
AMMA-Model Intercomparison Project
12
AMMA-Model Intercomparison Project Fr´ ed´ eric Hourdin * LMD/IPSL, UPMC Ionela Musat LMD/IPSL, UPMC Franc ¸oise Guichard CNRM-GAME (CNRS and M´ et´ eo-France) 42 avenue Coriolis 31057 Toulouse Cedex Paolo Michele Ruti ENEA Florence Favot CNRM-GAME (CNRS and M´ et´ eo-France) 42 avenue Coriolis 31057 Toulouse Cedex Marie-Ang` ele Filiberti Deceased Ma˝ i Pham SA/IPSL, UPMC Jean-Yves Grandpeix LMD/IPSL, UPMC Pascal Marquet, Aaron Boone, Jean-Philippe Lafore, Jean-Luc Redelsperger CNRM-GAME (CNRS and M´ et´ eo-France) 42 avenue Coriolis 31057 Toulouse Cedex Alessandro Dell’Aquila ENEA Teresa Losada Doval Departamento de Geofsica y Meteorologa, UCM, Madrid, Spain Abdoul Khadre Traore LPAOSF, UCAD, Dakar, Senegal Hubert Gall´ ee LGGE, CNRS, Grenoble, France A cross-section analysis provides light but relevant framework to assess the model skill in terms of sea- sonal and intra-seasonal variations of West African monsoon [mechanisms rainfall ]. * Corresponding author address: Fr´ ed´ eric Hourdin, Labora- toire de M´ et´ eorologie Dynamique du CNRS, UPMC, Tr 45-55, 3et, BP 99, 75252 Paris Cdex 05, France E-mail: [email protected] ABSTRACT AMMA-MIP is a Model Intercomparison Project developed within the framework of the African Mon- soon Multidisciplinary Analyses project (AMMA). It is a relatively light intercomparison and evaluation ex- ercise of both global and regional atmospheric models, focused on the study of the seasonal and intraseasonal variations of the climate and rainfall over the Sahel. Taking advantage of the relative zonal symmetry of the West African climate, one major target of the
Transcript of AMMA-Model Intercomparison Project

AMMA-Model Intercomparison Project
Frederic Hourdin ∗
LMD/IPSL, UPMC
Ionela MusatLMD/IPSL, UPMC
Francoise GuichardCNRM-GAME (CNRS and Meteo-France) 42 avenue Coriolis 31057 Toulouse Cedex
Paolo Michele RutiENEA
Florence FavotCNRM-GAME (CNRS and Meteo-France) 42 avenue Coriolis 31057 Toulouse Cedex
Marie-Angele FilibertiDeceased
Mai PhamSA/IPSL, UPMC
Jean-Yves GrandpeixLMD/IPSL, UPMC
Pascal Marquet, Aaron Boone, Jean-Philippe Lafore, Jean-Luc RedelspergerCNRM-GAME (CNRS and Meteo-France) 42 avenue Coriolis 31057 Toulouse Cedex
Alessandro Dell’AquilaENEA
Teresa Losada DovalDepartamento de Geofsica y Meteorologa, UCM, Madrid, Spain
Abdoul Khadre TraoreLPAOSF, UCAD, Dakar, Senegal
Hubert GalleeLGGE, CNRS, Grenoble, France
A cross-section analysis provides light but relevantframework to assess the model skill in terms of sea-sonal and intra-seasonal variations of West Africanmonsoon [mechanisms rainfall ].
∗Corresponding author address: Frederic Hourdin, Labora-toire de Meteorologie Dynamique du CNRS, UPMC, Tr 45-55,3et, BP 99, 75252 Paris Cdex 05, FranceE-mail: [email protected]
ABSTRACT
AMMA-MIP is a Model Intercomparison Projectdeveloped within the framework of the African Mon-soon Multidisciplinary Analyses project (AMMA). Itis a relatively light intercomparison and evaluation ex-ercise of both global and regional atmospheric models,focused on the study of the seasonal and intraseasonalvariations of the climate and rainfall over the Sahel.Taking advantage of the relative zonal symmetry ofthe West African climate, one major target of the

exercise is the documentation of a meridional crosssection made of zonally averaged (10W-10E) outputs.This paper presents the motivations and design of theexercise, and it discusses preliminary results and fur-ther extensions of the project.
1. The AMMA-MIP background
As emphasized in the introductory paper (Xueet al. (2008), this issue) global coupled models failto simulate properly the West African climate (IPCC2007; Cook and Vizy 2006). Atmospheric models forcedby observed sea surface temperatures do simulate manyfeatures of the West African Monsoon. However, theyfail to represent the full complexity of the monsoon aswill be illustrated herein.
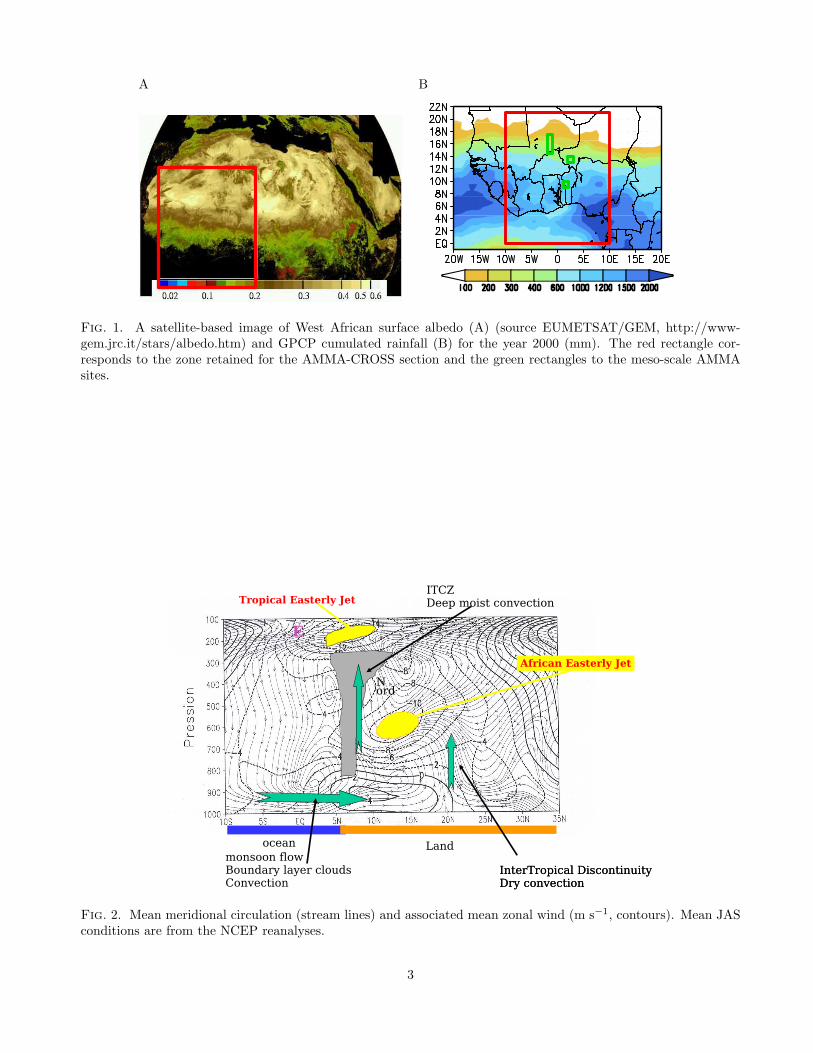
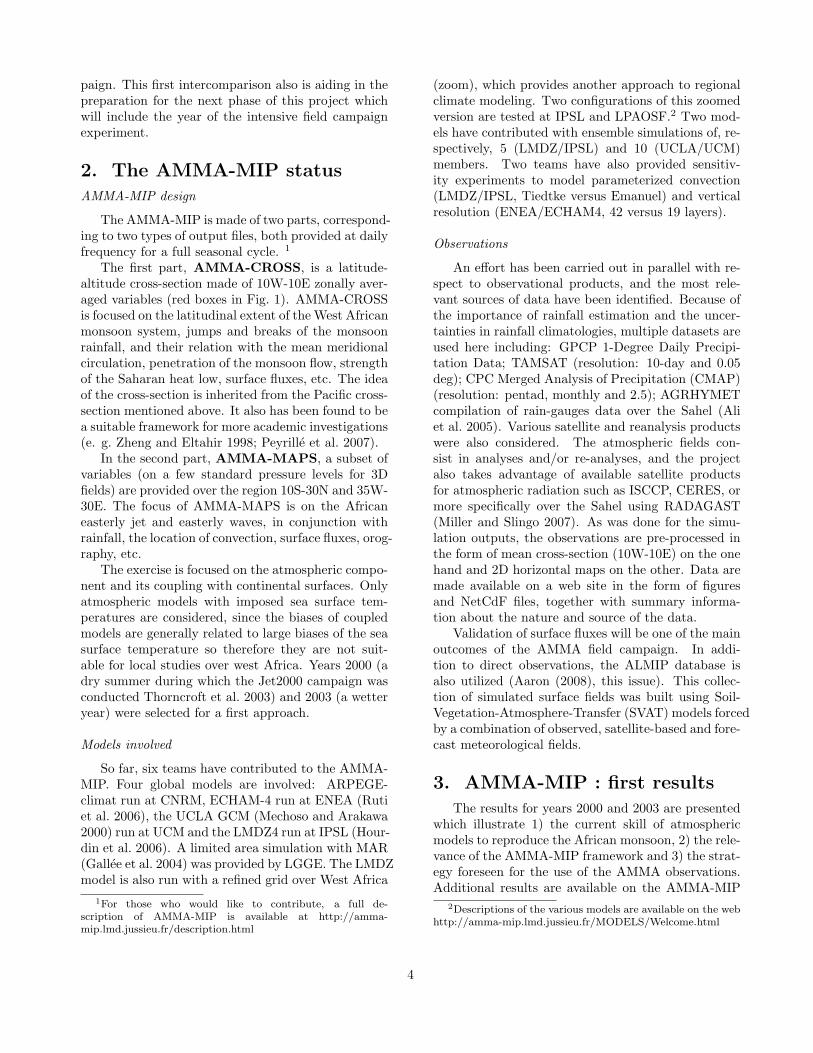
The African Monsoon is characterized by a well de-fined meridional structure of surface albedo and vege-tation (Fig. 1 A), with relatively weaker longitudinalvariations. This structure is tightly connected to thatof the mean rainfall (Fig. 1 B), with maximum rain-fall occuring in the Sudanian region (8N-12N) duringthe northern summer. In addition, there is a sharptransition over the Sahel (12N-20N), which is a par-ticularly sensitive region that experienced a signifi-cant drought in the late 70s and 80s. The meridionalstructure of the mean rainfall is itself related to themean meridional circulation (Fig. 2), characterized bya near surface monsoon flow which brings water evap-orated over the Guinea gulf over the African conti-nent. This monsoon flow converges with a southerlydry air flow coming from Sahara at the ”intertropi-cal discontinuity” in the region of the Saharan heatlow where dry convection occurs. The return branchof this Hadley circulation at around 600 hPa is as-sociated through the angular momentum budget andthermal wind balance with the African Easterly Jetwhich, in turn, transports additional moisture fromthe Indian ocean. The Inter Tropical ConvergenceZone is positioned at around 10N, where most of theconvective rainfall occurs, with a mean upward mo-tion which reaches 200 hPa where the TropopauseEasterly Jet is located.
The relative zonal symmetry of the climate meansdo not account for the strong longitudinal variationstaking place on a daily basis. The cumulated rainfallis the result of successive convective events, which arelocal or organized as meso-scale convective systemsor squall lines (Mathon et al. 2002). The interactionbetween the tropical waves and the convection playsa dominant role at both synoptic (the main convec-tive activity typically develops ahead of or within thetrough of the African Easterly Waves) and intrasea-sonal (very important for agriculture) time scales. At
these time scales, the African Monsoon is also stronglyinfluenced by global patterns of the sea surface tem-perature and local coupling with surface processes,but the amplitude and mechanisms of those couplingsare still very uncertain.
An important goal of the African Monsoon Mul-tidisciplinary Analyses project consists in addressingthe main uncertainties in atmospheric processes con-troling the monsoon system and to contribute to theevaluation and improvement of climate and weatherforecast models in that respect. The observationalstrategy included both reinforcement of the opera-tional network of surface stations and soundings on along term basis, and an intensive field campaign dur-ing the monsoon (northern summer) season in 2006(Redelsperger et al. 2006). Recognizing the merid-ional stratification of the monsoon system, a largepart of the observations were focused on a latitudi-nal transect located at approximately 0o longitude, inparticular over Benin, Niger and Mali. Three ”meso-scale sites”, corresponding to three typical climates,were equipped in order to document the land-atmosphereprocesses along the transect. At each site, in addi-tion to surface measurements (soil moisture, vegeta-tion, crops, ... ) and additional soundings, three tofour flux stations were deployed which represented themain land cover types of each site. Most aircraft mea-surements were also collected along the same transect.
The coordinated intercomparison and evaluationof global and regional atmospheric models started atthe beginning of the AMMA project. This led to thecreation of AMMA-MIP, a light and focused intercom-parison exercise. The models, global or regional, areevaluated in terms of their skill to reproduce the meanWest African climate, and in particular, the seasonaland intraseasonal variations of rainfall and associateddynamical structures.
The exercise is “light” in the sense that the mod-eling teams were only requested to provide relevantsubsets of the full model outputs. A parallel effort isalso carried out for observational data sets. A se-ries of graphics are made available through a webinterface (http://amma-mip.lmd.jussieu.fr). In thissense, AMMA-MIP is comparable to exercises orga-nized within the framework of the GEWEX Cloud-System-Study group, such as the EUROCS cross-sectionover the Eastern Pacific (Siebesma et al. 2004), thanto the classical MIPs developed in the climate commu-nity. It is also complementary to the efforts developedin the frame of WAMME (Xue et al. 2008). The modeloutputs can also be downloaded in NetCdF format.
The design of the AMMA-MIP is presented herein.Next, some results for two contrasting years (2000 and2003) are shown, which were selected prior to the cam-
2
A B
Fig. 1. A satellite-based image of West African surface albedo (A) (source EUMETSAT/GEM, http://www-gem.jrc.it/stars/albedo.htm) and GPCP cumulated rainfall (B) for the year 2000 (mm). The red rectangle cor-responds to the zone retained for the AMMA-CROSS section and the green rectangles to the meso-scale AMMAsites.
Fig. 2. Mean meridional circulation (stream lines) and associated mean zonal wind (m s−1, contours). Mean JASconditions are from the NCEP reanalyses.
3
paign. This first intercomparison also is aiding in thepreparation for the next phase of this project whichwill include the year of the intensive field campaignexperiment.
2. The AMMA-MIP status
AMMA-MIP design
The AMMA-MIP is made of two parts, correspond-ing to two types of output files, both provided at dailyfrequency for a full seasonal cycle. 1
The first part, AMMA-CROSS, is a latitude-altitude cross-section made of 10W-10E zonally aver-aged variables (red boxes in Fig. 1). AMMA-CROSSis focused on the latitudinal extent of the West Africanmonsoon system, jumps and breaks of the monsoonrainfall, and their relation with the mean meridionalcirculation, penetration of the monsoon flow, strengthof the Saharan heat low, surface fluxes, etc. The ideaof the cross-section is inherited from the Pacific cross-section mentioned above. It also has been found to bea suitable framework for more academic investigations(e. g. Zheng and Eltahir 1998; Peyrille et al. 2007).
In the second part, AMMA-MAPS, a subset ofvariables (on a few standard pressure levels for 3Dfields) are provided over the region 10S-30N and 35W-30E. The focus of AMMA-MAPS is on the Africaneasterly jet and easterly waves, in conjunction withrainfall, the location of convection, surface fluxes, orog-raphy, etc.
The exercise is focused on the atmospheric compo-nent and its coupling with continental surfaces. Onlyatmospheric models with imposed sea surface tem-peratures are considered, since the biases of coupledmodels are generally related to large biases of the seasurface temperature so therefore they are not suit-able for local studies over west Africa. Years 2000 (adry summer during which the Jet2000 campaign wasconducted Thorncroft et al. 2003) and 2003 (a wetteryear) were selected for a first approach.
Models involved
So far, six teams have contributed to the AMMA-MIP. Four global models are involved: ARPEGE-climat run at CNRM, ECHAM-4 run at ENEA (Rutiet al. 2006), the UCLA GCM (Mechoso and Arakawa2000) run at UCM and the LMDZ4 run at IPSL (Hour-din et al. 2006). A limited area simulation with MAR(Gallee et al. 2004) was provided by LGGE. The LMDZmodel is also run with a refined grid over West Africa
1For those who would like to contribute, a full de-scription of AMMA-MIP is available at http://amma-mip.lmd.jussieu.fr/description.html
(zoom), which provides another approach to regionalclimate modeling. Two configurations of this zoomedversion are tested at IPSL and LPAOSF.2 Two mod-els have contributed with ensemble simulations of, re-spectively, 5 (LMDZ/IPSL) and 10 (UCLA/UCM)members. Two teams have also provided sensitiv-ity experiments to model parameterized convection(LMDZ/IPSL, Tiedtke versus Emanuel) and verticalresolution (ENEA/ECHAM4, 42 versus 19 layers).
Observations
An effort has been carried out in parallel with re-spect to observational products, and the most rele-vant sources of data have been identified. Because ofthe importance of rainfall estimation and the uncer-tainties in rainfall climatologies, multiple datasets areused here including: GPCP 1-Degree Daily Precipi-tation Data; TAMSAT (resolution: 10-day and 0.05deg); CPC Merged Analysis of Precipitation (CMAP)(resolution: pentad, monthly and 2.5); AGRHYMETcompilation of rain-gauges data over the Sahel (Aliet al. 2005). Various satellite and reanalysis productswere also considered. The atmospheric fields con-sist in analyses and/or re-analyses, and the projectalso takes advantage of available satellite productsfor atmospheric radiation such as ISCCP, CERES, ormore specifically over the Sahel using RADAGAST(Miller and Slingo 2007). As was done for the simu-lation outputs, the observations are pre-processed inthe form of mean cross-section (10W-10E) on the onehand and 2D horizontal maps on the other. Data aremade available on a web site in the form of figuresand NetCdF files, together with summary informa-tion about the nature and source of the data.
Validation of surface fluxes will be one of the mainoutcomes of the AMMA field campaign. In addi-tion to direct observations, the ALMIP database isalso utilized (Aaron (2008), this issue). This collec-tion of simulated surface fields was built using Soil-Vegetation-Atmosphere-Transfer (SVAT) models forcedby a combination of observed, satellite-based and fore-cast meteorological fields.
3. AMMA-MIP : first results
The results for years 2000 and 2003 are presentedwhich illustrate 1) the current skill of atmosphericmodels to reproduce the African monsoon, 2) the rele-vance of the AMMA-MIP framework and 3) the strat-egy foreseen for the use of the AMMA observations.Additional results are available on the AMMA-MIP
2Descriptions of the various models are available on the webhttp://amma-mip.lmd.jussieu.fr/MODELS/Welcome.html
4

Simulation Model Horizontal number of detailsres (km) layers
CNRM ARPEGE-Climat 300 31 1 memberENEAL19 ECHAM-4 370 19 1 memberENEAL42 ECHAM-4 370 42 1 memberUCM1-10 UCLA 220 29 10 membersIPSL1-5 LMDZ4 300 19 5 membersIPSLTI LMDZ4 300 19 Tiedtke convection scheme instead of EmanuelIPSLWA LMDZ4 80 19 zoomed over West AfricaLPAOSF LMDZ4 150 19 zoomed over West AfricaLGGE MAR 40 40 Limited area model
Table 1. AMMA-MIP model configurations.
web site.
Mean dynamical structure
The post-onset conditions are presented first (15July - 15 August, 2000) which consist in the AMMA-CROSS mean zonal wind for all the AMMA-MIP mod-els and for NCEP and ERA40 reanalysis. The vari-ous models capture the main elements of the zonalcirculation such as the westerlies (positive contoursand red colors) near the surface within the monsoonflow (Eq-20N) or the predominance of easterlies inthe mid troposphere. However, important differencesare observed. The monsoon flow is too strong forsome models (IPSLTI, CNRM, UCM and LGGE) andmaybe somewhat too weak for others (ENEAL19 andENEAL42). ENEA, IPSL and LGGE correctly simu-late an isolated AEJ. The position of the Sub-TropicalJet also varies in latitude from one model to the other.
The comparison between the two ENEA simula-tions gives an idea of the impact of the vertical reso-lution; the comparison IPSL1/IPSLTI documents themajor impact of parameterized convection while thatof UCM run1 and UCM run2 illustrates the internal(not forced by SST variability) inter-annual variabil-ity as produced by GCMs. LPAOSF, IPSLWA andIPSL1 are run with model versions which are very sim-ilar to LMDZ but with different horizontal grids. TheLPAOSF and IPSLWA grids are refined over WestAfrica.
Rainfall
A preliminary comparison of the seasonal cycle ofrainfall over the 10W-10E cross section is shown inFig. 4 for the year 2000. The simulations displayed arethe same as in Fig. 3. The models generally capturethe latitudinal migration of the intertropical conver-gence zone from south of the Equator over the ocean(the Guinean coast is located at about 5N) duringnorthern winter, and to West Africa during the mon-
soon season. In more detail, the latitudinal extensionover the Sahel (beyond 15N in Fig. 4) is very differ-ent in the various models. No systematic conclusioncan be drawn. Some models predict a monsoon rain-fall band which is too narrow in latitude (IPSL) andfor others it is too broad (UCM and LGGE). Notethat even the reanalyzes (NCEP) show important de-ficiencies in this respect. This characteristic seems tobe quite sensitive to the model configuration as seenwhen comparing the IPSL, IPSLWA and LPAOSFsimulations run with the same LMDZ model. Alsonote that the CNRM model, which represents theAEJ rather poorly, performs quite well for rainfall.
All of the models show a significant intraseasonalvariability with active sequences and breaks and, onceagain, the interannual variability is probably too weakin some models (LPAOSF) and too strong in others(CNRM).
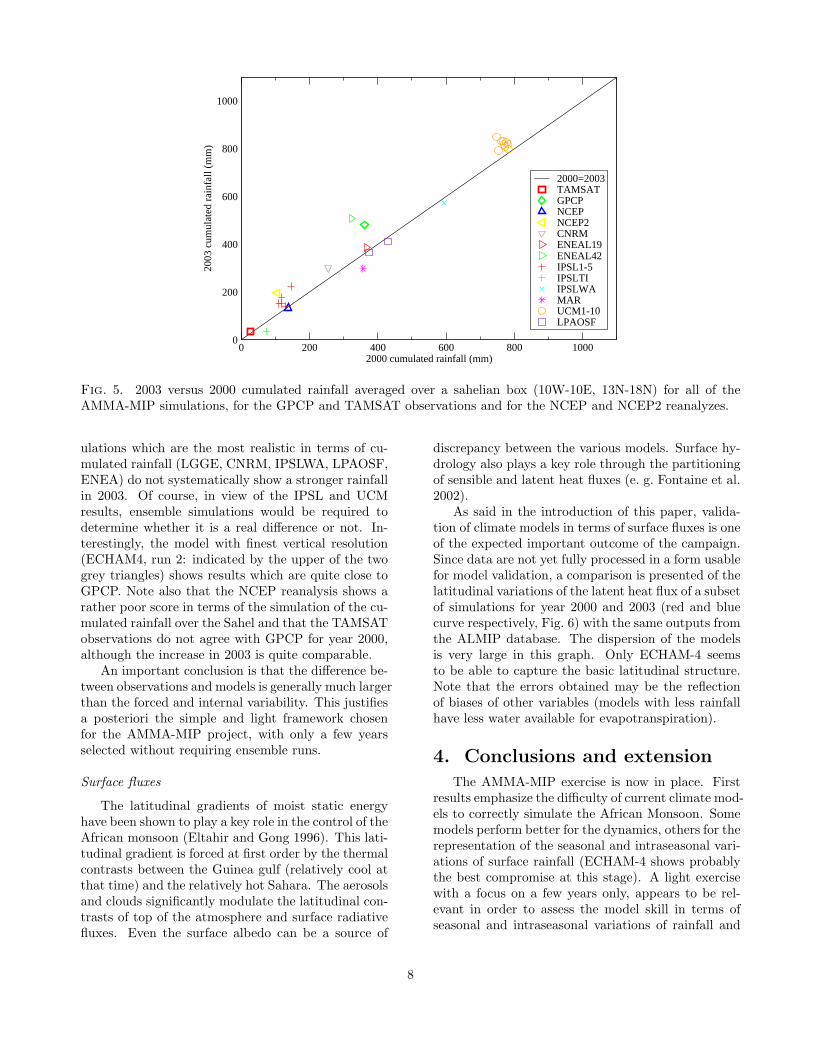
The annual cumulated rainfall over the Sahelianpart of the cross-section (10W-10E, 13N-18N) is shownin Fig. 5 for the year 2000 (x-axis) and 2003 (y-axis).Note that, in the simulations, the only difference inthe setup between year 2000 and 2003 comes from thespecification of boundary conditions, and, in partic-ular, of sea surface temperature. Only the ”forced”part of the observed variability can hopefully be re-produced by the climate models while the internalvariability can be checked when ensemble simulations(performed with the same boundary conditions buta different – random – initial state) are available.A different symbol is used for the various models.For UCM and IPSL, the ensembles are shown withthe same symbol. All the points above the straightoblique line correspond to a larger rainfall in 2003than in 2000. The GPCP observation shows thatrainfall was about 20% stronger in 2003. Globally,the models also predict a larger rainfall in 2003. It isclear, however, from the ensemble sets that the inter-nal variability is significant, compared with the forcedvariability for those two years. Note also that the sim-
5

1 ) CNRM (ARPEGE)
10S EQ 10N 20N 30N
100
300
200
500
800
600
700
900
400
1000
2 ) ENEAL19 (ECHAM)
10S EQ 10N 20N 30N
100
300
200
500
800
600
700
900
400
1000
3 ) ENEAL42 (ECHAM)
10S EQ 10N 20N 30N
100
300
200
500
800
600
700
900
400
1000
4 ) LPAOSF2 (LMDZ4)
10S EQ 10N 20N 30N
100
300
200
500
800
600
700
900
400
1000
5 ) IPSLTI (LMDZ4)
10S EQ 10N 20N 30N
100
300
200
500
800
600
700
900
400
1000
6 ) IPSL1 (LMDZ4)
10S EQ 10N 20N 30N
100
300
200
500
800
600
700
900
400
1000
7 ) IPSL−WA (LMDZ4)
10S EQ 10N 20N 30N
100
300
200
500
800
600
700
900
400
1000
8 ) LGGE (MAR)
10S EQ 10N 20N 30N
100
300
200
500
800
600
700
900
400
1000
9 ) UCM1 (UCLAV2)
10S EQ 10N 20N 30N
100
300
200
500
800
600
700
900
400
1000
10 ) UCM2 (UCLAV2)
10S EQ 10N 20N 30N
100
300
200
500
800
600
700
900
400
1000
11 ) V2 (NCEP)
10S EQ 10N 20N 30N
100
300
200
500
800
600
700
900
400
1000
12 ) ERA40 (ECMWF)
10S EQ 10N 20N 30N
100
300
200
500
800
600
700
900
400
1000
Zonal wind (m/s), After Onset (15Jul−15Aug), YR:2000, AMMA−cross, average 10W−10E
Fig. 3. Latitude-pressure cross-section (averaged between 10W and 10E) of the zonal wind (m/s) for the variousconfigurations (see Tab. 1) and for ECMWF and NCEP reanalyzes ; year 2000, after onset (15 July-15 August)
6

1 ) CNRM (ARPEGE)
Eq
10S
20N
10N
Jan Feb Mar Apr May Jun Jul Aug Sep Oct Nov Dec
2 ) ENEAL19 (ECHAM)
Eq
10S
20N
10N
Jan Feb Mar Apr May Jun Jul Aug Sep Oct Nov Dec
3 ) ENEAL42 (ECHAM)
Eq
10S
20N
10N
Jan Feb Mar Apr May Jun Jul Aug Sep Oct Nov Dec
4 ) LPAOSF2 (LMDZ4)
Eq
10S
20N
10N
Jan Feb Mar Apr May Jun Jul Aug Sep Oct Nov Dec
5 ) IPSLTI (LMDZ4)
Eq
10S
20N
10N
Jan Feb Mar Apr May Jun Jul Aug Sep Oct Nov Dec
6 ) IPSL1 (LMDZ4)
Eq
10S
20N
10N
Jan Feb Mar Apr May Jun Jul Aug Sep Oct Nov Dec
7 ) IPSL−WA (LMDZ4)
Eq
10S
20N
10N
Jan Feb Mar Apr May Jun Jul Aug Sep Oct Nov Dec
8 ) LGGE (MAR)
Eq
10S
20N
10N
Jan Feb Mar Apr May Jun Jul Aug Sep Oct Nov Dec
9 ) UCM1 (UCLAV2)
Eq
10S
20N
10N
Mar Apr May Jun Jul Aug Sep Oct Nov Dec
10 ) V2 (NCEP)
Eq
10S
20N
10N
Jan Feb Mar Apr May Jun Jul Aug Sep Oct Nov Dec
11 ) OBS (CMAP)
Eq
10S
20N
10N
Jan Feb Mar Apr May Jun Jul Aug Sep Oct Nov Dec
12 ) OBS (GPCP)
Eq
10S
20N
10N
Jan Feb Mar Apr May Jun Jul Aug Sep Oct Nov Dec
precipitation, Seasonal Cycle, YR:2000, AMMA−cross, average 10W−10E
Fig. 4. The seasonal evolution of the 10-day running mean of the 10W-10E averaged rainfall (mm/day) forsimulations CNRM, ENEAL19, ENEAL42 , LPAOSF, IPSLTI, IPSL1, IPSLWA, LGGE, UCM1 and UCM2, aswell as for NCEP reanalysis, CMAP and GPCP observations ; year 2000.
7
0 200 400 600 800 10002000 cumulated rainfall (mm)
0
200
400
600
800
1000
2003
cum
ulat
ed r
ainf
all (
mm
)
2000=2003TAMSATGPCPNCEPNCEP2CNRMENEAL19ENEAL42IPSL1-5IPSLTIIPSLWAMARUCM1-10LPAOSF
Fig. 5. 2003 versus 2000 cumulated rainfall averaged over a sahelian box (10W-10E, 13N-18N) for all of theAMMA-MIP simulations, for the GPCP and TAMSAT observations and for the NCEP and NCEP2 reanalyzes.
ulations which are the most realistic in terms of cu-mulated rainfall (LGGE, CNRM, IPSLWA, LPAOSF,ENEA) do not systematically show a stronger rainfallin 2003. Of course, in view of the IPSL and UCMresults, ensemble simulations would be required todetermine whether it is a real difference or not. In-terestingly, the model with finest vertical resolution(ECHAM4, run 2: indicated by the upper of the twogrey triangles) shows results which are quite close toGPCP. Note also that the NCEP reanalysis shows arather poor score in terms of the simulation of the cu-mulated rainfall over the Sahel and that the TAMSATobservations do not agree with GPCP for year 2000,although the increase in 2003 is quite comparable.
An important conclusion is that the difference be-tween observations and models is generally much largerthan the forced and internal variability. This justifiesa posteriori the simple and light framework chosenfor the AMMA-MIP project, with only a few yearsselected without requiring ensemble runs.
Surface fluxes
The latitudinal gradients of moist static energyhave been shown to play a key role in the control of theAfrican monsoon (Eltahir and Gong 1996). This lati-tudinal gradient is forced at first order by the thermalcontrasts between the Guinea gulf (relatively cool atthat time) and the relatively hot Sahara. The aerosolsand clouds significantly modulate the latitudinal con-trasts of top of the atmosphere and surface radiativefluxes. Even the surface albedo can be a source of
discrepancy between the various models. Surface hy-drology also plays a key role through the partitioningof sensible and latent heat fluxes (e. g. Fontaine et al.2002).
As said in the introduction of this paper, valida-tion of climate models in terms of surface fluxes is oneof the expected important outcome of the campaign.Since data are not yet fully processed in a form usablefor model validation, a comparison is presented of thelatitudinal variations of the latent heat flux of a subsetof simulations for year 2000 and 2003 (red and bluecurve respectively, Fig. 6) with the same outputs fromthe ALMIP database. The dispersion of the modelsis very large in this graph. Only ECHAM-4 seemsto be able to capture the basic latitudinal structure.Note that the errors obtained may be the reflectionof biases of other variables (models with less rainfallhave less water available for evapotranspiration).
4. Conclusions and extension
The AMMA-MIP exercise is now in place. Firstresults emphasize the difficulty of current climate mod-els to correctly simulate the African Monsoon. Somemodels perform better for the dynamics, others for therepresentation of the seasonal and intraseasonal vari-ations of surface rainfall (ECHAM-4 shows probablythe best compromise at this stage). A light exercisewith a focus on a few years only, appears to be rel-evant in order to assess the model skill in terms ofseasonal and intraseasonal variations of rainfall and
8

Fig. 6. Comparison of the surface latent heat flux (10W-10E average, W m−2) for various simulations and for thevarious models involved in the intercomparison exercise of surface schemes ALMIP. The AMMA-MIP simulationscorrespond to year 2000 (red) and 2003 (blue) while various models and years 2004 to 2006 are shown for ALMIPto give an idea of the uncertainty. All the flux values are averaged over June-July-August-September.
in order to evaluate model improvements which canbe obtained, for instance, by changing the horizontalor vertical resolution or modifying the parametrizedphysics. First results confirm that parametrized con-vection is a key issue here.
The AMMA-MIP exercise is currently extendedto the period of the intensive phase of the AMMAfield experiment in 2006 (Janicot et al. 2008). 2005is considered as well, both because the observing net-work were partially deployed at that time and becausethe 2006 monsoon onset occurred much later than in2005, together with a late setting up of the SST coldtongue along the Guinean coast. In order to fullyexploit the field campaign observations, and to allowthe study of the diurnal cycle, additional 3D outputsat a 2-hour frequency are requested for the summer,2006. Preliminary model results are now being col-lected. Note that this framework may help evalu-ate the biases of numerical weather forecast modelsas well. ECMWF has already provided time seriesaccording to the AMMA-MIP requirements for year2006, consisting in forecasts at various time ranges.
In terms of using campaign data, particular carewill be given to the compilation of soundings (clas-sical soundings, drop sounds sent from aircrafts orballoons, Parker et al. 2008). Boundary layer flights
were also dedicated to the documentation of the tran-sect, from the ocean (with a rendez-vous with scien-tific ships over the Guinea gulf) to the Sahara. Theywill also serve as a basis for comparison.
The use of the turbulent fluxes recorded at themeso-scale sites is a more complicated matter. How-ever, combining the ALMIP approach with AMMA-MIP model analysis (looking, for instance, at the cor-relation of the radiative or latent heat fluxes, rainfall,surface temperature, etc) should yield some clue toassess the representation of coupled processes at thesurface.
In order to try to separate the role of atmosphericprocesses from that of surface feedbacks, additionalsimulations will be encouraged in which surface evap-oration will be computed by specifying the ratio ofevaporation to potential evaporation (that of a freesurface of water) as a function of latitude and sea-son, thus cutting the feedback loop through surfacemoisture.
An additional interest of the AMMA campaignfor model evaluation is the joint observation of at-mospheric composition and dynamics. The links be-tween composition and dynamics is illustrated basedon results of the LMDZ model with the two deep con-vection schemes (similar to simulations IPSL1 and
9

A
B
C
Tiedtke Emanuel
Fig. 7. Illustration of the impact of parametrized convection – Tiedtke (1989) (left) versus Emanuel (1993) (right)scheme – in the AMMA-cross framework for July. A : mean meridional circulation (stream lines) and mean zonalwind (colors, m/s). B : relative humidity (%, colors) and parameterized convective heating rate (contours, K/day).C : CO concentrations (contours, ppmv) and idealized tracer emitted in the boundary layer over the Africancontinent, south of 10N (colors, arbitrary units).
10

IPSLTI in Fig. 3). With the Emanuel convectiveschemes (Fig. 7), the convective heating (panels B,contours, K/day) peaks higher up in the atmosphere,with stronger heating rates than for the Tiedtke scheme.The cooling (dashed contours) in the lower atmosphereover Sahel due to the evaporation of convective rain-fall is also stronger with Emanuel. Those differenceshave a strong impact on the large scale dynamics :the African Easterly Jet (panel A, colors) is muchbetter represented with the Emanuel scheme (as al-ready shown in Fig. 3); the mean meridional circu-lation (stream lines) shows a well marked ITCZ onlyin the Emanuel case. The relative humidity (panelB, colors) shows a signature of this different trans-port with, in particular, a local maximum which isstronger and higher in the ITCZ for the Emanuelscheme. Similar differences are obtained for CO withthe climate-chemistry model LMDZ-INCA (Hauglus-taine et al. 2004) as well as with an idealized traceremitted in the boundary layer (between surface and850hPa) over the African continent South of 10N, ex-periencing a radioactive decay with a life time of afew days (panel C). Based on those considerations, itwas decided to extend the AMMA-CROSS frameworkto the intercomparison of chemistry transport mod-els and coupled chemistry climate models, comparingboth realistic chemical tracers and tracers emitted inlatitude bands, close to the surface, either over thecontinent or ocean.
The AMMA-MIP project, and in particular theAMMA cross-section analysis, provides a relevant frame-work for focusing on the climate feedbacks and onthe interactions between climate components, such asatmosphere, land-surface, chemistry. It is a uniqueframework allowing the study of the impact of dif-ferent climatic components on the hydrological cycle,and it could be a good candidate for a GEWEX-GCSScase study.
REFERENCES
Aaron, B. p., 2008: The AMMA Land Surface ModelIntercomparison Project(ALMIP). Bull. Am. Me-
teorol. Soc., this issue.
Ali, A., A. Amani, A. Diedhiou, and T. Lebel, 2005:Rainfall Estimation in the Sahel. Part II: Evalua-tion of Rain Gauge Networks in the CILSS Coun-tries and Objective Intercomparison of RainfallProducts. J. Appl. Met., 44, 1707–1722.
Cook, K. H. and E. K. Vizy, 2006: Coupled ModelSimulations of the West African Monsoon System:
Twentieth- and Twenty-First-Century Simulations.J. Climate, 19, 3681–+, doi:10.1175/JCLI3814.1.
Eltahir, E. A. B. and C. Gong, 1996: Dynamics ofWet and Dry Years in West Africa. J. Climate, 9,1030–1042.
Emanuel, K. A., 1993: A cumulus representationbased on the episodic mixing model: the impor-tance of mixing and microphysics in predicting hu-midity. A.M.S. Meteorol. Monographs, 24 (46),185–192.
Fontaine, B., N. Philippon, S. Trzaska, andP. Roucou, 2002: Spring to summer changes in theWest African monsoon through NCEP/NCAR re-analyses (1968-1998). J. Geophys. Res., 107, 4186–+, doi:10.1029/2001JD000834.
Gallee, H., et al., 2004: A high-resolution simulationof a West African rainy season using a regional cli-mate model. J. Geophys. Res., 109, 5108–+, doi:10.1029/2003JD004020.
Hauglustaine, D. A., F. Hourdin, L. Jourdain, M.-A. Filiberti, S. Walters, J.-F. Lamarque, and E. A.Holland, 2004: Interactive chemistry in the Lab-oratoire de Meteorologie Dynamique general cir-culation model: Description and background tro-pospheric chemistry evaluation. J. Geophys. Res.,109, 4314–4357.
Hourdin, F., et al., 2006: The LMDZ4 general circu-lation model: climate performance and sensitivityto parametrized physics with emphasis on tropicalconvection. Climate Dynamics, 27, 787–813, doi:10.1007/s00382-006-0158-0.
IPCC, 2007: Climate Change 2007: The Scientific
Basis. Contribution of Working Group I to the
Fourth Assessment Report of the Intergovernmen-
tal Panel on Climate Change, S. Solomon, D. Qin,M. Manning, Z. Chen, M. Marquis, K. B. Av-eryt, M. Tignor, and H. L. Miller, Eds., CambridgeUniversity Press, Cambridge, United Kingdom andNew York, NY, USA, 996.
Janicot, S., et al., 2008: Large-scale overview of thesummer monsoon over west and central africa dur-ing the amma field experiment in 2006, submittedto annales geophysicae. submitted to Annales Geo-physicae.
Mathon, V., H. Laurent, and T. Lebel, 2002:Mesoscale Convective System Rainfall in the Sahel.Journal of Applied Meteorology, 41, 1081–1092.
11
Mechoso, J.-Y., C. R.and Yu and A. Arakawa, 2000:A coupled GCM pilgrimage: From climate catastro-
phe to ENSO simulations., 539–575.
Miller, M. A. and A. Slingo, 2007: The Arm Mo-bile Facility and Its First International Deploy-ment: Measuring Radiative Flux Divergence inWest Africa. Bull. Am. Meteorol. Soc., 88, 1229–+, doi:10.1175/BAMS-88-8-1229.
Parker, D. J., et al., 2008: The amma radiosonde pro-gram and its implications for the future of atmo-spheric monitoring over africa. BAMS, in press.
Peyrille, P., J.-P. Lafore, and J.-L. Redelsperger,2007: An Idealized Two-Dimensional Frameworkto Study the West African Monsoon. Part I: Vali-dation and Key Controlling Factors. J. Atmos. Sci.,64, 2765–+, doi:10.1175/JAS3919.1.
Redelsperger, J.-L., C. D. Thorncroft, A. Diedhiou,T. Lebel, D. J. Parker, and J. Polcher, 2006:African Monsoon Multidisciplinary Analysis: AnInternational Research Project and Field Cam-paign. Bulletin of the American Meteorological So-
ciety, vol. 87, issue 12, p. 1739, 87, 1739–+, doi:10.1175/BAMS-87-12-1739.
Ruti, P. M., D. di Rocco, and S. Gualdi, 2006: Im-pact of increased vertical resolution on simulationof tropical climate. Theoretical and Applied Clima-
tology, 85, 61–80, doi:10.1007/s00704-005-0174-8.
Siebesma, A. P., et al., 2004: Cloud representationin general-circulation models over the northern Pa-cific Ocean: A EUROCS intercomparison study.Q. J. R. Meteorol. Soc., 130, 3245–3267.
Thorncroft, C. D., et al., 2003: The JET2000 Project:Aircraft Observations of the African Easterly Jetand African Easterly Waves. Bulletin of the Ameri-
can Meteorological Society, vol. 84, Issue 3, pp.337-
351, 84, 337–351.
Tiedtke, M., 1989: A comprehensive mass flux schemefor cumulus parameterization in large-scale models.Mon. Wea. Rev., 117, 1179–1800.
Xue, Y., P. M. Ruti, A. Boone, and F. Hourdin, 2008:West African monsoon and its modeling. Bull. Am.
Meteorol. Soc., this issue.
Xue, Y., et al., 2008: The West African MonsoonModeling and Evaluation project (WAMME) andits First Model Intercomparison Experiment. Bull.
Am. Meteorol. Soc., this issue.
Zheng, X. and E. A. B. Eltahir, 1998: The Role ofVegetation in the Dynamics of West African Mon-soons. J. Climate, 11, 2078–2096.
12