Förster Resonance Energy Transfer from Terbium Complexes ...
252
HAL Id: tel-01342903 https://tel.archives-ouvertes.fr/tel-01342903 Submitted on 7 Jul 2016 HAL is a multi-disciplinary open access archive for the deposit and dissemination of sci- entific research documents, whether they are pub- lished or not. The documents may come from teaching and research institutions in France or abroad, or from public or private research centers. L’archive ouverte pluridisciplinaire HAL, est destinée au dépôt et à la diffusion de documents scientifiques de niveau recherche, publiés ou non, émanant des établissements d’enseignement et de recherche français ou étrangers, des laboratoires publics ou privés. Förster Resonance Energy Transfer from Terbium Complexes to Quantum Dots for Multiplexed Homogeneous Immunoassays and Molecular Rulers David Karl Wegner To cite this version: David Karl Wegner. Förster Resonance Energy Transfer from Terbium Complexes to Quantum Dots for Multiplexed Homogeneous Immunoassays and Molecular Rulers. Biological Physics [physics.bio- ph]. Université Paris Sud - Paris XI, 2015. English. NNT: 2015PA112109. tel-01342903
-
Upload
khangminh22 -
Category
Documents
-
view
0 -
download
0
Transcript of Förster Resonance Energy Transfer from Terbium Complexes ...

HAL Id: tel-01342903https://tel.archives-ouvertes.fr/tel-01342903
Submitted on 7 Jul 2016
HAL is a multi-disciplinary open accessarchive for the deposit and dissemination of sci-entific research documents, whether they are pub-lished or not. The documents may come fromteaching and research institutions in France orabroad, or from public or private research centers.
L’archive ouverte pluridisciplinaire HAL, estdestinée au dépôt et à la diffusion de documentsscientifiques de niveau recherche, publiés ou non,émanant des établissements d’enseignement et derecherche français ou étrangers, des laboratoirespublics ou privés.
Förster Resonance Energy Transfer from TerbiumComplexes to Quantum Dots for Multiplexed
Homogeneous Immunoassays and Molecular RulersDavid Karl Wegner
To cite this version:David Karl Wegner. Förster Resonance Energy Transfer from Terbium Complexes to Quantum Dotsfor Multiplexed Homogeneous Immunoassays and Molecular Rulers. Biological Physics [physics.bio-ph]. Université Paris Sud - Paris XI, 2015. English. �NNT : 2015PA112109�. �tel-01342903�
UNIVERSITE PARIS-SUD
ECOLE DOCTORALE : Sciences et Technologie de l’Information, desTelecommunications et des Systemes
Institut d’Electronique Fondamentale
DISCIPLINE : Physique
THESE DE DOCTORAT
soutenance prevue le 24/06/2015
par
Karl David WEGNER
Forster Resonance Energy Transfer from Terbium
Complexes to Quantum Dots for Multiplexed
Homogeneous Immunoassays and Molecular Rulers /
Transfert d’energie par resonance de type Forster entre
des complexes de terbium et des boıtes quantiques
pour des immunodosages et des reglettes moleculaires
multiplexes
Directeur de these : Niko HILDEBRANDT Professeur (IEF, Universite Paris-Sud)
Composition du jury :
Rapporteurs : Wolfgang PARAK Professeur (Universite de Marburg)
Martinus WERTS Charge de Recherche CNRS(Ecole normale superieure de Rennes)
Examinateurs : Fabienne MEROLA Directrice de Recherche CNRS(Universite de Paris-Sud)
Antigoni ALEXANDROU Directrice de Recherche CNRS(Ecole Polytechnique)
Loıc CHARBONNIERE Directeur de Recherche CNRS(LIMAA IPHC, Strasbourg)
Peter REISS Expert senior CEA (CEA Grenoble)


Acknowledgement
Foremost, I would like to express my sincere gratitude to my advisor / flatmate / friend Prof.Dr. Niko Hildebrandt for the continuous support of my PhD study and research, for his pa-tience, motivation, enthusiasm, and immense knowledge. During the last four years, his trustin my abilities, the liberties in the laboratory, opportunities to attend to different conferencesand his endless support, made me to the researcher, who I’m today and I’m very grateful forthat.
I thank Prof. Dr. Wolfgang Parak and Dr. Martinus Werts for being the reviewers of my PhDthesis.
Special thanks goes to Dr. Daniel Geißler, who supported me since my diploma studies andalso helped me in writing this thesis.
I would like to thank the former and actual members of the NanoBioPhotonics group forthe nice working atmosphere and discussions.
Dr. Frank Morgner, Dr. Thomas Pons and all of my coauthors of my publications I wouldlike to thank for the fruitful collaboration. Especially Dr. Igor Medintz I would like to thankfor his support concerning my PhD thesis and beyond.
I gratefully wish to acknowledge Dr. Loıc Charbonniere, Dr. Peter Reiss, and the companyCezanne for the productive collaboration in the NanoFRET project and for memorable projectmeetings.
I would like to take the opportunity to thank all members of the family Hildebrandt / ChanHuot, who have let me be a part of their life during the last years. Thank you for the niceBBQs in the french summer, for the help with the french administration, and for the open earsnot only for science problems.
In the end my greatest gratitude goes to my family for their love and support, believing inme, and all the advices that have brought me this far.
III

List of publications
Original publications
1. L. Mattsson, K. D. Wegner, N. Hildebrandt, and T. Soukka. Upconverting Nanoparticleto Quantum Dot FRET for Homogeneous Double-Nano Biosensors. RSC Advances 2015,5, 13270-13277.
2. S. Linden, M. K. Singh, K. D. Wegner, M. Regairaz, F. Dautry, F. Treussart, and N.Hildebrandt. Terbium-Based Time-Gated Forster Resonance Energy Transfer Imagingfor Evaluating Protein-Protein Interactions on Cell Membranes. Dalton Transactions2015, 44, 4994-5003.
3. B. Rogez, H. Yang, E. Le Moal, S. Leveque-Fort, E. Boer-Duchemin, F. Yao, Y. H. Lee, Y.ZhangY, K. D. Wegner, N. Hildebrandt, A. Mayne, and G. Dujardin. Fluorescence Life-time and Blinking of Individual Semiconductor Nanocrystals on Graphene. The Journalof Physical Chemistry C 2014, 118 (32), 18445-18452.
4. K. D. Wegner, F. Morgner, E. Oh, R. Goswami, K. Susumu, M. H. Stewart, I. L. Medintz,and N. Hildebrandt. Three-Dimensional Solution-Phase Forster Resonance Energy Trans-fer Analysis of Nanomolar Quantum Dot Bioconjugates with Subnanometer Resolution.Chemistry of Materials 2014, 26 (14), 4299-4312.
5. K. D. Wegner, S. Linden, Z. Jin, T. L. Jennings, R. el Khoulati, P. M. P. van Bergenen Henegouwen, and N. Hildebrandt. Nanobodies and Nanocrystals: Highly sensitivequantum dot-based homogeneous FRET-immunoassay for serum-based EGFR detection.Small 2014, 10 (4), 734-740.
6. K. D. Wegner, Z. Jin, S. Linden, T. L. Jennings, and N. Hildebrandt. Quantum-Dot-Based Forster Resonance Energy Transfer Immunoassay for Sensitive Clinical Diagnosticsof Low-Volume Serum Samples. ACS Nano 2013, 7 (8), 7411-7419.
7. K. Nchimi-Nono, K. D. Wegner, S. Linden, A. Lecointre, L. Ehret-Sabatier, S. Shakir,N. Hildebrandt, and L. J. Charbonniere. Activated Phosphonated Trifunctional Chelatesfor Highly Sensitive Lanthanide-based FRET Immunoassays Applied to Total ProstateSpecific Antigen Detection. Organic & Biomolecular Chemistry 2013, 11, 6493-6501.
8. K. D. Wegner, P. T. Lanh, T. Jennings, E. Oh, V. Jain, S. M. Fairclough, J. M. Smith,E. Giovanelli, N. Lequeux, T. Pons, and N. Hildebrandt. Influence of LuminescenceQuantum Yield, Surface Coating and Functionalization of Quantum Dots on the Sensi-tivity of Time-Resolved FRET Bioassays. ACS Applied Materials & Interfaces 2013, 5,2881-2892.
9. W. R. Algar, D. Wegner, A. L. Huston, J. B. Blanco-Canosa, M. H. Stewart, A. Arm-strong, P. E. Dawson, N. Hildebrandt, and I. L. Medintz. Quantum Dots as Simulta-neous Acceptors and Donors in Time-Gated Forster Resonance Energy Transfer Relays:Characterization and Biosensing. Journal of the American Chemical Society 2012 134,1876-1891.
V
10. D. Wegner, D. Geißler, S. Stufler, H.-G. Lohmannsroben, and N. Hildebrandt. Time-resolved and steady-state FRET spectroscopy on commercial biocompatible quantumdots. Proceedings of SPIE 7909 2011, DOI: 10.1117/12.874760.
Reviews
1. K. D. Wegner and N. Hildebrandt. Quantum Dots: Bright and Versatile In vitro and Invivo Fluorescence Imaging Biosensors. Chemical Society Reviews 2015,DOI: 10.1039/C4CS00532E.
2. N. Hildebrandt, K. D. Wegner, and W. R. Algar. Luminescent Terbium Complexes: Su-perior Forster Resonance Energy Transfer Donors for Flexible and Sensitive MultiplexedBiosensing. Coordination Chemistry Reviews 2014, 273-274, 125-138.
3. D. Geißler, S. Linden, K. Liermann, K. D. Wegner, L. J. Charbonniere, and N. Hilde-brandt. Lanthanides and Quantum Dots as Forster Resonance Energy Transfer Agentsfor Diagnostics and Cellular Imaging. Inorganic Chemistry 2014, 53, 1824-1838.
Oral presentations
1. K. D. Wegner, X. Qiu, and N. Hildebrandt. Nanoparticle-based homogenous FRET-immunoassays for sensitive multiplexed cancer diagnostics. 11th International Conferenceon Nanosciences & Nanotechnologies, Thessaloniki, Greece, 2014.
2. K. D. Wegner, X. Qiu, and N. Hildebrandt. Multiplexed quantum dot-based FRET im-munoassays for sensitive cancer diagnostics. Nanoscience with Nanocrystals (NaNaX) 6,Bad Hofgastein, Austria, 2014.
3. K. D. Wegner, S. Linden, Z. Jin, and N. Hildebrandt. Bunte Quantenpunkte: Nanopho-tonik fur Multiplexdiagnostik. 8. Deutsches BioSensor Symposium, Wildau, Germany,2013.
4. K. D. Wegner, D. Geißler, H. G. Lohmannsroben, and N. Hildebrandt. Time-resolved andsteady-state FRET spectroscopy on commercial biocompatible quantum dots. SPIE Pho-tonics West 2011 - Colloidal Quantum Dots / Nanocrystals for Biomedical ApplicationsVI ; San Francisco, USA, 2011.
5. K. D. Wegner, D. Geißler, H. G. Lohmannsroben, and N. Hildebrandt. Commercial quan-tum dots as FRET donors for nano-biotechnology.3rd EuCheMS Chemistry Congress -European Association for Chemical and Molecular Sciences Chemistry Congress, Nurn-berg, Germany, 2010.
Poster presentations
1. K. D. Wegner, X. Qiu, and N. Hildebrandt. Multicolor colloidal quantum dots for FRET-based multiplexed detection of cancer biomarkers. 30 years of colloidal quantum dotsconference, Paris, France, 2014.
2. K. D. Wegner, X. Qiu, and N. Hildebrandt. Semiconductor quantum dots in homogeneousmultiplexed FRET immunoassays. E-MRS Spring meeting - European Materials ResearchSociety Spring meeting, Lille, France, 2014.
3. K. D. Wegner, X. Qiu, S. Linden, Z. Jin, and N. Hildebrandt. Terbium to QuantumDot FRET for Multiplexed Cancer Diagnostics. Lanthanide-Based Compounds: fromChemical Design to Applications, Orleans, France, 2013.
4. W. R. Algar, K. D. Wegner, A. L. Huston, J. B. Blanco-Canosa, M. H. Stewart, A.Armstrong, P. E. Dawson, N. Hildebrandt, and I. L. Medintz. Quantum Dots as Simulta-neous Acceptors and Donors in Time-Gated Forster Resonance Energy Transfer Relays:Characterization and Biosensing. Nanoscience with Nanocrystals (NaNaX) 5, Fuengirola,Spain, 2012.
5. W. R. Algar, K. D. Wegner, A. L. Huston, J. B. Blanco-Canosa, M. H. Stewart, A. Arm-strong, P. E. Dawson, N. Hildebrandt, and I. L. Medintz. Quantum Dots as SimultaneousAcceptors and Donors in Time-Gated Forster Resonance Energy Transfer Relays: Char-acterization and Biosensing. 7th Workshop on Advanced Multiphoton and FluorescenceLifetime Imaging Techniques, Saarbrucken, Germany, 2012.
6. K. D. Wegner, D. Geißler, H. G. Lohmannsroben, and N. Hildebrandt. Time-resolvedand steady-state spectroscopy on commercial quantum dot-donor and dye-acceptor basedFRET systems. 22. Lecture Conference of the GDCh-Division Photochemistry, Erlangen,Germany, 2010.


Contents
1 Introduction 1
2 Background 72.1 Forster resonance energy transfer . . . . . . . . . . . . . . . . . . . . . . . . . . 7
2.1.1 Introduction . . . . . . . . . . . . . . . . . . . . . . . . . . . . . . . . . . 72.1.2 FRET theory . . . . . . . . . . . . . . . . . . . . . . . . . . . . . . . . . 8
2.2 FRET-based applications . . . . . . . . . . . . . . . . . . . . . . . . . . . . . . . 122.2.1 Immunoassays . . . . . . . . . . . . . . . . . . . . . . . . . . . . . . . . . 132.2.2 Spectroscopic ruler . . . . . . . . . . . . . . . . . . . . . . . . . . . . . . 21
2.3 Lanthanide complexes . . . . . . . . . . . . . . . . . . . . . . . . . . . . . . . . 252.3.1 Introduction . . . . . . . . . . . . . . . . . . . . . . . . . . . . . . . . . . 252.3.2 Luminescence of lanthanides . . . . . . . . . . . . . . . . . . . . . . . . . 262.3.3 Luminescent Tb complexes . . . . . . . . . . . . . . . . . . . . . . . . . . 292.3.4 Application of lanthanides . . . . . . . . . . . . . . . . . . . . . . . . . . 312.3.5 Lanthanide complexes as FRET donors . . . . . . . . . . . . . . . . . . . 33
2.4 Quantum dots . . . . . . . . . . . . . . . . . . . . . . . . . . . . . . . . . . . . . 342.4.1 Introduction . . . . . . . . . . . . . . . . . . . . . . . . . . . . . . . . . . 342.4.2 Preparation of QDs . . . . . . . . . . . . . . . . . . . . . . . . . . . . . . 342.4.3 Photophysical properties . . . . . . . . . . . . . . . . . . . . . . . . . . . 362.4.4 QD-based applications . . . . . . . . . . . . . . . . . . . . . . . . . . . . 37
3 Materials and Methods 403.1 Used Chemicals . . . . . . . . . . . . . . . . . . . . . . . . . . . . . . . . . . . . 40
3.1.1 Buffer solutions . . . . . . . . . . . . . . . . . . . . . . . . . . . . . . . . 403.2 Analytical methods . . . . . . . . . . . . . . . . . . . . . . . . . . . . . . . . . . 41
3.2.1 Characterization of the probes . . . . . . . . . . . . . . . . . . . . . . . . 413.2.2 Time-resolved FRET assays . . . . . . . . . . . . . . . . . . . . . . . . . 41
3.3 Data evaluation . . . . . . . . . . . . . . . . . . . . . . . . . . . . . . . . . . . . 42
4 Results and Discussion 434.1 Immunoassay . . . . . . . . . . . . . . . . . . . . . . . . . . . . . . . . . . . . . 43
4.1.1 Materials and Methods . . . . . . . . . . . . . . . . . . . . . . . . . . . . 454.1.2 Characterization of FRET donors and FRET acceptors . . . . . . . . . . 504.1.3 Influence of the fragmentation . . . . . . . . . . . . . . . . . . . . . . . . 594.1.4 Detection of TPSA / NSE / CEA using two QD colors . . . . . . . . . . . 644.1.5 Nanobodies for EGFR detection . . . . . . . . . . . . . . . . . . . . . . . 78
4.2 Spectroscopic ruler . . . . . . . . . . . . . . . . . . . . . . . . . . . . . . . . . . 824.2.1 Materials and Methods . . . . . . . . . . . . . . . . . . . . . . . . . . . . 834.2.2 FRET-based decay time analysis . . . . . . . . . . . . . . . . . . . . . . 854.2.3 Characterization of FRET donors and FRET acceptors . . . . . . . . . . 90
IX

4.2.4 Biotin-streptavidin system . . . . . . . . . . . . . . . . . . . . . . . . . . 954.2.5 QD - hexahistidine self-assembly . . . . . . . . . . . . . . . . . . . . . . . 103
5 Summary and Outlook 1155.1 Summary . . . . . . . . . . . . . . . . . . . . . . . . . . . . . . . . . . . . . . . 1155.2 Outlook . . . . . . . . . . . . . . . . . . . . . . . . . . . . . . . . . . . . . . . . 123
6 Appendix i6.1 Abbreviations . . . . . . . . . . . . . . . . . . . . . . . . . . . . . . . . . . . . . i6.2 Used bandpass filter . . . . . . . . . . . . . . . . . . . . . . . . . . . . . . . . . iii6.3 Immunoassay . . . . . . . . . . . . . . . . . . . . . . . . . . . . . . . . . . . . . iv
6.3.1 Characterization . . . . . . . . . . . . . . . . . . . . . . . . . . . . . . . iv6.3.2 Detection of TPSA / NSE / CEA using two QD colors . . . . . . . . . . . xii6.3.3 Influence of the fragmentation . . . . . . . . . . . . . . . . . . . . . . . . xv6.3.4 Nanobodies for EGFR detection . . . . . . . . . . . . . . . . . . . . . . . xxxi
6.4 Spectroscopic ruler . . . . . . . . . . . . . . . . . . . . . . . . . . . . . . . . . . xliii6.4.1 Biotin-streptavidin system . . . . . . . . . . . . . . . . . . . . . . . . . . xliii6.4.2 QD-hexahistidine self-assembly . . . . . . . . . . . . . . . . . . . . . . . lxvi
Bibliography cxviii

1 | Introduction
Biological systems like the human body are of great complexity and can be compared
with a clockwork. Like cogwheels in a clockwork many small reactions inside the biologi-
cal system result in the overall reaction of the whole system, for example the increase of
body temperature as reaction to an infection. Thereby most of the essential processes and
reactions can be followed back to interactions, which take place on a nanometer length
scale. The investigation of these interactions is of great importance for their understand-
ing and to show their responsibility in the whole system. The obtained information are
useful as they can improve medical treatment in case the clockwork got out of step. But
the investigation of those processes sets also high demands on the sensitivity and precision
of the analytical method used. Optical access in this nanometric distance range can be
obtained by super-resolution microscopy, but sophisticated instrumentation and complex
treatment of the obtained images is necessary and limit their applicability.
A simpler analytic method, which has shown to be very suitable for processes at the
nanometric scale, is based on Forster resonance energy transfer (FRET). FRET is a non-
radiative energy transfer from a donor to an acceptor based on Coulomb interaction. [1–3]
Theoretical descriptions can be traced back to the mid 1940s when Theodor Forster de-
rived the quantum mechanical description of this process used until today. [4] One corner-
stone for the large popularity of FRET in nanometric measurements is the strong distance
dependency for the transfer efficiency, also called FRET efficiency. The r−6 dependence
allows sensitive measurements of distances, structural changes, and biomolecular processes
in a distance range of ca. 1 nm to 20 nm. [1,3,5] The effective working distance for FRET
measurements strongly depends on the chosen donor-acceptor pair and is characterized
by their Forster distance, which is the donor-acceptor distance where the FRET efficiency
equals 50%. Common FRET pairs exhibit a Forster distance of around 3 to 6 nm, but the
combination of lanthanide terbium complexes (LTCs) as FRET donors and quantum dots
(QDs) as FRET acceptors enables exceptionally large Forster distances up to 11 nm. [6–8]
LTCs possess exceptionally long photoluminescence (PL) decay times of several millisec-
onds compared to conventional luminophores, which have a PL decay time in the nanosec-
ond range. [9,10] This long decay time and the well-structured PL emission bands of LTCs
originate in their forbidden f -f transitions within the Tb3+ ion. Due to the forbidden
character of these transitions the extinction coefficients of the Tb3+ ion is very low and
the use of coordinating ligands to cage the ion is beneficial. The ligands serve as light
1
2 CHAPTER 1. INTRODUCTION
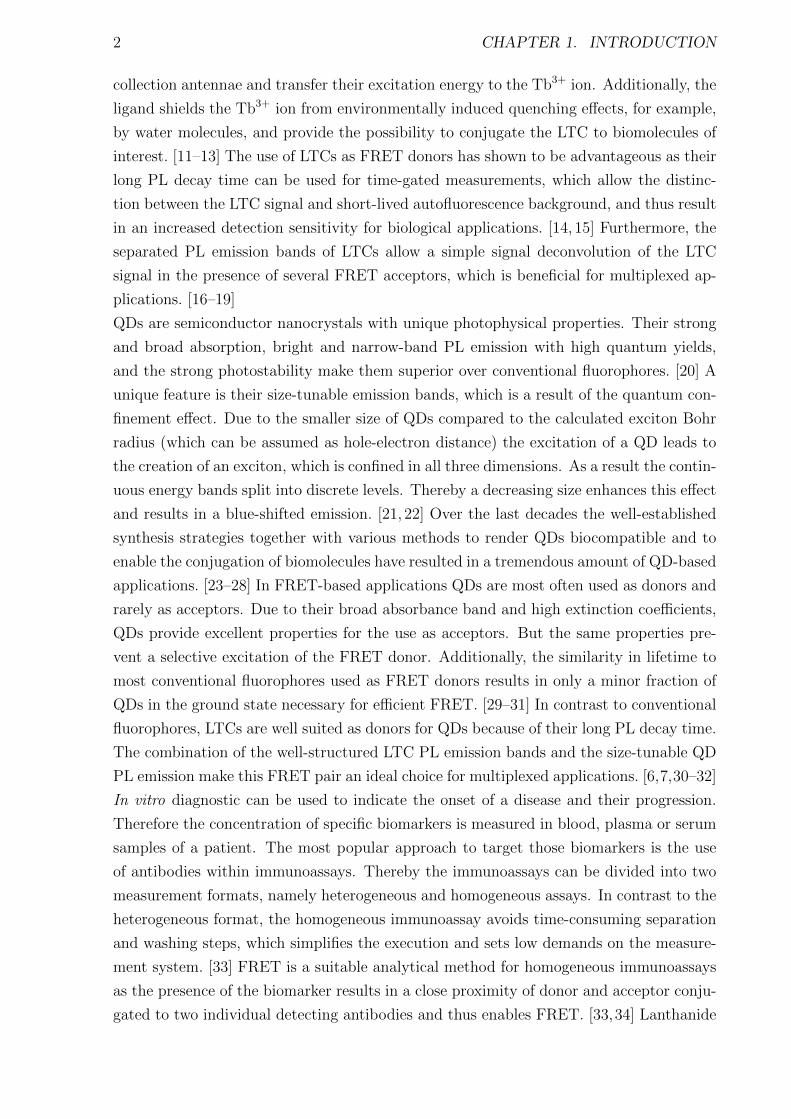
collection antennae and transfer their excitation energy to the Tb3+ ion. Additionally, the
ligand shields the Tb3+ ion from environmentally induced quenching effects, for example,
by water molecules, and provide the possibility to conjugate the LTC to biomolecules of
interest. [11–13] The use of LTCs as FRET donors has shown to be advantageous as their
long PL decay time can be used for time-gated measurements, which allow the distinc-
tion between the LTC signal and short-lived autofluorescence background, and thus result
in an increased detection sensitivity for biological applications. [14, 15] Furthermore, the
separated PL emission bands of LTCs allow a simple signal deconvolution of the LTC
signal in the presence of several FRET acceptors, which is beneficial for multiplexed ap-
plications. [16–19]
QDs are semiconductor nanocrystals with unique photophysical properties. Their strong
and broad absorption, bright and narrow-band PL emission with high quantum yields,
and the strong photostability make them superior over conventional fluorophores. [20] A
unique feature is their size-tunable emission bands, which is a result of the quantum con-
finement effect. Due to the smaller size of QDs compared to the calculated exciton Bohr
radius (which can be assumed as hole-electron distance) the excitation of a QD leads to
the creation of an exciton, which is confined in all three dimensions. As a result the contin-
uous energy bands split into discrete levels. Thereby a decreasing size enhances this effect
and results in a blue-shifted emission. [21, 22] Over the last decades the well-established
synthesis strategies together with various methods to render QDs biocompatible and to
enable the conjugation of biomolecules have resulted in a tremendous amount of QD-based
applications. [23–28] In FRET-based applications QDs are most often used as donors and
rarely as acceptors. Due to their broad absorbance band and high extinction coefficients,
QDs provide excellent properties for the use as acceptors. But the same properties pre-
vent a selective excitation of the FRET donor. Additionally, the similarity in lifetime to
most conventional fluorophores used as FRET donors results in only a minor fraction of
QDs in the ground state necessary for efficient FRET. [29–31] In contrast to conventional
fluorophores, LTCs are well suited as donors for QDs because of their long PL decay time.
The combination of the well-structured LTC PL emission bands and the size-tunable QD
PL emission make this FRET pair an ideal choice for multiplexed applications. [6,7,30–32]
In vitro diagnostic can be used to indicate the onset of a disease and their progression.
Therefore the concentration of specific biomarkers is measured in blood, plasma or serum
samples of a patient. The most popular approach to target those biomarkers is the use
of antibodies within immunoassays. Thereby the immunoassays can be divided into two
measurement formats, namely heterogeneous and homogeneous assays. In contrast to the
heterogeneous format, the homogeneous immunoassay avoids time-consuming separation
and washing steps, which simplifies the execution and sets low demands on the measure-
ment system. [33] FRET is a suitable analytical method for homogeneous immunoassays
as the presence of the biomarker results in a close proximity of donor and acceptor conju-
gated to two individual detecting antibodies and thus enables FRET. [33,34] Lanthanide
3
based FRET immunoassays are well established and have some advantages due to their
long PL decay time, which enables highly sensitive detection of biomarker against a low
background. [15, 35–39] The distance inside the immunoassays is given by the used anti-
bodies, biomarkers, and luminophores, which act as signal generation system. The latter
two cannot further be changed in their size, but the antibodies can be fragmented and
would still be able to bind to the biomarker. One of the aims in this work was to investi-
gate the influence of different antibody sizes on the sensitivity of the immunoassay for the
detection of specific biomarkers. Therefore the full size IgG antibodies were fragmented
into F(ab’)2 and F(ab) fragments and conjugated to either the donor or acceptor. The
biomarkers used in this work were total prostate specific antigen (TPSA), carcinoembry-
onic antigen (CEA), neuron-specific enolase (NSE), and epidermal growth factor receptor
(EGFR). TPSA comprises the sum of free PSA and PSA bound to proteins in the blood
and an increase of the TPSA level can be concomitant with the presence of prostate
cancer. The clinical cutoff value for TPSA is 4 ng/mL. NSE and CEA belong to a fam-
ily of lung cancer biomarkers used for the differentiation between small cell lung cancer
and non-small cell lung cancer. The clinical cutoff levels are 12.5 ng/mL and 5 ng/mL
for NSE and CEA, respectively. These biomarkers also largely differ in their molecular
weights, which are 32 kDa (TPSA), 95 kDa (NSE), and 180 kDa (CEA). Due to the strong
distance dependency of FRET, the optimization of the donor-acceptor distance via dif-
ferently sized antibodies conjugated either with donors or acceptors in order to find the
best combination to provide the highest sensitivity was one goal of this work. Smaller
than a F(ab) fragment are single domain antibodies, also called nanobodies. Nanobodies
are single domain antigen binding fragments of heavy chain antibodies with a molecular
weight of only 15 kDa and are used in many different antibody based applications. [40–43]
In this work they will be used for the first time in a homogeneous immunoassay for the
detection of a soluble form of EGFR based on LTC-to-QD FRET.
Next to the investigation of LTC-to-QD FRET in immunoassays this work also applied
the system as molecular ruler. Distance measurements using the strong distance depen-
dency of FRET date back to the initial publications of Stryer. [44,45] Nowadays, FRET is
used for the monitoring of inter- and intramolecular interactions, [46] protein folding, [47]
or the movement of cellular transporters. [48] Common donor-acceptor pairs are based on
organic dyes or fluorescent proteins, which are limited in their photophysical properties.
The low photostability, similar decay times than the background, and a small stokes shift
between absorbance and emission can make the measurements more difficult. Addition-
ally, the small Forster distances limit the measurable distance and prevent the use in
larger biological systems. The combination of LTC and QDs offers several advantages
like a good photostability, long decay times and larger Forster distances. One focus of
this work was the utilization of LTC-to-QD FRET for the characterization of the size and
shape of QDs. These parameters are crucial as they are responsible for the behavior of
QDs in biological applications. The structural analysis of QDs are mainly based on trans-

4 CHAPTER 1. INTRODUCTION
mission electron microscopy (TEM), dynamic light scattering (DLS) and size exclusion
chromatography on HPLC. [49] All of these techniques have drawbacks like two dimen-
sional view on QDs using TEM. Although DLS measurements provide information about
the QD together with the surface coating, the shape cannot be resolved and additionally
a hydration layer is included, which leads to an overestimation of the actual size. In
HPLC based measurements the size is estimated in correlation to the retention time of a
standard, which also does not allow any shape resolution and shows strong dependency
on the standard. More sophisticated approaches are possible, but in order to investigate
the QD size and shape in homogeneous measurements in a subnanomolar concentration
range, under conditions that are similar to those later used in the actual application,
FRET can be the method of choice. Time-resolved analysis of the LTC-to-QD FRET
system allows the estimation of donor-acceptor distances using the mathematically fitted
decay times and was already shown to be able to offer information about the size and
shape of QDs. [6]
The thesis is divided into five chapters and completed by the appendix, which consists
of the list of abbreviations, list of used bandpass filters, supplementary graphical infor-
mation and tables, original publications with their supplementary information, and the
bibliography. The first chapter provides the necessary background for FRET including
FRET-based applications with the focus on immunoassays and as molecular ruler. The
origin of the unique photophysical properties of the used LTCs and QDs will be explained
together with their advantages in different applications. The following “Materials and
Methods” chapter summarizes the used chemicals and contains the description of the ap-
plied analytical methods used for the characterization of the probes and the FRET assay
measurements together with information about the evaluation of the obtained data. In
two separated parts of the chapter “Results and Discussion” the results of the investiga-
tions using LTC-to-QD FRET in homogeneous immunoassays and as molecular ruler are
presented. A summary of the obtained results and findings together with an outlook into
future developments is given in the last chapter.
The thesis consists of two studies using LTC-to-QD FRET. In the first study the appli-
cation of LTC-to-QD FRET in homogeneous serum-based immunometric assays is inves-
tigated. A detailed spectroscopic characterization of the used luminophores is performed
before and after conjugation with different types of antibodies using stationary UV/Vis
absorption spectroscopy and stationary and time-resolved luminescence spectroscopy in
order to obtain the number of antibodies per luminophore and to verify any alteration of
the photophysical properties due to the biomolecule conjugation. In the following, differ-
ent combinations of conjugated full-size (IgG) antibodies and their fragments (F(ab’)2,
F(ab)) for the detection of TPSA were investigated to optimize the immunoassay sensi-
tivity using the Lumi4-Tb complex as FRET donor and eFluor 650 nanocrystal as FRET
acceptor. The results presented in this first investigation, about how the fragmenta-
tion of antibodies influences the performance of the immunoassay for the detection of
5
TPSA, were already published in reference [50] and the article is attached in the full
length together with supplementary information at the end of this work. Based on this
investigation, the influence of differently sized biomarkers is investigated using TPSA,
NSE, and CEA. Additionally, two other QDs (eFluor 605 nanocrystal, Qdot 705 ITK)
were included as FRET acceptors and conjugated as well with IgG, F(ab’)2 and F(ab)
antibodies for the detection of the different biomarkers. The immunoassay performance
using different combinations of antibody sizes and QD colors are compared to results
from already established commercial diagnostic kits targeting the same biomarkers and
measured under the same conditions. Clinical (human) samples were measured for the
biomarker TPSA to show the clinical applicability of the developed LTC-to-QD FRET
immunoassay. Finally, duplex measurements of the biomarkers NSE and CEA prove the
superior performance of LTC-to-QD FRET in multiplexing applications. The study is
rounded up by an investigation of nanobodies conjugated either with Lumi4-Tb complex
or to eFluor 650 nanocrystal for the detection of soluble EGFR. The presented results
are the first demonstration of nanobody-based FRET immunoassays using LTC-to-QD
energy transfer and were published in reference [51]. The article is attached in the full
length together with supplementary information at the end of this work.
In the second study LTC-to-QD FRET was exploited as molecular ruler for the structural
analysis of QDs. Prior to the presentation of the results the derivation of the distances
from the measured multi-exponential decay curves including the necessary correction for
LTCs not participating in FRET is explained, followed by the spectral characterization
of the used FRET donors and FRET acceptors. In the first part of the study three
different batches of biotinylated QDs with similar emission wavelengths are used in com-
bination with Lumi4-Tb complexes bound to streptavidin. The strong biotin-streptavidin
recognition enables efficient FRET and results in a donor-acceptor distance distribution
depending on the batch of QDs, which was used to estimate the size, shape, and number
of biotin bound on the surface. To avoid further alterations of the QD surface by the con-
jugation of biotin, a second approach for the establishment of a close proximity between
LTC and QD was investigated, namely polyhistidine mediated self-assembly. Therefore
the LTC was conjugated to a peptide and to a maltose binding protein, which both exhibit
a hexahistidine tag that enables, depending on the QD coating, the coordination to the
Zn-rich surface of QDs or to carboxylated surface ligands. A detailed time-resolved study
of 11 QDs was performed with different sizes, shapes, and surface coatings in combina-
tion with the two LTC-donors, which also possessed different sizes, shapes, orientations,
and binding conditions. The analysis of the multi-exponential decay curves of donor
and acceptor allowed to obtain information about the size, shape, and biofunctionality
of the investigated QD bioconjugates. The results were in agreement with other struc-
tural analysis methods, such as TEM or DLS, but with the advantage of a homogeneous
measurement with three-dimensional resolution (not easily possible for TEM), without
the inclusion of a hydration shell (drawback for DLS), and at low concentrations in the

6 CHAPTER 1. INTRODUCTION
same environment as used for the biological application. The results of both studies, us-
ing biotin-streptavidin recognition and polyhistidine mediated self-assembly, are already
published in references [52] and [53], respectively. These articles are attached in the full
length with their supplementary information at the end of the work.
2 | Background
2.1 Forster resonance energy transfer
2.1.1 Introduction
Many biosensing applications are based on the luminescence phenomenon for signal trans-
duction. The successful targeting of an analyte is displayed by a change in luminescence
intensity and/or lifetime. One opportunity for the manipulation of the luminescence prop-
erties in response to the analyte can be accomplished by non-radiative energy transfer.
Such energy transfer involves a donor that transfers its energy to an acceptor. In contrast
to non-radiative energy transfer, radiative energy transfer is based on the reabsorption
of photons emitted from the donor and is observed at donor-acceptor distances larger
than the wavelength. [2] There are several types of non-radiative transfers, which can be
categorized by their effective working distance. For donor-acceptor distances shorter than
ca. 2 nm electron exchange or electron transfer processes are predominant. Due to the re-
quirement of overlapping orbitals they show an exponential decrease in transfer efficiency
with increasing distance. Examples for long-range non-radiative interactions are nanosur-
face energy transfer (up to 40 nm), plasmon coupling (up to 80 nm), and singlet oxygen
transfer (up to 100 nm). The most applied non-radiative energy transfers in biological
sensing applications are Forster resonance energy transfer (FRET), bioluminescence reso-
nance energy transfer (BRET) and chemiluminescence resonance energy transfer (CRET),
which cover the distance range between ca. 1 nm to 20 nm. [8] Among these FRET is most
favored in the fields of biology and biochemical applications. The working distance lies
in a range that is important for many biological recognition processes and the strong
distance dependency can be used for the measurements of distances within a biological
system or for monitoring conformational changes of proteins. [5, 34,44,47,48,54–58]
This chapter provides the required theoretical background for a successful use of FRET
in biological applications. For more theory and a larger overview regarding the formalism
and applications the following references are recommended. [1–3,58]
7
8 CHAPTER 2. BACKGROUND
2.1.2 FRET theory
In the late 1940s the pieces of the puzzle for a theoretical description of the energy
transfer leading to sensitized fluorescence of a second fluorophore were lying on the table.
In experiments the phenomenon of sensitized fluorescence could be observed from the
vapors of silver, cadmium, lead, zinc, and indium in the presence of mercury vapor.
[59–61] First attempts for a theoretical description were done by Franck, Kallmann and
London, in which the requirement of resonance between donor and acceptor and the
correct distance dependence of the energy transfer was included but unrealistic sharp
spectra were assumed. [61–63] Based on this work, in a “father and son project”, J.
Perrin and F. Perrin extended the theoretical framework by modeling the fluorophores as
electrical dipoles oscillating in resonance and the assumption that the molecules can exist
in different electronic states, generally divided in the ground state and excited state. [64]
However, the predicted distance dependency was inversely proportional to the third power
and thus overestimated. Although F. Perrin did a step in the right direction with the
consideration of spectral broadening caused by the interaction of fluorophores within the
solvent, the working distance range was still too large. [61]
In 1946 Theodor Forster was the first who could assemble the puzzle due to the inclusion
of experimentally accessible parameters like spectra, quantum yields, and lifetimes. [65]
Later on, he could verify his approach in a quantum mechanical description. [4] As a
result, the predicted distance dependency was then inversely proportional to the sixth
power, which fits the experimental data and is the reason why this energy transfer is also
called Forster resonance energy transfer.
PL in
tensity
(a.u.
)
w a v e l e n g t h ( n m )
abso
rbanc
e (a.u
.)
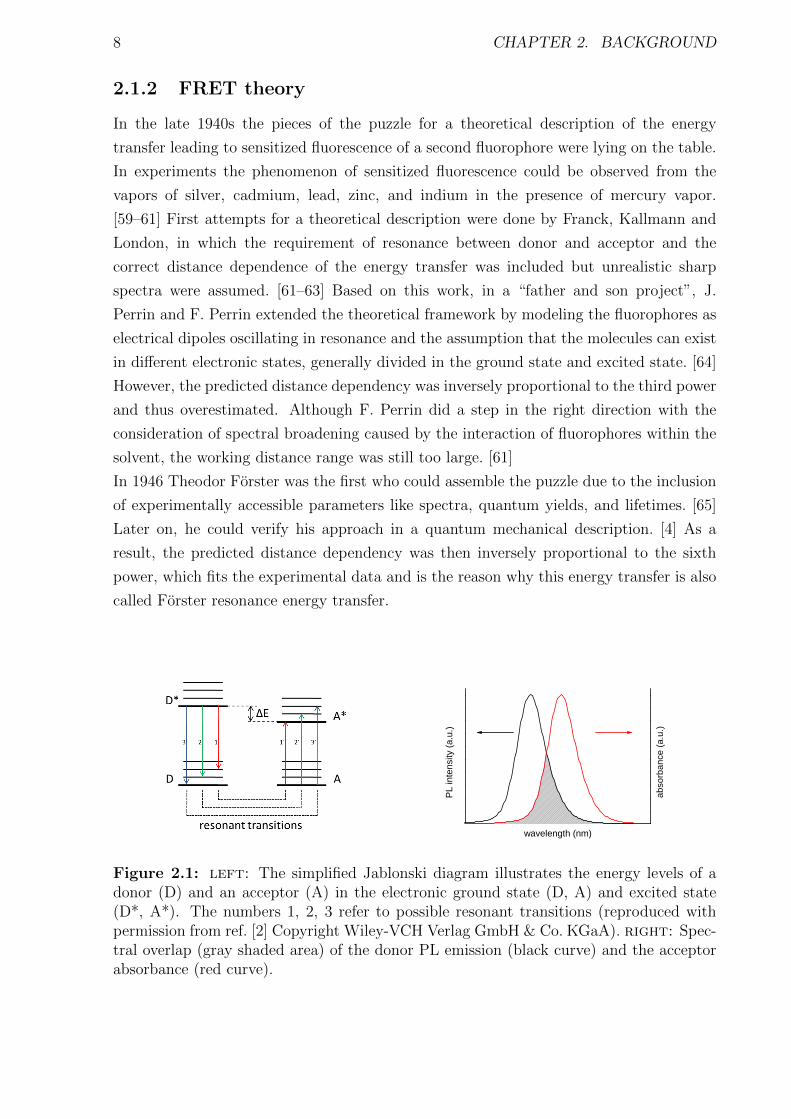
Figure 2.1: left: The simplified Jablonski diagram illustrates the energy levels of adonor (D) and an acceptor (A) in the electronic ground state (D, A) and excited state(D*, A*). The numbers 1, 2, 3 refer to possible resonant transitions (reproduced withpermission from ref. [2] Copyright Wiley-VCH Verlag GmbH & Co. KGaA). right: Spec-tral overlap (gray shaded area) of the donor PL emission (black curve) and the acceptorabsorbance (red curve).
2.1. FORSTER RESONANCE ENERGY TRANSFER 9
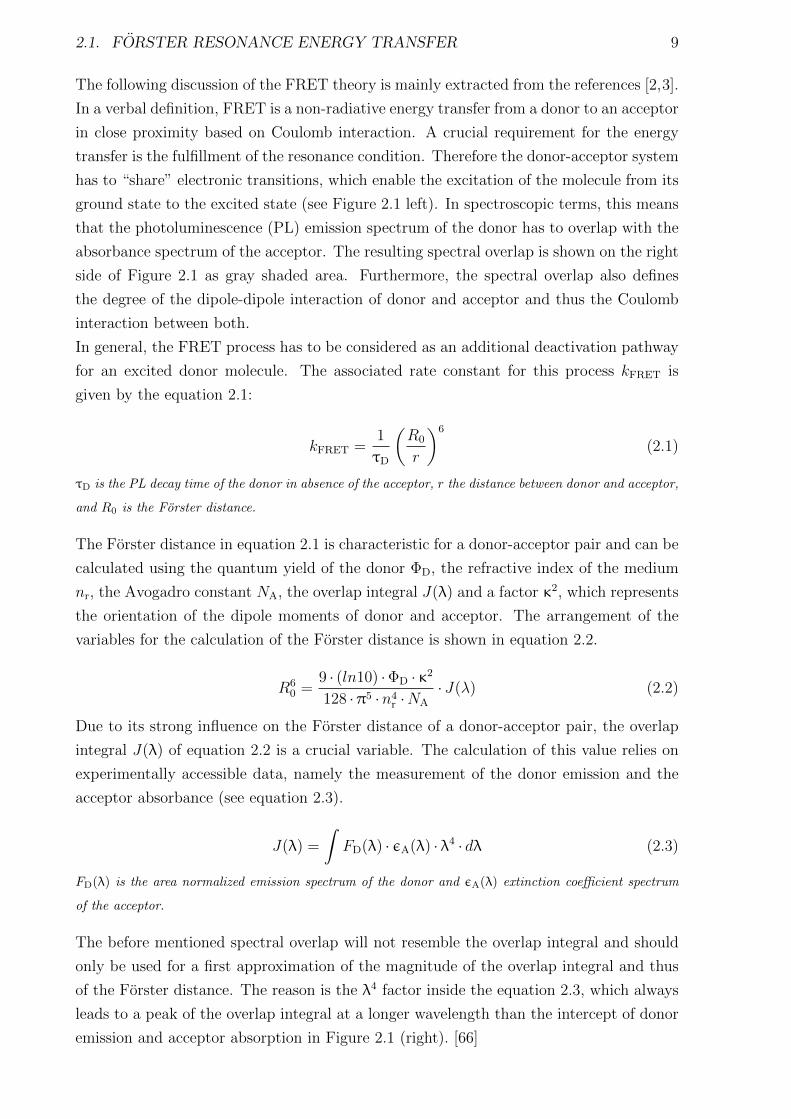
The following discussion of the FRET theory is mainly extracted from the references [2,3].
In a verbal definition, FRET is a non-radiative energy transfer from a donor to an acceptor
in close proximity based on Coulomb interaction. A crucial requirement for the energy
transfer is the fulfillment of the resonance condition. Therefore the donor-acceptor system
has to “share” electronic transitions, which enable the excitation of the molecule from its
ground state to the excited state (see Figure 2.1 left). In spectroscopic terms, this means
that the photoluminescence (PL) emission spectrum of the donor has to overlap with the
absorbance spectrum of the acceptor. The resulting spectral overlap is shown on the right
side of Figure 2.1 as gray shaded area. Furthermore, the spectral overlap also defines
the degree of the dipole-dipole interaction of donor and acceptor and thus the Coulomb
interaction between both.
In general, the FRET process has to be considered as an additional deactivation pathway
for an excited donor molecule. The associated rate constant for this process kFRET is
given by the equation 2.1:
kFRET =1
τD
(R0
r
)6
(2.1)
τD is the PL decay time of the donor in absence of the acceptor, r the distance between donor and acceptor,
and R0 is the Forster distance.
The Forster distance in equation 2.1 is characteristic for a donor-acceptor pair and can be
calculated using the quantum yield of the donor ΦD, the refractive index of the medium
nr, the Avogadro constant NA, the overlap integral J(λ) and a factor κ2, which represents
the orientation of the dipole moments of donor and acceptor. The arrangement of the
variables for the calculation of the Forster distance is shown in equation 2.2.
R60 =
9 · (ln10) ·ΦD · κ2
128 ·π5 ·n4r ·NA
· J(λ) (2.2)
Due to its strong influence on the Forster distance of a donor-acceptor pair, the overlap
integral J(λ) of equation 2.2 is a crucial variable. The calculation of this value relies on
experimentally accessible data, namely the measurement of the donor emission and the
acceptor absorbance (see equation 2.3).
J(λ) =
∫FD(λ) · εA(λ) · λ4 · dλ (2.3)
FD(λ) is the area normalized emission spectrum of the donor and εA(λ) extinction coefficient spectrum
of the acceptor.
The before mentioned spectral overlap will not resemble the overlap integral and should
only be used for a first approximation of the magnitude of the overlap integral and thus
of the Forster distance. The reason is the λ4 factor inside the equation 2.3, which always
leads to a peak of the overlap integral at a longer wavelength than the intercept of donor
emission and acceptor absorption in Figure 2.1 (right). [66]
10 CHAPTER 2. BACKGROUND
The refractive index describes how light propagates through a medium and is normally
larger than unity. Most FRET applications are performed in water-based solutions
where the refractive index can range from 1.33 (water) to ca. 1.6. In presence of small
biomolecules inside the solution like antibodies or proteins a value of 1.4 can be assumed
and is also used in many different FRET-based applications.
The quantum yield (QY) is defined as the ratio of emitted photons over the number of
absorbed photons by the fluorophore. A simple approach for the estimation of the QY is
the relative measurement to a standard fluorophore. More sophisticated is the absolute
measurement of the QY by using an integrating sphere or in conditions where all non-
radiative deactivation pathways are suppressed. A high QY of the donor is advantageous
for FRET, because it increases the probability for FRET due to the decreased number of
other non-radiative deactivation pathways.
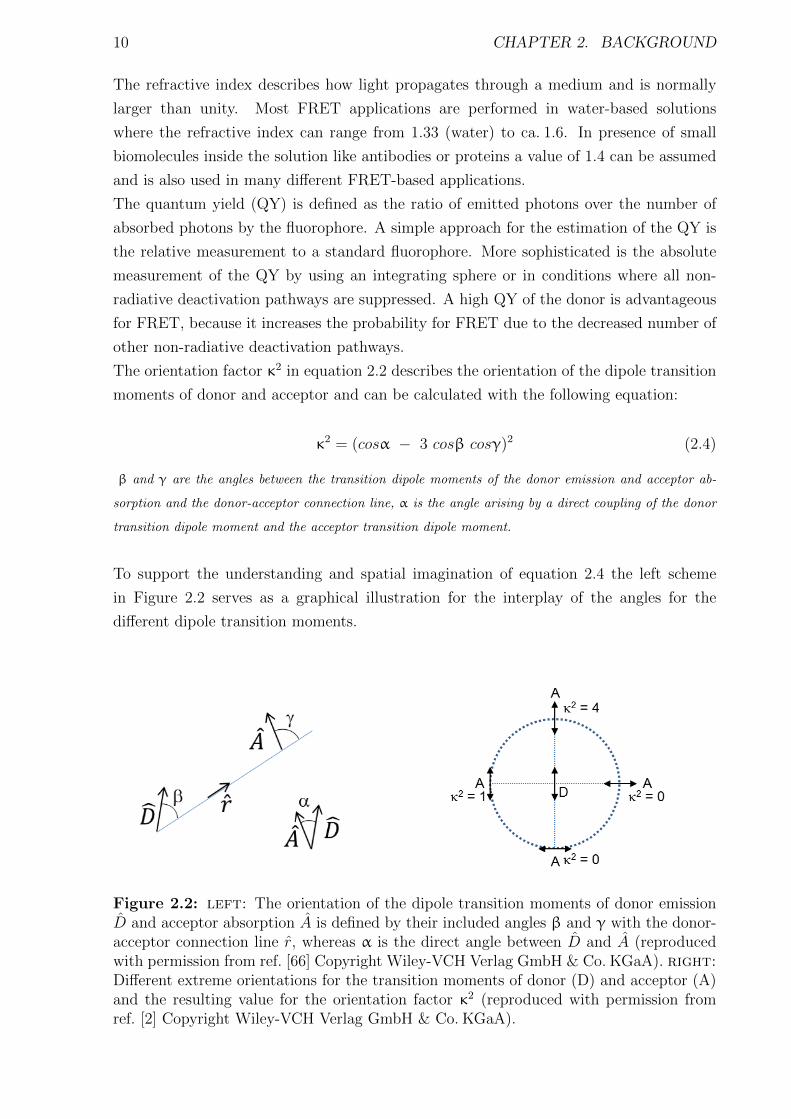
The orientation factor κ2 in equation 2.2 describes the orientation of the dipole transition
moments of donor and acceptor and can be calculated with the following equation:
κ2 = (cosα − 3 cosβ cosγ)2 (2.4)
β and γ are the angles between the transition dipole moments of the donor emission and acceptor ab-
sorption and the donor-acceptor connection line, α is the angle arising by a direct coupling of the donor
transition dipole moment and the acceptor transition dipole moment.
To support the understanding and spatial imagination of equation 2.4 the left scheme
in Figure 2.2 serves as a graphical illustration for the interplay of the angles for the
different dipole transition moments.
Figure 2.2: left: The orientation of the dipole transition moments of donor emissionD and acceptor absorption A is defined by their included angles β and γ with the donor-acceptor connection line r, whereas α is the direct angle between D and A (reproducedwith permission from ref. [66] Copyright Wiley-VCH Verlag GmbH & Co. KGaA). right:Different extreme orientations for the transition moments of donor (D) and acceptor (A)and the resulting value for the orientation factor κ2 (reproduced with permission fromref. [2] Copyright Wiley-VCH Verlag GmbH & Co. KGaA).

2.1. FORSTER RESONANCE ENERGY TRANSFER 11
Depending on the orientation of the transition dipole moments, the value for κ2 ranges
between 0 and 4. The corresponding orientations for the different values of κ2 are shown
in the right scheme of Figure 2.2. κ2 can be measured using x-ray crystal structure or
NMR structure analysis. However, those measurements are not applicable for most FRET
applications. As a result the famous averaged value, κ2 = 2/3, is used in many FRET-
based applications. Thereby the background for this averaged value is that the donor and
the acceptor fulfill the requirements for dynamic averaging. Dynamic averaging is based
on the assumption that the donor and acceptor are able to rotate rapidly and independent
from each other in all directions during the lifetime of the donor. This type of averaging
is not applicable for all donor-acceptor systems. In cases, for which the free rotation is
limited, due to the size of the fluorophore, intrinsic restricted rotation (as for fluorescent
proteins), or the binding of the fluorophore to larger rigid host molecule (as for DNA), the
isotropic assumption is no longer valid. Under these circumstances the donor-acceptor
system is in a static averaging regime and for three dimensional orientational and spatial
solution distributions κ2 can take values between 0 and 2/3. [67] To summarize, it can
be noted that a critical evaluation of the used donor-acceptor system concerning their
appropriate averaging regime for κ2 has to be done to avoid errors in the calculation of
the Forster distance. A general assumption of κ2 = 2/3 would result in a maximal error
of 35 % for R0, with one exception. If the real κ2 is close to 0 a huge increase of the error
is expected.
For the acquisition of quantitative information about the transfer efficiency, also called
FRET efficiency (ηFRET) the FRET transfer rate and the decay time of the donor can
be used like in the first part of equation 2.5. Under consideration of equation 2.1 the
right side of equation 2.5 can be rearranged using the Forster distance and the distance
between donor and acceptor r.
ηFRET =kFRET
τ−1D + kFRET
=R6
0
R60 + r6
(2.5)
Consequently, changes in the distance between donor and acceptor influences the FRET
efficiency. In a graphical illustration of equation 2.5 the strong distance dependency of
the FRET efficiency is observable (see Figure 2.3). As the FRET sensitivity to distance
changes is in the same range as many biological recognition systems or conformational
processes, FRET is also used as a spectroscopic ruler. But the inverse proportion to the
sixth power distance dependency also sets limits on the measurable distance range. As
a result, reliable distance measurements using FRET can be performed in the range of
ca. 0.5R0 to 2R0. Equation 2.5 also indicates that in case of r = R0 the FRET efficiency
equals 50 %. This characteristic parameter can be used to choose a donor-acceptor pair,
which covers the distance range for the envisaged application.
12 CHAPTER 2. BACKGROUND
0 5 1 0 1 5 2 0 2 50 . 0
0 . 5
1 . 0
R 0 = 1 0 n m
FRET
-effici
ency
(ηFR
ET)
r ( n m )
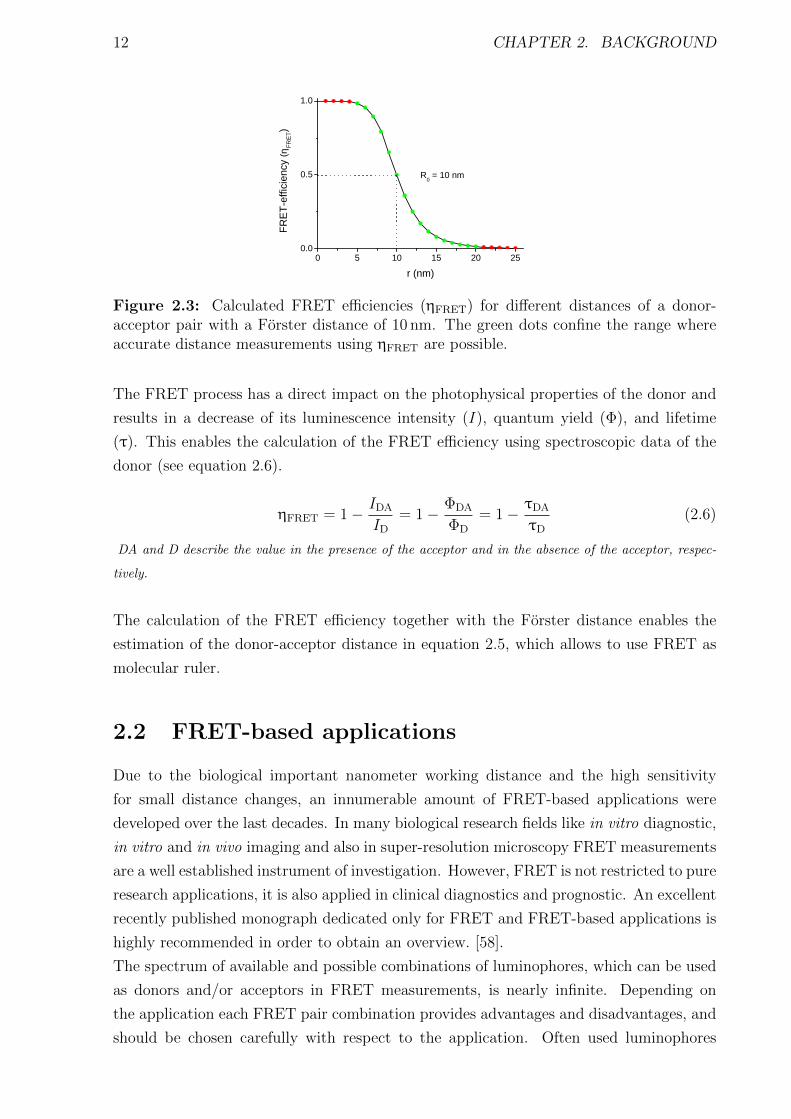
Figure 2.3: Calculated FRET efficiencies (ηFRET) for different distances of a donor-acceptor pair with a Forster distance of 10 nm. The green dots confine the range whereaccurate distance measurements using ηFRET are possible.
The FRET process has a direct impact on the photophysical properties of the donor and
results in a decrease of its luminescence intensity (I), quantum yield (Φ), and lifetime
(τ). This enables the calculation of the FRET efficiency using spectroscopic data of the
donor (see equation 2.6).
ηFRET = 1− IDA
ID= 1− ΦDA
ΦD
= 1− τDA
τD(2.6)
DA and D describe the value in the presence of the acceptor and in the absence of the acceptor, respec-
tively.
The calculation of the FRET efficiency together with the Forster distance enables the
estimation of the donor-acceptor distance in equation 2.5, which allows to use FRET as
molecular ruler.
2.2 FRET-based applications
Due to the biological important nanometer working distance and the high sensitivity
for small distance changes, an innumerable amount of FRET-based applications were
developed over the last decades. In many biological research fields like in vitro diagnostic,
in vitro and in vivo imaging and also in super-resolution microscopy FRET measurements
are a well established instrument of investigation. However, FRET is not restricted to pure
research applications, it is also applied in clinical diagnostics and prognostic. An excellent
recently published monograph dedicated only for FRET and FRET-based applications is
highly recommended in order to obtain an overview. [58].
The spectrum of available and possible combinations of luminophores, which can be used
as donors and/or acceptors in FRET measurements, is nearly infinite. Depending on
the application each FRET pair combination provides advantages and disadvantages, and
should be chosen carefully with respect to the application. Often used luminophores
2.2. FRET-BASED APPLICATIONS 13
are fluorescent proteins (FPs), organic dyes, lanthanide chelates, quantum dots (QDs),
and noble metal nanoparticles (NPs). [57] FRET applications can be divided roughly
in two categories, namely target sensing and structural analysis. Nearly every target
of interest, like cancer markers, pathogen markers, microbes, cells, nucleic acids, toxins,
drugs, can be sensed using FRET exploiting the wide field of recognition molecules, such
as antibodies, aptamers, oligonucleotides (DNA, RNA), and peptides. [68, 69] Thereby
most sensing techniques are based on the binding or cleavage of donor and acceptor in the
presence of the target, which can be measured mainly by changes of the donor/acceptor
emission intensity. The combination of FRET and microscopy techniques especially for
single-particle or single-molecule tracking showed to be very advantageous as it allows
highly resolved structural analysis of biomolecules, monitoring the folding of proteins, and
provide an inside view in inter- and intra-cellular processes. The dynamics in distance
changes can be measured by monitoring the alteration of donor/acceptor lifetimes and
anisotropy. [47, 48,70,71]
Due to the tremendous amount of possible donor-acceptor combinations and their use
in FRET applications, the following references provide a good overview about recent
advances and established systems in this field. [57,72–75]
Within this work, FRET was exploited for the detection of different cancer markers using
homogeneous sandwich-immunoassays and as spectroscopic ruler to obtain information
about the shape and size of nanoparticles. The next chapter provides a brief introduction
to the different kinds of immunoassays with the focus on homogeneous immunoassays and
a short introduction of the use of FRET as spectroscopic ruler. Additionally, the applied
binding systems are described, which were used to enable a defined distance between
donor and acceptor.
2.2.1 Immunoassays
The following discussion presents a summary extracted mainly from the reference [33],
which is an excellent resource for detailed information about this topic. Immunoassays
are used to detect an analyte or the corresponding antibody in blood or serum samples of
a patient. Antibodies are produced by the immune system in an immunogenic reaction
after contact with an analyte. The special properties of antibodies led to a widespread
use of immunoassays in sensing applications and are based on i) a wide range of possible
binding targets, for example natural and man-made chemicals, biomolecules, cells, and
viruses; ii) a high specificity, as the recognition process is based on a key-lock principle;
iii) a strong binding affinity. In general, two different measurement approaches can be
distinguished, namely heterogeneous and homogeneous immunoassays. Heterogeneous as-
says differ from homogeneous assays due to the immobilization of the antibody or analyte
on a solid surface and the existence of one or several separation steps. The separation
step is used for the purification of the sample from unbound material and thus leads to
an increase in selectivity and sensitivity. Both types of immunoassays can be performed
in two different variants depending on the size and type of the analyte.
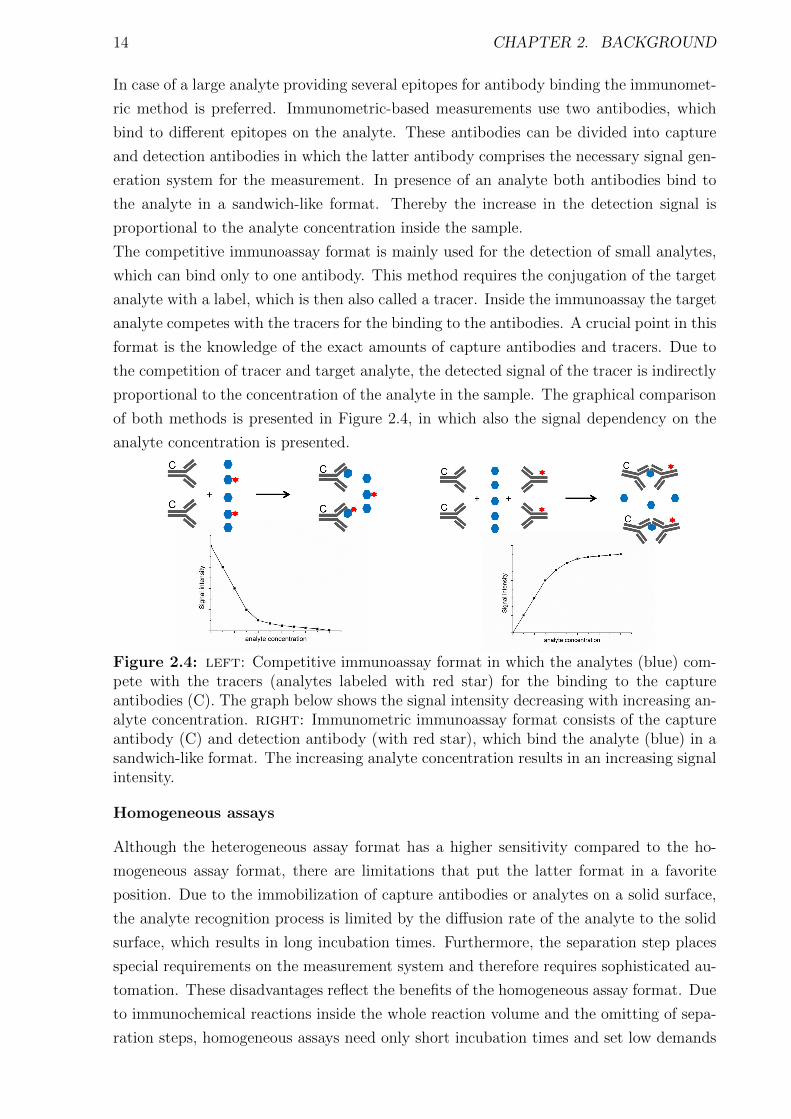
14 CHAPTER 2. BACKGROUND
In case of a large analyte providing several epitopes for antibody binding the immunomet-
ric method is preferred. Immunometric-based measurements use two antibodies, which
bind to different epitopes on the analyte. These antibodies can be divided into capture
and detection antibodies in which the latter antibody comprises the necessary signal gen-
eration system for the measurement. In presence of an analyte both antibodies bind to
the analyte in a sandwich-like format. Thereby the increase in the detection signal is
proportional to the analyte concentration inside the sample.
The competitive immunoassay format is mainly used for the detection of small analytes,
which can bind only to one antibody. This method requires the conjugation of the target
analyte with a label, which is then also called a tracer. Inside the immunoassay the target
analyte competes with the tracers for the binding to the antibodies. A crucial point in this
format is the knowledge of the exact amounts of capture antibodies and tracers. Due to
the competition of tracer and target analyte, the detected signal of the tracer is indirectly
proportional to the concentration of the analyte in the sample. The graphical comparison
of both methods is presented in Figure 2.4, in which also the signal dependency on the
analyte concentration is presented.
Figure 2.4: left: Competitive immunoassay format in which the analytes (blue) com-pete with the tracers (analytes labeled with red star) for the binding to the captureantibodies (C). The graph below shows the signal intensity decreasing with increasing an-alyte concentration. right: Immunometric immunoassay format consists of the captureantibody (C) and detection antibody (with red star), which bind the analyte (blue) in asandwich-like format. The increasing analyte concentration results in an increasing signalintensity.
Homogeneous assays
Although the heterogeneous assay format has a higher sensitivity compared to the ho-
mogeneous assay format, there are limitations that put the latter format in a favorite
position. Due to the immobilization of capture antibodies or analytes on a solid surface,
the analyte recognition process is limited by the diffusion rate of the analyte to the solid
surface, which results in long incubation times. Furthermore, the separation step places
special requirements on the measurement system and therefore requires sophisticated au-
tomation. These disadvantages reflect the benefits of the homogeneous assay format. Due
to immunochemical reactions inside the whole reaction volume and the omitting of sepa-
ration steps, homogeneous assays need only short incubation times and set low demands
2.2. FRET-BASED APPLICATIONS 15
on the measurement system. The crucial point in this format is the signal modulation in
presence of the analyte. Due to the omitted separation steps, homogeneous immunoas-
says need labels that change their measurable properties in presence of the analyte and
different assay formats compared to heterogeneous assays.
Homogeneous assay formats. One of the first performed homogeneous immunoas-
says was based on particle agglutination. Therefore human immunoglobulins were immo-
bilized on sheep erythrocytes and the presence of anti-immunoglobulin antibodies, present
in samples of rheumatoid arthritis patients, was monitored by the visible clumping of the
erythrocytes. [76] Nowadays, the immunochemical induced aggregation is measured by the
interference of the aggregates with light in terms of intensity changes (turbidimitry), scat-
tering (nephelometry), or particle counting. [77,78] Common methods are also colorimeter
measurements exploiting the color change of particles depending on their size, and dy-
namic light scattering (DLS). Although surface enhanced Raman scattering (SERS) can
be used to monitor aggregation of particles in close proximity to the surfaces of gold and
silver NPs, the application and sensitivity in homogeneous assays is limited. [79–81]
In lysis immunoassays the presence of the analyte induces the disruption of a liposome
membrane, which leads to the release of detectable substances. The signal detection is
based on a fluorescence enhancement effect triggered by the release of before quenched
fluorophores. Due to the release of a large amount of detectable substances caused by
a single analyte, the method is very sensitive but suffers from the lack of standardized
probes and from cross-reactivity. [82]
An assay method that allows obtaining results within 30 s and easy execution is based on
the change of the tumbling rate of nitroxide radicals measured by electron paramagnetic
resonance (EPR) spectroscopy. The binding of the analyte inhibits or slows down the free
rotation, which can be observed by a broadening of the spectra. The drawback of this
spin immunoassay is the high equipment cost. [83]
The use of radioactive isotopes as labels in immunoassays is controversial. On the one
hand these assays are very sensitive but on the other hand they are associated with a
strong biohazard effect and the disposal of probes and samples is problematic. Radio-
labels used in scintillation proximity assays release alpha and weak beta particles. The
collision of the high energetic particles with scintillator molecules result in the emission
of measurable photons. In the competitive format the radiolabel is conjugated to the
analyte. After the binding to antibodies, immobilized on a latex sphere with dissolved
fluorophores, the radiation will produce light pulses, which are detected by scintillation
counting. [84]
The presence of an analyte in homogeneous assays can also be measured by monitoring
the increase of a current, when electroactive labels like ferrocenes are used. Further-
more, in electrochemiluminescence immunoassays the presence of an analyte can enable
an oxidation/reduction cycle on the anode resulting in the excitation of an organic fluo-
rophore. [85,86]
16 CHAPTER 2. BACKGROUND
Enzymes as labels in homogeneous immunoassays play a critical role but as probes of
biological origin they have to fulfill some requirements. First of all enzyme and substrate
should not be present in the sample, the sample matrix should not affect their activ-
ity, and they have to be stable and retain activity under various conditions. Different
methods are used to modulate the detection signals using enzymes. In enzyme-multiplied
immunoassays techniques (EMITs) the binding of an antibody produces an inhibitory ef-
fect based on steric hindrance or conformation changes of the enzyme in order to prevent
the digestion of the substrate. [87] For an enhanced substrate digestion in the presence
of the analyte charge induced enzyme activation can be used. In this method antibodies
labeled with enzymes and negatively charged antibodies bind on a multiepitope antigen
and form a negatively charged complex. The Coulomb interaction between the negatively
charged antigen complex and the polycationic substrate increase the affinity and thus the
sensitivity. The drawback is the attraction of proteins inside the patient serum, which re-
sults in a nonlinear behavior of the calibration curve. [88] Promising methods, especially
for homogeneous immunoassays, are enzyme channeling or enzyme effector immunoas-
says. The first method is based on the presence of two enzymes, in which the first enzyme
catalyzes the formation of an intermediate substrate. If the second enzyme is in close
proximity this intermediate substrate gets digested to a detectable product. The other
method uses catalytic inert labels, like enzyme cofactors or enzyme fragments, that only
in combination and in close proximity build up an active holoenzyme suitable to digest
the actual substrate. [89,90]
Luminescence oxygen channeling immunoassays are similar to the enzyme channeling ap-
proach. The requirement for this method is the close proximity of two beads. One bead
consists of a incorporated photosensitizer, which produces singlet oxygen after radiation.
The incorporated olefin in the second bead reacts with the singlet oxygen and creates
an electronically excited product, which is luminescent. Due to a lifetime of ca. 4 µs, the
singlet oxygen can travel ca. 300 nm in all directions, which enables the measurement over
large distances. The limitation for this technique is the high reactivity of singlet oxygen
with, for example, proteins, which demands low serum amounts inside the sample. [91]
One of the major players in the field of homogeneous immunoassays are measurement
methods based on fluorescence. In fluorescence polarization immunoassays the restriction
of the otherwise fast rotating fluorophore label is used to measure the binding of the an-
alyte. The decrease of the rotation results in increased polarization of the emitter. Main
target analytes are small molecules in a competitive format, because too large molecules
do not allow fast reorientation. Consequently, there is only a minor difference in polar-
ization making the identification of the presence of the analyte impossible. [92] Another
variant for monitoring the temporal variation in fluorescence intensity is fluorescence cor-
relation spectroscopy. The method enables the measurement of single molecules in 1 fL
measurement volume. Bound and unbound antibodies can be distinguished by differences
in their diffusion rate, which is greatly influenced when the analyte binds to the antibody.
2.2. FRET-BASED APPLICATIONS 17
An extension of this method is fluorescence cross-correlation spectroscopy, in which the
detection of two fluorophores in close proximity is the evidence for the binding with the
analyte. [93]
FRET-based immunoassays. The use of FRET in homogeneous immunoassays is
characterized by a high sensitivity and selectivity. Different FRET pair combinations en-
able FRET from ca. 1 nm to 20 nm, which allows the detection of small and large analytes.
Thereby the presence of the analyte is responsible to establish the close proximity of donor
and acceptor at which FRET can occur. For an estimation of the analyte concentration
the extent of donor quenching or, more sensitive, the extent of acceptor sensitization can
be monitored.
In an immunometric format donor and acceptor are conjugated separately to monoclonal
antibodies, which bind to different epitopes on the antigen. This provides the immunoas-
says with a high selectivity, because only the binding of both antibodies to their specific
epitopes results in a positive FRET signal. In general, it is advantageous to conjugate
several donors and acceptors to the antibodies to increase the probability that a few of
them are in a distance for efficient FRET. Next to the direct labeling of the antibodies,
another approach is the use of labeled oligonucleotides attached to the antibodies, which
ensure, after binding of the analyte, a suitable distance of donor and acceptor for efficient
FRET. This also increases the FRET assay sensitivity due to the stabilization of the in-
termolecular sandwich complex by the hybridization of the oligonucleotides. [69]
From the photophysical point of view the used luminophores in FRET immunoassays
have to fulfill some requirements. First of all the excitation of the donor should cause a
negligible excitation of the acceptor to ensure that only the binding event causes a sen-
sitization of the acceptor. Spectrally separated emission spectra of donor and acceptor
are advantageous in order to avoid spectral crosstalk, which would distort the signal de-
tection. Furthermore, they have to be stable and their emission properties should not be
influenced by the sample matrix.
Luminophores used within homogeneous FRET immunoassays ranging from organic fluo-
rescent dyes, FPs, NPs, lanthanide chelates to upconversion nanoparticles (UCNPs). The
advantage of UCNPs compared to all other mentioned fluorophores is the ability of an
excitation in the infrared region (IR) and an emission in the visible region of the spec-
trum. The excitation in the infrared leads to negligible background from directly excited
acceptors. The use of moderate energy light sources for the excitation of UCNPs is ad-
vantageous over multiphoton excitation, which also produces a low background of direct
excited acceptors. But for multiphoton excitation an intense excitation source is necessary
to enable the simultaneous absorption of low energy photons to excite the donor. [94]
In other resonance energy transfer approaches the use of external excitation sources is
substituted by chemical activation or biochemical reaction. CRET uses, for example, iso-
luminol conjugated to an antigen, which can then sensitize fluorescein labeled antibodies
after binding. The main drawback is the susceptibility of the chemiluminescent reaction

18 CHAPTER 2. BACKGROUND
to differences in sample composition and is thus not suitable for clinical applications. [95]
The advantage in BRET is that the used chromophores are sequestered and minimally
affected by interfering substances.
Critical parameters in immunoassays. Among the critical parameters in immunoas-
says the most prominent are sensitivity and accuracy. Prior to an estimation of an un-
known analyte concentration in a patient sample the dose-response curve, also called
calibration curve, of the immunoassay needs to be measured. Therefore the changes of
the detector signal in dependence of known analyte concentrations are measured and plot-
ted as a function of the analyte concentration. An example for a calibration curve for an
immunometric immunoassay is shown in Figure 2.5. The increasing analyte concentration
results in an increase of the detection signal until all capture and detection antibodies are
bound to analytes, which results in a leveling of the curve. In the first part of the curve,
shown by the green dots, the calibration curve has a linear behavior and can be used to
estimate the concentration in a patient sample. In this particular range the immunoassay
performance needs to fulfill high standards in terms of sensitivity, selectivity, accuracy,
and precision.
0 2 4 6 8 1 0 1 202468
1 01 21 41 6
Signa
l inten
sity
a n a l y t e c o n c e n t r a t i o n
Figure 2.5: Calibration curve of a homogeneous immunoassay. The black line highlightsthe linear part of the curve in which the green dots represent the dynamic range for themeasurement of unknown analyte concentrations. Due to saturation effects the signalintensity saturates at higher concentrations. This concentration range cannot be used forthe estimation of the analyte (shown by the red dots).
Sensitivity is defined as the slope of the calibration curve. [96] But there is an ongoing
debate about this definition and the possibility to compare different analytical methods
based on the increase of the slope. [97, 98] The limit of detection (LOD) is the lowest
concentration of an analyte that can be detected with reasonable certainty. [96] This cer-
tainty corresponds to the confidence level, which describes the probability of covering the
expected value of an estimated parameter within an interval estimated for the parame-
ter. [96] A quite popular approach for the determination of the LOD is to use the analytical
sensitivity. Therefore the statistical deviation of the immunoassay in absence of the ana-
lyte is measured and added to the mean value using a specific factor, which corresponds
to a defined confidence level. For example three times the standard deviation result in
2.2. FRET-BASED APPLICATIONS 19
a confidence level of ca. 99 %. This theoretical determined value is mostly far below the
first concentration in a calibration curve, which raises the question of the reliability of
this value. Only if the curve consists of calibrator concentrations in the similar range as
the LOD, the value can be trusted. Using a linear expression to fit the calibration curve
can also be misleading as the probability is given that the fitted curve is below the actual
curve. To conclude, the analytical sensitivity is afflicted with uncertainties but may be
useful for a first impression of the LOD of a new system. Ekins et al. proposed to consider
the statistical error of the measurement and include this information in the calibration
curve by calculation the quotient of the error in response divided by response curve slope.
Due to the independence of the manner in which the calibration curve is plotted will allow
to make a statement about the precision of two different analytical method. [97] Another
more practical concept is the use of the functional sensitivity. [99] The crucial factor in
this approach is the coefficient of variation (CV). The CV is used as an indicator for
the repeatability of the analyte concentration estimation, which can be influenced by the
used antibodies, instrumentation, and environmental circumstances. In order to estimate
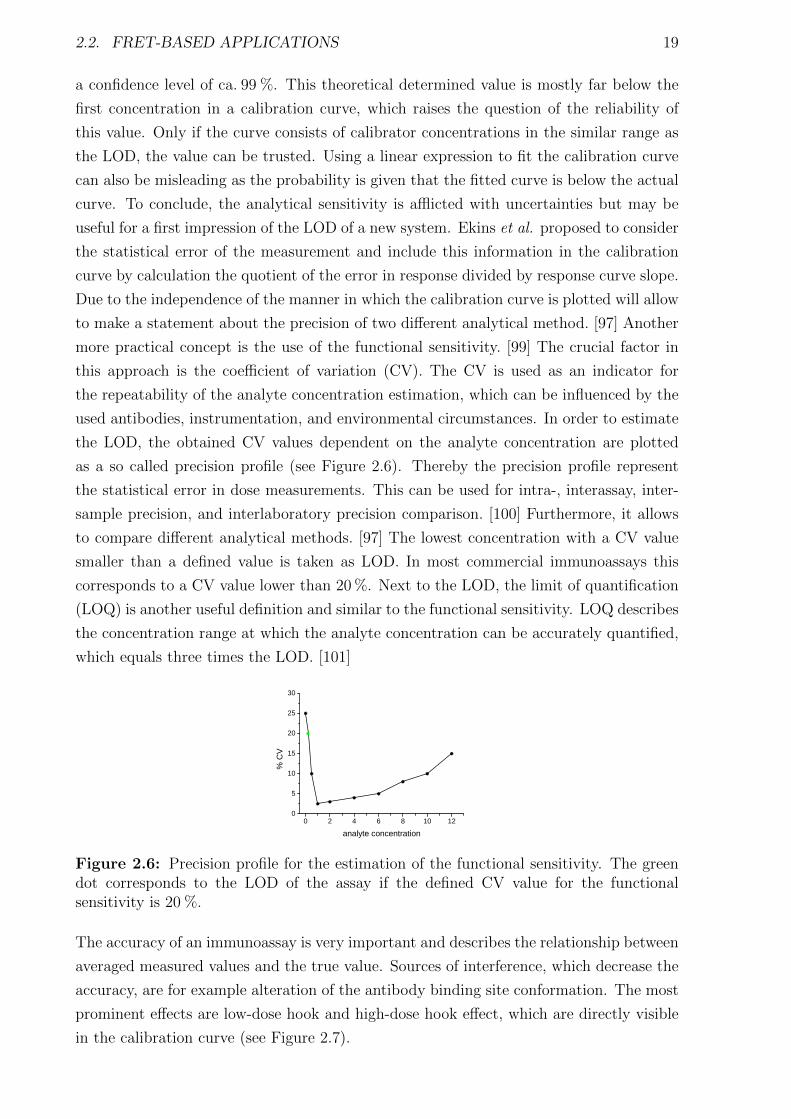
the LOD, the obtained CV values dependent on the analyte concentration are plotted
as a so called precision profile (see Figure 2.6). Thereby the precision profile represent
the statistical error in dose measurements. This can be used for intra-, interassay, inter-
sample precision, and interlaboratory precision comparison. [100] Furthermore, it allows
to compare different analytical methods. [97] The lowest concentration with a CV value
smaller than a defined value is taken as LOD. In most commercial immunoassays this
corresponds to a CV value lower than 20 %. Next to the LOD, the limit of quantification
(LOQ) is another useful definition and similar to the functional sensitivity. LOQ describes
the concentration range at which the analyte concentration can be accurately quantified,
which equals three times the LOD. [101]
0 2 4 6 8 1 0 1 20
5
1 0
1 5
2 0
2 5
3 0
% CV
a n a l y t e c o n c e n t r a t i o n
Figure 2.6: Precision profile for the estimation of the functional sensitivity. The greendot corresponds to the LOD of the assay if the defined CV value for the functionalsensitivity is 20 %.
The accuracy of an immunoassay is very important and describes the relationship between
averaged measured values and the true value. Sources of interference, which decrease the
accuracy, are for example alteration of the antibody binding site conformation. The most
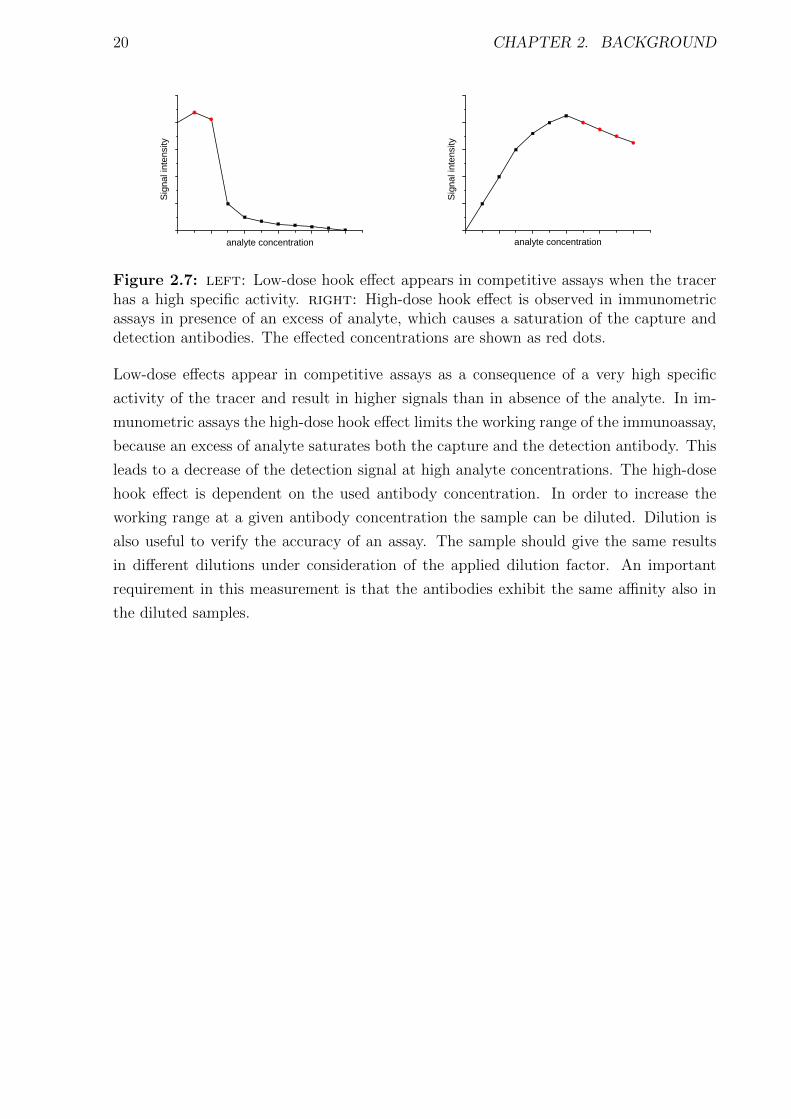
prominent effects are low-dose hook and high-dose hook effect, which are directly visible
in the calibration curve (see Figure 2.7).
20 CHAPTER 2. BACKGROUND
Signa
l inten
sity
a n a l y t e c o n c e n t r a t i o n
Signa
l inten
sity
a n a l y t e c o n c e n t r a t i o n
Figure 2.7: left: Low-dose hook effect appears in competitive assays when the tracerhas a high specific activity. right: High-dose hook effect is observed in immunometricassays in presence of an excess of analyte, which causes a saturation of the capture anddetection antibodies. The effected concentrations are shown as red dots.
Low-dose effects appear in competitive assays as a consequence of a very high specific
activity of the tracer and result in higher signals than in absence of the analyte. In im-
munometric assays the high-dose hook effect limits the working range of the immunoassay,
because an excess of analyte saturates both the capture and the detection antibody. This
leads to a decrease of the detection signal at high analyte concentrations. The high-dose
hook effect is dependent on the used antibody concentration. In order to increase the
working range at a given antibody concentration the sample can be diluted. Dilution is
also useful to verify the accuracy of an assay. The sample should give the same results
in different dilutions under consideration of the applied dilution factor. An important
requirement in this measurement is that the antibodies exhibit the same affinity also in
the diluted samples.
2.2. FRET-BASED APPLICATIONS 21
2.2.2 Spectroscopic ruler
The strong distance dependency of FRET can be used as a sensitive measurement tool to
gain access to conformational changes of proteins, inter- and intramolecular distances of
biomole-cules, and allows spatial as well as temporal analysis of proteins and DNA/RNA
association in cells. Reaction mechanism, function, and activity of biomolecules are highly
influenced by structural changes, which make the investigation of those changes important
for the understanding of the biomolecule behavior. Biological structural changes are
taking place in the (sub)millisecond time and nanometer length scale, which put the
nanosecond time-scale FRET process in a favorite position. [48] The first publication,
introducing FRET for the measurement of distances and thus as “spectroscopic ruler”,
was written by Stryer and Haugland in 1967. Within their work they also could verify the
theoretical predicted r−6 distance dependency of Forster. [44] Measurable distances using
FRET are far below the diffraction limit of light, which makes FRET the first applied
optical super-resolution technique. FRET provides at least as good as, if not better size
resolution than most of the super-resolution microscopy techniques. Another advantage
is the independency of the instrumental system, which results in negligible interferences
by instrumental noise and drift. [102] In order to calculate the distance from the Forster
formalism (presented in chapter 2.1.2), the donor and optional the acceptor emission has to
be measured using fluorescence spectrometers or fluorescence microscopy techniques. The
obtained results are used for the calculation of the FRET efficiency, which is convertible
to changes in donor-acceptor distance and/or orientation. Time-resolved measurements
are preferable over steady-state measurement, because the latter one allows only to obtain
a static, population-averaged FRET value. In contrast, time-resolved measurements are
independent of the total donor-acceptor concentration and allow an insight view in the
dynamics of conformational changes.
On the one hand, ensemble measurements of a large amount of donor-acceptor pairs
provide useful information, but on the other hand, the results are an average over all
measured distances. In order to obtain structural information of individual biomolecules
single-molecule FRET (smFRET) can be used. The measurement of only a single donor-
acceptor pair poses special requirements on the used fluorophores, like high brightness,
high signal-to-noise ratio (SNR), good photostability, and low fluctuation rate. [46, 103]
A common problem in all FRET measurements is the labeling ratio, which is normally
not 100 %. The use of alternating-laser excitation (ALEX) in smFRET measurements
allows to distinguish partially and complete labeled biomolecules. [104] The special feature
of this method is the use of two laser sources in a confocal microscopy setup, which
enable the switching between donor excitation and acceptor excitation. Next to the
measurement of smFRET also the donor-acceptor stoichiometry is obtained, which helps
to select only biomolecules where donor and acceptor are present. Other microscopy
techniques capable for the measurement of smFRET are standard total-internal reflection
illumination or nearfield scanning optical microscopy. [48] smFRET gave new insights in
22 CHAPTER 2. BACKGROUND
protein folding, [47] RNA folding [105] and enabled the monitoring of cellular transporters.
[48] Still an open project is the monitoring of correlated motion of multiple biomolecules
using smFRET. First experiments with the use of three colors could be shown for the
measurement of two independent distances within a single biomolecule. [70]
The distance range of FRET is limited to ca. 20 nm depending on the FRET pair used. For
distance measurements beyond this range other techniques can be applied, which widen
the range up to 70 nm. The most popular techniques exploiting noble nanoparticles for
plasmonic nanoparticle-based surface energy transfer (NSET) or SERS. [102]
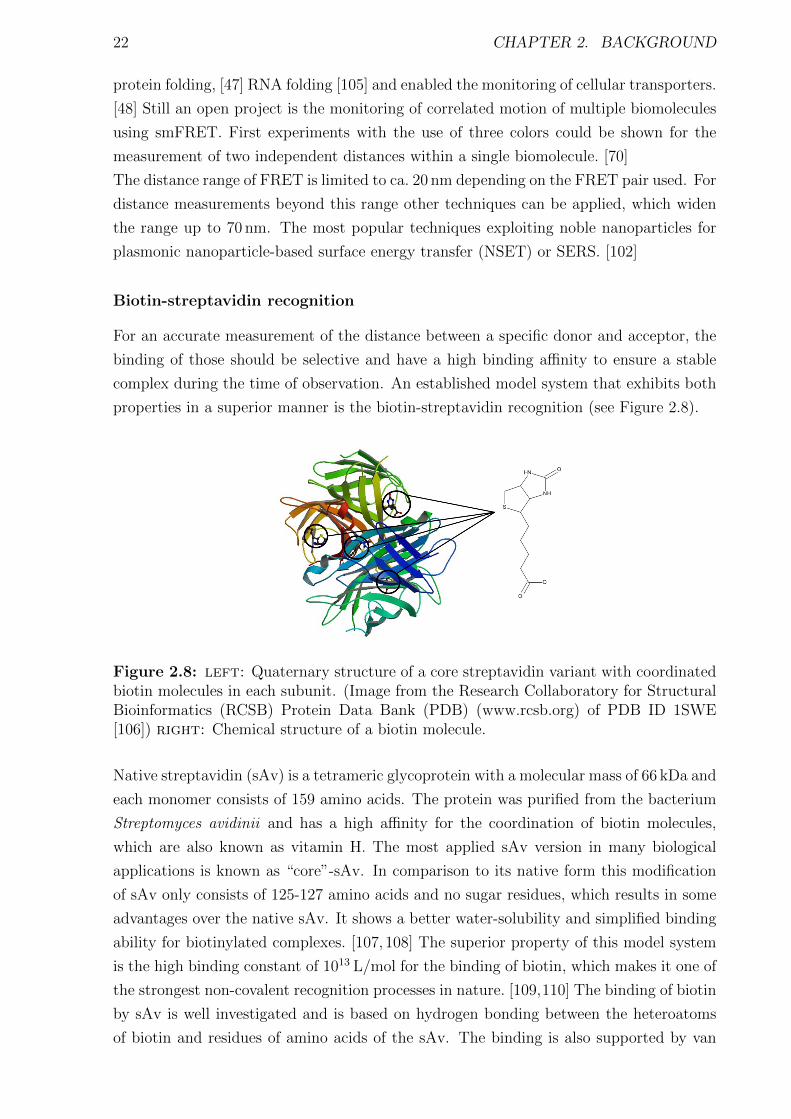
Biotin-streptavidin recognition
For an accurate measurement of the distance between a specific donor and acceptor, the
binding of those should be selective and have a high binding affinity to ensure a stable
complex during the time of observation. An established model system that exhibits both
properties in a superior manner is the biotin-streptavidin recognition (see Figure 2.8).
Figure 2.8: left: Quaternary structure of a core streptavidin variant with coordinatedbiotin molecules in each subunit. (Image from the Research Collaboratory for StructuralBioinformatics (RCSB) Protein Data Bank (PDB) (www.rcsb.org) of PDB ID 1SWE[106]) right: Chemical structure of a biotin molecule.
Native streptavidin (sAv) is a tetrameric glycoprotein with a molecular mass of 66 kDa and
each monomer consists of 159 amino acids. The protein was purified from the bacterium
Streptomyces avidinii and has a high affinity for the coordination of biotin molecules,
which are also known as vitamin H. The most applied sAv version in many biological
applications is known as “core”-sAv. In comparison to its native form this modification
of sAv only consists of 125-127 amino acids and no sugar residues, which results in some
advantages over the native sAv. It shows a better water-solubility and simplified binding
ability for biotinylated complexes. [107, 108] The superior property of this model system
is the high binding constant of 1013 L/mol for the binding of biotin, which makes it one of
the strongest non-covalent recognition processes in nature. [109,110] The binding of biotin
by sAv is well investigated and is based on hydrogen bonding between the heteroatoms
of biotin and residues of amino acids of the sAv. The binding is also supported by van
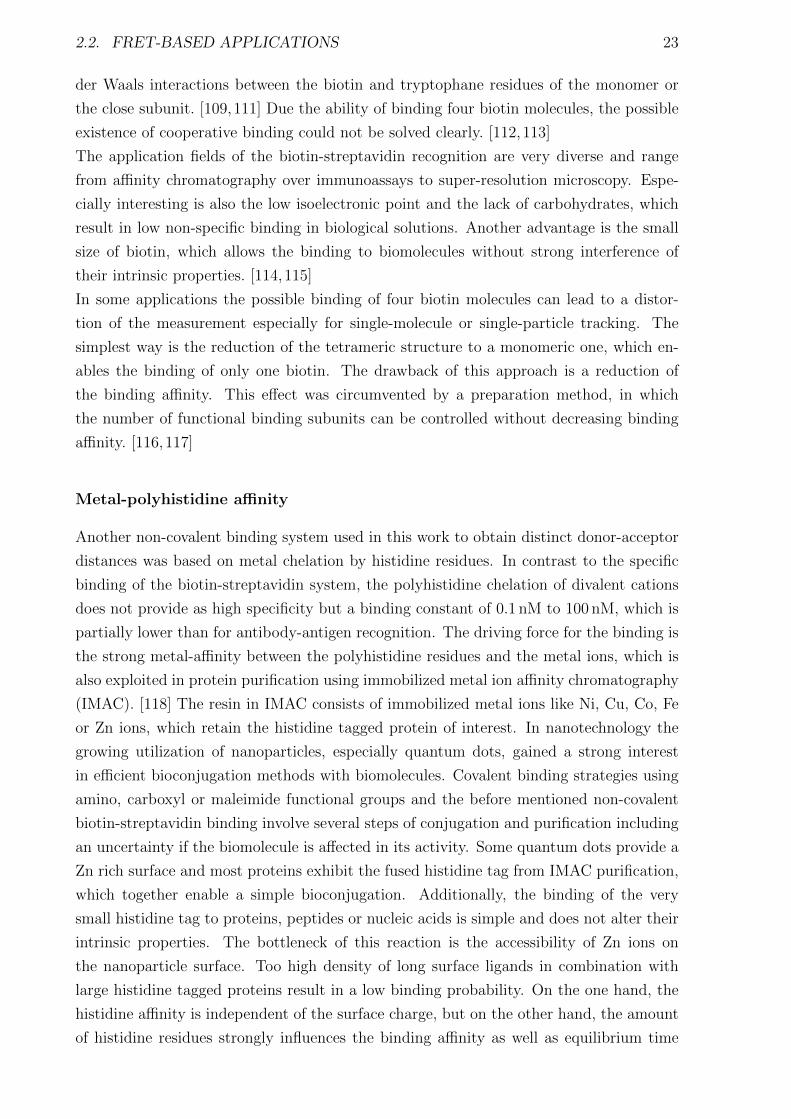
2.2. FRET-BASED APPLICATIONS 23
der Waals interactions between the biotin and tryptophane residues of the monomer or
the close subunit. [109,111] Due the ability of binding four biotin molecules, the possible
existence of cooperative binding could not be solved clearly. [112,113]
The application fields of the biotin-streptavidin recognition are very diverse and range
from affinity chromatography over immunoassays to super-resolution microscopy. Espe-
cially interesting is also the low isoelectronic point and the lack of carbohydrates, which
result in low non-specific binding in biological solutions. Another advantage is the small
size of biotin, which allows the binding to biomolecules without strong interference of
their intrinsic properties. [114,115]
In some applications the possible binding of four biotin molecules can lead to a distor-
tion of the measurement especially for single-molecule or single-particle tracking. The
simplest way is the reduction of the tetrameric structure to a monomeric one, which en-
ables the binding of only one biotin. The drawback of this approach is a reduction of
the binding affinity. This effect was circumvented by a preparation method, in which
the number of functional binding subunits can be controlled without decreasing binding
affinity. [116,117]
Metal-polyhistidine affinity
Another non-covalent binding system used in this work to obtain distinct donor-acceptor
distances was based on metal chelation by histidine residues. In contrast to the specific
binding of the biotin-streptavidin system, the polyhistidine chelation of divalent cations
does not provide as high specificity but a binding constant of 0.1 nM to 100 nM, which is
partially lower than for antibody-antigen recognition. The driving force for the binding is
the strong metal-affinity between the polyhistidine residues and the metal ions, which is
also exploited in protein purification using immobilized metal ion affinity chromatography
(IMAC). [118] The resin in IMAC consists of immobilized metal ions like Ni, Cu, Co, Fe
or Zn ions, which retain the histidine tagged protein of interest. In nanotechnology the
growing utilization of nanoparticles, especially quantum dots, gained a strong interest
in efficient bioconjugation methods with biomolecules. Covalent binding strategies using
amino, carboxyl or maleimide functional groups and the before mentioned non-covalent
biotin-streptavidin binding involve several steps of conjugation and purification including
an uncertainty if the biomolecule is affected in its activity. Some quantum dots provide a
Zn rich surface and most proteins exhibit the fused histidine tag from IMAC purification,
which together enable a simple bioconjugation. Additionally, the binding of the very
small histidine tag to proteins, peptides or nucleic acids is simple and does not alter their
intrinsic properties. The bottleneck of this reaction is the accessibility of Zn ions on
the nanoparticle surface. Too high density of long surface ligands in combination with
large histidine tagged proteins result in a low binding probability. On the one hand, the
histidine affinity is independent of the surface charge, but on the other hand, the amount
of histidine residues strongly influences the binding affinity as well as equilibrium time
24 CHAPTER 2. BACKGROUND
for the recognition process. Less than four histidine monomers result in a lower binding
affinity and longer equilibrium time, whereas more than six monomers show no further
improvement of both properties. Due to this reason the use of 6 histidine residues is
used in most applications. In case of the non-covalent binding on solid surface providing
divalent ions, the hexahistidine tags provide a polyvalency and cooperative interactions
with the surface (see Figure 2.9). The binding valency of biomolecules can be controlled
in a ratiometric approach. An advantage for FRET applications is a smaller distance
between donor and acceptor caused by the small size of the hexahistidine in comparison
to the biotin-streptavidin system. [118–121]
Figure 2.9: Hexahistidine binding to Zn ion rich surface. Different biomolecules pre-sented by R can be attached to the polyhistidine complex .
2.3. LANTHANIDE COMPLEXES 25
2.3 Lanthanide complexes
2.3.1 Introduction
Lanthanides are one of the cornerstones of our modern technology. They are omnipresent
and play a major role in the development of green energy sources, like for turbine gen-
erators in wind mills and in solar cells. They also can be found in a large variety of
consumer products like computers, cell-phones, televisions, automotive catalytic convert-
ers, petroleum refining, light emitting diodes (LEDs) and in clinical applications. This
versatile utilization of lanthanides is due to their unique electrical, optical and magnetic
properties, which will be discussed in this chapter. [122–124]
The term lanthanides (Ln) covers a group of 15 elements, which belong to the third sub-
group in the periodic system of elements. Ln together with the other members of the
third subgroup, scandium (21Sc) and yttrium (39Y), are also called rare earth elements
(REE). Although the name REE is misleading, as the most scarce REE thulium (69Tm)
can be found much more often in the earth crust than gold or platinum. [125] The dis-
covery of the REE started with the mineral “Ytterbite” in 1787, which was found in a
quarry near the village of Ytterby (Sweden). Johan Gadolin analyzed the mineral in 1794
and found an unknown oxide, which he named yttria. Further investigations were nec-
essary to obtain the pure element yttrium. Between 1839 and 1843, it was Carl Gustav
Mosander, who could separate two more oxides from yttria, namely erbium (68Er) and
terbium (65Tb). The last discovered Ln was promethium (59Pr) in 1938. The main reason
for the long period of time for the discovery of the REE and in special the lanthanides, is
their similarity in chemical behavior. [126]
This similarity can be explained by the electronic structure of the lanthanides. All 15
Ln from lanthanum (57La) to lutetium (71Lu) share the electron configuration of xenon,
which is characterized by filled 5s- and 5p-orbitals. The valence electrons are placed in the
6s-orbitals and in 4f -orbitals, with the exception of the lanthanides La, cerium (58Ce),
gadolinium (64Gd), and Lu, where also the 5d-orbitals are partially involved. Conse-
quently, the Ln differ mainly in the population of the 4f -orbitals. This leads to the
general electron configuration of [Xe]4f i6s2, whereby i ranges from 0 for La to 14 for
Lu. Due to the population of its inner 4f -orbitals and to their placement as f -block
elements between the s- and the d-block in the periodic system, Ln are also called inner
transition elements. In general, the chemical and physical properties of an element will
be influenced by the population of the outer orbitals. The special feature of Ln is the
shielding of the inner 4f -orbitals by the populated 5s- and 5p-orbitals, which leads to
a reduced response to the environment and only small differences in chemical behavior.
Due to the large size and diffuse localization of electrons in the f -orbitals, they provide an
incomplete shielding of the outer electrons from the increasing nuclear charge. [127] The
consequence is the so called lanthanide contraction, for which the ionic radius decreases
with the population of the 4f -orbitals and increasing nuclear charge. But the difference

26 CHAPTER 2. BACKGROUND
is just 0.18 A in the ionic radius from the first lanthanide La to the last lanthanide Lu.
This small ionic-radius interval and the favored appearance for Ln as trivalent ions lead
to an isomorphic replicability and to a collective occurrence. [124,128]
2.3.2 Luminescence of lanthanides
In the following text the term lanthanides or Ln refers to the trivalent lanthanide ions.
For the use in spectroscopy applications only Ln are suitable with unpaired electrons in
the 4f -orbitals, which is the case for the Ln from cerium (Ce3+) 4f 1 to ytterbium (Yb3+)
4f 13. [129] Prior to a detailed discussion about the spectral properties of lanthanides it is
necessary to clarify important terms and theoretical aspects.
The term luminescence describes the emission of light from “cold matter”. Incandescence
on the other hand describes the emission of light from “hot matter”, like from the sun or
a tungsten light bulb. Luminescence is a general term (incl. the two phenomena fluores-
cence and phosphorescence), which describes the radiative deactivation of excited matter.
The excitation of matter can be achieved through different processes, like the excitation
by photons (PL), (bio) chemical reaction (chemoluminescence or bioluminescence), or
by mechanical stress (triboluminescence). Dealing with lanthanides, photoluminescence
plays the major role. [124] Apart from the type of excitation also the nature of the excited
state is of importance, e.g., for the discrimination of fluorescence and phosphorescence.
Fluorescence is defined as the emission of light from an excited singlet state. Due to the
opposite spin of the electron in the excited state compared to the second electron in the
ground state, the deactivation process is spin allowed and occurs fast within nanoseconds.
In contrast to this the deactivation process in phosphorescence can last up to milliseconds
or even seconds. Due to a process called intersystem crossing a transition of an electron
from the excited singlet state to the excited triplet state is possible. The intersystem
crossing process is characterized by a change of the spin orientation, which makes it to
a formally forbidden transition according to one of the selection rules. [3] However, these
rules are not strict and should be rather seen as the probability of a transition. There are
three important ones, namely the spin selection rule, the symmetry selection rule, and
the vibrational selection rule. The triplet-singlet transition responsible for phosphores-
cence will be enabled by spin-orbit coupling, which alleviate the spin selection rule. Due
to the forbidden character of this transition the probability is quite low, which leads to
long excited state lifetimes. The most important selection rule in the discussion of the
emission of lanthanides is the symmetry selection rule also known as Laporte rule, which
does not allow electron transitions in the same subshell. This means that 4f -4f transi-
tions are forbidden, but these are the main transitions for lanthanides. This rule can be
partially repealed by the coupling of vibrational states, which leads to the disruption of
the spherical symmetry of the free ion once coupled to ligands. These before mentioned
rules count mainly for electric dipole transitions. However, the scene changes taking into
account the magnetic dipole transitions, which allow f -f transitions. [124]
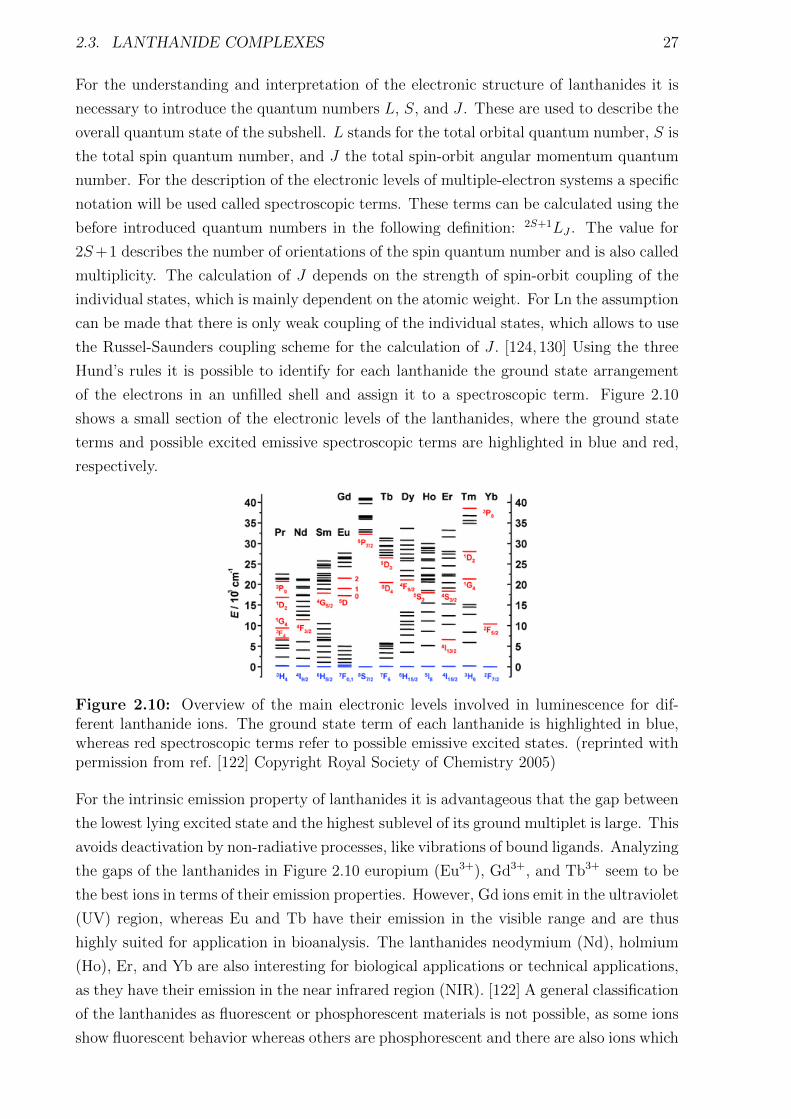
2.3. LANTHANIDE COMPLEXES 27
For the understanding and interpretation of the electronic structure of lanthanides it is
necessary to introduce the quantum numbers L, S, and J . These are used to describe the
overall quantum state of the subshell. L stands for the total orbital quantum number, S is
the total spin quantum number, and J the total spin-orbit angular momentum quantum
number. For the description of the electronic levels of multiple-electron systems a specific
notation will be used called spectroscopic terms. These terms can be calculated using the
before introduced quantum numbers in the following definition: 2S+1LJ . The value for
2S+1 describes the number of orientations of the spin quantum number and is also called
multiplicity. The calculation of J depends on the strength of spin-orbit coupling of the
individual states, which is mainly dependent on the atomic weight. For Ln the assumption
can be made that there is only weak coupling of the individual states, which allows to use
the Russel-Saunders coupling scheme for the calculation of J . [124, 130] Using the three
Hund’s rules it is possible to identify for each lanthanide the ground state arrangement
of the electrons in an unfilled shell and assign it to a spectroscopic term. Figure 2.10
shows a small section of the electronic levels of the lanthanides, where the ground state
terms and possible excited emissive spectroscopic terms are highlighted in blue and red,
respectively.
Figure 2.10: Overview of the main electronic levels involved in luminescence for dif-ferent lanthanide ions. The ground state term of each lanthanide is highlighted in blue,whereas red spectroscopic terms refer to possible emissive excited states. (reprinted withpermission from ref. [122] Copyright Royal Society of Chemistry 2005)
For the intrinsic emission property of lanthanides it is advantageous that the gap between
the lowest lying excited state and the highest sublevel of its ground multiplet is large. This
avoids deactivation by non-radiative processes, like vibrations of bound ligands. Analyzing
the gaps of the lanthanides in Figure 2.10 europium (Eu3+), Gd3+, and Tb3+ seem to be
the best ions in terms of their emission properties. However, Gd ions emit in the ultraviolet
(UV) region, whereas Eu and Tb have their emission in the visible range and are thus
highly suited for application in bioanalysis. The lanthanides neodymium (Nd), holmium
(Ho), Er, and Yb are also interesting for biological applications or technical applications,
as they have their emission in the near infrared region (NIR). [122] A general classification
of the lanthanides as fluorescent or phosphorescent materials is not possible, as some ions
show fluorescent behavior whereas others are phosphorescent and there are also ions which
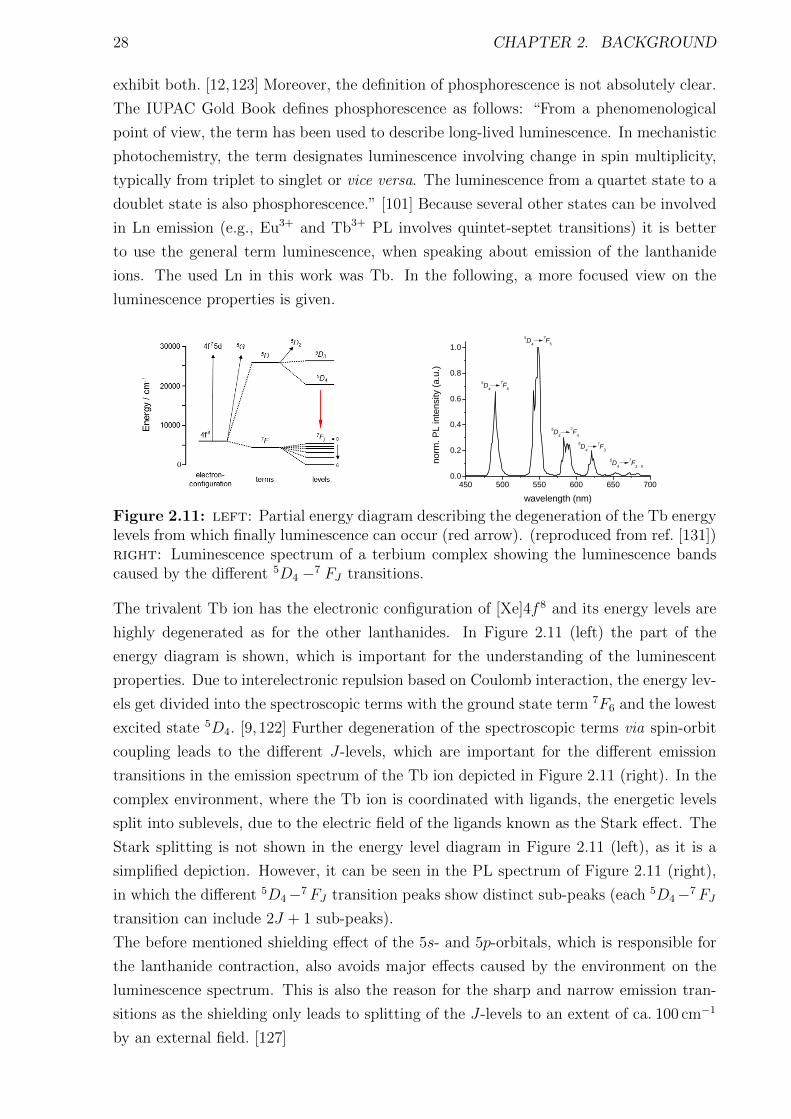
28 CHAPTER 2. BACKGROUND
exhibit both. [12,123] Moreover, the definition of phosphorescence is not absolutely clear.
The IUPAC Gold Book defines phosphorescence as follows: “From a phenomenological
point of view, the term has been used to describe long-lived luminescence. In mechanistic
photochemistry, the term designates luminescence involving change in spin multiplicity,
typically from triplet to singlet or vice versa. The luminescence from a quartet state to a
doublet state is also phosphorescence.” [101] Because several other states can be involved
in Ln emission (e.g., Eu3+ and Tb3+ PL involves quintet-septet transitions) it is better
to use the general term luminescence, when speaking about emission of the lanthanide
ions. The used Ln in this work was Tb. In the following, a more focused view on the
luminescence properties is given.
4 5 0 5 0 0 5 5 0 6 0 0 6 5 0 7 0 00 . 0
0 . 2
0 . 4
0 . 6
0 . 8
1 . 0
7 F 6
norm
. PL i
ntens
ity (a.
u.)
w a v e l e n g t h ( n m )
5 D 4
7 F 55 D 4
7 F 45 D 4
7 F 35 D 4
7 F 2 - 05 D 4
Figure 2.11: left: Partial energy diagram describing the degeneration of the Tb energylevels from which finally luminescence can occur (red arrow). (reproduced from ref. [131])right: Luminescence spectrum of a terbium complex showing the luminescence bandscaused by the different 5D4 −7 FJ transitions.
The trivalent Tb ion has the electronic configuration of [Xe]4f 8 and its energy levels are
highly degenerated as for the other lanthanides. In Figure 2.11 (left) the part of the
energy diagram is shown, which is important for the understanding of the luminescent
properties. Due to interelectronic repulsion based on Coulomb interaction, the energy lev-
els get divided into the spectroscopic terms with the ground state term 7F6 and the lowest
excited state 5D4. [9, 122] Further degeneration of the spectroscopic terms via spin-orbit
coupling leads to the different J-levels, which are important for the different emission
transitions in the emission spectrum of the Tb ion depicted in Figure 2.11 (right). In the
complex environment, where the Tb ion is coordinated with ligands, the energetic levels
split into sublevels, due to the electric field of the ligands known as the Stark effect. The
Stark splitting is not shown in the energy level diagram in Figure 2.11 (left), as it is a
simplified depiction. However, it can be seen in the PL spectrum of Figure 2.11 (right),
in which the different 5D4−7FJ transition peaks show distinct sub-peaks (each 5D4−7FJ
transition can include 2J + 1 sub-peaks).
The before mentioned shielding effect of the 5s- and 5p-orbitals, which is responsible for
the lanthanide contraction, also avoids major effects caused by the environment on the
luminescence spectrum. This is also the reason for the sharp and narrow emission tran-
sitions as the shielding only leads to splitting of the J-levels to an extent of ca. 100 cm−1
by an external field. [127]

2.3. LANTHANIDE COMPLEXES 29
2.3.3 Luminescent Tb complexes
The sharp and well-defined transitions of the Tb ion shown in Figure 2.11 (right) have
very low intensities. The reason for this is based on the low extinction coefficients, which
are for each transition smaller than 1 M−1cm−1. [132] The low extinction coefficients can
be explained by the forbidden transitions of electrons within the 4f -orbital subshell. Due
to the Laporte rule a direct excitation of Tb ions has a very low probability. Another
consequence of the formally forbidden transitions is that the lifetimes of the excited states
can be up to several milliseconds. [9, 10] Nevertheless, the use of the Tb ions within
luminescence applications can be enabled by the use of ligands, which act as sensitizer.
In this process, called photosensitization or antenna effect, the ligand is excited and
transfers the energy to the lanthanide cation. [133] In Figure 2.12 a simplified Jablonski
diagram is shown, which describes the sensitization of the Tb ion by the ligand.
Figure 2.12: Sensitization of the Tb ion via ligands used as antenna. The absorption ofphotons by the ligand (hνA) results in the promotion of the ligand from its ground stateS0 to its excited state S1. Next to the emission of photons (hνF) for the deexcitation ofthe ligand, the energy can be transferred via intersystem crossing kISC to the triplet stateT1. Similar energy levels for T1 and the 5D4 state of Tb, enable the energy transfer kETfrom the ligand to the Tb ion. If the energy difference between the T1 and 5D4 is to smallthe probability increases for unwanted back transfer kB. The radiative deexcitation hνTb
from the 5D4 to the different 7FJ states causes the characteristic emission bands of Tbshown in Figure 2.11 (right). In all cases non-radiative deexcitaion is possible and shownas dashed black arrows.
The ligand should possess a strong absorbance and a high efficiency for intersystem cross-
ing from the excited singlet to the triplet state. From this state the energy can be
transferred to the Tb ion via transfer processes depending on the distance and type of
transfer. [11,134,135] Transfer processes can be FRET, Dexter or charge transfer. Due to
a larger energy transfer range and the possible dipole-dipole coupling of the excited triplet
state of the ligand with 4f -orbitals, FRET is more likely for Ln. Dominant charge transfer
processes are mainly ligand to ligand charge transfer observable in solid state materials,
and ligand to metal charge transfer (LMCT). LMCT is limited to the easily reducible lan-
thanide ions (samarium (Sm), Eu, and Yb) embedded in inorganic materials containing
phosphors and play a minor role for the energy transfer to the Tb ion. However, the type
of energy transfer from the ligand to the Tb ion is so far unclear as sensitization of the
30 CHAPTER 2. BACKGROUND
lanthanide ion is very complex and involves numerous rate constants. [122, 124] Positive
consequences from the sensitization by the ligand is a large effective Stokes shift between
the absorption (250-400 nm) and emission (475-700 nm) of the Tb complex, which allows
an easy spectral discrimination of the emission from the excitation light.
There are several requirements for the ligands, which can enhance the transfer rate and
as such also the luminescence of Ln. First of all, the energy of the triplet state has to
provide an efficient transfer to the lanthanide ion and on the other hand minimize the
probability for back transfer. [127] This will also decrease the probability for photobleach-
ing of the ligand. [10] Secondly, the ligand should provide an adequate coordination to
form a kinetic and thermodynamic stable complex. For lanthanides the common coordi-
nation number is 8 to 9, where smaller coordination numbers will be balanced by solvent
molecules. [127] These balancing can be problematic as the solvent molecules such as wa-
ter can act as quencher and reduce the luminescence, due to an enhanced non-radiative
deactivation process based on high energy vibration of the O-H bond. [136] The entropy
driven complexation and the need for a saturated coordination sphere can be satisfied
using polydentate ligands, whose synthesis is quite challenging. [122]
A key parameter for the characterization of luminescent materials is the photolumines-
cence QY (Φ) (see chapter 2.1.2). For lanthanide complexes the Φ describes the number
of photons emitted by the lanthanide per number of photons absorbed by the ligand.
Therefore the overall quantum yield is given by
ΦLLn = ηET ·ΦLn
Ln (2.7)
where ΦLLn and ΦLn
Ln are the quantum yields resulting from indirect and direct excitation of
the Ln ion, respectively. The variable ηET describes the transfer efficiency from the ligand
to the lanthanide ion. [122, 123] The intrinsic Φ of the directly excited lanthanide does
not take into account the number of absorbed photons, but delivers information about
the non-radiative processes, like back transfer to the ligand and luminescence quenching.
The intrinsic Φ can be measured by the radiative lifetime of the lanthanide in absence of
all non-radiative pathways. [124] In the case of Eu ions the intrinsic quantum yield can
be measured using the corrected emission spectra or an integration sphere, which is not
possible for Tb ions. The absence of of an isolated magnetic dipole transition prevent the
simple estimation from the corrected emission spectra and the low absorbance does not
allow to use the integration sphere. Furthermore, the prediction of the spectral intensities
using the Judd-Ofelt theory is connected to larger uncertainties due to the proximity of
the 4f 7 5d1 and 4f 8 electronic configuration. [137,138] Due to those problems, a possible
way to estimate the intrinsic quantum yield is the stepwise cooling of the sample until a
minimum of non-radiative pathways is reached.
As water molecules increase the probability for non-radiative processes, it is important to
evaluate the coordination of the ligand by measuring the number of water molecules in the
first coordination sphere. This can be done by exchanging the solvent to its deuterated

2.3. LANTHANIDE COMPLEXES 31
analog, which do not lead to a deactivation of the excited state due to the lower vibrational
energy of O-D bonds compared to O-H bonds. The number of water molecules can then
be determined by measuring the observed lifetime in presence of water and deuterated
water using a theoretical approach of Supkowski and Horrocks. [124]
2.3.4 Application of lanthanidesAs stated in the beginning, lanthanides are an omnipresent material due to their special
physical and chemical properties. Especially lanthanide containing phosphors are used
in a broad variety of application fields, ranging from lighting and display devices, lasers,
optical communication, night vision, security inks, counterfeiting tags, luminescent coat-
ing, probes for luminescent immunoassays, and bioconjugates for medical imaging and
the photodynamic treatment of cancer. [139] Due to their wide luminescence range from
the UV to NIR, lanthanides can be used as converter materials to transform UV and
IR light into light with wavelengths in the visible (400 to 700 nm), which can be easily
absorbed by photosensitive devices such as solar cells. Lanthanides gave always rise to
new technologies. In this sense the invention of the Nd:YAG laser in 1964, with its main
emission line at 1064 nm, had a large impact on science and is now one of the most wide
spread lasers. Due to their favorable emission in the visible range, Tb and Eu are the most
used lanthanides for lighting devices, where the purity of their emitted light (i.e. their
narrow, line-shaped emissions spectra) makes them highly suitable for color reproduction
in LEDs and displays. [124]
g a t e
Signa
l inten
sity
t i m e
d e l a y
Figure 2.13: Time-gating measurements with lanthanide terbium complexes (LTCs).The excitation of the sample (purple line) results in the long lived decay of LTCs (greencurve) and short lived autofluorescence signal from biological components inside the sam-ple (red curve). During the delay, the time between excitation and actual measurement,the autofluorescence decays and allows a nearly background free detection of the signalin a certain gate. The gate width can be optimized to enhance the signal-to-noise ratio(SNR).
Apart from their technological impact, lanthanides are also beneficial in biological ap-
plication. The main reason for this originates in their forbidden f -f transitions, which
lead to long PL decay times in the micro to millisecond regime. Using time-resolved mea-
surements and/or time-gating, short signal components from autofluorescence or light
scattering of the biological sample can be easily distinguished, which greatly enhances
32 CHAPTER 2. BACKGROUND
the signal-to-noise ratio and thus the sensitivity. The time-gated approach is shown in
Figure 2.13. After pulsed excitation the detection of the signal will be started after the
autofluorescence has decayed. By varying the temporal width of the detection window
the SNR can be optimized.
The conjugation of lanthanide complexes to biomolecules will be established by covalently
bound functional groups on the ligand. The most popular conjugation strategies are the
use of Ln-complexes functionalized with NHS-esters or maleimide groups, which selec-
tively bind to amino or thiol groups, respectively. The first reported use of Ln-complexes
in biological applications was in the mid-1970s. Finnish researchers used Eu, Sm, Tb,
and dysprosium (Dy) polyaminocarboxylates and beta-diketones as luminescent sensors
in time-resolved luminescent immunoassays. [10]
The utilization of lanthanide complexes in microscopy has not been intensively inves-
tigated, mainly due to the lack of suitable microscopes that can excite the sample ef-
ficiently in the UV, and are able to image in time-gated mode on the long time scale
of lanthanides. However, first applications of lanthanide complexes for steady-state or
time-resolved imaging in cells and tissues could be shown. [140–145] Therefore they were
conjugated to proteins, [146] peptides, [147] or antibodies. [148, 149] To compensate the
low intensity of lanthanides complexes compared to well established dye stains, numerous
lanthanide complexes can be enclosed in one nanoparticle, which strongly enhance the
luminescence at one binding site. Furthermore, it is possible to bind a high amount of Ln
complexes in a small area of the biomolecule without causing self-quenching effects. [150]
A lanthanide that has strongly influenced the field of magnetic resonant imaging (MRI)
measurements is Gd. Due to the highest number of unpaired electrons in the 4f -orbitals
of lanthanides, Gd-complexes show a high degree of paramagnetism and thus have high
relaxivity. [124] The combination of Gd with NIR emitting Ln in one particle can be
used in multimodal applications, in which the shortcoming of one imaging technique is
compensated by the combination with another one using the same imaging agent. In this
case the combination of NIR imaging and MRI technique is advantageous. NIR enables
a relatively deep penetration into the biological material with a high sensitivity, whereas
MRI has a relatively low sensitivity, but enables a good spatial resolution and efficient
tissue penetration. [151,152]
The lanthanide complexes described above are so called downconversion materials, as they
emit photons of lower energy compared to the excitation energy. In upconversion pro-
cesses multiple photons are absorbed and lead to emission of a photon of higher energy.
Due to the long lifetime of metastable excited states, lanthanides offer the possibility for
sequential photon absorption, which make especially Tm, Nd, Dy, Ho, and Er highly suit-
able for the use in UCNPs. [122,139,153] UCNPs offer the advantage of the excitation in
the NIR and emission in the visible range or even in the ultraviolet. This effect produces
very low background signals and allows a deep penetration into biological material, which
leads to their extensive use in bioanalysis [154] and bioimaging. [155]
2.3. LANTHANIDE COMPLEXES 33
2.3.5 Lanthanide complexes as FRET donors
The most often used lanthanide complexes as FRET donors comprise Tb or Eu ions and
offer several advantages, which are mainly based on their exceptional photophysical prop-
erties. [12, 123, 156] Due to the use of lanthanide terbium complexes (LTCs) within this
work, the following explanations are focused on LTCs as FRET donors.
Most conspicuous in comparison to other luminophores is their long lifetime in the mil-
lisecond range. As described in the previous chapter, the long lifetime enables time-gating
measurements. Due to the much shorter lifetime of many acceptors, the emission of direct
excited acceptors can be easily distinguished from the actual FRET sensitization. The
long lifetime allows measurements with very low background. That is beneficial for the
measurement of FRET sensitization of donor-acceptor pairs, which are separated by a
large distance and thus exhibit a low FRET efficiency.
The circumstance that the donor lifetime is much longer than the intrinsic acceptor life-
time results in two major advantages. First of all it causes a similarity of the FRET-
sensitized acceptor lifetime (τAD) and the lifetime of the donor in presence of the acceptor
(τDA). This allows the substitution of τDA with τAD in equation 2.6 and enables the
possibility to calculate the FRET efficiency from two individual energetic transitions
(wavelengths). [2] The use of two individual channels in a ratiometric approach decreases
the interference from the measurement system such as excitation energy fluctuations. To
increase the FRET sensitization it is beneficial to populate several LTCs around a single
acceptor. The acceptor can then be excited via FRET several times as long as excited
LTCs are in close proximity. But this effect will not increase the FRET efficiency, it
rather results to a decreased efficiency as several LTCs donors have to compete for one
acceptor. [30]
Apart from the long lifetime the concentration of the emission in small bands leads to
high area-normalized emission spectra for LTCs and result in large overlap integrals in
combination with conventional FRET acceptors. [156–158] Furthermore, the well-defined
emission bands are highly suitable for multiplexing applications. [16–19] Therefore accep-
tors are chosen with emission maxima between or beyond the emission bands of LTC,
which result in a strong decreased probability for optical crosstalk.
All these advantages of LTCs in FRET-based applications are used for monitoring protein-
protein interactions, orthogonal ligand-dependent protein-peptide binding events, high-
through-put screening of potential drug candidates, and numerous in vitro bioassays. [75]
Some of them are already included in commercially clinical diagnostics kits for the de-
tection of different biomarkers. Such detection technologies are for example HTRF (CIS
bio) [159], TRACE (Thermo Fisher Scientific) [160], LANCE (PerkinElmer) [161] or Lan-
thaScreen (Life Technologies) [162].

34 CHAPTER 2. BACKGROUND
2.4 Quantum dots
2.4.1 Introduction
Other key luminophores of this work were semiconductor nanocrystals (quantum dots,
QDs). After the first theoretical descriptions and experiments in the 1980s, [163–166]
the number of scientific and technological applications using QDs increased exponen-
tially. The reason for their great utility in such diverse scientific fields as photovoltaics,
optoelectronics, and biomedical applications is based on their unique photophysical prop-
erties. [167]
Although QDs are a quite “young” class of luminophores, over the last 15 years they have
become an established label in the biological toolkit for luminescence based applications.
This development was initiated in 1998 by the publication of two articles using QDs as a
biological label in microscopy measurements for the first time. [168,169] Because QDs are
made of toxic heavy-metal ions, the increasing popularity in biological applications raised
the question of their toxicity in biological systems. Different studies gave only controver-
sial insights in their toxic behavior so that this question cannot be clearly answered.
The following chapter aims to give a brief overview of the preparation of QDs and the
origin of their unique photophysical properties. Afterwards, examples of QD-based bi-
ological applications are presented together with a discussion about the advantages of
using QDs inside FRET applications.
2.4.2 Preparation of QDs
In general, QDs can consist of atoms from the groups II-VI, III-V, or IV-VI of the periodic
table of elements. The most utilized QDs in biological applications are cadmium (Cd)-
based QDs due to well established synthetic routes and well-known conjugation strategies
for the labeling of biomolecules.
For the use of QDs in biological applications there is a need to synthesize uniform and
colloidal QDs with low polydispersity, which Murray et al. could establish in 1993 using a
high temperature organometallic process. [170] The resulting QDs exhibit a crystal struc-
ture in which disturbances on the surface, called trap states, can enhance surface-related
recombination, which is an unwanted non-radiative deactivation pathway of excited QDs.
To circumvent this effect the core can be surrounded by a shell. Due to a larger band-gap
in comparison to the core and the match in crystal structure, shells consisting of a few
atomic layers of ZnS or CdS are ideally suited for the reduction of surface-related recom-
binations. [171, 172] The drawback of the approach from Murray et al. was the use of
Cd(CH3)2 as precursor, which is a pyrophoric material and would not allow a simple large
scale synthesis. A big step for the synthesis and later commercialization was the exchange
of the precursor to CdO by Peng et al.. [173] The main parameters for the control of the
shape and size of QDs are temperature, growth time, and the amount of precursors. [174]

2.4. QUANTUM DOTS 35
Due to the synthesis in organic phase QDs are hydrophobic and need further processing
to render them water-soluble in order to use them in biological applications. This can be
achieved by the manipulation of the surface molecules of the QD. Popular strategies are a
complete surface cap exchange, capping with amphiphilic surface ligands, [175] encapsu-
lation in micelles or in silica shells. [25,27,176,177] The chosen surface molecules not only
influences the photophysical parameters, they also contribute to the overall size of the
QD, which is a critical parameter in biological applications. Next to the facile measure-
ment of the inorganic core by transmission electron microscopy (TEM), the measurement
of the hydrodynamic diameter is of importance for the later use as bioprobe. Especially
in imaging applications in which the probe has to diffuse through the sample to reach
the target, a small size is advantageous. [178] Furthermore, the large surface of QDs can
cause numerous non-specific interactions with proteins in the biological media, which can
influence the activity of the probe. [179] A surface ligand that provides a good solution
for both issues is poly(ethylene glycol)-dihydrolipoic acid (PEG-DHLA). The inclusion
of PEG inside the surface molecule structure has shown to be successfully decreasing
non-specific binding and simultaneously increase the stability in biological media. [180]
Using DHLA results in a small hydrodynamic diameter and additionally provides a good
colloidal stability of the QD over a large pH range. [181,182]
Figure 2.14: Overview about different strategies to render the QD water-soluble (a-e)and possible conjugation strategies (f-j) for the labeling of biomolecules (R).
The last step in the preparation of QDs is to provide functional groups to enable the
binding to biomolecules. Numerous methods can be found in the literature and are appli-
cable for nearly all kinds of biomolecules. [23, 24, 26, 27] The most popular strategies are
the binding to amino groups using aniline-catalyzed hydrazine bond formation or to thiol
groups via QDs functionalized with maleimide groups. [183] Due to the large surface, QDs
allow a high number of functional groups on the surface, which enable the conjugation

36 CHAPTER 2. BACKGROUND
of several biomolecules per QD. For the monitoring and tracking of single molecules one
functional group per QD is preferred. In an attempt to provide monovalent QDs differ-
ent approaches were investigated exploiting peptides, [184] oligonucleotides, [185] and the
modified streptavidin-biotin recognition described in chapter 2.2.2. Figure 2.14 shows an
overview about the different strategies for the preparation of a water-soluble QD and the
possible chemical conjugation methods for the labeling of biomolecules.
The before presented multistep strategy for the preparation of a biocompatible functional-
ized QD can be reduced to nearly one step by direct synthesis of QDs in water. Advantages
like the prevention of surface molecule manipulation, low cost production, and the use of
green chemistry make this approach attractive. [186–188] Although the aqueous synthe-
sized QDs have a lower QY than the organic synthesized ones, in a comparative study it
could be shown that aqueous QDs can have a better biomolecule conjugation efficiency
and stability in biological media. [189]
Next to classical synthesis approaches, QDs can also be produced within living organ-
isms. Responsible for the growth of QDs in rats or in standard wild-type Lumbricus
rubellus earthworms is an intrinsic heavy-metal detoxification process, which leads to the
formation of Cd-based QDs after the intake of CdCl2. [190,191]
2.4.3 Photophysical properties
The unique photophysical properties of QDs are based on their quasi zero-sized-dimension
and their semiconductor material. Semiconductors are defined as material, whose ener-
getic states can be divided into a conduction band and a valence band with a separation
by an energy bandgap of ca. 0.5 to 3.5 eV. [22] Depending on the size of the bandgap the
excitation of an electron from the valence band to the conduction band can be enabled
by using wavelengths with energies between the IR and the UV. In the condition of a
promoted electron in the conduction band a positive hole is left in the valence band. The
Coulomb interaction between the electron and the hole leads to the creation of a quasi-
particle, which is called an exciton. Thereby the exciton Bohr radius describes the spatial
distance between electron and hole within the exciton and can range from 1 to 100 nm.
Due to the fact that the size of QDs is in the same range, the exciton is confined in all
spatial directions, which results in a splitting of the continuous energy bands into discrete
energy levels. [22] This phenomenon also known as quantum confinement effect is respon-
sible for the unique photophysical properties of QDs and places them as an intermediate
between bulk material and single molecules. Due to the quantum confinement, QDs con-
sisting of the same material can emit at different wavelengths depending on their size (see
Figure 2.15). A stronger confinement of excitons in smaller QDs results in a larger energy
bandgap and thus in a blue shifted emission. The size dependent QD emission enables
the possibility to cover the whole spectrum from UV to NIR. [21] Characteristic for the
emission spectra is their Gaussian shape with a full width at half maximum (FWHM) of
ca. 25 to 35 nm depending on the polydispersity of the QD batch.

2.4. QUANTUM DOTS 37
4 5 0 5 0 0 5 5 0 6 0 0 6 5 0 7 0 0 7 5 00
1 x 1 0 6
2 x 1 0 6
3 x 1 0 6
4 x 1 0 6
5 x 1 0 6
6 x 1 0 6
molar
abso
rptivit
y (M-1 cm
-1 )
w a v e l e n g t h ( n m )0 . 0
0 . 2
0 . 4
0 . 6
0 . 8
1 . 0
norm
. PL i
ntens
ity (a.
u.)
Figure 2.15: Absorbance (dashed) and emission spectra of two QDs that consist of thesame material. The difference is there size as the QD with a emission peak at ca. 650 nm(red) is larger than the QD with the emission maximum at ca. 605 nm (orange).
Another unique property of QDs is their broadband absorbance spectrum, which is caused
by an increased absorbance probability with increasing excitation energy. This enables
the excitation of QDs at every wavelength below the emission band. [27,192] Concerning
their luminescence lifetime, QDs have a multi-exponential decay with lifetimes ranging
from 10 to 100 ns. Due to their high QY in combination with high molar extinction co-
efficients, QDs exhibit an exceptional brightness. [193] Furthermore, they provide a large
two-photon cross section up to 103 – 104 Goeppert-Mayer units, which is advantageous for
multiphoton excitation. [194,195] The before mentioned recombination of excitons on the
surface of QDs in the trap states is also responsible for a phenomenon called intermittent
fluorescence (blinking), visible only at the single QD level. [192]
In comparison to other common fluorophores like organic fluorescent dyes and fluorescent
proteins, QDs have several advantages. FP’s and fluorescent dyes exhibit a narrow exci-
tation band, small Stokes shift, and broad emission spectra with a pronounced shoulder
in the red, which limit the use in multiplex measurements. Due to the broad absorbance
band, the multiplex capability is superior for QDs as several QDs can be excited using
one excitation wavelength. Beneficial is also the Gaussian-shaped emission, which reduces
the probability of optical crosstalk. [27] Additionally the SNR for FPs and organic dyes is
strongly affected by their short lifetime (few nanoseconds) and tendency for photobleach-
ing. QDs on the other hand have a high SNR based on their high brightness, strong
photostability, and their longer lifetime, which allow time-gated measurements. [196–199]
A detailed discussion of advantages and disadvantages of QDs in comparison to dyes can
be found in the reference. [20]
2.4.4 QD-based applications
The unique photophysical properties of QDs result in a versatile utilization in different
fields of biology. Especially their brightness and negligible photobleaching make them pop-
ular luminophores for in vitro and in vivo detection/imaging of biomolecules, cells, and

38 CHAPTER 2. BACKGROUND
tissues. Apart from microscopy-related applications, they are also used for in vitro diag-
nostics where they enable ultrasensitive detection of biomolecules like nucleic acids, sugars,
enzymes, antigens, and antibodies. Furthermore, their large surface is used as carrier for
genes and drugs to monitor gene/drug delivery processes. [167] The tremendous amount
of QD-based applications and techniques were reviewed and summarized in focused re-
views specified after their use in biosensing, [27, 28, 200–202] in vitro imaging, [203–205]
and in vivo imaging. [192, 206–209] Recommended reviews about the controversial topic
of whether QDs are toxic or not can be found in the following references. [210–215]
As a passive label, QDs are mainly used within imaging applications. The bottleneck of
QDs in cellular, tissue and whole animal imaging are mainly their large size, which pro-
hibit an easy diffusion to the target. Different delivery strategies were developed, ranging
from alteration of the QD-surface, using active ligand receptor mediated transportation,
to mechanical delivery via electroporation or microinjection in order to enable the biolog-
ical entry of QDs. Thereby the large surface is an ideal scaffold to decorate the QDs with
different functions. Such manipulated QDs were successfully used for the detection of
cancerous cells, [216] investigation of trafficking, and subcellular distribution of different
biomarkers. [217] Due to the strong absorbance and scattering of biological tissue in the
visible range, NIR-QDs are favored labels for in vivo imaging. [218] The large two-photon
cross sections allow an efficient excitation of the QDs with two-photon excitation, which
strongly enhance the SNR. Major applications of QDs for in vivo imaging are tracking
of labeled stem cells, [219] neutrophils, [220] and viruses, [221] monitoring the efficiency
of drug delivery, and treatment of cancer cells. [222–224] They have also been used for
imaging-guided surgery of sentinel lymph nodes. [225,226]
The full potential of QDs can be exploited when using them as an active label. Thereby
the large surface is used to establish the biorecognition unit, which also causes a manip-
ulation of the QD emission in presence of the target. Signal transduction caused by the
change of the QD emission can be initiated by FRET. The utilization of QDs as donors
in FRET-based applications is very beneficial due to their unique photophysical proper-
ties. First of all their size-tunable emission enables to tune the spectral overlap with the
absorbance band of an acceptor in order to obtain the largest possible Forster distance.
Furthermore, the broad absorbance band of QDs allows the excitation at a wavelength
where the acceptor has a negligible absorbance, which increases the SNR due to less di-
rect excitation of the acceptor. The excitation of several QDs with only one excitation
wavelengths in combination with their narrow emission bands allows simple signal decon-
volution in multiplexing applications. [8, 30]
In most applications QDs are used as FRET donors, although they are highly suitable
FRET acceptors. The major limitation for using them as FRET acceptors is their broad
absorbance band, which does not allow a selective excitation of the FRET donor. Addi-
tionally the similarity in lifetime to most conventional fluorophores results in the presence
of only a small number of QDs in the ground state, which strongly limits the possibility
2.4. QUANTUM DOTS 39
for FRET. On the other hand the broad absorbance band enables also very large overlap
integrals as QDs can cover the whole emission spectrum of a FRET donor. [29–31]
The use of LTCs as FRET donors for QDs as FRET acceptors is very beneficial due to
their exorbitant long lifetimes. After excitation, both LTCs and QDs are in the excited
state, but after a few 100 nanoseconds the main fraction of QDs are in the ground state
whereas most of the LTCs are still in the excited state. This allows an efficient FRET
from the LTCs to QDs. Together with the time-gating measurement approach the signal
of directly excited QDs can be suppressed and the FRET-sensitized QD emission can
be selectively measured. Furthermore, the broad absorbance band with high extinction
coefficients can cover most of the LTC emission bands resulting in very large Forster
distances up to 11 nm. The size-tunability of QDs is advantageous for selecting emission
peaks between the emission peaks of LTC. These properties make the use of LTC-to-QD
FRET highly suitable for multiplexing application. [6, 7, 30–32]

3 | Materials and Methods
In this chapter the materials and methods will be described, which were used for the
application of LTC-to-QD FRET in immunoassays and as spectroscopic ruler. More
detailed information for the single applications can be found in the single chapters.
3.1 Used Chemicals
3.1.1 Buffer solutions
Table 3.1: Buffer ingredients
Name Purity Vendor
Albumin from bovine serum (BSA) ≥ 98.0 % Sigma-Aldrich Chimie Sarl
N,N -Dimethylformamide ≥ 99.8 % Sigma-Aldrich Chimie SarlHCON(CH3)2Hydrochloric acid – Sigma-Aldrich Chimie Sarl(HCl)
Newborn calf serum (NBCS) – Cezanne / Thermo FisherScientific
Phosphate buffered saline (1x PBS) – Sigma-Aldrich Chimie Sarl
Sodium bicarbonate ≥ 99.5 – 100.5 % Sigma-Aldrich Chimie Sarl(NaHCO3)
Sodium hydroxide – Sigma-Aldrich Chimie Sarl(NaOH)
Sodium tetraborate decahydrate ≥ 99.5 % Sigma-Aldrich Chimie Sarl(Na2B4O7 · 10 H2O)
Trizma R© hydrochloride ≥ 99.0 % Sigma-Aldrich Chimie Sarl(NH2C(CH2OH)3 ·HCl)
40

3.2. ANALYTICAL METHODS 41
3.2 Analytical methods
3.2.1 Characterization of the probes
Absorbance spectra of the conjugated samples were performed against air as reference in
small-volume quartz cuvettes on a standard UV/Vis-spectrometer (Lambda 35, Perkin
Elmer, USA) or using the SPECTROstarNANO (BMG-Labtech, Germany) in combination
with an LVis-microplate. The absorbance spectra were corrected for buffer absorbance.
Stationary as well as time-resolved photoluminescence emission spectra of the samples
were performed in small-volume quartz cuvettes on a FluoTime 300 “Easy Tau” (Pico
Quant, Germany) fluorescence spectrometer. In order to obtain the PL decay curves
of LTC-conjugates a xenon flash lamp with a repetition rate of 100 Hz at 350 nm was
used. For the measurements of the QD PL decay curves a picosecond pulsed diode laser
EPL-405 (Edinburgh Instruments, UK) with a center wavelength (405±7) nm was used
as excitation source.
3.2.2 Time-resolved FRET assays
All FRET immunoassays and the biotin-streptavidin self-assembly measurements were
performed on two fluorescence plate readers. The first plate reader was a modified KRYP-
TOR compact PLUS (Cezanne/Thermo Fisher Scientific, France) using 500 detection bins
of 2 µs integration time. The system has an integrated pulsed nitrogen laser with an ex-
citation wavelength of 337.1 nm and a repetition rate of 20 Hz. The second fluorescence
plate reader is a prototype from Edinburgh Instruments (UK) developed during a joined
project and referred in this work as EI plate reader. The system allows time-resolved
FRET assay measurements using 4000 detection bins of 2 µs integration time. The exci-
tation source was a pulsed nitrogen laser VSL 337 ND (Spectra Physics, USA) with an
excitation wavelength of 337.1 nm and a repetition rate of 20 Hz.
The QD-histidine self-assembly measurements were performed on a modified KRYPTOR
Immunoreader (Cezanne/Thermo Fisher Scientific, France) using 4000 detection-bins of
2 µs integration time. This plate reader has also an integrated pulsed nitrogen laser with
an excitation wavelength of 337.1 nm and a repetition rate of 20 Hz.
Dichroic mirrors and bandpass filter
The instrumental construction for all used plate readers is shown in Figure 3.1. After
sample excitation, a dichroic mirror is used to separate the emission signals from the
sample into two individual detection channels. This separation allows the simultaneous
measurement of the FRET acceptor signals (acceptor channel, ChA) and the FRET donor
signals (donor channel, ChD) using two photomultiplier tubes (PMTs). A further selection
of the emission wavelengths inside the channels is obtained by the use of bandpass filters,
which are optimized for the emission detection of the LTC-conjugate or for the different
QD-conjugates. A list of the used bandpass filter inside this work is shown in Table 6.1
in the Appendix 6.2.
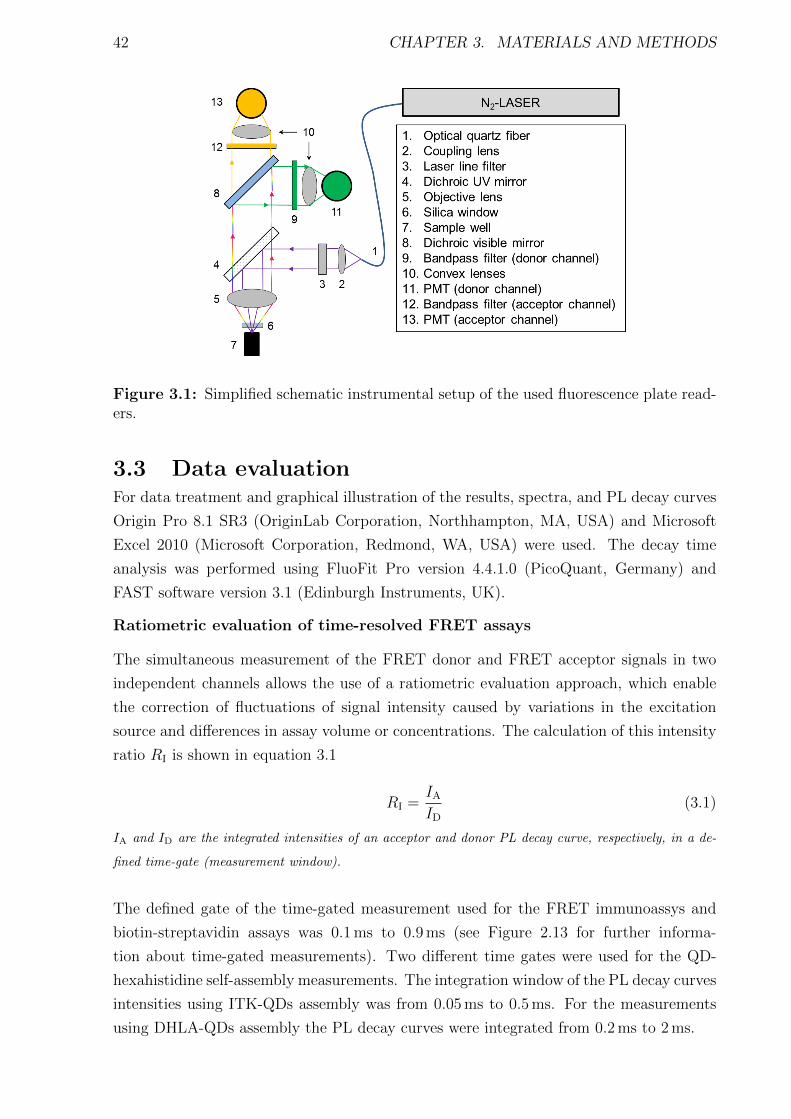
42 CHAPTER 3. MATERIALS AND METHODS
Figure 3.1: Simplified schematic instrumental setup of the used fluorescence plate read-ers.
3.3 Data evaluationFor data treatment and graphical illustration of the results, spectra, and PL decay curves
Origin Pro 8.1 SR3 (OriginLab Corporation, Northhampton, MA, USA) and Microsoft
Excel 2010 (Microsoft Corporation, Redmond, WA, USA) were used. The decay time
analysis was performed using FluoFit Pro version 4.4.1.0 (PicoQuant, Germany) and
FAST software version 3.1 (Edinburgh Instruments, UK).
Ratiometric evaluation of time-resolved FRET assays
The simultaneous measurement of the FRET donor and FRET acceptor signals in two
independent channels allows the use of a ratiometric evaluation approach, which enable
the correction of fluctuations of signal intensity caused by variations in the excitation
source and differences in assay volume or concentrations. The calculation of this intensity
ratio RI is shown in equation 3.1
RI =IAID
(3.1)
IA and ID are the integrated intensities of an acceptor and donor PL decay curve, respectively, in a de-
fined time-gate (measurement window).
The defined gate of the time-gated measurement used for the FRET immunoassys and
biotin-streptavidin assays was 0.1 ms to 0.9 ms (see Figure 2.13 for further informa-
tion about time-gated measurements). Two different time gates were used for the QD-
hexahistidine self-assembly measurements. The integration window of the PL decay curves
intensities using ITK-QDs assembly was from 0.05 ms to 0.5 ms. For the measurements
using DHLA-QDs assembly the PL decay curves were integrated from 0.2 ms to 2 ms.

4 | Results and Discussion
4.1 Immunoassay
The first part of this thesis was concerned about the application of LTC-to-QD FRET
inside homogeneous immunoassays. Due to the utilization of a capture and a detection
antibody to target the biomarker, respectively the antigen, the immunometric format
sets perfect requirements for the use of FRET as signal transduction method. By the
conjugation of the capture antibody with the donor and the detection antibody with the
acceptor, the binding of both to the antigen leads to a close proximity of donor and
acceptor and enables FRET. Consequently, the immunometric approach in combination
with FRET provides a high selectivity and specificity for the applied immunoassay.
Yet, the use of FRET sets also limitations in terms of the sensitivity for the immunoassay
based on the strong distance dependency. Inside the immunometric immunoassay two full
sized (IgG) antibodies detect the antigen and establish a certain distance depending on the
size of the antigen. The molecular weight of a single IgG antibody is around 150 kDa with a
dimension of 14.5 x 8.5 x 4 nm. [227] Assuming a biomarker size of ca. 2 nm, the maximum
elongation distance between donor and acceptor in the sandwich format is around 22 nm.
Additionally the utilization of QDs as luminophore with an approximate diameter of
15 nm results in possible donor-acceptor distances from ca. 15 to 30 nm. At these distances
conventional FRET pairs using QD and dyes have very low FRET efficiencies and thus a
very low FRET sensitization, which result in decreased sensitivity of the immunoassay. [3]
These circumstances put the LTC-to-QD FRET approach in a favorite position as this
combination can cover the large distances due to an effective energy transfer range up to
ca. 20 nm.
The influence of the distance dependency on the performance of the LTC-QD FRET pair
in the immunoassays were investigated using three differently sized biomarkers. These
biomarkers or antigens exhibit sizes of 32 kDa for TPSA, 95 kDa for NSE, and 180 kDa
for CEA. It is expected that with larger antigen size the donor-acceptor distance changes
and results in differences depending on the used biomarker. However, this distance also
depends on the position of the antibody binding epitopes on the antigen.
Next to the size of the biomarker also the influence of differently sized antibodies was
investigated. Figure 4.1 shows a typical IgG antibody. The IgG antibody can be divided
into two major regions, the Fc-domain and the antigen binding domain (AG-domain). As
43

44 CHAPTER 4. RESULTS AND DISCUSSION
Figure 4.1: Schematic illustration of an IgG antibody. Gray stripped shows the Fc-domain connected via the hinge region with the antigen binding domain (AG-domain),which consists of light chains (light gray) and the heavy chains (dark gray + orange) withthe actual antigen binding fragment (orange).
the name indicates the AG-domain is responsible for the binding of the antigen and con-
sists of light chains (light gray) and heavy chains (dark gray + orange part), whereof the
orange part is the actual antigen binding fragment. The hinge region which connects the
Fc-domain and the AG-domain consists of thiol bonds. Under mild reduction conditions
the thiol bonds in this area can be reduced and result in the splitting of the domains.
The resulting AG-domain fragment is termed F(ab’)2 due to the presence of two antigen
binding fragments. With enhanced reduction activity the F(ab’)2 can be divided into two
single F(ab) fragments, which are still able to bind the target antigen. The here explained
manipulation of an IgG antibody can be obtained using commercial kits and resultant
fragments are schematically presented in Figure 4.2 (a) and (b).
Figure 4.2: Schematic illustration of the obtained fragments under increasing reductioncondition from an IgG antibody: (a) F(ab’)2 fragment and (b) F(ab) fragment, (c) showsa single domain antibody (nanobody or VHH).
This fragmentation allows the application of differently sized antibodies ranging from
150 kDa for IgG, 100 kDa for F(ab’)2, to 50 kDa for F(ab) and enables the investigation
of the influence on the performance for the immunoassay. The single domain antibodies
(nanobodies, VHH) shown in Figure 4.2 (c) represent a specialty as they have a size of
only 15 kDa. This type of antibodies are the smallest antibodies that are still able to bind
the antigen in a sufficient manner.
The differently sized antigens and the large variety of antibody sizes allow a detailed
examination of the implementation of LTC-to-QD FRET in homogeneous immunometric
immunoassays. The variation of distances between donor and acceptor offer the possi-
bility to optimize the conditions for each targeted antigen to yield a high immunoassay
sensitivity.
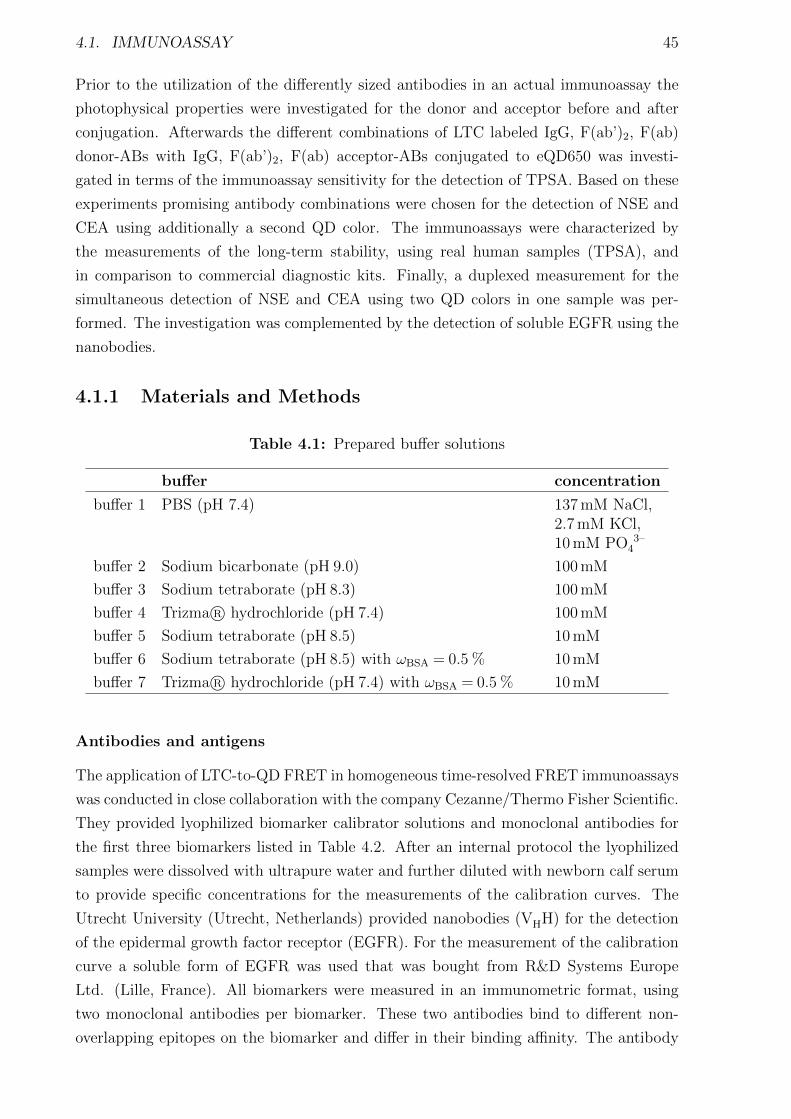
4.1. IMMUNOASSAY 45
Prior to the utilization of the differently sized antibodies in an actual immunoassay the
photophysical properties were investigated for the donor and acceptor before and after
conjugation. Afterwards the different combinations of LTC labeled IgG, F(ab’)2, F(ab)
donor-ABs with IgG, F(ab’)2, F(ab) acceptor-ABs conjugated to eQD650 was investi-
gated in terms of the immunoassay sensitivity for the detection of TPSA. Based on these
experiments promising antibody combinations were chosen for the detection of NSE and
CEA using additionally a second QD color. The immunoassays were characterized by
the measurements of the long-term stability, using real human samples (TPSA), and
in comparison to commercial diagnostic kits. Finally, a duplexed measurement for the
simultaneous detection of NSE and CEA using two QD colors in one sample was per-
formed. The investigation was complemented by the detection of soluble EGFR using the
nanobodies.
4.1.1 Materials and Methods
Table 4.1: Prepared buffer solutions
buffer concentration
buffer 1 PBS (pH 7.4) 137 mM NaCl,2.7 mM KCl,10 mM PO4
3–
buffer 2 Sodium bicarbonate (pH 9.0) 100 mM
buffer 3 Sodium tetraborate (pH 8.3) 100 mM
buffer 4 Trizma R© hydrochloride (pH 7.4) 100 mM
buffer 5 Sodium tetraborate (pH 8.5) 10 mM
buffer 6 Sodium tetraborate (pH 8.5) with ωBSA = 0.5 % 10 mM
buffer 7 Trizma R© hydrochloride (pH 7.4) with ωBSA = 0.5 % 10 mM
Antibodies and antigens
The application of LTC-to-QD FRET in homogeneous time-resolved FRET immunoassays
was conducted in close collaboration with the company Cezanne/Thermo Fisher Scientific.
They provided lyophilized biomarker calibrator solutions and monoclonal antibodies for
the first three biomarkers listed in Table 4.2. After an internal protocol the lyophilized
samples were dissolved with ultrapure water and further diluted with newborn calf serum
to provide specific concentrations for the measurements of the calibration curves. The
Utrecht University (Utrecht, Netherlands) provided nanobodies (VHH) for the detection
of the epidermal growth factor receptor (EGFR). For the measurement of the calibration
curve a soluble form of EGFR was used that was bought from R&D Systems Europe
Ltd. (Lille, France). All biomarkers were measured in an immunometric format, using
two monoclonal antibodies per biomarker. These two antibodies bind to different non-
overlapping epitopes on the biomarker and differ in their binding affinity. The antibody
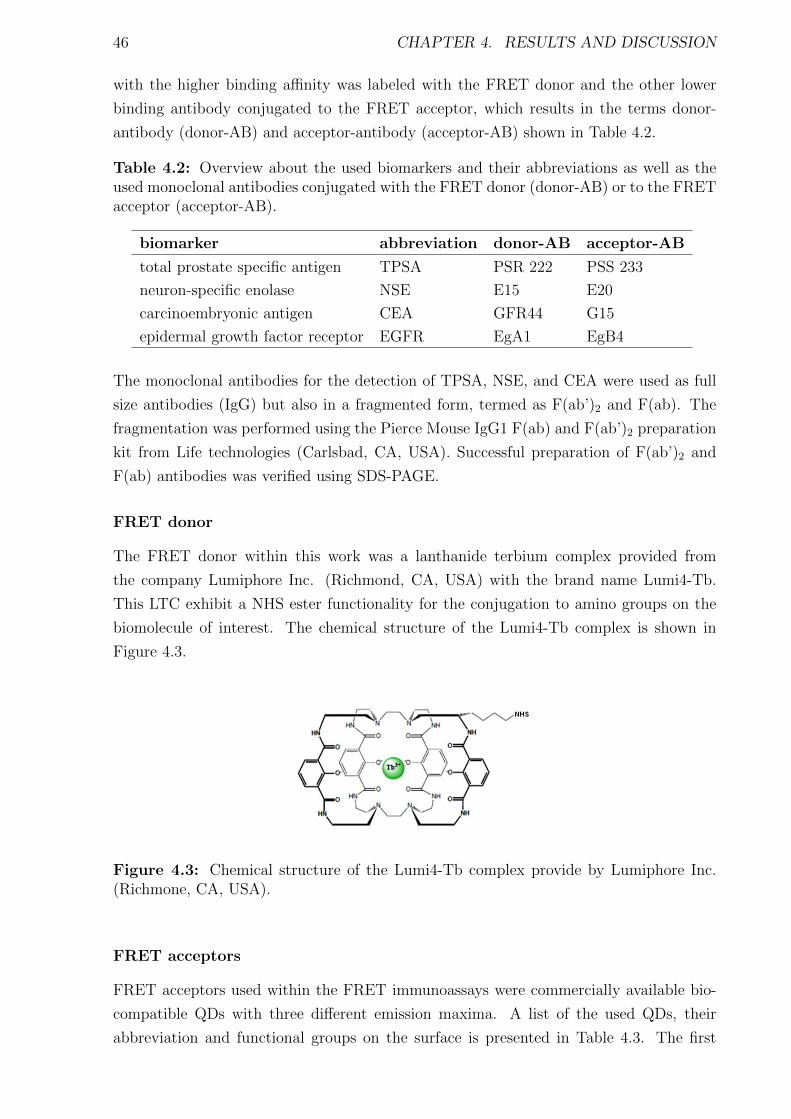
46 CHAPTER 4. RESULTS AND DISCUSSION
with the higher binding affinity was labeled with the FRET donor and the other lower
binding antibody conjugated to the FRET acceptor, which results in the terms donor-
antibody (donor-AB) and acceptor-antibody (acceptor-AB) shown in Table 4.2.
Table 4.2: Overview about the used biomarkers and their abbreviations as well as theused monoclonal antibodies conjugated with the FRET donor (donor-AB) or to the FRETacceptor (acceptor-AB).
biomarker abbreviation donor-AB acceptor-AB
total prostate specific antigen TPSA PSR 222 PSS 233
neuron-specific enolase NSE E15 E20
carcinoembryonic antigen CEA GFR44 G15
epidermal growth factor receptor EGFR EgA1 EgB4
The monoclonal antibodies for the detection of TPSA, NSE, and CEA were used as full
size antibodies (IgG) but also in a fragmented form, termed as F(ab’)2 and F(ab). The
fragmentation was performed using the Pierce Mouse IgG1 F(ab) and F(ab’)2 preparation
kit from Life technologies (Carlsbad, CA, USA). Successful preparation of F(ab’)2 and
F(ab) antibodies was verified using SDS-PAGE.
FRET donor
The FRET donor within this work was a lanthanide terbium complex provided from
the company Lumiphore Inc. (Richmond, CA, USA) with the brand name Lumi4-Tb.
This LTC exhibit a NHS ester functionality for the conjugation to amino groups on the
biomolecule of interest. The chemical structure of the Lumi4-Tb complex is shown in
Figure 4.3.
Figure 4.3: Chemical structure of the Lumi4-Tb complex provide by Lumiphore Inc.(Richmone, CA, USA).
FRET acceptors
FRET acceptors used within the FRET immunoassays were commercially available bio-
compatible QDs with three different emission maxima. A list of the used QDs, their
abbreviation and functional groups on the surface is presented in Table 4.3. The first

4.1. IMMUNOASSAY 47
two QDs were kindly provided by the company eBioscience (San Diego, CA, USA) as
sulfhydryl reactive - eFluor 605/650 nanocrystal conjugation kit, whereas iQD705 was
purchased from Invitrogen/Life Technologies (Carlsbad, CA, USA).
Table 4.3: Overview about the used quantum dots with their abbreviations and func-tional groups on the surface.
quantum dot abbreviation functional groups
eFluor 605 nanocrystal eQD605 maleimide
eFluor 650 nanocrystal eQD605 maleimide
Qdot 705 ITK iQD705 amino (PEG)
Conjugation strategy
LTC - antibody conjugation For the conjugation of the LTCs to the donor-ABs the
provided lyophilized Lumi4-Tb-NHS was dissolved in anhydrous N,N -dimethylformamide
to a final concentration of 8 mM. After the antibody solution was washed four times with
buffer 2 using a 30 kDa molecular weight cut-off (MWCO) Amicon Ultra-0.5 centrifugal
filter (Merck Millipore, Darmstadt, Germany) and a benchtop centrifuge at 14.000 g (Ep-
pendorf centrifuge 5424R, Hamburg, Germany), the dissolved LTC-solution was mixed
with the antibody solution and incubated at room temperature for 2 h rotating at 30 rpm
using an Intelli-Mixer RM-2M (ELMI). For the purification of free LTCs from donor-
AB-LTC conjugates, the solution was washed four to six times with buffer 4 using a
3 kDa MWCO Amicon Ultra-4 centrifugal filter (for VHH antibodies), 10 kDa or 30 kDa
MWCO Amicon Ultra-4 centrifugal filter (for the donor-AB fragments F(ab’)2 and F(ab)
of TPSA, NSE, and CEA), and 50 kDa MWCO Amicon Ultra-4 centrifugal filter (for the
full-sized donor-AB of TPSA, NSE, and CEA) in a benchtop centrifuge at 4000 g (HER-
AEUS Megafuge 40R, Thermo Scientific, Waltham, MA, USA). The estimation of the
final LTC concentration was obtained by absorbance measurements at 340 nm using a
molar absorptivity of 26.000 M−1cm−1 as provided by the manufacturer. For the calcula-
tion of the conjugation ratio the absorbance at 280 nm was measured and used for a linear
combination of the respective values of LTCs and antibodies within the LTC-antibody
conjugates.
QD - antibody conjugation The conjugation using the sulfhydryl-reactive eFluor
605/650 conjugation kits was performed after an optimized manufacturer protocol, in
which the incubation time was elongated from 2 h to 6 h. The acceptor-AB solution was
prepared in molar excess compared to the QD concentration using buffer 1. For the pu-
rification of unbound antibodies, the QD-antibody solution was washed three to six times
with buffer 3 using a 100 kDa MWCO Amicon Ultra-4 centrifugal filter (Merck Millipore,
Darmstadt, Germany) in a benchtop centrifuge at 1000 g (HERAEUS Megafuge 40R,
Thermo Scientific, Waltham, MA, USA). Resulting QD concentrations were determined
by absorbance measurements using the molar absorptivities provided by the manufac-
turer, which are 1.1 · 106 M−1cm−1 at 641 nm for eQD650 and 2.5 · 105 M−1cm−1 at 594 nm
48 CHAPTER 4. RESULTS AND DISCUSSION
for eQD605. For the determination of the antibody concentrations of IgG, F(ab’)2, and
F(ab) following molar absorptivities were used at a 280 nm: 210.000 M−1cm−1 (IgG),
140.000 M−1cm−1 (F(ab’)2) and 70.000 M−1cm−1 (F(ab)). With the linear combination of
the respective absorbance values of QDs and antibodies within the QD-antibody conju-
gates the labeling ratio was determined.
The above described conjugation protocol was used for the full-size as well as for the
fragmented antibodies responsible for the detection of TPSA, NSE, and CEA. However,
for the VHH antibodies an extra step was introduced in order to provide accessible thiol-
groups for the conjugation. Therefore protected sulfhydryl groups (N-Succinimidyl S-
Acetylthioacetate) were introduced to the acceptor-AB of EGFR (see Table 4.2) at five
times molar excess using the SATA kit (Life technologies, Carlsbad, CA, USA). After dea-
cylation of the sulfhydryl groups according to the manufacturer protocol, the antibody
solution was used for the conjugation to eQD650 using the sulfhydryl-reactive eFluor 650
conjugation kit and purified by washing three to six times with buffer 3 using a 100 kDa
MWCO Amicon Ultra-4 centrifugal filter (Merck Millipore, Darmstadt, Germany) in a
benchtop centrifuge at 1000 g (HERAEUS Megafuge 40R, Thermo Scientific, Waltham,
MA, USA). After quantification of the eQD650 concentration using the molar absorptivity
of 1.1 · 106 M−1cm−1 at 641 nm and the antibody concentration of VHH at 280 nm with
the molar absorptivity of 35.800 M−1cm−1, the labeling ratio of the QD-antibody mixture
was determined by the before mentioned linear combination approach.
The conjugation of iQD705 was different in comparison to the before mentioned QD con-
jugations. In a first step the thiol-groups of in buffer 1 dissolved F(ab’)2 antibodies were
reduced using tris(2-carboxyethyl)phosphine hydrochloride (TCEP, Sigma-Aldrich Chimie
Sarl, France) for 30 min while rotating at 30 rpm (Intelli-Mixer RM-2M, ELMI). In the
same time a tip of a spatula of N-ε-maleimidocaproyl-oxysulfosuccinimide ester (Sulfo-
EMCS, Life Technologies, Carlsbad, CA, USA) was added to iQD705 solution in buffer 1.
After careful mixing the solution was also incubated for 30 min rotating at 30 rpm (Intelli-
Mixer RM-2M, ELMI). For the purification of the access of TCEP as well as Sulfo-EMCS
two with buffer 1 equilibrated 7 k MWCO Zeba spin desalting columns (Life Technolo-
gies, Carlsbad, CA, USA) for each solution were used in an Eppendorf centrifuge 5424R
(Hamburg, Germany) at 1500 g. The purified antibody and QD solutions were mixed and
incubated at room temperature rotating at 30 rpm (Intelli-Mixer RM-2M, ELMI). After
an incubation time of 5 h the QD-antibody mixture was purified by washing three to six
times with buffer 3 using a 100 kDa MWCO Amicon-4 centrifugal filter (Merck Millipore,
Darmstadt, Germany) in a benchtop centrifuge at 1000 g (HERAEUS Megafuge 40R,
Thermo Scientific, Waltham, MA, USA). The QD concentration was quantified using the
molar absorptivity of 8.3 · 106 M−1cm−1 at 405 nm, whereas for the F(ab’)2 antibody con-
centration determination a molar absorptivity of 140.000 M−1cm−1 at 280 nm was used.
The labeling ratio was determined as described before.
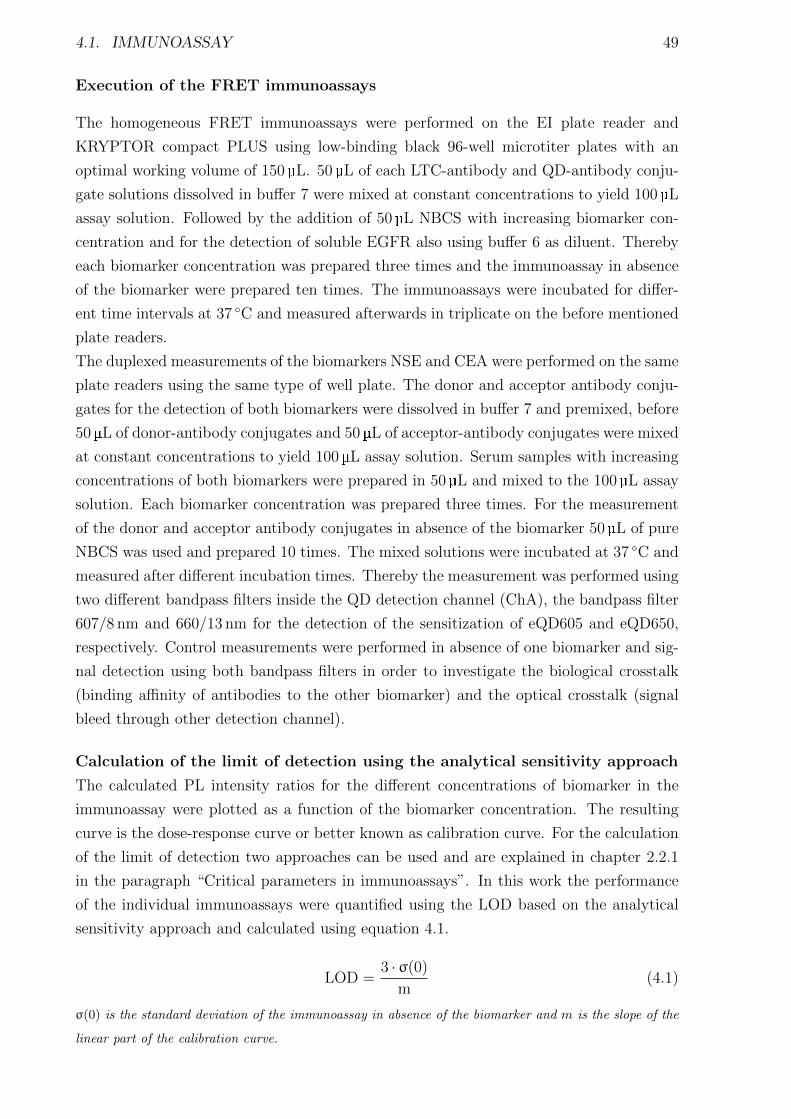
4.1. IMMUNOASSAY 49
Execution of the FRET immunoassays
The homogeneous FRET immunoassays were performed on the EI plate reader and
KRYPTOR compact PLUS using low-binding black 96-well microtiter plates with an
optimal working volume of 150 µL. 50 µL of each LTC-antibody and QD-antibody conju-
gate solutions dissolved in buffer 7 were mixed at constant concentrations to yield 100 µL
assay solution. Followed by the addition of 50 µL NBCS with increasing biomarker con-
centration and for the detection of soluble EGFR also using buffer 6 as diluent. Thereby
each biomarker concentration was prepared three times and the immunoassay in absence
of the biomarker were prepared ten times. The immunoassays were incubated for differ-
ent time intervals at 37 ◦C and measured afterwards in triplicate on the before mentioned
plate readers.
The duplexed measurements of the biomarkers NSE and CEA were performed on the same
plate readers using the same type of well plate. The donor and acceptor antibody conju-
gates for the detection of both biomarkers were dissolved in buffer 7 and premixed, before
50 µL of donor-antibody conjugates and 50 µL of acceptor-antibody conjugates were mixed
at constant concentrations to yield 100 µL assay solution. Serum samples with increasing
concentrations of both biomarkers were prepared in 50 µL and mixed to the 100 µL assay
solution. Each biomarker concentration was prepared three times. For the measurement
of the donor and acceptor antibody conjugates in absence of the biomarker 50 µL of pure
NBCS was used and prepared 10 times. The mixed solutions were incubated at 37 ◦C and
measured after different incubation times. Thereby the measurement was performed using
two different bandpass filters inside the QD detection channel (ChA), the bandpass filter
607/8 nm and 660/13 nm for the detection of the sensitization of eQD605 and eQD650,
respectively. Control measurements were performed in absence of one biomarker and sig-
nal detection using both bandpass filters in order to investigate the biological crosstalk
(binding affinity of antibodies to the other biomarker) and the optical crosstalk (signal
bleed through other detection channel).
Calculation of the limit of detection using the analytical sensitivity approach
The calculated PL intensity ratios for the different concentrations of biomarker in the
immunoassay were plotted as a function of the biomarker concentration. The resulting
curve is the dose-response curve or better known as calibration curve. For the calculation
of the limit of detection two approaches can be used and are explained in chapter 2.2.1
in the paragraph “Critical parameters in immunoassays”. In this work the performance
of the individual immunoassays were quantified using the LOD based on the analytical
sensitivity approach and calculated using equation 4.1.
LOD =3 ·σ(0)
m(4.1)
σ(0) is the standard deviation of the immunoassay in absence of the biomarker and m is the slope of the
linear part of the calibration curve.

50 CHAPTER 4. RESULTS AND DISCUSSION
4.1.2 Characterization of FRET donors and FRET acceptors
The photophysical properties of the LTC and QD conjugates were carefully characterized
by measuring the absorbance and emission spectra as well as the PL decay curves and
were compared to the properties of the starting material. Special attention was given to
the estimation of the labeling ratio, which is important for the later utilization of the
probes in the immunoassay.
FRET donor
The FRET donor used in this work was the Lumi4-Tb complex from Lumiphore Inc.
(Richmond, CA, USA). The complex was kindly provided by the company as Lumi4-
Tb-NHS ester, which enables the conjugation to amine groups on the antibody. In this
chapter the complete photophyscial characterization of the Lumi4-Tb complex conjugated
to IgG, F(ab’)2, and F(ab) donor-ABs for the detection of TPSA will be discussed. The
absorbance spectra, PL emission spectra, PL decay curves as well as information about
the labeling ratio and decay times of all used FRET donor conjugates within the FRET
immunoassays can be found in the Appendix 6.3.1. In the following text the simplified
term LTC will be used instead of Lumi4-Tb complex.
Absorbance spectra After the successful conjugation and purification of the LTC-
antibody conjugates the concentration of the LTC and the antibody was determined by
the measurement of the absorbance spectrum. The black curve in Figure 4.4 shows the
typical absorbance spectrum of the LTC-NHS ester. Important to note is that this is not
the absorption of the Tb3+, but the absorbance of the ligand. The absorbance maximum
at 340 nm with an extinction coefficient of 26.000 M−1cm−1 is typical for this LTC.
2 5 0 3 0 0 3 5 0 4 0 0 4 5 00
1 0 0 0 0
2 0 0 0 0
3 0 0 0 0
4 0 0 0 0
5 0 0 0 0 L T C - N H S L T C - I g G L T C - F ( a b ’ ) 2 L T C - F ( a b )
molar
abso
rptivit
y (M-1 cm
-1 )
w a v e l e n g t h ( n m )
Figure 4.4: Absorbance spectra of unmodified LTC-NHS (black curve) in comparisonto the differently sized TPSA donor-ABs conjugated with LTC.
After the conjugation of LTCs to different sized donor-ABs for the detection of TPSA,
namely IgG, F(ab’)2, and Fab, an increase in the absorption at 280 nm can be observed
and is caused by the presence of the antibodies. The conjugation of the LTCs to the

4.1. IMMUNOASSAY 51
antibody has a negligible influence on the absorbance band of the LTC-ligand, which can
be seen in Figure 4.4. In conclusion the photophysical properties of LTCs are not affected
by the labeling to the antibody.
A linear combination approach enables the estimation of the respective LTC and anti-
body concentrations of the LTC-antibody conjugate, which can be used to calculate the
labeling ratio of the conjugate. The results for the LTC-conjugates shown in Figure 4.4
are summarized in Table 4.4. The decreasing labeling ratio from IgG to F(ab) can be
explained by the smaller size of fragmented antibodies. A direct relation can be seen in
the comparison of the values for LTC-F(ab’)2 with 9.3 to LTC-F(ab) with a decreased
labeling ratio of 3.9, because the F(ab’)2 antibody consist of two F(ab).
Table 4.4: Overview of LTC and antibody concentrations of the purified LTC-antibodyconjugates shown in Figure 4.4 together with their calculated labeling ratio.
LTC-antibody LTC [µM] AB [µM] LTC/AB
LTC-IgG 41 3.2 12.8
LTC-F(ab’)2 14 1.5 9.3
LTC-F(ab) 22 5.6 3.9
PL emission spectra As described in chapter 2.3.3 the excited LTC-ligands serve as
antennae and sensitize the central Tb3+ via energy transfer, which results in LTC-typical5D4 −7 FJ transitions shown in the PL emission spectrum in Figure 4.5. The first four
transitions at 495 nm, 545 nm, 585 nm, and 625 nm are strong, whereas the transitions in
the range of 650 nm to 700 nm are much less pronounced.
The nearly identical emission spectra of the LTC-NHS and the different LTC-antibody
conjugates are expected as there were no changes in the comparison of the absorbance
spectra observed. Only minor differences inside the fine splitting of the individual emission
bands are visible, which arises from small changes within the complex geometry caused
by the labeling to the antibodies. [131]
4 5 0 5 0 0 5 5 0 6 0 0 6 5 0 7 0 00 . 0
0 . 2
0 . 4
0 . 6
0 . 8
1 . 0 L T C - N H S L T C - I g G L T C - F ( a b ’ ) 2 L T C - F ( a b )
norm
. PL i
ntens
ity (a.
u.)
w a v e l e n g t h ( n m )
Figure 4.5: Comparison of the emission spectra before conjugation (LTC-NHS) andafter conjugation to the differently sized donor-ABs for the detection of TPSA.

52 CHAPTER 4. RESULTS AND DISCUSSION
PL decay curves Due to the forbidden character of the 4f -4f transitions, the decay
time of LTCs is in the millisecond range. As described before, the long lifetime is very
beneficial in combination with time-gated measurements in order to perform sensitive
FRET immunoassays with a high signal-to-noise ratio (see chapter 2.3.4).
Figure 4.6 shows the measured PL decay curves for LTC-NHS and the LTC-antibody
conjugates. For a better comparison the PL decay curves were normalized to unity at
0.01 ms. Like the absorbance spectra and PL emission spectra, the shape of the PL decay
curves of all LTC-antibody conjugates are similar and show a minor multi-exponential
behavior. Due to the known dependency of PL decay times on the used diluent, the PL
decay curves were measured in buffer 7 and in the same buffer containing 30 % newborn
calf serum. To obtain the decay times, the PL decay curves were fitted using a bi-
exponential fitting function based on equation 4.2.
I(t) =∑
Ai · e−t/τi (4.2)
0 2 4 6 80 . 0 1
0 . 1
1
1 0 L T C - N H S L T C - I g G L T C - F ( a b ’ ) 2 L T C - F ( a b )
rel. P
L inte
nsity
(a.u.)
t i m e ( m s )
Figure 4.6: Comparison of the PL decay curves before conjugation (LTC-NHS) andafter the conjugation to the different sized donor-ABs for the detection of TPSA.
The results for the different decay times τi together with their amplitudes Ai for LTC-
NHS and the three LTC-antibody conjugates are shown in Table 4.5 and 4.6. Due to the
bi-exponential behavior the average intensity-weighted, 〈τ〉Int, and average amplitude-
weighted, 〈τ〉Amp, decay times were calculated according to the equation 4.3 and equation
4.4, and are included in the overview. [2, 3]
〈τ〉Int =
∑Aiτ
2i∑
Aiτi(4.3)
〈τ〉Amp =
∑Aiτi∑Ai
(4.4)
The comparison of averaged decay times for LTC-NHS and LTC-antibodies in Table 4.5
and 4.6 reveal that the conjugation results in a negligible change of the decay times.
But as expected the change of the diluent from pure buffer to buffer containing 30 %

4.1. IMMUNOASSAY 53
serum causes a strong decrease in the averaged decay time from 2.8 ms to ca. 2.3 ms. In
order to calculate the Forster distance after equation 2.2, the quantum yield ΦD has
to be calculated. Thereby the intrinsic QY, ΦLnLn of equation 2.7, is used instead of the
overall QY. As described in chapter 2.3.3 the intrinsic QY can be determined in absence
of all non-radiative pathways. Therefore the PL decay time of the LTC is measured in
a deuterated solution in order to prevent luminescence quenching by water. Under these
conditions Φref in equation 4.5 can be assumed as one and the measured decay time τref
equals the intrinsic decay time τ0 of the Tb.
ΦTb = Φref
〈τ〉Amp
τref≈〈τ〉Amp
τ0(4.5)
The measured τ0 under these condition for the used LTC is 3.45 ms and was applied in
equation 4.5 for the calculation of the ΦTb in Table 4.5 and 4.6. [32] Due to the later
utilization of the ΦTb for the calculation of the Forster distance, the QY was calculated
using the averaged amplitude-weighted decay time of the LTC-conjugates. The reason
for the use of 〈τ〉Amp instead of 〈τ〉Int is based on the dynamic quenching in FRET, which
result in a dependency of the detected signal on the excited-state population rather than
the integrated intensity. [228,229]
Table 4.5: Overview of the fitted single decay times, calculated average decay times andQYs for LTC-NHS and LTC-antibody conjugates measured in buffer 7.
LTC-antibody τi / ms Ai 〈τ〉Int / ms 〈τ〉Amp / ms ΦTb
LTC-NHS 1.7 303 2.8 2.8 0.812.9 2012
LTC-IgG 1.1 276 2.8 2.6 0.752.8 2144
LTC-F(ab’)2 0.9 241 2.8 2.7 0.782.8 2584
LTC-F(ab) 1.3 201 2.8 2.8 0.812.9 2317
Table 4.6: Overview of the fitted single decay times, the calculated average decay timesand the QYs of the LTC-antibody conjugates measured in presence of 30 % newborn calfserum.
LTC-antibody τi / ms Ai 〈τ〉Int / ms 〈τ〉Amp / ms ΦTb
LTC-IgG 0.6 399 2.3 2.2 0.642.3 4146
LTC-F(ab’)2 0.5 168 2.4 2.3 0.652.4 2249
LTC-F(ab) 0.4 67 2.3 2.3 0.662.3 2186

54 CHAPTER 4. RESULTS AND DISCUSSION
FRET acceptor
FRET acceptors used in the time-resolved FRET immunoassays were commercially bio-
compatible QDs, namely eQD605, eQD650, and iQD705. Thereby the numbers 605, 650,
and 705 denoting the emission maxima of those QDs. eQD605 and eQD650 were kindly
provided from the company eBioscience as a part of the sulfhydryl-reactive conjugation
kit, whereas iQD705 was purchased from Invitrogen and exhibit amino functional groups
on the surface. The first two QDs consist of a CdSe/ZnS core-shell structure, whereas
iQD705 is a CdSeTe/ZnS QD.
The following chapter aims to exemplarily discuss the photophysical characteristics of
the QDs conjugated with differently sized acceptor-ABs for the detection of TPSA. Ab-
sorbance spectra, PL emission spectra, PL decay curves as well as concentrations, labeling
ratios and decay times of all other QD-antibody conjugates used can be found in the Ap-
pendix 6.3.1.
Absorbance spectra Figure 4.7 shows the absorbance spectra of the QDs conjugated
with F(ab’)2 acceptor-ABs. The absorbance spectra are representative for semiconductor
materials, which are characterized by a broad absorbance band with more or less defined
exciton peaks. The progression of the absorbance curve depends on the bandgap of the QD
and starts at energies larger than the bandgap with a continuous increased absorbance to-
wards shorter wavelengths. Characteristic for the QDs in comparison with other common
luminophores are their very high extinction coefficients over the whole absorbance band.
For the calculation of the QD concentrations within the antibody-QD conjugates the
4 5 0 5 0 0 5 5 0 6 0 0 6 5 0 7 0 0 7 5 0 8 0 00
1 x 1 0 6
2 x 1 0 6
3 x 1 0 6
4 x 1 0 6
5 x 1 0 6
6 x 1 0 6
molar
abso
rptivit
y (M-1 cm
-1 )
w a v e l e n g t h ( n m )
e Q D 6 0 5 e Q D 6 5 0 i Q D 7 0 5
Figure 4.7: Absorbance spectra of eQD605, eQD650, and iQD705 conjugated withF(ab’)2 acceptor-ABs for the detection of TPSA measured in buffer 3.
extinction coefficients provided by the suppliers were used, which are 2.5 · 105 M−1cm−1 at
594 nm for eQD605, 1.1 · 106 M−1cm−1 at 641 nm for eQD650 and for iQD705 the extinc-
tion coefficient is 8.3 · 106 M−1cm−1 at 405 nm. Using a linear combination approach the
respective antibody concentrations were calculated from the absorbance values at 280 nm.
Due to the high background of QD absorption at 280 nm the estimation of the antibody
concentration was afflicted with larger uncertainties than for the LTC-antibody conju-
gates.
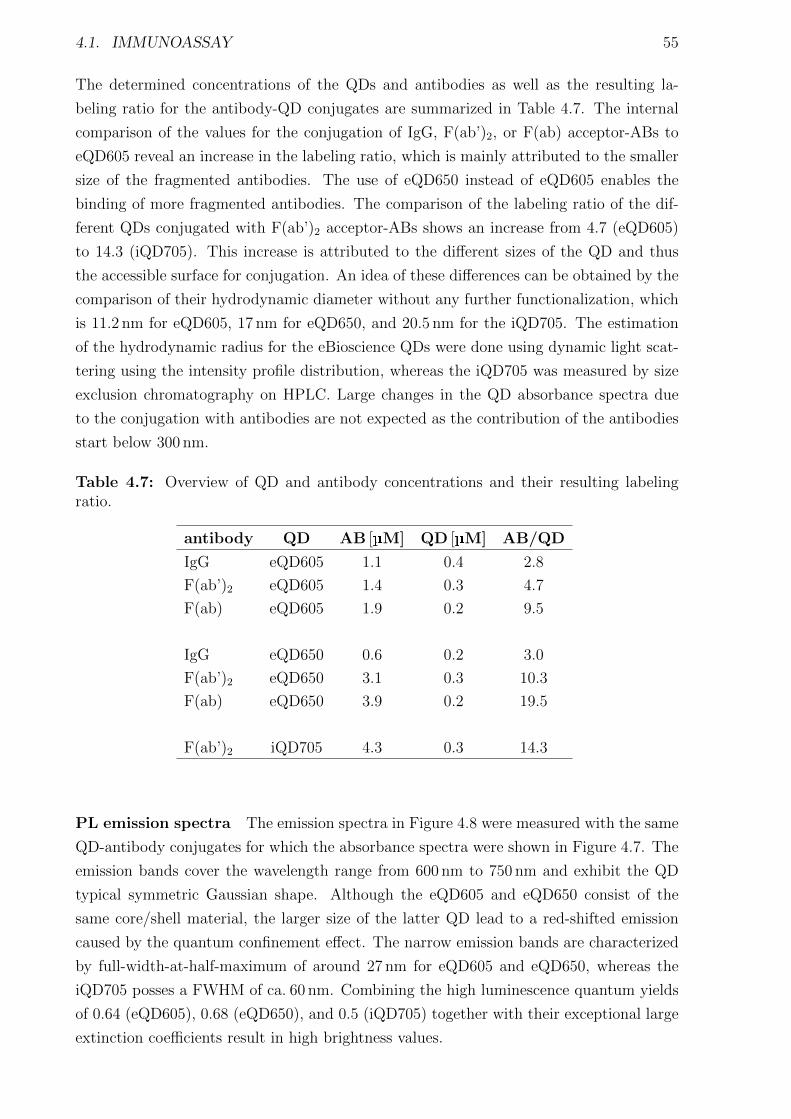
4.1. IMMUNOASSAY 55
The determined concentrations of the QDs and antibodies as well as the resulting la-
beling ratio for the antibody-QD conjugates are summarized in Table 4.7. The internal
comparison of the values for the conjugation of IgG, F(ab’)2, or F(ab) acceptor-ABs to
eQD605 reveal an increase in the labeling ratio, which is mainly attributed to the smaller
size of the fragmented antibodies. The use of eQD650 instead of eQD605 enables the
binding of more fragmented antibodies. The comparison of the labeling ratio of the dif-
ferent QDs conjugated with F(ab’)2 acceptor-ABs shows an increase from 4.7 (eQD605)
to 14.3 (iQD705). This increase is attributed to the different sizes of the QD and thus
the accessible surface for conjugation. An idea of these differences can be obtained by the
comparison of their hydrodynamic diameter without any further functionalization, which
is 11.2 nm for eQD605, 17 nm for eQD650, and 20.5 nm for the iQD705. The estimation
of the hydrodynamic radius for the eBioscience QDs were done using dynamic light scat-
tering using the intensity profile distribution, whereas the iQD705 was measured by size
exclusion chromatography on HPLC. Large changes in the QD absorbance spectra due
to the conjugation with antibodies are not expected as the contribution of the antibodies
start below 300 nm.
Table 4.7: Overview of QD and antibody concentrations and their resulting labelingratio.
antibody QD AB [µM] QD [µM] AB/QD
IgG eQD605 1.1 0.4 2.8
F(ab’)2 eQD605 1.4 0.3 4.7
F(ab) eQD605 1.9 0.2 9.5
IgG eQD650 0.6 0.2 3.0
F(ab’)2 eQD650 3.1 0.3 10.3
F(ab) eQD650 3.9 0.2 19.5
F(ab’)2 iQD705 4.3 0.3 14.3
PL emission spectra The emission spectra in Figure 4.8 were measured with the same
QD-antibody conjugates for which the absorbance spectra were shown in Figure 4.7. The
emission bands cover the wavelength range from 600 nm to 750 nm and exhibit the QD
typical symmetric Gaussian shape. Although the eQD605 and eQD650 consist of the
same core/shell material, the larger size of the latter QD lead to a red-shifted emission
caused by the quantum confinement effect. The narrow emission bands are characterized
by full-width-at-half-maximum of around 27 nm for eQD605 and eQD650, whereas the
iQD705 posses a FWHM of ca. 60 nm. Combining the high luminescence quantum yields
of 0.64 (eQD605), 0.68 (eQD650), and 0.5 (iQD705) together with their exceptional large
extinction coefficients result in high brightness values.
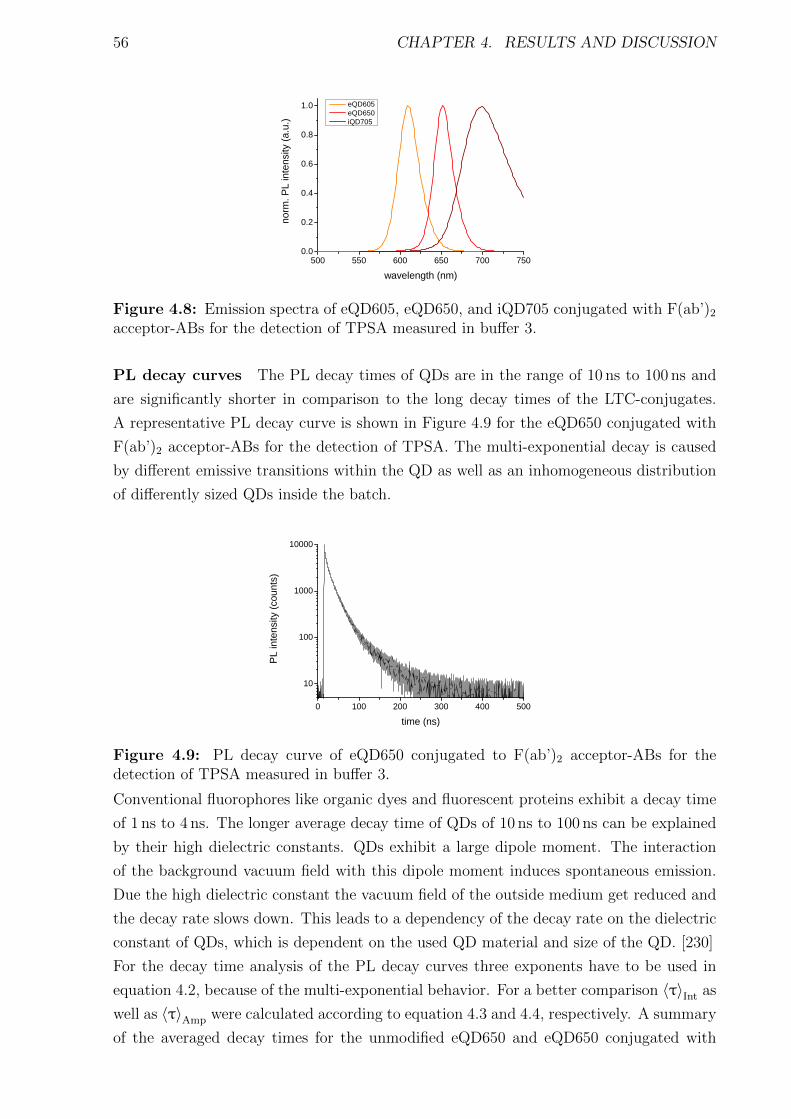
56 CHAPTER 4. RESULTS AND DISCUSSION
5 0 0 5 5 0 6 0 0 6 5 0 7 0 0 7 5 00 . 0
0 . 2
0 . 4
0 . 6
0 . 8
1 . 0
norm
. PL i
ntens
ity (a.
u.)w a v e l e n g t h ( n m )
e Q D 6 0 5 e Q D 6 5 0 i Q D 7 0 5
Figure 4.8: Emission spectra of eQD605, eQD650, and iQD705 conjugated with F(ab’)2acceptor-ABs for the detection of TPSA measured in buffer 3.
PL decay curves The PL decay times of QDs are in the range of 10 ns to 100 ns and
are significantly shorter in comparison to the long decay times of the LTC-conjugates.
A representative PL decay curve is shown in Figure 4.9 for the eQD650 conjugated with
F(ab’)2 acceptor-ABs for the detection of TPSA. The multi-exponential decay is caused
by different emissive transitions within the QD as well as an inhomogeneous distribution
of differently sized QDs inside the batch.
0 1 0 0 2 0 0 3 0 0 4 0 0 5 0 0
1 0
1 0 0
1 0 0 0
1 0 0 0 0
PL in
tensity
(cou
nts)
t i m e ( n s )
Figure 4.9: PL decay curve of eQD650 conjugated to F(ab’)2 acceptor-ABs for thedetection of TPSA measured in buffer 3.
Conventional fluorophores like organic dyes and fluorescent proteins exhibit a decay time
of 1 ns to 4 ns. The longer average decay time of QDs of 10 ns to 100 ns can be explained
by their high dielectric constants. QDs exhibit a large dipole moment. The interaction
of the background vacuum field with this dipole moment induces spontaneous emission.
Due the high dielectric constant the vacuum field of the outside medium get reduced and
the decay rate slows down. This leads to a dependency of the decay rate on the dielectric
constant of QDs, which is dependent on the used QD material and size of the QD. [230]
For the decay time analysis of the PL decay curves three exponents have to be used in
equation 4.2, because of the multi-exponential behavior. For a better comparison 〈τ〉Int as
well as 〈τ〉Amp were calculated according to equation 4.3 and 4.4, respectively. A summary
of the averaged decay times for the unmodified eQD650 and eQD650 conjugated with

4.1. IMMUNOASSAY 57
either IgG, F(ab’)2, or F(ab) acceptor-ABs for the detection of TPSA or NSE is shown
in Table 4.8. Depending on the conjugated acceptor-AB the averaged values show small
differences. The conjugation of fragmented TPSA acceptor-ABs result in a decreased
〈τ〉Amp from 10.7 ns to 8.8 ns. In case of the conjugation of fragmented NSE acceptor-ABs
to eQD650 the 〈τ〉Amp increases from 10.7 ns to 16.1 ns compared to unmodified eQD650.
An increase in the decay time reflects a decreased portion of non-radiative recombination
inside the PL, which is a further proof how the conjugation of proteins can effect QD PL
properties.
Table 4.8: Summary of the calculated intensity (〈τ〉Int) and amplitude (〈τ〉Amp) weightedaveraged decay times of an unmodified eQD650 and eQD650 conjugated with either IgG,F(ab’)2, or F(ab) acceptor-ABs for the detection of TPSA or NSE.
TPSA NSEantibody-QD 〈τ〉Amp / ns 〈τ〉Int / ns 〈τ〉Amp / ns 〈τ〉Int / ns
bare-eQD650 10.7 22.5 10.7 22.5
IgG-eQD650 14.4 23.1 10.8 20.1
F(ab’)2-eQD650 10.9 21.7 13.7 23.2
F(ab)-eQD650 8.8 19.4 16.1 24.9
FRET properties of donor-acceptor pairs
The major requirement for FRET is a spectral overlap between the absorbance spectrum
of the acceptor with the PL emission spectrum of the donor. The used QDs inside the
immunoassay measurements show an exceptional large spectral overlap with LTC, which
can be seen in Figure 4.10 left. In the left of Figure 4.10 the donor LTC PL emission
is shown as gray contour together with the characteristic broad absorbance bands of the
utilized QDs, which in case of eQD650 and iQD705 cover the whole emission spectrum of
the LTC.
4 5 0 5 0 0 5 5 0 6 0 0 6 5 0 7 0 00
1 x 1 0 6
2 x 1 0 6
3 x 1 0 6
4 x 1 0 6
5 x 1 0 6
0 . 0 0
0 . 0 1
0 . 0 2
0 . 0 3
0 . 0 4
0 . 0 5
area n
orm. P
L inte
nsity
(a.u.)
molar
abso
rptivit
y (M-1 cm
-1 )
w a v e l e n g t h ( n m )
e Q D 6 0 5 e Q D 6 5 0 i Q D 7 0 5
4 5 0 5 0 0 5 5 0 6 0 0 6 5 0 7 0 0 7 5 00 . 0
0 . 2
0 . 4
0 . 6
0 . 8
1 . 0
norm
. PL i
ntens
ity (a.
u.)
w a v e l e n g t h ( n m )
L T C e Q D 6 0 5 e Q D 6 5 0 i Q D 7 0 5
Figure 4.10: left: Spectral overlap between the PL emission spectra of LTC (graycontour) and the extinction coefficient spectra of eQD605, eQD650 and iQD705. right:Normalized PL emission spectrum of LTC, eQD605, eQD650, and iQD705.

58 CHAPTER 4. RESULTS AND DISCUSSION
With the use of the area normalized PL emission spectrum of the donor and the extinc-
tion coefficient spectra of the different acceptors the overlap integral J(λ) was calculated
according to equation 2.3. The results are shown in Table 4.9. As discussed in chapter
2.1.2 the Forster distance R0 can be calculated with the use of J(λ) and equation 2.2.
Therefore the refractive index was defined as 1.4 and the assumption of a dynamic system
was made, which results in κ2 = 2/3. Due to the presence of 30 % of serum inside the
immunoassay measurements, the donor QYs in Table 4.6 were used for the calculation of
the Forster distances. The resulting values of R0 for the different donor-acceptor pairs
are shown in Table 4.9.
Table 4.9: Summary of the calculated overlap integrals J(λ) and the resulting Forsterdistance R0 for eQD605, eQD650, iQD705 conjugated to F(ab’)2 for the detection ofTPSA.
LTC- J(λ)/ nm4
M · cm R0 / nm
eQD605 1.96 · 1016 7.6
eQD650 1.59 · 1017 10.8
iQD705 1.67 · 1017 10.9
In general, the Forster distances of the LTC-QD FRET pairs are much larger compared to
other FRET pairs. The main reason for the exceptional R0 values is the broad absorbance
band of QDs with extremely high extinction coefficients, which result in large overlap
integrals.
As discussed in the photophysical characterization of the FRET donor as well as FRET
acceptors, the amount and type of conjugated antibodies has a minor influence on neither
the extinction coefficient spectra of the QDs and the PL emission spectra of the LTC.
The fluctuations of the calculated values in Table 4.9 is in the range of ± 2 %.
The choice of the used QDs for the immunoassay measurements was not only based
on their expected large R0 values, but rather on their emission maxima. Figure 4.10
(right) shows the LTC PL emission spectrum together with PL emission spectra of the
different QDs. The emission maxima of the QDs are in between (eQD605, eQD650) and
beyond (iQD705) the emission bands of LTC. This allows a simple signal deconvolution
of the measured donor signals from sensitized acceptor signals and vice versa. Another
advantage are the small Gaussian shaped emission spectra, which also enable the use of
more than two QDs simultaneously as the optical crosstalk between them is expected to
be small. These properties make LTC-QD FRET pairs highly suitable for multiplexing
measurements and enable the simultaneous measurement of several biomarkers.
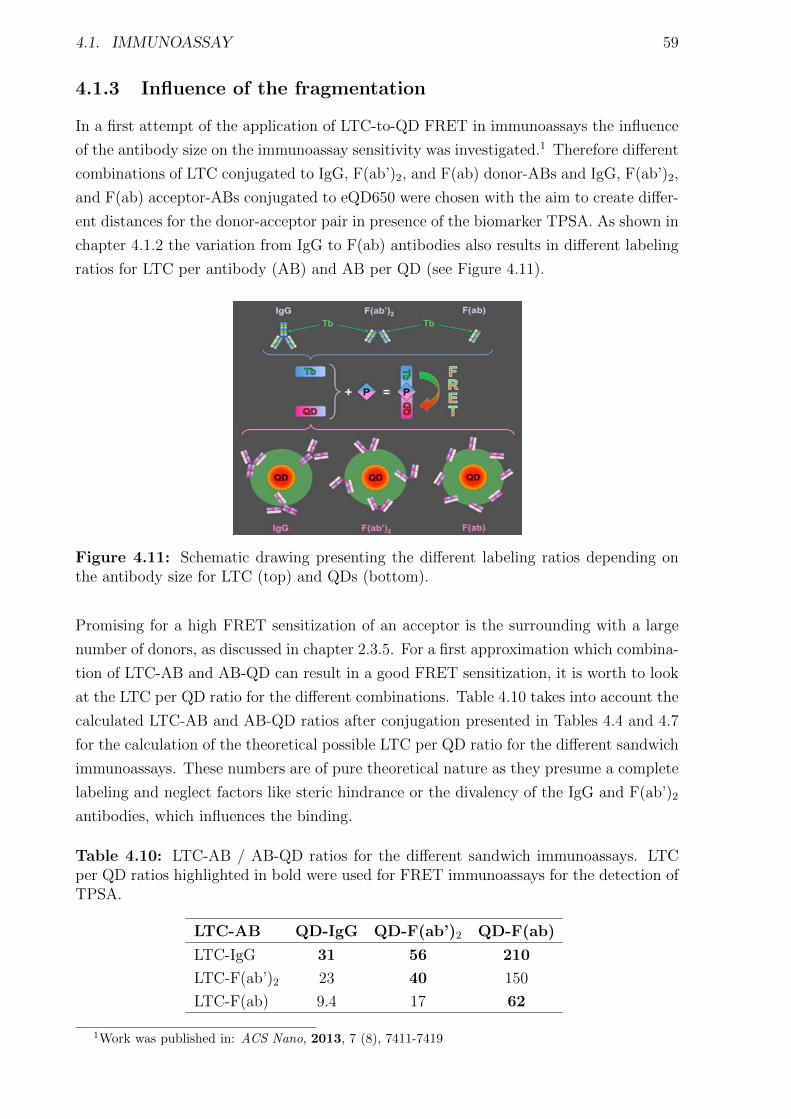
4.1. IMMUNOASSAY 59
4.1.3 Influence of the fragmentation
In a first attempt of the application of LTC-to-QD FRET in immunoassays the influence
of the antibody size on the immunoassay sensitivity was investigated.1 Therefore different
combinations of LTC conjugated to IgG, F(ab’)2, and F(ab) donor-ABs and IgG, F(ab’)2,
and F(ab) acceptor-ABs conjugated to eQD650 were chosen with the aim to create differ-
ent distances for the donor-acceptor pair in presence of the biomarker TPSA. As shown in
chapter 4.1.2 the variation from IgG to F(ab) antibodies also results in different labeling
ratios for LTC per antibody (AB) and AB per QD (see Figure 4.11).
Figure 4.11: Schematic drawing presenting the different labeling ratios depending onthe antibody size for LTC (top) and QDs (bottom).
Promising for a high FRET sensitization of an acceptor is the surrounding with a large
number of donors, as discussed in chapter 2.3.5. For a first approximation which combina-
tion of LTC-AB and AB-QD can result in a good FRET sensitization, it is worth to look
at the LTC per QD ratio for the different combinations. Table 4.10 takes into account the
calculated LTC-AB and AB-QD ratios after conjugation presented in Tables 4.4 and 4.7
for the calculation of the theoretical possible LTC per QD ratio for the different sandwich
immunoassays. These numbers are of pure theoretical nature as they presume a complete
labeling and neglect factors like steric hindrance or the divalency of the IgG and F(ab’)2
antibodies, which influences the binding.
Table 4.10: LTC-AB / AB-QD ratios for the different sandwich immunoassays. LTCper QD ratios highlighted in bold were used for FRET immunoassays for the detection ofTPSA.
LTC-AB QD-IgG QD-F(ab’)2 QD-F(ab)
LTC-IgG 31 56 210
LTC-F(ab’)2 23 40 150
LTC-F(ab) 9.4 17 62
1Work was published in: ACS Nano, 2013, 7 (8), 7411-7419
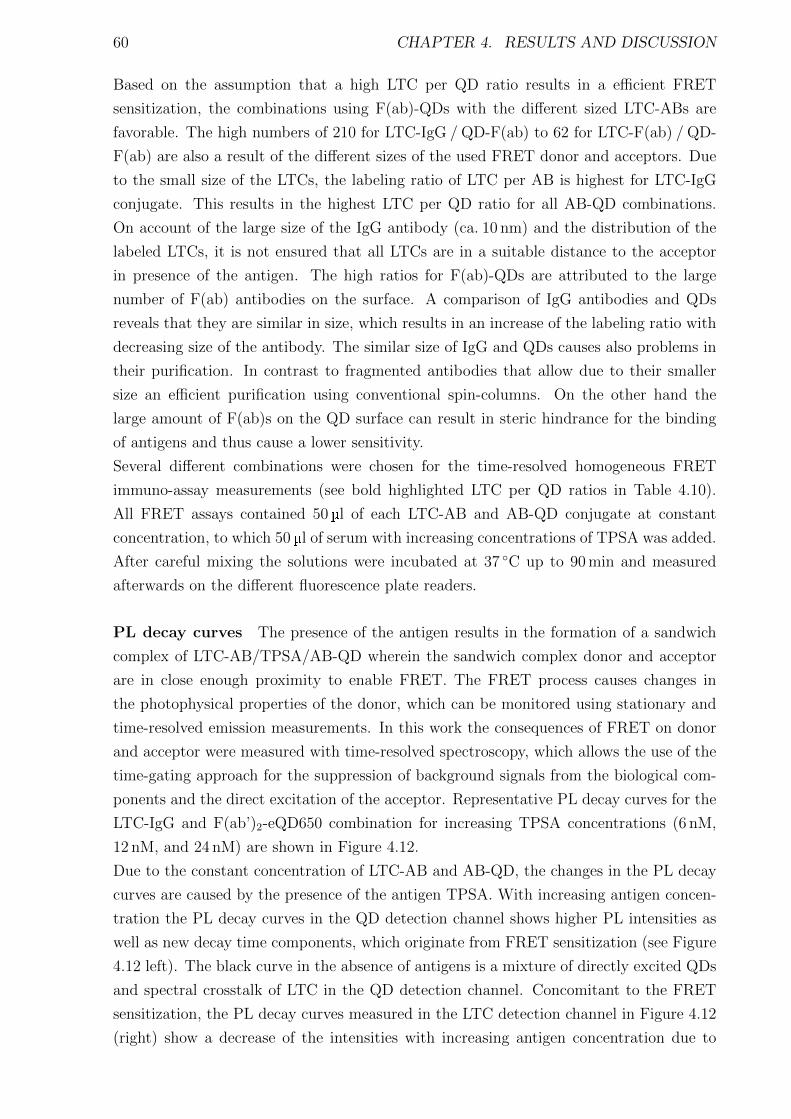
60 CHAPTER 4. RESULTS AND DISCUSSION
Based on the assumption that a high LTC per QD ratio results in a efficient FRET
sensitization, the combinations using F(ab)-QDs with the different sized LTC-ABs are
favorable. The high numbers of 210 for LTC-IgG / QD-F(ab) to 62 for LTC-F(ab) / QD-
F(ab) are also a result of the different sizes of the used FRET donor and acceptors. Due
to the small size of the LTCs, the labeling ratio of LTC per AB is highest for LTC-IgG
conjugate. This results in the highest LTC per QD ratio for all AB-QD combinations.
On account of the large size of the IgG antibody (ca. 10 nm) and the distribution of the
labeled LTCs, it is not ensured that all LTCs are in a suitable distance to the acceptor
in presence of the antigen. The high ratios for F(ab)-QDs are attributed to the large
number of F(ab) antibodies on the surface. A comparison of IgG antibodies and QDs
reveals that they are similar in size, which results in an increase of the labeling ratio with
decreasing size of the antibody. The similar size of IgG and QDs causes also problems in
their purification. In contrast to fragmented antibodies that allow due to their smaller
size an efficient purification using conventional spin-columns. On the other hand the
large amount of F(ab)s on the QD surface can result in steric hindrance for the binding
of antigens and thus cause a lower sensitivity.
Several different combinations were chosen for the time-resolved homogeneous FRET
immuno-assay measurements (see bold highlighted LTC per QD ratios in Table 4.10).
All FRET assays contained 50 µl of each LTC-AB and AB-QD conjugate at constant
concentration, to which 50 µl of serum with increasing concentrations of TPSA was added.
After careful mixing the solutions were incubated at 37 ◦C up to 90 min and measured
afterwards on the different fluorescence plate readers.
PL decay curves The presence of the antigen results in the formation of a sandwich
complex of LTC-AB/TPSA/AB-QD wherein the sandwich complex donor and acceptor
are in close enough proximity to enable FRET. The FRET process causes changes in
the photophysical properties of the donor, which can be monitored using stationary and
time-resolved emission measurements. In this work the consequences of FRET on donor
and acceptor were measured with time-resolved spectroscopy, which allows the use of the
time-gating approach for the suppression of background signals from the biological com-
ponents and the direct excitation of the acceptor. Representative PL decay curves for the
LTC-IgG and F(ab’)2-eQD650 combination for increasing TPSA concentrations (6 nM,
12 nM, and 24 nM) are shown in Figure 4.12.
Due to the constant concentration of LTC-AB and AB-QD, the changes in the PL decay
curves are caused by the presence of the antigen TPSA. With increasing antigen concen-
tration the PL decay curves in the QD detection channel shows higher PL intensities as
well as new decay time components, which originate from FRET sensitization (see Figure
4.12 left). The black curve in the absence of antigens is a mixture of directly excited QDs
and spectral crosstalk of LTC in the QD detection channel. Concomitant to the FRET
sensitization, the PL decay curves measured in the LTC detection channel in Figure 4.12
(right) show a decrease of the intensities with increasing antigen concentration due to
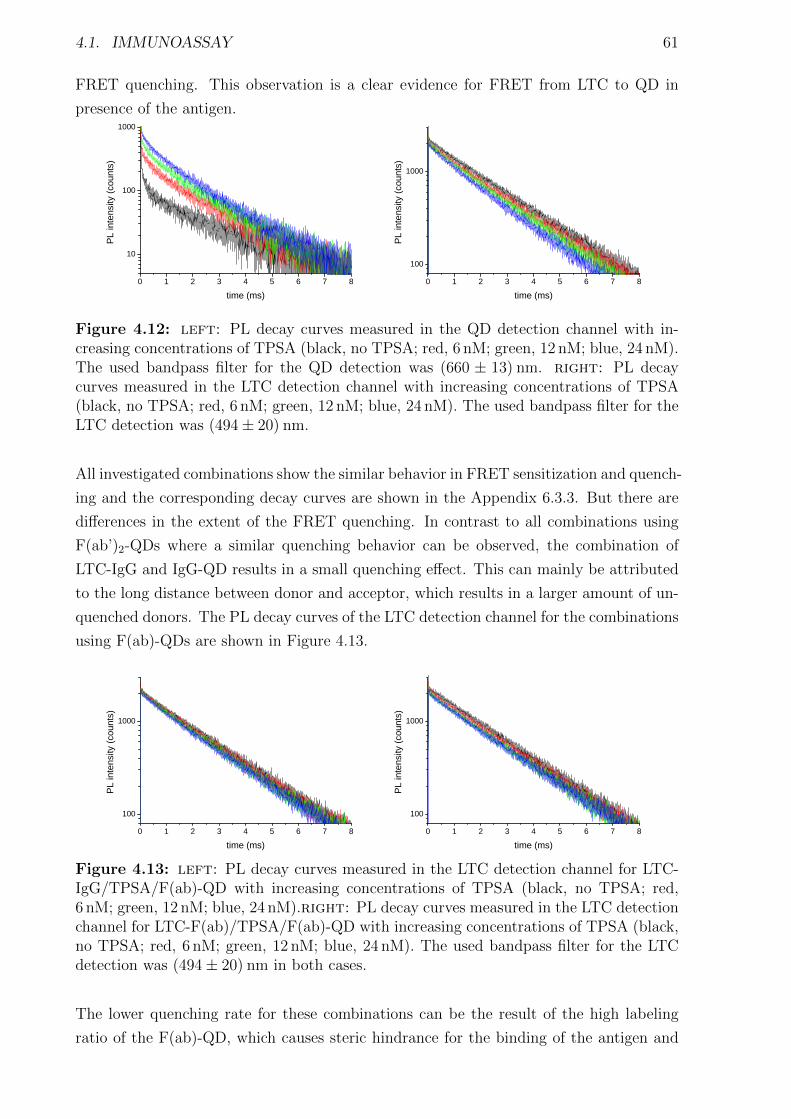
4.1. IMMUNOASSAY 61
FRET quenching. This observation is a clear evidence for FRET from LTC to QD in
presence of the antigen.
0 1 2 3 4 5 6 7 8
1 0
1 0 0
1 0 0 0PL
inten
sity (c
ounts
)
t i m e ( m s )0 1 2 3 4 5 6 7 8
1 0 0
1 0 0 0
PL in
tensity
(cou
nts)
t i m e ( m s )
Figure 4.12: left: PL decay curves measured in the QD detection channel with in-creasing concentrations of TPSA (black, no TPSA; red, 6 nM; green, 12 nM; blue, 24 nM).The used bandpass filter for the QD detection was (660 ± 13) nm. right: PL decaycurves measured in the LTC detection channel with increasing concentrations of TPSA(black, no TPSA; red, 6 nM; green, 12 nM; blue, 24 nM). The used bandpass filter for theLTC detection was (494± 20) nm.
All investigated combinations show the similar behavior in FRET sensitization and quench-
ing and the corresponding decay curves are shown in the Appendix 6.3.3. But there are
differences in the extent of the FRET quenching. In contrast to all combinations using
F(ab’)2-QDs where a similar quenching behavior can be observed, the combination of
LTC-IgG and IgG-QD results in a small quenching effect. This can mainly be attributed
to the long distance between donor and acceptor, which results in a larger amount of un-
quenched donors. The PL decay curves of the LTC detection channel for the combinations
using F(ab)-QDs are shown in Figure 4.13.
0 1 2 3 4 5 6 7 81 0 0
1 0 0 0
PL in
tensity
(cou
nts)
t i m e ( m s )0 1 2 3 4 5 6 7 8
1 0 0
1 0 0 0
PL in
tensity
(cou
nts)
t i m e ( m s )
Figure 4.13: left: PL decay curves measured in the LTC detection channel for LTC-IgG/TPSA/F(ab)-QD with increasing concentrations of TPSA (black, no TPSA; red,6 nM; green, 12 nM; blue, 24 nM).right: PL decay curves measured in the LTC detectionchannel for LTC-F(ab)/TPSA/F(ab)-QD with increasing concentrations of TPSA (black,no TPSA; red, 6 nM; green, 12 nM; blue, 24 nM). The used bandpass filter for the LTCdetection was (494± 20) nm in both cases.
The lower quenching rate for these combinations can be the result of the high labeling
ratio of the F(ab)-QD, which causes steric hindrance for the binding of the antigen and

62 CHAPTER 4. RESULTS AND DISCUSSION
thus the LTC-AB. Furthermore, the fragmentation of the antibody also reduces its bind-
ing affinity. Consequently there are more unbound LTC-AB in the sample causing a high
background of unquenched LTC-AB. Due to the large background of unquenched donor,
the FRET quenching is much harder to observe and makes the measurement of the accep-
tor sensitization so valuable. The lower background in the QD detection channel allows
to observe FRET sensitization even for small FRET intensities or low FRET efficiencies.
Time-gated FRET immunoassay For the quantification of the performance of the
different LTC-AB and AB-QD combinations, calibration curves were measured using 18
serum samples with increasing concentration of TPSA antigen from 0.6 nM to 36 nM.
The intensities from the simultaneously measured PL decay curves in the QD detection
channel as well as in the LTC detection channel were integrated from 0.1 ms to 0.9 ms
and the intensity ratios were calculated according to the equation 3.1. The resulting
calibration curves for the different combinations are shown in Figure 4.14.
0 6 1 2 1 8 2 4 3 0 3 60
5
1 0
1 5
2 0
2 5 I g G - I g G I g G - F ( a b ) 2 I g G - F a b F ( a b ) 2 - F ( a b ) 2 F a b - F a b
rel. ti
me-ga
ted PL
inten
sity ra
tio
[ T P S A ] ( n M )
0 2 2 0 4 4 0 6 6 0 8 8 0 1 1 0 0[ T P S A ] ( n g / m L )
Figure 4.14: Relative time-gated PL intensity ratios as a function of the TPSA antigenconcentration for the different LTC-AB and AB-QD combinations.
In general, with increasing antigen concentration the intensity ratios increase until 15 nM
to 25 nM where the leveling of the calibration curve indicates the saturation of the LTC-
AB and AB-QD conjugates. The saturation effect also limits the dynamic range, which is
the concentration between the LOD and the saturation concentration. For the measured
systems the dynamic range spans approximately 2 to 3 orders of magnitude. At higher
concentration the decreasing of the signal is caused by the high-dose hook effect, which
is based on the formation of individual LTC-AB/TPSA and TPSA/AB-QD conjugates.
The KRYPTOR compact PLUS clinical plate reader exhibits a dilution procedure for the
compensation of this effect, but this requires the use of the automatic pipette arm.
The comparison of the calibration curve curvatures reveals a strong difference for the
LTC-IgG/TPSA/IgG-QD FRET pair. The sigmoidal behavior is mainly attributed to
free IgG-AB caused by the insufficient purification of free IgG-AB from IgG-QD conju-
gate. As mentioned before, the similarity in size makes the purification complicated and
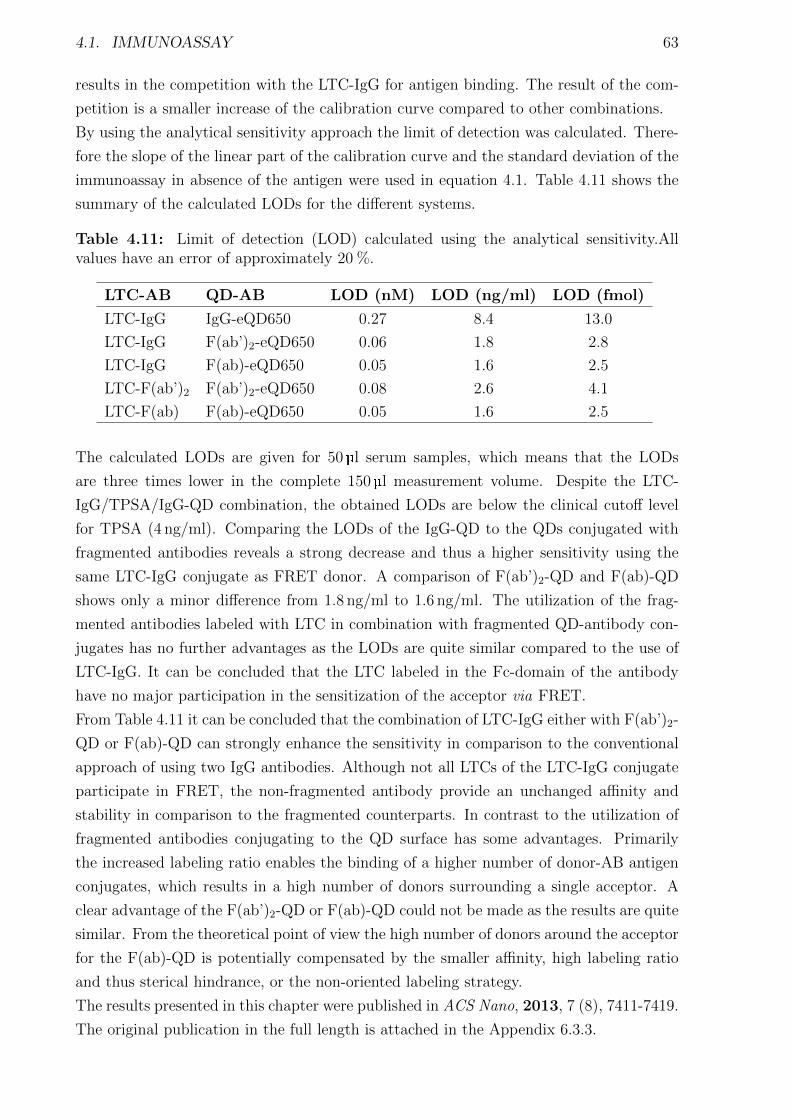
4.1. IMMUNOASSAY 63
results in the competition with the LTC-IgG for antigen binding. The result of the com-
petition is a smaller increase of the calibration curve compared to other combinations.
By using the analytical sensitivity approach the limit of detection was calculated. There-
fore the slope of the linear part of the calibration curve and the standard deviation of the
immunoassay in absence of the antigen were used in equation 4.1. Table 4.11 shows the
summary of the calculated LODs for the different systems.
Table 4.11: Limit of detection (LOD) calculated using the analytical sensitivity.Allvalues have an error of approximately 20 %.
LTC-AB QD-AB LOD (nM) LOD (ng/ml) LOD (fmol)
LTC-IgG IgG-eQD650 0.27 8.4 13.0
LTC-IgG F(ab’)2-eQD650 0.06 1.8 2.8
LTC-IgG F(ab)-eQD650 0.05 1.6 2.5
LTC-F(ab’)2 F(ab’)2-eQD650 0.08 2.6 4.1
LTC-F(ab) F(ab)-eQD650 0.05 1.6 2.5
The calculated LODs are given for 50 µl serum samples, which means that the LODs
are three times lower in the complete 150 µl measurement volume. Despite the LTC-
IgG/TPSA/IgG-QD combination, the obtained LODs are below the clinical cutoff level
for TPSA (4 ng/ml). Comparing the LODs of the IgG-QD to the QDs conjugated with
fragmented antibodies reveals a strong decrease and thus a higher sensitivity using the
same LTC-IgG conjugate as FRET donor. A comparison of F(ab’)2-QD and F(ab)-QD
shows only a minor difference from 1.8 ng/ml to 1.6 ng/ml. The utilization of the frag-
mented antibodies labeled with LTC in combination with fragmented QD-antibody con-
jugates has no further advantages as the LODs are quite similar compared to the use of
LTC-IgG. It can be concluded that the LTC labeled in the Fc-domain of the antibody
have no major participation in the sensitization of the acceptor via FRET.
From Table 4.11 it can be concluded that the combination of LTC-IgG either with F(ab’)2-
QD or F(ab)-QD can strongly enhance the sensitivity in comparison to the conventional
approach of using two IgG antibodies. Although not all LTCs of the LTC-IgG conjugate
participate in FRET, the non-fragmented antibody provide an unchanged affinity and
stability in comparison to the fragmented counterparts. In contrast to the utilization of
fragmented antibodies conjugating to the QD surface has some advantages. Primarily
the increased labeling ratio enables the binding of a higher number of donor-AB antigen
conjugates, which results in a high number of donors surrounding a single acceptor. A
clear advantage of the F(ab’)2-QD or F(ab)-QD could not be made as the results are quite
similar. From the theoretical point of view the high number of donors around the acceptor
for the F(ab)-QD is potentially compensated by the smaller affinity, high labeling ratio
and thus sterical hindrance, or the non-oriented labeling strategy.
The results presented in this chapter were published in ACS Nano, 2013, 7 (8), 7411-7419.
The original publication in the full length is attached in the Appendix 6.3.3.
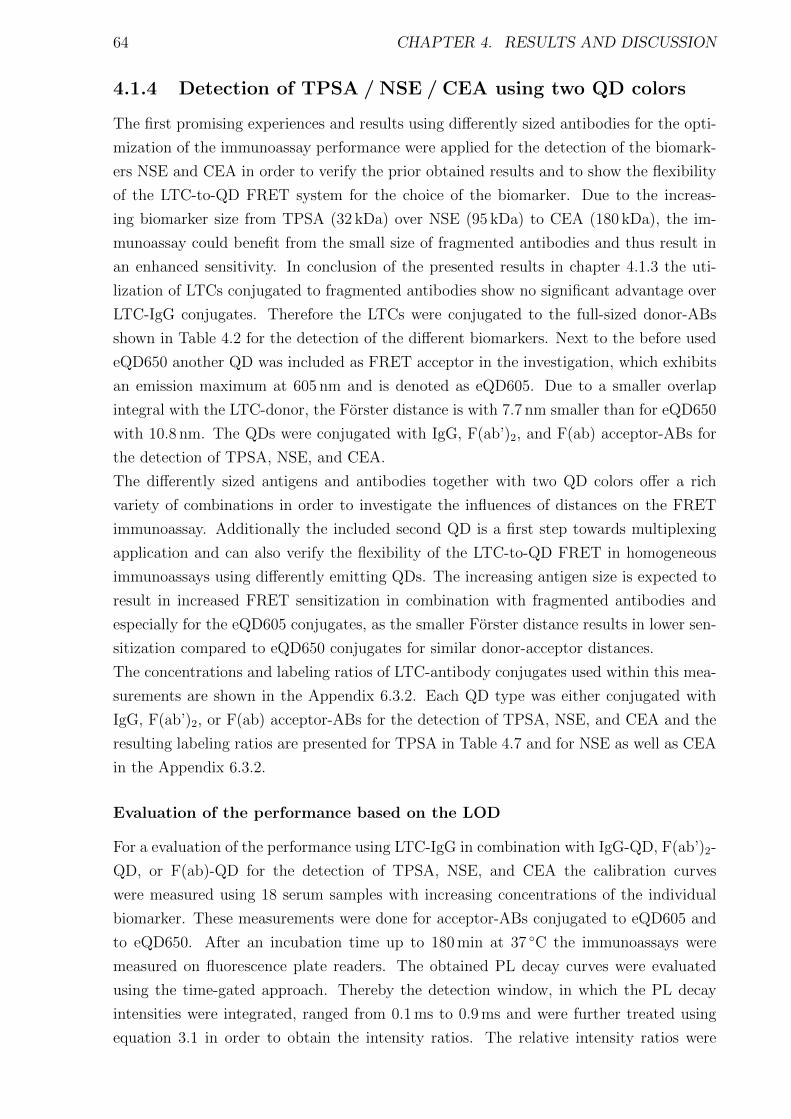
64 CHAPTER 4. RESULTS AND DISCUSSION
4.1.4 Detection of TPSA / NSE / CEA using two QD colors
The first promising experiences and results using differently sized antibodies for the opti-
mization of the immunoassay performance were applied for the detection of the biomark-
ers NSE and CEA in order to verify the prior obtained results and to show the flexibility
of the LTC-to-QD FRET system for the choice of the biomarker. Due to the increas-
ing biomarker size from TPSA (32 kDa) over NSE (95 kDa) to CEA (180 kDa), the im-
munoassay could benefit from the small size of fragmented antibodies and thus result in
an enhanced sensitivity. In conclusion of the presented results in chapter 4.1.3 the uti-
lization of LTCs conjugated to fragmented antibodies show no significant advantage over
LTC-IgG conjugates. Therefore the LTCs were conjugated to the full-sized donor-ABs
shown in Table 4.2 for the detection of the different biomarkers. Next to the before used
eQD650 another QD was included as FRET acceptor in the investigation, which exhibits
an emission maximum at 605 nm and is denoted as eQD605. Due to a smaller overlap
integral with the LTC-donor, the Forster distance is with 7.7 nm smaller than for eQD650
with 10.8 nm. The QDs were conjugated with IgG, F(ab’)2, and F(ab) acceptor-ABs for
the detection of TPSA, NSE, and CEA.
The differently sized antigens and antibodies together with two QD colors offer a rich
variety of combinations in order to investigate the influences of distances on the FRET
immunoassay. Additionally the included second QD is a first step towards multiplexing
application and can also verify the flexibility of the LTC-to-QD FRET in homogeneous
immunoassays using differently emitting QDs. The increasing antigen size is expected to
result in increased FRET sensitization in combination with fragmented antibodies and
especially for the eQD605 conjugates, as the smaller Forster distance results in lower sen-
sitization compared to eQD650 conjugates for similar donor-acceptor distances.
The concentrations and labeling ratios of LTC-antibody conjugates used within this mea-
surements are shown in the Appendix 6.3.2. Each QD type was either conjugated with
IgG, F(ab’)2, or F(ab) acceptor-ABs for the detection of TPSA, NSE, and CEA and the
resulting labeling ratios are presented for TPSA in Table 4.7 and for NSE as well as CEA
in the Appendix 6.3.2.
Evaluation of the performance based on the LOD
For a evaluation of the performance using LTC-IgG in combination with IgG-QD, F(ab’)2-
QD, or F(ab)-QD for the detection of TPSA, NSE, and CEA the calibration curves
were measured using 18 serum samples with increasing concentrations of the individual
biomarker. These measurements were done for acceptor-ABs conjugated to eQD605 and
to eQD650. After an incubation time up to 180 min at 37 ◦C the immunoassays were
measured on fluorescence plate readers. The obtained PL decay curves were evaluated
using the time-gated approach. Thereby the detection window, in which the PL decay
intensities were integrated, ranged from 0.1 ms to 0.9 ms and were further treated using
equation 3.1 in order to obtain the intensity ratios. The relative intensity ratios were

4.1. IMMUNOASSAY 65
plotted as a function of the antigen concentration and led to the calibration curve of the
used donor-acceptor combination. The calibration curves for the detection of NSE using
different sized acceptor-ABs conjugated to either eQD605 or eQD650 are shown in Figure
4.15.
All used combinations presented in Figure 4.15 show, independent of the used QD, an
increase in the intensity ratios with increasing antigen concentration. Due to the constant
concentration of LTC-AB and AB-QD, the increase is attributed to FRET sensitization
caused by the presence of the antigen. Depending on the QD used the saturation effect
appears between 1-2 nM for eQD605 and 2-3 nM for eQD650. The decreased dynamic
range using the same QD concentrations is caused by the lower antibody per QD labeling
ratio for eQD605. As shown in Table 4.7 the labeling ratios for eQD605 are smaller
than for eQD650, which is attributed to the smaller size and thus smaller surface of the
eQD605.
0 1 2 3 4 5 6 7 81
2
3
4 I g G - e Q D 6 0 5 F ( a b ’ ) 2 - e Q D 6 0 5 F ( a b ) - e Q D 6 0 5
rel. ti
me-ga
ted PL
inten
sity ra
tio
[ N S E ] ( n M )
0 9 5 1 9 0 2 8 5 3 8 0 4 7 5 5 7 0 6 6 5 7 6 0[ N S E ] ( n g / m L )
0 1 2 3 4 5 6 7 81
2
3
4
I g G - e Q D 6 5 0 F ( a b ’ ) 2 - e Q D 6 5 0 F ( a b ) - e Q D 6 5 0
rel. ti
me-ga
ted PL
inten
sity ra
tio
[ N S E ] ( n M )
0 9 5 1 9 0 2 8 5 3 8 0 4 7 5 5 7 0 6 6 5 7 6 0[ N S E ] ( n g / m L )
Figure 4.15: left: Relative time-gated PL intensity ratios as a function of the NSEantigen concentration for the combinations of LTC-IgG and differently sized acceptor-ABs conjugated to eQD605. right: Relative time-gated PL intensity ratios as a functionof the NSE antigen concentration for the combinations of LTC-IgG and differently sizedacceptor-ABs conjugated to eQD650.
A further proof of an earlier saturation of AB-eQD605 conjugates can be seen in the
appearance of the high-dose hook effect, which is not observed for AB-eQD650 conjugates.
Despite the difference in the saturation the AB-QD conjugates also differ in the extent of
the FRET sensitization, which can be seen by the higher intensity ratios of ca. 3.2 using
the F(ab’)2-eQD650 conjugate in comparison to 2.8 using the F(ab’)2-eQD605 conjugate.
The calibration curves measured with eQD605 and eQD650 conjugated with the differently
sized acceptor-ABs for the detection of TPSA and CEA show a similar behavior and are
presented in the Appendix 6.3.2.
For further quantification the slopes of the different calibration curves and the standard
deviations of the immunoassays in absence of the acceptor were used in equation 4.1
to obtain the limit of detection according to the analytical sensitivity approach. The
resulting LODs for the detection of NSE are shown in bars in Figure 4.16. Thereby the
LODs calculated for the utilization of eQD605-conjugates are highlighted in orange and
for eQD650-conjugates in red.

66 CHAPTER 4. RESULTS AND DISCUSSION
0 . 0 0 . 2 0 . 4 0 . 6 0 . 8 1 . 0 1 . 2 1 . 4 1 . 6 1 . 8 2 . 0
F ( a b ) - Q D
F ( a b ’ ) 2 - Q D
L O D [ n g / m L ]
I g G - Q D
Figure 4.16: Limit of detections (LODs) estimated according to the analytical sensitivityapproach for the detection of NSE using LTC-IgG and differently sized acceptor-ABsconjugated to either eQD605 (orange bars) or eQD650 (red bars). All values have anerror of approximately 20 %.
The variation of the acceptor-AB size from IgG to F(ab) conjugated to eQD650 for the
detection of NSE show no significant advantages for the utilization of fragmented anti-
bodies as the LOD remains at around 1.1 ng/mL. For the AB-eQD605 conjugates the
use of fragmented antibodies is beneficial as the LOD decreases from 1.8 ng/mL for the
IgG-eQD605 to 0.9 ng/mL for F(ab’)2-eQD605.
The calculated LODs for the detection of TPSA and CEA are shown in Figure 4.17 using
the same color coding as in Figure 4.16.
0 . 0 0 . 2 0 . 4 0 . 6 0 . 8 1 . 0
F ( a b ) - Q D
F ( a b ’ ) 2 - Q D
L O D [ n g / m L ]
I g G - Q D
0 . 0 0 . 4 0 . 8 1 . 2 1 . 6 2 . 0 2 . 4 2 . 8 3 . 2 3 . 6 4 . 0
F ( a b ) - Q D
F ( a b ’ ) 2 - Q D
L O D [ n g / m L ]
I g G - Q D
Figure 4.17: left: Limit of detections (LOD) estimated according to the analyti-cal sensitivity approach for the detection of TPSA using LTC-IgG and differently sizedacceptor-ABs conjugated to either eQD605 (orange bars) or eQD650 (red bars). right:LODs estimated after the analytical sensitivity approach for the detection of CEA usingLTC-IgG and differently sized acceptor-ABs conjugated to either eQD605 (orange bars)or eQD650 (red bars). All values have an error of approximately 20 %.
The presented LODs in Figure 4.17 left for the detection of TPSA using AB-eQD650
conjugates show an improvement to the LODs presented in chapter 4.1.3. Main reasons
for the improvement are an optimization of the purification of the probes and of the
measurement setup of the used fluorescence plate reader. The conjugation of fragmented
antibodies result in a slightly decreased LOD in combination with eQD650, whereas the
AB-eQD605 conjugates present similar LODs independent of the antibody type used.
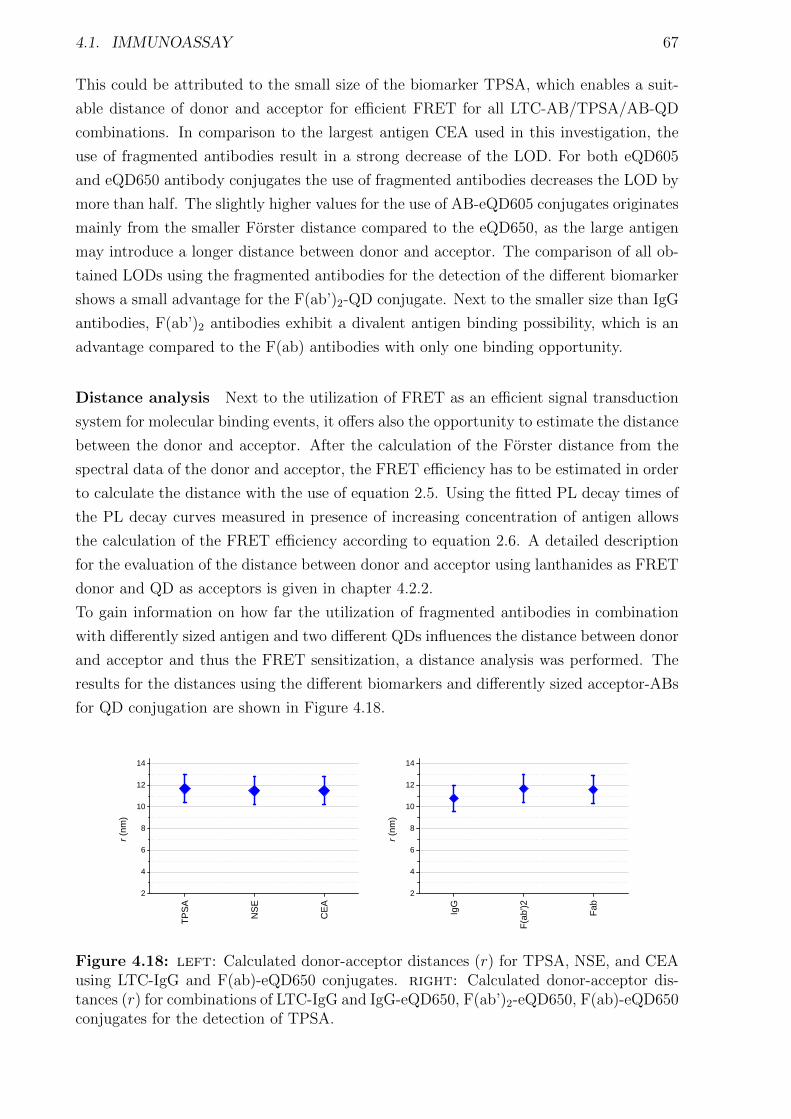
4.1. IMMUNOASSAY 67
This could be attributed to the small size of the biomarker TPSA, which enables a suit-
able distance of donor and acceptor for efficient FRET for all LTC-AB/TPSA/AB-QD
combinations. In comparison to the largest antigen CEA used in this investigation, the
use of fragmented antibodies result in a strong decrease of the LOD. For both eQD605
and eQD650 antibody conjugates the use of fragmented antibodies decreases the LOD by
more than half. The slightly higher values for the use of AB-eQD605 conjugates originates
mainly from the smaller Forster distance compared to the eQD650, as the large antigen
may introduce a longer distance between donor and acceptor. The comparison of all ob-
tained LODs using the fragmented antibodies for the detection of the different biomarker
shows a small advantage for the F(ab’)2-QD conjugate. Next to the smaller size than IgG
antibodies, F(ab’)2 antibodies exhibit a divalent antigen binding possibility, which is an
advantage compared to the F(ab) antibodies with only one binding opportunity.
Distance analysis Next to the utilization of FRET as an efficient signal transduction
system for molecular binding events, it offers also the opportunity to estimate the distance
between the donor and acceptor. After the calculation of the Forster distance from the
spectral data of the donor and acceptor, the FRET efficiency has to be estimated in order
to calculate the distance with the use of equation 2.5. Using the fitted PL decay times of
the PL decay curves measured in presence of increasing concentration of antigen allows
the calculation of the FRET efficiency according to equation 2.6. A detailed description
for the evaluation of the distance between donor and acceptor using lanthanides as FRET
donor and QD as acceptors is given in chapter 4.2.2.
To gain information on how far the utilization of fragmented antibodies in combination
with differently sized antigen and two different QDs influences the distance between donor
and acceptor and thus the FRET sensitization, a distance analysis was performed. The
results for the distances using the different biomarkers and differently sized acceptor-ABs
for QD conjugation are shown in Figure 4.18.
TPSA NS
E
CEA
2
4
6
8
1 0
1 2
1 4
r (nm)
IgG
F(ab’)
2
Fab
2
4
6
8
1 0
1 2
1 4
r (nm)
Figure 4.18: left: Calculated donor-acceptor distances (r) for TPSA, NSE, and CEAusing LTC-IgG and F(ab)-eQD650 conjugates. right: Calculated donor-acceptor dis-tances (r) for combinations of LTC-IgG and IgG-eQD650, F(ab’)2-eQD650, F(ab)-eQD650conjugates for the detection of TPSA.

68 CHAPTER 4. RESULTS AND DISCUSSION
The distances for the different biomarkers in Figure 4.18 (left) show no differences, al-
though their sizes increase significantly. The average distance using LTC-IgG and F(ab)-
eQD650 conjugates as measurement tool for each biomarker remains at around 12 nm. A
possible explanation for this unchanged distance could be given by the epitope binding
sites of the biomarker. The antibodies were provided by the company Cezanne and are
usually used in commercial diagnostic kits for the same biomarker. The signal transduc-
tion method of these kits is also based on FRET and the antibodies are chosen to reveal
a suitable donor-acceptor distance after binding to the biomarker. This basically means
that although the size of antigen increases the distance between the antibody binding
epitopes remains nearly the same, which is the reason for the unchanged donor-acceptor
distance using different biomarkers. But the distance similarity of the fragmented anti-
bodies compared to the full-sized antibody in Figure 4.18 (right) is unexpected as the
actual size of the antibody decreases. A major role inside the donor-acceptor distance
plays the orientation of the antibody. In case of the Y-shaped IgG antibodies the proba-
bility is high that they rather lay on the QD surface than to stand upright. This laying on
the QD surface would result in a similar distance of the IgG antibody to the fragmented
antibodies.
A large difference in the donor-acceptor distance can be observed for the utilization of
eQD605 and eQD650 within the immunoassay shown in Figure 4.19.
eQD6
05
eQD6
50
2
4
6
8
1 0
1 2
1 4
r (nm)
Figure 4.19: Calculated donor-acceptor distances (r) for the detection of TPSA usingLTC-IgG in combination with F(ab)-eQD605 or F(ab)-eQD650 conjugates.
The increase of the donor-acceptor distance from ca. 8 nm for F(ab)-eQD605 to ca. 12 nm
F(ab)-eQD650 in combination with LTC-IgG is attributed to the different size of the used
QDs.
In conclusion, the fragmented antibodies do not result in a shorter donor-acceptor distance
but rather lead to higher labeling ratio an enable the binding of more biomarker per QD.
The larger amount of LTC per QD concomitantly result in higher FRET sensitization
and thus an higher sensitivity. Due to the slight advantage of the combination using
LTC-IgG as FRET donor and F(ab’)2-QD as FRET acceptor, further investigations were
made with this combination.
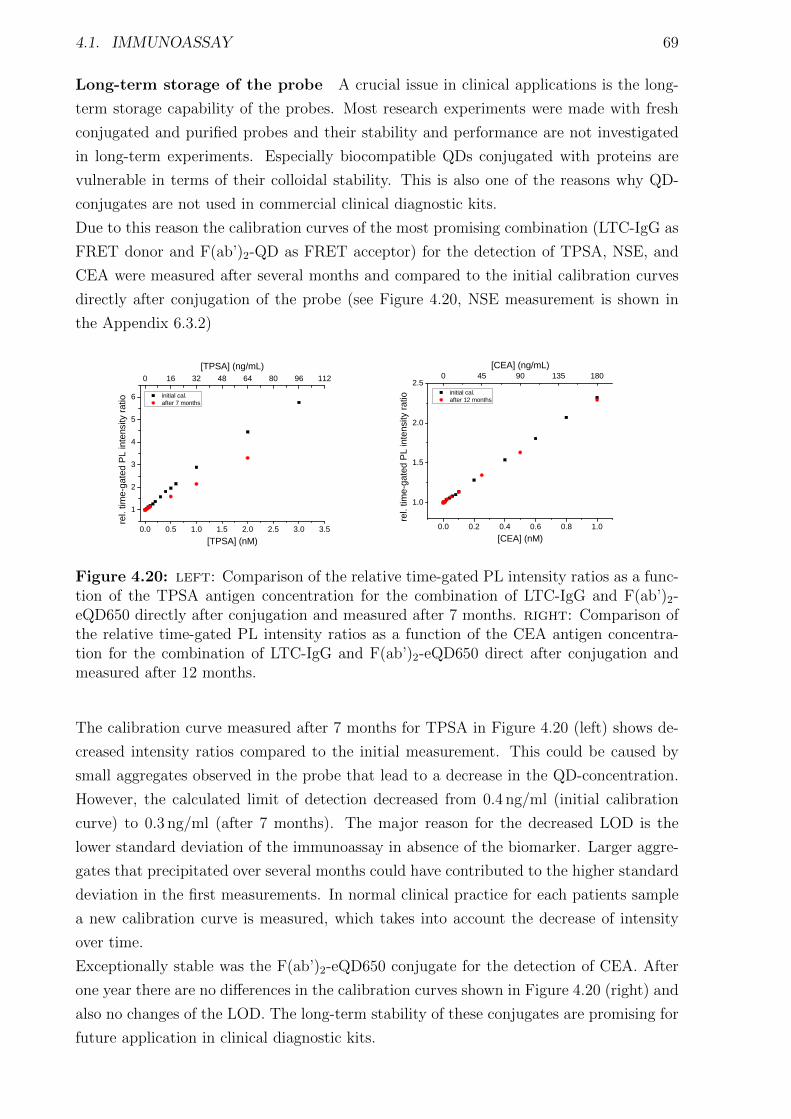
4.1. IMMUNOASSAY 69
Long-term storage of the probe A crucial issue in clinical applications is the long-
term storage capability of the probes. Most research experiments were made with fresh
conjugated and purified probes and their stability and performance are not investigated
in long-term experiments. Especially biocompatible QDs conjugated with proteins are
vulnerable in terms of their colloidal stability. This is also one of the reasons why QD-
conjugates are not used in commercial clinical diagnostic kits.
Due to this reason the calibration curves of the most promising combination (LTC-IgG as
FRET donor and F(ab’)2-QD as FRET acceptor) for the detection of TPSA, NSE, and
CEA were measured after several months and compared to the initial calibration curves
directly after conjugation of the probe (see Figure 4.20, NSE measurement is shown in
the Appendix 6.3.2)
0 . 0 0 . 5 1 . 0 1 . 5 2 . 0 2 . 5 3 . 0 3 . 51
2
3
4
5
6 i n i t i a l c a l . a f t e r 7 m o n t h s
rel. ti
me-ga
ted PL
inten
sity ra
tio
[ T P S A ] ( n M )
0 1 6 3 2 4 8 6 4 8 0 9 6 1 1 2[ T P S A ] ( n g / m L )
0 . 0 0 . 2 0 . 4 0 . 6 0 . 8 1 . 0
1 . 0
1 . 5
2 . 0
2 . 5 i n i t i a l c a l . a f t e r 1 2 m o n t h s
rel. ti
me-ga
ted PL
inten
sity ra
tio
[ C E A ] ( n M )
0 4 5 9 0 1 3 5 1 8 0[ C E A ] ( n g / m L )
Figure 4.20: left: Comparison of the relative time-gated PL intensity ratios as a func-tion of the TPSA antigen concentration for the combination of LTC-IgG and F(ab’)2-eQD650 directly after conjugation and measured after 7 months. right: Comparison ofthe relative time-gated PL intensity ratios as a function of the CEA antigen concentra-tion for the combination of LTC-IgG and F(ab’)2-eQD650 direct after conjugation andmeasured after 12 months.
The calibration curve measured after 7 months for TPSA in Figure 4.20 (left) shows de-
creased intensity ratios compared to the initial measurement. This could be caused by
small aggregates observed in the probe that lead to a decrease in the QD-concentration.
However, the calculated limit of detection decreased from 0.4 ng/ml (initial calibration
curve) to 0.3 ng/ml (after 7 months). The major reason for the decreased LOD is the
lower standard deviation of the immunoassay in absence of the biomarker. Larger aggre-
gates that precipitated over several months could have contributed to the higher standard
deviation in the first measurements. In normal clinical practice for each patients sample
a new calibration curve is measured, which takes into account the decrease of intensity
over time.
Exceptionally stable was the F(ab’)2-eQD650 conjugate for the detection of CEA. After
one year there are no differences in the calibration curves shown in Figure 4.20 (right) and
also no changes of the LOD. The long-term stability of these conjugates are promising for
future application in clinical diagnostic kits.

70 CHAPTER 4. RESULTS AND DISCUSSION
Real sample measurements For the estimation of an unknown biomarker concentra-
tion in a patient sample the measurement of a calibration curve is the first step. This
investigation would be incomplete without the measurement of real patient samples for
the biomarker TPSA in human sera purchased from the company biomnis (Lyon, France).
Three different concentrations were investigated LTC-IgG as FRET donor and F(ab’)2-
eQD650 conjugate as FRET acceptor. The real samples were treated like the self-prepared
serum samples and 50 µl were added to 100 µl LTC-AB and AB-QD mixture. Each con-
centration was prepared three times and measured in triplicate. The obtained intensity
ratio was used to estimate the concentration using the simultaneous measured calibration
curve. The results are listed in Table 4.12 together with the concentrations provided by
the supplier.
Table 4.12: Concentration estimated from the calibration curve measured with LTC-IgG as FRET donor and F(ab’)2-eQD650 conjugate as FRET acceptor and the providedconcentration by the supplier for three different real patient serum samples containingdifferent concentrations of the biomarker TPSA. All values have an error of approximately20 %.
TPSA TPSA Reference deviation[nM] [ng/ml] [ng/ml] (%)
Real sample 1 0.2 5.4 4.5 20
Real sample 2 -0.02 -0.56 0.55 202
Real sample 3 0.05 1.7 1.8 10
The second real sample in Table 4.12 has a TPSA concentration in the range of the
estimated LOD for this FRET pair combination, which could explain the large deviation
from the reference TPSA concentration. Real sample 1 and 3 exhibit higher biomarker
concentrations and the deviation is below 20 %, which is a good result for use of LTC-
to-QD FRET inside the homogeneous immunoassay for the detection of TPSA. These
first results of real samples using an unoptimized immunoassay are quite promising and
further optimization of the assay could improve the quantification.
Comparison to commercial kits As mentioned in the beginning the used antibodies
for the detection of TPSA, NSE, and CEA in an immunometric homogeneous immunoas-
say are already utilized in commercial diagnostic kits for these biomarkers. The signal
transduction is also based on FRET, but from a europium-complex to, depending on
the biomarker, different organic dyes. In order to compare the performance of the used
LTC-to-QD FRET with varied antibody sizes to the commercial kits, the LOD of the
commercial kits for the different bimomarker was evaluated using the same biomarker
concentrations and after the manual provided with the kit. The resulting LODs are listed
in Table 4.13 and 4.14 for the use of eQD605 and eQD650 AB-conjugates, respectively.
For a better comparison the LODs are calculated on the whole 150 µl reaction volume.
In comparison to the commercial kits the obtained LODs are higher for the investigated

4.1. IMMUNOASSAY 71
Table 4.13: Limit of detection (LOD) obtained using the commercial kit in comparisonto the LODs of the different combinations of LTC-IgG with IgG-eQD605, F(ab’)2-eQD605,and F(ab)-eQD605 conjugates. All values have an error of approximately 20 %.
LOD (Kit) LOD IgG LOD F(ab’)2 LOD F(ab)[ng/ml]
TPSA 0.02 0.18 0.09 0.15
NSE 0.09 0.61 0.30 0.37
CEA 0.1 1.18 0.46 0.64
Table 4.14: Limit of detection (LOD) obtained using the commercial kit in comparisonto the LODs of the different combinations of LTC-IgG with IgG-eQD650, F(ab’)2-eQD650,F(ab)-eQD650 conjugates. All values have an error of approximately 20 %.
LOD (Kit) LOD IgG LOD F(ab’)2 LOD F(ab)[ng/ml]
TPSA 0.02 0.27 0.12 0.15
NSE 0.09 0.35 0.33 0.40
CEA 0.1 0.91 0.32 0.33
LTC-to-QD FRET pair combinations, but in a similar range. A further optimization of
the immunoassay procedure and using automated pipetting could improve the obtained
values. On the other hand the measured LODs are very low and allow the quantification of
biomarkers far below their clinical cutoff values, which are 4 ng/ml for TPSA, 12.5 ng/ml
for NSE, and 5 ng/ml for CEA. Heterogeneous immunoassays like commercial ELISA-
based diagnostic kits show comparable detection limits as obtained for the FRET-based
commercial kits for all investigated antigens.
Simultaneous measurement of NSE and CEA biomarkers
Although the obtained LODs using LTC-donors and QD-acceptors are higher than for
the commercial diagnostic kits, there is one advantage offered only by this FRET pair
combination and that is the multiplexing capability. One trend in diagnostics is the
simultaneous measurement of several biomarkers in one sample. The advantages are less
time-consuming preparation of the different analysis methods, and reduction of material
and patients sample. The europium complex used as donor in combination with organic
dyes as acceptors in the commercial diagnostic kits for the measurement of TPSA, NSE,
and CEA cannot provide such application. The main limitation is that the donor only
provides one intense emission band in the visible spectrum and as such allows a spectral
overlap only with one optimized dye as acceptor. LTCs provide several intense emission
bands, which are suitable for the utilization of several acceptors. The combination of
LTC in a multiplexed assay using five different emitting dyes for the detection of different
lung cancer markers was demonstrated by Geißler et al. [19] The major obstacle in the
use of dyes as acceptors are their pronounced emission shoulder in the red. This causes
72 CHAPTER 4. RESULTS AND DISCUSSION
interferences for the simultaneous measurement of several dyes, as their emission bleeds
through into other measurement channels. This can lead to an increase in signal intensity
in a measurement channel, where actually no biomarker is present. To correct for this
pollution a mathematical correction of the obtained data has to be made.
The big advantage of using QDs as acceptors is their narrow symmetric Gaussian shape
emission spectra. In Figure 4.10 (right) it can be seen that the emission spectra of
the QDs are less affected by the other QD emission bands. With a careful selection
of the detection wavelength for the different QDs a minor spectral crosstalk inside the
measurement channel can be obtained. Together with the structured emission of the
LTC-donor the signal deconvolution should be simpler compared to the used LTC-to-dye
FRET multiplexing approach.
As proof of principle, the simultaneous detection of the biomarkers NSE and CEA was
chosen. The measurement system consisted of LTC-IgG and F(ab’)2-eQD605 or F(ab’)2-
eQD650 conjugates for the detection of either NSE or CEA.
Optical and biological crosstalk Prior to the simultaneous measurement of both
biomarkers, the measurement system has to be checked for biological and optical crosstalk.
Biological crosstalk originates from the binding of NSE detection antibodies to the CEA
antigen or the binding of the NSE antigen to CEA detection antibodies. This crosstalk
can interfere with the concentration estimation and lead to overestimated antigen con-
centrations.
To test the used system for biological crosstalk, immunoassays were performed with NSE
detection antibodies and increasing concentrations of CEA and the same for the CEA tar-
geting system. The results are exemplarily discussed for the combination of LTC-IgG and
F(ab’)2-eQD605 (NSE-AB) for the detection of NSE and LTC-IgG and F(ab’)2-eQD650
(CEA-AB) for the detection of CEA, the control measurements with exchanged QDs are
shown in the Appendix 6.3.2. For the detection of the QD sensitization in presence of
the respective antigen two different bandpass filters were used. The KRYPTOR compact
PLUS is equipped with a filter wheel, which allows a fast changing of the acceptor band-
pass filters. Figure 4.21 shows the calibration curves obtained using the bandpass filters
for the detection of NSE (left) and for the detection of CEA (right).
The Figure 4.21 left shows positive and negative controls measured in the NSE detection
channel in order to estimate the influence of either the CEA antigen (CEA AG) or the
presence of a second pair of antibodies in the solution. The increase of the intensity
ratios in presence of NSE-AB and increasing concentrations of NSE antigen (NSE AG)
represents the classical measurement of the antigen in a singleplex format. In contrast to
the increase in presence of NSE, the addition of CEA AG to NSE-ABs causes no change
in the intensity ratios. This is an evidence for a negligible biological crosstalk and the
presence of increasing CEA AG concentrations will not cause the binding of NSE-ABs
in an immunometric format and thus no FRET sensitization is observed. In presence
of NSE-AB and CEA-AB the addition of NSE antigen results in a lower increase of the
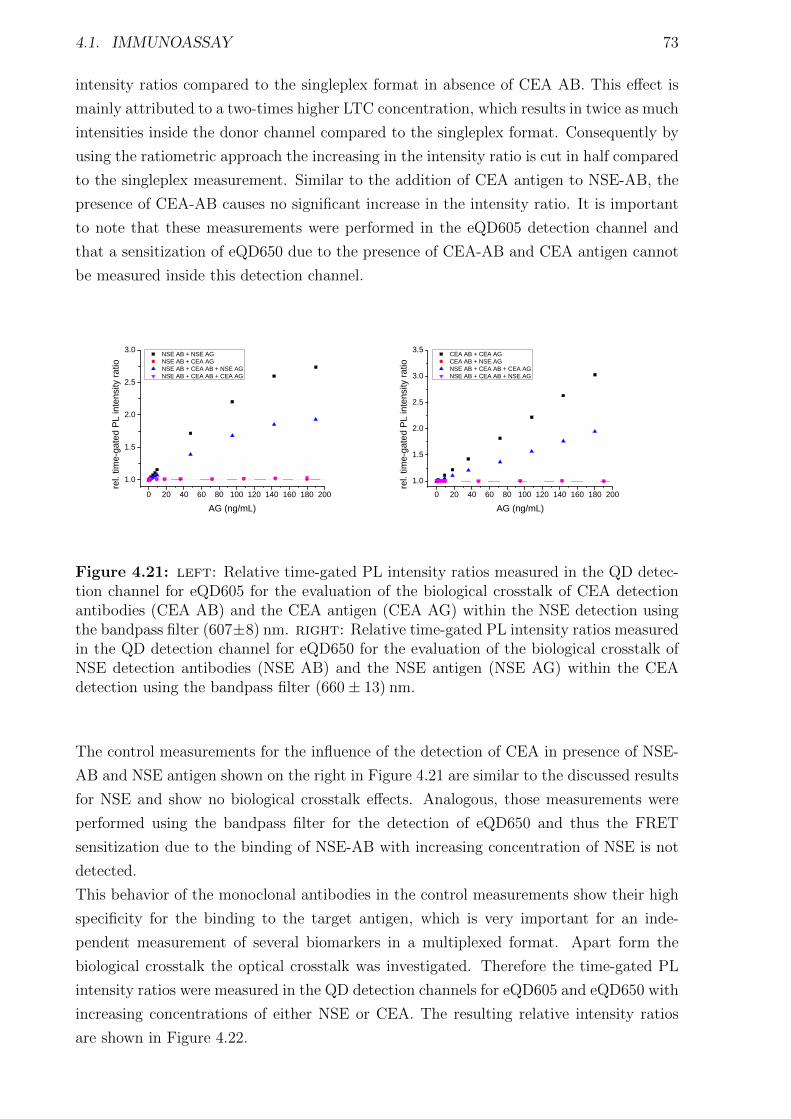
4.1. IMMUNOASSAY 73
intensity ratios compared to the singleplex format in absence of CEA AB. This effect is
mainly attributed to a two-times higher LTC concentration, which results in twice as much
intensities inside the donor channel compared to the singleplex format. Consequently by
using the ratiometric approach the increasing in the intensity ratio is cut in half compared
to the singleplex measurement. Similar to the addition of CEA antigen to NSE-AB, the
presence of CEA-AB causes no significant increase in the intensity ratio. It is important
to note that these measurements were performed in the eQD605 detection channel and
that a sensitization of eQD650 due to the presence of CEA-AB and CEA antigen cannot
be measured inside this detection channel.
0 2 0 4 0 6 0 8 0 1 0 0 1 2 0 1 4 0 1 6 0 1 8 0 2 0 01 . 0
1 . 5
2 . 0
2 . 5
3 . 0 N S E A B + N S E A G N S E A B + C E A A G N S E A B + C E A A B + N S E A G N S E A B + C E A A B + C E A A G
rel. ti
me-ga
ted PL
inten
sity ra
tio
A G ( n g / m L )0 2 0 4 0 6 0 8 0 1 0 0 1 2 0 1 4 0 1 6 0 1 8 0 2 0 0
1 . 0
1 . 5
2 . 0
2 . 5
3 . 0
3 . 5 C E A A B + C E A A G C E A A B + N S E A G N S E A B + C E A A B + C E A A G N S E A B + C E A A B + N S E A G
rel. ti
me-ga
ted PL
inten
sity ra
tio
A G ( n g / m L )
Figure 4.21: left: Relative time-gated PL intensity ratios measured in the QD detec-tion channel for eQD605 for the evaluation of the biological crosstalk of CEA detectionantibodies (CEA AB) and the CEA antigen (CEA AG) within the NSE detection usingthe bandpass filter (607±8) nm. right: Relative time-gated PL intensity ratios measuredin the QD detection channel for eQD650 for the evaluation of the biological crosstalk ofNSE detection antibodies (NSE AB) and the NSE antigen (NSE AG) within the CEAdetection using the bandpass filter (660± 13) nm.
The control measurements for the influence of the detection of CEA in presence of NSE-
AB and NSE antigen shown on the right in Figure 4.21 are similar to the discussed results
for NSE and show no biological crosstalk effects. Analogous, those measurements were
performed using the bandpass filter for the detection of eQD650 and thus the FRET
sensitization due to the binding of NSE-AB with increasing concentration of NSE is not
detected.
This behavior of the monoclonal antibodies in the control measurements show their high
specificity for the binding to the target antigen, which is very important for an inde-
pendent measurement of several biomarkers in a multiplexed format. Apart form the
biological crosstalk the optical crosstalk was investigated. Therefore the time-gated PL
intensity ratios were measured in the QD detection channels for eQD605 and eQD650 with
increasing concentrations of either NSE or CEA. The resulting relative intensity ratios
are shown in Figure 4.22.

74 CHAPTER 4. RESULTS AND DISCUSSION
0 2 0 4 0 6 0 8 0 1 0 0 1 2 0 1 4 0 1 6 0 1 8 0 2 0 01 . 0
1 . 5
2 . 0
2 . 5
3 . 0 C E A A B + C E A A G N S E A B + C E A A B + C E A A G
rel. ti
me-ga
ted PL
inten
sity ra
tio
C E A ( n g / m L )0 2 0 4 0 6 0 8 0 1 0 0 1 2 0 1 4 0 1 6 0 1 8 0 2 0 0
1 . 0
1 . 5
2 . 0
2 . 5
3 . 0
3 . 5 N S E A B + N S E A G N S E A B + C E A A B + N S E A G
rel. ti
me-ga
ted PL
inten
sity ra
tio
N S E ( n g / m L )
Figure 4.22: left: Relative time-gated PL intensity ratios measured in the QD de-tection channel for eQD605 with increasing CEA antigen (CEA AG) concentration inpresence of CEA detection antibodies (CEA-AB) or NSE detection antibodies (NSE-AB)+ CEA-AB using the bandpass filter (607 ± 8) nm. right: Relative time-gated PL in-tensity ratios measured in the QD detection channel for eQD650 with increasing NSEantigen (NSE AG) concentration in presence of NSE detection antibodies (NSE-AB) orCEA detection antibodies (CEA-AB) + NSE-AB using the bandpass filter (660±13) nm.
Optical crosstalk describes the bleed through of eQD650 emission in the QD detection
channel, in which the sensitization of eQD605 is supposed to be measured and vice versa.
The pollution, also called bleed through, into other measurement channels results in
overestimated biomarker concentrations. In order to estimate the optical crosstalk im-
munoassays were performed, in which increasing amounts of CEA antigen were added
to solutions of CEA-AB or CEA-AB + NSE-AB and the time-gated PL intensity ratio
was monitored in the QD-detection channel for the measurement of NSE (see Figure 4.22
left). The constant relative intensity ratios close to unity are an evidence for negligible
optical crosstalk of eQD650 with increasing sensitization. The same results were obtained
monitoring the QD detection channel of eQD650 with increasing emission of sensitized
eQD605 due to the FRET in presence of NSE antigen.
Duplexed measurements The control measurements reveal negligible influence of bi-
ological or optical crosstalk, which enables the independent concentration estimation of
the two biomarkers in a duplexed immunometric measurement format. The measurement
scheme was similar to the singleplex format. The donor-AB solutions for the detection
of NSE and CEA were premixed together as well as the acceptor-AB solutions. For each
measurement 50 µL of mixed donor-AB and acceptor-AB solution were added into the
wells of the 96-well microtiter plate. The antigen solutions were prepared using newborn
calf serum as diluent and contained increasing concentrations of both biomarkers. To the
100 µL of mixed donor-AB and acceptor-AB solution 50 µL of the serum-based antigen
mixture was added and carefully mixed. The samples were incubated at 37 ◦C for up
to 180 min and measured on the fluorescence plate readers, using a bandpass filter of
(607± 8) nm for the detection of eQD605 and a bandpass filter of (660± 13) nm for the
detection of eQD650. The resultant PL decay curves were treated after the time-gated
ratiometric approach presented earlier for the singleplex immunoassays. The obtained
relative intensity ratios are shown in Figure 4.23.
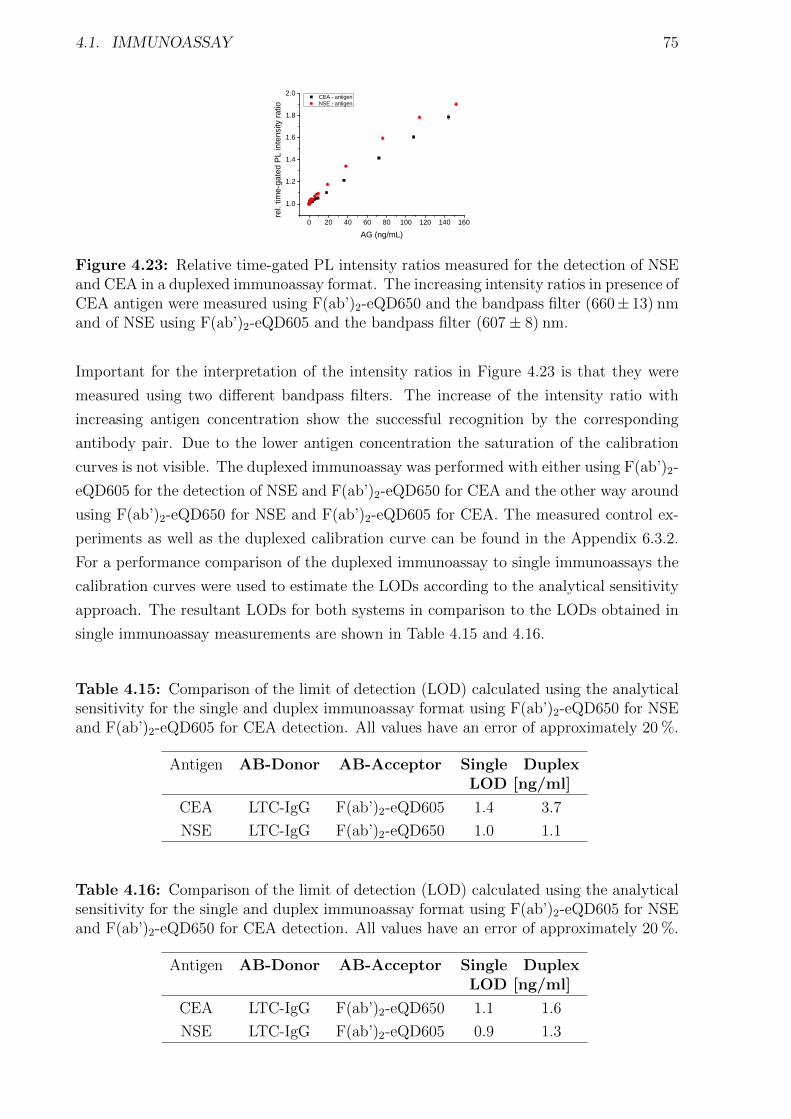
4.1. IMMUNOASSAY 75
0 2 0 4 0 6 0 8 0 1 0 0 1 2 0 1 4 0 1 6 0
1 . 0
1 . 2
1 . 4
1 . 6
1 . 8
2 . 0 C E A - a n t i g e n N S E - a n t i g e n
rel. ti
me-ga
ted PL
inten
sity ra
tio
A G ( n g / m L )
Figure 4.23: Relative time-gated PL intensity ratios measured for the detection of NSEand CEA in a duplexed immunoassay format. The increasing intensity ratios in presence ofCEA antigen were measured using F(ab’)2-eQD650 and the bandpass filter (660± 13) nmand of NSE using F(ab’)2-eQD605 and the bandpass filter (607± 8) nm.
Important for the interpretation of the intensity ratios in Figure 4.23 is that they were
measured using two different bandpass filters. The increase of the intensity ratio with
increasing antigen concentration show the successful recognition by the corresponding
antibody pair. Due to the lower antigen concentration the saturation of the calibration
curves is not visible. The duplexed immunoassay was performed with either using F(ab’)2-
eQD605 for the detection of NSE and F(ab’)2-eQD650 for CEA and the other way around
using F(ab’)2-eQD650 for NSE and F(ab’)2-eQD605 for CEA. The measured control ex-
periments as well as the duplexed calibration curve can be found in the Appendix 6.3.2.
For a performance comparison of the duplexed immunoassay to single immunoassays the
calibration curves were used to estimate the LODs according to the analytical sensitivity
approach. The resultant LODs for both systems in comparison to the LODs obtained in
single immunoassay measurements are shown in Table 4.15 and 4.16.
Table 4.15: Comparison of the limit of detection (LOD) calculated using the analyticalsensitivity for the single and duplex immunoassay format using F(ab’)2-eQD650 for NSEand F(ab’)2-eQD605 for CEA detection. All values have an error of approximately 20 %.
Antigen AB-Donor AB-Acceptor Single DuplexLOD [ng/ml]
CEA LTC-IgG F(ab’)2-eQD605 1.4 3.7
NSE LTC-IgG F(ab’)2-eQD650 1.0 1.1
Table 4.16: Comparison of the limit of detection (LOD) calculated using the analyticalsensitivity for the single and duplex immunoassay format using F(ab’)2-eQD605 for NSEand F(ab’)2-eQD650 for CEA detection. All values have an error of approximately 20 %.
Antigen AB-Donor AB-Acceptor Single DuplexLOD [ng/ml]
CEA LTC-IgG F(ab’)2-eQD650 1.1 1.6
NSE LTC-IgG F(ab’)2-eQD605 0.9 1.3

76 CHAPTER 4. RESULTS AND DISCUSSION
The duplexed measurement using F(ab’)2-eQD605 for the detection of CEA results in
an increase of the LOD from 1.4 ng/mL in the singleplex format to 3.7 ng/mL in the
duplexed format, whereas the LOD for the detection of NSE is in both formats around
1 ng/mL (see Table 4.15). This could be caused by the lower FRET sensitization of the
eQD605 in presence of CEA antigen. In comparison to the twice as high donor signal
the calculated intensity ratio get more affected resulting in a less steep increase of the
calibration curve. The performance for the detection of CEA in the duplexed format can
be improved exchanging the QDs for the detection of the antigens (see Table 4.16). In this
combination using F(ab’)2-eQD605 for NSE detection and F(ab’)2-eQD650 for CEA, the
obtained LODs are quite similar in both formats. In general, the LODs are far below the
clinical cutoff levels of the respective antigens and make the duplexed format a promising
approach for the detection of two biomarkers from a single sample. Thereby the system
is very flexible and each combination of antigen can be measured using the respective
antibodies.
Outlook to triplex measurement The structured emission bands of the LTCs exhibit
several gaps and the duplexed approach can be extended to up to five suitable acceptors.
As a short outlook a third QD, iQD705, was conjugated with F(ab’)2 acceptor-ABs for
the detection of TPSA. The emission maximum is in the range of 705 nm and thus beyond
the emission bands of the LTC. The performance for the detection of TPSA was compared
to the already implemented eQD605 and eQD650 and the resulting calibration curves are
shown in Figure 4.24.
0 5 1 0 1 5 2 0 2 5123456789
F ( a b ) 2 - e Q D 6 0 5 F ( a b ) 2 - e Q D 6 5 0 F ( a b ) 2 - i Q D 7 0 5rel
. time
-gated
PL in
tensity
[ T P S A ] ( n M )
Figure 4.24: Comparison of the relative time-gated PL intensity ratios using com-binations of LTC-IgG with F(ab’)2-eQD605, F(ab’)2-eQD650, or F(ab’)2-iQD705 withincreasing TPSA concentration.
In Figure 4.24 the sensitization of F(ab’)2-iQD705 is not as strong as for the antibody
conjugates using eQD605 and eQD650. The lower sensitization results also in a higher
LOD compared to afore mentioned QDs (see Table 4.17).
Although the iQD705 has a similar Forster distance as eQD650 and exhibits the highest
labeling ratio of F(ab’)2 antibodies per QD, the obtained LOD is with 0.9 ng/ml nearly
twice as high as for eQD605 or eQD650 (see Table 4.17). The main reason for the lower
sensitivity is attributed to the large size of the QD caused mainly by the thick PEG coat-
4.1. IMMUNOASSAY 77
Table 4.17: Comparison of the limit of detection (LODs) calculated using the analyt-ical sensitivity approach for the detection of TPSA using combinations from LTC-IgGwith F(ab’)2-eQD605, F(ab’)2-eQD650, or F(ab’)2-iQD705. All values have an error ofapproximately 20 %.
AB-Acceptor QD LOD [ng/ml]
F(ab’)2 eQD605 0.3
F(ab’)2 eQD650 0.4
F(ab’)2 iQD705 0.9
ing to render the QD water-soluble and biocompatible. As the Forster distance counts
from the center of the QD the thick coating prevents a close proximity of the donor com-
pared to eQD650. The larger distance results in a lower FRET efficiency and thus lower
sensitization in presence of the antigen.
However, the measurable calibration curve with an LOD much below the clinical cutoff
level using a QD from a different company and also different surface coating reveals the
flexibility in terms of the used LTC-to-QD FRET approach for homogeneous immunoas-
says. A future step is the implementation of the third QD inside a triplex immunoassays
for the simultaneous detection of TPSA, NSE and CEA.
78 CHAPTER 4. RESULTS AND DISCUSSION
4.1.5 Nanobodies for EGFR detection
Our collaboration partner from the Utrecht University kindly provided single domain
antigen binding fragments of heavy chain antibodies, which are also called nanobodies or
VHH. This term is attributed to their small size of only 15 kDa and 4 x 2.5 x 3 nm di-
mension, which is much smaller than the F(ab) fragments with 50 kDa used in the before
presented investigations. The nanobodies were used inside a homogeneous immunometric
immunoassay for the detection of soluble EGFR.2 Although the nanobodies are very small
the used EGFR is a dimer with total size of 190 kDa. For the realization of the sandwich
immunoassays two nanobodies were provided, which bind to non-overlapping epitopes on
the ectodomain I and III of EGFR. The distance between the epitopes on the EGFR is
about 4 nm. Counting the size of 4 nm for each nanobody plus the radius of the used QD
of 7 nm results in a maximum distance of ca. 19 nm. Due to the large Forster distance
of 10.8 nm and the established and optimized conjugation protocol, eQD650 was used as
FRET acceptor in combination with LTC as FRET donor.
Due to the small size of the nanobodies the labeling ratio of LTC per VHH was only
1.4. In contrast the conjugation of VHH to eQD650 was exceptional high with 30 VHH
per QD. The purification of free VHH from the VHH-eQD650 conjugate was very simple
and efficient due to the large size differences. However, the non-oriented labeling strategy
could lead to a certain percentage of inactive VHH on the QD-surface.
The same immunoassay preparation protocol was used like for the afore mentioned im-
munoassays. A volume of 50 µL of each LTC-VHH and VHH-QD conjugates were mixed
together, which gave 100 µL solution with a constant donor and acceptor concentration.
Then 50 µL antigen solution with different concentrations of EGFR, prepared in NBCS
or buffer 7, were added and after careful mixing incubated at 37 ◦C. The immunoassays
were measured on both fluorescence plate readers.
The pre-FRET incident
The measured PL decay curve of the immunoassay in absence of EGFR show a different
behavior as expected from the mathematical addition of the single measurement of LTC-
VHH and VHH-QD conjugates. Figure 4.25 shows the measured and calculated PL decay
curves.
In Figure 4.25 the gray PL decay curve is the calculated addition of the short-lived decay
curve of pure VHH-QD (magenta) and the long-lived decay curve of LTC-VHH (orange).
The black PL decay curve is the actual curve when both conjugates are present in the same
solution. The appearance of a new decay time components with increased intensity (shown
by the gray arrow) indicates a FRET sensitization also in absence of EGFR, termed pre-
FRET. Reasons for this behavior could be a possible intrinsic hydrophobicity of the used
VHH-conjugates. The partial aggregation and dimerization of the nanobodies could result
2Work was published in: Small, 2013, 734-740
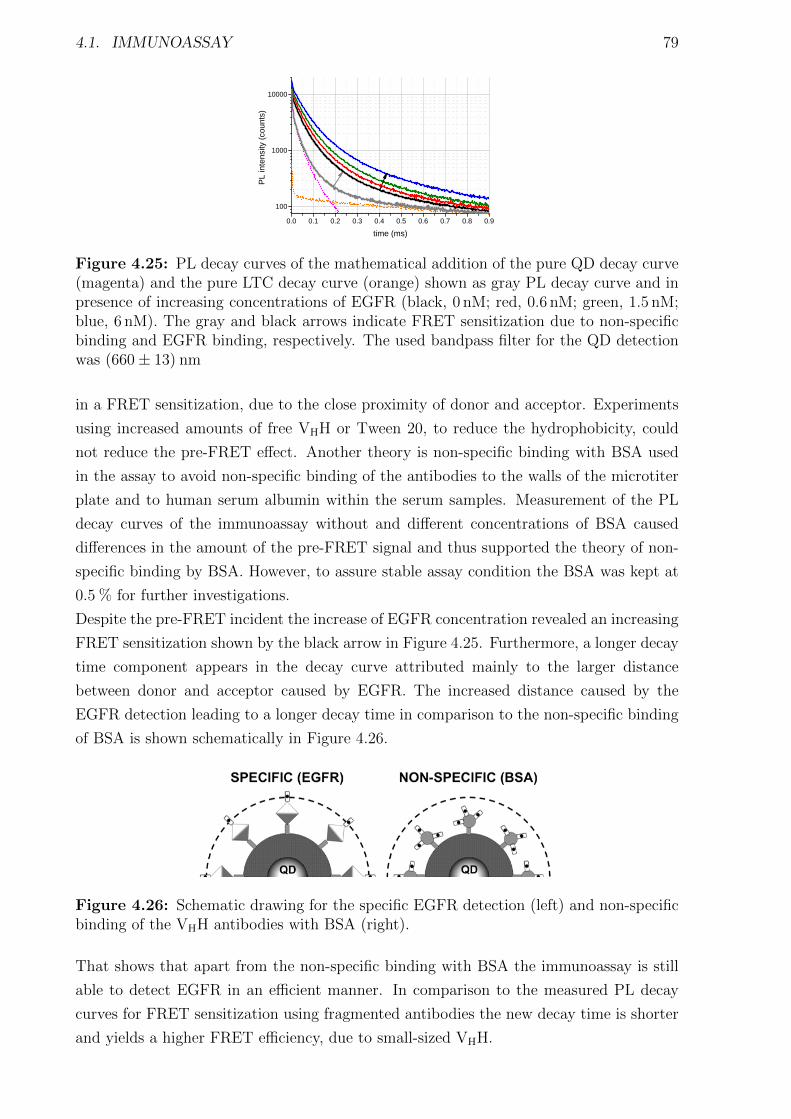
4.1. IMMUNOASSAY 79
0 . 0 0 . 1 0 . 2 0 . 3 0 . 4 0 . 5 0 . 6 0 . 7 0 . 8 0 . 91 0 0
1 0 0 0
1 0 0 0 0
PL in
tensity
(cou
nts)
t i m e ( m s )
Figure 4.25: PL decay curves of the mathematical addition of the pure QD decay curve(magenta) and the pure LTC decay curve (orange) shown as gray PL decay curve and inpresence of increasing concentrations of EGFR (black, 0 nM; red, 0.6 nM; green, 1.5 nM;blue, 6 nM). The gray and black arrows indicate FRET sensitization due to non-specificbinding and EGFR binding, respectively. The used bandpass filter for the QD detectionwas (660± 13) nm
in a FRET sensitization, due to the close proximity of donor and acceptor. Experiments
using increased amounts of free VHH or Tween 20, to reduce the hydrophobicity, could
not reduce the pre-FRET effect. Another theory is non-specific binding with BSA used
in the assay to avoid non-specific binding of the antibodies to the walls of the microtiter
plate and to human serum albumin within the serum samples. Measurement of the PL
decay curves of the immunoassay without and different concentrations of BSA caused
differences in the amount of the pre-FRET signal and thus supported the theory of non-
specific binding by BSA. However, to assure stable assay condition the BSA was kept at
0.5 % for further investigations.
Despite the pre-FRET incident the increase of EGFR concentration revealed an increasing
FRET sensitization shown by the black arrow in Figure 4.25. Furthermore, a longer decay
time component appears in the decay curve attributed mainly to the larger distance
between donor and acceptor caused by EGFR. The increased distance caused by the
EGFR detection leading to a longer decay time in comparison to the non-specific binding
of BSA is shown schematically in Figure 4.26.
Figure 4.26: Schematic drawing for the specific EGFR detection (left) and non-specificbinding of the VHH antibodies with BSA (right).
That shows that apart from the non-specific binding with BSA the immunoassay is still
able to detect EGFR in an efficient manner. In comparison to the measured PL decay
curves for FRET sensitization using fragmented antibodies the new decay time is shorter
and yields a higher FRET efficiency, due to small-sized VHH.

80 CHAPTER 4. RESULTS AND DISCUSSION
Time-gated analysis
The performance of the immunoassay was assessed by the measurement of 18 EGFR
samples with increasing concentrations ranging from 0.2 nM to 30 nM. The obtained time-
gated PL intensity ratios measured in the QD and LTC detection channels are shown in
Figure 4.27 left and right, respectively.
0 3 6 9 1 2 1 5 1 8 2 1 2 4 2 7 3 05 . 6 x 1 0 4
8 . 3 x 1 0 4
1 . 1 x 1 0 5
1 . 4 x 1 0 5
1 . 7 x 1 0 5
1 . 9 x 1 0 5
2 . 2 x 1 0 5
2 . 5 x 1 0 5
1 . 0
1 . 5
2 . 0
2 . 5
3 . 0
3 . 5
4 . 0
4 . 5
rel. F
RET s
ensiti
zatio
n
time-g
ated P
L inte
nsity
[ E G F R ] ( n M )0 3 6 9 1 2 1 5 1 8 2 1 2 4 2 7 3 02 . 5 1 x 1 0 6
2 . 5 6 x 1 0 6
2 . 6 2 x 1 0 6
2 . 6 7 x 1 0 6
2 . 7 2 x 1 0 6
2 . 7 8 x 1 0 6
2 . 8 3 x 1 0 6
0 . 9 4
0 . 9 6
0 . 9 8
1 . 0 0
1 . 0 2
1 . 0 4
1 . 0 6
rel. T
b PL i
ntens
ity
time-g
ated P
L inte
nsity
[ E G F R ] ( n M )
Figure 4.27: left: Time-gated PL intensities in the QD detection channel as a functionof the EGFR concentration. right: Time-gated PL intensities in the LTC detectionchannel as a function of the EGFR concentration.
In Figure 4.27 left the time-gated PL intensity ratios increases until they level off at a
EGFR concentration of ca. 3 nM. This saturation concentration is three to five times lower
than expected from the initially used LTC-VHH and VHH-QD conjugate concentrations
of 8 nM and 15 nM, respectively. This could be a consequence of the non-specific binding
to BSA as the involved VHH-conjugates cannot take part in the detection of EGFR.
The time-gated PL intensity ratios in the LTC detection channel fluctuate at around
± 6 % without any significant tendency for enhanced quenching in the presence of in-
creased EGFR concentration (see Figure 4.27 right). Due to a large fraction of LTC-VHH
conjugates that do not take part in FRET together with the low FRET efficiency, the
small fraction of FRET-quenched LTC conjugates is masked by the high background of
unquenched LTC conjugates. In comparison the low signal background in the QD detec-
tion channel in Figure 4.27 (left) enables the observation of the small signal changes due
to FRET sensitization. It also shows the high-dose hook effect for concentrations larger
than 9 nM.
Due to the encountered problems with non-specific binding to BSA the calibration curves
were measured using buffer or serum as diluent for the preparation of the EGFR con-
centrations. The measured relative time-gated PL intensity ratios are shown in Figure
4.28.
A clear difference can be observed in the time-gated PL intensities and thus the level of
FRET sensitization using buffer or serum as diluent for EGFR (see Figure 4.28). The
much smaller increase in the intensity ratios for serum samples can be attributed to an
increased amount of non-specific binding with proteins inside the serum. This also influ-
ences the estimated LODs where buffer as diluent yields a LOD of 0.12 nM (23 ng/mL)
and serum a higher LOD of 0.18 nM (34 ng/mL).
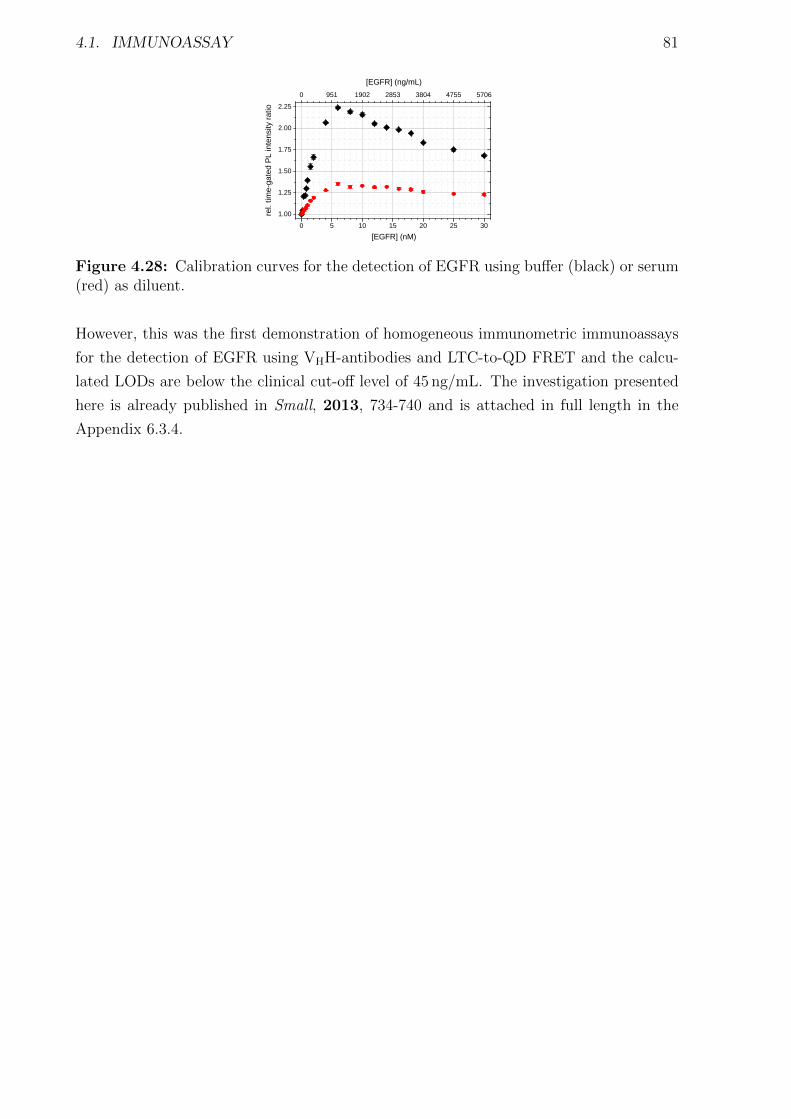
4.1. IMMUNOASSAY 81
0 5 1 0 1 5 2 0 2 5 3 01 . 0 0
1 . 2 5
1 . 5 0
1 . 7 5
2 . 0 0
2 . 2 50 9 5 1 1 9 0 2 2 8 5 3 3 8 0 4 4 7 5 5 5 7 0 6
[ E G F R ] ( n g / m L )
rel. ti
me-ga
ted PL
inten
sity ra
tio
[ E G F R ] ( n M )
Figure 4.28: Calibration curves for the detection of EGFR using buffer (black) or serum(red) as diluent.
However, this was the first demonstration of homogeneous immunometric immunoassays
for the detection of EGFR using VHH-antibodies and LTC-to-QD FRET and the calcu-
lated LODs are below the clinical cut-off level of 45 ng/mL. The investigation presented
here is already published in Small, 2013, 734-740 and is attached in full length in the
Appendix 6.3.4.
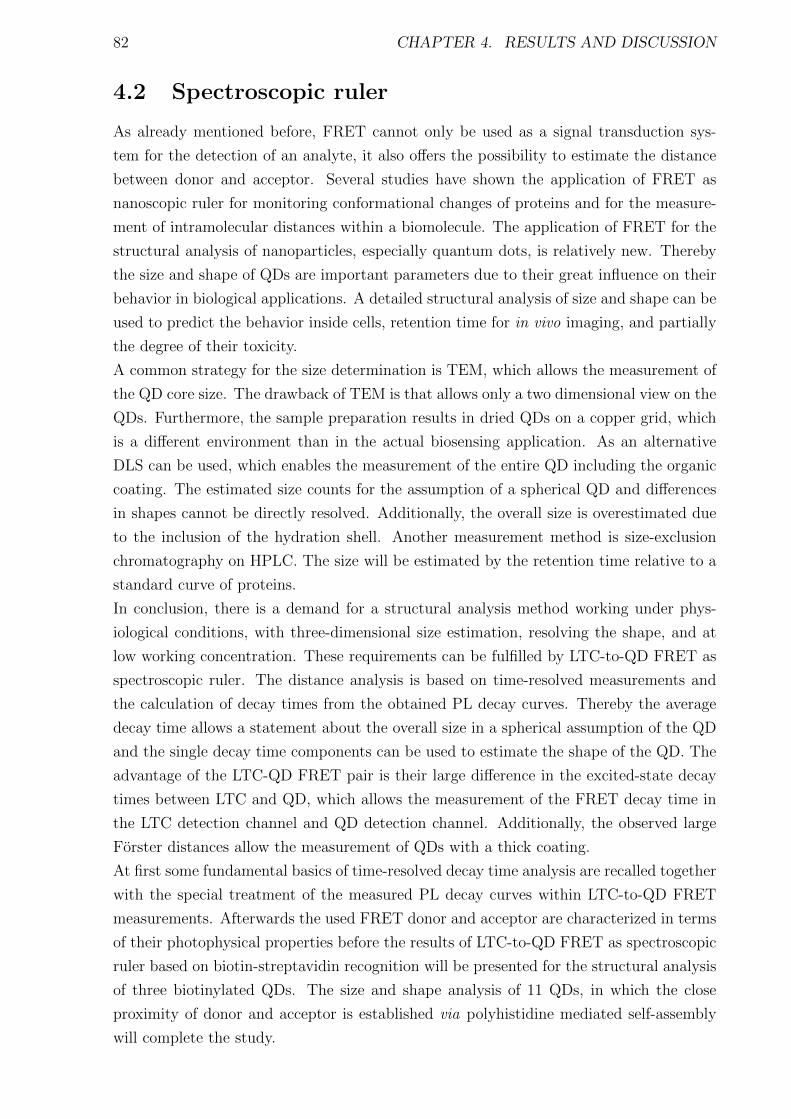
82 CHAPTER 4. RESULTS AND DISCUSSION
4.2 Spectroscopic ruler
As already mentioned before, FRET cannot only be used as a signal transduction sys-
tem for the detection of an analyte, it also offers the possibility to estimate the distance
between donor and acceptor. Several studies have shown the application of FRET as
nanoscopic ruler for monitoring conformational changes of proteins and for the measure-
ment of intramolecular distances within a biomolecule. The application of FRET for the
structural analysis of nanoparticles, especially quantum dots, is relatively new. Thereby
the size and shape of QDs are important parameters due to their great influence on their
behavior in biological applications. A detailed structural analysis of size and shape can be
used to predict the behavior inside cells, retention time for in vivo imaging, and partially
the degree of their toxicity.
A common strategy for the size determination is TEM, which allows the measurement of
the QD core size. The drawback of TEM is that allows only a two dimensional view on the
QDs. Furthermore, the sample preparation results in dried QDs on a copper grid, which
is a different environment than in the actual biosensing application. As an alternative
DLS can be used, which enables the measurement of the entire QD including the organic
coating. The estimated size counts for the assumption of a spherical QD and differences
in shapes cannot be directly resolved. Additionally, the overall size is overestimated due
to the inclusion of the hydration shell. Another measurement method is size-exclusion
chromatography on HPLC. The size will be estimated by the retention time relative to a
standard curve of proteins.
In conclusion, there is a demand for a structural analysis method working under phys-
iological conditions, with three-dimensional size estimation, resolving the shape, and at
low working concentration. These requirements can be fulfilled by LTC-to-QD FRET as
spectroscopic ruler. The distance analysis is based on time-resolved measurements and
the calculation of decay times from the obtained PL decay curves. Thereby the average
decay time allows a statement about the overall size in a spherical assumption of the QD
and the single decay time components can be used to estimate the shape of the QD. The
advantage of the LTC-QD FRET pair is their large difference in the excited-state decay
times between LTC and QD, which allows the measurement of the FRET decay time in
the LTC detection channel and QD detection channel. Additionally, the observed large
Forster distances allow the measurement of QDs with a thick coating.
At first some fundamental basics of time-resolved decay time analysis are recalled together
with the special treatment of the measured PL decay curves within LTC-to-QD FRET
measurements. Afterwards the used FRET donor and acceptor are characterized in terms
of their photophysical properties before the results of LTC-to-QD FRET as spectroscopic
ruler based on biotin-streptavidin recognition will be presented for the structural analysis
of three biotinylated QDs. The size and shape analysis of 11 QDs, in which the close
proximity of donor and acceptor is established via polyhistidine mediated self-assembly
will complete the study.

4.2. SPECTROSCOPIC RULER 83
4.2.1 Materials and Methods
Table 4.18: Prepared buffer solutions
buffer concentration
buffer 8 Sodium tetraborate (pH 8.5) with ωBSA = 0.1 % 10 mM
Biotin-streptavidin system
The FRET donor in the biotin-streptavidin assays was a commercially available strept-
avidin-labeled LTC Lumi4-Tb provided by the company Lumiphore Inc. (Richmond,
CA, USA) with the brand name Lumi4-Tb-Strep. The labeling ratio was 4.4 LTCs per
streptavidin. In the following part the used term for this conjugate is Tb-sAv.
The biotinylated QDs used as FRET acceptors are used without any further treatment
and are listed in Table 4.19. The last two QDs in Table 4.19 were self-synthesized QDs
kindly provided from our collaboration partner at the Ecole superieure de physique et de
chimie industrielles de la ville de Paris (ESPCI).
Table 4.19: Overview about the biotinylated QDs used as FRET acceptors with theirused abbreviations inside this work and their source.
Quantum dot abbreviation source
Qdot 605 biotin conjugate Biot-iQD605 Invitrogen/Life Technologies(Carlsbad, CA, USA)
eFluor 605 biotinylated NC Biot-eQD605 eBioscience(San Diego, CA, USA)
p(DT-SB)605(A) Biot-TPQD605 A ESPCI-CNRS-UPMC(Paris, France)
p(DT-SB)605(B) Biot-TPQD605 B ESPCI-CNRS-UPMC(Paris, France)
QD-hexahistidin system
The used FRET donors in the QD-hexahistidin self-assembly measurements were provided
by our collaboration partner (U.S. Naval Research Laboratory, Washington D.C., USA)
and consist of a Lumi4-Tb complex (Lumiphore Inc. Richmond, CA, USA), which was
conjugated either to a hexahistidine peptide with the sequence H2N · SGAAAGLS · (His)6
or to maltose binding proteins. Inside this work the abbreviation for these complexes are
Tb-PEP and Tb-MBP, respectively.
The five used Qdot ITK carboxyl quantum dots were purchased from Invitrogen/Life
Technologies (Carlsbad, CA, USA), whereas the DHLA capped QDs were self-synthesized

84 CHAPTER 4. RESULTS AND DISCUSSION
and kindly provided by our collaboration partner (U.S. Naval Research Laboratory, Wash-
ington D.C., USA). In Table 4.20 all used QDs within the measurements are listed together
with their used abbreviations inside this work.
Table 4.20: Overview about the QDs used as FRET acceptors in the QD-hexahistidinself-assembly measurements with their used abbreviations inside this work.
Quantum dot abbreviation
Qdot ITK 525 carboxyl ITK-QD525
Qdot ITK 565 carboxyl ITK-QD565
Qdot ITK 605 carboxyl ITK-QD605
Qdot ITK 655 carboxyl ITK-QD655
Qdot ITK 705 carboxyl ITK-QD705
DHLA-QD573
DHLA-QD578
DHLA-QD590
DHLA-QD615
Further Analytical methods
Dynamic light scattering and transmission electron microscopy measurements for the
structural characterization of the QDs used in the biotin-streptavidin and QD-hexahistidine
self-assembly measurements were carried out by the collaboration partners or were pro-
vided by the supplier. Specific information of the instrumental setup and experimental
conditions can be found in the attached original publications in the appendix 6.4.1 and
6.4.2.
Execution of the self-assembly assays
The biotin-streptavidin assays were performed in a low-binding black 96-well microtiter
plate with an optimal working volume of 150 µL. Tb-sAv concentration was kept constant
at 0.2 nM, whereas the Biot-QD concentration was varied from 0.02 nM to 0.6 nM. Each
Biot-QD concentration was prepared three times and the Tb-sAv only sample (zero QD
concentration) 10 times. Control measurements using the same Biot-QD concentrations
but without Tb-sAv were prepared in the same way. The pipetting scheme was divided
into three steps. At first 50 µL buffer 8 was added into the well plate followed by 50 µL
of Tb-sAv and finally 50 µL Biot-QD solution. Tb-sAv and the different Biot-QD con-
centrations were prepared using buffer 8. After an incubation time of 90 min at 37 ◦C the
samples were measured in triplicate using both the EI plate reader and the KRYPTOR
compact plus.
The QD-hexahistidine self-assembly measurements were performed at the Fraunhofer In-
stitute for Applied Polymer Research (Potsdam, Germany) and the data for further analy-
4.2. SPECTROSCOPIC RULER 85
sis was kindly provided by Dr. Frank Morgner. In brief the measurements were performed
on a modified KRYPTOR Immunoreader using a black 300-well microtiter plate with an
optimal working volume of 150 µL. The concentration of the different used QDs were
varied from 0.2 nM to 10 nM depending on the LTC-QD conjugate, whereas the LTC con-
centration was constant for Tb-PEP and Tb-MBP (between ca. 5 nM to 10 nM depending
as well on the LTC-QD-bioconjugate). The incubation time was 60 min.
4.2.2 FRET-based decay time analysis
For the following discussion it is essential to recall basic concepts and equations for the un-
derstanding of decay curves and their treatment in order to obtain the correct decay times
of the system. Provided information and equations inside the next chapter “Fundamental
basics” are taken mainly from the following reference [3]
Fundamental basics
In general, the emission properties of a fluorophore can be characterized by its emission
spectrum, quantum yield and decay time. The most sensitive parameter is the decay time
and its analysis allows to retrieve information about the condition of the fluorophore in
a given environment, which is not possible using the stationary emission spectrum or the
quantum yield.
The requirement for fluorescence is the excitation of a molecule from the ground state
to its excited state, schematically presented in the simplified Jablonski diagram for the
resonance transitions in Figure 2.1. After the promotion the deexcitation back the ground
state can be enabled under the emission of photons with the rate constant krad or due to
non-radiative pathways described by the general rate constant knr. The average time of
the molecule in the excited state prior to returning to its ground state is defined as decay
time or lifetime of the molecule and depends on the before mentioned rate constants as
shown in equation 4.6.
τ =1
krad + knr(4.6)
After the excitation of the sample a certain amount of molecules are in the excited state
and can be described by the population n0. The deexcitation of this population follow
the rate krad+knr and can be described by the following equation 4.7 in which n(t) is the
population at time t following excitation.
dn(t)
dt= (krad + knr) ·n(t) (4.7)
Fluorescence is a random process characterized by a spontaneous emission of photons
in a given period of time, which results in an exponential decay of the excited state
population according to n(t) = n0 · exp(−t/τ). The access to the excited state population

86 CHAPTER 4. RESULTS AND DISCUSSION
n(t) is given by its proportionality to the measurable fluorescence intensity. Consequently,
the population n(t) can be substituted by the time-dependent fluorescence intensity I(t).
The integration of equation 4.7 using the intensity results in the general expression for a
single exponential decay (see equation 4.8).
I(t) = I0 · exp(−t/τ) (4.8)
I0 is the intensity at time 0, τ the decay time defined in equation 4.6.
One has to keep in my mind that the fluorophores emit randomly throughout the decay of
the ensemble of fluorophores resulting in an averaged value for the obtained decay time.
The expression in equation 4.8 is valid for a fluorophore with a single decay time. In pres-
ence of a second fluorophore with a different decay time the situation is more complex and
results in a time distribution of emitted photons, which create a more complex intensity
decay. The different contributions can be taken into account by the introduction of pre-
exponential factors αi, which describe the fraction and thus the amount of fluorophores
with a specific decay time. In order to recover the different αi and their corresponding
decay time from the intensity curve, the expression in equation 4.8 has to be modified
and the resulting multi-exponential model is shown in equation 4.9.
I(t) =∑i
αi · exp(−t/τi) (4.9)
∑i αi is normalized to unity.
The reason for a multi-exponential decay is not restricted to the mixture of two different
molecules with different decay times, also a single fluorophore can decay in a complex
manner. This can be caused by different environments of the fluorophore in the same
sample, or also due to energy transfer processes. A common problem in decay time
analysis is the compensation of the pre-exponential factor for the decay time and vice
versa in order to achieve the best mathematical fit to the measured decay curve. The
mathematical correlation of both factors results in similar decay fits of the same decay
curve using different values for αi and τi.
LTC-based FRET spectroscopic ruler
A requirement for the calculation of the donor-acceptor distance according to equation 2.5
is the calculation of the Forster distance and the FRET efficiency. For the determination
of the Forster distance the equation 2.2 can be used, whereas the FRET efficiency is
accessible by using the PL decay times of the donor in presence and in absence of the
acceptor according to equation 2.6. The used FRET donor (LTC) and the FRET acceptor
(QDs) in this study exhibit a multi-exponential decay, which demand the use of equation
4.9 for the decay time analysis. Resultant single decay times and their corresponding
pre-exponential factors, also called amplitudes or fractions, can be used to calculate an

4.2. SPECTROSCOPIC RULER 87
average decay time of the donor in the absence and in the presence of the acceptor or of
the FRET-sensitized acceptor. Thereby the averaging has to be amplitude-weighted due
to the dynamic FRET process. [228, 229] These averaged decay times can then be used
in 2.6 for the calculation of the FRET efficiency and thus to estimate the donor-acceptor
distance.
The long decay time of LTCs is advantageous for the time-gating approach and for the
independent evaluation of the FRET decay time in the donor and acceptor channel, but
it also results in one drawback for the decay time analysis. Due to the presence of
unquenched LTCs, the measured PL decay curve in both measurement channels contains
signals from the unquenched donor. In order to estimate the pure FRET decay time for
the calculation of the donor-acceptor distance the measured PL decay times need to be
corrected for the free LTC. The description of the decay time correction is mainly taken
from reference [8].
Decay time correction for free LTC The following description is a general approach
for the correction of the influence of free LTC in the PL decay curves of LTC-to-QD
FRET systems. In general, the decay curve of LTCs bound to a biomolecule can be fit-
ted using two exponents, with a short τD1 and a dominant long decay time τD2. QDs
exhibit a multi-exponential decay curve and at least three exponents have to be used for
an acceptable fit. Due to the utilization of a least squares analysis method the quality
of the fit is judged by the parameter chi-square, which is minimized by optimizing the
parameter values (decay time and fraction). A chi-square around one and a random dis-
tribution of the residuals, between the measured and calculated decay curve, around zero
characterize a good fit. The assumption of the decay time correction is that the presence
of unquenched LTC results in a fixed decay time but, depending on the amount of free
LTC, different fractions. Due to the crosstalk of LTC emission also in the QD detection
channel, PL decay curves measured in both the donor as well as the acceptor channel
have to be corrected for the contribution of unquenched donor.
In case of FRET the donor decay curves can be fitted using triple-exponential decay func-
tions, whereas the FRET sensitized acceptor decay curve requires a quadruple exponential
fit. To increase the quality of the decay time fitting the fit range has to be carefully cho-
sen. Disturbances of directly excited QDs and autofluorescence in the first microseconds
can be avoided by introducing a delay of the fit starting point of around 10 µs to 50 µs
after the excitation pulse. Additionally, in the acceptor channel the signal intensity after
a certain time range contains mainly the contribution of the LTC crosstalk and should not
be taken into account for fitting. The mainly used fit approach for such long decay times
with a delay in the start point is the tail fit, which basically means that the fit starts at
a different time t0 for donor and acceptor decay channel after the excitation pulse. This
delayed start of the fit shows no large influences on the fitted decay time but the single
amplitudes Ai−FIT need to be corrected from t0 to the actual start at 0 to yield the correct
amplitudes Ai of the complete decay function according to equation 4.10.
88 CHAPTER 4. RESULTS AND DISCUSSION
I = Ai−FIT · exp(−t− t0
τ
)= Ai · exp
(− tτ
)→ Ai = Ai−FIT · exp
(t0τ
)(4.10)
The correction of the amplitudes is necessary as they are used for the estimation of the
average amplitude decay time in order to make a statement about the average donor-
acceptor distance and thus about the overall size of the QD. Additionally, the corrected
amplitudes contain information about the amount of an estimated donor-acceptor distance
from the single decay time on the overall size of the QD and thus deliver important
information about its shape.
The FRET quenched PL decay curves measured in the donor channel can then be fitted
with three exponents, yielding three amplitudes (αDA∗1,αDA∗2, and αDA∗0) and three
decay times (τDA1, τDA2, and τDA0). From which τDA0 is fixed to the intrinsic long decay
time τD2 of the LTC-complex. In order to estimate the average FRET decay time only
τDA1 and τDA2 are used as the third component represents the unquenched donor. The
exclusion of the third fraction demands a redefinition of the first two fractions according
to equation 4.11 and 4.12
αDA1 =αDA∗1
αDA∗1 + αDA∗2(4.11)
αDA2 =αDA∗2
αDA∗1 + αDA∗2(4.12)
The extraction of the dominant long decay time of unquenched donor is simple by intro-
ducing one dedicated exponent in the decay fit function. Due to similar decay times of
the short component τD1 in comparison to the FRET decay time, introducing of an extra
exponent will not resolve such similar decay times. Therefore a correction factor zD has
to be used, which is shown in equation 4.13. The obtained fraction for the long decay
time τDA0 in the FRET case is set in relation to the fraction in absence of the acceptor
τD2 in order to calculate the relative amount of donor taking part in FRET and concomi-
tantly the amount of free donor in presence of the FRET pair. The multiplication with
the fraction in absence of the acceptor of the short component αD1 yields the fraction of
unquenched donor molecules with a short decay time.
zD = αD1
(αDA∗0
αD2
)(4.13)
In order to calculate the average FRET quenched decay time under consideration of the
redefined αDA1 and αDA2 fractions (αDA1 +αDA2 = 1) and the correction factor zD for the
short component of unquenched donor equation 4.14 can be used.
4.2. SPECTROSCOPIC RULER 89
〈τDA〉 =αDA1τDA1 + αDA2τDA2 − zD(αDA1 + αDA2)τD1
αDA1 + αDA2 − zD(αDA1 + αDA2)=
αDA1τDA1 + αDA2τDA2 − zDτD1
1− zD(4.14)
The donor crosstalk inside the QD detection channel must also be corrected in order to
yield the pure FRET sensitized decay time. Thereby the obtained decay curves in the
acceptor channel are fitted using four exponents. The resultant fractions are αAD∗1, αAD∗2,
αAD∗3, and αAD∗0 with decay times τAD∗1, τAD∗2, τAD∗3, and τAD∗0, from which the last
one is fixed to the long decay time of the intrinsic donor τD2. Similar as in the donor
channel the short component of the donor in absence of the acceptor has to be corrected
using the correction factor zA according to equation 4.15.
zA = αD1
(αAD∗0
αD2
)(4.15)
For the calculation of the average FRET sensitized decay time only the first three com-
ponents are used as the fourth component is the free and unquenched donor. Thereby
the fractions αADi must be corrected by the FRET rate kFRETi = τ−1ADi − 〈τD〉−1. This
correction considers the FRET efficiency dependent excitation of the acceptors in different
donor-acceptor distances using equation 4.16.
αADi =(αAD∗i/kFRETi)
(αAD∗1/kFRET1) + (αAD∗2/kFRET2) + (αAD∗3/kFRET3)(4.16)
The corrected averaged FRET sensitized decay time can then be calculated after equation
4.17.
〈τAD〉 =αAD1τAD1 + αAD2τAD2 + αAD3τAD3 − zAτD1
1− zA(4.17)
Using this corrections to consider unquenched LTC contribution in the donor as well as
acceptor channel allows the calculation of the pure FRET quenched and FRET sensitized
decay times and thus the determination of donor-acceptor distances.
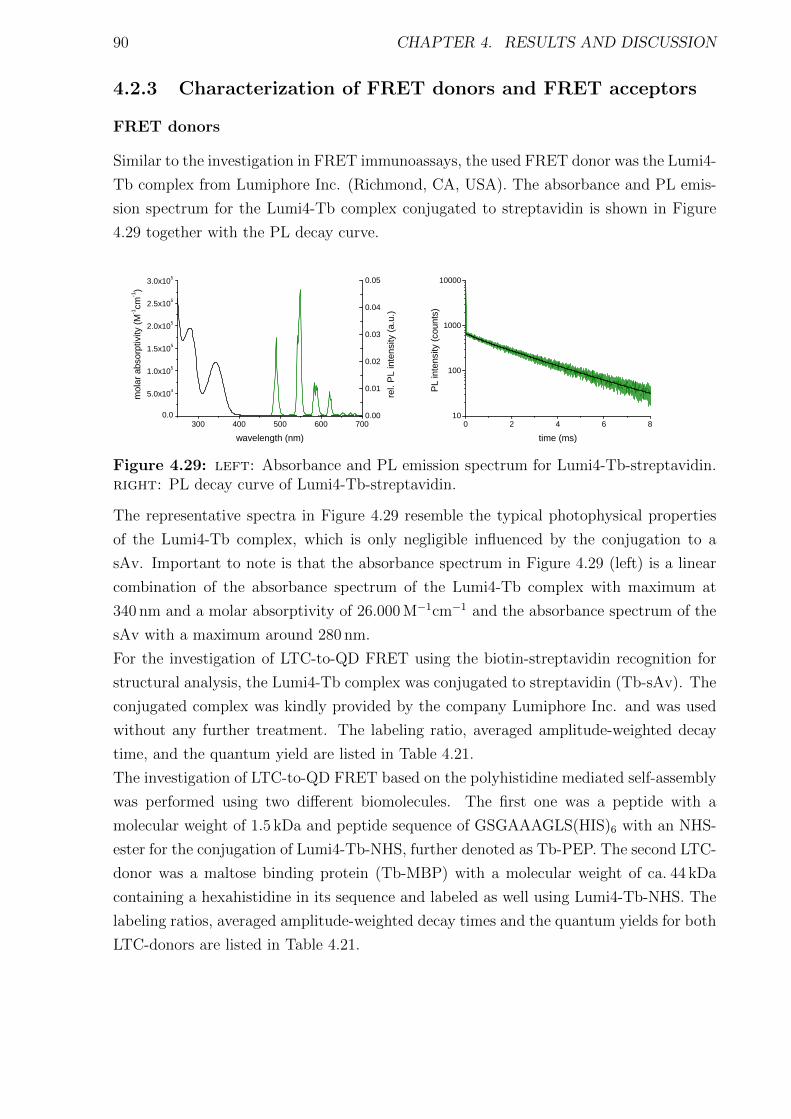
90 CHAPTER 4. RESULTS AND DISCUSSION
4.2.3 Characterization of FRET donors and FRET acceptors
FRET donors
Similar to the investigation in FRET immunoassays, the used FRET donor was the Lumi4-
Tb complex from Lumiphore Inc. (Richmond, CA, USA). The absorbance and PL emis-
sion spectrum for the Lumi4-Tb complex conjugated to streptavidin is shown in Figure
4.29 together with the PL decay curve.
3 0 0 4 0 0 5 0 0 6 0 0 7 0 00 . 0
5 . 0 x 1 0 4
1 . 0 x 1 0 5
1 . 5 x 1 0 5
2 . 0 x 1 0 5
2 . 5 x 1 0 5
3 . 0 x 1 0 5
molar
abso
rptivit
y (M-1 cm
-1 )
w a v e l e n g t h ( n m )0 . 0 0
0 . 0 1
0 . 0 2
0 . 0 3
0 . 0 4
0 . 0 5
rel. P
L inte
nsity
(a.u.)
0 2 4 6 81 0
1 0 0
1 0 0 0
1 0 0 0 0
PL in
tensity
(cou
nts)
t i m e ( m s )
Figure 4.29: left: Absorbance and PL emission spectrum for Lumi4-Tb-streptavidin.right: PL decay curve of Lumi4-Tb-streptavidin.
The representative spectra in Figure 4.29 resemble the typical photophysical properties
of the Lumi4-Tb complex, which is only negligible influenced by the conjugation to a
sAv. Important to note is that the absorbance spectrum in Figure 4.29 (left) is a linear
combination of the absorbance spectrum of the Lumi4-Tb complex with maximum at
340 nm and a molar absorptivity of 26.000 M−1cm−1 and the absorbance spectrum of the
sAv with a maximum around 280 nm.
For the investigation of LTC-to-QD FRET using the biotin-streptavidin recognition for
structural analysis, the Lumi4-Tb complex was conjugated to streptavidin (Tb-sAv). The
conjugated complex was kindly provided by the company Lumiphore Inc. and was used
without any further treatment. The labeling ratio, averaged amplitude-weighted decay
time, and the quantum yield are listed in Table 4.21.
The investigation of LTC-to-QD FRET based on the polyhistidine mediated self-assembly
was performed using two different biomolecules. The first one was a peptide with a
molecular weight of 1.5 kDa and peptide sequence of GSGAAAGLS(HIS)6 with an NHS-
ester for the conjugation of Lumi4-Tb-NHS, further denoted as Tb-PEP. The second LTC-
donor was a maltose binding protein (Tb-MBP) with a molecular weight of ca. 44 kDa
containing a hexahistidine in its sequence and labeled as well using Lumi4-Tb-NHS. The
labeling ratios, averaged amplitude-weighted decay times and the quantum yields for both
LTC-donors are listed in Table 4.21.
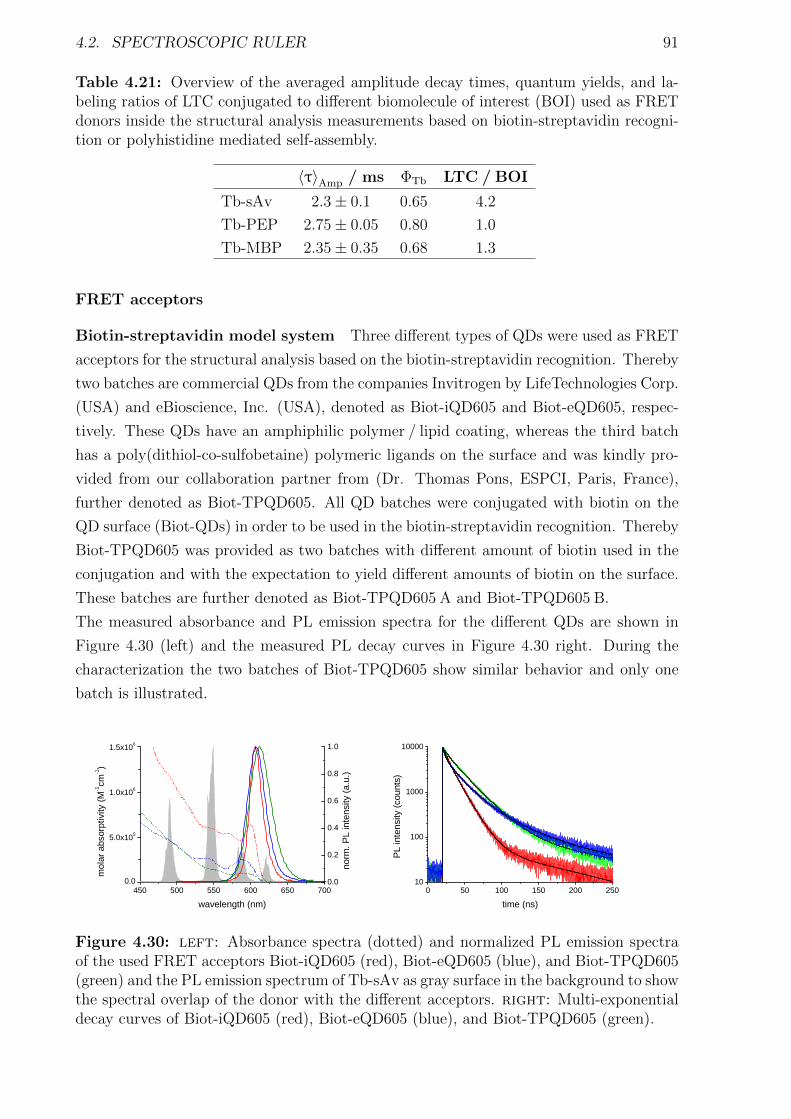
4.2. SPECTROSCOPIC RULER 91
Table 4.21: Overview of the averaged amplitude decay times, quantum yields, and la-beling ratios of LTC conjugated to different biomolecule of interest (BOI) used as FRETdonors inside the structural analysis measurements based on biotin-streptavidin recogni-tion or polyhistidine mediated self-assembly.
〈τ〉Amp / ms ΦTb LTC / BOI
Tb-sAv 2.3± 0.1 0.65 4.2
Tb-PEP 2.75± 0.05 0.80 1.0
Tb-MBP 2.35± 0.35 0.68 1.3
FRET acceptors
Biotin-streptavidin model system Three different types of QDs were used as FRET
acceptors for the structural analysis based on the biotin-streptavidin recognition. Thereby
two batches are commercial QDs from the companies Invitrogen by LifeTechnologies Corp.
(USA) and eBioscience, Inc. (USA), denoted as Biot-iQD605 and Biot-eQD605, respec-
tively. These QDs have an amphiphilic polymer / lipid coating, whereas the third batch
has a poly(dithiol-co-sulfobetaine) polymeric ligands on the surface and was kindly pro-
vided from our collaboration partner from (Dr. Thomas Pons, ESPCI, Paris, France),
further denoted as Biot-TPQD605. All QD batches were conjugated with biotin on the
QD surface (Biot-QDs) in order to be used in the biotin-streptavidin recognition. Thereby
Biot-TPQD605 was provided as two batches with different amount of biotin used in the
conjugation and with the expectation to yield different amounts of biotin on the surface.
These batches are further denoted as Biot-TPQD605 A and Biot-TPQD605 B.
The measured absorbance and PL emission spectra for the different QDs are shown in
Figure 4.30 (left) and the measured PL decay curves in Figure 4.30 right. During the
characterization the two batches of Biot-TPQD605 show similar behavior and only one
batch is illustrated.
4 5 0 5 0 0 5 5 0 6 0 0 6 5 0 7 0 00 . 0
5 . 0 x 1 0 5
1 . 0 x 1 0 6
1 . 5 x 1 0 6
0 . 0
0 . 2
0 . 4
0 . 6
0 . 8
1 . 0
norm
. PL i
ntens
ity (a.
u.)
molar
abso
rptivit
y (M-1 cm
-1 )
w a v e l e n g t h ( n m )0 5 0 1 0 0 1 5 0 2 0 0 2 5 0
1 0
1 0 0
1 0 0 0
1 0 0 0 0
PL in
tensity
(cou
nts)
t i m e ( n s )
Figure 4.30: left: Absorbance spectra (dotted) and normalized PL emission spectraof the used FRET acceptors Biot-iQD605 (red), Biot-eQD605 (blue), and Biot-TPQD605(green) and the PL emission spectrum of Tb-sAv as gray surface in the background to showthe spectral overlap of the donor with the different acceptors. right: Multi-exponentialdecay curves of Biot-iQD605 (red), Biot-eQD605 (blue), and Biot-TPQD605 (green).
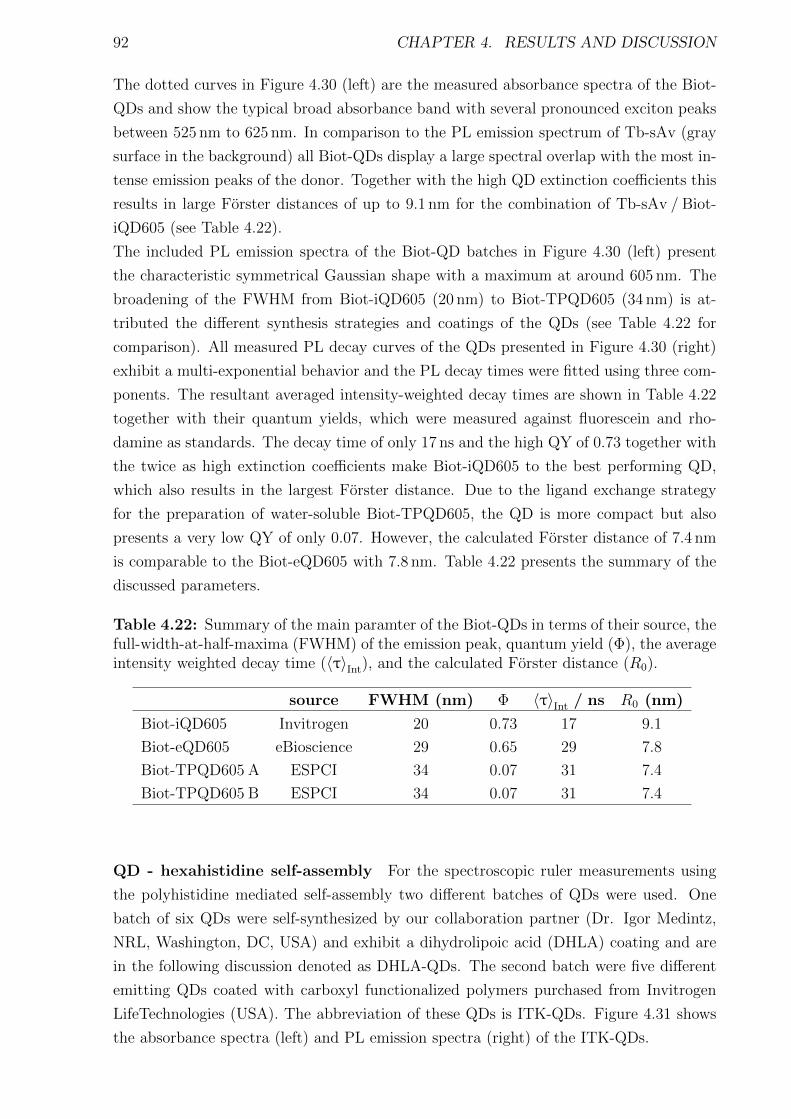
92 CHAPTER 4. RESULTS AND DISCUSSION
The dotted curves in Figure 4.30 (left) are the measured absorbance spectra of the Biot-
QDs and show the typical broad absorbance band with several pronounced exciton peaks
between 525 nm to 625 nm. In comparison to the PL emission spectrum of Tb-sAv (gray
surface in the background) all Biot-QDs display a large spectral overlap with the most in-
tense emission peaks of the donor. Together with the high QD extinction coefficients this
results in large Forster distances of up to 9.1 nm for the combination of Tb-sAv / Biot-
iQD605 (see Table 4.22).
The included PL emission spectra of the Biot-QD batches in Figure 4.30 (left) present
the characteristic symmetrical Gaussian shape with a maximum at around 605 nm. The
broadening of the FWHM from Biot-iQD605 (20 nm) to Biot-TPQD605 (34 nm) is at-
tributed the different synthesis strategies and coatings of the QDs (see Table 4.22 for
comparison). All measured PL decay curves of the QDs presented in Figure 4.30 (right)
exhibit a multi-exponential behavior and the PL decay times were fitted using three com-
ponents. The resultant averaged intensity-weighted decay times are shown in Table 4.22
together with their quantum yields, which were measured against fluorescein and rho-
damine as standards. The decay time of only 17 ns and the high QY of 0.73 together with
the twice as high extinction coefficients make Biot-iQD605 to the best performing QD,
which also results in the largest Forster distance. Due to the ligand exchange strategy
for the preparation of water-soluble Biot-TPQD605, the QD is more compact but also
presents a very low QY of only 0.07. However, the calculated Forster distance of 7.4 nm
is comparable to the Biot-eQD605 with 7.8 nm. Table 4.22 presents the summary of the
discussed parameters.
Table 4.22: Summary of the main paramter of the Biot-QDs in terms of their source, thefull-width-at-half-maxima (FWHM) of the emission peak, quantum yield (Φ), the averageintensity weighted decay time (〈τ〉Int), and the calculated Forster distance (R0).
source FWHM (nm) Φ 〈τ〉Int / ns R0 (nm)
Biot-iQD605 Invitrogen 20 0.73 17 9.1
Biot-eQD605 eBioscience 29 0.65 29 7.8
Biot-TPQD605 A ESPCI 34 0.07 31 7.4
Biot-TPQD605 B ESPCI 34 0.07 31 7.4
QD - hexahistidine self-assembly For the spectroscopic ruler measurements using
the polyhistidine mediated self-assembly two different batches of QDs were used. One
batch of six QDs were self-synthesized by our collaboration partner (Dr. Igor Medintz,
NRL, Washington, DC, USA) and exhibit a dihydrolipoic acid (DHLA) coating and are
in the following discussion denoted as DHLA-QDs. The second batch were five different
emitting QDs coated with carboxyl functionalized polymers purchased from Invitrogen
LifeTechnologies (USA). The abbreviation of these QDs is ITK-QDs. Figure 4.31 shows
the absorbance spectra (left) and PL emission spectra (right) of the ITK-QDs.
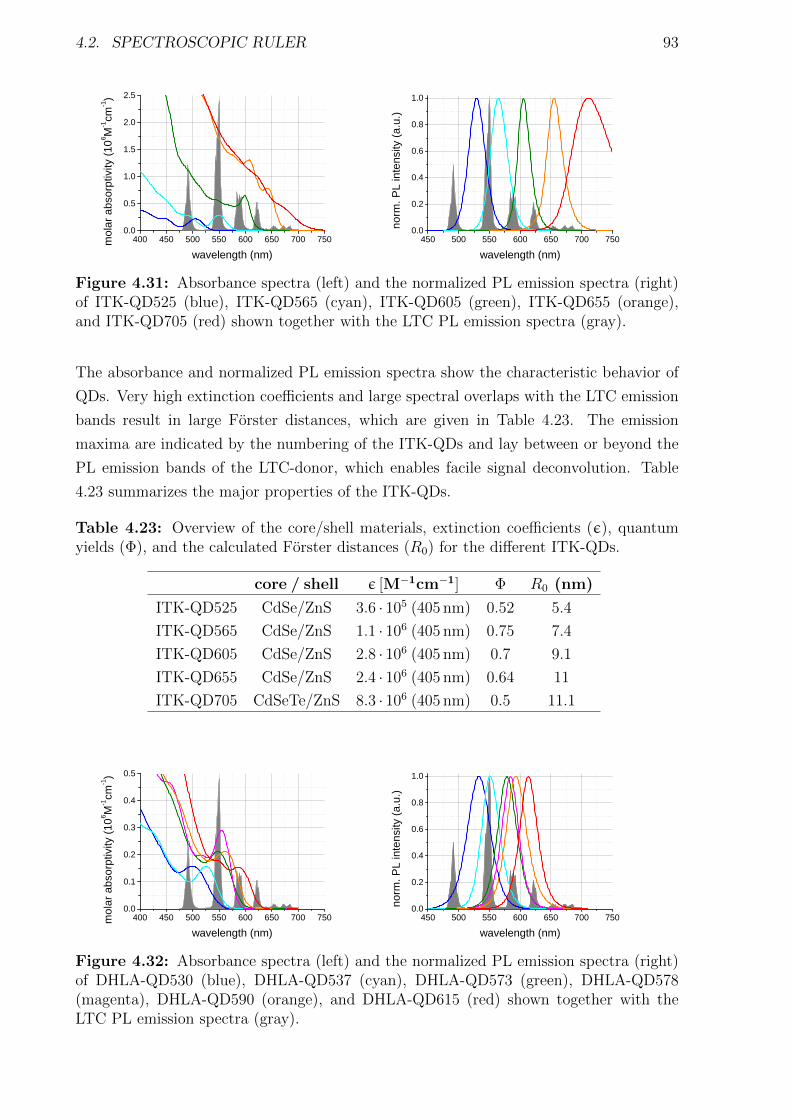
4.2. SPECTROSCOPIC RULER 93
4 0 0 4 5 0 5 0 0 5 5 0 6 0 0 6 5 0 7 0 0 7 5 00 . 0
0 . 5
1 . 0
1 . 5
2 . 0
2 . 5mo
lar ab
sorpt
ivity (
106 M-1 cm
-1 )
w a v e l e n g t h ( n m )4 5 0 5 0 0 5 5 0 6 0 0 6 5 0 7 0 0 7 5 0
0 . 0
0 . 2
0 . 4
0 . 6
0 . 8
1 . 0
norm
. PL i
ntens
ity (a.
u.)
w a v e l e n g t h ( n m )
Figure 4.31: Absorbance spectra (left) and the normalized PL emission spectra (right)of ITK-QD525 (blue), ITK-QD565 (cyan), ITK-QD605 (green), ITK-QD655 (orange),and ITK-QD705 (red) shown together with the LTC PL emission spectra (gray).
The absorbance and normalized PL emission spectra show the characteristic behavior of
QDs. Very high extinction coefficients and large spectral overlaps with the LTC emission
bands result in large Forster distances, which are given in Table 4.23. The emission
maxima are indicated by the numbering of the ITK-QDs and lay between or beyond the
PL emission bands of the LTC-donor, which enables facile signal deconvolution. Table
4.23 summarizes the major properties of the ITK-QDs.
Table 4.23: Overview of the core/shell materials, extinction coefficients (ε), quantumyields (Φ), and the calculated Forster distances (R0) for the different ITK-QDs.
core / shell ε [M−1cm−1] Φ R0 (nm)
ITK-QD525 CdSe/ZnS 3.6 · 105 (405 nm) 0.52 5.4
ITK-QD565 CdSe/ZnS 1.1 · 106 (405 nm) 0.75 7.4
ITK-QD605 CdSe/ZnS 2.8 · 106 (405 nm) 0.7 9.1
ITK-QD655 CdSe/ZnS 2.4 · 106 (405 nm) 0.64 11
ITK-QD705 CdSeTe/ZnS 8.3 · 106 (405 nm) 0.5 11.1
4 0 0 4 5 0 5 0 0 5 5 0 6 0 0 6 5 0 7 0 0 7 5 00 . 0
0 . 1
0 . 2
0 . 3
0 . 4
0 . 5
molar
abso
rptivit
y (10
6 M-1 cm-1 )
w a v e l e n g t h ( n m )4 5 0 5 0 0 5 5 0 6 0 0 6 5 0 7 0 0 7 5 0
0 . 0
0 . 2
0 . 4
0 . 6
0 . 8
1 . 0
norm
. PL i
ntens
ity (a.
u.)
w a v e l e n g t h ( n m )
Figure 4.32: Absorbance spectra (left) and the normalized PL emission spectra (right)of DHLA-QD530 (blue), DHLA-QD537 (cyan), DHLA-QD573 (green), DHLA-QD578(magenta), DHLA-QD590 (orange), and DHLA-QD615 (red) shown together with theLTC PL emission spectra (gray).
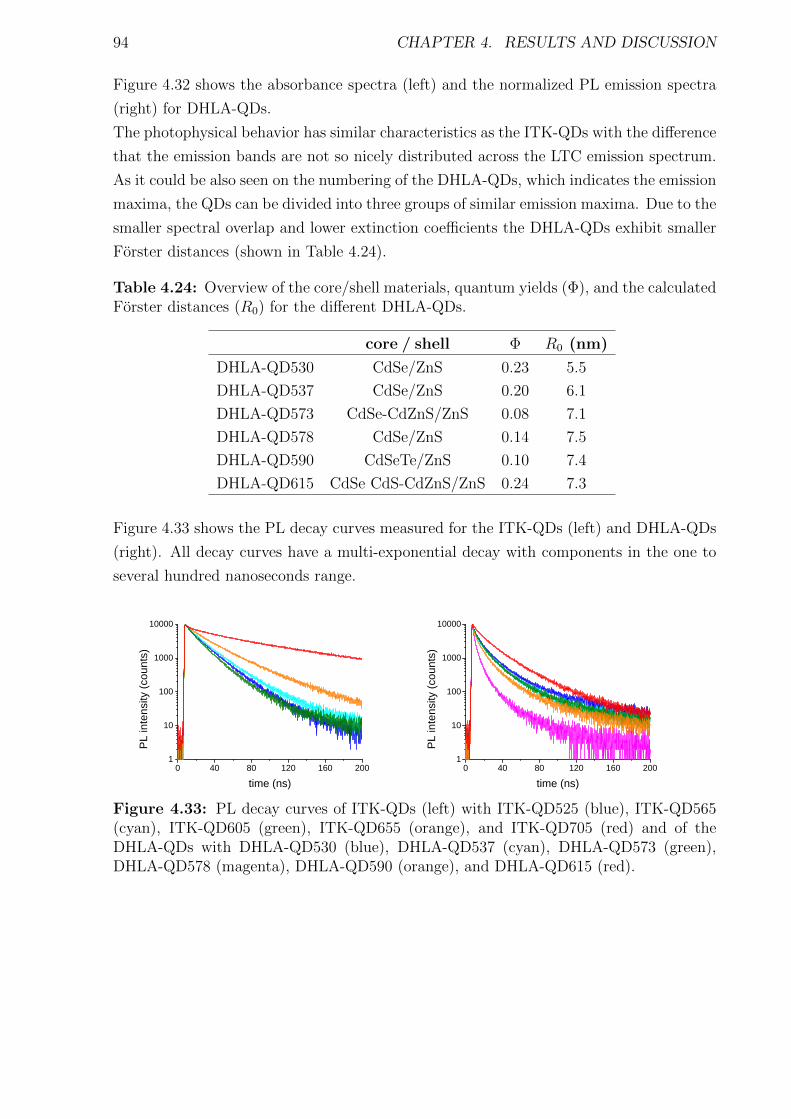
94 CHAPTER 4. RESULTS AND DISCUSSION
Figure 4.32 shows the absorbance spectra (left) and the normalized PL emission spectra
(right) for DHLA-QDs.
The photophysical behavior has similar characteristics as the ITK-QDs with the difference
that the emission bands are not so nicely distributed across the LTC emission spectrum.
As it could be also seen on the numbering of the DHLA-QDs, which indicates the emission
maxima, the QDs can be divided into three groups of similar emission maxima. Due to the
smaller spectral overlap and lower extinction coefficients the DHLA-QDs exhibit smaller
Forster distances (shown in Table 4.24).
Table 4.24: Overview of the core/shell materials, quantum yields (Φ), and the calculatedForster distances (R0) for the different DHLA-QDs.
core / shell Φ R0 (nm)
DHLA-QD530 CdSe/ZnS 0.23 5.5
DHLA-QD537 CdSe/ZnS 0.20 6.1
DHLA-QD573 CdSe-CdZnS/ZnS 0.08 7.1
DHLA-QD578 CdSe/ZnS 0.14 7.5
DHLA-QD590 CdSeTe/ZnS 0.10 7.4
DHLA-QD615 CdSe CdS-CdZnS/ZnS 0.24 7.3
Figure 4.33 shows the PL decay curves measured for the ITK-QDs (left) and DHLA-QDs
(right). All decay curves have a multi-exponential decay with components in the one to
several hundred nanoseconds range.
0 4 0 8 0 1 2 0 1 6 0 2 0 01
1 0
1 0 0
1 0 0 0
1 0 0 0 0
PL in
tensity
(cou
nts)
t i m e ( n s )0 4 0 8 0 1 2 0 1 6 0 2 0 0
1
1 0
1 0 0
1 0 0 0
1 0 0 0 0
PL in
tensity
(cou
nts)
t i m e ( n s )Figure 4.33: PL decay curves of ITK-QDs (left) with ITK-QD525 (blue), ITK-QD565(cyan), ITK-QD605 (green), ITK-QD655 (orange), and ITK-QD705 (red) and of theDHLA-QDs with DHLA-QD530 (blue), DHLA-QD537 (cyan), DHLA-QD573 (green),DHLA-QD578 (magenta), DHLA-QD590 (orange), and DHLA-QD615 (red).
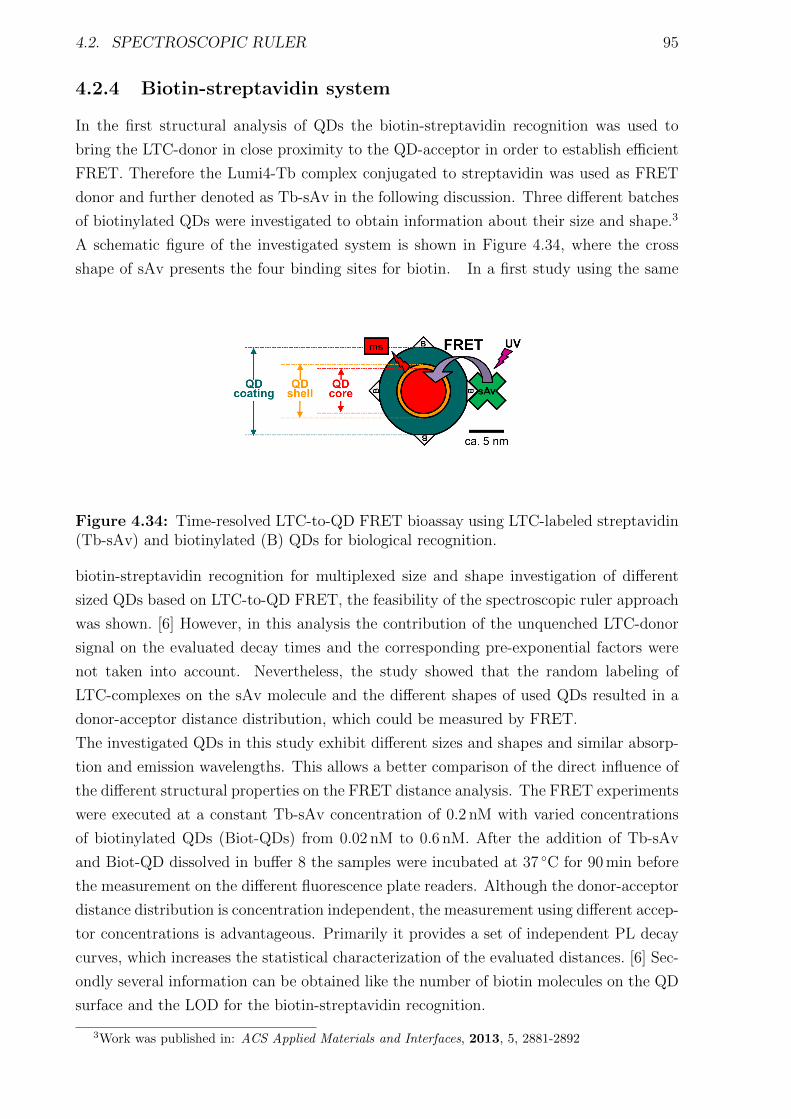
4.2. SPECTROSCOPIC RULER 95
4.2.4 Biotin-streptavidin system
In the first structural analysis of QDs the biotin-streptavidin recognition was used to
bring the LTC-donor in close proximity to the QD-acceptor in order to establish efficient
FRET. Therefore the Lumi4-Tb complex conjugated to streptavidin was used as FRET
donor and further denoted as Tb-sAv in the following discussion. Three different batches
of biotinylated QDs were investigated to obtain information about their size and shape.3
A schematic figure of the investigated system is shown in Figure 4.34, where the cross
shape of sAv presents the four binding sites for biotin. In a first study using the same
Figure 4.34: Time-resolved LTC-to-QD FRET bioassay using LTC-labeled streptavidin(Tb-sAv) and biotinylated (B) QDs for biological recognition.
biotin-streptavidin recognition for multiplexed size and shape investigation of different
sized QDs based on LTC-to-QD FRET, the feasibility of the spectroscopic ruler approach
was shown. [6] However, in this analysis the contribution of the unquenched LTC-donor
signal on the evaluated decay times and the corresponding pre-exponential factors were
not taken into account. Nevertheless, the study showed that the random labeling of
LTC-complexes on the sAv molecule and the different shapes of used QDs resulted in a
donor-acceptor distance distribution, which could be measured by FRET.
The investigated QDs in this study exhibit different sizes and shapes and similar absorp-
tion and emission wavelengths. This allows a better comparison of the direct influence of
the different structural properties on the FRET distance analysis. The FRET experiments
were executed at a constant Tb-sAv concentration of 0.2 nM with varied concentrations
of biotinylated QDs (Biot-QDs) from 0.02 nM to 0.6 nM. After the addition of Tb-sAv
and Biot-QD dissolved in buffer 8 the samples were incubated at 37 ◦C for 90 min before
the measurement on the different fluorescence plate readers. Although the donor-acceptor
distance distribution is concentration independent, the measurement using different accep-
tor concentrations is advantageous. Primarily it provides a set of independent PL decay
curves, which increases the statistical characterization of the evaluated distances. [6] Sec-
ondly several information can be obtained like the number of biotin molecules on the QD
surface and the LOD for the biotin-streptavidin recognition.
3Work was published in: ACS Applied Materials and Interfaces, 2013, 5, 2881-2892
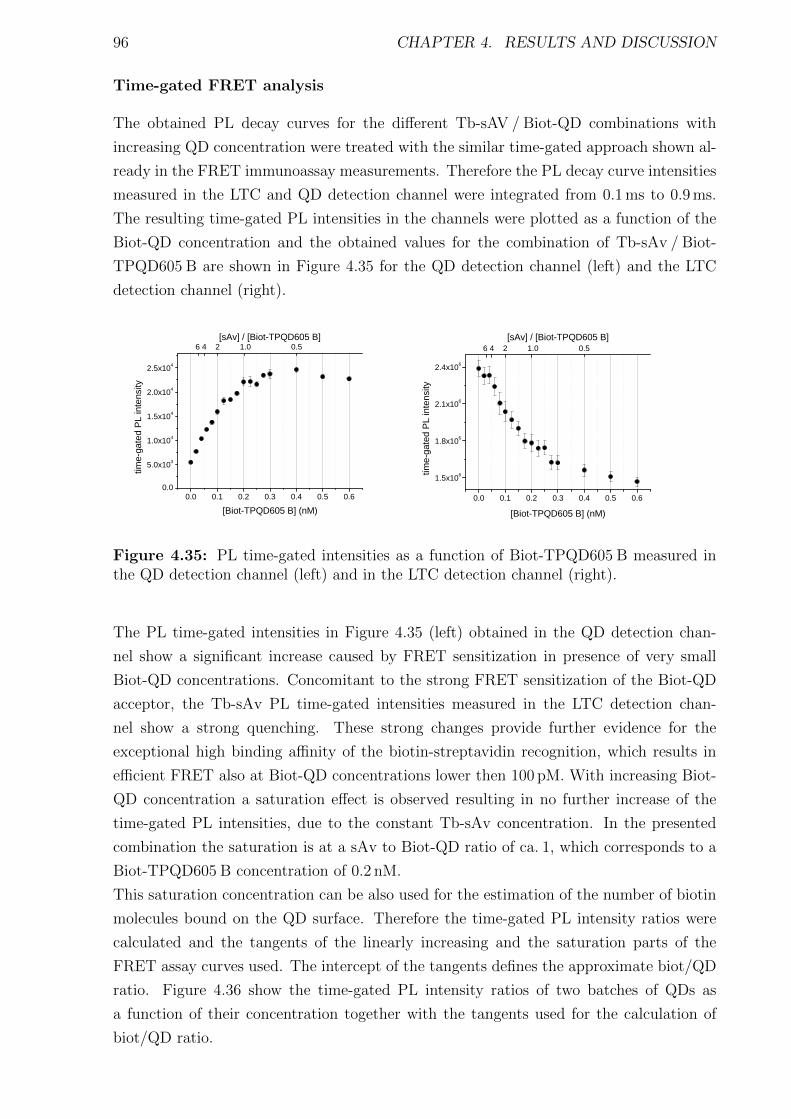
96 CHAPTER 4. RESULTS AND DISCUSSION
Time-gated FRET analysis
The obtained PL decay curves for the different Tb-sAV / Biot-QD combinations with
increasing QD concentration were treated with the similar time-gated approach shown al-
ready in the FRET immunoassay measurements. Therefore the PL decay curve intensities
measured in the LTC and QD detection channel were integrated from 0.1 ms to 0.9 ms.
The resulting time-gated PL intensities in the channels were plotted as a function of the
Biot-QD concentration and the obtained values for the combination of Tb-sAv / Biot-
TPQD605 B are shown in Figure 4.35 for the QD detection channel (left) and the LTC
detection channel (right).
0 . 0 0 . 1 0 . 2 0 . 3 0 . 4 0 . 5 0 . 60 . 0
5 . 0 x 1 0 3
1 . 0 x 1 0 4
1 . 5 x 1 0 4
2 . 0 x 1 0 4
2 . 5 x 1 0 4
time-g
ated P
L inte
nsity
[ B i o t - T P Q D 6 0 5 B ] ( n M )
6 4 2 1 . 0 0 . 5[ s A v ] / [ B i o t - T P Q D 6 0 5 B ]
0 . 0 0 . 1 0 . 2 0 . 3 0 . 4 0 . 5 0 . 61 . 5 x 1 0 6
1 . 8 x 1 0 6
2 . 1 x 1 0 6
2 . 4 x 1 0 6
time-g
ated P
L inte
nsity
[ B i o t - T P Q D 6 0 5 B ] ( n M )
6 4 2 1 . 0 0 . 5[ s A v ] / [ B i o t - T P Q D 6 0 5 B ]
Figure 4.35: PL time-gated intensities as a function of Biot-TPQD605 B measured inthe QD detection channel (left) and in the LTC detection channel (right).
The PL time-gated intensities in Figure 4.35 (left) obtained in the QD detection chan-
nel show a significant increase caused by FRET sensitization in presence of very small
Biot-QD concentrations. Concomitant to the strong FRET sensitization of the Biot-QD
acceptor, the Tb-sAv PL time-gated intensities measured in the LTC detection chan-
nel show a strong quenching. These strong changes provide further evidence for the
exceptional high binding affinity of the biotin-streptavidin recognition, which results in
efficient FRET also at Biot-QD concentrations lower then 100 pM. With increasing Biot-
QD concentration a saturation effect is observed resulting in no further increase of the
time-gated PL intensities, due to the constant Tb-sAv concentration. In the presented
combination the saturation is at a sAv to Biot-QD ratio of ca. 1, which corresponds to a
Biot-TPQD605 B concentration of 0.2 nM.
This saturation concentration can be also used for the estimation of the number of biotin
molecules bound on the QD surface. Therefore the time-gated PL intensity ratios were
calculated and the tangents of the linearly increasing and the saturation parts of the
FRET assay curves used. The intercept of the tangents defines the approximate biot/QD
ratio. Figure 4.36 show the time-gated PL intensity ratios of two batches of QDs as
a function of their concentration together with the tangents used for the calculation of
biot/QD ratio.
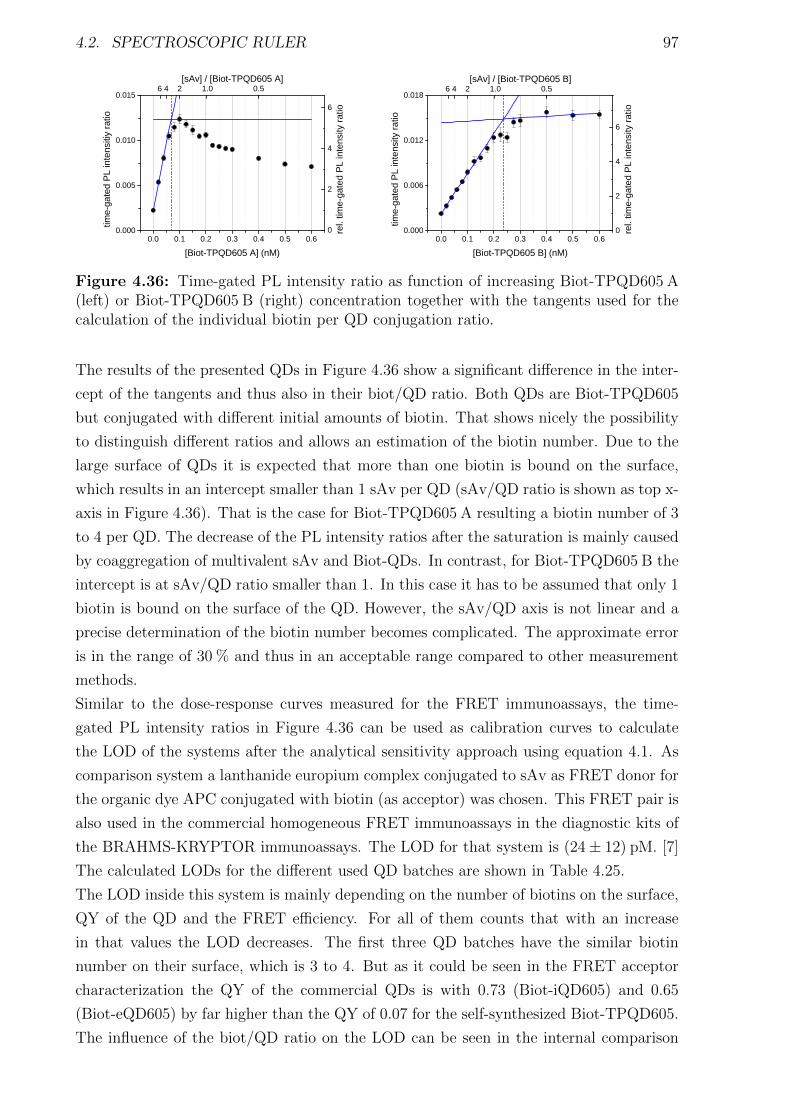
4.2. SPECTROSCOPIC RULER 97
0 . 0 0 . 1 0 . 2 0 . 3 0 . 4 0 . 5 0 . 60 . 0 0 0
0 . 0 0 5
0 . 0 1 0
0 . 0 1 5tim
e-gate
d PL i
ntens
itiy ra
tio
[ B i o t - T P Q D 6 0 5 A ] ( n M )
6 4 2 1 . 0 0 . 5[ s A v ] / [ B i o t - T P Q D 6 0 5 A ]
0
2
4
6
rel. ti
me-ga
ted PL
inten
sity ra
tio
0 . 0 0 . 1 0 . 2 0 . 3 0 . 4 0 . 5 0 . 60 . 0 0 0
0 . 0 0 6
0 . 0 1 2
0 . 0 1 8
time-g
ated P
L inte
nsity
ratio
[ B i o t - T P Q D 6 0 5 B ] ( n M )
6 4 2 1 . 0 0 . 5[ s A v ] / [ B i o t - T P Q D 6 0 5 B ]
0
2
4
6
rel. ti
me-ga
ted PL
inten
sity ra
tio
Figure 4.36: Time-gated PL intensity ratio as function of increasing Biot-TPQD605 A(left) or Biot-TPQD605 B (right) concentration together with the tangents used for thecalculation of the individual biotin per QD conjugation ratio.
The results of the presented QDs in Figure 4.36 show a significant difference in the inter-
cept of the tangents and thus also in their biot/QD ratio. Both QDs are Biot-TPQD605
but conjugated with different initial amounts of biotin. That shows nicely the possibility
to distinguish different ratios and allows an estimation of the biotin number. Due to the
large surface of QDs it is expected that more than one biotin is bound on the surface,
which results in an intercept smaller than 1 sAv per QD (sAv/QD ratio is shown as top x-
axis in Figure 4.36). That is the case for Biot-TPQD605 A resulting a biotin number of 3
to 4 per QD. The decrease of the PL intensity ratios after the saturation is mainly caused
by coaggregation of multivalent sAv and Biot-QDs. In contrast, for Biot-TPQD605 B the
intercept is at sAv/QD ratio smaller than 1. In this case it has to be assumed that only 1
biotin is bound on the surface of the QD. However, the sAv/QD axis is not linear and a
precise determination of the biotin number becomes complicated. The approximate error
is in the range of 30 % and thus in an acceptable range compared to other measurement
methods.
Similar to the dose-response curves measured for the FRET immunoassays, the time-
gated PL intensity ratios in Figure 4.36 can be used as calibration curves to calculate
the LOD of the systems after the analytical sensitivity approach using equation 4.1. As
comparison system a lanthanide europium complex conjugated to sAv as FRET donor for
the organic dye APC conjugated with biotin (as acceptor) was chosen. This FRET pair is
also used in the commercial homogeneous FRET immunoassays in the diagnostic kits of
the BRAHMS-KRYPTOR immunoassays. The LOD for that system is (24± 12) pM. [7]
The calculated LODs for the different used QD batches are shown in Table 4.25.
The LOD inside this system is mainly depending on the number of biotins on the surface,
QY of the QD and the FRET efficiency. For all of them counts that with an increase
in that values the LOD decreases. The first three QD batches have the similar biotin
number on their surface, which is 3 to 4. But as it could be seen in the FRET acceptor
characterization the QY of the commercial QDs is with 0.73 (Biot-iQD605) and 0.65
(Biot-eQD605) by far higher than the QY of 0.07 for the self-synthesized Biot-TPQD605.
The influence of the biot/QD ratio on the LOD can be seen in the internal comparison
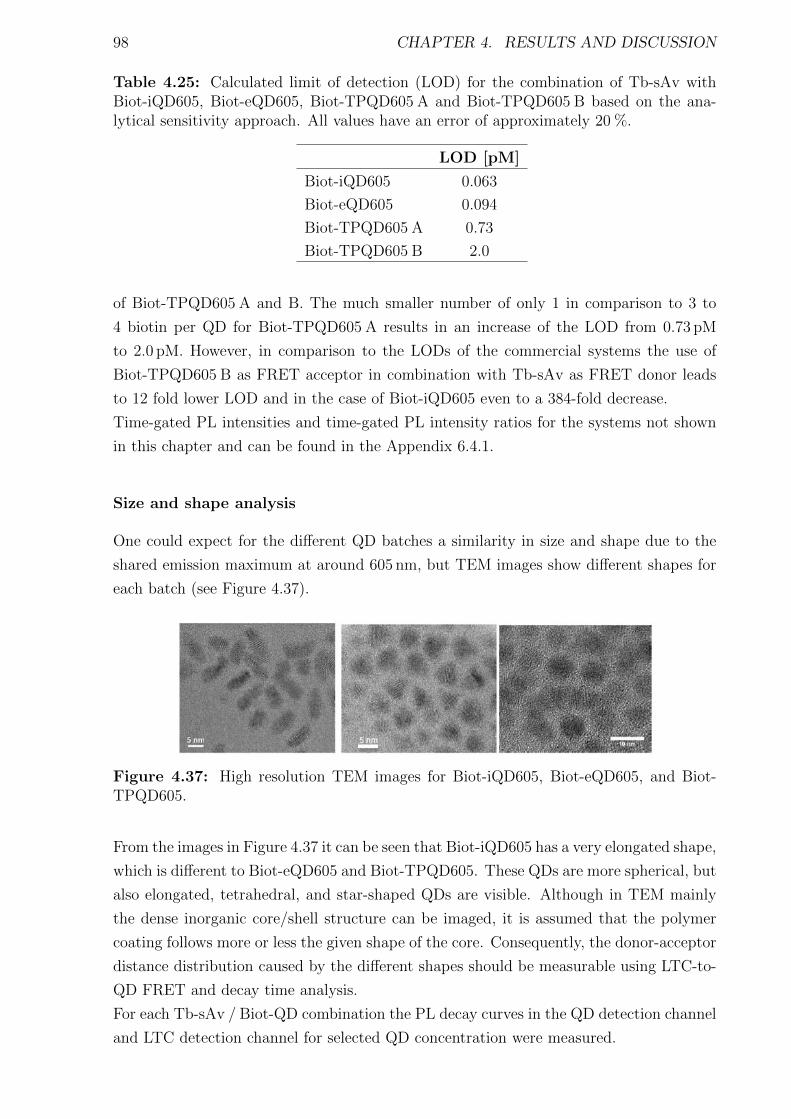
98 CHAPTER 4. RESULTS AND DISCUSSION
Table 4.25: Calculated limit of detection (LOD) for the combination of Tb-sAv withBiot-iQD605, Biot-eQD605, Biot-TPQD605 A and Biot-TPQD605 B based on the ana-lytical sensitivity approach. All values have an error of approximately 20 %.
LOD [pM]
Biot-iQD605 0.063
Biot-eQD605 0.094
Biot-TPQD605 A 0.73
Biot-TPQD605 B 2.0
of Biot-TPQD605 A and B. The much smaller number of only 1 in comparison to 3 to
4 biotin per QD for Biot-TPQD605 A results in an increase of the LOD from 0.73 pM
to 2.0 pM. However, in comparison to the LODs of the commercial systems the use of
Biot-TPQD605 B as FRET acceptor in combination with Tb-sAv as FRET donor leads
to 12 fold lower LOD and in the case of Biot-iQD605 even to a 384-fold decrease.
Time-gated PL intensities and time-gated PL intensity ratios for the systems not shown
in this chapter and can be found in the Appendix 6.4.1.
Size and shape analysis
One could expect for the different QD batches a similarity in size and shape due to the
shared emission maximum at around 605 nm, but TEM images show different shapes for
each batch (see Figure 4.37).
Figure 4.37: High resolution TEM images for Biot-iQD605, Biot-eQD605, and Biot-TPQD605.
From the images in Figure 4.37 it can be seen that Biot-iQD605 has a very elongated shape,
which is different to Biot-eQD605 and Biot-TPQD605. These QDs are more spherical, but
also elongated, tetrahedral, and star-shaped QDs are visible. Although in TEM mainly
the dense inorganic core/shell structure can be imaged, it is assumed that the polymer
coating follows more or less the given shape of the core. Consequently, the donor-acceptor
distance distribution caused by the different shapes should be measurable using LTC-to-
QD FRET and decay time analysis.
For each Tb-sAv / Biot-QD combination the PL decay curves in the QD detection channel
and LTC detection channel for selected QD concentration were measured.
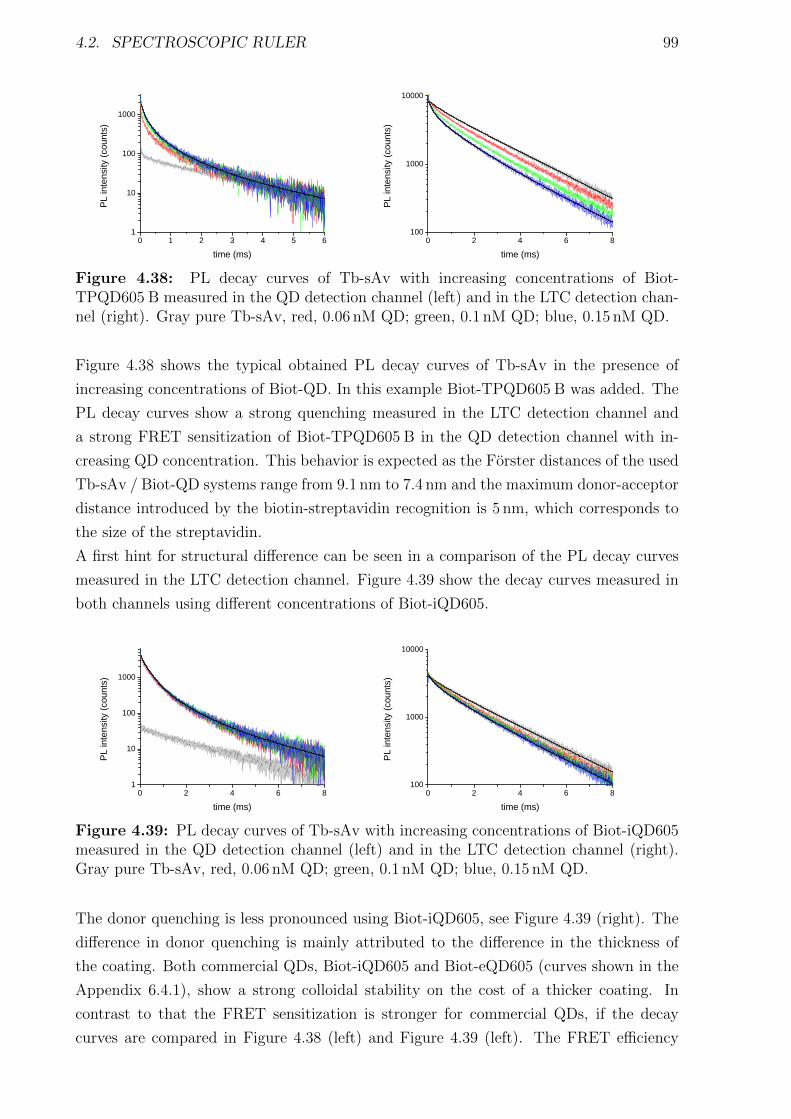
4.2. SPECTROSCOPIC RULER 99
0 1 2 3 4 5 61
1 0
1 0 0
1 0 0 0PL
inten
sity (c
ounts
)
t i m e ( m s )0 2 4 6 8
1 0 0
1 0 0 0
1 0 0 0 0
PL in
tensity
(cou
nts)
t i m e ( m s )
Figure 4.38: PL decay curves of Tb-sAv with increasing concentrations of Biot-TPQD605 B measured in the QD detection channel (left) and in the LTC detection chan-nel (right). Gray pure Tb-sAv, red, 0.06 nM QD; green, 0.1 nM QD; blue, 0.15 nM QD.
Figure 4.38 shows the typical obtained PL decay curves of Tb-sAv in the presence of
increasing concentrations of Biot-QD. In this example Biot-TPQD605 B was added. The
PL decay curves show a strong quenching measured in the LTC detection channel and
a strong FRET sensitization of Biot-TPQD605 B in the QD detection channel with in-
creasing QD concentration. This behavior is expected as the Forster distances of the used
Tb-sAv / Biot-QD systems range from 9.1 nm to 7.4 nm and the maximum donor-acceptor
distance introduced by the biotin-streptavidin recognition is 5 nm, which corresponds to
the size of the streptavidin.
A first hint for structural difference can be seen in a comparison of the PL decay curves
measured in the LTC detection channel. Figure 4.39 show the decay curves measured in
both channels using different concentrations of Biot-iQD605.
0 2 4 6 81
1 0
1 0 0
1 0 0 0
PL in
tensity
(cou
nts)
t i m e ( m s )0 2 4 6 8
1 0 0
1 0 0 0
1 0 0 0 0
PL in
tensity
(cou
nts)
t i m e ( m s )
Figure 4.39: PL decay curves of Tb-sAv with increasing concentrations of Biot-iQD605measured in the QD detection channel (left) and in the LTC detection channel (right).Gray pure Tb-sAv, red, 0.06 nM QD; green, 0.1 nM QD; blue, 0.15 nM QD.
The donor quenching is less pronounced using Biot-iQD605, see Figure 4.39 (right). The
difference in donor quenching is mainly attributed to the difference in the thickness of
the coating. Both commercial QDs, Biot-iQD605 and Biot-eQD605 (curves shown in the
Appendix 6.4.1), show a strong colloidal stability on the cost of a thicker coating. In
contrast to that the FRET sensitization is stronger for commercial QDs, if the decay
curves are compared in Figure 4.38 (left) and Figure 4.39 (left). The FRET efficiency

100 CHAPTER 4. RESULTS AND DISCUSSION
might be more efficient for the Biot-TPQD605 resulting to a stronger donor quenching,
but the low QY of only 7 % lead to a smaller sensitization output.
For more quantitative discussion about the differences in size and shape of the used QD
batches a detailed decay time analysis was performed using the measured PL decay curves.
Thereby the donor and acceptor decay curves were fitted under the consideration of the
influence of unquenched Tb-sAv inside the sample using the crosstalk approach presented
in chapter 4.2.2. In order to calculate the required FRET efficiency for the donor-acceptor
distance calculation the average amplitude-weighted decay time of the donor in absence of
the acceptor was calculated and is presented in Table 4.26 together with Forster distances
for each Tb-sAv / Biot-QD system.
Table 4.26: Average amplitude-weighted decay time of Tb-sAv in absence of the acceptorand Forster distances for each each Tb-sAv / Biot-QD system.
Biot-iQD605 Biot-eQD605 Biot-TPQD605 B
R0 (nm) 9.1± 0.4 7.8± 0.3 7.4± 0.3
〈τD〉 (µs) 2310± 120 2280± 120 2270± 120
The multi-exponential PL decay curves measured in the QD detection channel and in
the LTC detection channel were fitted according to the procedure describes in chapter
4.2.2 and the obtained decay times were used to calculate the FRET efficiencies. Table
4.27 summarizes the obtained results. Using the Forster distances of Table 4.26 and
the calculated FRET efficiencies enabled the calculation of the donor-acceptor distances
according to a equation 2.5 in chapter 2.1.2. The resultant donor-acceptor distances with
the corresponding fraction of the decay time are summarized in Table 4.28.
Comparing the average as well as the single decay times in Table 4.27 reveal a strong
similarity of those values independent of the used detection channel. This is an evidence
for the efficient energy transfer based on FRET from the LTC-donor to the QD-acceptor.
Only in the PL decay curves measured in the QD detection channel (acceptor channel)
a third decay component was found. The decay time of only 30 µs to 60 µs is very short
compared to the next larger decay time of around 200 µs and cannot be resolved in the LTC
detection channel (donor channel). The large background caused by unquenched Tb-sAv
covers the short component in the evaluation of the decay times in the donor channel.
A direct comparison of the decay time values obtained from the acceptor channel and
donor channel reveals slightly larger values for the latter one. This overestimation is also
caused by the strong fraction of long-lived LTC-emission in the donor channel. Due to
the significant influence of the long-lived decay components in the donor channel, the
estimated decay times from the acceptor channel have liability as they are less disturbed
by unquenched long-lived Tb-sAv components.
The average decay time can be used for the estimation of the average donor-acceptor
distance, which describes the overall size of the QD. In contrast to TEM where only
the inorganic core can be measured, these distance values count for the core plus the

4.2. SPECTROSCOPIC RULER 101
Table 4.27: Decay times and calculated FRET efficiencies for the different QD batches.All values have an error of approximately 10 %.
Biot-iQD605 Biot-eQD605 Biot-TPQD605 B
average
D 〈τDA〉 (µs) 790 890 610〈ηFRET−DA〉 0.66 0.61 0.73
A 〈τAD〉 (µs) 630 840 540〈ηFRET−AD〉 0.73 0.63 0.76
first
D τDA1 (µs) 270 240 200ηFRET−DA1 0.88 0.89 0.91
A τAD1 (µs) 320 300 230ηFRET−AD1 0.86 0.87 0.90
second
D τDA2 (µs) 1110 1110 1030ηFRET−DA2 0.52 0.51 0.54
A τAD2 (µs) 870 1010 740ηFRET−AD2 0.63 0.56 0.67
third
A τAD0 (µs) 60 60 30ηFRET−AD0 0.97 0.97 0.97
Table 4.28: Calculated donor-acceptor distances and the fraction of the correspondingdecay time. All values have an error of approximately 15 %.
Biot-iQD605 Biot-eQD605 Biot-TPQD605 B
average
D rDA (nm) 8.1 7.2 6.3
A rAD (nm) 7.7 7.1 6.1first
D αDA1 0.40 0.29 0.52rDA1 (nm) 6.5 5.5 5.0
A αAD1 0.40 0.20 0.32rAD1 (nm) 6.7 5.7 5.1
second
D αDA2 0.60 0.71 0.48rDA2 (nm) 9.0 7.7 7.2
A αAD2 0.58 0.77 0.62rAD2 (nm) 8.4 7.5 6.6
third
A αAD0 0.02 0.03 0.05rAD0 (nm) 5.0 4.3 4.1
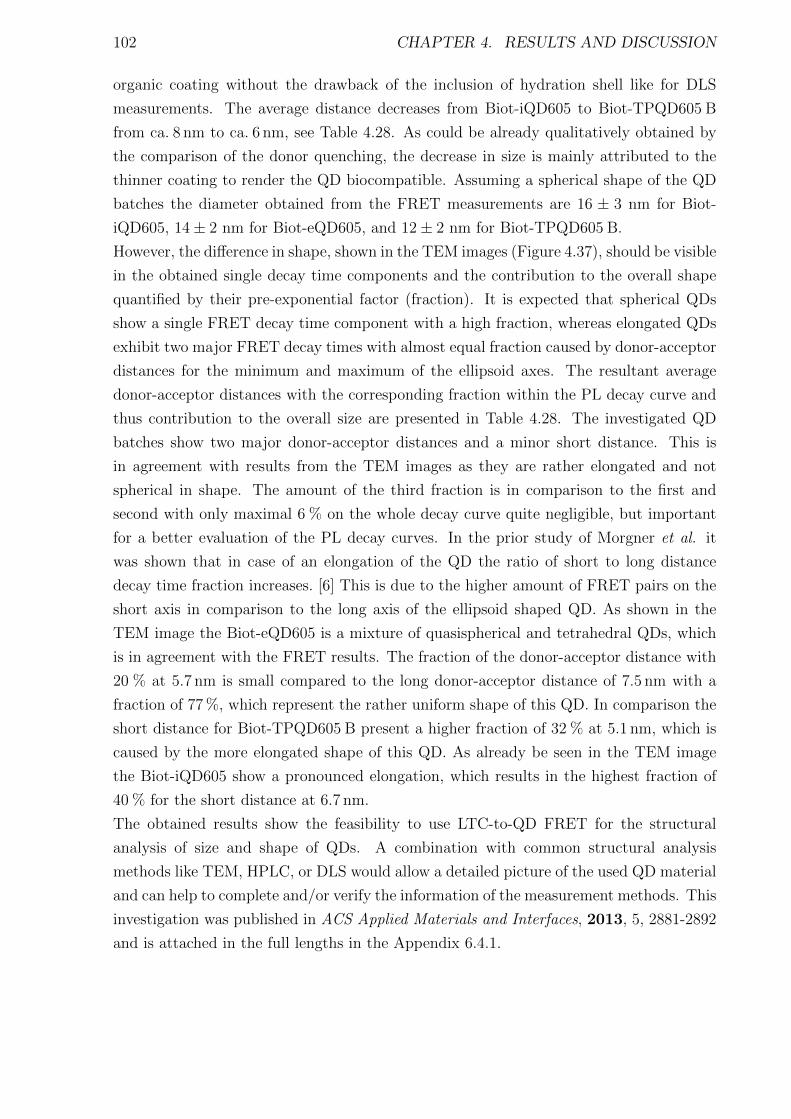
102 CHAPTER 4. RESULTS AND DISCUSSION
organic coating without the drawback of the inclusion of hydration shell like for DLS
measurements. The average distance decreases from Biot-iQD605 to Biot-TPQD605 B
from ca. 8 nm to ca. 6 nm, see Table 4.28. As could be already qualitatively obtained by
the comparison of the donor quenching, the decrease in size is mainly attributed to the
thinner coating to render the QD biocompatible. Assuming a spherical shape of the QD
batches the diameter obtained from the FRET measurements are 16 ± 3 nm for Biot-
iQD605, 14± 2 nm for Biot-eQD605, and 12± 2 nm for Biot-TPQD605 B.
However, the difference in shape, shown in the TEM images (Figure 4.37), should be visible
in the obtained single decay time components and the contribution to the overall shape
quantified by their pre-exponential factor (fraction). It is expected that spherical QDs
show a single FRET decay time component with a high fraction, whereas elongated QDs
exhibit two major FRET decay times with almost equal fraction caused by donor-acceptor
distances for the minimum and maximum of the ellipsoid axes. The resultant average
donor-acceptor distances with the corresponding fraction within the PL decay curve and
thus contribution to the overall size are presented in Table 4.28. The investigated QD
batches show two major donor-acceptor distances and a minor short distance. This is
in agreement with results from the TEM images as they are rather elongated and not
spherical in shape. The amount of the third fraction is in comparison to the first and
second with only maximal 6 % on the whole decay curve quite negligible, but important
for a better evaluation of the PL decay curves. In the prior study of Morgner et al. it
was shown that in case of an elongation of the QD the ratio of short to long distance
decay time fraction increases. [6] This is due to the higher amount of FRET pairs on the
short axis in comparison to the long axis of the ellipsoid shaped QD. As shown in the
TEM image the Biot-eQD605 is a mixture of quasispherical and tetrahedral QDs, which
is in agreement with the FRET results. The fraction of the donor-acceptor distance with
20 % at 5.7 nm is small compared to the long donor-acceptor distance of 7.5 nm with a
fraction of 77 %, which represent the rather uniform shape of this QD. In comparison the
short distance for Biot-TPQD605 B present a higher fraction of 32 % at 5.1 nm, which is
caused by the more elongated shape of this QD. As already be seen in the TEM image
the Biot-iQD605 show a pronounced elongation, which results in the highest fraction of
40 % for the short distance at 6.7 nm.
The obtained results show the feasibility to use LTC-to-QD FRET for the structural
analysis of size and shape of QDs. A combination with common structural analysis
methods like TEM, HPLC, or DLS would allow a detailed picture of the used QD material
and can help to complete and/or verify the information of the measurement methods. This
investigation was published in ACS Applied Materials and Interfaces, 2013, 5, 2881-2892
and is attached in the full lengths in the Appendix 6.4.1.
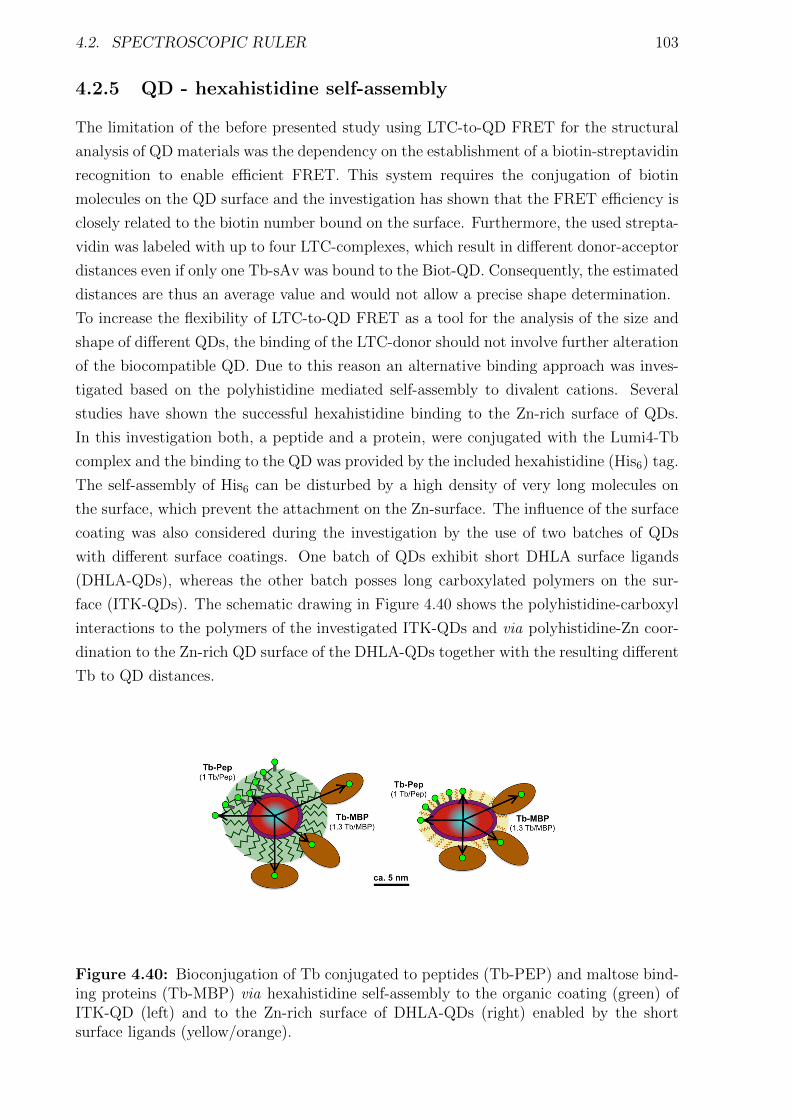
4.2. SPECTROSCOPIC RULER 103
4.2.5 QD - hexahistidine self-assembly
The limitation of the before presented study using LTC-to-QD FRET for the structural
analysis of QD materials was the dependency on the establishment of a biotin-streptavidin
recognition to enable efficient FRET. This system requires the conjugation of biotin
molecules on the QD surface and the investigation has shown that the FRET efficiency is
closely related to the biotin number bound on the surface. Furthermore, the used strepta-
vidin was labeled with up to four LTC-complexes, which result in different donor-acceptor
distances even if only one Tb-sAv was bound to the Biot-QD. Consequently, the estimated
distances are thus an average value and would not allow a precise shape determination.
To increase the flexibility of LTC-to-QD FRET as a tool for the analysis of the size and
shape of different QDs, the binding of the LTC-donor should not involve further alteration
of the biocompatible QD. Due to this reason an alternative binding approach was inves-
tigated based on the polyhistidine mediated self-assembly to divalent cations. Several
studies have shown the successful hexahistidine binding to the Zn-rich surface of QDs.
In this investigation both, a peptide and a protein, were conjugated with the Lumi4-Tb
complex and the binding to the QD was provided by the included hexahistidine (His6) tag.
The self-assembly of His6 can be disturbed by a high density of very long molecules on
the surface, which prevent the attachment on the Zn-surface. The influence of the surface
coating was also considered during the investigation by the use of two batches of QDs
with different surface coatings. One batch of QDs exhibit short DHLA surface ligands
(DHLA-QDs), whereas the other batch posses long carboxylated polymers on the sur-
face (ITK-QDs). The schematic drawing in Figure 4.40 shows the polyhistidine-carboxyl
interactions to the polymers of the investigated ITK-QDs and via polyhistidine-Zn coor-
dination to the Zn-rich QD surface of the DHLA-QDs together with the resulting different
Tb to QD distances.
Figure 4.40: Bioconjugation of Tb conjugated to peptides (Tb-PEP) and maltose bind-ing proteins (Tb-MBP) via hexahistidine self-assembly to the organic coating (green) ofITK-QD (left) and to the Zn-rich surface of DHLA-QDs (right) enabled by the shortsurface ligands (yellow/orange).
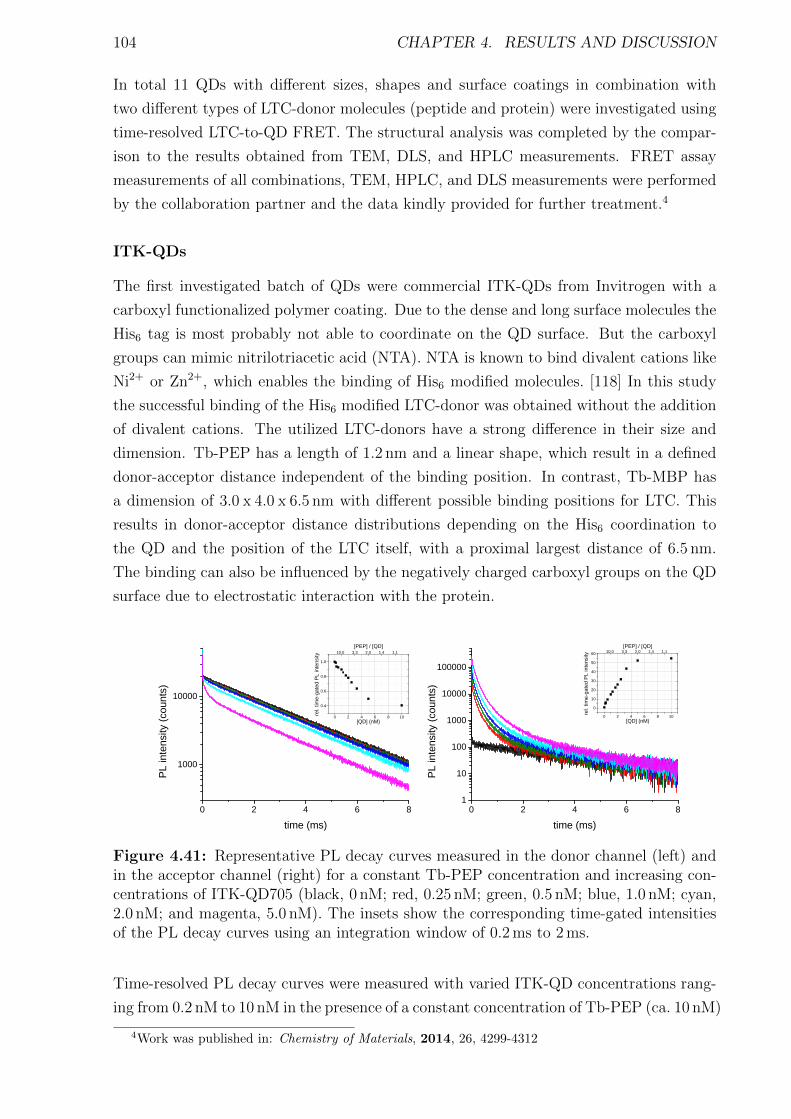
104 CHAPTER 4. RESULTS AND DISCUSSION
In total 11 QDs with different sizes, shapes and surface coatings in combination with
two different types of LTC-donor molecules (peptide and protein) were investigated using
time-resolved LTC-to-QD FRET. The structural analysis was completed by the compar-
ison to the results obtained from TEM, DLS, and HPLC measurements. FRET assay
measurements of all combinations, TEM, HPLC, and DLS measurements were performed
by the collaboration partner and the data kindly provided for further treatment.4
ITK-QDs
The first investigated batch of QDs were commercial ITK-QDs from Invitrogen with a
carboxyl functionalized polymer coating. Due to the dense and long surface molecules the
His6 tag is most probably not able to coordinate on the QD surface. But the carboxyl
groups can mimic nitrilotriacetic acid (NTA). NTA is known to bind divalent cations like
Ni2+ or Zn2+, which enables the binding of His6 modified molecules. [118] In this study
the successful binding of the His6 modified LTC-donor was obtained without the addition
of divalent cations. The utilized LTC-donors have a strong difference in their size and
dimension. Tb-PEP has a length of 1.2 nm and a linear shape, which result in a defined
donor-acceptor distance independent of the binding position. In contrast, Tb-MBP has
a dimension of 3.0 x 4.0 x 6.5 nm with different possible binding positions for LTC. This
results in donor-acceptor distance distributions depending on the His6 coordination to
the QD and the position of the LTC itself, with a proximal largest distance of 6.5 nm.
The binding can also be influenced by the negatively charged carboxyl groups on the QD
surface due to electrostatic interaction with the protein.
0 2 4 6 8
1 0 0 0
1 0 0 0 00 2 4 6 8 1 0
0 . 4
0 . 6
0 . 8
1 . 0
1 0 . 0 3 . 3 2 . 0 1 . 4 1 . 1[ P E P ] / [ Q D ]
rel. ti
me-ga
ted PL
inten
sity
[ Q D ] ( n M )
PL in
tensity
(cou
nts)
t i m e ( m s )0 2 4 6 8
1
1 0
1 0 0
1 0 0 0
1 0 0 0 0
1 0 0 0 0 0
0 2 4 6 8 1 00
1 02 03 04 05 06 0
rel. ti
me-ga
ted PL
inten
sity
[ Q D ] ( n M )
1 0 . 0 3 . 3 2 . 0 1 . 4 1 . 1[ P E P ] / [ Q D ]
PL in
tensity
(cou
nts)
t i m e ( m s )
Figure 4.41: Representative PL decay curves measured in the donor channel (left) andin the acceptor channel (right) for a constant Tb-PEP concentration and increasing con-centrations of ITK-QD705 (black, 0 nM; red, 0.25 nM; green, 0.5 nM; blue, 1.0 nM; cyan,2.0 nM; and magenta, 5.0 nM). The insets show the corresponding time-gated intensitiesof the PL decay curves using an integration window of 0.2 ms to 2 ms.
Time-resolved PL decay curves were measured with varied ITK-QD concentrations rang-
ing from 0.2 nM to 10 nM in the presence of a constant concentration of Tb-PEP (ca. 10 nM)
4Work was published in: Chemistry of Materials, 2014, 26, 4299-4312
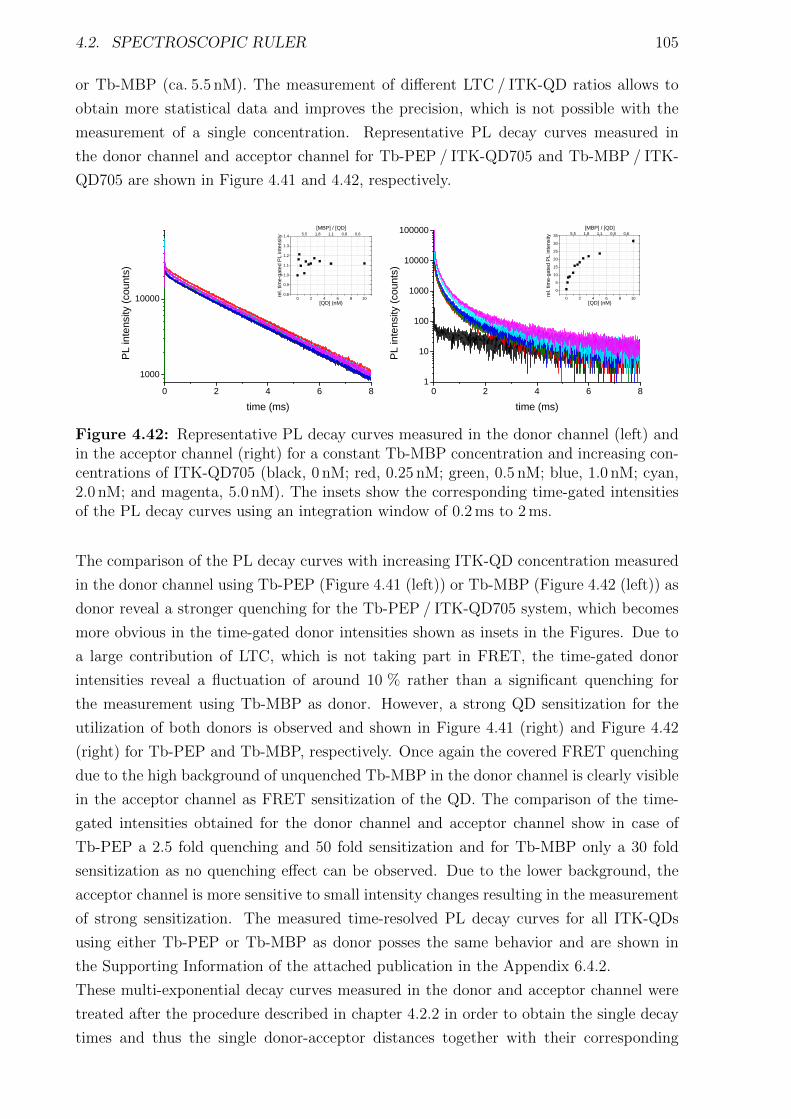
4.2. SPECTROSCOPIC RULER 105
or Tb-MBP (ca. 5.5 nM). The measurement of different LTC / ITK-QD ratios allows to
obtain more statistical data and improves the precision, which is not possible with the
measurement of a single concentration. Representative PL decay curves measured in
the donor channel and acceptor channel for Tb-PEP / ITK-QD705 and Tb-MBP / ITK-
QD705 are shown in Figure 4.41 and 4.42, respectively.
0 2 4 6 81 0 0 0
1 0 0 0 0 0 2 4 6 8 1 00 . 80 . 91 . 01 . 11 . 21 . 31 . 4
5 . 5 1 . 8 1 . 1 0 . 8 0 . 6[ M B P ] / [ Q D ]
rel. ti
me-ga
ted PL
inten
sity
[ Q D ] ( n M )
PL in
tensity
(cou
nts)
t i m e ( m s )0 2 4 6 8
1
1 0
1 0 0
1 0 0 0
1 0 0 0 0
1 0 0 0 0 0
0 2 4 6 8 1 005
1 01 52 02 53 03 5
rel. ti
me-ga
ted PL
inten
sity
[ Q D ] ( n M )
5 . 5 1 . 8 1 . 1 0 . 8 0 . 6[ M B P ] / [ Q D ]
PL in
tensity
(cou
nts)
t i m e ( m s )
Figure 4.42: Representative PL decay curves measured in the donor channel (left) andin the acceptor channel (right) for a constant Tb-MBP concentration and increasing con-centrations of ITK-QD705 (black, 0 nM; red, 0.25 nM; green, 0.5 nM; blue, 1.0 nM; cyan,2.0 nM; and magenta, 5.0 nM). The insets show the corresponding time-gated intensitiesof the PL decay curves using an integration window of 0.2 ms to 2 ms.
The comparison of the PL decay curves with increasing ITK-QD concentration measured
in the donor channel using Tb-PEP (Figure 4.41 (left)) or Tb-MBP (Figure 4.42 (left)) as
donor reveal a stronger quenching for the Tb-PEP / ITK-QD705 system, which becomes
more obvious in the time-gated donor intensities shown as insets in the Figures. Due to
a large contribution of LTC, which is not taking part in FRET, the time-gated donor
intensities reveal a fluctuation of around 10 % rather than a significant quenching for
the measurement using Tb-MBP as donor. However, a strong QD sensitization for the
utilization of both donors is observed and shown in Figure 4.41 (right) and Figure 4.42
(right) for Tb-PEP and Tb-MBP, respectively. Once again the covered FRET quenching
due to the high background of unquenched Tb-MBP in the donor channel is clearly visible
in the acceptor channel as FRET sensitization of the QD. The comparison of the time-
gated intensities obtained for the donor channel and acceptor channel show in case of
Tb-PEP a 2.5 fold quenching and 50 fold sensitization and for Tb-MBP only a 30 fold
sensitization as no quenching effect can be observed. Due to the lower background, the
acceptor channel is more sensitive to small intensity changes resulting in the measurement
of strong sensitization. The measured time-resolved PL decay curves for all ITK-QDs
using either Tb-PEP or Tb-MBP as donor posses the same behavior and are shown in
the Supporting Information of the attached publication in the Appendix 6.4.2.
These multi-exponential decay curves measured in the donor and acceptor channel were
treated after the procedure described in chapter 4.2.2 in order to obtain the single decay
times and thus the single donor-acceptor distances together with their corresponding
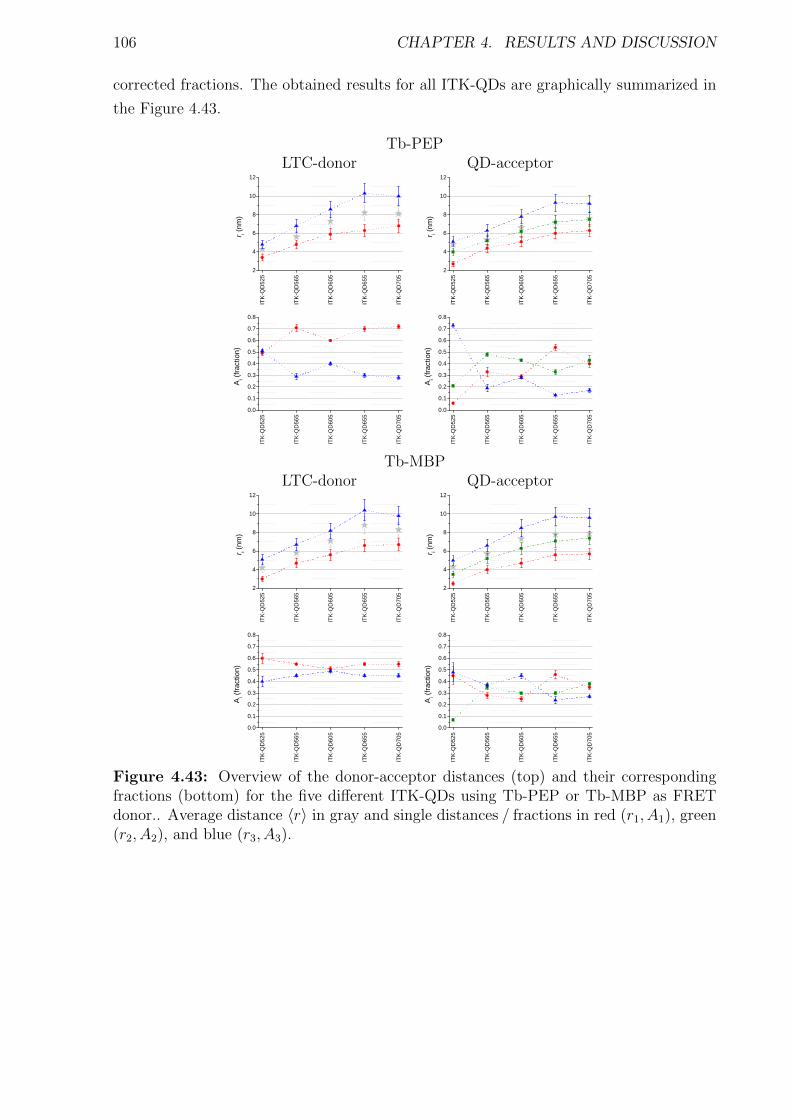
106 CHAPTER 4. RESULTS AND DISCUSSION
corrected fractions. The obtained results for all ITK-QDs are graphically summarized in
the Figure 4.43.
Tb-PEPLTC-donor QD-acceptor
ITK-Q
D525
ITK-Q
D565
ITK-Q
D605
ITK-Q
D655
ITK-Q
D705
2
4
6
8
1 0
1 2
r i (nm)
ITK-Q
D525
ITK-Q
D565
ITK-Q
D605
ITK-Q
D655
ITK-Q
D705
2
4
6
8
1 0
1 2
r i (nm)
ITK-Q
D525
ITK-Q
D565
ITK-Q
D605
ITK-Q
D655
ITK-Q
D705
0 . 00 . 10 . 20 . 30 . 40 . 50 . 60 . 70 . 8
A i (frac
tion)
ITK-Q
D525
ITK-Q
D565
ITK-Q
D605
ITK-Q
D655
ITK-Q
D705
0 . 00 . 10 . 20 . 30 . 40 . 50 . 60 . 70 . 8
A i (frac
tion)
Tb-MBPLTC-donor QD-acceptor
ITK-Q
D525
ITK-Q
D565
ITK-Q
D605
ITK-Q
D655
ITK-Q
D705
2
4
6
8
1 0
1 2
r i (nm)
ITK-Q
D525
ITK-Q
D565
ITK-Q
D605
ITK-Q
D655
ITK-Q
D705
2
4
6
8
1 0
1 2
r i (nm)
ITK-Q
D525
ITK-Q
D565
ITK-Q
D605
ITK-Q
D655
ITK-Q
D705
0 . 00 . 10 . 20 . 30 . 40 . 50 . 60 . 70 . 8
A i (frac
tion)
ITK-Q
D525
ITK-Q
D565
ITK-Q
D605
ITK-Q
D655
ITK-Q
D705
0 . 00 . 10 . 20 . 30 . 40 . 50 . 60 . 70 . 8
A i (frac
tion)
Figure 4.43: Overview of the donor-acceptor distances (top) and their correspondingfractions (bottom) for the five different ITK-QDs using Tb-PEP or Tb-MBP as FRETdonor.. Average distance 〈r〉 in gray and single distances / fractions in red (r1, A1), green(r2, A2), and blue (r3, A3).
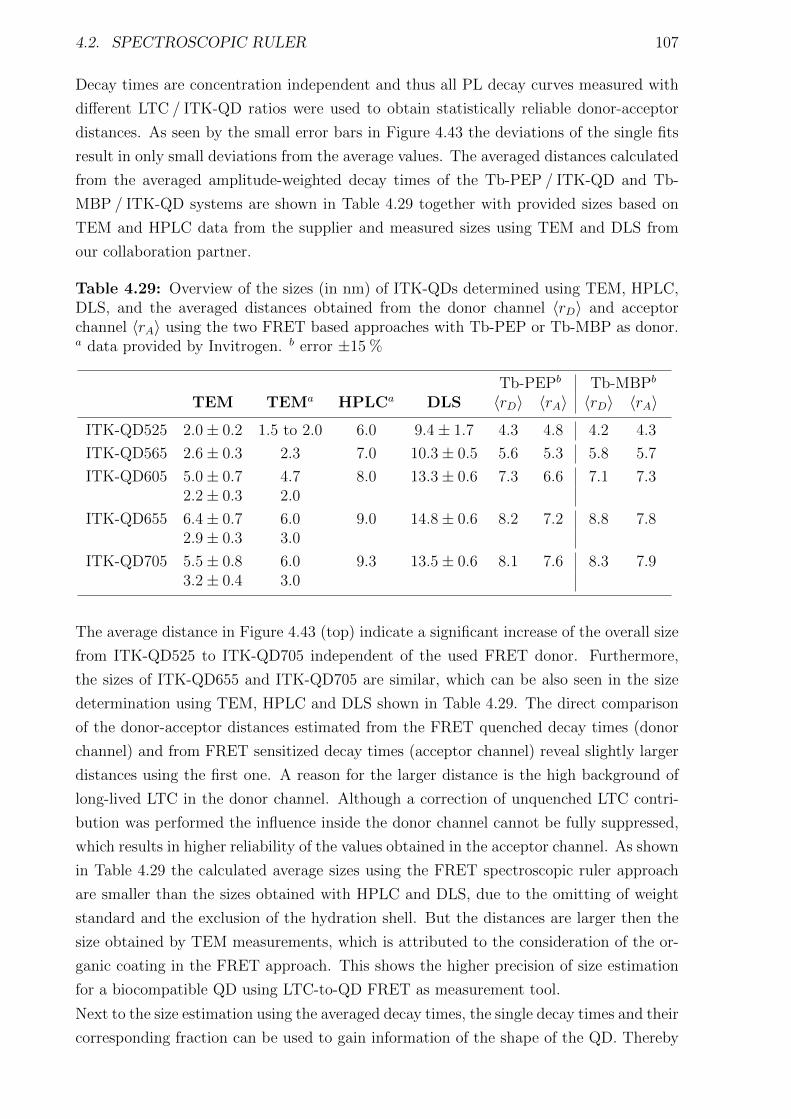
4.2. SPECTROSCOPIC RULER 107
Decay times are concentration independent and thus all PL decay curves measured with
different LTC / ITK-QD ratios were used to obtain statistically reliable donor-acceptor
distances. As seen by the small error bars in Figure 4.43 the deviations of the single fits
result in only small deviations from the average values. The averaged distances calculated
from the averaged amplitude-weighted decay times of the Tb-PEP / ITK-QD and Tb-
MBP / ITK-QD systems are shown in Table 4.29 together with provided sizes based on
TEM and HPLC data from the supplier and measured sizes using TEM and DLS from
our collaboration partner.
Table 4.29: Overview of the sizes (in nm) of ITK-QDs determined using TEM, HPLC,DLS, and the averaged distances obtained from the donor channel 〈rD〉 and acceptorchannel 〈rA〉 using the two FRET based approaches with Tb-PEP or Tb-MBP as donor.a data provided by Invitrogen. b error ±15 %
Tb-PEPb Tb-MBPb
TEM TEMa HPLCa DLS 〈rD〉 〈rA〉 〈rD〉 〈rA〉
ITK-QD525 2.0± 0.2 1.5 to 2.0 6.0 9.4± 1.7 4.3 4.8 4.2 4.3
ITK-QD565 2.6± 0.3 2.3 7.0 10.3± 0.5 5.6 5.3 5.8 5.7
ITK-QD605 5.0± 0.7 4.7 8.0 13.3± 0.6 7.3 6.6 7.1 7.32.2± 0.3 2.0
ITK-QD655 6.4± 0.7 6.0 9.0 14.8± 0.6 8.2 7.2 8.8 7.82.9± 0.3 3.0
ITK-QD705 5.5± 0.8 6.0 9.3 13.5± 0.6 8.1 7.6 8.3 7.93.2± 0.4 3.0
The average distance in Figure 4.43 (top) indicate a significant increase of the overall size
from ITK-QD525 to ITK-QD705 independent of the used FRET donor. Furthermore,
the sizes of ITK-QD655 and ITK-QD705 are similar, which can be also seen in the size
determination using TEM, HPLC and DLS shown in Table 4.29. The direct comparison
of the donor-acceptor distances estimated from the FRET quenched decay times (donor
channel) and from FRET sensitized decay times (acceptor channel) reveal slightly larger
distances using the first one. A reason for the larger distance is the high background of
long-lived LTC in the donor channel. Although a correction of unquenched LTC contri-
bution was performed the influence inside the donor channel cannot be fully suppressed,
which results in higher reliability of the values obtained in the acceptor channel. As shown
in Table 4.29 the calculated average sizes using the FRET spectroscopic ruler approach
are smaller than the sizes obtained with HPLC and DLS, due to the omitting of weight
standard and the exclusion of the hydration shell. But the distances are larger then the
size obtained by TEM measurements, which is attributed to the consideration of the or-
ganic coating in the FRET approach. This shows the higher precision of size estimation
for a biocompatible QD using LTC-to-QD FRET as measurement tool.
Next to the size estimation using the averaged decay times, the single decay times and their
corresponding fraction can be used to gain information of the shape of the QD. Thereby
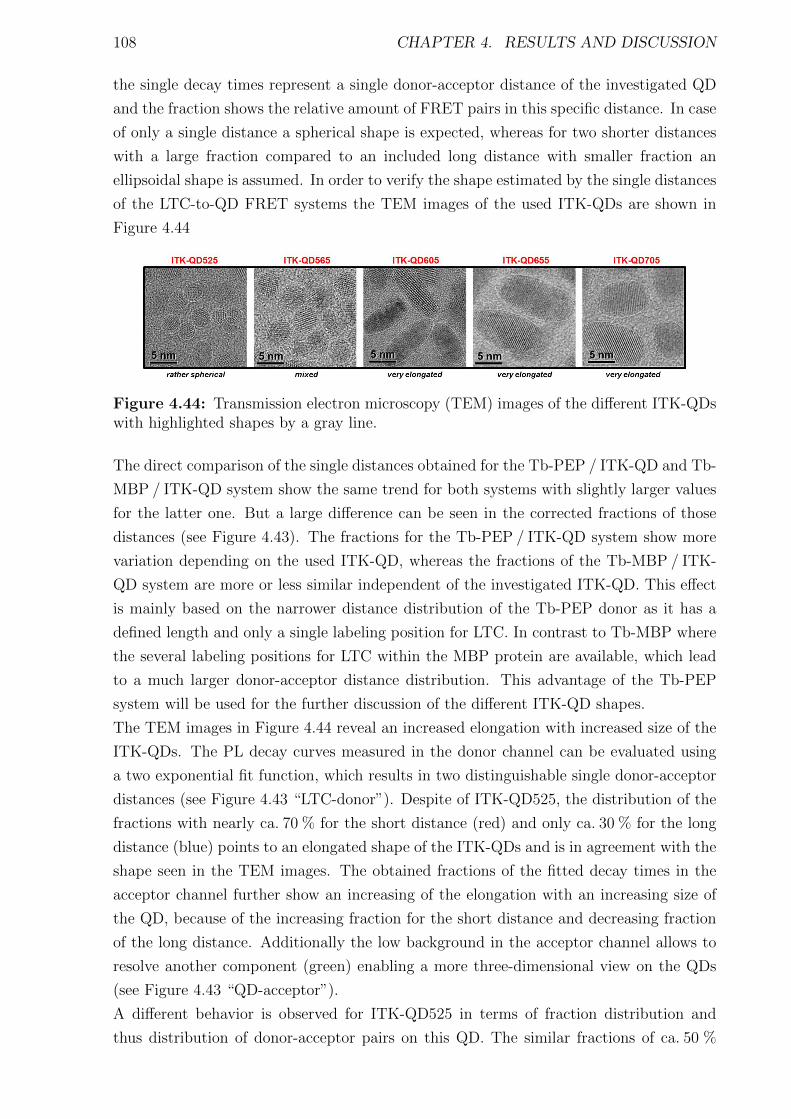
108 CHAPTER 4. RESULTS AND DISCUSSION
the single decay times represent a single donor-acceptor distance of the investigated QD
and the fraction shows the relative amount of FRET pairs in this specific distance. In case
of only a single distance a spherical shape is expected, whereas for two shorter distances
with a large fraction compared to an included long distance with smaller fraction an
ellipsoidal shape is assumed. In order to verify the shape estimated by the single distances
of the LTC-to-QD FRET systems the TEM images of the used ITK-QDs are shown in
Figure 4.44
Figure 4.44: Transmission electron microscopy (TEM) images of the different ITK-QDswith highlighted shapes by a gray line.
The direct comparison of the single distances obtained for the Tb-PEP / ITK-QD and Tb-
MBP / ITK-QD system show the same trend for both systems with slightly larger values
for the latter one. But a large difference can be seen in the corrected fractions of those
distances (see Figure 4.43). The fractions for the Tb-PEP / ITK-QD system show more
variation depending on the used ITK-QD, whereas the fractions of the Tb-MBP / ITK-
QD system are more or less similar independent of the investigated ITK-QD. This effect
is mainly based on the narrower distance distribution of the Tb-PEP donor as it has a
defined length and only a single labeling position for LTC. In contrast to Tb-MBP where
the several labeling positions for LTC within the MBP protein are available, which lead
to a much larger donor-acceptor distance distribution. This advantage of the Tb-PEP
system will be used for the further discussion of the different ITK-QD shapes.
The TEM images in Figure 4.44 reveal an increased elongation with increased size of the
ITK-QDs. The PL decay curves measured in the donor channel can be evaluated using
a two exponential fit function, which results in two distinguishable single donor-acceptor
distances (see Figure 4.43 “LTC-donor”). Despite of ITK-QD525, the distribution of the
fractions with nearly ca. 70 % for the short distance (red) and only ca. 30 % for the long
distance (blue) points to an elongated shape of the ITK-QDs and is in agreement with the
shape seen in the TEM images. The obtained fractions of the fitted decay times in the
acceptor channel further show an increasing of the elongation with an increasing size of
the QD, because of the increasing fraction for the short distance and decreasing fraction
of the long distance. Additionally the low background in the acceptor channel allows to
resolve another component (green) enabling a more three-dimensional view on the QDs
(see Figure 4.43 “QD-acceptor”).
A different behavior is observed for ITK-QD525 in terms of fraction distribution and
thus distribution of donor-acceptor pairs on this QD. The similar fractions of ca. 50 %
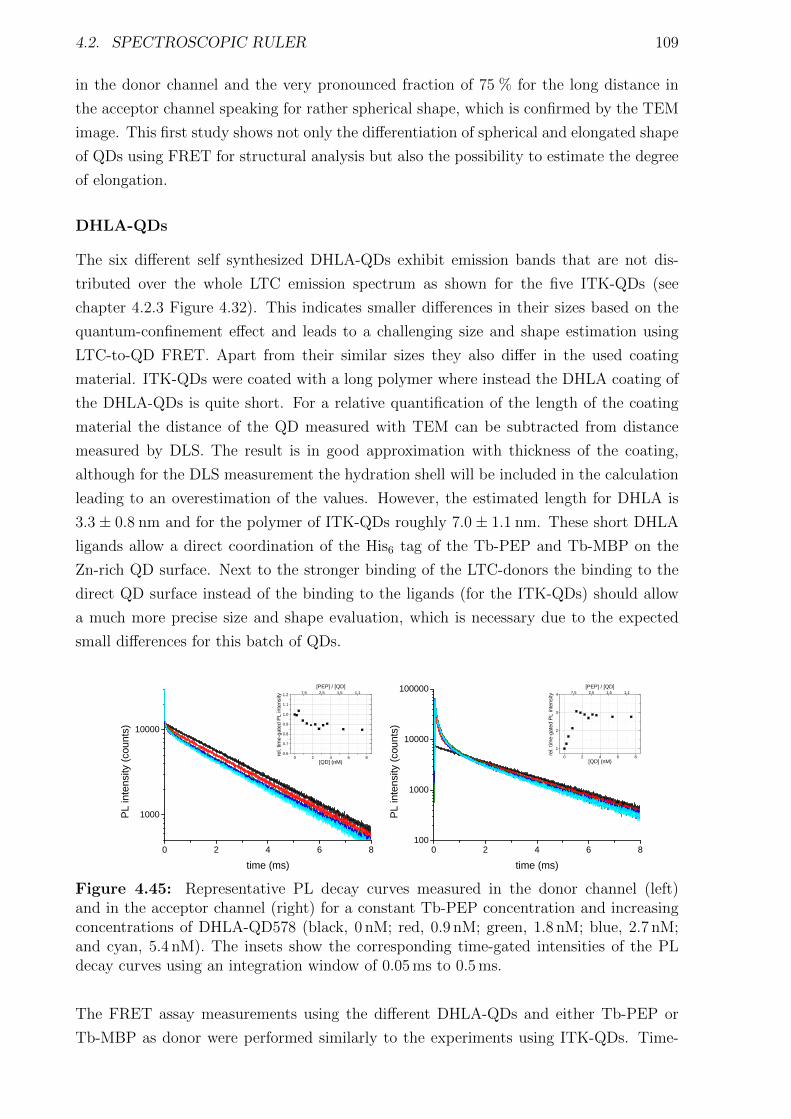
4.2. SPECTROSCOPIC RULER 109
in the donor channel and the very pronounced fraction of 75 % for the long distance in
the acceptor channel speaking for rather spherical shape, which is confirmed by the TEM
image. This first study shows not only the differentiation of spherical and elongated shape
of QDs using FRET for structural analysis but also the possibility to estimate the degree
of elongation.
DHLA-QDs
The six different self synthesized DHLA-QDs exhibit emission bands that are not dis-
tributed over the whole LTC emission spectrum as shown for the five ITK-QDs (see
chapter 4.2.3 Figure 4.32). This indicates smaller differences in their sizes based on the
quantum-confinement effect and leads to a challenging size and shape estimation using
LTC-to-QD FRET. Apart from their similar sizes they also differ in the used coating
material. ITK-QDs were coated with a long polymer where instead the DHLA coating of
the DHLA-QDs is quite short. For a relative quantification of the length of the coating
material the distance of the QD measured with TEM can be subtracted from distance
measured by DLS. The result is in good approximation with thickness of the coating,
although for the DLS measurement the hydration shell will be included in the calculation
leading to an overestimation of the values. However, the estimated length for DHLA is
3.3± 0.8 nm and for the polymer of ITK-QDs roughly 7.0± 1.1 nm. These short DHLA
ligands allow a direct coordination of the His6 tag of the Tb-PEP and Tb-MBP on the
Zn-rich QD surface. Next to the stronger binding of the LTC-donors the binding to the
direct QD surface instead of the binding to the ligands (for the ITK-QDs) should allow
a much more precise size and shape evaluation, which is necessary due to the expected
small differences for this batch of QDs.
0 2 4 6 8
1 0 0 0
1 0 0 0 0
0 2 4 6 80 . 60 . 70 . 80 . 91 . 01 . 11 . 2
[ P E P ] / [ Q D ]
rel. ti
me-ga
ted PL
inten
sity
[ Q D ] ( n M )
7 . 5 2 . 5 1 . 5 1 . 1
PL in
tensity
(cou
nts)
t i m e ( m s )0 2 4 6 8
1 0 0
1 0 0 0
1 0 0 0 0
1 0 0 0 0 0
0 2 4 6 81
2
3
4 7 . 5 2 . 5 1 . 5 1 . 1
rel. ti
me-ga
ted PL
inten
sity
[ Q D ] ( n M )
[ P E P ] / [ Q D ]
PL in
tensity
(cou
nts)
t i m e ( m s )Figure 4.45: Representative PL decay curves measured in the donor channel (left)and in the acceptor channel (right) for a constant Tb-PEP concentration and increasingconcentrations of DHLA-QD578 (black, 0 nM; red, 0.9 nM; green, 1.8 nM; blue, 2.7 nM;and cyan, 5.4 nM). The insets show the corresponding time-gated intensities of the PLdecay curves using an integration window of 0.05 ms to 0.5 ms.
The FRET assay measurements using the different DHLA-QDs and either Tb-PEP or
Tb-MBP as donor were performed similarly to the experiments using ITK-QDs. Time-

110 CHAPTER 4. RESULTS AND DISCUSSION
resolved PL decay curves were measured with varied DHLA-QD concentrations ranging
from 0.3 nM to 11 nM in the presence of a constant concentration of Tb-PEP (ca. 7.5 nM)
or Tb-MBP (ca. 11 nM). Representative PL decay curves measured in the donor chan-
nel and acceptor channel for Tb-PEP / DHLA-QD578 and Tb-MBP / DHLA-QD578 are
shown in Figure 4.45 and 4.46, respectively.
0 2 4 6 8
1 0 0 0
1 0 0 0 00 2 4 6 8 1 0 1 20 . 5
0 . 60 . 70 . 80 . 91 . 01 . 11 . 21 . 3 1 1 . 1 3 . 7 2 . 2 1 . 6 1 . 2 1 . 0
[ M B P ] / [ Q D ]
rel. ti
me-ga
ted PL
inten
sity[ Q D ] ( n M )
PL in
tensity
(cou
nts)
t i m e ( m s )0 2 4 6 8
1 0 0 0
1 0 0 0 0
1 0 0 0 0 0
0 2 4 6 8 1 0 1 2
1 . 0
1 . 5
2 . 0
2 . 5
3 . 0
rel. ti
me-ga
ted PL
inten
sity
[ Q D ] ( n M )
1 1 . 1 3 . 7 2 . 2 1 . 6 1 . 2 1 . 0[ M B P ] / [ Q D ]
PL in
tensity
(cou
nts)
t i m e ( m s )
Figure 4.46: Representative PL decay curves measured in the donor channel (left)and in the acceptor channel (right) for a constant Tb-MBP concentration and increasingconcentrations of DHLA-QD578 (black, 0 nM; red, 0.9 nM; green, 1.8 nM; blue, 2.7 nM;and cyan, 5.4 nM). The insets show the corresponding time-gated intensities of the PLdecay curves using an integration window of 0.05 ms to 0.5 ms.
The measured PL decay curves show a similar behavior to those measured using ITK-QDs.
With increasing QD concentration the Tb-PEP / DHLA-QD system shows a pronounced
quen-ching of the LTC-donor (left) and a strong sensitization of the QD (right) presented
in Figure 4.45. The strong UV excitation of the sample with a wavelength of 337 nm and
high molar absorptivity of QDs at this wavelength lead to a strong direct excitation of
QDs and thus very high PL intensities. This results in a saturation of the used detection
PMTs visible mainly in the acceptor channel (Figure 4.45 and 4.46 right). However, the
FRET sensitized PL curves are much more intense and show a significant longer decay.
Using an appropriate delay for the fit procedure allows to suppress this saturation effect.
For a better comparison of quenching and sensitization effects measured in the donor
and acceptor channel in the presence of increasing concentrations of DHLA-QD578, the
time-gated intensities were calculated from 0.05 ms to 0.5 ms of each PL decay curve. The
shorter integration window compared to ITK-QDs is attributed to the shorter FRET sen-
sitized PL decay curve. The insets in the Figure 4.45 and 4.46 show that the quenching
effect for Tb-PEP is smaller than for the ITK-QDs but still significant compared the Tb-
MBP / DHLA-QD system where only a fluctuation of the donor signals can be obtained.
Due to the lower background in the acceptor channels a significant increase with increas-
ing QD concentration of the time-gated intensities can be observed, with a maximum
of 3 fold using the Tb-PEP donor. However, the significantly shorter FRET sensitized
PL decay curves compared to those measured using ITK-QDs with the same LTC-donors
indicate shorter donor-acceptor distances attributed to the thinner DHLA coating.
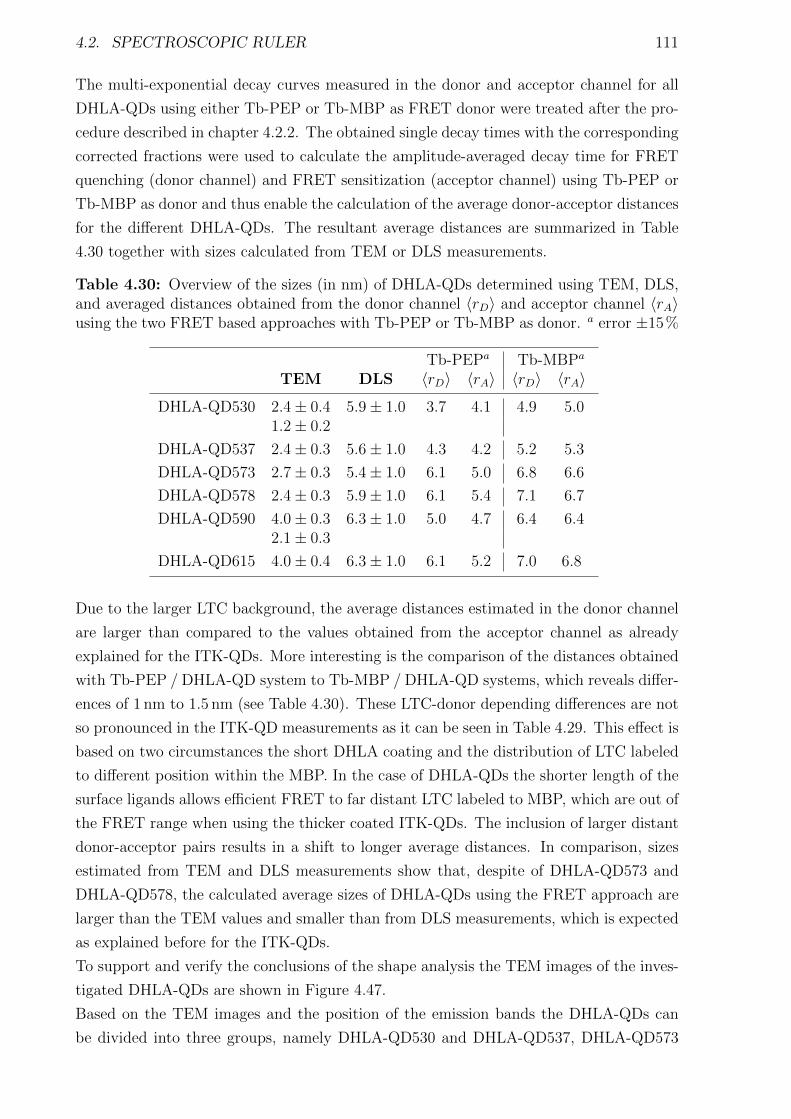
4.2. SPECTROSCOPIC RULER 111
The multi-exponential decay curves measured in the donor and acceptor channel for all
DHLA-QDs using either Tb-PEP or Tb-MBP as FRET donor were treated after the pro-
cedure described in chapter 4.2.2. The obtained single decay times with the corresponding
corrected fractions were used to calculate the amplitude-averaged decay time for FRET
quenching (donor channel) and FRET sensitization (acceptor channel) using Tb-PEP or
Tb-MBP as donor and thus enable the calculation of the average donor-acceptor distances
for the different DHLA-QDs. The resultant average distances are summarized in Table
4.30 together with sizes calculated from TEM or DLS measurements.
Table 4.30: Overview of the sizes (in nm) of DHLA-QDs determined using TEM, DLS,and averaged distances obtained from the donor channel 〈rD〉 and acceptor channel 〈rA〉using the two FRET based approaches with Tb-PEP or Tb-MBP as donor. a error ±15%
Tb-PEPa Tb-MBPa
TEM DLS 〈rD〉 〈rA〉 〈rD〉 〈rA〉
DHLA-QD530 2.4± 0.4 5.9± 1.0 3.7 4.1 4.9 5.01.2± 0.2
DHLA-QD537 2.4± 0.3 5.6± 1.0 4.3 4.2 5.2 5.3
DHLA-QD573 2.7± 0.3 5.4± 1.0 6.1 5.0 6.8 6.6
DHLA-QD578 2.4± 0.3 5.9± 1.0 6.1 5.4 7.1 6.7
DHLA-QD590 4.0± 0.3 6.3± 1.0 5.0 4.7 6.4 6.42.1± 0.3
DHLA-QD615 4.0± 0.4 6.3± 1.0 6.1 5.2 7.0 6.8
Due to the larger LTC background, the average distances estimated in the donor channel
are larger than compared to the values obtained from the acceptor channel as already
explained for the ITK-QDs. More interesting is the comparison of the distances obtained
with Tb-PEP / DHLA-QD system to Tb-MBP / DHLA-QD systems, which reveals differ-
ences of 1 nm to 1.5 nm (see Table 4.30). These LTC-donor depending differences are not
so pronounced in the ITK-QD measurements as it can be seen in Table 4.29. This effect is
based on two circumstances the short DHLA coating and the distribution of LTC labeled
to different position within the MBP. In the case of DHLA-QDs the shorter length of the
surface ligands allows efficient FRET to far distant LTC labeled to MBP, which are out of
the FRET range when using the thicker coated ITK-QDs. The inclusion of larger distant
donor-acceptor pairs results in a shift to longer average distances. In comparison, sizes
estimated from TEM and DLS measurements show that, despite of DHLA-QD573 and
DHLA-QD578, the calculated average sizes of DHLA-QDs using the FRET approach are
larger than the TEM values and smaller than from DLS measurements, which is expected
as explained before for the ITK-QDs.
To support and verify the conclusions of the shape analysis the TEM images of the inves-
tigated DHLA-QDs are shown in Figure 4.47.
Based on the TEM images and the position of the emission bands the DHLA-QDs can
be divided into three groups, namely DHLA-QD530 and DHLA-QD537, DHLA-QD573

112 CHAPTER 4. RESULTS AND DISCUSSION
Figure 4.47: Transmission electron microscopy (TEM) images of the different DHLA-QDs.
and DHLA-QD578, and DHLA-QD590 and DHLA-QD615. Each group is similar in their
average size but quite different in their shape. The fitted single decay times from the
multi-exponential decay curves were used to calculate single donor-acceptor distances,
which are shown with the corresponding fractions of the decay time in Figure 4.48 for
each DHLA-QD evaluated from the donor and acceptor channel.
Similar to the results for the ITK-QDs the use of Tb-PEP as donor enables more precise
shape information, due to the defined donor-acceptor distance. The comparison of the av-
erage distance reveals a smaller size for the first pair (DHLA-QD530 and DHLA-QD537),
whereas the other QDs are relatively similar in their size and no further general trend can
be observed. The utilization of Tb-MBP as donor shows the same trends in the average
size but a closer look to the corresponding fractions reveals similar values for measured
QDs. Due to a dominant fraction of 60 % to 70 % for the long distance, it can be assumed
that most of LTCs are in large distance to the QD.
Like for the ITK-QDs further estimation of the shape will be discussed with data pro-
vided for the measurements of the Tb-PEP / DHLA-QD system. Starting with the first
pair that shows an increase in the overall size from DHLA-QD530 to DHLA-QD537 but
no differences in their fractions measured in the donor channel (see Figure 4.48) But the
fractions obtained from the decay times observed in the acceptor channel allow a better
differentiation. The smaller fraction for the long distance (blue) with ca. 30 % in com-
parison to the shorter distance (green) with ca. 45 % points to rather elongated shape
for DHLA-QD530. In contrast the PL decay curves measured for DHLA-QD537 allow to
use only a two exponential function for a good fit. This results in only two distances in
the acceptor channel with a fraction for both of around 50 %, which strongly suggested a
spherical shape with a mixture of sizes between 3.8 nm to 4.8 nm.
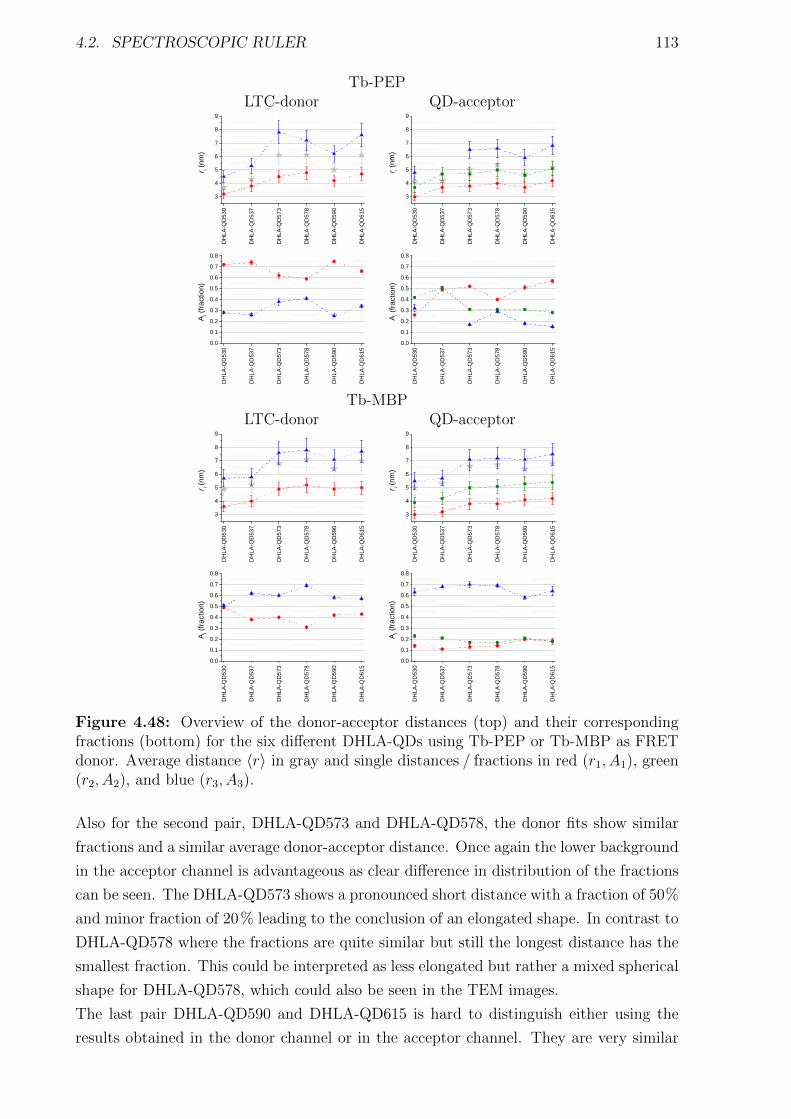
4.2. SPECTROSCOPIC RULER 113
Tb-PEPLTC-donor QD-acceptor
DHLA
-QD5
30
DHLA
-QD5
37
DHLA
-QD5
73
DHLA
-QD5
78
DHLA
-QD5
90
DHLA
-QD6
15
3456789
r i (nm)
DHLA
-QD5
30
DHLA
-QD5
37
DHLA
-QD5
73
DHLA
-QD5
78
DHLA
-QD5
90
DHLA
-QD6
15
3456789
r i (nm)
DHLA
-QD5
30
DHLA
-QD5
37
DHLA
-QD5
73
DHLA
-QD5
78
DHLA
-QD5
90
DHLA
-QD6
15
0 . 00 . 10 . 20 . 30 . 40 . 50 . 60 . 70 . 8
A i (frac
tion)
DHLA
-QD5
30
DHLA
-QD5
37
DHLA
-QD5
73
DHLA
-QD5
78
DHLA
-QD5
90
DHLA
-QD6
15
0 . 00 . 10 . 20 . 30 . 40 . 50 . 60 . 70 . 8
A i (fr
actio
n)Tb-MBP
LTC-donor QD-acceptor
DHLA
-QD5
30
DHLA
-QD5
37
DHLA
-QD5
73
DHLA
-QD5
78
DHLA
-QD5
90
DHLA
-QD6
15
3456789
r i (nm)
DHLA
-QD5
30
DHLA
-QD5
37
DHLA
-QD5
73
DHLA
-QD5
78
DHLA
-QD5
90
DHLA
-QD6
15
3456789
r i (nm)
DHLA
-QD5
30
DHLA
-QD5
37
DHLA
-QD5
73
DHLA
-QD5
78
DHLA
-QD5
90
DHLA
-QD6
15
0 . 00 . 10 . 20 . 30 . 40 . 50 . 60 . 70 . 8
A i (frac
tion)
DHLA
-QD5
30
DHLA
-QD5
37
DHLA
-QD5
73
DHLA
-QD5
78
DHLA
-QD5
90
DHLA
-QD6
15
0 . 00 . 10 . 20 . 30 . 40 . 50 . 60 . 70 . 8
A i (frac
tion)
Figure 4.48: Overview of the donor-acceptor distances (top) and their correspondingfractions (bottom) for the six different DHLA-QDs using Tb-PEP or Tb-MBP as FRETdonor. Average distance 〈r〉 in gray and single distances / fractions in red (r1, A1), green(r2, A2), and blue (r3, A3).
Also for the second pair, DHLA-QD573 and DHLA-QD578, the donor fits show similar
fractions and a similar average donor-acceptor distance. Once again the lower background
in the acceptor channel is advantageous as clear difference in distribution of the fractions
can be seen. The DHLA-QD573 shows a pronounced short distance with a fraction of 50%
and minor fraction of 20% leading to the conclusion of an elongated shape. In contrast to
DHLA-QD578 where the fractions are quite similar but still the longest distance has the
smallest fraction. This could be interpreted as less elongated but rather a mixed spherical
shape for DHLA-QD578, which could also be seen in the TEM images.
The last pair DHLA-QD590 and DHLA-QD615 is hard to distinguish either using the
results obtained in the donor channel or in the acceptor channel. They are very similar
114 CHAPTER 4. RESULTS AND DISCUSSION
in size and shape with a slightly larger size of DHLA-QD615. The distribution of the
fractions points towards elongated shape for both QDs.
The investigated DHLA-QDs are challenging in terms of the structural analysis due to the
similar shape and size. Additionally, the low QY result in less QD sensitization measured
in the acceptor channel, which makes decay time fitting more sophisticated than for the
ITK-QDs. Nevertheless, the LTC-to-QD FRET spectroscopic ruler approach could show
a nice differentiation of the QDs of the first and second pair and enabled to obtain precise
size and shape information of this QD batch.
This investigation was published in Chemistry of Materials, 2014, 26, 4299-4312 and is
attached in the full lengths in the Appendix 6.4.2.
5 | Summary and Outlook
5.1 Summary
This work presents the application of lanthanide terbium complexes (LTCs) and quan-
tum dots (QDs) as donor-acceptor pair for Forster resonance energy transfer (FRET)
in two distinct research fields. The long PL decay times of LTCs together with their
well-structured PL emission bands in combination with the broad absorbance bands and
size-tunable, narrow emission bands of QDs offer exceptional advantages compared to
other FRET pairs, like an increased signal-to-noise ratio and a strong multiplexing capa-
bility. These advantages were exploited for the application in homogeneous immunometric
assays for the detection of several biomarkers and as molecular ruler for the structural
analysis of biocompatible QDs. Important theoretical background for FRET, LTCs, and
QDs were also described in this work, including a brief overview about their advantages
in different biological applications.
In the first experimental part of this work the strong distance dependency of FRET was
exploited for the optimization of the performance of homogeneous immunoassays to de-
tect the biomarkers total prostate specific antigen (TPSA), neuron-specific enolase (NSE),
carcinoembryonic antigen (CEA), and epidermal growth factor receptor (EGFR). There-
fore differently sized antibodies were prepared using a commercial fragmentation kit for
the production of the fragments F(ab’)2 and F(ab) from an IgG antibody. The pre-
pared antibodies differ largely in their size as the IgG antibody has a molecular weight of
150 kDa, F(ab’)2 a molecular weight of 100 kDa, and F(ab) a molecular weight of 50 kDa,
and all of them were able to bind to the biomarker. After the successful preparation
of the differently sized antibodies they were conjugated with LTCs or to different QDs
and carefully characterized using stationary absorption spectroscopy and stationary as
well as time-resolved luminescence spectroscopy. The characterization was used to verify
any alteration caused by the conjugation of the luminophore with the antibody and to
estimate the conjugation ratio.
The conjugation of LTCs to the differently sized antibodies resulted in no alteration of
the absorbance spectra, as the main absorbance peak at 340 nm stayed unchanged for all
conjugates. Due to an increased absorption at 280 nm, the successful conjugation was
verified as it is the typical absorbance wavelength of proteins. Using a linear combi-
nation approach allowed to calculate the labeling ratio of LTCs to antibodies from the
absorbance measurement. Thereby the labeling ratio decreased from the IgG antibody to
115
116 CHAPTER 5. SUMMARY AND OUTLOOK
the F(ab) fragment, which was attributed to the smaller size of the antibody fragment.
The measured PL spectrum of LTC-conjugates showed the typical four intense emission
bands at 495 nm, 545 nm, 585 nm, and 625 nm, and only minor differences in the fine
splitting of the individual bands after antibody conjugation. Depending on the presence
of serum in the buffer solution the bi-exponential fit of the PL decay curves enabled the
calculation of amplitude averaged decay times between 2.2 ms and 2.8 ms. The quantum
yields calculated from the averaged decay times ranging between 64 % and 81 % and are
used for the calculation of the Forster distance. Similar to the LTC-antibody conjugates,
the QD-antibody conjugates showed also no alteration in their absorbance spectra due to
the conjugation. The typical broad band absorbance spectra with high extinction coeffi-
cients were observed and a linear combination approach was used to calculate the labeling
ratios. Due to the high background of QD absorption at 280 nm the estimation of the
antibody concentration was afflicted with larger uncertainties than for the LTC-antibody
conjugates. However, some general trends were observed. First of all with decreasing
antibody size the antibody per QD ratio was increased, which is attributed to the smaller
size of the fragments compared to the large IgG antibody. An intercomparison of the
F(ab’)2 fragment on three different QDs revealed an increase of the labeling ratio from
eQD605 to iQD705 caused by the larger size and thus larger surface of the latter QD.
The measured PL emission spectra of the three QDs used within the immunoassay mea-
surements (eQD605, eQD650, and iQD705) showed the typical size-dependent behavior
and narrow Gaussian shape emission covering the range from 605 nm to 705 nm. All QDs
showed a multi-exponential PL decay curve with decay times between 10 ns to 100 ns and
only minor changes depending on the conjugated antibody. In general, the conjugation of
the differently sized antibodies had less influence on the important parameters necessary
for the calculation of the Forster distance, namely the donor emission spectrum, donor
luminescence quantum yield, and acceptor absorbance spectra. The used FRET pairs
with LTC as donor and eQD605, eQD650, and iQD705 as acceptors result in calculated
Forster distances of 7.6 nm, 10.8 nm, and 10.9 nm, respectively.
In general LTC-to-QD FRET enabled the measurement of all biomarkers with subnanomo-
lar detection limits in 50 µL serum samples inside homogeneous immunometric assays
measured on two different fluorescence plate readers. Using differently sized antibodies
conjugated with LTCs or to QDs revealed that the decrease of the acceptor antibody
size is beneficial for the sensitivity of the immunoassay. The limit of detection (LOD),
which was used to compare the performance of the different combinations, was decreased
by nearly the half comparing full size antibodies to fragmented antibodies conjugated to
the QD surface. However, the difference in sensitivity between F(ab’)2 and F(ab) an-
tibodies was negligible for all investigated biomarkers. In contrast, the decrease of the
donor antibody size did not result in a further increased sensitivity. These results were
transferable as shown by the use of two differently emitting QDs as FRET acceptors. The
first assumption that a decreased size of the antibodies due to the fragmentation results

5.1. SUMMARY 117
in a shorter donor-acceptor distance and thus an higher FRET sensitization could not be
approved. Calculated average donor-acceptor distances from PL decay curves revealed a
similar distance for the use of IgG, F(ab’)2 or F(ab) antibodies conjugated on the QD
surface in combination with a full size antibody labeled with LTCs. A clear difference in
donor-acceptor distance was observed when the same antibody was conjugated to either
eQD605 or eQD650, which was attributed to the larger size of the eQD650 itself. Inter-
esting was also the comparison of the average donor-acceptor distance for the different
biomarkers. Although they are very different in size (TPSA with a molecular weight
of 32 kDa to CEA with a molecular weight of 180 kDa) there was no distance difference
observed in the average donor-acceptor distance. This can be explained by the origin of
the antibodies used. They are from commercial diagnostics kits and optimized for FRET
measurements. During this optimization antibodies were chosen, which bind to different
epitopes on the biomarker with similar distances to each other to enable efficient FRET
independent of the actual size of the biomarker. One crucial point for the use of antibody
conjugates in commercial applications is their long-term stability. In common diagnostic
kits the warrant long-term stability is around 4 weeks, depending on the used biomarker
and their corresponding antibodies. To prove the long-term stability of the QD-antibody
conjugates the LOD measurement was repeated after a few month up to one year after
preparation. It could be shown that the performance of the probes were similar to the
day when they were conjugated and thus revealed an exceptional long-term stability in
solution storing at 4 ◦C. To prove the developed LTC-QD FRET system for the applica-
tion in clinical measurements of biomarker concentrations, the TPSA concentrations in
human serum samples were investigated. The results gave a good agreement with the
reference values as they were within an error range of ±20 %. However, in comparison to
already commercial diagnostic kits for the measurement of the same biomarkers based on
a europium complex as donor and different organic dyes as acceptor, the used LTC-to-
QD FRET system showed lower sensitivity. A further optimization of the used antibody
concentrations, incubation time, and instrument settings could result in at least as good
as, if not better LODs than those of the commercial kits. Nevertheless, the sensitivity for
all biomarkers was below the cutoff level and in a clinical relevant concentration range.
Although the sensitivity of the commercial system was higher, it has the drawback that
the system cannot be used in multiplexed applications. The successful application of
the simultaneous detection of NSE and CEA was shown for the use of LTC as FRET
donor and eQD605 and eQD650 as FRET acceptors. The major problem of multiplexed
measurements is the spectral crosstalk caused by broad acceptor emission bands, which
result in the need of a post treatment to correct those values. Due to the narrow Gaus-
sian shaped emission spectra of the QDs no crosstalk correction was necessary and the
obtained data were directly usable to calculate the calibration curves. The comparison
between the detection of the biomarker in a single format and in the duplexed format re-
vealed only a minor increase of the LOD and showed also clinically relevant subnanomolar

118 CHAPTER 5. SUMMARY AND OUTLOOK
detection limits.
An exceptional LTC-to-QD FRET immunoassay was the detection of EGFR using nanobod-
ies. The very small size of the nanobodies resulted in high labeling ratios on QDs and
only a small ratio for the LTC labeling. Although the presence of proteins resulted in a
FRET signal in the absence of the antigen, the increase of the FRET signal in presence
of EGFR was more pronounced and could be used for the measurement of a calibration
curve and thus for an estimation of the LOD. The system showed further a sensitivity to
the presence of serum, which increased the LOD in comparison to a serum free diluent.
However, the estimated LODs where below the clinical cutoff level for both diluents and
presents the first application of nanobodies for the detection of an antigen using LTC-to-
QD FRET.
In conclusion the presented study examined the utilization of LTC-to-QD FRET in time-
gated homogeneous immunoassays using differently sized antibodies for the detection of
several biomarkers. All biomarkers were measured at clinically relevant concentrations in
small volume serum samples. The decreasing antibody size showed to be beneficial for the
performance of the immunoassay and sample preparation. Highlights of the study were
the measurement of real patient samples and the first duplexed application of LTC-to-QD
FRET for the simultaneous detection of two biomarkers in one sample.
The second experimental part investigated the application of LTC-to-QD FRET for the
structural analysis of biocompatible QDs. As size and shape have a great influence on the
behavior of QDs in biological applications, it is important to investigate those parame-
ters. The investigated FRET pair offers several advantages over classical characterization
methods like TEM, DLS, or HPLC measurements and especially as it enables a detailed
shape analysis. Due to the large size difference between small LTCs and large QDs, sev-
eral LTCs were arranged around one QD, which resulted in a donor-acceptor distance
distribution with different FRET efficiencies. A detailed decay time analysis of the multi-
exponentional PL decay curves of LTC and QDs allowed to retrieve single decay times.
Thereby the long decay times of LTCs are several magnitudes longer than the intrinsic
decay time of QDs, which allows to obtain the FRET decay time, necessary for distance
estimation, from the PL decay curves of either FRET donor or the FRET acceptor. The
corresponding FRET efficiencies were calculated using those FRET decay times and en-
abled the estimation of the donor-acceptor distances according to the Forster formalism.
The similarity of the FRET decay times was the proof for successful FRET between the
LTC and QD. Prior to the use of the retrieved decay times for distance calculation, the
data was corrected for unquenched LTC signals in both channels. To establish the LTCs
in close proximity to the QD two different strategies were used, namely biotin-streptavidin
recognition and polyhistidine mediated self-assembly. Each probe was carefully charac-
terized using stationary absorption spectroscopy and stationary as well as time-resolved
luminescence spectroscopy.
As donor in the two binding systems the LTC Lumi4-Tb complex was used and conju-
5.1. SUMMARY 119
gated to streptavidin (Tb-sAv), a peptide (Tb-PEP), and to the maltose binding protein
(Tb-MBP). The two latter donor complexes exhibited a hexahistidine (His6) tag for the
chelation to divalent cations like Zn. Similar to the LTC-antibody conjugates the ab-
sorbance and emission spectra as well as the PL decay curves were hardly affected by the
binding to the different biomolecules. The appearance of an absorbance band at 280 nm
proved the successful binding to the biomolecules. The typical characteristics of LTCs
with an absorbance band at 340 nm together with narrow and well separated emission
bands between 490 nm to 650 nm could be observed for all donor complexes. Thereby
the average amplitude decay times are between 2.3 ms and 2.75 ms with quantum yields
ranging from 65 % to 80 %. In total, three different batches of QDs were used during the
investigations. The first batch were biotinylated QDs to enable the biotin-streptavidin
recognition. For the polyhistidine mediated self-assembly two different batches of QDs
were used, which differ mainly in their surface coating. One batch exhibits dihydrolipoic
acid as surface ligands, whereas the second batch possessed long carboxylated polymers
on the surface. All QDs showed the characteristical broad absorbance band with high
extinction coefficients, narrow Gaussian shape PL emission bands with quantum yields
ranging from 7 % to 75 %, and multi-exponential PL decay curves with decay times be-
tween 10 ns to 100 ns. The calculated Forster distances range from 5.4 nm to 11.1 nm,
depending on the spectral overlap between LTC and QD.
In the first application of LTC-to-QD FRET the biotin-streptavidin recognition was ap-
plied using Tb-sAv and three different biotinylated QDs (Biot-QDs), which all exhibit a
similar emission maximum but different surface coatings. Two of them were from commer-
cial sources with an amphiphilic polymer/lipid coating (Biot-iQD605 and Biot-eQD605),
whereas the third one was self-synthesized and rendered water-soluble via ligand exchange
reaction (Biot-TPQD605). The FRET assays were executed using a constant concentra-
tion of Tb-sAv and increasing concentrations of the individual Biot-QD. The resulting
PL decay curves of LTC and Biot-QD were measured in the so called donor (LTC) and
acceptor (Biot-QD) channel on a fluorescence plate reader. The PL decay curves mea-
sured in the donor channel showed strong quenching of the LTC decay curve intensities
and concomitant the measured PL decay curve intensities in the acceptor channel in-
creased due to the strong FRET sensitization of the Biot-QD, which was observed for
all measured LTC-QD FRET pairs. These decay curves were used for a detailed decay
time analysis. The averaged FRET decay time was used for an estimation of the overall
QD size with the assumption of a spherical shape. It was shown that the size is decreas-
ing from Biot-iQD605 to Biot-TPQD605, which is attributed mainly to their different
coatings. The ligand exchange reaction yields a QD with a thinner coating than the am-
phiphilic encapsulation approach of the commercial QDs. Due to the thinner coating and
thus smaller donor-acceptor distance for Biot-TPQD605 the LTC quenching was more
pronounced than for the other Biot-QDs. More detailed shape information were obtained
from the single decay times and their fractions, which are very useful to make a state-
120 CHAPTER 5. SUMMARY AND OUTLOOK
ment about the QD dimension. Thereby the information from the acceptor channel were
more detailed as the smaller background of LTC allowed the evaluation of three distances
(three-dimensions), whereas in the donor channel only two distances could be retrieved.
The fraction of the single decay times are important as they contain the information
about the amount of donor-acceptor pairs in this particular distance. In general, the QD
batches showed two major donor-acceptor distances, which pointed towards an elongated
shape. Important for the degree of elongation was the proportion of the fractions of the
two major distances. An increasing amount of FRET pairs with short distance compared
to the fraction with longer donor-acceptor distance indicates a more elongated shape. In
case of the Biot-eQD605 there was only a small fraction for the short distance and a large
fraction for the long distance, arising from a rather mixed shape. The largest fraction for
the short distance was obtained for Biot-iQD605 as these are the most elongated QDs in
the study, which was confirmed by TEM measurements. Next to the shape analysis the
measurement of increasing Biot-QD concentrations in the presence of a constant concen-
tration of Tb-sAv was used for the evaluation of the obtained PL decay curves using the
time-gated approach. The obtained intensity ratios were plotted as a function of the QD
concentration. Due to the FRET sensitization of the QDs the intensity ratios for all Biot-
QDs were increasing until all biotins on the QD surface were saturated. This saturation
point was used for the estimation of the number of biotin on the QD surface. During the
preparation of the Biot-TPQD605 two different initial biotin concentrations were used,
resulting in two batches (denoted with A and B) with an unknown biotin number. Using
the LTC-to-QD FRET system the number of biotin was estimated for batch A to ca. 1
and for batch B to ca. 3 to 4 biotins on the QD surface. Similar values of 3 to 4 biotins
per QD were also found for the other Biot-QDs and enabled, next to the size and shape
information, insights into the bioconjugation performance.
The precision of the biotin-streptavidin system for dimensional analysis was limited by
the labeling ratio of four LTCs per Tb-sAv conjugate. Consequently, the binding of one
Tb-sAv to a Biot-QD already provide different donor-acceptor distances depending on
the position of the LTCs within the streptavidin molecule. Additionally, the presence of
biotin on the QD surface was necessary to establish the close proximity between donor
and acceptor. Due to these reasons another binding strategy was investigated based on
the polyhistidine mediated self-assembly of biomolecules on the QD surface, which did not
involve any further alteration of the QD surface. The binding and the application for size
and shape analysis was performed on two different batches of QDs, which differed mainly
in their surface coating. One batch of six QDs exhibited dihydrolipoic acid as surface
ligands (DHLA-QDs), which is a short ligand known to enable the binding of hexahis-
tidine (His6) tagged molecules. The other batch consisted of five commercial ITK-QDs
with long carboxylated polymers on the surface. The donors exhibiting a His6 tag were
Tb-PEP and Tb-MBP. All QDs were measured with both donors at a constant donor
concentration and increasing QD concentrations on a fluorescence plate reader. The ob-

5.1. SUMMARY 121
tained multi-exponential decay curves measured in the donor and acceptor channel were
used for an extensive decay time analysis to obtain the average decay times (information
about the average size) and single decay times (information about the three-dimensional
shape).
First of all, FRET was observed for all QDs using either Tb-MBP or Tb-PEP as donor.
But in a direct comparison of the used donor revealed large differences for the applicabil-
ity in the structural analysis of the investigated QDs. These differences were attributed
to the dimension of the used donor. Tb-PEP had a defined length of 1.2 nm with the His6
tag on one end and the LTC on the other. In contrast to Tb-MBP that had a dimen-
sion of 3.0 x 4.0 x 6.5 nm and offers several labeling positions for LTCs. Although the
labeling ratio for both donors was around one LTC per biomolecule the different available
positions in Tb-MBP resulted in larger donor-acceptor distance distributions than for
Tb-PEP. Due to that reason the average distances estimated using Tb-MBP were larger
compared to the utilization of Tb-PEP and furthermore in shape analysis the fractions of
the different donor-acceptor pairs showed no significant differences and thus could not be
used for a clear statement about the shape. Consequently, the Tb-PEP donor with well
defined length and small donor-acceptor distance distribution allowed to estimate more
precise information about the QD dimension.
The investigation of the five different ITK-QDs using Tb-PEP as donor revealed an in-
creasing average size from ITK-QD525 to ITK-QD705. Thereby the estimated size is
larger than from the TEM measurements (neglecting the organic coating) and smaller
than estimated by DLS measurements (inclusion of the hydration shell). These results
showed the higher precision of the FRET approach compared to the other methods. The
analysis of the single decay times showed a pronounced elongation with increasing size as
the fraction of the long distance decreases and the fraction of the short distance increases.
One exception is the ITK-QD525, which only shows one dominant fraction for the long
distance and minor fractions for the short distance, arising from its spherical shape. The
obtained results for the different shapes were in agreement with TEM images.
As the DHLA-QDs were quite similar in size, shown by their close emission maxima in the
PL emission spectra, the analysis was more complicated and the different QDs difficult to
distinguish. Additionally, the low QY resulted in less QD sensitization, which made the
decay time evaluation more sophisticated in comparison to the ITK-QDs. However, the
increasing overall size of the different DHLA-QDs could be measured and were in agree-
ment with the expected values compared with the TEM and DLS data. Furthermore, the
differentiation of DHLA-QDs with similar emission but different shapes were also possible
and in agreement with the TEM images.
The LTC-to-QD FRET approach for the structural analysis of biocompatible QDs was
successfully presented using: i) different binding strategies; ii) QDs with different size,
shape, and coatings; iii) LTCs conjugated to different biomolecules also with different
sizes, shapes, and binding conditions. Big advantages of this approach are that it is ho-

122 CHAPTER 5. SUMMARY AND OUTLOOK
mogeneous, fast, using very low concentrations at physiological conditions, and mostly has
a subnanometer resolution. Although this method allows more precise information about
the size and shape of QDs, in conditions in which they are also later applied, standard
measurements such as TEM, DLS and HPLC are still important to verify the obtained
results.
5.2. OUTLOOK 123
5.2 Outlook
The application of LTC-to-QD FRET in homogeneous immunoassays and as molecular
ruler demonstrate the versatility of this FRET pair. Advantages like large Forster dis-
tances, time-gated measurements, strong multiplexing capability, and large surfaces of
QDs for binding of different kinds of biomolecules in combination with the unique pho-
tophysical properties of the individual luminophores, make the application of this FRET
pair interesting as probe for in vitro and in vivo measurements and thus enable to gain
insights into the complex mechanism of biological systems.
Concerning the application of this FRET pair in immunoassays, the presented use of a
third QD color for the detection of TPSA will give access to the simultaneous measure-
ment of three different biomarkers using one LTC as donor and three QDs as acceptors.
It is expected that the small PL emission bands of QDs strongly reduce the probability
for optical crosstalk, which was the main drawback of organic dyes in LTC-based multi-
plex applications. The substitution of organic dyes as acceptors in the already presented
multiplexed application for the simultaneous measurement of five different markers for
the differentiation of non-small cell lung cancer and small cell lung cancer using five dif-
ferently colored QDs without the use of a crosstalk matrix and higher sensitivity would
be a big step towards a commercial application of QDs for in vitro diagnostics. As it was
shown in this work the system is generic for different biomarkers and can be applied for
the detection of all biomarkers for which two targeting antibodies exist.
The precise characterization of the size and shape of biocompatible QDs using LTC-
to-QD FRET presents a valuable alternative to already established structural analysis
techniques. Especially the measurement at low concentration and under physiological
conditions with three dimensional shape resolution distinguish this approach from others.
Thereby this method is not limited to QDs, any nanoparticle suitable acting as accep-
tor for the LTC-donor can be characterized and make the molecular ruler approach very
versatile. Apart from the structural analysis of nanoparticles, the experience in distance
distributions within the LTC-QD system can be used in future applications of the dis-
tance analysis in in vitro and in vivo. Therefore the large Forster distances will allow
measurements of distances in large biological systems. Furthermore, the multiplexing op-
portunity of the system can be used to study complex distance changes using different
acceptors, which enable the measurement of several distances from a single sample. The
advancement of this structural analysis technique by the introduction of mathematical
models for a more precise evaluation of the donor-acceptor distance distribution would be
beneficial in order to increase the sensitivity to the different shapes of QDs.
6 | Appendix
6.1 Abbreviations
acceptor-AB - acceptor-antibodyAB - antibodyAG-domain - antigen binding domainALEX - alternating-laser excitationBOI - biomolecule of interestBRET - bioluminescence resonance energy transferBSA - Albumin from bovine serumCEA - carcinoembryonic antigenChA - acceptor channelChD - donor channelCRET - chemiluminescence resonance energy transferCV - coefficient of variationDHLA - dihydrolipoic acidDLS - dynamic light scatteringDNA - deoxyribonucleic aciddonor-AB - donor-antibodyEGFR - epidermal growth factor receptorEMIT - enzyme-multiplied immunoassays techniqueEPR - electron paramagnetic resonanceFP - fluorescent proteinFRET - Forster resonance energy transferFWHM - full-width-at-half-maximumHis6 - hexahistidineHPLC - high performance liquid chromatographyIMAC - immobilized metal ion affinity chromatographyIR - infrared regionLED - light emitting diodeLMCT - ligand to metal charge transferLn - lanthanidesLOD - limit of detectionLOQ - limit of quantificationLTC - lanthanide terbium complexMRI - magnetic resonant imagingMWCO - molecular weight cut-offNBCS - newborn calf serumNIR - near infrared regionNMR - nuclear magnetic resonanceNP - nanoparticle
i

ii CHAPTER 6. APPENDIX
NSE - neuron-specific enolaseNSET - nanoparticle-based surface energy transferNTA - nitrilotriacetic acidPEG - poly(ethylene glycol)PL - photoluminescencePMT - photomultiplier tubeQD - quantum dotQY - quantum yieldRNA - ribonucleic acidREE - rare earth elementsref. - referencesAv - streptavidinSERS - surface enhanced Raman scatteringsmFRET - single-molecule FRETSNR - signal-to-noise ratioTEM - transmission electron microscopyTPSA - total prostate specific antigenUNCP - upconversion nanoparticleUV - ultravioletVis - visible
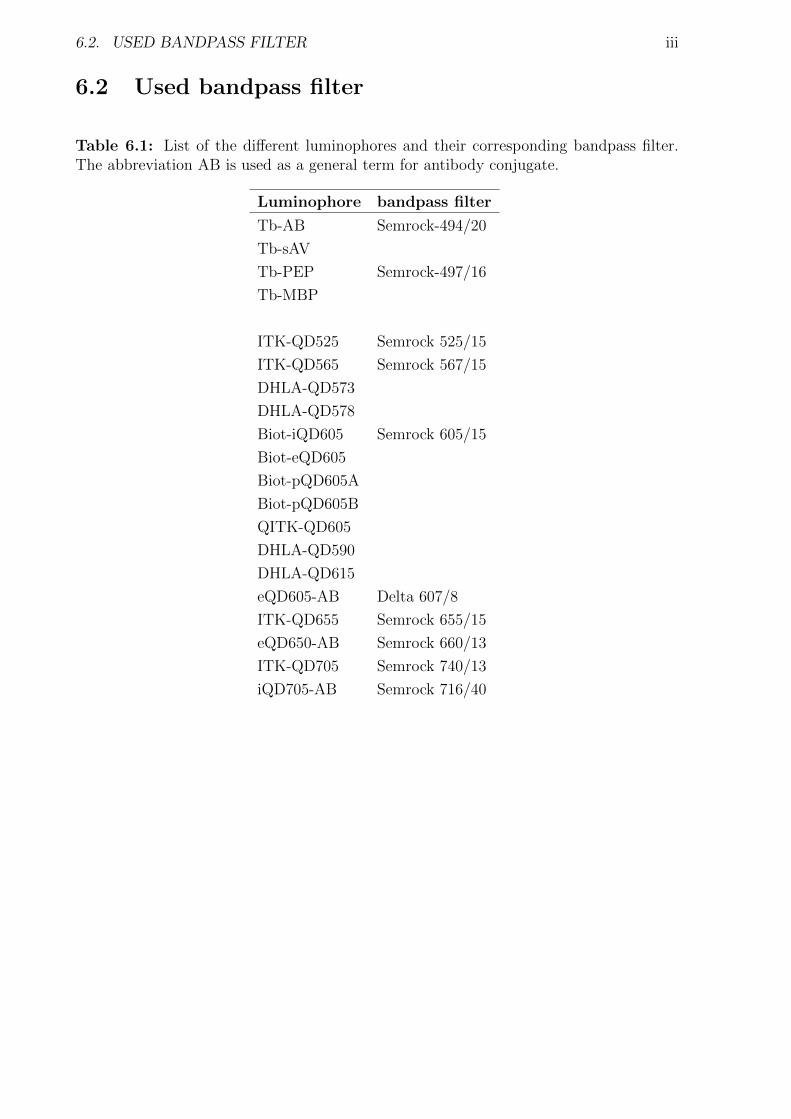
6.2. USED BANDPASS FILTER iii
6.2 Used bandpass filter
Table 6.1: List of the different luminophores and their corresponding bandpass filter.The abbreviation AB is used as a general term for antibody conjugate.
Luminophore bandpass filter
Tb-AB Semrock-494/20
Tb-sAV
Tb-PEP Semrock-497/16
Tb-MBP
ITK-QD525 Semrock 525/15
ITK-QD565 Semrock 567/15
DHLA-QD573
DHLA-QD578
Biot-iQD605 Semrock 605/15
Biot-eQD605
Biot-pQD605A
Biot-pQD605B
QITK-QD605
DHLA-QD590
DHLA-QD615
eQD605-AB Delta 607/8
ITK-QD655 Semrock 655/15
eQD650-AB Semrock 660/13
ITK-QD705 Semrock 740/13
iQD705-AB Semrock 716/40
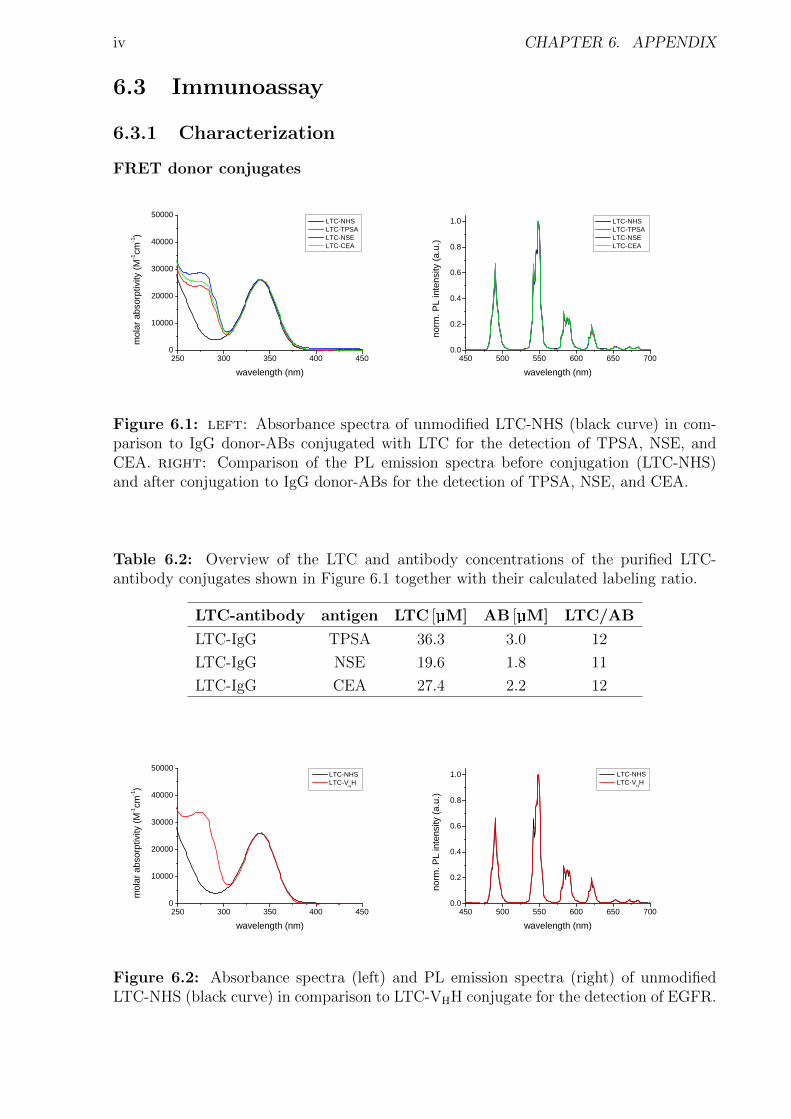
iv CHAPTER 6. APPENDIX
6.3 Immunoassay
6.3.1 Characterization
FRET donor conjugates
2 5 0 3 0 0 3 5 0 4 0 0 4 5 00
1 0 0 0 0
2 0 0 0 0
3 0 0 0 0
4 0 0 0 0
5 0 0 0 0 L T C - N H S L T C - T P S A L T C - N S E L T C - C E A
molar
abso
rptivit
y (M-1 cm
-1 )
w a v e l e n g t h ( n m )4 5 0 5 0 0 5 5 0 6 0 0 6 5 0 7 0 0
0 . 0
0 . 2
0 . 4
0 . 6
0 . 8
1 . 0 L T C - N H S L T C - T P S A L T C - N S E L T C - C E A
norm
. PL i
ntens
ity (a.
u.)
w a v e l e n g t h ( n m )
Figure 6.1: left: Absorbance spectra of unmodified LTC-NHS (black curve) in com-parison to IgG donor-ABs conjugated with LTC for the detection of TPSA, NSE, andCEA. right: Comparison of the PL emission spectra before conjugation (LTC-NHS)and after conjugation to IgG donor-ABs for the detection of TPSA, NSE, and CEA.
Table 6.2: Overview of the LTC and antibody concentrations of the purified LTC-antibody conjugates shown in Figure 6.1 together with their calculated labeling ratio.
LTC-antibody antigen LTC [µM] AB [µM] LTC/AB
LTC-IgG TPSA 36.3 3.0 12
LTC-IgG NSE 19.6 1.8 11
LTC-IgG CEA 27.4 2.2 12
2 5 0 3 0 0 3 5 0 4 0 0 4 5 00
1 0 0 0 0
2 0 0 0 0
3 0 0 0 0
4 0 0 0 0
5 0 0 0 0 L T C - N H S L T C - V H H
molar
abso
rptivit
y (M-1 cm
-1 )
w a v e l e n g t h ( n m )4 5 0 5 0 0 5 5 0 6 0 0 6 5 0 7 0 0
0 . 0
0 . 2
0 . 4
0 . 6
0 . 8
1 . 0 L T C - N H S L T C - V H H
norm
. PL i
ntens
ity (a.
u.)
w a v e l e n g t h ( n m )
Figure 6.2: Absorbance spectra (left) and PL emission spectra (right) of unmodifiedLTC-NHS (black curve) in comparison to LTC-VHH conjugate for the detection of EGFR.

6.3. IMMUNOASSAY v
Table 6.3: Concentration of the LTC and VHH of the probe together with the calculatedlabeling ratio for the detection of EGFR.
LTC-antibody antigen LTC [µM] AB [µM] LTC/AB
LTC-VHH EGFR 3.6 2.5 1.4
0 2 4 6 8 1 00 . 0 1
0 . 1
1
1 0 L T C - N H S L T C - T P S A L T C - N S E L T C - C E A
rel. P
L inte
nsity
(a.u.)
t i m e ( m s )
Figure 6.3: Comparison of the PL decay curves before conjugation (LTC-NHS) andafter conjugation to IgG donor-ABs for the detection of TPSA, NSE, and CEA.
Table 6.4: Overview about the fitted single decay times, calculated average decay timesand QYs for LTC-NHS and LTC-antibody conjugates measured in buffer 8.
LTC-antibody antigen τi / ms Ai 〈τ〉Int / ms 〈τ〉Amp / ms ΦLTC
LTC-NHS 1.7 303 2.8 2.8 0.812.9 2012
LTC-IgG TPSA 1.4 250 2.8 2.6 0.763.0 733
LTC-IgG NSE 1.5 213 2.8 2.7 0.783.0 879
LTC-IgG CEA 1.1 258 2.8 2.6 0.762.9 1485
Table 6.5: Overview of the fitted single decay times, the calculated average decay timesand the QYs of the LTC-antibody conjugates measured in presence of 30 % newborn calfserum.
LTC-antibody antigen τi / ms Ai 〈τ〉Int / ms 〈τ〉Amp / ms ΦLTC
LTC-IgG TPSA 0.8 1318 2.3 2.2 0.652.3 15838
LTC-IgG NSE 0.6 1095 2.2 2.1 0.602.3 8828
LTC-IgG CEA 0.5 989 2.2 2.1 0.612.3 8067
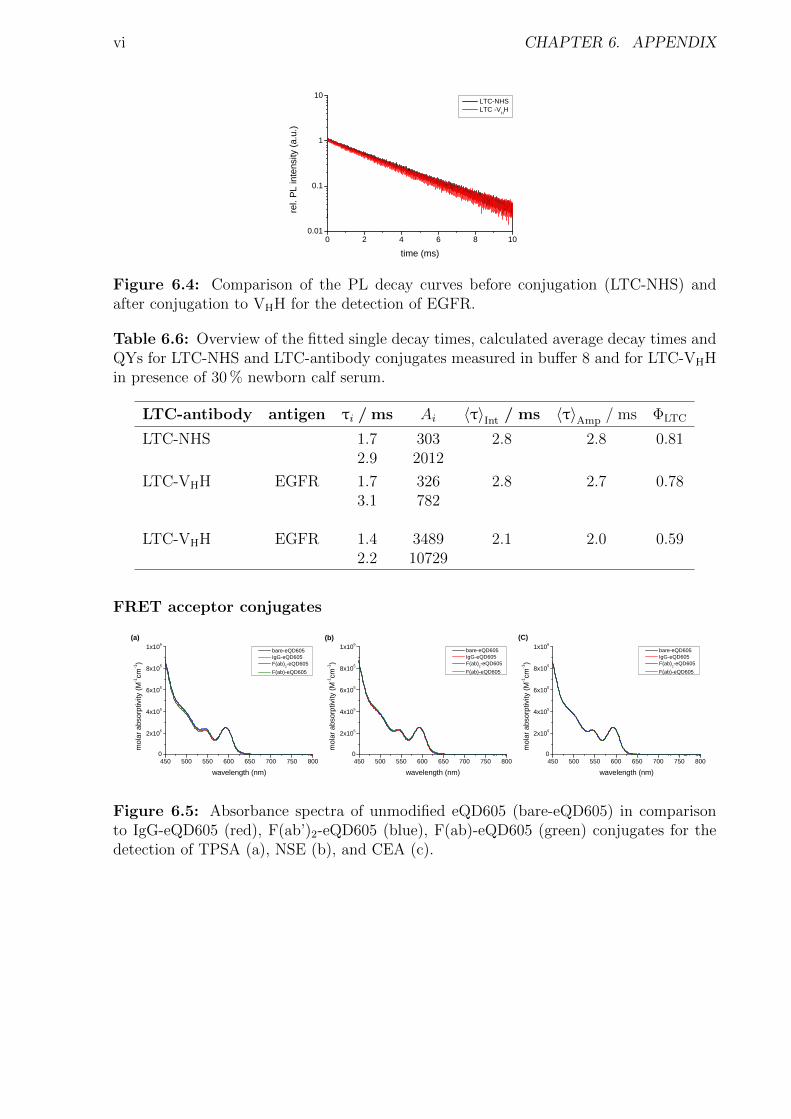
vi CHAPTER 6. APPENDIX
0 2 4 6 8 1 00 . 0 1
0 . 1
1
1 0 L T C - N H S L T C - V H H
rel. P
L inte
nsity
(a.u.)
t i m e ( m s )
Figure 6.4: Comparison of the PL decay curves before conjugation (LTC-NHS) andafter conjugation to VHH for the detection of EGFR.
Table 6.6: Overview of the fitted single decay times, calculated average decay times andQYs for LTC-NHS and LTC-antibody conjugates measured in buffer 8 and for LTC-VHHin presence of 30 % newborn calf serum.
LTC-antibody antigen τi / ms Ai 〈τ〉Int / ms 〈τ〉Amp / ms ΦLTC
LTC-NHS 1.7 303 2.8 2.8 0.812.9 2012
LTC-VHH EGFR 1.7 326 2.8 2.7 0.783.1 782
LTC-VHH EGFR 1.4 3489 2.1 2.0 0.592.2 10729
FRET acceptor conjugates
4 5 0 5 0 0 5 5 0 6 0 0 6 5 0 7 0 0 7 5 0 8 0 00
2 x 1 0 5
4 x 1 0 5
6 x 1 0 5
8 x 1 0 5
1 x 1 0 6( a )
molar
abso
rptivit
y (M-1 cm
-1 )
w a v e l e n g t h ( n m )
b a r e - e Q D 6 0 5 I g G - e Q D 6 0 5 F ( a b ) 2 - e Q D 6 0 5 F ( a b ) - e Q D 6 0 5
4 5 0 5 0 0 5 5 0 6 0 0 6 5 0 7 0 0 7 5 0 8 0 00
2 x 1 0 5
4 x 1 0 5
6 x 1 0 5
8 x 1 0 5
1 x 1 0 6( b )
molar
abso
rptivit
y (M-1 cm
-1 )
w a v e l e n g t h ( n m )
b a r e - e Q D 6 0 5 I g G - e Q D 6 0 5 F ( a b ) 2 - e Q D 6 0 5 F ( a b ) - e Q D 6 0 5
4 5 0 5 0 0 5 5 0 6 0 0 6 5 0 7 0 0 7 5 0 8 0 00
2 x 1 0 5
4 x 1 0 5
6 x 1 0 5
8 x 1 0 5
1 x 1 0 6
molar
abso
rptivit
y (M-1 cm
-1 )
w a v e l e n g t h ( n m )
b a r e - e Q D 6 0 5 I g G - e Q D 6 0 5 F ( a b ) 2 - e Q D 6 0 5 F ( a b ) - e Q D 6 0 5
( C )
Figure 6.5: Absorbance spectra of unmodified eQD605 (bare-eQD605) in comparisonto IgG-eQD605 (red), F(ab’)2-eQD605 (blue), F(ab)-eQD605 (green) conjugates for thedetection of TPSA (a), NSE (b), and CEA (c).

6.3. IMMUNOASSAY vii
4 5 0 5 0 0 5 5 0 6 0 0 6 5 0 7 0 0 7 5 0 8 0 00
2 x 1 0 6
4 x 1 0 6
6 x 1 0 6
8 x 1 0 6( a )
molar
abso
rptivit
y (M-1 cm
-1 )
w a v e l e n g t h ( n m )
b a r e - e Q D 6 5 0 I g G - e Q D 6 5 0 F ( a b ) 2 - e Q D 6 5 0 F ( a b ) - e Q D 6 5 0
4 5 0 5 0 0 5 5 0 6 0 0 6 5 0 7 0 0 7 5 0 8 0 00
2 x 1 0 6
4 x 1 0 6
6 x 1 0 6
8 x 1 0 6( b )
molar
abso
rptivit
y (M-1 cm
-1 )
w a v e l e n g t h ( n m )
b a r e - e Q D 6 5 0 I g G - e Q D 6 5 0 F ( a b ) 2 - e Q D 6 5 0 F ( a b ) - e Q D 6 5 0
4 5 0 5 0 0 5 5 0 6 0 0 6 5 0 7 0 0 7 5 0 8 0 00
2 x 1 0 6
4 x 1 0 6
6 x 1 0 6
8 x 1 0 6( c )
molar
abso
rptivit
y (M-1 cm
-1 )
w a v e l e n g t h ( n m )
b a r e - e Q D 6 5 0 I g G - e Q D 6 5 0 F ( a b ) 2 - e Q D 6 5 0 F ( a b ) - e Q D 6 5 0
Figure 6.6: Absorbance spectra of unmodified eQD650 (bare-eQD650) in comparisonto IgG-eQD650 (red), F(ab’)2-eQD650 (blue), F(ab)-eQD650 (green) conjugates for thedetection of TPSA (a), NSE (b), and CEA (c).
4 5 0 5 0 0 5 5 0 6 0 0 6 5 0 7 0 0 7 5 0 8 0 00
2 x 1 0 6
4 x 1 0 6
6 x 1 0 6
8 x 1 0 6
molar
abso
rptivit
y (M-1 cm
-1 )
w a v e l e n g t h ( n m )
b a r e - e Q D 6 5 0 V H H - e Q D 6 5 0
5 0 0 6 0 0 7 0 0 8 0 00
2 x 1 0 6
4 x 1 0 6
6 x 1 0 6
8 x 1 0 6mo
lar ab
sorpt
ivity (
M-1 cm-1 )
w a v e l e n g t h ( n m )
b a r e - i Q D 7 0 5 F ( a b ) 2 - i Q D 7 0 5
Figure 6.7: Absorbance spectra of unmodified eQD650 (bare-eQD650) and iQD705(bare-iQD705) in comparison to VHH-eQD650 for the detection of EGFR (left) andF(ab’)2-iQD705 for the detection of TPSA (right).
Table 6.7: Overview about QD and antibody concentrations and their resulting labelingratio for the different antibody-QD conjugates for the detection of TPSA used as probesin chapter 4.1.3.
antibody QD AB [µM] QD [µM] AB/QD
IgG eQD650 0.9 0.4 2.3
F(ab’)2 eQD650 1.1 0.3 3.7
F(ab) eQD650 4.6 0.3 15.3
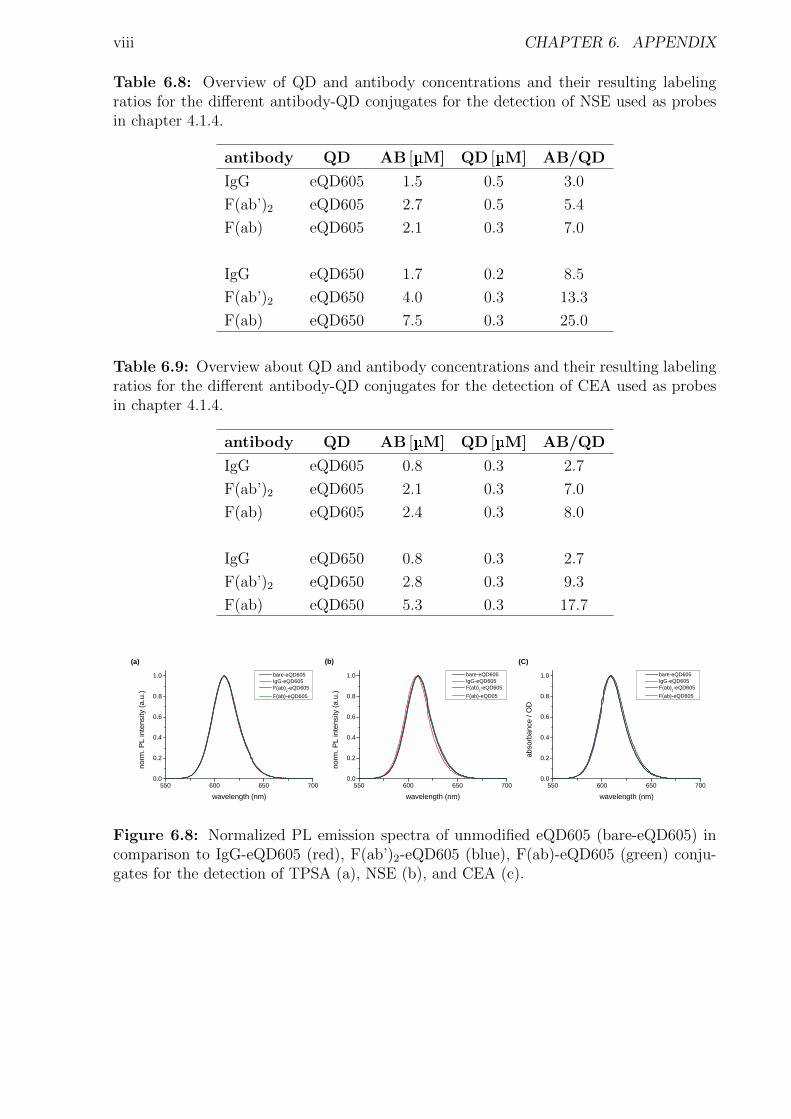
viii CHAPTER 6. APPENDIX
Table 6.8: Overview of QD and antibody concentrations and their resulting labelingratios for the different antibody-QD conjugates for the detection of NSE used as probesin chapter 4.1.4.
antibody QD AB [µM] QD [µM] AB/QD
IgG eQD605 1.5 0.5 3.0
F(ab’)2 eQD605 2.7 0.5 5.4
F(ab) eQD605 2.1 0.3 7.0
IgG eQD650 1.7 0.2 8.5
F(ab’)2 eQD650 4.0 0.3 13.3
F(ab) eQD650 7.5 0.3 25.0
Table 6.9: Overview about QD and antibody concentrations and their resulting labelingratios for the different antibody-QD conjugates for the detection of CEA used as probesin chapter 4.1.4.
antibody QD AB [µM] QD [µM] AB/QD
IgG eQD605 0.8 0.3 2.7
F(ab’)2 eQD605 2.1 0.3 7.0
F(ab) eQD605 2.4 0.3 8.0
IgG eQD650 0.8 0.3 2.7
F(ab’)2 eQD650 2.8 0.3 9.3
F(ab) eQD650 5.3 0.3 17.7
5 5 0 6 0 0 6 5 0 7 0 00 . 0
0 . 2
0 . 4
0 . 6
0 . 8
1 . 0( a )
norm
. PL i
ntens
ity (a.
u.)
w a v e l e n g t h ( n m )
b a r e - e Q D 6 0 5 I g G - e Q D 6 0 5 F ( a b ) 2 - e Q D 6 0 5 F ( a b ) - e Q D 6 0 5
5 5 0 6 0 0 6 5 0 7 0 00 . 0
0 . 2
0 . 4
0 . 6
0 . 8
1 . 0( b )
norm
. PL i
ntens
ity (a.
u.)
w a v e l e n g t h ( n m )
b a r e - e Q D 6 0 5 I g G - e Q D 6 0 5 F ( a b ) 2 - e Q D 6 0 5 F ( a b ) - e Q D 0 5
5 5 0 6 0 0 6 5 0 7 0 00 . 0
0 . 2
0 . 4
0 . 6
0 . 8
1 . 0( C )
abso
rbanc
e / O
D
w a v e l e n g t h ( n m )
b a r e - e Q D 6 0 5 I g G - e Q D 6 0 5 F ( a b ) 2 - e Q D 6 0 5 F ( a b ) - e Q D 6 0 5
Figure 6.8: Normalized PL emission spectra of unmodified eQD605 (bare-eQD605) incomparison to IgG-eQD605 (red), F(ab’)2-eQD605 (blue), F(ab)-eQD605 (green) conju-gates for the detection of TPSA (a), NSE (b), and CEA (c).

6.3. IMMUNOASSAY ix
5 5 0 6 0 0 6 5 0 7 0 0 7 5 00 . 0
0 . 2
0 . 4
0 . 6
0 . 8
1 . 0( a )
norm
. PL i
ntens
ity (a.
u.)
w a v e l e n g t h ( n m )
b a r e - e Q D 6 5 0 I g G - e Q D 6 5 0 F ( a b ) 2 - e Q D 6 5 0 F ( a b ) - e Q D 6 5 0
6 0 0 6 5 0 7 0 00 . 0
0 . 2
0 . 4
0 . 6
0 . 8
1 . 0( b )
norm
. PL i
ntens
ity (a.
u.)
w a v e l e n g t h ( n m )
b a r e - e Q D 6 5 0 I g G - e Q D 6 5 0 F ( a b ) 2 - e Q D 6 5 0 F ( a b ) - e Q D 6 5 0
5 5 0 6 0 0 6 5 0 7 0 0 7 5 00 . 0
0 . 2
0 . 4
0 . 6
0 . 8
1 . 0( c )
norm
. PL i
ntens
ity (a.
u.)
w a v e l e n g t h ( n m )
b a r e - e Q D 6 5 0 I g G - e Q D 6 5 0 F ( a b ) 2 - e Q D 6 5 0 F ( a b ) - e Q D 6 5 0
Figure 6.9: Normalized PL emission spectra of unmodified eQD650 (bare-eQD650) incomparison to IgG-eQD650 (red), F(ab’)2-eQD650 (blue), F(ab)-eQD650 (green) conju-gates for the detection of TPSA in chapter 4.1.3 (a) and for TPSA (b) and CEA (c)detection in chapter 4.1.4.
5 5 0 6 0 0 6 5 0 7 0 0 7 5 00 . 0
0 . 2
0 . 4
0 . 6
0 . 8
1 . 0
norm
. PL i
ntens
ity (a.
u.)
w a v e l e n g t h ( n m )
b a r e - e Q D 6 5 0 V H H - e Q D 6 5 0
5 5 0 6 0 0 6 5 0 7 0 0 7 5 0 8 0 0 8 5 00 . 0
0 . 2
0 . 4
0 . 6
0 . 8
1 . 0no
rm. P
L inte
nsity
(a.u.)
w a v e l e n g t h ( n m )
Figure 6.10: Normalized PL emission spectra of unmodified eQD650 (bare-eQD650) incomparison to VHH-eQD650 for the detection of EGFR (left) and F(ab’)2-iQD705 PLemission spectrum for the detection of TPSA (right).
0 1 5 0 3 0 0 4 5 01 0
1 0 0
1 0 0 0
1 0 0 0 0( a )
PL in
tensity
(cou
nts)
t i m e ( n s )
b a r e - e Q D 6 0 5 I g G - e Q D 6 0 5 F ( a b ) 2 - e Q D 6 0 5 F ( a b ) - e Q D 6 0 5
0 1 5 0 3 0 0 4 5 01 0
1 0 0
1 0 0 0
1 0 0 0 0( b )
PL in
tensity
(cou
nts)
t i m e ( n s )
b a r e - e Q D 6 0 5 I g G - e Q D 6 0 5 F ( a b ) 2 - e Q D 6 0 5 F ( a b ) - e Q D 6 0 5
0 1 5 0 3 0 0 4 5 01 0
1 0 0
1 0 0 0
1 0 0 0 0( C )
PL in
tensity
(cou
nts)
t i m e ( n s )
b a r e - e Q D 6 0 5 I g G - e Q D 6 0 5 F ( a b ) 2 - e Q D 6 0 5 F ( a b ) - e Q D 6 0 5
Figure 6.11: PL decay curves of unmodified eQD605 (bare-eQD605) in comparisonto IgG-eQD605 (red), F(ab’)2-eQD605 (blue), F(ab)-eQD605 (green) conjugates for thedetection of TPSA (a), NSE (b), and CEA (c).
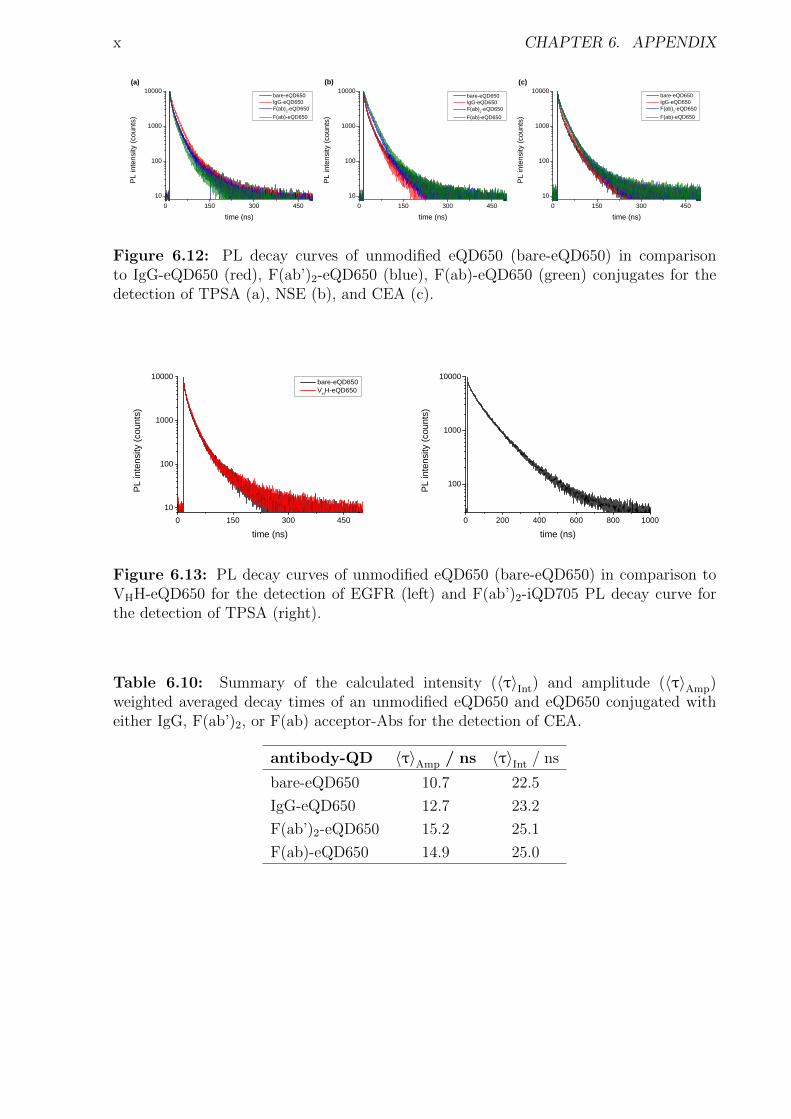
x CHAPTER 6. APPENDIX
0 1 5 0 3 0 0 4 5 01 0
1 0 0
1 0 0 0
1 0 0 0 0( a )
PL in
tensity
(cou
nts)
t i m e ( n s )
b a r e - e Q D 6 5 0 I g G - e Q D 6 5 0 F ( a b ) 2 - e Q D 6 5 0 F ( a b ) - e Q D 6 5 0
0 1 5 0 3 0 0 4 5 01 0
1 0 0
1 0 0 0
1 0 0 0 0( b )
PL in
tensity
(cou
nts)
t i m e ( n s )
b a r e - e Q D 6 5 0 I g G - e Q D 6 5 0 F ( a b ) 2 - e Q D 6 5 0 F ( a b ) - e Q D 6 5 0
0 1 5 0 3 0 0 4 5 01 0
1 0 0
1 0 0 0
1 0 0 0 0( c )
PL in
tensity
(cou
nts)
t i m e ( n s )
b a r e - e Q D 6 5 0 I g G - e Q D 6 5 0 F ( a b ) 2 - e Q D 6 5 0 F ( a b ) - e Q D 6 5 0
Figure 6.12: PL decay curves of unmodified eQD650 (bare-eQD650) in comparisonto IgG-eQD650 (red), F(ab’)2-eQD650 (blue), F(ab)-eQD650 (green) conjugates for thedetection of TPSA (a), NSE (b), and CEA (c).
0 1 5 0 3 0 0 4 5 01 0
1 0 0
1 0 0 0
1 0 0 0 0
PL in
tensity
(cou
nts)
t i m e ( n s )
b a r e - e Q D 6 5 0 V H H - e Q D 6 5 0
0 2 0 0 4 0 0 6 0 0 8 0 0 1 0 0 0
1 0 0
1 0 0 0
1 0 0 0 0
PL in
tensity
(cou
nts)
t i m e ( n s )
Figure 6.13: PL decay curves of unmodified eQD650 (bare-eQD650) in comparison toVHH-eQD650 for the detection of EGFR (left) and F(ab’)2-iQD705 PL decay curve forthe detection of TPSA (right).
Table 6.10: Summary of the calculated intensity (〈τ〉Int) and amplitude (〈τ〉Amp)weighted averaged decay times of an unmodified eQD650 and eQD650 conjugated witheither IgG, F(ab’)2, or F(ab) acceptor-Abs for the detection of CEA.
antibody-QD 〈τ〉Amp / ns 〈τ〉Int / ns
bare-eQD650 10.7 22.5
IgG-eQD650 12.7 23.2
F(ab’)2-eQD650 15.2 25.1
F(ab)-eQD650 14.9 25.0

6.3. IMMUNOASSAY xi
Table 6.11: Summary of the calculated intensity (〈τ〉Int) and amplitude (〈τ〉Amp)weighted averaged decay times of an unmodified eQD605 and eQD605 conjugated witheither IgG, F(ab’)2, or F(ab) acceptor-Abs for the detection of TPSA or NSE.
TPSA NSEantibody-QD 〈τ〉Amp / ns 〈τ〉Int / ns 〈τ〉Amp / ns 〈τ〉Int / ns
bare-eQD605 8.6 21.1 8.6 21.1
IgG-eQD605 11.5 21.6 9.0 20.0
F(ab’)2-eQD605 9.7 20.0 12.0 21.7
F(ab)-eQD605 6.5 16.4 9.8 20.0
Table 6.12: Summary of the calculated intensity (〈τ〉Int) and amplitude (〈τ〉Amp)weighted averaged decay times of an unmodified eQD605 and eQD605 conjugated witheither IgG, F(ab’)2, or F(ab) acceptor-Abs for the detection of CEA.
antibody-QD 〈τ〉Amp / ns 〈τ〉Int / ns
bare-eQD605 8.6 21.1
IgG-eQD605 12.3 22.3
F(ab’)2-eQD605 13.2 22.8
F(ab)-eQD605 11.3 21.7
Table 6.13: Summary of the calculated intensity (〈τ〉Int) and amplitude (〈τ〉Amp)weighted averaged decay times of an unmodified eQD650 and eQD650 conjugated withVHH for the detection of EGFR.
antibody-QD 〈τ〉Amp / ns 〈τ〉Int / ns
bare-eQD650 10.7 22.5
VHH-eQD650 11.5 22.7
Table 6.14: Summary of the calculated intensity (〈τ〉Int) and amplitude (〈τ〉Amp)weighted averaged decay times of iQD705 conjugated with F(ab’)2 acceptor-Abs for thedetection of TPSA.
antibody-QD 〈τ〉Amp / ns 〈τ〉Int / ns
F(ab’)2-iQD705 65.5 104.1
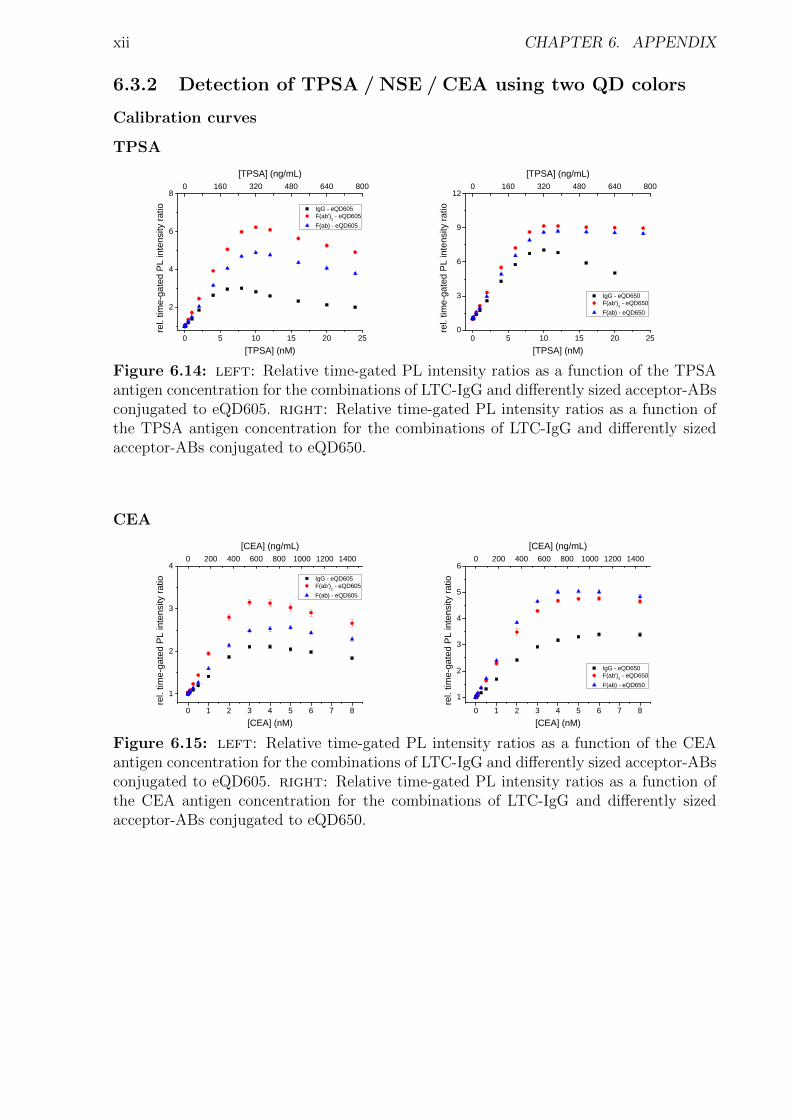
xii CHAPTER 6. APPENDIX
6.3.2 Detection of TPSA / NSE / CEA using two QD colors
Calibration curves
TPSA
0 5 1 0 1 5 2 0 2 5
2
4
6
8 I g G - e Q D 6 0 5 F ( a b ’ ) 2 - e Q D 6 0 5 F ( a b ) - e Q D 6 0 5
rel. ti
me-ga
ted PL
inten
sity ra
tio
[ T P S A ] ( n M )
0 1 6 0 3 2 0 4 8 0 6 4 0 8 0 0[ T P S A ] ( n g / m L )
0 5 1 0 1 5 2 0 2 50
3
6
9
1 2
I g G - e Q D 6 5 0 F ( a b ’ ) 2 - e Q D 6 5 0 F ( a b ) - e Q D 6 5 0
rel. ti
me-ga
ted PL
inten
sity ra
tio
[ T P S A ] ( n M )
0 1 6 0 3 2 0 4 8 0 6 4 0 8 0 0[ T P S A ] ( n g / m L )
Figure 6.14: left: Relative time-gated PL intensity ratios as a function of the TPSAantigen concentration for the combinations of LTC-IgG and differently sized acceptor-ABsconjugated to eQD605. right: Relative time-gated PL intensity ratios as a function ofthe TPSA antigen concentration for the combinations of LTC-IgG and differently sizedacceptor-ABs conjugated to eQD650.
CEA
0 1 2 3 4 5 6 7 81
2
3
4 I g G - e Q D 6 0 5 F ( a b ’ ) 2 - e Q D 6 0 5 F ( a b ) - e Q D 6 0 5
rel. ti
me-ga
ted PL
inten
sity ra
tio
[ C E A ] ( n M )
0 2 0 0 4 0 0 6 0 0 8 0 0 1 0 0 0 1 2 0 0 1 4 0 0[ C E A ] ( n g / m L )
0 1 2 3 4 5 6 7 81
2
3
4
5
6
I g G - e Q D 6 5 0 F ( a b ’ ) 2 - e Q D 6 5 0 F ( a b ) - e Q D 6 5 0
rel. ti
me-ga
ted PL
inten
sity ra
tio
[ C E A ] ( n M )
0 2 0 0 4 0 0 6 0 0 8 0 0 1 0 0 0 1 2 0 0 1 4 0 0[ C E A ] ( n g / m L )
Figure 6.15: left: Relative time-gated PL intensity ratios as a function of the CEAantigen concentration for the combinations of LTC-IgG and differently sized acceptor-ABsconjugated to eQD605. right: Relative time-gated PL intensity ratios as a function ofthe CEA antigen concentration for the combinations of LTC-IgG and differently sizedacceptor-ABs conjugated to eQD650.
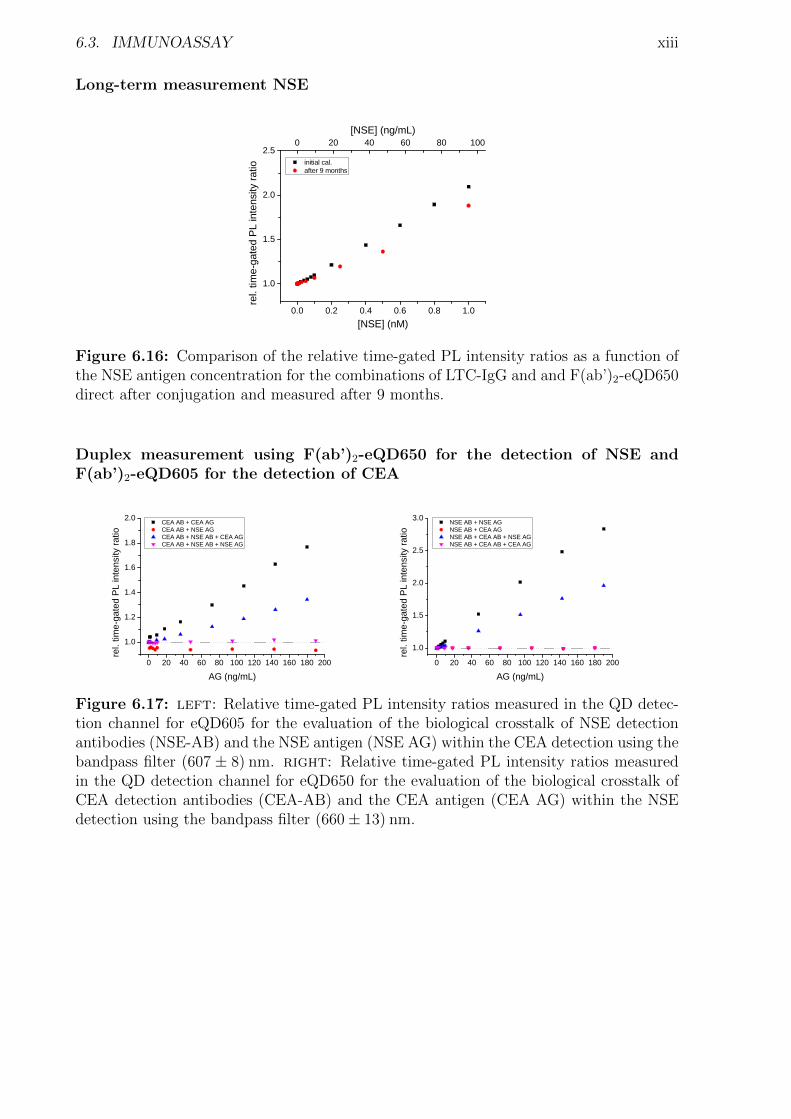
6.3. IMMUNOASSAY xiii
Long-term measurement NSE
0 . 0 0 . 2 0 . 4 0 . 6 0 . 8 1 . 0
1 . 0
1 . 5
2 . 0
2 . 5 i n i t i a l c a l . a f t e r 9 m o n t h s
rel. ti
me-ga
ted PL
inten
sity ra
tio
[ N S E ] ( n M )
0 2 0 4 0 6 0 8 0 1 0 0[ N S E ] ( n g / m L )
Figure 6.16: Comparison of the relative time-gated PL intensity ratios as a function ofthe NSE antigen concentration for the combinations of LTC-IgG and and F(ab’)2-eQD650direct after conjugation and measured after 9 months.
Duplex measurement using F(ab’)2-eQD650 for the detection of NSE andF(ab’)2-eQD605 for the detection of CEA
0 2 0 4 0 6 0 8 0 1 0 0 1 2 0 1 4 0 1 6 0 1 8 0 2 0 0
1 . 0
1 . 2
1 . 4
1 . 6
1 . 8
2 . 0 C E A A B + C E A A G C E A A B + N S E A G C E A A B + N S E A B + C E A A G C E A A B + N S E A B + N S E A G
rel. ti
me-ga
ted PL
inten
sity ra
tio
A G ( n g / m L )0 2 0 4 0 6 0 8 0 1 0 0 1 2 0 1 4 0 1 6 0 1 8 0 2 0 0
1 . 0
1 . 5
2 . 0
2 . 5
3 . 0 N S E A B + N S E A G N S E A B + C E A A G N S E A B + C E A A B + N S E A G N S E A B + C E A A B + C E A A G
rel. ti
me-ga
ted PL
inten
sity ra
tio
A G ( n g / m L )
Figure 6.17: left: Relative time-gated PL intensity ratios measured in the QD detec-tion channel for eQD605 for the evaluation of the biological crosstalk of NSE detectionantibodies (NSE-AB) and the NSE antigen (NSE AG) within the CEA detection using thebandpass filter (607 ± 8) nm. right: Relative time-gated PL intensity ratios measuredin the QD detection channel for eQD650 for the evaluation of the biological crosstalk ofCEA detection antibodies (CEA-AB) and the CEA antigen (CEA AG) within the NSEdetection using the bandpass filter (660± 13) nm.
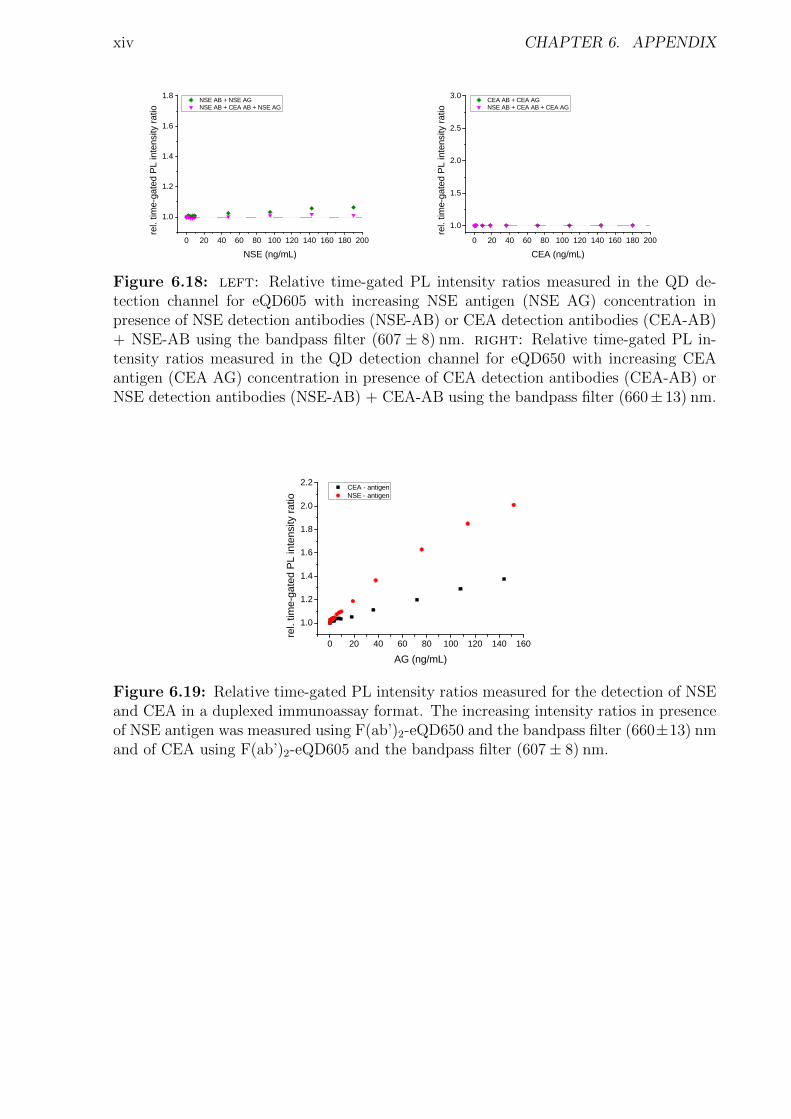
xiv CHAPTER 6. APPENDIX
0 2 0 4 0 6 0 8 0 1 0 0 1 2 0 1 4 0 1 6 0 1 8 0 2 0 0
1 . 0
1 . 2
1 . 4
1 . 6
1 . 8 N S E A B + N S E A G N S E A B + C E A A B + N S E A G
rel. ti
me-ga
ted PL
inten
sity ra
tio
N S E ( n g / m L )0 2 0 4 0 6 0 8 0 1 0 0 1 2 0 1 4 0 1 6 0 1 8 0 2 0 0
1 . 0
1 . 5
2 . 0
2 . 5
3 . 0 C E A A B + C E A A G N S E A B + C E A A B + C E A A G
rel. ti
me-ga
ted PL
inten
sity ra
tio
C E A ( n g / m L )
Figure 6.18: left: Relative time-gated PL intensity ratios measured in the QD de-tection channel for eQD605 with increasing NSE antigen (NSE AG) concentration inpresence of NSE detection antibodies (NSE-AB) or CEA detection antibodies (CEA-AB)+ NSE-AB using the bandpass filter (607 ± 8) nm. right: Relative time-gated PL in-tensity ratios measured in the QD detection channel for eQD650 with increasing CEAantigen (CEA AG) concentration in presence of CEA detection antibodies (CEA-AB) orNSE detection antibodies (NSE-AB) + CEA-AB using the bandpass filter (660± 13) nm.
0 2 0 4 0 6 0 8 0 1 0 0 1 2 0 1 4 0 1 6 01 . 0
1 . 2
1 . 4
1 . 6
1 . 8
2 . 0
2 . 2 C E A - a n t i g e n N S E - a n t i g e n
rel. ti
me-ga
ted PL
inten
sity ra
tio
A G ( n g / m L )
Figure 6.19: Relative time-gated PL intensity ratios measured for the detection of NSEand CEA in a duplexed immunoassay format. The increasing intensity ratios in presenceof NSE antigen was measured using F(ab’)2-eQD650 and the bandpass filter (660±13) nmand of CEA using F(ab’)2-eQD605 and the bandpass filter (607± 8) nm.
6.3. IMMUNOASSAY xv
6.3.3 Influence of the fragmentation
Original publication:
Quantum-Dot-Based Forster Resonance Energy TransferImmunoassay for Sensitive Clinical Diagnostics of Low-Volume
Serum Samples.K. D. Wegner, Z. Jin, S. Linden, T. L. Jennings, and N. Hildebrandt.
ACS Nano 2013, 7 (8), 7411-7419.

WEGNER ET AL. VOL. 7 ’ NO. 8 ’ 7411–7419 ’ 2013
www.acsnano.org
7411
August 02, 2013
C 2013 American Chemical Society
Quantum-Dot-Based Förster ResonanceEnergy Transfer Immunoassay forSensitive Clinical Diagnosticsof Low-Volume Serum SamplesK. David Wegner,† Zongwen Jin,† Stina Linden,† Travis L. Jennings,‡ and Niko Hildebrandt†,*
†Institut d'Electronique Fondamentale, Université Paris-Sud, 91405 Orsay Cedex, France and ‡eBioscience, Inc., 10255 Science Center Drive, San Diego,California 92121, United States
Next generation molecular diagno-stics platforms are focusing onemerging technologies capable of
providing rapid assays with enhanced sen-sitivity and efficient multiplexing perfor-mance for biomarker detection.1 A majordriving force is the desire to realize the goalsof personalized medicine and point-of-caretesting under clinically relevant conditions,especially for biomarkers found in blood,serum, or plasma.2 Nanobiophotonics, whichcouples the speed and sensitivity of lumines-cence with the ultrasmall dimensions ofnanoparticles,3 and in particular colloidalquantum dots (QDs), is in a competitiveposition to meet the challenging require-ments of multiplexed in vitro diagnostics(IVD). Although QDs offer distinct advan-tages in photostability with high brightnessand color tunability if used in appropriatesolvents,4�14 they have yet to gain acceptanceinto standard clinical practice as reporter tags,
due largely to either physical or chemicalstability issues or insufficient sensitivity inbiological media such as serum or plasma.15
A highly specific QDbioconjugate capable of
preserving its advantageous optical proper-tieswithin such indispensable clinical samplematrices would be of immense utility toward
meeting IVD criteria.Tb-to-QD Förster resonance energy transfer
(FRET) has proven itself to be an effi-cient tool for spectro-temporal multiplex-ing, offering several unique advantagesover organic dye-based FRET systems forbiomolecular sensing.16�21 For specific andsensitive biomarker detection in homoge-neous sandwich assays, antibodies remainthe biomolecule of choice. However, thecombination of QDs with antibodies hasyet to be established within this context.Such developments have been hindered byinsufficient labeling chemistries and the largedonor�acceptor distances, which result from
* Address correspondence [email protected].
Received for review June 26, 2013and accepted August 2, 2013.
Published online10.1021/nn403253y
ABSTRACT A myriad of quantum dot (QD) biosensor examples have
emerged from the literature over the past decade, but despite their photo-
physical advantages, QDs have yet to find acceptance as standard fluorescent
reagents in clinical diagnostics. Lack of reproducible, stable, and robust
immunoassays using easily prepared QD-antibody conjugates has historically
plagued this field, preventing researchers from advancing the deeper issues
concerning assay sensitivity and clinically relevant detection limits on low-
volume serum samples. Here we demonstrate a ratiometric multiplexable FRET
immunoassay using Tb donors and QD acceptors, which overcomes all the
aforementioned limitations toward application in clinical diagnostics. We demonstrate the determination of prostate specific antigen (PSA) in 50μL serum samples
with subnanomolar (1.6 ng/mL) detection limits using time-gated detection and two different QD colors. This concentration is well below the clinical cutoff value of
PSA, which demonstrates the possibility of direct integration into real-life in vitro diagnostics. The application of IgG, F(ab0)2, and F(ab) antibodies makes our
homogeneous immunoassay highly flexible and ready-to-use for the sensitive and specific homogeneous detection of many different biomarkers.
KEYWORDS: FRET . quantum dot . terbium . multiplexing . immunoassay . PSA . diagnostics
ARTIC
LE
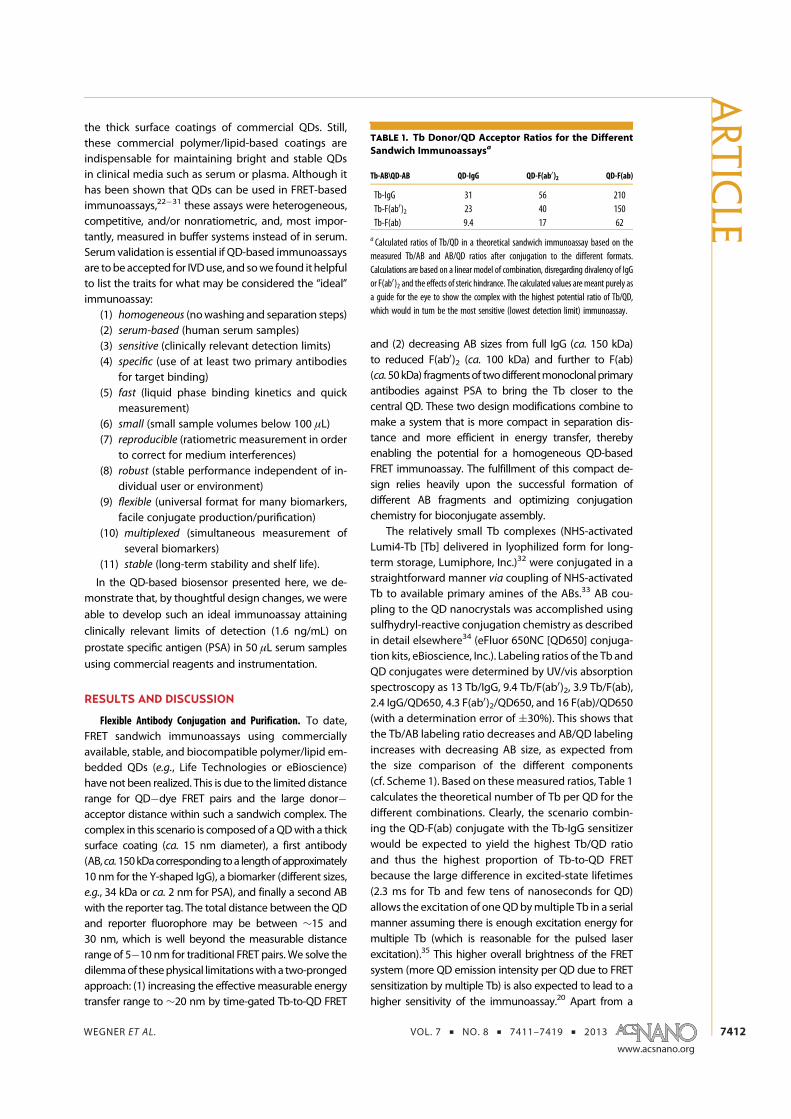
WEGNER ET AL. VOL. 7 ’ NO. 8 ’ 7411–7419 ’ 2013
www.acsnano.org
7412
the thick surface coatings of commercial QDs. Still,these commercial polymer/lipid-based coatings areindispensable for maintaining bright and stable QDsin clinical media such as serum or plasma. Although ithas been shown that QDs can be used in FRET-basedimmunoassays,22�31 these assays were heterogeneous,competitive, and/or nonratiometric, and, most impor-tantly, measured in buffer systems instead of in serum.Serumvalidation is essential if QD-based immunoassaysare tobeaccepted for IVDuse, and sowe found it helpfulto list the traits for what may be considered the “ideal”immunoassay:
(1) homogeneous (nowashing and separation steps)(2) serum-based (human serum samples)(3) sensitive (clinically relevant detection limits)(4) specific (use of at least two primary antibodies
for target binding)(5) fast (liquid phase binding kinetics and quick
measurement)(6) small (small sample volumes below 100 μL)(7) reproducible (ratiometric measurement in order
to correct for medium interferences)(8) robust (stable performance independent of in-
dividual user or environment)(9) flexible (universal format for many biomarkers,
facile conjugate production/purification)(10) multiplexed (simultaneous measurement of
several biomarkers)(11) stable (long-term stability and shelf life).
In the QD-based biosensor presented here, we de-monstrate that, by thoughtful design changes, we were
able to develop such an ideal immunoassay attaining
clinically relevant limits of detection (1.6 ng/mL) on
prostate specific antigen (PSA) in 50 μL serum samples
using commercial reagents and instrumentation.
RESULTS AND DISCUSSION
Flexible Antibody Conjugation and Purification. To date,FRET sandwich immunoassays using commerciallyavailable, stable, and biocompatible polymer/lipid em-bedded QDs (e.g., Life Technologies or eBioscience)have not been realized. This is due to the limited distancerange for QD�dye FRET pairs and the large donor�acceptor distance within such a sandwich complex. Thecomplex in this scenario is composed of aQDwith a thicksurface coating (ca. 15 nm diameter), a first antibody(AB,ca.150kDacorresponding toa lengthofapproximately10 nm for the Y-shaped IgG), a biomarker (different sizes,e.g., 34 kDa or ca. 2 nm for PSA), and finally a second ABwith the reporter tag. The total distance between the QDand reporter fluorophore may be between ∼15 and30 nm, which is well beyond the measurable distancerange of 5�10 nm for traditional FRET pairs. We solve thedilemmaof thesephysical limitationswitha two-prongedapproach: (1) increasing the effectivemeasurable energytransfer range to ∼20 nm by time-gated Tb-to-QD FRET
and (2) decreasing AB sizes from full IgG (ca. 150 kDa)to reduced F(ab0)2 (ca. 100 kDa) and further to F(ab)(ca.50kDa) fragmentsof twodifferentmonoclonalprimaryantibodies against PSA to bring the Tb closer to thecentral QD. These two design modifications combine tomake a system that is more compact in separation dis-tance and more efficient in energy transfer, therebyenabling the potential for a homogeneous QD-basedFRET immunoassay. The fulfillment of this compact de-sign relies heavily upon the successful formation ofdifferent AB fragments and optimizing conjugationchemistry for bioconjugate assembly.
The relatively small Tb complexes (NHS-activatedLumi4-Tb [Tb] delivered in lyophilized form for long-term storage, Lumiphore, Inc.)32 were conjugated in astraightforward manner via coupling of NHS-activatedTb to available primary amines of the ABs.33 AB cou-pling to the QD nanocrystals was accomplished usingsulfhydryl-reactive conjugation chemistry as describedin detail elsewhere34 (eFluor 650NC [QD650] conjuga-tion kits, eBioscience, Inc.). Labeling ratios of the Tb andQD conjugates were determined by UV/vis absorptionspectroscopy as 13 Tb/IgG, 9.4 Tb/F(ab0)2, 3.9 Tb/F(ab),2.4 IgG/QD650, 4.3 F(ab0)2/QD650, and 16 F(ab)/QD650(with a determination error of (30%). This shows thatthe Tb/AB labeling ratio decreases and AB/QD labelingincreases with decreasing AB size, as expected fromthe size comparison of the different components(cf. Scheme 1). Based on thesemeasured ratios, Table 1calculates the theoretical number of Tb per QD for thedifferent combinations. Clearly, the scenario combin-ing the QD-F(ab) conjugate with the Tb-IgG sensitizerwould be expected to yield the highest Tb/QD ratioand thus the highest proportion of Tb-to-QD FRETbecause the large difference in excited-state lifetimes(2.3 ms for Tb and few tens of nanoseconds for QD)allows the excitation of oneQDbymultiple Tb in a serialmanner assuming there is enough excitation energy formultiple Tb (which is reasonable for the pulsed laserexcitation).35 This higher overall brightness of the FRETsystem (more QD emission intensity per QD due to FRETsensitization by multiple Tb) is also expected to lead to ahigher sensitivity of the immunoassay.20 Apart from a
TABLE 1. Tb Donor/QD Acceptor Ratios for the Different
Sandwich Immunoassaysa
Tb-AB\QD-AB QD-IgG QD-F(ab0)2 QD-F(ab)
Tb-IgG 31 56 210Tb-F(ab0)2 23 40 150Tb-F(ab) 9.4 17 62
a Calculated ratios of Tb/QD in a theoretical sandwich immunoassay based on themeasured Tb/AB and AB/QD ratios after conjugation to the different formats.Calculations are based on a linear model of combination, disregarding divalency of IgGor F(ab0)2 and the effects of steric hindrance. The calculated values are meant purely asa guide for the eye to show the complex with the highest potential ratio of Tb/QD,which would in turn be the most sensitive (lowest detection limit) immunoassay.
ARTIC
LE

WEGNER ET AL. VOL. 7 ’ NO. 8 ’ 7411–7419 ’ 2013
www.acsnano.org
7413
possible higher FRET efficiency, the smaller ABs for QDconjugation have another important advantage, namely,an easier (QD-AB) conjugate purification (which is muchmore problematic for QD/IgG conjugates which aresimilar in size) by convenient spin column separation.One problem of high labeling ratios might be sterichindrance. The conjugation of ca. 16 F(ab) fragments ina random orientation on the QD surface might lead toinaccessibility of some F(ab)s to Tb-ABs via PSA binding,especially when the ABs are the relatively large IgGs. Aswould be expected from the Tb/QD ratio (Table 1), largerABs for QDs combined with smaller ABs for Tb weredisadvantageous (e.g., QD-IgG and Tb-F(ab) lead to fewlarge ABs on the QD and a low labeling ratio of Tb onsmall ABs; this results in the disadvantageous situation oflarge donor�acceptor distances and only few donor�acceptor pairs) and are therefore not treated furtherwithin this study.
In order to demonstrate the multiplexability ofour FRET assay by using different QD colors, we alsolabeled IgG antibodies to QD605 (eFluor 605NC,eBioscience) with an approximate labeling ratio of0.5 ( 0.3 IgG/QD605. The lower the labeling ratio, thehigher the probability to have a significant amount ofunconjugated QDs (assuming a Poisson distribution oflabeling), which cannot participate in FRET. However,due to the very long excited-state lifetimes of Tb,incomplete labeling is not problematic for FRET-basedassays.21 Unconjugated QDs provide a short-lived lu-minescence signal, which is not specific for binding to abiomarker and which contributes only very few back-ground signals that are largely suppressed due to time-gated detection in the millisecond range. FRET-sensi-tized QD emission can only be caused by binding withTb-ABs via PSA and is therefore specific for PSA. Thisluminescence is long-lived (due to sensitization bylong-lived Tb) and can therefore be efficiently distin-guished from the short-lived luminescence of unla-beled QDs.
Optical Characterization of the FRET Assays. The photo-physical properties (Figure 1) of Tb and QD were notinfluenced by AB conjugation. The broad overlap ofthe Tb emission and the QD absorption (Figure 1)combined with the large QD molar absorptivity values(especially for QD650) leads to very long Förster distances(donor�acceptor distance of 50% FRET efficiency), calcu-lated as R0 = 0.02108 (κ2ΦTbn
�4J)1/6 nm, with the FRETorientation factor κ2 = 2/3, the Tb-centered luminescencequantum yield ΦTb = 0.67 ( 0.5, the refractive indexn=1.35, and theoverlap integral J=
RFTbεQDλ
4dλ (from450to 700 nm with the area-normalized Tb emission spec-trum FTb and the QD molar absorptivity spectra εQD; cf.Figure 1). These values were R0 = 10.7 ( 0.5 nm andR0 = 7.7( 0.3 nm for the Tb-QD650 and Tb-QD605 FRETpairs, respectively. Taking into account that FRET ismeasurable between ca. 0.5 and 2 times R0, these largeFörster distances increase the FRET range to distances of
up to approximately 20 nm. Such Tb-to-QD FRET systemsfollow quite well the classical r�6 distance-dependentFRET model and have been studied extensivelybefore.17,18,20,21,35�40
All FRET assays contained 50 μL of each AB con-jugate (Tb and QD) at constant concentrations towhich 50 μL of serum with increasing concentrationsof PSA was added. For the QD650, all possible ABconfigurations from Scheme 1 were used. For QD605(which served to demonstrate the capability ofmultiplexing), only the IgG conjugates were applied.The Tb donor to QD acceptor distance (rDA) is expectedto be quite large due to two different antibodies, thePSA antigen and the thick QD coating. As mentionedabove, the system using two IgGs could easily leadto rDA values of ∼15 to 30 nm. In fact, an exact rDAestimation is extremely difficult because many dis-tance-determining factors need to be taken into ac-count: (1) the application of IgGs and smaller F(ab0)2and F(ab) fragments, (2) a random orientation anddistribution of the acceptor ABs on the QDs (as de-picted in Scheme 1), (3) a random distribution ofseveral Tb over the donor ABs, and (4) the variouspossible orientations and distances of the Tb-ABs tothe QD due to the flexibility of the “(Tb-AB)-PSA-(QD-AB)” binding and sterical hindrance problems forhighly labeled systems. Assuming a diameter of14 nm for the QD650,40 and a Tb-AB on the surfaceof the QD (due to the binding flexibility mentionedabove), the minimum rDA value would be approxi-mately 7 nm. The maximum distance would be causedby an elongated “(Tb-IgG)-PSA(QD-IgG)” system withTb and QD on opposite ends. This scenario would leadto a maximum rDA value of ca. 29 nm (10 nm IgG þ2 nm PSA þ 10 nm IgG þ 7 nm QD radius). Using the
Scheme 1. Principle of the QD-based homogeneous FRETimmunoassay. Tb-antibody conjugates (top) and QD-anti-body conjugates (bottom) contain each a different primaryantibody (which are further reduced to F(ab0)2 and F(ab)fragments) against PSA. All possible combinations of the sixdifferent conjugateswere used to specifically recognize PSA(P) in FRET sandwich immunoassays (center).
ARTIC
LE
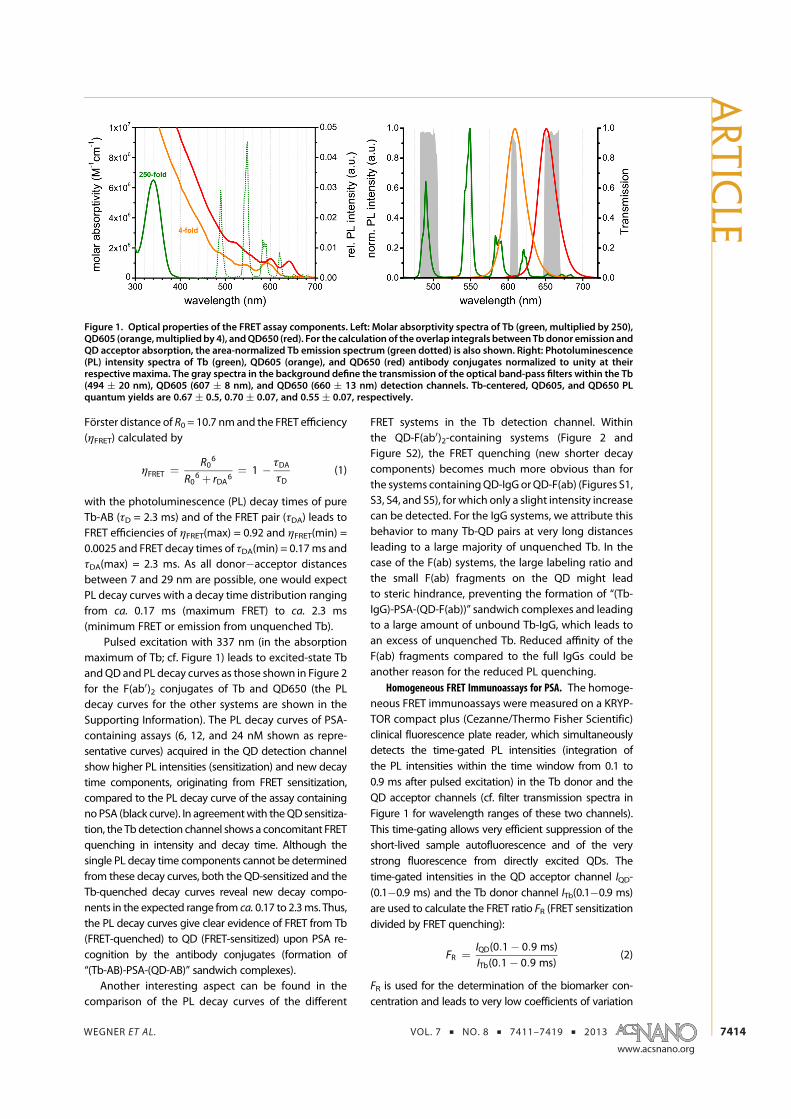
WEGNER ET AL. VOL. 7 ’ NO. 8 ’ 7411–7419 ’ 2013
www.acsnano.org
7414
Förster distance of R0 = 10.7 nmand the FRET efficiency(ηFRET) calculated by
ηFRET ¼ R06
R06 þ rDA6
¼ 1 � τDAτD
(1)
with the photoluminescence (PL) decay times of pureTb-AB (τD = 2.3 ms) and of the FRET pair (τDA) leads toFRET efficiencies of ηFRET(max) = 0.92 and ηFRET(min) =0.0025 and FRET decay times of τDA(min) = 0.17ms andτDA(max) = 2.3 ms. As all donor�acceptor distancesbetween 7 and 29 nm are possible, one would expectPL decay curves with a decay time distribution rangingfrom ca. 0.17 ms (maximum FRET) to ca. 2.3 ms(minimum FRET or emission from unquenched Tb).
Pulsed excitation with 337 nm (in the absorptionmaximum of Tb; cf. Figure 1) leads to excited-state TbandQD and PL decay curves as those shown in Figure 2for the F(ab0)2 conjugates of Tb and QD650 (the PLdecay curves for the other systems are shown in theSupporting Information). The PL decay curves of PSA-containing assays (6, 12, and 24 nM shown as repre-sentative curves) acquired in the QD detection channelshow higher PL intensities (sensitization) and new decaytime components, originating from FRET sensitization,compared to the PL decay curve of the assay containingno PSA (black curve). In agreementwith theQD sensitiza-tion, the Tb detection channel shows a concomitant FRETquenching in intensity and decay time. Although thesingle PL decay time components cannot be determinedfrom these decay curves, both the QD-sensitized and theTb-quenched decay curves reveal new decay compo-nents in the expected range from ca. 0.17 to 2.3ms. Thus,the PL decay curves give clear evidence of FRET from Tb(FRET-quenched) to QD (FRET-sensitized) upon PSA re-cognition by the antibody conjugates (formation of“(Tb-AB)-PSA-(QD-AB)” sandwich complexes).
Another interesting aspect can be found in thecomparison of the PL decay curves of the different
FRET systems in the Tb detection channel. Withinthe QD-F(ab0)2-containing systems (Figure 2 andFigure S2), the FRET quenching (new shorter decaycomponents) becomes much more obvious than forthe systems containingQD-IgG orQD-F(ab) (Figures S1,S3, S4, and S5), for which only a slight intensity increasecan be detected. For the IgG systems, we attribute thisbehavior to many Tb-QD pairs at very long distancesleading to a large majority of unquenched Tb. In thecase of the F(ab) systems, the large labeling ratio andthe small F(ab) fragments on the QD might leadto steric hindrance, preventing the formation of “(Tb-IgG)-PSA-(QD-F(ab))” sandwich complexes and leadingto a large amount of unbound Tb-IgG, which leads toan excess of unquenched Tb. Reduced affinity of theF(ab) fragments compared to the full IgGs could beanother reason for the reduced PL quenching.
Homogeneous FRET Immunoassays for PSA. The homoge-neous FRET immunoassays were measured on a KRYP-TOR compact plus (Cezanne/Thermo Fisher Scientific)clinical fluorescence plate reader, which simultaneouslydetects the time-gated PL intensities (integration ofthe PL intensities within the time window from 0.1 to0.9 ms after pulsed excitation) in the Tb donor and theQD acceptor channels (cf. filter transmission spectra inFigure 1 for wavelength ranges of these two channels).This time-gating allows very efficient suppression of theshort-lived sample autofluorescence and of the verystrong fluorescence from directly excited QDs. Thetime-gated intensities in the QD acceptor channel IQD-(0.1�0.9 ms) and the Tb donor channel ITb(0.1�0.9 ms)are used to calculate the FRET ratio FR (FRET sensitizationdivided by FRET quenching):
FR ¼ IQD(0:1� 0:9 ms)ITb(0:1� 0:9 ms)
(2)
FR is used for the determination of the biomarker con-centration and leads to very low coefficients of variation
Figure 1. Optical properties of the FRET assay components. Left: Molar absorptivity spectra of Tb (green, multiplied by 250),QD605 (orange,multipliedby 4), andQD650 (red). For the calculation of the overlap integrals betweenTb donor emission andQD acceptor absorption, the area-normalized Tb emission spectrum (green dotted) is also shown. Right: Photoluminescence(PL) intensity spectra of Tb (green), QD605 (orange), and QD650 (red) antibody conjugates normalized to unity at theirrespective maxima. The gray spectra in the background define the transmission of the optical band-pass filters within the Tb(494 ( 20 nm), QD605 (607 ( 8 nm), and QD650 (660 ( 13 nm) detection channels. Tb-centered, QD605, and QD650 PLquantum yields are 0.67 ( 0.5, 0.70 ( 0.07, and 0.55 ( 0.07, respectively.
ARTIC
LE
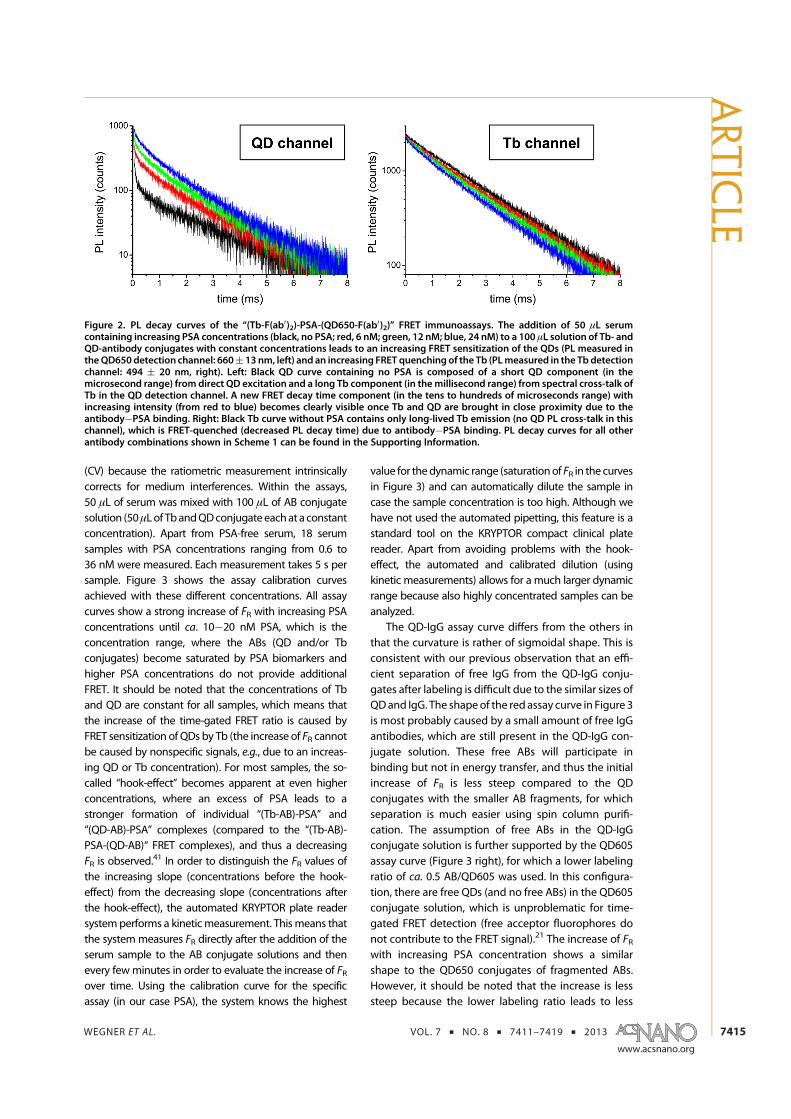
WEGNER ET AL. VOL. 7 ’ NO. 8 ’ 7411–7419 ’ 2013
www.acsnano.org
7415
(CV) because the ratiometric measurement intrinsicallycorrects for medium interferences. Within the assays,50 μL of serum was mixed with 100 μL of AB conjugatesolution (50μLof TbandQDconjugateeachat a constantconcentration). Apart from PSA-free serum, 18 serumsamples with PSA concentrations ranging from 0.6 to36 nM were measured. Each measurement takes 5 s persample. Figure 3 shows the assay calibration curvesachieved with these different concentrations. All assaycurves show a strong increase of FR with increasing PSAconcentrations until ca. 10�20 nM PSA, which is theconcentration range, where the ABs (QD and/or Tbconjugates) become saturated by PSA biomarkers andhigher PSA concentrations do not provide additionalFRET. It should be noted that the concentrations of Tband QD are constant for all samples, which means thatthe increase of the time-gated FRET ratio is caused byFRET sensitization of QDs by Tb (the increase of FR cannotbe caused by nonspecific signals, e.g., due to an increas-ing QD or Tb concentration). For most samples, the so-called “hook-effect” becomes apparent at even higherconcentrations, where an excess of PSA leads to astronger formation of individual “(Tb-AB)-PSA” and“(QD-AB)-PSA” complexes (compared to the “(Tb-AB)-PSA-(QD-AB)“ FRET complexes), and thus a decreasingFR is observed.
41 In order to distinguish the FR values ofthe increasing slope (concentrations before the hook-effect) from the decreasing slope (concentrations afterthe hook-effect), the automated KRYPTOR plate readersystemperforms a kineticmeasurement. Thismeans thatthe system measures FR directly after the addition of theserum sample to the AB conjugate solutions and thenevery fewminutes in order to evaluate the increase of FRover time. Using the calibration curve for the specificassay (in our case PSA), the system knows the highest
value for thedynamic range (saturationof FR in the curvesin Figure 3) and can automatically dilute the sample incase the sample concentration is too high. Although wehave not used the automated pipetting, this feature is astandard tool on the KRYPTOR compact clinical platereader. Apart from avoiding problems with the hook-effect, the automated and calibrated dilution (usingkinetic measurements) allows for a much larger dynamicrange because also highly concentrated samples can beanalyzed.
The QD-IgG assay curve differs from the others inthat the curvature is rather of sigmoidal shape. This isconsistent with our previous observation that an effi-cient separation of free IgG from the QD-IgG conju-gates after labeling is difficult due to the similar sizes ofQDand IgG. The shapeof the red assay curve in Figure 3is most probably caused by a small amount of free IgGantibodies, which are still present in the QD-IgG con-jugate solution. These free ABs will participate inbinding but not in energy transfer, and thus the initialincrease of FR is less steep compared to the QDconjugates with the smaller AB fragments, for whichseparation is much easier using spin column purifi-cation. The assumption of free ABs in the QD-IgGconjugate solution is further supported by the QD605assay curve (Figure 3 right), for which a lower labelingratio of ca. 0.5 AB/QD605 was used. In this configura-tion, there are free QDs (and no free ABs) in the QD605conjugate solution, which is unproblematic for time-gated FRET detection (free acceptor fluorophores donot contribute to the FRET signal).21 The increase of FRwith increasing PSA concentration shows a similarshape to the QD650 conjugates of fragmented ABs.However, it should be noted that the increase is lesssteep because the lower labeling ratio leads to less
Figure 2. PL decay curves of the “(Tb-F(ab0)2)-PSA-(QD650-F(ab0)2)” FRET immunoassays. The addition of 50 μL serumcontaining increasing PSA concentrations (black, no PSA; red, 6 nM; green, 12 nM; blue, 24 nM) to a 100 μL solution of Tb- andQD-antibody conjugates with constant concentrations leads to an increasing FRET sensitization of the QDs (PL measured intheQD650detection channel: 660( 13 nm, left) and an increasing FRET quenchingof the Tb (PLmeasured in the Tb detectionchannel: 494 ( 20 nm, right). Left: Black QD curve containing no PSA is composed of a short QD component (in themicrosecond range) from direct QD excitation and a long Tb component (in themillisecond range) from spectral cross-talk ofTb in the QD detection channel. A new FRET decay time component (in the tens to hundreds of microseconds range) withincreasing intensity (from red to blue) becomes clearly visible once Tb and QD are brought in close proximity due to theantibody�PSA binding. Right: Black Tb curve without PSA contains only long-lived Tb emission (no QD PL cross-talk in thischannel), which is FRET-quenched (decreased PL decay time) due to antibody�PSA binding. PL decay curves for all otherantibody combinations shown in Scheme 1 can be found in the Supporting Information.
ARTIC
LE

WEGNER ET AL. VOL. 7 ’ NO. 8 ’ 7411–7419 ’ 2013
www.acsnano.org
7416
FRET signal per AB. We also note that carefully opti-mized ultracentrifugation or gel filtration chromatog-raphy might lead to better purification results of theQD-IgG conjugates. However, we wanted to demon-strate improved separation of small AB fragmentsusing similar conditions for all QD-AB conjugates, inparticular, by using convenient spin column purifica-tion, which can be performed using a standard labora-tory benchtop centrifuge.
The limits of detection (LODs; cf. Table 2) of allhomogeneous FRET assays are in the subnanomolar(few ng/mL) PSA range, and the dynamic range spansapproximately 2 to 3 orders of magnitude. As expectedfrom Table 1, the LODs are favorable for the AB-fragment-containing QD conjugates. The differenceof ABs for the Tb conjugates is negligible, which weattribute to the relatively large distances in our sand-wich immunoassay (Tb donors labeled to the Fc regionof the IgG are too far away from the QD acceptor toparticipate in efficient FRET). Although the difference inLOD fromQD650-IgG to QD650-F(ab0)2 and QD650-F(ab)
is quite significant (0.27nMcompared to0.06and0.05nM),there is only a minor difference between QD-F(ab0)2and QD-F(ab). As already mentioned above, there mightbe two main reasons for this. First, a high labeling ratiomight lead to steric hindrance for Tb-AB binding via PSA.Second, F(ab) contains only one binding site (whereasIgG and F(ab0)2 contain two), and the randomorientationas well as the reduced affinity might lead to lowerbinding efficiencies per AB. In other words, the advan-tages of the small F(ab)s (compared to F(ab0)2) arecompensated by their disadvantages. Thus, both F(ab0)2and F(ab) are very well-suited for our Tb-to-QD FRETimmunoassays.
Another remarkable aspect concerns the very lowcoefficients of variation for the QD-F(ab)-containingFRET systems. This important advantage is most prob-ably caused by the higher labeling ratio of the smallF(ab) fragments per QD, which leads to a lower back-ground signal of directly excited QDs per “(Tb-AB)-PSA-(QD-AB)” binding (more FRET pairs per QD becausemultiple Tb can excite one QD in a serial manner due to
Figure 3. Tb-to-QD time-gated homogeneous FRET PSA immunoassays. Left (QD650): Relative time-gated (0.1�0.9 ms) PLintensity ratios (FRnormalized tounity at [total PSA] =0) as a functionof total PSAconcentration. The selectedantibodypairswereIgGþ IgG (red squares), IgGþ F(ab0)2 (green dots), IgGþ F(ab) (blue triangles), F(ab0)2þ F(ab0)2 (cyan rhombi), and F(ab)þ F(ab)(magenta stars) for Tb and QD650, respectively. Increasing PSA concentrations led to a strong increase of FR for all antibodycombinations with a linear detection range spanning ca. 3 orders of magnitude for the F(ab0)2 systems. For intercomparison,all curves were measured under the same experimental conditions. Right (QD605): Relative FR values of the “(Tb-IgG)-PSA-(QD-IgG)” pair show a similar behavior to the QD650-based FRET systems and demonstrate the feasibility of a QD-basedmultiplexed homogeneous immunoassay. Limits of detection (LODs) for the assays can be found in Table 2.
TABLE 2. Limits of Detection (LODs), Dynamic Range, and Maximum Coefficients of Variation (CVmax) for the Different
Homogeneous FRET Immunoassaysa
Tb conjugate QD conjugate LOD (nM) saturation (nM) LOD (ng/mL) LOD (fmol) CVmax (%)
Tb-IgG QD650-IgG 0.27 18 8.4 13.0 1.9Tb-IgG QD650-F(ab0)2 0.06 21 1.8 2.8 1.8Tb-IgG QD650-F(ab) 0.05 15 1.6 2.5 0.7Tb-F(ab0)2 QD650-F(ab0)2 0.08 21 2.6 4.1 2.6Tb-F(ab) QD650-F(ab) 0.05 15 1.6 2.5 0.6Tb-IgG QD605-IgG 0.25 15 7.9 12.0 1.3
a LODs of PSA are given for the 50 μL serum samples (LODs in the complete 150 μL measurement volume are 3 times lower). Saturation concentrations (the concentrations forwhich the PL intensity ratios in Figure 3 do not further increase) determine the dynamic range (which lies between the LOD and the saturation value). LODs were determinedusing the calibration curve concentration corresponding to the average FR value plus 3 times its standard deviation of 30 serum samples containing no PSA (zero biomarkersamples). The fmol LOD values were determined for a volume of 50 μL. The maximum coefficients of variation (CVmax) are given for the 30 serum samples containing no PSA.CVs for all samples containing PSA were below that maximum value. All values have an error of approximately 20%.
ARTIC
LE
WEGNER ET AL. VOL. 7 ’ NO. 8 ’ 7411–7419 ’ 2013
www.acsnano.org
7417
the large difference in excited-state lifetimes as ex-plained above). Therefore, the fluorescence reader sys-tem can be used at a higher detector sensitivity withoutdetector saturation. The best immunoassay systemcombining maximum sensitivity (minimum LOD), mini-mumantibodymodification (no IgG reduction for theTbconjugates), and maximum separation efficiency istherefore the “(Tb-IgG)þ(QD-F(ab))” system.
CONCLUSIONS
In this study, we examine the application of Tb-to-QD FRET in a time-gated homogeneous immunoassayfor PSA. We note that Chen et al. reported an initialdemonstration where they used FRET from self-madeTb complexes to QD-dopedmicroparticles for a homo-geneous detection of R-fetoprotein.31 However, in thispreliminary study, the authors only presented a super-ficial photophysical analysis of the FRET processes andperformed the assays in buffer. In contrast, we present(1) a full photophysical study of all pertinent FRETcomponents and processes; (2) the use of two stableand biocompatible QDs with different colors; (3) a fullcharacterization of assays using three types of antibodies(IgG, F(ab0)2, and F(ab)); and (4) high sensitivity in serumsamples, which is themediumof relevance for diagnosticapplications with minimal sample preparation.We find that the PL decays of both Tb- and
QD-antibody conjugates with and without PSA give clearevidence of PSA-binding-induced FRET from Tb to QD.The FRET ratio FR can be used to sensitively and accu-rately determine biomarker concentrations at clinicallyrelevant concentrations in small-volume serum samples.
In the case of the PSA assay presented here, the LOD of1.6 ng/mL (Table 2) is well below the commonly usedserum PSA cutoff value of 4 ng/mL and even below the 2ng/mL cutoff value proposed for higher-sensitivity PSAdiagnosis.42 Apart fromPSA, the homogeneous Tb-to-QDFRET immunoassay is suitable for any other biomarker forwhich two specific IgG antibodies exist. Our flexiblebioconjugation strategy offers facile assembly and puri-fication of the Tb- and QD-AB conjugates, where thehighest sensitivity assay (lowest LOD) resulted fromF(ab)-based QD conjugates, due to higher Tb/QD pairsat closer donor�acceptor distances. To our knowledge,this is thefirstQD-based immunoassay tocombinesuccess-fully all 11 attributes of an ideal homogeneous assay(as enumerated in the introduction) for real-life clinicaldiagnostics. Although our detection limits are very lowand in a clinically relevant concentration range, it shouldbe noted that commercial assays (e.g., the standardKRYPTOR total PSA kit) still provide lower LODs. Never-theless, these assays are fully optimized commercialimmunoassay kits, and they use conventional fluoro-phores as FRET acceptors, which limit their multiplexingcapability. Therefore, such assays do not exist as multi-plexed kits. Our demonstration of replacing such stan-dard fluorophores with QDs for homogeneous FRETimmunoassays in combination with our recent work onhighly increased sensitivity and multiplexing using up tofive different biomarkers18,19 strongly suggests thatfurther development and optimization of Tb-to-QD FRETimmunoassayswill soongeneratemultiplexeddiagnostickits with even lower LODs for fast, flexible, and efficientearly disease detection.
MATERIALS AND METHODSAntibodies. The anti-PSA IgGs “PSR222” and “PSS233” were
provided by Cezanne/Thermo Fisher Scientific. F(ab) and F(ab0)2fragments of IgGs were generated using Pierce Mouse IgG1F(ab) and F(ab0)2 preparation kit (Thermo Fisher Scientific).Fragmentation was verified using SDS-PAGE.
QD-Antibody Conjugates. eFluor650/605 nanocrystal conjuga-tion kit�sulfhydryl reactive (provided by eBioscience in lyoph-ilized form) was used for all QD conjugations. Details of theconjugation chemistry are described in ref 34. Antibody solu-tions (in concentration access compared to the QD solutions)were prepared in 1� PBS and conjugated to QDs according tothe manufacturer's instructions. Unbound proteins were sepa-rated by washing 3�6 times in 100 kDamolecular weight cutoff(MWCO) spin columns (Millipore) with 100 mM sodium tetra-borate buffer (pH 8.3) as the wash buffer. QD concentrationswere determined by absorbance measurements using molarabsorptivities of 1.1� 106 M�1 cm�1 (at 641 nm) for QD650 andof 2.5� 105M�1 cm�1 (at 594 nm) for QD605 as provided by themanufacturer. Antibodies were quantified by absorbance mea-surements at 280 nm using molar absorptivities of 210 000,140 000, and 70 000 M�1 cm�1 for IgG, F(ab0)2, and F(ab),respectively. The labeling ratios were determined by linearcombination of the respective absorbance values of QDs andantibodies within the QD-antibody conjugates.
Tb-Antibody Conjugates. Lumi4-Tb-NHS (provided by Lumi-phore in lyophilized form) was dissolved to 8 mM in anhydrousDMF and mixed (in concentration excess to the antibody
solutions) with the antibody samples in 100 mM carbonatebuffer at pH 9.0. The mixtures were incubated while rotating at25 rpm (Intelli-Mixer, ELMI) for 2 h at room temperature. ForTb-antibody conjugate purification, the samples were washed4�6 times with 100 mM Tris-Cl pH 7.2 using 10 kDa MWCO spincolumns (Millipore) for both F(ab0)2 and F(ab), and 50 kDaMWCO spin columns for IgG. Tb concentrations were deter-mined by absorbance measurements at 340 nm using a molarabsorptivity of 26 000 M�1 cm�1 as provided by the manufac-turer. Antibodieswere quantified by absorbancemeasurementsat 280 nm. The labeling ratios were determined by linearcombination of the respective absorbance values of Tb andantibodies within the Tb-antibody conjugates.
Optical Characterization. Absorption spectra (Lambda 35 UV/visSystem, PerkinElmer) and emission spectra (FluoTime 300,PicoQuant) were recorded in tris(hydroxymethyl)aminomethane(Tris-Cl, Sigma Aldrich) buffer with a pH of 7.4 and sodiumtetraborate buffer with a pH of 8.5 (Sigma Aldrich) for Tb andQD samples, respectively. PL quantumyields and Förster distanceswere determined as described elsewhere.40 PL decay curves wereacquired directly from the FRET immunoassay samples (vide infra)on an EI fluorescence plate reader (Edinburgh Instruments) using4000 detection bins of 2 μs integration time and nitrogen laser(VSL 337 ND, Spectra Physics) excitation (337.1 nm, 20 Hz). Opticaltransmission filter band-pass wavelengths were 494 ( 20 nm(Semrock) for the Tb detection channel, 660 ( 13 nm (Semrock)for the QD650 detection channel, and 607 ( 8 nm (Delta) for theQD605 detection channel.
ARTIC
LE
WEGNER ET AL. VOL. 7 ’ NO. 8 ’ 7411–7419 ’ 2013
www.acsnano.org
7418
Homogeneous FRET Immunoassays. The Tb- and QD-antibodyconjugates were each dissolved in 50 μL Tris-Cl buffer contain-ing 0.5% bovine serum albumin (BSA, Sigma-Aldrich). Theconcentrations (of the ABs; for the Tb and QD concentrations,see labeling ratios in the article) were approximately 6.9 nM forthe Tb-IgG, 11.4 nM for the Tb-F(ab0)2, 16.2 nM for the Tb-F(ab),12.6 nM for the QD650-IgG, 11.7 nM for the QD650-F(ab0)2,23.1 nM for the QD650-F(ab), and 2.1 nM for the QD605-IgG.Then, 50 μL serum samples (added to the 100 μL solutions contain-ing both the Tb and QD conjugates) were prepared from a stocksolution of normal human serum containing 69.7 μg/mL PSA bydilution with purified newborn calf serum (both provided byCezanne/Thermo Fisher Scientific) to yield the desired PSA concen-trations. Serum without PSA was pure newborn calf serum. Time-gated (0.1�0.9 ms) PL intensity measurements were acquired on aKRYPTORcompactplus fluorescenceplate reader (Cezanne/ThermoFisher Scientific) using 500 detection bins of 2 μs integration timeand nitrogen laser excitation (337.1 nm, 20 Hz, 100 pulses). Opticaltransmission filter band-pass wavelengths were 494 ( 20 nm(Semrock) for the Tb detection channel, 660 ( 13 nm (Semrock)for the QD650 detection channel, and 607( 10 nm (Delta) for theQD605 detection channel. All FRET assays were measured in black96-wellmicrotiter plateswith an optimal working volume of 150 μL.Each sample containing PSA serum samples was prepared threetimes, and the samples without PSA were prepared 10 times. Allsamplesweremeasured in triplicate. After sample preparation, themicrotiter plates were incubated for 120 min at 37 �C beforemeasurements on the KRYPTOR and EI fluorescence plate readers.
Conflict of Interest: The authors declare no competingfinancial interest.
Acknowledgment. The authors thank Lumiphore, Inc. for thegift of Lumi4-Tb-NHS reagent, and the European Commission(FP7project NANOGNOSTICS), the European InnovativeMedicinesInitiative IMI (project OncoTrack), the Investissements d'AvenirProgram France (project NanoCTC), and the Agence National de laRecherche France (project NanoFRET) for financial support.
Supporting Information Available: PL decay curves of thefollowing FRET immunoassays: (1) the “(Tb-IgG)-PSA-(QD650-IgG)”, (2) “(Tb-IgG)-PSA-(QD650-F(ab0)2)”, (3) “(Tb-IgG)-PSA-(QD650-F(ab))”, (4) “(Tb-F(ab))-PSA-(QD650-F(ab))”, and (5)“(Tb-IgG)-PSA-(QD605-IgG)”. This material is available free ofcharge via the Internet at http://pubs.acs.org.
REFERENCES AND NOTES1. Select Biosciences Market Report: Mutiplexed Diagnostics
2010, May 2010, Sudbury, UK.2. Jain, K. K. Applications of Nanobiotechnology in Clinical
Diagnostics. Clin. Chem. 2007, 53, 2002–2009.3. Hötzer, B.; Medintz, I. L.; Hildebrandt, N. Fluorescence
in Nanobiotechnology: Sophisticated Fluorophores forNovel Applications. Small 2012, 8, 2297–2326.
4. Algar, W. R.; Susumu, K.; Delehanty, J. B.; Medintz, I. L.Semiconductor QuantumDots in Bioanalysis: Crossing theValley of Death. Anal. Chem. 2011, 83, 8826–8837.
5. Gill, R.; Zayats, M.; Willner, I. Semiconductor Quantum Dotsfor Bioanalysis. Angew. Chem., Int. Ed. 2008, 47, 7602–7625.
6. Kuang, H.; Zhao, Y.; Ma, W.; Xu, L.; Wang, L.; Xu, C. RecentDevelopments in Analytical Applications of QuantumDots. TrAC, Trends Anal. Chem. 2011, 30, 1620–1636.
7. Medintz, I. L.; Uyeda, H. T.; Goldman, E. R.; Mattoussi, H.Quantum Dot Bioconjugates for Imaging, Labelling andSensing. Nat. Mater. 2005, 4, 435–446.
8. Rosenthal, S. J.; Chang, J. C.; Kovtun, O.; McBride, J. R.;Tomlinson, I. D. Biocompatible Quantum Dots for Biologi-cal Applications. Chem. Biol. 2011, 18, 10–24.
9. Alivisatos, A. P. Semiconductor Clusters, Nanocrystals, andQuantum Dots. Science 1996, 271, 933–937.
10. Alivisatos, P. The Use of Nanocrystals in Biological Detec-tion. Nat. Biotechnol. 2004, 22, 47–52.
11. Chan, W. C. W.; Nie, S. M. Quantum Dot Bioconjugates forUltrasensitive Nonisotopic Detection. Science 1998, 281,2016–2018.
12. Han, M. Y.; Gao, X. H.; Su, J. Z.; Nie, S. Quantum-Dot-TaggedMicrobeads for Multiplexed Optical Coding of Biomole-cules. Nat. Biotechnol. 2001, 19, 631–635.
13. Resch-Genger, U.; Grabolle, M.; Cavaliere-Jaricot, S.;Nitschke, R.; Nann, T. Quantum Dots versus Organic Dyesas Fluorescent Labels. Nat. Methods 2008, 5, 763–775.
14. Jin, Z.; Hildebrandt, N. Semiconductor Quantum Dots forIn VitroDiagnostics and Cellular Imaging. Trends Biotechnol.2012, 30, 394–403.
15. Hildebrandt, N. Biofunctional Quantum Dots: ControlledConjugation for Multiplexed Biosensors. ACS Nano 2011,5, 5286–5290.
16. Algar, W. R.; Malanoski, A. P.; Susumu, K.; Stewart, M. H.;Hildebrandt, N.; Medintz, I. L. Multiplexed Tracking ofProtease Activity Using a Single Color of Quantum DotVector and a Time-Gated Förster Resonance Energy Trans-fer Relay. Anal. Chem. 2012, 84, 10136–10146.
17. Algar, W. R.; Wegner, D.; Huston, A. L.; Blanco-Canosa, J. B.;Stewart, M. H.; Armstrong, A.; Dawson, P. E.; Hildebrandt,N.; Medintz, I. L. QuantumDots as Simultaneous Acceptorsand Donors in Time-Gated Förster Resonance EnergyTransfer Relays: Characterization and Biosensing. J. Am.Chem. Soc. 2012, 134, 1876–1891.
18. Geißler, D.; Charbonnière, L. J.; Ziessel, R. F.; Butlin, N. G.;Löhmannsröben, H.-G.; Hildebrandt, N. Quantum DotBiosensors for Ultrasensitive Multiplexed Diagnostics. An-gew. Chem., Int. Ed. 2010, 49, 1396–1401.
19. Geißler, D.; Stufler, S.; Löhmannsröben, H.-G.; Hildebrandt,N. Six-Color Time-Resolved Förster Resonance EnergyTransfer for Ultrasensitive Multiplexed Biosensing. J. Am.Chem. Soc. 2013, 135, 1102–1109.
20. Charbonnière, L. J.; Hildebrandt, N. Lanthanide Complexesand Quantum Dots: A Bright Wedding for ResonanceEnergy Transfer. Eur. J. Inorg. Chem. 2008, 3241–3251.
21. Geißler, D.; Hildebrandt, N. Lanthanide Complexes in FRETApplications. Curr. Inorg. Chem. 2011, 1, 17–35.
22. Esteve-Turrillas, F. A.; Abad-Fuentes, A. Applications ofQuantum Dots as Probes in Immunosensing of Small-Sized Analytes. Biosens. Bioelectron. 2013, 41, 12–29.
23. Ge, S.; Ge, L.; Yan, M.; Song, X.; Yu, J.; Liu, S. A DisposableImmunosensor Device for Point-of-Care Test of TumorMarker Based on Copper-Mediated Amplification. Biosens.Bioelectron. 2013, 43, 425–31.
24. Härmä, H.; Soukka, T.; Shavel, A.; Gaponik, N.; Weller, H.Luminescent Energy Transfer between Cadmium TellurideNanoparticle and Lanthanide(III) Chelate in CompetitiveBioaffinity Assays of Biotin and Estradiol. Anal. Chim. Acta2007, 604, 177–183.
25. Kattke, M. D.; Gao, E. J.; Sapsford, K. E.; Stephenson, L. D.;Kumar, A. FRET-Based Quantum Dot Immunoassay forRapid and Sensitive Detection of Aspergillus amstelodami.Sensors (Basel, Switzerland) 2011, 11, 6396–6410.
26. Long, F.; Gu, C.; Gu, A. Z.; Shi, H. Quantum Dot/Carrier-Protein/Haptens Conjugate as a Detection Nanobioprobefor FRET-Based Immunoassay of Small Analytes with All-Fiber Microfluidic Biosensing Platform. Anal. Chem. 2012,84, 3646–3653.
27. Qian, J.; Wang, C.; Pan, X.; Liu, S. A High-ThroughputHomogeneous Immunoassay Based on Förster ResonanceEnergy Transfer between Quantum Dots and Gold Nano-particles. Anal. Chim. Acta 2013, 763, 43–49.
28. Wei, O. D.; Lee, M.; Yu, X.; Lee, E. K.; Seong, G. H.; Choo, J.;Cho, Y. W. Development of an Open Sandwich Fluoroim-munoassay Based on Fluorescence Resonance EnergyTransfer. Anal. Biochem. 2006, 358, 31–37.
29. Zeng, Q. H.; Zhang, Y. L.; Liu, X. M.; Tu, L. P.; Kong, X. G.;Zhang, H. Multiple Homogeneous Immunoassays Basedon a Quantum Dots�Gold Nanorods FRET Nanoplatform.Chem. Commun. 2012, 48, 1781–1783.
30. Zhang, C. L.; Gao, D.; Zhou, G. H.; Chen, L.; Zhang, X. A.; Cui,Z. Q.; He, Z. K. Label-Free Homogeneous ImmunosensorBased on FRET for the Detection of Virus Antibody inSerum. Chem.;Asian. J. 2012, 7, 1764–1767.
31. Chen, M. J.; Wu, Y. S.; Lin, G. F.; Hou, J. Y.; Li, M.; Liu,T. C. Quantum-Dot-Based Homogeneous Time-Resolved
ARTIC
LE
WEGNER ET AL. VOL. 7 ’ NO. 8 ’ 7411–7419 ’ 2013
www.acsnano.org
7419
Fluoroimmunoassay of R-Fetoprotein. Anal. Chim. Acta2012, 741, 100–105.
32. Xu, J.; Corneillie, T. M.; Moore, E. G.; Law, G.-L.; Butlin, N. G.;Raymond, K. N. Octadentate Cages of Tb(III) 2-Hydroxyi-sophthalamides: ANew Standard for Luminescent Lantha-nide Labels. J. Am. Chem. Soc. 2011, 133, 19900–19910.
33. Hermanson, G. T. Bioconjugate Techniques, 2nd ed.; Aca-demic Press: San Diego, CA, 2008.
34. Jennings, T. L.; Becker-Catania, S. G.; Triulzi, R. C.; Tao, G.;Scott, B.; Sapsford, K. E.; Spindel, S.; Oh, E.; Jain, V.;Delehanty, J. B.; et al. Reactive Semiconductor Nanocryst-als for Chemoselective Biolabeling and Multiplexed Anal-ysis. ACS Nano 2011, 5, 5579–5593.
35. Algar,W. R.; Kim, H.; Medintz, I. L.; Hildebrandt, N. EmergingNon-traditional Förster Resonance Energy Transfer Con-figurations with Semiconductor Quantum Dots: Investiga-tions and Applications. Coord. Chem. Rev. 2013http://dx.doi.org/10.1016/j.ccr.2013.07.015.
36. Charbonniere, L. J.; Hildebrandt, N.; Ziessel, R. F.;Löhmannsröben, H.-G. Lanthanides to Quantum DotsResonance Energy Transfer in Time-Resolved Fluoro-im-munoassays and Luminescence Microscopy. J. Am. Chem.Soc. 2006, 128, 12800–12809.
37. Hildebrandt, N.; Charbonniere, L. J.; Beck, M.; Ziessel,R. F.; Löhmannsröben, H.-G. Quantum Dots as EfficientEnergy Acceptors in a Time-Resolved Fluoroimmunoas-say. Angew. Chem., Int. Ed. 2005, 44, 7612–7615.
38. Hildebrandt, N.; Charbonniere, L. J.; Löhmannsröben, H.-G.Time-Resolved Analysis of a Highly Sensitive Förster Re-sonance Energy Transfer Immunoassay Using TerbiumComplexes as Donors and Quantum Dots as Acceptors.J. Biomed. Biotechnol. 2007No. 79169.
39. Morgner, F.; Geißler, D.; Stufler, S.; Butlin, N. G.; Löhmannsröben,H.-G.; Hildebrandt, N. A Quantum-Dot-Based MolecularRuler for Multiplexed Optical Analysis. Angew. Chem., Int. Ed.2010, 49, 7570–7574.
40. Wegner, K. D.; Lanh, P. T.; Jennings, T.; Oh, E.; Vaibhav, J.;Fairclough, S. M.; Smith, J. M.; Giovanelli, E.; Lequeux, N.;Pons, T.; et al. Influence of Luminescence Quantum Yield,Surface Coating, and Functionalization of Quantum Dotson the Sensitivity of Time-Resolved FRET Bioassays. ACSAppl. Mater. Interfaces 2013, 5, 2881–2892.
41. Wild, D. The Immunoassay Handbook, 4th ed.; Elsevier:Amsterdam, 2013.
42. Greene, K. L.; Albertsen, P. C.; Babaian, R. J.; Carter, H. B.;Gann, P. H.; Han, M.; Kuban, D. A.; Sartor, A. O.; Stanford, J. L.;Zietman, A.; et al. Prostate Specific Antigen Best PracticeStatement: 2009 Update. J. Urol. 2013, 189, S2–S11.
ARTIC
LE
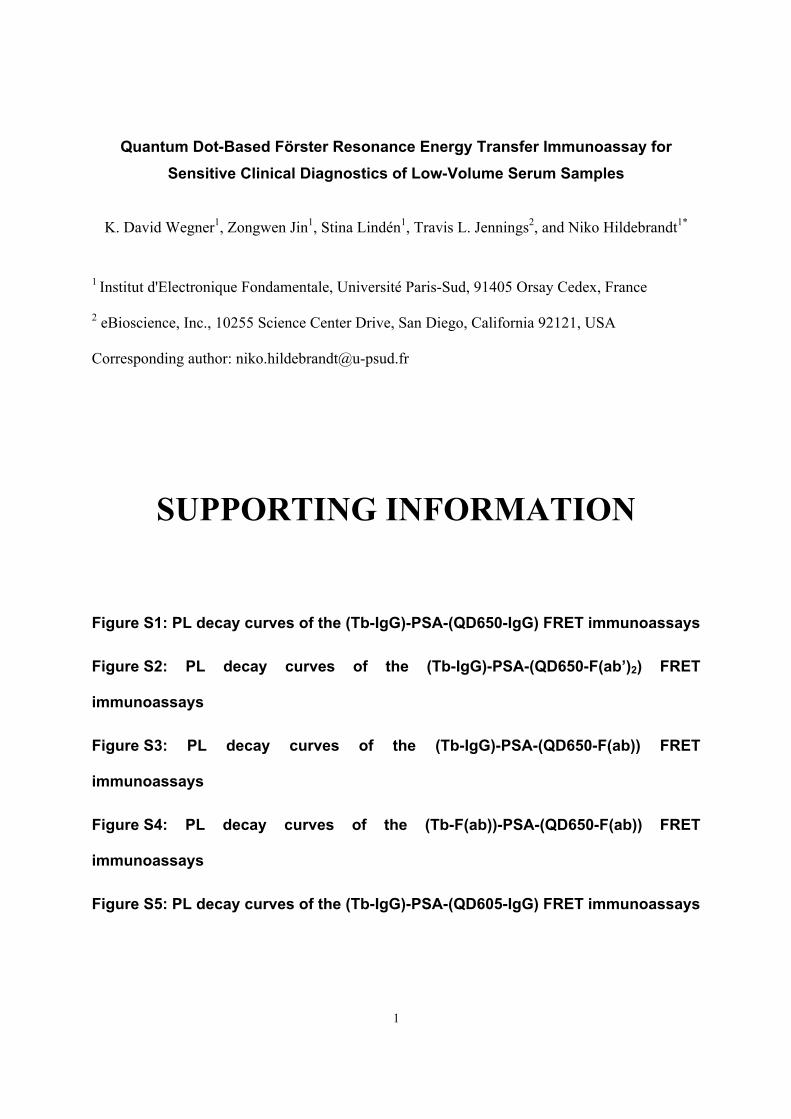
1
Quantum Dot-Based Förster Resonance Energy Transfer Immunoassay for Sensitive Clinical Diagnostics of Low-Volume Serum Samples
K. David Wegner1, Zongwen Jin1, Stina Lindén1, Travis L. Jennings2, and Niko Hildebrandt1*
1 Institut d'Electronique Fondamentale, Université Paris-Sud, 91405 Orsay Cedex, France 2 eBioscience, Inc., 10255 Science Center Drive, San Diego, California 92121, USA Corresponding author: [email protected]
SUPPORTING INFORMATION Figure S1: PL decay curves of the (Tb-IgG)-PSA-(QD650-IgG) FRET immunoassays
Figure S2: PL decay curves of the (Tb-IgG)-PSA-(QD650-F(ab’)2) FRET
immunoassays
Figure S3: PL decay curves of the (Tb-IgG)-PSA-(QD650-F(ab)) FRET
immunoassays
Figure S4: PL decay curves of the (Tb-F(ab))-PSA-(QD650-F(ab)) FRET
immunoassays
Figure S5: PL decay curves of the (Tb-IgG)-PSA-(QD605-IgG) FRET immunoassays
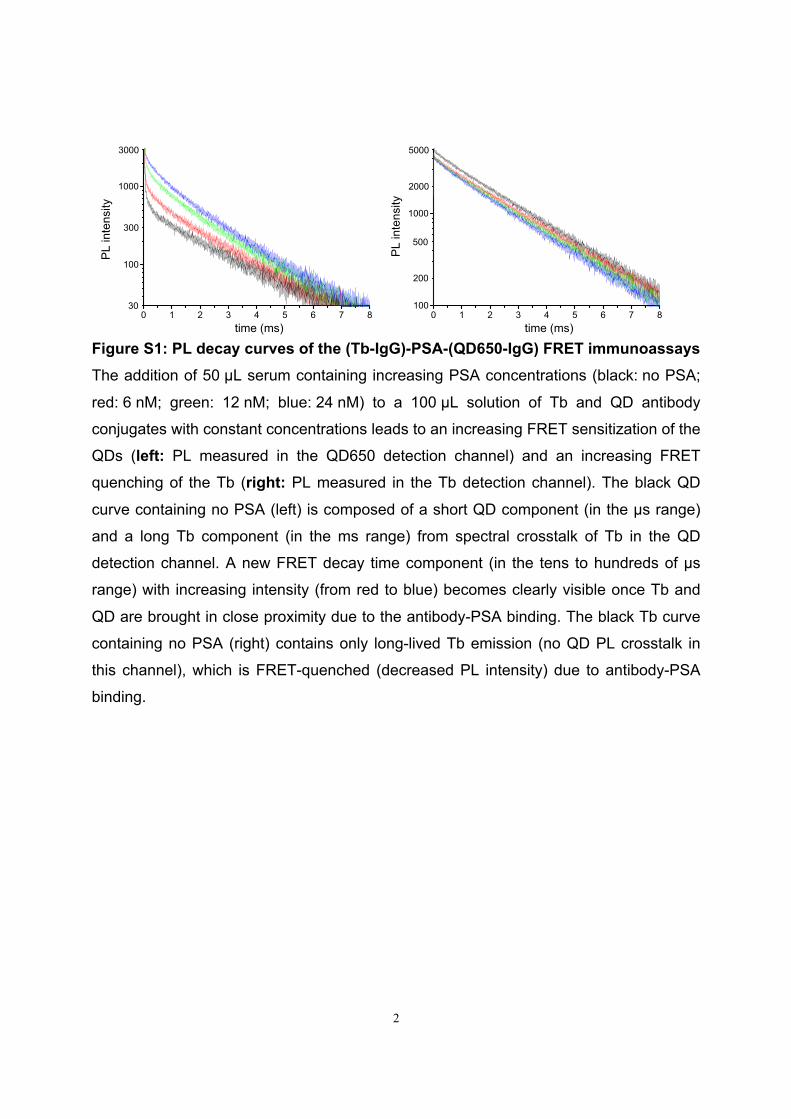
2
Figure S1: PL decay curves of the (Tb-IgG)-PSA-(QD650-IgG) FRET immunoassays The addition of 50 µL serum containing increasing PSA concentrations (black: no PSA;
red: 6 nM; green: 12 nM; blue: 24 nM) to a 100 µL solution of Tb and QD antibody
conjugates with constant concentrations leads to an increasing FRET sensitization of the
QDs (left: PL measured in the QD650 detection channel) and an increasing FRET
quenching of the Tb (right: PL measured in the Tb detection channel). The black QD
curve containing no PSA (left) is composed of a short QD component (in the µs range)
and a long Tb component (in the ms range) from spectral crosstalk of Tb in the QD
detection channel. A new FRET decay time component (in the tens to hundreds of µs
range) with increasing intensity (from red to blue) becomes clearly visible once Tb and
QD are brought in close proximity due to the antibody-PSA binding. The black Tb curve
containing no PSA (right) contains only long-lived Tb emission (no QD PL crosstalk in
this channel), which is FRET-quenched (decreased PL intensity) due to antibody-PSA
binding.

3
Figure S2: PL decay curves of the (Tb-IgG)-PSA-(QD650-F(ab’)2) FRET immunoassays The addition of 50 µL serum containing increasing PSA concentrations (black: no PSA;
red: 6 nM; green: 12 nM; blue: 24 nM) to a 100 µL solution of Tb and QD antibody
conjugates with constant concentrations leads to an increasing FRET sensitization of the
QDs (left: PL measured in the QD650 detection channel) and an increasing FRET
quenching of the Tb (right: PL measured in the Tb detection channel). The black QD
curve containing no PSA (left) is composed of a short QD component (in the µs range)
and a long Tb component (in the ms range) from spectral crosstalk of Tb in the QD
detection channel. A new FRET decay time component (in the tens to hundreds of µs
range) with increasing intensity (from red to blue) becomes clearly visible once Tb and
QD are brought in close proximity due to the antibody-PSA binding. The black Tb curve
containing no PSA (right) contains only long-lived Tb emission (no QD PL crosstalk in
this channel), which is FRET-quenched (decreased PL decay time) due to antibody-PSA
binding.
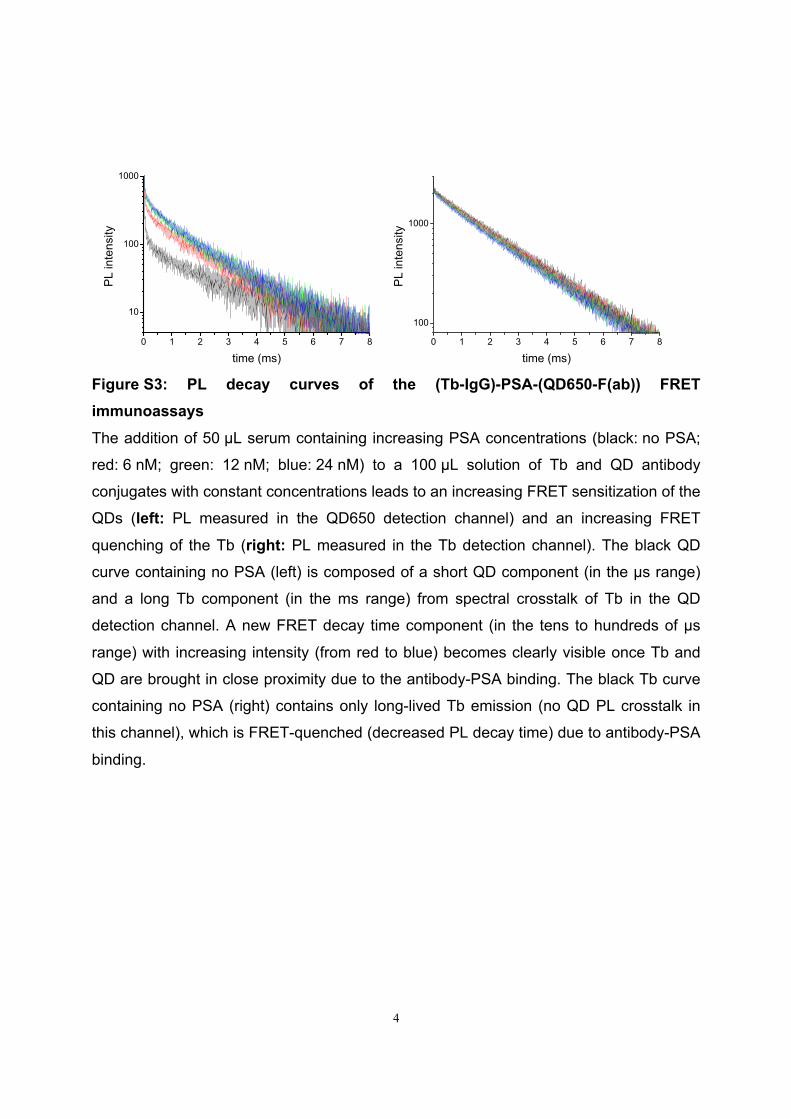
4
Figure S3: PL decay curves of the (Tb-IgG)-PSA-(QD650-F(ab)) FRET immunoassays The addition of 50 µL serum containing increasing PSA concentrations (black: no PSA;
red: 6 nM; green: 12 nM; blue: 24 nM) to a 100 µL solution of Tb and QD antibody
conjugates with constant concentrations leads to an increasing FRET sensitization of the
QDs (left: PL measured in the QD650 detection channel) and an increasing FRET
quenching of the Tb (right: PL measured in the Tb detection channel). The black QD
curve containing no PSA (left) is composed of a short QD component (in the µs range)
and a long Tb component (in the ms range) from spectral crosstalk of Tb in the QD
detection channel. A new FRET decay time component (in the tens to hundreds of µs
range) with increasing intensity (from red to blue) becomes clearly visible once Tb and
QD are brought in close proximity due to the antibody-PSA binding. The black Tb curve
containing no PSA (right) contains only long-lived Tb emission (no QD PL crosstalk in
this channel), which is FRET-quenched (decreased PL decay time) due to antibody-PSA
binding.
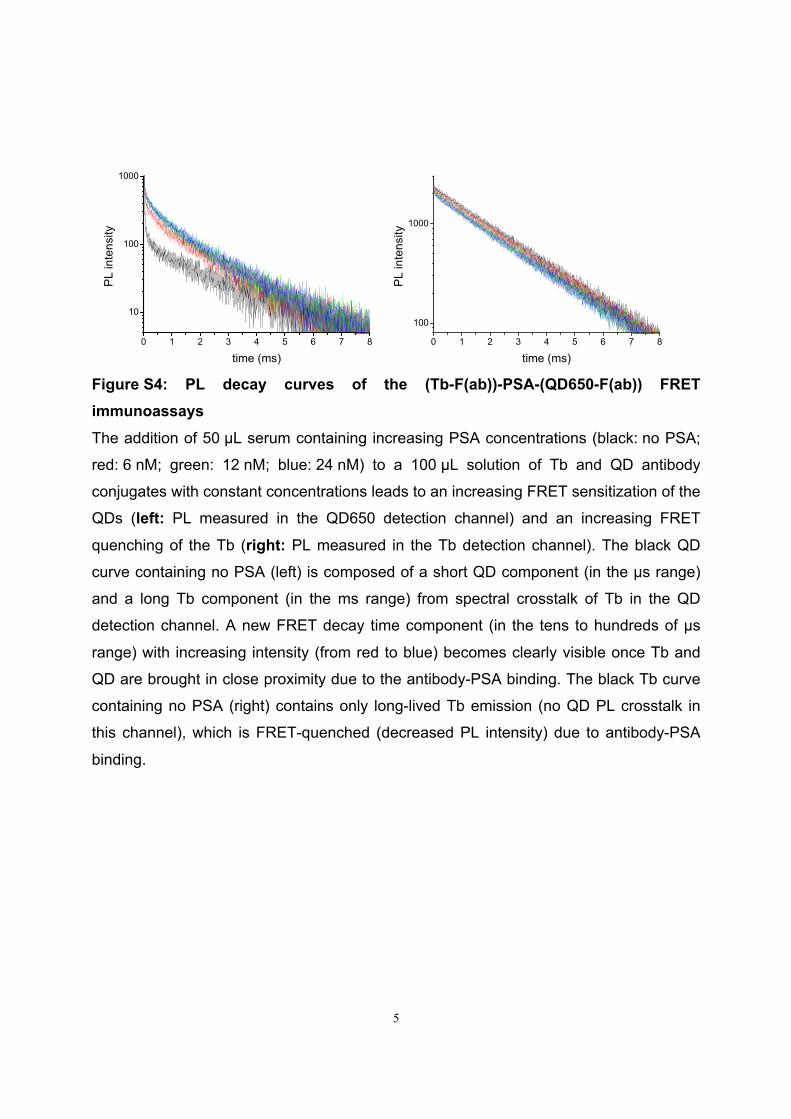
5
Figure S4: PL decay curves of the (Tb-F(ab))-PSA-(QD650-F(ab)) FRET immunoassays The addition of 50 µL serum containing increasing PSA concentrations (black: no PSA;
red: 6 nM; green: 12 nM; blue: 24 nM) to a 100 µL solution of Tb and QD antibody
conjugates with constant concentrations leads to an increasing FRET sensitization of the
QDs (left: PL measured in the QD650 detection channel) and an increasing FRET
quenching of the Tb (right: PL measured in the Tb detection channel). The black QD
curve containing no PSA (left) is composed of a short QD component (in the µs range)
and a long Tb component (in the ms range) from spectral crosstalk of Tb in the QD
detection channel. A new FRET decay time component (in the tens to hundreds of µs
range) with increasing intensity (from red to blue) becomes clearly visible once Tb and
QD are brought in close proximity due to the antibody-PSA binding. The black Tb curve
containing no PSA (right) contains only long-lived Tb emission (no QD PL crosstalk in
this channel), which is FRET-quenched (decreased PL intensity) due to antibody-PSA
binding.

6
Figure S5: PL decay curves of the (Tb-IgG)-PSA-(QD605-IgG) FRET immunoassays The addition of 50 µL serum containing increasing PSA concentrations (black: no PSA;
red: 6 nM; green: 12 nM; blue: 24 nM) to a 100 µL solution of Tb and QD antibody
conjugates with constant concentrations leads to an increasing FRET sensitization of the
QDs (left: PL measured in the QD605 detection channel) and an increasing FRET
quenching of the Tb (right: PL measured in the Tb detection channel). The black QD
curve containing no PSA (left) is composed of a short QD component (in the µs range)
and a long Tb component (in the ms range) from spectral crosstalk of Tb in the QD
detection channel. A new FRET decay time component (in the ms range) with increasing
intensity (from red to blue) becomes clearly visible once Tb and QD are brought in close
proximity due to the antibody-PSA binding. The black Tb curve containing no PSA (right)
contains only long-lived Tb emission (no QD PL crosstalk in this channel), which is
FRET-quenched (decreased PL intensity) due to antibody-PSA binding.

6.3. IMMUNOASSAY xxxi
6.3.4 Nanobodies for EGFR detection
Original publication:
Nanobodies and Nanocrystals: Highly Sensitive QuantumDot-based Homogeneous FRET Immunoassay for Serum-based
EGFR Detection.K. D. Wegner, S. Linden, Z. Jin, T. L. Jennings, R. el Khoulati, P. M. P. van Bergen
en Henegouwen, and N. Hildebrandt.Small 2014, 10 (4), 734-740.
734 © 2013 Wiley-VCH Verlag GmbH & Co. KGaA, Weinheimwileyonlinelibrary.com
full papers
1. Introduction
Semiconductor quantum dots (QDs) continue to be of large
interest for spectrally and temporally multiplexed biosensing
Nanobodies and Nanocrystals: Highly Sensitive Quantum Dot-Based Homogeneous FRET Immunoassay for Serum-Based EGFR Detection
K. David Wegner , Stina Lindén , Zongwen Jin , Travis L. Jennings , Rachid el Khoulati , Paul M. P. van Bergen en Henegouwen , and Niko Hildebrandt *
because they provide high photostability, bright fl uorescence,
size-tunable absorption and emission wavelengths and a
large surface area for attaching several biomolecules of the
same or different kind. [ 1–5 ] Functional bioconjugation of QDs
in particular, preserving both the QD photophysical proper-
ties and the binding properties of the biomolecule, has been
widely investigated. [ 6–8 ]
Antibodies are among the most applied tools for biomo-
lecular detection and targeted therapy, and are therefore one
of the most important biomolecules for QD-bioconjugation.
However, the large size of full IgG antibodies (ca. 150 kDa
molecular weight and 14.5 × 8.5 × 4 nm dimension) [ 9 ] and
the different possible antibody attachment groups for bio-
conjugation [ 10 ] are disadvantageous for labeling many anti-
bodies in a controlled manner to a QD. To overcome this
problem single domain antibodies (also called “nanobodies”
or V H H) have been proposed for QD conjugation. [ 11–14 ] DOI: 10.1002/smll.201302383
Semiconductor quantum dot nanocrystals (QDs) for optical biosensing applications often contain thick polyethylene glycol (PEG)-based coatings in order to retain the advantageous QD properties in biological media such as blood, serum or plasma. On the other hand, the application of QDs in Förster resonance energy transfer (FRET) immunoassays, one of the most sensitive and most common fl uorescence-based techniques for non-competitive homogeneous biomarker diagnostics, is limited by such thick coatings due to the increased donor-acceptor distance. In particular, the combination with large IgG antibodies usually leads to distances well beyond the common FRET range of approximately 1 to 10 nm. Herein, time-gated detection of Tb-to-QD FRET for background suppression and an increased FRET range is combined with single domain antibodies (or nanobodies) for a reduced distance in order to realize highly sensitive QD-based FRET immunoassays. The “(nano) 2 ” immunoassay (combination of nanocrystals and nanobodies) is performed on a commercial clinical fl uorescence plate reader and provides sub-nanomolar (few ng/mL) detection limits of soluble epidermal growth factor receptor (EGFR) in 50 μ L buffer or serum samples. Apart from the fi rst demonstration of using nanobodies for FRET-based immunoassays, the extremely low and clinically relevant detection limits of EGFR demonstrate the direct applicability of the (nano) 2− assay to fast and sensitive biomarker detection in clinical diagnostics.
Quantum Dots
K. D. Wegner, S. Lindén, Dr. Z. Jin, Prof. N. HildebrandtNanoBioPhotonics Institut d’Electronique FondamentaleUniversité Paris-Sud , 91405 Orsay Cedex , FranceE-mail: [email protected]
Dr. T. L. JenningseBioscience, Inc., 10255 Science Center Drive San Diego , California , 92121 , USA
R. el Khoulati, Dr. P. M. P. van Bergen en Henegouwen Cell Biology, Department of Biology, Science Faculty Utrecht University , Utrecht , The Netherlands
small 2014, 10, No. 4, 734–740

Single Domain Antibodies for Homogeneous Terbium-to-Quantum Dot FRET Immunoassays
735www.small-journal.com© 2013 Wiley-VCH Verlag GmbH & Co. KGaA, Weinheim
V H H are single domain antigen binding
fragments of heavy chain antibodies
(ca. 15 kDa and 4 × 2.5 × 3 nm) [ 15 ] that
were fi rst discovered in Camelus drom-
edarius. [ 16 ] To date, they are established
functional biomolecules that can be
easily selected, produced, and manipu-
lated using standard molecular biology
techniques. V H Hs can be found in many
antibody-based applications including
the detection of different targets such as
toxins, haptens, bacteria, viruses, and cel-
lular biomarkers. [ 12,15,17–20 ]
Despite the many advantages of
nanobodies, they have never been
applied in non-competitive homoge-
neous immunoassays, which do not
require any washing or separation steps
(simple mix-and-measure method) and are therefore
highly important for rapid and sensitive biosensing. [ 21 ]
Förster resonance energy transfer (FRET) is one of the
most sensitive and most common fluorescence-based
techniques for such homogeneous immunoassays. [ 21 ] As
FRET is strongly distance dependent, the use of the small
V H Hs for FRET sandwich immunoassays appears to be
very advantageous. Nabiev et al. have recently developed
compact QD-V H H conjugates, which could be successfully
used in flow cytometry and fluorescence immunostaining
and were also proposed as promising probes for FRET-
based biosensing. [ 12 ]
Here we show for the fi rst time that such QD-V H H con-
jugates can indeed be effi ciently applied for homogeneous
FRET-based biosensing. We selected a challenging sandwich
immunoassay, in which two V H H bind non-competitively
to different epitopes of the ectodomain of the epidermal
growth factor receptor (EGFR) in order to detect soluble
EGFR in serum samples. This is of high interest for the prog-
nosis and diagnosis of cancer. [ 22–24 ] The assay is not only
challenging in the sense of high sensitivity (ng/mL limits of
detection, LODs) and the measurement in serum (required
for clinical diagnostics). As we use commercial QDs with a
thick polyethylene glycol (PEG)-based coating (ca. 7 nm QD
radius), [ 25 ] two V H H (ca. 4 nm length per V H H, vide supra)
and a large EGFR dimer (ca. 190 kDa; V H Hs specifi c against
domain I and III at ca. 4 nm distance) the overall distance
for FRET is expected to be larger than 10 nm (7 nm + 4 nm
+ 4 nm + 4 nm = 19 nm in the case of maximum elongation),
which is beyond the distance range of conventional FRET
pairs. [ 26 ] We therefore used time-gated detection of FRET
from Tb-complexes to QDs, which allows Förster distances
(donor-acceptor distance for which FRET is 50% effi cient) of
up to 11 nm. [ 27 ] Our assay, which we have coined “(nano) 2 ”,
is performed on a clinical fl uorescence plate reader and pro-
vides sub-nanomolar (few ng/mL) LODs of soluble EGFR in
50 μ L buffer or serum samples. Our results demonstrate the
suitability of QD-V H H-based FRET for sensitive biosensing
in challenging environments (serum) and the direct applica-
tion to homogeneous serum-based biomarker detection in
clinical diagnostics.
2. Results and Discussion
The principle of the (nano) 2 -immunoassay is shown in
Scheme 1 . 50 μ L of each Tb-V H H and QD-V H H conjugate
solutions are mixed at constant concentrations to yield 100 μ L
of assay solution. Two different anti-EGFR V H H, which bind
to two different non-overlapping epitopes on the ectodomain
of EGFR, are used for Tb and QD. Commercial Tb-com-
plexes (Lumi4®-Tb-NHS, Lumiphore, Inc.) and QDs (eFluor
650NC antibody conjugation kit, eBioscience) were used
for bioconjugation. The broad spectral overlap of Tb-emis-
sion and QD-absorbance ( Figure 1 ) leads to a large Förster
distance calculated as R 0 = 0.02108 ( κ 2 Φ Tb n −4 J ) 1/6 nm = 11.0 ± 0.5 nm, with the FRET orientation factor κ 2 = 2/3, the Tb-centered luminescence quantum yield Φ Tb = 0.67 ± 0.5, the refractive index n = 1.35 and the spectral overlap inte-
gral J = ∫ F Tb ε QD λ 4 d λ (from 450 to 700 nm). This very large
Scheme 1. Principle of the homogeneous (nano) 2 -immunoassay. The combination of Tb-labeled V H H and V H H-labeled QDs allows the formation of Tb-V H H-EGFR-QD-V H H sandwich complexes, which results in FRET from several Tb to the central QD. Time-gated detection of FRET-sensitized QD photoluminescence is used for a sensitive quantifi cation of soluble EGFR in serum. Random labeling and orientation of the V H H is not taken into account in the Scheme.
Figure 1. Molar absorptivity spectra of the Tb donor ( ε Tb , black curve with gray background, multiplied by 250) and QD acceptor ( ε QD , black curve). For the calculation of the overlap integral J between Tb-donor emission and QD-acceptor absorption, the area normalized Tb photoluminescence (PL) spectrum ( F Tb , black dotted curve with gray background) is also shown.
small 2014, 10, No. 4, 734–740
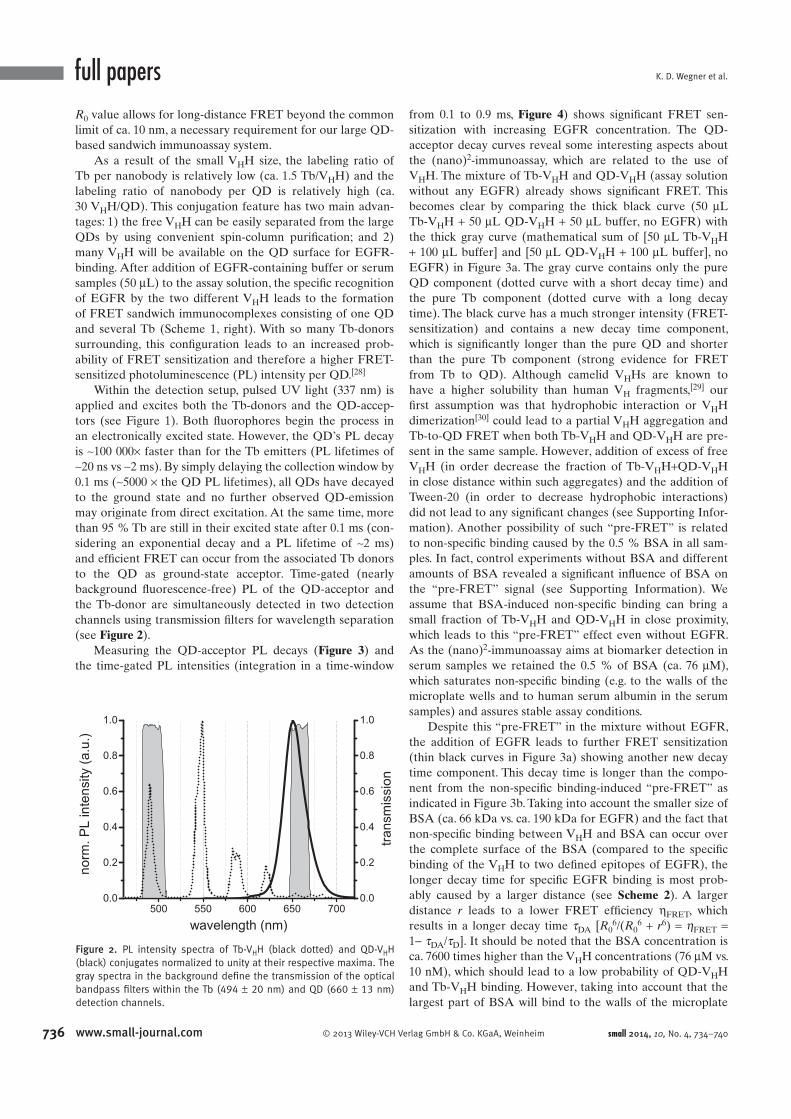
K. D. Wegner et al.
736 www.small-journal.com © 2013 Wiley-VCH Verlag GmbH & Co. KGaA, Weinheim
full papers R 0 value allows for long-distance FRET beyond the common
limit of ca. 10 nm, a necessary requirement for our large QD-
based sandwich immunoassay system.
As a result of the small V H H size, the labeling ratio of
Tb per nanobody is relatively low ( ca. 1.5 Tb/V H H) and the
labeling ratio of nanobody per QD is relatively high ( ca.
30 V H H/QD). This conjugation feature has two main advan-
tages: 1) the free V H H can be easily separated from the large
QDs by using convenient spin-column purifi cation; and 2)
many V H H will be available on the QD surface for EGFR-
binding. After addition of EGFR-containing buffer or serum
samples (50 μ L) to the assay solution, the specifi c recognition
of EGFR by the two different V H H leads to the formation
of FRET sandwich immunocomplexes consisting of one QD
and several Tb (Scheme 1 , right). With so many Tb-donors
surrounding, this confi guration leads to an increased prob-
ability of FRET sensitization and therefore a higher FRET-
sensitized photoluminescence (PL) intensity per QD. [ 28 ]
Within the detection setup, pulsed UV light (337 nm) is
applied and excites both the Tb-donors and the QD-accep-
tors (see Figure 1 ). Both fl uorophores begin the process in
an electronically excited state. However, the QD’s PL decay
is ∼ 100 000 × faster than for the Tb emitters (PL lifetimes of
∼ 20 ns vs ∼ 2 ms). By simply delaying the collection window by
0.1 ms ( ∼ 5000 × the QD PL lifetimes), all QDs have decayed
to the ground state and no further observed QD-emission
may originate from direct excitation. At the same time, more
than 95 % Tb are still in their excited state after 0.1 ms (con-
sidering an exponential decay and a PL lifetime of ∼ 2 ms)
and effi cient FRET can occur from the associated Tb donors
to the QD as ground-state acceptor. Time-gated (nearly
background fl uorescence-free) PL of the QD-acceptor and
the Tb-donor are simultaneously detected in two detection
channels using transmission fi lters for wavelength separation
(see Figure 2 ).
Measuring the QD-acceptor PL decays ( Figure 3 ) and
the time-gated PL intensities (integration in a time-window
from 0.1 to 0.9 ms, Figure 4 ) shows signifi cant FRET sen-
sitization with increasing EGFR concentration. The QD-
acceptor decay curves reveal some interesting aspects about
the (nano) 2 -immunoassay, which are related to the use of
V H H. The mixture of Tb-V H H and QD-V H H (assay solution
without any EGFR) already shows signifi cant FRET. This
becomes clear by comparing the thick black curve (50 μ L
Tb-V H H + 50 μ L QD-V H H + 50 μ L buffer, no EGFR) with
the thick gray curve (mathematical sum of [50 μ L Tb-V H H
+ 100 μ L buffer] and [50 μ L QD-V H H + 100 μ L buffer], no
EGFR) in Figure 3a . The gray curve contains only the pure
QD component (dotted curve with a short decay time) and
the pure Tb component (dotted curve with a long decay
time). The black curve has a much stronger intensity (FRET-
sensitization) and contains a new decay time component,
which is signifi cantly longer than the pure QD and shorter
than the pure Tb component (strong evidence for FRET
from Tb to QD). Although camelid V H Hs are known to
have a higher solubility than human V H fragments, [ 29 ] our
fi rst assumption was that hydrophobic interaction or V H H
dimerization [ 30 ] could lead to a partial V H H aggregation and
Tb-to-QD FRET when both Tb-V H H and QD-V H H are pre-
sent in the same sample. However, addition of excess of free
V H H (in order decrease the fraction of Tb-V H H + QD-V H H
in close distance within such aggregates) and the addition of
Tween-20 (in order to decrease hydrophobic interactions)
did not lead to any signifi cant changes (see Supporting Infor-
mation). Another possibility of such “pre-FRET” is related
to non-specifi c binding caused by the 0.5 % BSA in all sam-
ples. In fact, control experiments without BSA and different
amounts of BSA revealed a signifi cant infl uence of BSA on
the “pre-FRET” signal (see Supporting Information). We
assume that BSA-induced non-specifi c binding can bring a
small fraction of Tb-V H H and QD-V H H in close proximity,
which leads to this “pre-FRET” effect even without EGFR.
As the (nano) 2 -immunoassay aims at biomarker detection in
serum samples we retained the 0.5 % of BSA (ca. 76 μ M),
which saturates non-specifi c binding (e.g. to the walls of the
microplate wells and to human serum albumin in the serum
samples) and assures stable assay conditions.
Despite this “pre-FRET” in the mixture without EGFR,
the addition of EGFR leads to further FRET sensitization
(thin black curves in Figure 3 a) showing another new decay
time component. This decay time is longer than the compo-
nent from the non-specifi c binding-induced “pre-FRET” as
indicated in Figure 3 b. Taking into account the smaller size of
BSA (ca. 66 kDa vs. ca. 190 kDa for EGFR) and the fact that
non-specifi c binding between V H H and BSA can occur over
the complete surface of the BSA (compared to the specifi c
binding of the V H H to two defi ned epitopes of EGFR), the
longer decay time for specifi c EGFR binding is most prob-
ably caused by a larger distance (see Scheme 2 ). A larger
distance r leads to a lower FRET effi ciency η FRET , which
results in a longer decay time τ DA [ R 0 6 /( R 0
6 + r 6 ) = η FRET = 1− τ DA / τ D ]. It should be noted that the BSA concentration is
ca. 7600 times higher than the V H H concentrations (76 μ M vs.
10 nM), which should lead to a low probability of QD-V H H
and Tb-V H H binding. However, taking into account that the
largest part of BSA will bind to the walls of the microplate
Figure 2. PL intensity spectra of Tb-V H H (black dotted) and QD-V H H (black) conjugates normalized to unity at their respective maxima. The gray spectra in the background defi ne the transmission of the optical bandpass fi lters within the Tb (494 ± 20 nm) and QD (660 ± 13 nm) detection channels.
small 2014, 10, No. 4, 734–740
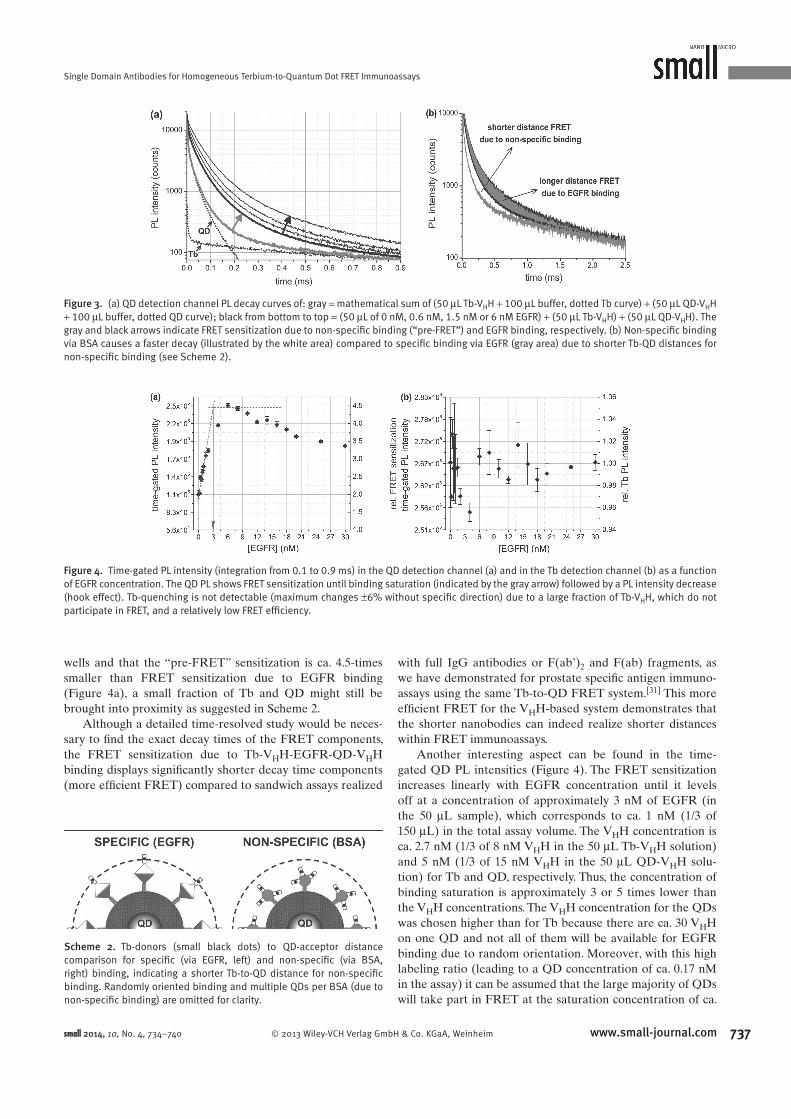
Single Domain Antibodies for Homogeneous Terbium-to-Quantum Dot FRET Immunoassays
737www.small-journal.com© 2013 Wiley-VCH Verlag GmbH & Co. KGaA, Weinheim
wells and that the “pre-FRET” sensitization is ca. 4.5-times
smaller than FRET sensitization due to EGFR binding
(Figure 4 a), a small fraction of Tb and QD might still be
brought into proximity as suggested in Scheme 2 .
Although a detailed time-resolved study would be neces-
sary to fi nd the exact decay times of the FRET components,
the FRET sensitization due to Tb-V H H-EGFR-QD-V H H
binding displays signifi cantly shorter decay time components
(more effi cient FRET) compared to sandwich assays realized
with full IgG antibodies or F(ab’) 2 and F(ab) fragments, as
we have demonstrated for prostate specifi c antigen immuno-
assays using the same Tb-to-QD FRET system. [ 31 ] This more
effi cient FRET for the V H H-based system demonstrates that
the shorter nanobodies can indeed realize shorter distances
within FRET immunoassays.
Another interesting aspect can be found in the time-
gated QD PL intensities (Figure 4 ). The FRET sensitization
increases linearly with EGFR concentration until it levels
off at a concentration of approximately 3 nM of EGFR (in
the 50 μ L sample), which corresponds to ca. 1 nM (1/3 of
150 μ L) in the total assay volume. The V H H concentration is
ca. 2.7 nM (1/3 of 8 nM V H H in the 50 μ L Tb-V H H solution)
and 5 nM (1/3 of 15 nM V H H in the 50 μ L QD-V H H solu-
tion) for Tb and QD, respectively. Thus, the concentration of
binding saturation is approximately 3 or 5 times lower than
the V H H concentrations. The V H H concentration for the QDs
was chosen higher than for Tb because there are ca. 30 V H H
on one QD and not all of them will be available for EGFR
binding due to random orientation. Moreover, with this high
labeling ratio (leading to a QD concentration of ca. 0.17 nM
in the assay) it can be assumed that the large majority of QDs
will take part in FRET at the saturation concentration of ca.
Figure 3. (a) QD detection channel PL decay curves of: gray = mathematical sum of (50 μ L Tb-V H H + 100 μ L buffer, dotted Tb curve) + (50 μ L QD-V H H + 100 μ L buffer, dotted QD curve); black from bottom to top = (50 μ L of 0 nM, 0.6 nM, 1.5 nM or 6 nM EGFR) + (50 μ L Tb-V H H) + (50 μ L QD-V H H). The gray and black arrows indicate FRET sensitization due to non-specifi c binding (“pre-FRET”) and EGFR binding, respectively. (b) Non-specifi c binding via BSA causes a faster decay (illustrated by the white area) compared to specifi c binding via EGFR (gray area) due to shorter Tb-QD distances for non-specifi c binding (see Scheme 2 ).
Figure 4. Time-gated PL intensity (integration from 0.1 to 0.9 ms) in the QD detection channel (a) and in the Tb detection channel (b) as a function of EGFR concentration. The QD PL shows FRET sensitization until binding saturation (indicated by the gray arrow) followed by a PL intensity decrease (hook effect). Tb-quenching is not detectable (maximum changes ± 6% without specifi c direction) due to a large fraction of Tb-V H H, which do not participate in FRET, and a relatively low FRET effi ciency.
Scheme 2. Tb-donors (small black dots) to QD-acceptor distance comparison for specifi c (via EGFR, left) and non-specifi c (via BSA, right) binding, indicating a shorter Tb-to-QD distance for non-specifi c binding. Randomly oriented binding and multiple QDs per BSA (due to non-specifi c binding) are omitted for clarity.
small 2014, 10, No. 4, 734–740

K. D. Wegner et al.
738 www.small-journal.com © 2013 Wiley-VCH Verlag GmbH & Co. KGaA, Weinheim
full papers
1 nM EGFR. On the other hand there is a large fraction (ca.
2/3) of the 2.7 nM Tb-V H H, which do not take part in binding,
possibly due to non-functional V H H and non-specifi c binding.
Taking into account a relatively low FRET effi ciency (due to
the large donor-acceptor distance) per Tb-donor on the one
hand and a high fraction of Tb-V H H per QD (see Scheme 1 )
on the other hand, this situation leads to minimal FRET-
quenching of the Tb PL intensity (Figure 4 b) but signifi cant
FRET sensitization of time-gated QD PL (Figure 4 a). In fact
this is one of the big advantages of measuring FRET sensi-
tization (small increasing signal against low background)
instead of FRET quenching (small decreasing signal against
high background). Apart from this behavior (Figure 4 ) the
assay is also showing the so-called hook effect, for which
the FRET sensitization decreases after binding saturation
because higher EGFR concentrations lead to the formation
of single Tb-V H H-EGFR or QD-V H H-EGFR complexes and
therefore less donor-acceptor pairs.
In order to evaluate the diagnostic performance of the
(nano) 2 -immunoassay we determined the limits of detec-
tion (LODs) for soluble EGFR in buffer and serum. We
therefore performed simultaneous time-gated (0.1–0.9 ms)
detection of the Tb-donor and the QD-acceptor PL inten-
sities on a KRYPTOR compact plus clinical fl uorescence
plate reader using 18 different EGFR concentrations ranging
from 0.2 to 30 nM. The FRET ratio (time-gated PL from the
QD-channel and the Tb-channel) was used for the acquisi-
tion of assay calibration curves in serum or buffer (Figure 5 ).
Although the buffer-based measurements show a stronger
FRET ratio increase compared to the serum measurements,
both lead to typical immunoassay calibration curves with an
increasing signal as a function of biomarker concentration
followed by a decreasing FRET ratio after binding satura-
tion (hook effect). The LODs were determined by using the
corresponding concentration of the average FRET ratio plus
three times its standard deviation (30 measurements) for the
EGFR-free samples. Both buffer and serum measurements
resulted in sub-nanomolar LODs (0.12 nM or 23 ng/mL
EGFR for buffer and 0.18 nM or 34 ng/mL EGFR for serum)
within the 50 μ L samples (LODs within the total 150 μ L
measuring volume are three times lower). These LODs are
below the recommended cut-off level of 45 ng/mL and well
in the concentration range for revealing relevant clinical
information. [ 23,24 ]
3. Conclusion
In conclusion we have demonstrated for the fi rst time a
homogeneous V H H-based FRET immunoassay, which
uses Tb-to-QD energy transfer. The (nano) 2 -immunoassay
requires relatively short incubation times (ca. 1h), does not
need any washing and separation steps (simple mix-and-
measure procedure), is measured quickly (5 s per sample)
and ratiometrically (low coeffi cients of variation), and time-
gated detection (void of autofl uorescence background and
directly excited QDs) allows sub-nanomolar detection limits
of EGFR (in both buffer or serum), which is in a relevant
clinical range of EGFR serum levels for cancer diagnostics.
This proof-of-principle for very sensitive V H H-based FRET
biosensing in combination with the fast, easy and inexpen-
sive production of ultra-small V H H antibodies (compared to
monoclonal IgG antibodies), the possibility of oriented V H H
conjugation, and the unrivaled optical properties of QDs for
sensitive and multiplexed biomarker detection will make
our (nano) 2 -immunoassay a valuable tool for future in vitro
diagnostics and other FRET-based biosensing applications in
imaging and spectroscopy.
4. Experimental Section
Nanobodies binding to EGFR (EgA1 and EgB4) [ 32 ] were produced as described elsewhere. [ 20 ] In brief, single bacterial clones were picked, grown in 2xTY containing 100 g/ml ampicillin and 0.1% (w/v) glucose and nanobody-expression was induced by the addi-tion of IPTG. After four hours of induction, bacteria were harvested by centrifugation (2000 rpm, 15 min) and the pellet was frozen overnight at −20 ° C. Cells were thawed, re-suspended in PBS and the nanobodies were purifi ed form the periplasmic fraction by IMAC using TALON beads. The nanobodies show high affi nity binding after fl uorophore conjugation. [ 19 ]
eFluor 650 Nanocrystal Conjugation Kit – Sulfhydryl Reac-tive (provided by eBioscience in lyophilized form) was used for QD conjugation. Prior to conjugation, protected sulfhydryl groups (N-Succinimidyl S-Acetylthioacetate) were introduced to V H H (EgB4) at 5 × molar excess using SATA kit (Thermo Fisher Scientifi c). The sulfhydryl groups were deprotected by diacyla-tion according to the manufacurer’s protocol. Sulfhydryl-activated V H H solutions (in concentration excess compared to the QD solu-tions) were prepared in 1 × PBS and conjugated to QDs according to manufacturer's instructions. Unbound V H H were separated by washing 3–6 times in 100 kDa molecular weight cutoff (MWCO) spin-columns (Millipore) using 100 mM sodium-tetraborate (pH
Figure 5. Calibration curves of the (nano) 2 -immunoassays using 50 μ L buffer (rhombi) or serum (circles) samples. The time-gated (0.1–0.9 ms) PL intensity ratios (normalized to unity for EGFR-free samples) increase with increasing EGFR concentration until the Tb-V H H-EGFR-QD-V H H binding is saturated and no further FRET sensitization occurs. Both curves were acquired using the same experimental conditions. The LODs (within the 50 μ L samples) are 0.12 nM (23 ng/mL or 6 fmol) and 0.18 nM (34 ng/mL or 9 fmol) for buffer and serum samples, respectively.
small 2014, 10, No. 4, 734–740
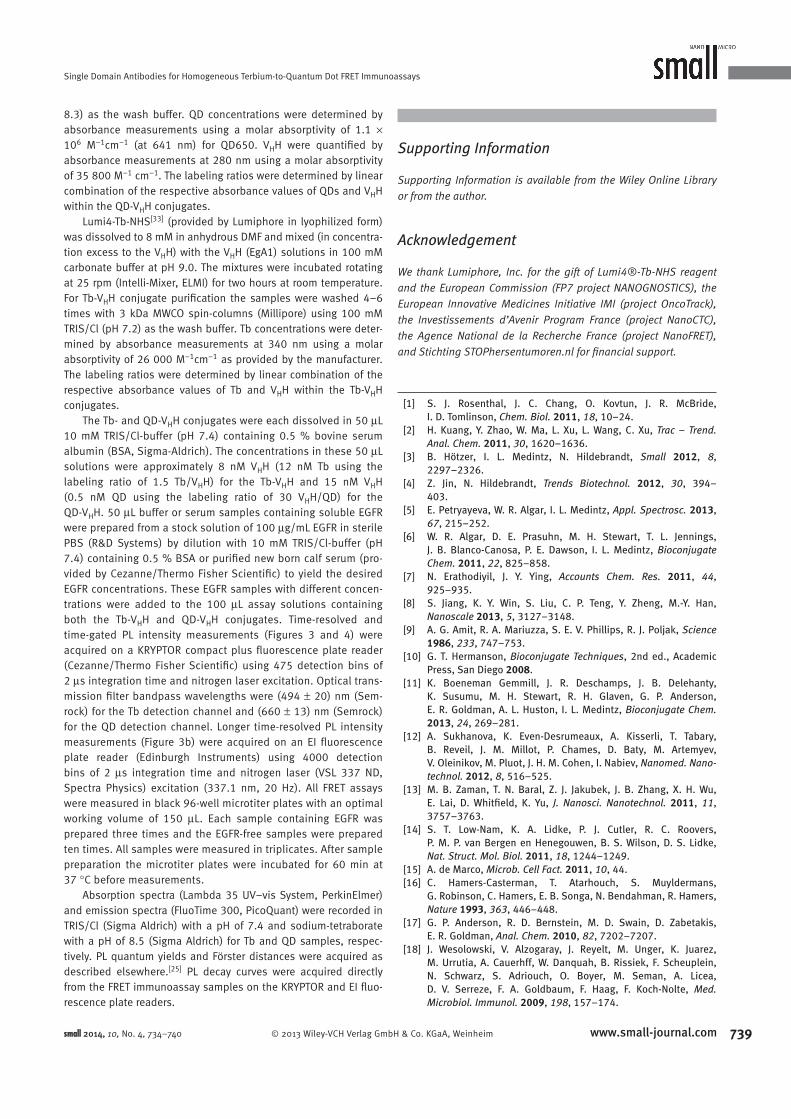
Single Domain Antibodies for Homogeneous Terbium-to-Quantum Dot FRET Immunoassays
739www.small-journal.com© 2013 Wiley-VCH Verlag GmbH & Co. KGaA, Weinheim
8.3) as the wash buffer. QD concentrations were determined by absorbance measurements using a molar absorptivity of 1.1 × 10 6 M −1 cm −1 (at 641 nm) for QD650. V H H were quantifi ed by absorbance measurements at 280 nm using a molar absorptivity of 35 800 M −1 cm −1 . The labeling ratios were determined by linear combination of the respective absorbance values of QDs and V H H within the QD-V H H conjugates.
Lumi4-Tb-NHS [ 33 ] (provided by Lumiphore in lyophilized form) was dissolved to 8 mM in anhydrous DMF and mixed (in concentra-tion excess to the V H H) with the V H H (EgA1) solutions in 100 mM carbonate buffer at pH 9.0. The mixtures were incubated rotating at 25 rpm (Intelli-Mixer, ELMI) for two hours at room temperature. For Tb-V H H conjugate purifi cation the samples were washed 4–6 times with 3 kDa MWCO spin-columns (Millipore) using 100 mM TRIS/Cl (pH 7.2) as the wash buffer. Tb concentrations were deter-mined by absorbance measurements at 340 nm using a molar absorptivity of 26 000 M −1 cm −1 as provided by the manufacturer. The labeling ratios were determined by linear combination of the respective absorbance values of Tb and V H H within the Tb-V H H conjugates.
The Tb- and QD-V H H conjugates were each dissolved in 50 μ L 10 mM TRIS/Cl-buffer (pH 7.4) containing 0.5 % bovine serum albumin (BSA, Sigma-Aldrich). The concentrations in these 50 μ L solutions were approximately 8 nM V H H (12 nM Tb using the labeling ratio of 1.5 Tb/V H H) for the Tb-V H H and 15 nM V H H (0.5 nM QD using the labeling ratio of 30 V H H/QD) for the QD-V H H. 50 μ L buffer or serum samples containing soluble EGFR were prepared from a stock solution of 100 μ g/mL EGFR in sterile PBS (R&D Systems) by dilution with 10 mM TRIS/Cl-buffer (pH 7.4) containing 0.5 % BSA or purifi ed new born calf serum (pro-vided by Cezanne/Thermo Fisher Scientifi c) to yield the desired EGFR concentrations. These EGFR samples with different concen-trations were added to the 100 μ L assay solutions containing both the Tb-V H H and QD-V H H conjugates. Time-resolved and time-gated PL intensity measurements (Figures 3 and 4 ) were acquired on a KRYPTOR compact plus fl uorescence plate reader (Cezanne/Thermo Fisher Scientifi c) using 475 detection bins of 2 μ s integration time and nitrogen laser excitation. Optical trans-mission fi lter bandpass wavelengths were (494 ± 20) nm (Sem-rock) for the Tb detection channel and (660 ± 13) nm (Semrock) for the QD detection channel. Longer time-resolved PL intensity measurements (Figure 3 b) were acquired on an EI fl uorescence plate reader (Edinburgh Instruments) using 4000 detection bins of 2 μ s integration time and nitrogen laser (VSL 337 ND, Spectra Physics) excitation (337.1 nm, 20 Hz). All FRET assays were measured in black 96-well microtiter plates with an optimal working volume of 150 μ L. Each sample containing EGFR was prepared three times and the EGFR-free samples were prepared ten times. All samples were measured in triplicates. After sample preparation the microtiter plates were incubated for 60 min at 37 ° C before measurements.
Absorption spectra (Lambda 35 UV–vis System, PerkinElmer) and emission spectra (FluoTime 300, PicoQuant) were recorded in TRIS/Cl (Sigma Aldrich) with a pH of 7.4 and sodium-tetraborate with a pH of 8.5 (Sigma Aldrich) for Tb and QD samples, respec-tively. PL quantum yields and Förster distances were acquired as described elsewhere. [ 25 ] PL decay curves were acquired directly from the FRET immunoassay samples on the KRYPTOR and EI fl uo-rescence plate readers.
Supporting Information
Supporting Information is available from the Wiley Online Library or from the author.
Acknowledgement
We thank Lumiphore, Inc. for the gift of Lumi4®-Tb-NHS reagent and the European Commission (FP7 project NANOGNOSTICS), the European Innovative Medicines Initiative IMI (project OncoTrack), the Investissements d’Avenir Program France (project NanoCTC), the Agence National de la Recherche France (project NanoFRET), and Stichting STOPhersentumoren.nl for fi nancial support.
[1] S. J. Rosenthal , J. C. Chang , O. Kovtun , J. R. McBride , I. D. Tomlinson , Chem. Biol. 2011 , 18 , 10 – 24 .
[2] H. Kuang , Y. Zhao , W. Ma , L. Xu , L. Wang , C. Xu , Trac – Trend. Anal. Chem. 2011 , 30 , 1620 – 1636 .
[3] B. Hötzer , I. L. Medintz , N. Hildebrandt , Small 2012 , 8 , 2297 – 2326 .
[4] Z. Jin , N. Hildebrandt , Trends Biotechnol. 2012 , 30 , 394 – 403 .
[5] E. Petryayeva , W. R. Algar , I. L. Medintz , Appl. Spectrosc. 2013 , 67 , 215 – 252 .
[6] W. R. Algar , D. E. Prasuhn , M. H. Stewart , T. L. Jennings , J. B. Blanco-Canosa , P. E. Dawson , I. L. Medintz , Bioconjugate Chem. 2011 , 22 , 825 – 858 .
[7] N. Erathodiyil , J. Y. Ying , Accounts Chem. Res. 2011 , 44 , 925 – 935 .
[8] S. Jiang , K. Y. Win , S. Liu , C. P. Teng , Y. Zheng , M.-Y. Han , Nanoscale 2013 , 5 , 3127 – 3148 .
[9] A. G. Amit , R. A. Mariuzza , S. E. V. Phillips , R. J. Poljak , Science 1986 , 233 , 747 – 753 .
[10] G. T. Hermanson , Bioconjugate Techniques , 2nd ed. , Academic Press , San Diego 2008 .
[11] K. Boeneman Gemmill , J. R. Deschamps , J. B. Delehanty , K. Susumu , M. H. Stewart , R. H. Glaven , G. P. Anderson , E. R. Goldman , A. L. Huston , I. L. Medintz , Bioconjugate Chem. 2013 , 24 , 269 – 281 .
[12] A. Sukhanova , K. Even-Desrumeaux , A. Kisserli , T. Tabary , B. Reveil , J. M. Millot , P. Chames , D. Baty , M. Artemyev , V. Oleinikov , M. Pluot , J. H. M. Cohen , I. Nabiev , Nanomed. Nano-technol. 2012 , 8 , 516 – 525 .
[13] M. B. Zaman , T. N. Baral , Z. J. Jakubek , J. B. Zhang , X. H. Wu , E. Lai , D. Whitfi eld , K. Yu , J. Nanosci. Nanotechnol. 2011 , 11 , 3757 – 3763 .
[14] S. T. Low-Nam , K. A. Lidke , P. J. Cutler , R. C. Roovers , P. M. P. van Bergen en Henegouwen , B. S. Wilson , D. S. Lidke , Nat. Struct. Mol. Biol. 2011 , 18 , 1244 – 1249 .
[15] A. de Marco , Microb. Cell Fact. 2011 , 10 , 44 . [16] C. Hamers-Casterman , T. Atarhouch , S. Muyldermans ,
G. Robinson , C. Hamers , E. B. Songa , N. Bendahman , R. Hamers , Nature 1993 , 363 , 446 – 448 .
[17] G. P. Anderson , R. D. Bernstein , M. D. Swain , D. Zabetakis , E. R. Goldman , Anal. Chem. 2010 , 82 , 7202 – 7207 .
[18] J. Wesolowski , V. Alzogaray , J. Reyelt , M. Unger , K. Juarez , M. Urrutia , A. Cauerhff , W. Danquah , B. Rissiek , F. Scheuplein , N. Schwarz , S. Adriouch , O. Boyer , M. Seman , A. Licea , D. V. Serreze , F. A. Goldbaum , F. Haag , F. Koch-Nolte , Med. Microbiol. Immunol. 2009 , 198 , 157 – 174 .
small 2014, 10, No. 4, 734–740
K. D. Wegner et al.
740 www.small-journal.com © 2013 Wiley-VCH Verlag GmbH & Co. KGaA, Weinheim
full papers [19] S. Oliveira , G. A. M. S. van Dongen , M. Stigter-van Walsum ,
R. C. Roovers , J. C. Stam , W. Mali , P. J. van Diest , P. M. P. van Bergen en Henegouwen , Mol. Imag. 2012 , 11 , 33 – 46 .
[20] R. C. Roovers , T. Laeremans , L. Huang , S. De Taeye , A. J. Verkleij , H. Revets , H. J. de Haard , P. M. P. van Bergen en Henegouwen , Cancer Immunol. Immunol. 2007 , 56 , 303 – 317 .
[21] D. Wild , The Immunoassay Handbook , 4th ed. , Elsevier , Amsterdam 2013 .
[22] A. A. Ghazani , S. McDermott , M. Pectasides , M. Sebas , M. Mino-Kenudson , H. Lee , R. Weissleder , C. M. Castro , Nanomed. Nanotechnol. 2013 , DOI: 10.1016/j.nano.2013.03.011 .
[23] K. S. Asgeirsson , A. Agrawal , C. Allen , A. Hitch , I. O. Ellis , C. Chapman , K. L. Cheung , J. F. R. Robertson , Breast Cancer Res. 2007 , 9 ( 6 ), R75 .
[24] V. Müller , I. Witzel , K. Pantel , S. Krenkel , H. J. Lück , R. Neumann , T. Keller , I. Dittmer , F. Jänicke , C. Thomssen , Anticancer Res. 2006 , 26 , 1479 – 1487 .
[25] K. D. Wegner , P. T. Lanh , T. Jennings , E. Oh , V. Jain , S. M. Fairclough , J. M. Smith , E. Giovanelli , N. Lequeux , T. Pons , N. Hildebrandt , ACS Appl. Mater. Interfaces 2013 , 5 , 2881 – 2892 .
[26] J.R. Lakowicz , Principles of Fluorescence Spectroscopy , 3rd ed. , Springer , New York 2006 .
[27] D. Geißler , L. J. Charbonnière , R. F. Ziessel , N. G. Butlin , H.-G. Löhmannsröben , N. Hildebrandt , Angew. Chem. Int. Ed. 2010 , 49 , 1396 – 1401 .
[28] L. J. Charbonnière , N. Hildebrandt , Eur. J. Inorg. Chem. 2008 , 3241 – 3251 .
[29] S. Muyldermans , Annu. Rev. Biochem. 2013 , 82 , 17. 1 – 17.23 .
[30] G. J. Sonneson , J. R. Horn , Biochemistry 2009 , 48 , 6693 – 6695 . [31] K. D. Wegner , Z. Jin , S. Lindén , T. L. Jennings , N. Hildebrandt ,
ACS Nano 2013 , 7 , 7411 – 7419 . [32] E. G. Hofman , M. O. Ruonala , A. N. Bader , D. van den Heuvel ,
J. Voortman , R. C. Roovers , A. J. Verkleij , H. C. Gerritsen , P. M. P. van Bergen en Henegouwen , J. Cell Sci. 2008 , 121 , 2519 – 2528 .
[33] J. Xu , T. M. Corneillie , E. G. Moore , G.-L. Law , N. G. Butlin , K. N. Raymond , J.Am. Chem. Soc. 2011 , 133 , 19900 – 19910 .
Received: August 4, 2013Published online: October 2, 2013
small 2014, 10, No. 4, 734–740
Copyright WILEY-VCH Verlag GmbH & Co. KGaA, 69469 Weinheim, Germany, 2013.
Supporting Information for Small, DOI: 10.1002/smll.201302383 Nanobodies and Nanocrystals: Highly Sensitive Quantum Dot-Based Homogeneous FRET Immunoassay for Serum-Based EGFR Detection K. David Wegner, Stina Lindén, Zongwen Jin, Travis L. Jennings, Rachid el Khoulati, Paul M. P. van Bergen en Henegouwen, and Niko Hildebrandt*
1
Nanobodies and Nanocrystals: Highly sensitive quantum dot-based homogeneous FRET-immunoassay for serum-based EGFR detection
K. David Wegner*, Stina Linden, Zongwen Jin, Travis L. Jennings, Rachid el Khoulati, Paul M.P. van Bergen en Henegouwen, and Niko Hildebrandt*
Supporting Information
Evaluation of possible VHH aggregation Excess of free VHH (20 nM) was added to the assay mixtures without EGFR (Tb-VHH and QD-VHH containing 2.7 nM and 5 nM of VHH, respectively) in order to evaluate if the “pre-FRET” (FRET in the assay mixture containing no EGFR) is caused by hydrophobic interactions or VHH dimerization leading to the formation of VHH aggregates. Addition of an excess of free VHH should lead to less Tb-VHH/QD-VHH in close proximity within such aggregates and therefore reduced FRET. However, the addiditon of neither EgA1 (VHH within Tb-VHH) nor EgB4 (VHH within QD-VHH) leads to any significant change in the pre-FRET curve (Supporting Figure 1). All samples were measured after 10, 20, 30, 60, 90 and 120 min. without significant differences in the decay curves. Therefore only the curves after 60 min. are shown in Supporting Figure 1. Another control experiment in order to evaluate the influence of hydrophobic interactions was the addition of 0.1% Tween-20 to the assay mixture (to reduce hydrophobic interactions). However, the addition of Tween-20 had no significant influence compared to the mixture without Tween-20 (it rather slightly increases the intensity of the curve) as shown in the comparison of Supporting Figure 2b (no Tween-20) and 2d (0.1 % Tween-20). Evaluation of BSA-induced non-specific binding For these control experiments the Tb-VHH and QD-VHH samples were prepared in TRIS/Cl buffer (pH 7.4) containing no BSA. For the Tb-VHH/QD-VHH mixtures 50 µL of each sample were mixed with 50 µL of TRIS/Cl buffer containing different amounts of BSA in order to give a final BSA concentration (in the complete assay volume) of 0 %, 0.5 % or 5 %. All samples were measured after 10, 20, 30, 60, 90 and 120 min. without significant differences in the decay curves. Therefore only the curves after 60 min. are shown in Supporting Figure 2. Comparison of Supporting Figure 2a, b and c shows a significant increase of “pre-FRET” (black curve compared to red curve for each graph) with increasing BSA concentration. Moreover the signals of the samples containing no BSA (Supporting Figure 2a) are much lower compared to the other samples, which is caused by non-specific binding of Tb-VHH and QD-VHH to the well walls, showing the necessity of BSA in the assays. It should be noted that the “pre-FRET” only becomes very obvious for 5 % BSA (Supporting Figure 2c), whereas the 0.5 % BSA curve (Supporting Figure 2b) shows only weak pre-FRET. This is in contrast to the assays presented in the manuscript, for which a significant “pre-FRET” is already visible for 0.5 % BSA (Figure 3a). This effect
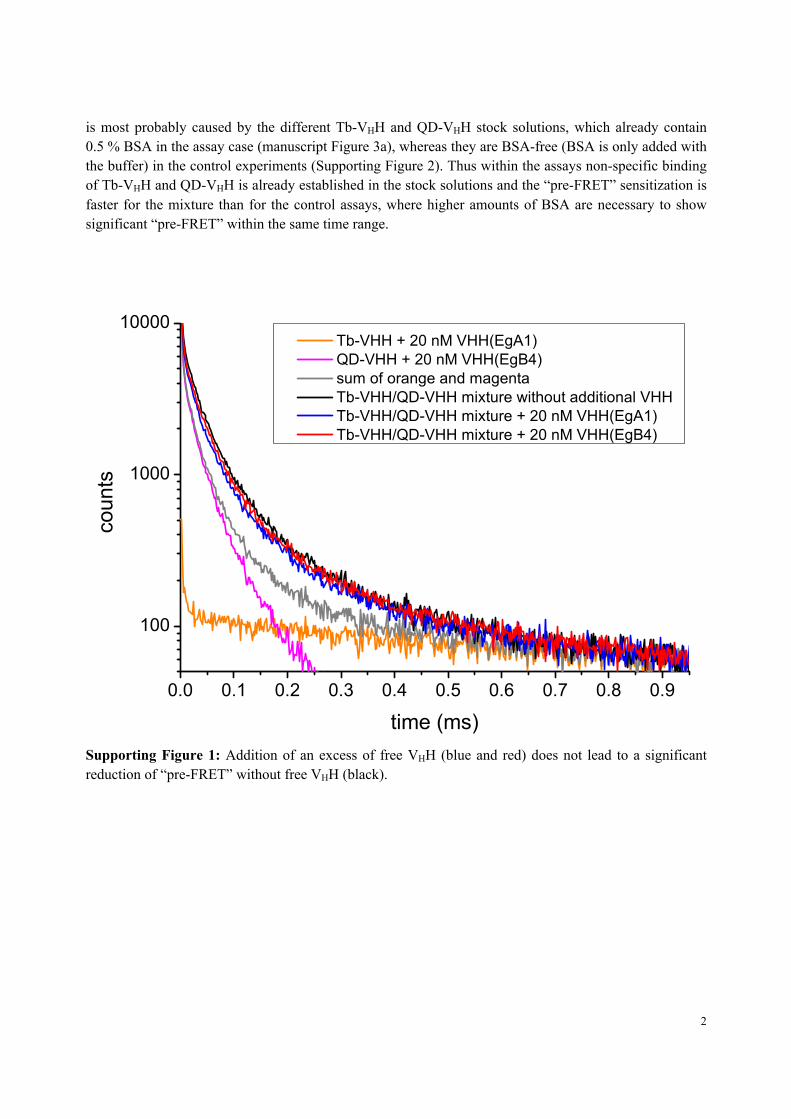
2
is most probably caused by the different Tb-VHH and QD-VHH stock solutions, which already contain 0.5 % BSA in the assay case (manuscript Figure 3a), whereas they are BSA-free (BSA is only added with the buffer) in the control experiments (Supporting Figure 2). Thus within the assays non-specific binding of Tb-VHH and QD-VHH is already established in the stock solutions and the “pre-FRET” sensitization is faster for the mixture than for the control assays, where higher amounts of BSA are necessary to show significant “pre-FRET” within the same time range.
Supporting Figure 1: Addition of an excess of free VHH (blue and red) does not lead to a significant reduction of “pre-FRET” without free VHH (black).

3
Supporting Figure 2: Pure Tb-VHH (orange), pure QD-VHH (magenta), the mathematical sum of both (red) and the mixture of both (black) at equal concentrations for all curves. The different samples contain 0% BSA (a), 0.5% BSA (b), 5% BSA (c) and 0.5% BSA + 0.1% Tween-20 (d). The difference between the black and the red curve increases from 0 to 0.5 to 5% BSA, which confirms that the pre-FRET signal is caused by BSA-induced non-specific binding. Addition of Tween-20 does not have any significant influence on the decay curves.
(a) (b)
(c) (d)

6.4. SPECTROSCOPIC RULER xliii
6.4 Spectroscopic ruler
6.4.1 Biotin-streptavidin system
Original publication:
Influence of Luminescence Quantum Yield, Surface Coating andFunctionalization of Quantum Dots on the Sensitivity of
Time-Resolved FRET Bioassays.K. D. Wegner, P. T. Lanh, T. Jennings, E. Oh, V. Jain, S. M. Fairclough, J. M.
Smith, E. Giovanelli, N. Lequeux, T. Pons, and N. Hildebrandt.ACS Applied Materials & Interfaces 2013, 5, 2881-2892.

Influence of Luminescence Quantum Yield, Surface Coating, andFunctionalization of Quantum Dots on the Sensitivity of Time-Resolved FRET BioassaysK. David Wegner,† Phung Thi Lanh,† Travis Jennings,‡ Eunkeu Oh,§,⊥ Vaibhav Jain,§
Simon M. Fairclough,# Jason M. Smith,# Emerson Giovanelli,|| Nicolas Lequeux,|| Thomas Pons,||
and Niko Hildebrandt†,*†Institut d’Electronique Fondamentale, Universite Paris-Sud, 91405 Orsay Cedex, France‡eBioscience, Inc., 10255 Science Center Drive San Diego, California 92121, United States§Optical Sciences Division, Code 5600, U.S. Naval Research Laboratory, Washington, D.C. 20375, United States⊥Sotera Defense Solutions, Annapolis Junction, Maryland 20701, United States#Department of Materials, University of Oxford, Oxford, Oxfordshire, OX1 3PH, United Kingdom||Laboratoire de Physique et d’Etude des Materiaux, ESPCI-CNRS-UPMC UMR8213, 75005 Paris, France
*S Supporting Information
ABSTRACT: In clinical diagnostics, homogeneous time-resolved (TR) FRETimmunoassays are used for fast and highly sensitive detection of biomarkers in serumsamples. The most common immunoassay format is based on europium chelate orcryptate donors and allophycocyanin acceptors. Replacing europium donors withterbium complexes and the acceptors with QDs offers large photophysical advantagesfor multiplexed diagnostics, because the Tb-complex can be used as FRET donor forQD acceptors of different colors. Water-soluble and biocompatible QDs arecommercially available or can be synthesized in the laboratory using many available recipes from the literature. Apart from thesemiconductor material composition, an important aspect of choosing the right QD for TR-FRET assays is the thickness of theQD coating, which will influence the photophysical properties and long-term stability as well as the donor−acceptor distance andFRET efficiency. Here we present a detailed time-resolved spectroscopic study of three different QDs with an emission maximumaround 605 nm for their application as FRET acceptors (using a common Tb donor) in TR-bioassays: (i) Invitrogen/LifeTechnologies Qdot605, (ii) eBioscience eFluorNC605 and iii) ter-polymer stabilized CdSe/CdS/ZnS QDs synthesized in ourlaboratories. All FRET systems are very stable and possess large Forster distances (7.4−9.1 nm), high FRET efficiencies (0.63−0.80) and low detection limits (0.06−2.0 pM) within the FRET-bioassays. Shapes, sizes and the biotin/QD ratio of thebiocompatible QDs could be determined directly in the solution phase bioassays at subnanomolar concentrations. Bothcommercial amphiphilic polymer/lipid encapsulated QDs and self-made ligand-exchanged QDs provide extremely low detectionlimits for highly sensitive TR-FRET bioassays.
KEYWORDS: FRET, quantum dot, biosensor, diagnostics, terbium, multiplexing, spectroscopy, immunoassay, biotin, streptavidin
■ INTRODUCTION
Semiconductor nanocrystals or quantum dots (QDs) areimportant fluorophores for optical biosensing applicationsbecause they combine spectrally broad absorption with highmolar absorptivity and spectrally narrow emission with highbrightness.1−4 Three-dimensional quantum confinement allowstuning of absorption and emission wavelengths over a largerange of the UV−vis−NIR spectral region by changing QDsizes and/or materials.1,5 Despite the photophysical advantagesof QDs, their applications in biosensing remain most oftenlimited to research studies. The adoption of QDs within clinicaldiagnostic kits is still limited although several commercialsuppliers of biocompatible QDs exist.6 QDs with superiorphotoluminescence (PL) properties are usually synthesized inorganic solvents and thus they require exchange of surface
ligands or coating with water-soluble shells (e.g., polymers orlipids) in order to be used in aqueous solutions.7,8 Such stepscan cause significant alterations in brightness, stability and/orsize of the QDs. Moreover, the relatively large surfaces of QDsgive rise to multiple interactions with the biological environ-ment, which can cause further changes in the physical andchemical properties of QDs. It is therefore very important toinvestigate various different QDs for each application. Adetailed steady-state and time-resolved spectroscopic analysis
Special Issue: Forum on Biomedical Applications of ColloidalPhotoluminescent Quantum Dots
Received: December 11, 2012Accepted: February 27, 2013Published: March 15, 2013
Forum Article
www.acsami.org
© 2013 American Chemical Society 2881 dx.doi.org/10.1021/am3030728 | ACS Appl. Mater. Interfaces 2013, 5, 2881−2892
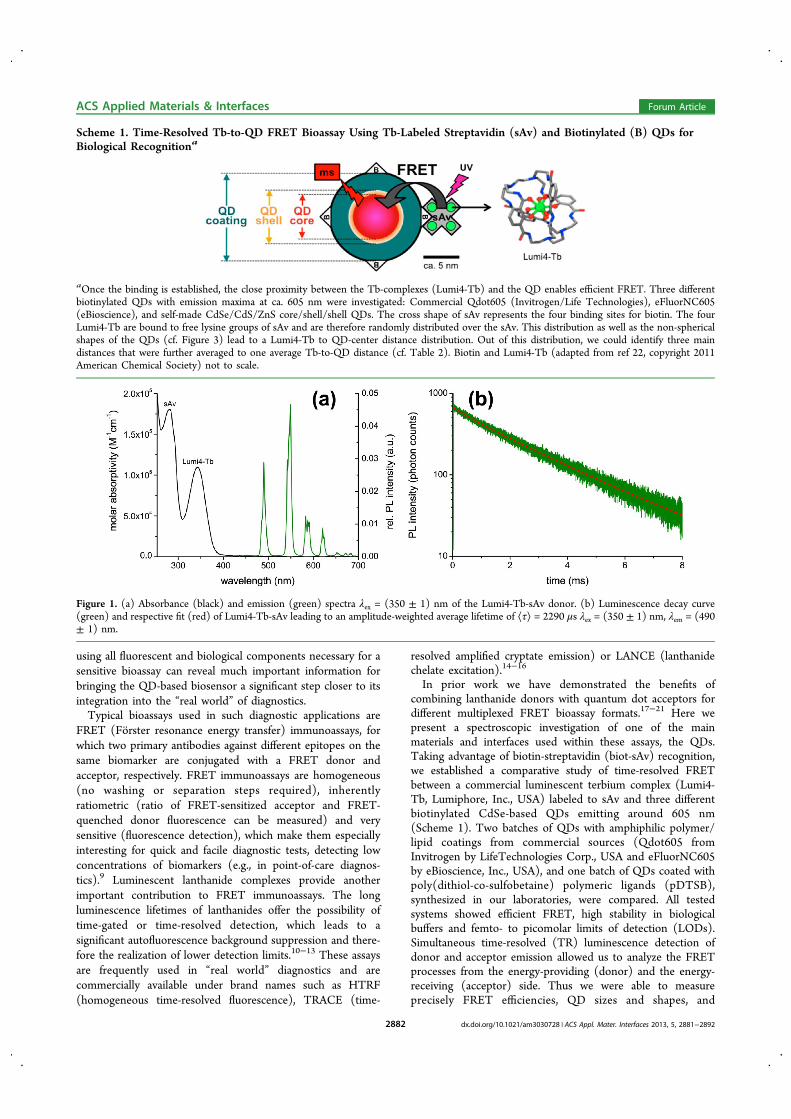
using all fluorescent and biological components necessary for asensitive bioassay can reveal much important information forbringing the QD-based biosensor a significant step closer to itsintegration into the “real world” of diagnostics.Typical bioassays used in such diagnostic applications are
FRET (Forster resonance energy transfer) immunoassays, forwhich two primary antibodies against different epitopes on thesame biomarker are conjugated with a FRET donor andacceptor, respectively. FRET immunoassays are homogeneous(no washing or separation steps required), inherentlyratiometric (ratio of FRET-sensitized acceptor and FRET-quenched donor fluorescence can be measured) and verysensitive (fluorescence detection), which make them especiallyinteresting for quick and facile diagnostic tests, detecting lowconcentrations of biomarkers (e.g., in point-of-care diagnos-tics).9 Luminescent lanthanide complexes provide anotherimportant contribution to FRET immunoassays. The longluminescence lifetimes of lanthanides offer the possibility oftime-gated or time-resolved detection, which leads to asignificant autofluorescence background suppression and there-fore the realization of lower detection limits.10−13 These assaysare frequently used in “real world” diagnostics and arecommercially available under brand names such as HTRF(homogeneous time-resolved fluorescence), TRACE (time-
resolved amplified cryptate emission) or LANCE (lanthanidechelate excitation).14−16
In prior work we have demonstrated the benefits ofcombining lanthanide donors with quantum dot acceptors fordifferent multiplexed FRET bioassay formats.17−21 Here wepresent a spectroscopic investigation of one of the mainmaterials and interfaces used within these assays, the QDs.Taking advantage of biotin-streptavidin (biot-sAv) recognition,we established a comparative study of time-resolved FRETbetween a commercial luminescent terbium complex (Lumi4-Tb, Lumiphore, Inc., USA) labeled to sAv and three differentbiotinylated CdSe-based QDs emitting around 605 nm(Scheme 1). Two batches of QDs with amphiphilic polymer/lipid coatings from commercial sources (Qdot605 fromInvitrogen by LifeTechnologies Corp., USA and eFluorNC605by eBioscience, Inc., USA), and one batch of QDs coated withpoly(dithiol-co-sulfobetaine) polymeric ligands (pDTSB),synthesized in our laboratories, were compared. All testedsystems showed efficient FRET, high stability in biologicalbuffers and femto- to picomolar limits of detection (LODs).Simultaneous time-resolved (TR) luminescence detection ofdonor and acceptor emission allowed us to analyze the FRETprocesses from the energy-providing (donor) and the energy-receiving (acceptor) side. Thus we were able to measureprecisely FRET efficiencies, QD sizes and shapes, and
Scheme 1. Time-Resolved Tb-to-QD FRET Bioassay Using Tb-Labeled Streptavidin (sAv) and Biotinylated (B) QDs forBiological Recognitiona
aOnce the binding is established, the close proximity between the Tb-complexes (Lumi4-Tb) and the QD enables efficient FRET. Three differentbiotinylated QDs with emission maxima at ca. 605 nm were investigated: Commercial Qdot605 (Invitrogen/Life Technologies), eFluorNC605(eBioscience), and self-made CdSe/CdS/ZnS core/shell/shell QDs. The cross shape of sAv represents the four binding sites for biotin. The fourLumi4-Tb are bound to free lysine groups of sAv and are therefore randomly distributed over the sAv. This distribution as well as the non-sphericalshapes of the QDs (cf. Figure 3) lead to a Lumi4-Tb to QD-center distance distribution. Out of this distribution, we could identify three maindistances that were further averaged to one average Tb-to-QD distance (cf. Table 2). Biotin and Lumi4-Tb (adapted from ref 22, copyright 2011American Chemical Society) not to scale.
Figure 1. (a) Absorbance (black) and emission (green) spectra λex = (350 ± 1) nm of the Lumi4-Tb-sAv donor. (b) Luminescence decay curve(green) and respective fit (red) of Lumi4-Tb-sAv leading to an amplitude-weighted average lifetime of ⟨τ⟩ = 2290 μs λex = (350 ± 1) nm, λem = (490± 1) nm.
ACS Applied Materials & Interfaces Forum Article
dx.doi.org/10.1021/am3030728 | ACS Appl. Mater. Interfaces 2013, 5, 2881−28922882
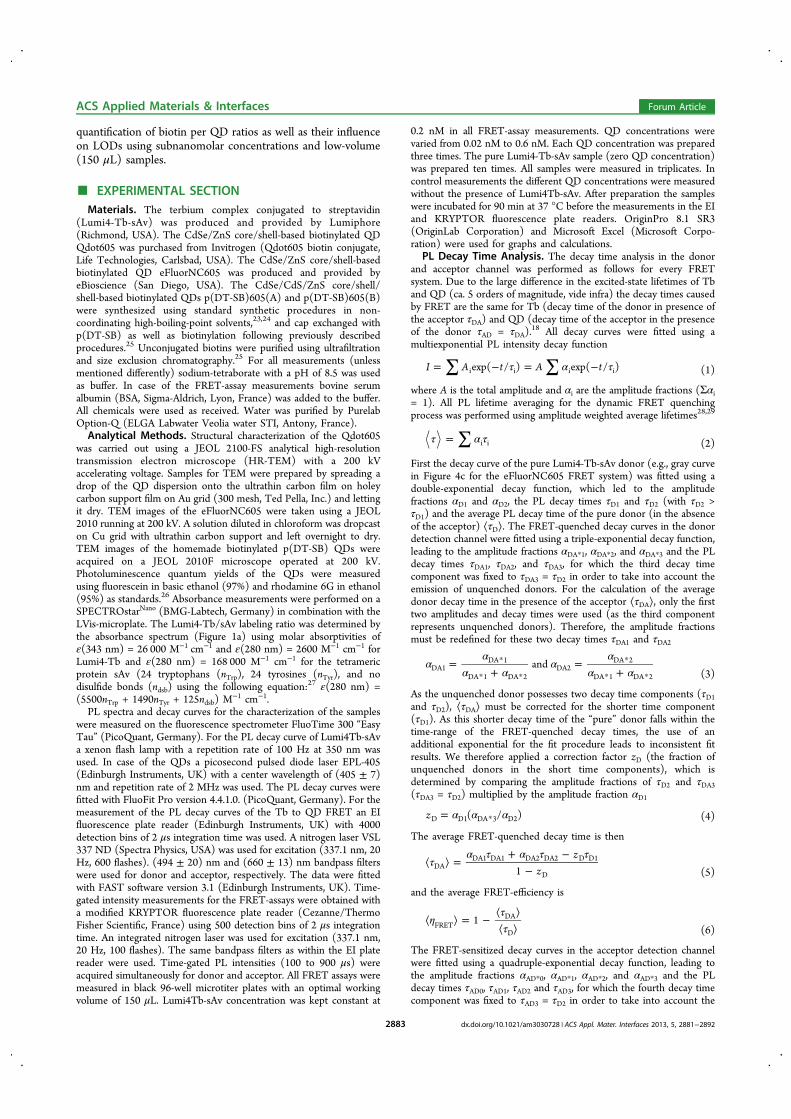
quantification of biotin per QD ratios as well as their influenceon LODs using subnanomolar concentrations and low-volume(150 μL) samples.
■ EXPERIMENTAL SECTIONMaterials. The terbium complex conjugated to streptavidin
(Lumi4-Tb-sAv) was produced and provided by Lumiphore(Richmond, USA). The CdSe/ZnS core/shell-based biotinylated QDQdot605 was purchased from Invitrogen (Qdot605 biotin conjugate,Life Technologies, Carlsbad, USA). The CdSe/ZnS core/shell-basedbiotinylated QD eFluorNC605 was produced and provided byeBioscience (San Diego, USA). The CdSe/CdS/ZnS core/shell/shell-based biotinylated QDs p(DT-SB)605(A) and p(DT-SB)605(B)were synthesized using standard synthetic procedures in non-coordinating high-boiling-point solvents,23,24 and cap exchanged withp(DT-SB) as well as biotinylation following previously describedprocedures.25 Unconjugated biotins were purified using ultrafiltrationand size exclusion chromatography.25 For all measurements (unlessmentioned differently) sodium-tetraborate with a pH of 8.5 was usedas buffer. In case of the FRET-assay measurements bovine serumalbumin (BSA, Sigma-Aldrich, Lyon, France) was added to the buffer.All chemicals were used as received. Water was purified by PurelabOption-Q (ELGA Labwater Veolia water STI, Antony, France).Analytical Methods. Structural characterization of the Qdot605
was carried out using a JEOL 2100-FS analytical high-resolutiontransmission electron microscope (HR-TEM) with a 200 kVaccelerating voltage. Samples for TEM were prepared by spreading adrop of the QD dispersion onto the ultrathin carbon film on holeycarbon support film on Au grid (300 mesh, Ted Pella, Inc.) and lettingit dry. TEM images of the eFluorNC605 were taken using a JEOL2010 running at 200 kV. A solution diluted in chloroform was dropcaston Cu grid with ultrathin carbon support and left overnight to dry.TEM images of the homemade biotinylated p(DT-SB) QDs wereacquired on a JEOL 2010F microscope operated at 200 kV.Photoluminescence quantum yields of the QDs were measuredusing fluorescein in basic ethanol (97%) and rhodamine 6G in ethanol(95%) as standards.26 Absorbance measurements were performed on aSPECTROstarNano (BMG-Labtech, Germany) in combination with theLVis-microplate. The Lumi4-Tb/sAv labeling ratio was determined bythe absorbance spectrum (Figure 1a) using molar absorptivities ofε(343 nm) = 26 000 M−1 cm−1 and ε(280 nm) = 2600 M−1 cm−1 forLumi4-Tb and ε(280 nm) = 168 000 M−1 cm−1 for the tetramericprotein sAv (24 tryptophans (nTrp), 24 tyrosines (nTyr), and nodisulfide bonds (ndsb) using the following equation:27 ε(280 nm) =(5500nTrp + 1490nTyr + 125ndsb) M
−1 cm−1.PL spectra and decay curves for the characterization of the samples
were measured on the fluorescence spectrometer FluoTime 300 “EasyTau” (PicoQuant, Germany). For the PL decay curve of Lumi4Tb-sAva xenon flash lamp with a repetition rate of 100 Hz at 350 nm wasused. In case of the QDs a picosecond pulsed diode laser EPL-405(Edinburgh Instruments, UK) with a center wavelength of (405 ± 7)nm and repetition rate of 2 MHz was used. The PL decay curves werefitted with FluoFit Pro version 4.4.1.0. (PicoQuant, Germany). For themeasurement of the PL decay curves of the Tb to QD FRET an EIfluorescence plate reader (Edinburgh Instruments, UK) with 4000detection bins of 2 μs integration time was used. A nitrogen laser VSL337 ND (Spectra Physics, USA) was used for excitation (337.1 nm, 20Hz, 600 flashes). (494 ± 20) nm and (660 ± 13) nm bandpass filterswere used for donor and acceptor, respectively. The data were fittedwith FAST software version 3.1 (Edinburgh Instruments, UK). Time-gated intensity measurements for the FRET-assays were obtained witha modified KRYPTOR fluorescence plate reader (Cezanne/ThermoFisher Scientific, France) using 500 detection bins of 2 μs integrationtime. An integrated nitrogen laser was used for excitation (337.1 nm,20 Hz, 100 flashes). The same bandpass filters as within the EI platereader were used. Time-gated PL intensities (100 to 900 μs) wereacquired simultaneously for donor and acceptor. All FRET assays weremeasured in black 96-well microtiter plates with an optimal workingvolume of 150 μL. Lumi4Tb-sAv concentration was kept constant at
0.2 nM in all FRET-assay measurements. QD concentrations werevaried from 0.02 nM to 0.6 nM. Each QD concentration was preparedthree times. The pure Lumi4-Tb-sAv sample (zero QD concentration)was prepared ten times. All samples were measured in triplicates. Incontrol measurements the different QD concentrations were measuredwithout the presence of Lumi4Tb-sAv. After preparation the sampleswere incubated for 90 min at 37 °C before the measurements in the EIand KRYPTOR fluorescence plate readers. OriginPro 8.1 SR3(OriginLab Corporation) and Microsoft Excel (Microsoft Corpo-ration) were used for graphs and calculations.
PL Decay Time Analysis. The decay time analysis in the donorand acceptor channel was performed as follows for every FRETsystem. Due to the large difference in the excited-state lifetimes of Tband QD (ca. 5 orders of magnitude, vide infra) the decay times causedby FRET are the same for Tb (decay time of the donor in presence ofthe acceptor τDA) and QD (decay time of the acceptor in the presenceof the donor τAD = τDA).
18 All decay curves were fitted using amultiexponential PL intensity decay function
∑ ∑τ α τ= − = −I A t A texp( / ) exp( / )i i i i (1)
where A is the total amplitude and αi are the amplitude fractions (Σαi= 1). All PL lifetime averaging for the dynamic FRET quenchingprocess was performed using amplitude weighted average lifetimes28,29
∑τ α τ= i i (2)
First the decay curve of the pure Lumi4-Tb-sAv donor (e.g., gray curvein Figure 4c for the eFluorNC605 FRET system) was fitted using adouble-exponential decay function, which led to the amplitudefractions αD1 and αD2, the PL decay times τD1 and τD2 (with τD2 >τD1) and the average PL decay time of the pure donor (in the absenceof the acceptor) ⟨τD⟩. The FRET-quenched decay curves in the donordetection channel were fitted using a triple-exponential decay function,leading to the amplitude fractions αDA*1, αDA*2, and αDA*3 and the PLdecay times τDA1, τDA2, and τDA3, for which the third decay timecomponent was fixed to τDA3 = τD2 in order to take into account theemission of unquenched donors. For the calculation of the averagedonor decay time in the presence of the acceptor ⟨τDA⟩, only the firsttwo amplitudes and decay times were used (as the third componentrepresents unquenched donors). Therefore, the amplitude fractionsmust be redefined for these two decay times τDA1 and τDA2
αα
α αα
αα α
=+
=+
*
* *
*
* *andDA1
DA 1
DA 1 DA 2DA2
DA 2
DA 1 DA 2 (3)
As the unquenched donor possesses two decay time components (τD1and τD2), ⟨τDA⟩ must be corrected for the shorter time component(τD1). As this shorter decay time of the “pure” donor falls within thetime-range of the FRET-quenched decay times, the use of anadditional exponential for the fit procedure leads to inconsistent fitresults. We therefore applied a correction factor zD (the fraction ofunquenched donors in the short time components), which isdetermined by comparing the amplitude fractions of τD2 and τDA3(τDA3 = τD2) multiplied by the amplitude fraction αD1
α α α= *z ( / )D D1 DA 3 D2 (4)
The average FRET-quenched decay time is then
τα τ α τ τ
⟨ ⟩ =+ −
−z
z1DADA1 DA1 DA2 DA2 D D1
D (5)
and the average FRET-efficiency is
ηττ
⟨ ⟩ = −⟨ ⟩⟨ ⟩
1FRETDA
D (6)
The FRET-sensitized decay curves in the acceptor detection channelwere fitted using a quadruple-exponential decay function, leading tothe amplitude fractions αAD*0, αAD*1, αAD*2, and αAD*3 and the PLdecay times τAD0, τAD1, τAD2 and τAD3, for which the fourth decay timecomponent was fixed to τAD3 = τD2 in order to take into account the
ACS Applied Materials & Interfaces Forum Article
dx.doi.org/10.1021/am3030728 | ACS Appl. Mater. Interfaces 2013, 5, 2881−28922883

emission of unquenched donors, which is much less intense comparedto the donor channel but still present due to spectral crosstalk of theTb emission in the QD acceptor detection channel. The correctionfactor zA (the fraction of unquenched donors in the short timecomponents) is almost negligible but is still taken into account for acorrect treatment
α α α= *z ( / )A D1 AD 3 D2 (7)
To calculate the average FRET decay time ⟨τAD⟩ only the amplitudesand lifetimes with i = 0−2 are taken into account (i = 3 represents theunquenched donor emission). Moreover, the amplitudes αAD*i must becorrected by the FRET rates ki = 1/τADi − 1/<τD>, to take intoaccount the dependence of the excitation of the acceptors (andtherefore the amplitude fractions) on the different FRET efficienciesfor the different distances (corresponding to the decay times τADi).The corrected amplitude fractions are (for i = 0−2)
αα
α= *
∑ *
kk
//ADi
AD i i
AD i i (8)
The average FRET decay time is then calculated by:
τα τ α τ α τ τ
⟨ ⟩ =+ + −
−z
z1ADAD0 AD0 AD1 AD1 AD2 AD2 A D1
A (9)
and the average FRET-efficiency is
ηττ
⟨ ⟩ = −⟨ ⟩⟨ ⟩
1FRETAD
D (10)
For each FRET decay time, the donor−acceptor distance rx can becalculated by
ττ τ
=⟨ ⟩ −
⎛⎝⎜
⎞⎠⎟r Rx
x
x0
D
1/6
(11)
where τx represents the different lifetimes τDAi, τADi, ⟨τDA⟩, or ⟨τAD⟩.The fractions of FRET-pairs found at the different distancescorresponding to τDAi and τADi are given by the amplitude fractionsof these decay times.
■ RESULTS AND DISCUSSIONSpectroscopic Analysis of FRET Donor and Acceptors.
To establish a profound basis for this comparative FRET studyusing one Tb-complex as donor and different QDs (Qdot605,eFluorNC605, and p(DT-SB)605) as acceptors, we performeda spectral and time-resolved analysis of the separated FRETcomponents. The donor within all FRET-pairs (Table 1) wasthe supramolecular Tb-complex Lumi4-Tb labeled to strepta-vidin (sAv). Lumi4-Tb consists of a chelating ligandcoordinating a Tb3+ ion in its center. The ligand shows astrong absorption band with a maximum molar absorptivity ofca. 26 000 M−1 cm−1 at 340 nm, which shifts to ca. 343 nmwhen labeled to sAv. The absorbance spectrum (Figure 1a)shows a linear combination of sAv (maximum at 280 nm) andLumi4-Tb (maximum at 343 nm) absorption, resulting in alabeling ratio of ca. 4.2 Lumi4-Tb/sAv. After ligand absorptionthe energy is transferred to the central Tb3+ ion, which thenshows the typical Tb-emission lines with major peaks around490, 545, 585, and 620 nm (and some peaks with minorintensities between 645 and 690 nm). Figure 1a shows theintensity-normalized (area under the emission spectrum from450 to 690 nm normalized to unity) emission spectrum ofLumi4-Tb. This emission has an almost monoexponential long-lifetime luminescence decay behavior (Figure 1b) with a minordecay time of 630 μs (4% and 14% of the overall intensity andamplitude, respectively) and a major decay time of 2560 μs(96% and 86% of the overall intensity and amplitude, T
able
1.Propertiesof
theTbDon
orandtheQD
Acceptors
UsedwithintheFR
ETStud
y
material
size
(nm)e
source
biom
olecule
Φg
R0(nm)h
Lumi4-Tb
supram
olecular
Tb-complexa
ca.1
.0Lu
miphore
streptavidin,ca.4.2Lu
mi4-Tb/sAv
0.67
donorforallacceptors
Qdot605
CdSe/ZnS
core/shellQD
coated
with
polymer/PEG
layerb
core/shell:
4.0×9.4
completeQD:16
Invitrogen/Life
Technologies
biotin,ca.3−
4biot/Q
D0.73
9.1
eFluorNC605
CdSe/ZnS
core/shellQD
coated
with
PEG-lipidlayerc
core/shell:
6.0
completeQD:14
eBioscience
biotin,ca.3−
4biot/Q
D0.65
7.8
p(DT-SB)605(A)
CdSe/CdS/Z
nScore/shell/shellQD
coated
with
ter-polymer
layerd
core/shell/shell:6−
7 completeQD:12
ESPC
Ifbiotin,ca.3−
4biot/Q
D0.07
7.4
p(DT-SB)605(B)
CdSe/CdS/Z
nScore/shell/shellQD
coated
with
ter-polymer
layerd
core/shell/shell:6−
7 completeQD:12
ESPC
Ifbiotin,ca.1biot/Q
D0.07
7.4
awww.lumiphore.com
.bwww.invitrogen.com
.c www.ebioscience.com
.dReference
25.e core/shell:diam
etersor
minimum
/maximum
length
ofellipsoid
axes
asmeasuredby
TEM;completeQDsincl.
coating:diam
etersasdeterm
ined
byourFR
ETdonor−
acceptor
distancesstudy;hydrodynam
icdiam
etervalues
provided
bysuppliers:16nm
forQdot605
(sizeexclusionchromatographyon
HPL
C),20−
26nm
foreFluorNC605(D
LS)and16−18
nmforp(DT-SB)605
(DLS
).f cf.addressesof
theauthors.gMeasuredin
boratebuffer
againstfluoresceinandrhodam
ineas
standardsfortheQDs.Measured
byΦ
=<τ>/τ intforLu
mi4-Tb,
with
τ int=3450
μstheintrinsiclifetimeof
Lumi4-Tb.17
hFo
rsterdistancesas
calculated
with
inthisstudy(cf.Supportin
gInform
ation).
ACS Applied Materials & Interfaces Forum Article
dx.doi.org/10.1021/am3030728 | ACS Appl. Mater. Interfaces 2013, 5, 2881−28922884

respectively). The average lifetime is ⟨τ⟩ = (2290 ± 100) μs.This is the amplitude-weighted average lifetime (cf. eq 2),which must be used for the donor within the dynamic FRETquenching process.28 The long excited-state lifetime is crucialfor FRET to QDs, because energy can only be transferred tothe QDs after these have decayed back to their ground statesfollowing their very efficient direct excitation at the UVexcitation wavelength of Lumi4-Tb. In our case the differencein lifetimes is ca. 5 orders of magnitude (ca. 2.3 ms for Lumi4-Tb and ca. 25 ns for the QDs, see Figures 1b and 2b).The acceptors for our FRET study were different surface
functionalized and biotinylated water-soluble QDs (Table 1).The p(DT-SB)605 QDs were synthesized with differentamounts of biotins on the surface in order to evaluate theinfluence of the biotin surface coverage for biosensingapplications. Apart from the Qdot605, for which a biot/QDratio of “typically 5 to 7” is given by the supplier, all biot/QDratios were unknown. The values in Table 1 were found withinour FRET experiments (vide infra). The biot/Qdot605 ratio is3 to 4 in our case. As a fresh sample of biot-Qdot605 was usedwe do not expect any loss of biotin over time. We ratherassume a batch-to-batch variation as already indicated by theexplanation “typically 5−7 Biotin molecules/Qdot conjugate”within the product description of LifeTechnologies. Tocompare the different QD performance in FRET bioassays,we chose similar absorption and emission wavelengths. Asshown in Figure 2a all QDs show the characteristic broad
absorption spectra with several pronounced exciton peaksbetween 525 and 625 nm. The absorption spectra have largemolar absorptivity values and are nicely overlapping with themost intense emission peaks of Lumi4-Tb (Figure 1a), whichleads to long Forster distances R0 (the donor−acceptordistance for which FRET is 50% efficient) between 7.4 and9.1 nm (Table 1). As the absorbance of the Qdot605 issignificantly larger than for the other two QDs, it also possessesthe highest R0 in combination with Lumi4-Tb as donor. All PLspectra are very symmetrical and have a maximum intensityaround 605 nm with full-width at half-maximum values of 20nm (Qdot605), 29 nm (eFluorNC605) and 34 nm (p(DT-SB)605). The PL decay curves (Figure 2b) are multi-exponential with intensity-weighted average lifetimes of 17 ns(Qdot605), 29 ns (eFluorNC605) and 31 ns (p(DT-SB)605).Qdot605 and eFluorNC605 are very bright with PL quantumyields of 73 and 65%, respectively. p(DT-SB)605 (7%) providesignificantly lower values, as expected from ligand-exchangedQDs, which are more compact but display a reduced quantumyield compared to encapsulated QDs.30,31
TEM images of the semiconductor parts (polymer coatingsnot visible) of the different QDs (Figure 3) show that theQDot605 QDs are very elongated, whereas the eFluorNC605and p(DT-SB)605 are much closer to spherical shape, althoughsome elongation as well as tetrahedral and star-shaped QDs arevisible. The difference in shape is quite interesting because itshould also become visible in the FRET data due to the
Figure 2. (a) Absorption (dotted lines) and PL emission spectra (λex = (410 ± 0.5) nm; intensity-normalized to unity at PL maxima) of the differentbiotinylated QDs used as FRET acceptors. (b) PL decay curves (λex = (405 ± 7) nm, λem in the intensity maxima) of the different biotinylated QDsand their respective multiexponential fit curves with average PL lifetimes of 17 ns (red), 29 ns (blue), and 31 ns (green). Red = Qdot605, blue =eFluorNC605, green = p(DT-SB)605.
Figure 3. TEM images (showing only the core/shell structure of the QDs) of Qdot605 (left), eFluorNC605 (center), and p(DT-SB)605 (right).High-resolution images can be found in the Supporting Information, Figure S1.
ACS Applied Materials & Interfaces Forum Article
dx.doi.org/10.1021/am3030728 | ACS Appl. Mater. Interfaces 2013, 5, 2881−28922885

strongly distance dependent FRET process and the randomdistribution of Lumi4-Tb-sAv all over the QD surfaces. In priorwork we had already demonstrated TR-FRET as a multiplexedmolecular ruler for the size and shape analysis of five differenttypes of QDs.32 The shape analysis of the QDs used within thisstudy by FRET will be further discussed in detail below.TR-FRET Analysis. Within all FRET experiments the
Lumi4-Tb-sAv donor concentration was kept constant at 0.2nM while the biot-QD concentrations were increased. First,time-gated intensities (100 − 900 μs) were measuredsimultaneously for the donor and the acceptor on theKRYPTOR fluorescence plate reader system. Afterwardcomplete PL decay curves (from 0 to 8 ms) of the donorand the acceptor were acquired on the EI fluorescence platereader for selected concentrations in order to perform a time-resolved FRET analysis. The time-gated PL intensity and decaytime curves are shown in Figure 4 and 5 for the FRET systemLumi4-Tb-sAv-biot-eFluorNC605 and Lumi4-Tb-sAv-biot-p(DT-SB)605(B). The curves for the other two FRET systems(Lumi4-Tb-sAv-biot-Qdot605 and Lumi4-Tb-sAv-biot-p(DT-SB)605(A)) can be found in the Supporting Information(Figures S2 and S3). For all FRET systems small concen-
trations of biotinylated QD acceptors (<100 pM) already leadto a significant Lumi4-Tb donor quenching and a very strongQD acceptor sensitization. After a sAv/QD ratio of one isreached (at ca. 0.2 nM QD concentration) these FRETquenching and sensitization processes are saturated becausefurther addition of QDs will not lead to additional FRET-pairs(the concentration of Lumi4-Tb-sAv is constant). Because ofseveral biotins per QD saturation starts already before thecomplete saturation (flat curve) at Lumi4-Tb-sAv/QD = 1. Thenumber of biotin molecules per QD and the stoichiometry ofthe FRET systems are discussed in an own section (vide infra).Tb donor quenching is most efficient for p(DT-SB)605,followed by eFluorNC605 and Qdot605. This indicates that theaverage donor−acceptor distance increases from p(DT-SB)605to Qdot605 or, in other words, that the QD surface coatingthickness increases from p(DT-SB)605 to Qdot605. On theacceptor side Qdot605 and eFluorNC605 show much strongersensitization than p(DT-SB)605, which can be explained by thedifferences in PL quantum yields (Table 1).Time-resolved spectroscopic measurements of lanthanide to
QD FRET systems have the large advantage, that the FRETanalysis can be performed for both the donor and the acceptor
Figure 4. Time-gated (100−900 μs) PL intensity (as a function of eFluorNC605 concentration) of (a) the Lumi4-Tb donor and (b) theeFluorNC605 acceptor showing efficient FRET donor quenching and acceptor sensitization, which increases until a sAv/eFluorNC605concentration ratio of approximately one. The PL decay curves of the (c) donor and (d) acceptor show a strongly multiexponential decay behaviorcaused by FRET from Lumi4-Tb to eFluorNC605 situated at different distances from the QD. Only some representative decay and fit curves arepresented. Gray: pure Lumi4-Tb-sAv (The pure Lumi4-Tb luminescence is also visible in the QD detection channel due to spectral crosstalk. Thisleads to a nonzero time-gated intensity at zero QD concentration in graph b. Such spectral crosstalk can be corrected for multiplexedmeasurements,33 but is not necessary for the ratiometric measurement approach we chose for our single donor−acceptor pair experiments); red, 0.06nM QD; green, 0.1 nM QD; blue, 0.15 nM QD; black, fit curves (for clarity, only a few representative fit curves are shown here).
ACS Applied Materials & Interfaces Forum Article
dx.doi.org/10.1021/am3030728 | ACS Appl. Mater. Interfaces 2013, 5, 2881−28922886
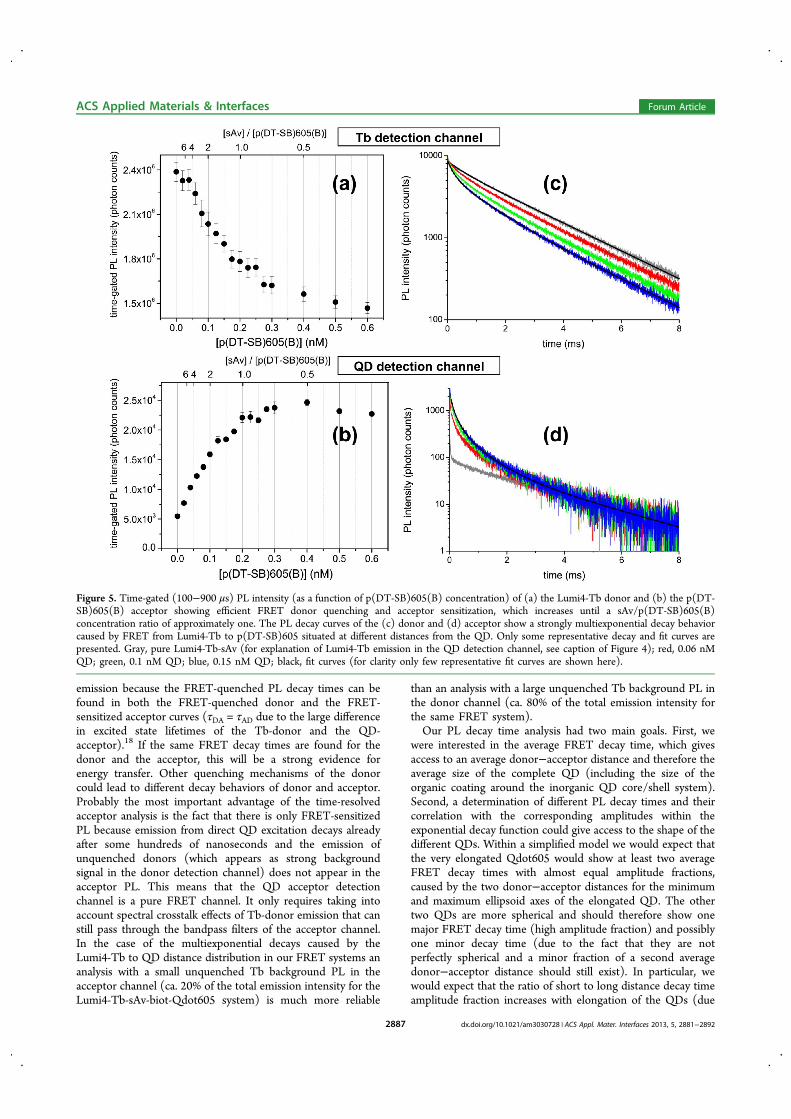
emission because the FRET-quenched PL decay times can befound in both the FRET-quenched donor and the FRET-sensitized acceptor curves (τDA = τAD due to the large differencein excited state lifetimes of the Tb-donor and the QD-acceptor).18 If the same FRET decay times are found for thedonor and the acceptor, this will be a strong evidence forenergy transfer. Other quenching mechanisms of the donorcould lead to different decay behaviors of donor and acceptor.Probably the most important advantage of the time-resolvedacceptor analysis is the fact that there is only FRET-sensitizedPL because emission from direct QD excitation decays alreadyafter some hundreds of nanoseconds and the emission ofunquenched donors (which appears as strong backgroundsignal in the donor detection channel) does not appear in theacceptor PL. This means that the QD acceptor detectionchannel is a pure FRET channel. It only requires taking intoaccount spectral crosstalk effects of Tb-donor emission that canstill pass through the bandpass filters of the acceptor channel.In the case of the multiexponential decays caused by theLumi4-Tb to QD distance distribution in our FRET systems ananalysis with a small unquenched Tb background PL in theacceptor channel (ca. 20% of the total emission intensity for theLumi4-Tb-sAv-biot-Qdot605 system) is much more reliable
than an analysis with a large unquenched Tb background PL inthe donor channel (ca. 80% of the total emission intensity forthe same FRET system).Our PL decay time analysis had two main goals. First, we
were interested in the average FRET decay time, which givesaccess to an average donor−acceptor distance and therefore theaverage size of the complete QD (including the size of theorganic coating around the inorganic QD core/shell system).Second, a determination of different PL decay times and theircorrelation with the corresponding amplitudes within theexponential decay function could give access to the shape of thedifferent QDs. Within a simplified model we would expect thatthe very elongated Qdot605 would show at least two averageFRET decay times with almost equal amplitude fractions,caused by the two donor−acceptor distances for the minimumand maximum ellipsoid axes of the elongated QD. The othertwo QDs are more spherical and should therefore show onemajor FRET decay time (high amplitude fraction) and possiblyone minor decay time (due to the fact that they are notperfectly spherical and a minor fraction of a second averagedonor−acceptor distance should still exist). In particular, wewould expect that the ratio of short to long distance decay timeamplitude fraction increases with elongation of the QDs (due
Figure 5. Time-gated (100−900 μs) PL intensity (as a function of p(DT-SB)605(B) concentration) of (a) the Lumi4-Tb donor and (b) the p(DT-SB)605(B) acceptor showing efficient FRET donor quenching and acceptor sensitization, which increases until a sAv/p(DT-SB)605(B)concentration ratio of approximately one. The PL decay curves of the (c) donor and (d) acceptor show a strongly multiexponential decay behaviorcaused by FRET from Lumi4-Tb to p(DT-SB)605 situated at different distances from the QD. Only some representative decay and fit curves arepresented. Gray, pure Lumi4-Tb-sAv (for explanation of Lumi4-Tb emission in the QD detection channel, see caption of Figure 4); red, 0.06 nMQD; green, 0.1 nM QD; blue, 0.15 nM QD; black, fit curves (for clarity only few representative fit curves are shown here).
ACS Applied Materials & Interfaces Forum Article
dx.doi.org/10.1021/am3030728 | ACS Appl. Mater. Interfaces 2013, 5, 2881−28922887
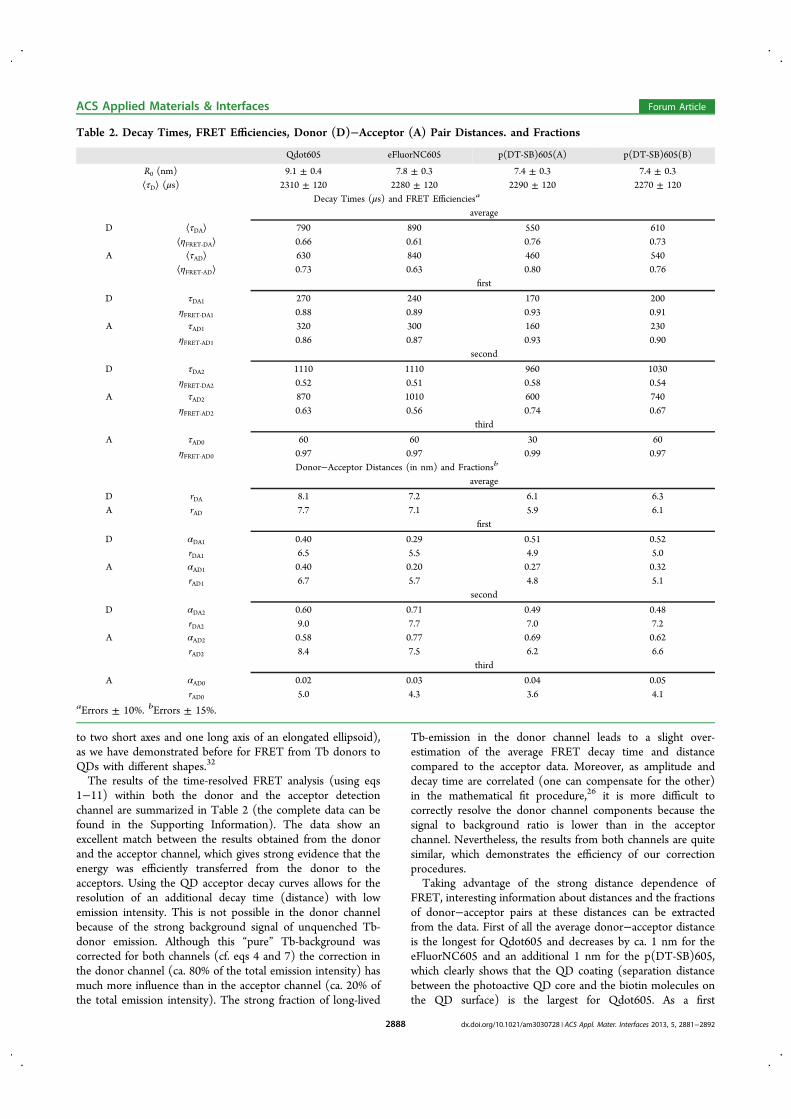
to two short axes and one long axis of an elongated ellipsoid),as we have demonstrated before for FRET from Tb donors toQDs with different shapes.32
The results of the time-resolved FRET analysis (using eqs1−11) within both the donor and the acceptor detectionchannel are summarized in Table 2 (the complete data can befound in the Supporting Information). The data show anexcellent match between the results obtained from the donorand the acceptor channel, which gives strong evidence that theenergy was efficiently transferred from the donor to theacceptors. Using the QD acceptor decay curves allows for theresolution of an additional decay time (distance) with lowemission intensity. This is not possible in the donor channelbecause of the strong background signal of unquenched Tb-donor emission. Although this “pure” Tb-background wascorrected for both channels (cf. eqs 4 and 7) the correction inthe donor channel (ca. 80% of the total emission intensity) hasmuch more influence than in the acceptor channel (ca. 20% ofthe total emission intensity). The strong fraction of long-lived
Tb-emission in the donor channel leads to a slight over-estimation of the average FRET decay time and distancecompared to the acceptor data. Moreover, as amplitude anddecay time are correlated (one can compensate for the other)in the mathematical fit procedure,26 it is more difficult tocorrectly resolve the donor channel components because thesignal to background ratio is lower than in the acceptorchannel. Nevertheless, the results from both channels are quitesimilar, which demonstrates the efficiency of our correctionprocedures.Taking advantage of the strong distance dependence of
FRET, interesting information about distances and the fractionsof donor−acceptor pairs at these distances can be extractedfrom the data. First of all the average donor−acceptor distanceis the longest for Qdot605 and decreases by ca. 1 nm for theeFluorNC605 and an additional 1 nm for the p(DT-SB)605,which clearly shows that the QD coating (separation distancebetween the photoactive QD core and the biotin molecules onthe QD surface) is the largest for Qdot605. As a first
Table 2. Decay Times, FRET Efficiencies, Donor (D)−Acceptor (A) Pair Distances. and Fractions
Qdot605 eFluorNC605 p(DT-SB)605(A) p(DT-SB)605(B)
R0 (nm) 9.1 ± 0.4 7.8 ± 0.3 7.4 ± 0.3 7.4 ± 0.3⟨τD⟩ (μs) 2310 ± 120 2280 ± 120 2290 ± 120 2270 ± 120
Decay Times (μs) and FRET Efficienciesa
average
D ⟨τDA⟩ 790 890 550 610⟨ηFRET‑DA⟩ 0.66 0.61 0.76 0.73
A ⟨τAD⟩ 630 840 460 540⟨ηFRET‑AD⟩ 0.73 0.63 0.80 0.76
first
D τDA1 270 240 170 200ηFRET‑DA1 0.88 0.89 0.93 0.91
A τAD1 320 300 160 230ηFRET‑AD1 0.86 0.87 0.93 0.90
second
D τDA2 1110 1110 960 1030ηFRET‑DA2 0.52 0.51 0.58 0.54
A τAD2 870 1010 600 740ηFRET‑AD2 0.63 0.56 0.74 0.67
third
A τAD0 60 60 30 60ηFRET‑AD0 0.97 0.97 0.99 0.97
Donor−Acceptor Distances (in nm) and Fractionsb
average
D rDA 8.1 7.2 6.1 6.3A rAD 7.7 7.1 5.9 6.1
first
D αDA1 0.40 0.29 0.51 0.52rDA1 6.5 5.5 4.9 5.0
A αAD1 0.40 0.20 0.27 0.32rAD1 6.7 5.7 4.8 5.1
second
D αDA2 0.60 0.71 0.49 0.48rDA2 9.0 7.7 7.0 7.2
A αAD2 0.58 0.77 0.69 0.62rAD2 8.4 7.5 6.2 6.6
third
A αAD0 0.02 0.03 0.04 0.05rAD0 5.0 4.3 3.6 4.1
aErrors ± 10%. bErrors ± 15%.
ACS Applied Materials & Interfaces Forum Article
dx.doi.org/10.1021/am3030728 | ACS Appl. Mater. Interfaces 2013, 5, 2881−28922888

approximation the average donor−acceptor distance can beused as the average radius of the QDs (assuming sphericalshape), leading to diameters of ca. (16 ± 3) nm, (14 ± 2) nm,and (12 ± 2) nm for the Qdot605, eFluorNC605, and p(DT-SB)605, respectively. These donor−acceptor distance-basedresults do not suffer from deviations in size determinationbecause of hydration or elongation of the nanoparticles, whichis often the case for dynamic light scattering or size exclusionchromatography.A closer look at the single distances calculated from the
multiexponential fit reveals additional information about theshape of the different QDs. Although the donor and acceptorchannel data provide similar information, the acceptor channelshould be less error-prone because of the higher signal tobackground ratio, as already mentioned above. As expected thep(DT-SB)605(A) and p(DT-SB)605(B) show the same resultsconcerning distances and fractions of donor−acceptor pairs atthe different distances and they are therefore treated together asp(DT-SB)605 in the following considerations. For the time-resolved FRET analysis these two dots serve rather as anotherindependent control of our fit procedures. Because of therelatively large (no point dipoles) and more or less elongatedQDs as well as the random labeling of Lumi4-Tb over the sAvprotein all of our investigated FRET systems displayed adonor−acceptor distance distribution. The aim of our time-resolved study was to extract reliable and reproducibleinformation from all the PL decay curves with as few fitparameters as possible. Therefore a triple-exponential fit wasapplied to the donor PL decays, whereas a quadruple-exponential fit was used for the acceptor PL decays (cf.Experimental Section for details). The determined PL decaytimes (and distances) can be interpreted as average decay times(and distances) within the overall distribution. All differentFRET systems show two main average donor−acceptordistances and one minor average short distance, which canonly be resolved within the acceptor channel. The appearanceof two main distances shows that none of the QDs is a sphericalparticle, for which only one major distance component wouldexist. The different α values in Table 2 represent the fractionsof donor−acceptor pairs at the three resolved distances. Theamount of donor−acceptor pairs at the shortest distance isalmost negligible (below 6% for all FRET systems). However, itis important to include the corresponding decay time in the fitsin order to improve the fit result and the resolution of the maintwo FRET distances. As already mentioned above the fractionof donor−acceptor pairs at the short major distance shouldincrease with elongation of the particle and this is exactly thecase for our results. The eFluorNC605 are a mixture of quasi-spherical and tetrahedral QDs (cf. Figure 3 center) withrelatively uniform sizes. This is reflected in the relatively smallfraction of the short main component (ca. 20% at a 5.7 nmdistance). The p(DT-SB)605 are a bit more elongated (Figure3 right), which results in a relative increase of the short mainFRET component (ca. 30% at a 5 nm distance). For thestrongly elongated Qdot605 (Figure 3 left) the short maincomponent further increases up to ca. 40% at a 6.7 nm distance.Although it is difficult to determine the exact shape of thenanoparticles with our three main average decay times and theiramplitude fractions, these three distances provide very usefulinformation about the QD sizes and shapes under conditionsfor which they were intended for (a solution phase bioassay atsubnanomolar concentrations in our case) instead of“unnatural” conditions such as the analysis on a TEM grid.
We believe that our FRET technique is extremely useful toprovide this “natural” information, which can be used profitablyin combination with the data obtained from TEM, DLS, HPLCor other analytical techniques to complete and/or verify theshape and size information about the QD materials.
Analysis of Unquenched Tb Luminescence and theNumber of Biotins per QD. Another interesting aspect of ourFRET systems is the remaining unquenched Tb luminescenceeven at concentrations, for which the QDs are in excess (seethe Supporting Information for the complete data). A priori,one would assume that all Lumi4-Tb are quenched (at leastpartially) once every Lumi4-Tb-sAv has bound to a QD.However, all decay time fits show a significant fraction ofunquenched Lumi4-Tb even at QD excess. These fractions aregiven by the amplitude (αDA*3) of the long unquenched decaytime component (τDA3) divided by the amplitude (αD2 = 0.86)of this same decay time component for the decay curves ofLumi4-Tb-sAv without biot-QD (τD2 = τDA3). This leads tounquenched Lumi4-Tb fractions of 64% for the Qdot605FRET system, 58% for the eFluorNC605 FRET system, 51%for the p(DT-SB)(A) FRET system and 26% for the p(DT-SB)(B) FRET system. One must take into account that this isnot the fraction of unquenched Lumi4-Tb-sAv but ofunquenched Lumi4-Tb. Due to the random labeling ratio of4.2 Lumi4-Tb per sAv some of the Lumi4-Tb complexes aretoo far away from the QD to be engaged in FRET. Thissituation is fulfilled for (i) Lumi4-Tb, which is situated on thefar end (from the organic QD coating surface) of the sAv(regarding the simplified picture of Scheme 1 this will beapproximately 50%), and (ii) Lumi4-Tb-sAv bound to QDcoating surface spaces, which are far away from the QD center(because of the nonspherical shape of the QDs, there are closerand further center-to-surface distances). The latter point alsoexplains why the fraction of unquenched Lumi4-Tb is largestfor the Qdot605 FRET system (largest and most elongatedQD) and decreases for the eFluorNC605 and the p(DT-SB)(A) FRET systems (smaller and less elongated). Anotherpossibility could be a fraction of unreactive (e.g., denatured)Lumi4-Tb-sAv. However, regarding the smallest fraction ofunquenched Lumi4-Tb (26%) for the p(DT-SB)(B) FRETsystem (for which the two long-distance arguments mentionedabove are still valid, although less pronounced, see discussionbelow) and the fact that we used the same Lumi4-Tb-sAv for allFRET systems, the fraction of nonreactive Lumi4-Tb-sAv israther small (significantly lower than 26%). The large differencein unquenched Lumi4-Tb-sAv for the two similar p(DT-SB)605(A) and (B) systems (only the number of biotins perQD are different) suggests that the higher overall quenchingefficiency within the p(DT-SB)605(B) FRET system is causedby the lower number of biotins per QD (see Table 1). Theintensity fraction (τDA*3αDA*3) of the long unquenched Tbluminescence decay component as a function of QD/sAv ratio(see the Supporting Information, Figure S5) shows a linearquenching behavior with increasing amounts of QD, caused bythe excess of Lumi4-Tb-sAv. The linear decrease of “pure” Tbemission intensity levels off at QD/sAv ratios below 0.5 andstays at a constant level after 0.5 QD/sAv for Qdot605,eFluorNC605, and p(DT-SB)605(A). This shows that for theseQDs several sAv can bind to the QD surface (several biotinsper QD) and there is no difference in Tb quenching betweenseveral sAv per QD or a single sAv per QD, as long as each sAvis bound to a biotin on a QD surface. The binding situation isdifferent for the p(DT-SB)605(B) FRET system (with ca. 1
ACS Applied Materials & Interfaces Forum Article
dx.doi.org/10.1021/am3030728 | ACS Appl. Mater. Interfaces 2013, 5, 2881−28922889
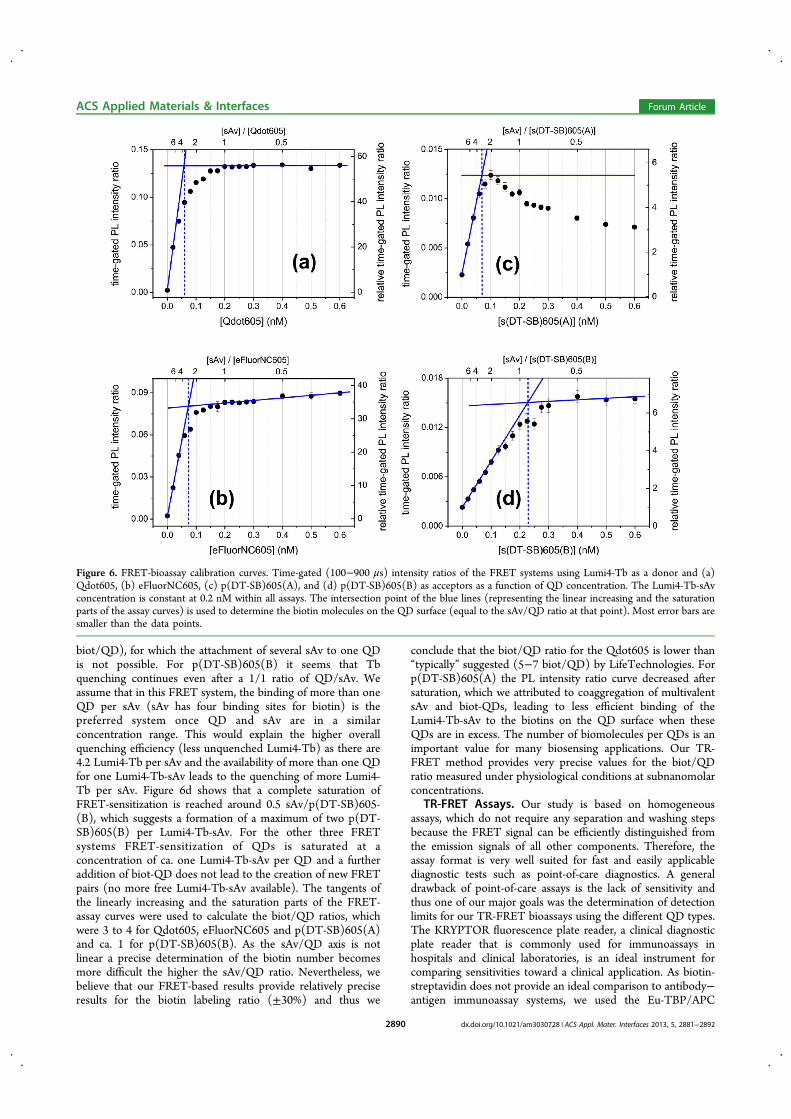
biot/QD), for which the attachment of several sAv to one QDis not possible. For p(DT-SB)605(B) it seems that Tbquenching continues even after a 1/1 ratio of QD/sAv. Weassume that in this FRET system, the binding of more than oneQD per sAv (sAv has four binding sites for biotin) is thepreferred system once QD and sAv are in a similarconcentration range. This would explain the higher overallquenching efficiency (less unquenched Lumi4-Tb) as there are4.2 Lumi4-Tb per sAv and the availability of more than one QDfor one Lumi4-Tb-sAv leads to the quenching of more Lumi4-Tb per sAv. Figure 6d shows that a complete saturation ofFRET-sensitization is reached around 0.5 sAv/p(DT-SB)605-(B), which suggests a formation of a maximum of two p(DT-SB)605(B) per Lumi4-Tb-sAv. For the other three FRETsystems FRET-sensitization of QDs is saturated at aconcentration of ca. one Lumi4-Tb-sAv per QD and a furtheraddition of biot-QD does not lead to the creation of new FRETpairs (no more free Lumi4-Tb-sAv available). The tangents ofthe linearly increasing and the saturation parts of the FRET-assay curves were used to calculate the biot/QD ratios, whichwere 3 to 4 for Qdot605, eFluorNC605 and p(DT-SB)605(A)and ca. 1 for p(DT-SB)605(B). As the sAv/QD axis is notlinear a precise determination of the biotin number becomesmore difficult the higher the sAv/QD ratio. Nevertheless, webelieve that our FRET-based results provide relatively preciseresults for the biotin labeling ratio (±30%) and thus we
conclude that the biot/QD ratio for the Qdot605 is lower than“typically” suggested (5−7 biot/QD) by LifeTechnologies. Forp(DT-SB)605(A) the PL intensity ratio curve decreased aftersaturation, which we attributed to coaggregation of multivalentsAv and biot-QDs, leading to less efficient binding of theLumi4-Tb-sAv to the biotins on the QD surface when theseQDs are in excess. The number of biomolecules per QDs is animportant value for many biosensing applications. Our TR-FRET method provides very precise values for the biot/QDratio measured under physiological conditions at subnanomolarconcentrations.
TR-FRET Assays. Our study is based on homogeneousassays, which do not require any separation and washing stepsbecause the FRET signal can be efficiently distinguished fromthe emission signals of all other components. Therefore, theassay format is very well suited for fast and easily applicablediagnostic tests such as point-of-care diagnostics. A generaldrawback of point-of-care assays is the lack of sensitivity andthus one of our major goals was the determination of detectionlimits for our TR-FRET bioassays using the different QD types.The KRYPTOR fluorescence plate reader, a clinical diagnosticplate reader that is commonly used for immunoassays inhospitals and clinical laboratories, is an ideal instrument forcomparing sensitivities toward a clinical application. As biotin-streptavidin does not provide an ideal comparison to antibody−antigen immunoassay systems, we used the Eu-TBP/APC
Figure 6. FRET-bioassay calibration curves. Time-gated (100−900 μs) intensity ratios of the FRET systems using Lumi4-Tb as a donor and (a)Qdot605, (b) eFluorNC605, (c) p(DT-SB)605(A), and (d) p(DT-SB)605(B) as acceptors as a function of QD concentration. The Lumi4-Tb-sAvconcentration is constant at 0.2 nM within all assays. The intersection point of the blue lines (representing the linear increasing and the saturationparts of the assay curves) is used to determine the biotin molecules on the QD surface (equal to the sAv/QD ratio at that point). Most error bars aresmaller than the data points.
ACS Applied Materials & Interfaces Forum Article
dx.doi.org/10.1021/am3030728 | ACS Appl. Mater. Interfaces 2013, 5, 2881−28922890

FRET pair (which is used in the commercial BRAHMS-KRYPTOR immunoassays) in the same biotin-streptavidinconfiguration for comparison. This Eu-TBP-sAv-biot-APCFRET system has an LOD of (24 ± 12) pM.20 We tookadvantage of the inherent ratiometric behavior of FRET andused the ratio of the time-gated PL intensities of the QDacceptors (e.g., graphs b in Figures 4 and 5) and the Tb-donor(e.g., graphs a in Figures 4 and 5) in order to achieve a veryaccurate and highly sensitive quantitative analysis. The time-gated PL ratios as a function of QD concentration for all Tb-to-QD FRET bioassays are presented in Figure 6.For all four assays the addition of small biot-QD
concentrations to Lumi4-Tb-sAv leads to a strong increase ofthe time-gated PL intensity ratio. This increase is linear until aconcentration for which all biotins on the QD surface arebound to one sAv. Higher concentrations lead to a decrease inLumi4-Tb-sAv per QD and the slope levels off. The limits ofdetection (LODs) for all assays were calculated as theconcentration value for the PL intensity ratio of the samplecontaining no QDs (zero concentration) plus three times thestandard deviation (of 30 measurements). The LOD isdependent on the amount of biotin per QD (more biotinresults in a steeper slope), the FRET efficiency and thequantum yield of the QD (the higher these values the steeperthe increasing slope of the PL intensity ratio curve). Moreover,the signal-to-noise ratio and reproducibility for the zeroconcentration sample is important but similar for all FRETsystems (as these samples all contain only Lumi4-Tb-sAv). Asthe biot/QD ratios are not significantly different for the firstthree QDs the higher quantum yields of Qdot605 andeFluorNC605 are the main aspect that lead to favorableLODs, 0.063 pM and 0.094 pM, respectively, compared to 0.73pM for p(DT-SB)605(A). The lower biot/QD ratio of p(DT-SB)605(B) leads to an additional increase of the LOD to 2.0pM. Although these values cannot be transferred as one-to-oneto an immunoassay LOD, they are 381-fold, 225-fold, 33-foldand 12-fold lower than the 24 pM LOD for the Eu-TBP/APC“gold standard” FRET system measured in the same biot-sAvconfiguration. We conclude that all QD systems (commercialand academic) provide very low (pico to subpicomolar) LODs,which means that they are all suitable for highly sensitivebiosensing.
■ CONCLUSIONSIn this TR-FRET study, we have shown that different types ofbiocompatible QDs (encapsulated and ligand exchanged) canbe used for highly sensitive biosensing with low pM to sub-pMdetection limits. Our simultaneous TR-FRET analysis of theLumi4-Tb donor and the QD acceptors allowed us to performa very precise characterization of the QD materials in terms ofshape, size and bioconjugation ratio. We found Qdot605 to bethe largest and most elongated QDs with the thickest organiccoating around the semiconductor material. Although this thickshell provides the QDs with high stability and brightness, theyhave the significant drawback of increasing the donor−acceptordistance, which decreases the FRET efficiency. From this pointof view the self-synthesized QDs (p(DT-SB)605) show thehighest FRET efficiency and thinnest coating. Time-resolvedand time-gated analysis also gives close insights into thebioconjugation performance (how many biotins are attached tothe QD surface). We could determine biot/QD ratios of ca. 3to 4 for Qdot605, eFluorNC605 and p(DT-SB)605(A) and ca.1 for p(DT-SB)605(B). In conclusion we have demonstrated
the suitability of all studied QDs for highly sensitive clinicalFRET-bioassays. We have performed a very precise anddetailed analysis of biocompatible QDs with TR-FRET fromTb-based donor complexes. On the contrary to most of theother analytical technologies (e.g., dynamic light scattering,HPLC and TEM) our FRET method can analyze thebiocompatible QDs under physiological conditions at sub-nanomolar concentrations and is therefore highly suited(ideally in combination with the other techniques) to give amore accurate picture of the QD properties at concentrationsand conditions in which they are usually applied withinfluorescence sensing applications.
■ ASSOCIATED CONTENT*S Supporting Information(1) Determination of the Forster distances; (2) high-resolutionTEM images of Qdot605, eFluorNC605 and p(DT-SB)605;(3) time-gated PL intensities and decays of Lumi4-Tb-sAv-biotQdot605 and of Lumi4-Tb-sAv-biot-p(DT-SB)605(A); (4)control experiments using Lumi4-Tb-sAv and QDs without anybiotin on the surface; (5) intensity fraction as a function ofp(DT-SB)605(B)/sAv ratio; (6) complete TR-analysis data ofthe Lumi4-Tb-sAv-biot-Qdot605 FRET system, the Lumi4-Tb-sAv-biot-eFluorNC605 FRET system, the Lumi4-Tb-sAv-biot-p(DT-SB)605(A) FRET system, and the Lumi4-Tb-sAv-biot-p(DT-SB)605(B) FRET system. This material is available freeof charge via the Internet at http://pubs.acs.org.
■ AUTHOR INFORMATIONCorresponding Author*E-mail: [email protected] authors declare no competing financial interest.
■ ACKNOWLEDGMENTSThe authors thank the Ministere de l’enseignement superieureet de la recherche France (Investissement d’avenir projectNanoCTC) and the European Commission (FP7 projectNANOGNOSTICS) for financial support.
■ REFERENCES(1) Algar, W. R.; Susumu, K.; Delehanty, J. B.; Medintz, I. L. Anal.Chem. 2011, 83, 8826.(2) Gill, R.; Zayats, M.; Willner, I. Angew. Chem., Int. Ed. 2008, 47,7602.(3) Jin, Z.; Hildebrandt, N. Trends Biotechnol. 2012, 30, 394.(4) Rosenthal, S. J.; Chang, J. C.; Kovtun, O.; McBride, J. R.;Tomlinson, I. D. Chem. Biol. 2011, 18, 10.(5) Reiss, P.; Protiere, M.; Li, L. Small 2009, 5, 154.(6) Hildebrandt, N. ACS Nano 2011, 5, 5286.(7) Hezinger, A. F. E.; Tessmar, J.; Goepferich, A. Eur. J. Pharm.Biopharm. 2008, 68, 138.(8) Medintz, I. L.; Uyeda, H. T.; Goldman, E. R.; Mattoussi, H. Nat.Mater. 2005, 4, 435.(9) Wild, D. The Immunoassay Handbook, 2nd ed.; Elsevier:Amsterdam, 2005.(10) Bunzli, J.-C. G. Chem. Rev. 2010, 110, 2729.(11) Eliseeva, S. V.; Bunzli, J.-C. G. Chem. Soc. Rev. 2010, 39, 189.(12) Hemmila, I.; Mukkala, V. M. Crit. Rev. Clin. Lab. Sci. 2001, 38,441.(13) Selvin, P. R. Annu. Rev. Biopharm. Biomed. 2002, 31, 275.(14) Mathis, G. Clin. Chem. 1993, 39, 1953.(15) Mathis, G. J. Biomol. Screen. 1999, 4, 309.(16) Hemmila, I. J. Biomol. Screen. 1999, 4, 303.
ACS Applied Materials & Interfaces Forum Article
dx.doi.org/10.1021/am3030728 | ACS Appl. Mater. Interfaces 2013, 5, 2881−28922891
(17) Algar, W. R.; Wegner, D.; Huston, A. L.; Blanco-Canosa, J. B.;Stewart, M. H.; Armstrong, A.; Dawson, P. E.; Hildebrandt, N.;Medintz, I. L. J. Am. Chem. Soc. 2012, 134, 1876.(18) Charbonniere, L. J.; Hildebrandt, N. Eur. J. Inorg. Chem. 2008,3241.(19) Charbonniere, L. J.; Hildebrandt, N.; Ziessel, R. F.;Lohmannsroben, H.-G. J. Am. Chem. Soc. 2006, 128, 12800.(20) Geißler, D.; Charbonniere, L. J.; Ziessel, R. F.; Butlin, N. G.;Lohmannsroben, H.-G.; Hildebrandt, N. Angew. Chem., Int. Ed. 2010,49, 1396.(21) Hildebrandt, N.; Charbonniere, L. J.; Beck, M.; Ziessel, R. F.;Lohmannsroben, H. -G. Angew. Chem., Int. Ed. 2005, 44, 7612.(22) Xu, J.; Corneillie, T. M.; Moore, E. G.; Law, G.-L.; Butlin, N. G.;Raymond, K. N. J. Am. Chem. Soc. 2011, 133, 19900.(23) Li, J. J.; Wang, Y. A.; Guo, W. Z.; Keay, J. C.; Mishima, T. D.;Johnson, M. B.; Peng, X. G. J. Am. Chem. Soc. 2003, 125, 12567.(24) Yu, W. W.; Peng, X. G. Angew. Chem., Int. Ed. 2002, 41, 2368.(25) Giovanelli, E.; Muro, E.; Sitbon, G.; Hanafi, M.; Pons, T.;Dubertret, B.; Lequeux, N. Langmuir 2012, 28, 15177.(26) Lakowicz, J. R. Principles of Fluorescence Spectroscopy, 2nd ed.;Kluwer Academic/Plenum: New York, 1999.(27) Pace, C. N.; Vajdos, F.; Fee, L.; Grimsley, G.; Gray, T. ProteinSci. 1995, 4, 2411.(28) Wu, P. G.; Brand, L. Anal. Biochem. 1994, 218, 1.(29) Sillen, A.; Engelborghs, Y. Photochem. Photobiol. 1998, 67, 475.(30) Liu, W.; Howarth, M.; Greytak, A. B.; Zheng, Y.; Nocera, D. G.;Ting, A. Y.; Bawendi, M. G. J. Am. Chem. Soc. 2008, 130, 1274.(31) Uyeda, H. T.; Medintz, I. L.; Jaiswal, J. K.; Simon, S. M.;Mattoussi, H. J. Am. Chem. Soc. 2005, 127, 3870.(32) Morgner, F.; Geißler, D.; Stufler, S.; Butlin, N. G.;Lohmannsroben, H.-G.; Hildebrandt, N. Angew. Chem., Int. Ed.2010, 49, 7570.(33) Geißler, D.; Stufler, S.; Lohmannsroben, H.-G.; Hildebrandt, N.J. Am. Chem. Soc. 2013, 135, 1102.
ACS Applied Materials & Interfaces Forum Article
dx.doi.org/10.1021/am3030728 | ACS Appl. Mater. Interfaces 2013, 5, 2881−28922892
S1
Influence of luminescence quantum yield, surface coating and functionalization of quantum dots on the sensitivity of time-resolved FRET bioassays
K. David Wegner1, Phung Thi Lanh1, Travis Jennings2, Eunkeu Oh3,4, Vaibhav Jain3, Simon M.
Fairclough5, Jason M. Smith5, Emerson Giovanelli6, Nicolas Lequeux6, Thomas Pons6 and Niko
Hildebrandt1*
Supporting Information Determination of the Förster distances S2
Figure S1: Additional TEM images of Qdot605, eFluorNC605 and p(DT-SB)605. S2
Figure S2: Time-gated PL intensities and decays of Lumi4-Tb-sAv-biotQdot605 S3
Figure S3: Time-gated PL intensities and decays of Lumi4-Tb-sAv-biot-p(DT-SB)605(A) S4
Figure S4: Time-gated PL intensities of Lumi4-Tb-sAv and eFluorNC650 (control experiment) S5
Figure S5: Intensity fraction (τDA*3 αDA*3) as a function of p(DT-SB)605(B)/sAv ratio S6
Complete TR-analysis data of the Lumi4-Tb-sAv-biot-Qdot605 FRET system S7
Complete TR-analysis data of the Lumi4-Tb-sAv-biot-eFluorNC605 FRET system S8
Complete TR-analysis data of the Lumi4-Tb-sAv-biot-p(DT-SB)605(A) FRET system S9
Complete TR-analysis data of the Lumi4-Tb-sAv-biot-p(DT-SB)605(B) FRET system S10
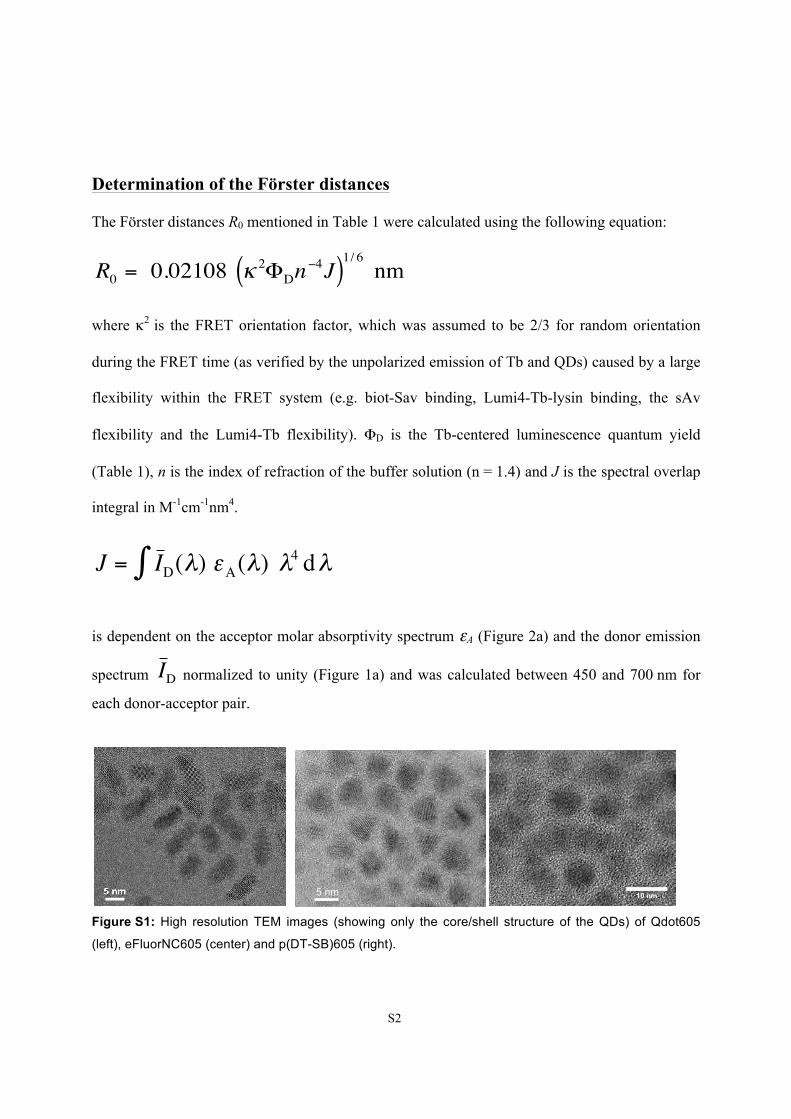
S2
Determination of the Förster distances
The Förster distances R0 mentioned in Table 1 were calculated using the following equation:
where κ2 is the FRET orientation factor, which was assumed to be 2/3 for random orientation
during the FRET time (as verified by the unpolarized emission of Tb and QDs) caused by a large
flexibility within the FRET system (e.g. biot-Sav binding, Lumi4-Tb-lysin binding, the sAv
flexibility and the Lumi4-Tb flexibility). ΦD is the Tb-centered luminescence quantum yield
(Table 1), n is the index of refraction of the buffer solution (n = 1.4) and J is the spectral overlap
integral in M-1cm-1nm4.
is dependent on the acceptor molar absorptivity spectrum εA (Figure 2a) and the donor emission
spectrum normalized to unity (Figure 1a) and was calculated between 450 and 700 nm for
each donor-acceptor pair.
Figure S1: High resolution TEM images (showing only the core/shell structure of the QDs) of Qdot605
(left), eFluorNC605 (center) and p(DT-SB)605 (right).
!
R0 = 0.02108 " 2#Dn$4J( )1/ 6 nm
!
J = I D(")# $A(") "4 d" = I D( ˜ % )# $A( ˜ % ) d ˜ % ˜ % 4
!
I D
5 nm
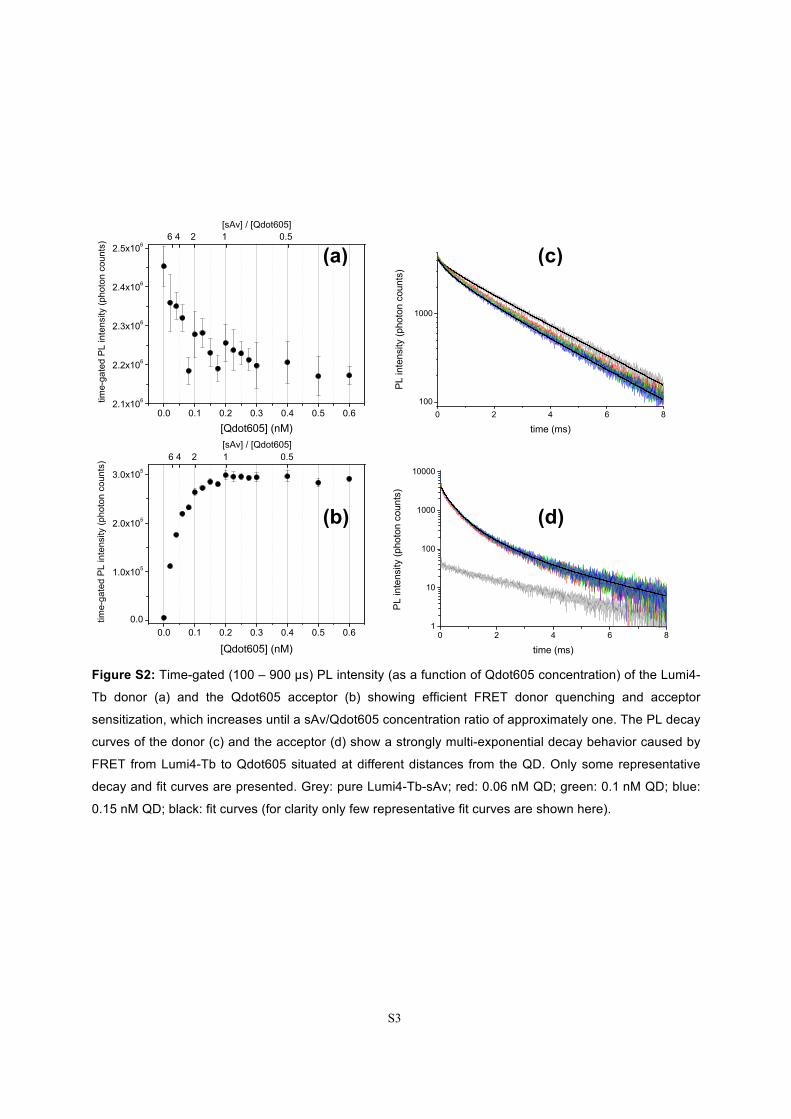
S3
Figure S2: Time-gated (100 – 900 µs) PL intensity (as a function of Qdot605 concentration) of the Lumi4-
Tb donor (a) and the Qdot605 acceptor (b) showing efficient FRET donor quenching and acceptor
sensitization, which increases until a sAv/Qdot605 concentration ratio of approximately one. The PL decay
curves of the donor (c) and the acceptor (d) show a strongly multi-exponential decay behavior caused by
FRET from Lumi4-Tb to Qdot605 situated at different distances from the QD. Only some representative
decay and fit curves are presented. Grey: pure Lumi4-Tb-sAv; red: 0.06 nM QD; green: 0.1 nM QD; blue:
0.15 nM QD; black: fit curves (for clarity only few representative fit curves are shown here).
(a) (c)
(b) (d)
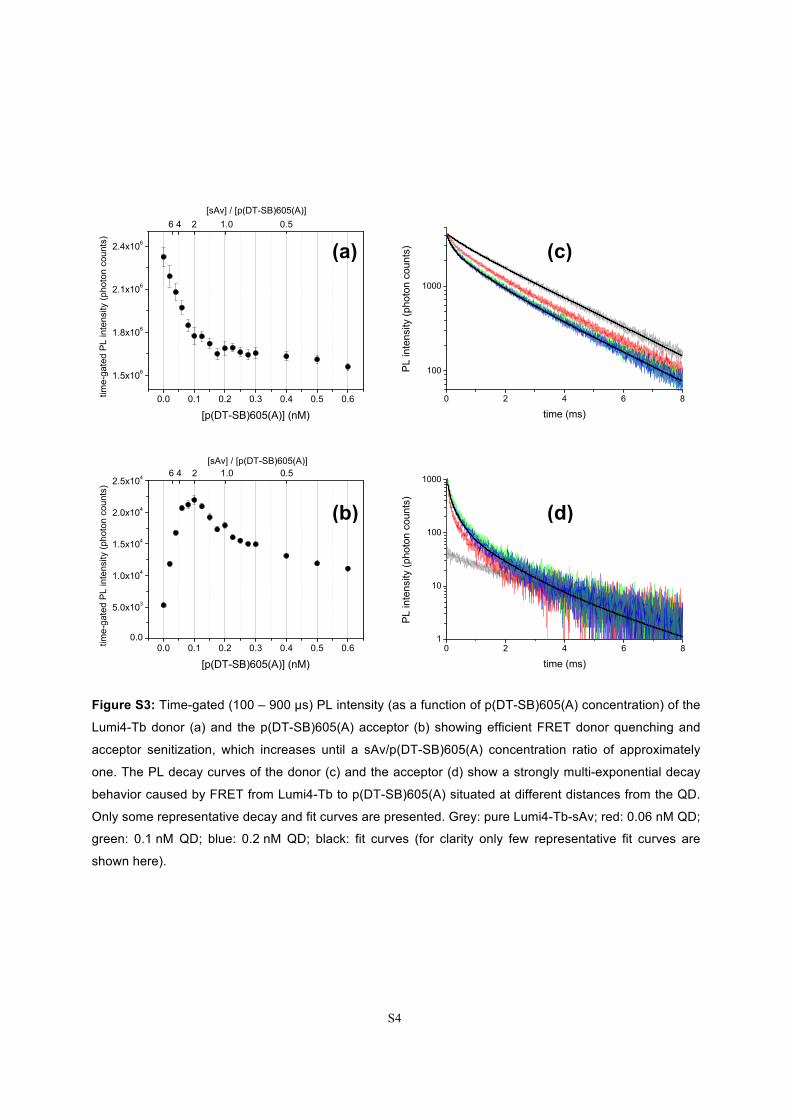
S4
Figure S3: Time-gated (100 – 900 µs) PL intensity (as a function of p(DT-SB)605(A) concentration) of the
Lumi4-Tb donor (a) and the p(DT-SB)605(A) acceptor (b) showing efficient FRET donor quenching and
acceptor senitization, which increases until a sAv/p(DT-SB)605(A) concentration ratio of approximately
one. The PL decay curves of the donor (c) and the acceptor (d) show a strongly multi-exponential decay
behavior caused by FRET from Lumi4-Tb to p(DT-SB)605(A) situated at different distances from the QD.
Only some representative decay and fit curves are presented. Grey: pure Lumi4-Tb-sAv; red: 0.06 nM QD;
green: 0.1 nM QD; blue: 0.2 nM QD; black: fit curves (for clarity only few representative fit curves are
shown here).
(a) (c)
(b) (d)
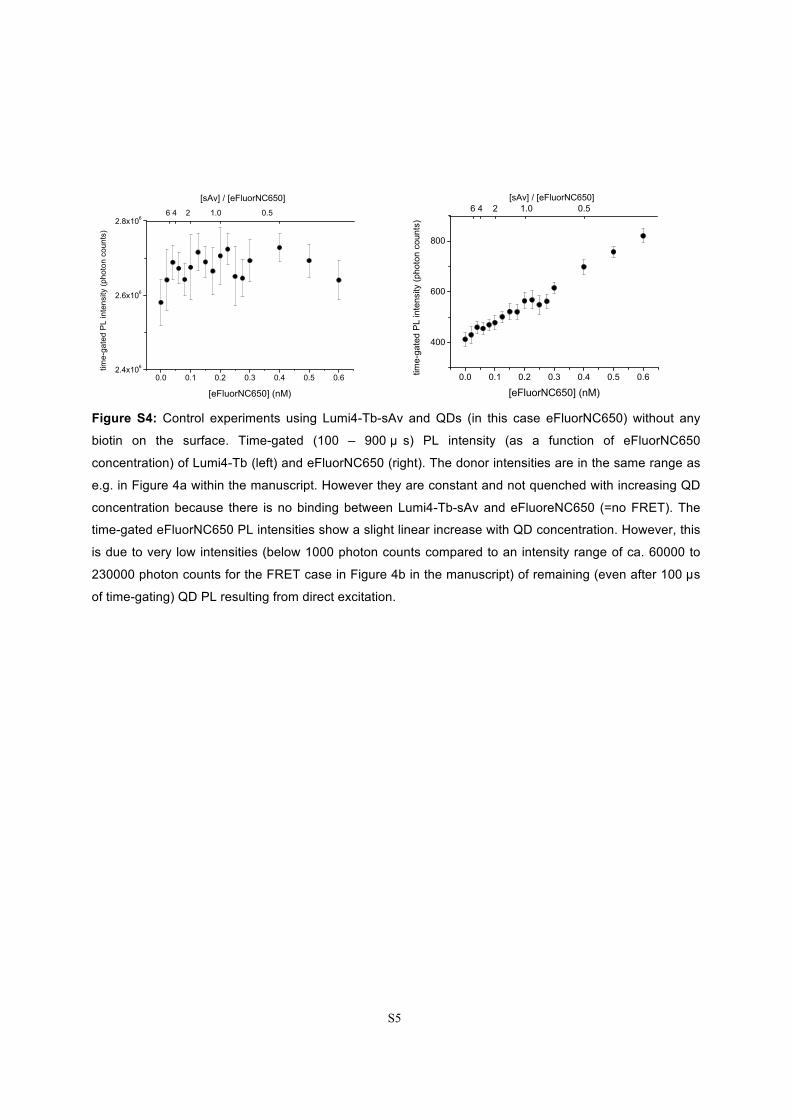
S5
Figure S4: Control experiments using Lumi4-Tb-sAv and QDs (in this case eFluorNC650) without any
biotin on the surface. Time-gated (100 – 900 µ s) PL intensity (as a function of eFluorNC650
concentration) of Lumi4-Tb (left) and eFluorNC650 (right). The donor intensities are in the same range as
e.g. in Figure 4a within the manuscript. However they are constant and not quenched with increasing QD
concentration because there is no binding between Lumi4-Tb-sAv and eFluoreNC650 (=no FRET). The
time-gated eFluorNC650 PL intensities show a slight linear increase with QD concentration. However, this
is due to very low intensities (below 1000 photon counts compared to an intensity range of ca. 60000 to
230000 photon counts for the FRET case in Figure 4b in the manuscript) of remaining (even after 100 µs
of time-gating) QD PL resulting from direct excitation.
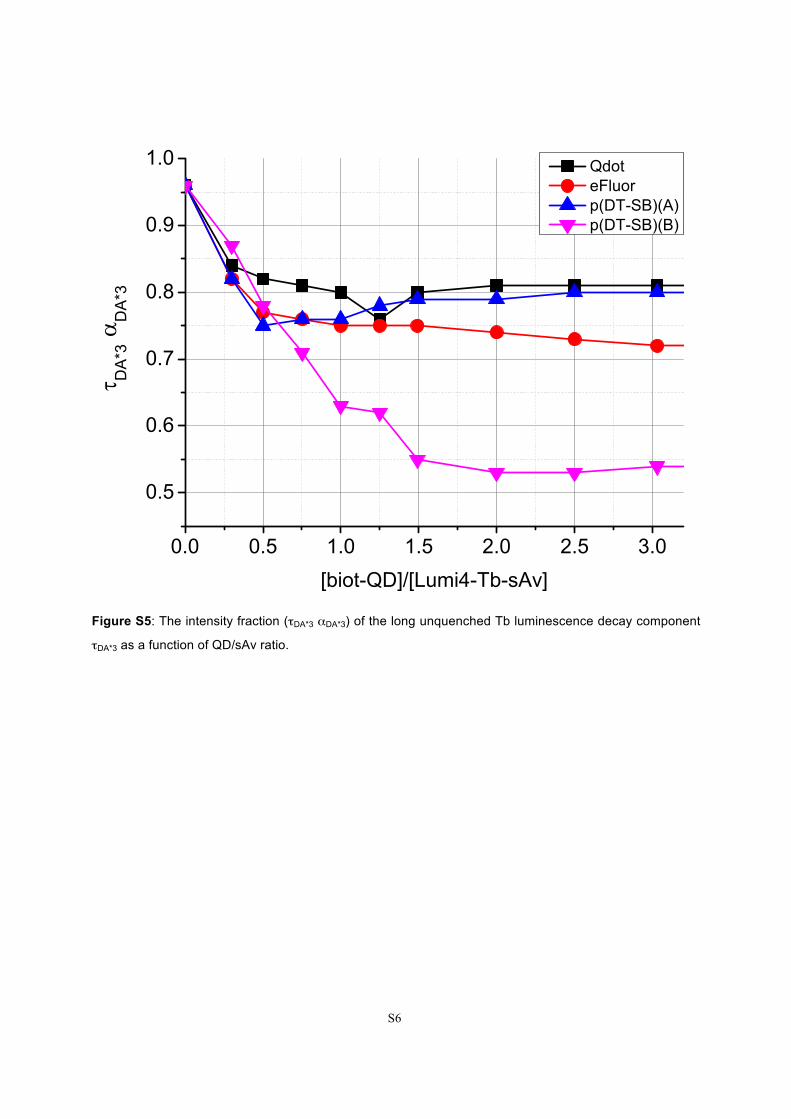
S6
Figure S5: The intensity fraction (τDA*3 αDA*3) of the long unquenched Tb luminescence decay component
τDA*3 as a function of QD/sAv ratio.

S7
Donor Channel R0(nm) 9.1 Biot/QDChannel 10-‐3999 fixed decay background fixed 4
D or DA Qdot [nM] τ1 A1 αDA*1 αDA1 τ2 A2 αDA*2 αDA2 <τDA> τ3 A3 αDA*3 <τD> z(D) <τDA>
corrηFRET
Qdot [nM] sAv/QD sAv/Biot % τ1∗α*1 % τ2∗α*2 % τ3∗α*3
D 0.00 644 583 0.14 2582 3610 0.86 2312 0.00 inf. inf. 0.000 0.039 0.96DA 0.06 264 680 0.16 0.39 1081 1055 0.24 0.61 761 2580 2630 0.60 1857 0.10 773 0.67 0.06 3.3 0.83 0.022 0.141 0.84DA 0.10 265 724 0.17 0.40 1094 1106 0.26 0.60 766 2580 2438 0.57 1802 0.09 778 0.66 0.10 2.0 0.50 0.025 0.157 0.82DA 0.15 267 769 0.18 0.40 1105 1130 0.27 0.60 766 2580 2338 0.55 1767 0.09 778 0.66 0.15 1.3 0.33 0.027 0.167 0.81DA 0.20 272 748 0.18 0.40 1106 1119 0.27 0.60 772 2580 2302 0.55 1770 0.09 784 0.66 0.20 1.0 0.25 0.028 0.168 0.80DA 0.25 269 777 0.17 0.34 1111 1529 0.33 0.66 827 2580 2322 0.50 1707 0.08 843 0.64 0.25 0.8 0.20 0.026 0.215 0.76DA 0.30 267 762 0.19 0.41 1114 1092 0.27 0.59 766 2580 2242 0.55 1759 0.09 778 0.66 0.30 0.7 0.17 0.028 0.169 0.80DA 0.40 250 722 0.17 0.39 1084 1132 0.27 0.61 759 2580 2275 0.55 1762 0.09 770 0.67 0.40 0.5 0.13 0.025 0.169 0.81DA 0.50 290 789 0.19 0.43 1132 1066 0.26 0.57 774 2580 2313 0.55 1776 0.09 787 0.66 0.50 0.4 0.10 0.031 0.163 0.81DA 0.60 275 806 0.19 0.42 1111 1121 0.26 0.58 761 2580 2384 0.55 1767 0.09 773 0.67 0.60 0.3 0.08 0.029 0.163 0.81
269 753 0.18 0.40 1104 1150 0.27 0.60 772 2580 2360 0.55 0.09 785 0.66 0.0 0.168 0.81269 762 0.18 0.40 1107 1162 0.27 0.60 774 2580 2327 0.55 0.09 786 0.66 0.0 0.171 0.80
6.5 9.0 8.1Acceptor Channel Biot/QDChannel 25-‐3000 fixed decay background fixed 4
τDAQdot [nM] τ0 A0 αAD*0 kFRET0 αAD0 τ1 A1 αAD*1 kFRET1 αAD1 τ2 A2 αAD*2 kFRET2 αAD2 <τDA> τ3 A3 αAD*3 z(A) <τDA>
corrηFRET
Qdot [nM] sAv/QD sAv/Biot
2312 0.06 71 552 0.16 0.0137 0.020 336 2035 0.59 0.00255 0.40 925 745 0.22 0.00065 0.58 671 2580 114 0.033 0.0054 671 0.71 0.06 3.3 0.832312 0.10 74 670 0.17 0.0132 0.024 334 2254 0.58 0.00257 0.41 898 826 0.21 0.00068 0.57 647 2580 128 0.033 0.0053 647 0.72 0.10 2.0 0.502312 0.15 67 681 0.17 0.0144 0.021 325 2360 0.57 0.00265 0.39 874 939 0.23 0.00071 0.58 640 2580 136 0.033 0.0053 640 0.72 0.15 1.3 0.332312 0.20 72 782 0.19 0.0135 0.025 342 2436 0.58 0.00249 0.42 925 834 0.20 0.00065 0.55 658 2580 132 0.032 0.0051 658 0.72 0.20 1.0 0.252312 0.25 58 759 0.18 0.0167 0.020 324 2432 0.57 0.00265 0.40 872 956 0.22 0.00071 0.58 637 2580 138 0.032 0.0052 637 0.72 0.25 0.8 0.202312 0.30 58 743 0.18 0.0167 0.020 320 2392 0.57 0.00269 0.40 862 941 0.22 0.00073 0.58 629 2580 137 0.032 0.0052 629 0.73 0.30 0.7 0.172312 0.40 53 833 0.19 0.0186 0.020 318 2423 0.56 0.00271 0.40 860 954 0.22 0.00073 0.58 628 2580 138 0.032 0.0051 628 0.73 0.40 0.5 0.132312 0.50 48 865 0.20 0.0203 0.019 311 2413 0.55 0.00279 0.39 832 997 0.23 0.00077 0.59 612 2580 145 0.033 0.0053 612 0.74 0.50 0.4 0.102312 0.60 42 969 0.20 0.0235 0.018 297 2520 0.52 0.00294 0.37 803 1173 0.24 0.00081 0.62 605 2580 154 0.032 0.0052 604 0.74 0.60 0.3 0.08
60 761 0.18 0.0167 0.021 323 2363 0.57 0.00267 0.40 872 929 0.22 0.00072 0.58 637 2580 136 0.032 0.0052 636 0.7259 788 0.18 0.0171 0.021 321 2404 0.56 0.00269 0.40 866 952 0.22 0.00072 0.58 632 2580 139 0.032 0.0052 632 0.73
5.0 6.7 8.4 7.7
% τ0∗α*0 % τ1∗α*1 % τ2∗α*2 % τ3∗α*3
0.023 0.40 0.40 0.170.026 0.40 0.40 0.180.023 0.39 0.41 0.180.028 0.42 0.39 0.170.022 0.39 0.41 0.180.022 0.39 0.41 0.180.022 0.39 0.41 0.180.021 0.38 0.42 0.190.019 0.35 0.44 0.190.023 0.39 0.41 0.180.023 0.39 0.41 0.18
Complete data from the TR-analysis of the Lumi4-Tb-sAv-biot-Qdot605 FRET system (all values are average values from three replicate measurements)
intensity information
averaging
intensity information
averaging
distance r
distance r

S8
Donor Channel R0(nm) 7.8 Biot/QDChannel 10-‐3999 fixed decay background fixed 4
D or DA eFluor [nM] τ1 A1 αDA*1 αDA1 τ2 A2 αDA*2 αDA2 <τDA> τ3 A3 αDA*3 <τD> z(D) <τDA>
corrηFRET
eFluor [nM] sAv/QD sAv/Biot % τ1∗α*1 % τ2∗α*2 % τ3∗α*3
D 0.00 619 596 0.14 2560 3515 0.86 2279 0.00 inf. inf. 0.000 0.039 0.96DA 0.06 234 522 0.12 0.30 1050 1238 0.29 0.70 808 2560 2480 0.58 1833 0.10 829 0.64 0.06 3.3 0.83 0.016 0.167 0.82DA 0.10 233 580 0.14 0.29 1094 1414 0.34 0.71 843 2560 2207 0.53 1745 0.09 865 0.62 0.10 2.0 0.50 0.018 0.211 0.77DA 0.15 235 572 0.14 0.29 1090 1427 0.35 0.71 846 2560 2120 0.51 1728 0.09 867 0.62 0.15 1.3 0.33 0.019 0.219 0.76DA 0.20 240 595 0.14 0.29 1111 1477 0.35 0.71 861 2560 2101 0.50 1716 0.09 883 0.61 0.20 1.0 0.25 0.020 0.229 0.75DA 0.25 240 560 0.14 0.28 1103 1443 0.35 0.72 862 2560 2073 0.51 1725 0.09 884 0.61 0.25 0.8 0.20 0.019 0.226 0.75DA 0.30 242 547 0.14 0.28 1107 1399 0.36 0.72 864 2560 1937 0.50 1710 0.08 886 0.61 0.30 0.7 0.17 0.020 0.233 0.75DA 0.40 250 567 0.15 0.29 1122 1419 0.37 0.71 873 2560 1898 0.49 1697 0.08 896 0.61 0.40 0.5 0.13 0.022 0.241 0.74DA 0.50 243 569 0.14 0.28 1123 1468 0.37 0.72 877 2560 1932 0.49 1696 0.08 901 0.60 0.50 0.4 0.10 0.021 0.245 0.73DA 0.60 262 610 0.15 0.29 1147 1472 0.37 0.71 887 2560 1903 0.48 1686 0.08 911 0.60 0.60 0.3 0.08 0.024 0.251 0.72
242 569 0.14 0.29 1105 1417 0.35 0.71 858 2560 2072 0.51 0.09 880 0.61 0.0 0.225 0.76243 575 0.14 0.29 1112 1440 0.36 0.71 864 2560 2021 0.50 0.08 887 0.61 0.0 0.232 0.75
5.5 7.7 7.2Acceptor Channel Biot/QDChannel 25-‐3000 fixed decay background fixed 4
τDAeFluor [nM] τ0 A0 αAD*0 kFRET0 αAD0 τ1 A1 αAD*1 kFRET1 αAD1 τ2 A2 αAD*2 kFRET2 αAD2 <τDA> τ3 A3 αAD*3 z(A) <τDA>
corrηFRET
eFluor [nM] sAv/QD sAv/Biot
2279 0.06 82 644 0.30 0.0118 0.033 348 830 0.38 0.00243 0.21 1075 614 0.28 0.00049 0.76 891 2560 85 0.039 0.0066 893 0.61 0.06 3.3 0.832279 0.10 74 755 0.28 0.0131 0.030 319 1011 0.38 0.00270 0.20 1009 814 0.30 0.00055 0.77 845 2560 108 0.040 0.0068 847 0.63 0.10 2.0 0.502279 0.15 70 776 0.28 0.0138 0.028 316 1073 0.39 0.00273 0.20 1032 817 0.29 0.00053 0.77 863 2560 104 0.038 0.0064 865 0.62 0.15 1.3 0.332279 0.20 60 828 0.27 0.0162 0.025 296 1177 0.39 0.00294 0.19 1003 898 0.30 0.00056 0.78 842 2560 116 0.038 0.0065 844 0.63 0.20 1.0 0.252279 0.25 63 874 0.30 0.0154 0.028 311 1129 0.38 0.00278 0.20 1024 838 0.28 0.00054 0.77 854 2560 110 0.037 0.0063 855 0.62 0.25 0.8 0.202279 0.30 57 877 0.30 0.0171 0.026 296 1127 0.38 0.00294 0.20 1009 840 0.28 0.00055 0.78 844 2560 109 0.037 0.0063 846 0.63 0.30 0.7 0.172279 0.40 56 963 0.31 0.0174 0.027 289 1191 0.38 0.00302 0.19 1002 879 0.28 0.00056 0.78 837 2560 114 0.036 0.0061 838 0.63 0.40 0.5 0.132279 0.50 54 1103 0.33 0.0181 0.030 286 1224 0.36 0.00306 0.19 982 923 0.27 0.00058 0.78 819 2560 123 0.036 0.0062 820 0.64 0.50 0.4 0.102279 0.60 53 1229 0.34 0.0184 0.031 288 1315 0.36 0.00303 0.20 1000 940 0.26 0.00056 0.77 829 2560 123 0.034 0.0058 830 0.64 0.60 0.3 0.08
63 894 0.30 0.0157 0.029 305 1120 0.38 0.00285 0.20 1015 840 0.28 0.00055 0.77 847 2560 110 0.037 0.0063 849 0.6361 926 0.30 0.0162 0.028 300 1156 0.38 0.00290 0.20 1008 869 0.28 0.00055 0.77 842 2560 113 0.037 0.0063 843 0.63
4.3 5.7 7.5 7.1
% τ0∗α*0 % τ1∗α*1 % τ2∗α*2 % τ3∗α*3
0.043 0.24 0.54 0.180.038 0.22 0.56 0.190.036 0.23 0.56 0.180.031 0.22 0.56 0.190.036 0.23 0.56 0.180.033 0.22 0.56 0.180.034 0.22 0.56 0.190.037 0.21 0.56 0.190.038 0.22 0.55 0.190.036 0.22 0.56 0.180.035 0.22 0.56 0.19
Complete data from the TR-analysis of the Lumi4-Tb-sAv-biot-eFluorNC605 FRET system (all values are average values from three replicate measurements)
intensity information
averaging
intensity information
averaging
distance r
distance r

S9
Donor Channel R0(nm) 7.4 Biot/QDChannel 10-‐3999 fixed decay background fixed 4
D or DA TP(A) [nM] τ1 A1 αDA*1 αDA1 τ2 A2 αDA*2 αDA2 <τDA> τ3 A3 αDA*3 <τD> z(D) <τDA>
corrηFRET
TP(A) [nM] sAv/QD sAv/Biot % τ1∗α*1 % τ2∗α*2 % τ3∗α*3
D 0.00 635 600 0.14 2566 3593 0.86 2289 0.00 inf. inf. 0.000 0.040 0.96DA 0.06 194 865 0.21 0.44 1007 1108 0.26 0.56 650 2570 2233 0.53 1669 0.09 652 0.72 0.06 3.3 0.83 0.024 0.159 0.82DA 0.10 196 1077 0.27 0.47 1017 1211 0.30 0.53 630 2570 1726 0.43 1464 0.07 630 0.72 0.10 2.0 0.50 0.036 0.210 0.75DA 0.15 185 1085 0.28 0.48 995 1174 0.30 0.52 606 2570 1663 0.42 1439 0.07 604 0.74 0.15 1.3 0.33 0.035 0.207 0.76DA 0.20 187 1111 0.29 0.50 996 1095 0.28 0.50 589 2570 1644 0.43 1434 0.07 585 0.74 0.20 1.0 0.25 0.038 0.197 0.76DA 0.25 175 1111 0.29 0.51 971 1076 0.28 0.49 567 2570 1697 0.44 1442 0.07 561 0.75 0.25 0.8 0.20 0.035 0.186 0.78DA 0.30 161 1093 0.29 0.51 943 1046 0.27 0.49 544 2570 1666 0.44 1431 0.07 536 0.77 0.30 0.7 0.17 0.032 0.181 0.79DA 0.40 163 1077 0.29 0.52 939 987 0.27 0.48 534 2570 1643 0.44 1436 0.07 526 0.77 0.40 0.5 0.13 0.033 0.174 0.79DA 0.50 154 1104 0.29 0.53 911 974 0.26 0.47 509 2570 1681 0.45 1430 0.07 498 0.78 0.50 0.4 0.10 0.032 0.165 0.80DA 0.60 149 1173 0.31 0.55 927 962 0.25 0.45 499 2570 1687 0.44 1413 0.07 489 0.79 0.60 0.3 0.08 0.032 0.165 0.80
174 1077 0.28 0.50 967 1070 0.28 0.50 570 2570 1738 0.45 0.07 565 0.75 0.0 0.183 0.78171 1104 0.29 0.51 962 1066 0.28 0.49 560 2570 1676 0.44 0.07 554 0.76 0.0 0.186 0.78
4.9 7.0 6.1Acceptor Channel Biot/QDChannel 25-‐3000 fixed decay background fixed 4
τDATP(A) [nM] τ0 A0 αAD*0 kFRET0 αAD0 τ1 A1 αAD*1 kFRET1 αAD1 τ2 A2 αAD*2 kFRET2 αAD2 <τDA> τ3 A3 αAD*3 z(A) <τDA>
corrηFRET
TP(A) [nM] sAv/QD sAv/Biot
2289 0.06 50 235 0.27 0.0196 0.041 199 390 0.44 0.00459 0.29 690 196 0.22 0.00101 0.67 520 2570 57 0.065 0.0108 519 0.77 0.06 3.3 0.832289 0.10 37 210 0.22 0.0266 0.026 160 459 0.48 0.00581 0.26 609 259 0.27 0.00121 0.71 477 2570 38 0.039 0.0066 475 0.79 0.10 2.0 0.502289 0.15 51 257 0.31 0.0192 0.044 211 366 0.44 0.00430 0.28 774 174 0.21 0.00086 0.67 583 2570 35 0.042 0.0070 583 0.75 0.15 1.3 0.332289 0.20 32 239 0.28 0.0308 0.032 174 378 0.45 0.00531 0.29 644 183 0.22 0.00112 0.68 487 2570 39 0.046 0.0078 486 0.79 0.20 1.0 0.252289 0.25 30 250 0.32 0.0329 0.037 158 326 0.41 0.00589 0.27 599 178 0.22 0.00123 0.70 460 2570 39 0.049 0.0082 459 0.80 0.25 0.8 0.202289 0.30 25 245 0.32 0.0396 0.032 158 333 0.43 0.00589 0.29 613 156 0.20 0.00119 0.68 461 2570 37 0.048 0.0080 460 0.80 0.30 0.7 0.172289 0.40 26 296 0.39 0.0380 0.045 151 283 0.37 0.00619 0.27 593 147 0.19 0.00125 0.69 449 2570 36 0.047 0.0079 448 0.80 0.40 0.5 0.132289 0.50 21 317 0.39 0.0472 0.050 131 308 0.38 0.00720 0.32 454 148 0.18 0.00177 0.63 329 2570 36 0.044 0.0074 326 0.86 0.50 0.4 0.102289 0.60 21 347 0.45 0.0472 0.051 123 233 0.30 0.00769 0.21 548 148 0.19 0.00139 0.74 432 2570 37 0.048 0.0081 430 0.81 0.60 0.3 0.08
33 266 0.33 0.0334 0.040 163 342 0.41 0.00587 0.28 614 177 0.21 0.00122 0.68 466 2570 39 0.048 0.0080 465 0.8030 270 0.33 0.0352 0.040 158 336 0.41 0.00604 0.27 604 174 0.21 0.00125 0.69 460 2570 37 0.046 0.0076 458 0.80
3.6 4.8 6.2 5.9
% τ0∗α*0 % τ1∗α*1 % τ2∗α*2 % τ3∗α*3
0.032 0.21 0.36 0.390.023 0.22 0.47 0.290.042 0.25 0.43 0.290.026 0.23 0.40 0.340.028 0.19 0.40 0.380.025 0.21 0.38 0.380.033 0.19 0.38 0.400.032 0.20 0.33 0.450.034 0.14 0.38 0.450.031 0.20 0.39 0.370.030 0.20 0.40 0.37
Complete data from the TR-analysis of the Lumi4-Tb-sAv-biot-TP605(A) FRET system (all values are average values from three replicate measurements)
intensity information
averaging
intensity information
averaging
distance r
distance r

S10
Donor Channel R0(nm) 7.4 Biot/QDChannel 10-‐3999 fixed decay background fixed 1
D or DA TP(B) [nM] τ1 A1 αDA*1 αDA1 τ2 A2 αDA*2 αDA2 <τDA> τ3 A3 αDA*3 <τD> z(D) <τDA>
corrηFRET
TP(B) [nM] sAv/QD sAv/Biot % τ1∗α*1 % τ2∗α*2 % τ3∗α*3
D 0.00 560 1242 0.14 2564 7351 0.86 2274 0.00 inf. inf. 0.000 0.036 0.96DA 0.06 168 1441 0.16 0.43 948 1942 0.22 0.57 616 2560 5532 0.62 1822 0.10 622 0.73 0.06 3.33 3.33 0.015 0.113 0.87DA 0.10 192 2101 0.25 0.47 1053 2397 0.28 0.53 651 2560 3982 0.47 1547 0.08 659 0.71 0.10 2.00 2.00 0.031 0.192 0.78DA 0.15 202 2473 0.30 0.48 1059 2671 0.32 0.52 647 2560 3109 0.38 1368 0.06 653 0.71 0.15 1.33 1.33 0.044 0.251 0.71DA 0.20 200 2841 0.36 0.50 1044 2843 0.36 0.50 622 2560 2310 0.29 1182 0.05 626 0.72 0.20 1.00 1.00 0.060 0.314 0.63DA 0.25 202 2889 0.36 0.50 1041 2865 0.36 0.50 620 2560 2234 0.28 1162 0.05 623 0.73 0.25 0.80 0.80 0.063 0.321 0.62DA 0.30 212 3097 0.41 0.53 1040 2764 0.37 0.47 602 2560 1694 0.22 1041 0.04 604 0.73 0.30 0.67 0.67 0.084 0.365 0.55DA 0.40 207 3195 0.43 0.54 1024 2773 0.37 0.46 586 2560 1545 0.21 992 0.03 587 0.74 0.40 0.50 0.50 0.089 0.381 0.53DA 0.50 204 3257 0.43 0.54 1017 2774 0.37 0.46 578 2560 1543 0.20 982 0.03 579 0.75 0.50 0.40 0.40 0.090 0.379 0.53DA 0.60 203 3285 0.43 0.54 1014 2787 0.36 0.46 575 2560 1581 0.21 985 0.03 576 0.75 0.60 0.33 0.33 0.088 0.375 0.54DA 0.70 201 3342 0.43 0.54 1012 2804 0.36 0.46 571 2560 1589 0.21 979 0.03 571 0.75 0.70 0.29 0.29 0.089 0.374 0.54
199 2792 0.36 0.51 1025 2662 0.34 0.49 607 2560 2512 0.31 0.05 610 0.73 0.07 0.31 0.63203 2942 0.38 0.52 1034 2742 0.35 0.48 606 2560 2176 0.27 0.05 609 0.73 0.07 0.33 0.60
5.0 7.2 6.3Acceptor Channel Biot/QDChannel 25-‐3000 fixed decay background fixed 1
τDATP(B) [nM] τ0 A0 αAD*0 kFRET0 αAD0 τ1 A1 αAD*1 kFRET1 αAD1 τ2 A2 αAD*2 kFRET2 αAD2 <τDA> τ3 A3 αAD*3 z(A) <τDA>
corrηFRET
TP(B) [nM] sAv/QD sAv/Biot
2274 0.06 69 277 0.29 0.0141 0.056 228 403 0.43 0.00395 0.29 799 186 0.20 0.00081 0.65 592 2560 77 0.082 0.0138 593 0.74 0.06 3.3 3.332274 0.10 62 397 0.28 0.0157 0.049 226 648 0.46 0.00398 0.31 773 282 0.20 0.00085 0.64 567 2560 74 0.053 0.0089 567 0.75 0.10 2.0 2.002274 0.15 61 507 0.29 0.0159 0.051 225 789 0.46 0.00401 0.31 746 361 0.21 0.00090 0.64 549 2560 71 0.041 0.0070 548 0.76 0.15 1.3 1.332274 0.20 63 615 0.30 0.0155 0.051 232 977 0.47 0.00386 0.33 770 412 0.20 0.00086 0.62 558 2560 66 0.032 0.0054 558 0.75 0.20 1.0 1.002274 0.25 66 622 0.31 0.0146 0.056 236 937 0.46 0.00380 0.33 771 401 0.20 0.00086 0.62 557 2560 63 0.031 0.0052 557 0.76 0.25 0.8 0.802274 0.30 72 722 0.34 0.0135 0.067 250 965 0.45 0.00356 0.34 792 389 0.18 0.00082 0.59 559 2560 56 0.026 0.0044 559 0.75 0.30 0.7 0.672274 0.40 62 706 0.32 0.0158 0.059 230 974 0.45 0.00390 0.33 718 445 0.20 0.00095 0.61 520 2560 60 0.027 0.0046 519 0.77 0.40 0.5 0.502274 0.50 55 622 0.29 0.0178 0.049 207 974 0.46 0.00438 0.31 673 478 0.22 0.00105 0.64 498 2560 63 0.029 0.0050 497 0.78 0.50 0.4 0.402274 0.60 52 661 0.29 0.0188 0.047 210 1061 0.47 0.00432 0.33 692 477 0.21 0.00101 0.63 505 2560 65 0.029 0.0048 505 0.78 0.60 0.3 0.332274 0.70 53 675 0.31 0.0185 0.051 219 997 0.46 0.00412 0.34 724 415 0.19 0.00094 0.61 520 2560 59 0.027 0.0046 520 0.77 1.60 0.1 0.13
61 580 0.303 0.0160 0.054 226 872 0.46 0.00399 0.32 746 385 0.20 0.00091 0.63 542 2560 65 0.038 0.0064 542 0.7661 614 0.304 0.0162 0.053 226 925 0.46 0.00399 0.32 740 407 0.20 0.00092 0.62 537 2560 64 0.033 0.0056 537 0.76
4.1 5.1 6.6 6.1
% τ0∗α*0 % τ1∗α*1 % τ2∗α*2 % τ3∗α*3
0.042 0.20 0.33 0.430.042 0.25 0.38 0.330.047 0.27 0.41 0.280.051 0.30 0.42 0.220.056 0.30 0.42 0.220.070 0.32 0.41 0.190.059 0.30 0.43 0.210.048 0.28 0.45 0.220.046 0.30 0.44 0.220.050 0.31 0.43 0.210.051 0.284 0.411 0.2540.052 0.293 0.421 0.234
Complete data from the TR-analysis of the Lumi4-Tb-sAv-biot-TP605(B) FRET system (all values are average values from three replicate measurements)
intensity information
averaging
intensity information
averaging
distance r
distance r
lxvi CHAPTER 6. APPENDIX
6.4.2 QD-hexahistidine self-assembly
Original publication:
Three-Dimensional Solution-Phase Forster Resonance EnergyTransfer Analysis of Nanomolar Quantum Dot Bioconjugates
with Subnanometer Resolution.K. D. Wegner, F. Morgner, E. Oh, R. Goswami, K. Susumu, M. H. Stewart, I. L.
Medintz, and N. Hildebrandt.Chemistry of Materials 2014, 26 (14), 4299-4312.
Three-Dimensional Solution-Phase Forster Resonance EnergyTransfer Analysis of Nanomolar Quantum Dot Bioconjugateswith Subnanometer ResolutionK. David Wegner,† Frank Morgner,‡ Eunkeu Oh,§,# Ramasis Goswami,∥ Kimihiro Susumu,§,#
Michael H. Stewart,§ Igor L. Medintz,⊥ and Niko Hildebrandt*,†
†NanoBioPhotonics, Institut d’Electronique Fondamentale, Universite Paris-Sud, 15 Rue Georges Clemenceau, 91400 Orsay, France‡Fraunhofer Institut fur Angewandte Polymerforschung, Geiselbergstraße 69, 14476 Potsdam, Germany§Optical Sciences Division, Code 5600, ∥Multifunctional Materials, Code 6351, and ⊥Center for Bio/Molecular Science andEngineering, Code 6900, U.S. Naval Research Laboratory, 4555 Overlook Avenue SW, Washington, DC 20375, United States#Sotera Defense Solutions, Inc., Columbia, MD 21046, United States
*S Supporting Information
ABSTRACT: Luminescent semiconductor quantum dots (QDs) play an important role in optical biosensing and, in particular,in FRET (Forster resonance energy transfer)-based luminescent probes. The QD materials that form the basis for these probesare in actuality quite heterogeneous and consist of different types of QDs with variations in material compositions, surfacecoatings, and available biofunctionalization strategies. To optimize their role in active sensors that rely on FRET, extensivephysicochemical characterization is required. A technique that can provide precise information about size, shape, andbioconjugation properties of different QD−biomolecule conjugates from a single sample and measurement under actualexperimental biosensing conditions would therefore be highly important for advancing QDs to a next generation nanobiosensingtool. Here, we present a detailed FRET study on a large set of QD−biomolecule conjugates, which allows for a homogeneoussolution-phase size, shape, and bioconjugation analysis of peptide and protein self-assembled QDs at subnanomolar concentrationsand with subnanometer resolution. Direct incorporation of luminescent Tb-complexes (Tb) in the peptides or proteins leads to Tb-to-QD FRET upon assembly to the different QD surfaces. Luminescence decay times and time-gated intensities, which preciselydecode the FRET interactions, provide a wealth of useful information on the underlying composite structure and even biochemicalfunctionality. In contrast to other high-resolution techniques, which require rather sophisticated instrumentation, well-definedexperimental conditions, and low sample throughput, our technique uses a commercial time-resolved fluorescence plate reader forvery fast and simple data acquisition of many aqueous samples in a standard microtiter plate.
■ INTRODUCTION
Among the most important properties of fluorescent biosensorsare brightness, photostability, and color-tunability. It is exactlybecause of these properties that semiconductor quantum dots(QDs) are immensely valuable tools in optical spectroscopy andmicroscopy.1−10 Driven by the occurrence of many biologicalinteractions on the nanometric distance scale, the advantageouscombination of QDs with FRET (Forster resonance energytransfer) has become an important biosensing technology.11−16
In particular, multiplexed (multiple targets), highly sensitive
(low detection limits), and homogeneous (no separation steps)assay formats are feasible using QD-based FRET.17−24
Despite the multiple photophysical and photochemicaladvantages of QDs for optical biosensing, the variability ofQD surface properties from one QD type to another prevents ageneral strategy of designing the ultimate QD-biosensor, which
Received: June 3, 2014Revised: June 10, 2014Published: June 11, 2014
Article
pubs.acs.org/cm
© 2014 American Chemical Society 4299 dx.doi.org/10.1021/cm502021m | Chem. Mater. 2014, 26, 4299−4312
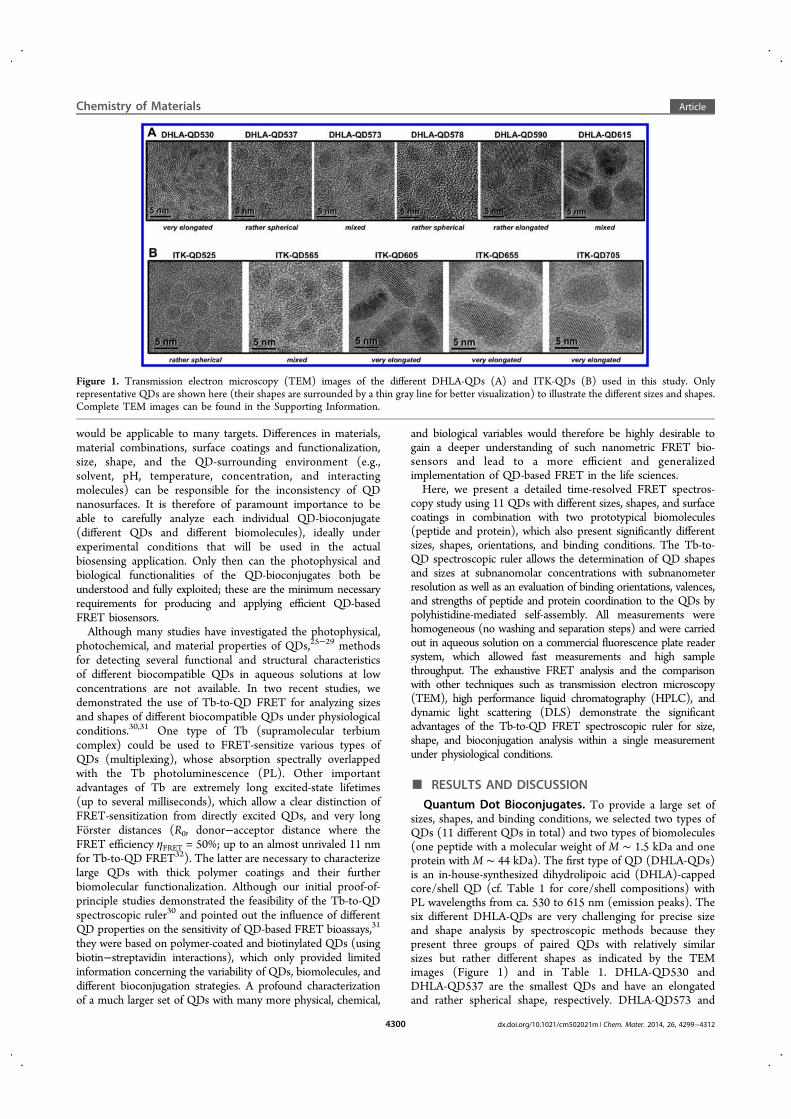
would be applicable to many targets. Differences in materials,material combinations, surface coatings and functionalization,size, shape, and the QD-surrounding environment (e.g.,solvent, pH, temperature, concentration, and interactingmolecules) can be responsible for the inconsistency of QDnanosurfaces. It is therefore of paramount importance to beable to carefully analyze each individual QD-bioconjugate(different QDs and different biomolecules), ideally underexperimental conditions that will be used in the actualbiosensing application. Only then can the photophysical andbiological functionalities of the QD-bioconjugates both beunderstood and fully exploited; these are the minimum necessaryrequirements for producing and applying efficient QD-basedFRET biosensors.Although many studies have investigated the photophysical,
photochemical, and material properties of QDs,25−29 methodsfor detecting several functional and structural characteristicsof different biocompatible QDs in aqueous solutions at lowconcentrations are not available. In two recent studies, wedemonstrated the use of Tb-to-QD FRET for analyzing sizesand shapes of different biocompatible QDs under physiologicalconditions.30,31 One type of Tb (supramolecular terbiumcomplex) could be used to FRET-sensitize various types ofQDs (multiplexing), whose absorption spectrally overlappedwith the Tb photoluminescence (PL). Other importantadvantages of Tb are extremely long excited-state lifetimes(up to several milliseconds), which allow a clear distinction ofFRET-sensitization from directly excited QDs, and very longForster distances (R0, donor−acceptor distance where theFRET efficiency ηFRET = 50%; up to an almost unrivaled 11 nmfor Tb-to-QD FRET32). The latter are necessary to characterizelarge QDs with thick polymer coatings and their furtherbiomolecular functionalization. Although our initial proof-of-principle studies demonstrated the feasibility of the Tb-to-QDspectroscopic ruler30 and pointed out the influence of differentQD properties on the sensitivity of QD-based FRET bioassays,31
they were based on polymer-coated and biotinylated QDs (usingbiotin−streptavidin interactions), which only provided limitedinformation concerning the variability of QDs, biomolecules, anddifferent bioconjugation strategies. A profound characterizationof a much larger set of QDs with many more physical, chemical,
and biological variables would therefore be highly desirable togain a deeper understanding of such nanometric FRET bio-sensors and lead to a more efficient and generalizedimplementation of QD-based FRET in the life sciences.Here, we present a detailed time-resolved FRET spectros-
copy study using 11 QDs with different sizes, shapes, and surfacecoatings in combination with two prototypical biomolecules(peptide and protein), which also present significantly differentsizes, shapes, orientations, and binding conditions. The Tb-to-QD spectroscopic ruler allows the determination of QD shapesand sizes at subnanomolar concentrations with subnanometerresolution as well as an evaluation of binding orientations, valences,and strengths of peptide and protein coordination to the QDs bypolyhistidine-mediated self-assembly. All measurements werehomogeneous (no washing and separation steps) and were carriedout in aqueous solution on a commercial fluorescence plate readersystem, which allowed fast measurements and high samplethroughput. The exhaustive FRET analysis and the comparisonwith other techniques such as transmission electron microscopy(TEM), high performance liquid chromatography (HPLC), anddynamic light scattering (DLS) demonstrate the significantadvantages of the Tb-to-QD FRET spectroscopic ruler for size,shape, and bioconjugation analysis within a single measurementunder physiological conditions.
■ RESULTS AND DISCUSSION
Quantum Dot Bioconjugates. To provide a large set ofsizes, shapes, and binding conditions, we selected two types ofQDs (11 different QDs in total) and two types of biomolecules(one peptide with a molecular weight of M ∼ 1.5 kDa and oneprotein with M ∼ 44 kDa). The first type of QD (DHLA-QDs)is an in-house-synthesized dihydrolipoic acid (DHLA)-cappedcore/shell QD (cf. Table 1 for core/shell compositions) withPL wavelengths from ca. 530 to 615 nm (emission peaks). Thesix different DHLA-QDs are very challenging for precise sizeand shape analysis by spectroscopic methods because theypresent three groups of paired QDs with relatively similarsizes but rather different shapes as indicated by the TEMimages (Figure 1) and in Table 1. DHLA-QD530 andDHLA-QD537 are the smallest QDs and have an elongatedand rather spherical shape, respectively. DHLA-QD573 and
Figure 1. Transmission electron microscopy (TEM) images of the different DHLA-QDs (A) and ITK-QDs (B) used in this study. Onlyrepresentative QDs are shown here (their shapes are surrounded by a thin gray line for better visualization) to illustrate the different sizes and shapes.Complete TEM images can be found in the Supporting Information.
Chemistry of Materials Article
dx.doi.org/10.1021/cm502021m | Chem. Mater. 2014, 26, 4299−43124300

Table
1.Distance,
Shape,
andPho
toph
ysical
Inform
ationof
theQD-Bioconjugatesa
quantum
dots
Tb-PE
P-QD
FRET
system
sTb-MBP-QD
FRET
system
s
sizes(radiior
ellipse
halfaxes)in
nmFR
ET-properties
sizes(D
-Adistances)
innm
FRET-properties
sizes(D
-Adistances)
innm
name
(com
position)
TEM
TEMb
HPL
Cb
DLS
⟨τ(T
b)⟩
inms
Φ(T
b)R0in
nm
estim
ated
Tb-QD
distance
range
innm
⟨r⟩
r 1r 2
r 3⟨τ(T
b)⟩
inms
Φ(T
b)R0in
nm
estim
ated
Tb-QD
distance
rangein
nm⟨r⟩
r 1r 2
r 3
DHLA
-QD530
(CdSe/ZnS)
2.4±0.4
5.9±
1.0
2.8
0.81
5.8
2.3−
4.1
D:3.7
D:3.2
A:3.7
D:4.5
2.18
0.63
5.5
3.2−
7.2
D:4.9
D:3.6
A:3.9
D:5.7
1.2±0.2
A:4.1
A:3.0
A:4.8
A:5.0
A:3.0
A:5.5
DHLA
-QD537
(CdSe/ZnS)
2.4±0.3
5.6±
1.0
2.8
0.81
6.3
3.4−
4.0
D:4.3
D:3.8
A:4.7
D:5.3
2.63
0.76
6.1
4.3−
7.1
D:5.2
D:4.0
A:4.2
D:5.8
A:4.2
A:3.7
A:5.3
A:3.2
A:5.7
DHLA
-QD573
(CdSe-CdZ
nS/
ZnS)
2.7±0.3
5.4±
1.0
2.8
0.81
7.5
3.7−
4.3
D:6.1
D:4.5
A:4.7
D:7.8
2.22
0.64
7.1
4.6−
7.4
D:6.8
D:4.9
A:5.0
D:7.6
A:5.0
A:3.8
A:6.5
A:6.6
A:3.8
A:7.1
DHLA
-QD578
(CdSe/ZnS)
2.4±0.3
5.9±
1.0
2.8
0.81
7.7
3.4−
4.0
D:6.1
D:4.8
A:5.0
D:7.2
2.68
0.78
7.5
4.3−
7.1
D:7.1
D:5.2
A:5.1
D:7.8
A:5.4
A:4.0
A:6.6
A:6.7
A:3.8
A:7.2
OHLA
-QD590
(CdSe/ZnS)
4.0±0.3
6.3±
1.0
2.8
0.81
7.6
3.2−
5.6
D:5.0
D:4.2
A:4.6
D:6.2
2.64
0.77
7.4
4.1−
7.7
D:6.4
D:4.9
A:5.3
D:7.1
2.1±0.3
A:4.7
A:3.7
A:5.9
A:6.4
A:4.1
A:7.1
DHLA
-QD615
(CdSeCdS-
CdZ
nS-ZnS)
4.0±0.4
6.3±
1.0
2.8
0.81
7.8
4.9−
5.7
D:6.1
D:4.7
A:5.1
D:7.6
2.11
0.61
7.3
5.8−
8.8
D:7.0
D:5.0
A:5.4
D:7.7
A:5.2
A:4.2
A:6.8
A:6.8
A:4.2
A:7.5
ITK-QD525
(CdSe/ZnS)
2.0±0.2
1.5to
2.0
6.0
9.4±
1.7
2.7
0.79
5.5
3.1−
10.5
D:4.3
D:3.4
A:4.0
D:4.8
2.25
0.65
5.4
4.0−
13.6
D:4.2
D:3.0
A:3.5
D:5.1
A:4.8
A:2.7
A:4.0
A:4.3
A:2.5
A:5.0
ITK-QD565
(CdSe/ZnS)
2.6±0.3
2.3
7.0
10.3
±0.5
2.7
0.79
7.7
3.6−
11.2
D:5.6
D:4.8
A:5.2
D:6.8
2.24
0.65
7.4
4.5−
14.3
D:5.8
D:4.7
A:5.2
D:6.7
A:5.3
A:4.4
A:5.2
A:5.7
A:4.0
A:6.6
ITK-QD605
(CdSe/ZnS)
5.0±0.7
4.7
8.0
13.3
±0.6
2.7
0.79
9.4
3.2−
14.0
D:7.3
D:5.9
A:6.2
D:8.6
2.21
0.64
9.1
4.1−
17.1
D:7.1
D:5.6
A:6.3
D:8.2
2.2±0.3
2.0
A:6.6
A:5.1
A:6.2
A:7.3
A:4.7
A:8.5
ITK-QD655
(CdSe/ZnS)
6.4±0.7
6.0
9.0
14.8
±0.6
2.8
0.80
11.3
3.9−
15.4
D:8.2
D:6.3
A:7.2
D:10.3
2.25
0.65
11.0
4.8−
18.5
D:8.8
D:6.6
A:7.1
D:10.4
2.9±0.3
3.0
A:7.2
A:6.0
A:7.2
A:7.8
A:5.6
A:9.7
ITK-QD705
(CdSeT
e/ZnS)
5.5±0.8
6.0
9.3
13.5
±0.6
2.7
0.79
11.5
4.1−
14.6
D:8.1
D:6.8
A:7.5
D:10.0
2.24
0.65
11.1
5.0−
17.7
D:8.3
D:6.7
A:7.4
D:9.8
3.2±0.4
3.0
A:7.6
A:6.3
A:7.5
A:7.9
A:5.7
A:9.6
a⟨τ
Tb⟩
andΦ
Tbaretheam
plitude-averagedexcited-statelifetimeandthePL
quantum
yieldof
theTb-ion,respectively.R0istheFo
rsterdistance
(donor−acceptor
distance
of50%FR
ETeffi
ciency)for
each
Tb-QD-pairbioconjugatecalculated
asR0=0.02108(κ
2Φ
Tbn−
4J)
1/6nm
,with
theFR
ETorientationfactor
κ2=2/3,therefractiveindexn=1.35,and
theoverlapintegralJ=∫F T
bε Q
Dλ4
dλ(from
450to
700nm
with
thearea-normalized
Tbem
ission
spectrum
F TbandtheQDmolarabsorptivity
spectraε Q
D;cf.Figure2).D
istancevalues
from
theFR
ETanalysisaregivenforthedecaytim
efitsinthe
Tb-donor(D
)andQD-acceptor(A)channels,respectively.Estim
ated
Tb-QD
distance
ranges
werecalculated
asfollows:The
length
ofDHLA
(coveringtheDHLA
-QDs)
was
estim
ated
to3.3nm
bysubtractingtheTEM
values
(average
halfaxisassumingonelong
andtwoshortellipsoidalaxes)from
theDLS
values
andtaking
theaverageof
allcalculatedvalues.T
helength
ofpolymers(coveringthe
ITK-Q
Ds)wasestim
ated
to7.0nm
bysubtractingtheaverageofTEM
andHPL
Cvalues
from
theDLS
values
andtaking
theaverageofallcalculatedvalues.PEPwasestim
ated
tobe
1.3nm
(1.1nm
PEP
+0.1nm
Tb+0.1nm
His6)inits
elongatedform
.MBPwasconsidered
tobind
totheQDsinits
elongatedform
(6.5nm
length)with
Tblabelinginthefirstthird
(2.2nm
)forshortestTb-QDdistance
estim
ationor
inthelastthird
(4.4nm
)forlongestTb-QDdistance
estim
ation.Fo
rthePE
P-system
s,theshortestTb-QDdistance
was
calculated
asthelowestTEM
valueplus
1.3nm
(PEPlength),and
thelongestTb-QDdistance
was
calculated
asthehighestTEM
valueplus
1.3nm
(PEP
length)forPE
P-DHLA
-QDsor
plus
8.3nm
(polym
erlength
plus
PEPlength)forPE
P-ITK-Q
Ds.Fo
rtheMBP-
system
s,theshortestTb-QDdistance
was
calculated
asthelowestTEM
valueplus
2.2nm
(Tbin
thefirstthird
ofMBP),and
thelongestTb-QDdistance
was
calculated
asthehighestTEM
valueplus
4.4nm
(Tbin
thelastthird
ofMBP)
forMBP-DHLA
-QDsor
plus
11.4
nm(polym
erlength
plus
Tbin
thelastthird
ofMBP)
forMBP-ITK-Q
Ds.bValuesas
provided
byLifeTechnologies.
Chemistry of Materials Article
dx.doi.org/10.1021/cm502021m | Chem. Mater. 2014, 26, 4299−43124301

DHLA-QD578 are slightly larger and have a mixed long andspherical shape, respectively. DHLA-QD590 and DHLA-QD615 are again slightly larger and have rather elongatedand mixed shapes, respectively. The second type of QD (ITK-QD) is commercial (LifeTechnologies) core/shell QDs (cf.Table 1 for core/shell compositions), which were purchasedwith a coating containing carboxyl-functionalized polymers(Qdot ITK carboxyl QDs). The five different ITK-QDsincrease in size and length with increasing PL wavelengths,which range from ca. 525 to 705 nm (emission peaks). Apartfrom the differences in sizes and shapes, the major difference ofthe two types of QDs can be found in their coatings, whichembed the semiconductor core/shell structures. The DHLA-QDs are coated with relatively short DHLA ligands, whereasthe ITK-QDs are coated with relatively long polymers.Subtracting the TEM (average of TEM and HPLC for ITK-QDs) from the DLS radii (Table 1) results in lengths of 3.3 ±0.8 nm and 7.0 ± 1.1 nm for DHLA and polymer, respectively.Although these values do not represent the real coating thicknesses(overestimated because DLS values include the hydrationthickness and solvation layer), they give at the least a goodindication of the significant difference of organic shell thicknessesbetween the two QD types.All QDs were conjugated with Lumi4 terbium complex
(Tb)-functionalized peptides (PEP, GSGAAAGLS(His)6,1 Tb/PEP) or Tb-functionalized maltose binding proteins (MBP,1.3 Tb/MBP) as shown in Scheme 1. Both biomolecules can bind
to the QDs via hexa-histidine self-assembly to the Zn-rich surfacesof the DHLA-QDs or to the COOH-functionalized polymers ofthe ITK-QDs.17,33,34 In the case of MBP, electrostatic interac-tions between the QD carboxyls and the protein may also play arole in MBP-QD attachment.35 The main difference between thePEP and MBP is their size, with a length of ca. 1.2 nm for PEP anda 3.0 nm × 4.0 nm × 6.5 nm shape for MBP.36−38 This dimensionaldifference leads to different binding conditions, which result inexpected binding maxima of ca. 50 PEP/QD and ca. 10 MBP/QDdepending on the type, size, and surface characteristics of the QD.38
Moreover, metal affinity coordination between His6 and Zn (for theDHLA-QDs) is expected to be stronger than coordination betweenHis6 and COOH (for the ITK-QDs). In the latter case, we assumethat there are sufficient COOH-groups available to mimicnitrilotriacetic acids (NTAs), which are known to efficientlychelate divalent metal cations, such as Ni(II) or Zn(II), whichin turn bind to His6.
17,33,34,36−39 After verifying that binding ofthe His6-modified PEP and MBP to the ITK-QDs was stillpossible without the addition of divalent ions, we did not useany in our FRET experiments to avoid interferences with theTb-complexes. More importantly, one of the aims of our studywas the evaluation of binding strengths, and we therefore usedthe differences in His6-Zn and His6-COOH assembly as twoprototypical binding conditions. Another major differencebetween the PEP and MBP systems is the Tb-conjugation.The short PEP is labeled with Tb at one terminus and His6 onthe other. Thus, after attachment to the QD surface, thedistance between Tb and the QD is relatively well-defined.MBP (which contains His6 in its sequence) was labeled with Tbvia amine-reactive chemistry. The approximately 30 availableprimary amines on MBP lead to very heterogeneous bindingconditions, which means that the Tb (1.3 Tb/MBP on average)can range from very close to ca. 6.5 nm away from the QDorganic surface coating (depending on Tb-labeling, on the typeof QD, and on MBP-to-QD orientation; cf. Scheme 1).
Photophysical Properties of the FRET System. OurFRET spectroscopic ruler is composed of a Tb-donor andseveral different QD-acceptors. The advantages of Tb-to-QDFRET for biosensing and nanometric distance measurementshave been described in detail elsewhere.19,21,22,40 Briefly, theseconsist of (i) access to large Forster distances originating fromthe excellent spectral overlap between Tb PL and QD absorptionand the large molar absorptivity values of QDs; (ii) access todeep multiplexing capabilities (due to spectral overlap, Tb-QDFRET pairs consisting of the same type of Tb but different typesand colors of QDs are possible); and (iii) the large difference inexcited-state lifetimes of Tb (milliseconds) and QDs (nano-seconds), which allows time-delayed FRET from Tb to QD,multiple sequential FRET steps from different Tb to the sameQD, and nearly background-free time-gated detection of Tb PLand FRET-sensitized QD PL. We have previously shown theefficient use of different Tb-to-QD-based FRET systems forhomogeneous multiplexed diagnostics as well as spectroscopicruler measurements using streptavidin−biotin binding.20,30 In thepresent article, we extend our former size- and shape-determinationstudies to a large set of different QDs from both custom in-houseproduction and commercial sources and to very distinctbiomolecules (PEP and MBP) conjugated via histidine-self-assembly to the QD inorganic (for DHLA-QDs) or organic (forthe ITK-QDs) surfaces.Most of the QD absorption spectra show excellent overlap
with the Tb emission spectrum, which result in R0 valuesranging from 5.4 nm to an almost unprecedented 11.5 nm(Table 1). The ITK-QDs provide larger molar absorptivities andtherefore longer Forster distances compared to the DHLA-QDs(Figure 2A and D). The PL spectra show the typical Gaussian-shaped narrow emission bands spanning a spectral range from ca.500 to 750 nm (Figure 2B and E). The native unconjugated PLdecay curves of directly excited QDs manifest a multiexponentialdecay with components in the one to several hundred nanosecondsrange (Figure 2C and F). The excited-state lifetimes of Tb dependon the environment and biomolecule they are conjugated to. TheTb-PEP has an almost single exponential PL decay with an average
Scheme 1. Illustration of the QD Bioconjugation andDistances to Tba
aThe inorganic core/shell structures are shown in red/purple (fordifferent shapes of all QDs, see Figure 1 and Table 1), whereas theorganic coatings are shown in green for ITK-QDs (polymer-basedcoating) and yellow/orange for DHLA-QDs (DHLA ligands). Thebiomolecules Tb-PEP (with a length of ca. 1.3 nm) and Tb-MBP (witha size of ca. 3.0 × 4.0 × 6.5 nm and ca. 1.3 Tb/MBP) are conjugatedvia polyhistidine−COOH interactions to the polymers of the ITK-QDs and via polyhistidine-Zn coordination to the Zn-rich QD surfaceof the DHLA-QDs, respectively. Tb-to-QD distances are variable dueto elongated QD shapes, nonoriented biomolecule conjugation, andheterogeneous labeling of Tb to MBP. Note: Shapes and sizes are notrepresentative for all QDs and were chosen arbitrarily. Chemical structuresof DHLA and the ITK amphiphilic polymer can be found in reference 35.
Chemistry of Materials Article
dx.doi.org/10.1021/cm502021m | Chem. Mater. 2014, 26, 4299−43124302
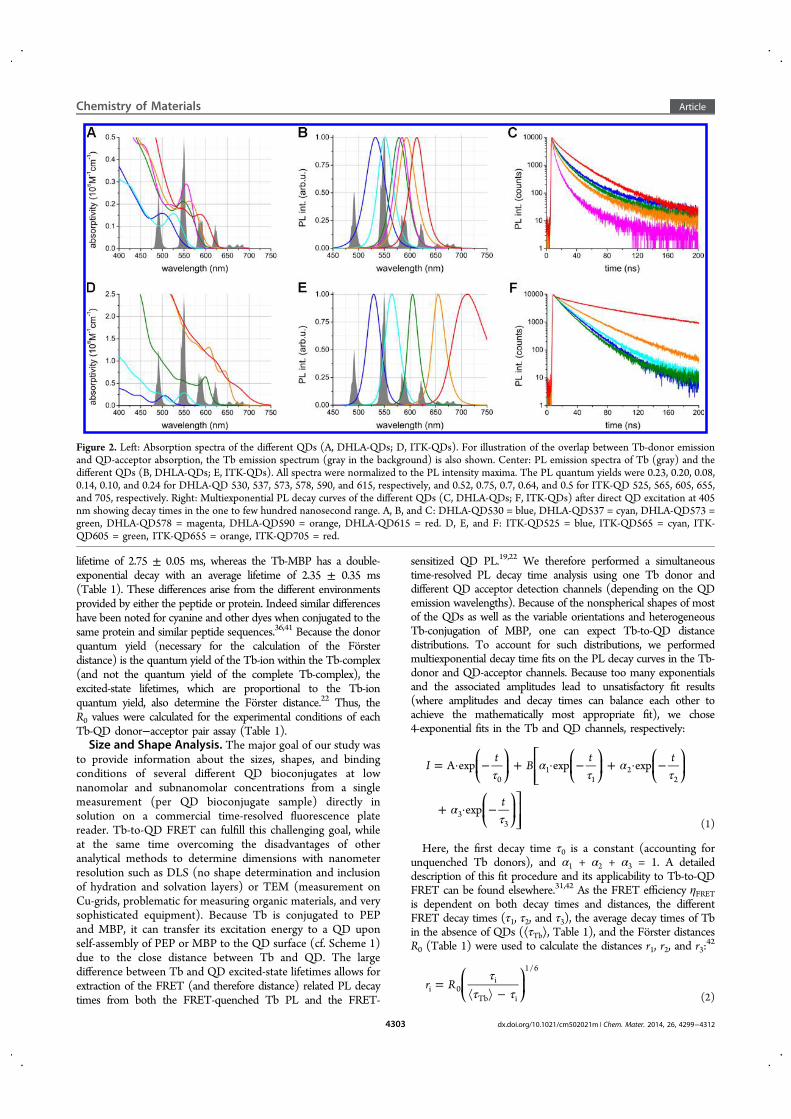
lifetime of 2.75 ± 0.05 ms, whereas the Tb-MBP has a double-exponential decay with an average lifetime of 2.35 ± 0.35 ms(Table 1). These differences arise from the different environmentsprovided by either the peptide or protein. Indeed similar differenceshave been noted for cyanine and other dyes when conjugated to thesame protein and similar peptide sequences.36,41 Because the donorquantum yield (necessary for the calculation of the Forsterdistance) is the quantum yield of the Tb-ion within the Tb-complex(and not the quantum yield of the complete Tb-complex), theexcited-state lifetimes, which are proportional to the Tb-ionquantum yield, also determine the Forster distance.22 Thus, theR0 values were calculated for the experimental conditions of eachTb-QD donor−acceptor pair assay (Table 1).Size and Shape Analysis. The major goal of our study was
to provide information about the sizes, shapes, and bindingconditions of several different QD bioconjugates at lownanomolar and subnanomolar concentrations from a singlemeasurement (per QD bioconjugate sample) directly insolution on a commercial time-resolved fluorescence platereader. Tb-to-QD FRET can fulfill this challenging goal, whileat the same time overcoming the disadvantages of otheranalytical methods to determine dimensions with nanometerresolution such as DLS (no shape determination and inclusionof hydration and solvation layers) or TEM (measurement onCu-grids, problematic for measuring organic materials, and verysophisticated equipment). Because Tb is conjugated to PEPand MBP, it can transfer its excitation energy to a QD uponself-assembly of PEP or MBP to the QD surface (cf. Scheme 1)due to the close distance between Tb and QD. The largedifference between Tb and QD excited-state lifetimes allows forextraction of the FRET (and therefore distance) related PL decaytimes from both the FRET-quenched Tb PL and the FRET-
sensitized QD PL.19,22 We therefore performed a simultaneoustime-resolved PL decay time analysis using one Tb donor anddifferent QD acceptor detection channels (depending on the QDemission wavelengths). Because of the nonspherical shapes of mostof the QDs as well as the variable orientations and heterogeneousTb-conjugation of MBP, one can expect Tb-to-QD distancedistributions. To account for such distributions, we performedmultiexponential decay time fits on the PL decay curves in the Tb-donor and QD-acceptor channels. Because too many exponentialsand the associated amplitudes lead to unsatisfactory fit results(where amplitudes and decay times can balance each other toachieve the mathematically most appropriate fit), we chose4-exponential fits in the Tb and QD channels, respectively:
τα
τα
τ
ατ
= · − + · − + · −
+ · −
⎛⎝⎜
⎞⎠⎟
⎡⎣⎢⎢
⎛⎝⎜
⎞⎠⎟
⎛⎝⎜
⎞⎠⎟
⎛⎝⎜
⎞⎠⎟⎤⎦⎥⎥
It
Bt t
t
A exp exp exp
exp
01
12
2
33 (1)
Here, the first decay time τ0 is a constant (accounting forunquenched Tb donors), and α1 + α2 + α3 = 1. A detaileddescription of this fit procedure and its applicability to Tb-to-QDFRET can be found elsewhere.31,42 As the FRET efficiency ηFRETis dependent on both decay times and distances, the differentFRET decay times (τ1, τ2, and τ3), the average decay times of Tbin the absence of QDs (⟨τTb⟩, Table 1), and the Forster distancesR0 (Table 1) were used to calculate the distances r1, r2, and r3:
42
ττ τ
=−
⎛⎝⎜
⎞⎠⎟r Ri 0
i
Tb i
1/6
(2)
Figure 2. Left: Absorption spectra of the different QDs (A, DHLA-QDs; D, ITK-QDs). For illustration of the overlap between Tb-donor emissionand QD-acceptor absorption, the Tb emission spectrum (gray in the background) is also shown. Center: PL emission spectra of Tb (gray) and thedifferent QDs (B, DHLA-QDs; E, ITK-QDs). All spectra were normalized to the PL intensity maxima. The PL quantum yields were 0.23, 0.20, 0.08,0.14, 0.10, and 0.24 for DHLA-QD 530, 537, 573, 578, 590, and 615, respectively, and 0.52, 0.75, 0.7, 0.64, and 0.5 for ITK-QD 525, 565, 605, 655,and 705, respectively. Right: Multiexponential PL decay curves of the different QDs (C, DHLA-QDs; F, ITK-QDs) after direct QD excitation at 405nm showing decay times in the one to few hundred nanosecond range. A, B, and C: DHLA-QD530 = blue, DHLA-QD537 = cyan, DHLA-QD573 =green, DHLA-QD578 = magenta, DHLA-QD590 = orange, DHLA-QD615 = red. D, E, and F: ITK-QD525 = blue, ITK-QD565 = cyan, ITK-QD605 = green, ITK-QD655 = orange, ITK-QD705 = red.
Chemistry of Materials Article
dx.doi.org/10.1021/cm502021m | Chem. Mater. 2014, 26, 4299−43124303
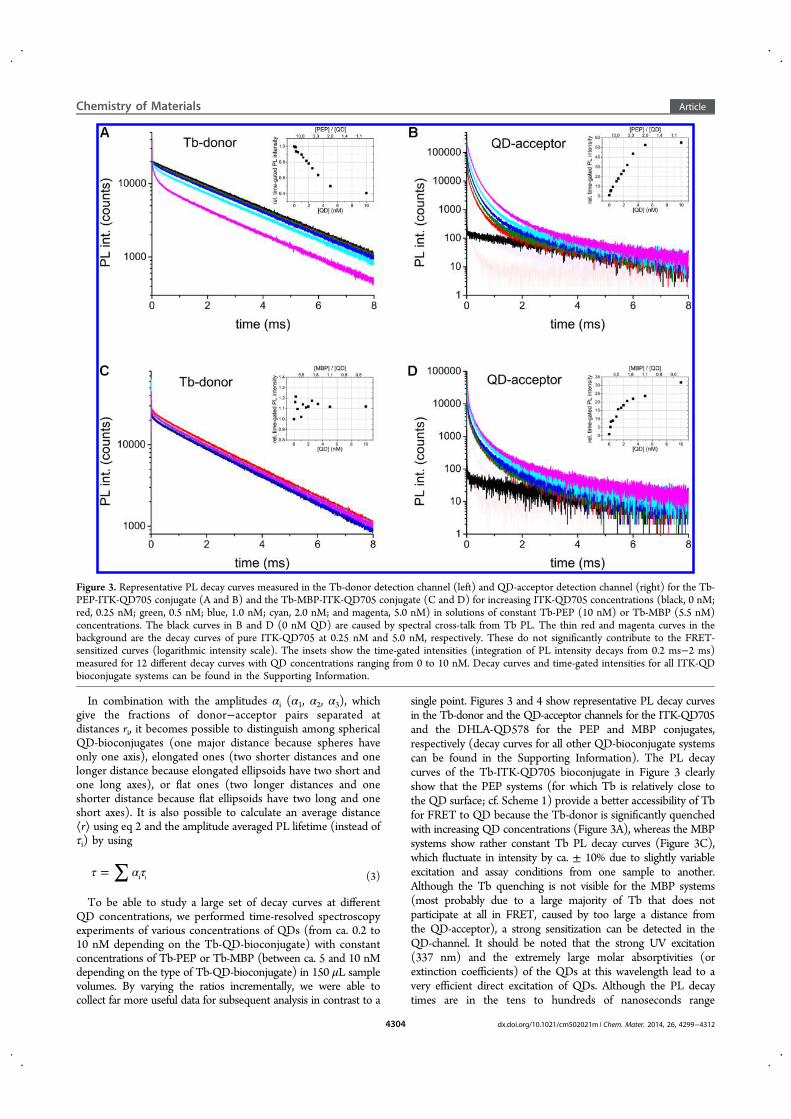
In combination with the amplitudes αi (α1, α2, α3), whichgive the fractions of donor−acceptor pairs separated atdistances ri, it becomes possible to distinguish among sphericalQD-bioconjugates (one major distance because spheres haveonly one axis), elongated ones (two shorter distances and onelonger distance because elongated ellipsoids have two short andone long axes), or flat ones (two longer distances and oneshorter distance because flat ellipsoids have two long and oneshort axes). It is also possible to calculate an average distance⟨r⟩ using eq 2 and the amplitude averaged PL lifetime (instead ofτi) by using
∑τ α τ= i i (3)
To be able to study a large set of decay curves at differentQD concentrations, we performed time-resolved spectroscopyexperiments of various concentrations of QDs (from ca. 0.2 to10 nM depending on the Tb-QD-bioconjugate) with constantconcentrations of Tb-PEP or Tb-MBP (between ca. 5 and 10 nMdepending on the type of Tb-QD-bioconjugate) in 150 μL samplevolumes. By varying the ratios incrementally, we were able tocollect far more useful data for subsequent analysis in contrast to a
single point. Figures 3 and 4 show representative PL decay curvesin the Tb-donor and the QD-acceptor channels for the ITK-QD705and the DHLA-QD578 for the PEP and MBP conjugates,respectively (decay curves for all other QD-bioconjugate systemscan be found in the Supporting Information). The PL decaycurves of the Tb-ITK-QD705 bioconjugate in Figure 3 clearlyshow that the PEP systems (for which Tb is relatively close tothe QD surface; cf. Scheme 1) provide a better accessibility of Tbfor FRET to QD because the Tb-donor is significantly quenchedwith increasing QD concentrations (Figure 3A), whereas the MBPsystems show rather constant Tb PL decay curves (Figure 3C),which fluctuate in intensity by ca. ± 10% due to slightly variableexcitation and assay conditions from one sample to another.Although the Tb quenching is not visible for the MBP systems(most probably due to a large majority of Tb that does notparticipate at all in FRET, caused by too large a distance fromthe QD-acceptor), a strong sensitization can be detected in theQD-channel. It should be noted that the strong UV excitation(337 nm) and the extremely large molar absorptivities (orextinction coefficients) of the QDs at this wavelength lead to avery efficient direct excitation of QDs. Although the PL decaytimes are in the tens to hundreds of nanoseconds range
Figure 3. Representative PL decay curves measured in the Tb-donor detection channel (left) and QD-acceptor detection channel (right) for the Tb-PEP-ITK-QD705 conjugate (A and B) and the Tb-MBP-ITK-QD705 conjugate (C and D) for increasing ITK-QD705 concentrations (black, 0 nM;red, 0.25 nM; green, 0.5 nM; blue, 1.0 nM; cyan, 2.0 nM; and magenta, 5.0 nM) in solutions of constant Tb-PEP (10 nM) or Tb-MBP (5.5 nM)concentrations. The black curves in B and D (0 nM QD) are caused by spectral cross-talk from Tb PL. The thin red and magenta curves in thebackground are the decay curves of pure ITK-QD705 at 0.25 nM and 5.0 nM, respectively. These do not significantly contribute to the FRET-sensitized curves (logarithmic intensity scale). The insets show the time-gated intensities (integration of PL intensity decays from 0.2 ms−2 ms)measured for 12 different decay curves with QD concentrations ranging from 0 to 10 nM. Decay curves and time-gated intensities for all ITK-QDbioconjugate systems can be found in the Supporting Information.
Chemistry of Materials Article
dx.doi.org/10.1021/cm502021m | Chem. Mater. 2014, 26, 4299−43124304

(cf. Figure 2C and F), the very high PL intensity saturates thevery sensitive detection setup, which is optimized for the measure-ment of long-lived PL signals. This saturation leads to a muchslower decaying photon count signal of the PMT (photomultipliertube) detectors (thin curves in Figure 3B and D). However, theFRET-sensitized PL decay curves show a significantly longer andmuch more intense (logarithmic intensity scale) decay than thesum of pure Tb PL (which can be detected in the QD channelsdue to spectral cross-talk; black curves in Figure 3B and D) andpure QD PL (thin curves) signals. Therefore, the analysis oflong-lived FRET-sensitized QD PL has the clear advantage ofmeasuring against a low background signal (weak Tb cross-talkand weak directly excited QD signals), whereas Tb-quenchingis measured against a very high background (Tb at constantconcentration and many unquenched Tb), which leads to largedifferences in relative quenching and sensitization. Integratingthe PL intensities from 0.2 to 2.0 ms after the excitation pulseleads to ca. 2.5-fold quenching and ca. 50-fold sensitization forthe PEP systems (insets in Figure 3A and B), and no quenchingand ca. 30-fold sensitization for the MBP systems (insets inFigure 3C and D).
The Tb-donor PL decay curves of the Tb-DHLA-QD578bioconjugate in Figure 4 show behavior similar to that of theITK curves in Figure 3, namely, quenching for the PEP systemsand fluctuation (without quenching) for the MBP conjugateswith increasing QD concentrations. Again the FRET-sensitizedQD curves provide more information about FRET. Althoughthe Tb cross-talk (black curves in Figure 4B and D) is muchstronger for this detection wavelength (in addition, the signalsfrom direct QD excitation are much weaker compared to thatof the pure Tb signal) and the QD quantum yield is lower,there is still efficient time-gated (integration from 0.05 to 0.5 ms)intensity sensitization (up to ca. 3-fold; inset in Figure 4B).Moreover, the FRET-sensitized long PL decay times are signi-ficantly shorter (in the first 1.5 ms of the decay curves)compared to the ones in Figure 3, which is in good agreementwith the much thinner organic layer of the DHLA-QDs (cf.Scheme 1) leading to shorter donor−acceptor distances.For obtaining detailed information about the shapes and
distances of all QD-bioconjugates, their decay curves were fitusing eq 1, and the Tb-QD donor−acceptor distances werecalculated using eqs 2 and 3. All the extrapolated distances canbe found in Table 1 and are presented graphically together with
Figure 4. Representative PL decay curves measured in the Tb-donor detection channel (left) and QD-acceptor detection channel (right) for the Tb-PEP-DHLA-QD578 conjugate (A and B) and the Tb-MBP-DHLA-QD578 conjugate (C and D) for increasing DHLA-QD578 concentrations(black, 0 nM; red, 0.9 nM; green, 1.8 nM; blue, 2.7 nM; and cyan, 5.4 nM) in solutions of constant Tb-PEP (7.5 nM) or Tb-MBP (11 nM)concentrations. The black curves in B and D (0 nM QD) are caused by spectral cross-talk from Tb PL. The thin red and magenta curves (within thefirst 0.5 ms) are the decay curves of pure DHLA-QD578 at 0.9 nM and 5.4 nM, respectively. These do not significantly contribute to the FRET-sensitized curves (logarithmic intensity scale). The insets show the time-gated intensities (integration of PL intensity decays from 0.05 ms−0.5 ms)measured for 12 different decay curves with QD concentrations ranging from 0 to 7.5 nM (0 to 11 nM for Tb-MBP-DHLA-QD578). Decay curvesand time-gated intensities for all DHLA-QD bioconjugate systems can be found in the Supporting Information.
Chemistry of Materials Article
dx.doi.org/10.1021/cm502021m | Chem. Mater. 2014, 26, 4299−43124305

the fractions corresponding to each component for each singledistance in Figure 5 for the ITK-QDs and in Figure 6 for theDHLA-QDs. As PL decay times are concentration independent,all decay curves (from lowest to highest concentration for allQD-bioconjugates) were used to determine the variousdistances. In fact for the majority of the Tb-QD-systems eventhe subnanomolar concentrations of QDs inside the 150 μLsamples (subpicomol) gave very good fit results without largedeviations from the average values of the complete set offits. For the ITK-QDs (Figure 5) and for both biomolecules
(PEP and MBP), the average size (⟨r⟩) increases from ITK-525to ITK-QD655 (ITK-QD705 shows a size similar to that ofITK-QD655) as expected from the TEM data and previousresults.30 On average, the donor fits lead to larger distance values,which is most probably caused by the long-lifetime componentof the unquenched Tb. This signal can be quite strong in theTb-donor detection channel (cf. Figures 3 and 4). Although ourfit algorithm contains an efficient correction for the free Tb PLbackground,31,42 this much larger background compared to thatof the QD-acceptor channel still leads to slightly larger distance
Figure 5. (A) Average distances (⟨r⟩ in gray) and single distances (r1 = red, r2 = green, and r3 = blue) as determined from the FRET PL decay curvefits of the ITK-QD bioconjugates and calculated by eqs 1 to 3. (B) Fractions (α1 = red, α2 = green, and α3 = blue) of the single distances ascalculated from eq 1.
Figure 6. (A) Average distances (⟨r⟩ in gray) and single distances (r1 = red, r2 = green, and r3 = blue) as determined from the FRET PL decay curvefits of the DHLA-QD bioconjugates and calculated by eqs 1 to 3. (B) Fractions (α1 = red, α2 = green, and α3 = blue) of the single distances ascalculated from eq 1.
Chemistry of Materials Article
dx.doi.org/10.1021/cm502021m | Chem. Mater. 2014, 26, 4299−43124306

values. Another inherent advantage of the lower background PLin the QD channel is the possibility to fit with three differentdecay times (not possible for the donor curves, which provideonly two decay times), which gives access to a third distance andtherefore more information about the shape of the QDs. Theaverage distances are lower than HPLC and DLS values (Table 1)because the FRET measurements do not require a weightstandard (as with HPLC) and are not dependent on hydrationand solvation effects (as with DLS). Moreover, they are largerthan the TEM distances because TEM does not measure theorganic coatings of the QDs. Therefore, the FRET distance valuesare expected to be closer to the real distances of the QD systems.Both Tb-donor and QD-acceptor curves show that (apart fromthe DHLA-QD578 and DHLA-QD590) the FRET-distancesare within the expected distance range (from TEM, HPLC, andDLS measurements; cf. Table 1). Because of the lowerbackground signal, QD-acceptor fits provide better agreementwith the expected distance ranges. Because the Tb-PEP systemcauses almost no distance distribution (only one Tb terminallyattached per PEP and a relatively stable distance due to the short1.2 nm peptide length), the PEP distance values are also bettersuited for extracting more reliable distance and shape information.ITK-QD Bioconjugates. Regarding the ITK-QD bioconju-
gates, the Tb-donor fits of the PEP systems (Figure 5A) showan increasing difference between the short (red) and the long(blue) distance with increasing size, which suggests anelongation. This effect is much less pronounced in the MBPsystems. The fractions (Figure 5B) of the Tb-donor fits alsoprovide more information for PEP compared to that for MBP.The ITK-QD525 shows two equal fractions (of distances withonly ca. 1.5 nm difference) suggesting a rather spherical shapewith relatively narrow distance distribution as confirmed by theTEM data. All the other ITK-QDs show two well distinguish-able fractions, for which the short one is ca. 70%. This suggestsa rather ellipsoidal shape (two short and one long axes). Thefractions of the MBP systems are very similar for all QDs anddo not allow for the extraction of significant shape information,which would be in agreement with the TEM shapes. TheQD-acceptor fits lead to three distinguishable distances ri(three-dimensional fit), and it is very important to relate thesedistances to their respective fractions αi. The fractions of D-A pairsseparated by ri (Figure 5B) are very valuable for characterizing theQD shapes and show that the Tb-PEP systems contain muchmore information due to the narrower distance distributioncompared to that of Tb-MBP. For the PEP QD-acceptor fits, theITK-QD525 fractions show a clear preference for one distance(fraction of ca. 75%), which confirms the spherical character ofthis QD. For the other QDs, there is a tendency of an increasingshorter fraction (red) and simultaneously decreasing longerfractions (green and blue) with the longest distance (blue) alwaysshowing the lowest fraction, pointing again to an elongation withincreasing size. Although the MBP QD-acceptor fits can alsodistinguish between the spherical ITK-QD525 (only two mainfractions) and the other ITK-QDs, a distinction among those isnot possible using the fraction information. This first set of ITK-QDs already shows the advantages of well-defined donor−acceptor distances (PEP binding) and the FRET analysis of theQD-acceptor channels (low background and strong sensitization)for size and shape analysis.DHLA-QD Bioconjugates. The DHLA-QD bioconjugates
present a very challenging system for size and shape analysisbecause there are three groups of paired QDs (DHLA-QD530/537, DHLA-QD573/578, and DHLA-QD590/615), which are
very similar in size as shown in the average distance values ofFigure 6A and in the TEM and DLS data (cf. Figure 1 andTable 1). Moreover, these QDs have less of a size range andchange in aspect ratio compared to those of the ITK-QDs. Wetherefore discuss the fit results for the three paired systemsstarting with the PEP systems, which (similar to the ITKsystems) provide more distance and shape information.
DHLA-QD530/537 PEP. The Tb-donor fits do not providesufficient information to distinguish these two QDs. Thefractions are very similar, and the distances (⟨r⟩, r1 and r3) areslightly increasing. However, the TEM images show that onlythe shapes but not the sizes are different (cf. Figure 1). TheQD-acceptor fits can clearly distinguish these two QDs.Although the average distance ⟨r⟩ is very similar, the singledistances ri show significant differences. DHLA-QD530 hasthree distinguishable distances with fractions between ca.25 and 45%. This suggests an elongation (or a very broadsize distribution). The DHLA-QD537 can only be fit for twodifferent FRET distances both with ca. 50% of the fraction,which suggests rather spherical QDs with a relatively broad sizedistribution around the main distance values of 3.8 and 4.8 nm.
DHLA-QD573/578 PEP. These two QDs are also very similarin shape and size (cf. Figure 1), and the Tb-donor fits cannotdistinguish between them. The QD-acceptor fits confirm thesimilar size (three very similar distances), and in addition, theyprovide shape information. The slightly longer shape of theDHLA-QD573 is visible through the more pronounced shortdistance (ca. 50%) and the lower amount of long distancefraction (ca. 20%). For the DHLA-QD578, the short fraction isdecreased, the long fraction is increased, and the mediumdistance is unchanged, which can be attributed to lesselongation compared to that of DHLA-QD573. For bothQDs (and especially for the Tb-donor fits), the sizes fromFRET-analysis are larger than the expected values from TEMand DLS (Table 1).
DHLA-QD590/615 PEP. These two QDs cannot be clearlydistinguished by the time-resolved FRET analysis because theyhave similar sizes and are rather elongated (for QD590) andmixed (for QD615), which leads to similar FRET distances.Nevertheless, both QDs show two (for the donor) or three(for the acceptor) clearly distinguishable distances with largerfractions for the shorter distances, pointing toward elongationor distribution as mentioned above. Both the Tb-donor and theQD-acceptor fits also suggest that the DHLA-QD615 areslightly larger than the DHLA-QD590, which confirms theestimated Tb-QD distance range using TEM and DLS values(Table 1).
DHLA-QD MBP Systems. On average, the distances of theMBP systems show the same trend as the PEP systems with ca.1 to 1.5 nm increased values. This increase of distances fromPEP to MBP is stronger compared to that of the ITK-QDs,which we attribute to the thicker organic coating of the ITK-QDs. The attachment of MBP to the carboxyl-functionalizedpolymers places a significant amount of Tb very far away fromthe QD (cf. Scheme 1), so they cannot participate in FRET. Inother words, only Tb which are close to the ITK-QD surfacecan transfer their energy to the QD, and therefore, thedifference in average Tb-QD FRET distances from PEP toMBP is not very large. For the DHLA-QDs, the organic ligandsare much shorter, and all Tb on the MBP (close and far fromthe QD surface) can participate in FRET (independent of theorientation and labeling position), which provides informationabout the complete MBP and therefore a larger difference in
Chemistry of Materials Article
dx.doi.org/10.1021/cm502021m | Chem. Mater. 2014, 26, 4299−43124307

distances between PEP and MBP compared to the ITK-QDs.In fact, the fraction of the longest distance (Figure 6, blue) isquite dominant (ca. 60 to 70%) for all DHLA-QD MBPbioconjugates, which indicates that on average less Tb are closeto the QD surface. The distribution of Tb over the MBP doesnot allow any specific distinction between the QD shapesbecause the changes in fraction over the complete set of QDsare almost negligible.Although the DHLA-QD bioconjugate FRET size and shape
analysis was more challenging compared to that of the ITK-QDs, the data clearly show that quite precise distance andshape information (without the problems arising from TEM,HPLC, and DLS measurements) can be achieved at very lowconcentrations under physiological conditions. The shorter andmore rigid PEP with a 1:1 Tb/PEP labeling can provide muchmore precise distance and shape information than the hetero-geneously labeled and relatively large and elongated MBP. The
three-dimensional character of the QD-acceptor fits provides aclear advantage over the two-dimensional Tb-donor fits for shapeanalysis. Nevertheless, as both Tb-donor and QD-acceptor can bemeasured simultaneously, the most information can be obtainedby analyzing both PL decay curves and in the best case inconnection with TEM, HPLC, and DLS.
Binding Analysis of Peptide and Maltose BindingProtein Quantum Dot Conjugates. Taking the time-gatedintensities (integrated intensities of the PL decay curves from0.2 to 2.0 ms for the ITK-QD systems and from 0.05 to 0.5 msfor the DHLA-QD systems) of the Tb-donor and QD-acceptorchannels (insets in Figures 3 and 4) allows for calculation ofFRET-ratios (ratio of time-gated QD and Tb intensities), whichare much less prone to fluctuations from varying excitation orsample conditions and combine Tb-donor quenching andQD-acceptor sensitization in one graph. Within these experiments,the concentrations of Tb-PEP (Figure 7A-I and B-I) or Tb-MBP
Figure 7. FRET-ratios (ratios of time-gated intensities of QD-acceptor and Tb-donor normalized to unity at concentrations of [QD] = 0) as afunction of concentration (±40% error) for [Tb-PEP]-[ITK-QD] (A-I), [Tb-MBP]-[ITK-QD] (A-II), [Tb-PEP]-[DHLA-QD] (B-I), and [Tb-MBP]-[DHLA-QD] (B-II). Tb-PEP (±20% error) and Tb-MBP (±25% error) have constant concentrations of 10 nM, 5.5 nM, 11 nM, and 7.5 nMfor Tb-PEP]-[ITK-QD], [Tb-MBP]-[ITK-QD], [Tb-PEP]-[DHLA-QD], and [Tb-PEP]-[DHLA-QD], respectively. Note that DHLA-QD530 andDHLA-QD537 were not included in this concentration-dependent study because of their relatively large errors in QD-concentration (more than±100%). It should be noted that the differences of FRET-ratio values of the different QDs at a given QD concentration do not comprise anyinformation about the amount of FRET-pairs but are caused by the differences in FRET-efficiencies for the different Tb-QD FRET-pairs and thespectral cross-talk of Tb in the QD detection channels. (For example, for ITK-QD705 the spectral cross-talk from Tb is very low, and the FRET-efficieny is very high, and therefore, the relative FRET-ratio increases from 1 to 140, whereas spectral cross-talk is higher and FRET-efficiency lowerfor the Tb-ITK-QD565 FRET-pair. Thus, the increase is only from 1 to 11.) Applied time-gates were 0.2 ms−2 ms for the ITK-QD-based systemsand 0.05 ms−0.5 ms for the DHLA-QD-based systems.
Chemistry of Materials Article
dx.doi.org/10.1021/cm502021m | Chem. Mater. 2014, 26, 4299−43124308

(Figure 7A-II and B-II) were kept constant, and the concentrationsof ITK-QDs or DHLA-QDs were increased. Because the time-gated intensities are measured in a time window that mainlycontains the PL decay time changes caused by FRET (Tb-donorquenching and QD-acceptor sensitization), the relative FRET-ratiosas a function of QD-acceptor concentration represent the amountof Tb-QD FRET-pairs. We expected that the addition of increasingconcentrations of QDs to the samples (containing constantconcentrations of Tb-PEP or Tb-MBP) leads to an increasingFRET-ratio because more QDs can be FRET-sensitized by Tb(more Tb-QD FRET-pairs). The very large difference in excited-state lifetimes (milliseconds for Tb and nanoseconds for QDs)allows for sequential FRET-sensitization of the same QD by manyTb (on the surface of that QD) after only one excitationpulse.22,24,40 In contrast to the creation of biexcitons, which wouldnecessitate a very fast second excitation of the QD before itsrelaxation to the ground state, the QD acceptor receives excitationenergy from a first Tb, and the generated exciton leads to almostimmediate photon emission (nanosecond excited-state lifetime ofQD) and relaxation of the QD. This FRET-excitation andphoton-emission process can be repeated with many other Tbdonors because of their extremely long excited-state lifetimes(after each QD relaxation, the probability of finding anotherexcited Tb donor is very high). This means that one QD can beexcited by several Tb donors and that there will be no significantdifference in the FRET-sensitized signals between, for example,one QD with 50 Tb and 50 QDs with one Tb each. At QDconcentrations that correspond to PEP/QD or MBP/QD con-centration ratios of saturated PEP- or MBP-binding to the QDsurface, the FRET-ratios are expected to saturate, and furtheraddition of QDs should not lead to additional Tb-QD FRET-pairs.In the case of biexcitonic excitation of one QD-acceptor byseveral Tb-donors, a 1:1 Tb-per-QD ratio would be preferredto high Tb-to-QD ratios because biexciton quantum yields aresignificantly lower (due to Auger effects).43 This would lead toan increasing FRET-ratio with increasing QD concentrationsuntil a 1:1 Tb-per-QD ratio is reached. Taking into account thenanosecond excited-state lifetimes of the QD acceptors, themillisecond excited-state lifetimes of the Tb-donors, and therelatively long donor−acceptor distances (moderate FRETefficiencies), the probability of sequential FRET is much highercompared to that of simultaneous FRET. Therefore, evaluationof slopes and saturations of the increasing FRET-ratios over QDconcentrations should allow comparison of valences (biomoleculesper QD) and binding strengths (association/dissociation ofbiomolecules to/from QD) among the four different bioconjugatesystems ([Tb-PEP]-[ITK-QD], [Tb-MBP]-[ITK-QD], [Tb-PEP]-[DHLA-QD], and [Tb-MBP]-[DHLA-QD]). Indeed, the experi-ments show an increase of the FRET-ratios with increasing QDconcentrations for all bioconjugate systems (Figure 7). However,there are significant differences in the saturation concentrations.PEP-Based Systems. For the ITK-QDs (Figure 7A-I), the
FRET-ratios of the PEP systems increase until saturationbecomes visible at concentrations between ca. 8 and 10 nM(ca. 1.3−1.0 PEP/QD) for some of the QDs. Regarding thelarge surface of the ITK-QDs, many PEP should be able to bindto one QD. It has been shown that ca. 50 ± 10 peptides canself-assemble on average via hexa-histidine to the Zn-richsurface of a single DHLA-functionalized QD.38 However, saturationbecomes only visible at concentrations of an approximate PEP/QDconcentration ratio of 1 and not at much higher ratios (lower QDconcentrations) as expected from a pure QD-surface-availabilityestimation. This “late” FRET-ratio saturation can be attributed to
the polyhistidine-mediated self-assembly to the carboxyls of theorganic ITK-QD coating. As expected, the polyhistidine−COOHinteraction (COOH-groups mimicking NTA, vide supra) is lesseffective than the polyhistidine-Zn coordination (with the Zn-richsurface of the semiconductor QD), which was shown to provide adissociation constant of ca. 2 nM.34 In fact, the FRET-ratios for the[Tb-PEP]-[DHLA-QD] systems (Figure 7B-I) increase very steeplyuntil saturation is reached at QD concentrations between ca.0.5 and 3 nM (ca. 15−6 PEP/QD), which is very close to thepreviously found dissociation constant of 2 nM. The differentvalences (PEP/QD) of these two systems contain anotherinteresting aspect. Although they were somewhat lower thanexpected, the results show that simultaneous QD FRETsensitization (generation of biexcitons) plays a minor role.Such a fast process should be much more efficient for higherFRET efficiencies. In contrast to this requirement, the FRETsystem with the significantly shorter donor−acceptor distance(higher FRET efficiency), namely, [Tb-PEP]-[DHLA-QD],shows a saturation at elevated PEP/QD ratios (6 to 15),whereas the larger [Tb-PEP]-[ITK-QD] system (lower FRETefficiency) saturates at much lower PEP/QD ratios (1.0 to 1.3).We therefore believe that the low nanomolar concentrationsand the different binding strengths are the major reasons forthese lower and differing valences.
MBP-Based Systems. The [Tb-MBP]-[DHLA-QD] systems(Figure 7B-II) show a much less inclined increase of the FRET-ratio, and a saturation is not obvious for any of the QDs withinthe applied range of concentrations. This effect can be attributed to alower accessibility of the large polyhistidine-modified protein to theQD surface as well as a much lower valence (the 3.0 nm × 4.0 nm ×6.5 nm size of MBP results in a much lower theoretical MBP/QDsurface coverage) compared to that of the smaller peptide (ca.1.1 nm). The [Tb-MBP]-[ITK-QD] systems (Figure 7A-II)show a steeper FRET-ratio increase with saturations reachedbetween ca. 2 and 6 nM (ca. 3 to 1 MBP/QD) for the differentQDs, which we attribute to the lower Tb-MBP concentrations(5.5 nM) and the larger ITK-QDs, which provide a larger surfaceand therefore a larger valence of MBP/QD compared to thesmaller DHLA-QDs. Moreover, charged as well as hydrophobicand hydrophilic patches on the protein can also interact with thecarboxylated QD surface for an increased binding strength.The analysis of QD-concentration-dependent FRET-ratios
provides a good quantitative estimation of valences and bindingstrengths and a very good comparison of the different bindingconditions for peptides and MBPs to the various QDs.Moreover, the same PL intensity decay curves as those forthe FRET distance and shape analysis were used, which isextremely convenient as all data can be extracted from oneexperimental setup under conditions that are also used for theapplication of the nanoconjugates for biosensing.
■ CONCLUSIONSPrecise size, shape, and bioconjugation analysis of biocompat-ible, water-soluble QDs at low concentrations within a singlehomogeneous measurement is a challenging task that cannot befulfilled by analytical methods such as TEM, DLS, and HPLC.Here, we described a 3-dimensional size and shape character-ization study using 11 QDs with different organic surfacecoatings, which bind to two different biomolecules, namely, PEPand MBP, via polyhistidine self-assembly. Conjugating PEP andMBP with Tb allowed fast and homogeneous time-resolveddetection of FRET from Tb to QD at QD concentrationsranging from 0.2 to 12 nM in 150 μL samples on a commercial
Chemistry of Materials Article
dx.doi.org/10.1021/cm502021m | Chem. Mater. 2014, 26, 4299−43124309
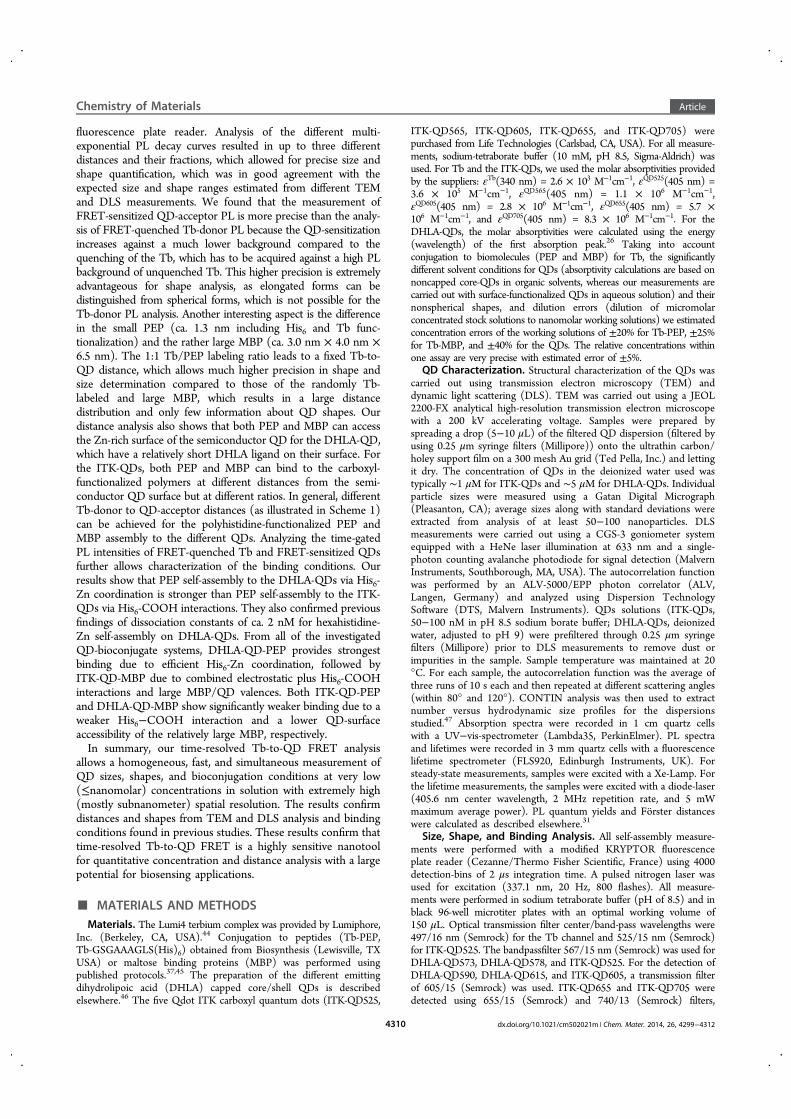
fluorescence plate reader. Analysis of the different multi-exponential PL decay curves resulted in up to three differentdistances and their fractions, which allowed for precise size andshape quantification, which was in good agreement with theexpected size and shape ranges estimated from different TEMand DLS measurements. We found that the measurement ofFRET-sensitized QD-acceptor PL is more precise than the analy-sis of FRET-quenched Tb-donor PL because the QD-sensitizationincreases against a much lower background compared to thequenching of the Tb, which has to be acquired against a high PLbackground of unquenched Tb. This higher precision is extremelyadvantageous for shape analysis, as elongated forms can bedistinguished from spherical forms, which is not possible for theTb-donor PL analysis. Another interesting aspect is the differencein the small PEP (ca. 1.3 nm including His6 and Tb func-tionalization) and the rather large MBP (ca. 3.0 nm × 4.0 nm ×6.5 nm). The 1:1 Tb/PEP labeling ratio leads to a fixed Tb-to-QD distance, which allows much higher precision in shape andsize determination compared to those of the randomly Tb-labeled and large MBP, which results in a large distancedistribution and only few information about QD shapes. Ourdistance analysis also shows that both PEP and MBP can accessthe Zn-rich surface of the semiconductor QD for the DHLA-QD,which have a relatively short DHLA ligand on their surface. Forthe ITK-QDs, both PEP and MBP can bind to the carboxyl-functionalized polymers at different distances from the semi-conductor QD surface but at different ratios. In general, differentTb-donor to QD-acceptor distances (as illustrated in Scheme 1)can be achieved for the polyhistidine-functionalized PEP andMBP assembly to the different QDs. Analyzing the time-gatedPL intensities of FRET-quenched Tb and FRET-sensitized QDsfurther allows characterization of the binding conditions. Ourresults show that PEP self-assembly to the DHLA-QDs via His6-Zn coordination is stronger than PEP self-assembly to the ITK-QDs via His6-COOH interactions. They also confirmed previousfindings of dissociation constants of ca. 2 nM for hexahistidine-Zn self-assembly on DHLA-QDs. From all of the investigatedQD-bioconjugate systems, DHLA-QD-PEP provides strongestbinding due to efficient His6-Zn coordination, followed byITK-QD-MBP due to combined electrostatic plus His6-COOHinteractions and large MBP/QD valences. Both ITK-QD-PEPand DHLA-QD-MBP show significantly weaker binding due to aweaker His6−COOH interaction and a lower QD-surfaceaccessibility of the relatively large MBP, respectively.In summary, our time-resolved Tb-to-QD FRET analysis
allows a homogeneous, fast, and simultaneous measurement ofQD sizes, shapes, and bioconjugation conditions at very low(≤nanomolar) concentrations in solution with extremely high(mostly subnanometer) spatial resolution. The results confirmdistances and shapes from TEM and DLS analysis and bindingconditions found in previous studies. These results confirm thattime-resolved Tb-to-QD FRET is a highly sensitive nanotoolfor quantitative concentration and distance analysis with a largepotential for biosensing applications.
■ MATERIALS AND METHODSMaterials. The Lumi4 terbium complex was provided by Lumiphore,
Inc. (Berkeley, CA, USA).44 Conjugation to peptides (Tb-PEP,Tb-GSGAAAGLS(His)6) obtained from Biosynthesis (Lewisville, TXUSA) or maltose binding proteins (MBP) was performed usingpublished protocols.37,45 The preparation of the different emittingdihydrolipoic acid (DHLA) capped core/shell QDs is describedelsewhere.46 The five Qdot ITK carboxyl quantum dots (ITK-QD525,
ITK-QD565, ITK-QD605, ITK-QD655, and ITK-QD705) werepurchased from Life Technologies (Carlsbad, CA, USA). For all measure-ments, sodium-tetraborate buffer (10 mM, pH 8.5, Sigma-Aldrich) wasused. For Tb and the ITK-QDs, we used the molar absorptivities providedby the suppliers: εTb(340 nm) = 2.6 × 10³ M−1cm−1, εQD525(405 nm) =3.6 × 10⁵ M−1cm−1, εQD565(405 nm) = 1.1 × 10⁶ M−1cm−1,εQD605(405 nm) = 2.8 × 10⁶ M−1cm−1, εQD655(405 nm) = 5.7 ×10⁶ M−1cm−1, and εQD705(405 nm) = 8.3 × 10⁶ M−1cm−1. For theDHLA-QDs, the molar absorptivities were calculated using the energy(wavelength) of the first absorption peak.26 Taking into accountconjugation to biomolecules (PEP and MBP) for Tb, the significantlydifferent solvent conditions for QDs (absorptivity calculations are based onnoncapped core-QDs in organic solvents, whereas our measurements arecarried out with surface-functionalized QDs in aqueous solution) and theirnonspherical shapes, and dilution errors (dilution of micromolarconcentrated stock solutions to nanomolar working solutions) we estimatedconcentration errors of the working solutions of ±20% for Tb-PEP, ±25%for Tb-MBP, and ±40% for the QDs. The relative concentrations withinone assay are very precise with estimated error of ±5%.
QD Characterization. Structural characterization of the QDs wascarried out using transmission electron microscopy (TEM) anddynamic light scattering (DLS). TEM was carried out using a JEOL2200-FX analytical high-resolution transmission electron microscopewith a 200 kV accelerating voltage. Samples were prepared byspreading a drop (5−10 μL) of the filtered QD dispersion (filtered byusing 0.25 μm syringe filters (Millipore)) onto the ultrathin carbon/holey support film on a 300 mesh Au grid (Ted Pella, Inc.) and lettingit dry. The concentration of QDs in the deionized water used wastypically ∼1 μM for ITK-QDs and ∼5 μM for DHLA-QDs. Individualparticle sizes were measured using a Gatan Digital Micrograph(Pleasanton, CA); average sizes along with standard deviations wereextracted from analysis of at least 50−100 nanoparticles. DLSmeasurements were carried out using a CGS-3 goniometer systemequipped with a HeNe laser illumination at 633 nm and a single-photon counting avalanche photodiode for signal detection (MalvernInstruments, Southborough, MA, USA). The autocorrelation functionwas performed by an ALV-5000/EPP photon correlator (ALV,Langen, Germany) and analyzed using Dispersion TechnologySoftware (DTS, Malvern Instruments). QDs solutions (ITK-QDs,50−100 nM in pH 8.5 sodium borate buffer; DHLA-QDs, deionizedwater, adjusted to pH 9) were prefiltered through 0.25 μm syringefilters (Millipore) prior to DLS measurements to remove dust orimpurities in the sample. Sample temperature was maintained at 20°C. For each sample, the autocorrelation function was the average ofthree runs of 10 s each and then repeated at different scattering angles(within 80° and 120°). CONTIN analysis was then used to extractnumber versus hydrodynamic size profiles for the dispersionsstudied.47 Absorption spectra were recorded in 1 cm quartz cellswith a UV−vis-spectrometer (Lambda35, PerkinElmer). PL spectraand lifetimes were recorded in 3 mm quartz cells with a fluorescencelifetime spectrometer (FLS920, Edinburgh Instruments, UK). Forsteady-state measurements, samples were excited with a Xe-Lamp. Forthe lifetime measurements, the samples were excited with a diode-laser(405.6 nm center wavelength, 2 MHz repetition rate, and 5 mWmaximum average power). PL quantum yields and Forster distanceswere calculated as described elsewhere.31
Size, Shape, and Binding Analysis. All self-assembly measure-ments were performed with a modified KRYPTOR fluorescenceplate reader (Cezanne/Thermo Fisher Scientific, France) using 4000detection-bins of 2 μs integration time. A pulsed nitrogen laser wasused for excitation (337.1 nm, 20 Hz, 800 flashes). All measure-ments were performed in sodium tetraborate buffer (pH of 8.5) and inblack 96-well microtiter plates with an optimal working volume of150 μL. Optical transmission filter center/band-pass wavelengths were497/16 nm (Semrock) for the Tb channel and 525/15 nm (Semrock)for ITK-QD525. The bandpassfilter 567/15 nm (Semrock) was used forDHLA-QD573, DHLA-QD578, and ITK-QD525. For the detection ofDHLA-QD590, DHLA-QD615, and ITK-QD605, a transmission filterof 605/15 (Semrock) was used. ITK-QD655 and ITK-QD705 weredetected using 655/15 (Semrock) and 740/13 (Semrock) filters,
Chemistry of Materials Article
dx.doi.org/10.1021/cm502021m | Chem. Mater. 2014, 26, 4299−43124310
respectively. The different samples contained increasing concentrationsof QDs and constant concentrations of Tb-PEP or Tb-MBP for eachQD-bioconjugate system. The solutions were incubated for 1 h beforethe measurements on the KRYPTOR. The PL decay data were fittedusing FAST software, version 3.1 (Edinburgh Instruments, UK). OriginPro 8.1 SR3 (OriginLab Corporation) and Microsoft Excel (MicrosoftCorporation) were used for graphs and calculations.
■ ASSOCIATED CONTENT*S Supporting InformationTEM images of all ITK-QDs and DHLA-QDs, and PL decaycurves and time-gated intensities for all ITK-QD and DHLA-QDbioconjugate systems. This material is available free of charge viathe Internet at http://pubs.acs.org.
■ AUTHOR INFORMATIONCorresponding Author*E-mail: [email protected].
NotesThe authors declare no competing financial interest.
■ ACKNOWLEDGMENTSWe thank Lumiphore, Inc. for the gift of Lumi4-Tb-NHS reagentand the European Commission (FP7 project NANOGNOSTICS)and the Agence National de la Recherche France (projectNanoFRET) for financial support. We also acknowledge supportfrom the Office of Naval Research (ONR), the Naval ResearchLaboratory (NRL), the NRL Nanosciences Institute (NSI), andthe Defense Threat Reduction Agency Joint Science andTechnological Office (DTRA-JSTO) Military InterdepartmentalPurchase Requisition (MIPR) #B112582M.
■ REFERENCES(1) Algar, W. R.; Susumu, K.; Delehanty, J. B.; Medintz, I. L. Anal.Chem. 2011, 83, 8826−8837.(2) Biju, V.; Itoh, T.; Ishikawa, M. Chem. Soc. Rev. 2010, 39, 3031−3056.(3) Hildebrandt, N. ACS Nano 2011, 5, 5286−5290.(4) Jin, Z.; Hildebrandt, N. Trends Biotechnol. 2012, 30, 394−403.(5) Mattoussi, H.; Palui, G.; Na, H. B. Adv. Drug Delivery Rev. 2012,64, 138−166.(6) Petryayeva, E.; Algar, W. R.; Medintz, I. L. Appl. Spectrosc. 2013,67, 215−252.(7) Zrazhevskiy, P.; Sena, M.; Gao, X. H. Chem. Soc. Rev. 2010, 39,4326−4354.(8) Rosenthal, S. J.; Chang, J. C.; Kovtun, O.; McBride, J. R.;Tomlinson, I. D. Chem. Biol. 2011, 18, 10−24.(9) Grigsby, C. L.; Ho, Y.-P.; Leong, K. W. Nanomedicine 2012, 7,565−577.(10) Tyrakowski, C. M.; Snee, P. T. Phys. Chem. Chem. Phys. 2014,16, 837−855.(11) Algar, W. R.; Tavares, A. J.; Krull, U. J. Anal. Chim. Acta 2010,673, 1−25.(12) Freeman, R.; Willner, I. Chem. Soc. Rev. 2012, 41, 4067−4085.(13) Hotzer, B.; Medintz, I. L.; Hildebrandt, N. Small 2012, 8, 2297−2326.(14) Medintz, I. L.; Hildebrandt, N., Eds. FRET - Forster ResonanceEnergy Transfer. From Theory to Applications; Wiley-VCH: Weinheim,Germany, 2014.(15) Medintz, I. L.; Mattoussi, H. Phys. Chem. Chem. Phys. 2009, 11,17−45.(16) Sapsford, K. E.; Wildt, B.; Mariani, A.; Yeatts, A. B.; Medintz, I.L. In FRET - Forster Resonance Energy Transfer. From Theory toApplications; Medintz, I. L., Hildebrandt, N., Eds.; Wiley-VCH:Weinheim, Germany, 2014; pp 165−268.
(17) Blanco-Canosa, J. B.; Wu, M.; Susumu, K.; Petryayeva, E.;Jennings, T. L.; Dawson, P. E.; Algar, W. R.; Medintz, I. L. Coord.Chem. Rev. 2014, 263−264, 101−137.(18) Algar, W. R.; Wegner, D.; Huston, A. L.; Blanco-Canosa, J. B.;Stewart, M. H.; Armstrong, A.; Dawson, P. E.; Hildebrandt, N.;Medintz, I. L. J. Am. Chem. Soc. 2012, 134, 1876−1891.(19) Charbonniere, L. J.; Hildebrandt, N. Eur. J. Inorg. Chem. 2008,3241−3251.(20) Geißler, D.; Charbonniere, L. J.; Ziessel, R. F.; Butlin, N. G.;Lohmannsroben, H.-G.; Hildebrandt, N. Angew. Chem. Int. Ed. 2010,49, 1396−1401.(21) Geißler, D.; Linden, S.; Liermann, K.; Wegner, K. D.;Charbonniere, L. J.; Hildebrandt, N. Inorg. Chem. 2014, 53, 1824−1838.(22) Hildebrandt, N.; Wegner, K. D.; Algar, W. R. Coord. Chem. Rev.2014, 273−274, 125−138.(23) Wegner, K. D.; Jin, Z.; Linden, S.; Jennings, T. L.; Hildebrandt,N. ACS Nano 2013, 7, 7411−7419.(24) Wegner, K. D.; Linden, S.; Jin, Z. W.; Jennings, T. L.; elKhoulati, R.; van Bergen en Henegouwen, P. M. P.; Hildebrandt, N.Small 2014, 10, 734−740.(25) Snee, P. T.; Tyrakowski, C. M.; Page, L. E.; Isovic, A.; Jawaid, A.M. J. Phys. Chem. C 2011, 115, 19578−19582.(26) Jasieniak, J.; Smith, L.; van Embden, J.; Mulvaney, P.; Califano,M. J. Phys. Chem. C 2009, 113, 19468−19474.(27) Pelaz, B.; Jaber, S.; de Aberasturi, D. J.; Wulf, V.; Aida, T.; de laFuente, J. M.; Feldmann, J.; Gaub, H. E.; Josephson, L.; Kagan, C. R.;Kotov, N. A.; Liz-Marzan, L. M.; Mattoussi, H.; Mulvaney, P.; Murray,C. B.; Rogach, A. L.; Weiss, P. S.; Willner, I.; Parak, W. J. ACS Nano2012, 6, 8468−8483.(28) Wang, X. Y.; Ren, X. F.; Kahen, K.; Hahn, M. A.; Rajeswaran,M.; Maccagnano-Zacher, S.; Silcox, J.; Cragg, G. E.; Efros, A. L.;Krauss, T. D. Nature 2009, 459, 686−689.(29) Shen, H.; Jawaid, A. M.; Snee, P. T. ACS Nano 2009, 3, 915−923.(30) Morgner, F.; Geißler, D.; Stufler, S.; Butlin, N. G.;Lohmannsroben, H.-G.; Hildebrandt, N. Angew. Chem. Int. Ed. 2010,49, 7570−7574.(31) Wegner, K. D.; Phung Thi, L.; Jennings, T.; Oh, E.; Jain, V.;Fairclough, S. M.; Smith, J. M.; Giovanelli, E.; Lequeux, N.; Pons, T.;Hildebrandt, N. ACS Appl. Mater. Interfaces 2013, 5, 2881−2892.(32) Byrne, A. G.; Byrne, M. M.; Coker, G., III; Boeneman-Gemmill,K.; Spillman, C.; Medintz, I. L.; Sloan, S. L.; van der Meer, B. W. InFRET - Forster Resonance Energy Transfer. From Theory to Applications;Medintz, I. L., Hildebrandt, N., Eds.; Wiley-VCH: Weinheim,Germany, 2014; pp 657−766.(33) Boeneman, K.; Delehanty, J. B.; Susumu, K.; Stewart, M. H.;Medintz, I. L. J. Am. Chem. Soc. 2010, 132, 5975−5977.(34) Sapsford, K. E.; Pons, T.; Medintz, I. L.; Higashiya, S.; Brunel, F.M.; Dawson, P. E.; Mattoussi, H. J. Phys. Chem. C 2007, 111, 11528−11538.(35) Dennis, A. M.; Sotto, D. C.; Mei, B. C.; Medintz, I. L.;Mattoussi, H.; Bao, G. Bioconjugate Chem. 2010, 21, 1160−1170.(36) Medintz, I. L.; Clapp, A. R.; Mattoussi, H.; Goldman, E. R.;Fisher, B.; Mauro, J. M. Nat. Mater. 2003, 2, 630−638.(37) Medintz, I. L.; Goldman, E. R.; Lassman, M. E.; Mauro, J. M.Bioconjugate Chem. 2003, 14, 909−918.(38) Prasuhn, D. E.; Deschamps, J. R.; Susumu, K.; Stewart, M. H.;Boeneman, K.; Blanco-Canosa, J. B.; Dawson, P. E.; Medintz, I. L.Small 2010, 6, 555−564.(39) Sapsford, K. E.; Algar, W. R.; Berti, L.; Gemmill, K. B.; Casey, B.J.; Oh, E.; Stewart, M. H.; Medintz, I. L. Chem. Rev. 2013, 113, 1904−2074.(40) Algar, W. R.; Kim, H.; Medintz, I. L.; Hildebrandt, N. Coord.Chem. Rev. 2014, 263−264, 65−85.(41) Clapp, A. R.; Medintz, I. L.; Mauro, J. M.; Fisher, B. R.;Bawendi, M. G.; Mattoussi, H. J. Am. Chem. Soc. 2004, 126, 301−310.
Chemistry of Materials Article
dx.doi.org/10.1021/cm502021m | Chem. Mater. 2014, 26, 4299−43124311
(42) Hildebrandt, N. In FRET - Forster Resonance Energy Transfer.From Theory to Applications; Medintz, I. L., Hildebrandt, N., Eds.;Wiley-VCH: Weinheim, Germany, 2014; pp 105−164.(43) Klimov, V. I.; Mikhailovsky, A. A.; Su, Xu; Malko, A.;Hollingsworth, J. A.; Leatherdale, C. A.; Eisler, H.-J.; Bawendi, M.G. Science 2000, 290, 314−317.(44) Xu, J.; Corneillie, T. M.; Moore, E. G.; Law, G.-L.; Butlin, N. G.;Raymond, K. N. J. Am. Chem. Soc. 2011, 133, 19900−19910.(45) Sapsford, K. E.; Farrell, D.; Sun, S.; Rasooly, A.; Mattoussi, H.;Medintz, I. L. Sens. Actuators, B 2009, 139, 13−21.(46) Clapp, A. R.; Goldman, E. R.; Mattoussi, H. Nat. Protoc. 2006, 1,1258−1266.(47) Oh, E.; Susumu, K.; Jain, V.; Kim, M.; Huston, A. J. ColloidInterface Sci. 2012, 376, 107−111.
■ NOTE ADDED AFTER ASAP PUBLICATIONThis article was published ASAP on June 27, 2014, with minortext errors and incorrect versions of Figures 5 and 6. Thecorrected version was published ASAP on July 2, 2014.
Chemistry of Materials Article
dx.doi.org/10.1021/cm502021m | Chem. Mater. 2014, 26, 4299−43124312
1
Three-dimensional solution-phase Förster resonance energy transfer analysis of
nanomolar quantum dot bioconjugates with sub-nanometer resolution
K. David Wegner1, Frank Morgner
2, Eunkeu Oh
3,4, Ramasis Goswami,
5 Kimihiro Susumu
3,4,
Michael H. Stewart3, Igor L. Medintz
6, and Niko Hildebrandt
1*
1 NanoBioPhotonics, Institut d’Electronique Fondamentale, Université Paris-Sud, Orsay, France
2 Fraunhofer Institut für Angewandte Polymerforschung, Potsdam, Germany
3 Optical Sciences Division, Code 5600 5 Multifunctional Materials, Code 6351 6 Center for Bio/Molecular Science and Engineering, Code 6900
U.S. Naval Research Laboratory, Washington, DC, USA
4 Sotera Defense Solutions, Inc., Columbia, MD, USA
*corresponding author: [email protected]
SUPPORTING INFORMATION
Pages 2 – 5: TEM images of all ITK-QDs
Pages 6 – 10: TEM images of all DHLA-QDs
Pages 11 – 15: Decay curves and time-gated intensities for all ITK-QD bioconjugate systems
Pages 16 – 21: Decay curves and time-gated intensities for all DHLA-QD bioconjugate systems
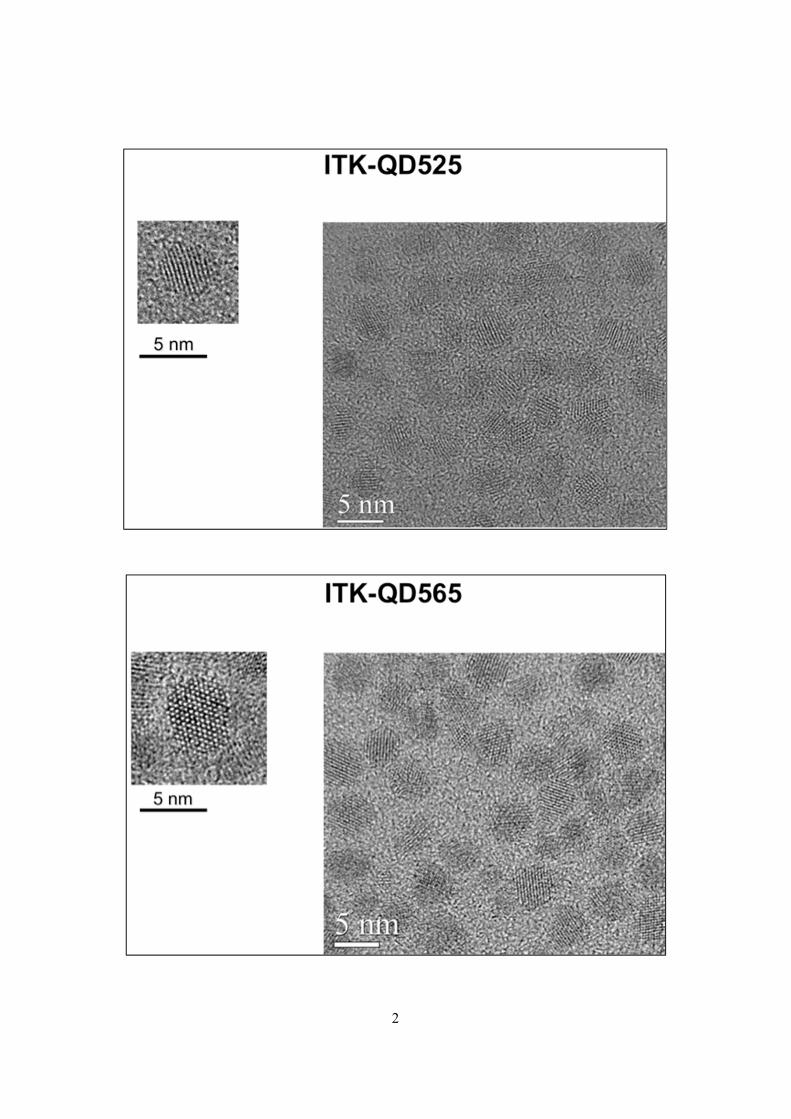
2
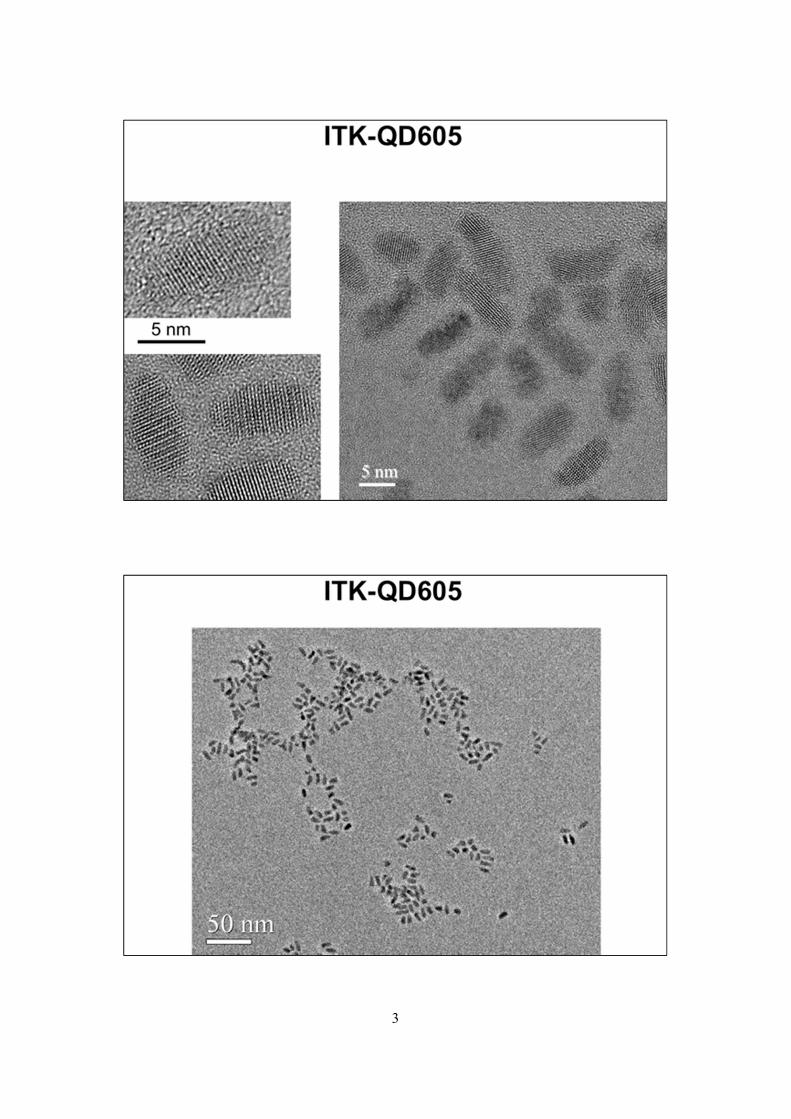
3

4

5
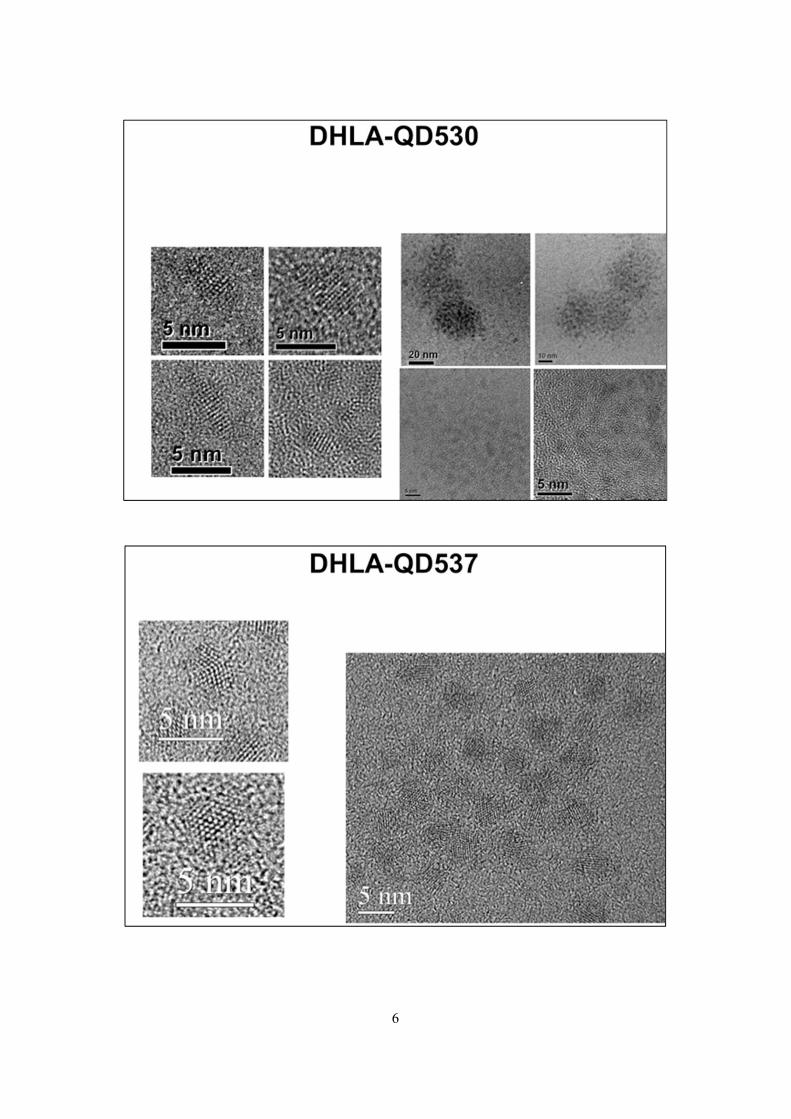
6

7
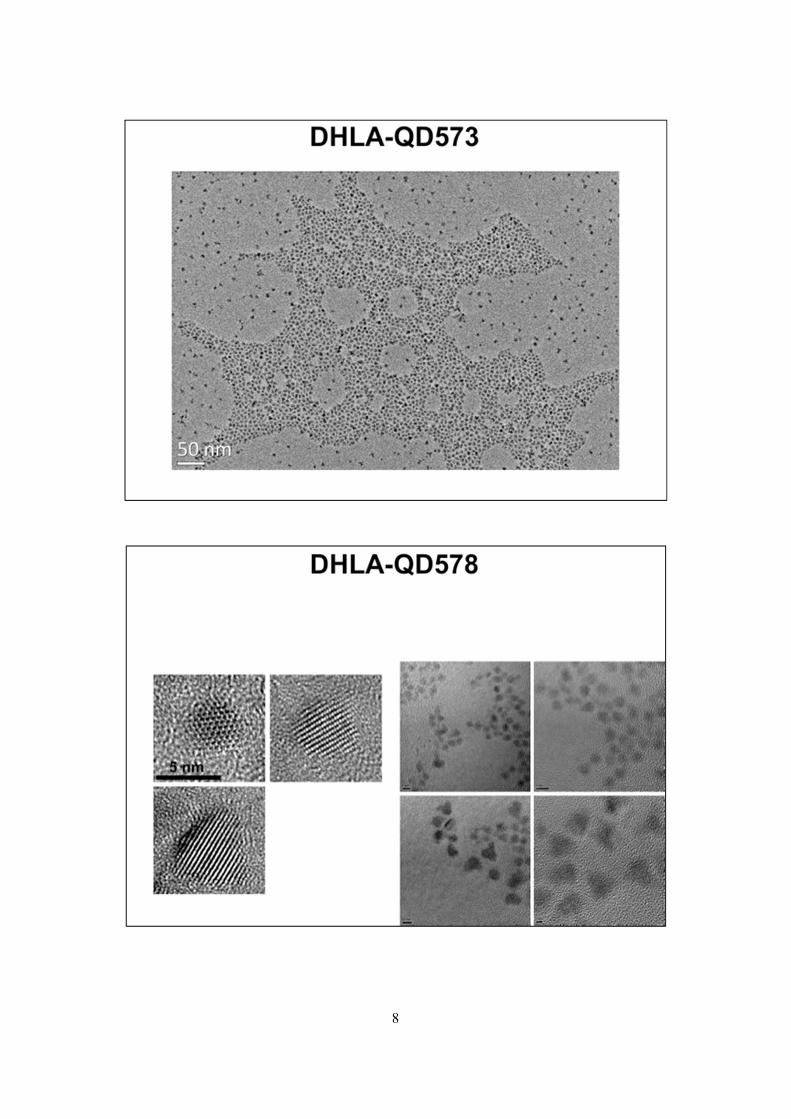
8

9
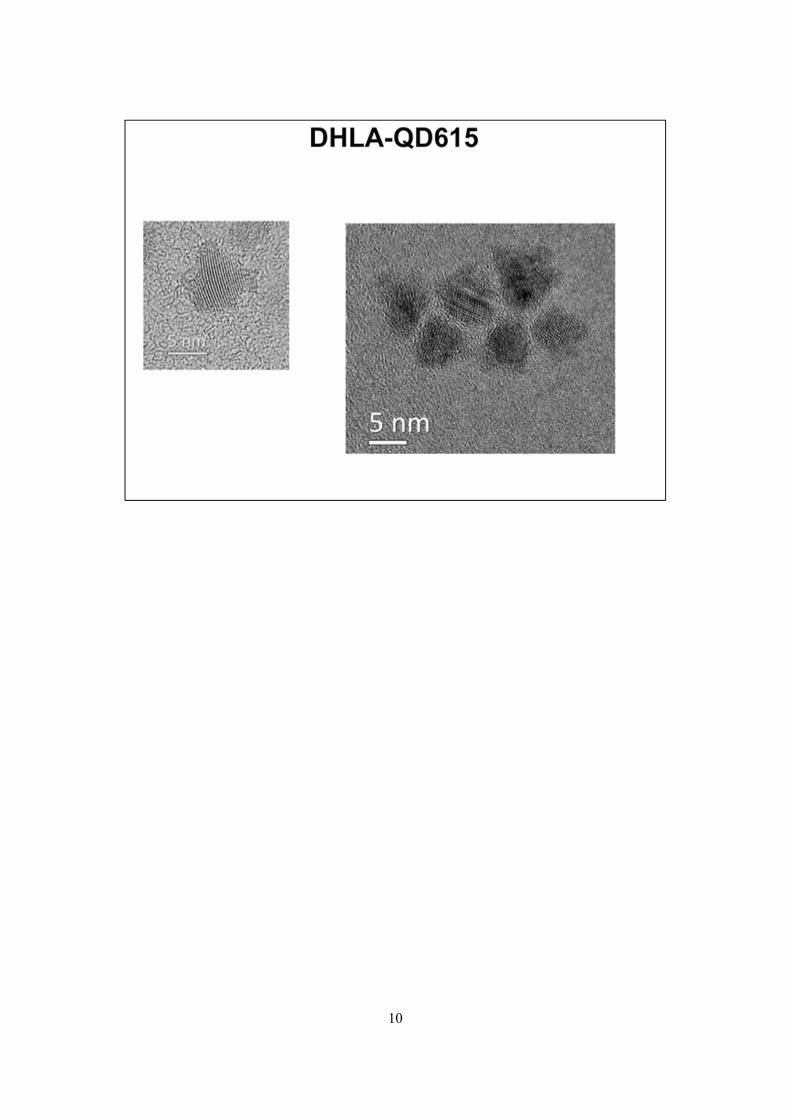
10
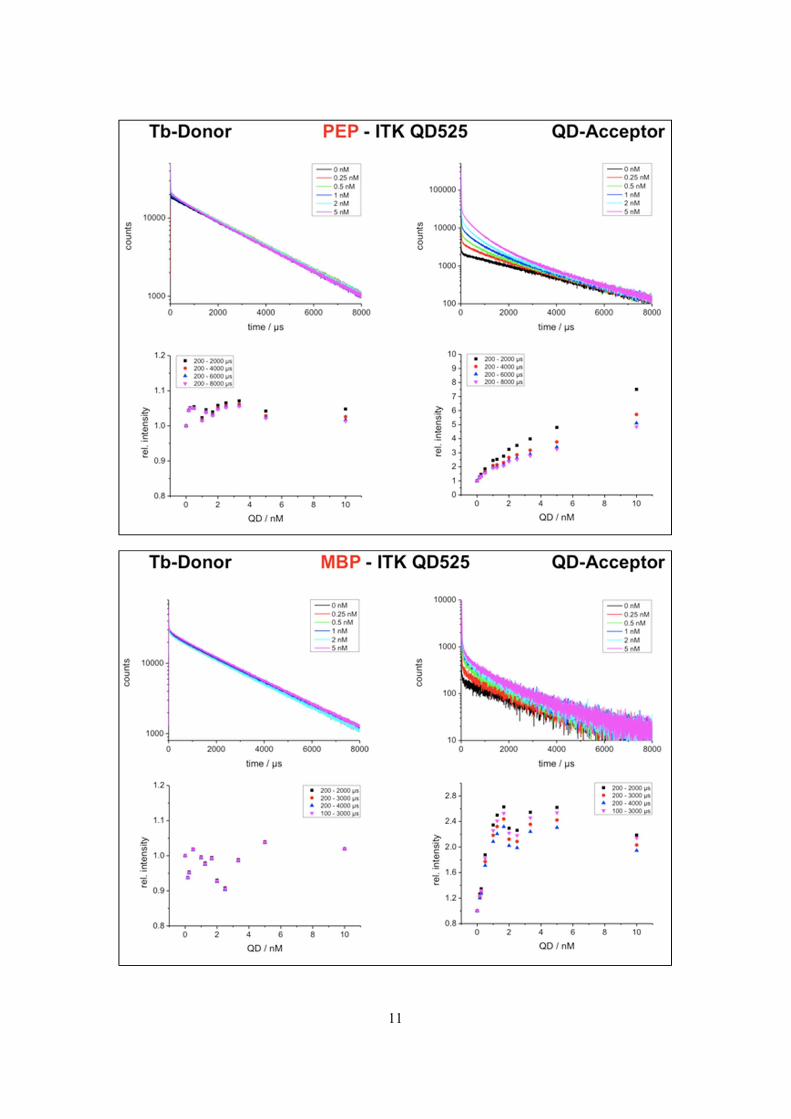
11

12
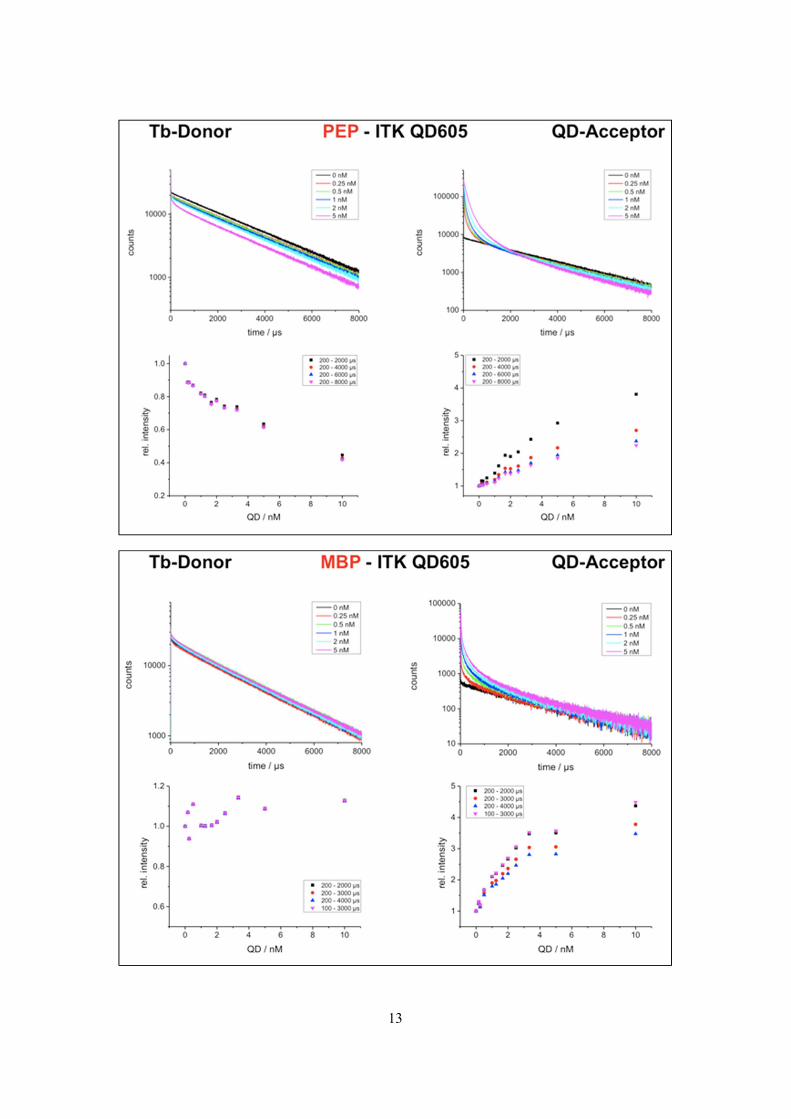
13
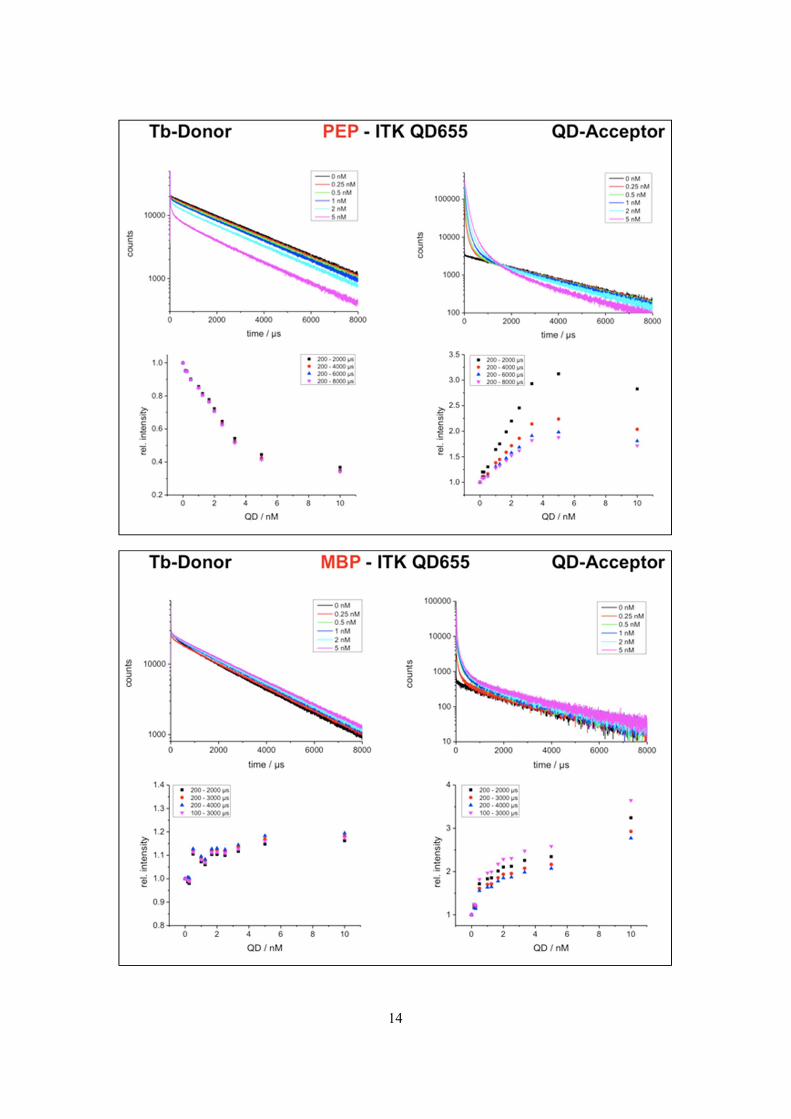
14
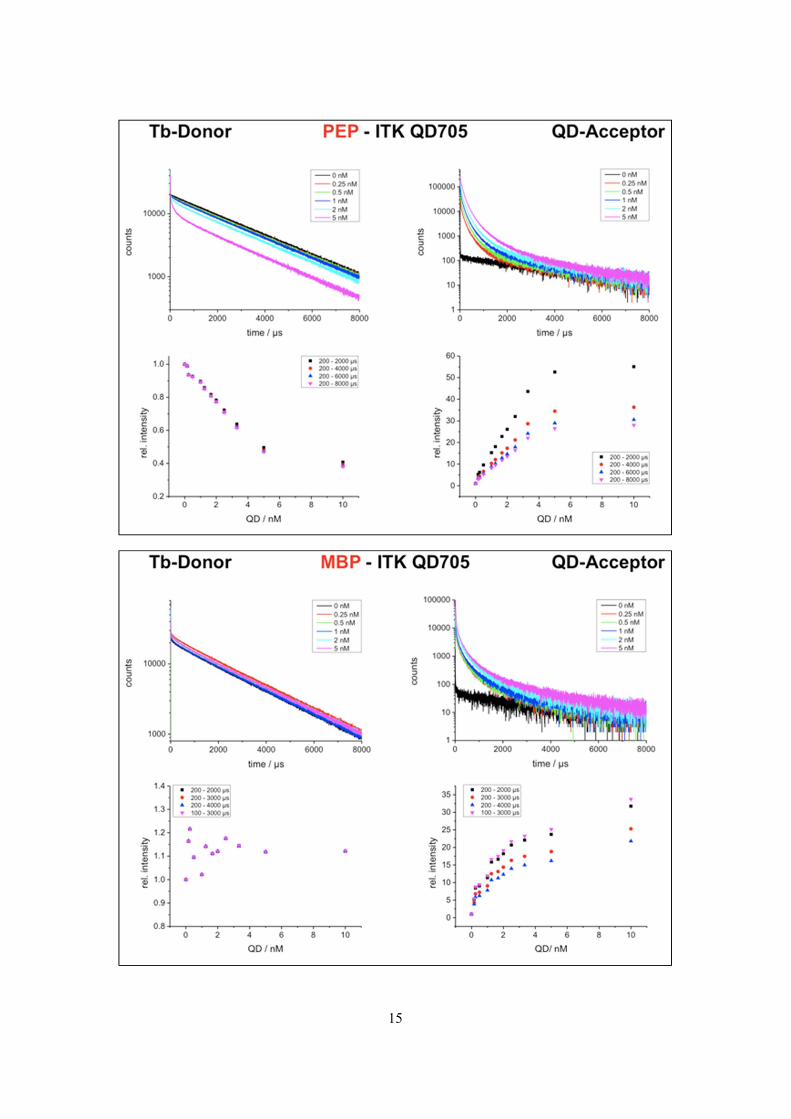
15
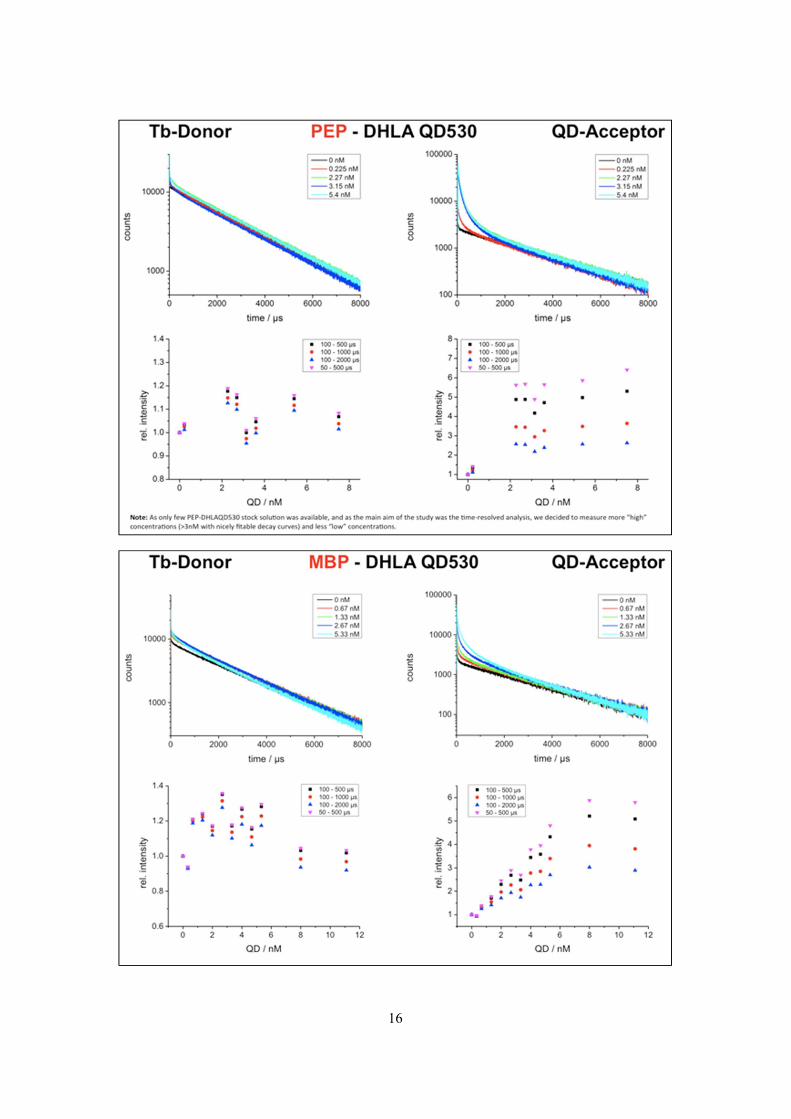
16

17

18
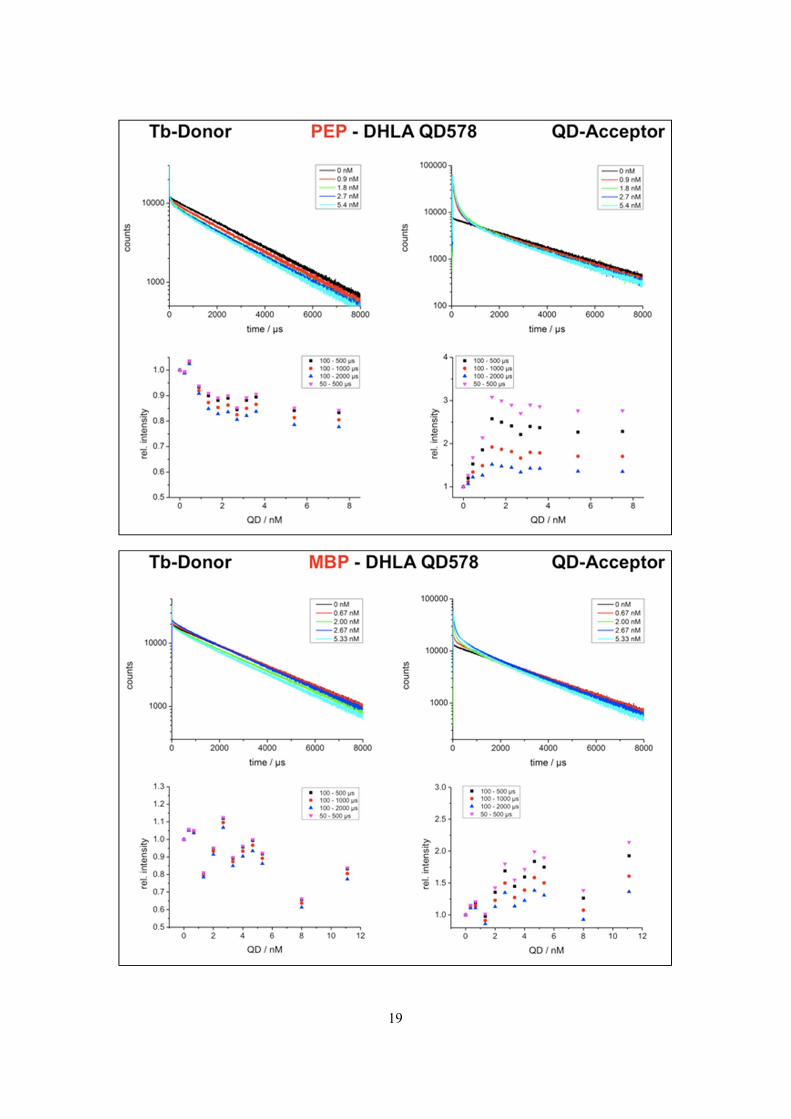
19
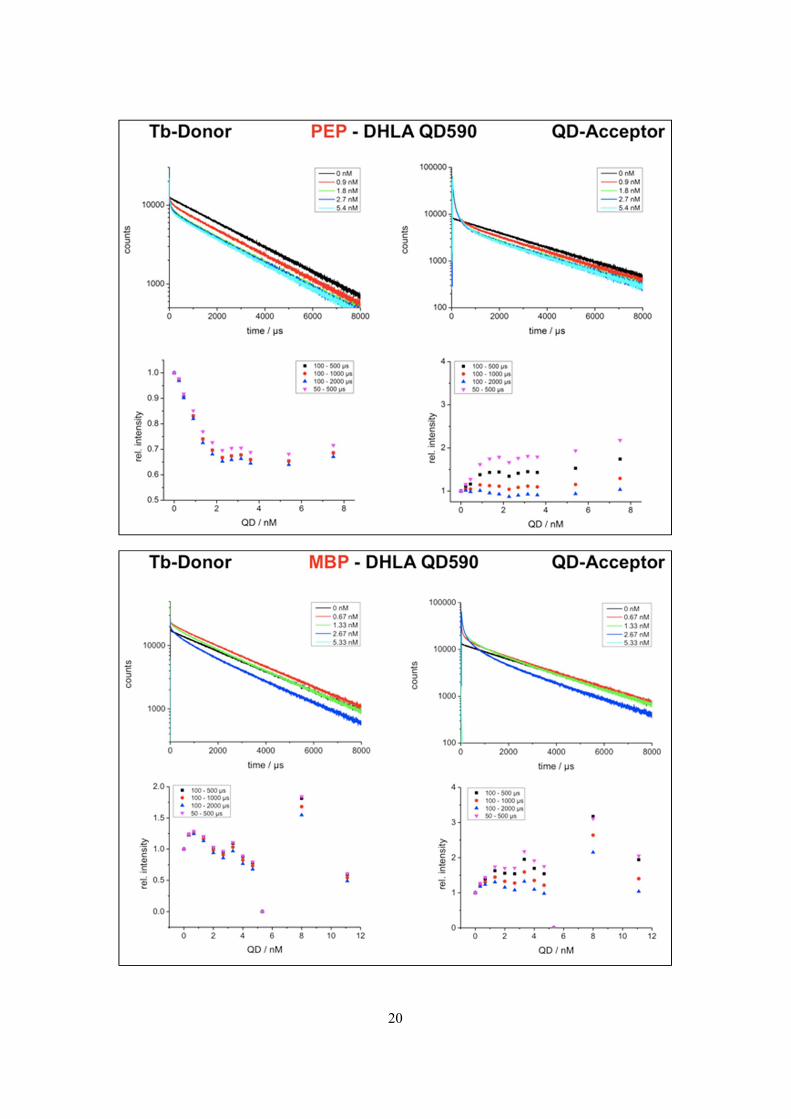
20

21
Bibliography
[1] B. W. Van der Meer, G. Coker, and S.-Y. S. Chen. Resonance Energy Transfer:Theory and Data. Wiley-VCH Verlag GmbH, Weinheim, 1994.
[2] B. Valeur. Molecular Fluorescence: Principles and Applications. Wiley-VCH VerlagGmbH, Weinheim, 2002.
[3] J. R. Lakowicz. Principles of fluorescence spectroscopy. Springer, New York, 3rdedition, 2006.
[4] T. Forster. Zwischenmolekulare Energiewanderung und Fluoreszenz. Annalen derPhysik, 2:55–75, 1948.
[5] H. Sahoo. Forster resonance energy transfer – A spectroscopic nanoruler: Principleand applications. Journal of Photochemistry and Photobiology C: PhotochemistryReviews, 12:20–30, 2011.
[6] F. Morgner, D. Geißler, S. Stufler, N. G. Butlin, H.-G. Lohmannsroben, andN. Hildebrandt. A Quantum-Dot-Based Molecular Ruler for Multiplexed OpticalAnalysis. Angewandte Chemie International Edition, 49:7570–7574, 2010.
[7] D. Geißler, L. J. Charbonniere, R. F. Ziessel, N. G. Butlin, H.-G. Lohmannsroben,and N. Hildebrandt. Quantum Dot Biosensors for Ultrasensitive Multiplexed Diag-nostics. Angewandte Chemie International Edition, 49:1396–1401, 2010.
[8] N. Hildebrandt. How to Apply FRET: From Experimental Design to Data Analysis.In FRET - Forster Resonance Energy Transfer From Theory to Applications, pages105–156. Wiley-VCH Verlag GmbH, Weinheim, 2014.
[9] F. S. Richardson. Terbium(III) and europium(III) ions as luminescent probes andstains for biomolecular systems. Chemical Reviews, 82:541–552, 1982.
[10] J.-C. G. Bunzli. Lanthanide Luminescence for Biomedical Analyses and Imaging.Chemical Reviews, 110:2729–2755, 2010.
[11] E. G. Moore, A. P. S. Samuel, and K. N. Raymond. From Antenna to Assay: LessonsLearned in Lanthanide Luminescence. Accounts of Chemical Research, 42:542–552,2009.
[12] J.-C. G. Bunzli, A.-S. Chauvin, H. K. Kim, E. Deiters, and S. V. Eliseeva. Lan-thanide luminescence efficiency in eight- and nine-coordinate complexes: Role ofthe radiative lifetime. Coordination Chemistry Reviews, 254:2623–2633, 2010.
[13] M. Starck, P. Kadjane, E. Bois, B. Darbouret, A. Incamps, R. Ziessel, and L. J.Charbonniere. Towards Libraries of Luminescent Lanthanide Complexes and Labelsfrom Generic Synthons. Chemistry - A European Journal, 17:9164–9179, 2011.
cii
BIBLIOGRAPHY ciii
[14] E. P. Diamandis. Immunoassays with time-resolved fluorescence spectroscopy: Prin-ciples and applications. Clinical Biochemistry, 21:139–150, 1988.
[15] A. K. Hagan and T. Zuchner. Lanthanide-based time-resolved luminescence im-munoassays. Analytical and Bioanalytical Chemistry, 400:2847–2864, 2011.
[16] K. R. Kupcho, D. K. Stafslien, T. DeRosier, T. M. Hallis, M. S. Ozers, and K. W.Vogel. Simultaneous Monitoring of Discrete Binding Events Using Dual-AcceptorTerbium-Based LRET. Journal of the American Chemical Society, 129:13372–13373, 2007.
[17] T. Kokko, T. Liljenback, M. T. Peltola, L. Kokko, and T. Soukka. HomogeneousDual-Parameter Assay for Prostate-Specific Antigen Based on Fluorescence Reso-nance Energy Transfer. Analytical Chemistry, 80:9763–9768, 2008.
[18] T. Kokko, L. Kokko, and T. Soukka. Terbium(III) Chelate as an Efficient Donor forMultiple-Wavelength Fluorescent Acceptors. Journal of Fluorescence, 19:159–164,2009.
[19] D. Geißler, S. Stufler, H.-G. Lohmannsroben, and N. Hildebrandt. Six-Color Time-Resolved Forster Resonance Energy Transfer for Ultrasensitive Multiplexed Biosens-ing. Journal of the American Chemical Society, 135:1102–1109, 2013.
[20] U. Resch-Genger, M. Grabolle, S. Cavaliere-Jaricot, R. Nitschke, and T. Nann.Quantum dots versus organic dyes as fluorescent labels. Nature Methods, 5:763–775, 2008.
[21] A. P. Alivisatos. Semiconductor Clusters, Nanocrystals, and Quantum Dots. Sci-ence, 271:933–937, 1996.
[22] C. J. Murphy and J. L. Coffer. Quantum Dots: A Primer. Applied Spectroscopy,56:16–27, 2002.
[23] W. J. Parak, D. Gerion, T. Pellegrino, D. Zanchet, C. Micheel, S. C. Williams,R. Boudreau, M. A. L. Gros, C. A. Larabell, and A. P. Alivisatos. Biologicalapplications of colloidal nanocrystals. Nanotechnology, 14:R15–R27, 2003.
[24] V. Biju, T. Itoh, and M. Ishikawa. Delivering quantum dots to cells: bioconjugatedquantum dots for targeted and nonspecific extracellular and intracellular imaging.Chemical Society Reviews, 39:3031–3056, 2010.
[25] R. A. Sperling and W. J. Parak. Surface modification, functionalization and bio-conjugation of colloidal inorganic nanoparticles. Philosophical Transactions of theRoyal Society A: Mathematical, Physical and Engineering Sciences, 368:1333–1383,2010.
[26] P. Zrazhevskiy, M. Sena, and X. Gao. Designing multifunctional quantum dots forbioimaging, detection, and drug delivery. Chemical Society Reviews, 39:4326–4354,2010.
[27] W. R. Algar, K. Susumu, J. B. Delehanty, and I. L. Medintz. Semiconductor Quan-tum Dots in Bioanalysis: Crossing the Valley of Death. Analytical Chemistry,83:8826–8837, 2011.
civ BIBLIOGRAPHY
[28] E. Petryayeva, W. R. Algar, and I. L. Medintz. Quantum Dots in Bioanalysis: AReview of Applications Across Various Platforms for Fluorescence Spectroscopy andImaging. Applied Spectroscopy, 67:215–252, 2013.
[29] A. R. Clapp, I. L. Medintz, B. R. Fisher, G. P. Anderson, and H. Mattoussi. Can Lu-minescent Quantum Dots Be Efficient Energy Acceptors with Organic Dye Donors?Journal of the American Chemical Society, 127:1242–1250, 2005.
[30] D. Geißler, S. Linden, K. Liermann, K. D. Wegner, L. J. Charbonniere, and N. Hilde-brandt. Lanthanides and Quantum Dots as Forster Resonance Energy TransferAgents for Diagnostics and Cellular Imaging. Inorganic Chemistry, 53:1824–1838,2014.
[31] N. Hildebrandt, K. D. Wegner, and W. R. Algar. Luminescent terbium complexes:Superior Forster resonance energy transfer donors for flexible and sensitive multi-plexed biosensing. Coordination Chemistry Reviews, 273-274:125–138, 2014.
[32] W. R. Algar, D. Wegner, A. L. Huston, J. B. Blanco-Canosa, M. H. Stewart, A. Arm-strong, P. E. Dawson, N. Hildebrandt, and I. L. Medintz. Quantum Dots as Simul-taneous Acceptors and Donors in Time-Gated Forster Resonance Energy TransferRelays: Characterization and Biosensing. Journal of the American Chemical Soci-ety, 134:1876–1891, 2012.
[33] D. Wild. The immunoassay handbook: theory and applications of ligand binding,ELISA, and related techniques. Elsevier, Oxford ; Waltham, MA, 4th edition, 2013.
[34] J. Szollosi, S. Damjanovich, and L. Matyus. Application of fluorescence resonanceenergy transfer in the clinical laboratory: routine and research. Cytometry, 34:159–179, 1998.
[35] G. Mathis. Rare earth cryptates and homogeneous fluoroimmunoassays with humansera. Clinical Chemistry, 39:1953–1959, 1993.
[36] G. Mathis. Probing molecular interactions with homogeneous techniques based onrare earth cryptates and fluorescence energy transfer. Clinical Chemistry, 41:1391–1397, 1995.
[37] G. Mathis. HTRF(R) Technology. Journal of Biomolecular Screening, 4:309–313,1999.
[38] K. Blomberg, P. Hurskainen, and I. Hemmila. Terbium and rhodamine as labels ina homogeneous time-resolved fluorometric energy transfer assay of the beta subunitof human chorionic gonadotropin in serum. Clinical Chemistry, 45:855–861, 1999.
[39] G. Wang. Homogeneous time-resolved fluoroimmunoassay of bensulfuron-methyl byusing terbium fluorescence energy transfer. Talanta, 55:1119–1125, 2001.
[40] R. C. Roovers, T. Laeremans, L. Huang, S. De Taeye, A. J. Verkleij, H. Revets,H. J. de Haard, and P. M. P. van Bergen en Henegouwen. Efficient inhibition ofEGFR signalling and of tumour growth by antagonistic anti-EGFR Nanobodies.Cancer Immunology, Immunotherapy, 56:303–317, 2007.
[41] G. P. Anderson, R. D. Bernstein, M. D. Swain, D. Zabetakis, and E. R. Goldman.Binding Kinetics of Antiricin Single Domain Antibodies and Improved DetectionUsing a B Chain Specific Binder. Analytical Chemistry, 82:7202–7207, 2010.

BIBLIOGRAPHY cv
[42] A. de Marco. Biotechnological applications of recombinant single-domain antibodyfragments. Microbial Cell Factories, 10:44, 2011.
[43] A. Sukhanova, K. Even-Desrumeaux, A. Kisserli, T. Tabary, B. Reveil, J.-M. Mil-lot, P. Chames, D. Baty, M. Artemyev, V. Oleinikov, M. Pluot, J. H.M. Cohen,and I. Nabiev. Oriented conjugates of single-domain antibodies and quantum dots:toward a new generation of ultrasmall diagnostic nanoprobes. Nanomedicine: Nan-otechnology, Biology and Medicine, 8:516–525, 2012.
[44] L. Stryer and R. P. Haugland. Energy transfer: a spectroscopic ruler. Proceedingsof the National Academy of Sciences, 58:719–726, 1967.
[45] L. Stryer. Fluorescence Energy Transfer as a Spectroscopic Ruler. Annual Reviewof Biochemistry, 47:819–846, 1978.
[46] B. Schuler, E. A. Lipman, P. J. Steinbach, M. Kumke, and W. A. Eaton. Polyprolineand the “spectroscopic ruler” revisited with single-molecule fluorescence. Proceed-ings of the National Academy of Sciences, 102:2754–2759, 2005.
[47] B. Schuler and W. A. Eaton. Protein folding studied by single-molecule FRET.Current Opinion in Structural Biology, 18:16–26, 2008.
[48] B. Prevo and E. J. G. Peterman. Forster resonance energy transfer and kinesinmotor proteins. Chemical Society Reviews, 43:1144–1155, 2014.
[49] R.A. Sperling, T. Liedl, S. Duhr, S. Kudera, M. Zanella, C.-A.J. Lin, W.H. Chang,D. Braun, and W.J. Parak. Size Determination of (Bio)conjugated Water-SolubleColloidal Nanoparticles: A Comparison of Different Techniques. Journal of PhysicalChemistry C, 111:11552–11559, 2007.
[50] K. D. Wegner, Z. Jin, S. Linden, T. L. Jennings, and N. Hildebrandt. Quantum-Dot-Based Forster Resonance Energy Transfer Immunoassay for Sensitive ClinicalDiagnostics of Low-Volume Serum Samples. ACS Nano, 7:7411–7419, 2013.
[51] K. D. Wegner, S. Linden, Z. Jin, T. L. Jennings, R. el Khoulati, P. M. P. vanBergen en Henegouwen, and N. Hildebrandt. Nanobodies and Nanocrystals: HighlySensitive Quantum Dot-Based Homogeneous FRET Immunoassay for Serum-BasedEGFR Detection. Small, 10:734–740, 2014.
[52] K. D. Wegner, P. T. Lanh, T. Jennings, E. Oh, V. Jain, S. M. Fairclough, J. M.Smith, E. Giovanelli, N. Lequeux, T. Pons, and N. Hildebrandt. Influence of Lumi-nescence Quantum Yield, Surface Coating, and Functionalization of Quantum Dotson the Sensitivity of Time-Resolved FRET Bioassays. ACS Applied Materials &Interfaces, 5:2881–2892, 2013.
[53] K. D. Wegner, F. Morgner, E. Oh, R. Goswami, K. Susumu, M. H. Stewart, I. L.Medintz, and N. Hildebrandt. Three-Dimensional Solution-Phase Forster Reso-nance Energy Transfer Analysis of Nanomolar Quantum Dot Bioconjugates withSubnanometer Resolution. Chemistry of Materials, 26:4299–4312, 2014.
[54] L. E. Morrison. Time-resolved detection of energy transfer: Theory and applicationto immunoassays. Analytical Biochemistry, 174:101–120, 1988.
[55] P. R. Selvin. The renaissance of fluorescence resonance energy transfer. NatureStructural Biology, 7:730–734, 2000.
cvi BIBLIOGRAPHY
[56] E. A. Jares-Erijman and T. M. Jovin. FRET imaging. Nature Biotechnology,21:1387–1395, 2003.
[57] K. E. Sapsford, L. Berti, and I. L. Medintz. Materials for Fluorescence Reso-nance Energy Transfer Analysis: Beyond Traditional Donor–Acceptor Combina-tions. Angewandte Chemie International Edition, 45:4562–4589, 2006.
[58] I. L Medintz and N. Hildebrandt. FRET - Forster resonance energy transfer fromtheory to applications. Wiley-VCH Verlag GmbH, Weinheim, Germany, 2014.
[59] G. Cario. Uber Entstehung wahrer Lichtabsorption und scheinbare Kopplung vonQuantensprungen. Zeitschrift fur Physik, 10(1):185–199, 1922.
[60] G. Cario and J. Franck. Uber Zerlegung von Wasserstoffmolekulen durch angeregteQuecksilberatome. Zeitschrift fur Physik, 11:161–166, 1922.
[61] R. M. Clegg. The history of FRET. In C. D. Geddes and J. R. Lakowicz, editors,Reviews in Fluorescence, pages 1–45. Springer, Boston, MA, 2006.
[62] J. Franck. Einige aus der Theorie von Klein und Bosseland zu ziehende Folgerungenuber Fluoreszenz, photochemische Prozesse und die Elektronenemission gluhenderKorper. Zeitschrift fur Physik, 9:259–266, 1922.
[63] H. Kallmann and F. London. Uber quantenmeachnische Energieubertragung zwis-chen atomaren Systemen. Ein Beitrag zum Problem der anomalgrossen Wirkungs-querschnitte. Zeitschrift fur physikalische Chemie, B2:207–243, 1929.
[64] M. N. Berberan-Santos. Pioneering Contributions of Jean and Francis Perrin toMolecular Luminescence. In B. Valeur and J.-C. Brochon, editors, New Trends inFluorescence Spectroscopy. Application to Chemical and Life Sciences, pages 7–33.Springer-Verlag, Berlin, 2001.
[65] T. Forster. Energiewanderung und Fluoreszenz. Naturwissenschaften, 33:166–175,1946.
[66] B. W. Van der Meer. Forster theory. In I. L. Medintz and N. Hildebrandt, editors,FRET - Forster resonance energy transfer from theory to applications, pages 23–59.Wiley-VCH Verlag GmbH, Weinheim, Germany, 2014.
[67] B. W. Van der Meer, D. M. Van der Meer, and S. S. Vogel. Optimizing the orienta-tion factor kappa-squared for more accurate FRET measurements. In I. L. Medintzand N. Hildebrandt, editors, FRET - Forster resonance energy transfer from the-ory to applications, pages 63–103. Wiley-VCH Verlag GmbH, Weinheim, Germany,2014.
[68] V. Gubala, L. F. Harris, A. J. Ricco, M. X. Tan, and D. E. Williams. Point of CareDiagnostics: Status and Future. Analytical Chemistry, 84:487–515, 2012.
[69] S. Spindel, J. Granek, and K. E. Sapsford. In vitro FRET sensing, diagnostics, andpersonalized medicine. In I. L. Medintz and N. Hildebrandt, editors, FRET - Forsterresonance energy transfer from theory to applications, pages 269–305. Wiley-VCHVerlag GmbH, Weinheim, Germany, 2014.
[70] S. Hohng, S. Lee, J. Lee, and M. H. Jo. Maximizing information content of single-molecule FRET experiments: multi-color FRET and FRET combined with force ortorque. Chemical Society Reviews, 43:1007–1013, 2014.
BIBLIOGRAPHY cvii
[71] T. Pons. Single-molecule applications. In I. L. Medintz and N. Hildebrandt, editors,FRET - Forster resonance energy transfer from theory to applications, pages 323–353. Wiley-VCH Verlag GmbH, Weinheim, Germany, 2014.
[72] A. Roda, E. Guardigli, M.and Michelini, and M. Mirasoli. Nanobioanalytical lu-minescence: Forster-type energy transfer methods. Analytical and BioanalyticalChemistry, 393:109–123, 2009.
[73] W. Zhong. Nanomaterials in fluorescence-based biosensing. Analytical and Bioan-alytical Chemistry, 394:47–59, 2009.
[74] B. Hotzer, I. L. Medintz, and N. Hildebrandt. Fluorescence in Nanobiotechnology:Sophisticated Fluorophores for Novel Applications. Small, 8:2297–2326, 2012.
[75] K. E. Sapsford, B. Wildt, A. Mariani, A. B. Yeatts, and I. L. Medintz. Materialsfor FRET analysis: Beyond traditional dye-dye combinations. In I. L. Medintz andN. Hildebrandt, editors, FRET - Forster resonance energy transfer from theory toapplications, pages 165–236. Wiley-VCH Verlag GmbH, Weinheim, Germany, 2014.
[76] J. M. Singer and R. M. Plotz. The latex fixation test. I. Application to the serologicdiagnosis of rheumatoid arthritis. Am. J. Med., 21:888–892, 1956.
[77] P. L. Masson, C. L. Cambiaso, D. Collet-Cassart, C. G. M. Magnusson, C. B.Richards, and C. J. M. Sindic. Methods Enzymology, 74:106–139, 1981.
[78] Gustav K. Von Schulthess, Richard J. Cohen, and George B. Benedek. Laser lightscattering spectroscopic immunoassay in the agglutination-inhibition mode for hu-man chorionic gonadotropin (hCG) and human luteinizing hormone (hLH). Im-munochemistry, 13:963–966, 1976.
[79] J. H. Leuvering, P. J. Thal, M. van der Waart, and A. H. Schuurs. Sol particleimmunoassay (SPIA). Journal of Immunoassay, 1:77–91, 1980.
[80] Xiong Liu, Qiu Dai, Lauren Austin, Janelle Coutts, Genevieve Knowles, JianhuaZou, Hui Chen, and Qun Huo. A One-Step Homogeneous Immunoassay for CancerBiomarker Detection Using Gold Nanoparticle Probes Coupled with Dynamic LightScattering. Journal of the American Chemical Society, 130:2780–2782, 2008.
[81] Ji-Wei Chen, Yong Lei, Xiang-Jiang Liu, Jian-Hui Jiang, Guo-Li Shen, and Ru-QinYu. Immunoassay using surface-enhanced Raman scattering based on aggregation ofreporter-labeled immunogold nanoparticles. Analytical and Bioanalytical Chemistry,392:187–193, 2008.
[82] A. Yasuda, Y. Ishimori, and M. Umeda. Immunoassay Using Fluorescent Dye-Trapped Liposomes Liposome Immune Lysis Assay (LILA). Nonisotopic Immunoas-say, pages 389–399, 1988.
[83] R. Leute, E. F. Ullman, and A. Goldstein. Spin immunoassay of opium narcoticsin urine and saliva. J. Am. Med. Asso., 221:1231–1234, 1972.
[84] H. E. Hart and E. B. Greenwald. Scintillation proximity assay (SPA)–a new methodof immunoassay. Direct and inhibition mode detection with human albumin andrabbit antihuman albumin. Molecular Immunology, 16:265–267, 1979.
cviii BIBLIOGRAPHY
[85] G. A. Robinson, G. Martinazzo, and G. C. Forrest. A homogeneous bioelectrochem-ical immunoassay for thyroxine. Journal of Immunoassay, 7:1–15, 1986.
[86] Y. Ikariyama, H. Kunoh, and M. Aizawa. Electrochemical luminescence-based ho-mogeneous immunoassay. Biochemical and Biophysical Research Communications,128:987–992, 1985.
[87] N. Hoshino, R. Nakajima, and I. Yamazaki. The effect of polymerization ofhorseradish peroxidase on the peroxidase activity in the presence of excess H2o2:a background for a homogeneous enzyme immunoassay. Journal of Biochemistry,102:785–791, 1987.
[88] I. Gibbons, T. M. Hanlon, C. N. Skold, M. E. Russel, and E. F. Ullman. Enzyme-enhancement immunoassay: a homogeneous assay for polyvalent ligands and anti-bodies. Clinical Chemistry, 27:1602–1608, 1981.
[89] D. J. Litman, T. M. Hanlon, and E. F. Ullman. Enzyme channeling immunoas-say: a new homogeneous enzyme immunoassay technique. Analytical Biochemistry,106:223–229, 1980.
[90] M. Gonnelli, E. Gabellieri, G. Montagnoli, and R. Felicioli. Complementing S-peptide as modulator in enzyme immunoassay. Biochemical and Biophysical Re-search Communications, 102:917–923, 1981.
[91] E. F. Ullman, H. Kirakossian, A. C. Switchenko, J. Ishkanian, M. Ericson, C. A.Wartchow, M. Pirio, J. Pease, B. R. Irvin, S. Singh, R. Singh, R. Patel, A. Dafforn,D. Davalian, C. Skold, N. Kurn, and D. B. Wagner. Luminescent oxygen channelingassay (LOCI): sensitive, broadly applicable homogeneous immunoassay method.Clinical Chemistry, 42:1518–1526, 1996.
[92] David M. Jameson and Justin A. Ross. Fluorescence polarization/anisotropy indiagnostics and imaging. Chemical Reviews, 110:2685–2708, 2010.
[93] Christian Eggeling, Peet Kask, Dirk Winkler, and Stefan Jager. Rapid analysisof Forster resonance energy transfer by two-color global fluorescence correlationspectroscopy: trypsin proteinase reaction. Biophysical Journal, 89:605–618, 2005.
[94] K. Kuningas, H. Pakkila, T. Ukonaho, T. Rantanen, T. Lovgren, and T. Soukka.Upconversion Fluorescence Enables Homogeneous Immunoassay in Whole Blood.Clinical Chemistry, 53:145–146, 2006.
[95] A. Patel and A. K. Campbell. Homogeneous immunoassay based on chemilumines-cence energy transfer. Clinical Chemistry, 29:1604–1608, 1983.
[96] M. Nic, J. Jirat, B. Kosata, A. Jenkins, and A. McNaught, editors. IUPAC Com-pendium of Chemical Terminology: Gold Book,http://goldbook.iupac.org. IUPAC,Research Triagle Park, NC, 2.1.0 edition, 2009.
[97] R. Ekins and P. Edwards. On the meaning of “sensitivity”. Clinical Chemistry,43:1824–1831, 1997.
[98] H. L. Pardue. The inseparable triad: analytical sensitivity, measurement uncer-tainty, and quantitative resolution. Clinical Chemistry, 43:1831–1837, 1997.
BIBLIOGRAPHY cix
[99] C. A. Spencer. Thyroid profiling for the 1990’s: free T4 estimate or sensitive TSHmeasurement. J. Clin. Immunoassay, 12:82–89, 1989.
[100] R. B. Murphy. On the meaning of precision and accuracy. Mater. Res. Stand.,1:264–267, 1961.
[101] D. MacDougall and W. B. Crummett. Guidelines for data acquisition and dataquality evaluation in environmental chemistry. Analytical Chemistry, 52:2242–2249,1980.
[102] P. C. Ray, Z. Fan, R. A. Crouch, S. S. Sinha, and A. Pramanik. Nanoscopic opticalrulers beyond the FRET distance limit: fundamentals and applications. ChemicalSociety Reviews, 43:6370–6404, 2014.
[103] S. Weiss. Fluorescence Spectroscopy of Single Biomolecules. Science, 283:1676–1683,1999.
[104] J. Hohlbein, T. D. Craggs, and T. Cordes. Alternating-laser excitation: single-molecule FRET and beyond. Chemical Society Reviews, 43:1156–1171, 2014.
[105] X. Zhuang. Single-Molecule RNA Science. Annual Review of Biophysics andBiomolecular Structure, 34:399–414, 2005.
[106] R. E. Stenkamp, I. Le. Trong, L. Klumb, P. S. Stayton, and S. Freitag. Structuralstudies of the streptavidin binding loop. Protein Science, 6:1157–1166, 1997.
[107] A. Pahler, W. A. Hendrickson, M. A. Kolks, C. E. Argarana, and C. R. Cantor.Characterization and crystallization of core streptavidin. The Journal of BiologicalChemistry, 262:13933–13937, 1987.
[108] W. A. Hendrickson, A. Pahler, J. L. Smith, Y. Satow, E. A. Merritt, and R. P.Phizackerley. Crystal structure of core streptavidin determined from multiwave-length anomalous diffraction of synchrotron radiation. Proceedings of the NationalAcademy of Sciences, 86:2190–2194, 1989.
[109] P. Weber, D. Ohlendorf, J. Wendoloski, and F. Salemme. Structural origins ofhigh-affinity biotin binding to streptavidin. Science, 243:85–88, 1989.
[110] A. Loosli, U. E. Rusbandi, J. Gradinaru, K. Bernauer, C. W. Schlaepfer, M. Meyer,S. Mazurek, M. Novic, and T. R. Ward. (Strept)avidin as Host for BiotinylatedCoordination Complexes: Stability, Chiral Discrimination, and Cooperativity. In-organic Chemistry, 45:660–668, 2006.
[111] S. Freitag, I. Le Trong, L. Klumb, P. S. Stayton, and R. E. Stenkamp. Structuralstudies of the streptavidin binding loop. Protein Science: A Publication of theProtein Society, 6:1157–1166, 1997.
[112] T. Sano and C. R. Cantor. Cooperative biotin binding by streptavidin. Elec-trophoretic behavior and subunit association of streptavidin in the presence of 6M urea. The Journal of Biological Chemistry, 265:3369–3373, 1990.
[113] M. Lisa Jones and Gary P. Kurzban. Noncooperativity of Biotin Binding toTetrameric Streptavidin. Biochemistry, 34:11750–11756, 1995.
[114] N. M. Green. Avidin and Streptavidin. Methods Enzymology, 184:51–67, 1990.
cx BIBLIOGRAPHY
[115] E. A. Bayer, H. Ben-Hur, and M. Wilchek. Isolation and Properties of Streptavidin.Methods Enzymology, 184:80–89, 1990.
[116] M. Howarth, D. J.-F. Chinnapen, K. Gerrow, P. C. Dorrestein, M. R. Grandy, N. L.Kelleher, A. El-Husseini, and A. Y. Ting. A monovalent streptavidin with a singlefemtomolar biotin binding site. Nature Methods, 3:267–273, 2006.
[117] M. Howarth and A. Y. Ting. Imaging proteins in live mammalian cells with biotinligase and monovalent streptavidin. Nature Protocols, 3:534–545, 2008.
[118] K.E. Sapsford, T. Pons, I.L. Medintz, S. Higashiya, F.M. Brunel, P.E. Dawson,and H. Mattoussi. Kinetics of Metal-Affinity Driven Self-Assembly between Pro-teins or Peptides and CdSe-ZnS Quantum Dots. Journal of Physical Chemistry C,111:11528–11538, 2007.
[119] A. M. Dennis and G. Bao. Quantum dot-fluorescent protein pairs as novel fluores-cence resonance energy transfer probes. Nano Letters, 8:1439–1445, 2008.
[120] D. E. Prasuhn, J. B. Blanco-Canosa, G. J. Vora, J. B. Delehanty, K. Susumu,B. C. Mei, P. E. Dawson, and I. L. Medintz. Combining Chemoselective Ligationwith Polyhistidine-Driven Self-Assembly for the Modular Display of Biomoleculeson Quantum Dots. ACS Nano, 4:267–278, 2010.
[121] A. M. Dennis, D. C. Sotto, B. C. Mei, I. L. Medintz, H. Mattoussi, and G. Bao. Sur-face Ligand Effects on Metal-Affinity Coordination to Quantum Dots: Implicationsfor Nanoprobe Self-Assembly. Bioconjugate Chemistry, 21:1160–1170, 2010.
[122] J.-C. G. Bunzli and C. Piguet. Taking advantage of luminescent lanthanide ions.Chemical Society Reviews, 34:1048–1077, 2005.
[123] S. V. Eliseeva and J.-C. G. Bunzli. Lanthanide luminescence for functional materialsand bio-sciences. Chemical Society Reviews, 39:189–227, 2010.
[124] D. A. Atwood. The rare earth elements: fundamentals and applications. John Wiley& Sons, Inc, Chichester, West Sussex, United Kingdom ; Hoboken, 2012.
[125] C. Janiak, T. M. Klapotke, H.-J. Meyer, and E. Riedel. Moderne anorganischeChemie. De Gruyter, Berlin; New York, 2nd edition, 2003.
[126] Richard Beatty. The lanthanides. The elements. Marshall Cavendish Benchmark,New York, 2008.
[127] F. A. Cotton. Advanced inorganic chemistry. Wiley, New York, 6th edition, 1999.
[128] A. F. Holleman, E. Wiberg, and N. Wiberg. Lehrbuch der anorganischen Chemie.de Gruyter, Berlin; New York, 2007.
[129] C. Gorller-Walrand and K. Binnemans. Rationalization of Crystal-FieldParametrization. In Handbook on the Physics and Chemistry of Rare Earths, pages121–283. Elsevier Science B. V., 1996.
[130] P. W. Atkins, A. Hopfner, and A. Schleitzer. Physikalische Chemie. Wiley-VCH,Weinheim, 2001.
BIBLIOGRAPHY cxi
[131] Niko Hildebrandt. Lanthanides and Quantum Dots - Time-Resolved Laser Spec-troscopy of Biochemical Forster Resonance Energy Transfer (FRET) Systems. PhDthesis, University Potsdam, 2006.
[132] William T. Carnell. The absorption and fluorescence spectra of rare earth ion sinsolution. In K. A. Geschneidner and L. Eyring, editors, Handbook on the Physicsand Chemistry of Rare Earth, pages 171–208. North-Holland Publishing Company,1979.
[133] S. I. Weissman. Intramolecular Energy Transfer The Fluorescence of Complexes ofEuropium. The Journal of Chemical Physics, 10:214–217, 1942.
[134] B. D. Schlyer, D. G. Steel, and A. Gafni. Direct Kinetic Evidence for TripletState Energy Transfer from Escherichia coli Alkaline Phosphatase Tryptophan 109to Bound Terbium. Journal of Biological Chemistry, 270:22890–22894, 1995.
[135] M. Latva, H. Takalo, V.-M. Mukkala, C. Matachescu, J. C. Rodrıguez-Ubis, andJ. Kankare. Correlation between the lowest triplet state energy level of the ligandand lanthanide(III) luminescence quantum yield. Journal of Luminescence, 75:149–169, 1997.
[136] W. DeW. Horrocks and D. R. Sudnick. Lanthanide ion probes of structure in biology.Laser-induced luminescence decay constants provide a direct measure of the numberof metal-coordinated water molecules. Journal of the American Chemical Society,101:334–340, 1979.
[137] Martinus H. V. Werts, Ronald T. F. Jukes, and Jan W. Verhoeven. The emissionspectrum and the radiative lifetime of Eu3+ in luminescent lanthanide complexes.Physical Chemistry Chemical Physics, 4:1542–1548, 2002.
[138] Annina Aebischer, Frederic Gumy, and Jean-Claude G. Bunzli. Intrinsic quantumyields and radiative lifetimes of lanthanide tris(dipicolinates). Physical ChemistryChemical Physics, 11:1346, 2009.
[139] J.-C. G. Bunzli and S. V. Eliseeva. Intriguing aspects of lanthanide luminescence.Chemical Science, 4:1939–1949, 2013.
[140] Erkki Soini, Timo Lovgren, and Charles B. Reimer. Time-Resolved Fluorescence ofLanthanide Probes and Applications in Biotechnology. C R C Critical Reviews inAnalytical Chemistry, 18:105–154, 1987.
[141] L. Seveus, M. Vaisala, S. Syrjanen, M. Sandberg, A. Kuusisto, R. Harju, J. Salo,I. Hemmila, H. Kojola, and E. Soini. Time-resolved fluorescence imaging of eu-ropium chelate label in immunohistochemistry and in situ hybridization. Cytometry,13:329–338, 1992.
[142] J. Yu, D. Parker, R. Pal, R. A. Poole, and M. J. Cann. A Europium Complex ThatSelectively Stains Nucleoli of Cells. Journal of the American Chemical Society,128:2294–2299, 2006.
[143] B. Song, C. D. B. Vandevyver, A.-S. Chauvin, and J.-C. G. Bunzli. Time-resolvedluminescence microscopy of bimetallic lanthanide helicates in living cells. Organic& Biomolecular Chemistry, 6:4125, 2008.
cxii BIBLIOGRAPHY
[144] C. P. Montgomery, B. S. Murray, E. J. New, R. Pal, and D. Parker. Cell-PenetratingMetal Complex Optical Probes: Targeted and Responsive Systems Based on Lan-thanide Luminescence. Accounts of Chemical Research, 42:925–937, 2009.
[145] E. J. New, D. Parker, D. G. Smith, and J. W. Walton. Development of responsivelanthanide probes for cellular applications. Current Opinion in Chemical Biology,14:238–246, 2010.
[146] H. Rajapakse, D. R. Reddy, S. Mohandessi, N. Butlin, and L. W. Miller. Lu-minescent Terbium Protein Labels for Time-Resolved Microscopy and Screening.Angewandte Chemie International Edition, 48:4990–4992, 2009.
[147] T. Ito, M. Inoue, K. Akamatsu, E. Kusaka, K. Tanabe, and S.-i. Nishimoto. αvβ3-Integrin-targeting lanthanide complex: Synthesis and evaluation as a tumor-homingluminescent probe. Bioorganic & Medicinal Chemistry Letters, 21:3515–3518, 2011.
[148] V. Fernandez-Moreira, B. Song, V. Sivagnanam, A.-S. Chauvin, C. D. B. Van-devyver, M. Gijs, I. Hemmila, H.-A. Lehr, and J.-C. G. Bunzli. Bioconjugatedlanthanide luminescent helicates as multilabels for lab-on-a-chip detection of cancerbiomarkers. The Analyst, 135:42–52, 2010.
[149] S. Linden, M. K. Singh, K. D. Wegner, M. Regairaz, F. Dautry, F. Treussart,and N. Hildebrandt. Terbium-based time-gated Forster resonance energy trans-fer imaging for evaluating protein–protein interactions on cell membranes. DaltonTransaction, 44:4994–5003, 2015.
[150] C. Bouzigues, T. Gacoin, and A. Alexandrou. Biological Applications of Rare-EarthBased Nanoparticles. ACS Nano, 5:8488–8505, 2011.
[151] C. S. Bonnet, F. Buron, F. Caille, C. M. Shade, B. Drahos, L. Pellegatti, J. Zhang,S. Villette, L. Helm, C. Pichon, F. Suzenet, S. Petoud, and E. Toth. Pyridine-Based Lanthanide Complexes Combining MRI and NIR Luminescence Activities.Chemistry - A European Journal, 18:1419–1431, 2012.
[152] F. Caille, C. S. Bonnet, F. Buron, S. Villette, L. Helm, S. Petoud, F. Suzenet, andE. Toth. Isoquinoline-Based Lanthanide Complexes: Bright NIR Optical Probesand Efficient MRI Agents. Inorganic Chemistry, 51:2522–2532, 2012.
[153] F. Auzel. Upconversion and Anti-Stokes Processes with f and d Ions in Solids.Chemical Reviews, 104:139–174, 2004.
[154] G. Chen, H. Qiu, P. N. Prasad, and X. Chen. Upconversion Nanoparticles: Design,Nanochemistry, and Applications in Theranostics. Chemical Reviews, 114:5161–5214, 2014.
[155] J. Zhou, Z. Liu, and F. Li. Upconversion nanophosphors for small-animal imaging.Chemical Society Reviews, 41:1323–1349, 2012.
[156] P. R. Selvin. Principles and Biophysical Applications of Lanthanoid-Based Probes.Annual Review of Biophysics and Biomolecular Structure, 31:275–302, 2002.
[157] L. J. Charbonniere, N. Hildebrandt, R. F. Ziessel, and H.-G. Lohmannsroben. Lan-thanides to Quantum Dots Resonance Energy Transfer in Time-Resolved Fluoro-Immunoassays and Luminescence Microscopy. Journal of the American ChemicalSociety, 128:12800–12809, 2006.
BIBLIOGRAPHY cxiii
[158] L. J. Charbonniere and N. Hildebrandt. Lanthanide Complexes and Quantum Dots:A Bright Wedding for Resonance Energy Transfer (Eur. J. Inorg. Chem. 21/2008).European Journal of Inorganic Chemistry, 2008:3231–3231, 2008.
[159] Cisbio, “HTFR Technology”. http://www.cisbio.com/usa/drug-discovery/htrf-technology, (24.04.2015).
[160] BRAHMS, “TRACE Technology”. http://www.kryptor.net/Default.aspx?tabindex= 4&tabid=254, (24.04.2015).
[161] Perkin elmer, “LANCE TR-FRET assays”. http://www.perkinelmer.com/catalog/category/id/lance%20reagents, (24.04.2015).
[162] Life Technologies, “LanthaScreen TR-FRET”. http://www.lifetechnologies.com/fr/fr/home/life-science/drug-discovery/target-and-lead-identification-and-validation/kinasebiology/kinase-activity-assays/lanthascreen-tr-fret-toolbox/lanthascreen-tr-fret-technology-overview.html, (24.04.2015).
[163] A. I. Ekimov and A. A. Onushchenko. Quantum size effect in three-dimensionalmicroscopic semiconductor crystals. JETP Letters, 34:345–349, 1981.
[164] A. L. Efros and A. L. Efros. Interband Absorption of Light in a SemiconductorSphere. Soviet Physics-Semiconductors, 16:772–775, 1982.
[165] R. Rosetti, J. L. Ellison, J. M. Gibson, and L. E. Brus. Size effects in the excitedelectronic states of small colloidal CdS crystallites. The Journal of Chemical Physics,80:4464–4469, 1984.
[166] L. Brus. Electronic wave functions in semiconductor clusters: experiment and the-ory. The Journal of Physical Chemistry, 90:2555–2560, 1986.
[167] V. Biju. Chemical modifications and bioconjugate reactions of nanomaterials forsensing, imaging, drug delivery and therapy. Chemical Society Reviews, 43:744–764,2014.
[168] M. Bruchez Jr., M. Moronne, P. Gin, S. Weiss, and A. P. Alivisatos. SemiconductorNanocrystals as Fluorescent Biological Labels. Science, 281:2013–2016, 1998.
[169] W. C. W. Chan and S. Nie. Quantum Dot Bioconjugates for Ultrasensitive Noniso-topic Detection. Science, 281:2016–2018, 1998.
[170] C. B. Murray, D. J. Norris, and M. G. Bawendi. Synthesis and characterization ofnearly monodisperse CdE (E = sulfur, selenium, tellurium) semiconductor nanocrys-tallites. Journal of the American Chemical Society, 115:8706–8715, 1993.
[171] M. A. Hines and P. Guyot-Sionnest. Synthesis and Characterization of StronglyLuminescing ZnS-Capped CdSe Nanocrystals. The Journal of Physical Chemistry,100:468–471, 1996.
[172] B. O. Dabbousi, J. Rodriguez-Viejo, F. V. Mikulec, J. R. Heine, H. Mattoussi,R. Ober, K. F. Jensen, and M. G. Bawendi. (CdSe)ZnS Core-Shell Quantum Dots:Synthesis and Characterization of a Size Series of Highly Luminescent Nanocrystal-lites. The Journal of Physical Chemistry B, 101:9463–9475, 1997.
cxiv BIBLIOGRAPHY
[173] Z. A. Peng and X. Peng. Formation of High-Quality CdTe, CdSe, and CdS Nanocrys-tals Using CdO as Precursor. Journal of the American Chemical Society, 123:183–184, 2001.
[174] A. P. Alivisatos, W. Gu, and C. Larabell. QUANTUM DOTS AS CELLULARPROBES. Annual Review of Biomedical Engineering, 7:55–76, 2005.
[175] T. Pellegrino, L. Manna, S. Kudera, T. Liedl, D. Koktysh, A. L. Rogach, S. Keller,J. Radler, G. Natile, and W. J. Parak. Hydrophobic Nanocrystals Coated with anAmphiphilic Polymer Shell: A General Route to Water Soluble Nanocrystals. NanoLetters, 4:703–707, 2004.
[176] D. Gerion, F. Pinaud, S. C. Williams, W. J. Parak, D. Zanchet, S. Weiss, and A. P.Alivisatos. Synthesis and Properties of Biocompatible Water-Soluble Silica-CoatedCdSe/ZnS Semiconductor Quantum Dots †. The Journal of Physical Chemistry B,105:8861–8871, 2001.
[177] H. Mattoussi, G. Palui, and H. B. Na. Luminescent quantum dots as platforms forprobing in vitro and in vivo biological processes. Advanced Drug Delivery Reviews,64:138–166, 2012.
[178] T. Pons, H. T. Uyeda, I. L. Medintz, and H. Mattoussi. Hydrodynamic Dimensions,Electrophoretic Mobility, and Stability of Hydrophilic Quantum Dots. The Journalof Physical Chemistry B, 110:20308–20316, 2006.
[179] P. del Pino, B. Pelaz, Q. Zhang, P. Maffre, G. U. Nienhaus, and W. J. Parak. Proteincorona formation around nanoparticles – from the past to the future. MaterialsHorizon, 1:301–313, 2014.
[180] E. L. Bentzen, I. D. Tomlinson, J. Mason, P. Gresch, M. R. Warnement, D. Wright,E. Sanders-Bush, R. Blakely, and S. J. Rosenthal. Surface Modification To ReduceNonspecific Binding of Quantum Dots in Live Cell Assays. Bioconjugate Chemistry,16:1488–1494, 2005.
[181] K. Susumu, H. T. Uyeda, I. L. Medintz, T. Pons, J. B. Delehanty, and H. Mat-toussi. Enhancing the Stability and Biological Functionalities of Quantum Dotsvia Compact Multifunctional Ligands. Journal of the American Chemical Society,129:13987–13996, 2007.
[182] B. C. Mei, K. Susumu, I. L. Medintz, J. B. Delehanty, T. J. Mountziaris, andH. Mattoussi. Modular poly(ethylene glycol) ligands for biocompatible semiconduc-tor and gold nanocrystals with extended pH and ionic stability. Journal of MaterialsChemistry, 18:4949–4958, 2008.
[183] T. L. Jennings, S. G. Becker-Catania, R. C. Triulzi, G. Tao, B. Scott, K. E. Sapsford,S. Spindel, E. Oh, V. Jain, J. B. Delehanty, D. E. Prasuhn, K. Boeneman, W. R.Algar, and I. L. Medintz. Reactive Semiconductor Nanocrystals for ChemoselectiveBiolabeling and Multiplexed Analysis. ACS Nano, 5:5579–5593, 2011.
[184] S. Clarke, F. Pinaud, O. Beutel, C. You, J. Piehler, and M. Dahan. CovalentMonofunctionalization of Peptide-Coated Quantum Dots for Single-Molecule As-says. Nano Letters, 10:2147–2154, 2010.
BIBLIOGRAPHY cxv
[185] J. Farlow, D. Seo, K. E. Broaders, M. J. Taylor, Z. J. Gartner, and Y.-W. Jun. For-mation of targeted monovalent quantum dots by steric exclusion. Nature Methods,10:1203–1205, 2013.
[186] A. L. Rogach, L. Katsikas, A. Kornowski, D. Su, A. Eychmuller, and H. Weller. Syn-thesis and characterization of thiol-stabilized CdTe nanocrystals. Ber. Bunsenges.Phys. Chem., 100:1772–1778, 1996.
[187] Y. Zheng, S. Gao, and J. Y. Ying. Synthesis and Cell-Imaging Applications ofGlutathione-Capped CdTe Quantum Dots. Advanced Materials, 19:376–380, 2007.
[188] W.-C. Law, K.-T. Yong, I. Roy, H. Ding, R. Hu, W. Zhao, and P. N. Prasad.Aqueous-Phase Synthesis of Highly Luminescent CdTe/ZnTe Core/Shell QuantumDots Optimized for Targeted Bioimaging. Small, 5:1302–1310, 2009.
[189] G. H. T. Au, W. Y. Shih, and W.-H. Shih. High-conjugation-efficiency aqueousCdSe quantum dots. The Analyst, 138:7316–7325, 2013.
[190] S. R. Sturzenbaum, M. Hockner, A. Panneerselvam, J. Levitt, J.-S. Bouillard,S. Taniguchi, L.-A. Dailey, R. Ahmad Khanbeigi, E. V. Rosca, M. Thanou, K. Suh-ling, A. V. Zayats, and M. Green. Biosynthesis of luminescent quantum dots in anearthworm. Nature Nanotechnology, 8:57–60, 2012.
[191] H. Trabelsi, I. Azzouz, M. Sakly, and H. Abdelmelek. Subacute toxicity of cad-mium on hepatocytes and nephrocytes in the rat could be considered as a greenbiosynthesis of nanoparticles. International Journal of Nanomedicine, 8:1121–1128,2013.
[192] X. Michalet. Quantum Dots for Live Cells, in Vivo Imaging, and Diagnostics.Science, 307:538–544, 2005.
[193] C. A. Leatherdale, W.-K. Woo, F. V. Mikulec, and M. G. Bawendi. On the Absorp-tion Cross Section of CdSe Nanocrystal Quantum Dots. The Journal of PhysicalChemistry B, 106:7619–7622, 2002.
[194] D. R. Larson. Water-Soluble Quantum Dots for Multiphoton Fluorescence Imagingin Vivo. Science, 300:1434–1436, 2003.
[195] A. R. Clapp, T. Pons, I. L. Medintz, J. B. Delehanty, J. S. Melinger, T. Tiefen-brunn, P. E. Dawson, B. R. Fisher, B. O’Rourke, and H. Mattoussi. Two-PhotonExcitation of Quantum-Dot-Based Fluorescence Resonance Energy Transfer and ItsApplications. Advanced Materials, 19:1921–1926, 2007.
[196] M. Dahan, T. Laurence, F. Pinaud, D. S. Chemla, A. P. Alivisatos, M. Sauer, andS. Weiss. Time-gated biological imaging by use of colloidal quantum dots. OpticsLetters, 26:825–827, 2001.
[197] X. Wu, H. Liu, J. Liu, K. N. Haley, J. A. Treadway, J. P. Larson, N. Ge, F. Peale,and M. P. Bruchez. Immunofluorescent labeling of cancer marker Her2 and othercellular targets with semiconductor quantum dots. Nature Biotechnology, 21:41–46,2002.
[198] H.E. Grecco, K.A. Lidke, R. Heintzmann, D.S. Lidke, C. Spagnuolo, O.E. Martinez,E.A. Jares-Erijman, and T.M. Jovin. Ensemble and single particle photophysical
cxvi BIBLIOGRAPHY
properties (two-photon excitation, anisotropy, FRET, lifetime, spectral conversion)of commercial quantum dots in solution and in live cells. Microscopy Research andTechnique, 65:169–179, 2004.
[199] Y. Choi, H. P. Kim, S. M. Hong, J. Y. Ryu, S. J. Han, and R. Song. In situ Visual-ization of Gene Expression Using Polymer-Coated Quantum-Dot-DNA Conjugates.Small, 5:2085–2091, 2009.
[200] I. L. Medintz and H. Mattoussi. Quantum dot-based resonance energy transfer andits growing application in biology. Physical Chemistry Chemical Physics, 11:17–45,2009.
[201] W. R. Algar, A. J. Tavares, and U. J. Krull. Beyond labels: A review of theapplication of quantum dots as integrated components of assays, bioprobes, andbiosensors utilizing optical transduction. Analytica Chimica Acta, 673:1–25, 2010.
[202] Z. Jin and N. Hildebrandt. Semiconductor quantum dots for in vitro diagnosticsand cellular imaging. Trends in Biotechnology, 30:394–403, 2012.
[203] W. J. Parak, T. Pellegrino, and C. Plank. Labelling of cells with quantum dots.Nanotechnology, 16:R9–R25, 2005.
[204] Q. Li, L. Liu, J.-W. Liu, J.-H. Jiang, R.-Q. Yu, and X. Chu. Nanomaterial-based flu-orescent probes for live-cell imaging. TrAC Trends in Analytical Chemistry, 58:130–144, 2014.
[205] M. Chen, X. He, K. Wang, D. He, X. Yang, and H. Shi. Inorganic fluorescentnanoprobes for cellular and subcellular imaging. TrAC Trends in Analytical Chem-istry, 58:120–129, 2014.
[206] X. Gao, L. Yang, J. A. Petros, F. F. Marshall, J. W. Simons, and S. Nie. In vivomolecular and cellular imaging with quantum dots. Current Opinion in Biotechnol-ogy, 16:63–72, 2005.
[207] L. A. Bentolila, Y. Ebenstein, and S. Weiss. Quantum Dots for In Vivo Small-Animal Imaging. Journal of Nuclear Medicine, 50:493–496, 2009.
[208] M. A. Walling, J. A. Novak, and J. R. E. Shepard. Quantum Dots for Live Cell andIn Vivo Imaging. International Journal of Molecular Sciences, 10:441–491, 2009.
[209] V. Biju, S. Mundayoor, R. V. Omkumar, A. Anas, and M. Ishikawa. Bioconjugatedquantum dots for cancer research: Present status, prospects and remaining issues.Biotechnology Advances, 28:199–213, 2010.
[210] R. Hardman. A Toxicologic Review of Quantum Dots: Toxicity Depends on Physic-ochemical and Environmental Factors. Environmental Health Perspectives, 114:165–172, 2006.
[211] B. A. Rzigalinski and J. S. Strobl. Cadmium-containing nanoparticles: Perspec-tives on pharmacology and toxicology of quantum dots. Toxicology and AppliedPharmacology, 238:280–288, 2009.
[212] J. L. Pelley, A. S. Daar, and M. A. Saner. State of Academic Knowledge on Toxicityand Biological Fate of Quantum Dots. Toxicological Sciences, 112:276–296, 2009.
BIBLIOGRAPHY cxvii
[213] M. Bottrill and M. Green. Some aspects of quantum dot toxicity. Chemical Com-munications, 47:7039–7050, 2011.
[214] S. J. Soenen, P. Rivera-Gil, J.-M. Montenegro, W. J. Parak, S. C. De Smedt, andK. Braeckmans. Cellular toxicity of inorganic nanoparticles: Common aspects andguidelines for improved nanotoxicity evaluation. Nano Today, 6:446–465, 2011.
[215] F. M. Winnik and D. Maysinger. Quantum Dot Cytotoxicity and Ways To ReduceIt. Accounts of Chemical Research, 46:672–680, 2013.
[216] R. L. Orndorff and S. J. Rosenthal. Neurotoxin Quantum Dot Conjugates DetectEndogenous Targets Expressed in Live Cancer Cells. Nano Letters, 9:2589–2599,2009.
[217] D.-H. Huang, L. Su, X.-H. Peng, H. Zhang, F. R. Khuri, D. M. Shin, and Z. Chen.Quantum dot-based quantification revealed differences in subcellular localization ofEGFR and E-cadherin between EGFR-TKI sensitive and insensitive cancer cells.Nanotechnology, 20:225102, 2009.
[218] W. Jiang, A. Singhal, B. Kim, J. Zheng, J. Rutka, C. Wang, and W. Chan. As-sessing Near-Infrared Quantum Dots for Deep Tissue, Organ, and Animal ImagingApplications. Journal of the Association for Laboratory Automation, 13:6–12, 2008.
[219] A. B. Rosen, D. J. Kelly, A. J. T. Schuldt, J. Lu, I. A. Potapova, S. V. Doronin,K. J. Robichaud, R. B. Robinson, M. R. Rosen, P. R. Brink, G. R. Gaudette,and I. S. Cohen. Finding Fluorescent Needles in the Cardiac Haystack: TrackingHuman Mesenchymal Stem Cells Labeled with Quantum Dots for Quantitative InVivo Three-Dimensional Fluorescence Analysis. Stem Cells, 25:2128–2138, 2007.
[220] K. Kikushima, S. Kita, and H. Higuchi. A non-invasive imaging for the in vivotracking of high-speed vesicle transport in mouse neutrophils. Scientific Reports,3:1913, 2013.
[221] Y. Zhao, S. L. Lo, Y. Zheng, D. H. Lam, C. Wu, M. Y. Han, and S. Wang. Quan-tum dot coating of baculoviral vectors enables visualization of transduced cells andtissues. Biochemical and Biophysical Research Communications, 434:110–116, 2013.
[222] R. Savla, O. Taratula, O. Garbuzenko, and T. Minko. Tumor targeted quantumdot-mucin 1 aptamer-doxorubicin conjugate for imaging and treatment of cancer.Journal of Controlled Release, 153:16–22, 2011.
[223] D. Shao, J. Li, X. Xiao, M. Zhang, Y. Pan, S. Li, Z. Wang, X. Zhang, H. Zheng,X. Zhang, and L. Chen. Real-Time Visualizing and Tracing of HSV-TK/GCVSuicide Gene Therapy by Near-Infrared Fluorescent Quantum Dots. ACS AppliedMaterials & Interfaces, 6:11082–11090, 2014.
[224] C.-J. Wen, C. T. Sung, I. A. Aljuffali, Y.-J. Huang, and J.-Y. Fang. Nanocompositeliposomes containing quantum dots and anticancer drugs for bioimaging and ther-apeutic delivery: a comparison of cationic, PEGylated and deformable liposomes.Nanotechnology, 24:325101, 2013.
[225] S. Kim, Y. T. Lim, E. G. Soltesz, A. M. De Grand, Ja. Lee, A. Nakayama, J. A.Parker, T. Mihaljevic, R. G. Laurence, D. M. Dor, L. H. Cohn, M. G. Bawendi, andJ. V. Frangioni. Near-infrared fluorescent type II quantum dots for sentinel lymphnode mapping. Nature Biotechnology, 22:93–97, 2004.
cxviii BIBLIOGRAPHY
[226] E. Tanaka, H. S. Choi, H. Fujii, M. G. Bawendi, and J. V. Frangioni. Image-GuidedOncologic Surgery Using Invisible Light: Completed Pre-Clinical Development forSentinel Lymph Node Mapping. Annals of Surgical Oncology, 13:1671–1681, 2006.
[227] A. Amit, R. Mariuzza, S. Phillips, and R. Poljak. Three-dimensional structure ofan antigen-antibody complex at 2.8 A resolution. Science, 233:747–753, 1986.
[228] P.G. Wu and L. Brand. Resonance Energy Transfer: Methods and Applications.Analytical Biochemistry, 218:1–13, 1994.
[229] A. Sillen and Y. Engelborghs. The correct use of “average” fluorescence parameters.Photochemistry and Photobiology, 67:475–486, 1998.
[230] Lei Zhu, Sarath Samudrala, Nikolai Stelmakh, and Michael Vasilyev. Spontaneousdecay of CdSe / ZnS core-shell quantum dots at the air-dielectric interface. OpticsExpress, 20:3144, 2012.