Principles of resonance energy transfer
16
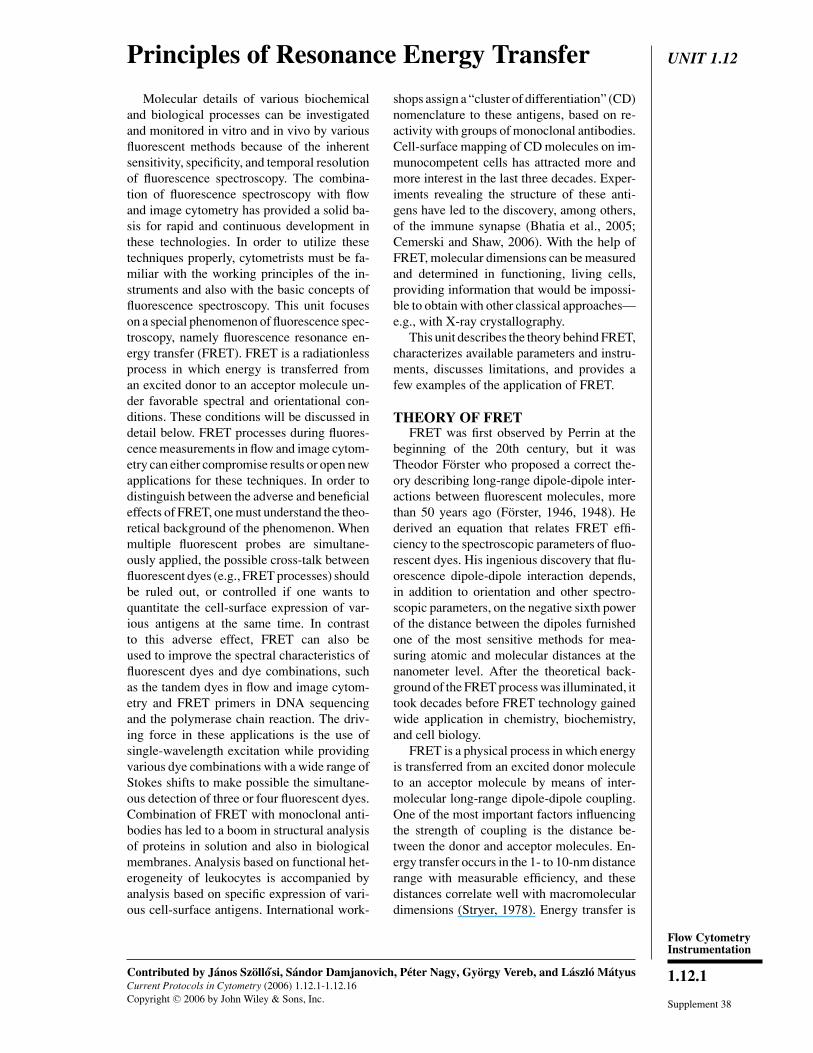
UNIT 1.12 Principles of Resonance Energy Transfer Molecular details of various biochemical and biological processes can be investigated and monitored in vitro and in vivo by various fluorescent methods because of the inherent sensitivity, specificity, and temporal resolution of fluorescence spectroscopy. The combina- tion of fluorescence spectroscopy with flow and image cytometry has provided a solid ba- sis for rapid and continuous development in these technologies. In order to utilize these techniques properly, cytometrists must be fa- miliar with the working principles of the in- struments and also with the basic concepts of fluorescence spectroscopy. This unit focuses on a special phenomenon of fluorescence spec- troscopy, namely fluorescence resonance en- ergy transfer (FRET). FRET is a radiationless process in which energy is transferred from an excited donor to an acceptor molecule un- der favorable spectral and orientational con- ditions. These conditions will be discussed in detail below. FRET processes during fluores- cence measurements in flow and image cytom- etry can either compromise results or open new applications for these techniques. In order to distinguish between the adverse and beneficial effects of FRET, one must understand the theo- retical background of the phenomenon. When multiple fluorescent probes are simultane- ously applied, the possible cross-talk between fluorescent dyes (e.g., FRET processes) should be ruled out, or controlled if one wants to quantitate the cell-surface expression of var- ious antigens at the same time. In contrast to this adverse effect, FRET can also be used to improve the spectral characteristics of fluorescent dyes and dye combinations, such as the tandem dyes in flow and image cytom- etry and FRET primers in DNA sequencing and the polymerase chain reaction. The driv- ing force in these applications is the use of single-wavelength excitation while providing various dye combinations with a wide range of Stokes shifts to make possible the simultane- ous detection of three or four fluorescent dyes. Combination of FRET with monoclonal anti- bodies has led to a boom in structural analysis of proteins in solution and also in biological membranes. Analysis based on functional het- erogeneity of leukocytes is accompanied by analysis based on specific expression of vari- ous cell-surface antigens. International work- shops assign a “cluster of differentiation” (CD) nomenclature to these antigens, based on re- activity with groups of monoclonal antibodies. Cell-surface mapping of CD molecules on im- munocompetent cells has attracted more and more interest in the last three decades. Exper- iments revealing the structure of these anti- gens have led to the discovery, among others, of the immune synapse (Bhatia et al., 2005; Cemerski and Shaw, 2006). With the help of FRET, molecular dimensions can be measured and determined in functioning, living cells, providing information that would be impossi- ble to obtain with other classical approaches— e.g., with X-ray crystallography. This unit describes the theory behind FRET, characterizes available parameters and instru- ments, discusses limitations, and provides a few examples of the application of FRET. THEORY OF FRET FRET was first observed by Perrin at the beginning of the 20th century, but it was Theodor F¨ orster who proposed a correct the- ory describing long-range dipole-dipole inter- actions between fluorescent molecules, more than 50 years ago (F¨ orster, 1946, 1948). He derived an equation that relates FRET effi- ciency to the spectroscopic parameters of fluo- rescent dyes. His ingenious discovery that flu- orescence dipole-dipole interaction depends, in addition to orientation and other spectro- scopic parameters, on the negative sixth power of the distance between the dipoles furnished one of the most sensitive methods for mea- suring atomic and molecular distances at the nanometer level. After the theoretical back- ground of the FRET process was illuminated, it took decades before FRET technology gained wide application in chemistry, biochemistry, and cell biology. FRET is a physical process in which energy is transferred from an excited donor molecule to an acceptor molecule by means of inter- molecular long-range dipole-dipole coupling. One of the most important factors influencing the strength of coupling is the distance be- tween the donor and acceptor molecules. En- ergy transfer occurs in the 1- to 10-nm distance range with measurable efficiency, and these distances correlate well with macromolecular dimensions (Stryer, 1978). Energy transfer is Contributed by J´ anos Sz¨ oll´ o´si, S´ andor Damjanovich, P´ eter Nagy, Gy ¨ orgy Vereb, and L´ aszl´ oM´ atyus Current Protocols in Cytometry (2006) 1.12.1-1.12.16 Copyright C 2006 by John Wiley & Sons, Inc. Flow Cytometry Instrumentation 1.12.1 Supplement 38
Transcript of Principles of resonance energy transfer
UNIT 1.12Principles of Resonance Energy Transfer
Molecular details of various biochemicaland biological processes can be investigatedand monitored in vitro and in vivo by variousfluorescent methods because of the inherentsensitivity, specificity, and temporal resolutionof fluorescence spectroscopy. The combina-tion of fluorescence spectroscopy with flowand image cytometry has provided a solid ba-sis for rapid and continuous development inthese technologies. In order to utilize thesetechniques properly, cytometrists must be fa-miliar with the working principles of the in-struments and also with the basic concepts offluorescence spectroscopy. This unit focuseson a special phenomenon of fluorescence spec-troscopy, namely fluorescence resonance en-ergy transfer (FRET). FRET is a radiationlessprocess in which energy is transferred froman excited donor to an acceptor molecule un-der favorable spectral and orientational con-ditions. These conditions will be discussed indetail below. FRET processes during fluores-cence measurements in flow and image cytom-etry can either compromise results or open newapplications for these techniques. In order todistinguish between the adverse and beneficialeffects of FRET, one must understand the theo-retical background of the phenomenon. Whenmultiple fluorescent probes are simultane-ously applied, the possible cross-talk betweenfluorescent dyes (e.g., FRET processes) shouldbe ruled out, or controlled if one wants toquantitate the cell-surface expression of var-ious antigens at the same time. In contrastto this adverse effect, FRET can also beused to improve the spectral characteristics offluorescent dyes and dye combinations, suchas the tandem dyes in flow and image cytom-etry and FRET primers in DNA sequencingand the polymerase chain reaction. The driv-ing force in these applications is the use ofsingle-wavelength excitation while providingvarious dye combinations with a wide range ofStokes shifts to make possible the simultane-ous detection of three or four fluorescent dyes.Combination of FRET with monoclonal anti-bodies has led to a boom in structural analysisof proteins in solution and also in biologicalmembranes. Analysis based on functional het-erogeneity of leukocytes is accompanied byanalysis based on specific expression of vari-ous cell-surface antigens. International work-
shops assign a “cluster of differentiation” (CD)nomenclature to these antigens, based on re-activity with groups of monoclonal antibodies.Cell-surface mapping of CD molecules on im-munocompetent cells has attracted more andmore interest in the last three decades. Exper-iments revealing the structure of these anti-gens have led to the discovery, among others,of the immune synapse (Bhatia et al., 2005;Cemerski and Shaw, 2006). With the help ofFRET, molecular dimensions can be measuredand determined in functioning, living cells,providing information that would be impossi-ble to obtain with other classical approaches—e.g., with X-ray crystallography.
This unit describes the theory behind FRET,characterizes available parameters and instru-ments, discusses limitations, and provides afew examples of the application of FRET.
THEORY OF FRETFRET was first observed by Perrin at the
beginning of the 20th century, but it wasTheodor Forster who proposed a correct the-ory describing long-range dipole-dipole inter-actions between fluorescent molecules, morethan 50 years ago (Forster, 1946, 1948). Hederived an equation that relates FRET effi-ciency to the spectroscopic parameters of fluo-rescent dyes. His ingenious discovery that flu-orescence dipole-dipole interaction depends,in addition to orientation and other spectro-scopic parameters, on the negative sixth powerof the distance between the dipoles furnishedone of the most sensitive methods for mea-suring atomic and molecular distances at thenanometer level. After the theoretical back-ground of the FRET process was illuminated, ittook decades before FRET technology gainedwide application in chemistry, biochemistry,and cell biology.
FRET is a physical process in which energyis transferred from an excited donor moleculeto an acceptor molecule by means of inter-molecular long-range dipole-dipole coupling.One of the most important factors influencingthe strength of coupling is the distance be-tween the donor and acceptor molecules. En-ergy transfer occurs in the 1- to 10-nm distancerange with measurable efficiency, and thesedistances correlate well with macromoleculardimensions (Stryer, 1978). Energy transfer is
Contributed by Janos Szollo si, Sandor Damjanovich, Peter Nagy, Gyorgy Vereb, and Laszlo MatyusCurrent Protocols in Cytometry (2006) 1.12.1-1.12.16Copyright C© 2006 by John Wiley & Sons, Inc.
Flow CytometryInstrumentation
1.12.1
Supplement 38
Principles ofResonance Energy
Transfer
1.12.2
Supplement 38 Current Protocols in Cytometry
nonradiative—i.e., the donor does not actuallyemit a photon and the acceptor does not ab-sorb a photon. The so-called “trivial” radiativeenergy transfer has very low probability at lowconcentrations (<10−6 M) of the fluorescentprobes.
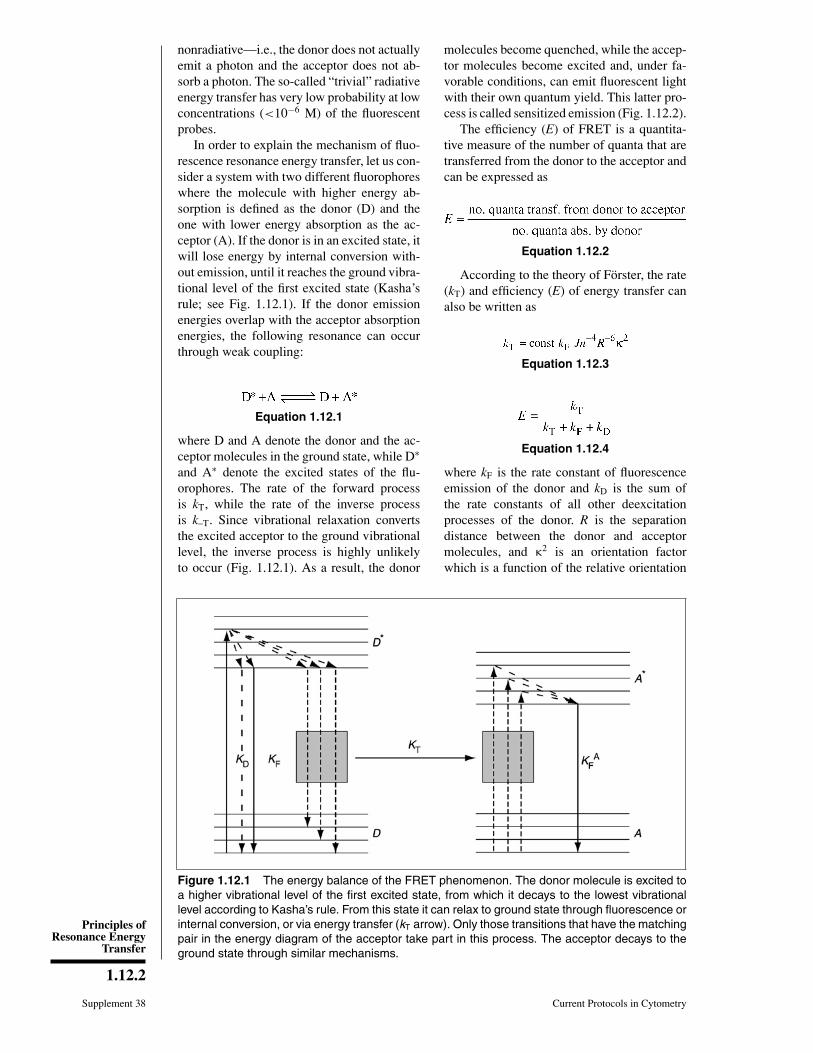
In order to explain the mechanism of fluo-rescence resonance energy transfer, let us con-sider a system with two different fluorophoreswhere the molecule with higher energy ab-sorption is defined as the donor (D) and theone with lower energy absorption as the ac-ceptor (A). If the donor is in an excited state, itwill lose energy by internal conversion with-out emission, until it reaches the ground vibra-tional level of the first excited state (Kasha’srule; see Fig. 1.12.1). If the donor emissionenergies overlap with the acceptor absorptionenergies, the following resonance can occurthrough weak coupling:
Equation 1.12.1
where D and A denote the donor and the ac-ceptor molecules in the ground state, while D∗
and A∗ denote the excited states of the flu-orophores. The rate of the forward processis kT, while the rate of the inverse processis k–T. Since vibrational relaxation convertsthe excited acceptor to the ground vibrationallevel, the inverse process is highly unlikelyto occur (Fig. 1.12.1). As a result, the donor
molecules become quenched, while the accep-tor molecules become excited and, under fa-vorable conditions, can emit fluorescent lightwith their own quantum yield. This latter pro-cess is called sensitized emission (Fig. 1.12.2).
The efficiency (E) of FRET is a quantita-tive measure of the number of quanta that aretransferred from the donor to the acceptor andcan be expressed as
Equation 1.12.2
According to the theory of Forster, the rate(kT) and efficiency (E) of energy transfer canalso be written as
Equation 1.12.3
Equation 1.12.4
where kF is the rate constant of fluorescenceemission of the donor and kD is the sum ofthe rate constants of all other deexcitationprocesses of the donor. R is the separationdistance between the donor and acceptormolecules, and κ2 is an orientation factorwhich is a function of the relative orientation
Figure 1.12.1 The energy balance of the FRET phenomenon. The donor molecule is excited toa higher vibrational level of the first excited state, from which it decays to the lowest vibrationallevel according to Kasha’s rule. From this state it can relax to ground state through fluorescence orinternal conversion, or via energy transfer (kT arrow). Only those transitions that have the matchingpair in the energy diagram of the acceptor take part in this process. The acceptor decays to theground state through similar mechanisms.
Flow CytometryInstrumentation
1.12.3
Current Protocols in Cytometry Supplement 38
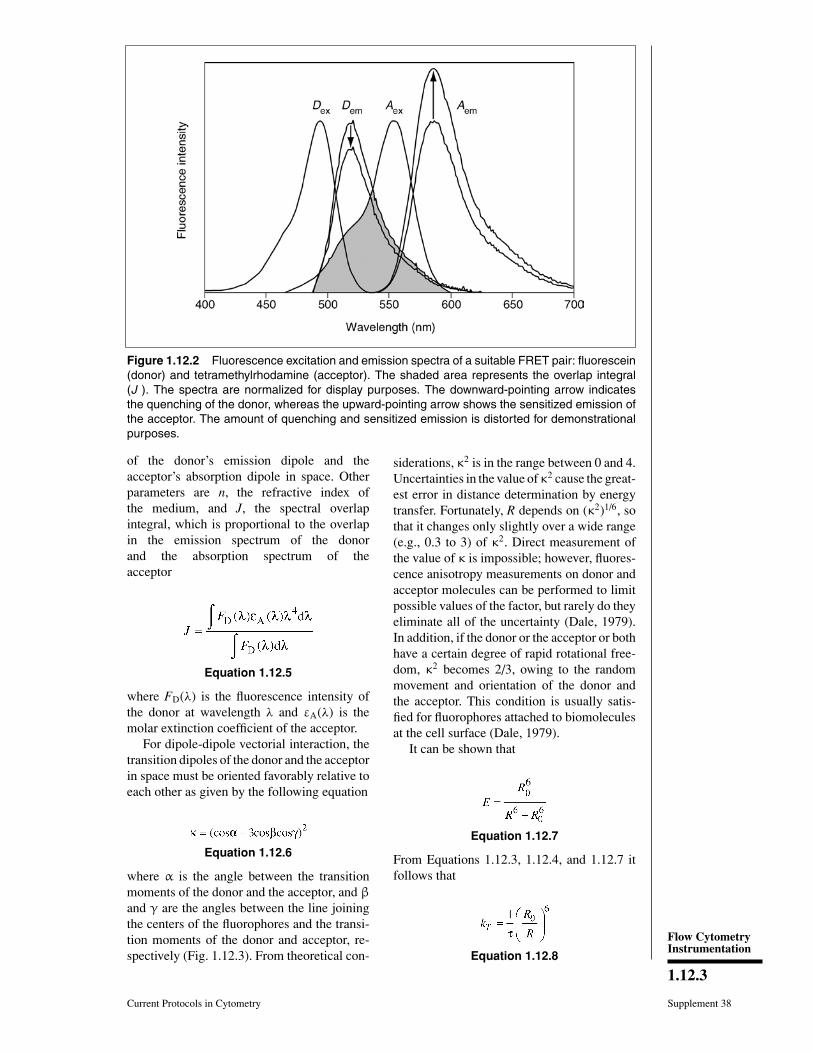
Figure 1.12.2 Fluorescence excitation and emission spectra of a suitable FRET pair: fluorescein(donor) and tetramethylrhodamine (acceptor). The shaded area represents the overlap integral(J ). The spectra are normalized for display purposes. The downward-pointing arrow indicatesthe quenching of the donor, whereas the upward-pointing arrow shows the sensitized emission ofthe acceptor. The amount of quenching and sensitized emission is distorted for demonstrationalpurposes.
of the donor’s emission dipole and theacceptor’s absorption dipole in space. Otherparameters are n, the refractive index ofthe medium, and J, the spectral overlapintegral, which is proportional to the overlapin the emission spectrum of the donorand the absorption spectrum of theacceptor
Equation 1.12.5
where FD(λ) is the fluorescence intensity ofthe donor at wavelength λ and εA(λ) is themolar extinction coefficient of the acceptor.
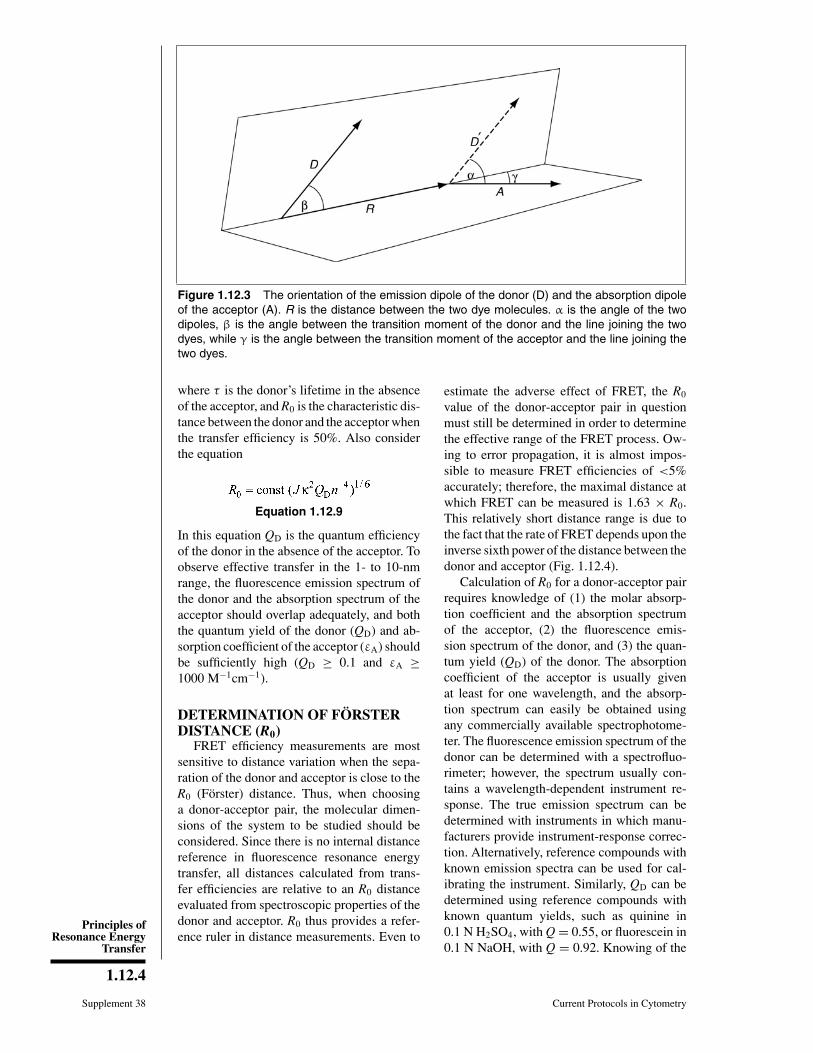
For dipole-dipole vectorial interaction, thetransition dipoles of the donor and the acceptorin space must be oriented favorably relative toeach other as given by the following equation
Equation 1.12.6
where α is the angle between the transitionmoments of the donor and the acceptor, and β
and γ are the angles between the line joiningthe centers of the fluorophores and the transi-tion moments of the donor and acceptor, re-spectively (Fig. 1.12.3). From theoretical con-
siderations, κ2 is in the range between 0 and 4.Uncertainties in the value of κ2 cause the great-est error in distance determination by energytransfer. Fortunately, R depends on (κ2)1/6, sothat it changes only slightly over a wide range(e.g., 0.3 to 3) of κ2. Direct measurement ofthe value of κ is impossible; however, fluores-cence anisotropy measurements on donor andacceptor molecules can be performed to limitpossible values of the factor, but rarely do theyeliminate all of the uncertainty (Dale, 1979).In addition, if the donor or the acceptor or bothhave a certain degree of rapid rotational free-dom, κ2 becomes 2/3, owing to the randommovement and orientation of the donor andthe acceptor. This condition is usually satis-fied for fluorophores attached to biomoleculesat the cell surface (Dale, 1979).
It can be shown that
Equation 1.12.7
From Equations 1.12.3, 1.12.4, and 1.12.7 itfollows that
Equation 1.12.8
Principles ofResonance Energy
Transfer
1.12.4
Supplement 38 Current Protocols in Cytometry
Figure 1.12.3 The orientation of the emission dipole of the donor (D) and the absorption dipoleof the acceptor (A). R is the distance between the two dye molecules. α is the angle of the twodipoles, β is the angle between the transition moment of the donor and the line joining the twodyes, while γ is the angle between the transition moment of the acceptor and the line joining thetwo dyes.
where τ is the donor’s lifetime in the absenceof the acceptor, and R0 is the characteristic dis-tance between the donor and the acceptor whenthe transfer efficiency is 50%. Also considerthe equation
Equation 1.12.9
In this equation QD is the quantum efficiencyof the donor in the absence of the acceptor. Toobserve effective transfer in the 1- to 10-nmrange, the fluorescence emission spectrum ofthe donor and the absorption spectrum of theacceptor should overlap adequately, and boththe quantum yield of the donor (QD) and ab-sorption coefficient of the acceptor (εA) shouldbe sufficiently high (QD ≥ 0.1 and εA ≥1000 M−1cm−1).
DETERMINATION OF FORSTERDISTANCE (R0)
FRET efficiency measurements are mostsensitive to distance variation when the sepa-ration of the donor and acceptor is close to theR0 (Forster) distance. Thus, when choosinga donor-acceptor pair, the molecular dimen-sions of the system to be studied should beconsidered. Since there is no internal distancereference in fluorescence resonance energytransfer, all distances calculated from trans-fer efficiencies are relative to an R0 distanceevaluated from spectroscopic properties of thedonor and acceptor. R0 thus provides a refer-ence ruler in distance measurements. Even to
estimate the adverse effect of FRET, the R0
value of the donor-acceptor pair in questionmust still be determined in order to determinethe effective range of the FRET process. Ow-ing to error propagation, it is almost impos-sible to measure FRET efficiencies of <5%accurately; therefore, the maximal distance atwhich FRET can be measured is 1.63 × R0.This relatively short distance range is due tothe fact that the rate of FRET depends upon theinverse sixth power of the distance between thedonor and acceptor (Fig. 1.12.4).
Calculation of R0 for a donor-acceptor pairrequires knowledge of (1) the molar absorp-tion coefficient and the absorption spectrumof the acceptor, (2) the fluorescence emis-sion spectrum of the donor, and (3) the quan-tum yield (QD) of the donor. The absorptioncoefficient of the acceptor is usually givenat least for one wavelength, and the absorp-tion spectrum can easily be obtained usingany commercially available spectrophotome-ter. The fluorescence emission spectrum of thedonor can be determined with a spectrofluo-rimeter; however, the spectrum usually con-tains a wavelength-dependent instrument re-sponse. The true emission spectrum can bedetermined with instruments in which manu-facturers provide instrument-response correc-tion. Alternatively, reference compounds withknown emission spectra can be used for cal-ibrating the instrument. Similarly, QD can bedetermined using reference compounds withknown quantum yields, such as quinine in0.1 N H2SO4, with Q = 0.55, or fluorescein in0.1 N NaOH, with Q = 0.92. Knowing of the

Flow CytometryInstrumentation
1.12.5
Current Protocols in Cytometry Supplement 38
Figure 1.12.4 Distance dependence of the energy transfer efficiency. Distances are expressedin R0 units. The shaded area shows the useful distance range, where the energy transfer efficiencyis between 0.95 and 0.05, meaning (0.61 × R0) to (1.63 × R0). Note that the curve is asymmetrical.
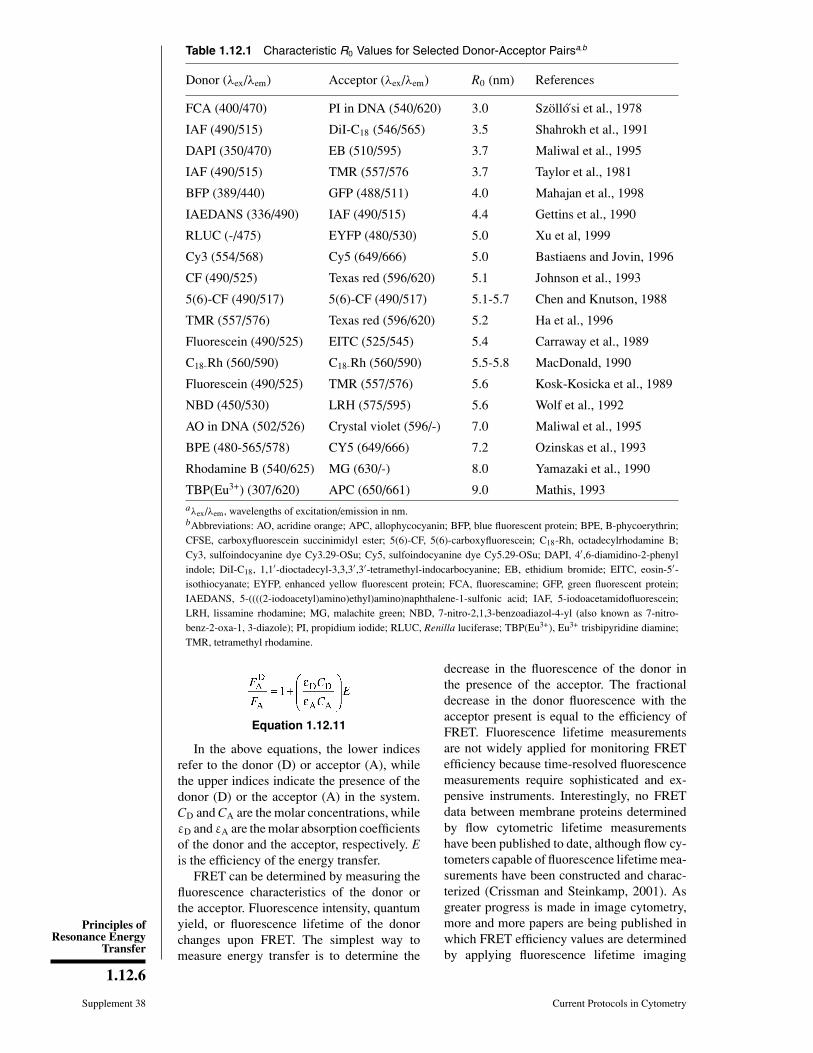
absorption spectrum of the acceptor and thetrue emission spectrum of the donor, the over-lap integral (J ) can be calculated accordingto Equation 1.12.5. After J and QD have beendetermined, R0 can be calculated, assumingn = 1.33 for aqueous solution and κ2 = 2/3 forrandom dipole orientation, according to Equa-tion 1.12.9. Since quantum yield and spectralshape may be environment sensitive, R0 dis-tances may vary as solution conditions change.A selected list of R0 distances for donor-acceptor pairs applied in flow and image cyto-metric measurements is shown in Table 1.12.1.A comprehensive and useful list of R0 valuesfor over 70 donor-acceptor pairs is providedby Wu and Brand (1994). The largest R0 valuereported for a single donor-acceptor pair is8.0 nm for the rhodamine B–malachite greendye pair (Yamazaki et al., 1990). The use ofmolecules that have clusters of acceptors withhigh molar absorption coefficient for each ac-ceptor can extend the R0 value. Along this line,Mathis reported an exceptionally large R0 of9.0 nm using europium cryptate as donor andallophycocyanin as acceptor (Mathis, 1993).When applying phycobilin proteins, it shouldbe kept in mind that these molecules have
bulky dimensions, which can interfere withthe original goal, i.e., with accurate distancemeasurements. For those taking interest in R0
values for various green fluorescent protein(GFP) analogs, an accurate and comprehensiveanalysis of green fluorescent protein pairs isgiven in Patterson et al. (2000). This paper alsoprovides R0 values for possible homo-transfers(i.e., FRET between spectroscopically identi-cal molecules).
HOW TO MEASURE FRETEFFICIENCY
The energy transfer efficiency, as followsfrom the above formulas, can be determinedin a number of different ways. Since energyis transferred from the excited donor to theacceptor, the lifetime (τ ), quantum efficiency(Q), and fluorescence intensity (F) of the donordecrease, if the acceptor is present (Equation1.12.10). As a consequence, the fluorescenceintensity of the acceptor increases (sensitiza-tion) if the donor is present (Equation 1.12.11).
Equation 1.12.10
Principles ofResonance Energy
Transfer
1.12.6
Supplement 38 Current Protocols in Cytometry
Table 1.12.1 Characteristic R0 Values for Selected Donor-Acceptor Pairsa,b
Donor (λex/λem) Acceptor (λex/λem) R0 (nm) References
FCA (400/470) PI in DNA (540/620) 3.0 Szollo si et al., 1978
IAF (490/515) DiI-C18 (546/565) 3.5 Shahrokh et al., 1991
DAPI (350/470) EB (510/595) 3.7 Maliwal et al., 1995
IAF (490/515) TMR (557/576 3.7 Taylor et al., 1981
BFP (389/440) GFP (488/511) 4.0 Mahajan et al., 1998
IAEDANS (336/490) IAF (490/515) 4.4 Gettins et al., 1990
RLUC (-/475) EYFP (480/530) 5.0 Xu et al, 1999
Cy3 (554/568) Cy5 (649/666) 5.0 Bastiaens and Jovin, 1996
CF (490/525) Texas red (596/620) 5.1 Johnson et al., 1993
5(6)-CF (490/517) 5(6)-CF (490/517) 5.1-5.7 Chen and Knutson, 1988
TMR (557/576) Texas red (596/620) 5.2 Ha et al., 1996
Fluorescein (490/525) EITC (525/545) 5.4 Carraway et al., 1989
C18-Rh (560/590) C18-Rh (560/590) 5.5-5.8 MacDonald, 1990
Fluorescein (490/525) TMR (557/576) 5.6 Kosk-Kosicka et al., 1989
NBD (450/530) LRH (575/595) 5.6 Wolf et al., 1992
AO in DNA (502/526) Crystal violet (596/-) 7.0 Maliwal et al., 1995
BPE (480-565/578) CY5 (649/666) 7.2 Ozinskas et al., 1993
Rhodamine B (540/625) MG (630/-) 8.0 Yamazaki et al., 1990
TBP(Eu3+) (307/620) APC (650/661) 9.0 Mathis, 1993aλex/λem, wavelengths of excitation/emission in nm.bAbbreviations: AO, acridine orange; APC, allophycocyanin; BFP, blue fluorescent protein; BPE, B-phycoerythrin;CFSE, carboxyfluorescein succinimidyl ester; 5(6)-CF, 5(6)-carboxyfluorescein; C18-Rh, octadecylrhodamine B;Cy3, sulfoindocyanine dye Cy3.29-OSu; Cy5, sulfoindocyanine dye Cy5.29-OSu; DAPI, 4′,6-diamidino-2-phenylindole; DiI-C18, 1,1′-dioctadecyl-3,3,3′,3′-tetramethyl-indocarbocyanine; EB, ethidium bromide; EITC, eosin-5′-isothiocyanate; EYFP, enhanced yellow fluorescent protein; FCA, fluorescamine; GFP, green fluorescent protein;IAEDANS, 5-((((2-iodoacetyl)amino)ethyl)amino)naphthalene-1-sulfonic acid; IAF, 5-iodoacetamidofluorescein;LRH, lissamine rhodamine; MG, malachite green; NBD, 7-nitro-2,1,3-benzoadiazol-4-yl (also known as 7-nitro-benz-2-oxa-1, 3-diazole); PI, propidium iodide; RLUC, Renilla luciferase; TBP(Eu3+), Eu3+ trisbipyridine diamine;TMR, tetramethyl rhodamine.
Equation 1.12.11
In the above equations, the lower indicesrefer to the donor (D) or acceptor (A), whilethe upper indices indicate the presence of thedonor (D) or the acceptor (A) in the system.CD and CA are the molar concentrations, whileεD and εA are the molar absorption coefficientsof the donor and the acceptor, respectively. Eis the efficiency of the energy transfer.
FRET can be determined by measuring thefluorescence characteristics of the donor orthe acceptor. Fluorescence intensity, quantumyield, or fluorescence lifetime of the donorchanges upon FRET. The simplest way tomeasure energy transfer is to determine the
decrease in the fluorescence of the donor inthe presence of the acceptor. The fractionaldecrease in the donor fluorescence with theacceptor present is equal to the efficiency ofFRET. Fluorescence lifetime measurementsare not widely applied for monitoring FRETefficiency because time-resolved fluorescencemeasurements require sophisticated and ex-pensive instruments. Interestingly, no FRETdata between membrane proteins determinedby flow cytometric lifetime measurementshave been published to date, although flow cy-tometers capable of fluorescence lifetime mea-surements have been constructed and charac-terized (Crissman and Steinkamp, 2001). Asgreater progress is made in image cytometry,more and more papers are being published inwhich FRET efficiency values are determinedby applying fluorescence lifetime imaging
Flow CytometryInstrumentation
1.12.7
Current Protocols in Cytometry Supplement 38
(FLIM) microscopy (Wallrabe and Periasamy,2005; Waharte et al., 2006).
Although it is not necessary to have afluorescent acceptor, the observation of theincreased emission of the acceptor is an im-portant confirmation of energy transfer, be-cause it arises only from FRET, whereasdonor quenching can arise from several triv-ial sources. In an ideal case, where a systemis excited at the excitation maximum of thedonor and the fluorescence detected at theemission maximum of the acceptor, we candetect fluorescence only if both donor and ac-ceptor molecules are present and there is FRETbetween them. (Donor-only and acceptor-onlysamples will not produce measurable fluo-rescence intensities under these ideal condi-tions.) Generally, the donor has a tail in theemission spectrum contributing to the fluores-cence intensities at the emission maximum ofthe acceptor. In addition, most acceptors havesome absorption at the excitation wavelengthof the donor. Hence, the calculation of en-ergy transfer efficiency is more complicatedowing to these correction factors. The spec-tral overlap between the donor’s fluorescenceand the acceptor’s own fluorescence should betaken into account when calculating the FRETefficiency.
In addition to methods involving thequenching of the donor and the sensitiza-tion of the acceptor, FRET efficiency canbe determined using time-resolved or steady-state anisotropy measurements. These mea-surements entail quantitation of the anisotropyincrease of the donor in the presence of anacceptor dye due to the decreased fluores-cence lifetime of the donor (Matko et al., 1993;Damjanovich et al., 1997). On the other hand,anisotropy may decrease when FRET occursbetween the same molecules in identical en-vironments (homo-transfer), possibly due toa change in fluorophore orientation, whereasthere is no change in the fluorescence inten-sity or the lifetime of the dyes. The efficiencyof homo-transfer can be determined only withfluorescence anisotropy measurements. Utiliz-ing the so-called energy-migration FRET, thedegree of homo-association of visible fluores-cent proteins was determined without the ne-cessity of two independent transfections in thesame cell (Lidke et al., 2003). With the helpof a more elaborate version of flow cytomet-ric fluorescence homo-transfer measurements,the existence of receptor trimers on the cell sur-face of immunocompetent cells was detected(Bene et al., 2005).
Another possibility for determining the en-ergy transfer efficiency is based on the al-tered photobleaching rate of the donor in thepresence of acceptor. Although photobleach-ing should usually be minimized, it can insome cases actually be exploited to measureFRET efficiency. Photobleaching of the donoroccurs only when it is in the excited state; be-fore de-excitation occurs, there is some proba-bility that photobleaching will remove that flu-orophore from the excited state by destroyingits molecular structure. The excited-state reac-tions are instrumental in photobleaching pro-cesses. The donor photobleaches more slowlyif energy transfer to an acceptor occurs, sinceenergy transfer is an alternative pathway forthe excited-state relaxation. It can be shownthat the fractional increase in the photobleach-ing time constant is the same as the fractionaldecrease in the fluorescence lifetime of thedonor (Jovin and Arndt-Jovin, 1989a, b). Theefficiency of FRET can be determined by com-paring the bleaching rate of the donor in thepresence and absence of acceptor (Jovin andArndt-Jovin, 1989a,b; Nagy et al., 1998a,b). Acomputer program for analyzing photobleach-ing FRET image series has been publishedrecently (Szentesi et al., 2005). A new vari-ant of donor-photobleaching FRET has beenintroduced where the efficiency of FRET isdetermined from the kinetics of the photo-bleaching of the acceptor, which has beensensitized by a donor. This technique uti-lizes dye combinations in which the accep-tor bleaches much faster than the donor, evenwhen only the donor is excited. This donor-mediated acceptor-photobleaching FRET al-lows the measurement of FRET efficiencieswith exceptional accuracy (Mekler, 1997).
In another approach, the acceptor is directlyexcited and bleached at its absorption maxi-mum, and the intensity of the donor is com-pared before and after the photodestructionof the acceptor (Bastiaens et al., 1996; Verebet al., 1997). A detailed description of the ac-ceptor photobleaching method has been givenelsewhere (Vereb et al., 2004), and a proto-col for FRET measurements utilizing acceptorphotobleaching is described in UNIT 12.7. Thelist of methods for FRET measurement dis-cussed above is far from complete. For imag-ing FRET, 22 different methods have beendescribed recently. Jares-Erijman and Jovin(2003) have created an impressive catalog ofFRET microscopy methods in their review,providing a systematic classification andcharacterization of 22 possible approaches. In

Principles ofResonance Energy
Transfer
1.12.8
Supplement 38 Current Protocols in Cytometry
addition to the FRET methods used already,several new and exotic strategies have beensuggested with potential for implementation influorescence microscopy (Jares-Erijman andJovin, 2003).
While there are currently 22 different waysof assessing FRET, the literature includesmany papers applying a 23rd method, whichis a simple but highly incorrect and unreli-able approach based on exciting the donor anddetecting acceptor emission. So-called FRETimages are taken using filter sets specificallysold for this purpose. The assumption madeis that the stronger the signal, the more effi-cient FRET is at a given pixel. However, thesignal obtained in the acceptor channel uponexcitation at the donor absorption maximumwill actually consist of four components, vary-ing individually from pixel to pixel: the quan-tity of the donor fluorophore and its emissionleaking into the acceptor channel; the quan-tity of the acceptor fluorophore and its emis-sion upon excitation in the donor absorptionregime; the efficiency of FRET convolved withthe quantity of both the donor and acceptor flu-orophores; and, finally, the autofluorescence.It follows that labeling conditions, expressionof protein targets for donor and acceptor la-beling (or donor and acceptor fluorescent pro-teins), and fluorescent metabolites producedby the cell will greatly influence the signalregistered from each cell and even from eachpixel, making the FRET signal only a compo-nent of what is detected, and with a contribu-tion weight that is difficult to determine. It isthus not sufficient to take such FRET images,but donor and acceptor signals that would bepresent in the absence of FRET must also beestimated by acquiring images with donor- andacceptor-specific fluorescence filter sets, anddetermining the spectral spillage factors (andpossibly also the autofluorescence contribu-tion) from single-labeled samples (see proto-cols described in UNIT 12.8).
CHOICE OF INSTRUMENT FORFRET MEASUREMENT
When designing a FRET study, the firstquestion to consider is whether the biolog-ical problems are best addressed by spec-trofluorimetry, flow cytometry, or imaging mi-croscopy. Spectrofluorimetry is often mucheasier to implement than quantitative flow cy-tometry or imaging-microscopy studies, de-spite the advances in instrumentation and soft-ware. Usually, donor quenching or acceptorsensitization is measured in this approach. Inspectrofluorimetry, the cells can be either in
suspension or attached to a coverslip held atan angle to the incident beam. Average fluores-cence intensity for thousands of cells can berapidly measured by these methods. A com-plete set of samples for FRET efficiency de-termination should contain at least one unla-beled, two single-labeled (one labeled withdonor only, and one labeled with acceptoronly), and one double-labeled sample (labeledwith donor and acceptor simultaneously). Themeasured fluorescence intensities must be cor-rected for light scattering and autofluorescenceusing the unlabeled sample. At the same time,the fluorescence intensities should be normal-ized to the same donor and acceptor concentra-tion. For both corrections, very accurate sam-ple preparation is required; cell concentrationshould be carefully controlled. Another pos-sible source of error is the contribution to thespecific fluorescence signal from unbound flu-orophores and cell debris. This is very difficult,if not impossible, to control, especially if thefluorescent label has a low binding constant.Multiple washings decrease the contribution offree fluorophores to the fluorescence intensity,but unavoidably increase the amount of cell de-bris. Another problem is that some cells maybecome extremely bright during fluorescentlabeling (e.g., dead cells in some immunoflu-orescence experiments). Some potential prob-lems occurring in spectrofluorimetry could beless serious in flow cytometry or microscopy.Distortion caused by dead cells, free dye, ordebris can be avoided, and uncertainties in cellconcentration do not cause a problem owing tothe cell-by-cell type measurement. These areeasily excluded in analyses of flow cytome-try data or in selecting fields for analysis bymicroscopy. A detailed comparison of energytransfer measurements in spectrofluorimetryand flow cytometry is described in several ref-erences (Matyus, 1992; Szollo si et al, 1994;Tron, 1994).
Flow cytometry can provide quantitativemeasurements on thousands of individualcells, allowing convenient determination of thedistribution of fluorescence intensities and en-ergy transfer values in a population. To achievea high rate of analysis, cells should be in sus-pension, meaning that cells growing attachedto a substrate should be detached mechanicallyor enzymatically for flow cytometric measure-ments. These treatments can interfere with thecellular parameters to be investigated. In flowcytometry, donor quenching cannot be usedto determine transfer efficiency on a cell-by-cell basis; because the expression levels ofvarious proteins have broad distributions, the

Flow CytometryInstrumentation
1.12.9
Current Protocols in Cytometry Supplement 38
donor intensity cannot be measured in the ab-sence and presence of acceptor on the samecell. (For mean values, donor quenching canalso be used as in spectrofluorimetric mea-surements to provide a single mean FRET ef-ficiency value for the whole cell population.)Sensitized emission of the acceptor, however,can be applied to calculate the transfer effi-ciency on a cell-by-cell basis, since with mul-tiple excitations the direct and sensitized emis-sions of the acceptor can be determined onthe same cell. As with spectrofluorimetry, foursamples are needed for FRET measurements.Unlabeled cells are used for autofluorescencecorrection, cells labeled with donor only fordetermining spectral overlap correction factor,and cells labeled with acceptor only for deter-mining the correction factor for direct excita-tion of the acceptor; cells labeled with bothdonor and acceptor are used for calculationof the FRET efficiency on a cell-by-cell ba-sis. In flow cytometric measurements, thereare three unknown fluorescence parameters:the unquenched donor intensity, the nonen-hanced acceptor intensity, and the efficiencyof FRET. In order to determine these param-eters, three independent signals for the samecell must be measured. The three independentfluorescence signals differ from each other inthe wavelength of the excitation or the spectralrange of the detection. Because of the differentwavelength dependence of the absorption andemission spectra of the donor and acceptor, thecorrected transfer signal can be evaluated fromthe three independently measured parameters,using correction factors determined with thehelp of single-labeled cells. In this case, bio-logical variations in the level of expression ofthe investigated protein has no effect on the ac-curacy of the FRET measurement. The gener-ated distribution histogram of FRET efficiencywill provide information about the heterogene-ity of the cell population with high statisticalaccuracy. If there is a change in the FRET ef-ficiency upon stimulus, flow cytometry cannotprovide information about the time course of aresponse in a single cell, but it can easily mea-sure the time course of response in a popula-tion of cells. In addition, flow cytometry givesonly one value for one cell; the intracellularheterogeneity in FRET efficiency cannot bestudied. In many studies, however, the abilityof flow cytometry to measure the propertiesof thousands of cells may be more valuablethan detailed information on a smaller numberof cells obtained by microscopy. Technical de-tails of how to perform flow cytometric energytransfer measurements can be found in several
recent reviews (Szollo si and Damjanovich,1994; Damjanovich et al., 1997; Szollo siet al., 1998; Szollo si et al., 2002; Szollo siand Alexander, 2003; Vereb et al., 2004;Matyus et al., 2006). Originally, the auto-fluorescence correction for flow cytometricFRET calculations was performed by subtract-ing a constant value calculated as the averageof autofluorescence intensities of the entire cellpopulation from the appropriate fluorescencesignals. It should be noted that there is usu-ally a good correlation between the autofluo-rescence detected in different regions of thespectrum in most cell types, so a more elab-orate correction method is also possible. Inthis method, another independent parametershould be detected, a fourth fluorescence in-tensity, and this way autofluorescence can becalculated on a cell-by-cell basis (Sebestyenet al., 2002). Naturally, high autofluorescencemay decrease the precision of measurements,and therefore it is better to choose fluorophorepairs with long-wavelength emission charac-teristics, right-shifted from the maximum ofthe autofluorescence spectrum. Critical param-eters influencing the selection of the rightFRET donor-acceptor pairs have been dis-cussed recently (Horvath et al., 2005). A ver-satile computer program for calculating FRETvalues from flow cytometric data is available(Szentesi et al., 2004). This program is capa-ble of incorporating autofluorescence correc-tion on a cell-by-cell basis.
The obvious advantage of image cytome-try is that it yields spatial information at thesingle-cell level regarding FRET efficiency,a type of information that is not availablethrough other approaches. Resolution of sub-cellular structures, and analysis of cells in situ,can be achieved only by imaging microscopy.Similarly, time-course measurements in singlecells can be obtained only by microscopy. Lowstatistical accuracy is one of the disadvantagesof image cytometric FRET measurements,since only a relatively small number of cellscan be investigated within a reasonable timeframe. The availability of modern digital imag-ing cameras, as well as associated computerhardware and software, has resulted in rapidlyincreasing interest in FRET microscopy. Thesedevelopments have enabled an easy and rapidmeasurement of fluorescence over 106 pix-els of an image simultaneously. One ofthe approaches frequently applied in FRETmeasurements is donor photobleaching. A ma-jor advantage of the photobleaching methodis that it uses only a single excitation andemission wavelength (Vereb et al., 2004). The
Principles ofResonance Energy
Transfer
1.12.10
Supplement 38 Current Protocols in Cytometry
bleaching rate of the donor in the absence ofacceptor should be measured under the sameexperimental conditions as the double-labeledsample, because bleaching rates can varysignificantly in different environments. If theefficiency of FRET is relatively low, if theacceptor is nonfluorescent, or if rapid pho-tobleaching prevents measurements of stablefluorescence intensities, the photobleachingmethod may provide the only practical way tomeasure FRET efficiency. Because of the de-structive nature of the photobleaching method,kinetic measurements of FRET efficiency can-not be performed on the same cell by thismethod. Intensity-based measurements usingthe sensitization of acceptor fluorescence canalso be used to determine the FRET efficiencyon a pixel-by-pixel basis without losing tem-poral resolution. A thorough comparative anal-ysis of intensity- and donor photobleaching–based FRET microscopic analyses has beencarried out (Nagy et al., 1998b). It has beenshown that the photobleaching-based methodinherently overestimates the FRET efficiency,because this technique weights the FRET ef-ficiency values in single pixels, which is dif-ferent from the intensity-based energy transferapproach.
Another disadvantage of donor photo-bleaching FRET is that for calculating FRETefficiency in the double-labeled image on apixel-by-pixel basis, the photobleaching rateaveraged from a donor-only sample must beused. Differences in sample preparation andhandling can result in changes in oxygena-tion and temperature, yielding photobleachingrates that are not comparable across samples.However, combining the method with accep-tor photobleaching can improve on this situ-ation in two ways. The procedure to followis to prepare double-labeled samples, select aregion of interest (ROI), and perform the ac-ceptor photobleaching on a part (usually half)of this ROI. This allows calculation of FRETfrom donor dequenching in this half, which isone advantage of combining the two methods.As an added bonus, in the other half of the ROI,the same calculations should yield a FRET his-togram centered at zero, or otherwise enablecorrection for unwanted donor bleaching dur-ing the protocol. The next step is to performthe usual donor photobleaching routine andcalculations on the whole ROI. In the acceptor-bleached part, the procedure yields a distribu-tion of the donor photobleaching times withoutacceptor, which can be used for calculating theFRET image in the double-labeled other half.Although, even in this approach, an average
bleaching time is used for normalization, atleast donor bleaching curves in the presenceand absence of the acceptor are obtained inthe same sample, ROI, and experiment.
It has already been mentioned that the avail-ability of instruments for time-resolved FRETstudies is limited because they are sophis-ticated and expensive. However, significantprogress has resulted from the latest devel-opments in this field. Time-resolved fluores-cence measurements not only provide an easyway to obtain averaged lifetimes without theexact knowledge of donor concentration, but,more importantly, also give detailed structuralinformation about the donor-acceptor system.The past decade has witnessed tremendousimprovements in this area. Picosecond andnanosecond technologies are considered ma-ture now, and commercial instruments areavailable. Fluorescence decays can be detectedby either the single-photon-counting or thephase-modulation method. Both approacheshave been successfully applied in spectrofluo-rimetry; interesting results are summarized inWu and Brand (1994). Although fluorescence-lifetime measurement based on phase modu-lation has been available in flow cytometry foryears (Steinkamp, 1993), no FRET applicationhas been published so far.
Like spectrofluorimetry, both time-gatedand phase-modulated lifetime measurementscan be implemented in imaging microscopy.Several nanosecond time-resolved fluores-cence images of a sample can be obtained atvarious delays after pulsed laser excitationof the microscope’s entire field of view.Lifetimes are calculated on a pixel-by-pixelbasis from these time-resolved images, andthe spatial variation of the lifetimes is thendisplayed. This technique has been used todetect endosome-endosome fusion in singlecells (Oida et al., 1993). The other approach,using modulated illumination in microscopy,resulted in successful application of FRETstudies for monitoring oligomerization of epi-dermal growth factor receptors (Gadella andJovin, 1995). A point calibration procedure toreveal minimum resolved differences (Hanleyet al., 2001), as well as a method to avoidphotobleaching-related artifacts during phase-modulation lifetime imaging (van Munsterand Gadella, 2004), has also been elaborated.Combination of lifetime imaging with pro-grammable array microscopy (PAM) hasfurther improved the quality of lifetimeimages of samples with multiple fluorophoresor spatially varying fluorescence resonanceenergy transfer efficiency by suppressing

Flow CytometryInstrumentation
1.12.11
Current Protocols in Cytometry Supplement 38
out-of-focus light contributions (Hanley et al.,2005).
One of the latest developments influorescence microscopy is spectral imaging,which allows the creation of increasingly com-plex multicolored samples. Recent improve-ments in confocal laser scanning microscopycombine sophisticated hardware to obtainfluorescence emission spectra on a single-pixelbasis with a mathematical procedure called“linear unmixing” of fluorescence signals.Spectral imaging microscopy has demon-strated substantial superiority over the con-ventional band-pass filter detection systemswith respect to detection accuracy and scale ofapplicable dye combinations. Spectral imag-ing has also provided new possibilities forvisualizing macromolecular interactions orconformational changes that manifest in al-tered FRET efficiency (Ecker et al., 2004;Zimmerman, 2005).
LIMITATIONS OF FRET STUDIESFor proper application of FRET, it is im-
portant to understand its limitations as wellas its advantages. The most serious drawbackof FRET is its modest capacity for determin-ing absolute distances. It is quite good at de-termining relative distances, namely, whethertwo points are getting closer or farther apartupon a stimulus. This is caused by the factthat FRET efficiency depends not only on thedistance between the donor and acceptor, butalso on the relative orientation (κ2) of the dyes(see discussion of Theory of FRET). Evenwhen measuring relative distances, care mustbe taken to ensure that the orientation factor(κ2) does not change between the two sys-tems under comparison. In addition, the sys-tem can be more complicated when a ran-dom conjugation of the fluorescent label isapplied. For example, in a substantial frac-tion of experiments, fluorophore-conjugatedmonoclonal antibodies are used to label cell-surface antigens. According to common prac-tice, covalent coupling reactions frequentlyoccur between isothiocyanate or succinimidylester reactive groups of appropriate derivativesof the fluorophore and the ε-amino groupsof lysine side chains of immunoglobulins.The number of exposed lysine side chains ofcomparable reactivity found in an antibodymolecule usually exceeds one. Each antibodymolecule may carry several fluorophores, andthe labeled lysine side chains of the individualantibody molecules may be different. Reactivegroups are often attached to the fluorophoresvia an n-carbon linker, with n typically ranging
from 2 to 12. The linker often allows relativelyfree rotation of the dye, which minimizes un-certainty of κ2. It also minimizes quenchingof the dye by the protein, especially if it isdue to a hydrophobic environment. The linker,however, has the disadvantage of adding un-certainty to the exact position of the dye. Ingeneral, the minimal length that allows freerotation of the dyes and does not cause quench-ing is around six carbon atoms. More specificlabeling of antibodies or antibody fragmentscan be achieved if SH groups are targeted withmaleimide derivatives of fluorophores insteadof lysine side chains. In this case, however, thetargeted SH group should be introduced intothe Fab fragments by genetic modification. Ge-netically engineered Fab′ antibody fragmentsare designed so that an SH group is introducedon the opposite side of the molecule farthestfrom the epitope-recognizing portion. Com-prehensive FRET studies utilizing combina-tions of noncompeting Fab′ fragments recog-nizing different epitopes of ErbB2 receptor ty-rosine kinase have provided an epitope map ofthe ErbB2 molecule (Bagossi et al., 2005).
Another problem is that FRET has verysharp distance dependence. For this reason,it is difficult to measure relatively long dis-tances because the signal gets very weak. Atthe same time, energy transfer tends to be allor none; if the donor and acceptor are within adistance of 1.63 × R0, there is energy transfer,but if they are farther apart, energy is trans-ferred with very little efficiency.
When studying cells labeled with donor-and acceptor-conjugated monoclonal antibod-ies, averaging is performed at different lev-els. The first averaging follows from the ran-dom conjugation of the fluorescent label. Anadditional averaging is brought about by theeventual distribution of separation distancesbetween the epitopes labeled with monoclonalantibodies. This multiple averaging, an in-evitable consequence of the nonuniform sto-ichiometry, explains why the goal of FRETmeasurements is different in purified molec-ular systems and on the surface of the cyto-plasmic membrane. In the former case, FRETefficiency values can be converted into ab-solute distances. Calculation of distance re-lationships from energy-transfer efficienciesis easy in the case of a single-donor/single-acceptor system if the localization and relativeorientation of the fluorophores are known.However, if cell-membrane components areinvestigated, a two-dimensional restriction ap-plies to the labeled molecules. Analytical so-lutions for randomly distributed donor and
Principles ofResonance Energy
Transfer
1.12.12
Supplement 38 Current Protocols in Cytometry
acceptor molecules and numerical solutionsfor nonrandom distributions have been elabo-rated by different groups (Wolber and Hudson,1979; Dewey and Hammes, 1980; Snyder andFreire, 1982). In order to differentiate betweenrandom and nonrandom distributions, energytransfer efficiencies have to be determined atdifferent acceptor concentrations.
APPLICATIONSFRET is widely utilized for a variety of ap-
plications. In one series of studies, FRET isused to obtain structural information that isotherwise difficult to obtain. The major ad-vantage of FRET for structural studies is thatowing to the specificity of labeling the ex-perimental object can be investigated in situand/or in vivo with little or no interferencefrom the rest of the system. Even complexand heterogeneous systems can be studied thisway. In cytometry, usually cells or cell-likeobjects, such as ghosts and liposomes, are in-vestigated. FRET applications for liposomefusion or for localization of drugs and mem-brane proteins in liposomes are reviewed bySzollo si and Damjanovich (1994). Several re-views are available concerning FRET mea-surements in biological membranes (Szollo siand Damjanovich, 1994; Wu and Brand, 1994;Damjanovich et al., 1997; Szollo si et al., 1998;Szollo si et al., 2002; Szollo si and Alexander,2003; Vereb et al., 2004; Matyus et al., 2006).These reviews deal with associations of vari-ous membrane proteins, structures of recep-tors, and conformational changes in trans-membrane proteins evoked by ligands andmembrane potential changes.
In another series of studies, FRET is used asa tool for ensuring high sensitivity of variousbiological assays. The biotechnological appli-cations of FRET are summarized in reviewsthat thoroughly discuss working principles ofFRET-based enzyme assays and immunoas-says, as well as design of tandem dyes andFRET primers for DNA analysis (Clegg, 1995;Szollo si et al., 1998).
A detailed list of possible FRET applica-tions is beyond the scope of this unit. Readersare referred to the reviews cited above to finduseful examples of FRET studies. Here, a fewexamples are mentioned, demonstrating newand interesting applications of FRET.
Photobleaching FRET measurements havebeen used to monitor intercellular proximityin order to reveal spatial organization of in-teracting proteins in the contact region of twocells participating in cytolysis (Bacso et al.,1996). Interactions between CD8 and major
histocompatibility complex (MHC) class Imolecules and between leukocyte functionantigen 1 (LFA-1) and intercellular adhe-sion molecule 1 (ICAM-1) have been investi-gated using donor (fluorescein)– and acceptor(rhodamine)–labeled monoclonal antibodies.The geometry of the orientation of these pro-teins based on FRET data was consistent withthe observed blocking effects of monoclonalantibodies on the cytolytic activity of killer Tlymphocytes (Bacso et al., 1996).
A steadily expanding new field in FRETstudies is based on the application of green flu-orescent protein (GFP) as a sensitive reporter.When two differently colored mutants of GFP,such as enhanced green fluorescent protein(EGFP) and enhanced blue fluorescent protein(EBFP), are covalently linked to different in-tracellular proteins, and these proteins interactwith each other, FRET can be detected. Us-ing this approach, spatial and temporal inter-action of Bcl-2 and Bax proteins was studied atthe single-cell level by monitoring FRET effi-ciency (Mahajan et al., 1998). Developmentof different fluorescent protein variants byrandom mutagenesis has overcome severalobstacles such as slow maturation rates, dimer-ization or oligomerization, sensitivity to envi-ronmental ion concentrations, or photobleach-ing. These improved fluorescent proteins serveas a basis for creating FRET-based intra-cellular sensors for monitoring cellular con-centrations of calcium (Evanko and Hay-don, 2005), phosphoinositides (Cicchetti et al.,2004), cGMP (Nikolaev et al., 2006), andmembrane potential (Sakai et al., 2001), tomention just a few cellular parameters. Re-cently, a novel dual FRET fluorescent indicatorprobe has been developed to monitor the activ-ity of two distinct caspases simultaneously inliving cells (Wu et al., 2006). Quantitation ofFRET efficiency calculated between GFP vari-ants often poses a problem in flow cytometricmeasurements. Therefore, chimeras in whichthe cyan fluorescent protein was separated byamino acid linkers of different lengths from theyellow fluorescent protein were generated andused to calibrate flow cytometric FRET mea-surements. Calibration was achieved by cal-culating the FRET efficiency in two differentways and minimizing the squared differencesbetween the two results by changing the appro-priate spectral parameter (Nagy et al., 2005).
A new extension of the application of GFPproteins in FRET studies has been achieved bycombining GFP with luciferase. Biolumines-cent resonance energy transfer (BRET) usesbioluminescent luciferase that is genetically
Flow CytometryInstrumentation
1.12.13
Current Protocols in Cytometry Supplement 38
fused to one candidate protein and a GFPmutant, enhanced yellow fluorescent protein(EYFP), fused to another protein of interest.If the two fusion proteins come close enough,resonance energy transfer can occur, resultingin changes in the spectrum of the biolumines-cent emission. The BRET method was used toassay interactions between proteins encodedby the circadian clock genes kaiA and kaiB incyanobacterium (Xu et al., 1999). The BRETtechnique has been applied to detect the as-sociation state of the melanocortin receptor.Toward this end, melanocortin receptors werefused with either modified GFP or Renillaluciferase at their C terminus. BRET assaysrevealed that the melanocortin 4 receptor ex-ists as a constitutive homodimer, which is notregulated by peptide interaction (Nickolls andMaki, 2006).
A single-molecule fluorescence resonanceenergy transfer (FRET) method has beendeveloped to observe the activation of thesmall G protein Ras at the level of individ-ual molecules. Human epidermoid mouth car-cinoma (KB) cells expressing H- or K-Rasfused with YFP (donor) were microinjectedwith the fluorescent GTP analog Bodipy TR-GTP (acceptor), and the epidermal growthfactor–induced binding of Bodipy TR-GTP toYFP-(H or K)-Ras was monitored by single-molecule FRET using total internal reflectionmicroscopy. On activation, Ras diffusion wasgreatly suppressed/immobilized, suggestingthe formation of large, activated Ras-signalingcomplexes. These complexes may work asplatforms for transducing the Ras signal to ef-fector molecules, further suggesting that Rassignal transduction requires more than simplecollisions with effector molecules (Murakoshiet al., 2004).
FRET data and molecular modeling can becombined to provide hints about possible ori-entation and arrangements of membrane pro-teins. Recently a model has been proposedfor the nearly full-length ErbB2 using FRETmeasurements, crystal structures of the ErbB2ectodomain, and molecular modeling meth-ods. Using fluorescently labeled Fab′ antibodyfragments recognizing different epitopes of theErbB2 receptor tyrosine kinase, the proximityof the ErbB2 ectodomain to the cell mem-brane has been determined by FRET mea-surements. Interestingly, in this case the rateof FRET efficiency depends upon the fourthpower of the distance between the epitopeand the plane of the membrane, because ofthe two-dimensional restriction of the acceptormolecule incorporated into the cell membrane.
It has been concluded that ErbB2 moleculesform homodimers, and the modeling has re-vealed a structure possessing three potentialinteracting regions (Bagossi et al., 2005).
Since Forster first established the analy-sis of FRET phenomena in 1946, the num-ber of applications of FRET has increasedenormously in various fields of research andbiotechnology. Technical improvements inspectrofluorimeters, flow cytometers, and mi-croscopes, as well as introduction of new fluo-rescent probes with better photophysical prop-erties, open up new areas for employing theFRET method innovatively and successfully.
LITERATURE CITEDBacso, Z., Bene, L., Bodnar, A., Matko, J., and
Damjanovich, S. 1996. A photobleaching en-ergy transfer analysis of CD8/MHC-I and LFA-1/ICAM-1 interactions in CTL-target cell con-jugates. Immunol. Lett. 54:151-156.
Bagossi, P., Horvath, G., Vereb, G., Szollo si, J., andTozser, J. 2005. Molecular modeling of nearlyfull-length ErbB2 receptor. Biophys. J. 88:1354-1363.
Bastiaens, P.I.H. and Jovin, T.M. 1996. Mi-crospectroscopic imaging tracks the intracellu-lar processing of a signal transduction protein:Fluorescent-labeled protein kinase CβI. Proc.Natl. Acad. Sci. U.S.A. 93:8407-8412.
Bastiaens, P.I.H., Majoul, I.V., Verveer, P. J., Soling,H.-D., and Jovin, T.M. 1996. Imaging the intra-cellular trafficking and state of the AB5 qua-ternary structure of cholera toxin. EMBO J.15:4246-4253.
Bene, L., Szollo si, J., Szentesi, G., Damjanovich,L., Gaspar, R. Jr., Waldmann, T.A., andDamjanovich, S. 2005. Detection of receptortrimers on the cell surface by flow cytometric flu-orescence energy homotransfer measurements.Biochim. Biophys. Acta. 1744:176-198.
Bhatia, S., Edidin, M., Almo, S.C., andNathenson, S.G. 2005. Different cell surfaceoligomeric states of B7-1 and B7-2: Implica-tions for signaling. Proc. Natl. Acad. Sci. U.S.A.102:15569-15574.
Carraway, K.L. III., Koland, J.G., and Cerione, R.A.1989. Visualization of epidermal growth fac-tor (EGF) receptor aggregation in plasma mem-branes by fluorescence resonance energy trans-fer. J. Biol. Chem. 264:8699-8707.
Cemerski, S. and Shaw, A. 2006. Immune synapsesin T-cell activation. Curr. Opin. Immunol.18:298-304.
Chen, R.F. and Knutson, J.R. 1988. Mechanismof fluorescence concentration quenching of car-boxyfluorescein in liposomes: Energy transfer tononfluorescent dimers. Anal. Biochem. 172:61-77.
Cicchetti, G., Biernacki, M., Farquharson, J., andAllen, P.G. 2004. A ratiometric expressibleFRET sensor for phosphoinositides displays asignal change in highly dynamic membrane
Principles ofResonance Energy
Transfer
1.12.14
Supplement 38 Current Protocols in Cytometry
structures in fibroblasts. Biochemistry 43:1939-1949.
Clegg, R.M. 1995. Fluorescence resonance energytransfer. Curr. Opin. Biotechnol. 6:103-110.
Crissman, H.A. and Steinkamp, J.A. 2001. Flowcytometric fluorescence lifetime measurements.Methods Cell Biol. 63:131-148.
Dale, R.E., Eisinger, J., and Blumberg, W.E. 1979.The orientational freedom of molecular probes:The orientation factor in intramolecular energytransfer. Biophys. J. 26:161-194.
Damjanovich, S., Gaspar, R., and Pieri, C. 1997.Dynamic receptor superstructure at plasmamembrane. Q. Rev. Biophys. 30:67-106.
Dewey, T.G. and Hammes, G.G. 1980. Calcula-tion of fluorescence resonance energy transferon surfaces. Biophys. J. 32:1023-1035.
Ecker, R.C., de Martin, R., Steiner, G.E., andSchmid, J.A. 2004. Application of spectralimaging microscopy in cytomics and fluores-cence resonance energy transfer (FRET) analy-sis. Cytometry A 59:172-181.
Evanko, D.S. and Haydon, P.G. 2005. Elimina-tion of environmental sensitivity in a cameleonFRET-based calcium sensor via replacement ofthe acceptor with Venus. Cell Calcium 37:341-348.
Forster, T. 1946. Energiewanderung und Fluo-reszenz. Naturwissenschaften 6:166-175.
Forster, T. 1948. Zwischenmolekulare Energiewan-derung und Fluoreszenz . Ann. Phys. (Leipzig)2:55-75.
Gadella, T.W.J. and Jovin, T.M. 1995. Oligomer-ization of epidermal growth factor receptors onA431 cells studied by time-resolved fluores-cence imaging microscopy: A stereochemicalmodel for tyrosine kinase receptor activation. J.Cell Biol. 129:1543-1558.
Gettins, P., Beechem, J.M., Crews, B.C., andCunningham, L.W. 1990. Separation and lo-calization of the four cysteine-949 residuesin human β2-macroglobulin using fluores-cence energy transfer. Biochemistry 29:7747-7753.
Ha, T., Enderle, Th., Odletree, D.F., Chemla, D.S.,Selvin, P.R., and Weiss, S. 1996. Probing theinteraction between two single molecules: Flu-orescence resonance energy transfer between asingle donor and a single acceptor. Proc. Natl.Acad. Sci. U.S.A. 93:6264-6268.
Hanley, Q.S., Subramaniam, V., Arndt-Jovin, D.J.,and Jovin, T.M. 2001. Fluorescence lifetimeimaging: Multi-point calibration, minimum re-solvable differences, and artifact suppression.Cytometry 43:248-260.
Hanley, Q.S., Lidke, K.A., Heintzmann, R., Arndt-Jovin, D.J., and Jovin, T.M. 2005. Fluorescencelifetime imaging in an optically sectioning pro-grammable array microscope (PAM). CytometryA 67:112-118.
Horvath, G., Petras, M., Szentesi, G., Fabian, A.,Park, J.W., Vereb, G., and Szollo si, J. 2005. Se-lecting the right fluorophores and flow cytome-
ter for fluorescence resonance energy transfermeasurements. Cytometry A 65:148-157.
Jares-Erijman, E.A. and Jovin, T.M. 2003. FRETimaging. Nat. Biotechnol. 21:1387-1395.
Johnson, D.A., Leathers, V.L., Martinez, A.M.,Walsh, D.A., and Fletcher, W.H. 1993. Fluo-rescence resonance energy transfer within a het-erochromatic cAMP-dependent protein kinaseholoenzyme under equilibrium conditions: Newinsights into the conformational changes that re-sult in cAMP-dependent activation. Biochem-istry 32:6402-6410.
Jovin, T.M. and Arndt-Jovin, D.J. 1989a. Lumi-nescence digital imaging microscopy. Ann. Rev.Biophys. Biophys. Chem. 18:271-308.
Jovin, T.M. and Arndt-Jovin, D.J. 1989b. FRETmicroscopy: Digital imaging of fluorescenceresonance energy transfer: Application in cellbiology. In Microspectrofluorometry of SingleLiving Cells (E. Kohen, J.S. Ploem, and J.G.Hirschberg, eds.) pp. 99-117. Academic Press,Orlando.
Kosk-Kosicka, D., Bzdega, T., and Wawrynow,A. 1989. Fluorescence energy transfer stud-ies of purified erythrocyte Ca2+-ATPase Ca2+-regulated activation by oligomerization. J.Biol.Chem. 264:19495-19499.
Lidke, D.S., Nagy, P., Barisas, B.G., Heintzmann,R., Post, J.N., Lidke, K.A., Clayton, A.H.,Arndt-Jovin, D.J., and Jovin, T.M. 2003. Imag-ing molecular interactions in cells by dynamicand static fluorescence anisotropy (rFLIM andemFRET). Biochem. Soc. Trans. 31:1020-1027.
MacDonald, R.I. 1990. Characteristics of self-quenching of the fluorescence of lipid-conjugated rhodamine in membranes. J. Biol.Chem. 265:13533-13539.
Mahajan, N.P., Linder, K., Berry, G., Gordon, G.W.,Heim, R., and Herman, B. 1998. Bcl-2 and Baxinteractions in mitochondria probed with greenfluorescent protein and fluorescence resonanceenergy transfer. Nature Biotechnol. 6:547-552.
Maliwal, B.P., Kusba, J., and Lakowicz, J.R. 1995.Fluorescence energy transfer in one dimension:Frequency-domain fluorescence study ofDNA-fluorophore complexes. Biopolymers35:245-255.
Mathis, G. 1993. Rare earth cryptates and homo-geneous fluoroimmunoassays with human sera.Clin. Chem. 39:1953-1959.
Matko, J., Jenei, A., Matyus, L., Ameloot, M., andDamjanovich, S. 1993. Mapping of cell sur-face protein-patterns by combined fluorescenceanisotropy and energy transfer measurements. J.Photochem. Photobiol. B Biol. 19:69-73.
Matyus, L. 1992. Fluorescence resonance energytransfer measurements on cell surfaces: A spec-troscopic tool for determining protein interac-tions . J. Photochem. Photobiol. B Biol. 12:323-337.
Matyus, L., Szollo si, J., and Jenei, A. 2006. Steady-state fluorescence quenching applications forstudying protein structure and dynamics. J. Pho-tochem. Photobiol. B. 83:223-236.
Flow CytometryInstrumentation
1.12.15
Current Protocols in Cytometry Supplement 38
Mekler, V.M. 1997. A photochemical technique toenhance sensitivity of detection of fluorescenceresonance energy transfer. Photochem. Photo-biol. 59:615-620.
Murakoshi, H., Iino, R., Kobayashi, T., Fujiwara,T., Ohshima, C., Yoshimura, A., and Kusumi,A. 2004. Single-molecule imaging analysis ofRas activation in living cells. Proc. Natl. Acad.Sci. U.S.A. 101:7317-7322.
Nagy, P., Bene, L., Balazs, M., Hyun, W.C.,Lockett, S.J., Chiang, N.Y., Waldman, F., Feuer-stein, B.G., Damjanovich, S., and Szollo si, J.1998a. EGF-induced redistribution of erbB2 onbreast tumor cells: Flow and image cytomet-ric energy transfer measurements. Cytometry32:120-131.
Nagy, P., Vamosi, G., Bodnar, A., Lockett, S.J.,and Szollo si, J. 1998b. Intensity-based energytransfer measurements in digital imaging mi-croscopy. Eur. Biophys. J. 27:377-389.
Nagy, P., Bene, L., Hyun, W.C., Vereb, G., Braun,M., Antz, C., Paysan, J., Damjanovich, S., Park,J.W., and Szollo si, J. 2005. Novel calibrationmethod for flow cytometric fluorescence res-onance energy transfer measurements betweenvisible fluorescent proteins. Cytometry A 67:86-96.
Nickolls, S.A. and Maki, R.A. 2006. Dimerizationof the melanocortin 4 receptor: A study using bi-oluminescence resonance energy transfer. Pep-tides 27:380-387.
Nikolaev, V.O., Gambaryan, S., and Lohse, M.J.2006. Fluorescent sensors for rapid monitoringof intracellular cGMP. Nat. Methods 3:23-25.
Oida, T., Sako, Y., and Kusumi, A. 1993. Fluores-cence lifetime imaging microscopy (flimscopy):Methodology development and application tostudies of endosome fusion in single cells. Bio-phys. J. 64:676-685.
Ozinskas, A.J., Malak, H., Joshi, J., Szmacinski,H., Britz, J., Thompson, R.B., Koen, P.A.,and Lakowicz, J.R. 1993. Homogeneous modelimmunoassay of thyroxin by phase modula-tion fluorescence spectroscopy. Anal. Biochem.213:264-270.
Patterson, G.H., Piston, D.W., and Barisas, B.G.2000. Forster distances between green fluores-cent protein pairs. Anal. Biochem. 284:438-440.
Sakai, R., Repunte-Canonigo, V., Raj, C.D., andKnopfel, T. 2001. Design and characterizationof a DNA-encoded, voltage-sensitive fluores-cent protein. Eur. J. Neurosci. 13:2314-2318.
Sebestyen, Z., Nagy, P., Horvath, G, Vamosi, G.,Debets, R., Gratama, J.W., Alexander, D.R.,and Szollo si, J. 2002. Long wavelength fluo-rophores and cell-by-cell correction for autoflu-orescence significantly improves the accuracy offlow cytometric energy transfer measurementson a dual-laser benchtop flow cytometer. Cy-tometry 48:124-35.
Shahrokh, Z., Verkman, A.S., and Shohet, S.B.1991. Distance between skeletal protein 4.1and the erythrocyte membrane bilayer measuredby resonance energy transfer. J. Biol. Chem.266:12082-12089.
Snyder, B. and Freire, E. 1982. Fluorescence energytransfer in two dimensions: A numeric solutionfor random and nonrandom distributions. Bio-phys. J. 40:137-148.
Steinkamp, J.A. and Crissman, H.A. 1993. Resolu-tion of fluorescence signals from cells labeledwith fluorochromes having different lifetimesby phase-sensitive flow cytometry. Cytometry14:210-216.
Stryer, L. 1978. Fluorescence energy transfer asa spectroscopic ruler. Annu. Rev. Biochem.47:819-846.
Szentesi, G., Horvath, G., Bori, I., Vamosi, G.,Szollo si, J., Gaspar, R., Damjanovich, S., Jenei,A., and Matyus, L. 2004. Computer programfor determining fluorescence resonance energytransfer efficiency from flow cytometric data ona cell-by-cell basis. Comput. Methods ProgramsBiomed. 75:201-211.
Szentesi, G., Vereb, G., Horvath, G., Bodnar, A.,Fabian, A., Matko, J., Gaspar, R., Damjanovich,S., Matyus, L., and Jenei, A. 2005. Computerprogram for analyzing donor photobleachingFRET image series. Cytometry 67A:119-128.
Szollo si, J. and Alexander, D.R. 2003. The applica-tion of fluorescence resonance energy transfer tothe investigation of phosphatases. Methods En-zymol. 366:203-224.
Szollo si, J. and Damjanovich, S. 1994. Mappingof membrane structures by energy transfer mea-surements. In Mobility and Proximity in Biolog-ical Membranes. (S. Damjanovich, J. Szollo si,L. Tron, and M. Edidin, eds.) pp. 49-108. CRCPress, Boca Raton, Fla.
Szollo si, J., Nagy, P., Sebestyen, Z., Damjanovich,S., Park, J.W., and Matyus, L. 2002. Applica-tions of fluorescence resonance energy transferfor mapping biological membranes. J. Biotech-nol. 82:251-266.
Szollo si, J., Szabo, G., Somogyi, B., andDamjanovich, S. 1978. Simultaneous fluo-rescence labeling of human fibroblast cellswith fluorescamine and propidium iodide. ActaBiochem. Biophys. Acad. Sci. Hung. 13:63-66.
Szollo si, J., Tron, L., Damjanovich, S., Helliwell,S.H., Arndt-Jovin, D.J., and Jovin, T.M. 1984.Fluorescence energy transfer measurements oncell surfaces: A critical comparison of steady-state and flow cytometric methods. Cytometry5:210-216.
Szollo si, J., Damjanovich, S., and Matyus, L. 1998.Application of fluorescence resonance energytransfer in the clinical laboratory: Routine andresearch. Cytometry 34:159-179.
Taylor, D.L., Reidler, J., Spudich, J.A., and Stryer,L. 1981. Detection of actin assembly by fluo-rescence energy transfer. J. Cell. Biol. 89:362-367.
Tron, L. 1994. Experimental methods to measurefluorescence resonance energy transfer. In Mo-bility and Proximity in Biological Membranes.(S. Damjanovich, J. Szollo si, L. Tron, and M.Edidin, eds.) pp. 1-47. CRC Press, Boca Raton,Fla.
Principles ofResonance Energy
Transfer
1.12.16
Supplement 38 Current Protocols in Cytometry
van Munster, E.B. and Gadella, T.W. Jr. 2004. Sup-pression of photobleaching-induced artifacts infrequency-domain FLIM by permutation of therecording order. Cytometry A 58:185-194.
Vereb, G., Meyer, C.K., and Jovin, T.M. 1997.Novel microscope-based approaches for the in-vestigation of protein-protein interactions insignal transduction. In Interacting Protein Do-mains: Their Role in Signal and Energy Trans-duction. Volume 102, NATO ASI Series, H:CellBiology. (L.M.G. Heilmeyer, ed.) pp. 49-52.Springer Verlag, Berlin.
Vereb, G., Matko, J., and Szollo si, J. 2004. Cytom-etry of fluorescence resonance energy transfer.Methods Cell Biol. 75:105-152.
Waharte, F., Spriet, C., and Heliot, L. 2006. Setupand characterization of a multiphoton FLIMinstrument for protein-protein interaction mea-surements in living cells. Cytometry A. 69:299-306.
Wallrabe, H. and Periasamy, A. 2005. Imagingprotein molecules using FRET and FLIM mi-croscopy. Curr. Opin. Biotechnol. 16:19-27.
Wolber, P.K. and Hudson, B.S. 1979. An analyticsolution to the Forster energy transfer problemin two dimensions. Biophys. J. 28:197-210.
Wolf, D.E., Winiski, A.P., Ting, A.E., Bocian, K.M.,and Pagano, R.E. 1992. Determination of thetransbilayer distribution of fluorescent lipid ana-
logues by nonradiative fluorescence resonanceenergy transfer. Biochemistry 31:2865-2873.
Wu, P. and Brand, L. 1994. Resonance energy trans-fer: Methods and applications. Anal. Biochem.218:1-13.
Wu, X., Simone, J., Hewgill, D., Siegel, R., Lipsky,P.E., and He, L. 2006. Measurement of two cas-pase activities simultaneously in living cells bya novel dual FRET fluorescent indicator probe.Cytometry A 69:477-486.
Xu, Y., Piston, D.W., and Johnson, C.H. 1999.A bioluminescence resonance energy transfer(BRET) system: Application to interacting cir-cadian clock proteins. Proc. Natl. Acad. Sci.U.S.A. 96:151-156.
Yamazaki, I., Tamai, N., and Yamazaki, T. 1990.Electronic excitation transfer in organizedmolecular assemblies. J. Phys. Chem. 94:516-525.
Zimmermann, T. 2005. Spectral imaging and linearunmixing in light microscopy. Adv. Biochem.Eng. Biotechnol. 95:245-265.
Contributed by Janos Szollo si, SandorDamjanovich, Peter Nagy, GyorgyVereb, and Laszlo Matyus
University Medical School of DebrecenDebrecen, Hungary
The authors wish to acknowledge support by the Hungarian Academy of Sciences (grantnumbers: OTKA F049025, T043509, T043061, K626h8), the Peter Pazmany Program forRegional Knowledge Centers (contract number: 06/2004), and the European Commission(contract numbers: LSHC-CT-2005-018914, LSHB-CT-2004-503467, MRTN-CT-2005-019h81, MRTN-CT-2006-035946-2).