Asian Resonance - Social Research Foundation
113
ISSN No. 0976-8602 VOL.-1 * ISSUE-2*April-2012 Asian Resonance Contents 1. Financial Inclusions in India: The Role of Human Resource 01 (Challenges & Possibilities) Rachna Saxena - Bareilly & Garima Jain - Mumbai 2. Retailing Scenario in India: with Special Reference to FDI 08 Preeti Gupta, Mathura 3. Understanding Role of Relationship in Management for organizational 13 Effectiveness Ajay Bhadauria, Kanpur 4. Global Performance Management: The State of Global Art 20 Prabhat Dwivedi - Kanpur, Alka Dubey - Kanpur & Richa Tiwari - Unnao 5. Quality of Work Life as Related to Motivational Pattern of Employees in 27 Select Indian Organization Deepali Saxena - Kanpur 6. A Study of Masson's Slope in Dioxane - Propylene - Necarbonate Mixtures by 35 Magnetic Float Densitometer using Tetra -Alkylammonium Iodides at 25 0 R. N. Pathak - Lucknow & Archana Maurya - Unnao 7. Acid Deposition and Critical Load Analysis in Kanpur City, India 38 Rupali Dixit - Kanpur 8. Portrayal of Women in Literature 41 Anupama Deshraj - Amravati 9. Effect of Different Medicine in Reducing the Body Weight of Selected 45 Obese Adolescent Girls Mukta Vohra - Bhopal & Neelma Kunwar - Kanpur 10. Study on Preferencial Choice for Embellishment on Kurtas among Young Ladies 47 Sonali Saharia - Kanpur & Geeta Mathur - Kanpur 11. Some Factors Responsible for Heart Diseases 49 Swati Sachan - Bhopal, Neelma Kunwar - Kanpur & Divya Singh - Gorakhpur 12. Trickling Filter Process & Its Design for Industrial Use 52 Abhishek Arora - Kanpur 13. Construction of Linear Programme on Teaching Verb in English Grammar at 60 Junior High School Level Chandra Dev Yadav - Kanpur & Archana Charan - Gorakhpur 14. Effect of Computer Based Learning Using Method of Enquiry in Mathematics 64 Teaching in Senior Secondary Schools Ajay Kumar Singh - Gorakhpur
-
Upload
khangminh22 -
Category
Documents
-
view
1 -
download
0
Transcript of Asian Resonance - Social Research Foundation
ISSN No. 0976-8602 VOL.-1 * ISSUE-2*April-2012
Asian Resonance
Contents 1. Financial Inclusions in India: The Role of Human Resource 01
(Challenges & Possibilities)
Rachna Saxena - Bareilly & Garima Jain - Mumbai
2. Retailing Scenario in India: with Special Reference to FDI 08
Preeti Gupta, Mathura
3. Understanding Role of Relationship in Management for organizational 13
Effectiveness
Ajay Bhadauria, Kanpur
4. Global Performance Management: The State of Global Art 20
Prabhat Dwivedi - Kanpur, Alka Dubey - Kanpur & Richa Tiwari - Unnao
5. Quality of Work Life as Related to Motivational Pattern of Employees in 27
Select Indian Organization
Deepali Saxena - Kanpur
6. A Study of Masson's Slope in Dioxane - Propylene - Necarbonate Mixtures by 35
Magnetic Float Densitometer using Tetra -Alkylammonium Iodides at 250 R. N. Pathak - Lucknow & Archana Maurya - Unnao
7. Acid Deposition and Critical Load Analysis in Kanpur City, India 38 Rupali Dixit - Kanpur 8. Portrayal of Women in Literature 41 Anupama Deshraj - Amravati 9. Effect of Different Medicine in Reducing the Body Weight of Selected 45 Obese Adolescent Girls Mukta Vohra - Bhopal & Neelma Kunwar - Kanpur 10. Study on Preferencial Choice for Embellishment on Kurtas among Young Ladies 47 Sonali Saharia - Kanpur & Geeta Mathur - Kanpur 11. Some Factors Responsible for Heart Diseases 49 Swati Sachan - Bhopal, Neelma Kunwar - Kanpur & Divya Singh - Gorakhpur 12. Trickling Filter Process & Its Design for Industrial Use 52 Abhishek Arora - Kanpur 13. Construction of Linear Programme on Teaching Verb in English Grammar at 60 Junior High School Level Chandra Dev Yadav - Kanpur & Archana Charan - Gorakhpur 14. Effect of Computer Based Learning Using Method of Enquiry in Mathematics 64 Teaching in Senior Secondary Schools Ajay Kumar Singh - Gorakhpur

ISSN No. 0976-8602 VOL.-1 * ISSUE-2*April-2012
Asian Resonance
15. Information Communication Technologies in Teacher Education 68 Poonam Madan - Kanpur 16. Integrating ICTs in Teaching Learning: A Boom 72 Suman Lata - Kanpur 17. Teaching Learning Material for Inculcating Reading Habits in Children 76 Vivek Kumar - Allahabad & Trapti Tiwari - Kanpur 18. A New Dimension in Environmental Protection 80 Sangeeta Sachan - Kanpur & Aruna Kumari - Kanpur 19. Poverty Alleviation: Renewing Lives by Restoring Ecosystems 84 Laxmi Yadav - Mirzapur , Ramod K Maurya - Mirzapur & Surendra Sing Yadav - Mirzapur 20. A Sociological Study of Job Satisfaction and Commitment among Female 89 Teachers of Intermediate and Degree Colleges of Kanpur Ruchi Dubey - Kanpur & S. K. Tripathi - Kanpur 21. Causes of Son Preference in Rural Culture: A Sociological Study 93 (In Reference of Jaunpur District) Pawan K. Mishra - Kanpur & Rajesh K. Vishnoi - Kanpur 22. Application of Fluid Dynamics: Artificial Kidney 95 Reeta Dixit - Kanpur 23. Screening of Some Wheat Genotypes against Sitophilus 106 Priyanka Yadav & Naheed Sultana - Kanpur 24. Women Entrepreneurship: Problems & Solutions 108 Saba Yunus - Kanpur & Manorama Gupta - Kanpur

ISSN No. 0976-8602 VOL.-1 * ISSUE-2*April-2012
Asian Resonance
Financial Inclusion in India: The Role of Human Resource (Challenges and
Possibilities)
Rachna Saxena Assoc. Professor Management Department Invertis University Bareilly [email protected]
Garima Jain Faculty Trainee Academic Division Institute of Banking Personnel Selection Mumbai [email protected]
Abstract Rationale for Financial Inclusion in Indian economy in general and financial services in particular have made rapid strides in the recent past. However, a substantial section of the rural population, particularly the weaker sections and low-income groups continue to remain excluded from even the most basic opportunities and services provided by the financial sector. In order to address the issue of such financial exclusion in a holistic manner, it is necessary to make sure that a range of financial services is available to every individual in the country. Financial Exclusion is evident as it has been found that financial services are used only by a section of the population. There is demand for these services but they have not been provided. Mostly, the excluded regions are rural and poor, where people live in harsh climatic conditions and hence, consequently it is difficult to provide these financial services .This study is an attempt to evaluate the role of human resource in ensuring the effective installation of Financial Inclusion machinery.
Introduction
The Government of India‘s committee on financial inclusion defines financial inclusion as ―the process of ensuring access to financial services and timely and adequate credit where needed by vulnerable groups such as the weaker sections and low income groups at an affordable cost‖ (Rangarajan Committee, 2008). World Bank‘s literature suggests that the absence of financial inclusion keeps the disadvantaged and poor away from the economic growth. This is referred to as ‗financial exclusion‘. It prevents such individuals are prevented from gaining access to mainstream providers‘ appropriate, low-cost, and safe financial products and services (Mohan 2006; Conroy, 2005). Financial exclusion is significant in the creation and amplification of poverty. Hence, financial inclusion‘s growing importance has been recognized as a way to eliminate poverty and related problems across nations. Reasons for financial exclusion from the supply side include, among others ,distance from branch, branch hours, cumbersome documentation procedures, unsuitable products, language barriers, and staff attitudes. Some reasons from the demand side include lack of awareness, low incomes/assets, social exclusion, and illiteracy. All of these factors result in higher transaction costs for the seeker and provider, apart from procedural hassles. Fortunately, many countries have adopted broader policies to tackle the supply-side issues while working toward alleviating the demand-side constraints. Objectives
The proposal discusses financial inclusion policies and practices from HR perspective in India. It is an attempt to comprehend and distinguish the significance of financial inclusion in the context of a developing country like India wherein a large population is deprived of the financial services which are very much essential for overall economic growth of a country. Some of the salient objectives of the study are:

ISSN No. 0976-8602 VOL.-1 * ISSUE-2*April-2012
Asian Resonance
To evaluate the extent of financial exclusion in India in terms of:
Spatial distribution of banking services;
Number of deposit and credit accounts in scheduled commercial banks;
Population coverage per office region-wise; Methodology
This paper is based on review of available literature and secondary data. The main data sources for the study are World Bank, Consultative Group to Assist the Poor (CGAP). The study has mainly relied upon the data/indices provided in Financial Access 2010. The study attempts to realize the objectives by employing a well-structured and more appropriate methodology. The approach and data collection methods are explained below: The Approach Based on the well-accepted approaches for evaluation of the coverage of financial inclusion, the study employs the following criteria for understanding the extent of financial inclusion:
Analysis of the spatial distribution of banking services;
Analysis on the basis of the performance of rural credit;
Analysis on the basis of coverage of farmer households; and
Number of bank accounts (deposit and credit accounts) of households;
Regional distribution of banking services; Rationale for Financial Inclusion in Indian economy in general and financial services in particular have made rapid strides in the recent past. However, a substantial section of the rural population, particularly the weaker sections and low-income groups continue to remain excluded from even the most basic opportunities and services provided by the financial sector. In order to address the issue of such financial exclusion in a holistic manner, it is necessary to make sure that a range of financial services is available to every individual in the country. Financial Exclusion is evident as it has been found that financial services are used only by a section of the population. There is demand for these services but they have not been provided. Mostly, the excluded regions are rural and poor, where people live in harsh climatic conditions and hence, consequently it is difficult to provide these financial services. As per Census 2001, in India only 36% of the people use some kind of banking services. The Boston Consulting Group Report on financial inclusion in India also affirms that financial exclusion reflects the stark socioeconomic divide that characterizes the emerging markets (Sinha and Subramanian, 2007). Among the excluded are the huge groups of viable customers for the banking sector, whose potential has been greatly undermined .
Table 1
Further, It has been observed that the poor living in urban areas do not utilize the financial services as they find financial services are costly and thus are unaffordable. In view of this, even if financial services
are available, the high costs deter the poor from accessing them. Other Barriers It is observed in general that access to formal financial services also requires documents of proof regarding a person‘s identity, income, etc. Generally, the poor people do not have these documents and thus are excluded from these services. Also, these people may subscribe to the services initially, but may not use them subsequently as actively as others because of the factors such as long distance between the bank and their residence, poor infrastructure, etc. Behavioral Aspects Research in behavioral economics has revealed that many people are not contented with using formal financial services. The reasons of course are: difficulty in understanding the language, various documents and conditions that accompany the financial services. According to Thorat (2007), financial inclusion can be thought of in two ways.
One is financial exclusion from the payment system by way of not having access to a bank account and the second being exclusion from formal credit markets. Ever since the nationalization of major banks in 1969, we have seen a massive branch expansion in unbanked areas and stepping up of priority lending, thereby increasing the focus on establishing the basic right of every person to have access to affordable basic banking services. The above rationale explains why it is not enough to assume that financial inclusion will happen on its own. Structure of Indian Banking Indian banking industry today is quite robust and strong to be able to take on the challenges of achieving greater financial inclusion but are the personnel employed therein ready to contribute to the cause ? The ubiquitous challenge in Indian banking today is to extend banking services to the country‘s vast rural hinterland. This challenge is driven not merely by the desire/need for business growth, but also by the government‘s social mandate, which endeavors to get the unbanked people out of the clutches of traditional moneylenders and into the organized banking system.
There are close to 370 cooperative banks, 96 Regional Rural Banks (RRBs) with 14,000 branches in rural India, and in addition to that there are more than 25,000 farmers‘ clubs. More than 50% of the population, in spite of this huge network , do not have access to formal financial services. In the Annual Policy of the RBI for 2004-05, the Governor, Y V Reddy observed, ―There has been expansion, greater competition and diversification of ownership of banks leading to both enhanced efficiency and systemic resilience in the banking sector‖ (Reddy, 2005).
Financial Inclusion Approach RBI has recently issued guidelines to banks in India to provide ‗no frills‘ bank accounts as well as a general purpose credit card with no collateral requirements. These measures are intended to promote financial inclusion and have already been adopted by the Banking Codes and Standards Board of India. Prernasri (2008) states that there are two obstacles to greater financial inclusion.

ISSN No. 0976-8602 VOL.-1 * ISSUE-2*April-2012
Asian Resonance
The first is simply commercial. Transaction costs for in disbursing credit, which is essentially a high cost. Further, interest rates remained high in many parts of the country in the absence of structured credit assessments. The second is policy requirements, such as Know Your Customer (KYC) procedures that limit the reach of financial services due to documentary requirements. Mathew (2006) argues that financial inclusion is not an end in itself. According to him, having a bank account, or an insurance coverage, ipso facto, does not mean an enhancement in the economic position or well-being of a person. However, it acts as a facilitator. These observations definitely highlight two issues. First is to take care of the commercial hurdles like high cost of lending and higher rate of interest. But equally importantly the second obstacle in the name of human resource machinery working as implemental force that has not even gained proper attention also. The IUP Journal of Financial Economics, Vol. IX, No. 2, 2011(2008) suggested that rural branches of commercial banks must go beyond providing credit and provide extension services, including advice on farm-related activities. This is part of the seven-point action plan recommended by C Rangarajan to strengthen rural credit delivery system so as to achieve financial inclusion. One common measure of financial inclusion that is by and large accepted universally is the percentage of adult population having bank accounts. According to the available data on the number of savings banks, we note that on an all-India basis 59% of adult population has bank accounts. In other words, 41% of the population is unbanked. In rural areas, the coverage is found to be 39% as against 60% in urban areas. The unbanked population is largely observed in the northeastern and eastern regions .Table 2 illustrates that rural and semi-urban offices constitute a majority of the commercial bank offices in India. Rural bank offices as a percent of total have increased from 22 in 1969to 45 in 2005. It is observed that the share of deposits and credit in rural and semi-urban areas is on the decline. In contrast, the share in metropolitan areas is rising. Further, it can be noticed that the share of credit is lower than that of deposits in all regions, except metropolitan, implying that resources get intermediated in metropolitan areas.
Table 1.
Source: RBI; Census, 2001 Table 2: Extent of Financial Exclusion in Indian States Source
Mohan (2006)18 The IUP Journal of Financial Economics, Vol. IX, No. 2, 2011financial inclusion than their counterparts in other rural regions and all urban regions. In terms of number of credit accounts per 100 persons, the scenario is no different with the figure falling in all regions, except urban areas of southern and western regions in India. Analysis Based on the Performance of Rural Credit Banking system in India needs to adjust to the realities in the rural sector. There is evidence that they are finding it
difficult to do so. It is generally believed that agricultural credit to total GDP declines as the ratio of agricultural GDP to total GDP declines.
Table 2
Year Ag. Credit/Ag. GDP
Ag. Credit/Total GDP
Ag. Credit/Total Credit
1970s 5.4 2.1 10.8
1980s 8.3 2.6 8.5
1990s 7.4 2.0 6.4
1999-00 10.0 2.6 8.1
2000-01 11.3 2.8 7.9
2001-02 14.0 3.0 8.2
2002-03 16.6 3.1 7.7
2003-04 18.0 3.4 8.6
2004-05 25.0 4.4 9.8
2005-06 25.9 4.9 9.3
Spatial Distribution of Banking Services
Even after often emphasized policy intervention by the government and the concerted efforts of RBI and the public sector banks and a significant increase in the number of bank offices in the rural areas, the coverage was not adequate for the large population living in the rural areas. For a population of 70%, only 45%of bank offices provide the financial services.
Deposit Accounts
81 91 96 01 04 05
Current Accounts Rural
3.6 5.5 4.7 4.9 4.4 4.6
Urban 15.0 23.4 24.1 19.2 17.5 18.3
Savings Accounts Rural
59.6 137.0
129.8
123.3 126.8
131.5
Urban 135.5 243.7
249.7
197.4 206.5
213.1
Current and Rural
63.2 142.6
134.5
128.2 131.1
136.1
Saving Accounts Urban
150.5 267.2
273.7
216.6 224.0
231.4
Term Deposits Rural
22.9 41.8 45.5 52.0 48.3 45.7
Accounts Urban
74.6 96.9 105.0
105.6 113.4
104.0
Total Deposits Rural
86.1 184.4
180.0
180.1 179.4
181.8
Accounts Urban
225.1 364.1
378.7
322.2 337.4
335.4
Credit Accounts Rural
18.0 44.3 36.0 26.5 28.7 32.2
Urban 15.1 29.9 27.1 28.4 42.5 50.2
ISSN No. 0976-8602 VOL.-1 * ISSUE-2*April-2012
Asian Resonance
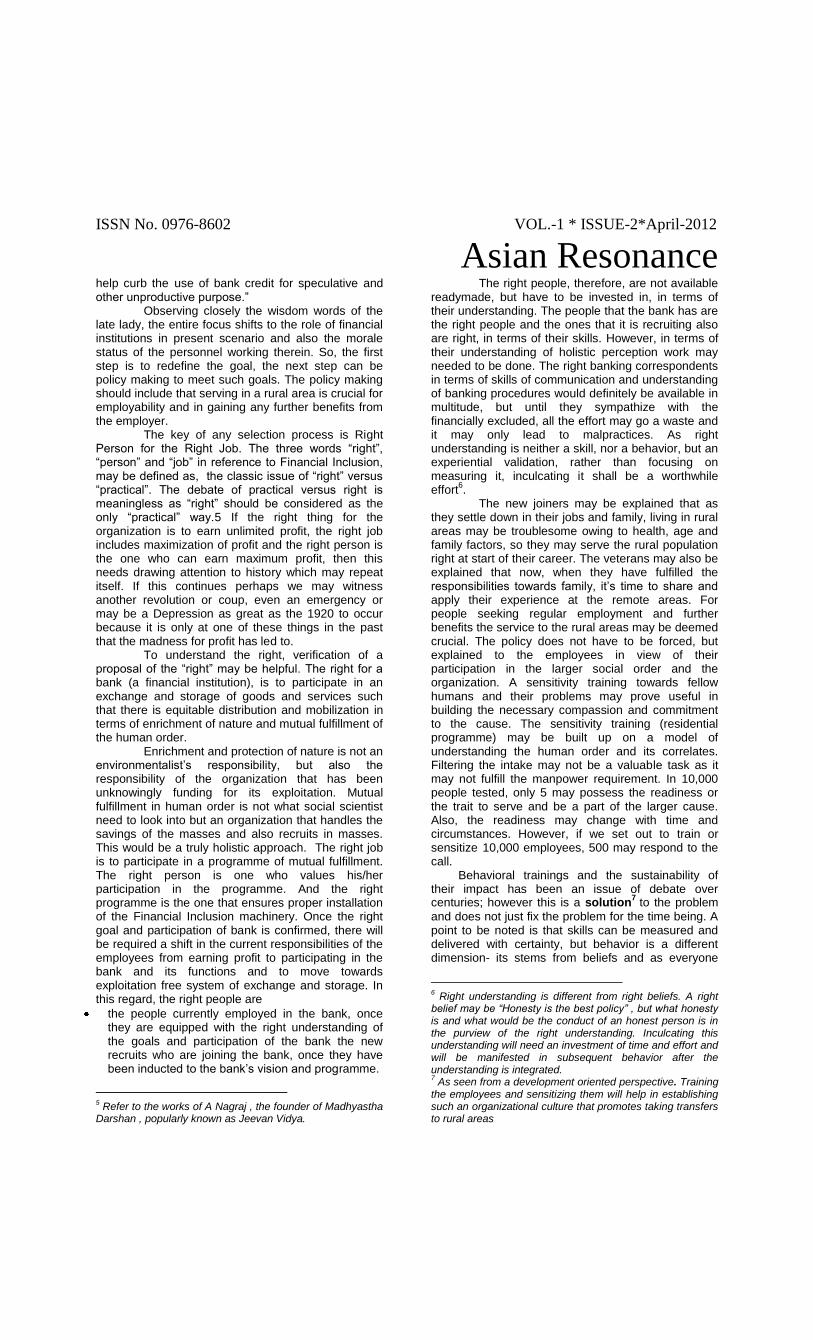
Number of Bank Accounts (Deposit and Credit) of Households: Even in the case of the number of households having bank accounts, there is a vast bias in favor of urban areas. For the rural households which constitute about 70% of population the percentage of number of households having deposit accounts is 181.8, while it is 335.4 in the case of urban households, which constitute only 30% of the population. Similarly, in case of credit linkage, it is 32.2% in the case of rural households and 50.2% in case of urban households. This indicates that there is a need for further broadening of the bank services in the rural areas. It is also worth mentioning that a similar result was obtained from the study by Agarwal (2008), who made illustrative analysis of the distribution of bank offices in India and also the extent of financial deepening in India. Regional Distribution of Banking Services
The analysis brings to the fore that there has been uneven distribution of the banking services in terms of population coverage per bank office in the six regions of the country, viz., northern, northeastern, eastern, central, western and southern. For an equitable growth in all the regions of the country, there is a need for addressing the banking needs of the northeastern, eastern and central regions of the country. Major Issues and Challenges
Bank Specific Challenges: Financial inclusion in a large scale is possible only if the banks join hands with likeminded partners in their initiative. While BC model introduced by RBI enables such partnerships to evolve, the major concerns would be that there is no proven /tested model, the initial take off may be slow till sufficient experience is gathered. It is essential that the programme is viable for all the partners. Referring to HR policies of various banks as the weak enforcement mechanisms shall not be taken as the exaggeration of facts. HR policies of banks across the world are aimed at organizational development and are directly seen as contributing to the nation‘s development. While studying HR issues in evaluation of the successful installation of Financial inclusion, the one issue regularly heard of is ―Public servants are reluctant to take transfers to the rural areas‖.
On face value it seems that the urban population had an edge over the rural when it comes to selections. It seems that the rural population is not adequately represented and the selection tests seemed biased towards the urban population, though the machinery of Financial inclusion needs more of such recruitments. Thereafter it may also be observed that there is a general trend amongst the candidates to complete the HSC/SSC from a semi urban area and move to the urban areas for higher studies and greater opportunities.
Understanding this trend, it is proposed that there be some revision of the selection process where people who are interested in serving the rural areas be selected (especially with reference to public sector
banks where there are mass recruitments going on).The focus is that there may be some personality testing such that the readiness of the person can be predicted. This is to be seen in the light of installation of financial inclusion machinery. The selection and recruitment of these banking correspondents focuses on spotting the right people for the right job. Examined carefully , this appears a problem more of overall degradation in morale of employees in view of the fact that major public sector primarily focus at profit maximization and not on service. With the bank job being perceived as a safe regular employment, the image of the bank in the employee market is not of an organization that participates in the exchange and storage of produce aimed at regulating the exploitative practices in the financial sector, thereby ensuring zero exploitation. This shift in goal is essential. Almost all the major banks have a social responsibility listed on their websites and policies but how deeply that is ingrained in an employee when s/he is inducted to the bank may be questionable. Until profit maximization is put across as an employee as the major motive of the bank, the inclination to serve would be difficult to in build.
The banks definitely need to take some concrete steps to put the serving capacity at the premier and the profit at the boundary to be able to face minimum resistance from employees for rural postings1. Microfinance related
There have been reports that the very high rate of interest ranging of 31.63 percent to 56.8 percent per annum charged by the MFIs has affected the poor borrowers with a low income base and crushing household debt burdens to commit suicide (Arunachalam, S,2011). Thirty suicide cases were reported in Andhra Pradesh during August-October 2010.This matter has serious global implications. Financial Times and Wall Street Journal, characterized the government policy as being a response to allegations of widspread abuses by MFIs. Microfinance as an industry is at the mercy of regulators and politicians who are more likely to get things wrong than they are to get things right (Felix Salmon, Reuters, 2010).The issue was so sensitive that the Andhra Pradesh Government was forced to immediately proulgate an ordinance ―The AP Micro Finance Institutions Ordinance, 2010‖ to protect the women Self Help Groups from exploitation by the Micro Finance Institutions in the State. Under this new law, MFIs cannot deploy any agent for recovery of loans or resort to any coercive action. Punishment for
1 Considering that banks lend money at a rate almost three
times the interest rates they pay on the savings, this does not seem to be an arduous task. Also, profit limit has to be defined. A non defined profit limit is like chasing something that does not at all exist. The banks can work out their expenses and also the need for each expense and define how much profit would suffice for the year. They may boycott some industries, or charge them a higher rate (almost double) of interest on loans as a mark of discouragement

ISSN No. 0976-8602 VOL.-1 * ISSUE-2*April-2012
Asian Resonance
non-compliance will result in imprisonment for six months, a fine which may extend up to Rs.10, 000 (US$220), or both. Secondly, the progress of micro finance movement so far has been skewed. The movement has taken stronger roots in the southern parts of the country, while the progress in the other parts has been slow. Thirdly, MFIs, which are on the growth path, face paucity of owned funds, which becomes a constraint for them in scaling up their operations. Many of them are socially-oriented institutions and have little access to financial capital. As a result, they have high debt-equity ratios. Fourthly, owing to the fast growth of the SHG bank linkage programme, the quality of SHGs has come under stress. This is reflected particularly in indicators such as the poor maintenance of books and accounts. Financial literacy related: Independent studies conducted by RBI (January 22, 2009) through external agencies on the claim of SLBCs of Andhra Pradesh, Gujarat, Himachal Pradesh, Karnataka, Orissa, Punjab, Rajasthan and West Bengal for achievement of 100 per cent financial inclusion in 26 districts found that actual financial inclusion as claimed has not been to that extent in all the sample districts. Further, most of the accounts that have been opened as a part of the financial inclusion drive have remained inoperative due to various reasons such as illiteracy, distance from the branch, lack of interest, non-availability of passbooks, etc. Recommendations
Financial inclusion is an increasing priority for developing countries. Accordingly, financial inclusion must be continued as a policy priority for India in order to bring in the vast unbanked rural people into the process of speedier economic development. Strategize the Provision of Bank Credit Need is felt to strategize the provision of bank credit to the rural farmer households. Majority of the marginal farmer households are not at all covered by formal finance. As such, public sector banks and the cooperative banks in the rural areas have to be sensitized about the need for provision of timely and cheaper credit to these segments. RBI in consultation with NABARD should come out with a comprehensive strategy for revitalizing the quiescent rural credit mechanism. Procedural/Documentation Changes
It is inevitable on the part of the regulators to find out an easy way of procuring the documents for opening of bank accounts and availing loans. The present guidelines are more tedious and result in huge costs for the poor in accessing the banks for any kind of services. Proactive Role of Government
State governments should be asked by the center to play a proactive role in facilitating financial inclusion. Issuance of official identity documents for opening bank accounts, creating awareness, involving district and block level functionaries in the entire process, meeting cost of cards and other devices for pilot studies/projects, and undertaking financial
literacy drives are some of the steps that have been taken up by the state and district administration. A Role for Rural Post Offices
Post offices in rural areas can be asked to provide their services in accelerating the financial inclusion activity. The Indian postman‘s intimate knowledge of the local population and the enormous trust that he commands can be of good use in the process of financial inclusion. Effective Use of IT Solutions
The use of Information Technology (IT) enables banks to handle the enormously increasing volumes of transactions involving application processing, credit scoring, credit record and follow up. Further, the use of IT solutions for providing banking facilities at the doorstep holds the potential for achieving scalability of the financial inclusion initiatives. Adequate Publicity for the Project of Financial Inclusion: In a huge country like India, there needs to be widespread publicity for popularizing the concept and its benefits to the common man.
To quote Mrs. Indira Gandhi 2 ―Financial Institutions are among the most important levers that any society has its command for the achievement of its social and economic objectives3.
The nationalization of major banks is a significant step in this process… It is necessary to mobilize the savings of the people to the largest possible extent and to utilize them for productive purposes in accordance with our plans and priorities. … Effective mobilization and deployment of national resources so that our objectives can be realized with a greater degree of assurance. …‖
She went on to say ―Operations of the banking system should be informed by a larger social purpose and should be subject to close public regulation. … Needs of productive sectors of the economy and in particular the farmers, small scale industrialists and self employed professional groups are met in an increasing measure. It will be one of the positive objectives of nationalized banks to actively foster the growth of new and progressive entrepreneurs and to create fresh opportunities for hitherto neglected and backward areas in different parts of the country. The banks will now be better placed to serve
4 the farmer and to
promote agricultural production and rural development generally. Public ownership will also
2 Prime Minister of India, the quoted speech is dated
21.July.1969, two days after she promulgated the ordinance nationalizing 14 “commercial banks”- as commercial banks, the banks aimed at profit maximization, but with being nationalized, their participation in nation building becomes crucial. The same applies to other public sector organizations also. Nation building inherently calls for harmony in social order 3 Mrs. Gandhi clearly mentions the social objectives first and
the economic objectives later. 4 The larger social purpose refers to primarily
serving the nation.
ISSN No. 0976-8602 VOL.-1 * ISSUE-2*April-2012
Asian Resonance
help curb the use of bank credit for speculative and other unproductive purpose.‖
Observing closely the wisdom words of the late lady, the entire focus shifts to the role of financial institutions in present scenario and also the morale status of the personnel working therein. So, the first step is to redefine the goal, the next step can be policy making to meet such goals. The policy making should include that serving in a rural area is crucial for employability and in gaining any further benefits from the employer.
The key of any selection process is Right Person for the Right Job. The three words ―right‖, ―person‖ and ―job‖ in reference to Financial Inclusion, may be defined as, the classic issue of ―right‖ versus ―practical‖. The debate of practical versus right is meaningless as ―right‖ should be considered as the only ―practical‖ way.5 If the right thing for the organization is to earn unlimited profit, the right job includes maximization of profit and the right person is the one who can earn maximum profit, then this needs drawing attention to history which may repeat itself. If this continues perhaps we may witness another revolution or coup, even an emergency or may be a Depression as great as the 1920 to occur because it is only at one of these things in the past that the madness for profit has led to.
To understand the right, verification of a proposal of the ―right‖ may be helpful. The right for a bank (a financial institution), is to participate in an exchange and storage of goods and services such that there is equitable distribution and mobilization in terms of enrichment of nature and mutual fulfillment of the human order.
Enrichment and protection of nature is not an environmentalist‘s responsibility, but also the responsibility of the organization that has been unknowingly funding for its exploitation. Mutual fulfillment in human order is not what social scientist need to look into but an organization that handles the savings of the masses and also recruits in masses. This would be a truly holistic approach. The right job is to participate in a programme of mutual fulfillment. The right person is one who values his/her participation in the programme. And the right programme is the one that ensures proper installation of the Financial Inclusion machinery. Once the right goal and participation of bank is confirmed, there will be required a shift in the current responsibilities of the employees from earning profit to participating in the bank and its functions and to move towards exploitation free system of exchange and storage. In this regard, the right people are
the people currently employed in the bank, once they are equipped with the right understanding of the goals and participation of the bank the new recruits who are joining the bank, once they have been inducted to the bank‘s vision and programme.
5 Refer to the works of A Nagraj , the founder of Madhyastha
Darshan , popularly known as Jeevan Vidya.
The right people, therefore, are not available readymade, but have to be invested in, in terms of their understanding. The people that the bank has are the right people and the ones that it is recruiting also are right, in terms of their skills. However, in terms of their understanding of holistic perception work may needed to be done. The right banking correspondents in terms of skills of communication and understanding of banking procedures would definitely be available in multitude, but until they sympathize with the financially excluded, all the effort may go a waste and it may only lead to malpractices. As right understanding is neither a skill, nor a behavior, but an experiential validation, rather than focusing on measuring it, inculcating it shall be a worthwhile effort
6.
The new joiners may be explained that as they settle down in their jobs and family, living in rural areas may be troublesome owing to health, age and family factors, so they may serve the rural population right at start of their career. The veterans may also be explained that now, when they have fulfilled the responsibilities towards family, it‘s time to share and apply their experience at the remote areas. For people seeking regular employment and further benefits the service to the rural areas may be deemed crucial. The policy does not have to be forced, but explained to the employees in view of their participation in the larger social order and the organization. A sensitivity training towards fellow humans and their problems may prove useful in building the necessary compassion and commitment to the cause. The sensitivity training (residential programme) may be built up on a model of understanding the human order and its correlates. Filtering the intake may not be a valuable task as it may not fulfill the manpower requirement. In 10,000 people tested, only 5 may possess the readiness or the trait to serve and be a part of the larger cause. Also, the readiness may change with time and circumstances. However, if we set out to train or sensitize 10,000 employees, 500 may respond to the call.
Behavioral trainings and the sustainability of their impact has been an issue of debate over centuries; however this is a solution
7 to the problem
and does not just fix the problem for the time being. A point to be noted is that skills can be measured and delivered with certainty, but behavior is a different dimension- its stems from beliefs and as everyone
6 Right understanding is different from right beliefs. A right
belief may be “Honesty is the best policy” , but what honesty is and what would be the conduct of an honest person is in the purview of the right understanding. Inculcating this understanding will need an investment of time and effort and will be manifested in subsequent behavior after the understanding is integrated. 7 As seen from a development oriented perspective. Training
the employees and sensitizing them will help in establishing such an organizational culture that promotes taking transfers to rural areas

ISSN No. 0976-8602 VOL.-1 * ISSUE-2*April-2012
Asian Resonance
has a different set of beliefs their response to the same training input would be different. We must not forget that once we repeatedly draw the attention of the trainees to the common goal, eventually the shift would occur. The process is slow and at face value seems cumbersome and futile, however the human ―resource‖ – is a human. We must not undermine the capacity of the human to learn, grow, change, develop and contribute. The resource that we have at disposal has a well set notion of things. Considering that in a particular human the notions have been ingrained in the first five years of life, it is only apt to expect the change take five years to start occurring (it has been observed that unlearning takes more time than learning). Also noteworthy is that, the notions have been ingrained through repeated exposure to a particular set of stimuli; here also, repeated exposure may be required. Conclusion
The importance of financial inclusion arises from the problem of financial exclusion of nearly3 billion people from the formal financial services across the world. India, with only 34% of population engaged in formal banking and 135 million financially excluded households, is in the second highest after China. Further, the real rate of financial inclusion in India is also very low and about 40% of the bank account holders use their accounts not even once a month. Financial inclusion has, in reality, far reaching positive consequences which can help resource poor people to access the formal financial services in order to pull themselves out of abject poverty. The focus on the common man is particularly imperative in India as he is the more often ignored one in the process of economic development. Indeed, with the process of financial inclusion, the attempt should be to lift the resource poor from poverty through coordinated action amongst the banks, the government and other related institutions in order to facilitate access to bank accounts and other related services. The importance of financial inclusion as a precondition to inclusive development has widely been recognized across countries. The policy of financial inclusion, an important goal of the India, includes nationalization and regulation of banks, branch expansion, provision of credit at subsidised rates to priority sectors and interest rate ceilings on credit to low-income households, etc. The study observes that the high rate of interest in the sector has caused serious problems leading to debt burden default by clients and has posed challenges to the policy makers, bankers and others. Another concern is the weak enforcement mechanisms as institutional structures are the weakest in India. References 1. Arora Rashmi Umesh, (2010), Measuring Financial
Access, Griffith University, Australia, June; 2. Arunachalam, S,R,(2011), The Journey of Indian Mi c r
o - F i n a n c e : L e s s o n s f o r t h e F u t u r e Aa p t I Publications, Chennai, pp 170-199
3. Baltagi, B. H., Demetriades, P. O. and Law, S. H (2008).Financial Development.
4. Beck, Thorsten, Asli Demirgüç-Kunt, and Maria Soledad Martinez Peria (2008). Banking Services for Everyone? Barriers to Bank Access and Use around the World.
5. World Bank Economic Review 22(3): 397–430. 6. CGAP (2010), Financial Access 2010: The State of
Financial Inclusion through the Crisis, Washington, D.C. 7. h t t p : / / w w w . c g a p . o r g / g m / d o c u m e nt . ./
FA_2010_Financial_Access_2010_Rev.pdf, also see I n n o v a t i v e F i n a n c i a l I n c l u s i o n , M a y 2 5 , a t www.cgap.org/p/cite c/template.rc/1.26.1473/and www.G24.ORG/AFISUR.PDF Accessed on January 17, 2011.
8. Cointegration and Causality Tests for 16 Countries‖, Journal of Developments
9. Conroy (2005). APEC And Financial Exclusion: Missed Opportunities For Collective Action? Asia-Pacific Development Journal, 12(1), June
10. Deme t r iade s, P. And Hus s e in, K (1996). Financial Development and Economic Growth:
11. Economics, 51(2): 387-411. 12. Felix Salmon, Reuters (2010). A Reader‘s Roadmap to
the A n d h r a P r a d e s h C r i s i s ,www.mi c rof inanc egat eway.org, Ac c e s s ed on January 12, 2010
13. Growth: The Egyptian Experience, Journal of Policy Modelling, 30 (5): 887-898.
14. h t t p : / / w w w . m i x m a r k e t . o r g / m f i / r e g i o n / South%20Asia, Accessed on January 14, 2011
15. Indian Council for Research on International Economic Relations, www. i c r i e r .org/pdf/Mandi ra%20Sarma-Paper.pd Accessed on January 7, 2011
16. Mohan Rakesh (2006). Economic Growth, Financial Deepening and Financial Inclusion, Address at the Annual Bankers‘ Conference 2006, Hyderabad. http://rbidocs.rbi.org.in/rdocs/Speeches/PDFs/73697.pdf> Accessed on September 22, 2010
17. Openness : Evidenc e from Panel Data‖, Journal of Development Economics Rangarajan Committee, (2008) Report of the Committee o n F i n a n c i a l I n c l u s i o n , w w w . n a b a r d . o r g / report_comfinancial.asp, Accessed on December 17, 2010
18. Reserve Bank of India (2008). Financial Inclusion, Report on Currency & Finance 2006-08, Vol I and I I, September. Also see RBI circulars/ notifications dated January 25, March 22, 2006; April 24, August 27, 2008; January 22, April 24, November 30, 2009; September 9, 2010 on financial inclusion drives at www.rbi.org.in
19. Sarma, Mandira (2007), ―Index of Financial Inclusion‖ available at <www.icrier.org>.
20. Sharma and Pais (2008). Financial Inclusion and Development: A Cross Country Analysis,
21. Thorat Usha (2008). Financial Inclusion and Information Technology, Keynote address on ―Financial Inclusion and Information Technology‖ at ―Vision 2020 – Indian Financial Services Sector‖ hosted by N D T V , M u m b a i ,September 12 , h t t p : / /www.bis.org/review/r080917d.pdf Accessed on January 14, 2011
22. World Bank (2006). Micro Finance in South Asia – Towards Financial Inclusion of the Poor
23. World Bank (2008). Finance for All – Policy and Pitfalls in Expanding Access, the World Bank, Washington, D.C
24. World Economic Forum, 2010, The Financial Report 2010, www.weforum.org, Accessed on January 30, 2011.
ISSN No. 0976-8602 VOL.-1 * ISSUE-2*April-2012
Asian Resonance
ISSN No. 0976-8602 VOL.-1 * ISSUE-2*April-2012
Asian Resonance
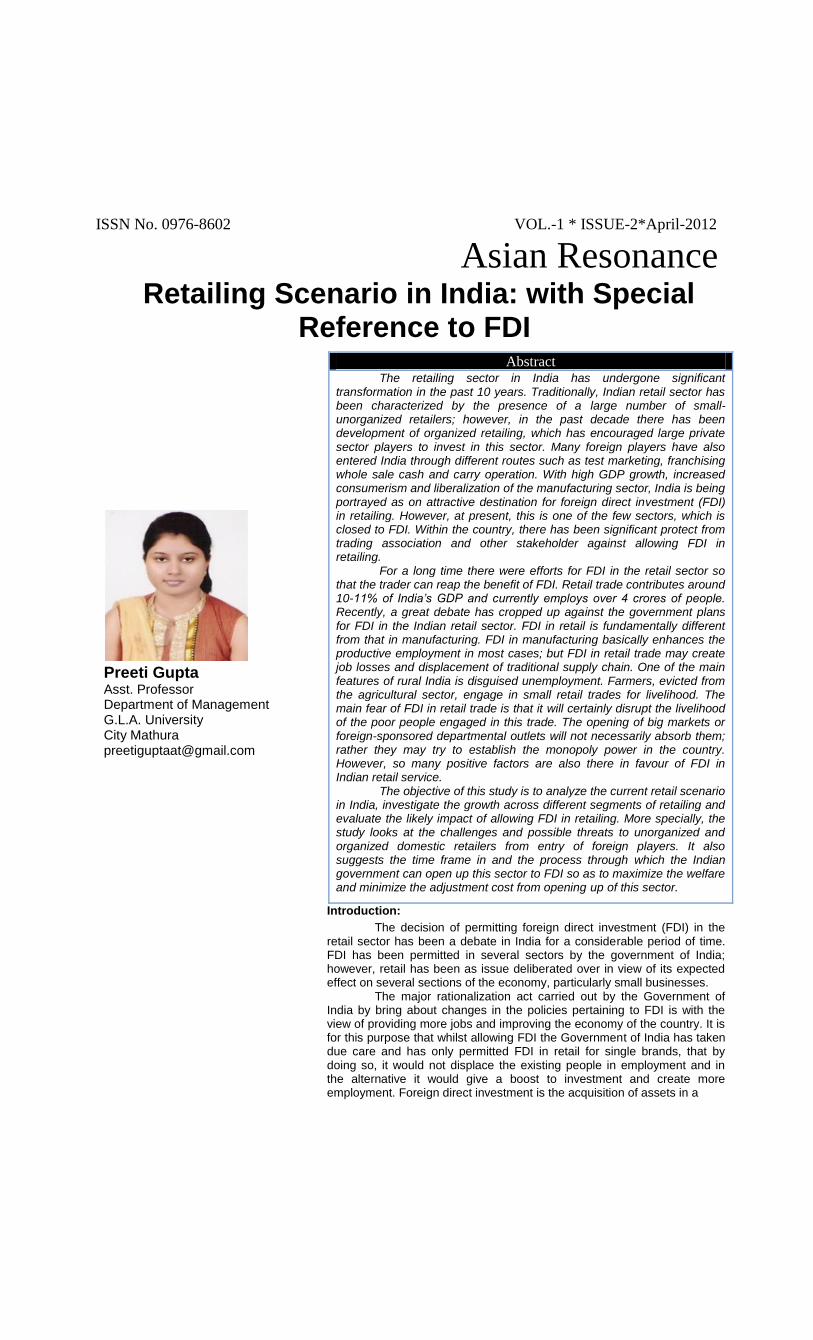
Retailing Scenario in India: with Special Reference to FDI
Preeti Gupta Asst. Professor Department of Management G.L.A. University City Mathura [email protected]
Introduction:
The decision of permitting foreign direct investment (FDI) in the retail sector has been a debate in India for a considerable period of time. FDI has been permitted in several sectors by the government of India; however, retail has been as issue deliberated over in view of its expected effect on several sections of the economy, particularly small businesses. The major rationalization act carried out by the Government of India by bring about changes in the policies pertaining to FDI is with the view of providing more jobs and improving the economy of the country. It is for this purpose that whilst allowing FDI the Government of India has taken due care and has only permitted FDI in retail for single brands, that by doing so, it would not displace the existing people in employment and in the alternative it would give a boost to investment and create more employment. Foreign direct investment is the acquisition of assets in a
Abstract The retailing sector in India has undergone significant transformation in the past 10 years. Traditionally, Indian retail sector has been characterized by the presence of a large number of small- unorganized retailers; however, in the past decade there has been development of organized retailing, which has encouraged large private sector players to invest in this sector. Many foreign players have also entered India through different routes such as test marketing, franchising whole sale cash and carry operation. With high GDP growth, increased consumerism and liberalization of the manufacturing sector, India is being portrayed as on attractive destination for foreign direct investment (FDI) in retailing. However, at present, this is one of the few sectors, which is closed to FDI. Within the country, there has been significant protect from trading association and other stakeholder against allowing FDI in retailing. For a long time there were efforts for FDI in the retail sector so that the trader can reap the benefit of FDI. Retail trade contributes around 10-11% of India‟s GDP and currently employs over 4 crores of people. Recently, a great debate has cropped up against the government plans for FDI in the Indian retail sector. FDI in retail is fundamentally different from that in manufacturing. FDI in manufacturing basically enhances the productive employment in most cases; but FDI in retail trade may create job losses and displacement of traditional supply chain. One of the main features of rural India is disguised unemployment. Farmers, evicted from the agricultural sector, engage in small retail trades for livelihood. The main fear of FDI in retail trade is that it will certainly disrupt the livelihood of the poor people engaged in this trade. The opening of big markets or foreign-sponsored departmental outlets will not necessarily absorb them; rather they may try to establish the monopoly power in the country. However, so many positive factors are also there in favour of FDI in Indian retail service. The objective of this study is to analyze the current retail scenario in India, investigate the growth across different segments of retailing and evaluate the likely impact of allowing FDI in retailing. More specially, the study looks at the challenges and possible threats to unorganized and organized domestic retailers from entry of foreign players. It also suggests the time frame in and the process through which the Indian government can open up this sector to FDI so as to maximize the welfare and minimize the adjustment cost from opening up of this sector.

ISSN No. 0976-8602 VOL.-1 * ISSUE-2*April-2012
Asian Resonance
9
country by foreign entities for the purpose of control. FDI is ownership of at least 10% of a business. Background
In 1997, the Indian retail sector witnessed the first footprints of FDI with 100% FDI being permitted in cash & carry wholesale trading under the government approval route, subsequently brought under the automatic route in 2006. As a step ahead, FDI in single brand retail was permitted to the extent of 51% in 2006, while FDI in multi-brand retail remained prohibited till recently. In July 2010, the Department of Industrial Policy and Promotion (DIPP) had put up a discussion paper proposing FDI in multi-brand retail. In July 2011, a Committee of Secretaries (COS) had cleared the proposal to allow upto 51% FDI in multi-brand retail, which has been approved by the Union Cabinet in November 2011, albeit with a few riders. The Union Cabinet has also approved increasing the FDI limit in single brand retail to 100% with government approval. While no parliamentary approval is needed for the decision, State Governments have the prerogative to disallow the same in their respective states. Mounting opposition by several political parties and State Governments has raised hurdles in the effective implementation of the key reform measure. As part of the economic liberalization process set in place by the Industrial Policy of 1991, the Indian government has opened the retail sector to FDI slowly through a series of steps:
According to the Ministry of Commerce &
Industry, "FDI is freely allowed in all sectors including
the services sector, except few sectors where the
existing and notified sectoral policy does not permit
FDI beyond a ceiling. FDI for virtually all items/activities
can be brought in through the Automatic Route under
powers delegated to the Reserve Bank of India (RBI),
and for the remaining items/activities through
Government approval. Government approvals are
accorded on the recommendation of the Foreign
Investment Promotion Board (FIPB)."
Currently, foreign companies are only allowed to
own 10% of a business in the retail sector. Prime
Minister Manmohan Singh is trying to convince his
coalition partners to open up FDI along the lines of
what is allowed in other industries. FDI limits for other
sectors are as follows:
Banking - 74%
Non-banking financial companies (stock broking, credit cards, financial consulting, etc.) - 100%
Insurance - 26%
Telecommunications - 74%
Private petrol refining - 100%
Construction development - 100%
Coal & lignite - 74%
Trading - 51%
Electricity - 100%
Pharmaceuticals - 100%
Transportation infrastructure - 100 %
Tourism - 100%
Mining - 74%
Advertising - 100%
Airports - 74%
Films - 100%
Domestic airlines - 49%
Mass transit - 100%
Pollution control - 100%
Print media - 26% for newspapers and current events, 100 % for scientific and technical periodicals
FDI in single brand product
Foreign Investment in Single Brand product retail trading is aimed at attracting investments in production and marketing, improving the availability of such goods for the consumer, encouraging increased sourcing of goods from India, and enhancing competitiveness of Indian enterprises through access to global designs, technologies and management practices. FDI in Single Brand product retail trading would be subject to the following conditions: (a) Products to be sold should be of a 'Single Brand'
only. (b) Products should be sold under the same brand
internationally i.e. products should be sold under the same brand in one or more countries other than India.
(c) 'Single Brand' product-retail trading would cover only products which are branded during manufacturing.
(d) The foreign investor should be the owner of the brand.
(e) In respect of proposals involving FDI beyond 51%, mandatory sourcing of at least 30% of the value of products sold would have to be done from

ISSN No. 0976-8602 VOL.-1 * ISSUE-2*April-2012
Asian Resonance
10
Indian 'small industries/ village and cottage industries, artisans and craftsmen'. 'Small industries' would be defined as industries which have a total investment in plant & machinery not exceeding US $ 1.00 million. This valuation refers to the value at the time of installation, without providing for depreciation. Further, if at any point in time, this valuation is exceeded, the industry shall not qualify as a 'small industry' for this purpose. The compliance of this condition will be ensured through self-certification by the company, to be subsequently checked, by statutory auditors, from the duly certified accounts, which the company will be required to maintain. Application seeking permission of the Government for FDI in retail trade of 'Single Brand' products would be made to the Secretariat for Industrial Assistance (SIA) in the Department of Industrial Policy & Promotion. The application would specifically indicate the product/ product categories which are proposed to be sold under a 'Single Brand'. Any addition to the product/ product categories to be sold under 'Single Brand' would require a fresh approval of the Government. Applications would be processed in the Department of Industrial Policy & Promotion, to determine whether the products proposed to be sold satisfy the notified guidelines, before being considered by the FIPB for Government approval.
FDI in Multi Brand Retail
The government has also not defined the term Multi Brand. FDI in Multi Brand retail implies that a retail store with a foreign investment can sell multiple brands under one roof. In July 2010, Department of Industrial Policy and Promotion (DIPP), Ministry of Commerce circulated a discussion paper on allowing FDI in multi-brand retail. The paper doesn‘t suggest any upper limit on FDI in multi-brand retail. If implemented, it would open the doors for global retail giants to enter and establish their footprints on the retail landscape of India. Opening up FDI in multi-brand retail will mean that global retailers including Wal-Mart, Carrefour and Tesco can open stores offering a range of household items and grocery directly to consumers in the same way as the ubiquitous ‘kirana‘ store. Advantages of FDI in retail sector in India:
Growth in economy: Due to coming of foreign
companies‘ new infrastructure will be build, thus real estate sector will grow consequently banking sector, as money need to be required to build infrastructure would be provided by banks.
Job opportunities: Estimates shows that this will
create about 80Lakh jobs. These career opportunities will be created mostly in retail, real estate. But it will create positive impact on others sectors as well.
Benefits to farmers: In most cases, in the retailing
business, the intermediaries have dominated the interface between the manufacturers or producers and the consumers. Hence the farmers and manufacturers lose their actual share of profit margin
as the lion‘s share is eaten up by the middle men. This issue can be resolved by FDI, as farmers might get contract farming where they will supply to a retailer based upon demand and will get good cash for that, they need not to search for buyers.
Benefits to consumers: Consumer will get variety
of products at low prices compared to market rates, and will have more choice to get international brands at one place.
Disadvantages of FDI in retail sector in India:
According to the non-government cult, FDI will drain out the country‘s share of revenue to foreign countries which may cause negative impact on India‘s overall economy.
The domestic organized retail sector might not be competitive enough to tackle international players and might lose its market share.
Many of the small business owners and workers from other functional areas may lose their jobs, as lots of people are into unorganized retail business such as small shops.
The relief in the form of lower prices is more often a myth; consumers in US and Europe know it. This is not a good beginning for India. Often it is being argued that the step would not affect small retailers numbering over four crore in the country and involving another four crore. Many small shops all over the country have closed down as prices soared and they went into losses during the past two years. It calls for a probe whether prices are being manipulated by the large MNC chains. It gives Indian retailers a bad name and paves the way for the entry of foreign brands. The onslaught on the nation and the masses has come in many ways during the past few weeks. The FDI in retail- opening doors to giant retail MNCs- has been given the green signal. The stores are said to have made huge profits as the prices of commodities soared. The consumers were not passed on the benefit of lower prices, contrary to what the big retailers claim. The consumers are made to spend more in reality as the stores bunch up goods for sale, announcing a hypothetical cut which is never more than one to two per cent of the listed price. The potato farmers in Haryana and some parts of Uttar Pradesh are facing a piquant situation. Some of these MNC operators encouraged them to sow a particular type of potato, assuring them that they would buy back all the harvest. Now there is a glut, potato prices are crashing and the promoters are refusing to buy. It has made deep holes in farmers‘ pockets. These are only some instances of how big retailers, even before they are fully operational, behave with the farmers and rarely give any relief to the consumer The decision to allow 100 per cent FDI in single-brand retail and 51 per cent in multi-brand retail has been taken at a crucial time. The Indian retail market size is of $28 billion and expected to rise almost ten-fold by 2020 to $260 billion. The earlier decision to allow FDI in single-brand retail was also taken at a similar crucial time — shortly before the 2009 general election
ISSN No. 0976-8602 VOL.-1 * ISSUE-2*April-2012
Asian Resonance
11
Findings
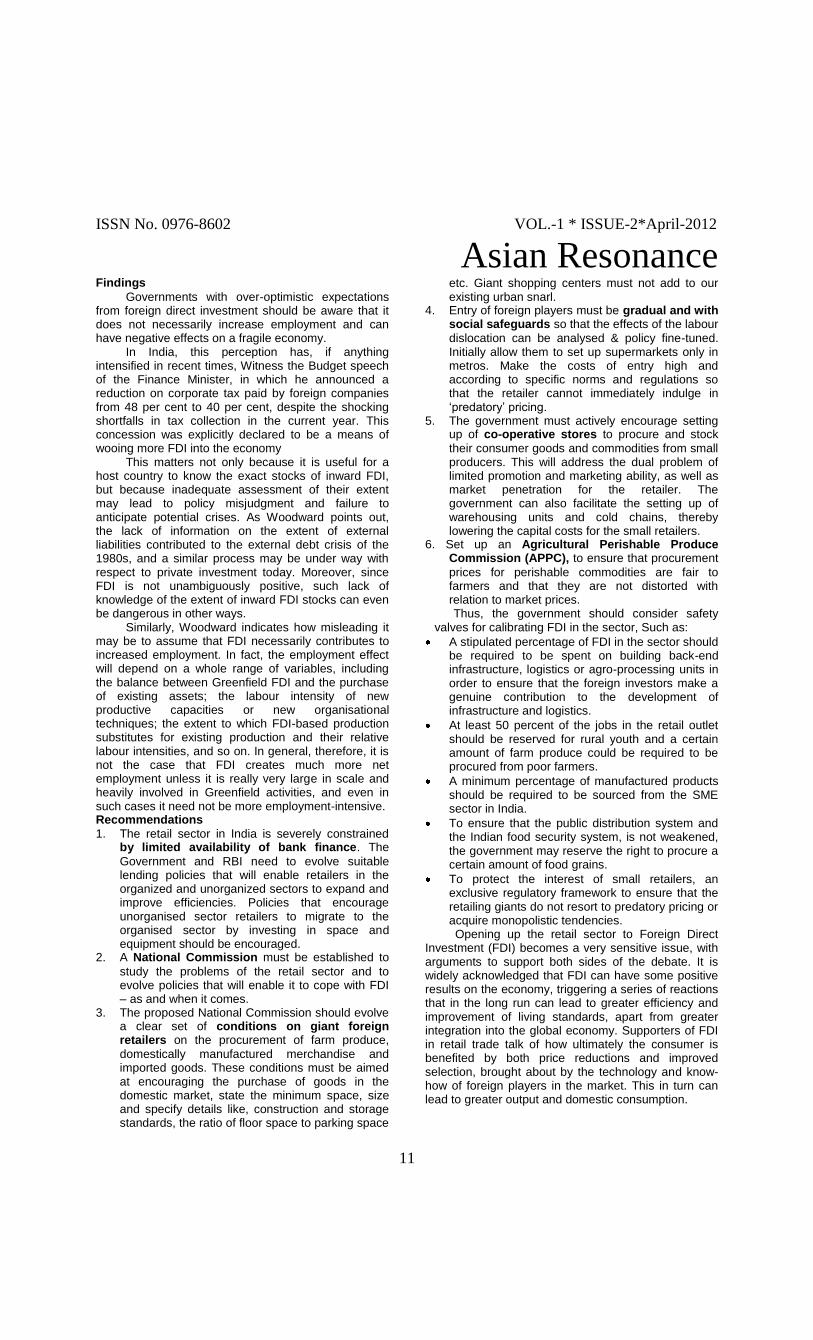
Governments with over-optimistic expectations from foreign direct investment should be aware that it does not necessarily increase employment and can have negative effects on a fragile economy. In India, this perception has, if anything intensified in recent times, Witness the Budget speech of the Finance Minister, in which he announced a reduction on corporate tax paid by foreign companies from 48 per cent to 40 per cent, despite the shocking shortfalls in tax collection in the current year. This concession was explicitly declared to be a means of wooing more FDI into the economy This matters not only because it is useful for a host country to know the exact stocks of inward FDI, but because inadequate assessment of their extent may lead to policy misjudgment and failure to anticipate potential crises. As Woodward points out, the lack of information on the extent of external liabilities contributed to the external debt crisis of the 1980s, and a similar process may be under way with respect to private investment today. Moreover, since FDI is not unambiguously positive, such lack of knowledge of the extent of inward FDI stocks can even be dangerous in other ways. Similarly, Woodward indicates how misleading it may be to assume that FDI necessarily contributes to increased employment. In fact, the employment effect will depend on a whole range of variables, including the balance between Greenfield FDI and the purchase of existing assets; the labour intensity of new productive capacities or new organisational techniques; the extent to which FDI-based production substitutes for existing production and their relative labour intensities, and so on. In general, therefore, it is not the case that FDI creates much more net employment unless it is really very large in scale and heavily involved in Greenfield activities, and even in such cases it need not be more employment-intensive. Recommendations
1. The retail sector in India is severely constrained by limited availability of bank finance. The
Government and RBI need to evolve suitable lending policies that will enable retailers in the organized and unorganized sectors to expand and improve efficiencies. Policies that encourage unorganised sector retailers to migrate to the organised sector by investing in space and equipment should be encouraged.
2. A National Commission must be established to
study the problems of the retail sector and to evolve policies that will enable it to cope with FDI – as and when it comes.
3. The proposed National Commission should evolve a clear set of conditions on giant foreign retailers on the procurement of farm produce,
domestically manufactured merchandise and imported goods. These conditions must be aimed at encouraging the purchase of goods in the domestic market, state the minimum space, size and specify details like, construction and storage standards, the ratio of floor space to parking space
etc. Giant shopping centers must not add to our existing urban snarl.
4. Entry of foreign players must be gradual and with social safeguards so that the effects of the labour
dislocation can be analysed & policy fine-tuned. Initially allow them to set up supermarkets only in metros. Make the costs of entry high and according to specific norms and regulations so that the retailer cannot immediately indulge in ‗predatory‘ pricing.
5. The government must actively encourage setting up of co-operative stores to procure and stock
their consumer goods and commodities from small producers. This will address the dual problem of limited promotion and marketing ability, as well as market penetration for the retailer. The government can also facilitate the setting up of warehousing units and cold chains, thereby lowering the capital costs for the small retailers.
6. Set up an Agricultural Perishable Produce Commission (APPC), to ensure that procurement
prices for perishable commodities are fair to farmers and that they are not distorted with relation to market prices. Thus, the government should consider safety
valves for calibrating FDI in the sector, Such as:
A stipulated percentage of FDI in the sector should be required to be spent on building back-end infrastructure, logistics or agro-processing units in order to ensure that the foreign investors make a genuine contribution to the development of infrastructure and logistics.
At least 50 percent of the jobs in the retail outlet should be reserved for rural youth and a certain amount of farm produce could be required to be procured from poor farmers.
A minimum percentage of manufactured products should be required to be sourced from the SME sector in India.
To ensure that the public distribution system and the Indian food security system, is not weakened, the government may reserve the right to procure a certain amount of food grains.
To protect the interest of small retailers, an exclusive regulatory framework to ensure that the retailing giants do not resort to predatory pricing or acquire monopolistic tendencies.
Opening up the retail sector to Foreign Direct Investment (FDI) becomes a very sensitive issue, with arguments to support both sides of the debate. It is widely acknowledged that FDI can have some positive results on the economy, triggering a series of reactions that in the long run can lead to greater efficiency and improvement of living standards, apart from greater integration into the global economy. Supporters of FDI in retail trade talk of how ultimately the consumer is benefited by both price reductions and improved selection, brought about by the technology and know-how of foreign players in the market. This in turn can lead to greater output and domestic consumption.

ISSN No. 0976-8602 VOL.-1 * ISSUE-2*April-2012
Asian Resonance
12
But the most important factor against FDI driven ―modern retailing‖ is that it is labour displacing to the extent that it can only expand by destroying the traditional retail sector. Till such time we are in a position to create jobs on a large scale in manufacturing, it would make eminent sense that any policy that results in the elimination of jobs in the un-organised retail sector should be kept on hold. References
1. AITKEN B and HARRISON A (1999). Do domestic firms benefit from foreign investment? Evidence from Venezuela. American Economic Review, 89: 605–618.
2. BLOMSTROM M and PERSSON H (1983). Foreign investment and spillover efficiency in an underdeveloped economy: Evidence from Mexican manufacturing industry. World Development, 11: 493–501.
3. BORENSZTEIN, E., J. DE GREGORIO, AND J-W. LEE (1998). ‗How Does Foreign Direct Investment Affect Economic Growth?‘ Journal of International Economics,
4. CAVES, R. E. (1971). ‗International Corporations: The Industrial Economics of Foreign Investment‘. Economica
5. DE MELLO, L. (1999). ‗Foreign Direct Investment-led Growth: Evidence from Time Series and Panel Data‘. Oxford Economic Papers
6. DAMAYANTHI/S.PRADEEKUMAR-FDI is it the Need of the Hour? Google search
7. FIGLIO DN and BLONIGEN BA (1999). The effects of direct foreign investment on local communities (mimeo). Gainesville, FL, University of Florida.
8. GLOBERMAN S (1979). Foreign direct investment and ―spillover‖ efficiency benefits in Canadian manufacturing industries. Canadian Journal of Economics,
9. GORG H., MOLANA H., MONTAGNA C. Foreign Direct Investment, Tax Competition and Social Expenditure, University of Nottingham, DP 07/03;
10. HAUSMANN R and FERNANDEZ-ARIAS E (2000). Foreign direct investment: Good cholesterol? (mimeo). Washington, DC, Inter-American Development Bank.
11. KUBNY J., LUNDSGAARDE E., PATEL F. FDI – a means to foster sustainable development? DIE, Bonn, Germany, 12/2008
12. LIU, X., H. SONG, AND P. ROMILLY (1997). ‗An Empirical Investigation of the Casual Relationship between Openness and Economic Growth in China‘. Applied Economics, 29 (12): 1679-86.
13. LIPSEY ROBERT, The Role of FDI in International capital flows, National Bureau of Economic Research, WP 7094, Cambridge, 1999
14. NOORZOY, M. S. (1979). ‗Flows of Direct Investment and their Effects on Investment in Canada‘. Economic Letters, 2 (3): 257-61.
15. UNCTAD (1999c). World Investment Report 1999: Foreign Direct Investment and the Challenge of Development. New York and Geneva, United Nations.
16. WHEELER D and MODY A (1992). International investment location decisions. Journal of International Economics, 33: 57–76.
17. WOODWARD D. The Next Crisis? Direct and Equity Investment in Developing Countries, Zed Books, London and New York, 2001, p. 145;
18. www.rbi.org.in 19. www.dipp.nic.in 20. www.legallyindia.com 21. www.retailguru.com

ISSN No. 0976-8602 VOL.-1 * ISSUE-2*April-2012
Asian Resonance
13
Understanding Role of Relationship in Management for Organizational
Effectiveness
Ajay Prakash Singh Bhadauria Associate Professor, Management Dept, Rama Institute of Engineering & Technology, Kanpur [email protected]
Introduction
Organizations are nothing but people. They utilize resources – physical, financial and human – to produce results. To be a long distance runner, every organization requires extraordinary efforts from its people. It‘s the people factor that separates the mediocre organizations from the outstanding ones. When people work to the best of their abilities and work with zeal, enthusiasm and commitment, organizations grow to gigantic proportion. When people fail
to live up to expectations, organizations fall behind in the competitive race and get pushed to the wall eventually. In fact, every organization has more or less the same kind of resources to work with – materials, equipments, land, and building, finance etc. The only differentiating element between competing organizations is the ‗people factor‘. If the organization is able to utilize its human resources to best advantage, there is nothing to stop the company from reaching the top of the ladder. As Thomas I. Watson, the founder of IBM once commented, ―you can get capital and erect buildings, but it takes people to build a business‖. ―If you are not thinking all the time about making every person valuable, you don‘t have a chance, says former General Electric‘s head Jack Welch. Human resources constitute the backbone of an organization. They invent and utilize technology. They offer great ideas for product improvement and offer suggestions for delivering superior customer service
Abstract
Human beings, the employees of an organization, are the heart and soul of the organization. They make the business run. They are the breath of life that enables a business to be something more than an idea. An organization cannot run without human beings. Human beings interact in the organization with superiors, peers and subordinates to achieve organizational goal using various resources and technologies. Human factor is the most important factor in determining organization‟s objective whether it be objective setting or objective achieving. Human beings play pivotal role in an organization. Effective human beings (employees) along with other resources make the organization grow. Effectiveness of an organization can be ensured if its employees are satisfied and performing well. Money/Physical facilities (food, clothes, house, car, etc) are necessary to human beings to fulfill his/her basic needs and to be happy but they do not guarantee happiness. Physical facilities do not complete a person. In order to be happy and feel complete human beings need relationship in life. The term relationship here means, “a feeling of connection between one human being and the other human being wherein one human being recognizes the other human being similar to himself and behaves with him/her with the feeling of trust, respect and affection and genuinely cares him/her.” “When the other reciprocate the feelings and care, the relation become mutually fulfilling.” In this research, we shall explore the role of relationship and physical facilities towards organizational effectiveness. Physical compensation (cash or kind) and position of an employee may vary in the organization based on his/her competence. However, need of relationship remains the same for all employees irrespective of his/her post and level of competence. Managing organization‟s employees through relationship can be instrumental to employee‟s satisfaction and organizational effectiveness. Keywords: Relationship, Mutual Trust, Mutual Respect, Mutually Fulfilling Relation, Organizational Effectiveness.

ISSN No. 0976-8602 VOL.-1 * ISSUE-2*April-2012
Asian Resonance
14
They gather, analyze and disseminate information. They formulate and implement strategy. Above all, they are capable of enlargement i.e. capable of producing an output that is greater than the sum of inputs. Once, they get inspired can move mountains! They can help an organization achieve results quickly, efficiently and effectively (Rao VSP, 2010). In order to achieve organizational results quickly, efficiently and effectively, organizations need to pay attention to its employee‘s aspirations i.e. to live in relation and have adequate physical facility. Human by his natural instinct wants to live in relationship. He feels happy when he is in good relation with others and unhappy when in contradiction. If an organisation understands and build relationship with its employees and help them to have healthy relations amongst themselves and remunerate them adequately, it can help it to become more effective. Managing organization‘s employees through Right Understanding (Right understanding means, correct understanding about human being‘s (employee‘s) need to live in relation and his/her need for physical facilities) and Relationship can be instrumental to employee‘s satisfaction and organizational effectiveness. Literature review
Importance of Relationship in organizations was studied during various researches. Hawthorne Experiments (1924-1932) by Elton Mayo, Whitehead and Roethlisberger is a torch bear as far as the Human Relation movement is concerned. The Hawthorne Studies laid the foundation for the Human Relations Movement and was responsible for the development of various concepts like participatory management, team building, etc. Vilfredo Pareto extended the implications of human relations approach further as Social Systems Approach of management. Later Chester Barnard synthesized the concept of Social Systems Approach. According to this approach, an organization is essentially a cultural system composed of people who work in cooperation. According to Douglas McGregor, cooperation and conflict are two states in the continuum of industrial relations (McGregor, Douglas, and Union-Management Cooperation – A Psychological Approach). The dynamics of cooperation lie in the recognition of a sphere of common interest. Cooperation between union (workers representative) and management, the two actor of industrial relation drama, differing in economic power, wealth and education, depends primarily on their ability and willingness to make contracts at point of mutual concern (Northcott, 1962). Cooperation is learned characteristic and does not come easily to individuals and groups especially within the structure of business (Calhoon R, 1963). Good industrial relations imply the existence of an atmosphere of cooperation, confidence and respect within the enterprise. In such an atmosphere, there are common goals, which motivate all members of the organization to contribute their best. Consequently, there is higher productivity, higher income and increased job satisfaction; all resulting in higher morale of the workforce (Chhabra T.N, Suri R.K, 2009).
People spend a large portion of their time in an organization interacting with others - superior, subordinates, co-workers or outsiders (LM Prasad 2010). These interactions provide the connective tissues that help to hold the subparts of the organization together. They behave in a particular way, which may be either cooperative or conflicting. Prasad says conflicting relation is dysfunctional to both organization and individual. Positive thinking, mutual trust, empathy, courtesy and avoidance of ego problem are the skills for cooperative interpersonal behaviour (Prasad 2010). Trust plays pivotal role in cooperative interpersonal behaviour. Trust is a two-way traffic, that is, if someone wants that other should trust him; he must also trust other (Prasad 2010). Deutsch (1957) saw trust as a prerequisite to the existence of a stable cooperative system. Effective cooperation amongst employees can be ensured by developing healthy relation amongst employees. Trust is the foundation of Human relation (RR Gaur, R Sangal, GP Bagaria, 2009). Rodericks M Karmer (2009) says, ―Trust is our default position: we trust routinely, reflexively, and somewhat mindlessly across a broad range of social situations. Bidault and Jarillo (1997) defined trust as ―believing that the other party will behave in our best interests‖. RR Gaur, R Sangal, GP Bagaria (2009) defined the trust as, ―To be assured that each human inherently wants oneself and the other to be happy and prosperous‖. For managers and professionals in organizations, developing and maintaining trust relationships is especially important. As boundary spanners, managers work through critical horizontal ties to external constituencies on which their departments or organizations depend (Mintzberg, 1973; Sayles 1979). Given the complexity and uncertainty inherent in managerial work and the amount of mutual accommodation, it involves, effective horizontal working relationships within organizations are also critical (Gabarro, 1990; Sayles, 1979). As Thompson (1967) observed, under conditions of uncertainty and complexity, requiring mutual adjustment, sustained effective coordinated action is only possible where there is mutual confidence or trust. Interpersonal trust is a pervasive phenomenon in organizational life. Trust enables people to take risks: "where there is trust there is the feeling that others will not take advantage of me" (Porter et al., 1975: 497). Trust is based on the expectation that one will find what is expected rather than what is feared (Deutsch, 1973). Trust is believed to reduce governance costs (management costs), costs for internalization (acquisition), and transaction costs in and between organizations, and by opening chances for decentralization and informal collaboration in networks. Trust enables more open communication, information sharing and conflict management (Bidault and Jarillo, 1997; Creed and Miles, 1996; Barney and Hansen, 1994; Sako, 1992 and Blomqvist 2002; Aulakh Kotabe, and Sahay, 1997). Trust has been identified as an important component, which makes teamwork, intra-organizational cooperation, inter-organizational partnership, strategic alliances, and performance of

ISSN No. 0976-8602 VOL.-1 * ISSUE-2*April-2012
Asian Resonance
15
networks of small firms successful (eg. Sako. 1998, 88. Larson, 1992; Dogson, 1993; Young-Ybarra and Wiersema, 1999; Virolainen, 1998, Puumalainen et al, 2001 Blomqvist, 2002 Aulakh et al 1997). Trust and commitment are the key elements to maintain the partnership, but trust is the premise to fulfill the commitment while commitment is the result of trust (Moorman et al., 1992). Morgan and Hunt (1994) argued that trust is the confidence to the partners presently, while commitment means the wish to continue the relationship in the future. So the level of trust will impact on the quality of the relationship commitment. Commitment towards the group goals is prerequisite for group performance. The commitment has to be effective. Affective Commitment is an attachment characterized by an identification to and involvement with the organization (Allen and Meyer, 2000). Affectively committed individuals tend to perform their jobs better and be more productive (Allen and Meyer, 2000; Jaramillo et al., 2005; Meyer and Herscovitch, 2001; Meyer et al., 2002; Riketta, 2002). Affective Commitment leads to fewer intentions to quit the organization (Allen and Meyer, 1996; Vandenberghe and Tremblay, 2008), lower turnover (Allen and Meyer, 1996; Maertz et al., 2007; Meyer et al., 2002), reduced absenteeism (Allen and Meyer, 1996; Eby et al., 1999; Somers, 1995), more customer-oriented behaviors (Chang and Lin, 2008), and improved in-role and extra-role performance (Allen and Meyer, 1996; Jaramillo et al., 2005;Meyer et al., 2002; Riketta, 2002; Vandenberghe et al., 2004). Thus, to strive for better performance, organizations must be able to develop their employees' Affective Commitment (Meyer and Herscovitch, 2001) Trust and commitment are both the key elements to maintain the relationship. This has to be from both interacting partners/parties. Mutual Trust plays the foundational role in building relationship. The other factors such as mutual respect, healthy intercommunication, just and transparent behaviour and participation equally important for building and maintaining relationship. Participation of employees in group‘s or organizational issues gives the feeling in the employees that they are considered part of the group or organization. Participation in decision making (Farmer and Fedor , 1997), empowerment (Laschinger and Finegan, 2004), and perception of fairness(McFarlin and Sweeney, 1992) are proved to affect organizational commitment. Employee‘s overall perception of inducements offered by organization, i.e., perceived organization support, has positive effect on employee‘s task performance, and organizational commitment (Wayne, Shore, Bommer and Tetrick, 2002). Healthy intercommunication coupled with mutual respect, and just & transparent behaviour is instrumental in developing trust and relationship. Organization needs to build such procedures, which ensure justice to all its employees equally. Procedural justice theorists have argued that fair procedures serve two purposes. One is to help protect individuals'
interests; over the long run, fair procedures should result in individuals' receiving what they are due. Consequently, the fairness of procedures is associated with positive attitudes toward a decision, such as satisfaction, agreement, and commitment (Lind & Tyler, 1988). The second function of fair procedures is symbolic and helps to strengthen individuals' relationships with a group, leader, and organization. Fair procedures serve as a sign to individuals that they are valued and respected members of the group or organization and thus promote harmony and trust in relationships with others. Consequently, fair procedures are associated with positive attitudes toward the group, leader, and organization, such as group harmony, trust in the leader, and organizational commitment (Lind & Tyler, 1988). Employees refer equity whether in respect to relationship or compensation. As per J. Stacy Adams Equity Theory, there exists exchange relationship between person‘ inputs/outcomes in relations to those of other person is of three types – overpaid inequity, underpaid inequity, and equity. In the overpaid inequity, the person perceives that his outcomes are more as compared to his inputs in relation to other, the person experience guilt feeling. In case of underpaid equity; the person perceives that his outcomes are lower as compared to his inputs in relation to other, the person experiences dissonance. In case of equity, the person perceives that his outcomes in relation to his inputs are equal to those of others, the person experiences satisfaction. Hence, fair treatment is important for employee‘s satisfaction. When employees feel they are not fairly treated, they engage in counter productive work behaviour (CWB). Consistent support has been found for the relationships between perceived unfairness and CWB (Bennett & Robinson, 2003). Individuals who feel unfairly treated seek revenge, which is often manifested in CWB (Bies & Tripp, 1996). A number of studies show that individuals who perceive greater unfairness tend to engage in more CWB (e.g., Aquino, Galperin, & Bennett, 2004). This could be detrimental to organizational effectiveness. Based on social exchange principles (e.g., Blau, 1964), the agent–system model of justice suggests that individuals tend to direct their responses toward the perceived source of fair or unfair treatment (Bies & Moag, 1986; Masterson et al., 2000). Because individuals who believe they benefit from another party‘s discretionary actions tend to feel obligated to reciprocate (Gouldner, 1960), employees who believe they are treated fairly by their supervisors, for example, might reciprocate through cooperative behaviors that benefit their supervisors. Alternatively, individuals who believe they are treated unfairly may reciprocate through some type of negative response, such as CWB (Eisenberger, Lynch, Aselage,& Rohdieck, 2004; Gouldner, 1960). Given that employees form social exchange relationships with both their supervisors and their employing organizations (Rupp & Cropanzano, 2002), employees may respond to perceived unfairness by engaging in CWB, depending upon
ISSN No. 0976-8602 VOL.-1 * ISSUE-2*April-2012
Asian Resonance
16
whether a supervisor or the organization is perceived as the source of injustice. Individuals are believed to seek revenge for violations of the ‗‗social covenant‘‘—the shared belief that people deserve to be treated with respect and dignity—which represent the ‗‗ultimate universal affront‘‘ (Folger & Skarlicki, 1998, p. 69). According to the adjacent principle suggested by Foa and Foa (1980), social exchange resources are categorized in six types whether they are concrete or abstract; need long time to complete exchange or short time. These six types of social resources are currency, goods, service (including behavior), information, status, and love. It has been proved that people prefer exchange of adjacent resources with similar characteristics. With regard to exchange resources in organizational relationship, economic inducements are mainly currency, and commitment is some kind of love, so economic inducements offered by organization are difficult to be paid off by employee‘s commitment. A Florida State University study suggests “Employees Leave Bosses, Not Jobs”. The study
conducted by FSU professor Wayne Hochwarter and two doctoral students - Paul Harvey and Jason Stoner (2007). As per the study respondents of the survey indicated that a good work environment was often much more important than their current pay level. The study also finds the importance of relationship. Gaur, Sangal & Bagaria (2009) also emphasized on the right understanding and relationship in human life. Human prefers to be in good relation with everyone, no matter if he/she is provided with some less facility. Objectives of the study
Objectives of the study are as follows:
To develop and standardize a questionnaire to measure relationship at workplace.
To find out the relation between Relationship at Workplace and Organization Effectiveness.
Research Methodology Sample
The study was conducted in different educational institutes. For this purpose, 200 employees (academic professionals) were contacted personally and requested to fill up a questionnaire comprising measure of Relationship. The questionnaire on a 5 point Likert scale, where 1 indicated Strongly Disagree and 5 indicated Strongly Agree consisting of 38 items has been used. Convenience sampling technique has been used to collect data. Tools for Data Analysis
Item to total correlation has been applied to check the consistency of various items used in the questionnaire. Reliability method (Cronbach Alpha) has been applied to the items. Underlined factors were found out through Factor Analysis. The Hypothesis was formed:
Ho1 = There is a significant relations between
Relationship at Workplace and Commitment towards Organization.
H1 = There is no significant relations between
Relationship at Workplace and Commitment towards Organization.
Ho2 = There is significant relations between
Relationship at Workplace and Organizational Effectiveness.
H2 = There is no significant relations between
Relationship at Workplace and Organizational Effectiveness.
Consistency, Reliability & Significance Measure:
Firstly, consistency of all the items in the questionnaire was checked through item to total correlation. KMO was 0.929, which was an indicator that factors were good and reliable. Significance was 0.0001, which is less than 0.05, therefore, factors were significant. Communalities were > 0.5. Hence, the variables taken in the study are explaining the factors. Factor Analysis
The factors were calculated with the help of total variance explained. The final 9 factors, which come, were calculated from the rotated sum of squared value loading which was the outcome of SPSS software. The factors identified were mutual trust, mutual respect, intercommunication, transparency, just, participation, Need for Money in Life, Commitment towards Organization, and Organizational Effectiveness. Result and Discussion
Ho1 = There is significant relations between
Relationship at Workplace and Commitment towards Organization.
H1 = There is no significant relations between
Relationship at Workplace and Commitment towards Organization. The adjusted R square value was .402. The
adjusted R Square value indicates 40.2% variation in dependent variable i.e. Commitment towards Organization is explained by independent variable of Relationship at Workplace. The beta value was calculated 0.636 and the significant value was calculated .000. This is showing that Relationship at Workplace is significantly impacting the Commitment towards Organization (Table 1) Therefore, the null
hypothesis Ho1 was accepted and alternative hypothesis rejected. Thus, it could be concluded that there was significant relation between Relationship at Workplace and Commitment towards Organization.
Table 1: The Regression Table
Variable Adjusted R Square Beta Sig Value
Relationship at
Workplace .402 .636 .000
Dependent Variable: Commitment towards Organization Note: Significance at 95% level of confidence.
Ho2 = There is significant relations between
Relationship at Workplace and Organizational Effectiveness.
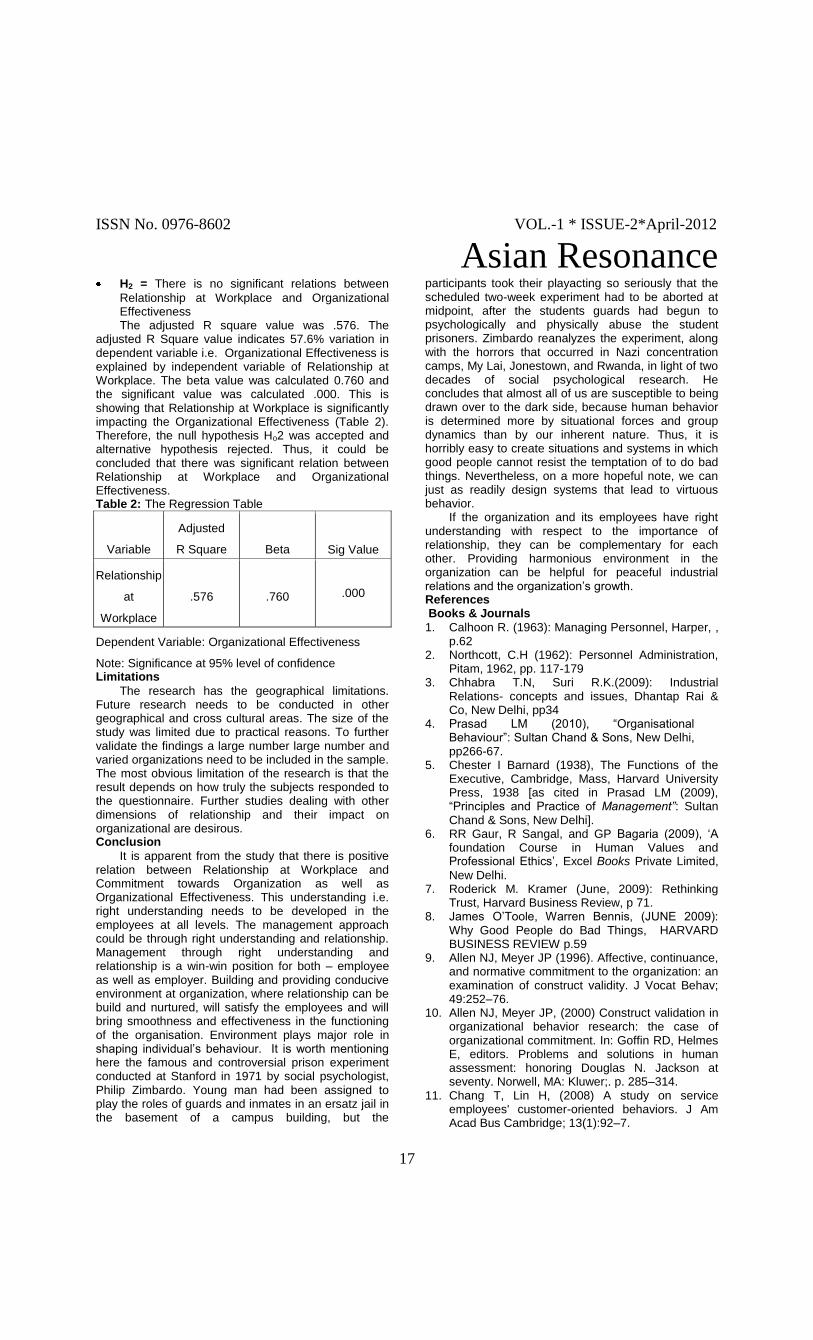
ISSN No. 0976-8602 VOL.-1 * ISSUE-2*April-2012
Asian Resonance
17
H2 = There is no significant relations between
Relationship at Workplace and Organizational Effectiveness The adjusted R square value was .576. The
adjusted R Square value indicates 57.6% variation in dependent variable i.e. Organizational Effectiveness is explained by independent variable of Relationship at Workplace. The beta value was calculated 0.760 and the significant value was calculated .000. This is showing that Relationship at Workplace is significantly impacting the Organizational Effectiveness (Table 2). Therefore, the null hypothesis Ho2 was accepted and alternative hypothesis rejected. Thus, it could be concluded that there was significant relation between Relationship at Workplace and Organizational Effectiveness. Table 2: The Regression Table
Variable
Adjusted
R Square Beta Sig Value
Relationship
at
Workplace
.576 .760 .000
Dependent Variable: Organizational Effectiveness
Note: Significance at 95% level of confidence Limitations
The research has the geographical limitations. Future research needs to be conducted in other geographical and cross cultural areas. The size of the study was limited due to practical reasons. To further validate the findings a large number large number and varied organizations need to be included in the sample. The most obvious limitation of the research is that the result depends on how truly the subjects responded to the questionnaire. Further studies dealing with other dimensions of relationship and their impact on organizational are desirous. Conclusion
It is apparent from the study that there is positive relation between Relationship at Workplace and Commitment towards Organization as well as Organizational Effectiveness. This understanding i.e. right understanding needs to be developed in the employees at all levels. The management approach could be through right understanding and relationship. Management through right understanding and relationship is a win-win position for both – employee as well as employer. Building and providing conducive environment at organization, where relationship can be build and nurtured, will satisfy the employees and will bring smoothness and effectiveness in the functioning of the organisation. Environment plays major role in shaping individual‘s behaviour. It is worth mentioning here the famous and controversial prison experiment conducted at Stanford in 1971 by social psychologist, Philip Zimbardo. Young man had been assigned to play the roles of guards and inmates in an ersatz jail in the basement of a campus building, but the
participants took their playacting so seriously that the scheduled two-week experiment had to be aborted at midpoint, after the students guards had begun to psychologically and physically abuse the student prisoners. Zimbardo reanalyzes the experiment, along with the horrors that occurred in Nazi concentration camps, My Lai, Jonestown, and Rwanda, in light of two decades of social psychological research. He concludes that almost all of us are susceptible to being drawn over to the dark side, because human behavior is determined more by situational forces and group dynamics than by our inherent nature. Thus, it is horribly easy to create situations and systems in which good people cannot resist the temptation of to do bad things. Nevertheless, on a more hopeful note, we can just as readily design systems that lead to virtuous behavior. If the organization and its employees have right understanding with respect to the importance of relationship, they can be complementary for each other. Providing harmonious environment in the organization can be helpful for peaceful industrial relations and the organization‘s growth. References Books & Journals
1. Calhoon R. (1963): Managing Personnel, Harper, , p.62
2. Northcott, C.H (1962): Personnel Administration, Pitam, 1962, pp. 117-179
3. Chhabra T.N, Suri R.K.(2009): Industrial Relations- concepts and issues, Dhantap Rai & Co, New Delhi, pp34
4. Prasad LM (2010), ―Organisational Behaviour‖: Sultan Chand & Sons, New Delhi, pp266-67.
5. Chester I Barnard (1938), The Functions of the Executive, Cambridge, Mass, Harvard University Press, 1938 [as cited in Prasad LM (2009), ―Principles and Practice of Management”: Sultan Chand & Sons, New Delhi].
6. RR Gaur, R Sangal, and GP Bagaria (2009), ‗A foundation Course in Human Values and Professional Ethics‘, Excel Books Private Limited,
New Delhi. 7. Roderick M. Kramer (June, 2009): Rethinking
Trust, Harvard Business Review, p 71. 8. James O‘Toole, Warren Bennis, (JUNE 2009):
Why Good People do Bad Things, HARVARD BUSINESS REVIEW p.59
9. Allen NJ, Meyer JP (1996). Affective, continuance, and normative commitment to the organization: an examination of construct validity. J Vocat Behav; 49:252–76.
10. Allen NJ, Meyer JP, (2000) Construct validation in organizational behavior research: the case of organizational commitment. In: Goffin RD, Helmes E, editors. Problems and solutions in human assessment: honoring Douglas N. Jackson at seventy. Norwell, MA: Kluwer;. p. 285–314.
11. Chang T, Lin H, (2008) A study on service employees' customer-oriented behaviors. J Am Acad Bus Cambridge; 13(1):92–7.

ISSN No. 0976-8602 VOL.-1 * ISSUE-2*April-2012
Asian Resonance
18
12. Eby LT, Freeman DM, Rush MC, Lance CE, (1999) Motivational bases of affective organizational commitment: a partial test of an integrative theoretical model. J Occup Organ Psychol; 72:463–83.
13. Jaramillo F, Mulki JP, Marshall GW, (2005) A meta-analysis of the relationship between organizational commitment and salesperson job performance: 25 years of research. J Bus Res; 58:705–14.
14. Maertz Jr CP, Griffeth RW, Campbell NS, Allen DG, (2007) the effects of perceived organizational support and perceived supervisor support on employee turnover. J Organ Behav; 28(8):1059–75.
15. Meyer JP, Herscovitch L, (2001) Commitment in the workplace: toward a general model. Hum Resour Manage Rev; 11:299–326.
16. Meyer JP, Stanley D, Herscovich L, Topolnytsky L, (2002). Affective, continuance, and normative commitment to the organization: a meta-analysis of antecedents, correlates, and consequences. J Vocat Behav; 61:20–52.
17. Riketta M, (2002). Attitudinal organizational commitment and job performance: a meta-analysis. J Organ Behav; 23:257–66.
18. Somers MJ, (1995). Organizational commitment, turnover and absenteeism: an examination of direct and indirect effects. J Organ Behav; 16(1):49–58.
19. Vandenberghe C, Tremblay M, (2008). The role of pay satisfaction and organizational commitment in turnover intentions: a two-sample study. J Bus Psychol; 22(3):275–86.
20. Vandenberghe C, Bentein K, Stinglhamber F, (2004) Affective commitment to the organization, supervisor, and work group: antecedents and outcomes. J Vocat Behav; 64(1): 47–71.
21. Deutsch, M. (1957). Trust and suspicion. Conflict Resolution, 2: 265-279.
22. Lind, E. A., & Tyler, T. R. (1988). The social psychology of procedural justice. New York: Plenum.
23. Aquino, K., Galperin, B., & Bennett, R. J. (2004). Social status and aggressiveness as moderators of the relationship between interactional justice and workplace deviance. Journal of Applied Social Psychology, 34, 1001–1029.
24. Bennett, R. J., & Robinson, S. L. (2003). The past, present and future of workplace deviance research. In J. Greenberg (Ed.), Organizational behavior: The state of the science (2nd ed., pp. 247–281). Hillsdale, NJ: Lawrence Erlbaum.
25. Bies, R. J., & Moag, J. S. (1986). Interactional justice: Communications criteria of fairness. In R. Lewicki, B. Sheppard, &M. Bazerman (Eds.), Research on negotiation in organizations (Vol. 1, pp. 43–55). Greenwich, CT: JAI Press.
26. Bies, R. J., & Tripp, T. (1996). Beyond distrust: ‗‗Getting even‘‘ and the need for revenge. In R. M. Kramer, & T. Tyler (Eds.), Trust in organizations (pp. 246–260). Thousand Oaks, CA: Sage.
27. Blau, P. (1964). Exchange and power in social life. New York: John Wiley and Sons.
28. Eisenberger, R., Lynch, P., Aselage, J., & Rohdieck, S. (2004). Who takes the most revenge? Individual differences in negative reciprocity norm endorsement. Personality and Social Psychology Bulletin, 30, 787–799.
29. Folger, R., & Skarlicki, D. P. (1998). A popcorn metaphor for employee aggression. In R.W. Griffin, A. O‘Leary- Kelly, & J. M. Collins (Eds.), Dysfunctional behavior in organizations: Violent and deviant behavior (Vol. 1, pp.43–81). Greenwich, CT: JAI Press.
30. Gouldner, A. W. (1960). The norm of reciprocity: A preliminary statement. American Sociological Review, 25,161–178.
31. Masterson, S. S., Lewis, K., Goldman, B. M., & Taylor, M. S. (2000). Integrating justice and social exchange: The differing effects of fair procedures and treatment on work relationships. Academy of Management Journal, 43,738–748.
32. Rupp, D. E., & Cropanzano, R. (2002). The mediating effects of social exchange relationships in predicting Workplace outcomes from multifoci organizational justice. Organizational Behavior and Human Decision Processes, 89, 925–946.
33. Deutsch, M. 1973. The resolution of conflict: constructive and destructive processes. New Haven: Yale University Press.
34. Gabarro, J. 1990. The development of working relationships. In J. Galagher, R. E. Kraut, & C.
35. Egido (Eds.), Intellectual teamwork: Social and technological foundations of cooperative work: 79-110. Hillsdale, NJ: Erlbaum.
36. Granovetter, M. S. 1985. Economic action and social structure: The problem of embeddedness. American Journal of Sociology, 91: 481-510.
37. Griesinger, D. W. 1990. The human side of economic organization. Academy of Management Review, 15: 478-490.
38. Mintzberg, H. 1973. The nature of managerial work. New York: Harper & Row.
39. Pennings, J. M., & Woiceshyn, J. 1987. A typology of organizational control and its metaphors.
40. In S. B. Bacharach & S. M. Mitchell (Eds.), Research in the sociology of organizations, vol. 5: 75-104. Greenwich, CT: JAI Press.
41. Porter, L. W., Lawler, E. E., & Hackman, J. R. 1975. Behavior in organizations. New York: McGraw-Hill.
42. Sayles, L. R. 1979. Leadership: What effective managers really do... and how they do it. New York: McGraw-Hill.
43. Thompson, J. D. 1967. Organizations in action. New York: McGraw-Hill.
44. Aulakh, P.S.; Kotabe, M. & Sahay, A. (1997). ‖Trust and performance in cross-border marketing partnerships: A behavioral approach‖, Journal of International Business Studies, Vol. 27, special issue, 1005-1032.
45. Barney, J.B. & Hansen, M.H. (1994). ‖Trustworthiness as a source of competitive

ISSN No. 0976-8602 VOL.-1 * ISSUE-2*April-2012
Asian Resonance
19
advantage‖, Strategic Management Journal, Vol. 15, 175-190.
46. Bidault, F. & Jarillo, J.C. (1997). ―Trust in economic transactions‖. In: Bidault, F. & Gomez, P-Y. & Marion, G. (Eds.), ―Trust: Firm and society‖, Editions ESKA, Paris.
47. Blomqvist, K. (2002). ―Partnering in the dynamic environment – the role of trust in asymmetric partership formation‖. Thesis for the degree of doctor of science, Lappeenranta University of Technology.
48. Creed, W.E.D. & Miles, R.E. (1996). ―Trust in organisations: A conceptual framework linking organizational forms, managerial philosophies, and the opportunity costs of controls‖. In: Kramer,
49. R.M. & Tyler, T.R. (Eds.), ―Trust in organisations: frontiers of theory and research‖. SAGE Publications, Thousand Oaks.
50. Dogson, M. (1993). ―Learning, Trust, and Technological Collaboration‖. Human Relations, Vol. 46, Iss. 1, 77-94.
51. Larson, A. (1992). ―Network Dyads in Entrepreneurial Settings: A Study of the Governance of Exchange Processes. Administrative Science Quarterly, Vol. 37, Iss. 1, March, 76-104.
52. Moorman, C.; Zaltman, G. & Deshpande, R. (1992). ―Relationships between providers and users of market research: The dynamics of trust within and between organizations‖, Journal of Marketing Research, Vol. XXIX, August, 314-328.
53. Puumalainen, K; Varis, J; Saarenketo, S; Niiranen, J; Blomqvist, K; Kuivalainen, O; Kyläheiko, K; Porras, J; Savolainen, P; Virolainen, V_M & Äijö, T. (2001). ‖Tietoliikennetekniikan PK-lisäarvopalvelutuottajat Suomessa tutkimusraportti‖, Research Reports 3, Telecom Business Research Center, Lappeenranta University of Technology, Lappeenranta.
54. Sako, M. (1992). ―Prices, quality and trust: Inter-firm relations in Britain and Japan‖. Cambridge University Press, Cambridge.
55. Sako, M. (1998). ―Does Trust Improve Business Performance?‖, In: Lane, C. & Bachmann, R. ―Trust within and between organizations‖. Oxford University Press, Oxford.
56. Virolainen, V-M. (1998). ‖Motives, Circumstances, and Success Factors in Partnership Sourcing‖. Ph.D. Thesis, Research Papers 71, Lappeenranta University of Technology, Lappeenranta.
57. Young-Ybarra, C. & Wiersema, M.F. (1999). ―Strategic Flexibility in Information Technology Alliances: The Influence of Transaction Cost Economics and Social Exchange Theory‖, Organization Science, Vol. 10, Iss. 4, 439-459.
58. Moorman, C., Zaltman, G. and Deshpand, R. (1992), ―Relationships between providers and users of market research: the dynamics of trust within and between organizations‖, Journal of Marketing Research, Vol. 29, August, pp. 314-28.
59. Morgan, C. and Hunt, S. (1994), ―The commitment trust theory of relationship marketing‖, Journal of Marketing, Vol. 58, July, pp. 197-206.
Website
Employees Leave Bosses, Not Jobs, retrieved on March 07, 2012 from http://www.therainmakergroupinc.com

ISSN No. 0976-8602 VOL.-1 * ISSUE-2*April-2012
Asian Resonance
14
ISSN No. 0976-8602 VOL.-1 * ISSUE-2*April-2012
Asian Resonance Global Performance Management: The
State of Global Art
Prabhat Dwivedi Asst. Professor MBA Programme STEP-HBTI, Kanpur [email protected]
Alka Dubey Faculty Rama Institute of Business Studies, Kanpur [email protected]
Richa Tiwari Student, MBA Final Year Kanpur Institute of Management Studies Unnao. [email protected]
Abstract Performance management (PM) is one human resource practice that is of importance for the company. This paper focuses on global PM in multinational enterprises. The aim is to present advances in the PM research framework, give managerial suggestions and find out future needs and trends. Recent research reveals that the majority of organizations are utilizing performance management systems / performance management software and many are in the process of revamping their first generation systems. It is likely the majority of employees equate "performance management" to their performance appraisal form and yearly discussion with their manager about "how they are doing in their job." The goals of performance management can be explained from the strong performance orientation to a strong development orientation. It is viewed in many organizations that people are not able to clearly identify the difference between the two terms; „Performance Management‟ and „Performance Appraisal‟. In this paper the whole model of performance management is being discussed which is having four major parts: Performance Planning, Performance Coaching, Performance Appraisal, and Reinforcing Performance. Basically, the purpose of performance management relates to increasing performance of employees and fostering employee motivation and development. This article explores how performance management can be utilized effectively within the organization to benefit staff and organization. However the use of performance management is not complete without studying its challenges and identifying the thrust areas in the field of performance management. The article throws some light on performance culture also as a tool for developing performance management system. Along with the performance culture, present paper also focusses upon the Extended Performance Management (ExPM), Enriched Performance Management (EnPM) as well as Key Performance Indicators (KPIs), Key words: Performance Appraisal, GPM, Key Performance Indicators, ExPM, EnPM.
Introduction: The performance Management process is the main function in any organization which affects the career growth and development of an employee as well as the organization directly. So, employees should handle this performance management very carefully as a very crucial part of their job. All the successful HR professionals got their success due to this extremely important function- Performance Management.
According to SHRM (the Society for Human Resource Management), "performance management is the organized method of monitoring results of work activities, collecting and evaluating performance to determine achievement of goals, and using performance information to make decisions, allocate resources and communicate whether objectives are met." Performance management is not just like evaluating the performance of the employee at the end of the year, it is basically beyond the performance appraisal because it involves the process of planning performance, appraising performance, providing its feedback, and counseling an employee to improve his performance. Thus, we can say that Performance Management involves four distinct activities: Performance Planning which reveals to an employee what is expected to achieve with the available resources and within predetermined time period,
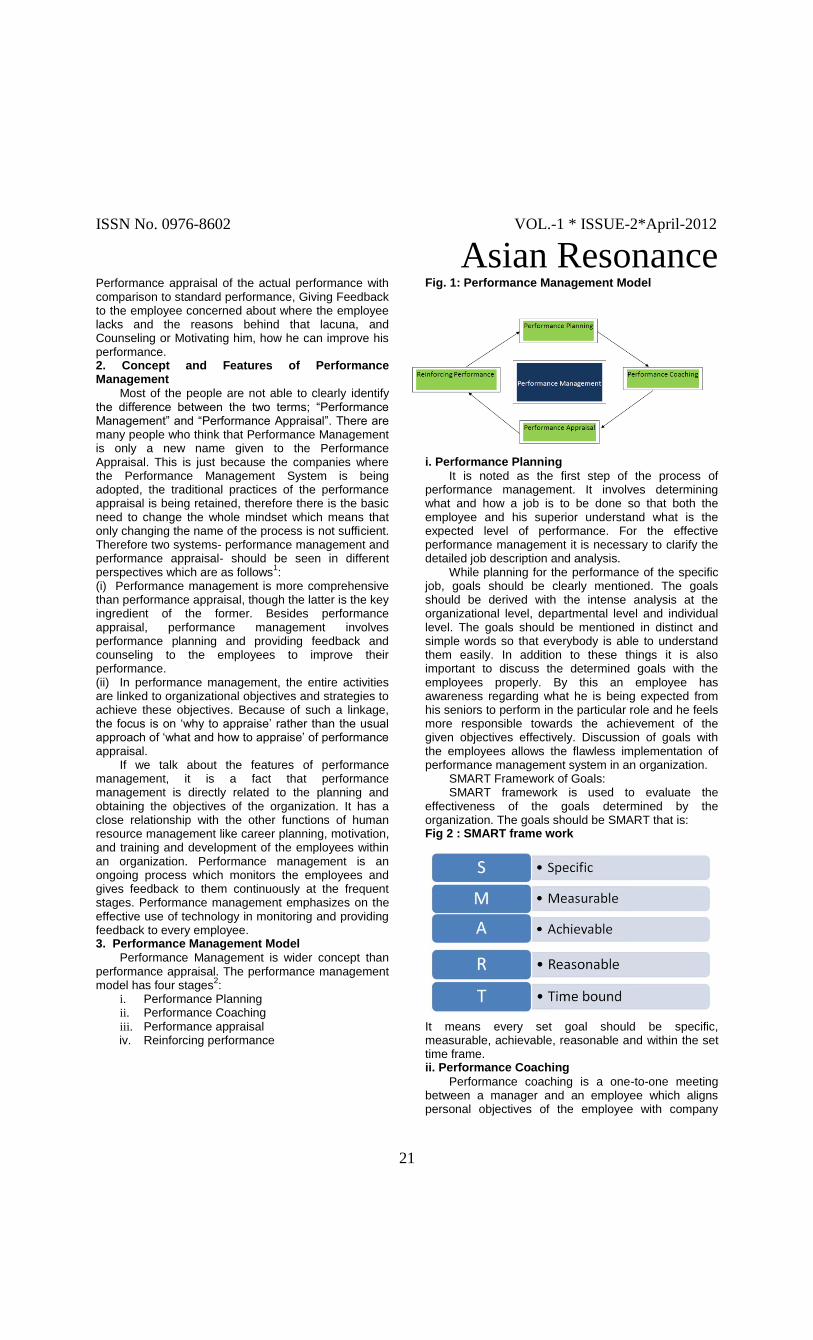
ISSN No. 0976-8602 VOL.-1 * ISSUE-2*April-2012
Asian Resonance
21
Performance appraisal of the actual performance with comparison to standard performance, Giving Feedback to the employee concerned about where the employee lacks and the reasons behind that lacuna, and Counseling or Motivating him, how he can improve his performance. 2. Concept and Features of Performance Management
Most of the people are not able to clearly identify the difference between the two terms; ―Performance Management‖ and ―Performance Appraisal‖. There are many people who think that Performance Management is only a new name given to the Performance Appraisal. This is just because the companies where the Performance Management System is being adopted, the traditional practices of the performance appraisal is being retained, therefore there is the basic need to change the whole mindset which means that only changing the name of the process is not sufficient. Therefore two systems- performance management and performance appraisal- should be seen in different perspectives which are as follows
1:
(i) Performance management is more comprehensive than performance appraisal, though the latter is the key ingredient of the former. Besides performance appraisal, performance management involves performance planning and providing feedback and counseling to the employees to improve their performance. (ii) In performance management, the entire activities are linked to organizational objectives and strategies to achieve these objectives. Because of such a linkage, the focus is on ‗why to appraise‘ rather than the usual approach of ‗what and how to appraise‘ of performance appraisal.
If we talk about the features of performance management, it is a fact that performance management is directly related to the planning and obtaining the objectives of the organization. It has a close relationship with the other functions of human resource management like career planning, motivation, and training and development of the employees within an organization. Performance management is an ongoing process which monitors the employees and gives feedback to them continuously at the frequent stages. Performance management emphasizes on the effective use of technology in monitoring and providing feedback to every employee. 3. Performance Management Model
Performance Management is wider concept than performance appraisal. The performance management model has four stages
2:
i. Performance Planning ii. Performance Coaching iii. Performance appraisal
iv. Reinforcing performance
Fig. 1: Performance Management Model
i. Performance Planning
It is noted as the first step of the process of performance management. It involves determining what and how a job is to be done so that both the employee and his superior understand what is the expected level of performance. For the effective performance management it is necessary to clarify the detailed job description and analysis.
While planning for the performance of the specific job, goals should be clearly mentioned. The goals should be derived with the intense analysis at the organizational level, departmental level and individual level. The goals should be mentioned in distinct and simple words so that everybody is able to understand them easily. In addition to these things it is also important to discuss the determined goals with the employees properly. By this an employee has awareness regarding what he is being expected from his seniors to perform in the particular role and he feels more responsible towards the achievement of the given objectives effectively. Discussion of goals with the employees allows the flawless implementation of performance management system in an organization.
SMART Framework of Goals: SMART framework is used to evaluate the
effectiveness of the goals determined by the organization. The goals should be SMART that is: Fig 2 : SMART frame work
It means every set goal should be specific, measurable, achievable, reasonable and within the set time frame. ii. Performance Coaching
Performance coaching is a one-to-one meeting between a manager and an employee which aligns personal objectives of the employee with company
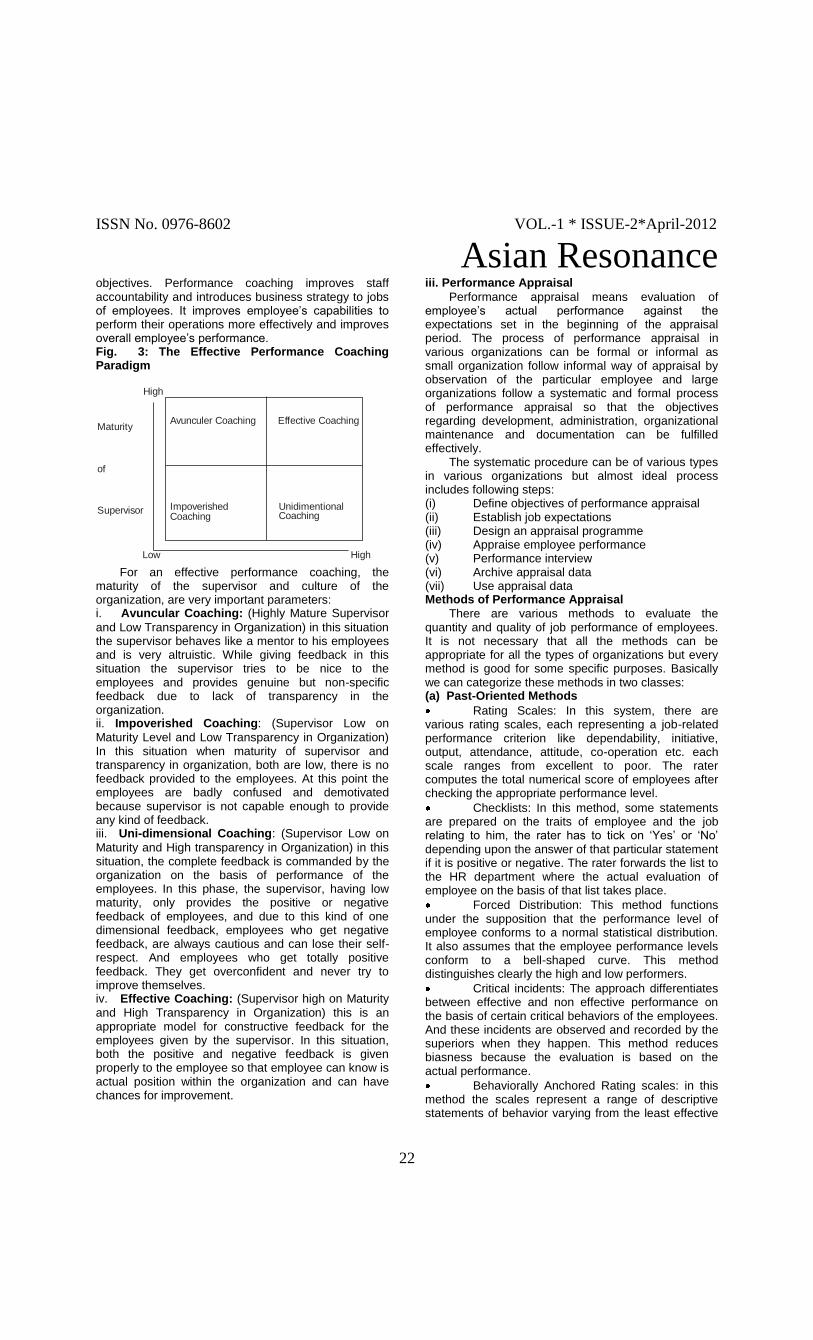
ISSN No. 0976-8602 VOL.-1 * ISSUE-2*April-2012
Asian Resonance
22
Avunculer CoachingMaturity
Effective Coaching
Supervisor ImpoverishedCoaching
Unidimentional Coaching
High
of
HighLow
objectives. Performance coaching improves staff accountability and introduces business strategy to jobs of employees. It improves employee‘s capabilities to perform their operations more effectively and improves overall employee‘s performance. Fig. 3: The Effective Performance Coaching Paradigm
For an effective performance coaching, the maturity of the supervisor and culture of the organization, are very important parameters: i. Avuncular Coaching: (Highly Mature Supervisor
and Low Transparency in Organization) in this situation the supervisor behaves like a mentor to his employees and is very altruistic. While giving feedback in this situation the supervisor tries to be nice to the employees and provides genuine but non-specific feedback due to lack of transparency in the organization. ii. Impoverished Coaching: (Supervisor Low on
Maturity Level and Low Transparency in Organization) In this situation when maturity of supervisor and transparency in organization, both are low, there is no feedback provided to the employees. At this point the employees are badly confused and demotivated because supervisor is not capable enough to provide any kind of feedback. iii. Uni-dimensional Coaching: (Supervisor Low on
Maturity and High transparency in Organization) in this situation, the complete feedback is commanded by the organization on the basis of performance of the employees. In this phase, the supervisor, having low maturity, only provides the positive or negative feedback of employees, and due to this kind of one dimensional feedback, employees who get negative feedback, are always cautious and can lose their self- respect. And employees who get totally positive feedback. They get overconfident and never try to improve themselves. iv. Effective Coaching: (Supervisor high on Maturity
and High Transparency in Organization) this is an appropriate model for constructive feedback for the employees given by the supervisor. In this situation, both the positive and negative feedback is given properly to the employee so that employee can know is actual position within the organization and can have chances for improvement.
iii. Performance Appraisal
Performance appraisal means evaluation of employee‘s actual performance against the expectations set in the beginning of the appraisal period. The process of performance appraisal in various organizations can be formal or informal as small organization follow informal way of appraisal by observation of the particular employee and large organizations follow a systematic and formal process of performance appraisal so that the objectives regarding development, administration, organizational maintenance and documentation can be fulfilled effectively.
The systematic procedure can be of various types in various organizations but almost ideal process includes following steps: (i) Define objectives of performance appraisal (ii) Establish job expectations (iii) Design an appraisal programme (iv) Appraise employee performance (v) Performance interview (vi) Archive appraisal data (vii) Use appraisal data Methods of Performance Appraisal
There are various methods to evaluate the quantity and quality of job performance of employees. It is not necessary that all the methods can be appropriate for all the types of organizations but every method is good for some specific purposes. Basically we can categorize these methods in two classes: (a) Past-Oriented Methods
Rating Scales: In this system, there are various rating scales, each representing a job-related performance criterion like dependability, initiative, output, attendance, attitude, co-operation etc. each scale ranges from excellent to poor. The rater computes the total numerical score of employees after checking the appropriate performance level.
Checklists: In this method, some statements are prepared on the traits of employee and the job relating to him, the rater has to tick on ‗Yes‘ or ‗No‘ depending upon the answer of that particular statement if it is positive or negative. The rater forwards the list to the HR department where the actual evaluation of employee on the basis of that list takes place.
Forced Distribution: This method functions under the supposition that the performance level of employee conforms to a normal statistical distribution. It also assumes that the employee performance levels conform to a bell-shaped curve. This method distinguishes clearly the high and low performers.
Critical incidents: The approach differentiates between effective and non effective performance on the basis of certain critical behaviors of the employees. And these incidents are observed and recorded by the superiors when they happen. This method reduces biasness because the evaluation is based on the actual performance.
Behaviorally Anchored Rating scales: in this method the scales represent a range of descriptive statements of behavior varying from the least effective

ISSN No. 0976-8602 VOL.-1 * ISSUE-2*April-2012
Asian Resonance
23
to the most effective. And a rater is expected to select the point which behavior on each scale best describes an employee‘s performance.
Essay Method: In this method, no forms are there to fill or tick the points. The rater is free to explain about employee performance in his own words. And this method is highly useful in filling gaps about the employees which often occur in checklist method.
Comparative Evaluation: In this method the rater compare employee‘s job performance with his co-workers. (b) Future Oriented Methods
Management by Objectives: In this method first
step to be followed is goal setting, after that we set performance standard. After execution we compare the actual performance with the goals agreed upon. And whatever the feedback comes, employee gets new goals based on the performance and feedback loop.
Assessment Center: In this method, the
performance of top management is measured by the group of experienced appraisers. The assesses are requested to participate in work groups, in-basket exercise, computer simulations, role playing, and other similar activities which require the same traits for successful performance, as in the actual job.
Psychological Appraisals: In this method, the
focus is on assessment of future potentials and not the actual performance of the employee. Industrial psychologists are hired for conducting these appraisals.
360-degree Appraisal: this is a holistic process of
performance appraisal of employees. In this method feedback is taken from all the stakeholders involved in interfacing with an employee. iv. Reinforcing Performance
When we talk about reinforcement, we find that there are two types of reinforcement, positive and negative. (a) Positive Reinforcement
According to this form of reinforcement, an employee exhibits positive behavior when he feels that desired outcome or result has come from his efforts and this would result in the same behavior being repeated in the future with the hope of similar desired results.
Promotion: it leads to a gain in monetary terms
as well as in role of employee which fulfills employee‘s security and esteem needs according to Maslow Need Hierarchy Theory. Promotion leads to good performance in current role and capability in terms of competencies held and total experience.
Salary Increment: Salary increment is also a
method to reinforce desired behavior due to improved performance.
Role Switch: This method also ensures the
motivation of employee in repeating desired behavior by switching into a more interesting, enriched role.
Incentives or bonus: There are monetary
benefits which help in reinforcing good performance of the employee.
(b) Negative Reinforcement
According to this form of reinforcement when employee feels that the comfort level is withdrawn from his position. He tries to attain a position of comfort and stability by demonstrating expected behavior.
Performance Improvement Plan: In the situation
where the performance of an employee does not meet the desired outcome or standards set for him by the organization, the employee is given a short time bound assignment to demonstrate improved performance by him. This way of improvement is socially degrading and organization provides an unfavorable response to the undesired behaviors, and forces the employee to improve.
Pay Cutting: This is very strong method of
negative reinforcement which causes a major loss of face before colleagues as well as financial inconvenience by reduced pay and promotion denied.
Termination: This is the harshest form of negative
reinforcement which reinforced to other employees more than the employee terminated.
4. Performance Culture
In an organization when people from different environment come together for a common purpose, it is necessary to decide their behavior by some written and unwritten rules. These written or unwritten rules impact individuals and develop some distinctive standards of behavior for that civilization. And this develops certain prototype of behavior of particular culture and cultural divergences could be observed in that situation.
Performance culture means a culture of organizations which is proactive in its achievement obstructs and weeds out actions and behaviours which cause obstacles and destruction, encourages and enforces those actions and behaviors which are positive, and rewards for the same. And this motivates employees to be committed and engaged towards their organization. Fig. 4: Elements of Performance Culture
Sources: HRM Review, November 2010 (edited)
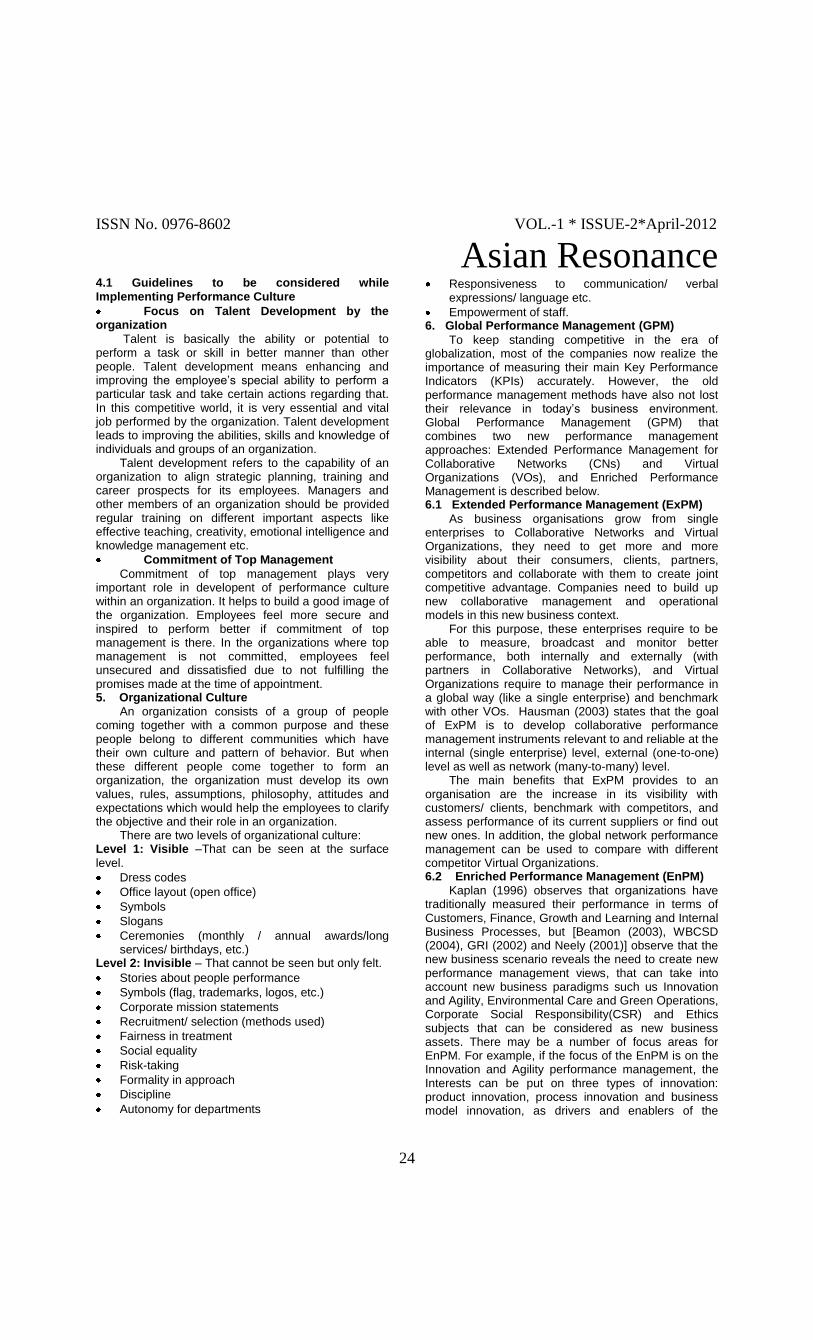
ISSN No. 0976-8602 VOL.-1 * ISSUE-2*April-2012
Asian Resonance
24
4.1 Guidelines to be considered while Implementing Performance Culture
Focus on Talent Development by the organization
Talent is basically the ability or potential to perform a task or skill in better manner than other people. Talent development means enhancing and improving the employee‘s special ability to perform a particular task and take certain actions regarding that. In this competitive world, it is very essential and vital job performed by the organization. Talent development leads to improving the abilities, skills and knowledge of individuals and groups of an organization.
Talent development refers to the capability of an organization to align strategic planning, training and career prospects for its employees. Managers and other members of an organization should be provided regular training on different important aspects like effective teaching, creativity, emotional intelligence and knowledge management etc.
Commitment of Top Management
Commitment of top management plays very important role in developent of performance culture within an organization. It helps to build a good image of the organization. Employees feel more secure and inspired to perform better if commitment of top management is there. In the organizations where top management is not committed, employees feel unsecured and dissatisfied due to not fulfilling the promises made at the time of appointment. 5. Organizational Culture
An organization consists of a group of people coming together with a common purpose and these people belong to different communities which have their own culture and pattern of behavior. But when these different people come together to form an organization, the organization must develop its own values, rules, assumptions, philosophy, attitudes and expectations which would help the employees to clarify the objective and their role in an organization.
There are two levels of organizational culture: Level 1: Visible –That can be seen at the surface
level.
Dress codes
Office layout (open office)
Symbols
Slogans
Ceremonies (monthly / annual awards/long services/ birthdays, etc.)
Level 2: Invisible – That cannot be seen but only felt.
Stories about people performance
Symbols (flag, trademarks, logos, etc.)
Corporate mission statements
Recruitment/ selection (methods used)
Fairness in treatment
Social equality
Risk-taking
Formality in approach
Discipline
Autonomy for departments
Responsiveness to communication/ verbal expressions/ language etc.
Empowerment of staff. 6. Global Performance Management (GPM)
To keep standing competitive in the era of globalization, most of the companies now realize the importance of measuring their main Key Performance Indicators (KPIs) accurately. However, the old performance management methods have also not lost their relevance in today‘s business environment. Global Performance Management (GPM) that combines two new performance management approaches: Extended Performance Management for Collaborative Networks (CNs) and Virtual Organizations (VOs), and Enriched Performance Management is described below. 6.1 Extended Performance Management (ExPM)
As business organisations grow from single enterprises to Collaborative Networks and Virtual Organizations, they need to get more and more visibility about their consumers, clients, partners, competitors and collaborate with them to create joint competitive advantage. Companies need to build up new collaborative management and operational models in this new business context.
For this purpose, these enterprises require to be able to measure, broadcast and monitor better performance, both internally and externally (with partners in Collaborative Networks), and Virtual Organizations require to manage their performance in a global way (like a single enterprise) and benchmark with other VOs. Hausman (2003) states that the goal of ExPM is to develop collaborative performance management instruments relevant to and reliable at the internal (single enterprise) level, external (one-to-one) level as well as network (many-to-many) level.
The main benefits that ExPM provides to an organisation are the increase in its visibility with customers/ clients, benchmark with competitors, and assess performance of its current suppliers or find out new ones. In addition, the global network performance management can be used to compare with different competitor Virtual Organizations. 6.2 Enriched Performance Management (EnPM)
Kaplan (1996) observes that organizations have traditionally measured their performance in terms of Customers, Finance, Growth and Learning and Internal Business Processes, but [Beamon (2003), WBCSD (2004), GRI (2002) and Neely (2001)] observe that the new business scenario reveals the need to create new performance management views, that can take into account new business paradigms such us Innovation and Agility, Environmental Care and Green Operations, Corporate Social Responsibility(CSR) and Ethics subjects that can be considered as new business assets. There may be a number of focus areas for EnPM. For example, if the focus of the EnPM is on the Innovation and Agility performance management, the Interests can be put on three types of innovation: product innovation, process innovation and business model innovation, as drivers and enablers of the

ISSN No. 0976-8602 VOL.-1 * ISSUE-2*April-2012
Asian Resonance
25
concept of Agility, which shows the capability to quickly and continuously respond to internal and external changes.
The main benefits that EnPM provides to an organisation are to increase their business volume and decrease their costs/prices by the application of innovation at global parameters. In addition, it provides user friendly and affordable tools to respond to the fast changing customer demand. 7. Key Performance Indicator (KPI)
KPI is the term which is one of the most over-used but little understood. Theoretically, it provides various yardsticks to internal managers and external investors to judge the business and how it‘s prospects over the time. Ibis Associates defined KPI as
A set of quantifiable measures that a company or industry uses to gauge or compare performance in terms of meeting their strategic and operational goals. KPIs vary between companies and industries, depending on their priorities or performance criteria. Also referred to as "key success indicators (KSI)".
According to Wikipedia, ‗KPIs are commonly used by an organization to evaluate its success or the success of a particular activity in which it is engaged. Sometimes success is defined in terms of making progress toward strategic goals, but often, success is simply the repeated achievement of some level of operational goal (zero defects, 10/10 customer satisfaction etc.). Accordingly, choosing the right KPIs is reliant upon having a good understanding of what is important to the organization. 'What is important' often depends on the department measuring the performance - the KPIs useful to a Finance Team will be quite different to the KPIs assigned to the sales force, for example. Because of the need to develop a good understanding of what is important, performance indicator selection is often closely associated with the use of various techniques to assess the present state of the business, and its key activities. These assessments often lead to the identification of potential improvements; and as a consequence, performance indicators are routinely associated with 'performance improvement' initiatives. A very common method for choosing KPIs is to apply a management framework such as the balanced scorecard.‘ 7.1 Key Components of a KPI
The KPI can be seen as: Fig. 5: Components of a KPI
KPI works as a Key
when it is of core importance to get edge over competitors. It is actually a make or break component in the success or failure of the organisation.
KPI is effective if and only if it relates to Performance which can be clearly measured,
quantified and influenced by the organisation.
KPI works as an Indicator only if it is able to
provide leading information on future performance. Obviously, KPIs cannot be established without
proper understanding of what is possible, what is not. To establish a KPI, one has to set lower and upper limits of the KPI in context to the market and competition. Therefore, to make KPIs useful it is necessary to have clear understanding of benchmarks
specific to the organization and market because they show the clear picture of the current performance level in context to both, established organizations and new ventures, however they are more important for the former. Moreover, Benchmarks help to reveal what other successful enterprises are seeing as important and unavoidable in building and maintaining competitive edge, as these successful enterprises are exemplars and central to any type of competitive analysis. 7.2. The Balanced Scorecard and KPIs
Generally, every enterprise tries to create a balanced scorecard. A balanced scorecard generally comprises of the standard elements which are gross profit, return on capital and Z scores (a measure of the liquidity of the enterprise and clearly defines positive or negative trends). Identification of KPIs in each of the operational areas is very helpful in the planned development the enterprise. These KPIs are not established once for all, but they change over time. 7.3. The Process of Identifying KPIs Fig. 6: The key stages involved in identifying KPIs
The process shown in the figure 6 is self- explanatory.
In addition, a KPI also follows the SMART criteria. 7.4. Advantages of KPIs
i) KPIs, Benchmarks and Prioritisation After dentifying the relevant KPIs and benchmarks, the organisation can prioritise for change and potential returns on investment. ii) KPIs and the Management Information System
The choice of KPIs should be the initial activity to re-evaluate the information system to make it more valuable and relevant in a decentralised planning system focused around knowledge centers. In fact, the choices of KPI determine what will drive that part of the organisation and what information must be gathered to analyse and manage it. For the purpose, some choices of softwares may have to be made. Such information gathering or software

ISSN No. 0976-8602 VOL.-1 * ISSUE-2*April-2012
Asian Resonance
26
choices help in creating relevant and valuable information networks which provide precise data to be used specifically for operational purposes and minimize information overload.
iii) Other Utilities of KPIs
In the planning platform, the KPI is central to a number of other elements because it prepares the ground to answer the three core planning questions: i. Where are we? ii. Where do we want to be (and when)? iii. How are we going to get there cost effectively? KPIs help not only in creating knowledge centres
and monitoring business but also playing a vital role in planning and implementation of actions with an emphasis on management by objectives (MBO); training as part of an enterprise wide approach focusing on staff and management on necessary operational requirements; and identifying necessary actions in change management, survival, recovery planning and exit planning. Thus, KPIs emerge as a central to business planning as it is a core part of the business plan outline. 8. Benefits of Performance Management
There are various benefits of good performance management as:
Performance management focuses on results, rather than activities and behavior of employees.
Performance management aligns organizational processes and activities to the objectives of the organization.
Performance management nurtures a long term view of the organization.
Performance management cultivates meaningful measurements for the organization.
Performance management optimizes incentive plans to specific goals provided to the employees.
It facilitates the engagement of the employee towards the organization.
It simplifies the communication of strategic goals with the employees.
It helps in reducing the cost in the organization and facilitates to increased sales.
9. Conclusion
The term ‗Performance Management‘ is frequently talked of but little understood in an organization. So the performance management process in an organization is often the most abused. This is because most of the HR Heads and Talent Managers treat performance management as synonymous with performance appraisal. The firms which seem to take it in its right meaning, while trying to align their performance management system (PMS) to the ideal performance management process, restrict them to the appraisal process only. For an organization, reaching an ideal PMS may be difficult and time taking but is not at all impossible. The concept of PMS is quite difficult to realize unless organizational culture is not suitable for. Organizational culture is one of the important tools for PMS. It supports the organization in achieving success
and excellence. The new business environment is steered by three major factors: globalisation, increasing competition moving more and more from organisations to value chains, and increasing customer dictatorship which is introducing an enriched definition of business excellence enhancing the traditional quality/cost/time variables with new views such as innovation and agility, eco-responsibility, ethics and social responsibility. This changed environment is putting increasing pressure on organizations to think not of performance management, rather global performance management for enhanced competitive advantage by identifying their key performance indicators in context. References Books & Journals 1. Alfaro, J.J.; Ortiz, A.; Poler, R.; Franco, R. ‗Performance
Measurement for e-Business Enterprises‘.International Journal of Business Performance Management 2002; Vol. 4, Nº 2, 3, 4.
2. Aswathappa, K., ‗Human Resource Management- Text and Cases‘ Tata Mc Graw Hill Publishing Co.Ltd., New Delhi, 7
th Reprint, 2008, pp.238-251.
3. Carol Taylor Fitz-Gibbon (1990), "Performance Indicators", BERA Dialogue(2), ISBN 9781853590924
4. De, Abhishek & De, Vishakha Shanbhag (2010). ‗Performance Management: The Necessary Evil‘ HRM Review, September 2010, pp.25-30.
5. Joshi, Jyoti Deepak (2010). ‗Performance Culture: Tool for Developing Performance Management System‘. HRM Review, November 2010, pp.52-57.
6. Kaplan, R.S.; Norton, D.P. The Balanced Scorecard. Harvard Business School Press, 1996.
7. Neely, A.; Adams, C. ‗Perspectives on Performance‘. The Performance Prism. Web Site of Neely A. www.som.cranfield.ac.uk/som/cbp/adn.htm, 2001.
8. Prasad, L. M.(2005), ‗Human Resource Management‘ 2nd
Edition (2005), Sultan Chand & Sons Pub., New Delhi, pp.440-475.
Online Sources 1. World Business Council for Sustainable Development
(WBCSD). WBCSD Annual Review 2004. 2. A Decade of Action and Learning. Web site of the
WMCSD: www.wbcsd.ch, 2004. 3. David Parmenter, Key Performance Indicators. John
Wiley & Sons 2007, ISBN 0-470-09588-1. http://books.google.com/?id=uxK0MUHeiI4C
4. Alba Marc, Díez Luis, Olmos Esther, Rodríguez Raúl. ‗Global Performance Management For Small And Medium-Sized Enterprises (GPM-SME), accessed at: www.gpm-sme.org
5. http://www.archive.org/details/animalintelligen00thor 6. http://en.allexperts.com/q/Human-Resources-
2866/2008/2/culture.htm 7. http://www.ibisassoc.co.uk/key-performance-
indicators.htm as accessed on 20/05/2011 8. http://en.wikipedia.org/wiki/Performance_indicator as
accessed on 20/05/2011

ISSN No. 0976-8602 VOL.-1 * ISSUE-2*April-2012
Asian Resonance
27
ISSN No. 0976-8602 VOL.-1 * ISSUE-2*April-2012
Asian Resonance Quality of Work Life as Related to
Motivational Pattern of Employees in Select Indian Organization
Deepali Saxena Ph.D (Management) Research Scholar, Singhania University
Introduction
Quality of work life (QWL) is viewed as an alternative to the control approach of managing people. The QWL approach considers people as an ‗asset‘ to the organization rather than as liability. It believes that people perform better when they are allowed to participate in managing their work and make decisions, therein. The Quality of work Life movement aims at integrating the socio-psychological need of employees, the unique requirements of a particular technology, the structure and process of the organization and the existing socio-culture milieu. It seeks to create a culture of work commitment to organizations and society at large so as to ensure high productivity and greater job satisfaction of employees. Quality of work life signifies the human being‘s continuous search for finding the true meaning of the work they undertake. The term has significance for organizations too as it signifies their effectiveness in bringing and enhancing human values and ethos into the organization which depend not only the extent of economic benefit but also the extent to which it bears responsibilities towards the society at large. Hence, this concept was considered to be important area of academic research.
Abstract
In the present scenario of global competition and rapid advancement in technology, it is universally accepted that the success and survival of an organization will depend now largely on how an organization attracts talents, how it motivates the talent and how it retains the talent. Explosion of knowledge in the last century has offered ample talent but has invited problem in utilization. Increasing rate of attrition is questioning organizations to relook into their strategies. Increasing financial incentives is not able to check attrition. It has been lately recognized that the workers now want quality in their work and life. Organizations are required to adopt a strategy to improve the employees “quality of work life” to satisfy both the organizational objectives and employee‟s needs. Quality of work life (QWL) is viewed as an alternative to the control approach of managing people. The QWL approach considers people as an „asset‟ to the organization rather than as liability. It believes that people perform better when they are allowed to participate in managing their work and make decisions, therein. The Quality of work Life movement aims at integrating the socio-psychological need of employees, the unique requirements of a particular technology, the structure and process of the organization and the existing socio-culture milieu. It seeks to create a culture of work commitment to organizations and society at large so as to ensure high productivity and greater job satisfaction of employees. Key Words: Quality of Work Life, Motivation, Organization Climate.

ISSN No. 0976-8602 VOL.-1 * ISSUE-2*April-2012
Asian Resonance
28
the organization‘s overall effectiveness. It is a proactive approach of an organization to find ways to empower employees so that they draw on their ―brains and wits,‖ and become more involved in decision-making process, as far as their work is concerned. Quality of work life means ―the degree to which members of a work organization are able to satisfy important personal needs through their experience in the organization‖. QWL could be defined as ―the Quality of the relationship between the man and task. Quality of work life has gained deserved prominence in the Organizational Behavior as an indicator of the overall human experience in the work place. It expresses a special way of thinking about people, their work and the organization in which career needs are fulfilled. QWL refers to the relationship between a worker and his environment. It adds human dimension to the technical and economic dimensions within which the work is normally viewed and designed. QWL focus on the problem of creating a human working environment where employees work cooperatively and achieve results collectively. It also seeks to
Include collaboration among the groups.
Promote team spirit among the individuals.
Ensure compatibility between individual needs and organizational needs.
Satisfy workers through performing their work.
Motivate workers for bettering their performance.
Give an experience of commitment to the organization.
Give an experience of involvement in organizational activities.
Provide an opportunity to the workers in decision making.
What has been stated so far, leads us to conceptualize that QWL is a cognitive concept. It is a perception of quality in one‘s work and in one‘s life. Therefore, it can be conceived that there are three elements or components in QWL. The first one is the work or organization which gives the information to the individual about quality of his work. This is the determinant of QWL. The second one is the personal life of the individual which may be pleasant or unpleasant. The third is the individual who is the receiver of the information may perceive quality or no quality according to fulfillment of motivational needs. It is likely that organizations variables may be affecting quality in his life positively or negatively. It is also likely that his personal life variables may be affecting quality in work; therefore, it appears necessary to understand the concept of QWL and motivational climate of the organization. QWL refers to the level of satisfaction, motivation, involvement and commitment individuals experience with respect to their line at work. QWL is the degree of excellence brought about work and working conditions which contribute to the overall satisfaction and performance primarily at the individual level but finally at the organizational level.
QWL is a prescriptive concept, it attempts to design work environments so as to maximize concern for human welfare. QWL acts in two dimensions.
Goal
Process QWL dimensions are broadly divided into
Classical dimensions and Contemporary dimensions. Classical dimensions include physical working conditions, employees' welfare, employee assistance, job factors and financial factors whereas, Contemporary dimensions include collective bargaining, industrial safety and health, grievance redressal procedure, quality circles, work-life balance, workers' participation in management etc. Industrial Safety is one of the contemporary factors, which influence the QWL of the employees. Concept and research review of quality of work life
Quality of work life is a concept of behavioral scientist, and the term was first introduced by Davis in 1972 (Mathur, 1989; Hian and Einstein, 1990). According Robins (1990) QWL is ―a process by which an organization responds to employee needs by developing mechanisms to allow them to share fully in making the decisions that design their lives at work‖. The key elements of QWL in the literature include job security, job satisfaction, better reward system, employee benefits, employee involvement and organizational performance (Havlovic, 1991; Scobel, 1975). For the purpose of this study, QWL is defined as the favorable condition and environment of employee‘s benefit, employees‘ welfare and management attitudes towards operational workers as well as employees in general. Qualities of Work Life defined by Miller, 1978; Kirkman, 1981; Metz, 1982; Mirvis & Lawler, 1984; Cooper, 1988: are broadly similar to the study on Singaporean Employees Development, which suggest four dimensions of Quality of work life labeled as, i) Favorable work environment ii) Personal growth and autonomy iii) Nature of job and iv) Stimulating opportunities and co-workers. Good performance is recognized in addition to rewards being based upon performance while employees are respected and treated like mature people. The Study on Singaporean Employees development, Cheng S says, in a high QWL there should be a positive impact on personal life, an opportunity to be involved in decision as well as an acceptable level of physical comfort. Jobs seen to exist within high QWL work situations are those in which there is minimal negative impact on one‘s personal life, and hopefully one which has a positive impact on one‘s personal life. It is expected that these dimensions comprising QWL that were found in the sample of Singaporean study are consistent with the rapid economic growth and increasingly higher levels of educational standards in Singapore. Research studies (Taylor, 1977; Taylor, 1978; Donald, 1997) have generally established that QWL is positively associated with job satisfaction and can be a significant motivator. One implication of this finding for management is the need to consider the

ISSN No. 0976-8602 VOL.-1 * ISSUE-2*April-2012
Asian Resonance
29
type of intrinsic and extrinsic factors highlighted by the four aspects of QWL that comprise the motivational reward-incentive system used in organizations. Designing the job and the work environment so as to include the characteristics of the QWL dimensions discussed above will contribute to the worker‘s sense of well-being, and provide a more positive start to other work motivation programmes within the organization. Kirkman (1989) suggests that in the future work society; the drive for more humanitarian treatment both in and out of work will increase. Cheng S in his paper QWL through employee
participation in Singapore has discussed the following four different approaches to QWL Employee - share option scheme, Joint management consultation, Quality circle and Industrial relations circle. This is an interesting situation given the high degree of emphasis on achieving high standards in performance and quality known in Singapore. Concept of motivation
Rensis Likerthas called motivation as the core of management. Motivation is the core of management. Motivation is an effective instrument in the hands of the management in inspiring the work force .It is the major task of every manager to motivate his subordinate or to create the will to work among the subordinates .It should also be remembered that the worker may be immensely capable of doing some work, nothing can be achieved if he is not willing to work .creation of a will to work is motivation in simple but true sense of term. Motivation is an important function which very manager performs for actuating the people to work for accomplishment of objectives of the organization .Issuance of well conceived instructions and orders does not mean that they will be followed. A manager has to make appropriate use of motivation to enthuse the employees to follow them. Effective motivation succeeds not only in having an order accepted but also in gaining a determination to see that it is executed efficiently and effectively. In order to motivate workers to work for the organizational goals, the managers must determine the motives or needs of the workers and provide an environment in which appropriate incentives are available for their satisfaction .If the management is successful in doing so; it will also be successful in increasing the willingness of the workers to work. This will increase efficiency and effectiveness of the organization .There will be better utilization of resources and workers abilities and capacities. Conceptual frame work of organizational climate
Conceptual frame work of Organizational climate can be defined as the perceived attribution of an organization and its subsystems, as reflected in the way an organization deals with its member, groups and issues. One conceptual framework of climate (Litwin and Stringer, 1968) emphasizes on the following motivational linkages.
Achievement Expert Influence
Control Extension
Dependency Affiliation
Likert (1967) proposed 6 dimensions of organizational climate: leadership, motivation, communication, decisions, goals and control. Litwin and Stringer (1968) proposed 7 dimensions: conformity, responsibility, standards, rewards, organizational clarity, warmth and support, and leadership. A review of various studies, and discussion with managers suggested the following12 processes (Udai Pareek and Surabhi Purohit, 2010).
Orientation: If the dominant orientation or concern is
to adhere to established rules, the climate will be characterized by control, on the other hand, if the orientation is to excel, the climate will be characterized by achievement.
Interpersonal relationship: An organization‘s
interpersonal relations are reflected in the way informal groups are formed.
Supervision: Supervisory practices contribute
significantly to climate and atmosphere.
Problem management: Problem can be solved by
the supervisor alone, jointly by the supervisor and the subordinate(s) concerned, or they can be referred to a higher level. These different perspectives and way of handling problems contribute to the creation of organizational climate.
Management of Mistakes: Supervisor attitudes
toward a subordinate‘s mistakes develop the organizational orientation. An organization‘s approach to mistakes influences the climate.
Conflict Management: The process of dealing with
conflicts has a significant effect on climate.
Communication: Communication is concerned with
the flow of information.
Decision Making: An organization‘s approach to
decision making can be focused on maintaining good relations. The elements of decision making are relevant to the establishment of a particular climate.
Trust: the degree of trust or its absence among
various members and groups in the organization affect the climate.
Management of Reward: Rewards reinforce specific
behaviors, thereby arousing and sustaining specific motives. Consequently, what is rewarded in an organization influences the organization climate.
Risk Taking: How people respond to risk, and whose
help is sought in situations involving risk, are important determinant of climate.
Innovation and change: how change and
innovations are perceived, and how change in implemented are all critical in establishing climate.
When for many people sex and relationships are troublesome--since they are often hazardous to our health--work plays an even greater role in keeping us "out of trouble." Regardless of how much we earn, most of us have some kind of agenda or work plan. And with so many people opening a home and a cyber-office, with mounting levels of technology-related stress (which Bruria Ginton, owner turned content-provider, calls frustression), many of us end up involved in more than one job, which we feel compelled to get done, spending the greatest portion of our lives

ISSN No. 0976-8602 VOL.-1 * ISSUE-2*April-2012
Asian Resonance
30
in what we consider our workplace. So Quality of Work Life (QWL) is not some notion of frivolous luxury. QWL is just as real and useful as virtual reality itself. Statement of the problem
The review of research on QWL and crucial role played by organizational (motivational) climate in increasing/decreasing feeling of organizations members in regard to QWL; it was decided to undertake a study on, ―Quality of work life as related to motivational pattern of employees in select Indian organization.‖ Main objective of the study
The study aims to 1. Identify the objective role conditions in respect of
each select organization which are likely to promote.
Autonomy
Personal growth opportunity
Work speed and Routine
Work Complexity
Task related interaction 2. Present a comparative picture of the status of five
variables within select organizational group. 3. Compare various groups of a select organization in
regard to the five variables of QWL. 4. Correlate the five variables of QWL with
demographic variables. 5. Correlate the six needs with demographic variables. 6. Compare various organizations on five QWL
variables. 7. Compare various organizations on six needs. 8. Identify motivational pattern of organizational
members in government and private sector organization
Research methodology: Procedure of data collection
Information collected through Primary and Secondary data. Primary data: ―Primary data collected through the
HRD workshop of QWL and motivational climate of various organizations. The workshops will be conducted by HRD specialists. Duration of workshop will be full day starting from 10 am to 5:00 pm with an hour for lunch. Test of QWL and MAO - C will be conducted by trainers and candidates will be asked to self secure their responses. To get questionnaires filled up the interaction with the personnel of the organization will be made through - Personally meeting them & by contracting them through phone calls. Secondary data: ―Secondary data collected from
books, journals, and relevant websites etc. Sample
The study was conducted in 3 different organizations. For this purpose, 150 working professionals were contacted personally and requested to fill up a questionnaire comprising measure of Quality of work life and Motivational analysis of organizational climate. Males and females of various age groups were divided according to the ratio of their availability. Tools
The well tested tools and Questionnaire has been taken two tools have been used MAO-C by Udai Preek
and QWL-C/F by Marshall Sashkin and Joseph J. Lengermann 1. Motivational analysis of organizational: CLIMATE (MAO-C): MAO- C Profile developed by
Pareek, will be used MAO-C is designed to study organizational climate, with special regard to motivation. It consists of 12 categories, each of which includes 6 statements. Dealing with six needs i.e.
Achievement Expert Influence
Control Extension
Dependency Affiliation 12 categories of MAO - C
1. Orientation 2.Interpersonal relationship 3. Supervision 4. Problem management 5. Management of mistakes 6.Conflict management 7. Communication 8. Decision making 9. Trust 10. Management of rewards 11. Risk taking 12. Innovation and change 2. Quality of work life condition/feeling: QWL-C/F developed by Marshall Sashkin and Joseph J. Lengermann. It consist of two short
instruments: the first measures how well three, basic, human work needs are met by objective job conditions; the second provides one score representing the respondent‘s overall feeling of separation or alienation from his or her own work self. It consists of five variables.
Autonomy
Personal growth opportunity
Work speed and routine
Work complexity
Task-related interaction Data analysis
T-Test and One way Anova was used to compare the motives of MAO-C and variable of QWL- C/F with the demographic variables of working professionals. Hypothesis has been formed for applying T-Test and one way Anova between demographic variables. T- Test was used to compare Quality of Work Life and MAO-C of working professionals. Hypotheses have been formed for applying T-test between Genders: Following hypothesis were formed for applying T-test between genders: Ho1 = There is no significant difference Between
Quality of Work Life of Male and Females working Professionals. (Table1) Ho2 = There is no significant difference Between
Motivational Analysis of Organizational Climate of Male and Females working Professionals. (Table2)
Working professionals were again compared on the basis of the presence of different factors. T-test was applied to compare these factors. Following hypotheses were formed: T-Test was applied to compare the factors with Male and Females (Table 3) Ho1 = There is no significant difference between Male
and Females working Professionals for the motive Achievement.

ISSN No. 0976-8602 VOL.-1 * ISSUE-2*April-2012
Asian Resonance
31
Ho2 = There is no significant difference between Male
and Females working Professionals for the motive Expert Influence. Ho3 = There is no significant difference between Male
and Females working Professionals for the motive Extension. Ho4 = There is no significant difference between Male
and Females working Professionals for the motive Control. Ho5 = There is no significant difference between Male
and Females working Professionals for the motive Affiliation. Ho6 = There is no significant difference between Male
and Females working Professionals for the motive Dependency. Ho7 = There is no significant difference between Male
and Females working Professionals for the motive Autonomy. Ho8 = There is no significant difference between Male
and Females working Professionals for the motive PGO. Ho9 = There is no significant difference between Male
and Females working Professionals for the motive WSR. Ho10 = There is no significant difference between
Male and Females working Professionals for the motive WCO. Ho11 = There is no significant difference between
Male and Females working Professionals for the motive TRI. Ho12 = There is no significant difference between
Male and Females working Professionals for the motive QWL/F. One Way Anova test was applied to compare the factors with different Age group. (Table 4) Ho1 = There is no significant difference between the
different age groups of working Professionals as for as the motive Achievement is considered. Ho2 = There is no significant difference between the
different age groups of working Professionals as for as the motive Expert influence is considered.. Ho3 = There is no significant difference between the
different age groups of working Professionals for the motive Extension. Ho4 = There is no significant difference between the
different age groups of working Professionals for the motive Control. Ho5 = There is no significant difference between the
different age groups of working Professionals for the motive Affiliation. Ho6 = There is no significant difference between the
different age groups of working Professionals for the motive Dependency. Ho7 = There is no significant difference between the
different age groups of working Professionals for the motive Autonomy. Ho8 = There is no significant difference between the
different age groups of working Professionals for the motive PGO. Ho9 = There is no significant difference between the
different age groups of working Professionals for the motive WSR.
Ho10 = There is no significant difference between the
different age groups of working Professionals for the motive WCO. Ho11 = There is no significant difference between the
different age groups of working Professionals for the motive TRI. Ho12 = There is no significant difference between the
different age groups of working Professionals for the motive QWL/F. One Way Anova test was applied to compare the factors with different qualification level of working professionals.( Table 5) Ho1 = There is no significant difference between the
different qualification levels of working Professionals as for as the motive Achievement is considered. Ho2 = There is no significant difference between the
different qualification levels of working Professionals as for as the Expert influence is considered. Ho3 = There is no significant difference between the
different qualification levels of working Professionals for the motive Extension. Ho4 = There is no significant difference between the
different qualification levels of working Professionals for the motive Control. Ho5 = There is no significant difference between the
different qualification levels of working Professionals for the motive Affiliation. Ho6 = There is no significant difference between the
different qualification levels of working Professionals for the motive Dependency. Ho7 = There is no significant difference between the
different qualification levels of working Professionals for the motive Autonomy. Ho8 = There is no significant difference between the
different qualification levels of working Professionals for the motive PGO. Ho9 = There is no significant difference between the
different qualification levels of working Professionals for the motive WSR. Ho10 = There is no significant difference between the
different qualification levels of working Professionals for the motive WCO. Ho11 = There is no significant difference between the
different qualification levels of working Professionals for the motive TRI. Ho12 = There is no significant difference between the
different qualification levels of working Professionals for the motive QWL/F. One Way Anova test was applied to compare the factors with different work experience of working professionals. (Table 6) Ho1 = There is no significant difference between the
different work experiences of working Professionals as for as the motive Achievement is considered. Ho2 = There is no significant difference between the
different work experiences of working Professionals as for as the Expert influence is considered. Ho3 = There is no significant difference between the
different work experiences of working Professionals for the motive Extension.

ISSN No. 0976-8602 VOL.-1 * ISSUE-2*April-2012
Asian Resonance
32
Ho4 = There is no significant difference between the
different work experiences of working Professionals for the motive Control. Ho5 = There is no significant difference between the
different work experiences of working Professionals for the motive Affiliation. Ho6 = There is no significant difference between the
different work experiences of working Professionals for the motive Dependency. Ho7 = There is no significant difference between the
different work experiences of working Professionals for the motive Autonomy. Ho8 = There is no significant difference between the
different work experiences of working Professionals for the motive PGO. Ho9 = There is no significant difference between the
different work experiences of working Professionals for the motive WSR. Ho10 = There is no significant difference between the
different work experiences of working Professionals for the motive WCO. Ho11 = There is no significant difference between the
different work experiences of working Professionals for the motive TRI. Ho12 = There is no significant difference between the
different work experiences of working Professionals for the motive QWL/F. Result and discussion Co-relation:- The motive achievement of MAO-C is
positively correlated with Autonomy, PGO, QWL/C And QWL/F Negatively Co- related with WSR, WCO, and TRI of QWL/C. (Table 7)
The motive expert influence is positively correlated with Autonomy, PGO and PRI. And negatively correlated with WSR, WCO, and QWL/F. The motive extension s positively correlated with Autonomy, PGO, WSR, WCO, and QWL/F. Negatively with TRI The motive Control is positively correlated with WSR, WCO and TRI. Negatively correlated with Autonomy, PGO and QWL The motive affiliation is positively correlated with PGO, WCO and TRI. Negatively with Autonomy, WSR, QWL/F The motive dependency is positively correlated with Autonomy and WSR and negatively correlated with PGO, WCO, TRI and QWL/F. Factor Analysis: The Factor Analysis is used for
Quality of Work Life, factors were calculated with the help of total variance explained, were calculated from the rotated sum of squared value loading which was the outcome of SPSS software. T-Test: Comparison of Quality Of Work Life and Motivational Analysis of Organizational Climate between male and female working Professionals
Significance value for Quality of Work Life is .589 which is quite higher than table value .05 so the null hypothesis is accepted which states that there is no significant difference between Quality of work Life of male and female working Professionals. Significance value for MAO-C is .548 which is higher than the table value .05 so the null hypothesis accepted.
Comparison of different Factors between Male and Female working Professionals
Further the T-Test was applied among the Factors. The Factors like ACH, E.I, Extension, Control, Affiliation, Dependency, PGO, WSR, WCO, TRI, and QWL/F shows the greater value than the table value hence the Null Hypothesis accepted and it can be concluded that there is no significant difference between Male and Female working Professional for these Factors. The Factor Autonomy shows the lesser value than the table value hence the null hypothesis rejected which state that there is a significant difference between male and Female for this Factor. Comparison of Factors between Age Groups
The Factors like ACH, Extension, PGO, and QWL/F shows the lesser value than the table value hence the null hypothesis rejected which state that there is a significant difference between different age groups working Professionals for these factors. The Factors like E.I, Control, Dependency, Affiliation, Autonomy, WSR, WCO, TRI shows the greater value than the table value hence the null hypothesis accepted which state that there is no significant difference between different age groups working Professionals for these Factors. Comparison of Factors between Different Qualification Levels
The Factor like Extension show the lesser value than the table value hence the null hypothesis rejected hence it can be calculated that there is a significant difference. The Factors like E.I, Control, Dependency, Affiliation, Autonomy, WSR, WCO, TRI, PGO, QWL/F, ACH shows the greater value than the table value hence the null hypothesis accepted which state that there is no significant difference. Comparison of Factors between different Work Experiences
The Factors like ACH, PGO, and QWL/F shows the lesser value than the table value hence the null hypothesis rejected. The Factors like E.I, Extension Control, Dependency, Affiliation, Autonomy, WSR, WCO, TRI shows the greater value than the table value hence the null hypothesis accepted. Note: The Research Methodology for the research
study would be on need basis during the research work and will be modified accordingly. Conclusion
The present study was attempted to examine the different factor of MAO-C and QWL/C QWL/F between various age groups and gender and different qualification level and work experience. T-test was applied to compare the different factor of MAO-C and QWL- C/F between Males and Females. The Co-relation test was also used to find out the co-relation between the different factors of MAO-C and QWL – C/F. References
1. Pareek Udai (2009) Training Instrument in HRD and OD.
2. Rao V.S.P (2005) Human Resource management, second edition
3. Prasad L.M (2000) Organizational Behaviour.
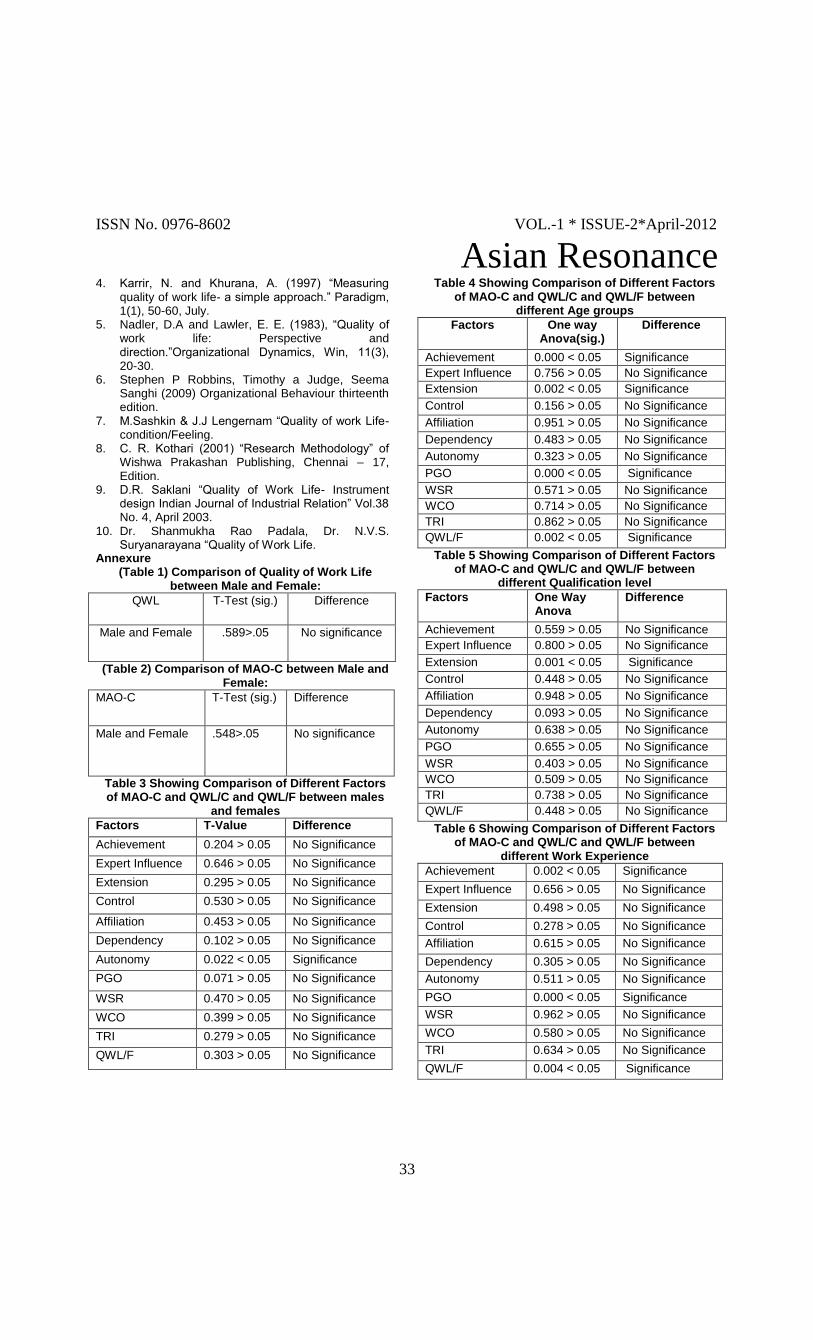
ISSN No. 0976-8602 VOL.-1 * ISSUE-2*April-2012
Asian Resonance
33
4. Karrir, N. and Khurana, A. (1997) ―Measuring quality of work life- a simple approach.‖ Paradigm, 1(1), 50-60, July.
5. Nadler, D.A and Lawler, E. E. (1983), ―Quality of work life: Perspective and direction.‖Organizational Dynamics, Win, 11(3), 20-30.
6. Stephen P Robbins, Timothy a Judge, Seema Sanghi (2009) Organizational Behaviour thirteenth edition.
7. M.Sashkin & J.J Lengernam ―Quality of work Life-condition/Feeling.
8. C. R. Kothari (2001) ―Research Methodology‖ of Wishwa Prakashan Publishing, Chennai – 17, Edition.
9. D.R. Saklani ―Quality of Work Life- Instrument design Indian Journal of Industrial Relation‖ Vol.38 No. 4, April 2003.
10. Dr. Shanmukha Rao Padala, Dr. N.V.S. Suryanarayana ―Quality of Work Life.
Annexure (Table 1) Comparison of Quality of Work Life
between Male and Female:
QWL T-Test (sig.) Difference
Male and Female .589>.05 No significance
(Table 2) Comparison of MAO-C between Male and Female:
MAO-C T-Test (sig.) Difference
Male and Female .548>.05 No significance
Table 3 Showing Comparison of Different Factors of MAO-C and QWL/C and QWL/F between males
and females
Factors T-Value Difference
Achievement 0.204 > 0.05 No Significance
Expert Influence 0.646 > 0.05 No Significance
Extension 0.295 > 0.05 No Significance
Control 0.530 > 0.05 No Significance
Affiliation 0.453 > 0.05 No Significance
Dependency 0.102 > 0.05 No Significance
Autonomy 0.022 < 0.05 Significance
PGO 0.071 > 0.05 No Significance
WSR 0.470 > 0.05 No Significance
WCO 0.399 > 0.05 No Significance
TRI 0.279 > 0.05 No Significance
QWL/F 0.303 > 0.05 No Significance
Table 4 Showing Comparison of Different Factors of MAO-C and QWL/C and QWL/F between
different Age groups
Factors One way Anova(sig.)
Difference
Achievement 0.000 < 0.05 Significance
Expert Influence 0.756 > 0.05 No Significance
Extension 0.002 < 0.05 Significance
Control 0.156 > 0.05 No Significance
Affiliation 0.951 > 0.05 No Significance
Dependency 0.483 > 0.05 No Significance
Autonomy 0.323 > 0.05 No Significance
PGO 0.000 < 0.05 Significance
WSR 0.571 > 0.05 No Significance
WCO 0.714 > 0.05 No Significance
TRI 0.862 > 0.05 No Significance
QWL/F 0.002 < 0.05 Significance
Table 5 Showing Comparison of Different Factors of MAO-C and QWL/C and QWL/F between
different Qualification level
Factors One Way Anova
Difference
Achievement 0.559 > 0.05 No Significance
Expert Influence 0.800 > 0.05 No Significance
Extension 0.001 < 0.05 Significance
Control 0.448 > 0.05 No Significance
Affiliation 0.948 > 0.05 No Significance
Dependency 0.093 > 0.05 No Significance
Autonomy 0.638 > 0.05 No Significance
PGO 0.655 > 0.05 No Significance
WSR 0.403 > 0.05 No Significance
WCO 0.509 > 0.05 No Significance
TRI 0.738 > 0.05 No Significance
QWL/F 0.448 > 0.05 No Significance
Table 6 Showing Comparison of Different Factors of MAO-C and QWL/C and QWL/F between
different Work Experience
Achievement 0.002 < 0.05 Significance
Expert Influence 0.656 > 0.05 No Significance
Extension 0.498 > 0.05 No Significance
Control 0.278 > 0.05 No Significance
Affiliation 0.615 > 0.05 No Significance
Dependency 0.305 > 0.05 No Significance
Autonomy 0.511 > 0.05 No Significance
PGO 0.000 < 0.05 Significance
WSR 0.962 > 0.05 No Significance
WCO 0.580 > 0.05 No Significance
TRI 0.634 > 0.05 No Significance
QWL/F 0.004 < 0.05 Significance
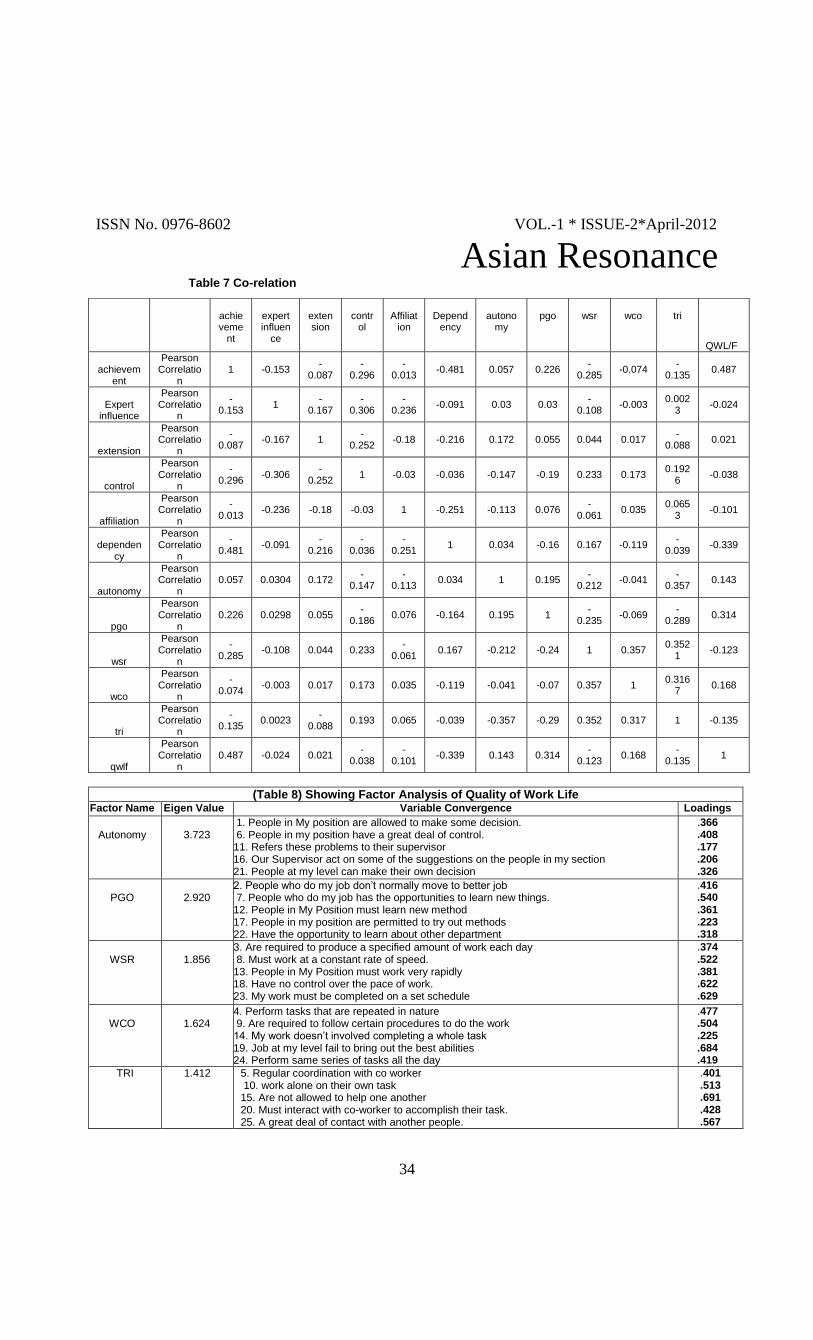
ISSN No. 0976-8602 VOL.-1 * ISSUE-2*April-2012
Asian Resonance
34
Table 7 Co-relation
(Table 8) Showing Factor Analysis of Quality of Work Life Factor Name Eigen Value Variable Convergence Loadings
Autonomy
3.723
1. People in My position are allowed to make some decision. 6. People in my position have a great deal of control. 11. Refers these problems to their supervisor 16. Our Supervisor act on some of the suggestions on the people in my section 21. People at my level can make their own decision
.366
.408
.177
.206
.326
PGO
2.920
2. People who do my job don‘t normally move to better job 7. People who do my job has the opportunities to learn new things. 12. People in My Position must learn new method 17. People in my position are permitted to try out methods 22. Have the opportunity to learn about other department
.416
.540
.361
.223
.318
WSR
1.856
3. Are required to produce a specified amount of work each day 8. Must work at a constant rate of speed. 13. People in My Position must work very rapidly 18. Have no control over the pace of work. 23. My work must be completed on a set schedule
.374
.522
.381
.622
.629
WCO
1.624
4. Perform tasks that are repeated in nature 9. Are required to follow certain procedures to do the work 14. My work doesn‘t involved completing a whole task 19. Job at my level fail to bring out the best abilities 24. Perform same series of tasks all the day
.477
.504
.225
.684
.419
TRI 1.412 5. Regular coordination with co worker 10. work alone on their own task 15. Are not allowed to help one another 20. Must interact with co-worker to accomplish their task. 25. A great deal of contact with another people.
.401
.513
.691
.428
.567
achieveme
nt
expert influen
ce
extension
contr
ol
Affiliat
ion
Depend
ency
autono
my
pgo
wsr
wco
tri
QWL/F
achievement
Pearson Correlatio
n 1 -0.153
-0.087
-0.296
-0.013
-0.481 0.057 0.226 -
0.285 -0.074
-0.135
0.487
Expert influence
Pearson Correlatio
n
-0.153
1 -
0.167 -
0.306 -
0.236 -0.091 0.03 0.03
-0.108
-0.003 0.002
3 -0.024
extension
Pearson Correlatio
n
-0.087
-0.167 1 -
0.252 -0.18 -0.216 0.172 0.055 0.044 0.017
-0.088
0.021
control
Pearson Correlatio
n
-0.296
-0.306 -
0.252 1 -0.03 -0.036 -0.147 -0.19 0.233 0.173
0.1926
-0.038
affiliation
Pearson Correlatio
n
-0.013
-0.236 -0.18 -0.03 1 -0.251 -0.113 0.076 -
0.061 0.035
0.0653
-0.101
dependency
Pearson Correlatio
n
-0.481
-0.091 -
0.216 -
0.036 -
0.251 1 0.034 -0.16 0.167 -0.119
-0.039
-0.339
autonomy
Pearson Correlatio
n 0.057 0.0304 0.172
-0.147
-0.113
0.034 1 0.195 -
0.212 -0.041
-0.357
0.143
pgo
Pearson Correlatio
n 0.226 0.0298 0.055
-0.186
0.076 -0.164 0.195 1 -
0.235 -0.069
-0.289
0.314
wsr
Pearson Correlatio
n
-0.285
-0.108 0.044 0.233 -
0.061 0.167 -0.212 -0.24 1 0.357
0.3521
-0.123
wco
Pearson Correlatio
n
-0.074
-0.003 0.017 0.173 0.035 -0.119 -0.041 -0.07 0.357 1 0.316
7 0.168
tri
Pearson Correlatio
n
-0.135
0.0023 -
0.088 0.193 0.065 -0.039 -0.357 -0.29 0.352 0.317 1 -0.135
qwlf
Pearson Correlatio
n 0.487 -0.024 0.021
-0.038
-0.101
-0.339 0.143 0.314 -
0.123 0.168
-0.135
1

ISSN No. 0976-8602 VOL.-1 * ISSUE-2*April-2012
Asian Resonance
35
ISSN No. 0976-8602 VOL.-1 * ISSUE-2*April-2012
Asian Resonance A Study of Masson's Slope in Dioxane -
Propylene - Necarbonate Mixtures by Magnetic Float Densitometer using Tetra -
Alkylammonium Iodides at 250
R.N. Pathak Dept. of Chemistry, Lucknow University, Lucknow.
Archana Maurya Dept. of Chemistry, D.S.N.P.G. College, Unnao. [email protected]
Introduction
The Literature survey shows that many scientists have been working on ion-ion and ion-solvent interactions in different electrolyte solutions using aqueous and non-aqueous mixtures as the solvents. Their basic approach was first to find out the densities of solvent mixtures and solutions and then from density data thus obtained they
calculated the apparent molar volumes (S
) to explain ion-ion and
ion-solvent interactions and slope (Sv) of Masson's equation.
v = 0 + Sv c, where
0 is the limiting apparent molar volume
and C be the molar concentration. The studies on apparent molar volumes in solvents of low and
medium dielectric constants(1-4);
only a positive slope, on their v vs
C curves for tetra alkylammoniam salts, has been reported. The
apparent molar volume work in water and other solvents of high
dielectric constants(5-8)
, showed a negative slope in v vs C curves
for these salts. Many workers tried to solve this peculiar behaviour of the slope (sometimes positive and sometimes negative) of tetra - alkyl ammonium salts. In an attempt to get some more clear picture of Masson's slope, it seemed us worthwhile to investigate how the slope (Sv) observed for some tetra - alkylammonium salts on Dioxane would change on increasing the dielectric constants of the solvent by adding suitable quantities of Propylene carbonate.
We have determined the densities (ρo's) of Formamide-
Dioxane mixtures and the densities (ρ0's) of some tetra-alkyl
ammonium iodide- solutions in these solvents mixtures by entirely new technique magnetic float densitometer (9).
Abstract
A very new technique of measuring the densities of solvents and solutions by using magnetic float densitometer have been given. Using this technique, the densities (ρo's) of 0, 20, 40, 60, 80 and
100% Dioxane -Propylene carbonate mixtures and the densities (ρ's) of some tetra-alkylammonium Iodide solutions have been determined at
250C. The apparent molar volumes ('vs) have been calculated and
then the slope of Masson's equation have been examined for these salts. The slope as found to be positive for all the tetra-alkylammonium iodides in all the selected composition of Dioxane-Propylene carbonate mixtures the data have been explained on the basis of dielectric constant of the solvent mixtures, size of the electrolyte ions.

ISSN No. 0976-8602 VOL.-1 * ISSUE-2*April-2012
Asian Resonance
36
v
Experimental
The dielectric constants of six compositions 0, 20, 40, 60, 80 and 100%. Propylenecarbonate in Dioxane have been determined by assuming a linear relationship between them. A graph was plotted between them taking first and last points and then joining them. The dielectric constants of other compositions were thus calculated.
The densities (ρ0's) of solvent mixtures and the densities (ρ0's) of tetra alkyl ammonium iodide
solutions prepared in these solvent mixtures were determined by magnetic float densitometer
(9) Po
data have been shown in Table 1 and P data have been summarized in Table 2.
The apparent molar volumes ( v's) of these
solutions in the concentration range C = .002 - 0. 014 M were calculated from the density data of Table 1 and Table 2 using the equation:
v = 1000 (ρo – ρ) +
M Cρo ρo
M = Molecular weight of solution
C = Concentration and
ρo = Density of solvent
ρ = Density of solution
Results and Discussion
The apparent molar volumes ( v's) were
calculated in 0, 20, 40, 60, 80 and 100% Propylene carbonate in Dioxane from density data obtained by magnetic float densitometer for Et4NI, Pr4NI, Bu4NI and Pen4NI salts in each solvent mixtures
using table 1 and 2 and then v vs C curves were
drawn for each solvent composition (Here only the data in 0 & 20% (Propylenecarbonate are being given). The first salt tetra-alkyl ammonium iodide could not be examined in these mixtures due to solubility restriction.
The v vs C curves for all the electrolytes are
found to be straight lines hence Masson's equation would be applicable in all the cases in the concentration range 0.002 to 0.014N.
It is clean from Table 2 that the apparent molar
volume ( v) increases with increase in concentration
for each electrolyte. This is clear from the Figure-l (0% Propylenecarbonate) and Figure-2 (20% Propylenecarbonate) as well as from the data's of tables. This gives rise to positive value of Masson's slope S, in each case.
The slopes of v vs C curves have been
summarized in Table 3. This table clearly indicates that on increasing the dielectric constant of the solvent medium by mixing propylene carbonate to dioxane, the slope gradually decreased for each salt. Thus we may say that the nature of the slope changes with variation of the dielectric constant of the solvent medium. It is also clear from table that
the magnitude of the slope as however gradually decreasing from smaller size Et4NI to larger size Pen4NI salt. This clearly indicates that the size of the soluble molecule has also an influence on the slope. This decrease in slope from Et4NI to Pen4NI can explained as below:
The size of the electrolyte ions as increasing in
the order Et4N+ <Pr4N+ <Bu4N+
<Pen4N+ ion. Since the
larger size of ion, smaller will be its charge density. Therefore, charge density of the ion will be in reverse order i.e. it will be highest for Et4N+ion and smallest for Pen4N+ -ion. The ion-ion interaction in case of Et4N+ ions will be greatest giving large steepness in
v vs C curve (i.e. large positive Sv value). This ion-
ion interaction(10-11)
will go on decreasing because of decreasing amount of charge density of ions from Et4N+ ion to Pen4N+ -ion. Thus the slope will also be in decreasing order.
The study of Masson's slope in Dioxane-PC mixtures for tetra alkyl ammonium iodide salts shows that slope S, is always positive, irrespective of the electrolyte or the composition of the solvent mixture selected. This is perhaps due to low dielectric constant of the solvent mixture (Є= 2.1 to Є
= 64.9) if the solvent or solvent mixture has low
dielectric constant, the inter ionic forces will be appreciable resulting in strong ion-ion interaction. The strong ion-ion interaction always favours a positive slope hence Sv's are positive.

ISSN No. 0976-8602 VOL.-1 * ISSUE-2*April-2012
Asian Resonance
37
Acknowledgement
The authors are thankful to the Head, Department of Chemistry, Lucknow University, Lucknow for providing Laboratory facilities. References
1. Gopal R, Agrawal D.K. and Kumar R, 1973, Bull. CheM.Soc.Japan.46.
2. Gopal R, Agrawal D.K. and Kumar R, 1973, Z. Phy.Chern. (New Folge) 84, 141.
3. Gopal R and Singh K. 1974, Z. Phys.Chern. (New Folge), 91, 98.
4. Gopal R, Agrawal D.K. and Kumar R, 1976, J. Indian Chem.Soc., 53,124.
5. Gopal R, Siddiqui M.A., 1969, Z.Phys.Chem (New Folge)., 67, 122.
6. Gopal R, Siddiqui M.A., 1969, J.Phys.Chern, 73, 3390.
7. Gopal R, Singh K., 1970, Z.Phys.Chern (New Folge), 69,81.
8. Gopal R and Siddiqui M.A. and Singh K. 1971, Z.Phys.Chem, 75, 7.
9. Pathak R.N. and Saxena Indu 1998, Indian 1. Engg. & Mat. Sciences, 5, 278.
10. J. Ishwara Bhat and T.N. Sreelatna, Indian Journal of Chemistry,45A, 1165-1169 (May 2006)
11. M.L. Parmar and D.S. Banyal, Indian Journal of Chemistry, 48-A,1667-1672 (Dec 2009)

ISSN No. 0976-8602 VOL.-1 * ISSUE-2*April-2012
Asian Resonance
38
ISSN No. 0976-8602 VOL.-1 * ISSUE-2*April-2012
Asian Resonance
Acid Deposition and Critical Load Analysis in Kanpur City, India
Rupali Dixit Research Scholar, C.M.J. University, Shillong. [email protected]
Anindita Bhattacharya Assoc. Professor, Dept. of Chemistry Christ Church College. The Mall, Kanpur.
Introduction
It is increasingly realized that composition of air changes both by natural processes and human activities which ultimately affects the forest ecosystem and soil chemistry. Natural processes are mainly volcanic eruptions, forest fires, vegetation decay and anthropogenic activities are emissions from automobiles, generators, engines, tanneries and industries. These emissions undergo chemical processes in atmosphere and ultimately disturb the dynamic equilibrium of the nature. There are major five pollutants which contribute around 90 % of the air pollutants
1. These are- carbon monoxide (CO), nitrogen oxides
(NOx), hydrocarbons (HC), sulphur oxides (SO2) and particulate matter. In the last few years there is a growing concern regarding the increasing gaseous pollutant and strategies to reduce them
2, 3 .As per the
present state of knowledge many studies are undertaken at different parts of nation and world in the same field
4 .In this study both wet and dry
deposition have been observed for nitrogen oxides and sulphur oxides for the area. In the country like India most of the deposition is dry whereas wet season is confined to only 2-3 months. The deposition includes both wet and dry materials. The dry components include mainly dust particles that come from both natural processes and anthropogenic activities. Wet deposition process is a pathway which removes the pollutants from the atmosphere and transfers them to the biosphere. It involves conversion of SO2 and NO2 to H2SO4 and HNO3 in the cloud
1
Objective
This report attempts to identify a framework for Kanpur-wide determination and mapping of critical loads of acidity
5. The principal
objective of this report was to analyze gaseous pollutants and present load of sulphur and nitrogen deposition for soils in Kanpur city of India. Significant effects may arise due to short term and long term deposition levels which in turn may give rise to further effect on biota. Materials and Methodology Study area
This study considered the entire Kanpur region. Nine sampling sites located at Christ Church College, Lal bungalow, Kidwai Nagar, Kalyanpur, Golaghat, Ashok Nagar, Rail Bazaar, Jajmau, Green Park. Kanpur (26028‖ N , 80)24‖ E) is situated in the middle of Ganga valley on the southern bank of the river Ganga.
Abstract
This study was conducted to obtain the present load of sulphur and nitrogen in KEq/ha/yr in Kanpur region of India by analyzing the gaseous pollutants mainly NOx and SO2 .This has been achieved by dividing the city into 8 regions at farthest point which are Lal Bungalow, Kidwai Nagar, Kalyanpur, Golaghat, Ashok Nagar, Rail Bazaar,Jjajmau, Green Park and a Central Point as Christ Church College, Kanpur. A 48 hr sampling was done for each sampling site. Sampling for each site was done on the basis of season‟s i. e. summer, winter and monsoon. Load of sulphur and nitrogen was obtained by gaseous pollutants .i.e. NOx and SO2.This study also made and attempts to study the minimum level of pollution sustained by living biota termed as critical load. Key words- present load, Kanpur region, critical load

ISSN No. 0976-8602 VOL.-1 * ISSUE-2*April-2012
Asian Resonance
39
Sampling
Sampling was done from January 2011- December 2011.Three samples were collected from each site for different seasons viz. winter, summer and monsoon. Sampling was done on the basis of 48 hours at each sampling site. The general set up and procedure has been explained by Madhavan et al
9 -13
Methodology For critical load exceedance the inputs required for the SSMB model [Steady State Mass Balance] are atmospheric deposition, base cation weathering rate and critical alkalinity leaching. Air samples were analyzed by modified West and Gaeke method using UV- VISIBLE spectrophotometer (chemitospectrophotometer) .Present load of Sulphur and nitrogen deposition was obtained by the gaseous pollutants.The pH of the samples was determined immediately after the collection of sample. It varied from 7.3- 8.5.
Analysis
The steady state mass balance method was used to determine the critical pollution load. SSMB is the commonly used method for critical load analysis. The critical load of actual acidity CL (Ac act) was calculated by the method given by Hettelingh et al
6-8
CL (Ac act) = BC w + [H] critQ + [Al] critQ
Where, BC w = base cation weathering (eq. /ha/hr) Q = runoff (eq/ha/yr) [H] crit = critical hydrogen leaching(eq/m3) [Al] crit = critical aluminium leaching (eq/ m3)
Result Table 1 showing result values of atmospheric deposition [both wet and dry] of SO2 and NOX for the
year2011.
S.No. Sampling site Season NOX
(µg/m3) SO2 (µg/m3)
Nitrogen depositin
Sulphur depositin
1.
Christ Church college
Winter 36.2 7.49 13.34 3.75
2. summer 36.8 7.12 13.62 3.56
3. monsoon 35.64 7.02 13.19 3.51
4. Lal Bungalow
Winter 39.36 7.46 14.56 3.23
5. summer 39.74 7.34 14.70 3.67
6. monsoon 36.03 6.86 13.33 3.43
7.
Kidwai Nagar
Winter 44.77 7.85 16.57 3.93
8. summer 38.14 7.63 14.11 3.82
9. monsoon 37.78 6.70 13.98 3.35
10.
kalyanpur
Winter 35.17 7.51 13.01 3.75
11. summer 39.48 7.23 14.61 3.61
12. monsoon 32.56 7.11 12.05 3.55
13.
Jajmau
Winter 37.09 7.82 13.72 3.91
14. summer 41.25 7.74 15.26 3.87
15. monsoon 39.61 7.39 14.66 3.69
16.
Golaghat
Winter 32.24 7.04 11.93 3.52
17. summer 31.63 6.96 11.70 3.48
18. monsoon 30.29 6.79 11.21 3.39
19.
Ashok nagar
Winter 35.77 7.09 13.23 3.54
20. summer 34.09 7.05 12.61 3.52
21. monsoon 32.83 6.40 12.15 3.2
22.
Green Park
Winter 35.7 7.13 13.21 3.56
23. summer 35.66 6.63 13.19 3.31
24. monsoon 34.78 6.40 12.87 3.2
25.
Rail Bazaar
Winter 34.8 7.44 12.87 3.72
26. summer 34.23 6.98 12.67 3.49
27. monsoon 31.69 6.24 11.72 3.12

ISSN No. 0976-8602 VOL.-1 * ISSUE-2*April-2012
Asian Resonance
40
Table 1 depicts the values of wet and dry deposition of sulphate and nitrate. Authors of this paper have calculated the values of sulphur and nitrogen by unitary method. Annual nitrogen deposition is as follows: Mean average of summer season was found to be 11.34, that of winter was found to be 11.29 and that of monsoon was 9.74.Annual sulphur deposition is as follows: Mean average of summer season was found to be 3.7, that of winter was found to be 3.48 and that of monsoon was 3.53. Discussion
It has been observed that level of NOX was maximum in winter season which is due to higher atmospheric pressure. NOX level was found minimum in monsoon season because the gases are washed off in this season. NOX level was midway in summer season which may be due to increased UV rays as NO is easily converted to NO2. Also ozone undergoes photochemical reactions and increases the NOX
concentration. Conclusion
Among the entire sampling site JAJMAU was found to be most polluted due to emissions from tanneries, generators, national highway, and automobiles. This area is under concern because the nitrogen content was found maximum in the region which will affect the living biota. So policies should be made to reduce the emissions from mainly tanneries. The level of gaseous pollutants was found minimum in Green park and Golaghat which may be due to the fact that these places are near river Ganga which acts as sink for the gases. Acknowledgement
Authors of this paper give their due respect and thanks to State Pollution Control Board, Kalyanpur for their unstinted support. References
1. A.K De(2006) :―Air Pollution‖, Environmental Chemistry, New Age International (P) Ltd .Pg No. 122,126,127
2. DEFRA: department for environment food and
rural affairs. 3. Critical loads and critical levels- guide to the data
provided in APIS. 4. Dr. Julian Aherne (February 2008): ―Calculation
Critical loads of acid deposition for forest soils in Albert.‖ Critical load exceedance and limitations. Final report- Canadian council of ministers of the environment 2008.
5. Miroslav Josipovic, Harold J. Annegarn ,Melavie A. Kneen, Jacobus J. Pienaar, Stuart J Piketh (2011): ―Atmospheric dry and wet deposition of sulphur and nitrogen species and assessment of critical loads of acidic deposition of exceedance in South Africa.‖
a. South African journal of science April 2011 Vol.107
6. ―Environment Canada‖: Canadian council of ministers of the environment 2008.
7. A. Bhattacharya, S.Bhattacharya and S. Bhattacharya: ―Critical loads analysis of acid deposition in Kanpur City‖,precedings of national conference on scientific and legal challenges of global warming, Brahmanand College, Kanpur, 2008,February,54.
8. A.Bhattacharye and A. Taneja : ― Critical load assessment;major constraints and future issues‖;Asian journal of microbiology, biotechnology and environmental studies,2005 Vol.7(4),629-632.
9. T.M. Mahadevan, V. Meenakshi, A.P. Sathe, : ―Some observation on the chemical composition of precipitation in an industrial area and and its use in air quality assessment‖, Mausam 35 (1984 )87.
10. E.C.Voldner, A. Sirosis,‘‘Monthly mean spatial variation of dry deposition velocities‖, Water Air Soil pollution. 30 (1986) 179.
11. C.U. Ro , A. J.S. Tang , W.H. Chan, R.W. Kirk , N.W. Reid, M.A. Lusis:, ―Wet and dry deposition of sulphur and nitrogen compounds in Ontario‖, Atmospheric Environment 22 (12) ( 1988) 2763-2772
12. J.G. Dikaiakos, C.G. Tsitouris, P.A. Siskos, D.A. Melissos, P. Nastos:, ―Rainwater composition in Athens , Greece‖ , Atmospheric Environment. 24 B (1) (1990) 171
13. H. Minoura , Y. Iwasaka:, ―Rapid change in nitrate and sulphate concentrations observed in early stage of precipitation and their deposition processes‖, J. Atmos. Chem. 24 ( 1996) 39
ISSN No. 0976-8602 VOL.-1 * ISSUE-2*April-2012
Asian Resonance
41
ISSN No. 0976-8602 VOL.-1 * ISSUE-2*April-2012
Asian Resonance Portrayal of Women in Literature
Anupama D. Deshraj Assoc.Professor, Dept. of English, G.V.I.S.H, .Amravati
Introduction
Literature is the finer side of life. The Nobel Prize winner Alexander Solzhenitsyn in 1972 in his acceptance speech defined it as ―literature………becomes the living memory of a nation.‖ Literature is the art of composition in prose and verse. Chamber‘s dictionary defines literatures as the whole body of literary composition universally or in any language.‖For a teacher teaching literature means to foster literary appreciation. Literature consists of poetry, prose, novels, short stories, essays and criticism. Classics are forever green. In this paper an attempt has been made to bring out the importance of women characters i.e. the heroines, the projection and portrayal of women in literature. Classics have been kind to women. The projection of women in literature right from the times of Chaucer to Shakespeare to the modern writers has been magnanimous. Like Wife Of Bath in Canterbury Tales is one of the first feminist as she
had the choice to marry five times. Bath is an English town on the Avon River, not the name of this woman‘s husband. Though she is a seamstress by occupation, she seems to be a professional wife. She has been married five times and had many other affairs in her youth, making her well practiced in the art of love. She presents herself as someone who loves marriage and sex, but, from what we see of her, she also takes pleasure in rich attire, talking and arguing. She is deaf in one ear and has a gap between her front teeth, which was considered attractive in Chaucer‘s time. She has travelled on pilgrimages to Jerusalem three times and elsewhere in Europe as well. The character of Wife of Bath is an immemorial one; she is too modern for her times and can be considered to be inspiration for the coming generations. Another character is Madame Therese Defarge—the villain of A Tale of Two Cities, by Charles Dickens She has a revolutionary spirit-her
dispassionate demand for violence and particulary the deaths of the main female character Lucy Manette and Darnay, her husband Charles—is not explained till almost the end of the novel. Long before Madame Defarge married her husband, her sister and brother were victims of terrible abuse and cruelty by the Evermonde brothers, one of whom was Charles Darnay‘s father. Thus, she is determined to see the Evermonde line, down to the Darnay‘s young daughter killed. Her specialty is knitting and, through out the novel, she is knitting names to be guillotined. The saying ―Hell hath no fury as a woman scorned‖, is apt for her. Womanhood and wives, loyalty and obedience as virtues were the roles assigned to women in a patriarchal society. Anna Karenina by Leo
Tolstoy is another such character. She is beautiful, passionate, educated wife of a cold, passionless Government official. Rich in complexities— guilty of desecrating her marriage and home, she remains noble and admirable nonetheless. She is a writer of children‘s books, intelligent, elegant, under-stated in dressing (plays the role of cultivated, beautiful, society wife hostess with grace and poise). She has the determination to live life on her own terms. She is feminist of sports.
Abstract
English literature is abundant and has richly portrayed women as strong and beautiful, as survivors and successful and also as cunning and conniving. Down the ages, the portrayal has struck a balance between good qualities possessed by the heroines and also the negative traits lurking in them. The Greek Classics to Shakespeare, from Tolstoy to Margaret Mitchell each has done justice to womanhood depicting the minute nuances of female character like Portia, Lady Macbeth, Anna Karenina,Elizabeth Bennet, Tess, and Scarlett O‟Hara, etc. Such true to life portrayals have inspired not only the readers but also fellow writers.

ISSN No. 0976-8602 VOL.-1 * ISSUE-2*April-2012
Asian Resonance
42
Though disgraced, she refuses to be, exiled and rejects her husband‘s offer of mere façade of a marriage. She rejects social conventions and insists on living according to dictates of her heart, and this makes her a pioneer - a woman searching for autonomy and passion in a male-dominated society. Lady Macbeth is a famous character created by Shakespeare in the tragic drama Macbeth. She is
the archetypal fatal. Her manipulation of Macbeth inevitably leads them to both their deaths: she commits suicide and he is slain. In her ambition to become queen, she encourages her husband to murder. She has given us some of the famous proverbs which we use in a daily life like, ―What‘s done is done‖, ―The milk of human kindness,‖ ―All the perfumes of Arabia will not sweeten this little hand.‖ Portia is an equally important female Shakespearean character, one of the leading characters in ―The Merchant of Venice‖. She is
beautiful and her beauty brings different suitors for marriage, but she prays that Bassanio should win the contest as he has stolen her heart and her wish is granted as Bassanio wins the contest by his intelligence. She is a rich heiress, only daughter of Shylock the Jew, a business man. She is gracious in her doing, generous and loyal to her friends. She is intelligent and quick-witted and wins the case against her father and saves Antonio life in the trial scene. When Shylocks demands a pound of Antonio‘s flesh, she very tactfully, argues and says that he can have a pound of flesh without dropping any blood from his body. She is resourceful and shows that women can also out-wit men sometimes with their intelligence. The quality of women to succeed despite odds and to come up triumphant in life is epitomized by Scarlett O‘Hara , the protagonist of Gone With The Wind ,written by Margaret Mitchell ---- is an
unforgettable character. Love her or hate her ,Margaret Mitchell‘s iconic southern belle has certainly left a massive impact on popular culture, both she and the Gone With The Wind itself inspire legions of zealous followers referring to themselves as ‗windies‘. And yes all that in spite of the book‘s lamentable sexual and racial politics. Scarlett is a dark-haired, green-eyed Georgia belle who struggles through the hardship of the civil war and reconstruction. Scarlett exhibits more of their father‘s hard-headedness than her mother‘s refined southern manners. Although initially she tries to behave prettily, her instinct rises up against social restrictions. Determination defines Scarlett and drives her to achieve everything she desires by any means necessary. This determination first manifests itself in her narcissistic and sometimes backstabbing efforts to excite the admiration of every young man in the neighborhood. Later, under threat of starvation and even death, she is determined to survive and does so by picking cotton, running her entire plantation forging a successful business, and even killing a man. Scarlett also aims to win Ashley Wilkes and her failure to do so guides the plot of the novel. Ashley‘s marriage to Melanie Hamilton and rejection of Scarlett drives nearly all of Scarlett‘s
important subsequent decisions. She marries Charles Hamilton to hurt Ashley stays by Melanie‘s side through the war because she promises Ashley she will and loses her true love, Rhett Butler, because of her persistent desire to win Ashley. She possesses remarkable talent for business and leadership. She recovers her father‘s plantation, Tara after the war leaves it decimated, and she achieves great success with her sawmill in Atlanta. Despite her sharp intelligence, however, she has almost no ability to understand the motivations and feelings of herself or others. Scarlett lives her life rationally. She decides what constitutes success, and does not consider concepts like honour and kindness. She often professes to see no other choice than the ones she makes. She is an inspiring character even today , her motivation keeps the present day females to take any endeavors .She has given us the famous saying,‖ Tomorrow is another Day.‖ Across cultures, the role of women remained the same. The Chinese in particular seemed to be harsher on women, especially the rural women. O-Lan the leading female character in the Nobel Prize winning novel The Good Earth by Pearl.S. Buck is ugly in
looks but shows extreme courage and strength that not every woman possesses. She is responsible in bringing the green revolution in China. In many ways the strongest and most memorable character in The Good Earth, O-Lan exemplifies the situation of women
in traditional China and the sacrifices they had to make in order to adhere to cultural notions of feminine respectability. O-Lan spends her life working for an endeavor for which she never sees a reward: she gives all her effort and applies all her considerable capability to improving Wang Lung‘s position, and she receives neither loyalty nor passion from him in return. He is annoyed when she becomes pregnant with her second child, fearing that her condition will keep her from working in the fields, and later he has no qualms about cruelly insulting her unbound feet and taking her treasured pearls to give to his concubine. O-Lan spends much of the novel in the position of victim, but she gains a great deal of dignity in the reader‘s eyes by stolidly and uncomplainingly enduring her husband‘s behaviour. It is O-Lan who makes many of the hardest decisions in the novel—smothering her infant daughter to spare food for the family, for instance—and she bears these hard decisions with admirable fortitude. Because O-Lan is so reticent, silence being a quality that is highly valued in wives in Wang Lung‘s culture, Buck uses means other than speech to indicate the extent of O-Lan‘s inner pain. For instance, on her wedding night, O-Lan unconsciously flinches away from Wang Lung, which suggests that she has been abused as a slave in the House of Hwang. O-Lan never complains about Wang Lung‘s cruelty in insulting her feet—but she does immediately begin binding her daughter‘s feet, warning her daughter not to complain of the pain for fear of angering Wang Lung. We see the extent of O-Lan‘s bravery when she makes no complaint for years and years about the grave illness that swells her belly. O-Lan represents the dignity and
ISSN No. 0976-8602 VOL.-1 * ISSUE-2*April-2012
Asian Resonance
43
courage of the marginalized wife. She is a strong diligent woman whose only hope in her life was to please her husband and children, neglected her own needs and desires to give everything she could to her family and died without anyone recognizing her sacrifices. She is an inspiring character too many modern women all over the world England was fortunate to have Jane Austen and Charlotte Bronte creating the most beautiful romances ever written in the form of Pride and Prejudice and Jane Eyre. Next important female
character is Elizabeth Bennet , the heroine of Jane Austen‘s famous novel Pride and Prejudice. She is
lovely, clever, a brilliant conversationalist, honest, virtuous, witty, always balances social and familial turmoil well. Because of all these virtues she wins the heart Darcy. The second daughter in the Bennet family, and the most intelligent and quick-witted, Elizabeth is the protagonist of Pride and Prejudice
and one of the most well-known female characters in English literature. Her admirable qualities are numerous—she is lovely, clever, and, in a novel defined by dialogue, she converses as brilliantly as anyone. Her honesty, virtue, and lively wit enable her to rise above the nonsense and bad behaviour that pervade her class-bound and often spiteful society. Nevertheless, her sharp tongue and tendency to make hasty judgments often lead her astray; Pride and Prejudice is essentially the story of how she (and her
true love, Darcy) overcome all obstacles—including their own personal failings—to find romantic happiness. Elizabeth must not only cope with a hopeless mother, a distant father, two badly behaved younger siblings, and several snobbish, antagonizing females, she must also overcome her own mistaken impressions of Darcy, which initially lead her to reject his proposals of marriage. Her charms are sufficient to keep him interested, fortunately, while she navigates familial and social turmoil. As she gradually comes to recognize the nobility of Darcy‘s character, she realizes the error of her initial prejudice against him. She is really a true modern day inspirational character.
Jane Eyre the Victorian heroine of Charlotte Bronte in the novel Jane Eyre is also an important
character to be discussed in this context where we are talking about unforgettable female characters .The development of Jane Eyre‘s character is central to the novel. From the beginning, Jane possesses a sense of her self-worth and dignity, a commitment to justice and principle, a trust in God, and a passionate disposition. Her integrity is continually tested over the course of the novel, and Jane must learn to balance the frequently conflicting aspects of her so as to find contentment. An orphan since early childhood, Jane feels exiled and ostracized at the beginning of the novel, and the cruel treatment she receives from her Aunt Reed and her cousins only exacerbates her feeling of alienation. Afraid that she will never find a true sense of home or community, Jane feels the need to belong somewhere, to find ―kin,‖ or at least ―kindred spirits.‖ This desire tempers her equally intense need for autonomy and freedom .She has a sense of self-worth, dignity, has
commitment to justice and principle, and has immense trust in God, passionate disposition for true freedom. In her search for freedom, Jane also struggles with the question of what type of freedom she wants. While Rochester initially offers Jane a chance to liberate her passions, Jane comes to realize that such freedom could also mean enslavement—by living as Rochester‘s mistress, she would be sacrificing her dignity and integrity for the sake of her feelings. St. John Rivers offers Jane another kind of freedom: the freedom to act unreservedly on her principles. He opens to Jane the possibility of exercising her talents fully by working and living with him in India. Jane eventually realizes, though, that this freedom would also constitute a form of imprisonment, because she would be forced to keep her true feelings and her true passions always in check. Charlotte Brontë may have created the character of Jane Eyre as a means of coming to terms with elements of her own life. Much evidence suggests that Brontë, too, struggled to find a balance between love and freedom and to find others who understood her. At many points in the book, Jane voices the author‘s then-radical opinions on religion, social class, and gender. Next important character is Tess, the heroine of the famous novel Tess of D‟Uberville, written by
Thomas Hardy where he has placed women above everything in his novel. Intelligent, strikingly attractive, and distinguished by her deep moral sensitivity and passionate intensity, Tess is indisputably the central character of the novel that bears her name. But she is also more than a distinctive individual: Hardy makes her into somewhat of a mythical heroine. Her name, formally Theresa, recalls St. Teresa of Avila, another martyr whose vision of a higher reality cost her her life. Other characters often refer to Tess in mythical terms, as when Angel calls her a ―Daughter of Nature‖ in Chapter XVIII, or refers to her by the Greek mythological names ―Artemis‖ and ―Demeter‖ in Chapter XX. The narrator himself sometimes describes Tess as more than an individual woman, but as something closer to a mythical incarnation of womanhood. In Chapter XIV, he says that her eyes are ―neither black nor blue nor grey nor violet; rather all these shades together,‖ like ―an almost standard woman.‖ Tess‘s story may thus be a ―standard‖ story, representing a deeper and larger experience than that of a single individual. In part, Tess represents the changing role of the agricultural workers in England in the late nineteenth century. Possessing an education that her unschooled parents' lack, since she has passed the Sixth Standard of the National Schools, Tess does not quite fit into the folk culture of her predecessors, but financial constraints keep her from rising to a higher station in life. She belongs in that higher world, however, as we discover on the first page of the novel with the news that the Durbeyfields are the surviving members of the noble and ancient family of the d‘Urbervilles. There is aristocracy in Tess‘s blood, visible in her graceful beauty—yet she is forced to work as a farmhand and milkmaid. When she tries to express her joy by singing

ISSN No. 0976-8602 VOL.-1 * ISSUE-2*April-2012
Asian Resonance
44
lower-class folk ballads at the beginning of the third part of the novel, they do not satisfy her—she seems not quite comfortable with those popular songs. But, on the other hand, her diction, while more polished than her mother‘s, is not quite up to the level of Alec‘s or Angel‘s. She is in between, both socially and culturally. Thus, Tess is a symbol of unclear and unstable notions of class in nineteenth-century Britain, where old family lines retained their earlier glamour, but where cold economic realities made sheer wealth more important than inner nobility. Beyond her social symbolism, Tess represents fallen humanity in a religious sense, as the frequent biblical allusions in the novel remind us. Just as Tess‘s clan was once glorious and powerful but is now sadly diminished, so too did the early glory of the first humans, Adam and Eve, fade with their expulsion from Eden, making humans sad shadows of what they once were. Tess thus represents what is known in Christian theology as original sin, the degraded state in which all humans live, even when—like Tess she after killing Prince or succumbing to Alec—they are not wholly or directly responsible for the sins for which they are punished. This torment represents the most universal side of Tess: she is the myth of the human who suffers for crimes that are not her own and lives a life more degraded than she deserves. The ancient Greeks had their fair share of beautiful women characters that have left lasting effect on all literature written thereafter. The next female character to be talked of is Helen of Troy , also known as Helen of Sparta, was the daughter of Zeus and Leda (or Nemesis), step-daughter of King Tyndareus, wife of Menelaus and sister of Castor, Polydeuces and Clytemnestra. Her abduction by Paris brought about the Trojan War. She is one the most beautiful woman of the world, has destructive beauty, is a symbol of man‘s erotic desires and of all the varied moods of womanhood, is also responsible for launching thousand ships. And is the cause of Trojan War. She is the most inspiring character of all times including modern and ancient literature.
Another important character is Delilah of Samson and Delilah. Dlila, Standard Hebrew meaning
[She who] weakened or uprooted or impoverished" from the root dal meaning "weak or poor") appears only in the Hebrew bible Book of Judges 16, where she is the "woman in the valley of Sorek" whom Samson loved, and who was his downfall. Her figure, one of several dangerous temptresses in the Hebrew bible, has become emblematic: "Samson loved Delilah, she betrayed him, and, what is worse, she did it for money" .She is beautiful hence wins the heart of Samson, She is untrustworthy, disloyal, learns her husband‘s secret and reveals it to his enemies. She causes her husband‘s fall or destruction just for a few gold coins.
The right balance between the positive and negative attributes of womanhood has been depicted in the classics. Women in the novels were no goddess to be merely worshipped; neither was they slaves to be exploited. Great women characters have been created by master artists, epitomizing womanhood. I have short listed my favourites to be discussed in this
paper.. They are not necessarily in order of my preference –if I could, I would place all of them right there on the top. Thus through this paper an attempt has been made to bring out the portrayal of women in literature through classics -down the ages. References
1. Bison, Lillian. ―Chaucer and the Late Medieval World‖. New York: St. Martin's Press, 1998. ISBN 0-312-10667-X
2. Bloom, Harold (2010). ―Interpretations: William Shakespeare's the Merchant of Venice‖. New York: Info base. p. 27. ISBN 978-1-60413-885-6.
3. Charles Boyce, ―Encyclopedia of Shakespeare‖, New York, Roundtable Press, 1990, p. 35
4. Austen, Jane, and Carol Howard. Pride and Prejudice. New York: Barnes & Noble Classics, 2003. Print.
5. Margaret Mitchell, ―Gone With The Wind‖, Macmillan publisher,1936,US
6. B Wood hall, N., (2006), Norrie's Tale: ―An Autobiography of the Last of the 'Hardy Players‖, Wareham: Lullworde Publication
7. Pearl. S. Buck,‖The Good Earth‖, John Day, 1931, US.
8. Rabkin 2007, course booklet p. 48 9. www.portrayal of women in literature.com.

ISSN No. 0976-8602 VOL.-1 * ISSUE-2*April-2012
Asian Resonance
45
ISSN No. 0976-8602 VOL.-1 * ISSUE-2*April-2012
Asian Resonance Effect of Different Medicine in Reducing the Body Weight of Selected Obese Adolescent
Girls
Mukta Vohra M.P. Bhoj (Open) University, Bhopal
Neelma Kunwar Head of the Department, C.S. Azad University of Agriculture and Technology, Kanpur.
Introduction
Herbs which contain primary natural nutrients help to reduce weight by being diuretic (helps in reducing water retention). They have the ability to reduce fat and cholesterol. Finally they also aid in suppressing excessive appetite and food cravings and regularizing body metabolism at the same time. Methodology
This study was conducted in Bareilly district. Five Hindi and five English medium schools were randomly selected. Total 100 obese adolescent girls were selected in this study. Dependent and independent variables were used such as age, religion, weight, B.M.I., obesity etc. The
statistical tools were used such as S.D. ‗t‘-test, Cr, 2. Results
Table 1 Distribution of adolescent girls according to religion
Religion Frequency Per cent
Hindu 63 63.0
Muslim 22 22.0
Sikh 9 9.0
Christian 6 6.0
Total 100 100.0
2 82.800*** P < 0.001
The prevalence estimates from several studies of weight loss and/or weight control efforts by adolescents because of awareness about their physique in their religion.
Abstract
Modern society encourages the research for the perfect body. Today‟s aesthetic ideal is a thin body, and now superimposed on this ideal is the need to be physically fit. This drive for fitness is mainly prevalent in adolescents is trying to lose or gain weight or change their body proportion. Maturational physical changes place a heavier burden on female adolescents, who encounter thinness as a cultural standard of beauty for female. Key words : body weight, effect
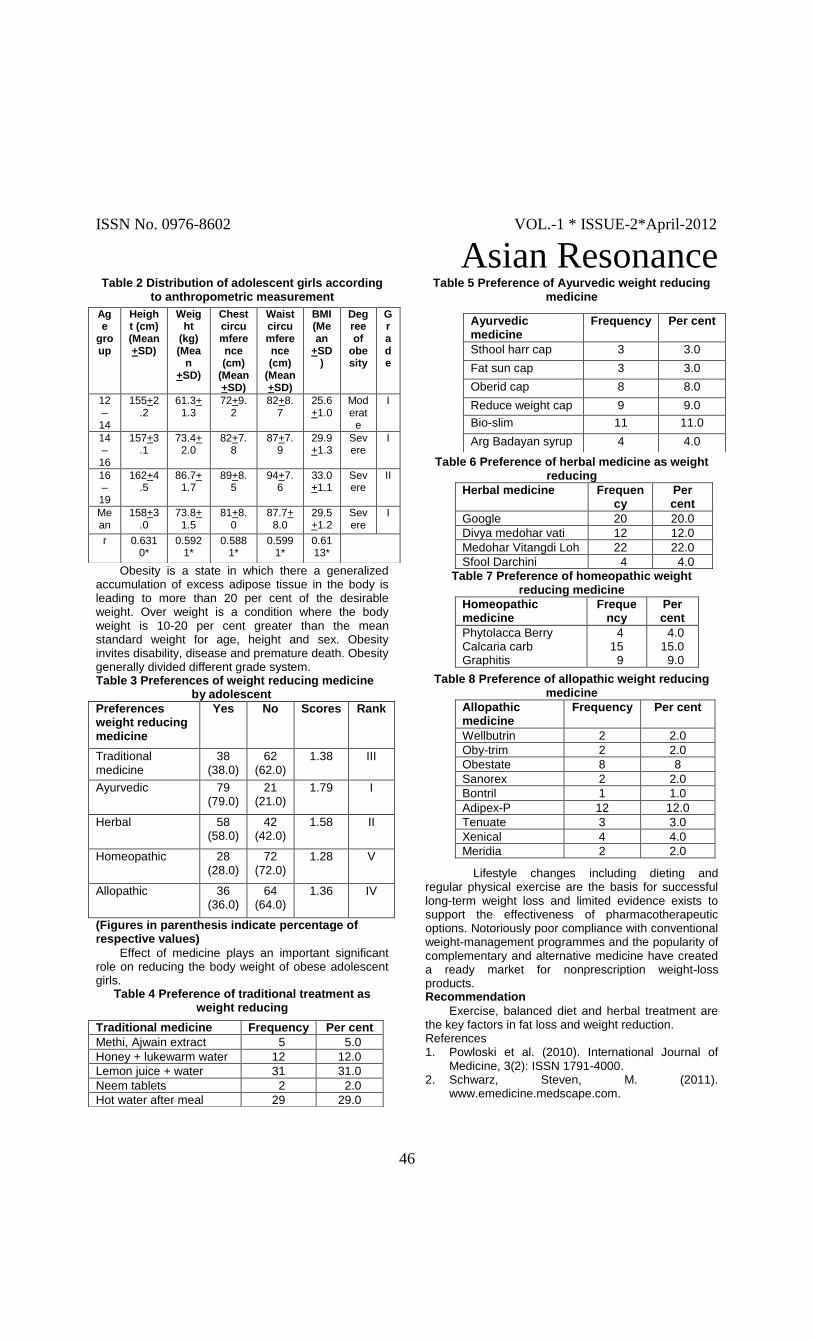
ISSN No. 0976-8602 VOL.-1 * ISSUE-2*April-2012
Asian Resonance
46
Table 2 Distribution of adolescent girls according to anthropometric measurement
Obesity is a state in which there a generalized accumulation of excess adipose tissue in the body is leading to more than 20 per cent of the desirable weight. Over weight is a condition where the body weight is 10-20 per cent greater than the mean standard weight for age, height and sex. Obesity invites disability, disease and premature death. Obesity generally divided different grade system. Table 3 Preferences of weight reducing medicine by adolescent
Preferences weight reducing medicine
Yes No Scores Rank
Traditional medicine
38 (38.0)
62 (62.0)
1.38 III
Ayurvedic 79 (79.0)
21 (21.0)
1.79 I
Herbal 58 (58.0)
42 (42.0)
1.58 II
Homeopathic 28 (28.0)
72 (72.0)
1.28 V
Allopathic 36 (36.0)
64 (64.0)
1.36 IV
(Figures in parenthesis indicate percentage of respective values)
Effect of medicine plays an important significant role on reducing the body weight of obese adolescent girls.
Table 4 Preference of traditional treatment as weight reducing
Table 5 Preference of Ayurvedic weight reducing medicine
Table 6 Preference of herbal medicine as weight reducing
Herbal medicine Frequency
Per cent
Google 20 20.0
Divya medohar vati 12 12.0
Medohar Vitangdi Loh 22 22.0
Sfool Darchini 4 4.0
Table 7 Preference of homeopathic weight reducing medicine
Homeopathic medicine
Frequency
Per cent
Phytolacca Berry 4 4.0 Calcaria carb 15 15.0 Graphitis 9 9.0
Table 8 Preference of allopathic weight reducing medicine
Allopathic medicine
Frequency Per cent
Wellbutrin 2 2.0
Oby-trim 2 2.0
Obestate 8 8
Sanorex 2 2.0
Bontril 1 1.0
Adipex-P 12 12.0
Tenuate 3 3.0
Xenical 4 4.0
Meridia 2 2.0
Lifestyle changes including dieting and regular physical exercise are the basis for successful long-term weight loss and limited evidence exists to support the effectiveness of pharmacotherapeutic options. Notoriously poor compliance with conventional weight-management programmes and the popularity of complementary and alternative medicine have created a ready market for nonprescription weight-loss products. Recommendation
Exercise, balanced diet and herbal treatment are the key factors in fat loss and weight reduction. References 1. Powloski et al. (2010). International Journal of
Medicine, 3(2): ISSN 1791-4000. 2. Schwarz, Steven, M. (2011).
www.emedicine.medscape.com.
Age
group
Height (cm) (Mean+SD)
Weight
(kg) (Mea
n +SD)
Chest circumference (cm)
(Mean+SD)
Waist circumference (cm)
(Mean+SD)
BMI (Mean
+SD)
Degree of
obesity
Grade
12 – 14
155+2.2
61.3+1.3
72+9.2
82+8.7
25.6+1.0
Moderat
e
I
14 – 16
157+3.1
73.4+2.0
82+7.8
87+7.9
29.9+1.3
Severe
I
16 – 19
162+4.5
86.7+1.7
89+8.5
94+7.6
33.0+1.1
Severe
II
Mean
158+3.0
73.8+1.5
81+8.0
87.7+8.0
29.5+1.2
Severe
I
r 0.6310*
0.5921*
0.5881*
0.5991*
0.6113*
Traditional medicine Frequency Per cent
Methi, Ajwain extract 5 5.0
Honey + lukewarm water 12 12.0
Lemon juice + water 31 31.0
Neem tablets 2 2.0
Hot water after meal 29 29.0
Ayurvedic medicine
Frequency Per cent
Sthool harr cap 3 3.0
Fat sun cap 3 3.0
Oberid cap 8 8.0
Reduce weight cap 9 9.0
Bio-slim 11 11.0
Arg Badayan syrup 4 4.0

ISSN No. 0976-8602 VOL.-1 * ISSUE-2*April-2012
Asian Resonance
47
ISSN No. 0976-8602 VOL.-1 * ISSUE-2*April-2012
Asian Resonance Study on Preferencial Choice for
Embellishment on Kurtas among Young Ladies
Sonal Saharia Research Scholar
Geeta Mathur Assoc. Professor, Dept. of Home Science, Juhari Devi Girls PG College, Kanpur.
Introduction
Clothes mean more to girls than they do to boys as down through the ages, girls have had pride in their personal appearance to attain the beautification of self through clothes and ornaments. In the words of odelum ―clothes means much more to women than to men, they often
mean an added zip to life, a heightening of women‘s belief in her, her youth, gaiety and happiness. When she knows she is well dressed she is sure of herself, unselfconscious, friendly and at ease‖. The YOUNG LADIES at college use clothes as a symbol of her independence. By wearing what her friends wear rather than what her parents want her to wear, she tells her peers that she is not ―tied to her mother‘s apron strings anymore.” (Hurlock, 1974.} Objectives
The study was undertaken to know the preference for embellishment on ladies Kurta and the choice of special features of embellishment by young ladies. Research methodology
Every young women aims is to look charming and attractive and proper clothes add feathers to their personality. Therefore, this study was carried out to gather information regarding the clothing preference for embellishment on Kurtas among 80 young ladies studying in different colleges of Kanpur city. A structured, pretested interview schedule was designed & used to collect the information from the respondents selected. Results and discussions
Background information
The study showed that 50% respondents are in the age group of 21-23 years of age. 90% of the samples are unmarried, living in nuclear family, and are graduates, from middle income groups, and using Kurta as daily wear to college, as well as at home. Preference for embellishment features in kurtas
Table-1- Type of embellishments on kurta S.No.
Embellishment Frequency Percentage
1
Dyed 08 10
2
Print 28 35
3
Embroidery 48 60
4
Patch Work 28 35
Abstract
Indian fashion history depicts the ladies Kurta as a popular and favorite dress among the youth. Kurta is versatile apparel which can be worn over a salwar churidar and pants. EMBELLISHMENT is an act of adding extraneous decoration or ornamentation to something. New breed designers are using various embellishments for innovation and creativity, to give the dress a new look. The young ladies are major perspective buyer of FASHION and STYLE in clothing, it is necessary to know the preferential choice for embellishment on Kurtas.

ISSN No. 0976-8602 VOL.-1 * ISSUE-2*April-2012
Asian Resonance
48
Embellishments on garments give a gorgeous look to the dress. 48 (60%) samples prefer embroidery on the Kurta while 28 (35%) samples each prefer print and patch work respectively. 8 (10%) samples prefer dyed embellishment on their Kurtas. The above table reveals that embroidery is the most preferred embellishment on Kurta by the respondents. Table-2-Preferential type of embroidery on kurta
S.No.
Type of Embroidery
Frequency Percentage
1 Hand 43 54
2 Machine 57 71
3 Both 73 91
Multiple choice answers
Table 2 shows multiple choice answers showing preference for the type of embroidery. 43 (54%) samples out of 80 samples prefer Handmade embroidery, 57 (71%) samples prefer Machine embroidery and 73 (91%) samples preferred both type of embroidery or mixed embroidery. This table reveals that there is large preference for the both hand and machine embroidery.
Table-3-Preferential type of additional work on kurta
S.No.
Additional Work
Frequency Percentage
1 Bead work 52 65
2 Zari 32 40
3 Sequence 63 79
4 Mirror Work
40 50
5 Thread Work
69 86
Multiple choice answers 52 (65%) samples prefer bead work on the dresses, 32 (40%) samples prefer Zari on their Kurtas, 63 (79%) samples prefer Sequence on their dresses, and 40 (50%) samples prefer Mirror work while 69 (86%) samples prefer Thread work on their Kurtas.
The above table revels that Thread work is highly preferred as the additional work on the dresses followed by Sequence work. Zari work is less preferred now and is losing its charm among the college going girls. Table-4-Type of motifs in embellishment
S.No.
Type of Motifs in Embellishment
Frequen
cy
Percenta
ge
1 Big 08 10
2 Small 57 71
3 Conventional 71 89
4 Unconventional abstract
21 26
The embellishment on Kurtas changes with the change in fashion but conventional (traditional) motifs in embellishments are largely preferred. 08 (10%) samples prefer big motifs in embellishment, 57 (71%) samples prefer small motifs, and 71 (89%) samples prefer conventional motifs while
21 (26%) samples prefer unconventional motifs in embellishment on their Kurtas. Table-5-Arrangement of embellishment on kurtas
S.No.
Arrangement of Embellishment
Frequency
Percentage
1
Selective areas
66
83
2
All over
22
27
Arrangement of embellishment on Kurtas is largely preferred on selective areas of Kurtas. 66 (83%) samples prefer embellishment on selective areas while 22 (27%) prefer embellishment all over the Kurtas. The result shows that young ladies are choosy and selective for placement of embellishment on their Kurtas. Conclusion
Based on the findings it can be concluded that preference and choice of clothing is a matter of individual sensitivity affected by personal choice and environment. The young ladies appreciated the importance of attention value of clothing but they are also aware that over and extreme in–style will reflect un-favorable attention. The selection of apparel and fabric is one of the most difficult problems of young ladies where the clothing market is highly complex. Majority of respondents preferred embroidery among various types of embellishments, both hand and machine embroidery on Kurta. Embellishment was preferred selectively arranged by majority of the respondents mostly on necklines and sleeves. The results show that conventional motifs were preferred in comparison to abstract or unconventional, by majority of the respondents. The Findings of this study would help the apparel industry, entrepreneur, accessories industry in the area of fashion designing, apparel designing and clothing and textile. References
1. Anonymous.(2004),IndianDresses.www.info4india.comm/indian-fashion/indian dresses2.shtml
2. Clark,A.C.andAtkin,R(2005)Beaded embellishment. Published weekly (on Wednesday), Colorona.
3. Gandotra, V and Saggu, H. (1991). Buying practices of designed suits of college girls. J. Rese. Pau.28 (4): 575-80.
4. Sidhu, S.P. (1984), Clothing preferences of college girls. J. Res. Pb. Agric. Univ. 2: 442 – 446.
5. Sarkar,S.R.; Singh, R.K.P. and Sil, A.(2005), Impact of communication media on clothing purchasing behavior of tribal girls. Textile Industry and trade journal, Vol 43 (11-12) pages 53-56.
6. Saral, I 2003, Factors affecting clothing purchase practice of urban household in Kanpur city. M.Sc. Thesis, Chandra Shekhar Azad University of Agriculture and Technology, Kanpur.

ISSN No. 0976-8602 VOL.-1 * ISSUE-2*April-2012
Asian Resonance
49
ISSN No. 0976-8602 VOL.-1 * ISSUE-2*April-2012
Asian Resonance Some Factors Responsible for Heart Disease
Swati Sachan M.P. Bhoj (Open) University, Bhopal
Neelma Kunwar Head of the Department, C.S. Azad University of Agriculture and Technology,
Kanpur. Divya Singh Dean, Home Science, Deen Dayal Upadhyay University, Gorakhpur
Introduction
Some factors that affect people‘s risk of heart diseases, including their age, race, sex and their blood pressure levels at the start of the study, their weight and other aspects of their behaviour that could have made them healthier and less likely to get heart disease. Obesity is an important determinant of cardiovascular disease (CVD). Methodology
This study was conducted in Kanpur district. One medical college, two private nursing homes and two heart centers were selected in this study. 240 heart patients were selected in the study area. Dependent and independent variable were used such as age, caste, religion, life style,
diseases etc. The statistical tools were used such as S.D., Cr, 2.
Results Table 1 Distribution of the heart patients according to religion
(Figures in parenthesis indicate percentage of respective values)
28.3 per cent male and 21.7 per cent female respondents have from Hindu religion, whereas 18.8 per cent male and 9.2 per cent female respondents have belonged to Muslim religion. 50.0 per cent heart patients were from Hindu religion and minimum only 5.0 per cent respondents from Christian community. Many religions incorporate some element of fasting into their religious practices. Laws regarding fasting or restricting food and drink have been described as a call to holiness by many religions.
Table 2 Distribution of heart patients according to minor attack
(Figures in parenthesis indicate percentage of respective values)
81.2 per cent respondents have faced 1st attack in which 45.8 per cent male and 35.4 per cent heart patient whereas 18.8 per cent respondents have faced 2nd attack in which 12.5 per cent male and 6.3 per cent female heart patient.
Abstract
Most people with unstable angina or mild heart attack experience typical angina symptoms including chest pain that feels like squeezing, tightness, aching, or heaviness on either or both sides of the chest, as well as pain in the arms, a large number of patients, especially women have a typical symptoms. Key words: Factors, disease.
Religion Male Female Total
Hindu 68 (28.3) 52 (21.7) 120 (50.0)
Muslim 45 (18.8) 22 ( 9.2) 67 (27.9)
Sikh 20 ( 8.3) 21 ( 8.7) 41 (17.1)
Christian 7 ( 2.9) 5 ( 2.1) 12 ( 5.0)
Total 140 (58.3) 100 (41.7)
240 (100.0)
χ2
3.826 P > 0.05
Minor attack
Male Female Total
1st attack 110 (45.8) 85 (35.4) 195 (81.2)
2nd
attack 30 (12.5) 15 ( 6.3) 45 (18.8)
Total 140 (58.3) 100 (41.7) 240 (100.0)
χ2
1.582 P > 0.05

ISSN No. 0976-8602 VOL.-1 * ISSUE-2*April-2012
Asian Resonance
50
Table 3 Physical factors of heart patients
(Figures in parenthesis indicate percentage of respective values)
Physical factors affected the heart disease 95.7
per cent male and 78.0 per cent female heart patients have given first rank of diabetes. 89.3 per cent male respondents were given rank II to high BP whereas female respondents given rank II to physical inactivity and III rank to high BP. 85.7 per cent male respondents have given third rank to heredity and fourth rank (1.57) to obesity. People with a combination
of risk factors have the greatest risk of developing CHD.
Table 4 Dietary factors responsible for heart patients
This refers to eating properly and exercising sufficiently. If one does not eat properly, it is obvious
Physical factors
Male Female
Yes No Scores
Rank
Yes
No Scores
Rank
High blood pressure
125 (89.3)
15 (10.7
)
1.89
II 48 (48.0)
52 (52.0)
1.48 III
High cholesterol
57 (40.7)
83 (59.3
)
1.41
VI
24 (24.0)
76 (76.0)
1.24 VII
Diabetes mellitus
134 (95.7)
6 (4.3)
1.96
I 78 (78.0)
22 (22.0)
1.78 I
Physical inactivity
34 (24.3)
106 (75.7
)
1.24
IX
54 (54.0)
46 (46.0)
1.54 II
Sedentary life style
45 (32.1)
95 (67.9
)
1.32
VIII
21 (21.0)
79 (79.0)
1.21 VIII
Sex 72 (51.4)
68 (48.6
)
1.51
V 9 (9.0)
91 (91.0)
1.09 IX
Age 50 (35.7)
90 (64.3
)
1.36
VII
45 (45.0)
55 (55.0)
1.45 IV
Heredity
120 (85.7)
20 (14.3
)
1.86
III 29 (29.0)
71 (71.0)
1.29 V
Obesity
80 (57.1)
60 (42.9
)
1.57
IV
28 (28.0)
72 (72.0)
1.28 VI
P
0.8176* P > 0.05
Dietar
y
factors
Male Female
Ye
s
N
o
Sco
res
R
a
n
k
Ye
s
N
o
S
co
re
s
R
a
n
k
Exces
s use
of fat
82
(5
8.6
)
58
(4
1.
4)
1.5
9
II 60
(60
.0)
40
(4
0.
0)
1.
60
II
I
Exces
s use
of
sodiu
m
26
(1
8.6
)
11
4
(8
1.
4)
1.1
9
V 55
(55
.0)
45
(4
5.
0)
1.
55
I
V
Exces
s of
alcoho
l
39
(2
7.9
)
10
1
(7
2.
1)
1.2
8
I
V
85
(85
.0)
15
(1
5.
0)
1.
85
I
Exces
s use
of
smoki
ng
99
(7
0.7
)
41
(2
9.
3)
1.7
1
I 80
(80
.0)
20
(2
0.
0)
1.
80
II
Bad
food
habits
64
(4
5.7
)
76
(5
4.
3)
1.4
6
III 15
(15
.0)
85
(8
5.
0)
1.
15
V
I
Exces
s use
of
sugar
82
(5
8.6
)
58
(4
1.
4)
1.5
9
II 38
(38
.0)
62
(6
2.
0)
1.
38
V
P
0.7429* P > 0.05

ISSN No. 0976-8602 VOL.-1 * ISSUE-2*April-2012
Asian Resonance
51
that the human body is denied of nutritional supplies in some view of this, it must be asserted that too much of anything in excess is never good. Hence if particular foods are consumed in excess it could mean trouble for him. This refers to the consumption of cholesterol rich foods. Table 5 Psychological factors of heart patients
Psychological factors
Male Female
Yes No Scores
Rank
Yes
No Scores
Rank
Mental stress
99 (70.7
)
41 (29.3)
1.71
II 48 (48.0)
52 (52.0)
1.48
II
Social isolation
130 (92.9
)
10 (7.1)
1.93
I 77 (77.0)
23 (23.0)
1.77
I
Depression frustration
78 (55.7
)
62 (44.3)
1.56
III 27 (27.0)
73 (73.0)
1.27
V
Aggressiveness'/angriness
59 (42.1
)
81 (57.9)
1.42
IV
39 (39.0)
61 (61.0)
1.39
IV
Guilt 8 (5.7)
132 (94.3)
1.06
VI
46 (46.0)
54 (54.0)
1.46
III
Behaviour
14 (10.0
)
126 (90.0)
1.10
V 13 (13.0)
87 (87.0)
1.13
VI
P
0.6900* P < 0.05
(Figures in parenthesis indicate percentage of respective values)
Circulating triglyceride concentration remains widely misunderstood and controversial coronary risk factors. Increased triglyceride levels are associated with elevated CHD risk, when considered in isolation but triglyceride levels lose their predictive power when an adjustment is made for other risk factors especially HDL-C. Elevated triglyceride levels are often associated with obesity, diabetes, hypertension, low HDL-C and small dense LDL particles. Conclusion
Factors responsible for heart disease and independent variables, education of the male respondents positively correlated with physical and promoted factors whereas income of male respondents positively correlated with dietary, physical and
promoted factors. In male group caste is positively correlated with physical, psychological and promoted factors. In female group education of the respondents are positively correlated with dietary and psychological factors and family income correlated with income. Recommendation
Love and show affection to everyone, if you do this it will really help in dropping your blood pressure, further reducing the risk of heart problems. References 1. Singh, V.N., Voelker, D.J. and Sharma, R.K. (2010).
―Cardiac risk stratification; Role of coronary calcium score. Vasc Health Risk Manage, 6 : 603-611.
2. Smulders, Y.M.; Thijs, A. and Twisk, J.W. (2011). ―New cardiovascular risk determinants do exist and are clinically useful‖. Eur. Heart J., 29 : 436-440.
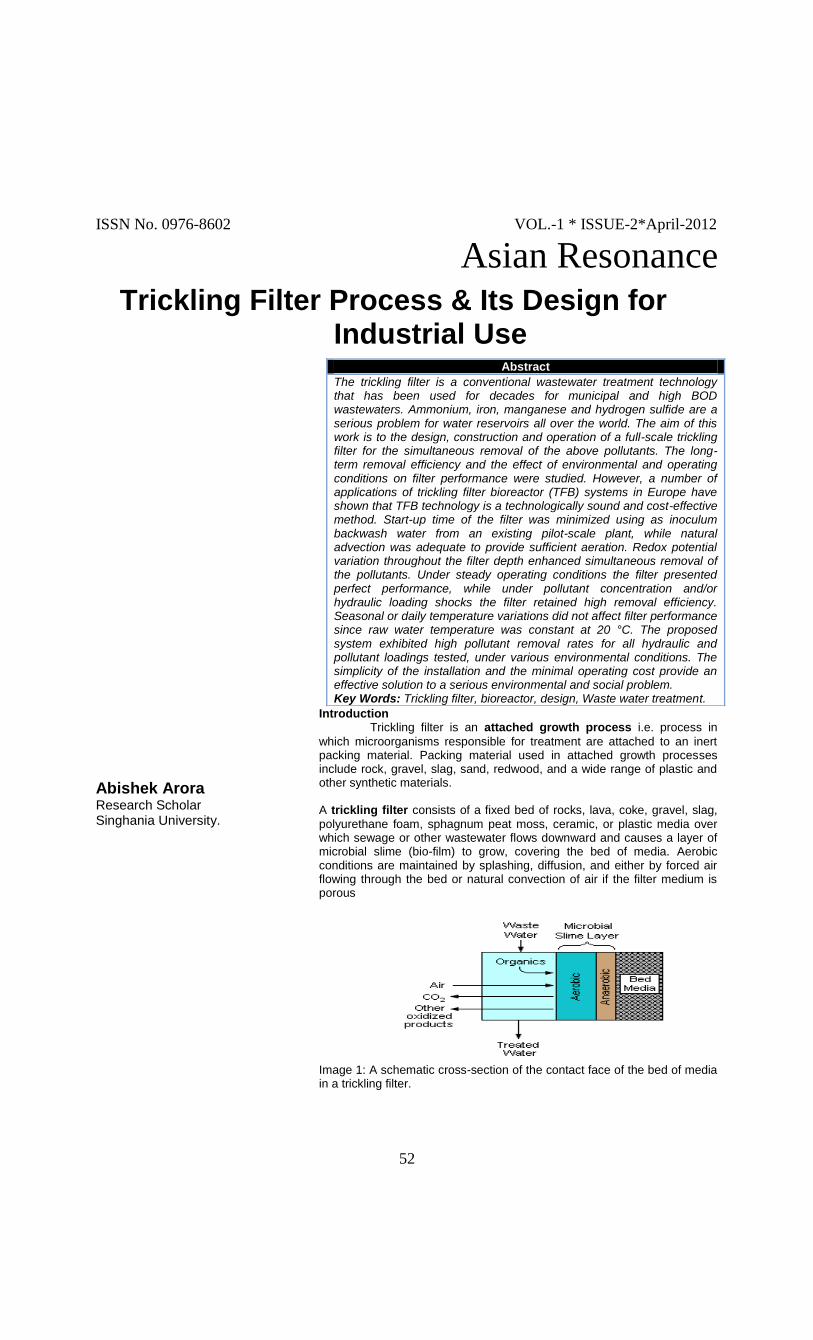
ISSN No. 0976-8602 VOL.-1 * ISSUE-2*April-2012
Asian Resonance
52
ISSN No. 0976-8602 VOL.-1 * ISSUE-2*April-2012
Asian Resonance
Trickling Filter Process & Its Design for Industrial Use
Abishek Arora Research Scholar Singhania University.
Introduction Trickling filter is an attached growth process i.e. process in
which microorganisms responsible for treatment are attached to an inert packing material. Packing material used in attached growth processes include rock, gravel, slag, sand, redwood, and a wide range of plastic and other synthetic materials. A trickling filter consists of a fixed bed of rocks, lava, coke, gravel, slag,
polyurethane foam, sphagnum peat moss, ceramic, or plastic media over which sewage or other wastewater flows downward and causes a layer of microbial slime (bio-film) to grow, covering the bed of media. Aerobic conditions are maintained by splashing, diffusion, and either by forced air flowing through the bed or natural convection of air if the filter medium is porous
Image 1: A schematic cross-section of the contact face of the bed of media in a trickling filter.
Abstract
The trickling filter is a conventional wastewater treatment technology that has been used for decades for municipal and high BOD wastewaters. Ammonium, iron, manganese and hydrogen sulfide are a serious problem for water reservoirs all over the world. The aim of this work is to the design, construction and operation of a full-scale trickling filter for the simultaneous removal of the above pollutants. The long-term removal efficiency and the effect of environmental and operating conditions on filter performance were studied. However, a number of applications of trickling filter bioreactor (TFB) systems in Europe have shown that TFB technology is a technologically sound and cost-effective method. Start-up time of the filter was minimized using as inoculum backwash water from an existing pilot-scale plant, while natural advection was adequate to provide sufficient aeration. Redox potential variation throughout the filter depth enhanced simultaneous removal of the pollutants. Under steady operating conditions the filter presented perfect performance, while under pollutant concentration and/or hydraulic loading shocks the filter retained high removal efficiency. Seasonal or daily temperature variations did not affect filter performance since raw water temperature was constant at 20 °C. The proposed system exhibited high pollutant removal rates for all hydraulic and pollutant loadings tested, under various environmental conditions. The simplicity of the installation and the minimal operating cost provide an effective solution to a serious environmental and social problem. Key Words: Trickling filter, bioreactor, design, Waste water treatment.

ISSN No. 0976-8602 VOL.-1 * ISSUE-2*April-2012
Asian Resonance
53
The terms trickle filter, trickling biofilter, biofilter, biological filter and biological trickling filter are often used to refer to a trickling filter. These systems have also been described as roughing filters, intermittent filters, packed media bed filters, alternative septic systems, percolating filters, attached growth processes, and fixed film processes. The removal of pollutants from the wastewater stream involves both absorption and adsorption of organic compounds by the layer of microbial bio film. The filter media is typically chosen to provide a very high surface area to volume. Typical materials are often porous and have considerable internal surface area in addition to the external surface of the medium. Passage of the waste-water over the media furnishes dissolved air, the oxygen which the slime layer requires for the biochemical oxidation of the organic compounds and releases carbon dioxide gas, water and other oxidized end products. As the bio film layer thickens, it eventually sloughs off into the treated effluent and subsequently forms part of the secondary sludge. Typically, a trickling filter is followed by a clarifier or sedimentation tank for the separation and removal of the sloughing. Other filters utilizing higher-density media such as sand, foam and peat moss do not produce a sludge that must be removed but require forced air blowers and backwashing or an enclosed anaerobic environment. The treatment of sewage or other wastewater with trickling filters is among the oldest and most well characterized treatment technologies. Process Flow Diagram of Water Treatment using Trickling Filter
The wastewater in trickling filter is distributed over the top area of a vessel containing non-submerged packing material.
Air circulation in the void space, by either natural draft or blowers, provides oxygen for the microorganisms growing as
an attached bio film.
During operation, the organic material present in the wastewater is metabolized by the biomass attached to the
medium. The biological slime grows in thickness as the organic matter abstracted from the flowing wastewater is
synthesized into new cellular material.
The thickness of the aerobic layer is limited to availability of oxygen at the depth of the microbial layer.
The micro-organisms near the medium face enter the endogenous phase as the substrate is metabolized before it can reach the micro-organisms near the medium face as a
result of increased thickness of the slime layer and lose their ability to cling to the media surface. The liquid then washes
the slime off the medium and a new slime layer starts to grow. This phenomenon of losing the slime layer is called
sloughing.
The sloughed off film and treated wastewater are collected by an under drainage which also allows circulation of air through filter. The collected liquid is passed to a settling tank used for
solid- liquid separation.
Classification of Trickling Filters
Trickling filters are classified as high rate or low rate based on the organic and hydraulic loading applied to the unit.
S.No
Design Feature Low Rate Filter
High Rate Filter
1 Hydraulic loading, m3/m2.d
1.0 - 4.0 10.0 - 40.0
2 Organic loading,kg BOD
/ m3.d
0.08 - 0.32 0.32 - 1.0
3 Depth, m. 1.8 - 3.0 0.9 - 2.5
4 Recirculation ratio
0 0.5 - 3.0 (domestic wastewater) up to 8 for strong industrial waste water.
The hydraulic loading rate is the total flow including recirculation applied on unit area of the filter in a day, while the organic loading rate is the 5 day 20°C BOD, excluding the BOD of the re-circulant, applied per unit volume in a day.
Recirculation is generally not adopted in low rate filters.
A well operated low rate trickling filter in combination with secondary settling tank may remove 75 to 90% BOD and produce highly nitrified effluent. It is suitable for treatment of low to medium strength domestic wastewaters.
The high rate trickling filter, single stage or two stages are recommended for medium to relatively high strength domestic and industrial wastewater. The BOD removal efficiency is around 75 to 90% but the effluent is only partially nitrified.
Single stage unit consists of a primary settling tank, filter, secondary settling tank and facilities for recirculation of the effluent. Two stage filters consist of two filters in series with a primary settling tank, an intermediate settling tank, which may be omitted in certain cases, and a final settling tank.
Types of Trickle filters
The three basic types of trickle filters are used based on application are as follows:
the treatment of small individual residential or rural sewage
Large centralized systems for treatment of municipal sewage
Systems applied to the treatment of industrial wastewater.
Septic system leach field
This is the simplest form of waste liquid disposal system, typically using pipes buried in loose sand or gravel to dissipate the liquid outflow from a septic tank. Liquid purification is performed by a bio film, which naturally forms as a coating on the sand

ISSN No. 0976-8602 VOL.-1 * ISSUE-2*April-2012
Asian Resonance
54
and gravel in the absorption field and feeds on the dissolved nutrients in the waste stream. Due to the system being completely buried and generally isolated from the surface environment, the process of waste breakdown is slow and requires a relatively large surface area to absorb and process liquid wastes. If too much liquid wastes enter the field too quickly, the wastes may pass out of the bio film before waste consumption can occur, leading to pollution of groundwater. In order to prolong the life of a leaching field, one method of construction is to build two fields of piping side-by-side, and use a rotating flow valve to direct waste into one field at a time, switching between fields every year or two. This allows a period of rest to let the microorganisms have time to break down the wastes built up in the gravel bed. In areas where the ground is insufficiently absorptive (fails the percolation test) a homeowner may be required to construct a mound system which is a special engineered waste disposal bed of sand and gravel mounded on the surface of the ground with poor liquids absorption. Leach field dosing
Generally it is better if the biofilm is permitted a period of time to rest between liquid influxes and for the liquids to be evenly distributed through the leaching bed to promote biofilm growth throughout the pipe network. Typically flows from septic systems are either small surges (hand washing) or very large surges (clothes washer emptying), resulting in highly erratic liquid outflow into the field and uneven biofilm growth concentrating primarily around the field inlet and dropping off in the outer reaches of the piping system. For this reason it is common for engineered mound systems to include an electrically powered dosing system which consists of a large capacity underground storage tank and lift pump after the septic tank. When the tank fills to a predetermined level, it is emptied into the leaching field. The storage tank collects small outflows such as from hand washing and saves them for dosing when the tank fills from other sources. During this fill period the field is able to rest continuously. When full, the discharge dose fills out the entire field completely to the same degree of flow, every time, promoting an even bio film growth throughout the system. Dosing systems have maintenance requirements over traditional non-powered surge systems. The pump and float system can break down and require replacement, and the dosing system also needs electricity. However, the system can be designed so that in the event of power failure the storage tank overflows to the field operating in the traditional surge-flow manner until power is restored or repairs can be done. Soil Compaction issues
The biofilm is most productive if the absorption field is loosely packed, to permit easy air infiltration down into the biofilm bed. Consequently the land over the leaching field is often a restricted area where large vehicles cannot be allowed to drive,
because the heavy weight will compact the bed, and potentially cause system failure due to hindering of bio film growth. One method to help prevent compaction of the field is to place a U-shaped cover over gravel trenches in the bed, with a dosing pipe suspended above the bed by the cover. Any weight from above is passed to the sides of the trench keeping the bed directly under the cover free from compaction. Sewage treatment trickle filters
Onsite sewage facilities (OSSF) are recognized as viable, low-cost, long-term, decentralized approaches to sewage treatment if they are planned, designed, installed, operated and maintained properly (USEPA, 1997). Sewage trickling filters are used in areas not serviced by municipal wastewater treatment plants (WWTP). They are typically installed in areas where the traditional septic tank system are failing, cannot be installed due to site limitations, or where improved levels of treatment are required for environmental benefits such as preventing contamination of ground water or surface water. Sites with a high water table, high bedrock, heavy clay, small land area, or which require minimal site destruction (for example, tree removal) are ideally suited for trickling filters. All varieties of sewage trickling filters have low and sometimes intermittent power consumption. They can be somewhat more expensive than traditional septic tank-leach field systems, however their use allows for better treatment, a reduction in size of disposal area, less excavation, and higher density land development. Configurations and components
All sewage trickling filter systems share the same fundamental components:
a septic tank for fermentation and primary settling of solids
a filter medium upon which beneficial microbes (biomass, biofilm) are promoted and developed
a container which houses the filter medium
a distribution system for applying wastewater to be treated to the filter medium
a distribution system for disposal of the treated effluent or percolation ponds.
By treating septic tank effluent before it is distributed into the ground, higher treatment levels are obtained and smaller disposal means such as leach field, shallow pressure trench or area beds are required. Systems can be configured for single-pass use where the treated water is applied to the trickling filter once before being disposed of, or for multi-pass use where a portion of the treated water is cycled back to the septic tank and re-treated via a closed-loop. Multi-pass systems result in higher treatment quality and assist in removing Total Nitrogen (TN) levels by promoting nitrification in the aerobic media bed and denitrification in the anaerobic septic tank. Trickling filters differ primarily in the type of filter media used to house the microbial colonies.

ISSN No. 0976-8602 VOL.-1 * ISSUE-2*April-2012
Asian Resonance
55
Types of media most commonly used include plastic matrix material, open-cell polyurethane foam, sphagnum peat moss, recycled tires, clinker, gravel, sand and geo-textiles. Ideal filter medium optimizes surface area for microbial attachment, wastewater retention time, allows airflow, resists plugging and does not degrade. Some residential systems require forced aeration units, which will increase maintenance and operational costs. Industrial wastewater treatment trickle filters
Wastewaters from a variety of industrial processes have been treated in trickling filters. Such industrial wastewater trickling filters consist of two types:
Large tanks or concrete enclosures filled with plastic packing or other media.
Vertical towers filled with plastic packing or other media.
The availability of inexpensive plastic tower packing has led to their use as trickling filter beds in tall towers, some as high as 20 meters. As early as the 1960s, such towers were in use at: the Great Northern Oil's Pine Bend Refinery in Minnesota; the Cities Service Oil Company Trafalgar Refinery in Oakville, Ontario and at a kraft paper mill. The treated water effluent from industrial wastewater trickling filters is very often subsequently processed in a clarifier-settler to remove the sludge that sloughs off the microbial slime layer attached to the trickling filter media (shown in Image 1). Currently, some of the latest trickle filter technology involves aerated bio-filter which are essentially trickle filters consisting of plastic media in vessels using blowers to inject air at the bottom of the vessels, with either down flow or up flow of the wastewater.
Advantages of trickling filtration plant
Simple and reliable process that is suitable in areas where large tracts of land are not available for a WSP treatment system
Effective in treating high concentrations of organic material depending on the type of media used;
Very efficient in removal of ammonia from wastewater;
Appropriate for small- to medium-sized communities
With the introduction of plastic filter media to replace the rock media, speed control, and more reliable rotary distributor mechanisms, the performance of trickling filters has been greatly enhanced.
Ability to handle and recover from shock loads
Relatively low power requirements; They require power for pumping only and do not need large power-hungry aeration blowers. From motor-driven rotary distributors are powered by fractional horsepower electric motors.
They produce less sludge than suspended-growth systems. The sludge tends to settle well because it is compact and heavy.
Level of skill and technical expertise needed to manage and operate the system is moderate
The cost to operate a trickling filter is very low.
Disadvantages of trickling filtration plant
Additional treatment may be needed for the effluent to meet strict discharge standards;
generates sludge that must be treated and disposed of;
Regular operators attention is needed;
Relatively high incidence of clogging;
Relatively low loadings required depending on the media;
Limited flexibility and control in comparison with activated sludge processes. They require high maintenance costs of rotary distributor center mechanisms. Any maintenance service for the rotary distribution mechanism would require a crane and complete removal of the rotary distributor mechanism, guy rods, and arms.
Sizing a Bio-filter
Sizing a bio-filter can be a daunting task for the novice in the aquaculture industry. One has to pick and choose between many technologies and options. Once you have chosen a type of bio-filter there are still a tremendous number of variables to consider and make decisions about. Due to the wide disparity in the data reported in the literature, it is wise to oversize bio-filters or provide for a modular design that will allow for expansion. Trickling filters are relatively easy to design and build. Here is an example of a simplified procedure for a trickling filter that may help to start the design process.
Estimate the maximum amount of feed you will be feeding your fish at any time in the crop cycle. This will determine the maximum load the bio-filter will need to handle.
Decide or determine the TAN (total ammonia nitrogen) level that your fish will be able to tolerate with no ill effects. Based on the allowable ammonia concentration in the culture tank, determine the ammonia removal rate. Make a guess about the hydraulic loading rate that you will use. See Graph 1.
Decide on the amount of water that will flow through the bio-filter.. One way to look at water

ISSN No. 0976-8602 VOL.-1 * ISSUE-2*April-2012
Asian Resonance
56
flow is to calculate how long it will take for all of the water in the culture tank will pass through the filtration system. A very slow system might re-circulate all of the water in 12 hours. A very fast system might re-circulate all the water in 5 min. A good starting point for a lightly loaded system might be a 1 hr. turnover time. In other words, all the water in the tank is passed through the filter in 1 hour. For example, a 5000 gallon tank would need a flow rate of 5000 gallons per hour or 83 GPM.
If you are adding oxygen with a system that is external to your culture tank, your re-circulating flow rate will probably be determined by the oxygen requirements of the fish. If your oxygen addition is within your culture tank, then the solids removal and bio-filtration will guide your flow rate.
Based on the amount of feed to be used and the ammonia removal rate, calculate the total amount of surface area required for the bio-filter packing.
Decide on the density or SSA (specific surface area) of the bio-filter material. The three commonly used SSA's for structured media are 119, 69 and 48 ft2/ft3 (390, 226 and 157 m2/m3).
Divide the total amount of surface area required by the SSA of the filter material. This gives you the volume of bio-filter media required.
Decide on the shape of the bio-filter.
Determine the hydraulic loading rate. If the hydraulic loading rate is too low, either increase the water flow or make the trickling filter taller and narrower. The hydraulic loading rate influences the ammonia removal rate as shown in graph 1. In addition, there is a recommended minimum water loading rate based on the specific surface area of the media. The more surface area in a given volume, the more water is required to fully wet all the surfaces.
The sq.ft. in the water loading refers to the plan area (top area) of the trickling filter. The sq.ft. in the specific surface area refers to the surface contained in the packing or media.
Graph 1 This graph is based on the data presented in the very useful paper by Kamstra, Van der Heul and Nijhof ―Performance and optimization of trickling filters on eel farms‖ Aquacultural Engineering 1998 p. 175 – 192. This graph gives approximate removal rates for warm, freshwater trickling filters with good water distribution and sufficient dissolved oxygen. Saltwater systems will have lower removal rates and cold water systems will have lower removal rates. New systems will have lower removal rates. Systems that have wide swings in ammonia concentration will have lower removal rates. Nitrifying bacteria are inhibited by light so filters exposed to bright lights will have lower results. Systems using various therapeutic agents like formaldehyde can have lower results. Use this graph with caution!! You may get better results but you can also get worse results. It is much better to include a generous safety factor than have a system limited by the bio-filter. Lower ammonia concentrations are always better than higher concentrations. To the best of my knowledge, no fish ever died as a result of an oversized bio-filter but many have died from undersized ones. Here is an example of a sizing calculation:
Crop Size 500 kg (1,100 lbs.) of fish
Feeding rate 2% bw /day
Amount of Feed 10 kg (22 lbs.) at 32% protein
Allowable TAN 1.5 ppm
Water Flow 83 gpm
Amount of Ammonia Produced .03 x 10 kg = 300 gm/day
Ammonia Removal Rate .6 gm/m2-day at 6 gpm/ft2 hydraulic loading rate
Surface area required (300 gm/day)/(.6 gm/m2-day)=500 m2
Convert M2 to ft2 500 m2 x 10.76 ft2/m2 = 5380 ft2
Packing density or SSA 69 ft2/ft3 (226m2/m3)
Volume of media = (500 m2)/ (226 m2/m3) = 2.21 m3
Or
Volume of media = (4035 ft2)/ (69 ft2/ft3) = 78 ft3
If we start with a stack of media 4 ft wide by 4 ft long by 5 ft high we get 80 ft3. Using the 83 gpm flow rate, the hydraulic loading would be about 5.2 gpm/ft2 Hydraulic loading : 83 gpm/(4' x 4') = 5.2 gpm/ft2
Ammonium Removal Rate
at different hydraulic loading rates
0
0.2
0.4
0.6
0.8
1
1.2
1.4
1.6
0 0.5 1 1.5 2 2.5 3
Ammonium Concentration ppm
Rem
ov
al
Rate
gm
s/sq
.m-d
ay
12 GPM/ft2
10 GPM/ft2
8 GPM/ft2
6 GPM/ft2
4 GPM/ft2
Specific Surface area Sq.ft./cu.ft
Minimum Water loading GPM/sq.ft.
30 3
50 4
70 5
120 7

ISSN No. 0976-8602 VOL.-1 * ISSUE-2*April-2012
Asian Resonance
57
This is higher than the minimum hydraulic loading rate for this media but lower than the 6 GPM/ft2 we guessed at when reading graph 1. The easy thing to do is to increase the water flow rate slightly to 96 gpm (4' x 4' x 6 gpm/ft2). The above procedure is a simplified, general guideline for the process of designing a trickling filter. Predicting the amount of packing required for a given application is not an exact science. If the filter is undersized for the application, the level of TAN at design conditions may be higher than desired. Generally, it is wiser to oversize a bio-filter rather than undersize it. Fish will not die from an oversized bio-filter. Other Design Concerns
One of the most important considerations in any bio-filter design is providing all of the bugs (micro organisms) with a constant supply of food (nutrients) and oxygen. The reason the word "all" is emphasized because many bio-filter designs do not distribute the flow of food and oxygen evenly. Some parts of the bio-filter may have a high flow of water past them and other parts may have almost no flow. This is a common cause of poor performance by a bio-filter. Even hydraulic loading (water flow) throughout the filter is extremely critical to proper utilization of the bio-filter media. Rotating Biological Contactors (RBCs) are consistently shown to have very high treatment efficiencies. This is because the media is consistently and evenly moved through the water to be treated. All of the bugs on the surface area contained in the RBC are exposed to a steady stream of food and oxygen. Trickling filters and submerged filters can achieve high treatment efficiencies if they also have a constant, even flow of water to all of the surface area contained in the filter. Trickling Filters
We begin the discussion of design with trickling filters because they are easier to design and size than a submerged filter. Once the size and shape of the trickling filter has been decided, the water distribution system must be designed. It cannot be overemphasized that the water must be evenly distributed over the top of the media. Areas that are dry will not provide any bio-filtration benefit. In addition, the interface area between the wet and dry areas will tend to accumulate solids and eventually lead to plugging. In general, it is easier to evenly distribute the water for systems with high hydraulic loadings compared to low hydraulic loadings. There is no maximum water loading for structured packing. There are two common ways to get an even distribution using a fixed spray system. For square or rectangular vessels one way is to use solid cone, square pattern spray nozzles. The edge of each spray pattern should touch the edge of each adjacent pattern. This system is easy to visualize and design. The only requirement is that the nozzle spray pattern must be well defined by the manufacturer so that the designer can size the system properly. The most common drawback to this system is that not all nozzles have an even spray pattern even though they are sold
as solid cone nozzles. Very often the center of the spray pattern has a lower water loading than the edge of the pattern. The second way to get an even water distribution is to use many over lapping spray patterns. Often, the individual nozzle spray pattern is hollow but the combination of many patterns covering the same spot gives an even coverage. The main problem with this system is that the wall of the vessel will intercept a certain amount of water. Any water that hits the wall will generally not go through the filter media. In a very large vessel, this is not a problem because the ratio of the perimeter to the area is small. In small vessels this system will not work well. There is a third method of distributing water that can be used in round vessels. Rotating arm distribution systems can give an even distribution if they are sized properly. They also have a low head compared to some spray systems. The drawback to rotating arm systems is the wear and tear on moving parts and the required maintenance. Part of the art of designing a trickling filter is to balance the competing requirements on the design.
In order to keep the energy costs to a minimum, the pumping head for the filter should be as low as possible. The maximum plan area covered by the filter is determined by the minimum water loading.
In order to minimize the floor space used by the filter, the filter should be as tall as possible. The practical limitations are the height of the building, the head limits on the pump and the structural and stability considerations of the vessel.
A taller filter will have a longer flow path for the water. This means a more complete treatment of the water with each pass.
Taller filters will have higher specific water loadings. This means better flushing action, more turbulent water films and higher ammonium removal rates.
Trickling filters for industrial applications are sometimes 30 ft. tall. This is not practical for aquaculture systems. In general, trickling filters for aquaculture are between 3 and 10 ft. tall.
Ideally the flow path through a submerged filter should be as long as possible. A long thin raceway is the best. This type of bio-filter is known as

ISSN No. 0976-8602 VOL.-1 * ISSUE-2*April-2012
Asian Resonance
58
a long path, plug flow submerged filter. (see the paper written on this filter type). Another possible alternative is the use of aeration to induce a circulating flow around a tank. The key to properly designed submerged bio-filters is the velocity through the media. The goal should always be to provide a high enough velocity through the media so that the flow is turbulent and all of the media has an equal flow of water. Equal flows of water insure a fresh supply of oxygen and nutrients to all of the bugs on the surface of the media. Summary
While there are guidelines for the design of bio-filters, it is not an exact science. Lightly loaded systems such as water gardens and koi ponds are more forgiving and sizing considerations are not very exact or critical. For intensive aquaculture systems, the bio-filter represents a critical component of the system that may limit production if it is not sized or operated properly. Experienced professionals should be consulted by those persons intending to build systems where financial investments are at risk.
Designing & Flow of Trickle Filter Process
Image 3: A generalized flow of trickling filter process
Generally trickling filter design is based on empirical relationships to find the required filter volume for a designed degree of wastewater treatment. Types of equations
NRC equations (National Research Council of USA)
Rankins equation
Eckenfilder equation
Galler and Gotaas equation NRC and Rankin's equations are commonly used. NRC equations give satisfactory values when there is no re-circulation, the seasonal variations in temperature are not large and fluctuations with high organic loading. Rankin's equation is used for high rate filters. NRC equations
These equations are applicable to both low rate and high rate filters. The efficiency of single stage or first stage of two stage filters, E2 is given by
E2= _________100_____________ 1+0.44(F1.BOD/V1.Rf1)
1/2
For the second stage filter, the efficiency E3 is given by
E3=__________100_______________
[(1+0.44)/(1- E2)](F2.BOD/V2.Rf2)1/2
E2= % efficiency in BOD removal of single stage or first stage of two-stage filter,
E3=% efficiency of second stage filter,
F1.BOD = BOD loading of settled raw sewage in single stage of the two-stage filter in kg/d,
F2.BOD= F1.BOD(1- E2)= BOD loading on second-stage filter in kg/d, V1= volume of first stage filter, m3; V2= volume of second stage filter, m3; Rf1= Recirculation factor for first stage, R1= Recirculation ratio for first stage filter, Rf2= Recirculation factor for second stage, R2= Recirculation ratio for second stage filter. Rankins equation
This equation also known as Tentative Method of Ten States USA has been successfully used over wide range of temperature. It requires following conditions to be observed for single stage filters: 1. Raw settled domestic sewage BOD applied to filters
should not exceed 1.2 kg BOD5/day/ m3 filter volume.
2. Hydraulic load (including recirculation) should not exceed 30m
3/m
2 filter surface-day.
3. Recirculation ratio (R/Q) should be such that BOD entering filter (including recirculation) is not more than three times the BOD expected in effluent. This implies that as long as the above conditions are satisfied efficiency is only a function of recirculation and is given by:
E= _(R/Q) + 1__
(R/Q) + 1.5
Trickling Filter Design
Designing a low rate filter to treat 6.0 Mld of sewage of BOD of 210 mg/l. The final effluent should be 30 mg/l and organic loading rate is 320 g/m3/d.
Assume 30% of BOD load removed in primary sedimentation i.e.,
= 210 x 0.30 = 63 mg/l. Remaining BOD = 210 - 63 = 147mg/l.
Percent of BOD removal required = (147-30) x 100/147 = 80%
BOD load applied to the filter = flow x conc. of sewage (kg/d)
= 6 x 106 x 147/106 = 882 kg/d To find out filter volume, using NRC equation
E2= ______100 _____________ 1+0.44(F1.BOD/V1.Rf1)
1/2
80 = 100 Rf1= 1, because no circulation.
1+ 0.44(882/V1)1/2
V1= 2704 m3 Depth of filter = 1.5 m, Filter area = 2704/1.5 = 1802.66 m2, and Diameter = 48 m < 60 m Hydraulic loading rate = 6 x 10⁶/103 x 1/1802.66 = 3.33m3/d/m2 < 4

ISSN No. 0976-8602 VOL.-1 * ISSUE-2*April-2012
Asian Resonance
59
Hence o.k. Organic loading rate = 882 x 1000 / 2704 = 326.18 g/d/m3 which is approx. equal to 320. References
1. Greiner, A. D., Timmons, N. B., 1998. Evaluation of the nitrification rates of microbead and trickling filters in an intensive recirculating tilapia production facility. Aquacultural Engineering pp 189 - 200
2. Kamstra, A., Van der Heul, J.W., Nijhof, M., 1998. Performance and optimization of trickling filters on eel farms. Aquacultural Engineering pp 175-192
3. Saucier, B., Chen, S., Zhu, S., ―Nitrification Potential and Oxygen Limitation in Biofilters‖ presented at the Third International Conference on Recirculating Aquaculture July 2000.
4. Timmons, M.B., Losordo, T. M., 1994. Aquaculture Water reuse Systems: Engineering Design and Management Elsevier Science B.V.
5. Coulson, J.M.; Richardson, J.F.: Chemical Engineering, Vol. II ± Unit Operations. Pergamon Press, 2nd Edn, 1974
6. Fletcher, M: Bacterial Metabolism in Bio®lms. In: L.F. Melo et al. (eds) Bio®lms-Science and Technology, Kluwer Academic Publishers (1992) 113±124
7. Peixoto, J.; Mota, M: Volatile organic compounds evaporation chamber for the simulation of gas ef¯uents in laboratory research. Biotech. Techniques 11 (1997) 1±6
8. Pelczar, M.J.; Chan, E.C.S.; KruÈg, N.R.: Microbiology-Concepts and Applications, McGraw-Hill, 1993
9. Perry, R.H.; Green, D.: Perry's Chemical Engineers' Handbook, 6th Edn. New York, McGraw-Hill International Editions, Chemical Engineering Series, 1984
10. Reid, R.C.; Prausnitz, J.M.; Sherwood, T.K.: The properties of Gases and Liquids, 3rd Edn. New York, McGraw-Hill Chemical Engineering Series, 1977

ISSN No. 0976-8602 VOL.-1 * ISSUE-2*April-2012
Asian Resonance
60
ISSN No. 0976-8602 VOL.-1 * ISSUE-2*April-2012
Asian Resonance Construction of Linear Programme on
Teaching Verb in English Grammar at Junior High School Level
Chandra Dev Yadav Principal DAV Training College, Kanpur. [email protected]
Archana Charan Asst. Professor, B.Ed Dept, St. Andrew's College, Gorakhpur. [email protected]
Introduction
Of the Creations Of God, Human life is the most Sacred. It has two aspects – the biological and the sociological. While the biological aspects of human life is maintained and transmitted by nutrition and reproduction, the society the primary needs of man comprised food, shelter and clothing. With the progress of society and civilization, however, these primaries needs have been multiplied into six viz., food, shelter, clothing, Education, recreate on and health. Man is primarily distinguishable from the lower animals because of his decidable ability. He is end owed with intelligence; he wants to remain active, energetic and even original. He desires to go ahead. This list of human achievements is very big. How has this been done? Through education. It is education which promotes his intelligence, enables him to be industrious and ensures his progress. Sir John Adams used to tell his students that education is the dynamic side of philosophical means of realizing ideas of life.
Mahatma Gandhi defines education and points out: ―By education I mean all round drawing out of the best in child and man – body, mind and spirit.‖
In this way it may be said that ―Education is the process where by human kind is working into fruition of its own inner nature; it is a man‘s means of realizing his destination; of reaching his goal of largest power, joy and series‖. Thus enabling him to develop into the fullness of his stature.
So, if our approach is the correct one, education in the last resort cannot take place without influence. There must be some Qualification of the modern doctrine that the best education consists in withholding all influence from the child, allowing him to develop entirely as his nature prompts. Education then, we reiterate implies modification of natural development. A discussion of education and its categories lead us to believe that education is a necessity of life both biologically and socially considered. That it is needed for living a better life – a socially desirable life, nobody can deny. It is Education which bridges the gulf – the ever widening gulf – between the original nature of the immature child and the standards, Customs and exacting demands of society which increase with the growth of civilization. Education renews and rebuilds the social fabric and gives social consciousness. In the everyday sense Education is widely understood to mean a process of teaching and learning that result in changes in behaviour. To educate means to change. Teaching refers to our attempts to effect certain desired changes in the behaviour of our learners have occurred, and we
Abstract
At the present time, the selection of this problem is very important because at present the method of English teaching is traditional at the junior high school level. The traditional teaching system, teacher and the curriculum are given priority but the student is secondary. The traditional teaching methods do not prefer the interest, ability and strength of student. The student wants to learning by the experiments and self-gaining the experience though the immediate results so under the teaching learning process, construction of programme is only the method which gives the immediate results to the students.

ISSN No. 0976-8602 VOL.-1 * ISSUE-2*April-2012
Asian Resonance
64
concluded that our instruction has been effective. We reckon that we are effective teachers.
The process of teaching – learning is as old as human being on earth. it has been carried out by human beings and even by animals to teach their young ones for successful adjustment in the environment. The process has undergone several changes from non – formal to formal with the passage of time. Traditionally, teaching has been viewed as an art practice by each teacher, often intuitively, according to his or her unique. Beliefs, values, abilities, and other personal characteristics. Only relatively recently has teaching come to be seen also as a science, that is, as a systematic application of the rules of a science of human behavior. consequently, we are now beginning to remove from teaching some of the institution necessary perhaps for the practice of an art, but clearly insufficient for effective instruction. The old concept of teaching as giving of in formations has been completely discarded. According to modern educationists, it is not even half the battle to tell the child things and to fill in information on in his mind. According to the changed concept, teaching is to cause the child to learn and acquire the desired Knowledge, skills and also desired ways of living in the society. The main of teaching is to help the child to respond to his environment in an effective way. Burton has given a very precise but comprehensive definition of teaching as ―Teaching is the stimulation, guidance, direction and encouragement of learning.‖ In this way, teaching and learning are two aspects of a process which is popularly called as education. The instruction in the classroom may be understood essentially as an interactive process where as the teacher and learner participate in a reciprocal manner it may be clearly understood by the diagram given below:
Goals of Education
Teaching Learning Process
Teacher Learner Interaction
In Teaching – Learning process, there is an interaction takes place to achieve the goal of education completely. Need of Construction of Programme in English
Voltaire, Long before, had said, ―Education means to know every thing about something and something about everything.‖ Really, now-a-days, one should have some knowledge about everything because the evolution of modern scientific and technical knowledge has changed the whole life of mankind. It is now urged that the peace and co-
operation are very much needed on account of rapidly increasing social and environmental balance in the world. In this reference also help to understanding the socio-economic conditions and the problems of the country. Thus, the teaching of English has much significance in to day‘s world. In modern time it has been felt that under the knowledge of English the student must be imparted the knowledge of subject matter of the school subjects up to the level of high school. Because generally an account of ample span of period the pupil teachers forget the subject matter of school subjects and students feel some difficult in English grammar. Traditional method of teaching English grammar is not much satisfactory because this age is formed only by the modern technique or the computerized age. Need of Linear Programme
Linear programming model was developed by prof.B.F.Skinner (1954) of Harvard University. He attained ‗open day‘ of his daughter‘s school and found that most of the class-room teachings were infective. He tried to apply his theory of effective teaching learning. He developed an article ―Science of Learning and Art of Teaching‖ in 1954. The application of operant conditioning model of teaching is known as Linear Programme presents tremendous potentialities to meet new challenge of class-room teaching and instruction Linear Programming has been defined by psychologists as: ―A programmed material sequence in which each student proceeds in a straight line through a fixed set of items.‖ This programming is popularly known as Skinnerian programme, because, for the first time skinner used this type of sequence to shape the behaviour of animals and prepared ground for human being, on the basis of extensive of extensive experimentation on rats and pigeons. Thus, the linear programming is most important strategy for behavioral change point of view. It has tremendous contribution for solving teaching learning problems. In class-room teaching, a teaching tries to pace with the average students and he ignores the bright and poor students of the class. The problem of teaching learning can be solved effectively by the use programmed learning strategy. It incorporates the psychological principles of learning. Thus, linear programme gave a new wing to the entire educational system. In the frame of reference of teaching learning process its world-wide popularity is without any rival. It made evolutionary changes in the detaching learning process and solved challenging problems of human learning effectively.
Back ground of the study
All students are given equal opportunities to understand the things. In doing so their personal verifications are accepted. Due to the exception of personal variations the development of the student is obstacle. The problem of personal variation can be solved by raising Linear understanding programme in English. Every student has his own pace of learning.

ISSN No. 0976-8602 VOL.-1 * ISSUE-2*April-2012
Asian Resonance
64
They are solutions/or awareness) themselves. Therefore, by the selection of this problem, we can provide with opportunities of learning particularly in English subject to the dull and sharp witted students ass per their pace. Objectives of the study
The investigator has formulated the following objectives of her study:
To construct a Skinnerian programme on Teaching ‗verb‘ in English grammar at junior High school level.
To validate the programme on internal as well as external criteria.
To compare the relative effectiveness of the programme and the traditional method of teaching.
To show the ability of this teaching at present time The hypothesis of the present study
The educational achievement of this topic related to the progress of students after teaching ‗verb‘ in English grammar at junior high school level on linear programming. At the junior High school level in the teaching of English grammar if linear programme is used to teach about ‗verb‘ the incredible increase would be, seen in it. Above hypothesis has formulated on the basis of negative or null hypotheses. Sample and the tools of the present study
Present study deals with a traditional teaching method and linear Programming. The male students of junior high school of Gorakhpur with in the age of 11 to 15 years constitute the element of universe only class 8
th have selected.
The method of sampling used in multistatified and randomly. The technique is used in order to obtain E.B. Test for the (60) representative sample. To measure the learner‘s Knowledge of what they should know before the beginning of the programme a test of (E.B.) entering behaviour was administered. Those students who possessed the prerequisite behaviour or skill were selected in the sample. The final numbers of students are fifty on the basis of E.B. Test. This group is divided into two parts. Every group has 25-25 students.
Table-1
School Class
Group Number of students
St. Andrews Inter College Gorakhpur
8
th
Control
25
8
th
Experiment
25
Collection of Data
Data is a group of Known, given is ascertained facts from which conclusion is drawn. The Subject for study where selected from St. Andrews Inter College Gorakhpur. The sample of 25 boys has taken in control group and 25 boys have taken in Experimental group.
Table-2 Level of performance of controlled and Experimental groups
90/90 standard was computed which is given in the following table
Table-3 Showing 90/90 standard
Gain ratio was computed by the formula given by Mc Guinn and Peter*. The Table given below shows it clearly.
Table-4
Table showing significance of difference between means of Programmed learning group and traditional method group at Pre – test stage.
Table-5
Group
mean S.D „t‟ value
Result
controlled group
2.56 1.07
.41
No
significance difference
Experimental group
2.68 .99
Table showing significance of difference between means of Programmed learning and traditional method groups after Post- test.
Table-6
Group
Mean
Total No. of
All questi
ons
Level of
performance in %
Controlled group
14.32
20
71.60%
Experimental group
16.4
20
82%
Group
mean
of pre-test
mean
of post-test
expect
ed achieve
ment
actual
achievement
90/90 standard
controlled group
2.56
12.8%
14.32
71.60%
87.2
58.8
58.8 87.2
experimental group
2.68
13.4%
16.4
82%
86.6
68.6
68.6 86.6
mean of pre-test
mean of
post-test
mean of
maximum marks
Gain ratio
2.68
16.4
20
13.72 17.32

ISSN No. 0976-8602 VOL.-1 * ISSUE-2*April-2012
Asian Resonance
64
Group
mean S.D „t‟ value
Result
controlled group
14.32 2.1 3.46
No significance difference
Experimental group
16.4 2.30
Findings
The investigator constructs the linear programme on English ‗verb‘ at the Junior high school level. This Linear Programmed compared by the Traditional Method of Teaching. The basis of Pre- Test, there were difference between the Controlled group and Experimental group, because ‗t‘ value is insignificant but when the Controlled group was taught by the Traditional Method and Experimental group was taught by the Programmed Booklet, then there was significant difference in mean of score, standard deviation and ‗t‘ value. The cause of this difference is standardization of programmed booklet and the significant difference of both groups is .01 and .05.
On the basis of Pre-Test. The mean of the scores of controlled group is 2.56 and the mean of the scores of experimental group was 2. 68. The difference of both groups was .12.
On the basis of Pre-Test the standard deviation of controlled group was 1.07 and Experimental was .99. There is no significant difference of both groups, only the difference is .08.
The ‗t‘ value of both groups was .41 on the basis of pre-test. There is no significant on any level.
The mean of controlled group is 14.32 and Experimental group is 16.4 seen on the basis of Post-Test. It seems that Experimental group is better because the difference of both group is 2.08.
The standard deviation of controlled group is 2.1 and Experimental group is 2.30 on the Basis of Post-Test. The difference of both groups is .20.
The level of conclusion is different in both groups. The level of conclusion of Controlled group is 71.6% percent and Experimental group 82% percent shows the effectiveness of programme learning.
The level of 90/ 90 standard of Controlled group is obtained 58.8/ 87.2 and Experiments group is obtained 68.6/ 86.6. It indicates that programme instruction is the best.
The‗t‘ value of the mean of Controlled and Experimental groups is between 3.46 on the basis of Post-Test. It is valid in both levels.
The utility of the present study investigator found the linear programmed instruction is valuable for those students who do not attend regular teaching. The linear programmed instruction (made) presents the subject material in small steps of subject matter in small units. Linear instruction is useful for primary and secondary classes. The subject matter of Linear
Instruction is used in correspondence course of curriculum. Linear programmed is very useful for general and low achiever students. It is useful to solve the different individual problems of students. Because there is no attention to teach the individuals in Traditional Method of teaching, therefore all students take a chance for learning their ability by linear programmed.
References
1. Kochhar, S.K1981: ‗Pivotal Issues in Indian Education‘.p.1.
2. Jesperson O.J.1998: How To Teach A Foreign Language.
3. Report of the education2007: P.16. 4. Report of the education commission2006: P.16. 5. Bhatia and Bhatia2004: The Principle and Method
of Teaching.P.4. 6. Markle,S.M.1969: ‗Good Frame And Bad‘ :A
Grammar of Frame Writing Wiley, 7. Hong Lei Antonio Moreira Ph.D D.C.L.,D.D.E.T,of 8. Aveiro,UniversityPortugal.2001
[email protected],[email protected] 9. Best John .w2002: Research Methology, Hall of
India-110001, P.11. 10. Khan James V.2003: University of Illinois at
Chicago, Research in Education, Pentice, Hall of India, P.hd, New Delhi-110001.2002.P32
11. Kapadia, G.S. (1972), Programmed Learning: Task Analysis and Specification of Behaviour, M.S. University of Baroda.
12. De cecco, John p. (1974), Psychology of Learning and Instruction,Englewood Cliffs: Prentice- Hall International, Inc.
13. Guilford J.P.2010: Fundamental Statistics in Psychology and Education,Forth Edition, p.44
14. 13-Sharma.R.A.2011 : Programmed Instruction: An Instruction Publishing House, Meerut,
ISSN No. 0976-8602 VOL.-1 * ISSUE-2*April-2012
Asian Resonance
64
ISSN No. 0976-8602 VOL.-1 * ISSUE-2*April-2012
Asian Resonance Effect of Computer Based Learning Using
Method of Enquiry in Mathematics Teaching in Senior Secondary Schools
Ajay Kumar Singh Asst. Professor, B.Ed Dept, St. Andrew's College, Gorakhpur. [email protected]
Introduction
Studies on concept attainment suggest that its achievement essentially involves facilitating linkages between student‘s personal knowledge and experiences with formal scientific knowledge. Thus, one teaching strategy may involve creating a possible discrepancy between the two, via demonstrations and activities, whereby students may perceive a conflict between their existing beliefs and laboratory experience (Burbules and Linm, 1991; White, 1993; Allen, 1997), The resolution of this conflict is expected to produce a consensually driven explanation (Meyer and Woodruff, 1997) where students achieve consensus through a process of and gradual refinement (Roscelle, 1992) in which more powerful explanations replace the weaker ones, The first part of this teaching strategy has a parallel in Richard Suchman‘s inquiry training mode! where the objective is to arouse curiosity among students by presenting puzzling events and test. out ideas by asking questions that lead to discussion. During the resolution of this conflict, students learn how to organize data, reason about cause and effect and build and test theories. Edelson (2001) made a paradigm shift by combining Computer Assisted Learning (CAL) with inquiry training where he explored the possibility of technology supported inquiry learning that provide opportunity for integrating content and process learning. Taking the advantage of computer technology he used a framework that supports the design of content-intensive, inquiry- based science learning activities, He concluded that the design not only helps in concept attainment but also helps in inquiry training. Taking into account this tradition of using computer-based environment for, teaching through inquiry, the Investigator blended together one Teacher-focused model (e.g. Inquiry Training Model) and one Student-focused model (e.g. Computer Assisted‘ Instruction Model) to create a new model (Computer Assisted Learning by Method of Inquiry CALMI) and compared its effectiveness with respect to the traditional lecture-discussion method, The investigator decided to use- interactive multimedia software Where students can manipulate the vital environment of experiment and learn in inquiry mode.
Abstract
Computer Assisted Learning (CAL) with inquiry training where he explored the possibility of technology supported inquiry learning that provide opportunity for integrating content and process learning. Taking the advantage of computer technology he used a framework that supports the design of content-intensive, inquiry- based science learning activities, He concluded that the design not only helps in concept attainment but also helps in inquiry training. The resolution of this conflict, students learn how to organize data, reason about cause and effect and build and test theories The Investigator blended together one Teacher-focused model (e.g. Inquiry Training Model) and one Student-focused model (e.g. Computer Assisted‟ Instruction Model) to create a new model (Computer Assisted Learning by Method of Inquiry CALMI) and compared its effectiveness with respect to the traditional lecture-discussion method, The investigator decided to use- interactive multimedia software Where students can manipulate the vital environment of experiment and learn in inquiry mode.
Objectives

ISSN No. 0976-8602 VOL.-1 * ISSUE-2*April-2012
Asian Resonance
66
The study was conducted with the following objectives: • To test the efficacy of Computer Aided Learning
using method of inquiry (CALMI) in teaching physics at the secondary level on achievement attainment.
• To study differential effect of CALMI, if any, across the sex divide.
Hypotheses
The following null hypotheses were formulated to facilitate conclusion:
• There is a significant difference in achievement in Mathematics between experimental group and control group.
• There is no significant difference in concept attainment test (CAT) score between experimental group and control group.
• There is no significant difference between boys and girls in Achievement in Mathematics
• There is no significant difference between boys and girls in concept attainment.
Delimitations
• Only two secondary schools (both English medium and co educational) of Gorakhpur District of Uttar Pradesh are included in the study.
• The sample of the study is confined to the students of class XI only.
• (N The Sam 1€ of the stud is confined • Only the objectives of cognitive domain are given
priority during teaching. • The content selected for teaching is confined
Mathematics lessons of Class XI Mathematics textbook.
Methodology
The investigator in this present study has followed the Quasi-experimental method. The variables in this experiment were: • Independent variables like method re of teaching
or treatment. • Dependent variables like scores on scholastic
achievement and concept attainment. Design
For this a pre-test and post-test matched ye group design was chosen to be the experimental design. This required two groups of students, matched in intelligence and achievement. One group underwent the experimental treatment (CALMI) and the second was given control treatment. The variable intelligence was selected for matching because of its influencing nature with achievement though other intervening variables like socio-economic status; interest, attention level in the class. Infrastructure facilities and the like were controlled through proper student- teacher interaction. O1 x O2 O1 O3 = Pretests O3 x O4 O2 O4 = Post tests Sample
Considering the non-feasibility of formulating randomized groups in a school setting. It was decided to have purposive sampling as the method of sampling for this experiment Two sections of Class XI in each of the two schools were taken as experimental group and
control group respectively. The distribution of the sample is presented In the table below. School E C Total
St. Josephus inter college LFS
29 23
30 21
59 44
Total 52 51 103
Since sex is an independent variable in our study, sex-wise distribution of the sample is as follows:
Tools
To interpret the statistical analysis, the following
tools were chosen for the present study.
• Mixed Group Text of Intelligence (MGTF) by P.N:
Mehrotra (1975)
• Achievement Test in Mathematics
• Concept Attainment Test (CAT)
First test was a standardized test and the last two
were developed by the researcher in collaboration with
teachers.
Treatment (Teaching using CALMS)
The method that the attempted by blending two different models together, Is unique in many respects This type of approach has been tried elsewhere in recent past (Andarloroet al. 1997; Ferguson 2001; Edelson 2001) which encouraged the investigator to try it in our cultural context. The students of the were divided Into single sex groups of about Seven students The groups were given a free hand to run the relevant software for the selected topics themselves, manipulate the simulated note the changes observed in each case and to draw conclusions. The role of the Investigator was limited to helping them to build hypotheses and to ensure that they continue with the experiments to See if their hypotheses stood in the face of experimental observation. Each group discussed the topic individually and then all the hypotheses were discussed in the class as a whole so as to arrive at a consensus. The main features of this approach are :
• A pre-sequenced set of activities for presenting related phenomena.
• Recording predictions before presenting the discrepant event.
• Manipulation of materials observation hypothesis forming experimentation, hypothesis testing and prediction by Students.
• Socio-.generative context in which consensus is developed locally to the small group-setting and later challenged whole class discussions.
School Sec (A) Experimen
tal-II
Sec (B) Control
Total
St. Josephus
inter college
LFS
Total
B
G B G B G
13
16 12 11 25 27
17
13 10 22 27 24
30
29 22 22 52 51

ISSN No. 0976-8602 VOL.-1 * ISSUE-2*April-2012
Asian Resonance
67
• An extended time frame that permits ideas to be revisited. Generative teaching models take longer to implement than didactic models, since students need time to develop and debate the implications. However, because of the use of computer in this blended model approach no extra time was required. Longer time available for discussion was compensated by less time required for preparation of results using a computer.
Major Findings of the Study Testing of Hypotheses
The present study was conducted with the main objective of investigating the effectiveness of CALMI on achievement and concept attainment vis-a-vis traditional method of teaching For this, the pre-test and post-test were conducted and the collected data were subjected to statistical analysis. The analysis of variance (ANOVA) in respect of achievement in input questions (knowledge level) of Mathematics indicates that the main effect of treatment of pre-test and post-test is significant. It is also found that the interaction of treatment and sessions is significant. This indicates that the intervention is more effective in attainment at knowledge level than the conventional teaching method. This observation is true for both the sexes as the main effect of sex and its interaction effect with others is found to be significant. The analysis of variance in respect of achievement in processing-level questions (understanding level) of Mathematics leads to exactly similar conclusions. Again the main effects of treatment and session are significant. It is also found that the interaction of treatment and session is significant. Thus, CALMI is more effective than the conventional method in the attainment of understanding level. This observation is true for both the sexes as the main effect of sex and its interaction effect with others is found to be non- significant. The analysis of variance in respect of achievement in output questions (higher cognitive levels) of Mathematics leads to similar but same conclusions. It is again found that the main effect of treatment and sessions are significant. Thus, CALMI is found to facilitate attainment of higher cognitive level. The interaction of sex and treatment also shows statistical significance (p<0.05). This indicates that the treatments differentially affect pupils across se division in their achievement in higher cognitive domains.
Table- 1
Summary of ANOVA in respect of achievement in
input-questions (Knowledge Level) of Mathematics
Source SS df MS F P
Treatment
(A)
Pre-post
session (B)
C
A x B
A x C
B x C
A x B x C
Error
145.96
5198.90
3.49
131.08
34.72
1.38
10.19
2299-64
2
1
1
2
2
1
2
300
72.98
5198.90
3-49
65.54
17.36
1.38
5.10
7.67
9.52
678.22
0.46
8.55
2.27
0.18
0.67
**
**
ns
**
ns
ns
ns
Table- 2
Summary of ANOVA in respect of achievement in
processing-level questions (Understanding Level) of
Mathematics
Source SS df MS F P
Treatment
(A)
Pre-post
session (B)
C
A x B
A x C
B x C
A x B x C
Error
297.12
5999.19
6.64
150.86
11.13
2.34
5.73
1879.99
2
1
1
2
2
1
2
300
148.56
5999.19
6.64
75.43
5.56
2.34
2.87
6.27
23.71
957.32
1.06
12.04
0.89
0.37
0.46
**
**
ns
**
ns
ns
ns
Table- 3
Summary of ANOVA in respect of achievement in
out-put questions (Higher Congnitive Level) of
Mathematics
Source SS df MS F P
Treatment (A)
Pre-post
session (B)
C
A x B
A x C
B x C
A x B x C
Error
110.66
2070.72
4.26
47.04
22.65
0.37
1.99
1038.93
2
1
1
2
2
1
2
300
55.33
2070.72
4.26
23.52
11.33
0.37
1.00
3.46
15.98
597.94
1.23
6.79
3.27
0.11
0.29
**
**
ns
**
**
ns
ns
Table- 4
Summary of ANOVA in respect of total
achievement scores in Mathematics
Source SS df MS F P
Treatment
(A)
Pre-post
session (B)
C
A x B
A x C
B x C
A x B x C
Error
1552.82
380049.54
7.69
891.99
179.03
10.99
48.34
11299.47
2
1
1
2
2
1
2
300
776.41
38048.5
4
7.69
445.99
89.51
10.99
24.17
37.67
20.61
1010.21
0.20
11.84
2.38
0.29
0.64
**
**
ns
**
ns
ns
ns
Table- 5
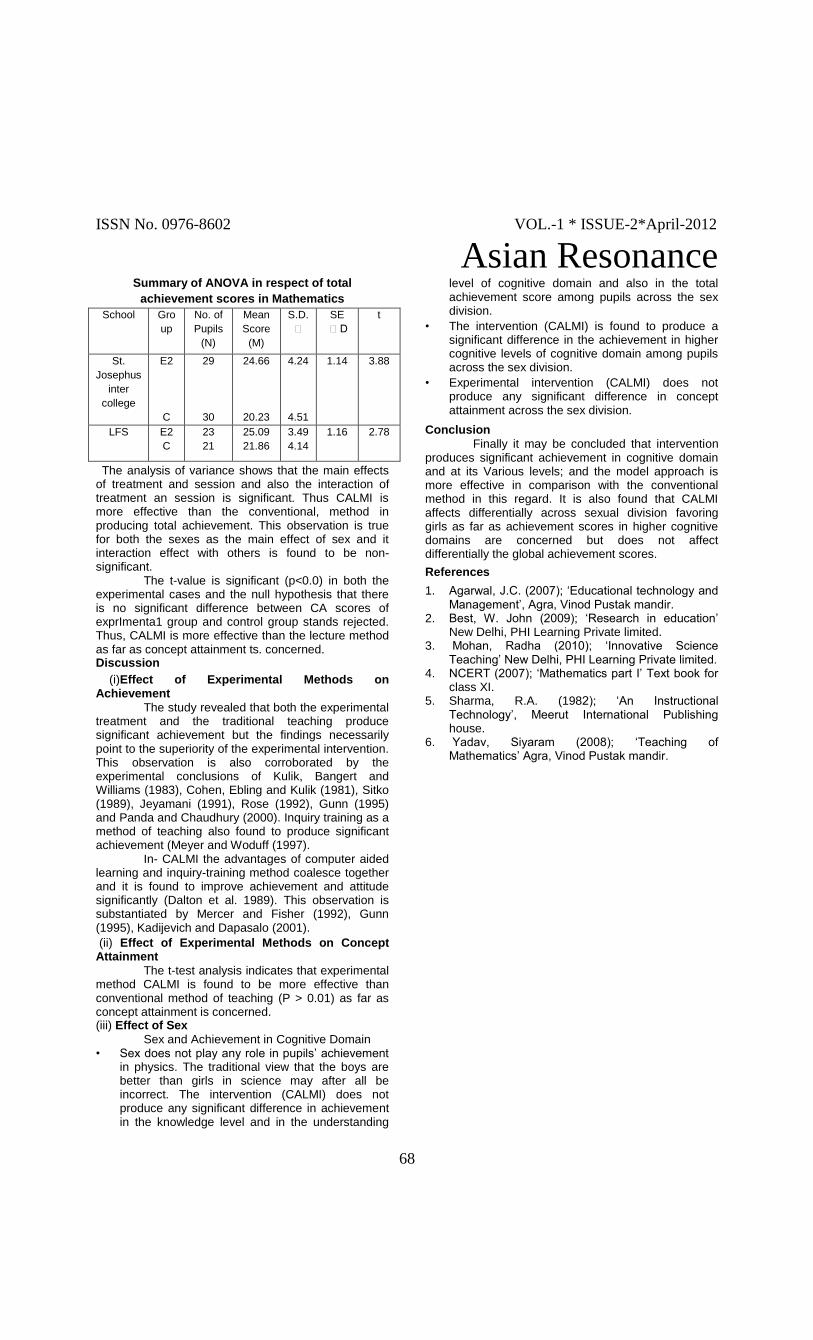
ISSN No. 0976-8602 VOL.-1 * ISSUE-2*April-2012
Asian Resonance
68
Summary of ANOVA in respect of total
achievement scores in Mathematics School Gro
up
No. of
Pupils
(N)
Mean
Score
(M)
S.D.
SE
D
t
St.
Josephus
inter
college
E2
C
29
30
24.66
20.23
4.24
4.51
1.14 3.88
LFS E2
C
23
21
25.09
21.86
3.49
4.14
1.16 2.78
The analysis of variance shows that the main effects of treatment and session and also the interaction of treatment an session is significant. Thus CALMI is more effective than the conventional, method in producing total achievement. This observation is true for both the sexes as the main effect of sex and it interaction effect with others is found to be non-significant. The t-value is significant (p<0.0) in both the experimental cases and the null hypothesis that there is no significant difference between CA scores of exprImenta1 group and control group stands rejected. Thus, CALMI is more effective than the lecture method as far as concept attainment ts. concerned. Discussion
(i)Effect of Experimental Methods on Achievement
The study revealed that both the experimental treatment and the traditional teaching produce significant achievement but the findings necessarily point to the superiority of the experimental intervention. This observation is also corroborated by the experimental conclusions of Kulik, Bangert and Williams (1983), Cohen, Ebling and Kulik (1981), Sitko (1989), Jeyamani (1991), Rose (1992), Gunn (1995) and Panda and Chaudhury (2000). Inquiry training as a method of teaching also found to produce significant achievement (Meyer and Woduff (1997). In- CALMI the advantages of computer aided learning and inquiry-training method coalesce together and it is found to improve achievement and attitude significantly (Dalton et al. 1989). This observation is substantiated by Mercer and Fisher (1992), Gunn (1995), Kadijevich and Dapasalo (2001).
(ii) Effect of Experimental Methods on Concept Attainment
The t-test analysis indicates that experimental method CALMI is found to be more effective than conventional method of teaching (P > 0.01) as far as concept attainment is concerned. (iii) Effect of Sex
Sex and Achievement in Cognitive Domain • Sex does not play any role in pupils‘ achievement
in physics. The traditional view that the boys are better than girls in science may after all be incorrect. The intervention (CALMI) does not produce any significant difference in achievement in the knowledge level and in the understanding
level of cognitive domain and also in the total achievement score among pupils across the sex division.
• The intervention (CALMI) is found to produce a significant difference in the achievement in higher cognitive levels of cognitive domain among pupils across the sex division.
• Experimental intervention (CALMI) does not produce any significant difference in concept attainment across the sex division.
Conclusion
Finally it may be concluded that intervention produces significant achievement in cognitive domain and at its Various levels; and the model approach is more effective in comparison with the conventional method in this regard. It is also found that CALMI affects differentially across sexual division favoring girls as far as achievement scores in higher cognitive domains are concerned but does not affect differentially the global achievement scores.
References
1. Agarwal, J.C. (2007); ‗Educational technology and Management‘, Agra, Vinod Pustak mandir.
2. Best, W. John (2009); ‗Research in education‘ New Delhi, PHI Learning Private limited.
3. Mohan, Radha (2010); ‗Innovative Science Teaching‘ New Delhi, PHI Learning Private limited.
4. NCERT (2007); ‗Mathematics part I‘ Text book for class XI.
5. Sharma, R.A. (1982); ‗An Instructional Technology‘, Meerut International Publishing house.
6. Yadav, Siyaram (2008); ‗Teaching of Mathematics‘ Agra, Vinod Pustak mandir.

ISSN No. 0976-8602 VOL.-1 * ISSUE-2*April-2012
Asian Resonance
68
ISSN No. 0976-8602 VOL.-1 * ISSUE-2*April-2012
Asian Resonance Information Communication
Technologies in Teacher Education
Poonam Madan Sr. Lecturer Dr. V.S.I.P.S. Kidwai Nagar, Kanpur
Introduction
It is the age of globalization and in globalized era, many trends are putting new pressures on the conventional education system and as a result education has grown from chalkboard to weblog, from physical classroom to electronic room and from Hardware to software. Due to ever increasing and diversified needs of the students, technological advancements are taking place in the field of education every day. Learning has just acquired a new nimbler form. So, in this changing world when we have reached the threshold of development of New Technologies, which are revolutionized classroom teaching, the role and function of teachers is also changing. Now the teacher acts as a facilitator to introduce students with the new technologies. So in this modern perspective, It is ultimate truth that the teacher must be motivated and committed to adopt a variety of techniques including the computer technology, electronic media and hypermedia for dissemination of knowledge to their students for their all round development like cognitive affective and psychomotor development. The National curriculum frame work for school Education 2005. States that the new technology had a tremendous potential to revolutionalise education that can transform school dramatically. Integration of ICT into schooling demand that the educational planners look beyond the current urban classroom devisiting updated plans for education in an electronic environment even in the far flung areas expanding their length so that computer being an integral part of schooling process, where any information can be accepted, created, communicated and analyzed through ICT. The reason is that the use of ICT not only increased. Productivity, creativity but also encourages self directed learning. Internet has become the life line of young generation. It could do wonders for the lecture lesson of teachers and educators and could be useful in the field of education in a magical way.‖ Undoubtedly ICT has brought about many challenges and opportunities for education. If educational Institutions have to ensure that their students leave the institutions as confident individuals, capable of using new technology creatively and productively than their teachers
Abstract
It is the age of globalization and in globalized era many trends are putting) new pressures on the conventional education system. Now the teacher acts as a facilitator to introduce students with the new technologies. So in this modern perspective, It is ultimate truth that the teacher must be motivated and committed to adopt a variety of techniques including the computer technology, electronic media and hypermedia for dissemination of knowledge to their student for their all round development. Integration of ICT in to schooling demand that the educational planners look beyond the current urban classroom de-visiting updated plans for education in an electronics environment even in the far flung areas. The reason is that the use of ICT not only increased. Productivity creativity but also encourages self directed learning. Accordingly to NCTE, a teacher's educator needs to acquire mastery in (i) Five performance areas (ii) Ten competencies (iii) Five Commitment areas. For the successful integration of ICT in teacher education, the teacher educators, in addition to taking up the role responsibilities must encourage technology interactions among the trainees. In this direction e-resources are useful in many ways.

ISSN No. 0976-8602 VOL.-1 * ISSUE-2*April-2012
Asian Resonance
69
should have the competencies to integrate the emerging technologies and the digital content with all their operations. For this, the institutions must invest in training their teachers' computer competency skills and provide them a supportive environment, incentives and technical help to encourage the use of ICT resources. So there is a challenge for higher education institutions, particularly teacher education, to make the teachers capable of employing a variety of technology tools in all phases of academic administrative, research and extension functions. A widespread use of ICT resources is still a distant reality, due to various reasons, ranging from non- availability of resources to the under preparedness of teachers to use it. In Institutions, where the resources are available, one would encounter the resistance from the teachers concerned with regard to ICT use. But, whatever may be the apprehension of the people concerned. ―There is no way out other than to face the challenges of the technological revolution‖. Why e-learning for Professional Development of Teachers
Now, there is a necessity to redefine the role of teacher educator in the changed scenario. Accordingly to NCTE, a teacher educator needs to acquire mastery in (i) Five performance areas (ii) Ten competencies (iii) Five Commitment areas. For the successful integration of ICT in teacher education, the teacher educators, in addition to taking up the role responsibilities must encourage technology interactions among the trainees. They should be involved in planning and implementation of ICT, professional development training with the latest technological development interact through e-plan forum with trainees plan, design and demonstrate the use of multimedia applications for instructional use and become active competent on-line users of telecommunication services and use internet as an instructional tool. As internet has become an integral part of our life, we need to accept and adopt to be called ourselves updated teacher educators of the modern technological society. Considering over improving the quality of teacher-education, we the teacher educators, try to achieve our goal of professional development as earliest as possible. For this e-resources are useful in the following ways.
Promoting high quality decision making and reasoning abilities.
Obtaining errorless and updated knowledge of concepts.
Processing information more efficiently and effectively.
Getting new information about various Training programs seminars, conferences and workshops for development of professional abilities and advancement in teaching learning process.
Promoting experimentation and innovation.
Infusion and integration of information & Best practices.
ICT has brought us various innovable e-learning tools and resources technology usage in classroom to motivate students and teachers to facilitate instruction.
Use of Various E-resources for Teacher Educators
Web Blog
A blog is a user-generated website where entries are made in journal style and displayed in a reverse choronological order. The term ―Blog‖ is a mingling of the words web and log. Blogs provide comments or news on a particulars subject. A typical Blog Combines text, images and links to other blogs, web pages and other media related to its topic.
WIKI
A wiki is a type of website that allows users to easily add, remove or otherwise edit all content, very quickly, easily and sometimes even within the need of registration. It provides free space to write, group projects etc. It also allows for linking among any number of pages. Thus, a wiki is an uncomplicated, easy to use, maintained database for creating, browsing and searching information. RSS is a Web feed format used to publish frequently updated digital content, such as blogs, new feeds or podcosts, vod casts etc. The user subscribes to a feed by entering a link to the feed into the reader programme.
Podcasting
Podcasting is a fusion of two words - Pod and broadcasting. Pod costs are basically digital audio programms that can be subscribed to and downloaded by listeners by RSS. It can be accessed on an array of digital audio devices like MP3 players desktop computers, laptops, mobile, etc. Some good podcasting are.
Ed. Tech. Talk – Podcast about educational technology.
Language learning Podcasts-Learning Languages.
Technology Pod costs innovations and technology.
Instant Messaging
Instant messaging applications allow one to communicate another person's over a network in relative privacy.
Text Chat
Internet relates chat (IRC) and other online chat allow users to join chat rooms and communicate with many people at one place publically.
Internet Forums
An Internet forum allows users to host a ―Topic‖ for others to review. Other users can view the topic and post their own comments in a linear fashion one after the other. Most forums use public allowing anybody to sign up to any time while a few are private, where one has to pay a small fee to join. Virtual Classrooms:
There is also an increased use of virtual classrooms (on line presentation delivered live) as an online learning platform and classroom for the diverge set of education providers.

ISSN No. 0976-8602 VOL.-1 * ISSUE-2*April-2012
Asian Resonance
70
Readymade website
Educational websites provide readymade matter for educational purpose. Some of the subject related website are:
www. want2learn com/grammer,
http://boggles world.com (English),
www.- mahatma.com,
www.nationalgeographies.com
www.wikispaces.com
www.teacherdesk.org.
www.teach learning.com These websites provide students and pupil teachers a directional initiation to learn about the world of information already available. On the educational websites, one finds subject material of general intelligence. Readymade power point Presentations and web pages
Being teachers and teacher educators we need to link our lessons with latest knowledge. For this, readymade PowerPoint slides give opportunity to provide updated matter to the students and in a better understandable time saving form. Just add‘ ppt‘ to your searches and enjoy the difference. Search Engines
By using these searches, a list of the related website would open and one can find the relevant information. Thus the quality of teaching and learning should be refined using these search engines. Some of the popular search engines are -
www.google.com;
www.yahoo.com,
www.altavista.com.
www.khoj.com. Online Encyclopedias/Dictionary
The websites containing encyclopedias help the teachers and student in gathering information about a particular concept of as to make the whole process of teaching - learning interesting. These websites are helpful in knowing different meanings of words in different forms. E-Resources for Information about Related Institutions
As teacher educators, we need to keep a track of changes in our related field too. We must be in touch with necessary information / modification in teacher education program. Some of useful websites are.
www.ncte-india.org,
wwwugc.ac in,
www.ncert.nic.in.,
www.cbse.nic.in,
www.highaden.deligovt.co.in. Which provide information relevant to subjects etc. E-Resources for Information about seminars conferences and workshops
These events are very useful in professional development of teachers as well as for teachers' educators too. Some popular website providing information in this area, are
www.semnarsinformation.com.
www.envfor.nic. in,
www.entsdu.ac.in,
www.ask laila com. Events/ seminar city etc. Training and development for using ICT resources
For the successful implementation of ICT, teacher trainers, teacher trainees and teacher educators need to be trained in the following dimensions.
The teachers should be aware of the importance and possibilities of ICT.
Learning theories and technology integration.
Knowledge of Basic hardware skills.
Understanding of system software, i.e. features of desktops, starting an application, resizing windows, organization files (Creating, educating, saving and renaming.)
Using application / productive of software, i.e. word processing, spreadsheet, database, presentation, publishing creation of PDF files, data, logging, image processing etc.
Using multimedia for creating multimedia presentation.
Using internet.
Pedagogal application of ICT tools in subjects.
Introduction to open source software.
Social, legal, ethical and health issues.
ICT for professional and personal productivity. Suggestions for Enhancing the Use of E Resources
Teacher educators must have essential knowledge of Information and Communication Technology.
Teachers should develop knowledge and skill in using e-Resources.
Teachers must adopt learning through internet and create e-learning opportunities in pupil teachers and ultimately in school students.
Teacher educators should help pupil teachers in becoming self-motivated, self-directed and self-regulated in using e-learning for their knowledge inculcation and up gradation.
Administrators should create e-learning environment and provide Information and Communication Technology infrastructure in their schools and colleges.
Orientation and Refresher courses on information and communication technology must be organized regularly by regulating and affiliating bodies like NCTE, NCERT, SCERTs, UGC and NUEPA for teacher educators and in-service teachers.
Integrating ICT can make a real difference in how teachers teach. It enables the teacher to spend more time with individual students, less time teaching to the whole class and allows students to carry out more independent work.
In service training and motivation should be provided to teachers for increasing their effectiveness.
Training should be provided to teachers as regards to the use of media, especially ICT, because with the advent of acute modernization pupils are supposed to be more well-versed in the use of computers than teachers.

ISSN No. 0976-8602 VOL.-1 * ISSUE-2*April-2012
Asian Resonance
71
Staff development programs should be held quite often for teachers to keep them up to date with the latest technologies in education.
Teachers must be provided with 'on the job training' in the use of ICT in subject -classes, individualization and differentiation of classroom work and managing personal and performance data of pupils.
Time should be provided to teachers for planning and learning about implementing technology applications. The school administration should provide time to teacher for ongoing professional development since incentives (such as job security, financial help) may be offered to teachers to use technology as they need to prepare student For the technological work.
Integration of ICT should be taken seriously if we want to transform our education system.
Specific curriculum practices, skills, attitudes and policies can be enhanced through the use of technology.
ICT facilities and equipments should be provided in teacher training institutions. Elementary schools also are equipped with these known-how's so that trainee teachers are provided -.with technology rich environment during their teaching practice.
References
1. Edre cum (2001), the impact of ICT on Schools, A study of Schools in Australia, USA, England and Hong Kong, 2000. Retried August 10, 2005 from http://piano.dsi.uminho. st/rapds.
2. Keyes, J. I. (2003), the competitive use of information McGraw – fill, Inc.
3. Maheswari, A.N. (2003) Networking of Teachers Education Institutions using ICT and Ku-bond Satellite Edusat. In D.N. Khosla (ed.) Envisioning Teacher Education in the 10
th Plan and Beyond,
New Delhi. NCTE. 4. Mohanty J. (2008) Multimedia approach to
learning, Education 7, 11 July. 5. National Council for Teacher Education (1998)
Competency Based Commitment oriented Teacher Education for quality school education. Initiation Document, New Delhi NCTE.
6. NCERT (2006) National Curriculum framework for School Education, New Delhi.
7. Sharma G.D. (2005) knowledge packaging for face-face and self paced learning, developed of E-content on higher education consortium for Educational communication New Delhi.
8. UNESCO (2002) Information and Communication Technologies in Teacher Education. A planning Guide retrieved January 12, 2005 from the UNESCO website at http:/\/ unesdoc.unersco.org/images/0012 /001295/ 129533e.pdf.
9. Vernal L. & Paily, M.V. (2004) : ICT in Teacher Education : A case study university news, 42 (39), 1-7.
10. Woods, R. (2006) communication, Technology and the development of People, Roultledge London.

ISSN No. 0976-8602 VOL.-1 * ISSUE-2*April-2012
Asian Resonance
72
ISSN No. 0976-8602 VOL.-1 * ISSUE-2*April-2012
Asian Resonance Integrating ICTs in Teaching Learning: A Boom
Suman Lata Senior Lecturer Dept. Of Education A.N.D. College, Kanpur.
Introduction
ICTs have influenced all aspects of human life and higher education cannot be exception. Dr. Harendra Singh and Dr.R.S. Mishra find in their study that E-learning may be effective in developing cognitive ability of pupil teachers. India has enormous geographic disparity in ICT use but at the same time she has greater potentialities and possesses the largest ICT workforce in the world. In present scenario, arrival of computer and internet in the field of education has changed the procedure and pattern of learning. Today‘s learning pattern knocks at the door of student or learner. Any one learns, anywhere, anytime. ICT is an acronym that stands for :
Information – Information covers topics such as meaning and value
of information; how information is controlled; the limitations of ICT; legal considerations. Information is nothing but refined data that have been put into meaningful and useful context and communicated to a recipient who uses it to make decisions.
Communication- Communication is the process of interaction of
ideas between the communicator and the receiver to arrive at a common understanding for mutual benefit. This refers to the communication of data by electronic means, usually over a distance. This is often achieved via networks of sending and receiving equipment, wires and satellite links.
Technology – It is the current state of humanity‘s knowledge of how
to combine resources to produce desired products, to solve problems, fulfill needs or satisfy wants; it includes technical methods, skills, processes, techniques, tools and raw materials.
Abstract ICTs can be described as a varied set of goods, applications and services used to produce, store, process, distribute and exchange information through the use of television, radio, telephone (traditional ICTs) and the relatively newer ones- web based personal computers, mobile phones, satellite, wireless sets, internet services, WLL network, projectors, I-Pods and interactive boards which are helping people to gather information and also communicate through the same. ICT supported education can promote the acquisition of the knowledge and skills that will empower students for lifelong learning. The new ways of teaching and learning are underpinned by constructivist theories of learning and constitute a shift from a teacher-centred pedagogy to one that is learner centred. It is a well known fact that not a single teacher is capable of giving up to date and complete information in his own subject. The ICT can fill this gap because it can provide access to different sources of information. Teacher + technology = A complete teacher and on the other hand, Teacher- Technology = Teacher becomes zero. ICTs help in exchanging ideas and views of the students and teachers, provides variety in the presentation of content which helps learners in concentration, better understanding, and long retention of information which is not possible otherwise. It also develops judgemental and decision making ability, improves comprehension, speed and vocabulary and most importantly develops proper study habits of students. National Programme on Technology Enhanced Learning (NPTEL), e-Gyankosh, Pan African Network Project (PANP) are a few of the Indian Government initiatives which can be a landmark step for the multifarious development of e-learning in the country.
ISSN No. 0976-8602 VOL.-1 * ISSUE-2*April-2012
Asian Resonance
73
ICTs seen as a tool to help teachers in creating more learner centric learning environment. The new ways of teaching and learning are underpinned by constructivist theories of learning and constitute a shift from a teacher-centred pedagogy – in its worst form characterized by memorization and rote learning – to one that is learner centred. ICT supported education can promote the acquisition of the knowledge and skills that will empower students for lifelong learning. ICT is a movement of educational technology from its traditional base, the school or college, towards the home environment. ICTs: As a knowledgeable tool For Students
One of the most commonly cited reasons for using ICT in education has been to better prepare the current generation of students for a workplace where ICT, particularly computers, the Internet and related technologies, are becoming more and more ubiquitous. ICT provides flexibility to learners which are denied by the traditional process and method. Flexibility is a must for mastery learning and quality learning. The ability to use ICT effectively and efficiently, is thus seen as representing a competitive edge in an increasingly globalizing job market. For Teaching
The government wants all pupils to have the necessary skills; hence their teachers should know and understand the importance of ICT. Current priorities in education include the development by pupils of basic skills, not only in literacy and numeracy, but also in transferable skills, which industry and government advisors suggest are needed by all in the modern information society. Many teachers use ICT in their personal lives such as: they may write articles and letters or surf art or antique collections on the web. The need for professional development may be the reason for further use of ICT, especially if this is connected to promotion. Many traditional training courses provided by higher education also turn to ICT for cheaper and more efficient delivery; so teachers are again given the opportunity to achieve professional and personal goals through the implementation of ICT. Teacher + technology = A complete teacher and on the other hand, Teacher- Technology = Teacher becomes zero. Till mid of 20
th century the
entire education process revolves around the teacher which was popularly called as teacher centric education. During that age learners were passive listeners and teachers keep on transmitting factual information. Because of the emergence of significance of Information and Communication Technology role of teacher has been changed as facilitator and now the role has become of that of the navigator. Teachers are expected to satisfy the needs of the students in educational arena. The performances of the learners are directly connected with the teacher‘s capabilities and in fact on the basis of performance of the learners, the teachers are gauged in the profession. It is a well known fact that not a single teacher is capable of giving up to date
and complete information in his own subject. The ICT can fill this gap because it can provide access to different sources of information. It will provide correct information as comprehensive as possible in different formats with different examples. ICT provides Online interaction facility. Students and teachers can exchange their ideas and views, and get clarification on any topic from different experts, practitioners, etc. It helps learners to broaden the information base. ICT provides variety in the presentation of content which helps learners in concentration, better understanding, and long retention of information which is not possible otherwise. The learners can get opportunity to work on any live project with learners and experts from other countries. The super highway and cyber space also help in qualitative improvement of Teaching – Learning Process. Other Reasons
Lots of possible areas are there for the use of ICTs in teaching and learning like presentation, calculation, completing assignments, information sources, and some of the other possibilities are:
developing understanding and application of the concepts
developing expression power
developing reasoning and thinking power
development of judgment and decision making ability
improving comprehension, speed and vocabulary
developing self-concept and value clarification
developing proper study habits
developing tolerance and ambiguity, risk taking capacity, scientific temper, etc.
ICTS – A mode for higher education
ICTs based Higher Education may be of three kinds:
Online distance – learning courses: The majority of it not all, instruction takes place online. There are no requirements for face- to-face between students and instructor.
Hybrid courses – In these courses the instructor combines elements of online distance learning courses and traditional courses. Online forums or Web- based activities may replace a portion of classroom sessions, which is known as blended learning.
Traditional courses with technology elements – These courses are traditional in that the instructor teaches all sessions in the classroom but with occasional use of technology, such as Web – based activities, multimedia simulations, online testing, which is known as e – enhancement.
Information technology has brought a revolution in almost every field of life. In the root of information revolution lie one very important factor, known as micro- computer. Right from first generation computer to fifth generation computer, it advanced information technology. It has the potential to gather information, store it and display it, whenever required, immediately.

ISSN No. 0976-8602 VOL.-1 * ISSUE-2*April-2012
Asian Resonance
74
E- learning
E- learning is a concept that involves email, synchronous chat rooms, teleconference, video conference, hypermedia, websites, Wiki and other such technologies either as independent or in combination to provide the content. Content was designed to lead a learner through the content, providing a wide and ever- increasing set of interactions, experiences assessments, and simulations. Now, e- learning takes place through conversations about content and grounded interaction about problems and actions. It is claimed by advocates of social learning that one of the best ways to learn something is to teach it to others. For ex: Blogs in Education or Edublogs are written by anyone with a vested interest in education and its outcomes. It offers
Students and teachers the opportunity to surface their ideas and views in a social plane.
Share teachers‘ ideas and resources for teaching – learning activities.
Post students work such as art, poetry; photos and comments on classroom activities.
Link your class/institution with another class/institution somewhere else in the world.
E – learning can be effective module for panel discussions, presentations, assignments, future recording, workshops, conferences, seminars, guest lectures, etc. Some universities which have incorporated e- learning in their higher education courses include BITS Pilani, Central Institute of English and Foreign Language, Hyderabad, Hyderabad University, Aligarh Muslim University, Terna College Mumbai, MDI Gurgaon etc.
Mobile Learning
Mobile Learning (M- learning) can be defined as ― Learning that happens across locations or that takes advantages of learning opportunities offered by portable technologies.‖ It can be mainly used for :
Autonomy, anonymity and motivation to the learners.
Colllaborative data gathering and participatory simulations.
Ensuring all students have equal data and thus motivating self – directed learning.
M- learning can be distributed through the following mobile devices :
Personal Digital Assistance (PDA) : they have small sizes and significant processor power. The main operating system used are palm and Microsoft Pocket PC.
Mobile Phones : These are used mainly for voice communication and sending and recieving of text message. Students of Oslo University are using them to read information and discuss problems with colleagues, to organize social events mainly by sending SMS. Mobile phones can be used to internet access via GPRS technologies. University of Taiwan uses GPRS and Bluetooth for paperless education.
Mobile phones will become the dominant handheld device for mobile learning in the next 5 years due to access to specific information, non- work hour training, learning at outdoors etc. Other examples may be include that of Podcasting and Vodcasting Podcasting is a means of publishing audio content on the web as a series of episodes with a common theme. Learners can download and audio file to a portable device and listen to it at their convenience. Similarly, publishing video content on the web is called Vodcasting. The mobility and time shifting afforded by podcasting and Vodcasting enable learners and instructors to expand the boundaries of the classroom and bring together course content and the world outside the campus. U-Learning
U- learning ―means‖ everywhere learning. It fulfils e- learning‘s promises of anytime, anywhere, and any context. Students have the freedom to learn within a learning environment, which offers adaptability to their individual needs and learning styles as well as the flexibility of pervasive and unobtrusive computer systems. U- learning is developing in higher speed and it will be the next generation learning strategy. Main characteristics of u-learning include permanency, faster and flexible learning, reduced overall cost, available at 24x7x365. It includes the following types: Web Based Learning(WBL), Mobile Based Learning(MBL), Technology Based Learning (TBL), Synchronous Learning, Asynchronous Learning. Students have the freedom to learn anywhere, at own pace and ease, anytime in U-learning environment. The students are desirous to learn new technologies like mobile phones, i- phones, i-pod, internet etc. U-learning is the extended and advanced form of E-learning. It has the characteristics of both as E- learning and M-learning with benefits of ubiquitous computing and flexibility of mobile devices. Benefits of ICT in Education
ICT is a teaching tool. Its potential for improving the quality and standards of pupils‘ education is significant. Development of ICT has radically change, opinion and limits of over common people IT provides opportunities and challenges for corporate organisations, academic institution and more over the people of 21
st century.
Computers can improve independent access for students to education.
Students with profound and multiple learning difficulties can communicate more easily.
Reduces isolation of teachers working in Special Educational needs by enabling them to communicate electronically with colleagues.
Enhances professional development and the
effectiveness of the use of ICT with students
through collaboration with peers.
Use of voice communication aids encourages parents to have higher expectations of children‘s sociability and potential level of participation.
ISSN No. 0976-8602 VOL.-1 * ISSUE-2*April-2012
Asian Resonance
75
Making learning more effective, involving more senses in a multimedia context and more connections in a hypermedia context.
Providing a broader international context for approaching problems as well as being more sensitive response to local needs, etc.
Provide scaffolding to support higher – level thinking and tools to increase student productivity.
Promote active learning and authentic assessment & investigate reality and build knowledge.
With the use of ICTs techniques in learning, administrative support IT specializations are being re-structured in universities.
Government Initiatives and Support for Implementation of E-learning through ICT Integration
Indian government initiatives in the promotion of E-learning and ICT integration is encouraging. National Programme on Technology Enhanced Learning (NPTEL), National Mission on Education through ICT, National Knowledge Network, Sakshat Portal, eGyankosh, Pan African Network Project (PANP) are a few of the Indian Government initiatives which can be a landmark step for the multifarious development of e-learning in the country. The government‘s role in this sector is quite futuristic and effective that sho w itself from the above world standard project.
References
1. Hussain, Imran; Alam, M Afshar; and Kazmi, Niloufer A (2011), ―Promotion of E-Learning through ICT: Role of Indian Government and Higher Educational Institutions‖ Vol 49(39), Sept 26- Oct 02, University News, New Delhi, pp 22-24.
2. Jaiswal, Deepak (2010), ―M-learning: A New Paradigm in Education‖, Vol.48 (42), Oct. 18-24, University News, New Delhi, pp 16-19.
3. Jaiswal, Vijay & Gupta, Priyanka (2011), ―ICTs Enabled Teaching Strategies for Quality Higher Education‖, in ―Quality Enhancement in Higher Education in India‖ by Nisha Agarwal and Chitra Singh Tomar(Ed), Roshni Publications, Kanpur
4. Maheshwari, V.K. Suraksha Bansal, Rawat, S.C. (Ed.) ―Essentials of Education Technology‖. R.Lallbook, Meerut.
5. Neelam Yadav, (Ed.) (2003) ―A Handbook of Educational Technology‖, Anmol Publication Pvt. Ltd. New Delhi.
6. Parthiban, S. & Dharma Raja, B. William 2009, ―M-Learning: A Novel Avenue to Erudition‖, Vol 47(48), Nov30-Dec06, University News, New Delhi, pp 16-19.
7. Sanpath, S. (2011), ―Interaction among the Learner, Teacher,Curriculum and Educational Programme with ICT‖, Vol 49(23), University News, New Delhi, pp15-17
8. Singh, Harendra and Misra, R.S. (2009), ―Effectiveness of E- learning: An Experimental Study‖, Vol. 47(27), July 6-12, University News, New Delhi, pp 20-21.
9. Yasodhapriya, M. (Dec. 2010), ―The Role of ICT In Improving The Quality Of Education‖, Vol. 10(4), Edu Tracks, Neelkamal Publications Pvt. Ltd., Hyderabad, pp 19-22.
ISSN No. 0976-8602 VOL.-1 * ISSUE-2*April-2012
Asian Resonance
76
ISSN No. 0976-8602 VOL.-1 * ISSUE-2*April-2012
Asian Resonance Teaching Learning Material for
Inculcating Reading Habits in Children
Vivek Kumar Research Scholar U.P.Rajarshi Tondon Open University, Allahabad
Trapti Tiwari Research Scholar S. S. J. M. University, Kanpur
Introduction
Education leads to the development of an individual‘s creativity, improved participation in the social, economic, cultural and political life of the society and hence to a more effective contribution to human development. Free and compulsory education for all children as enshrined in the Constitution of India includes enrolment and retention of students in elementary stage from 5 years to 14 years of age. The National Policy on Education 1986 as updated in 1992 and the Programme of Action 1992 (POA) reaffirm the national commitment of Universalisation of Elementary Education (UEE) Para 5.12 on NPE resolves that free and compulsory education of satisfactory quality should be provided to all children upto 14 years of age before we enter 21st century (DPEP). But despite the introduction of new approach in the present education system, many children leave their studies before completing primary education either due to the failure at evaluation stage, or due to inability to cope with their studies which make their education disfunctional in the long run. To help children pursue their studies in a joyful manner it is needed to identify some teaching learning material (TLM) which can retain the interest of children for studies. Generally TLM are used to enhance scholastic achievement of the student but in practice the approach remains skewed in as much as either no, or scanty attention is paid to enhance the reading comprehension of the children. This study identifies those TLM which could motivate the children to read with understanding. Objectives
To identify and suggest necessary TLM which may be more useful in inculcating reading habits among the primary school children.
Abstract
There are making many effort to make education interesting and child centered but unfortunately they do not completed his education due to no interest and they dropout from the school. “This is an effort to marking that teaching learning equipments which are used in class 1 to 3 for developing the reading habits in children who develop the interest for the education and develop the reading habits in children.” There are total 100 basic primary school of Kanpur Nagar for the research in which 50 schools are rural and 50 from urban taking as sample for the purposive. A questionnaire is prepared for the teacher of class 1 to 3 in which the T.L.M. used in the classrooms is selected and distributed in four STEP. STEP 1: That things who attracts the mind of children. STEP2 : That things who develop the listening and talking capacity of Children. STEP3: That things who develop the reading and thinking capacity of children. STEP 4: That stories who loved by the children to much. In each step there are putting 11 various learning equipments according to class wise effectiveness by their teachers. The effectiveness is defined by the number as 1(maximum effective) and 11 (less effective) A questionnaire is prepared for the class 1 to 3 and for the class 4 & 5 the case study done by the researcher. By the result of this study the conclusion comes out that the T.L.M. used in the class room is not for the purpose of only “use” it is used by the teacher according to the mental status and intensions of student.
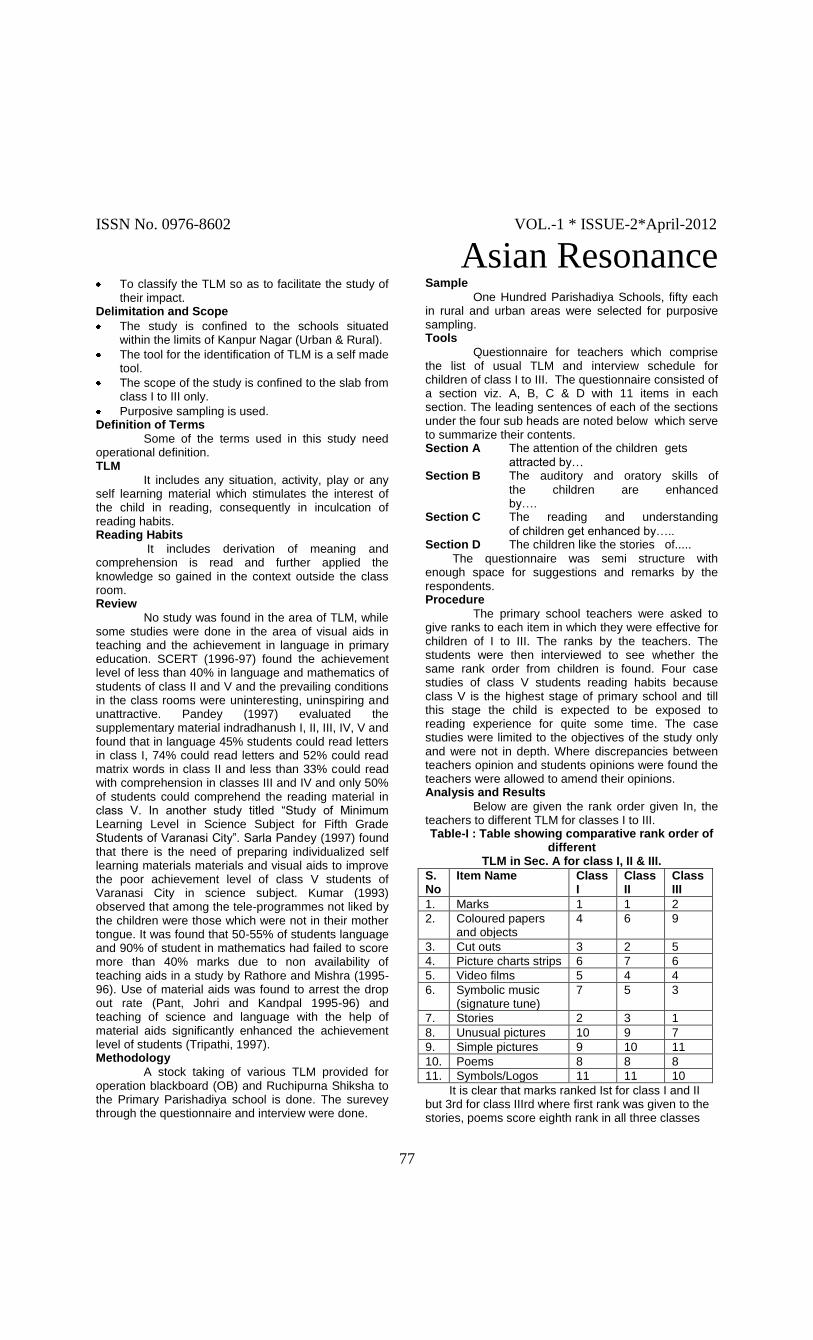
ISSN No. 0976-8602 VOL.-1 * ISSUE-2*April-2012
Asian Resonance
77
To classify the TLM so as to facilitate the study of their impact.
Delimitation and Scope
The study is confined to the schools situated within the limits of Kanpur Nagar (Urban & Rural).
The tool for the identification of TLM is a self made tool.
The scope of the study is confined to the slab from class I to III only.
Purposive sampling is used. Definition of Terms
Some of the terms used in this study need operational definition. TLM
It includes any situation, activity, play or any self learning material which stimulates the interest of the child in reading, consequently in inculcation of reading habits. Reading Habits
It includes derivation of meaning and comprehension is read and further applied the knowledge so gained in the context outside the class room. Review
No study was found in the area of TLM, while some studies were done in the area of visual aids in teaching and the achievement in language in primary education. SCERT (1996-97) found the achievement level of less than 40% in language and mathematics of students of class II and V and the prevailing conditions in the class rooms were uninteresting, uninspiring and unattractive. Pandey (1997) evaluated the supplementary material indradhanush I, II, III, IV, V and found that in language 45% students could read letters in class I, 74% could read letters and 52% could read matrix words in class II and less than 33% could read with comprehension in classes III and IV and only 50% of students could comprehend the reading material in class V. In another study titled ―Study of Minimum Learning Level in Science Subject for Fifth Grade Students of Varanasi City‖. Sarla Pandey (1997) found that there is the need of preparing individualized self learning materials materials and visual aids to improve the poor achievement level of class V students of Varanasi City in science subject. Kumar (1993) observed that among the tele-programmes not liked by the children were those which were not in their mother tongue. It was found that 50-55% of students language and 90% of student in mathematics had failed to score more than 40% marks due to non availability of teaching aids in a study by Rathore and Mishra (1995-96). Use of material aids was found to arrest the drop out rate (Pant, Johri and Kandpal 1995-96) and teaching of science and language with the help of material aids significantly enhanced the achievement level of students (Tripathi, 1997). Methodology
A stock taking of various TLM provided for operation blackboard (OB) and Ruchipurna Shiksha to the Primary Parishadiya school is done. The surevey through the questionnaire and interview were done.
Sample
One Hundred Parishadiya Schools, fifty each in rural and urban areas were selected for purposive sampling. Tools
Questionnaire for teachers which comprise the list of usual TLM and interview schedule for children of class I to III. The questionnaire consisted of a section viz. A, B, C & D with 11 items in each section. The leading sentences of each of the sections under the four sub heads are noted below which serve to summarize their contents. Section A The attention of the children gets
attracted by… Section B The auditory and oratory skills of
the children are enhanced by…. Section C The reading and understanding
of children get enhanced by….. Section D The children like the stories of.....
The questionnaire was semi structure with enough space for suggestions and remarks by the respondents. Procedure
The primary school teachers were asked to give ranks to each item in which they were effective for children of I to III. The ranks by the teachers. The students were then interviewed to see whether the same rank order from children is found. Four case studies of class V students reading habits because class V is the highest stage of primary school and till this stage the child is expected to be exposed to reading experience for quite some time. The case studies were limited to the objectives of the study only and were not in depth. Where discrepancies between teachers opinion and students opinions were found the teachers were allowed to amend their opinions. Analysis and Results
Below are given the rank order given In, the teachers to different TLM for classes I to III. Table-I : Table showing comparative rank order of
different TLM in Sec. A for class I, II & III.
S.No
Item Name Class I
Class II
Class III
1. Marks 1 1 2
2. Coloured papers and objects
4 6 9
3. Cut outs 3 2 5
4. Picture charts strips 6 7 6
5. Video films 5 4 4
6. Symbolic music (signature tune)
7 5 3
7. Stories 2 3 1
8. Unusual pictures 10 9 7
9. Simple pictures 9 10 11
10. Poems 8 8 8
11. Symbols/Logos 11 11 10
It is clear that marks ranked Ist for class I and II but 3rd for class IIIrd where first rank was given to the stories, poems score eighth rank in all three classes
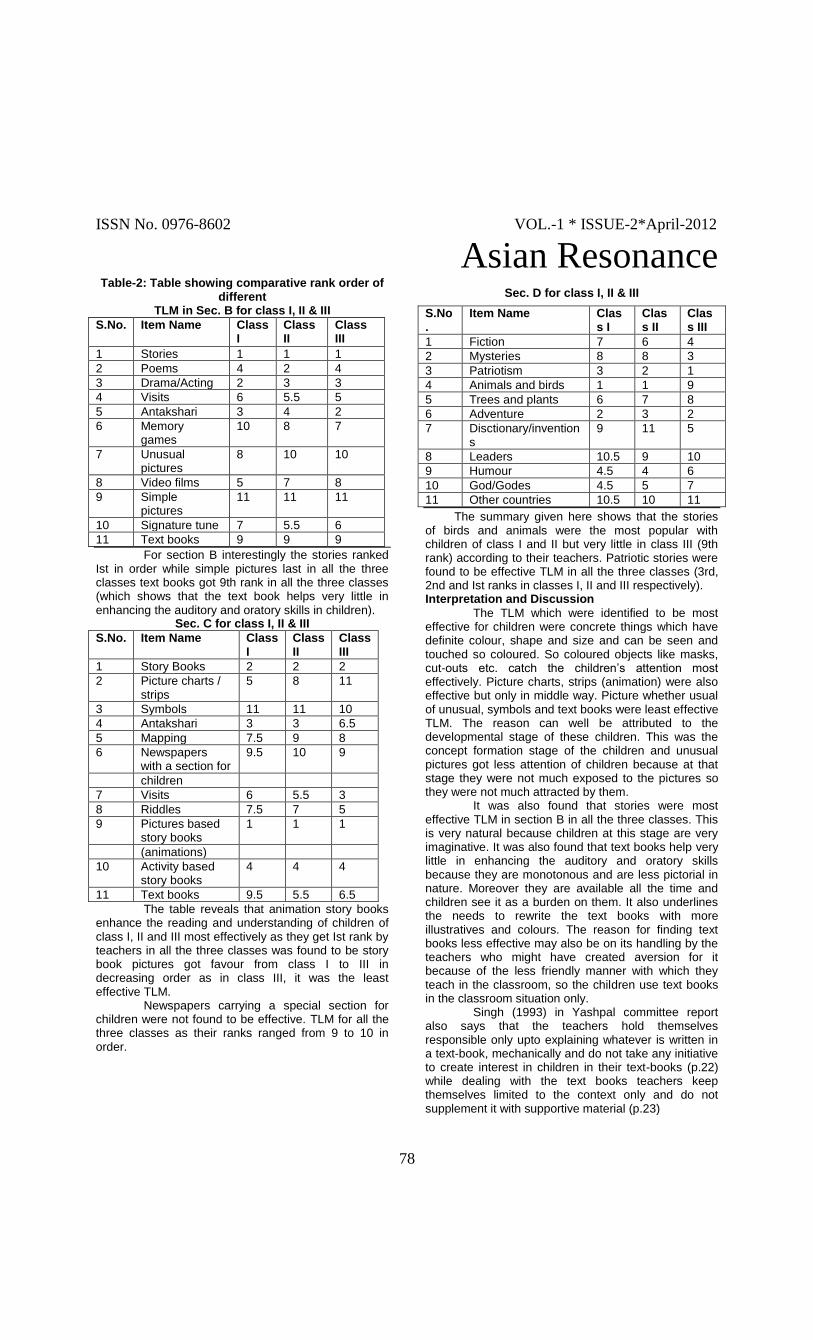
ISSN No. 0976-8602 VOL.-1 * ISSUE-2*April-2012
Asian Resonance
78
Table-2: Table showing comparative rank order of different
TLM in Sec. B for class I, II & III
S.No. Item Name Class I
Class II
Class III
1 Stories 1 1 1
2 Poems 4 2 4
3 Drama/Acting 2 3 3
4 Visits 6 5.5 5
5 Antakshari 3 4 2
6 Memory games
10 8 7
7 Unusual pictures
8 10 10
8 Video films 5 7 8
9 Simple pictures
11 11 11
10 Signature tune 7 5.5 6
11 Text books 9 9 9
For section B interestingly the stories ranked Ist in order while simple pictures last in all the three classes text books got 9th rank in all the three classes (which shows that the text book helps very little in enhancing the auditory and oratory skills in children).
Sec. C for class I, II & III
S.No. Item Name Class I
Class II
Class III
1 Story Books 2 2 2
2 Picture charts / strips
5 8 11
3 Symbols 11 11 10
4 Antakshari 3 3 6.5
5 Mapping 7.5 9 8
6 Newspapers with a section for
9.5 10 9
children
7 Visits 6 5.5 3
8 Riddles 7.5 7 5
9 Pictures based story books
1 1 1
(animations)
10 Activity based story books
4 4 4
11 Text books 9.5 5.5 6.5
The table reveals that animation story books enhance the reading and understanding of children of class I, II and III most effectively as they get Ist rank by teachers in all the three classes was found to be story book pictures got favour from class I to III in decreasing order as in class III, it was the least effective TLM. Newspapers carrying a special section for children were not found to be effective. TLM for all the three classes as their ranks ranged from 9 to 10 in order.
Sec. D for class I, II & III
S.No.
Item Name Class I
Class II
Class III
1 Fiction 7 6 4
2 Mysteries 8 8 3
3 Patriotism 3 2 1
4 Animals and birds 1 1 9
5 Trees and plants 6 7 8
6 Adventure 2 3 2
7 Disctionary/inventions
9 11 5
8 Leaders 10.5 9 10
9 Humour 4.5 4 6
10 God/Godes 4.5 5 7
11 Other countries 10.5 10 11
The summary given here shows that the stories of birds and animals were the most popular with children of class I and II but very little in class III (9th rank) according to their teachers. Patriotic stories were found to be effective TLM in all the three classes (3rd, 2nd and Ist ranks in classes I, II and III respectively). Interpretation and Discussion
The TLM which were identified to be most effective for children were concrete things which have definite colour, shape and size and can be seen and touched so coloured. So coloured objects like masks, cut-outs etc. catch the children‘s attention most effectively. Picture charts, strips (animation) were also effective but only in middle way. Picture whether usual of unusual, symbols and text books were least effective TLM. The reason can well be attributed to the developmental stage of these children. This was the concept formation stage of the children and unusual pictures got less attention of children because at that stage they were not much exposed to the pictures so they were not much attracted by them. It was also found that stories were most effective TLM in section B in all the three classes. This is very natural because children at this stage are very imaginative. It was also found that text books help very little in enhancing the auditory and oratory skills because they are monotonous and are less pictorial in nature. Moreover they are available all the time and children see it as a burden on them. It also underlines the needs to rewrite the text books with more illustratives and colours. The reason for finding text books less effective may also be on its handling by the teachers who might have created aversion for it because of the less friendly manner with which they teach in the classroom, so the children use text books in the classroom situation only. Singh (1993) in Yashpal committee report also says that the teachers hold themselves responsible only upto explaining whatever is written in a text-book, mechanically and do not take any initiative to create interest in children in their text-books (p.22) while dealing with the text books teachers keep themselves limited to the context only and do not supplement it with supportive material (p.23)
ISSN No. 0976-8602 VOL.-1 * ISSUE-2*April-2012
Asian Resonance
79
In section C of the questionnaire picture (animation) based story books were found to be most effective in all the three classes- Story books ranked several in affectively in all the three class which shows that children like stories a lot and sometimes identify, themselves with characters in the story. The stories provide them the role models also. They reason why special section for children in newspaper were found to be least affective may be because they are not as decorative in appearance as the children books. Moreover newspaper is very little accessible to the children as they get it only after elders have read it. Children find newspaper difficult to be handled because of its size also. So why its utility is less in inculcating reading habit in children is well explained. In section D the ranking show inconsistency in all the three classes in most of the TLMs. Some similarities were found in ranking patriotic leaders, other countries and adventure. Children at this stage are very, impressionable and they try to identify themselves with, their country. That may be the reason for it being ranked first three. The order in which they ranked it is clear. As the child grows his curiosity for the identify raises. In class III children are of the age group of 7 to 9 years and their understanding is raised by their recognition of their identify (The additional element of sentiment in patriotic stories need a developed intelligence which is only after 7 years of age and above). The plants and trees are at sixth, seventh and eighth ranks for class I, II and III respectively may be because they are inactive and do not respond visibly to the activities of children and do not express their feelings of happiness or sorrow. Conclusion
The gaps in the management of the primary education are found at this level. A child can enjoy reading making it a part of her/his natural growth when helped to enhance reading with comprehension. Mismatched use of TLM is more difficult a problem to be tackled than that of no use of TLM. It is clear that a variety of TLM should be used to enhance scholastic achievement of children. If the results of this study are of any inaction they explain why the resources are wasted and expected results are not found. They also suggest the strategies for optimization of resources in the area of primary education. References
1. SCERT (1996-97) : Baseline Assessment Studies of 15 DPEP Disctncts (Volume 1, II and III), Lucknow
2. Kumar; B (1993): A study of the attitude of teacher and student towards tele programmes in Uttar Pradesh and their impact on learning, An unpublish Ph.D. Thesis. Department of Education, Lucknow University, Lucknow, P. 160
3. DPEP Guidelines : Department of Education Ministry of Human Resource Development, New Delhi (p.1)
4. Singh K.R.P. (1993). Shiksha Bina Bojh Ke, Yashpal Committee Report (1992) translated in Hindi by SCERT, Varun Marg, Defence Coloiky, New Dzii,i, Government of India, Ministry of
Haman Resource Development, Department of Education, New Delhi p. 22-23.
5. Pandey S.P. (1994): Evaluation of Supplementary reading material Indradhanush I, 1L III, IV, V (1997) as quoted in ‗Research Trends in U.P. elementary education (1992-97). An analytical study.
6. Pandey S. (1997) : Study of Minimum Learning Level in Science Subject for Fifth Grade Students of Varanasi City (B-6-43) as quoted in Research Trends in U.P. Elementary Education (p. 137)
7. Pant C. B., Joshi C.M. and Kandpal M. S. (1995-96): To study the illustration of material provided under OR scheme in primary schools of Pithoragarh Districts (B-4-2-9) as hooted in Research Trends in U.P. Elementary Education (p. 89).
8. Rathore and Mishra (1995-95): A Survey of Availability of Teaching Aids and Their use in Primary Schools of Lucknow covered under Ruchipura Shiksha Paddhati as quoted in Research Trends in U.P. Elementary Education.
9. Ruchi Purva Shiksha Prabodhika (for 1, 11 and III) Rajya Stariya Ruchipura Shiksha Prakoshth then Education Directorate (Basic) Uttar Pradesh Prathmik Shikshak Sangh UNICEF, Lucknow.
10. Tripathi S.B. (1997) : A Study on Availability and Use of Material Aids in the Primary Schools under the Interesting Teaching (B-4.20) as quoted in Research Trends in U.P. Elementary Education (p. 61).

ISSN No. 0976-8602 VOL.-1 * ISSUE-2*April-2012
Asian Resonance
80
ISSN No. 0976-8602 VOL.-1 * ISSUE-2*April-2012
Asian Resonance A New Dimension in Environmental
Protection
Sangeeta Sachan Dept.of Geography V.S.S.D.College, Kanpur [email protected]
Aruna Kumari Assoc. Professor, Dept.of Geography V.S.SD.College, Kanpur
Abstract The environment may be designed as that outer physical and Biological system in which man and other organisms live with many interacting components. Environment education is concerned with those aspects of human behaviour, which are more directly related to mains interaction with bio-physical environment and his ability to understand this interaction. Which seek to develop new knowledge, and skills, values and attitude in a drive towards a better quality of environment. The approaches to environmental education should be continuous process, inter-disciplinary critical thinking and all sections of society by adopting different stratagem.
Introduction
Environment implies everything around us, which effect our living. Living implies living in good health – Physical, mental and spiritual. Living also implies to reside, work, relax and move about in reasonable freedom. Thus environment refers to natural things around us which sustain life such as the earth‘s atmosphere or healthy air or drinkable water. The environment may be designed as that outer physical and Biological system in which man and other organisms live with many interacting components. The usually identified components of the environment include its rocks, minerals, soils and waters, its land and other present and potential vegetation, its animal life and its climate. Thus environmental can be known as the sum total of oil conditions and influences that effect the development and life of organisms. The environment of an individual, in addition to physical factors such as natural and man made constituents also consists of social events like family, community life, festivals, and socially acceptable habits and attitudes for effective living and functioning in a society.
Environmental Education
Environmental education is concerned with those aspects of human behavior which are more directly related to man‘s interaction with bio-physical environment and his ability to understand this interaction. UNESCO defines environmental education as ―A basic aim to succeed in making individuals and communities understand the complex nature of the natural and built up environment resulting from the interaction of their biological, physical, social, economical and cultural aspects and acquire the knowledge, values, attitudes and practical skills to participate in a reasonable, responsible and effective way in anticipating and solving problems and in the management of the quality of the environment‖.
Thus environmental education – Programmes seek to develop new knowledge, and skills, values and attitude in a drive towards a better quality of environment. Environmental education aims
1. To foster a clean awareness of and concern about economical, social, political and ecological interdependence in urban and rural areas.
2. To provide every person with opportunities to acquire the knowledge, values, attitudes, commitments and skills needed to protect and improve the environment.
3. To create new patter of behavior of individuals, groups and society as a whole towards the environment – in short to create an environmentally literate population.

ISSN No. 0976-8602 VOL.-1 * ISSUE-2*April-2012
Asian Resonance
81
According to UNESCO the objectives of environmental education are
i. Awareness – To help acquire an awareness and sensitivity to total environment and its allied problems.
ii. Knowledge – To help gain a variety of experience and acquire a basic understanding of the environment and its associated problems.
iii. Attitudes – To help acquire a set of values and feelings of concerns for the environment and the motivation for actively participating in environmental protection.
iv. Skills – To help acquire skills for identifying and solving environmental problems.
v. Participation – To provide an opportunity to be actively involved at all levels in working towards the solution of environmental problems.
Belgrade conference (1975) defined environmental education as the tool for developing a world population that is aware of and concerned for the environment and its associated problems and which has the knowledge skills, attitude, motivation and commitment to work individually and collectively towards a solution to current problems and the prevention of new ones. Need for environmental education (e.e.).
a) Since time immemorial human beings (and animals too) have explicated the environment and natural resources for their necessities, comforts and luxuries. Since these sources are finite, we need to consume them with great care and conserved.
b) In industrial era, the pace of exploitation has reached to such an extent that self-stabilization is not possible.
c) In his greedy pursuit of material wealth and higher standards of life, man has shown disregard for the impact of his activities on the environment.
d) Environmental degradation has resulted in numerous problems some of which are so large that they threaten the very existence of life on earth.
e) Pollution of soil and water with human waste and subsequent contamination of feed and drinky produce infection which in combination with malnutrition leads to largest single category of diseases.
f) Disasters like Bhopal gas tragedy of 1984 has drawn the attention of every one towards environmental safety from Chemical pollutants.
g) Since Industrialization is essential to provide the basic necessities of life to our exploding population, for proper environmental balance, the planning and management are needed. E.E. can play an important role in this process.
Environmental Education (E.E.) can lead to better understanding of the environment by giving the people knowledge of the universe, society and individuals and by helping them in understanding their attitude towards each other and their bio-physical and socio-economical environment.
―E.E. is to help arouse social consciousness and make the community aware of the fact that good of the individual and that of the community are both harmed by ecological disruptions‖. According to T.N. Kheshee (1986), ―The Chief Objective of E.E. is that individual and Social groups should acquire awareness and knowledge, develop attitudes, skills and abilities and participate in solving real life environmental problems. Better understanding of the environment can only come through E.E. and hence the need and importance of E.E. need not be ever emphasized. Environmental Concerns of Developing Countries
S. No.
Environmental aspect
Developing Countries
1. Air Air pollution in major cities
2. Land & Soil Soil erosion, desertification
3. Water Fresh water shortage.
4. Flora and fauna Deforestation
5. Natural Disasters Floods, droughts, storms.
6. Biosphere Less of aerable land, fuel wood and water storage.
7. Human settlements
Migration, urban growth.
Approach to environmental education (e.e).
a) EE should be a continuous process. b) EE should be interdisciplinary with each discipline
playing specific role in making possible a holistic and balanced perspective.
c) EE should emphasize active participation in preventing and solving environmental problems.
d) EE should get insights into environmental conditions of other geographical areas.
e) EE should emphasize the complexity of environmental problems and thereby the need to develop critical thinking and problem solving skills.
f) EE should help learners to find out the symptoms and the real causes of environmental problems.
g) EE should impart to all sections of society through formal and non-formal methods.
EE should not be treated merely as one more subject otherwise only a few specialists would be interested in it. A new approach should be adopted which should bring about awareness in all areas. It should also be devised so as to meet the diversified demand of our country. Formal environmental education
Formal education includes contemporary environmental education given at schools, colleges and universities. For convenience the subject can be discussed under two sections viz. (i) School education and (ii) College/ University education. (i) School Education :
It falls under four major components viz:
Awareness
Real life situation
Conservation
Sustainable development This should be matched with the need of primary and secondary school education. At primary school

ISSN No. 0976-8602 VOL.-1 * ISSUE-2*April-2012
Asian Resonance
82
stage emphasis should be on building up on awareness of the environment which implies making children conscious about the physical, social & aesthetic aspects of environment and idea of existence of numerous species including mankind on the universe. At the secondary school level, real life situation such as industrial pollution, soil erosion and conservation as well as sustainable developments should be explained. Attempt should be made to stress the inter relationship of various life supporting systems. N.C.E.R.T. is doing commendable work in these areas. School and College Education in Environment
Stage Objective Content Strategy Primary Awareness Home and
School Surroundings
Audio-Visual and field visits.
Lower Secondary
Real-Life experience, problem identification.
Home & School surroundings and General Science.
Teaching, practicals and field-visits.
Higher secondary
Conservation problem identification, Action skills
Science-based and action oriented work.
Teaching, practicals and field-works.
College and University.
Sustainable development, conservation.
Science & technology
Teaching, practicals, action oriented field-work.
(ii) College/University Education
a) Environmental education at this level can be divided into four broad groups.
b) Environmental Engineering. c) Environmental Conservation & Management. d) Environmental Health; and e) Social ecology. Environmental subjects at Post Graduate
Sr. No.
Group Subjects covered
1. Environmental Engineering.
Architecture, Civil Engineering, Town and Country Planning, Landscape architecture, Industrial design, Urban ecosystem, etc.
2. Conservation & Management
Land use, Forestry, Agriculture, Energy, Waste Management, National Parks, Biosphere reserves, Water resources management, Mining Management etc.
3. Environmental health
Public Health, Sanitary Engineering, Occupational Health and safety, Nutrition, Drugs, etc.
4. Social Ecology Human ecology, Sociology, Social planning, Community organization, environmental ethics, etc.
Non formal environmental education
The present day programme in E.E. has reached to only upper sections of the society. To create
environmental awareness in every section of the Society, environmental education on mass scale is necessary. This can only be achieved through the means of non formal environmental education. Environmental information packs, posters, slides audio/video tapes, exhibits and other similar materials should be developed in local language. Also essay and painting competitions should be held for various groups. Another excellent medium of non-formal E.E. is the eco-development camps involving youth which can become tool for sound rural development. Major action taken
a) National committee on environmental planning and co-ordination (NCEPC) has been set up (1972) to identify important problems, find out solutions and also to review policies and programmes.
b) Law for the prevention and control of water pollution (1974) was passed and set up a Central Water Pollution Control Board.
c) Similarly pollution control boards have been set up in every state.
d) A separate department of environment has been set up by the Government of India to Co-ordinate the activities and advise the Government on the environmental matters.
e) Department of Environment has also been set up by many State Governments, Gujarat is one of them.
f) Following legislations have been passed. i. The Water (Prevention and Control of pollution)
Act, 1974. ii. The water (Prevention and Control of Pollution)
Amendment Act, 1978 iii. The Water (Prevention and Control of
Pollution) Cess Act, 1977. iv. The Air (Prevention and Control of Pollution)
Act, 1981. v. The Environmental Protection Act, 1986.
g) The Division of Environmental Education and Information within the Ministry of Environment and Forest is charged with responsibility of Planning, develop and implementing programmes and projects for environmental education and training and providing a network of storage, retrieval and dissemination of information.
h) A major National Environmental Awareness campaign (NEAC) has been launched since July 1986 to create environmental awareness at all levels, of the public.
As part of N.E.A.C., National Environmental month (N.E.M.) has also been organized. In order to recognize excellence in research D.O.E. has instituted Pitambar Pant National Environmental Fellowship Award in 1978. D.O.E. has also instituted Indira Gandhi Paryavaran Puraskar to be awarded annually to any citizen of India or organization for significant contribution to the field of environment.

ISSN No. 0976-8602 VOL.-1 * ISSUE-2*April-2012
Asian Resonance
83
i. D.O.E. has established two centres of Excellence in the country. Centre of Environmental Education at Ahmedabad for development of educational material and Institute for Environmental Management to provide research and Training.
j. 5th
June every year is celebrated as World Environmental Day.
k. The National Museum of Natural History, set up at New Delhi is promoting non formal education in ecology, Wild life and environment. A regional centre in Mysore is also established.
l. National Environmental Engineering Research Institute (NEERT) is established at Nagpur for research and training work.
Conclusion
We all wish to have a clean environment around us. But very few of us are aware and concerned about the environment. Most people now a day's recognize the need for some environmental education but very few of them have any clear idea about what needs to be done for this purpose. To defend and improve the environment for present and future generations has become an imperative goal of mankind. This understanding needs knowledge about the environment to all members of the community who can then effectively participate in sustainable developments which will contribute to the improvement of their quality of life. It is not to suggest that environmental education alone and by itself will – solve all environmental problems. But for a better environmental management it is a pre-requisite. An atmosphere be created which will not disturb the environment but rather be in harmony with nature. Environmental education can play a very important and constructive role in preventive and curative task of environmental pollution which is a stupendous work. E.E. should be regarded not as a new subject but as a NEW DIMENSION in the awareness of the World around us. It is to be a integrated with existing educational programme. Each individual must develop a stake in the environment and become its protector. Environmental protection is a partnership programme in which an individual plays a pivotal role. It is heartening to not that in India E.E. has taken a very healthy position. It is understood that the Nation very much needs industrialization but has to be cautious about the mistakes that very often crop up in this process due to motives of private profits. The Tiwari Committee Report (1980) mentions that ―India has new accepted the need to cultivate sound and well organized interest in environment and incorporate E.E. at all levels.‖ Reference
1. UNESCO – U.N.E.P. Environmental Education Newsletters – ARIS
2. Environmental Management in India by R.K. Sapru Ashish Publishing House – Delhi 26
3. Environmental Pollution, By Y.N. Shrivastava Ashish Publishing House – Delhi 26.
4. Environmental Pollution and Health Problems, By Rais Akhtar, Ashish Publishing House – Delhi 26.
5. H.R.D. & Environment, By R.D. Sharma, Commonwealth Publishers – Delhi – 2.
6. Environmental Priorities in India and Sustainable Development. Lecture by T.N. Khosheel at India Science Congress – Calcutta – 1986.
7. Bandhu D & Ramanathan NL (Eds, 1982) Education for Environmental Planning and Conservation, Indian Environmental Society, New Delhi.
8. Johnson V.O.I. (1978) The Role of UNEP in Environmental Education in T.S. Bakshi & Z Navesh (Eds) Environmental Education: Principles, Methods and Applications Plenum Press, New York pp 77 - 93.
9. World Commission on Environment & Development (1987): Our Common future, Oxford University Press, Delhi.

ISSN No. 0976-8602 VOL.-1 * ISSUE-2*April-2012
Asian Resonance
84
ISSN No. 0976-8602 VOL.-1 * ISSUE-2*April-2012
Asian Resonance Poverty Alleviation: Renewing Lives by
Restoring Ecosystems
Laxmi Yadav Lecturer Dept. of Zoology Smt. Indira Gandhi Govt. P.G. College, Lalganj, Mirzapur.
Ramod K. Maurya Lecturer Dept. of Sociology Smt. Indira Gandhi Govt. P.G. College, Lalganj, Mirzapur.
Surendra Singh Yadav Lecturer Dept. of Med. History. Smt. Indira Gandhi Govt. P.G. College, Lalganj, Mirzapur.
Introduction
About one-third of the world‘s poor live in India, i.e., 55 percent of India‘s population of 1.1 billion, or 645 million people, are living in poverty. The Multidimensional Poverty Index (MPI) has been developed by the Oxford Poverty and Human Development Initiative and the United Nations Development Program (UNDP) as a more precise and comprehensive means of estimating poverty levels. It will replace the Human Poverty Index that has been used in the UNDP‘s annual Human Development Report since 1997. The MPI assesses a range of factors or ―deprivations‖ at the household level as well as income and assets. These include: child mortality, nutrition, access to clean drinking water, sanitation, cooking fuel, electricity, and years of schooling and child enrolment. ―A person is considered poor if they are deprived in at least 30 percent of the weighted indicators,‖ the study states. As measured by the new index, half of the world‘s poor are in South Asia (51 percent or 844 million people) and one quarter in Africa (28 per cent or 458 million). While poverty in Africa is often highlighted, the Oxford research found that there was more acute poverty in India than many African countries combined. Poverty in eight Indian states—Bihar, Chhattisgarh, Jharkhand, Madhya Pradesh, Orissa, Rajasthan, Uttar
Abstract Since 1972 poverty has been defined on basis of the money required to buy food worth 2100 calories in urban areas and 2400 calories in rural areas. In June 2011, a government committee headed by NC Saxena committee estimated 50% Indians were poor as against Planning Commission‟s 2006 figure of 28.5%. Poverty is one of the main problems which have attracted attention of sociologists, economists and environmentalists. It indicates a condition in which a person fails to maintain a living standard adequate for his physical and mental efficiency. It is a situation people want to escape. It gives rise to a feeling of a discrepancy between what one has and what one should have. The term poverty is a relative concept. It is very difficult to draw a demarcation line between affluence and poverty. According to Adam Smith - Man is rich or poor according to the degree in which he can afford to enjoy the necessaries, the conveniences and the amusements of human life. The population, especially poor, has a great impact on its ecosystem therefore environmental health is of utmost importance for India‟s future, as 65 percent of its population makes out a living from soil, water, forests, and biomass. Even after more than 60 years of Independence India still has the world's largest number of poor people in a single country. Since the 1970s the Indian government has made poverty reduction a priority in its development planning. Policies have focused on improving the poor standard of living by ensuring food security, promoting self-employment through greater access to assets, increasing wage employment and improving access to basic social services. The lack of transparency and accountability has hampered our economic development at all levels. The problem of poverty persists because of a number of leakages in the system. New laws need to be evolved to ensure more accountability. The present work is taken up to analyze the governments‟ steps towards this major issue which the country is facing. Key Words: poverty, poverty line, India, development, plans, environmental health.

ISSN No. 0976-8602 VOL.-1 * ISSUE-2*April-2012
Asian Resonance
85
Pradesh, and West Bengal—exceeded that of the 26 poorest African countries The Planning Commission of India has accepted the Tendulkar Committee report which says that 37% of people in India live below the poverty line(BPL). The Arjun Sengupta Report (from National Commission for Enterprises in the Unorganised Sector) states that 77% of Indians live on less than 20 a day (about $0.50 per day). The N.C. Saxena Committee report states that 50% of Indians live below the poverty line. Even after more than 60 years of Independence India still has the world's largest number of poor people in a single country. Since the 1970s the
Indian government has made poverty reduction a priority in its development planning. Policies have focused on improving the poor standard of living by ensuring food security, promoting self-employment through greater access to assets, increasing wage employment and improving access to basic social services. The lack of transparency and accountability has hampered our economic development at all levels. The problem of poverty persists because of a number of leakages in the system. New laws need to be evolved to ensure more accountability. . It is now accepted that in poor countries production and planning need to be specifically geared to the satisfaction of basic human needs. In fact, the United Nations Development Programme in its Human Development Report (1997) provided HPI (Human Poverty Index) values for several countries in the Asia-Pacific region which clearly indicate the existence of large numbers of people below the poverty line. The Poverty Line
The concept of basic human needs has recently gained favour in the thinking of experts concerned with new strategies of development for poor countries. These thinkers are unanimous in their agreement that production and planning must be specifically geared to the satisfaction of these needs. Poverty is the condition where human beings are not able to meet the basic needs of life. One way to determine the number of people in this condition is to use the concept of the ―poverty line.‖ There are several indicators we can use to determine where to draw this line: · per capita income · household consumption · per capita consumption of specific items such as
cereals · proportion of expenditure on food items · calorie intake · basic metabolic rate and other medical indicators Characteristics of the poor
According to the UNDP report a little more than a quarter of the total population of the Asia-Pacific region are poor. They are mostly illiterate, with low incomes. There is an uneven distribution of poor people within a country, with a high concentration in rural areas. The poor are exposed to many risks and hazards due to their living conditions and means of livelihood. The appalling living conditions of the poor, especially in regard to inadequate ventilation, unsafe
drinking water and poor sanitation, expose them to constant disease. The poor are generally without land and capital, and have no way to acquire the skills needed for remunerative labour. Because of social and legal Discrimination, women and girls are more commonly the victims of poverty. They have to accept without question their subordinate status in the home and in society. Children from poor families suffer both physically and psychologically. Malnutrition forces them to start life with poor health, impaired development and reduced resistance to disease. The hallmarks of the poor, especially the rural poor, are illiteracy, malnutrition,poor health, and economic, social and cultural exploitation by the more powerful groups in society. Poverty alleviation: the need for action
Although mainstream economists may insist that poverty will be addressed by the regular growth processes of the economy, many of them also agree that economic growth alone cannot alleviate poverty without structural changes in favour of the poor.
There is also a growing realization that market mechanisms are neither efficient nor reliable instruments for allocating resources when the income distribution is highly distorted as is the case in India (and other densely populated countries of South Asia, like Pakistan and Bangladesh). The need for a direct attack on poverty in these countries cannot be over-emphasized. The main determinants of poverty are:

ISSN No. 0976-8602 VOL.-1 * ISSUE-2*April-2012
Asian Resonance
86
1. Lack of income and purchasing power due to lack of productive employment and considerable under employment (not to lack of employment per se);
2. A continuous increase in the price of food, especially food grains which account for 70-80 per cent of consumption; and
3. Inadequate social infrastructure, which affects the quality of life of the people and their employability.
The states are listed in increasing order of poverty based on the Multi-dimensional Poverty Index.
Estimates by NCAER (National Council of Applied Economic Research) show that 48% of the Indian households earn more than 90,000 (US$1,825.2) annually (or more than US$ 3 PPP per person). According to NCAER, in 2009, of the 222 million households in India, the absolutely poor households (annual incomes below 45,000) accounted for only 15.6% of them or about 35 million (about 200 million Indians). Another 80 million households are in income levels of 45,000– 90,000 per year. These numbers also are more or less in line with the latest World Bank estimates of the ―below-the-poverty-line‖ households that may total about 100 million (or about 456 million individuals)
MPI rank
States Population (in millions) 2007
MPI Proportion of poor
Average intensity
Contribution to overall poverty
Number of MPI poor (in millions)
— India 1,164.7 0.296 55.4% 53.5% - 645.0
1 Kerala 35.0 0.065 15.9% 40.9% 0.6% 5.6
2 Goa 1.6 0.094 21.7% 43.4% 0.0% 0.4
3 Punjab 27.1 0.120 26.2% 46.0% 1.0% 7.1
4 Himachal Pradesh
6.7 0.131 31.0% 42.3% 0.3% 2.1
5 Tamil Nadu 68.0 0.141 32.4% 43.6% 2.6% 22.0
6 Uttarakhand 9.6 0.189 40.3% 46.9% 0.5% 3.9
7 Maharashtra 108.7 0.193 40.1% 48.1% 6.0% 43.6
8 Haryana 24.1 0.199 41.6% 47.9% 1.3% 10.0
9 Gujarat 57.3 0.205 41.5% 49.2% 3.4% 23.8
10 Jammu and Kashmir
12.2 0.209 43.8% 47.7% 0.7% 5.4
11 Andhra Pradesh
83.9 0.211 44.7% 47.1% 5.1% 37.5
12 Karnataka 58.6 0.223 46.1% 48.3% 4.2% 27.0
13 Eastern Indian States
44.2 0.303 57.6% 52.5% 4.0% 25.5
14 West Bengal 89.5 0.317 58.3% 54.3% 8.5% 52.2
15 Orissa 40.7 0.345 64.0% 54.0% 4.3% 26.0
16 Rajasthan 65.4 0.351 64.2% 54.7% 7.0% 41.9
17 Uttar Pradesh
192.6 0.386 69.9% 55.2% 21.3% 134.7
18 Chhattisgarh 23.9 0.387 71.9% 53.9% 2.9% 17.2
19 Madhya Pradesh
70.0 0.389 69.5% 56.0% 8.5% 48.6
20 Jharkhand 30.5 0.463 77.0% 60.2% 4.2% 23.5
21 Bihar 95.0 0.499 81.4% 61.3% 13.5% 77.3
ISSN No. 0976-8602 VOL.-1 * ISSUE-2*April-2012
Asian Resonance
87
The World Bank estimates that 80% of India's population lives on less than $2 a day which means a higher proportion of its population lives on less than $2 per day as compared with sub-Saharan Africa. Poverty alleviation programmes
These programmes essentially aim at generating incremental incomes for the poor. This means a direct transfer of additional purchasing power into the hands of people living below the poverty line. It is also an attempt to alleviate the problem of almost negligible ―trickle down‖ from economic growth to the bottom rungs of society because of structural constraints. India has implemented a number of income and employment generating programmes for poverty alleviation in the last three decades. Self-Employment Programmes
1. Integrated Rural Development Programme (IRDP)
2. Training of Rural Youth for Self-Employment (TRYSEM)
3. Supply of Improved Toolkits to Rural Artisans (SITRA)
Rural Wage Employment Programmes
1. Rural Manpower Programme (RMP)
2. Crash Scheme for Rural Employment (CSRE)
3. National Rural Employment Programme (NREP)
4. Rural Labourers Employment Guarantee Programme (RLEGP)
5. Jawahar Rozgar Yojana (JRY) Special Area Development Programmes
1. Drought Prone Areas Programme (DPEP)
2. Desert Development Programme (DDP)
3. Hill Area Development Programme (HADP) Development of Women and Children in Rural Areas (DWCRA) Restoring ecosystem renewing life
With India clocking an enviable economic growth rate of over 9 percent per annum, it is easy to forget that as much as 70 percent of its people depend on agriculture and allied activities (including forests), a sector that today contributes only 24 percent of the country‘s GDP and grew a mere 2.3 percent during the past decade. One of the major challenges India faces is how to speed up economic growth and food security for its more than one billion people without exhausting the resources on which this growth depends. Environmental health is of utmost importance for India‘s future, as 65 percent of its population makes out a living from soil, water, forests, and biomass. Healthy soil and land resources are critical to providing the ever-increasing human population with food and livestock with fodder. Forests support many forest dwellers, help in water retention in river catchments, provide fuel for heating and cooking, and supply fodder. The most important environmental problems in rural areas are land degradation, the loss of soil nutrients, forest and groundwater depletion, and diminishing biodiversity (Ministry of Environment and
Forests, 2001).Over 70 percent of the agricultural land in India is rainfed and produces more than 50 percent of grains, coarse cereals, and oil seeds. Productivity in this area is completely dependent upon the availability of rain, but the rainfall pattern is erratic in terms of frequency, intensity, and spatial distribution. Generally, the rainy days do not exceed forty-five days per year and are concentrated within a maximum period of three months. The vegetative growth period in these areas is less than 150 days. The pressure on the land is extremely high, both from the human and animal populations, and has resulted in fragile environments and disrupted ecological relationships. Overall, depending upon the topography, rainfall, and vegetative cover, all these areas are prone to severe erosion, heavy runoff from flash floods and cloudbursts, and low infiltration. Soil erosion is quite severe. It is estimated that an average of sixteen tons of soil is washed away from each hectare of land annually, along with essential micronutrients. Among the most noticeable and defining characteristics of the majority of people living in rain-dependent, ecologically fragile regions are poverty and marginalization. This is because of the close and symbiotic relationship between the environment and the local communities residing therein. As much as 80 percent of a rural household‘s basket of consumption comes from natural and biotic resources obtained from the local environment, its primary source of survival. A robust and vibrant ecology leads to a healthy and resource abundant environment, which for the inhabitants means better provisioning, as well as secure and stable sources of food, water, fuel, fodder, and livelihood. Conclusion
Eradication of poverty in India is generally only considered to be a long-term goal. Poverty alleviation is expected to make better progress in the next 50 years than in the past, as a trickle-down effect of the growing middle class. Increasing stress on education, reservation of seats in government jobs and the increasing empowerment of women and the economically weaker sections of society, are also expected to contribute to the alleviation of poverty. It is incorrect to say that all poverty reduction programmes have failed. The growth of the middle class (which was virtually non-existent when India became a free nation in August 1947) indicates that economic prosperity has indeed been very impressive in India, but the distribution of wealth is not at all even. The environmental pressure has also affected the country‘s economy to a great extent. An ecologically fragile and resource-poor environment, on the other hand, means a harsher and leaner level of subsistence, frequently punctuated by periods of heightened stress and insecurity. This puts immense pressure on existing resources and creates unequal and exploitative social relationships that lead to marginalization, alienation, pauperization, and migration on a seasonal or permanent basis After the liberalization process and moving away from the socialist model, India is adding 60 to 70

ISSN No. 0976-8602 VOL.-1 * ISSUE-2*April-2012
Asian Resonance
88
million people to its middle class every year. Analysts such as the founder of "Forecasting International", Marvin J. Cetron writes that an estimated 390 million Indians now belong to the middle class; one-third of them have emerged from poverty in the last ten years. At the current rate of growth, a majority of Indians will be middle-class by 2025. Literacy rates have risen from 52 percent to 74 percent during the past decade of liberalization (2011). References
1. "It's official: 37 pc live below poverty line". Ibnlive.in.com. Retrieved 2011-10-16.
2. "Report on Condition of Work and Promotion of Livelihoods in the unorganized sector.". http://nceuis.nic.in/Condition_of_workers_sep_2007.pdf.
3. "Multidimensional Poverty Index | Oxford Poverty & Human Development Initiative". OPHI. http://www.ophi.org.uk/policy/multidimensional-poverty-index/. Retrieved 2011-10-16.
4. "8 Indian states have more poor than 26 poorest African nations". Times of India. July 12, 2010.
5. "Country Briefing: India". Oxford Poverty and Human Development Initiative. 2010. http://www.ophi.org.uk/wp-content/uploads/Country-Brief-India.pdf. Retrieved 2011-06-14.
6. http://www.ncaer.org/downloads/MediaClips/Press/businesstandard-arvindsingal.pdf
7. "80% of Indians live on less than 2$ a day". http://www.livemint.com/articles/2007/10/16235421/80-of-Indians-live-on-less-th.html.
8. "One-third of world's poor in India". The Times of India. 2008-08-27/india/27893090_1_poverty-rate-power-parity-decline.
9. "Inclusive Growth and Service delivery: Building on India‘s Success" (PDF). World Bank. 2006. http://siteresources.worldbank.org/SOUTHASIAEXT/Resources/DPR_FullReport.pdf. Retrieved 2007-04-28.
10. The Economic Times, April 23, 2010. Accessed: May 27, 2007.
11. Intergovernmental Panel on Climate Change (2007). Climate change 2007: Impacts, adaptation and vulnerability (Contribution of Working Group II to the Fourth Assessment Report of the Intergovernmental Panel on Climate Change). Retrieved July 11, 2007, from www.ipcc-wg2.org/.

ISSN No. 0976-8602 VOL.-1 * ISSUE-2*April-2012
Asian Resonance
89
ISSN No. 0976-8602 VOL.-1 * ISSUE-2*April-2012
Asian Resonance A Sociological Study of Job Satisfaction
and Commitment among Female Teachers of Intermediate and Degree
Colleges of Kanpur
Ruchi Dubey Lecturer B. Ed. Dept. D. G. College Kanpur
S. K. Tripathi Lecturer Sociology Dept. S. S. PG College Kanpur
Abstract At Present job satisfaction has become a very important issue. People are interested to work in the organization/institutions where they get more job satisfaction. Factors like salary, academic qualification, career prospects, management, working environment, culture etc. are supposed to affect job satisfaction and commitment. But in reality how for such job satisfaction and commitment are ensured in different jobs? Researchers have tried to analyse the job satisfaction and commitment among female teachers of Intermediate and Degree college of Kanpur. Though job satisfaction and commitment are considered as factors of social psychology but in this study job satisfaction and commitment are analysed from organization perspective.
Introduction:
Education has been the mainstay of our culture, right from the time of the Gurukul to the present day, from the days, when education was the domain of a privileged few to the present time when education is succeeding to cross all barriers of languages, status, caste and creed. In ancient times, the Guru, commended the highest respect in the professional hierarchy. His Shisyas or students took care of his every need in exchange for the knowledge he imparted to them. A very close and tangible relationship existed between the Guru & his shisyas. Even today, the most important factor in the educational system is the teachers, their educational qualifications, their professional training and the place they occupy in the school or college. Teacher performance and commitment is a crucial input in the field of education. An educational organization is one of the most important social institutions in a society. The effectiveness of an educational organization depends on mainly the interaction of the administrator, teacher and students who are the permanent items of the learning and teaching process. Within this interaction, the school manager is the director of the school and teacher is the director of the classroom. In this respect, teachers commit themselves to their schools, students, teaching activities, occupation and colleagues. Wilson (1982, 'The teacher's Role : A sociological Analysis')
points out that the teacher becomes a social weaning agent, helping the child to acquire new attitudes of mind, new values, new knowledge and new motivations. The teacher has to help the child towards social mobility. He has to transmit personal standards, orientations, ideals of attainment which diverge from those which are learned in the home. The teachers must extend the horizon of the child, diversify its knowledge of opportunity, raise its threshold of aspirations, and induce it to exercise its talent, so that it may find a place in the social structure which is different from and not contingent upon the roles of its parents. When teacher's job satisfaction level and commitment level to their profession is high, the quality of their services improve. Teachers with low commitment and job satisfaction are satisfied to do the minimum just enough to keep their jobs. The goals of the organization seem remote and the organization seem remote and they remain unattached to them in any meaningful way.

ISSN No. 0976-8602 VOL.-1 * ISSUE-2*April-2012
Asian Resonance
90
S. Narayan Rao (1986) in this book 'Work
adjustment and job satisfaction of teachers' cited: - The term 'job satisfactions' has been used in variety of ways. Job satisfaction is a pleasurable or positive emotional state resulting from the appraisal of one's job experience. Job satisfaction is related to but distinguishable for from morale and job involvement since a job is not an entity or a physical thing, but a complex of inter relationships of likes, roles, responsibilities, interactions, incentives and rewards, job satisfaction has to be intimately related to all of them. The important job dimensions are: 1. Work: including intrinsic interest, variety,
opportunity for learning, difficulty, chances of success, etc.
2. Pay: Including amount, fairness or equity, method
of payment etc. 3. Promotion : Including opportunities of growth in
the job 4. Recognition: including praise for
accomplishment, credit for work done, criticism, etc.
5. Benefits: Such as pension, annual leave, paid
vacations etc. 6. Working condition: Such as hours of work, rest
pause, location, etc. 7. Supervision: Including supervisory style &
influence, human relation etc. 8. Co-workers: Competence, helpfulness,
friendliness, etc. 9. Management policy: concern for employees,
human relations, etc. Job satisfaction result from the attainment of
values. Which are conceptible with one's need. Among the most important values or conditions conclusive to job satisfactions are: 1. Mentally challenging work which the individual can cope successfully. 2. Personal interest in the work itself. 3. Work which is not too physically tiring. 4. Rewards for performance which are just and in comparison with the individual's personal aspirations. 5. Working conditions which are compatible with the individual's physical need & which facilitates the accomplishment of this work goals. 6. High self esteem on the part of the employee. 7. Conditions (including individuals) in the work place which help the employees to attain the job values such as interest in work, pay and promotion, etc. and who minimize role conflict and role ambiguity.
Professional commitment indicates the role incumbents' acceptance of the normative aspects of a given role. Committed teachers not only involves themselves and are loyal to this profession but also develop attachment to the role they perform (P.V.L.
Ramana 'Modernity and role performance of women teacher's, 1992).
Thomas Chathamparampil in his book: Organizational commitment of teachers of higher education' (2004) cited that there are three major correlates of teacher commitment: 1. Work values 2. Self actualization 3. Leader behaviour.
Work values arc defined as enduring beliefs about work that guide actions, attitudes, judgments beyond immediate goals to more ultimate goals in the work situation.
Self actualization means actualizing one's potentials, becoming everything one is capable of becoming.
Leadership is a process in which a person attempts to influence another to accomplish goals. It is the principal dynamic force that motivates and coordinates the organization in the accomplishment of its objectives.
The teacher's level of commitment and job satisfaction is affected by the interaction among the teacher in the school or colleges, the communication between the teachers and the students and leadership beahviour of heads. The less committed teachers may create difficulties or cause deviation from the educational aims of the school/colleges.
This present study aims to find out the factors that influence and affect the commitment level and job satisfaction of women teachers. Women are actively involved in all spheres and streams in our society. Now, they are no more a passive part of our social fabric. A majority of teachers working in the schools and colleges are women. This study is designed to investigate the level of commitment and job satisfaction among women teachers of intermediate and university and its affiliated colleges in Kanpur city. 1.1 Relevance of the Study
Many researches on commitment and job satisfaction among teachers have been done and a few studies have been done on commitment & job satisfaction of women teachers. However, in Kanpur city, there has been no such research on commitment and job satisfaction among women teachers. Beside this, the present study is a comparative study of commitment and job satisfaction among women teachers of intermediate and university affiliated post-graduate degree colleges. As a majority of teachers in schools and colleges are women, therefore, this study has been conducted to investigate the level of job satisfaction and commitment among women teachers of Kanpur city. 1.2 Aims and Objectives of the Study
To find out the problems of women teachers of intermediate and university & affiliated colleges.
To find out the extent of commitment to their job of both intermediate and university and affiliated colleges.

ISSN No. 0976-8602 VOL.-1 * ISSUE-2*April-2012
Asian Resonance
91
To find out the extent of job satisfaction among teachers of intermediate and university & affiliated colleges.
To compare the commitment level and extent of job satisfaction among women teachers of intermediate and university & affiliated colleges.
To find out the factors which affect the level of commitment & job satisfaction of women teachers.
1.3 Research Methodology
In this study, experimental ad descriptive research design has been used. The Universe covers women teachers of the intermediate and university affiliated post graduate degree colleges of Kanpur city. For selection of samples from Universe Random method has been used for collection of data primary and secondary sources has been used interview schedule has been used as primary source of data collection.
Table 1.1 Handsome salary gives Job Satisfaction
Handsome salary gives job satisfaction
Intermediate Teachers
University affiliated college
teachers
No. of Respondents
Percentage
No. of respond
ents
Percentage
Yes 13 65 08 40
No 07 35 12 60
Total 20 100 20 100
65% of intermediate teachers and 40% of university affiliated college teachers agreed with the statement that handsome salary gives job satisfaction, where 35% of intermediate and 60% of university affiliated college teachers did not agree.
Table 1.2 Rating of Physical Environment of School/College
Rating Physical environment of school/college
Intermediate Teacher
University affiliated college
teachers
No. of Respondents
Percentage
No. of respondents
Percentage
Satisfactory
12 60 13 65
Non-satisfactory
04 20 06 30
Can't say
04 20 01 05
Total 20 100 20 100
60% of the intermediate and 65% of the college teachers were satisfied with their physical environment of the school/college, 20% of the intermediate and 30% of college teachers were not satisfied, 20% of
intermediate and 5% of college teachers were undecided about this.
Table 1.3 Availability of Benefits
Availability of Benefits
Intermediate Teacher
University affiliated college teachers
No. of Respondents
Percentage
No. of respond
ents
Percentage
Paid leaves
09 45 09 45
Medical leaves
09 45 12 60
Housing allowance
04 20 08 40
Transport
04 20 01 05
Pension 10 50 11 55
Any other (specify)
00 00 00 00
N.A. 05 25 04 20
This question has multiple choices, 45% of both the intermediate and the college teachers had got paid leaves, 45% of the intermediate and 60% of college teachers had got medical leaves, 20% of intermediate and 5% of college teachers had got transport facility, 50% of intermediate and 55% of college teachers had got pension. This question was not applicable to 25% of intermediate and 20% of college teachers.
Table 1.4 Level of Satisfaction with the Job
Level of satisfaction with the job
Intermediate Teachers
University affiliated college teachers
No. of Respond
ents
Percentage
No. of respond
ents
Percentage
Completely satisfied
05 25 06 30
Satisfied
07 35 11 55
Neutral 01 05 01 05
Dissatisfied
07 35 02 10
Completely dissatisfied
00 00 00 00
Total 20 100 20 100
Among intermediate teachers, 25% of them were completely satisfied with their job, 35% them were satisfied, 5% of them were neutral on this question, while 35% of them were dissatisfied with their job. Among University affiliated college teachers, 30% of them were completely satisfied, 85 of them were satisfied, 5% of them were neutral and 10% of them were dissatisfied with their job.
ISSN No. 0976-8602 VOL.-1 * ISSUE-2*April-2012
Asian Resonance
92
Conclusion: Hypothesis 1: It is likely that the salary structure has a
great impact on the commitment and job satisfaction among women teachers.
According to Table 1.1 and 1.4, it is analyzed that salary structure has a great impact on the commitment and job satisfaction and 40% of the college teachers believed that handsome salary gives. Job satisfaction. Intermediate teachers felt that good salary structure enhances job satisfaction as compared to college teachers.
This hypothesis has been validated. Hypothesis 2: It is likely that the physical environment
(infrastructure) of school building, other facilities) influence the level of commitment and job satisfaction.
According to Table 1.2 and 1.4 it is analyzed that physical environment (infrastructure of school building, other facilities) influence the level of commitment and job satisfaction. 60% of the Intermediate and 65% of college teachers were satisfied with their physical environment 25% of the Intermediate and 30% of college teachers were completely satisfied 35% of the intermediate with physical environment. College teachers were more satisfied with their job as compared to intermediate teachers.
The hypothesis has been validated. Hypothesis 3: It is likely that benefits like paid leaves,
medical leaves, allowance, fringe benefits etc. have an effect on the commitment level and job satisfaction.
According to Table 1.3 and 1.4 it is analyzed that benefits like paid leaves medical leaves, allowances, pension, fringe benefits etc. have an effect on the commitment and job satisfaction. Most of the teachers (12 intermediate and 17 college teachers) satisfied with their job get these benefits. Among teachers not satisfied (7 in intermediate and 2 college teachers) with their job, most of them did not get any benefits. Intermediate teachers were more dissatisfied with their job did not get any benefit.
This hypothesis has been validated. References
1. Evans, Linda (1998), "Teachers Morale, Job satisfaction and motivation.'
2. Mukharjee, R. N. (2009) 'Social Research and Statistics' Vivek Prakashan, Delhi.
3. Ramana, P. V. (1992) Modernity and role performance of women teachers, Karti Publications.
4. Rao, Narayan S. (1986) Work adjustment and job satisfaction of teachers. Mittal Publications,Delhi.
5. Wilson, B. R (1982) "The Teacher's Role". A sociological analysis, British Journal of sociology, Vol.13 PP. 15-31.
6. Thomas Chathamparamphil (2204, June)" Organizational Commitment of teachers of higher education" center for Publications, Crist Church, Bangalore.

ISSN No. 0976-8602 VOL.-1 * ISSUE-2*April-2012
Asian Resonance
93
ISSN No. 0976-8602 VOL.-1 * ISSUE-2*April-2012
Asian Resonance Causes of Son Preference in Rural Culture:
A Sociological Study (In Reference of Jaunpur District)
Pawan K. Mishra
Asst. Professor, Industrial
Sociology
Kanpur Institute of Technology
Rajesh K. Vishnoi
Lecturer, Sociology
RPP College
Ramabainagar
Introduction
The preference for male children transcends many societies and
cultures, making it an issue of local and global dimensions. While son
preference is not a new phenomenon and has existed historically in many
parts of Asia. According new studies commissioned by the United Nations
Population Fund (UNFPA), prenatal son selection in several Asian
countries could result in severe social consequences – such as a surge in
sexual violence and trafficking of women. its contemporary expressions
illustrate the gendered outcomes of social power relations as they interact
and intersect with culture, economy and technologies. It has been seen in
numerous studies that most of Indian couples have a strong preference for
sons over daughters. Sons are getting priority from the ancient period due
to war and family responsibilities. According to mythology a son getting out
his parents from the hell. In a rural community sons are preferred by their
resources reasons. Some traditions and costumes are also responsible for
making partiality between son and daughter for example dowry system can
be mentioned. People think that if they get female issue their base honor
will be decreased. Therefore they have just wished for son. In an effort to
have sons, many couples continue to have children after achieving their
desired family size.
Methodology
Normative survey method has been used for the study.
Abstract It has been seen in numerous studies that most of Indian couples have a strong preference for sons over daughters. Sons are getting priority from the ancient period due to war and family responsibilities. According to mythology a son getting out his parents from the hell. In a rural community sons are preferred by their resources reasons. Some traditions and costumes are also responsible for making partiality between son and daughter for example dowry system can be mentioned. People think that if they get female issue their base honor will be decreased. Therefore they have just wished for son. In an effort to have sons, many couples continue to have children after achieving their desired family size. This practice may have retarded India‟s fertility decline. Using data from National Family Health Survey, report assesses the prevalence of son preference in Indian social structure. The root level analysis is important because fertility levels, social and economic conditions, and the strength of son preference vary widely from one part of the society to another. The present research focuses on the issue of son preferences in rural area of Jaunpur district. It has been realized that women, constituting nearly half of the human population act as pervasive partners in conception bearing and rearing and thus in directly determining the quality and quantity of human population. They play key role in reproduction and production, formally and informally, and both visibly and invisibly. Despite of that, what factors are working behind the mentality of female foeticide and son preference is subject matter of this research paper. Key Words: Son preference, Succession,

ISSN No. 0976-8602 VOL.-1 * ISSUE-2*April-2012
Asian Resonance
94
Using data from National Family Health Survey, report
assesses the prevalence of son preference in Indian
social structure. The root level analysis is important
because fertility levels, social and economic conditions,
and the strength of son preference vary widely from
one part of the society to another.
The present research focuses on the issue of son
preferences in rural area of Jaunpur district. It has
been realized that women, constituting nearly half of
the human population act as pervasive partners in
conception bearing and rearing and thus in directly
determining the quality and quantity of human
population. They play key role in reproduction and
production, formally and informally, and both visibly
and invisibly. Despite of that, what factors are working
behind the mentality of female foeticide and son
preference is subject matter of this research paper.
Sampling
For this purpose a small hamlet is selected
named Umarpur by deliberately method of sampling.
The population of this village 563 and total no of
O.B.C. population is 204 and Schedule Class is
96.Present study is focused on the son preference in
other backward class and scheduled class
respondents.
Status of son preference:
For more than 100 years, the Indian census
has shown a marked gap between the number of boys
and girls, men and women. This gap, which has
nationwide implications, is the result of decisions made
at the most local level—the family. Common wisdom is
that the preference for sons is motivated by economic,
religious, social and emotional desires and norms that
favor males and make females less desirable: Parents
expect sons—but not daughters—to provide financial
and emotional care, especially in their old age; sons
add to family wealth and property while daughters
drain it through dowries; sons continue the family
lineage while daughters are married away to another
household; sons perform important religious roles; and
sons defend or exercise the family‘s power while
daughters have to be defended and protected, creating
a perceived burden on the household.
Son preference is term of traditional Indian
society. On the question of son preference
respondents expressed their views and according their
views a table have been formed by researchers.
Table 1.1 showing status of son preference
S.
N.
Resp
onde
nt
Eq
ual
ity
Percent
No
n
Equ
alit
y
Percen
t
To
tal
Perc
ent
1. S.C. 23 (23.96%) 73 (76.04) 96 100
%
2. O.B.
C.
35 (17.15%) 169 (82.84
%)
20
4
100
%
3. Comb
ined
58 (19.33%) 242 (80.67
%)
30
0
100
%
As above data indicate that more than 80.67
percent have partiality between son and daughter while
19.33 percent make no partiality between son and
daughter. S.C. women, have more partiality problems.
Table 1.2 : Reason behind son preference
S.
N.
Respo
ndent
Succe
ssion
Econ
omic
help
Due
to
traditi
on
Coul
d not
say
Don't
make
partial
ity
1. S.C. 96
(100%)
43
(44.79
%)
17
(17.7
0%)
13(13.
54%)
0 23
(23.95
%)
2. O.B.C.
204(10
0%)
92(45.
04%)
37
(18.1
3%)
26
(12.74
%)
14(8.
86%)
35(17.
15%)
3. Combi
ned
300
(100%)
135(45
%)
54(18
%)
39(13
%)
14(4.
67%)
58
(19.33
%)
Respondents expressed reason behind son
preference which are given following table. According
to the data 45 percent respondents think that sons are
necessary for succession while 18 percent for
economic help. Due to tradition 13 percent women give
opinion in favour of sons.
After the analysis it is found that succession
point make Indian couple for having discriminating
approach between son and daughter. Despite it
economy and tradition are also big issue for son
preference.
References
1.Navtej K. Purewal(2010)Son Preference: Sex Selection,
Gender and Culture in South Asia ISBN:1845204689
2.United Nations Population Fund (UNFPA)2007 United
Nations
3.Dorette Wesemann, Edited by Rangnar Mullr(2008),
Traditional son preference, Amezen.
4. Rangamuthia Mutharayappa, Minja Kim Choe, Fred Arnold,
and T. K. Roy(1997),National Family Health Survey Subject
Reports.
5.Rohini Pande and Anju Malhotra(2006)ICRW, New Dehli.

ISSN No. 0976-8602 VOL.-1 * ISSUE-2*April-2012
Asian Resonance
95
ISSN No. 0976-8602 VOL.-1 * ISSUE-2*April-2012
Asian Resonance Application of Fluid Dynamics: Artificial
Kidney
Reeta Dixit Dept. of Mathematics, D.A.V. PG Colege, C.S.J.M University. reeta.dixit [email protected]
Introduction
The rate of blood through both kidneys of a 70 kg man is about 1200 ml/minute. The portion of the total cardiac output that passes through the kidneys is called the renal fraction. Since the normal cardiac output of a 70 kg adult man is about 5600 ml/minute and the blood flow through both the kidneys is about 1200 ml. minute, one can calculate that the normal renal fraction about 21 percent. This can vary from as little as 12 percent to as high as 30 percent in the normal resting person. Note in figure (6.1) that there are two capillary beds associated with nephron. [1] the glomerulus and [2] the pertitubular capillaries. The glomerular capillary bed receives its blood from the afferent arteriole and from this bed the blood flows into the particular capillary bed through the efferent arieriols which offers considerable resistance to the blood flow. As a result, the glomerular capillary bed is a high pressure bed while the peritubular capillary bed is a low pressure bed, because of the high pressure in glomerules, it functions in much the same way as the usual arterial ends of the tissue capilaries : with fluid filtering continually out of the glomerules into Bawmans capsule. On the other hand, the low pressure in the peritubular capillary system causes it to function in much the same way as the venous ends of the tissue capillaries, with the fluid being absorbed continually into the capillaries.
Abstract Generation of certain products, more precisely, waste products due to metabolism is a phenomenon that occurs within the body of any normal healthy human being-Retention of these astabolic products, such as urea etc., within the body is undesirable. Nature has provided in the body kidneys whose main function is to remove the waste products which are contained in the blood and eject them in the form of urine, Uremia is a is a pathological state associated with malfunction of kidneys. Due to this kidney salfunction kidneys, products of metabolism are retained within the blood, where urea is the most undesirable metabolic product. Retention of undesirable quantity of urea by blood corresponds to renal failure. Many disease follow as a consequences of renal failure. If no proper treatment is not given to a case of renal failure the death is certain in a due course of time. In connection with the treatment for a uremic patient, if no drug administration is effective to bring the kidneys back to their normal working conditions and healthy state, then the only idea which can come to mind is to treat the patient externally i.e., that taking the blood out of the body, purifying it by some artificial means and inserting it back to body. This idea gave to an engineering device called artificial kidney. With the application of this device, the patients survived and got significantly longer lives. Today, this therapy is being given to a very large number of uremic patients, who would otherwise die and is thus a vital from the point of view of uremic patients.

ISSN No. 0976-8602 VOL.-1 * ISSUE-2*April-2012
Asian Resonance
96
A special portion of the peritubular capillary system is the vasa recta, which are a network of capillaries that descend around the lower portion of the loops of Henle. These capillaries form loops in the medulla of the kidney and then return to the cortex before emptying into the veins. The vasa recta plays a special role in the formation of concentrated urine, which will be discussed in the following chapter. Only a small proportion of the total renal blood flow, about 1 to 2 percent flows through the vasarecta. In other words, blood flow through the medulla of the kidney is sluggish in contract to the rapid blood flow in the cortex. Figure (6.2) gives the approximate pressure in the different parts of the renal veins into which the blood finally drains. The two major areas of resistance to blood flow through the nephron are (1) the small renal arteries and afferent arteriole and (2) the efferent arteriole in the small arteries and afferent arteriole the pressure falls from 100 mm Hg at its arterial end to an estimated mean pressure of about 60 mm Hg in the glomerulus (this pressure is still in serious doubt, having been calculated to be as high as 70 mm Hg in the dog and measured to be as low as 45 mm Hg in the rate. Therefore, 60 mm Hg is only an average estimate) as the blood flows through the efferent arteriols from the glomerulus to the peritubular capilary system, the pressure falls another 47 mm Hg to a mean peritubular capillary pressure of 13 mm hg. Thus, the high pressure capillary bed in the glromeulus operates at a mean pressure of about 60 mm Hg and therefore causes rapid filtration of fluid, where as the low pressure capillary bed in the peritubular capillary system operates at a mean capillary pressure of anout 13 mm hg. Therefore allowing rapid absorption of fluid because of the high osmotic pressure of the plasma.
The kidney is encased in a tight fibroush capsule. When a needle is inserted into the kidney and the pressure in the needle is gradually raised untill fluid flows into the kidney tissue, the pressure at which flow begins is between 10 and 18 mm Hg averaging perhaps 13 mm. This "needle" pressure is called the intrarchal pressure that such needle pressure to not measure the interstitial fluid pressure but instead measure the total tissue pressure (the pressure that tends to collapse blood vessels and tubules). Recent attempts to measure the interstitial fluid pressure of the kidney utilizing implanted perforated capsules as described in chapter have given an average mean value of +6 mm Hg, Which at present is probably the best estimate of interstitial fluid pressure of the kidney. Early milestone which led to hemo dialyzer device is the first clinical artificial kidney designed by Kolff. He was the first to treat a uremic patient in 1943. Since Kolff's Pioneer work, development of hemodialyzer design has gone steadily the early popular designs are skeggs-leonards flat duet, Koefftwin coil and Kul flat duet artifical kidneys. Some recent designs are grimsurd — Babb artificial kidney and hollow fiber artificial kidney. Hemodialyzer is named according to the membrance geometrieal configuration two designs are very common, namely, flat duet hemodialyzer and circular duet hemodialyzer in the former, the blood passage is formed by two parallel flat membranes with finite normal gap in the latter, the blood passage is formed by a membrane having shape of straight duet of circular cross-section. The same forces that cause fluid to filter from any high pressure capillary also apoply to filtration through the glomerulus that is pressure inside the glomerular capillaries promotes filtration of fluid through the capillary membrane into Bowman's capsule. On the other hand, celloid osmotic pressure in the blood and pressure in Bowman's capsule oppose the filtration. (Ordinarily, the amount of Protein in the filtrate in Bowmans's capsule is too slight to be of any significance, but if this ever becomes increased to a
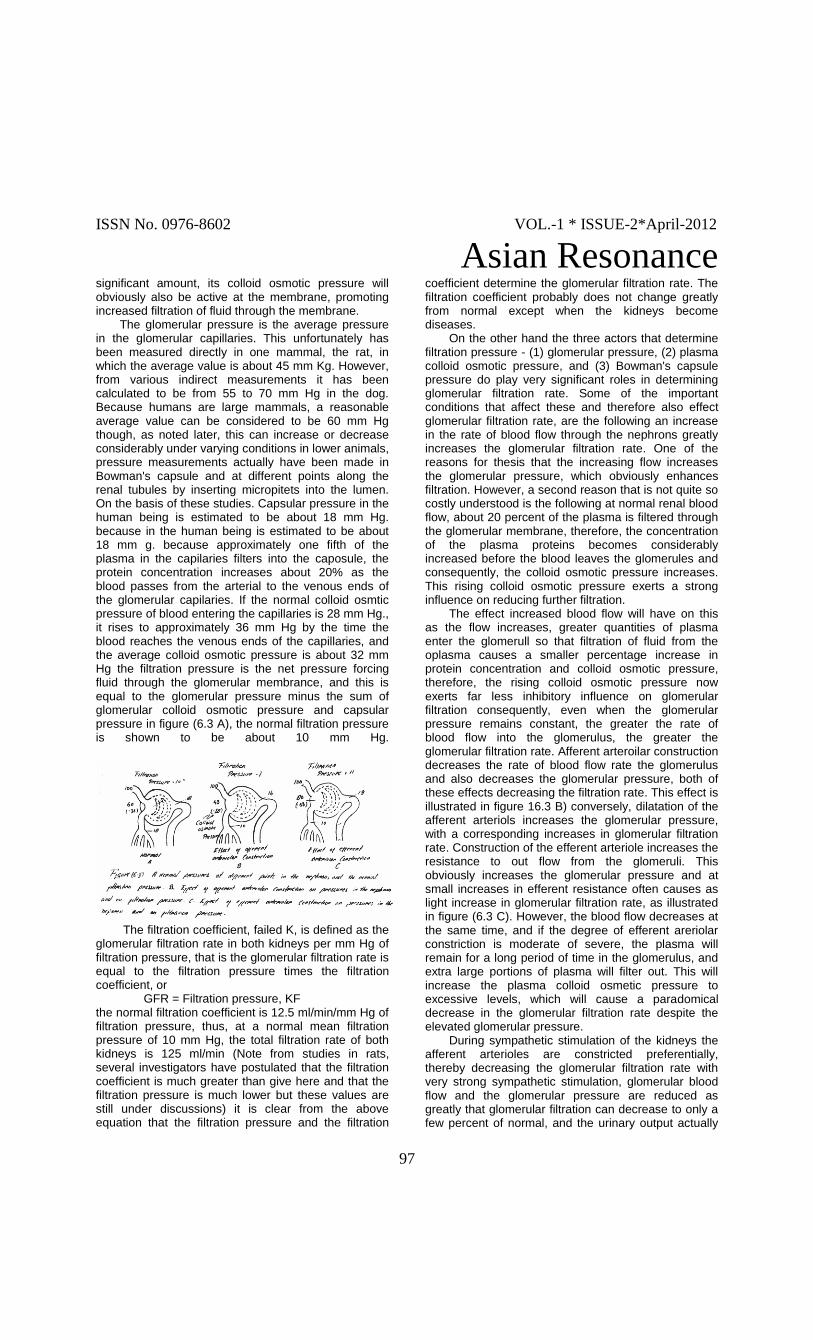
ISSN No. 0976-8602 VOL.-1 * ISSUE-2*April-2012
Asian Resonance
97
significant amount, its colloid osmotic pressure will obviously also be active at the membrane, promoting increased filtration of fluid through the membrane. The glomerular pressure is the average pressure in the glomerular capillaries. This unfortunately has been measured directly in one mammal, the rat, in which the average value is about 45 mm Kg. However, from various indirect measurements it has been calculated to be from 55 to 70 mm Hg in the dog. Because humans are large mammals, a reasonable average value can be considered to be 60 mm Hg though, as noted later, this can increase or decrease considerably under varying conditions in lower animals, pressure measurements actually have been made in Bowman's capsule and at different points along the renal tubules by inserting micropitets into the lumen. On the basis of these studies. Capsular pressure in the human being is estimated to be about 18 mm Hg. because in the human being is estimated to be about 18 mm g. because approximately one fifth of the plasma in the capilaries filters into the caposule, the protein concentration increases about 20% as the blood passes from the arterial to the venous ends of the glomerular capilaries. If the normal colloid osmtic pressure of blood entering the capillaries is 28 mm Hg., it rises to approximately 36 mm Hg by the time the blood reaches the venous ends of the capillaries, and the average colloid osmotic pressure is about 32 mm Hg the filtration pressure is the net pressure forcing fluid through the glomerular membrance, and this is equal to the glomerular pressure minus the sum of glomerular colloid osmotic pressure and capsular pressure in figure (6.3 A), the normal filtration pressure is shown to be about 10 mm Hg.
The filtration coefficient, failed K, is defined as the glomerular filtration rate in both kidneys per mm Hg of filtration pressure, that is the glomerular filtration rate is equal to the filtration pressure times the filtration coefficient, or GFR = Filtration pressure, KF the normal filtration coefficient is 12.5 ml/min/mm Hg of filtration pressure, thus, at a normal mean filtration pressure of 10 mm Hg, the total filtration rate of both kidneys is 125 ml/min (Note from studies in rats, several investigators have postulated that the filtration coefficient is much greater than give here and that the filtration pressure is much lower but these values are still under discussions) it is clear from the above equation that the filtration pressure and the filtration
coefficient determine the glomerular filtration rate. The filtration coefficient probably does not change greatly from normal except when the kidneys become diseases. On the other hand the three actors that determine filtration pressure - (1) glomerular pressure, (2) plasma colloid osmotic pressure, and (3) Bowman's capsule pressure do play very significant roles in determining glomerular filtration rate. Some of the important conditions that affect these and therefore also effect glomerular filtration rate, are the following an increase in the rate of blood flow through the nephrons greatly increases the glomerular filtration rate. One of the reasons for thesis that the increasing flow increases the glomerular pressure, which obviously enhances filtration. However, a second reason that is not quite so costly understood is the following at normal renal blood flow, about 20 percent of the plasma is filtered through the glomerular membrane, therefore, the concentration of the plasma proteins becomes considerably increased before the blood leaves the glomerules and consequently, the colloid osmotic pressure increases. This rising colloid osmotic pressure exerts a strong influence on reducing further filtration. The effect increased blood flow will have on this as the flow increases, greater quantities of plasma enter the glomerull so that filtration of fluid from the oplasma causes a smaller percentage increase in protein concentration and colloid osmotic pressure, therefore, the rising colloid osmotic pressure now exerts far less inhibitory influence on glomerular filtration consequently, even when the glomerular pressure remains constant, the greater the rate of blood flow into the glomerulus, the greater the glomerular filtration rate. Afferent arteroilar construction decreases the rate of blood flow rate the glomerulus and also decreases the glomerular pressure, both of these effects decreasing the filtration rate. This effect is illustrated in figure 16.3 B) conversely, dilatation of the afferent arteriols increases the glomerular pressure, with a corresponding increases in glomerular filtration rate. Construction of the efferent arteriole increases the resistance to out flow from the glomeruli. This obviously increases the glomerular pressure and at small increases in efferent resistance often causes as light increase in glomerular filtration rate, as illustrated in figure (6.3 C). However, the blood flow decreases at the same time, and if the degree of efferent areriolar constriction is moderate of severe, the plasma will remain for a long period of time in the glomerulus, and extra large portions of plasma will filter out. This will increase the plasma colloid osmetic pressure to excessive levels, which will cause a paradomical decrease in the glomerular filtration rate despite the elevated glomerular pressure. During sympathetic stimulation of the kidneys the afferent arterioles are constricted preferentially, thereby decreasing the glomerular filtration rate with very strong sympathetic stimulation, glomerular blood flow and the glomerular pressure are reduced as greatly that glomerular filtration can decrease to only a few percent of normal, and the urinary output actually

ISSN No. 0976-8602 VOL.-1 * ISSUE-2*April-2012
Asian Resonance
98
canfall to zero for as long as 5 to 10 minutes. One would expect an increase in arterial pressure in cause a propotionate increase in all pressures in the nephron and therefore to increase the glomerular filteration rate to a great extent. In actual fact, this effect is greatly blunted because of a phenomenon called autoregulation, which is explained in the following chapter. Briefly, when the arterial pressure rises, afferent arteriolar constriction occurs automatically. This prevails a significant rise in glomerular pressure despite the rise in arterial pressure. Therefore, the glomerular filteration rate usually increases only a few percent even when the mean arterial pressure rises from its normal value of 100 on Hg to as high as 150 mm Hg. Never the less, we shall also see in the following chapter that even a small percentage increase in glomerular filteration rate can cause amany fold increase in urinary output. Therefore, an increase in arteial pressure can greatly increase urinary output even though it affects glomerular filteration rate only slightly. In order to properly design and optimize clinical hemodializer, knowledge of mass transfer process in a idealized dialyser, through a systematic theoretical analysis is required. In this content, the blood flow transfer in hemodialyzer is to be formulated problem. For this purpose, various aspects are required to be contained in order to make assumptions for the sake of possible mathematical analysis. The following assumption have been recognised both for circular duct and flat duct hemodialyzers. 6.1 Steady state condition: Blood and dialyzate are
continuously supplied at constant rates in homodialyzer. As result, velocity and concentration fields are found practically independent. 6.2. Constant physical properties: The
arrangements are such that hemodiatlyzer system works under isothermal condition. As result, physical properties are temperature — independent. Most diffusivity coefficient and membrane, permeability to metabolite may be function of concentration, but the concentration differences in hermodialyzer are such as to allow for taking them as constant physical properties. 6.3 No membrane; sag : The placement and
mounting of membrane in hemodialyzer assembly is done in such a way that no sag is found with the membrane. As result, the blood passage is straight and has invariant cross-section. 6.4 No osmotic and ultra filtration effects: The
effective osmotic pressure that exists in the urea-cellophrance membrane system hemodialyzer is quite small in comparison with applied transmembrance pressure. Therefore, osmotic effect are negligible. A high transmembrane pressure is maintained to keep the membrane sag free, but it is not that high as to warrant ultrafiltration. Hemodialyzer use commercial cellophane menbrances and cuprophane membranes which have negligible utrafiltration properties. 6.5 Fulux developed blood flow: In
hemodialyzer, the membrance duct is extended on both ends such that blood approaches the membrane
with fully developed velocity profile and leaves the membrance same velocity profile. The only cause of mass transfer in blood is the membrane permeability for a metabolite. Thus in the membrance duct, the velocity profile of the blood flow is fully developed but concentration profile is developing. In any case, since Schmidt number for blood is very large of fully developed velocity profile with developing concentration profile prevails. 6.6 Constant membrane permeability: The
membrane permeability is fixed once the particular membrane. Solute system is decided and can therefore be treated as constant physical quantity for a particular hemodialyzer. The membrane permability is nothing but the membrane, mass transfer coenficient and therefore its inverse is membrane resistance. 6.7 Turbulent flow condition in dialyzate bath:
High order turbulence by means of continuous through stirring and continuous fast dialyzate supply is maintained in dialyzate bath in order to improve upon the hemodialyzer performance. Therefore the dialyzate side mass transfer resistance is negligible and the concentration on the outer side of the membrane is constant and since the membrane, available for use in hemodialyzers are all semipermeable membranes (i.e. finitely permeable membranes), the third kind boundary conditions of constants wall resistance is satisfied at the inner surface of the membrane. 6.8 Blood flow as Newtonian fluid: Blood
behaves, under certain conditions, as non-Newtonian fluid. Research workers have proposed various non Newtonian models, such as micropolar fluid, case on fluidetc. to simulate non-Newtonian character of bolid. Casson fluid is good model for blood and is acceptable to physiologists. However, using any non-Newtonian model for blood the algebraic and computational work increase significantly. It has seen that the results based upon Casson theory differ only slightly. In the cases of interest, from these based upon Newtonian theory. Moreover, in hemodialyzer the shear rates are such that the blood flow can be regarded as flow of an incompressible Newtonian fluid. 6.9. Blood flow as laminar flow: In any
hemodialyzer, the blood flow Reynolds number is not high always belong to the range of laminar flow Reynolds numbers. In the opinion of physiologists and other specialists in the fields of medical science, blood flow as turbulent flow is unwanted anywhere for the reasons of deterioration of red cells and clotting of blood and for other reasons. One can briefly dwell upon the deterioration of red cells under tureulence as follows: There is some evidence that the red cells are mechanically especially the scale of enddies becomes comparable of smaller than the diameter of red cells. On the other hand under stream lined motion (i.e. laminar motion), the red cells align themselves in the plane of sheer and continue to follow with the rest of the fluid, i.e., plasme. Thus to avoid there deterioration the red cells should move in stream lines. Therefore, blood flow should necessarily confine to laminar regime in hamodialyzer. In any contemplating hemodialysis device external blood pumping should be

ISSN No. 0976-8602 VOL.-1 * ISSUE-2*April-2012
Asian Resonance
99
eliminated, as high flow rates of blood in external circuit can cause a certain degree of damage to blood cells. 6.10 Negligible iongitunial diffusion: In
hemodialyzer applications, the logitudinal mass diffusion is very less than the mass convection and can there for be neglected in hemodialyzer application, the peelet number is so high that the longitudinal mass diffusion practically zero. Plected number is nothing but Schmidt number times. Roynolds number, Blood Schmidt number is of the order 300 whereas Reynolds number in hemodialyzer is of the order 50. 6.11 Constant concentration at the mass transfer entrance section : If longitudinal diffusion is
negligible, then there is no mass diffusion on the upstream side of the mass transfer entrance section. Therefore, the concentration profile at the mass transfer entrance section remains same as it is on the upstream side. In hemodialyzer, blood has constant concentration before approaching the membrane, therefore the blood concentration at the mass transfer entrance section is constant. In this presentation, a mass transfer problem which is uptodate well recognised simulation for blood flow mass transfer in circular duct hemodialyzer in considered. The problem is described below. The problem
Let there be a duct through which flows a fluid. The duct is straight and has circular cross-section of constant area. The cylindrical polar coordinate system, (r
*, , x
*) is choosen, as it is the most
appropriate one, for this configuration, where the origin lines some where in the duct exis (i.e., the line passing through the centres of cross-section) and x
* increases
in the direction of fluid motion inside the duct. The motion of the fluid in the Duct is laminar. The fluid is a solution in which the solute has been distribution hemodialyzer. The duct wall in inpermeable to solute in the region : x
*<0 and permeable to solute in the region
: x*>0. The fluid is an incompressible Newtonian fluid,
has constant solute concentration at the entry to the duct and has no mass sources or sinks. The physical properties are constant. The lingitudinal mass diffusion is zero and, therefore, the concentration at the mass transfer entrance section, x
*=0 is constant. The velocity
and concentration fields are steady. In the region : x
*>0). The concentration profile is developing but
velocity profile is fully developed even at x*=0). The
concentration at outer surface of the duct wall in constant. The wall Permeability is non-zerol, finite and constant (i.e., constant wall mass transfer resistance. Governing equations :
Thus representation at this point (r*, , x*),
where 0<r<R and x*>0, is governed by
2 * * * 2 * *
*
* * * *2 *
C 1 C C cD 2 u
r r s *
... (6.1) Where D = diffusivity C* = concentration u
* = fully developed velocity
r* = radial coordinate x* = longitudinal coordinate R = Cross-sectional radius It may be noted that the velocity profile is independent of , since the duct cross-section in circular. Further, boundary conditions are also independent of . Therefore, the concentration within the duct will not depend of . The concentration at the mass transfer entrance section is stated as
* * * *
inC C at x 0 for 0 r R
The boundary condition which accepts for the about duct axis which replaces the condition of finite concentration at the axis) is stated as
*
*
*
CD 0 at r 0 for x 0
r ... (6.3)
The boundary condition, taking the constant wall mass transfer resistance into account is stated as :
*
* *
d*
aP C C at r R for x 0
r
Since the longitudinal mass diffusion has been
regarded as zero the term 2 *
*2
eD
x
is zero in
equation (6.1). The velocity profile satisfying given condition, is given (Schlichting).
2
* *
m
ru 2U 1
R ... (6.5)
Thus equation (6.1) reduces to
2
22 * * * * *
*
m* * **
C 1 C r CD 2U 1
r r R xr
... (6.6) Non dimensionalization
Introducing the non dimensional quantities: *
2 *
*
e
C d r xC , r and x
C C*d R RP
... (6.7)
Where
*
e
2UmRP
D , is the Peclet number
... (6.8) The system of equations (6.2, 6.6, 6.3, and 6.4) reduces to
2
2 * *
2
*
C 1 C C1 r
r r xr
... (6.9) c=1 at x = 0 for 0 < r < 1 ... (6.10)
e0 at r 0 for x 0
r
... (6.11)

ISSN No. 0976-8602 VOL.-1 * ISSUE-2*April-2012
Asian Resonance
100
w
eSh e 0 at r 1 for x 0
r
... (6.12)
Where v
PRSh
D
... (6.13) is called wall Sherwood number, since it is obtained by replacing the mass transfer coefficient in the Sherwood number by the wall permeability. In the case of constant wall concentration (zero wall resistance), C=0 and the wall sharwood number infinity. For this case equation (6.12) becomes C = 0 at r = 1 for x > 0 ... (6.14) The solution for this limiting case may be obtained from the general solution in the limit Shw > in the sequel solution will be denoted by the subscript c. Earlier method of solution
The differential equation (6.9) with boundary conditions (6, 10, 6, 11 and 6.12) has been solved by many authors using the method of separation of variables. A variable separable solution of (6.9) may be written as:
2
n n nn 1
C 1 A R (r) exp x
... (6.15)
Where d
n are eigenvalues and
2
nR are
corresponding eigen functions. The constants n
A are
determined by the condition of orthogonality of eigenfunctions Rn. Substituting the value of C from equation (6.15) in to *(6.9), (6.11) and (6.12) leads to the differential equation in Rn
2
2
2 2n n
n n
d R 1 dR1 r R 0
r drdr
... (6.16)
with boundary condition nd R
0 at r 0dr
... (6.17)
And n
w n
d RSh R 0 at r 1
dr
... (6.18) Thus basically the equation (6.16) is to be solved under the boundary condition (6.17) and 6.18). This was first attempted by Schenk and Dumore in their excellent paper in the year 1954. The well-known Frobenious method of series solution was applied.
Thus they assumed t
m
n m,nm 0,2,4
R N r
... (6.19) The equation only powers of r occurs because of the condition (6.17). Substituting the series for Rn in equation (6.16) and equating the coefficients of each power of r to zero, the occurrence relation
2
n
2Nn,n Nm 2,n Nm 4.n
m
... (6.20) for Nm,n is obtained. Equation (6.20) involves the sigenvalues, n is to be determined. Schenke and Dumore found the eigenvalues by a trail and error method, i.e., by putting preliminary values in (6.20) and checking how nearly (6.18) is satisfied. The value of N.n arbitrary in itself, is taken to be one. They reported only the first three eigenvalues. In the latter paper the same equations were by Sideman, luss and Peck by adopting a procedure similar in nature to that of Schenk and Dumore. They calculated the first five egenvalues by suing ten significant figures Arithmetic. Although as many as 300 terms of the series (6.19) were taken, the accuracy was not the best possible. Furthermore, accuracy in the sigenvalues obtained by this method decreases as higher eigenvalues are taken e.g. In the recent paper, Davis and Parkinson employing the same technique and using a double procosion computation scheme, calculated first seven eigenvalues. For higher eigenvlues, the differential equation (6.16) with boundary conditions (6.17) and (6.18) was integrated numerically by modified Adam-Bashforth Integration Technique. To summarize explicit knowledge of the local concentration (which is essential to answer most of the mass transfer questions) given by equation *6.15), the following main computational steps are involved.
(i) To compute the eigenvalues and the constants Nm,n,o from a system of coupled equation. Hero it may be remarked that the eigenfunction series (6.19) is very slowly converging one and even taking 300 terms of the series accuracy in the fifth eigenvalue sideman, lues and Pack. For higher eigenvalues (in > 7), one is required to solve the equation (6.16) numerically Davis and Parkinson. It is remarked by sideman, Luss and Peck that for purposes, it is enough to take first chree eigenvalues. However the necessity of calculating higher eigenvalues except for very small was sherwood numbers, Shw have been recognised see Davis and Parkinson.
(ii) To evaluate the eigenfunctions Rn for each n, for substituting in equation (6.15).
(iii) Calculation of Ans the eight-constant by making use of arthogonality of Rns which are not again given in explicit analytic forms, it is noteworthy that all these steps (i) to (ii) are to be repeated for each value of the wall sherwood number, Shv, Thus the method is basically a numerical procedure and inherits all the disadvantages of a numerical method. The results are less intelligible because the numerical work is to be repeated for every point of interest and therefore it is not possible to get a broad spectrum of the physical phenomenon involved. In this presentation the above procedure is abandoned and a method of finding closed form analytical approximation is suggested which gives results atleast as accurate as in earlier cases but mere simply and elegantly. It has the added advantage that

ISSN No. 0976-8602 VOL.-1 * ISSUE-2*April-2012
Asian Resonance
101
since the solution is analytical, the results are immediately available for all paints under considerations. Briefly the method consists in converting the partial different equation (6.9) inco an ordinary differential equation by using Laplace transformation. This equation with the appropriate boundary conditions is the solved by calorkin method. Present analysis
Denoting Laplaco transormation of C with
respect to longitudina distance x by C ;
0C C exp (sx) dx,
... (6.21) equations (6.2, 6.9, 6.2, 6.11 and 6.12) reduce to
2
2
2d C 1 dC1 r sC 1 0
r d rd r
... (6.22)
dC0 at r 0
d r
... (6.23)
w
d CSh C 0 at r 1
d r
... (6.24) a closed form approximate solution of equation (6.22) with boundary conditions (6.23 and 6.24) may be obtained by using Calerkin method. Calerkin Method
In 1951, calerkin proposed an approximate method to solve boundary value problem for simply connected regions. It is usually characterized under variation methods although it does not require any physically consideration. This peculiarity turns it in to a perfect universal method. It is direct, simple in application and more general in comparison with other varitional methods. A good description of this method and its other related aspects is given in the book of Kantorovitch and Krylov. The basic idea is elaborated here by considering the solution if the boundary value problem governed by equation (6.6, 6.22, 6.6, 6.23 and 6.24). An approximate solution of the problem is sought in the
form : n
i ii 1
C a f (r)
... (6.25)
where ia are undetermined coefficients and Ci(r)
(i=1,2,3 ...n) represent the first n function of an infinite sequence of functions {f1 (r),i=1,2,3 ...n...} whose elements satisfy the following conditions : (i) fi.s are twice continuously differentiable over the interval 0<=r<=1, (ii) are linearly independent, (iii) satisfy the boundary conditions (6.23) and (6.24) and
(iv) the sequence of functions is complete in the interval 0<=r<=i. substituting the equation (6.25) for C the
left hand side of the equation (6.22) becomes
2 n n n2 2
R i i i i i i2i 1 i 1 i 1
d 1 dL (C) a f a f S 1 r a f (1 r )
dr r d r
... (6.26) In order that be the exact solution of the equation (6.22) it is necessary that residnal LR(C) be identically equal to zero; and requirement, since LR(C) is conditions, is equivalent to the requirement of orthogonality of the residnal (6.26) to all functions fi(=1,2,3,...n...). However, having at our disposal only n
coefficients i 2 na a ... ... ... a we can satisfy only n
conditions of orthogonality. Thus, we arrive at the system of n equations:
2n n ni 2 2i L
L i L L2i 1 i 1 i 1
d f 1 dfa a s(1 r ) a r (1 r ) f rdr 0
dr r dr
.. (6.27) which determine the coefficients
i 2 na a ... ... ... a
Equations (6.27) form a nonhomogenous system of n equations, which is linear since the differential equation
(6.22) is linea. Hence, ia are easily calculable, once
iia and f in equation (6.25), we arrive at the
required nth order approximation. This solution converges to exact solution of the problem as n tends to infinity. Thus the preliminary requirement of Galerkin method is essentially to construct a complete sequence of linearly independent and twice continuously differentiable functions fi, satisfying the given boundary conditions. The system of n simultaneous equations (6.27) may be written as
n
LL j ji 1
e a g i 1, 2, 3 ............n
... (6.28) where
i j L j L jC b ad
and L j i j j
b , d and g are given by
21
1 i
L j i20
d f 1 1 dfb f r dr
dr r r dr
1 2
i j i j0d r 1 r f f dr
... (6.29)
and 1 2
j j0g r 1 r f dr
The following sequence of functions is proposed:
2iW
i
W
Shf 1 r (i 1,2,3... ..., n)
Sh 2i
... (6.30) The functions f1 are algebraic polynomials and have been introduced in this chapter for the first time. It can be easily seen that they satisfy the above mentioned conditions (i) to (iii). For constant will concentration case (boundary condition (6.14), i.e., zero wall resistance, the function fL,0 may be directly deduced from the functions fi as a limiting case, ShW. Thus fi,0 are given by fi,0=(1–r
2i) ; (i=1,2,3...)

ISSN No. 0976-8602 VOL.-1 * ISSUE-2*April-2012
Asian Resonance
102
... (6.31) Substituting the expression for fi from (6.30) in equation (6.29), we get
w W
i j
W W
2ij Sh Sh 2i 2jb
i j Sh 2i Sh 2j
W W
i j
W W
1 1 Sh Shd
2 2 (Sh 2i) (i 1) (1 2) (Sh 2j)( j 1)( j 2)
2
w
w w
Sh
(sh 2i)(Sh 2j) (i j 1)(1 j 2)
... (6.32) and
w
j
w
1 1 Shg
2 2 (sh 2j)( j 1) ( j 2)
For limiting case, Shw, equations (2.32)_
reduce to L j, c
2 ijb
(i j)
L j c
1 1 1 1 1d
2 2 (1 ) (1 2) ( j 1) ( j 2) (i j 1)(i j 2)
... (6.33)
andLj.C
j( j 3)g
4( j 1)( j 2)
The nonhomogenous system of equations (6.28) is solved with the help of cramer's rule, which gives
(n )(n ) L
i(n )
Da ; i 1,2,3, ... ...n)
D
... (6.34) Super script (n) in (6.34) and in sequel denotes
the nth order approximation. (n )
iD and
(n )
iD are
determinants of nth order given by (n )
i kmD det (e ) ... (6.35)
and (n) (i)
i kmD det e (k 1,2,3... ... n)
(m = 1,2,3, ... ... n) where (i)
km kme e for m i
... (6.36)
Kg for m 1
It is seen that in the case of the nth order
approximation, the determinants (n )
iD and
(n )
iD are
polynomials in s of degree (n-1) and n1 respectively. Let these polynomials be represented by (n )
iP (s) and
(h )Q (s) respectively.
Thus the nth order approximate order in the
transferred domain is n
(n) (n )
i ii 1
e a f (r)
... (6.37)
where (n )
ia are given by equation (6.34) and fL by
(6.30). Local Concentration
By taking inverse Laplace transform of C–(n)
by means of vashelrenke zakharchenko expansion thearm (Luikov
67), with respect to s, the solution (6.37)
reduces to n
(n) (n )
L ii 1
C a f (r)
... (6.38) which is solution in actual domain. Here
(n ) (n )n
j(n ) (n )
i j(n ) (n )i 1
j
p sa exp s x
Q s
... (6.39)
(denotes differentiation with respect to s) and (n )
is are
the roots of the equation : (n )Q (s) 0
... (6.40) For constant wall concentration case (boundary condition (6.14), the local concentration may be deduced from (6.38) as a limiting case.
v
(n ) (n )
osh
C Lt C
... (6.41)
Thus n
(n) (n ) (r )
c rC i,ei 1
C a f
... (6.42)
where (n )
reia are the coefficients to be calculated from
equation by using equations (6.33) instead of (6.32). Hence the boundary value problem given by system of equations (6.2, 6.9, 6.10, 6.11 and 6.12) has been completely solved. Mixed mean concentration
It is an important quantity since it is involved in the circulation of various kinds of Sherwood numbers which are of interest is designing the mass exchangers. It is also called cup-mixing concentration; mean transport concentration or fluid bulk mean concentration. For a circular duct it is defined as :
2 R
* * * *
m 2 *0m
1C C u r dr d
R U
... (6.43) Expressing it in the non-dimensional form by using
* * * *
m m d n dC C C / C C
... (6.44)
we get
0
1
m
2C 4 C 1 r dr
r
... (6.45) Here and in sequel we shall call Cm as mixed
mean concentration though *
mC is actual mixed mean
concentration. Using nth order approximate solution given by (6.38), it may be seen that
(n )n(n )
M ii 1 i
C 4 g a
... (6.46)

ISSN No. 0976-8602 VOL.-1 * ISSUE-2*April-2012
Asian Resonance
103
For the limiting case, w
Sh
(n )n(n )
M,C Li 1 i,c
C 4 g a
... (6.47) Local fluid wall Sherwood number : Sh
This quantity is defined by means of mass transfer coefficient, in which is given by the fundamental
equation * *
M dm h C C (where m is the
mass five across a given area of the duct wall. It measures the local average of mass transfer is the dialyzate as a function of imagitunal distance down the duct. The appropriate nondimensional mass transfer coefficient which is called local fluid-wall sherwood number, is defined by:
hR
ShD
... (6.48) where h is the mass transfer coefficient given by
*
*
*
r R
* *
M d
CD
rh
C C
which gives by using (6.44) and (6.7)
M
CSh r 1/ C
r
... (6.49) Using equations (6.38) and (6.44)
n n(n) (n) (n)L
i i , c ii 1 i 1
v
1ShSh a / 2 g a
2i Sh
... (6.50) For the limiting case, it becomes
n n
(n) (n ) (n )
i , C i , c L ,ci 1 i 1
Sh ia / 2 g a
... (6.51) Logarithmic fluid-wall Sherwood number, Sh
For experimental measurements a mean mass transfer coefficient is generally more useful than local coefficient. This is based on the average mass transfered to the dialyzale between the inlet and the cross-section, at a longitudinal distance, n. The logarithmic fluid wall sherwood number is the non-dimensional form of this coefficient and is defined by :
x
0
1Sh Sh dx
x
... (6.52) Applying Gause divergence thereorem, the equation
(6.9) gives M
r 1
C 1 dC
r 4 dx
... (6.53)
Thus, m
1Sh 1n C
x
... (6.54)
using equation (6.46) (n)
(n)
M
1Sh in C
4x
... (6.55) for the limiting case Sh , the Sherwood
number Sh and Sh are equal.
Local fluid Sherwood number, Sh :
This quantity measures the local average mass transfer to the wall as a function of longituval distance, x and is defined by;
f r
Sh h R / D
... (6.56)
where, *
*
*
r R
r m W* *
M W
CD
rh / (C * C *)
C C
is the fluidside mass transfer coefficient. Making use of the equations (6.48) and (6.4)
* *
* *
* *
r R r R* * * * * *
M v M d w d
w
C CD D
r rC C C C C C
Sh Sh
r w
1 1 1
Sh Sh Sh
... (6.57) Using equation (6.50)
(n)n n(n) (n) i
f ii 1 i 1
w v
2i i(1 3)aSh a /
2i Sh (i 1)(1 2)(Sh 2i)
... (6.58) Logarithmic fluid Sherwood number, Shf t–
This quantity measures the average mass transferred to the wall between inlet and the cross section at the longitudinal distance, x and is defined in
a way similar to local fluid Sherwood number, fSh
Thus,
f f w
1 1 1
Sh Sh Sh
... (6.59) Using the equation (6.55)
(n )
(n ) v mf
(n )
w M
Sh In CSh
4 x Sh 1n C
... (6.60) It is clear that in the limiting case when
wSh the local fluid Sherwood number,
fsh
and logarithmic fluid Sherwood number, fSh are
equal to Sh, Asymptotic value of Sherwood numbers (in fully developed region) :
The asymptotic value of local fluid wall and local fluid sherwood numbers may be easily calculated when longitudinal distance x tens to infinity. In this region,

ISSN No. 0976-8602 VOL.-1 * ISSUE-2*April-2012
Asian Resonance
104
both the sherwood numbers, Sh and Sh are equal
and given by (n )(n )
(n ) 1S
Sh Sh4
... (6.61)
where (n )
iSh is the first root (root having the lowest
absolute value) of the nth degree polynomial equation (6.40).
The local fluid sherwood number, f
Sh in
this region may be written similarly by using equation (6.57) or (6.59) as
(n)(n)
(n) w if ,00f ,00 (n)
w i
S sSh Sh
4x Sh s
... (6.62) The correction factor, Sh :
The local fluid sherwood number, Shf is often approximated with the help of a correction factor and local fluid-wall, Sherwood number, Shc (sherwood number or constant wall concentration case) since the
variation in f
sh is small with respect to wall sherwood
number, Shw This correction factor is defined as
f c
c
Sh ShSh
Sh
... (6.63)
which gives crSh Sh 1 Sh
... (6.64) using equations (6.58) and (6.54)
(n) (n) (n) (n)
f C CSh S S / Sh
... (6.65)
The correction factor, Sh :
Similar to the correction factor fSh , the correction
factor, Sh is used for approximating the logarithmic
fluid sherwood number, cSh , with the help of
logarithmic fluid wall sherwood number for limiting
case, cSh and is defined by
f c cSh Sh Sh / Sh
... (6.66)
cf
Sh Sh 1 Sh
... (6.67)
which gives(n ) (n ) (n )
(n )f c cSh Sh Sh / Sh
... (6.68)
using equations (6.60) the correction factor is Thus various physical quantities of interest in to context of the given physical problem has been calculated by using nth order approximate solution for local concentration given by equation (6.38). In principle, for any value of n an approximate solution may be obtained, however, this method is very fast converging one and one need not go beyond fourth order solution for practical purposes in most of the cases. Conclusions
A mass transfer problem which is upto date well recognised simulation for blood flow mass transfer in circular duet hemodialyzer is considered the duct is straight and has circular cross-section of constant area, the cylindrical Polar coordinate system, (r
*, Q, x
*)
is chooren, as it is the most appropriate one, for this configuration, where the origin lies some where in the ductaxis (the line passing through the centres of crossectional) and x
* Increases in the direction of fluid
motion inside the duct. The motion of the fluid in the duct is laminar. The fluid is a solution in which the solute has been distributed homogeneously. The duct wall is ampermeable to solute in the region x
*<0 and
Pemeable to solute in the region x*>0. The fluid is an
incompressible newtonian fluid, has constant solute concentrational the entry to the duct and has no mass sources or sinks the physical properties are constant. Various physical quantities of interest in the context of the given physical problem has been calculated by using 4th order approximate solution for local concentration given by equation (6.38). In principal, for any value of any approximate solution may be obtained. However, this method is very fast converging one and one need not go beyond fourth order solution for practical purposes in most of the cases. References 1. Fredrickson A.G. and Bird R.B. (1958) 2. Ind. Eng. Che., 50 347. 3. Forrester, J.H. and D.E. Young. (1970) 4. Flow through a converging diverging tube and its
implications in occlusive vascular disease. 5. J. Biomech, 3, 297-316. 6. Fox, J.A. and A.E. Hugd. (1966). 7. Localization of Atheroma : A theory based on boundary
layer separation 8. Br. Heart J., 28, 388-399. 9. Fry, D.L. (1986). 10. Acute vascular endo theliar changes associated with
circulation Res, EE, 165-197. 11. Forrester, J.H., and Young B.F. 1970). 12. Flow through a converging diverging tube and its
application in occlusive vascular disease J. Biomech, 3, 297-316.
13. Foias C., Temam R., (1979). 14. Some analytic and geometric properties of the solutions
of the evolution navier-stores equations, J. Math. Pures Appl .. 50,339-368.
15. Forester, HJ.H. and Young D.F., (1970). 16. Flow through a converging diverging tube and its
implicions, J. Biomechanics, 3:297-316. 17. Fry, D.L. 1968(). 18. Active vascular endothelial changes associated with
increased blood velocvity oradients. 19. CIR, RES, EE: 165-197.

ISSN No. 0976-8602 VOL.-1 * ISSUE-2*April-2012
Asian Resonance
105
20. Fry, D.L. (1973). 21. Response of the arterial wall to certain physical factors,
Ciba Foundation Symp, 12:93-125. 22. Fung, Y.C., (1969). 23. Blood Flow in Capillary Bed, 24. J. Biomechanics, Z. 353-372. 25. Kaimal, M.R. (1981). 26. Propogation characteristics in distchsible tubes containg
a viscoelastic fluid. J. Biomechanics 14, 457-53. 27. Kapur, J.N. (1962). 28. "On the two dimensional jet of an incompressible pseudo
plastic fluid" Journal of the Physical Society of Japan. Vol. 17, PP. 138-1309.
29. Kalthia, N.L. (1974). 30. "On the laminar two dimensional freeset of an in
compressible pseudoplastic fluid". Asme Journal of Applied Mechanics Vol. 41. PP. 835-836.
31. Keulegan, G.H. Beij K.H.J. (1937) RES NAT BUR. Stanel. 1889 December. H. Dr. Rer. 1973).
32. Nat Thesis, Universitat Stuttgart. 33. Kuemmerer, H., (1977). 34. Rheol, ACTA 16, 261. 35. Rusamizu, S., L.A. Holmes, A.A. Modre and J.D. Perry,
(1968). "The Steady State Compnance of Polyme Solutions:, Trans 80C. Rheol, 12 559.
36. K001JMAN, J.M. (1973)., 37. "Laminar heat of mass transfer in rectangular channels
and in cylindrical tuebs for fully developed flow: Comparison of solutions obtained for various boundary conditions Chem. Eng., SI., 28, 1149-1160.
38. Kozicki W. and TIV. C. (1971). 39. CAN, J. CHE, 49 562. 40. KV. D.N. (1983). 41. Demodynamics and other ogenesis at the human carotid
bifurcation Ph.D. Thesis Georgia Institute of Technology, Atlanta, GA.
42. Kaldni P.N. (1965). 43. On creeping flow of viscoelastic liquid in converging
channels, J. Phys. Soc., JPN, 20, 132. 44. Sparrow, E.M. Lin, S.H. and Lundgrem, T.S. (1964). 45. "Flow development in the hydrodynamic region of tubes
and ducts", Pnys. Fluids, 7, 338. 46. Spielberg, K. and H. Timan. (1960). 47. "On three and two dimensional disturbences of pipe flow
J. Aprl. MKech. 27 381. 48. Slater, L.J., (1960) 49. "Confluent hypergeometric functions. Cameridge Uni.
Press, Cambridge. 50. Schensted, I.V. (1960). 51. "Contributions to the theory of hydrodynamic stability"
Tech report of college of Eng. Univ. Michigan Ann Arbor. 52. Salwem. H. and C.E. Grosch. 53. "The stability of poiseville flow in a pipe of circular cross
section", J. Fluid mech, 54, 93. 54. Squire, H.B., (1955). 55. "Radial Jets," 50 Jahse crenzs chichtforschung Crtlas H,
and Tollmein, W., EDS Vieweg, Braunschweing. 56. Shukla, J.B., (1980). 57. Parihar, R.S. and Gupta, S.P., Effects of peripheral layer
viscosity on blood flow through the artery with mild stemosis, Bull, Math. Biol, 42:797-805.
58. Stesart, R.R. and Morrazzi, C.A., (1973). 59. Oxygen transport in human brain, analytical solution adv.
in Exp. Med. biol. 37 (B): 843-848. 60. Skalak, R., (1972). 61. Mechanics of the Microcir culation in proceedings of the
Symp. on biomechanics its foundation and objectives. Held in Lajolla. California, Edited by Y.C. Fung, . Perrone and M. Enliken.
62. Shyy. W. and Braten, M., (1986). 63. "A study of recirculation flow computation using body
fitted coordinates consistency aspects and mech skewness" Numerical Heat Transfer, Vol. 9, p. 559.

ISSN No. 0976-8602 VOL.-1 * ISSUE-2*April-2012
Asian Resonance
106

ISSN No. 0976-8602 VOL.-1 * ISSUE-2*April-2012
Asian Resonance
106
ISSN No. 0976-8602 VOL.-1 * ISSUE-2*April-2012
Asian Resonance Screening of Some Wheat Genotypes
against Sitophilus
Priyanka Yadav
Naheed Sultana Designation Zoology A. N. D. College Kanpur E mail :
Abstract Various wheat genotypes Vi2, K 88, K 9824, K 8020, K 9533, K 424, CL 7843, NW 2036, PBW 343, LOK 1, HP 1633, HD 2733 and K 711 were tested against sitophilus oryzae (Linn), in which K 88, K 9533, K 424 and PBW 343 were found most susceptible showing heavy loss and higher growth index. The wheat genotypes K 8020, HP 1633, K 711 and HD 2733 were moderately resistant providing least infestation and poor growth index of S. oryzae. Rest of the varieties i.e. K 9824, DL 7843, NW 2036 and LOK 1 showed intermediate behaviour. Keywords: S. Oryzae, growth index, wheat genotypes.
Introduction:
Sitophilus oryzae (curculionidae: coleopteran) is a serious insect pest of various food grains under storage, causing upto 50% loss in weight (Koura and El-Halfway, 1967). It is an internal feeder and causes a considerable loss to cereals affecting the quantity as well as quality of the grains. Metrials and Methods
The varieties Vi 2, K 88, K 9824, K 8020, K 9533, K 424, DL 7843, NW 2036, PW 343, LOK 1, HP 1633, HD 2733 AND K 711 were obtained from the wheat breeder department economic botanist Rabi cereals of Chandrashekher Azad University of Agriculture and Technology, Kanpur.
The moisture of wheat each variety was observed by O.S.A.W universal moisture meter in the department of Economic Botanist Rabi cereals of C. S. Azad University of Agriculture and Technology, Kanpur.
The parameters Vi 2, grain weight loss percentage, damaged grain percentage, growth index, F1 progeny and moisture content were taken to evaluate relative susceptibility to S. Oryzae. Pupation percentage and larval period were recorded in each variety of wheat. All the experiments were replicated thrice in laboratory.
For the loss assessment, about 30gms of fresh and healthy grains of each variety were selected and counted with the help of hand lens and kept in glass vials (10×4cm). covering the top with muslin cloth 10 pairs of already examined beetles of same age obtained from the laboratory culture were introduced at the same time in each vials, which were kept in desiccators at 75±5% relative humidity and constant temperature of 30±10º C. At the end of the experiment after 120 days, the grains and their particles were weighed after removing all the dust, insects and their stages. The difference was recorded between initial and final weights to assess the loss of the weight in grains. Percentage of damaged grains was also calculated.
The relative resistance and susceptibility of different wheat varieties were determined on the basis of growth index, which was calculated according to formula published by Pant and Dang (1969).
Growth index = Popution percentage Average larval period For adult emergence of S. Oryzae 20gms of fresh and healthy grains
of wheat were kept in glass vials and the mouths were covered with muslin cloth and tired with rubber bands.
All the jars were kept under the controlled conditions without disturbing them for 20days. After 20days, the adults were removed and the grains were allowed to remain in the jars till the emergence of F1 population were counted up to the end of their emergence and after each counting; they were removed to prevent the egg laying. Finally, the total number of male and females of F1 population were recorded.

ISSN No. 0976-8602 VOL.-1 * ISSUE-2*April-2012
Asian Resonance
107
Results and Discussions
Data in respect of percent loss of weight, percent damaged grains, growth index, F1 progeny and moisture content of grain have been presented in table – 1. The percentage of loss in weight of various wheat varieties due to infestation of S. Oryzae was minimum in variety HD 2733 (12.85) followed by K 711 (12.98), HP 1633 (13.54) and K 8020 (13.69). The minimum loss in weight ranging from 15.04 to 26.17%.
Lasker et al (2004) observed loss in weight upto 13.50% in susceptible variety of wheat, while Saljoqi et al (2002) found the loss in weight ranging from 3.90 to 7.99% in wheat due to the infestation of S. Oryzae. Singh et al (1991) observed loss in weight up to 20.01% is susceptible variety of barley. All these investigations are in agreement with the present work.
The percentage of damaged grains was more in K 88, K 9533, K 424 and PBW 343 having 49.25, 47.30, 46.50 and 40.61 %, while the loss damage in grains was observed in HD 2733, K 711, HP 1633 and K 8020, i.e. 14.65, 14.90, 18.83 and 20.27 % respectively. Yadav et al (2008) studied in the same pattern and reported the resistance and susceptibility varieties of wheat against S. Oryzae.
Vyas and Mishra (2007) also evaluated the relative resistance of some sorghum varieties against S. Oryzae. Singh et al (1991) also evaluated the same relative resistance of few barley varieties against S. Oryzae. They obtained the percentage of damaged grain up to 71.60 in most susceptible variety of barley.
The relative effect of different wheat varieties juged on the basis of growth index of the pest which was increased in ascending order i.e. HD 2733 (2.016), K 711 (2.019), HP 1633 (2.136) and K 8020 (2.158), LOR (2.385), NW 2036 (2.431), DL 7843 (2.636), K 9824 (2.813), PBW 343 (3.567), K 424 (3.953), K 9533 (4.234) and K 88 (4.309). The varieties having maximum developmental period provided minimum growth index and vice versa. Pandey and Pandey (1982) observed minimum growth index in least preferred and maximum in most preferred varieties, similar to the present findings.
As regards the F1 progeny, the highest population of adults was found in K 88 (161.11) which did not differ significantly to the population obtained from K 9533 (151.08), K 424 (147.34) and PBW 343 (142.88), but was significantly higher in comparison to all other varieties. The lowest population was observed in HD 2733 (81.74) followed by K 711 (82.41), HP 1633 (92.08) and K 8020 (98.98) being significantly different themselves. The remaining varieties were found to have intermediary population ranging from 118.28 to 132.44 weevils.
From these observations, it was indicated that the varieties having maximum population were highly susceptibility and vice-versa. Patel et al (2006) found similar results in different varieties of wheat against S. Oryzae.
The moisture content in different wheat varieties varied from 10 – 12% being maximum K 88 and minimum HD 2733. It is clear from the findings that
higher moisture percentage was observed in the varieties which were found to be susceptible and vice-versa. Somewhat similar results were observed by Singh et al (1985) also found that the grains of different barley varieties containing maximum moisture were highly susceptible for the attack of S. Oryzae. Singh et al (1991) found similar results in different varieties of barley against S. Oryzae. References
1. Koura, A and El – Halway, M (1967). Studies on the susceptiblility of certain Egyptian varieties of maize, zea mays to infestation with rice weevil and lesser grain borer and the host preferences at these insects. Agri. Res. Review, Cairo, 45(2): 49-55.
2. Laskar, N; Ghosh, S.K (2004) relative susceptibility of some wheat varieties against sitophilus oryzae. Environment and ecology; 22(3): 411 – 413.
3. Pandey, V and Pandey, N.D (1982) Resistance of maize varieties to sitolroga ceralella oliver. L. physical factors. Bulletin of Grain Technology; 20(3): 168 – 174.
4. Patel, Y (2006) Characterization of relative susceptibility of wheat varieties against rice weevil Sitophillus Oryzae. Lin Asian Journal of Bioscience, 1(2): 106-108.
5. Saljoqi, A; Afridi M.K; Sajjad Ahmad and Abdur Raqib (2002). Relative resistance of some wheat cultivations to Sotophillus in stored wheat grains. Sarhad Journal of Agriculture; 18(2): 237 – 240.
6. Singh, D.K, Singh B, Singh Y.P, Pandey N.D and Malik Y.P (1991). Relative resistance of some barley varieties to Sitophilus Oryzae. MSc Thesis C.S Azad University of Agriculture and technology, Kanpur.
7. Vyas A and Mishra R (2007) Reaction of sorghum genotypes against rice weevil Sitophilus Oryzae. Journal of entomological research; 31(3): 257 – 258.
8. Yadav J.P and Bhargav M.C (2008) Relative susceptibility of some promising wheat varieties to Sitophilus Oryzae Linn during storage. Journal of insect science, Ludhiana; 21(2): 146 – 153.1
Relative Susceptibility and Moisture content of different varieties of wheat to Sitophillus Oryzae (Linn)
Varie-ties
Perce-ntage loss in weight
% dam-aged grain
Growth index
F1 pro-gency
Mois-ture con-tent
K 88 45.21 49.25 4.309 161.11 12
K 9824 26.17 31.23 2.813 132.44 11
K 8020 13.69 18.83 2.158 98.98 10
K 9533 38.74 47.30 4.234 151.08 12
K 424 37.54 46.50 3.953 147.34 12
DL 7843 16.18 26.10 2.636 126.71 11
NW 2036 16.10 26.02 2.431 121.51 11
PBW 343 36.34 40.61 3.567 142.88 12
LoK 1 15.04 22.60 2.385 118.28 11
HP 1633 13.54 14.90 2.136 92.08 10
HD 2733 12.85 13.45 2.016 81.74 10
K 711 12.98 14.65 2.091 82.41 10

ISSN No. 0976-8602 VOL.-1 * ISSUE-2*April-2012
Asian Resonance
108
ISSN No. 0976-8602 VOL.-1 * ISSUE-2*April-2012
Asian Resonance
Women Entrepreneurship: Problems & Solutions
Saba Yunus Lecturer Sociology MMV PG College Kanpur [email protected]
Manorama Gupta Asst. Professor Political Science MMV PG College Kanpur E mail :
Abstract Entrepreneurship is the core of economic development. It is a multi- dimensional task and essentially a creative activity. Entrepreneur is key factor of entrepreneurship. Women entrepreneurship is a recent phenomenon and in the process have to face various problems. The initial problems faced by these women seem similar to those faced by women in western countries. This paper examined the problems these women faced during the setting up and continued operation of their businesses and will try to figure out the solution for this problem. Keywords: Entrepreneurship, Women Entrepreneurship, problem, women empowerment etc.
Introduction:
From time immemorial men endeavor has been for the up-liftment or enrichment of society. In recent times the single most important factor contributing to this advancement has been industrialization by bringing about social and economic development of the society. Industrialization can be achieved both by collective and individual efforts which are two different forms of entrepreneurship. Entrepreneurship is neither a science nor an art it is a practice, but as in all practices, medicine or engineering for instance. Knowledge in entrepreneurship is a means to an end. It is not a ―flash of genius‖ but purposeful task that can be organized into systematic work. The entrepreneurs in the modern sense are the self starters and doers of a business who have organized and built their own enterprise or enterprises. In common parlance, almost anyone who starts an enterprise, industry, shop is called and entrepreneur. Enterprises started by women are no longer confined to conventional fields like embroidery, knitting and tailoring they are venturing into new fields like electronics, pharmaceuticals, engineering and services. These women are mostly urban appropriately educated, sometimes having specialize skills and are also equipping themselves with some training and financial support. Need for women entrepreneurial Development
Human resources, both men and women, of working age constitute the main strength of economic development of the nation. Women form an important segment of the labour force and the economic role played by them cannot be isolated from the frame work of development as the role and degree of integration of women in economic development is always an indicator of women economic independence and social status. The government is therefore making planned efforts to inculcate the spirit of enterprise among women through many incentives and developmental programs. These efforts are expected to spin good results with many more women taking to entrepreneurship. Entrepreneurship seems to be idle for women seeking participation in the country‘s economic development because of certain factors. Emergence of entrepreneurship is considered to be closely linked to social, cultural, religious and psychological variables and these changes seems to have become acceptable norms in the context of women at work in the Indian situation today with more and more women participating in the economic development. Some recent researches indicate that several women are becoming entrepreneurs, specially the middle class women due to the pull and push of the traditional and changing values. Under the pull factors, the women entrepreneur chooses the profession as a challenge, as an adventure with an urge to do something new and to have an independent occupation.

ISSN No. 0976-8602 VOL.-1 * ISSUE-2*April-2012
Asian Resonance
109
Under the push factors women take up business enterprises to get over financial difficulties when a responsibility is thrust into them due to family circumstances. As such women both in the rural and urban sectors and especially belonging to the middle classes are turning towards entrepreneurship to fulfill their aspirations both economically and socially. Problems Associated With Women Entrepreneurs
Basically all women entrepreneurs almost suffer from two main categories of problems, such problems can be designated as follows: - 1) Specific Problems 2) General Problems. The first category of problems affect women specifically in their smooth operations of enterprise ,while the other category of problems have a general or over-all affect on the enterprises owned by such group of women entrepreneurs. Over-all these problems can be summed up as under:-
Problem of Finances arrangement
Finance is said to be the ―life blood‖ of every business undertaking, be it large or medium or small scale enterprise. Usually women entrepreneurs face the problems of shortage of finance on two important grounds. Firstly, women do not generally have property on their own names to use that as collateral securities for obtaining loans/funds from banks and other financial institutions. Thus their access to external sources is very limited .Secondly, the banks also consider women less credit worthy and discourage women borrowers on the belief that they cannot repay back the amount of loans taken by them.
Scarcity of raw materials required for productive capacities
They have to even face the problems of scarcity of raw-materials and necessary inputs. On the top of this, is the high prices of raw materials, on one hand and getting raw materials at minimum discount rates is the other.
Cut-throat competition with other group of men and established self-sufficient entrepreneurs
Women entrepreneurs do not have a proper organizational set-up to pump in a lot of money for canvassing and advertisements. Thus they have to face a stiff competition with the men entrepreneurs who easily involve in the promotion and development area and carry out easy marketing of their products with both the organized sector and their male counterparts. Such a competition ultimately results in the liquidation of women entrepreneurs.
Limited mobility factor in case of women entrepreneurs
Unlike men, women mobility in India is highly limited due to many factors/reasons. A single women asking for room is still looked with suspicion. Cumbersome exercise involved in starting with an enterprise coupled with officials humiliating attitude towards women compels them to give up their spirit of surviving in enterprise altogether.
Family responsibilities, ties as well as commitments
In India, mainly a woman‘s duty is to look after her children and manage the other members of the family.
Man plays a secondary role only. In case of married women she has to strike a fine balance between her business and family. Her total involvement in family leaves little or almost no time or energy to be diverted for the business activities. Support and approval of husbands seems to be necessary condition for women entry into business. Accordingly, the educational level and family background of husbands also influences women participation in the field of enterprise.
Lack of education and prevalent levels of illiteracy amongst women
In India, around 3/5th
(60%) of women are still illiterate. Illiteracy is the root cause of socio-economic barriers or hurdles. Due to lack of education and that to qualitative education, women are not aware of business, technology and market knowledge. Also lack of education causes low achievement motivation amongst women. Thus lack of education creates problems before women to set up competitive enterprises.
Domination by male and ideology of male dominated society
Male chauvinism is still prevalent in many parts of the country yet. The constitution of India speaks about the equality between both the sexes, i.e. men and women. But in practice, women are looked upon as ―ablaa‖ i.e. weak in all respects. Thus women suffer from a number of problems, in a nutshell in a male dominated society; women are not treated equal to men. This in turn, serves as a barrier to woman‘s entry into business.
Lesser risk and uncertainty bearing attitude
Women in India lead a protected life. They are even less educated and economically not stable neither self-depended. All these factors reduce their ability to bear risks and uncertainties involved in a business unit, which is the most important criteria of every business activity.
Lack of self-confidence and optimistic attitude amongst women
Today all the women are suffering from one major problem of lack of self-confidence, will-power, strong mental outlook, optimism etc. They always fear from committing mistakes while doing their piece of work, more over there is limited initiative of taking risk and bearing uncertainty in them. Thus all these psychological factors often obstruct their path of achieving success in the area of enterprise.
Old and outdated social outlook to stop women from entering in the field of entrepreneurship
Also one of the dominant reasons for their failure is the attitude of society people towards their modern business prospects and developing attitude. Women nowadays have low risk taking ability because of the number of questions put forward by the conservative society people. Thus they are under a social pressure which restrains them to prosper and achieve success in the field of entrepreneurship.

ISSN No. 0976-8602 VOL.-1 * ISSUE-2*April-2012
Asian Resonance
110
Absence of proper support and back-up for women by their own family members and the outside world people
Many a times their own family members are not supporting and cooperating as well as having encouraging attitude to dare to enter into the entrepreneurship field. They are always making many pessimistic feelings to be aroused in their minds and making them feel that family and not business is a place meant for them. Due to such limited scope of help and cooperation from family and other people, they drop the idea of excelling in the enterprise field. Apart from the above discussed problems there may occur other series of serious problems faced by women entrepreneurs are improper infrastructural facilities, high cost of production, attitude of people of society towards the women modern business outlook, low needs of achievement and socio-economic constraints often puts women behind in the field of enterprise. Solutions for solving the above discussed problems:-
On the basis of the above mentioned problems faced by women entrepreneurs and various other problems too, there is a provision of a number of solution measures to overcome the aforesaid problems. Such solutions or remedies can be well understood as under:- • There should be a continuous attempt to inspire,
encourage, motivate and co-operate women entrepreneurs.
• Attempts should be there to enhance the standards of education of women in general as well making effective provisions for their training, practical experience and personality development programmes, to improvise their over-all personality standards.
• Attempts to establish for them proper training institutes for enhancing their level of work-knowledge, skills, risk-taking abilities, enhancing their capabilities.
• Attempts to bring about a society attitude change, generation of awareness and consciousness on the policy of self-development of women entrepreneurs.
• Attempts by various NGO‘s and government organizations to spread information about policies, plans and strategies on the development of women in the field of industry, trade and commerce.
• Establishing various policies to offer easy finance schemes for economically strengthening the position of women.
• Forming a cooperative association of women entrepreneurs to mobilize resources and pooling capital funds, in order to help the women in the field of industry, trade and commerce.
• Offering seed capital, up-liftmen schemes, women entrepreneurs fund etc. to encourage them economically.
• To extend confessional rates facilities and schemes for women entrepreneurs to prosper in the field of enterprise.
• To establish all India Forum to discuss the problems, grievances, issues, and filing complaints against constraints or shortcomings towards the economic progress path of women entrepreneurs and giving suitable decisions in the favor of women entrepreneurs and taking strict stand against the policies or strategies that obstruct the path of economic development of such group of women entrepreneurs.
Thus by adopting the following aforesaid measures in letter and spirit the problems associated with women can be solved. Conclusion
It can be said that today we are in a better position wherein women participation in the field of entrepreneurship is increasing at a considerable rate, efforts are being taken at the economy as well as global level to enhance woman‘s involvement in the enterprise sector. This is mainly because of attitude change, diverted conservative mindset of society to modern one, daring and risk-taking abilities of women, support and cooperation by society members, changes and relaxations in government policies, granting various up-liftment schemes to women entrepreneurs etc. Thus, what else is required is to continue with the above changed trend, emphasizing on educating women strata of population, spreading awareness and consciousness amongst women to outshine in the enterprise field, making them realize their strengths, and important position in the society and the great contribution they can make for their industry as well as the entire economy. For this many NGO‘s should also come forward to extend their support services in the form of pooling financial resources for helping them and spreading education amongst various category of people of the society to encourage woman‘s in their families to represent themselves in the entrepreneurship sector and earn a good name, reputation, financial status, and goodwill in the field of industry, trade and commerce. If every citizen works with such an attitude towards respecting the important position occupied by women in society and understanding their vital role in the modern business field too, then very soon we can pre-estimate our chances of out beating our own conservative and rigid thought process which is the biggest barrier in our country‘s development process. Reference 1. Drucker, F.P.,‗Innovations and Entrepreneurship, Practice
and Principles, Pan Books, London, 1986, Preface, pp.9-10. 2. Lakshmana, Rao, V., ‗Industrial Entrepreneurship in India,
Chugh publications, Allahabad, India, PP. 21. 3. Mohiuddin,A.,‗Enterpreneurship development among
women-Retrospects and prospects, pp. 5-6, 1983, pp. 5-6. 4. Women Entrepreneurship and Economic Development – By
Sanjay Tiwari, Anshuja Tiwari. Publish :Sarup and Sons 5. Entrepreneurship Development –By S.S Khanka. S. Chand
& Company Limited. (Ram Nagar, New Delhi-110055). 6. Dynamics of entrepreneurial development and
management–By Vasant Desai. Himalaya Publishing House.
7. Indian Entrepreneurship (Theory and Practice)- By Dr. D.D. Sharma & Dr. S.K. Dhameja Abhishek Publications Chandigarh-17 (India).