Asian Research Policy
134
Volume 8 Issue 2 December 2017 A sian R esearch P olicy Internationalisation of R&D: A Review of Drivers, Impacts, and New Lines of Research Bernhard Dachs Article 17 Ex-ante Evaluation System of Government R&D Programs in Korea Hyun-Kyu Kang 40 Study on Innovation Model for the Enhancement of Entrepreneurial Competency of Science and Technology Personnel in the Era of the 4 Industrial Revolution Jung-hwan Lee th 52 A Study of Foreign Direct Investment and Technology Spillover Effect: Empirical Evidence from OECD Member Countries Geon-woo Park 68 Policy Integration in the Energy Sector of Indonesia: Analysis of Current Climate Policy Implementation and the Way Forward Towards SDGs Syamsidar Thamrin and Heiner von Lüpke Special Article 1 Policy Trajectories and Initiatives in STEM Education Science and Technology Trends STEAM Education in Korea: Current Policies and Future Directions Oksu Hong 91 Integrating STEM Education into the Global Landscape in China Yuan Gao 102 STEM Education in Malaysia: Policy, Trajectories and Initiatives Edy Hafizan Mohd Shahali, Ihsan Ismail and Lilia Halim 121 Contents
-
Upload
khangminh22 -
Category
Documents
-
view
4 -
download
0
Transcript of Asian Research Policy

Volume 8 Issue 2December 2017
Asian Research Policy
Internationalisation of R&D: A Review of Drivers, Impacts, and New Lines of ResearchBernhard Dachs
Article17
Ex-ante Evaluation System of Government R&D Programs in KoreaHyun-Kyu Kang
40
Study on Innovation Model for the Enhancement of Entrepreneurial Competency of Science and Technology Personnel in the Era of the 4 Industrial RevolutionJung-hwan Lee
th52
A Study of Foreign Direct Investment and Technology Spillover Effect:Empirical Evidence from OECD Member CountriesGeon-woo Park
68
Policy Integration in the Energy Sector of Indonesia:Analysis of Current Climate Policy Implementation and the Way Forward Towards SDGsSyamsidar Thamrin and Heiner von Lüpke
Special Article1
Policy Trajectories and Initiatives in STEM Education
Science and Technology Trends
STEAM Education in Korea: Current Policies and Future Directions Oksu Hong
91
Integrating STEM Education into the Global Landscape in ChinaYuan Gao
102
STEM Education in Malaysia: Policy, Trajectories and Initiatives Edy Hafizan Mohd Shahali, Ihsan Ismail and Lilia Halim
121
Contents


Special Article
1
Policy Integration in the Energy Sector of Indonesia:Analysis of Current Climate Policy Implementation and the Way Forward Towards SDGs
Syamsidar Thamrin1,*, Heiner von Lüpke2
1. Background and Objective of the Article
This article reviews processes of policy integration in the Indonesian energy sector with frameworks of the Sustainable development goals and climate policy as implied by the UNFCCC Paris Agreement and related Nationally Determined Contributions (NDCs). It was developed against the backdrop of an emerging body of literature in the context of developing countries’ efforts to contribute to the mitigation of climate change, both in line with current UNFCCC obligations (“pre-2020”) as well as the Nationally Determined Contributions (NDCs) which were submitted by parties to the United Nations Framework on Climate Change (UNFCCC) with a view to the period following 2020. Our intention was to analyze, in how far the two major frameworks of the international agenda – the UNFCCC process as well the UN based Sustainable Development Goals (SDGs) – are integrated with the development planning system of the Indonesian energy sector. With that objective in mind, we reviewed research articles, analyzed key policy documents, conducted stakeholder interviews related to the climate and energy policy field in Indonesia and inferred conclusions and recommendations for the way forward.
2. Policy Integration of UNFCCC and SDGs with national policies and planning systems
From a science background, there is little doubt that countries worldwide need to act quickly and ambitiously on climate change mitigation. The findings of the Intergovernmental Panel on Climate Change (Edenhofer et al., 2014) suggest that all countries, including developed and developing countries take up responsibilities to reduce emissions of greenhouse gases (GHG) in order to stay below 2 degrees global warming. In the negotiations of the UNFCCC, the group of developing countries has agreed principally to contribute to the mitigation of climate change (Bali Action plan 2007, Copenhagen pledges 2009, Intended Nationally Determined Contributions 2015 (INDCs), and Nationally Determined Contributions (NDCs).
Negotiations have resulted in a global agreement on climate change, the Paris Agreement (UNFCCC, 2015) that outlines principal elements in article 4 for the NDCs as the main vehicle by countries for global climate protection. They are very relevant for domestic climate policy design: every five years, the ambition level of mitigation actions of the NDCs should exceed the present level and countries should
1 Climate & Energy, National Development Planning Ministry, Jalan Taman Suropati No.2, Jakarta 10310, Indonesia2 Climate Policy, Deutsche Gesellschaft für Internationale Zusammenarbeit (GIZ), 53113 Bonn, Dag-Hammarskjöld-Weg 1-5 65760 Eschborn, Germany* Corresponding author: [email protected]

2
Syamsidar Thamrin et al. / Asian Research Policy 8 (2017) 1-16
provide the information necessary for clarity, transparency and understanding of the NDCs.
Within the larger group of developing countries (listed as non-annex I countries under the UNFCCC), the major developing economies play crucial roles in global mitigation efforts which will become even more important over the next 3-4 decades (Fekete, Vieweg, & Mersmann, 2013) (International Monetary Fund, 2008) (Edenhofer et al., 2014). This is because their economic growth rates are estimated to be significant over the next decades with equally significant GHG emissions rates if no major efforts to decouple GHG emissions from economic growth rates will occur.
In order for countries to embark on a transformation pathway in their development and to deviate substantially from business as usual scenarios, a paradigm shift has to occur in the countries. This will need to involve a systemic change, including (among others) political visions for integrated low carbon development, introducing new policies and technologies, and enhancing the capacities of actors and institutions to plan and implement low carbon development and mitigation measures (Olsen & Fenhann, 2015). According to the German Advisory Council on Global Change (2011), the goal of transformational change is a low-carbon society, including through the decarbonization of sectors such as energy. The proactive state and the change agents are key players in such change processes.
For domestic climate policy to be effective and to contribute to achieving the ultimate objective of the UNFCCC Paris Agreement to stay globally below 2 degrees warming and to deliver on the provisions of Article 4 (UNFCCC, 2015), climate policy needs to aim at a deviation from a normal path of development (characterized by current GHG emission
levels) by lowering emissions of greenhouse gases in the sectors where they are implemented. Without the intervention of climate policy, the sectors are likely to continue with a business as usual type of development. Developing countries agreed to these provisions but argue that climate policies should not interfere negatively with national development objectives (Mayrhofer & Gupta, 2016).
Developing countries take a multitude of different approaches to formulate and implement mitigation policies – ranging from economy wide targets (e.g., Mexico, Indonesia) over policies and measures (e.g., Argentina) and sector-specific projects (e.g., Botswana). A common denominator among them is that climate change mitigation policy is led by a national entity, typically the ministry for environment, a commission or committee, or a planning agency of a country (UNFCCC, 2013 and 2016)3. In most cases, these bodies brought forward a national climate change mitigation goal, and most of them deal with mitigation policy multisectorally, because a climate change goal of a country involves typically mitigation actions in more than one sector. The implementation of the mitigation policies, however takes place in the respective sectors (energy, transport, land use etc.) so that a situation develops in which climate policy needs to be integrated between a central (national) climate change body and the sectors.
During the UN Special summit in 20154, the Sustainable Development Goals (SDGs) were adopted and lay out a new framework for sustainable development. They incorporate a new world vision for economic development that is socially inclusive and environmentally sustainable (Sachs, 2016)5. There is a growing recognition that the success of SDGs, will depend on the ability of governments,
3 For a synopsis of pre-2020 Nationally mitigation actions by developing countries, see UNFCCC (2013) and for a synthesis of all Intended nationally determined contributions (INDCs), see UNFCCC (2016).
4 https://sustainabledevelopment.un.org/post2015/transformingourworld5 ACHIEVING THE SUSTAINABLE DEVELOPMENT GOALS: The Key Roles of Northern Europe, Prof. Jeffrey D. Sachs, February 26,
2016, High-Level Launch of SDSN Northern Europe At Chalmers University

Special Article
3
businesses, and civil society to track progress and make informed decisions using data more effectively (Jeffrey D. Sachs, Sep 18, 2015). Learning from the implementation of the Millennium Development Goals (MDGs) in the past, mainstreaming of the SDGs into national development plans will the first strategic step to take full ownership of the goals by a country for successful implementation. The comprehensive nature of the SDGs will require better integration between national policies related to 17 goals which can be grouped into 4 clusters (social, economics, environments, good governance). For example, even though goal 7 included in cluster economics, but it has big impact to the achievement of goal 13 (climate change) which is included in cluster of environment. Therefore, better and stronger policy integration between related goals under SGDs and the national plans, policies and strategies is required. Given the complementarity of goals under the SDG framework for energy and climate (the NDC targets), we can consider the SDGs as the wider framework, in which the NDCs can be integrated.
3. Policy Integration
The need for policy integration was one of the key messages of the Brundtland report (World Commission on Environment and Development, 1987:313): “The ability to choose policy paths that are sustainable requires that the ecological dimensions of policy be considered at the same time as the economic, trade, energy, agricultural, industrial, and other dimensions on the same agendas and in the same national and international institutions. That is the chief institutional challenge of the 1990s.”
It was taken further in the UNFCCC original convention text (UN, 1992), where it is stated in article 3.4 that policies and measures to protect the climate should be integrated with countries’ development planning system.
The academic literature on policy integration is however not unified but rather fragmented due to the various perspectives of sectors and topics through which it is addressed, rendering it challenging to establish an overview and draw conclusions for a general concept of policy integration (Lang & Tosun, 2014). The literature yields a wide variety of definitions and concepts (Adelle & Russel, 2013; Bauer & Rametsteiner, 2006; Lang & Tosun, 2014; Candel & Biesbroek, 2016; Cejudo & Michel, 2015), but certain types can be identified to address climate policy integration processes in developing countries.
The literature can be grouped in three broad threats: 1. General policy integration (not referring to a particular sector), 2. Climate policy integration as a progression from environmental policy integration (EU centered) and 3. Climate policy integration in developing countries.
A commonality among these threads is that most of the definitions of what policy integration means goes back to Underdal (1980) who states that “…a policy is fully integrated if consequences for that policy are recognized as decision premises, integrated into an overall evaluation and incorporated at all policy levels and into all government agencies involved in its implementation.”
Despite of the many variations of terms, concepts and definitions that followed the work of Underdal, one can identify certain core elements which are used by most authors (compare (Lafferty & Hovden, 2003); Bauer & Rametsteiner, 2006). Climate policy integration is accordingly about the incorporation of climate policy goals in all stages of policy making in other policy fields, considering the expected impacts of climate change in the evaluation of policy and accompanied by attempts to minimize contradictions between climate and other policies (ensuring coherence). Proper policy coordination and cross-sector collaboration are essential for successful CPI (Lang & Tosun, 2014), as well as political commitment (see Dupont & Primova, 2011).

4
Syamsidar Thamrin et al. / Asian Research Policy 8 (2017) 1-16
Despite the considerable work conducted on CPI thus far, several aspects deserve attention and further development, in several of the points below particularly in the context of policy frameworks of developing countries.
Normative objectives versus developmental trade-offs: The strong normative connotation of a principled priority approach (environment / climate issue over sector objectives and priorities) as it is already rooted in the definition by Lafferty and Hovden (2003) and taken further by other authors primarily in the EU context (CPI as progression from environmental policy integration, Dupont & Primova, 2011) does not fit to the political reality of developing countries (also brought forward by Rietig, 2012). The ongoing debate in the UNFCCC about balancing between developmental and climate related goals of policies rather calls for more work to make CPI applicable in the context of policy development involving possible trade-offs with sector socio-economic goals and priorities, to account fully the development context and taking into account the crucial importance of co-benefits.
Transferability of CPI approaches to developing countries: Conceptual work and results from empirical research is still very scarce on the topic of climate policy integration in developing countries. A larger body of literature exists under the label of climate change mainstreaming or climate proofing, and root-concepts include principles agreed between the international (donor) community and developing countries, such as importance of ownership of governments, alignment of climate change objectives with national strategies, planning and budgeting instruments (OECD, 2009). However, these approaches have focused so far much less on institutional structures, processes and policy development (Nunan, Campbell, & Foster, 2012). Many authors have analysed mechanisms, oftentimes international ones, for example NAMAs or SD-PAMS (Fukuda & Tamura, 2012); (Román, Linnér, &
Mickwitz, 2015) (Shrivastava & Upadhyaya, 2014), but not yet taken the national climate policy processes and governance systems into consideration. The few articles published so far on CPI with a view to application in developing countries (Kawanishi et al (2015), di Gregorio et al (2017)) hint clearly to the argument that European and western CPI frameworks need to be adapted to allow for assessments of policy processes, degrees of inclusion and policy coherence as well as to select success factors for CPI. Policy change as an output of CPI was not researched so far in the context of developing countries so far.
Recognition of CPI as a process linked to governance: A stronger focus on the processes of CPI appears to correspond well to the evolving climate polices and related implementation processes. According to Candel & Biesbroek (2016) they can be asynchronous and multi-dimensional processes of policy and institutional changes while taking into account the governance systems in which they are embedded in. In this concept, outputs of the policy integration process are described (policy frame, degree of subsystem involvement, adoption of a specific concern as policy goal within the policies and strategies of a governance system, substantive and/or procedural policy instruments). With a view to developing countries, di Gregorio et al (2017) conclude that the absence of a strong overarching governance structure for successful climate change policy integration processes is a major challenge, given the various interests of actors in sectoral policy domains which influence and constrain CPI. Also, Shannon (2010) points out the need to take a wider governance perspective to understand policy integration. Such a wider perspective seems to fit well with the newly emerging climate governance systems in developing countries, in which governments develop and implement domestic climate policies.

Special Article
5
4. The Indonesian Energy Sector in the Context of Climate Change Mitigation and the SDGs
Indonesia refers to the need for policy integration in its NDC (Government of Indonesia, 2015):
- “Recognizing that climate change adaptation and mitigation efforts are inherently multi-sectoral in nature, Indonesia takes an integrated, landscape-scale approach covering terrestrial, coastal and marine ecosystems.”
- “Recognizing the needs to integrate climate change into development and spatial planning and the budgeting process, Indonesia will include key climate change indicators in formulating its development programme’s targets.”
- “The pathway towards decarbonization of the economy will be fully integrated into Indonesia’s National Medium-Term Development Plan for the period 2020-2024.”
Based on the national action plan for GHG emission reduction (RAN-GRK) of 2011, needs for integration are given in the article one, in which it is stated that measures to reduce emissions of GHGs need to be implemented in accordance with the national development planning system.
In the RAN-GRK, the Ministry for Energy and Mineral Resources (ESDM) is responsible for achieving the target of reducing 38 Mio tons of CO2e (cumulatively) until the year 20206. The activities to achieve this objective consist of enhancing energy conservation (introducing mandatory energy management systems in energy intensive industries, building efficiency partnerships with companies, targeting household level
consumption) as well as further development of new and renewable energies (geothermal, hydro, solar, biomass) and further deployment of natural gas supplies. The efforts are to be done entirely by national budgets and resources, which includes national public and private sectors (the latter encompasses also the State Owned Enterprises (SOEs). A slightly higher target of 56 Mio T CO2e is stated to contribute to the national GHG mitigation target of -41% until the year 2020, however depending on the availability of international support. Activities to achieve this conditional mitigation target are not included in the RAN-GRK.
The mitigation activities referred to by the RAN-GRK are all based on projects within the frame of the government´s energy sector programs and policies especially from the existing mid-term development plan (RPJM 2010-2014), which are predating the issuance of the RAN-GRK in 2011.
In regards to these energy sector programs, Indonesia has issued several instruments and policies to promote the development of renewable energies already since the early 2000. The country has a national objective to increase the share of renewables from 4.3% in 2005 to 23% by 2025 (targets contained in the 2007 Energy Policy7). Various feed-in tariffs, laws for biofuel (2006) and geothermal energy (revised 2014) were enacted in recent years. No obvious influence of or relation with the climate change policy of Indonesia is discernible in the case of these energy sector policies, despite the possible synergies between mitigation actions and increasing deployment of renewable energies.
The RAN-GRK itself is a policy output of the previous administration of President Susilo Bambang Yudhoyono known as President SBY, who announced an international mitigation target of Indonesia first during the G20 meeting in 2009, and later officially
6 Targets which are stated at Presidential Decree number 61/2011 of national action plan for GHG emission reduction7 Energy Policy (Kebijakan Energi Nasional = KEN) is developed by Energy Council and approved by Parliament. The energy council is
chaired by the President. Based on study by Center for Data and Information of ESDM in 2013, using KEN scenario, emission reduction from energy sector around 106 million ton CO2e or ~ 8,5% compare to BAU in 2020

6
Syamsidar Thamrin et al. / Asian Research Policy 8 (2017) 1-16
submitted it to the UNFCCC in 2010. The targets of Indonesia were applauded internationally as a significant contribution to the global climate protection. It has been a core concern of president SBY to show the international integration and positive contribution to the protection of global goods.
In addition to this GHG emission reduction target, the energy sector also is challenged to meet the SDGs, especially goal number 7 (Affordable and Clean Energy) with the electrification ratio around 92.8% in 20178, still more than 5.7 million households without access to electricity. In line with its mid-term Development (RPJM), access to energy is an essential factor for sustainable development and poverty eradication, while tackling climate change will only be possible if the SDGs are met. Therefore, the Indonesian Government recently issued a presidential decree for SDGs followed by SDGs Action Plans and Roadmaps to make sure all efforts such as RAN-GRK (and National Determined Contribution) are synergized toward SDGs achievement9. From a climate change perspective (RAN-GRK) on the energy sector, the government currently only emphasizes on increasing utilization of RE and EE, but for SDGs the energy sector policies should not only be green (low emission), but also be affordable and reliable. Therefore, there are more indicators to be monitored to see affordability and reliability. For example, for SDGs’ goal 7, in Indonesia now being discussed to use electricity tariff for affordability and SAIDI10
/SAIFI11 for reliability indicators.
Climate policy: Very Low Energy Emission Target. The period, during which the climate policy for the energy sector was shaped, took
place during 2010. In this year, arguments for and against certain mitigation options (ranging from ambitious renewable energy and efficiency targets, including measures in the substitution of oil, clean coal, Carbon Capture & Storage (CCS), nuclear and increase use of natural gas to the exclusion of the entire sector from the national climate change target were debated within stakeholder meetings and consultations, which included government officials, NGOs, Civil society organizations (CSOs) and private sector representatives (stakeholder interview 09/2017).
The information basis to allow assessing mitigation options and potentials included various background studies and sectoral roadmaps commissioned by the government. Furthermore, media coverage and international pressure influenced the deliberations, but only to a minor extent, given that the principal policy objective was already selected. Influence from the industries and state owned enterprises on the process was more obvious, as several stakeholder expressed concern that ambitious mitigation actions would hamper the energy sector development.
The main reasons why the energy sector´s, including transport and industry sectors, share of the national GHG emission reduction is comparably low are related to the sector s concern that yet another burden on the sector´s development would further hamper the implementation of national energy generation and efficiency programs, including the achievement of the main sector target to provide energy access for the population. There was less pressure on the energy sector from climate change advocacy groups, because those actors who were actively involved in the climate change discussion
8 June 2017 data: https://www.esdm.go.id/assets/media/content/9 Guideline to Develop SDGs Action Plan: http://sdgsindonesia.or.id/index.php/dokumen10 System Average Interruption Duration Index (SAIDI): This index measures the total duration of an interruption for the average
customer during a given time period. This is the most often used performance measurement for a sustained interruption and is normally calculated on either monthly or yearly basis
11 SAIFI stands for System Average Interruption Frequency Index

Special Article
7
were dominated by discourses around climate and forest as well as environmental concerns in other sectors (for example, Jakarta Post, 2015; stakeholder interview, 2017), without much technical and political representation from the energy sector. Discussions were more of a normative character, and stakeholders from the energy sector resorted more to economics and developmental issues than to climate change. In addition, the news at Indonesian TV and newspapers related to climate change was more dominated by forest fire and peatland issues. Furthermore, in early 2010, it was decided by the government during several coordination meetings that the major share of potential emission reduction in the energy sector, especially power sector such as geothermal, was to be dedicated for sale on the carbon market since some discussions with potential buyers were already taking place. However, market transactions of carbon credits never materialized with the consequence in recent years to put back all these power sector emission reduction into the
framework of national efforts in achieving the 2020 and 2030 mitigation targets.
As laid out above, in the multi-sectoral deliberations about the target level for mitigation it was decided that the major share should be bourne by the Land Use Land Use Change and Forestry (LULUCF) sector (67212 Mio TCO2e) and not by the energy sector (38 Mio TCO2e), even though the emission projections in the latter case are constantly rising between 2000 and the present date13 as seen in the Figure 1 and exceed the LULUCF by 2020. For these reasons, the country’s massive programs to expand electricity generation on coal basis by 50 % over the next decades were not touched by climate policy, except requirement to use Super Critical Coal Power Technology which only applies for big capacity. Options to include efficiency gains in the coal based energy generation were discussed in the policy formation phase, but ultimately not included in the RAN-GRK.
Figure 1. Forecast of share baseline emission (INDC modelling, Bappenas, August 2015)
12 This number equal to around 87.6% of the Indonesia’ unilateral target -26% (767 Mio TCO2e)13 Future scenarios also indicate a relatively steep incline of GHG emissions in this sector, while LULUCF is expected to eventually decline.

8
Syamsidar Thamrin et al. / Asian Research Policy 8 (2017) 1-16
5. Coordination, Coherence and Integration of Climate Policy and the Energy Sector
In this section, we present the analysis of the Indonesian energy sector according to the main aspects of the policy integration concept we described earlier (section 4 above). We assess the situation in the light of policy coordination, policy coherence and rate whether this aggregates to a real policy integration outcome.
a. Policy Coordination The ministry of national development planning (BAPPENAS) is per RAN-GRK decree responsible for the coordination of implementation of the action plan, including the local government plans (RAD-GRK) as seen in the Figure 2.
On activity level in the RAN-GRK the responsible institution is ESDM for the above-mentioned energy
sector activities. Coordination between BAPPENAS and ESDM takes place in form of:
- 6-monthly reporting on progress of RAN-GRK implementation
- Regular meetings about status of RAN-GRK implementation
- Irregular meetings based on specific issues- Communication and capacity building for local
government for RAD-GRK implementations
The coordination process went smoothly as individuals on both sides BAPPENAS and ESDM had a commitment to champion the RAN-GRK activities (including based on individual sector affiliation), even though the GHG emission reduction target is comparatively low in the sector until 2020. For future commitments in the energy sector it is rising its share as seen in Figure 3.
Figure 2. Flow of mechanism for monitoring, evaluation and reporting of RAN-GRK and RAD-GRK achievements (authors own elaboration)

Special Article
9
Figure 3. Energy emission reduction target “fair” and “ambitious”, (INDC Modelling, Bappenas, August 2015)
Financial resources from domestic sources for the coordination process did not allow to go beyond regular budget funding. Therefore, international support in form of bilateral and multilateral funding have been instrumental to increase the frequency of the coordination meetings, including the numbers of participants and experts involved in the socialization and capacity building programs. However, very limited additional financial resources were made available for the actual implementation of the mitigation activities both at national level and local level. The emphasis of the line-ministries was more on monitoring on the implementations of the actions and conducting capacity building measures with local governments as described in the Figure 4.
b. Policy CoherenceAnother reason, why the coordination process was
not met with too many challenges is related to the topic of coherence: as mentioned above, the sub-sector of fossil fuel based energy generation was excluded except natural gas. This implies that
Figure 4. Regional allocation interplay of levels of the RAN GRK (author´s own elaboration)
a major issue for coherence with climate change objectives was excluded from the start, i.e., the climate policy formation period. The critical question for coherence of RAN-GRK scope with more general climate change objectives was brought up regularly by concerned NGOs, international organizations and the research communities, who questioned critically the exclusion of high carbon lock-in effects due to the expansion programs for coal based electricity generation from the RAN-GRK. But given that it was not considered by the actual RAN-GRK, this question of substance coherence was not a regular topic of the coordination process between government institutions.
In the National Energy Policy (KEN)14, the renewable energy target is relatively high (23% in 2025 from 6% in 2017) (ESDM, 2016)15. Including this target in the climate policy of Indonesia could be a big contributor to achieving the GHG emission reduction target in the NDC for 2030. However, considering the lack of operational basis of the government programs for renewable energy (RE), it doesn’t seem likely that this target of 23 % will be
14 http://jdih.esdm.go.id/view/download.php?page=peraturan&id=91515 Presentation by Director General of Renewable Energy & Energy Conservation at workshop “New & Renewable Energy, Micro grids
and Smart grids”, March 07th, 2016

10
Syamsidar Thamrin et al. / Asian Research Policy 8 (2017) 1-16
met. To achieve 23% target for power sector, for example, with the current RE total capacity and double growth total capacity in 2030, it means that more than 50% of new power plants has to be RE (while from the 35,000 MW program, only incorporate with top up 7,000 MW RE)
Other issues of coherence – investment needs for renewable energy expansion versus actual investment flows and incentives as well as review and reform of policy instruments for renewable energies (FIT) and energy efficiency – were taken up during the coordination process, however without tangible impact on the policy process.
At the same time, the government also not included relevant programs such as the substitution of gasoline with liquified petroleum gas (LPG) and reduction of electricity subsidy into RAN-GRK, even though those policies have a high potential to reduce GHG emissions significantly. However, the impacts in terms of emission reductions from both policies was still discussed controversially and eventually it was decided to exclude them from the RAN-GRK.
c. Climate Policy Integration (CPI)
As mentioned above, CPI is about the integration and thereby recognition of one policy field objective (climate policy) in another policy field (here the energy sector). Given the nature of the climate policy objective – reducing emissions reductions compared to the business as usual (BAU) scenario– this requires a deviation from the BAU type of development and hence a change or transformation in the sector.
In the literature, linkages of policy integration with the body of work on institutional and policy change (e.g., Hall, 1993; Streeck & Thelen, 2005) are not yet well established, but raised by Candel & Biesbroek (2016) as an essential function of policy integration, i.e., policy integration is done with a view to achieve policy and institutional change. This resonates well with the objectives of climate policy which typically centers around the deviation from business as usual
pathways and triggering transformational change. Hence, we conclude that CPI is done with the goal of achieving policy and institutional change through coordination and coherence. It can be measured with four indicators:
1. Recognition and highlighting of climate change aspects in existing sector programs
2. Improved implementation of existing programs3. Expansion of existing programs4. Policy reform processes and / or establishment
of entirely new policies
We can see clearly that indicator 1 is fulfilled, because the RAN-GRK incorporates (and thereby recognizes the climate relevance) the energy sector´s renewable energy and energy efficiency activities (to a certain extent at least). It is visible in the form of ESDM key performance indicators, which reflect the climate change mitigation goal of RAN-GRK.
It is claimed that number 2 is partly fulfilled, but the evidences still need to be analyzed. This holds true for the energy efficiency (RE) programs, less so for the RE programs, where climate policy could not contribute much to overcoming the prevailing barriers (e.g., pricing policies, market distortions).
Number 3 and 4 are not fulfilled.
d. Outreach to other Actors. The influence of national climate policy within the RAN-GRK context beyond BAPPENAS and ESDM is relatively restricted: PT. PLN as the state-owned electricity utility has a generally conflictive relationship with ESDM, as the SOE is reporting to the Ministry for SOEs and often reacts to ESDM policy initiatives in a reserved way. This is also reflected in the implementation process, where PLN was only represented in larger meetings. The

Special Article
11
ministry of finance was involved related to special issues of funding, but the influence of BAPPENAS and ESDM was held within tight boundaries. The ministry of home affairs played a role in terms of facilitation and process moderation above all on Local Mitigation Action Plan (RAD-GRK) levels, but did not contribute to policy coherence and integration.
6. Implementation process of RAN-GRK
The implementation progress of the energy sector in the RAN-GRK is influenced by a number of factors, which are often very divergent in character:
a. Domestic Political EffectThe policy itself was issued during previous
presidency of SBY, and the driving motivation behind it was not shared necessarily by both his ministers of ESDM and BAPPENAS (who gave on daily political level more importance to traditional energy sector goals)
The subsequent presidency of Joko Widodo and his cabinet ministers of BAPPENAS and ESDM pursued on two levels different political objectives for the energy sector, both in relation to the global contribution to climate change mitigation as well as on internal, domestic levels of Indonesia.
The implementation of RAN-GRK was taken forward irrespectively by the administrative body, but with relatively little backing from the political level. Without the backing of the political level, it depended very much on the individual interest of the responsible government officers, including degree of conviction and belief in the topic of climate change.
An issue which leads to a dichotomy between political and implementation level is related to different professional backgrounds and associated
communication and value systems: while top level political level follows traditional approaches16 to energy development – evaluating policy options based on financial assessments and related outputs, which means for RE / EE options a significant disadvantage. This creates a significant barrier for GHG emission reduction programs in the Indonesian energy sector because of the monopoly structure and dominance by SOEs such as PLN (for electricity) and PERTAMINA (for oil and gas) and relatively lack of incentives for independent power producers. Without strong political support from minister of energy and minister of SOE to emission reduction efforts, renewable energies and energy efficiency will not be assigned with higher priority and likely not provide incentives to trigger significant investments.
Long-term technical staff on policy implementation levels however generally have more experience with policy implementation from various angles and struggle to convince the top level for taking a more integrative approach to policy making and implementation. Due to the vertically pronounced top-down structure of the ESDM Leadership, government officers on lower ranks struggle to provide the top level with information and arguments for climate change mitigation from the bottom up.
This dichotomy of implementation includes also a certain mismatch between ideas coming from the political (ministerial) level and implementing level, because ideas need careful consideration of implementation factors in order to be feasible. The mitigation target for the energy sector of RAN GRK is considered too small in order to catch the attention of the ESDM leadership and there is no link between emission reductions in energy sector for minister of energy performance indicators. There is almost no public pressure to the top political level to reduce emission in the sector.
16 Since the law for SOEs require SOEs only take financial profitable projects. Therefore, if the project/program is not financial profitable, SOE couldn’t do it except formally assigned by government (for example: Minister of SOEs or Minister of Energy)

12
Syamsidar Thamrin et al. / Asian Research Policy 8 (2017) 1-16
b. International Support Support from the international community played a certain role in the implementation dynamics of RAN-GRK, but not necessarily with the effect of triggering policy reform, or change since the international support still relatively small and focus on capacity building and awareness raising but less on support for real investment/construction.
On the other hand, the international level influences significantly the priority setting of the top level, this can be witnessed as direct effect of clean energy ministerial meetings (electric vehicles and solar power as examples), but the climate change meetings of the UNFCCC did not show this effect yet as the minister of energy (ESDM) like most of ministers of energy from other countries did not participate up to now.
c. Local Dynamic The situation and process on national level is very different to the situation on the local level of RAD-GRK implementation, where it oftentimes depend on the political will and priorities of the respective governor, mayor (walikota) and regency head (bupati) to bring together the stakeholders of RAD-GRK and implement measures in renewable energies and energy efficiency.
While it can be observed that local governments did not show significant new investments for climate change activities, positive responses towards capacity building and awareness raising programs can be attested17. On the basis of this observation, it can be expected that future mainstreaming climate change issue into local development planning (budgeting, monitoring, programs) will be met with greater success.
In general, local governments appear to assign less priority to the level of the sector emission target in
their region but are rather concerned with issues in the sector that is priority for them. This could be a valuable lesson for the NDC implementation post 2020. For instance, the big sources of GHG emissions in the energy sector like power, air/railroad transport and big industry are under the line-ministries (central government) responsibility, so local action plans are more focus off-grid or related to community’s need for energy. Therefore, in terms of the total emission reduction from the local mitigation action plan (RAD-GRK) in the energy sector is relatively low compared to the national target (RAN-GRK). However, during the process of awareness raising and capacity building, one could observe a sort of competition between regions to outperform each other in term of achieving local mitigation targets. While this is certainly a positive development, contents centered mostly on issues close to local governance and less about climate change per se.
7. Way forward: Energy and NDC vis a vis SDGs in Indonesia
In 2015, during the same year of the climate change negotiation milestone, the Paris Agreement, the SDGs were also agreed at the UN. For Indonesia, the SDGs are relevant not only as a global commitment, but also as a guidance to become a more advanced country. The SDGs receive high attention by the current President Joko Widodo, and a new presidential degree number 59 for SDGs was issued in 201718. In this decree, a national SDG working group is established, chaired by the President and making it mandatory to develop a national action plan, a roadmap and local action plans. For Indonesia, the SDGs can be a source of reference in
17 From the reports submitted, there is significant increase in term of amount of data and information related to RAD-GRK and number of participants attending socialization or capacity building events: http://www.sekretariat-rangrk.org/publikasi
18 http://sdgsindonesia.or.id/index.php/dokumen/item/287-perpres-no-59-tahun-2017-tentang-sdgs-dan-tindak-lanjutnya

Special Article
13
national/local development planning and implementing regional and global partnerships towards a more prosperous, peaceful and sustainable development path. The SDGs lays out a framework that is comprehensive, integrated, and indivisible, which balances the three dimensions of sustainable development: economic, social and environmental. Therefore, in Indonesia, the country´s commitment to the Paris Agreement (NDC) will be placed under the framework of SDGs. This view is very much related to the comprehensive nature of the SDGs. For example, in Indonesia the current National Medium-Term Development Plan (RPJM) 2015-2019 has incorporated and mainstreamed 94 targets out of 169 targets of SDGs, while the forthcoming National Medium-Term Development Plan 2020-2024 will include all of the relevant targets19. Thus, for Indonesia, SDGs implementation means implementing its own national development.
In the SDGs framework, climate change (goal 13) is incorporated and grouped under the environment cluster, but energy (goal 7) is incorporated under the economic cluster. In terms of policy integration, it will be interesting to see how Indonesia will define the overlap between action plans for each goals of SDGs and related monitoring: challenges will likely consist in the coordination due to pre-existing action plans which are exist before SDGs such as action plan for climate change mitigation (RAN-GRK), action plan for human right, action plan for city development, etc and action plan for energy related to climate change. Indonesia has mapped out the interconnectedness between goals and
clusters, and still continuing its works to develop action plans and roadmap for SDGs.
Apart from the technical-political challenges to synergize the action plans, the SDGs bring bigger and more diverse audiences such as philanthropy groups, CSOs and the business community in the process. Furthermore, the President decided to make the SDGs a “movement” and not just a technocratic exercise. Since its inception, the concept of SDGs is easier to get public’s intention and interest compared to climate change, with not too many negative voices and actors against its broad implementation in Indonesia. Under the SDG framework, it could be a chance for more successful implementation of climate change actions in the energy sector as the SDGs are less fraught with suspicions by certain groups on the domestic level of Indonesia, that developing countries are expected to do more for GHG emission reduction than the industrialized countries and that mitigation actions by developing nations hinder economic development.
Therefore, the discussion achieving SDGs for goal 7 which is the group “economy” being supported by basically everyone because it’s in line with Indonesia´s constitution to provide basic services to all population, with the national development goals to achieve 100% electrification ratio and the already quoted energy target mix aiming at increasing the portion of renewable energy (23% in 2025). Therefore, SGDs’ movement seem will able to boost achieving the climate change target especially energy sector as long as issue of climate change and energy could be injected consistently to the process as diagram in Figure 5 suggested.
19 Minister of National Development Planning/Chairman of Bappenas‘ speech at the High-Level Political Forum 2017 on Sustainable Development, United Nation, New York, July 17th, 2017

14
Syamsidar Thamrin et al. / Asian Research Policy 8 (2017) 1-16
Figure 5. Mainstreaming process of SDGs into mid-term development (author´s own elaboration)
8. Conclusions
As the process of coordination and the issue of coherence shows, the governmental implementation process will take up those aspects which are included in the national action plan, while attempts to go beyond the scope of RAN-GRK activities are not necessarily rewarded or encouraged by the top level of ministers and president. This is because of the relatively low importance assigned to climate change mitigation by the current presidency, compared to the number one target of enabling energy access to all of the population and stimulating economic development through energy supply.
This situation also shows that a critical phase for climate policy integration is the formation phase: if the political level decides to include mitigation actions in the field of fossil fuels, and to drastically increase the importance of renewables in the national climate policy, chances are much greater that this is included and considered in the implementation phase.
The issue of climate policy integration (achieving policy and institutional change through coordination and coherence) with sectors is grossly underestimated by the political level. The decision on a reduction goal of -26%/-41% in 2020 and -29%/-41% in 2030
implies a change in policies and institutions and collaboration across sector boundaries, which was presumably not recognized during the policy formation phase before it was given to the administrative body for implementation.
It is surprising that the mitigation target for the energy is comparably low, considering that even the general RE policy target is much higher (increasing RE share of 15% until 2025). One would expect that a stronger integration of the climate policy with the renewable energy sector might help the government to achieve the energy sector targets, but that doesn’t seem to be the case.
There is strong need for policy integration for SDGs because of it’s very comprehensive and multi-sectoral framework for economic growth, environment, social and good governance. SDGs will become only effective for Indonesia and other countries, if they are incorporated and reflected in the national policy fields. Ownership of each country and quality data will be key for SDGs’ implementation process. Mainstreaming the SDGs including NDC into the national development plan is the first strategic step by Indonesia to take full ownership of the goals for successful implementations.

Special Article
15
References
Adelle, C., & Russel, D. (2013). Climate Policy Integration: A Case of Deja Vu? Environmental Policy and Governance, 23(1), 1–12. Retrieved from https://doi.org/10.1002/eet.1601
BAPPENAS (2017) Monitoring report of RAN-GRK and RAD-GRK Implementation, Retrieved from http://pep.pprk. bappenas.go.id/php
BAPPENAS (2017). Guideline for SDGs Implementation in Indonesia (Buku Pedomana Penyusunan Rencana Aksi Nasional TPB). Retrieved from http://www.sdgs.bappenas. go.id/
Bauer, A., & Rametsteiner, E. (2006). Policy integration and coordination: Theoretical; methodical and conceptual aspects.
Birch, Eugenie. (2015). The Age of Sustainable Development, by Jeffrey D. Sachs. Journal of the American Planning Association. 81. 5-6. 10.1080/01944363.2015.1077080.
Bryson, J. M., & Crosby, B. C. (2015). Designing and Implementing Cross-Sector Collaborations: Needed and challenging. Public Administration Review.
Candel, J. J. L., & Biesbroek, R. (2016). Toward a processual understanding of policy integration. Policy Sciences, 49(3), 211–231. Retrieved from https://doi.org/10.1007/s11077- 016-9248-y
Cejudo, G. M., & Michel, C. (2015). Addressing fragmented government action: Coordination, coherence, and integration. Second International Conference on Public Policy.
Di Gregorio, M., Ridho, D., Paavola, J., Maya, I., Fatorelli, L., Pramova, E., … Dyah, S. (2017). Environmental Science & Policy Climate policy integration in the land use sector : Mitigation , adaptation and sustainable development linkages. Environmental Science and Policy, 67, 35–43.
Dupont, C., & Primova, R. (2011). Combating complexity: the integration of EU climate and energy policies. European Integration Online Papers, 15(1), 1–21. Retrieved from https://doi.org/ 10.1695/2011008
Edenhofer, O., Pichs-Madruga, R., Sokona, Y., Minx, J. C., Farahani, E., Susanne, K., … Zwickel, T. (2014). Climate Change 2014: Mitigation of Climate Change. Working Group III Contribution to the Fifth Assessment Report of the Intergovernmental Panel on Climate Change. Retrieved from https://doi.org/10.1017/CBO9781107415416
Elzen, M., Fekete, H., Admiraal, A., & Forsell, N. (2015). Enhanced policy scenarios for major emitting countries.
Fekete, H., Vieweg, M., & Mersmann, F. (2013). Climate change mitigation in emerging economies: From potentials
to action. Umweltbundesamt Climate Change, 19.German Advisory Council on Global Change. (2011). A Social
Contract for Sustainability. Retrieved from http://www.wbgu. de/en/flagship- reports/fr-2011-a-social-contract/
Government of Indonesia (2011). Presidential Decree 61/2011 about National Mitigation Action Plan (RAN-GRK), Retrieved from http://ranradgrk.bappenas.go.id/rangrk/index.php
Government of Indonesia (2016). First Nationally Determined contribution. Retrieved from http://www4.unfccc.in/ndcregistry/ PublishedDocuments/Indonesia First/First NDC Indonesia_ submitted to UNFCCC Set_November 2016.pdf
Government of Indonesia (2017). Presidential Decree 57/2017 about SDGs, Retrieved from http://www.sdgs.bappenas.go.id/
Government of Indonesia (2017). Presidential Decree 22/2017 about General National Energy Policy (RUEN): Retrieved from http://www.den.go.id/index.php/publikasi
Hall, P.A. (1993). Policy Paradigms, Social Learning, and the State: The Case of Economic Policymaking in Britain. Comparative Politics, Vol. 25, No. 3 (Apr., 1993)
Hill, M., & Hupe, P. (2002). Implementing public policy. Sage publications.
International Monetary Fund (IMF). (2008). Climate change and the global economy. World Economic Outlook, 146, 2–3.
Jakarta Post (25. August 2015). RI sets higher emission reduction target, focusing on energy. Retrieved from http://www.thejakartapost.com/news/2015/08/25/ri-sets-higher-emission-reduction- target-focusing-energy.htm
Kawanishi, M., Setiawan, B., & Meutia, I. (2015). Evaluation of climate policy integration into development: A case study in North Sumatra, Indonesia. Conference paper.
Lafferty, W. M., & Hovden, E. (2003). Environmental Policy Integration: Towards an Analytical Framework. Environmental Politics, 4016(May), 157–159. Retrieved from https://doi.org/ 10.1080/09644010412331308254
Lang, A., & Tosun, J. (2014). Policy Integration und verwandte Ansätze: Möglichkeiten der Theorieintegration. Zeitschrift Für Politikwissenschaft, 1–20.
Mayrhofer, J. P., & Gupta, J. (2016). The science and politics of co-benefits in climate policy. Environmental Science and Policy, 57(DECEMBER), 22–30.
Nunan, F., Campbell, A., & Foster, E. (2012). Environmental mainstreaming: The organisational challenges of policy integration, 277, 262–277
OECD (2009). Integrating Climate Change Adaptation into Development Co-operation. Policy guidance.

16
Syamsidar Thamrin et al. / Asian Research Policy 8 (2017) 1-16
Olsen, K. H., & Fenhann, J. (2015). Transformational Change for Low Carbon and Sustainable Development. Perspective Series. Retrieved from http://orbit.dtu.dk/files/115264160/UNEP_Trans formational_web.pdf
Román, M., Linnér, B., & Mickwitz, P. (2015). Development policies as a vehicle for addressing climate change, Climate and Development, 4:3, 251-260
Sachs, J.D., Badiee, S., Chen, R., & Giovannini E. The Data Revolution for Sustainable Development. Project Syndicate. Sep 18, 2015: Retrieved from https://www. project-syndicate.org/ commentary/sdgs-data-collection-by- jeffrey-d-sachs-et-al-2015-09?barrier=accessreg
Shannon, M. A. (2010). Theoretical Approaches to Understanding Intersectoral Policy Integration.
Shrivastava, M. K., & Upadhyaya, P. (2014). Whither multilateralism? Implications of bilateral NAMA finance for development and soverignty concerns of developing countries. Linköping University Post Print.
Streeck, W., & Thelen, K. A. (2005). Beyond Continuity: Institutional Change in Advanced Political Economies. Oxford University Press.
Underdal, A. (1980). Integrated marine policy: What? Why? How? Marine Policy, 4(3), 159–169.
United Nations (1993). United Nations Framework Convention on Climate Change. Retrieved from http://unfccc. int/files/essential_background/background_publications_htmlpdf/application/pdf/conveng.pdf
UNFCCC. (2015). Paris Agreement. Retrieved from https://doi.org/FCCC/CP/2015/L.9
UNFCCC. (2016). Aggregate effect of the intended nationally determined contributions: an update. Retrieved fromhttps://doi.org/10.1093/iclqaj/24.3.577
United Nations. Transforming our world: the 2030 Agenda for Sustainable Development. Retrieved from https://sustainable development.un.org/post2015/transformingourworld
World Commission on Environment and Development (1987). Our Common Future. Retrieved from http://www.un- documents.net/our-common-future.pdf
Abbreviations
Nationally Determined Contributions (NDCs)The United Nations Framework on Climate Change (UNFCCC)Sustainable Development Goals (SDGs)Emissions of Greenhouse Gases (GHG)Intended Nationally Determined Contributions 2015 (INDCs)National Medium-Term Development Plan (RPJM)National Action Plan for GHG Emission Reduction (RAN-GRK)Ministry for Energy and Mineral Resources (ESDM)State Owned Enterprises (SOEs)Carbon Capture Storage (CCS)Civil Society Organizations (CSOs)Land Use Land Use Change and Forestry (LULUCF)The Ministry of National Development Planning (BAPPENAS)National Energy Policy (KEN)Renewable Energy (RE)Climate policy integration (CPI)Business as Usual (BAU)Energy Efficiency (EE)Local Mitigation Action Plan (RAD-GRK)PT. PLN “Perusahaan Listrik Negara” as the state-owned
electricity utilityPT. PERTAMINA “Perusahaan Pertambangan Minyak dan
Gas Bumi Negara” as the state-owned electricity utility

Articles
17
Internationalisation of R&D:A Review of Drivers, Impacts, and new Lines of Research
Bernhard Dachs
AbstractThis paper reviews the growing literature on the internationalisation of R&D in the business sector. By internationalisation of R&D, this paper means the fact that firms conduct research and development at locations outside their home countries. The survey focuses on three issues: first, the drivers of the process at the country, the sectoral and the firm level – why firms go abroad with R&D activities. Second, evidence on the effects of the internationalisation of R&D on the host and home countries of multinational firms. So far, there is a consensus in the literature that R&D internationalisation benefits the host countries. Third, the paper discusses some new lines of research on R&D internationalisation related to the role of indirect funding for R&D, R&D internationalisation in services and multinationals from emerging economies.
Keywords: internationalisation, R&D, innovation, foreign-owned firms, outsourcing
1. Introduction
Foreign-owned firms are among the top performers of research and development (R&D) in many countries. In 2013, foreign-owned firms accounted for more than 20% of business R&D in France, Germany, the Netherlands, and Italy; between 30% and 50% in Spain, Poland, and Sweden; and for more than 50% in the United Kingdom, Austria, Belgium, the Czech Republic, Hungary, Slovakia and Ireland (Iversen et al. 2016). Thus, foreign-owned firms have a considerable influence on the technological capabilities of countries, which in turn determine competitiveness to a considerable degree. This makes the internationalisation of R&D a key dimension of science, innovation and technology policy.
This paper reviews the growing literature on R&D internationalisation in the business sector. By
internationalisation of R&D, this paper means the fact that firms conduct research and development at locations outside their home countries. The survey focuses on three issues: first, the drivers of the process – why firms go abroad with R&D activities. Second, the effects of the internationalisation of R&D on the host and home countries of multinational firms. Third, I will discuss some new lines of research on R&D internationalisation.
The survey has three important limitations. First, it does not present empirical evidence on R&D internationalisation; readers can refer to recent publications such as Iversen et al. 2016, Dachs, et al. 2014, or OECD 2008a which present this information in detail. Second, the survey will only include the literature on the internationalisation of
AIT Austrian Institute of Technology, Center for Innovation Systems & Policy, Vienna, Austria E-mail: [email protected]

18
Bernhard Dachs / Asian Research Policy 8 (2017) 17-39
R&D in firms, and leave internationalisation in higher education or public research centres aside. Third, the literature on foreign direct investment (FDI) and multinational enterprises is only included if it relates to R&D. Internationalisation refers to the internationalisation of business R&D through the remainder of this paper, unless otherwise stated.
The internationalisation of R&D is a relatively young phenomenon, although scientists, knowledge and artefacts have always crossed borders easily in economic history. The early literature regarded internationalisation of R&D as an unlikely phenomenon, because of the strong linkages of large firms to universities and other research organisations in their home countries (Patel and Pavitt, 1991). The oldest literature on the internationalisation of R&D dates back to the end of the 1960s and the beginning of the 1970s (e. g. Dunning 1958; Brash 1966; Safarian 1966). Only few articles and surveys emerged in the 1970s (examples are Creamer 1976; Ronstadt 1977; Lall 1979) and in the 1980s and early 1990s (Behrman and Fischer 1980, Cantwell 1989, Pearce 1992).
Since the year 2000, a growing body of literature provides evidence that the internationalisation of R&D is gaining momentum (OECD 2005; UNCTAD 2005; Hatzichronoglou 2008; OECD 2008a; OECD 2008b; OECD 2008c; Shapira et al. 2009, OECD 2010, Hall 2010, - Alkemade et al. 2015 and Laurens et al. 2015 see it differently). This literature is accompanied by a number of international comparisons of policies towards R&D internationalisation (CREST Working Group 2007, OECD 2008a, TAFTIE 2009, Schwaag Serger and Wise 2010, OECD 2016a).
2. Search Strategy
The paper employs a very simple search strategy: we searched at Google Scholar for three search terms:
internationalisation of R&D, offshoring of R&D, and R&D by foreign-owned firms. Existing review articles such as Narula and Zanfrei (2005), Veugelers (2005), Cantwell (2009), Hall (2010), or Santos-Paulino et al. (2014) helped in the selection of these search terms and provided an additional source for identifying relevant research. Google Scholar offers the advantage that it also provides working papers and other articles not yet published in academic journals. The survey mainly considers papers published after the year 2000. The selection of papers is subjective, because due to space constraints not every paper can enter the review. I found it most important to consider papers that can help to identify variables and issues helpful for further empirical research.
3. Drivers of R&D Internationalisation
The benefits and costs associated with the internationalisation of R&D vary between firms, industries, regions or countries. It is therefore important to distinguish between these three levels. I start with a discussion of the drivers at the regional and country level and then go to the sectoral and firm level.
3.1. Drivers at the Regional and Country Level
The potential host country or host region shapes the internationalisation decisions of firms by providing different incentives, as well as different framework conditions to invest in R&D. Drivers at the regional or country level are also important from a policy perspective, because they give room for policy intervention to increase the locational advantages of regions or countries.
A first important driver at regional or country level is economic size, measured by income and market size. Size is an important driver, because

Articles
19
high income and high income growth attracts FDI (Ekholm and Midelfart 2004; Blonigen 2005; Jensen 2006; Athukorala and Kohpaiboon 2010; Hall, 2010). The importance of market size points to the relationship between R&D and other MNE activities: R&D investments often follow FDI, and overseas R&D activities are, in most cases, an extension of existing overseas production and marketing activities (Birkinshaw and Hood 1998; Birkinshaw et al. 1998; Archibugi and Iammarino 1999, De Backer et al. 2016). Moreover, firms may find it easier to cover the cost of R&D in a country with a large market where they expect larger absolute revenues than in a country with a small domestic market, even if wages are considerably lower.
Another important attractor of R&D of MNEs is a skilled workforce and the quality of the education system. In a survey of multinational firms, Thursby and Thursby (2006) find that highly qualified R&D personnel is the most important driver for location decisions in R&D. Tübke et al. (2016) come to a similar conclusion in a recent survey. Ernst (2006) relates the success of India and other Asian countries in attracting R&D of foreign MNEs to their expanding pool of graduates in science and technology. Hedge and Hicks (2008) demonstrate that the innovation activities of overseas US subsidiaries are strongly related to the scientific and engineering capabilities of the host countries.
In turn, skills shortage and a growing demand for engineers and scientists in the home country is often a motive for firms to go abroad with R&D. Kinkel and Maloca (2008) find that capacity bottlenecks are the most frequent reason why German firms move R&D to locations abroad. In the research of Lewin et al. (2009), an emerging shortage of high skilled science and engineering talent partially explains the relocation of product development from the United States to other parts of the world, most notably to Asian countries.
Potential knowledge spillovers between
foreign-owned firms and host country organisations are another driver for R&D internationalisation. A discussion of spillovers as an effect of R&D internationalisation is found in the next chapter. Spillovers as a determinant for R&D location decisions point to the importance of the quality of university research as a driver of R&D internationalisation at the country level (Belderbos et al. 2009; Thomson 2013; Siedschlag et al. 2013). Knowledge spillovers may be even more relevant at the regional than at the country level, because spillovers diminish with distance between sender and receiver (Jaffe et al. 1993; Breschi and Lissoni 2001). As a consequence, firms which want to utilize such localised knowledge spillovers have to be present where they occur, and innovative activity tends to cluster locally in industries with a high level of spillovers (Audretsch and Feldman 1996). This effect is related to institutional or technological conditions, such as tacitness of the knowledge base, but also to the existence of specialised local or regional labour markets (see the survey of Breschi and Lissoni 2001).
An example of the importance of spillovers give Siedschlag et al. (2013). They show that agglomeration economies from foreign R&D activities, human capital, proximity to centres of research excellence and the research and innovation capacity of the region are crucial for the R&D location decisions of multinational firms in the European Union. Other evidence for regional knowledge spillovers by R&D of foreign-owned firms present Castellani and Pieri (2013).
Differences in labour cost between the home country and locations abroad are one of the most important motives for the internationalisation of production (Barba Navaretti and Venables 2004; Brennan et al. 2015). Empirical evidence that differences in the cost of R&D personnel are a major driver for the internationalisation of R&D, however, is weak. Survey results as well as econometric studies see only a modest influence of wage differences in R&D location decisions compared to other factors

20
Bernhard Dachs / Asian Research Policy 8 (2017) 17-39
(Booz Allen Hamilton and INSEAD 2006; Thursby and Thursby 2006; Kinkel and Maloca 2008; Belderbos et al. 2009; Tübke et al. 2017). However, cost differences may become important when firms can choose between two locations that are similar in many other locational factors (Booz Allen Hamilton and INSEAD 2006; Thursby and Thursby 2006; Cincera et al. 2010; Athukorala and Kohpaiboon 2010).
Previous research has also pointed out that geographical proximity between host and home country leads to higher levels of cross-border R&D investments (Guellec and van Pottelsberghe de la Potterie 2001). However, there is also evidence that geographic distance may play smaller role for R&D than for other types of international activity (Dachs and Pyka 2010, Castellani et al. 2013). The distance effect is often explained by additional co-ordination cost, the cost of transferring knowledge over distance, and a loss of economies of scale and scope when R&D becomes more decentralised (von Zedtwitz and Gassmann 2002; Sanna-Randaccio and Veugelers 2007; Gersbach and Schmutzler 2011). In addition, the distance effect may also be explained by cultural, social and institutional factors. The international business literature stresses that foreign-owned firms have to master additional institutional and cultural barriers in their host countries. This disadvantage is known as the ‘liability of foreignness’ (Zaheer 1995; Eden and Miller 2004) or the ‘liability of outsidership’ (Johanson and Vahlne 2009). Foreign-owned firms may suffer from a lack of market knowledge and understanding of customer demands, but also a lower degree of embeddedness in informal networks in the host country (Lööf 2009). Disadvantages from the liability of foreignness tend to decrease over time, but may even exist in long-established affiliates with a local management and staff, because the affiliate is embedded in intra-firm networks and have to stick to the rules, norms and standards of the multinational group.
The role of policy for R&D location decisions of MNEs has been investigated by a number of empirical studies (Cantwell and Mudambi 2000; Kumar 2001; Cantwell and Piscitello 2002; Thursby and Thursby 2006; Kinkel and Maloca 2008; De Backer and Hatem 2010; Athukorala and Kohpaiboon 2010). Policy instruments include subsidies for investments or R&D activities, or non-monetary measures such as investment services, match-making, provision of infrastructure, legal support etc. (OECD 2016a). Fostering intellectual property rights – although not a typical inward investment promotion activity – can also be regarded as an important policy instrument (Branstetter et al. 2006; Thursby and Thursby 2006; Holmes et al. 2016 on China; Schmiele 2013 is more sceptical). Moreover, with the expansion of European and US MNEs into Asia, local content requirements in R&D (mandatory technology transfer, mandatory joint ventures, requirements to perform R&D in the host country) gained some prominence as a policy tool (Walsh 2007, Weiss 2016).
Two findings on the role of policy in R&D internationalisation find a wide consensus in the literature: first, special financial incentives and a positive discrimination of foreign-owned firms in general are not regarded as an appropriate instrument to attract foreign R&D. Athukorala and Kohpaiboon (2010) conclude in their analysis of overseas R&D activities of US firms that ‘there is no evidence to suggest that R&D specific incentives have a significant impact on inter-country differences in R&D intensity (of US firms) when controlled for other relevant variables’. This does not mean, however, that science, technology and innovation policy has no role in attracting foreign R&D. Measures to improve university education or to foster co-operation between firms and universities can considerably shape the attractiveness of locations by improving the capabilities of the national innovation systems and leveraging R&D efforts of

Articles
21
firms. These measures, however, should be open to every firm, domestically or foreign-owned. Siedschlag et al. (2013), for example, show that high public R&D expenditures increase the probability of location of R&D activities by European multinational firms in a particular region.
Second, governments that want to attract R&D of foreign multinational firms should instead focus on the economic fundamentals and provide political stability, good public infrastructure, reasonable tax rates, a stable legal system, and increase the embeddedness of foreign-owned firms in the domestic innovation system (Cantwell and Mudambi 2000; Narula and Guimón 2009; Guimónh 2009; Ascani et al. 2016). This reflects the finding discussed above that the location of R&D often depends on the location of production, sales or other business functions of the firm.
3.2. Drivers at the Sectoral Level
A second important level for the analysis of drivers is the sector where the firm operates. Empirical studies found huge differences between sectors in terms of R&D internationalisation (OECD 2008; Dachs et al. 2014): R&D internationalisation tends to concentrate in high-technology sectors, such as pharmaceuticals, computers, electronics, machinery, or the automotive industry. However, there is not much literature that would explain these differences. I will therefore present some thoughts based on the innovation economics literature.
Sectors matter for R&D internationalisation in two ways: on the one hand, R&D intensive sectors have a disproportionate share on global foreign direct investment (Markusen 1995, p. 172; Bellak 2004). Hence, there is already a bias towards R&D-intensive sectors in underlying FDI decisions. On the other hand, sectors matter because R&D intensity and R&D processes differ considerably between sectors (Marsili 2001; Malerba 2005; Castellacci 2007;
Peneder 2010). These intersectoral differences shape the R&D behaviour of firms to a considerable degree, including decisions to locate R&D abroad, leading to different degrees of internationalisation at the sectoral level.
A first important determinant at the industry level is the degree of tacitness of the knowledge base of a sector. Tacitness results from the fact that cognitive capabilities and abstract concepts are not easy to articulate explicitly and to transfer between people (Cowan et al. 2000). A knowledge base which is highly tacit and bound to individuals may be an obstacle to internationalisation, because it makes knowledge exchange over distance costly. Tacitness, however, may also be a driver for internationalisation, because firms have to move to the place where this knowledge is available when it cannot be transferred over distance.
Second, sectoral knowledge bases also differ in their degree of cumulativeness, or, in other words, in the degree future innovation success depends on the knowledge which has been built up in the past (Marsili 2001). Cumulativeness is high in chemicals, pharmaceuticals, telecommunications and electronics, but low in mechanical engineering, food, clothing, or civil engineering (Malerba and Orsenigo 1996; Marsili 2001). A high degree of cumulativeness may require a high degree of specialisation in R&D, which gives advantages to centralised R&D. Cumulativeness may also promote R&D centralisation when strong learning effects lead to increasing returns to scale in R&D, or when the R&D process includes economies of scope and effects from cross-fertilisation. Moreover, cumulativeness of the knowledge base may also imply that R&D activities require a certain minimum scale in order to be successful.
Third, sectors also differ in terms of appropriability, the degree to which an innovation can be protected from imitation (Cohen et al. 2000; Cohen 2010). Firms in sectors with a low degree of appropriability, like many service sectors, may be reluctant to internationalise R&D because they have only weak

22
Bernhard Dachs / Asian Research Policy 8 (2017) 17-39
means to prevent involuntary knowledge spillovers.Fourth, another source for inter-sectoral differences
is the firm’s network of external relations with suppliers, clients, universities, public administration, etc. (Marsili 2001; Malerba 2002). Some industries, such as biotechnology or pharmaceuticals, have strong linkages to basic science, and firms in these industries may find it useful to locate R&D close to excellent research universities. Belderbos et al. (2009) show that firms with a strong science orientation prefer to locate R&D in host countries with strengths in academic research. Another very important locational factor for high R&D intensive sectors is the framework for R&D, including intellectual property rights (Tübke et al. 2017). Firms in other sectors, such as the automotive of the electronics industry, are closely connected to suppliers and customers through international production networks. Enterprises in these sectors may be forced to internationalise their R&D to gain market access, in particular have development capabilities in proximity to key clients. Tübke et al. (2017) show that for medium- and low-tech sectors, market access is more important than a reliable framework for R&D. The existence of lead users or other potential co-operation partners may also pose a strong incentive to locate R&D in a particular country.
3.3. Drivers at the Firm Level
The third relevant level for the explanation of overall patterns of R&D internationalisation is the firm level. Internationalisation paths of two firms can be completely different – even if they operate in the same region and operate in the same industry – when they differ in their firm characteristics (for example, size, internationalisation experience), the costs and benefits that arise for them from internationalisation, and resulting motives and strategies. The interplay of these three factors, together with framework conditions from the country, regional and sectoral level, determines
the degree of R&D internationalisation of firms.Internationalisation decisions in R&D are closely
connected with internationalisation decisions in production and the emergence of global value chains (these are discussed in Amador and Chabral 2016; Timmer et al. 2014). This relationship can be explained by two reasons. First, internationalisation in production can be a result of superior, firm-specific assets. Firms internationalise, because they want to exploit these assets at foreign markets via their subsidiaries (Dunning 1973; Markusen 1995; Caves 1996 (1974); Markusen 2002). Dunning (1973; 1981) suggests that firms exploit these assets via FDI and not via exports or licensing because of ownership, location and internalisation advantages associated with this mode of exploitation. Thus, firm heterogeneity leads to self-selection in the internationalisation strategies of firms (Head and Ries 2003; Helpman et al. 2004; Helpman 2006). Only the most productive (and thus innovation intensive) firms expand their operations via FDI, while less productive firms choose to export or serve only domestic markets. However, the relationship also exists in the other direction: globally engaged firms use more innovative inputs and generate more innovative outputs, leading to a higher productivity (Criscuolo et al. 2010). In addition, there is also evidence for a positive relationship between innovation and exports at the firm level (Greenhalgh and Taylor 1990; Lachenmaier and Wößmann 2006; Harris and Li 2009).
Second, there is a mutual relationship between R&D and international expansion because they are both driven by the same determinants. Some firm characteristics that are positively related to R&D intensity also drive internationalisation (Arvanitis and Hollenstein 2006, Cerrato 2009). Dogson and Rothwell (1994), Cohen (1995, 2010), Kleinknecht and Mohnen (2002) or the OECD (2009) have examined the determinants of R&D and innovation in detail. R&D and R&D intensity is, at first, associated with firm size. There are different advantages and disadvantages of small and large

Articles
23
firms in the innovation process, leading to a U-shaped relationship between size and R&D (Kleinknecht 1989; Cohen 1995). Regression analysis also finds a significant and positive association between firm size and the internationalisation of R&D (Arvanitis and Hollenstein 2006; Kinkel and Maloca 2008; Schmiele 2012). R&D is also positively related to the internal knowledge and capabilities of the firm (Cohen and Levinthal 1989 and 1990; Teece et al. 1997). These capabilities enable the firm to create new knowledge, but also absorb knowledge from external sources.
Besides firm characteristics, another source of firm heterogeneity in the internationalisation of R&D are the costs of a decentralised organisation of R&D (Sanna-Randaccio and Veugelers 2007; Gersbach and Schmutzler 2011, Belderbos et al. 2013). These costs first comprise the foregone benefits of R&D centralisation, including economies of scale and scope from specialisation and a tighter control over core technologies of the firm. Second, additional costs also arise from higher co-ordination efforts and the cost of transferring knowledge within the MNE. Proximity also facilitates co-ordination of R&D activities with other parts of the firm, such as production and marketing, and mutual learning between these parts. A growing literature discusses the need of firms to co-locate production and R&D to enable mutual learning effects (Ketokivi and Ali-Yrkkö 2009, Defever 2012, Alcacer and Delgado 2016). Loosing such co-location advantages would be a hampering factor for R&D internationalisation. Third, a concentration of R&D activity in the home country is also favoured by various linkages between the firm and the home country innovation system. Patel and Pavitt (1999), Narula (2002), or Belderbos et al. 2013 point out that firms are strongly embedded in and dependent on their home country innovation system. The ties that bind firms to their home country include formal R&D co-operations with domestic universities, but also informal networks that grew from doing business together in the past. Informal
networks between firms may also evolve from recruiting staff from the same universities and labour mobility. Removing these linkages by moving R&D abroad would incur considerable costs on the firms, because they would need to re-install similar linkages with host country organisations.
Finally, firm characteristics and the costs of R&D internationalisation have to be seen alongside the benefits of R&D internationalisation and the resulting strategies of the firms. A first benefit is that R&D can support overseas production. Products and technologies often have to be adapted to consumer preferences, regulation, or environmental conditions of foreign markets in order to facilitate their exploitation in these markets. These adaptations can be done more easily in proximity to potential clients in the host countries. MNEs therefore locate design, engineering and R&D units in main foreign markets to support marketing and production facilities abroad. There are various names for this motive in the literature, including asset-exploiting behaviour (Dunning and Narula 1995), competence-exploiting subsidiary mandates (Cantwell and Mudambi 2005), home-base exploiting strategies (Kuemmerle 1999), or market-driven internationalisation of R&D (von Zedtwitz and Gassmann 2002).
A second benefit and important driver of R&D internationalisation at the firm level is access to knowledge and the creation of new knowledge abroad. This motive is known as the asset-seeking motive (Dunning and Narula 1995), competence-creating subsidiary mandate (Cantwell and Mudambi 2005), home-base augmenting strategy (Kuemmerle 1999), or global R&D strategy (von Zedtwitz and Gassmann 2002) in the literature.
Asset-seeking strategies are driven, on the one hand, by the existence of superior local knowledge and favourable framework conditions for R&D in various host countries. Some types of knowledge are tacit, bound to their local context, and transferable over distance only at high costs (Cowan et al. 2000; Breschi and Lissoni 2001). This knowledge may

24
Bernhard Dachs / Asian Research Policy 8 (2017) 17-39
be found at universities and other research organisations, in clusters, or be available from clients, suppliers or competitors. Various authors describe foreign-owned subsidiaries as ‘surveillance outposts’ or ‘antennas’ (Florida 1997; Almeida 1999) that extensively monitor and assimilate knowledge from local sources. On the other hand, asset-seeking strategies may also be driven by factors related to the nature of various technologies and changing firm strategies. Narula and Zanfei (2005) for example, suggest that the increasing complexity of products is a driver of the internationalisation of R&D. Rising technological complexity increases the knowledge requirements of firms and forces them to search for new knowledge abroad. A similar argument is brought forward by Chesbrough (2003). He points out that many innovative firms have moved to an ‘open innovation’ model where they exploit ideas and knowledge not only provided by internal R&D, but also from a broad range of external sources and actors. In this respect, asset-seeking can be seen as a variant of ‘open innovation’ strategies with a focus on their geographical dimension.
There is evidence that asset-seeking strategies have become more frequent in the recent years, although asset-exploiting strategies still prevail (Narula and Zanfei 2005; Sachwald 2008). Moreover, some authors (for example Criscuolo et al. 2005) stress the fact that the two motives cannot be separated
in a number of cases. Firms – intentionally or unintentionally – often follow both strategies simultaneously. Microsoft’s efforts to adapt their products to the Chinese language resulted in new knowledge that could also be used in other contexts (Gassmann and Han 2004).
Finally, an important aspect of firm strategy towards R&D internationalisation is the degree of decentralisation. In order to make internationalisation of R&D possible, the head office of the MNE has to allow a higher degree of decentralisation by changing firm organisation and giving a higher degree of autonomy to the subsidiaries (Birkinshaw and Hood 1998; Birkinshaw et al. 1998; Zanfei 2000).
4. Impacts of MNE R&D Activities on Host and Home Countries
The technological and economic characteristics of countries provide different locational advantages and disadvantages for foreign-owned firms to set up R&D and innovation activities. However, R&D activities of MNE affiliates may also influence the innovation systems of their host and home countries to a considerable degree. The literature has identified various potential opportunities and challenges for host and home countries from the internationalisation of R&D and innovation (see Table 1).
Table 1. Potential opportunities and challenges for national innovation systems from the internationalisation of R&D and innovation
Opportunities Challenges
Host country
Ÿ Increases in aggregate R&D and innovation expenditureŸ Knowledge diffusion to the host economyŸ Demand for skilled personnelŸ Structural change and agglomeration effects
Ÿ Competition with domestically owned firms for resources; crowding-out
Ÿ Loss of control over domestic innovation capacity Ÿ Separation of R&D and productionŸ Less strategic research, less radical innovations, more
adapting
Home Country
Ÿ Improved overall R&D efficiencyŸ Reverse technology transferŸ Market expansion effectsŸ Exploitation of foreign knowledge at home
Ÿ Loss of jobs due to relocationŸ ‘Hollowing out’ of domestic R&D and innovation activitiesŸ Technology leakage and involuntary knowledge diffusion
Source: Adapted from Sheehan (2004), UNCTAD (2005), Veugelers (2005).

Articles
25
4.1. Impacts of MNE R&D and Innovation Activities on Host Countries
I first discuss the perspective of the host country (the two upper cells in Table 1). The presence of MNE affiliates in a country can considerably raise aggregate R&D expenditure of this country over the short and medium term. Multinational firms spend huge amounts on R&D, even compared with aggregate R&D expenditure of countries (OECD 2010, p. 121). A new R&D activity of an MNE may therefore considerably affect aggregate R&D activity of the host country, in particular in small and medium-sized countries. Empirical evidence suggests that small countries benefit most in relative terms, also because they usually exhibit higher degrees of internationalisation in FDI than large countries (Lonmo and Anderson 2003; Costa and Filippov 2008). MNE affiliates – in contrast to domestically owned firms – can access financial means of their parent enterprise abroad; expansion of R&D activity is therefore not limited by a lack of internal resources or incomplete credit markets in the host country. There is also evidence that affiliates of foreign-owned firms perform better in many aspects of innovation behaviour than domestically owned firms (Frenz and Ietto Gillies 2007, Dachs et al. 2008, Sadowski and Sadowski-Rasters 2008, Cozza and Zanfei 2016). This includes, for example, higher levels of innovation output and higher labour productivity, and a higher propensity to co-operate than domestically owned enterprises after controlling for size, sector and innovation input.
A second benefit for the host country is the diffusion of information and knowledge (knowledge spillovers1) to host country organisations. Potential receivers of this knowledge are domestic firms, universities, or research centres. The literature gives considerable attention to knowledge diffusion and spillovers by foreign-owned firms (see the surveys by Keller 2004, 2010, Mayer and Sinani 2009, or
Hayakawa et al 2010). More recently, the literature also discusses spillovers from R&D between foreign-owned firms and the innovation systems of emerging economies (Qu et al. 2013, Feng 2017).
According to Blomström and Kokko (2003), spillovers are the strongest argument as to why countries should try to attract inward investment. Empirical evidence on the size and the effects of spillovers, however, is mixed. Meta-studies (Görg and Strobl 2001, Görg and Greenaway 2004; Mayer and Sinani 2009; Havránek and Iršová 2010) show no clear relationship between foreign presence and the performance of domestically owned firms. Görg and Strobl (2001) for example indicate that the number of studies that identify positive spillovers roughly equals those identifying no effects or even negative consequences from the presence of foreign-owned firms. In the majority of cases considered by Görg and Greenaway (2004), no significant effect of MNE presence on domestic firm productivity is observed. Veugelers (2005, p 37) finds that it is ‘fair to conclude that the results on positive spillovers on host economies are not strong and robust’. Empirical evidence is clearer below the aggregate level. Contributions by Singh (2007), Keller and Yeaple (2009) and by Coe et al. (2009) reveal substantial spillover effects from foreign R&D stocks and the presence of foreign-owned firms at the sectoral level. Marin and Bell (2006) provide a similar result at the firm level.
A main reason for this vagueness of the results, besides measurement issues, is the fact that spillovers from foreign-owned firms to the local economy are bound to specific industry and economy-wide conditions to occur. These factors include a certain level of absorptive capacity (Cohen and Levinthal 1989, 1990; Cantner and Pyka 1998) of domestic organisations; weak instruments of foreign-owned firms to protect proprietary knowledge, which is mostly sector-specific; and the propensity of the transfer channel or type of interaction between

26
Bernhard Dachs / Asian Research Policy 8 (2017) 17-39
foreign-owned firms and domestic organisations (Veugelers and Cassiman 2004).
R&D activities of foreign-owned firms in a particular country may also help to enhance the level and quality of human resources. New R&D labs by MNEs may create additional demand for researchers and give incentives to governments to improve higher education systems. MNEs are attractive employers, because they can offer international career perspectives and pay higher wages than domestically owned enterprises (Lipsey 2002; Bailey and Driffield 2007; Hijzen et al. 2013; Nilsson Hakkala et al. 2014). Moreover, jobs created by foreign-owned firms appear to be more persistent than jobs generated in domestically owned plants (Görg and Strobl 2003).
Finally, foreign-owned firms can also contribute to structural change towards a higher share of technology-intensive firms and to the emergence of clusters in the host country. Structural change is related in two ways to the presence of foreign-owned firms. On the one hand, foreign-owned firms operate predominantly in technology-intensive industries. Market entrance and subsequent growth of the foreign-owned firm will therefore shift the industrial structure of a country towards a higher technology intensity (Blonigen and Slaughter 2001; Driffield et al. 2009). On the other hand, MNE subsidiaries trigger structural change because their demand for inputs favours the growth of technology-intensive suppliers in the host country. This demand may lead to the emergence of clusters and other agglomerations at the regional level in the host country (Young et al. 1994; Bellandi 2001; Pavlínek 2004). Foreign-owned subsidiaries in clusters often strongly embedded locally, but have also a lot of ties with international partners inside and outside their company group, and can therefore act as bridges for knowledge transfer between domestic organisations and abroad (Birkinshaw and Hood 2000; Lorenzen and Mahnke 2002).
I now turn to potential challenges for host countries that emerge from the presence of foreign-owned firms. One striking aspect in the literature on FDI spillovers is the number of studies that report negative effects (see, for example, Aitken and Harrison 1999; Konings 2001; Castellani and Zanfei 2002; Damijan et al. 2003; Marin and Sasidharan 2010; Damijan et al. 2013, Rojec and Knell, 2015). These negative spillovers are often found in studies on developing and transition economies. Wang (2010), for example, investigates the determinants of R&D investment at the national level for 26 OECD countries from 1996-2006 and finds that foreign technology inflows through trade and FDI had a robust and negative impact on domestic R&D. One explanation for these negative impacts is increased competition in product and factor markets due to foreign presence (Aitken and Harrison 1999; Konings 2001). In the context of R&D, competition for staff (Figini and Görg 1999; Driffield and Taylor 2000) seems to be relevant in particular. Additional demand by MNEs for skilled personnel is beneficial for the host country in the short run when there are unemployed scientists, engineers and technicians and alternative employment opportunities – for example at domestic universities – are scarce. However, it may have negative consequences for the host country when the supply for research personnel is inelastic and foreign-owned firms and domestic organisations compete for qualified staff. In the long run, the effects of the demand by foreign-owned firms on the labour market for R&D staff look more positive. Stronger demand for high-skilled labour due to market entry of foreign-owned firms and structural change may foster academic training and increase the number of graduates in science and technology in the long run. A higher skill intensity in the economy, in turn, may foster locational advantages and further increase the attractiveness of the country for inward investment. Barry (2004) illustrates such a ‘virtuous circle’ for the case of Ireland.

Articles
27
Fears that a high share of foreign-owned firms on aggregate R&D expenditure may lead to negative effects are also nurtured by more general concerns against MNE presence (see Barba Navaretti and Venables 2004; Jensen 2006; Forsgren 2008 for a summary of this discussion). This is less an academic and more a general policy discussion, so there are only very few academic papers that investigate these issues. These concerns include: the assumption that the internationalisation of R&D leads to a loss of control over domestic innovation capacity, because decisions on R&D of foreign-owned firms may not be taken by the subsidiaries themselves, but by corporate headquarters abroad; the assumption that R&D activities of MNEs are more ‘footloose’ than those of domestically owned firms, because they can be easily transferred between countries; the assumption that foreign-owned enterprises act in ways that are not in accordance with the national interest; the assumption that an important motive for R&D internationalisation is rent-seeking in selecting locations. Another concern against foreign ownership is that R&D of foreign-owned firms is associated with a higher degree of adaptation and less basic, strategic research, because MNEs often concentrate strategic, long-term R&D in the home country; rising shares of foreign ownership on aggregate innovation activity may therefore lead to fewer radical innovations than in the case of domestic ownership.
Empirical evidence that supports these concerns is thin. Internationalisation certainly leads to a shift of control from domestic head offices to MNE headquarters abroad. However, domestic policy does not necessarily have a higher ability to influence R&D decisions when enterprises are domestically owned (Dunning and Lundan 2008, p. 249 ff). In addition, it seems that autonomy of MNE subsidiaries over their R&D activities has been rising over time (Dunning and Lundan 2009, chapter 8). The question if foreign ownership is
associated with a downsizing of R&D activity has been evaluated both for take-overs as well as for all foreign-owned and domestically owned firms. In the case of take-overs, there are both, examples of downsizing as well as examples of expansion, depending on the complementarity between acquiring and acquired firms and other factors (Cassiman et al. 2005; Bertrand 2009; Bandick et al. 2010; Stiebale and Reize 2011). Studies that compare innovation input and output of domestically owned and foreign-owned firms find no negative effect of foreign ownership after controlling for firm characteristics such as size, sector, or export intensity (Sadowski and Sadowski-Rasters 2006, Dachs et al. 2010).
R&D internationalisation may also be associated with a separation of R&D and production (Pearce 2004; Pearce and Papanastassiou 2009). MNEs have much more choices in the location and organisation of R&D and production than mono-national firms. R&D and production is not necessarily located in the same country, because MNEs may find it useful to develop products in one country and manufacture in another country where conditions for production seem more favourable. As a consequence, policy measures to promote R&D and product development may yield only few jobs and give only a weak stimulus to growth when foreign-owned firms decide to produce abroad. To my knowledge, no empirical study has thoroughly examined the effects from the separation of R&D and production so far. It is, however, plausible that such a leaking-out is stronger in small countries and in countries with a high share of foreign-controlled R&D, and weaker when foreign-owned firms have a high degree of autonomy and strong mandates in their enterprise groups, because these firms may try to concentrate not only R&D, but also production at their location to maximise influence in their enterprise group.

28
Bernhard Dachs / Asian Research Policy 8 (2017) 17-39
4.2. Impacts of R&D and Innovation Activities abroad on the Home Countries
The internationalisation of R&D has also implications for the home country of the multinational firm. D’Agostino (2015) provides a recent survey of these effects, so this section will be short.
As discussed above, a main reason for firms to go abroad with R&D activities is to get access to knowledge not available in the home country. Hence, a first main benefit for the home countries is the transfer of results from overseas R&D activities which brings new knowledge into the home country. Various studies provide evidence for such reverse knowledge transfers (Fors 1997; Feinberg and Gupta 2004; Todo and Shimizutani 2005; Ambos and Schlegelmilch 2006; Piscitello and Rabbiosi 2006; Narula and Michel 2009; Rabbiosi 2009; AlAzzawi 2011). Reverse knowledge transfers can increase overall technological capacities, help to develop new products and foster growth and employment in the home country. R&D activities abroad can therefore strengthen the growth of the parent company in the home country (Rammer and Schmiele 2008). The size of these benefits depends on the absorptive capacities and other firm characteristics of the parent company (Schmiele 2012), on the degree of complementarity between activities abroad and at home (Arvanitis and Hollenstein 2011), and on the motives for R&D activities abroad. Todo and Shimizutani (2005) demonstrate for Japan that effects of reverse technology transfer on the productivity of firms in the home country is large when foreign-owned affiliates undertake R&D to tap into advanced knowledge abroad. Adaptive R&D however was found to improve productivity in the host country, but did not contribute to enhanced productivity in the home country. Griffith et al. (2004) find that R&D by UK firms in the
US have resulted in benefits from reverse technology with the effects being larger in the case of R&D units set up to source technology. Results for Sweden, however (Fors 1997; Braconier et al. 2002) indicate that there have not been significant spillovers to the home country, possibly because much R&D has been of the adaptive type. AlAzzawi (2011) finds that R&D abroad had a positive impact on the home country’s level of innovation activity in both developed and newly industrialised countries, but finds productivity benefits for newly industrialised countries only. Moreover, there seems to be a positive relationship between internationalisation and the returns from R&D at home (Criscuolo and Martin 2009; Añón Higón et al. 2011) which may further increase the benefits for the home country.
Potential challenges or costs from the internationalisation of R&D for the home country may arise when firms replace domestic R&D and innovation activities with similar activities abroad. This type of substitution has become an important topic in international economics (see the survey of Crinò 2009). It may lead to a ‘hollowing out’ (Criscuolo and Patel 2003) of domestic innovation capacity, a loss of jobs in R&D, and a downward pressure on wages of R&D personnel in the home country. Despite public discussions on the offshoring of R&D and possible consequences for home country innovation systems2, empirical results that confirm such ‘hollowing out’-effects are rare. The reason for this are complementarities between overseas adaptations and R&D at the home base (D’Agostino and Santangelo 2012). Studies based on patent data give no indication for a substitutive relationship between R&D abroad and home-based R&D activities (D’Agostino et al. 2013). However, data on R&D expenditure of domestic firms abroad is available only for a very small number of countries, which makes a test of the assumption difficult.

Articles
29
5. New Directions for Research on R&D Internationalisation
R&D internationalisation today is a well-established research field within international economics literature, the international business literature and within the economics of innovation and technological change. There is a consensus on the main drivers as well on the impacts of the process. However, some questions remain open, and new questions arise. This is why the final chapter – instead of a summary - points to three fields where more research in needed in the future.
5.1. Tax Credits for R&D as Policy Incentives
There is a consensus in the literature that the best countries can do to attract R&D of foreign-owned firms is to create favourable conditions for doing business and R&D that benefit both, domestic and foreign-owned countries (see Section 3.1). Financial incentives for foreign-owned are not regarded as a suitable instrument to attract these activities.
This consensus has been challenged in recent years by the emergence of tax incentives for R&D. In 2015, this type of incentive is offered by 28 of the 34 OECD countries and a number of non-OECD countries (OECD 2016, chapter 4; Appelt et al. 2016). Bellak and Leibrecht (2016) discuss tax incentives for R&D and their welfare effects in the context of general investment incentives for foreign direct investment.
The effect of R&D tax incentives on location choices of MNEs is still an unexplored topic (Appelt et al. 2016, 19). From the arguments brought forward in the literature, however, it seems that tax credits for R&D are a very appealing instrument for MNEs (Mohnen 2013, Appelt et al. 2016, Bellak and Leibrecht 2016):
- MNEs operate more often in R&D intensive sectors and more perform R&D frequently than
single-national firms. Thus, a subsidy that focusses on R&D seems more appealing to MNEs than other non-R&D investment incentives.
- Tax credits for R&D favour large R&D spenders (Mohnen 2013) MNEs may in particular favour fiscal incentives because they offer them opportunities to minimize corporate income taxes single-national firms or smaller firms do not have, for example by shifting R&D costs between countries.
- Large firms have considerably lower application costs in R&D tax credit schemes than in the case of direct R&D funding which usually involves various eligibility checks. This may again favour large R&D spenders, which do not have to administer a large number of single funding applications. Moreover, A number of countries have no upper ceiling for R&D tax credits.
- Income-based tax incentives for R&D (tax breaks for income from trademarks, patents and other forms of intellectual capital) in the form of patent boxes etc. may be particularly appealing for MNEs with multiple R&D locations because it may also provide them with incentives for shifting profits via licence income.
As a consequence, R&D tax incentives may be much more effective than other forms of policy incentives to attract foreign-owned firms. There is some empirical support for these arguments; Dachs (2016) report that foreign-owned firms in Austria – in contrast to domestically owned firms – receive the bulk of their public support for R&D via tax credits. Results by Poti and Spallone (2016) indicate a significant and positive correlation between R&D tax credits and R&D of foreign-owned firms.
5.2. R&D Internationalisation in Service Industries
Services are the ‘dark matter’ of R&D internationalisation – we know there should be a lot

30
Bernhard Dachs / Asian Research Policy 8 (2017) 17-39
of it, but so far, we cannot see it. Only a limited number of countries (most prominent the USA) provide data on R&D by foreign-owned firms in the services sectors. This data indicates that services account for around a third of total R&D by foreign-owned firms. If we generalize these observations there should be much more R&D by foreign-owned firms than we currently observe in official statistics.
The expansion of services in R&D internationalisation cannot be explained by a single reason. On the one hand, the use of new technologies makes service firms increasingly R&D intensive, like in the case of information and communication services. On the other hand, R&D intensity in services increases because services and parts of the service value chain become increasingly tradable (O’Mahony 2013). As a result, manufacturing firms outsource R&D to specialized suppliers of R&D services. The most prominent example of this development is the pharmaceutical industry (Ramirez 2013) which moves clinical trials and other stages of the R&D process to specialized firms. Moreover, the emergence of small biotechnology firms has created a new type of divisions of labour between small and large firms in the pharmaceutical industry.
Both developments lead to a higher internationalisation in services, and to more overseas R&D activities in service firms in particular, because of the asset-augmenting and the asset-exploiting motive discussed above. Questions, however, remain about the service-specific drivers and obstacles of service firms, as well as the co-ordination costs and conditions for knowledge-transfer within service firms which may be shaped by different degrees of taciteness compared to manufacturing.
5.3. Multinational Firms from Emerging Economies
Multinational enterprises originating from emerging economies (EMNEs) became important players in foreign direct investment in recent years.
According to the 2014 World Investment Report, the share of developing and transition economies on total FDI outflows has climbed from 7% in 1999 to 39% in 2013 (UNCTAD 2014, p. 7). The rise of is not surprising; the international business as well as international economics literature predicts that firms with superior knowledge capital and assets will increasingly turn invest abroad to exploit these assets at international markets. In recent years, expenditures for R&D have increased considerably in emerging economies – most notably in China (OECD 2014), a strong indicator for the build-up of knowledge and superior assets.
Moreover, we can expect that EMNEs – once they have established international production –
increasingly move from asset-exploiting to asset-creating strategies in their foreign activities. This means that EMNEs increasingly create and collect knowledge outside their home countries by locating R&D and innovation activities in various host countries. Various authors (Di Minin and Zhang 2010; Di Minin et al. 2012; Giuliani et al. 2014, Crescenzi et al. 206) are observing the first R&D active EMNE subsidiaries in Europe and the US.
The rise of EMNEs creates new questions for research on the internationalisation of R&D. It challanges old views on the global diffusion of knowledge from the most to least developed countries, and raises new questions on the nature of superior assets of EMNEs, given that these firms evolve in more restrained environments than firms in advanced economies (Narula 2012). Moreover, it brings back family and state ownership, two models of governance which have become quite unfamiliar among US and European multinational firms. Family- and state-owned firms may have different cultures of decision-making, and follow different rationales in R&D internationalisation. For example, the rise of EMNEs has created fears of ‘predatory behaviour’ - that state-owned EMNEs will acquire domestic companies, exploit their knowledge and

Articles
31
leave. Such concerns, however, are not new, and have also been raised against MNEs from other countries as well.
Acknowledgements
The author wants to thank the European Commission, DG Research and Innovation, for its financial support of the project "Internationalisation of business investments in R&D and analysis of their economic impact", contract number 30-CE-0677869/00-21/A4/2014, specific contract under the framework contract for the provision of services to the Commission in the fields of research evaluation and research policy analysis, Ref. OJ 2010/S 172-262618.
Notes
1. The concept of spillovers found in the international economics literature differs in some respect from the concept of knowledge flows in the innovation economics literature where knowledge flows are also frequently labelled as spillovers. Spillovers in the context of the international economics literature do not exclusively focus on the transfer of information or knowledge, but also include other non-compensated effects like competition, labour market or agglomeration effects (see Harris and Robinson 2004 for a typology of spillovers). One example is a lower price level in a certain market due to increased competition after market entry of a foreign-owned firm. Another form of spillover not related to knowledge is the threat of market entry by R&D intensive MNEs that may spur R&D activities of domestically owned firms (Aghion et al. 2009).
2. An example is the June 2010 issue of the Journal of Technology Transfer which discusses production offshoring and its effects on US manufacturing R&D in detail.
References
Aghion, P., Blundell, R., Griffith, R., Howitt, P. and S. Prantl (2009), ‘The effects of entry on incumbent innovation and productivity’, Review of Economics and Statistics 91(1), 20-32.
Aitken, B.J. and A.E. Harrison (1999), ‘Do domestic firms benefit from direct foreign investment? Evidence from Venezuela’, American Economic Review 89(3), 605-18.
AlAzzawi, S. (2011), ‘Multinational corporations and knowledge flows: evidence from patent citations’, Economic Development and Cultural Change, 59(3), 649-80.
Alcácer, J. and Delgado, M. (2016). ‘Spatial Organization of Firms and Location Choices Through the Value Chain’. Management Science 62(11): 3213-3234.
Alkemade, F., G. Heimeriks, A. Schoen, L. Villard, and P. Laurens (2015), ‘Tracking the internationalization of multinational corporate inventive activity: national and sectoral characteristics‘. Research Policy 44(9): 1763-72.
Almeida, P. (1999), ‘Knowledge Sourcing by Foreign Multinationals: Patent Citation Analysis in the U.S. Semiconductor Industry’, in J. Cantwell (ed.), Foreign direct investment and technological change, Cheltenham: Edward Elgar, 421-31.
Amador, J., and S. Cabral (2016), ‘Global Value Chains: A Survey of Drivers and Measures’, Journal of Economic Surveys 30(2): 278-301.
Ambos, B. and B.B. Schlegelmilch (2006), ‘Learning from foreign subsidiaries: An empirical investigation of headquarters’ benefits from reverse knowledge transfers’, International Business Review 15(3), 294-312.
Añón Higón, D., Manjón Antolín, M. and J.A. Mañez (2011), ‘Multinationals, R&D, and productivity: evidence for UK manufacturing firms’, Industrial and Corporate Change, 20(2), 641-59.
Appelt, S., M. Bajgar, C. Criscuolo, and F. Galindo-Rueda. 2016. R&D Tax Incentives: Evidence on design, incidence and impacts. OECD Science, Technology and Industry Policy Papers No. 32, Paris
Archibugi, D. and S. Iammarino (1999), ‘The policy implications of the globalisation of innovation’, Research Policy 28(2-3), 317-36.
Arvanitis, S. and H. Hollenstein (2006), ‘Determinants of Swiss firms’ R&D activities at foreign locations: an empirical analysis based on firm-level data’, Zurich: Swiss Institute for Business Cycle Research (KOF) Working Paper no. 127.

32
Bernhard Dachs / Asian Research Policy 8 (2017) 17-39
Arvanitis, S. and H. Hollenstein (2011), ‘How do different drivers of R&D investment in foreign locations affect domestic firm performance? An analysis based on Swiss panel micro data’, Industrial and Corporate Change, 20(2), 605-40.
Ascani, A., R. Crescenzi, and S. Iammarino (2016), ‘Economic Institutions and the Location Strategies of European Multinationals in their Geographic Neighborhood’, Economic Geography, 92(4), 401-429.
Athukorala, P.-C., and A. Kohpaiboon (2010), ‘Globalization of R&D by US-based multinational enterprises’, Research Policy, 39(10), 1335-347.
Audretsch, D. and M. Feldman (1996), ‘R&D spillovers and the geography of innovation and production’, American Economic Review 86(3), 630-40.
Bailey, D. and N.L. Driffield (2007), ‘Industrial policy, FDI and employment: still ‘missing a strategy’’, Journal for Industry, Competition and Trade 7(3-4), 189-211.
Bandick, R., Görg, H. and P. Karpaty (2010), ‘Foreign acquisitions, domestic multinationals, and R&D’, Kiel: Kiel Working Papers no. 1651.
Barba Navaretti, G. and A.M. Falzoni (2004), ‘Home country effects of foreign direct investment’, in G. Barba Navaretti and A.J. Venables (eds), Multinational firms in the world economy, Princeton and Oxford: Princeton University Press, pp. 217-39.
Barba Navaretti, G. and A.J. Venables (2004), Multinational firms in the world economy, Princeton and Oxford: Princeton University Press.
Barry, F. (2004), ‘FDI and the host economy: a case study of Ireland’, in G. Barba Navaretti and A.J. Venables (eds), Multinational firms in the world economy, Princeton and Oxford: Princeton University Press, pp. 187-215.
Behrman, J.N. and W.A. Fischer (1980), Overseas R&D Activities of Transnational Companies, Cambridge, Mass: Oelgesclagert, Gunn & Hein.
Belderbos, R., Leten, B. and S. Suzuki (2009), ‘Does excellence in scientific research attract foreign R&D?’, Maastricht: UNU-Merit Working Paper 2009-066.
Belderbos, R., Leten, B., and S. Suzuki (2013), ‘How global is R&D? Firm-level determinants of home-country bias in R&D’, Journal of International Business Studies 44(8): 765-86.
Bellak, C. (2004), ‘How Domestic and Foreign Firms Differ and Why Does It Matter? ’ Journal of Economic Surveys 18(4): 483-514.
Bellak, C. and M. Leibrecht (2016), ‘The Use of Investment Incentives: The Cases of R&D-Related Incentives and
International Investment Agreements’, Rethinking Investment Incentives: Trends and Policy Options, ed. A.T. Tavares-Lehmann, L. Sachs, L. Johnson, and P. Toledano, 63-93. New York, Chichester: Columbia University Press.
Bellandi, M. (2001), ‘Local development and embedded large firms’, Entrepreneurship & Regional Development 13(3), 189-210.
Bertrand, O. (2009), ‘Effects of foreign acquisitions on R&D activity: Evidence from firm-level data for France’, Research Policy 38(6), 1021-31.
Birkinshaw, J.M. and N. Hood (1998), ‘Multinational subsidiary evolution: capability and charter change in foreign-owned subsidiary companies’, Academy of Management Review 23(4), 773-95.
Birkinshaw, J.M. and N. Hood (2000), ‘Characteristics of Foreign Subsidiaries in Industry Clusters’, Journal of International Business Studies 31(1), 141-54.
Birkinshaw, J.M., Hood, N. and S. Jonsson (1998), ‘Building firm-specific advantages in multinational corporations: the role of subsidiary initiative’, Strategic Management Journal 19(3), 221-41.
Blomström, M. and A. Kokko (2003), ‘The economics of foreign direct investment incentives’, Cambridge (Mass.): National Bureau of Economic Research (NBER) Working Paper no. 9489.
Blonigen, B.A. (2005), ‘A review of the empirical literature on FDI determinants’, Cambridge (Mass.): National Bureau of Economic Research (NBER) Working Paper no. 11299.
Blonigen, B.A. and M.J. Slaughter (2001), ‘Foreign-affiliate activity and US skill upgrading’, Review of Economics and Statistics 83(2), 362-76.
Booz Allen Hamilton and INSEAD (2006), Innovation: Is Global the Way Forward? Paris: INSEAD.
Braconier, H., Henrik, K. and K.H. Midelfart-Knarvik (2002), ‘Does FDI work as a channel for R&D spillovers? Evidence based on Swedish Data’, Stockholm: The Research Institute of Industrial Economics Working Paper no 551.
Brash, D.T. (1966), American Investment in Australian Industry, Cambridge, Mass: Harvard University Press.
Brennan, L., Ferdows, K., Godsell, J., Golini, R., Keegan, R., Kinkel, S., Srai, J.S., and Taylor, M. (2015), ‘Manufacturing in the world: where next? ’, International Journal of Operations & Production Management 35( 9): 1253-1274.
Breschi, S. and F. Lissoni (2001), ‘Knowledge spillovers and local innovation systems: a critical survey’, Industrial and Corporate Change 10(4), 975-1005.
Articles
33
Cantner, U. and A. Pyka (1998), ‘Absorbing Technological Spillovers: Simulations in an Evolutionary Framework’, Industrial and Corporate Change 7(2), 369-397.
Cantwell, J. (2009), ‘Innovation and Information Technology in the MNE’, in A.M. Rugman (ed.), The Oxford Handbook of International Business, Oxford: Oxford University Press, pp. 417-446.
Cantwell, J. and R. Mudambi (2000), ‘The location of MNE R&D activity; the role of investment incentives’, Management International Review 40(1), 127-48.
Cantwell, J. and R. Mudambi (2005), ‘MNE competence-creating subsidiary mandates’, Strategic Management Journal 26(12), 1109-128.
Cantwell, J. and L. Piscitello (2002), ‘The location of technological activities of MNCs in European regions: The role of spillovers and local competencies’, Journal of International Management 8(1), 69-96.
Cassiman, B., Colombo, M.G., Garrone, P. and R. Veugelers (2005), ‘The impact of M&A on the R&D process. An empirical analysis of the role of technological- and market-relatedness’, Research Policy 34(2), 195-220.
Castellacci, F. (2007), ‘Technological regimes and sectoral differences in productivity growth’, Industrial and Corporate Change 16(6), 1105-145.
Castellani, D. and A. Zanfei (2002), ‘Multinational experience and the creation of linkages with local firms. Evidence from the electronics industry’, Cambridge Journal of Economics 26(1), 1-25.
Castellani, D., Jimenez, A. and A. Zanfei (2013). ‘How remote are R&D labs? Distance factors and international innovative activities.’ Journal of International Business Studies 44(7): 649-675.
Caves, R. (1996), Multinational enterprises and economic analysis, Cambridge: Cambridge University Press.
Cerrato, D. (2009), ‘Does innovation lead to global orientation? Empirical evidence from a sample of Italian firms’, European Management Journal 27(5), 305-15.
Chesbrough, H.W. (2003), Open innovation: The new imperative for creating and profiting from technology, Boston: Harvard Business School Press.
Cincera, M. Cozza, C. and A. Tübke (2010), ‘The main drivers for the internationalization of R&D activities by EU MNEs’, Seville: JRC-IPTS Working Papers on Corporate R&D and Innovation no 2010-02.
Coe, D.T., Helpman, E. and A.W. Hoffmaister (2009), ‘International R&D spillovers and institutions’, European Economic Review 53(7), 723-41.
Cohen, W.M. (1995), ‘Empirical studies of innovative activity’, in P. Stoneman (ed), Handbook of innovation and technological change, Oxford: Blackwell, pp. 182-264.
Cohen, W.M. (2010), ‘Fifty years of empirical studies of innovative activity and performance’, in B.A. Hall and N. Rosenberg (eds), Handbook of economics of innovation, Amsterdam: Elsevier, pp. 129-213.
Cohen, W.M. and D. Levinthal (1989), ‘Innovation and learning: the two faces of R&D’, Economic Journal 99(September), 569-96.
Cohen, W.M. and D. Levinthal (1990), ‘Absorptive capacity: a new perspective on learning and innovation’, Administrative Science Quarterly 35(1), 128-52.
Cohen, W.M., Nelson, R.R. and J. Walsh (2000), ‘Protecting their intellectual assets: appropriability conditions and why U.S. manufacturing firms patent (or not)’, Cambridge (Mass.): National Bureau of Economic Research (NBER) Working Paper no. 7552.
Costa, I. and S. Filippov (2008), ‘Foreign-owned subsidiaries: a neglected nexus between foreign direct investment, industrial and innovation policies’, Science and Public Policy 35(6), 379-90.
Cowan, R., David, P.A. and D. Foray (2000), ‘The explicit economics of knowledge codification and tacitness’, Industrial and Corporate Change 9(2), 211-53.
Cozza, C. and Zanfei, A. (2016). ‘Firm heterogeneity, absorptive capacity and technical linkages with external parties in Italy.’ The Journal of Technology Transfer 41(4): 872-890.
Creamer, D.B. (1976), Overseas research and development by the US multinationals, New York: The Conference Board.
Crescenzi, R., C. Pietrobelli, and R. Rabellotti (2016), ‘Regional strategic assets and the location strategies of emerging countries’ multinationals in Europe, European Planning Studies, 24(4): 645-667.
CREST Working Group (2007), Internationalisation of R&D – facing the challenge of globalisation: approaches to a proactive International policy in S&T, Brussles: CREST.
Crinò, R. (2009), ‘Offshoring, Multinationals and Labor Market: A Review of the Empirical Literature’, Journal of Economic Surveys 23(2): 197–249.
Criscuolo, C. and R. Martin (2009), ‘Multinationals and U.S. productivity leadership: Evidence from Great Britain’, Review of Economics and Statistics 91(2), 263-81.

34
Bernhard Dachs / Asian Research Policy 8 (2017) 17-39
Criscuolo, C., J. E. Haskel, and M. J. Slaughter (2010), ‘Global engagement and the innovation activities of firms’, International Journal of Industrial Organization 28(2): 191-202.
Criscuolo, P., Narula, R. and B. Verspagen (2005), ‘Role of home and host country innovation systems in R&D internationalisation: a patent citation analysis’, Economics of Innovation and New Technology 14(5), 417-33.
Criscuolo, P. and P. Patel (2003), Large Firms and internationalisation of R&D: Hollowing out of National Technological Capacity?, paper presented at the SETI Workshop: Rome.
D’Agostino, L. M. (2015). ‘The neglected effects of R&D captive offshoring in emerging countries on the creation of knowledge at home.’ Economia e Politica Industriale 42(1): 61-91.
D’Agostino, L.M., Laursen, K. and G.D. Santangelo (2013), ‘The impact of R&D offshoring on the home knowledge production of OECD investing regions’, Journal of Economic Geography 13(1), 145-75.
D’Agostino, L. M. and Santangelo, G. D. (2012). ‘Do Overseas R&D Laboratories in Emerging Markets Contribute to Home Knowledge Creation? ’ Management International Review 52(2): 251-273.
Dachs, B. (2016), Internationalisierung als Motor des Aufholprozesses im österreichischen Innovationssystem. Wirtschaftspolitische Blätter 63(2): 427-46.
Dachs, B., Ebersberger, B., Lööf, H. (2008), ‘The Innovative Performance of Foreign-owned Enterprises in Small Open Economies. ’ Journal of Technology Transfer 33, p. 393-406.
Dachs, B., Kampik, F., Peters, B., Rammer, C., Schartinger, D., Schmiele, A. and G. Zahradnik (2010), Foreign corporate R&D and innovation activities in the European Union. Background report for the 2010 Competitiveness Report, Brussels: European Commission.
Dachs, B. and A. Pyka (2010), ‘What drives the internationalisation of innovation? Evidence from European patent data’, Economics of Innovation and New Technology 19(1), 71-86.
Dachs, B., R. Stehrer and G. Zahradnik (eds., 2014), The Internationalisation of Business R&D. Cheltenham: Edward Elgar.
Damijan, J.P., Knell, M., Majcen, B. and M. Rojec (2003), ‘The role of FDI, R&D accumulation and trade in transferring technology to transition countries: evidence from firm panel data for eight transition countries’, Economic Systems 27(2), 189-204.
Damijan, J. P., B. Majcen, M. Knell, and M. Rojec (2013). ‘Impact of firm heterogeneity on direct and spillover effects of FDI: Micro-evidence from ten transition countries’, Journal of Comparative Economics, 41(3), 895–922.
De Backer, K., and F. Hatem (2010), Attractiveness for Innovation. Location Factors for International Investment, Paris: OECD Publishing.
De Backer, K., Menon, C., Desnoyers-James, I., Moussiegt, L. (2016) Reshoring: Myth or Reality? Paris: OECD Publishing.
Defever, F. (2012). ‘The spatial organization of multinational firms.’ Canadian Journal of Economics 45(2): 672-697.
Di Minin, A., and J. Zhang (2010), ‘An Exploratory Study on International R&D Strategies of Chinese Companies in Europe’, Review of Policy Research 27(4), 433-55.
Di Minin, A., J. Zhang, and P. Gammeltoft (2012), ‘Chinese foreign direct investment in R&D in Europe: A new model of R&D internationalization? ’, European Management Journal 30(3), 189-203.
Dogson, M. and R. Rothwell (1994), ‘Innovation and the size of the firm’, in M. Dogson and R. Rothwell (eds), The handbook of industrial innovation, Cheltenham: Edward Elgar, pp. 310-25.
Driffield, N., Love, J.H. and K. Taylor (2009), ‘Productivity and labour demand effects of inward and outward foreign direct investment on UK industry’, The Manchester School 77(2), 171-203.
Driffield, N.L. and K. Taylor (2000), ‘FDI and the labour market: a review of the evidence and policy implications’, Oxford Review of Economic Policy 16(3), 90-103.
Dunning, J. (1958), American investment in British manufacturing industry, London: Allen and Unwin.
Dunning, J. (1973), ‘The determinants of international production’, Oxford Economic Papers 25(3), 289-336.
Dunning, J. (1981), International production and the multinational enterprise, London: Allen and Unwin.
Dunning, J., and S.M. Lundan (2008), Multinational enterprises and the global economy (2nd ed.), Cheltenham: Edward Elgar.
Dunning, J. and S.M. Lundan (2009), ‘The internationalization of corporate R&D: A review of the evidence and some policy implications for home countries’, Review of Policy Research 26(1-2), 13-33.
Dunning, J. and R. Narula (1995), ‘The R&D activities of foreign firms in the United States’, International Studies of Management & Organization 25(1-2), 39-72.

Articles
35
Economist Intelligence Unit (2004), Scattering the Seeds of Innovation: The Globalization of Research and Development, London: Economist Intelligence Unit.
Eden, L. and S. Miller (2004), ‘Distance matters: Liability of foreignness, institutional distance and ownership strategy’, in M.A. Hitt, and J.L.C. Cheng (eds), The evolving theory of the multinational firm. Advances in International Management, Vol. 16, Amsterdam: Elsevier, pp. 187-221.
Ekholm, K. and K.H. Midelfart (2004), ‘Determinants of FDI: the evidence’, in G. Barba Navaretti and A.J. Venables (eds), Multinational firms in the world economy, Princeton and Oxford: Princeton University Press, pp. 127-50.
Ernst, D. (2006), Innovation offshoring – Asia’s emerging role in global innovation networks, Honolulu: East-West Center Report Nr. 10.
Feinberg, S.E. and A.K. Gupta (2004), ‘Knowledge spillovers and the assignment of R&D responsibilities to foreign subsidiaries’, Strategic Management Journal 25(8-9), 823-45.
Feng, H. L. (2017), ‘Does foreign direct investment improve the productivity of domestic firms? Technology spillovers, industry linkages, and firm capabilities‘, Research Policy 46(1), p. 138-59
Figini, P. and H. Görg (1999), ‘Multinational companies and wage inequality in the host country: The case of Ireland’, Review of World Economics 135(4), p. 594-612.
Florida, R. (1997), ‘The globalization of R&D: Results of a survey of foreign-affiliated R&D laboratories in the USA’, Research Policy 26(1), 85-103.
Fors, G. (1997), ‘Utilization of R&D Results in the Home and Foreign Plants of Multinationals’, Journal of Industrial Economics 45(3), 341-58.
Forsgren, M. (2008), Theories of the Multinational Firm, Cheltenham: Edward Elgar.
Frenz, M. and Ietto-Gillies, G. (2007). ‘Does Multinationality Affect the Propensity to Innovate? An Analysis of the Third UK Community Innovation Survey.’ International Review of Applied Economics 21(1): 99-117.
Gassmann, O. and Z. Han (2004), ‘Motivations and barriers of foreign R&D activities in China’, R&D Management 34(4), 423-37.
Gersbach, H. and A. Schmutzler, (2011), ‘Foreign Direct Investment and R&D Offshoring’, Oxford Economic Papers 63(1), 134-57.
Gerybadze, A. and G. Reger (1999), ‘Globalization of R&D: Recent Changes in the Management of Innovation in Transnational Corporations’, Research Policy 28, 251-274.
Giuliani, E., S. Gorgoni, C. Günther, and R. Rabellotti. 2014. ‘Emerging versus advanced country MNEs investing in Europe: A typology of subsidiary global–local connections’, International Business Review 23(4), 680-91.
Görg, H. and D. Greenaway (2004), ‘Much Ado about Nothing? Do Domestic Firms Really Benefit from Foreign Direct Investment?’, The World Bank Research Observer 19(2), 171-97.
Görg, H., and E. Strobl (2001), ‘Multinational Companies and Productivity Spillovers: A Meta-analysis’, Economic Journal 111(November), 723-39.
Görg, H. and E. Strobl (2003), ‘“Footloose” Multinationals?’, The Manchester School 71(1), 1-19.
Greenhalgh, C.A. and P. Taylor (1990), ‘Innovation and Export Volumes and Prices: A Disaggregated Study’, London: CEPR Discussion Papers 487.
Griffith, R., Redding, S. and H. Simpson (2004), ‘Foreign Ownership and Productivity: New Evidence from the Service Sector and the R&D Lab’, London: CEP Discussion Paper 649.
Guellec, D. and B. van Pottelsberghe de la Potterie (2001), ‘The Internationalisation of Technology Analysed with Patent Data’, Research Policy 30(8), 1253-266.
Guimón, J. (2009), ‘Government strategies to attract R&D-intensive FDI’, Journal of Technology Transfer 34(4), 364-79.
Nilsson Hakkala, K., F. Heyman, and F. Sjöholm (2014), ‘Multinational firms, acquisitions and job tasks’, European Economic Review, 66(Supplement C), 248-265.
Hall, B. A. (2010), The internationalization of R&D, Berkeley: University of California. <http://elsa.berkeley.edu/ users/bhhall/papers/BHH10_RND_international_August.pdf>
Harris, R. and Q.C. Li (2009), ‘Exporting, R&D, and absorptive capacity in UK establishments’, Oxford Economic Papers 61(1), 74-103.
Harris, R. and C. Robinson (2004), ‘Productivity impacts and spillovers from foreign ownership in the United Kingdom’, National Institute Economic Review 185(1), 58-75.
Hatzichronoglou, T. (2008), The Location of investment of multinationals linked to innovation, Paris: OECD.
Havránek, T. and Z. Iršová (2010), ‘Which Foreigners Are Worth Wooing? A Meta-Analysis of Vertical Spillovers from FDI’, Prague: Czech National Bank Working paper 3/2010.
Hayakawa, K., T. Machikita and F. Kimura. (2012), ‘Globalization and Productivity: A Survey of Firm-level Analysis’, Journal of Economic Surveys 26(2): 332-50.

36
Bernhard Dachs / Asian Research Policy 8 (2017) 17-39
Head, K. and J. Ries (2003), ‘Heterogeneity and the FDI versus Export Decision of Japanese Manufacturers’, Cambridge (Mass.): National Bureau of Economic Research (NBER) Working Paper 10052.
Hedge, D. and D. Hicks (2008), ‘The maturation of global corporate R&D: Evidence from the activity of U.S. foreign subsidiaries’, Research Policy 37(3), 390-406.
Helpman, E. (2006), ‘Trade, FDI and the organisation of firms’, Journal of Economic Literature 44(3), 589-631.
Helpman, E., Melitz, M.J. and S.R. Yeaple (2004), ‘Export versus FDI with heterogeneous firms’, American Economic Review 94(1), 300-16.
Hijzen, A., P. S. Martins, T. Schank, and R. Upward (2013), ‘Foreign-owned firms around the world: A comparative analysis of wages and employment at the micro-level’, European Economic Review, 60(Supplement C), 170-188.
Holmes, R. M., H. Li, M. A. Hitt, K. DeGhetto, and T. Sutton (2016), ‘The Effects of Location and MNC Attributes on MNCs' Establishment of Foreign R&D Centers: Evidence from China’, Long Range Planning 49(5): 594-613.
Iversen, E., Dachs, B., Poti, B., Patel, P., Cerulli, G., Spallone, R., Zahradnik, G., Knell, M. and F. Lang (2016), Internationalisation of business investments in R&D and analysis of their economic impact (BERD Flows). Final report. Project for the European Commission, DG Research and Innovation.
Jaffe, A.B., Trajtenberg, M. and R. Henderson (1993), ‘Geographic localization of knowledge spillovers as evidenced by patent citations’, Quarterly Journal of Economics 108(3), 577-598.
Jensen, N.M. (2006), Nation-states and the multinational corporation, Princeton and Oxford: Princeton University Press.
Johanson, J. and J.-E. Vahlne (2009), ‘The Uppsala internationalization process model revisited: From liability of foreignness to liability of outsidership’, Journal of International Business Studies 40(9), 1411-431.
Keller, W. (2004), ‘International technology diffusion’, Journal of Economic Literature 42(3), 752-58.
Keller, W. (2010), ‘International trade, foreign direct investment, and technology spillovers’, in B.A. Hall and N. Rosenberg (eds), Handbook of the economics of innovation, Vol. 2, Amsterdam, Elsevier, pp. 794-829.
Keller, W. and S.R. Yeaple (2009), ‘Multinational enterprises, international trade, and productivity growth: firm-level evidence from the United States’, Review of Economics and Statistics 91(4), 821-31.
Ketokivi, M. and J. Ali-Yrkkö (2009), ‘Unbundling R&D and manufacturing: postindustrial myth or economic reality?’, Review of Policy Research 26(1-2), 35-54.
Kinkel, S. and S. Maloca (2008), FuE-Verlagerungen in Ausland - Ausverkauf deutscher Entwicklungskompetenz?, Karlsruhe: Fraunhofer ISI.
Kleinknecht, A. (1989), ‘Firm size and Innovation’, Small Business Economics 1(3), 215-22.
Kleinknecht, A. and P. Mohnen (eds)(2002), Innovation and Firm Performance. Basingstoke and New York: Palgrave.
Konings, J. (2001), ‘The effects of foreign direct investment on domestic firms. Evidence from firm-level panel data in emerging economies’, Economics of Transition 9(3), 619-33.
Kuemmerle, W. (1997), ‘Building effective R&D capabilities abroad’, Harvard Business Review 75(2), 61-70.
Kuemmerle, W. (1999), ‘Foreign direct investment in industrial research in the pharmaceutical and electronics industries – results from a survey of multinational firms’, Research Policy 28(2-3), 179-93.
Kumar, N. (2001), ‘Determinants of location of overseas R&D activity of multinational enterprises: the case of US and Japanese corporations’, Research Policy 30(1), 159-74.
Lachenmaier, S. and L. Wößmann (2006), ‘Does innovation cause exports? Evidence from exogenous innovation impulses and obstacles using German micro data’, Oxford Economic Papers 58(2), 317-50.
Lall, S. (1979), ‘The international allocation of research activity by US multinationals’, Oxford Bulletin of Economics and Statistics 41(4), 313-31.
Laurens, P., C. Le Bas, A. Schoen, L. Villard, and P. Larédo. (2015), ‘The rate and motives of the internationalisation of large firm R&D (1994–2005): Towards a turning point? ’ Research Policy 44(3): 765-76.
Lee, G. (2004). ‘How the globalization of R&D competition affects trade and growth’, Japanese Economic Review 55(3), 267-85.
Lewin, A.Y., Massini, S. and C. Peeters (2009), ‘Why are companies offshoring innovation? The emerging global race for talent’, Journal of International Business Studies 40(6), 901-25.
Lipsey, R.E. (2002), Home and host country effects of FDI, Cambridge (Mass.): National Bureau of Economic Research (NBER) Working Paper 9293.
Lonmo, C. and F. Anderson (2003), A comparison of international R&D performance: an analysis of countries that have significantly increased their GERD/GDP ratios during

Articles
37
the period 1989-1999, Ottawa: Statistics Canada 88F0006XIE2003001.
Lööf, H. (2009), ‘Multinational enterprises and innovation: firm level evidence on spillover via R&D collaboration’, Journal of Evolutionary Economics 19(1), 41-71.
Lorenzen, M. and V. Mahnke (2002), Global strategy and the acquisition of local knowledge: how MNCs enter regional knowledge clusters, Copenhagen: DRUID Working Paper 02-08.
Malerba, F. (2002), ‘Sectoral Systems of Innovation and Production’, Research Policy 31(2), 247-64.
Malerba, F. (2005), ‘Sectoral systems of innovation’, in J. Fagerberg, D. Mowery and R.R. Nelson (eds), The Oxford Handbook of Innovation, Oxford: Oxford University Press, pp. 380-406.
Malerba, F. and L. Orsenigo (1996), ‘Schumpeterian patterns of innovation are technology-specific’, Research Policy 25(3), 451-78.
Marin, A. and Bell, M. (2006). ‘Technology spillovers from Foreign Direct Investment (FDI): the active role of MNC subsidiaries in Argentina in the 1990s.’ The Journal of Development Studies 42(4): 678-697.
Marin, A. and S. Sasidharan (2010), ‘Heterogeneous MNC subsidiaries and technological spillovers: Explaining positive and negative effects in India’, Research Policy 39(9), 1227–241.
Markusen, J.R. (1995), ‘The Boundaries of Multinational Enterprises and the Theory of International Trade’, Journal of Economic Perspectives 9(2), 169-89.
Markusen, J.R. (2002), Multinational firms and the theory of international trade, Cambridge [Mass.]: MIT Press.
Marsili, O. (2001), The anatomy and evolution of industries: technological change and industrial dynamics, Cheltenham: Edward Elgar.
Mayer, K.E. and E. Sinani (2009), ‘When and Where Does Foreign Direct Investment Generate Positive Spillovers? A Meta-Analysis’, Journal of International Business Studies 40(7), 1075-94.
Michailova, S. and Z. Mustaffa (2012), ‘Subsidiary knowledge flows in multinational corporations: Research accomplishments, gaps, and opportunities’, Journal of World Business 47, 383-396.
Mohnen, P. (2013), ‘R&D Tax Incentives’, I4G Policy Brief 25. Bristol.
Narula, R. (2002), ‘Innovation Systems and “Inertia” in R&D Location: Norwegian Firms and the Role of Systemic Lock-in’, Research Policy 31(5), 795-816.
Narula, R. (2012), ‘Do we need different frameworks to explain infant MNEs from developing countries? ’, Global Strategy Journal 2(3): 188-204.
Narula, R., and J. Guimón (2009), The contribution of multinational enterprises to the upgrading of national innovation systems in the EU new member states: policy implications. Paper presented at the OECD Global Forum on International Investment, 7-8 December 2009.
Narula, R. and J. Michel (2009), Reverse knowledge transfer and its implications for European policy, Maastricht: UNU-MERIT Working Paper 2009-035.
Narula, R. and A. Zanfei (2005), ‘Globalisation of innovation: the role of multinational enterprises’, in J. Fagerberg, D.C. Movery and R.R. Nelson (eds), The Oxford Handbook of Innovation, Oxford: Oxford University Press, pp. 318-48.
O'Mahony, M. (2013), Internationalisation of service markets and growth: Synthesis, Birmingham: SERVICEGAP Discussion Paper 52.
OECD (2005), Measuring globalisation: OECD economic globalisation indicators, Paris: OECD.
OECD (2008a), The Internationalisation of business R&D: evidence, impacts and implications, Paris: OECD.
OECD (2008b), Open Innovation in Global Networks, Paris: OECD.
OECD (2008c), Recent trends in the internationalisation of R&D in the enterprise sector, Paris: DSTI/EAS/IND/SWP (2006)1/Final.
OECD (2008d), OECD Science, Technology and Industry Outlook 2008, Paris: OECD.
OECD (2009), Innovation in Firms. A Microeconomic Perspective, Paris: OECD.
OECD (2010), Measuring Globalisation: OECD Economic Globalisation Indicators 2010, Paris: OECD.
OECD (2012), OECD Science, Technology and Industry Outlook 2012, Paris: OECD.
OECD (2014), OECD Science, Technology and Industry Outlook 2014, Paris: OECD.
OECD (2016), OECD Science, Technology and Industry Outlook 2016, Paris: OECD.
OECD (2016a) Attracting international S&T investments by firms, in: OECD (Ed.), OECD Science, Technology and Innovation Outlook 2016. OECD, Paris.
Patel, P., Pavitt, K., (1991), ‘Large Firms in the Production of the World's Technology: An Important Case of "Non-Globalisation"’, Journal of International Business Studies 22, 1-22.
38
Bernhard Dachs / Asian Research Policy 8 (2017) 17-39
Patel, P. and K. Pavitt (1999), ‘Global Corporations and National Systems of Innovation: Who Dominates Whom?’, in D. Archibugi, J. Howells, and J. Michie (eds), Innovation Policy in a Global Economy, Cambridge: Cambridge University Press, pp. 94-119.
Pavlínek, P. (2004), ‘Regional Development Implications of Foreign Direct Investment in Central Europe’, European Urban and Regional Studies 11(1), 47-70.
Pearce, R. (1992), ‘Factors Influencing the Internationalisation of Research and Development in Multinational Enterprises’, in P.J. Buckley and M. Casson (eds), Multinational Enterprises in the World Economy, Cheltenham: Edward Elgar, pp. 75-95.
Pearce, R. (2004), National systems of innovation and the international technology strategy of multinationals, Reading: University of Reading Discussion paper 2004-06.
Pearce, R. and M. Papanastassiou (2009), ‘Multinationals and National Systems of Innovation: Strategy and Policy Issues’, in R. Pearce and M. Papanastassiou (eds), The Strategic Development of Multinationals Subsidiaries and Innovation Basingstoke: Macmillan Publishers, pp. 289-307.
Peneder, M. (2010), ‘Technological regimes and the variety of innovation behaviour: Creating integrated taxonomies of firms and sectors’, Research Policy 39(3), 323-34.
Piscitello, L. and L. Rabbiosi (2006), How does Knowledge Transfer from Foreign Subsidiaries affect Parent Companies’ Innovative Capacity?, Copenhagen: Druid Working Paper No. 06-22.
Poti, B., and R. Spallone (2016) ‘Fiscal Incentives and their Impact on Inward BERD. A Case Study’, Deliverable for the project ‘R&D Internationalisation of business investments in R&D and analysis of their economic impact’ on behalf of the European Commission, DG Research and Innovation.
Qu, Z., C. Huang, M. Zhang, and Y. Zhao (2013), R& D offshoring, technology learning and R& D efforts of host country firms in emerging economies. Research Policy 42(2): 502-16.
Rabbiosi, L. (2009), ‘The impact of reverse knowledge transfer on the parent company’s innovativeness : Which role for organizational mechanisms and subsidiary’s characteristics?’, in L. Piscitello and G. Santangelo (eds), Multinationals and local competitiveness, Milan: Edizioni Franco Angeli, pp. 167-95.
Ramirez, P. (2013), The new modes and geography of pharmaceutical R&D: Implications for policy, Birmingham: SERVICEGAP Discussion Paper 49.
Rammer, C. and A. Schmiele (2008), ‘Globalisation of
innovation in SMEs: why they go abroad and what they bring back’, Applied Economics Quarterly 59(Supplement), 173-206.
Rojec, M., and M. Knell (2015), Why is there little evidence of knowledge spillovers from foreign direct investment?, Oslo: U-Know project report.
Ronstadt, R.C. (1977), Research and Development Abroad by U.S. Multinationals, New York: Praeger Publishers.
Sachwald, F. (2008), ‘Location choices within global innovation networks: the case of Europe’, Journal of Technology Transfer 33(4), 364-78.
Sadowski, B.M. and G. Sadowski-Rasters (2006), ‘On the innovativeness of foreign affiliates: Evidence from companies in The Netherlands’, Research Policy 35(3), 447-62.
Safarian, A.E. (1966), Foreign Ownership of Canadian Industry, Toronto: McGraw Hill.
Sanna-Randaccio, F. and R. Veugelers (2007), ‘Multinational knowledge spillovers with decentralised R&D: a game-theoretic approach’, Journal of International Business Studies 38(1), 47-63.
Santos-Paulino, A. U., M. Squicciarini, and P. Fan (2014), ‘Foreign Direct Investment, R&D Mobility and the New Economic Geography: A Survey’. The World Economy, 37(12): 1692-1715.
Schmiele, A. (2012), ‘Drivers for international innovation activities in developed and emerging countries’, Journal of Technology Transfer 37(1), 98-123.
Schmiele, A. (2013), ‘Intellectual property infringements due to R&D abroad? A comparative analysis between firms with international and domestic innovation activities’, Research Policy 42(8), 1482-1495.
Schwaag Serger, S. and E. Wise (2010), Internationalization of Research and Innovation – new policy developments, Seville: paper presented at the 2010 Concord Conference.
Shapira, P., J. Edler, D. Gagliardi, A. Verbeek, E. Lykogianni, and M. Knell (2009), Analysis of R&D international funding flows and their impact on the research system in selected Member States, Brussels: RINDICATE specific assignment 7.
Sheehan, J. (2004), Globalisation of R&D: Trends, Drivers and Policy Implications, Den Haag: paper presented at the IST 2004 conference.
Siedschlag, I., D. Smith, C. Turcu, and X. Zhang (2013). ‘What determines the location choice of R&D activities by multinational firms?’, Research Policy 42(8), 1420-430.
Singh, J. (2007), ‘Asymmetry of Knowledge Spillovers between MNCs and Host Country Firms’, Journal of International Business Studies 38(5), 764-86.

Articles
39
Stiebale, J. and F. Reize (2011), ‘The impact of FDI through mergers and acquisitions on innovation in target firms’, International Journal of Industrial Organization 29(2), 155-67.
TAFTIE (2009), Internationalisation of National Innovation Agencies, Stockholm: TAFTIE.
Teece, D.J. Pisano, G. and A. Shuen (1997), ‘Dynamic capabilities and strategic management’, Strategic Management Journal 18(7), 509-33.
Thomson, R. (2013), ‘National scientific capacity and R&D offshoring’. Research Policy 42(2): 517-28.
Thursby, J. and M. Thursby (2006), Here or There? A Survey of Factors in Multinational R&D Location, Washington DC: National Academies Press.
Timmer, M.P., A.A. Erumban, B. Los, R. Stehrer and G.J. de Vries, 2014 ‘Slicing Up Global Value Chains’, Journal of Economic Perspectives 28(2): 99-118.
Todo, Y. and S. Shimizutani (2005), Overseas R&D activities by multinational enterprises: evidence from Japanese firm-level data, Tokyo: Hi-Stat Discussion Paper Series no. 05-91, Institute of Economic Research, Hitotsubashi University.
Tübke, A., F. Hervás, N. Grassano, and L. Potters (2017), The 2016 Survey on R&D Investment Business Trends. Seville: IPTS.
UNCTAD (2005), World Investment Report 2005: Transnational Corporations and the Internationalization of R&D, New York and Geneva: United Nations.
UNCTAD (2014), World Investment Report 2014: Investing in the SDGs: An Action Plan, New York and Geneva: United Nations.
Verbeek, A., Shapira, P., Edler, J., Gagliardi, D., Lykogianni, E. and M. Knell (2009), RINDICATE. Analysis of R&D international funding flows and their impact on the research system in selected Member States, Brussels: Report for the European Commission, DG Research.
Veugelers, R. (2005), Internationalisation of R&D: Trends, Issues and Implications for S&T policies, Background report for the OECD Forum on the internationalization of R&D, Paris: OECD.
Veugelers, R. and B. Cassiman (2004), ‘Foreign Subsidiaries as a Channel of International Technology Diffusion: Some Direct Firm Level Evidence from Belgium’, European Economic Review 48(2), 455-76.
Von Zedtwitz, M. and O. Gassmann (2002), ‘Market versus Technology Drive in R&D Internationalization: Four different Patterns of Managing Research and Development’, Research Policy 31(4), 569-58.
Walsh, K. A. (2007), ‘China R&D: A High-Tech Field of Dreams’, Asia Pacific Business Review 13(3), 321–35.
Wang, E.C. (2010), ‘Determinants of R&D investment: the extreme-bounds-analysis approach applied to 26 OECD countries’, Research Policy 39(1), 103-16.
Weiss, M. (2016) The role of local content policies in manufacturing and mining in low- and middle-income countries, Vienna: UNIDO.
Young, S., N. Hood, and E. Peters (1994), ‘Multinational enterprises and regional economic development’, Regional Studies 28(7), 657-77.
Zaheer, S. (1995), ‘Overcoming the Liability of Foreignness’, Academy of Management Journal 38(2), 341-64.
Zanfei, A. (2000), ‘Transnational Firms and the Changing Organisation of Innovative Activities’, Cambridge Journal of Economics 24(5), 515-42.

40
Hyun-Kyu Kang / Asian Research Policy 8 (2017) 40-51
Ex-ante Evaluation System of Government R&D Programs in Korea
Hyun-Kyu Kang
AbstractSince 2008, the Korean government has employed the preliminary feasibility study (PFS), an ex-ante evaluation, to enhance the efficiency of fiscal management in large-scale government research and development (R&D) programs and to determine whether to invest in each R&D program. Most PFS results are directly reflected in budget formulations, making the PFS an important step in budgetary decisions. The PFS has been developed and improved as a comprehensive evaluation system of R&D program proposals in terms of technology, policy and economics. Over the past 10 years, 66.2% of R&D programs and 37.4% of program budgets have passed the PFS. The PFS has contributed to enhanced fiscal efficiency in public investment by preventing non-feasible programs from being launched. This paper explains the framework, methodologies, results, and issues of the PFS on R&D programs in Korea.
Keywords: ex-ante evaluation, preliminary feasibility study, government R&D program, logic model, R&D budget
1. Introduction
It isn’t easy to predict the results or effects of any work. Prediction is even more difficult if this is the first time the work is being attempted. Not being easy, however, will not stop the continuing attempts to forecast the future. The ex-ante evaluation is part of this effort to predict what will happen as the result of any intended work.
In the second half of 1997, South Korea suffered a financial crisis and received bailouts from the International Monetary Fund (IMF) (Kim, 2000; Chopra et al., 2001). In the wake of the financial crisis, the issue of fiscal soundness became an important policy agenda. To enhance the efficiency of public investment management (PIM), in 1999 the Korean government adopted the preliminary feasibility study (PFS), an ex-ante evaluation, for newly
proposed large-scale projects with budgets of more than 50 billion Korean won (KRW) (about 45 million USD), including more than 30 billion KRW in central government expenditures. The National Finance Act of 2006 provides the legal basis of PFS. The PFS aims at improving the efficiency of fiscal management and preventing budgetary waste through a careful decision on whether a large-scale fiscal project will be implemented (MoSF, 2014). Initially, the PFS focused on economic infrastructure and has expanded to social infrastructure and non-infrastructure (e.g. R&D, welfare) programs.
Korea has become the world’s most research-intensive country. In 1999, Korea’s investment in research and development (R&D) totaled 2.07% of its gross domestic product (GDP), just below the average for
Korea Institute of S&T Evaluation and Planning (KISTEP), 5F Dongwon F&B Bldg., 68, Mabang-ro, Seocho-gu, Seoul, 06775, KoreaE-mail: [email protected]

Articles
41
nations in the Organization for Economic Co-operation and Development (OECD) (Zastrow, 2016). In 2015, however, that figure had increased to 4.23%, which was ranked first in the world (MSIP and KISTEP, 2017). The Korean government has more than tripled the R&D budget from 5.7 trillion KRW in 2001 to 19.6 trillion KRW (about 17.8 billion dollars) in 2017. From the middle of 2000, the Korean government began to take an interest in raising the efficiency of government R&D investment.
In 2008, the PFS was introduced to newly proposed large-scaled, long-term R&D programs also (Lee and Park, 2011; Ahn, 2017), making 2017 the 10th year since the PFS was employed in government R&D programs in Korea. The fundamental purpose of PFS is to provide important information to help the Ministry of Strategy and Finance (MoSF), the government fiscal authority, to decide whether to implement R&D programs proposed by government ministries. MoSF can make an informed decision based on results of the PFS for each R&D program proposal. Only the programs that pass the PFS qualify for a budget investment. In addition, the PFS also improves an R&D program proposal by complementing small drawbacks of the program during the PFS process (Kang, 2012). Korea Institute of Science & Technology Evaluation and Planning (KISTEP) has played the key role of PFS of R&D programs.
The PFS of R&D programs is an ex-ante evaluation performing in points of views of technology, policy, and economics. In general, the ex-post evaluation focuses on measuring the final outcomes and performance of a project, whereas the ex-ante evaluation is used to evaluate mainly why the project should be implemented and what the project aims to do (Bulathsinhala, 2015). Because the PFS is applied to R&D programs before the programs begin, it is more difficult to evaluate the future performance in an ex-ante evaluation than
the actual performance in an ex-post evaluation. In this paper, on the 10th anniversary of the PFS
on R&D programs, the framework of the PFS currently conducted in Korea is presented and the achievements and issues are discussed. In section two, the analysis structure of PFS is explained. In sections three to five, the three major criteria, technological analysis, policy analysis, and economic analysis, are presented. The overall analysis method is described in section six. Section seven focuses on the results of the PFS conducted so far and issues on the PFS. The final section explains the importance of the ex-ante evaluation of R&D programs in the budgetary process.
2. Main Criteria of the PFS of R&D Program
The PFS of each R&D program is conducted by a multi-disciplinary research team organized by KISTEP. As project manager (PM) of PFS, the research staff of KISTEP is in charge of the research team for the R&D program. The PM composes his or her research team with external experts that have expertise in technology, policy, and economics. The mix of specialists from different backgrounds and organizations helps provide diverse ideas for the evaluation and improves the transparency and objectivity of the decision-making process. Experts in technology, policy, and economics analyze the program proposal at each point of view. Then the research team discusses together several times about their opinions and develops a comprehensive evaluation report of the program proposal.
Figure 1 shows the basic analysis structure of the PFS of R&D programs. This analysis structure has three levels and every R&D program proposal should be analyzed according to this structure. The AHP method is performed for all criteria in the analysis structure.

42
Hyun-Kyu Kang / Asian Research Policy 8 (2017) 40-51
Figure 1. Basic analysis structure for the ex-ante evaluation of R&D programs
3. Technological Feasibility Analysis
In the technological feasibility analysis, the completeness and appropriateness of an R&D program proposal are analyzed. The technological feasibility analysis consists of three sub-criteria: R&D logic analysis, technological viability, and overlap possibility.
3.1. R&D Logic Analysis
The R&D logic analysis includes the whole framework for analyzing logical linkages and rationales of an R&D program proposal. The R&D logic analysis can explain what the proposed program is, why the proposed program is valid, how the investment results in desired outcomes, and who the private or public beneficiaries are. This 2nd level criterion is most important in the PFS of R&D programs.
We developed the logic analysis model as an important tool in identifying problems and issues for the ex-ante evaluation of R&D programs as shown in Figure 2 (Kang, 2013). The program logic model
creates a picture of how organizations do their work and how outputs/outcomes link to relevant issues/problems, program objectives, and activities/ processes. A logic model is a systematic and visual way to present and share the understanding of the relationships among the resources, activities, and changes or results to be achieved. Many papers have demonstrated that the logic model can provide a basis for good evaluation and performance monitoring as well as being utilized for program design and building a shared understanding of what a program plans to achieve and how the program will achieve (McLaughlin et al., 1999; Millar et al., 2001; W.K. Kellogg Foundation, 2004; Renger and Hurley, 2006; McLaughlin, 2010; Samsuri, 2011).
The logic model is a core tool for the R&D logic analysis. The meaning of each element of the logic model is shown in Figure 2. Arrows in the logic model illustrate the direction of the relationship between elements. We simplified the logic model to make it easier to apply. However, the logic model presented in Figure 2 is a general model and can be modified to match the characteristics of each R&D program.

Articles
43
Figure 2. Logic model for the ex-ante evaluation of R&D programs
The logic model analysis plays an important role in helping the PFS evaluators define key issues for designing an evaluation plan at the beginning of the PFS prior to the in-depth analysis according to each evaluation criterion. The logic model disassembles the program into problem/issue, objective, input, activity, output, and outcome/impact to understand the concept of the program. Using this logic model, we can generally identify important factors of an R&D program proposal such as why this program is needed, what the objectives are, who the beneficiaries will be, what and how many resources will be necessary, what activities will be conducted, what kind of output will be produced and when, and what outcomes and impacts will occur. We also can analyze the logic flow of an R&D program proposal and find any disconnects or gaps in the logic flow among elements.
The R&D logic analysis consists of three sub-criteria
(level 3): proper planning process, proper objectives, and proper composition and contents. We established evaluation questionnaires to maintain the consistency of analysis in each sub-criterion as shown in Table 1. To develop the standard questionnaire, we reviewed past cases of PFS and evaluation systems of other countries such as the Program Assessment Rating Tool (PART) by the Office of Management and Budget (OMB) and the Evaluation Methods by the Department of Energy (DOE) in the United States, and the Green Book in the United Kingdom.
The questionnaire consists of essential and optional questions. Whereas essential questions should be applied to all R&D programs, optional questions may be applied depending on the characteristics of each R&D program. For each question, evaluators can apply one or more suitable methods from several evaluation methods for R&D programs (Ruegg and Jordan, 2007).

44
Hyun-Kyu Kang / Asian Research Policy 8 (2017) 40-51
Table 1. Questionnaire of R&D Logic Analysis
Level 3 Criteria Evaluation questions
Proper planning process 1. Was the expert group that participated in the planning suitably organized?2. Was the demand for R&D of the related field suitably understood?3. Was the priority setting process rationally carried out?
Proper objectives 1. Is the problem or issue to be solved suitably deduced?※ Is there any other efficient alternative plan aside from R&D?2. Does the program objective specifically present the effect that is intended to be accomplished?3. Is there a correlation between the objective and the problem to be solved?(System development program) Is the mission and concept design suitably organized?4. Is the targeting of the beneficiaries for the program outcome suitably carried out?※ Is the promotion strategy to accomplish the objective suitable?※ Is the role of government support considering the attributes of technology suitable?
Proper composition and contents1. Are detailed activities deduced and presented at a suitable level?2. Are detailed activities logically related to the objective?(R&D Infra establishment) Are facilities/equipment established in consonance with R&D activities?(System development program) Is a suitable work breakdown structure (WBS) organized around the core component technology?3. Are the outcome indicators of detailed activities suitably presented?4. Are the period estimates of detailed activities and temporal order logical?
‘※’ mark means that the question is optional.
3.2. Technological Viability
Technological viability is intended to analyze in terms of the attributes of the technology to be developed in an R&D program. This criterion is not meant to analyze the success or failure of technology development. Because It is not desirable to pursue large-scale investments with only vague expectations about the effect of R&D, technological viability aims to analyze whether the present time is the appropriate time for a large-scale investment in the proposed technology field and whether there may be schedule delays or cost overruns not identified in the R&D program proposal. This criterion consists of two analysis elements: technological trend analysis and technological competitiveness analysis.
Technological trend analysis determines whether this is a suitable time for large-scale investment considering the objectives of an R&D program and the advancement trend of a proposed technology.
Methods such as data mining, expert judgement, and technology readiness level (TRL) may be used for technological trend analysis. Generally, patent analysis is utilized most frequently as a proxy for data mining. If it is hard to expect the rise of a proposed technology in the near future because the technology is at very early stage, or if the proposed technology is worn-out, it is not an appropriate time for a new large investment in the technology. If the timing of the investment is not appropriate, there is a high probability of schedule delays or cost overruns not identified in the R&D program proposal.
Technological competitiveness analysis assesses the competitive position and technology gap among key research subjects. Technology level evaluation reports published biannually by KISTEP, scientometrics, expert judgement may be used for this purpose. If domestic technology level is high and R&D is considered as the only source of growth, technological competitiveness analysis will yield a

Articles
45
relatively favorable opinion. On the other hand, if the domestic technology level is low and there are alternative methods of growth besides R&D, the analysis will yield a relatively negative finding.
3.3. Overlap Possibility
National fiscal management aims to establish a foundation for efficient, performance-oriented, transparent fiscal management and soundness (MoSF, 2006). Therefore an investment in an R&D project that overlaps an existing R&D project is likely to be regarded as inefficient and useless. The Korean government is actively pushing the readjustment of similar and overlapped R&D projects to solve the problem of redundant investments. Overlap possibility analysis also is important in minimizing the causes of waste in fiscal management. In this criterion, the overlap possibility of the R&D program, R&D activity, large research facility, and equipment are analyzed. If the overlap possibility is high, a negative evaluation opinion is given.
4. Feasibility Analysis on Policy
To conduct the government R&D program, a significant amount of tax revenues may be expended. As a result, government R&D programs should be based on the national science and technology (S&T) strategies and the level of program expenses should reflect a consensus of national policy and society. We recognize the importance of analyzing policy issues in the PFS of R&D programs and have devised approaches to analyze the feasibility on policy.
The feasibility analysis on policy deals with policy issues and other issues that could not be analyzed in technological and economic feasibility analyses. This evaluation criterion has two second level sub-criteria: the policy consistency and program implementation system and the potential risk.
4.1. Policy Consistency and Program Implementation System
4.1.1. Consistency with National Plans
Because government R&D programs are a method for implementing national S&T strategies, programs should be planned in accordance with national strategies. The extent to which an R&D program is consistent with national S&T strategies is one criterion to evaluate whether an R&D program will be promoted. To evaluate this criterion, objectives and contents of the R&D program should be compared to and analyzed with contents of national S&T plans. In Korea, national S&T strategy has been hierarchically organized in the Science and Technology Basic Plan - a top-level plan that includes many sub S&T plans from various technological and policy areas.
To promote the efficient use of a limited governmental R&D budget, the Korean government specifies important technologies in medium- and long-term S&T plans (i.e. 120 strategic technologies in the 3rd Science and Technology Basic Plan).
For any R&D program to develop specific technology or to construct specific R&D infrastructure, we can determine that the program has a consistency with national S&T strategies, if the technology or R&D infrastructure is described obviously in some national S&T plans. The Science and Technology Basic Plan, the supreme master plan, is analyzed for all R&D programs and other S&T plans are analyzed selectively. The consistency level between an R&D program and S&T plans is evaluated as high, medium, or low.
4.1.2. Implementation System and Stakeholders’ Initiatives
Implementation system proper to characteristics of individual R&D program is likely to enhance the probability of program success. To ensure the successful enforcement of an R&D program, the

46
Hyun-Kyu Kang / Asian Research Policy 8 (2017) 40-51
role-sharing and cooperation among the principal ministry, related ministries, and research institutes should be reviewed. The efficient program operation scheme and the strong will of participating agents also are important to consider.
The propriety of comprehensive program management system that involves the vertical funds transfer structure and horizontal cooperation system must be analyzed in terms of R&D program governance. In other words, the evaluation of the implementation system is intended to analyze the appropriateness of program management system and procedure to achieve policy goals from a legal and institutional point of view.
To evaluate the stakeholders' initiative, the will of agents to conduct an R&D program and the preferences of the stakeholders (beneficiaries or expense persons) should be analyzed. The will to conduct a program can be evaluated by the extent of preparation in the detailed contents and strategy of an R&D program proposed by any government ministry. The preferences of the stakeholders can be evaluated by identifying the number of agents, such as research institutes, companies, and universities trying to participate in the R&D program, and the extent of their will to participate as well as the size of matching funds from private companies.
4.2. Potential Risk
The risk factor analysis is performed to identify the stakeholders' responsibilities by raising the transparency of risk information inherent in the R&D program. The potential risk analysis for the feasibility analysis on policy deals with the external risk factors that are not directly relevant to the technology development activities, such as fund procurement risk and legal and institutional risks.
4.2.1. Financial Capability
Financial capability is determined by analyzing the possibility of problems in the time and scale of R&D program expenses. This analysis exposes risk factors that could delay the implementation of the R&D program due to problems with financial procurements. R&D program expenses are classified as central government expenditure, local government expenditure, and matching funds from private sectors. The certainty of the procurement plan by these financial resources and other risk factors is analyzed to evaluate the financial risk.
4.2.2. Legal and Institutional Risk
The legal and institutional risk factors are classified as domestic laws and institutions, and international treaties and conventions. Because a government R&D program is conducted mainly with public investments, it should be analyzed to determine if the program will be carried out in accordance with the relevant laws, institutions, and treaty provisions. It’s also possible to identify conflicts with laws in R&D activities and the use and spread of outcomes from R&D programs.
There is a point that should be considered when the products developed through any R&D program will be international trade goods. As international trade has increased, incidents related to government R&D programs that evoke a conflict with foreign nations also have increased. Because R&D activities spread in an industry in conjunction with technological innovation, the possibility that R&D activities may cause regulatory issues in trade with other nations is higher than in the past. To minimize these trade issues, R&D programs that develop industrial technologies should consider the Agreement on Subsidies and Countervailing Measures established by World Trade Organization (WTO).
Information on these risk factors can be utilized as important basic data for the risk response plan

Articles
47
in the implementation process of the R&D program, so there is a need for the careful consideration about risk factors at the planning phase of a program.
5. Economic Feasibility Analysis
The economic feasibility analysis is done to estimate the total cost for conducting an R&D program and to identify outcomes and spillover effects caused by an R&D program based on the efficiency of the fiscal management.
First, the appropriateness of the budget of an R&D program proposal is reviewed and analyzed for hidden costs. To estimate the appropriate cost of a proposed R&D program, we use the cost classification scheme shown in Table 2. This cost classification scheme for R&D programs is the standard format in Korea. Every ministry that proposes a new R&D program should submit a detailed proposal showing all costs for R&D, research facilities and large equipment, and program management. To estimate reasonable costs in a proposed program, several methods such as analogy estimating, statistical analysis, detailed calibration, and expert opinion may be used.
Economic analysis is used to evaluate the domestic economic effects produced by outcomes of an R&D program. For this purpose, cost-benefit analysis, which is an incremental approach, is used widely. The cost-benefit analysis compares a scenario with-the-program with a counterfactual baseline scenario without-the-program (EC, 2014). The difference in social welfare should be determined by comparing benefits “with or without” implementing the program, not by comparing benefits “before and after” the implementation of the program. In the PFS, only direct benefits of an R&D program are examined. Direct benefit means a benefit directly related to the objective of the R&D program. We classify benefits of R&D programs in Table 3.
Looking at past PFS cases, the most frequently applied benefit is the producer-based, value-creating benefit because the proportion of R&D programs aimed at creating an industrial spillover effect is high. For this case, we developed the market demand approach to estimate the benefit. This benefit can be estimated from the probabilistic value added or created in the future target market due to the contribution of the R&D program.
Table 2. Classification of costs of R&D programs
Categories Contents
Cost for research & development Labor cost of researchers, research fund, etc.
Cost for research facilities and equipment Cost for purchase and maintenance of research facilities and large equipment
Cost for R&D management Cost for planning & assessment, management of the R&D program, etc.
Table 3. Classification of benefits of R&D programs
Categories Subcategories
Value-creating benefit Consumer-based benefitProducer-based benefit
Cost-reducing benefit Production cost-reducing benefitDamage cost-reducing benefit

48
Hyun-Kyu Kang / Asian Research Policy 8 (2017) 40-51
Cost-benefit analysis is used as the basic method to analyze the effects of an R&D program on the national economy. If the expected outcome or spillover effect of an R&D program can be quantified as a monetary value, the cost-benefit analysis may be used for economic feasibility analysis. However, if the outcome or spillover effect of an R&D program cannot be quantified as a monetary value, the cost-effectiveness analysis should be used.
6. Overall Feasibility Analysis
A final decision on whether to invest in the R&D program is made by synthesizing evaluation results from technology, policy, and economics analyses. Technological, policy, and economic analyses are performed independently and the results are combined in the final analysis. Analytic Hierarchy Process (AHP) (Saaty and Vargas, 2006) method, a multi-criteria analysis method, is utilized as a means for collecting the decision-making information for each R&D program proposal. AHP decomposes a problem into a hierarchy with several levels where each decision element should be independent (Lee et al., 2009). The evaluation is conducted based on pairwise comparisons at each level of the hierarchy (Saaty, 1987).
AHP has been employed in many different areas, such as selection, evaluation, benefit-cost analysis, allocation, planning and development, and priority and ranking (Vaidya and Kumar, 2006). It also has been used widely as an R&D evaluation method that can handle multiple objectives for R&D projects and can decompose the problem into a multilevel structure or hierarchy. AHP has merit in that both qualitative and quantitative data can be considered simultaneously (Pho et al., 2001). Because results of technological analysis and policy analysis are qualitative and result of
economic analysis is quantitative, AHP is useful to the PFS.
Generally, the overall AHP score of more than 0.5 means that an R&D program is feasible. Based on the final AHP result, MoSF can make the decision of whether to invest in the R&D program.
7. Results and Issues
7.1. Results of PFS on R&D Programs
KISTEP finished a PFS for 130 R&D programs from 2008 to September 2017. Because 86 R&D program proposals had positive results, the pass rate for all proposals was about 66.2%. The budgets for passed programs have been adjusted to enhance the efficiency of the investment and, as a result, budgets of most programs have been reduced. Therefore, the pass rate of program budgets was about 37.4% for all examined programs and about 51.7% for passed programs.
Because PFS pass rates were the same for programs with or without matching funds from the private sector, the participation of private companies does not seem to affect the pass rate for R&D programs.
The correlations between overall AHP score and each AHP score from the technological, policy, and economic analyses, were analyzed to identify which criterion was most relevant to the overall feasibility result. As shown in Table 4 and Figure 3, the technological feasibility analysis had the highest correlation with overall AHP score. Therefore, we can understand that in the PFS of R&D programs the most important criterion is the technology analysis. The correlation between the overall AHP score and the policy analysis score was relatively low because most R&D programs had been based on national S&T strategies and contained few risk factors.

Articles
49
Table 4. Correlation coefficients between overall AHP score and each AHP score of major criteria
Technological analysis - Overall Policy analysis - Overall Economic analysis - Overall
Correlation coefficient 0.974 0.780 0.971
Figure 3. Correlation analysis between overall feasibility and each major criterion
7.2. Current issues on the PFS
There is the controversy about pre-evaluating the economic effect of an R&D program to be occurred in the future. Because the amount of future benefit due to the R&D program is the important information for the R&D funding allocation, the fiscal authority wants to predict it. However the period of R&D programs is generally 5~10 years, and the benefit analysis in the distant future after the end of programs
involves high uncertainty. Therefore the careful reconsideration about applying the benefit analysis in the ex-ante evaluation on all R&D programs is needed. On the other hand, the strict cost analysis should be conducted beforehand for the efficient fiscal management.
There is an issue that the evaluation period is prolonged because the modification of program proposals of ministries is permitted during the PFS period currently. Ministries tend to poorly establish

50
Hyun-Kyu Kang / Asian Research Policy 8 (2017) 40-51
program proposals to apply for budgets early. If the program proposal gets negative result from the intermediate evaluation, most ministries will modify their program proposals for several months and this will lead to a longer PFS period. Because the PFS is one of the budgetary processes conducted by government, it is desirable not to allow the modification of program proposals during evaluation period to prevent the waste of administrative power and the prolongation of PFS period.
Each PFS of an R&D program is conducted for at least six months. Through this in-depth analysis of the R&D program proposal, reasonable directions and policy suggestions may be derived for the implementation of the program. To ensure the coherence of policy, it is necessary to link ex-ante and ex-post evaluations (Mergaert and Minto, 2015). Therefore, it is important to the improvement of the national R&D system to link the results of PFS of an R&D program to the implementation and ex-post evaluation of program.
8. Conclusions
Because there is no country that conducts the ex-ante evaluation of all large-scale R&D programs under the leadership of government except Korea, this paper is meaningful in that it describes the regional and practical case of the unique government fiscal and R&D system. The purpose of the PFS is to promote the use of sound, evidence-based decision making in the budgetary process. Most of the PFS results have been reflected directly in the formulation of program budgets in Korea, making the PFS an important step in budgetary decisions. The PFS also has contributed to enhance of fiscal efficiency of public investment by preventing non-feasible programs from being launched (Kim, 2012; MoSF, 2014).
The improvement of an ex-ante evaluation system on government programs at the ex-ante phase is
very important for ensuring sound public expenditure. To establish the rational ex-ante evaluation system of government R&D programs, we have developed and improved the evaluation system and methodologies, such as logic model and questionnaire for R&D logic analysis and the market demand approach for estimating benefits. This paper has explained the framework and methodologies for the ex-ante evaluation of R&D programs being conducted in Korea. The standard guidelines for PFS of R&D programs (KISTEP, 2016) were established to ensure the consistency, objectivity, and transparency in analysis processes and methods. The PFS of R&D programs consists of three major evaluation criteria based on technology, policy, and economics. Technological feasibility analysis is the most important criterion in the decision of ‘whether to invest in the R&D program proposal’.
To make the PFS a more credible system, continuous efforts should be made to improve the ex-ante evaluation methodology. Based on the PFS results and issues for the last 10 years, discussions are underway to improve the PFS system. We expect improvements in the PFS system because of these in-depth discussions on evaluation procedures, criteria, and methodologies.
Acknowledgement
I would like to thank the Ministry of Strategy and Finance (MoSF) and Korea Institute of Science & Technology Evaluation and Planning (KISTEP) for the financial support. I also wish to thank the PFS research group in KISTEP and external experts for their intellectual support. I also wish to thank the anonymous reviewers for their comments.

Articles
51
References
Ahn, S. J. (2017) “Institutional basis for research boom: From catch-up development to advanced economy”, Technological Forecasting & Social Change, 119, 53-63.
Bulathsinhala, N. A. (2015) “Ex-ante evaluation of publicly funded R&D projects: Searching for exploration”, Science and Public Policy, 42, 162-75.
Chopra, A., Kang, K., Karasulu, M., Liang, H., Ma, H. and Richards, A. (2001) From crisis to recovery in Korea: Strategy, achievements, and lessons. Washington, DC: International Monetary Fund.
EC (2014) Guide to cost-benefit analysis of investment projects. Brussels: European Commission.
Kang, H. K. (2012) “Improvement of new government R&D program plans through preliminary feasibility studies”, International Journal of Social, Behavioral, Educational, Economic, Business and Industrial Engineering, 6(11), 2963-5.
Kang, H. K. (2013). “Development of logic model for R&D program plan analysis in preliminary feasibility study”, International Journal of Social, Behavioral, Educational, Economic, Business and Industrial Engineering, 7(9), 2613-6.
Kim, J. H. (2012) The republic of Korea: PIM reform after the financial crisis, country case study. Washington, DC: World Bank Group.
Kim, K. S. (2000) The 1997 financial crisis and governance: The case of South Korea. Notre Dame: Kellogg Institute for International Studies.
Lee, H., Lee, S. and Park, Y. (2009) “Selection of technology acquisition mode using the analytic network process”, Mathematical and Computer Modelling, 49(5), 1274-82.
Lee, Y. B. and Park, J. Y. (2011) “Assessment system for feasibility analysis of national R&D programs”, International Journal of Innovation and Technology Management, 8, 661-76.
McLaughlin, J. A. and Jordan, G. B. (1999) “Logic models: a tool for telling your program’s performance story”, Evaluation and Program Planning, 22, 65-72.
McLaughlin, J. A. and Jordan, G. B. (2010) ‘Using logic models’. In: J. S. Wholey, H. P. Hatry and K. E. Newcomer (Eds.), Handbook of practical program evaluation (Third Edition), pp.55-80. San Francisco: Jossey-Bass.
Mergaert, L. and Minto, R. (2015) “Ex ante and ex post evaluations: Two sides of the same coin?”, European Journal of Risk Regulation, 6(1), 47-56.
Millar, A., Simeone, R. S. and Carnevale, J. T. (2001) “Logic models: a systems tool for performance management”, Evaluation and Program Planning, 24, 73-81.
MSIP and KISTEP (2017) 2015 Survey of research and development in Korea. Seoul: Ministry of Science, ICT and Future Planning and Korea Institute of Science and Technology Evaluation and Planning.
MoSF (2014) The Budget System of Korea. Sejong: Ministry of Strategy and Finance.
KISTEP (2016) The guideline for preliminary feasibility study of R&D program (2-1 ed.) (in Korean). Seoul: Korea Institute of Science and Technology Evaluation and Planning.
Poh, K. L., Ang, B. W. and Bai, F. (2001) “A comparative analysis of R&D project evaluation methods”, R&D Management, 31(1), 63-75.
Renger, R. and Hurley, C. (2006) “From theory to practice: Lessons learned in the application of the ATM approach to developing logic models”, Evaluation and Program Planning, 29, 106-119.
Ruegg, R. and Jordan, G. (2007) Overview of evaluation methods for R&D programs. Washington, DC: U.S. Department of Energy.
Saaty, R. W. (1987) “The analytic hierarchy process - what it is and how it is used”, Mathematical Modelling, 9(3-5), 161-76.
Saaty, T. L. and Vargas, L. G. (2006) Decision making with the analytic networking process; Economic, political, social and technological applications with benefits, opportunities, costs and risks. New York: Springer.
Samsuri, M. (2011) “Design R&D program evaluation based on the logic model approach: An example from a productivity program in Indonesia”, Asian Research Policy, 2(2), 127-138.
Vaidya, O. S. and Kumar, S. (2006) “Analytic hierarchy process: An overview of applications”, European Journal of Operational Research, 169(1), 1-29.
W. K. Kellogg Foundation (2004) Logic model development guide. Battle Creek: W.K. Kellogg Foundation.
Zastrow, M. (2016) “Why South Korea is the world’s biggest investor in research”, Nature, 01 June 20.

52
Jung-hwan Lee / Asian Research Policy 8 (2017) 52-67
Study on an Innovation Model for the Enhancement of the Entrepreneurial Competency of Science and Technology Personnel in the Era of the 4th Industrial Revolution†
Jung-hwan Lee
AbstractThis study developed out of a recognition that to adapt to the era of the 4th industrial Revolution, the direction of human resource policy in the field of science and technology must shift from quantitative support to qualitative improvement. To accomplish this type of improvement, an in-depth understanding of science and technology personnel is needed, and to this end the author began by classifying science and technology personnel based on creativity, and carried out an analysis on the level of entrepreneurial competency for each group. Then, the author proposes a mutual cooperation model that will enable the fostering of specialized talents that meet the needs of industry, and will strengthen the entrepreneurial competency of government, corporations and universities.First, science and technology (S&T) personnel were divided into 4 groups, based on three factors: creative attitude, knowledge and skill. In contrast to the initial expectations, the results of the analysis showed that the subdivided groups could be separated based on the level of entrepreneurial competency (expected level, highness and lowness of current level) rather than personal competency. In the evaluation of the sub-categories of entrepreneurial competency, science and technology personnel showed a high level of human relationship, social orientation and ethical consciousness to meet the level of expectations. However, they showed a relatively low level in evaluation categories such as market orientation, risk perception, and knowledge on the major scientific field, showing the need for improvement in these areas. Then, the author introduces the cases of Aalto University (Finland), Georgia Tech (USA), and Waterloo University (Canada) in order to facilitate the understanding that in order to improve the industry-academia innovation system for capacity-building of entrepreneurs, a transition from current individual efforts to collaborative cooperation is required.The concepts of the level of entrepreneurial competencies and the stimulation of interaction between innovators should be applied and expanded in order to establish a new innovative ecosystem and programs to enhance actual entrepreneurial competencies.
Keywords: entrepreneurial competencies, 4th industrial revolution, creativity, educational needs, S&T personnel segmentation, Triple Helix Model
1. Introduction
1.1. Aims and Objectives
Many experts have diagnosed that the Korean
economy is in crisis. As the low-growth trend continues around the world, Korea is being pressured by threats from internal and external factors, such as increasing economic uncertainty, the prominence of Chinese companies, pressures to restructure core
Chungbuk National University, Chungdae-ro 1, Seowon-Gu, Cheongju, Chungbuk 28644, Korea E-mail: [email protected]† This paper was funded by KISTEP through the 2017 Creative KISTEP Fellowship Program.
Articles
53
industry corporations, an insufficient institutional response to the 4th Industrial Revolution, and depression in the domestic economy. In the midst of such threats, the Korean government is constantly searching for opportunities to again promote new growth through technology-based innovation. Some of its efforts include creativity-focused reinforcement of university education, the promotion of start-ups, and addressing the current issues of science and technology R&D. However, such measures seem to be limited when it comes to solving the fundamental problems in the sense that these innovative policies are focused on quantitative support, emphasize short-term performance, lack detailed implementation strategies, and lead to manpower training which cannot meet the actual needs of the industry.
Therefore, this study suggests a model for science and technology innovation that suits the era of the 4th Industrial Revolution, which fosters personnel that can meet the demands of industry, and redefines the modes of mutual cooperation between the government, business, and academia. The study ultimately seeks a transition of the current policies on technological innovation toward qualitative capacity-building, and focuses on fostering future-oriented pace-setting industries, thereby creating a more dynamic ecosystem in the field of science and technology.
1.2. Research Methods
Despite quantitative growth of investments in science and technology in Korea, there is still much to be improved in terms of quality. By observing some cases, it can be easily noted that although the number of patent applications is high, the basic science capability is still underdeveloped, and corporate investment is concentrated only on applied science, such as semiconductors and telecommunications. More than 70% of R&D
investment from the private sector comes from large corporations, and it is common for public sector investors to approach issues with a somewhat nearsighted mindset. An example that illustrates this well was the Go competition between AI AlphaGo and a human competitor, which became a hot topic of conversation last year. At that time, the government announced plans to invest 1 trillion KRW in the field of AI (Artificial Intelligence) by 2020. However, the general evaluation on the current status is that the government failed to properly react to the issue. In its approach to issues such as this one, while the government does make plans and preparations before implementing policies, it usually ends up taking a ‘Fast-follower’ strategy, trying to jump on a bandwagon. What makes it even worse is that this is becoming an endless routine. The government had already declared in the 2000s that the country must shift its R&D policy from being a follower to being a leader, and also had presented numerous alternatives such as defining the role of the government and the private sector in technology development, industrial restructuring to emphasize contents and services more rather than pursuing a manufacturing-oriented structure, securing the competitiveness of small businesses for entrance to global markets, expanding investment in original studies, strengthening cooperation between industry and academia, and facilitating technological innovation. However, the same issues are again being pointed out without proper feedback and solutions based on previous diagnoses, and other alternatives still fail to address the fundamental problems, thus creating a vicious cycle.
As such, we must stop this vicious cycle of posing questions and leaving them unsolved, and come up with more fundamental measures for problem-solving. In this sense, the study aims to conduct the following analysis, based on the alternative of fostering S&T personnel from the perspective of entrepreneurial competency, to meet

54
Jung-hwan Lee / Asian Research Policy 8 (2017) 52-67
the demands of the 4th Industrial Revolution, in order to provide a more constructive solution to the issues being addressed.
First, the study will classify the characteristics of current S&T personnel, and analyze their entrepreneurial competency, to understand what competencies they lack and need to improve, and ultimately come up with customized measures for innovative training. Second, the study will examine various global cases involving supportive measures and programs of advanced countries, implemented to foster S&T personnel in response to the 4th Industrial Revolution, to review whether such measures actually proved to be effective. Then, the study will provide alternatives that aim to maximize the effects of new responsive policies for the 4th Industrial revolution, and to avoid consumptive arguments on the problems of the current issues. Finally, the study proposes to redefine the roles of each of the subjects of innovation to strengthen the entrepreneurial competency of S&T personnel, based on the Triple Helix Model (H. Etzkowitz 1993). The triple helix model analyzes the roles and functions of the university, the industry, and the government, the three subjects of science and technology innovation, in the form of a complicated triple spiral structure. This approach does not merely emphasize cooperation between the industry and the academia, but also requires certain premises including creativity-based education programs, outstanding research infrastructure, active government and private investments, and an innovation partnership among the related parties. Based on this, the study will seek solutions to current issues, focusing on generating synergies between the supporting organizations and institutions which connect each subject, the common goal and the establishment of an innovative ecosystem, and innovative strategies that will enable cooperation between new types of education and research.
2. Review of Literature
2.1. Training Science and Technology Personnel
Recently, every field of society has been affected by the 4th Industrial Revolution. The 4th Industrial Revolution is the next wave of the Industrial Revolution that is being led by ICT convergence, artificial intelligence, robotics, and biotechnology. Also it is considered to be a new wave that will revolutionize the structure of global industry. With the arrival of this revolutionary tide in this contemporary age when science and technology contribute to a nation's competitiveness, the balance of power around the world in the 21st century will be changed based on who makes the most efficient investment. Training human resources in the field of science and technology will be as important as investment. Thus far, this importance has been recognized mainly by the government, and policies to nurture growth and provide support to science and technology personnel have been implemented. Included among those policies were policies to reinforce job finding and business initiating capability, enhance the competency of science and engineering colleges, expand the base career development and career activity for science and technology personnel, reinforce the creative capacity of future talents, and maximize the utilization of potential talents.
The directions of the previous studies on the training of science and technology personnel can be classified into three categories. The first category is studies on the status and key statistics of science and technology personnel. Studies in this category focused on identifying S&T personnel’s school selection, graduation, employment, working status, etc. and investigating basic statistical data on specific manpower (e.g. PhDs, engineers, etc.). The second category is studies on analysis and proposals for human resource development policies targeting

Articles
55
[Current Status of S&T Personnel and Statistics]
Hong(2016)
Ÿ Analysis of the higher education, graduation, employment and recruitment status of S&T personnel Investigating changing status of S&T personnel in the employment market Investigating meaning and limitations of S&T field focused restructuring
Kim(2016)
Ÿ Diagnosis of the status of major S&T personnel (S&T field Doctorates, Technicians, National R&D Manager and etc.
Ÿ Securing reference data for the execution of an S&T personnel training and support policy and policy review.
Kang(2014)
Ÿ Trend analysis of S&T personnel in major countries based on quantitative (ratio of doctors among researchers) qualitative (the number of prize winners / paper citation) and environmental (effect of brain drains, attraction on the country) variables
Ÿ Necessity of industry-academia collaborative education to reinforce technology development competency, establishment of a research environment from a long-term point of view, continuous support for original research.
Ÿ Necessity of national effort to improve the socioeconomic status of S&T personnel.
[Human Resource Fostering Policies]
Choi & Choi (2015)
Ÿ Identifying the factors influencing regional human resource development policies and reviewing the current policies.
Ÿ Seeking a direction for an effective regional human resource development policy
Hong et al. (2011)
Ÿ Competency model, labor market, human resource development policy status and impact analysis of core science and technology personnel
Ÿ Proposes strategies for strengthening infrastructure for the creation of new industries while securing core science and technology manpower
Lee(2012)
Ÿ Analysis of formulation, content, and result of female S&T personnel support policies in terms of gender mainstreaming, job-family compatibility and gender governance.
Ÿ Such perspective was reflected in the legislation of related bills and childbirth and childcare support, but the support policy still has many limitations and there is the need to review directions for its improvement
women or talents from specific regions. Studies in this category have focused on the supply and demand for S&T personnel, HR fostering environment, and global entrepreneurship. The third category is studies on policies related to the competencies of S&T personnel. Competencies analyzed in such studies include career development capability, convertibility, and core competencies by stage of career. Policies analyzed in such studies are very specific, such as
expanding major education hours to address a lack of problem-solving capabilities among graduates and a weakness in knowledge about the major, activating industry-related education, establishing interdisciplinary majors and conducting leading research to solve future problems, attracting high-value human resources to the field of science and technology, and reinforcing global competitiveness. Table 1 shows a summary of the key existing studies.
Table 1. Studies on training S&T personnel

56
Jung-hwan Lee / Asian Research Policy 8 (2017) 52-67
[S&T Personnel Competence Enhancement]
Lee & Kim(2016)
Ÿ Analysis of gap between market demand and current level of the transition ability of new S&T personnel
Ÿ Teamwork, problem solving and creativity are the most important variables and there is no difference among industries in the level of demand
Ÿ Present implications on policy making from an engineering education perspective
Hong et al. (2013)
Ÿ Present the 5 keywords of future human resources, converging human resources, challenging human resources, global human resources and learning human resources, as the creative human resources shall be utilized differently from previous S&T human resources
Ÿ The core competency of creative human resources is vision, talent, convergence, professionalism, challenge, globalism, and life-long learning. To nurture this kind of human resource, a comprehensive system that combines research and development in each stage of career and educational training is required.
2.2. Entrepreneurial Competency, Business Initiation, and Innovative Ecosystem
Despite its effects and expectations, the 4th Industrial Revolution is expected to further worsen employment insecurity by allowing AI or robots to replace human labor. It is estimated that such technology-induced unemployment will cause half a million jobs to disappear worldwide by 2020 (Source: The Future of Jobs' Report, World Economic Forum). In this ever-changing society, R&D personnel entering the field need to be equipped with an enhanced entrepreneurial competency more than ever before, not only to secure their personal competitiveness but also for a national-level response to future transitions. In businesses in their earliest stages without a professionally structured R&D organization, entrepreneurial competency plays a significant role in inducing the commitment of the members and establishing the basis for continuous growth through communication. Also, in terms of individual characteristics, entrepreneurial competency is a factor that cultivates excellent management performance in a specific position.
There are many general definitions related to competency, and sometimes terms like skills,
expertise, and acumen are used to represent the same concepts without any proper distinction. In general, competency refers to the standout characteristics of people with excellent performance and effective behavior in a specific job, and shows a particularly higher relevance in small, new businesses. It could be said that discussions on entrepreneurial competency are actually still in their initial stages (Brinckmann, 2008). It is relatively easier to describe people like Bill Gates or Steve Jobs and present examples of entrepreneurial competency, but standardizing the features of such competency is not simple. Generally, entrepreneurial competency is an important part of business growth and success, not only in the field of management but also in R&D.
Looking at the trend of research on entrepreneurial competency, business initiation, and ecosystem innovation, the following characteristics were observed. First, studies on entrepreneurial competency have mainly been focused on defining what entrepreneurial competency is, specifying its features, or analyzing the causal relationship between entrepreneurial competencies and performance, including enhanced productivity, management performance, and technical commercialization. There have also been some studies on technical expertise, strategy, and organizational structure,

Articles
57
which influence entrepreneurial competency. Second, studies related to business initiation have focused on the characteristics of educational programs and operating systems, and there also have been studies that analyzed entrepreneurship, entrepreneurial intention, analysis of various examples of business foundation overseas and the
success factors of business initiation. Third, in the area of ecosystem innovation, there have been studies defining the roles of various constituents or analyzing environments, such as level of activation of the cluster or innovation of the science and technology field. Table 2 summarizes the content of the important studies.
Table 2. Research on entrepreneurial competency, business initiation and innovation ecosystem
[Entrepreneurial Competency]
Baum et al. (2001)
Ÿ Defines entrepreneurial competency as the personal attributes (skills, expertise, and acumen) required to perform a certain task
Man et al.(2002)
Ÿ Defines entrepreneurial competency as the capability to successfully carry out tasks in technology-based start-ups
Ÿ The entrepreneur’s experience, training, education, family background, personal traits, skills and knowledge are also part of entrepreneurial competency.
Choi et al.(2003)
Ÿ Among the entrepreneurial competencies, management and administration skills and technical professionalism can directly affect the performance of the business
Ÿ Communication capacity has an indirect effect through management strategy and organizational structure variables
[Business Initiation]Choi &
Yang(2012)
Ÿ Research on the operational system and effect of field training education necessary for business initiation
Lee et al.(2014)
Ÿ Analysis on the effect of the ‘new shop program,’ in which a university student receives field training at a small business.
Ÿ The field training enhanced the students’ will to start a new business, and also improved the management performance of the small businesses.
Lee & Hwang (2015)
Ÿ Analysis of the history of entrepreneurship education in Korea through the collection of various data
Ÿ Analyzed the spread of entrepreneurship education in Korea, the increase in the number of related lectures and the expansion of the field of research.
[Innovation Ecosystem]
Kim (2013)
Ÿ Analyzed the process of initial investment collection and the change of policy in the trend of venture business spread and the coexistence of businesses of various sizes
Lee & Jeong (2014)
Ÿ Analyzed policy aspects of Daedeok Science Town such as enhancement of interaction between innovation subjects, activation of networking, nurturing of civil intermediate organizations, establishment of business-minded universities, strengthening the role of universities.
Kim et al.(2015)
Ÿ Presented the need for an exclusive organization for entrepreneurship education, incentive for participation, training of devoted faculty, and the expansion of cross-university, cross-region and cross-field entrepreneurship education to enhance business initiation training in S&T universities.

58
Jung-hwan Lee / Asian Research Policy 8 (2017) 52-67
Figure 1. Trends of previous research and distinctive factors of this study
The study utilizes the findings of previous research as shown in Table 4, but goes a step further in order to define the detailed characteristics of S&T personnel, diagnose the current level, and analyze and propose the interactive relationships between businesses, academia, and the government that are appropriate for the 4th Industrial Revolution by focusing on entrepreneurial competency, which wasn’t identified in detail in previous studies. Figure 1 summarizes the differences between the trends of previous research and this study.
2.3. Trend of Overseas Entrepreneurial Competence Enhancement Programs
There has been a global wave of discussion on 'entrepreneurship,' spreading from Silicon Valley in the United States, which has a high concentration of global start-ups. On this topic, the Wall Street Journal published an article several years ago with
the title “Can Entrepreneurship Be Taught?” The content of the article dealt with whether an entrepreneurial curriculum, which has seen exponential growth in universities, actually contributes to nurturing entrepreneurs. On one hand, Professor Noam Wasserman, an entrepreneurship professor at Harvard Business School, argues that while it is not possible to teach everything in the classroom, entrepreneurship education can still be helpful in overcoming factors of failure and increasing the possibility of success. On the other, Victor W. Hwang, a renowned venture capitalist, states that one cannot be fully trained to handle the many unexpected variables that are part of every entrepreneurship experience, and being taught ways to avoid failure can actually become a negative factor for entrepreneurship. The course of this debate shows that there are opposing views on entrepreneurship education.
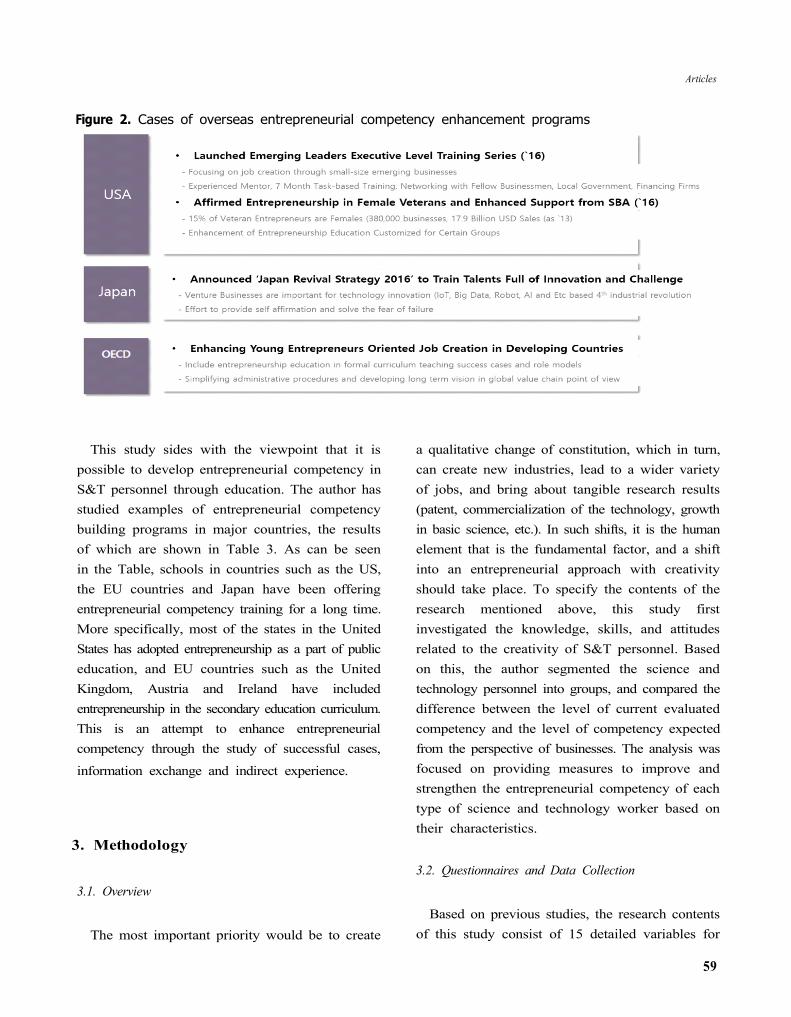
Articles
59
Figure 2. Cases of overseas entrepreneurial competency enhancement programs
This study sides with the viewpoint that it is possible to develop entrepreneurial competency in S&T personnel through education. The author has studied examples of entrepreneurial competency building programs in major countries, the results of which are shown in Table 3. As can be seen in the Table, schools in countries such as the US, the EU countries and Japan have been offering entrepreneurial competency training for a long time. More specifically, most of the states in the United States has adopted entrepreneurship as a part of public education, and EU countries such as the United Kingdom, Austria and Ireland have included entrepreneurship in the secondary education curriculum. This is an attempt to enhance entrepreneurial competency through the study of successful cases,
information exchange and indirect experience.
3. Methodology
3.1. Overview
The most important priority would be to create
a qualitative change of constitution, which in turn, can create new industries, lead to a wider variety of jobs, and bring about tangible research results (patent, commercialization of the technology, growth in basic science, etc.). In such shifts, it is the human element that is the fundamental factor, and a shift into an entrepreneurial approach with creativity should take place. To specify the contents of the research mentioned above, this study first investigated the knowledge, skills, and attitudes related to the creativity of S&T personnel. Based on this, the author segmented the science and technology personnel into groups, and compared the difference between the level of current evaluated competency and the level of competency expected from the perspective of businesses. The analysis was focused on providing measures to improve and strengthen the entrepreneurial competency of each type of science and technology worker based on their characteristics.
3.2. Questionnaires and Data Collection
Based on previous studies, the research contents of this study consist of 15 detailed variables for

60
Jung-hwan Lee / Asian Research Policy 8 (2017) 52-67
the measurement of entrepreneurial competency. In detail, the author used Driessen’s 10 entrepreneurial competency measurement variables (2005), while also reflecting the major variables related to entrepreneurial competency assessments in competency building cases, including the McKinsey Report ('98), AT & T ('93), Samsung ('09), and LG (’11). Finally, as shown in Table 4, a total of 15 items were used as factors for evaluating the entrepreneurial competency of S&T personnel. ‘Required level’ and ‘current level’ of each entrepreneurial competency variable needed to successfully carry out the tasks were measured on a 7-point scale. For detailed analysis, the SPSS software package was used.
Survey samples were chosen by allocating numbers by domestic industry (major business category), size of enterprise, and region, and the final data were obtained from a survey of 630 companies conducted in March 2017. Direct supervisors or managers mentoring newly employed S&T personnel in target companies were surveyed. The composition of the
sample is as shown in Table 5.
Table 4. Entrepreneurial competency measurement variables
Table 5. Composition of the sample
4. Analysis of Result
4.1. Segmentation of Science and Technology Personnel
In general, segmentation refers to division of a group of a certain size into subdivisions that share common characteristics and behaviors. Criteria for segmentation include demographic, regional, social, and psychological factors. The results of the subdivision should maximize the heterogeneity between each subdivision, and ensure homogeneity within them.
This study segmented the science and technology personnel by creativity and compared the entrepreneurial competencies of each group. To accomplish this, the author began by examining the level of individual creativity, and conducted factor analysis based on it. The Varimax rotation method was used to show clear correlation between each factor and creativity. The Eigenvalues of all three factors were greater than 1 and accounted for 89.7% of the total variance. Based on the results of this analysis, each factor was named, as shown in Figure 3. Next, K-Means cluster analysis was conducted with four factor values derived from each surveyee through factor analysis. K-Means cluster analysis is a non-hierarchical cluster analysis method that classifies homogeneous groups with

Articles
61
similar characteristics into a set number of groups based on various characteristics of factors. This method allows for the confirmation of the distinctions between entrepreneurial competencies among each group. In this study, the author decided to set the number of clusters to 4 as shown on the right side of Figure 3, because it was the most appropriate number of groups that could minimize the size of the segment, its similarity, and redundancy in each group. The four segments of science and technology personnel classified according to their level of creativity are as follows: those showing an appropriate level of performance based on their skills (Group 1); a smart group with a high level of knowledge (Group 2); those who are highly enthusiastic, but with unsatisfactory
performance (Group 3); and those with excellent skills but showing a significant difference between current performance and expectations (Group 4). The result of the segmentation revealed that in contrast to what had been expected at the planning stage of this study, the groups were classified not based on the difference in terms of various capabilities (e.g. creative attitude group, high knowledge group, high job skill group, etc.) but rather on the gap in the level of general entrepreneurial competency (High - Mid-High –
Middle – Low). It can be assumed that such trend in segmentation was caused by differences in the personal tendencies of the subjects (e.g. high expectation, low performance) or the level of direct
task relevance (nominal mentor).
Figure 3. Factor analysis for the segmentation of S&T personnel and the result of segment analysis

62
Jung-hwan Lee / Asian Research Policy 8 (2017) 52-67
4.2. Analysis on the Degree of Educational Needs
A survey of the direct supervisors and mentors of S&T on the current level of evaluation and the level required in the future was conducted to analyze the entrepreneurial competency of science and technology personnel. In other words, the author measured the gap between the level of competencies personnel should have, and what they currently have.
The detailed diagnosis of the required level of entrepreneurial competency and the current level of competency in each group revealed that Group 2 (Smart group with high level of knowledge) was generally highly evaluated, and the difference between the required level and the current level was not big. It was not difficult to find cases where the current level was higher than the demanded level in most of the competencies.
Group 1 (those showing an appropriate level of performance based on their skill), showed higher competencies in comparison to Groups 3 and 4, but showed a certain gap between the current level and the expected level of competencies in human relationships, self-efficacy and creativity. Group 3 (those who are highly enthusiastic, but with unsatisfactory performance) showed a level of competencies that does not meet the required level in general, and Group 4 (those with excellent skills but showing a significant difference between the current performance and expectations) showed the lowest level of current competency. A similar pattern is observed throughout the evaluated value of 15 entrepreneurial competency variables in each segment. Figure 4 below shows the comparison between the expected level of competency
and the current level in each segmented group.
Figure 4. Gap between current level and expected level in accordance with segments
Group 1 Group 3
Group 2 Group 4
※ 1. Human Relationship 2. Self-Efficiency 3. Social Orientation 4. Sense of Ethics 5. Need for Autonomy 6. Mutual Communication 7. Need for Achievement 8. Creativity 9. Bargaining Power 10. Endurance 11. Flexibility 12. Leadership & Power 13. Scientific Knowledge 14. Risk Taking 15. Market Awareness

Articles
63
Figure 5. Evaluation on entrepreneurial competence of S&T personnel
In addition to evaluating the entrepreneurial competencies of each segmented group, the author also conducted an analysis on the overall S&T personnel, as can be found in existing studies, and the results were as shown in Figure 5.
Figure 5 shows that the average of each expected competency level and current competency level was 4.78 and 4.31. Looking at individual entrepreneurial competency evaluation variables, S&T personnel were expected to have high level of relationship-related competencies such as human relationship, self-efficiency, need for autonomy, and mutual communication, but showed a low current level in these variables. In addition, there was a relatively large gap between the expected levels and current levels of market awareness about the field and risk-taking competency, revealing the need for special enhancement in education for these areas. In addition, the levels of scientific knowledge,
leadership & power, flexibility and bargaining power in science and technology personnel were lower than expected, compared to the average.
The results of this study are as follows. Figure 4 and Figure 5 show that science and technology personnel are segmented into four levels according to their level of creativity and overall entrepreneurial capability (High – Mid-high – Middle – Low). To make a comparison among variables based on their characteristics, the personnel were relatively higher in variables related to human relationships, sociality or a sense of ethics, but lower in competencies such as market awareness, which is necessary for problem solving, risk-taking, or professional knowledge in their field of major. Therefore, considering such findings, it can be assumed that an improvement in the educational curriculum to enhance entrepreneurial competency is needed.

64
Jung-hwan Lee / Asian Research Policy 8 (2017) 52-67
5. Conclusions and Implications
5.1. The Significance and Distinctive Characteristics of the Study
Various policies and systems have been created to prepare for the new future based on science and technology. To be specific, attempts have been made to create new organizations to address the issue of the absence of a higher-level general coordination mechanism, or to prepare more rational operational plans due to the inefficiency caused by divergence in regulatory bodies. Whenever a new government has been inaugurated in Korea, it has reorganized the science and technology administrative system, and emphasized the importance of finding new growth engines in areas of high value where Korea has upper ground. The government has always suggested so-called alternatives in the areas of autonomous program operation, allocation of roles among the organizations, or conducting cross-organizational projects. The role allocation of the government supporting the development of basic technology and the training of manpower while private sector participants develop technology for commercialization and create new markets is already a familiar direction of policy. However, years of application of these solutions have brought about no tangible improvements, suggesting that these policies are not effective. Therefore, this study proposes that the training of science and technology personnel with a focus on the reinforcement of entrepreneurial competency is the most suitable solution for the problems that will emerge in the era of the 4th Industrial Revolution, and this is the largest differentiation factor in comparison to previous research in this area.
Peter F. Drucker, the guru of modern business administration, stated that entrepreneurial competency is the ability that will enable innovation in organization and society, and argued that it is
not an innate disposition but rather ‘a matter of behavioral patterns.’ In this context, entrepreneurial competency can be taught through sufficient training, and innovation across society could be brought about through entrepreneurship. In this study, ‘entrepreneurial competency’ does not refer to a special talent manifested in the special few, but rather the result and motivation of will and action to overcome problematic situations and seek changes, which anyone can have. Although there might be limitations to this research due to its academic methodology, it is clear that what is required in the era of the 4th Industrial Revolution is the establishment of a basis for demonstrating entrepreneurial competency in accordance with the situation and environment of science and technology personnel of each segment.
5.2. Direction of Improvement for Entrepreneurial Competence Enhancement Education
In this study, the author classified the expected level of entrepreneurial competency and the current level of competency. Suggestions for the improvement of entrepreneurial competency education based on the results of the analysis are as follows.
First, in general, it was found that the entrepreneurial competency of science and technology personnel was estimated to be lower than the expected level. In particular, scientific and technological personnel have high competency in some basic areas such as human relationships, self-efficiency, social orientation, sense of ethics, need for autonomy, and mutual communication. However, when it comes to the creative and challenging capabilities needed in the era of the 4th Industrial Revolution era such as leadership & power, scientific knowledge, risk taking and market awareness, the science and technology personnel were evaluated to have a lower current level than average. This suggests that the personnel need to

Articles
65
be trained more on research capacity, will to take challenges and risks in business environments, and problem-solving ability based on market awareness rather than an ability to form relationships with others. The current entrepreneurial competency education programs and policy focus on intangible, conscious parts such as the ability to find and solve a problem. From now on, due to the current change in the environment in which massive market data is being collected, what will be more important is the ability to objectively perceive problems and directions based on market data analysis,
Second, in the era of the 4th Industrial Revolution, science and technology personnel must be educated to be patient, creative and flexible in the face of various problem situations. This is becoming more important in the current business environment, which is going through a transition from an HW-centered, production-oriented, settled mindset into an SW-centered, service-oriented mindset. The direction of education in general fields must be set with this transition in mind.
Lastly, entrepreneurial competency building education should be helpful in enhancing the skills and attitudes that are closely related to the actual industrial field rather than focusing on the transfer of knowledge. In recent years, entrepreneurial competency building education around the world has shifted to providing motivation, which is more adequate for the current start-up environment. Competency building education in Korea should also be shifted in a direction that more fits the situation in the field. To accomplish this, ‘self-guided education’ in which learners enhance their competency by experiencing field practice and finding out what areas could be improved for themselves must be expanded.
5.3. Improvement of Industry-University Innovation System for Entrepreneurial Competence Enhancement
Government, industry, and universities have made
efforts from various directions to strengthen the
entrepreneurial competency of science and technology personnel. In order to approach this from a more connected type of effort rather than previous individual efforts, the author proposes a collaboration between the three entities of universities, industry, and government based on the model of a triple helix. The triple helix innovation model is a concept proposed by Etzkowitz (2008). The ideal triple helix model is an interaction model in which universities and businesses voluntarily collaborate through government policy projects. This includes a clear distinction in sphere of the role of each subject, sharing of interactive knowledge, establishment of an agreement, and even the formation of a physical and regional collaborative space. There was an expectation that the Creative Economy Innovation Center established by the last government could play the role of a physical space for collaboration, but the lack of consensus on common tasks has presented an obstacle.
The role of each innovation subject in enhancing the entrepreneurial competency of science and technology personnel proposed in this study is as follows. In the past, the relationship between universities, industries, and governments, which are the subjects of science and technology, was a collaborative and cooperative relationship with a comprehensive viewpoint. In order to solve the various complicated problems that are emerging in the era of the 4th Industrial Revolution, the roles and functions of each subject must be reflected in multiple ways, according to the given situation. In other words, education and research must have a strong foundation with investment from the public and private sectors, and a strong partnership among the subjects. This shall lead to synergies between support systems and institutions, the establishment of innovative ecosystems through common goals, and in-field application of policies that link new education and research.
To explain the specific method for the application, the three following cases will be introduced.
66
Jung-hwan Lee / Asian Research Policy 8 (2017) 52-67
The first is Aalto-yliopisto University in Finland. When the Finnish economy was at stake due to the downfall of Nokia that resulted from its failure to properly respond to the smartphone revolution, the Finnish government decided in 2010 to merge the three universities (Helsinki University of Technology, the Helsinki School of Economics, and the University of Art and Design Helsinki) that had been leading Finland’s industry, economy and culture in order to establish a new type of innovative environment with a business orientation. Aalto University has focused on building a convergence system that effectively supports start-ups with a slogan of 'learning by doing.' In particular, it has presented a meaningful example of a new paradigm in which researchers in universities and companies can learn from each other and ‘co-create’ knowledge, escaping from the old framework of transferring academia-produced technology and knowledge into businesses.
The second is Georgia Tech's TI: GER® (Technological Innovation: Generating Economic Results) program. The founders of this program judged that the obstacles to the commercialization of research results were legal or institutional rather than technical. To overcome this issue, the program took a multidisciplinary approach. Specifically, the TI: GER® program has two MBA students and two law students participating in lectures and experiments to support the research commercialization of one doctoral student. Georgia Tech students majoring in science, engineering and computer science apply for this program and receive hands-on training in creating practical business opportunities from the initial stage of research. They can receive high quality advice from legal experts and corporate CEOs who participate as mentors, as well as engage in consulting projects with start-up companies affiliated with Georgia Tech's incubators, getting support from various institutions and companies.
The third is the co-op model used by the University of Waterloo (Canada), which is located near Toronto. This model is enabling students to have corporate field experience as part of the university curriculum. A student can earn up to two years of experience at a company regardless of his or her major. Through this experience, the student can achieve competitiveness in the employment market. The role of the government here was to provide support that enables outstanding results through an ideal interaction between business and academia.
The cases mentioned above can be understood as examples of creating an industry-academia- government community by breaking down the boundaries between educational institutions, research institutes and industries. In other words, it was the establishment of a new triple-helix system that stimulated the interaction between the individual innovation subjects and the practical reinforcement of entrepreneurial competency based on that system. Of course, in order to strengthen the entrepreneurial competency of science and technology personnel, policy objectives such as creative education, cooperation between industry, academia and research, small startup projects and technology commercialization should be linked with customized evaluation indexes, and the establishment of a total policy governance system to control similar policies conducted by different government associations is also necessary.
The 4th Industrial Revolution in Korea must differ from the past tendency of government leading and businesses and universities following. New values should be formed through close interaction and cooperation between the subjects of innovation based on the distinctive attributes of creativity. Such interaction and cooperation will lead to a sustainable virtuous cycle within an innovation ecosystem of science and technology, which in turn would lead to the nurturing of new industries, producing new
markets and new jobs.

Articles
67
Reference
Baum, J. R. et al.,(2001). A multidimensional model of venture growth. Academy of Management Journal, 44, 292–303.
Brinckmann, J. (2008). Competence of Top Management Teams and the Success of New Technology Based Firms: A Theoretical and Empirical Analysis Concerning Competencies of Entrepreneurial Teams and the Development of Their Ventures, Gabler Publishing, Wiesbaden
Choi, H.M., & Choi, S.W. (2015). A Study of Factors Influencing the Performance of Management System for the Regional Human Resource Development Policy Using Structural Equation Model –Focused on Governance System of HRD, Journal of the Korean Regional Development Association 27(2), 17-36
Choi, J.I.,& Yang, Y.S. (2015). Program development task for entrepreneurship education, Venture Entrepreneurship Research, 7(1).
Choi, Y.H. et al., (2003). Effects of CEO, Strategy and Structure Factors on the Performance of SMEs. A Study on the Small and Medium Business, 25(2), 103-125.
Driessen, M.P. (2005). E-scan ondernemerstest, boordeling en ontwikkeling van ondernemerscompetentie.(E-scan entrepreneurship test: assessment and development of entrepreneurship competence). Doctoral thesis, University of Groningen.
Etzkowitz, H. (2008). The Triple Helix: University-Industry –Government Innovation in Action. Routledge, London.
Hong, S.M. (2016). Analysis of Current Status on HRST Employment and Implications, Science and Technology Policy Institute, Science and Technology Policy, 26(3).
Hong, S.M. et al., (2011). A Study of the Strategy to Foster Core S&T Personnel Who Can Create New Technology Industries. Science and Technology Policy, (2011.12).
Hong, S.M. et al., (2013). Strategy to cultivate human re-sources in response to future science and technology talents. Stepi insight, 131.
Ismail, Verni Y., & Efendy Zain. (2015). The portrait of entrepreneurial competency on student entrepreneurs. Procedia-Social and Behavioral Sciences, 169, 178-188.
Kelley, R. & Caplan, J. (1993). How Bell Labs Creates Star Performers. Harvard Business Review, 71.
Kim, H.J. (2014). Statistical Analysis on Human Resource for Science and Technology of Major Countries, Science and Technology Policy 24(3/4).
Kim, S, W. et al., (2015). A Study of Entrepreneurship Education of University in Science and Engineering for Vitalization of Technology-based Startup, Journal of Engineering Education Research, 18(2), 3-7.
Kim, J.Y. (2016). The Survey on the Current Status of Science and Engineering Manpower. Korea Institute of S&T Evaluation and Planning.
Lee, E.K. (2012) From Gender to Human Resource: the Growth of Korean Policy for Women in Science & Technology and its Limit, Keimyung University Institute of Women's Studies, Gender and Culture 5(2), 7-35.
Lee, J.J., & Kim, J.Y. (2015). A Study on Transferable Skills of HRST. Korean Society for Engineering Education, 18(1), 41-46.
Lee, W.J., & Yun, H. (2015), The Chronology of Korean Entrepreneurship Education. Asia-Pacific Journal of Business Venturing and Entrepreneurship 10(3), 171-183.
Lee, S, J., & Jeong, S, Y., (2014). Interaction between Innovation Actors in Innovation Cluster: A Case of Daedeok Innopolis, Journal of Technology Innovation,17(4), 820-844.
Lee, W.J., & HwangBo, Y. (2015). The Chronology of Korean Entrepreneurship Education : The feature analysis and future development of entrepreneurship education, Venture Entrepreneurship Research, 10(3).
Lee, Y.T. et al., (2016). The Study of the Increase of Entrepreneurship and Entrepreneurial Competency Thru Win-Win Type Field Study : New Store Movement Case, Venture Entrepreneurship Research, 11(1).
Man, W.Y. et al., (2002). The competitiveness of small and medium enterprises a conceptualization with focus on entrepreneurial competencies. Journal of Business Venturing, 17, 123–142.
Markman, G. D., & Baron, R. A. (2003). Person–
entrepreneurship fit: Why some people are more successful as entrepreneurs than others. Human resource management review, 13(2), 281-301.
Mitchelmore, S., & Rowley, J. (2010). Entrepreneurial competencies: a literature review and development agenda. International journal of entrepreneurial Behavior & Research, 16(2), 92-111.
Nová, J. (2015). Developing the entrepreneurial competencies of sport management students. Procedia-Social and behavioral sciences, 174, 3916-3924.
Yoon, K. C., & Kim, Y. R.(2009). A Study on the Business Performance and Degree of Globalization of Korean Venture Enterprises, International Business Journal, 20(2), 29-63.

68
Geon-woo Park / Asian Research Policy 8 (2017) 68-90
A Study of Foreign Direct Investment and Technology Spillover Effect:Empirical Evidence from OECD Member Countries†
Geon-woo Park
AbstractThe study aims to empirically analyze the impact of foreign direct investment (FDI) on the economic development and technology spillover effect of OECD member countries. Technology spillover through FDI has been one of the most important topics of discussion related to FDI, and various approaches have been taken to address this topic since the late 1980s. This is because the effects of FDI have great significance in enhancing the productivity of local firms, and in promoting national competitiveness and economic growth. Nevertheless, previous studies lacked a comparative analysis between countries, and were mainly focused on a single industrial field within a specific country. To address this shortcoming, the study tried to overcome the limitations of existing studies, and used vector auto regression analysis, Granger causality analysis, impulse response function model, and panel regression analysis to discover more concrete implications. According to the analysis, a correlation was found in some of the OECD member countries, but the existence of a technology spillover effect differed in each country. It is expected that the findings of this study can contribute to a better understanding of the productivity and technology spillover effects from FDI.
Keywords: Foreign Direct Investment, technology spillover effect, economic development
1. Introduction
The capital flow among nations has grown rapidly, in line with globalization. According to the World Investment Report of the United Nations Conference on Trade and Development (UNCTAD), the scale of foreign direct investment (FDI) in 2016 was approximately USD 1,746 billion, more than 10 times of that in 1990, which was USD 171.6 billion.1 This is because FDI has been acknowledged as one of the most significant factors that can invigorate a
nation’s economic growth and enhance its national competitiveness. For this reason, both developed nations and developing nations have made various policy efforts to promote the introduction of FDI.2
For example, Korea had conducted major policy reforms on investment attraction after the IMF East Asia financial crisis. As a result, the FDI inflow to Korea has been showing a continuous increase during the last several years. This is not limited
Department of Public Administration, Room 012, Yonhee Hall, Yonsei University, 50 Yonei-ro, Seodaemun-gu, Seoul 03722, KoreaE-mail: [email protected]† This paper was funded by KISTEP through the 2017 Creative KISTEP Fellowship Program.
1 Statement based on the contents of World Investment Report of 2000 and 2017 of UNCTAD. The sizes of stock were compared. 2 For instance, best practices such as bilateral investment treaty (BIT) and free trade agreement (FTA) can be suggested as examples.
Policies to establish global-level investment friendly environments are included.

Articles
69
to Korea. As different countries are trying to attract investment, through policy support to bring global corporations into their countries. China also expanded its influx of FDI through rapid economic growth after the late 1990s. Alongside with the US, China is one of the nations that has been attracting the largest amount of FDI. In other words, the market size, relative cost-efficiency of Chinese labor, and the policy of China's central government have served as significant factors behind the expansion of FDI in China.
On the other hand, technology transfer and technology spillover effects, which are the effects of FDI, are analyzed to have contributed greatly to the economic growth of developing countries. The importance of this should be emphasized, in that foreign direct investment is more likely to contribute to economic growth than domestic investment (Borensztein et al., 1998). Also, according to Javorcik (2004), FDI from multinational corporations is likely to influence domestic investments through technology transfer and expand productivity. Due to these effects of FDI, the proportion of FDI in the global economy has grown, and is considered to be more important than ever.
1.1. The Objectives of the Study
The technological spillover of FDI has been recognized as an important research topic over the last several decades, due to its great influence on economic growth regardless of a nation’s development status, and also its universality. With the expansion of FDI, studies on why FDI between nations take place, what the anticipated effects and influences of FDI are, and what changes in policy could be applied to expand the introduction of FDI have been pursued through various approaches. FDI is not limited to a single nation, and it occurs diversely in all nations,
resulting in varied study outcomes. As such, a more specific and detailed approach is needed to address the topic.
Existing studies suggest that FDI is closely related to technology spillover effect (Fan. E, 2002)3, resulting in a substantial number of empirical analyses. Yet there has been no agreement on the results and arguments (Oh & Oh, 2017). Some suggested that FDI positively influences the productivity improvement of domestic firms of the host country (Fotopoulos & Louri, 2004; Mansfield & Romeo, 1980; Blomstrom, 1986), while others argued that FDI promotes economic development through technology transfer (Borensztein et al., 1998). However, some have presented contrasting views, stating that there is no technology spillover from FDI (Harris & Robinson, 2004; Haddad and Harrison, 1993). Aitken & Harrison (1999) argues that FDI has a negative impact on the productivity of the firms of host countries, and this negative effect may differ based on the level of technology or economic development, which can be considered as intrinsic characteristics of the country.
When analyzing the factors of R&D investment of firms, previous studies have not been able to focus on the dynamic changes, and were mainly restricted to company or industry-level analysis. Also, existing studies have conducted analysis without proper consideration of absorptive capacities, including the intrinsic characteristics of each of the host countries. Although previous discussions have empirically discovered that FDI can create technology spillover effects, this notion cannot be applied to every country. Therefore, this study aims to observe the dynamic changes using a vector autoregressive model (VAR), Granger causality analysis (G-causality), and Impulse Response Function.
The research aims to focus on empirically analyzing the technology spillover effect induced
3 However, Fan E. (2002) explains that although empirical analysis on FDI and technology spillover has been conducted to a certain extent, there have not been a sufficient number of studies that took a theoretical approach.
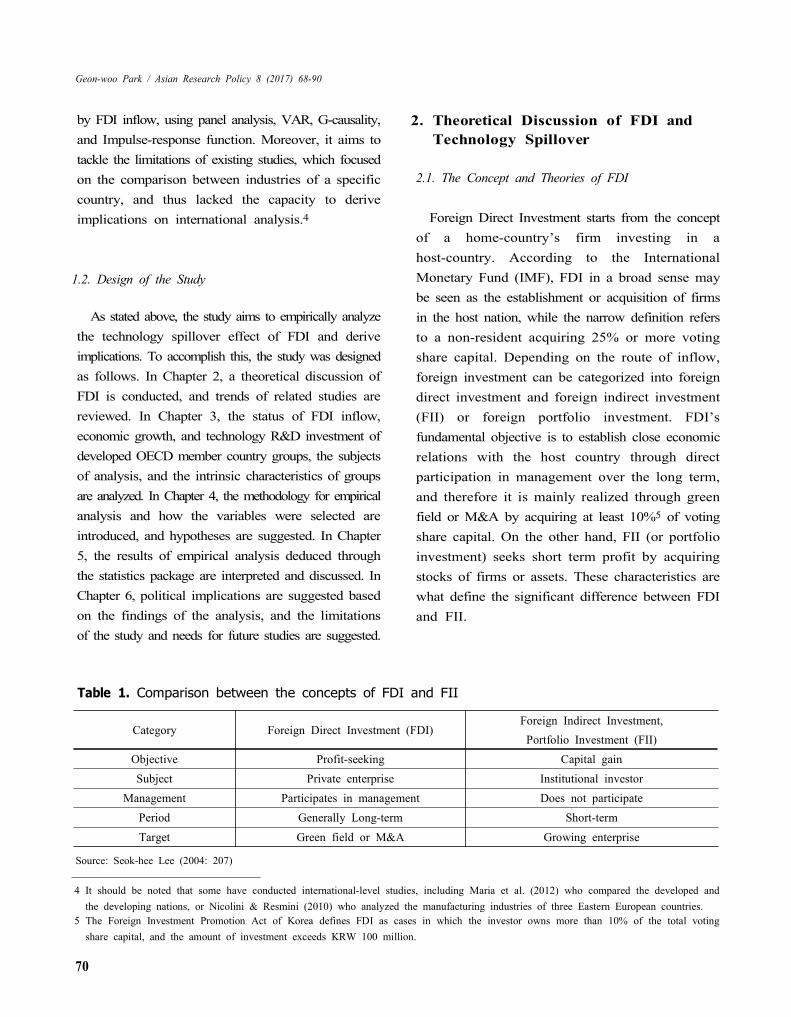
70
Geon-woo Park / Asian Research Policy 8 (2017) 68-90
by FDI inflow, using panel analysis, VAR, G-causality, and Impulse-response function. Moreover, it aims to tackle the limitations of existing studies, which focused on the comparison between industries of a specific country, and thus lacked the capacity to derive implications on international analysis.4
1.2. Design of the Study
As stated above, the study aims to empirically analyze the technology spillover effect of FDI and derive implications. To accomplish this, the study was designed as follows. In Chapter 2, a theoretical discussion of FDI is conducted, and trends of related studies are reviewed. In Chapter 3, the status of FDI inflow, economic growth, and technology R&D investment of developed OECD member country groups, the subjects of analysis, and the intrinsic characteristics of groups are analyzed. In Chapter 4, the methodology for empirical analysis and how the variables were selected are introduced, and hypotheses are suggested. In Chapter 5, the results of empirical analysis deduced through the statistics package are interpreted and discussed. In Chapter 6, political implications are suggested based on the findings of the analysis, and the limitations of the study and needs for future studies are suggested.
2. Theoretical Discussion of FDI and Technology Spillover
2.1. The Concept and Theories of FDI
Foreign Direct Investment starts from the concept of a home-country’s firm investing in a host-country. According to the International Monetary Fund (IMF), FDI in a broad sense may be seen as the establishment or acquisition of firms in the host nation, while the narrow definition refers to a non-resident acquiring 25% or more voting share capital. Depending on the route of inflow, foreign investment can be categorized into foreign direct investment and foreign indirect investment (FII) or foreign portfolio investment. FDI’s fundamental objective is to establish close economic relations with the host country through direct participation in management over the long term, and therefore it is mainly realized through green field or M&A by acquiring at least 10%5 of voting share capital. On the other hand, FII (or portfolio investment) seeks short term profit by acquiring stocks of firms or assets. These characteristics are what define the significant difference between FDI and FII.
Category Foreign Direct Investment (FDI)Foreign Indirect Investment,
Portfolio Investment (FII)Objective Profit-seeking Capital gainSubject Private enterprise Institutional investor
Management Participates in management Does not participatePeriod Generally Long-term Short-term
Target Green field or M&A Growing enterprise
Table 1. Comparison between the concepts of FDI and FII
Source: Seok-hee Lee (2004: 207)
4 It should be noted that some have conducted international-level studies, including Maria et al. (2012) who compared the developed and the developing nations, or Nicolini & Resmini (2010) who analyzed the manufacturing industries of three Eastern European countries.
5 The Foreign Investment Promotion Act of Korea defines FDI as cases in which the investor owns more than 10% of the total voting share capital, and the amount of investment exceeds KRW 100 million.

Articles
71
Advantages Determinants
Form ofMarket Entry
Ownership-specific Advantages
InternalizationAdvantages
Location-specific Advantages
Foreign Direct Investment (FDI) ○ ○ ○Export ○ ○ ☓Contractual resource transfers ○ ☓ ☓
Table 2. Dunning’s OLI paradigm
Source: Dunning (1981)
Hymer's (1976) study, which begins by highlighting the roles and impacts of multinational corporations as a global industrial organization, is cited as the pioneering work in theoretically explaining FDI. Hymer breaks free from neoclassical economics and quotes industrial organization theory, to emphasize that FDI should not be seen as a mere means to transfer capital, but to transfer a series of integrated packages which consists of capital, technology, and management skills. The work of Caves (1971) and Kindleberger (1984) have further developed the concept of FDI in the school of industrial organization theory, and analyzed corporate behaviors as the determinant of FDI. Furthermore, various other theories have been used in explaining FDI, including internalization theory, macroscopic approach, and oligopoly theory.
Eclectic theory, which was proposed by Dunning (1981), is one of the most significant approaches in FDI research. The theory explains why the corporation conducts FDI from a more comprehensive perspective, using three weighting factors. These three factors are ownership-specific advantage, locational advantage and internalization advantage, and they comprise what is referred to as the OLI paradigm or OLI framework. Ownership-specific advantage means that the corporation making the foreign investment has advantages in technology, capital and management capacities. Locational advantage includes host country’s characteristics which is related to decide foreign investors’ investment such as market size, investment environment, and, policies. Lastly, internalization
advantage means that foreign direct investment is more advantageous as compared to other forms of entry, such as trade or licensing. The OLI paradigm can be further shaped by the distinct characteristics of the host country, industry, or firm (Dunning, 1981: 35).
2.2. Technology Spillover Effect of FDI
Creation of new jobs, maximization of tax revenues and transfer of technology, which are the positive impacts of FDI, have motivated governments around the world to maximize FDI. In particular, technology spillover through transfer can be considered a crucial factor in economic growth. According to Emma (2002), most of the theoretical models explaining FDI and technology spillover have been constructed through the framework of industrial organization theory. The spillover effects triggered by FDI can be categorized into horizontal spillover effects and vertical spillover effects. Horizontal spillover effects occur within the same industry, and include imitation and competition, while vertical spillover effects are the phenomenon in which an industry influences another industry, and can be categorized into forward linkage effects and backward linkage effects. Vertical spillover occurs in the relationship between the foreign direct investor and the domestic firm.
According to Blomstrom & Wang (1992), market competition of the host country narrows the technology gap between the advanced country and the host country, and it may trigger more technology R&D activities as the investor focuses more on

72
Geon-woo Park / Asian Research Policy 8 (2017) 68-90
management activities in the host country than in the home country to seek management profit and to maintain the market. In this series of events, technology spillover from the foreign direct investor of the home country occurs through its subsidiary. Blomstrom et al. (1992) also found empirical evidence from Mexico's manufacturing industry, which was strongly related to technology transfer. More specifically, this study showed that competition among the local companies had a positive impact on the technology import of foreign owned firms.
According to Javorcik (2004: 607), a technology spillover effect occurs when a domestic firm enhances its efficiency through technology transfer from a foreign direct investor, and when the foreign investor seeks technology development to enhance the efficiency of the domestic firm when competition in the market of the host country intensifies. Foreign investors usually have a comparably higher level of R&D investment, employ professional technicians, produce intensively based on new technologies, and possess advanced management capacities (advertisement and product differentiation) (Markusen, 1995), and thus have a high chance to increase the productivity of and enhance technology spillover to the firms of host countries. Also, more effective technology transfer may take place if the investor enters the host country market through a joint venture, rather than a sole venture or M&A, and such effectiveness may be utilized through the internalization of various techniques, including observation and training, execution, and learning through sharing (UNCTAD, 1990).
The significance of technology spillover of FDI has attracted the interest of many scholars. In particular, Görg & Greenaway (2004) explained that the analysis of FDI spillover effects in host countries was recognized as important, and that continuous discussions have been made. Previous studies have focused on the analysis from a microscopic perspective, such as horizontal effect and vertical effect, mainly consisting of firm-level or
industry-level analysis. However, as Sjoholm (1997) pointed out, technology spillover or enhancement in productivity through FDI does not occur unconditionally, and the results of empirical analysis may differ, meaning that other various factors may also prove to be influential. Maria et al. (2012) empirically analyzed the spillover from FDI, focusing on the manufacturing industries of developed and developing countries, and suggested that FDI positively influences certain industries (advanced technologies and capital-intensive industries). Also, Nicolini (2010) analyzed the manufacturing industries of three Eastern European countries of Bulgaria, Poland, and Romania, to study productivity spillover of FDI on domestic firms.
In analyzing the productivity spillover from foreign investors to domestic firms via FDI, the factors that may be considered important are investment in technology R&D, and human capital such as employment training. These factors can be considered as the absorptive capacity of domestic firms, and the productivity may be enhanced during the process in which the domestic firms pursue and imitate the technology created through the investment of foreign investors (Görg and Greenaway, 2004; Blalock and Gertler, 2009).
Another important factor in considering the spillover effect of foreign investment corporations on productivity is the absorptive capacity, which includes R&D investment, qualitative standard of human resources, and personnel training. These factors contribute to enhancing the productivity of corporations through the process of imitating and tracking the technology of foreign investment corporations. Blalock & Gertler (2009) found that not only the existence of foreign firms, but also the interaction with R&D investment, which represents the technology absorption capacity, generated a positive spillover effect on productivity enhancement of domestic firms.
As an example, Fotopoulos & Louri (2004) analyzed 2,640 manufacturers from Greece and

Articles
73
Author (Year) Main Contents (FDI and Technology Spillover)
Blomstrom (1986)Analyzes case of Mexican manufacturing industry, to suggest that foreign direct investors positively contribute to the enhancement of productivity of the general industry, but do not influence technological advancement of firms with low productivity
Aitken & Harrison (1990)Analyzes the case of Venezuela to suggest that foreign direct investors have a negative impact on the productivity of domestic firms
Mansfield & Romeo (1980)Foreign direct investments of a small number of MNCs promote technology spillover of local competitors
Hejazi & Safarian (1999) Analysis using total factor productivity suggested that FDI is more likely to trigger technology spillover than trade
Görg & Greenaway (2004) Technology spillover through FDI creates mixed (positive, negative and neutral) effects
Rhee & Belot (1990)Cases of Bangladesh and Mauritius suggests that the entry of foreign direct investors led to the rapid development of the domestic textile industry
Cantwell (1989)Analyzed the existence of technology spillover by observing FDI of the US and Europe. Spillover occurs in certain industries
Alleyne & Edwards (2011)Analysis of FDI inflow to Latin America suggests that technology spillover may take place when the level of human capital meets a certain point
Driffield (2001)Analyzed UK manufacturing industry to observe technology spillover of R&D activities, to argue that FDI has no impact on technology spillover
Haddad & Harrison (1993)The results of analysis on manufacturing firms suggest that positive spillover does not exist, and technology gaps act as an obstacle to technology transfer
Moura & Forte (2009)Expansion of FDI inflow increases technology dependency of the host country on foreign firms, thereby having a negative impact on economic growth
Oh & Oh (2017)The analysis of forward/backward technology spillover of FDI, considering TFC as Malmquist index, suggests that the effect of horizontal spillover is insignificant, while backward linkage effect was found to have a positive impact
Table 4. Summary of existing studies on technology spillover effect of FDI
suggested that FDI is helpful for the growth and development of corporations. However, this study did not differentiate between the horizontal and the vertical technology spillover effects of FDI. On the other hand, there also are studies which argue that the technology spillover effect of FDI doesn’t exist. Using the panel data, Morocco, Haddad & Harrison (1993) suggested that FDI did not have a significant impact on the productivity of Moroccan firms, while Harris & Robinson (2004) categorized the technology spillover of FDI into spillover to the same industry
and spillover to another industry, and analyzed the manufacturing industry of the United Kingdom, ultimately suggesting that there was no technology spillover from FDI. Also, Aitken & Harrison (1999) argued that the increase of FDI has a negative impact on the productivity of domestic firms, and that its significance may vary depending on various factors, including the degree of development of the host country and the technology gap. A summary of the previous literature on the technology spillover effects of FDI is presented in Table 3.
Source: The author

74
Geon-woo Park / Asian Research Policy 8 (2017) 68-90
3. FDI Status and Characteristics of Major Countries
3.1. Expansion of Global FDI
Theoretically, the expansion of global FDI is closely correlated with the development of individual economic entities. Therefore, promoting the economic development of a country creates an environment for more opportunities and capacities for overseas investment. According to Dunning (1981), the growth of FDI can be explained with investment development path (IDP) theory. The IDP theory is constituted with five stages, and the major argument of this frame is the amount of foreign direct investment, which is related to economic growth of the country. Thus, if country’s economic growth is continued, it can be lead to increase foreign direct investment. This cycle ultimately reaches 0 status once the size of FDI is equivalent to domestic investment. The majority of developing countries belong to stages between 1 and 3, while developed countries who already have many FDIs are categorized between stages 4 and 5. To summarize, the size of foreign investment increases in relation to a country’s economic growth. The process is shown in Figure 5.
The changes in global FDI stocks since 1990 are as follows. The size of FDI continues to increase, except in 2008 when the global financial crisis occurred. The total FDI inflow in 1990 (USD 219.7 billion) increased by more than 10 times in 2016 (USD 2,672 billion), which indicates the significant expansion of economic activities between countries. In addition, ratio of FDI inflow to developing countries to total FDI was 23.2% in 1990, and it continually increased with the total amount of FDI.
In 2016, the ratio of FDI inflow to developing countries was 34%, which increased about 10% comparing with that of 1990. From this, it can be understood that as a result of the rapid economic growth of developing countries, the majority of FDI, which was previously invested in developed countries, is now being invested by developed countries, in developing countries. This is because the markets of developing countries have relatively low labor costs and the size of their markets is also in the growth stage, making it more suitable for multinational corporations in developed countries to enter and to invest. For developing countries, attracting investment is important for economic development. Due to these mutually aligned priorities, FDI in developing countries has continued to grow.
Next, the size of yearly FDI flow (inflow) in 2014 decreased by about 8% compared to 2013, however it increased dramatically by 34% in 2015, reaching 177.4 billion. Also, according to the World Investment Report by UNCTAD (2017: 4), in 2017, it is expected that FDI inflow to developing countries will increase by 2–15% more than FDI inflow to the developed countries, compared to the previous year. In particular, the expected FDI inflow in 2017 will be the highest in Asia (15%), compared to Europe (5%), North America (-15%), Africa (10%) and Latin America (-10%). Therefore, the expansion of FDI to Asia is the most characteristic trend, and this aligns the trend among global firms of preferring FDI in Asia. Also, according to the survey conducted by UNCTAD (2017: 6), the majority of firms predicted that FDI will continue to increase in the future, being prevalent in all industrial sectors of both developing and developed countries.6
6 Looking more carefully at the influx of FDI by industry sector, it can be seen that the service industry sector's margin of increase is very high. Global FDI, which was around USD 4 trillion in 2001, increased by more than four times to reach USD 16 trillion in 2016. The manufacturing sector increased threefold, from USD 2 trillion to 7 trillion .

Articles
75
Figure 5. Expansion of FDI based on the patterns of the investment development path
Note: Net Outward Investment (NOI) can be calculated using the difference between overseas investment and FDISource: Fonseca et al. (2007: 4)
Figure 5. Global FDI stock (1990-2016)(Units: one billion USD, %)
Note: Percentage calculated using FDI Stock dataSource: Reconstructed by author based on UNCTAD FDI Statistics (www.unctad.org/fdistatistics) data

76
Geon-woo Park / Asian Research Policy 8 (2017) 68-90
2014 2015 2016 2017 Estimate
World 1,324 1,774 1,745 1,670-1,870
Developed Economies 563 984 1,032 940-1,050
Europe 272 566 533 560
North America 231 390 425 360
Developing Economies 704 752 646 660-740
Africa 71 61 59 65
Asia 460 524 443 515
Latin America and the Caribbean 170 165 142 130
Transition Economies 57 38 68 75-85
Table 5. Yearly FDI inflow(Unit: billion USD)
Note: Values refer to FDI Inflow per year by groups. The values in parentheses refer to the annual growth rate.Source: UNCTAD (2017: 4)
2015 Ranking 2015 FDI Inflow 2016 FDI Inflow
1 United States 348 391
2 Ireland 188 22
3 Hong Kong 174 108
4 China 136 134
5 Singapore 71 62
Table 6. FDI inflow rankings(Unit: one billion USD)
Source: UNCTAD (2016)
Looking at the FDI influx rankings of 2016, the United States attracted the most FDI at USD 3,480 billion, followed by Ireland at USD 1,880 billion, Hong Kong at USD 1,740 billion, China at 1,360 billion, and Singapore at USD 710 billion. The United States has both the highest inflows and outflows of FDIs in the world. For South Korea, the influx is relatively low, but in terms of the size, it was ranked 17th in 2015, investing USD 240 billion.
The following table shows the ratio of FDI to the economic scale of the OECD member countries,
the subject of analysis in this study. In most OECD member countries, the ratio of FDI to GDP is greater than 1. During the period from 1985-2015, the entire average ratio of FDI to GDP of these countries was about 4.95. However, the ratio of Japan, South Korea, Italy, and Greece was less than 1, meaning that the FDI is smaller than the size of their economy. Meanwhile, Belgium (12.05%), Ireland (12.04%), Luxembourg (41.03%), and the Netherlands (14.51%) have shown a considerably higher FDI to GDP ratio.

Articles
77
CountryRatio of GDP to FDI
(Mean)SD Country
Ratio of GDP to FDI(Mean)
SD
Australia 2.68 1.77 Italy 0.65 0.55
Austria 2.51 5.57 Japan 0.12 0.14
Belgium 12.05 12.84 Korea, Rep 0.79 0.52
Canada 2.52 2.10 Luxembourg 41.03 69.41
Czech Rep 4.54 2.74 Netherlands 14.51 18.78
Denmark 2.18 4.41 New Zealand 2.32 2.20
Finland 2.66 3.45 Norway 1.98 1.94
France 1.72 1.04 Portugal 2.87 2.27
Germany 1.48 2.34 Spain 2.64 1.41
Greece 0.78 0.45 Sweden 3.69 4.59
Iceland 2.49 4.98 Switzerland 3.36 3.90
Ireland 12.04 14.88 United Kingdom 3.39 2.68
Israel 2.36 2.10 United States 1.39 0.73
Table 7. Ratio of FDI to GDP of OECD member countries (1985-2015)(Unit: %)
Source: Reconstructed by the author using data from the World Bank
3.2. Economic Growth and Technology R&D of OECD Member Countries
Looking at the economic growth of OECD member countries based on gross domestic production (GDP) and gross domestic production per capita (gross domestic production per capita), they increased by 3.3% and 2.6% on average, respectively, during 1994-2000, however it was found that the number of units decreased to less than 2% in 2001. After the negative growth due to the global financial crisis in 2008, the economic growth rate recovered again during 2010 to 2016, of which they showed average growth rates of 2% and 1.4%, respectively.
The R&D investment activities of domestic firms in OECD member countries generally showed a pattern of growth during 1985-2015. In 2015, the R&D investments of domestic firms in these countries were about USD 34.668 billion, more than double the amount of 1985. During the same period, the overall average growth rate was 3.6%, and the
growth rate shows a convergence to 0%. The data showed a considerable degree of variance in R&D activities prior to the 2000s, which decreased as time went on.
Looking into the technology R&D investment by domestic firms of OECD member countries in each period, it was greatly increased in all countries after 2000. During 2000-2015, the United States were the biggest investors in R&D at USD 273.726 billion, followed by Japan’s USD 107.802 billion. Considering the scale of the economy, Korean firms were also big investors in R&D, at USD 34.329 billion. Looking at R&D investment growth rate by period, Portugal was the highest with a 571% increase, followed by Iceland’s 507%. Based on such data, it can be inferred that domestic firms of all OECD member countries have been enhancing their competitiveness through technology innovation and development, by significantly increasing the size of R&D investment expenditure.
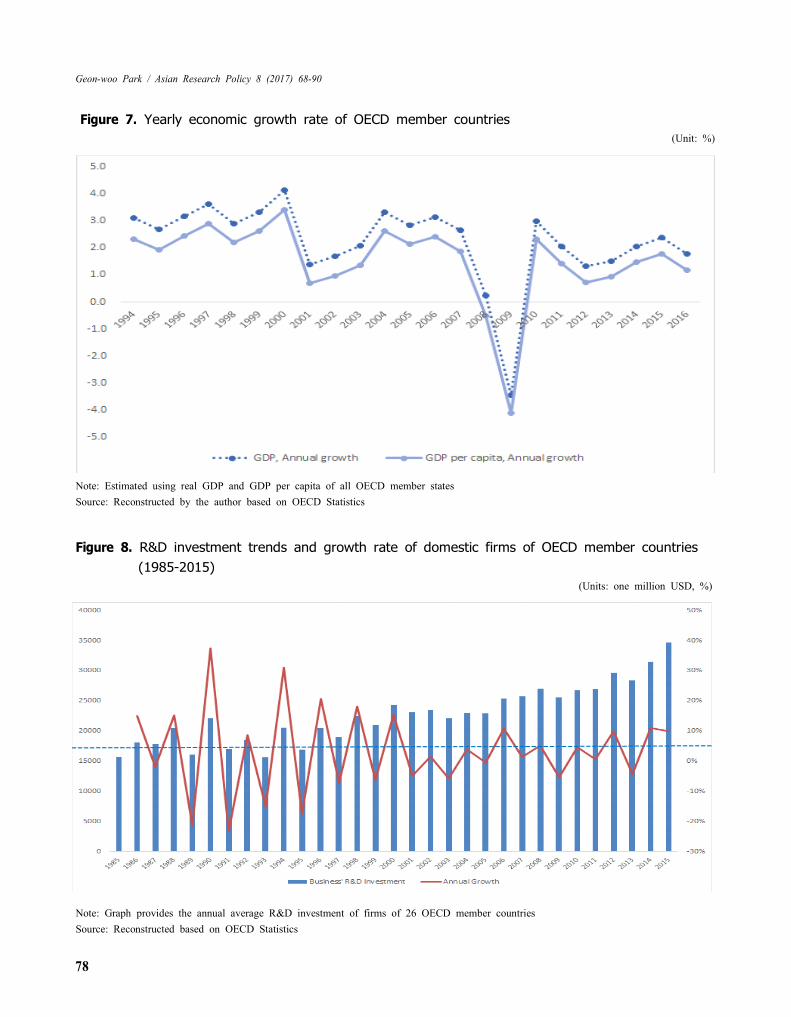
78
Geon-woo Park / Asian Research Policy 8 (2017) 68-90
Figure 7. Yearly economic growth rate of OECD member countries(Unit: %)
Note: Estimated using real GDP and GDP per capita of all OECD member statesSource: Reconstructed by the author based on OECD Statistics
Figure 8. R&D investment trends and growth rate of domestic firms of OECD member countries (1985-2015)
(Units: one million USD, %)
Note: Graph provides the annual average R&D investment of firms of 26 OECD member countriesSource: Reconstructed based on OECD Statistics

Articles
79
Countries 1985-1999 2000-2015 Growth Rate
Australia 3230.1 9357.8 290%
Austria 2030.5 6387.6 315%
Belgium 3600.8 6038.1 168%
Canada 7633.8 13508.1 177%
Czech Republic 1428.8 2199.1 154%
Denmark 1755.7 4348.2 248%
Finland 1836.4 4774.7 260%
France 22864.7 31182.5 136%
Germany 39356.8 56900.3 145%
Greece 222.1 617.8 278%
Iceland 32.8 166.2 507%
Ireland 583.2 1731.8 297%
Israel 2037.4 6934.2 340%
Italy 10012.8 12525.2 125%
Japan 69255.6 107802.2 156%
Korea, Rep. 13025.5 34329.0 264%
Netherlands 5007.1 6984.9 139%
New Zealand 230.2 644.5 280%
Norway 1444.3 2413.5 167%
Portugal 241.7 1379.1 571%
Spain 3612.0 8864.5 245%
Sweden 5387.7 9221.3 171%
Switzerland 5318.2 7509.4 141%
United Kingdom 18857.4 22999.2 122%
United States 172596.4 273726.9 159%
Table 8. Private technology R&D investment of OECD member countries(Unit: million USD, %)
Source: Reconstructed based on OECD Statistics
When comparing the R&D expenditure of the private and the public sector, it was found that while the ratio of private R&D expenditure to that of the public sector was relatively low, with approx. 83.9% in the 1st percentile, the ratio increased significantly at higher percentiles. At the 95th percentile standard, the ratio was 840%, meaning that private R&D
investment was more than eight times larger than that of the public sector. This leads us to assume that the R&D expenditure of domestic firms conducting management and investment activities within the OECD member countries is significantly higher than that of the government.

80
Geon-woo Park / Asian Research Policy 8 (2017) 68-90
PercentilePrivate R&D Expenditure
(A)Public R&D Expenditure
(B)Ratio of Private R&D Expenditure to
Public R&D Expenditure(A)/(B)
Lower⇩
Upper
1% 29 34 83.9%
5% 191 83 231.0%
10% 400 146 273.3%
25% 1710 319 536.6%
50% 5470 778 702.7%
75% 17114 3725 459.4%
90% 56951 9730 585.3%
95% 119079 14168 840.5%
99% 285842 49457 578.0%
Table 9. Percentiles of R&D expenditure of 26 OECD member countries(Units: one million USD, %)
Source: Reconstructed based on OECD Statistics
4. Methodology and Variables
4.1. Methodology
Based on the results of the analysis, the author aims to estimate whether there is significant positive, negative, or no correlation between the scale and status of FDI in OECD member countries and technological development. For the analysis, a panel regression analysis model utilizing fixed-effect model and vector-autoregressive regression (VAR) were used. A panel regression analysis model is a combined form of time series data and cross-sectional data which is useful in analyzing time-varying panel change. Also, factors such as labor, capital, and technological innovation were used to estimate economic growth based on the general Cobb – Douglas production). In particular, technology innovation was used as total factor productivity (TFP)7 in many studies. The related production function can be expressed as follows.
Y=A σL 1-aK a
Here, , , , and .
In addition, an impulse-response model was constructed through analysis of the vector- autoregressive model and Granger causality, and its influence was investigated. Vector-autoregressive analysis is one of the most widely used analysis methods in time series analysis and is found to be suitable for analyzing macroeconomic problems over an extended period of time. Therefore, impulse response function can be utilized to investigate the influence of FDI's technology spillover effect from a long-term perspective, and can be seen as a suitable approach for dynamic analysis. The impulse response function can analyze the changing dynamic reactions when impulse of 1 standard deviation occurs on
7 Total factor productivity refers to "the rate of change in output per unit input that can collectively measure national competitiveness and industrial production efficiency, and can generally be interpreted as technological progress (Korea Productivity Center, 2016 :2-3).”

Articles
81
prediction error. That is, the impulse of one standard deviation can trigger an impulse response called FDI and the impulse response of R&D investment by domestic firms, or in other words, a technology spillover effect. This impulse response function is useful in the sense that “it allows the understanding of the dynamic impact of change of the variable on the intrinsic variable.” (Moon, 1997:24)
4.2. Analysis Target and Variables
The subjects of analysis in this study are 26 major OECD member countries, whose data are relatively well-organized.8 The period of analysis is from 1991 to 2015 for panel analysis for the estimation of
economic growth, and from 1985 to 2015 for the model for analyzing the influence of the dynamic technology spillover effect in order to track down 31 years of dynamic changes of individual countries. By 2017, all OECD member countries, with the exception of the Czech Republic, Israel and South Korea, were original member countries registered at the beginning of the OECD, and are countries with very high ratios of global FDI movement in the international community. The scope of analysis was restricted to these countries because it was relatively easier to collect and utilize data for comparison and analysis. Table 9 shows the information of major OECD member countries.9
Countries Dates Joined Countries Dates Joined
AUSTRALIA 7 June 1971 ITALY 29 March 1962
AUSTRIA 29 September 1961 JAPAN 28 April 1964
BELGIUM 13 September 1961 KOREA 12 December 1996
CANADA 10 April 1961 LUXEMBOURG 7 December 1961
CZECH REPUBLIC 21 December 1995 NETHERLANDS 13 November 1961
DENMARK 30 May 1961 NEW ZEALAND 29 May 1973
FINLAND 28 January 1969 NORWAY 4 July 1961
FRANCE 7 August 1961 PORTUGAL 4 August 1961
GERMANY 27 September 1961 SPAIN 3 August 1961
GREECE 27 September 1961 SWEDEN 28 September 1961
ICELAND 5 June 1961 SWITZERLAND 28 September 1961
IRELAND 17 August 1961 UNITED KINGDOM 2 May 1961
ISRAEL 7 September 2010 UNITED STATES 12 April 1961
Table 10. OECD member countries and dates joined
Source: OECD Website(http://www.oecd.org/about/membersandpartners/list-oecd-member-countries.htm)
8 Member countries not included here as of 2017 are Chile, Estonia, Poland, Hungary, Latvia, Poland, Slovenia, Slovakia, and Mexico.9 In the case of the impulse response function model, analysis of only the major countries was carried out due to a lack of data.

82
Geon-woo Park / Asian Research Policy 8 (2017) 68-90
Contents
Subject 26 OECD Member Countries (by country)
PeriodEconomic Growth Analysis Model: 1991-2015Impulse Response Function Model: 1985-2015
Model Panel Regression Analysis Model, Vector Auto Regression Model, Granger Causality Analysis
Dependent Variables Yearly Private (firms) R&D Investment of Each Countries
Key Explanatory Variables Yearly Foreign Direct Investment Stock
Table 11. Overview of analysis
Figure 9. Schematization of analysis
The dependent variables of the study were designed to measure the influence of the technology spillover effect exerted by FDI, and were focused on the investment of domestic firms, based on existing research and theory. Previous studies have used various proxy variables to analyze technology spillover. In theory, technology spillover can be seen as a series of technology R&D investment which takes place through various channels including the pursuit, learning, and competition of local or domestic firms, following FDI, as the firms may increase expenditure on technology R&D during the process. Therefore, the research used data on technology R&D of firms, provided by OECD, as the dependent variable, while for an independent variable the stock size of FDI, or to be exact, the yearly stock of FDI of each country was used. The
data were collected from materials provided by the World Bank, UNCTAD, and OECD statistics, and were coded. Table 10 presents an overview of the analysis.
5. Results of Empirical Analysis
First, the impact of FDI on economic development was analyzed. Two-way fixed effect was used as the model of analysis, and thus two panel objects of the characteristics of countries and the effect of time were fixed. Also, through the Husman Test, the null hypothesis of ‘there is no difference between the fixed effect and random effect model’ was not ruled out, and thus the results were provided using a random effect model. The results showed that FDI

Articles
83
was found to positively influence economic growth in general throughout the entire period. The basic economic growth model was designed based on the inflow of FDI, considering the factors of labor, capital, and total factor productivity (TFP) based on the Cobb-Douglas production function, and it was found that if FDI increases by 1%, the growth of GDP increases by 0.00473% (1991-2015), 0.0106% (1991-2000), 0.00615% (1991-2008), and 0.0585% (2009-2015). Also, based on the theoretical model, it was found that capital, labor, and technology innovation including gross fixed capital formation also had a significant impact on economic growth.
Observing the degree of contribution of GDP on TFP of OECD member countries during the period of 1985-2016, Korea was the highest with 3.22%, followed by Ireland with 2.29%. This is above the OECD average by approximately 0.9%, meaning that the increase in TFP contributed significantly to the economic development of Korea. On the other hand, Italy and Spain showed a relatively lower GDP contribution, at 0.29% and 0.27% each, respectively. Generally, economic growth takes place when labor and capital input is increased, or overall efficiency such as TFP is enhanced. Considering that labor and capital are relatively fixed and limited assets, it can be assumed that economic growth through the further enhancement of TFP is required.
Therefore, after synthesizing the results of the regression analysis, it can be surmised that although procurement of foreign capital such as FDI inflow is also an important means in estimating economic growth, factors such as labor, capital, and technology innovation are more important, based on the Cobb-Douglas function model which explains economic growth in a more fundamental perspective. To realize technology innovation, the R&D activity of the public and private sector, particularly corporate
R&D, and procurement of human capital are extremely important, as higher economic growth and sustained competence can be secured by expanding R&D expenditure. Moreover, based on the existing theories and studies, it can be assumed that the expansion of R&D may be more effective through FDI, meaning that the technology spillover effect of FDI may positively contribute to R&D activities. Based on these findings, the author seeks to empirically observe the changes in the dynamic influence of FDI’s technology spillover effect.
Before observing the technology spillover of FDI in a more detailed manner, it was found that it was generally the case for OECD member countries that an increase in the size of FDI led to an increase in technology R&D investment, or in other words, a positive (+) pattern.10 The United States showed both the highest FDI and technology development, while for the Netherlands and the UK, R&D investment was lower compared to the amount of FDI inflow. In Germany and France, the level of technology R&D was comparative higher, despite a mid-level size of FDI. Korea also showed a higher investment in technology R&D despite an extremely low FDI inflow, while Japan showed extremely high technology R&D investment despite the fact that the size of FDI inflow was similar to that of Korea. However, if the data of the US is excluded from the analysis, the correlation may in fact prove to be negative (-), as the US data seems like a series of outliers, and the pattern of other countries may generally be seen as a pattern in which R&D investment decreases as FDI increases. Therefore, it is important to interpret the correlation between the two factors by performing a more detailed analysis. Figure 10 shows the correlation between FDI and R&D investment of major OECD member countries.
10 The relationship between FDI and technology development investment is shown to have a significantly high positive correlation at 0.7315 (p <0.01). This means that domestic firms’ investment in technology R&D will increase as FDI increases.

84
Geon-woo Park / Asian Research Policy 8 (2017) 68-90
(1) 1991-2015 (2) 1991-2000 (3) 1991-2008 (4) 2009-2015
log (FDI) 0.00473* (1.73) 0.0106* (1.65) 0.00615* (1.79) 0.0585*** (4.69)
log(Gross Capital Formation)
0.186*** (19.60) 0.199*** (10.46) 0.211*** (16.83) 0.186*** (14.30)
log (Labor) 0.742*** (37.63) 0.767*** (25.06) 0.736*** (31.02) 0.755*** (25.35)
TFP Growth Rate 0.00943*** (35.02) 0.00912*** (10.92) 0.00889*** (23.62) 0.00710*** (7.78)
Constant Term 9.516*** (40.51) 8.667*** (22.41) 8.993*** (32.88) 8.201*** (16.29)
Year Fixed Effect Yes Yes Yes Yes
Observation 496 201 360 136
Table 12. FDI’s impact on economic growth, using economic growth model
Note: Values in parentheses refer to T-statistics, and the significance levels are as follows(* p < 0.1, **p < 0.05, ***p < 0.01)
Figure 10. Correlation between FDI and R&D of OECD member countries (1985-2015)
Note: Calculated using mean values between 1985-2015
All OECD Member Countries
FDI ⇏ R&D 0.940
R&D ⇏ FDI 0.031
Table 13. Results of granger causality analysis on FDI and R&D investment of all OECD member countries
Note: Values inside the parentheses refer to significance

Articles
85
First, after analyzing the technology spillover effect of FDI of all subject countries of OECD, it was found through panel VAR that private technology R&D investment was increased by 0.006% when FDI inflow increases by 1%, with a lag of one year; however, this finding was not statistically significant. Also, as shown in Table 12, the panel Granger causality analysis could not reject the null hypothesis, meaning that the correlation between the FDI and the technology R&D investment of domestic firms of OECD member countries cannot be explained by G-causality analysis. Based on these results, it can be inferred that the technology spillover effect of FDI does not exist when analyzing the entire group of subject countries as a whole. However, the results may prove otherwise if countries are analyzed separately.
Next, G-causality test was conducted on countries separately, using the VAR model. It was found that the optimal lag for the majority of the countries was two years. According to the results of G-causality, the cases of the US, the UK, Japan, the Netherlands, and Portugal were found to be statistically significant, while the cases of France, Germany, Italy, Finland, and Spain were found to be insignificant. Also, the G-causality of technology development on FDI were all found to be statistically insignificant. The following is a summary of the results of cases that were found to be statistically significant.
Based on these results, the results of the impulse response function based on the influx of individual national FDI were presented. The impulse response of the countries following an increase of 1 SD of FDI were diverse. The impact was comparably bigger in the short term, and was relatively decreased in the long term. In other words, it can be understood that FDI inflow significantly increases technology R&D investment in the short term, but the expenditure decreases after a certain point, leading to a decrease in the technology spillover effect of FDI.
The cases of the US, the UK, Japan, and the Netherlands show the trend of spillover through FDI continuously expanding. From this, it can be understood that technology spillover through FDI has a positive effect, a finding similar to that of previous studies. However, a sustained decreasing pattern is found after 4 years in the cases of the US and the UK, whereas in Japan the fluctuation continued. For the case of the Netherlands, the response was increasing and decreasing comparably gradually.
In the case of Portugal, the trend of the spillover effect of FDI was different. In contrast to the countries above, Portugal’s technology spillover in the short term showed a decreasing pattern, and showed repeated fluctuating patterns afterwards, similar to the trend seen in Japan.
United States United Kingdom Japan Netherlands Portugal
FDI ⇏ R&D 0.0029 0.0485 0.0126 0.0836 0.0611
R&D ⇏ FDI 0.5518 0.1241 0.2033 0.4467 0.1145
Table 14. Results of granger causality analysis
Note: Values inside the parentheses refer to significance

86
Geon-woo Park / Asian Research Policy 8 (2017) 68-90
0
.02
.04
.06
0 4 8 12 16 20
FDI => R&D
95% CI orthogonalized irf
step
Figure 11. Impulse response function of FDI technology spillover effect of the United States
-.02
0
.02
.04
.06
0 4 8 12 16 20
FDI => R&D
95% CI orthogonalized irf
step
Figure 12. Impulse response function of FDI technology spillover effect of the United Kingdom

Articles
87
-.02
0
.02
.04
.06
0 4 8 12 16 20
FDI=> R&D
95% CI orthogonalized irf
step
Figure 13. Impulse response function of FDI technology spillover effect of Japan
-.005
0
.005
.01
.015
0 4 8 12 16 20
FDI => R&D
95% CI orthogonalized irf
step
Figure 14. Impulse response function of FDI technology spillover effect of the Netherlands

88
Geon-woo Park / Asian Research Policy 8 (2017) 68-90
-.1
0
.1
.2
0 4 8 12 16 20
FDI => R&D
95% CI orthogonalized irf
step
Figure 15. Impulse response function of FDI technology spillover effect of Portugal
To sum up, it can be inferred that the technology spillover from FDI is different for all major countries, as the analysis of individual countries showed a statistically significant technology spillover, in contrast to the analysis of the group of subject countries as a whole. However, it should be noted that a more detailed discussion is needed to interpret such results, as the study did not observe the factor which determines such difference. Nevertheless, the study is believed to have achieved the initial goal of comparatively analyzing the technology spillover effect of FDI, and observing the differences between the subject countries.
6. Conclusion and Implications
To summarize, the results of the analysis imply that a technology spillover effect through FDI does not occur unconditionally in all countries. In other
words, there will be differences among countries in terms of whether there is a technology spillover effect through FDI or not, and that while the technology spillover effect is not significant when all countries are examined, in some countries significant effects are seen, while in others they are not. Many previous studies have recognized FDI as a series of channels for transferring technology to host countries, but further discussion is needed to derive matched results (Emma, 2002). Nonetheless, the technology spillover effect through FDI will inevitable become more important due to the global trend of FDI expansion, particularly for developing countries in which it may be a crucial policy agenda for economic growth and national development. As such, applying the technology spillover effects of FDI to developing countries will be an important means of overcoming the technical gap of domestic firms and securing competitiveness through technological innovation and development.

Articles
89
By looking at the concept of the technology spillover effect, one of the actual economic effects of FDI, this study aims to emphasize the influence of FDI on national economic growth. Thus, the establishment of investment environments and institutional infrastructures that improve the inflow of FDI are necessary. The findings of the study are expected to provide evidence in support of a strategic shift in investment attraction policy. Moreover, this study concretely restricted the scope of analysis of the technology spillover effect of FDI to the influence on local firms in the host country, and was able to show the implication that results may vary depending on each country. The study was also able to present the exploratory finding that actual technology spillover may take place if FDI inflow reaches a substantial amount.
These findings imply that it is crucial to empirically verify that the technology spillover effect of FDI may vary according to the intrinsic characteristics of the country. They may also provide a starting point for policy changes needed to improve the actual effects of FDI. To embody these arguments, the following research needs are presented. First, as can be found in the majority of existing studies, the construction of a systematic model in consideration of key variables to prevent falsification of results is needed to empirically analyze the technology spillover effect of FDI. This is because while previous studies did measure technology spillover through various variables and proxy variables, not only the design of the model, but the construction of variables also acts as a crucial issue, in order to explain a more convincing causal mechanism.
Also, it is necessary for future studies to focus on the case of a single country in order to observe what spillover effects may take place in the region following the inflow of FDI. For example, it will be necessary to consider the influence of the regional allocation of FDI flowing into Korea on the substantial technology spillover effect in the region.
Such studies may contribute to deriving more specific policy settings and implications. Also, based on the results of the analysis, it would be crucial to understand the importance of FDI inflow by analyzing the spillover effect in each industry, and verifying the actual unit change based on the consideration of the industrial linkage model.
The spillover effects of FDI are also an issue of great importance to Korea, and both the public and the private sector should strive for the qualitative enhancement and quantitative expansion of FDI, as through the attraction of FDI the country will not only enjoy technology spillover but also the overall growth of the national economy. To that end, policies must be prepared which can improve on existing investment promotion policies and allow various domestic firms with competitiveness to grow by helping them attract FDI from foreign firms.
ReferencesBarrios, S. (2000). Foreign Direct Investment and
Productivity Spillovers: Evidence from the Spanish Experience. Working Paper 2000-19. Fundación de Estudios de Economía Aplicada, Madrid: 1-43.
Blalock, G., & Gertler, P.J. (2009). How Firm Capabilities Affect Who Benefits from Foreign Technology. Journal of Development Economics 90, pp192-199
Blomstrom, M., Zejan, M., & Kokko, A. (1992). Host Country Competition and Technology Transfer by Multinationals. NBER Working Paper #4131
Blomstrom, M., & Wang, J.Y. (1992). Foreign investment and Technology Transfer. European Economic Review, Vol. 36.
Blomstrom, M. (1986). Foreign Investment and Productive Efficiency: The Case of Mexico. Journal of Industrial Economics 15: 97-110.
Bwalya, S.M. (2006). Foreign direct investment and technology spillovers: Evidence from panel data analysis of manufacturing firms in Zambia. Journal of Development Economics. 81(2): 514-526.
Cantwell, J. (1989). Technological Innvation and Multinational Corporations, Oxford: Basil Blakwell Ltd.
Caves, R. E. (1971). International Corporations: The Industrial Economics of Foreign Investment. Economica 38:1-27.
Chiesa, V. (1996). Strategies for Global R&D. Research Technology Management 39(5): 19-25.

90
Geon-woo Park / Asian Research Policy 8 (2017) 68-90
Choi, B.R., Maeng, G.R., & Yoo, C.H. (2011). Technology Spillover Effect of Foreign Direct Investment into China. International Trade Review, 16(4): 33-61.
Cipollina, M., Giovannetti, G., Pietrovito, F., & Pozzolp, A.F. (2012). FDI and Growth: What Cross-country Industry Data Say, The World Economy 2012, pp.1600-1692.
Crespo, N., & Fontoura M.P. (2007). Determinant Factors of FDI Spillovers – What Do We Really Know? World Development, 35: 410-425.
Dunning, J.H. (1981). Explaining the International Direct Investment Position of Countries: Towards a Dynamic or Developmental Approach. Weltwirtschaftliches Archiv, Bd. 117, H.1, pp. 30-64.
Driffield, N. (2001). The Impact on Domestic Productivity of Inward Investment in UK. The Manchester School 69(1): 103-119.
Fan, E. (2002). Technological Spillovers from Foreign Direct Investment: A Survey. Asian Development Bank Economics and Research Department Working Paper, No.33.
Fonseca, M., Mendonça, A., & Passos J. (2007). The Investment Development Path Hypothesis: Evidence from the Portuguese Case – A Panel Data Analysis. Working Papers Department of Economics 2007/21, ISEG - Lisbon School of Economics and Management, Department of Economics, Universidade de Lisboa.
Globerman, S. (1979). Foreign Direct Investment and Spillover Efficiency Benefits in Canadian Manufacturing Industries. Canadian Journal of Economics 12: 42-56.
Girma S., Greenway D., & Wakelin, K. (2001). Who Benefits from Foreign Direct Investment in the UK? Scottish Journal of Political Economy, 48(2): 119-133.
Hansen, B.E. (1999). Threshold Effects in Non-dynamic Panels: Estimation, Testing, and Inference. Journal of Econometrics 93: 345-368.
Hejazi, W., & Safarian, A.E. (1999). Trade, Foreign Direct Investment, and R&D Spillovers. Journal of International Business Studies 30(3): 491-511.
Holger G., & Greenway, D. (2004). “Much Ado About Nothing? Do Domestic Firms Really Benefit from Foreign Direct Investment?”, The World Bank Research Observer Vol. 19, No. 2, pp.171-197.
Hymer, S. H. (1976). The International Corporations of National Firms: A Study of Direct Foreign Investment (1960). MIT Monographs in Economics, Cambridge, Massachusetts.
Jang, G.N., Jeong, Y.W., & Kim C. (2011). FDI Technology Spillover Effect on the Influence of the Innovation Ability. International Area Studies Review, 15(3): 451-470.
Javorcik, B. (2004). Does Foreign Direct Investment Increase the Productivity of Domestic Firms?: In Search of Spillover through Backward Linkages. American Economic Review 94(3): 605-627.
Javorcik, B.S., & Spatareanu M. (2008). To Share or not to Share: Does Local Participation Matter for Spillovers from Foreign Direct Investment? Journal of Development Economics. 85: 194-217.
Kim, H.H., & Kim, J.D. (2010). Productivity Spillover Effect of Foreign Direct Investment into Korea. Journal of East Asian Economic Integration. 14(2): 21-47.
Kindleberger, C. P. (1984). Multinational Excursions. Cambridge: MIT Press.
Kremer, S., Bick, A., & Nautz, D. (2013). Inflation and growth: new evidence from a dynamic panel threshold analysis. Empirical Economics, 44(2), 861–878.
Lee, S.H. (2004). A Study on Measures to Invigorate FDI in Linkage with Regional Industrial Development Strategy. Daegu Gyeongbuk Development Institute.
Mansfield, E., & A. Romeo. (1980). Technology Transfer to Overseas Subsidiaries by US-based Firms. Quarterly Journal of Economics 95(4):737-50.
Markusen J. R., & Venables A. J. (1999). Foreign Direct Investment as a Catalyst for Industrial Development. European Economic Review 43(2).
Moon, G.S. (1997). A Study on the Vector Auto Regression (VAR) Model. Statistical Analysis Review 2(1): 23-56.
Nicolini, M., & Resmini, L. (2010). FDI Spillovers in New EU member states, Economics of Transition, Volume 18(3), pp.487-511.
Oh C., & Oh G.Y. (2017). Technology Spillover Effects of FDI on Total Factor Productivity: Using Firm Data of Korean Manufacturing. International Trade Review, 22(1): 25-57.
Park, J.G. (2004). Determinants of R&D Activities of Foreign Direct Investment Firms in Korea. International Trade Review, 9(1): 71-93.
Pottelsberghe, B.V., & Lichtenberg, F. (2001). Does Foreign Direct Investment Transfer Technology Across Borders? Review of Economics and Statistics 83: 490-497.
Rhee, Y. W., & Belot, T. (1990). Export Catalysts in Low-Income Countries. The World Bank, Washington, D. C.
Todo, Y., Zhang, W., & Zhou, L.A. (2006). Intra-Industry Knowledge Spillover from Foreign Direct Investment in R&D: Evidence from a Chinese Science Park. SSRN Working Paper. 1-34.
Trojette, I. (2016). The Effect of Foreign Direct Investment on Economic Growth: The Institutional Threshold. Region et Developpement 43: 111-138.
UNCTAD (2000) World Investment Report. UNCTAD.UNCTAD (2017) World Investment Report. UNCTAD.
Science and Technology Trends
91
Science and Technology TrendsPolicy Trajectories and Initiatives in STEM Education
STEAM Education in Korea:Current Policies and Future Directions
Oksu Hong1
1. Introduction
In the era of the Fourth Industrial Revolution, in which artificial intelligence is continuously in development and jobs evolve at a rapid pace, creative human resources are needed in order to create new jobs and solve future problems. With changes emerging in the economy, society, culture, and the ecological environment, education for future generations must advance, as well. The World Economic Forum (2016) presented the key skills required for the Fourth Industrial Revolution by 2020, such as complex problem solving, critical thinking, and creativity. While identifying the skills required for students to succeed in work, life, and as citizens of the world, Partnership for 21st Century Skills (P21) focused on the 4Cs: Critical thinking, Communication, Collaboration, and Creativity (http://www.p21.org).
The Korean government has continually driven STEAM (Science, Technology, Engineering, Arts,
and Mathematics) education policy since announcing “The second basic plan to foster and support human resources in science and technology (2011-2015),” which includes STEAM education (The Korean Ministry of Education, Science and Technology, 2011). As the most representative national institution for STEAM education, as well as science, mathematics, and software education, the Korea Foundation for the Advancement of Science and Creativity (KOFAC) has managed systematic STEAM education programs at the national level. To help STEAM education become more well established, KOFAC cultivates and supports leading groups, reinforces teachers’ capabilities, develops and distributes content, promotes interactive and exploratory activities for students, and institutionalizes and builds infrastructure (see Figure 1).
Korea Foundation for the Advancement of Science & Creativity, 602 Seolleungno, Gangnam-Gu, Seoul 135-847, Korea E-mail:[email protected]

92
Policy Trajectories and Initiatives in STEM Education / Korea
Figure 1. The structure of STEAM education programs managed by KOFAC
Source: Korea Foundation for the Advancement of Science and Creativity, 2016 (p.45)
The Learning Standards Framework of STEAM Classes has been developed so that it can be utilized to design classes that meet the goals of STEAM education. The framework consists of the following three steps: Context presentation, Creative design, and Emotional touch. A description for each step is given in Figure 2. It is recommended that STEAM classes be conducted based on this framework.
Korea’s new national curriculum, ‘2015 Revised Curriculum,’ aims to cultivate creative talents with integrative thinking and problem solving. STEAM education will thus continue to be emphasized as
an educational strategy for future generations. It is, therefore, meaningful to look into STEAM education policy put forward thus far and to propose the next step based on what has already been established. In this report, an outline is presented on the current policy of STEAM education in Korea based on the three elements of education: the teacher who teaches, the student who learns, and the educational content that mediates the teaching and learning (Shin, 2005), future directions for STEAM education are then suggested.

Science and Technology Trends
93
Figure 2. Learning standards framework of STEAM classes
Source: Korea Foundation for the Advancement of Science and Creativity, 2016 (p.25)
2. STEAM Professional Development for Teachers
Teachers’ capabilities in practicing STEAM education are of great importance. According to research conducted to investigate the current status of STEAM education by analyzing online survey responses collected from 56.8% (N = 6,473) of elementary, middle, and high schools in Korea, it was found that 48.3% (N = 3,127) of the responding schools conducted STEAM education (Park et al., 2016). Assuming that schools not participating in
the survey do not implement STEAM education, it can be understood that approximately 27.1% of all schools in the country have conducted STEAM education classes (see Table 1). This research discovered that the most important factor in implementing STEAM education was the ‘voluntary efforts of teachers,’ and the main reason for not implementing STEAM education was difficulties in drawing a consensus from teachers regarding STEAM education. This result indicates that the role of teachers is very important in the implementation of STEAM education.
Table 1. The number of schools that implement STEAM education no.(%)
School Level
Total schools
Responding schools
Implementing STEAM
Not Implementing STEAM
Implementing STEAM/Total
Elementary 5,978 3,362 (100.0) 1,838 (54.7) 1,524 (45.3) 1,838/5,978 (30.8)
Middle 3,204 1,831 (100.0) 879 (48.0) 952 (52.0) 879/3,204 (27.4)
High 2,344 1,280 (100.0) 410 (32.0) 870 (68.0) 410/2,344 (17.5)
Total 11,526 6,473 (100.0) 3,127 (48.3) 3,346 (51.7) 3,127/11,526 (27.1)
Source: Park et al., 2016 (p.671)

94
Policy Trajectories and Initiatives in STEM Education / Korea
To support STEAM professional development for teachers, three steps of teacher training programs are currently being operated. ‘Introductory training’ focuses on helping teachers understand the concepts, policies, and representative content of STEAM education. ‘Basic Training’ involves a 15-hour online program centered on sharing best practices, such as how to organize STEAM education suitable for the school curriculum or how to implement STEAM education for after-school programs. ‘Intensive Training,’ a mixture of online and offline programs, has the purpose of improving teachers’ capabilities to develop and implement their own educational materials for STEAM classes. The 60-hour training program includes fieldwork, as participants attend the Teacher Training Center for Cutting-edge Science and STEAM fairs, as well as group activities in developing classroom-applicable STEAM educational materials.
In spite of these great efforts made to train STEAM teachers, many teachers have difficulty in selecting appropriate topics, integrating two or more subjects, developing educational materials, and evaluating classes (Noh & Paik, 2014; Lee & Shin, 2014). Jho, Hong,
and Song (2016) categorized in-service training programs for STEAM education in Korea, including three steps of teacher training programs, by adopting Ryn and Cowan’s (1996) framework with two dimensions of knowledge and learning (see Figure 3). Knowledge construction is separated into the individual level and the community level, while learning construction is categorized as content-oriented and activity-oriented. This research asserted that teacher training programs for STEAM education should focus on designing a learning community that is activity-oriented at the community level (top right plane of Figure 3) to foster sustainable professional development.
Considering this assertion, STEAM research groups of teachers, made up of experienced teachers and experts in relevant fields, work together to develop and apply STEAM educational materials, serving as a good model for sustaining STEAM professional development. Furthermore, according to the report surveying teachers’ needs for STEAM education, what STEAM teachers reported most often was the need for support for teacher communities in terms of learning and research (KOFAC, 2013).
Figure 3. Mapping in-service training programs of STEAM education in Korea
Source: Jho, Hong, & Song, 2016 (p.1847)
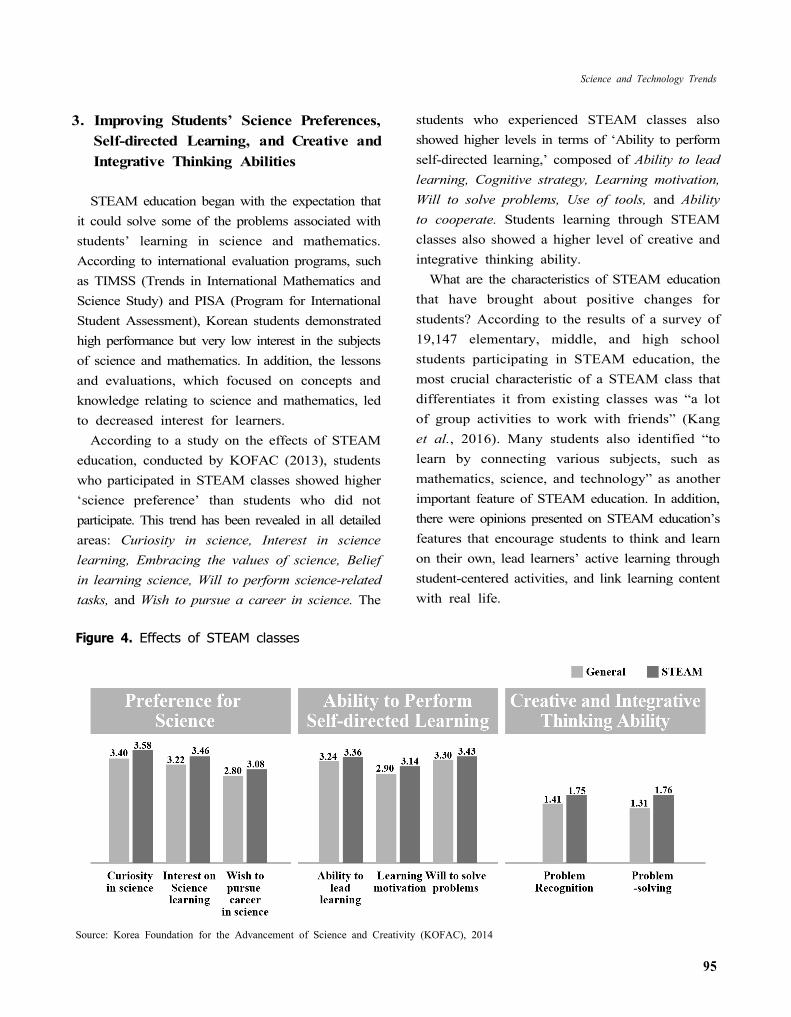
Science and Technology Trends
95
3. Improving Students’ Science Preferences, Self-directed Learning, and Creative and Integrative Thinking Abilities
STEAM education began with the expectation that it could solve some of the problems associated with students’ learning in science and mathematics. According to international evaluation programs, such as TIMSS (Trends in International Mathematics and Science Study) and PISA (Program for International Student Assessment), Korean students demonstrated high performance but very low interest in the subjects of science and mathematics. In addition, the lessons and evaluations, which focused on concepts and knowledge relating to science and mathematics, led to decreased interest for learners.
According to a study on the effects of STEAM education, conducted by KOFAC (2013), students who participated in STEAM classes showed higher ‘science preference’ than students who did not participate. This trend has been revealed in all detailed areas: Curiosity in science, Interest in science learning, Embracing the values of science, Belief in learning science, Will to perform science-related tasks, and Wish to pursue a career in science. The
students who experienced STEAM classes also showed higher levels in terms of ‘Ability to perform self-directed learning,’ composed of Ability to lead learning, Cognitive strategy, Learning motivation, Will to solve problems, Use of tools, and Ability to cooperate. Students learning through STEAM classes also showed a higher level of creative and integrative thinking ability.
What are the characteristics of STEAM education that have brought about positive changes for students? According to the results of a survey of 19,147 elementary, middle, and high school students participating in STEAM education, the most crucial characteristic of a STEAM class that differentiates it from existing classes was “a lot of group activities to work with friends” (Kang et al., 2016). Many students also identified “to learn by connecting various subjects, such as mathematics, science, and technology” as another important feature of STEAM education. In addition, there were opinions presented on STEAM education’s features that encourage students to think and learn on their own, lead learners’ active learning through student-centered activities, and link learning content with real life.
Figure 4. Effects of STEAM classes
Source: Korea Foundation for the Advancement of Science and Creativity (KOFAC), 2014
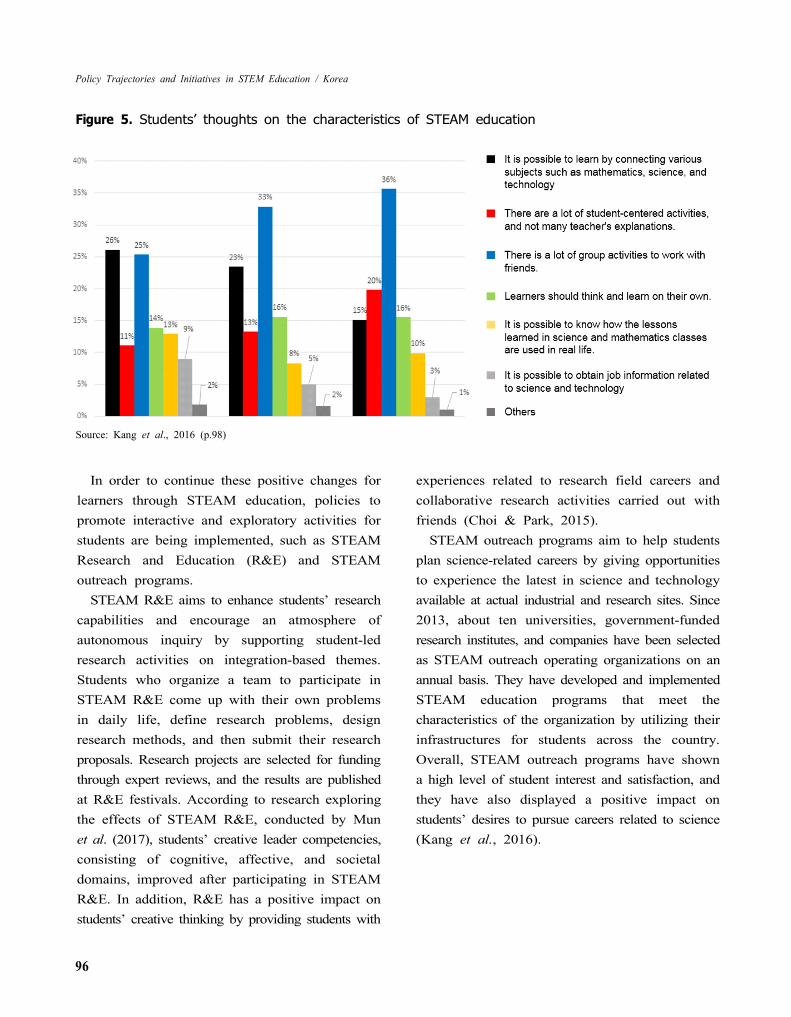
96
Policy Trajectories and Initiatives in STEM Education / Korea
Figure 5. Students’ thoughts on the characteristics of STEAM education
Source: Kang et al., 2016 (p.98)
In order to continue these positive changes for learners through STEAM education, policies to promote interactive and exploratory activities for students are being implemented, such as STEAM Research and Education (R&E) and STEAM outreach programs.
STEAM R&E aims to enhance students’ research capabilities and encourage an atmosphere of autonomous inquiry by supporting student-led research activities on integration-based themes. Students who organize a team to participate in STEAM R&E come up with their own problems in daily life, define research problems, design research methods, and then submit their research proposals. Research projects are selected for funding through expert reviews, and the results are published at R&E festivals. According to research exploring the effects of STEAM R&E, conducted by Mun et al. (2017), students’ creative leader competencies, consisting of cognitive, affective, and societal domains, improved after participating in STEAM R&E. In addition, R&E has a positive impact on students’ creative thinking by providing students with
experiences related to research field careers and collaborative research activities carried out with friends (Choi & Park, 2015).
STEAM outreach programs aim to help students plan science-related careers by giving opportunities to experience the latest in science and technology available at actual industrial and research sites. Since 2013, about ten universities, government-funded research institutes, and companies have been selected as STEAM outreach operating organizations on an annual basis. They have developed and implemented STEAM education programs that meet the characteristics of the organization by utilizing their infrastructures for students across the country. Overall, STEAM outreach programs have shown a high level of student interest and satisfaction, and they have also displayed a positive impact on students’ desires to pursue careers related to science (Kang et al., 2016).

Science and Technology Trends
97
4. STEAM Education Content that Brings Positive Change
According to the analysis of 821 STEM/STEAM related research papers published in Korea over the last ten years (Kim & Kim, 2017), the most frequently researched topic was ‘program/instructional materials,’ which accounted for 72% of the total. Furthermore, ‘program’ and ‘development’ were the keywords that emerged most often. This shows that studies in the field of STEAM education have been focused on the development of diverse educational materials and programs that promote the practice of STEAM education.
The Korean Ministry of Education and KOFAC are continuing to develop four types of STEAM programs to be used in schools: Integration-based programs for each theme of STEAM (e.g., biotechnology, global environment, and appropriate technology), Programs to utilize up-to-date products (e.g., up-to-date ICT, up-to-date medical appliances, and up-to-date vehicles), Integration-based programs in science and art (e.g., topographical maps in science and art, creative activities in manufacturing, and world-changing designs), and Design-based programs connected to promising future jobs (e.g., cognitive engineers, robot engineers, and information systems professionals). In addition, STEAM research groups of teachers, in which teachers and experts work together, have continuously developed a variety of high-quality teaching materials. STEAM educational materials and programs developed through these processes are uploaded to the STEAM homepage (http://steam.kofac.re.kr) and can be freely accessed by anyone.
Table 2 shows a checklist that can be used in designing a STEAM class. It consists of the following four categories: Purpose of STEAM education, Concept of STEAM education, Learning standards framework for STEAM classes (i.e., Context presentation, Creative design, and Emotional touch),
and Evaluation of STEAM education. In order to apply STEAM classes that satisfy the checklist, despite the already organized schedules based on each subject, three types of curriculum activity can be applied: Subject curriculum activity connecting the factors of S, T, E, A, and M with a main subject; Creative curriculum activity connecting multiple subjects for a main theme; and Extra-curriculum activity reconstructing the curriculum or developing a separate program for a main theme. Among these, an example of ‘Subject curriculum activity’ can be found in Table 3.
Some studies analyzing STEAM programs and educational materials have pointed out that the degree of integration was limited. According to the results of analyzing STEAM educational materials developed by STEAM leading groups, such as leader schools and research groups of teachers, based on the linking frequency of each of S, T, E, A, and M in elementary educational materials, linkages between science (S) and arts (A) have been frequent, while technology (T) and engineering (E) are not frequently connected with other fields (Ahn & Kwon, 2013). For secondary educational materials, the frequency of linkages between technology and engineering was higher than for elementary materials.
According to the research analyzing 821 theses and articles on STEAM education published in Korea, research on science (S) accounted for the highest percentage (27%) when the core subject covered by the research included a single subject, and research dealing with science (S) and arts (A) together accounted for the highest percentage (2.6%) when the core subject covered by the research was an integrative type. Although STEAM education emphasizes Creative Design as an element of the learning standards framework for STEAM classes, technology (T) and engineering (E) were not emphasized in both academic research and educational program development.

98
Policy Trajectories and Initiatives in STEM Education / Korea
Table 2. STEAM class checklist
Category Element Details
Purpose of STEAM Education
Nurturing Talents for Integration
Is the class appropriate for the purpose of nurturing talents for integration?
Concept of STEAM Education
Increasing Students’ Interest
Is the class designed to increase the students’ interest in scientific technology?
Connection to the Real World
In the theme related to scientific technology in the real world?
Cultivation of Integrated Thinking
Abilities
Is the program designed to cultivate the integrated thinking abilities of students?
Learning Standards
Framework of STEAM
Classes
Context Presentation
Connections to the Real World
Does the class present problematic situations for student to solve in the real world?
Interest and Immersion
Is it a specific situation that can arouse the interest of students and appropriate for their level?
Creative Design
CreativityIs the process of creative design clearly revealed for the students to think about how they will solve the problem?
Focusing on Students
Is the class made up of activities focusing on play and experiences, and is there a process for the students to personally devise and think about the issues at hand?
Results(Ideas)
Is the class designed for various results (or ideas) to be presented by each students (or group) as a result of creative design?
Use of ToolsIs the class designed for students to solve problems using devices from the real world?
Emotional Touch
Solving ProblemsAre the contents presented in the context presentation step for students to feel the joys of success in solving a problem?
Learning through Cooperation
Is the class designed for students to solve problems through cooperation in coming up with their results?
Sprit of ChallengeIs the class guided for students to challenge new tasks through the process of solving problems?
Evaluation of STEAM Education
Detailed Perspective
Is it made to evaluate the experience of success for students having solved the problem?
Are various results (ideas) analyzed in the evaluation of students?
Is the aim to conduct not a results-focused evaluation but rather an evaluation focusing on the process and its steps?
Source: Korea Foundation for the Advancement of Science and Creativity, 2016 (pp.33-34)

Science and Technology Trends
99
Table 3. Example of subject curriculum activity of STEAM Education from teacher’s guide
Source: Korean Ministry of Education (2014), Korea Foundation for the Advancement of Science and Creativity, 2016 (p.63)
5. Suggestions for Future Directions of STEAM Education
In the previous chapters, I presented the current policy of STEAM education in Korea based on the three elements of education: the teacher, the student, and the educational content. Based on this, I would like to briefly suggest potential future directions for STEAM education.
Firstly, for teachers, systematic educational opportunities should be provided so that teachers can bridge the gap between education and our changing world. For this, it is suggested to develop a model for (and implement) a ‘STEAM bridge center’ (Cho et al., 2017) in which academic and industry experts and experienced teachers can work together to develop educational materials, teach students, and collect and analyze data on students. The National Science Foundation (NSF) supported ‘Research + Practice
Collaboratory’ programs that develop curriculum, technology, and after-school programs through the cooperation of researchers and teachers, from the point of view that STEM education research should be promoted through the active participation of teachers (http://collaboratory.mspnet.org). In order to strengthen the capabilities of STEAM teachers, it is necessary to construct research and learning communities beyond individual-level training programs (Jho, Hong, & Song, 2016). The ‘STEAM bridge center’ model for collaborative research between researchers and teachers will contribute to the improvement of teacher capabilities and can also be used as an effective method for the development of qualified STEAM educational content.
Secondly, for students, more experience in participating in social problem-solving projects should be provided so that students can find social problems and solve them through STEAM education. These experiences help students to grow as democratic citizens

100
Policy Trajectories and Initiatives in STEM Education / Korea
who participate and practice, and to grow as leaders who solve diverse problems caused by rapid changes in industry. Furthermore, until now, STEAM education has been mainly implemented in primary and secondary education, but it should be extended to university education. Recently, the Japanese government announced the ‘Articulation Reforms of High Schools and Universities (ARHSUS)’ in order to transform high school and university education into something more adequate for people living in the future (Anzai, 2017). Since 2011, STEAM education aiming to transform education to prepare students for the future society has brought positive changes to primary and secondary school classes. If STEAM education is implemented in universities, realistic projects dealing with problems in real industries and communities will be pursued based on the ideas of university students, and student-led Research and Solution Development (R & SD) for solving social problems will be realized. Furthermore, STEAM education in universities will help students develop the problem-solving, collaborative, and creative talents required for future jobs and careers.
Thirdly, for educational content, the degree of integration should be expanded so that STEAM classes can reveal students’ creativity by naturally linking various subjects or disciplines – as was the original purpose. More attention should be given to technology (T) and engineering (E), which have not been emphasized in current STEAM educational materials, despite their importance in the Creative Design process. Furthermore, it is necessary to place additional emphasis on computational thinking, an approach to solve problems efficiently by integrating human ability and computing power, in STEAM education, as many problems emerging with our future society will be difficult to solve without the help of computing devices. The NSF has supported
‘STEM+Computing Partnerships (STEM+C)’ programs that integrate computing with one or more STEM disciplines, or integrate STEM into computing education (NSF, 2017). In 2017, in a similar vein, KOFAC published a series of educational books titled ‘Problem-Solving Activities for Computational Thinkers’ to provide various STEAM activities based on computational thinking with topics related to cutting-edge technologies (e.g., Artificial Intelligence, Autonomous Cars, Virtual Reality, Space Launch Vehicles, Natural Disasters, and Sports Statistics). I believe that computational thinking is a very important keyword in presenting the future directions of STEAM education.
Finally, teachers, students, and educational content are all important elements in understanding STEAM education, but an integrated approach –
rather than an individual approach – must be taken in order to understand and properly analyze STEAM classes. According to Kim & Kim (2017), ‘creativity’ was the most frequently presented keyword as a dependent variable in the study of the effectiveness of STEAM education. Creativity is highlighted time and again as a key skill required for future generations. Recently, in Korea, there has been much discussion regarding collective creativity at the group level, including an attempt to conceptualize and analyze ‘classroom creativity’ that integrally considers students, teachers, environment, engagement, and creative behavior (Hong, 2016). As a representative future education policy in Korea, STEAM education make students actively participate and communicate with others in order for creativity to be naturally revealed in the process. Therefore, in order to design the next step of STEAM education policy, it is necessary to holistically understand and analyze STEAM classes that enhance the active interaction between teachers, students, and educational content.

Science and Technology Trends
101
References
Ahn, J., & Kwon, N. (2017). An Analysis on STEAM Education Teaching and Learning Program on Technology and Engineering. Journal of the Korean Association for Science Education, 33(4), 708-717.
Anzai, Y. (2017). The grand reform of Japanese education and university admissions: the present status and future prospects. Paper presented at the future jobs and education forum by Korean national assembly. Seoul, Korea.
Cho, H., Hong, O., Heo, K., Jeong, W., Lee, H., Kim, K., Lee, H., & Na, J. (2017). A planning study on direction, method and contents of mathematics and science education in the era of the 4th industrial revolution. Seoul: KOFAC.
Choi, H. & Park, K. (2015). The students’ perceptions of “Research & Education” programs administered in the science specialized gifted high schools in Korea. Journal of Learner-Centered Curriculum and Instruction, 15(2), 409-431.
Hong, O. (2016). A conceptualization and scale development of science classroom creativity. Doctoral dissertation, Seoul National University, Seoul, Korea.
Jho, H., Hong, O., & Song, J. (2016). An analysis of STEM/STEAM teacher education in Korea with a case study of two schools from a community of practice perspective. Eurasia Journal of Mathematics, Science & Technology Education, 12(7), 1843-1862.
Kang, N., Yu, J., Byun, S., Im, S., Oh, K., Jeong, J., & Lee, N. (2017). The effect of STEAM Projects: Year 2016 Analysis. Seoul: KOFAC.
Kim, Y., & Kim, J. (2017). Analysis of status about theses and articles related to domestic STEAM education. Journal of the Korean Institute of Industrial Educators, 42(2), 140-159.
Korea Foundation for the Advancement of Science and Creativity. (2013). Study of policies on creative integrative talents in science: an analytical study on the efficacy of STEAM. Seoul: KOFAC.
Korea Foundation for the Advancement of Science and Creativity. (2014). Development of evaluation tool for outcome of STEAM. Seoul: KOFAC.
Korea Foundation for the Advancement of Science and Creativity. (2016). Introduction to STEAM education. Seoul: KOFAC.
Korean Ministry of Education, Science and Technology. (2011). The second basic plan to foster and support the human resources in science and technology (2011-2015). Seoul: MEST.
Korean Ministry of Education. (2014). Guidebook for science teachers for grade 3 and 4. Seoul: MEST.
Lee, J., & Shin, Y. (2014). An analysis of elementary school teachers’ difficulties in the STEAM class. Journal of Korean Elementary Science Education, 33(3), 588-596.
Mun, K., Mun, J., Hwang, Y., & Kim, S. (2017). Changes in High School Students’ Creative Leader Competency through STEAM R&E. Journal of the Korean Association for Science Education, 37(5), 825-833.
National Science Foundation. (2017). STEM + Computing Partnerships (STEM+C). Retrieved from https://www.nsf.gov/funding/pgm_summ.jsp?pims_id=505006&org=DRL&from=home.
Noh, H., & Paik, S. (2014). STEAM experienced teachers’ perception of STEAM in secondary education. Journal of Learner-Centered Curriculum and Instruction, 14(10), 375-402.
Park, H., Byun, S., Sim, J., Baek, Y., & Jeong, J. (2016). A study on the current status of STEAM Education. Journal of the Korean Association for Science Education, 36(4), 669-679.
Partnership for 21st Century Skills. (2009). Framework for 21st Century Learning. Retrieved from http://images.apple.com/education/docs/leaders/Apple-P21Framework.pdf.
Ryn, S., & Cowan, S. (1996). Ecological design. Washington: Island Press.
Shin. C. (2005). Introduction to education. Goyang: SeoHyun.
World Economic Forum. (2016). The 10 skills you need to thrive in the Fourth Industrial Revolution. Retrieved from https://www.weforum.org/agenda/2016/01/the-10-skills-you-need-to-thrive-in-the-fourth-industrial-revolution.

102
Policy Trajectories and Initiatives in STEM Education / China
Science and Technology TrendsPolicy Trajectories and Initiatives in STEM Education
Integrating STEM Education into the Global Landscape in China
Yuan Gao1
1. Introduction
As the largest reservoir of science and technology (S&T) talent in the world, China always has prioritised science education throughout students’ schooling. On the one hand, China’s substantial investment in science education is driven by the key role that S&T plays in the national economy, while on the other hand, it is related closely to the social value attached to it. Science education in China originates from very early times, as Chinese society always has attached great importance to science education and regarded it as the cornerstone of the nation state. This is illustrated vividly by the Chinese proverb that states, “To learn Maths, Physics, and Chemistry well, one will be able to travel all over the world with no fear.”
In the Chinese context, science refers to mathematics, basic natural sciences, and interdisciplinary subjects. Science explores natural laws, and drives S&T and economic development. It serves as the foundation of the entire system of knowledge and directs the future, thereby advancing human civilization. Science education, particularly in the higher education sector, has the mission to nurture scientific research and cultivate talent. Now, its mission also involves advocating scientific
literacy among university students. The success of a nation’s science education is related closely to national S&T development, economic prosperity, national security, and even social progress. Therefore, China always has seen science education as a strategic priority. In general, science education in China consists of two major aspects: cultivating science talent (specialised education) and implementing scientific education, which refers to providing basic science training to students who do not major in science, and fostering the scientific literacy of all students. This also is an indispensable part of liberal education or quality-oriented education (Science Specialty Committee of China Higher Education Society, 2009).
This article is designed to document and analyse major national policies and initiatives in China to promote and improve STEM education (Science, Technology, Engineering, and Mathematics) at different levels. Because of the complexity of the education system throughout the country, this article cannot address all such policies and strategies exhaustively, but focuses on those with wide and profound effects. Specifically, the article will shed light on the most current trends in STEM education
Centre for International Research of Education Systems, Victoria University, 300 Queen Street, Victoria, Australia, 3000E-mail: [email protected]; [email protected]

Science and Technology Trends
103
in China, which is to integrate the national education system into the global landscape, and some of the key endeavours in this integration will be covered and discussed in detail.
2. Science and Technology in the National Interest
The role of S&T in driving the country’s core competencies shapes the policies on, and strategies for, STEM education in China to a large extent. Therefore, this section reviews the national S&T policies and development to provide the context necessary to understand its educational strategies. Giants of science emerge when the society’s economy becomes extraordinarily robust by world standards. France, Germany, Britain, and the U.S. are examples. An evolving multi-polar world economy is leading to multiple centres of science, and as the Chinese economy has boomed in the last two decades, it has emerged as an important science power (Rogers Hollingsworth, Müller, & Hollingsworth, 2008; Zhou & Glanzel, 2010).
Like any developing country, the financial investment in R&D is a decisive factor in the progress of S&T in China, in which government allocations play a major role. R&D in China more than quadrupled between 2005 (¥245.00 billion) and 2014 (¥1.302 trillion). In 2014, investment in basic science reached ¥61.35 billion, and accounted for 4.7 per cent of investment in R&D overall. Compared to the investment in applied research (¥139.85 billion) and experimental development (¥1.1 trillion)1, the proportion of basic science seems to be relatively small, which reflects the major difference in the allotment of R&D investment between China and certain developed countries. Because the top priority in a growing economy is to eliminate poverty, China
has to focus its resources on applied and experimental research. There have always been arguments about this issue in the scientific community, with many appealing for more emphasis on basic research. Basic research is the driving force behind the progress of civilisation, and is the cradle that nurtures talent, while new discoveries and inventions are sources of new knowledge and technologies (Song, 2008). In 2015, China ranked 18th in the world in its national comprehensive innovation capabilities,2 while the contribution rate of technology to economic growth jumped from 20.9 per cent in 2010 to 55.3 per cent in 20153.
National policies and strategies to boost scientific and technological innovation in China have fostered the growing expenditure on scientific research and experiments. Most recently, the State Council issued a national scientific and technological innovation plan in a bid in 2016 to build China into an innovative country and a scientific and technological power. Based on the idea that innovation is the primary driving force in development, the plan is a blueprint designed to develop technological innovation during the period of the 13th Five-Year Plan (2016-2020). The plan’s goal is to improve China’s technology and innovation capabilities substantially, and advance the country’s comprehensive innovation capabilities into the world’s top 15. In addition, the plan urges the building of a Belt and Road innovation community intended to improve the country’s ability to allocate global innovation resources and participate fully in the governance of global innovation (The State Council of People’s Republic of China, 2016).
3. The Pipeline of STEM Talent
Formal schooling in China can be divided into compulsory education, senior secondary education,
1 Data source: National Bureau of Statistics of the People’s Republic of China, 20152 Data source: https://www.globalinnovationindex.org3 Data source: National Bureau of Statistics of the People’s Republic of China, 2016

104
Policy Trajectories and Initiatives in STEM Education / China
and higher education, with three years of preschool prior to compulsory education. Compulsory education lasts for nine years, and consists of primary and junior secondary education. Junior secondary graduates who would like to continue their studies in general or academic, rather than specialised or vocational pathways, must pass the entrance examination for general senior secondary schools. The subjects covered in the entrance exam vary from city to city and the policies are adjusted from year to year. Taking Beijing as an example, six subjects were included in the entrance exam in 2017: Chinese, Mathematics, English, Physics, Chemistry, and P.E. However, a new round of exam reform will take place in 2018, and will result in changes of subjects. Students who will graduate in 2018 have to take four compulsory subjects in the entrance exam, including Chinese, Mathematics, English, and P.E. In addition, they need to choose another three subjects as electives from Physics, Biology (Chemistry), History, Politics, and Geography (Beijing Municipal Education Commission, 2015).
These changes in exam subjects indicate a higher level of coherence between subjects taught in junior and senior secondary schools, which may help students transition more smoothly between the two. The changes also echo the reform in the National College Entrance Exam (NCEE), which has been piloted since 2014 in Shanghai and Zhejiang Province and was extended to six other cities and provinces in 2017. Both of the entrance exams intend to provide students more freedom to select the subjects that they prefer and facilitate the development of individual talents and interests. The ongoing reforms in the selection mechanism at different levels also reflect the government’s endeavours gradually to adapt the Chinese education system to internationally prevalent models.
Senior secondary education consists of Years 10 to 12. In most areas of China, students are required to decide whether to take either of the two divisions
of arts and science at the beginning of Year 11. Students who choose the science track will continue to study physics, chemistry, and biology as compulsory subjects in the final year to prepare them to the fullest extent possible for the highly competitive NCEE, which determines whether they can enrol in a university. Mathematics is compulsory for students in both divisions. All students enrolled in senior secondary schools are required to take the Academic Test for General Senior Secondary Students (ATGSSS), which covers all the major subjects, throughout the three years. Students who meet the ATGSSS requirements are granted a graduate certificate. For students with special needs, the test for a particular subject can be taken twice (The State Council of People’s Republic of China, 2014).
The division of the science and arts pathways at the senior secondary level has been criticised for decades because of its restrictions on subject selection. Unlike most Western countries, in which students are entitled to choose the specific subjects they would like to take, students in China have to accept the set selected for them, and those students who are interested in both arts and science subjects have to make a compromise. This situation has begun to change since 2014, when the latest NCEE reform was piloted in Shanghai and Zhejiang Province, and the division between the two pathways was eliminated. The pilot was extended to include another six cities and provinces this year, and all of the other areas are scheduled to follow, such that the reform will be completed by the end of 2019 (The State Council of People’s Republic of China, 2014). This reform has had far-reaching effects on the senior secondary school curriculum throughout the country, as well as participation in STEM at the tertiary level. As it remains in the initial stage, further investigation will be needed to determine its effects. In addition, this major change to the NCEE could be seen as another sign of the Chinese education system’s efforts to become integrated in the global landscape.

Science and Technology Trends
105
Students usually enter different types of higher education institutions (HEIs) after completing their senior secondary studies. China is similar to Canada with respect to the general pattern of post-secondary education. Students may choose short-cycle college diploma programs or pursue Bachelor’s, Master’s, and/or Doctoral degrees. An important way to categorise post-secondary programs is whether they belong to regular higher education or adult education. These two types of education differ in many ways, including the institutions, curricula, admission and graduation requirements, and quality control standards overall. In reality, regular education is considered to be of better quality and therefore, is regarded more highly (Sun, 2005). It is offered by degree-granting institutions (universities), research institutions, or institutions that offer diploma programs only. In this report, the discussion of STEM education at the tertiary level is limited to the regular higher education sector.
4. Planting the STEM Seed
In February of 2017, China’s Ministry of Education issued a new curriculum for science education at the primary level that requires primary schools to make science a compulsory subject beginning in Year 1 and to allot at least one teaching session to science in both Years 1 and 2 (Ministry of Education, 2017). Previously, formal science education began in Year 3 at the primary level and science subjects accounted for 7 to 9 per cent of all teaching sessions (Ministry of Education, 2001). The change in the primary science curriculum is designed to plant the STEM seed at the very beginning of formal schooling. The government has recognised that, without thorough preliminary schooling, training in science is futile. Similarly, without early inculcation of orderly mental processes, comprehension of science is virtually impossible.
It is fatuous to assume that scientific talent is a natural gift that will be expressed independent of skilled direction, and that there lurks in every individual the spark of scientific achievement that requires only the sight of laboratory equipment to burst into flame (R.R.L.F., 1926).
4.1. The New Science Curriculum (Years 1 to 6)
The Compulsory Science Curriculum (Year 1 to Year 6) issued recently articulates the goals, philosophy, and content of science education in China at the elementary level, and also offers guidelines for practice and evaluation. The Curriculum was drafted in 2015 and was amended to be implemented in 2017. Scientific literacy is defined in the Curriculum as the understanding of basic S&T knowledge and its influences on society and individuals, knowing basic scientific methods, recognising the essence of science, developing and appreciating the scientific spirit, and acquiring the ability to use scientific knowledge for problem solving and public affairs. It also clarifies the nature of a science subject, which is a fundamental subject that fosters primary students’ scientific literacy, an activity-based practical subject, and a comprehensive subject related closely to others. Four rules were followed when designing the curriculum:
- Accommodating all students- Promoting inquiry-based learning- Nurturing students’ curiosity- Being student-centred (Ministry of Education, 2017)
The goal of the Curriculum is to foster students’ scientific literacy overall. Specifically, it can be divided into four areas, including science knowledge, science inquiry, scientific attitude, and S&T within society and the environment. In addition, the Curriculum outlines the content that must be delivered through the six years of primary schooling:

106
Policy Trajectories and Initiatives in STEM Education / China
physical, life, and earth and space sciences, and technology and engineering. The Curriculum defines the scope of each of the four fields, key concepts to be covered, and detailed learning units.
4.2. Changes in Curricula and their Implications
Compared to the previous science curriculum (Years 3 to 6) issued at the beginning of the 21st Century that has been implemented for 16 years, there is a number of notable key changes in the new curriculum. First, science education begins now in Year 1. Many countries worldwide, particularly those with advanced economies and education, include science among their core subjects, as are the native language and mathematics, at the primary level. There are two reasons to commence science subjects at the outset. First, the beginning of primary education is a key phase during which children begin to explore and understand the world. Meanwhile, primary education has the widest participation, and thus fosters citizens’ scientific literacy significantly. In 2014, 94.51 million students were enrolled in primary schools, and the enrolment rate of the age cohort reached 99.81 per cent4. Therefore, having science subjects throughout primary schooling is expected to contribute to the improvement of both the quantity and quality of national scientific literacy. It also is assumed that it will help primary students learn language and mathematics.
Second, for the first time, the new curriculum employs the concept of STEM education in primary education, including technology and engineering. This signals the first official government recognition of STEM education in China. The Curriculum encourages interdisciplinary learning, and structures STEM contents that uses a project-based and problem-solving oriented approach. The science subject integrates all of the STEM disciplines, which fosters students’ ability to be innovative. The
interdisciplinary approach is indeed a key feature of the new curriculum, according to Yu Peng, a senior science teacher at the STEM experiment centre of High School affiliated with Shanghai Jiao Tong University. He argued that the Curriculum emphasises the connections among science, mathematics, Chinese, and practical activities. For example, science learning requires data processing acquired through mathematics, articulation learnt through Chinese, and inquiry-based methods developed through practice activities (Zhang, 2017).
Third, the new curriculum stresses the key role that laboratory exercises play in science education, and requires explicitly that all primary schools have laboratories and the equipment necessary for science experiments. In addition, these experiment facilities should be used effectively by teachers and teaching assistants to achieve the best teaching results, and the science teachers’ shared responsibilities for laboratory management should be counted as teaching hours. Fourth, the Curriculum requires students to understand S&T in the social and environmental context. Among the four goals of primary science education, the last is S&T within society and the environment. Students should be encouraged to think about the relation between S&T and society, develop their understanding of ethics, and use S&T creatively to solve social problems. This is actually demanding for both teachers and students, as creative thinking is not an end in itself, but S&T should be used to solve real world problems and create a better life.
Finally, the Suggestions for Implementation section indicates that inquiry-based learning is not the exclusive approach to science education in China. Science literacy is a multidimensional concept and should be fostered through various learning approaches. Science teachers are encouraged to learn diverse pedagogies and strategies intended to inspire their students’ interest in science. The Curriculum
4 Data source: Education Yearbook 2015, http://www.moe.gov.cn/jyb_sjzl/moe_364/zgjynj_2015/

Science and Technology Trends
107
illustrates some of the potential strategies for science teaching at the primary level, including drama performances, science games, model making, field work, science debates, etc. This initiative adopts the inquiry-based learning approach prevalent internationally and adds its own innovations. Rather than adopting all international practices unselectively, integrating Chinese science education into the global landscape means preserving its own advantages creatively and adapting to international conventions.
4.3. Learning by Doing
The new curriculum sets definite national standards for primary science education in formal schooling. In addition to the Curriculum, there are numerous initiatives at the national and provincial levels to improve students’ science learning that cannot be discussed exhaustively here. Thus, the “Learning by Doing” Project was selected as an example because of its extensive participation and profound effects. In 2001, the Ministry of Education and China Association for Science and Technology launched this joint science education reform. This project is designed to promote hands-on, inquiry-based science learning and teaching in preschool and primary education. The connotation of “Learning by Doing” is to engage children in the discovery of objects and natural phenomena (natural science). Through observation and experiment, children can acquire key scientific concepts and their connections, master inquiry skills, and develop language and presentation skills. The “Learning by Doing” approach also is assumed to promote children’s curiosity, inspire their interests and imagination, extend their thinking, and improve their abilities to collaborate and communicate (Wei, 2004).
The “Hands-on Inquiry-Based Learning” reform is an international initiative to enhance preschool and primary science education to foster scientific
thinking. According to the National Research Council, U.S. (1996):
“Inquiry is a multifaceted activity that involves marking observations; posing questions; examining books and other sources of information to see what is already known; planning investigations; reviewing what is already known in light of experimental evidence; using tools to gather, analyse, and interpret data; proposing answers; explanations, and predictions; and communicating the results. Inquiry requires identification of assumptions, use of critical and logical thinking, and consideration of alternative explanations.” (p. 23)
The Ministry of Education in China and the French Academy of Science collaborate closely on the Project, which project involves the development of teaching resources, teacher training, and international forums. The Handsbrain website was established to update the project’s progress and disseminate project-related information and resources. The initiatives were piloted initially in 44 preschools and primary schools in Beijing, Shanghai, Nanjing, and Shantou, and then extended to over 200 preschools and primary schools in 18 cities (Wei, 2004).
Although it is an ongoing project, some preliminary achievements have been made. A long-term partnership has been established with the GE Foundation to collaborate in science education. The “Learning by Doing” inquiry approach has been promoted in GE communities and schools, which have become the backbone for practicing and disseminating science education in China. 30 science teachers have received project training and are able to carry out inquiry-based science teaching and develop teaching resources independently. Further, the project also established a team of community workers who are enthusiastic about science education practice. Taken together, this has created an environment favourable for science education in the GE communities, and

108
Policy Trajectories and Initiatives in STEM Education / China
has improved the scientific literacy of all community members. Inquiry-based science education packages in two fields have been developed separately for children ages 5 and 10: the physical world and S&T. Each package includes textbooks, cases, multimedia course slides, and experimental teaching aids. These packages have been applied in teaching practice in China, particularly in disadvantaged regions. Most importantly, according to an evaluation conducted by authoritative institutes, the project has resulted in improvement in participating students’ science knowledge, creative thinking, scientific inquiry ability, and social and emotional abilities (Handsbrain Education & Training Centre, 2006).
In April, 2007, the Preschool and Primary School Inquiry Based Science Education Experimental Project–Learning by Doing Content Standards was launched officially, which informed significantly the design of the national science curriculum released most recently. Traditionally, science teaching in China is not enquiry-based, but focuses on the use of textbooks and rote learning. Now, enquiry-based teaching is becoming more commonplace, although there remains much to do to provide teachers with the relevant skills. The Project is working to provide the appropriate professional development, and is drawing upon international best practices to ensure that the change will be appropriate and current in the global education landscape in which China is engaged now.
4.4. The Science Curriculum (Year 7 to Year 9)
Based on primary science education, the current national Compulsory Science Curriculum (Year 7 to Year 9) emphasises two key features: integration and inquiry. As stated in the Curriculum (Year 7 to Year 9):
“Extensive and profound interaction has emerged among various S&T fields unprecedentedly, resulting in high-tech areas such as information technology,
modern biological technology, space technology, and new materials technology. The advancement of S&T is featured with specialisation on one hand and integration on the other hand, towards a multi-layer and comprehensive entity. This character makes new requirements for contemporary science education.” (Ministry of Education, 2011, p.1)
Responding to these new requirements, the Curriculum (Year 7 to Year 9) is intended to guide students in understanding nature from a holistic perspective. Science subjects should retain their structural core concepts independently and reflect the connection between different subjects simultaneously. Such integrated science education also means multiple foci on science knowledge and skills, scientific attitudes, values, processes, methods, and capabilities, rather than just knowledge itself. It is required to mirror the interaction among S&T, society, and the environment, and its relevance. The stress on inquiry develops students’ scientific literacy by advocating a diversity of inquiry-based activities. Moreover, students are encouraged to engage actively in inquiry-based activities with which they are familiar and comfortable (Ministry of Education, 2011). The content is structured similarly to that at the primary level, and includes the same five broad fields: science inquiry, physical science, bioscience, earth and space sciences, and S&T within society and the environment. This similarity guarantees that science education at the two levels is consistent and eases the students’ transition from primary to secondary education. The five fields are divided further into the themes and special topics shown in Table 1. It is beyond the scope of this discussion to investigate the specific content required for each theme and topic, but it is worthwhile to undertake further investigation, particularly comparative studies, to reveal the international variation in science education in detail.

Science and Technology Trends
109
Table 1. Themes and special topics included in the Compulsory Science Education Curriculum (Year 7 to Year 9)
Field Theme Special topic
Bioscience
Composition of life systemsObservation of a wide range of creaturesThe cells, tissues, organs, and systems that make up an organismPopulations, biome, ecosystems, and biosphere
Transformation of materials and energy in the living body
Flowering plantsConversion of material and energy in human body
Adjustment of life activitiesPhotoperiodicity of plants, animal behaviour, basic structures and functions of the human nervous and endocrine systems, adjustment of human physiological activities
The continuation and evolution of life
Fungi and fungal reproductionReproduction and development of flowering plantsReproduction and development of humans and animalsGenetics and evolution
People, health, and environmentHuman healthHealth and the environmentHuman and the ecological environment
Physical science
Common materials
The nature of materialsWater AirMetalCommon compounds
Material and structureParticles that make up materialsElementsMaterial classification
Physical movement and interaction
Basic chemical reactionsMechanical movements and forcesElectric and magnetic wavesCycling of elements and material transformation
Energy Energy transformation and energy conservationEnergy and society
Earth and space science
The location ofthe earth in the universe
StarsSolar system and the motion of planetsGalaxy and the universe
The earth onwhich humans live
Crustal movement and topographic changesSoilWater on earthWeather and climate
S&T within society and the environment
The connections among science, technology, society, and the environment
History of S&T Technical designContemporary key issues
Source: Ministry of Education. (2011). Compulsory Science Education Curriculum Year 7 to Year 9 (2011 edition). Beijing: Beijing Normal University Publishing Group.
110
Policy Trajectories and Initiatives in STEM Education / China
It should be noted that the national Curriculum specifies only the minimum content that science subjects must cover. In practice, provinces and cities may have their own regional or local curricula and use the national one as a guideline. The content usually is extended and deepened in classroom teaching to achieve a higher level of scientific understanding on the students’ part. Unlike in primary education, in which science is taught as an integrated subject, in Years 7 to 9, science education normally is divided into three subjects: physics, biology, and chemistry5. In addition, the schools have the right to structure their science subjects and allot teaching hours for each subject to accommodate their school context and students’ learning capabilities best. In most cases, biology is introduced in Year 7, followed by physics in Year 8, and chemistry is the final subject added to the curriculum in Year 9. The teaching hours allotted for biology can range from one to two teaching sessions per week, and may range from two to four per week for physics and chemistry. It is known well that Chinese students rank highest in math and science consistently in PISA. In 2015, B-S-J-G6 (China) ranked 10th in science and 6th in math. In 2012, Shanghai ranked 1st in both science and math (OECD, 2012, 2015). Chinese students’ outstanding achievements in international comparisons in STEM subjects cannot be separated from the seed planted solidly in the early stage of schooling.
5. Nurturing the STEM Seed
The primary purpose of compulsory science education in China is to introduce science to students and inspire their interest and curiosity in learning science, while science education at the senior
secondary level is much more intensive. Students are required to master scientific knowledge more broadly and deeply and their scientific skills must be sharpened as well. The fierce competition of the NCEE reinforces further the intensity of science learning in senior secondary schools.
5.1. National Standards for Senior Secondary Science Education
Science education at the senior level is subject-based. The Ministry of Education has developed national standards for what is to be taught for each science subject and mathematics. The national standards used currently for senior secondary schools were issued in 2003, in which the goal of education at this level overall is defined as public-oriented fundamental education to improve citizens’ literacy further and to serve as the base of students’ lifelong learning (Ministry of Education, 2003). The standards are based on the beliefs in “developing students’ scientific literacy,” “science for all children,” and “teaching science through inquiry,” which defines the collective values and goals, target population, and approaches to teaching science (X.-F. Liu et al., 2012). These philosophies are consistent not only with international trends in science education reforms, but also with the demands of rapid economic development and social changes in China. Inquiry is not only a teaching and learning approach, but also part of the content. Laboratory activities are designed to help students understand the way in which science knowledge can be applied to technology. In general, two approaches are taken to update the content; one is to replace outdated knowledge with the latest scientific developments, and the other is to connect science learning with technologies that students encounter in their daily lives (E.-S. Liu, 2011).
The senior secondary curriculum is structured in
5 In some cities and provinces like Shanghai, science continues to be taught as an integrated subject in Year 7 and is divided into the three subjects in Year 8.
6 B-S-J-G stands for Beijing, Shanghai, Jiangsu, and Guangdong

Science and Technology Trends
111
three layers: learning areas, subjects, and modules. There are eight learning areas, including languages and literature, mathematics, humanities and society, science, technology, arts, PE & health, and comprehensive practical activities. Science consists of three subjects—physics, chemistry, and biology. There are 52 weeks in an academic year, including 40 teaching weeks, one social activities week, and 11 weeks of school holidays. The academic year includes two terms, each of which is divided into two sessions of 10 weeks each. Of the 10 weeks, nine are teaching weeks and one is devoted to examinations. Normally, 36 teaching sessions (4 per week) are needed for one module study. To be granted a graduate certificate, students have to obtain 144 credits, including 116 compulsory credits (incl. 15 of inquiry learning activities, 2 of community activities, and 6 of social activities) and 28 elective credits. The study of all different science subjects is compulsory. Physics, chemistry, and biology account for 6 credits, respectively, and technology (incl. information and communication technology) accounts for 8. As a core subject, Mathematics accounts for 10 credits (Ministry of Education, 2003).
Again, it is beyond the scope of this article to document the content of the national standards for each of the five STEM subjects specifically. The standards serve as the highest level of guidelines for senior secondary science education, and textbooks, materials, teacher preparation, and professional development are all clearly consistent with these standards. In particular, textbooks function as the central pillar for science lessons delivered in the classroom, rather than as occasional references or sources as in most Western countries.
5.2. The Appealing Chinese Approach
Science education has a long history in China. Because of the influence of traditional Confucian culture, the teaching and learning of science has
evolved with unique characteristics. It usually is described as centred on the teachercentred, focused on theory, oriented to the national examination, and supplemented with homework. Earlier, this Chinese approach was criticised by Western educators because it discouraged students’ creativity and their active role in learning. However, this situation has begun to change since Chinese students began to outperform their Western counterparts in math and science in internationally comparable assessments such as PISA. Although part of the achievements Chinese students have made can be attributed to culture, such as high social expectations, particularly substantial parental pressure, there is no doubt that teaching practices contribute significantly, and the merits of the Chinese approach to teaching has attracted Western countries’ attention. The British government has hosted a teacher exchange program since 2014 that invites Shanghai math teachers to teach in primary schools throughout England. Teacher reports show that the Shanghai methods already have raised the standards in schools that took part in the first phase of the exchange.
As stated in the beginning of this article, cultural heritage plays an indispensable role in shaping science education in China. Western cultures stress individualism and competition, and values personal achievement and independence. This explains the student-centred and individualised approach in most Western classrooms. In contrast, Eastern cultures emphasises the social roles of individuals and classes, and values collectivism, in which individuals work for the wellbeing of the whole. This results in a “group-based, teacher-dominated, highly structured pedagogical culture” in China’s classrooms (Wang & Fan, 2007).
In most Chinese science classrooms, it is notable that lectures remain the primary method used to deliver content. It is not unusual for a science teacher to dominate the entire teaching session and to present his or her prepared lectures monotonously from the

112
Policy Trajectories and Initiatives in STEM Education / China
beginning until the last minute of the class. One advantage of using lectures as the primary means of instruction is that students are exposed to a considerable amount of information in a limited time (usually 45 minutes per session). This method also allows a teacher to manage the class better. The shortcomings, however, are that this approach neglects students’ varying abilities and needs.
In addition to the teaching approach, the cultural elements that are rooted deeply and underlie Chinese education also should be taken into account. Formal Chinese schooling dates back 5,000 years. Chinese students normally are depicted to have a strong work ethic that is based on the cultural commitment to education. Because of the strong cultural value attached to education, schools in China are focused highly on academic achievement. As students and the entire society appreciate education greatly, it is unsurprising that students spend long hours on homework, private tuition, and examination preparation. Students usually are motivated to succeed to seize the opportunities that can be accessed only by those with a good education, and effort, not ability, is presumed to determine success in school (Stewart, 2006). It is a common practice for students whose families can afford the cost to pay for additional tuition outside school, either by an individual tutor or in tutoring schools. Further, many students attend residential or boarding schools at the senior level, which also extends their hours of study (Asia Society, 2006).
5.3. The Major Reform in the NCEE
One of the key differences in senior secondary education in China and most Western countries is that students in China have to choose either the arts or the science track in Year 11, while in Western countries, senior secondary education normally is subject-based, which allows students to study both arts and science. The existence of the arts and science
tracks is attributable to the arrangement of the NCEE. Although in recent years, there has been a strong appeal to eliminate the division of arts and science tracks, this can hardly be realised without reforming the NCEE, the importance of which can never be overemphasised. Students must take the NCEE to enter a university, and the competition is intense for those who want to enrol in a prestigious institution. Math and science scores attained in the NCEE are of considerable importance in differentiating students who seek university admission. Obviously, students and parents take the NCEE seriously, as to some extent, it is the examination that determines a student’s future. Senior secondary science teachers work under the enormous pressure of the NCEE, because the scores their students attain are viewed as an indicator of their effectiveness as teachers. School leaders value the NCEE as well, because their students’ performance on the examination has a direct bearing on their schools’ reputation.
The NCEE has undergone significant reform since 2014; the key change is consistent with the format and arrangement of the examination, and, as many have advocated, the reformed NCEE finally has eliminated the division of the arts and science tracks. The score of candidates consists overall of the scores on the three compulsory subjects: Chinese, math, and foreign languages, and the scores on another three subjects that students can select freely from those included in the ATGSSS (e.g., politics, history, geography, physics, chemistry, and biology). Candidates will be offered two opportunities for their foreign languages exam (The State Council of People’s Republic of China, 2014). The reform in the NCEE brings substantial changes to senior secondary schooling. Previously, the division of the arts and science tracks resulted in a fixed class arrangement in which students in Years 11 and 12 attended the same class for every subject. Such a fixed system enables a stable relationship between subject teachers and students. The teachers know

Science and Technology Trends
113
their students very well, and the fixed classes are easy to organise and manage. However, the reform now departs from the original system. Students remain in a fixed class for the three compulsory subjects, but a mobile learning system is required for the other subjects, which could be very challenging both for teachers and school managers because of their lack of experience. Because the reformed NCEE has been piloted only for three years in two regions, it is too early to analyse its effects systemically. What is certain is that with the expansion of the reform, its effects will reach more corners of secondary schooling in China and bring fundamental changes.
5.4. Fertiliser for STEM Talent
To facilitate the progress of students who are talented in science subjects, the “Science Experimental Class” (SEC) in most key senior secondary schools in China is organised as a special education program. In the beginning, the purpose of the SEC was to provide additional training for talented students who wished to attend the International Science Olympiad. Now, it has developed into an elite education program to cultivate individualised talent (Liao, 2009), and schools have the autonomy to recruit students to attend the SEC from among junior secondary graduates. In most cases, students need to take extra examinations to get into the SEC or perform outstandingly in provincial or national Science Competitions at the primary or junior secondary level. They usually have superior intelligence and competence, and exhibit great talent in math, physics, or chemistry. This group of students also demonstrates the qualities of independent thinking and preference for challenge (Ruan & Yu, 2012).
The SEC employs a unique, school-designed curriculum that differs from the standardised general senior secondary curriculum. Students are able to
choose various modules to study according to their own preferences and interests. Small learning groups are then formed by students with shared interests. These small groups facilitate communication between group members and create an inspiring learning community. In addition, research often is included in their curriculum. Students choose their own research topics, and the teachers give them tasks related to those topics, and through self-learning, group discussion, and tutorials, students accomplish their own research (X.-N. Liu, 2012; Ruan & Yu, 2012). Students who win a prize in international competitions are eligible for exemption from the NCEE and are enrolled by top universities in advance.
As universities have been given more autonomy in the admission process, SEC has become the shortcut to top institutions. Given this, parents invest all of their efforts to have their children accepted in the SEC to obtain a better chance to enter elite universities. For example, a student’s competence in solving Mathematical Olympiad problems is a key criterion in SEC selection, and it has become a common practice for parents to send even their primary school children for tuition for the Mathematical Olympiad. Often, students are forced to attend extra classes regardless of their interest and competence (Dong, 2012). This situation deviates from the original purpose of the program, which is to identify talented students and provide additional support to develop their talents further and ultimately contribute to mathematics research. The negative effects and the substantial resources invested in the SEC have resulted in questions about its rationality and effectiveness on the part of both practitioners and policymakers. Consequently, in recent years, the SEC is no longer encouraged by the government and has become less popular.
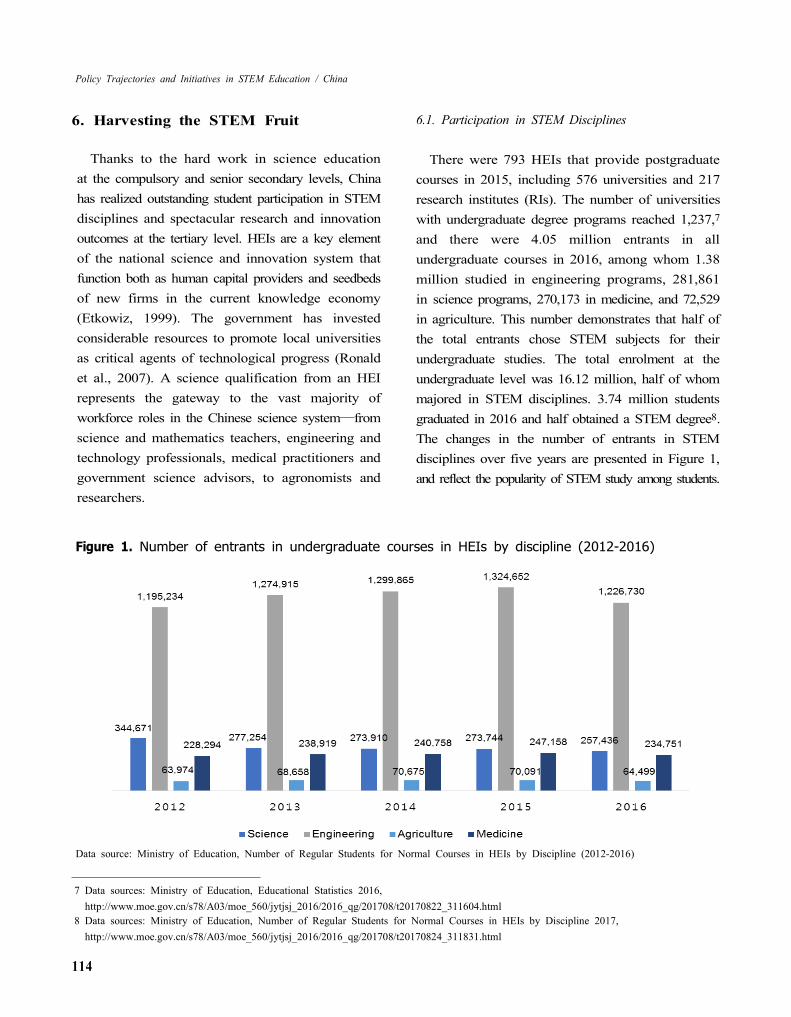
114
Policy Trajectories and Initiatives in STEM Education / China
6. Harvesting the STEM Fruit
Thanks to the hard work in science education at the compulsory and senior secondary levels, China has realized outstanding student participation in STEM disciplines and spectacular research and innovation outcomes at the tertiary level. HEIs are a key element of the national science and innovation system that function both as human capital providers and seedbeds of new firms in the current knowledge economy (Etkowiz, 1999). The government has invested considerable resources to promote local universities as critical agents of technological progress (Ronald et al., 2007). A science qualification from an HEI represents the gateway to the vast majority of workforce roles in the Chinese science system—from science and mathematics teachers, engineering and technology professionals, medical practitioners and government science advisors, to agronomists and researchers.
6.1. Participation in STEM Disciplines
There were 793 HEIs that provide postgraduate courses in 2015, including 576 universities and 217 research institutes (RIs). The number of universities with undergraduate degree programs reached 1,237,7 and there were 4.05 million entrants in all undergraduate courses in 2016, among whom 1.38 million studied in engineering programs, 281,861 in science programs, 270,173 in medicine, and 72,529 in agriculture. This number demonstrates that half of the total entrants chose STEM subjects for their undergraduate studies. The total enrolment at the undergraduate level was 16.12 million, half of whom majored in STEM disciplines. 3.74 million students graduated in 2016 and half obtained a STEM degree8. The changes in the number of entrants in STEM disciplines over five years are presented in Figure 1, and reflect the popularity of STEM study among students.
Figure 1. Number of entrants in undergraduate courses in HEIs by discipline (2012-2016)
Data source: Ministry of Education, Number of Regular Students for Normal Courses in HEIs by Discipline (2012-2016)
7 Data sources: Ministry of Education, Educational Statistics 2016, http://www.moe.gov.cn/s78/A03/moe_560/jytjsj_2016/2016_qg/201708/t20170822_311604.html
8 Data sources: Ministry of Education, Number of Regular Students for Normal Courses in HEIs by Discipline 2017, http://www.moe.gov.cn/s78/A03/moe_560/jytjsj_2016/2016_qg/201708/t20170824_311831.html

Science and Technology Trends
115
The data show that engineering is always the most popular discipline that the majority of students choose as their undergraduate major. Science and medicine also have attracted a considerable number of entrants, while Agriculture is the least popular. The intake of all four disciplines has remained stable over the five years, which implies that China faces less pressure in STEM participation at the tertiary level than do some Western countries.
The participation in STEM studies at the postgraduate level shows a similar pattern to that at the undergraduate level. In 2016, there was a total of 667,064 entrants in both doctoral (77,252) and master’s (589,812) programs. The number of entrants in doctoral programs in STEM fields reached 59,670, including 29,643 in engineering, 16,084 in science, 10,463 in medicine, and 3,480 in agriculture. There was a total of 345,451 entrants in master’s courses in STEM fields, including 202,981 in engineering, 68,878 in medicine, 50,115 in science and 23,477 in agriculture9. There were 342,027 PhD students enrolled, of whom 255,903 studied in STEM fields. There were 1,639,024
enrolled in master’s courses, including 958,940 in STEM fields. These figures indicate that STEM disciplines are even more popular among students at the postgraduate level, and account for 74.82 per cent of the total enrolment in doctoral programs and 58.51 per cent of the total enrolment in master’s courses. The large participation in STEM studies at the tertiary level in China guarantees a sufficient STEM workforce that will contribute sustainably to the national economy and competence.
Figure 2 presents the changes among entrants in STEM fields at the postgraduate level over five years, and shows a stable increase in all four disciplines. This growth is attributable to the government’s substantial investment in building world-class research universities. To a large extent, the quantity and quality of postgraduate students and programs determines a particular HEI’s research capacity. Compared with undergraduates, higher research degree students in STEM are supposed to make a greater contribution to national R&D activities and S&T development because of their specialised knowledge and advanced research skills.
Figure 2. Number of entrants in postgraduate programs in HEIs by discipline (2012-2016)
Data source: Ministry of Education, Number of postgraduate students by academic field (2012-2015)
9 Data sources: Ministry of Education, Educational Statistics 2016, http://www.moe.gov.cn/s78/A03/moe_560/jytjsj_2016/2016_qg/201708/t20170822_311599.html

116
Policy Trajectories and Initiatives in STEM Education / China
6.2. Spectacular achievements in S&T research and application
Tertiary education in China has shifted from elitist to mass education (the higher education enrolment rate reached 42.7 percent in 2016). China has a large pool of S&T personnel educated at home and abroad, a group of world-class RIs and universities, and an expanding high-quality academic team. Thus, the country’s research capacity has improved considerably. In 2013, the number of domestic S&T papers published exceeded 510,000, of which more than a quarter derived from the higher education sector10. The number of Chinese S&T papers indexed by SCI, EI, and CPCI-S was 465,000 in 2013, a 65.48 per cent increase compared to the number in 2009. China ranked second in the number of papers indexed by SCI and CPCI-S, and first in the number of papers indexed internationally by EI11. According to SCImago Journal & Country Rank (2016), the country ranked second in the total number of papers published in science-related fields, and in the areas of engineering and material science, China overtook the U.S. to rank number one in the world.
The State Intellectual Property Office of the People’s Republic of China reported that it received over 1 million applications for invention patents in 2015, which was a new record. Approximately 359,000 patents were authorized, a 61.9 per cent increase compared to the previous year. By the end of 2015, China held 872,000 valid patents, and the number per annum for each 10,000 head of population reached 6.3. China now has been at the top of the world’s patent application list for five years, and its invention patent applications have increased faster than the other two types of patent
applications (utility model and design). In addition, nearly a quarter of applications came from HEIs and RIs, and more than a third of the patents granted originated from the same sector12.
6.3. National Initiatives to Boost STEM at the Tertiary Level
The spectacular outcomes achieved in S&T research and innovation cannot be separated from the intensive and persistent endeavours the government has made to build world-class universities and RIs. To boost STEM teaching, learning, and research at the tertiary level, the government has launched nationwide projects, provided policy support, and subsidised HEIs generously.
6.3.1. The First-Class Universities and Disciplines Plan
Building world-class universities and disciplines has been a national priority of the educational agenda for more than two decades. Significant progress has been achieved in this respect through the implementation of Projects 211 and 985 in the 1990s. At the same time, there are issues that need to be noted in these projects, such as lack of competition and duplicated disciplines in different universities. These issues have motivated policymakers to integrate resources and develop innovative ways in which to implement national projects. As a result, the government initiated a new strategic national plan in 2015 to facilitate the building of world-class universities and disciplines. This plan is known as The First-Class Universities and Disciplines Plan, or the combo first-class plan. It replaced Projects 211 and 985 to become the new major nationwide initiative at the tertiary level (The State Council
10 Ministry of Science and Technology of the People’s Republic of China, Chinese Science & Technology Statistics Data Book 2014, http://www.sts.org.cn/sjkl/kjtjdt/data2014/%E7%A7%91%E6%8A%80%E7%BB%9F%E8%AE%A1%E6%95%B0%E6%8D%AE2014.pdf
11 ibid12 State Intellectual Property Office of the People’s Republic of China, China Received over 1 Million Invention Patent Applications in
2015, http://english.sipo.gov.cn/news/official/201601/t20160120_1231391.html
Science and Technology Trends
117
of People’s Republic of China, 2015). The goal of the new plan overall is to help a
number of high quality universities and disciplines reach world-class levels. At the same time, it is designed to increase the modernisation of university governance, and improve the effectiveness of talent training, scientific research, social service, and cultural inheritance in the higher education sector. Ultimately, the new plan intends to transform the HEIs into the driving force in knowledge discovery and S&T innovation, the cradle of advanced thoughts and culture, and the robust base for training a variety of high quality talent. The new plan also sets specific goals for different phases:
- By 2020, a number of universities and disciplines will become world-class
- By 2030, more universities and disciplines will become world-class. A number of universities will enter the forefront of world-class universities, as will a number of disciplines. The higher education capacity overall will rise significantly
- By the mid-21st century, the quantity and quality of world-class universities and disciplines in China will be comparable to those of advanced countries, and China will become a learning power in higher education (The State Council of People’s Republic of China, 2015).
The Jumbo plan includes five construction and five reform missions. The construction missions include building a first-class academic workforce, fostering high quality innovative talent, enhancing the level of scientific research, inheriting and innovating culture, and promoting the transformation of scientific research outputs into social economic benefits. The reform missions include strengthening and improving the China Communist Party’s
leadership in universities, improving university governance, achieving breakthroughs in management, building a mechanism for social participation, and facilitating international exchange and communication. The new plan has been projected by the central government and financed at both the central and provincial levels. This financing mechanism is performance-oriented and dynamic. A third party will be introduced to evaluate universities’ performance, and will determine the adjustment of financial support provided to individual universities. Given that building world-class universities and disciplines is a long-term task that requires input from all parties, relevant departments and enterprises are encouraged to plan to play an active contributing role (The State Council of People’s Republic of China, 2015). There are 42 universities (36 A Class and 6 B Class)13 involved in the first-class university scheme and 95 in the first-class discipline scheme on the list of universities and disciplines supported by the new plan the Ministry of Education issued in 2017. There are 465 subjects in 137 universities listed on the first-class subject scheme that cover 108 study areas (Ministry of Education, 2017).
6.3.2. Collaboration among Industries, Universities, and RIs
Universities/RIs and companies are the main actors in the national innovation system (Lundvall, 1992; Nelson, 1993), and knowledge is generated and diffused among these organizations. The knowledge transfer between universities/RIs and industries has wide effects on the development of the national innovation system (Chen & Kenney, 2007; Motohashi & Yun, 2007). Universities in the knowledge economy have acquired a third mission in addition to science teaching and learning—to serve as key agents in commercialising technology. Consequently, many research universities have developed close links
13 All the 36 universities in Class A were involved originally in Project 985. Three B Class universities were involved previously in Project 985 and the other three were involved in Project 211.

118
Policy Trajectories and Initiatives in STEM Education / China
with industries through various forms of collaboration, including university-affiliated technology enterprises, technology transfer contracts, patent licensing, joint-authored publications, and university science parks (Ying, 2012).
Among these, the university science parks and university-affiliated enterprises are the dominant forms of university-industry linkages. As incubators of university-affiliated enterprises and high-tech firms, university science parks play an important role in universities’ social service function, and 86 national university science parks have been established since 2011 (Ying, 2012). Successful endeavours in science parks help fund university operations and scientific research, and drive local economic development, as well as attract highly-skilled overseas Chinese back to the mainland. Other initiatives also have made great contributions to both universities/RIs’ research capacity building and companies’ innovation and enhanced competitiveness. Because such a large variety of collaborative programs have been implemented in different universities in China, they cannot be elaborated in this article.
The strengthened collaboration among industries, universities, and RIs represents the co-development of higher education and S&T policies. China is now crafting policies designed to encourage an environment conducive to indigenous innovation as a mechanism to advance the global production value chain, and HEIs have multiple roles to play as both knowledge creators and communicators in this newly-emerging vision of China as a global player in cutting-edge scientific research and technology development.
7. Closing remarks
This article reviewed the process of STEM education in China and the national policies and strategies designed to enhance the quality of STEM
education at different levels. This review addressed the core of STEM education—curriculum and assessment. With respect to STEM education, unlike its Western counterparts whose major concerns are the lack of participation in STEM and less than satisfactory student performance, China is facing its own challenges. Because it has the largest population in the world, China can take advantage of its demographic dividends in S&T development. However, it has to face the pressures and issues that accompany its large population. Given Chinese students’ consistent outstanding performance in internationally comparable assessments, it is fair to say that science education in China has become sufficiently effective, at least in major urban areas. Thus, its current focus should be on equity and providing equal access to quality educational resources for students throughout the country. Students from disadvantaged backgrounds, such as those from peasant families, remote areas, and ethnic minorities, continue to struggle with inadequate access to quality educational resources. It should be remembered that half of the Chinese population lives in rural areas. This urgent issue has attracted the government’s attention, and in February 2006, the State Council launched the National Scientific Quality Action Plan (2006-2010-2020). The primary goal of the plan is to narrow the gap between urban and rural citizens’ scientific ability (The State Council of People’s Republic of China, 2006).
Throughout the reforms in curriculum and assessment, STEM education in China has retained its cultural traditions and characteristics, while at the same time, it gradually has absorbed more international elements. From knowledge-based teaching and learning to an inquiry-based approach, STEM education in China has benefited significantly from internationally prevalent practices. It also is the obligation of Chinese educational practitioners and researchers to investigate the Chinese approach wisely and communicate its experiences with other

Science and Technology Trends
119
countries. Undoubtedly, China will continue to play a leading role in global S&T innovation and its STEM education should contribute globally as well.
References
Asia Society, A. (2006). Math and science education in a global age: What the U.S. can learn from China. New York, NY: Asia Society.
Beijing Municipal Education Commission. (2015). Reforming entry exam for senior secondary schools, adopting 3+3 approach. Retrieved 28 November 2017 from https://www.jiemodui.com/N/41479.html
Chen, K., & Kenney, M. (2007). Universities/research institutions and regional innovation systems: The cases of Beijing and Shenzhen. World Development, 35(6), 1056-1074.
Dong, J. (2012). Problems existing in Mathematical Olympiad of China and countermeasure. Journal of Henan Institute of Education (Natural Science Edition), 21(1), 55-57 (in Chinese).
Etkowiz, H. (1999). The second academic revolution: MIT and the rise of entrepreneurial science. London, UK: Gordon and Breach.
Handsbrain Education & Training Centre. (2006). Project achievements. Retrieved 28th November 2017 from http://www.handsbrain.com/article_5388.html
Liu, E.-S. (2011). Prospection on the next ten years of science curriculum development in China. General Education Curricula, 12, 17-18 (in Chinese).
Liu, X.-N. (2012). Science experimental class: Cultivating the future science leader. Fundamental Education Curriculum, 106, 38-40 (in Chinese).
Liu, X.-F., Liang, L.-L., & Liu, E.-S. (2012). Science education research in China: Challenges and promises. International Journal of Science Education, 34(13), 1961-1970.
Lundvall, B. A. (1992). National systems of innovation: Towards a theory of innovation and interactive learning. London; New York, NY: Anthem.
Ministry of Education. (2001). Notice on Compulsory Education Curriculum Experimental Plan. Retrieved 28 November 2017 from http://old.moe.gov.cn//publicfiles/ business/htmlfiles/moe/moe_711/201006/xxgk_88602.html
Ministry of Education. (2003). General Senior High school curriculum (Experiment). Retrieved 28th November 2017 from http://www.moe.gov.cn/srcsite/A26/s8001/200303/t20030331_167349.html
Ministry of Education. (2011). Compulsory Science Education Curriculum Year 7 to Year 9 (2011 edition). Beijing, China: Beijing Normal University Publishing Group.
Ministry of Education. (2017). Notice of Ministry of Education, Ministry of Finance, Ministry of National Development and Reform on the announcement of the lists for the First-Class Universities and Disciplines Plan. Retrieved 28th November 2017 from http://www.moe.gov.cn/srcsite/ A22/moe_843/201709/t20170921_314942.html
Motohashi, K., & Yun, X. (2007). China’s innovation system reform and growing industry and science linkages. Research Policy, 36, 1251-1260.
National Research Council. (1996). National science education standards. Washington, DC: National Academy Press. Retrieved 28th November 2017 from https://www.csun.edu/ science/ref/curriculum/reforms/nses/nses-complete.pdf
Nelson, R. R. (1993). National innovation system: A comparative analysis. Oxford, UK: Oxford University Press.
OECD. (2012). PISA 2012 results in focus: What 15-year-olds know and what they can do with they know: Key results from PISA 2012. Paris, France: OECD. Retrieved 28th November 2017 from http://www.oecd.org/pisa/keyfindings/pisa-2012- results-overview.pdf
OECD. (2015). PISA 2015: Results in focus. Paris, France: OECD. Retrieved 28th November 2017 from https://www. oecd.org/pisa/pisa-2015-results-in-focus.pdf
Rogers Hollingsworth, J., Müller, K. H., & Hollingsworth, E. J. (2008). China: The end of the science superpowers. Nature, 454(7203), 412-413.
Ronald, N. K., Michael, B. B., Robert, L. R., Christine, A. B., Alan, S. I., Kimberley, F. N.,…& Michael, P. (2007). Chinese science and technology—Structure and infrastructure. Technological Forecasting & Social Change, 74, 1539-1573.
R.R.L.F. (1926). Scientific education in China—The China story. Retrieved 28 November 2017 from https://www.thechinastory. org/ritp/scientific-education-in-china/
Ruan, G.-J., & Yu, H.-F. (2012). Science experimental class: The cradle for high-quality science talents. Beijing Education, 11, 37-38 (in Chinese).
Science Specialty Committee of China Higher Education Society. (2009). Guidelines for reforms and development of higher education of science. Higher Education of Science 1, 4-7 (in Chinese).

120
Policy Trajectories and Initiatives in STEM Education / China
Song, J. (2008). Awakening: Evolution of China’s science and technology policies. Technology in Science, 30, 235-241.
Stewart, V. (2006). China’s modernization plan. March, 22, 2006, Education Week.
Sun, H.-C. (2005). Country education profile: People’s Republic of China. In Alberta Advanced Education (Ed.), International Qualification Assessment Service (IQAS). Alberta, Canada: Alberta Advanced Education.
The State Council of People’s Republic of China. (2006). National Scientific Quality Action Plan (2006-2010-2020). Retrieved 28 November 2017 from http://www.gov.cn/jrzg/ 2006-03/20/content_231610.htm
The State Council of People’s Republic of China. (2014). Opinions on deepening the reform of Examination and Admission Institute. Retrieved 28th November 2017 from http://www.gov.cn/zhengce/ content/2014-09/04/content_9065.htm
The State Council of People’s Republic of China. (2015). Notice of the State Council on printing and distributing the overall plan for promoting the building of first-class universities and first-class disciplines in the world. Retrieved 28th November 2017 from http://www.gov.cn/zhengce/content/ 2015-11/05/content_10269.htm
The State Council of People’s Republic of China. (2016). 13th Five-Year Plan for National Scientific and Technological Innovation. Retrieved 28th November 2017 from http://www .gov.cn/zhengce/content/2016-08/08/content_5098072.htm
Wang, L., & Fan, D. (2007). The history of science education in general education. Beijing, China: Science Popularization Press.
Wei, Y. (2004). Introduction of the “Learning by Doing” Project. Nanjing, China: Research Centre for Learning Science. Retrieved 28th November 2017 from http://blog.handsbrain. com/weiyu/entry/10008
Ying, H. (2012). The University Science Park as a way of promoting university’s third mission in China: A Case study of Xi’an Jiaotong University Science Park. Retrieved 28th November 2017 from http://urn.nb. -32335 no/URN:NBN:no.
Zhang, P. (2017). The Ministry of Education of People’s Republic of China issued primary science curriculum. Beijing, China: China Research Institute for Science Popularization. http://www.crsp.org.cn/m/view.php?aid=1931
Zhou, P., & Glanzel, W. (2010). In-depth analysis of China’s international cooperation in science. Scientometrics, 82, 597-612.
Science and Technology Trends
121
Science and Technology TrendsPolicy Trajectories and Initiatives in STEM Education
STEM Education in Malaysia:Policy, Trajectories and Initiatives
Edy Hafizan Mohd Shahali1, Ihsan Ismail2 & Lilia Halim1,*
1. Introduction
Malaysia places great importance on STEM education as a means of becoming a developed nation, and to achieve the targeted number of STEM workforce and ultimately to meet the challenges and demands of a STEM-driven economy by 2020. Malaysian government through The New Economic Model (NEM) aims to create 1.3 million jobs in STEM discipline in various sectors by 2020, enabling infrastructure and supporting the development of industrial clusters. NEM is an economic plan launched by the Malaysian Government in 2 010 with the main goal to transform Malaysia into an inclusive and sustainable developed nation by 2020. The NEM envisages that Malaysia will be renowned for vibrant transformation arising from the resourcefulness of its people and exemplified by its harmonious diversity and rich cultural traditions. The economy will be market-led, well-governed, regionally integrated, entrepreneurial and innovative. NEM intends to stimulate economic growth by improving worker productivity across all sectors of society. According to The National Council for Scientific Research and Development, Malaysia
needs a workforce of 493,830 people in STEM related industries by 2020 to support the current government initiatives in NEM. This means that the rate of increase of STEM should be about 31% per year (MOE, 2013).
1.1. The Issues
Despite the government’s commitment to align the STEM initiatives to the objectives of the New Economic Model, Economic Transformation Programme and the Government Transformation Plan launched in 2010, however, there are still challenges in implementing these policies. One of the major issues that Malaysia has been battling is meeting the human capital demand that will be necessary in 2020. The number of students who have chosen STEM fields has continued to decline in recent years (Halim & Subahan, 2016). Currently, only 42% of middle school students in Malaysia chose to do Science, including technical and vocational programmes at high school (MOE, 2016). The percentage of middle secondary school students who met the requirement to study Science at upper
1 Faculty of Education, Universiti Kebangsaan Malaysia, Malaysia2 Educational Planning and Research Division, Ministry of Education, Malaysia* Corresponding author: [email protected]

122
Policy Trajectories and Initiatives in STEM Education / Malaysia
secondary but chose not to do so increased to approximately 15% (MOE, 2013). The current demand for STEM-capable workers surpasses the supply of applicants who have trained for those careers. The Ministry of Science, Technology and Innovation (MOSTI) estimates that there will be a shortfall of 236,000 professionals in STEM-related fields (MOSTI, 2012). Given these shortfalls for a STEM-capable workforce, the nation’s economic future depends on preparing more students to enter these fields.
The second challenge is the decline in science and mathematics achievement of Malaysian secondary students in international assessment studies. Malaysia’s performance in Trends in International Mathematics and Science Study (TIMSS) between 1999 and 2011 indicates that student performance has fallen. The results of the 2009 Programme for International Student Assessment (PISA) also showed that Malaysia ranked in the bottom third of 74 participating countries, below the international and Organisation for Economic Co-operation and Development (OECD) average. Parallel to this, according to Martin et al. (2012), a total of 18% of Malaysian children have limited prerequisite knowledge and skills in science classrooms; meanwhile, 55% of them had limited prior knowledge in science. According to MOSTI (2008), only 44.9% of Malaysians are interested in new science inventions or discoveries. In contrast, far more Americans (87.0%) and Europeans (78.0%) expressed an interest in these issues, exceeding Malaysians by 42.1% and 33.1%, respectively. These percentages are based on a general sample collection following on the children’s interest in Science & Technology fields. As for the Malaysian population, this proves that more than one-third of the children clearly expressed a lack of interest in Science & Technology.
The third challenge is the quality of STEM education. The quality of STEM education is perceived differently by various stakeholders. One
of the questions that is frequently asked by employers: Does the quality of STEM education in schools today fulfil the needs of the work force in STEM fields? and Are we preparing our students to meet the demands of the STEM-driven economy?. While for policy makers, the questions asked include whether our students are able to compete globally in international assessments or competitions. Studies shows that teaching and learning approaches are teacher-centred and students lack sufficient opportunities to be critical, creative and innovative (MOE 2013). Some teachers also lack the requisite knowledge in Science and Mathematics subjects. In addition, some teachers invest heavily in preparing their students for examinations, at the expense of the practical elements of the curriculum (MOE 2013). Students are not doing science experiments because the science practical examinations (in upper secondary level) have been replaced by school based assessment for more than 15 years which resulting in teachers are less likely to allow students to explore scientifically and mathematically due to perceived lack of time, resources, tools, professional support and laboratory infrastructure. This factor contributes to reduced student interest levels in this science.
2. STEM Education Conceptual Framework
The Malaysian STEM education aims at ensuring that Malaysia has STEM literate society and a sufficient number of highly skilled qualified STEM workforce that can contribute to new innovation. Cultivating a culture that values STEM at an early age is essential to increase awareness of the importance of STEM in the society. As shown in STEM education conceptual framework in Figure 1, Malaysia puts the importance of STEM education at the early childhood with the focus to trigger and fostering student interest through activities that can stimulate curiosity. At the primary school level,

Science and Technology Trends
123
Figure 1. STEM education conceptual framework
Source: Implementation Guide for Science, Technology, Engineering, and Mathematics (STEM) in Teaching and Learning , MOE (2016)
pupils are exposed to the basic of STEM knowledge and associate their knowledge with daily life situations through investigation and exploration activities. Then, at the lower secondary education level, the focus is to grow and develop students’ STEM skills through activities involving analyzing local and global issues as well as problem solving. At the upper secondary level, activities that strengthening and enriching STEM skills will be given a priority. At the tertiary level, STEM education provides students with the ability to cope with STEM career challenges, to prepare them in industry and community as they will contribute to productivity and national development through innovation.
3. The Concept of STEM In Malaysia
To contextualize STEM in the Malaysian education system, various stakeholders in both basic and higher education sectors came together in 2014 to clarify the concept. They resolved that ‘STEM’ should serve as a benchmark to raise the standard of Malaysian S&T Education, aligning it with international practices. The concept of STEM is defined from three perspectives: STEM field, STEM stream and STEM approach (MOE 2016)
- STEM field: STEM as a field covers traditional disciplines such as Science, Chemistry, Mathematics, Sustainability Foundation, Technical Communication Graphics, and Computer Science, as well as the more specialized disciplines such as Mechanical Engineering, Medical, Bio-chemistry, and Computing & Information Systems.

124
Policy Trajectories and Initiatives in STEM Education / Malaysia
- STEM Stream: STEM Stream refers to enrolling of students in upper secondary school to a stream of their choice and inclination. In Malaysia school system, upper secondary students are given the opportunity to choose the stream offered either a Science or Arts Stream. Students who choose Science Stream studied Physics, Chemistry, Biology, Mathematics and additional Mathematics at upper secondary level. MOE then renamed the Science Stream to Science & Technology (S&T) Stream with the introduction of more specialized
S&T subjects in school such as ICT and Invention. S&T Stream students were described as upper secondary students who studied a minimum of two sciences and mathematics subjects (Refer Table 1). Currently, 29% of students are taking all three pure sciences (Physics, Biology and Chemistry) with Additional Mathematics, while approximately 13% opt for two S&T subjects with Mathematics. As Malaysia MOE adopts STEM to replace S&T, a change of nomenclature to the STEM stream is being contemplated.
Table 1. Samples of packages offered to Malaysian upper secondary school S&T stream
STEM Subjects Level Hours per week (current) Hours per week (beginning 2017)
Primary SchoolMathematics 1 & 2 3 4 Science 1 1 1.5Science 2 2 2 ICT/Design & Technology 2 1.5 1.5 Secondary SchoolMathematics 3 & 4 3.3 3.5 Science 3 & 4 3.3 3.5 Design & Technology/Basic Computer Science (either one)
3 - 2
Computer Science 4 - 3Elective STEM Subjects at Secondary SchoolsAdditional Science 4 3 3 Additional Mathematics 4 3 3 Chemistry 4 3 3 Physics 4 3 3 Biology 4 3 3 Technical Graphic Communication 4 3 3 Basics of Sustainability 4 - 3 Invention 4 3 3 Sport Science 4 3 3 Home Science 4 3 3 Engineering Drawing 4 3 3 Mechanical Engineering 4 3 3 Agriculture Science 4 3 3 ICT 4 3 3
Note: Level 1 refers to Primary Year 1 – 3, Level 2 refers to Primary Year 4-6, Level 3 refers to Secondary Form 1-3, Level 4 refers to Secondary Form 4-5

Science and Technology Trends
125
Figure 1. STEM as teaching and learning approach
Source: Implementation Guide for Science, Technology, Engineering, and Mathematics (STEM) in Teaching and Learning , MOE (2016)
- STEM Approach: STEM approach refers to teaching and learning strategy that involving the application of knowledge, skills and values of Science, Technology, Engineering, and Mathematics, in an integrated manner to solve problems in the context of life daily, community and environment as shown in Figure 1. This approach encourages students to inquire and explore the environment through inquiries and problem solving related to the real world. Among the teaching and learning approaches are based on inquiry-based, project-based, and problem-based. In this approach, students learn collaboratively and engage in problem-solving activities as they research, investigate, design, evaluate, carry out inquiry activities, innovate and reflect. The learning experiences gained through these inquiry-oriented, problem-based activities, provide opportunities for students to understand relevant issues and ability to think critically as well as creatively about the process of solving related problems. This form of contextual learning involving design thinking in preparing students
to face challenges and be competitive at the global level. In engineering design process, scientific and engineering skills are core skills in this approach. STEM students are also provided with learning opportunities to learn independently and to use technology.
In the teaching and learning strategies, STEM knowledge is an idea, concept, principle, theory and understanding in the STEM field that is enacted in the curriculum of all STEM subjects. The curriculum designed and developed aims to provide students with knowledge, skills and values through the activities provided by the teachers inside or out of class while in the classroom. STEM skills are the competence and competence to explore, solve problems, designing and producing products. Such skills can be obtained through the activities, projects or tasks that are desired in all curriculum STEM subjects. STEM skills consist of Process Skills and Technical Skills. Process Skills are the skills used in the learning process and apply knowledge in solving problems. Process Skills involving science

126
Policy Trajectories and Initiatives in STEM Education / Malaysia
process skills, math process skills, design skills form and computational thinking skills. Technical skills are psychomotor skills involving manipulative skills, management and handling skills of materials, tools and machines in a manner that right and safe. While, values and STEM ethics is a moral and guidelines that must be complied with STEM students. The application of STEM values and ethics is important in producing students who are not only knowledgeable and competent, but has a high personality. Among the values being emphasized are systematic, objective, consistent, rational thinking, persevering, committed, challenging, courageous trying, open-minded, innovative, and more. While ethical examples should have complied with STEM students such as laboratory regulations, workshop rules and steps security measures.
4. STEM Elements in Malaysian Education Curricula
The Malaysian education system encompasses students from pre-school through university. Pre tertiary education (pre-school to secondary education) is under the authority of the Ministry of Education (MOE) while the custodian for tertiary education is the Ministry of Higher Education (MOHE). STEM in Primary School Standard Curriculum (KSSR), Secondary School Integrated Curriculum (KBSM) and Secondary School Standard Curriculum (KSSM) encompass three elements, namely the knowledge, skills and values available in the curriculum of all STEM subjects. Through all of these subjects the STEM Curricula at all levels (preschool to pre-university) in Malaysia are developed to address the needs of all students.
ⅰ) Pre-School: The emphasis of STEM at the pre-school level is contained within the National Preschool Curriculum (NPC). NPC
emphasis on the acquisition of basic skills in STEM (scientific skills) through its two component which are Early Mathematics and Early Science. In Early Science, children explore nature and the world around them, engage in inquiry learning and acquire basic process skills such as observing, comparing and grouping in the process. In Early Mathematics, children are exposed to number sense, early numeracy activities and simple problem solving activities. Methods of delivery include thematic learning, play-based learning as well as inquiry-based learning. The emphasis of STEM in NPC is important for promotion of inquisitiveness and to develop early science and mathematics process skills.
ⅱ) Primary and Secondary Schools Core Science Subjects: The primary and secondary school core science curricula are compulsory for all students. Primary Core Science and Secondary Core Science Subjects have been designed to reflect the characteristics of STEM education, especially the STEM approach. The curriculum emphasizes thinking skills, science process skills, problem solving in real life situations, designing, innovating, working collaboratively as well as inquiry-based learning using approaches such as the 5E (engage, explore, explain, elaborate and evaluate). Scientific attitudes and noble values are instilled through experiential learning either through spontaneous or planned activities. These attitudes and values, together with scientific knowledge and skills, are used in the process of scientific investigation and conducting projects. The Primary School Science Curriculum is organized under six themes: scientific inquiry, biological science, physical science, material science, earth and

Science and Technology Trends
127
space, technology and sustainable living. The Secondary School Science Curriculum is organized into six content areas, which are Management and Continuity of Life, Man and Variety of Living Things, Matter in Nature, Force and Motion, Technological and Industrial Development in Life, and Astronomy and Space Exploration. School Science education provides opportunities for students to explore through experiments and projects collaboratively.
ⅲ) Primary and Secondary Schools Mathematics: The Mathematics curricula for both primary and secondary schools are designed to develop mathematical thinking among students. Mathematics Curriculum Standards stress on mathematical processes which are: problem solving, reasoning, communicating mathematically and making relationships and representations. Solving both routine and non-routine problems, as well as integrating the use of ICT in teaching and learning of Mathematics is essential in Malaysia’s Mathematics curricula. Higher level thinking and non-routine questions are stressed to achieve the desire of the country to produce learners who are thoughtful, creative and innovative, competitive in the globalization era, as well as capable of facing 21st century challenges. The Mathematics curriculum covers content areas of Numbers and Operations, Measurement and Geometry, Relationship and Algebra, Statistics and Probability and Discrete Mathematics.
ⅳ) Secondary School Elective STEM subjects: At the upper secondary level, students are allowed to choose elective subjects to be taken together with the core subjects. There are four groups of elective subjects, which are language, STEM, Islamic studies,
humanities and professional arts. The list of STEM subjects and the time allocation is outlined in Table 1.
ⅴ) Pre-university STEM subjects: Pre-university courses related to STEM often include Physics, Chemistry, Biology and Mathematics. These subjects are foundation to various STEM subjects and programs at the tertiary level.
5. STEM Education Related Policies In Malaysia
The Malaysian government has identified STEM as one of the catalysts for transforming the country to a developed status by 2020. The value chain of the educational system must be in sync to meet the demand of human capital trained in STEM with STEM-related human capital, resources and infrastructure being the necessary pillars in this endeavour. The Government of Malaysia has painstakingly integrated STEM development into many of its policies as well as developed specific STEM policies in order to achieve the target set by the country. This section highlights some of the important STEM Education-related policies.
5.1. 60:40 Science/Technical: Arts (60:40) Policy
Malaysia places great importance on education as a means of becoming a developed nation to meet the challenges and demands of a STEM-driven economy, by 2020. Accordingly, the Malaysia Higher Education Planning Committee instituted the 60:40 Science/Technical: Arts (60:40) Policy in education in 1967 and started implementing it in 1970. The policy refers to the Ministry’s target for the ratio of students with significant STEM education to those with a greater focus on the Arts (science to arts ratio should be 60:40) in order to fulfill the future

128
Policy Trajectories and Initiatives in STEM Education / Malaysia
demand of a developing nation. The policy has been used as an anchor in planning for students’ enrolment, infrastructure prepared, teaching prepared, teaching staff trained in the secondary school and tertiary education in the last four decades. This policy has, however, never been met due to various factors. Currently, 42% of students in upper secondary school level are a STEM stream (MOE, 2016). Although the target of 60:40 has not been achieved, MOE continues to pursue this policy, which has so far contributed to production of a significant proportion of STEM manpower. Science and Mathematics are compulsory subjects for all primary and secondary school students. However, at upper secondary school, students can opt to join a STEM Stream and take more S&T related subjects or remain in a non-STEM Stream taking only one core Science and one core Mathematics subject. Upper secondary school STEM Stream students take an average of five STEM subjects and spend an average of 15 hours per week studying STEM subjects. This curriculum policy prepares the students for future STEM studies or careers.
Under the 60:40 policy, students who score a grade A or B in both Science and Mathematics at the Lower Secondary Assessment which is administered at the end of lower secondary school are automatically placed in the STEM stream at upper secondary level unless there is an objection from the students or parents. For the last four decades, this policy has facilitated selection of students who have the necessary aptitude and academic ability to study STEM subjects.
5.2 Malaysia Education Blueprint 2013-2025 (PPPM 2013-2025)
Strengthening of STEM initiative is one of the 100 major initiatives in the MEB and taking into account the success of the MOE strategies to achieve the 60:40 Science/Technical:Arts Stream Policy.
MOE will ensure that it prepares students with the skills required to meet the challenges of a world that is being transformed by the applications of science, technology, engineering and mathematics. It will also work in laying the foundations at the school level towards ensuring that Malaysia has a sufficient number of qualified STEM graduates to fulfil the employment needs of the industries that fuel its economy.
The MOE through the MEB has implemented various strategies to strengthen the STEM related subjects in its effort to produce more experts in the field for national interest. Strengthening STEM is one of the key elements under the shift of ‘providing equal access to quality education of an international standard. At the out-set of MEB, factors contributing to enrolment and quality of students’ outcomes in STEM were identified, specifically on unawareness, curriculum, quality of teaching and learning and infrastructure. Three core measures under this STEM initiative were identified:
ⅰ) Raising student interest through new learning approaches and an enhanced curriculum: incorporating higher-order thinking skills, increasing use of practical teaching tools and making the content relevant to everyday life to increase interest;
ⅱ) Sharpening skills and abilities of teachers: training teachers in primary and secondary schools to teach the revised curriculum; and
ⅲ) Building public and student awareness: increasing parents and students’ STEM awareness through national campaigns.
The ultimate aim of the STEM initiative is to ensure Malaysia has a sufficient number of qualified STEM graduates to fulfil the employment needs of the industries that support its economy. STEM graduates are expected to take up jobs in among other sectors, engineering and medicine. Further to

Science and Technology Trends
129
Table 2. Aspects of STEM under MEB
Wave Focus
Wave 1 (2013–2015): Strengthening the foundations
Ÿ Raising students’ interest through new learning approaches and an enhanced curriculum emphasizing higher order thinking Sharpening skills and abilities of teachers
Ÿ Building public and student awarenessŸ Enabling high performing teachers and school leaders
Wave 2 (2016–2020): Building on the foundations of Wave 1
Ÿ Rolling out the new primary and secondary schools curriculum (KSSM and Revised KSSR curriculum)
Ÿ Encourage development of inter-school learning communitiesŸ Upgrade existing science equipment and facilities in schools to ensure that they are
optimal for effective teaching and learning of STEMŸ Extension of STEM awareness programmes, to primary school students and parentsŸ 50% reduction in the urban-rural students’ achievement gap, 25% reduction in the
socio-economic and gender students’ achievement gap
Wave 3 (2021–2025): Innovating to the next level
Ÿ Introduce fresh initiatives and programmes based on the success of the first two Waves and develop a roadmap for the future
Ÿ Maintain or improve on 50% reduction in the urban rural, socio-economic and gender students’ achievement gap
providing quality STEM education through the academic pathway, MEB also promotes the vocational education pathway. Projections show that by 2020, at least 46% of all jobs will require vocational certificates or diplomas compared to 22% requiring university degrees (MOE, 2013). Majority of these vocational courses are STEM related. This will also contribute towards achieving the 60:40 policy.
MEB is being rolled out in three (3) phases which is called Waves: Wave 1 on strengthening the foundations, Wave 2: building on the foundations in Wave 1, and Wave 3: emphasizing innovations. Aspects of STEM under each Wave are outlined in Table 2.
6. National STEM Action Plan
To deliver the STEM education aspirations as outlined in the related policy, MOE together with Ministry of Science, Technology and Innovation (MOSTI) and Ministry of Higher Education (MOHE)
are currently developing a National STEM action plan which involves all government agencies in Malaysia and in collaboration with private sectors. This action plan looks into many aspects of STEM such as awareness, education, infrastructure, research, career opportunities, and information gathering. In terms of information, MOE are trying to get a comprehensive data from both supply and demand sides to set the required number of STEM graduates and the required learning courses.
As part of National STEM Action Plan, MOE is implementing an initiative called STEM Education Initiative. MOE defines its concept of STEM Education as life-long learning which integrates; formal learning for STEM which is based on the national curriculum and assessment; non-formal learning through students’ participation in co-academic and co-curricular activities; and informal learning through indirect means at all age level from early childhood, primary and secondary level, at tertiary level up to the industry and community. In other words, it is advocated that all students must be STEM literate with the hope that
130
Policy Trajectories and Initiatives in STEM Education / Malaysia
through this initiative, more students will choose to be in the science or STEM related stream for their upper secondary education. This is to achieve the target on having 60% of upper secondary students to pursue in STEM related stream.
The outcomes that are hoped to achieve under the STEM initiative are to nurture STEM-literate students who are capable of logical thinking, adept at using technology, have the skills to solve problems, innovate, create new ideas, design or invent new products; skills which shall be acquired through an integrated learning of science, technology, engineering and mathematics, and a teaching and learning process which apply the real world context through open-ended exploration and hands-on approach.
In preparing students with skills to meet the challenges of science and technology which is continuously evolving, and to ensure that Malaysia has sufficient qualified STEM graduates, measures taken to support the STEM initiative include stimulating students’ interest in STEM through an enhanced curriculum and new learning approaches, sharpening teachers’ skills and abilities to teach and facilitate STEM subjects and activities, and building public and student awareness and understanding of STEM. Among the strategies implemented to support the teachers include:
ⅰ) Colloquiums and Conference on STEM –
the colloquiums are organised to create awareness among school administrators, teachers teaching STEM subjects as well as school counsellors about STEM and STEM-related careers, while the conference provides opportunities to academicians and other researchers to share their research findings related to STEM, as well as create a platform for professional networking among academicians and school teachers. These would encourage further collaborations among
them in enhancing students’ awareness and interest towards STEM, sharing best practices in teaching and learning and/or in developing new approaches in teaching and learning;
ⅱ) Developing a series of interactive videos to complement teaching and learning activities known as the Blended Learning Open Source Science or Math Studies (BLOSSOMS). This was started in 2015 in collaboration with Massachuset Institute of Technology (MIT) and University of Technology Malaysia. Now, MOE is collaborating with University of Technology Malaysia to continue developing more videos to assist the teaching and learning of STEM
ⅲ) Developing Exemplar STEM Resources –
a teaching and learning module for STEM subjects which employs a project-based approach. 12 modules have been developed last year and 17 more modules are being developed this year;
ⅳ) STEM Teachers Competency Assessment –
a diagnostic test on Science and Mathematics teachers to gauge their knowledge and skills in STEM areas. Teachers who did not perform at the ‘Good’ and above level will be identified and given professional training to enhance their competencies;
ⅴ) Science practical training for secondary and primary school teachers.
There are a lot of strategies to support students in this STEM Education Initiative. One of it is the introduction of the STEM+ Club which inculcates creativity and innovation among students through STEM-based activities. This year, this club was established in 30 schools as a pioneer project. This project is also in collaboration with British Council Malaysia and Malaysian Industry-Government Group for High Technology (MIGHT). Among activities in this club are hands-on activities in real

Science and Technology Trends
131
world context related to STEM topics that student has learned in school. For example, application of force and motion where students are encouraged to explore alternative designs for flying objects and create their own. An exploration of how things fly brings endless opportunities for exploration and innovation. In this activity, student uses a “squeeze” bottle to launch a straw “winged missile”. This can be done as a competition to see who can create the effective glider for accuracy or distance.
There are also some outreach programmes initiated by higher learning institutions and STEM related agencies who support and expose students to careers in STEM. One of the programmes under STEM education initiative is called STEM mentor-mentee Programme. This is a collaboration between universities and schools where professors/lecturers become mentors to teachers while students from higher education institutions become mentors to school students. The main objectives are to increase/strengthen the content knowledge of the teachers especially with the latest development in STEM field and to increase the interest of students in STEM by doing hands-on activities and relating what they learn in school to the real world contexts with the help from their seniors at university. It is more effective when mentors are among seniors at university as compared to teachers as mentors to students.
MOE has also work with other government agencies as well as private sectors in Malaysia in organising various competitions, hands-on STEM sessions and STEM camps. One example is a competition called School Lab Competition co-organised by British Council Malaysia and the MOE with collaboration from MIGHT and Petrosains. In this competition, students have to create a video describing a STEM concept creatively and with innovation. The video produced can be in a form of an act, a song and others. The video will then be uploaded into YouTube for evaluation.
8 best videos were selected from each state for final event at the state level and 5 videos from all states were selected for final event at the national level. The competition organised early this year has created a lot interest among students and teachers. Many students said that their interest in STEM has increased tremendously through this competition even though their videos were not selected for final event at the state or national level.
MOE has also initiated School-Parents Collaboration to develop parent’s role as partners with school to improve children’s awareness about the importance of STEM fields and STEM-related careers. MOE are currently developing a STEM based reality TV programme. It is a game show with 12 episodes where in each episode participants need to have strong STEM knowledge in order to advance and win the game. This programme will be aired on our national/private TV channel and can be viewed by public. It is hope that this programme will increase parents’ awareness on STEM education.
Engaging volunteer from various STEM-related organisations as their corporate social responsibility (CSR) to collaborate with parents and the wider community, the private sector to support girls in pursuing careers in STEM. We have established an organisation called National STEM Movement. This organisation comprises of members from government agencies, universities, private organisation and people from industry. So far, National STEM Movement is doing a great job in creating awareness on STEM among parents and public as well as getting more students into STEM education through activities such as STEM Carnival, mentor mentee programme and STEM colloquium.
7. The Way Forward
STEM education in Malaysia has undergone various curricula and policy changes. These changes are still ongoing for the goal are not fully met as

132
Policy Trajectories and Initiatives in STEM Education / Malaysia
well as the need to keep in pace with the ever evolving knowledge in the improvement of STEM education. The way forward for Malaysia future directions of STEM education we believe is to strengthen the (i) quality of STEM curricula and instruction, (ii) enhancing professionalism of STEM teacher through long term continuous professional development plan, (iii) creating quality STEM teacher educator workforce in university and teacher training institution, (iv) more opportunities for informal STEM activities through collaboration with STEM’s related agencies, (v) campaigns to educate the public about the diversity of career opportunities in STEM, and (vi) popularizing informal STEM learning centres, using more contemporary youth oriented approach in teaching and learning, and partnership between schools and relevant agencies in collaborative research or projects. Continual research on the effectiveness of the curricula, policies and initiatives should be given priority in the strategic plans related to STEM and STEM education.
References
Curriculum Development Centre, Ministry of Education Malaysia (MOE) (2016) Implementation Guide for Science, Technology, Engineering, and Mathematics (STEM) in Teaching and Learning. Putrajaya: MOE.
Halim, L., & Meerah, T. S. M. (2016). Science Education Research and Practice in Malaysia. In M.-H. Chiu (Eds.), Science Education Research and Practice in Asia (pp. 71-93). Singapore: Springer.
Ministry of Education Malaysia (MOE) (2013). Malaysia Education Blueprint 2013-2025. Putrajaya: MOE.
Ministry of Science, Technology and Innovation (MOSTI). (2012). Science and Technology Human Capital Roadmap: Towards 2020. Putrajaya: Malaysian Science and Technology Information Centre, MOSTI.
Martin, M.O. et al. (2012). TIMSS 2011 International Results in Science. TIMSS & PIRLS International Study Centre, Lynch-School of Education, Boston College, Chestnut Hill (MA).
Ministry of Science, Technology and Innovation (MOSTI). 2008. Malaysian Science and Technology Indicators 2008 Reports. Putrajaya: Malaysian Science and Technology Information Centre, MOSTI.
Petroski, H. (2010). The essential engineer: Why science alone will not solve our global problems. New York: Vintage Books: A division for random house.