Journal of Economic Policy & Research - IPE India
92
1 JOURNAL OF ECONOMIC POLICY & RESEARCH April-September 2018 Vol.13 No.2 Financial Inclusion and its Determinants: The Case of Goa Meenakshi Bawa and PK Sudarsan Information Asymmetry, IPO grading & Pricing Efficiency: An Empirical Analysis of IPOs in India AR Tripathi and Shri Narayan Pandey Rural to Urban India: A Sustainable or Smart Transformation? SN Nandy A Study on Role of Agriculture in Indian Economy A Kotishwar Factors Influence to Participate in MGNREGA Work: A Case Study in Shettihalli GP in Karnataka I Maruthi and Pesala Peter Financial and Social Efficiency: A Non-Radial Bilateral Performance Comparison of Microfinance Institutions of India and Bangladesh Pallavi Pandey and Ram Pratap Sinha National Social Assistance (NSA)Programme: A Study on Women Beneficiaries among Dalits and Non-Dalits P Raghupathi Indexed in: • Indian Citation Index • Ebsco Database • ProQuest • Ulrichsweb ISSN 0975-8577
-
Upload
khangminh22 -
Category
Documents
-
view
3 -
download
0
Transcript of Journal of Economic Policy & Research - IPE India

1
JOURNAL OF
ECONOMIC POLICY& RESEARCH
April-September 2018
Vol.13 No.2
Financial Inclusion and its Determinants: The Case of GoaMeenakshi Bawa and PK Sudarsan
Information Asymmetry, IPO grading & Pricing Effi ciency: An Empirical Analysis of IPOs in IndiaAR Tripathi and Shri Narayan Pandey
Rural to Urban India: A Sustainable or Smart Transformation?SN Nandy
A Study on Role of Agriculture in Indian EconomyA Kotishwar
Factors Infl uence to Participate in MGNREGA Work: A Case Study in Shettihalli GP in KarnatakaI Maruthi and Pesala Peter
Financial and Social Effi ciency: A Non-Radial Bilateral Performance Comparison of Microfi nance Institutions of India and BangladeshPallavi Pandey and Ram Pratap Sinha
National Social Assistance (NSA)Programme: A Study on Women Benefi ciaries among Dalits and Non-DalitsP Raghupathi
indexed in:• Indian Citation Index• Ebsco Database• ProQuest• Ulrichsweb
ISSN 0975-8577

AIMS AND SCOPE
Journal of Economic Policy & Research, a refereed bi-annual publication, provides an opportunity fordiscussionandexchangeoffindings across thebroad spectrumofscholarly opinion in order to stimulate theoretical, empirical and comparative studies in the context of economic policy and research, both in India and abroad.
• Theviewsexpressedinthepublicationarethoseoftheindividualauthorsanddonotreflecttheviews of the Institute of Public Enterprise.
• Nopartofthispublicationmaybereproducedwithoutthewrittenconsentofthepublisher.
• Copyright©2018,InstituteofPublicEnterprise.AllRightsReserved.
Published By: Satyam N Kandula on behalf of Institute of Public Enterprise
Owned By: Institute of Public Enterprise
Printed By: Satyam N Kandula on behalf of Institute of Public Enterprise
Printed At: WideReachAdvertisingPvtLtd,21,SuryaEnclave,Trimulgherry,Hyderabad-500015
Place of Publication: Institute of Public Enterprise, OUCampus,Hyderabad-500007

Journal of Economic Policy & Research
Editorial Board
Editor-in-ChiefRK Mishra, Director, Institute of Public Enterprise, Hyderabad
EditorB Sai Sailaja, Asst. Professor, Institute of Public Enterprise, Hyderabad
Editorial Advisory BoardAni Matei, National School of Political Studies & Public Administration, Bucharest, RomaniaS Mahendra Dev, Director (Vice-Chancellor), Indira Gandhi Institute of Development Research, MumbaiCPChandraSekhar,Centre for Economic Studies & Planning, Jawaharlal Nehru University, New DelhiGeeta Gouri, Regulatory Economist & Advisor, Centre for Civil Society & Competition Advisory Services (India) LLP, New DelhiSunil Mani, Professor, Centre for Development Studies Thiruvananthapuram, KeralaTCAAnant,Secretary, Ministry of Statistics & Programme Implementation and Chief Statistician of India, New DelhiNaresh Kumar Sharma, Department of Economics, University of Hyderabad, HyderabadNJ Kurian, Visiting Professor, Council of Social Development, New Delhi
Editorial SupportAV Bala Krishna, Institute of Public Enterprise, Hyderabad

General Framework• An abstract of 300 words should accompany the
article.• The author(s) present position, other affiliations,complete mailing address(es) (both postal ande-mail),mobilenumbersshouldbeprovided.
• Any special circumstance concerning the articlesuch as its earlier presentation at a meeting, seminar, workshop or conference should be mentioned.
• The article should be professionally proof-readin terms of clarity, grammar, spellings, punctuation and consistency of references to minimize editorial changes.
• Submit the articles as e-mail attachment [email protected]
• Paperswillbeacknowledgedviae-mailuponreceipt.• IPE reserves the right to reject any article it may
deem unsuitable for publication, without assigning reasons.
• Articlescanbeprocessedspeedilyiftheyconformtothe style and format listed hereunder.
• Editorshavetherighttoeditthetexttoimproveitsclarity and make it conform to journal style.
Format• Limitthelevelsofheadingswithinanarticletotwo
or at the most three.• Avoidlengthysub-headings.• Everysub-headingshouldbeboldandcapitalized.• The text, abstract, notes, references and all other
matter should be typed in double space.• Avoidgraphics fromthewebsite.Re-drawthemor
get detailed originals.
Quotations & Acronyms• All quotations should be checked carefully for
accuracy and should be unaltered except for ellipses and bracketed insertions.
• Acronyms shouldbe speltoutonfirstoccurrence.Capitalization should be kept to theminimum andapplied consistently.
• However,wheretwoformsarewidelyinusesuchasliberalise/liberalize, consistency should be maintained in terms of usage throughout the article.
Numbers & Percentage• Thewordpercent,notthesymbol%shouldbeused
in the text.• Figures below 10 should be spelt out in words,elevenandaboveinfigures,unlessthereferenceistopercentages:3percent,distance6kmsorage9yearsold.
• Sourcesandunitofmeasurementshouldbepreciselystated.
Tables & Figures• TablesandFiguresshouldhavecaptionsandnumbers.• Tablesshouldbementionedinthetextandnumbered1,2,3etc.
• Figuresshouldalsobereferredto inthetext,withtheirown1,2,3,etc.,sequences.
• Tablewidthandcellsizeshouldbeevenandallthecontents should be centered.
• All Figures (Charts, Diagrams and Line Drawings)and plates (Photographic images) should be ofclear quality in black and white and numberedconsecutively.
• Numbertheillustrationsaccordingtotheirsequencein the text.
Notes & References• Allnotesandreferencesshouldbeattheendofthepaper–first‘Notes’andthen‘References’.
• Notesshouldbeseriallynumberedinthetextusingsuperscript and the corresponding notes should be listed out separately at the en d of the article.
• Pleaseensurethateveryreferencecitedinthetextis also present in the reference list and vice versa.
• References listed at the end should be arrangedalphabetically by the names of the author.
Forexample:
Reference Format Outline
Book Book with Single Author
Surname,Initials(Year)Title, Place of Publication: Publisher.
Book Book with more than two Authors
Surname, Initials, & SurnameInitials(year)Title, Place of Publication: Publisher.
Book Chapterinanedited Book
Surname,Initials(Year),Chapter,TitleinSurname,Initials & Surname, Initials (Eds)Title,PlaceofPublication: Publisher
Book Books(withnoauthor)
Corporate/Govt/DeptName(Year),Title,PlaceofPublication: Publisher
Journal Articles
Author Surname,Initials(Year),Title of the Paper, Journal Name, Volume Number: Issue Number
Economic & Business Dailies
Author Surname,Initials(Year),Title of the Paper, Newspaper’sName,Month,Day
Business Magazines
Author Surname,Initials(Year),Title of the Paper, Business Magazine’sName,VolumeNumber: Issue Number
Postal Address & e-mail IDs for sending ManuscriptsAll the manuscripts have to be sent to The Editor, Journal of Economic Policy & Research, Osmania UniversityCampus,Hyderabad-500007.Themanuscriptcan also be submitted by email at [email protected]; [email protected]
Guidelines for Authors

Vol13No.2 Apr-Sept2018 ISSN0975-8577
Journal of Economic Policy &
Research
Contents
FinancialInclusionanditsDeterminants:TheCaseofGoaMeenakshi Bawa and P. K. Sudarsan 2
InformationAsymmetry,IPOgrading&PricingEfficiency: An Empirical Analysis of IPOs in IndiaAR Tripathi and Shri Narayan Pandey 17
Rural to Urban India: A Sustainable or Smart Transformation?SN Nandy 25
A Study on Role of Agriculture in Indian EconomyA Kotishwar 37
FactorsInfluencetoParticipateinMGNREGAwork: ACaseStudyinShettihalliGPinKarnatakaI Maruthi and Pesala Peter 47
FinancialandSocialEfficiency:ANon-RadialBilateralPerformance ComparisonofMicrofinanceInstitutionsofIndiaandBangladeshPallavi Pandey and Ram Pratap Sinha 57
NationalSocialAssistance(NSA)Programme:AStudyonWomenBeneficiariesamong Dalits and Non-DalitsP Raghupathi 68

Volume 13, No 2, April-September 20182
AbstractTheaimofthepaperistoexaminetheextentoffinancialinclusioninGoathroughan in- depth analysis of the access and usage of banking services across the talukas inGoafortheperiodfrom1994-95to2014-15.Thestudyisbasedonthedatacollected from the Directorate of Planning, Statistics and Evaluation, Government ofGoa.ByusinganIndexofFinancialInclusion,thestudyclassifiesalltalukasinGoaintohigh,mediumandlowcategories,withrespecttofinancialinclusion.Inordertounderstandthefactorsaffectingfinancialinclusion,amultipleregressionmodelisdevelopedandestimatedfollowingthemethodofordinaryleastsquares.The results show that the spread of the commercial banking network is not evenly distributed across talukas in Goa. It is observed from the study that although there has been an improvement in outreach activity in the banking sector, the achievementisnotsignificant.Thefindingsalsoindicatethatregionscharacterizedby low levels of education, lower degree of urbanization and lower levels of tourist arrivalsseemtobelessfinanciallyinclusive.Inotherwords,regionsthatarelessdevelopedarealsolessfinanciallyinclusive.Theresultsoftheregressionanalysisshow that the three independent variables, namely, urbanization, school enrolment and tourist arrivals, are found to have a positive impact on financial inclusionandarestatisticallysignificant.Thefindingsofthisstudyhavepolicyimplicationsforinitiatingmeasuresthatwouldenhancethelevelsoffinancialinclusioninallregions, especially the less developed ones.
Keywords: Financial Inclusion, Index of Financial Inclusion,Access Dimension,Usage Dimension
IntroductionAfter liberation in 1961, the state of Goa has been brought into the mainstream of national economic development. Within a span of five decades, Goa has made significant progress in both economic and social fields. The benefits of development are, however, not evenly distributed over the entire state. The state of Goa is divided into two districts, namely, North Goa (comprising of the six
Financial Inclusion and its Determinants: The Case of Goa
Meenakshi Bawa1
P. K. Sudarsan2
ISSN 0975-8577 Volume 13, No 2, April-September 2018 pp. 2-16
Journal of Economic Policy & Research
1 Associate Professor, Economics, M.E.S. College of Arts and Commerce (affiliated to GoaUniversity)[email protected]
2 Professor,Economics,[email protected]

3
talukas of Tiswadi, Bardez, Pernem, Bicholim, Sattari and Ponda) and South Goa (comprising of the five talukas of Sanguem, Canacona, Quepem, Salcete and Mormugao).
Goa has an excellent network of banks and banking facilities. Goa has a presence of almost all public sector and new generation commercial and private sector banks. The State Bank of India with a network of 52 branches in North Goa District and 28 branches in South Goa District is the Lead Bank in the state. Over the years, there has been a phenomenal growth of banking facilities in Goa. There is a scheduled commercial bank for every 3014 people in Goa, as against the all-India average of 9963 people (RBI 2015).The State Level Bankers’ Committee (SLBC) had identified both districts of Goa for 100% financial inclusion. It has been claimed that all banks in North Goa and South Goa districts have already achieved 100% financial inclusion by the end of March 2008 (NABARD 2011a; 2011b).
Financial inclusion is defined,for the purpose of this study, as the process that ensures the ease of access and usage of the formal financial system for all members of an economy. This definition emphasizes two dimensions of financial inclusion, namely, access and usage of the financial system. Further, banking inclusion is considered as analogous to financial inclusion. This study refers exclusively to commercial and cooperative banks functioning in the state of Goa for the simple reason that the banking sector intermediates most of the funds in the economy.
In the present study, an attempt is made to examine the extent of financial inclusion across the talukas in Goa for the period from 1994-95 to 2014-15. Specifically, the study aims at (i) analyzing the trends in the access to and usage of banking services across the talukas in Goa; (ii) measuring the degree of financial inclusion by using a composite index of financial inclusion; and (iii) identifying the factors affecting financial inclusion.
To begin with, it describes the Index of Financial Inclusion (IFI). The next section provides an overview of the access and usage of banking services in Goa. This is followed by an analysis of the degree of financial inclusion across the talukas in Goa and the factors determining financial inclusion. The final section concludes the paper.
Theoretical and Methodological FrameworkSeveral indicators have been used to measure the extent of financial inclusion. Earlier studies on financial inclusion have used individual indicators separately to assess the extent of financial inclusion. Beck et al., (2007) use several indicators of banking sector outreach such as geographic and demographic branch penetration, loan and deposit accounts per capita, and loan-income and deposit-income ratios. Some of the most common indicators used in earlier studies have been the number of bank accounts (per 1000 persons), the number of bank branches (per million people), the number of ATMs (per million people), amount of bank credit and amount of bank deposit. These indicators no doubt provide important and useful information on the outreach of the financial system of an economy. However, the process of financial inclusion / exclusion is multidimensional. Thus, if these indicators are used individually, it can lead to a wrong understanding of the extent of financial inclusion in an economy.
Financial Inclusion and its Determinants: The Case of Goa

Volume 13, No 2, April-September 20184
This study is restricted to two dimensions of financial inclusion largely due to non-availability of relevant and consistent taluka-wise data so as to compute comparable IFI. It must be noted that access to banking services is not synonymous with the use of banking services. Individuals and households who enjoy access to banking services might decide not to use them, due to socio-cultural reasons or high opportunity costs. Access refers to the possibility to use banking services and usage refers to the actual use of financial services.
The access to banking services is measured in terms of two indicators, namely, geographic branch penetration (i.e., bank branches per 100 sq. km.) and demographic branch penetration (i.e., bank branches per 10000 people), basically reflecting the availability of banking services. The indicator of branches per square kilometer helps characterize the geographic penetration of banks and can be interpreted as a proxy for the average distance of a potential customer from the nearest bank branch. Higher geographic penetration would indicate lesser distance and easier geographic access. The per capita measure of branches is used to characterize the demographic penetration of banks and can be interpreted as a proxy for the average number of people served by each bank branch. Higher demographic penetration would indicate fewer customers per branch and hence easier access. Higher branch intensity in demographic and geographic terms implies greater access to the use of banking services by households. The use of banking services is measured in terms of total deposits mobilized and total credit advanced. A larger amount of deposits and credit is interpreted as greater usage of banking services by households.
Sarma (2008) constructed a multidimensional index of financial inclusion (IFI) across countries by considering three dimensions of financial inclusion, namely, accessibility, availability and usage of banking services. Researchers have measured the extent of financial inclusion in India in terms of the IFI by using a multi-dimensional approach similar to that used by Sarma (Kumar and Mishra 2011; Kumar 2011; Chattopadhyay 2011; Singh and Kodan 2011). In the present study, the IFI has been constructed largely following the methodology used by Sarma (2008, 2010, 2012). The index has been modified so as to suit the taluka-level analysis of financial inclusion.
The IFI is computed by first calculating a dimension index for each dimension of financial inclusion. The dimension index for the ith dimension in taluka k, dik, is computed by the following formula:
= ........................... (1)wherewdi= Weight given to dimension i, 0 ≤ wdi ≤ 1Aik= Actual value of dimension i in taluka kli = Minimum value of dimension i (empirically observed lowest value)Mi = Maximum value of dimension i (empirically observed highest value)In computing this index, the empirically observed maximum and minimum
values are considered for each dimension. Since the IFI is calculated for different talukas within the same state, there is only a remote possibility of the empirically observed highest value being an outlier. It may be noted that these empirically observed upper and lower bounds are different for different years. The IFI measures the extent of financial inclusion in a particular taluka relative to the prevailing situation in all talukas.
Journal of Economic Policy & Research, Vol 13, No 2

5
Financial Inclusion and its Determinants: The Case of Goa
Following Sarma (2012), if n dimensions of financial inclusion are considered, a region’s achievements in these dimensions will be represented by a point Y =(d1, d2, d3….dn) in the n- dimensional Cartesian space. Point O = (0, 0, 0…0) will represent the worst situation and point W = (wd1, wd2,……wdn) will represent the ideal situation. In order to compute the IFI, Y1 (distance between Y and O) and Y2 (inverse distance between Y and W) are computed. The final IFI is computed by taking a simple average of Y1 and Y2.
The formulae are as follows:
........................... (2)
........................... (3)
........................... (4) 2
In the present index, a weight of 0.6 has been provided for the index of acces-sibility and 0.4 for the index of usage. Given these weights, we can represent a taluka k by a point (ak, uk) in the two dimensional space, such that 0 ≤ ak≤0.6 and 0≤ uk ≤0.4, where ak and uk are the access and usage dimension indexes respectively for taluka k computed using formula (1). In the two dimensional space, the point (0, 0) will indicate the worst situation (complete financial exclusion) and the point (0.6, 0.4) will indicate the best or ideal situation (complete financial inclusion).
The IFIk for taluka k is measured as follows:
........................... (5)The IFI used in the present study has certain limitations. Firstly, it does not
consider all dimensions of financial inclusion. It includes only the accessibility and usage dimensions but does not take into account dimensions such as the cost and ease of transactions. There is no doubt that a multi-dimensional approach would lead to a more robust IFI. However, the present study had to restrict itself to only two dimensions mainly due to non-availability of taluka-wise data on other dimensions of financial inclusion. Secondly, the IFI suffers from lack of taluka-specific information due to the aggregative nature of the data. For instance, geographical aspects of financial inclusion such as the rural-urban divide and gender related aspects are not covered in the study. Thirdly, the IFI does not distinguish between resident and non-resident bank accounts. As a result of this, certain talukas such as Salcete and Bardez may show high levels of financial inclusion on account of a large number of non-resident banking activities. Finally, though both dimensions are considered equally important for measuring financial inclusion, relatively less weight(i.e. weight less than one) is given to the dimensions

Volume 13, No 2, April-September 20186
due to lack of adequate data on important indicators that completely characterize these dimensions. As far as accessibility of banking services is concerned, the importance of bank branches has come down, particularly in the urban areas, on account of the introduction of internet banking and provision of banking services through telephones. Similarly, data on credit and deposit do not completely depict the usage of the financial system, as other services of the banking system, such as payments, remittances and transfers are not included in the analysis.
Access to and Usage of Banking Services in GoaThe state of Goa has witnessed tremendous progress in banking since liberation. The number of banking branches in Goa steadily increased from five in 1962, just after liberation, to 300 bank branches in 1988 after it gained Statehood and further to 799 bank branches in 2015. The aggregate deposits registered an increase from Rs. 9 crore in 1962 to Rs.55611.52 crore in 2014-15. The gross credit also registered a rise from Rs. 3 crore in 1962 to Rs.17469.66 crore by 2014-15. As a result of this, the credit deposit ratio in 2014-15 was 31% (GOG 2015).
The spread of the commercial banking network is not evenly distributed across talukas. Table 1 shows the distribution of bank branches across talukas in Goa for the period from 1994-95 to 2014-15. It can be observed that about 60 per cent of the banking offices are located in North Goa District. For the same period, approximately 81 per cent of the bank branches are located in the talukas of Bardez, Salcete, Tiswadi, Mormugao and Ponda. These five talukas are the relatively more economically developed talukas of Goa. On the other hand, the talukas of Sattari, Pernem, Sanguem and Canacona account for only about 11 per cent of the bank branches in Goa. In 2014-15, the maximum number of branches were located in Bardez (163) which constituted 20 per cent of the total number of branches. At the other extreme, the least number of branches was located in Sattari (17) which constituted 2.13 per cent of the total number of branches in the state. Thus, it can be seen that the bank branches have not been evenly distributed across the state. Further, even in those talukas which have a large number of bank branches, there are a number of villages where there are no banks at all.
Table 1: Taluka-wise Number of Bank Branches in Goa
YearTaluka 1994-95 2000-01 2005-06 2009-10 2014-15
Tiswadi 66 87 94 102 149Bardez 70 92 102 118 163Pernem 10 15 15 17 31Bicholim 19 20 21 23 35Sattari 7 11 11 11 17Ponda 32 41 44 57 82North Goa District 204 266 287 328 477Sanguem 15 15 15 17 23Canacona 9 11 12 15 21Quepem 12 15 16 17 26Salcete 70 93 100 121 181Mormugao 32 44 46 49 71South Goa District 138 178 189 219 322Goa State 342 444 476 547 799
Source:ReportsonCredit-DepositRatioinGoa1994-95to2014-15,DirectorateofPlanning,Statistics and Evaluation, Government of Goa
Journal of Economic Policy & Research, Vol 13, No 2

7
Financial Inclusion and its Determinants: The Case of Goa
The growth in banking facilities has not been uniform across the state. Over the same period, the highest growth has been witnessed in Pernem (210 per cent)followed by Salcete (158.57 per cent) Ponda (156.25 per cent) and Sattari (142.86 per cent). The least growth is observed in Sanguem (53.33 per cent) followed by Bicholim (84.21 per cent). All the other talukas have recorded growth between 116 to 133 per cent.
The access to banking services is measured in terms of geographic and demographic penetration. As far as geographic penetration (GP) is concerned, the highest ranking talukas have been Tiswadi, Mormugao, Bardez and Salcete and the lowest ranking talukas have been Sanguem, Sattari and Canacona over the period from 1994-95 to 2014-15. As far as demographic penetration (DP) is concerned, the highest ranking talukas have been Tiswadi, Mormugao, Bardez and Salcete and the lowest ranking talukas have been Sattari, Pernem and Quepem over the same period. The highest ranking talukas remain the same for geographic penetration. However, as far as demographic penetration is concerned, it is observed that Ponda emerged as the fourth highest ranking taluka and Mormugao slipped to the fifth position in 2014-15. Sattari taluka remained the lowest ranking taluka for demographic penetration. In 2014-15, Sanguem was the lowest ranking taluka for geographic penetration. The usage of banking services is measured in terms of total deposits mobilized (TD) and total credit advanced (TC). There has been a growth in deposits and credit across the state during the period under study. However, deposits have been larger and have been growing at a faster rate than credit. As a result, the credit-deposit ratio has been low. The low credit-deposit ratio in the state is due to low credit off-take in the state and high level of deposits with banks on account of huge inflow of foreign remittances.
During the period from 1994-95 to 2014-15, the talukas of Salcete, Tiswadi Bardez and Mormugao accounted for around 86.56 per cent of the total deposits mobilized in the state. At the other end, the aggregate deposits mobilized in the six talukas of Sattari, Canacona, Quepem, Sanguem, Pernem and Bicholim accounted for about 8 per cent of the total deposits. As far as credits are concerned, approximately 86 per cent of the credits were accounted are from the talukas of Tiswadi, Salcete, Mormugao and Bardez. The lowest advances were in Pernem, Canacona and Sattari. It is evident that the talukas of Tiswadi, Bardez, Salcete and Mormugao, comprising the important commercial centers of Goa, have been dominating the banking scene. These talukas have been the highest ranking talukas with respect to both access and usage of banking services.
Table 2: DescriptiveStatisticsofIndicatorsofDifferentDimensionsofFinancialInclusion
A] Access Dimension1994-95 2000-01 2005-06 2009-10 2014-15
GP DP GP DP GP DP GP DP GP DP
Minimum 1.43 1.41 1.79 1.88 1.79 1.74 2.03 1.64 2.75 1.95
Maximum 30.14 4.23 40.74 5.43 43.68 5.48 45.98 5.55 69.76 6.14
Mean 13.01 2.42 17.08 2.89 18.26 2.86 20.7 3.05 30.34 3.49
SD 12.05 0.86 16.25 1.07 17.49 1.14 19.47 1.21 28.07 1.26
CV 0.93 0.35 0.95 0.37 0.96 0.40 0.94 0.40 0.93 0.36

Volume 13, No 2, April-September 20188
B] Usage Dimension1994-95 2000-01 2005-06 2009-10 2014-15
TD TC TD TC TD TC TD TC TD TCMinimum 15.69 6.38 46.01 13.26 74.73 25.55 133.48 53.81 294.72 142.81Maximum 888.88 378.50 2479.0 957.40 5777.00 1569.60 8351.60 4568.80 16037.82 6771.09Mean 291.61 96.79 765.08 218.65 1613.90 386.84 2682.30 878.34 5055.59 1588.15SD 358.87 116.55 944.23 291.52 2057.00 491.32 3246.40 1324.70 6007.57 2079.48CV 1.23 1.20 1.23 1.33 1.27 1.27 1.21 1.51 1.19 1.31
Note:(i)ThevaluesforGPandDParecomputedonthebasisofthedatafromtheReportsonCredit-DepositRatioinGoa1994-95to2014-15,DirectorateofPlanning,StatisticsandEvaluation,Government of Goa.(ii)ThevaluesforTDandTCareactualvaluesobtainedfromtheReportsonCredit-DepositRatioinGoa1994-95to2014-15,DirectorateofPlanning,StatisticsandEvaluation,GovernmentofGoa.(iii)SD=standarddeviationandCV=Coefficientofvariation
Table 2 presents some descriptive statistics of the available data for computing the index of financial inclusion for selected years between 1994-95 and 2014-15. Statistics pertaining to each dimension (and to each indicator pertaining to each dimension) of the index are presented.
As far as the access dimension is concerned, on an average, geographic penetration has steadily increased from 13.01 branches per 100 square kilometers in 1994-95 to 30.04 branches per 100 square kilometers in 2014-15. On an average, demographic penetration increased from 2.42 bank branches per 10000 people in 1994-95 to 3.89 bank branches per 10000 people in 2000-01. It registered a slight decline in 2005-06, but rose to 3.49 bank branches per 10000 people in 2014-15 (Table 2). It can be observed that for both geographic and demographic penetration, the maximum and minimum value recorded has been increasing over the period. On an average there has been an increase in the access to banking services in Goa. As far as geographic penetration is concerned, the coefficient of variation has been substantially high, but it was more or less the same over the period of study being 0.93 in 1994-95 and in 2014-15. The coefficient of variation for demographic penetration has been comparatively lower, increasing marginally from 0.35 in 1994-95 to 0.36 in 2014-15.
As far as the usage dimension is concerned, on an average, total deposits increased from Rs.291.61 crores in 1994-95 to Rs.5055.59 crores in 2014-15, whereas total credit increased from Rs.96.79 crores in 1994-95 to Rs.188.15 crores in 2014-15 (Table 2). The maximum and minimum values for total deposits and total credit have increased substantially over the period. The coefficient of variation has been high for both deposits and credit. It showed a decline from 1.23 to 1.19 in the case of total deposits, whereas it rose from 1.20 to 1.31 in the case of total credit for the same period. It is revealed that the usage of banking facilities has also increased over the period.
Index of Financial Inclusion for GoaThe Index of Financial Inclusion (IFI) has been computed for all the talukas in the state of Goa. Since the IFI depends on the access and usage dimensions, the index of access and usage dimensions are discussed first. Table 3 presents the computed index values for the two dimensions respectively for selected years between 1994-95 and 2014-15.
Journal of Economic Policy & Research, Vol 13, No 2

9
Financial Inclusion and its Determinants: The Case of Goa
Table 3:IndexValuesforDimensionsofFinancialInclusion
YearTaluka 1994-95 2000-01 2005-06 2009-10 2014-15
Access Usage Access Usage Access Usage Access Usage Access Usage
Tiswadi 0.599 0.400 0.600 0.375 0.600 0.345 0.599 0.400 0.599 0.400
Bardez 0.481 0.236 0.437 0.207 0.459 0.189 0.512 0.164 0.564 0.213
Pernem 0.026 0.002 0.049 0.003 0.045 0.001 0.064 0.001 0.119 0.006
Bicholim 0.143 0.040 0.078 0.022 0.083 0.019 0.095 0.018 0.102 0.019
Sattari 0.002 0.000 0.003 0.000 0.003 0.001 0.001 0.001 0.003 0.001
Ponda 0.198 0.057 0.167 0.055 0.174 0.052 0.249 0.065 0.235 0.063
Sanguem 0.106 0.016 0.039 0.009 0.034 0.005 0.052 0.007 0.046 0.006
Canacona 0.082 0.005 0.063 0.004 0.076 0.003 0.118 0.005 0.120 0.004
Quepem 0.061 0.018 0.035 0.019 0.045 0.018 0.050 0.016 0.053 0.015
Salcete 0.403 0.302 0.372 0.298 0.378 0.305 0.451 0.261 0.451 0.279
Mormugao 0.415 0.153 0.394 0.136 0.386 0.170 0.400 0.145 0.382 0.138
Note:TheindexvaluescomputedinthistablearebasedondatafromtheReportsonCredit-DepositRatio1994-95to2014-15,DirectorateofPlanning,StatisticsandEvaluation,GovernmentofGoa
The indicators used to compute the index for the access dimension are geographic penetration and demographic penetration. These indicators are given equal weights and the average of these indexes represents the index for the access dimension. The index value for the access dimension was the highest for Tiswadi (0.599) followed by Bardez (0.564), Salcete (0.451) and Mormugao (0.382) in 2014-15. The ranking remained more or less the same throughout the period, the only exception being that Mormugao occupied the third position in 1994-95, 2000-01 and 2005-06 but moved to the fourth position in 2014-15. The lowest ranking talukas were Sattari, Sanguem, Quepem, Pernem,and Canacona in 1994-95 and in 2014-15.
The index value for Sattari taluka has been noticeably very low and was close to zero thereby making Sattari the lowest ranking taluka in terms of access.
The indicators used to compute the index for the usage dimension are total deposits and total credit. These indicators are also given equal weights and the average of these indexes represents the index for the usage dimension. As far as the usage dimension is concerned, the index value was the highest for Tiswadi (0.400) followed by Salcete (0.279), Bardez (0.213) and Mormugao (0.138) in 2014-15. The ranking has remained the same throughout the period. The lowest ranking talukas were Sattari, Pernem, Sanguem, Canacona and Quepem in 1994-95 and in 2014-15. As in the case of the access dimension, the index value of the usage dimension for Sattari taluka was very low and has been zero or close to zero throughout the period, thereby making Sattari the lowest ranking taluka in terms of usage.
It can be observed that for the period of study, Tiswadi has ranked the highest for both the access and usage dimensions. Bardez ranked second for the access dimension but third for the usage dimension. It is revealed that Salcete has performed better than Bardez for the usage dimension. This implies that even though the access to banking services as measured by banking penetration has not

Volume 13, No 2, April-September 201810
been as high in Salcete as compared to Bardez, the usage of banking services in terms of deposits and credit has been relatively higher there. The larger deposits are probably due to the larger inflow of foreign remittances and the larger credit could be attributed to the greater industrial development and hence greater need for credit in Salcete. Mormugao taluka seems to have been performing better in terms of access as compared to usage of banking services. Bicholim and Ponda talukas have also fared better in terms of access as compared to usage. The same is the case in Canacona, Pernem, Sanguem Quepem and Sattari. Sattari has ranked the lowest in terms of both access and usage of banking services, the index values being close to zero for the entire period.
Table 4 presents the IFI values and the categorization of talukas for selected years between 1994-95 and 2014-15. As evident from the table, and as expected, the talukas across the state of Goa are at different levels of financial inclusion.
Table 4: IFIValuesandCategorizationofTalukasinGoa
Year 1994-95 2000-01 2005-06 2009-10 2014-15Taluka IFI Category IFI Category IFI Category IFI Category IFI Category
Tiswadi 0.999 High 0.973 High 0.942 High 0.999 High 0.998 High
Bardez 0.731 High 0.661 High 0.668 High 0.698 High 0.786 High
Pernem 0.035 Low 0.063 Low 0.057 Low 0.082 Low 0.152 Low
Bicholim 0.200 Low 0.109 Low 0.113 Low 0.129 Low 0.137 Low
Sattari 0.003 Low 0.004 Low 0.005 Low 0.002 Low 0.004 Low
Ponda 0.277 Low 0.237 Low 0.245 Low 0.342 Medium 0.325 Medium
Sanguem 0.140 Low 0.053 Low 0.046 Low 0.069 Low 0.061 Low
Canacona 0.105 Low 0.081 Low 0.097 Low 0.150 Low 0.153 Low
Quepem 0.086 Low 0.055 Low 0.066 Low 0.072 Low 0.074 Low
Salcete 0.696 High 0.657 High 0.670 High 0.720 High 0.736 High
Mormugao 0.593 Medium 0.557 Medium 0.574 Medium 0.571 Medium 0.546 Medium
Note:TheIFIvaluescomputedinthistablearebasedondatafromtheReportsonCredit-DepositRatio1994-95to2014-15,DirectorateofPlanning,StatisticsandEvaluation,GovernmentofGoa
In the year 2014-15, for instance, the levels of financial inclusion, as measured by the IFI, varied from as low as 0.000 for Sattari to as high as 0.998 for Tiswadi. For the entire period of study, Tiswadi has been the highest ranking taluka with respect to the IFI. The value of the IFI has been very close to 1 in Tiswadi, thus implying that Tiswadi has the highest level of financial inclusion as compared to all the other talukas. In 2014-15, the highest ranking talukas were Tiswadi (0.998), followed by Bardez (0.786), Salcete (0.736), and Mormugao (0.546). The ranking has remained more or less the same throughout the period, with the exception that Bardez occupied the second position and Salcete occupied the third position in 1994-95, 2000-01 and 2012-13,
At the other extreme, Sattari has been the lowest ranking taluka with respect to the IFI. In Sattari taluka, the IFI has been very close to zero throughout the period and hence Sattari can be characterized as the taluka with the lowest level of financial inclusion. In 1994-95, the IFI was the lowest in Sattari (0.003), followed by Pernem (0.035), Quepem (0.086) and Canacona (0.105). The situation changed in 2000-01 with Quepem, Sanguem and Pernem becoming the second, third and fourth lowest
Journal of Economic Policy & Research, Vol 13, No 2

11
Financial Inclusion and its Determinants: The Case of Goa
ranking talukas respectively. Thereafter the situation worsened in Sanguem as it became the second lowest ranking taluka in 2005-06. However, between 2005-06 and 2014-15, the IFI showed a significant improvement in Canacona. This is attributable to the deeper banking penetration in Canacona due to the increase in bank branches implying greater access to banking services there. However, though there was improvement in access to banking services in Canacona, there was no corresponding improvement in usage. This indicates that there is no guarantee that if a region fares better in terms of access, it will necessarily fare better in terms of usage of banking services. Nevertheless there was an improvement in the overall IFI in Canacona. In 2014-15, the lowest ranking talukas continued to be Sattari (0.004), followed by Sanguem (0.061), Quepem (0.074) and Pernem (0.152).
Generally, it is expected that with development and improvements in incomes financial inclusion is likely to improve. Further, a major decline in IFI values is not expected, unless there are situations such as financial crisis or outbreak of war. Thus, in general, we could expect the IFI values to improve for all regions over the years. In the present study, there has been no consistent or significant change in the IFI over a period of time.
The talukas have been placed into three categories on the basis of their IFI values as follows:
1. 0.6 ≤ IFI ≤ 1 – high financial inclusion2. 0.3 ≤ IFI < 0.6 – medium financial inclusion3. 0.0 ≤ IFI < 0.3 – low financial inclusionTiswadi, Bardez and Salcete talukas have had consistently high IFI values of
above 0.6 throughout this period and are categorized as talukas with high financial inclusion. Mormugao has been in the range of medium financial inclusion throughout, the value of the IFI being between 0.5 and 0.6. Ponda, on the other hand, has moved from being a low IFI taluka to being a medium IFI taluka in 2009-10 All the remaining six talukas are categorized in the category of low level of financial inclusion, the IFI values ranging between 0 and 0.3. Within this category, Sattari has had the lowest IFI values throughout. The talukas of Sanguem, Quepem and Pernem have also had low values of IFI, generally below 0.1 throughout the period.
Factors Determining Financial InclusionThere are several factors that affect financial inclusion and the interaction of
these factors with each other is likely to be significant. Sarma and Pais (2011) identified certain factors and categorized them as (i) socio-economic factors such as income, employment, inequality, educational attainment, literacy and so on, (ii) factors relating to physical infrastructure such as road network, telephone and television network, access to information through newspapers, radio, cable TV, computer and internet and (iii) banking sector factors such as soundness of the banking system, ownership pattern of banks and interest rates.
Several studies have highlighted the importance of socio-economic factors in influencing financial inclusion. These factors include income levels, income distribution, caste, religion, education, urbanization and migration (Barr 2004; Devlin 2009; Sarma and Pais 2011; Buckland et al., 2005). Studies have shown

Volume 13, No 2, April-September 201812
that people living in rural areas and in locations that are remote from urban areas are more likely to be financially excluded (Leyshon and Thrift 1995; Kempson and Whyley 2001; Beck and Brown 2011). Employment has also been found to be associated with financial inclusion (Goodwin et al., 1999).
Studies have shown that the use of banking services is found to be more common among households located in urban areas, households with higher income and wealth, as well as for households in which an adult member had professional education and formal employment (Martinez 2006; Beck and Brown 2011; Pal and Pal 2012). Rural population or the proportion of rural population has been found to be negatively associated with financial inclusion. In other words, urbanisation is positively associated with financial inclusion (Sarma and Pais 2011; Solo and Monroth 2006; Al-Hussainy et al., 2008). Urbanization is considered to be an important factor influencing financial inclusion. Urbanization is defined here as the percentage of urban population to total population. For the present study, the figures for urbanization are available only for the census years. For the years in between the census years, the figures have been arrived at by the interpolation method by using the percentage change method. Urbanization is accompanied by industrialization and economic development. In the present analysis, urbanization is expected to be a positive determinant of financial inclusion.
Higher literacy rates, particularly adult literacy, have also been found to be positively associated with financial inclusion (Sarma and Pais 2011). The level of education of the people in a region influences the level of financial inclusion (Kliza and Pederson 2002; Caskey et al., 2006; Al-Hussainy et al., 2008; Ghosh 2011; Cull and Scott 2011; Seluhinga 2013). In the present analysis, the total number of students enrolled in schools at the higher secondary education level, colleges and university is considered as a proxy for the education level. It is believed that generally an individual who has completed his/her higher secondary education, graduation or post-graduation, would be in a better position to make financial decisions than an individual who is a school dropout. Hence, this is considered as an important factor determining financial inclusion. An increase in the number of students enrolled, and hence in the level of education, is expected to be a positive determinant of financial inclusion.
Tourism is one of Goa’s fastest growing industries. Tourism does have significant direct benefits at the local level by generating employment and improving wages, and several indirect effects such as stimulating growth in tourism-related activities such as services and transportation. Tourism revenues go beyond hotel operators and employees, tour operators and restaurateurs. Tourist expenditures are typically incurred partly on local goods and services, further raising output and incomes. Thus, tourism does have an impact on financial inclusion as well. It is argued here that an increase in the number of tourists in a particular region will result in higher levels of financial inclusion. In other words, there is a direct relationship between tourist arrivals and financial inclusion.
In order to understand the factors affecting financial inclusion, a multiple regression model is developed and estimated. A pooled regression model is estimated using the method of ordinary least squares using data of the 11 talukas for
Journal of Economic Policy & Research, Vol 13, No 2

13
Financial Inclusion and its Determinants: The Case of Goa
period 1994-95 to 2014-15. In the present analysis, a pooled regression approach is used instead of a fixed effects or random effects model for the simple reason that the talukas that are pooled together do not show much heterogeneity. In the present analysis, the dependent variable, y, is a logit transformation of the index of financial inclusion (IFI).While the IFI lies between 0 and 1, the transformed variable lies between -∞ and ∞. By incorporating the transformed variable, we are able to carry out the classical OLS regression (Sarma and Pais 2011; Singh and Kodan 2011).The transformed variable, y, is a monotonically increasing function of IFI. The transformed variable, y, is a logit function of the IFI.
It is defined as follows: ........................... (6)
The general form of the regression equation is ........................... (7)
In the present analysis, the transformed IFI variable, y, is regressed over three socio-economic variables namely, urbanization, student enrollment and tourist arrivals. The transformed IFI variable, y, is expressed as a function of these three independent variables and the regression equation is expressed as follows:
........................... (8)where: y=Transformed IFISE=Number of students enrolled in schools at the post-matric level, colleges
and universityUR=Percentage of urban population to total populationTA=Number of tourist arrivals (domestic and foreign)It is hypothesized that all the three independent variables, namely, student
enrolment (SE) which is considered as a proxy for education level, urbanization (UR) and tourist arrivals (TA), are positive determinants of financial inclusion. Urbanization and tourist arrivals could be considered as proxies for economic development. The analysis is restricted to these three variables on account of non-availability of taluka-wise data for other relevant variables such as income and employment.
The results of the regression are presented in Table 5. The results of the regression model are satisfactory and interesting. It can be seen that all the three independent variables are found to have a positive impact on financial inclusion as the estimated coefficients have positive signs which are the expected signs as stated. The estimated coefficients are significant at 1% level.
The coefficient of student enrolment is positive and highly significant. Thus, student enrolment is found to have a positive impact on financial inclusion thus implying higher levels of financial inclusion at higher levels of education. Urbanization is also found to have a positive impact on financial inclusion. This means that as the proportion of urban population to the total population increases, the level of financial inclusion will also increase. Tourist arrivals are also positively related to financial inclusion. This implies that as the number of tourists

Volume 13, No 2, April-September 201814
increases,the level of financial inclusion will also increase. The model has been corrected for heteroskedasticity and robust standard errors have been reported.
Table 5: Results of Regression Analysis
Dependent Variable:y[y=ln(IFI/(1-IFI))]
Variable Coefficients Standard Error# t- ratio p- value
Constant -4.5372 0.2436 -18.620 0.000***SE 0.0002 0.00004 6.344 0.000***UR 0.0427 0.0046 9.249 0.000***TA 0.000002 0.0000007 3.287 0.001***No. of observations 231
F(3,227) 103.73P-value(F) 0.000R-squared 0.695Adjusted R- squared 0.691
Note:#Robust standard errors
***Significantat0.01level
The adjusted R squared is 0.691, which is fairly good considering the fact that we have used pooled data. The model fits well because 69.1% of the variation in the dependent variable is explained by the explanatory variables. The F-value is 95.75 and the p-value of obtaining an F-value of 95.75 or greater is practically zero. This reveals that all independent variables jointly determine the dependent variable and the model is very good. In other words, all the explanatory variables are found to be individually and collectively statistically significant.
Conclusions and Policy ImplicationsIt is evident from the study that there has been a phenomenal growth of banking
facilities in Goa. However, financial inclusion in the context of access and usage has not been satisfactory. Moreover, bank branches are not evenly distributed across the state. There are wide disparities in financial inclusion across the talukas. The talukas of Tiswadi, Bardez, Salcete and Mormugao have been the highest ranking talukas in terms of both access and usage of banking services for the period of study. Sattari has been the lowest ranking taluka in terms of both dimensions of financial inclusion. The study shows that even though a region performs better in terms of the access dimension, it does not necessarily perform better in terms of the usage dimension.
The IFI values clearly indicate that the level of financial inclusion is significantly low in large parts of the state of Goa. The talukas of Tiswadi, Bardez and Salcete have had consistently high IFI values, whereas Mormugao has been in the range of medium financial inclusion throughout the period 1994-95 to 2014-15. All the other talukas have had low levels of financial inclusion, with the exception of Ponda, which moved from low levels to medium levels of financial inclusion in 2009-10. It is observed from the study that although there has been an improvement in outreach activity in the banking sector, the achievement is not significant. The findings also
Journal of Economic Policy & Research, Vol 13, No 2

15
Financial Inclusion and its Determinants: The Case of Goa
indicate that regions characterized by low levels of education, lower degree of urbanization and lower levels of tourist arrivals seem to be less financially inclusive. In other words, regions that are less developed are also less financially inclusive. From the above analysis, it can be seen that though Goa has been declared as a completely financially inclusive state, the degree of financial inclusion varies across talukas. The level of development has a direct correlation with the degree of financial inclusion and concerted efforts need to be made to bring about the development of the backward and less developed regions. The government has to initiate steps to attain more balanced regional development to make financial inclusion more meaningful. Each region has its own peculiar characteristics and therefore it is imperative to adopt region-specific measures. Government policy to improve levels of education and urbanization, and also to promote tourism, will have a positive impact on the status of financial inclusion in Goa.
ReferencesAl-Hussainy, E., Beck, T.,Demirgüç - Kunt, A.& Zia, B. (2008). Household use of
Financial Services. Barr, M. (2004). Banking the poor, Yale Journal on Regulation, 21(121), pp: 122-239.Beck, T. and Brown, M. (2011).Which households use banks? Evidence from the
transition economies, Working Paper Series No 1295, European Central Bank (ECB), Germany.
Beck, T., Demirgüç-Kunt, A., and Martinez Peria, M. S. (2007). Reaching out: Access to and use of banking services across countries, Journal of Financial Economics, 85(1), pp:234-266.
Buckland, J., et al., (2005). There Are No Banks Here: Financial and Insurance Exclusion Services in Winnipeg’s North End, Winnipeg Inner-City Research Alliance (WIRA), University of Winnipeg: Canada.
Caskey, J.P., Durán, C.R. and Solo, T.M. (2006). The Urban Unbanked in Mexico and the United States, Policy Research Working Paper 3835, World Bank.
Chattopadhyay, S. K. (2011). Financial Inclusion in India: A case-study of West Bengal, RBI Working Paper Series, W P S (DEPR): 8 / 2011, Department of Economic and Policy Research, Reserve Bank of India.
Cull, R. and Scott, K. (2010). Measuring Household Usage of Financial Services: Does it matter how or whom you ask?, The World Bank Economic Review, 24(2), pp: 199-233.
Devlin, J. F. (2009). An analysis of influences on total financial exclusion, The Service Industries Journal, 29(8), pp: 1021-1036.
Ghosh, S. (2011). Banking Outreach across Indian States: An Assessment, MPRA (Munich Personal Repec Archive) Paper No. 38650.
Goodwin, D., et al. (1999). Debt, money management and access to financial services: Evidence from the 1999 PSE Survey of Britain, 1999 PSE Survey Working Paper 8, Centre for Research in Social Policy, Loughborough University.
Government of Goa (2015).Statistical handbooks of Goa 1994-95 to 2014-15. Government of Goa, (2015).Goa at a Glance 1995 to 2015.Government of Goa, (2015). Reports on Credit-Deposit Ratio in Goa 1994-95 to
2014-15.

Volume 13, No 2, April-September 201816
Kempson, E. and Whyley, C. (2001). Payment of Pension and Benefits: A survey of social security recipients paid by order book or girocheque, Research Report No 146, Leeds: Department for Work and Pension .
Kliza, B. and Pederson, G. (2002). Household Financial Savings Mobilization: Empirical Evidence from Uganda, Journal of African Economies, 10(4), pp: 390-409.
Kumar, C. and Mishra, S. (2011). Banking Outreach and Household level Access: Analyzing Financial Inclusion in India, Indira Gandhi Institute of Development Research (IGIDR), Mumbai.
Kumar, N. (2011). Financial Inclusion and its determinants: Evidence from state level empirical analysis in India.
Leyshon, A. and Thrift, N. (1995). Geographies of financial exclusion: financial abandonment in Britain and the United States, Transactions of the Institute of British Geographers, New Series, 20(3), pp: 312-341.
Martinez J. L. (2006). Access to financial services in Zambia, World Bank Policy Research Working Paper 4061.
National Bank for Agriculture and Rural Development, (2011a). Potential Linked Credit Plan 2012-13, North Goa District, NABARD Goa Regional Office, Panaji, Goa, P. 124.
National Bank for Agriculture and Rural Development, (2011b). Potential Linked Credit Plan 2012-13, South Goa District, NABARD Goa Regional Office, Panaji, Goa, P.123.
Pal, R. and Pal, R. (2012). Income Related Inequality in Financial Inclusion and Role of Banks: Evidence on Financial Exclusion in India, Working Paper 2012-2013, Indira Gandhi Institute of Development Research, Mumbai.
Reserve Bank of India, (2015). Quarterly Statistics on Deposits and Credit of Scheduled Commercial Banks.
Sarma, M. (2008). Index of Financial Inclusion, Working Paper No. 215, Indian Council For Research on International Economic Relations, New Delhi.
Sarma, M. (2010). Index of Financial Inclusion, Discussion Paper 10-05, Centre for International Trade and Development, School of International Studies, Jawaharlal Nehru University, New Delhi.
Sarma, M. and Pais, J. (2011). Financial Inclusion and Development, Journal of International Development, 23, pp: 613-628.
Sarma, M. (2012). Index of Financial Inclusion – A measure of financial sector inclusiveness, Working Paper No. 07/2012, Berlin Working Papers on Money, Finance, Trade and Development, Competence Center, Berlin.
Seluhinga, N. S. (2013). Determinants of The Probability of obtaining Formal Financial Services in Tanzania, Journal of Sustainable Development in Africa, 15(2), pp:68-80.
Singh, K. and Kodan, A. S. (2011). Financial Inclusion, Development and its Determinants: An Empirical Evidence of Indian States, Asian Economic Review. 53(1), pp: 115-134.
Solo, T. M. and Manroth, A. (2006). Access to financial services in Colombia: The “Unbanked” in Bogota, World Bank Policy Research Working Paper 3834.
Journal of Economic Policy & Research, Vol 13, No 2

17
AbstractResearches in the past have clearly witnessed the evidence of underpricing of IPOs globally. Many efforts have been made to explain this phenomenon and ‘InformationAsymmetry’hasbeencitedasoneofthemostsignificantcauses.In2006,SEBIintroducedIPOgradingasatechniqueofIPOcertification,asapioneereffort in the world and made it mandatory in May, 2007. It was emphasizedby SEBI that it can reduce under-pricing by curtailing the level of information asymmetry.Thepurposeofthiscertificationprocessistoprovideinformationtothe individual investors regarding fundamental of the issuer. SEBI again made IPOs gradingvoluntaryinFebruary2014citingthat,‘IPOgradinghadfailedtoserveitspre stated objectives. SEBI alleged that correlation was found neither between grading and subscription nor between grading and post listing performance’.Thisstudyaimsatanalysingwhetherthegradingtechniqueishelpfulinreducingunderpricing and assisting retail investors in better decision making? The data havebeencollectedfor5yearsfrom2011-2015forbookbuiltIPOsonly.Thefirstthreeyearsi.e.from2011to2013istheperiodwhengradingwasmandatoryandnexttwoyearsi.e.2014&2015whengradingwasnotmandatory.OLSregressionanalysis has been used for analysing this cross sectional data. The study reveals that higher graded IPOs are not better subscribed by retail investors. The paper alsoconcludedthattheunder-pricingisnotsignificantlydifferentforgradedandnon-graded IPOs but when only graded IPOs were analysed it was found that highergraded(withgrade4&5)IPOswitnessedlesserunder-pricing.Theauthorsare of the opinion that if retail investors would have been made more aware, the performance of the IPO grading may have been different as some of the studies shows that the higher graded IPOs are better subscribed by institutional investors.
Keywords: Information Asymmetry, IPO Grading & Pricing Efficiency &Underpricing
IntroductionThe role of certification in Initial Public Offerings (IPOs) is important because of the information asymmetry between the issuing firm and the investors; and among investors themselves. Unless the certification is credible, the investors are going to pay a lower price to the firm for having an informational advantage over them. (Khurshed, Paleari, Pande, & Vismara, 2008). In 2006, SEBI introduced
Information Asymmetry, IPO Grading & Pricing Efficiency: An Empirical Analysis of IPOs in India
A. R. Tripathi1Shri Narayan Pandey2
ISSN 0975-8577 Volume 13, No 2, April-September 2018 pp. 17-24
Journal of Economic Policy & Research
1 Professor,Ex-Head&Dean,FacultyofCommerce,BanarasHinduUniversityandcanbereachedat [email protected]
2 Research Scholar, Faculty of Commerce, Banaras Hindu University and can be reached [email protected]

Volume 13, No 2, April-September 201818
IPO grading as a technique of IPO certification, as a pioneer effort in the world and made its made compliance mandatory in May, 2007. In a review meeting on 30 October 2013, Securities and Exchange Board of India (SEBI) concluded that IPO grading had failed to serve its pre stated objectives. Correlation was found neither between grading and subscription nor between grading and post listing performance; and SEBI again made IPOs grading voluntary in February 2014.
Historically, India was a regulated economy and there were no Institutional players in the capital markets. This was because the economy was tightly controlled by the Government and there was little incentive for the private sector to set up banks, mutual funds and other financial institutions. In such a scenario, the retail investors were the only source of funds for firms who wanted to go public. Gradually as the economy liberalized, and the Institutional players became important, there were some compulsory allocations to be made to Institutional players. However the retail investors continued to receive the attention of the regulators in terms of protection of their interests. Recently, the IPO Grading exercise is also an attempt to ensure that the retail investors have some “information” about the fundamentals of the firms going public. (Khurshed, Paleari, Pande, & Vismara). Thus, we can observe that the prime motive of IPO grading is to reduce Information Asymmetry. ‘The grade, acting as a certification, is expected to help the judgment of retail investors, especially, in the context of IPOs by small and unknown firms. The grade could help them to make a more objective judgment as it claims to compress the various issue related information into an `easy-to-use’ symbol.’ (Jacob & Agarwalla, 2012)
IPO GradingSEBI’s guidelines suggest that the grading of IPOs is a service aimed at facilitating assessment of equity issues offered to the public. The Grade assigned to any individual IPO is an assessment of the “fundamentals” of the issuer concerned on a relative grading scale, in relation to the other listed equity securities in India. The grading is assigned on a five-point with a higher score indicating stronger fundamentals and vice versa as below.
IPO grade 1: Poor fundamentalsIPO grade 2: Below average fundamentalsIPO grade 3: Average fundamentalsIPO grade 4: Above average fundamentalsIPO grade 5: Strong fundamentalsThe Grading exercise emphasizes on evaluating the prospects of the industry in
which the company operates, and the company’s competitive strengths that would allow it to address the risks inherent in the business. SEBI registered Credit Rating Agencies (CRA) like CRISIL, CARE, ICRA, India Ratings & Research (earlier Fitch India) as well as Brickwork Rating were entrusted with the job of Grading the IPOs. CRAs claim that ‘IPO grading is neither a recommendation to buy, sell or hold the securities nor it supplements to the valuation or pricing of the IPO’.
Information Asymmetry & Under-PricingThe main rationale for liberalization of IPO pricing in India is to reduce the amount of under-pricing. Free pricing of IPOs is expected to reduce but not completely
Journal of Economic Policy & Research, Vol 13, No 2

19
eliminate under-pricing. (Krishnamurti & Kumar, 2002). Several IPO under-pricing models are built around information asymmetry (for example, Rock 1986; Benveniste and Spindt 1989).
Under these models, the under-pricing is expected to be higher when the information asymmetry is greater. (Jacob & Agarwalla, 2012). (Rock, 1986), while discussing Winner’s curse theory, categorized investors into two types: informed and uninformed. Informed investors are knowledgeable about the future prospects of the shares being sold and will only attempt to buy when the issue is underpriced. Uninformed investors, on the other hand, do not know which issues are underpriced or overpriced, and therefore do not discriminate between issues when they apply for IPOs. They will be allocated only a small fraction (or none at all if the demand is too strong) of the most desirable new issues, while they are certain to get full allotment of the least attractive new issues. The uninformed investors face a winner’s curse: if they get all of the shares that they demand, it is due to the fact that the informed investors do not want them. Due to this adverse selection problem, the uninformed investors will exit the market unless IPOs are sufficiently underpriced on average to recompense them for their informational handicap. An implication of the winner’s curse theory is that riskier issues should be underpriced more. Indian IPOs are expected to be underpriced more than the IPOs from developed markets, due to the higher degree of participation by individual investors. (Singla, 2012) simplified the theory and opined that all Investors are not equally informed as information research is costly and time consuming. Some investors become informed and learn the true firm’s value while others remain uninformed. Informed investors subscribe IPOs only when they know that these issues are underpriced and there is money to be made, while uninformed investors can subscribe to any IPO. Since the management’s goal is to maximize the expected proceeds, they try to fix a price for IPO, which gives them desired funds at the same time ensure that the IPO is subscribed. A lower price induces more uninformed investors to submit bids in the offering. An increasing number of investors, who potentially submit bids in the offering, also increase the probability that the offering will succeed.
IPO grading was introduced by SEBI and it was emphasized that it can reduce under-pricing by curtailing the level of information asymmetry. The purpose of this certification process is to provide information to the individual investors regarding fundamental of the issuer. ‘IPO Grading exercise is also an attempt to ensure that the retail investors have some ‘information’ about the fundamentals of the firms going public.’ (Khurshed, Paleari, Pande, & Vismara, 2008)
Literature Review(Ritter J. R., 1984) analyzes the “hot issue” market of 1980, the 15-month period starting in January 1980 and extending through March 1981 during which the average initial return on un-seasoned new issues of common stock was 48.4%. (This is not an annualized return.) This average initial return compares with an average of 16.3% during the “cold issue” market comprising the rest of the 1977-82 period. An equilibrium explanation for this difference in average initial returns is investigated but is found to be insufficient. Instead, this hot issue market is found to be associated almost exclusively with natural resource issues. For firms in other industries, a hot issue market is barely perceptible.
Information Asymmetry, IPO Grading & Pricing Efficiency: An Empirical Analysis of IPOs in India

Volume 13, No 2, April-September 201820
(Khurshed, Paleari, Pande, & Vismara, 2008) investigate if the recently introduced IPO Grading process in India is able to reduce the ex-ante uncertainty and hence the first day returns. The results suggest that as of now the IPO Grading process is not significantly able to reduce the ex-ante uncertainty and therefore there is no significant drop in the first day returns of Indian IPOs after the introduction of Grading. Authors further investigated whether any of the three investor groups is making use of the Grades and found that the more informed QIB investors do invest more in IPOs with higher Grades; and find that older firms are associated with IPOs of higher grades but contrary to popular perception higher size issues are not necessarily associated with better Grades. Further it was observed that the retail investors find the unique regulatory feature of the transparency of the book to be a much stronger signal than the information provided by the Grades.
(Poudyal, 2008) conducted regression analysis study of a total of 63 IPOs that had been graded. Through the study, author finds that securities with higher IPO grades, the subscription rate of the IPOs improves across all class of investors, including retail investors. Further it was found that IPO grades are inversely related to short term liquidity of the IPOs i.e. at least in the short term, higher graded IPOs don’t exhibit high turnover ratio. It was also concluded that IPO grade fails to explain with any significance the subsequent market performance of the issues in terms of capital gains.
(Jacob & Agarwalla, 2012) opine that results tend to suggest that the IPO grading had only a limited impact on the bidding of investors for IPOs in India. It appears that the grading influences investor demand for IPOs. High grade issues experience greater subscription from both the institutional and retail investors, and the low grade issues, on the other hand, tend to attract lower subscription. The grading which was expected to guide the retail investors, however, appears to be less significant for their demand. The efficiency of IPO pricing, however, appears to be uninfluenced by the IPO grades. The underpricing of the issues is unrelated to their grade. Graded issues, which are expected to have lower information asymmetry, do not have a relatively lower underpricing compared to ungraded issues or high grade issues do not have lower underpricing compared to the low grade issues.
(Singla, 2012) investigates the effects of IPO grading on short term performance of IPOs. The findings suggest that there is a significant difference between the return generated by graded IPOs and non-graded IPOs. Graded IPOs generate better returns, which contradicts the information asymmetry theory of underpricing in short term. At the same time when the effect of a particular grade at the short term performance of IPOs is analysed, there is no evidence of any effect of IPO grade on short term performance of IPOs. Therefore the difference which is observed can be attributed to external factors and different market conditions that prevailed during the study period.
(Deb & Marisetty, 2010) one of the earliest studies on the grading, found that the IPOs after the introduction of grading is associated with lower under-pricing. Using data of 159 Indian IPOs, they find, grading decreases IPO under-pricing and influences demand of retail investors. Post listing, highly graded IPOs attract greater liquidity and exhibit lower risk. IPO grading successfully capture firm size, business group affiliation and firm’s quality of corporate governance. Our findings imply that in emerging markets regulator’s role to signal the quality of an IPO contributes towards the market welfare.
Journal of Economic Policy & Research, Vol 13, No 2

21
(Bansal & Khanna, 2013) procure that the grading decreases IPO under-pricing and positively influences demand of retail investors, issue size, earnings before interest and dividend, long-term debt-equity equity ratio and profit to the book value ratio. Grading diminishes the number of share offered, a debt-equity ratio, and earnings before interest, dividend and tax, fixed to assess ratio and is having much impact on Ex-Ante uncertainty. Not withstanding, grading does not affect subscription rate, offer timing (difference in days between offer days and listing days), firm’s age, debtors turnover ratio, creditor payment method, cash to price earnings ratio, PIPH (post issue promoter’s holding), interest coverage ratio, inventory turnover ratio, market capitalization, price earnings ratio, return on capital employed and return on net worth of the IPOs. IPO grading is prominent to capture firm size, business group affiliation and firm’s quality of corporate governance.
Research ObjectiveThe objective of this study is to analyse the impact of IPO grading on short term under-pricing (i.e. listing day performance) and on retail subscription of the IPOs.
Research HypothesesH01: Retail Subscription for high graded and low graded IPOs are not
significantly different.H02: There is no significant difference in the magnitude of under-pricing
between graded and non-graded IPOs.H03: Under-pricing is not significantly different for high graded and low graded
IPOs.
Empirical MethodologyThis study is based on secondary data (cross-sectional) collected from different web portal like chittoregarh.com, SEBI, BSE and NSE. Data have been collected for five years from 2011-2015. The first three years i.e. from 2011 to 2013 is the period when grading was mandatory and next two years i.e. 2014 & 2015 when grading was not mandatory. Three regression models have been developed to test the hypotheses. Issue size and firm’s age has been used as control variable and dummy variable has been used for IPO grades. SPSS and E-views have been used for data analysis. Only book built IPOs have been considered for this study. The impact of IPO grading on retail subscription has been studied by applying multivariate regression (OLS).
Ln_RetailSubs = α+ β1Grade_dummy + β2Issue_Size+ β3Age +Ɛi (1)Where,Grade_dummy is a dummy variable used for actual grade i.e. low grade and
high grade IPOs.To study the power of grading in explaining underpricing, another OLS
regression model had been used, which can be expressed as:Ln_UP= α+ β1 Grade_dummy + β2Issue_Size+ β3Retail_Subs+ β4Age+ Ɛi (2)Where,
Information Asymmetry, IPO Grading & Pricing Efficiency: An Empirical Analysis of IPOs in India

Volume 13, No 2, April-September 201822
Ln_UP is under-pricing calculated as difference of log of closing pricing on listing day and log of issue price.
And, Grade_dummy variable has been used for graded and non-graded IPOsTo assess the impact of individual grades on under-pricing, one more regression
model has been applied as below:Ln_UP= α+ β1 Grade_dummy + β2Issue_Size+ β3Retail_Subs+ β4Age+ Ɛi (3)Where,Grade_dummy is a dummy variable used for high graded (With graded 4 & 5)
and low graded (with graded 1, 2 &3) IPOs.
ResultsDescriptive findings of the study have been summarized in Table 1. It depicts that as the grade decreases, retail subscription also decreases. But, for grade 2 retail subscription is exceptionally high. More or less, we can also observe that under-pricing is more if the grade is low. It can be clearly inferred that, higher the grade, lesser is the under-pricing.
Table 1: Descriptive Results
Grade Retail Subscription Under-Pricing
5 10.09 0.1275
4 3.64 0.0955
3 1.68 0.1907
2 4.32 0.5774
1 1.70 0.2265
IPO Grading and Retail SubscriptionLiterature suggests that higher the grade, higher should be retail subscription. For this study we classified IPOs under two categories namely low grade (Grade 1 & 2) and high grade (grade 4&5). The purpose is to assess whether higher graded IPOs are subscribed more or not by retail investors. The regression coefficient of grade dummy for high and low grades reveals that it does not have any significant impact on retail subscription. This leads to the acceptance of null hypothesis and further proves that grading has failed as a mechanism in helping retail investors in making informed decision.
Table 2: RetailSubscriptionandGrading(highandlowgrade)
Variable Coefficient Std. Error t-statistics Prob.
Grade_dummyLn_IssueSizeLn_AgeC
0.560491-0.165393-0.0162541.549097
0.3480460.1446570.2235191.061568
1.610394-1.143349-0.0727191.459254
0.11420.25880.94230.1513
R-squared 0.156891AdjustedR-squared 0.101906F-statistic 2.853327Prob(F-statistic) 0.047402
Journal of Economic Policy & Research, Vol 13, No 2

23
Information Asymmetry, IPO grading & Pricing Efficiency: An Empirical Analysis of IPOs in India
IPO Grading and Under-PricingWhile abolishing mandatory grading of IPOs, SEBI claimed, ‘IPO grading had failed to serve its pre-stated objectives. Correlation was found neither between grading and subscription nor between grading and post listing performance’. Based on this claim, this study formulated two hypotheses, as stated above. First one, to cogitate difference of under-pricing between graded & non-graded IPOs and another one between high grade and low grade IPOs; and the findings has been presented in table 3 & 4. Table 3 shows the impact of grading on retail subscription. The coefficient of the grade dummy (used for graded and non-graded IPOs) is not able to explain under-pricing. It means under-pricing is same for both graded and non-graded IPOs.
Table 3: Under-PricingandGrading(gradedandnon-gradedIPOs)
Variable Coefficient Std. Error t-statistics Prob.Grade_dummyLn_IssueSizeLn_RetailSubsLn_AgeC
0.049447-0.0713330.074005-0.1065950.822421
0.0783350.0334810.0305910.0444480.210041
0.631221-2.1305772.419136-2.3982013.915536
0.53200.04020.02090.02190.0004
R-squared 0.318630AdjustedR-squared 0.240759F-statistic 4.091775Prob(F-statistic) 0.007983
Table 4 depicts that under-pricing is high if the IPOs are graded low. The coefficient of the grade dummy (for high and low grade IPOs) is significant at 5% confidence level and depicts a negative relation between under-pricing and grade dummy. It means high graded (with Grade 4&5) IPOs are less underpriced. This is contrary to (Jacob & Agarwalla, 2012) but consistent with (Poudyal, 2008).
Table 4: Under-PricingandGrading(highandlowgradeIPOs)
Variable Coefficient Std. Error t-statistics Prob.Grade_dummyLn_IssueSizeLn_RetailSubsLn_AgeC
-0.236864-0.0468020.035399-0.1238990.933958
0.1010230.0427870.0428160.0689170.266518
-2.344666-1.0938260.826777-1.7978033.504301
0.03070.28850.41920.08900.0025
R-squared 0.540520AdjustedR-squared 0.438413F-statistic 5.293674Prob(F-statistic) 0.005354
ConclusionIPO grading when introduced in India, as a unique experiment, aimed at reducing information asymmetry thereby helping retail investors making informed decision. It was hypothesized that higher graded IPOs will be less underpriced and better subscribed. But, the results of this study are different. The study reveals that higher graded IPOs are not better subscribed by retail investors. This finding resembles with (Khurshed, Paleari, Pande, & Vismara, 2008) and (Jacob & Agarwalla, 2012) but is contrary to the earlier finding of (Deb & Marisetty, 2010). The paper also

Volume 13, No 2, April-September 201824
concluded that the underpricing is not significantly different for graded and non- graded IPOs but when only graded IPOs were analysed it was found that higher graded (with grade 4&5) IPOs witnessed lesser underpricing. But, the authors are of the opinion that if retail investors would have been made more aware, the performance of the IPO grading may have been different as some of the studies shows that the higher graded IPOs are better subscribed by institutional investors.
ReferencesBansal, R., and Khanna, A. (2013). High credit rating IPOs and determinants of
underpricing, Journal of Economics and International Finance, pp:131-38.Chauhan, A. K. (n.d.). An Analysis of Initial and Post Issue Performance of IPOs
in Indian Stock Market.Deb, S. S., and Marisetty, V. B. (2010). Information Content of IPO Grading,
Journal of Banking & Finance, pp:2294-2305.Divya, H. (2013). A Study on Performance of Indian IPOs During the Financial
Year 2010-2011, International Journal of Marketing and Financial Services & Management Research.
Jacob, J., and Agarwalla, S. K. (2012). Mandatory IPO Grading: Does It Help Pricing E_ciency?, W.P. No. 2012-12-07 - IIMA.
Khurshed, A., et al. (2008). Grading in India: Does it add value to the bookbuilding process? Available at www. unibg. it/dati/bacheca/530/36104. pdf
Krishnamurti, C., and Kumar, P. (2002). The initial listing performance of Indian IPOs, Managerial Finance, pp:39-51.
Kumar, P. (2012). A Study on Popularity of Book Building over Fixed Price Option, International Journal in Multidisciplinary and Academic Research.
Murthy, K. V., and Singh, A. K. (n.d.). IPO Market: Underpricing or overpricing?Pandey, A. (2004), Initial Returns, Long Run Performance and Characteristics of
Issuers: Differences in Indian IPOs Following Fixed Price and Book Building Process.
Poudyal, S. (2008). Grading Initial Public Offerings (IPOs) in India’s Capital Markets: A Globally Unique Concept, W.P. No.2008-12-08 - IIMA.
Rock, K. F. (1986). Why new issues are underpriced, Journal of Financial Economics, pp:187-212.
Singla, H. K. (2012), IPO Grading and Short Term Performance of IPOs in India, UDYOG PRAGATI - The Journal for Practising Managers.
www.chittorgarh.com.
Journal of Economic Policy & Research, Vol 13, No 2

25
AbstractIndia contributesmore than17per centofworld’s total population and ranksecond in terms of human population globally. India, though predominantly rural, its urbanmassshares11percentoftheworld’surbanpopulation,whichisprojectedtoriseto15percentby2050.TheurbanpopulationgrowthrateinIndiaismuchhigher than the rural growth rate and as a result, transforming rapidly to be an urbanizednationby2050.Thisurbangrowth is inevitableandaccompaniedbyincreaseinpercapitaincomeaswellascountry’sGDPbutproduceenormousstress on the eco-system. Due to rapid and uncontrolled urbanization, the environment is being degraded causing problems like land degradation, worsening ofwaterquality,waterscarcity,wastedisposal,increaseinindustrialcorridors,airpollution and slum areas in the periphery of cities. This paper present a detailed analysis of urban growth in India, which is based on secondary data collected from different sources. The distribution of urban areas, large and million plus populated cities along with polluted clusters across the state / UTs in the country has been depicted. The effect on urbanization has been studied in two key areas; economy and environment. The urbanization has shown a positive impact on the GDP of the country up to a certain level. Environmental sustainability of different states has been assessed in respect to urbanization. Rapid transformation of rural India to urban base is also causing sectoral changes in the employment pattern and gradually shifting avenues towards informal sector. The urbanization is essential for country’seconomicdevelopment,butinsteadofsmartandrapidtransformationemphasis should be given on sustainable urbanization which would be free from slum-life of industrial city.
Keywords: Urbanization, Economic Development, EPI, ESI, Smart City,Environmental Sustainability, Socio-economic Indicator
IntroductionAlong with the world India is an integral part of the urban transformation, and is gradually shifting from its rural-base to urban. As per the Census of India 2011 out of 1.21 billion of total population of the country, 377 million lives in urban areas. This is accounted to 31.15 per cent of total population of India, however, there are wide variation of urban population among the states in the country. The decennial
Rural to Urban India: A Sustainable or Smart Transformation?
S.N. Nandy*
ISSN 0975-8577 Volume 13, No 2, April-September 2018 pp. 25-36
Journal of Economic Policy & Research
* HARSAC,CCSHaryanaAgriculturalUniversityCampus,[email protected]

Volume 13, No 2, April-September 201826
growth rate (2001-2011) of human population in India has recorded 17.7 per cent growth. The urban population has grown at the rate of 32.15 per cent against the rural growth rate of 12.38 per cent during the decade. As the higher growth of urban population persists over the years, it is estimated that above 50 per cent of total population of India will be urban by 2050 (Kundu, 2016).
The process of urbanization in developed countries are generally slow but stable and has been accompanied by agriculture and industrial revolution, higher per capita income and higher standard of living, whereas in developing countries the rate of urbanization is fast and is accompanied by rapid growth of service sector in the economies (Macbeth and Collinson, 2002). Urban areas, particularly large and metropolitan cities contribute significantly to the national economy of any country. According to McKinsey Global Institute estimates (2011), about 80 per cent of the world’s gross domestic product (GDP) is being generated in urban areas. The urban economic mass is concentrated on large cities, as the top 100 cities in the world is contributing about 38 per cent and top 600 cities producing about 60 per cent of the global GDP (Anonymous, 2011). In India the urban GDP accounted about 58 per cent of overall GDP of the nation in 2008 and by 2030, Indian cities could generate more than 70 per cent of national GDP.
Urbanization, though inevitable has direct linkage with environmental parameters such as change in land use pattern, habitation, population density, environmental pollution, increase in energy consumption and generation of waste, etc. The rural to urban transformation though enhance economy but causing havoc in terms of over exploitation of natural resources and environmental degradation. There are several factors of urban growth in India, such as, natural increase of human population, rural to urban migration, inclusion of peripheral areas within the city boundaries and reclassification of settlements from rural to urban, etc. The cities in India has also shown peripheral expansion where small municipalities and large villages merged with the core city and become part of the larger metropolitan area (Sharma, 2012). Various initiatives have been taken up by the government to tackle the issues of urban development, infrastructure development, express-way, road-rail-air connectivity, etc. but sustainability issue is being overlooked as prime objective. The environmental sustainability also have limited relevance in the development paradigm of the world, where most people live hand to mouth and focus of development is to meet the short term region-specific goal of local people. For such people environmental sustainability has simply no immediate relevance; the struggle of surviving holds obvious priority (Roth, 2013).
State of Economy and Habitat of IndiaThe habitation of India is primarily rural and most of the people in large states reside in the rural areas. However, in some smaller states and union territories (UTs) a significant percentage of people live in urban areas. The percentage of urban population widely varies across the state/UTs from as low as 10.04 per cent in Himachal Pradesh to above 97 per cent in Chandigarh (UT). The economy of smaller states/UTs with higher percentage of urban population is better as compared to larger states in the country. Generally the share of GDP by all large states is higher than that of smaller states. However, there is exception like Bihar,
Journal of Economic Policy & Research, Vol 13, No 2

27
the third largest state in terms of population, where the net state domestic product (NSDP) at current price is lowest among all states/UTs in the country (Table 1).
Table 1: Socio-EconomicStatusofIndianStates/UTs(2011)
State/UTsPopulation (million)on 2011census
Dec.growthrate
(2001-11)
Population density (person/sq. km.)
Share of country’s
population (in %)
Contribution to country’s GDP (%)
% of urban population (out of total population)
NSDP at Current Price
(in Rs.)
% of BPL population@ (out of total population)
Andaman & Nicobar Islands 0.38 6.68 46 0.03 - 35.67 76883 1.0
Andhra Pradesh 84.67 11.10 308 6.99 8.02 33.49 62912 9.2
Arunachal Pradesh 1.38 25.92 17 0.11 0.10 22.67 55789 34.7
Assam 31.17 16.93 397 2.57 1.94 14.08 30569 32.0
Bihar 103.80 25.07 1,102 8.57 2.95 11.30 20708 33.7
Chandigarh 1.05 17.10 9,252 0.09 - 97.25 128634 21.8
Chhattisgarh 25.54 22.59 189 2.11 1.91 23.24 40412 39.9
Dadra&NagarHaveli 0.34 55.50 698 0.03 - 46.62 - 39.3
Daman & Diu 0.24 53.54 2,169 0.02 - 75.16 - 9.9
Goa 1.46 8.17 394 0.12 0.43 62.17 168572 5.1
Gujarat 60.38 19.17 308 4.99 7.58 42.58 75115 16.6
Haryana 25.35 19.90 573 2.09 3.77 34.79 94680 11.2
HimachalPradesh 6.86 12.81 123 0.57 0.84 10.04 65535 8.1
Jammu & Kashmir 12.55 23.71 124 1.04 0.86 27.21 37496 10.3
Jharkhand 32.97 22.34 414 2.72 2.19 24.05 29786 37.0
Karnataka 61.13 15.67 319 5.05 5.61 38.57 62912 20.9
Kerala 33.39 4.86 859 2.76 3.95 47.72 71434 7.1
Lakshadweep 0.06 6.23 2,013 0.01 - 78.08 - 2.8
Madhya Pradesh 72.60 20.30 236 6.00 3.82 27.63 32222 31.6
Maharashtra 112.37 15.99 365 9.28 15.17 45.23 83471 17.4
Manipur 2.72 18.65 122 0.22 0.19 30.21 29684 36.9
Meghalaya 2.96 27.82 132 0.24 0.21 20.08 50427 11.9
Mizoram 1.09 22.78 52 0.09 0.09 51.51 48591 20.4
Nagaland 1.98 -0.47 119 0.16 - 28.97 52643 18.9
NCTofDelhi 16.75 20.96 11,297 1.38 - 97.50 150653 9.9
Odisha 41.95 13.97 269 3.47 2.72 16.68 41167 32.6
Puducherry 1.24 27.72 2,598 0.10 - 68.31 150653 9.7
Punjab 27.70 13.73 550 2.29 3.68 37.49 69737 8.3
Rajasthan 68.62 21.44 201 5.67 4.23 24.89 42434 14.7
Sikkim 0.61 12.36 86 0.05 0.06 24.97 81159 8.2
Tamil Nadu 72.14 15.60 555 5.96 7.34 48.45 72993 11.3
Tripura 3.67 14.75 350 0.30 0.31 26.18 44965 14.0
Uttar Pradesh 199.58 20.09 828 16.49 9.32 22.28 26355 29.4
Uttarakhand 10.12 19.17 189 0.84 0.88 30.55 36368 11.3
West Bengal 91.35 13.93 1,029 7.55 8.12 31.89 48536 20.0
INDIA 1210.56 17.64 382 100 100 31.15 98719 21.9
@2011-12figuresasperTendulkarMethodology.
The urbanization has a direct relationship with per capita income, as higher urbanized states (above 40 per cent urban population) is having higher per capita
Rural to Urban India: A Sustainable or Smart Transformation?

Volume 13, No 2, April-September 201828
income as compared to the predominantly rural states. The below poverty line (BPL) population is also relatively small in urbanized states as compared to the states inhabited mostly by rural. The gross state domestic product (GSDP) which is expressed in monitory term as the volume of all goods and service produced within the state during a given period of time, has also a positive correlation with urbanization as highly urbanized large states like Maharashtra, Tamil Nadu and Gujarat has recorded higher GSDP in the country (Figure 2). In contrast the rural states like Bihar, Odisha, Assam has recorded lower GSDP among all large states in the country.
Distribution of Urban AreasThe urban population in India has recorded about 14 fold increase from 1901 to 2011. This growth is largely uneven but not skewed to a single region or concentrated to a specific city of the country (Nandy, 2015). Among the large states the habitation of Bihar, Assam and Odisha are mostly rural (above 80 per cent of rural population) whereas in Tamil Nadu, Kerala and Maharashtra a substantial population (above 45 per cent of total population) lives in urban areas. As per 2011 Census 100 most populous cities (including million plus populated cities) are spread across 21 states/UTs in India (Figure 1). Among these cities more than 50 cities are located in five states namely, Uttar Pradesh, Maharashtra, Tamil Nadu, Kerala and Gujarat.
Table 2: State-WiseDistributionofPopulousCities,ProposedSmartCitiesandPollutedAreas
States / UTs
100 Most Populous Cities(Census 2011)
100 Proposed Smart Cities
88 Polluted Cities, Industrial Cluster/Area (as per CEPI
Index)Million Plus
Populated Cities (MP_CITY)
Other Large Cities
(LARGE_CITY)
Andaman & Nicobar Islands
- - Port Blair -
Andhra Pradesh# Hyderabad,Vishakhapatnam, Vijayawada
Warangal, Guntur, Nellore, Rajahmundry
GreaterHyderabad,Greater Warangal, Vishakhapatnam, Tirupati, Kakinada
Vishakhapatnam*,Patancheru-Bollaram*,Kathedan, Kukatpalli, Vijayawada
Arunachal Pradesh - - Pasighat -Assam - Guwahati Guwahati Digboi*,Burnihat,Bihar Patna - Muzaffarpur,
Bhagalpur, BiharsharifHajipur
Chandigarh Chandigarh - Chandigarh -Chhattisgarh Raipur, Durg-
Bhilainagar- Raipur, Bilaspur Korba*,Bhilai-Durg,
RaipurDadra&NagarHaveli - - Silvassa -Daman & Diu - - Diu -Delhi Delhi - New Delhi Municipal
CouncilNazafgarh drain basin*(includingAnand Parvat, Naraina, Okhla and Wazirpur)
Journal of Economic Policy & Research, Vol 13, No 2

29
States / UTs
100 Most Populous Cities(Census 2011)
100 Proposed Smart Cities
88 Polluted Cities, Industrial Cluster/Area (as per CEPI
Index)Million Plus
Populated Cities (MP_CITY)
Other Large Cities
(LARGE_CITY)
Goa - - Panaji -Gujarat Ahmedabad, Surat,
Vadodara, RajkotBhavnagar, Jamnagar
Gandhinagar, Ahmedabad, Surat, Vadodara, Rajkot, Dahod
Ankaleshwar*,Vapi*,Ahmedabad,Bhavnagar, Junagarh, Vatva, Rajkot, Surat, Vadodara
Haryana Faridabad Gurugram (Gurgaon)
Karnal,Faridabad Faridabad,Panipat
HimachalPradesh - - Dharamshala Parwanoo*,Baddi,Kala Amb
Jammu & Kashmir Srinagar Jammu TBD1 -Jharkhand Jamshedpur, Dhanbad,
RanchiBokaro Steel City
Ranchi Dhanbad*,BadaJamda, Jamshedpur, Saraikela, Ramgarh, West Singhbhum
Karnataka Bangaluru Mysore,Hubli-Dharwad, Mangalore, Belgaum, Gulbarga
Mangalore, Belagavi, Shivamogga,Hubli-Dharwad, Tumakuru, Devanegere
Bhadravathi*,Bidar,Mangalore, Pinia, Raichur
Kerala Kochi, Kozhikode, Thrissur, Malappuram, Thiruvananthapuram, Kannur, Kollam
- Kochi GreaterKochi*
Lakshadweep - - Kavaratti -Madhya Pradesh Indore, Bhopal,
Jabalpur, GwaliorUjjain Bhopal, Indore,
Jabalpur, Gwalior, Sagar, Satna, Ujjain
Nagda-Ratlam*,Indore, Dewas, Gwalior, Nagda- Pitampur
Maharashtra Greater Mumbai, Pune, Nagpur, Nashik, Vasai Virar, Aurangabad
Bhiwandi, Solapur, Amravati, Malegaon, Kolhapur, Nanded-Waghala, Sangali
Navi Mumbai, Nashik, Thane, Greater Mumbai, Amravati, Solapur, Nagpur, Kalyan-Dombivali, Aurangabad, Pune
Chembur*,Tarapur*,Aurangabad, Chandrapur,Dombivalli, Nashik, Navi Mumbai, Pimpari-Chinchwad
Manipur - - Imphal -Meghalaya - - Shillong -Mizoram - - Aizawl -Nagaland - - Kohima -Odisha - Bhubaneswar,
Cuttack,Raurkela
Bhubaneshwar, Raurkela
Angul-Talcher*,IbValley, Jharsuguda, Paradeep
Puducherry - Puducherry Oulgaret -Punjab Ludhiana, Amritsar Jalandhar Ludhiana, Jalandhar,
AmritsarMandiGobindgarh*,Ludhiana, Batala, Jalandhar
Rural to Urban India: A Sustainable or Smart Transformation?

Volume 13, No 2, April-September 201830
States / UTs
100 Most Populous Cities(Census 2011)
100 Proposed Smart Cities
88 Polluted Cities, Industrial Cluster/Area (as per CEPI
Index)Million Plus
Populated Cities (MP_CITY)
Other Large Cities
(LARGE_CITY)
Rajasthan Jaipur, Jodhpur, Kota Bikaner, Ajmer Jaipur, Udaipur, Kota, Ajmer
Jodhpur*,Pali*,Bhiwadi, Jaipur,
Sikkim - - Namchi -Tamil Nadu Chennai,
Coimbatore,Madurai,Tiruchirappalli
Tiruppur, Salem, Erode, Tirunelveli, Vellore
Tiruchirapalli, Tirunelveli, Dindigul, Thanjavur, Tiruppur, Salem, Vellore, Coimbatore,Madurai, Erode, Thoothukudi, Chennai
Manali*,Vellore(NorthArcot)*,Coimbatore,Cuddalore,Tirupur,Mettur, Erode
Tripura - - Agartala -Uttar Pradesh Kanpur, Lucknow,
Ghaziabad, Agra, Varanasi, Meerut, Allahabad
Bareilly, Aligarh, Moradabad, Saharanpur, Gorakhpur, Noida, Firozabad,Jhansi, Muzffarnagar
Moradabad, Aligarh, Saharanpur, Bareilly, Jhansi, Kanpur, Allahabad, Lucknow, Varanasi, Ghaziabad, Agra, Rampur, TBD1
Singrauli*,Agra,Aligarh, Kanpur, Bulandsahar-Khurza, Noida,Firozabad,Mathura, Meerut, Varanasi-Mirzapur, Ghaziabad, Moradabad
Uttarakhand - Dehradun Dehradun Haridwar,Udhamsingh Nagar
West Bengal Kolkata, Asansol Siliguri, Durgapur
New Town – Kolkata, Bidhannagar, Durgapur,Haldia
Howrah*,Durgapur*,Asansol,Haldia
Source:2015MoUD,GoI,2009CPCBandNandy,2015
# IncludesTelanganastate,formedon2014bydividingofAndhraPradesh
*Industrialclusters/areasinclude24existingcriticallypollutedareas(asperCPCBassessment)ofthecityorpartofthecitylikeNazafgarhdrainbasinofDelhi,ChemburofGreaterMumbai,etc.
TBD1: one city yet to be decided
Among Central Pollution Control Board (CPCB, 2009) assessment, maximum numbers of polluted cities/industrial clusters are located in Uttar Pradesh followed by Gujarat, Maharashtra and Tamil Nadu (Table 2). In a major urban initiative the Government of India has proposed 100 Smart Cities on 2015 across different state/UTs in India. The number of smart cities proposed for Uttar Pradesh is also highest (13) in the country followed by Tamil Nadu (12) and Maharashtra (10). Among other large states 7 smart cities has been proposed for Madhya Pradesh and 6 each for Gujarat and Karnataka. All the Himalayan hill states are environmentally rich, less polluted and one smart city has been proposed for each state.
Journal of Economic Policy & Research, Vol 13, No 2

31
Figure 1: Spatialdistributionofurbanizedstates,millionpluscities(MP_CITY)andotherpopulouslargecities(LARGE_CITY)inIndia[MapSource:Nandy,2015].
Urbanization and Environmental SustainabilityUrbanization generally accompanied by major change in habitation, land-use pattern, infrastructure facilities causing land degradation, environmental pollution and large waste disposal. The goal of sustainable urban development is to achieve a balance between the development of the urban areas and protection of the environment/eco-system. To attain the goal of environmental sustainability several initiatives have been taken by the government stressing on economically viable and socially equitable development (Sengupta and Baranwal, 2012). In the recent past, environmental conservation is gaining major concern across the world and several measures have been adapted to judge and quantify the state of environment of a region or a country world-wide. The Environmental Performance Index (EPI) is one of the indices which globally rank the performance of countries on environmental issues in the areas of protection of human health and ecosystems. EPI scores a country based on 22 performance indicators in ten policy categories that reflect facets of environmental public health and ecosystem vitality (YCELP, 2012). Hsu et al., of Yale University (2016) has also developed a relationship between countries’ EPI performance and economic development. The general trend indicates that countries with more financial resources can implement policies to protect human health and the environment in better way. However, this is not always the case. For instance, China and India, both have high GDP per purchasing power parity (PPP) but scores low on the overall EPI. The world ranking of India’s EPI is 141 (in 2016) among analyzed data of 180 countries globally.
Rural to Urban India: A Sustainable or Smart Transformation?

Volume 13, No 2, April-September 201832
Figure 2: Grossstatedomesticproduct(GSDP)andurbanpopulation of Indian states/UTs
In national level, the Planning Commission of India (now NITI Aayog) has developed a methodology to calculate environmental performance index (PC–EPI) on some selected environmental indicators for all the states and UTs in India. The score/rank of each state is calculated based on 16 indicators broadly on 5 categories comprising air pollution, water quality, forests, waste management and climate change (Chandrasekharan et al., 2013). Among all the states in the country, Andhra Pradesh, Sikkim and Himachal Pradesh score high on this performance index during 2012. For category like air pollution, the country is having its own air quality index (AQI) measure. It tracks the air pollution in large cities of the country using a relative scale from good to worst based on pollutant reading lowest to highest AQI, respectively. The Central Pollution Control Board (CPCB) monitors and regulates the standard spectrum of air pollutants, including tiny, dangerous particles known as PM2.5, ozone, carbon monoxide, etc. Similarly for other categories like water, forests and waste management different agencies are monitoring the respective data regularly.
Further, India has launched an Environmental Sustainability Index (ESI) at the state level, which focus on critical intra-country issues such as population pressures, waste management, and environmental budgets. ESI indicator is an aggregation of indices like air quality and pollution, water quality and availability, land-use and agriculture, forest and biodiversity, waste generation and management, energy management, impact on human health and ecosystem, population pressure on ecosystem, environmental budget, etc. (Dash, 2011). The ESI score of individual states are measured in percentage scale. Higher the percentage means highly environmental sustainable state and vice versa.
A scatter diagram depicting the ESI score (2011) and urban population (2011) in percentage scale for all states of India in the format of matrix (5x4 order). The lower/bottom-left cell (block) of the matrix represent worst environmental rank, whereas the top-right cell represent highly environmental sustainable urbanized state (Figure 3). The states of the country depict a dispersed picture, with none
Journal of Economic Policy & Research, Vol 13, No 2

33
of the state fall in these two extreme blocks (bottom-left and top-right). North-eastern states particularly Manipur, Mizoram, Nagaland, Sikkim and Tripura are among the highly sustainable states, whereas Punjab and Gujarat are in the bottom line of environmental sustainability (Figure 3). Other environmental sustainable states are Himachal Pradesh, Assam and Odisha, though they are least urbanized (less than 20 per cent of urban population).
Figure 3: Scatter Matrix of Urban Population vs. ESI Score of Indian States
Socio-Economic Impact of UrbanizationThe goal of sustainable development should not only restrict to the issues of eco-system conservation but also focus on the economically viable and socially equitable development. Urban development irrespective of sustainability, is directly proportional to the economy. The economic impact of urbanization is positive as it opens up the avenues in industry and service sector of the society. The development of the industry and services sectors is measured by their combined stake in GSDP and it is found that the sector has a positive impact on urbanization. As the level of urbanization increases, environmental performance also improves and this performance deteriorates after a certain level of urbanization (Saxena, 2016). The relationship between urbanization and income levels across the states of India also depict a positive trend. The higher urbanization level is associated with the higher per capita income (Dash, 2011).
In the economic front, the composition of GDP has changed gradually in favour of non-primary-sector activities, particularly in favour of service sector. The informal sector contributes the lion-share in employment generation in urban areas. The share of the informal sector is about 70 per cent of the total urban working population with an annual average growth rate of 4.03 per cent, which is higher than that of the formal sector (2.54 per cent) in urban areas (Naik, 2003).
The unemployment rate in urban areas of the country has declined during the first decade of this century. Between short span of time (2004-05 to 2011-12) India has lifted over 15 million persons out of poverty in the urban areas. This unemployment rates declined for both male and female. However, the unemployment continues to be higher among females than that of males.
Rural to Urban India: A Sustainable or Smart Transformation?

Volume 13, No 2, April-September 201834
Smart City InitiativeTo meet the need of the urban population, town planners in India aim at developing the urban eco-system on the four pillars of comprehensive development plan viz., institutional, physical, social and economic infrastructure (Anonymous, 2014). This long term goal can be achieved by comprehensive infrastructure development incrementally. The focus is on sustainable and inclusive development and a ‘smart’ solution for the quality of life to its citizens. The United Nation (UN) sustainable criterion of ‘smart city’ is to provide efficient and clean environment and equal opportunities for all residents of the city. The Smart City Mission of the Government of India is a new initiative in this direction and it is meant to set examples that can be replicated for the creation of similar smart cities in other parts of the country. The focus infrastructure elements in Smart City Mission would include adequate water supply; assured electricity supply; sanitation and waste management; efficient urban mobility and public transport; affordable housing, health and education; robust IT connectivity; good governance; sustainable environment; and safety and security of citizens, etc. (Anonymous, 2015).
The total population of these proposed 100 smart cities (98 declared + 2 to be decided) is about 12 crore contributing for 35 per cent of country’s total urban population as per the 2011 census. The selection criteria of smart city is based on the scoring calculated from various parameters like existing service levels, institutional systems, self-financing and past track record of the city, etc. And a state has to forward the names of highest-scoring cities to the Centre for short-listing in smart cities. The Mission will be operated as a Centrally Sponsored Scheme (CSS) and Government proposes to give financial support of Rs. 100 crore per city per year on an average. An equal amount will have to be contributed by the urban and local body (ULB) of the respective state where the city is located.
ConclusionIndia is the fourth largest emitter of green house gases (GHG) in the world and Indian cities are becoming more vulnerable to climate change. There are many reasons behind vulnerable cities like improper land-use; high population density in urban slum and flood-prone areas; improper infrastructure planning; and competing use of scarce resources, etc. Though India has a lower energy intensity as compared to other large countries like China and United States. This low-carbon character of the country is gradually changing, as urban areas account for 60 per cent of the overall energy consumption of the country. At the same time, the productivity of the urban sector is about to attain 60 per cent to India’s GDP. So there is an urgent need of equilibrium between economic development and energy consumption due to rapid urbanization, particularly the depletion of non-renewable natural resources. To meet this need the government is working to achieve the goal of sustainable urbanization. Consistent with these goals, the Government of India has launched a number of initiatives like, Smart City Mission, Atal Mission for Rejuvenation of Urban Transformation (AMRUT), Swachh Bharat (Clean India) Mission, Pradhan Mantri Awas Yojana - Housing For All (HFA), Heritage City Development and Augmentation Yojana (HRIDAY), and Urban Mission, etc.
The economic development of a country or a region is generally expressed in terms of the growth of its income. And a developed country is expressed in terms
Journal of Economic Policy & Research, Vol 13, No 2

35
of higher level of GDP, GNP, per capita income as well as highly industrialized and technologically advanced nation. However, these indicators of economic development do not take into account the use and depreciation of the renewable or non-renewable natural resources as well as environmental degradation. As the environment is being a multi-disciplinary subject involve complex themes like biodiversity, atmosphere, water, land, soil, human settlements, human activities, etc. and it is quite difficult to collect, analyze and study the relationships among these components. So, how much environmental degradation or loss of ecosystem occurred due to per degree of urbanization needs complex calculation of accounting matrix for different environmental parameters. Further, rapid urbanization rate do not reflect immediately into environmental parameters, as environmental change detection is time variant and require a longer duration to assess and quantify. The scope of this paper is to sketch the urban growth in India, its distribution pattern, spread of large cities, polluted areas across the state/UTs and its impact on environment and socio-economy of the country. A detailed long-term time series data of various environmental and economical parameters is required to define the cause and consequences of urbanization and its impact on economy and environment. Hence, urbanization is inevitable and required for the economic development of the country and there is an urgent need to develop an environmental-economic accounting system to monitor and control the natural resources for environmental sustainability.
ReferencesCentral Pollution Control Board (CPCB) (2009). Comprehensive Environmental
Assessment of Industrial Clusters, New Delhi, P. 32.McKinsey Global Institute (2011). Urban world: mapping the economic power of
cities, P. 12.Ministry of Urban Development, Government of India (2014). Concept note on
Smart City Scheme, P. 46.Ministry of Urban Development, Government of India (2015). Smart Cities:
Mission statement & guidelines, P. 43.Ministry of Urban Development, Government of India (2016). Handbook of
Urban Statistics 2016, P. 383.Ministry of Housing and Urban Poverty Alleviation, Government of India (2016).
India Habitat III: National Report 2016, P. 140.Chandrasekharan, I, et al. (2013). Construction of environmental performance
index and ranking of states, Current Science, 104(4), pp: 435-439.Dash, R. (2011). Environmental Sustainable Index for Indian States 2011, Institute
for Financial Management and Research, Chennai, P. 36.Hsu, A. et al. (2016). Environmental Performance Index 2016, New Haven, CT:
Yale University. Yale Center for Environmental Law and Policy, Yale University and Center for International Earth Science Information Network, Columbia University.
Kundu, D. (2016). Towns of India – Status of Demography, Economy, Social Structures, Housing and Basic Infrastructure, HSMI-HUDCO Chair-NIUA, P. 236.
Rural to Urban India: A Sustainable or Smart Transformation?

Volume 13, No 2, April-September 201836
Macbeth, H. and Collinson, P. (2002). Human population dynamics: Cross-disciplinary perspectives, Cambridge: Cambridge University Press (Eds.), P. 21
Naik, A. K. (2003). Measuring the Informal Economy in Developing Countries. Presented at the IARIW – SAIM Conference, Nepal: IARIW.
Nandy, S.N. (2015). Urbanization in India – past, present and future consequences, Urban India, 35(2), pp: 8-24.
Roth, I.J. (2013). Urbanization in India: Growth of sustainable cities. Saxena, R. (2016). Urbanization and Environmental Performance across Indian
States and Union Territories: A Regression Analysis, 8th Biennial Conference Report of INSEE at IISc. Bangalore.
Sengupta, I. and Baranwal, V. (2012). Sustainability in urban development: an Indian standpoint, Management Insight, 8(2), pp: 41-50.
Sharma, D. (2012). Urban rural convergence, TERI-The Energy and Resources Institute.
YCELP (2012). 2012 Environmental Performance Index and Pilot Trend. Yale Center for Environmental Law & Policy / Center for International Earth Science Information Network In collaboration with World Economic Forum / Joint Research Centre of the European Commission.
Journal of Economic Policy & Research, Vol 13, No 2

37
AbstractThe study has emphasized the role of agriculture in Indian economy by considering the select economic factors from the period of 2008 to 2017.The Role ofagriculture in Indianeconomyisgettingwiderwhich ishavingthe influenceontheeconomicgrowth.ThestudyhasconsideredtheCanonicalCorrelationandmeasured correlation between the agricultural production and the GDP growth. Theordinaryleastsquareanalysishasbeenappliedandtheresultindicatedthatalltheselectedeconomicindicatorsarehavingtheinfluenceontheagricultureproduction. The vector auto regression has been applied and predicted the future movement of role of Indian agriculture based on the GDP growth.
Keywords: GDP, Agriculture Sector, Economy, Production
IntroductionAgriculture plays an important role in Indian economy. Agriculture is mainly dependent on the rural households. India is mainly depend on agricultural country. Agriculture is the most important occupation for most of the Indian families. India is mainly an agriculture country.
In India 70 per cent of the population are living in rural areas. Agriculture is an important sector of Indian economy as it provides employment to over 60% of the population and it contributes about 17% to the total GDP. In the last few decades the growth was impressive in Indian agriculture. The food grains production has increased from 51 million tons in the year 1950-51 to 250 million tons in the year 2011-12. Thus, the growth of the food grains production was phenomenally high.
Over 60% of India’s land area is cultivated making it the second largest country in terms of total cultivated land. Rice, wheat, potato, tomato, onion, mangoes, sugarcane, beans, cotton, etc. are the agricultural products of significant economic value.
Agriculture included farm related activities for growing crops and it includes the rearing of animals for agriculture purposes. In India, agricultural produce
A Study on Role of Agriculture in Indian Economy
A Kotishwar*
ISSN 0975-8577 Volume 13, No 2, April-September 2018 pp. 37-46
Journal of Economic Policy & Research
* Professor&HOD,DepartmentofMasterofBusinessAdministration,CMRCollegeofEngineering& Technology, Medchal Road, Telangana, and can be reached at [email protected] /[email protected]

Volume 13, No 2, April-September 201838
contributes about ten percent (10%) of total exports and sixteen percent (16%) of total GDP.
It has a significant role in Indian economy. It is the means of livelihood for two-thirds of our population and is an important source of raw materials for several industries. The Indian agriculture has witnessed profound changes during successive decades of its planning, more particularly in the wake of new agricultural strategies adopted in the mid-sixties.
Role of Indian Agriculture in Economic DevelopmentAgriculture sector is also known as primary sector and economic growth is essential in any economy including India. It has emerged as the essential-growing sector in the global economy since independence. This sector contributing 13.7 per cent of GDP. In employment generation, this sector is occupying the first place. Its respectable share in Foreign Direct Investment (FDI) inflows as well as in total exports make it the engine of economic growth. The present study deals with an analysis of the Indian agriculture sector. Over the years the study confirms that agriculture sector has achieved tremendous growth. Besides, their contributions in GDP, employment and exports are also rising considerably. To maintain and accelerate the growth and contributions of this sector and to develop it as a true engine of economic growth, there is logic and rationale of complementary investments in physical infrastructure as well as in human capital. (Himani, 2011).
Indian people’s main occupation is the Agriculture. Agriculture sector is dependent upon the growth and performance of Indian economy. It contributes nearly 13% of total exports and 16% of India’s Gross Domestic Product (GDP). Agriculture provides employment and livelihood security to more than 620 million people and in terms of per centage, 52% to the country’s work force. In economic development agriculture plays an important role, such as provision of food to the nation, enlarging exports, securing markets for industrialization, contribution to capital formation, transfer of manpower to non-agricultural sectors. Agriculture forms the backbone of Indian economy and even though large industrialization took place in the last 60 years, agriculture still occupies the prime place. (Vijay M. Kumbhar, 2011)
Agriculture is an important part of India’s economy and at present India is among the top two farm producers in the world. This sector provides approximately 52 percent of the total number of jobs available in India and contributes around 18.1 percent to the GDP. Agriculture is the only means of living for almost two-thirds of the employed class in India. As being stated by the economic data of financial year 2006-07, agriculture has acquired 18 percent of India’s GDP. The agriculture sector of India has occupied almost 43 percent of India’s geographical area. (Kekane Maruti Arjun, 2013)
Objectives of the StudyThe present study aims to study the trend of Indian agricultural production
and GDP growth, the Indian agriculture production impact on select economic indicators and measure the role of Indian agriculture in future economic growth.
Journal of Economic Policy & Research, Vol 13, No 2

39
Hypothesis of the Study Null hypothesis(H01) : There is no relationship between Indian agricultural
production and GDP growth.
Null hypothesis (H02) : There is no impact between select Economic indicators and Indian agriculture production.
Null hypothesis (H03) : There is no growth between the role of Indian agriculture in future economic growth.
Empirical AnalysisThe data is collected from the secondary sources. The sample period considered for this study was from 2008 to 2017. From the review of literature it has been observed that for the study the impact of selected economic indicators, no primary data is required and so this is based on the secondary data only. This study used the research tools such as Canonical Correlation, Multiple Regression and Vector Auto Regression (VAR). The present study has been carried out based on secondary data by using descriptive statistical tools. The following formulas were used.
Canonical Correlation: It is also known as Canonical-Correlation Analysis (CCA) and is a way of inferring information from cross-covariance matrices. If we have two vectors X = (X1, ..., Xn) and Y = (Y1, ..., Ym) of random variables, and there are correlations among the variables, then canonical-correlation analysis will find linear combinations of X and Y which have maximum correlation with each other.[1] T. R. Knapp notes that “virtually all of the commonly encountered parametric tests of significance can be treated as special cases of canonical-correlation analysis, which is the general procedure for investigating the relationships between two sets of variables.”.
Multiple Regression Analysis: Multiple Regression is an extension of simple linear regression. It is used when we want to predict the value of a variable based on the value of two or more other variables. The variable we want to predict is called the dependent variable (or sometimes, the outcome, target or criterion variable). The variables that we use to predict the value of the dependent variable are called the independent variables (or sometimes, the predictor, explanatory or regressor variables).
VAR MODEL: A VAR model describes the evolution of a set of k variables (called endogenous variables) over the same sample period (t = 1, ...,T) as a linear function of only their past values. The variables are collected in a k × 1 vectoryt, which has as the ith element, yi,t, the observation at time “t” of the ith variable. For example, if the ith variable is GDP, then yi,t is the value of GDP at time t.
A p-th order VAR, denoted VAR(p)Formula
EVIEWS SOFTWARE is also used for this research
A Study on Role of Agriculture in Indian Economy

Volume 13, No 2, April-September 201840
Data Analysis To study the trend of Indian agricultural production and GDP growth.Null hypothesis (H01) : There is no relationship between Indian
agricultural production and GDP growth.Alternative hypothesis (H11) : There is relationship between Indian
agricultural production and GDP growth.
Table 1: CanonicalCorrelation
CorrelationsAgriculture Production
GDP
Kendall’stau_b
Agriculture Production
CorrelationCoefficient 1.000 .630**Sig.(2-tailed) . .000N 44 44
GDPCorrelationCoefficient .630** 1.000Sig.(2-tailed) .000 .N 44 44
**.Correlationissignificantatthe0.01level(2-tailed).Source:Complieddata
The above table depicts the relationship of Indian agricultural production with GDP her having strong relationship with Indian agricultural production which Global GDP seem to be having positive relationship with Indian agricultural production with its person values 0.630. Hence it is concluded that Null Hypothesis has been rejected and Alternative Hypothesis has been accepted i.e., this is a relationship between Indian agricultural production with GDP.
To study the Indian agriculture production impact on select economic indicators, the author assumed the following.
Null hypothesis (H01) : There is no impact between select Economic indicators and Indian agriculture production.
Alternative hypothesis (H12) : There is impact between select Economic indicators and Indian agriculture production.
Table 2: TheJohansenCo-IntegrationTest
Sample(adjusted):344Includedobservations:42afteradjustmentsTrend assumption: Linear deterministic trendSeries:AGRIGDPIIPINFLATIONLagsinterval(infirstdifferences):1to1UnrestrictedCointegrationRankTest(Trace)Hypothesized Trace 0.05No.ofCE(s) Eigenvalue Statistic CriticalValue Prob.**None* 0.605459 57.74321 47.85613 0.0045
At most 1 0.233827 18.68184 29.79707 0.5160Atmost2 0.099404 7.495274 15.49471 0.5208Atmost3 0.071106 3.097948 3.841466 0.0784
Tracetestindicates1cointegratingeqn(s)atthe0.05level*denotesrejectionofthehypothesisatthe0.05level**MacKinnon-Haug-Michelis(1999)p-valuesUnrestrictedCointegrationRankTest(MaximumEigenvalue)Hypothesized Max-Eigen 0.05No.ofCE(s) Eigenvalue Statistic CriticalValue Prob.**None* 0.605459 39.06137 27.58434 0.0011
At most 1 0.233827 11.18656 21.13162 0.6286Atmost2 0.099404 4.397327 14.26460 0.8152Atmost3 0.071106 3.097948 3.841466 0.0784
Journal of Economic Policy & Research, Vol 13, No 2

41
Max-eigenvaluetestindicates1cointegratingeqn(s)atthe0.05level*denotesrejectionofthehypothesisatthe0.05level**MacKinnon-Haug-Michelis(1999)p-valuesSource:Complieddata
Above table indicates the Johansen co-integration test depict the integration with ARGI to select variables. Such as GDP, IIP AND INFLATION. Trace test indicate that there is having 1 co-integration equation at 5% or 0.05 level. Similarly Max-Eigen value test also indicate that there is having 1 co-integrating equation at 5% or 0.05 level. Hence concluded those variables are co-integrative with each other.
Table 3: GrangerCausalityTest
PairwiseGrangerCausalityTestsSample: 1 44Lags:2NullHypothesis Obs F-Statistic Prob. GDPdoesnotGrangerCauseAGRI 42 4.78824 0.0141AGRIdoesnotGrangerCauseGDP 4.30932 0.0208IIPdoesnotGrangerCauseAGRI 42 5.79064 0.0065AGRIdoesnotGrangerCauseIIP 0.22280 0.8013INFLATIONdoesnotGrangerCauseAGRI 42 1.02742 0.3679AGRIdoesnotGrangerCauseINFLATION 1.10096 0.3432Source:Complieddata
The above granger causality test depicts the null hypothesis (H0) as select variable (GDP, IIP, and Inflation). Since the probability value seemed to be greater than 0.05. Which indicates that (H0) has been rejected (H1) has been accepted. Therefore that is select variable (GDP, IIP, Inflation) granger cause to AGRI.
Table 4: LeastSquares
Dependent Variable: AGRIMethod:LeastSquaresSample: 1 44Included observations: 44
Variable Coefficient Std. Error t-Statistic Prob. GDP 0.109539 0.021313 5.139607 0.0000IIP -17.67640 9.900644 -1.785378 0.0816
INFLATION 26.18848 11.92988 2.195201 0.0339R-squared 0.675095 Mean dependent var 3190.284AdjustedR-squared 0.659246 S.D. dependent var 1366.286S.E. of regression 797.5583 Akaike info criterion 16.26673Sumsquaredresid 26080071 Schwarz criterion 16.38838Log likelihood -354.8681 Hannan-Quinncriter 16.31185Durbin-Watson stat 1.965276Source:Complieddata
The table Least Square Regression shows the impact of Economic Factors (GDP, IIP AND INFLATION) on the AGRI. The Adjusted R-Squared (0.67>0.60) is observed to be strongly fit. Regression result indicates that p-value for GDP is observed to be statistically significant at 5% level which signified that GDP is having influence on AGRI with its coefficient value as 0.1095. Whereas remaining variable such as IIP and inflation probability value is observed to be statistically insignificant which signifies that those variable are having no influence on ARGI.
A Study on Role of Agriculture in Indian Economy

Volume 13, No 2, April-September 201842
Leverage plots
-2,000
-1,000
0
1,000
2,000
3,000
4,000
-10,000 0 5,000 15,000
GDP
-2,000
-1,000
0
1,000
2,000
3,000
-30 -20 -10 0 10 20 30
IIP
-2,000
-1,000
0
1,000
2,000
3,000
-30 -20 -10 0 10 20 30
INFLATION
AGRI vs. Variables (Partialled on Regressors)
Above leverage plots depict that the independent variables (IIP, GDP, Inflation) on dependent variable (agriculture production).
The plot of GDP and Inflation are pushing agriculture production to upward direction which signifies that those Macroeconomic factors are pushing agriculture production towards the upward direction. Whereas, IIP are pulling agriculture production to downward direction which indicate those macroeconomic factor are pulling agriculture production towards downward direction.
To measure the role of Indian agriculture in future economic growth.Null hypothesis (H03) : There is no growth between the role of Indian
agriculture in future economic growth.Alternative hypothesis (H13) : There is growth between the role of Indian
agriculture in future economic growth.
Journal of Economic Policy & Research, Vol 13, No 2

43
Table 5: VAR(VectorAutoRegression)
Lag selection criteriaVARLagOrderSelectionCriteriaEndogenous variables: AGRI GDP Exogenousvariables:CSample: 1 44Includedobservations:38
Lag LogL LR FPE AIC SC HQ
0 -700.9932 NA 4.02 36.99964 37.08583 37.030311 -629.7886 131.1664 1.17 33.46256 33.72112 33.554552 -625.7487 7.016638 1.17 33.46046 33.89140 33.613783 -625.3412 0.664902 1.42 33.64954 34.25286 33.864194 -597.6764 42.22521 4.13 32.40402 33.17972 32.680015 -581.0138 23.67837 2.15 31.73757 32.68565 32.074896 -567.0136 18.42133* 1.30* 31.21124* 32.33170* 31.60989*
*indicateslagorderselectedbythecriterionLR:sequentialmodifiedLRteststatistic(eachtestat5%level)FPE:FinalpredictionerrorAIC:AkaikeinformationcriterionSC:SchwarzinformationcriterionHQ:Hannan-QuinninformationcriterionSource:Complieddata
The above table illustrates the lag order selection for VAR model. Result indicates that LR test and Final prediction error are observed to be fit at lag6. Similarly criterion such as AKaike Information criterion (AIC), Schwarz information criterion(SIC), Hannan-Quinn Information criterion (HQ) are observed to be fit at lag 6. Hence overall table state that lag 6 is having lower value which signifies that it is best model to fit VAR.
Table 6: Vector auto regression
Vector Autoregression EstimatesSample(adjusted):744Includedobservations:38afteradjustmentsStandarderrorsin()&t-statisticsin[]
AGRI GDPAGRI(-1) 0.645342 -0.293685
(0.23505) (0.35387)[2.74561] [-0.82993]
AGRI(-2) 0.041782 1.690126(0.27398) (0.41248)[0.15250] [4.09746]
AGRI(-3) -0.189995 -0.045908(0.14095) (0.21221)[-1.34795] [-0.21633]
AGRI(-4) 0.803088 0.566793(0.13748) (0.20699)[5.84132] [2.73830]
AGRI(-5) -0.846651 0.607275(0.30974) (0.46632)[-2.73347] [1.30228]
A Study on Role of Agriculture in Indian Economy

Volume 13, No 2, April-September 201844
AGRI(-6) -0.219528 -1.586353(0.33918) (0.51065)[-0.64723] [-3.10655]
GDP(-1) 0.084195 0.370182(0.13752) (0.20704)[0.61223] [1.78794]
GDP(-2) 0.027267 0.471310(0.15683) (0.23612)[0.17386] [1.99609]
GDP(-3) 0.062305 -0.002492(0.10901) (0.16412)[0.57155] [-0.01519]
GDP(-4) 0.014395 -0.106452(0.11029) (0.16605)[0.13052] [-0.64108]
GDP(-5) -0.052764 0.104178(0.11146) (0.16781)[-0.47339] [0.62083]
GDP(-6) -0.029295 0.038241(0.08337) (0.12551)[-0.35139] [0.30468]
C 270.6477 139.5589(276.073) (415.637)[0.98035] [0.33577]
R-squared 0.894793 0.992017Adj.R-squared 0.844294 0.988185Sumsq.resids 6439138. 14595187S.E.equation 507.5091 764.0730F-statistic 17.71894 258.8849Log likelihood -282.6857 -298.2334AkaikeAIC 15.56241 16.38070SchwarzSC 16.12263 16.94093Mean dependent 3448.067 20503.51S.D. dependent 1286.149 7029.403Determinantresidcovariance(dofadj.) 7.23E+10Determinant resid covariance 3.13E+10Log likelihood -567.0136Akaike information criterion 31.21124Schwarz criterion 32.33170Numberofcoefficients 26
The above table depicts the vector auto regression model in which ARGI as independent variable and GDP as dependent variable. Result indicates that ARGI is having negative influence on GDP under lag1. Similarly under lag3 and lag6 it has been observed that ARGI is having negative influence on GDP. Underlag2, lag4 and lag5 AGRI seemed to be having positive influence on GDP. Hence it is concluded that ARGI is having influence on GDP.
Journal of Economic Policy & Research, Vol 13, No 2

45
AR polynomial graph
-1.5
-1.0
-0.5
0.0
0.5
1.0
1.5
-1.5 -1.0 -0.5 0.0 0.5 1.0 1.5
Inverse Roots of AR Characteristic Polynomial
The above AR polynomial graph indicates that the estimated values are following inside the circle which signifies that the select variables have growth in near future.
Findings of the StudyThe study found from trend analysis that agriculture production is mainly
dependent upon the growth of GDP. It used Kendall’s tau relation and it revealed that agriculture production is having strong relationship with Gross Domestic product. It found from Johnson test that economic factors such as GDP, IIP and Inflation are having co-integration equation with Agriculture production. The study found from Least Square method that GDP and Inflation are having influence on Agriculture Index with their respective coefficient values as 0.109 and 26.188. It is also found the Index of Industrial production is not having much influence on Agriculture production. The study found from VAR model that Growth of GDP will leads to Growth in agriculture production and also found that data is normally distributed.
The study suggests to the stakeholders of the state governments and central government to focus on the key areas of agriculture sector, so that it will have the stronger positive influence on the GDP growth rate. It suggests to the industries to observe the agriculture production so that they can plan their activity properly. The IIP is having the significant impact on the growth of the agriculture. It suggests to bankers to treat the agri loans differently and RBI also should coordinate with the various state governments and central government so that the agriculture sector will have the stronger growth in the country.
Conclusion of the StudyThe present analysis has considered the 10 years data from the MCX time series historical data and in the analysis 3 agriculture commodities based on the high market capitalization has been considered. The study has considered the economic
A Study on Role of Agriculture in Indian Economy

Volume 13, No 2, April-September 201846
factors impact observed on the agriculture production. The future growth of the selected commodities prices have been predicted with the help of VAR model and the result indicated that barely future direction price momentum is expected to go down but the select economic factors predicted the future GDP is expected to go in positive direction based on the agriculture commodity index. Hence there is a need to do research in this area by considering the various other agriculture commodities and impact of the rainfall on this agriculture commodities prices, so that the investor of commodities can take and inform the decision to maximize the return with the minimum risk.
ReferencesFICCI (2011). Economic Outlook SurveyGDP, https://dbie.rbi.org.in/DBIE/dbie.rbi?site=home.Himani (2011). An Analysis of Agriculture Sector in Indian Economy, IOSR
Journal of Humanities And Social Science (IOSR-JHSS), 19(1), pp: 47-54.IIP, https://dbie.rbi.org.in/BOE/OpenDocument/1807141045/OpenDocument/
opendoc/openDocument.faces?logonSuccessful=true&shareId=3Kekane Maruti Arjun (2013). Indian Agriculture- Status, Importance and Role
in Indian Economy, International Journal of Agriculture and Food Science Technology, 4(4), pp: 343-346.
Kumbhar, Vijay M.(2011). Performance of Agriculture Sector in India: Special Reference to Post Reform Period. [Available at https://ssrn.com/abstract=1748246]
Ministry of Agriculture, Govt. of India(n.d.). Agricultural Statistics at a GlanceThe Department of Agriculture, Cooperation & Farmers Welfare (DAC&FW),
Government of IndiaRBI, https://www.rbi.org.inWPI, https://dbie.rbi.org.in/BOE/OpenDocument/1807141045/OpenDocument/
opendoc/openDocument.faces?logonSuccessful=true&shareId=2
Journal of Economic Policy & Research, Vol 13, No 2

47
AbstractThe Government of India introduced Mahatma Gandhi National Rural Employment GuaranteeAct (MGNREGA) in India.Now the program is implemented in allmost all districts in India. MGNREGA is a largest public employment program in the country. This is one of the best successful program in India. The study followed purposive sample method. The study conducted 31 beneficiary householdsand10non-beneficiary(control)householdsand isbasedonavailabilityof thehouseholdsatthetimeofsurvey.ThestudyconductedFocusGroupDiscussion(FGD), Participatory RuralAppraisal (PRA) and Personal Interviews (PI) werecollected. The main objective of the paper is to investigate the factors which are influentialtoparticipateintheMGNREGAwork.Themainfindingsofthestudyare;Majorityofthebeneficiaryheadofthehouseholdswereilliterates.Whoeverthe land holding was found very small their participation in MGNREGA works were taken up. The study reveals that the MGNREGA participation rate is high in semi-pucca and Thatched / Kachacha houses in sample households. It indicates that most of the participants were economically poor and socially deprived sections. We conclude that whoever involved fully in agriculture activities their participation rate was very less, villagers who lack work in village and are poor were the only willing to participate in MGNREGA.
Keywords: HouseholdsParticipationinMGNREGA,CaseStudy,Karnataka
IntroductionThe Government of India introduced Mahatma Gandhi National Rural Employment Guarantee Act (MGNREGA) in a phase wise manner in India. Now the program is implemented in most of the districts of India. Ambasta (2008) explained about that MGNREGA is a largest ever public employment program visualized in human history in the country. This is the one of the best successful program in India. The main objectives of the MGNREGA program was to provide minimum 100 days of
Factors Influence to Participate in MGNREGA Work: A Case Study in Shettihalli GP in Karnataka
I. Maruthi1Pesala Peter2
1 Associate Professor and HeadADRTC, ISEC, Nagarabhavi, Bengaluru and can be reached [email protected]
2 ConsultantinADRTCentre,ISEC,Nagarabhavi,[email protected]
ISSN 0975-8577 Volume 13, No 2, April-September 2018 pp. 47-56
Journal of Economic Policy & Research

Volume 13, No 2, April-September 201848
unskilled labour work in rural India. To enhance the livelihood security of people in rural areas through providing minimum 100 days of wage employment in every financial year in rural households with unskilled manual work. To improve socio-economic conditions of the rural people in India and reduce the migration from rural to urban areas through providing employment under this program. The main reason to the success of this program in the rural area is due to the people participation rate that is gradually increasing in this program. In the same manner the participation of women and dalits are high among the social groups and gender. In addition to that, the program is providing 100 working days for rural unskilled labour. Reddy Gangadhara and Aswath (2016) investigated the performance of Mahatma Gandhi National Rural Employment Guarantee Act in Karnataka, India. According to author the Mahatma Gandhi National Rural Employment Guarantee Act is the biggest poverty alleviation program in the world. In Karnataka the MGNREGA has been introduced on 2nd February 2006 and it first introduced in Bidar, Gulbarga, Raichur, Davanagere and Chitradurga districts. According to the study, the MGNREGA provided 67.83 crore person days of employment during 2006-07 to 2014-15. In the same manner MGNREGA enhanced the livelihood in rural areas particularly drought prone district like Karnataka.
Methodology of the StudyShettihalli Gram Panchayat (GP) provided less man days in Mandya district of Karnataka state. The beneficiary households meaning is whoever participated in the MGNREGA work during 10 years. We consider as a beneficiary households and whoever never participated in the scheme we treated as a non-beneficiary households. During the study time most of them were involving their agriculture and allied activities and some households were involving in casual wage labour work in the village and outside the GP. In this we constrain the study conducted to 31 beneficiary households and 10 non-beneficiary (control) households based on availability of the households at the time of survey. The study conducted focus group discussion, Participatory Rural Appraisal (PRA) and personal interviews(PI). The main objective of the paper is to investigate the factors which are influential to participate the MGNRGS work. To investigate the above objective we used some important variables namely; land, education of head of the households, house type, social status, agricultural income, non-wage income and primary occupation.
Location of the VillageShettihalli Gram Panchyat (GP) is located in Malvalli Taluk, Mandya District of Karnataka State. Malavalli is two kilometers distance from the Shettihalli village. In the same manner Shettihalli village to Mysuru main bypass road is only one kilometers distance. The Shettihalli village to Mysuru town distance is nearly 45 kilometers. This information reveals that village is having good infrastructure facilities. In addition to that bus facilities are connected to the village. Villagers are going everyday from this village to Malvalli town as daily wage labour/causal labour. For any major households items also brought from this town, since village is located very near to the town. Some time villagers will go for entertainment. Shettihalli, Basvanapura, magnur and Mugankoplu villagers are part of the Shettihalli GP.
Journal of Economic Policy & Research, Vol 13, No 2

49
Social GroupsIndia is a caste based society. In the sample chosen village most of the villagers belong to SC (nearly 50%) and BCs and Other Category (OC). Only two households belong to Scheduled Tribe (ST). Here the sample size suggested that SCs are 18 in beneficiary households and eight non-beneficiary households were interviewed. But the 12 OBCs are in beneficiary households and two in non-beneficiary households were interviewed. Only one Scheduled Tribe (ST) household details were considered for the study and the details are presented in Table 1. The study used totally 41 households in this paper. The below table indicated that SCs participation rate is higher than the other social groups.
Table 1: Social Group in Shettihalli GP in Karnataka
Beneficiary /Non-Beneficiary
Sample Households PercentageSC ST OBC Total SC ST OBC Total
Beneficiary 18 1 12 31 58.06 3.23 38.71 100Non-Beneficiary 8 2 10 80.00 0.00 20.00 100Total 26 1 14 41 63.41 2.44 34.15 100
Source:Primarydatacollected,2018
Educational StatusPeople were educated in general and particularly in Scheduled Caste (SC). Highly educated women were married to low educated men in general, Shettihalli village is particular. One person completed Ph.D degree in the village and some others have completed technical education like B.Tech, MCA and etc. One person was studying Law course in the village. Most of the educated youth were unemployed in the Shettihalli village. The unemployed youth were preparing for competition exams and some were learning technical skills. In majority of observations, head of the households were illiterates (25) in beneficiary and six households were illiterates in non-beneficiary households. And three non-beneficiary households were educated up to secondary education, and the details are presented in Table 2. The table highlighted that the beneficiary head of the households were not educated due to this reason the illiterate participation rate is higher than the literates and this is the one of the indicator to measure / estimate the participation of MGNRGEGA, similar results find in Harish et al., (2011). Harish et al., (2011) emphasized on land, education, gender etc. factors were influential to participate the MGNREGA work. The study expressed that MGNREGA work not only provides employment but also it focused on inclusive growth in various asset creation in rural areas. The study conducted primary survey in Chikmagalur district of Karnataka state during the year 2009-10. The study followed Multi-stage sampling method for selection of the sample. In Chikmagalur district, the study selected kadur and Chikmagalur taluks which were dry taluks in the district. In each taluks three Gram Panchayat were selected and the study also used secondary data. The study selected each Taluk 45 MGNREGA beneficiary households and 15 non-beneficiary households (each GP 5 households) were selected randomly. The total sample size was 120. The study used multiple linear regression analyses and finds that, if workers were male it leads to decrease the participation of MGNREGA work. In the similar way increasing the education status leads to decrease the participation of the
Factors Influence to Participate in MGNREGA Work: A Case Study in Shettihalli GP in Karnataka

Volume 13, No 2, April-September 201850
MGNREGA work. In the same manner if the land size increased by one acre then it leads to decrease the number of days participation in MGNREGA work.
Table 2: HeadoftheHouseholds’EducationStatusinShettihalliGP
Beneficiary/Non-Beneficiary
Head of the Household Education Status Percentages
SC ST OBC Total SC S OBC TotalBeneficiary 18 1 12 31 69.23 100.0 85.71 75.61
Illiterate 13 1 11 25 50.00 100.00 78.57 60.98Primary education(Class1to5) 1 1 3.85 0.00 0.00 2.44
Secondary education(Class9to10) 2 1 3 7.69 0.00 7.14 7.32
Highersecondaryeducation(Class11to12)
2 2 7.69 0.00 0.00 4.88
Non-Beneficiary 8 2 10 30.77 0.00 14.29 24.39Illiterate 4 2 6 15.38 0.00 14.29 14.63Primary education(Class1to5) 1 1 3.85 0.00 0.00 2.44
Secondary education(Class9to10) 3 3 11.54 0.00 0.00 7.32
Total 26 1 14 41 100.0 100.0 100.0 100.0Source:Primarydatacollected,2018
Family Size of the Sample HouseholdsOne of the major indicators to estimate the economic development is family size. If family size is more, their economic condition is not improved much in general and particularly in rural areas. The average family size is very less (3) in ST households in beneficiary households whereas average family size is 3.7 in SCs and 3.8 in OBC households. But the non-beneficiary households, the average family size is four that is in OBC group and the details are presented in below Table 3.
Table 3: AverageFamilySizeSelectedSampleHouseholdsinShettihalliGP
Beneficiary /Non-Beneficiary
Total Family Members Average Family SizeSC ST OBC Total SC ST OBC Total
Beneficiary 70 3 45 118 3.7 3.0 3.8 3.7Non-Beneficiary 24 8 32 3.4 4.0 3.6Grand Total 94 3 53 150 3.6 3.0 3.8 3.7Source:Primarydatacollected,2018
Land Holdings of the HouseholdsLand is a very important economic asset of the households. Without land survival is very difficult for the villagers. According to our field observation most of the villagers were land less labour and some of them were having less than one acre. Here land cost is very high since village is located very near to Mallavalli town and Mysuru city (45 km distance). In an enquiry we found that the land cost per acre was nearly 75 lakhs to one crore at the time of investigation. Whoever having the land in this gram panchyat they were rich people and their names could be countable on finger tips. According to Table 4 among the 41 selected households
Journal of Economic Policy & Research, Vol 13, No 2

51
Factors Influence to Participate in MGNREGA Work: A Case Study in Shettihalli GP in Karnataka
only 22 households were having the land and it means that nearly 50 per cent of the sample households were landless. The average land size was less than one acre in all beneficiary/all social group households whereas the non-beneficiary households the land size was one acre in OBC households and 1.25 acres in SC households. Only two households were holding irrigated land and one was 0.30 acres and another was having 2.14 acres. The total irrigated and dry land details are presented in the Table 5. According to the table the average total land was little high in non-beneficiary households as compared to beneficiary households and this household belongs to Other Backward Caste (OBC). Here the table indicated that since land holding was very small due to this even though they are having little land they are participating in the MGNREGA work. Similar results find in Ahuja et al., (2011). According to them whoever having land and livestock ownership do not participate in the MGNREGA works. In the same way same study find that whoever having less land and livestock they participated very well in the MGNREGA works.
Table 4: TotalDryLandSelectedSampleHouseholdsinShettihalliGP
Beneficiary /Non-
Beneficiary
Total Land Having Households Total Dry Land Average Dry Land
SC ST OBC Total SC ST OBC Total SC ST OBC TotalBeneficiary 12 1 7 20 6.85 0.5 4.2 11.55 0.57 0.50 0.60 0.58Non-Beneficiary 1 1 2 1.25 1 2.25 1.25 1.00 1.13Total 13 1 8 22 8.1 0.5 5.2 13.8 0.62 0.50 0.65 0.63Source:Primarydatacollected,2018
Table 5: TotalLandof(DryandIrrigated)SelectedHouseholdsinShettihalliGP
Beneficiary /Non-Beneficiary
Land Having Households Total Land Average Total Land
SC ST OBC Total SC ST OBC Total SC ST OBC TotalBeneficiary 12 1 7 20 7.15 0.50 4.20 11.85 0.60 0.50 0.60 0.59Non-Beneficiary 1 1 2 1.25 3.14 4.39 1.25 1.57 1.46Total 13 1 8 22 8.40 0.50 7.34 16.24 0.65 0.50 0.82 0.71Source:Primarydatacollected,2018
Type of HouseMost of the villagers were having pucca and semi-pucca houses in this village. And very few of the villagers were having Thatched / kachacha houses. Some of the households were having toilet facilities in their houses. Whoever were not having toilet in their houses they were going for open defection. Most of the villagers were having the awareness about the sanitation facilities in the village. And majority of the villagers were having two rooms in their houses and few of them were having only one room and most of them belong to Scheduled Caste (SC) community. According to the Table 6, most of the non-beneficiary households were having pucca households as compared to beneficiary households. It means that in the non-beneficiary household’s economic conditions were improved. The pucca house is more comfortable for the households. In majority of the beneficiary households were having semi-pucca and thatched / kachacha houses and the details are presented in Table 6. Here the house indicated that their economic conditions. The study reveals that the MGNREGA participation rate is high in

Volume 13, No 2, April-September 201852
semi-pucca and Thatched/Kachacha houses in sample study. It indicates that most of the participants are economically poor and socially deprived people.
Table 6: TypeofHouse
Beneficiary /Non-Beneficiary
Social Group / Type of House PercentagesSC ST OBC Total SC ST OBC Total
Beneficiary 18 1 12 31 58.06 3.23 38.71 100Pucca 7 2 9 77.78 0.00 22.22 100Semi-pucca 7 1 5 13 53.85 7.69 38.46 100Thatched/Kachacha 4 5 9 44.44 0.00 55.56 100Non-Beneficiary 8 2 10 80.00 0.00 20.00 100Pucca 8 1 9 88.89 0.00 11.11 100Semi-pucca 1 1 0.00 0.00 100.0 100Total 26 1 14 41 63.41 2.44 34.15 100Source:Primarydatacollected,2018.
Primary Occupation of Selected Sample HouseholdsPrimary occupation is main important income source for households. Majority of the households’ primary occupation is agriculture and allied activities, followed by Casual wage labours. Majority (8) of the non-beneficiary households were concentrated on agriculture and allied activities. The beneficiary households were concentration on agriculture and casual wage work. Here it indicates that whoever involved fully in agriculture activities their participation rate is very less. Because of lack of work in the village, and poverty, villagers were willingly and voluntarily participated the MGNREGA work.
Table 7: PrimaryOccupationinSelectedHouseholdsinShettihalliGP
Beneficiary /Non-Beneficiary
Main Occupation PercentagesSC ST OBC Total SC ST OBC Total
Beneficiary 18 1 12 31 69.23 100.0 85.71 75.61Agriculture and allied activities 13 1 4 18 50.00 100.0 28.57 43.90Casualwagelabourer 5 8 13 19.23 0.00 57.14 31.71
Non-Beneficiary 8 2 10 30.77 0.00 14.29 24.39Agriculture and allied activities 6 2 8 23.08 0.00 14.29 19.51Old age 1 1 3.85 0.00 0.00 2.44Transport 1 1 3.85 0.00 0.00 2.44
Total 26 1 14 41 100.0 100.0 100.0 100.0Source:Primarydatacollected,2018
Wage and Employment in the GPIn the GP the agriculture wage rate per day was Rs.100. Whereas the MGNREGA work wage rate was Rs.236 per day during 2017-18. Most of the villagers were participated in the work in Malvalli town and got nearly Rs.500/- per day. Whoever willing to work in town they earned more income during study period. According to Table 8, the average earned income is very high (Rs.53,000/-) in non-beneficiary households as compared to beneficiary (Rs.37,714) households. The average beneficiary households earned income is high in ST category and followed by OBC and SCs. Here the SC average earned income was very low
Journal of Economic Policy & Research, Vol 13, No 2

53
Factors Influence to Participate in MGNREGA Work: A Case Study in Shettihalli GP in Karnataka
due to their social discrimination in the labour market. Majority of the beneficiary sample households were not having land and participated only 14 households in agricultural activities. In the same manner non-beneficiary households were also not having much land and participated in agricultural activities very less. The average agricultural income earned was very high in non-beneficiary households as compared to beneficiary households and that OBCs were earned more income as compared to SC, and details are presented in Table 9.
Table 8: Non-AgricultureWagesIncomeEarnedbyHouseholdsDuring2016-17
Beneficiary /Non-Beneficiary
Total Non-Agricultural Income Households
Averages Non-Agricultural Income
SC ST OBC Total SC ST OBC TotalBeneficiary 9 1 4 14 34444 45000 43250 37714Non-Beneficiary 8 8 53000 53000Total 17 1 4 22 43176 45000 43250 43273
Source:Primarydatacollected,2018
Table 9: AgricultureIncomeEarnedbyHouseholdsDuring2016-17
Beneficiary /Non-Beneficiary
Agricultural Income Households Average Income
SC OBC Total SC OBC TotalBeneficiary 8 6 14 13375 25500 18571Non-Beneficiary 1 2 3 12000 80000 57333Total 9 8 17 13222 39125 25412
Source:Primarydatacollected,2018
Assets CreationAssets creation is very important for the employment and income generation of the program. There was no digging of individual farm ponds and community farm ponds due to this reasons employment generation was very less in the study area. In the same manner there was no construction of cattle shed and sericulture shed. There were no individual land development activities that were taken in the GP. For all the above assets were not created in the village. Lack of land in GP is the main reason for no creation of assets. In this village land is very expensive as we mentioned earlier in the land holdings of the village. The Gram panchyat has provided employment like construction of cement road. This work was provided for very less days in the village. And also GP provided toilet construction work and other work in the village, but the number of man days were very less. Only two households could construct livestock shelter another three households could construct toilets and one household could construct house through MGNREGA. Kumar (2016) accomplished that the MGNREGA provided good employment and improved the rural livelihood of the poor people in Mysuru district in Karnataka state. In the same manner Chauhan and Rajdeep (2016) study selected purposive sampling method. And they chose Nabjidu village in Kawant block of Chota Udaipur district, Gujarat state. The study 104 sample households were selected based on stratified random sampling techniques. In the village 52 male and 52

Volume 13, No 2, April-September 201854
female households were selected for the study. In addition to that six Focus Group Discussions (FGD) were conducted during December 2015. The study nearly 80 per cent of the respondents were having livestock at the time of interview. The study expressed that MGNREGA was a largest poverty alleviation program in India. The study finds that lack of awareness about beneficiaries rights in MGNREGA work, respondents could not receive unemployment fund. Gundappa (2013) emphasized on Hyderabad Karnataka region in MGNREGA implementation. According to his observation Hyderabad and Karnataka region was a backward area. The study used secondary data and observed that the success of MGNREGA depends upon realization of the nature of work. Mahesh (2017) emphasized on the impact of MGNREGA on employment generation in selected districts of Chickmagalur and Tumkur. The study finds that through MGNREGA government of India provided employment to the rural unskilled labour in Karnataka state. Under this program rural people were able to improve their purchasing power parity (PPP).
Income from MGNREGAThe sample households were participated in MGNREGA work and earned income in different levels. Among the households one household participated in MGNREGA work during 2016-17 due to his personal work. The average highest wage earned through MGNREGA by OBC category, followed by SCs and STs. OBCs are economically benefited under this scheme (Table10). There is no wage discrimination under this scheme. Whoever participated more working days and they got wages accordingly. Reddy et al., (2016) examined the Impact of MGNREGA on income, expenditure, savings pattern of beneficiaries in North-Eastern Karnataka. The study conducted primary survey in two Taluk. In each Taluk selected two villages from fully and partially implemented villages and from each village 30 participants were selected randomly. The total sample size was 120. The study conducted survey during 2013-14. The data was analyzed using multiple regression analysis were applied. The main findings of the paper is whoever participated MGNREGA work saw an increase in the income in fully implemented MGNREGA villages as compared to partially implemented MGNREGA villages. In the similar way savings and expenditure were increased in whoever participated MGNREGA work were increase in the income in fully implemented MGNREGA villages as compared to partially implemented MGNREGA villages. Here we can say that whoever participated in MGNREGA work they earned good income during 2016-17. And the MGNREGA work also implemented during slack season of agriculture in the Gram panchyat. According to Murthy et al., (2011) Karnataka and Rajasthan are the two most drought prone states of India. Rajasthan has occupied first highest drought prone state in India and second placed occupied by Karnataka. The study concluded that MGNREGA program offered supplementary employment during the off-season. In the same manner Kumar (2016) accomplished that the MGNREGA provided good employment and improved the rural livelihood of the poor people in Mysuru district in Karnataka state.
Journal of Economic Policy & Research, Vol 13, No 2

55
Factors Influence to Participate in MGNREGA Work: A Case Study in Shettihalli GP in Karnataka
Table 10: IncomeEarnedbyHouseholdsthroughMGNREGAWorkDuring2016-17
IncomeNumber of households Income earned through
MGNREGASC ST OBC Total SC ST OBC Total
Total Income 17 1 12 30 257631 15000 191696 464327Average Income 17 1 12 30 15155 15000 15975 15478
Source:Primarydatacollected,2018
Participation of MGNREGAThe participation of MGNREGA works influenced by many factors like social status, education status, land holdings, type of house, main occupation and wage employment in Shettihalli GP in Karntaka state. According to Bahuguna et al., (2016) study mentioned that the MGNREGA is a great program to improve the economic condition of the rural people. The study conducted 177 sample beneficiary households in Rudraprayag district of Uttarakhand. The study finds that beneficiary households improved the economies status after participation of MGNREGA.
Conclusion of the StudyIn the participation of the MGNREGA work in Karnataka state, many factors stood influenced. The major findings of the study are: the beneficiary head of the households were not educated due to this reason the illiterate participation rate was higher than the literates and this is one of the indicators to measure the participation of MGNRGEGA. Secondly the land holding was very small in selected Gram panchyat due to this participating is high in MGNREGA work. Most of the sample household’s houses indicated that their economic conditions were poor. The study reveals that the MGNREGA participation rate is high in semi-pucca and Thatched/Kachacha houses in sample households. It indicates that most of the participants are economically poor and are from socially deprived section. In the same manner whoever involved fully in agriculture activities their participation rate was very less as compared to landless households. Because of lack of work in the village, and poor, villagers were willingly and voluntarily participating in the MGNREGA work during study period. However, whoever participated in MGNREGA work they earned good income during 2016-17. And the MGNREGA work also implemented during slack season of agriculture in the Gram panchyat.
ReferencesAmbasta Pramathesh, P S Vijay Shankar, Mihir Shah. (2008). Two Years of
NREGA: The Road Ahead, Economic & Political Weekly, 43 (08), pp: 41-50.Bahuguna Rahul, Akhilesh Chandra Pandey, Vishal Soodan.(2016).A Study on
Socio Economic Impact of MGNREGA on Beneficiaries in Rudrapryag District of Uttarakhand, India, International Journal of Management and Applied Science, 2(10), pp: 44-47.

Volume 13, No 2, April-September 201856
Chauhan Kalpeshkumar Ambalal and Rajdeep Singha. (2016). An Analysis of the Impact of MGNREGA within the Livelihood Framework: Study of a Gujarat Village, India, The International Journal of Humanities & Social Studies, 4(12), pp:26-30.
Dheeraja C, Madhuri N. V and Antaripa Daimari.(2013). Research Study on Factors Facilitating Participation of Women in Mahatma Gandhi NREGS, NIRD, Research Reports Series 98.
Gundappa Mudakappa. (2013). Mahatma Gandhi National Rural Employment Guarantee Act (mgnrega) In Karnataka – a Case Study of Hyderabad Karnataka Region, Golden Research Thoughts, 3(2), pp:1-5.
Harish B.G. et al., (2011), Impacts and Implications of MGNREGA on Labour Supply and Income Generation for Agriculture in Central Dry Zone of Karnataka, Agricultural Economics Research Review, 24 (Conference Number) pp: 485-494.
Kumar Ashok H. (2016). Performance of MGNREGA in Mysore District, Karnataka, International Journal of Research in Humanities and Social Studies, 3(6), pp: 1-7.
Murthy P.S. Srikantha and S. Indumati. (2011). Economic Analysis of MGNREGA in the Drought-prone States of Karnataka, Rajasthan and Irrigation-dominated State of Andhra Pradesh, Agricultural Economics Research Review, 24 (Conference Number), pp: 531-536.
Mahesh S. (2017). Performance Analysis of Mahatma Gandhi National Rural Employment Guarantee Act in Karnataka: A Comparative Study of Chikkamagalur and Tumkur District, Proceedings of the Sixth Middle East Conference on Global Business, Economics, Finance and Banking (ME17Dubai Conference), Paper ID: D749, source: www.globalbizresearch.org.
Reddy P. Divakar et al., (2016). Impact of MGNREGA on income, expenditure, savings pattern of beneficiaries in North-Eastern Karnataka, Economic Affairs, 61(1), pp:101-106.
Reddy Y Gangadhara and Aswath G.R. (2016). Performance of Mahatma Gandhi National Rural Employment Guarantee Act in Karnataka, India, International Research Journal of Social Sciences, 5(1), pp: 15-19.
Shankari Uma. (2018). Agrarian Crisis A Ringside View-II, Economic & Political Weekly, 56 (8), pp. 56-61.
Tiwari Rakesh, et al., (2011). MGNREGA for Environmental Service Enhancement and Vulnerability Reduction: Rapid Appraisal in Chitradurga District, Karnataka, Economic and Political Weekly, 46 (20), pp: 39-47.
Vij Sumit, et al., (2017). Women in MGNREGS in Telangana and Andhra Pradesh, Economic and Political Weekly, 52 (32), pp: 67-73.
Journal of Economic Policy & Research, Vol 13, No 2

57
AbstractThe study compares the performance of 15 microfinance institutions ofBangladeshand13microfinance institutionsof India for theperiod from2014to2016,usinganon-radialbilateralcomparisonmodel.Further,thepapermakesuse of Wilcoxon Rank Sum Statistic to draw inference about the distribution of efficiency scores of the in-samplemicrofinance institutions of Bangladesh andmicrofinance institutions of India.The results suggestmicrofinance institutionsinIndiaoutperformedthemicrofinanceinstitutionsofBangladeshfrom2014to2016onfinancialandsocialefficiencyparameters.
Keywords: Microfinance, Social Efficiency, Financial Efficiency, Bilateral Comparison
IntroductionFinancial inclusion is one of the most important prerequisites for a just and the equitable growth of the economy. It is the process of ensuring access to financial services (small loans, savings, insurance, pension, money transfers etc) to socially vulnerable groups excluded from the mainstream financing at affordable rates. Microfinance has emerged as a tool which plays a dominant role in the financial inclusion providing the wide range of the credit and non-credit financial services to poor and low income households. It is based on the objective of sustainability, outreach and impact (Zeller and Meyer, 2002, Morduch, 1999). Specialized financial institutions united under the banner, sharing the commitment to work towards financial inclusion is called the microfinance institutions. The nature of these institutions is quite different to conventional financial institutions as they limit their services to poor households and provide collateral free loans to people who are financially challenged but have feasible and promising investment ideas that can turn into profitable initiatives.
Financial and Social Efficiency: A Non-Radial Bilateral Performance Comparison of Microfinance Institutions of India and Bangladesh
Pallavi Pandey1
Ram Pratap Sinha2
1 Research Scholar, Bundelkhand University, U.P. and can be reached at [email protected]
2 AssociateProfessorofEconomics,GovernmentCollegeofEngineeringandLeatherTechnology,[email protected]
ISSN 0975-8577 Volume 13, No 2, April-September 2018 pp. 57-67
Journal of Economic Policy & Research

Volume 13, No 2, April-September 201858
In the South Asian countries, microfinance institutions play a crucial role in promoting inclusive growth. In view of this, the present study seeks to compare the performance of 15 Microfinance Institutions of Bangladesh and 13 Microfinance Institutions of India for the period from 2014 to 2016, using a non-radial bilateral comparison model. Further, the study makes use of Wilcoxon Rank Sum Statistic to draw inference about the distribution of efficiency scores of the in-sample microfinance institutions of the two countries.
The paper has five sections and proceeds in the following manner. Section 1 provides an overview of the microfinance sectors of India and Bangladesh. Section 2 discusses the related research work. Section 3 describes the methodology of bilateral comparison. Section 4 includes the results. Section 5 concludes the paper.
An Overview of Microfinance Sectors in India and BangladeshMicrofinance in India originated in 1974 when the self-employed women association (SEWA) from the state of Gujarat got registered itself as the Urban Cooperative Bank called the Shri Mahila SEWA Sahakari Bank, for providing the banking services to poor women who were employed in the unorganized sector in the Ahmedabad city, Gujarat thus paved the way for the growth of microfinance institutions in India. The beginning of the state led microfinance movement in India could be traced through the NABARD sponsored action research project by an NGO MYRADA to cater to the financial needs of the poor in the rural areas and the SHG-bank linkages programme which were started as the pilot programme in 1992 by the NABARD after the RBI’s recognition of informal groups in 1991. The result so obtained led NABARD to offer refinance to banks for collateral-free loans to groups. The programme not only proved successful but emerged as most popular model of microfinance in India.
The Microfinance Industry in India is growing rapidly towards the financial inclusion. As per the Bharat Microfinance Report 2017, it comprises of 233 MFIs catering to over 40 million low income customers with an outstanding portfolio of 7,79,54,26,150 US $. According to NABARD’s “Status of Microfinance in India (2016-17)” report, as on 31 March 2017, the SHG bank linkage program covered “10 crore families through 85 lakh SHGs with savings deposits of 2,34,79,53,214 US$ and 48.4 lakh groups with collateral-free loan outstanding of over 8,96,10,97,350 US$ of which, 88% for rural women”.
Microfinance sector in Bangladesh was founded by Noble laureate Muhammad Yunus in the mid-1970s. In 1990, Bangladesh experienced huge expansion of Microfinance activities which drew attention of all important stakeholders (donors, developing partners and policy makers). These activities facilitated three million unbanked people under Financial Inclusion with an outstanding gross loan portfolio of 93,17,961.95 US $, 16284 branches of licensed MFIs, 23.28 million borrowers (MRA-MIS Database Bangladesh, June 2016).
Related Research WorkGutierrez-Nieto et al., (2007) examined the efficiency of 30 Latin American microcredit institutions using DEA approach. The results obtained shows that
Journal of Economic Policy & Research, Vol 13, No 2

59
the approach to efficiency analysis not only produces an overall ranking of microfinance institutions in terms of the use they make of input and output, but also reveals the features that distinguish NGO institutions from non-NGO institutions so that we are able to explain the reasons why some institutions are efficient (while others are not) and whether the results are country-specific.
Bassem (2008) examined the efficiency of 35 microfinance institutions in the Mediterranean zone during the period of 2004-2005. The results showed that eight institutions are relatively efficient and have notable level of average efficiency and a potential of evolution while referring to their technical efficiency. The study also reveals that the size of the MFI has a negative effect on their efficiency, since the institutions of medium size are more efficient.
Babu and Kulshreshtha (2014) examined 34 Indian MFIs from 2005-2006 to 2010-2011 calculated Malmquist Total Factor productivity using DEA. According to the outcomes of the study, the Indian MFI should focus on R&D, product and process innovation for improvement in their financial operations.
Kumar and Sensarma (2015) estimated operating efficiency of 75 MFIs of India for the period from 2004 to 2011 using stochastic distance function method. The results showed Indian MFIs exhibit tradeoff when it comes to reaching to the poor but there is no such tradeoff when it comes to women empowerment. There are significant inefficiency effects but efficiency is improving over time. Profitability, size and leverage seem to increase efficiency whereas age of MFI is associated with higher inefficiency and suggest that the efficiency-outreach literature is more nuanced than is presented in the literature.
Mia and Chandran (2015) used the Malmquist total factor productivity approach with a balanced panel dataset of 162 MFIs ranging from 2007 to 2012 to measure productivity performance. The results indicate that the microfinance sector in Bangladesh exhibited 4.3 % in overall productivity progress and attributed mainly to better managerial efficiency. Further splitting the output into financial and social outreach, known as ‘dual mission’, this study observed 3.9% and 5% productivity progress per annum respectively, with five best practicing MFIs being identified due to their balanced growth in both objectives.
Gutierrez-Goiria et al., (2017) examined large number of MFIs (over 400 all over the world) using DEA and seemingly unrelated regression which determines what factors influence social and economic efficiency at MFI at international level. The paper present the first analysis of legal status, target market, scale and age as the determining factor of efficiency of MFI. Using international data it also demonstrated that social and economic goals are compatible with each other and found high positive correlation between them.
Kaur (2016) estimated efficiency of 84 MFIs in India using non-parametric data envelopment analysis from financial and social perspective. The results showed that the microfinance institutions in India exhibit more financial efficiency than social efficiency and there is a positive correlation between the financial and social efficiency. The study suggests social objectives follow the financial objectives and there is lack of evidence regarding the existence of trade off between social and financial efficiency.
Babu and Kulshreshtha (2017) examined the technical efficiency and scale efficiency of 79 MFIs of India. The analysis shows that NBFC-MFIs and NGO-MFIs are relatively more efficient as compared to other types of MFIs. Further, most of the MFIs are operating with decreasing returns to scale.
Financial and Social Efficiency: A Non-Radial Bilateral Performance Comparison of Microfinance Institutions of India and Bangladesh

Volume 13, No 2, April-September 201860
The Methodology
Comparison of PerformanceIn the present context, the performance of the in-sample microfinance institutions for the observed years has been evaluated in terms of technical efficiency. The concept of technical efficiency, which is often used in the efficiency/productivity related literature, emerged from the writings of Koopmans and Farrell.
Koopmans (1951) defined technical efficiency in the following manner. A producer is considered technically efficient if (a) an increase in any of the outputs requires – a reduction in at least one other output or an increase in at least one of the inputs, (b) a reduction in any input requires, an increase in at least one other input, or a reduction in at least one output. Because of the Paretian implication embedded in the definition of Koopmans, this approach is known as the Pareto-Koopmans approach.
Measurement of Technical EfficiencyIn the production approach, measurement of technical efficiency requires the construction of a production frontier. This is because efficiency is computed by measuring the distance of an observed point from an idealized production frontier. There are, however, two major competing paradigms for the construction of the frontiers – econometric and mathematical programming DEA/FDH (Data Envelopment Analysis/Free Disposal Hull). This paper uses the DEA approach
Data Envelopment AnalysisDEA is a linear programming methodology, popularized by Charnes et al., (1978), by building on the efficiency ideas put forth by Farrell (1957). It is a data oriented approach for evaluating the performance of a set of entities which convert multiple inputs into multiple outputs. DEA evaluates the efficiency of each entity through an objective weight system that the model calculates from the data, without relying on the subjective opinions of researchers. The model assigns that set of weights to an entity that maximizes its efficiency score. This method is widely accepted among strategic, policy and operational circles, particularly in the service and nonprofit sectors (Siems and Barr 1998). Its wide acceptance is due to its ability to estimate efficiency scores for complex multi-input or multi-output firms, where the underlying production process is not well understood. Since this work intends to assess the relative efficiency scores of Indian MFIs, whose production process cannot be analytically represented, the DEA method is found most suitable for this purpose.
Bilateral Comparison of performanceDEA models are based on the assumption of convexity of technology. Convexity implies that if two activities (xa,ya) and (xb,yb) belong to the feasible set then each point lying on the segment combining the two activities also lies within the feasible set. However, when the decision making units belong to two different systems, this assumption is no longer valid. For example, the activities (xa,ya) and (xb,yb) may be accomplished by using different technology. Thus, no activity formed out of combination of the two is possible. This concept is now extended in the context of Indian and Bangladeshi microfinance institutions which operate under different
Journal of Economic Policy & Research, Vol 13, No 2

61
Financial and Social Efficiency: A Non-Radial Bilateral Performance Comparison of Microfinance Institutions of India and Bangladesh
environments and due to the presence of idiosyncratic factors in each country, we can not think of combining the two sets of methodologies.
In such a situation, we can make use of the bilateral comparison methodology which would help us to understand the differences between the two systems. The unique feature of this method is that when decision making units included in a particular system (say system A) are evaluated, the benchmark reference set for A excludes system A decision making units. Similarly, when decision making units belonging to system B are evaluated, the reference set includes only system A units.
In the present paper, the efficiency frontiers of two groups of microfinance institutions of India and Bangladesh are compared. For this, microfinance institutions belonging to the group of Bangladesh is evaluated with respect to microfinance institutions included in the group of India and vice versa. We have used the Slacks-Based Measure Model (non-oriented) introduced by Tone (2001) for bilateral comparison of the microfinance institutions.
For using a non-oriented slacks based measure of bilateral comparison let us divide the DMUs into two groups: A and B. For each DMU belonging to group A, technical efficiency can be computed on the basis of the following linear program (for m inputs and n outputs):
Where the vector (X1A0, X2A
0,……, XmA0) denotes the observed input bundle (m
inputs) of the DMUs belonging to Group A and the vector(Y1A0, Y2A
0,……, YnA0)
denote the observed output bundle (n outputs) of the same decision making unit. s- and s+ represent negative (input) and positive (output) slacks respectively. We can proceed similarly for the DMUs belonging to Group B.Statistical Significance of Efficiency ScoresFor comparing the efficiency of two different countries, it is often useful to test the efficiency difference between the two groups statistically. However, one cannot make use of parametric tests for this purpose because the theoretical distribution of efficiency scores estimated from DEA is not known. Under the circumstances, one needs to make use of non-parametric tests for the distribution of efficiency scores. In this context, following Brockett and Golany (1996), we use the Rank Sum Test for comparing the distribution of efficiency scores of the in-sample microfinance institutions in the groups of India and Bangladesh respectively. The test is based on the ranking of data. A brief description of the methodology follows in the next paragraph.
Let the data related to the two groups of observations (for India and Bangladesh be represented by A = {a1, a2, …..,ap} and B = {b1, b2, ……, bq}. Now, we form a

Volume 13, No 2, April-September 201862
new sequence of observations C by merging A and B. In the new sequence the data are arranged in the descending order. C is now ranked from 1 to R =p + q.
If there is a tie, the mid rank is used for the tied observation. Next, A’s rank data are summed. Let the resultant figure be S. The statistic S follows an approximately normal distribution with mean p(p + q +1)/2 and variance pq(p = q + 1)/12 for m, n≥ 10. By normalizing S, we have:
Z = [S – p (p + q +1)/2]/√pq (p = q + 1)/12Z has an approximately standard normal distribution. Using Z, we can test
the normal hypothesis that the two groups have same distribution against the alternative hypothesis at the significance level a. The null hypothesis is rejected if Z ≤ –Z a/2 or Z ≥ Z a/2. Here, Za/2 correspond to the upper a/2 percentile of the standard normal distribution
Variables, Data and Results
Description of VariablesThis study views MFIs as financial institutions have both social and financial goals (Wolleretal.1999; Schreiner 2002; Guitierrez-Nieto et al., 2008). The social and financial goals of the microfinance institutions form the basis for the selection of outputs for the DEA model used in this study. The social goal is denoted by depth of outreach, i.e. the extent to which microfinance reaches the poor. Depth of outreach can be captured by poverty level and gender of the clients (Christen 2001; Navajas et al., 2000; Bhatt and Tang 2001). The underlying assumption is that the greater the number of poor clientele and women clientele served by microfinance, the deeper is the outreach. Both these variables are included as outputs in the DEA model, as per production approach. The financial goal on the other hand is denoted by the MFI’s ability to generate a surplus on its growing loan portfolio (Otero 2000; Robinson 2001). These are captured by the gross loan portfolio of an MFI and the interest and fee income charged by them.
In the present study, we have used three inputs and four outputs for efficiency evaluation. The three inputs include total asset, operating cost and the number of loan offers. The four outputs are gross loan portfolio, total revenue, number of women borrowers and the number of poor borrowers.
The number of poor borrowers is calculated from the value of average loan size per capita gross national income (GNI), using the premise stated by Guitierrez-Nieto et al., (2008). The premise is as follows: ‘Given any two MFIs with identical inputs, the one that makes many small loans (small relative to the country’s per capita GNI) will be more socially efficient than the one that makes larger loans’. Based on this premise the equation used for deriving the poor borrowers figure is as follows:
Pi = pi x Bi where pi=proportion of poor borrowers for the ith micro finance institution, 0<pi<1
Pi=number of poor borrowers for the ith microfinance institution and Bi=total number of borrowers for the ith microfinance institution.
Journal of Economic Policy & Research, Vol 13, No 2

63
Financial and Social Effi ciency: A Non-Radial Bilateral Performance Comparison of Microfi nance Institutions of India and Bangladesh
Data SourceFor applying a non-radial bilateral comparison model in the comparative study of microfi nance institutions of India and Bangladesh, data have been collected from MIX markets, a global web based microfi nance information platform and annual reports of the MFIs. We have used information of 15 MFIs of Bangladesh and 13 MFIs of India for the period of three years from (2013-14 to 2015-16) in the empirical study.
Descriptive Statistics of Effi ciency Scores of the In-Sample Microfi nance InstitutionsTable 1 includes the descriptive statistics of effi ciency scores of the in-sample microfi nance institutions for the observed years computed separately for the two groups of observations. Figure 1 provides a graphical representation of mean effi ciency scores of the two groups of microfi nance institutions. From table 1 we fi nd that the microfi nance institutions have considerably higher level of mean effi ciency score relative to the Bangladeshi institutions. The institution wise effi ciency scores and the ranks are presented in appendix tables A1 and A2 respectively.
Table 1: DescriptiveStatisticsofEfficiencyScores
Particulars 2013-14 2014-15 2015-16Indianmicrofinanceinstitutions
Mean 2.6143 2.7032 2.3149Standard Deviation 1.1981 1.6879 2.3508
Maximum 4.4950 8.0971 10.3491Minimum 1 1 1
BangladeshimicrofinanceinstitutionsMean 0.8480 0.7974 1.0329
Standard Deviation 0.0990 0.1280 0.1925Maximum 1 1 1.5084Minimum 0.6865 0.6648 0.7835
Source:Calculated
Figure 1: AComparisonofMeanEfficiencyScores

Volume 13, No 2, April-September 201864
Testing for the distribution of efficiency scores: Indian and Bangladeshi microfinance institutionsIn order to find out whether the two groups (group A: Bangladesh and group B: India) of microfinance Institutions have the same distribution of efficiency scores, the Wilcoxon Rank Sum Test is applied using STATA version 14.1. The null hypothesis is that the two groups have the same distribution of efficiency scores, while the alternative hypothesis is that they have different distribution of efficiency scores. The results are included in table 2 and confirm the dominance of Indian microfinance institutions over their Bangladeshi counterparts.
Table 2: Ranksumtestforcomparingthedistributionofefficiencyscores
Particulars 2013-14 2014-15 2015-16Rank sum for group
A institutions 297 298.5 279.5
Rank sum for group B institutions 109 107.5 126.5
Test statistics 3.672 3.736 2.862
Acceptance /rejection of Null
hypothesis
NullHypothesisisrejected- group B outperforms group Aatsignificancelevelof.0004
NullHypothesisisRejected- group B outperforms group Aatsignificancelevelof.0002
NullHypothesisisrejected- group B outperforms group A atsignificancelevelof.0042
Concluding ObservationsIn this paper, the bilateral comparison model has been used to compare the performance of major microfinance institutions of India and Bangladesh for the years from 2013-14 to 2015-2016, using four output indicators (i.e gross loan portfolio and financial revenue) representing financial and social efficiency and (number of women borrowers and number of poorest reached). As we analyze the parameters to estimate the social and financial efficiency the result showed the parameters have improved considerably in Bangladesh over the years as the result of the initiatives taken by the Micro Credit Regulatory authority of Bangladesh in the microfinance sector including the introduction of KYC e norms and reduction in risk in respect of outstanding loan portfolio. However, when we compared the performance of the microfinance institutions of Bangladesh with India, we found that the Indian institutions outperformed the microfinance institution of Bangladesh for the observed years from 2013-14 to 2015-16 on financial and social efficiency parameters. The results indicate that more measures are required to be taken by the regulatory authorities of Bangladesh to include unbanked rural population in main stream financing.
ReferencesBabu-Muneer, M., &Kulshreshtha, P. ( 2014). Productivity Change and Technical
Efficiency in Indian Microfinance Institutions, Studies in Microeconomics, 2(2), pp:165-200.
Babu- Muneer, M., &Kulshreshtha, P.(2017). Efficiency of Indian Microfinance Institutions, The Indian Economic Journal, 60(4), pp:81-101.
Balkenhol B.(2007). Efficiency and sustainability in microfinance in Balkenhol,
Journal of Economic Policy & Research, Vol 13, No 2

65
Financial and Social Efficiency: A Non-Radial Bilateral Performance Comparison of Microfinance Institutions of India and Bangladesh
B. (Ed.), Microfinace and Public Policy: Outreach, Performance and Efficiency, International Labor Office, Geneva, Switzerland, New York: Palgrave Macmillan, pp:211-229.
Bassem, B.S. (2008). Efficiency of microfinance institutions in the Mediterranean: an application of DEA, Transition Studies Review, 15 (2), pp:343-354.
Bhatt,N and Tang S.Y. (2001). Delivering microfinance in developing countries:controversies and policy perspective, Policy Studies Organisation, 29(2), pp:319-334
Brockett,Patrick.L., Boaz Golany, (1996). Using Rank Statistics for Determining Programmatic Efficiency Differences in Data Envelopment Analysis, Management Science, 42(3), pp:466-472.
Charnes A, Cooper W and Rhodes E (1978). Measuring Efficiency of Decision Making Unit, European Journal of Operational Research, 2(6), pp:429-444.
Christen, R.P. (2001).Commercialization and mission drift: The transformation of microfinance in Latin America, Consultative Group to Assist the Poor (CGAP) Occasional Paper 5, Washington, DC.
Farrell M J (1957). The Measurement of Productive Efficiency, Journal of the Royal Statistical Society, Series A, General, 120(3), pp:253-281.
Gutierrez-Niéto B, Serrano-Cinca C&Molinero C.M. (2007).Microfinance institutions and efficiency, International Journal of Management Science, 35, pp:131-142.
Gutierrez-Goiria J, San-Jose L &, Luis-Retolaza J (2017). Social Efficiency in Microfinance Institutions: Identifying How To Improve It, Journal of International Development, 29(2), pp:253-280.
Haq, M., Skully, M. and Pathan, S. (2009). Efficiency of Microfinance Institutions: A Data Envelopment Analysis, Asia-Pacific Financial Markets, 17(1), pp:63-97.
Kaur,P.(2016). Efficiency of Microfinance Institutions in India: Are They Reaching the Poorest of the Poor?, Vision - The Journal of Business Perspectives, 20(1), pp:54-65.
Koopmans, T.C. (1951). An Analysis of Production as an Efficient Combination of Activities, in Koopmans T C (Ed.), Activity Analysis of Production and Allocation, Cowles Commission for Research in Economics, Monograph No. 13, New York: John Wiley and Sons.
Kumar, N. and Sensarma, Rudra (2015). Efficiency of micro finance institutions in India: A stochastic distance function approach, http://hdl.handle.net/2259/679.
Mersland , R. and Strom R.O(2008). Performance and trade-offs in microfinance organizations – does ownership matter?, Journal of International Development, 20(5), pp:598-612.
Microcredit Regulatory Authority(MRA) (2016). NGO-MFIs in Bangladesh, June.Mia Aslam Md and Chandran V.G.R(2016).Measuring Financial and Social
Outreach Productivity of Microfinance Institutions in Bangladesh, Quality and Quantity: International Journal of Methodology, 50(3), pp:1285-1298.
Morduch J. (1999).The role of subsidies in Microfinance: Evidence from Grameen Bank, Journal of Development Economics, 60 (1), pp:229-248.
Navajas S, Schreiner M, Richard M, Claudio G &Rodriguez-meza J (2000). Microcredit and the poorest of the poor: Theory and evidence from Bolivia, World Development, 28(2), pp:333-346.

Volume 13, No 2, April-September 201866
Otero, M (2000). Bringing development back to micro finance, Journal of Micro Finance, 1(1), pp:8-19
Robinson SM (2001). The micro finances revolution: sustainable finance for the poor, World Bank, Washington, DC.
Sa-Dhan (2017). The Bharat Microfinance Report 2017. Schreiner, M (2002). Aspects of outreach: a framework for discussion of the
social benefits of microfinance, Journal of International Development, 14(5), pp:591-603.
Siems,T.F and Barr R.S. (1998).Benchmarking the productive efficiency of US banks, Financial Industry Studies, Federal Reserve Bank of Dallas, Dec 1998, pp.11-24.
Woller G, Dunford C and Warner, W (1999). Where to microfinance, International Journal of Economic Development, 1, pp:29-64
Zeller M and Meyer R(2002). The Triangle of Microfinance: Financial Sustainability, Outreach and Impact, Baltimore; John Hopkins University Press.
Appendix
Table A1: MFIwiseTechnicalEfficiencyScores
Microfinance Institution 2014 2015 2016ASA Bangladesh 1.0000 1.0000 1.0000BEES Bangladesh 0.7734 0.7004 0.9184BRACBangladesh 1.0000 1.0000 1.0000BURO Bangladesh 0.9139 0.8684 1.5084CDIPBangladesh 0.8414 0.7788 1.2252Grameen Bank 1.0000 1.0000 1.0000GUK Bangladesh 0.9180 0.9550 0.9362JCFBangladesh 0.7597 0.6836 0.8626RDRS Bangladesh 0.7479 0.6757 0.9150RRFBangladesh 0.8420 0.7538 1.0434Sajida Bangladesh 0.8249 0.6702 1.3411SSS Bangladesh 0.7415 0.6648 1.0789TMSS Bangladesh 0.7774 0.7341 0.7860UDDIPAN Bangladesh 0.6865 0.6731 0.7835WAVE Bangladesh 0.8940 0.8029 1.0954AnnapurnaMicrofinanceIndia 2.2692 1.9077 1.8281Arohan India 2.0101 2.1433 1.5313ASA India 4.4880 2.6501 2.0794CashporIndia 3.2117 2.5206 1.8532Janalakshmi India 1.1137 1.0000 1.0000RGVN India 3.3010 2.9714 2.5268Samasta India 4.4950 3.1481 1.6013Satin India 2.2610 1.8234 1.3556SKDRDP India 1.0000 8.0971 10.3491BharatFinancial(SKS) 1.0000 1.8139 1.4282Sonata India 1.8713 1.8556 1.1239Spandana India 4.0542 3.4683 1.5863VillageFinancialIndia 2.9101 1.7425 1.8308
Source:Calculated
Journal of Economic Policy & Research, Vol 13, No 2

67
Financial and Social Efficiency: A Non-Radial Bilateral Performance Comparison of Microfinance Institutions of India and Bangladesh
Table A2: MFIwiseRankBasedonTechnicalEfficiencyScores
Microfinance Institution 2014 2015 2016ASA Bangladesh 11 12 16BEES Bangladesh 23 22 21BRACBangladesh 11 12 26BURO Bangladesh 17 17 16CDIPBangladesh 20 19 8Grameen Bank 11 12 12GUK Bangladesh 16 16 16JCFBangladesh 24 23 20RDRS Bangladesh 25 24 23RRFBangladesh 19 20 26Sajida Bangladesh 21 26 22SSS Bangladesh 26 27 15TMSS Bangladesh 22 21 26UDDIPAN Bangladesh 27 25 11WAVE Bangladesh 18 18 14AnnapurnaMicrofinanceIndia 6 8 24Arohan India 8 7 25ASA India 2 5 13CashporIndia 5 6 5Janalakshmi India 10 12 7RGVN India 4 4 3Samasta India 1 3 4Satin India 7 10 16SKDRDP India 11 1 2BharatFinancial(SKS) 11 11 6Sonata India 9 9 10Spandana India 3 2 1VillageFinancialIndia 28 28 9
Source:Calculated.

Volume 13, No 2, April-September 201868
National Social Assistance (NSA)Programme: A Study on Women Beneficiaries among Dalits and Non-Dalits
P. Raghupathi*
ISSN 0975-8577 Volume 13, No 2, April-September 2018 pp. 68-80
Journal of Economic Policy & Research
* AssistantProfessor,CESSUnit,DevelopmentStudiesBhavan,AcharyaNagarjunaUniversity,[email protected]
AbstractTheNationalSocialAssistanceProgramme(NSAP) isasignificantsteptowardsthefulfillmentoftheDirectivePrinciplesofStatePolicypreservedintheConstitutionof India, which order the State to undertake within its means many welfare measures. In accordance with these magnanimous principles, the Government ofIndia,on15thAugust1995,takenintoaccounttheNSAPintheUnionBudgetfor1995-96.Providingsocialprotectiontotheunemployed,theelderlypersons,sick and disabled, among different sections of the people in the society, has been the most important objective of this social assistance programme. A remarkable feature of this programme is that it alone covers about 70% of the women,irrespective of the social category to which they belong. In addition, Article 41 oftheConstitutionofIndiaenjoinstheStatetoprovidepublicassistancetoitscitizens in case of unemployment, old age, sickness and disablement and in other cases of undeserved want. Even though such programmes have been in operation forquitesometime,theirintendedbenefitshavestillnotmanydeprivedsections.A large number of women are still being deprived of social protection at the grassrootslevel.Thispaperisbasedonafieldstudyinavillage,withparticularreference to the reach of the National Social Assistance programmes to the deprived communities. This study will seek to bring out that there has been continuous discrimination in identifying the actual women beneficiaries fromDalits,coupledwithnepotismandmanipulationintheselectionofbeneficiariesamong non-Dalits.
Key Words: Dalit Women, Landholdings, NSA Programmes
Introduction The National Social Assistance Programme (NSAP) includes elements like the National Old Age Pension Scheme (NOAPS), National Family Benefit Scheme (NFBS) and National Maternity Benefit Scheme (NMBS). These programmes seek to provide social assistance benefit to the aged, the BPL households in the case of death of the primary breadwinner and assistance in cases of maternity. These programmes are aimed at ensuring at least the minimum national health standards, in addition to the benefits that the States are providing, or would provide in future.
Further, NSAP represent an important step towards the fulfillment of the Directive Principles of State Policy safeguarded in the Constitution of India which

69
National Social Assistance (NSA)Programme: A Study on Women Beneficiaries among Dalits and Non-Dalits
direct upon the State to undertake, within its means, numerous welfare measures. This scheme came into force by the Central Government on 15th August 1995. The programme aims at providing social protection to the unemployed, the elderly, sick and disabled among different sections of the people in the society. It may be mentioned here that state should provide public assistance to its citizens in case of old age, unemployment, sickness and disablement etc., as directed in the Article 41 of the Constitution of India. Abiding by the direction of the Constitution of India, these programmes are being initiated and implemented both in rural and urban areas of the country.
Review of LiteratureThere is an enormous body of literature on rural development in general, but very little literature available on rural developmental programmes, in general, and Andhra Pradesh state, in particular. Some of the available literature on state-initiated rural developmental programmes, in general, and Dalits, in particular, has been reviewed.
Even though various special developmental programmes have been initiated and implemented since the First Five Year Plan, there has not been any significant improvement in the living standards of Dalits (Nancharaiah, G, 2000). Development policies have brought some positive change, but the process of transformation has been very slow. As a result, these social groups continue to suffer from a high degree of poverty and economic deprivation. (Thorat, S, 2004). The Indian government spends about $ 5.5 billion on poverty reduction programmes. Unfortunately, much of this amount, ironically, never reaches the poor or the downtrodden people of the society. Therefore, they have become economically insecure (S.K.L. Das, 2008). Employment opportunities have been availed by people below the poverty line, but not by SCs and women to the expected level. All activities under JRY are constructive, but the benefits are not reaching SCs/STs and women to the full extent (Rajendra Patil, 2000)
The above studies are rich in their methodology, content analysis and scope. However, the present study intends to focus on the Dalits and rural development in a village, where more than 60 per cent of the population is landless. Thus, the present study will have its own importance within the ambit of rural development and the empowerment of marginalised sections like the Dalits.
Statement of the ProblemThe above reviews were carried on Dalits only with respect to the government policies and programmes. A few studies were substantially reviewed, by examining various developmental programmes. Despite the richness of content, analysis and information in these studies, there are certain gaps and limitations, which the present study would like to bridge to the extent possible. Some of the studies highlighted the poor performance of developmental programmes, but failed to provide caste-wise details of the intended beneficiaries. These studies have not shown either micro or macro level data, in order to assess the Dalit beneficiaries. Further, these studies ignored comparative analysis between Dalits and non-Dalits with respect to poverty alleviation programmes. Further, many studies have paid greater attention to assess the performance of a single programme, i.e.,

Volume 13, No 2, April-September 201870
Journal of Economic Policy & Research, Vol 13, No 2
IRDP, JRY, rather than focusing on the performance of multi poverty alleviation programmes. Above all, most of the earlier studies were conducted, irrespective of micro or macro only to estimate the proportion of the overall beneficiaries. No study examined genderwise beneficiaries ratio, either at the macro or micro, level. Hence, this study has given significant importance to estimate the gender-wise distribution of beneficiaries of national social assistance programme at the grassroots level.
MethodologyThis study has been conducted in the Chittoor district of Andhra Pradesh state. In fact, in Andhra Pradesh, ancillary to the 1961 Census, though originally 46 villages were proposed to be covered, actually only 32 village studies were completed. Panchalamarri village is among them and may be considered as a typical village in Rayalaseema region of the State, which is subjected to frequent droughts and adverse seasonal conditions. Therefore, Panchalamarri village has been randomly selected from the 1961 Census village survey.Beside the Panchalamarri village 8 adjoining hamlets of Malapalli, Madigapalli, Gundlurivaripalli, Vasanthagaripalli, Muttrasingannagaripalli, Kanchendinnepalli, Nallapureddigaripalli and Mekalavaripalli have been treated as one unit, i.e., the Panchalamarri revenue Panchayat. The studied Panchayat comprises of a total of 231 households, of which 48 are of Dalits and 183 of non-Dalits. For this study, all total Dalits households were covered and from non-Dalits only 30 households were randomly selected, for obtaining a comparative picture, based on land categorisation, namely, landless, marginal, small, medium and large.
Data collection has been done through field observation and pre-structured questionnaire survey methods. Information has also been collected through group discussions with the eligible beneficiaries, and in-depth interviews with some key informants like Panchayat members and government representatives at the grassroots level. Sometimes, participant and focused group interview method was followed during the study.
Objectives of the StudyThe present study aims to understand the National Social Assistance (NSA)
Programme in Social Security Perspective, to analyse the land, and occupational structure of Dalits and Non-Dalits at the village level, to study the role of the state and the impact of National Social Assistance Programme (NSAP) on the conditions of living of Dalits and to identify factors facilitating and hindering the socio-economic status of rural poor in general and Dalit community in particular.
Socio-economic Profile of Panchalamarri VillageThere are 231 households in the village. Out of the total households, 78 households were selected for the empirical survey. Keeping in view that the main focus of the study is on Dalits, all Dalit households were covered. However, for obtaining a comparative picture, 30 non-Dalit household were selected. Of these, 7 households were of BCs and 23 households were of OCs. All BC households were covered, since there were only seven such households in the study village. For this study, households were selected on the basis of land categorisation.
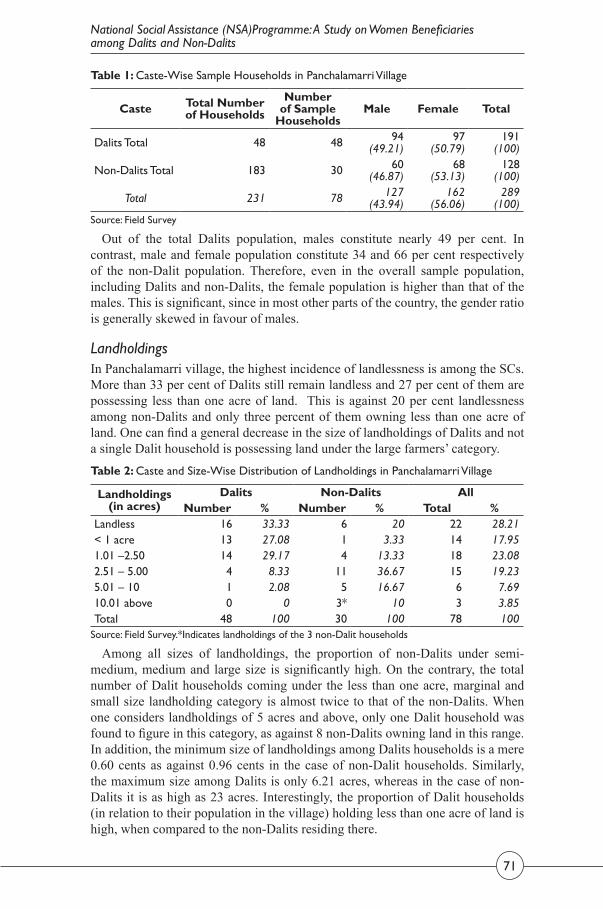
71
Table 1: Caste-WiseSampleHouseholdsinPanchalamarriVillage
Caste Total Number of Households
Number of Sample
HouseholdsMale Female Total
Dalits Total 48 48 94(49.21)
97(50.79)
191(100)
Non-Dalits Total 183 30 60(46.87)
68(53.13)
128(100)
Total 231 78 127(43.94)
162(56.06)
289(100)
Source:FieldSurvey
Out of the total Dalits population, males constitute nearly 49 per cent. In contrast, male and female population constitute 34 and 66 per cent respectively of the non-Dalit population. Therefore, even in the overall sample population, including Dalits and non-Dalits, the female population is higher than that of the males. This is significant, since in most other parts of the country, the gender ratio is generally skewed in favour of males.
LandholdingsIn Panchalamarri village, the highest incidence of landlessness is among the SCs. More than 33 per cent of Dalits still remain landless and 27 per cent of them are possessing less than one acre of land. This is against 20 per cent landlessness among non-Dalits and only three percent of them owning less than one acre of land. One can find a general decrease in the size of landholdings of Dalits and not a single Dalit household is possessing land under the large farmers’ category.
Table 2: CasteandSize-WiseDistributionofLandholdingsinPanchalamarriVillage
Landholdings(in acres)
Dalits Non-Dalits AllNumber % Number % Total %
Landless 16 33.33 6 20 22 28.21< 1 acre 13 27.08 1 3.33 14 17.951.01–2.50 14 29.17 4 13.33 18 23.082.51–5.00 4 8.33 11 36.67 15 19.235.01–10 1 2.08 5 16.67 6 7.6910.01above 0 0 3* 10 3 3.85Total 48 100 30 100 78 100Source:FieldSurvey.*Indicateslandholdingsofthe3non-Dalithouseholds
Among all sizes of landholdings, the proportion of non-Dalits under semi-medium, medium and large size is significantly high. On the contrary, the total number of Dalit households coming under the less than one acre, marginal and small size landholding category is almost twice to that of the non-Dalits. When one considers landholdings of 5 acres and above, only one Dalit household was found to figure in this category, as against 8 non-Dalits owning land in this range. In addition, the minimum size of landholdings among Dalits households is a mere 0.60 cents as against 0.96 cents in the case of non-Dalit households. Similarly, the maximum size among Dalits is only 6.21 acres, whereas in the case of non-Dalits it is as high as 23 acres. Interestingly, the proportion of Dalit households (in relation to their population in the village) holding less than one acre of land is high, when compared to the non-Dalits residing there.
National Social Assistance (NSA)Programme: A Study on Women Beneficiaries among Dalits and Non-Dalits

Volume 13, No 2, April-September 201872
Journal of Economic Policy & Research, Vol 13, No 2
It was also observed that all Dalit households owning less than one acre of land were to be fully dependent on monsoons for irrigating their fields. However, some of the non-Dalits, falling under this category, have managed to get bore wells dug in their fields and are able to grow commercial crops like mulberry and sugarcane.
WorkforcePanchalamarri continues to be a predominantly agricultural village in terms of the occupational distribution of the working population. Table 3 shows the workforce distribution in this village. The rural non-farm sector is considered to be a very important source of supplementary income for the small farmers’ class, but it is very weak, in general, and in the case of Dalits, in particular.
Table 3: Population of Workforce in Panchalamarri Village
CategoryDalits Non-Dalits Total
Male Female Total Male Female Total Male Female TotalTotal Population 94 97 191 60 68 128 154 165 319Total Non-Workers 37 36 73 21 26 47 58 62 120Non-Workers%toTotalPopulation 39.36 37.11 38.22 35.00 38.24 36.72 37.66 37.58 37.62
Total Workers 57 61 118 39 42 81 96 103 199Workers%toTotalPopulation 60.64 62.89 61.78 65.00 61.76 63.28 62.34 62.42 62.38
Agricultural Workers 43 57 100 21 16 37 64 73 137%ofAgriculturalWorkersto Total Workers 75.44 93.44 84.75 53.85 38.10 45.68 66.67 70.87 68.84
Non-Agricultural Workers 14 4 18 18 26 44 32 30 62%ofNon-agriculturalWorkers to Total Workers 24.56 6.56 15.25 46.15 61.90 54.32 33.33 29.13 31.16
Source:FieldSurvey.
Out of the total population in the village the proportion of total workers among Dalits and non-Dalits is more or less the same. When it comes to the gender distribution, female proportion among both Dalits and non-Dalits is approximately the same. As regards the male workers’ proportion, non-Dalits males were found to be about five percent more than that of Dalits males.
It was also found that out of the total workers among the Dalits about 85 per cent of them were agricultural workers. The corresponding figure for non-Dalits was as low as 45.68 percent. However, when one considers the non-agricultural workers, the figure for non-Dalits was as high as 54.32 per cent, but only 15.25 percent in the case of Dalit workers. It can thus be concluded that most of Dalits still depend on agricultural labour work, while non-Dalits have been accessing non-agricultural sources of income as well.
National Social Assistance Programme: An Overview The National Social Assistance Programme (NSAP) has been incorporated in the Central Budget during 1995-96. A Committee under the Chairmanship of the Rural Development Secretary has worked out relating to the details of the programme by making discussions with the representatives of the State Governments.
The following are the guidelines and procedures to be followed while implementing the National Social Assistance Programme (NSAP). Further, other

73
matters like releasing of assistance, under this programme, to states by the central is also relevant to the NSAP.
Objectives of the NSA ProgrammeThe following three schemes were covered under NSAP for the time being:• National Old Age Pension Scheme (NOAPS)• National Family Benefit Scheme (NFBS)• National Maternity Benefit Scheme (NMBS).
Under NSAP, which is a centrally sponsored programme, 100% assistance by the Central Government is accorded to the States / UTs. Benefits are to be provided bearing upon the terms and conditions laid down by the Central Government.
In the case of old age, death of the breadwinner of a household and maternity, the NSAP objective is to ensure at least the minimum national standards, besides the benefits that the States are currently delivering or might deliver in the future. The prime objective of the programme is to provide 100% central assistance in order to ensure social protection to the eligible beneficiaries all over in the country uniformly without any obstruction.
Financial Assistance under NSAPScheme-wise Financial Assistance under NSAP for its Eligible Beneficiaries would be as under:• Under National Old Age Pension Scheme (NOAPS), the eligible beneficiary
receives Rs.1000/- per month. • Under National Family Benefit Scheme (NFBS), the eligible beneficiary is
paid Rs. 10,000/- in case of death of the primary breadwinner of the household.• Under National Maternity Benefit Scheme (NMBS), the eligible beneficiary
receives Rs.500/- per pregnancy up to the first two live births.
Beneficiaries under National Old Age Pension Scheme (NOAPS): National Old Age Pension Scheme (NOAPS) is a centrally sponsored scheme and it came into force from 15 August 1995. Under this scheme 100 per cent central assistance is extended to the States to provide the benefits conforming to the guidelines and conditions laid down by the central government. The eligibility criteria is the eligible beneficiary, either male or female, shall be 65 years of age or higher. The eligible applicant must be a destitute having no regular means of income or financial support from the family members, or other sources (see annexure).
Table 4:CasteWiseNumberofPersonsBenefitedUndertheNationalOldAgePensionScheme(NOAPS)inPanchalamarriVillage
CategoryDalits Non-Dalits All
Male Female Total Male Female Total Male Female TotalTotal Persons Eligible for of Old Age Persons
16(64)
9(36)
25(100)
5(71.43)
2(28.57)
7(100)
21(65.63)
11(34.38)
32(100)
Number of Beneficiaries Under NOPS
10(62.50)
5(55.56)
15(60)
5(100)
2(100)
7(100)
15(71.43)
7(63.64)
22(68.75)
Number of Persons not Benefited
6(37.5)
4(44.44)
10(40)
0(0)
0(0)
0(0)
6(28.57)
4(36.36)
10(31.25)
Source:FieldSurvey
National Social Assistance (NSA)Programme: A Study on Women Beneficiaries among Dalits and Non-Dalits

Volume 13, No 2, April-September 201874
Journal of Economic Policy & Research, Vol 13, No 2
It could be seen that, out of the 25 Dalits eligible for this pension, as many as 10 persons were denied this benefit. On the other hand, all the 7 eligible non-Dalits (which include both males and females) have been granted the old age pension. One cannot fail to notice that 37.5 percent of the eligible Dalit males and 44.44 percent of the eligible Dalit females were not granted this pension. Overall, 40 percent of the total Dalits have been denied the old age pension.
A very amazing fact that came to the fore during the field study of this writer was that 3 non-Dalits (2 males and 1 female) were drawing this pension, even though they had not attained the age of 65 years (the basic criteria for providing this benefit). It needs to be stressed here is that, even though most social welfare schemes are intended for improving the lot of the downtrodden sections of society, many Dalits are still not able to benefit from these schemes. A possible reason for this is the low awareness levels, particularly regarding their eligibility, among the Dalits. A study also found that a greater proportion of non-Dalits is benefitting from old age and widow pensions, when compared to the Dalits (Rao, Padmanabha P., 2006)
According to Dalit respondents, particularly who did not benefit even though they are legitimately eligible, caste prejudices are preventing them from drawing benefits from the various developmental programmes, including this one. On top, the applicants have to contend with the cumbersome registration process and the high handedness of the concerned officials. A respondent informed this writer that, even though he had submitted his application fulfilling the criteria in all respects, he was not made a beneficiary of this scheme. Some of the respondents brought out glaring instances of the concerned authorities applying different eligibility conditions for the Dalits and non-Dalits. For instance, some female Dalit senior citizens were excluded from the NOPS on the plea that only one person (the male member) from a household could draw this pension, even in cases where both the male and female members were eligible. However, the same criterion was not being followed in the case of non-Dalit households. Next, this village Panchayat has peculiar characteristics particularly in the case of Dalit localities. Thus, Dalit households are isolated into two hamlets as Malapalli and Madigapalli which are away about two km from non-Dalit hamlets. Hence, these hamlets are not merged with non-Dalit households. As a result, local Panchayat leaders/authorities have wider scope to practice nepotism, while selecting beneficiaries at the hamlet level. Further, while disbursing the pension, the local authorities direct all Dalit beneficiaries to assemble at one place for receiving the due amounts. On the other hand, the ‘eligible’ non-Dalit beneficiaries receive their pension benefits at their door steps itself. It was also stated that a few non-Dalits, belonging to the large farmers’ category, though officially not eligible for it, are getting pension under this scheme.
It is reported by a few respondents that due to recommendations by local leaders and local middlemen majority beneficiaries are always selected. Prof. Haragopal recounts an instance of starvation deaths taken place in Mahbubnagar district of then AP due to famine type conditions. Studies also revealed that many eligible families, in this area, had not received their pensions since they do not have proximity to the local leaders. Thus, the selection of beneficiaries are largely influenced by political individuals despite pensions are distributed in an open forum (the Gram Sabha). According to Haragopal, it is emphasized that the

75
magnitude of eligible beneficiaries in a village is always higher in comparison with the number of persons benefited by the pension scheme. However, there have also been a few instances where non-eligible candidates from the ruling party have entertained the pensions for their kith and kin.
Beneficiaries under National Family Benefit Scheme (NFBS): From Table 5 below, it can be seen that three Dalit households were eligible for the national family benefit scheme. As per information available, even though all of them fulfilled the terms and conditions stipulated in the scheme, and merely one Dalit household was provided this benefit and she received just Rs.8000/-. On the other hand, a single non-Dalit household was benefited with financial assistance of Rs 10,000/- under this scheme.
Table 5: CasteWiseNumberofHouseholdsBenefitedUnderNationalFamilyBenefitScheme(NFBS)inPanchalamarriVillage
Number of Eligible Households
Number of Beneficiaries
YearofDeath
Age at which theConcerned
Person Died Financial
AssistanceNumber of HouseholdsnotBenefited
Dalits
31 1991 28 Nil 11 2001 30 Nil 11 2008 42 Rs.8000 0
Total 3 2Non-Dalits
1 1 2009 41 Rs.10,000 0Source:FieldSurvey
Of the total 48 Dalits households surveyed; only three households were identified as eligible under this scheme. It is found that about 67 per cent Dalit women are neglected while providing benefits under the National Social Assistance Programme (NSAP). As per the criterion prescribed by the Government of India, the bereaved household must be below the poverty line. These three households were found to be in the BPL category, with the annual family income ranging between Rs.10,000/- and Rs.25,000/-. Two of the respondents informed that they were deliberately disqualified for the benefit by the local Panchayat officials on the plea that the particular household breadwinner should not have been more than 25 years of age. According to the terms and conditions laid down in the NFBS, the primary breadwinner’s age should be less than 65 years. However, in the case of non-Dalit household, which lost its breadwinner at the age 41, the bereaved family received the proposed total benefit within a span of four months. A widowed beneficiary told that she could avail the benefit since she was a close relative of the then village Panchayat president. Therefore, this clearly shows that the Panchayat officials do not properly cooperate with Dalits in particular. Consequently, many Dalits are being deprived of their legitimate benefits like old age pension,, death of head of the household benefit and maternity benefit, etc.
It is also observed that many Dalits do not have proper awareness about basic rural development programmes. Some of them only know about old age and widow pensions. With regard to their literacy level, majority of them found to be illiterates, due to which they are not aware about such schemes. It is to be noted that, on the one hand, it is very difficult for an illiterate person to submit an
National Social Assistance (NSA)Programme: A Study on Women Beneficiaries among Dalits and Non-Dalits

Volume 13, No 2, April-September 201876
Journal of Economic Policy & Research, Vol 13, No 2
application for such schemes; and, on the other, it is almost a herculean task for obtaining the death certificate of the breadwinner. The unhelpful attitude of most local Panchayat leaders and local officials is the major hindrance for many Dalits in securing their legitimate benefits. As regard the non-Dalit household which obtained the benefit under this scheme, it emerged that the Sarpanch of the village Panchayat was a close relative of the deceased person.
Beneficiaries under National Maternity Benefit Scheme (NMBS): This scheme provides financial assistance of Rs.500/- to the BPL pregnancy women up to the first two live births. In addition, the children below five years of age are regularly administered polio drops when the medical camp is conducted for this purpose.
Table 6: Caste-WiseNumberofWomenBenefitedUndertheNationalMaternityBenefitScheme(NMBS)intheStudyVillage
Category Dalits % Non-Dalits % All %
Total Number of Women Eligible for NMBS 13 100 8 100 21 100
NumberofBeneficiariesUnder NMBS 9 69.2 7 87.5 16 76.19
Number of Persons not Benefited 4 30.8 1 12.5 5 23.81
Source:FieldSurvey
One can find a glaring disparity in the figures for Dalit and non-Dalit respondents. While 87.5 percent of non-Dalit women received benefits under this scheme, the corresponding figure for dalit women was 69.2 percent. It emerged that four out of the nine Dalit respondents had to opt for delivery in private hospitals, since the concerned local authorities told them that they were not covered under this scheme. As per the prescribed procedure for this scheme, a three months pregnant woman has to register her name with government ANM nurse who regularly visit the villages and supplies medicines such as iron, calcium tablets etc., free of cost to her. All registered pregnant women have to be admitted in their respective government hospital for the delivery and only such women are eligible for maternity benefits. These instructions are being followed only in the case of Dalits. However, a number of non-Dalit women, who were admitted in private hospitals for cesarean operations, received benefit under this programme.
Table 7: Caste-wisePercentageofWomenBeneficiariesunderNationalSocialAssistance(NSA)Programme
Name of the
Programme
Dalits Non-DalitsTotal Number
of Women Eligible for the
Programme
Number of Women Benefited
Number of Women Not Benefited
Total Number of Women
Eligible for the Programme
Number of Women Benefited
Number of Women Not Benefited
NOAPS 9 5(55.56)
4(44.44) 2 2
(100)0
(0)
NFBS 3 1(33.33)
2(66.67) 1 1
(100)0
(0)
NMBS 13 9(69.23)
4(30.8) 8 7
(87.5)1
(12.5)Source:ComputedfromScheme-wiseTables

77
One glaring fact that emerges is that, in all the three programmes, the proportion for Dalit applicants who did not receive the benefits is very noticeable – 44.44 percent in the case of NOAPS; 67 percent in the case of NFBS and 31 percent in the case of NMBS. The corresponding figures for non-Dalits were: 0 percent; 0 percent and 12.5 percent respectively. A number of Dalit respondents reported that in the process of selecting the beneficiaries, various unrelated issues which are, in fact, not laid down in the NOAPS design, are cited so as to keep them out of the purview of such schemes. As a result, a large number of eligible Dalit applicants are excluded from this scheme. On the other hand, a significant number ineligible non-Dalits are extensively covered under this scheme.
NSA Programme and Evaluation of the StakeholdersOpinions of the beneficiaries and non-beneficiaries have been considered to
estimate about the functioning of the NSA Programme. On an average, around 56 per cent Dalit and about 91 per cent of non-Dalit beneficiaries have answered positively to the performance of the programme. It is observed that the proportion of non-Dalits beneficiaries is 35 per cent higher than that of Dalits. As far as non-Dalits are concerned, all of them are satisfied with the selection method used. As against this, 44 per cent of Dalit non-beneficiaries have responded negatively about the implementation of the programme. They are very much dissatisfied with the existing selection procedure and the mechanism being adopted while disbursing benefits to the eligible beneficiaries. Both beneficiaries, as well as non-beneficiaries, felt that selection procedure for beneficiaries by the local authorities is playing a signification role. As a result, nepotism and manipulation of beneficiaries prevails across the programme which ultimately paves the way for registering higher number of beneficiaries from the non-Dalits community. In addition, awareness about such programme is very low among Dalits as compared with the non-Dalits. Since all the local authorities are non-Dalits, awareness levels among the eligible Dalit beneficiaries are generally low.
Conclusions and Suggestions for ImprovementAs far as the NSA programme is concerned, the government generally tends to direct all its energies to fulfill the targets in the given time period. Further, only a substantial number of non-Dalits are taken into account while fulfilling its targets and the actual eligible beneficiaries, in general, and BPL category Dalits, in particular, tend to be deprived of the benefits. It is observed that there seems to be less concentration on the effective implementation of all these schemes at the grassroots level. The study found that there is large-scale caste discrimination, nepotism and manipulation in the selection of the beneficiaries. Eligible terms and conditions prescribed by the government in these schemes are not applied for the Dalits which ultimately give scope for depriving many Dalits of the benefits. The study also found that, in a number of cases, the BPL list is manipulated. Therefore, the BPL list must be prioritized according to the level of income and land holding criterion or any other specified measure. Thus, a greater degree of transparency and lower degree of caste discrimination from the implementing authorities and better awareness by the eligible beneficiaries would ensure better results. Above all, appointing a caste representative, while selecting beneficiaries, would also bring about appropriate result exclusively in the case of eligible Dalit women.
National Social Assistance (NSA)Programme: A Study on Women Beneficiaries among Dalits and Non-Dalits

Volume 13, No 2, April-September 201878
Journal of Economic Policy & Research, Vol 13, No 2
It appears that there is no proper monitoring of the implementation of these schemes. As a result, there is great scope for the ground-level functionaries to interpret such schemes according to their whims and fancies. The implementing authorities need to be sensitised about issues like transparency, equity and social justice. One may argue about the need for granting greater autonomy to the grassroots level institutions, but then, total lack of control can lead to mismanagement. It must be stressed here that the welfare amounts are all from public funds. Hence, there should not be any scope for personal prejudices to play havoc with issues like the selection of beneficiaries.
It would be pertinent, in this context, to cite a famous principle of management, you must not only be fair, but must also appear to be fair.
References Chakravarty, B. & Rajeswar, D. (1998). Rural Housing Schemes in Andhra
Pradesh and Orissa: With focus on Participation, Utility and Acceptability, National Institute of Rural Development Research Study, [Available at: http://www.nird.org/clic/reshigh28-1998.htm].
Commissioners of the Supreme Court (2007). Seventh Report of the Commissioners to the Supreme Court, CWP 196/2001 available at www.sccommissioners.org and Annual Work plan & Budget documents of the state governments (2007-08) [Available at: education.nic.in]
Galab, S. (1999). Some Micro-level Arrangements of Social Security in Andhra Pradesh, Indian Journal of Labour Economics, 42(3).
Galab, S et al., (1997). District Poverty Initiatives Project: Anantapur, mimeo, Centre for Economic and Social Studies, Hyderabad.
George Mathew (2003). Panchayat Raj Institution and Human Rights in India, Economic and Political Weekly, 38(2).
Government of India (2006). National Programme of Nutritional Support to Primary Education, 2006: Guidelines, Ministry of Human Resource Development, New Delhi.
Planning Commission (2002), Tenth Five Year Plan (2002-2007), New Delhi.Press Note on Poverty Estimates, 2011-12 (2013). Government of India, Planning
Commission, July. Raghbendra Jha, Raghav Gaiha & Manoj K. Pandey, (2010). Food Price
Subsidy under Public Distribution System in Andhra Pradesh, Maharashtra and Rajasthan, ASARC Working Paper 2010/07.
Rao, Padmanabha P (2006). Impact of Poverty Alleviation Programmes in Andhra Pradesh: An Assessment. In: Chengappa D (ed.), Self Employment & Government Policy: Future Challenges, New Delhi: Anmol Publications Pvt. Ltd.
Ravi, C & S Indrakant (2003). Food Security and Public Distribution System. In: C H Hanumantha Rao and S Mahendra Dev (ed.), Andhra Pradesh Development: Economic Reforms and Challenges Ahead, New Delhi: Manohar Publishers and Distributors.
S. Srinivasa Rao (2002). Dalits in Education and Workforce, Economic and Political Weekly, 37(29).

79
SukhadeoThorat (2000). New Economic Policy and Its Impact on Employment and Poverty of the Scheduled Castes. In K. P. Kumaran (ed.), Impact of Economic Reforms on Scheduled Castes and Scheduled Tribes, National Institute of Rural Development, Hyderabad.
SukhadeoThorat and Joel Lee, (2010). Food Security Schemes and Caste Discrimination. In SukhadeoThorat & Katherine S. Newman (ed.), Blocked by Caste: Economic Discrimination in Modern India, New Delhi: Oxford University Press.
Surajit Deb, (2009). Public Distribution of Rice in Andhra Pradesh: Efficiency and Reform Options, Economic and Political Weekly, 46(51).
Tara S Nair (1999). Housing: the Missing Concerns (EPW Commentary), Economic and Political Weekly, 34(28).
Venkatramaiah, P., Galab, S., Gopinath Reddy, M and Swaminathan, M. C (1997). Concurrent Evaluation of Integrated Rural Development Programme Report for Andhra Pradesh (5th Round, July, 1995-June 1996), Centre for Economic and Social Studies, Hyderabad.
AnnexuresNational Old Age Pension Scheme – (NOAPS)In order to claim Central assistance under NOAPS, the following measures shall apply.• The eligible beneficiary, irrespective of male or female should be of 65 years
or above in age. • The eligible beneficiary must be a needy in the sense that he / she should
not have any regular means of income either from his / her own sources of income or through other sources like financial support from family members. The State / UTs Government may also be followed special measures in order to estimate destitution. However, the Government of India has right to evaluate such criteria and suggest suitable revised criteria.
• The eligible beneficiary under old age pension scheme is paid Rs.1000 per month.
• The States / UTs are specified with regard to ceiling on the total number of old age pensions in order to claim central assistance.
• According to the State government directions, the eligible beneficiary under NOAPS is paid his/her benefit in not less than two installments in a year. In addition, the benefit may be distributed in more installments as well.
As part of the procedure, village panchayats and relevant municipalities are to play a key role in reporting to the appropriate sanctioning authority regarding each case of the death of a pensioner soon after its occurrence. Accordingly, the appropriate sanctioning authority intended to ensure that payments are stopped thereafter.
In case of any false or mistaken information came to light subsequently regarding eligibility of the beneficiary, the sanctioning authority shall have the right to stop or recover payments if sanctioned pension to such cases.
National Social Assistance (NSA)Programme: A Study on Women Beneficiaries among Dalits and Non-Dalits

Volume 13, No 2, April-September 201880
Journal of Economic Policy & Research, Vol 13, No 2
National Family Benefit Scheme – (NFBS)A lumpsum family benefit is given as Central assistance for the below poverty line household on the death of the primary breadwinner of the family alone. The following measures shall apply to claim Central assistance under NFBS.
• The Head of the household (Primary Breadwinner) must be a family member of the household (male / female) whose earnings contribute to a large-scale to the total household income.
• The age group of the death of primary breadwinner should be between 18 and 64 years.
• As per the Government of India’s prescribed criterion, the bereaved family must belong to the below poverty line (BPL) household.
• In the event of the death of the primary breadwinner, a lumpsum Central assistance of Rs.10,000/- is paid under NFBS.
• The States / UTs are specified with regard to ceiling on the total number of family benefits in order to claim central assistance.
The appropriate sanctioning authority shall have the right to ensure the recovery of the payment made on the false or mistaken information that came to light with regard to eligibility.
National Maternity Benefit Scheme – (NMBS)Under NMB scheme, a lump sum cash assistance is given to women of BPL category households.
The following measures shall apply to claim Central assistance under NMBS
• The maternity benefit is confined only to pregnant women for up to the first two live births and she should attain the age of 19 years and above.
• As per the criteria prescribed by the Government of India, the eligible beneficiary should belong to the BPL household category.
• The lump sum ceiling amount of the benefit for purposes of claiming Central assistance is Rs.500/- only.
• The States / UTs are specified with regard to ceiling on the total number of maternity benefits in order to claim central assistance.
The lumpsum maternity benefit is disbursed prior to the delivery in one installment within 8-12 weeks. However, subject to the sanctioning authority’s satisfaction about the authenticity of the case, the benefit can be paid even after the delivery of child.
Based on the false or mistaken information that came to light subsequently regarding eligibility of the beneficiary, the appropriate sanctioning authority shall have the right to stop or recover payments, if sanctioned benefit, to such cases.

81
SNo Title of Programme Dates Programme Director(s)
1 Emerging Issues in Public Policy
Oct 22-27, 2018 Dr P Geeta
2 Financial Models for Sustainable Excellence
Oct 29-30, 2018 Mr M Chandrashekar
3 Goods And Services Tax (GST)
Nov 2-3, 2018 Dr K V Ramesh
4
Urban Common and Right to City (in association with Action Aid and European Union)
Nov 10-30, 2018
Dr Ch Lakshmi Kumari & Action Aid Team
5
International Conference on ‘Expanding HR Value: Unraveling the Future of Work’
Nov 15-16, 2018
Dr Shulagna Sarkar &Dr Samarendra Mohanty
6 Enhancing Sales Performance
Nov 26-27, 2018
Dr V Srikanth &Mr P Mahesh
7Understanding Foreign Currencies Risk and Global Finance
Nov 29-30, 2018
Dr Rajesh G &Dr M Karthik
8 Essentials of Corporate Finance
Nov 29-30, 2018
Dr A Pawan Kumar & Dr Harishankar Vidyarti
9 Cyber Security and Safety Measures
Dec 3-5, 2018 Mr AS Kalyana Kumar
10 Leadership and Change Management
Dec 6-7, 2018 Mr V Anji Raju
11 Contract Management Dec 10-11, 2018 Dr KV Ramesh
12 e-Procurement System for Vigilant and Transparency
Dec 10-12, 2018 Mr AS Kalyana Kumar
13Effective Logistics & Supply Chain Management for Operational Excellence
Dec 17-19, 2018
Mr S Satish Kumar &Mr CV Sunil Kumar
14
6th National Conference on ‘Diversity in Management – Development of Women Executives’
Dec 20-21, 2018
Dr Narendranath Menon Dr Anupama Dubey & Dr Prarthana Kumar
15 Enterprise Risk Management
Dec 27-29, 2018 Mr S Satish Kumar
IPE Training Calendar for October-December 2018

Volume 13, No 2, April-September 201882
Journal ofEconomic Policy and Research
Advertisement tAriff
Journal of marketing vistas will accept a limited number of corporate and institutional advertisements. The size of the journal is 6.3” X 9.5”.
Rs 1 lakh valid for 1 year
Advertisement (Back side cover page- Multi colour in two consecutive issues)
issue-wise details
Rs.75,000/- Backside Cover Page - Multi Colour
Rs.50,000/- Inner Cover Page - Multi Colour
Rs.40,000/- One Full Page - Multi Colour
Rs.30,000/- One Full Page - Black & White
Rs.20,000/- Half Page - Multi Colour
Rs.15,000/- Half Page - Black & White
Enquiries about corporate advertisements and appropriate art work should be sent to:
the editorJournal of Economic Policy and Research
Institute of Public EnterpriseOU Campus, Hyderabad - 500007
Contact DetailsE-mail: [email protected] Mobile: 9391932156

83
COMMON SubSCRIPTION FOrMToThe Publications Division,Institute of Public Enterprise,OU Campus, Hyderabad - 500 007Telangana, India.
Dear Sir / Madam,I/We wish to subscribe for the following Journal(s) for ________________ year(s) from _________________ to _________________.
S. No. Journal Title
Annual Subscription Rates Put aTick
(√) for Selection
For India For other countries
Indi-viduals
Academic Libraries
Corpo-rates
Foreign Subscribers
(US$)1 The Journal of Institute of Public
Enterprise 1500/- 2000/- 3000/- 200
2 Journal of Economic Policy & Research 1500/- 2000/- 3000/- 200
3 Journal of International Economics 1500/- 2000/- 3000/- 200
4 Journal of Marketing Vistas 1500/- 2000/- 3000/- 2005 IPE Journal of Management 1500/- 2000/- 3000/- 2006 Journal of Governance & Public
Policy 1500/- 2000/- 3000/- 200
Please find enclosed herewith a Demand Draft / Cheque, bearing No. ___________ drawn on Bank_______________________________ dated_______________for Rs/US$. ___________________ (In words)_______________________________drawn in favour of ‘Institute of Public Enterprise’, payable at Hyderabad. Please effect the subscription from next issue onwards.
Names of the Journals for which subscription is sent:1._____________________________ 2. __________________________3._____________________________ 4. __________________________5._____________________________ 6. __________________________
Journal Dispatch Address:Name of the Individual / Organization__________________________________Address__________________________________________________________City___________________________ Pin___________ Country____________ Ph. No.____________________________ Mobile No.____________________ E-mail Address_____________________________________________________
Signature: Office Seal:

Call for artiCles
I introduce myself as Dr. B. Sai Sailaja, Asst. Professor, Institute of Public Enterprise, Hyderabad, India. I am writing to you to invite scholarly theoretical and empirical articles / research papers/case studies to publish in our half-yearly journal, Journal of Economic Policy & Research. Before proceeding further, however, I would like to provide a brief profile of IPE. The Institute of Public Enterprise (IPE), Hyderabad is a non-profit educational society established in 1964. It is devoted to Education, Training, Research and Consultancy for business enterprises in the public and private sectors. IPE is the premier Business School at Hyderabad and is recognized as a “Centre of Excellence” by the Indian Council of Social Science Research (ICSSR), MHRD, GOI for doctoral studies. It has developed strong linkages with industry and academic institutions and is the founder member of the Association of Indian Management Schools (AIMS) and is also the member of Confederation of Indian Industry (CID, Computer Society of India (CSI) and European Federation for Management Education (EFMD). It is involved in Research, Training (Corporate and Faculty Training), Management Education, Publications and Consultancy. As part of the publications department, IPE publishes 7 Journals, Newsletter, various monographs and research publications and conference proceedings, apart from the books on various management related topics from time-to-time, the details of which are available on www.ipeindia.org/publications. These publications are targeted at academicians, research scholars, policy makers, working executives and general public at large. Eminent academicians, CEOs, and other practicing professionals, have also ventilated their thoughts through our publications from time-to-time giving our journals a rich flavour of theory and practice.
The Journal, ‘Journal of Economic Policy and Research’, provides an opportunity for discussion and exchange of findings across the broadest spectrum of scholarly opinion to stimulate theoretical, empirical and comparative studies in the context of economic policy and research both in India and abroad. Different aspects of Economic Policy and its implication on the different sectors of the economy and the country in general, are the main areas covered in this Journal.
With personal regards, Yours sincerely, Dr. B. Sai Sailaja Editor [email protected]

JOuRNAL SubSCRIPTION RATES‘Journal of Economic Policy and Research’ is published twice in a year (January-June & July-December). The subscription rates of the Journal per annum are as follows:
IndiaForeign Countries
Individuals Academic Corporates 1,500/- 2,000/- 3,000/- US$ 200
The subscription amount is payable in advance by Demand Draft / Banker’s Cheque only in favour of ‘Institute of Public Enterprise’ payable at Hyderabad. The Bank Draft / Banker’s Cheque may be sent along with the ‘Subscription Request Form’ given below:
SubSCRIPTION REquEST FOrMToThe EditorJournal of Economic Policy and ResearchInstitute of Public EnterpriseOU Campus, Hyderabad - 500007Telangana, India
Dear Sir / Madam,
I / We wish to subscribe to ‘Journal of Economic Policy and Research’
for _________ year(s). Accordingly, a Demand Draft / Cheque, bearing
No._____________________ dated ______________ for / US$___________
drawn in favour of ‘Institute of Public Enterprise’ payable at Hyderabad’ is
enclosed herewith. Please effect the subscription from next issue onwards.
Name____________________________________________________________
Address__________________________________________________________
_________________________________________________________________
City______________________ PIN_______________ Country______________
Phones___________________________________________________________
E-mail Address_____________________________________________________
_______________________
Signature


institute of Public enterprise (IPE) is a non-profi t educational society devoted to Education, Training, Research and Consultancy for business enterprises in the public and private sector.
IPE is a premier B-School and is recognized as a ‘Centre of Excellence’ by the Indian Council of Social Science Research (ICSSR), Ministry of HRD, Government of India, for doctoral studies. It is also recognized by nine universities for guidance of PhD scholars. It has developed strong links with industry and academic institutions and is the founder member of the Association of Indian Management Schools (AIMS).
IPE strongly believes that HR development including education is crucial for economic growth. As part of its long-term education program, the Institute runs an AICTE-approved PG Diploma in Business Management, which is also recognized as equivalent to MBA by the Association of Indian Universities (AIU). Added to it, the Institute offers
Shamirpet Campus, Medchal-Malkajgiri Dist, Hyderabad - 500101Ph: +91-40-234 90 900 Fax: +91-40-234 90 999 www.ipeindia.org
About IPE
Registered with the Registrar of Newspapers in India under Serial No. APENG/2011/44838
MBA in Public Enterprise for practicing managers in collaboration with Osmania University. With the changing needs of the industry, the Institute also runs sector-specifi c PGDM programs in Retail & Marketing, Banking, Insurance and Financial Services, Biotechnology and International Business, as well as an Executive PGDM program.
The Institute has a strong research wing with a number of research scholars, sponsored by ICSSR and IPE, working on topics of current interest. Its Ph. D program is one of the largest in the social science fi eld. Research, both basic and applied, is the forte of the Institute and helps it in its training and educational activities. IPE’s research studies are extensively used by the Committee on Public Undertakings (COPU), other Legislative and Government Committees, the Economic Advisory Council to the Prime Minister, several Ministries of the Government of India, Planning Commission, SCOPE and several Finance & Pay Commissions.
Apart from Journal of Economic Policy and Research, IPE also publishes the following six journals:
• The Journal of Institute of Public Enterprise• Journal of Marketing Vistas• Journal of Governance and Public Policy• Journal of International Economics• Indian Journal of Corporate Governance• IPE Journal of Management

ADMISSIONS OPEN2019-21
*** Approved by AICTE, recognized as MBA equivalent by AIU, NBA Accredited ** Approved by AICTE, recognized as MBA equivalent by AIU* Approved by AICTE
$ AICTE approved program for Foreign Nationals, PIO, OCI, Gulf residents
Attractive Merit Scholarships for top scorers of
CAT / XAT / GMAT / MAT / CMAT / ATMA
SHAMIRPET, HYDERABAD
Association of Indian Universities Approved by AICTEUnder the aegis of
ICSSR, MHRD, GoISouth Asian Quality Assurance System
For eligibility and other details visit www.ipeindia.org Tollfree: 1800 3000 4473Email: [email protected] Contact: 9391932129
Inspirational track record
of PLACEMENTS
Institute of Public Enterprise, State of Art Shamirpet Campus - Awarded ‘Five Star’ rating by GRIHA
Member of EUROPEAN FOUNDATION FOR MANAGEMENT DEVELOPMENT
The Institute of Public Enterprise (IPE) was established in 1964 as an autonomous non-pro� t society with the objective of furthering studies, research and consultancy in Management Sciences. IPE functions under the aegis of Indian Council of Social Science Research, Ministry of HRD, Govt of India.The Board of Governors of the Institute comprise:
Shri K Madhava Rao, IAS (Retd), President, IPE and Former Chief Secretary and Election Commissioner, Govt of AP, Advisor to the Governor of Bihar, the Chairman, High Power Committee for Urban Cooperative Banks Director, Central Board of Reserve Bank of India, Member of Board for Financial Supervision of RBI.
Dr P Rama Rao, Emeritus President, IPE; Chairman, Governing Council, IISc, and former Secretary, Department of Science and Technology and Ocean Development, GoIShri TV Mohandas Pai, Chairman, Manipal Global Education Services Pvt LtdDr K Pradeep Chandra, IAS (Retd), Former Chief Secretary, Govt of TelanganaSmt Mahpara Ali, Former CGM (L&D) Corporate Centre, State Bank of IndiaShri MB Raju, Executive Chairman, Deccan Cements LtdShri Shashi Shanker, CMD, ONGC LtdShri Anil Kumar Jha, CMD, Coal India LtdSmt Seema Bahuguna, IAS, Secretary, Department of Public Enterprises, GoIShri N Baijendra Kumar, IAS, CMD, NMDC LtdShri Rakesh Kumar, CMD, NLC India LtdShri Jayesh Ranjan, IAS, Principle Secretary, Industries & Commerce, Information Technology, Electronics & Communications, Govt of TelanganaShri N Sridhar, IAS, CMD, The Singareni Collieries Company LtdProf S Ramachandram, Vice-Chancellor, Osmania UniversityProf Virendra Kumar Malhotra, Member Secretary, ICSSR, MHRD, GoIDr RK Mishra, Director, IPE - Member Secretary
FROM DIRECTOR'S DESKThe management education at IPE provides an opportunity to the PGDM students to access integrated knowledge of practice and theory of management. Born out of our � ve decade experience in conducting management development programmes, management research, problem-solving
consultancies and international publications, students at IPE get connected to the myriad stakeholders. Once placed, they present themselves as the most suitable candidates to understand and serve the needs of organizations resulting in high value addition for the businesses and the society. Management Education at IPE goes beyond aspiring for a career. The management students through the case study based curriculum, continuous interaction with fellow students, access to faculty and availability of top class infrastructure inculcate values and aspirations which drive them with hope and courage to make their lives a pleasant and delightful experience. We impart futuristic vision to prepare our students to meet future challenges.
Prof RK Mishra
RESEARCH AT IPEIPE strongly believes in conducting ‘usable’ and ‘meaningful’ research and thereby, Research at IPE is primarily devoted to provide inputs to policies and decisions. Research is carried out to enhance the existing body of knowledge in the � elds of management and social sciences. Encompassing both institutional and sponsored research, IPE’s research thrust is based on priorities indicated by policy makers, end-users and its own faculty. As a ‘Centre of Excellence in Research’ recognized by the ICSSR, MHRD, GoI, about 200 research projects and consultancy assignments have been successfully completed by the institute.
IPE’s research links exist with a number of national and international universities and agencies including the UNDP, ADB, IDRC and OECD. The Institute publishes six in-house journals apart from the Journal on Corporate Governance published by SAGE*. IPE’s doctoral programme, under the aegis of ICSSR, has produced so far 75 Ph.Ds. Currently 30 research scholars are working for their PhDs in Social Sciences and Management studies. ICSSR, MHRD, GoI has instituted 10 fellowships for pursuing doctoral work at IPE.
IPE JOURNALSThe Journal of Institute of Public EnterpriseJournal of Economic Policy & ResearchIndian Journal of Corporate GovernanceJournal of Marketing VistasJournal of International EconomicsJournal of Governance & Public PolicyIPE Journal of Management
MDPsIPE has become well known for its quality of Management Development Programmes, workshops, training programs and customized organization-based programmes. IPE o� ers open programmers, theme based MDPs and faculty specialization oriented training programmes bringing industry, government and organizations closer to the frontiers of knowledge that could add value to their activities. Over the years, IPE has developed infrastructure and facilities suited to impart training and MDPs for the di� erent echolance of executives in the public and private sector enterprises, government, and third sector of economy. IPE so far conducted over 100 MDPs for nearly 2000 IAS / IFS / IPS o� cers and other government o� cials, as well as 650 MDPs (including in-company programmes) for over 40,000 practicing managers of the corporate sector. The Institute has also conducted several seminars, conferences and other programmes sponsored by various national and international organizations.
Forthcoming Management Development Programs, Conferences Dates
Advanced Leadership Programme for Women Executives Oct 3-4, 2018Cyber Attacks & Network Security Oct 11-12, 2018Enhancing Accountability and Responsiveness in Scienti� c Organizations [DST Prog] Oct 15-19, 2018
Strategic Marketing for PSUs Oct 24-25, 2018Financial Models for Sustainable Excellence Oct 29-30, 2018Project Management for Competitive Advantage Nov 1-3, 2018Goods And Services Tax (GST) Nov 2-3, 2018Management of Technology & Innovation Nov 5-9, 2018Creativity & Problem Solving Nov 5-6, 2018SIPPA Programme Nov 10-1 Dec, 2018International Conference on “Expanding HR Value : Unraveling the Future of Work” Nov 15-16, 2018
GST – Policies, Perspectives and Practices (An Industry-oriented Programme) Nov 15-16, 2018
e-Procurement System for Vigilant and Transparency Nov 19-20, 2018Enhancing Sales Performance Nov 26-27, 2018Understanding Foreign Currencies Risk and Global Finance Nov 29-30, 2018Ethical Hacking and Cyber Security Dec 3-5, 2018Leadership and Change Management Dec 6-7, 2018Contract Management Dec 10-11, 2018Reservation Policy for SCs, STs and OBCs in CPSEs, SLPEs and Banks Dec 13-14, 2018
International Conference on “Operations and Supply Chain Excellence” Dec 17-18, 2018
6th National Conference on “Diversity in Management – Development of Women Executives” Dec 20-21, 2018
Enterprise Risk Management Dec 27-29, 2018Essentials of Corporate Finance Dec 27-28, 2018International Conference on "New Trade Policies and Capital Flows in the Context of Emerging Economies Under Deglobalization"
Dec 30-31, 2018
International Conference on Sustainable Development Goals Jan 1, 2019
Sustainable Lean Management Practices for Improved Business Performance Jan 3-5, 2019
Emotional Intelligence Jan 9-10, 2019Digital Marketing Jan 17-18, 2019Strategic Management in PSUs for Success Jan 23-24, 20196th International Conference on “Corporate Social Responsibility” Feb 4-5, 2019
Communication for Managerial E� ectiveness Feb 6-8, 2019National Conference on “Data Science, Machine Learning, AI, IoT and Analytics” Feb 7-8, 2019
2nd National Conference on “Marketing in Digital India : Trends, Opportunities & Challenges” Feb 18-19, 2019
10th International Conference on “Corporate Governance: Governance & Integrity” Feb 21-22, 2019
Commodity Trading and Price Risk Management Feb 27-28, 2019
TRANSFORMING STUDENTS INTO GLOBAL BUSINESS LEADERS
Best of the corporates are looking at IPEAre you?
Post Graduate Diploma in Management***$
PGDM - Banking, Insurance and Financial Services***$
PGDM - International Business***$
PGDM - Marketing Management**$
PGDM - Human Resource Management* PGDM - Executive*