Economic Policy and Statistics
32
The economic impact of EU membership on the UK Standard Note: SN/EP/6730 Last updated: 17 September 2013 Author: Gavin Thompson and Daniel Harari Section Economic Policy and Statistics This note examines the various channels through which membership of the EU affects the UK economy. A general sense of the EU’s economic impact can be gained by reading Section 1 alone. Subsequent sections deal with particular issues, such as the EU’s effect on UK trade relations, in more detail, and compare the UK’s situation with alternative arrangements. Contents 1 Introduction and summary 2 2 Cost-benefit analyses of EU membership 5 3 The effect of the EU on UK trade relations 6 4 Impact of immigration from the EU 16 5 The impact of EU regulation 20 6 Fiscal consequences of EU membership – the EU budget 23 7 The EU’s effect on consumer prices 28 8 Foreign direct investment (FDI) 30 Appendix table: a comparison of the EU with alternative trading arrangements 32 Boxes Would independence over trade policy lead to better results? 15 The EU budget – winners and losers 27 Trade barriers and economic efficiency 29 Related Library briefings Leaving the EU, Research Paper RP13/42 In brief: UK-EU economic relations, Standard Note SN6091 Norway’ s relationship with the EU, Standard Note SN6522 Switzerland’s relationship with the EU, Standard Note SN6090 The UK and Europe: time for a new relationship?, Standard Note SN6393
-
Upload
independent -
Category
Documents
-
view
0 -
download
0
Transcript of Economic Policy and Statistics

The economic impact of EU membership on the UK
Standard Note: SN/EP/6730
Last updated: 17 September 2013
Author: Gavin Thompson and Daniel Harari
Section Economic Policy and Statistics
This note examines the various channels through which membership of the EU affects the
UK economy. A general sense of the EU’s economic impact can be gained by reading
Section 1 alone. Subsequent sections deal with particular issues, such as the EU’s effect on
UK trade relations, in more detail, and compare the UK’s situation with alternative
arrangements.
Contents
1 Introduction and summary 2
2 Cost-benefit analyses of EU membership 5
3 The effect of the EU on UK trade relations 6
4 Impact of immigration from the EU 16
5 The impact of EU regulation 20
6 Fiscal consequences of EU membership – the EU budget 23
7 The EU’s effect on consumer prices 28
8 Foreign direct investment (FDI) 30
Appendix table: a comparison of the EU with alternative trading arrangements 32
Boxes
Would independence over trade policy lead to better results? 15
The EU budget – winners and losers 27
Trade barriers and economic efficiency 29
Related Library briefings
Leaving the EU, Research Paper RP13/42
In brief: UK-EU economic relations, Standard Note SN6091
Norway’s relationship with the EU, Standard Note SN6522
Switzerland’s relationship with the EU, Standard Note SN6090
The UK and Europe: time for a new relationship?, Standard Note SN6393

2
1 Introduction and summary
1.1 Understanding the economic impact of EU membership
EU membership influences the UK economy in a number of ways. The most important effects
arise through the Single Market, the programme of economic integration through which the
EU’s ‘four freedoms’1 are guaranteed. But the economic impact of the EU is felt in other
areas of its policy, too. The EU has exclusive competence to negotiate trade and investment
agreements with countries outside the Union; and it is a customs union with a common
external tariff on imported goods. Membership thus profoundly affects the UK’s trade
relations with non-EU members. There are also fiscal consequences to membership as a
result of the UK’s contributions to the EU budget; and consumer prices are affected through
the Common Agricultural Policy and common external tariffs levied on imports. The fact of
EU membership may also influence decisions made by foreigners about whether to invest in
the UK.
Understanding these economic impacts provides us with a framework to evaluate the costs
and benefits of EU membership, but it does not tell us whether the UK would be better off
outside the EU. In order to do this, a counterfactual scenario is required: for cost-benefit
purposes, it is no use knowing that the Common Agricultural Policy costs the UK £10bn per
year without specifying whether and how the UK agricultural sector would be supported in its
absence.
The purpose of this note is not to reach a conclusion on the economic merits of the UK’s EU
membership (a brief overview of such cost-benefit analyses is provided in Section 2), but to
describe some of its economic impacts, and the possible implications of alternative
arrangements. Were the UK to withdraw from the EU, its subsequent relations would be the
product of negotiation, and would be unlikely to mimic precisely the situation of another
country. However, looking at other countries’ relationships with the EU – from the non-EU
members of the European Economic Area (EEA)2 who adopt the majority of EU law in return
for access to the Single Market, to those that are entirely free from EU influence and trade
without any preferences – will help to clarify the effects of membership, and offers an insight
into the trade-offs that might arise in the event of UK withdrawal.
1.2 Summary of the impact of the Single Market and economic integration
The free movement of goods, services, people and capital has been a fundamental principle
of the EU since the 1957 Treaty of Rome. However, as discussed in Section 3.1, achieving
the extensive harmonisation of law and levels of economic integration necessary to achieve
such openness in practice is a complex and continuous exercise.
Effect of free movement of goods and services
The stripping away of barriers to the free movement of goods and services should stimulate
trade. Theoretically, this is beneficial for all Member States because it allows them to
specialise in those goods and services that they are relatively more efficient at producing.
Reducing barriers to trade also increases the competition faced by domestic firms. By
increasing the size of the market into which firms can sell, it also enables them to reap
economies of scale. All these effects serve to lower prices for consumers and raise overall
1 The term ‘four freedoms’ refers to the freedom of movement of goods, services, capital and people. 2 The EEA comprises the Member States of the European Union (except Croatia), together with Norway, Iceland
and Liechtenstein

3
economic welfare, though this may come at the cost of the disruption or demise of certain
sectors exposed to foreign competition.
These benefits arising from trade creation may be counteracted by trade diversion from
countries outside the EU. This occurs because of the barriers to trade in goods and services
entering the UK from outside the Single Market; for instance, the EU applies a tariff of 9.8%
on motor vehicles and 32% on wine imported from outside the Union.3 Some commentators
believe the EU is so ‘protectionist’ that it diverts more trade than it creates,4 although such
conclusions are generally based on data from a period when average EU tariffs were much
higher, and rest on the assumption that, were the UK to withdraw from the EU, it would
unilaterally remove all its tariffs on non-EU imports.
The impact of EU membership on the UK’s trade relations is discussed in Section 3.
Effect of free movement of capital and labour
The free movement of goods and services allows the production of goods and services to
take place where it is relatively most efficient. Similarly, the free movement of capital and
people theoretically increases the efficiency with which inputs to production process are
allocated, by allowing investment and labour to flow to where returns are highest.
Theoretically, this serves to reduce prices and raise overall economic welfare.
In practice, achieving free movement of capital and labour means the elimination of capital
and exchange controls, freedom for businesses to invest and locate wherever they wish in
the EU without discrimination, and, more controversially, the elimination of immigration
restrictions within the EU.5 Despite the theoretical benefits, there remain concerns that the
free movement of labour in particular comes with economic costs, in the form of depressed
wages and unemployment for the domestic population, and pressure on public services.
The impact on the UK of free movement of labour within the EU is discussed in Section 4.
Sovereignty implications of the Single Market
The Single Market today is the product of a vast array of legislation designed to minimise or
eliminate differences in the way markets function between Member States. This ranges from
product standards for goods, and EU-wide rules on consumer protection, to health and safety
legislation, and competition policy. The benefits associated with creating a ‘level playing field’
across the EU in these areas may be counteracted by the loss of individual governments’
ability to set standards and devise regulation that is sensitive to domestic priorities and
changing circumstances; in effect, costs may arise to the extent that the optimal policy that
the UK would set individually differs from what is collectively decided by EU Member States.
A separate but related sovereignty ‘cost’ arises from governments losing the ‘right’ to
regulate and structure their economies in precisely the way they want; for instance, the EU’s
competition policy on the one hand prevents state-subsidised firms gaining an unfair
advantage over unaided competitors, but on the other limits the extent to which governments
can support domestic industry or shield sectors from the disruptive effects of foreign
competition.
3 WTO Tariff Download Facility 4 See, for instance, Patrick Minford (2005) Should Britain leave the EU?, Chapter 7 5 Even with the removal of these impediments, there remain cultural and linguistic barriers to businesses
establishing and people moving abroad.
4
While a degree of pooled sovereignty and collective action in certain areas may be
necessary to achieve seamless markets and free trade, other EU regulation enacted ‘in the
name of’ the Single Market has a more tenuous relation to its core objectives, at least as they
are commonly understood in the UK (namely, the maximisation of trade and competition).
Just as the boundaries of EU competence more broadly are often the subject of dispute, so
the purpose and principles of the Single Market are open to debate. Some have seen the
Single Market as a vehicle for political and social, as well as economic integration; for
instance, Jacques Delors, former president of the European Commission and architect of the
first Single Market programme described its social aspect as a ‘vital dimension’ in a 1988
speech to the Trades Union Congress.6 The conception was challenged by Margaret
Thatcher in her ‘Bruges speech’ that same year, when she stated that ‘we have not
successfully rolled back the frontiers of the state in Britain, only to see them reimposed at a
European level’.7 The position of the UK Government with respect to the Single Market
remains similar today:8
the right way of strengthening the social dimension of the Single Market is to allow
Member States to regulate their labour market and their social systems according to
their needs and political priorities.
Such differences within the EU about the purpose and objectives of the Single Market
heighten the sovereignty trade-off, and increase the potential for divergence between EU
regulation, and the measures that would otherwise have been pursued at a national level.
The impact of EU regulation on the UK is discussed in Section 5.
1.3 Summary of other impacts of membership
Outside the Single Market, the EU has competence to act in a host of policy areas that have
direct economic impacts. The Common Agricultural Policy, when combined with tariffs and
quotas on agricultural products, serves to protect EU farmers from foreign competition, but at
the cost of higher consumer prices and a fiscal contribution from Member States. EU regional
policy aims to reduce economic and social disparities across the EU, and ultimately may lead
to larger markets for UK exports, but it entails a net contribution from richer Member States,
including the UK.
The fiscal implications of the UK’s membership of the EU are discussed in Section 6.
As discussed above, the effect of producer support under the CAP, and the EU’s tariffs on
goods from outside the EU is to create ‘trade diversion’, whereby certain imports to the UK
come not from the lowest-cost country, but from a less efficient one within the Single Market.
The effect of this, relative to a position where domestic markets are completely open to
foreign goods and services, can be to raise prices for consumers.
The impact of EU membership on consumer prices is discussed in Section 7.
Finally, membership of the EU may encourage foreign direct investment from non-EU
countries seeking to gain access to the Single Market.
The impact of EU membership on foreign direct investment to the UK is discussed in Section
8. 6 Jacques Delors, Speech to Trades Union Congress, Bournemouth, 8 September 1988 7 Margaret Thatcher, Speech to the College of Europe, Bruges, 20 September 1988 8 BIS (2011) UK Government Response to European Commission Consultation on the Single Market Act, p.31
5
2 Cost-benefit analyses of EU membership
There is no definitive study of the economic impact of the UK’s EU membership, or
equivalently, the costs and benefits of withdrawal. Framing the aggregate impact in terms of
a single number, or even irrefutably demonstrating that the net effects are positive or
negative, is a formidably difficult exercise. This is partly because many of the costs and
benefits are, in certain respects, subjective, diffuse or intangible; and partly because a host
of assumptions must be made about the terms on which the UK would depart the EU, and
how Government would fill the policy vacuum left in areas where the EU currently has
competence.
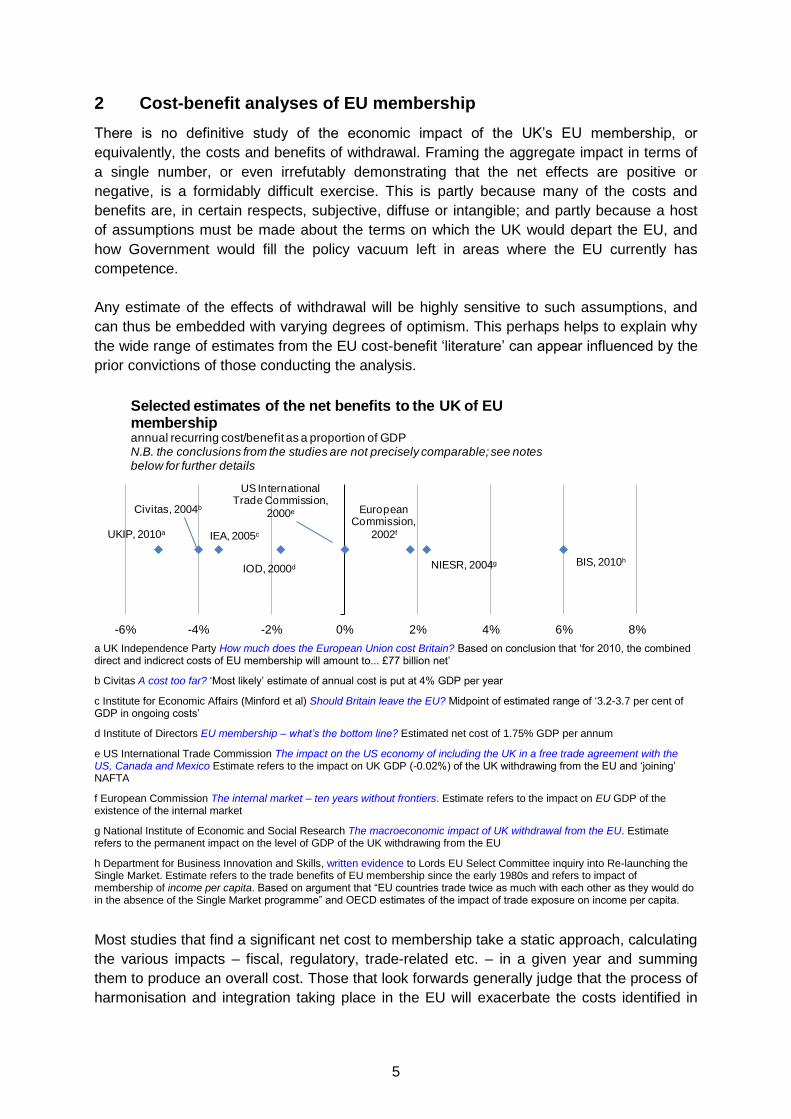
Any estimate of the effects of withdrawal will be highly sensitive to such assumptions, and
can thus be embedded with varying degrees of optimism. This perhaps helps to explain why
the wide range of estimates from the EU cost-benefit ‘literature’ can appear influenced by the
prior convictions of those conducting the analysis.
a UK Independence Party How much does the European Union cost Britain? Based on conclusion that ‘for 2010, the combined direct and indicrect costs of EU membership will amount to... £77 billion net’
b Civitas A cost too far? ‘Most likely’ estimate of annual cost is put at 4% GDP per year
c Institute for Economic Affairs (Minford et al) Should Britain leave the EU? Midpoint of estimated range of ‘3.2-3.7 per cent of GDP in ongoing costs’
d Institute of Directors EU membership – what’s the bottom line? Estimated net cost of 1.75% GDP per annum
e US International Trade Commission The impact on the US economy of including the UK in a free trade agreement with the US, Canada and Mexico Estimate refers to the impact on UK GDP (-0.02%) of the UK withdrawing from the EU and ‘joining’ NAFTA
f European Commission The internal market – ten years without frontiers. Estimate refers to the impact on EU GDP of the existence of the internal market
g National Institute of Economic and Social Research The macroeconomic impact of UK withdrawal from the EU. Estimate refers to the permanent impact on the level of GDP of the UK withdrawing from the EU
h Department for Business Innovation and Skills, written evidence to Lords EU Select Committee inquiry into Re-launching the Single Market. Estimate refers to the trade benefits of EU membership since the early 1980s and refers to impact of membership of income per capita. Based on argument that “EU countries trade twice as much with each other as they would do in the absence of the Single Market programme” and OECD estimates of the impact of trade exposure on income per capita.
Most studies that find a significant net cost to membership take a static approach, calculating
the various impacts – fiscal, regulatory, trade-related etc. – in a given year and summing
them to produce an overall cost. Those that look forwards generally judge that the process of
harmonisation and integration taking place in the EU will exacerbate the costs identified in
BIS, 2010hNIESR, 2004g
IOD, 2000d
IEA, 2005c
Civitas, 2004b
UKIP, 2010a
European Commission,
2002f
US International Trade Commission,
2000e
0.8-6% -4% -2% 0% 2% 4% 6% 8%
Selected estimates of the net benefits to the UK of EU membershipannual recurring cost/benefit as a proportion of GDPN.B. the conclusions from the studies are not precisely comparable; see notes below for further details

6
the static analysis. Those studies that find a net benefit tend to look at the longer-run effects
of the UK being a member of the EU versus some more restrictive trading arrangement, with
gains accruing each year in the form of higher trade flows and foreign direct investment
serving to offset the clear fiscal cost. No recent study has seriously tested the sensitivity of its
findings to alternative assumptions or counterfactuals, or attempted to model the impact of
alternative policy scenarios or trade relationships following the UK’s withdrawal.
Whether or not the UK would benefit economically from being outside the EU, withdrawal
would have significant impacts on certain sectors (e.g. farming, which currently receives
subsidies under the Common Agricultural Policy) and in certain areas (e.g. west Wales,
which is currently eligible for the highest level of regional funding from the EU budget). How
the UK Government of the day filled the gaps in economic policy left by withdrawal from the
EU would have an important bearing on its consequences.
3 The effect of the EU on UK trade relations
3.1 How it works now
EU Member States are part of a customs union, with no tariffs on goods moving between
Member States, and a common tariff applied to goods entering from outside the EU. Member
States cannot operate independent trade policies, for instance by pursuing bilateral free
trade agreements with non-EU countries; instead, external trade relationships are co-
ordinated at EU level through the Common Commercial Policy (CCP). The EU Trade
Commissioner acts as the negotiator in multilateral and bilateral trade talks, with the Council
and Parliament making certain formal decisions regarding the commencement and mandate
for the negotiations, and approving their final result.
The principle of free trade in services between EU member states (i.e. that businesses
should be free to provide services within the EU, either on a cross-border basis or through
establishing in the countries of their choosing) is also enshrined in the EU Treaties. In
practice, however, there remain legal, regulatory, administrative and cultural barriers that
mean trade in services within the EU is more restricted than trade in goods. These include:
Differences in the way services are regulated between Member States, particularly in
‘network industries’ like water, power and telecoms
Favourable tax treatment for services purchased from local providers
Residence requirements for shareholders, staff and regulated professions
Failure to recognise foreign diplomas and professional qualifications
The main instrument through which regulatory harmonisation and other services trade
liberalisation takes place at EU level is the Services Directive, adopted in late 2006.
Implementation by Member States has in some cases been slow and patchy, however. The
structure of the UK economy, and its comparative advantage in certain services sectors,
mean the Government has put particular emphasis on the full implementation of the Services
Directive, describing it as ‘the first priority for boosting competitiveness in services’.9
9 UK Government response to European Commission consultation on the Single Market Act (2011)

7
More generally, tackling outstanding and emerging barriers to trade within the EU, including
those affecting services, is an ongoing exercise. The European Commission and successive
meetings of the European Council have recognised the importance of ‘completing the Single
Market’ while the UK Government has described further reducing intra-EU barriers to trade
as ‘an opportunity not to be missed’, estimating the UK GDP could be 7% higher as a result.10
Currently, the principal instruments through which further EU trade liberalisation is
undertaken are the Single Market Acts, two packages of legislative and regulatory measures
proposed by the European Commission in April 2011 and October 2012.11
3.2 Alternatives to EU membership
No preferential access
A vast number of different arrangements could result from the UK’s leaving the EU. However,
considering a situation in which the UK has no preferential access to EU markets offers a
convenient point of reference. In this instance, the terms of World Trade Organisation (WTO)
membership limit the range of outcomes. The details of such an arrangement are discussed
below.
Tariff barriers
The principle of non-discrimination requires WTO members not to treat any member less
advantageously than any other: grant one country preferential treatment, and the same must
be done for all others. There are exceptions
for regional free trade areas and customs
unions like the EU, but the principle implies
that, outside of these, the tariff that applies to
the ‘most-favoured nation’ (MFN) must
similarly apply to all.
In practice, this would prevent discriminatory
or punitive tariffs being levied by either the
EU on the UK, or vice versa. The maximum
tariff would be that applied to the MFN. As
the chart shows, the EU’s MFN tariff has
fallen over time, meaning that in this
particular context the ‘advantage’ of
membership has declined.
However, given that MFN tariffs would be imposed on around 90% of the UK’s goods exports
to the EU by value,12 it would necessarily mean many exporters becoming less price
competitive, to varying degrees, than their counterparts operating within the remaining EU,
and those within countries with which the EU has preferential trading relationships. Similarly,
because the UK has negotiated as part of the EU at the WTO, it is likely that it would inherit
the EU’s tariff regime at the time of leaving, meaning, at least initially, higher prices would be
faced by consumers buying imports from the EU and those countries with which the EU has
10 BIS (2011) Economic consequences for the UK and the EU of completing the Single Market 11 Further details are available on this page of the European Commission website. 12 Uktradeinfo database and WTO tariff download facility
0
1
2
3
4
5
6
7
1988 1993 1998 2003 2008
EU average (trade-weighted) MFN tariffpercent, 1988-2011
Source: data.worldbank.org

8
trade agreements. Without any change, a 32% tariff would be levied on imports of wine, for
instance, and a 9.8% tariff on motor vehicles.
The implications of a move to an MFN trading arrangement for exporters and domestic
consumers would vary considerably by sector, as illustrated in the chart below, which
compares the EU’s average MFN tariff across over 1,200 product groups with the UK’s trade
balance in each. The size of the bubbles represents total trade in the commodity (imports
plus exports). For instance, without a trade agreement, a tariff of 4.1% would be applied to
liquefied natural gas exports from the UK to the EU; a tariff of 12.8% to wheat and meslin;
and a tariff of 6% to unwrought aluminium, all items which the UK currently runs a trade
surplus with the EU.
Sources: HMRC trade data and WTO tariff download facility. An interactive version of this chart is available here.
Non-tariff barriers
Non-tariff barriers to trade cover a range of measures that have the effect of reducing
imports, either intentionally or unintentionally. They include anti-dumping measures that
prevent goods being exported at a price below production cost (usually by the application of
an additional duty), and product standards, such as labelling, packaging and sanitary
requirements. Support to domestic producers and export subsidies, such as those provided
under the Common Agricultural Policy, can also be interpreted as non-tariff barriers since
they inhibit market access by foreign producers on equal terms. In the context of falling tariff
wheat and meslin£0.3bn surplus
12.8% tariff
wine£1.8bn deficit
32% tariff
Non-crude oil(esp liquefied natural gas)
£2.9bn surplus
4.1% tariff
unwrought aluminium£0.6bn surplus
6% tariff
motor cars£10.5bn deficit
9.8% tariff
goods vehicles£1.9bn deficit
12.1% tariff
motor vehicle parts£4.7bn deficit
3.8% tariff
-5
0
5
10
15
20
25
30
35
40
45
-12 -10 -8 -6 -4 -2 0 2 4 6 8 10 12 14
tari
ff r
ate
(%
)
trade balance, £bn
EU MFN tariff (vertical axis) vs UK-EU trade bance (horizontal axis), 2011HS4 product categories; bubble size represents total value of trade (imports plus exports)

9
barriers, such non-tariff measures have become more widely used as a means to protect
domestic producers from foreign competition.
The terms of WTO agreements limit the circumstances in which such measures can be
applied, and in particular uphold the principle of non-discrimination that would prohibit
punitive measures against the UK were it to leave. Nonetheless, at the time of writing, the EU
had definitive anti-dumping tariffs in place against 84 products in 24 countries, including the
US, Canada and Korea.13
Just as important in a trade context are the standards the required of products imported from
outside the EU. All UK businesses must comply with these standards already, although as in
other areas of regulation (see Section 5), withdrawal from the EU raises the prospect of
costly divergences between the UK and EU product standards. On the other hand, some
proponents of withdrawal point out that, were the UK to leave the both EU and the Single
Market, only exporters would have to be bound by the EU’s product standards, leaving other
businesses free to operate under a UK regime.
Restrictions on services trade
Without further negotiation, the UK’s trade in services with the EU would be governed by the
WTO General Agreement on Trade in Services (GATS). Under this agreement, EU Member
States (and other parties to the agreement) have chosen which sectors they are prepared to
liberalise, and the time scale over which they wish to do so. As with trade in goods, GATS
also operates on the principle of non-discrimination, meaning broadly that outside of
preferential agreements, restrictions on market access must be applied uniformly across all
countries.
Barriers to services trade are usually in the form of non-tariff barriers, such as domestic laws
and regulations, also known as ‘behind the border’ measures. In general, services markets
are more highly regulated than the market for goods. Often, regulation is intended to meet
social objectives, or to correct failures in supply, rather than directly to restrict foreign
suppliers, but the effect on market access for foreign companies can in some cases be highly
restrictive.
EU Member States retain considerable national discretion over services regulation and
supervision. Just as a fully level playing field in services trade does not exist within the EU,
so exporters from outside the EU face different levels of market access in individual Member
States. However, the level of market access would generally be far more limited for UK
exporters under a GATS arrangement than it is currently for a number of reasons.14
many restrictions that are forbidden within the EU remain applicable to firms outside
the EU because Member States have made no commitments under the GATS
schedules in those areas
13 European Commission, Anti-dumping and anti-safeguard statistics covering the first eight months of 2013 14 See, for instance, Centre for European Policy Studies (2013) Access barriers to services markets

10
the EU (unlike the GATS) has pursued the harmonisation of regulation and
supervision in several large services sectors, thereby taking away the justification of
Member States to insist on national regulation in this respect
the right of commercial establishment is guaranteed under EU treaties, significantly
facilitating trade in services provided via the commercial presence of a foreign firm
similarly, the free movement of labour facilitates trade in those services provided
through the presence of people in the territory of another economy
EU competition policy prevents, to an extent, barriers to services trade arising from
incumbent firms benefitting from excessive market power
the Treaty rights with respect to free movement of services, freedom of
establishment, and free movement of labour are enforced supranationally by the
Court of Justice of the European Union, underpinned by extensive case law on
services exchange. Under GATS, an independent panel can be appointed to settle
and enforce disputes, but there is no presumed right of market access; the job of the
panel is merely to assess whether the barrier in question non-discriminatory.
As well as affecting cross-border trade in services, these restrictions could also have
implications for UK companies providing services through a commercial presence (effectively
outward direct investment) in other Member States.15 The EU treaties require that a service
provider from one Member State be legally free to establish in another, while continuing to
regulated by the authorities of its home country. A UK company that provides services
through establishments in other Member States may find, if Britain is no longer a member of
the EU, that it has to comply with the requirements of a foreign regulatory authority.
A negotiated arrangement
Beyond the ‘default’ most-favoured nation position, there are a host of more preferential
trade arrangements between the EU and UK that may be negotiated were it to leave,
although there is likely to be a trade-off between the level of access to the Single Market (i.e.
freedom from tariff and non-tariff barriers to trade), and freedom from EU product regulations,
social and employment legislation, and budgetary contributions. The particular obligations
that arise from entering into such arrangements are discussed further in Section 5.
Under a ‘Swiss’ or an EEA model, assuming such an arrangement could be negotiated, the
restrictions on trade outlined above would be significantly reduced. In particular, the EEA has
full, tariff-free access to the internal market, and the EU’s ‘four freedoms’ concerning
movement of goods, services, capital and labour, apply equally to Norway, Iceland and
Liechtenstein as they do to full Member States. However, relative to a position of full EU
membership, a number of restrictions on trade would still apply under an EEA or ‘Swiss’
approach. These are discussed below.
15 This is recognised as a form of services ‘trade’ under GATS, but is not measured in trade statistics, which are
intended to record cross-border trade. The effects of withdrawal on inward foreign direct investment to the UK are discussed in the following chapter.

11
Rules of origin
Because the EU operates with a common external tariff, goods entering from outside can
travel freely within the Union once that tariff has been paid (e.g. a mobile phone imported into
the UK from China can be re-exported to the rest of the EU tariff free). The same is not true
of goods that enter the EU via the EEA (e.g. a mobile phone from China re-exported to the
EU from Norway) or via other countries with which the EU has a free or preferential trading
relationship, because they do not share the EU’s common external tariff.
Determining where a good originated, and hence whether it should attract tariffs, is done
through the EU’s Rules of Origin. Given the complexity of some global supply chains and the
range of preferential trading relationships the EU operates, this can be a difficult, time-
consuming and often subjective process.16 Some of this burden, according to the Trade
Policy Research Centre, would fall on UK firms in the form of administrative and compliance
costs; they note that “the process of adapting to rules of origin-based duty-free trade under a
new UK-EU free trade agreement would be tedious, costly and disruptive to trade”.
In its briefing on Rules of Origin, the US Congressional Research Service also noted that
satisfying their requirements could be costly for businesses:17
The benefit conferred by the preferential schemes in certain cases becomes marginal
in comparison with the administrative workload and cost to plan the product mix to
comply with the preferential ROO. This often leads to instances where firms, although
meeting the necessary conditions for origin, decide that it is simpler and cheaper to
pay the MFN tariff rates.
The briefing cites a 1992 study in connection with the EC-EFTA agreement that found that
the cost of border formalities to determine the origin of products amounted to at least 3% of
the value of the goods concerned.18
Anti-dumping and other non-tariff barriers
Were the UK in the EEA or adopted the Swiss model, goods would still be susceptible to
anti-dumping action by the EU; for instance, in 2005, the EU imposed a 16% duty on
Norwegian salmon. As discussed in Section 5, membership of the EEA or the negotiation of
bilateral agreements analogous to those in Switzerland would also require the UK to adopt
EU product standards (and other regulations) across the whole economy.
Restrictions on services trade
As part of the Single Market, EEA countries like Norway are able to conduct services trade
on the same basis as other Member States. However, as in other areas, they lack direct
influence over how services are regulated at EU level. The loss of influence over the
regulatory agenda and the ability to push directly for further services trade liberalisation may
be particularly important for the UK, given that it has a comparative advantage in a number of
sectors, and runs a services trade surplus with the EU.
16 In very simple terms, origin is determined on the principle of goods being wholly obtained in the exporting
country, or substantially transformed there. 17 Congressional Research Service (2012) International trade: rules of origin 18 The study in question is Waer, P. (1992), “European Community Rules of Origin”, in: Edwin Vermulst, Paul
Waer and Jacques Bourgeois(eds.), Rules of Origin in International Trade: A Comparative Study,
12
Many voices in the financial services industry believe that the UK’s ongoing influence over
the regulatory agenda is important, particularly as the eurozone crisis brings about a wave of
euro area-specific regulation and reform that could be potentially discriminatory to the City. In
evidence to the Foreign Affairs Committee, TheCityUK, the lobbying body for the financial
services industry, wrote:19
the provision of financial services in the UK by non-UK firms has become to a large
degree dependent on the maintenance of [a] common EU legal framework and the
UK’s part in devising it and operating within it. The evolutionary character of this
common legal framework means that the UK must be engaged at all levels of policy
development
An example of such regulation is the effort by the European Central Bank, backed by France
and Germany, to bring clearing houses that deal in significant volumes of euro-denominated
transactions to be located within the euro area;20 the UK Government is currently challenging
these proposals at the European Court of Justice on the grounds that they contravene the
Single Market principles of free movement of services and capital across the union. On the
other hand, sceptics might point out that the very fact that the UK failed to secure
concessions for its financial services industry, despite demanding them at the December
2011 Council summit at which it eventually wielded its ‘veto’, illustrates its powerlessness to
influence the agenda even within the EU.21
Were it to leave both the EU and the EEA, in negotiating its trade relationship with the EU,
the UK may face particular difficulties firstly in securing ongoing access to services markets,
and secondly in ensuring it benefits from further liberalisation of trade in services within the
EU. For instance, despite extensive negotiations on the matter, there is no general and
encompassing agreement on the free movement of services between the EU and
Switzerland.
Financial services trade is an area that could be particularly affected by a ‘Swiss’ approach.
Currently, non-EEA financial services providers must generally establish a subsidiary or
branch in the EU in order to provide cross-border services. The precise requirements are
currently a matter for national regulators in individual Member States, but developments in
EU-level financial regulation, and in particular the MiFID II proposals, are likely to make
provision of financial services to the EU from outside the EEA increasingly difficult. After
2019, off-shore (i.e. non-EEA) providers will be able to offer a more limited range of services,
and only on condition that they register with the European Securities Markets Authority
(ESMA); the requirements for registration, according to a briefing note by KPMG, will be
“strict and difficult to fulfil”.22 In written evidence to the Parliamentary Commission on Banking
Standards, Goldman Sachs and JPMorgan both noted the importance of EU membership to
the UK financial services industry:
19 Foreign Affairs Select Committee, The future of the European Union: UK Government policy, (written evidence),
11 Jun 2013, HC 87-II 20 See, for instance, Reuters ECB’s Noyer ups pressure on London as Europe’s finance hub, 22 Apr 2013. Full
details of the ECB’s ‘location policy’ proposals were outlined in Standards for the use of central counterparties in Eurosystem foreign reserve management operations (Nov 2011).
21 One of the Government’s demands, which it did not get, was that the ECB’s location policy proposals be scrapped. The leaked negotiating position is available here.
22 KPMG Provision of services by financial intermediaries from third countries in EU financial markets regulation
13
We believe that a key risk to London’s retaining its status as a financial hub is an exit
by the UK from the European Union. In common with financial institutions across the
City our ability to provide services to clients and engage in investment activities
throughout Europe is dependent on the passport that London-based firms enjoy to
operate on a cross-border basis within the Union. If the UK leaves, it is likely that the
passport will no longer be available, thereby forcing firms that wish to access EU
markets to move their operations to within those markets.23
We value the flexibility London offers as a platform for access to the Single Market in a
variety of formats. Our trading activity in London benefits from an EU passport across
the EU.24
3.3 The impact of membership on trade relationships outside the EU
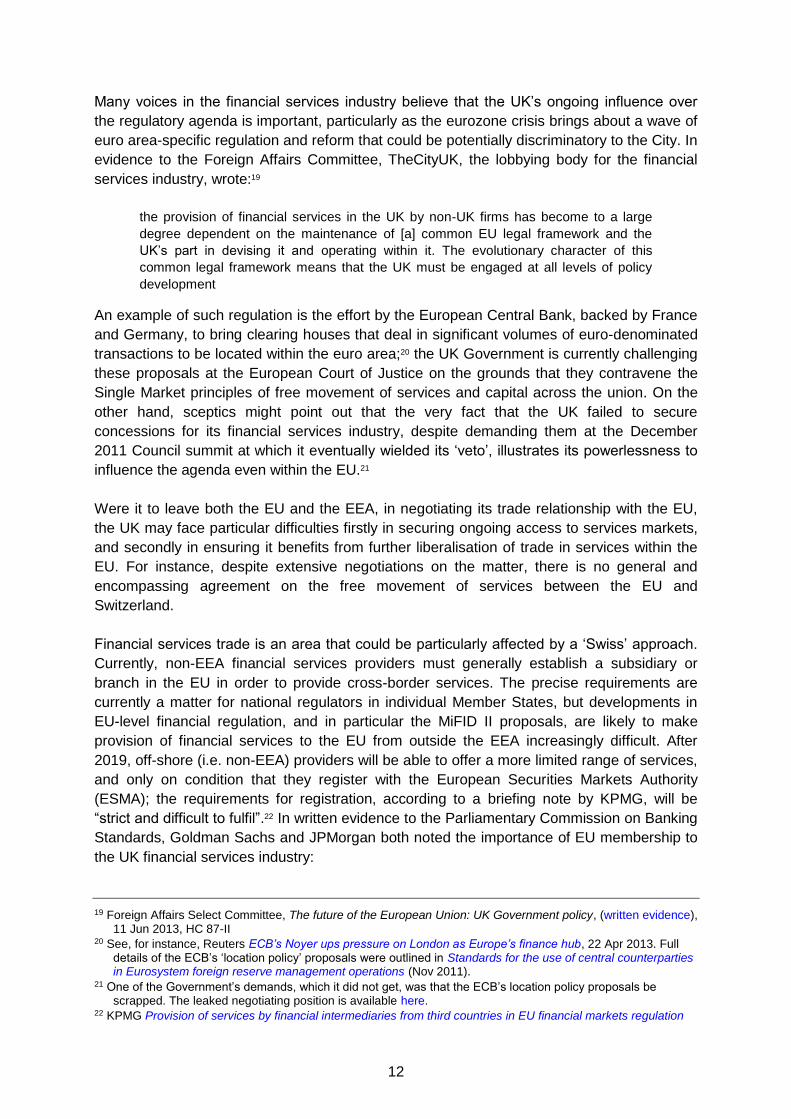
EU preferential trading agreements completed and under negotiation
With the UK as part of it, the EU has negotiated an array of preferential trade agreements with other countries (see map). As with its trade relationship with the EU, the UK would have to negotiate ongoing market access with these countries were it to leave the Union, or else face the MFN tariffs levied by these countries. If an arrangement that was analogous in terms of market access could not be reached, there is a possibility that the EU would have to pay compensation to the affected countries with which it has a trade agreement, as a result of the ‘shrinking’ of the market from what was originally agreed. This concern was raised by the European Commission in the run-up to Greenland’s departure from the EU:25
The free trade agreements concluded by the Community with the EFTA countries,
which at present enjoy exemption from customs duties and free access without
23 Goldman Sachs International, written evidence to the Parliamentary Commission on Banking Standards 24 JPMorgan Chase & Co., written evidence to the Parliamentary Commission on Banking Standards 25 European Commission (1983) Status of Greenland: Commission opinion, COM (83) 66 final, Annex A, p.22
14
quantitative restrictions to the Greenland market, would automatically cease to apply to
Greenland. The question whether the Community would have to negotiate with its
partners compensation for the rights and benefits which those countries would lose as
a result of the 'shrinking' of the Community would not arise if the same rights and
benefits were granted by Greenland.
Any negotiated solution may therefore require the UK to maintain consistency in its trade treatment with countries outside the EU, thereby limiting the extent of trade policy independence it would gain on withdrawal. Finally, there is no guarantee that the UK would be able to participate in EU trade agreements currently under negotiation. Most important among these is the US-EU Transatlantic Trade and Investment Partnership. According to some reports, US Administration officials have indicated to the UK Government that getting the TTIP through Congress would be made significantly more difficult were the UK to exit, and that even if an agreement could be reached, Britain’s inclusion would not be guaranteed.26
26 See, for instance, The Guardian, EU exit would put US trade deal at risk, Britain warned, 27 May 2013

15
Would independence over trade policy lead to better results? It is often suggested that independence over trade policy would allow the UK to join other free trade areas, such as NAFTA,a and forge its own bilateral free trade agreements that are tailored to its particular economic circumstances; as part of the EU, this is legally impossible. This freedom, it is argued, would allow the UK to refocus its trade on economies with brighter prospects and rectify its persistent trade deficit. It is open to debate whether the UK’s capacity to export to the rest of the world, and particularly to high growth emerging economies, is significantly held back by EU membership. Trade between the UK on the one hand, and China and India on the other, has more than doubled in the space of five years, while the share of exports going to the EU has declined from 54% in 2006 to 46% in 2012. Germany, meanwhile, exported four times more to China than the UK does by value and came close to a current account balance with it in 2012. Even outside the EU, the structure and orientation of the UK economy are likely to place important constraints on its capacity to reorientate its trade in the medium-term. From a British perspective, the EU’s trade policy does not appear to be wholly misguided in geographical terms; most of the countries the EU is currently in trade negotiations with are among the UK’s top trading partners.b Some have noted that the EU has less interest in pursuing free trade agreements with Commonwealth countries than the UK: at 9.5%, the UK’s export share to the Commonwealth is greater than, for instance, France’s (5.7%) or Germany’s (5.0%).c The EU already has preferential trading arrangements with 16 of the 53 other Commonwealth members, covering around a third of the UK’s total Commonwealth exports, and is in negotiations with a further 26, covering an additional 45%; notable exceptions include Australia and Pakistan.d The EU has thus far failed to secure any preferential trade agreements with Brazil, India or China. But whether the UK’s trade negotiating strength and efficiency would be greater outside the EU is uncertain. On the one hand, concluding deals might be easier for the UK alone, given the greater diversity of interests involved when the EU negotiates as a group; on the other, the smaller size of its market may mean deals with the EU, like the Transatlantic Trade and Investment Partnership (the proposed FTA with the United States) are afforded greater priority by non-EU countries than deals with the UK alone. Typically, the EFTA countries follow in the EU’s path when it comes to FTA negotiation (i.e. agreements are reached with the EEA and EFTA are reached shortly after those with the EU), although in the case of the recent South Korea FTA, EFTA led the way.e A particular area where UK interests may be poorly represented in EU trade negotiations is services market access. Language, time zone and structural features of the UK economy give it a comparative advantage in cross-border services trade, but, according to OpenEurope, “the EU’s lack of domestic liberalisation in services trade limits the enthusiasm of member states to push and prioritise these issues with third countries”.f The recent exclusion of audiovisual services from the US free-trade negotiations, following pressure from France, is an example of the sensitivities attached to this area of trade liberalisation, and the compromises that must be struck when 28 countries negotiate as a group. References:
a See, for instance, Wall Street Journal Britain’s future lies with America, not Europe, 29 Dec 2011 b These include Canada, India and the US. c UNCTADstat database d European Commission (2013) EU trade relations world wide – a map e EFTA also have a free trade agreement with Canada, something that the EU is currently negotiating. f Open Europe (2012) Trading places: is EU membership still the best option for UK trade?
16
4 Impact of immigration from the EU
4.1 Overview and statistics
Under EU Directive 2004/38/EC, EU nationals do not require a visa to enter another Member
State, and no time limit may be placed on their stay. Non-EU EEA and Swiss nationals enjoy
broadly similar free movement rights to EU citizens and are treated in line with EU citizens for
UK immigration control purposes. The inability of the UK to impose limits on immigration from
the EEA and Switzerland is a controversial aspect of EU membership, particularly since the
expansion of the EU to eastern Europe from 2004, which has driven a rise in net migration.
The economic consequences of immigration are often a key part of this debate.
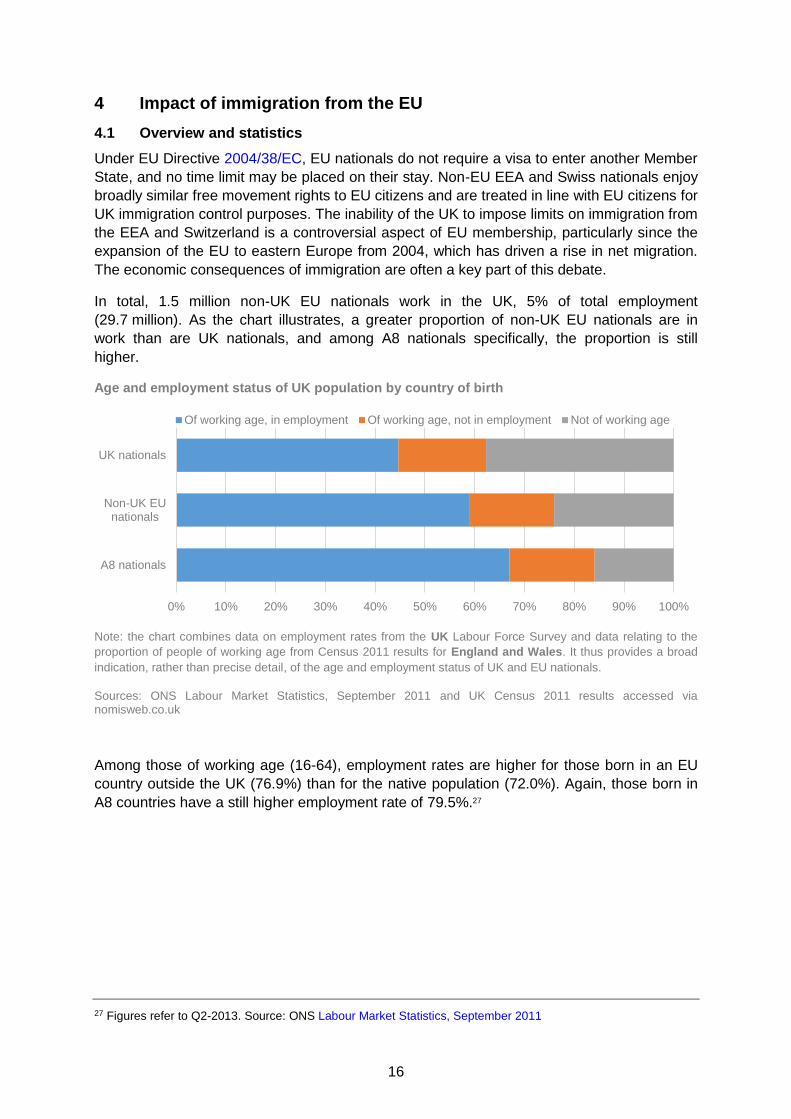
In total, 1.5 million non-UK EU nationals work in the UK, 5% of total employment
(29.7 million). As the chart illustrates, a greater proportion of non-UK EU nationals are in
work than are UK nationals, and among A8 nationals specifically, the proportion is still
higher.
Age and employment status of UK population by country of birth
Note: the chart combines data on employment rates from the UK Labour Force Survey and data relating to the
proportion of people of working age from Census 2011 results for England and Wales. It thus provides a broad
indication, rather than precise detail, of the age and employment status of UK and EU nationals.
Sources: ONS Labour Market Statistics, September 2011 and UK Census 2011 results accessed via nomisweb.co.uk
Among those of working age (16-64), employment rates are higher for those born in an EU
country outside the UK (76.9%) than for the native population (72.0%). Again, those born in
A8 countries have a still higher employment rate of 79.5%.27
27 Figures refer to Q2-2013. Source: ONS Labour Market Statistics, September 2011
0% 10% 20% 30% 40% 50% 60% 70% 80% 90% 100%
A8 nationals
Non-UK EUnationals
UK nationals
Of working age, in employment Of working age, not in employment Not of working age

17
4.2 Economic impact of immigration
There is no widely accepted estimate of the effects of EU immigration, or immigration
generally, on economic welfare. Most studies on the impact of migration on the UK economy
as a whole have found weak or ambiguous effects on living standards, employment and
wages. A few studies, however, show some depression of wages or displacement of resident
employment in low-skilled jobs. Where they do exist, effects are likely to vary significantly by
locality; as the map shows, the proportion of UK residents born in other EU Member States28
varies by parliamentary constituency varies from 17% in Tottenham to 0.6% in Rhondda.
They will also depend crucially
on the characteristics of the
migrants, as compared with
those of the local population.
The impact of migration on
overall living standards,
measured by GDP per capita is
found in a number of studies to
be small but positive. In
evidence to a 2008 enquiry into
the economic impact of
immigration by the Lords
Economic Affairs Committee,
the previous Labour
Government estimated a
positive effect of 0.15% per
year on the GDP per capita of
the native population in the
decade to 2006.29 Looking
specifically at migration from
the ‘A8’ accession states,30 the
National Institute for Economic
and Social Research estimated
the effect to be 0.25% per year
over the ‘long-run’.31
The effect of immigration on
employment and wages
depends on whether the
particular skills and qualities
possessed by migrants
substitute for (i.e. compete with)
those possessed the ‘native’
workforce,32 or complement 28 The map does not ‘count’ those born in Ireland. 29 House of Lords Select Committee on Economic Affairs The Economic Impact of Immigration (written evidence),
1 April 2008, HL 82-II p.358 30 NIESR (2011) Labour mobility within the EU: the impact of enlargement and transitional arrangements – August
2011 update, Table 3.17 31 In one scenario, described as “an extreme position” by the authors, where migrant productivity is only one-fifth
that of the resident workforce, the impact on long-run GDP per capita was negative at -0.13% in the UK. 32 The term ‘native workforce’ is often used in the literature to describe non-migrant workers.
Source: UK 2011 Census results, accessed via www.nomisweb.co.uk * ‘British Isles’ includes UK, Ireland, the Channel Islands and the Isle of Man
Geographical distribution of UK residents born in EU outside British Isles* by Parliamentary constituency,
England and Wales, 2011

18
them. The more migrant workers can be considered a direct substitute for existing workers,
the more downward pressure there is likely to be on wages for those jobs. Research
generally finds that that immigration does not displace native workers, nor does it lead to
lower average wages for native workers.33
There is, however, some evidence that migration can affect pay at different points across the
wage distribution. Focussing on immigration during the period 1997-2005, Dustmann et al
found that each 1% increase in the share of migrants in the UK-born working-age population
led to a 0.6% decline in the wages of the 5% lowest paid workers, a 0.4% decline for the
10% lowest paid, and to an increase in the wages of higher paid workers.34 Similarly, another
study focusing on wage effects at the occupational level during 1992 and 2006, found that in
the unskilled and semi-skilled service sector, a 1 percentage point rise in the share of
migrants reduced average wages in that occupation by 0.5%.35
In terms of their effect on public finances, existing research generally finds migrants’ net
fiscal contribution to be small but positive. Such research is very sensitive to how a migrant is
defined: for instance, whether spending on services for children born to one migrant parent
and a UK-born parent is included in the resident population or immigrant population.36
The impacts of migrants on the UK housing market depend on their characteristics and how
these compare with those of the resident population. For instance the effects will differ
depending on how likely migrants are to rent, buy homes or use social housing. Crucially, the
impact would also depend on how responsive the supply of housing is to changes in
demand. A fixed housing stock inevitably results in immigration placing upward pressure on
rents and/or prices.
4.3 Alternative arrangements
Should the UK wish to remain in the EU Single Market but outside the EEA, like Switzerland,
then it would probably have to accept certain EU regulations. Whether or not this would
include the free
movement of people
would depend on the
outcome of UK-EU
negotiations.
If the UK were to
leave the Single
Market, it would be
free to impose its own
controls on EU/EEA
immigration; for
instance, it could
choose to apply the
immigration controls
that currently apply to
non-EU/EEA
33 A good summary of existing research is available from: Migration Advisory Committee, “Analysis of the Impact
of Migration”, January 2012, Chapter 4.2, page 57 and table 4.2-4.5, page 66 34 Dustmann, C., Frattini, T. and Preston, I, The Effect of Immigration along the Distribution of Wages, 2008 35 Nickell, S. and Salaheen, J., The Impact of Immigration on Occupational Wages: Evidence from Britain, 2008 36 The Migration Observatory, University of Oxford, The fiscal impact of immigration in the UK, February 2013.
0
5
10
15
20
25
30
35
40
Low Lower middle Upper middle High
UK-born EU 14 EU A8 Rest of the World
% of all workers in country-of-birth group in each job-skill level, Q1 2011
19
nationals. This would restrict economic migration to predominantly high-skilled migrants (via
a points-based system) and reduce the flow of migrant workers doing low-skilled jobs. As the
chart shows, this would particularly affect A8 nationals entering the UK, who tend to be lower
skilled than those coming from western Europe.
Just as the UK would be able to impose its own controls on EU/EEA immigration outside the
Single Market, so the rights of UK citizens to visit or move to an EU/EEA Member State
would depend on what visa requirements those states chose to apply. All parties would also
have to consider how to ensure continuity of immigration status for persons exercising their
free movement rights at the time of the UK’s exit from the EU. Sudden mass
expulsions/returns of their nationals could create significant costs and upheaval; it would, for
instance, result in a reduction in the UK labour force of up to 5% that would only partially be
offset by any return of UK nationals working in the EU.37
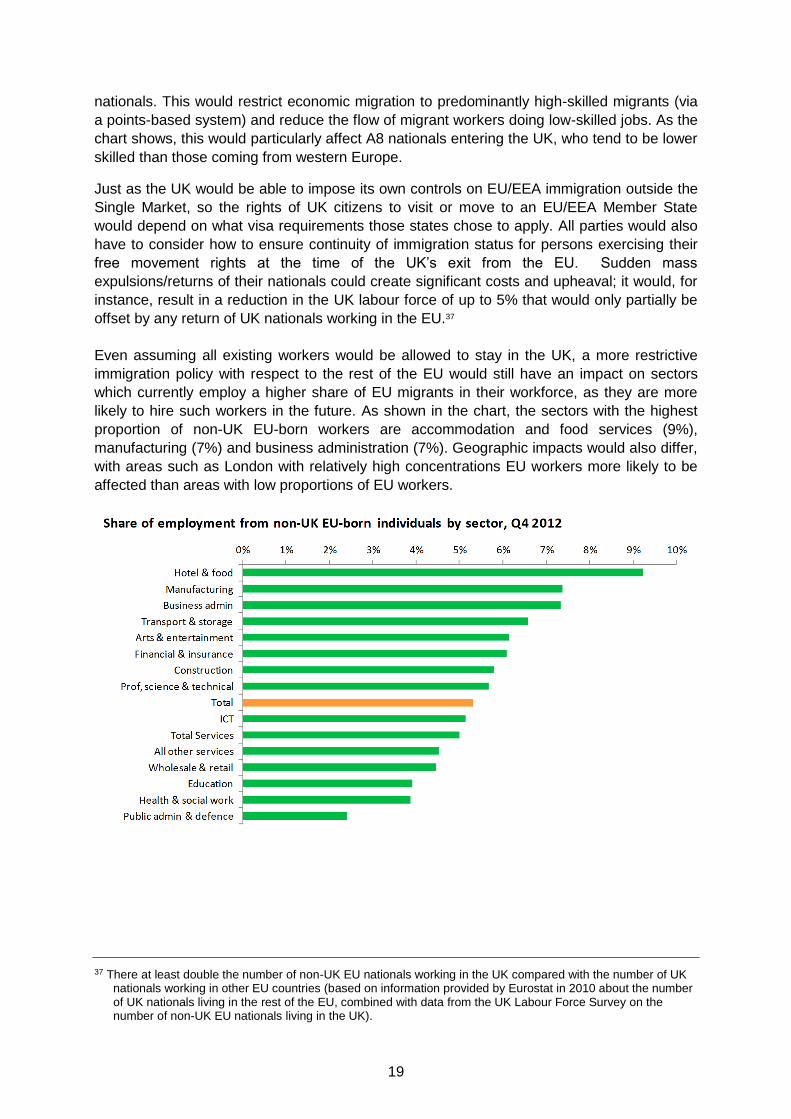
Even assuming all existing workers would be allowed to stay in the UK, a more restrictive
immigration policy with respect to the rest of the EU would still have an impact on sectors
which currently employ a higher share of EU migrants in their workforce, as they are more
likely to hire such workers in the future. As shown in the chart, the sectors with the highest
proportion of non-UK EU-born workers are accommodation and food services (9%),
manufacturing (7%) and business administration (7%). Geographic impacts would also differ,
with areas such as London with relatively high concentrations EU workers more likely to be
affected than areas with low proportions of EU workers.
37 There at least double the number of non-UK EU nationals working in the UK compared with the number of UK
nationals working in other EU countries (based on information provided by Eurostat in 2010 about the number of UK nationals living in the rest of the EU, combined with data from the UK Labour Force Survey on the number of non-UK EU nationals living in the UK).

20
5 The impact of EU regulation
5.1 Understanding and measuring the impact of EU regulation
Through successive Treaties, the policy areas in which the EU has competence to legislate
have been gradually expanded, although the volume of new ‘hard’ law (regulations and
directives) emanating from the EU has declined from a peak in the early 1980s.38 In
particular, new EU aims and areas of activity in sustainable development, social protection
and human rights have raised concerns about the impact of EU membership on business
and the wider economy. Regulation in these areas, some argue, has little to do with the EU’s
founding purpose of establishing a common market between Member States, and imposes
burdens that offset the trade benefits of membership.
The EU has the power to legislate in a number of areas that directly affect businesses. These
include:
Product specifications, e.g. Directive 2000/36/EC on cocoa and chocolate products
intended for human consumption
Competition, e.g. Council Regulation 139/2004 on the control of concentrations
between undertakings, aka the EC Merger Regulation
Employment terms, e.g. Directive 2008/104/EC on Temporary and Agency Workers
Health and safety, e.g. Directive 2009/148/EC on exposure to asbestos at work
Consumer protection (e.g. Directive 93/13/EC on Unfair Terms in Consumer
Contracts)
Several studies have attempted to estimate the ‘cost’ of EU law to the UK using the Impact
Assessments (IAs) prepared by the Government that assess the various potential costs and
(sometimes)39 the benefits associated with a particular measure. IAs are usually produced in
response to Directives (where the Government will have some discretion over how EU
requirements will be transposed into national law), but not Regulations or Decisions, which
do not trigger a new piece of domestic legislation. The potential costs in question arise from
administrative burdens on companies and the public sector (e.g. notifying the authorities
about the possible presence of asbestos dust before commencing work), and from the
additional practical obligations of putting the policy of the regulation into practice (e.g.
providing employees who may come into contact with asbestos with relevant training). There
may also be wider consequences arising from regulation (e.g. the demise of industries allied
to asbestos manufacture) though these are rarely quantified in IAs.
A study of 2,500 IAs produced since 1998 by Open Europe estimated that the annual cost of
regulation stemming from EU legislation in 2009 was £19.3bn and that the cumulative cost
since 1998 had been £124bn.40 Using a similar approach, but looking at a smaller number of
regulations with the largest associated costs, the British Chambers of Commerce estimated
the annual cost to be £7.6bn and the cumulative cost since 1998 to be £60.8bn.41 Among the
regulations cited by both as imposing the highest costs are the Working Time Directive, the
38 The number of EU laws reached a peak of over 14,000 instruments in the early 1980s and there was a lower
peak in the mid-1990s. See HC Library Research Paper 10/62 How much legislation comes from Europe? 39 Benefits are only quantified in a minority of Impact Assessments produced since 1998 40 Open Europe (2010) Still out of control? Measuring eleven years of EU regulation 41 British Chambers of Commerce (2010) The burdens barometer
21
Pollution Directive, the Data Protection Directive and the Directive on the Sale of Consumer
Goods.
The costs to businesses of complying with EU regulations are not equivalent to their
economic impact because they will be offset by benefits, most obviously to employees and
consumers. Open Europe acknowledge this in their analysis, noting that “the whole point of
regulation is for it to produce a total benefit... which outweighs the total cost”, adding that “the
benefits of regulations on the whole outweigh the costs”. Their analysis, however, finds that
the benefit-cost ratio of EU regulation, at 1.02, is considerably below that of regulation
imposed directly by the UK Government (2.35). This may at least partly be due to the
particular policy areas in which the EU regulates; it has also been argued that the wider
benefits of EU regulation that improves access to the Single Market are particularly great, but
are left unquantified in Impact Assessments.42
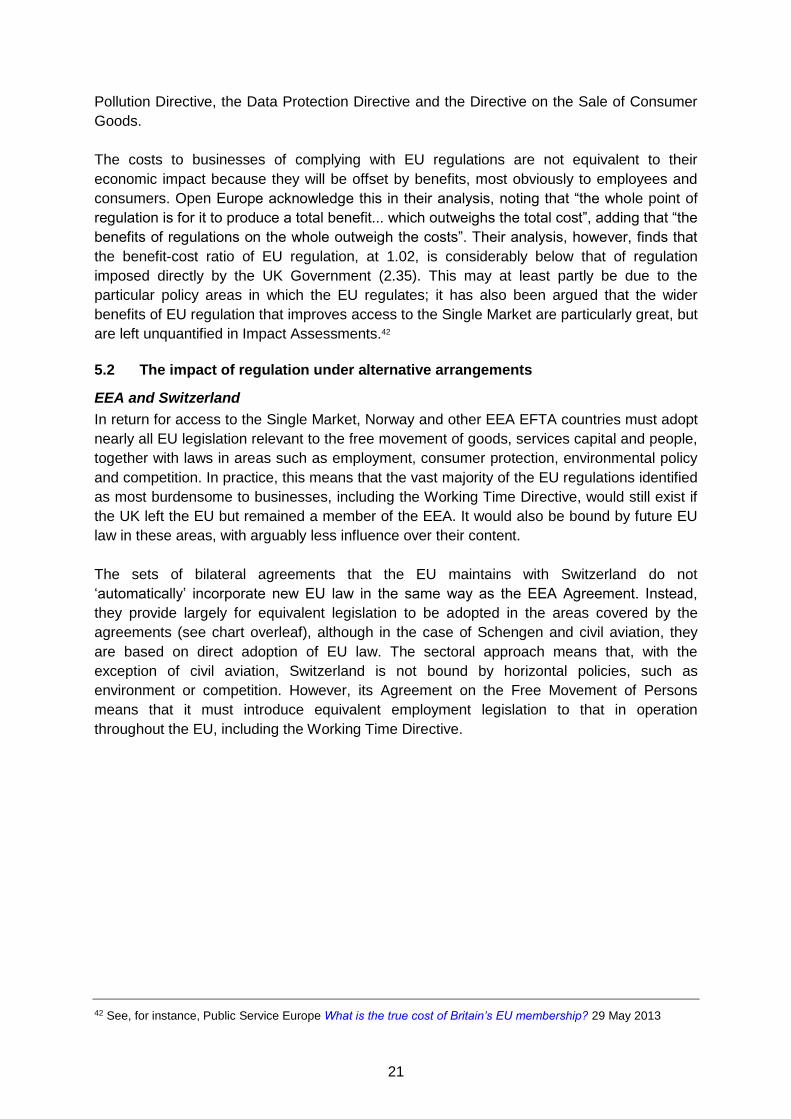
5.2 The impact of regulation under alternative arrangements
EEA and Switzerland
In return for access to the Single Market, Norway and other EEA EFTA countries must adopt
nearly all EU legislation relevant to the free movement of goods, services capital and people,
together with laws in areas such as employment, consumer protection, environmental policy
and competition. In practice, this means that the vast majority of the EU regulations identified
as most burdensome to businesses, including the Working Time Directive, would still exist if
the UK left the EU but remained a member of the EEA. It would also be bound by future EU
law in these areas, with arguably less influence over their content.
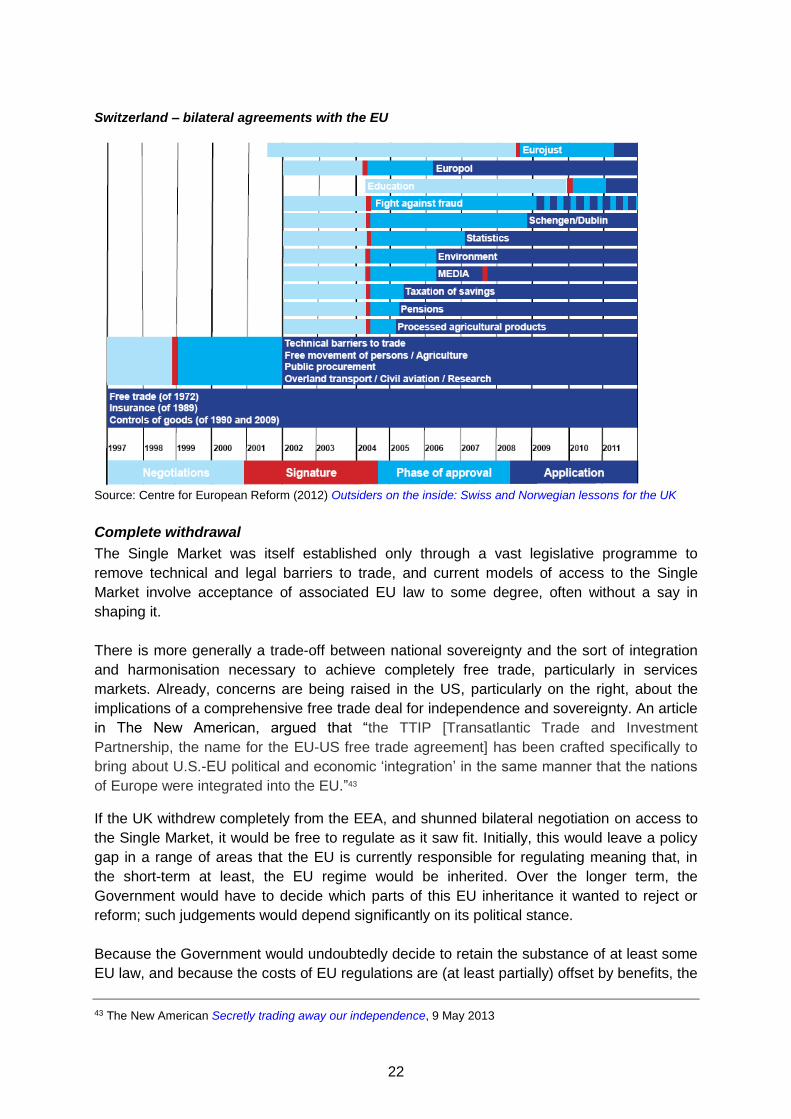
The sets of bilateral agreements that the EU maintains with Switzerland do not
‘automatically’ incorporate new EU law in the same way as the EEA Agreement. Instead,
they provide largely for equivalent legislation to be adopted in the areas covered by the
agreements (see chart overleaf), although in the case of Schengen and civil aviation, they
are based on direct adoption of EU law. The sectoral approach means that, with the
exception of civil aviation, Switzerland is not bound by horizontal policies, such as
environment or competition. However, its Agreement on the Free Movement of Persons
means that it must introduce equivalent employment legislation to that in operation
throughout the EU, including the Working Time Directive.
42 See, for instance, Public Service Europe What is the true cost of Britain’s EU membership? 29 May 2013
22
Switzerland – bilateral agreements with the EU
Source: Centre for European Reform (2012) Outsiders on the inside: Swiss and Norwegian lessons for the UK
Complete withdrawal
The Single Market was itself established only through a vast legislative programme to
remove technical and legal barriers to trade, and current models of access to the Single
Market involve acceptance of associated EU law to some degree, often without a say in
shaping it.
There is more generally a trade-off between national sovereignty and the sort of integration
and harmonisation necessary to achieve completely free trade, particularly in services
markets. Already, concerns are being raised in the US, particularly on the right, about the
implications of a comprehensive free trade deal for independence and sovereignty. An article
in The New American, argued that “the TTIP [Transatlantic Trade and Investment
Partnership, the name for the EU-US free trade agreement] has been crafted specifically to
bring about U.S.-EU political and economic ‘integration’ in the same manner that the nations
of Europe were integrated into the EU.”43
If the UK withdrew completely from the EEA, and shunned bilateral negotiation on access to
the Single Market, it would be free to regulate as it saw fit. Initially, this would leave a policy
gap in a range of areas that the EU is currently responsible for regulating meaning that, in
the short-term at least, the EU regime would be inherited. Over the longer term, the
Government would have to decide which parts of this EU inheritance it wanted to reject or
reform; such judgements would depend significantly on its political stance.
Because the Government would undoubtedly decide to retain the substance of at least some
EU law, and because the costs of EU regulations are (at least partially) offset by benefits, the
43 The New American Secretly trading away our independence, 9 May 2013
23
cost of regulation estimated by Open Europe and the BCC is emphatically not equivalent to
the economic benefit of withdrawal. Proponents of withdrawal, however, argue that the UK
would be better able to balance the costs and benefits of regulation according to its own
domestic priorities; and that the regulatory regime would be more responsive to changing
circumstances (amending EU law requires negotiations with all Member States and the
European Parliament). On the other hand, businesses that export to the EU would still have
to comply with product standards which, if the UK pursued an alternative regime may be
different from those required to sell to the domestic market.
The argument over the effect of withdrawal in this context, then, boils down not to the size of
the ‘burden’ on businesses, but to whether the benefits of having a more tailored and flexible
national regulatory regime outweigh the loss of access to the Single Market that may come
with pursuing an independent agenda.
6 Fiscal consequences of EU membership – the EU budget
The UK’s budgetary contribution to the EU is one of the more quantifiable costs of its
membership. Net of receipts under the Common Agricultural Policy, EU regional funding, and
the budget rebate, the Government contributed an estimated £6.9bn to the EU in 2012,
around 1% of total public expenditure and equivalent to 0.4% of GDP.44
6.1 How it works now
The EU’s budget is used to pay for policies carried out at a European level, including
agricultural subsidies via the Common Agricultural Policy, regional funding to assist poorer
parts of the EU, research, and some aid to developing countries.
The basis for budgeting in the EU is a financial framework set for a period of years. The
current framework runs from 2007 to 2013 and was agreed in 2006; the subsequent one will
run from 2014-20. The framework sets out annual expenditure ceilings, and allocates
spending to broad priorities. A separate, but concurrently negotiated decision sets out the
limits and sources of revenue for the budget. Year-to-year expenditure and revenue are set
through an annual budgeting process that takes place within the limits set by the financial
framework.
Contributions by Member States to the Budget consist of four elements, called ‘own
resources’. These are described in more detail in Library Standard Note The EU budget
2007-13. By far the most important element, accounting for 87% of total revenue, are GNI-
based contributions, which are calculated by taking the same proportion of each Member
State’s Gross National Income (0.7288% in 2013).
Around 6% of the EU’s budget is spent on administration and a further 6% on the EU’s
foreign policies, international development, and pre-accession aid. The remainder is
redistributed back to Member States in the form of agricultural and regional funding.
Depending on its standards of living in relation to the EU average, and depending on the size
of its agricultural sector, a Member State may get more or less back than they ‘put in’. In
2011, 10 of the 27 EU Member States, including the UK, were net contributors to the budget. 44 HM Treasury Annual Statement on EU Finances 2012 and Public Expenditure Statistical Analyses 2013 Table
4.1; ONS National Accounts Series YBHA
24
Per capita, contributions ranged from net receipts of €752 in Greece to net contributions of
€208 in the Netherlands. The UK’s per capita contribution was €150.45
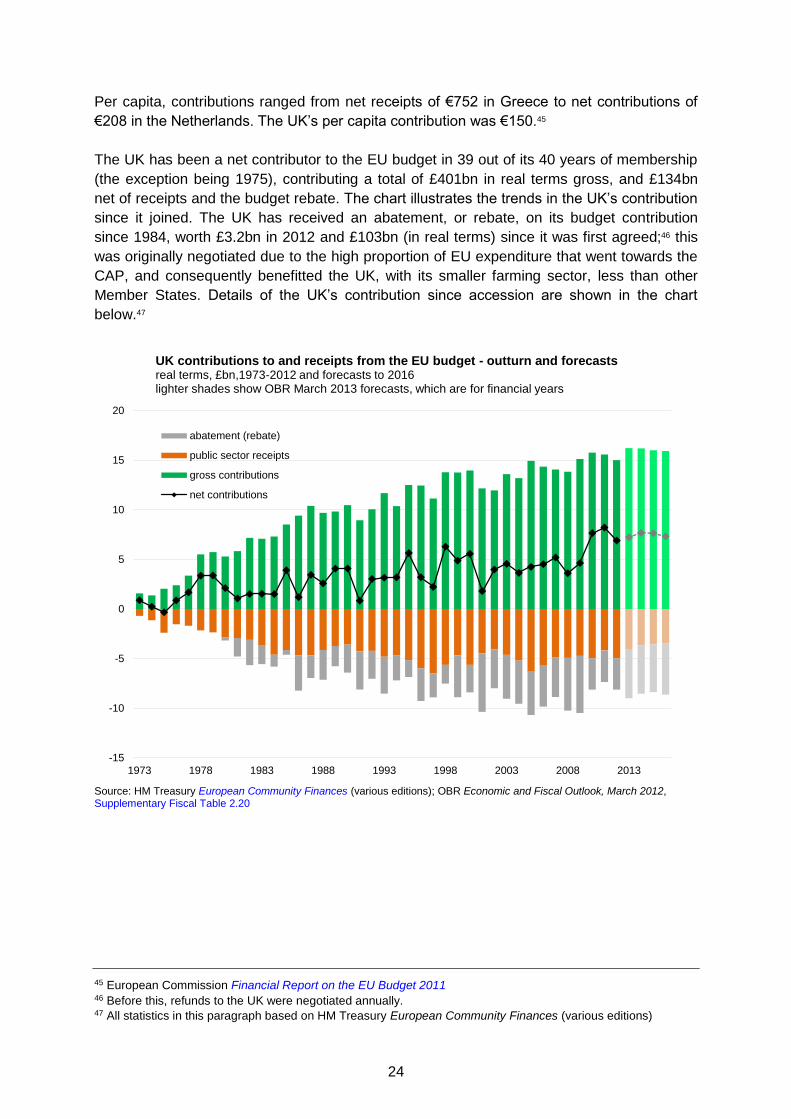
The UK has been a net contributor to the EU budget in 39 out of its 40 years of membership
(the exception being 1975), contributing a total of £401bn in real terms gross, and £134bn
net of receipts and the budget rebate. The chart illustrates the trends in the UK’s contribution
since it joined. The UK has received an abatement, or rebate, on its budget contribution
since 1984, worth £3.2bn in 2012 and £103bn (in real terms) since it was first agreed;46 this
was originally negotiated due to the high proportion of EU expenditure that went towards the
CAP, and consequently benefitted the UK, with its smaller farming sector, less than other
Member States. Details of the UK’s contribution since accession are shown in the chart
below.47
Source: HM Treasury European Community Finances (various editions); OBR Economic and Fiscal Outlook, March 2012, Supplementary Fiscal Table 2.20
45 European Commission Financial Report on the EU Budget 2011 46 Before this, refunds to the UK were negotiated annually. 47 All statistics in this paragraph based on HM Treasury European Community Finances (various editions)
-15
-10
-5
0
5
10
15
20
1973 1978 1983 1988 1993 1998 2003 2008 2013
UK contributions to and receipts from the EU budget - outturn and forecastsreal terms, £bn,1973-2012 and forecasts to 2016lighter shades show OBR March 2013 forecasts, which are for financial years
abatement (rebate)
public sector receipts
gross contributions
net contributions
25
6.2 The fiscal impact under alternative arrangements
EEA
Since the entry into force of the EEA agreement in 1994, the EEA EFTA states (Norway,
Iceland and Liechtenstein) have made financial contributions to the EU in two ways. Firstly,
they contribute to broad EU regional policy goals by providing grants to ‘reduce social and
economic disparities in the EEA.’48 Since the 2004 enlargement, funds have been provided
under two schemes: ‘EEA Grants’, which Norway, Iceland and Liechtenstein all contribute to,
and which is targeted at the twelve new Member States, plus Greece, Spain and Portugal;
and ‘Norway Grants’, which Norway alone contributes to, and is targeted at the twelve new
Member States only. €1.79bn has been allocated to both schemes for the period 2009-14, to
which Norway provides 97% of the total.49
Secondly, EEA countries contribute to the costs of the EU programmes in which they
participate under the EEA Agreement, in proportion to their percentage of EU GDP. The EEA
states have also committed to second national experts to the Commission as an ‘in kind’
contribution to these programmes.50
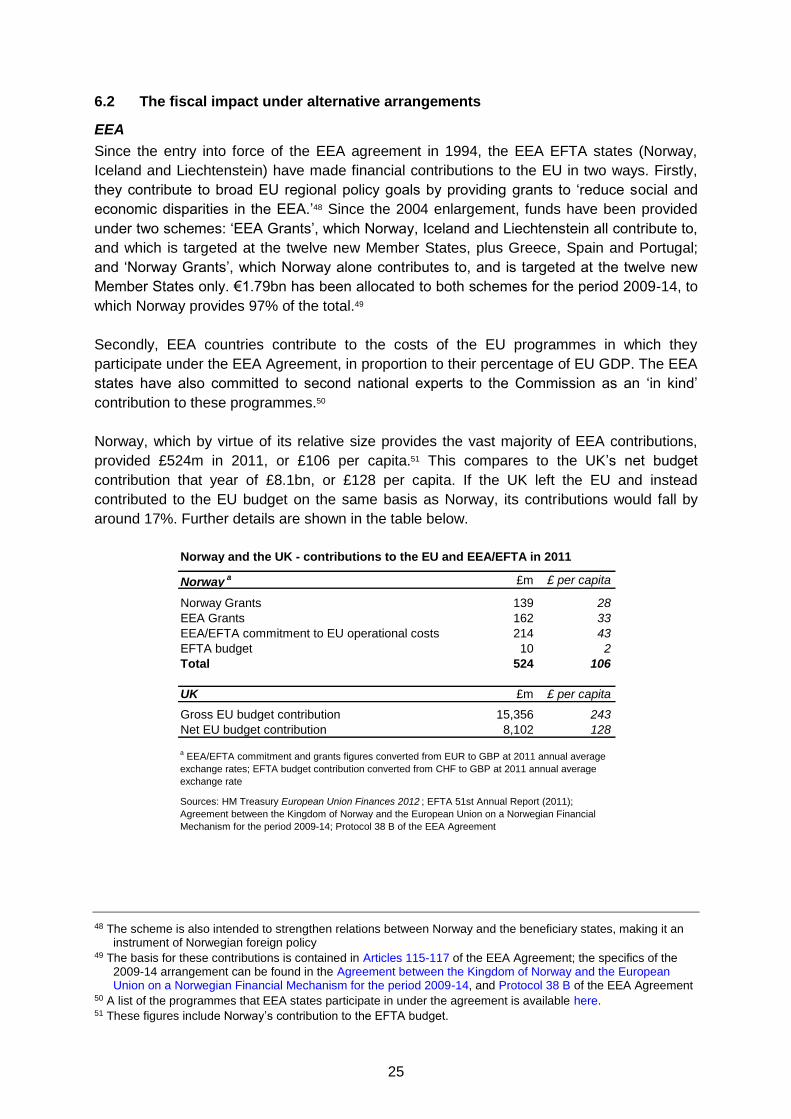
Norway, which by virtue of its relative size provides the vast majority of EEA contributions,
provided £524m in 2011, or £106 per capita.51 This compares to the UK’s net budget
contribution that year of £8.1bn, or £128 per capita. If the UK left the EU and instead
contributed to the EU budget on the same basis as Norway, its contributions would fall by
around 17%. Further details are shown in the table below.
48 The scheme is also intended to strengthen relations between Norway and the beneficiary states, making it an
instrument of Norwegian foreign policy 49 The basis for these contributions is contained in Articles 115-117 of the EEA Agreement; the specifics of the
2009-14 arrangement can be found in the Agreement between the Kingdom of Norway and the European Union on a Norwegian Financial Mechanism for the period 2009-14, and Protocol 38 B of the EEA Agreement
50 A list of the programmes that EEA states participate in under the agreement is available here. 51 These figures include Norway’s contribution to the EFTA budget.
Norway and the UK - contributions to the EU and EEA/EFTA in 2011
Norwaya £m £ per capita
Norway Grants 139 28
EEA Grants 162 33
EEA/EFTA commitment to EU operational costs 214 43
EFTA budget 10 2
Total 524 106
UK £m £ per capita
Gross EU budget contribution 15,356 243
Net EU budget contribution 8,102 128
a EEA/EFTA commitment and grants figures converted from EUR to GBP at 2011 annual average
exchange rates; EFTA budget contribution converted from CHF to GBP at 2011 annual average
exchange rate
Sources: HM Treasury European Union Finances 2012 ; EFTA 51st Annual Report (2011);
Agreement between the Kingdom of Norway and the European Union on a Norwegian Financial
Mechanism for the period 2009-14; Protocol 38 B of the EEA Agreement

26
Switzerland
Like the EEA contries, Switzerland contributes to both enlargement costs ‘to reduce
economic and social disparities’, and the EU programmes in which it participates under its
array of bilateral agreements. Its enlargement contributions are provided under multi-year
frameworks, the most recent of which covered the five year period to 2012; negotiations on a
new one are ongoing. Switzerland’s contribution in recent years has been around £420m per
annum, or £53 per head. If the UK left the EU and contributed on the same basis as
Switzerland, its contributions would fall by around 59%.52
52 Based on information published by the Swiss Government in its 2009 brochure Bilateral agreements
Switzerland-EU

27
The EU budget – winners and losers Although the UK is a net contributor to the EU, certain regions where living standards fall short of the EU average receive significant levels of support from the budget through the European Regional Development Fund and the European Social Fund, boosted by matched funding from government or the private sector. Farmers, too, receive payments under the Common Agricultural Policy. Receipts from the EU budget for the financial year 2008/09 (the latest year for which data underpinning the calculations are available) are broken down by the four UK nations in the table below. Wales, a significant part of which is eligible for the highest level of regional funding and has a large agricultural sector receives £163 per head. England, by contrast receives just £52.
This divergence in public sector receipts means that some parts of the UK (Wales and Northern Ireland) are effectively net recipients from the EU budget while others (England and, more marginally, Scotland) are net contributors, as illustrated in the table below.
The tables do not show the net ‘cost’ of withdrawal for each of the UK nations; rather, they indicate that, as with other policy areas where the EU has competence, withdrawal from the EU will leave a policy vacuum which the Government must fill if it wants to avoid certain regions and sectors losing out. How it chooses to do so has important implications for the fiscal and broader economic consequences of withdrawal.
Indicative receipts from the EU budget in 2008/09
UK constituent nations
Wales England Scotland N Ireland
Structural funding 207 659 103 63
Agricultural/fisheries funding 290 1,990 512 289
Other 0 53 0 12
Total 497 2,702 615 364
Structural funding 68 13 20 35
Agricultural/fisheries funding 95 38 99 162
Other 0 1 0 7
Total 163 52 118 204
£m
£ per
capita
Source: HM Treasury Consolidated statement on the use of EU funds in the UK for year ended 31 Mar 2009 ;
ONS mid-year population estimates
£m unless stated
UK Wales England Scotland N Ireland
Gross 13,155 474 11,287 1,092 303
Less abatement 5,595 201 4,801 464 129
Less public sector receipts 4,558 497 2,702 615 364
Net 3,002 -225 3,784 12 -190
Net per capita (£) 48 -74 72 2 -106
Note: Gross contributions are disaggregated using GVA share. Public sector receipts are disaggregated using
HMT Consolidated Statement on use of EU funds
EU budget contributions and receipts, 2008/09 - indicative disaggregation by UK
constituent nations
Sources: ONS Regional, sub-regional and local Gross Value Added 2009 ; ONS mid-year population estimates;
HM Treasury European Union Finances 2010 , Table 3.2A; HM Treasury Consolidated statement on the use of EU
funds in the UK for year ended 31 Mar 2009 , Table 2

28
7 The EU’s effect on consumer prices
7.1 Food prices and the Common Agricultural Policy (CAP)
Farmers operating in the EU are supported in two ways: through subsidies via the CAP, and through a common external tariff on agricultural produce imported from outside the EU. Around 70% of the CAP budget is paid out in direct income support to farmers on the condition that they meet safety, environmental and animal welfare standards; the remainder goes towards rural development (farm modernisation, land management, and economic diversification and development in rural areas) and interventions to support the price of agricultural output. The CAP also mandates production quotas for certain products (e.g. sugar). The wide-ranging criticisms of the CAP and the substantial reform it has undergone over the past two decades are beyond the scope of this analysis. But the principal criticism of the policy from an economic perspective is that it artificially inflates food prices for consumers and diverts productive resources from areas in which the EU might have a true trade advantage. The cost of the CAP to the UK is considered to be particularly high because it imports more and produces less agricultural produce than, for instance, France, Italy and Spain. The OECD produces regular estimates of the extent of support arising from its members’ agricultural policies, including the cost to consumers of paying higher prices.53 The results are shown in the chart, which illustrates the following:
the overall level of support provided under the CAP has declined from over 4% GDP
in 1986 to less than 1% GDP today. This is partly due to a series of reforms over this
period, but also because agriculture’s share of total output has declined substantially
reforms that have largely delinked financial support from farm production have
caused a payments based on agricultural output, which have partially been replaced
with other forms of producer support
the delinking has been accompanied by reforms to reduce other price- and trade-
distorting aspects of the CAP. This, combined with the convergence of world food
prices to target prices under the CAP has reduced the total support to farmers arising
from consumers paying higher prices
53 OECD (2012) Agricultural policy monitoring and evaluation
0.0%
0.5%
1.0%
1.5%
2.0%
2.5%
3.0%
3.5%
4.0%
4.5%
5.0%
1986 1990 1994 1998 2002 2006 2010
Support under the Common Agricultural Policy% EU GDP, 1986-2011
support paid by consumers
other producer support
support based on output
Source: OECD Agricultural policy monitoring and evaluation
29
The UK’s share of direct support to producers in 2011 from the EU budget was around €6.7bn. Total support paid by consumers in 2011 was estimated by the OECD to be €7bn, of which the share paid by UK consumers would be around €1bn.
Leaving the EU would require the Government to consider whether and how to support UK farmers that are currently insulated by common external tariff and CAP payments. 7.2 Other prices
Consumer prices across a range of other goods imported from outside the EU are raised as
a result of the common external tariff and non-tariff barriers to trade imposed by the EU.
These include footwear (a 17% tariff), bicycles (15% tariff) and a range of clothing (12%
tariff), although tariffs are not applied uniformly, and least developed countries benefit from
tariff-free access to EU markets. Although they raise prices for consumers, they also help
producers by shielding them from more price competitive imports; so while the Government
would be free to set its own tariffs outside the EU, removing the protection they afford to
certain industries could prove politically difficult, given that the costs will be specific and
localised, but the benefits diffuse.
Trade barriers and economic efficiency Conventional economic theory shows that tariffs reduce aggregate economic welfare, not only because they raise prices for consumers, but because, by shielding certain sectors from the vagaries of domestic competition, they divert productive resources away from sectors in which there might exist a trade advantage. In other words, some of the labour and capital tied up in the car industry might, absent a tariff, be more productively employed in, say, business services. In evidence to the Foreign Affairs Committee, Patrick Minford summed up this view thus:a
If you leave a protectionist organisation, the prices of protected things fall. Consumers
gain and certain producers lose... jobs are not lost; jobs are created overall, because
you become a more competitive economy, producing the things that you are better at
On this basis, he went on to advocate a withdrawal from the EU and a move towards an abolition of all import tariffs in the UK. While the UK, on leaving the EU, might wish to alter its tariff regime for the benefit of consumers and to encourage a reorientation of activity to more competitive sectors, it is unlikely that it would unilaterally remove all tariff barriers, despite the theoretical benefits of doing so. Such a move could, at least in the short-term, create unemployment and worsen the trade deficit as domestic producers are forced to compete with cheaper imports. The political imperative to protect domestic industry, and the leverage that existing tariff barriers command in negotiating trade agreements, have meant that all major economies have taken a more measured approach to trade liberalisation. References a Foreign Affairs Committee The future of the European Union: UK Government Policy, oral evidence

30
8 Foreign direct investment (FDI)
8.1 FDI in the UK – extent and effect
At $1.2tn, the UK had the second
largest stock of inward foreign
direct investment (FDI) in the
world in 2011, behind the United
States,54 and it was recognised
the most attractive location for
investment in the EU in the 2013
Ernst and Young European
Attractiveness Survey.55 48% of
the FDI stock is a result of inward
investment by other EU
countries, a figure that has
declined from a peak of 53% in
2009, but remains above levels
seen before 2005.
In 2011, foreign companies
invested £31.9 billion in the UK, a
slight fall on 2010 and the lowest
investment since 2004. The
largest decreases in inward investment flows in 2011 were from the EFTA countries and the
Americas.
If it involves the construction of new operational facilities (‘greenfield’ investment), such
investment can have benefits for the economy directly through the creation of jobs; and even
where it does not (e.g. the Qatari Government’s acquisition of Harrods), FDI can theoretically
benefit the economy indirectly by improving productivity through the introduction of new
working practices and transfers of technology that can spread to indigenous firms. However,
establishing the existence of these theoretical benefits empirically, particularly the ‘spillover
effects’ of FDI on the domestic economy, has proved challenging, and the econometric
analysis has produced, at best, mixed results.56
8.2 Impact of EU membership
It is often argued that being part of the EU makes the UK a more attractive place to invest, as
firms with a presence in the UK benefit from unrestricted access to the markets of other EU
Member States via the Single Market. However, establishing the existence and estimating
the magnitude of the ‘EU effect’ on UK inward FDI, and hence the consequences of
withdrawal, is very difficult. The decision to invest is motivated by any number of factors,
54 FDI, also known as (international) direct investment, forms part of the capital account of the balance of
payments. ‘Direct Investment’ is defined as an investment that adds to, deducts from, or acquires a lasting interest in an enterprise operating in an economy other than that of the investor where the purpose is to have an ‘effective voice’ in the management of the enterprise.
55 Ernst and Young 2013 European Attractiveness Survey 56 See, for instance, Rodrik, D. (2008) One economics, many recipes: globalisation, institutions and economic
growth
Source: ONS Foreign Direct Investment, 2011 (MA4)
0
100
200
300
400
500
600
700
800
2002 2003 2004 2005 2006 2007 2008 2009 2010 2011
UK - stock of inward foreign direct investment by source£bn, 2002-11
rest of world
US
EU

31
including the integrity of the UK legal system, the availability of particular skills and services,
and the status of the English language. Disentangling these motivations from those arising
from the Single Market, and accounting for other factors that have caused a surge in FDI
over the period of EU integration, including the removal of capital restrictions and the
development of capital-intensive technologies, is, in the words of a 2005 Treasury paper
‘fraught with problems’.57 Going on to judge the contribution of such investment to UK output
and productivity is still more problematic.
On the one hand, the removal of barriers to trade eliminates an important incentive to
physically locate abroad, meaning the Single Market could be argued to discourage intra EU
investment. On the other, membership of the Single Market should stimulate inward
investment in the UK from outside the EU, since by doing so, they can access 27 other EU
markets tariff-free.58 The choice of foreign car manufacturers, including Honda, Nissan,
BMW, Toyota and General Motors, to locate in the UK, is often cited as an example of
companies locating in the UK as a bridgehead to other EU markets.
In a survey of 2,272 multinationals, the UN Conference on Trade and Development found
that size of the local market was the most important criterion determining the location of FDI
for both the manufacturing and services sectors, and the third most important for the primary
sector.59 This would suggest that EU membership plays an important role in determining
investment decisions. However, the results of the Ernst and Young UK Attractiveness Survey
on this issue are more equivocal: 72% of companies interviewed in North America thought
reduced integration with the EU would make the UK more attractive as a destination, against
38% of those interviewed in Western Europe.60
On the whole, it is reasonable to conclude that membership of the Single Market is one of a
number of important determinants of FDI; but outside the EU, the UK may be able to
establish a regulatory regime more favourable to overseas investors that could offset the
effect of its departure. In particular, the UK would regain competence to negotiate
international agreements on foreign direct investment with third countries, something which it
has not been able to do since the Lisbon treaty entered force in 2009.
57 HM Treasury (2005) EU membership and FDI 58 Including Croatia, which will accede to the EU on 1 July 2013 59 UNCTAD (2009) World investment prospects survey 2009-2011, p.18 60 Ernst and Young 2013 UK attractiveness survey, p.35

32
Appendix Table: a comparison of the freedoms and obligations of countries in the EU with those in other trading arrangements
EU EEA Switzerland
Countries with no
preferential access to EU
markets
tariff barriers none none none
exports face EU's 'most-
favoured nation' tariff, which
currently averages 1% on a
trade-weighted basis
non-tariff
barriersnone
must comply with rules of
origin procedure; eligible for
EU anti-dumping measures
as for EEA
exports can be subject to full
range of non-tariff barriers,
provided these are applied in a
non-discriminatory way and
comply with WTO agreements
Services Directive has not
been fully implemented and
tackling outstanding and
emerging barriers is an
ongoing exercise
EEA countries conduct
services trade on same basis
as EU members, though they
lack direct influence over
services market regulation
no general agreement on free
movement of services
Services trade goverened by
GATS. No presumed right of
access as under EU treaties;
market access at discretion of
Member States (but must not
be discriminatory)
preferential agreements with
45 countries (not including
EEA). The EU's trade
restrictiveness index score* is
5.6% (2009)
EFTA has preferential
agreements with 36 countries,
including Canada, which has
no EU agreement yet.
Norway's trade restrictiveness
index score* is 8.9% (2009)
In addition to the EFTA
agreements, Switzerland has
agreements with Japan and
China. Switzerlands's trade
restrictiveness index score* is
3.6% (2009)
depends on trade policy
pursued and agreements
negotiated by particular
country
the EU has a common external
tariff and it has exclusive
competence to conduct trade
and investment agreements
with non-EU countries
trade agreements are
conducted through EFTA or
bilaterally; EEA members can
determine their own trade
policy, including tariff levels,
subject to these agreements
trade agreements are
conducted through EFTA or
bilaterally; Switzerland can
determine its own trade policy,
including tariff levels, subject
to these agreements
trade agreements purused and
trade policy determined
independently
free movement of persons
EU nationals are free to move
between Member States
without a visa and no time limit
may be placed on their stay
EU provisions on free
movement apply equally to
other EEA members
arrangements analogous to
EU/EEA members, under
Agreement on Free Movement
of Persons
no right of free movement in
EU; immigration controls vary
by Member State (but free to
apply own immigration
restrictions to EU nationals)
influence
representation on EU decision-
making bodies, with seats in
European Parliament and
votes in Council reflecting
population size
no formal access to EU
decision-making bodies
(Parliament and Council);
some access to Commission
expert groups and comitology
committees
no access to EU decision-
making bodies or to
Commission working groups
and comitology committees
no formal means of
inflluencing EU law, including
product market regulations
complianceadoption of all EU legislation
unless specific opt-outs
negotiated
EEA members must adopt
nearly all EU legislation
relevant to the free movement
of goods, services capital and
people, together with laws in
areas such as employment,
consumer protection,
environmental policy and
competition
Bilateral agreements largely
provide for equivalent domestic
legislation to be adopted in
relevant areas. Switzerland is
not bound by horizontal
policies, such as environment
or competition; and unlike EEA
countries it is not obkliged to
take on new EU legislation
no requirement to adopt or
transpose EU law, but goods
exported to the EU must
comply with EU product
standards; service providers
with a commercial presence in
the EU may be required to
submit to the regulatory regime
of the host country
fiscal contributions
obliged to contribute to all
areas of the EU budget, with
size of contribution determined
substanitally by relative
economic size. Some
provisions for reductions (e.g.
UK abatement)
financial contributions to meet
objectives of EU regional
policy and for participation in
particular EU programmes
as for EEA countries, although
the size of the contribution in
practice has been lower, per
capita
no obligation to contribute
Sources: Open Europe (2012) Trading Places: is EU membership still the best option for UK trade? ; Centre for European Reform (2012) Outsiders on the inside: Swiss and
Norwegian lessons for the UK; Kee et al (2009, updated July 2012) for World Bank Estimating trade restrictiveness indices; Centre for European Policy Studies (2013) Access
barriers to services markets
barriers to goods
trade with EU
EU
law/regulation
freedom to pursue trade
relationships with non-EU
countries
the colours are intended to give a broad indication of the relative extent of freedom each group or country enjoys across each dimension, running from green (free) through yellow,
orange, to red (restricted). For example, countries in the EU enjoy tariff-free access to EU markets (green), but are not free to pursue trade relationships with non-EU countries
(red).
barriers to trade with non-EU
countries
barriers to services trade with EU
*This measures the extent of tariff and non-tariff barriers to trade imposed on imports; lower values imply a less restrictive trade policy (with respect to imports)