2002 ECONOMIC BACKGROUND - Census and Statistics ...
301
2002 ECONOMIC BACKGROUND ECONOMIC ANALYSIS DIVISION FINANCIAL SERVICES AND THE TREASURY BUREAU GOVERNMENT OF THE HONG KONG SPECIAL ADMINISTRATIVE REGION March 2003
-
Upload
khangminh22 -
Category
Documents
-
view
0 -
download
0
Transcript of 2002 ECONOMIC BACKGROUND - Census and Statistics ...

2002 ECONOMIC BACKGROUND
ECONOMIC ANALYSIS DIVISIONFINANCIAL SERVICES AND THE TREASURY BUREAU
GOVERNMENT OF THEHONG KONG SPECIAL ADMINISTRATIVE REGION
March 2003


CONTENTS
Paragraphs
CHAPTER 1: OVERALL VIEW
Overall situation 1.1 - 1.9The external sector 1.10 - 1.18Domestic demand 1.19 - 1.25Implications of the preliminary GDP figures for the economy 1.26 - 1.29The Government account 1.30 - 1.32The property market 1.33 - 1.38The labour market 1.39 - 1.42Prices 1.43 - 1.45The financial sector 1.46 - 1.51
CHAPTER 2: THE EXTERNAL SECTOR
Major external influences 2.1 - 2.6Overall visible and invisible trade situation 2.7 - 2.14Visible trade
Total exports of goods 2.15 - 2.28Re-exports 2.29 - 2.32Domestic exports 2.33 - 2.34Outward processing trade 2.35 - 2.37Imports of goods 2.38 - 2.39Retained imports 2.40 - 2.43
Invisible tradeExports of services 2.44 - 2.45Imports of services 2.46 - 2.47
Overall balance of payments 2.48 - 2.50
CHAPTER 3: THE DOMESTIC ECONOMY
Net output or value added by economic activity 3.1 - 3.4Local manufacturing output 3.5 - 3.6Service sector receipts 3.7Property 3.8 - 3.20Building and construction 3.21 - 3.27Land 3.28 - 3.31Electricity and gas 3.32 - 3.33Internal transport 3.34 - 3.35External transport 3.36 - 3.39Tourism 3.40 - 3.45Telecommunications 3.46 - 3.48
CHAPTER 4: THE FINANCIAL SECTOR
Overall financial market situation 4.1Exchange rates 4.2 - 4.4Interest rates 4.5 - 4.7Deposits and money supply 4.8 - 4.12Authorized institutions’ Hong Kong dollar external claims and liabilities
4.13 - 4.14
Loans and advances 4.15 - 4.19Banks and other deposit-taking institutions 4.20 - 4.22Insurance 4.23The debt market 4.24 - 4.28The stock, futures and gold markets 4.29 - 4.38Unit trusts and mutual funds 4.39 - 4.40

CHAPTER 5: THE LABOUR SECTOR
Overall labour market situation 5.1 - 5.5Profile of unemployment and underemployment 5.6 - 5.10Demand for and supply of labour 5.11 - 5.12Profile of employment 5.13 - 5.17Vacancies 5.18 - 5.20Earnings and wages 5.21 - 5.30
CHAPTER 6: PRICES
Consumer prices 6.1 - 6.6Import prices 6.7 - 6.10Prices of key inputs 6.11 - 6.12Prices of local manufacturing output 6.13Prices of output in selected service sectors 6.14Export prices 6.15 - 6.16Terms of trade 6.17GDP deflator 6.18
CALENDAR OF EVENTS OF SIGNIFICANCE TO THE HONG KONGECONOMY IN 2002
STATISTICAL APPENDIX

1
CHAPTER 1 : OVERALL VIEW
Overall situation
1.1 The Hong Kong economy, following a distinct slow-down in 2001,revived progressively under the impetus from the external sector over the courseof 2002. Total exports of goods reverted from decline in the first quarter topositive growth in the second quarter, and then accentuated sharply in the thirdquarter and further in the fourth quarter. Within the total, exports to markets inEast Asia, including notably the mainland of China (the Mainland), wereparticularly robust, attaining double-digit growth across many markets for theyear as a whole. Exports to both the United States and the European Unionpicked up visibly in the latter part of the year. Exports of services had an evenstronger performance than exports of goods, and the growth rate likewiseaccelerated through the year. There was a broad-based surge in inbound tourism,offshore trade and transportation services.
1.2 In the domestic sector, consumer spending fell in 2002, for the firsttime since 1998. Consumers were generally less willing to spend, amidst muchconcern over the prevailing employment and income conditions and with thedistinct fall-off in the asset markets inflicting a negative wealth effect. Declinesin consumer spending occurred through the four quarters of last year. Overallinvestment spending also shrank in 2002, mainly depressed by a plunge inmachinery and equipment intake amidst an uncertain business outlook. Yet withmachinery and equipment intake rebounding to positive growth towards theyear-end, and even with building and construction activity concurrently showinga relapse, overall investment spending turned up to a modest rise in the fourthquarter.
1.3 Overall, the Gross Domestic Product (GDP)(1) had a 2.3% growth inreal terms in 2002, up from a 0.6% growth in 2001. With a generally subduedeconomic performance carried over from the preceding months, GDP was downby 0.5% in real terms in the first quarter of 2002 over a year earlier. Then, alongwith reviving external trade, GDP resumed positive growth at 0.8% in the secondquarter, followed by distinctly faster growth at 3.3% in the third quarter and 5.0%in the fourth quarter. On a seasonally adjusted quarter-to-quarter comparison(2),GDP went up through the four quarters of 2002, with increases of 0.3%, 1.0%,1.9% and 1.7% respectively in real terms.
/Diagram 1.1 .....

2
Gross Domestic Product*
(a) Annual profile
Diagram 1.1
1992 1993 1994 1995 1996 1997 1998 1999 2000 2001 2002
0
2
4
6
8
10
12
14
-2
-4
-6
Percent
Rate of change in real terms
Q1 Q2 Q3 Q4 Q1 Q2 Q3 Q4 Q1 Q2 Q3 Q4 Q1 Q2 Q3 Q4 Q1 Q2 Q3 Q4 Q1 Q2 Q3 Q41997 1998 1999 2000 2001 2002
0
24
6
8
10
12
14
16
-2
-4
-6
-8
-10
Percent
Year-on-year rate of change in real terms
Seasonally adjusted quarter-to-quarter rate of
change in real terms
(b) Quarterly profile
Note : (*) Revised series incorporating the results of a technical revisionto GDP as announced on 1 August 2002.
/Table 1.1 .....

3
Table 1.1Gross Domestic Product and its main expenditure components
and the main price indicators(year-on-year rate of change (%))
2001 2002+ 2001 2002Q1 Q2 Q3 Q4 Q1 Q2 Q3 Q4+
Change in real terms ofGDP and its mainexpenditure components (%)Private consumption expenditure
1.4 -1.6 2.8 2.8 1.3 -1.1 -0.3 -2.4 -1.5 -2.1
Government consumption expenditure
6.0 2.4 4.9 4.8 7.3 7.0 2.2 2.7 3.6 0.9
Gross domestic fixed capital formation
2.9 -4.4 10.2 3.0 3.2 -4.2 -12.3 -0.6 -5.0 0.5
of which : Building and construction(a) -1.9 1.8 -2.4 2.3 -6.2 -1.0 -4.0 7.2 7.9 -2.7 Machinery, equipment and computer software
7.3 -9.6 24.5 3.2 10.7 -5.8 -20.1 -7.0 -12.9 2.4
Total exports of goods -3.3 8.6 3.6 -2.2 -4.4 -8.8 -2.4 5.9 11.4 18.4 Domestic exports -10.2 -11.2 -13.0 -7.4 -11.9 -8.3 -11.1 -13.6 -7.6 -12.9 Re-exports -2.4 11.0 5.9 -1.6 -3.4 -8.9 -1.4 8.4 13.6 22.2Imports of goods(b) -1.9 7.9 5.7 -0.5 -2.8 -8.7 -4.0 6.0 10.8 18.2Exports of services 5.9 12.1 7.4 7.6 3.7 5.3 7.7 8.6 14.1 17.2Imports of services -0.2 -0.8 3.3 1.5 -2.4 -2.8 -1.3 -4.0 1.0 0.9Gross Domestic Product 0.6 2.3 2.3 1.6 -0.3 -0.9 -0.5 0.8 3.3 5.0
GDP at current marketprices ($ billion)
1,279 1,271 310 312 326 331 301 308 326 335
GDP at constant (2000)market prices ($ billion)
1,297 1,326 312 316 332 337 310 318 343 354
Changes in inventories atconstant (2000) marketprices ($ billion)
-3 4 1 2 -3 -4 -3 2 3 3
Change in the mainprice indicators (%) GDP deflator -1.4 -2.7 -2.0 -1.7 -1.2 -0.8 -2.1 -2.1 -3.0 -3.8Composite Consumer Price Index(c) -1.6 -3.0 -2.0 -1.3 -1.0 -2.1 -2.6 -3.2 -3.5 -2.9
Consumer Price Index (A)(c) -1.7 -3.2 -2.0 -1.1 -0.7 -2.8 -2.8 -3.6 -4.1 -2.4
Notes : The GDP figures in this table are based on the revised series incorporating the results of a technicalrevision to GDP as announced on 1 August 2002. For details, see the Special Report on Gross DomesticProduct, published by the Census and Statistics Department in August 2002.(+) Preliminary figures.(a) Following a review of the presentation by the Census and Statistics Department, real estate
developers’ margin is now incorporated into private sector expenditure on building and construction,instead of being delineated separately in the expenditure components of GDP. For details, seeNote (5).
(b) Here imports of goods are valued on f.o.b. basis, instead of on c.i.f. basis as is the on-going practicefor the merchandise trade statistics.
(c) Final figures./Table 1.2 .....

4
Table 1.2
Gross Domestic Product and its main expenditure componentsand the main price indicators
(seasonally adjusted quarter-to-quarter rate of change (%))
2001 2002Q1 Q2 Q3 Q4 Q1# Q2# Q3# Q4+
Change in real terms ofGDP and its mainexpenditure components (%)
Private consumption expenditure
0.6 0.9 -1.1 -0.7 0.4 -0.9 -0.3 -0.9
Government consumption expenditure
4.3 * 1.8 0.6 0.1 0.1 2.5 -1.4
Gross domestic fixed capital formation
N.A. N.A. N.A. N.A. N.A. N.A. N.A. N.A.
Total exports of goods -3.7 -2.7 0.3 -3.8 4.6 5.7 4.0 4.1
Domestic exports -3.5 1.3 -5.8 -0.8 -5.5 -2.0 -0.8 -4.2
Re-exports -3.7 -3.2 1.1 -4.1 5.8 6.6 4.4 4.8
Imports of goods(a) -1.0 -4.9 1.2 -4.6 4.6 5.9 4.6 3.0
Exports of services 0.9 3.2 0.8 0.7 3.3 3.8 5.4 4.1
Imports of services -1.0 1.7 -2.2 -1.1 0.6 -1.2 2.5 -0.7
Gross Domestic Product^ -0.4 -0.6 * * 0.3 1.0 1.9 1.7Change in the mainprice indicators (%) GDP deflator 0.8 -1.1 -0.3 -0.2 -0.6 -1.0 -1.1 -0.9
Composite Consumer Price Index(b) -0.6 * -0.4 -1.1 -1.1 -0.6 -0.7 -0.6
Consumer Price Index (A)(b) -0.8 0.3 -0.2 -2.2 -0.6 -0.6 -0.7 -0.6
Notes : The GDP figures in this table are based on the revised series incorporating the results of a technicalrevision to GDP as announced on 1 August 2002. For details, see the Special Report on Gross DomesticProduct, published by the Census and Statistics Department in August 2002.(#) Revised figures.(+) Preliminary figures.N.A. Not applicable, as no clear seasonal pattern is found in gross domestic fixed capital formation, due
to the presence of considerable short-term fluctuations.(^) As gross domestic fixed capital formation does not exhibit a clear seasonal pattern, the seasonally
adjusted series of GDP is compiled separately at the overall level.(*) Change of less than 0.05%.(a) Here imports of goods are valued on f.o.b. basis, instead of on c.i.f. basis as is the on-going
practice for the merchandise trade statistics.(b) Final figures.
/1.4 .....

5
1.4 The labour market slackened further in the first half of 2002, ascorporate downsizing and rationalisation continued to take place, and this liftedthe seasonally adjusted unemployment rate from 6.2% in the fourth quarter of2001 to a record high of 7.8% in May - July 2002. Then, as total employmentimproved along with the turnaround in economic activity, the seasonally adjustedunemployment rate fell back somewhat in the second half of the year, to 7.2% inthe fourth quarter. The underemployment rate hovered within the range of 2.8%to 3.2% during the past year. Even with some pick-up in the latter part of the year,total employment still fell by 0.6% for 2002 as a whole, as against a 1.8% growthin total labour force. Labour earnings drifted lower, by an average of 1.0% inmoney terms in the first three quarters of 2002 over a year earlier.
1.5 The residential property market slid further in 2002, as demand wascurbed by high unemployment and moderated income, and as the abundantsupply of new flats undermined buying interest. There was a brief pick-up intransactions in the second quarter, on the back of upbeat land auction results inApril and June and the Government’s announcement in early June to resume saleof subsidised sale flats yet in a cautious and orderly manner upon expiry of theten-month moratorium. Trading activities soon faltered, upon the unemploymenthike and with growing uncertainties in the external environment also dampeningsentiment. But with the Government’s announcement in mid-November of thenine measures to stabilise the housing market, coupled with improvedemployment conditions, the market was re-activated somewhat towards theyear-end. Amidst a generally weak sales market, flat prices drifted successivelylower during the year, cumulating to a distinct further decline of on average 13%for 2002 as a whole. The rental market likewise weakened, with flat rentalsfalling on average also by 13% for the year.
1.6 The local financial markets showed a mixed performance in 2002. Thespot exchange rate of the Hong Kong dollar against the US dollar continued tostay close to the linked rate during 2002. As to the twelve-month Hong Kongdollar/US dollar forward rate against the spot rate, the premium held broadlystable in the early part of 2002. It then narrowed down in the summer months, yetwidened distinctly after mid-September amidst renewed market concern over theprotracted fiscal deficit, before shrinking back appreciably towards the year-end.Local inter-bank interest rates remained generally soft in 2002, largely followingtheir US dollar counterparts. Hong Kong dollar loans fell modestly and HongKong dollar deposits slightly less so during 2002, giving a slightly lower Hong
/Kong .....

6
Kong dollar loan-to-deposit ratio at end-2002 than a year earlier. The local stockmarket in 2002 was affected much by gyrations in the US stock market, whereinvestor sentiment was undermined by the hesitant pace of US economicrecovery and a spate of US corporate frauds. In the latter part of the year, therewas additional downward impact from heightened war pressure on Iraq. TheHang Seng Index plummeted to a four-year low of 8 859 in mid-October, andthen rose back somewhat to close the year at 9 321, 18% below the level atend-2001. Average daily turnover in the market also fell.
1.7 Overall consumer prices fell for 50 consecutive months byDecember 2002. The Composite Consumer Price Index was on average down by3.0% in 2002, after a 1.6% decrease in 2001. Part of the price decline in the pastyear was nevertheless due to the special relief measures announced in the 2001Policy Address and the 2002/03 Budget, including two rounds of rates concessionand the waiver of water and sewage charges, which had the combined effect oflowering the Composite CPI for the year by 1.1 percentage points. Apart fromthis discrete factor, local consumer prices were kept down by slack demand, keencompetition in the retail market, and downward adjustments in labour wages andproperty rentals. Import prices were also soft, though with moderated declinetowards the year-end along with a weaker US dollar and a pick-up in worldcommodity prices.
1.8 Statistics on the Gross National Product (GNP)(3) are available up to thethird quarter of 2002. Both external factor income inflow and outflow declined inthe third quarter of 2002 over a year earlier, mainly attributable to a plunge ininterest income into and out of Hong Kong amidst a distinctly low interest rateenvironment. Taken together, net external factor income inflow was considerablyreduced, yet it still amounted to 2.5% of GDP in the third quarter. GNP rose by1.2% in real terms in the third quarter of 2002 over a year earlier, following a0.1% increase in the first quarter and a 0.1% decrease in the second quarter. Forthe first three quarters of 2002 as a whole, GNP grew by 0.4% in real terms over ayear earlier, slower than the 1.3% growth in GDP in that period.
1.9 Within the net external factor income flow, net direct investmentincome outflow rose in the third quarter of 2002 over a year earlier, uponincreased investment earnings from the local economy for investors abroad. Netportfolio investment income inflow fell slightly in the third quarter, attributable
/to .....

7
to less interest income from holding of non-resident debt securities as well asmore dividend pay-outs by resident companies. Net income inflow from otherinvestment plunged sharply in the third quarter, owing to reduced interest incomefrom offshore loans and deposits placed by local banks, by much more than thereduction in interest income from placements here by foreign banks.
Table 1.3
Gross National Product andexternal factor income flows
2000 2001 2001 2002Q1 Q2 Q3 Q4 Q1 Q2 Q3
Year-on-year rate ofchange in money terms (%)
Total external factor income flow(a)
Inflow 14.2 -7.7 -5.9 0.5 -3.3 -23.1 -17.0 -28.4 -9.5Outflow 19.7 -13.1 -12.3 5.3 -14.6 -30.3 -21.1 -26.8 -3.0
Net external factorincome flow at currentmarket prices ($ billion)
22 41 14 5 15 7 15 2 8
GDP at currentmarket prices ($ billion)#
1,288(3.4)
1,279(-0.7)
310(0.4)
312(-0.1)
326(-1.5)
331(-1.6)
301(-2.6)
308(-1.3)
326(0.2)
GNP at currentmarket prices ($ billion)#(b)
1,310(2.3)
1,320(0.8)
323(2.2)
318(-1.5)
341(1.9)
338(0.6)
316(-2.1)
311(-2.3)
335(-1.8)
Year-on-year rate ofchange in real terms (%)
Gross National Product# 9.0 2.2 4.2 0.1 3.1 1.3 0.1 -0.1 1.2
Notes : (#) Figures are revised, consequential to a technical revision to GDP as announced on1 August 2002.
(a) External factor income comprises direct investment income, portfolio investment income,other investment income, and compensation of employees.
(b) GNP is equal to GDP plus net external factor income flow.
( ) Figures in brackets represent the year-on-year rates of change in money terms in GDP andGNP respectively.
The external sector
1.10 According to the merchandise trade statistics, Hong Kong’s totalexports of goods (comprising re-exports and domestic exports) registered notable
/growth .....

8
growth at 8.6% in real terms in 2002, representing a significant turnaround fromthe 3.3% fall in 2001. Total exports of goods showed distinct improvement overthe course of the year. After a 2.5% decline in real terms in the first quarter of2002 over a year earlier, they reverted to positive growth at 5.9% in the secondquarter, and then picked up to double-digit growth at 11.4% and 18.3%respectively in the third and fourth quarters. On a seasonally adjustedquarter-to-quarter comparison, total exports of goods recorded increasethroughout the four quarters of 2002, by 4.5%, 5.8%, 4.0% and 4.0% respectivelyin real terms. Continued robust demand in the Mainland and resurgence inintra-regional trade, coupled with revived import absorption in the conventionaloverseas markets, was the key factor underpinning the sharp rebound in HongKong’s exports in 2002. Improvement in Hong Kong’s external pricecompetitiveness brought about by a weaker US dollar rendered an additionalboost (paragraphs 2.5 to 2.7).
Total exports of goods
Q1 Q2 Q3 Q4 Q1 Q2 Q3 Q4 Q1 Q2 Q3 Q4 Q1 Q2 Q3 Q4 Q1 Q2 Q3 Q4 Q1 Q2 Q3 Q41997 1998 1999 2000 2001 2002
0
5
10
15
20
25
-5
-10
Percent
Diagram 1.2
Year-on-year rate of change in real terms*
Seasonally adjusted quarter-to-quarter rate of
change in real terms #
Notes : (*) From the first quarter of 2001 onwards, the rates of change arecomputed from the new 2000-based trade index series. Beforethen, the rates of change are computed from the old 1990-basedseries. Re-scaling using conversion factors as derived from thelevels of the old and the new series in their overlapping periodof 2000 has been applied to the indices to maintain continuity.
(#) From the second quarter of 2000 onwards, the rates of changeare computed from the new 2000-based trade index series.Before then, the rates of change are computed from the old1990-based series. Re-scaling using conversion factors asderived from the levels of the old and the new series in theiroverlapping period of 2000 has been applied to the indices tomaintain continuity.
/1.11 .....

9
1.11 Within total exports of goods, re-exports remained the key driver ofexport performance, attaining double-digit growth at 10.9% in real terms in 2002,also representing a sharp turnaround from the 2.4% decrease in 2001. Havingshown a mild contraction by 1.5% in real terms in the first quarter of 2002 over ayear earlier, re-exports rebounded to a distinct growth at 8.3% in the secondquarter, followed by even more robust growth at 13.6% and 22.1% respectively inthe third and fourth quarters. On a seasonally adjusted quarter-to-quartercomparison, re-exports surged throughout the four quarters of 2002, by 5.7%,6.6%, 4.5% and 4.7% respectively in real terms (paragraph 2.8).
1.12 On the other hand, owing to the on-going structural shift towardsre-exports and offshore trade, domestic exports shrank further, by 11.3% in realterms in 2002, slightly larger than the 10.2% dip in 2001. Domestic exportsplummeted throughout the four quarters of 2002, with year-on-year declines by11.2%, 13.7%, 7.6% and 12.9% respectively in real terms. On a seasonallyadjusted quarter-to-quarter comparison, domestic exports also fell in all fourquarters, by 5.6%, 2.0%, 0.7% and 4.3% respectively in real terms(paragraph 2.9).
Composition of total exports of goodsDiagram 1.3
Q1 Q2 Q3 Q4 Q1 Q2 Q3 Q4 Q1 Q2 Q3 Q4 Q1 Q2 Q3 Q4 Q1 Q2 Q3 Q4 Q1 Q2 Q3 Q41997 1998 1999 2000 2001 2002
0
100
200
300
400
500HK$ Billion
Re-exports Domestic exports
/1.13 .....

10
1.13 Total exports of goods to East Asia as a whole staged a sharp rebound,along with economic recovery in the region. There was a 13.4% surge in realterms in 2002, significantly up from the 1.8% increase in 2001. Exports to theMainland, the Republic of Korea and Thailand were strong all through the fourquarters of the year. Exports to Singapore and Malaysia also picked up distinctlyafter the first quarter. Exports to Japan were still weak in the first half of the year,yet improved distinctly towards the year-end. Total exports of goods to NorthAmerica likewise regained strength, along with greater import intake in theUnited States and Canada, and helped further by better price competitiveness ofHong Kong’s exports upon weakening of the US dollar. There was a 3.9% rise inreal terms in 2002, in contrast to an 8.8% decline in 2001. Total exports of goodsto the European Union were still held back by sluggish demand in the euro areaand a relatively weak euro earlier on, yet there was also a distinct pick-up morerecently, along with improved import demand and a stronger euro. A marginaldecline of 0.4% in real terms was recorded in 2002, much narrowed from the8.5% decrease in 2001 (paragraphs 2.16 to 2.18).
1.14 Imports of goods likewise rebounded, rising by 7.8% in real terms in2002, also distinctly improved from the 2.0% decline in 2001. Mirroring theprofile of pick-up in re-exports over the course of the year, imports of goods, afterfalling by 4.1% in real terms in the first quarter of 2002 over a year earlier,resumed positive growth at 5.7% in the second quarter, and then acceleratedmarkedly to double-digit growth at 10.8% and 18.1% respectively in the third andfourth quarters. Imports retained for local use likewise revived during the year,though at a less robust pace than that of re-exports. Specifically, retained importsstill had an 8.9% decline in real terms in the first quarter of 2002 over a yearearlier, yet reverted to increase by 0.8% in the second quarter, followed byconsiderably faster increases by 5.2% and 10.0% respectively in the third andfourth quarters. For 2002 as a whole, retained imports grew by only 1.8% in realterms, having declined by 1.1% in 2001. On a seasonally adjustedquarter-to-quarter comparison, imports of goods rose by 4.5%, 5.8%, 4.8% and2.9% respectively in real terms through the four quarters of 2002. Retainedimports rose in the first three quarters of 2002, by 2.3%, 4.2% and 5.4%respectively in real terms, but fell back by 1.0% in the fourth quarter(paragraph 2.10).
/1.15 .....

11
1.15 As the value of total exports of goods rose faster than the value ofimports of goods, the visible trade deficit reckoned on a BoP basis dwindled to$40.0 billion or 2.5% of the value of imports of goods in 2002, from $65.0 billionor 4.2% in 2001 (paragraph 2.11).
1.16 On invisible trade, exports of services continued to fare better thanexports of goods, with double-digit growth at 12.1% in real terms in 2002,markedly better than the 5.9% growth in 2001. As with exports of goods, exportsof services accelerated in growth over the course of the year. On a year-on-yearcomparison, growth was already rather robust at 7.7% and 8.6% respectively inreal terms in the first and second quarters of 2002, yet followed by even strongergrowth at 14.1% and 17.2% respectively in the third and fourth quarters. On aseasonally adjusted quarter-to-quarter comparison, exports of services leapedthroughout the four quarters of 2002, by 3.3%, 3.8%, 5.4% and 4.1% respectivelyin real terms (paragraph 2.12).
Exports of services*
Q1 Q2 Q3 Q4 Q1 Q2 Q3 Q4 Q1 Q2 Q3 Q4 Q1 Q2 Q3 Q4 Q1 Q2 Q3 Q4 Q1 Q2 Q3 Q41997 1998 1999 2000 2001 2002
0
5
10
15
20
-5
-10
Percent
Diagram 1.4
Year-on-year rate of change in real terms
Seasonally adjusted quarter-to-quarter rate of
change in real terms
Note : (*) Revised series incorporating the results of a technical revisionto GDP as announced on 1 August 2002.
/1.17 .....

12
1.17 Yet imports of services remained weak, with a decline of 0.8% in realterms in 2002, slightly worse than the 0.2% decrease in 2001. An improvementwas nevertheless seen over the course of the year. On a year-on-year comparison,imports of services had decreases of 1.3% and 4.0% respectively in real termsin the first and second quarters of 2002, and then reverted to increase by 1.0% and0.9% respectively in the third and fourth quarters. On a seasonally adjustedquarter-to-quarter comparison, imports of services edged up by 0.6% in realterms in the first quarter of 2002, and then fell back by 1.2% in the second quarter,before bouncing up to increase by 2.5% in the third quarter, yet followed by a0.7% decline in the fourth quarter (paragraph 2.13).
1.18 As exports of services leaped while imports of services fell marginally,the invisible trade surplus reckoned on a BoP basis expanded markedly, to$163.4 billion or 86.6% of the value of imports of services in 2002, from$133.5 billion or 70.4% in 2001. Together with a much reduced visible tradedeficit, the combined surplus reckoned on a BoP basis surged to $123.4 billion or6.9% of the total value of imports of goods and services in 2002, from$68.5 billion or 3.9% in 2001 (paragraph 2.14).
Domestic demand
1.19 Local consumer spending remained subdued in most of 2002, asconsumers’ willingness to spend was held back by high unemployment,moderated income, and weakness in asset prices. Even with the support of asharp upsurge in inbound tourism in the year, the volume of retail sales stilldeclined by 2.6% in 2002, after a 1.2% increase in 2001. A relative improvementin retail business nevertheless emerged in the latter part of the year, upon steadieremployment conditions and an even stronger surge in incoming visitors. On ayear-on-year comparison, the volume of retail sales fell by 1.8% in the firstquarter of 2002, and more so by 4.5% in the second quarter. The decline thennarrowed back, to 3.0% in the third quarter, and further to 1.1% in the fourthquarter. On a seasonally adjusted quarter-to-quarter comparison, the volume ofretail sales rose markedly by 4.6% in the first quarter of 2002, and then fell backby 2.4% and 3.1% respectively in the second and third quarters, yet reverted toincrease by 0.2% in the fourth quarter.
1.20 Private consumption expenditure (PCE) likewise fell in 2002, though toa lesser extent than the decline in retail sales, as the continued growth in spending
/on .....

13
on consumer services cushioned the setback in spending on goods. On ayear-on-year comparison, PCE fell in all the four quarters of 2002, with declinesby 0.3% in real terms in the first quarter, 2.4% in the second quarter, 1.5% in thethird quarter, and 2.1% in the fourth quarter. For 2002 as a whole, PCE wentdown by 1.6% in real terms, having gone up by 1.4% in 2001. This was the firstannual decline since 1998. Analysed by major category of consumer spending in2002, spending on non-durable goods had a more distinct setback. Spending byHong Kong residents travelling abroad likewise fell. Spending on durable goodsresumed some increase in the latter part of the year, giving a marginal growth forthe year as a whole. Spending on food was more stable. Spending on servicessustained fairly solid growth. On a seasonally adjusted quarter-to-quartercomparison, PCE rose by 0.4% in real terms in the first quarter of 2002, and thenfell back in the ensuing three quarters, by 0.9%, 0.3% and 0.9% respectively.
Table 1.4
Local consumer and visitor spending in the domestic market#
(year-on-year rate of change in real terms (%))
Retail sales(a) Consumer spending by major component(a)Visitor
spending(b)
Food DurablesNon-
durables Services
Residents’expenditure
abroad Total
2001 Annual 1.2 3 4 -1 2 1 2 8
Q1 2.5 (3.5) 3 8 * 3 3 3 5Q2 4.8 (1.1) 3 12 2 3 1 3 10Q3 0.5 (-5.1) 3 4 -2 2 * 1 4Q4 -3.0 (-1.8) 2 -5 -4 2 1 * 11
2002 Annual -2.6 * * -5 3 -4 * 21
Q1 -1.8 (4.6) 1 * -3 2 -4 * 8Q2 -4.5 (-2.4) * -4 -8 3 -6 -1 14Q3 -3.0 (-3.1) -1 * -7 4 -3 1 24Q4 -1.1 (0.2) * 5 -4 3 -2 1 35
Notes : (#) Local consumer and visitor spending in the domestic market has incorporated the results of atechnical revision to GDP as announced on 1 August 2002.
(a) Retail sales and consumer spending by major component include both local consumer and visitorspending, which are not separable from the survey data.
(b) This is a broad estimate of spending by non-residents in the domestic market, as a deduction itemwithin private consumption expenditure amongst the expenditure components of GDP.
( ) Figures in brackets represent the seasonally adjusted quarter-to-quarter % changes in real terms.
(*) Change of less than 0.5%.
/Diagram 1.5 .....

14
Domestic demand *(year-on-year rate of change in real terms)
Q1 Q2 Q3 Q4 Q1 Q2 Q3 Q4 Q1 Q2 Q3 Q4 Q1 Q2 Q3 Q4 Q1 Q2 Q3 Q4 Q1 Q2 Q3 Q41997 1998 1999 2000 2001 2002
0
10
20
-10
-20
-30
Percent
Diagram 1.5
Investment demand in terms of gross domestic fixed capital formation
Consumption demand #
Notes : (*) Revised series incorporating the results of a technicalrevision to GDP as announced on 1 August 2002.
(#) Comprising private consumption expenditure andgovernment consumption expenditure.
1.21 Government consumption expenditure (GCE) reckoned on a nationalaccounts basis(4) rose moderately throughout the four quarters of 2002, by 2.2%,2.7%, 3.6% and 0.9% respectively in real terms over a year earlier. For 2002 as awhole, GCE went up by 2.4% in real terms, yet considerably slower than the6.0% increase in 2001. On a seasonally adjusted quarter-to-quarter comparison,GCE had meagre growth at 0.1% in real terms in both the first and secondquarters of 2002, accelerated to a 2.5% rise in the third quarter, and then easedback to a 1.4% decline in the fourth quarter.
1.22 Overall investment spending, as represented by gross domestic fixedcapital formation (GDFCF), remained weak in most of 2002. Continuing thesetback towards the end of 2001, GDFCF plummeted by 12.3% in real terms inthe first quarter of 2002 over a year earlier. This was followed by lesser declines
/of .....

15
of 0.6% and 5.0% respectively in the second and third quarters. It then turned upto a modest increase of 0.5% in the fourth quarter. For 2002 as a whole, GDFCFfell by 4.4% in real terms, after a 2.9% rise in 2001.
1.23 The relapse in overall investment spending in 2002 was mainly due to asharp fall-off in expenditure on machinery, equipment and computer software,amidst an uncertain business outlook and an overhang of excess capacity. Suchexpenditure plummeted by 9.6% in real terms for 2002 as a whole, reversing the7.3% increase in 2001. There were marked declines by 20.1%, 7.0% and 12.9%respectively in real terms in the first three quarters of 2002 over a year earlier,though followed by a rebound to a 2.4% increase in the fourth quarter as washelped in part by a low base a year earlier.
1.24 On the other hand, expenditure on building and construction(5) turnedup to a modest increase of 1.8% in real terms in 2002, having declined for fourconsecutive years. After a 4.0% decrease in real terms in the first quarter of 2002over a year earlier, such expenditure turned up by 7.2% and 7.9% respectively inthe ensuing two quarters, and then relapsed to a 2.7% fall in the fourth quarter.The pick-up in the second and third quarters was narrowly based, mainly drivenby more intensive work on some major private sector projects. As work on theseprojects subsequently tapered, there was a fall-back in the fourth quarter. Publicsector building and construction activity stayed weak in most of the past year, andwas on a decline for three years in a row. The MTR Tseung Kwan O Extensionwas completed in August 2002, and work on the KCR West Rail had beentapering. Moreover, output under the Public Housing Programme continued toshrink. Yet work on Container Terminal No. 9 had been intensive.
1.25 In parallel with the pace of overall economic activity, inventories wentdown further in the first quarter of 2002, and then reverted to some build-up in theensuing three quarters. This resulted in a modest increase in inventoriesequivalent to 0.3% of GDP for 2002 as a whole.
/Implications .....

16
Implications of the preliminary GDP figures for the economy
1.26 Nominal GDP had a marginal decline of 0.6% to $1,271 billion in 2002,broadly similar to the decline of 0.7% in 2001. The decline last year was mainlydue to a larger fall in overall prices as reflected by the GDP deflator, more thanoffsetting the pick-up in real GDP growth. As with the profile of real GDP,nominal GDP showed a progressive improvement over the course of the year,reverting from declines in the first and second quarters of 2002 to small increasesin the third and fourth quarters.
1.27 Per capita GDP turned up to modest growth at 1.3% in real terms in2002, after a 0.3% decline in 2001. Again, as there was a larger decline in theoverall price level, per capita GDP was still down by 1.5% in nominal terms to$187,300 in 2002, also broadly similar to the decline of 1.6% in 2001.
1.28 Total final demand, excluding re-exports but with the re-export marginretained, went up by 1.8% in real terms in 2002. While this represented animprovement from the meagre 0.2% growth in 2001, it was still slightly belowthe 2.3% growth in aggregate supply as denoted by GDP. Thus the overalldemand/supply balance in the economy still tended to be loose.
1.29 The pick-up in total final demand was entirely driven by the sharprebound in external demand. After a 1.8% fall in 2001, external demand revivedmarkedly to a 9.3% growth in real terms in 2002, with exports of goods andservices both yielding double-digit increase in the second half of the year. On theother hand, domestic demand slackened to a 1.4% decline in real terms in 2002,from an already meagre growth of 0.8% in 2001. Within it, private sectordemand fell back by 1.8% in real terms in 2002, after a 0.4% rise in 2001. Publicsector demand likewise moderated, yet still had a small increase of 0.7% in realterms in 2002, following a 3.1% rise in 2001.
The Government account
1.30 In the financial year 2002/03, the revised estimate of governmentrevenue amounts to $173.3 billion, down by 1.3% in money terms from theoutturn of $175.6 billion in the financial year 2001/02. Within the total for thefinancial year 2002/03, revenue from utilities, general rates, stamp duties andprofits tax registered pronounced declines. The declines in revenue from utilities
/and .....

17
and general rates were mainly attributable to special relief measures in the formof one-off concessions announced in the 2001 Policy Address and the2002/03 Budget.
1.31 The revised estimate of total government spending in the financial year2002/03 amounts to $243.4 billion, up by 1.9% in money terms over the outturnof $238.9 billion in the financial year 2001/02. Within the total for the financialyear 2002/03, operating expenditure rose by 1.9% to $202.6 billion, while capitalspending went up by 1.6% to $40.8 billion.
1.32 The revised estimated fiscal deficit for the financial year 2002/03amounts to $70.0 billion, equivalent to 5.5% of GDP. This is larger than the fiscaldeficit at $63.3 billion in the financial year 2001/02, equivalent to 5.0% of GDP.
The property market
1.33 The property market as a whole underwent further consolidation in2002. Acquisition and lease demand generally fell short of absorbing theabundant supply, both existing and in the pipeline, and this led to a continuedsoftening in property prices and rentals. Yet the markets for different types ofproperty faced somewhat different circumstances and difficulties(paragraph 3.8).
1.34 The sales market for residential property remained generally slack in2002. While flat prices went down visibly further in 2002, there was a modestpick-up in transaction volume. The increase in trading activity was concentratedin the first half of the year, especially in the second quarter. Market sentimentwas lifted by upbeat results of the two land auctions held in April and June, aswell as the Government’s announcement to resume sale of subsidised sale flatsyet in a cautious and orderly manner after expiry of the ten-month moratorium atend-June. But acquisition interest dwindled during most of the ensuing months,amidst renewed concern about job security and income instability, falling shareprices, and in particular the continued ample supply of new flats. The briefrebound in trading volume seen in September was mainly stimulated by afresh round of intensive sales promotion by developers, through offering evenlarger price discounts and other more generous concessions to prospectivepurchasers. As a result, the primary market diverted the demand further and thesecondary market was undermined even more. Towards the year-end, market
/activity .....

18
activity again showed some pick-up, conceivably spurred by the Government’spromulgation of nine policy measures to stabilise the housing market(paragraph 3.9).
1.35 On a quarter-to-quarter comparison, flat prices went lower on averageby 2%, 4% and 7% respectively in the second, third and fourth quarters of 2002,having shown nil change in the first quarter. For the year as a whole, flat priceson average fell by 13%. Against the peak level in the third quarter of 1997, flatprices in the fourth quarter of 2002 plummeted by an average of 62%. Followingthe marked decline in flat prices and successive cuts in mortgage rate, andnotwithstanding reduced household income, there was a substantial improvementin home purchase affordability over the past several years (paragraph 3.10).
1.36 The rental market for private residential flats stayed subdued in 2002.Apart from lesser lease demand upon the impact of reduced salaries and housingallowances, there appeared to have been increased supply of flats for lease fromthose hitherto for sale. Flat rentals came under greater downward pressure inthose areas with a lot of newly completed flats. On a quarter-to-quartercomparison, private housing rentals on average declined by 4%, 3%, 2% and 4%respectively in the four quarters of 2002. For the year as a whole, there was onaverage a drop of 13%. Against the peak level in the third quarter of 1997,private housing rentals were significantly down in the fourth quarter of 2002, byan average of 43%. Mainly consequential to the distinct fall in flat rentals, leaseaffordability likewise improved over the past several years (paragraph 3.11).
1.37 On commercial property, the rental market for office space weakenedfurther in 2002, as demand continued to be dampened by on-going downsizingand rationalisation in the business sector. Grade A office space was additionallyhit by an excess supply particularly in the central business district. Also relevantwas the move by some companies to relocate their offices to secondary districtsfor saving costs. In order to uphold the occupancy rate, landlords generallyoffered larger rental cuts, longer rent-free period and other concessions to theirtenants. The sales market for office space was stagnant in 2002. Reducedrental yield against the heavy capital investment up-front had led potentialpurchasers to stay on the sideline. The rental market for shopping space wasmoderate in 2002, as demand remained generally languid amidst continuedsetback in the retail trade. Space in well-managed shopping arcades and in thepopular shopping districts was nevertheless better sought after. The sales market
/for .....

19
for shopping space stayed quiet in 2002, as investors continued to adopt acautious attitude in face of the slack conditions in the retail trade and an uncertainnear-term outlook. On industrial property, the rental market was inactive in 2002.Demand for conventional factory space was restrained by a further contraction inlocal manufacturing activity. Demand for modern industrial premises for use asdata centres and back-up service centres was also on the wane, amidst furtherconsolidation in the information technology sector. The sales market forindustrial property was at a standstill in 2002, in the lack of buying interest(paragraphs 3.15 to 3.17).
1.38 Planned developments of all types of property in the private sector, asindicated by the total usable floor area on building plans with consent tocommence work, fell only slightly by 1% in 2002, after a 25% plunge in 2001.Analysed by main type of property, planned developments of private residentialproperty were reduced by 35% in terms of units, distinctly enlarged from the 12%fall in 2001. In terms of total usable floor area, the decrease of 21% in 2002 alsoexceeded that of 12% in 2001. On the other hand, planned developments ofnon-residential property rose sharply in 2002, yet this was primarily due to thelow base in 2001. Specifically, planned developments of commercial property,industrial property, and property in the “others” category leaped by 38%, 134%and 46% respectively in 2002, following the pronounced decreases of 21%, 65%and 69% in 2001 (paragraph 3.20).
The labour market
1.39 The labour market remained slack in overall terms in 2002. Yet someimprovement was seen in the latter part of the year, mainly attributable to apick-up in total employment upon an upturn in economic activity. For 2002 as awhole, the unemployment rate averaged at 7.3%, markedly up from 5.1% in 2001.The seasonally adjusted unemployment rate surged in the early part of the year,from 6.2% in the fourth quarter of 2001 to 7.0% and 7.7% respectively in the firsttwo quarters of 2002, and further to a peak of 7.8% in May - July, amidst moreextensive downsizing and lay-offs in the corporate sector. It then fell backsomewhat in the latter part of the year, to 7.4% in the third quarter and 7.2% in thefourth quarter. The total number of unemployed persons (not seasonally adjusted)stood at 252 600 in the fourth quarter. On the median duration of unemployment,there was a distinct lengthening over the past year, from 82 days in the fourthquarter of 2001 to 90 days in the fourth quarter of 2002. As to the proportion of
/persons .....

20
persons unemployed for six months or more, it likewise went up visibly, from24% to 30% (paragraph 5.1).
1.40 The underemployment rate also moved higher, averaging at 3.0% in2002, as against 2.5% in 2001. It rose from 3.0% in the fourth quarter of 2001 to3.2% in the first quarter of 2002, then declined to 2.9% in both the second andthird quarters, but edged up again to 3.1% in the fourth quarter. The totalnumbers underemployed stood at 109 700 in the fourth quarter. For persons inemployment, work intensity was high. The proportion of employed personsworking for 50 hours or more per week rose visibly, from 35% in the fourthquarter of 2001 to 40% in the fourth quarter of 2002, as did the proportion ofemployed persons working for 60 hours or more per week, from 21% to 24%. Yettaking all the employed persons together, the median hours of work stayed at48 hours per week for most of 2002 (paragraphs 5.2 and 5.3).
Unemployment and underemployment rates
Q1 Q2 Q3 Q4 Q1 Q2 Q3 Q4 Q1 Q2 Q3 Q4 Q1 Q2 Q3 Q4 Q1 Q2 Q3 Q4 Q1 Q2 Q3 Q41997 1998 1999 2000 2001 2002
0.00.51.01.52.02.53.03.54.04.55.05.56.06.57.07.58.0
Percent
Diagram 1.6
Seasonally adjusted unemployment rate
Underemployment rate
0
/1.41 .....

21
1.41 Total employment as enumerated from households staged an upturntowards the end of last year, to a year-on-year increase of 0.8% in the fourthquarter, having worsened from a 1.0% decrease in the first quarter. It stood at3.27 million in the fourth quarter of 2002. Total labour force had a faster growthover the past year, with the year-on-year increase picking up to 2.0% in the fourthquarter of 2002, from 1.7% in the first quarter. It stood at 3.52 million in thefourth quarter of 2002. The swing in the growth rate differential between totallabour force and total employment pointed to a relative narrowing in the overallmanpower resource balance, leading to lower unemployment rate in the latter partof last year (paragraph 5.4).
Total labour force and total employment(year-on-year rate of change)
Q2 Q3 Q4 Q1 Q2 Q3 Q4 Q1 Q2 Q3 Q4 Q1 Q2 Q3 Q4 Q1 Q2 Q3 Q4 Q1 Q2 Q3 Q41997 1998 1999 2000 2001 2002
0
1
2
3
4
5
6
-1
-2
-3
-4
Percent
Diagram 1.7
Total labour force
Total employment
Note : Year-on-year rates of change from the new series of labour forcestatistics, which has adopted the “resident population” definition,are available as from the second quarter of 1997.
1.42 Overall labour income had been moderating over the past year, amidstmore incidents of pay freeze or cuts. Labour earnings went down by an averageof 1.0% in money terms in the first three quarters of 2002 over a year earlier,albeit still up by 2.1% in real terms. This compared with the respective increases
/of .....

22
of 1.8% and 3.5% in 2001. Labour wages likewise fell, by an average of 1.1% inmoney terms in the first nine months of 2002 over a year earlier, yet still higherby 2.4% in real terms. This compared with the respective increases of 0.8% and3.4% in 2001 (paragraph 5.5).
Prices
1.43 Overall consumer prices continued to decline in 2002. By December,overall consumer prices had fallen for 50 consecutive months. Though withsome relative narrowing towards the year-end, the decrease for 2002 as a wholewidened considerably from that in 2001. This reflected mostly the influence ofdomestic factors. In particular, there were the special relief measures of ratesconcession and waiver of water and sewage charges implemented by theGovernment during the year. Domestic cost pressure was lessened, by softeningin both labour wages and property rentals. Also, local retailers reduced the pricesof their goods and services further, in face of sluggish consumer demand andkeen competition in the retail market. On the external front, while import pricesstayed soft in overall terms, the decline moderated over the past year, upon aweaker US dollar and a rebound in world commodity prices (paragraph 6.1).
1.44 For 2002 as a whole, the Composite Consumer Price Index went downby 3.0%, nearly double the 1.6% fall in 2001. There was an enlargement in theyear-on-year decrease for most of the year, from 2.6% in the first quarter of 2002to 3.2% in the second quarter and further to 3.5% in the third quarter. To a largeextent, this was due to the two rounds of rates concession as well as the waiver ofwater and sewage charges granted as from the early part of 2002. (Netting out theeffect of these special relief measures, the decline widened only modestly overthe period.) Also relevant were further reductions in the prices of basic foodstuffsand in the charges of such services items as mobile phone and othertelecommunications services. The year-on-year decrease then narrowed to 2.9%in the fourth quarter of 2002. Yet this was mostly attributable to a low base ofcomparison a year earlier, caused by a waiver of public housing rentals by theHousing Authority and Housing Society in December 2001. On aquarter-to-quarter comparison, the seasonally adjusted Composite CPI wentdown by 1.1% in the first quarter of 2002, followed by more modest declines of0.6-0.7% in the ensuing three quarters. The larger drop in the first quarter mainlyreflected the dampening effects of the rates concession effected in January as wellas the special one-off rebate of electricity charges granted by a power company inJanuary and February (paragraphs 6.2 and 6.4).
/Diagram 1.8 .....

23
Composite Consumer Price Index
Q1 Q2 Q3 Q4 Q1 Q2 Q3 Q4 Q1 Q2 Q3 Q4 Q1 Q2 Q3 Q4 Q1 Q2 Q3 Q4 Q1 Q2 Q3 Q41997 1998 1999 2000 2001 2002
0
2
4
6
8
-2
-4
-6
-8
Percent
Diagram 1.8
Seasonally adjusted quarter-to-quarter rate of change #
Year-on-year rate of change *
Notes : (*) From the fourth quarter of 2000 onwards, the year-on-yearchanges in the Composite CPI are computed from the new1999/2000-based series. Before then, the year-on-yearchanges are computed from the old 1994/95-based series.Splicing has been applied to the indices to maintain continuity.
(#) From the first quarter of 2000 onwards, the quarter-to-quarterchanges in the seasonally adjusted Composite CPI arecomputed from the new 1999/2000-based series. Before then,the quarter-to-quarter changes are computed from the old1994/95-based series. Splicing has been applied to the indicesto maintain continuity.
1.45 The GDP deflator, as a broad measure of overall price change in theeconomy, decreased by 3.8% in the fourth quarter of 2002 from a year earlier.This exceeded the declines of 2.1%, 2.1% and 3.0% respectively in the first threequarters. For 2002 as a whole, the GDP deflator went down by 2.7%, larger thanthe 1.4% fall in 2001. Within the GDP deflator, the domestic demand deflatorand the total final demand deflator both showed larger decreases in 2002 than in2001, by 4.2% and 3.4% respectively as against 1.8% and 2.4%. On a seasonallyadjusted quarter-to-quarter comparison, the GDP deflator declined further by0.9% in the fourth quarter of 2002, having fallen by 0.6%, 1.0% and 1.1%respectively in the first three quarters (paragraph 6.18).
/Diagram 1.9 .....

24
GDP deflator*
Q1 Q2 Q3 Q4 Q1 Q2 Q3 Q4 Q1 Q2 Q3 Q4 Q1 Q2 Q3 Q4 Q1 Q2 Q3 Q4 Q1 Q2 Q3 Q41997 1998 1999 2000 2001 2002
0
2
4
6
8
-2
-4
-6
-8
Percent
Diagram 1.9
Year-on-year rate of change
Seasonally adjusted quarter-to-quarter
rate of change
Note : (*) Revised series incorporating the results of a technical revisionto GDP as announced on 1 August 2002.
The financial sector
1.46 The performance of the local financial markets was mixed in 2002. Thespot exchange rate of the Hong Kong dollar against the US dollar stayed close tothe linked rate throughout 2002, moving within a narrow range of 7.796 to 7.800.As to the spread of the twelve-month forward rate against the spot rate, thepremium held generally stable in the early part of 2002, except for a brief pick-upto above 250 pips (each pip equivalent to HK$0.0001) in mid-March. It thennarrowed distinctly in the ensuing months, to an eight-month low of merelyone pip on 26 June. It widened after mid-September amidst market concern overthe protracted fiscal deficit in Hong Kong, moving mostly in the range of 250 to350 pips between mid-October and late November. Yet it shrank again towardsthe year-end, and closed 2002 at 169 pips, considerably reduced from that of235 pips at end-2001 (paragraphs 4.1 and 4.2).
/1.47 .....

25
1.47 Under the linked exchange rate system, the movements in the exchangerates of the Hong Kong dollar against other major currencies follow closely thosein the US dollar. The US dollar remained strong at the beginning of 2002, butweakened against the major currencies since mid-April, due to uncertainties overthe pace of US economic recovery and plausible military action on Iraq. Thedollar - euro exchange rate, at an average of 0.946 in 2002, weakened by 5.6%from that of 0.896 in 2001. The dollar - pound sterling exchange rate alsoweakened, by 4.4% to an average of 1.504 in 2002, from that of 1.441 in 2001.The yen - dollar exchange rate, averaged at 125.2 in 2002, nevertheless went upby 3.0% from 121.5 in 2001, signifying relative strengthening in the US dollar.In 2002, most of the other major East Asian currencies appreciated to variousextent against the US dollar. Taking these currency movements together, thetrade-weighted Nominal Effective Exchange Rate Index of the Hong Kong dollarffell slightly by 0.7%, to an average of 104.0 in 2002, from 104.7 in 2001. Afteradjusting for relative movements in the respective consumer price indices, thetrade-weighted Real Effective Exchange Rate Index of the Hong Kong dollar felldistinctly more by 3.9%, to an average of 96.1 in 2002, from 100.0 in 2001(paragraphs 4.3 and 4.4).
1.48 In the money market, local short-term interest rates largely trackedtheir US dollar counterparts. They remained low during most of 2002, and easedfurther in the last two months of the year. The three-month HIBOR went down to1.4% at end-2002, from 1.9% at end-2001. The average spread between thethree-month HIBOR and the corresponding Euro-dollar deposit rate reversedfrom a discount of 6 basis points in December 2001 to a premium of 10 basispoints in December 2002. Following the movement in the US Fed Funds targetrate, the Base Rate under the Discount Window operated by the Hong KongMonetary Authority was maintained at 3.25% until early November 2002, whenit was reduced by 50 basis points to 2.75%. The best lending rate of the majorcommercial banks was lowered to 5.00% at end-2002, from 5.13% at end-2001.Savings deposit rates offered by the major banks were also trimmed, to anaverage of merely 0.03% at end-2002, from 0.15% at end-2001. The averagespread of the best lending rate over the three-month time deposit rate widenedslightly, to 4.71 percentage points in 2002, from 4.62 percentage points in 2001(paragraphs 4.5 and 4.6).
1.49 Hong Kong dollar deposits fell modestly, by 1.6% during 2002, havingrisen marginally by 0.2% during 2001. Hong Kong dollar loans also declined
/modestly .....

26
modestly, by 1.9% during 2002, further to a 0.3% decrease during 2001. As thedecline in Hong Kong dollar loans was slightly more than that in Hong Kongdollar deposits during 2002, the Hong Kong dollar loan-to-deposit ratio fellslightly further, to a new low of 88.5% at end-2002, from that of 88.8% atend-2001 (paragraphs 4.8, 4.15 and 4.16).
1.50 The local stock market exhibited much volatility over the course of2002. There was a brief rally at the beginning of the year, upon a price surge intechnology-related shares in the United States. With greater optimism about asooner-than-expected recovery in the US economy, local share prices continuedto hold up well in February and March. Fund inflows and market expectation forno imminent rise in US interest rates then pushed the Hang Seng Index to a highof 11 975 on 17 May (paragraph 4.29).
1.51 Local share prices soon drifted lower, with the Hang Seng Index fallingto levels below 10 000 in late July. Apart from lacklustre corporate performancein the local economy, market sentiment was also weighed down by growingconcern worldwide about the uncertain tempo of US economic recovery and thelikely consequence of US corporate frauds. Then, looming war pressure on Iraqled to a further dip in share prices in September. The Hang Seng Index plungedto a four-year low of 8 859 on 10 October. Local share prices recovered some lostground in November, upon the US interest rate cut and steadier employmentconditions locally. But as war pressure on Iraq escalated and tension over nuclearcontrol in North Korea broke out towards the year-end, local share prices weredampened again. The Hang Seng Index closed the year at 9 321, 18.2% lowerthan the level of 11 397 at end-2001. Share prices in the major stock marketsoverseas likewise plummeted during 2002, for some by even greater magnitudesthan in the local market. Average daily turnover in the market fell distinctly, to$6.7 billion in 2002, from $8.2 billion in 2001 (paragraphs 4.30 and 4.31).
Notes :
(1) The Gross Domestic Product (GDP) is an overall measure of net output produced withinan economy in a specified period, such as a calendar year or a quarter, before deductingthe consumption of fixed capital. In accordance with the expenditure approach to itsestimation, GDP is the sum of private consumption expenditure, governmentconsumption expenditure, gross domestic fixed capital formation, changes ininventories, and exports less imports of goods and services.
/(2) .....

27
(2) The seasonally adjusted quarter-to-quarter GDP series, by removing the variations thatoccur at about the same time and in about the same magnitude each year, providesanother perspective for discerning the trend, particularly in regard to turning points. Adetailed examination reveals the presence of seasonality in the overall GDP and in someof its main components, including private consumption expenditure, governmentconsumption expenditure, exports of goods, imports of goods, exports of services, andimports of services. However, due to the presence of considerable short-termfluctuations, no clear seasonal pattern is found in gross domestic fixed capital formation.Therefore, the seasonally adjusted series of GDP is compiled separately at the overalllevel, rather than summing up from its main components.
(3) The Gross National Product (GNP) is obtained by adding net external factor incomeflow, being the income inflow minus the corresponding income outflow, to GDP.External factor income inflow refers to income earned by residents from abroad, whileexternal factor income outflow refers to income earned by non-residents from within thedomestic territory. Hence GNP is an overall measure of income earned by the residentsof an economy in a specified period, both domestically and from elsewhere. Itdistinguishes from GDP in that GDP is an overall measure of income earned by bothresidents and non-residents, from within the domestic territory in a specified period.Factor income comprises direct investment income, portfolio investment income, otherinvestment income, and compensation of employees.
(4) Government consumption expenditure reckoned on a national accounts basis covers therecurrent expenditure on goods and services incurred by government departments. Italso covers the recurrent expenditure of quasi-government non-profit bodies, such as theHong Kong Trade Development Council, Hong Kong Productivity Council, Hong KongTourism Board, Consumer Council and Hospital Authority. On the other hand, it doesnot include the expenditure of those government departments and statutory entitiesengaged in the production of goods and services principally for sale to the public, suchas the Housing Department, Post Office and Water Supplies Department, and such as theMass Transit Railway Corporation Limited, Kowloon-Canton Railway Corporation andAirport Authority Hong Kong. Government subventions to the various organisationsproviding community and welfare services are also excluded, because such expenditureis in the nature of transfer payments and not direct consumption of economic resources.
(5) Following a review of the presentation by the Census and Statistics Department, realestate developers’ margin is now incorporated into private sector expenditure onbuilding and construction, instead of being delineated separately in the expenditurecomponents of GDP. This amounts to bringing up the private sector investment inbuilding and construction much closer to its overall output value, from its direct assessedphysical construction cost. The change in presentation is in line with internationalstatistical practice, and reflects the recognition that real estate developers’ margin is anintegral part of private sector investment in building and construction.

28
CHAPTER 2 : THE EXTERNAL SECTOR
Major external influences
2.1 After a seemingly robust turnaround in early 2002, the globaleconomic environment weakened again in the ensuing period, amidst concernabout the tempo of US economic recovery and jitters from the synchronisedplunge in stock markets worldwide. While a progressive resurrection in importdemand was seen over the course of the year, domestic demand in most of themajor economies had yet to embark on a broader upturn. In the last few monthsof the year, a spate of terrorist activities, mounting war pressure on Iraq, andlately rising tension in North Korea dented sentiment further. For 2002 as awhole, the global economy grew by just around 3% in real terms, only modestlybetter than the 2% growth in 2001.
2.2 Of the major regions, the US economy had a solid start in 2002. Butthe pace of recovery had since moderated, as industrial activity lost momentumagain after a robust initial pick-up, and as business investment was put back bythe corporate accounting scandals, reduced business earnings, and the stockmarket plunge. Yet consumer spending still held up relatively well for most ofthe year, rendering a key support to the overall economic growth.
2.3 The EU economy, having undergone an abrupt downturn in 2001 andslackened more in early 2002, turned up mildly thereafter. Exports accentuateddistinctly. But domestic demand was persistently weak, being held back byrising unemployment, subdued business sentiment, and relatively restrictivefiscal and monetary policies.
2.4 In East Asia, almost all the economies embarked on a solid recoveryduring 2002, benefiting from a turnaround in global demand for IT productsand inventory replenishment in the United States. The Japanese economy,whilst still sluggish in early 2002, improved over the course of the year upon apick-up in its exports. The Mainland economy was again the best performer inthe region in 2002, with its overall economic growth picking up to 8.0%, andwith its external trade, domestic demand and inward foreign direct investmentall surging ahead. The other East Asian economies revived to various degreesin 2002, driven likewise by a sharp upturn in exports yet also with fairly steadydomestic demand.
/Table 2.1 .....

29
Table 2.1Gross Domestic Product of selected major economies
(year-on-year rate of change in real terms (%))
UnitedStates
EuropeanUnion
Mainlandof China Japan Taiwan Singapore
Republicof Korea
2001 Annual 0.3 1.5 7.3 0.4 -2.2 -2.1 3.0
H1 0.7 2.0 7.9 2.4 -1.3 1.9 3.3H2 -0.1 1.0 6.7 -1.5 -3.0 -5.7 2.8
Q1 1.5 (-0.2) 2.4 (0.5) 8.1 3.7 (0.5) 0.6 4.3 3.7 (1.2)Q2 -0.1 (-0.4) 1.6 (*) 7.8 1.1 (-1.4) -3.3 -0.5 2.9 (0.3)Q3 -0.4 (-0.1) 1.3 (0.2) 7.0 -0.5 (-1.1) -4.4 -5.1 1.9 (1.3)Q4 0.1 (0.7) 0.6 (-0.1) 6.5 -2.3 (-0.4) -1.6 -6.4 3.7 (1.6)
2002 Annual 2.4 N.A. 8.0 0.3 3.5 N.A. N.A.
H1 1.8 0.7 7.8 -1.6 2.6 0.9 6.1H2 3.0 N.A. 8.2 2.1 4.5 N.A. N.A.
Q1 1.4 (1.2) 0.5 (0.4) 7.6 -3.0 (0.1) 1.2 -1.7 5.8 (1.9)Q2 2.2 (0.3) 0.9 (0.4) 8.0 -0.2 (1.3) 4.0 3.4 6.4 (1.4)Q3 3.3 (1.0) 1.1 (0.4) 8.1 1.8 (0.7) 4.8 3.5 5.8 (1.3)Q4 2.8 (0.2) N.A. 8.3 2.4 (0.5) 4.2 N.A. N.A.
Notes : Figures in brackets are the seasonally adjusted quarter-to-quarter rates of change.For the mainland of China, Taiwan and Singapore, seasonally adjusted series are notavailable.
N.A. Not yet available.
(*) Change of less than 0.05%.
2.5 Notwithstanding the mixed tempo of economic recovery, there was aprogressive revival in import intake in most of the major overseas markets overthe course of the year. The pick-up in imports was most visible in the EastAsian economies and the United States. Imports in Europe also improvedtowards the year-end. Continued robust demand in the Mainland andresurgence in intra-regional trade, coupled with revived import absorption inthe conventional overseas markets, was the key factor underpinning the sharprebound in Hong Kong’s exports in 2002.
/Table 2.2 .....

30
Table 2.2Total exports of goods of selected major economies
(year-on-year rate of change in US dollar terms (%))
UnitedStates
EuropeanUnion
Mainlandof China Japan Taiwan Singapore#
Republicof Korea
2001 Annual -6.9 0.7 6.8 -15.9 -17.2 -17.7 -12.7
H1 0.5 2.3 8.7 -11.4 -10.8 -7.0 -5.1H2 -14.0 -0.9 5.1 -20.1 -22.9 -26.8 -19.7
Q1 4.3 5.3 13.8 -6.6 -3.6 0.4 2.2Q2 -3.1 -0.7 4.6 -16.0 -17.1 -14.0 -11.6Q3 -13.5 0.4 3.8 -19.2 -28.7 -30.2 -19.8Q4 -14.5 -2.2 6.5 -20.9 -17.0 -23.4 -19.6
2002 Annual -5.0 4.5(a) 22.3 3.2 6.3 2.1 8.2
H1 -10.9 -1.4 14.1 -5.8 -1.1 -9.8 -3.2H2 1.6 11.9(a) 29.6 13.3 14.1 15.3 21.1
Q1 -15.1 -7.5 9.9 -13.3 -7.9 -18.8 -11.1Q2 -6.6 5.1 17.8 2.3 5.8 0.1 5.0Q3 1.1 11.7 28.7 9.3 18.9 17.5 16.6Q4 2.0 12.2(a) 30.5 17.4 10.0 13.2 25.5
Notes : (#) Non-oil domestic exports.
(a) Crude estimate only, as data on exports in the European Union are availableonly up to November 2002.
Table 2.3Imports of goods of selected major economies
(year-on-year rate of change in US dollar terms (%))
UnitedStates
EuropeanUnion
Mainlandof China Japan Taiwan Singapore
Republicof Korea
2001 Annual -6.4 -1.8 8.2 -8.1 -23.4 -13.9 -12.1
H1 0.5 1.3 14.1 0.2 -17.0 -3.8 -7.7H2 -12.8 -4.8 3.3 -15.4 -29.5 -22.4 -16.3
Q1 5.0 4.1 17.3 4.8 -10.2 5.8 -1.8Q2 -3.7 -1.5 11.4 -4.3 -22.9 -12.4 -13.4Q3 -11.4 -3.4 6.5 -11.8 -34.1 -20.4 -15.5Q4 -14.1 -6.2 0.2 -18.9 -24.6 -24.4 -17.1
2002 Annual 1.8 1.7(a) 21.2 -3.5 5.0 0.5 7.7
H1 -6.0 -5.0 10.4 -13.1 -6.4 -6.7 -2.3H2 10.1 9.9(a) 31.1 7.2 17.7 8.1 18.5
Q1 -12.6 -10.2 5.1 -18.3 -15.2 -16.2 -11.5Q2 0.8 0.6 15.0 -7.6 2.5 3.5 7.8Q3 7.7 8.7 29.3 4.1 23.0 6.6 13.5Q4 12.6 11.9(a) 33.1 10.5 12.7 9.7 23.4
Note : (a) Crude estimate only, as data on imports in the European Union are availableonly up to November 2002.
/Diagram 2.1 .....

31
Hong Kong's total exports of goods
(year-on-year rate of change)
Hong Kong's total exports of goods
and total import demand in Hong Kong's major markets
Q1 Q2 Q3 Q4 Q1 Q2 Q3 Q4 Q1 Q2 Q3 Q4 Q1 Q2 Q3 Q4 Q1 Q2 Q3 Q4 Q1 Q2 Q3 Q41997 1998 1999 2000 2001 2002
0
5
10
15
20
25
30
-5
-10
Percent
Total import demand in Hong Kong's major markets
Diagram 2.1
*
Notes : Total exports of goods as depicted refer to the year-on-year rate ofchange in real terms, while total import demand in Hong Kong’smajor markets as depicted refers to the year-on-year rate of changein US dollar terms in the aggregate import demand in East Asia, theUnited States and the European Union taken together.
(*) Total import demand for the fourth quarter of 2002 is only acrude estimate, as data on imports in the European Union areavailable only up to November 2002.
2.6 On exchange rate movements, the US dollar weakened against theother major currencies after mid-April 2002, triggered by concern aboutsustainability of the US economic recovery, adverse US economic news, andtumbling US stock market. Towards the year-end, mounting war pressure onIraq and tension in North Korea pulled the US dollar to a three-year low againstthe euro and a nearly three-year low against the pound sterling. The US dollaralso fell against the yen, though by relatively less in face of possibleintervention by the Japanese government. The US dollar likewise weakenedduring the year against most of the other East Asian currencies, most noticeablythe Korean won, the Indonesian rupiah and the Thai baht. Comparingthe average level in 2002 with that in 2001, the US dollar lost 5.3% against the
/euro .....

32
euro and 4.2% against the pound sterling, but gained 3.0% against the yen. Itwas still higher against the New Taiwan dollar and broadly unchanged againstthe Singapore dollar. Tracking closely the movements in the US dollar, andcoupled with a larger price decline in Hong Kong than in its trading partners,the trade-weighted Real Effective Exchange Rate Index of the Hong Kongdollar in 2002 fell by an average of 3.9% over 2001, with a more distinct fall inthe latter part of the year. The improvement in Hong Kong’s external pricecompetitiveness thus signified should have been another visible factorunderpinning the rebound in Hong Kong’s exports in 2002.
Table 2.4Exchange rates of the major currencies
and of selected East Asian currencies against the US dollar
% changein terms of averagein the quarter over
the preceding quarterJapanese
yen EuroPoundsterling
NewTaiwandollar
Singaporedollar
Koreanwon
2001 Q1 -7.0 6.1 0.9 -0.3 -0.3 -8.3Q2 -3.6 -5.4 -2.6 -2.7 -3.5 -2.6Q3 0.8 2.0 1.1 -3.5 2.0 0.9Q4 -1.7 0.5 0.4 0.2 -2.6 0.1
2002 Q1 -6.6 -2.0 -1.1 -1.3 -0.4 -2.1Q2 4.3 4.7 2.5 1.7 1.6 4.0Q3 6.4 7.1 6.0 1.4 2.6 6.0Q4 -2.6 1.7 1.5 -2.5 -0.5 -1.9
% change interms of averagein 2002 over2001
-2.9 5.6 4.4 -2.2 0.1 3.2
/Diagram 2.2 .....

33
Hong Kong's total exports of goods and exchange rate movements(year-on-year rate of change in real terms)
Diagram 2.2
Hong Kong's total exports of goods
(left scale)
Q1 Q2 Q3 Q4 Q1 Q2 Q3 Q4 Q1 Q2 Q3 Q4 Q1 Q2 Q3 Q4 Q1 Q2 Q3 Q4 Q1 Q2 Q3 Q41997 1998 1999 2000 2001 2002
0
5
10
15
20
25
-5
-10
-15
-20
-25
Percent
02468101214
-2-4-6-8-10-12-14
Percent
Trade-weighted Real EERI*(right scale)
-12-10-8-6-4-202468
1012
-14
14
Note : (*) The Real Effective Exchange Rate Index of the Hong Kong dollar(Real EERI), as compiled by the Hong Kong Monetary Authority, isa weighted average of the exchange rates of the Hong Kong dollaragainst the currencies of 14 major trading partners after adjustingfor relative movements in the respective seasonally adjustedconsumer price indices, with the weights adopted being the sharesof these 14 trading partners in the overall value of Hong Kong’smerchandise trade.
Positive changes in the Real EERI denote real appreciation of theHong Kong dollar, and negative changes denote real depreciation.For ease of comparison with the rate of change in Hong Kong’stotal exports of goods, the scale for the Real EERI is presented hereupside down, so that positive changes appear at the lower part andnegative changes at the upper part of the diagram.
Overall visible and invisible trade situation
2.7 On visible trade, Hong Kong’s total exports of goods (comprisingre-exports and domestic exports), at $1,560.5 billion in 2002, reverted topositive growth at 5.4% in value terms. After netting out the decrease in prices,there was an 8.6% rise in real terms(1), representing a significant turnaroundfrom the 3.3% fall in 2001. Total exports of goods showed distinctimprovement over the course of the year. After a 2.5% decline in real terms
/in .....

34
in the first quarter of 2002 over a year earlier, they reverted to positive growthat 5.9% in the second quarter, and then picked up to double-digit growth at11.4% and 18.3% respectively in the third and fourth quarters. On a seasonallyadjusted quarter-to-quarter comparison, total exports of goods recordedincrease throughout the four quarters of 2002, by 4.5%, 5.8%, 4.0% and 4.0%respectively in real terms.
2.8 Within total exports of goods, re-exports(2) remained the key driver ofexport performance, attaining growth at 7.7% in value terms to $1,429.6 billionin 2002. After netting out the decrease in prices, re-exports had double-digitgrowth at 10.9% in real terms, also representing a sharp turnaround from the2.4% decrease in 2001. Having shown a mild contraction by 1.5% in real termsin the first quarter of 2002 over a year earlier, re-exports rebounded to a distinctgrowth at 8.3% in the second quarter, followed by even more robust growth at13.6% and 22.1% respectively in the third and fourth quarters. On a seasonallyadjusted quarter-to-quarter comparison, re-exports surged throughout the fourquarters of 2002, by 5.7%, 6.6%, 4.5% and 4.7% respectively in real terms.
2.9 On the other hand, owing to the on-going structural shift towardsre-exports and offshore trade(3), domestic exports shrank further, by 14.7% invalue terms to $130.9 billion in 2002. After netting out the decrease in prices,the shrinkage was 11.3% in real terms, slightly larger than the 10.2% dip in2001. Domestic exports plummeted throughout the four quarters of 2002, withyear-on-year declines by 11.2%, 13.7%, 7.6% and 12.9% respectively in realterms. On a seasonally adjusted quarter-to-quarter comparison, domesticexports also fell in all four quarters, by 5.6%, 2.0%, 0.7% and 4.3%respectively in real terms.
/Table 2.5 .....

35
Table 2.5Total exports of goods, re-exports and domestic exports
(year-on-year rate of change (%))
Total exports of goods Re-exports Domestic exports
In value In real Change In value In real Change In value In real Change terms terms in prices terms terms in prices terms terms in prices
2001 Annual -5.8 -3.3 -2.3 -4.6 -2.4 -2.0 -15.2 -10.2 -4.7
H1 -1.4 0.5 -1.7 0.2 1.9 -1.5 -13.3 -10.1 -3.2H2 -9.6 -6.6 -2.8 -8.6 -6.1 -2.4 -16.8 -10.2 -6.1
Q1 2.3 3.6 -1.1 4.8 5.9 -0.9 -15.3 -13.0 -2.5Q2 -4.7 -2.2 -2.3 -3.9 -1.6 -2.1 -11.4 -7.4 -3.8Q3 -7.2 -4.4 -2.6 -5.8 -3.4 -2.2 -17.9 -11.9 -5.8Q4 -12.0 -8.8 -3.0 -11.6 -8.9 -2.6 -15.6 -8.3 -6.5
2002 Annual 5.4 8.6 -2.7 7.7 10.9 -2.7 -14.7 -11.3 -3.3
H1 -1.6 1.8 -3.1 0.2 3.5 -2.9 -17.7 -12.5 -4.4H2 11.8 14.7 -2.4 14.6 17.7 -2.4 -11.9 -10.2 -2.2
Q1 -6.2 -2.5 -3.4 -5.0 -1.5 -3.2 -17.5 -11.2 -5.4Q2 2.8 5.9 -2.7 5.3 8.3 -2.6 -17.8 -13.7 -3.6Q3 8.5 11.4 -2.4 10.6 13.6 -2.3 -10.4 -7.6 -3.1Q4 15.5 18.3 -2.3 18.8 22.1 -2.4 -13.6 -12.9 -1.2
Note : New series of unit value indices and quantum indices using 2000 as the updated baseare released as from June 2002 to replace the old 1990-based series. For the periodprior to 2000, the unit value indices and quantum indices are obtained by re-scaling thepreviously released 1990-based series, using conversion factors as derived from thelevels of the old and the new series in their overlapping period of 2000. There may beminor differences in some of the rates of change in the unit value indices and quantumindices for the period from the first quarter of 2001 to the first quarter of 2002.
/Table 2.6 .....

36
Table 2.6Total exports of goods, re-exports and domestic exports
(seasonally adjusted quarter-to-quarterrate of change in real terms (%))
Total exports of goods Re-exports Domestic exports
2001 Q1 -3.7 -3.7 -3.5Q2 -2.7 -3.2 1.3Q3 0.3 1.1 -5.8Q4 -3.8 -4.1 -0.8
2002 Q1 4.5 5.7 -5.6Q2 5.8 6.6 -2.0Q3 4.0 4.5 -0.7Q4 4.0 4.7 -4.3
Note : See the footnote to Table 2.5.
Total exports of goods, re-exports and domestic exports(a) Year-on-year rate of change in real terms
Q1 Q2 Q3 Q4 Q1 Q2 Q3 Q4 Q1 Q2 Q3 Q4 Q1 Q2 Q3 Q4 Q1 Q2 Q3 Q4 Q1 Q2 Q3 Q41997 1998 1999 2000 2001 2002
0
5
10
15
20
25
30
-5
-10
-15
-20
Percent
Diagram 2.3
Re-exports
Total exports of goods
Domestic exports
Note : From the first quarter of 2001 onwards, the rates of change arecomputed from the new 2000-based trade index series. Beforethen, the rates of change are computed from the old 1990-basedseries. Re-scaling using conversion factors as derived from thelevels of the old and the new series in their overlapping period of2000 has been applied to the indices to maintain continuity.
/Diagram 2.3 (cont’d) .....

37
(b) Seasonally adjusted quarter-to-quarterrate of change in real terms
Q1 Q2 Q3 Q4 Q1 Q2 Q3 Q4 Q1 Q2 Q3 Q4 Q1 Q2 Q3 Q4 Q1 Q2 Q3 Q4 Q1 Q2 Q3 Q41997 1998 1999 2000 2001 2002
0
2
4
6
8
10
12
-2
-4
-6
-8
-10
Percent
Re-exportsTotal exports of goods
Domestic exports
Diagram 2.3 (cont'd)
Note : From the second quarter of 2000 onwards, the rates of change arecomputed from the new 2000-based trade index series. Beforethen, the rates of change are computed from the old 1990-basedseries. Re-scaling using conversion factors as derived from thelevels of the old and the new series in their overlapping period of2000 has been applied to the indices to maintain continuity.
2.10 Imports of goods likewise rebounded, rising by 3.3% in value terms to$1,619.4 billion in 2002. After netting out the decrease in prices, there was a7.8% rise in real terms, also distinctly improved from the 2.0% decline in 2001.Mirroring the profile of pick-up in re-exports over the course of the year,imports of goods, after falling by 4.1% in real terms in the first quarter of 2002over a year earlier, resumed positive growth at 5.7% in the second quarter, andthen accelerated markedly to double-digit growth at 10.8% and 18.1%respectively in the third and fourth quarters. Imports retained for local uselikewise revived during the year, though at a less robust pace than that ofre-exports. Specifically, retained imports still had an 8.9% decline in realterms in the first quarter of 2002 over a year earlier, yet reverted to increase by0.8% in the second quarter, followed by considerably faster increases by 5.2%and 10.0% respectively in the third and fourth quarters. For 2002 as a whole,
/retained .....

38
retained imports grew by only 1.8% in real terms, having declined by 1.1% in2001. On a seasonally adjusted quarter-to-quarter comparison, imports ofgoods rose by 4.5%, 5.8%, 4.8% and 2.9% respectively in real terms throughthe four quarters of 2002. Retained imports rose in the first three quarters of2002, by 2.3%, 4.2% and 5.4% respectively in real terms, but fell back by 1.0%in the fourth quarter.
Table 2.7Imports of goods and retained imports
(year-on-year rate of change (%))
Imports of goods Retained imports(a)
In value In real Change In value In real Change terms terms in prices terms terms in prices
2001 Annual -5.4 -2.0 -3.1 -9.1 -1.1 -7.6
H1 -0.1 2.4 -2.1 -2.8 3.2 -5.2H2 -10.0 -5.8 -4.1 -14.9 -5.1 -9.9
Q1 3.6 5.6 -1.6 -0.8 5.0 -5.0Q2 -3.4 -0.5 -2.5 -4.6 1.5 -5.4Q3 -6.6 -2.9 -3.5 -10.5 -1.8 -8.4Q4 -13.5 -8.7 -4.8 -19.4 -8.4 -11.6
2002 Annual 3.3 7.8 -3.9 -5.9 1.8 -6.6
H1 -4.2 0.9 -4.8 -12.9 -3.9 -8.9H2 10.5 14.3 -3.0 1.4 7.5 -4.3
Q1 -9.1 -4.1 -4.9 -17.2 -8.9 -8.8Q2 0.4 5.7 -4.6 -8.9 0.8 -8.9Q3 6.5 10.8 -3.6 -2.6 5.2 -6.4Q4 14.9 18.1 -2.3 6.0 10.0 -2.0
Notes : (a) Based on the results of the Annual Survey of Re-export Trade conducted bythe Census and Statistics Department, re-export margins by individual end-usecategory are estimated and adopted for deriving the value of imports retainedfor use in Hong Kong.
Also see the footnote to Table 2.5.
/Table 2.8 .....

39
Table 2.8Imports of goods and retained imports(seasonally adjusted quarter-to-quarter
rate of change in real terms (%))
Imports of goods Retained imports(a)
2001 Q1 -1.0 4.4Q2 -4.8 -7.8Q3 1.1 1.1Q4 -4.7 -5.8
2002 Q1 4.5 2.3Q2 5.8 4.2Q3 4.8 5.4Q4 2.9 -1.0
Notes : (a) See Note (a) to Table 2.7.
Also see the footnote to Table 2.5.
Imports of goods and retained imports(a) Year-on-year rate of change in real terms
Q1 Q2 Q3 Q4 Q1 Q2 Q3 Q4 Q1 Q2 Q3 Q4 Q1 Q2 Q3 Q4 Q1 Q2 Q3 Q4 Q1 Q2 Q3 Q41997 1998 1999 2000 2001 2002
0
10
20
30
-10
-20
-30
Percent
Diagram 2.4
Imports of goods
Retained imports
Note : See the footnote to Diagram 2.3 (a).
/Diagram 2.4 (cont’d) .....

40
(b) Seasonally adjusted quarter-to-quarterrate of change in real terms
Q1 Q2 Q3 Q4 Q1 Q2 Q3 Q4 Q1 Q2 Q3 Q4 Q1 Q2 Q3 Q4 Q1 Q2 Q3 Q4 Q1 Q2 Q3 Q41997 1998 1999 2000 2001 2002
0
5
10
15
-5
-10
-15
Percent
Imports of goods
Retained imports
Diagram 2.4 (cont'd)
Note : See the footnote to Diagram 2.3 (b).
2.11 As the value of total exports of goods rose faster than the value ofimports of goods, the visible trade deficit reckoned on a BoP basis (4) dwindledto $40.0 billion or 2.5% of the value of imports of goods in 2002, from$65.0 billion or 4.2% in 2001.
/Diagram 2.5 .....

41
Q1 Q2 Q3 Q4 Q1 Q2 Q3 Q4 Q1 Q2 Q3 Q4 Q1 Q2 Q3 Q41999 2000 2001 2002
0
50
100
150
200
250
300
350
400
450
500
550
-50
-100
HK$ Billion
Total exports of goods Imports of goods Visible trade balance
Value of Hong Kong's visible trade and the visible trade balance
Diagram 2.5
2.12 On invisible trade, exports of services continued to fare better thanexports of goods, with a 9.0% leap in value terms to $352.2 billion in 2002.After netting out the decline in prices, there was double-digit growth at 12.1%in real terms, markedly better than the 5.9% growth in 2001. As with exportsof goods, exports of services accelerated in growth over the course of the year.On a year-on-year comparison, growth was already rather robust at 7.7% and8.6% respectively in real terms in the first and second quarters of 2002, yetfollowed by even stronger growth at 14.1% and 17.2% respectively in the thirdand fourth quarters. On a seasonally adjusted quarter-to-quarter comparison,exports of services leaped throughout the four quarters of 2002, by 3.3%, 3.8%,5.4% and 4.1% respectively in real terms.
2.13 Imports of services were however virtually flat, falling marginally by0.4% in value terms to $188.8 billion in 2002. With little change in prices, thedecline in real terms was 0.8%, slightly worse than the 0.2% decrease in 2001.Yet a relative improvement was seen over the course of the year. On ayear-on-year comparison, imports of services had decreases of 1.3% and 4.0%respectively in real terms in the first and second quarters of 2002, and thenreverted to increase by 1.0% and 0.9% respectively in the third and fourthquarters. On a seasonally adjusted quarter-to-quarter comparison, imports ofservices edged up by 0.6% in real terms in the first quarter of 2002, and thenfell back by 1.2% in the second quarter, before bouncing up to increase by2.5% in the third quarter, yet followed by a 0.7% decline in the fourth quarter.
/Table 2.9 .....

42
Table 2.9Exports and imports of services
(year-on-year rate of change (%))
Exports of services Imports of services
In valueterms
In realterms
Changein prices
In valueterms
In realterms
Changein prices
2001 Annual 1.7 5.9 -3.9 -1.0 -0.2 -0.8
H1 5.2 7.5 -2.1 1.9 2.4 -0.5H2 -1.3 4.5 -5.6 -3.8 -2.6 -1.2
Q1 6.4 7.4 -0.9 3.0 3.3 -0.3Q2 4.2 7.6 -3.1 0.8 1.5 -0.7Q3 -1.4 3.7 -4.8 -3.4 -2.4 -1.0Q4 -1.2 5.3 -6.3 -4.2 -2.8 -1.4
2002 Annual 9.0 12.1 -2.8 -0.4 -0.8 0.4
H1 3.6 8.2 -4.2 -3.6 -2.6 -1.0H2 14.0 15.7 -1.4 2.7 0.9 1.8
Q1 2.5 7.7 -5.0 -3.3 -1.3 -2.0Q2 4.6 8.6 -3.7 -4.0 -4.0 -0.1Q3 11.3 14.1 -2.5 2.4 1.0 1.4Q4 16.7 17.2 -0.4 3.1 0.9 2.2
Note : Figures in this table are based on the revised GDP series, incorporating the results ofa technical revision to GDP in August 2002.
Table 2.10Exports and imports of services
(seasonally adjusted quarter-to-quarterrate of change in real terms (%))
Exports of services Imports of services
2001 Q1 0.9 -1.0Q2 3.2 1.7Q3 0.8 -2.2Q4 0.7 -1.1
2002 Q1 3.3 0.6Q2 3.8 -1.2Q3 5.4 2.5Q4 4.1 -0.7
Note : See the footnote to Table 2.9.
/Diagram 2.6 .....

43
(a) Year-on-year rate of change in real terms
Q1 Q2 Q3 Q4 Q1 Q2 Q3 Q4 Q1 Q2 Q3 Q4 Q1 Q2 Q3 Q4 Q1 Q2 Q3 Q4 Q1 Q2 Q3 Q41997 1998 1999 2000 2001 2002
0
5
10
15
20
-5
-10
Percent
Exports of services
Imports of services
Diagram 2.6Exports and imports of services
(b) Seasonally adjusted quarter-to-quarterrate of change in real terms
Q1 Q2 Q3 Q4 Q1 Q2 Q3 Q4 Q1 Q2 Q3 Q4 Q1 Q2 Q3 Q4 Q1 Q2 Q3 Q4 Q1 Q2 Q3 Q41997 1998 1999 2000 2001 2002
0
2
4
6
8
10
12
-2
-4
-6
Percent
Exports of services
Imports of services
Note : See the footnote to Table 2.9.
/Diagram 2.7 .....

44
Q1 Q2 Q3 Q4 Q1 Q2 Q3 Q4 Q1 Q2 Q3 Q4 Q1 Q2 Q3 Q4 Q1 Q2 Q3 Q4 Q1 Q2 Q3 Q41997 1998 1999 2000 2001 2002
0
20
40
60
80
100
120HK$ Billion
Exports of services Imports of services Invisible trade balance
Value of Hong Kong's invisible trade and Diagram 2.7
the invisible trade balance
2.14 As exports of services leaped while imports of services fell marginally,the invisible trade surplus(5) reckoned on a BoP basis expanded markedly, to$163.4 billion or 86.6% of the value of imports of services in 2002, from$133.5 billion or 70.4% in 2001. Together with a much reduced visible tradedeficit, the combined surplus reckoned on a BoP basis surged to $123.4 billionor 6.9% of the total value of imports of goods and services in 2002, from$68.5 billion or 3.9% in 2001.
/Table 2.11 .....

45
Table 2.11Visible and invisible trade balance($ billion at current market prices)
Total exports Imports Trade balance
Goods Services Goods Services Goods Services Combined
2001 Annual 1,489.0 323.1 1,554.0 189.6 -65.0 133.5 68.5
H1 714.5 155.0 763.0 94.8 -48.5 60.1 11.6 H2 774.5 168.1 790.9 94.8 -16.4 73.3 56.9
Q1 350.4 76.5 375.1 48.0 -24.6 28.4 3.8 Q2 364.1 78.5 388.0 46.8 -23.9 31.7 7.8 Q3 403.0 82.8 414.4 49.6 -11.4 33.3 21.8 Q4 371.5 85.3 376.5 45.2 -5.0 40.1 35.1
2002 Annual 1,561.5 352.2 1,601.5 188.8 -40.0 163.4 123.4
H1 699.8 160.5 728.6 91.4 -28.8 69.1 40.3 H2 861.7 191.7 872.9 97.4 -11.2 94.3 83.1
Q1 326.1 78.3 338.5 46.4 -12.4 31.9 19.5 Q2 373.7 82.2 390.1 44.9 -16.4 37.2 20.8 Q3 434.9 92.2 440.5 50.7 -5.6 41.4 35.8 Q4 426.8 99.5 432.4 46.6 -5.6 52.9 47.3
Notes : Figures in this table are reckoned on a BoP basis. Specifically, imports of goods arevalued on f.o.b. basis, instead of on c.i.f. basis as is still the on-going practice for themerchandise trade statistics.
Figures may not add up exactly to the total due to rounding.
/Diagram 2.8 .....

46
Visible and invisible trade balance
Q1 Q2 Q3 Q4 Q1 Q2 Q3 Q4 Q1 Q2 Q3 Q4 Q1 Q2 Q3 Q41999 2000 2001 2002
0
10
20
30
40
50
60
-10
-20
-30
-40
HK$ Billion Visible trade balance Invisible trade balance Combined visible and invisible trade balance
Diagram 2.8
Note : See the first footnote to Table 2.11.
Visible trade
Total exports of goods
2.15 Reflecting the intimate trade linkages between Hong Kong and theregion, East Asia(6) continued to account for the largest share in Hong Kong’stotal exports of goods, at 54% by value in 2002. It was followed by NorthAmerica(7) (with a share of 23%) and the European Union(8) (13%).
/Diagram 2.9 .....

47
Diagram 2.9Total exports of goods by major region in 2002
Total exports of goods in 2002 : $1,560.5 billion
East Asia$850.4 billion (54%)
North America$356.5 billion (23%)
European Union$206.7 billion (13%)
Others$146.9 billion (9%)
2.16 Total exports of goods to East Asia as a whole staged a sharp rebound,along with economic recovery in the region. There was a 13.4% surge in realterms in 2002, significantly up from the 1.8% increase in 2001. Exports to theMainland, the Republic of Korea and Thailand were strong all through the fourquarters of the year. Exports to Singapore and Malaysia also picked updistinctly after the first quarter. Exports to Japan were still weak in the firsthalf of the year, yet improved distinctly towards the year-end.
2.17 Total exports of goods to North America likewise regained strength,along with greater import intake in the United States and Canada, and helpedfurther by better price competitiveness of Hong Kong’s exports uponweakening of the US dollar. After a rather weak start in the first quarter of2002, exports to this area turned up to positive growth in the second quarter andaccelerated further in the third and fourth quarters. There was a 3.9% rise inreal terms in 2002, in contrast to an 8.8% decline in 2001.
/2.18 .....

48
2.18 Total exports of goods to the European Union were still held back bysluggish demand in the euro area and a relatively weak euro earlier on, yet therewas also a distinct pick-up more recently, along with improved import demandand a stronger euro. A marginal decline of 0.4% in real terms was recorded in2002, much narrowed from the 8.5% decrease in 2001.
Table 2.12Total exports of goods by major region
(year-on-year rate of change in real terms (%))
East Asia(a)(d)North
America(b) European
Union(c)
2001 Annual 1.8 -8.8 -8.5
H1 5.4 -5.1 -4.7H2 -1.3 -11.7 -11.7
Q1 8.0 -1.0 -1.4Q2 3.1 -8.7 -7.9Q3 2.0 -10.5 -11.3Q4 -4.7 -12.9 -12.1
2002 Annual 13.4 3.9 -0.4
H1 7.1 -4.1 -8.1H2 19.2 10.8 6.6
Q1 4.8 -12.4 -12.1Q2 9.3 3.5 -3.9Q3 14.7 9.5 3.6Q4 23.9 12.3 9.7
Notes : (a) For the coverage of East Asia, see Note (6).
(b) For the coverage of North America, see Note (7).
(c) For the coverage of the European Union, see Note (8).
(d) For those constituent markets where separate quantum indices are notcompiled, their levels of total exports of goods in real terms are estimated froman aggregate implicit price deflator covering all those export markets in theAsia-Pacific region for which separate unit value indices are not available.
Also see the footnote to Table 2.5.
/2.19 .....

49
2.19 The Mainland remained the largest single market for Hong Kong’stotal exports of goods, accounting for 39% of the total value in 2002. It wasfollowed by the United States (with a share of 21%), Japan (5%), the UnitedKingdom (3%), Germany (3%), Taiwan (2%), Singapore (2%), and theRepublic of Korea (2%).
Diagram 2.10Total exports of goods by major market in 2002
Total exports of goods in 2002 : $1,560.5 billion
Mainland of China$613.2 billion (39%)
United States$333.0 billion (21%)
Japan$83.7 billion (5%)
Germany$48.8 billion (3%)
United Kingdom$54.2 billion (3%)
Others$331.0 billion (21%)
Taiwan$34.6 billion (2%)
Singapore$31.6 billion (2%)
Republic of Korea$30.4 billion (2%)
/Table 2.13 .....

50
Table 2.13Value of total exports of goods by market
2001 2002
Value($Bn)
Sharein total
(%)
Rateof change
(%)Value($Bn)
Sharein total
(%)
Rateof change
(%)
All markets 1,481.0 100 -5.8 1,560.5 100 5.4
Mainland of China
546.1 37 0.6 613.2 39 12.3
United States
329.8 22 -9.8 333.0 21 1.0
Japan 87.6 6 0.5 83.7 5 -4.5United Kingdom
55.3 4 -12.2 54.2 3 -2.0
Germany 51.6 3 -13.9 48.8 3 -5.3Taiwan 35.4 2 -11.1 34.6 2 -2.2Singapore 29.6 2 -19.5 31.6 2 6.8Republic of Korea
25.9 2 -9.4 30.4 2 17.2
Rest of the world
319.7 22 -8.4 331.0 21 3.5
Table 2.14Total exports of goods by major market
(year-on-year rate of change in real terms (%))
Mainlandof China
UnitedStates Japan
UnitedKingdom Germany Taiwan Singapore
Republicof Korea
2001 Annual 4.2 -9.1 2.4 -10.1 -11.9 -6.9 -16.1 -5.9
H1 7.0 -5.5 10.4 -7.4 -11.3 -3.3 -13.0 -2.7H2 1.8 -12.0 -4.3 -12.3 -12.5 -10.1 -18.8 -8.8
Q1 9.3 -0.9 14.9 -3.8 -3.4 -1.3 -7.0 -2.3Q2 5.1 -9.3 5.9 -10.6 -18.8 -5.2 -18.5 -3.2Q3 7.1 -10.9 -1.4 -11.3 -15.4 -16.1 -22.0 -10.4Q4 -3.6 -13.2 -7.0 -13.4 -9.6 -4.1 -15.2 -7.4
2002 Annual 15.5 3.7 -1.0 0.7 -2.4 2.1 11.7 20.8
H1 9.5 -4.5 -8.4 -6.0 -11.2 -3.7 8.5 16.0H2 20.8 10.8 6.0 6.4 5.3 7.8 14.7 25.5
Q1 7.5 -13.1 -10.4 -10.7 -16.2 -5.2 3.4 16.7Q2 11.4 3.6 -6.1 -1.4 -5.4 -2.2 14.0 15.3Q3 14.8 9.9 1.6 5.2 3.9 14.9 11.4 22.4Q4 27.4 12.0 10.5 7.7 6.7 1.6 18.0 28.3
Note : See the footnote to Table 2.5.
/2.20 .....

51
2.20 Total exports of goods to the Mainland attained highly robust growth,at 15.5% in real terms in 2002, markedly up from the moderate increase by4.2% in 2001. Hong Kong’s exports to the Mainland for meeting its owndemand surged throughout the year, in line with the strong domestic demandthere. Also, along with the sharp pick-up in the Mainland’s exports, HongKong’s exports to the Mainland for outward processing rebounded distinctlyover the course of the year (paragraph 2.36).
Q1 Q3 Q1 Q3 Q1 Q3 Q1 Q3 Q1 Q3 Q1 Q31997 1998 1999 2000 2001 2002
05
101520253035404550
-5-10-15
Percent
Total exports of goods to themainland of China and the
(year-on-year rate of change)
Total exports of goods to the
Mainland
The Mainland's import demand
Q1 Q3 Q1 Q3 Q1 Q3 Q1 Q3 Q1 Q3 Q1 Q31997 1998 1999 2000 2001 2002
05101520253035404550
-5-10-15
Percent
goods and its importsThe Mainland's exports of
(year-on-year rate of change)
The Mainland's imports for
processing trade
The Mainland's exports of goods
Diagram 2.11
for processing tradeMainland's import demand
Note : Total exports of goods to thismarket as depicted refer tothe year-on-year rate ofchange in real terms, whileimport demand in this marketrefers to the year-on-year rateof change in US dollar terms.
Note : Both refer to theyear-on-year rate of changein US dollar terms.
/2.21 .....

52
2.21 Total exports of goods to the United States turned up to a 3.7%growth in real terms in 2002, having fallen distinctly by 9.1% in 2001, asimport demand in this market gradually revived over the course of the year.Apart from increased import intake, improvement in the price competitivenessof Hong Kong’s exports also helped the rebound.
Q1 Q3 Q1 Q3 Q1 Q3 Q1 Q3 Q1 Q3 Q1 Q31997 1998 1999 2000 2001 2002
0
5
10
15
20
25
-5
-10
-15
-20
-25
Percent
Q1 Q3 Q1 Q3 Q1 Q3 Q1 Q3 Q1 Q3 Q1 Q31997 1998 1999 2000 2001 2002
0
10
20
30
40
50
-10
-20
-30
-40
-50
Percent
Diagram 2.12
Total exports of goods to US
US importdemand
Averageexchange
rate of NT$ against HK$
relative price competitivenessTotal exports of goods to US and
(year-on-year rate of change)
Total exports of goods to USand US import demand
(year-on-year rate of change
Average exchange rate
of Korean won against HK$
Total exports of goods to US
in real terms)
Note : (+) represents appreciation and(–) represents depreciation ofthe NT$ and Korean wonagainst HK$.
/2.22 .....

53
2.22 Total exports of goods to Japan were weak for most of 2002, yetsurged to double-digit growth towards the year-end. This was attributable toimproved economic performance in Japan, though the relative strengthening ofthe yen during the year also mattered. For 2002 as a whole, exports to Japanstill recorded a small decline of 1.0% in real terms, down from the 2.4% rise in2001.
Q1 Q3 Q1 Q3 Q1 Q3 Q1 Q3 Q1 Q3 Q1 Q31997 1998 1999 2000 2001 2002
0
10
20
30
40
-10
-20
-30
Percent
Q1 Q3 Q1 Q3 Q1 Q3 Q1 Q3 Q1 Q3 Q1 Q31997 1998 1999 2000 2001 2002
0
10
20
30
40
-10
-20
-30
Percent
Diagram 2.13
and the exchange rate factorTotal exports of goods to Japan
(year-on-year rate of change)
Total exports of goods to Japanand Japan's import demand(year-on-year rate of change
Total exports of goods to Japan
Japan's import
demand
Average exchangerate of yen
against HK$
Total exports of goods to Japan
in real terms)
Note : (+) represents appreciation and(–) represents depreciation ofthe yen against HK$.
/2.23 .....

54
2.23 Total exports of goods to the United Kingdom were still distinctlyweak in the first half of 2002. But as its import demand firmed up, exports ofconsumer goods and capital goods to this market progressively improvedduring the year, while exports of material inputs showed a lesser decline. For2002 as a whole, exports to the United Kingdom had a meagre rise of 0.7% inreal terms, yet already markedly improved from the 10.1% decline in 2001.
Q1 Q3 Q1 Q3 Q1 Q3 Q1 Q3 Q1 Q3 Q1 Q31997 1998 1999 2000 2001 2002
0
5
10
15
20
25
30
35
-5
-10
-15
Percent
Q1 Q3 Q1 Q3 Q1 Q3 Q1 Q3 Q1 Q3 Q1 Q31997 1998 1999 2000 2001 2002
0
5
10
15
20
25
30
35
-5
-10
-15
Percent
Diagram 2.14
and the exchange rate factorTotal exports of goods to UK
(year-on-year rate of change)
Total exports of goods to UKand UK's import demand(year-on-year rate of change
Total exports of goods to UK
UK's import demand*
Total exports of goods to UK
in real terms)
Aveage exchange rate of pound sterling
against HK$
Note : (*) UK's import demandas depicted refers toits imports sourcedfrom outside theEuropean Union.
Note : (+) represents appreciation and(–) represents depreciation ofthe pound sterling againstHK$.
/2.24 .....

55
2.24 Total exports of goods to Germany were still subdued in 2002, amidstthe sluggish domestic demand there. Yet there was likewise a turnaround topositive growth in the second half of the year. A relative improvement indemand in this market and a stronger euro conceivably helped. Exports toGermany, with a 2.4% fall in real terms in 2002, was not as worse as the 11.9%decline in 2001.
Q1 Q3 Q1 Q3 Q1 Q3 Q1 Q3 Q1 Q3 Q1 Q31997 1998 1999 2000 2001 2002
0
10
20
30
-10
-20
Percent
Q1 Q3 Q1 Q3 Q1 Q3 Q1 Q3 Q1 Q3 Q1 Q31997 1998 1999 2000 2001 2002
0
10
20
30
-10
-20
Percent
Diagram 2.15
and the exchange rate factorTotal exports of goods to Germany
(year-on-year rate of change)
Total exports of goods to Germanyand Germany's import demand
(year-on-year rate of change)
Total exportsof goods to Germany
Total exportsof goods to GermanyGermany's
import demand
Average exchangerate of euroagainst HK$
Note : Total exports of goods tothis market as depictedrefer to the year-on-yearrate of change in realterms, while importdemand in this marketrefers to the year-on-yearrate of change in valueterms, i.e. in terms of itslocal currency.
Note : (+) represents appreciation and(–) represents depreciation ofthe euro against HK$.
/2.25 .....

56
2.25 Total exports of goods to Taiwan reverted to positive growth at 2.1%in real terms in 2002, after a distinct decrease by 6.9% in 2001. Theperformance of exports to this market was however somewhat unsteady, withdeclines in the first two quarters followed by a sharp rebound in the thirdquarter and then a markedly slower growth in the fourth quarter. The relapsetowards the year-end was due to a sharp fall-off in exports of material inputs,while exports of consumer goods also slackened visibly.
Q1 Q3 Q1 Q3 Q1 Q3 Q1 Q3 Q1 Q3 Q1 Q31997 1998 1999 2000 2001 2002
0
10
20
30
40
-10
-20
-30
Percent
Q1 Q3 Q1 Q3 Q1 Q3 Q1 Q3 Q1 Q3 Q1 Q31997 1998 1999 2000 2001 2002
0
10
20
30
40
-10
-20
-30
Percent
Diagram 2.16
and the exchange rate factorTotal exports of goods to Taiwan
(year-on-year rate of change)
Total exports of goods to Taiwanand Taiwan's import demand(year-on-year rate of change)
Total exports of goods to
Taiwan
Total exports of goods to
Taiwan
Average exchange rate of NT$ against HK$
Taiwan's import demand
Note : See the footnote toDiagram 2.15.
Note : (+) represents appreciation and(–) represents depreciation ofthe NT$ against HK$.
/2.26 .....

57
2.26 Total exports of goods to Singapore rebounded sharply over thecourse of 2002, as its import demand was resurrected after a distinct setbackearlier. Following a modest growth in the first quarter, exports to this marketwere at double-digit growth for the rest of the year. Exports of consumer goodsand capital goods were more robust, while exports of material inputs alsoimproved. For 2002 as a whole, exports to this market surged by 11.7% in realterms, in stark contrast to the 16.1% slump in 2001.
Q1 Q3 Q1 Q3 Q1 Q3 Q1 Q3 Q1 Q3 Q1 Q31997 1998 1999 2000 2001 2002
0
10
20
30
-10
-20
-30
Percent
Q1 Q3 Q1 Q3 Q1 Q3 Q1 Q3 Q1 Q3 Q1 Q31997 1998 1999 2000 2001 2002
0
10
20
30
-10
-20
-30
Percent
Diagram 2.17
and the exchange rate factorTotal exports of goods to Singapore
(year-on-year rate of change)
Total exports of goods to Singaporeand Singapore's import demand
(year-on-year rate of change
Total exports of goods to Singapore
Total exports of goods to Singapore
Average exchange rate of S$
against HK$
Singapore's import demand
in real terms)
Note : (+) represents appreciation and(–) represents depreciation ofthe S$ against HK$.
/2.27 .....

58
2.27 Total exports of goods to the Republic of Korea rebounded even morestrongly in 2002, with double-digit growth attained in all quarters. The upsurgewas particularly pronounced in the latter part of the year, consistent with therobust export performance of the country. There were leaps in exports to thismarket for almost all the major end-use categories. For 2002 as a whole,exports to this market soared by 20.8% in real terms. This contrasted with a5.9% decline in 2001.
Q1 Q3 Q1 Q3 Q1 Q3 Q1 Q3 Q1 Q3 Q1 Q31997 1998 1999 2000 2001 2002
0
20
40
60
80
100
-20
-40
-60
Percent
Q1 Q3 Q1 Q3 Q1 Q3 Q1 Q3 Q1 Q3 Q1 Q31997 1998 1999 2000 2001 2002
0
20
40
60
80
100
-20
-40
-60
Percent
Diagram 2.18
the exchange rate factor(year-on-year rate of change)
Total exports of goods to theRepublic of Korea and the Republic
(year-on-year rate of change)
Total exports of goods to the
Republic of Korea
Average exchange rate of Korean won
against HK$The Republic
of Korea's import demand
of Korea's import demand
Total exports of goods tothe Republic of Korea and
Total exports of goods to the
Republic of Korea
Note : See the footnote toDiagram 2.11.
Note : (+) represents appreciation and(–) represents depreciation ofthe Korean won against HK$.
/2.28 .....

59
2.28 Analysed by major commodity group, electronic componentscontinued to account for the largest share by value of Hong Kong’s totalexports of goods, at 15% in 2002. This was followed by telecommunicationsand sound recording and reproducing equipment (with a share of 11%),clothing (11%), textiles (6%), toys (5%), and office machines and equipment(5%). The rebound in export performance in 2002 was seen in almost all themajor commodity groups, with particularly sharp surge in exports of officemachines and equipment and of telecommunications products, and with alsosignificant gain in exports of electronic components.
Diagram 2.19Total exports of goods by major commodity group in 2002
Total exports of goods in 2002 : $1,560.5 billion
Electronic components$237.8 billion (15%)
Clothing$175.0 billion (11%)
Watches and clocks$38.6 billion (2%)
Textiles$96.9 billion (6%)
Telecommunications and sound recording and reproducing equipment$179.3 billion (11%)
Metal manufactures$53.0 billion (3%)
Jewellery $42.2 billion (3%)
Office machines and equipment$71.5 billion (5%)
Others$580.8 billion (37%)
Toys$85.5 billion (5%)
/Table 2.15 .....

60
Table 2.15Total exports of goods by major commodity group
(year-on-year rate of change in real terms (%))
Electroniccomponents
Telecom-munications
and soundrecording andreproducingequipment Clothing Textiles Toys
Officemachines
andequipment
2001 Annual 4.7 -2.3 0.1 -7.0 -15.3 14.6
H1 11.5 3.5 3.7 -5.2 -10.6 18.0H2 -1.0 -6.6 -2.6 -8.7 -18.3 11.8
Q1 13.3 12.4 0.2 2.3 -0.5 16.8Q2 9.8 -4.1 7.2 -10.6 -18.1 19.2Q3 -0.3 -11.1 -3.5 -8.2 -10.7 16.8Q4 -1.8 -2.1 -1.6 -9.2 -27.5 7.2
2002 Annual 20.4 24.6 -1.1 5.5 1.4 31.1
H1 9.4 10.7 -5.5 2.3 -5.2 36.4H2 30.9 36.3 2.4 8.6 6.0 26.4
Q1 5.1 6.6 -7.7 -7.3 -12.6 37.8Q2 13.6 14.7 -3.6 10.3 1.5 35.0Q3 22.8 40.1 5.4 5.5 -1.8 18.7Q4 39.0 32.7 -0.9 11.9 17.5 33.9
Re-exports
2.29 Re-exports continued to take up a predominant share of total exportsof goods, at 92% by value in 2002, further up from 90% in 2001. Analysed bymajor market, the Mainland remained the largest market for Hong Kong’sre-exports, accounting for 40% of the total value in 2002. It was followed bythe United States (with a share of 20%), Japan (6%), the United Kingdom (3%),Germany (3%), Taiwan (2%), Singapore (2%), and the Republic of Korea (2%).
/Diagram 2.20 .....

61
Diagram 2.20
Re-exports by major market in 2002
Total re-exports in 2002 : $1,429.6 billion
Mainland of China$571.9 billion (40%)
United States$291.0 billion (20%)
Japan$80.7 billion (6%)
Germany$44.6 billion (3%)
United Kingdom$46.6 billion (3%)
Others$305.8 billion (21%)
Taiwan$30.2 billion (2%)
Singapore$29.4 billion (2%)
Republic of Korea$29.3 billion (2%)
Table 2.16Value of re-exports by market
2001 2002
Value($Bn)
Sharein total
(%)
Rateof change
(%)Value($Bn)
Sharein total
(%)
Rateof change
(%)
All markets 1,327.5 100 -4.6 1,429.6 100 7.7
Mainland of China
496.6 37 1.6 571.9 40 15.2
United States
282.2 21 -9.3 291.0 20 3.1
Japan 83.6 6 1.8 80.7 6 -3.4United Kingdom
46.8 4 -10.7 46.6 3 -0.3
Germany 45.8 3 -9.5 44.6 3 -2.6Taiwan 30.0 2 -10.9 30.2 2 0.6Singapore 26.9 2 -15.9 29.4 2 9.3Republic of Korea
24.6 2 -8.7 29.3 2 18.8
Rest of the world
291.0 22 -7.4 305.8 21 5.1
/2.30 .....

62
2.30 The pick-up in re-exports to the major markets in 2002 was almostacross-the-board. Re-exports to many of the East Asian markets, including theMainland, the Republic of Korea, Malaysia, Singapore and Thailand, attaineddouble-digit growth in real terms in 2002, with the growth momentumaccelerating even more markedly towards the end of the year. Re-exports toJapan, though also reviving distinctly over the course of the year, had virtuallyzero growth for 2002 as a whole. Re-exports to the United States reverted topositive growth in the second quarter, with growth picking up visibly further inthe third and fourth quarters. Re-exports to the United Kingdom and Germanyhad a similar profile, though at a less rapid acceleration than those to the UnitedStates.
Table 2.17Re-exports by major market
(year-on-year rate of change in real terms (%))
Mainlandof China
UnitedStates Japan
UnitedKingdom Germany Taiwan Singapore
Republicof Korea
2001 Annual 4.8 -8.9 3.7 -9.0 -8.1 -7.7 -12.6 -5.4
H1 8.3 -5.0 12.4 -5.5 -7.0 -3.3 -9.6 -2.0H2 1.9 -12.1 -3.5 -11.7 -9.0 -11.6 -15.3 -8.4
Q1 11.1 1.3 17.4 0.6 1.7 -2.4 -3.1 -1.4Q2 6.0 -10.2 7.5 -10.9 -15.2 -4.2 -15.6 -2.6Q3 7.8 -10.2 -0.3 -9.8 -11.4 -17.0 -18.9 -10.3Q4 -3.9 -14.2 -6.4 -13.6 -6.7 -6.1 -11.3 -6.6
2002 Annual 18.5 6.0 * 2.8 0.7 4.7 13.8 22.5
H1 11.1 -2.6 -7.9 -2.7 -8.4 -3.8 12.0 18.2H2 25.1 13.5 7.6 7.4 8.6 13.2 15.4 26.7
Q1 7.8 -12.2 -10.3 -8.4 -13.7 -6.0 7.1 19.5Q2 14.0 6.5 -5.3 2.9 -2.5 -1.7 17.2 16.8Q3 18.4 11.2 3.1 6.2 6.6 18.8 12.5 23.6Q4 32.5 16.1 12.1 8.7 10.4 8.2 18.1 29.7
Notes : See the footnote to Table 2.5.
(*) Change of less than 0.05%.
/2.31 .....

63
2.31 The Mainland remained the largest source of Hong Kong’s re-exports,supplying 60% by value of the goods re-exported through Hong Kong in 2002.Other major sources included Japan (with a share of 9%), Taiwan (7%), theUnited States (4%), and the Republic of Korea (3%).
2.32 Re-exports from almost all the major sources showed improvementalbeit to different degrees in 2002. Re-exports sourced from Taiwan and theRepublic of Korea had the most distinct growth. But re-exports sourced fromthe United States remained on a decline.
Diagram 2.21
Re-exports by major source in 2002
Total re-exports in 2002 : $1,429.6 billion
Mainland of China$864.0 billion (60%)
United States$62.9 billion (4%)
Japan$135.8 billion (9%)
Republic of Korea$47.2 billion (3%)
Taiwan$94.3 billion (7%)
Others$225.4 billion (16%)
/Table 2.18 .....

64
Table 2.18Value of re-exports by source
2001 2002
Value($Bn)
Sharein total
(%)
Rateof change
(%)Value($Bn)
Sharein total
(%)
Rateof change
(%)
All sources 1,327.5 100 -4.6 1,429.6 100 7.7
Mainland of China
808.4 61 -4.8 864.0 60 6.9
Japan 125.6 9 -8.5 135.8 9 8.1Taiwan 80.3 6 -8.7 94.3 7 17.4United States
65.2 5 -0.4 62.9 4 -3.5
Republic of Korea
39.8 3 -13.6 47.2 3 18.7
Rest of the world
208.2 16 1.3 225.4 16 8.3
Domestic exports
2.33 The Mainland and the United States were the largest markets forHong Kong’s domestic exports, both accounting for 32% of the total value in2002. They were followed by the United Kingdom (with a share of 6%),Taiwan (3%), Germany (3%), the Netherlands (3%), Japan (2%),Malaysia (2%), Canada (2%), and Singapore (2%).
2.34 Domestic exports to nearly all of the major markets fell distinctlyfurther in 2002, as the structural shift to re-exports and offshore trade continued.For domestic exports to the United Kingdom and Singapore, some relativeimprovement was nevertheless observed in the second half of the year. Butdomestic exports to most of the other major markets were weak all through theyear.
/Diagram 2.22 .....

65
Diagram 2.22
Domestic exports by major market in 2002
Total domestic exports in 2002 : $130.9 billion
Mainland of China$41.4 billion (32%)
United States$41.9 billion (32%)
Japan $3.0 billion (2%)
Germany$4.3 billion (3%)
United Kingdom$7.6 billion (6%)
Others$17.7 billion (14%)
Taiwan$4.4 billion (3%)
Singapore $2.2 billion (2%)
Netherlands $3.5 billion (3%)
Malaysia $2.6 billion (2%)Canada $2.4 billion (2%)
Table 2.19Value of domestic exports by market
2001 2002
Value($Bn)
Sharein total
(%)
Rateof change
(%)Value($Bn)
Sharein total
(%)
Rateof change
(%)
All markets 153.5 100 -15.2 130.9 100 -14.7
United States 47.6 31 -12.6 41.9 32 -11.9Mainland of China
49.5 32 -8.5 41.4 32 -16.5
United Kingdom
8.6 6 -19.7 7.6 6 -11.5
Taiwan 5.3 3 -12.4 4.4 3 -17.9Germany 5.8 4 -37.4 4.3 3 -26.6Netherlands 4.6 3 18.1 3.5 3 -24.9Japan 4.1 3 -20.1 3.0 2 -26.9Malaysia 1.7 1 -35.7 2.6 2 53.6Canada 3.1 2 -3.7 2.4 2 -22.0Singapore 2.7 2 -43.8 2.2 2 -18.4Rest of the world
20.5 13 -23.2 17.7 14 -13.4
/Table 2.20 .....
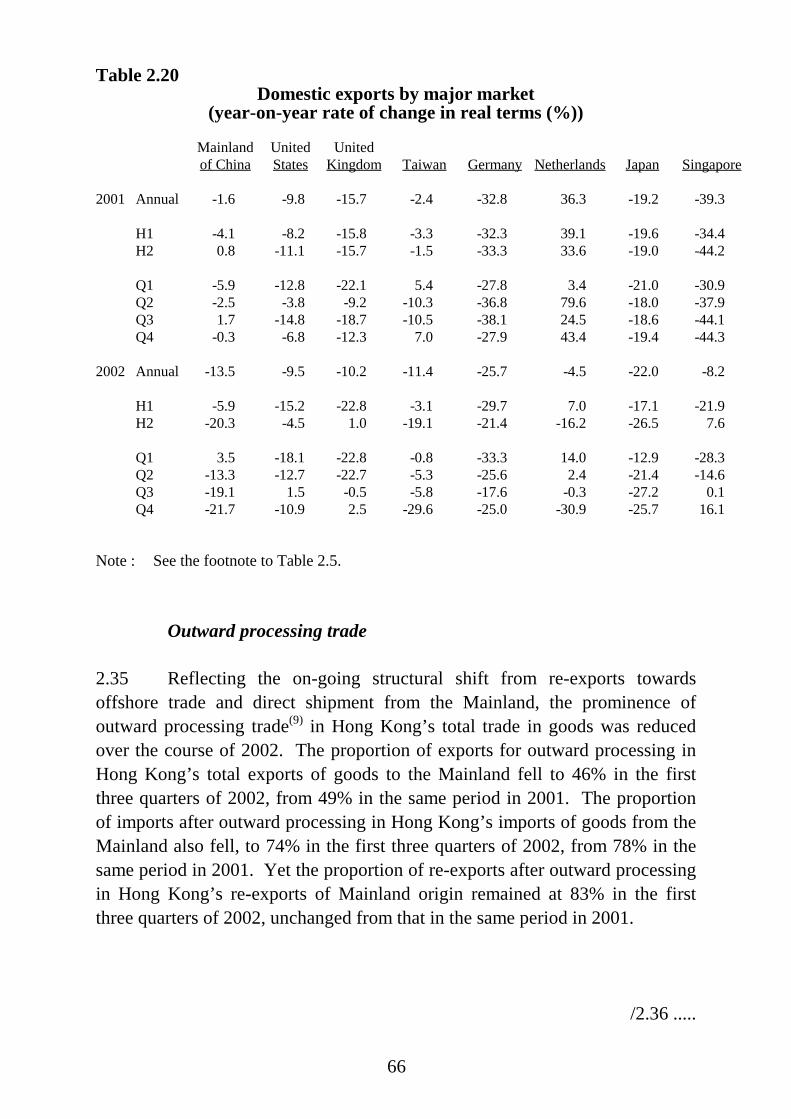
66
Table 2.20Domestic exports by major market
(year-on-year rate of change in real terms (%))
Mainlandof China
UnitedStates
UnitedKingdom Taiwan Germany Netherlands Japan Singapore
2001 Annual -1.6 -9.8 -15.7 -2.4 -32.8 36.3 -19.2 -39.3
H1 -4.1 -8.2 -15.8 -3.3 -32.3 39.1 -19.6 -34.4H2 0.8 -11.1 -15.7 -1.5 -33.3 33.6 -19.0 -44.2
Q1 -5.9 -12.8 -22.1 5.4 -27.8 3.4 -21.0 -30.9Q2 -2.5 -3.8 -9.2 -10.3 -36.8 79.6 -18.0 -37.9Q3 1.7 -14.8 -18.7 -10.5 -38.1 24.5 -18.6 -44.1Q4 -0.3 -6.8 -12.3 7.0 -27.9 43.4 -19.4 -44.3
2002 Annual -13.5 -9.5 -10.2 -11.4 -25.7 -4.5 -22.0 -8.2
H1 -5.9 -15.2 -22.8 -3.1 -29.7 7.0 -17.1 -21.9H2 -20.3 -4.5 1.0 -19.1 -21.4 -16.2 -26.5 7.6
Q1 3.5 -18.1 -22.8 -0.8 -33.3 14.0 -12.9 -28.3Q2 -13.3 -12.7 -22.7 -5.3 -25.6 2.4 -21.4 -14.6Q3 -19.1 1.5 -0.5 -5.8 -17.6 -0.3 -27.2 0.1Q4 -21.7 -10.9 2.5 -29.6 -25.0 -30.9 -25.7 16.1
Note : See the footnote to Table 2.5.
Outward processing trade
2.35 Reflecting the on-going structural shift from re-exports towardsoffshore trade and direct shipment from the Mainland, the prominence ofoutward processing trade(9) in Hong Kong’s total trade in goods was reducedover the course of 2002. The proportion of exports for outward processing inHong Kong’s total exports of goods to the Mainland fell to 46% in the firstthree quarters of 2002, from 49% in the same period in 2001. The proportionof imports after outward processing in Hong Kong’s imports of goods from theMainland also fell, to 74% in the first three quarters of 2002, from 78% in thesame period in 2001. Yet the proportion of re-exports after outward processingin Hong Kong’s re-exports of Mainland origin remained at 83% in the firstthree quarters of 2002, unchanged from that in the same period in 2001.
/2.36 .....

67
2.36 Total exports of goods to the Mainland for outward processingimproved progressively during the year, along with a stronger import intake inthe Mainland for export processing. Yet because of a weak start, there wasvirtually no change in value terms for the first three quarters of 2002 takentogether from a year earlier. This still represented a relative gain from the 8.0%decline in 2001. Total exports of goods to the Mainland for meeting its owndemand were robust throughout, and more so in the third quarter. For the firstthree quarters of 2002 taken together, there was a 13.3% surge in value termsover a year earlier, up further from the 10.0% leap in 2001.
Exports to the mainland of China for outward processing and for meeting its own demand
(year-on-year rate of change in value terms)
Q1 Q2 Q3 Q4 Q1 Q2 Q3 Q4 Q1 Q2 Q3 Q4 Q1 Q2 Q3 Q4 Q1 Q2 Q3 Q4 Q1 Q2 Q31997 1998 1999 2000 2001 2002
0
10
20
30
-10
-20
-30
Percent
Diagram 2.23
Exports to the Mainland for outward processing
Exports to the Mainland for meeting its own demand
/Table 2.21 .....

68
Table 2.21Total exports of goods to the mainland of China
for outward processing and for meeting its own demand(year-on-year rate of change in value terms (%))
Total exportsof goods to
the Mainland
Of which :
Total exportsof goods to
the Mainlandfor outward
processing
Total exportsof goods to
the Mainlandfor meeting
its own demand
2001 Annual 0.6 -8.0 10.0
H1 4.4 -2.5 11.8H2 -2.7 -12.8 8.4
Q1 8.0 6.1 9.9Q2 1.4 -9.5 13.4Q3 2.7 -1.6 7.3Q4 -8.0 -23.6 9.5
2002 H1 3.6 -2.7 9.5Q1-Q3 6.9 0.1 13.3
Q1 1.1 -8.2 10.3 Q2 5.8 2.4 8.8
Q3 12.8 5.1 20.3
2.37 Imports of goods from the Mainland after outward processing, thoughresuming growth in the third quarter, still had a 4.3% decrease in value termsfor the first three quarters of 2002 taken together over a year earlier. This cameafter a 6.2% fall in 2001. Re-exports of Mainland origin after outwardprocessing had a broadly similar profile, with resumed growth in the thirdquarter, yet still down by 2.6% in value terms in the first three quarters of 2002taken together over a year earlier. This followed a 10.7% dip in 2001.
/Table 2.22 .....

69
Table 2.22Imports of goods from the mainland of China
and re-exports of Mainland originto overseas markets after outward processing
(year-on-year rate of change in value terms (%))
Imports of goods Re-exports of from the Mainland Mainland origin after
after outward processing outward processing
2001 Annual -6.2 -10.7
H1 -0.2 -4.3H2 -11.0 -16.0
Q1 4.6 0.8Q2 -4.1 -8.6Q3 -11.4 -11.2Q4 -10.6 -20.8
2002 H1 -10.4 -6.5Q1-Q3 -4.3 -2.6
Q1 -10.9 -6.4Q2 -9.9 -6.7Q3 6.3 4.3
Imports of goods
2.38 The Mainland continued to be the largest source of Hong Kong’simports of goods, accounting for 44% of the total value in 2002. Other majorsources of imports included Japan (with a share of 11%), Taiwan (7%), theUnited States (6%), the Republic of Korea (5%), and Singapore (5%).
2.39 Propelled by the resurgence in intra-regional trade, imports from allthe East Asian economies reverted to positive growth in 2002. But importsfrom the United States had an enlarged decline.
/Diagram 2.24 .....

70
Diagram 2.24Imports of goods by major source in 2002
Total imports of goods in 2002 : $1,619.4 billion
Mainland of China$717.1 billion (44%)
Japan$182.6 billion (11%)
Taiwan$115.9 billion (7%)
Singapore$75.7 billion (5%)
Others$360.7 billion (22%)
United States$91.5 billion (6%)
Republic of Korea $76.0 billion (5%)
Table 2.23Value of imports of goods by source
2001 2002
Value($Bn)
Sharein total
(%)
Rateof change
(%)Value($Bn)
Sharein total
(%)
Rateof change
(%)
All sources 1,568.2 100 -5.4 1,619.4 100 3.3
Mainland of China
682.0 43 -4.6 717.1 44 5.1
Japan 176.6 11 -11.2 182.6 11 3.4Taiwan 107.9 7 -13.1 115.9 7 7.4United States
104.9 7 -7.0 91.5 6 -12.8
Republic of Korea
70.8 5 -12.2 76.0 5 7.3
Singapore 72.9 5 -2.8 75.7 5 3.9Rest of the World
353.1 23 0.5 360.7 22 2.2
/Table 2.24 .....

71
Table 2.24Imports of goods by major source
(year-on-year rate of change in real terms (%))
Mainlandof China Japan Taiwan
UnitedStates
Republicof Korea Singapore
2001 Annual -2.9 -7.1 -7.1 -4.5 -5.3 2.4
H1 0.7 -0.2 -0.8 3.6 1.6 5.5H2 -5.9 -13.2 -12.6 -11.7 -11.6 -0.3
Q1 6.2 1.1 1.4 3.3 -2.5 11.3Q2 -4.0 -1.4 -2.7 3.8 5.9 0.5Q3 -5.9 -8.7 -11.0 -2.9 -8.7 0.8Q4 -5.9 -17.6 -14.3 -20.1 -14.4 -1.5
2002 Annual 9.0 7.7 12.0 -7.9 12.5 10.0
H1 3.1 -3.0 3.3 -14.4 1.1 1.3H2 14.2 18.8 20.8 -1.2 24.3 18.5
Q1 -2.7 -7.4 1.0 -16.4 -3.1 -1.0Q2 8.6 1.2 5.4 -12.5 5.2 3.4Q3 11.9 12.7 16.9 -8.0 24.6 9.8Q4 16.7 25.2 25.0 6.7 24.1 27.9
Note : See the footnote to Table 2.5.
Retained imports
2.40 Japan again overtook the Mainland to become the largest source ofHong Kong’s retained imports in 2002, having been surpassed by the Mainlandin 2001. They accounted for about 14% and 12% respectively of the total valueof retained imports in 2002. Other major suppliers of retained imports includedthe Republic of Korea (with a share of 9%), Singapore (8%), the United States(7%), and Taiwan (6%).
2.41 Analysed by end-use category, retained imports of consumer goodsrose more moderately by 5.7% in real terms in 2002, after a faster growth of8.4% in 2001. The growth was more notable in electrical appliances andjewellery, yet more modest in clothing. Retained imports of foodstuffs hadfurther moderate growth at 5.3% in real terms in 2002, having risen by 2.2% in2001.
/2.42 .....

72
2.42 Retained imports of capital goods plummeted by 13.6% in real termsin 2002, in stark contrast to an 8.1% growth in 2001. There was nevertheless arelative improvement towards the end of the year, helped in part by a low baseof comparison a year earlier. The setback in 2002 was mainly concentrated inintake of office equipment and of capital goods in the “others” category. Intakeof construction machinery nevertheless held up rather well for much of the year.Intake of industrial machinery had a lesser decline. Intake oftelecommunications equipment fell slightly.
2.43 Retained imports of raw materials and semi-manufactures, havingplunged by 14.5% in 2001, reverted to positive growth at 9.8% in real terms in2002. There should have been some inventory replenishment following thedraw-down in 2001. Retained imports of fuels picked up to a 4.8% rise in realterms in 2002, after a meagre increase of 0.2% in 2001.
Table 2.25Retained imports by end-use category
(year-on-year rate of change in real terms (%))
Consumergoods Foodstuffs
Capitalgoods
Rawmaterials and
semi-manufactures Fuels
2001 Annual 8.4 2.2 8.1 -14.5 0.2
H1 6.6 -1.6 14.7 -6.2 3.0H2 10.2 5.9 2.6 -22.2 -2.3
Q1 1.3 2.2 28.3 -7.6 4.7Q2 11.8 -5.3 3.5 -4.8 1.5Q3 12.3 16.3 12.3 -23.2 -8.2Q4 8.0 -3.9 -7.0 -21.2 4.1
2002 Annual 5.7 5.3 -13.6 9.8 4.8
H1 0.7 9.7 -16.6 -2.1 0.7H2 10.7 1.2 -10.9 23.1 8.8
Q1 -2.3 14.2 -23.0 -9.2 -3.3Q2 3.3 5.0 -10.1 4.4 4.4Q3 11.9 -8.9 -18.0 27.1 7.8Q4 9.3 12.7 -2.3 19.1 9.7
Note : See the footnote to Table 2.5 and Note (a) to Table 2.7.
/Table 2.26 .....

73
Table 2.26Retained imports of capital goods by broad type(year-on-year rate of change in real terms (%))
Industrialmachinery for
manufacturing useConstructionmachinery
Officeequipment
Tele-communications
equipment
Othercapitalgoods
2001 Annual -4.2 35.0 -10.0 27.7 31.1
H1 3.7 23.9 -7.7 65.9 21.0H2 -11.1 47.9 -12.1 2.6 39.8
Q1 6.8 36.1 17.3 77.8 30.2Q2 1.1 15.2 -26.0 55.3 12.7Q3 -15.2 40.6 3.1 23.3 52.3Q4 -6.2 55.2 -27.6 -12.0 26.1
2002 Annual -1.5 11.1 -12.3 -2.5 -38.9
H1 -6.0 14.7 -22.9 -10.5 -30.9H2 3.0 7.7 -2.4 6.1 -44.9
Q1 -7.5 2.2 -43.5 -4.3 -36.2Q2 -4.6 25.3 1.0 -16.7 -25.2Q3 -5.3 19.8 -18.5 12.7 -50.0Q4 12.1 -3.3 21.0 -0.5 -38.2
Note : See the footnote to Table 2.5 and Note (a) to Table 2.7.
Invisible trade
Exports of services
2.44 Transportation services and trade-related services (comprising mainlyoffshore trade) both accounted for the largest shares in Hong Kong’s exports ofservices, each at 31% by value in 2002. This was followed by exports of travelservices (with a share of 22%), and financial, business and other services (16%).
/Diagram 2.25 .....

74
Diagram 2.25Exports of services by major service group in 2002
Exports of services in 2002 : $352.2 billion
Transportation services$109.7 billion (31%)
Financial, businessand other services$55.3 billion (16%)
Trade-related services$109.1 billion (31%)
Travel services$78.0 billion (22%)
2.45 Exports of services accelerated in growth over the course of the year,giving a double-digit increase by 12.1% in real terms for 2002 as a whole. Thiswas distinctly up from the 5.9% rise in 2001. Within the total, exports of travelservices performed particularly well on the back of soaring incoming visitors,with a 21.1% growth in real terms in 2002. Exports of transportation servicesbenefited from the distinct pick-up in external trade, with a 12.7% growth inreal terms. Exports of trade-related services flourished, amidst the on-goingshift towards offshore trading activities, with a 13.0% growth in real terms.But exports of financial, business and other services were generally subdued,with a 0.2% decline in real terms.
/Table 2.27 .....

75
Table 2.27Exports of services by major service group
(year-on-year rate of change in real terms (%))
Exportsof services
Of which :
Transportationservices
Trade-relatedservices(a)
Travelservices(b)
Financial,businessand otherservices
2001 Annual 5.9 7.2 5.8 7.5 2.1
H1 7.5 9.2 8.3 7.5 3.4H2 4.5 5.4 4.0 7.5 0.9
Q1 7.4 9.9 11.3 4.7 0.9Q2 7.6 8.6 5.3 10.0 6.2Q3 3.7 5.1 3.7 3.4 1.7Q4 5.3 5.8 4.4 11.3 *
2002 Annual 12.1 12.7 13.0 21.1 -0.2
H1 8.2 10.7 6.8 11.5 2.1H2 15.7 14.6 17.5 30.5 -2.3
Q1 7.7 12.0 5.4 8.0 3.7Q2 8.6 9.4 8.3 14.4 0.3Q3 14.1 14.8 15.0 24.6 0.2Q4 17.2 14.4 19.8 35.6 -4.8
Notes : (a) Comprising mainly offshore trade.
(b) Comprising mainly inbound tourism receipts.
(*) Change of less than 0.05%.
Also see the footnote to Table 2.9.
Imports of services
2.46 Travel services continued to account for the largest share in HongKong’s imports of services, at 50% by value in 2002. This was followed byimports of transportation services (with a share of 26%), financial, business andother services (18%), and trade-related services (5%).
/Diagram 2.26 .....

76
Diagram 2.26Imports of services by major service group in 2002
Imports of services in 2002 : $188.8 billion
Transportation services$50.0 billion (26%)
Travel services$94.9 billion (50%)
Financial, business and other services$33.6 billion (18%)
Trade-related services$10.4 billion (5%)
2.47 With the decline in the early part of the year offset by the pick-up inthe latter part, imports of services recorded a slight decline of 0.8% in realterms for 2002 as a whole, after a 0.2% decline in 2001. Within the total,imports of transportation services and trade-related services both reverted topositive growth at 1.5% and 2.5% respectively in real terms in 2002, along withthe pick-up in merchandise trade. But imports of travel services and imports offinancial, business and other services were both weak, falling by 2.2% and1.1% respectively in real terms.
/Table 2.28 .....

77
Table 2.28Imports of services by major service group
(year-on-year rate of change in real terms (%))
Of which : Financial,
Importsof services
Travel services(a)
Transportationservices
Trade-relatedservices
businessand otherservices
2001 Annual -0.2 0.9 -2.8 -2.9 1.3
H1 2.4 2.3 2.6 -0.6 3.2H2 -2.6 -0.5 -7.9 -4.5 -0.4
Q1 3.3 3.2 4.8 2.2 1.9Q2 1.5 1.3 0.8 -3.3 4.6Q3 -2.4 -0.9 -6.3 -4.8 -0.1Q4 -2.8 * -9.6 -4.1 -0.6
2002 Annual -0.8 -2.2 1.5 2.5 -1.1
H1 -2.6 -3.7 -2.9 -1.9 0.9H2 0.9 -0.7 6.0 5.7 -3.0
Q1 -1.3 -2.0 -2.1 -3.2 2.6Q2 -4.0 -5.6 -3.6 -0.6 -0.8Q3 1.0 -1.5 6.9 3.5 -1.3Q4 0.9 0.2 4.9 7.8 -4.6
Notes : (a) Comprising mainly outbound travel spending.
(*) Change of less than 0.05%.
Also see the footnote to Table 2.9.
Overall balance of payments(10)
2.48 In the third quarter of 2002, the current account remained in sizeablesurplus, at $40.1 billion, equivalent to 12.3% of GDP in that quarter. This wasmore than doubled the surplus at $19.3 billion or 6.3% of GDP in the secondquarter. The enlarged surplus was due to a distinct narrowing in the visibletrade deficit, a further increase in the invisible trade surplus, as well as a largernet external factor income inflow.
2.49 In the capital and financial account, there was a net outflow offinancial non-reserve assets in the third quarter of 2002, at $62.8 billion,
/equivalent .....

78
equivalent to 19.3% of GDP in that quarter. This was also more than doubledthe net outflow at $25.9 billion or 8.4% of GDP in the second quarter. Withinthe total, portfolio investment recorded a further large, albeit reduced, netoutflow of $82.5 billion in the third quarter. This was mainly attributable to aplunge in portfolio investment inflow amidst the volatile local stock market, aswell as a surge in portfolio investment outflow to foreign equity securities.Direct investment switched to a net outflow of $32.7 billion in the third quarter.Yet this was mainly due to a significant merger and acquisition activityconducted in that quarter. Other investment nevertheless had a further netinflow of $58.1 billion in the third quarter. Also, there was a net cashsettlement of financial derivatives, as net outflow at $5.7 billion in the thirdquarter.
2.50 Overall, there was hence a balance of payments deficit at $7.7 billion,equivalent to 2.4% of GDP, in the third quarter of 2002. Reserve assetsdecreased correspondingly by the same amount. Together with a surplus at$0.7 billion in the first half of the year, there was an overall balance ofpayments deficit at $7.0 billion, equivalent to 0.7% of GDP, in the first threequarters of 2002 taken together.
Q1 Q2 Q3 Q4 Q1 Q2 Q3 Q4 Q1 Q2 Q3 Q4 Q1 Q2 Q31999 2000 2001 2002
0
20
40
60
80
-20
-40
-60
-80
HK$ Billion
Current account balance Net change in capital and financial non-reserve assets Net change in reserve assets
Major balances in Hong Kong's balance of paymentsDiagram 2.27
Note : A negative value for net change in reserve assets represents a netincrease, and a positive value represents a net decrease.
/Table 2.29 .....

79
Table 2.29Hong Kong’s balance of payments account
($ billion at current market prices)
2000# 2001# 2001 2002
Q1# Q2# Q3# Q4# Q1# Q2# Q3#
Current account(a) 71.0 95.8 13.8 9.8 33.3 38.9 30.8 19.3 40.1
Trade in goods -63.8 -65.0 -24.6 -23.9 -11.4 -5.0 -12.4 -16.4 -5.6
Trade in services 126.0 133.5 28.4 31.7 33.3 40.1 31.9 37.2 41.4
External factor income flows 21.8 41.2 13.6 5.3 15.1 7.2 14.8 2.1 8.1
Current transfers -13.0 -13.9 -3.6 -3.3 -3.6 -3.4 -3.5 -3.6 -3.8
Capital and financial account -57.9 -97.4 -28.1 -9.0 -35.5 -24.8 -46.8 -30.4 -57.1
Net change in capital transfers -12.0 -9.2 -1.5 -3.2 -2.9 -1.6 -3.0 -7.6 -1.9
Net change in financial non-reserve assets
32.5 -51.7 34.3 4.2 -58.9 -31.3 -40.0 -25.9 -62.8
of which :
Direct investment 20.0 96.9 55.2 40.2 7.4 -5.9 -10.1 15.3 -32.7
Portfolio investment 190.8 -322.0 -111.4 -35.3 -82.4 -92.9 7.1 -117.8 -82.5
Financial derivatives 1.7 39.6 -7.2 12.8 25.3 8.6 12.3 6.1 -5.7
Other investment -179.9 133.8 97.7 -13.6 -9.3 58.9 -49.2 70.6 58.1
Net change in reserve assets(b) -78.3 -36.5 -61.0 -9.9 26.3 8.0 -3.9 3.1 7.7
Net errors and omissions -13.1 1.6 14.3 -0.8 2.1 -14.1 16.0 11.0 17.0
Overall balance of payments 78.3 36.5 61.0 9.9 -26.3 -8.0 3.9 -3.1 -7.7
Notes : (#) Revised figures.
(a) According to the international statistical standard for compiling balance of payments (BoP)account, imports of goods are valued on free-on-board (f.o.b.) basis, which is different fromthe practice for merchandise trade statistics where imports are valued on cost, insurance andfreight (c.i.f.) basis. In the BoP account, the insurance and freight costs related to merchandiseimports are entered as imports of services.
(b) A negative value for net change in reserve assets represents a net increase, and a positive valuerepresents a net decrease.
/Notes .....

80
Notes :
(1) Estimates of price changes for the trade aggregates are based on changes in unitvalues, which do not take into account changes in the composition or quality of thegoods traded, except for some selected commodities for which specific price indicesare available. Changes in real terms are derived by discounting the effect of pricechanges from changes in the value of the trade aggregates.
(2) Re-exports are those goods which have previously been imported into Hong Kong andare subsequently exported without having undergone in Hong Kong anymanufacturing processes which change permanently the shape, nature, form or utilityof the goods.
(3) Offshore trade is covered in exports of trade-related services within the broadercomponent of exports of services in the Gross Domestic Product. It covers theservices of both “merchanting” and “merchandising for offshore transactions”.Merchanting is defined as the services associated with trading of goods which arepurchased from a party outside Hong Kong and then sold to another party outsideHong Kong, without the goods ever entering and leaving Hong Kong. Merchandisingfor offshore transactions is defined as the services of arranging on behalf ofbuyers/sellers outside Hong Kong the purchase/sale of goods according to theirspecifications. Earnings from offshore trade include the gross margin frommerchanting and the commission from merchandising for offshore transactions.
(4) Under the BoP account, imports of goods are valued on free-on-board (f.o.b) basis,which is different from the practice for merchandise trade statistics where imports arevalued on cost, insurance and freight (c.i.f.) basis. The insurance and freight costsrelated to merchandise imports are entered as imports of services.
(5) Exports of financial and banking services in the GDP account include commissionsand fees for rendering financial and related ancillary services to non-residents.However, these do not include interest receipts from non-residents, which account fora major part of the external receipts of financial intermediaries in Hong Kong. Interestreceipts from non-residents are correctly classified as investment income from abroadunder GNP. The same situation applies, in an opposite direction, to interest paymentsto non-residents. Hence the trade in services component and the invisible tradesurplus of Hong Kong would have been larger if such interest receipts and paymentswere classified to the services account.
(6) East Asia here covers nine major markets in the region, namely the mainland of China,Japan, Taiwan, Singapore, the Republic of Korea, the Philippines, Thailand, Malaysiaand Indonesia.
(7) North America here comprises the United States and Canada.
/(8) .....

81
(8) There are currently 15 member countries in the European Union, namely the UnitedKingdom, Germany, the Netherlands, France, Sweden, Italy, Denmark, Spain, Finland,Belgium, Luxembourg, Ireland, Austria, Greece and Portugal.
(9) Outward processing arrangements are made between Hong Kong companies andmanufacturing entities in the Mainland under which the companies concernedsub-contract the whole or part of the production processes relating to their products tothe Mainland entities. Raw materials or semi-manufactures are normally exported tothe Mainland for such processing. The Mainland entity involved can be a localenterprise, a joint venture, or some other forms of business involving foreigninvestment.
There is no restriction on outward processing activities in general. However, outwardprocessing on goods which claim Hong Kong origin status is strictly governed by theHong Kong origin rules. The Trade and Industry Department operates an effectiveadministrative arrangement whereby goods manufactured in Hong Kong but havingundergone outward processing activities can be conferred Hong Kong origin statussubject to the Hong Kong origin rules being fully met.
(10) A balance of payments (BoP) account is a statistical framework that systematicallysummarises the external transactions of an economy with the rest of the world in aspecific time period.
A complete BoP account comprises the current account and the capital and financialaccount. The current account records the flows of real resources, including exports andimports of goods and services, factor income received from and paid to abroad, andcurrent transfers from and to abroad. The capital account records external capitaltransfers, and external acquisitions and disposals of non-produced and non-financialassets. The financial account records transactions in financial assets and liabilitiesbetween residents and non-residents, including direct investment, portfolio investment,financial derivatives, and other investment. Also included is net change in reserveassets.
Within the overall BoP account, the current account balance and the net change incapital and financial non-reserve assets taken together, which is deemed to representthe BoP position of the economy, matches exactly the net change in reserve assets, byvirtue of the BoP accounting identity.

82
CHAPTER 3 : THE DOMESTIC ECONOMY
Net output or value added by economic activity
3.1 As indicated by the new data series on quarterly GDP by economicactivity at constant prices(1), net output or value added for all the service sectorstaken together(2) was 4.2% higher in real terms in the third quarter of 2002 thana year earlier, further improved from nil change in the first quarter and a 1.8%increase in the second quarter. For the first three quarters of 2002 as a whole,there was a 2.1% rise in real terms, modestly exceeding the 1.4% increase in2001. Analysed by constituent sector and on a year-on-year comparison in realterms, net output in transport, storage and communications rose by 3.2% in thefirst three quarters of 2002, underpinned by a further growth in internationaltelephone and mobile phone traffic volumes, as well as by an expansion incargo handling activity upon a rebound in external trade. Net output in thewholesale, retail and import/export trades, restaurants and hotels increased by1.9%, along with a pick-up in trade-related services and inbound tourism. Netoutput in community, social and personal services went up by 0.9%, mostlyattributable to increase in education and social welfare services. Net output infinancing, insurance, real estate and business services edged up by 0.2% in realterms, as increased real estate and insurance businesses were virtually offset byreduced financing and business services.
3.2 On the other hand, net output in the local manufacturing sectorcontinued to decline, by 6.4% in real terms in the third quarter of 2002 over ayear earlier, although this was smaller than the reductions of 11.3% and 10.8%respectively in the first and second quarters. For the first three quarters of2002 as a whole, there was a 9.4% decrease in real terms, further to a 8.6% fallin 2001. The weak performance of domestic exports and an on-goingrelocation of production processes outside Hong Kong were the majordampening factors. As to the construction sector, net output went up furtherby 2.4% in real terms in the third quarter of 2002 over a year earlier, havingshrunk by 1.7% in the first quarter and rebounded by 3.2% in the second quarter.For the first three quarters of 2002 as a whole, there was a 1.2% increase in realterms, reversing a 4.3% fall in 2001. This was mainly attributable to moreintensive work on some of the major private sector development projects duringthe year.
/Table 3.1 .....

83
Table 3.1
GDP by economic activity (a)
(year-on-year rate of change in real terms (%))
2001 2002
Annual# Q1# Q2# Q3# Q4# Q1-Q3# Q1# Q2# Q3#
Manufacturing -8.6 -3.7 -4.0 -11.6 -13.8 -9.4 -11.3 -10.8 -6.4
Construction -4.3 -6.7 -4.4 -8.3 1.6 1.2 -1.7 3.2 2.4
Services(b) 1.4 3.3 2.0 0.9 -0.3 2.1 * 1.8 4.2
Of which :
Wholesale, retail andimport/export trades,restaurants and hotels
-0.3 5.2 0.3 -0.6 -5.0 1.9 -2.8 1.0 6.8
Transport, storage andcommunications
2.1 7.7 1.2 0.6 -0.4 3.2 0.2 3.6 5.5
Financing, insurance,real estate andbusiness services
-0.6 -3.3 3.5 -1.8 -0.5 0.2 -2.0 1.2 1.4
Community, social andpersonal services
3.9 6.7 2.5 4.4 2.6 0.9 1.1 0.6 1.2
Notes : (a) The GDP figures shown in this table are compiled from the productionapproach, in parallel with those shown in Table 1.1 which are compiled fromthe expenditure approach. For details, see Note (1) to this chapter.
(b) In the context of value-added contribution to GDP, the service sectors includeownership of premises as well, which is analytically a service activity. Also,charges of financial intermediation services are deducted.
(#) Revised figures.
(*) Change of less than 0.05%.
/3.3 .....

84
3.3 There was a continued shift in the structure of the economy frommanufacturing to services over the past years. Between 1991 and 2001, netoutput for the service sectors as a whole rose by an average of 8.0% per annumin value terms, whereas net output of the local manufacturing sector contractedby an average of 4.2% per annum in value terms. This led to a further distinctincrease in the contribution of the service sectors as a whole to GDP from76.6% to 86.5% over the period, concurrent with a distinct decrease in thecontribution of the local manufacturing sector to GDP from 15.3% to 5.2%.Within the total for the service sectors in 2001, the wholesale, retail andimport/export trades, restaurants and hotels continued to be the largestcontributor to GDP, with a share of 26.7%. This was followed by financing,insurance, real estate and business services (22.6%), community, social andpersonal services (21.8%), and transport, storage and communications (10.2%).As to the construction sector, net output rose by an average of 5.4% per annumin value terms from 1991 to 2001. Its contribution to GDP however fellmodestly over the period, from 5.4% to 4.8%.
3.4 The sectoral composition of employment exhibited a broadly similarshift as the sectoral contributions to GDP over the past decade. For the servicesectors as a whole, the share in total employment(3) had an even more distinctrise, from 69.0% in 1992 to 84.0% in 2002, in parallel with an even moredistinct decline in the share for the local manufacturing sector from 21.5% to6.1%. Concurrently, the share for the construction sector rose modestly, from8.0% to 9.0%.
/Diagram 3.1 .....

85
Gross Domestic Product by economic sector
Financing,insurance, realestate andbusiness services22.9%
Transport,storage and communications9.6%
Transport,storage and communications10.2%
1991 2001
Others6.2%
Others8.6%Community,
social andpersonal services14.8%
Financing,insurance, realestate andbusiness services22.6%
Wholesale, retail and import/export trades, restaurants and hotels25.8%
Manufacturing15.3%
Construction5.4%
Manufacturing5.2%
Construction4.8%
Wholesale, retail and import/export trades, restaurants and hotels26.7%
Community, socialand personal services21.8%
Diagram 3.1
Employment by economic sector*
Financing,insurance, realestate andbusiness services8.1%
Transport,storage and communications10.3%
Transport,storage and communications11.1%
1992 2002
Others1.5%
Others0.9%
Community, socialand personal services18.8%
Financing,insurance, realestate andbusinessservices15.0%
Manufacturing21.5%
Construction8.0%
Manufacturing6.1%Community,
socialand personal services26.0%
Wholesale, retail and import/export trades, restaurants and hotels31.8%
Wholesale, retail and import/export trades, restaurants and hotels32.0%
Construction9.0%
Diagram 3.2
Note : (*) These are the composite employment estimates, as derived from the basic data of theGeneral Household Survey and the Quarterly Survey of Employment and Vacancieson business establishments. Figures for 1992 refer to the annual average, whilefigures for 2002 refer to the average for the first three quarters of the year.
/Local .....

86
Local manufacturing output
3.5 The Index of Industrial Production(4), as also reflecting output in thelocal manufacturing sector, fell by 11.6%, 11.2% and 7.3% respectively involume in the first, second and third quarters of 2002 over a year earlier. Forthe first three quarters of 2002 as a whole, the Index shrank by 10.0% in volumeover a year earlier, distinctly enlarged from the 4.4% drop in 2001. Analysedby major industry group and on a year-on-year comparison, output of thefabricated metal products, the consumer electrical and electronic products, andthe machinery and equipment industries plummeted by 29.6%, 19.5% and16.2% respectively in volume for the first three quarters of 2002 as a whole.Output of the plastic products, the textiles and the wearing apparel industrieswere also down visibly, by 11.9%, 7.5% and 6.4% in volume. Output of thepaper products and printing industry had a more moderate decline, by 2.9% involume. On a seasonally adjusted quarter-to-quarter comparison, the Indexedged lower by 0.7% in volume in the third quarter of 2002, followingdecreases of 2.4 % and 1.3% respectively in the first and second quarters.
/Table 3.2 .....

87
Table 3.2
Index of Industrial Production for the major local manufacturing industries(year-on-year rate of change in volume (%))
2001 2002
Annual Q1 Q2 Q3 Q4 Q1-Q3# Q1 Q2 Q3#
Industry groupWearing apparel -0.1 3.1 3.4 -9.8 3.8 -6.4 -13.4 -10.5 4.0Textiles -0.3 3.5 1.7 -2.6 -2.0 -7.5 -10.6 -7.3 -5.9Plastic products -15.2 -12.4 -11.0 -12.0 -25.7 -11.9 -13.1 -7.4 -15.6Consumer electrical and
electronic products* -0.3 -2.0 -0.5 2.8 -19.5 -0.8 -29.6 -28.1
Machinery and equipment -8.5 5.7 4.3 -13.7 -24.9 -16.2 -17.4 -19.7 -11.4Fabricated metal products -10.2 -7.0 -9.3 -14.5 -9.4 -29.6 -27.4 -30.7 -30.6Paper products and
printing-1.2 0.2 2.0 -2.9 -4.2 -2.9 -10.5 1.0 0.1
Overall manufacturing -4.4 -0.2 -0.1 -7.1 -9.3 -10.0 -11.6 -11.2 -7.3<1.4> <-0.3> <-7.3> <-2.4> <-2.4> <-1.3> <-0.7>
Notes : (#) Provisional figures.(*) Change of less than 0.05%.< > Seasonally adjusted quarter-to-quarter % change in volume.
/Diagram 3.3 .....

88
Local manufacturing output and domestic exports(year-on-year rate of change in real terms)
Diagram 3.3
Q1 Q2 Q3 Q4 Q1 Q2 Q3 Q4 Q1 Q2 Q3 Q4 Q1 Q2 Q3 Q4 Q1 Q2 Q3 Q4 Q1 Q2 Q31997 1998 1999 2000 2001 2002
0
5
10
15
20
-5
-10
-15
-20
Percent
Index of Industrial Production
Domestic exports
3.6 In the fourth quarter of 2002, domestic exports were still markedlylower in real terms than a year earlier, as were orders-on-hand in value terms inthe local manufacturing sector(5). These pointed to a further decrease in localmanufacturing output in that quarter.
/Diagram 3.4 .....

89
Orders-on-hand and domestic exports(year-on-year rate of change in value terms)
M J S D M J S D M J S D M J S D M J S D M J S D1997 1998 1999 2000 2001 2002
0
10
20
30
-10
-20
-30
Percent
Diagram 3.4
Domestic exports
Orders-on-hand
200220012000199919981997
Table 3.3
Orders-on-hand in the local manufacturing sector
Value index oforders-on-hand
(1993=100)
Year-on-year rate ofchange in value terms
(%)
2001 Mar 61.1 -3.8Jun 62.7 -7.7Sep 53.1 -13.4Dec 47.5 -15.0
2002 Mar 54.1 -11.5Jun 55.6 -11.3Sep 49.2 -7.3Dec# 42.4 -10.7
Note : (#) Provisional figures.
/Service .....

90
Service sector receipts
3.7 Business receipts declined extensively across most of the servicesectors surveyed in the first three quarters of 2002, continuing the generaldowntrend observed since late 2000. Analysed by constituent sector and on ayear-on-year comparison in value terms, business receipts in storage plunged by23.2% for the first three quarters of 2002 as a whole, owing to a markedreduction in rental income amidst much vacant storage space. Businessreceipts in financing (except banking) dipped by 15.2%, mainly reflecting theeffects of lower share prices and subdued trading. Business receipts in filmentertainment contracted by 11.4%, on account of lower receipts from cinemas.Business receipts in the wholesale trade went down by 12.2%, and businessreceipts in restaurants and the retail trade by 5.3% and 4.6% respectively, beingaffected by sluggish consumer spending and larger price discounts by thebusiness operators on their goods and services. Business receipts in hotelsdecreased by 7.5%, as the concessions offered on hotel tariffs more than offsetthe improvement in hotel room occupancy. Business receipts in businessservices declined by 6.5%, along with a general slow-down in commercialactivities. Business receipts in the import/export trade and transport droppedby 5.3% and 0.5% respectively, with most of the decrease occurring in the earlypart of the year amidst the continued setback in external trade at that time.Business receipts in communications slid by 3.7%, consequential to a slash incharges for mobile phone and some other telecommunications services.Business receipts in banking were also reduced by 3.7%, with less interestincome outweighing more income arising from commissions and service fees.Business receipts in real estate sank by 1.7%, as property prices and rentalscontinued to ease in moderate trading. Yet business receipts in insurance roseby 8.5%, in tandem with continued expansion in both general insurance and lifeinsurance.
/Table 3.4 .....

91
Table 3.4Index of Business Receipts for individual service sectors
(year-on-year rate of change in value terms (%))
2001 2002
Annual Q1 Q2 Q3 Q4 Q1-Q3 Q1 Q2 Q3
Service sector
Import/export trade -14.1 -2.1 -13.7 -18.5 -20.0 -5.3 -15.4 -2.6 1.8
Wholesale trade -12.0 -8.3 -12.5 -13.5 -13.3 -12.2 -14.7 -12.8 -8.9
Retail trade -1.2 -0.1 2.3 -2.0 -5.3 -4.6 -3.7 -5.8 -4.3
Restaurants -2.5 0.1 -0.7 -4.5 -4.8 -5.3 -5.4 -6.0 -4.5
Hotels -7.6 3.3 1.9 -10.5 -21.3 -7.5 -12.5 -6.6 -2.5
Banking 2.7 -1.7 4.5 3.6 4.5 -3.7 -7.2 0.3 -4.2
Financing (other thanbanking)
-12.6 -14.5 1.5 -22.6 -13.5 -15.2 -25.2 -11.4 -6.9
Insurance 14.2 4.2 24.9 13.9 13.9 8.5 10.0 6.0 9.8
Real estate -16.9 -22.0 -21.4 -18.1 -3.8 -1.7 -0.1 3.5 -8.4
Business services -9.6 -0.7 -6.9 -12.8 -16.5 -6.5 -10.4 -4.0 -5.0
Transport -2.4 11.3 -2.4 -8.2 -7.5 -0.5 -8.2 0.3 6.1
Storage -14.9 -7.7 -13.1 -16.8 -22.0 -23.2 -21.7 -27.4 -20.4
Communications -13.2 -11.0 -11.7 -16.0 -13.9 -3.7 -5.2 -4.3 -1.4
Film entertainment 15.2 3.0 22.2 18.1 17.6 -11.4 2.6 -15.5 -18.9
/Property .....

92
Property
3.8 The property market as a whole underwent further consolidation in2002. Acquisition and lease demand generally fell short of absorbing theabundant supply, both existing and in the pipeline, and this led to a continuedsoftening in property prices and rentals. Yet the markets for different types ofproperty faced somewhat different circumstances and difficulties.
3.9 The sales market for residential property remained generally slack in2002. While flat prices went down visibly further in 2002, there was a modestpick-up in transaction volume. The increase in trading activity wasconcentrated in the first half of the year, especially in the second quarter.Market sentiment was lifted by upbeat results of the two land auctions held inApril and June, as well as the Government’s announcement to resume sale ofsubsidised sale flats yet in a cautious and orderly manner after expiry of theten-month moratorium at end-June(6). But acquisition interest dwindled duringmost of the ensuing months, amidst renewed concern about job security andincome instability, falling share prices, and in particular the continued amplesupply of new flats. The brief rebound in trading volume seen in Septemberwas mainly stimulated by a fresh round of intensive sales promotion bydevelopers, through offering even larger price discounts and other moregenerous concessions to prospective purchasers(7). As a result, the primarymarket diverted the demand further and the secondary market was underminedeven more. Towards the year-end, market activity again showed some pick-up,conceivably spurred by the Government’s promulgation of nine policy measuresto stabilise the housing market(8).
3.10 On a quarter-to-quarter comparison, flat prices went lower on averageby 2%, 4% and 7% respectively in the second, third and fourth quarters of 2002,having shown nil change in the first quarter. For the year as a whole, flatprices on average fell by 13%. Against the peak level in the third quarter of1997, flat prices in the fourth quarter of 2002 plummeted by an average of 62%.Following the marked decline in flat prices and successive cuts in mortgage rate,and notwithstanding reduced household income, there was a substantialimprovement in home purchase affordability over the past several years.
/3.11 .....

93
3.11 The rental market for private residential flats stayed subdued in 2002.Apart from lesser lease demand upon the impact of reduced salaries and housingallowances, there appeared to have been increased supply of flats for lease fromthose hitherto for sale. Flat rentals came under greater downward pressure inthose areas with a lot of newly completed flats. On a quarter-to-quartercomparison, private housing rentals on average declined by 4%, 3%, 2% and4% respectively in the four quarters of 2002. For the year as a whole, therewas on average a drop of 13%. Against the peak level in the third quarter of1997, private housing rentals were significantly down in the fourth quarter of2002, by an average of 43%. Mainly consequential to the distinct fall in flatrentals, lease affordability likewise improved over the past several years.
3.12 On the sale of government-subsidised flats, there was only one newround of sale of flats under the Home Ownership Scheme (HOS) in 2002, viz.HOS Phase 24A in July covering 2 451 new flats, following expiry of theten-month moratorium on sale of subsidised sale flats at end-June 2002. Bythe year-end, 56% of these flats had been sold. As to the Tenant PurchaseScheme (TPS) for designated units in the public rental estates, a new batch of25 728 flats was put out for sale under TPS Phase 5 in January. By theyear-end, 50% of these flats had been sold to the sitting tenants.
3.13 On home ownership loans, 10 807 applications for the Home PurchaseLoan Scheme (HPLS) were received in 2002, up substantially by 20% fromthose in 2001. Within this total, 6 601 applications were from Green Formapplicants and 4 206 applications from White Form applicants. On the otherhand, the number of applications for the Home Starter Loan Scheme (HSLS)went down substantially from those in 2001, by 72% to 6 186 in 2002, of which2 449 applications were from family households and 3 737 applications fromsingleton households. As from January 2003, HPLS and HSLS were replacedby a new Home Assistance Loan Scheme (HALS), providing eligiblehouseholds with either interest-free loans or mortgage loan subsidies(9). HALSserved to render greater flexibility and broader choice to eligible homepurchasers, in line with the Government’s move to stabilise the housing marketas well as its policy to retreat from direct involvement in the market.
/3.14 .....

94
3.14 On supply of new private residential flats, completions rose by 30% to34 035 units in 2002, considerably accentuated from the 2% increase in 2001.Thus even with a concurrent rise in new take-ups, the vacancy rate moved upfurther, from 5.7% at end-2001 to 6.8% at end-2002. Completions ofGovernment-subsidised flats fell sharply, by 48% to 11 658 units in 2002, aftera 6% rise in 2001. Of this total, 9 188 units were HOS flats and 2 470 unitswere Private Sector Participation Scheme (PSPS) flats.
3.15 On commercial property, the rental market for office space weakenedfurther in 2002, as demand continued to be dampened by on-going downsizingand rationalisation in the business sector. Grade A office space wasadditionally hit by an excess supply particularly in the central business district.Also relevant was the move by some companies to relocate their offices tosecondary districts for saving costs. In order to uphold the occupancy rate,landlords generally offered larger rental cuts, longer rent-free period and otherconcessions to their tenants. On a quarter-to-quarter comparison, office rentalson average fell by 6%, 5%, 2% and 2% respectively in the four quarters of 2002.For the year as a whole, office rentals on average dipped by 14%. The salesmarket for office space was stagnant in 2002. Reduced rental yield against theheavy capital investment up-front had led potential purchasers to stay on thesideline. On a quarter-to-quarter comparison, prices of office space, havingbeen static in the first quarter of 2002, moved lower on average by 3%, 2% and5% respectively in the ensuing three quarters. For the year as a whole, therewas on average a fall of 10%. Against their respective peak levels in 1997,prices and rentals of office space both plunged, by an average of 71% and 48%in the fourth quarter of 2002. On supply of new office space, completionssoared by 117% to 166 000 m2 in 2002, after decreasing by 20% in 2001.Together with a reduction in new take-ups, this resulted in a rise in the vacancyrate from 11.1% at end-2001 to 12.6% at end-2002.
/3.16 .....

95
3.16 The rental market for shopping space was moderate in 2002, asdemand remained generally languid amidst continued setback in the retail trade.Space in well-managed shopping arcades and in the popular shopping districtswas nevertheless better sought after. On a quarter-to-quarter comparison, shoprentals on average went down by 3% and 1% respectively in the first twoquarters of 2002, yet held steady in the third and fourth quarters. For the yearas a whole, there was on average a 5% drop. The sales market for shoppingspace stayed quiet in 2002, as investors continued to adopt a cautious attitude inface of the slack conditions in the retail trade and an uncertain near-termoutlook. On a quarter-to-quarter comparison, prices of shopping space, havingon average held steady in the first and third quarters of 2002 and edged up by3% in the second quarter, fell back by 7% in the fourth quarter. For the year asa whole, there was on average a decline of 3%. Yet against their respectivepeak levels in the third quarter of 1997, prices and rentals of shopping spaceboth tumbled, by an average of 58% and 26% in the fourth quarter of 2002.On supply of new shopping space, completions increased further by 5% to138 000 m2 in 2002, after surging sharply by 105% in 2001. Together with ashrinkage in demand, this led to a rise in the vacancy rate for shopping spacefrom 8.2% at end-2001 to 10.7% at end-2002.
3.17 On industrial property, the rental market was inactive in 2002.Demand for conventional factory space was restrained by a further contractionin local manufacturing activity. Demand for modern industrial premises foruse as data centres and back-up service centres was also on the wane, amidstfurther consolidation in the information technology sector. On aquarter-to-quarter comparison, rentals of industrial space drifted lower in thefirst three quarters of 2002, on average by 2%, 3% and 2% respectively, andthen edged up by 1% in the fourth quarter. For the year as a whole, rentals ofindustrial space on average slid by 6%. The sales market for industrialproperty was at a standstill in 2002, in the lack of buying interest. On aquarter-to-quarter comparison, prices of industrial space on average fell by 3%each in the first, third and fourth quarters of 2002, more than offsetting the 2%rise in the second quarter. For the year as a whole, there was on average adecrease of 7%. Against their respective peak levels in 1994, prices andrentals of industrial space both slumped, by an average of 68% and 46% in thefourth quarter of 2002. On supply of new industrial property, completions ofconventional flatted factory space plummeted by 91% to 3 000 m2 in 2002, andthere was nil completion of industrial-cum-office space. Vacancy rate forthese two types of industrial property declined, from 10.9% and 15.0%respectively at end-2001 to 10.5% and 12.5% at end-2002.
/Table 3.5 .....

96
Table 3.5
Indices of Property Prices and Rentals
Residential flats Office space Shopping spaceConventional
flatted factory space
Price index(a)
(1999=100)Rental index(b)
(1999=100)Price index(1999=100)
Rental index(b)
(1999 =100)Price index(1999=100)
Rental index(b)
(1999=100)Price index(1999=100)
Rental index(b)
(1999=100)
2001 Q1 81.0 (-4) 97.7 (-1) 85.5 (-1) 104.6 (3) 89.1 (-3) 101.2 (-1) 84.4 (-4) 93.8 (-2)
Q2 81.2 (*) 96.9 (-1) 82.1 (-4) 103.2 (-1) 87.1 (-2) 99.9 (-1) 83.2 (-1) 91.5 (-2)
Q3 78.6 (-3) 95.4 (-2) 76.1 (-7) 100.6 (-3) 87.0 (*) 99.1 (-1) 82.8 (*) 88.5 (-3)
Q4 73.8 (-6) 91.4 (-4) 71.2 (-6) 95.6 (-5) 84.0 (-3) 97.4 (-2) 77.7 (-6) 87.4 (-1)
2002 Q1 73.8 (*) 87.4 (-4) 71.2 (*) 89.6 (-6) 84.4 (*) 94.0 (-3) 75.4 (-3) 85.5 (-2)
Q2 72.2 (-2) 84.8 (-3) 68.8 (-3) 85.4 (-5) 86.6 (3) 92.6 (-1) 76.9 (2) 83.0 (-3)
Q3^ 69.1 (-4) 82.7 (-2) 67.5 (-2) 84.0 (-2) 87.0 (*) 92.9 (*) 74.4 (-3) 81.2 (-2)
Q4^ 64.1 (-7) 79.3 (-4) 64.3 (-5) 82.6 (-2) 81.3 (-7) 92.6 (*) 71.9 (-3) 81.8 (1)
Notes : All rental indices shown in this table have been adjusted for changes in concessionary leasing terms suchas provision of refurbishment, granting of rent-free periods, and waiver of miscellaneous charges, ifknown.
(a) Prices for residential property in this table cover existing flats traded in the secondary market, butnot new flats sold in the primary market.
(b) Rentals for residential property in this table cover only new tenancies for which rentals are freshly
determined, while rentals for non-residential property in this table cover also lease renewals uponwhich rentals may be revised.
( ) % change over the preceding quarter.
(^) Provisional figures.
(*) Change of less than 0.5%.
Source : Rating and Valuation Department.
/Diagram 3.5 .....

97
Property prices and rentals
Q1 Q3 Q1 Q3 Q1 Q3 Q1 Q3 Q1 Q3 Q1 Q31997 1998 1999 2000 2001 2002
0
50
100
150
200
250Index (1999=100)
Q1 Q3 Q1 Q3 Q1 Q3 Q1 Q3 Q1 Q3 Q1 Q31997 1998 1999 2000 2001 2002
0
50
100
150
200
250Index (1999=100)
(a) Residential property (b) Office space
Rental index
Price index
Price index
Rental index
Diagram 3.5
Q1 Q3 Q1 Q3 Q1 Q3 Q1 Q3 Q1 Q3 Q1 Q31997 1998 1999 2000 2001 2002
0
50
100
150
200
250Index (1999=100)
Q1 Q3 Q1 Q3 Q1 Q3 Q1 Q3 Q1 Q3 Q1 Q31997 1998 1999 2000 2001 2002
0
50
100
150
200
250Index (1999=100)
Rental index
Price index
Rental index
Price index
(c) Shopping space (d) Conventional flatted factory space
Note : See the footnotes to Table 3.5.
/Table 3.6 .....

98
Table 3.6Relationship between mortgage rate
and monthly instalment payment
Average of thebest lending rates
quoted by theprincipal banksin Hong Kong
Average of theeffective mortgage
rates charged on newmortgages by theprincipal banks
in Hong Kong(a)
Monthly instalment on$100,000 mortgage
loan charged according tothe average effective mortgagerate with mortgage period of (b)
(%) (%) ($)
10 years 15 years 20 years
2001 Q1 8.70 6.44 1,133 868 742Q2 7.40 5.15 1,068 798 668Q3 6.59 4.34 1,029 757 624Q4 5.34 2.93 962 687 551
2002 Q1 5.13 2.63 949 673 536Q2 5.13 2.63 949 673 536Q3 5.13 2.63 949 673 536Q4 5.07 2.55 945 669 533
Jan 5.13 2.63 949 673 536Feb 5.13 2.63 949 673 536Mar 5.13 2.63 949 673 536
Apr 5.13 2.63 949 673 536May 5.13 2.63 949 673 536Jun 5.13 2.63 949 673 536
Jul 5.13 2.63 949 673 536Aug 5.13 2.63 949 673 536Sep 5.13 2.63 949 673 536
Oct 5.13 2.63 949 673 536Nov 5.03 2.53 944 668 531Dec 5.00 2.50 943 667 530
Notes : (a) Here the effective mortgage rate refers to the modal value, representing the rate mostcommonly charged to customers amongst the banks.
(b) These figures are based on equal monthly repayments throughout the mortgageperiod.
/Table 3.7 .....

99
Table 3.7Completions of new property by the private sector
('000m2 of internal floor area)Residentialproperty(a)
Commercialproperty
Industrial property (c)
(in units)
Officespace
Othercommercialpremises(b)
Sub-total
Conventionalflatted factory space
Storagepremises(d)
Industrial-cum-office
premises Sub-total
2001 Annual 26 262 76 132 208 30 0 14 45(2) (-20) (105) (30) (63) (-100) (-61) (-28)
Q1 6 528 29 34 63 0 0 0 0(-6) (252) (472) (345) (--) (-100) (--) (-100)
Q2 6 206 20 37 57 0 0 14 14(-7) (-47) (259) (20) (-100) (--) (--) (-5)
Q3 5 090 24 53 77 16 0 0 16(16) (2) (210) (89) (--) (-100) (-100) (5)
Q4 8 438 4 8 11 15 0 0 15(9) (-87) (-76) (-81) (306) (--) (-100) (-46)
2002 Annual^ 34 035 166 138 304 3 27 0 29(30) (117) (5) (46) (-91) (--) (-100) (-35)
Q1 3 356 52 18 69 3 0 0 3(-49) (79) (-49) (10) (--) (--) (--) (--)
Q2 6 272 53 22 75 0 0 0 0(1) (171) (-41) (33) (--) (--) (-100) (-100)
Q3 13 348 9 41 49 0 0 0 0(162) (-64) (-23) (-36) (-100) (--) (--) (-100)
Q4^ 11 059 52 58 110 0 27 0 27(31) (1 389) (671) (899) (-100) (--) (--) (82)
Notes : (a) These include all newly completed residential premises to which either temporary or fullOccupation Permits have been granted, as well as village-type houses issued with Lettersof Compliance. Property developments subject to a Consent Scheme will need aCertificate of Compliance, Consent to Assign or Consent to Lease, in addition to anOccupation Permit, before the premises can be individually assigned.The figures shown here are in respect of private residential units, excluding unitscompleted by the Hong Kong Housing Authority and the Hong Kong Housing Society.
(b) These include shopping arcades in residential and commercial developments, as well aspremises designed or adapted for commercial use other than offices, in the nature ofnon-domestic space on the podium floors of tenement apartment/commercial buildings.Car-parking space is excluded.
(c) Including industrial-cum-office premises, but excluding specialised factory buildingswhich are developed mainly for own use.
(d) Including storage premises at the container terminals and the airport.( ) % change over a year earlier.(^) Provisional figures.(--) Not applicable.
Source : Rating and Valuation Department./Diagram 3.6 .....

100
Completions of new property by major category
Q1 Q2 Q3 Q4 Q1 Q2 Q3 Q4 Q1 Q2 Q3 Q4 Q1 Q2 Q3 Q4 Q1 Q2 Q3 Q4 Q1 Q2 Q3 Q41997 1998 1999 2000 2001 2002
0
2
4
6
8
10
12
14
16
18Number of units ('000)
Sale units of Housing Authority and Housing Society Private residential units
Diagram 3.6
Sale units of the Hong Kong Housing Authority and the Hong Kong Housing Society
Private residential units
Q1 Q2 Q3 Q4 Q1 Q2 Q3 Q4 Q1 Q2 Q3 Q4 Q1 Q2 Q3 Q4 Q1 Q2 Q3 Q4 Q1 Q2 Q3 Q41997 1998 1999 2000 2001 2002
0
50
100
150
200
250
300
350
400
450
500Internal floor area ('000 sq. metres)
Office space Other commercial premises (mainly shopping space)
Office spaceOther commercial premises (mainly shopping space)
Q1 Q2 Q3 Q4 Q1 Q2 Q3 Q4 Q1 Q2 Q3 Q4 Q1 Q2 Q3 Q4 Q1 Q2 Q3 Q4 Q1 Q2 Q3 Q41997 1998 1999 2000 2001 2002
0
20
40
60
80
100
120Internal floor area ('000 sq. metres)
Industrial-cum-office premises Conventional flatted factory space Conventional flatted factory space
Industrial-cum-office premises
Note : See the footnotes to Table 3.7.
/3.18 .....

101
3.18 Property transactions, as measured by agreements for sale andpurchase of property registered with the Land Registry, shrank by 3% in numberin 2002. The decrease was concentrated in the second half of the year,outweighing the increase in the first half. In 2001, there was a rise of 3%. Intotal value, property transactions were also down, by 4% in 2002, which wasnevertheless smaller than the 13% fall in 2001. Analysed by main type ofproperty, transactions in residential property rose modestly, by 5% in numberand 2% in total value in 2002. The increase occurred mainly in the first half ofthe year. By contrast, transactions in non-residential property contractedconsiderably, by 30% in number and 26% in total value in 2002. There was amuch larger decline in the first half of the year than in the second half.
3.19 Property transfer assignments, being a lagging indicator of propertytransactions, fell by 17% in number and 19% in total value in 2002. Theseexceeded much the decreases of 5% and 11% in 2001. As to mortgagearrangements, there was likewise a more distinct drop in number in 2002 than in2001, by 22% as against 14%. This was attributable to the fall-off in propertytransfer assignments, as well as reduced re-financing arrangements for existingproperty.
/Table 3.8 .....

102
Table 3.8
Agreements for sale and purchase of property
Number Total value ($Bn)
Residentialproperty(a)
Non-residentialproperty Total
Residentialproperty(a)
Non-residentialproperty Total
2001 Annual 69 667 (7) 18 523 (-9) 88 190 (3) 150.9 (-10) 41.9 (-23) 192.8 (-13)
H1 32 730 (7) 10 995 (8) 43 725 (7) 71.0 (-9) 23.2 (-18) 94.1 (-11)H2 36 937 (6) 7 528 (-26) 44 465 (-1) 79.9 (-12) 18.7 (-28) 98.7 (-15)
Q1 15 105 (-1) 5 913 (13) 21 018 (2) 34.3 (-16) 11.0 (-22) 45.2 (-18)Q2 17 625 (16) 5 082 (3) 22 707 (13) 36.7 (*) 12.2 (-13) 48.9 (-4)Q3 18 164 (-6) 3 733 (-45) 21 897 (-16) 41.2 (-11) 8.7 (-48) 49.9 (-21)Q4 18 773 (21) 3 795 (11) 22 568 (19) 38.8 (-13) 10.0 (8) 48.7 (-9)
2002 Annual 72 974 (5) 12 947 (-30) 85 921 (-3) 154.3 (2) 31.4 (-26) 185.4 (-4)
H1 40 921 (25) 6 877 (-37) 47 798 (9) 89.9 (27) 14.4 (-38) 104.3 (11)H2 32 053 (-13) 6 070 (-19) 38 123 (-14) 64.4 (-19) 16.7 (-11) 81.1 (-18)
Q1 18 992 (26) 3 569 (-40) 22 561 (7) 41.5 (21) 6.1 (-44) 47.7 (5)Q2 21 929 (24) 3 308 (-35) 25 237 (11) 48.3 (32) 8.3 (-32) 56.6 (16)Q3 16 120 (-11) 3 277 (-12) 19 397 (-11) 32.3 (-22) 11.9 (37) 44.2 (-11)Q4 15 933 (-15) 2 793 (-26) 18 726 (-17) 32.1 (-17) 4.8 (-52) 36.9 (-24)
<-1> <-15> <-3> <*> <-60> <-17>
Jan 7 847 (103) 1 381 (76) 9 228 (99) 18.2 (91) 2.5 (-21) 20.7 (63)Feb 5 695 (42) 1 135 (20) 6 830 (38) 12.4 (39) 1.6 (-30) 14.0 (25)Mar 5 450 (-25) 1 053 (-75) 6 503 (-43) 11.0 (-31) 2.0 (-64) 13.0 (-39)
Apr 7 409 (48) 1 047 (-63) 8 456 (8) 15.3 (40) 2.0 (-72) 17.3 (-4)May 7 325 (16) 1 145 (10) 8 470 (15) 16.9 (39) 3.4 (53) 20.3 (41)Jun 7 195 (14) 1 116 (-6) 8 311 (11) 16.1 (19) 2.9 (2) 19.0 (16)
Jul 4 961 (-20) 1 205 (7) 6 166 (-16) 10.3 (-34) 5.5 (54) 15.8 (-17)Aug 4 881 (-25) 1 172 (-12) 6 053 (-23) 9.9 (-31) 3.6 (31) 13.4 (-21)Sep 6 278 (15) 900 (-29) 7 178 (7) 12.1 (7) 2.9 (19) 15.0 (9)
Oct 5 863 (37) 944 (3) 6 807 (31) 11.7 (40) 1.8 (-69) 13.5 (-5)Nov 4 941 (-37) 867 (-53) 5 808 (-40) 9.1 (-38) 1.3 (-38) 10.4 (-38)Dec 5 129 (-23) 982 (-5) 6 111 (-20) 11.4 (-28) 1.6 (-18) 13.0 (-27)
Notes : Figures may not add up exactly to the total due to rounding.
(a) It should be noted that primary sales of units under the Home Ownership Scheme (HOS)and the Tenants Purchase Scheme (TPS) are not covered in this table, as sale andpurchase agreements are commonly not required for these transactions. Also, sale andpurchase agreements for primary sales of units under the Private Sector ParticipationScheme (PSPS) are not included in the column on residential property, yet they areincluded in the column on non-residential property, and thus also in the total column.
( ) % change over a year earlier.
< > % change over the preceding quarter.
(*) Change of less than 0.5%.
Source : Land Registry.
/Diagram 3.7 .....

103
Sale and purchase agreements by broad type of property
Q1 Q2 Q3 Q4 Q1 Q2 Q3 Q4 Q1 Q2 Q3 Q4 Q1 Q2 Q3 Q4 Q1 Q2 Q3 Q4 Q1 Q2 Q3 Q41997 1998 1999 2000 2001 2002
0
10
20
30
40
50
60
70
80Number ('000)
Residential property # Non-residential property
Diagram 3.7
Residential property #Non-residential property
Note : (#) See Footnote (a) to Table 3.8.
/Table 3.9 .....

104
Table 3.9
Property transfer assignments and mortgage arrangementsProperty transfer
assignments(a)Mortgages other thanbuilding mortgages(b)
Number Total value ($Bn) Number2001 Annual 144 037 (-5) 243.5 (-11) 157 064 (-14)
H1 75 756 (-8) 125.7 (-13) 79 953 (-19)H2 68 281 (-3) 117.8 (-8) 77 111 (-9)Q1 39 135 (1) 63.5 (-12) 41 132 (-17)Q2 36 621 (-15) 62.2 (-14) 38 821 (-21)Q3 40 968 (8) 76.7 (11) 46 181 (-5)Q4 27 313 (-15) 41.1 (-31) 30 930 (-14)
2002 Annual 119 734 (-17) 198.1 (-19) 121 791 (-22)
H1 61 350 (-19) 100.5 (-20) 64 384 (-19)H2 58 384 (-14) 97.6 (-17) 57 407 (-26)Q1 31 512 (-19) 48.5 (-24) 33 650 (-18)Q2 29 838 (-19) 52.0 (-17) 30 734 (-21)Q3 30 998 (-24) 49.1 (-36) 30 721 (-33)Q4 27 386 (*) 48.5 (18) 26 686 (-14)
<-12> <-1> <-13>Jan 12 048 (-8) 21.7 (-8) 13 332 (-3)Feb 8 346 (-40) 12.6 (-41) 9 282 (-36)Mar 11 118 (-9) 14.2 (-23) 11 036 (-15)Apr 9 190 (13) 16.9 (-6) 9 347 (6)May 8 932 (-42) 14.0 (-45) 8 982 (-46)Jun 11 716 (-10) 21.1 (13) 12 405 (-8)Jul 12 660 (5) 22.1 (-20) 13 194 (-7)Aug 10 361 (-33) 15.2 (-46) 9 932 (-42)Sep 7 977 (-40) 11.8 (-44) 7 595 (-49)Oct 10 301 (14) 22.9 (40) 10 884 (1)Nov 9 039 (-15) 13.5 (-5) 8 064 (-31)Dec 8 046 (6) 12.1 (16) 7 738 (-10)
Notes : (a) Figures on property transfer assignments do not necessarily tally with those onagreements for sale and purchase of property, for various reasons. These includepossibly long time lag between the two documents, cancellation of transaction beforeits completion, and waiver of the agreement for sale and purchase of property subjectto consent by the parties concerned.
(b) Most of these mortgages are related to the purchase of residential flats or of otherpremises. Building mortgages, on the other hand, are related to the financing ofbuilding projects under construction.Figures on the total value of mortgage arrangements are not shown, as they are likelyto be incomplete. This is because in many of the mortgage arrangements lodged forregistration, the value of the mortgage loan is not stated in the mortgage deed butinstead is separately notified by the bank to the mortgagor.
( ) % change over a year earlier.< > % change over the preceding quarter.
(*) Change of less than 0.5%.
Source : Land Registry./3.20 .....

105
3.20 Planned developments of all types of property in the private sector, asindicated by the total usable floor area on building plans with consent tocommence work, fell only slightly by 1% in 2002, after a 25% plunge in 2001.Analysed by main type of property, planned developments of private residentialproperty were reduced by 35% in terms of units, distinctly enlarged from the12% fall in 2001. In terms of total usable floor area, the decrease of 21% in2002 also exceeded that of 12% in 2001. On the other hand, planneddevelopments of non-residential property rose sharply in 2002, yet this wasprimarily due to the low base in 2001. Specifically, planned developments ofcommercial property, industrial property, and property in the “others” categoryleaped by 38%, 134% and 46% respectively in 2002, following the pronounceddecreases of 21%, 65% and 69% in 2001.
/Table 3.10 .....

106
Table 3.10
Building plans with consent tocommence work in the private sector
('000m2 of usable floor area)
Residentialproperty (a)
Commercialproperty
Industrialproperty (b)
Otherproperty Total
2001 Annual 1 002 <26 461> 265 46 75 1 388(-12) (-12) (-21) (-65) (-69) (-25)
Q1 404 <10 226> 33 8 47 493(-15) (-21) (-28) (-82) (-61) (-28)
Q2 187 <5 013> 149 3 15 355(42) (102) (230) (-79) (21) (75)
Q3 122 <3 449> 39 * 8 170(-53) (-58) (-75) ( -99) (-86) (-68)
Q4 289 <7 773> 43 34 4 370(5) (22) (-53) (91) (-92) (-14)
2002 Annual 790 <17 292> 365 107 109 1 372(-21) (-35) (38) (134) (46) (-1)
Q1 126 <2 889> 73 14 16 229(-69) (-72) (119) (66) (-66) (-54)
Q2 327 <6 561> 57 18 16 428(74) (31) (-62) (550) (2) (18)
Q3 185 <4 150> 136 * 48 368(51) (20) (247) (9) (466) (117)
Q4 153 <3 692> 99 75 30 356(-47) (-53) (130) (118) (705) (-4)
Notes : (a) The classification of residential property has been revised to include developmentsunder the Urban Improvement Scheme of the Hong Kong Housing Society, but toexclude developments under the Private Sector Participation Scheme of the HongKong Housing Authority.
(b) Including multi-purpose industrial premises designed also for office use.
< > Figures represent number of units.
( ) % change over a year earlier.
(*) Usable floor area of less than 500m2.
Source : Buildings Department.
/Diagram 3.8 .....

107
Building plans with consent to commence work
Q1 Q2 Q3 Q4 Q1 Q2 Q3 Q4 Q1 Q2 Q3 Q4 Q1 Q2 Q3 Q4 Q1 Q2 Q3 Q4 Q1 Q2 Q3 Q41997 1998 1999 2000 2001 2002
0
100
200
300
400
500
600
700
800
900
1000Usable floor area ('000 sq. metres)
Commercial Residential
Diagram 3.8
in the private sector by major category
Q1 Q2 Q3 Q4 Q1 Q2 Q3 Q4 Q1 Q2 Q3 Q4 Q1 Q2 Q3 Q4 Q1 Q2 Q3 Q4 Q1 Q2 Q3 Q41997 1998 1999 2000 2001 2002
0
20
40
60
80
100
120
140
160
180
200
220Usable floor area ('000 sq. metres)
Others Industrial
Note : See the footnotes to Table 3.10.
/Building .....

108
Building and construction
3.21 Building and construction activity had a small rebound in overallterms in 2002. Total expenditure on building and construction edged up by2% in real terms in 2002, with increased expenditure in the private sectoroutweighing reduced expenditure in the public sector. This came after a 2%decline in the total expenditure in 2001. On a year-on-year comparison andexpressed in real terms, total expenditure on building and construction went upby 7% and 8% respectively in the second and third quarters of 2002, more thanoffsetting the decreases of 4% and 3% in the first and fourth quarters. 3.22 Expenditure on building and construction by the public sector was cutfurther by 6% in real terms in 2002, after a 5% fall in 2001. To a large extent,this was due to continued scale-back in the Public Housing Programme, uponcompletion or winding down of projects in Tin Shui Wai, Yau Tong and Ma OnShan. Also contributed were tapering in work on the KCR West Rail andcompletion of the MTR Tseung Kwan O Extension. Yet work on severalmajor public sector projects continued apace, including superstructure for theScience Park in Pak Shek Kok and supporting infrastructure for the Hong KongDisneyland in Penny’s Bay.
3.23 Expenditure on building and construction by the private sector(10) wentup by 6% in real terms in 2002, after showing little change in 2001. It rosenotwithstanding that overall building consents had been on a continuous declinefor the past three years. Work on a number of private sector residential andcommercial building projects intensified during the course of 2002.
/Table 3.11 .....

109
Table 3.11
Expenditure on building and construction(year-on-year rate of change in real terms (%))
Private sector(a) Public sector Total
2001 Annual# * -5 -2
H1# -1 1 *H2# * -12 -4
Q1# -5 1 -2Q2# 3 * 2Q3# -4 -11 -6Q4# 4 -12 -1
2002 Annual+ 6 -6 2
H1# 7 -10 1H2+ 4 -2 2
Q1# 4 -18 -4Q2# 9 2 7Q3# 14 -6 8Q4+ -5 2 -3
Notes : (a) Following a review of the presentation by the Census and StatisticsDepartment, real estate developers’ margin is now incorporated intoprivate sector expenditure on building and construction, instead ofbeing delineated separately in the expenditure components of GDP.For details, see Note (10) to this chapter.
(#) Revised figures.
(+) Preliminary figures.
(*) Change of less than 0.5%.
/Diagram 3.9 .....

110
Expenditure on building and construction(year-on-year rate of change in real terms)
Q1 Q2 Q3 Q4 Q1 Q2 Q3 Q4 Q1 Q2 Q3 Q4 Q1 Q2 Q3 Q4 Q1 Q2 Q3 Q4 Q1 Q2 Q3 Q41997 1998 1999 2000 2001 2002
0
10
20
30
-10
-20
-30
Percent
Private sector #
Public sector
Overall
Diagram 3.9
Note : (#) See Footnote (a) to Table 3.11.
Private sector building expenditure and building consents(year-on-year rate of change in real terms)
Q1 Q2 Q3 Q4 Q1 Q2 Q3 Q4 Q1 Q2 Q3 Q4 Q1 Q2 Q3 Q4 Q1 Q2 Q3 Q4 Q1 Q2 Q3 Q41997 1998 1999 2000 2001 2002
0
20
40
60
-20
-40
Percent
0
50
100
150
-50
-100
Percent
Building consents (right scale)
Diagram 3.10
Private sector building expenditure #
(left scale)
Note : (#) See Footnote (a) to Table 3.11.
/3.24 .....

111
3.24 Retained imports of construction machinery continued to growstrongly, by 11% in real terms in 2002, after a 35% surge in 2001. Theincrease was concentrated in retained imports of construction equipment forcivil engineering projects, such as mechanical shovels, shovel loaders andexcavators.
3.25 Yet retained imports of construction materials contracted markedlyfurther, by 10% in real terms in 2002, following a 6% drop in 2001. Moredistinct decreases were observed in retained imports of iron and steel, lime,cement, and some sundry building materials.
3.26 Labour cost in the building and construction sector, as measured bythe Labour Cost Index, held broadly stable in the first three quarters of 2002 ascompared to a year earlier. Building material cost, as measured by theMaterial Cost Index, declined slightly, by 1% over the same period. Takentogether, the combined Labour and Material Cost Index was still virtually flat inthe first three quarters of 2002 as compared to a year earlier, after showing nilchange in 2001. On a quarter-to-quarter comparison, both the Labour CostIndex and the Material Cost Index were little changed in the third quarter of2002. Thus the combined Labour and Material Cost Index was static in thatquarter.
/Table 3.12 .....
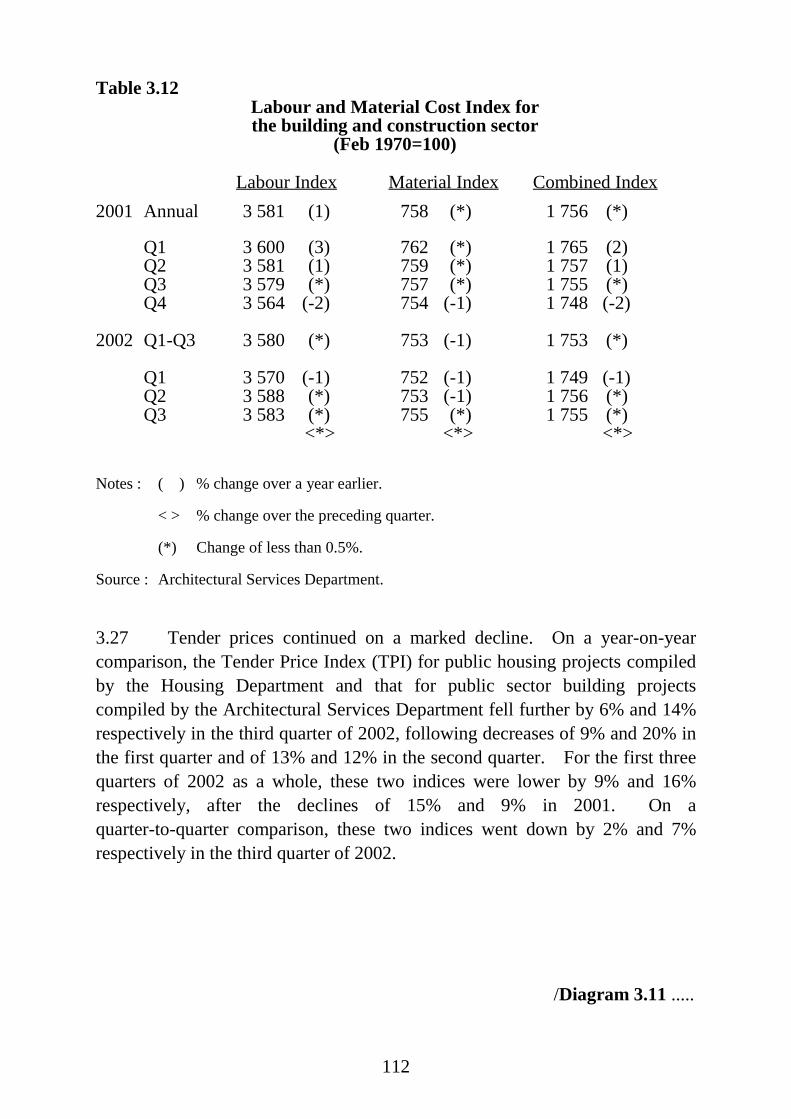
112
Table 3.12Labour and Material Cost Index forthe building and construction sector
(Feb 1970=100)
Labour Index Material Index Combined Index2001 Annual 3 581 (1) 758 (*) 1 756 (*)
Q1 3 600 (3) 762 (*) 1 765 (2)Q2 3 581 (1) 759 (*) 1 757 (1)Q3 3 579 (*) 757 (*) 1 755 (*)Q4 3 564 (-2) 754 (-1) 1 748 (-2)
2002 Q1-Q3 3 580 (*) 753 (-1) 1 753 (*)
Q1 3 570 (-1) 752 (-1) 1 749 (-1)Q2 3 588 (*) 753 (-1) 1 756 (*)Q3 3 583 (*) 755 (*) 1 755 (*)
<*> <*> <*>
Notes : ( ) % change over a year earlier.
< > % change over the preceding quarter.
(*) Change of less than 0.5%.
Source : Architectural Services Department.
3.27 Tender prices continued on a marked decline. On a year-on-yearcomparison, the Tender Price Index (TPI) for public housing projects compiledby the Housing Department and that for public sector building projectscompiled by the Architectural Services Department fell further by 6% and 14%respectively in the third quarter of 2002, following decreases of 9% and 20% inthe first quarter and of 13% and 12% in the second quarter. For the first threequarters of 2002 as a whole, these two indices were lower by 9% and 16%respectively, after the declines of 15% and 9% in 2001. On aquarter-to-quarter comparison, these two indices went down by 2% and 7%respectively in the third quarter of 2002.
/Diagram 3.11 .....

113
Diagram 3.11Labour and Material Cost Index
(year-on-year rate of change)
Q1 Q2 Q3 Q4 Q1 Q2 Q3 Q4 Q1 Q2 Q3 Q4 Q1 Q2 Q3 Q4 Q1 Q2 Q3 Q4 Q1 Q2 Q31997 1998 1999 2000 2001 2002
0
5
10
15
-5
-10
-15
Percent
OverallLabour
Material
Table 3.13
Tender Price Indices (TPI) for public sector projects
TPI for publichousing projects(a)
(Jan 1970=100)
TPI for public sectorbuilding projects(b)
(Jan 1970=100)2001 Annual 584 (-15) 808 (-9)
Q1 612 (-18) 862 (-10)Q2 611 (-14) 842 (-4)Q3 558 (-17) 807 (-6)Q4 553 (-12) 721 (-15)
2002 Q1-Q3 538 (-9) 707 (-16)
Q1 556 (-9) 687 (-20)Q2 533 (-13) 742 (-12)Q3 525 (-6) 692 (-14)
<-2> <-7>
Notes : (a) Compiled by the Housing Department.
(b) Compiled by the Architectural Services Department.
( ) % change over a year earlier.
< > % change over the preceding quarter.
/Diagram 3.12 .....

114
Diagram 3.12Tender Price Indices
(year-on-year rate of change)
Q1 Q2 Q3 Q4 Q1 Q2 Q3 Q4 Q1 Q2 Q3 Q4 Q1 Q2 Q3 Q4 Q1 Q2 Q3 Q4 Q1 Q2 Q31997 1998 1999 2000 2001 2002
0
5
10
15
20
25
30
-5
-10
-15
-20
-25
-30
Percent
TPI for public housing projects
TPI for public sector building projects
Land
3.28 The Government disposed of nine residential sites and oneresidential-cum-commercial site totalling 6.4 hectares in 2002, down from 8.8hectares in 2001. These sites were sold at the three land auctions held in April,June and September 2002 respectively. Two of the sites were released fromthe Government’s Application List(11). Meanwhile, no site was disposed ofthrough tender. On 13 November 2002, the Government announced itsdecision to cancel the two scheduled land auctions in the remainder of thefinancial year 2002/03 and to suspend the Application List until December 2003,as part of the package of measures to stabilise the housing market.
/Table 3.14 .....

115
Table 3.14
Land sales at auction and by tenderby the Government (hectares)
Usage 2001 2002
Residential 5.3 6.4Residential/commercial * 0.1Commercial 3.0 -Industrial - -Others 0.4 -Total 8.8 6.4
Note : Figures may not add up exactly to the total due to rounding.
Source : Lands Department.
3.29 On modification of lease on existing developed and developable landin the private sector domain(12), 162 applications were approved by theGovernment in 2002, mostly in the first half of the year. Of this total, 63applications were for residential development, 33 for education and communityfacilities, 18 for residential-cum-commercial development, 11 for commercialdevelopment, and six for industrial development. The remaining 31applications were for other purposes such as development oftelecommunications station and godown.
3.30 As to the industrial estates, there was no new take-up of sites in 2002.At the same time, two sites totalling 3.2 hectares in the Tai Po Industrial Estate,one site of 2.4 hectares in the Yuen Long Industrial Estate, and one site of 0.6hectare in the Tseung Kwan O Industrial Estate were surrendered. As a result,the take-up rates in these three industrial estates fell from 99.0%, 95.8% and48.6% respectively at end-2001 to 94.7%, 92.1% and 47.9% at end-2002.
/3.31 .....

116
3.31 The Science Park in Pak Shek Kok was officially opened on 27 June2002, upon completion of Phase 1a of the development project. By the endof the year, approvals were granted to 22 technology companies for admissioninto the Science Park. Most of them were engaged in the electronics,biotechnology, information technology and telecommunications, and precisionengineering fields. The remainder of Phase 1 would be completed bymid-2004. As to Phase 2, construction work would commence in 2004.
Electricity and gas
3.32 Local electricity consumption continued to rise steadily, by 2% to137 100 terajoules in 2002, broadly similar to the 3% increase in 2001.Analysed by main user type, domestic consumption and commercialconsumption went up by 2% and 4% respectively in 2002, outweighing the fallin industrial consumption by 4%. Electricity exports to the Mainland, whichaccounted for 5% of the total electricity generated in Hong Kong, leaped furtherby 38% in 2002, after a 34% jump in 2001. This was attributable to asustained surge in electricity demand in the Pearl River Delta region, in tandemwith the rapid expansion in economic activities there.
3.33 Towngas consumption was little changed at 26 600 terajoules in 2002,after rising by 2% in 2001. Within this total, domestic consumption increasedby 2%, virtually offsetting the decreases of 2% in both commercial andindustrial consumption.
Internal transport
3.34 Total patronage on public transport edged up further by 2% to4.1 billion in 2002, after a 1% rise in 2001. The increase might have beenpartly stimulated by the fare concessions offered by some of the public transportoperators during the year. Also partly contributed was the opening of theMTR Tseung Kwan O Extension in August. Analysed by mode of transport,patronage on the Mass Transit Railway rose by 2% in 2002, with the increasebeing concentrated mostly in the last four months of the year. Patronage onfranchised buses also went higher by 2% in 2002, while patronage on theKowloon-Canton Railway, mini-buses and ferries increased by 1% each.Patronage on trams and taxis held steady. On the other hand, patronage on theLight Rail decreased marginally, by 2%.
/3.35 .....

117
3.35 On private transport, the total number of newly registered private carsfell distinctly, by 12% to 30 900 in 2002, having risen slightly by 1% in 2001.At end-2002, the total number of registered private cars was up by 1% over ayear earlier to 384 900, while the total number of licensed private cars wasvirtually unchanged at 340 900.
Passenger journeys by mode of public transport in 2002Diagram 3.13
Total passenger journeys in 2002 : 4.08 billion
MTR0.79 billion (19%)
Franchised buses1.58 billion (39%)
Minibuses0.60 billion (15%)
Light rail 0.11 billion (3%)
KCR0.30 billion (7%)
Taxis0.48 billion (12%)
Ferries 0.04 billion (1%)Trams 0.09 billion (2%)
Others 0.10 billion (2%)
External transport
3.36 On air transport, total air passenger movements rose by 2% to23.6 million in 2002, improved from zero growth in 2001. Within the total for2002, air passenger arrivals increased by 3% to 11.8 million, and air passengerdepartures by 2% to 11.7 million. The major impetus to growth came from airpassenger movements from and to the Mainland, with more distinct increases of6% and 4% respectively. As to aircraft movements (including passenger andcargo flights), there was a further solid growth of 5% to 206 700 in 2002, yetthis was slower than the 8% rise in 2001.
/Diagram 3.14 .....

118
Number of air passenger movements
Q1 Q2 Q3 Q4 Q1 Q2 Q3 Q4 Q1 Q2 Q3 Q4 Q1 Q2 Q3 Q4 Q1 Q2 Q3 Q4 Q1 Q2 Q3 Q41997 1998 1999 2000 2001 2002
0
1
2
3
4
5
6
7
8
9
10
11
12Number (million)
0
5
10
15
20
25
30
35
40
-5
-10
-15
-20
Percent
Total number Year-on-year rate of change
Diagram 3.14
J F M A M J J A S O N D J F M A M J J A S O N D2001 2002
0.0
0.5
1.0
1.5
2.0
2.5Number (million)
051015202530
-5-10-15-20
Percent
3.37 Total air cargo movements soared by 20% to 2.5 million tonnes in2002, representing a significant turnaround from the 7% dip in 2001. This wasunderpinned by a pick-up in external trade in the second half of 2002. Alsocontributed was keener demand from local exporters for prompt delivery ofhigher-value products to cater for urgent orders, and in particular for meetingshipment deadlines amidst shut-down of the US West Coast ports in October.Within the total for 2002, inward air cargo leaped by 12% to 1.0 million tonnes,and outward cargo surged even more by 25% to 1.5 million tonnes. Thesecontrasted with the decreases of 6% and 8% respectively in 2001.
/Diagram 3.15 .....

119
Cargo carried by air
Q1 Q2 Q3 Q4 Q1 Q2 Q3 Q4 Q1 Q2 Q3 Q4 Q1 Q2 Q3 Q4 Q1 Q2 Q3 Q4 Q1 Q2 Q3 Q41997 1998 1999 2000 2001 2002
0
100
200
300
400
500
600
700
800
900
1000
1100
1200Tonnes ('000)
0
10
20
30
40
50
60
70
80
90
-10
-20
-30
Percent
Total volume Year-on-year rate of change
Diagram 3.15
*
J F M A M J J A S O N D J F M A M J J A S O N D2001 2002
0
50
100
150
200
250
300Tonnes ('000)
05101520253035
-5-10-15
Percent
**
Note : (*) Provisional figures.
3.38 On ocean transport, total ocean cargo movements amounted to125.9 million tonnes in the first eleven months of 2002, up 5% from a yearearlier. This came after zero growth in 2001. Transhipment cargo continuedto register a robust increase, while direct shipment cargo rose only marginally.Within the total for the first eleven months of 2002, inward and outward oceancargo went up by 5% and 6% respectively over a year earlier, to 85.0 milliontonnes and 40.9 million tonnes respectively. These fared better than thecorresponding changes of 1% and -2% in 2001.
/Diagram 3.16.....

120
Cargo carried by sea
Q1 Q2 Q3 Q4 Q1 Q2 Q3 Q4 Q1 Q2 Q3 Q4 Q1 Q2 Q3 Q4 Q1 Q2 Q3 Q4 Q1 Q2 Q31997 1998 1999 2000 2001 2002
0
5
10
1520
2530
35
4045
50
55
60
65Tonnes (million)
05
1015
20
2530
35
40
45
50
-5
-10
-15
Percent
Total volume Year-on-year rate of change
Diagram 3.16
J F M A M J J A S O N D J F M A M J J A S O N2001 2002
0
2
4
6
8
10
12
14Tonnes (million)
0
5
10
15
20
-5
-10
-15
Percent
3.39 As to container traffic, total container throughput in terms ofTwenty-foot Equivalent Units (TEUs) went up by 6% over a year earlier to17.4 million TEUs in the first eleven months of 2002. (A latest estimate putsthe total container throughput at around 19 million TEUs for 2002 as a whole,7% more than that in 2001.) This was an appreciable rebound from the 1% fallin 2001. Within the total for the first eleven months of 2002, inward andoutward container throughput moved up by 7% and 6% respectively over a yearearlier to 8.6 million TEUs and 8.8 million TEUs, in contrast to the decreases of2% and 1% in 2001. Concurrently, there was an on-going trend ofmanufactured products being shipped out directly from the nearby Mainlandports rather than indirectly through the Hong Kong port. Reflecting this,container throughput at the Yantian port soared by 56% in 2002, even fasterthan the 28% surge in 2001.
/Diagram 3.17 .....

121
Container throughput
Q1 Q2 Q3 Q4 Q1 Q2 Q3 Q4 Q1 Q2 Q3 Q4 Q1 Q2 Q3 Q4 Q1 Q2 Q3 Q4 Q1 Q2 Q31997 1998 1999 2000 2001 2002
0000
1000
2000
3000
4000
5000
6000
7000
8000TEUs ('000)
0510152025303540455055606570
-5-10
Percent
Total number Year-on-year rate of change
Diagram 3.17
J F M A M J J A S O N D J F M A M J J A S O N2001 2002
0
500
1000
1500
2000TEUs('000)
0
10
20
30
-10
-20
Percent
0
Tourism
3.40 The growth momentum in inbound tourism strengthened considerably.The total number of incoming visitors went up by 21% to 16.6 million in 2002,much exceeding the 5% rise in 2001(13). This increase, whilst common tovisitors from all the major sources, was most pronounced in respect of visitorsfrom the Mainland. This was mainly boosted by abolition of the quota forMainland visitors under the Hong Kong Group Tour Scheme in January 2002,as well as by extension of the effective period for multiple business visitsendorsement for Mainland visitors as from December 2001(14). On ayear-on-year comparison, the growth in the total number of incoming visitorsaccelerated markedly, from 12% and 13% respectively in the first two quartersof 2002 to 22% in the third quarter, and further to 34% in the fourth quarter.Apart from the boost from Mainland visitors, it could have also beencontributed by recovery of economies in the region, as well as by the weakeningin the US dollar and hence the Hong Kong dollar over the year.
/3.41 .....

122
3.41 Analysed by major source, visitors from the Mainland were sharply upby 53% in 2002. Visitors from South and Southeast Asia also had a moresignificant rise, by 9%. Visitors from the United States and the UnitedKingdom rose by 7% and 5% respectively, with a more distinct increase in thefourth quarter owing to a low base a year earlier. Visitors from Japan rosemore moderately, by 4%, while visitors from Taiwan held broadly stable.
Number of incoming visitorsDiagram 3.18
Q1 Q2 Q3 Q4 Q1 Q2 Q3 Q4 Q1 Q2 Q3 Q4 Q1 Q2 Q3 Q4 Q1 Q2 Q3 Q4 Q1 Q2 Q3 Q41997 1998 1999 2000 2001 2002
0
1
2
3
4
5
6
7
8Number (million)
0
10
20
30
40
50
60
70
80
-10
-20
-30
-40
Percent
Total number Year-on-year rate of change
J F M A M J J A S O N D J F M A M J J A S O N D2001 2002
0.00.20.40.60.81.01.21.41.61.8
Number (million)
0510152025303540
-5-10
Percent
/Table 3.15 .....
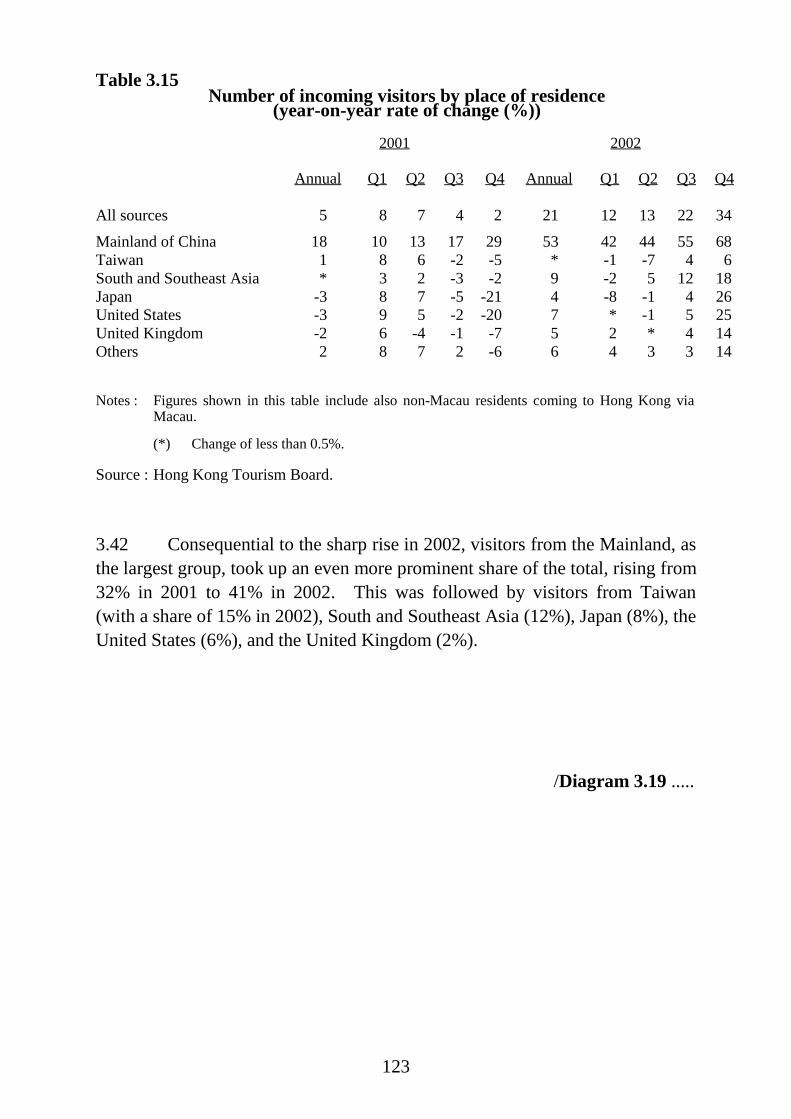
123
Table 3.15Number of incoming visitors by place of residence
(year-on-year rate of change (%))
2001 2002
Annual Q1 Q2 Q3 Q4 Annual Q1 Q2 Q3 Q4
All sources 5 8 7 4 2 21 12 13 22 34
Mainland of China 18 10 13 17 29 53 42 44 55 68Taiwan 1 8 6 -2 -5 * -1 -7 4 6South and Southeast Asia * 3 2 -3 -2 9 -2 5 12 18Japan -3 8 7 -5 -21 4 -8 -1 4 26United States -3 9 5 -2 -20 7 * -1 5 25United Kingdom -2 6 -4 -1 -7 5 2 * 4 14Others 2 8 7 2 -6 6 4 3 3 14
Notes : Figures shown in this table include also non-Macau residents coming to Hong Kong viaMacau.
(*) Change of less than 0.5%.
Source : Hong Kong Tourism Board.
3.42 Consequential to the sharp rise in 2002, visitors from the Mainland, asthe largest group, took up an even more prominent share of the total, rising from32% in 2001 to 41% in 2002. This was followed by visitors from Taiwan(with a share of 15% in 2002), South and Southeast Asia (12%), Japan (8%), theUnited States (6%), and the United Kingdom (2%).
/Diagram 3.19 .....

124
Number of incoming visitors by source in 2002
Total number of incoming visitors in 2002 : 16.57 million
Diagram 3.19
Mainland of China6.83 million (41%)
Japan1.40 million (8%)
Taiwan2.43 million (15%)
South andSoutheast Asia1.91 million (12%)
United States1.00 million (6%)
United Kingdom0.38 million (2%)
Others2.63 million (16%)
3.43 As at end-2002, there were 43 634 hotel rooms in Hong Kong.Consequential to the large inflow of visitors, the average hotel room occupancyrate went up distinctly, to 89% in the fourth quarter of 2002, from 80% in thesame quarter in 2001.
/Table 3.16 .....

125
Table 3.16
Stock of hotel rooms and occupancy rate
Number of hotel roomsas at end of period*
Average hotel roomoccupancy rate
during the period(%)
2001 Annual 35 999 (2) 79
Q1 36 712 (4) 78Q2 36 971 (4) 79Q3 36 591 (4) 78Q4 35 999 (2) 80
2002 Annual 43 634 (--) 84
Q1 41 829 (--) 81Q2 42 747 (--) 83Q3 42 758 (--) 83Q4 43 634 (--) 89
Notes : (*) For 2001, this covers only high-tariff hotels, medium-tariff hotels,hostels and guest houses which were members of the former HongKong Tourist Association (renamed as the Hong Kong Tourism Boardas from April 2001). As from the first quarter of 2002, this has awider coverage, including all hotels and tourist guest houses on therecord of the Office of the Licensing Authority in the Home AffairsDepartment. As such, the data for the first quarter of 2002 onwardsare not directly comparable to those in the earlier periods.
( ) % change over a year earlier.
(--) Not applicable.
Source : Hong Kong Tourism Board.
/3.44 .....

126
3.44 On Hong Kong residents travelling abroad, the total number ofresident departures rose further, by 6% to 64.5 million in 2002, faster than the4% growth in 2001. This was partly stimulated by a further cut in charges forpackage tours, amidst intense competition in outbound tourism business.Analysed by major destination, resident departures to the Mainland and Europeboth rose by 7% in 2002, while resident departures to North Asia and Taiwanhad lesser increases, by 2% each. On the other hand, resident departures toAmericas and to Australia and New Zealand declined, by 8% and 6%respectively. Resident departures to Macau and to South and Southeast Asiaalso fell, though more modestly, by 3% each.
Table 3.17
Number of Hong Kong resident departures by destination(year-on-year rate of change (%))
2001 2002
Annual Q1 Q2 Q3 Q4 Annual Q1 Q2 Q3 Q4
All destinations 4 8 1 1 5 6 7 5 6 4
Mainland of China 4 8 * 2 6 7 9 7 7 5Macau 2 7 8 -5 -1 -3 -3 -5 * -2South and Southeast
Asia5 16 8 1 -5 -3 -2 -11 1 -1
North Asia 3 13 -3 -3 6 2 5 -7 3 6Americas(a) -6 7 5 -13 -21 -8 -14 -20 -6 18Taiwan 12 8 9 12 19 2 20 -10 -3 5Europe * 4 3 -4 -2 7 10 * 8 13Australia and
New Zealand3 4 3 6 -3 -6 -8 -16 -2 2
Others 17 84 28 -3 -32 -16 -40 -24 -2 35
Notes : (a) This includes the United States, Canada, Central America and South America.
(*) Change of less than 0.5%.
Source : Hong Kong Tourism Board.
/Diagram 3.20 .....

127
Number of Hong Kong resident departuresDiagram 3.20
Q1 Q2 Q3 Q4 Q1 Q2 Q3 Q4 Q1 Q2 Q3 Q4 Q1 Q2 Q3 Q4 Q1 Q2 Q3 Q4 Q1 Q2 Q3 Q41997 1998 1999 2000 2001 2002
02468
1012141618202224262830
Number (million)
024681012141618202224262830
Percent
Total number Year-on-year rate of change
J F M A M J J A S O N D J F M A M J J A S O N D2001 2002
0
1
2
3
4
5
6
7Number (million)
0
5
10
15
20
25
-5
-10
Percent
3.45 The Mainland continued to be the most popular destination for HongKong resident departures, accounting for a predominant share of 86% in thetotal outbound trips in 2002. Most of these trips were destined for GuangdongProvince. Macau came next (with a share of 6%), followed by South andSoutheast Asia (4%), and North Asia (1%).
/Diagram 3.21 .....

128
Number of Hong Kong resident departures by destination in 2002
Total number of resident departures in 2002 : 64.54 million
Mainland of China55.65 million (86%)
Macau4.18 million (6%)
South and Southeast Asia2.42 million (4%)
Others1.51 million (2%)
Diagram 3.21
North Asia0.77 million (1%)
Telecommunications
3.46 The fixed-line segment of telecommunications had a mixedperformance in 2002. On wireline services, the total number of directexchange lines continued on a downtrend, falling by 2% over a year earlier to3.84 million at end-2002. Within this total, the number of fixed telephonelines went down by 6% over a year earlier to 3.30 million at end-2002. Itcomprised falls in the number of lines for business customers and residentialcustomers by 3% and 9% respectively to 1.50 million and 1.80 million. Thesetwo particular groups of customer accounted for 45% and 55% respectively ofall the fixed telephone lines installed at the year-end. At 48 fixed telephonelines per 100 inhabitants, per capita tele-density in Hong Kong was amongst thehighest in Asia. As regards the number of facsimile lines, it leaped by 33%over a year earlier to 546 300 at end-2002. This was mostly the result of activepromotion by a major telephone operator in the middle of the year. At 32facsimile lines per 100 business exchange lines, Hong Kong again rankedamongst the highest in Asia. On external telecommunications, externaltelephone traffic volume(15) went up by 5% over a year earlier to 5.7 billionminutes in 2002. As to Internet usage, broadband services continued on asharp uptrend, with the traffic volume surging by 192% to 215 300 terabits in2002. There was a further profound shift in Internet usage away from thepublic switch telephone network, where the traffic volume plummeted by 50%to 5.5 billion minutes in 2002.
/Diagram 3.22 .....

129
Number of fixed telephone lines* by main user category(as at end of quarter)
Q1 Q2 Q3 Q4 Q1 Q2 Q3 Q4 Q1 Q2 Q3 Q4 Q1 Q2 Q3 Q4 Q1 Q2 Q3 Q4 Q1 Q2 Q3 Q41997 1998 1999 2000 2001 2002
0
500
1000
1500
2000
2500
3000Number ('000)
0
4
8
12
16
20
-4
-8
Percent
Number of business users Number of residential users Year-on-year rate of change for business users Year-on-year rate of change for residential users
Diagram 3.22
Note : (*) Not including facsimile lines.
External telephone traffic volume*(in the quarter)
Q2 Q3 Q4 Q1 Q2 Q3 Q4 Q1 Q2 Q3 Q4 Q1 Q2 Q3 Q4 Q1 Q2 Q3 Q41998 1999 2000 2001 2002
0
200
400
600
800
1000
1200
1400
1600Minutes (million)
0
5
10
15
20
25
30
35
-5
Percent
Traffic volume Year-on-year rate of change
Diagram 3.23
rate
Notes : Data prior to the second quarter of 1998 are not available.
(*) Including access by international direct dialing (IDD)through telephone lines, facsimile lines and datel lines.
/3.47 .....

130
3.47 On wireless services, the mobile phone segment settled to a moremoderate yet steadier growth pace, having undergone a marked expansion overthe past several years. At end-2002, the number of mobile phone customerswent up by 9% from a year earlier to 6.2 million(16). This corresponded to amobile phone penetration rate of 91%, which was one of the highest in theworld. Meanwhile, the paging segment continued to shrink, with the numberof paging customers at 197 400 at end-2002 dipping further by 22% from a yearearlier.
3.48 Following finalisation of the implementation details, the local FixedTelecommunications Network Services (FTNS) market is fully liberalised asfrom January 2003. There is no longer a pre-set limit on the number oflicences issued. In addition, there is no requirement set for network rollout andcapital expenditure. These measures are expected to promote development ofthe local FTNS market and enhance service provision to consumers.Together with the other liberalisation drives implemented in recent years, allsegments of the telecommunications market are fully opened up for competitionas from January 2003.
Number of public mobile radiotelephone service customers*(as at end of quarter)
Q1 Q2 Q3 Q4 Q1 Q2 Q3 Q4 Q1 Q2 Q3 Q4 Q1 Q2 Q3 Q4 Q1 Q2 Q3 Q4 Q1 Q2 Q3 Q41997 1998 1999 2000 2001 2002
0
1000
2000
3000
4000
5000
6000
7000Number ('000)
0
20
40
60
80
100
120 Percent
Number Year-on-year rate of change
rate
Diagram 3.24
Note : (*) Including all mobile phone service subscribers and thestock of pre-paid Subscribed Identity Module (SIM)cards already sold to customers.
/Notes .....

131
Notes :
(1) On 1 August 2002, the Census and Statistics Department introduced a technicalrevision to the existing GDP series, as compiled from the expenditure approach. Atthe same time, a new data series on quarterly GDP by economic activity at constantprices, backdated to the first quarter of 2000, was released. This new GDP series, ascompiled from the production approach, enables analysis to be done of the value-addedcontributions of the various economic sectors in real terms, in regard to their trend andrelative significance.
(2) The service sectors comprise the wholesale, retail and import/export trades, restaurantsand hotels; transport, storage and communications; financing, insurance, real estate andbusiness services; and community, social and personal services. In respect ofcontribution to GDP, the service sectors also include ownership of premises, which isanalytically a service activity. Charges of financial intermediation are howeverdeducted.
(3) In order to provide a more accurate picture of the distribution of employment byeconomic sector, a set of composite employment estimates is derived by the Census andStatistics Department by reconciling under an integrated statistical framework theemployment figures obtained from the General Household Survey and the QuarterlySurvey of Employment and Vacancies on business establishments. Accordingly, theshares of persons engaged in the various economic sectors against the total employedpopulation in the economy are based on these composite employment estimates.
The composite employment estimates as from 1996 are based on the “residentpopulation” definition, with the results of the 2001 Population Census incorporated.
(4) The Index of Industrial Production is intended to reflect the recent trend of net outputin real terms in the various local manufacturing industries. Output from outwardprocessing operations across the boundary is not included.
(5) The Monthly Survey of Orders-on-hand covers manufacturing firms engaging 50 ormore workers. Its main purpose is to provide a broad indicator of the orders positionin value terms in the local manufacturing sector at monthly intervals. Orders to be metby outward processing across the boundary are not included.
(6) On 5 June 2002, the Chief Secretary for Administration announced that the ten-monthmoratorium on the sale of subsidised sale flats would cease to apply upon its expiry atend-June 2002, and that their sale would resume in a cautious and considered mannerthereafter. Two tranches of new subsidised sale flats totalling about 4 900 units wouldbe put up for sale by the end of the financial year 2002/03, in compliance with thepre-set annual ceiling of 9 000 units up to the financial year 2005/06. He alsoannounced that from the financial year 2006/07 onwards, the Government would movetowards a level of sale at no more than 2 000 units a year as far as possible, with thecut-back in supply of flats being matched by an additional number of home ownershiploans to the eligible families.
/(7) .....

132
(7) Developers were offering a variety of inducements including flexible payment terms,top-up loans, cash rebates, and mortgage subsidies in the early part of the repaymentperiod. Flat buyers could opt for different combinations of these privileges, or elseseek a direct price discount. In effect, the acquisition cost initially and/or the mortgagecost in the ensuing few years would be reduced for the flat buyers.
(8) On 13 November 2002, the Secretary for Housing, Planning and Lands announced ninespecific measures to redress supply and demand imbalance with a view to stabilising thehousing market, as summarised below:
(a) The system of arranging scheduled land auctions would be stopped. Theremaining two scheduled land auctions in the financial year 2002/03 would becancelled. Also, the Application List would be suspended with immediate effectup to December 2003. After this date, the supply of new land would only betriggered from the Application List.
(b) The Government would step up liaison with the Mass Transit Railway CorporationLimited and the Kowloon-Canton Railway Corporation to better co-ordinate thetendering of railway-related housing projects. The Government and the tworailway corporations had reached a consensus whereby no railway propertydevelopments would be put up for tender in 2003.
(c) Except for a small number of unsold and returned flats, the production and sale offlats under the Home Ownership Scheme (HOS)/Private Sector ParticipationScheme (PSPS) would cease. HOS/PSPS flats that were already completed orunder construction would be disposed of through market-friendly means.
(d) All mixed development projects, including the Flat For Sale Scheme operated bythe Housing Society, would be stopped.
(e) The sale of public rental housing (PRH) units under the Tenants Purchase Scheme(TPS) would be halted, except for the flats that were already sold and those that hadbeen announced to be sold under TPS Phase 6.
(f) The scale of the PRH construction programme would be demand driven, with aview to maintaining an average waiting time of three years.
(g) A new interest-free loan scheme would be provided by the Housing Authority tohelp eligible families to buy their own homes.
(h) A further review of the Landlord and Tenant (Consolidation) Ordinance would beconducted, with a view to removing all outdated and excessive protection ofsecurity of tenure, in a bid to revitalise the rental market for private residentialproperty.
(i) The remaining anti-speculation measures in respect of the restriction on internalsale quota and the restriction that each purchaser could only buy one residentialunit together with no more than two car parking spaces would be removed.
/(9) .....

133
(9) Under the Home Assistance Loan Scheme, an initial quota of 10 000 assistance cases,for either interest-free loan or mortgage subsidy, is earmarked for 2003. This will beequally split between Green Form applicants (including mainly existing public housingtenants and eligible applicants on the Waiting List of public rental housing) and WhiteForm applicants (other applicants). A successful family applicant irrespective ofcategory will be eligible for an interest-free loan at $530,000 repayable by 13 years or$390,000 repayable by 20 years, or else a monthly mortgage subsidy at $3,800 lastingfor four years. The corresponding amount of loan and subsidy for a successfulsingleton applicant will be halved.
(10) Following a review of the presentation by the Census and Statistics Department, realestate developers’ margin is now incorporated into private sector expenditure onbuilding and construction, instead of being delineated separately in the expenditurecomponents of GDP. This amounts to bringing up the private sector investment inbuilding and construction much closer to its overall output value, from its directassessed physical construction cost. The change in presentation is in line withinternational statistical practice, and reflects the recognition that real estate developers’margin is an integral part of private sector investment in building and construction.
(11) The Government operates an Application System under the Land Sale Programme asfrom April 1999, whereby additional sites are set aside on an Application List for openapplication by property developers. Provided that the minimum price offered by theapplicant is acceptable to the Government, the site involved can be released from theApplication List for open auction or tender. This helps ensure a flexible supply ofGovernment land in response to market demand.
(12) Virtually all the land in Hong Kong is held on a leasehold basis. A predominant partof the existing developed and developable land is already in the private sector domain.In order to facilitate redevelopment in line with the town planning and urban renewalobjectives, modification of usage (including modification by way of land exchange)may be granted by the Government to old leases of land upon application from thelandlords. A land premium, equivalent to the difference in land value between theold and the new usage, is normally required for granting of the modification.
(13) In the light of the significant changes over the past year in the number and profile ofvisitor arrivals to Hong Kong, the Hong Kong Tourism Board is reviewing the touristreceipts and per capita spending figures for the sake of compiling an improved set ofestimates. At the same time, a new means of presenting the figures is beingcontemplated. The improved estimates are expected to be available later in the year.
(14) As from 1 January 2002, the quota of 1 500 a day set for Mainland visitors under theHong Kong Group Tour Scheme is abolished, so as to facilitate more Mainland visitorscoming for tours in Hong Kong. Also, the number of Mainland travel agencieslicensed to organise group tours to Hong Kong has henceforth gone up substantially,from 4 to 528. The greatly increased competition amongst these travel agencies hasled to a drastic reduction in the tour fees, which is conducive to more group tourscoming to Hong Kong.
As from 1 December 2001, the Mainland authorities have extended the effective periodfor multiple business visits endorsement from six months to a maximum of three years.This further enables more Mainland visitors to come to Hong Kong.
/(15) .....

134
(15) This includes access by international direct dialing (IDD) through telephone lines,facsimile lines and datel lines.
(16) This figure includes all mobile phone service subscribers and the stock of pre-paidSubscribed Identity Module (SIM) cards already sold to customers.

135
CHAPTER 4 : THE FINANCIAL SECTOR*
Overall financial market situation
4.1 The performance of the local financial markets was mixed in 2002.The spot exchange rate of the Hong Kong dollar against the US dollarcontinued to stay close to the linked rate. As to the spread of the twelve-monthforward rate against the spot rate, the premium was broadly stable in the earlypart of 2002, except for a brief pick-up in mid-March. The premium thennarrowed distinctly until mid-September when it widened sharply amidstmarket concern over the protracted fiscal deficit in Hong Kong, yet shrankagain since late November. Local inter-bank interest rates remained soft inmost of 2002, largely following their US dollar counterparts. With low costs ofholding liquid balances, narrow money supply continued to increase throughoutthe course of 2002, while broad money supply fell during the year. The localstock market was volatile in 2002, largely affected by the gyrations in the USstock market where investor sentiment was undermined by uncertainties overthe pace of US economic recovery and a spate of corporate frauds, and in thelatter part of the year, also by heightened war pressure on Iraq. The Hang SengIndex plummeted to a four-year low of 8 859 in mid-October, recoveredsomewhat in November, but drifted lower again to close the year at 9 321, 18%below the level at the end of 2001.
Exchange rates
4.2 The spot exchange rate of the Hong Kong dollar against the US dollarstayed close to the linked rate throughout 2002, moving within a narrow rangeof 7.796 to 7.800. As to the spread of the twelve-month forward rate againstthe spot rate, the premium held generally stable in the early part of 2002, exceptfor a brief pick-up to above 250 pips (each pip equivalent to HK$0.0001) inmid-March. It then narrowed distinctly in the ensuing months, to aneight-month low of merely one pip on 26 June. It widened after mid-Septemberamidst market concern over the protracted fiscal deficit in Hong Kong, moving
_________
(*) This chapter is jointly prepared by the Hong Kong Monetary Authority and theEconomic Analysis Division.
/mostly .....

136
mostly in the range of 250 to 350 pips between mid-October and late November.Yet it shrank again towards the year-end, and closed 2002 at 169 pips,considerably reduced from that of 235 pips at end-2001.
4.3 Under the linked exchange rate system(1), the movements in theexchange rates of the Hong Kong dollar against other major currencies followclosely those in the US dollar. The US dollar remained strong at the beginningof 2002, but weakened against the major currencies since mid-April, due touncertainties over the pace of US economic recovery and plausible militaryaction on Iraq. The dollar - euro exchange rate, at an average of 0.946 in 2002,weakened by 5.6% from that of 0.896 in 2001. The dollar - pound sterlingexchange rate also weakened, by 4.4% to an average of 1.504 in 2002, fromthat of 1.441 in 2001. The yen - dollar exchange rate, averaged at 125.2 in2002, nevertheless went up by 3.0% from 121.5 in 2001, signifying relativestrengthening in the US dollar. In 2002, most of the other major East Asiancurrencies appreciated to various extent against the US dollar.
4.4 Taking these currency movements together, the trade-weightedNominal Effective Exchange Rate Index(2) of the Hong Kong dollar fell slightlyby 0.7%, to an average of 104.0 in 2002, from 104.7 in 2001. After adjustingfor relative movements in the respective consumer price indices, thetrade-weighted Real Effective Exchange Rate Index of the Hong Kong dollarfell distinctly more by 3.9%, to an average of 96.1 in 2002, from 100.0 in 2001.
/Table 4.1 .....

137
Table 4.1
Trade-weighted Effective Exchange Rate Indexof the Hong Kong dollar
Averagefor the month
Trade-weightedNominal EERI(a)
(Jan 2000 = 100)
Trade-weightedReal EERI(b)
(Jan 2000 = 100)
2001 Mar 104.3 (1.0) 100.1 (-0.2)Jun 105.6 (1.2) 101.0 (0.9)Sep 104.3 (-1.2) 99.4 (-1.5)Dec 105.4 (1.1) 98.2 (-1.3)
2002 Mar 105.9 (0.5) 99.3 (1.1)Jun 103.5 (-2.3) 95.5 (-3.8)Sep 103.0 (-0.5) 94.4 (-1.1)Dec 102.7 (-0.3) 93.3 (-1.2)
Notes : (a) The Nominal Effective Exchange Rate Index of the Hong Kong dollar is aweighted average of the exchange rates of the Hong Kong dollar against thecurrencies of its major trading partners, with the weights adopted being therespective shares of these trading partners in the total value of merchandisetrade for Hong Kong.
As from 2 January 2002, a new series of nominal EERI replaces the old series,with the weights updated to reflect the average pattern of merchandise tradeduring 1999 and 2000, and with the base period brought up to January 2000.
The currency basket of the new series has also been updated to include the euroand the Philippine peso, and to exclude the five currencies pertaining to theparticipating countries of the euro.
(b) The Real Effective Exchange Rate Index of the Hong Kong dollar is obtainedby adjusting the Nominal EERI for relative movements in the seasonallyadjusted consumer price indices of the respective trading partners.
( ) % change over three months earlier.
/Diagram 4.1 .....

138
Exchange rate of the Hong Kong dollar against the US dollarDiagram 4.1
M J S D M J S D M J S D M J S D M J S D M J S D7.5
7.7
7.9
8.1
8.3
8.5HK$/US$
0
HK$/US$ spot rate
HK$/US$twelve-month forward rate
HK$/US$three-month forward rate
20021997 1998 1999 2000 2001
Diagram 4.2Trade-weighted Effective Exchange Rate Index
of the Hong Kong dollar
M J S D M J S D M J S D M J S D M J S D M J S D80
90
100
110
120Index (Jan 2000 = 100)
Nominal EERI
0
Real EERI
20021997 1998 1999 2000 2001
Note : See Notes (a) and (b) to Table 4.1.
/Interest .....

139
Interest rates
4.5 After successive rate cuts leading to substantial monetary easing in2001, the US Federal Reserve lowered the Fed Funds target rate only once inNovember 2002, by 50 basis points to a new 41-year low of 1.25%. With theexception of some temporary increases in March and September, localshort-term interest rates largely tracked their US dollar counterparts. Theyremained low during most of 2002, and eased further in the last two months ofthe year. The three-month HIBOR went down to 1.4% at end-2002, from 1.9%at end-2001. The average spread between the three-month HIBOR and thecorresponding Euro-dollar deposit rate reversed from a discount of6 basis points in December 2001 to a premium of 10 basis points inDecember 2002.
4.6 Following the movement in the US Fed Funds target rate, the BaseRate under the Discount Window operated by the Hong Kong MonetaryAuthority was maintained at 3.25% until early November 2002, when it wasreduced by 50 basis points to 2.75%. The best lending rate of the majorcommercial banks was lowered to 5.00% at end-2002, from 5.13% at end-2001.Savings deposit rates offered by the major banks were also trimmed, to anaverage of merely 0.03% at end-2002, from 0.15% at end-2001. The averagespread of the best lending rate over the three-month time deposit rate widenedslightly, to 4.71 percentage points in 2002, from 4.62 percentage points in 2001.
4.7 Competition among the banks for residential mortgage businessintensified further. The proportion of new residential mortgages granted atmore than 2.25 percentage points below the best lending rate rose distinctlyfurther, from 73.9% in December 2001 to 79.0% in December 2002. Evenmore visibly, the proportion of new residential mortgages granted at more than2.5 percentage points below the best lending rate, at 45.3% in December 2002,was way above that of only 5.0% in December 2001(3).
/Diagram 4.3 .....

140
(a) Base Rate under the Discount Window, andInterest ratesDiagram 4.3
M J S D M J S D M J S D M J S D M J S D M J S D0
2
4
6
8
10
12Percent per annum
Overnight Euro-dollar deposit rate
Overnight HIBOR
overnight HIBOR and Euro-dollar deposit rate
Base Rate under the Discount Window
20021997 1998 1999 2000 2001
(average for the month)
(b) Three-month HIBOR and Euro-dollar deposit rate
M J S D M J S D M J S D M J S D M J S D M J S D0
2
4
6
8
10
12
14Percent per annum
Three-month Euro-dollardeposit rate
Three-month HIBOR
20021997 1998 1999 2000 2001
(average for the month)
/Diagram 4.3 (cont’d) .....

141
(c) Twelve-month HIBOR and Euro-dollar deposit rate
M J S D M J S D M J S D M J S D M J S D M J S D0
2
4
6
8
10
12
14Percent per annum
Twelve-month Euro-dollar deposit rate
Twelve-month HIBOR
20021997 1998 1999 2000 2001
(average for the month)
Table 4.2
Hong Kong dollar inter-bank offer rates (HIBORs)(% per annum)
Averagefor the month
OvernightHIBOR
Three-monthHIBOR
Twelve-monthHIBOR
2001 Mar 4.94 (-39) 4.83 (-9) 4.74 (1)Jun 3.85 (-11) 3.67 (-12) 3.92 (-9)Sep 2.96 (-15) 2.84 (-11) 2.93 (-11)Dec 1.75 (-9) 1.81 (-6) 2.44 (6)
2002 Jan 1.74 (-3) 1.76 (-1) 2.36 (5)Feb 1.81 (3) 1.90 (4) 2.47 (9)Mar 1.86 (9) 2.12 (17) 2.93 (11)
Apr 1.73 (-4) 1.95 (5) 2.80 (8)May 1.60 (-17) 1.81 (-4) 2.54 (-5)Jun 1.41 (-35) 1.75 (-9) 2.34 (-4)
Jul 1.52 (-23) 1.75 (-6) 2.04 (-6)Aug 1.53 (-25) 1.65 (-9) 1.78 (-8)Sep 1.67 (-11) 1.77 (*) 1.82 (-3)
Oct 1.90 (13) 1.97 (23) 1.99 (20)Nov 1.37 (-1) 1.56 (14) 1.79 (18)Dec 1.16 (-13) 1.48 (10) 1.68 (12)
Notes : ( ) Figures in brackets represent the spread between the HIBOR and thecorresponding Euro-dollar deposit rate in basis points. A positive value denotes adifferential in favour of the Hong Kong dollar, while a negative value denotes adifferential in favour of the US dollar.
(*) Spread of less than one basis point./Table 4.3 .....
Diagram 4.3 (cont’d)

142
Table 4.3
Hong Kong dollar deposit and lending rates(% per annum, as average of the rates
quoted by the major banks)
Time deposit rates fordeposits of less than HK$100,000
Averagefor the month
One-week
One-month
Three-month
Six-month
Twelve-month
Savings deposit rate
Bestlending rate
2001 Mar 3.53 3.74 3.73 3.71 3.71 3.65 8.40Jun 2.22 2.41 2.46 2.52 2.73 2.25 7.00Sep 1.36 1.59 1.58 1.63 1.73 1.33 6.30Dec 0.22 0.51 0.51 0.63 1.04 0.20 5.17
2002 Jan 0.17 0.41 0.46 0.57 0.92 0.16 5.13Feb 0.18 0.48 0.55 0.71 1.08 0.16 5.13Mar 0.21 0.55 0.62 0.84 1.39 0.16 5.13
Apr 0.17 0.45 0.56 0.82 1.41 0.16 5.13May 0.17 0.34 0.43 0.58 1.02 0.16 5.13Jun 0.17 0.29 0.36 0.46 0.74 0.16 5.13
Jul 0.17 0.31 0.37 0.41 0.56 0.16 5.13Aug 0.16 0.32 0.36 0.39 0.44 0.16 5.13Sep 0.16 0.33 0.38 0.40 0.43 0.16 5.13
Oct 0.17 0.37 0.43 0.44 0.48 0.16 5.13Nov 0.10 0.16 0.20 0.24 0.30 0.07 5.03Dec 0.09 0.13 0.15 0.19 0.25 0.03 5.00
Deposits and money supply
4.8 Following a marginal rise of 0.2% during 2001, Hong Kong dollardeposits (adjusted to include foreign currency swap deposits(4)) fell modestly,by 1.6% over a year earlier to $1,825 billion at end-2002. They fell by 1.3%during the first quarter of 2002, before reversing to increase by 1.0% during thesecond quarter. They decreased again by 1.5% during the third quarter, andthen picked up slightly by 0.2% during the fourth quarter. The share of HongKong dollar deposits in total deposits edged higher, to 55.0% at end-2002, from54.4% at end-2001.
/4.9 .....

143
4.9 Amidst low cost in holding liquid balances in a low interest rateenvironment, time deposits continued to shrink throughout 2002 whereasdemand deposits and savings deposits both recorded distinct increases.Compared with a year earlier, demand deposits and savings deposits went up by14.0% and 9.8% respectively to $146 billion and $674 billion at end-2002,whereas time deposits went down by 9.7% to $1,004 billion at end-2002.
Table 4.4
Hong Kong dollar deposits with authorized institutions
% changeduring
the quarterDemanddeposits
Savingsdeposits
Time deposits(a)(b)
TotalHong Kong
dollar deposits(a)
2001 Q1 -6.1 1.4 -0.6 -0.4Q2 0.9 8.3 -2.9 0.3Q3 5.9 4.4 -2.4 0.1Q4 13.9 8.7 -5.2 0.2
2002 Q1 -4.9 0.5 -1.9 -1.3Q2 3.6 3.9 -1.0 1.0Q3 4.7 -0.9 -2.5 -1.5Q4 10.5 6.2 -4.7 0.2
Total amountat the end ofDecember 2002(HK$Bn))
146 674 1,004 1,825
% change overa year earlier
14.0 9.8 -9.7 -1.6
Notes : (a) Adjusted to include foreign currency swap deposits.
(b) Time deposits with licensed banks plus deposits with restricted licence banksand deposit-taking companies.
/4.10 .....

144
4.10 With US dollar and non-US dollar deposits both declining, totalforeign currency deposits (adjusted to exclude foreign currency swap deposits)continued on a downtrend, falling by 3.8% over a year earlier to $1,493 billionat end-2002, after a 7.4% decrease during 2001. Within the foreign currencydeposits, US dollar deposits fell by 1.9% during 2002, smaller than the declineof 5.5% during 2001. Non-US dollar deposits plunged further by 7.6% during2002, having contracted by 11.0% during 2001. On the quarterly profile, totalforeign currency deposits declined by 6.2% during the first quarter of 2002,picked up by 1.7% during the second quarter, yet fell again by 0.9% during thethird quarter, before rising by 1.7% during the fourth quarter.
Table 4.5
Foreign currency deposits with authorized institutions
% change duringthe quarter
US$deposits(a)
Non-US$ deposits(a)
Total foreigncurrency
deposits(a)
Foreigncurrency
swap deposits
2001 Q1 -3.9 -7.1 -5.0 -10.3Q2 2.1 2.8 2.4 -20.4Q3 -0.9 0.1 -0.6 -7.5Q4 -2.9 -6.9 -4.3 -7.8
2002 Q1 -2.9 -12.7 -6.2 -6.9Q2 1.1 3.2 1.7 -8.0Q3 -3.3 4.2 -0.9 -7.5Q4 3.4 -1.5 1.7 -8.6
Total amountat the end ofDecember 2002(HK$Bn)
1,013 480 1,493 2
% change overa year earlier
-1.9 -7.6 -3.8 -27.7
Note : (a) Adjusted to exclude foreign currency swap deposits.
/Diagram 4.4 .....

145
Deposits with authorized institutionsby currency denomination and
Diagram 4.4
share of Hong Kong dollar deposits in total deposits
Q1 Q2 Q3 Q4 Q1 Q2 Q3 Q4 Q1 Q2 Q3 Q4 Q1 Q2 Q3 Q4 Q1 Q2 Q3 Q4 Q1 Q2 Q3 Q41997 1998 1999 2000 2001 2002
0
2
4
6
8
10
-2
-4
-6
-8
Rate of change during the quarter (percent)
0
10
20
30
40
50
60
70 Share in total (percent)
HK$ deposits *(left scale)
Foreign currency deposits *(left scale)
Share of HK$ deposits * in total deposits
(right scale)
Note : (*) Adjusted for foreign currency swap deposits.
4.11 Total deposits with all authorized institutions in Hong Kong fell by2.6% over a year earlier to $3,318 billion at end-2002, following a 3.4%decrease during 2001. The fall during 2002 was due to the declines of 3.5%and 1.2% respectively during the first and third quarters, which more thanoffset the increases of 1.3% and 0.9% respectively during the second and fourthquarters. A closely similar quarterly pattern was observed for deposits withlicensed banks, which took up 98.7% of the total deposits with all authorizedinstitutions. Deposits with deposit-taking companies and licensed banks fell by8.8% and 2.7% respectively during the year, whereas deposits with restrictedlicence banks went up, by 7.4%.
/Table 4.6 .....

146
Table 4.6
Total deposits by major type of authorized institution
Withlicensed banks
Withrestrictedlicence banks
Withdeposit-taking
companies
% change duringthe quarter
Demanddeposits
Savingsdeposits
Timedeposits
Sub-total
Timedeposits
Timedeposits Total
2001 Q1 -13.0 0.8 -3.0 -2.7 4.7 5.5 -2.6Q2 0.6 7.3 -0.2 1.3 -3.2 -6.5 1.3Q3 6.7 4.3 -2.0 -0.3 7.0 16.0 -0.2Q4 10.2 8.5 -5.8 -1.9 -2.0 -1.9 -1.9
2002 Q1 -1.5 0.2 -5.0 -3.5 -3.0 -7.0 -3.5Q2 4.4 4.4 -0.2 1.2 10.6 -3.0 1.3Q3 2.2 0.3 -2.2 -1.3 7.7 -2.2 -1.2Q4 10.9 6.1 -1.8 1.0 -6.9 3.3 0.9
Total amountat the end ofDecember 2002(HK$Bn)
182 947 2,147 3,276 36 6 3,318
% changeover a yearearlier
16.6 11.2 -9.0 -2.7 7.4 -8.8 -2.6
4.12 Following a strong increase of 12.7% during 2001, narrow moneysupply, HK$M1(5), continued to expand markedly, by 12.9% over a year earlierto $259 billion at end-2002. Having declined marginally by 0.1% during thefirst quarter of 2002, HK$M1 resumed increases by 1.7%, 3.5% and 7.3%during the ensuing three quarters. On a seasonally adjusted basis, HK$M1 roseby 0.5%, 5.4% , 2.9% and 3.4% respectively during the four quarters of 2002(6).By contrast, the broader definitions of money supply, HK$M2 and HK$M3(adjusted to include foreign currency swap deposits) at $1,984 billion and$2,004 billion respectively at end-2002, were down by 0.7% and 0.6% over ayear earlier. These reversed the corresponding increases of 0.5% and 0.7%during 2001. On the quarterly profile, both HK$M2 and HK$M3 fell by 1.0%during the first quarter of 2002 and rose back by 1.2% during the secondquarter. They then fell again during the third quarter, by 1.4% and 1.3%respectively, yet increased again during the fourth quarter, by 0.4% and 0.5%
/respectively .....

147
respectively. Apart from being influenced by the low cost of holding cash,HK$M1 in particular was boosted by a greater demand for cash brought aboutby the continued surge in visitors from the Mainland.
Table 4.7
Hong Kong dollar money supply and total money supply
% changeduring
M1 M2 M3
the quarter HK$ Total HK$(a) Total HK$(a) Total
2001 Q1 -2.6 (0.4) -7.5 -0.5 -2.6 -0.5 -2.5Q2 1.0 (1.7) 0.9 0.4 1.5 0.4 1.4Q3 5.1 (4.8) 5.7 0.4 * 0.5 0.1Q4 8.9 (5.0) 7.3 0.3 -1.6 0.3 -1.6
2002 Q1 -0.1 (0.5) 1.5 -1.0 -3.1 -1.0 -3.1Q2 1.7 (5.4) 2.4 1.2 1.7 1.2 1.7Q3 3.5 (2.9) 2.1 -1.4 -0.8 -1.3 -0.7Q4 7.3 (3.4) 8.0 0.4 1.4 0.5 1.3
Total amountat the end ofDecember 2002(HK$Bn)
259 (253) 296 1,984 3,519 2,004 3,562
% change overa year earlier
12.9 (12.7) 14.6 -0.7 -0.9 -0.6 -0.9
Notes : ( ) Figures in brackets represent percentage changes on the basis of the seasonallyadjusted series of HK$M1. Seasonality is not apparent for the other monetaryaggregates.
(a) Adjusted to include foreign currency swap deposits.
(*) Change of less than 0.05%.
/Diagram 4.5 .....

148
Hong Kong dollar money supply
Q1 Q2 Q3 Q4 Q1 Q2 Q3 Q4 Q1 Q2 Q3 Q4 Q1 Q2 Q3 Q4 Q1 Q2 Q3 Q4 Q1 Q2 Q3 Q41997 1998 1999 2000 2001 2002
0
2
4
6
8
10
12
-2
-4
-6
-8
-10
Percent
HK$M1
HK$M2 *
HK$M3 *
Diagram 4.5
(rate of change during the quarter)
Note : (*) Adjusted to include foreign currency swap deposits.
Authorized institutions’ Hong Kong dollar external claims and liabilities
4.13 Hong Kong dollar claims held by Hong Kong’s authorized institutionson banks outside Hong Kong rose by 15.4% during the first eleven months of2002, from $170.0 billion at end-2001 to $196.2 billion at end-November 2002.Compared with a year earlier, the increase at end-November 2002 was 7.8%.The rise was mainly attributable to more placements with banks in Europe. Bycontrast, Hong Kong dollar liabilities owed by Hong Kong’s authorizedinstitutions to banks outside Hong Kong continued to fall, by 9.9% during thefirst eleven months of 2002, from $175.4 billion at end-2001 to $158.1 billionat end-November 2002. Compared with a year earlier, the decrease atend-November 2002 was 11.7%. The fall was due to less deposits fromMainland banks. Taken together, the external position of Hong Kong’sauthorized institutions against banks abroad reverted to net claims of$38.0 billion at end-November 2002, from net liabilities of $5.5 billion atend-2001. At end-November 2001, there was net claims of $2.8 billion.
/4.14 .....

149
4.14 As to external position against banks in the Mainland, Hong Kongdollar liabilities owed by Hong Kong’s authorized institutions to banks in theMainland continued to be the most prominent, with a 48% share in thecorresponding total liabilities at end-November 2002. Yet as deposits frombanks in the Mainland declined, these liabilities fell by 20.8% during the firsteleven months of 2002, from $96.0 billion at end-2001 to $76.0 billion atend-November 2002. Compared with a year earlier, the decline atend-November 2002 was slightly larger, at 23.2%. The significance of HongKong dollar claims held by Hong Kong’s authorized institutions on banks inthe Mainland was much less, with a 11% share at end-November 2002. Butthese claims increased by 14.9% during the first eleven months of 2002, from$18.5 billion at end-2001 to $21.3 billion at end-November 2002. Comparedwith a year earlier, the rise at end-November 2002 was 14.4%. Taken together,net Hong Kong dollar liabilities of Hong Kong’s authorized institutions tobanks in the Mainland fell considerably, to $54.7 billion at end-November2002, from $77.4 billion at end-2001 and $80.3 billion at end-November 2001.
Table 4.8
Hong Kong dollar external claims and liabilitiesheld by Hong Kong’s authorized institutions
As at theend of
Claims on banksoutside Hong Kong
(HK$Bn)
Liabilities to banksoutside Hong Kong
(HK$Bn)
Net liabilities to banksoutside Hong Kong
(HK$Bn)
Overall
Involvingbanks in
the Mainland Overall
Involvingbanks in
the Mainland Overall
Involvingbanks in
the Mainland
2001 Q1 194.3 (-3.4) 42.5 (-0.3) 213.3 (-8.1) 141.1 (-10.3) 19.0 98.6Q2 160.3 (-17.5) 19.0 (-55.4) 190.6 (-10.6) 115.6 (-18.1) 30.3 96.6Q3 178.2 (11.1) 18.8 (-1.1) 188.3 (-1.2) 111.5 (-3.5) 10.1 92.7Q4 170.0 (-4.6) 18.5 (-1.2) 175.4 (-6.8) 96.0 (-13.9) 5.5 77.4
2002 Q1 171.8 (1.1) 19.1 (3.2) 147.0(-16.2) 68.4 (-28.7) -24.9 49.3Q2 190.1 (10.6) 19.8 (3.4) 151.2 (2.9) 67.4 (-1.4) -38.9 47.6Q3 192.3 (1.2) 21.5 (8.7) 154.3 (2.1) 70.6 (4.6) -38.0 49.0
Oct 184.3 (-4.2) 20.6 (-4.5) 150.1 (-2.7) 67.7 (-4.0) -34.2 47.2Nov 196.2 (6.4) 21.3 (3.7) 158.1 (5.3) 76.0 (12.2) -38.0 54.7
<7.8> <14.4> <-11.7> <-23.2>
Notes : ( ) % change during the period.
< > % change over a year earlier.
/Loans .....

150
Loans and advances
4.15 Total loans and advances shrank by 4.9% over a year earlier to$2,077 billion at end-2002. Though smaller than the 11.2% decrease during2001, this represented the fifth consecutive year of decline. The contractionduring 2002 was made up of declines of 1.2%, 0.5%, 2.2% and 1.0%respectively during the four quarters. As in the previous years, the shrinkagewas concentrated in foreign currency loans, which fell by 14.2% during 2002,albeit lesser than the 33.6% decrease during 2001. Foreign currency loansdwindled by 7.2%, 5.5% and 2.3% during the first, third and fourth quarters of2002, yet a marginal increase of 0.2% was recorded during the second quarter.Hong Kong dollar loans declined modestly by 1.9% over a year earlier to$1,616 billion at end-2002, further to a 0.3% decrease during 2001. Havingincreased by 0.7% during the first quarter of 2002, Hong Kong dollar loans fellby 0.8%, 1.3% and 0.6% respectively during the ensuing three quarters. Theshare of Hong Kong dollar loans in total loans and advances stood at 77.8% atend-2002, higher than that of 75.4% at end-2001.
Table 4.9
Loans and advances by currency denomination
% change during the quarter
Hong Kongdollar loans
Foreigncurrency loans
Total loansand advances
2001 Q1 1.9 -14.0 -3.4Q2 -0.5 -7.7 -2.6Q3 -1.5 -6.9 -3.0Q4 -0.1 -10.1 -2.8
2002 Q1 0.7 -7.2 -1.2Q2 -0.8 0.2 -0.5Q3 -1.3 -5.5 -2.2Q4 -0.6 -2.3 -1.0
Total amountat the end ofDecember 2002(HK$Bn)
1,616 461 2,077
% change overa year earlier
-1.9 -14.2 -4.9
/Diagram 4.6 .....

151
Loans and advances by currency denomination
Q1 Q2 Q3 Q4 Q1 Q2 Q3 Q4 Q1 Q2 Q3 Q4 Q1 Q2 Q3 Q4 Q1 Q2 Q3 Q4 Q1 Q2 Q3 Q41997 1998 1999 2000 2001 2002
0
5
10
15
-5
-10
-15
-20
Rate of change during the quarter (percent)
0
10
20
30
40
50
60
70
80
90
100Share in total (percent)
Diagram 4.6
Foreigncurrency loans
(left scale)
HK$ loans(left scale)
and share of Hong Kong dollar loans in total loans and advances
Share of HK$ loans in total loans and advances
(right scale)
4.16 As the decline in Hong Kong dollar loans was slightly more than thatin Hong Kong dollar deposits during 2002, the Hong Kong dollarloan-to-deposit ratio fell slightly further, to a new low of 88.5% at end-2002,from that of 88.8% at end-2001.
Table 4.10
Hong Kong dollar loan-to-deposit ratio(a)
As at the end of %
2001 Q1 91.3Q2 90.5Q3 89.1Q4 88.8
2002 Q1 90.7Q2 89.1Q3 89.3Q4 88.5
Note : (a) Hong Kong dollar deposits have been adjusted to include foreign currency swapdeposits.
/Diagram 4.7 .....

152
Hong Kong dollar loan-to-deposit ratio*
Q1 Q2 Q3 Q4 Q1 Q2 Q3 Q4 Q1 Q2 Q3 Q4 Q1 Q2 Q3 Q4 Q1 Q2 Q3 Q4 Q1 Q2 Q3 Q41997 1998 1999 2000 2001 2002
85
90
95
100
105
110
115
120Percent
Diagram 4.7
0
Note : (*) See the footnote to Table 4.10.
4.17 Analysed by place of usage, loans for use in Hong Kong, at$1,834 billion at end-2002, fell by 2.4% during the year, after a decline of 4.4%during 2001. This was in line with the subdued domestic business activity.Loans for use outside Hong Kong, at $243 billion at end-2002, contractedsignificantly further by 20.7% during the year, having already fallen sharply by38.3% during 2001. This was due to continued cut-backs in Euro-yen ImpactLoans(7).
/Table 4.11 .....

153
Table 4.11
Loans and advances by place of usage
% change during Loans for use Loans for usethe quarter in Hong Kong(a) outside Hong Kong(b)
2001 Q1 -0.9 -13.0Q2 -0.4 -12.5Q3 -1.7 -9.6Q4 -1.4 -10.2
2002 Q1 0.1 -9.6Q2 -0.5 -0.8Q3 -1.6 -6.6Q4 -0.4 -5.3
Total amount 1,834 243at the end ofDecember 2002(HK$Bn)
% change over -2.4 -20.7a year earlier
Notes : (a) Including trade financing loans.(b) Including loans where the place of usage is unknown.
Loans and advances by place of usage
Q1 Q2 Q3 Q4 Q1 Q2 Q3 Q4 Q1 Q2 Q3 Q4 Q1 Q2 Q3 Q4 Q1 Q2 Q3 Q4 Q1 Q2 Q3 Q41997 1998 1999 2000 2001 2002
0
5
10
15
-5
-10
-15
-20
-25
Percent
Diagram 4.8
Loans for use outside HK
Loans for use in HK
(rate of change during the quarter)
/4.18 .....

154
4.18 Analysed by major usage, the decline in domestic loans was almostacross-the-board. Loans to financial concerns fell the most, by 10.1% during2002, along with the slide in the local stock market. Loans to stockbrokerscame down by 6.8%, for a similar reason. Loans for building, construction,property development and property investment fell by 3.9%, amidst a dearth ofnew building projects. These were followed by loans for the wholesale andretail trade (with a 2.4% decrease); loans to the manufacturing sector(1.3% decrease); and loans for residential mortgages (0.8% decrease). Butloans for trade financing went up by 2.6% during 2002, in line with thedistinctly improved export performance.
Table 4.12
Loans and advances for use in Hong Kong by major usage(a)
Loans to :Building,
construction,Whole- property
sale develop- Purchase% change Finance Manu- and ment and resi- during visible Facturing retail property dential Financial Stock-
the quarter trade Sector trades investment property(b) concerns brokers Others
2001 Q1 -4.1 0.8 -2.5 2.0 0.7 -1.8 -12.0 -4.3Q2 2.0 2.9 -0.9 -3.2 1.0 -5.7 27.2 0.7Q3 -4.2 -5.7 -6.0 -2.2 0.8 -8.0 -2.0 -0.3Q4 -8.9 -0.4 -7.1 0.9 0.5 -0.8 -11.3 -3.4
2002 Q1 -2.6 1.2 1.0 -0.5 * 0.9 2.1 0.7Q2 7.3 1.3 -0.1 -1.9 0.6 -8.2 23.9 -0.8Q3 1.9 -4.9 -0.9 -2.4 -0.7 -3.2 -22.2 -1.5Q4 -3.6 1.2 -2.5 1.0 -0.7 0.3 -5.2 -0.3
Total amountat the end ofDecember2002(HK$Bn)
91 71 100 379 642 125 8 418
% changeover a yearearlier
2.6 -1.3 -2.4 -3.9 -0.8 -10.1 -6.8 -1.9
Notes : (a) Figures in this table are revised on a regular basis to incorporate subsequentamendments and loan re-classifications made by the authorized institutions concerned.The rates of change for the earlier quarters have been adjusted for the revisions knownup to the latest reference quarter.
(b) Including loans for the purchase of flats under the Home Ownership Scheme, PrivateSector Participation Scheme, and Tenants Purchase Scheme.
(*) Change of less than 0.05%.
/4.19 .....

155
4.19 Although bank loans had yet to rebound, asset quality of the banks inHong Kong continued to improve in overall terms. The ratio ofnon-performing loans to total loans fell from 5.16% at end-2001 to 4.13% atend-September 2002. The ratio of classified loans to total loans likewisedecreased, from 6.53% to 5.18%. The ratio of overdue and rescheduled loansto total loans also went down, from 4.57% to 3.99%(8). Arrears for over threemonths in mortgage repayments declined during the same period, from 1.22%to 1.08%. Arrears for over three months in credit card repayments, at 1.32% atend-September 2002, were up from 1.28% at end-2001, yet they fell during thesecond and third quarters, reversing the uptrend in the preceding two years.Local banks remained well capitalised, with their consolidated capital adequacyratio averaging at 16.3% at end-September, well above the standard set by theBank for International Settlements.
Banks and other deposit-taking institutions
4.20 The number of licensed banks decreased by 14 during the year to 133at end-December 2002. Yet this was due to the merger of a key China-relatedbanking group last year. The number of restricted licence banks fell by three to46 and the number of deposit-taking companies by nine to 45. Altogether, 224authorized institutions (excluding representative offices) from 31 countries andterritories maintained a presence in Hong Kong at end-2002. Total assets of theauthorized institutions in Hong Kong as a whole declined by 2.6% over a yearearlier to $5,993 billion at end-December 2002.
4.21 For enhancing deposit protection in Hong Kong, opinions obtainedfrom a public consultation exercise in the latter part of 2000 indicated broadsupport for the introduction of a deposit insurance scheme in Hong Kong.Following a more detailed study by HKMA, the Administration approved inprinciple the proposal to introduce such a scheme in Hong Kong. Aftercompleting consideration on how the scheme should be structured, HKMAissued a further consultation paper in March 2002 setting out the detailedproposals for the scheme. The consultation ended in May. With the detaileddesign features for the scheme determined, HKMA is preparing the requisitelegislation, with a view to introducing it to the Legislative Council in the firsthalf of 2003.
/4.22 .....

156
4.22 For enhancing the capability of the banks in their assessment ofconsumer credit, HKMA issued a circular to all authorized institutions inFebruary 2002, recommending the best practices for management of credit cardoperations and also setting out the measures for preventing abuse of thebankruptcy provisions. The Hong Kong Association of Banks and the PrivacyCommissioner (PC) have reached broad agreement on the scope of positiveconsumer credit data to be shared amongst the banks. Taking into account theviews expressed in a public consultation, PC is of the opinion that greatersharing of credit data, when implemented with appropriate measures tosafeguard privacy protection, will be beneficial to the credit environment,which in turn will benefit both lenders and borrowers. The Code of Practice onConsumer Credit Data is being revised accordingly.
Insurance
4.23 At end-2002, the total number of insurance companies was reducedby nine to 195. Within this total, 46 were engaged wholly in long-termbusiness, 130 wholly in general business, and 19 in composite business. Takentogether, insurance companies from 27 countries and territories maintained apresence in Hong Kong at end-2002. Reflecting continued notable growth ofthe insurance industry, the value of its business receipts rose further, by 8% inthe first three quarters of 2002 over a year earlier, after a 14% increase in 2001.
The debt market
4.24 In 2002, a total of 114 issues of Exchange Fund paper were launchedto replace the maturing issues(9). The total market value of Exchange Fundpaper outstanding rose by $3.7 billion during the year, to $117.5 billion atend-2002. Market response to the tenders of Exchange Fund paper continuedto be favourable, with an average over-subscription rate of 5.3 times in 2002,up from 4.9 times in 2001. Trading in Exchange Fund paper also increased,with average daily turnover of $22.3 billion in 2002, being higher than that of$21.2 billion in 2001. The yield spread of five-year Exchange Fund Notes overthe corresponding US Treasuries narrowed, from 92 basis points at end-2001 to48 basis points at end-2002.
/Table 4.13 .....

157
Table 4.13
Exchange Fund Bills and Notes issued by HKMA
Amount outstanding Average daily turnoveras at the end of the quarter in the quarter
(HK$Bn) (HK$Bn)
2001 Q1 110.1 21.5Q2 111.5 20.7Q3 112.7 19.7Q4 113.8 22.9
2002 Q1 114.7 22.3Q2 115.7 22.7Q3 116.6 23.4Q4 117.5 21.0
Hong Kong dollar and US dollar yield curvesDiagram 4.9
Time to Maturity
1M 1 Y 2 Y 3 Y 4 Y 5 Y 6 Y 7 Y 8 Y 9 Y 10 Y0
1
2
3
4
5
6
7Percent per annum
0
(as at the end of December 2002)
EIBUS Treasuries
Exchange Fund
Bills/Notes
IBRD
EIB
EIB
IFC
NIB
Note : AAA Hong Kong dollar debt issuers
EIB European Investment BankIBRD International Bank for Reconstruction and DevelopmentIFC International Finance CorporationNIB Nordic Investment Bank
/4.25 .....

158
4.25 The Hong Kong Mortgage Corporation (HKMC) has become one ofthe major issuers of debt securities in Hong Kong. In 2002, $15.0 billion worthof HKMC debt paper was launched. The total outstanding value of debtsecurities issued by HKMC under its Note Issuance Programme stood at$5.0 billion at end-2002, while that under its Debt Issuance Programme was$17.5 billion. There were also retail bonds issued by HKMC, with theoutstanding value totalling $6.1 billion at end-2002.
4.26 In 2002, $109.7 billion worth of new negotiable certificates of deposit(NCDs) was launched, up from $84.0 billion in 2001. Of the new issuance ofNCDs in 2002, $71.2 billion was denominated in Hong Kong dollars, also morethan that of $56.2 billion in 2001. The total value of NCDs outstanding rose to$211.2 billion at end-2002, from $172.3 billion at end-2001. Within this total,$138.4 billion was denominated in Hong Kong dollars at end-2002, larger thanthat of $134.9 billion at end-2001. The proportion of Hong Kong dollardenominated NCDs held by the local banking sector declined, to 52.3% atend-2002, from 55.3% at end-2001.
Table 4.14
NCDs issued by authorized institutions in Hong Kong
Issued andoutstanding
Held byauthorizedinstitutions
Held outsidethe local
banking sector(HK$Bn) (HK$Bn) (HK$Bn)
As at the end of In HK$ Total In HK$ Total In HK$ Total
2001 Q1 146.7 172.8 90.4 102.9 56.2 69.9Q2 148.6 180.1 91.5 104.8 57.1 75.2Q3 147.4 179.7 86.0 98.6 61.4 81.1Q4 134.9 172.3 74.6 86.3 60.4 86.0
2002 Q1 132.1 173.3 73.5 85.0 58.6 88.2Q2 142.0 192.3 77.2 86.2 64.8 106.1Q3 136.8 201.0 72.9 82.0 63.9 118.9Q4 138.4 211.2 72.4 80.2 66.1 131.1
/4.27 .....

159
4.27 757 new issues of other Hong Kong dollar debt instruments, totalling$109.2 billion, were launched by the private sector in 2002. This was less thanthe 806 new issues for $96.7 billion in 2001. Partly reflecting risk aversion bydebt issuers against potential interest rate volatility, issuance of fixed ratebonds by the private sector, at $70.5 billion in 2002, continued to exceedconsiderably that of floating rate notes, at $38.7 billion. At end-2002,outstanding Hong Kong dollar fixed rate bonds and floating rate notes from theprivate sector amounted to $193.9 billion and $75.7 billion respectively, givinga total of $269.6 billion(10). These were all higher than the correspondingfigures of $181.8 billion, $53.3 billion and $235.1 billion at end-2001. Therewere eight new issues of Hong Kong dollar debt paper by multilateral agenciesin 2002, raising a total of $5.2 billion, as compared to 15 issues for $7.5 billionin 2001.
4.28 Taking the public and private sectors together, the total value of HongKong dollar debt paper outstanding amounted to $532.4 billion at end-2002(11),up from that of $493.8 billion at end-2001. The size of the Hong Kong dollardebt market was equivalent to 26.6% of HK$M3, or 19.9% of the Hong Kongdollar denominated assets of the entire banking sector.
The stock, futures and gold markets
4.29 The local stock market exhibited much volatility over the course of2002. There was a brief rally at the beginning of the year, upon a price surge intechnology-related shares in the United States. With greater optimism about asooner-than-expected recovery in the US economy, local share prices continuedto hold up well in February and March. Fund inflows and market expectationfor no imminent rise in US interest rates then pushed the Hang Seng Index to ahigh of 11 975 on 17 May.
4.30 Local share prices soon drifted lower, with the Hang Seng Indexfalling to levels below 10 000 in late July. Apart from lacklustre corporateperformance in the local economy, market sentiment was also weighed down bygrowing concern worldwide about the uncertain tempo of US economicrecovery and the likely consequence of US corporate frauds. Then, loomingwar pressure on Iraq led to a further dip in share prices in September. TheHang Seng Index plunged to a four-year low of 8 859 on 10 October. Localshare prices recovered some lost ground in November, upon the US interest rate
/cut .....

160
cut and steadier employment conditions locally. But as war pressure on Iraqescalated and tension over nuclear control in North Korea broke out towardsthe year-end, local share prices were dampened again. The Hang Seng Indexclosed the year at 9 321, 18.2% lower than the level of 11 397 at end-2001.Share prices in the major stock markets overseas likewise plummeted during2002, for some by even greater magnitudes than in the local market.
Hang Seng Index
J FMAM J J A S OND J FMAM J J A S OND J FMAM J J A S OND J FMAM J J A S OND50006000700080009000
10000110001200013000140001500016000170001800019000
Index (31 July 1964 = 100)
Diagram 4.10
0 0
1999 2000 2001 2002
Table 4.15Movements in the Hang Seng Index and
in the share price indices in selected stock markets overseas(index as at the last trading day of the quarter)
HangSengIndex
NewYorkDowJones
IndustrialAverage
TokyoNikkei
Average
LondonFinancial
Times Index
FrankfurtDAX 30 Index
ParisCAC 40 Index
SydneyAll
Ordinaries Index
SingaporeStraitsTimes Index
2001 Q1 12 761 9 879 13 000 5 634 5 830 5 180 3 097 1 674Q2 13 043 10 502 12 969 5 643 6 058 5 225 3 425 1 727Q3 9 951 8 848 9 775 4 903 4 308 4 079 2 988 1 320Q4 11 397 10 022 10 543 5 217 5 160 4 625 3 360 1 624
2002 Q1 11 033 10 404 11 025 5 272 5 397 4 688 3 363 1 803Q2 10 599 9 243 10 622 4 656 4 383 3 898 3 163 1 553Q3 9 072 7 592 9 383 3 722 2 769 2 777 2 928 1 352Q4 9 321 8 342 8 579 3 940 2 893 3 064 2 976 1 341
% changeduring 2002
-18.2 -16.8 -18.6 -24.5 -43.9 -33.7 -11.4 -17.4
/4.31 .....

161
4.31 In parallel with the fall in share prices, total stock marketcapitalisation, including the Main Board and the Growth Enterprise Market(GEM)(12), was reduced by 8% over a year earlier to $3,611 billion at end-2002.Average daily turnover in the local stock market fell distinctly, to $6.7 billionin 2002, from $8.2 billion in 2001.
Table 4.16
Average daily turnover and total market capitalisationof the Hong Kong stock market
Average daily turnoverin the quarter
Total market capitalisationas at the end of the quarter
(HK$Bn) (HK$Bn)
MainBoard
GrowthEnterprise Market Total
MainBoard
GrowthEnterprise
Market Total
2001 Q1 8.9 0.1 9.0 4,179 61 4,240Q2 9.7 0.3 10.0 4,450 70 4,520Q3 6.6 0.1 6.7 3,373 46 3,420Q4 6.9 0.2 7.1 3,885 61 3,946
2002 Q1 6.9 0.3 7.1 3,855 69 3,924Q2 7.8 0.2 8.0 3,792 61 3,852Q3 5.8 0.2 5.9 3,327 53 3,381Q4 5.6 0.1 5.6 3,559 52 3,611
4.32 In 2002, 117 new share flotations (including two companies switchingfrom GEM to the Main Board without raising capital) were launched on theStock Exchange of Hong Kong, raising a total equity capital of $52.0 billion.These were distinctly higher than the corresponding figures of 88 and$25.7 billion in 2001. Of these, 60 were listed on the Main Board and 57 onGEM, raising equity capital of $45.0 billion and $7.0 billion respectively.Amongst these new issues, 12 pertained to H shares and were listed on GEM,raising equity capital of $1.1 billion. In addition to the new flotations, around$16.3 billion was raised through private placements by 133 companies, andaround $5.9 billion through rights issues by 47 companies.
4.33 The Securities and Futures Ordinance (SFO) was enacted on13 March 2002 and will come into effect on 1 April 2003. This represents amajor milestone in the modernisation and consolidation of Hong Kong’ssecurities legislation. The enhanced SFO provides Hong Kong with a clear and
/user-friendly .....

162
user-friendly regulatory framework for a fair, efficient and transparent market.It includes the introduction of a streamlined single licensing regime,proportionate disciplinary sanctions to combat market misconduct, measures toprotect the interests of investors, a comprehensive investor compensationscheme, and a tighter regime for disclosure of interests in listed companies. Assuch, investors can be better protected and the competitive edge of HongKong’s financial sector henceforth strengthened.
4.34 On trading in derivatives on the Hong Kong Exchanges and ClearingLtd, average daily turnover of Hang Seng Index futures contracts increased by8% over a year earlier to 19 602 contracts in 2002, while average daily turnoverof Hang Seng Index options contracts rose by 47% to 4 369 contracts. Butaverage daily turnover of MSCI China Free Index futures contracts(13) was verythin, at only eight contracts in 2002.
Table 4.17
Average daily turnover of Hang Seng Index futuresand options contracts in the Hong Kong derivatives market
Duringthe quarter
Hang Seng Indexfutures contracts
Hang Seng Indexoptions contracts
(no. of contracts) (no. of contracts)
2001 Q1 17 443 2 763Q2 17 447 2 480Q3 18 758 2 992Q4 19 206 3 619
2002 Q1 17 956 3 338Q2 18 739 3 185Q3 21 053 4 652Q4 20 508 6 242
4.35 At end-2002, there were 33 classes of stock options contracts and32 classes of stock futures contracts. Average daily turnover of stock optionscontracts decreased by 8% over a year earlier to 15 203 contracts in 2002.Concurrently, average daily turnover of stock futures contracts, at 86 contractsin 2002, was almost two times more than a year earlier.
/4.36 .....

163
4.36 Average daily turnover of three-month HIBOR futures contractsdropped by 56% over a year earlier to 1 144 contracts in 2002. Average dailyturnover of three-year Exchange Fund Note futures contracts, whichcommenced trading in late 2001, was 15 contracts in 2002. Trading in RollingForex Futures contracts was suspended in May 2002.
4.37 There were 414 issues of warrants listed on the Main Board atend-2002. These were made up of 67 issues of equity warrants and 347 issuesof derivative warrants. Average daily turnover of equity warrants was$7.1 million in 2002, 46% less than in 2001. Average daily turnover ofderivative warrants was $457 million, 6% more than in 2001. As to GEM, onlyfour issues of warrants were listed at end-2002. Trading in them remainednegligible in 2002.
4.38 Gold prices soared over the course of 2002. Demand for goldholdings as an asset was rekindled, as share prices in the major stock marketsfell sharply during the year. Also, along with the depreciation of the US dollar,the price of gold being denominated in US dollar was cheaper in terms of theother major currencies. Then there was the low interest rate environment,which made the opportunity cost of holding gold lower as against holdinginterest-bearing investment items. The looming war pressure on Iraq furtherboosted the demand for gold as hedge. The price of loco-London gold leapedto a 5½-year high of US$349.5 per troy ounce on 27 December and closed 2002at US$344.0, 26% higher than that of US$276.6 at the end of 2001. Gold priceat the Chinese Gold and Silver Exchange Society surged in parallel, by 24%during the year to $3,199 per tael at end-2002, from $2,572 per tael at end-2001.Turnover on the Exchange was 3.5 million taels in 2002, lower than that of4.3 million taels in 2001.
Unit trusts and mutual funds
4.39 The total number of unit trusts and mutual funds (including sub-fundsand umbrella funds) in Hong Kong stood at 942 at end-2002, down from 952 atend-2001. Gross sales of mutual funds amounted to US$12.6 billion in 2002,representing a sharp increase of 34% from US$9.5 billion in 2001. Afterdeducting redemptions, net sales was US$4.6 billion in 2002, 11% more thanthat of US$4.1 billion in 2001. Amongst the various types of mutual funds,equity funds continued to account for the largest share, at 59% of the total
/value …..

164
value of funds at end-2002. This was followed by bond funds, asset allocationfunds and money market funds, with shares of 24%, 9% and 8% respectively(14).
4.40 The Mandatory Provident Fund (MPF) System(15) continues togenerate a substantial amount of retirement fund assets which, in the course oftime, should add impetus to further development of the local financial market.At end-2002, the aggregate net asset value of the approved constituent funds ofMPF schemes rose further to $55.1 billion, from $36.0 billion at end-2001.This was mainly attributable to continued contributions from the enrolledpopulation. By end-2002, there were 20 approved corporate trustees. On MPFproducts, 45 master trust schemes, two industry schemes and two employersponsored schemes, comprising altogether 311 constituent funds, wereapproved by the Mandatory Provident Fund Schemes Authority. About217 000 employers, 1.73 million employees and 302 000 self-employed personshad been enrolled in MPF schemes, with the compliance rates for employers,relevant employees and self-employed persons at 94%, 96% and 81%respectively.
Notes :
(1) Under the linked exchange rate system established in October 1983, the note-issuingcommercial banks are required to pay US dollars to the Hong Kong MonetaryAuthority (HKMA) for the account of the Exchange Fund at the fixed rate of HK$7.8to US$1.0 in return for non-interest-bearing Certificates of Indebtedness (CIs), asbacking for the issue of their Hong Kong dollar banknotes. As from 7 September1998, HKMA also provides an explicit undertaking to convert the Hong Kong dollarbalances held in the clearing accounts maintained by the banks with HKMA at theConvertibility Undertaking Rate. This was set at the then market exchange rate of7.750 when the convertibility undertaking was introduced. From 1 April 1999, theConvertibility Undertaking Rate for the Aggregate Balance was raised from 7.750 by1 pip per calendar day, reaching 7.800 on 12 August 2000, where it has stayed.
(2) The trade-weighted Nominal Effective Exchange Rate Index (EERI) is an indicator ofthe overall exchange value of the Hong Kong dollar against a fixed basket of othercurrencies. These currencies are selected on account of their importance in HongKong's trade, and the weights reflect their relative importance in Hong Kong'smerchandise trade.
/As .....

165
As from 2 January 2002, a new series of nominal Effective Exchange Rate Indexreplaces the old series. The weights adopted for the new EERI series are based on theaverage pattern of Hong Kong’s merchandise trade during 1999 and 2000, as againstthat during 1991 to 1993 for the old series. The currency basket for the new series hasalso been updated to include the euro and the Philipino peso, and to exclude the fivecurrencies pertaining to the participating countries of the euro. Thus the currencybasket for the new series contains 14 currencies, instead of 17 currencies for the oldseries. The base period is changed from October 1983 to January 2000.
The corresponding Real EERI, which takes into account the relative movements in theseasonally adjusted consumer price indices of the respective economies, is revisedaccordingly, in line with the updated weights and the new base period of the nominalEERI.
It is important to note that the EERIs thus compiled adopt constant weights on therespective currencies, while the pattern of merchandise trade changes over time. Inparticular, Hong Kong’s trade with the Mainland has shifted more towards re-exports,from domestic exports and retained imports. Also, with the Mainland being thelargest source of Hong Kong’s re-exports, movements in the exchange rate of theRenminbi could have somewhat different implications for Hong Kong’s exportcompetitiveness, as against movements in the other currencies.
(3) In the light of the changing market shares of individual authorized institutions (AIs) inthe residential mortgage business, the coverage of the Monthly Survey on ResidentialMortgage Lending conducted by HKMA has been expanded as from May 2001, inorder to increase the proportion of business covered by the survey. Altogether 38 AIswere so included immediately after the coverage expansion. The number of AIs hassince fallen to 28 due to banking sector consolidation. The AIs currently coveredtogether account for around 96% of the total business, as compared to 92% for the32 AIs formerly covered. The outstanding amount of mortgage loans covered by thesurvey is hence lifted, by 8.8%.
(4) Foreign currency swap deposits are deposits involving customers buying foreigncurrencies in the spot market and placing them as deposits with authorizedinstitutions, whilst at the same time entering into a contract to sell such foreigncurrencies (principal plus interest) forward in line with the maturity of such deposits.For most analytical purposes, they should be regarded as Hong Kong dollar deposits.
(5) The various definitions of the money supply are as follows:
M1 : notes and coins with the public, plus customers’ demand deposits withlicensed banks.
M2 : M1 plus customers’ savings and time deposits with licensed banks, plusnegotiable certificates of deposit (NCDs) issued by licensed banks and heldoutside the monetary sector.
/As .....

166
As from June 2002, short-term Exchange Fund placements of less than onemonth are included under time deposits as part of the monetary aggregates. Thedata series on time deposits and M2 are backdated to April 1997 using thisrevised definition.
M3 : M2 plus customers’ deposits with restricted licence banks and deposit-takingcompanies, plus NCDs issued by such institutions and held outside themonetary sector.
(6) Amongst the various monetary aggregates, more apparent seasonal patterns are foundin HK$M1, currency held by the public, and demand deposits. Seasonally adjusteddata on these three series back-dated to January 1990 have been compiled. Thedeseasonalised data facilitate analysis of the underlying trends. For details, see theNovember 2000 issue of the HKMA Quarterly Bulletin.
(7) Euro-yen Impact Loans (EYIL) are loans made to customers in Japan by a domesticbranch of a Japanese bank but booked in an overseas branch of the bank. Loansbooked in this way generally have tax and funding cost advantages for customers.Reflecting a more cautious lending stance by the Japanese banks and the need toreduce the size of their balance sheets, EYIL has declined substantially since thesecond half of 1997.
(8) Overdue loans are defined here as those that have been overdue for more than threemonths. Rescheduled loans are those that have been restructured or renegotiatedbecause of deterioration in the financial position of the borrower, or because ofinability of the borrower to meet the original repayment schedule. Non-performingloans are those on which interest has been placed in suspense or on which interestaccrual has ceased. Classified loans are those that have been classified assubstandard, doubtful or loss. Of these categorisations, classified loans overlap tocertain extent with overdue and rescheduled loans.
(9) As from 1 April 1999, interest payments on Exchange Fund paper are allowed forexpanding the stock of outstanding Exchange Fund paper.
(10) These figures may not represent a full coverage of all the Hong Kong dollar debtpaper issued by the private sector.
(11) Due to different sources for NCD data, the total value of Hong Kong dollar debt paperoutstanding may not equal the sum of the outstanding values of Exchange Fund paper,HKMC debts, NCDs, and other Hong Kong dollar debt instruments issued by theprivate sector.
/(12) .....

167
(12) The Growth Enterprise Market was launched by the then Stock Exchange of HongKong Ltd in November 1999 as an alternative market to the Main Board, in order togive emerging growth companies easier access to the funds of the investing public.Although it is open to companies in all industries and of all sizes, it is expected toprovide an efficient venue for fund raising by small and medium-sized enterprises,particularly those engaged in technology-related businesses.
(13) The MSCI China Free Index is a market-capitalisation-weighted stocks index,covering Red-chip shares and H shares listed in Hong Kong, B shares listed inShanghai and Shenzhen, and N shares listed in New York. The Index thus representsthe universe of Chinese stocks open to investors outside the Mainland, andcomplements the Red-chip and H share markets in Hong Kong. Trading in MSCIChina Free Index futures contracts commenced on 7 May 2001.
Trading in Red-chip options contracts and in Red-chip futures contracts have beensuspended as from 31 July 2001 and 31 August 2001 respectively.
(14) These figures are sourced from the sales and redemptions and performance surveyconducted by the Hong Kong Investment Funds Association on their members, and assuch cover only the active authorized funds that have responded to the survey.
(15) The Mandatory Provident Fund (MPF) System, launched on 1 December 2000, is aprivately managed mandatory system of provident fund schemes covering members ofthe workforce aged between 18 and 65, subject to certain exceptions. It provides forjoint contributions by the employer and the employee, each at 5% of the employee’srelevant income, to a registered MPF scheme, subject to a maximum and a minimumlevel of income for MPF contribution purposes. As from February 2003, theminimum income level for MPF contribution purpose is raised from $4,000 permonth to $5,000, yet the maximum income level is kept at $20,000 per month. Theaccrued MPF benefits are fully vested in the scheme, and members can be transferredfrom scheme to scheme when there is a change in employment.
The Mandatory Provident Fund Schemes Authority (MPFA) is the statutory bodytasked with the responsibility for regulation and supervision of the MPF System andfor ensuring compliance with the Mandatory Provident Fund Schemes Ordinance.
An MPF scheme may consist of one or more constituent funds each with its owninvestment policy. A constituent fund may maintain a portfolio of direct investmentin equities, bonds or other debt instruments, or may invest in approved pooledinvestment funds which may be in the form of unit trusts authorized by the Securitiesand Futures Commission or insurance policies issued by authorized insurers. Bothconstituent funds and pooled investment funds have to be approved by MPFA, and besubject to investment standards applicable to MPF investment funds. Following arecent legislative amendment, a constituent fund may also be invested in some othertypes of financial products, such as an index-tracking collective investment scheme,subject to MPFA’s prior approval.

168
CHAPTER 5 : THE LABOUR SECTOR
Overall labour market situation(1)
5.1 The labour market remained slack in overall terms in 2002. Yet someimprovement was seen in the latter part of the year, mainly attributable to apick-up in total employment upon an upturn in economic activity. For 2002 asa whole, the unemployment rate(2) averaged at 7.3%, markedly up from 5.1% in2001. The seasonally adjusted unemployment rate surged in the early part ofthe year, from 6.2% in the fourth quarter of 2001 to 7.0% and 7.7% respectivelyin the first two quarters of 2002, and further to a peak of 7.8% in May - July,amidst more extensive downsizing and lay-offs in the corporate sector. It thenfell back somewhat in the latter part of the year, to 7.4% in the third quarter and7.2% in the fourth quarter. The total number of unemployed persons (notseasonally adjusted) stood at 252 600 in the fourth quarter. On the medianduration of unemployment, there was a distinct lengthening over the past year,from 82 days in the fourth quarter of 2001 to 90 days in the fourth quarter of2002. As to the proportion of persons unemployed for six months or more, itlikewise went up visibly, from 24% to 30%.
5.2 The underemployment rate(3) also moved higher, averaging at 3.0% in2002, as against 2.5% in 2001. It rose from 3.0% in the fourth quarter of 2001to 3.2% in the first quarter of 2002, then declined to 2.9% in both the secondand third quarters, but edged up again to 3.1% in the fourth quarter. The totalnumbers underemployed stood at 109 700 in the fourth quarter.
/5.3 .....

169
5.3 For persons in employment, work intensity was high. The proportionof employed persons working for 50 hours or more per week rose visibly, from35% in the fourth quarter of 2001 to 40% in the fourth quarter of 2002, as didthe proportion of employed persons working for 60 hours or more per week,from 21% to 24%. This reflected greater work effort being exerted by theemployed workforce in general, as the corporate sector underwent further staffconsolidation over the past year. Yet taking all the employed persons together,the median hours of work stayed at 48 hours per week for most of 2002.
Table 5.1
Unemployment and underemployment rates
Seasonally adjustedunemployment rate
(%)Underemployment rate
(%)
2001 Annual 5.1 2.5
Q1 4.5 2.3Q2 4.5 2.2Q3 5.2 2.5Q4 6.2 3.0
2002 Annual 7.3 3.0
Q1 7.0 3.2Q2 7.7 2.9Q3 7.4 2.9Q4 7.2 3.1
Note : Labour force statistics for 2001 have been slightly revised upon finalisation of theend-2001 population estimates in August 2002.
Source : General Household Survey, Census and Statistics Department.
/Diagram 5.1 .....

170
Unemployment and underemployment ratesDiagram 5.1
Q1 Q2 Q3 Q4 Q1 Q2 Q3 Q4 Q1 Q2 Q3 Q4 Q1 Q2 Q3 Q4 Q1 Q2 Q3 Q4 Q1 Q2 Q3 Q41997 1998 1999 2000 2001 2002
0.00.51.01.52.02.53.03.54.04.55.05.56.06.57.07.58.0
Percent
Seasonally adjusted unemployment rate
Underemployment rate
0
Table 5.2
The labour force, and persons employed,unemployed and underemployed
Labour force Persons employed Persons
unemployed(a)Persons
underemployed
2001 Annual 3 427 100 (1.6) 3 252 300 (1.4) 174 800 85 500
Q1 3 403 400 (2.0) 3 253 700 (3.1) 149 600 77 700Q2 3 410 300 (1.3) 3 257 700 (1.9) 152 600 75 200Q3 3 443 400 (1.5) 3 257 300 (1.0) 186 100 84 500Q4 3 451 200 (1.4) 3 240 500 (-0.4) 210 700 104 500
2002 Annual 3 487 900 (1.8) 3 232 300 (-0.6) 255 500 105 200
Q1 3 459 600 (1.7) 3 220 700 (-1.0) 238 900 109 300Q2 3 460 100 (1.5) 3 196 700 (-1.9) 263 400 100 500Q3 3 512 900 (2.0) 3 245 700 (-0.4) 267 200 101 400Q4 3 518 800 (2.0) 3 266 200 (0.8) 252 600 109 700
<0.2> <0.6>
Notes : (a) These include first-time job-seekers and re-entrants into the labour force.
( ) % change over a year earlier.
< > % change over the preceding quarter.
Source : General Household Survey, Census and Statistics Department.
/Table 5.3 .....

171
Table 5.3Median duration of unemployment and
proportion of the unemployed populationby duration of unemployment
Proportion unemployed for :Median
duration ofunemployment
(Days)
Less than 3 months
(%)
3 months to less than 6 months
(%)
6 months or more
(%)2001 Annual 75 59 19 22
Q1 75 58 20 22Q2 68 62 18 21Q3 72 61 16 23Q4 82 55 21 24
2002 Annual 87 52 19 29Q1 87 53 20 27Q2 89 51 19 30Q3 82 55 17 28Q4 90 51 19 30
Note : Figures may not add up exactly to the total due to rounding.
Source : General Household Survey, Census and Statistics Department.
Table 5.4Median hours of work per week and
proportion of the employed populationworking for 50 hours or more per week
Proportion of employed persons working for :Median hours ofwork per week
for allemployed persons
(Hours)
50-59 hours per week
(%)
60 hours or more per week
(%)
50 hours or more per week
(%)2001 Annual 48 14 20 34
Q1 48 14 19 33Q2 45 14 18 32Q3 48 15 20 36Q4 48 14 21 35
2002 Annual 48 16 22 38Q1 45 14 20 34Q2 48 15 21 36Q3 48 17 22 40Q4 48 16 24 40
Note : Figures may not add up exactly to the total due to rounding.
Source : General Household Survey, Census and Statistics Department.
/5.4 .....

172
5.4 Total employment(4) as enumerated from households staged an upturntowards the end of last year, to a year-on-year increase of 0.8% in the fourthquarter, having worsened from a 1.0% decrease in the first quarter. It stood at3.27 million in the fourth quarter of 2002. Total labour force(5) had a fastergrowth over the past year, with the year-on-year increase picking up to 2.0% inthe fourth quarter of 2002, from 1.7% in the first quarter. It stood at 3.52million in the fourth quarter of 2002. The swing in the growth rate differentialbetween total labour force and total employment pointed to a relative narrowingin the overall manpower resource balance, leading to lower unemployment ratein the latter part of last year.
Total labour force and total employment(year-on-year rate of change)
Q2 Q3 Q4 Q1 Q2 Q3 Q4 Q1 Q2 Q3 Q4 Q1 Q2 Q3 Q4 Q1 Q2 Q3 Q4 Q1 Q2 Q3 Q41997 1998 1999 2000 2001 2002
0
1
2
3
4
5
6
-1
-2
-3
-4
Percent
Diagram 5.2
Total labour force
Total employment
Note : Year-on-year rates of change from the new series of labour forcestatistics, which has adopted the “resident population” definition,are available as from the second quarter of 1997.
/5.5 .....

173
5.5 Overall labour income had been moderating over the past year, amidstmore incidents of pay freeze or cuts. Labour earnings(6) went down by anaverage of 1.0% in money terms in the first three quarters of 2002 over a yearearlier, albeit still up by 2.1% in real terms. This compared with the respectiveincreases of 1.8% and 3.5% in 2001. Labour wages(7) likewise fell, by anaverage of 1.1% in money terms in the first nine months of 2002 over a yearearlier, yet still higher by 2.4% in real terms. This compared with therespective increases of 0.8% and 3.4% in 2001.
Profile of unemployment and underemployment
5.6 Analysed by economic sector, the decrease in unemployment rate inthe fourth quarter of 2002 over the third quarter occurred mainly in foundationand superstructure construction, and manufacturing, as well as in community,social and personal services, the retail trade, and financing. Yet constructionand manufacturing were also the sectors where a more distinct increase inunderemployment rate was observed. Conceivably, this was attributable to theengagement of more temporary and part-time workers, especially at buildingand construction sites. Other sectors also having a noticeable rise inunderemployment rate included transport and the import/export trade.Comparing the fourth quarter of 2002 with a year earlier, the unemploymentrate jumped extensively across almost all the major economic sectors. The risewas particularly visible in foundation and superstructure construction, as wellas in restaurants and communications, with the former sector being affected bythe scale-down in the Public Housing Programme and completion of the MTRTseung Kwan O Extension, and the latter sectors by subdued demand in thelocal economy. As to the underemployment rate, increases were concentratedin decoration and maintenance, the retail trade, transport, restaurants, theimport/export trade, and community, social and personal services, more thanoffsetting the decreases seen in foundation and superstructure construction andin manufacturing.
/Table 5.5 .....

174
Table 5.5
Unemployment rates by major economic sector (%)(a)
2001 2002
Annual Q1 Q2 Q3 Q4 Annual Q1 Q2 Q3 Q4
Wholesale, retail and import/export trades, restaurants and hotels
5.5 4.6 5.1 5.8 6.5 7.8 7.4 8.3 7.7 7.9
Transport, storage and communications
4.4 4.2 4.2 3.8 5.2 5.4 5.7 5.3 5.3 5.4
Financing, insurance, real estate and business services
3.0 2.7 2.5 3.1 3.9 4.7 4.9 4.5 4.5 4.7
Community, social and personal services
2.0 1.9 1.7 2.0 2.5 3.2 2.7 3.3 3.5 3.1
Manufacturing 5.3 4.0 4.9 5.6 6.8 7.3 7.2 8.2 7.1 6.6
Construction(b) 10.7 10.3 9.7 10.3 12.6 15.8 15.7 16.9 15.6 15.2
Notes : (a) Not seasonally adjusted, and not including first-time job-seekers and re-entrantsinto the labour force.
(b) Including both site and non-site workers.
Source : General Household Survey, Census and Statistics Department.
/Table 5.6 .....

175
Table 5.6
Underemployment rates by major economic sector (%)
2001 2002
Annual Q1 Q2 Q3 Q4 Annual Q1 Q2 Q3 Q4
Wholesale, retail and import/export trades, restaurants and hotels
1.3 1.1 1.1 1.3 1.5 1.8 1.8 1.6 1.8 1.7
Transport, storage and communications
2.7 2.4 2.6 2.6 3.1 3.0 3.1 3.0 2.5 3.4
Financing, insurance, real estate and business services
0.4 0.3 0.3 0.3 0.7 0.6 0.7 0.5 0.6 0.5
Community, social and personal services
1.4 1.3 1.2 1.3 1.7 2.1 2.3 1.8 2.1 2.0
Manufacturing 2.4 2.1 2.3 2.2 3.0 2.5 2.4 2.6 2.3 2.6
Construction(a) 12.5 11.7 10.7 12.3 15.2 13.8 14.2 13.7 12.8 14.6
Note : (a) Including both site and non-site workers.
Source : General Household Survey, Census and Statistics Department.
/Table 5.7 .....

176
Table 5.7
Unemployment and underemployment ratesby detailed economic sub-sector in the fourth quarter of 2002
Unemployment Numbers Underemploy- Numbersrate(a) unemployed(a) ment rate underemployed(%) (%)
Wholesale, retail and import/export trades, restaurants and hotels
7.9 83 500 1.7 18 200
Wholesale/retail trade 8.5 30 600 2.1 7 400 Import/export trade 5.2 21 600 0.8 3 100 Restaurants and hotels 11.1 31 300 2.7 7 700
Transport, storage and communications 5.4 19 400 3.4 12 200
Transport 4.8 14 500 3.6 10 800 Storage 11.1 700 1.5 100 Communications 8.1 4 300 2.3 1 200
Financing, insurance, real estate and business services
4.7 24 100 0.5 2 500
Financing 3.7 5 300 0.3 400 Insurance 4.9 2 100 0.6 300 Real estate 5.0 6 100 0.2 300 Business services 5.2 10 600 0.8 1 600
Community, social and personal services
3.1 27 400 2.0 18 000
Public administration 0.9 1 300 0.4 500 Education, medical and other health and welfare services
2.1 6 800 1.4 4 600
Other services 4.6 19 400 3.0 12 900
Manufacturing 6.6 20 100 2.6 8 100
Food and beverages 4.9 1 100 2.0 500 Clothing and footwear 8.1 6 800 4.2 3 500 Paper and printing 6.5 3 900 1.8 1 000 Plastic products 9.3 1 800 0 0 Metal products 4.6 900 5.0 1 000 Electrical and electronic products 6.7 3 900 1.5 900 Other manufacturing industries 4.1 1 600 2.9 1 200
Construction 15.2 52 700 14.6 50 700
Foundation and superstructure 13.6 35 700 12.2 32 100 Decoration and maintenance 20.0 17 000 21.9 18 600
Notes : As the above figures are based on a sample survey, they are subject to sampling errors,more so for the finer breakdowns.
Figures may not add up exactly to the total due to rounding.
(a) Not seasonally adjusted, and not including first-time job-seekers and re-entrants intothe labour force.
Source : General Household Survey, Census and Statistics Department.
/Diagram 5.3 .....

177
Unemployment rates by major economic sector*
Q1 Q2 Q3 Q4 Q1 Q2 Q3 Q4 Q1 Q2 Q3 Q4 Q1 Q2 Q3 Q4 Q1 Q2 Q3 Q4 Q1 Q2 Q3 Q41997 1998 1999 2000 2001 2002
0
5
10
15
20Percent
Manufacturing Construction #
Diagram 5.3
Q1 Q2 Q3 Q4 Q1 Q2 Q3 Q4 Q1 Q2 Q3 Q4 Q1 Q2 Q3 Q4 Q1 Q2 Q3 Q4 Q1 Q2 Q3 Q41997 1998 1999 2000 2001 2002
0
1
2
3
4
5
6
7
8
9
10Percent
Wholesale, retail and import/export trades, restaurants and hotels Transport, storage and communications Financing, insurance, real estate and business services Community, social and personal services
Notes : (*) Not seasonally adjusted, and not including first-timejob-seekers and re-entrants into the labour force.
(#) Including both site and non-site workers.
/Diagram 5.4 .....

178
Underemployment rates by major economic sector
Q1 Q2 Q3 Q4 Q1 Q2 Q3 Q4 Q1 Q2 Q3 Q4 Q1 Q2 Q3 Q4 Q1 Q2 Q3 Q4 Q1 Q2 Q3 Q41997 1998 1999 2000 2001 2002
0
2
4
6
8
10
12
14
16Percent
Manufacturing Construction #
Diagram 5.4
Q1 Q2 Q3 Q4 Q1 Q2 Q3 Q4 Q1 Q2 Q3 Q4 Q1 Q2 Q3 Q4 Q1 Q2 Q3 Q4 Q1 Q2 Q3 Q41997 1998 1999 2000 2001 2002
0
1
2
3
4
5
6Percent
Wholesale, retail and import/export trades, restaurants and hotels Transport, storage and communications Financing, insurance, real estate and business services Community, social and personal services
Note : (#) Including both site and non-site workers.
/5.7 .....

179
5.7 Analysed by occupation category, the decline in unemployment ratebetween the third and fourth quarters of 2002 was more visible amongst craftand related workers, mostly in construction. Other occupation categories alsoregistering decreases in unemployment rate were managers and administrators,professionals, associate professionals, clerks, and plant and machine operatorsand assemblers. As to the underemployment rate, increases were seen amongstcraft and related workers, plant and machine operators and assemblers, andworkers in elementary occupations. On a year-on-year comparison, theunemployment rate surged across many of the major occupation categories inthe fourth quarter of 2002, more so amongst craft and related workers, serviceworkers and shop sales workers, and workers in elementary occupations. As tothe underemployment rate, increases took place largely amongst craft andrelated workers, service workers and shop sales workers, and clerks,outweighing the decreases observed amongst plant and machine operators andassemblers, and workers in elementary occupations.
Table 5.8
Unemployment rates by major occupation category (%)(a)
2001 2002
Annual Q1 Q2 Q3 Q4 Annual Q1 Q2 Q3 Q4
Managers and administrators 1.9 1.4 1.6 2.0 2.4 2.7 3.5 3.1 2.3 1.9
Professionals 1.9 1.2 1.5 2.2 2.6 2.4 2.6 2.5 2.3 2.1
Associate professionals(b) 2.9 2.6 2.6 3.0 3.4 4.3 4.2 4.3 4.5 4.3
Clerks 3.7 3.1 3.2 3.7 4.9 5.3 5.2 5.5 5.4 5.2
Service workers and shop sales workers
6.5 5.6 6.1 6.9 7.5 9.1 8.5 9.6 9.1 9.4
Craft and related workers 9.3 8.9 8.1 9.3 10.7 14.0 12.6 15.7 14.3 13.5
Plant and machine operators and assemblers
4.6 4.0 3.9 4.8 5.9 5.9 6.4 6.6 5.4 5.2
Elementary occupations 5.2 4.8 5.0 4.8 6.2 7.7 7.4 7.7 7.8 7.9
Others 3.1 1.2 8.0 1.6 1.3 3.4 2.4 2.9 4.7 3.9
Notes : (a) Not seasonally adjusted, and not including first-time job-seekers and re-entrants intothe labour force.
(b) Including technicians and supervisors.
Source : General Household Survey, Census and Statistics Department.
/Table 5.9 .....

180
Table 5.9
Underemployment rates by major occupation category (%)
2001 2002
Annual Q1 Q2 Q3 Q4 Annual Q1 Q2 Q3 Q4
Managers and administrators 0.1 0.1 * 0.1 0.1 * * 0 0.2 0
Professionals 0.2 0.1 0.3 0.1 0.3 0.3 0.4 0.3 0.3 0.2
Associate professionals(a) 0.5 0.5 0.5 0.5 0.5 0.8 0.8 1.0 0.8 0.7
Clerks 0.7 0.6 0.6 0.8 0.9 1.1 1.1 0.9 1.2 1.2
Service workers and shop sales workers
1.7 1.5 1.7 1.7 2.1 2.5 2.6 2.3 2.8 2.4
Craft and related workers 9.3 9.1 8.0 8.8 11.5 11.3 11.2 11.0 10.6 12.5
Plant and machine operators and assemblers
3.4 2.8 3.4 3.2 4.2 3.8 4.3 3.8 3.1 3.9
Elementary occupations 4.3 3.8 3.7 4.5 5.2 4.8 5.2 4.5 4.6 5.0
Others 3.4 0 3.8 8.9 1.3 3.5 0.8 6.7 5.8 0
Notes : (a) Including technicians and supervisors.
(*) Less than 0.05%.
Source : General Household Survey, Census and Statistics Department.
/5.8 .....

181
5.8 Analysed by sex, male workers generally faced a smaller decline inunemployment rate than female workers between the third and fourth quartersof 2002. As a result, the difference between the two unemployment rateswidened, to 2.3 percentage points in the fourth quarter. Comparing the fourthquarter of 2002 with a year earlier, the unemployment rates for male and femaleworkers went up by virtually the same magnitude, giving no change in thedifference between them over the period.
Table 5.10
Unemployment rates by sex (%)(a)
Male Female
2001 Annual 6.0 3.9
Q1 5.3 3.1Q2 5.3 3.4Q3 6.3 4.1Q4 7.1 4.8
2002 Annual 8.4 6.0
Q1 8.1 5.3Q2 8.8 6.1Q3 8.5 6.5Q4 8.2 5.9
Note : (a) Not seasonally adjusted, but including first-time job-seekers and re-entrants into thelabour force.
Source : General Household Survey, Census and Statistics Department.
/5.9 .....

182
5.9 Analysed by age group, the decline in unemployment rate in thefourth quarter of 2002 over the third quarter was most apparent amongstyounger persons aged 15-24, due to increased absorption of first-timejob-seekers at this age into employment upon the recent upturn in economicactivity. Also having decrease in unemployment rate were persons aged 25-29and 50 and above. Comparing the fourth quarter of 2002 with a year earlier,there was a broader-based increase in unemployment rate across almost all theage groups. The rise was most distinct amongst persons aged 15-19 and 50-59.The former group was constrained by relatively limited practical skills andworking experience, and the latter group by those within the group havingrelatively lower educational attainment, so that persons in both groupsgenerally tended to have greater difficulty in finding jobs under slack labourmarket conditions.
Table 5.11
Unemployment rates by age group (%)(a)
2001 2002
Annual Q1 Q2 Q3 Q4 Annual Q1 Q2 Q3 Q4
15-19 23.4 21.0 21.2 25.1 26.1 30.7 27.2 30.1 35.1 29.4
20-24 8.7 7.1 6.5 11.4 9.7 11.3 9.8 11.3 13.5 10.5
25-29 4.4 3.9 4.0 4.5 5.4 6.1 6.2 6.5 6.1 5.5
30-39 3.5 3.1 3.2 3.4 4.5 5.4 5.6 5.5 5.1 5.6
40-49 4.6 3.8 4.1 4.8 5.8 6.7 6.3 7.2 6.6 6.5
50-59 5.4 5.1 5.1 5.2 6.0 8.2 7.3 8.5 8.7 8.5
60 and above 2.7 2.7 2.3 2.5 3.1 5.0 5.3 6.0 4.6 4.2
Note : (a) Not seasonally adjusted, but including first-time job-seekers and re-entrants into thelabour force.
Source : General Household Survey, Census and Statistics Department.
/5.10 .....

183
5.10 Analysed by educational attainment, the unemployment rate moveddown more notably amongst persons with upper secondary education and withtertiary education in the fourth quarter of 2002 over the third quarter. Bycontrast, persons with no schooling/kindergarten education and with lowersecondary education faced a distinct rise in unemployment rate. Comparing thefourth quarter of 2002 with a year earlier, the unemployment rate, whilstsurging across many of the educational levels, had a sharper increase amongstpersons with lower secondary education and with primary education. Apartfrom reflecting a relatively better demand for higher educated persons, thismight also reflect a downward stretch by the higher educated persons for jobopportunities at a lower level under slack labour market conditions.
Table 5.12
Unemployment rates by educational attainment (%)(a)
2001 2002
Annual Q1 Q2 Q3 Q4 Annual Q1 Q2 Q3 Q4
No schooling/kindergarten 5.6 2.8 5.3 4.7 9.6 8.7 8.4 8.9 8.4 9.1
Primary 6.4 5.9 5.9 6.2 7.6 9.8 8.6 10.0 10.4 10.4
Lower secondary 7.5 7.1 6.7 7.6 8.7 10.9 10.4 11.5 10.5 11.1
Upper secondary(b) 4.7 4.1 4.1 5.1 5.7 6.9 6.6 7.3 7.2 6.5
Matriculation 3.6 2.6 3.0 4.7 4.1 5.2 5.2 5.4 5.1 5.3
Tertiary 3.2 2.3 2.7 3.9 4.0 4.3 3.9 4.2 5.0 4.0
of which :
Non-degree 3.9 2.6 3.5 4.7 4.8 5.5 5.1 5.3 6.1 5.4
Degree 2.8 2.0 2.2 3.5 3.5 3.6 3.3 3.6 4.4 3.2
Notes : (a) Not seasonally adjusted, but including first-time job-seekers and re-entrants into thelabour force.
(b) Including craft courses.
Source : General Household Survey, Census and Statistics Department.
/Demand .....

184
Demand for and supply of labour
5.11 In 2002, total labour force expanded by an average of 1.8% to anaverage of 3.49 million, following a 1.6% rise in 2001. This comprisedyear-on-year increases of 1.7% and 1.5% respectively in the first and secondquarters of 2002, picking up to 2.0% in both the third and fourth quarters.Underlying this profile was a distinct rise in the overall labour forceparticipation rate(8), from 61.3% in the first quarter of 2001 to 62.0% in thefourth quarter of 2002. This in turn was attributable to a surge in the labourforce participation rate for females especially those aged 30-59, as well as thatfor males aged 15-19. Thus apparently, there was greater inclination amongsthousewives and youngsters to find jobs over the past year.
5.12 On the other hand, total employment shrank by an average of 0.6% toan average of 3.23 million in 2002, reversing the 1.4% gain in 2001. Decreasestook place entirely in the first three quarters of 2002, by 1.0%, 1.9% and 0.4%respectively over a year earlier, while an increase of 0.8% occurred in thefourth quarter. The recent upturn was more visible amongst persons withtertiary education as well as amongst persons at the upper segment of theoccupational hierarchy including in particular professionals and associateprofessionals, yet with increases of smaller magnitude also observed amongstservice workers and shop sales workers and amongst workers in elementaryoccupations. As to changes by employment status, the number of employeesunderwent a continuous downtrend, attributable to subdued business conditionsand more extensive corporate downsizing. The number of employers likewisefell for most of the past year, consequential to more cessations of business, yetreverted to increase in the fourth quarter. By contrast, the number ofself-employed persons continued on a distinct rise, as apparently more personsresorted to self-employment as individual vendors, free-lance workers, etc.against reduced job opportunities in the corporate sector.
/Table 5.13 .....

185
Table 5.13
Total labour force and total employment
Labour force
Year-on-year % change
Persons employed
Year-on-year % change
1997 3 234 800 1.5(a) 3 163 600 2.0 (a)
1998 3 276 100 1.3 3 122 000 -1.3
1999 3 319 600 1.3 3 112 100 -0.3
2000 3 374 200 1.6 3 207 300 3.1
2001 3 427 100 1.6 3 252 300 1.4
2002 3 487 900 1.8 3 232 300 -0.6
Note : (a) This figure refers to the average change for the second, third and fourthquarters of 1997 taken together as compared to a year earlier, as the new seriesof labour force statistics, adopting the “resident population” definition andincorporating the results of the 2001 Population Census, is available only asfrom the second quarter of 1996.
Source : General Household Survey, Census and Statistics Department.
Table 5.14
Labour force participation rates by sex (%)
Male Female Both sexes combined
2001 Annual 72.9 50.7 61.4
Q1 73.0 50.3 61.3Q2 72.7 50.6 61.3Q3 73.2 50.8 61.6Q4 72.8 51.0 61.5
2002 Annual 72.5 52.0 61.8
Q1 72.4 51.5 61.6Q2 72.3 51.4 61.5Q3 73.0 52.3 62.3Q4 72.3 52.5 62.0
Source : General Household Survey, Census and Statistics Department.
/Table 5.15 .....

186
Table 5.15
Labour force participation rates by sex and by age group (%)
1997 1998 1999 2000 2001 2002Male
15-19 21.2 20.0 20.2 18.0 17.1 18.020-24 77.8 77.8 76.5 75.8 72.4 71.225-29 97.1 97.3 97.1 96.6 96.4 95.730-39 98.2 98.1 97.9 97.7 97.4 97.440-49 97.1 97.1 96.5 96.4 96.3 95.850-59 85.5 85.3 85.7 86.0 85.6 84.660 and above 23.7 22.3 21.1 20.6 20.2 19.4
Overall 75.1 74.6 74.0 73.5 72.9 72.5
Female
15-19 17.0 18.2 16.6 15.7 15.4 16.220-24 76.5 75.9 76.1 74.6 72.5 72.825-29 83.7 84.5 84.4 86.5 87.0 87.530-39 64.6 65.4 67.0 68.7 70.7 72.240-49 53.5 53.6 55.4 56.1 58.4 61.450-59 35.5 38.0 39.8 41.1 42.0 44.460 and above 4.2 4.3 4.3 4.0 3.8 4.5
Overall 47.9 48.5 49.2 49.9 50.7 52.0
Both sexes combined
15-19 19.1 19.1 18.5 16.9 16.3 17.120-24 77.2 76.8 76.3 75.2 72.4 72.025-29 89.8 90.4 90.2 91.1 91.3 91.330-39 80.8 80.9 81.4 82.0 82.6 83.340-49 75.7 75.6 76.1 76.3 77.2 78.250-59 62.6 63.6 64.4 65.0 64.9 65.260 and above 13.5 12.9 12.4 12.0 11.7 11.7
Overall 61.3 61.3 61.3 61.4 61.4 61.8
Source : General Household Survey, Census and Statistics Department.
/Diagram 5.5 .....

187
Labour force participation rates by age group
Q1 Q2 Q3 Q4 Q1 Q2 Q3 Q4 Q1 Q2 Q3 Q4 Q1 Q2 Q3 Q4 Q1 Q2 Q3 Q4 Q1 Q2 Q3 Q41997 1998 1999 2000 2001 2002
55
60
65
70
75
80
85
90
95Percent
Age 25-29
Age 30-39
Age 40-49
Age 50-59
Overall
0
Diagram 5.5
Q1 Q2 Q3 Q4 Q1 Q2 Q3 Q4 Q1 Q2 Q3 Q4 Q1 Q2 Q3 Q4 Q1 Q2 Q3 Q4 Q1 Q2 Q3 Q41997 1998 1999 2000 2001 2002
5
10
15
20
25
30
35
40Percent
0
20
40
60
80
100
0
Age 20-24(right scale)
Age 15-19(left scale)
Age 60 and above(left scale)
0
/Profile .....

188
Profile of employment
5.13 Employment as enumerated from business establishments continuedon a decline, as the corporate sector underwent further consolidation andrationalisation. For all the private sector establishments surveyed takentogether, total employment shrank by 1.5% in September 2002 over a yearearlier, further to a 1.1% decrease in March and a 2.7% decrease in June. Forthe first nine months of 2002 as a whole, total employment dwindled by anaverage of 1.8%, after an increase of only 0.2% in 2001. On a seasonallyadjusted quarter-to-quarter comparison, total employment was virtually static inSeptember 2002, having decreased by 0.7% in March and 0.6% in June.
5.14 Taking all the service sectors surveyed together(9), employment wasreduced by 0.4% in September 2002 over a year earlier, further to a 2.1%decline in June. Employment growth varied amongst the constituent sectors.On a year-on-year comparison, employment in storage and communications fellvisibly, by 7.3% in September 2002, attributable to further consolidation in thetelecommunications sector. Employment in restaurants and hotels and in theretail trade contracted by 4.8% and 1.7% respectively, amidst subdued localconsumer demand, and notwithstanding buoyancy in inbound tourism.Employment in financing, insurance, real estate and business services and inwater transport, air transport and services allied to transport declined by 2.9%and 0.6% respectively. On the other hand, employment in the wholesale andimport/export trades went up, albeit only marginally, by 0.2%, in tandem with apick-up in external trade. Employment in community, social and personalservices rose more, by 5.7%, underpinned by sustained strong demand forwelfare, education, medical and health, sanitary and recreational services.
5.15 As to the local manufacturing sector, its workforce underwent furtherdownsizing, amidst continued weak performance of domestic exports andon-going relocation of production processes to the Mainland. In September2002, employment in this sector went down further, by 9.2% from a year earlier,after an 8.5% dip in June.
/5.16 .....
189
5.16 Employment of manual workers at building and construction sitesalso shrank visibly, by 8.0% in September 2002 over a year earlier, muchenlarged from the 1.3% fall in June. This was mainly due to the significantreduction in employment at public sector sites, by 14.5%, upon progressivescale-back of the Public Housing Programme and completion of the MTRTseung Kwan O Extension. Concurrently, employment at private sector sitesdecreased by 3.0%, as reduced employment in quite a number of privatebuilding sites more than offset the gain seen at the construction site forContainer Terminal No. 9. Analysed by type of project, employment atbuilding sites and civil engineering sites both dropped, by 10.9% and 1.0%respectively in September 2002 over a year earlier. Taking into account off-siteworkers and related professional and support staff, employment for the entirebuilding and construction sector(10) was 2.7% less in the third quarter of 2002than a year earlier, though smaller than the 4.4% decline in the second quarter.
5.17 In line with the Government’s move to contain recurrent expenditureand the size of the Civil Service(11), employment in the Civil Service wasslashed by 3.5% in September 2002 from a year earlier, after a 3.9% cut in June.As indicated in the Chief Executive’s Policy Address on 8 January 2003, theGovernment plans to reduce the Civil Service establishment by 10% to around160 000 by the financial year 2006/07. It will also freeze recruitment to theCivil Service, as from 1 April 2003. Details of the Second VoluntaryRetirement Scheme have been announced recently.
/Table 5.16 .....

190
Table 5.16
Employment by major economic sector
2001 2002 Annual average Mar Jun Sep Dec Mar Jun Sep
Wholesale and import/export trades
577 200(-3.5)
581 100(-3.5)
581 500(-3.6)
579 300(-5.0)
566 800(-1.8)
566 100(-2.6)
556 000(-4.4)
580 400(0.2)
Retail trade 219 700(2.6)
215 400(3.9)
228 300(8.1)
225 000(0.9)
210 200(-2.2)
216 300(0.4)
218 400(-4.3)
221 300(-1.7)
Restaurants and hotels 222 200(1.2)
220 600(0.9)
225 100(1.4)
223 000(1.1)
219 900(1.3)
213 600(-3.2)
213 700(-5.1)
212 300(-4.8)
Water transport, air transport and services allied to transport
99 900(2.1)
98 200(2.1)
100 500(1.1)
101 600(1.5)
99 100(3.6)
100 800(2.6)
102 300(1.8)
101 000(-0.6)
Storage and communications
44 400(2.8)
44 600(8.2)
46 000(6.2)
43 700(-3.0)
43 400(0.3)
41 300(-7.2)
41 600(-9.7)
40 500(-7.3)
Financing, insurance, real estate and business services
435 600(1.6)
428 900(3.4)
442 500(3.1)
437 300(0.1)
433 900(-0.1)
423 400(-1.3)
430 300(-2.8)
424 500(-2.9)
Community, social and personal services
373 800(7.2)
360 500(4.5)
372 500(7.6)
377 000(8.1)
385 100(8.6)
392 100(8.8)
390 800(4.9)
398 300(5.7)
Manufacturing 212 000(-8.6)
217 000(-7.2)
218 700(-8.4)
209 300(-8.8)
203 000(-10.3)
197 400(-9.0)
200 100(-8.5)
190 100(-9.2)
Building and construction sites
80 300(0.9)
87 800(17.8)
80 300(1.3)
76 500(-5.2)
76 600(-8.7)
76 900(-12.4)
79 200(-1.3)
70 400(-8.0)
All establishments surveyed in the private sector(a)
2 312 600(0.2)
2 301 600(0.9)
<0.2>
2 343 200(1.0)
<1.1>
2 319 900(-0.9)
<-1.2>
2 285 500(-0.3)
<-0.2>
2 275 500(-1.1)
<-0.7>
2 280 100(-2.7)
<-0.6>
2 286 100(-1.5)<*>
Civil Service(b) 177 700(-3.5)
181 000(-2.6)
178 700(-3.3)
176 700(-3.7)
174 500(-4.4)
173 000(-4.4)
171 700(-3.9)
170 500(-3.5)
Notes : Employment figures enumerated from business establishments, as obtained from the Quarterly Survey ofEmployment and Vacancies, are somewhat different from those enumerated from households, as obtained fromthe General Household Survey. This is mainly due to difference in sectoral coverage: while the former surveycovers selected major sectors, the latter survey covers all sectors in the economy.
(a) The total figures on private sector employment cover also employment in mining and quarrying and inelectricity and gas supply, besides employment in the major sectors indicated above.
(b) These figures cover only those employed on Civil Service terms of appointment. Judicial officers, ICACofficers, consultants, contract staff and temporary staff not appointed on Civil Service terms are notincluded.
( ) % change over a year earlier.
< > Seasonally adjusted quarter-to-quarter % change.
(*) Change of less than 0.05%.
Source : Quarterly Survey of Employment and Vacancies, Census and Statistics Department.
/Diagram 5.6 .....

191
Employment by broad economic sector
M J S D M J S D M J S D M J S D M J S D M J S1997 1998 1999 2000 2001 2002
0
200
400
600
800
1000
1200
1400
1600
1800
2000
2200Number ('000)
60
65
70
75
80
85
90
95
100Number ('000)
Diagram 5.6
Service sectors as a whole(left scale)
Building and construction sites(right scale)
Manufacturing sector(left scale) 0
Employment in the major service sectors
M J S D M J S D M J S D M J S D M J S D M J S1997 1998 1999 2000 2001 2002
0
100
200
300
400
500
600
700Number ('000)
Diagram 5.7
Wholesale and import/export trades
Financing, insurance, real estate and business services
Restaurants and hotels
Retail trade
Community, social and personal services
Water transport, air transportand services allied to transport
/Vacancies .....

192
Vacancies
5.18 Vacancies in the private sector continued on a downtrend, yet thedecrease on a year-on-year comparison tended to taper during the past year.Taking all the private sector establishments surveyed together, vacancies weredown by 11.6% in September 2002 over a year earlier, smaller than the 30.8%fall in March and the 14.9% fall in June. For the first nine months of 2002 as awhole, the decrease averaged at 20.2%, again narrowed from the 28.0% drop in2001. On a seasonally adjusted quarter-to-quarter comparison, vacancies fellby 12.7% in September 2002, following a 2.7% fall in March and a 12.1% risein June. The overall vacancy rate in the private sector thus moved lower to0.8% in September 2002, from 0.9% in both March and June.
5.19 Analysed by economic sector, vacancies for all the service sectorssurveyed taken together contracted by 12.6% in September 2002 over a yearearlier, as against a 14.2% dip in June. On a year-on-year comparison for theconstituent sectors, vacancies in the retail trade and in community, social andpersonal services plummeted by 33.1% and 23.8% respectively in September2002. Vacancies in storage and communications, in restaurants and hotels, andin financing, insurance, real estate and business services decreased by 11.3%,10.8% and 8.4% respectively. On the other hand, vacancies in water transport,air transport and services allied to transport surged by 17.2%, due to a low basea year earlier. Vacancies in the wholesale and import/export trades increasedmodestly, by 3.5%. As to the local manufacturing sector, vacancies increasedby 3.9% in September 2002 over a year earlier, reversing the 22.0% decline inJune as well as the downtrend evident since September 2000. Vacancies formanual workers at building and construction sites were 19.7% fewer inSeptember 2002 than a year earlier, yet much narrowed from the 48.6% plungein June. Vacancies in the Civil Service went up by 1.9% in September 2002over a year earlier, after a 16.0% leap in June, with the increases occurringmostly in the security, social welfare and education fields, mainly stemmingfrom natural wastage.
/Table 5.17 .....

193
Table 5.17Vacancies by major economic sector
No. of vacancies
2001 2002Annualaverage Mar
Jun
Sep Dec Mar Jun Sep
Vacancy ratein Sep 2002
(%)
Wholesale and import/export trades
4 700(-45.0)
7 400(-29.0)
4 600(-50.2)
4 000(-56.5)
3 000(-46.8)
5 000(-32.2)
5 000(9.5)
4 200(3.5)
0.7
Retail trade 2 100(-20.5)
2 400(-3.2)
2 100(-20.3)
2 400(-20.1)
1 500(-38.7)
1 700(-31.4)
2 500(20.0)
1 600(-33.1)
0.7
Restaurants and hotels
1 600(-21.0)
2 200(7.0)
1 300(-29.8)
1 500(-35.9)
1 200(-24.1)
1 600(-28.5)
1 400(4.7)
1 400(-10.8)
0.6
Water transport, air transport and services allied to transport
700(-33.2)
900(6.1)
800(-24.4)
400(-68.8)
500(-30.1)
500(-48.3)
600(-21.6)
500(17.2)
0.5
Storage and communications
500(-25.6)
600(-29.2)
500(-50.4)
500(-23.2)
500(38.0)
400(-31.0)
400(-15.7)
400(-11.3)
1.1
Financing, insurance, real estate and business services
6 400(-30.5)
8 200(-12.9)
7 800(-22.2)
5 300(-48.8)
4 300(-39.3)
5 400(-34.6)
6 000(-22.3)
4 800(-8.4)
1.1
Community, social and personal services
5 600(0.5)
5 700(5.5)
6 500(16.0)
5 500(-11.1)
4 700(-8.0)
4 400(-23.5)
4 200(-35.4)
4 200(-23.8)
1.0
Manufacturing 1 600(-35.2)
1 900(-34.1)
1 900(-34.0)
1 400(-37.8)
1 100(-36.1)
1 400(-25.0)
1 500(-22.0)
1 400(3.9)
0.7
Building and construction sites
100(-55.3)
200(3.3)
100(-75.3)
100(-72.4)
100(-57.6)
100(-42.7)
100(-48.6)
100(-19.7)
0.1
All establishments surveyed in the private sector(a)
23 500(-28.0)
30 000(-13.8)<-4.3>
25 700(-26.4)<-8.2>
21 200(-40.6)
<-16.6>
17 200(-32.1)<-7.0>
20 800(-30.8)<-2.7>
21 900(-14.9)
<12.1>
18 800(-11.6)
<-12.7>
0.8
Civil Service(b) 1 700(-12.3)
1 500(-31.8)
1 700(-19.7)
1 700(-8.1)
1 900(19.8)
1 700(9.0)
1 900(16.0)
1 700(1.9)
1.0
Notes : Vacancy rate refers to the ratio of vacancies to total employment opportunities (actual employment plus vacancies).
(a) The total figures on private sector vacancies cover also vacancies in mining and quarrying and in electricityand gas supply, besides vacancies in the major sectors indicated above.
(b) These figures cover only vacancies for those staff to be employed on Civil Service terms of appointment.They have been adjusted by deducting the vacant posts emerging from the Voluntary Retirement Scheme.
( ) % change over a year earlier.
< > Seasonally adjusted quarter-to-quarter % change.
Source : Quarterly Survey of Employment and Vacancies, Census and Statistics Department.
/Diagram 5.8 .....

194
Vacancies by broad economic sector
M J S D M J S D M J S D M J S D M J S D M J S1997 1998 1999 2000 2001 2002
0
10
20
30
40
50
60Number ('000)
0
0.5
1
1.5
2
2.5Number ('000)
Diagram 5.8
Service sectors as a whole(left scale)
Building and construction sites
(right scale)
Manufacturing sector
(left scale)
5.20 Analysed by occupation category, vacancies in the private sector werereduced fairly extensively. Specifically, vacancies for craft and related workers,clerks, professionals and workers in elementary occupations fell markedly, by40.9%, 26.7%, 26.5% and 13.8% respectively in September 2002 over a yearearlier, while vacancies for service workers and shop sales workers and forassociate professionals had much more modest decreases, by 4.4% and 4.1%respectively. On the other hand, vacancies for managers and administrators andfor plant and machine operators and assemblers leaped, by 23.2% and 22.5%respectively in September 2002 over a year earlier, yet these followedconsiderable declines of 31.0% and 31.9% in June.
/Table 5.18 .....

195
Table 5.18
Vacancies by major occupation category
No. of vacancies
2001 2002Annualaverage Mar Jun Sep Dec Mar Jun Sep
Managers and administrators 600(-3.2)
800(35.1)
700(4.6)
400(-33.1)
400(-20.5)
400(-48.7)
500(-31.0)
500(23.2)
Professionals 1 800(-41.8)
2 600(-17.8)
2 300(-30.4)
1 200(-64.6)
1 000(-56.4)
1 300(-52.0)
1 100(-53.5)
900(-26.5)
Associate professionals 7 300(-37.5)
9 600(-25.0)
7 700(-40.6)
6 700(-46.9)
5 400(-37.7)
7 500(-21.8)
8 300(7.2)
6 400(-4.1)
Clerks 5 600(-10.3)
7 100(5.2)
6 700(8.2)
4 700(-26.0)
3 700(-32.4)
4 100(-42.7)
4 200(-37.9)
3 400(-26.7)
Service workers and shop sales workers
4 000(-17.8)
4 900(-1.7)
3 600(-24.0)
4 000(-30.2)
3 400(-12.0)
3 900(-20.1)
3 900(7.3)
3 800(-4.4)
Craft and related workers 700(-43.8)
900(-26.0)
700(-56.6)
700(-43.3)
500(-46.8)
600(-37.8)
600(-13.9)
400(-40.9)
Plant and machine operators and assemblers
800(-33.3)
800(-41.1)
1 100(-22.8)
700(-41.4)
600(-24.7)
900(3.0)
700(-31.9)
900(22.5)
Elementary occupations 2 800(-26.3)
3 300(-15.3)
2 900(-27.3)
2 800(-38.4)
2 100(-20.5)
2 200(-32.4)
2 700(-8.0)
2 400(-13.8)
Note : ( ) % change over a year earlier.
Source : Quarterly Survey of Employment and Vacancies, Census and Statistics Department.
/Earnings .....

196
Earnings and wages
5.21 Overall labour earnings in the private sector, as measured by payrollper person engaged, turned down to decrease in money terms in the first quarterof 2002, for the first time since the fourth quarter of 1999, and the decreasewidened in the ensuing two quarters. In the third quarter of 2002, there was afall of 1.5% in money terms over a year earlier, having declined by 0.6% and1.0% respectively in the first and the second quarters. Amongst the businessestablishments surveyed in the third quarter of 2002, 43% reported a decreasein average labour earnings over a year earlier. Another 23% reported virtuallyno change. The remaining 34% reported an increase in average labour earnings,but this was partly due to a shift in the employment composition towardshigher-skill and thus better-paid employees upon retrenchment of employees atthe lower level. Netting out an enlarged fall in consumer prices as reflected bythe Composite CPI, overall labour earnings still gained by 2.1% in real terms inthe third quarter of 2002 over a year earlier, similar to the 2.1% increase in thefirst quarter and the 2.2% increase in the second quarter. For the first threequarters of 2002 as a whole, overall labour earnings declined on average by1.0% in money terms over a year earlier, but were still up by 2.1% in real terms.In 2001, overall labour earnings were higher both in money terms and in realterms, by 1.8% and 3.5% respectively. On a seasonally adjustedquarter-to-quarter comparison, overall labour earnings edged down by 0.3% inmoney terms in the third quarter of 2002, similar to the 0.2% decrease in thefirst quarter and the 0.3% decrease in the second quarter. In real terms, theymoved up by 0.5% in the third quarter of 2002, having risen by 0.7% in the firstquarter and 0.6% in the second quarter.
5.22 Analysed by economic sector, labour earnings fell across all theconstituent sectors. Taking all the service sectors surveyed together, earningsdecreased by 1.8% in the third quarter of 2002 over a year earlier, exceedingthe 1.2% decline in the second quarter. In real terms, earnings neverthelessrose by 1.8% and 2.1% respectively in these two quarters over a year earlier.Amongst the various service sectors, earnings in restaurants and hotels had alarger decrease, by 3.0% in money terms in the third quarter of 2002 over a yearearlier, but still went higher by 0.5% in real terms. Earnings in transport,storage and communications, in community, social and personal services, andin the wholesale, retail and import/export trades were lower by around2.1 - 2.5% in money terms, yet higher by around 1.0 - 1.5% in real terms.Earnings in financing, insurance, real estate and business services went down
/by .....

197
by 1.4% in money terms, but moved up by 2.2% in real terms. As to the localmanufacturing sector, earnings declined by 1.1% in money terms in the thirdquarter of 2002 over a year earlier, larger than the 0.6% fall in the secondquarter. In real terms, there were still increases of 2.6% and 2.7% respectivelyin these two quarters.
Table 5.19
Labour earnings by major economic sector(year-on-year rate of change (%))
Payroll per person engaged
2001 2002 Averageamount in
Annual Q1 Q2 Q3 Q4 Q1-Q3 Q1 Q2 Q3 Q3 2002($)
Wholesale, retail and import/export trades
2.0(3.7)
2.7(4.8)
2.4(3.7)
1.5(2.6)
1.2(3.3)
-1.5(1.6)
-1.0(1.6)
-1.6(1.7)
-2.1(1.5)
11,500
Restaurants and hotels 0.1(1.7)
1.6(3.7)
1.4(2.7)
-0.8(0.3)
-2.2(-0.1)
-4.5(-1.5)
-4.9(-2.3)
-5.5(-2.4)
-3.0(0.5)
8,300
Transport, storage and communications
1.3(3.0)
2.7(4.8)
1.4(2.8)
1.6(2.7)
-0.5(1.5)
-1.0(2.1)
-1.9(0.7)
1.5(4.9)
-2.5(1.0)
17,400
Financing, insurance, real estate and business services
0.4(2.0)
2.5(4.6)
1.7(3.0)
-0.8(0.3)
-2.0(0.1)
-2.0(1.1)
-2.0(0.6)
-2.6(0.6)
-1.4(2.2)
17,300
Community, social and personal services
0.7(2.3)
0.8(2.8)
-0.8(0.5)
3.1(4.2)
-0.5(1.6)
-0.8(2.4)
*(2.7)
0.1(3.4)
-2.4(1.2)
20,100
Manufacturing 2.1(3.8)
3.0(5.1)
2.5(3.8)
2.2(3.3)
0.6(2.7)
-0.8(2.3)
-0.8(1.8)
-0.6(2.7)
-1.1(2.6)
11,200
All sectors surveyed in the private sector
1.8(3.5)
2.7(4.8)
2.2(3.5)
2.0(3.1)
0.4(2.5)
-1.0(2.1)
-0.6(2.1)
-1.0(2.2)
-1.5(2.1)
14,500
<0.8>{1.2}
<0.2>{0.4}
<0.1>{0.6}
<-0.7>{0.4}
<-0.2>{0.7}
<-0.3>{0.6}
<-0.3>{0.5}
Notes : Figures not in brackets represent percentage changes in money terms, while those inround brackets represent percentage changes in real terms.
< > Seasonally adjusted quarter-to-quarter % change in money terms.
{ } Seasonally adjusted quarter-to-quarter % change in real terms.
(*) Change of less than 0.05%.
Source : Labour Earnings Survey, Census and Statistics Department.
/Diagram 5.9 .....
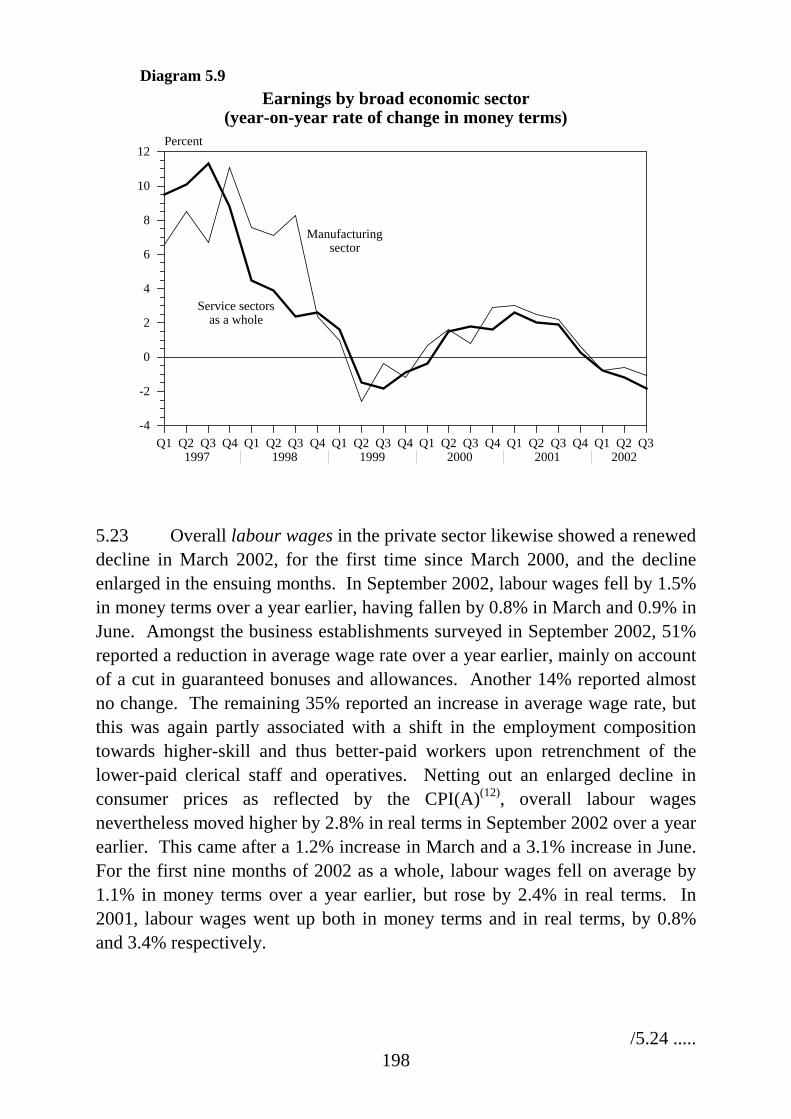
198
Earnings by broad economic sector(year-on-year rate of change in money terms)
Q1 Q2 Q3 Q4 Q1 Q2 Q3 Q4 Q1 Q2 Q3 Q4 Q1 Q2 Q3 Q4 Q1 Q2 Q3 Q4 Q1 Q2 Q31997 1998 1999 2000 2001 2002
0
2
4
6
8
10
12
-2
-4
Percent
Diagram 5.9
Service sectors as a whole
Manufacturing sector
5.23 Overall labour wages in the private sector likewise showed a reneweddecline in March 2002, for the first time since March 2000, and the declineenlarged in the ensuing months. In September 2002, labour wages fell by 1.5%in money terms over a year earlier, having fallen by 0.8% in March and 0.9% inJune. Amongst the business establishments surveyed in September 2002, 51%reported a reduction in average wage rate over a year earlier, mainly on accountof a cut in guaranteed bonuses and allowances. Another 14% reported almostno change. The remaining 35% reported an increase in average wage rate, butthis was again partly associated with a shift in the employment compositiontowards higher-skill and thus better-paid workers upon retrenchment of thelower-paid clerical staff and operatives. Netting out an enlarged decline inconsumer prices as reflected by the CPI(A)(12), overall labour wagesnevertheless moved higher by 2.8% in real terms in September 2002 over a yearearlier. This came after a 1.2% increase in March and a 3.1% increase in June.For the first nine months of 2002 as a whole, labour wages fell on average by1.1% in money terms over a year earlier, but rose by 2.4% in real terms. In2001, labour wages went up both in money terms and in real terms, by 0.8%and 3.4% respectively.
/5.24 .....

199
5.24 Analysed by economic sector, and within the service sectors surveyed,wages in personal services, in restaurants and hotels, and in the wholesale,retail and import/export trades went down by 3.0%, 2.7% and 2.0% respectivelyin money terms in September 2002 over a year earlier. These neverthelesscorresponded to increases of 1.3%, 1.6% and 2.4% in real terms. Wages intransport services and in financing, insurance, real estate and business servicesshowed nil change in money terms, but were up by 4.4% in real terms. As towages in the local manufacturing sector, there was a 1.5% decline in moneyterms in September 2002 over a year earlier, yet a 2.8% rise in real terms.
Table 5.20
Wages by selected major economic sector(year-on-year rate of change (%))
By reference to the wage index
2001 2002
Annual Mar Jun Sep Dec(a) Jan - Sep Mar Jun Sep
Wholesale, retail and import/export trades
1.4(4.1)
1.8(4.0)
1.7(2.4)
1.2(2.1)
1.1(7.8)
-0.5(2.9)
*(2.1)
0.3(4.4)
-2.0(2.4)
Restaurants and hotels 0.7(3.3)
0.8(3.0)
0.6(1.4)
0.9(1.9)
0.2(6.9)
-2.4(1.0)
-1.4(0.6)
-3.3(0.6)
-2.7(1.6)
Transport services 0.7(3.4)
0.5(2.7)
0.1(0.9)
0.3(1.3)
2.0(8.7)
0.6(4.1)
1.1(3.1)
0.8(4.9)
*(4.4)
Financing, insurance, real estate and business services
-0.9(1.7)
0.8(3.0)
-0.1(0.6)
-1.7(-0.8)
-2.5(4.0)
-1.1(2.3)
-1.7(0.3)
-1.8(2.2)
*(4.4)
Personal services 0.7(3.3)
1.4(3.5)
1.0(1.7)
1.4(2.3)
-0.9(5.7)
-2.0(1.5)
-0.9(1.1)
-2.0(2.0)
-3.0(1.3)
Manufacturing 2.2(4.8)
3.0(5.2)
1.6(2.4)
2.7(3.6)
1.4(8.1)
-1.5(2.0)
-2.1(-0.2)
-0.7(3.4)
-1.5(2.8)
All selected sectors surveyed in the private sector
0.8(3.4)
1.4(3.6)
0.9(1.7)
0.7(1.6)
0.2(6.9)
-1.1(2.4)
-0.8(1.2)
-0.9(3.1)
-1.5(2.8)
Notes : Figures not in brackets represent percentage changes in money terms, while those inbrackets represent percentage changes in real terms.
(a) The large difference between the nominal and the real changes in wages inDecember 2001 over a year earlier was caused by an abrupt fall in the CPI(A) inDecember 2001, owing to a waiver of public housing rentals in that month. TheCPI(A) instead of the Composite CPI is taken as the price deflator here, on accountof its closer relevance to the occupation coverage of the wage series.
(*) Change of less than 0.05%.
Source : Labour Earnings Survey, Census and Statistics Department.
/5.25 .....

200
5.25 Analysed by occupation category, wages for service workers, clericaland secretarial workers, and miscellaneous non-production workers all camedown, by 3.4%, 1.8% and 1.8% respectively in money terms in September 2002over a year earlier, although they still went up by 0.9%, 2.5% and 2.6% in realterms. Wages for craftsmen, operatives, and supervisory and technical workersfell relatively less, by 1.5%, 1.3% and 0.7% respectively in money terms, andthus had larger increases by 2.9%, 3.0% and 3.7% respectively in real terms.
Table 5.21Wages by selected major occupation category
(year-on-year rate of change (%))
By reference to the wage index
2001 2002
Annual Mar Jun Sep Dec(a) Jan - Sep Mar Jun Sep
Supervisory and technical workers
0.9(3.5)
1.8(4.0)
1.1(1.8)
0.4(1.3)
0.1(6.8)
-0.2(3.2)
-0.2(1.8)
0.1(4.2)
-0.7(3.7)
Clerical and secretarial workers
1.8(4.4)
2.0(4.1)
1.7(2.4)
2.0(3.0)
1.4(8.2)
-0.9(2.5)
-0.2(1.8)
-0.8(3.2)
-1.8(2.5)
Craftsmen 1.0(3.6)
0.8(3.0)
1.5(2.2)
0.9(1.8)
0.9(7.6)
-1.2(2.2)
-0.6(1.4)
-1.6(2.4)
-1.5(2.9)
Operatives 2.6(5.2)
4.3(6.5)
0.6(1.3)
3.1(4.0)
2.3(9.1)
-0.7(2.7)
-1.0(1.0)
0.1(4.2)
-1.3(3.0)
Service workers -1.8(0.8)
-0.9(1.2)
-1.2(-0.5)
-1.4(-0.5)
-3.5(2.9)
-3.3(*)
-3.0(-1.0)
-3.6(0.3)
-3.4(0.9)
Miscellaneous non-production workers
1.2(3.9)
1.3(3.5)
1.6(2.3)
0.6(1.5)
1.5(8.2)
-1.3(2.1)
-0.9(1.1)
-1.4(2.6)
-1.8(2.6)
Notes : Figures not in brackets represent percentage changes in money terms, while those inbrackets represent percentage changes in real terms.
Also see Note (a) to Table 5.20.
(*) Change of less than 0.05%.
Source : Labour Earnings Survey, Census and Statistics Department.
/Diagram 5.10 .....

201
Earnings, wages and the unemployment rate
Q1 Q2 Q3 Q4 Q1 Q2 Q3 Q4 Q1 Q2 Q3 Q4 Q1 Q2 Q3 Q4 Q1 Q2 Q3 Q4 Q1 Q2 Q3 Q41997 1998 1999 2000 2001 2002
0
2
4
6
8
10
12
14
16
-2
-4
Percent
Diagram 5.10
Seasonally adjusted unemployment rate
Earnings for all major sectors surveyed*
Wages for all selectedmajor sectors surveyed*
Note : (*) Depicted as year-on-year rates of change in money terms.
5.26 Overall wage rates in the construction sector eased back by 0.4% inmoney terms in the third quarter of 2002 over a year earlier, following a 0.2%fall in the first quarter and a 1.6% rise in the second quarter. Netting out thedecline in consumer prices as reflected by the CPI(A), these wages went up by3.8% in real terms in the third quarter of 2002 over a year earlier, afterincreases of 2.6% and 5.3% respectively in the first and the second quarters.Taking the first three quarters of 2002 together, construction wages were higherby 0.3% in money terms or 3.9% in real terms over a year earlier. In 2001, thecorresponding changes were -0.1% and 1.6%.
5.27 Amongst the various job categories, wages for painters, fitters,plumbers, truck drivers and plasterers decreased by 1.3 - 4.5% in money termsin the third quarter of 2002 over a year earlier. On the other hand, wages forelectricians (wiremen) and plant operators edged up by 0.3% and 0.2%respectively in money terms, while wages for carpenters and joiners,steelbenders, and concretors/bricklayers/drainlayers had larger increases, by1.1 - 5.6% in money terms.
/Table 5.22 .....

202
Table 5.22
Construction wage rates by selected job category(year-on-year rate of change (%))
2001 2002
Annual Q1 Q2 Q3 Q4 Q1-Q3 Q1 Q2 Q3
Concretors/bricklayers/ drainlayers
-1.1 3.3 -2.7 -2.0 -2.7 1.3 -0.2 3.0 1.1
Steelbenders -1.6 0.6 -2.1 -2.8 -2.1 2.5 1.0 3.1 3.4
Carpenters and joiners -4.3 -0.7 -6.8 -5.3 -4.2 3.0 -1.5 5.2 5.6
Plumbers 5.3 11.1 9.2 4.5 -2.8 -2.7 -3.8 -2.1 -2.3
Fitters 2.8 1.4 4.0 2.3 3.2 -0.2 2.6 -0.7 -2.4
Plasterers 3.7 10.8 9.2 1.1 -5.2 -2.3 -3.6 -1.9 -1.3
Painters 4.9 3.8 7.2 6.0 2.8 -3.4 -2.1 -3.6 -4.5
Electricians (wiremen) 0.8 -1.3 -0.4 2.9 1.8 2.1 3.3 2.7 0.3
Plant operators 2.3 2.6 2.2 2.0 2.5 2.1 3.3 2.8 0.2
Truck drivers 2.1 1.9 0.4 2.6 3.5 0.6 2.5 1.3 -1.9
All job categories in the construction sector(a)
-0.1(1.6)
1.5(3.6)
-0.7(0.4)
*(0.7)
-1.0(1.9)
0.3(3.9)
-0.2(2.6)
1.6(5.3)
-0.4(3.8)
Notes : Figures not in brackets represent percentage changes in money terms, while those inbrackets represent percentage changes in real terms.
(a) Apart from the above selected job categories, this also covers such other jobcategories as masons, blacksmiths, terrazzo and granolithic workers, glaziers, heavyload coolies, pneumatic drillers, bamboo workers and scaffolders, structural steelerectors, divers, and diver’s linesmen. Yet as the employment involved in such jobcategories is much smaller, their respective wages are of lesser significance and aretherefore not separately shown in this table.
(*) Change of less than 0.05%.
Source : Census and Statistics Department.
/5.28 .....

203
5.28 Following enactment of the Public Officers Pay AdjustmentOrdinance on 19 July 2002, Civil Service pay at the directorate level and theupper salary band was adjusted downward by 4.42%, and those at the middleand the lower salary bands by 1.64% and 1.58% respectively, as from1 October 2002. When deciding on this pay reduction, the Government hadtaken into consideration all relevant factors under the existing Civil Service payadjustment mechanism, including the results of the 2001/02 Pay TrendSurvey(13), change in cost of living, the state of the economy, the Government’sbudgetary consideration, staff sides’ pay claims and Civil Service morale. Aswith the previous pay adjustments, salary increments on the pay scales werenetted out.
5.29 On 25 February 2003, the Government announced that the dollarvalue of all Civil Service pay points below D3 or equivalent should be restoredto the levels as at 30 June 1997 in cash terms by two adjustments of broadlyequal amount to be implemented on 1 January 2004 and 1 January 2005respectively, while the dollar value of all Civil Service pay points at D3 andabove or equivalent should be restored to the levels as at 30 June 1997 in cashterms from 1 January 2004. The Government will introduce draft legislationinto the Legislative Council as soon as possible to implement the pay reductiondecision.
5.30 The Government has also decided to develop in consultation withstaff an improved Civil Service pay adjustment mechanism on the basis of theexisting mechanism. It will comprise the conduct of periodic pay level surveysto compare Civil Service pay levels with those in the private sector, the conductof annual pay trend surveys based on an improved methodology, and aneffective means for implementing both upward and downward adjustments.The aim is to complete the exercise, including the conduct of a pay level survey,within 2004.
/Notes .....

204
Notes :
(1) On 17 September 2001, the Census and Statistics Department released a revised seriesof labour force statistics backdated to the second quarter of 1996, which are based onthe “resident population” definition, with the results of the 2001 Population Censusincorporated. While the resultant revisions to the total labour force, total employment,total numbers unemployed and total numbers underemployed are very small inmagnitude, the revisions to their respective rates of change are relatively larger. For theunemployment and underemployment rates, which are ratios of these primary labourforce statistics, the revisions are generally marginal.
(2) For a person aged 15 or above to be classified as unemployed, he or she should: (a) nothave a job and not be performing any work for pay or profit during the reference period(i.e. seven days before enumeration); and (b) be available for work during the referenceperiod; and (c) be seeking work during the 30 days before enumeration.
Notwithstanding the above, the following types of persons are also considered asunemployed: (a) persons without a job, having sought work but not available for workbecause of temporary sickness; (b) persons without a job, available for work but nothaving sought work because they will take up new jobs or start business at a subsequentdate, or expect to return to their original jobs; and (c) discouraged workers not havingsought work because they believe work is not available to them.
Even at full employment, some frictional unemployment is bound to exist as workersmove between jobs in order to obtain better terms of employment. The precise level ofunemployment which can be described as purely frictional varies amongst economies,depending on the structure and characteristics of their labour markets.
In April 2001, the Census and Statistics Department put out a revised series ofseasonally adjusted unemployment rate compiled by reference to the X-11 ARIMAmethod, which adjusts for all seasonal variations in employment and unemployment(i.e. the changes due to holiday effects, seasonally ups and downs in economic activity,seasonal variations in first-time job-seekers, etc). This replaces the former serieswhich adjusts only for seasonal variations in the proportion of first-time job-seekers inthe labour force. For more details, see Note (3) at the end of Chapter 5 of theHalf-yearly Economic Report 2001.
(3) The main criteria for an employed person aged 15 or above to be classified asunderemployed are: involuntarily working less than 35 hours during the referenceperiod (i.e. seven days before enumeration), and either available for additional workduring the reference period or seeking additional work during the 30 days beforeenumeration.
(4) The employed population refers to those persons aged 15 or above who performed workfor pay or profit or had a formal job attachment during the reference period (i.e. sevendays before enumeration).
(5) The labour force, or the economically active population, is defined to include allpersons aged 15 or above who either were engaged in productive work during thereference period (i.e. seven days before enumeration) or would otherwise have beenengaged in productive work but were unemployed.
/(6) .....

205
(6) In addition to wages, which include all regular payments like basic pay and stipulatedbonuses and allowances, earnings also cover overtime pay and other non-guaranteed orirregular bonuses and allowances, except severance pay and long service payment.Because of this difference, as well as the difference in sectoral and occupationalcoverage, the movements in average earnings, as measured by payroll per personengaged, do not necessarily match closely with those in wage rates.
(7) The wage data as collected have a more limited coverage than the correspondingearnings data. More specifically, the coverage of the service sectors in the wage data isfar from complete, and the coverage of occupation categories in the wage data is onlyup to the supervisory and technical level.
(8) The labour force participation rate is defined as the proportion of economically activepopulation (i.e. those working or unemployed) in the population aged 15 or above.
(9) The service sectors cover the wholesale, retail and import/export trades, restaurants andhotels; transport, storage and communications; financing, insurance, real estate andbusiness services; and community, social and personal services.
(10) Employment for the construction sector as a whole is enumerated from the GeneralHousehold Survey carried out by the Census and Statistics Department. Apart from siteworkers, it also includes non-site workers engaged in minor alteration and addition,repair, maintenance and interior decoration work on existing buildings. In addition, itincludes professional, administrative and other support personnel engaged in thatsector, such as engineers, architects, surveyors and contract managers, as well asgeneral clerical staff.
(11) In his 2002/03 Budget, the Financial Secretary announced that the Government wouldstringently contain the growth of the Civil Service in all ranks, and should be able toattain the target of reducing the Civil Service establishment to around 181 000 byMarch 2003. Also, it would review the demand for services and its priorities fordeployment of resources, and strive to meet additional service needs with the resourcesreleased through streamlining procedures, simplifying structures and economising onmanpower.
(12) Different consumer price indices are used for compiling the real indices of labourearnings and wages, taking into account their relevance to the respective occupationcoverage. Specifically, the Composite CPI, being an indicator of overall consumerprices, is taken as the price deflator for labour earnings received by employees at alllevels of the occupational hierarchy. The CPI(A), being an indicator of consumer pricesfor the middle to lower income groups, is taken as the price deflator for labour wages inrespect of workers on occupations up to the supervisory level, and also in respect ofmanual workers engaged in the construction sector.
(13) The results of the 2001/02 Pay Trend Survey covering some 91 private sector firms, asconducted for the period 2 April 2001 to 1 April 2002, were released in May 2002.These results indicated that salaries for the upper, middle and lower pay bands fell by3.39%, 0.60% and 0.79% respectively in money terms over that period.

206
CHAPTER 6 : PRICES
Consumer prices
6.1 Overall consumer prices continued to decline in 2002. By December,overall consumer prices had fallen for 50 consecutive months. Though withsome relative narrowing towards the year-end, the decrease for 2002 as a wholewidened considerably from that in 2001. This reflected mostly the influence ofdomestic factors. In particular, there were the special relief measures of ratesconcession and waiver of water and sewage charges implemented by theGovernment during the year. Domestic cost pressure was lessened, bysoftening in both labour wages and property rentals. Also, local retailersreduced the prices of their goods and services further, in face of sluggishconsumer demand and keen competition in the retail market. On the externalfront, while import prices stayed soft in overall terms, the decline moderatedover the past year, upon a weaker US dollar and a rebound in world commodityprices.
6.2 For 2002 as a whole, the Composite Consumer Price Index(1) wentdown by 3.0%, nearly double the 1.6% fall in 2001. There was an enlargementin the year-on-year decrease for most of the year, from 2.6% in the first quarterof 2002 to 3.2% in the second quarter and further to 3.5% in the third quarter.To a large extent, this was due to the two rounds of rates concession(2) as well asthe waiver of water and sewage charges(3) granted as from the early part of 2002.(Netting out the effect of these special relief measures, the decline widened onlymodestly over the period.) Also relevant were further reductions in the pricesof basic foodstuffs and in the charges of such service items as mobile phone andother telecommunications services. The year-on-year decrease then narrowedto 2.9% in the fourth quarter of 2002. Yet this was mostly attributable to a lowbase of comparison a year earlier, caused by a waiver of public housing rentalsby the Housing Authority and Housing Society in December 2001(4).
/6.3 .....

207
6.3 Analysed by sub-index, the CPI(A), CPI(B) and CPI(C) all camedown, by 3.2%, 3.1% and 2.8% respectively for 2002 as a whole, larger than thedecreases of 1.7%, 1.6% and 1.5% in 2001. For the CPI(A) and CPI(B), therespective year-on-year declines likewise accentuated, from 2.8% and 2.7% inthe first quarter of 2002 to 3.6% and 3.1% in the second quarter and further to4.1% and 3.4% in the third quarter, before moderating to 2.4% and 3.2% in thefourth quarter. As to the CPI(C), the year-on-year decrease, having enlargedfrom 2.5% in the first quarter of 2002 to 2.9% and 2.8% respectively in thesecond and third quarters, showed a further widening to 3.0% in the fourthquarter. This was due to the fact that the CPI(C) was unaffected by the waiverof public housing rentals in December 2001.
Q1 Q2 Q3 Q4 Q1 Q2 Q3 Q4 Q1 Q2 Q3 Q4 Q1 Q2 Q3 Q4 Q1 Q2 Q3 Q4 Q1 Q2 Q3 Q41997 1998 1999 2000 2001 2002
0
2
4
6
8
-2
-4
-6
-8
Percent
Consumer Price Indices(year-on-year rate of change)
Diagram 6.1
Consumer Price Index (A)
Composite ConsumerPrice Index
Consumer Price Index (B) Consumer Price Index (C)
Note : From the fourth quarter of 2000 onwards, the year-on-yearchanges in the Consumer Price Indices are computed from thenew 1999/2000-based CPI series. Before then, the year-on-yearchanges are computed from the old 1994/95-based CPI series.Splicing has been applied to the indices to maintain continuity.
/Table 6.1 .....

208
Table 6.1Consumer Price Indices
(year-on-year rate of change (%))Composite CPI CPI(A) CPI(B) CPI(C)
2001 Annual -1.6 -1.7 -1.6 -1.5H1 -1.7 -1.6 -1.7 -1.6H2 -1.5 -1.8 -1.5 -1.4Q1 -2.0 -2.0 -2.1 -1.8Q2 -1.3 -1.1 -1.4 -1.4Q3 -1.0 -0.7 -1.2 -1.3Q4 -2.1 -2.8 -1.9 -1.5
2002 Annual -3.0 -3.2 -3.1 -2.8H1 -2.9 -3.2 -2.9 -2.7H2 -3.2 -3.3 -3.3 -2.9Q1* -2.6 -2.8 -2.7 -2.5Q2# -3.2 -3.6 -3.1 -2.9Q3 -3.5 -4.1 -3.4 -2.8Q4 -2.9 -2.4 -3.2 -3.0Jan -3.5 -3.9 -3.4 -3.2Feb+ -2.3 -2.4 -2.3 -2.0Mar -2.2 -2.0 -2.3 -2.5Apr -3.1 -3.3 -3.0 -2.9May -3.1 -3.5 -3.0 -2.9Jun -3.3 -3.9 -3.2 -2.8Jul -3.4 -4.1 -3.3 -2.7Aug -3.3 -3.7 -3.2 -2.8Sep -3.7 -4.2 -3.7 -3.0Oct -3.6 -4.0 -3.5 -3.2Nov -3.6 -4.1 -3.6 -3.1Dec^ -1.5 1.0 -2.6 -2.8
Notes : (*) The enlarged year-on-year decline observed for most of the CPIs in the firstquarter of 2002 was primarily due to the rates concession granted by theGovernment as from January 2002. This measure had the effect of lowering theComposite CPI by 0.9 of a percentage point in that quarter. The correspondingdampening effects were 1.2 percentage points for the CPI(A), 1.0 percentagepoint for the CPI(B), and 0.7 of a percentage point for the CPI(C).
(#) The further widening in year-on-year decline in the CPIs in the second quarterof 2002 was due in part to the waiver of water and sewage charges as well as theadditional rates concession granted by the Government as from April 2002.These measures had the effect of lowering the Composite CPI, CPI(A), CPI(B)and CPI(C) by 0.4, 0.5, 0.4 and 0.5 of a percentage point respectively.
(+) The narrower year-on-year decline in the CPIs in February than in January 2002was attributable in part to the difference in timing of the Lunar New YearFestival, which occurred in February last year but in January in the year before it.As consumer prices tended to be boosted in the sales period near the Festivaland eased shortly afterwards, this difference in timing had led to a largeryear-on-year decline in consumer prices in January 2002, but a smalleryear-on-year decline in February 2002.
(^) The distinctly narrowed year-on-year decline in the Composite CPI and CPI(B),as well as a renewed increase in the CPI(A), in December 2002 was mainly dueto the low base of comparison in December 2001, when a waiver of publichousing rentals was granted by the Housing Authority and Housing Society inthat month. The CPI(C) was unaffected by such a measure, public housingcost being irrelevant to this sub-index.
/Diagram 6.2 .....

209
Diagram 6.2Composite Consumer Price Index vis-à-vis labour wages,
residential flat rentals, and prices of retained imports(year-on-year rate of change)
Q1 Q2 Q3 Q4 Q1 Q2 Q3 Q4 Q1 Q2 Q3 Q4 Q1 Q2 Q3 Q4 Q1 Q2 Q3 Q4 Q1 Q2 Q3 Q41997 1998 1999 2000 2001 2002
0
2
4
6
8
-2
-4
-6
-8
Percent
Nominal wage index
(a) Compared with labour wages
Composite Consumer Price Index
Q1 Q2 Q3 Q4 Q1 Q2 Q3 Q4 Q1 Q2 Q3 Q4 Q1 Q2 Q3 Q4 Q1 Q2 Q3 Q4 Q1 Q2 Q3 Q41997 1998 1999 2000 2001 2002
0
5
10
15
20
-5
-10
-15
-20
-25
-30
Percent
Residential flatrental index
(b) Compared with residential flat rentals
Composite Consumer Price Index
Private housing cost in the Composite CPI
/Diagram 6.2 (cont’d) .....

210
Diagram 6.2 (cont’d)
Q1 Q2 Q3 Q4 Q1 Q2 Q3 Q4 Q1 Q2 Q3 Q4 Q1 Q2 Q3 Q4 Q1 Q2 Q3 Q4 Q1 Q2 Q3 Q41997 1998 1999 2000 2001 2002
0
4
8
12
-4
-8
-12
Percent
Prices of all retained imports
(c) Compared with prices of retained imports
Composite ConsumerPrice Index
Prices of retained imports of foodstuffs and consumer goods
Note : See the footnote to Diagram 6.1.
6.4 On a quarter-to-quarter comparison, the seasonally adjustedComposite CPI went down by 1.1% in the first quarter of 2002, followed bymore modest declines of 0.6-0.7% in the ensuing three quarters. The larger dropin the first quarter mainly reflected the dampening effects of the ratesconcession effected in January as well as the special one-off rebate of electricitycharges granted by a power company in January and February(5). Theseasonally adjusted CPI(B) and CPI(C) showed a similar movement, with largerfalls of 1.4% and 1.3% respectively in the first quarter of 2002, and then smallerdecreases of 0.5-0.7% in the remaining three quarters. Yet for the seasonallyadjusted CPI(A), the decline in the first quarter of 2002 was smaller, at 0.6%.This was due to a lower base for this sub-index in the preceding quarter, onaccount of the waiver of public housing rentals in December 2001. Thedeclines in the subsequent three quarters, at 0.6-0.7%, were roughly similar tothat in the first quarter.
/Table 6.2 .....

211
Table 6.2
Seasonally adjusted Consumer Price Indices(quarter-to-quarter rate of change (%))
Composite CPI CPI(A) CPI(B) CPI(C)
2001 Q1 -0.6 -0.8 -0.6 -0.5Q2 * 0.3 -0.1 -0.2Q3 -0.4 -0.2 -0.4 -0.5Q4# -1.1 -2.2 -0.8 -0.4
2002 Q1+ -1.1 -0.6 -1.4 -1.3Q2@ -0.6 -0.6 -0.6 -0.7Q3 -0.7 -0.7 -0.7 -0.5Q4 -0.6 -0.6 -0.6 -0.6
Notes : (#) The enlarged quarter-to-quarter decline in the seasonally adjusted CompositeCPI, CPI(A) and CPI(B) in the fourth quarter of 2001 was mainly due to thewaiver of public housing rentals in December 2001. This had the effect oflowering the seasonally adjusted Composite CPI, CPI(A) and CPI(B) by 0.7of a percentage point, 1.7 percentage points, and 0.3 of a percentage pointrespectively in the fourth quarter of 2001. Yet the seasonally adjusted CPI(C)was unaffected by such a measure.
(+) The further quarter-to-quarter decline in the seasonally adjusted CPIs in thefirst quarter of 2002, notwithstanding dissipation of the effect of waiver ofpublic housing rentals, was mainly due to the rates concession for 2002 aswell as the one-off rebate of electricity charges granted by a power companyin January and February 2002. The former factor had the effect of loweringthe seasonally adjusted Composite CPI, CPI(A), CPI(B) and CPI(C) by 0.9 ofa percentage point, 1.2 percentage points, 0.9 of a percentage point and 0.7 ofa percentage point respectively in the first quarter of 2002. For the latter factor,the corresponding dampening effects were 0.3, 0.5, 0.2 and 0.1 of apercentage point in the same quarter.
(@) The quarter-to-quarter decline in the seasonally adjusted CPIs mostlynarrowed in the second quarter of 2002. There was little additionaldampening effect from the rates concession in the second quarter, given thatthe base of comparison in the first quarter was already lowered by thatmeasure. Also, the effect of the one-off rebate of electricity charges grantedby a power company in the first two months of 2002 had dissipated. Theseoutweighed the new dampening effect from the waiver of water and sewagecharges for one year as from April 2002.
(*) Change of less than 0.05%.
/Diagram 6.3 .....

212
Q1 Q2 Q3 Q4 Q1 Q2 Q3 Q4 Q1 Q2 Q3 Q4 Q1 Q2 Q3 Q4 Q1 Q2 Q3 Q4 Q1 Q2 Q3 Q41997 1998 1999 2000 2001 2002
0
1
2
3
-1
-2
-3
Percent
Seasonally adjusted Consumer Price Indices(quarter-to-quarter rate of change)
Diagram 6.3
Consumer Price Index (A)
Composite Consumer Price Index
Consumer Price Index (B)
Consumer Price Index (C)
Note : From the first quarter of 2000 onwards, the quarter-to-quarterchanges in the seasonally adjusted Consumer Price Indices arecomputed from the new 1999/2000-based CPI series. Beforethen, the quarter-to-quarter changes are computed from the old1994/95-based CPI series. Splicing has been applied to theindices to maintain continuity.
/6.5 .....

213
6.5 Analysed by major commodity group in the Composite CPI, chargesfor electricity, gas and water went down by 7.0% in 2002, distinctly larger thanthe 1.9% decline in 2001. This was mainly due to the waiver of water andsewage charges effected as from April 2002. Private housing cost also fellmore in 2002 than in 2001, by 6.5% as against 2.9%. The continued easing inprivate residential rentals was a major contributory factor(6), besides the ratesconcession. Public housing cost was reduced by 2.7% in 2002, on account ofthe rates concession. Yet this was smaller than the 8.3% drop in 2001, causedby the waiver of public housing rentals in December 2001. The prices ofdurable goods, having eased by 7.1% in 2001, slid further by 6.3% in 2002, dueto lower prices of computers and telecommunications equipment. The pricesof basic foodstuffs had an enlarged decrease, from 1.7% in 2001 to 3.1% in2002, along with further cut in the prices of fresh foodstuffs especially those ofvegetables, meat and poultry imported from the Mainland. Charges for mealsat restaurants also had an enlarged decline, from 0.3% in 2001 to 1.5% in 2002,owing to the lower food cost, coupled with keen competition in this trade. Asto the prices of miscellaneous services, there was a dip of 2.3% in 2002,reversing the 0.5% rise in 2001. Lower charges for mobile phone services andpackage tours largely contributed. The cost of transport likewise turned into adecrease, by 0.6% in 2002, from an increase of 0.4% in 2001, due to fareconcessions offered by some public transport operators. By contrast, theprices of clothing and footwear reverted to a 0.7% rise in 2002, from a 4.6% fallin 2001, along with some firming up in the prices of outerclothing. The pricesof alcoholic drinks and tobacco went on an uptrend, rising by 3.3% in 2001 andfurther by 2.4% in 2002, on account of higher prices of certain beer andcigarettes as well as increased duty rate for wine as from March 2002(7). Sodid the prices of miscellaneous goods, ascending by 1.3% in 2001 and 1.7% in2002, upon upward adjustments in the prices of jewellery and textbooks.
/6.6 .....

214
6.6 On a year-on-year comparison, the major commodity groups in theComposite CPI showed different patterns of movement during the course of2002. On charges for electricity, gas and water and private housing cost, theyhad larger decreases in the second half of 2002 than in the first half, by 7.8%and 7.1% as against 6.1% and 5.9%. The prices of basic foodstuffs, the pricesof miscellaneous services, the charges for meals at restaurants, and the cost oftransport likewise had accentuated falls, from 2.9%, 1.7%, 1.1% and 0.5%respectively in the first half of 2002 to 3.3%, 2.9%, 1.8% and 0.8% in thesecond half. On the other hand, the decline in the prices of durable goodsnarrowed, from 6.7% to 5.8%. Public housing cost even went up, by 6.7% inthe second half of 2002, reversing the 10.5% drop in the first half. But thiswas primarily due to a low base in the latter part of 2001. The prices ofmiscellaneous goods had an accelerated rise, from 1.4% in the first half of 2002to 2.0% in the second half. Yet the prices of alcoholic drinks and tobacco andof clothing and footwear had moderated increases, from 3.2% and 1.4%respectively to 1.6% and 0.1% between the two periods.
/Table 6.3 .....

215
Table 6.3Consumer Price Indices by component
(year-on-year rate of change (%))(a) In 2001 and 2002
Composite CPI CPI(A) CPI(B) CPI(C)Expenditurecomponent 2001 2002 2001 2002 2001 2002 2001 2002
Food -0.8 -2.1 -1.0 -2.2 -1.0 -2.1 -0.2 -1.7Meals bought
away from home-0.3 -1.5 -0.5 -1.7 -0.6 -1.9 0.8 -0.3
Other foodstuffs -1.7 -3.1 -1.8 -2.9 -1.6 -2.6 -1.9 -4.0Housing# -3.1 -5.7 -3.6 -5.7 -2.8 -5.9 -2.8 -5.5
Private dwellings -2.9 -6.5 -2.9 -6.8 -2.9 -6.6 -3.1 -6.0Public dwellings -8.3 -2.7 -8.2 -2.7 -8.3 -2.7 -- --
Electricity, gas and water -1.9 -7.0 -2.7 -8.2 -1.7 -6.7 -0.7 -5.1Alcoholic drinks and
tobacco3.3 2.4 3.6 2.4 3.4 2.4 1.6 2.2
Clothing and footwear -4.6 0.7 -4.3 2.6 -4.3 2.0 -5.2 -2.8Durable goods -7.1 -6.3 -6.9 -6.0 -7.7 -6.5 -6.5 -6.2Miscellaneous goods 1.3 1.7 2.7 1.0 1.2 1.4 0.1 2.8Transport 0.4 -0.6 0.5 -0.6 0.3 -0.5 0.3 -0.9Miscellaneous services 0.5 -2.3 0.6 -3.3 0.4 -2.3 0.2 -1.4All items -1.6 -3.0 -1.7 -3.2 -1.6 -3.1 -1.5 -2.8
(b) In the first and second halves of 2002
Composite CPI CPI(A) CPI(B) CPI(C)Expenditurecomponent 2002 H1 2002 H2 2002 H1 2002 H2 2002 H1 2002 H2 2002 H1 2002 H2
Food -1.8 -2.3 -1.9 -2.6 -1.8 -2.5 -1.8 -1.6Meals bought
away from home-1.1 -1.8 -1.3 -2.0 -1.5 -2.2 -0.2 -0.4
Other foodstuffs -2.9 -3.3 -2.5 -3.3 -2.4 -2.9 -4.4 -3.7Housing# -5.8 -5.6 -6.6 -4.7 -5.7 -6.1 -5.1 -5.9
Private dwellings -5.9 -7.1 -6.1 -7.5 -6.0 -7.1 -5.5 -6.4Public dwellings -10.5 6.7 -10.5 6.7 -10.5 6.7 -- --
Electricity, gas and water -6.1 -7.8 -7.2 -9.1 -5.8 -7.5 -4.4 -5.8Alcoholic drinks and
tobacco3.2 1.6 3.4 1.4 3.3 1.6 2.2 2.3
Clothing andfootwear
1.4 0.1 3.9 1.4 2.9 1.1 -3.2 -2.5
Durable goods -6.7 -5.8 -6.3 -5.7 -7.2 -5.9 -6.6 -5.8Miscellaneous goods 1.4 2.0 1.1 1.0 1.1 1.7 2.0 3.6Transport -0.5 -0.8 -0.4 -0.7 -0.4 -0.6 -0.7 -1.1Miscellaneous services -1.7 -2.9 -2.5 -4.1 -1.7 -2.9 -1.0 -1.7All items -2.9 -3.2 -3.2 -3.3 -2.9 -3.3 -2.7 -2.9
Notes : (#) The housing component covers rents, rates, Government rent, maintenance costs and otherhousing charges. Its sub-components on private and public dwellings as presented here, however,cover rents, rates and Government rent only.
(--) Not applicable.
/Diagram 6.4 .....

216
Diagram 6.4
Composite Consumer Price Index by component(year-on-year rate of change)
Food Meals Other Housing Private Public Electricity, Alcoholic Clothing Durable Misc. Transport Misc.
0
2
4
6
-2
-4
-6
-8
-10
Percent
2001 abc 2002 abc
gas anddwellingsdwellingsout foodstuffs drinks and
tobacco
goodsgoods servicesandfootwearwaterFood Housing
(a) 2001 and 2002
Food Meals Other Housing Private Public Electricity, Alcoholic Clothing Durable Misc. Transport Misc.
0
2
4
6
8
10
-2
-4
-6
-8
-10
-12
-14
Percent
First half of 2002 Second half of 2002
gas anddwellingsdwellingsout foodstuffs drinks and
tobacco
goodsgoods servicesandfootwearwaterFood Housing
(b) In the first and second halves of 2002
/Diagram 6.5 .....

217
Diagram 6.5
Consumer Price Index (A) by component(year-on-year rate of change)
Food Meals Other Housing Private Public Electricity, Alcoholic Clothing Durable Misc. Transport Misc.
0
2
4
6
-2
-4
-6
-8
-10
Percent
2001 abc 2002 abc
gas anddwellingsdwellingsout foodstuffs drinks and
tobacco
goodsgoods servicesandfootwearwaterFood Housing
(a) 2001 and 2002
Food Meals Other Housing Private Public Electricity, Alcoholic Clothing Durable Misc. Transport Misc.
0
2
4
6
8
10
-2
-4
-6
-8
-10
-12
-14
Percent
First half of 2002 Second half of 2002
gas anddwellingsdwellingsout foodstuffs drinks and
tobacco
goodsgoods servicesandfootwearwaterFood Housing
(b) In the first and second halves of 2002
/Import .....

218
Import prices
6.7 The prices of imports of goods remained soft in overall terms. Asmeasured by the unit value index of imports of goods(8), the prices of imports ofgoods went down slightly more by 3.9% in 2002, after a 3.1% decline in 2001.Yet there was a progressive narrowing in year-on-year decrease in the prices ofimports of goods during 2002, from 4.9% in the first quarter, 4.6% in the secondquarter, 3.6% in the third quarter, to 2.3% in the fourth quarter. This was moreso in the second half of the year, upon a weakening in the US dollar and adistinct rebound in world commodity prices. For crude oil price in particular, theprice of North Sea Brent soared to an almost two-year high of around US$30per barrel by the end of 2002, amidst worries about possible outbreak of war onIraq and also in face of some reduction in oil supply caused by political tensionin Venezuela.
6.8 Analysed by major source, the fall in import prices occurred virtuallyacross-the-board. The prices of goods imported from the United States dippedby 5.0% in 2002, considerably enlarged from the 2.2% fall in 2001. This wasin line with the easing in US export prices, amidst excess productive capacity inthe country and intensified competition in the global market. The prices ofgoods imported from the Mainland also showed a larger decline, by 3.3% in2002, after a 1.6% decrease in 2001. This was mainly due to enlarged falls inthe import prices of consumer goods and capital equipment from this source.The prices of goods imported from Japan and Taiwan fell by 3.7% and 3.5%respectively in 2002, yet these were smaller than the decreases of 4.1% and6.0% in 2001. Moderation in year-on-year declines in the import prices forthese two sources was more apparent in the second half of 2002 than in the firsthalf, upon a strengthening in the Japanese yen and the New Taiwan dollar. Forthe other major sources, the year-on-year declines in import prices likewisemoderated between the two periods.
/Table 6.4 .....

219
Table 6.4World commodity prices
(year-on-year rate of change (%))
Of which :
FuelsAll non-fuelcommodities
Food andbeverages
Agriculturalraw materials Metals
2001 Annual -14.0 -5.4 -0.1 -6.9 -9.6H1 -1.3 -4.7 -2.3 -6.2 -4.3H2 -25.4 -6.1 2.1 -7.7 -14.9Q1 -2.4 -4.4 -1.6 -6.1 -5.0Q2 -0.3 -4.8 -3.1 -6.3 -3.6Q3 -15.9 -4.5 5.8 -6.1 -14.8Q4 -35.0 -7.8 -1.4 -9.3 -14.9
2002 Annual 2.7 3.9 10.0 2.5 -4.3H1 -12.5 -3.9 2.9 -7.7 -9.1H2 20.9 12.2 17.1 13.7 1.3Q1 -19.6 -5.9 0.4 -9.0 -11.2Q2 -5.6 -2.0 5.6 -6.4 -7.0Q3 7.7 8.1 13.6 8.3 -1.7Q4 37.9 16.4 20.8 19.4 4.3
Source : IMF International Financial Statistics.
Spot price of crude oil*
M J S D M J S D M J S D M J S D M J S D M J S D1997 1998 1999 2000 2001 2002
0
5
10
15
20
25
30
35
40US$ per barrel
Diagram 6.6
West Texas Intermediate
North Sea Brent
Note : (*) Month-end figures./Table 6.5 .....

220
Table 6.5
Unit value indices of imports of goods by major source(year-on-year rate of change (%))
Mainlandof China Japan Taiwan United States All sources
2001 Annual -1.6 -4.1 -6.0 -2.2 -3.1H1 -1.1 -2.3 -4.5 -0.8 -2.1H2 -2.1 -5.9 -7.4 -3.6 -4.1Q1 -1.0 -1.2 -3.1 -0.4 -1.6Q2 -1.2 -3.3 -5.7 -1.3 -2.5Q3 -1.5 -5.2 -6.9 -2.8 -3.5Q4 -2.6 -6.6 -8.0 -4.5 -4.8
2002 Annual -3.3 -3.7 -3.5 -5.0 -3.9H1 -3.4 -6.1 -5.4 -5.3 -4.8H2 -3.2 -1.3 -1.7 -4.6 -3.0
Q1 -3.2 -7.0 -6.4 -5.1 -4.9Q2 -3.5 -5.4 -4.4 -5.6 -4.6Q3 -3.5 -2.1 -2.7 -4.6 -3.6Q4 -2.8 -0.5 -0.6 -4.5 -2.3
Note : From the first quarter of 2001 onwards, the year-on-year changes in import pricesare computed from the new 2000-based unit value indices. Before then, theyear-on-year changes are computed from the old 1990-based series. Splicing hasbeen applied to the indices to maintain continuity.
/Diagram 6.7 .....

221
Q1 Q3 Q1 Q3 Q1 Q3 Q1 Q3 Q1 Q3 Q1 Q31997 1998 1999 2000 2001 2002
0
2
4
6
-2
-4
-6
Percent
Diagram 6.7
Q1 Q3 Q1 Q3 Q1 Q3 Q1 Q3 Q1 Q3 Q1 Q31997 1998 1999 2000 2001 2002
0
4
8
12
-4
-8
-12
Percent
Prices of importsfrom the Mainland
Japan's export prices adjusted for exchange rate of yen
Prices of imports from Japan
Retail prices in the Mainland adjusted for the market exchange
rate of renminbi
(b) For imports from Japan
Prices of imports of goods by major source(year-on-year rate of change)
(a) For imports from the mainland of China
Q1 Q3 Q1 Q3 Q1 Q3 Q1 Q3 Q1 Q3 Q1 Q31997 1998 1999 2000 2001 2002
0
1
2
3
-1
-2
-3
-4
-5
-6
Percent
Q1 Q3 Q1 Q3 Q1 Q3 Q1 Q3 Q1 Q3 Q1 Q31997 1998 1999 2000 2001 2002
0
2
4
6
-2
-4
-6
-8
-10
-12
Percent
(d) For imports from the United States
Prices of imports from
Taiwan
Taiwan's export prices adjusted for exchange
rate of NT$
Prices ofimports from US
US export prices adjusted for exchange
rate of US$
(c) For imports from Taiwan
Note : See the footnote to Table 6.5.
/6.9 .....

222
6.9 The prices of retained imports, as measured by the unit value index ofretained imports, fell to a lesser extent in 2002 than in 2001, by 6.6% as against7.6%. Moreover, the year-on-year decrease, having held steady at 8.8% and8.9% respectively in the first two quarters of 2002, narrowed to 6.4% in thethird quarter and further to 2.0% in the fourth quarter.
6.10 Analysed by end-use category, the prices of retained imports of capitalgoods had the largest fall, by 7.8% in 2002, attributable to lower import pricesof industrial machinery, office machinery and telecommunications equipment,although this was lesser than the 9.3% dip in 2001. The prices of retainedimports of raw materials and semi-manufactures sank by 7.7% in 2002, likewisenarrowed from the decline of 8.8% in 2001. By contrast, the prices of retainedimports of consumer goods had an enlarged decrease, from 3.1% in 2001 to6.3% in 2002, mainly due to an accelerated fall in the prices of such retainedimports from the Mainland. The prices of retained imports of foodstuffs alsoshowed an accentuated decline, from 3.8% in 2001 to 4.6% in 2002, upon alarger decrease in the prices of such retained imports from many major sources.The prices of retained imports of fuels edged up by 0.5% in 2002, as theupsurge in international crude price in the second half of the year offset thedecline seen in the first half. This contrasted with a 10.6% drop in 2001. Forall these end-use categories, the prices of retained imports had lesseryear-on-year declines in the second half of 2002 than in the first half, or in thecase of fuels, even reverted to increase during the year.
/Table 6.6 .....

223
Table 6.6
Unit value indices of retained imports by end-use category(year-on-year rate of change (%))
Food-stuffs
Consumer goods Fuels
Rawmaterialsand semi-
manufacturesCapital goods
Allcategories
2001 Annual -3.8 -3.1 -10.6 -8.8 -9.3 -7.6H1 -2.4 -1.6 1.8 -4.6 -10.7 -5.2H2 -5.0 -4.7 -20.6 -13.1 -8.1 -9.9Q1 -1.6 -1.3 * -3.6 -11.6 -5.0Q2 -3.2 -1.6 3.5 -5.5 -9.9 -5.4Q3 -4.1 -3.1 -13.1 -10.8 -8.3 -8.4Q4 -6.1 -6.4 -27.9 -15.4 -8.2 -11.6
2002 Annual -4.6 -6.3 0.5 -7.7 -7.8 -6.6H1 -6.3 -6.7 -10.7 -10.7 -8.4 -8.9H2 -2.8 -5.9 11.8 -4.2 -7.3 -4.3Q1 -6.5 -6.7 -15.7 -10.3 -7.5 -8.8Q2 -6.2 -6.6 -6.9 -11.0 -9.4 -8.9Q3 -3.6 -6.1 0.1 -7.7 -8.0 -6.4Q4 -1.9 -5.6 25.7 -0.5 -6.2 -2.0
Notes : See the footnote to Table 6.5.
(*) Change of less than 0.05%.
/Prices .....

224
Prices of key inputs
6.11 The prices of the major inputs all moved lower in 2002. On labourcost, labour earnings fell slightly, by 0.6% in money terms in the first quarter of2002 over a year earlier, representing the first decrease since the fourth quarterof 1999. The decrease widened to 1.0% in the second quarter, and further to1.5% in the third quarter. On the cost of material inputs, the prices of retainedimports of capital goods and of raw materials and semi-manufactures also fell in2002, yet the respective year-on-year declines narrowed for most of the year, to6.2% and 0.5% in the fourth quarter. On property cost, the prices of officespace, shopping space and conventional flatted factory space continued to comedown in 2002, with year-on-year decreases by 9.7%, 3.2% and 7.5%respectively in the fourth quarter. The corresponding rentals also had visibleyear-on-year declines, by 13.6%, 4.9% and 6.4% in the fourth quarter.
6.12 These cost and price easing pointed to a further reduction in the costof doing business in Hong Kong, and should have also contributed to thecontinued downtrend in local consumer prices.
Prices of local manufacturing output
6.13 The prices of local manufacturing output, as measured by theProducer Price Index(9), went down by 2.9% in the first three quarters of 2002over a year earlier, exceeding the 1.6% fall in 2001. Reduced costs of inputsand keen competition in the product markets mattered. Analysed by majorindustry group and on a year-on-year comparison, output prices in the consumerelectrical and electronic products and the machinery and equipment industriesfell by 4.9% and 4.8% respectively in the first three quarters of 2002. Thiswas followed by output prices in the wearing apparel industry (down by 3.7%),the fabricated metal products industry (2.6%), the plastic products industry(2.5%), the paper products and printing industry (2.1%), and the textilesindustry (1.6%).
/Table 6.7 .....

225
Table 6.7Producer Price Index for the local manufacturing sector
(year-on-year rate of change (%))
2001 2002
Annual Q1 Q2 Q3 Q4 Q1-Q3 Q1 Q2 Q3
Industry groupWearing apparel -0.2 0.4 0.1 -0.5 -1.0 -3.7 -3.2 -4.1 -3.7Textiles -1.2 * -1.1 -1.7 -2.1 -1.6 -1.8 -1.8 -1.1Plastic products -0.3 -0.6 -2.3 0.3 1.6 -2.5 -1.7 -1.5 -4.1Consumer electrical and
electronic products-1.9 -2.1 -2.1 -1.6 -1.6 -4.9 -4.4 -5.7 -4.6
Machinery and equipment -2.8 -3.3 -2.2 -4.2 -1.4 -4.8 -3.8 -5.2 -5.4Fabricated metal products -1.8 1.0 -0.4 -3.9 -3.8 -2.6 -3.1 -2.5 -2.1Paper products and
printing-0.3 -0.9 -0.3 -0.2 0.1 -2.1 -2.6 -1.7 -2.1
Overall manufacturing -1.6 -0.9 -1.6 -2.1 -1.7 -2.9 -3.3 -2.6 -2.7
Note : (*) Change of less than 0.05%.
Producer Price Index, world commodity prices, and prices
(year-on-year rate of change)
Q1 Q2 Q3 Q4 Q1 Q2 Q3 Q4 Q1 Q2 Q3 Q4 Q1 Q2 Q3 Q4 Q1 Q2 Q3 Q4 Q1 Q2 Q3 Q41997 1998 1999 2000 2001 2002
0
4
8
12
16
20
-4
-8
-12
-16
-20
Percent
Diagram 6.8
of retained imports of raw materials and semi-manufactures
Prices of all non-fuel commodities in the world market
Prices of retained imports of raw materials and semi-manufactures
Producer Price Index
/Prices .....

226
Prices of output in selected service sectors
6.14 The prices of output in selected service sectors, as measured by therespective Producer Price Indices, exhibited a broad-based decline. On ayear-on-year comparison, output prices in telecommunications plunged by20.9% in the first three quarters of 2002, much exceeding the 8.4% dip in 2001.This was mainly attributable to a sharp reduction in the charges for internationalcalls and Internet services, as well as in the prices of mobile phone sets andrelated items. Output prices in hotels and boarding houses moved down by4.6% in the first three quarters of 2002, in contrast to a 1.0% rise in 2001, owingto a cut in hotel room tariffs. Output prices in maritime transport were reducedby 4.2% in the first three quarters of 2002, further to a decrease of 5.6% in 2001,on account of downward adjustment in freight charges for sea cargo. Outputprices in air transport also came down, by 1.9% in the first three quarters of2002, yet smaller than the 6.0% fall in 2001, mainly reflecting lower airpassenger fares. Output prices in land transport edged down further by 1.8%in the first three quarters of 2002, after a 0.5% fall in 2001, upon lower chargesfor freight transport and fare concessions for some public transport services.On the other hand, output prices in miscellaneous communications services rosefurther by 2.3% in the first three quarters of 2002, after a 1.3% increase in 2001,due to higher charges for international courier service.
/Table 6.8 .....

227
Table 6.8
Producer Price Indices for selected service sectors+
(year-on-year rate of change (%))
2001 2002Annual Q1 Q2 Q3 Q4 Q1-Q3 Q1 Q2 Q3
Selected service sector
Hotels and boardinghouses
1.0 5.8 5.2 1.1 -7.1 -4.6 -5.8 -4.2 -3.8
Land transport -0.5 -1.0 -0.3 -0.2 -0.6 -1.8 -1.4 -2.0 -2.1Maritime transport -5.6 -0.2 -3.3 -9.3 -9.5 -4.2 -9.4 -5.5 2.9Air transport -6.0 -2.3 -4.9 -8.8 -7.8 -1.9 -5.5 -3.4 3.6Telecommunications -8.4 -5.5 -1.3 -12.9 -14.5 -20.9 -21.7 -24.5 -15.7Miscellaneous
communicationsservices
1.3 2.8 1.2 0.7 0.5 2.3 0.4 0.1 6.3
Note : (+) Producer Price Indices for other service sectors are not available, due to thedifficulties involved in defining and delineating the various types of servicesand hence in measuring their respective price changes. This is particularly sofor such sectors as banking and insurance, where the producers often do notcharge their customers explicitly.
Export prices
6.15 Export prices were still kept down by the generally slack demandconditions and intensified competition in the overseas markets. The prices oftotal exports of goods, as measured by the unit value index of total exports ofgoods, fell further by 2.7% in 2002, after a 2.3% decrease in 2001. Within thistotal, the prices of domestic exports sank by 3.3% in 2002, after a 4.7% fall in2001, and the prices of re-exports sank by 2.7% in 2002, after a 2.0% fall in2001. Yet there was a progressive moderation in the year-on-year decrease inthe prices of total exports of goods over the course of 2002, from 3.4% in thefirst quarter, 2.7% in the second quarter, 2.4% in the third quarter, to 2.3% in thefourth quarter.
/6.16 .....

228
6.16 Analysed by major market, the prices of total exports of goods toSingapore fell further by 3.9% in 2002, following a 4.0% drop in 2001. Theprices of total exports of goods to Japan declined by 3.2% in 2002, double the1.6% decrease in 2001. The prices of total exports of goods to Germany, theUnited States and the United Kingdom also drifted lower, by 3.2%, 2.6% and2.5% respectively in 2002, after the falls of 2.3%, 0.4% and 2.1% in 2001.The prices of total exports of goods to the Mainland were reduced further by2.5% in 2002, having decreased by 3.3% in 2001. For most of these majormarkets, the year-on-year declines in export prices likewise narrowed betweenthe first half and second half of 2002.
Table 6.9
Unit value indices of total exports of goods by major market(year-on-year rate of change (%))
UnitedStates
Mainlandof China Germany
UnitedKingdom Japan Singapore
Allmarkets
2001 Annual -0.4 -3.3 -2.3 -2.1 -1.6 -4.0 -2.3
H1 -0.1 -2.4 -1.9 -1.2 -1.2 -2.9 -1.7H2 -0.6 -4.2 -2.6 -2.9 -2.1 -5.1 -2.8
Q1 0.1 -1.3 -1.9 -0.9 -0.8 -2.0 -1.1Q2 -0.3 -3.3 -2.0 -1.6 -1.5 -3.9 -2.3Q3 -0.4 -4.1 -2.6 -2.3 -1.4 -4.9 -2.6Q4 -0.9 -4.4 -2.6 -3.5 -2.7 -5.4 -3.0
2002 Annual -2.6 -2.5 -3.2 -2.5 -3.2 -3.9 -2.7
H1 -2.2 -3.5 -3.4 -3.0 -3.5 -4.2 -3.1H2 -2.9 -1.6 -2.9 -2.1 -2.9 -3.4 -2.4
Q1 -1.9 -4.2 -4.0 -3.6 -3.5 -4.8 -3.4Q2 -2.4 -2.8 -2.8 -2.3 -3.4 -3.5 -2.7Q3 -3.2 -1.6 -2.8 -2.3 -2.7 -3.1 -2.4Q4 -2.6 -1.5 -3.0 -1.9 -3.0 -3.6 -2.3
Note : From the first quarter of 2001 onwards, the year-on-year changes in export prices arecomputed from the new 2000-based unit value indices. Before then, the year-on-yearchanges are computed from the old 1990-based series. Splicing has been applied tothe indices to maintain continuity.
/Diagram 6.9 .....

229
Q1 Q3 Q1 Q3 Q1 Q3 Q1 Q3 Q1 Q3 Q1 Q31997 1998 1999 2000 2001 2002
0
5
10
15
20
-5
-10
-15
-20
Percent
Diagram 6.9
Q1 Q3 Q1 Q3 Q1 Q3 Q1 Q3 Q1 Q3 Q1 Q31997 1998 1999 2000 2001 2002
0
2
4
6
8
10
-2
-4
-6
-8
-10
Percent
Prices of exportsto the Mainland
US import prices adjusted for exchange rate of US$
Prices of exports to US
Retail prices in the Mainland adjusted for the market exchange
rate of renminbi
(a) For exports to the mainland of China
(b) For exports to the United States
Prices of total exports of goods by major market(year-on-year rate of change)
Q1 Q3 Q1 Q3 Q1 Q3 Q1 Q3 Q1 Q3 Q1 Q31997 1998 1999 2000 2001 2002
0
5
10
15
-5
-10
-15
Percent
Q1 Q3 Q1 Q3 Q1 Q3 Q1 Q3 Q1 Q3 Q1 Q31997 1998 1999 2000 2001 2002
0
5
10
15
20
-5
-10
-15
-20
Percent
(d) For exports to Germany
Prices of exports to
Japan
Japan's import prices adjusted for exchange
rate of yen
Prices ofexports to Germany
Germany's import prices adjusted for
exchange rate of euro
(c) For exports to Japan
Note : See the footnote to Table 6.9.
/Terms .....

230
Terms of trade
6.17 As the prices of imports of goods fell by more than the prices of totalexports of goods, the terms of trade in goods(10) for Hong Kong improved by1.2% in 2002. This followed a 0.9% rise in 2001. Yet the improvementtended to taper in the latter part of last year, as the rate of decline in the prices ofimports of goods narrowed by more than that in the prices of total exports ofgoods.
Table 6.10
Terms of trade in goods
Index on the terms of trade in goods
(2000 = 100)
Year-on-yearrate of change
(%)
2001 Annual 100.9 0.9
H1 100.5 0.4H2 101.2 1.4
Q1 100.6 0.5Q2 100.5 0.3Q3 100.8 0.9Q4 101.7 1.8
2002 Annual 102.1 1.2
H1 102.3 1.8H2 101.9 0.7
Q1 102.2 1.6Q2 102.5 2.0Q3 102.1 1.2Q4 101.7 *
Notes : From the first quarter of 2001 onwards, the year-on-year changes interms of trade in goods are computed from the new 2000-based unitvalue indices. Before then, the year-on-year changes are computedfrom the old 1990-based series. Splicing has been applied to theindices to maintain continuity.
(*) Change of less than 0.05%.
/Diagram 6.10 .....

231
Unit value indices of total exports of goods and imports of goods
Q1 Q2 Q3 Q4 Q1 Q2 Q3 Q4 Q1 Q2 Q3 Q4 Q1 Q2 Q3 Q4 Q1 Q2 Q3 Q4 Q1 Q2 Q3 Q41997 1998 1999 2000 2001 2002
0
1
2
3
4
-1
-2
-3
-4
-5
-6
Percent (year-on-year rate of change)
Imports of goods
Total exports of goods
Diagram 6.10
Terms of trade in goods
Q1 Q2 Q3 Q4 Q1 Q2 Q3 Q4 Q1 Q2 Q3 Q4 Q1 Q2 Q3 Q4 Q1 Q2 Q3 Q4 Q1 Q2 Q3 Q41997 1998 1999 2000 2001 2002
97
98
99
100
101
102
103Index (2000=100)
0
0.5
1
1.5
2
2.5
3
-0.5
-1
-1.5
Percent
Index on the terms of trade in goods Year-on-year rate of change
Diagram 6.11
0
Note : From the first quarter of 2001 onwards, the year-on-yearchanges in import prices, export prices and terms of trade ingoods are computed from the new 2000-based unit valueindices. Before then, the year-on-year changes are computedfrom the old 1990-based series. Splicing has been applied tothe indices to maintain continuity.
/GDP .....

232
GDP deflator
6.18 The GDP deflator(11), as a broad measure of overall price change in theeconomy, decreased by 3.8% in the fourth quarter of 2002 from a year earlier(12).This exceeded the declines of 2.1%, 2.1% and 3.0% respectively in the firstthree quarters. For 2002 as a whole, the GDP deflator went down by 2.7%,larger than the 1.4% fall in 2001. This was mainly attributable to accentuateddrops in the price deflators for private consumption expenditure and for grossdomestic fixed capital formation, as well as renewed decrease in thegovernment consumption expenditure deflator, more than offsetting theimprovement in the terms of trade in goods and services. Within the GDPdeflator, the domestic demand deflator and the total final demand deflator bothshowed larger decreases in 2002 than in 2001, by 4.2% and 3.4% respectivelyas against 1.8% and 2.4%. On a seasonally adjusted quarter-to-quartercomparison, the GDP deflator declined further by 0.9% in the fourth quarter of2002, having fallen by 0.6%, 1.0% and 1.1% respectively in the first threequarters.
/Table 6.11 .....

233
Table 6.11
GDP deflator and the main expenditure component deflators(year-on-year rate of change (%))
2000 2001# 2002+ 2002
Q1# Q2# Q3# Q4+
Private consumptionexpenditure
-5.1 -1.3 -3.3 -3.0 -3.4 -3.6 -3.9
Government consumptionexpenditure
-1.9 1.2 -0.4 1.8 -0.1 -0.7 -2.7
Gross domestic fixedcapital formation
-3.8 -4.3 -7.0 -6.1 -7.5 -7.7 -6.5
Total exports of goods -0.5 -2.6 -2.9 -3.8 -3.0 -2.7 -2.4
Imports of goods 0.8 -3.5 -4.2 -5.2 -4.9 -3.9 -2.6
Exports of services 0.8 -3.9 -2.8 -5.0 -3.7 -2.5 -0.4
Imports of services -0.2 -0.8 0.4 -2.0 -0.1 1.4 2.2
Gross Domestic Product -6.2 -1.4 -2.7 -2.1 -2.1 -3.0 -3.8<-0.6> <-1.0> <-1.1> <-0.9>
Total final demand -2.9 -2.4 -3.4 -3.7 -3.6 -3.3 -3.0
Domestic demand -5.4 -1.8 -4.2 -3.1 -4.2 -4.4 -4.6
Notes : Figures in this table are based on the revised series incorporating the results of the technicalrevision to GDP as announced on 1 August 2002.
(#) Revised figures.
(+) Preliminary figures.
< > Seasonally adjusted quarter-to-quarter % change.
/Diagram 6.12 .....

234
GDP deflator, total final demand deflatorand domestic demand deflator
Q1 Q2 Q3 Q4 Q1 Q2 Q3 Q4 Q1 Q2 Q3 Q4 Q1 Q2 Q3 Q4 Q1 Q2 Q3 Q4 Q1 Q2 Q3 Q41997 1998 1999 2000 2001 2002
0
2
4
6
8
-2
-4
-6
-8
Percent
GDP deflator
Domestic demand deflator
Diagram 6.12
(year-on-year rate of change)
*
Total final demand deflator
Notes : See the footnotes to Table 6.11.
(*) Preliminary figures.
GDP deflator
Q1 Q2 Q3 Q4 Q1 Q2 Q3 Q4 Q1 Q2 Q3 Q4 Q1 Q2 Q3 Q4 Q1 Q2 Q3 Q4 Q1 Q2 Q3 Q41997 1998 1999 2000 2001 2002
0
1
2
3
4
-1
-2
Percent
Diagram 6.13
(seasonally adjusted quarter-to-quarter rate of change)
*
Notes : See the footnotes to Table 6.11.
(*) Preliminary figure./Notes .....

235
Notes :(1) The Consumer Price Indices (A), (B) and (C) are compiled by reference to the average
expenditure patterns for different groups of households as enumerated from theHousehold Expenditure Survey. Then, by aggregating the expenditure patterns of allthe households covered by these three indices, a Composite CPI is compiled.
The expenditure ranges of the households covered in the 1999/2000-based CPIs areshown below:
Approximate proportion of households covered
Monthly expenditure range(at 1999/2000 prices)
(%) ($)
CPI(A) 50 4,500 to 18,499CPI(B) 30 18,500 to 32,499CPI(C) 10 32,500 to 65,999
The weightings of the various components in the 1999/2000-based CPIs are as follows:
Expenditurecomponent Composite CPI CPI(A) CPI(B) CPI(C)
(%) (%) (%) (%)
Food 26.67 31.88 25.94 21.38Meals bought
away from home16.39 17.94 17.20 13.28
Other foodstuffs 10.28 13.94 8.74 8.10Housing 29.91 29.13 29.68 31.22
Private dwellings 24.59 21.76 25.48 26.67Public dwellings 2.07 5.08 1.03 --Maintenance costs
and otherhousing charges
3.25 2.29 3.17 4.55
Electricity, gas andwater
2.98 3.99 2.81 2.02
Alcoholic drinks andtobacco
0.94 1.50 0.86 0.39
Clothing andfootwear
4.13 3.36 4.47 4.55
Durable goods 6.24 4.96 6.93 6.73Miscellaneous goods 5.70 5.25 5.58 6.43Transport 9.01 8.23 9.05 9.94Miscellaneous
services14.42 11.70 14.68 17.34
All items 100.00 100.00 100.00 100.00
(2) The Chief Executive in his 2001 Policy Address announced that a concession on ratespayable for 2002 was to be granted by a maximum of $2,000 per household. TheFinancial Secretary in his 2002/03 Budget further announced that the maximumamount of reduction in rates payable for 2002 was to be raised to $5,000. These tworounds of rates concession taken together had the effect of lowering the Composite CPIby 0.9 of a percentage point in 2002. Owing to different weightings attached to therates payment and different impacts of these two successive rounds of concessions onhouseholds in the various expenditure ranges, the dampening effects on the threesub-indices varied. Specifically, the CPI(A) was lowered by 1.2 percentage points,the CPI(B) by 0.9 of a percentage point, and the CPI(C) by 0.6 of a percentage point.
/(3) .....

236
(3) As announced by the Financial Secretary in the 2002/03 Budget, water and sewagecharges for domestic households were to be waived for one year, subject to maximumamounts of $800 and $200 respectively. This had the effect of lowering theComposite CPI by 0.2 of a percentage point in 2002. Reflecting relatively greatereffect on the lower income households, the corresponding dampening effects on theCPI(A), CPI(B) and CPI(C) were 0.3, 0.2 and 0.1 of a percentage point.
(4) The waiver of public housing rentals in December 2001 covered most of the publichousing tenants, except those paying additional rents. This had the effect of loweringthe Composite CPI by 0.6 of a percentage point in the fourth quarter of 2001. Thecorresponding dampening effects on the CPI(A) and CPI(B) were 1.6 percentagepoints and 0.3 of a percentage point. The CPI(C) was unaffected, as public housingcost was irrelevant to this sub-index.
(5) The special one-off rebate of electricity charges for January and February 2002 grantedby a power company had the effect of lowering the seasonally adjusted Composite CPIby 0.3 of a percentage point in the first quarter of 2002. The correspondingdampening effects on the CPI(A), CPI(B) and CPI(C) were 0.5, 0.2 and 0.1 of apercentage point. Yet the effect on a year-on-year basis was insignificant, beingneutralised by a similar rebate granted in February and March 2001.
(6) In any particular period, only a small proportion of the tenancies of private dwellingsare new lettings for which rentals are freshly determined, and lease renewals uponwhich rentals are revised. The majority of the tenancies are existing leases withrentals fixed until their expiry. Upon aggregation, the movements in private housingcost, as indicated in the various CPIs, thus tend to be less responsive than thecorresponding movements in market rentals, as reflected in the Rating and ValuationDepartment’s rental index for private residential flats.
(7) As announced in the 2002/03 Budget, the duty rate on wine was raised from 60% to80%, as from 6 March 2002.
(8) Rebasing of the trade indices from 1990 to 2000 may have led to minor differences insome of the rates of change during the change-over period from the first quarter of2001 to the first quarter of 2002.
(9) The Producer Price Index is designed to reflect changes in the prices of goods andservices received by local producers. Producer prices refer to the transacted prices,net of any discounts or rebates allowed to the buyers. Transportation and otherincidental charges are not included.
(10) The terms of trade in goods is defined as the ratio of the prices of total exports ofgoods to the prices of imports of goods.
/(11) .....

237
(11) The implicit price deflators of GDP and its main expenditure components are derivedby dividing GDP at current prices by the corresponding constant price figures. Incompiling the constant price GDP at the finer sub-component level, a standarddeflation approach is adopted whereby an appropriate price index is used to deflateeach of the sub-components of GDP at current prices. Summing up the individuallydeflated sub-components gives the main expenditure components of GDP at constantprices. These are further aggregated to arrive at the overall GDP at constant prices.Then, by dividing the current price GDP with the corresponding constant price GDP atthe overall level, the GDP deflator is implicitly obtained. Similarly, by dividing eachof the main expenditure components of GDP at current prices with each of thecorresponding measures at constant prices, the respective price deflators at the mainexpenditure component level are implicitly obtained. Hence as it stands, the implicitprice deflators of GDP and its main expenditure components are not used as input forcompiling the corresponding constant price measures. By the same token, the growthrates in real terms of GDP and its main expenditure components are not derived fromtheir corresponding growth rates in money terms using the rates of change in therespective implicit prices deflators. Rather, the growth rates in real terms arecalculated directly by comparing the constant price measures over two periods.
The rate of change in the GDP deflator may differ substantially from that in theComposite CPI over the same time span. The Composite CPI covers consumer priceinflation in particular. Yet the GDP deflator is a much broader measure of inflationfor the entire economy, and takes into account all the price changes related toconsumption, investment, exports and imports. Also, as total final demand in theeconomy is equated to GDP plus imports, the rate of change in the GDP deflator maydiffer appreciably from that in the total final demand deflator, depending on themovement in the prices of imports. Likewise, as domestic demand in the economy isequated to GDP plus imports and less exports, the rate of change in the GDP deflatormay differ appreciably from that in the domestic demand deflator, depending on themovement in the prices of imports and exports.
(12) The figures as quoted are based on a revised series of the GDP deflator, in parallel withthat for GDP consequential to a technical revision to GDP as announced in August2002. The results for the GDP deflator are summarised below:
Level of the GDP deflator Rate of change in the GDP deflator (%)
Previous Revised Previous RevisedExtent of
revision in % point(1990=100) (2000=100)
1996 150.9 106.9 5.9 5.8 -0.11997 159.7 113.0 5.8 5.7 -0.11998 160.4 113.2 0.4 0.2 -0.21999 151.7 106.6 -5.4 -5.8 -0.42000 141.8 100.0 -6.5 -6.2 0.32001 141.1 98.6 -0.5 -1.4 -0.9
Note: Figures for 2001 are subject to revision when more data become available.
The extent of revision to the rate of change in the GDP deflator is generally not large for1996 to 2000. The relatively larger revision for 2001 is due in part to downwardadjustments in the rates of change in the price deflators for government consumptionexpenditure and for exports of services.

238
Calendar of Events of Significanceto the Hong Kong Economy in 2002
1 Jan The United States (US) legislation granting Permanent Normal TradeRelations status to China came into force.
The mainland of China (the Mainland) implemented its commitments onimport tariffs, following its accession to the World Trade Organisation(WTO). The tariff rates were lowered from an average of 15.3% to 12.7%.Import tariff rates on 5 332 items out of 7 316 items were reduced to variousextent.
Taiwan formally became a member of WTO as a “Separate Customs Territoryof Taiwan, Penghu, Kinmen and Matsu”.
The Ministry of Foreign Trade and Economic Cooperation announced that thequota and sole agent systems on chilled chicken and meat as well as onfrozen chicken and meat were abolished.
As part of the Insurance Intermediaries Quality Assurance Scheme, the Officeof the Commissioner of Insurance (OCI) implemented the ContinuingProfessional Development requirement for insurance intermediaries to helpthem maintain and enhance their professional standards.
The quota system under the Hong Kong Group Tour Scheme for visitors fromthe Mainland was abolished.
7 Jan The Planning Department launched the Stage Two public consultation on the“Hong Kong 2030: Planning Vision and Strategy” Study, focusing on ninekey planning issues and evaluation criteria. It was followed by a publicforum held on 26 January 2002 and five focus group meetings held betweenFebruary and March 2002 for more in-depth discussion with variousstakeholders and concerned groups.
8 Jan An agreement on mutual abolition of visa requirements was signed betweenthe Governments of the HKSAR and Hungary.
11 Jan The Government agreed to provide direct insurers with a facility of up to$10 billion in aggregate to cover claims arising out of terrorism under theiremployees compensation (EC) insurance policies. This facility wouldensure that employers and employees could continue to have EC insurancecover, despite unavailability of the necessary reinsurance support in themarket.
The Office of the Telecommunications Authority (OFTA) announced detailson implementation of the Government's policy to fully liberalise the fixedline telecommunications network services (FTNS) market as from1 January 2003, with no pre-set limit on the number of licences to be issuedand no time limit for licence applications.
15 Jan The Hong Kong Monetary Authority (HKMA) and the China GovernmentSecurities Depository Trust & Clearing Co. Ltd. (CDC) agreed in principle toestablish a link between their securities settlement systems in a bid to

239
promote development of the debt market infrastructure in the Mainland andHong Kong. The link between HKMA’s Central Moneymarkets Unit (CMU)and CDC’s Government Securities Book-Entry System would enableMainland financial institutions authorized to deal in foreign exchangetransactions to hold and settle debt securities in Hong Kong.
16 Jan The Trade and Industry Department (TID) launched the Small and MediumEnterprises (SME) Training Fund to encourage and help SMEs providetraining to their employers and employees. Three other SME fundingschemes, namely the SME Business Installation and Equipment LoanGuarantee Scheme, the SME Export Marketing Fund, and the SMEDevelopment Fund, were launched in December 2001.
17 Jan The US Customs launched the Container Security Initiative to preventocean-going containers from being exploited by terrorists.
HKMA announced the operating results of the Exchange Fund for the year2001. The Exchange Fund recorded a positive investment income of$7.0 billion in 2001. Yet owing to net drawdown of fiscal reserves, totalassets of the Exchange Fund decreased by $42.8 billion, from$1,023.4 billion at end-December 2000 to $980.6 billion at end-December2001. After deducting costs and the sharing of investment income with thefiscal reserves placed with the Exchange Fund, the Accumulated Surplusregistered a decline of $4.4 billion.
23 Jan Monaco granted visa-free treatment to holders of HKSAR passport withimmediate effect.
25 Jan Consultations with the Mainland on the Mainland/Hong Kong CloserEconomic Partnership Arrangement (CEPA) formally commenced. Theproposed CEPA would cover trade in goods, trade in services, as well as tradeand investment facilitation measures.
Qatar granted entry visa to holders of HKSAR passport upon arrival withimmediate effect.
28 Jan The Securities and Futures Commission (SFC) introduced requirements forauthorization of index funds under the Code on Unit Trusts and MutualFunds.
The derivative warrant market on the Stock Exchange of Hong Kong wasre-launched following a revision of the Listing Rules.
30 Jan -1 Feb
Hong Kong hosted the Plenary Meeting of the Financial Action Task Force onMoney Laundering (FATF).
The Commissioner for Narcotics, as President of FATF, presided at a globalforum on terrorist financing held at the conclusion of the Plenary Meeting on1 February 2002. About 60 jurisdictions from FATF and FATF-styleregional bodies, the Offshore Group of Banking Supervisors, and nineinternational organisations participated in the forum.

240
31 Jan The First Meeting of the Mainland/HKSAR Conference on the Coordinationof Major Infrastructure Projects was held in Beijing. The Conferenceagreed that Hong Kong and cities in the Pearl River Delta Region shouldfully utilise the existing infrastructure for future economic development. Inbuilding new infrastructure, communication between both sides should beenhanced at the planning stage so as to forestall any duplication of efforts.Besides, both sides should step up communication regarding the developmentof railways, roads, ports and airports so as to explore possibilities forcooperation. It was also agreed to set up two expert groups, namely the“Joint Expert Group on Guangzhou-Shenzhen-Hong Kong Express RailLink” and “Expert Group on Port and Logistics Planning and Development”under the Conference.
1 Feb The People’s Bank of China (PBOC) revised the “Regulations onManagement of Foreign Financial Institutions”. Foreign banks could gaindirect access to the Mainland market by setting up branches, establishingwholly-owned banks, or establishing banks jointly with Mainland financialinstitutions/companies.
Foreign banks in the Mainland were allowed to expand their clientele forforeign exchange business from foreign-funded enterprises to all Mainlandindividuals and enterprises.
SFC introduced further revisions to the Codes on Takeovers and Mergers andShare Repurchases so as to rationalise the voting requirements for companyprivatisation proposals and for delistings, and to strengthen the requirementsfor asset valuation.
3 Feb The Hong Kong International Airport (HKIA) was named “Cargo Airport ofthe Year” by the London-based Air Cargo News, a leading international aircargo trade publication.
5 Feb SFC published Guidelines for the Regulation of Automated Trading Services.
An International Monetary Fund (IMF) Staff Mission to Hong Kongsupported the Government’s policy framework to deal with the challengesahead, and expected a moderate recovery for the Hong Kong economy in thenear term, depending on an upturn in external demand. It noted that thelonger-term outlook would depend on Hong Kong’s success in capitalising onthe opportunities arising from growing integration with the Mainland. Theassessment was made by the IMF Mission in its Concluding Statement for theannual Article IV Consultation with China in respect of Hong Kong.
7 Feb The US Congressional Task Force on Hong Kong issued its report on HongKong, commenting favourably on the developments in Hong Kong during theperiod between August 2000 and December 2001, and concluded that “theunprecedented ‘One Country, Two Systems’ experiment thus far continues tobe a success”.
8 Feb Oman granted entry visa to holders of HKSAR passport upon arrival withimmediate effect.

241
15 Feb The Mandatory Provident Fund (MPF) Schemes (Amendment) Ordinance2002 was enacted to render better protection of scheme members’ interestsand more effective operation of the MPF System.
21 Feb PBOC cut the interest rates for renminbi deposits and loans, on average by0.25 and 0.5 of a percentage point respectively.
The State Council promulgated the “Provisions on Guidance for ForeignInvestment”, which guided foreign investors to adapt to the Mainland’snational economic and social development programmes. Foreigninvestment projects were divided into four categories, namely encouraged,permitted, restricted and prohibited projects. This was implemented on1 April 2002.
22 Feb An Air Services Agreement (ASA) was signed between the Governments ofthe HKSAR and Czech Republic.
25 Feb -1 Mar
The Intellectual Property Department hosted the Asia-Pacific EconomicCooperation (APEC) Intellectual Property Experts Capacity BuildingProgramme for implementation of WTO’s Agreement on Trade-RelatedAspects of Intellectual Property Rights (TRIPS) in Hong Kong.
26 Feb The Government awarded a contract for system development for theintroduction of a smart identity card in Hong Kong. The card, expected tobe rolled out in mid-2003, would provide (apart from normal immigrationfunctions) further multiple uses as a storage of an e-Cert, as a library card,and as medium for driving licence related functions. It would also havereserved capacity for an electronic purse in future.
28 Feb The Housing Authority (HA) revised the mechanism for determiningeligibility for public housing, both for rent and for sale, by rationalisingcalculation of the income and asset limits. New features of the revisedformula included the introduction of differential unit rents for small familiesto reflect more closely their pattern of housing costs, and the provision ofcontingency money to provide for emergency or other long-term plans.Subsequently the income and asset limits on the Waiting List for public rentalhousing (PRH) were reduced by an average of 5% and 10% respectively, andthose for the Home Ownership Scheme (HOS) were lowered by 16% and20% respectively.
A $100 million Professional Services Development Assistance Scheme waslaunched to provide financial support for projects aimed at increasing thecompetitiveness of Hong Kong’s professional services in overseas markets,as well as for projects seeking to enhance the standard of professionalservices in Hong Kong.
Mr Tung Chee-hwa was elected as Chief Executive of the HKSAR for thesecond term. The term of office of the Chief Executive, for five years,commenced on 1 July 2002.
2 Mar The Vice Chairman of the State Development Planning Commission led aMainland delegation to Hong Kong to visit the territory’s major infrastructurefacilities. The Second Meeting of the Mainland/HKSAR Conference on the

242
Coordination of Major Infrastructure Projects was held alongside the visit.
4 Mar The Government announced the Land Sale and Development Programme for2002/03 to 2006/07. In 2002/03, about seven hectares of private residentialand non-residential land were scheduled to be put up for sale in regular landauctions and tenders, and another 33 hectares would be available for salethrough application.
5 Mar At the opening of the Fifth Session of the Ninth National People’s Congress,Premier Zhu Rongji set out several major economic tasks for 2002.Domestic demand would be expanded to support growth. Development ofagriculture and the rural economy would be speeded up to raise farmers’income. Economic reform and institutional restructuring would beaccelerated. The economy would be opened up further to foreignparticipation following China’s accession to WTO.
6 Mar The Financial Secretary presented the Budget for the financial year 2002/03to the Legislative Council.
The Budget proposed a number of relief measures including reducing ratespayment by up to $5,000 per tenement; waiving water and sewage chargesfor one year, subject to maximum amounts set at $800 and $200 respectivelyfor domestic households, and $3,200 and $800 respectively for non-domesticconsumers; reducing trade effluent surcharge by 30% for one year; waivingbusiness registration fee for one year; extending duty concession for ultralow sulphur diesel for one year; and freezing Government fees and chargesfor one year.
In order to improve the fiscal position, some modest non-livelihood revenue-raising measures were proposed. These included raising duty rate on winefrom 60% to 80%, and reducing duty-free tobacco allowance for localresidents by 40% to 60 cigarettes or 15 cigars or 75 grammes of tobacco aswell as duty-free still wine allowance by 25% to 750 millilitres.
The 2001 Economic Background and 2002 Economic Prospects werepublished. On economic outlook for the current year, the Gross DomesticProduct (GDP) was forecast to grow by 1% in real terms in 2002, while theComposite Consumer Price Index (CPI) was forecast to decline by 2.8%.
7 -10 Mar The Information Infrastructure Expo and Conference 2002 was held. Sinceits inception in 1998, this event had become a major international informationtechnology event held in Hong Kong. A total of 350 exhibitors and 85 800visitors participated this year.
11 Mar The State Development Planning Commission, the State Economic and TradeCommission and the Ministry of Foreign Trade and Economic Cooperationjointly promulgated a new “Industrial Catalogue for Foreign Investment”under the “Provisions on Guidance for Foreign Investment”, to take effect on1 April 2002. A total of 262 types of foreign investment projects were listedunder the encouraged category, and another 75 and 34 types of projects fellunder the restricted and prohibited categories respectively.

243
12 Mar The Government announced proposals for improving certain provisions of theCopyright Ordinance, including making permanent the arrangement in theCopyright (Suspension of Amendments) Ordinance 2001 where end-usercriminal liability for possessing infringing copies of copyright works inbusiness was to apply only to computer program, movie, television dramaand musical recording.
The then Information Technology and Broadcasting Bureau and the FederalMinistry of Economics and Technology of the Federal Republic of Germanysigned a Memorandum of Understanding (MOU) on co-operation ininformation and communications technology.
13 Mar The Securities and Futures Ordinance (SFO) was enacted, representing amajor milestone in the modernisation of Hong Kong’s securities legislation.SFO and its subsidiary legislation introduced a number of significant changesfor regulation of the securities and future markets. These included (a) astreamlined single licensing regime; (b) proportionate disciplinary sanctionsto combat market misconduct; (c) measures to protect the interests ofinvestors, such as personal rights of action through the civil courts for losscaused by market misconduct or false or misleading public statementsconcerning securities; (d) a comprehensive investor compensation scheme;and (e) a tighter regime for disclosure of interests in listed companies. Assuch, SFO ensured Hong Kong’s market regulation to be on par withinternational best practices, affording appropriate protection to investors onthe one hand and leaving enough room for market development on the other.
14 Mar The then Information Technology and Broadcasting Bureau and the Ministryof Economy, Finance and Industry of the Government of France signed aMOU on co-operation in information and communications technology.
The Land Registry awarded the key contract to develop an IntegratedRegistration Information System (IRIS), which would facilitateimplementation of a Centralised Registration System and provide muchgreater efficiency of operations and capacity for future development in landregistration services.
15 Mar The Fifth Meeting of the Hong Kong/Guangdong Cooperation JointConference was held in Zhuhai. The meeting reached consensus on anumber of issues including co-location of immigration and customs facilitiesat Lok Ma Chau/Huanggang and Shenzhen Western Corridor, co-operation intourism development, and provision of passenger ferry services connectingthe major ports in the Pearl River Delta region with HKIA.
18 Mar The Court imposed for the first time immediate custodial sentences onpersons manipulating stocks on the Stock Exchange of Hong Kong.
The iPermit Scheme was launched to facilitate Taiwanese visitors enteringHong Kong.
HKMA reached agreement with the Guangzhou Branch of PBOC on a newJoint Clearing Facility to speed up the processing of Hong Kong dollarcheques issued by the banks in Guangdong and presented in Hong Kong.

244
19 - 20 Mar The Intellectual Property Department hosted the 14th APEC IntellectualProperty Rights Experts Group Meeting in Hong Kong.
19 - 22 Mar The Department of Health and the Intellectual Property Departmentco-organised an APEC Symposium on Traditional Medicine. Thesymposium was aimed at bringing about a deeper understanding of traditionalmedicine and the intellectual property issues involved.
20 Mar The Hongkong Post Certification Authority signed a Cross CertificationCooperation Arrangement with the Guangdong Electronic CertificationAuthority Ltd., with a view to establishing a cross-certification system tofacilitate e-commerce activities between Hong Kong and Guangdong.
21 Mar SFC revised the authorization requirements of guaranteed funds so as tostrengthen the qualification requirements for guarantors, enhance thedisclosure requirements of offering documents and advertisements, and henceincrease investor protection.
The Stock Exchange of Hong Kong reduced substantially the fees for listingderivative warrants launched on or after 2 April 2002.
27 Mar HKMA released a second consultation paper on the proposed introduction ofdeposit insurance. The paper set out HKMA’s detailed proposals on how thedeposit insurance scheme in Hong Kong should be structured. Recommendedfeatures included establishment of an independent Deposit Insurance Boardto operate the scheme, compulsory participation for full licensed banks, andstipulation of the coverage limit at $100,000 per depositor per bank.
29 Mar The Taiwanese government announced relaxation of restrictions oninvestment by Taiwanese enterprises in fabrication plants for production of8-inch wafers in the Mainland.
31 Mar The Home Starter Loan Scheme (HSLS) operated by the Housing Societylapsed.
1 Apr The agreements on avoidance of double taxation on shipping income with theUnited Kingdom and the Netherlands took effect.
2 Apr The Office of the US Trade Representative released the 2002 National TradeEstimate Report on Foreign Trade Barriers. The report gave recognition toHong Kong's strong legal system and rigorously enforced anti-corruptionregime, and commented that Hong Kong was well-positioned to benefit fromthe growth in trade resulting from China’s WTO accession.
3 Apr The essential supporting infrastructure for the first phase of the Cyberportwas completed. The Cyberport Road and the Cyberport Public TransportInterchange were officially opened.
8 Apr Andorra granted visa-free treatment to holders of HKSAR passport withimmediate effect.
9 Apr The then Information Technology and Broadcasting Bureau and the Ministryof Transport, Public Works and Water Management of the Government of the

245
Netherlands signed a MOU on co-operation in information technology,information services and telecommunications.
10 Apr The US State Department published its fifth report on Hong Kong after HongKong’s reunification with the Mainland. The report gave an overall positiveassessment of the developments in Hong Kong in the eight months endingMarch 2002. It concluded in categorical terms that Hong Kong’s promisedhigh degree of autonomy remained a reality, and that Hong Kong remainedone of the Asia’s freest cities. The report also gave recognition to HongKong’s strong support for global anti-terrorism efforts.
Construction of the Ngong Shuen Chau Viaduct, the first works contract ofRoute 9, commenced. The whole Route 9, at a total project cost of$17 billion and targetted for completion in 2008, would provide a 13.5 kmtrunk road connecting Tsing Yi and Sha Tin.
11 Apr SFC issued the Disciplinary Fining Guidelines, which would be applied withSFO coming into effect in 2003. The Guidelines set out the factors whichSFC should consider when imposing fines on intermediaries.
29 Apr The State Council published a white paper on China’s labour market andsocial security situation. The paper put accentuated importance on the roleof economic growth in generating employment. The coverage of socialsecurity would be expanded to include all workers, as well as the retrenchedand the retired.
Under the Electronic Transactions Ordinance (Cap. 553), the Director ofInformation Technology Services granted recognition to two morecertification authorities, bringing the number of recognised certificationauthorities operating in Hong Kong to four.
The Government of the HKSAR and the Guangdong Provincial Governmentreached consensus to improve air quality in the Pearl River Delta region byreducing, on a best endeavour basis, the emission of four major pollutantsinto the ambient air by such levels as would achieve the current air qualityobjectives of the two places by 2010.
30 Apr In its World Competitiveness Yearbook 2002, the International Institute forManagement Development (IMD) based in Switzerland ranked Hong Kongas the ninth most competitive economy in the world, falling from the sixth inthe previous round of assessment. The fall in Hong Kong’s ranking waslargely attributable to the sharp slow-down to near zero GDP growth in 2001,which led directly to the slip in “economic performance”, and indirectly alsoto the decline in “business efficiency”. Yet IMD recognised that HongKong’s low corporate tax rate, flexible labour regulations andentrepreneurship would continue to underpin its competitiveness.
The Office of the US Trade Representative released the 2002 Special 301Report. Hong Kong continued to remain off from any watch lists regardingintellectual property rights protection. The report also highlighted theprogress made by Hong Kong in controlling optical media production and useof authorized software.

246
2 May Cyprus granted visa-free treatment to holders of HKSAR passport withimmediate effect.
6 May SFC proposed a dual filing framework to enhance the effectiveness of thedisclosure-based regulatory regime. Listed companies and listing applicantswould be required to file corporate disclosure materials and listing documentssimultaneously with the Stock Exchange of Hong Kong and SFC, henceestablishing SFC as the statutory regulator of corporate disclosure. Theframework would become operational with SFO coming into effect in 2003.
Dow Jones Industrial Average Futures began trading on the FuturesExchange. This enabled investors to respond quickly to market events beforeor after the regular US trading hours.
7 May The Government announced its 2001-based population projection for theperiod 2002 - 2031. Hong Kong resident population was projected toincrease from 6.72 million at mid-2001 to 8.72 million at mid-2031, or at anaverage annual rate of 0.9%. Indicating a continuous aging trend, theproportion of persons aged under 15 was projected to decline from 16% in2001 to 12% in 2031, while the proportion of persons aged 65 and over wasprojected to rise markedly from 11% to 24%.
The granting of land for urban renewal projects to the Urban RenewalAuthority at the nominal premium for supporting the urban renewalprogramme was approved.
8 May HKIA was named for the second year as “Airport of the Year”, in alarge-scale passenger survey conducted by Skytrax Research in the UnitedKingdom involving 1.4 million nominations around the world.
10 May HKMA’s proposals to improve certain market entry criteria for the bankingsector was endorsed. These included: reducing the asset size criterion foroverseas-incorporated bank applicants, reducing the period of operation as arestricted licence bank or deposit-taking company from ten to three years toupgrade to licensed bank status, and increasing the minimum capitalrequirement for locally incorporated bank applicants.
15 May The IMF Staff Report on the HKSAR gave a positive assessment of HongKong’s economic prospects and commended its policies to deal with the twinchallenges of a sharp cyclical downturn and structural adjustments fromgrowing economic integration with the Mainland.
The Government introduced the Telecommunications (Amendment) Bill 2002to the Legislative Council. It sought to establish a clear regulatoryframework for mergers and acquisitions in the telecommunications market, tohelp promote fair and effective competition in the market, and to protectconsumer interest.
16 May Marking a milestone in the restructuring of China’s telecommunicationsindustry, the new China Telecom and China Netcom were established. Thetwo companies were to provide fixed line, long distance and internationaltelephone services as well as Internet services. The former was to operate in21 provinces/municipalities in the northwest and southern part of China,

247
while the latter was to cover the remaining 10 provinces/municipalities in thenorth.
The Hong Kong Exchanges and Clearing Ltd. (HKEx) began to introduceCCASS/3, the new generation of the Central Clearing and Settlement System,in phases. CCASS/3 could support more regional and global products withdifferent features and settlement periods, thereby improving the operationalefficiency of the Hong Kong market and the market participants.
Hong Kong participated in the Organisation for Economic Cooperation andDevelopment (OECD) Ministerial Council Meeting, Session with Non-Members, to discuss issues relevant to promoting global trade.
22 May The first Asia Pacific Regional Conference on Environmental Issues inTelecommunications was held in Hong Kong. The Conference wasorganised by the Global e-Sustainability Initiative (GeSI), and co-hosted bythe Internet and Telecom Association of Hong Kong and OFTA. It exploredhow a pro-active stance on environmental protection could benefit theinformation and communications technology industry.
23 May The then Information Technology and Broadcasting Bureau and the Ministryof Communications of the Government of the Italian Republic signed a MOUon co-operation in telecommunications and information technologies.
Cook Islands granted visa free treatment to holders of HKSAR passport withimmediate effect.
28 May HKMA and Clearstream Banking Luxembourg reached agreement to developa direct link between HKMA’s CMU and the settlement system ofClearstream Banking Luxembourg. Scheduled to go live in January 2003, thenew link would significantly improve settlement efficiency, enabling Asianinvestors to trade international securities in a secure and robustly designedenvironment.
31 May The Government published the First Quarter Economic Report 2002. Thereport pointed out that overall economic activity remained modest in the firstquarter of 2002, after the severe downturn in 2001. GDP fell by 0.9% inreal terms in the first quarter of 2002 over a year earlier. Externally, totalexports of goods were still weak at the beginning of the year, yet picked upprogressively in the ensuing months as the global and regional economicconditions improved. Exports of services accelerated on the back of a swiftrecovery in inbound tourism, a sustained rise in offshore trade, and a markedrebound in exports of transportation services. Locally, consumer spendingmoderated further along with rising unemployment and wage restraint.While machinery and equipment intake was held back by an uncertainbusiness outlook and weakened corporate profits, building and constructionactivity also remained slack in overall terms.
In the May update of the economic forecasts for 2002, the forecast growthrate in real terms of GDP was maintained at 1%, same as that in the Budgetround. The forecast rate of change in the Composite CPI was also kept at-2.8%.

248
An ASA was signed between the Governments of the HKSAR and theHellenic Republic.
1 Jun Malta granted visa-free treatment to holders of HKSAR passport withimmediate effect.
Applications to the $5 billion Continuing Education Fund commenced. TheFund was to help pursuit of continuing education so as to prepare HongKong's workforce for the knowledge-based economy. Eligible applicantsshould seek to enrol in approved courses in a number of specific sectors and,upon successful completion of the course, would be reimbursed 80% of thecourse fee or up to $10,000.
5 Jun The Government announced that the sale of subsidised sale flats wouldresume after a ten-month moratorium, yet in a cautious and orderly manner.
6 Jun HKMA announced that the new two-way Joint Clearing Facility establishedwith the Guangzhou Branch of PBOC would commence operation on 22 June2002. Under the new clearing arrangement, the time required for clearingHong Kong dollar cheques drawn on banks in Guangdong, includingShenzhen, and presented in Hong Kong was reduced to two working days.
7 Jun An ASA was signed between the Governments of the HKSAR and theRepublic of Croatia.
10 Jun Rwanda granted visa-free treatment to holders of HKSAR passport withimmediate effect.
11 Jun The Lok Ma Chau Spur Line was authorized, for construction to commenceat end-2002. The project cost would be around $10 billion.
OFTA announced the implementation plan for the Billing and MeteringIntegrity Scheme. Operators were given a six-month transition period tomake their systems ready to comply with the respective standards andprocedures as from 1 January 2003.
OFTA issued a statement setting out the views of the TelecommunicationsAuthority on interconnection charging arrangements for International CallForwarding Services.
12 Jun A 3-month reward scheme administered by the Hong Kong Customs andfinanced by the Business Software Alliance to combat the use of piratedcomputer software in business was launched.
14 Jun The Hong Kong Mortgage Corporation (HKMC) announced the introductionof the Home Owner Mortgage Enhancement Programme. This was a newmortgage insurance programme to reduce the financial burden ofhome-owners in negative equity and to provide an effective tool for banks toreduce the credit risk of mortgage loans with a current loan-to-value ratioabove 100%. It provided insurance to cover a bank’s credit exposure above90% and up to 140% of the current value of the residential property at thetime of refinancing.

249
15 Jun TID and the Office of the US Trade Representative reached agreement onimplementation of the paperless Electronic Visa Information System, underwhich no paper visas would be required for customs clearance in the UnitedStates in respect of imports of textiles items subject to quota control.
19 - 20 Jun Hong Kong hosted the OECD Global Forum on Trade: Workshop on theDevelopment Dimension of the Singapore Issues. More than 80 participantsfrom some 20 economies attended the workshop.
19 - 21 Jun The Commissioner for Narcotics presided at the Plenary Meeting of theFinancial Action Task Force on Money Laundering (FATF) held in Paris.This was the last Plenary Meeting of FATF under Hong Kong’s presidency.During its tenure as President of FATF from July 2001 to June 2002, HongKong had assumed a leadership role in the formulation and promotion ofpolicies and measures for combating money laundering and terroristfinancing.
21 Jun International investment position (IIP) statistics, as a balance sheet showingthe external financial assets and liabilities of an economy at a particular timepoint, were released for Hong Kong for the first time. Following release ofdetailed balance of payments (BoP) statistics in June 2000, the release ofannual IIP statistics was a major statistical milestone for Hong Kong, in linewith enhancing the transparency of Hong Kong’s financial markets.
The Finance Committee of the Legislative Council approved an injection of$10 billion as equity into the Urban Renewal Authority in phases over thefive financial years from 2002/03 to 2006/07 to facilitate implementation ofthe urban renewal programme.
24 Jun Detailed external debt (ED) statistics was released for Hong Kong for the firsttime. The release of quarterly ED statistics, in addition to quarterly BoPstatistics and annual IIP statistics, would help enhance further thetransparency of Hong Kong’s financial markets and help support financialsurveillance. Hong Kong’s external debt position was healthy, with a majorproportion of it arising from normal operations of the banking sector and withthe Government incurring no external debt (indeed no debt at all).
The State Council announced its decision to abolish the “ProvisionalMeasures for Unloading State-owned Shares to Raise Funds for the SocialSecurity System”, which required those state-owned enterprises planning toraise capital in the Mainland stock markets to sell state-owned sharesequivalent to 10% of the equity capital to be raised for supporting the socialsecurity system.
The Government signed a supplemental agreement with the Motor Insurers’Bureau of Hong Kong to set up a facility to cover third party bodily injury ordeath claims arising from an act of terrorism under a motor insurance policy.
25 Jun The Cato Institute of the United States, in conjunction with the FraserInstitute of Canada and other research institutes around the world, releasedthe Economic Freedom of the World: 2002 Annual Report. Hong Kong wasagain ranked the freest economy in the world. Hong Kong continued to farewell in regard to “size of government”, “freedom to exchange with

250
foreigners” and “regulation of credit, labour and business”.
The Government awarded the Shatin to Central Link to the Kowloon-CantonRailway Corporation (KCRC). The project cost would be around$26 billion at 2000 prices.
The Government announced its intention to conduct a feasibility study on thepros and cons of merging KCRC and the Mass Transit Railway CorporationLtd. (MTRCL).
25 - 26 Jun The Asia Leadership Forum was held in Hong Kong. This wasBusinessWeek’s flagship event in Asia. Entitled “Transcending Hierarchy:Leadership in an Empowered World”, the event was attended by some 300senior corporate leaders and policy makers from 15 countries.
27 Jun The Chief Executive officially opened the Hong Kong Science Park. It wasaimed at creating a focal point and a conducive environment for theclustering of technology-based firms for applied research and developmentactivities. The initial clusters being developed were information technologyand telecommunications, electronics, biotechnology and precisionengineering.
27 - 28 Jun The SME Market Day organised by the Hong Kong Trade DevelopmentCouncil (TDC) attracted participation by trade promotion organisations fromover 24 countries and regions. The event had fast become the region’spremier one-stop shop for information on partnership opportunities for localSMEs and their overseas and Mainland counterparts.
28 Jun SFC introduced an additional alternative client identification procedure tofacilitate the opening of trading accounts over the Internet.
The Financial Market Development Task Force submitted its first phaserecommendations to the Financial Secretary. "Quick win" proposalsrecommended by the Task Force included streamlining procedures andlowering costs for the public offering of debt and equity, and relaxing shortselling rules.
The Financial Secretary announced plans for the issue of a new $10 note. Itwas to be issued by the Government of the HKSAR, and would be graduallyput into circulation in late summer and early autumn 2002. It wouldcirculate in addition to the $10 coin and the existing green $10 note, both toremain as legal tender.
The then Financial Services Bureau issued a consultation paper on theoutcome of a consultancy to review the role of the Official Receiver's Office.
29 Jun The Standing Committee of the National People’s Congress passed the Lawon Promotion of Small and Medium-sized Enterprises (SMEs), which wouldstrengthen the support being provided to SMEs in the Mainland. SMEswere encouraged to introduce foreign capital, technology and managementskills to their businesses, and to establish Chinese-foreign equity jointventures and Chinese-foreign contractual joint ventures.

251
HA invited applications for funding support from the $20 million HousingAuthority Research Fund (HARF), which was newly launched to promoteresearch activities that could improve the quality of public housingdevelopment and construction.
1 Jul The Chief Executive Mr Tung Chee-hwa was sworn in by the President ofthe People’s Republic of China.
The Chief Executive (CE) launched the Accountability System for theGovernment of the HKSAR. Under this new system, three Secretaries ofDepartment and eleven Directors of Bureaux are nominated by the CE fromboth inside and outside the civil service for appointment by the CentralPeople's Government as Principal Officials (POs) under the Basic Law.These POs are employed on terms and conditions different from those of theCivil Service and they are not civil servants. All POs are accountable to theCE for the success or failure of matters under their policy portfolios. AllDirectors of Bureaux continue to be supported by civil servants in theformulation and implementation of policies. The Civil Service remainspermanent, meritocratic and politically neutral under the new system, and thesystem for civil service appointment, posting, promotion and disciplinaryaction remains unchanged.
3 Jul HKMA announced that Standard Chartered Bank was appointed as theSettlement Institution for the euro clearing system in Hong Kong. Thesystem was to facilitate the efficient settlement of euro transactions on areal-time basis within the Hong Kong time zone.
10 Jul HKEx consulted the market on the proposed model of Third Party Clearing,which would give Exchange Participants the option to out-source clearingand settlement of their stock exchange trades to a designated GeneralClearing Participant, thereby enabling them to conduct their business moreflexibly.
11 Jul The Industrial and Commercial Bank of China announced commencement ofits direct remittance service with banks in Taiwan, following lifting of the banby the Taiwanese government on direct remittance between Mainland banksand Taiwanese banks.
14 Jul Aruba granted visa-free treatment to holders of HKSAR passport withimmediate effect.
18 Jul HKEx and Standard & Poor's announced an agreement providing for thecreation of a new series of equity indices covering stocks listed in HongKong.
19 Jul The Prevention of Copyright Piracy Ordinance (Amendment of Schedule 1)Order 2002 commenced operation. It established a statutory licensingrequirement for manufacturing stampers used for the mass production ofoptical discs.
The Mandatory Provident Fund Schemes (Amendment) (No. 2) Ordinancewas enacted so as to improve the effectiveness and efficiency of the MPFSystem. This included setting up a mechanism for adjusting the minimum

252
and maximum levels of relevant income for MPF contributions, adjusting theminimum level of relevant income from $4,000 to $5,000 for taking effect on1 February 2003, simplifying MPF scheme administration, and enhancingprotection of scheme members’ interests.
21 Jul Hong Kong Customs implemented the Electronic Data Interchange - DutiableCommodities Permit, enabling the submission of permit applications via arecognised electronic service.
24 Jul The Government and MTRCL entered into a Project Agreement on thePenny’s Bay Rail Link, as the a principal gateway to Hong Kong Disneyland.The project, estimated to cost $2 billion, would be completed in 2005 to tiein with the opening of the theme park.
Greenland and Faroe Islands granted visa free access to holders of HKSARpassport with immediate effect.
The Labour Department launched the Youth Work Experience and TrainingScheme to provide on-the-job training of 6 – 12 months duration to youngpeople aged 15 – 24 with educational attainment below degree level. Thescheme would provide training for 10 000 young people in two years with aview to enhancing their employability.
25 Jul HKEx issued a consultation paper on the proposed amendments to the ListingRules relating to initial listing and continuing listing criteria and cancellationof listing procedures. Prices of many low-priced stocks fell significantly onthe following day. Responding to public reaction, the Financial Secretary on31 July 2002 appointed an independent Panel of Inquiry to look into thecircumstances relating to the preparation and release of the consultationpaper. HKEx on 15 November 2002 released a revised consultation paper oncontinuing listing criteria and related issues.
29 Jul HKMA announced that its CMU would introduce a new clearing, settlementand custodian service for US Treasuries. The new service would commencein the fourth quarter of 2002, enabling investors in Hong Kong and elsewherein Asia to settle US Treasuries during Hong Kong hours through CMU.Also, HKMA appointed Citibank as its custodian for custody of USTreasuries on behalf of CMU.
31 Jul The Government signed a Provisional Agreement with MTRCL for the TungChung Cable Car Project. This enabled MTRCL to take forward thedetailed design and the necessary statutory procedures before the formalaward of the franchise. The Project was scheduled for completion in thesecond half of 2005.
1 Aug The Census and Statistics Department released a revised GDP series as aresult of a major revision exercise. It was mainly for benchmarking andrebasing so as to bring the compilation framework up-to-date, as well as forgearing in with the latest statistical standards in this area.
The Government started construction work on Phase II of the Hong KongWetland Park as a major eco-tourism facility. The Park was scheduled forcompletion in the second half of 2005.

253
2 Aug The Taiwanese government lifted the ban on direct investment by Taiwaneseenterprises in the Mainland.
Hong Kong Customs signed a Cooperative Arrangement with the NationalCopyright Administration of the Mainland for strengthening enforcementcooperation.
4 Aug HA set up a Business Opportunity Centre to provide one-stop services toprospective business operators seeking to rent HA premises. It wouldprovide the latest information on lettable shops and rent levels, as well asbriefings on letting procedures and leasing arrangements.
5 Aug OCI issued a “Guidance Note on the Corporate Governance of AuthorizedInsurers”.
The first six Equity Linked Instruments were listed, after the Stock Exchangeof Hong Kong introduced new Listing Rules to allow for a wider range ofderivative products.
7 Aug The European Commission published its fourth report on the HKSAR. Thereport concluded that Hong Kong maintained its unique and separate identitywithin China under the “One Country, Two Systems” principle. It alsohighlighted the good trade relations between the European Union and HongKong.
16 Aug The Government announced full liberalisation of the rice trade as from1 January 2003, whereby import quota for rice would be removed.Interested parties were invited to apply for registration as rice stockholdersfor 2003.
18 Aug The MTR Tseung Kwan O Line commenced service, extending the MTRservice to the Tseung Kwan O and Yau Tong areas.
27 Aug TDC and the Guangdong Sub-Council of the China Council for thePromotion of International Trade co-organised a Guangdong-Hong Kong-Taiwan Economic Cooperation Forum in Hong Kong. The Chief Executiveof the HKSAR, the Governor of Guangdong Province, and the Chairman ofthe Chamber of Taiwan Businessmen in China spoke at the forum.
30 Aug The Government published the Half-yearly Economic Report 2002. Thereported pointed out that the Hong Kong economy resumed positive growthat 0.5% in real terms in the second quarter of 2002 over a year earlier, afterreceding in the past three quarters. This was mainly propelled by a visiblepick-up on the external front. On the back of firmer regional demand andalso improved external price competitiveness from a weaker US dollar, totalexports of goods reverted to increase. Exports of services were bolstered bysignificant leaps in inbound tourism and offshore trade. But locally,consumer spending was restrained by the unemployment hike andmoderating wages. Machinery and equipment intake was held back bysubdued business climate and an overhang of excess capacity, which morethan offset a mild increase in building and construction output uponintensification of work on some major projects.

254
In the August update of the economic forecasts for 2002, the forecast of GDPgrowth was revised up to 1.5% in real terms, from 1% in the May update.The forecast rate of change in the Composite CPI, at -2.8%, was the same asthe May update.
31 Aug HA revised the income and asset limits for HOS applicants for the secondhalf of 2002/03, following a mid-year review to reflect the downwardadjustments in the general price level and the average mortgage rate in thepreceding 12 months.
9 Sep HA’s Commercial Properties Committee endorsed the refund of part of therent deposit to commercial tenants. Rent deposit for all commercial tenantswas henceforth standardised at two months’ rent.
10 Sep The Financial Secretary released the report of the Panel of Inquiry appointedon 31 July 2002 to look into the circumstances relating to the preparation andrelease of the consultation paper on amendments to the Listing Rules byHKEx. The report made various recommendations on the consultationprocess.
12 Sep US President George W. Bush, in his speech before the United Nations,implicitly warned military action against Iraq, unilateral from the UnitedStates if necessary, if the United Nations did not enforce the existingresolutions on Iraq to eliminate its weapons of mass destruction.
13 Sep With a grant and related support from the Government, and a donation fromthe Hong Kong Jockey Club Charities Trust, the Hong Kong Design Centrecommenced operation. As a multi-disciplinary design centre, it wouldpromote design as a value-added activity, raise design standards, fosterdesign-related education, and lift the profile of Hong Kong as an innovativeand creative hub.
18 Sep Hong Kong was named the best-performing host economy for foreign directinvestment in Asia, according to the World Investment Report 2002 releasedby the United Nations Conference on Trade and Development. Hong Kongheld the second place in the global ranking, after Belgium/Luxembourg.
20 Sep The Government received the Phase One Final Report of the Task Force onReview of Civil Service Pay Policy System. It made recommendations onthe priority areas for more detailed study in the short, medium and long term.It was then released on the same day for public consultation until15 November 2002.
20 Sep The Chief Secretary for Administration led a delegation to Shanghai to attendthe Third Meeting of the Mainland/HKSAR Conference on the Coordinationof Major Infrastructure Projects. At the meeting, the Joint Expert Group onGuangzhou-Shenzhen-Hong Kong Express Rail Link and the Expert Groupon Port and Logistics Planning and Development reported the work progressand discussed the plans ahead. Consensus reached by both sides includedaffirming in principle the necessity for development of a Guangzhou-Shenzhen-Hong Kong express rail link, and agreeing to launch a phase twostudy on the two more viable alignment options; commissioning research

255
bodies to jointly explore the room for cooperation in logistics developmentand identify specific project items for collaboration; and conducting a jointstudy on an express transport link connecting Hong Kong and the west bankof the Pearl River Delta.
23 Sep Hong Kong Customs and US Customs signed a Declaration of Principles onHong Kong’s participation in the Container Security Initiative. It signifiedcommitment by the two sides to enhancing the security of ocean-goingcontainers through intensifying information exchange and strengtheningcustoms cooperation at seaport.
Affected by a possibly imminent outbreak of war on Iraq, the price of Brentcrude oil surged to a year-high of nearly US$30 per barrel.
24 Sep The Government asked KCRC to proceed with detailed planning and designof the Kowloon Southern Link. The project was estimated to cost around$9.2 billion.
24 - 26 Sep Hong Kong hosted the 2002 Forbes Global CEO Conference, which broughtsome 350 leading business executives to Hong Kong to discuss issues aroundthe theme of “reassessing the business blueprint”.
26 Sep The Financial Secretary appointed an Expert Group to review the operation ofthe three-tier regulatory structure of the Hong Kong financial market,particularly in relation to listing related matters. The Expert Group wasexpected to submit its report by the end of March 2003.
1 Oct SFC amended its Financial Resources Rules to improve risk management ofintermediaries engaged in securities margin lending.
The pay of civil servants and specified public officers was reduced by 1.58%to 4.42% in accordance with the Public Officers Pay Adjustment Ordinance.
To enhance vehicular throughput during the overnight period at the Lok MaChau/Huanggang Boundary crossing, the number of inspection lanes at theHuangguang Control Point on the Shenzhen side was increased from three(one northbound and two southbound) to five lanes (one northbound and foursouthbound) between midnight and 7 am. Corresponding adjustment wasmade at the Lok Ma Chau Control Point on the Hong Kong side.
OFTA reduced further the interconnection charge over the network of PCCW-HKT for mobile phone services from 4.8 cents per minute to 4.5 cents perminute. The interconnection charge for value-added services remainedunchanged.
2 Oct Airport Authority Hong Kong awarded a 15-year franchise to DHLInternational (Hong Kong) Ltd. for the development, construction andoperation of a dedicated express cargo terminal at HKIA.
HKMC announced the launch of a new issue of retail bonds which would beplaced to investors through an enlarged group of placing banks. The newissue would also feature more choice on structure and return as well as areliable market making arrangement.

256
9 Oct Cathay Pacific Airways Ltd. (CPA) and DHL Worldwide ExpressInternational Ltd. (DHL) announced that they had concluded a newjoint-venture agreement under which DHL would acquire a 30% stake inCPA’s wholly owned subsidiary, Air Hong Kong Ltd. (AHK). AHK wouldthen purchase a fleet of mid-range, wide-bodied aircraft to operate, therebyenabling DHL to enhance its service network to the major cities in the AsiaPacific region.
The Government completed and handed over the first patch of reclaimed landof about 68 hectares to the Hongkong International Theme Parks Ltd. Thistriggered superstructure construction of the Hong Kong Disneyland.
11 Oct The US Congress voted to give the President the authorization to use armedforces against Iraq.
Restructuring of China’s airline industry was completed with theestablishment of three airline groups, namely China Airlines, China EasternAirlines and China Southern Airlines. Along with the restructuring, the roleof the General Administration of Civil Aviation would be reduced to aregulator in air traffic management, aviation security and public relations.
OFTA decided to give the 3G licensees a one-year waiver on the submissionof performance bonds, in face of the changing market conditions.
OFTA finalised the details of the Class Licence for In-buildingTelecommunications Systems to regulate the provision of in-buildingtelecommunications services and to facilitate the development of advancedin-building telecommunications systems and intelligent buildings in HongKong.
14 Oct The Economic and Trade Office (ETO) of the HKSAR Government inGuangdong was officially opened in Guangzhou, after four months of initialoperation. It was the first ETO established in the Mainland, and was taskedwith strengthening the already intimate economic and trade ties betweenHong Kong and Guangdong.
15 Oct The Government set up the Manpower Development Committee chaired bythe Secretary for Education and Manpower to render advice on the manpowerneeds of Hong Kong and the promotion and regulation of the vocational,post-secondary and continuing education sectors.
16 Oct Vice Premier Qian Qichen stated that “santong” between the Mainland andTaiwan was an economic issue and should not require political negotiations.He further proposed defining direct air and shipping links between theMainland and Taiwan as “cross straits” rather than “domestic”.
21 Oct The Hong Kong Public Key Infrastructure Forum was established with thePostmaster General elected as Chairman, and comprising public and privatesector organisations with a common interest to promote secure e-commerce.It would represent Hong Kong in international fora to foster cooperation insuch matters as cross-certification, application development andinter-operability arrangements.

257
The Government revamped the Task Force on Employment chaired by theFinancial Secretary so as to widen its representation to include members ofthe Legislative Council pertaining to the political parties. The newcomposition would enhance the role of the Task Force as a high-level forumto tap the views of the business community, labour sector, academia andpolitical parties on ways to tackle unemployment.
22 Oct New bus franchises for about ten years for the North Lantau and Airport busnetwork were granted to Citybus Ltd., Long Win Bus Co. Ltd. and NewWorld First Bus Services Ltd. respectively. The new franchises wouldcommence upon expiry of the existing franchises of these companies inmid-2003.
26 - 27 Oct The Chief Executive attended the Tenth Asia Pacific Economic CooperationEconomic Leaders’ Meeting in Los Cabos, Mexico. Leaders re-affirmedtheir full commitment to ensuring the successful completion of the DohaDevelopment Agenda negotiations by 1 January 2005.
30 Oct China announced the formal inauguration of its Gold Trading Centre inShanghai.
31 Oct US Customs issued a final rule on 24 hours advance cargo declaration filing.
HA decided to defer the rent review on the vast majority of public rentalhousing (PRH) units for another year until 1 December 2003, covering over540 000 PRH flats and 7 700 Interim Housing units.
HA also endorsed the recommendations of the Ad Hoc Committee on Reviewof Domestic Rent Policy to enhance the Rent Assistance Scheme. Theseincluded relaxation of the eligibility criteria for elderly households,acceptance of tenants affected by redevelopment to apply for rent assistanceimmediately upon rehousing to new or refurbished flats, and extension of thegrace period for beneficiaries of the scheme to move to cheaper flats fromtwo to three years.
4 Nov China and the Association of Southeast Asian Nations (ASEAN) signed aFramework Agreement on Comprehensive Economic Cooperation at theSixth China-ASEAN Summit held in Phnom Penh to initiate the processtowards establishing a China-ASEAN Free Trade Area (FTA) by 2010. As afirst step, negotiations on abolition of import tariffs on some 600 agriculturalitems would take place soon. Negotiations on other tariff concessions andon trade in services would commence in due course.
5 Nov Construction of Route 9 – Cheung Sha Wan to Sha Tin commenced. Theproject, to be completed by April 2007, was estimated to cost $6.8 billion.
6 Nov The US Fed Funds target rate was reduced by 50 basis points to 1.25% as anew 41-year low, for the first time in 2002. The Base Rate under theDiscount Window of HKMA was adjusted by the same magnitude, to 2.75%on the next day. The best lending rate of the commercial banks in HongKong and the savings deposit rates of the major banks in Hong Kong werethen lowered by lesser magnitudes, by 12.5 basis points to 5.0% and onaverage by 12 basis points to a historical low of 0.03% respectively.

258
7 Nov The China Securities Regulatory Commission (CSRC) and jointly issued the“Provisional Measures on Administration of Domestic Securities Investmentsof Qualified Foreign Institutional Investors (QFII)”, allowing QFII to investin A shares and bonds listed on China’s stock exchanges. These newmeasures came into effect on 1 December 2002.
8 Nov The United Nations Security Council unanimously adopted Resolution 1441on Iraqi disarmament.
The 16th National Congress of the Communist Party of China (CPC)commenced. The “Three Represents” was incorporated in the Partyconstitution. A wider spectrum of people, including private entrepreneurs,was admitted into the Party. The Congress also re-affirmed the direction ofeconomic reform, modernisation and liberalisation. The ultimate aim was tobuild a better-off society in an all-rounded way, with real GDP quadrupling thelevel in 2000 by 2020.
12 Nov The 2003 Index of Economic Freedom published by the US HeritageFoundation (HF) ranked Hong Kong as the freest economy in the world forthe ninth consecutive year since the Index was first published in 1995. HFrecognised Hong Kong’s virtues in having a duty-free port, low cost ofgovernment, very low level of inflation, very low barriers to foreigninvestment, very low level of restrictions in banking and finance, low level ofintervention in wages and prices, strong property rights, very low level ofregulation, and low level of black market activity. Yet it also notedincreasing government intervention in the economy.
In the 2002 Global Competitiveness Report released by the World EconomicForum (WEF) based in Switzerland, Hong Kong’s ranking fell further from13th to 17th. This fall was largely due to a deterioration in the rating on“public institutions”. The ratings on “technology” and “macroeconomicenvironment” showed marginal improvement.
The domestic free television programme services licences of Asia TelevisionLtd. and Television Broadcasts Ltd., both for twelve years, were renewed.The renewed licences provided for migration from analogue to digitalbroadcasting.
13 Nov The Secretary for Housing, Planning and Lands announced a package of ninemeasures to stabilise the housing market. These measures included amoratorium on land sales for 14 months and suspension of propertydevelopment tenders from the two railway corporations, cessation of HOS,Tenants Purchase Scheme (TPS) and mixed development schemes withprivate developers, close monitoring of the public rental housing productionprogramme, implementation of a new home loan scheme, and relaxation oftenancy control and anti-speculation measures.
14 - 15 Nov Hong Kong participated in the WTO Informal Ministerial Meeting hosted byAustralia, to discuss multilateral trade issues with 24 other Trade Ministersand the Director-General of WTO.
15 Nov The Hong Kong Shipping Register hit a new record of 16 million grosstonnes.

259
18 Nov HKEx launched the Mini-Hang Seng Index (Mini-HSI) Options for trading.Margins for the Mini-HSI Options were a fraction of the HSI options, therebyenabling more individual investors to participate in the stock index optionsmarket.
19 Nov HKMC announced an expansion in the Mortgage Insurance Programme.The loan size ceiling for mortgage loans on property under construction (i.e.equitable mortgage loans) covered by the Programme was increased from$5 million to $8 million with a loan-to-value ratio of up to 85%.
21 Nov The Government’s Inter-operability Framework (IF) was released after wideconsultation with the general public, the IT industry and Government bureauxand departments. This was a set of technical and data specifications forachieving greater inter-operability amongst Government systems and forenabling more effective implementation of joined-up e-government services.It would also enable the Government systems to interact much moreseamlessly with those in the private sector. Compliance with IF by theGovernment systems would be mandatory as from January 2003.
25 Nov The direct link from HKMA's CMU to Euroclear, the Brussels-basedinternational central securities depository, commenced live operation, tosupplement the existing link from Euroclear to CMU established in 1994.
26 Nov The Deep Bay Link was authorized. The project, estimated to cost$4.6 billion, would be completed by end-2005 together with the ShenzhenWestern Corridor.
The Government issued an Invitation for Expressions of Interest to occupyand use the Tuen Mun Pier for the operation of cross-boundary passengerferry services. The Government would examine the submissions with aview to determining whether to proceed with a tender exercise to implementthe project.
28 Nov HA endorsed the Government’s request to re-position itself into a facilitatingand enabling role. It agreed to halt the production and sale of HOS andPrivate Sector Participation Scheme (PSPS) indefinitely, to give cashsubsidies to eligible non-elderly families for renting accommodation in theprivate sector under the proposed General Rental Allowance, as well as tohalt the sale of rental units under TPS after Phases 6A and 6B. Also, itdecided not to pursue the mixed development project at the former NorthPoint Estate.
SFC announced that three hedge funds had been authorized for sale to thepublic. This followed the introduction of hedge funds authorizationguidelines in May.
28 - 29 Nov The Mainland and HKSAR Joint Commission on Commerce and Trade heldits fourth meeting in Hong Kong. The two sides held in-depth discussionson issues of mutual interest in the area of promoting and enhancing bilateraltrade and investment.

260
29 Nov The Joint Commission set up an E-business Working Group to enhanceexchange and co-operation in e-commerce amongst the governments andbusiness sectors in the Mainland and Hong Kong.
Restructuring of China’s power industry was completed with theestablishment of five nationwide independent power generation companiesand two regional based electricity distribution companies. These companieswere formed by breaking up the monopoly of the former State PowerCorporation. A new regulatory body, the State Power RegulatoryCommission, was also set up.
The Government published the Third Quarter Economic Report 2002. Thereport pointed out that the Hong Kong economy, after turning around to amodest growth in the second quarter of 2002, picked up visibly further to ayear-on-year growth of 3.3% in real terms in the third quarter. Externally,total exports of goods continued to benefit from sustained strong demand inthe Mainland, generally increased import intake in the region, and a furthergain in external price competitiveness from the earlier weakening in the USdollar. Exports of services performed even better, upon an extensive surgein inbound tourism, offshore trade and transportation services. Thedomestic sector, whilst still weak, also showed some relative improvement inoverall terms. Consumer spending had a lesser decline. But the reductionin intake of machinery, equipment and computer software outweighed themodest increase in overall building and construction output. In tandem withthe pick-up in overall economic activity, labour market conditions alsoimproved.
In the November update of the economic forecasts for 2002, the forecast ofGDP growth was raised further to 2% in real terms, from 1.5% in the Augustupdate. The forecast rate of change in the Composite CPI was loweredslightly to -3%, from -2.8% in the August update.
The Government of the HKSAR entered into bilateral agreements oninformation and communications technology and on SMEs respectively withthe Government of Ireland, for strengthening trade and economic linksbetween Hong Kong and Ireland.
1 Dec Five more cities in the Mainland, viz. Guangzhou, Zhuhai, Wuhan, Nanjingand Qingdao, were opened up to foreign banks for conducting renminbibusiness. Before that, renminbi business was open to foreign banks only infour cities, viz. Shanghai, Shenzhen, Tianjin and Dalian.
2 Dec The US rule on 24 hours advance cargo declaration filing came intooperation.
After reaching consensus with the Mainland authorities on the inspection andquarantine requirements for chilled chicken imported from the Mainland, thefirst three consignments of Mainland chilled chicken arrived in Hong Kong.
OCI initiated a consultancy study on the feasibility of establishing aninsurance policyholders protection fund in Hong Kong.

261
3 Dec Shanghai won the bid to host the World Exposition in 2010.
HKMA and the Exchange Fund Investment Ltd. (EFIL) announced that witheffect from January 2003, the management of the Exchange Fund's long-termHong Kong equity portfolio would be transferred from EFIL to HKMA.HKMA would continue to manage the Hong Kong equity portfolio throughthe existing external fund managers appointed by EFIL. EFIL’s operationswould then be wound down by end-January 2003.
4 Dec The Commerce, Industry and Technology Bureau and Industry Canada of theCanadian Government renewed the MOU on co-operation in information andcommunications technology.
The Commerce, Industry and Technology Bureau signed a MOU onco-operation in biotechnology with Industry Canada of the CanadianGovernment.
7 Dec The Shanghai Municipal Government and the Universal Studios signed anagreement in principle to build a theme park in Shanghai by 2006.
9 Dec Hong Kong Customs signed a MOU under the “Watch-out Programme”with 16 representatives from the cargo industry for promoting cooperationand partnership.
SFC published the Report of the Steering Committee on the Enhancement ofFinancial Infrastructure II, which outlined recommendations aiming to makeHong Kong the preferred location in the Asian time zone for investors.
12 Dec SFC and HKMA signed a new MOU, setting out their respective roles andresponsibilities in the regulation and supervision of Registered Institutionsand their relevant staff under SFO. Registered Institutions would beauthorized institutions under the Banking Ordinance having registered withSFC to conduct regulated securities activities.
13 Dec The Secretary for Financial Services and the Treasury announced the target tobring SFO into operation on 1 April 2003.
14 Dec The Government accepted the recommendations of the SME Committee toenhance further the effectiveness of the SME funding schemes. Theseincluded expanding the scope of the Government’s guarantee to includeworking capital loans, raising the ceilings of the guarantee/grant forindividual SMEs, extending the guarantee period, and rationalising theapplication procedures.
16 Dec HA approved a new Home Assistance Loan Scheme (HALS). To belaunched in January 2003, it would replace the Home Purchase Loan Scheme(HPLS) managed by HA and the Home Starter Loan Scheme (HSLS)operated by the Hong Kong Housing Society to ensure rational allocation ofhousing resources and improve operational efficiency. It would be availableto both Green Form and White Form applicants, who would receive the sameamount of interest-free loan or monthly mortgage subsidy to acquire theirown homes in the private sector.

262
17 Dec TDC and the Hong Kong Logistics Development Council co-organised theHong Kong Logistics Services Expo & Conference in Guangzhou. Thiswas Hong Kong’s first large-scale event to promote its value-added logisticsservice capabilities in the Mainland.
Hong Kong Accreditation Service (HKAS) signed a MOU with the Collegeof Pathologists (HKCPath) on co-operation in the accreditation programmefor medical testing laboratories. It was scheduled to be launched in April2003.
18 Dec The Landlord and Tenant (Consolidation)(Amendment) Ordinance 2001, forstreamlining statutory procedures for repossession of leased premises andtenancy renewal in the private domestic rental market, was enacted.
23 Dec The Chief Secretary for Administration led a delegation to Beijing toexchange views with officials of the Hong Kong and Macao Affairs Office ofthe State Council on a number of proposals to improve the operation ofboundary crossings. Consensus was reached on setting the long-termobjective to complete cross-boundary clearance on both sides within30 minutes for passengers and 60 minutes for goods vehicles, implementing24-hour passenger clearance at Lok Ma Chau/Huangang before the comingLunar New Year, exploring the possibility of increasing the through trainservice between Hong Kong and Guangzhou, and conducting a study on anadditional bridge linking the checkpoints at Lok Ma Chau and Huanggang.
27 Dec Amidst heightened war tension on Iraq, the price of Brent Crude oil reacheda near two-year peak of US$31.3 per barrel.
31 Dec By end-2002, the Government had already provided e-options for 81% of thepublic services that were amenable to the electronic mode of service delivery.It would strive to achieve the overall e-government target of providinge-options for 90% of such public services by end-2003.
Hong Kong’s container throughput rose by 7% over 2001 to around19 million TEUs in 2002. The Hong Kong port remained as the busiest portin the world in terms of containers handled.
Visitor arrivals reached a new record high of 16.6 million in 2002,representing a hefty increase of 21% over 2001.

263
Statistical Appendix
Table Page
1. Gross Domestic Product 265
2. Gross Domestic Product by main expenditure component(at current market prices)
266
3. Gross Domestic Product by main expenditure component(at constant (2000) market prices)
267
4. Gross Domestic Product by economic activity(at current prices)
268
5. Gross Domestic Product by economic activity(at constant (2000) prices)
269
6. Gross National Product and external factor income flows by income component (at current market prices)
270
7. Balance of payments account by major component 271
8. Visible and invisible trade(at current market prices)
272
9. Re-exports by market 273
10. Re-exports by source 273
11. Re-exports by selected commodity group 274
12. Domestic exports by market 273
13. Domestic exports by selected commodity group 275
14. Imports of goods by source 275
15. Imports of goods by end-use category 276
16. Exports and imports of services by component(at current market prices)
276
17. Travel and tourism 277
18. Incoming visitors by source 277
19. Hong Kong residents travelling abroad by destination 278
20. Private consumption expenditure by broad category 278
21. Expenditure on building and construction 279
22. Property prices and rentals 279

264
Table Page
23. Cost and price indices for the building and construction industry 280
24. Expenditure on machinery, equipment and computer software 280
25. Indices of Industrial Production 281
26. Business receipts indices for service industries/domains 28227. Market exchange rate of the Hong Kong dollar against
the US dollar and the Effective Exchange Rate Index283
28. Hong Kong dollar interest rates 284
29. Deposits by major type of authorized institution 285
30. Money supply 286
31. Loans and advances extended by authorized institutions 287
32. Assets and liabilities of authorized institutions 288
33. Balance sheet of the Exchange Fund 289
34. Labour force characteristics 290
35. Employment in selected major economic sectors 291
36. Reported vacancies in selected major economic sectors 292
37. Number of workers engaged at building and construction sites 293
38. Average labour earnings by major economic sector 293
39. Wage indices by selected major economic sector 294
40. Composite Consumer Price Index 295
41. Consumer Price Index (A) 296
42. Implicit price deflators of GDP and its main expenditure components 297

265
Table 1 : Gross Domestic Product# (GDP)
At current market prices At constant (2000) market prices
Overall GDP Per capita GDP Overall GDP Per capita GDP
$Mn%
change $ %
change $Mn%
change $%
change
1992 791,319 16.8 136,423 15.9 931,692 6.6 160,622 5.7
1993 912,809 15.4 154,687 13.4 990,831 6.3 167,908 4.5
1994 1,029,773 12.8 170,622 10.3 1,045,154 5.5 173,170 3.1
1995 1,096,263 6.5 178,078 4.4 1,085,764 3.9 176,371 1.8
1996 1,210,925 10.5 188,163 5.7 1,132,524 4.3 175,981 -0.2
1997 1,344,546 11.0 207,194 10.1 1,189,966 5.1 183,374 4.2
1998 1,279,850 -4.8 195,585 -5.6 1,130,838 -5.0 172,813 -5.8
1999 1,246,134 -2.6 188,622 -3.6 1,169,474 3.4 177,019 2.4
2000 1,288,338 3.4 193,299 2.5 1,288,338 10.2 193,299 9.2
2001 1,278,995 -0.7 190,188 -1.6 1,296,512 0.6 192,793 -0.3
2002+ 1,271,082 -0.6 187,282 -1.5 1,325,687 2.3 195,327 1.3
Average annual growth rate:
1992-2002 (10 years) 4.9 3.2 3.6 2.0
1997-2002 (5 years) -1.1 -2.0 2.2 1.3
Notes : (#) Revised series incorporating the results of a technical revision to GDP as announced on1 August 2002.
(+) Preliminary figures.

266
Table 2 : Gross Domestic Product by main expenditure component#
(at current market prices)
1998 1999 2000 2001 2002+
$Mn%
change $Mn%
change $Mn%
change $Mn%
change $Mn%
change
Privateconsumptionexpenditure
772,347 -4.3 740,819 -4.1 744,401 0.5 745,537 0.2 708,579 -5.0
Governmentconsumptionexpenditure
116,539 3.4 119,984 3.0 120,148 0.1 128,844 7.2 131,363 2.0
Gross domesticfixed capitalformation
388,731 -14.0 325,328 -16.3 347,375 6.8 341,847 -1.6 303,951 -11.1
Change ininventories
-15,651 -- -10,612 -- 14,399 -- -2,466 -- 3,789 --
Exports of goods 1,347,649 -7.4 1,349,000 0.1 1,572,689 16.6 1,480,987 -5.8 1,561,499 5.4
Less Imports ofgoods
1,408,317 -11.4 1,373,500 -2.5 1,636,711 19.2 1,549,222 -5.3 1,601,518 3.4
Exports of services 272,112 -6.5 279,167 2.6 317,580 13.8 323,087 1.7 352,187 9.0
Less Imports ofservices
193,560 -1.4 184,052 -4.9 191,543 4.1 189,619 -1.0 188,768 -0.4
Gross DomesticProduct
1,279,850 -4.8 1,246,134 -2.6 1,288,338 3.4 1,278,995 -0.7 1,271,082 -0.6
Notes : Figures may not add up exactly to the total due to rounding.(#) Revised series incorporating the results of a technical revision to GDP as announced on 1 August
2002.(+) Preliminary figures.(--) Not applicable.

267
Table 3 : Gross Domestic Product by main expenditure component#
(at constant (2000) market prices)
1998 1999 2000 2001 2002+
%change
%change $Mn
%change $Mn
%change $Mn
%change
Privateconsumptionexpenditure
-6.7 1.3 744,401 5.9 754,979 1.4 743,036 -1.6
Governmentconsumptionexpenditure
0.7 3.1 120,148 2.0 127,357 6.0 130,350 2.4
Gross domesticfixed capitalformation
-7.3 -16.6 347,375 11.0 357,305 2.9 341,569 -4.4
Change ininventories
-- -- 14,399 -- -3,184 -- 4,337 --
Exports of goods -4.3 3.7 1,572,689 17.1 1,520,244 -3.3 1,651,357 8.6
Less Imports ofgoods
-7.3 * 1,636,711 18.2 1,605,267 -1.9 1,732,470 7.9
Exports ofservices
-1.1 6.4 317,580 12.9 336,295 5.9 377,122 12.1
Less Imports ofservices
1.6 -4.1 191,543 4.2 191,217 -0.2 189,614 -0.8
Gross DomesticProduct
-5.0 3.4 1,288,338 10.2 1,296,512 0.6 1,325,687 2.3
Notes : Figures may not add up exactly to the total due to rounding.(#) Revised series incorporating the results of a technical revision to GDP as announced on
1 August 2002. The level figures in respect of GDP by component at constant (2000) marketprices before 2000 are not available.
(+) Preliminary figures.(*) Change of less than 0.05%.(--) Not applicable.

268
Table 4 : Gross Domestic Product (GDP) by economic activity#
(at current prices)
1997 1998 1999 2000 2001
$Mn%
share $Mn%
share $Mn%
share $Mn%
share $Mn%
share
Agriculture and fishing 1,464 0.1 1,530 0.1 1,171 0.1 920 0.1 1,003 0.1
Mining and quarrying 272 * 301 * 307 * 241 * 174 *
Manufacturing 81,722 6.4 72,601 6.0 67,540 5.7 71,655 5.8 63,519 5.2
Electricity, gas and water 32,328 2.6 36,081 3.0 37,211 3.2 38,853 3.2 40,126 3.3
Construction 72,759 5.7 71,000 5.9 67,232 5.7 64,026 5.2 58,971 4.8
Services 1,078,943 85.1 1,023,836 84.9 1,004,335 85.3 1,053,202 85.7 1,052,582 86.5
Wholesale, retail and import/export trades, restaurants and hotels
325,514 25.7 301,693 25.0 296,318 25.2 324,622 26.4 324,652 26.7
Transport, storage and communications
115,648 9.1 111,409 9.2 112,667 9.6 125,724 10.2 124,260 10.2
Financing, insurance, real estate and business services
335,927 26.5 296,352 24.6 281,439 23.9 291,062 23.7 274,919 22.6
Community, social and
personal services
220,636 17.4 233,169 19.3 246,003 20.9 252,435 20.5 265,073 21.8
Ownership of premises 171,383 13.5 170,660 14.2 162,488 13.8 155,303 12.6 159,260 13.1
less Adjustment for financial
intermediation services
indirectly measured
90,164 7.1 89,446 7.4 94,580 8.0 95,945 7.8 95,582 7.9
GDP at factor cost 1,267,489 100.0 1,205,349 100.0 1,177,796 100.0 1,228,897 100.0 1,216,374 100.0
Taxes on production andimports
82,205 60,372 53,474 57,908 53,943
Statistical discrepancy (%)
-0.4 1.1 1.2 0.1 0.7
GDP at current market prices
1,344,546 1,279,850 1,246,134 1,288,338 1,278,995
Notes : Figures may not add up exactly to the total due to rounding.
(#) Revised series incorporating the results of a technical revision to GDP as announced on 1 August 2002.
(*) Share of less than 0.05%.

269
Table 5 : Gross Domestic Product (GDP) by economic activity#
(at constant (2000) prices)
2000 2001 2002
Q1 Q2 Q3
$Mn $Mn%
change $Mn%
change $Mn%
change $Mn%
change
Agriculture and fishing 920 958 4.1 246 3.4 262 6.9 226 2.7
Mining and quarrying 241 207 -14.1 40 -23.1 40 -20.0 38 -30.9
Manufacturing 71,655 65,508 -8.6 13,477 -11.3 15,031 -10.8 16,108 -6.4
Electricity, gas and water 38,853 39,841 2.5 8,506 1.2 10,632 6.9 12,157 2.9
Construction 64,026 61,267 -4.3 14,876 -1.7 14,128 3.2 15,156 2.4
Services 1,053,202 1,068,119 1.4 256,556 * 265,064 1.8 285,489 4.2
Wholesale, retail and import/export trades, restaurants and hotels
324,622 323,515 -0.3 73,372 -2.8 75,924 1.0 93,438 6.8
Transport, storage and communications
125,724 128,417 2.1 31,263 0.2 31,988 3.6 35,141 5.5
Financing, insurance, real estate and business services
291,062 289,395 -0.6 69,983 -2.0 73,536 1.2 73,095 1.4
Community, social and
personal services
252,435 262,386 3.9 63,947 1.1 66,519 0.6 65,474 1.2
Ownership of premises 155,303 161,234 3.8 40,905 2.9 40,341 1.6 41,567 2.1
less Adjustment for financial
intermediation services
indirectly measured
95,945 96,828 0.9 22,914 -6.8 23,244 -4.3 23,227 -4.8
Taxes on production andimports
57,908 57,309 -1.0 15,021 * 15,394 1.1 12,524 -0.7
Statistical discrepancy (%)
0.1 0.3 -- 0.5 -- -0.7 -- 0.5 --
GDP at constant(2000) market prices
1,288,338 1,296,512 0.6 310,256 -0.5 318,263 0.8 343,371 3.3
Notes : Figures may not add up exactly to the total due to rounding.
(#) Revised figures.
(*) Change of less than 0.05%.
(--) Not applicable.

270
Table 6 : Gross National Product (GNP) and external factorincome flows (EFIF) by income component#
(at current market prices)
1998 1999 2000 2001 2002+
Q1-Q3
$Mn%
change $Mn%
change $Mn%
change $Mn%
change $Mn%
change
Type of income componentDirect investment income
Inflow 124,999 -35.3 136,454 9.2 153,848 12.7 168,497 9.5 128,078 -4.5Outflow 136,350 -44.3 197,094 44.5 266,324 35.1 244,838 -8.1 175,154 -9.5
Portfolio investment incomeInflow 74,444 -22.9 86,291 15.9 95,086 10.2 96,338 1.3 72,505 -3.6Outflow 24,696 -39.2 25,410 2.9 26,900 5.9 26,835 -0.2 20,616 -4.6
Other investment incomeInflow 162,913 -8.9 142,008 -12.8 167,787 18.2 119,730 -28.6 49,753 -49.3Outflow 172,548 0.1 107,472 -37.7 101,729 -5.3 71,718 -29.5 29,549 -49.4
Compensation of employeesInflow 363 -44.7 110 -69.7 53 -51.8 30 -43.4 13 -45.8Outflow 363 -44.7 110 -69.7 53 -51.8 30 -43.4 13 -45.8
Total EFIFInflow 362,719 -22.7 364,863 0.6 416,774 14.2 384,595 -7.7 250,348 -18.6Outflow 333,957 -27.2 330,086 -1.2 395,006 19.7 343,420 -13.1 225,332 -17.7Net flow 28,762 -- 34,777 -- 21,768 -- 41,174 -- 25,015 --
GDP ($Mn) 1,279,850 -4.8 1,246,134 -2.6 1,288,338 3.4 1,278,995 -0.7 936,342 -1.2
Per capita GDP ($) 195,585 -5.6 188,622 -3.6 193,299 2.5 190,188 -1.6 N.A. N.A.
GNP ($Mn) 1,308,612 -3.4 1,280,911 -2.1 1,310,106 2.3 1,320,169 0.8 961,357 -2.1
Per capita GNP ($) 199,980 -4.2 193,886 -3.0 196,565 1.4 196,311 -0.1 N.A. N.A.
Notes : Figures may not add up exactly to the total due to rounding.
(#) Revised figures.
(+) Preliminary figures.
(--) Not applicable.
N.A. Not available.

271
Table 7 : Balance of payments account by major component#
1998 1999 2000 2001 2002Q1-Q3
$Mn $Mn $Mn $Mn $Mn
Current account(a) 34,283 93,447 70,960 95,795 90,204
Goods -60,667 -24,501 -63,832 -64,970 -34,426
Services 78,552 95,115 126,037 133,468 110,517
Factor income 28,762 34,777 21,768 41,174 25,015
Current transfers -12,364 -11,943 -13,013 -13,878 -10,901
Capital and financial account(a)
-31,514 -83,374 -57,863 -97,359 -134,228
Capital transfers -18,445 -13,812 -12,044 -9,155 -12,496
Direct investment -17,192 40,511 19,976 96,948 -27,620
Portfolio investment 171,052 256,812 190,782 -322,045 -193,187
Financial derivatives 25,550 79,225 1,661 39,640 12,664
Other investment -245,059 -368,243 -179,917 133,783 79,452
Reserve assets(net change)(b)
52,581 -77,867 -78,321 -36,530 6,959
Net errors and omissions
-2,770 -10,074 -13,097 1,565 44,023
Overall balance of payments
-52,581(in deficit)
77,867(in surplus)
78,321(in surplus)
36,530(in surplus)
-6,959(in deficit)
Notes : Figures may not add up exactly to the total due to rounding.
(a) In accordance with the balance of payments accounting rules, a positive value for the balancefigure in the current account represents a surplus whereas a negative value represents a deficit.In the capital and financial account, a positive value for the balance figure indicates a netinflow and a negative value indicates a net outflow. As increases in external assets are debitentries and decreases are credit entries, a negative value for net change in reserve assetsrepresents a net increase and a positive value represents a net decrease.
(b) The estimates on net change in reserve assets under the balance of payments framework aretransaction figures. Effects from valuation changes (including price changes and exchange ratechanges) and reclassifications are excluded.
(#) Revised figures.

272
Table 8: Visible and invisible trade#
(at current market prices)
1998 1999 2000 2001 2002+
$Mn $Mn $Mn $Mn $Mn
Total exports of goods 1,361,885 1,355,529 1,579,367 1,488,982 1,561,499
Imports of goods(a) 1,422,552 1,380,030 1,643,199 1,553,952 1,601,518
Visible trade balance -60,667 -24,501 -63,832 -64,970 -40,019(-4.3) (-1.8) (-3.9) (-4.2) (-2.5)
Exports of services 272,112 279,167 317,580 323,087 352,187
Imports of services 193,560 184,052 191,543 189,619 188,768
Invisible trade balance 78,552 95,115 126,037 133,468 163,419
Visible and invisible 17,885 70,614 62,205 68,498 123,400trade balance <1.1> <4.5> <3.4> <3.9> <6.9>
Notes : (a) Imports of goods are valued on f.o.b. basis, instead of on c.i.f. basis which is still the on-goingpractice for the merchandise trade statistics, as presented in Tables 14 and 15.
(#) Revised series incorporating the results of a technical revision to GDP as announced on1 August 2002. Figures in this table are reckoned on a BoP basis.
(+) Preliminary figures.
( ) As a percentage of the total value of imports of goods on f.o.b. basis.
< > As a percentage of the total value of imports of goods and services.

273
Table 9 : Re-exports by market
1998 1999 2000 2001 2002
$Mn%
change $Mn%
change $Mn%
change $Mn%
change $Mn%
change
All markets 1,159,195 -6.9 1,178,400 1.7 1,391,722 18.1 1,327,467 -4.6 1,429,590 7.7
Mainland of China 407,366 -8.2 399,188 -2.0 488,823 22.5 496,574 1.6 571,870 15.2
United States 259,856 -0.6 269,444 3.7 311,047 15.4 282,189 -9.3 291,043 3.1
Japan 64,194 -17.4 67,506 5.2 82,050 21.5 83,551 1.8 80,743 -3.4
United Kingdom 42,259 8.2 45,541 7.8 52,356 15.0 46,764 -10.7 46,644 -0.3
Germany 42,161 -9.0 44,122 4.7 50,599 14.7 45,774 -9.5 44,567 -2.6
Taiwan 27,368 -7.5 27,859 1.8 33,696 21.0 30,021 -10.9 30,193 0.6
Singapore 25,625 -12.8 28,716 12.1 32,028 11.5 26,929 -15.9 29,424 9.3
Republic of Korea 12,241 -36.6 19,793 61.7 26,978 36.3 24,640 -8.7 29,264 18.8
Rest of the world 278,125 -6.6 276,230 -0.7 314,146 13.7 291,025 -7.4 305,844 5.1
Note : Figures may not add up exactly to the total due to rounding.
Table 10 : Re-exports by source
1998 1999 2000 2001 2002
$Mn%
change $Mn%
change $Mn%
change $Mn%
change $Mn%
change
All sources 1,159,195 -6.9 1,178,400 1.7 1,391,722 18.1 1,327,467 -4.6 1,429,590 7.7
Mainland of China 691,219 -4.5 720,126 4.2 849,517 18.0 808,370 -4.8 863,967 6.9
Japan 123,879 -7.4 121,265 -2.1 137,338 13.3 125,649 -8.5 135,793 8.1
Taiwan 71,782 -13.9 71,957 0.2 87,942 22.2 80,321 -8.7 94,275 17.4
United States 54,530 -12.9 56,737 4.0 65,465 15.4 65,193 -0.4 62,900 -3.5
Republic of Korea 39,637 -0.1 38,822 -2.1 46,057 18.6 39,775 -13.6 47,218 18.7
Malaysia 17,473 -11.8 19,031 8.9 27,050 42.1 27,170 0.4 27,412 0.9
Germany 15,633 -5.9 15,558 -0.5 18,790 20.8 20,322 8.2 21,890 7.7
Singapore 20,175 -27.6 13,805 -31.6 14,991 8.6 14,650 -2.3 16,676 13.8
Rest of the world 124,867 -9.1 121,099 -3.0 144,572 19.4 146,017 1.0 159,459 9.2
Note : Figures may not add up exactly to the total due to rounding.

274
Table 11 : Re-exports by selected commodity group
1998 1999 2000 2001 2002
$Mn%
change $Mn%
change $Mn%
change $Mn%
change $Mn%
change
All re-exports 1,159,195 -6.9 1,178,400 1.7 1,391,722 18.1 1,327,467 -4.6 1,429,590 7.7
Office machinery 93,070 7.7 98,331 5.7 120,755 22.8 132,892 10.1 154,032 15.9
Electronic components 46,226 -10.1 61,502 33.0 97,724 58.9 99,418 1.7 122,255 23.0
Clothing 96,799 -9.3 99,308 2.6 111,268 12.0 110,609 -0.6 109,912 -0.6
Electrical machinery 62,560 6.0 72,209 15.4 97,238 34.7 89,471 -8.0 99,484 11.2
Toys, games and sportinggoods
92,706 -5.6 92,661 * 102,588 10.7 85,666 -16.5 85,139 -0.6
Radios, television-sets,gramophones, records,tape recorders andamplifiers
54,108 -10.2 47,177 -12.8 59,203 25.5 54,831 -7.4 64,716 18.0
Telecommunicationequipment
34,439 9.9 34,951 1.5 42,637 22.0 41,643 -2.3 46,259 11.1
Footwear 51,913 -20.9 47,840 -7.8 50,534 5.6 45,938 -9.1 44,905 -2.2
Plastic materials 34,042 -9.7 35,353 3.9 41,806 18.3 36,219 -13.4 40,172 10.9
Jewellery, preciousstones and relatedarticles
16,563 0.4 22,071 33.3 29,688 34.5 29,403 -1.0 36,701 24.8
Others 576,770 -8.7 566,997 -1.7 638,280 12.6 601,377 -5.8 626,015 4.1
Notes : Figures may not add up exactly to the total due to rounding.
(*) Change of less than 0.05%.
Table 12 : Domestic exports by market
1998 1999 2000 2001 2002
$Mn%
change $Mn%
change $Mn%
change $Mn%
change $Mn%
change
All markets 188,454 -10.9 170,600 -9.5 180,967 6.1 153,520 -15.2 130,926 -14.7
United States 54,842 -0.4 51,358 -6.4 54,438 6.0 47,589 -12.6 41,908 -11.9
Mainland of China 56,066 -12.2 50,414 -10.1 54,158 7.4 49,547 -8.5 41,374 -16.5
United Kingdom 10,058 -6.2 10,392 3.3 10,681 2.8 8,578 -19.7 7,588 -11.5
Taiwan 6,505 -7.5 5,101 -21.6 6,104 19.7 5,346 -12.4 4,388 -17.9
Germany 9,805 -5.0 8,543 -12.9 9,294 8.8 5,818 -37.4 4,273 -26.6
Netherlands 4,736 -7.8 4,119 -13.0 3,910 -5.1 4,619 18.1 3,470 -24.9
Japan 6,435 -39.5 5,459 -15.2 5,084 -6.9 4,060 -20.1 2,969 -26.9
Malaysia 1,821 -32.1 1,945 6.8 2,668 37.1 1,716 -35.7 2,637 53.6
Rest of the world 38,187 -16.9 33,269 -12.9 34,630 4.1 26,247 -24.2 22,320 -15.0
Note : Figures may not add up exactly to the total due to rounding.

275
Table 13 : Domestic exports by selected commodity group
1998 1999 2000 2001 2002
$Mn%
change $Mn%
change $Mn%
change $Mn%
change $Mn%
change
All domestic exports 188,454 -10.9 170,600 -9.5 180,967 6.1 153,520 -15.2 130,926 -14.7
Clothing 74,874 3.7 74,251 -0.8 77,415 4.3 72,240 -6.7 65,039 -10.0
Electronic components 25,884 -14.3 22,874 -11.6 26,554 16.1 19,184 -27.8 14,940 -22.1
Textiles 10,767 -14.9 9,488 -11.9 9,164 -3.4 8,193 -10.6 7,645 -6.7
Jewellery, preciousstones and relatedarticles
5,120 -11.4 5,430 6.1 6,350 16.9 5,138 -19.1 5,472 6.5
Office machines andequipment
3,611 -10.8 3,571 -1.1 3,049 -14.6 2,734 -10.3 3,567 30.5
Scientific, medical,optical measuringand controllinginstruments andapparatus
6,003 24.1 5,913 -1.5 7,923 34.0 4,554 -42.5 1,833 -59.7
Metal manufactures 4,090 -21.4 3,823 -6.5 3,896 1.9 2,398 -38.4 1,665 -30.6
Watches and clocks 8,937 -17.2 5,040 -43.6 3,012 -40.2 2,354 -21.8 1,164 -50.6
Telecommunicationsand sound recordingand reproducingequipment
6,305 -31.9 3,798 -39.8 4,211 10.9 3,511 -16.6 1,105 -68.5
Others 42,862 -24.0 36,411 -15.1 39,393 8.2 33,213 -15.7 28,496 -14.2
Note : Figures may not add up exactly to the total due to rounding.
Table 14 : Imports of goods by source
1998 1999 2000 2001 2002
$Mn%
change $Mn%
change $Mn%
change $Mn%
change $Mn%
change
All sources 1,429,092 -11.5 1,392,718 -2.5 1,657,962 19.0 1,568,194 -5.4 1,619,419 3.3
Mainland of China 580,614 -4.6 607,546 4.6 714,987 17.7 681,980 -4.6 717,074 5.1
Japan 179,947 -18.8 162,652 -9.6 198,976 22.3 176,599 -11.2 182,569 3.4
Taiwan 104,075 -16.4 100,426 -3.5 124,172 23.6 107,929 -13.1 115,906 7.4
United States 106,537 -15.0 98,572 -7.5 112,801 14.4 104,941 -7.0 91,478 -12.8
Republic of Korea
68,836 -6.0 65,432 -4.9 80,600 23.2 70,791 -12.2 75,955 7.3
Singapore 61,457 -22.4 60,017 -2.3 74,998 25.0 72,898 -2.8 75,740 3.9
Rest of the world 327,626 -14.4 298,073 -9.0 351,430 17.9 353,057 0.5 360,698 2.2
Note : Figures may not add up exactly to the total due to rounding.

276
Table 15 : Imports of goods by end-use category
1998 1999 2000 2001 2002
$Mn%
change $Mn%
change $Mn%
change $Mn%
change $Mn%
change
All imports of goods(a) 1,429,092 -11.5 1,392,718 -2.5 1,657,962 19.0 1,568,194 -5.4 1,619,419 3.3
Foodstuffs(a) 68,487 -10.4 61,555 -10.1 63,671 3.4 60,353 -5.2 59,145 -2.0
Consumer goods 506,047 -13.0 502,749 -0.7 562,188 11.8 537,967 -4.3 543,203 1.0
Fuels 23,369 -22.0 27,362 17.1 34,006 24.3 30,362 -10.7 31,288 3.1
Raw materials andsemi-manufactures
485,167 -14.1 472,995 -2.5 580,475 22.7 511,367 -11.9 558,088 9.1
Capital goods 346,021 -4.5 328,056 -5.2 417,622 27.3 428,147 2.5 427,695 -0.1
Notes : Figures may not add up exactly to the total due to rounding.
(a) Including imports of fresh water.
Table 16 : Exports and imports of services by component#
(at current market prices)
1997 1998 1999 2000 2001
$Mn%
change $Mn%
change $Mn%
change $Mn%
change $Mn%
change
Exports of services 291,100 -1.2 272,112 -6.5 279,167 2.6 317,580 13.8 323,087 1.7
Transportation 87,342 -1.2 85,074 -2.6 89,230 4.9 99,513 11.5 101,815 2.3
Travel 78,001 -16.7 58,661 -24.8 56,471 -3.7 61,786 9.4 64,594 4.5
Insurance 2,665 9.1 3,102 16.4 3,065 -1.2 3,452 12.6 3,942 14.2
Financial 18,951 7.6 16,324 -13.9 19,206 17.7 20,859 8.6 19,739 -5.4
Trade-related 73,441 12.8 76,866 4.7 81,524 6.1 97,616 19.7 99,323 1.7
Other business 30,700 12.5 32,086 4.5 29,672 -7.5 34,355 15.8 33,674 -2.0
Imports of services 196,362 4.6 193,560 -1.4 184,052 -4.9 191,543 4.1 189,619 -1.0
Transportation 50,240 -1.7 42,865 -14.7 39,238 -8.5 48,628 23.9 49,334 1.5
Travel 98,155 10.7 104,361 6.3 101,889 -2.4 97,402 -4.4 96,057 -1.4
Insurance 4,501 -4.6 4,600 2.2 4,975 8.2 4,111 -17.4 4,048 -1.5
Financial 5,792 8.8 6,739 16.4 5,729 -15.0 5,536 -3.4 5,320 -3.9
Trade-related 9,856 -9.3 8,505 -13.7 10,510 23.6 11,170 6.3 10,494 -6.1
Other business 27,818 2.6 26,490 -4.8 21,711 -18.0 24,695 13.7 24,366 -1.3
Net exports of services 94,378 -11.6 78,552 -16.8 95,115 21.1 126,037 32.5 133,468 5.9
Note : (#) Revised series incorporating the results of a technical revision to GDP as announced on 1 August 2002.

277
Table 17 : Travel and tourism
Incoming visitors
Foreign visitors passingthrough Hong Kong
to Mainland of ChinaHong Kong residents
travelling abroad
Number('000)
% changeover a
year earlier Number('000)
% changeover a
year earlier Number('000)
% changeover a
year earlier
1998 10 160 -9.9 2 181 -5.9 47 594 14.4
1999 11 328 11.5 2 496 14.4 53 144 11.7
2000 13 059 15.3 3 001 20.2 58 901 10.8
2001 13 725 5.1 3 177 5.9 61 096 3.7
2002 16 566 20.7 3 464 9.0 64 540 5.6
Table 18 : Incoming visitors by source
1998 1999 2000 2001 2002
Number%
change Number%
change Number%
change Number%
change Number%
change('000) ('000) ('000) ('000) ('000)
All sources 10 160 -9.9 11 328 11.5 13 059 15.3 13 725 5.1 16 566 20.7
Mainland of China 2 672 13.0 3 206 20.0 3 786 18.1 4 449 17.5 6 825 53.4
Taiwan 1 886 -1.8 2 063 9.4 2 386 15.6 2 419 1.4 2 429 0.4
South andSoutheast Asia
1 273 -21.7 1 511 18.6 1 747 15.6 1 747 * 1 905 9.1
Japan 1 101 -32.2 1 174 6.7 1 382 17.7 1 337 -3.3 1 395 4.4
United States 828 -3.8 859 3.7 966 12.5 936 -3.1 1 001 7.0
United Kingdom 353 -4.5 334 -5.3 368 10.2 361 -2.0 380 5.4
Others 2 047 -18.3 2 181 6.5 2 424 11.2 2 479 2.2 2 631 6.1
Notes : Figures may not add up exactly to the total due to rounding.
(*) Change of less than 0.05%.

278
Table 19 : Hong Kong residents travelling abroad by destination
1998 1999 2000 2001 2002
Number%
change Number%
change Number%
change Number%
change Number%
change(’000) (’000) (’000) (’000) (’000)
All destinations 47 594 14.4 53 144 11.7 58 901 10.8 61 096 3.7 64 540 5.6
Mainland of China 39 140 16.2 45 175 15.4 50 083 10.9 52 003 3.8 55 648 7.0
Macao 4 257 2.1 3 794 -10.9 4 207 10.9 4 294 2.1 4 182 -2.6
South andSoutheast Asia
1 888 10.4 1 986 5.1 2 390 20.3 2 505 4.8 2 422 -3.3
North Asia 880 41.1 778 -11.5 739 -5.0 762 3.1 774 1.7
Taiwan 381 4.8 420 10.3 469 11.6 526 12.1 538 2.4
Americas(a) 432 -3.1 398 -7.9 399 0.2 377 -5.7 346 -8.1
Europe 321 -2.5 307 -4.2 323 5.2 324 0.1 347 7.1
Australia andNew Zealand
237 4.4 230 -2.7 232 0.5 237 2.6 223 -6.0
Others 58 -0.8 55 -5.5 60 8.8 70 17.0 59 -15.6
Notes : Figures may not add up exactly to the total due to rounding.
(a) This includes the United States, Canada, Central America and South America.
Table 20 : Private consumption expenditure by broad category#
(rate of change in real terms (%))
1998 1999 2000 2001 2002+
Private consumptionexpenditure
-6.7 1.3 5.9 1.4 -1.6
Consumption expenditure inthe domestic market
-9.6 1.6 7.2 2.0 0.7
Food -8.9 2.1 5.4 2.6 0.2Consumer durables -22.2 -2.6 14.9 4.5 0.3Consumer
non-durables-16.4 -0.7 4.8 -1.0 -5.3
Services -0.7 3.9 6.4 2.4 2.9
Expenditure of residentsabroad
9.2 0.2 -3.0 1.1 -3.6
Less Expenditure ofnon-residents in thedomestic market
-16.6 5.8 8.3 7.6 20.8
Notes : (#) Revised series incorporating the results of a technical revision to GDP as announced on 1 August 2002.(+) Preliminary figures.

279
Table 21 : Expenditure on building and construction#
At current market prices At constant (2000) market prices^
Private sector Public sector(a) Total Private sector Public sector(a) Total
$Mn%
share $Mn%
share $Mn $Mn
%changeover a
yearearlier $Mn
%changeover a
yearearlier $Mn
%changeover a
yearearlier
1998 157,247 75.5 50,988 24.5 208,235 N.A. 1.1 N.A. -11.5 N.A. -2.4
1999 116,952 68.0 54,978 32.0 171,930 N.A. -21.1 N.A. 1.0 N.A. -15.5
2000 104,125 67.0 51,316 33.0 155,441 104,125 -7.1 51,316 -8.8 155,441 -7.6
2001 96,610 66.7 48,170 33.3 144,780 103,840 -0.3 48,602 -5.3 152,442 -1.9
2002+ 94,870 68.7 43,210 31.3 138,080 109,573 5.5 45,635 -6.1 155,208 -1.8
Notes : (a) Including the Mass Transit Railway Corporation Limited, the Kowloon-Canton Railway Corporation andthe Airport Authority Hong Kong.
(#) Revised series incorporating the results of a technical revision to GDP as announced on 1 August 2002.Following a review of the presentation by the Census and Statistics Department, real estate developers’margin is now incorporated into private sector expenditure on building and construction, instead of beingdelineated separately in the expenditure components of GDP.
(^) The level figures at constant (2000) market prices before 2000 are not available.(+) Preliminary figures.N.A. Not available.
Table 22 : Property prices and rentals
Residential flats Office space(c) Shopping spaceConventional flatted
factory spacePriceIndex(a)
(1999=100)
RentalIndex(b)
(1999=100)
PriceIndex
(1999=100)
RentalIndex(b)
(1999=100)
PriceIndex
(1999=100)
RentalIndex(b)
(1999=100)
PriceIndex
(1999=100)
RentalIndex(b)
(1999=100)%
changeover a
yearearlier
%changeover a
yearearlier
%changeover a
yearearlier
%changeover a
yearearlier
%changeover a
yearearlier
%changeover a
yearearlier
%changeover a
yearearlier
%changeover a
yearearlier
1998 117.1 -28 112.6 -16 134.5 -37 135.9 -13 128.3 -28 111.2 -10 131.8 -22 118.1 -11
1999 100.0 -15 100.0 -11 100.0 -26 100.0 -26 100.0 -22 100.0 -10 100.0 -24 100.0 -15
2000 89.6 -10 98.1 -2 89.9 -10 98.5 -2 93.6 -6 101.3 1 91.2 -9 95.4 -5
2001 78.7 -12 95.4 -3 78.7 -12 101.0 3 86.8 -7 99.4 -2 82.0 -10 90.3 -5
2002^ 69.8 -11 83.6 -12 68.0 -14 85.4 -15 84.8 -2 93.0 -6 74.6 -9 82.9 -8
Notes : (a) Prices for residential property in this table cover existing flats traded in the secondary market, but not newflats sold in the primary market.
(b) Rentals for residential property in this table cover only new tenancies for which rentals are freshlydetermined, while rentals for non-residential property cover also lease renewals upon which rentals arerevised.
(c) Since 2000, the price and rental indices for office space in the private sector have been recompiledaccording to the revised grading criteria for office space. Hence, the figures from 2000 onwards are notstrictly comparable to those in the earlier years.
(^) Provisional figures.

280
Table 23 : Cost and price indices for the building and construction industry
Labour and Material Cost Index(Feb 1970 = 100)
Tender PriceIndex for
public sectorbuilding projects(Jan 1970 = 100)
Tender PriceIndex for
public housingprojects
(Jan 1970 = 100)
Labour Index Material Index Combined Index
%changeover a
yearearlier
%changeover a
yearearlier
%changeover a
yearearlier
%changeover a
yearearlier
%changeover a
yearearlier
1998 3 405 12.4 763 -3.0 1 698 7.5 1 064 9.1 808 9.0
1999 3 493 2.6 752 -1.5 1 721 1.4 1 017 -4.4 781 -3.3
2000 3 562 2.0 761 1.3 1 752 1.8 884 -13.1 687 -11.9
2001 3 581 0.5 758 -0.4 1 756 0.3 808 -8.5 584 -15.1
2002Jan-Nov
3 576 -0.2 754 -0.6 1 752 -0.3 707^ -15.5^ 538^ -9.4^
Note : (^) Figures for Jan-Sep 2002.
Table 24 : Expenditure on machinery, equipment and computer software#
At current market prices At constant (2000) market prices^
Private sector Public sector(a) Total Private sector Public sector(a) Total
$Mn%
share $Mn%
share $Mn $Mn%
change $Mn%
change $Mn%
change
1998 154,953 94 10,224 6 165,177 N.A. -8.2 N.A. -2.9 N.A. -7.9
1999 130,676 92 10,673 8 141,349 N.A. -19.4 N.A. -0.6 N.A. -18.2
2000 171,120 95 9,084 5 180,204 171,120 30.3 9,084 -15.3 180,204 27.0
2001 176,789 95 9,904 5 186,693 183,099 7.0 10,233 12.6 193,332 7.3
2002+ 145,932 93 10,503 7 156,435 163,128 -10.9 11,570 13.1 174,698 -9.6
Notes : (a) Including the Mass Transit Railway Corporation Limited, the Kowloon-Canton RailwayCorporation and the Airport Authority Hong Kong.
(#) Revised series incorporating the results of a technical revision to GDP as announced on1 August 2002.
(^) The level figures at constant (2000) market prices before 2000 are not available.(+) Preliminary figures.N.A. Not available.

281
Table 25 : Indices of Industrial Production(year-on-year rate of change (%))
of which:
Allmanufacturing
industries
Food,beverages
andtobacco
Wearingapparel(except
footwear)
Textile(including
knitting)
Paperproducts
andprinting
Chemical,rubber,
plastic andnon-metallic
mineralproducts
Plasticproducts
1998 -8.7 -9.1 -6.0 -10.5 -7.8 -13.2 -19.6
1999 -6.4 -1.6 -0.1 -5.5 -9.6 -14.9 -18.6
2000 -0.5 -3.1 3.0 3.8 2.0 -14.4 -10.9
2001 -4.4 -1.7 -0.1 -0.3 -1.2 -7.8 -15.2
2002 Q1-Q3 -10.0 8.9 -6.4 -7.5 -2.9 -15.4 -11.9
Basic metalsand fabricatedmetal products
Fabricatedmetal
products
Electrical andelectronicproducts,
machinery,professional
equipment andoptical goods
Consumerelectrical and
electronicproducts
Machinery,equipmentapparatus,parts and
components
Miscellaneousmanufacturing
industries
1998 -10.0 -17.8 -6.8 -13.3 1.5 -11.7
1999 -19.7 -21.3 -1.9 -2.8 0.9 -11.8
2000 -11.2 -18.5 0.8 -1.1 7.0 4.3
2001 -15.4 -10.2 -7.9 * -8.5 -5.1
2002 Q1-Q3 -25.3 -29.6 -20.9 -19.5 -16.2 -1.2
Note: (*) Change of less than 0.05%.

282
Table 26 : Business receipts indices for service industries/domains(year-on-year rate of change in value terms (%))
Wholesaletrade
Retailtrade
Import/export trade Restaurants Hotels Transport^ Storage Communications
1998 -15.2 -16.7 -12.6 -4.1 -27.1 -11.5 -6.7 -2.8
1999 -13.7 -8.1 -13.9 0.4 -3.8 4.5 -20.7 -14.9
2000 3.6 3.8 12.0 2.1 16.7 20.8 2.0 8.7
2001 -12.0 -1.2 -14.1 -2.5 -7.6 -2.4 -14.9 -13.2
2002 Q1-Q3 -12.1 -4.6 -5.3 -5.3 -7.5 -0.5 -23.2 -3.6
Banking
Financing(other
thanbanking) Insurance
Realestate
Businessservices
Filmentertainment
Tourism,convention
andexhibition
services
Computerand
informationservices
1998 -6.1 -35.5 4.6 -24.1 -6.6 -6.2 -28.5 -2.5
1999 6.6 3.1 4.0 -14.1 -10.1 -7.8 -1.7 5.6
2000 0.8 40.7 13.1 -0.1 2.4 14.4 16.9 24.6
2001 2.7 -12.6 14.2 -16.9 -9.6 15.2 -1.6 -11.6
2002 Q1-Q3 -3.7 -15.3 8.5 -1.7 -6.5 -11.4 2.4 3.3
Note : (^) Including business receipts from the Airport Authority Hong Kong as from the third quarter of1998.

283
Table 27 : Market exchange rate of the Hong Kong dollar against the US dollarand the Effective Exchange Rate Index
Effective Exchange Rate Index(a)
(January 2000 = 100)
Average for
Market exchangerate of HK$against US$
Trade-weighted
Import-weighted
Export-weighted
1998 7.745 103.4 105.5 101.3
1999 7.758 100.9 101.4 100.4
2000 7.791 101.7 101.5 101.9
2001 7.799 104.7 105.1 104.3
2002 7.799 104.0 104.7 103.3
2002 Jan 7.798 106.0 106.8 105.2
Feb 7.800 106.3 107.0 105.5
Mar 7.799 105.9 106.6 105.2
Apr 7.799 105.7 106.5 104.9
May 7.799 104.6 105.2 103.9
Jun 7.799 103.5 104.1 102.9
Jul 7.799 102.3 102.7 101.8
Aug 7.799 102.7 103.2 102.3
Sep 7.799 103.0 103.6 102.4
Oct 7.799 103.5 104.3 102.7
Nov 7.799 102.9 103.6 102.2
Dec 7.798 102.7 103.4 101.9
Note : (a) The Effective Exchange Rate Indices (EERIs) from January 2000 onwards are compliedbased on the average merchandise trade pattern from 1999 to 2000. The EERIs for earlierperiods are compiled based on old weights and have been re-scaled to the new base periodfor linking with the new index series.

284
Table 28 : Hong Kong dollar interest rates
Hong Kong dollarinter-bank offered rates
Time deposit rates for depositsof less than HK$100,000
Average for OvernightThree-month
Twelve-month
One-week
Three-month
Twelve-month
Savingsdeposits
rate
Bestlending
rate(Percent per annum)1998 5.59 8.06 9.31 5.60 7.35 8.32 5.19 9.94
1999 4.81 5.84 6.88 3.77 4.85 5.76 3.74 8.49
2000 5.54 6.11 6.63 4.39 4.97 5.40 4.47 9.22
2001 3.58 3.56 3.73 2.10 2.36 2.53 2.16 7.00
2002 1.61 1.79 2.20 0.16 0.40 0.74 0.14 5.11
2002 Jan 1.74 1.76 2.36 0.17 0.46 0.92 0.16 5.13
Feb 1.81 1.90 2.47 0.18 0.55 1.08 0.16 5.13
Mar 1.86 2.12 2.93 0.21 0.62 1.39 0.16 5.13
Apr 1.73 1.95 2.80 0.17 0.56 1.41 0.16 5.13
May 1.60 1.81 2.54 0.17 0.43 1.02 0.16 5.13
Jun 1.41 1.75 2.34 0.17 0.36 0.74 0.16 5.13
Jul 1.52 1.75 2.04 0.17 0.37 0.56 0.16 5.13
Aug 1.53 1.65 1.78 0.16 0.36 0.44 0.16 5.13
Sep 1.67 1.77 1.82 0.16 0.38 0.43 0.16 5.13
Oct 1.90 1.97 1.99 0.17 0.43 0.48 0.16 5.13
Nov 1.37 1.56 1.79 0.10 0.20 0.30 0.07 5.03
Dec 1.16 1.48 1.68 0.09 0.15 0.25 0.03 5.00

285
Table 29 : Deposits by major type of authorized institution
Licensed banks
Restricted licencebanks and deposit-taking companies
All authorizedInstitutions
As atend of HK$(a)
Foreigncurrency(b) Total HK$(a)
Foreigncurrency(b) Total HK$(a)
Foreigncurrency(b) Total
($ billion)
1998 1,689 1,265 2,954 10 36 46 1,700 1,300 3,000
1999 1,763 1,447 3,210 10 31 41 1,773 1,477 3,251
2000 1,839 1,652 3,491 12 25 37 1,851 1,677 3,528
2001 1,838 1,528 3,367 16 23 40 1,855 1,552 3,407
2002 1,806 1,470 3,276 19 23 42 1,825 1,493 3,318
(Rate of change during the period (%))
1998 10.0 14.1 11.7 -34.0 -29.7 -30.7 9.5 12.2 10.7
1999 4.4 14.4 8.7 -1.6 -14.3 -11.4 4.3 13.6 8.4
2000 4.3 14.2 8.7 23.1 -19.4 -8.8 4.4 13.5 8.5
2001 * -7.5 -3.6 31.7 -5.2 7.2 0.2 -7.4 -3.4
2002 -1.8 -3.8 -2.7 15.6 -2.8 4.8 -1.6 -3.8 -2.6
Notes : Figures may not add up exactly to the total due to rounding.(a) Adjusted to include foreign currency swap deposits.(b) Adjusted to exclude foreign currency swap deposits.(*) Change of less than 0.05%.

286
Table 30 : Money supply
M1 M2 M3
As atend of HK$
Foreigncurrency Total HK$(a)
Foreigncurrency(b) Total HK$(a)
Foreigncurrency(b) Total
($ billion)
1998 178 (176) 19 198 1,829 1,283 3,112 1,841 1,327 3,168
1999 205 (191) 20 225 1,923 1,463 3,386 1,935 1,499 3,434
2000 204 (200) 40 244 1,988 1,662 3,649 2,002 1,690 3,693
2001 230 (224) 28 258 1,999 1,551 3,550 2,017 1,577 3,594
2002 259 (253) 36 296 1,984 1,535 3,519 2,004 1,558 3,562
(Rate of change during the period (%))
1998 -5.2 (-5.4) -2.8 -5.0 9.7 14.3 11.6 9.3 11.8 10.3
1999 15.2 (8.6) 2.1 13.9 5.2 14.0 8.8 5.1 12.9 8.4
2000 -0.7 (4.8) 101.2 8.3 3.4 13.6 7.8 3.5 12.8 7.5
2001 12.7 (12.3) -29.3 5.8 0.5 -6.6 -2.7 0.7 -6.7 -2.7
2002 12.9 (12.7) 28.4 14.6 -0.7 -1.1 -0.9 -0.6 -1.2 -0.9
Notes : Figures may not add up exactly to the total due to rounding.(a) Adjusted to include foreign currency swap deposits.(b) Adjusted to exclude foreign currency swap deposits.( ) Figures in brackets represent the corresponding level or change based on the seasonally
adjusted series for HK$M1.

287
Table 31 : Loans and advances extended by authorized institutions
Loans for usein Hong Kong(a)
Loans for useoutside Hong Kong Others(b)
Total loansand advances
As at end of HK$ Foreigncurrency HK$
Foreigncurrency HK$
Foreigncurrency HK$
Foreigncurrency
($ billion)
1998 1,665 444 26 1,141 4 24 1,695 1,609
1999 1,584 349 20 837 3 20 1,607 1,206
2000 1,626 339 22 455 4 15 1,652 809
2001 1,626 252 19 278 2 7 1,648 537
2002 1,591 243 23 210 2 8 1,616 461
(Rate of change during the period (%))
1998 -2.4 -15.3 -13.1 -37.1 -45.4 -42.1 -2.7 -32.4
1999 -4.9 -21.5 -23.1 -26.6 -26.8 -17.6 -5.2 -25.1
2000 2.6 -2.8 11.5 -45.7 43.1 -22.9 2.8 -32.9
2001 * -25.6 -15.5 -38.9 -37.5 -52.2 -0.3 -33.6
2002 -2.2 -3.7 20.0 -24.4 -1.5 7.3 -1.9 -14.2
Notes : Figures may not add up exactly to the total due to rounding.(a) Including trade financing loans.(b) Including mainly those loans for which the place of usage is not clearly known.(*) Change of less than 0.05%.

288
Table 32 : Assets and liabilities of authorized institutions
As at end of :
1998 1999 2000 2001 2002
$Bn%
change $Bn%
change $Bn%
change $Bn%
change $Bn%
change
Liabilities
Amount due to authorizedinstitutions in Hong Kong
622 -19.5 529 -15.0 543 2.7 470 -13.4 394 -16.2
Amount due to banksabroad
2,803 -29.6 2,202 -21.5 1,752 -20.4 1,459 -16.7 1,394 -4.5
Deposits from customers 3,000 11.3 3,251 8.4 3,528 8.5 3,407 -3.4 3,318 -2.6
NCDs outstanding 209 -4.9 199 -4.8 178 -10.9 172 -2.9 211 22.6
Other liabilities 619 -14.9 604 -2.5 661 9.5 646 -2.2 676 4.6
Total liabilities 7,254 -13.6 6,784 -6.5 6,661 -1.8 6,154 -7.6 5,993 -2.6
Assets
Notes and coins 14 -1.6 27 96.8 15 -41.8 14 -10.0 14 -2.7
Amount due from authorizedinstitutions in Hong Kong
629 -18.4 536 -14.8 551 2.9 468 -15.1 395 -15.6
Amount due from banksabroad
2,312 0.1 2,389 3.3 2,450 2.6 2,160 -11.9 1,919 -11.1
NCDs held 144 -16.3 138 -4.2 135 -2.7 128 -5.3 134 4.7
Loans and advances tocustomers
3,304 -19.8 2,813 -14.9 2,461 -12.5 2,185 -11.2 2,077 -4.9
Other assets 850 -15.7 882 3.7 1,048 18.9 1,200 14.5 1,454 21.2
Total assets 7,254 -13.6 6,784 -6.5 6,661 -1.8 6,154 -7.6 5,993 -2.6
Note : Figures may not add up exactly to the total due to rounding.

289
Table 33 : Balance sheet of the Exchange Fund
As at end of :1998 1999 2000 2001 2002^
Assets$Mn
%change $Mn
%change $Mn
%change $Mn
%change $Mn
%change
Foreign currency assets 701,239 19.2 755,115 7.7 856,680 13.5 877,427 2.4 891,684 1.6Hong Kong dollar assets 211,036 337.9 247,641 17.3 166,683 -32.7 101,719 -39.0 63,433 -37.6Total assets(a) 912,275 43.3 1,002,756 9.9 1,023,363 2.1 979,146 -4.3 955,117 -2.5
Liabilities and Fund ResourcesCertificates of Indebtedness(b) 86,465 -0.6 118,195 36.7 99,265 -16.0 107,545 8.3 118,475 10.2Coins in circulation 5,778 7.0 5,777 * 5,918 2.4 5,691 -3.8 5,891 3.5Balance of banking system(c) 2,527 753.7 7,960 215.0 669 -91.6 671 0.3 525 -21.8Exchange Fund Bills
and Notes98,334 10.1 101,828 3.6 109,288 7.3 118,157 8.1 122,925 4.0
Placements by othergovernment funds(d)
424,562 78.7 392,206 -7.6 417,162 6.4 380,602 -8.8 301,669 -20.7
Other liabilities(e) 52,364 95.6 85,932 64.1 83,962 -2.3 63,891 -23.9 78,374 22.7Total liabilities(a) 670,030 50.1 711,898 6.2 716,264 0.6 676,557 -5.5 627,859 -7.2
Accumulated Surplus 242,245 27.3 290,858 20.1 307,099 5.6 302,589 -1.5 327,258 8.2
Notes:
The balance sheet comprises the accounts of the Exchange Fund only and does not include those of the subsidiary companies.
(a) (i) InvestmentsThe Fund is invested in interest-bearing deposits with banks both in Hong Kong and outside Hong Kong and in a variety offinancial instruments, including bonds, notes, treasury bills and equities.
(ii) Foreign currency assets distributionA large proportion of the Fund’s foreign currency assets is held in US dollars. Apart from the US dollar, the Fund alsoholds assets denominated in other foreign currencies, including the Australian dollar, Canadian dollar, Danish krone,Deutschmark, Euro, Japanese yen, pound sterling, Swiss franc.
(iii) Location of assetsThe assets are held in deposit, trustee and safe-keeping accounts with banks, central banks and custodial organisationssituated in Hong Kong and other major financial centres.
(iv) Valuation of assets and liabilitiesFinancial assets and liabilities, which are traded in an active market, are valued in the accounts at market value at thebalance sheet date. Fixed deposits, certificates of deposit, placements by other government funds for which interest ispayable at predetermined fixed rates, placements by other statutory bodies and other borrowings are valued according to aprice matrix of discounted cash flows using period end interest rates for discounting. The consequential change in value ofthe asset or liability is reflected in the carrying value of the relevant asset or liability in the Balance Sheet except in the caseof placements by other government funds for which interest is payable at predetermined fixed rates, which are stated in theBalance Sheet at the principal amounts payable at the balance sheet date with the revaluation differences included in otherliabilities. Placements by other government funds for which interest is payable at rates determined by reference to theinvestment income of the Fund are stated at the principal amounts payable at the balance sheet date.
(v) Translation of foreign currency assets and liabilitiesAssets and liabilities denominated in foreign currencies are translated into Hong Kong dollars at the rates of exchangeruling at the balance sheet date. Exchange gains and losses on foreign currency assets and liabilities are included in theIncome and Expenditure Account.Certificates of Indebtedness which are denominated in Hong Kong dollars but are issued and redeemed in US dollars at thelinked exchange rate of US$1=HK$7.80 are stated in the accounts at their Hong Kong dollar face value. At the balancesheet date the difference between their Hong Kong dollar face value and the market value of the US dollars required fortheir redemption is included in other assets.
(b) As backing for their bank note issues, each note-issuing bank is required to hold a non-interest bearing Certificate ofIndebtedness issued by the Financial Secretary. Payments for the issuance and redemption of notes against these Certificates aremade in US dollars at a fixed rate of US$1 = HK$7.80.
(c) Under the interbank payment system based on Real Time Gross Settlement principles, all licensed banks maintain a clearingaccount with the Monetary Authority for the account of the Exchange Fund. The aggregate balance in these accounts representsthe total level of liquidity in the interbank market.
(d) These represent placements by other government funds with the Exchange Fund. Until 31 March 1998, all placements by othergovernment funds bore interest at predetermined fixed rates. With effect from 1 April 1998, the basis of interest payable oncertain placements by other government funds was amended from predetermined fixed rates to rates determined by reference tothe investment income of the Fund.
(e) Other liabilities include placements by other institutions, interest payable on Exchange Fund Notes and placements by othergovernment funds, other accrued expenses and the revaluation differences of placements by other government funds for whichinterest is payable at predetermined fixed rates.
(^) Unaudited figures.
(*) Change of less than 0.05%.

290
Table 34 : Labour force characteristics
Population ofworking age
Labour forceparticipation rate Labour force
Personsemployed
As in Q4 of Number
% changeover a
year earlier % Number
% changeover a
year earlier Number
% changeover a
year earlier
1998 5 379 700 1.3 61.5 3 309 600 0.4 3 115 000 -3.3
1999 5 447 000 1.3 61.3 3 339 800 0.9 3 131 100 0.5
2000 5 537 600 1.7 61.4 3 402 200 1.9 3 252 500 3.9
2001 5 609 400 1.3 61.5 3 451 200 1.4 3 240 500 -0.4
2002 5 676 000 1.2 62.0 3 518 800 2.0 3 266 200 0.8
Personsunemployed
Seasonally adjustedunemployment rate
Personsunderemployed
Under-employment rate
As in Q4 of Number
% changeover a
year earlier % Number
% changeover a
year earlier %
1998 194 600 157.3 5.9 96 300 126.2 2.9
1999 208 700 7.2 6.3 93 500 -2.9 2.8
2000 149 600 -28.3 4.4 88 700 -5.1 2.6
2001 210 700 40.8 6.2 104 500 17.8 3.0
2002 252 600 19.9 7.2 109 700 5.0 3.1

291
Table 35 : Employment in selected major economic sectors
As in September of:1998 1999 2000 2001 2002
Major economic sector No.
%changeover a
yearearlier No.
%changeover a
yearearlier No.
%changeover a
yearearlier No.
%changeover a
yearearlier No.
%changeover a
yearearlier
Manufacturing 257 000 -16.9 244 500 -4.9 229 400 -6.2 209 300 -8.8 190 100 -9.2of which :Wearing apparel,
except footwear44 900 -19.1 43 200 -3.9 37 000 -14.4 31 700 -14.1 25 200 -20.5
Textiles 35 100 -20.0 31 800 -9.5 29 400 -7.4 27 100 -8.0 26 400 -2.6Electronics 24 800 -26.5 25 500 2.9 26 100 2.6 20 900 -19.9 18 600 -11.3Plastic products 8 700 -29.4 8 000 -8.1 6 800 -14.2 5 900 -13.1 4 500 -24.8Fabricated metal
products, exceptmachinery and equipment
15 000 -20.7 12 500 -16.8 12 100 -3.4 9 800 -19.1 7 700 -21.5
Wholesale, retail, import/export trades,restaurants and hotels
946 600 -7.8 997 500 5.4 1 053 300 5.6 1 027 300 -2.5 1 014 000 -1.3
of which :Wholesale, retail and
import/exporttrades
740 900 -8.1 784 900 5.9 832 600 6.1 804 300 -3.4 801 700 -0.3
Restaurants and hotels 205 600 -6.8 212 600 3.4 220 600 3.8 223 000 1.1 212 300 -4.8Transport, storage and
communications169 600 -4.5 175 600 3.6 183 300 4.4 184 200 0.5 180 400 -2.1
of which :Land transport 37 900 7.9 39 000 2.9 38 200 -2.1 38 800 1.8 38 800 *Water transport 26 900 -0.3 26 500 -1.5 29 000 9.2 28 800 -0.7 28 500 -0.8Services allied to
transport48 300 -12.9 51 900 7.6 53 900 3.9 53 800 -0.2 52 900 -1.7
Financing, insurance, real estate andbusiness services
398 100 -4.3 406 900 2.2 437 000 7.4 437 300 0.1 424 500 -2.9
of which :Financial institutions 128 400 -10.6 137 400 7.0 137 400 * 136 300 -0.8 126 600 -7.2
Insurance 26 500 22.5 27 100 2.4 25 400 -6.3 26 900 6.1 26 200 -2.8Real estate 78 800 -7.5 81 900 3.9 83 900 2.4 82 200 -1.9 83 400 1.4Business services
except machinery and equipment rental and leasing
163 000 -0.6 159 500 -2.2 189 200 18.6 190 800 0.9 187 200 -1.9
Community, social andpersonal services
323 900 3.2 340 000 5.0 348 900 2.6 377 000 8.1 398 300 5.7
of which :Sanitary and similar
services37 300 18.5 42 800 14.9 42 600 -0.5 46 800 9.8 53 700 14.8
Education services 104 200 4.5 109 000 4.6 112 800 3.4 120 600 7.0 123 300 2.3Medical, dental and
other health services67 000 7.6 68 200 1.7 68 200 * 71 700 5.2 74 100 3.4
Welfare institutions 28 300 5.2 29 600 4.6 35 900 21.5 41 000 14.0 46 000 12.2Civil Service(a) 188 400 2.3 188 000 -0.2 183 400 -2.4 176 700 -3.7 170 500 -3.5
Notes : (a) These figures cover only those employed on Civil Service terms of appointment. Judicial officers,consultants, contract staff and temporary staff not appointed on Civil Service terms are not included.
(*) Change of less than 0.05%.

292
Table 36 : Reported vacancies in selected major economic sectors
As in September of:
1998 1999 2000 2001 2002
Vacancyrate in
Sep 2002
Major economic sector No.
%changeover a
yearearlier No.
%changeover a
yearearlier No.
%changeover a
yearearlier No.
%changeover a
yearearlier No.
%changeover a
yearearlier %
Manufacturing 2 000 -71.2 2 200 8.6 2 200 * 1 400 -37.8 1 400 3.9 0.7of which :Wearing apparel,
except footwear700 -59.0 600 -14.7 500 -12.5 400 -24.2 700 74.4 2.6
Textiles 200 -76.4 200 -3.1 100 -28.5 100 -52.2 # -22.2 0.2Electronics 200 -85.0 400 130.5 400 11.0 100 -68.3 100 -19.2 0.5Plastic products 100 -71.9 100 55.6 100 -28.6 # -56.7 # -26.9 0.4Fabricated metal
products, exceptmachinery and equipment
100 -78.8 100 -20.3 # -37.3 100 51.4 # -62.5 0.3
Wholesale, retail, import/export trades,restaurants and hotels
9 000 -61.1 9 700 7.7 14 700 51.1 8 000 -45.7 7 100 -10.3 0.7
of which :Wholesale, retail and
import/exporttrades
7 300 -58.3 8 400 14.5 12 300 46.6 6 400 -47.6 5 800 -10.2 0.7
Restaurants and hotels 1 700 -70.0 1 300 -22.0 2 400 79.8 1 500 -35.9 1 400 -10.8 0.6Transport, storage and
communications1 600 -57.2 1 800 8.7 2 300 28.8 1 100 -50.1 1 200 5.4 0.7
of which :Land transport 400 -50.9 200 -45.0 300 54.1 200 -32.5 300 21.6 0.7Water transport 100 -66.6 200 32.4 400 106.9 100 -73.3 100 10.6 0.4Services allied to
transport400 -53.3 800 79.2 800 -1.8 300 -62.5 200 -21.3 0.4
Financing, insurance,real estate andbusiness services
6 200 -53.3 6 200 -0.1 10 300 64.9 5 300 -48.8 4 800 -8.4 1.1
of which :Financial institutions 800 -68.6 1 200 55.3 2 300 88.0 1 500 -35.9 1 000 -33.1 0.8Insurance 1 700 21.6 800 -54.2 1 400 83.3 600 -59.1 900 59.4 3.4Real estate 1 900 -53.3 1 800 -5.7 2 200 21.1 1 300 -41.4 1 000 -21.1 1.2Business services
except machineryand equipment rental and leasing
1 800 -65.3 2 400 31.2 4 300 78.5 1 900 -56.0 1 900 -0.2 1.0
Community, social andpersonal services 4 900 -40.9 4 700 -3.4 6 100 30.2 5 500 -11.1 4 200 -23.8 1.0
of which:Sanitary and similar
services400 -44.6 400 5.7 700 95.2 300 -63.1 300 17.5 0.6
Education services 600 -27.4 400 -36.1 900 139.5 800 -14.1 600 -17.9 0.5Medical, dental and
other health services2 100 -3.5 2 100 -0.1 2 200 4.3 1 900 -16.3 1 400 -23.7 1.9
Welfare institutions 700 -31.8 600 -14.9 700 20.8 800 11.7 700 -16.3 1.4Civil Service(a) 4 400 -14.2 3 000 -32.5 1 900 -37.5 1700 -8.1 1 700 1.9 1.0
Notes : Vacancy rate refers to the ratio of vacancies to total employment opportunities (actual employment plus vacancies).(a) As from June 1999, the definition of Civil Service vacancies is revised to exclude posts pending deletion,
posts held by temporary staff, and posts reserved for other staff. Figures for 1996-98 have been revisedaccordingly to facilitate year-on-year comparison. As from December 2000, Civil Service vacancies alsoexclude voluntary retirements.
(*) Change of less than 0.05%.(#) Less than 50.

293
Table 37: Number of workers engaged at building and construction sites
Building sites Civil engineering sites Total
Privatesector
Publicsector(a) Sub-total
Privatesector
Publicsector(a) Sub-total
As inSeptember of No.
%changeover a
yearearlier No.
%changeover a
yearearlier No.
%changeover a
yearearlier No.
%changeover a
yearearlier No.
%changeover a
yearearlier No.
%changeover a
yearearlier No.
%changeover a
yearearlier
1998 40 780 6.1 22 238 6.2 63 018 6.1 1 830 25.8 10 962 -36.5 12 792 -31.7 75 810 -2.9
1999 28 371 -30.4 28 124 26.5 56 495 -10.4 1 447 -20.9 10 741 -2.0 12 188 -4.7 68 683 -9.4
2000 35 060 23.6 26 691 -5.1 61 751 9.3 1 378 -4.8 17 562 63.5 18 940 55.4 80 691 17.5
2001 40 551 15.7 14 042 -47.4 54 593 -11.6 2 484 80.3 19 447 10.7 21 931 15.8 76 524 -5.2
2002 39 022 -3.8 9 638 -31.4 48 660 -10.9 2 790 9.1 19 007 -2.3 21 716 -1.0 70 376 -8.0
Note : (a) Including the Mass Transit Railway Corporation Limited, the Kowloon-Canton Railway Corporation and the AirportAuthority Hong Kong.
Table 38: Average labour earnings by major economic sector
As in Q3 of:
Major economic sector1998
$1999
$2000
$2001
$2002
$
Wholesale, retail andimport/export trades
11,500(3)
<1>
11,200(-2)<4>
11,600(4)
<7>
11,800(2)
<3>
11,500(-2)<2>
Restaurants and hotels 9,000(1)
<-2>
8,600(-4)<2>
8,600(*)
<3>
8,600(-1)<*>
8,300(-3)<1>
Transport, storage andcommunications
18,100(2)
<*>
17,100(-5)<1>
17,500(2)
<5>
17,800(2)
<3>
17,400(-3)<1>
Financing, insurance,real estate and businessservices
17,700(-3)
<-5>
17,400(-1)<5>
17,700(1)
<4>
17,500(-1)<*>
17,300(-1)<2>
Community, social andpersonal services
20,200(5)
<2>
20,200(*)
<7>
20,000(-1)<2>
20,700(3)
<4>
20,100(-2)<1>
Manufacturing 11,100(8)
<5>
10,900(*)
<6>
11,000(1)
<4>
11,300(2)
<3>
11,200(-1)<3>
All sectors surveyed 14,400(3)
<*>
14,200(-1)<5>
14,400(2)
<5>
14,700(2)
<3>
14,500(-2)<2>
Notes : ( ) % change over a year earlier in money terms.
< > % change over a year earlier in real terms.
(*) Change of less than 0.5%.

294
Table 39: Wage indices by selected major economic sector(year-on-year rate of change (%))
As in September of :
1998 1999 2000 2001 2002
Selected majoreconomic sector
Inmoneyterms
Inreal
terms
Inmoneyterms
Inreal
terms
Inmoneyterms
Inreal
terms
Inmoneyterms
Inreal
terms
Inmoneyterms
Inreal
terms
Wholesale, retail andimport/export trades
2 * -1 5 3 5 1 2 -2 2
Restaurants and hotels * -2 * 5 -1 1 1 2 -3 2
Transport services 4 2 -2 3 -3 -1 * 1 * 4
Financing, insurance,real estate andbusiness services
4 2 -2 3 2 4 -2 -1 * 4
Personal services 4 1 * 5 * 2 1 2 -3 1
Manufacturing 1 -1 -1 5 2 5 3 4 -2 3
All sector surveyed 2 * -1 4 1 4 1 2 -2 3
Note : (*) Change of less than 0.5%.

Table 40: Composite Consumer Price Index(year-on-year rate of change (%))
of which :
Year/monthAll
items Food
Mealsbought
awayfrom
homeOther
food Housing
of which :
Privatedwellings
PublicDwellings
Electricity,gas and
water
Alcoholicdrinks and
tobacco(for home
consumption)
Clothingand
footwearDurable
goodsMiscellaneous
goods TransportMiscellaneous
services
1998 2.8 1.9 2.2 1.5 4.7 5.5 -3.4 1.4 6.6 -0.8 0.2 2.6 3.9 2.7
1999 -4.0 -1.8 -1.2 -2.8 -5.1 -6.1 1.4 -0.4 1.2 -20.6 -6.3 -0.7 0.5 -1.3
2000 -3.8 -2.2 -0.9 -4.2 -8.2 -9.8 1.1 3.6 -0.9 -10.1 -4.6 0.9 1.0 -0.2
2001 -1.6 -0.8 -0.3 -1.7 -3.1 -2.9 -8.3 -1.9 3.3 -4.6 -7.1 1.3 0.4 0.5
2002 -3.0 -2.1 -1.5 -3.1 -5.7 -6.5 -2.7 -7.0 2.4 0.7 -6.3 1.7 -0.6 -2.3
2002 Jan -3.5 -1.8 -0.8 -3.3 -5.4 -5.4 -10.7 -16.6 6.0 0.9 -7.3 0.1 -1.5 -2.9Feb -2.3 -1.0 -0.6 -1.6 -5.5 -5.6 -10.7 -4.1 5.1 1.1 -7.3 0.4 0.4 0.3Mar -2.2 -1.1 -1.1 -1.1 -5.8 -5.8 -10.7 12.7 2.5 -1.4 -7.2 1.0 -0.1 -1.1Apr -3.1 -1.9 -1.1 -3.2 -6.0 -6.1 -10.4 -9.3 2.5 1.5 -6.9 2.0 -0.7 -1.7May -3.1 -2.2 -1.7 -3.1 -6.0 -6.1 -10.4 -8.4 2.3 2.4 -6.1 2.1 -0.5 -2.4Jun -3.3 -3.0 -1.6 -5.1 -6.3 -6.5 -10.4 -8.2 1.3 3.4 -5.7 2.8 -0.4 -2.6Jul -3.4 -3.4 -1.8 -6.0 -6.1 -6.3 -10.4 -8.5 2.7 2.5 -5.8 2.2 -0.1 -2.4Aug -3.3 -2.1 -1.8 -2.6 -6.4 -6.6 -10.4 -8.5 3.1 2.1 -5.5 2.0 -0.6 -2.9Sep -3.7 -2.5 -1.8 -3.6 -6.6 -6.9 -10.4 -8.4 2.2 -0.3 -5.4 1.8 -0.6 -3.7Oct -3.6 -1.9 -1.7 -2.3 -6.7 -7.0 -10.4 -7.9 0.7 0.8 -6.3 1.3 -1.3 -3.4Nov -3.6 -2.0 -1.7 -2.4 -7.1 -7.5 -10.2 -7.2 0.6 -0.7 -6.0 2.3 -1.2 -3.3Dec -1.5 -2.1 -1.8 -2.5 -0.5 -7.9 2205.8 -6.2 0.3 -3.0 -5.8 2.6 -0.9 -1.4
Notes : As from October 2000 onwards, the year-on-year rates of change are computed from the 1999/2000-based Consumer Price Indices series. For the earlier periods, the year-on-year rates of change are computed from the 1994/95-based CPI series.
295

Table 41 : Consumer Price Index (A)(year-on-year rate of change (%))
of which :
Year/monthAll
items Food
Mealsbought
awayfrom
homeOther
food Housing
of which :
Privatedwellings
Publicdwellings
Electricity,gas and
water
Alcoholicdrinks and
tobacco(for home
consumption)
Clothingand
footwearDurable
goodsMiscellaneous
goods TransportMiscellaneous
services
1998 2.6 1.9 2.5 1.1 3.1 4.9 -3.4 1.2 6.6 0.1 0.3 3.6 4.3 4.2
1999 -3.3 -2.2 -1.4 -3.1 -4.5 -6.4 1.5 -0.6 1.1 -19.9 -5.2 -0.1 0.4 -0.6
2000 -3.0 -2.4 -0.8 -4.3 -6.2 -8.8 1.1 3.9 -0.8 -11.9 -4.2 1.5 0.6 *
2001 -1.7 -1.0 -0.5 -1.8 -3.6 -2.9 -8.2 -2.7 3.6 -4.3 -6.9 2.7 0.5 0.6
2002 -3.2 -2.2 -1.7 -2.9 -5.7 -6.8 -2.7 -8.2 2.4 2.6 -6.0 1.0 -0.6 -3.3
2002 Jan -3.9 -2.0 -1.0 -3.2 -6.3 -5.8 -10.7 -21.0 6.1 4.2 -6.6 0.5 -1.2 -3.2Feb -2.4 -0.9 -0.8 -1.1 -6.4 -5.9 -10.7 -5.2 5.6 4.3 -6.7 0.6 0.5 -0.7Mar -2.0 -0.9 -1.2 -0.5 -6.5 -6.0 -10.7 17.4 2.7 1.6 -6.4 1.0 0.1 -1.9Apr -3.3 -1.8 -1.2 -2.5 -6.6 -6.3 -10.4 -10.7 2.5 3.0 -6.5 1.4 -0.6 -2.4May -3.5 -2.2 -1.8 -2.8 -6.7 -6.3 -10.4 -9.8 2.4 4.5 -5.8 1.4 -0.5 -3.4Jun -3.9 -3.2 -1.8 -5.0 -6.9 -6.7 -10.4 -9.6 1.3 5.7 -5.6 1.7 -0.5 -3.7Jul -4.1 -3.9 -2.0 -6.3 -7.0 -6.8 -10.4 -9.9 2.7 4.4 -5.7 1.4 * -3.7Aug -3.7 -2.1 -2.0 -2.3 -7.2 -7.0 -10.4 -9.8 3.0 4.1 -5.4 1.2 -0.6 -4.3Sep -4.2 -2.9 -2.1 -3.8 -7.4 -7.4 -10.4 -9.7 2.3 0.6 -5.0 0.5 -0.6 -5.2Oct -4.0 -2.1 -2.0 -2.2 -7.4 -7.4 -10.4 -9.3 0.4 3.3 -6.2 0.4 -1.2 -4.8Nov -4.1 -2.1 -2.0 -2.3 -7.8 -7.9 -10.2 -8.5 0.3 0.1 -6.1 1.1 -1.2 -4.6Dec 1.0 -2.5 -2.1 -3.0 11.2 -8.5 2196.4 -7.5 0.1 -3.1 -6.0 1.2 -0.9 -2.0
Notes : As from October 2000 onwards, the year-on-year rates of change are computed from the 1999/2000-based Consumer Price Indices series. For the earlier periods, the year-on-year rates of change are computed from the 1994/95-based CPI series.
(*) Change of less than 0.05%.
296

297
Table 42 : Implicit price deflators of GDP and its main expenditure components#
(rate of change (%))
1998 1999 2000 2001 2002+
Private consumptionexpenditure
2.6 -5.2 -5.1 -1.3 -3.3
Government consumptionexpenditure
2.6 -0.1 -1.9 1.2 -0.4
Gross domestic fixedcapital formation
-7.2 0.4 -3.8 -4.3 -7.0
Total exports of goods -3.3 -3.4 -0.5 -2.6 -2.9
Imports of goods -4.4 -2.6 0.8 -3.5 -4.2
Exports of services -5.6 -3.6 0.8 -3.9 -2.8
Imports of services -3.0 -0.8 -0.2 -0.8 0.4
Gross Domestic Product 0.2 -5.8 -6.2 -1.4 -2.7
Total final demand -2.3 -3.7 -2.9 -2.4 -3.4
Domestic demand 0.6 -2.3 -5.4 -1.8 -4.2
Notes : (#) Revised series incorporating the results of a technical revision to GDP as announced on1 August 2002.
(+) Preliminary figures.