User Engagement National Statistics Review Policy changes ...
20
Tax Credit Finalised Awards 2014-15: Geographical analysis User Engagement https://www.gov.uk/government/organisations/hm-revenue-customs/about/statistics#contact-us https://www.gov.uk/government/organisations/hm-revenue-customs/about/statistics#contact-us National Statistics Review https://www.gov.uk/government/uploads/system/uploads/attachment_data/file/277973/report.pdf Policy changes that affect this publication - the removal of the second income threshold; Since April 2013 - the income rise disregard has been reduced from £10,000 to £5,000. A number of policy changes that affect Tax Credits were introduced on 6th April 2012 as part of the Coalition Government’s announcements in the June 2010 Budget and the 2010 Spending Review. These include: - the introduction of a disregard for income falls, at £2,500; - the abolition of the 50+ elements. - A new working hours condition for couples with children. At least one adult must work 16 hours or more per week, and their combined working hours must be 24 hours or more in order to be eligible for WTC. The removal of the second income threshold means that most families that used to receive the Family Element or less are no longer entitled to receive anything. As a result some categories in this publication have been changed. The previous distinction between In-work families receiving 'More than the Family Element' 'the Family element' and 'Less than the Family Element' has been removed, and will now be referred to as 'CTC Only'. Bespoke analysis of tax credits data is possible although there may be a charge depending on the level of complexity and the resources required to produce. If you would like to discuss your requirements, to comment on the current publications, or for further information about the tax credits statistics please use the contact information at the beginning of this publication, or from the GOV.uk website: We are committed to improving the official statistics we publish. We want to encourage and promote user engagement, so we can improve our statistical outputs. We would welcome any views you have using the link to the feedback form below. We will undertake to review user comments on a quarterly basis and use this information to influence the development of our official statistics. We will summarise and publish user comments at regular intervals. A formal review of our National and Official Statistics publications was held between May and August 2011. Over 130 responses were received from a broad range of users. A report summarising the responses received has been published. 7 HMRC
-
Upload
khangminh22 -
Category
Documents
-
view
1 -
download
0
Transcript of User Engagement National Statistics Review Policy changes ...
Tax Credit Finalised Awards 2014-15: Geographical analysis
User Engagement
https://www.gov.uk/government/organisations/hm-revenue-customs/about/statistics#contact-us
https://www.gov.uk/government/organisations/hm-revenue-customs/about/statistics#contact-us
National Statistics Review
https://www.gov.uk/government/uploads/system/uploads/attachment_data/file/277973/report.pdf
Policy changes that affect this publication
- the removal of the second income threshold;
Since April 2013
- the income rise disregard has been reduced from £10,000 to £5,000.
A number of policy changes that affect Tax Credits were introduced on 6th April 2012 as
part of the Coalition Government’s announcements in the June 2010 Budget and the 2010
Spending Review. These include:
- the introduction of a disregard for income falls, at £2,500;
- the abolition of the 50+ elements.
- A new working hours condition for couples with children. At least one adult must work 16
hours or more per week, and their combined working hours must be 24 hours or more in
order to be eligible for WTC.
The removal of the second income threshold means that most families that used to receive
the Family Element or less are no longer entitled to receive anything. As a result some
categories in this publication have been changed. The previous distinction between In-work
families receiving 'More than the Family Element' 'the Family element' and 'Less than the
Family Element' has been removed, and will now be referred to as 'CTC Only'.
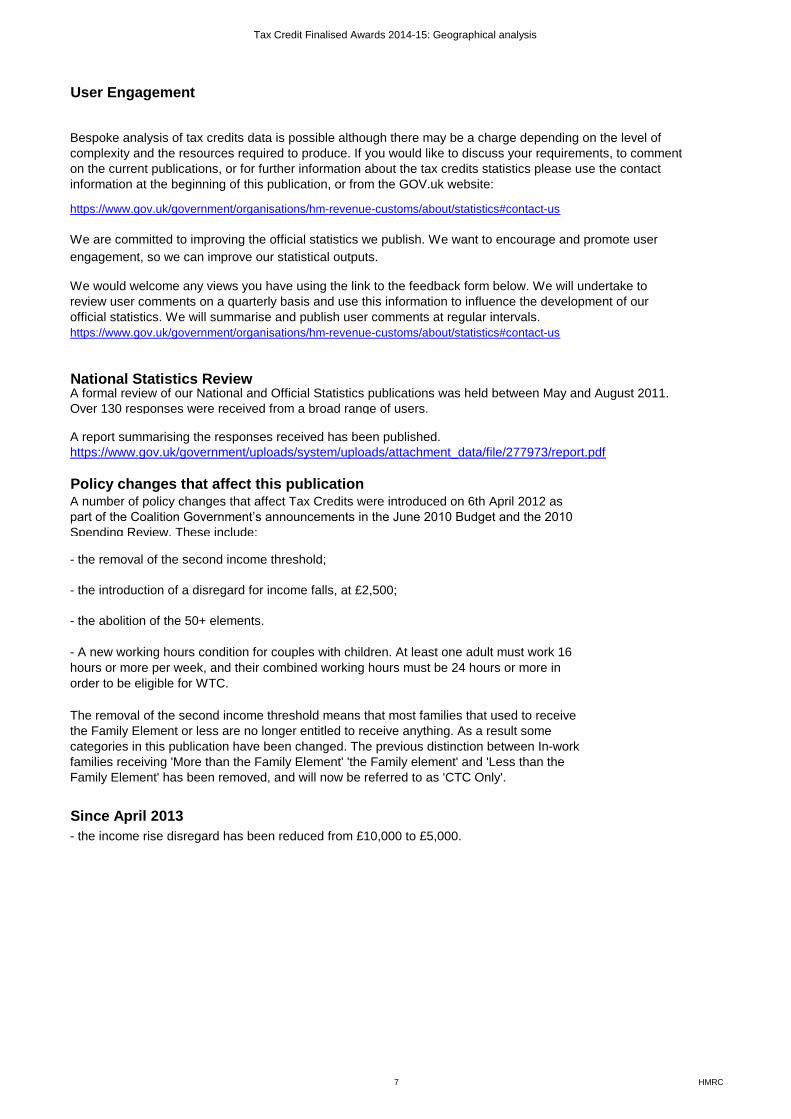
Bespoke analysis of tax credits data is possible although there may be a charge depending on the level of
complexity and the resources required to produce. If you would like to discuss your requirements, to comment
on the current publications, or for further information about the tax credits statistics please use the contact
information at the beginning of this publication, or from the GOV.uk website:
We are committed to improving the official statistics we publish. We want to encourage and promote user
engagement, so we can improve our statistical outputs.
We would welcome any views you have using the link to the feedback form below. We will undertake to
review user comments on a quarterly basis and use this information to influence the development of our
official statistics. We will summarise and publish user comments at regular intervals.
A formal review of our National and Official Statistics publications was held between May and August 2011.
Over 130 responses were received from a broad range of users.
A report summarising the responses received has been published.
7 HMRC

Tax Credit Finalised Awards 2014-15: Geographical analysis
7 HMRC
Tax Credit Finalised Awards 2014-15: Geographical Analysis
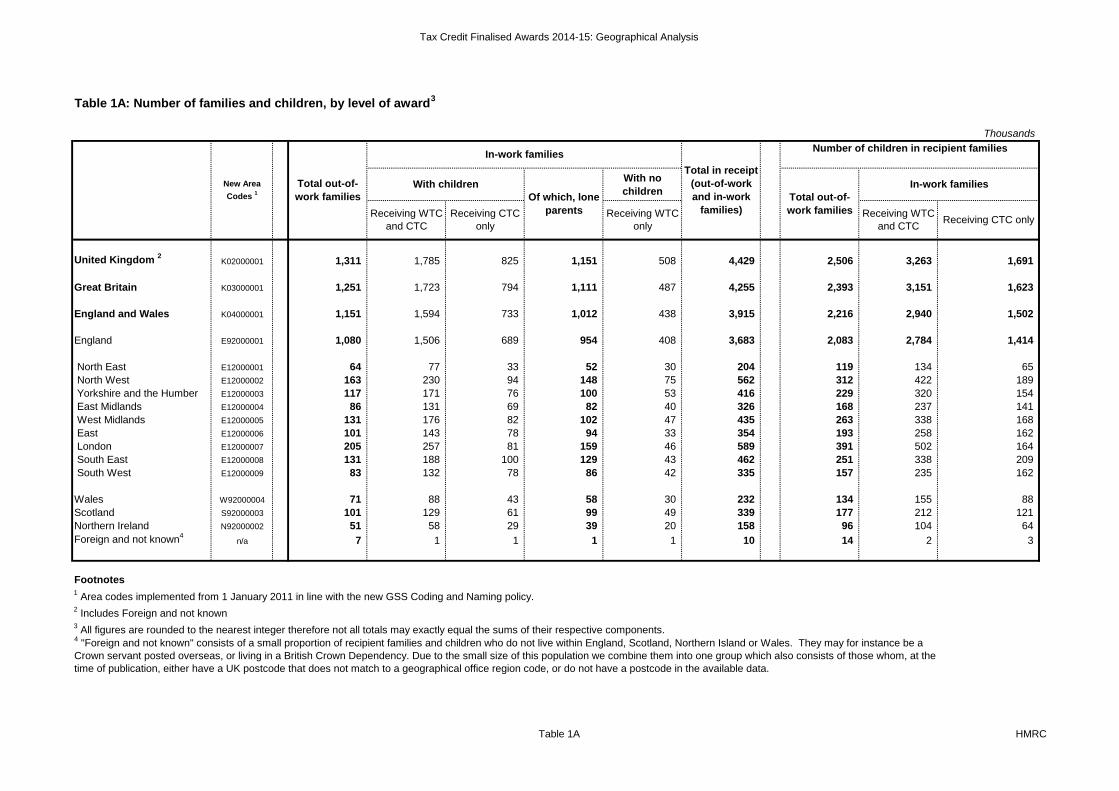
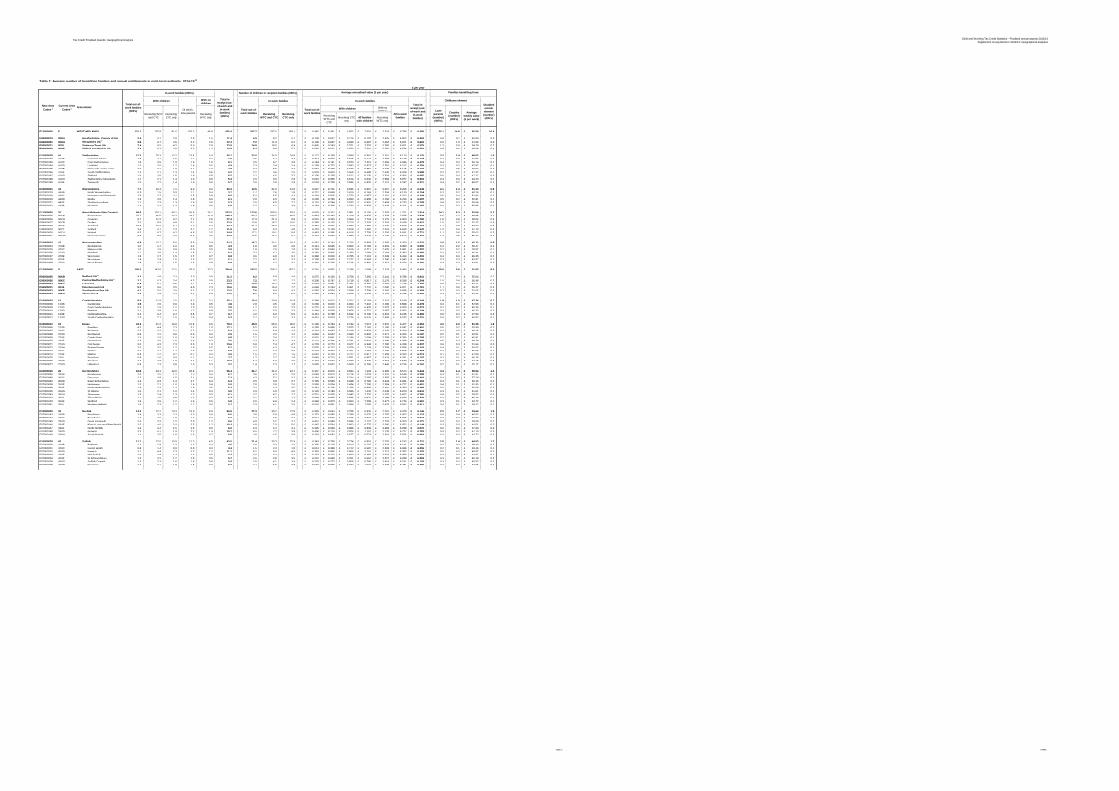
Table 1A: Number of families and children, by level of award3
Thousands
With no
children
United Kingdom 2
K02000001 1,311 1,785 825 1,151 508 4,429 2,506 3,263 1,691
Great Britain K03000001 1,251 1,723 794 1,111 487 4,255 2,393 3,151 1,623
England and Wales K04000001 1,151 1,594 733 1,012 438 3,915 2,216 2,940 1,502
England E92000001 1,080 1,506 689 954 408 3,683 2,083 2,784 1,414
North East E12000001 64 77 33 52 30 204 119 134 65
North West E12000002 163 230 94 148 75 562 312 422 189
Yorkshire and the Humber E12000003 117 171 76 100 53 416 229 320 154
East Midlands E12000004 86 131 69 82 40 326 168 237 141
West Midlands E12000005 131 176 82 102 47 435 263 338 168
East E12000006 101 143 78 94 33 354 193 258 162
London E12000007 205 257 81 159 46 589 391 502 164
South East E12000008 131 188 100 129 43 462 251 338 209
South West E12000009 83 132 78 86 42 335 157 235 162
Wales W92000004 71 88 43 58 30 232 134 155 88
Scotland S92000003 101 129 61 99 49 339 177 212 121
Northern Ireland N92000002 51 58 29 39 20 158 96 104 64
Foreign and not known4
n/a 7 1 1 1 1 10 14 2 3
Footnotes1 Area codes implemented from 1 January 2011 in line with the new GSS Coding and Naming policy.
2 Includes Foreign and not known
3 All figures are rounded to the nearest integer therefore not all totals may exactly equal the sums of their respective components.
4 "Foreign and not known" consists of a small proportion of recipient families and children who do not live within England, Scotland, Northern Island or Wales. They may for instance be a
Crown servant posted overseas, or living in a British Crown Dependency. Due to the small size of this population we combine them into one group which also consists of those whom, at the
time of publication, either have a UK postcode that does not match to a geographical office region code, or do not have a postcode in the available data.
Number of children in recipient families
Total out-of-
work families Receiving WTC
and CTC
With children
Of which, lone
parentsReceiving CTC only
In-work familiesNew Area
Codes 1
Total out-of-
work families
Receiving WTC
only
Receiving CTC
only
Receiving WTC
and CTC
Total in receipt
(out-of-work
and in-work
families)
In-work families
Table 1A HMRC
Tax Credit Finalised Awards: Geographical Analysis
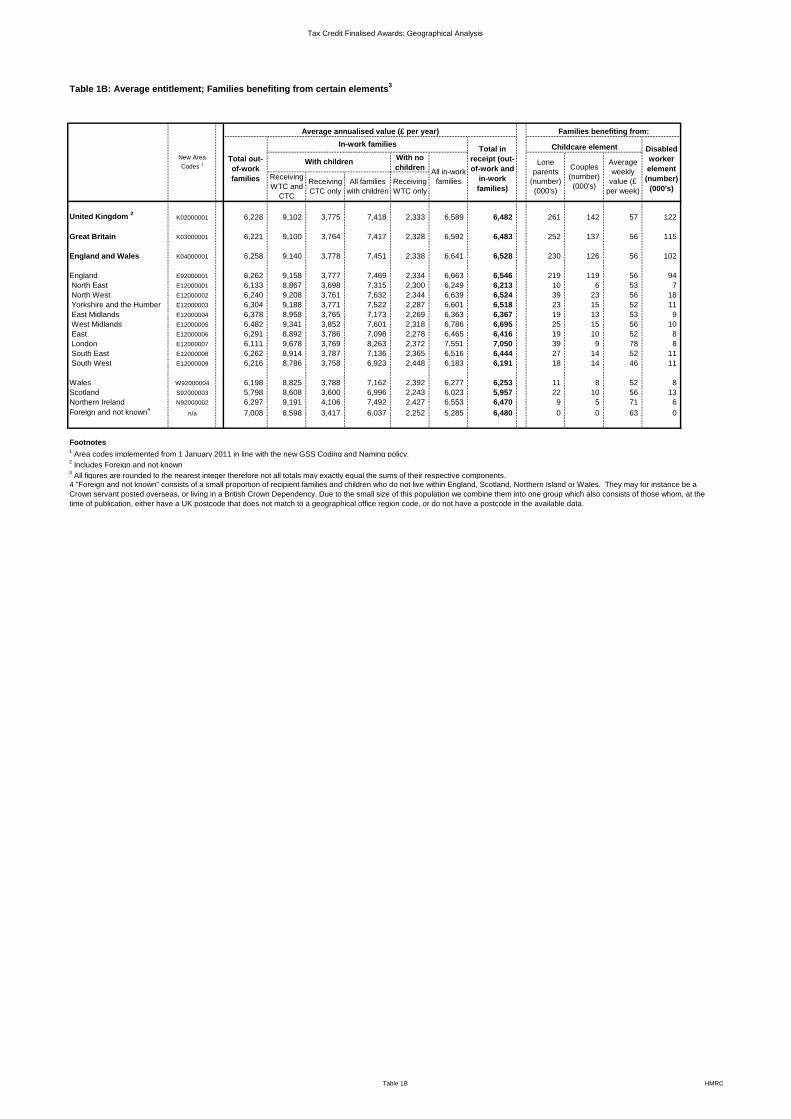
Table 1B: Average entitlement; Families benefiting from certain elements3
With no
children
United Kingdom 2
K02000001 6,228 9,102 3,775 7,418 2,333 6,589 6,482 261 142 57 122
Great Britain K03000001 6,221 9,100 3,764 7,417 2,328 6,592 6,483 252 137 56 115
England and Wales K04000001 6,258 9,140 3,778 7,451 2,338 6,641 6,528 230 126 56 102
England E92000001 6,262 9,158 3,777 7,469 2,334 6,663 6,546 219 119 56 94
North East E12000001 6,133 8,867 3,698 7,315 2,300 6,249 6,213 10 6 53 7
North West E12000002 6,240 9,208 3,761 7,632 2,344 6,639 6,524 39 23 56 18
Yorkshire and the Humber E12000003 6,304 9,188 3,771 7,522 2,287 6,601 6,518 23 15 52 11
East Midlands E12000004 6,378 8,958 3,765 7,173 2,269 6,363 6,367 19 13 53 9
West Midlands E12000005 6,482 9,341 3,852 7,601 2,318 6,786 6,695 25 15 56 10
East E12000006 6,291 8,892 3,786 7,098 2,278 6,465 6,416 19 10 52 8
London E12000007 6,111 9,678 3,769 8,263 2,372 7,551 7,050 39 9 78 8
South East E12000008 6,262 8,914 3,787 7,136 2,365 6,516 6,444 27 14 52 11
South West E12000009 6,216 8,786 3,758 6,923 2,448 6,183 6,191 18 14 46 11
Wales W92000004 6,198 8,825 3,788 7,162 2,392 6,277 6,253 11 8 52 8
Scotland S92000003 5,798 8,608 3,600 6,996 2,243 6,023 5,957 22 10 56 13
Northern Ireland N92000002 6,297 9,191 4,106 7,492 2,427 6,553 6,470 9 5 71 6
Foreign and not known4
n/a 7,008 8,598 3,417 6,037 2,252 5,285 6,480 0 0 63 0
Footnotes1 Area codes implemented from 1 January 2011 in line with the new GSS Coding and Naming policy.
2 Includes Foreign and not known
3 All figures are rounded to the nearest integer therefore not all totals may exactly equal the sums of their respective components.
4 "Foreign and not known" consists of a small proportion of recipient families and children who do not live within England, Scotland, Northern Island or Wales. They may for instance be a
Crown servant posted overseas, or living in a British Crown Dependency. Due to the small size of this population we combine them into one group which also consists of those whom, at the
time of publication, either have a UK postcode that does not match to a geographical office region code, or do not have a postcode in the available data.
New Area
Codes 1 Lone
parents
(number)
(000's)
Couples
(number)
(000's)
Total out-
of-work
familiesAll in-work
families
With children
Average annualised value (£ per year)
Receiving
WTC and
CTC
Families benefiting from:
Receiving
CTC only
In-work families
All families
with children
Receiving
WTC only
Total in
receipt (out-
of-work and
in-work
families)
Disabled
worker
element
(number)
(000's)
Average
weekly
value (£
per week)
Childcare element
Table 1B HMRC
Tax Credits Finalised Awards 2014-15: Geographical analysis
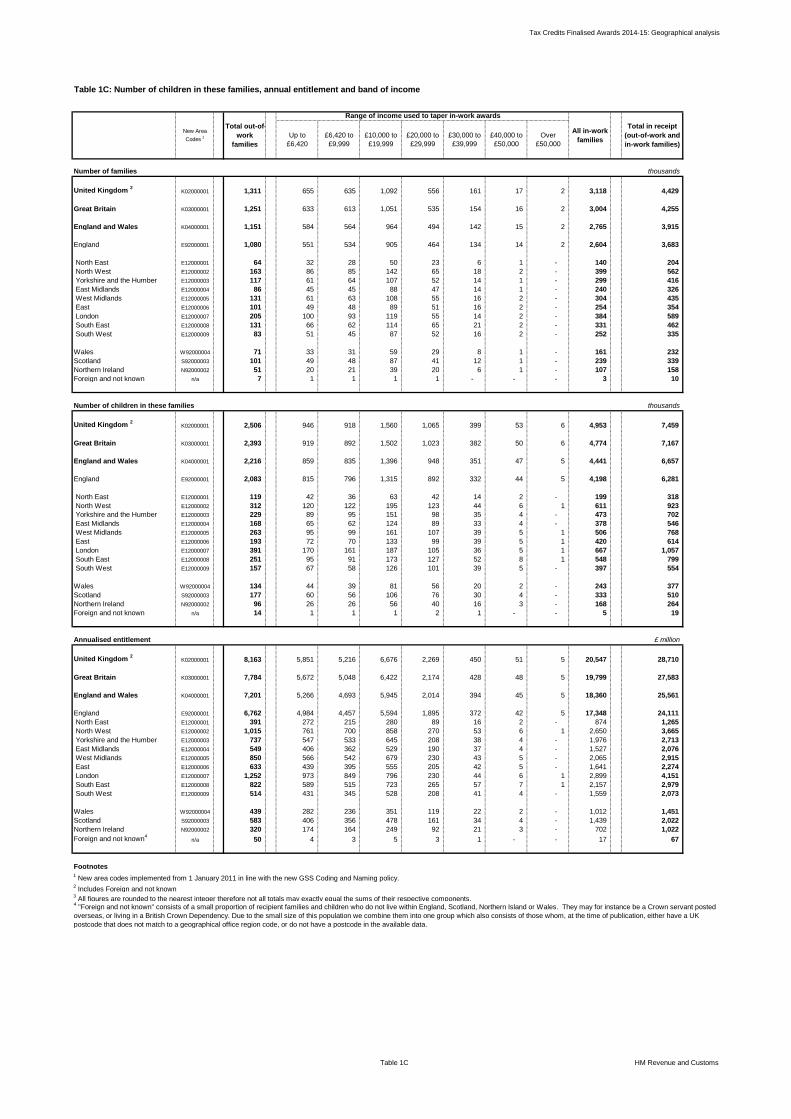
Table 1C: Number of children in these families, annual entitlement and band of income
Number of families thousands
United Kingdom 2
K02000001 1,311 655 635 1,092 556 161 17 2 3,118 4,429
Great Britain K03000001 1,251 633 613 1,051 535 154 16 2 3,004 4,255
England and Wales K04000001 1,151 584 564 964 494 142 15 2 2,765 3,915
England E92000001 1,080 551 534 905 464 134 14 2 2,604 3,683
North East E12000001 64 32 28 50 23 6 1 - 140 204
North West E12000002 163 86 85 142 65 18 2 - 399 562
Yorkshire and the Humber E12000003 117 61 64 107 52 14 1 - 299 416
East Midlands E12000004 86 45 45 88 47 14 1 - 240 326
West Midlands E12000005 131 61 63 108 55 16 2 - 304 435
East E12000006 101 49 48 89 51 16 2 - 254 354
London E12000007 205 100 93 119 55 14 2 - 384 589
South East E12000008 131 66 62 114 65 21 2 - 331 462
South West E12000009 83 51 45 87 52 16 2 - 252 335
Wales W92000004 71 33 31 59 29 8 1 - 161 232
Scotland S92000003 101 49 48 87 41 12 1 - 239 339
Northern Ireland N92000002 51 20 21 39 20 6 1 - 107 158
Foreign and not known n/a 7 1 1 1 1 - - - 3 10
Number of children in these families thousands
United Kingdom 2
K02000001 2,506 946 918 1,560 1,065 399 53 6 4,953 7,459
Great Britain K03000001 2,393 919 892 1,502 1,023 382 50 6 4,774 7,167
England and Wales K04000001 2,216 859 835 1,396 948 351 47 5 4,441 6,657
England E92000001 2,083 815 796 1,315 892 332 44 5 4,198 6,281
North East E12000001 119 42 36 63 42 14 2 - 199 318
North West E12000002 312 120 122 195 123 44 6 1 611 923
Yorkshire and the Humber E12000003 229 89 95 151 98 35 4 - 473 702
East Midlands E12000004 168 65 62 124 89 33 4 - 378 546
West Midlands E12000005 263 95 99 161 107 39 5 1 506 768
East E12000006 193 72 70 133 99 39 5 1 420 614
London E12000007 391 170 161 187 105 36 5 1 667 1,057
South East E12000008 251 95 91 173 127 52 8 1 548 799
South West E12000009 157 67 58 126 101 39 5 - 397 554
Wales W92000004 134 44 39 81 56 20 2 - 243 377
Scotland S92000003 177 60 56 106 76 30 4 - 333 510
Northern Ireland N92000002 96 26 26 56 40 16 3 - 168 264
Foreign and not known n/a 14 1 1 1 2 1 - - 5 19
Annualised entitlement £ million
United Kingdom 2
K02000001 8,163 5,851 5,216 6,676 2,269 450 51 5 20,547 28,710
Great Britain K03000001 7,784 5,672 5,048 6,422 2,174 428 48 5 19,799 27,583
England and Wales K04000001 7,201 5,266 4,693 5,945 2,014 394 45 5 18,360 25,561
England E92000001 6,762 4,984 4,457 5,594 1,895 372 42 5 17,348 24,111
North East E12000001 391 272 215 280 89 16 2 - 874 1,265
North West E12000002 1,015 761 700 858 270 53 6 1 2,650 3,665
Yorkshire and the Humber E12000003 737 547 533 645 208 38 4 - 1,976 2,713
East Midlands E12000004 549 406 362 529 190 37 4 - 1,527 2,076
West Midlands E12000005 850 566 542 679 230 43 5 - 2,065 2,915
East E12000006 633 439 395 555 205 42 5 - 1,641 2,274
London E12000007 1,252 973 849 796 230 44 6 1 2,899 4,151
South East E12000008 822 589 515 723 265 57 7 1 2,157 2,979
South West E12000009 514 431 345 528 208 41 4 - 1,559 2,073
Wales W92000004 439 282 236 351 119 22 2 - 1,012 1,451
Scotland S92000003 583 406 356 478 161 34 4 - 1,439 2,022
Northern Ireland N92000002 320 174 164 249 92 21 3 - 702 1,022
Foreign and not known4
n/a 50 4 3 5 3 1 - - 17 67
Footnotes1 New area codes implemented from 1 January 2011 in line with the new GSS Coding and Naming policy.
2 Includes Foreign and not known
3 All figures are rounded to the nearest integer therefore not all totals may exactly equal the sums of their respective components.
4 "Foreign and not known" consists of a small proportion of recipient families and children who do not live within England, Scotland, Northern Island or Wales. They may for instance be a Crown servant posted
overseas, or living in a British Crown Dependency. Due to the small size of this population we combine them into one group which also consists of those whom, at the time of publication, either have a UK
postcode that does not match to a geographical office region code, or do not have a postcode in the available data.
Total in receipt
(out-of-work and
in-work families)
Up to
£6,420
£6,420 to
£9,999
£10,000 to
£19,999
£20,000 to
£29,999
£30,000 to
£39,999
All in-work
families£40,000 to
£50,000
Over
£50,000
New Area
Codes 1
Total out-of-
work
families
Range of income used to taper in-work awards
Table 1C HM Revenue and Customs
Tax Credit Finalised Awards: Geographical Analysis
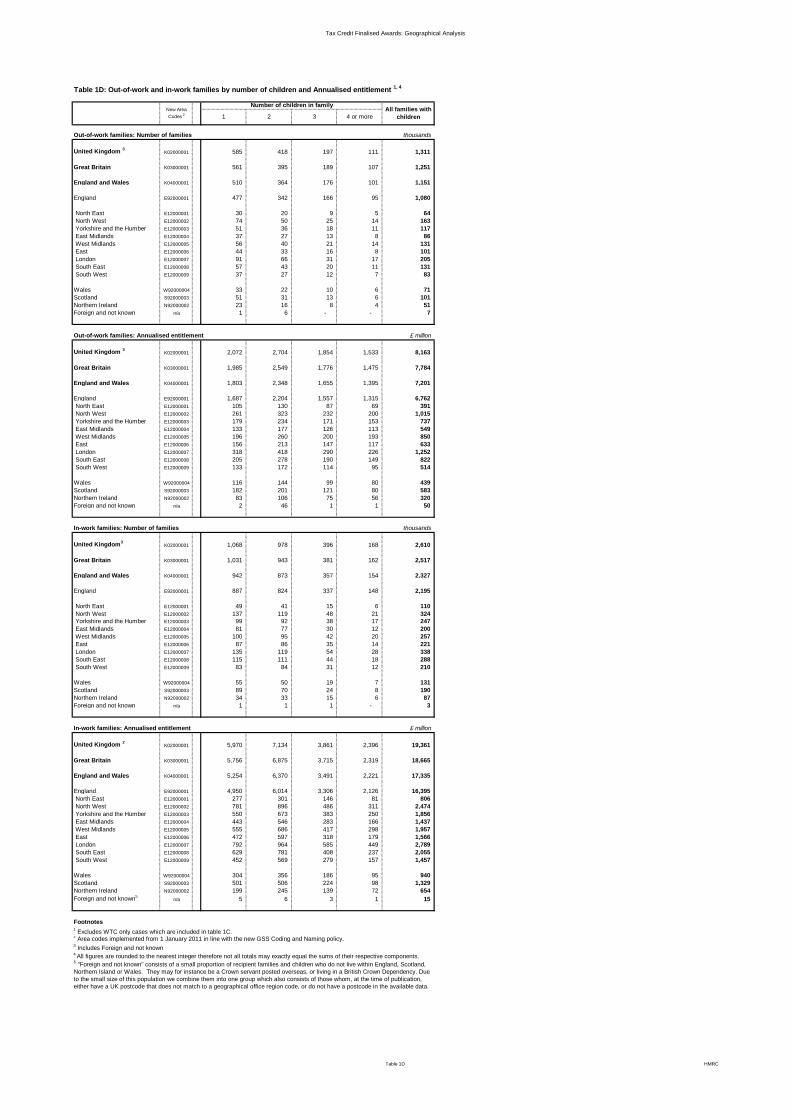
Table 1D: Out-of-work and in-work families by number of children and Annualised entitlement 1, 4
Out-of-work families: Number of families thousands
United Kingdom 3
K02000001 585 418 197 111 1,311
Great Britain K03000001 561 395 189 107 1,251
England and Wales K04000001 510 364 176 101 1,151
England E92000001 477 342 166 95 1,080
North East E12000001 30 20 9 5 64
North West E12000002 74 50 25 14 163
Yorkshire and the Humber E12000003 51 36 18 11 117
East Midlands E12000004 37 27 13 8 86
West Midlands E12000005 56 40 21 14 131
East E12000006 44 33 16 8 101
London E12000007 91 66 31 17 205
South East E12000008 57 43 20 11 131
South West E12000009 37 27 12 7 83
Wales W92000004 33 22 10 6 71
Scotland S92000003 51 31 13 6 101
Northern Ireland N92000002 23 16 8 4 51
Foreign and not known n/a 1 6 - - 7
Out-of-work families: Annualised entitlement £ million
United Kingdom 3
K02000001 2,072 2,704 1,854 1,533 8,163
Great Britain K03000001 1,985 2,549 1,776 1,475 7,784
England and Wales K04000001 1,803 2,348 1,655 1,395 7,201
England E92000001 1,687 2,204 1,557 1,315 6,762
North East E12000001 105 130 87 69 391
North West E12000002 261 323 232 200 1,015
Yorkshire and the Humber E12000003 179 234 171 153 737
East Midlands E12000004 133 177 126 113 549
West Midlands E12000005 196 260 200 193 850
East E12000006 156 213 147 117 633
London E12000007 318 418 290 226 1,252
South East E12000008 205 278 190 149 822
South West E12000009 133 172 114 95 514
Wales W92000004 116 144 99 80 439
Scotland S92000003 182 201 121 80 583
Northern Ireland N92000002 83 106 75 56 320
Foreign and not known n/a 2 46 1 1 50
In-work families: Number of families thousands
United Kingdom3
K02000001 1,068 978 396 168 2,610
Great Britain K03000001 1,031 943 381 162 2,517
England and Wales K04000001 942 873 357 154 2,327
England E92000001 887 824 337 148 2,195
North East E12000001 49 41 15 6 110
North West E12000002 137 119 48 21 324
Yorkshire and the Humber E12000003 99 92 38 17 247
East Midlands E12000004 81 77 30 12 200
West Midlands E12000005 100 95 42 20 257
East E12000006 87 86 35 14 221
London E12000007 135 119 54 28 338
South East E12000008 115 111 44 18 288
South West E12000009 83 84 31 12 210
Wales W92000004 55 50 19 7 131
Scotland S92000003 89 70 24 8 190
Northern Ireland N92000002 34 33 15 6 87
Foreign and not known n/a 1 1 1 - 3
In-work families: Annualised entitlement £ million
United Kingdom 2
K02000001 5,970 7,134 3,861 2,396 19,361
Great Britain K03000001 5,756 6,875 3,715 2,319 18,665
England and Wales K04000001 5,254 6,370 3,491 2,221 17,335
England E92000001 4,950 6,014 3,306 2,126 16,395
North East E12000001 277 301 146 81 806
North West E12000002 781 896 486 311 2,474
Yorkshire and the Humber E12000003 550 673 383 250 1,856
East Midlands E12000004 443 546 283 166 1,437
West Midlands E12000005 555 686 417 298 1,957
East E12000006 472 597 318 179 1,566
London E12000007 792 964 585 449 2,789
South East E12000008 629 781 408 237 2,055
South West E12000009 452 569 279 157 1,457
Wales W92000004 304 356 186 95 940
Scotland S92000003 501 506 224 98 1,329
Northern Ireland N92000002 199 245 139 72 654
Foreign and not known5
n/a 5 6 3 1 15
Footnotes1 Excludes WTC only cases which are included in table 1C.
2 Area codes implemented from 1 January 2011 in line with the new GSS Coding and Naming policy.
3 Includes Foreign and not known
4 All figures are rounded to the nearest integer therefore not all totals may exactly equal the sums of their respective components.
5 "Foreign and not known" consists of a small proportion of recipient families and children who do not live within England, Scotland,
Northern Island or Wales. They may for instance be a Crown servant posted overseas, or living in a British Crown Dependency. Due
to the small size of this population we combine them into one group which also consists of those whom, at the time of publication,
either have a UK postcode that does not match to a geographical office region code, or do not have a postcode in the available data.
4 or more
Number of children in familyAll families with
children
New Area
Codes 2
1 2 3
Table 1D HMRC
Tax Credit Finalised Awards: Geographical AnalysisChild and Working Tax Credit Statistics - Finalised annual awards 2012/13
Supplement on payments in 2012/13: Geographical analyses
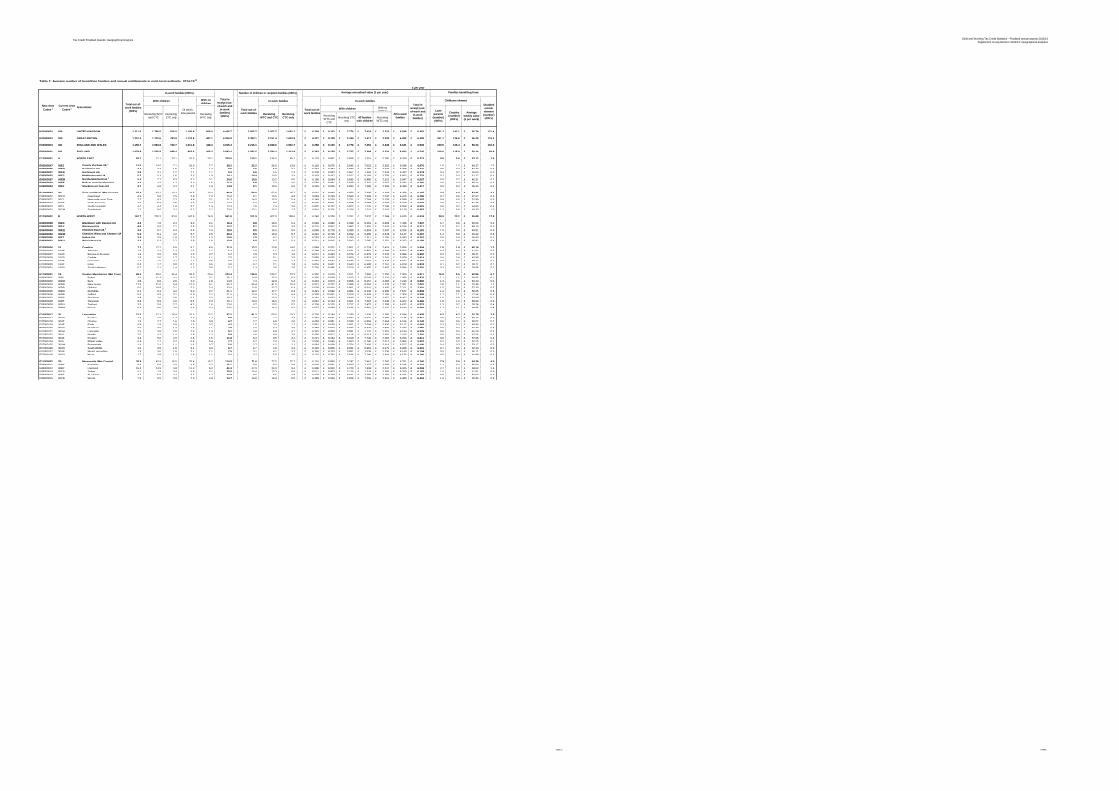
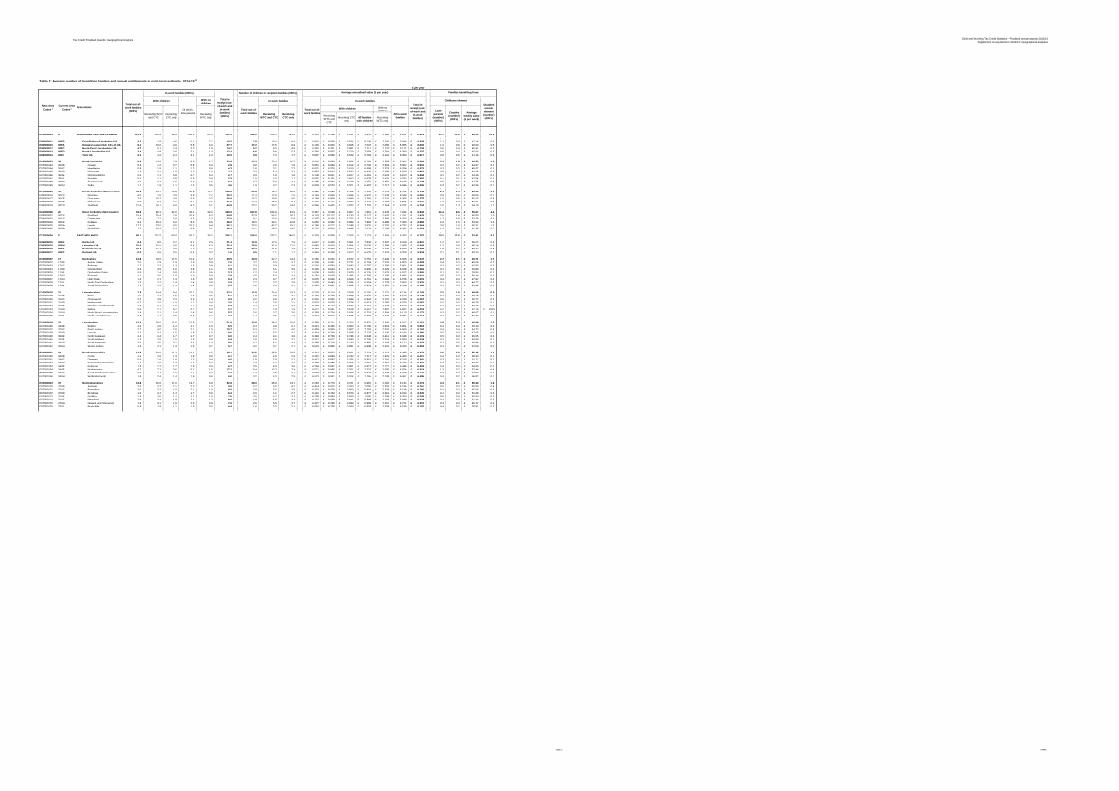
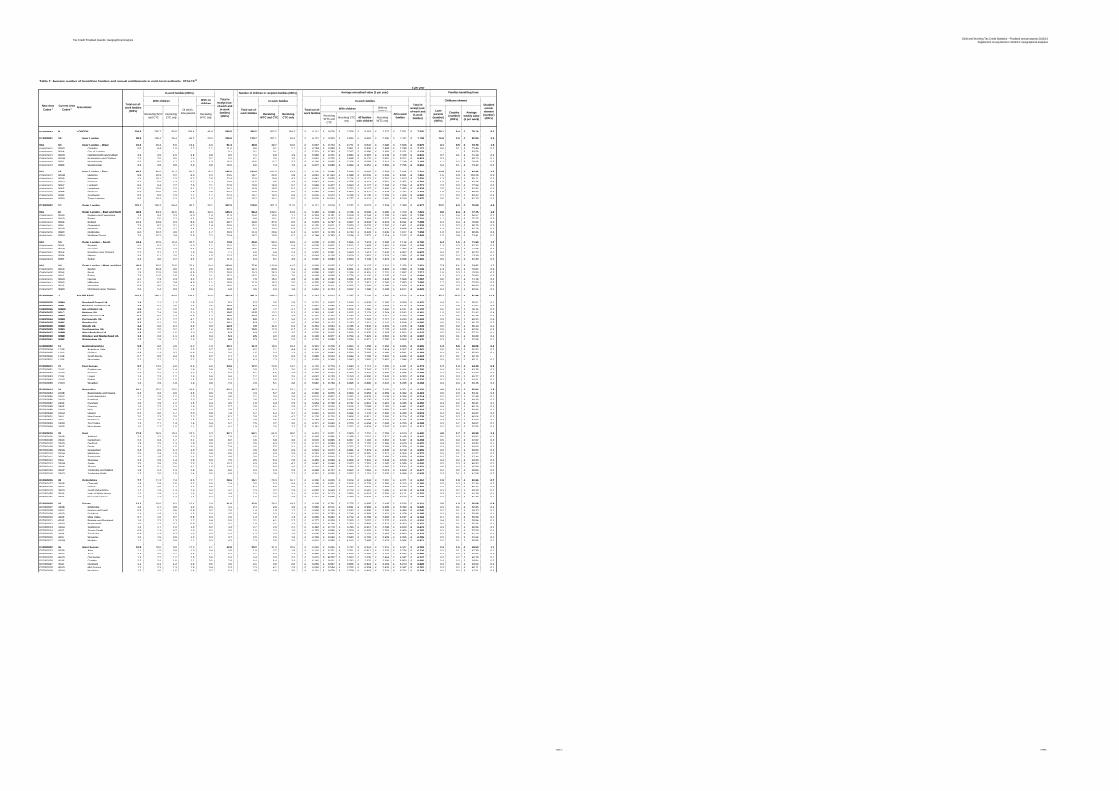
Table 2: Average number of benefiting families and annual entitlements in each local authority, 2014-1516
£ per year
With no
children
With no
children
K02000001 926 UNITED KINGDOM 1,311.0 1,785.0 825.0 1,150.8 508.0 4,428.7 2,505.7 3,262.7 1,691.2 6,228£ 9,102£ 3,775£ 7,418£ 2,333£ 6,589£ 6,482£ 261.2 142.1 56.79£ 121.4
K03000001 925 GREAT BRITAIN 1,251.3 1,722.6 793.9 1,110.8 487.1 4,254.9 2,393.1 3,151.4 1,622.9 6,221£ 9,100£ 3,764£ 7,417£ 2,328£ 6,592£ 6,483£ 251.7 136.6 56.25£ 115.3
K04000001 941 ENGLAND AND WALES 1,150.7 1,593.8 732.7 1,011.8 438.3 3,915.4 2,216.1 2,939.6 1,501.7 6,258£ 9,140£ 3,778£ 7,451£ 2,338£ 6,641£ 6,528£ 229.5 126.4 56.23£ 101.9
E92000001 921 ENGLAND 1,079.9 1,505.8 689.4 953.6 408.3 3,683.4 2,082.5 2,784.4 1,413.9 6,262£ 9,158£ 3,777£ 7,469£ 2,334£ 6,663£ 6,546£ 218.6 118.8 56.44£ 93.9
E12000001 A NORTH EAST 63.7 77.1 33.1 52.5 29.7 203.6 119.1 134.0 65.2 6,133£ 8,867£ 3,698£ 7,315£ 2,300£ 6,249£ 6,213£ 9.9 5.6 53.12£ 7.0
E06000047 00EJ County Durham UA 3
12.0 14.5 7.1 10.0 5.7 39.2 22.2 24.6 13.8 6,118£ 8,670£ 3,645£ 7,023£ 2,362£ 6,049£ 6,070£ 1.8 1.2 49.37£ 1.6
E06000005 00EH Darlington UA 2.4 3.3 1.5 2.2 1.2 8.5 4.6 5.8 3.1 6,264£ 8,752£ 3,689£ 7,159£ 2,323£ 6,205£ 6,221£ 0.5 0.3 52.70£ 0.3
E06000001 00EB Hartlepool UA 2.9 3.1 1.2 2.1 1.1 8.3 5.6 5.5 2.3 6,338£ 8,893£ 3,657£ 7,458£ 2,344£ 6,392£ 6,374£ 0.4 0.2 50.05£ 0.3
E06000002 00EC Middlesbrough UA 5.3 5.3 1.6 3.3 1.9 14.1 10.4 10.0 3.4 6,418£ 9,437£ 3,977£ 8,156£ 2,283£ 6,902£ 6,722£ 0.7 0.3 57.27£ 0.4
E06000057 00EM Northumberland UA 4
5.6 7.7 4.3 5.2 3.1 20.6 10.5 13.2 8.6 6,168£ 8,664£ 3,695£ 6,885£ 2,315£ 5,947£ 6,007£ 0.9 0.7 46.31£ 0.7
E06000003 00EE Redcar and Cleveland UA 3.7 4.2 1.7 3.0 1.5 11.0 6.8 7.0 3.5 6,082£ 8,861£ 3,839£ 7,415£ 2,215£ 6,333£ 6,250£ 0.6 0.3 59.14£ 0.3
E06000004 00EF Stockton-on-Tees UA 4.7 5.8 2.4 4.1 1.9 14.9 9.1 10.3 5.0 6,248£ 9,025£ 3,834£ 7,486£ 2,259£ 6,496£ 6,417£ 0.9 0.4 56.35£ 0.4
- -
E11000004 2D Tyne and Wear (Met County) 27.3 33.1 13.2 22.5 13.3 86.9 50.0 57.6 25.7 6,031£ 8,890£ 3,653£ 7,395£ 2,283£ 6,258£ 6,187£ 4.2 2.3 54.81£ 3.1
E08000037 00CH Gateshead 4.5 5.8 2.5 3.9 2.3 15.0 8.1 10.5 4.8 5,884£ 9,268£ 3,569£ 7,569£ 2,242£ 6,415£ 6,256£ 0.7 0.6 67.62£ 0.5
E08000021 00CJ Newcastle upon Tyne 7.3 8.2 2.7 4.9 3.1 21.3 14.0 15.0 5.4 6,349£ 9,150£ 3,731£ 7,794£ 2,328£ 6,588£ 6,507£ 0.9 0.5 52.99£ 0.6
E08000022 00CK North Tyneside 4.0 5.8 2.5 4.3 2.3 14.6 7.2 9.6 4.9 5,979£ 8,571£ 3,605£ 7,058£ 2,248£ 6,018£ 6,007£ 0.8 0.4 51.36£ 0.5
E08000023 00CL South Tyneside 4.2 4.4 1.8 3.2 1.9 12.4 7.6 7.4 3.5 5,892£ 8,707£ 3,622£ 7,225£ 2,186£ 6,058£ 6,001£ 0.6 0.2 54.85£ 0.4
E08000024 00CM Sunderland 7.2 9.0 3.7 6.3 3.7 23.6 13.1 15.2 7.2 5,914£ 8,705£ 3,700£ 7,241£ 2,342£ 6,129£ 6,063£ 1.2 0.6 49.30£ 1.0
- -
E12000002 B NORTH WEST 162.7 230.3 93.8 147.9 74.9 561.8 311.9 422.0 188.6 6,240£ 9,208£ 3,761£ 7,632£ 2,344£ 6,639£ 6,524£ 38.9 23.2 55.88£ 17.8
- -
E06000008 00EX Blackburn with Darwen UA 4.3 7.6 2.4 3.0 2.1 16.4 8.8 16.0 5.1 6,583£ 9,862£ 4,098£ 8,461£ 2,603£ 7,426£ 7,207£ 0.7 0.6 60.55£ 0.5
E06000009 00EY Blackpool UA 4.6 5.8 2.1 3.6 2.8 15.2 8.7 10.0 3.9 6,275£ 8,857£ 3,662£ 7,487£ 2,470£ 6,184£ 6,211£ 1.0 0.7 48.19£ 0.5
E06000049 00EQ Cheshire East UA 5
4.5 8.2 4.3 5.8 2.4 19.5 8.5 14.3 8.6 6,099£ 8,718£ 3,588£ 6,954£ 2,347£ 6,206£ 6,181£ 1.5 0.9 49.91£ 0.6
E06000050 00EW Cheshire West and Chester UA 6
5.3 8.1 4.2 5.7 2.6 20.2 9.9 13.9 8.7 6,224£ 8,715£ 3,622£ 6,965£ 2,243£ 6,147£ 6,167£ 1.4 0.9 48.22£ 0.6
E06000006 00ET Halton UA 3.6 3.9 1.8 2.9 1.3 10.6 7.0 6.7 3.7 6,287£ 8,974£ 3,799£ 7,311£ 2,195£ 6,393£ 6,357£ 0.8 0.4 55.60£ 0.3
E06000007 00EU Warrington UA 3.2 5.3 2.7 3.9 1.6 12.9 6.0 9.2 5.4 6,011£ 8,815£ 3,642£ 7,065£ 2,207£ 6,252£ 6,192£ 1.0 0.6 56.92£ 0.4
- -
E10000006 16 Cumbria 7.3 12.2 6.8 8.1 4.8 31.0 13.2 20.8 14.0 5,884£ 8,552£ 3,601£ 6,774£ 2,419£ 5,896£ 5,894£ 1.5 1.4 40.14£ 1.3
E07000026 16UB Allerdale 1.6 2.4 1.3 1.6 1.1 6.3 2.8 4.1 2.6 5,789£ 8,544£ 3,671£ 6,857£ 2,499£ 5,873£ 5,852£ 0.3 0.2 41.82£ 0.3
E07000027 16UC Barrow-in-Furness 1.6 2.0 0.9 1.3 0.7 5.2 2.9 3.3 1.9 6,011£ 8,453£ 3,576£ 6,879£ 2,332£ 5,984£ 5,992£ 0.3 0.2 38.21£ 0.2
E07000028 16UD Carlisle 1.8 3.0 1.7 2.0 1.1 7.5 3.3 5.1 3.5 5,868£ 8,635£ 3,600£ 6,813£ 2,241£ 5,928£ 5,914£ 0.4 0.4 40.98£ 0.3
E07000029 16UE Copeland 1.2 1.5 0.7 1.1 0.5 3.9 2.2 2.6 1.3 5,981£ 8,562£ 3,633£ 7,097£ 2,446£ 6,167£ 6,110£ 0.2 0.1 38.77£ 0.1
E07000030 16UF Eden 0.4 1.2 0.8 0.7 0.5 3.0 0.7 2.1 1.8 5,816£ 8,631£ 3,643£ 6,588£ 2,751£ 5,818£ 5,818£ 0.1 0.2 39.71£ 0.1
E07000031 16UG South Lakeland 0.7 2.1 1.4 1.3 0.8 5.1 1.3 3.6 2.9 5,730£ 8,486£ 3,516£ 6,455£ 2,407£ 5,684£ 5,691£ 0.3 0.3 39.98£ 0.2
- -
E11000001 2A Greater Manchester (Met County) 69.5 99.0 36.4 59.9 28.4 233.4 136.9 189.7 73.3 6,352£ 9,519£ 3,811£ 7,983£ 2,350£ 7,006£ 6,811£ 16.8 9.5 60.96£ 6.7
E08000001 00BL Bolton 7.5 11.3 4.1 6.0 3.1 26.1 14.9 22.3 8.4 6,355£ 9,549£ 3,910£ 8,045£ 2,370£ 7,085£ 6,876£ 1.7 1.1 59.65£ 0.7
E08000002 00BM Bury 3.8 6.6 2.6 4.0 1.8 14.8 7.3 12.9 5.4 6,234£ 9,870£ 3,856£ 8,157£ 2,484£ 7,210£ 6,960£ 1.3 0.9 62.43£ 0.5
E08000003 00BN Manchester 17.9 21.0 5.4 12.0 6.1 50.3 36.4 41.5 10.9 6,521£ 9,732£ 3,999£ 8,563£ 2,328£ 7,391£ 7,081£ 2.8 1.1 70.48£ 1.2
E08000004 00BP Oldham 6.6 10.8 3.1 5.3 2.4 23.0 13.8 22.7 6.4 6,638£ 10,040£ 3,861£ 8,641£ 2,405£ 7,711£ 7,401£ 1.5 0.8 57.30£ 0.5
E08000005 00BQ Rochdale 6.1 9.1 3.2 5.0 2.7 21.1 12.2 17.7 6.4 6,421£ 9,592£ 3,961£ 8,133£ 2,395£ 7,107£ 6,908£ 1.4 0.8 59.65£ 0.5
E08000006 00BR Salford 6.9 8.9 3.1 5.9 2.7 21.5 13.4 17.5 6.4 6,338£ 10,041£ 3,919£ 8,449£ 2,165£ 7,304£ 6,996£ 1.7 1.1 72.44£ 0.6
E08000007 00BS Stockport 4.8 7.6 3.6 5.5 2.3 18.3 9.0 13.2 7.2 6,181£ 8,923£ 3,640£ 7,219£ 2,457£ 6,407£ 6,348£ 1.5 0.8 53.69£ 0.7
E08000008 00BT Tameside 5.8 8.3 3.6 5.4 2.3 20.1 10.9 15.0 7.0 6,061£ 9,133£ 3,601£ 7,467£ 2,335£ 6,622£ 6,460£ 1.8 1.0 58.59£ 0.6
E08000009 00BU Trafford 3.5 5.8 2.7 4.2 1.6 13.6 6.7 10.5 5.5 6,209£ 9,155£ 3,717£ 7,422£ 2,288£ 6,632£ 6,523£ 1.3 0.7 59.24£ 0.4
E08000010 00BW Wigan 6.6 9.6 4.9 6.6 3.3 24.5 12.4 16.3 9.7 6,077£ 8,669£ 3,636£ 6,962£ 2,331£ 6,100£ 6,094£ 1.7 1.1 49.95£ 0.8
- -
E10000017 30 Lancashire 21.5 37.3 16.4 22.5 12.2 87.5 41.2 69.0 33.2 6,238£ 9,184£ 3,789£ 7,536£ 2,395£ 6,584£ 6,499£ 6.3 4.7 52.76£ 2.9
E07000117 30UD Burnley 2.5 4.0 1.2 2.2 1.2 8.8 4.9 7.7 2.3 6,352£ 9,561£ 3,684£ 8,207£ 2,366£ 7,135£ 6,911£ 0.6 0.4 60.74£ 0.3
E07000118 30UE Chorley 1.5 2.7 1.6 1.9 0.9 6.7 2.7 4.8 3.0 6,053£ 8,881£ 3,538£ 6,953£ 2,364£ 6,166£ 6,142£ 0.6 0.5 50.07£ 0.2
E07000119 30UF Fylde 0.9 1.8 0.8 1.3 0.7 4.2 1.5 3.0 1.7 5,861£ 8,639£ 3,661£ 7,044£ 2,430£ 6,117£ 6,064£ 0.3 0.3 48.84£ 0.2
E07000120 30UG Hyndburn 2.0 3.6 1.2 1.9 1.1 7.9 4.0 7.2 2.5 6,387£ 9,842£ 3,877£ 8,329£ 2,509£ 7,277£ 7,050£ 0.6 0.4 62.79£ 0.3
E07000121 30UH Lancaster 2.5 3.8 2.0 2.5 1.4 9.7 4.8 6.8 4.1 6,343£ 8,830£ 3,891£ 7,131£ 2,307£ 6,190£ 6,229£ 0.6 0.5 45.20£ 0.3
E07000122 30UJ Pendle 2.0 4.2 1.4 1.8 1.3 8.9 4.0 8.9 2.9 6,456£ 9,977£ 4,116£ 8,513£ 2,497£ 7,416£ 7,201£ 0.5 0.4 52.55£ 0.2
E07000123 30UK Preston 3.3 5.0 2.0 2.6 1.5 11.8 6.3 9.5 4.1 6,221£ 9,264£ 3,918£ 7,743£ 2,282£ 6,760£ 6,611£ 0.8 0.5 57.68£ 0.4
E07000124 30UL Ribble Valley 0.4 1.2 0.7 0.8 0.4 2.7 0.7 2.0 1.5 5,550£ 8,640£ 3,663£ 6,740£ 2,517£ 5,966£ 5,907£ 0.2 0.2 50.25£ 0.1
E07000125 30UM Rossendale 1.4 2.4 1.1 1.4 0.7 5.6 2.7 4.2 2.1 6,084£ 9,039£ 3,754£ 7,400£ 2,414£ 6,517£ 6,406£ 0.4 0.3 53.17£ 0.2
E07000126 30UN South Ribble 1.5 2.8 1.6 2.1 0.9 6.7 2.7 4.8 3.2 6,104£ 8,859£ 3,631£ 6,981£ 2,479£ 6,228£ 6,201£ 0.7 0.5 52.10£ 0.3
E07000127 30UP West Lancashire 1.9 3.0 1.6 2.1 1.1 7.5 3.7 5.1 3.2 6,355£ 8,703£ 3,891£ 7,038£ 2,336£ 6,140£ 6,194£ 0.5 0.3 50.11£ 0.3
E07000128 30UQ Wyre 1.7 2.9 1.3 1.9 1.1 7.1 3.2 5.0 2.5 6,132£ 8,792£ 3,638£ 7,196£ 2,404£ 6,176£ 6,166£ 0.5 0.4 44.99£ 0.3
- -
E11000002 2B Merseyside (Met County) 38.9 42.9 16.5 32.4 16.7 114.9 71.6 72.5 32.7 6,101£ 8,890£ 3,747£ 7,461£ 2,260£ 6,321£ 6,246£ 7.9 3.5 54.38£ 4.0
E08000011 00BX Knowsley 5.3 5.6 2.0 4.5 2.2 15.1 9.9 9.3 3.9 6,018£ 8,831£ 3,623£ 7,477£ 2,292£ 6,325£ 6,216£ 1.1 0.4 55.60£ 0.6
E08000012 00BY Liverpool 15.3 14.9 4.8 11.3 6.3 41.3 27.9 24.9 9.4 5,998£ 8,902£ 3,729£ 7,638£ 2,247£ 6,325£ 6,204£ 2.7 1.0 58.63£ 1.5
E08000014 00CA Sefton 5.7 7.9 3.4 5.8 3.1 20.0 10.4 13.3 6.6 6,071£ 8,803£ 3,710£ 7,274£ 2,260£ 6,200£ 6,163£ 1.5 0.8 51.81£ 0.6
E08000013 00BZ St. Helens 4.7 5.0 2.4 3.7 1.7 13.8 8.6 8.6 4.8 6,078£ 8,749£ 3,641£ 7,086£ 2,150£ 6,191£ 6,153£ 0.8 0.4 53.67£ 0.4
E08000015 00CB Wirral 7.9 9.5 3.9 7.0 3.4 24.7 14.8 16.4 8.0 6,389£ 9,054£ 3,928£ 7,558£ 2,316£ 6,485£ 6,454£ 1.9 0.9 50.45£ 0.9
Receiving
WTC and
CTC
Receiving CTC
only
Receiving
WTC only
Receiving
WTC and CTC
Total out-of-
work families
(000's)
Total in
receipt (out-
of-work and
in-work
families)
(000's)
Couples
(number)
(000's)
In-work families (000's) Number of children in recipient families (000's) Families benefiting from:
In-work families Childcare element
Receiving
WTC only
All in-work
families
Total in
receipt (out-
of-work and
in-work
families)
Average
weekly value
(£ per week)
Disabled
worker
element
(number)
(000's)
Average annualised value (£ per year)
Current Area
Codes 2
Area names
Lone
parents
(number)
(000's)
In-work families
All families
with children
Of which,
lone parents
Total out-of-
work familiesReceiving WTC
and CTC
Total out-of-
work families
With children
Receiving
CTC only
With childrenNew Area
Codes 1
Receiving
CTC only
Table 2 HMRC
Tax Credit Finalised Awards: Geographical AnalysisChild and Working Tax Credit Statistics - Finalised annual awards 2012/13
Supplement on payments in 2012/13: Geographical analyses
Table 2: Average number of benefiting families and annual entitlements in each local authority, 2014-1516
£ per year
With no
children
With no
children
Receiving
WTC and
CTC
Receiving CTC
only
Receiving
WTC only
Receiving
WTC and CTC
Total out-of-
work families
(000's)
Total in
receipt (out-
of-work and
in-work
families)
(000's)
Couples
(number)
(000's)
In-work families (000's) Number of children in recipient families (000's) Families benefiting from:
In-work families Childcare element
Receiving
WTC only
All in-work
families
Total in
receipt (out-
of-work and
in-work
families)
Average
weekly value
(£ per week)
Disabled
worker
element
(number)
(000's)
Average annualised value (£ per year)
Current Area
Codes 2
Area names
Lone
parents
(number)
(000's)
In-work families
All families
with children
Of which,
lone parents
Total out-of-
work familiesReceiving WTC
and CTC
Total out-of-
work families
With children
Receiving
CTC only
With childrenNew Area
Codes 1
Receiving
CTC only
- -
E12000003 D YORKSHIRE AND THE HUMBER 116.9 170.8 75.8 100.3 52.7 416.3 228.6 319.7 153.6 6,304£ 9,188£ 3,771£ 7,522£ 2,287£ 6,601£ 6,518£ 23.1 14.9 52.02£ 10.6
- -
E06000011 00FB East Riding of Yorkshire UA 4.2 7.8 4.6 5.1 2.7 19.3 7.8 13.4 9.4 5,952£ 8,590£ 3,624£ 6,736£ 2,240£ 5,934£ 5,938£ 1.1 0.9 42.16£ 0.5
E06000010 00FA Kingston upon Hull, City of UA 9.1 10.0 4.6 5.8 4.0 27.7 17.2 17.5 8.9 6,100£ 8,603£ 3,605£ 7,032£ 2,056£ 5,955£ 6,002£ 1.0 0.8 48.63£ 0.5
E06000012 00FC North East Lincolnshire UA 4.7 5.1 2.4 3.3 1.9 14.2 9.2 9.0 4.9 6,362£ 8,761£ 3,881£ 7,211£ 2,137£ 6,177£ 6,239£ 0.6 0.4 45.41£ 0.3
E06000013 00FD North Lincolnshire UA 3.4 4.9 2.6 3.1 1.4 12.4 6.6 8.9 5.3 6,260£ 8,825£ 3,710£ 7,058£ 2,204£ 6,280£ 6,275£ 0.6 0.4 45.04£ 0.3
E06000014 00FF York UA 2.1 4.2 2.4 3.1 1.2 10.0 3.9 7.3 4.7 5,897£ 8,569£ 3,542£ 6,769£ 2,191£ 6,050£ 6,017£ 0.8 0.5 44.16£ 0.3
- -
E10000023 36 North Yorkshire 6.6 13.6 7.9 9.0 4.7 32.8 12.3 23.4 16.2 6,016£ 8,660£ 3,605£ 6,794£ 2,388£ 6,004£ 6,006£ 2.2 1.8 45.82£ 1.0
E07000163 36UB Craven 0.4 1.2 0.7 0.8 0.4 2.8 0.8 2.0 1.5 5,951£ 8,684£ 3,614£ 6,706£ 2,504£ 5,902£ 5,910£ 0.2 0.2 44.97£ 0.1
E07000164 36UC Hambleton 0.8 1.8 1.1 1.2 0.6 4.3 1.6 3.1 2.2 6,015£ 8,576£ 3,610£ 6,698£ 2,523£ 6,024£ 6,023£ 0.3 0.3 49.07£ 0.1
E07000165 36UD Harrogate 1.3 3.1 1.9 2.3 1.0 7.2 2.3 5.2 3.7 5,857£ 8,542£ 3,532£ 6,676£ 2,299£ 5,973£ 5,952£ 0.6 0.4 46.25£ 0.2
E07000166 36UE Richmondshire 0.5 1.1 0.8 0.7 0.3 2.7 0.9 1.8 1.8 5,738£ 8,621£ 3,627£ 6,461£ 2,523£ 5,873£ 5,848£ 0.2 0.2 54.36£ 0.1
E07000167 36UF Ryedale 0.5 1.1 0.8 0.6 0.4 2.9 1.0 2.0 1.7 6,092£ 8,761£ 3,652£ 6,638£ 2,525£ 5,932£ 5,962£ 0.1 0.1 42.64£ 0.1
E07000168 36UG Scarborough 2.0 3.4 1.5 2.0 1.5 8.4 3.7 5.9 3.1 6,195£ 8,834£ 3,713£ 7,257£ 2,350£ 6,108£ 6,128£ 0.5 0.4 42.75£ 0.3
E07000169 36UH Selby 1.1 1.9 1.1 1.3 0.5 4.5 1.9 3.2 2.3 6,003£ 8,570£ 3,521£ 6,687£ 2,217£ 6,046£ 6,036£ 0.3 0.2 43.34£ 0.1
- -
E11000003 2C South Yorkshire (Met County) 32.8 43.1 19.8 25.8 14.1 109.8 63.9 78.4 39.6 6,385£ 9,083£ 3,796£ 7,420£ 2,273£ 6,475£ 6,448£ 5.4 3.4 53.00£ 3.2
E08000016 00CC Barnsley 6.0 7.6 3.9 4.8 2.7 20.2 11.3 12.9 7.5 6,163£ 8,569£ 3,696£ 6,932£ 2,336£ 6,046£ 6,081£ 0.9 0.6 48.06£ 0.7
E08000017 00CE Doncaster 7.6 10.7 4.8 6.6 3.7 26.8 14.7 18.9 9.6 6,199£ 8,908£ 3,699£ 7,282£ 2,224£ 6,305£ 6,275£ 1.5 0.8 56.47£ 0.8
E08000018 00CF Rotherham 6.5 8.7 4.1 5.1 2.6 21.9 12.7 15.9 8.4 6,416£ 9,111£ 3,873£ 7,422£ 2,293£ 6,566£ 6,521£ 1.0 0.7 50.61£ 0.6
E08000019 00CG Sheffield 12.6 16.1 6.9 9.3 5.1 40.8 25.2 30.7 14.0 6,586£ 9,425£ 3,872£ 7,753£ 2,264£ 6,757£ 6,704£ 2.0 1.3 54.19£ 1.1
- -
E11000006 2F West Yorkshire (Met County) 53.9 82.1 31.6 45.1 22.5 190.2 107.6 161.8 64.5 6,367£ 9,538£ 3,857£ 7,961£ 2,346£ 7,032£ 6,843£ 11.4 6.6 55.67£ 4.4
E08000032 00CX Bradford 15.4 25.4 7.6 10.4 6.3 54.8 32.9 55.2 16.2 6,770£ 10,172£ 4,133£ 8,772£ 2,470£ 7,757£ 7,479£ 2.5 1.6 60.80£ 1.0
E08000033 00CY Calderdale 4.6 7.2 2.9 4.4 2.2 17.0 9.1 13.6 5.9 6,335£ 9,326£ 3,733£ 7,710£ 2,396£ 6,763£ 6,646£ 1.3 0.8 52.28£ 0.4
E08000034 00CZ Kirklees 9.2 16.2 6.2 8.3 4.5 36.0 18.0 32.1 12.8 6,256£ 9,560£ 3,882£ 7,993£ 2,488£ 7,063£ 6,858£ 2.4 1.5 53.52£ 1.0
E08000035 00DA Leeds 17.2 23.0 9.5 15.2 6.4 56.1 33.5 42.7 19.1 6,186£ 9,217£ 3,748£ 7,620£ 2,220£ 6,732£ 6,564£ 3.8 1.9 56.31£ 1.3
E08000036 00DB Wakefield 7.5 10.3 5.3 6.8 3.1 26.2 14.1 18.3 10.5 6,107£ 8,810£ 3,698£ 7,074£ 2,108£ 6,264£ 6,219£ 1.4 0.8 51.36£ 0.7
- -
E12000004 E EAST MIDLANDS 86.1 131.5 68.8 82.2 39.7 326.1 168.0 237.2 140.5 6,378£ 8,958£ 3,765£ 7,173£ 2,269£ 6,363£ 6,367£ 19.2 12.6 53.41£ 9.2
- -
E06000015 00FK Derby UA 6.3 9.0 3.7 5.1 2.5 21.4 12.9 17.3 7.5 6,617£ 9,420£ 3,951£ 7,835£ 2,307£ 6,919£ 6,831£ 1.2 0.7 56.07£ 0.6
E06000016 00FN Leicester UA 10.0 15.5 5.6 6.4 4.3 35.4 20.9 31.4 11.5 6,645£ 9,500£ 3,954£ 8,030£ 2,289£ 7,068£ 6,949£ 1.3 0.9 68.14£ 0.6
E06000018 00FY Nottingham UA 10.3 11.7 3.9 7.2 4.1 29.9 20.3 21.6 7.6 6,392£ 9,393£ 3,922£ 8,039£ 2,245£ 6,843£ 6,688£ 1.8 0.7 68.37£ 0.8
E06000017 00FP Rutland UA 0.3 0.6 0.5 0.4 0.2 1.6 0.5 1.1 1.1 5,963£ 8,948£ 3,672£ 6,529£ 2,378£ 5,928£ 5,934£ 0.1 0.1 49.25£ 0.1
E10000007 17 Derbyshire 12.8 19.0 11.5 12.4 6.2 49.5 23.9 32.7 23.3 6,166£ 8,620£ 3,672£ 6,752£ 2,349£ 6,005£ 6,047£ 2.7 2.1 49.71£ 1.7
E07000032 17UB Amber Valley 2.0 2.9 1.9 1.9 0.9 7.6 3.7 5.0 3.7 6,338£ 8,591£ 3,731£ 6,704£ 2,329£ 6,003£ 6,089£ 0.4 0.3 48.68£ 0.2
E07000033 17UC Bolsover 1.7 2.2 1.3 1.3 0.8 6.1 3.3 3.9 2.6 6,234£ 8,593£ 3,683£ 6,757£ 2,286£ 5,901£ 5,996£ 0.2 0.2 45.93£ 0.2
E07000034 17UD Chesterfield 2.2 2.9 1.6 1.8 1.1 7.8 4.1 5.1 3.2 6,105£ 8,613£ 3,771£ 6,905£ 2,429£ 6,048£ 6,064£ 0.4 0.3 49.89£ 0.4
E07000035 17UF Derbyshire Dales 0.6 1.4 0.8 0.9 0.5 3.3 1.2 2.4 1.7 5,936£ 8,635£ 3,629£ 6,735£ 2,523£ 5,972£ 5,965£ 0.1 0.1 39.85£ 0.1
E07000036 17UG Erewash 2.1 3.0 1.8 2.0 0.9 7.8 4.0 5.0 3.4 6,154£ 8,628£ 3,486£ 6,705£ 2,186£ 5,984£ 6,031£ 0.5 0.3 56.44£ 0.2
E07000037 17UH High Peak 1.3 2.1 1.3 1.5 0.6 5.4 2.3 3.7 2.7 6,070£ 8,640£ 3,669£ 6,761£ 2,393£ 6,078£ 6,076£ 0.4 0.3 47.92£ 0.2
E07000038 17UJ North East Derbyshire 1.5 2.2 1.4 1.4 0.8 5.9 2.7 3.7 2.8 5,938£ 8,443£ 3,596£ 6,554£ 2,278£ 5,800£ 5,835£ 0.3 0.3 44.77£ 0.2
E07000039 17UK South Derbyshire 1.3 2.2 1.4 1.6 0.6 5.6 2.6 4.0 3.1 6,397£ 8,831£ 3,805£ 6,874£ 2,467£ 6,249£ 6,285£ 0.4 0.3 54.96£ 0.2
E10000018 31 Leicestershire 7.9 14.4 9.4 10.1 3.9 35.5 15.0 25.4 19.3 6,278£ 8,774£ 3,658£ 6,755£ 2,231£ 6,124£ 6,158£ 2.5 1.8 49.66£ 0.9
E07000129 31UB Blaby 1.0 2.2 1.5 1.6 0.5 5.1 1.8 3.8 3.1 6,140£ 8,749£ 3,599£ 6,676£ 2,291£ 6,150£ 6,149£ 0.4 0.3 49.18£ 0.1
E07000130 31UC Charnwood 2.2 3.8 2.3 2.5 1.0 9.3 4.2 6.8 4.7 6,316£ 8,932£ 3,684£ 6,942£ 2,157£ 6,239£ 6,257£ 0.6 0.5 50.77£ 0.2
E07000131 31UD Harborough 0.7 1.5 1.0 1.1 0.4 3.6 1.4 2.6 2.1 6,033£ 8,678£ 3,578£ 6,613£ 2,266£ 6,070£ 6,062£ 0.2 0.2 49.26£ 0.1
E07000132 31UE Hinckley and Bosworth 1.3 2.4 1.6 1.7 0.6 5.9 2.4 4.2 3.2 6,293£ 8,712£ 3,634£ 6,719£ 2,246£ 6,103£ 6,144£ 0.4 0.3 50.26£ 0.2
E07000133 31UG Melton 0.6 1.1 0.7 0.7 0.3 2.7 1.1 1.8 1.5 6,512£ 8,591£ 3,678£ 6,551£ 1,981£ 5,892£ 6,024£ 0.2 0.2 42.70£ # #####
E07000134 31UH North West Leicestershire 1.4 2.1 1.4 1.4 0.6 5.5 2.6 3.7 3.0 6,359£ 8,724£ 3,826£ 6,732£ 2,394£ 6,110£ 6,172£ 0.3 0.2 48.67£ 0.1
E07000135 31UJ Oadby and Wigston 0.8 1.4 0.9 0.9 0.4 3.4 1.4 2.5 1.7 6,234£ 8,813£ 3,528£ 6,797£ 2,243£ 6,081£ 6,114£ 0.2 0.2 54.30£ 0.1
E10000019 32 Lincolnshire 12.4 20.6 11.6 12.8 7.3 51.8 23.8 36.0 23.6 6,389£ 8,711£ 3,754£ 6,931£ 2,290£ 6,077£ 6,152£ 2.9 2.2 46.69£ 1.5
E07000136 32UB Boston 1.2 2.9 1.4 1.7 1.0 6.5 2.4 4.8 2.7 6,211£ 8,326£ 3,564£ 6,790£ 1,919£ 5,851£ 5,919£ 0.3 0.2 49.19£ 0.2
E07000137 32UC East Lindsey 2.7 4.0 2.0 2.1 1.9 10.7 5.3 7.1 4.0 6,459£ 8,869£ 3,807£ 7,183£ 2,532£ 6,060£ 6,163£ 0.4 0.4 44.72£ 0.4
E07000138 32UD Lincoln 2.2 3.2 1.5 1.9 1.0 8.0 4.2 5.5 3.1 6,434£ 8,748£ 3,828£ 7,137£ 2,130£ 6,234£ 6,290£ 0.5 0.3 47.65£ 0.2
E07000139 32UE North Kesteven 1.2 2.4 1.7 1.7 0.7 6.0 2.4 4.1 3.6 6,393£ 8,736£ 3,746£ 6,648£ 2,411£ 6,048£ 6,119£ 0.5 0.3 45.05£ 0.2
E07000140 32UF South Holland 1.3 2.6 1.5 1.6 0.9 6.4 2.6 4.6 3.1 6,317£ 8,617£ 3,690£ 6,795£ 2,216£ 5,959£ 6,034£ 0.3 0.2 49.89£ 0.1
E07000141 32UG South Kesteven 2.0 3.5 2.1 2.4 1.0 8.6 3.7 6.1 4.4 6,288£ 8,779£ 3,742£ 6,865£ 2,193£ 6,177£ 6,202£ 0.7 0.5 46.96£ 0.2
E07000142 32UH West Lindsey 1.6 2.1 1.3 1.3 0.7 5.7 3.2 3.7 2.7 6,523£ 8,860£ 3,891£ 6,998£ 2,516£ 6,203£ 6,294£ 0.3 0.2 44.59£ 0.2
E10000021 34 Northamptonshire 12.5 20.0 11.2 14.1 4.5 48.1 24.5 35.8 23.5 6,412£ 8,972£ 3,821£ 7,124£ 2,112£ 6,495£ 6,474£ 3.5 2.0 55.45£ 1.1
E07000150 34UB Corby 1.6 2.6 1.3 1.8 0.6 6.1 3.0 4.5 2.6 6,257£ 8,899£ 3,743£ 7,217£ 1,925£ 6,480£ 6,421£ 0.4 0.2 58.93£ 0.1
E07000151 34UC Daventry 0.9 1.6 1.0 1.2 0.4 4.0 1.8 2.9 2.1 6,412£ 8,883£ 3,765£ 6,951£ 2,197£ 6,319£ 6,341£ 0.3 0.2 51.77£ 0.1
E07000152 34UD East Northamptonshire 1.2 1.9 1.3 1.4 0.4 4.8 2.3 3.4 2.7 6,338£ 8,986£ 3,976£ 7,010£ 2,257£ 6,433£ 6,410£ 0.3 0.2 52.94£ 0.1
E07000153 34UE Kettering 1.8 2.7 1.7 1.9 0.5 6.7 3.5 4.9 3.6 6,284£ 8,892£ 3,881£ 6,977£ 2,171£ 6,446£ 6,403£ 0.4 0.3 54.59£ 0.2
E07000154 34UF Northampton 4.7 7.3 3.6 5.1 1.6 17.2 9.4 13.3 7.4 6,521£ 9,086£ 3,761£ 7,322£ 2,085£ 6,654£ 6,618£ 1.3 0.7 57.44£ 0.4
E07000155 34UG South Northamptonshire 0.6 1.4 1.0 1.1 0.3 3.3 1.2 2.5 2.1 6,093£ 8,637£ 3,769£ 6,642£ 2,228£ 6,198£ 6,177£ 0.3 0.2 47.50£ 0.1
E07000156 34UH Wellingborough 1.6 2.4 1.4 1.6 0.6 6.0 3.2 4.3 2.9 6,573£ 9,041£ 3,914£ 7,155£ 2,109£ 6,467£ 6,496£ 0.4 0.2 56.82£ 0.1
E10000024 37 Nottinghamshire 13.8 20.6 11.6 13.7 6.8 52.8 26.0 35.8 23.1 6,284£ 8,773£ 3,701£ 6,952£ 2,284£ 6,134£ 6,173£ 3.3 2.1 50.33£ 1.9
E07000170 37UB Ashfield 2.9 3.7 2.1 2.3 1.3 9.9 5.7 6.5 4.2 6,414£ 8,915£ 3,763£ 7,050£ 2,353£ 6,196£ 6,261£ 0.5 0.3 55.80£ 0.4
E07000171 37UC Bassetlaw 2.0 3.2 1.8 2.1 1.0 8.0 3.9 5.5 3.6 6,332£ 8,679£ 3,800£ 6,919£ 2,229£ 6,128£ 6,180£ 0.4 0.2 45.06£ 0.3
E07000172 37UD Broxtowe 1.6 2.4 1.4 1.7 0.9 6.2 2.9 4.1 2.7 6,110£ 8,762£ 3,570£ 6,877£ 2,261£ 6,010£ 6,035£ 0.4 0.3 51.68£ 0.2
E07000173 37UE Gedling 1.9 3.0 1.7 2.1 1.0 7.6 3.5 5.2 3.3 6,208£ 8,884£ 3,630£ 7,005£ 2,298£ 6,209£ 6,209£ 0.6 0.4 49.90£ 0.3
E07000174 37UF Mansfield 2.6 3.4 1.8 2.1 1.3 9.0 4.9 5.8 3.4 6,232£ 8,599£ 3,641£ 6,898£ 2,183£ 5,948£ 6,029£ 0.4 0.3 51.44£ 0.3
E07000175 37UG Newark and Sherwood 1.9 3.1 1.8 2.0 0.9 7.6 3.6 5.5 3.7 6,427£ 8,798£ 3,843£ 6,989£ 2,261£ 6,271£ 6,310£ 0.4 0.3 46.72£ 0.3
E07000176 37UJ Rushcliffe 0.9 1.9 1.1 1.5 0.5 4.4 1.6 3.2 2.2 6,063£ 8,758£ 3,560£ 6,859£ 2,509£ 6,180£ 6,157£ 0.4 0.2 50.81£ 0.2
Table 2 HMRC
Tax Credit Finalised Awards: Geographical AnalysisChild and Working Tax Credit Statistics - Finalised annual awards 2012/13
Supplement on payments in 2012/13: Geographical analyses
Table 2: Average number of benefiting families and annual entitlements in each local authority, 2014-1516
£ per year
With no
children
With no
children
Receiving
WTC and
CTC
Receiving CTC
only
Receiving
WTC only
Receiving
WTC and CTC
Total out-of-
work families
(000's)
Total in
receipt (out-
of-work and
in-work
families)
(000's)
Couples
(number)
(000's)
In-work families (000's) Number of children in recipient families (000's) Families benefiting from:
In-work families Childcare element
Receiving
WTC only
All in-work
families
Total in
receipt (out-
of-work and
in-work
families)
Average
weekly value
(£ per week)
Disabled
worker
element
(number)
(000's)
Average annualised value (£ per year)
Current Area
Codes 2
Area names
Lone
parents
(number)
(000's)
In-work families
All families
with children
Of which,
lone parents
Total out-of-
work familiesReceiving WTC
and CTC
Total out-of-
work families
With children
Receiving
CTC only
With childrenNew Area
Codes 1
Receiving
CTC only
E12000005 F WEST MIDLANDS 131.1 175.8 81.6 102.3 46.9 435.4 262.7 337.6 168.1 6,482£ 9,341£ 3,852£ 7,601£ 2,318£ 6,786£ 6,695£ 25.1 14.8 55.56£ 10.4
E06000019 00GA Herefordshire, County of UA 2.4 4.7 2.8 2.9 1.5 11.4 4.5 8.2 5.7 6,100£ 8,627£ 3,715£ 6,792£ 2,425£ 6,052£ 6,062£ 0.6 0.7 40.90£ 0.3
E06000051 00GG Shropshire UA 7
3.8 6.7 4.5 4.2 2.5 17.4 7.2 11.9 9.2 6,108£ 8,667£ 3,699£ 6,687£ 2,454£ 5,921£ 5,962£ 0.9 1.0 41.08£ 0.6
E06000021 00GL Stoke-on-Trent UA 7.4 9.5 4.2 5.0 2.8 23.9 14.8 18.0 8.4 6,406£ 9,243£ 3,751£ 7,553£ 2,285£ 6,651£ 6,575£ 1.3 0.9 54.29£ 0.7
E06000020 00GF Telford and Wrekin UA 4.3 5.4 2.8 3.3 1.4 13.8 8.4 9.9 5.7 6,530£ 9,011£ 3,973£ 7,301£ 2,291£ 6,576£ 6,562£ 0.8 0.6 49.08£ 0.4
E10000028 41 Staffordshire 12.2 20.3 12.2 13.4 5.9 50.7 23.0 35.9 24.8 6,172£ 8,769£ 3,699£ 6,867£ 2,357£ 6,170£ 6,170£ 3.2 2.4 48.02£ 1.6
E07000192 41UB Cannock Chase 1.8 2.7 1.6 1.7 0.7 7.0 3.5 4.7 3.3 6,313£ 8,620£ 3,676£ 6,772£ 2,368£ 6,129£ 6,178£ 0.4 0.3 44.84£ 0.2
E07000193 41UC East Staffordshire 1.8 3.5 1.9 1.9 1.0 8.1 3.5 6.7 3.8 6,244£ 9,141£ 3,873£ 7,315£ 2,356£ 6,546£ 6,479£ 0.4 0.3 53.16£ 0.2
E07000194 41UD Lichfield 1.2 2.0 1.2 1.4 0.5 4.9 2.3 3.4 2.4 6,169£ 8,727£ 3,693£ 6,872£ 2,381£ 6,217£ 6,205£ 0.3 0.2 47.97£ 0.1
E07000195 41UE Newcastle-under-Lyme 2.0 3.1 1.9 2.1 1.0 7.9 3.7 5.5 3.7 6,064£ 8,728£ 3,673£ 6,851£ 2,270£ 6,115£ 6,102£ 0.6 0.5 49.52£ 0.2
E07000196 41UF South Staffordshire 1.3 2.1 1.3 1.4 0.6 5.2 2.2 3.6 2.5 5,833£ 8,603£ 3,558£ 6,688£ 2,430£ 6,038£ 5,988£ 0.3 0.2 47.32£ 0.1
E07000197 41UG Stafford 1.5 2.6 1.6 1.9 0.8 6.5 2.7 4.5 3.2 6,100£ 8,738£ 3,577£ 6,735£ 2,316£ 6,055£ 6,065£ 0.5 0.4 47.27£ 0.3
E07000198 41UH Staffordshire Moorlands 1.1 2.1 1.4 1.3 0.8 5.3 2.0 3.6 2.8 6,001£ 8,656£ 3,614£ 6,642£ 2,583£ 5,877£ 5,902£ 0.3 0.3 44.20£ 0.2
E07000199 41UK Tamworth 1.5 2.2 1.4 1.6 0.6 5.7 3.0 3.9 2.9 6,524£ 8,759£ 3,886£ 6,876£ 2,115£ 6,247£ 6,321£ 0.4 0.2 49.07£ 0.2
E10000031 44 Warwickshire 7.7 12.4 7.1 9.0 3.2 30.4 14.5 21.6 14.6 6,227£ 8,751£ 3,695£ 6,907£ 2,257£ 6,256£ 6,249£ 2.1 1.3 51.13£ 0.8
E07000218 44UB North Warwickshire 0.9 1.5 0.9 1.1 0.4 3.7 1.7 2.6 1.8 6,227£ 8,668£ 3,615£ 6,764£ 2,304£ 6,130£ 6,154£ 0.3 0.2 48.24£ 0.1
E07000219 44UC Nuneaton and Bedworth 2.8 3.7 2.1 2.5 0.9 9.5 5.4 6.5 4.4 6,304£ 8,815£ 3,770£ 6,957£ 2,210£ 6,312£ 6,309£ 0.6 0.4 51.94£ 0.2
E07000220 44UD Rugby 1.5 2.6 1.4 1.9 0.6 6.1 2.8 4.5 2.9 6,235£ 8,756£ 3,653£ 6,955£ 2,150£ 6,316£ 6,297£ 0.5 0.2 52.91£ 0.1
E07000221 44UE Stratford-on-Avon 1.1 2.3 1.3 1.6 0.6 5.3 2.0 4.0 2.7 6,110£ 8,744£ 3,635£ 6,901£ 2,409£ 6,233£ 6,208£ 0.4 0.3 50.04£ 0.2
E07000222 44UF Warwick 1.4 2.4 1.4 1.8 0.6 5.8 2.7 4.1 2.8 6,154£ 8,705£ 3,733£ 6,876£ 2,246£ 6,211£ 6,197£ 0.4 0.2 50.95£ 0.2
E11000005 2E West Midlands (Met County) 84.6 103.1 40.1 55.6 25.7 253.5 173.6 208.0 83.5 6,602£ 9,707£ 3,981£ 8,105£ 2,303£ 7,221£ 7,014£ 14.1 6.3 63.04£ 5.2
E08000025 00CN Birmingham 37.7 46.5 14.2 22.7 11.0 109.3 80.7 100.7 30.5 6,864£ 10,292£ 4,219£ 8,875£ 2,378£ 7,878£ 7,528£ 6.6 2.4 69.88£ 2.1
E08000026 00CQ Coventry 8.7 11.2 4.7 7.1 2.8 27.4 17.4 21.3 9.8 6,515£ 9,353£ 3,864£ 7,724£ 2,175£ 6,903£ 6,780£ 1.8 0.8 58.04£ 0.6
E08000027 00CR Dudley 7.0 8.9 4.9 5.1 2.6 23.5 13.8 16.7 10.0 6,385£ 9,135£ 3,710£ 7,202£ 2,318£ 6,428£ 6,415£ 1.0 0.7 51.27£ 0.6
E08000028 00CS Sandwell 10.6 13.2 5.7 7.0 3.2 32.7 21.2 25.6 11.6 6,381£ 9,321£ 3,830£ 7,660£ 2,225£ 6,876£ 6,716£ 1.7 0.8 64.52£ 0.6
E08000029 00CT Solihull 3.6 4.7 2.3 3.7 1.2 11.9 6.8 8.3 4.8 6,319£ 9,139£ 3,818£ 7,382£ 2,324£ 6,640£ 6,542£ 1.0 0.4 57.79£ 0.4
E08000030 00CU Walsall 8.5 9.7 4.2 4.8 2.5 24.9 17.1 19.1 8.9 6,463£ 9,396£ 4,018£ 7,758£ 2,326£ 6,931£ 6,771£ 1.1 0.6 55.62£ 0.5
E08000031 00CW Wolverhampton 8.5 8.9 4.0 5.3 2.5 23.9 16.5 16.2 8.1 6,243£ 8,879£ 3,880£ 7,343£ 2,170£ 6,512£ 6,416£ 1.0 0.5 55.43£ 0.4
E10000034 47 Worcestershire 8.8 13.7 8.0 8.9 3.9 34.3 16.7 24.1 16.2 6,287£ 8,744£ 3,725£ 6,893£ 2,306£ 6,200£ 6,222£ 2.0 1.5 45.12£ 0.9
E07000234 47UB Bromsgrove 1.0 1.7 1.0 1.4 0.5 4.3 1.8 3.0 2.0 6,111£ 8,625£ 3,650£ 6,784£ 2,301£ 6,083£ 6,090£ 0.4 0.2 50.47£ 0.1
E07000235 47UC Malvern Hills 1.0 1.5 0.9 0.9 0.5 3.8 1.8 2.6 1.8 6,263£ 8,540£ 3,616£ 6,711£ 2,476£ 5,981£ 6,052£ 0.2 0.2 39.87£ 0.1
E07000236 47UD Redditch 1.7 2.6 1.4 1.6 0.7 6.4 3.2 4.7 3.0 6,291£ 8,905£ 3,790£ 7,084£ 2,194£ 6,392£ 6,366£ 0.4 0.3 45.41£ 0.2
E07000237 47UE Worcester 1.9 2.7 1.5 1.7 0.7 6.8 3.6 4.9 3.1 6,368£ 8,919£ 3,785£ 7,101£ 2,249£ 6,414£ 6,401£ 0.4 0.3 46.35£ 0.2
E07000238 47UF Wychavon 1.4 2.4 1.6 1.6 0.7 6.1 2.7 4.2 3.3 6,308£ 8,605£ 3,727£ 6,668£ 2,340£ 6,042£ 6,105£ 0.3 0.3 43.87£ 0.2
E07000239 47UG Wyre Forest 1.8 2.7 1.5 1.6 0.8 6.8 3.5 4.7 3.1 6,291£ 8,726£ 3,716£ 6,891£ 2,317£ 6,154£ 6,191£ 0.3 0.3 43.01£ 0.2
- -
E12000006 G EAST 100.5 143.0 77.5 93.9 33.3 354.4 193.5 258.3 162.2 6,291£ 8,892£ 3,786£ 7,098£ 2,278£ 6,465£ 6,416£ 18.6 9.8 51.65£ 8.0
E06000055 00KB Bedford UA 8
3.2 4.8 2.3 3.0 0.9 11.2 6.2 8.9 4.9 6,275£ 9,130£ 3,758£ 7,365£ 2,141£ 6,788£ 6,641£ 0.7 0.3 55.04£ 0.2
E06000056 00KC Central Bedfordshire UA 9
3.7 5.3 3.4 4.2 0.9 13.3 7.2 9.2 7.2 6,308£ 8,787£ 3,718£ 6,817£ 2,176£ 6,358£ 6,344£ 1.0 0.4 50.46£ 0.2
E06000032 00KA Luton UA 5.8 9.1 3.5 4.1 1.6 19.9 12.0 19.7 7.8 6,604£ 9,951£ 4,264£ 8,387£ 2,392£ 7,726£ 7,402£ 0.9 0.4 62.11£ 0.3
E06000031 00JA Peterborough UA 5.2 8.6 3.5 4.9 2.3 19.6 10.6 16.4 7.2 6,668£ 9,263£ 3,961£ 7,731£ 2,000£ 6,821£ 6,781£ 1.1 0.6 55.37£ 0.3
E06000033 00KF Southend-on-Sea UA 4.1 5.0 2.0 3.3 1.3 12.5 7.6 9.0 4.2 6,092£ 8,974£ 3,839£ 7,509£ 2,342£ 6,689£ 6,494£ 0.7 0.3 51.05£ 0.3
E06000034 00KG Thurrock UA 4.2 4.8 2.4 3.4 0.8 12.0 8.1 8.6 5.0 6,283£ 8,987£ 3,826£ 7,275£ 2,137£ 6,776£ 6,606£ 0.7 0.3 67.31£ 0.2
- -
E10000003 12 Cambridgeshire 8.0 11.8 7.5 8.3 2.7 30.1 15.4 20.9 15.8 6,388£ 8,672£ 3,757£ 6,759£ 2,242£ 6,199£ 6,249£ 1.8 1.0 47.34£ 0.7
E07000008 12UB Cambridge 1.5 2.0 0.9 1.3 0.5 4.8 2.8 3.5 1.8 6,206£ 8,810£ 3,963£ 7,331£ 2,186£ 6,598£ 6,478£ 0.3 0.1 52.50£ 0.1
E07000009 12UC East Cambridgeshire 0.9 1.5 1.2 1.0 0.3 3.8 1.7 2.6 2.5 6,215£ 8,615£ 3,673£ 6,435£ 2,573£ 6,029£ 6,073£ 0.2 0.2 45.36£ 0.1
E07000010 12UD Fenland 2.1 2.9 1.6 1.7 0.9 7.5 4.1 5.0 3.3 6,494£ 8,508£ 3,656£ 6,771£ 2,097£ 6,002£ 6,139£ 0.3 0.2 46.33£ 0.2
E07000011 12UE Huntingdonshire 2.2 3.4 2.4 2.5 0.7 8.7 4.2 6.0 5.0 6,441£ 8,788£ 3,812£ 6,730£ 2,231£ 6,245£ 6,295£ 0.6 0.4 47.50£ 0.2
E07000012 12UG South Cambridgeshire 1.3 2.1 1.5 1.6 0.4 5.3 2.7 3.7 3.2 6,451£ 8,619£ 3,725£ 6,575£ 2,406£ 6,182£ 6,251£ 0.4 0.2 45.87£ 0.1
E10000012 22 Essex 24.3 31.2 16.8 21.8 6.9 79.2 45.9 55.0 35.0 6,190£ 8,784£ 3,744£ 7,021£ 2,301£ 6,427£ 6,354£ 4.2 2.0 51.25£ 1.8
E07000066 22UB Basildon 4.3 4.4 2.3 3.1 1.0 12.1 8.5 8.0 4.9 6,390£ 8,898£ 3,875£ 7,165£ 2,180£ 6,547£ 6,491£ 0.6 0.2 55.99£ 0.3
E07000067 22UC Braintree 2.3 3.2 2.1 2.2 0.7 8.3 4.3 5.9 4.4 6,243£ 8,832£ 3,749£ 6,828£ 2,246£ 6,320£ 6,299£ 0.4 0.3 48.15£ 0.2
E07000068 22UD Brentwood 0.8 1.2 0.6 0.9 0.3 2.9 1.5 2.0 1.2 5,853£ 8,522£ 3,580£ 6,894£ 2,371£ 6,325£ 6,187£ 0.2 0.1 52.91£ 0.1
E07000069 22UE Castle Point 1.5 1.9 1.0 1.4 0.4 4.8 2.7 3.4 2.1 6,001£ 8,641£ 3,745£ 7,004£ 2,268£ 6,385£ 6,268£ 0.2 0.1 45.81£ 0.1
E07000070 22UF Chelmsford 2.3 3.0 1.6 2.3 0.7 7.6 4.2 5.2 3.4 6,112£ 8,706£ 3,731£ 6,942£ 2,299£ 6,359£ 6,285£ 0.5 0.2 48.79£ 0.2
E07000071 22UG Colchester 3.0 4.3 2.3 3.0 1.0 10.6 5.8 7.4 4.7 6,229£ 8,723£ 3,622£ 6,948£ 2,280£ 6,338£ 6,307£ 0.6 0.3 51.66£ 0.3
E07000072 22UH Epping Forest 2.0 2.5 1.2 1.9 0.5 6.2 3.7 4.3 2.4 5,835£ 8,717£ 3,679£ 7,124£ 2,359£ 6,588£ 6,343£ 0.4 0.1 62.62£ 0.1
E07000073 22UJ Harlow 2.2 2.7 1.4 1.9 0.5 6.8 4.2 4.9 3.0 6,223£ 8,802£ 3,791£ 7,084£ 2,195£ 6,566£ 6,458£ 0.4 0.2 55.56£ 0.1
E07000074 22UK Maldon 0.8 1.2 0.7 0.7 0.3 3.0 1.5 2.1 1.5 6,081£ 8,733£ 3,727£ 6,817£ 2,408£ 6,263£ 6,213£ 0.1 0.1 47.89£ 0.1
E07000075 22UL Rochford 0.9 1.6 0.9 1.1 0.4 3.7 1.7 2.7 1.8 5,949£ 8,712£ 3,551£ 6,857£ 2,474£ 6,281£ 6,197£ 0.2 0.1 46.15£ 0.1
E07000076 22UN Tendring 3.3 3.8 1.8 2.4 1.1 10.0 6.4 6.9 3.9 6,422£ 9,023£ 3,970£ 7,376£ 2,364£ 6,579£ 6,527£ 0.4 0.3 43.18£ 0.3
E07000077 22UQ Uttlesford 0.8 1.3 0.8 1.0 0.3 3.2 1.4 2.3 1.7 5,955£ 8,652£ 3,569£ 6,706£ 2,440£ 6,226£ 6,162£ 0.2 0.1 52.17£ 0.1
E10000015 26 Hertfordshire 16.8 23.1 12.0 16.6 4.4 56.4 31.7 41.2 24.7 6,137£ 8,870£ 3,694£ 7,103£ 2,390£ 6,574£ 6,444£ 3.4 1.4 59.04£ 1.3
E07000095 26UB Broxbourne 2.0 2.5 1.2 1.7 0.4 6.1 3.6 4.3 2.5 6,049£ 8,673£ 3,716£ 7,033£ 2,331£ 6,548£ 6,388£ 0.4 0.1 61.41£ 0.1
E07000096 26UC Dacorum 2.2 2.9 1.5 2.1 0.6 7.3 4.3 5.2 3.2 6,264£ 8,862£ 3,744£ 7,097£ 2,395£ 6,548£ 6,462£ 0.4 0.2 57.19£ 0.2
E07000242 26UD East Hertfordshire 1.4 2.3 1.3 1.7 0.4 5.4 2.5 3.8 2.7 5,795£ 8,555£ 3,628£ 6,760£ 2,443£ 6,281£ 6,154£ 0.3 0.1 52.16£ 0.1
E07000098 26UE Hertsmere 1.5 2.1 1.0 1.6 0.4 5.0 2.8 3.8 2.0 5,956£ 9,034£ 3,434£ 7,290£ 2,384£ 6,727£ 6,491£ 0.4 0.1 61.95£ 0.1
E07000099 26UF North Hertfordshire 1.8 2.4 1.4 1.8 0.5 6.2 3.4 4.3 3.0 6,387£ 8,706£ 3,795£ 6,883£ 2,401£ 6,360£ 6,368£ 0.3 0.2 50.59£ 0.2
E07000240 26UG St Albans 1.5 2.1 1.0 1.4 0.4 5.0 2.9 4.0 2.0 6,120£ 9,189£ 3,585£ 7,442£ 2,439£ 6,870£ 6,641£ 0.3 0.1 61.61£ 0.1
E07000243 26UH Stevenage 1.9 2.4 1.3 1.7 0.5 6.1 3.7 4.2 2.7 6,531£ 9,028£ 3,943£ 7,225£ 2,325£ 6,602£ 6,580£ 0.4 0.2 59.92£ 0.2
E07000102 26UJ Three Rivers 1.1 1.5 0.8 1.2 0.2 3.7 2.1 2.7 1.7 5,909£ 8,805£ 3,586£ 6,971£ 2,189£ 6,526£ 6,336£ 0.2 0.1 65.16£ 0.1
E07000103 26UK Watford 1.6 2.6 1.2 1.6 0.5 5.8 3.0 4.8 2.4 6,048£ 8,973£ 3,653£ 7,298£ 2,477£ 6,776£ 6,581£ 0.3 0.1 63.72£ 0.1
E07000241 26UL Welwyn Hatfield 1.8 2.3 1.2 1.7 0.4 5.7 3.3 4.1 2.5 6,076£ 8,891£ 3,694£ 7,063£ 2,433£ 6,562£ 6,411£ 0.4 0.1 59.27£ 0.1
E10000020 33 Norfolk 14.3 22.2 13.3 13.3 6.9 56.8 27.3 39.2 27.5 6,345£ 8,644£ 3,785£ 6,826£ 2,261£ 6,079£ 6,146£ 2.2 1.7 43.64£ 1.5
E07000143 33UB Breckland 1.9 3.3 2.3 2.0 0.9 8.5 3.8 5.9 4.9 6,372£ 8,686£ 3,799£ 6,675£ 2,255£ 6,062£ 6,133£ 0.4 0.4 46.02£ 0.2
E07000144 33UC Broadland 1.2 2.6 1.8 1.7 0.7 6.3 2.2 4.5 3.7 5,911£ 8,506£ 3,636£ 6,502£ 2,294£ 5,926£ 5,923£ 0.3 0.2 42.94£ 0.2
E07000145 33UD Great Yarmouth 2.6 3.3 1.5 2.0 1.2 8.6 4.9 5.7 3.1 6,431£ 8,689£ 3,896£ 7,172£ 2,229£ 6,203£ 6,272£ 0.3 0.2 39.58£ 0.2
E07000146 33UE King’s Lynn and West Norfolk 2.5 4.0 2.4 2.5 1.2 10.2 4.8 7.0 5.0 6,445£ 8,564£ 3,802£ 6,775£ 2,280£ 6,052£ 6,149£ 0.3 0.3 44.51£ 0.2
E07000147 33UF North Norfolk 1.2 2.4 1.5 1.3 0.9 6.0 2.3 4.4 3.1 6,195£ 8,648£ 3,886£ 6,839£ 2,383£ 6,038£ 6,070£ 0.2 0.2 37.20£ 0.2
E07000148 33UG Norwich 3.3 4.1 1.9 2.2 1.4 10.7 6.5 7.2 3.8 6,406£ 8,715£ 3,825£ 7,157£ 2,126£ 6,227£ 6,283£ 0.4 0.2 47.10£ 0.3
E07000149 33UH South Norfolk 1.4 2.5 1.8 1.6 0.7 6.5 2.8 4.5 3.8 6,333£ 8,682£ 3,677£ 6,573£ 2,364£ 5,976£ 6,054£ 0.3 0.3 43.72£ 0.2
E10000029 42 Suffolk 11.1 17.0 10.9 11.2 4.5 43.5 21.4 30.3 22.9 6,343£ 8,758£ 3,774£ 6,816£ 2,332£ 6,192£ 6,231£ 2.0 1.4 44.53£ 1.2
E07000200 42UB Babergh 1.1 1.8 1.2 1.2 0.4 4.5 2.0 3.3 2.4 6,305£ 8,716£ 3,613£ 6,707£ 2,343£ 6,141£ 6,180£ 0.2 0.2 39.40£ 0.1
E07000201 42UC Forest Heath 0.8 1.4 0.9 0.9 0.3 3.4 1.5 2.3 1.9 6,014£ 8,488£ 3,712£ 6,587£ 2,309£ 6,068£ 6,055£ 0.2 0.1 49.45£ 0.1
E07000202 42UD Ipswich 3.1 4.4 2.3 2.7 1.2 11.1 6.1 8.0 4.9 6,350£ 8,866£ 3,806£ 7,116£ 2,213£ 6,387£ 6,376£ 0.5 0.3 45.87£ 0.3
E07000203 42UE Mid Suffolk 1.0 1.8 1.4 1.2 0.5 4.7 2.0 3.2 3.1 6,473£ 8,717£ 3,653£ 6,450£ 2,523£ 5,965£ 6,074£ 0.3 0.2 42.61£ 0.1
E07000204 42UF St Edmundsbury 1.3 2.2 1.7 1.6 0.5 5.7 2.6 3.8 3.5 6,231£ 8,668£ 3,761£ 6,561£ 2,327£ 6,038£ 6,083£ 0.3 0.2 45.18£ 0.2
E07000205 42UG Suffolk Coastal 1.3 2.3 1.6 1.6 0.6 5.9 2.5 4.1 3.4 6,233£ 8,772£ 3,808£ 6,790£ 2,419£ 6,181£ 6,193£ 0.3 0.2 45.53£ 0.2
E07000206 42UH Waveney 2.4 3.1 1.8 1.8 0.9 8.3 4.7 5.6 3.8 6,533£ 8,826£ 3,944£ 7,037£ 2,336£ 6,281£ 6,355£ 0.3 0.2 43.05£ 0.2
Table 2 HMRC
Tax Credit Finalised Awards: Geographical AnalysisChild and Working Tax Credit Statistics - Finalised annual awards 2012/13
Supplement on payments in 2012/13: Geographical analyses
Table 2: Average number of benefiting families and annual entitlements in each local authority, 2014-1516
£ per year
With no
children
With no
children
Receiving
WTC and
CTC
Receiving CTC
only
Receiving
WTC only
Receiving
WTC and CTC
Total out-of-
work families
(000's)
Total in
receipt (out-
of-work and
in-work
families)
(000's)
Couples
(number)
(000's)
In-work families (000's) Number of children in recipient families (000's) Families benefiting from:
In-work families Childcare element
Receiving
WTC only
All in-work
families
Total in
receipt (out-
of-work and
in-work
families)
Average
weekly value
(£ per week)
Disabled
worker
element
(number)
(000's)
Average annualised value (£ per year)
Current Area
Codes 2
Area names
Lone
parents
(number)
(000's)
In-work families
All families
with children
Of which,
lone parents
Total out-of-
work familiesReceiving WTC
and CTC
Total out-of-
work families
With children
Receiving
CTC only
With childrenNew Area
Codes 1
Receiving
CTC only
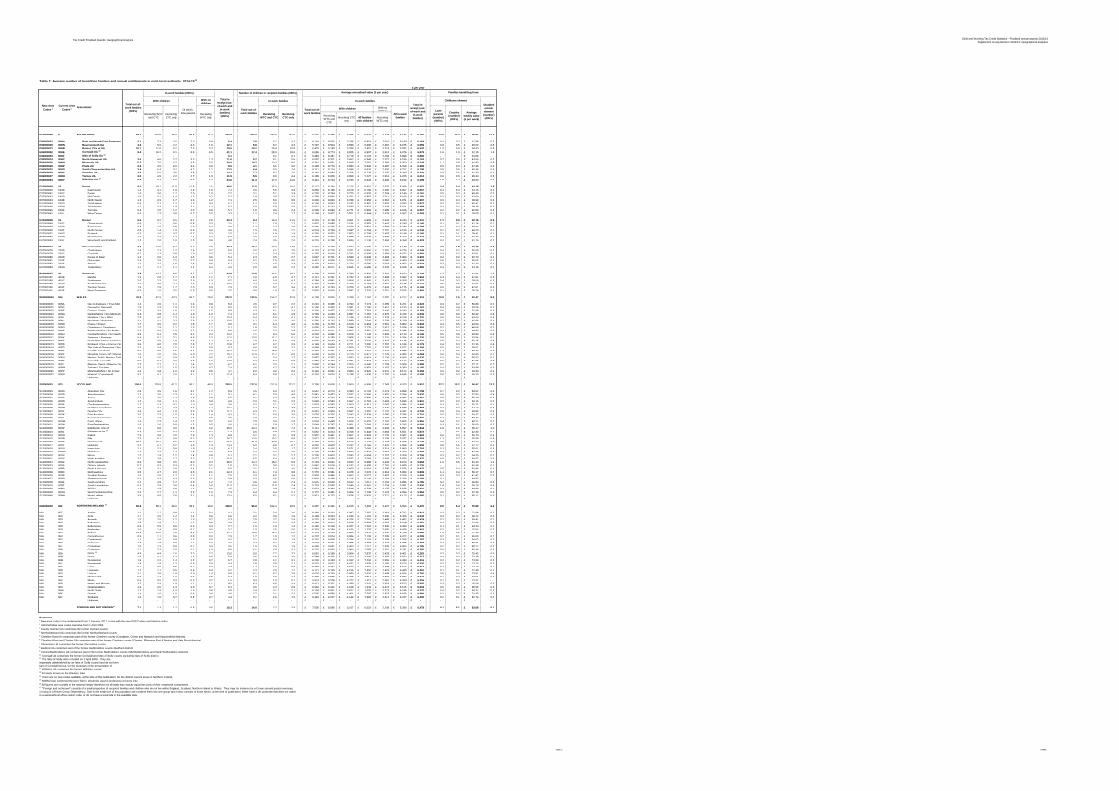
E12000007 H LONDON 204.9 256.7 80.8 159.4 46.4 588.9 390.5 502.5 164.3 6,111£ 9,678£ 3,769£ 8,263£ 2,372£ 7,551£ 7,050£ 39.1 9.4 78.16£ 8.3
E13000001 1B Inner London 89.8 100.4 26.4 64.2 20.3 236.9 170.7 201.1 53.4 6,112£ 9,933£ 3,834£ 8,662£ 2,395£ 7,797£ 7,158£ 15.9 3.5 82.80£ 3.5
N/A 1D Inner London – West 21.2 20.4 5.0 13.4 4.6 51.3 39.9 39.7 10.0 6,067£ 9,723£ 3,771£ 8,542£ 2,488£ 7,608£ 6,970£ 3.1 0.5 73.70£ 1.0
E09000007 00AG Camden 5.0 4.4 1.0 2.7 1.1 11.6 9.6 9.1 2.1 6,284£ 9,998£ 3,861£ 8,836£ 2,488£ 7,749£ 7,121£ 0.6 0.1 73.46£ 0.2
E09000001 00AA City of London - - - - - 0.1 0.1 0.1 - 5,323£ 8,780£ 2,767£ 6,696£ 2,393£ 5,471£ 5,428£ - - 83.58£ -
E09000013 00AN Hammersmith and Fulham 3.8 3.6 1.0 2.8 0.8 9.2 7.1 6.8 1.9 5,960£ 9,471£ 3,854£ 8,287£ 2,448£ 7,449£ 6,831£ 0.7 0.1 71.19£ 0.2
E09000020 00AW Kensington and Chelsea 2.3 2.0 0.5 1.5 0.7 5.5 4.1 3.5 1.0 5,661£ 9,320£ 3,648£ 8,132£ 2,601£ 6,977£ 6,419£ 0.3 - 69.13£ 0.1
E09000032 00BJ Wandsworth 5.5 6.5 1.7 4.2 1.3 15.0 10.5 12.7 3.3 6,156£ 9,826£ 3,758£ 8,568£ 2,414£ 7,749£ 7,162£ 1.1 0.2 76.66£ 0.3
E09000033 00BK Westminster 4.6 3.8 0.8 2.3 0.8 10.0 8.6 7.4 1.5 6,027£ 9,688£ 3,694£ 8,651£ 2,556£ 7,756£ 6,961£ 0.4 0.1 73.32£ 0.2
N/A 1E Inner London – East 68.5 80.0 21.4 50.7 15.7 185.6 130.8 161.5 43.4 6,125£ 9,986£ 3,849£ 8,692£ 2,368£ 7,846£ 7,210£ 12.8 3.0 84.85£ 2.5
E09000012 00AM Hackney 8.8 10.3 2.2 6.0 2.2 23.5 16.7 24.0 4.8 6,061£ 11,334£ 4,088£ 10,045£ 2,459£ 8,931£ 7,861£ 1.5 0.9 103.26£ 0.3
E09000014 00AP Haringey 7.5 10.1 2.2 6.3 2.6 22.4 13.9 19.9 4.3 5,947£ 9,839£ 3,714£ 8,722£ 2,267£ 7,613£ 7,055£ 1.3 0.4 85.71£ 0.2
E09000019 00AU Islington 6.3 5.0 1.3 3.7 1.2 13.8 11.5 9.5 2.6 5,967£ 9,641£ 3,755£ 8,413£ 2,561£ 7,457£ 6,782£ 1.0 0.1 67.46£ 0.3
E09000022 00AY Lambeth 8.6 9.4 2.7 7.9 2.1 22.8 15.8 16.9 5.2 5,969£ 9,427£ 3,653£ 8,127£ 2,268£ 7,254£ 6,771£ 2.3 0.3 77.54£ 0.3
E09000023 00AZ Lewisham 9.2 10.0 3.2 8.1 1.7 24.1 16.9 18.0 6.2 6,012£ 9,576£ 3,732£ 8,157£ 2,400£ 7,495£ 6,929£ 2.5 0.4 81.93£ 0.3
E09000025 00BB Newham 9.9 16.0 4.6 7.8 2.8 33.2 19.6 32.8 9.5 6,280£ 9,802£ 3,853£ 8,477£ 2,348£ 7,737£ 7,304£ 1.6 0.4 88.99£ 0.4
E09000028 00BE Southwark 8.9 8.9 2.9 7.7 1.7 22.4 16.7 16.3 5.8 6,035£ 9,523£ 3,788£ 8,130£ 2,309£ 7,406£ 6,860£ 2.1 0.3 83.42£ 0.4
E09000030 00BG Tower Hamlets 9.5 10.4 2.2 3.3 1.4 23.5 19.7 24.1 5.0 6,603£ 10,534£ 4,277£ 9,431£ 2,462£ 8,740£ 7,875£ 0.6 0.1 81.20£ 0.2
E13000002 1C Outer London 115.1 156.3 54.4 95.2 26.1 352.0 219.8 301.3 111.0 6,111£ 9,514£ 3,737£ 8,023£ 2,354£ 7,398£ 6,977£ 23.2 6.0 75.09£ 4.8
N/A 1F Outer London – East and North East 49.9 63.3 21.5 40.1 10.4 145.1 96.4 122.1 44.6 6,162£ 9,568£ 3,768£ 8,099£ 2,380£ 7,472£ 7,021£ 9.6 2.4 77.75£ 1.9
E09000002 00AB Barking and Dagenham 7.8 9.4 3.3 6.0 1.4 21.9 15.6 18.5 7.1 6,359£ 9,781£ 3,918£ 8,244£ 2,298£ 7,668£ 7,200£ 1.5 0.4 84.57£ 0.2
E09000004 00AD Bexley 5.1 5.6 2.7 4.4 0.9 14.3 9.9 10.1 5.7 6,230£ 9,237£ 3,852£ 7,493£ 2,327£ 6,989£ 6,716£ 1.1 0.3 75.75£ 0.3
E09000010 00AK Enfield 10.6 13.9 3.3 8.6 1.9 29.7 19.8 27.6 6.5 5,979£ 9,797£ 3,667£ 8,633£ 2,374£ 8,011£ 7,288£ 2.1 0.4 76.80£ 0.3
E09000011 00AL Greenwich 7.9 8.2 3.1 6.2 1.4 20.6 15.1 15.5 6.6 6,192£ 9,611£ 3,920£ 8,032£ 2,392£ 7,401£ 6,939£ 1.5 0.3 86.25£ 0.3
E09000016 00AR Havering 4.9 5.8 2.7 4.4 1.0 14.4 9.3 10.3 5.6 6,073£ 9,010£ 3,646£ 7,319£ 2,413£ 6,808£ 6,557£ 1.0 0.3 62.78£ 0.2
E09000026 00BC Redbridge 6.0 10.2 3.0 4.7 1.7 20.9 11.9 20.6 6.4 6,222£ 9,700£ 3,733£ 8,333£ 2,535£ 7,677£ 7,258£ 1.0 0.3 80.85£ 0.3
E09000031 00BH Waltham Forest 7.6 10.2 3.4 5.8 2.2 23.4 14.7 19.6 6.7 6,144£ 9,393£ 3,634£ 7,973£ 2,314£ 7,187£ 6,849£ 1.5 0.4 73.41£ 0.2
N/A 1G Outer London – South 24.6 32.5 12.4 22.7 5.3 74.9 45.8 58.3 24.8 6,038£ 9,204£ 3,666£ 7,674£ 2,390£ 7,114£ 6,760£ 6.4 1.5 71.60£ 1.2
E09000006 00AF Bromley 5.5 6.2 2.7 5.0 1.1 15.5 10.1 10.6 5.4 6,038£ 9,001£ 3,672£ 7,408£ 2,452£ 6,845£ 6,558£ 1.3 0.3 67.32£ 0.3
E09000008 00AH Croydon 9.9 12.9 4.3 9.5 1.9 28.9 18.5 23.5 8.6 6,076£ 9,505£ 3,712£ 8,062£ 2,354£ 7,484£ 7,004£ 3.1 0.6 77.08£ 0.4
E09000021 00AX Kingston upon Thames 2.2 3.1 1.2 1.9 0.5 7.1 4.0 5.6 2.4 5,902£ 8,981£ 3,659£ 7,513£ 2,443£ 6,952£ 6,623£ 0.4 0.1 62.23£ 0.1
E09000024 00BA Merton 3.6 5.7 2.0 3.1 1.0 12.3 6.8 10.4 4.1 6,049£ 9,130£ 3,679£ 7,687£ 2,343£ 7,065£ 6,768£ 0.9 0.2 73.49£ 0.2
E09000029 00BF Sutton 3.4 4.6 2.2 3.2 0.7 11.0 6.3 8.1 4.5 6,002£ 8,884£ 3,560£ 7,138£ 2,419£ 6,698£ 6,481£ 0.8 0.3 62.40£ 0.2
N/A 1H Outer London – West and North West 40.6 60.5 20.5 32.4 10.4 132.0 77.6 120.9 41.5 6,093£ 9,625£ 3,747£ 8,137£ 2,310£ 7,476£ 7,051£ 7.2 2.1 74.67£ 1.7
E09000003 00AC Barnet 6.7 10.3 3.0 5.7 2.0 22.0 12.4 20.6 6.1 5,896£ 9,811£ 3,851£ 8,475£ 2,381£ 7,683£ 7,136£ 1.3 0.6 76.64£ 0.3
E09000005 00AE Brent 7.9 12.9 3.8 6.9 2.2 26.8 15.3 26.3 7.6 6,086£ 9,802£ 3,766£ 8,415£ 2,231£ 7,692£ 7,217£ 1.6 0.3 79.90£ 0.3
E09000009 00AJ Ealing 7.8 11.5 3.8 5.6 2.1 25.2 15.0 23.0 7.6 6,069£ 9,566£ 3,776£ 8,130£ 2,235£ 7,411£ 6,994£ 1.2 0.3 76.90£ 0.3
E09000015 00AQ Harrow 4.1 7.3 2.4 3.2 1.1 14.9 7.9 15.2 4.8 6,195£ 9,762£ 3,689£ 8,270£ 2,433£ 7,669£ 7,267£ 0.6 0.2 71.19£ 0.2
E09000017 00AS Hillingdon 6.1 8.2 3.4 4.9 1.1 18.8 11.9 16.3 7.0 6,305£ 9,645£ 3,721£ 7,912£ 2,343£ 7,433£ 7,066£ 1.2 0.3 73.50£ 0.3
E09000018 00AT Hounslow 5.9 8.0 3.2 4.3 1.4 18.6 11.6 15.5 6.6 6,215£ 9,311£ 3,703£ 7,700£ 2,289£ 7,108£ 6,823£ 0.9 0.3 69.60£ 0.3
E09000027 00BD Richmond upon Thames 2.0 2.4 0.9 1.8 0.5 5.8 3.5 4.0 1.8 5,652£ 8,704£ 3,622£ 7,286£ 2,408£ 6,677£ 6,322£ 0.4 0.1 62.54£ 0.1
E12000008 J SOUTH EAST 131.2 188.1 99.9 129.4 43.0 462.2 251.2 338.4 209.4 6,262£ 8,914£ 3,787£ 7,136£ 2,365£ 6,516£ 6,444£ 27.1 14.3 51.99£ 11.4
E06000036 00MA Bracknell Forest UA 1.4 2.1 1.3 1.8 0.3 5.1 2.7 3.6 2.8 6,222£ 8,802£ 3,930£ 6,938£ 2,266£ 6,569£ 6,470£ 0.4 0.1 58.01£ 0.1
E06000043 00ML Brighton and Hove UA 4.6 6.2 2.6 4.3 2.6 16.0 8.2 10.3 5.0 5,851£ 8,685£ 3,626£ 7,192£ 2,558£ 6,116£ 6,040£ 1.0 0.6 47.97£ 0.6
E06000046 00MW Isle of Wight UA 2.6 4.1 2.0 2.4 1.5 10.3 4.7 7.2 4.1 5,989£ 8,692£ 3,826£ 7,085£ 2,450£ 6,181£ 6,132£ 0.5 0.4 36.34£ 0.3
E06000035 00LC Medway UA 6.5 7.4 3.9 5.0 1.7 19.5 12.5 13.2 8.3 6,360£ 8,961£ 3,825£ 7,174£ 2,264£ 6,542£ 6,481£ 1.0 0.5 51.42£ 0.4
E06000042 00MG Milton Keynes UA 5.3 8.3 3.7 5.8 1.2 18.6 10.7 16.0 7.8 6,401£ 9,494£ 3,777£ 7,722£ 2,311£ 7,220£ 6,985£ 1.6 0.6 60.48£ 0.3
E06000044 00MR Portsmouth UA 4.7 6.1 2.7 4.1 1.5 15.1 9.0 11.1 5.6 6,172£ 8,973£ 3,777£ 7,383£ 2,212£ 6,639£ 6,493£ 0.9 0.4 48.93£ 0.4
E06000038 00MC Reading UA 3.2 4.2 2.0 2.8 0.7 10.1 6.3 7.7 4.0 6,369£ 9,122£ 3,783£ 7,412£ 2,147£ 6,849£ 6,695£ 0.6 0.2 60.79£ 0.2
E06000039 00MD Slough UA 3.4 5.6 2.4 2.9 0.9 12.3 7.0 11.5 5.2 6,461£ 9,594£ 3,786£ 7,840£ 2,301£ 7,276£ 7,049£ 0.5 0.2 66.13£ 0.1
E06000045 00MS Southampton UA 5.4 7.0 3.2 4.2 1.6 17.3 10.5 12.9 6.7 6,262£ 8,956£ 3,856£ 7,347£ 2,178£ 6,635£ 6,519£ 0.9 0.4 49.54£ 0.4
E06000037 00MB West Berkshire UA 1.6 2.5 1.6 2.0 0.4 6.2 3.2 4.5 3.5 6,500£ 8,915£ 3,928£ 6,976£ 2,268£ 6,563£ 6,547£ 0.5 0.2 57.22£ 0.1
E06000040 00ME Windsor and Maidenhead UA 1.3 2.2 1.1 1.6 0.4 5.1 2.5 4.0 2.3 6,136£ 8,977£ 3,754£ 7,221£ 2,515£ 6,720£ 6,567£ 0.3 0.1 63.68£ 0.1
E06000041 00MF Wokingham UA 1.2 1.9 1.2 1.6 0.3 4.6 2.3 3.4 2.5 6,230£ 8,888£ 3,834£ 6,971£ 2,350£ 6,508£ 6,435£ 0.3 0.1 57.98£ 0.1
E10000002 11 Buckinghamshire 5.8 9.6 4.9 6.2 1.9 22.1 11.3 18.3 10.4 6,301£ 9,200£ 3,854£ 7,398£ 2,460£ 6,835£ 6,695£ 1.3 0.6 58.06£ 0.4
E07000004 11UB Aylesbury Vale 2.1 3.7 2.1 2.5 0.7 8.6 4.2 7.1 4.4 6,341£ 9,204£ 3,886£ 7,299£ 2,414£ 6,767£ 6,662£ 0.6 0.3 55.93£ 0.2
E07000005 11UC Chiltern 0.8 1.3 0.7 0.9 0.2 3.0 1.5 2.4 1.4 6,120£ 8,892£ 3,533£ 7,087£ 2,496£ 6,581£ 6,458£ 0.2 0.1 55.92£ 0.1
E07000006 11UE South Bucks 0.7 0.8 0.4 0.6 0.2 2.1 1.2 1.5 0.9 5,980£ 8,913£ 3,844£ 7,195£ 2,591£ 6,635£ 6,424£ 0.1 0.1 62.15£ -
E07000007 11UF Wycombe 2.2 3.7 1.7 2.2 0.7 8.4 4.3 7.3 3.7 6,429£ 9,368£ 3,943£ 7,662£ 2,461£ 7,044£ 6,884£ 0.5 0.2 60.11£ 0.1
E10000011 21 East Sussex 9.2 13.5 6.8 8.6 4.0 33.5 17.2 23.8 14.2 6,120£ 8,774£ 3,840£ 7,113£ 2,355£ 6,331£ 6,273£ 1.7 1.3 44.39£ 0.9
E07000061 21UC Eastbourne 2.1 3.0 1.4 1.9 0.9 7.4 3.8 5.3 3.0 6,025£ 8,803£ 3,973£ 7,242£ 2,217£ 6,414£ 6,306£ 0.4 0.3 43.38£ 0.2
E07000062 21UD Hastings 2.7 3.2 1.4 2.0 1.1 8.3 5.1 5.6 2.8 6,183£ 8,837£ 3,769£ 7,304£ 2,380£ 6,355£ 6,299£ 0.4 0.3 44.07£ 0.2
E07000063 21UF Lewes 1.4 2.3 1.2 1.5 0.6 5.6 2.7 4.0 2.5 6,042£ 8,739£ 3,750£ 6,990£ 2,443£ 6,300£ 6,234£ 0.3 0.3 45.22£ 0.2
E07000064 21UG Rother 1.4 2.2 1.0 1.4 0.6 5.3 2.7 3.8 2.1 6,368£ 8,722£ 3,765£ 7,123£ 2,347£ 6,323£ 6,335£ 0.2 0.2 44.01£ 0.1
E07000065 21UH Wealden 1.6 2.9 1.8 1.9 0.8 7.0 2.9 5.1 3.8 5,982£ 8,739£ 3,895£ 6,886£ 2,410£ 6,255£ 6,193£ 0.3 0.3 45.45£ 0.2
E10000014 24 Hampshire 16.1 25.0 15.6 18.6 5.3 62.1 30.7 44.4 33.1 6,269£ 8,827£ 3,722£ 6,868£ 2,426£ 6,351£ 6,330£ 4.0 2.3 50.94£ 1.8
E07000084 24UB Basingstoke and Deane 2.2 3.2 2.0 2.6 0.6 7.9 4.3 5.7 4.2 6,390£ 8,876£ 3,809£ 6,953£ 2,259£ 6,492£ 6,463£ 0.6 0.3 53.41£ 0.2
E07000085 24UC East Hampshire 1.1 1.9 1.2 1.3 0.4 4.6 2.1 3.4 2.6 6,070£ 8,837£ 3,762£ 6,878£ 2,534£ 6,394£ 6,314£ 0.2 0.2 51.48£ 0.1
E07000086 24UD Eastleigh 1.4 2.6 1.6 2.0 0.5 6.1 2.6 4.5 3.4 6,224£ 8,720£ 3,555£ 6,736£ 2,476£ 6,255£ 6,248£ 0.5 0.3 49.30£ 0.2
E07000087 24UE Fareham 1.0 1.9 1.2 1.5 0.4 4.5 1.8 3.3 2.5 5,954£ 8,738£ 3,732£ 6,810£ 2,467£ 6,335£ 6,252£ 0.3 0.2 50.31£ 0.1
E07000088 24UF Gosport 1.6 2.3 1.3 1.6 0.5 5.7 3.0 4.1 2.9 6,321£ 9,016£ 3,816£ 7,088£ 2,183£ 6,441£ 6,407£ 0.4 0.2 49.16£ 0.2
E07000089 24UG Hart 0.7 1.2 0.8 1.0 0.2 2.9 1.3 2.1 1.7 5,934£ 8,832£ 3,568£ 6,709£ 2,566£ 6,287£ 6,203£ 0.2 0.1 53.90£ 0.1
E07000090 24UH Havant 2.4 3.0 1.7 2.0 0.8 7.8 4.7 5.4 3.7 6,581£ 8,970£ 3,966£ 7,176£ 2,350£ 6,490£ 6,518£ 0.4 0.3 46.02£ 0.2
E07000091 24UJ New Forest 2.0 3.3 2.0 2.3 0.8 8.1 3.8 5.8 4.2 6,130£ 8,735£ 3,666£ 6,811£ 2,550£ 6,274£ 6,238£ 0.4 0.3 46.04£ 0.2
E07000092 24UL Rushmoor 1.5 2.0 1.4 1.5 0.3 5.1 2.8 3.5 2.9 6,183£ 8,801£ 3,528£ 6,596£ 2,325£ 6,241£ 6,225£ 0.3 0.2 57.90£ 0.1
E07000093 24UN Test Valley 1.3 2.1 1.4 1.6 0.4 5.2 2.5 3.7 3.0 6,321£ 8,690£ 3,709£ 6,694£ 2,543£ 6,250£ 6,268£ 0.3 0.2 54.67£ 0.2
E07000094 24UP Winchester 1.0 1.7 1.0 1.1 0.5 4.1 1.9 3.0 2.2 6,341£ 8,859£ 3,762£ 6,934£ 2,547£ 6,303£ 6,312£ 0.2 0.2 53.56£ 0.2
E10000016 29 Kent 27.9 36.5 18.4 24.3 9.3 92.1 54.1 64.9 38.0 6,413£ 8,921£ 3,809£ 7,210£ 2,359£ 6,510£ 6,480£ 4.8 2.7 49.99£ 2.4
E07000105 29UB Ashford 2.3 3.2 1.8 2.0 0.7 7.9 4.5 5.7 3.7 6,449£ 8,895£ 3,768£ 7,037£ 2,377£ 6,446£ 6,447£ 0.5 0.3 48.92£ 0.2
E07000106 29UC Canterbury 2.4 3.3 1.7 2.1 0.9 8.2 4.6 5.8 3.6 6,510£ 8,895£ 3,907£ 7,192£ 2,352£ 6,437£ 6,458£ 0.5 0.3 42.62£ 0.2
E07000107 29UD Dartford 1.9 2.5 1.3 1.8 0.5 6.2 3.5 4.3 2.7 6,117£ 8,998£ 3,721£ 7,152£ 2,366£ 6,629£ 6,470£ 0.4 0.2 63.80£ 0.1
E07000108 29UE Dover 2.4 3.1 1.5 2.0 0.9 7.9 4.6 5.5 3.1 6,364£ 8,770£ 3,702£ 7,121£ 2,293£ 6,359£ 6,360£ 0.3 0.2 40.00£ 0.2
E07000109 29UG Gravesham 2.3 2.9 1.4 1.9 0.6 7.2 4.5 5.3 2.9 6,519£ 9,074£ 3,861£ 7,379£ 2,236£ 6,718£ 6,655£ 0.3 0.1 63.50£ 0.1
E07000110 29UH Maidstone 2.5 3.4 1.9 2.3 0.8 8.6 4.8 5.9 3.9 6,242£ 8,836£ 3,643£ 6,981£ 2,371£ 6,354£ 6,322£ 0.5 0.2 57.02£ 0.2
E07000111 29UK Sevenoaks 1.5 1.9 1.0 1.4 0.4 4.8 3.0 3.4 2.1 6,324£ 8,910£ 3,734£ 7,139£ 2,486£ 6,589£ 6,504£ 0.2 0.1 57.44£ 0.1
E07000112 29UL Shepway 2.3 2.9 1.4 1.9 0.8 7.5 4.5 5.3 2.8 6,455£ 8,968£ 3,808£ 7,331£ 2,333£ 6,516£ 6,497£ 0.4 0.2 43.50£ 0.2
E07000113 29UM Swale 3.5 3.8 2.0 2.5 1.0 10.3 6.9 6.9 4.2 6,642£ 9,048£ 3,973£ 7,301£ 2,347£ 6,588£ 6,606£ 0.5 0.3 48.93£ 0.2
E07000114 29UN Thanet 3.8 5.1 2.0 3.1 1.6 12.5 7.3 9.0 4.0 6,424£ 8,985£ 3,798£ 7,511£ 2,355£ 6,542£ 6,507£ 0.6 0.4 45.59£ 0.4
E07000115 29UP Tonbridge and Malling 1.8 2.4 1.3 1.8 0.5 6.0 3.4 4.3 2.9 6,399£ 8,747£ 3,952£ 7,050£ 2,413£ 6,509£ 6,477£ 0.4 0.2 48.85£ 0.2
E07000116 29UQ Tunbridge Wells 1.3 2.0 1.0 1.4 0.5 4.9 2.5 3.6 2.2 6,247£ 8,826£ 3,822£ 7,115£ 2,530£ 6,496£ 6,428£ 0.3 0.1 47.58£ 0.2
E10000025 38 Oxfordshire 7.7 11.3 7.4 8.5 2.2 28.6 15.1 20.3 16.1 6,300£ 8,835£ 3,814£ 6,849£ 2,391£ 6,371£ 6,352£ 1.9 1.0 52.65£ 0.7
E07000177 38UB Cherwell 1.8 2.9 2.0 2.2 0.6 7.4 3.5 5.3 4.4 6,198£ 8,831£ 3,816£ 6,779£ 2,390£ 6,313£ 6,285£ 0.5 0.3 51.24£ 0.2
E07000178 38UC Oxford 2.6 2.9 1.4 2.0 0.5 7.4 5.2 5.5 3.0 6,529£ 9,209£ 3,923£ 7,522£ 2,384£ 6,942£ 6,800£ 0.4 0.2 56.44£ 0.2
E07000179 38UD South Oxfordshire 1.2 1.9 1.3 1.5 0.4 4.7 2.3 3.2 2.8 6,082£ 8,569£ 3,724£ 6,581£ 2,409£ 6,138£ 6,124£ 0.3 0.2 49.30£ 0.1
E07000180 38UE Vale of White Horse 1.2 1.8 1.4 1.5 0.4 4.8 2.3 3.3 3.1 6,315£ 8,773£ 3,800£ 6,618£ 2,305£ 6,171£ 6,207£ 0.3 0.2 54.28£ 0.1
E07000181 38UF West Oxfordshire 1.0 1.7 1.3 1.4 0.4 4.3 1.9 3.0 2.8 6,141£ 8,555£ 3,799£ 6,526£ 2,476£ 6,100£ 6,109£ 0.3 0.2 51.39£ 0.1
E10000030 43 Surrey 12.2 16.6 9.2 12.4 2.9 41.0 23.0 29.3 19.3 6,208£ 8,791£ 3,775£ 6,995£ 2,408£ 6,526£ 6,431£ 2.5 1.0 56.69£ 0.9
E07000207 43UB Elmbridge 1.3 1.7 0.8 1.3 0.3 4.1 2.4 2.8 1.6 5,969£ 8,571£ 3,691£ 6,969£ 2,396£ 6,490£ 6,320£ 0.3 0.1 52.65£ 0.1
E07000208 43UC Epsom and Ewell 0.8 1.1 0.6 0.8 0.2 2.6 1.4 1.8 1.2 5,990£ 8,746£ 3,533£ 6,906£ 2,399£ 6,488£ 6,340£ 0.2 0.1 59.33£ 0.1
E07000209 43UD Guildford 1.4 1.8 1.0 1.3 0.3 4.5 2.6 3.2 2.1 6,210£ 8,793£ 3,748£ 6,968£ 2,431£ 6,479£ 6,395£ 0.2 0.1 53.89£ 0.1
E07000210 43UE Mole Valley 0.7 1.0 0.7 0.8 0.3 2.6 1.3 1.8 1.3 6,069£ 8,692£ 3,714£ 6,758£ 2,655£ 6,197£ 6,163£ 0.1 0.1 50.59£ 0.1
E07000211 43UF Reigate and Banstead 1.6 2.3 1.3 1.7 0.4 5.6 3.1 4.1 2.7 6,277£ 8,939£ 3,765£ 7,057£ 2,337£ 6,615£ 6,516£ 0.4 0.1 58.84£ 0.1
E07000212 43UG Runnymede 1.0 1.2 0.7 0.9 0.2 3.1 1.9 2.1 1.4 6,374£ 8,740£ 3,704£ 6,893£ 2,372£ 6,452£ 6,427£ 0.2 0.1 55.35£ 0.1
E07000213 43UH Spelthorne 1.4 1.7 1.0 1.3 0.2 4.3 2.7 2.9 2.1 6,382£ 8,779£ 3,789£ 6,912£ 2,208£ 6,520£ 6,475£ 0.3 0.1 60.96£ 0.1
E07000214 43UJ Surrey Heath 0.8 1.3 0.7 1.0 0.2 3.0 1.5 2.2 1.5 6,153£ 8,686£ 3,709£ 6,903£ 2,353£ 6,469£ 6,383£ 0.2 0.1 57.09£ 0.1
E07000215 43UK Tandridge 0.9 1.3 0.7 1.0 0.3 3.2 1.7 2.3 1.6 6,006£ 8,935£ 3,800£ 7,102£ 2,487£ 6,592£ 6,423£ 0.2 0.1 61.10£ 0.1
E07000216 43UL Waverley 1.0 1.5 0.9 1.2 0.3 3.7 2.0 2.5 1.9 6,259£ 8,560£ 3,840£ 6,792£ 2,409£ 6,295£ 6,285£ 0.2 0.1 51.64£ 0.1
E07000217 43UM Woking 1.2 1.9 0.9 1.1 0.3 4.3 2.3 3.6 2.0 6,410£ 9,080£ 4,103£ 7,468£ 2,423£ 6,966£ 6,812£ 0.2 0.1 56.86£ 0.1
E10000032 45 West Sussex 10.8 18.0 9.8 12.3 4.1 42.8 20.2 31.9 20.5 6,040£ 8,695£ 3,732£ 6,944£ 2,315£ 6,347£ 6,269£ 2.4 1.5 49.53£ 1.1
E07000223 45UB Adur 1.1 1.5 0.9 1.0 0.4 3.8 1.9 2.7 1.8 6,116£ 8,721£ 3,761£ 6,911£ 2,333£ 6,274£ 6,230£ 0.2 0.1 47.39£ 0.1
E07000224 45UC Arun 2.3 3.9 2.1 2.5 1.1 9.4 4.1 6.7 4.3 5,886£ 8,470£ 3,630£ 6,760£ 2,119£ 6,034£ 5,999£ 0.4 0.3 46.07£ 0.2
E07000225 45UD Chichester 1.3 2.2 1.2 1.5 0.6 5.3 2.4 3.9 2.5 5,915£ 8,717£ 3,903£ 7,035£ 2,454£ 6,347£ 6,237£ 0.3 0.2 49.78£ 0.1
E07000226 45UE Crawley 2.3 3.4 1.6 2.1 0.5 7.8 4.4 6.4 3.4 6,145£ 9,011£ 3,782£ 7,322£ 2,384£ 6,900£ 6,680£ 0.4 0.2 58.84£ 0.2
E07000227 45UF Horsham 1.1 2.1 1.2 1.6 0.5 4.9 2.1 3.6 2.6 6,069£ 8,697£ 3,666£ 6,823£ 2,403£ 6,273£ 6,226£ 0.3 0.2 48.52£ 0.1
E07000228 45UG Mid Sussex 1.2 2.3 1.3 1.8 0.4 5.3 2.3 4.1 2.8 6,060£ 8,584£ 3,755£ 6,804£ 2,433£ 6,347£ 6,281£ 0.3 0.2 48.11£ 0.1
E07000229 45UH Worthing 1.5 2.6 1.5 1.8 0.7 6.3 2.9 4.6 3.0 6,131£ 8,679£ 3,709£ 6,918£ 2,324£ 6,274£ 6,239£ 0.4 0.3 47.61£ 0.2
Table 2 HMRC
Tax Credit Finalised Awards: Geographical AnalysisChild and Working Tax Credit Statistics - Finalised annual awards 2012/13
Supplement on payments in 2012/13: Geographical analyses
Table 2: Average number of benefiting families and annual entitlements in each local authority, 2014-1516
£ per year
With no
children
With no
children
Receiving
WTC and
CTC
Receiving CTC
only
Receiving
WTC only
Receiving
WTC and CTC
Total out-of-
work families
(000's)
Total in
receipt (out-
of-work and
in-work
families)
(000's)
Couples
(number)
(000's)
In-work families (000's) Number of children in recipient families (000's) Families benefiting from:
In-work families Childcare element
Receiving
WTC only
All in-work
families
Total in
receipt (out-
of-work and
in-work
families)
Average
weekly value
(£ per week)
Disabled
worker
element
(number)
(000's)
Average annualised value (£ per year)
Current Area
Codes 2
Area names
Lone
parents
(number)
(000's)
In-work families
All families
with children
Of which,
lone parents
Total out-of-
work familiesReceiving WTC
and CTC
Total out-of-
work families
With children
Receiving
CTC only
With childrenNew Area
Codes 1
Receiving
CTC only
E12000009 K SOUTH WEST 82.7 132.5 78.0 85.8 41.7 334.8 157.0 234.8 161.9 6,216£ 8,786£ 3,758£ 6,923£ 2,448£ 6,183£ 6,191£ 17.6 14.3 45.51£ 11.2
E06000022 00HA Bath and North East Somerset UA 2.1 3.3 2.0 2.3 0.9 8.4 3.8 5.7 4.2 6,119£ 8,625£ 3,796£ 6,819£ 2,510£ 6,180£ 6,164£ 0.4 0.3 47.88£ 0.3
E06000028 00HN Bournemouth UA 3.3 5.0 2.2 3.3 1.6 12.1 5.8 8.2 4.3 5,797£ 8,504£ 3,589£ 6,995£ 2,481£ 6,155£ 6,059£ 0.8 0.5 48.60£ 0.5
E06000023 00HB Bristol, City of UA 10.1 11.0 5.2 7.3 3.3 29.5 20.2 20.4 10.8 6,479£ 9,189£ 3,788£ 7,452£ 2,318£ 6,582£ 6,547£ 1.5 0.9 54.93£ 0.8
E06000052 00HE Cornwall UA 10
9.4 16.2 9.1 8.8 6.5 41.1 17.4 28.9 18.6 6,086£ 8,774£ 3,825£ 6,997£ 2,514£ 6,076£ 6,079£ 1.6 1.9 42.15£ 1.5
E06000053 00HF Isles of Scilly UA 11
- - - - - 0.1 - 0.1 0.1 5,383£ 8,487£ 3,778£ 6,129£ 2,458£ 5,698£ 5,685£ - - 54.08£ -
E06000024 00HC North Somerset UA 3.0 4.6 2.7 3.3 1.3 11.6 5.7 8.1 5.6 6,097£ 8,701£ 3,662£ 6,848£ 2,372£ 6,186£ 6,163£ 0.7 0.5 43.66£ 0.3
E06000026 00HG Plymouth UA 5.7 7.6 4.2 4.8 2.6 20.0 10.7 13.2 8.6 6,361£ 8,831£ 3,848£ 7,063£ 2,280£ 6,203£ 6,248£ 1.1 0.8 44.93£ 0.8
E06000029 00HP Poole UA 2.2 3.5 2.0 2.4 0.9 8.5 4.1 6.1 4.0 6,128£ 8,773£ 3,680£ 6,940£ 2,487£ 6,318£ 6,269£ 0.5 0.3 47.35£ 0.3
E06000025 00HD South Gloucestershire UA 3.4 5.4 3.7 4.2 1.1 13.5 6.4 9.5 7.6 6,111£ 8,714£ 3,646£ 6,676£ 2,420£ 6,227£ 6,198£ 0.9 0.6 46.46£ 0.4
E06000030 00HX Swindon UA 4.0 5.5 3.6 3.8 1.1 14.2 7.7 9.7 7.5 6,181£ 8,684£ 3,756£ 6,729£ 2,245£ 6,240£ 6,224£ 0.9 0.5 51.30£ 0.3
E06000027 00HH Torbay UA 3.0 4.5 2.2 2.7 1.8 11.5 5.5 8.0 4.4 6,185£ 8,828£ 3,858£ 7,227£ 2,513£ 6,225£ 6,214£ 0.6 0.5 45.33£ 0.5
E06000054 00HY Wiltshire UA 12
5.9 9.7 6.9 6.9 2.2 24.6 11.3 17.0 14.6 6,341£ 8,714£ 3,730£ 6,643£ 2,406£ 6,154£ 6,199£ 1.5 1.2 48.03£ 0.7
E10000008 18 Devon 9.5 19.7 11.9 11.8 7.5 48.6 17.8 35.0 24.5 6,172£ 8,795£ 3,775£ 6,910£ 2,535£ 6,066£ 6,087£ 2.4 2.4 42.18£ 1.8
E07000040 18UB East Devon 1.4 3.1 1.9 1.9 1.0 7.4 2.6 5.5 3.9 6,056£ 8,788£ 3,578£ 6,796£ 2,400£ 6,057£ 6,057£ 0.4 0.4 43.75£ 0.2
E07000041 18UC Exeter 1.6 3.0 1.7 2.0 1.0 7.2 3.1 5.1 3.4 6,230£ 8,764£ 3,725£ 6,933£ 2,304£ 6,140£ 6,161£ 0.5 0.3 48.49£ 0.3
E07000042 18UD Mid Devon 1.0 2.1 1.4 1.2 0.7 5.2 1.9 3.8 3.2 6,359£ 8,846£ 4,021£ 6,862£ 2,511£ 6,100£ 6,150£ 0.2 0.3 43.00£ 0.2
E07000043 18UE North Devon 1.3 2.9 1.7 1.6 1.2 7.1 2.5 5.2 3.5 6,209£ 8,840£ 3,788£ 6,958£ 2,564£ 6,071£ 6,097£ 0.3 0.4 38.99£ 0.3
E07000044 18UG South Hams 0.9 2.1 1.2 1.3 0.9 5.1 1.7 3.5 2.4 6,156£ 8,653£ 3,742£ 6,887£ 2,653£ 5,933£ 5,973£ 0.2 0.2 40.47£ 0.2
E07000045 18UH Teignbridge 1.7 3.4 1.9 2.1 1.2 8.2 3.0 5.9 4.0 6,037£ 8,742£ 3,833£ 6,937£ 2,548£ 6,101£ 6,088£ 0.4 0.4 39.48£ 0.3
E07000046 18UK Torridge 0.9 2.0 1.2 1.0 0.9 5.1 1.8 3.6 2.4 6,238£ 8,894£ 3,771£ 6,995£ 2,685£ 6,016£ 6,057£ 0.2 0.2 40.89£ 0.2
E07000047 18UL West Devon 0.6 1.3 0.8 0.7 0.5 3.3 1.2 2.4 1.7 6,184£ 8,907£ 3,801£ 6,944£ 2,674£ 6,067£ 6,089£ 0.1 0.1 38.08£ 0.1
E10000009 19 Dorset 5.0 9.2 5.5 6.1 2.6 22.4 9.4 16.3 11.5 6,223£ 8,738£ 3,801£ 6,893£ 2,544£ 6,233£ 6,231£ 1.1 0.9 42.76£ 0.9
E07000048 19UC Christchurch 0.6 1.1 0.6 0.8 0.3 2.5 1.1 1.9 1.2 5,852£ 8,688£ 3,535£ 6,883£ 2,447£ 6,240£ 6,145£ 0.1 0.1 41.14£ 0.1
E07000049 19UD East Dorset 0.8 1.5 0.9 1.0 0.4 3.6 1.4 2.7 1.9 6,036£ 8,745£ 3,679£ 6,831£ 2,586£ 6,230£ 6,189£ 0.2 0.2 45.64£ 0.2
E07000050 19UE North Dorset 0.8 1.4 1.0 0.9 0.4 3.6 1.5 2.5 2.2 6,524£ 8,759£ 3,897£ 6,704£ 2,701£ 6,155£ 6,236£ 0.2 0.2 49.20£ 0.2
E07000051 19UG Purbeck 0.5 1.0 0.7 0.7 0.3 2.5 1.0 1.8 1.4 6,230£ 8,552£ 3,853£ 6,709£ 2,497£ 6,148£ 6,166£ 0.1 0.1 38.41£ 0.1
E07000052 19UH West Dorset 1.0 2.2 1.3 1.4 0.7 5.3 2.0 4.0 2.9 6,346£ 8,793£ 3,868£ 6,949£ 2,539£ 6,217£ 6,242£ 0.3 0.2 40.40£ 0.2
E07000053 19UJ Weymouth and Portland 1.3 2.0 1.0 1.3 0.6 4.8 2.4 3.5 2.0 6,225£ 8,780£ 3,845£ 7,136£ 2,484£ 6,358£ 6,323£ 0.3 0.2 41.25£ 0.2
E10000013 23 Gloucestershire 8.4 13.5 8.4 9.3 3.5 33.7 16.2 23.9 17.5 6,231£ 8,728£ 3,674£ 6,790£ 2,342£ 6,179£ 6,192£ 2.0 1.5 46.39£ 0.8
E07000078 23UB Cheltenham 1.6 2.3 1.2 1.6 0.7 5.8 3.0 4.1 2.5 6,173£ 8,718£ 3,701£ 6,991£ 2,391£ 6,276£ 6,248£ 0.4 0.2 52.08£ 0.2
E07000079 23UC Cotswold 0.7 1.3 0.9 1.0 0.3 3.4 1.4 2.4 2.0 6,165£ 8,610£ 3,742£ 6,609£ 2,394£ 6,072£ 6,092£ 0.2 0.2 43.61£ 0.1
E07000080 23UD Forest of Dean 1.2 2.0 1.3 1.2 0.6 5.1 2.3 3.5 2.7 6,067£ 8,701£ 3,589£ 6,648£ 2,483£ 5,969£ 5,992£ 0.2 0.2 40.73£ 0.1
E07000081 23UE Gloucester 2.6 3.9 2.2 2.7 0.8 9.4 5.2 7.0 4.6 6,412£ 8,926£ 3,704£ 7,037£ 2,080£ 6,469£ 6,454£ 0.6 0.4 50.05£ 0.2
E07000082 23UF Stroud 1.2 2.2 1.6 1.6 0.6 5.7 2.3 4.0 3.4 6,100£ 8,612£ 3,724£ 6,595£ 2,519£ 6,003£ 6,024£ 0.3 0.3 41.42£ 0.1
E07000083 23UG Tewkesbury 1.1 1.7 1.1 1.2 0.4 4.4 2.0 3.0 2.4 6,262£ 8,571£ 3,555£ 6,586£ 2,229£ 6,028£ 6,085£ 0.3 0.3 44.16£ 0.1
E10000027 40 Somerset 7.8 13.7 8.6 8.7 4.7 34.8 14.8 24.6 18.2 6,209£ 8,815£ 3,780£ 6,876£ 2,462£ 6,102£ 6,126£ 1.7 1.7 41.94£ 1.3
E07000187 40UB Mendip 1.5 2.8 1.7 1.8 1.1 7.1 2.8 4.8 3.7 6,111£ 8,751£ 3,733£ 6,807£ 2,489£ 5,962£ 5,994£ 0.3 0.4 41.81£ 0.3
E07000188 40UC Sedgemoor 2.0 3.2 2.0 2.0 1.0 8.2 4.0 5.8 4.2 6,284£ 8,841£ 3,856£ 6,942£ 2,421£ 6,208£ 6,227£ 0.4 0.3 39.59£ 0.3
E07000189 40UD South Somerset 2.2 3.9 2.7 2.5 1.2 10.0 4.3 7.0 5.7 6,330£ 8,838£ 3,760£ 6,768£ 2,597£ 6,125£ 6,171£ 0.5 0.5 44.01£ 0.4
E07000190 40UE Taunton Deane 1.5 2.9 1.7 2.0 0.9 7.0 2.9 5.2 3.6 6,147£ 8,753£ 3,708£ 6,879£ 2,433£ 6,175£ 6,169£ 0.5 0.4 42.61£ 0.3
E07000191 40UF West Somerset 0.5 1.0 0.5 0.5 0.6 2.5 0.8 1.8 1.0 5,807£ 9,000£ 3,997£ 7,325£ 2,251£ 5,878£ 5,865£ 0.1 0.1 38.29£ 0.1
W92000004 924 WALES 70.8 87.9 43.3 58.2 29.9 232.0 133.5 155.2 87.8 6,198£ 8,825£ 3,788£ 7,162£ 2,392£ 6,277£ 6,253£ 10.9 7.6 52.47£ 8.0
W06000001 00NA Isle of Anglesey / Ynys Môn 1.4 2.0 1.1 1.3 0.8 5.3 2.6 3.7 2.2 6,231£ 8,965£ 3,793£ 7,173£ 2,455£ 6,221£ 6,224£ 0.3 0.2 56.80£ 0.2
W06000002 00NC Gwynedd / Gwynedd 1.8 3.3 1.9 2.0 1.4 8.5 3.5 6.2 4.1 6,196£ 9,000£ 3,981£ 7,186£ 2,412£ 6,153£ 6,162£ 0.4 0.4 53.56£ 0.2
W06000003 00NE Conwy / Conwy 2.2 3.4 1.6 2.2 1.5 8.8 4.3 6.1 3.3 6,304£ 9,057£ 3,780£ 7,363£ 2,445£ 6,243£ 6,259£ 0.6 0.5 51.69£ 0.3
W06000004 00NG Denbighshire / Sir Ddinbych 2.2 2.8 1.4 1.9 1.0 7.4 4.4 5.1 2.9 6,735£ 9,220£ 3,887£ 7,467£ 2,375£ 6,470£ 6,549£ 0.6 0.5 52.22£ 0.2
W06000005 00NJ Flintshire / Sir y Fflint 2.8 4.0 2.3 2.9 1.2 10.4 5.4 6.9 4.7 6,383£ 8,659£ 3,748£ 6,891£ 2,328£ 6,158£ 6,220£ 0.6 0.4 49.05£ 0.4
W06000006 00NL Wrexham / Wrecsam 3.1 4.1 2.2 2.8 1.3 10.6 5.7 7.0 4.5 6,256£ 8,742£ 3,899£ 7,040£ 2,238£ 6,229£ 6,237£ 0.7 0.5 45.66£ 0.4
W06000023 00NN Powys / Powys 1.7 3.5 2.2 1.8 1.7 9.0 3.1 6.3 4.6 6,155£ 8,700£ 3,910£ 6,854£ 2,551£ 5,882£ 5,933£ 0.3 0.5 44.50£ 0.3
W06000008 00NQ Ceredigion / Ceredigion 1.0 1.9 1.1 1.0 1.2 5.1 1.8 3.5 2.2 6,090£ 8,979£ 3,844£ 7,135£ 2,912£ 5,924£ 5,955£ 0.2 0.2 48.66£ 0.3
W06000009 00NS Pembrokeshire / Sir Benfro 2.3 3.8 1.8 2.2 1.6 9.6 4.5 7.0 3.8 6,322£ 9,011£ 3,907£ 7,351£ 2,602£ 6,285£ 6,294£ 0.4 0.4 48.82£ 0.4
W06000010 00NU Carmarthenshire / Sir Gaerfyrddin 3.8 5.3 2.8 3.2 2.4 14.2 7.1 9.4 5.6 6,233£ 8,860£ 3,876£ 7,146£ 2,609£ 6,113£ 6,145£ 0.5 0.6 50.80£ 0.6
W06000011 00NX Swansea / Abertawe 5.4 6.7 3.1 4.6 2.3 17.5 10.0 11.7 6.1 6,154£ 8,789£ 3,668£ 7,160£ 2,375£ 6,264£ 6,230£ 0.8 0.5 52.64£ 0.7
W06000012 00NZ Neath Port Talbot / Castell-nedd Port Talbot3.9 3.9 1.9 2.8 1.4 11.0 7.0 6.6 3.8 6,076£ 8,633£ 3,781£ 7,040£ 2,315£ 6,145£ 6,121£ 0.5 0.2 50.15£ 0.5
W06000013 00PB Bridgend / Pen-y-bont ar Ogwr 3.6 4.0 2.0 2.9 1.2 10.8 6.7 6.7 3.9 6,149£ 8,634£ 3,711£ 7,000£ 2,287£ 6,194£ 6,179£ 0.4 0.3 51.35£ 0.4
W06000014 00PD The Vale of Glamorgan / Bro Morgannwg 2.5 3.4 1.5 2.5 0.8 8.3 4.6 5.8 3.2 6,089£ 8,806£ 3,809£ 7,252£ 2,287£ 6,527£ 6,396£ 0.5 0.3 58.01£ 0.2
W06000015 00PT Cardiff / Caerdydd 9.0 9.9 3.5 6.4 2.6 25.0 17.9 18.8 7.1 6,392£ 9,351£ 3,802£ 7,901£ 2,222£ 6,988£ 6,773£ 1.2 0.5 59.40£ 0.6
W06000016 00PF Rhondda Cynon Taf / Rhondda Cynon Taf 7.0 7.0 3.5 5.0 2.2 19.7 12.9 11.7 6.9 6,084£ 8,476£ 3,710£ 6,877£ 2,276£ 6,084£ 6,084£ 0.6 0.4 54.99£ 0.7
W06000024 00PH Merthyr Tydfil / Merthyr Tudful 1.9 2.0 0.9 1.5 0.6 5.5 3.4 3.4 1.7 5,987£ 8,387£ 3,683£ 6,919£ 2,126£ 6,060£ 6,035£ 0.2 0.1 55.03£ 0.2
W06000018 00PK Caerphilly / Caerffili 5.0 5.4 2.9 3.8 1.6 14.9 9.2 9.2 5.8 6,056£ 8,490£ 3,781£ 6,843£ 2,312£ 6,114£ 6,095£ 0.6 0.4 51.95£ 0.5
W06000019 00PL Blaenau Gwent / Blaenau Gwent 2.3 2.1 1.1 1.4 0.7 6.2 4.1 3.5 2.1 5,860£ 8,244£ 3,550£ 6,646£ 2,258£ 5,904£ 5,888£ 0.2 0.1 57.17£ 0.2
W06000020 00PM Torfaen / Tor-faen 2.5 2.7 1.5 1.9 0.7 7.4 4.6 4.7 2.9 6,008£ 8,763£ 3,618£ 6,953£ 2,187£ 6,290£ 6,195£ 0.4 0.3 54.98£ 0.2
W06000021 00PP Monmouthshire / Sir Fynwy 1.2 1.8 1.0 1.2 0.6 4.7 2.2 3.2 2.2 6,110£ 8,651£ 3,803£ 6,922£ 2,547£ 6,174£ 6,158£ 0.2 0.2 49.39£ 0.1
W06000022 00PR Newport / Casnewydd 4.3 4.7 2.0 3.1 1.2 12.4 8.4 8.6 4.1 6,254£ 9,024£ 3,748£ 7,436£ 2,292£ 6,646£ 6,508£ 0.6 0.3 55.20£ 0.3
Unknown - - - - - - - - - -£ -£ -£ -£ -£ -£ -£ - - -£ -
S92000003 923 SCOTLAND 100.6 128.8 61.2 99.1 48.9 339.5 177.0 211.8 121.2 5,798£ 8,608£ 3,600£ 6,996£ 2,243£ 6,023£ 5,957£ 22.2 10.2 56.47£ 13.3
- -
S12000033 00QA Aberdeen City 2.6 3.5 1.6 3.1 1.2 8.9 4.5 5.3 3.1 5,557£ 8,273£ 3,383£ 6,732£ 2,273£ 5,898£ 5,798£ 0.7 0.2 63.02£ 0.4
S12000034 00QB Aberdeenshire 2.2 3.6 2.3 3.1 1.1 9.1 4.1 5.8 4.8 5,941£ 8,433£ 3,637£ 6,566£ 2,470£ 5,934£ 5,936£ 0.6 0.2 52.90£ 0.4
S12000041 00QC Angus 1.7 2.6 1.4 1.9 0.8 6.5 3.1 4.3 2.9 5,967£ 8,744£ 3,592£ 6,906£ 2,130£ 6,094£ 6,061£ 0.5 0.2 55.18£ 0.2
S12000035 00QD Argyll & Bute 1.2 1.8 1.1 1.3 0.8 4.9 2.0 3.1 2.3 5,693£ 8,593£ 3,667£ 6,763£ 2,403£ 5,835£ 5,801£ 0.2 0.2 53.16£ 0.2
S12000005 00QF Clackmannanshire 1.2 1.3 0.7 1.0 0.4 3.6 2.2 2.1 1.3 5,853£ 8,582£ 3,500£ 6,817£ 2,063£ 5,994£ 5,946£ 0.2 0.1 55.21£ 0.1
S12000006 00QH Dumfries & Galloway 2.5 3.7 2.3 2.3 1.7 10.1 4.4 6.4 4.8 5,923£ 8,663£ 3,755£ 6,794£ 2,375£ 5,838£ 5,858£ 0.4 0.4 47.12£ 0.4
S12000042 00QJ Dundee City 3.6 4.4 1.8 3.3 1.5 11.2 6.3 7.1 3.3 5,991£ 8,909£ 3,597£ 7,382£ 2,132£ 6,341£ 6,230£ 0.9 0.4 69.86£ 0.4
S12000008 00QK East Ayrshire 3.0 3.3 1.5 2.4 1.4 9.2 5.1 5.4 3.0 5,554£ 8,376£ 3,542£ 6,839£ 2,086£ 5,784£ 5,710£ 0.5 0.2 54.27£ 0.2
S12000045 00QL East Dunbartonshire 1.2 1.8 1.0 1.6 0.5 4.5 2.0 3.0 2.0 5,800£ 8,551£ 3,518£ 6,770£ 2,305£ 6,058£ 5,991£ 0.4 0.2 57.72£ 0.2
S12000010 00QM East Lothian 1.6 2.3 1.4 1.7 0.7 6.0 2.9 3.8 2.8 5,824£ 8,449£ 3,429£ 6,553£ 2,192£ 5,865£ 5,855£ 0.4 0.2 48.21£ 0.2
S12000011 00QN East Renfrewshire 1.0 1.6 0.8 1.3 0.5 4.0 1.8 2.8 1.7 5,649£ 8,797£ 3,661£ 7,094£ 2,406£ 6,245£ 6,093£ 0.3 0.1 56.00£ 0.2
S12000036 00QP Edinburgh, City of 7.1 9.6 4.0 6.8 4.2 25.0 12.4 15.4 7.4 5,711£ 8,529£ 3,388£ 7,009£ 2,232£ 5,897£ 5,844£ 1.8 1.0 56.17£ 1.0
S12000013 00RJ Eileanan an Iar 13
0.3 0.5 0.4 0.4 0.2 1.3 0.5 0.8 0.8 5,652£ 8,314£ 3,708£ 6,348£ 2,663£ 5,551£ 5,572£ - 0.1 42.30£ 0.1
S12000014 00QQ Falkirk 2.9 3.8 2.0 2.9 1.3 9.9 5.2 6.1 3.9 5,957£ 8,441£ 3,662£ 6,804£ 2,176£ 5,967£ 5,964£ 0.6 0.3 56.73£ 0.4
S12000015 00QR Fife 7.5 9.1 4.9 6.7 3.2 24.7 13.5 15.2 9.8 5,917£ 8,552£ 3,699£ 6,860£ 2,159£ 5,977£ 5,959£ 1.3 0.7 55.58£ 0.8
S12000046 00QS Glasgow City 18.0 19.7 5.5 15.0 8.2 51.5 31.3 32.8 10.1 5,753£ 8,874£ 3,579£ 7,722£ 2,194£ 6,358£ 6,146£ 4.0 1.1 57.12£ 2.0
S12000017 00QT Highland 3.2 5.1 3.2 3.8 1.9 13.4 6.0 8.6 6.7 6,092£ 8,609£ 3,782£ 6,765£ 2,425£ 5,968£ 5,998£ 0.8 0.5 51.17£ 0.5
S12000018 00QU Inverclyde 2.1 2.2 0.9 1.9 1.0 6.2 3.4 3.5 1.7 5,567£ 8,416£ 3,671£ 7,068£ 2,314£ 5,890£ 5,783£ 0.3 0.1 55.01£ 0.3
S12000019 00QW Midlothian 1.7 2.3 1.2 1.8 0.6 5.8 3.2 3.7 2.5 6,178£ 8,689£ 3,557£ 6,872£ 2,262£ 6,220£ 6,207£ 0.4 0.2 54.73£ 0.2
S12000020 00QX Moray 1.2 1.9 1.2 1.4 0.8 5.1 2.1 3.1 2.7 5,705£ 8,603£ 3,593£ 6,604£ 2,257£ 5,706£ 5,706£ 0.3 0.2 54.30£ 0.2
S12000021 00QY North Ayrshire 3.7 3.9 1.7 3.0 1.7 11.0 6.5 6.4 3.4 5,677£ 8,659£ 3,537£ 7,093£ 2,183£ 5,976£ 5,875£ 0.6 0.3 60.07£ 0.4
S12000044 00QZ North Lanarkshire 8.2 9.8 4.5 8.0 3.4 26.0 14.4 16.1 8.9 5,791£ 8,531£ 3,643£ 6,988£ 2,236£ 6,073£ 5,984£ 1.5 0.5 61.10£ 1.1
S12000023 00RA Orkney Islands 0.2 0.3 0.3 0.2 0.2 1.0 0.3 0.6 0.7 5,942£ 8,576£ 4,192£ 6,498£ 2,781£ 5,689£ 5,735£ - - 45.46£ 0.1
S12000024 00RB Perth & Kinross 1.8 3.1 2.0 2.4 1.1 8.0 3.1 5.2 4.0 5,883£ 8,561£ 3,660£ 6,663£ 2,285£ 5,876£ 5,877£ 0.5 0.4 54.96£ 0.3
S12000038 00RC Renfrewshire 3.5 4.7 2.0 4.0 2.1 12.2 6.1 7.4 3.8 5,770£ 8,581£ 3,478£ 7,076£ 2,312£ 5,952£ 5,899£ 1.1 0.4 56.17£ 0.7
S12000026 00QE Scottish Borders 1.6 2.6 1.7 1.7 1.1 7.0 2.9 4.5 3.4 5,939£ 8,446£ 3,662£ 6,577£ 2,453£ 5,769£ 5,808£ 0.3 0.3 41.47£ 0.3
S12000027 00RD Shetland Islands 0.2 0.3 0.3 0.3 0.1 0.8 0.3 0.5 0.6 5,918£ 8,439£ 3,716£ 6,140£ 2,784£ 5,756£ 5,793£ 0.1 - 48.93£ -
S12000028 00RE South Ayrshire 2.1 2.8 1.2 2.0 1.2 7.2 3.6 4.5 2.3 5,515£ 8,509£ 3,542£ 7,011£ 2,104£ 5,895£ 5,785£ 0.4 0.2 55.83£ 0.2
S12000029 00RF South Lanarkshire 6.3 7.9 3.8 6.4 3.0 21.0 10.9 12.8 7.4 5,729£ 8,580£ 3,549£ 6,941£ 2,234£ 5,981£ 5,905£ 1.4 0.6 59.16£ 0.9
S12000030 00RG Stirling 1.2 1.8 0.9 1.4 0.6 4.5 2.1 2.8 1.8 5,674£ 8,360£ 3,549£ 6,738£ 2,175£ 5,876£ 5,821£ 0.3 0.2 49.90£ 0.1
S12000039 00QG West Dunbartonshire 2.5 2.7 1.1 2.3 1.0 7.3 4.4 4.4 2.1 5,772£ 8,491£ 3,604£ 7,108£ 2,123£ 6,094£ 5,984£ 0.5 0.2 57.28£ 0.3
S12000040 00RH West Lothian 3.6 4.8 2.6 3.7 1.6 12.5 6.5 8.1 5.2 5,927£ 8,723£ 3,626£ 6,925£ 2,277£ 6,113£ 6,060£ 0.7 0.3 60.17£ 0.5
Unknown - - - - - - - - - -£ -£ -£ -£ -£ -£ -£ - - -£ -
N92000002 922 NORTHERN IRELAND 14
50.8 58.1 29.2 39.1 19.9 158.0 95.9 104.3 63.5 6,297£ 9,191£ 4,106£ 7,492£ 2,427£ 6,553£ 6,470£ 9.0 5.4 70.80£ 6.3
N/A 95T Antrim 1.1 1.7 0.9 1.1 0.4 4.1 2.1 3.0 2.0 6,260£ 9,234£ 4,067£ 7,387£ 2,454£ 6,747£ 6,612£ 0.3 0.2 71.66£ 0.2
N/A 95X Ards 1.7 2.0 1.2 1.4 0.6 5.6 3.2 3.6 2.6 6,199£ 8,943£ 4,189£ 7,191£ 2,330£ 6,405£ 6,342£ 0.3 0.2 58.74£ 0.2
N/A 95O Armagh 1.5 2.0 1.2 1.0 0.7 5.3 2.8 3.7 2.9 6,270£ 9,268£ 4,326£ 7,381£ 2,449£ 6,482£ 6,424£ 0.2 0.3 69.41£ 0.2
N/A 95G Ballymena 1.3 1.9 1.1 1.2 0.6 4.9 2.6 3.3 2.3 6,468£ 8,814£ 3,818£ 6,984£ 2,152£ 6,168£ 6,251£ 0.2 0.2 71.06£ 0.2
N/A 95D Ballymoney 0.8 0.9 0.6 0.5 0.3 2.7 1.5 1.8 1.4 6,182£ 9,138£ 4,327£ 7,262£ 2,335£ 6,390£ 6,329£ 0.1 0.1 63.33£ 0.1
N/A 95Q Banbridge 1.0 1.4 0.9 0.7 0.5 3.7 1.9 2.6 2.0 6,352£ 9,184£ 4,165£ 7,228£ 2,600£ 6,439£ 6,416£ 0.2 0.2 70.05£ 0.2
N/A 95Z Belfast 10.8 10.0 2.8 8.6 3.4 27.1 19.9 16.7 5.5 6,224£ 9,129£ 3,863£ 7,972£ 2,245£ 6,776£ 6,555£ 1.9 0.5 71.49£ 1.1
N/A 95V Carrickfergus 0.9 1.1 0.6 0.9 0.3 2.9 1.7 1.8 1.2 6,237£ 8,814£ 3,886£ 7,135£ 2,285£ 6,322£ 6,295£ 0.2 0.1 65.00£ 0.1
N/A 95Y Castlereagh 1.1 1.6 0.9 1.3 0.5 4.2 2.1 2.8 1.9 6,263£ 9,009£ 3,794£ 7,103£ 2,189£ 6,269£ 6,267£ 0.3 0.2 64.03£ 0.2
N/A 95C Coleraine 1.5 1.8 0.9 1.1 0.7 4.9 2.7 3.3 1.9 6,007£ 9,031£ 4,055£ 7,398£ 2,323£ 6,385£ 6,269£ 0.2 0.2 60.51£ 0.2
N/A 95I Cookstown 1.0 1.3 0.8 0.7 0.4 3.5 1.9 2.6 1.9 6,459£ 9,691£ 4,403£ 7,717£ 2,926£ 6,905£ 6,785£ 0.2 0.2 80.17£ 0.2
N/A 95N Craigavon 2.7 3.3 2.0 2.1 1.0 8.9 5.1 5.9 4.2 6,210£ 8,934£ 3,964£ 7,068£ 2,251£ 6,331£ 6,295£ 0.5 0.3 65.48£ 0.3
N/A 95A Derry 15
4.9 4.4 1.6 3.3 2.2 13.0 9.0 7.7 3.3 6,081£ 9,189£ 3,964£ 7,837£ 2,433£ 6,401£ 6,282£ 0.7 0.3 76.42£ 0.6
N/A 95R Down 1.9 2.1 1.2 1.4 0.6 5.8 3.5 4.0 2.6 6,399£ 9,476£ 4,312£ 7,640£ 2,392£ 6,872£ 6,717£ 0.4 0.3 72.29£ 0.2
N/A 95M Dungannon 1.5 2.2 1.4 1.2 0.7 5.7 2.8 4.1 3.1 6,233£ 9,153£ 4,182£ 7,204£ 2,553£ 6,480£ 6,416£ 0.2 0.2 74.59£ 0.2
N/A 95L Fermanagh 1.4 1.9 1.2 0.9 0.9 5.4 2.8 3.8 2.7 6,533£ 9,612£ 4,427£ 7,628£ 2,766£ 6,515£ 6,520£ 0.2 0.3 73.75£ 0.3
N/A 95F Larne 0.7 0.9 0.5 0.7 0.3 2.3 1.2 1.6 0.9 6,265£ 9,467£ 3,523£ 7,501£ 2,308£ 6,614£ 6,514£ 0.2 0.1 74.10£ 0.1
N/A 95B Limavady 1.2 1.1 0.5 0.6 0.4 3.2 2.3 2.0 1.2 6,121£ 9,139£ 4,155£ 7,492£ 2,473£ 6,485£ 6,351£ 0.1 0.1 72.49£ 0.1
N/A 95S Lisburn 3.1 3.8 1.8 3.0 1.0 9.8 6.1 6.7 3.8 6,624£ 9,334£ 3,980£ 7,626£ 2,448£ 6,824£ 6,760£ 0.8 0.4 73.91£ 0.4
N/A 95H Magherafelt 0.9 1.3 1.0 0.6 0.5 3.7 1.9 2.6 2.4 6,735£ 9,595£ 4,778£ 7,514£ 2,804£ 6,657£ 6,677£ 0.1 0.2 73.01£ 0.2
N/A 95E Moyle 0.5 0.5 0.3 0.3 0.2 1.5 0.9 1.0 0.7 5,974£ 9,206£ 4,222£ 7,412£ 2,362£ 6,390£ 6,255£ 0.1 0.1 73.31£ -
N/A 95P Newry and Mourne 3.2 3.4 1.9 1.7 1.1 9.5 6.3 6.6 4.4 6,471£ 9,321£ 4,389£ 7,541£ 2,553£ 6,672£ 6,605£ 0.3 0.3 76.58£ 0.3
N/A 95U Newtownabbey 1.9 2.5 1.3 2.0 0.7 6.4 3.5 4.3 2.8 6,332£ 9,101£ 4,018£ 7,349£ 2,374£ 6,576£ 6,504£ 0.5 0.2 66.56£ 0.3
N/A 95W North Down 1.3 1.9 1.0 1.5 0.6 4.8 2.4 3.1 2.1 6,194£ 8,851£ 3,627£ 7,003£ 2,373£ 6,246£ 6,232£ 0.4 0.2 64.37£ 0.2
N/A 95K Omagh 1.4 1.6 1.0 0.6 0.6 4.6 2.7 3.1 2.3 6,505£ 9,598£ 4,401£ 7,587£ 2,823£ 6,628£ 6,590£ 0.2 0.3 74.35£ 0.3
N/A 95J Strabane 1.6 1.5 0.7 0.8 0.7 4.4 3.1 2.6 1.5 6,443£ 9,227£ 4,144£ 7,592£ 2,511£ 6,377£ 6,400£ 0.2 0.1 82.74£ 0.2
Unknown - - - - - - - - - -£ -£ -£ -£ -£ -£ -£ - - -£ -
FOREIGN AND NOT KNOWN17
7.1 1.3 1.2 0.8 0.6 10.3 14.0 2.2 2.8 7,005£ 8,596£ 3,417£ 6,032£ 2,249£ 5,280£ 6,478£ 0.1 0.1 63.09£ 0.1
Footnotes1 New area codes to be implemented from 1 January 2011; in line with the new GSS Coding and Naming policy.
2 Administrative area codes operative from 1 April 2009.
3 County Durham UA comprises the former Durham county.
4 Northumberland UA comprises the former Northumberland county.
5 Cheshire East UA comprises part of the former Cheshire county (Congleton, Crewe and Nantwich and Macclesfield districts).
6 Cheshire West and Chester UA comprises part of the former Cheshire county (Chester, Ellesmere Port & Neston and Vale Royal districts).
7 Shropshire UA comprises the former Shropshire county.
8 Bedford UA comprises part of the former Bedfordshire county (Bedford district).
9 Central Bedfordshire UA comprises part of the former Bedfordshire county (Mid Bedfordshire and South Bedfordshire districts).
10 Cornwall UA comprises the former Cornwall and Isles of Scilly county excluding Isles of Scilly district.
12 Wiltshire UA comprises the former Wiltshire county.
13 Formerly known as the Western Isles.
14 There are no new codes available, at the time of this publication, for the district council areas in Northern Ireland.
15 NISRA have confirmed the term 'Derry' should be used in preference to Derry City.
16 All figures are rounded to the nearest integer therefore not all totals may exactly equal the sums of their respective components.
17 "Foreign and not known" consists of a small proportion of recipient families and children who do not live within England, Scotland, Northern Island or Wales. They may for instance be a Crown servant posted overseas,
or living in a British Crown Dependency. Due to the small size of this population we combine them into one group which also consists of those whom, at the time of publication, either have a UK postcode that does not match
to a geographical office region code, or do not have a postcode in the available data.
11 The Isles of Scilly were recoded on 1 April 2009. They are
separately administered by an Isles of Scilly council and do not form
part of Cornwall UA but, for the purposes of the presentation of
Table 2 HMRC

Tax Credit Finalised Awards 2014-15: Geographical AnalysisChild and Working Tax Credit Statistics - Finalised annual awards 2012/13
Supplement on payments in 2012/13: Geographical analyses
Table 3: Average number of benefiting families and annual entitlements in each Westminster Parliamentary Constituency, 2014-15
With no
childrenWith no
children
K02000001 926 UNITED KINGDOM 1,311.0 1,785.0 825.0 1,150.8 508.0 4,429.0 2,505.7 3,262.7 1,691.2 6,228£ 9,102£ 3,775£ 7,418£ 2,333£ 6,589£ 6,482£ 261.2 142.1 56.79£ 121.4
K03000001 925 GREAT BRITAIN 1,251.3 1,722.7 793.9 1,110.8 487.1 4,254.9 2,393.1 3,151.4 1,622.9 6,221£ 9,100£ 3,764£ 7,417£ 2,328£ 6,592£ 6,483£ 251.7 136.6 56.25£ 115.3
K04000001 941 ENGLAND AND WALES 1,150.7 1,593.8 732.7 1,011.8 438.3 3,915.5 2,216.1 2,939.6 1,501.7 6,258£ 9,140£ 3,778£ 7,451£ 2,338£ 6,641£ 6,528£ 229.5 126.4 56.23£ 101.9
E92000001 921 ENGLAND 1,079.9 1,505.8 689.4 953.6 408.3 3,683.4 2,082.5 2,784.4 1,413.9 6,262£ 9,158£ 3,777£ 7,469£ 2,334£ 6,663£ 6,546£ 218.6 118.8 56.44£ 93.9
E15000001 1 NORTH EAST 63.7 77.1 33.1 52.5 29.7 203.6 119.1 134.0 65.2 6,133£ 8,867£ 3,698£ 7,315£ 2,300£ 6,249£ 6,213£ 9.9 5.6 53.12£ 7.0
E14000554 A25 Berwick-upon-Tweed 1.1 1.8 1.1 1.1 0.8 4.7 2.0 3.1 2.2 6,232£ 8,649£ 3,698£ 6,780£ 2,360£ 5,837£ 5,927£ 0.2 0.2 42.64£ 0.1
E14000569 A40 Bishop Auckland 2.1 2.6 1.3 1.8 1.0 7.0 4.0 4.4 2.5 6,240£ 8,708£ 3,613£ 7,021£ 2,307£ 6,019£ 6,086£ 0.3 0.2 45.01£ 0.3
E14000574 A45 Blaydon 1.6 2.2 1.1 1.6 0.9 5.8 2.8 3.6 2.2 5,828£ 8,477£ 3,567£ 6,835£ 2,295£ 5,898£ 5,879£ 0.3 0.2 46.83£ 0.2
E14000575 A46 Blyth Valley 1.8 2.3 1.2 1.6 0.9 6.2 3.5 4.0 2.4 6,315£ 8,763£ 3,671£ 7,000£ 2,248£ 6,047£ 6,126£ 0.3 0.2 52.12£ 0.2
E14000641 B13 City of Durham 1.4 1.9 1.0 1.4 0.7 5.1 2.7 3.2 2.0 6,147£ 8,534£ 3,606£ 6,857£ 2,354£ 5,944£ 6,001£ 0.3 0.2 49.30£ 0.2
E14000658 B30 Darlington 2.2 3.1 1.4 2.1 1.1 7.9 4.3 5.3 2.8 6,262£ 8,708£ 3,689£ 7,148£ 2,292£ 6,180£ 6,204£ 0.4 0.3 52.55£ 0.3
E14000677 B49 Easington 2.6 2.8 1.2 1.9 1.1 7.7 4.9 4.6 2.3 6,105£ 8,667£ 3,725£ 7,197£ 2,440£ 6,156£ 6,139£ 0.3 0.2 53.94£ 0.4
E14000709 B81 Gateshead 2.6 3.1 1.1 1.9 1.2 8.0 4.7 6.0 2.1 5,949£ 9,969£ 3,615£ 8,290£ 2,202£ 6,915£ 6,602£ 0.3 0.4 86.26£ 0.3
E14000733 C06 Hartlepool 2.9 3.1 1.2 2.1 1.1 8.3 5.6 5.5 2.3 6,338£ 8,893£ 3,657£ 7,458£ 2,344£ 6,392£ 6,374£ 0.4 0.2 50.05£ 0.3
E14000746 C19 Hexham 0.7 1.4 0.9 0.9 0.6 3.5 1.2 2.4 1.8 5,635£ 8,552£ 3,707£ 6,710£ 2,491£ 5,864£ 5,819£ 0.2 0.2 41.00£ 0.1
E14000754 C27 Houghton and Sunderland South 2.3 2.9 1.3 2.1 1.2 7.6 4.0 4.8 2.4 5,796£ 8,575£ 3,708£ 7,076£ 2,383£ 6,031£ 5,961£ 0.4 0.2 47.23£ 0.4
E14000765 C38 Jarrow 2.1 2.4 1.1 1.9 1.0 6.5 3.8 4.0 2.0 5,912£ 8,646£ 3,542£ 7,076£ 2,239£ 5,995£ 5,968£ 0.4 0.1 53.44£ 0.2
E14000819 C92 Middlesbrough 4.0 3.9 1.1 2.2 1.4 10.4 7.9 7.6 2.3 6,433£ 9,554£ 4,111£ 8,365£ 2,312£ 7,047£ 6,813£ 0.4 0.2 58.92£ 0.3
E14000820 C93 Middlesbrough South and East Cleveland 2.4 2.8 1.2 2.0 1.0 7.3 4.5 4.8 2.4 6,229£ 8,927£ 3,817£ 7,418£ 2,277£ 6,370£ 6,324£ 0.4 0.2 53.56£ 0.2
E14000831 D05 Newcastle upon Tyne Central 3.2 3.6 1.0 1.7 1.2 8.9 6.3 7.2 2.0 6,479£ 9,590£ 3,981£ 8,398£ 2,382£ 7,174£ 6,927£ 0.2 0.2 55.28£ 0.2
E14000832 D06 Newcastle upon Tyne East 2.1 2.1 0.7 1.4 1.1 6.0 4.0 3.6 1.3 6,281£ 8,883£ 3,650£ 7,613£ 2,345£ 6,126£ 6,181£ 0.2 0.1 50.99£ 0.2
E14000833 D07 Newcastle upon Tyne North 2.0 2.5 1.1 1.8 0.8 6.4 3.7 4.2 2.1 6,214£ 8,746£ 3,561£ 7,168£ 2,231£ 6,235£ 6,229£ 0.4 0.2 52.61£ 0.2
E14000840 D14 North Durham 2.0 2.5 1.2 1.8 1.0 6.8 3.7 4.3 2.4 6,018£ 8,662£ 3,691£ 7,045£ 2,302£ 6,054£ 6,043£ 0.3 0.2 48.07£ 0.3
E14000853 D27 North Tyneside 2.4 3.3 1.4 2.4 1.3 8.4 4.3 5.4 2.7 5,912£ 8,506£ 3,618£ 7,040£ 2,166£ 5,977£ 5,958£ 0.5 0.2 51.79£ 0.2
E14000856 D30 North West Durham 1.9 2.6 1.3 1.8 1.1 6.9 3.5 4.5 2.5 6,108£ 8,634£ 3,544£ 6,950£ 2,368£ 5,977£ 6,013£ 0.3 0.2 50.96£ 0.3
E14000891 D65 Redcar 2.6 2.8 1.1 2.0 1.0 7.4 4.8 4.7 2.1 6,092£ 8,918£ 3,793£ 7,510£ 2,147£ 6,386£ 6,284£ 0.4 0.2 61.96£ 0.2
E14000915 D89 Sedgefield 2.0 2.3 1.2 1.6 0.8 6.3 3.7 4.0 2.5 6,108£ 8,867£ 3,698£ 7,057£ 2,434£ 6,174£ 6,153£ 0.3 0.2 49.79£ 0.2
E14000944 E19 South Shields 2.5 2.5 1.0 1.8 1.1 7.1 4.4 4.3 1.9 5,840£ 8,715£ 3,645£ 7,282£ 2,149£ 6,076£ 5,994£ 0.3 0.1 54.40£ 0.2
E14000970 E45 Stockton North 2.9 3.1 1.2 2.2 1.0 8.3 5.6 5.4 2.5 6,260£ 8,947£ 4,011£ 7,546£ 2,222£ 6,511£ 6,423£ 0.4 0.2 57.38£ 0.2
E14000971 E46 Stockton South 1.8 2.7 1.2 1.9 0.9 6.6 3.5 4.9 2.4 6,229£ 9,114£ 3,654£ 7,419£ 2,303£ 6,480£ 6,411£ 0.4 0.2 55.28£ 0.2
E14000982 E57 Sunderland Central 2.4 2.9 1.1 2.0 1.3 7.8 4.4 5.1 2.1 5,974£ 8,860£ 3,608£ 7,435£ 2,357£ 6,180£ 6,116£ 0.4 0.2 50.24£ 0.3
E14001006 E81 Tynemouth 1.6 2.5 1.1 1.9 1.0 6.2 2.9 4.2 2.2 6,080£ 8,656£ 3,589£ 7,081£ 2,357£ 6,071£ 6,074£ 0.4 0.2 50.86£ 0.2
E14001014 E89 Wansbeck 2.0 2.2 1.1 1.6 0.9 6.2 3.8 3.8 2.2 6,186£ 8,645£ 3,708£ 6,973£ 2,227£ 5,991£ 6,054£ 0.3 0.2 46.57£ 0.2
E14001020 E95 Washington and Sunderland West 2.6 3.1 1.3 2.2 1.2 8.3 4.7 5.3 2.6 5,962£ 8,679£ 3,769£ 7,221£ 2,284£ 6,175£ 6,108£ 0.4 0.2 50.35£ 0.3
E15000002 2 NORTH WEST 162.7 230.3 93.8 147.9 74.9 561.8 311.9 422.0 188.6 6,240£ 9,208£ 3,761£ 7,632£ 2,344£ 6,639£ 6,524£ 38.9 23.2 55.88£ 17.8
E14000532 A03 Altrincham and Sale West 0.9 1.8 0.9 1.4 0.5 4.1 1.7 3.1 1.8 5,867£ 8,938£ 3,642£ 7,172£ 2,280£ 6,439£ 6,306£ 0.4 0.2 60.37£ 0.1
E14000537 A08 Ashton-under-Lyne 2.7 3.7 1.5 2.4 1.0 8.9 5.0 6.8 2.9 6,005£ 9,281£ 3,622£ 7,649£ 2,356£ 6,787£ 6,554£ 0.8 0.4 58.95£ 0.3
E14000543 A14 Barrow and Furness 1.7 2.3 1.2 1.6 0.9 6.2 3.1 3.9 2.4 5,978£ 8,464£ 3,557£ 6,828£ 2,347£ 5,910£ 5,929£ 0.3 0.2 37.78£ 0.3
E14000559 A30 Birkenhead 3.4 3.4 1.1 2.5 1.3 9.2 6.4 5.8 2.3 6,404£ 9,168£ 4,095£ 7,880£ 2,229£ 6,628£ 6,545£ 0.7 0.2 52.20£ 0.3
E14000570 A41 Blackburn 3.5 6.3 1.8 2.1 1.7 13.3 7.4 13.7 4.0 6,712£ 10,024£ 4,253£ 8,719£ 2,634£ 7,660£ 7,412£ 0.5 0.4 61.43£ 0.4
E14000571 A42 Blackley and Broughton 5.0 6.4 1.5 3.0 1.7 14.6 10.4 14.9 3.2 6,559£ 11,089£ 4,409£ 9,846£ 2,280£ 8,528£ 7,849£ 0.7 0.7 91.84£ 0.3
E14000572 A43 Blackpool North and Cleveleys 2.1 3.0 1.2 1.9 1.3 7.6 4.0 5.1 2.3 6,192£ 8,887£ 3,617£ 7,331£ 2,360£ 6,159£ 6,168£ 0.5 0.4 44.82£ 0.3
E14000573 A44 Blackpool South 2.8 3.5 1.1 2.1 1.7 9.1 5.4 5.9 2.1 6,298£ 8,808£ 3,642£ 7,522£ 2,552£ 6,177£ 6,214£ 0.6 0.4 49.63£ 0.3
E14000578 A49 Bolton North East 2.7 4.0 1.4 2.1 1.1 9.2 5.5 7.7 2.8 6,377£ 9,452£ 3,904£ 8,015£ 2,334£ 7,014£ 6,826£ 0.6 0.4 60.68£ 0.3
E14000579 A50 Bolton South East 3.5 5.1 1.6 2.3 1.3 11.5 7.0 10.7 3.4 6,388£ 9,934£ 4,069£ 8,502£ 2,418£ 7,516£ 7,175£ 0.6 0.4 61.96£ 0.3
E14000580 A51 Bolton West 1.7 2.8 1.3 2.0 0.9 6.8 3.3 4.9 2.6 6,293£ 8,872£ 3,636£ 7,205£ 2,345£ 6,337£ 6,326£ 0.6 0.4 54.85£ 0.2
E14000581 A52 Bootle 3.5 3.5 1.3 2.7 1.4 9.7 6.4 5.9 2.5 6,141£ 8,855£ 3,697£ 7,482£ 2,280£ 6,279£ 6,229£ 0.7 0.3 52.57£ 0.3
E14000609 A80 Burnley 2.5 4.0 1.2 2.2 1.2 8.8 4.9 7.7 2.3 6,352£ 9,561£ 3,684£ 8,207£ 2,366£ 7,135£ 6,911£ 0.6 0.4 60.74£ 0.3
E14000611 A82 Bury North 1.8 3.1 1.2 1.8 0.9 6.9 3.4 5.8 2.3 6,196£ 9,461£ 3,702£ 7,883£ 2,496£ 6,971£ 6,774£ 0.6 0.3 56.26£ 0.2
E14000612 A83 Bury South 2.0 3.5 1.4 2.2 1.0 7.9 4.0 7.1 3.1 6,267£ 10,235£ 3,980£ 8,396£ 2,474£ 7,418£ 7,121£ 0.7 0.6 66.94£ 0.3
E14000620 A91 Carlisle 1.6 2.5 1.4 1.7 0.8 6.3 2.9 4.2 2.9 5,884£ 8,554£ 3,581£ 6,753£ 2,138£ 5,948£ 5,932£ 0.4 0.3 40.84£ 0.2
E14000627 A98 Cheadle 0.7 1.7 0.9 1.3 0.5 3.9 1.4 3.1 1.9 6,054£ 9,012£ 3,687£ 7,163£ 2,584£ 6,415£ 6,347£ 0.4 0.2 52.85£ 0.2
E14000637 B09 Chorley 1.4 2.6 1.4 1.7 0.8 6.2 2.6 4.5 2.8 6,080£ 8,903£ 3,578£ 7,015£ 2,343£ 6,206£ 6,178£ 0.5 0.4 50.46£ 0.2
E14000640 B12 City of Chester 1.4 2.2 1.0 1.5 0.8 5.4 2.6 3.7 2.0 6,107£ 8,652£ 3,461£ 6,992£ 2,177£ 6,068£ 6,078£ 0.4 0.2 49.24£ 0.2
E14000646 B18 Congleton 1.0 1.9 1.1 1.3 0.5 4.5 1.9 3.2 2.2 6,123£ 8,733£ 3,469£ 6,781£ 2,496£ 6,122£ 6,122£ 0.4 0.2 46.14£ 0.2
E14000647 B19 Copeland 1.3 1.7 0.8 1.2 0.7 4.4 2.3 3.0 1.5 5,952£ 8,601£ 3,607£ 7,082£ 2,445£ 6,116£ 6,069£ 0.2 0.1 40.27£ 0.2
E14000653 B25 Crewe and Nantwich 1.9 3.3 1.7 2.1 0.9 7.7 3.7 5.8 3.3 6,278£ 8,725£ 3,687£ 7,026£ 2,117£ 6,269£ 6,272£ 0.5 0.3 50.16£ 0.2
E14000661 B33 Denton and Reddish 2.0 3.2 1.4 2.4 0.9 7.5 3.6 5.4 2.7 5,893£ 8,867£ 3,438£ 7,188£ 2,340£ 6,410£ 6,273£ 0.8 0.4 59.94£ 0.3
E14000686 B58 Eddisbury 1.3 1.9 1.1 1.3 0.7 5.0 2.5 3.4 2.2 6,427£ 8,796£ 3,698£ 6,969£ 2,425£ 6,098£ 6,184£ 0.3 0.2 44.88£ 0.2
E14000688 B60 Ellesmere Port and Neston 1.6 2.4 1.3 1.8 0.7 6.1 3.1 4.2 2.6 6,238£ 8,739£ 3,667£ 7,006£ 2,128£ 6,227£ 6,230£ 0.4 0.3 49.26£ 0.2
E14000706 B78 Fylde 0.9 1.9 0.9 1.4 0.7 4.5 1.7 3.3 1.8 5,935£ 8,688£ 3,665£ 7,070£ 2,418£ 6,144£ 6,100£ 0.4 0.3 49.47£ 0.2
E14000708 B80 Garston and Halewood 2.8 3.1 1.1 2.5 1.1 8.2 5.1 5.2 2.2 5,987£ 8,838£ 3,800£ 7,513£ 2,268£ 6,415£ 6,268£ 0.7 0.2 57.52£ 0.3
E14000725 B97 Halton 2.6 3.0 1.4 2.3 0.9 7.9 5.0 5.1 2.8 6,211£ 8,933£ 3,824£ 7,325£ 2,211£ 6,412£ 6,345£ 0.6 0.3 55.47£ 0.2
E14000738 C11 Hazel Grove 1.1 1.9 1.0 1.4 0.6 4.6 2.0 3.3 2.0 6,270£ 8,846£ 3,628£ 7,056£ 2,480£ 6,307£ 6,298£ 0.4 0.2 50.66£ 0.2
E14000747 C20 Heywood and Middleton 2.7 3.8 1.6 2.7 1.2 9.2 5.0 6.5 3.2 6,144£ 8,963£ 3,845£ 7,459£ 2,253£ 6,534£ 6,421£ 0.8 0.4 58.72£ 0.3
E14000758 C31 Hyndburn 2.3 4.1 1.4 2.1 1.2 9.0 4.6 8.1 2.8 6,348£ 9,770£ 3,895£ 8,271£ 2,507£ 7,241£ 7,012£ 0.6 0.5 61.10£ 0.3
E14000775 C48 Knowsley 4.1 4.2 1.4 3.3 1.7 11.4 7.6 6.9 2.7 5,953£ 8,852£ 3,662£ 7,559£ 2,304£ 6,337£ 6,198£ 0.8 0.3 57.40£ 0.4
E14000776 C49 Lancaster and Fleetwood 1.5 2.2 1.0 1.4 0.9 5.6 2.8 3.9 2.1 6,262£ 8,915£ 3,910£ 7,329£ 2,384£ 6,229£ 6,237£ 0.4 0.3 44.81£ 0.2
E14000785 C58 Leigh 2.2 3.2 1.6 2.2 1.1 8.0 4.0 5.4 3.2 5,961£ 8,716£ 3,679£ 6,993£ 2,339£ 6,147£ 6,096£ 0.6 0.4 53.89£ 0.3
E14000793 C66 Liverpool, Riverside 3.0 2.5 0.7 1.9 1.5 7.7 5.4 4.3 1.3 5,997£ 9,058£ 3,703£ 7,949£ 2,333£ 6,142£ 6,086£ 0.4 0.1 60.54£ 0.3
E14000794 C67 Liverpool, Walton 4.0 3.7 1.1 2.9 1.5 10.2 7.3 6.1 2.2 6,021£ 8,871£ 3,778£ 7,678£ 2,183£ 6,399£ 6,251£ 0.7 0.2 57.85£ 0.3
E14000795 C68 Liverpool, Wavertree 2.7 2.7 0.9 1.9 1.2 7.5 4.9 4.7 1.8 5,904£ 8,902£ 3,654£ 7,609£ 2,262£ 6,304£ 6,161£ 0.4 0.2 58.25£ 0.2
E14000796 C69 Liverpool, West Derby 3.3 3.5 1.3 2.7 1.3 9.4 6.2 5.9 2.4 6,067£ 8,844£ 3,665£ 7,484£ 2,182£ 6,349£ 6,249£ 0.6 0.3 57.76£ 0.3
E14000802 C75 Macclesfield 1.0 1.8 1.0 1.3 0.6 4.4 1.7 3.0 1.9 5,840£ 8,616£ 3,549£ 6,796£ 2,493£ 6,057£ 6,008£ 0.4 0.3 52.75£ 0.2
E14000805 C78 Makerfield 1.7 2.7 1.5 2.0 0.9 6.9 3.3 4.6 3.0 6,046£ 8,608£ 3,645£ 6,808£ 2,377£ 6,024£ 6,030£ 0.5 0.3 48.97£ 0.2
E14000807 C80 Manchester Central 5.0 5.0 1.1 3.3 1.6 12.7 10.4 9.7 2.3 6,630£ 9,650£ 3,933£ 8,591£ 2,254£ 7,295£ 7,034£ 0.8 0.3 72.99£ 0.3
E14000808 C81 Manchester, Gorton 3.9 5.3 1.1 2.2 1.4 11.6 8.1 11.3 2.3 6,631£ 10,153£ 4,269£ 9,136£ 2,496£ 7,944£ 7,504£ 0.5 0.2 68.38£ 0.2
E14000809 C82 Manchester, Withington 1.8 2.4 0.7 1.5 0.9 5.9 3.7 4.7 1.4 6,453£ 9,559£ 3,833£ 8,253£ 2,322£ 6,914£ 6,769£ 0.4 0.2 61.82£ 0.2
E14000825 C98 Morecambe and Lunesdale 2.0 2.9 1.5 1.9 1.0 7.3 3.8 5.1 3.0 6,400£ 8,861£ 3,852£ 7,161£ 2,253£ 6,246£ 6,287£ 0.4 0.4 47.07£ 0.2
E14000870 D44 Oldham East and Saddleworth 2.9 4.5 1.4 2.3 1.1 9.9 5.9 9.3 2.8 6,557£ 9,914£ 3,795£ 8,475£ 2,422£ 7,512£ 7,235£ 0.7 0.4 55.06£ 0.2
E14000871 D45 Oldham West and Royton 3.3 5.5 1.4 2.3 1.1 11.3 7.1 12.2 2.9 6,867£ 10,311£ 4,014£ 9,010£ 2,418£ 8,084£ 7,730£ 0.6 0.4 58.96£ 0.3
E14000875 D49 Pendle 2.0 4.2 1.4 1.8 1.3 8.9 4.0 8.9 2.9 6,456£ 9,977£ 4,116£ 8,513£ 2,497£ 7,416£ 7,201£ 0.5 0.4 52.55£ 0.2
E14000877 D51 Penrith and The Border 0.7 1.9 1.2 1.1 0.9 4.7 1.3 3.3 2.6 5,771£ 8,726£ 3,655£ 6,732£ 2,663£ 5,821£ 5,813£ 0.2 0.2 39.80£ 0.2
E14000885 D59 Preston 3.0 4.2 1.5 2.1 1.3 10.0 5.8 7.9 3.1 6,251£ 9,282£ 4,002£ 7,866£ 2,265£ 6,850£ 6,672£ 0.6 0.4 59.91£ 0.3
E14000894 D68 Ribble Valley 0.8 2.2 1.3 1.6 0.7 5.1 1.4 3.6 2.6 5,601£ 8,689£ 3,658£ 6,795£ 2,465£ 6,032£ 5,961£ 0.5 0.4 51.05£ 0.2
E14000897 D71 Rochdale 3.5 5.3 1.6 2.3 1.5 11.9 7.1 11.2 3.3 6,635£ 10,042£ 4,076£ 8,658£ 2,504£ 7,552£ 7,286£ 0.6 0.4 60.79£ 0.3
E14000902 D76 Rossendale and Darwen 1.9 3.2 1.5 2.1 1.0 7.6 3.6 5.6 3.0 6,059£ 9,022£ 3,668£ 7,314£ 2,433£ 6,421£ 6,329£ 0.6 0.4 56.43£ 0.3
E14000911 D85 Salford and Eccles 2.9 3.6 1.3 2.7 1.3 9.0 5.6 6.1 2.5 6,233£ 8,921£ 3,745£ 7,574£ 2,101£ 6,446£ 6,377£ 0.8 0.3 62.19£ 0.3
E14000916 D90 Sefton Central 0.8 1.5 0.8 1.2 0.6 3.7 1.4 2.5 1.6 5,969£ 8,685£ 3,593£ 6,904£ 2,400£ 5,977£ 5,975£ 0.3 0.2 51.10£ 0.2
E14000943 E18 South Ribble 1.2 2.3 1.3 1.8 0.8 5.7 2.3 4.0 2.7 6,193£ 8,867£ 3,615£ 6,956£ 2,561£ 6,209£ 6,205£ 0.5 0.4 50.68£ 0.2
E14000958 E33 Southport 1.4 2.9 1.3 1.9 1.0 6.7 2.6 4.9 2.6 5,962£ 8,799£ 3,793£ 7,237£ 2,152£ 6,228£ 6,171£ 0.5 0.3 51.34£ 0.2
E14000967 E42 Stalybridge and Hyde 2.3 3.2 1.5 2.1 0.9 7.9 4.5 5.8 2.9 6,150£ 9,042£ 3,684£ 7,376£ 2,319£ 6,537£ 6,424£ 0.6 0.4 56.15£ 0.2
E14000962 E37 St Helens North 2.5 2.8 1.4 2.0 0.9 7.6 4.6 4.7 2.8 6,065£ 8,780£ 3,704£ 7,099£ 2,122£ 6,208£ 6,161£ 0.4 0.3 54.23£ 0.2
E14000963 E38 St Helens South and Whiston 2.8 3.0 1.4 2.3 1.0 8.2 5.3 5.1 2.8 6,163£ 8,731£ 3,541£ 7,070£ 2,208£ 6,170£ 6,167£ 0.5 0.3 52.58£ 0.3
E14000969 E44 Stockport 2.3 2.9 1.2 2.0 0.9 7.3 4.3 5.0 2.4 6,231£ 8,968£ 3,664£ 7,392£ 2,374£ 6,475£ 6,399£ 0.5 0.3 56.06£ 0.3
E14000979 E54 Stretford and Urmston 2.2 3.5 1.5 2.3 0.9 8.1 4.4 6.4 3.2 6,373£ 9,342£ 3,850£ 7,644£ 2,308£ 6,827£ 6,704£ 0.8 0.3 59.77£ 0.2
E14000987 E62 Tatton 0.8 1.6 0.7 1.2 0.5 3.6 1.5 2.7 1.5 5,937£ 8,811£ 3,675£ 7,190£ 2,378£ 6,376£ 6,278£ 0.3 0.2 51.27£ 0.1
E14001010 E85 Wallasey 2.6 3.1 1.3 2.3 1.1 8.2 5.0 5.5 2.6 6,399£ 9,166£ 3,964£ 7,654£ 2,368£ 6,603£ 6,537£ 0.6 0.3 51.31£ 0.3
E14001017 E92 Warrington North 1.9 2.9 1.4 2.1 0.9 7.0 3.4 4.9 2.8 5,998£ 8,821£ 3,619£ 7,111£ 2,228£ 6,268£ 6,197£ 0.5 0.3 60.57£ 0.2
E14001018 E93 Warrington South 1.4 2.5 1.3 1.9 0.7 5.9 2.6 4.3 2.6 6,028£ 8,808£ 3,667£ 7,014£ 2,181£ 6,234£ 6,186£ 0.5 0.3 53.11£ 0.2
E14001024 E99 Weaver Vale 1.8 2.2 1.2 1.6 0.7 5.8 3.5 3.8 2.4 6,319£ 8,833£ 3,642£ 7,029£ 2,236£ 6,244£ 6,267£ 0.4 0.2 51.26£ 0.2
E14001033 F09 West Lancashire 1.8 2.6 1.3 1.8 0.9 6.6 3.4 4.4 2.8 6,408£ 8,698£ 3,887£ 7,055£ 2,289£ 6,146£ 6,216£ 0.4 0.3 51.07£ 0.2
E14001037 F13 Westmorland and Lonsdale 0.6 1.7 1.2 1.1 0.6 4.1 1.0 2.9 2.5 5,747£ 8,478£ 3,523£ 6,427£ 2,409£ 5,709£ 5,714£ 0.2 0.3 40.72£ 0.2
E14001039 F15 Wigan 2.2 3.2 1.5 2.1 1.1 8.1 4.2 5.4 3.0 6,127£ 8,628£ 3,612£ 7,008£ 2,282£ 6,086£ 6,098£ 0.5 0.3 45.44£ 0.3
E14001043 F19 Wirral South 0.9 1.5 0.8 1.2 0.5 3.7 1.7 2.6 1.5 6,513£ 8,856£ 3,838£ 7,190£ 2,330£ 6,330£ 6,376£ 0.3 0.2 48.54£ 0.1
E14001044 F20 Wirral West 0.9 1.5 0.7 1.1 0.6 3.7 1.6 2.5 1.4 6,182£ 8,762£ 3,695£ 7,084£ 2,396£ 6,103£ 6,123£ 0.3 0.1 47.28£ 0.2
E14001053 F29 Workington 1.4 2.0 1.1 1.4 0.9 5.4 2.5 3.4 2.2 5,818£ 8,513£ 3,696£ 6,858£ 2,497£ 5,890£ 5,872£ 0.2 0.2 41.62£ 0.2
E14001054 F30 Worsley and Eccles South 3.0 3.6 1.5 2.7 1.0 9.2 5.8 6.4 3.0 6,285£ 9,119£ 3,738£ 7,536£ 2,250£ 6,660£ 6,537£ 0.8 0.4 60.33£ 0.3
E14001057 F33 Wyre and Preston North 0.6 1.7 0.9 1.2 0.6 3.9 1.2 3.1 1.8 5,754£ 8,771£ 3,620£ 7,018£ 2,425£ 6,143£ 6,079£ 0.4 0.3 46.36£ 0.1
E14001059 F35 Wythenshawe and Sale East 3.4 4.1 1.6 3.0 1.1 10.2 6.5 7.1 3.1 6,259£ 9,046£ 3,709£ 7,560£ 2,218£ 6,684£ 6,542£ 0.8 0.3 68.02£ 0.3
0.8 0.3 69.18£ 0.3
New Area Codes 1 Current Area
Codes 2Area names
In-work families (000's)
With children
Receiving CTC only
Total out-of-
work
families
(000's)Couples (number) (000's)
Average weekly
value (£ per week)
Receiving WTC only
Total in
receipt
(out-of-
work and
in-work
families)
Childcare element
Lone parents
(number) (000's)
Total out-
of-work
families Receiving WTC and
CTC
Receiving CTC only
All families with
children
In-work families
Receiving WTC only
Receiving WTC and
CTC
All in-work families
Receiving CTC only
Number of children in recipient
families (000's)
Receiving WTC and
CTC
Of which, lone
parents
Disabled
worker
element
(number)
(000's)
Total in
receipt
(out-of-
work and
in-work
families)
(000's)
Average annualised value (£ per year)
With children
In-work families
Families benefiting from:
Total out-
of-work
families
Table 3 HMRC] HM Revenue and Customs
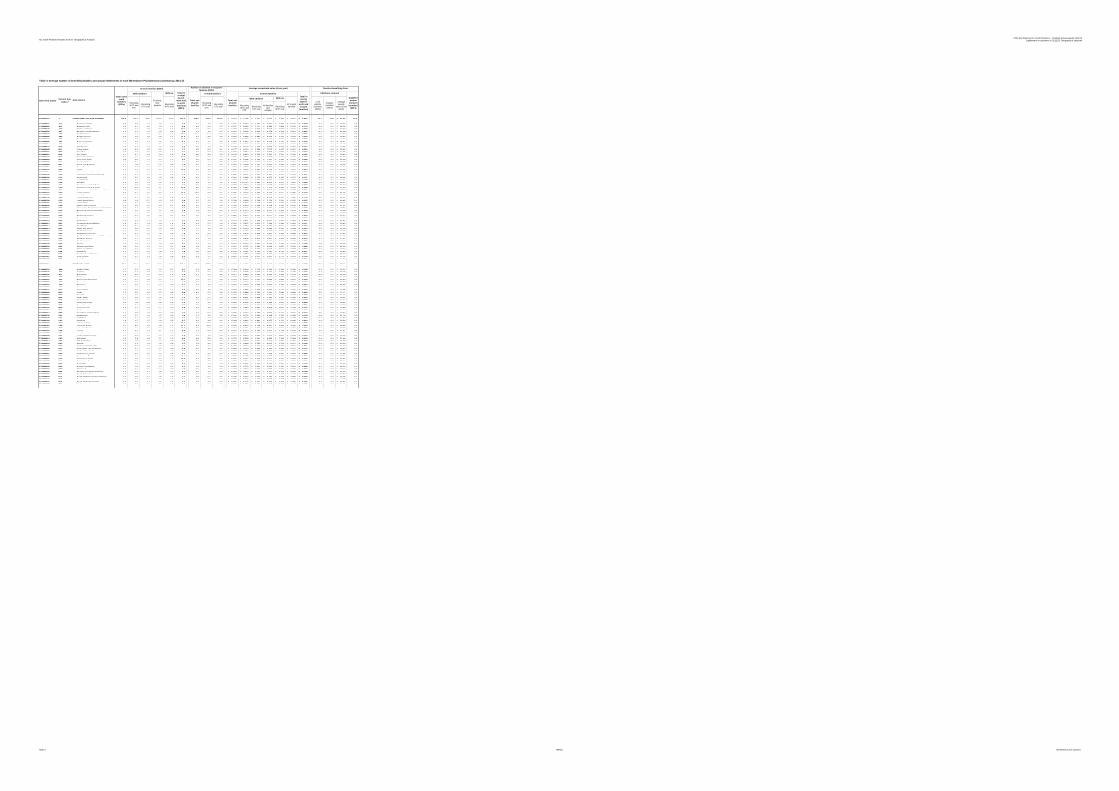
Tax Credit Finalised Awards 2014-15: Geographical AnalysisChild and Working Tax Credit Statistics - Finalised annual awards 2012/13
Supplement on payments in 2012/13: Geographical analyses
Table 3: Average number of benefiting families and annual entitlements in each Westminster Parliamentary Constituency, 2014-15
With no
childrenWith no
childrenNew Area Codes 1 Current Area
Codes 2Area names
In-work families (000's)
With children
Receiving CTC only
Total out-of-
work
families
(000's)Couples (number) (000's)
Average weekly
value (£ per week)
Receiving WTC only
Total in
receipt
(out-of-
work and
in-work
families)
Childcare element
Lone parents
(number) (000's)
Total out-
of-work
families Receiving WTC and
CTC
Receiving CTC only
All families with
children
In-work families
Receiving WTC only
Receiving WTC and
CTC
All in-work families
Receiving CTC only
Number of children in recipient
families (000's)
Receiving WTC and
CTC
Of which, lone
parents
Disabled
worker
element
(number)
(000's)
Total in
receipt
(out-of-
work and
in-work
families)
(000's)
Average annualised value (£ per year)
With children
In-work families
Families benefiting from:
Total out-
of-work
families
E15000003 3 YORKSHIRE AND THE HUMBER 116.9 170.8 75.8 100.3 52.7 416.3 228.6 319.7 153.6 6,304£ 9,188£ 3,771£ 7,522£ 2,287£ 6,601£ 6,518£ 23.1 14.9 52.02£ 10.6
E14000541 A12 Barnsley Central 2.3 2.9 1.4 1.8 1.1 7.8 4.2 4.8 2.8 6,071£ 8,463£ 3,662£ 6,891£ 2,256£ 5,941£ 5,979£ 0.4 0.2 48.30£ 0.3
E14000542 A13 Barnsley East 2.6 3.1 1.6 1.9 1.1 8.4 4.9 5.4 3.2 6,237£ 8,665£ 3,771£ 6,989£ 2,408£ 6,145£ 6,173£ 0.4 0.3 48.76£ 0.3
E14000548 A19 Batley and Spen 2.3 4.7 1.8 2.2 1.3 10.1 4.7 9.5 3.7 6,302£ 9,569£ 3,879£ 8,026£ 2,530£ 7,131£ 6,938£ 0.6 0.4 53.69£ 0.2
E14000556 A27 Beverley and Holderness 1.3 2.3 1.3 1.5 0.8 5.6 2.3 3.9 2.7 6,022£ 8,635£ 3,626£ 6,779£ 2,293£ 5,972£ 5,983£ 0.3 0.3 43.28£ 0.2
E14000587 A58 Bradford East 4.6 7.1 1.8 2.4 1.6 15.1 10.1 16.4 3.9 6,919£ 10,506£ 4,467£ 9,290£ 2,498£ 8,264£ 7,855£ 0.5 0.3 64.89£ 0.2
E14000588 A59 Bradford South 3.6 4.9 1.9 2.9 1.2 11.6 7.4 9.6 3.8 6,637£ 9,569£ 3,992£ 8,047£ 2,312£ 7,166£ 7,004£ 0.8 0.4 60.60£ 0.2
E14000589 A60 Bradford West 4.1 7.2 1.5 1.8 1.9 14.7 9.2 17.1 3.4 7,001£ 10,688£ 4,488£ 9,607£ 2,598£ 8,362£ 7,982£ 0.3 0.3 71.23£ 0.2
E14000596 A67 Brigg and Goole 1.3 2.3 1.3 1.6 0.7 5.7 2.5 4.1 2.6 6,056£ 8,584£ 3,627£ 6,819£ 2,240£ 6,081£ 6,075£ 0.3 0.2 45.51£ 0.1
E14000614 A85 Calder Valley 1.7 2.9 1.4 2.1 1.0 7.0 3.1 5.0 2.7 6,029£ 8,857£ 3,555£ 7,155£ 2,376£ 6,246£ 6,193£ 0.7 0.4 50.18£ 0.2
E14000643 B15 Cleethorpes 1.9 2.4 1.3 1.6 0.9 6.5 3.9 4.2 2.6 6,475£ 8,718£ 3,755£ 6,998£ 2,238£ 6,097£ 6,210£ 0.3 0.2 43.36£ 0.2
E14000645 B17 Colne Valley 1.8 3.3 1.5 2.0 1.0 7.7 3.5 6.3 3.1 6,177£ 9,222£ 3,754£ 7,517£ 2,417£ 6,622£ 6,516£ 0.6 0.4 50.33£ 0.2
E14000666 B38 Dewsbury 2.4 4.3 1.6 1.8 1.1 9.4 4.9 9.2 3.3 6,484£ 9,854£ 4,011£ 8,308£ 2,599£ 7,401£ 7,167£ 0.5 0.3 54.25£ 0.2
E14000667 B39 Don Valley 2.1 3.1 1.5 2.0 1.0 7.6 4.0 5.4 2.9 6,124£ 8,870£ 3,735£ 7,207£ 2,291£ 6,342£ 6,281£ 0.5 0.2 53.83£ 0.3
E14000668 B40 Doncaster Central 2.7 4.0 1.7 2.3 1.6 10.0 5.2 7.1 3.3 6,226£ 8,850£ 3,605£ 7,280£ 2,135£ 6,185£ 6,196£ 0.5 0.3 55.02£ 0.2
E14000669 B41 Doncaster North 2.8 3.6 1.7 2.3 1.2 9.2 5.5 6.4 3.3 6,231£ 9,006£ 3,764£ 7,351£ 2,285£ 6,410£ 6,355£ 0.5 0.3 60.29£ 0.3
E14000683 B55 East Yorkshire 1.6 2.6 1.4 1.5 1.0 6.5 2.9 4.6 3.0 5,950£ 8,760£ 3,732£ 6,954£ 2,321£ 6,051£ 6,027£ 0.3 0.3 39.52£ 0.2
E14000689 B61 Elmet and Rothwell 1.1 1.9 1.1 1.5 0.5 4.6 2.0 3.4 2.3 6,053£ 8,639£ 3,754£ 6,844£ 2,358£ 6,253£ 6,207£ 0.4 0.2 48.06£ 0.1
E14000716 B88 Great Grimsby 3.2 3.3 1.4 2.1 1.2 9.1 6.2 5.8 2.9 6,233£ 8,795£ 3,974£ 7,353£ 2,068£ 6,254£ 6,247£ 0.4 0.2 46.80£ 0.2
E14000723 B95 Halifax 3.0 4.3 1.6 2.2 1.2 10.0 6.0 8.6 3.2 6,509£ 9,645£ 3,892£ 8,118£ 2,414£ 7,153£ 6,962£ 0.6 0.4 54.46£ 0.2
E14000724 B96 Haltemprice and Howden 0.6 1.5 1.0 1.1 0.5 3.7 1.2 2.5 2.1 5,915£ 8,343£ 3,534£ 6,369£ 2,259£ 5,676£ 5,717£ 0.3 0.2 40.97£ 0.1
E14000730 C03 Harrogate and Knaresborough 0.9 2.1 1.2 1.6 0.6 4.9 1.6 3.5 2.3 5,805£ 8,466£ 3,536£ 6,681£ 2,223£ 5,973£ 5,941£ 0.4 0.3 46.37£ 0.1
E14000740 C13 Hemsworth 2.3 3.0 1.6 1.9 0.8 7.6 4.2 5.1 3.1 6,041£ 8,668£ 3,756£ 6,975£ 2,165£ 6,227£ 6,171£ 0.3 0.2 46.44£ 0.2
E14000756 C29 Huddersfield 2.6 3.7 1.3 2.2 1.1 8.8 4.9 7.1 2.7 6,058£ 9,511£ 3,879£ 8,040£ 2,397£ 7,013£ 6,733£ 0.7 0.3 56.06£ 0.3
E14000766 C39 Keighley 1.8 3.6 1.3 1.6 1.0 7.7 3.9 7.7 2.6 6,737£ 10,177£ 3,957£ 8,553£ 2,514£ 7,562£ 7,364£ 0.4 0.3 56.27£ 0.2
E14000771 C44 Kingston upon Hull East 3.2 3.5 1.7 2.1 1.3 9.7 6.0 6.0 3.4 5,987£ 8,563£ 3,637£ 6,925£ 2,022£ 5,966£ 5,973£ 0.4 0.3 50.23£ 0.2
E14000772 C45 Kingston upon Hull North 3.3 3.6 1.6 2.1 1.5 10.0 6.5 6.5 3.1 6,268£ 8,661£ 3,623£ 7,112£ 2,069£ 6,002£ 6,089£ 0.4 0.3 47.35£ 0.2
E14000773 C46 Kingston upon Hull West and Hessle 2.7 3.3 1.5 1.9 1.4 8.9 5.1 5.6 2.9 5,992£ 8,572£ 3,518£ 7,003£ 2,055£ 5,872£ 5,909£ 0.4 0.3 47.10£ 0.2
E14000777 C50 Leeds Central 5.0 5.1 1.5 3.0 1.6 13.2 10.0 9.8 3.1 6,286£ 9,418£ 3,936£ 8,136£ 2,071£ 6,986£ 6,720£ 0.6 0.3 65.78£ 0.2
E14000778 C51 Leeds East 3.7 4.6 1.5 2.7 1.1 10.9 7.6 9.1 3.2 6,431£ 9,702£ 3,899£ 8,253£ 2,241£ 7,356£ 7,040£ 0.6 0.3 63.08£ 0.2
E14000779 C52 Leeds North East 1.6 2.7 1.0 1.7 0.8 6.1 3.0 5.3 2.0 6,036£ 9,542£ 3,783£ 8,028£ 2,394£ 7,035£ 6,778£ 0.5 0.2 56.94£ 0.2
E14000780 C53 Leeds North West 0.8 1.4 0.7 1.0 0.5 3.4 1.5 2.5 1.4 5,799£ 8,969£ 3,799£ 7,276£ 2,291£ 6,335£ 6,207£ 0.3 0.2 49.46£ 0.1
E14000781 C54 Leeds West 3.0 3.4 1.5 2.4 1.1 8.9 5.8 6.0 2.9 6,221£ 8,950£ 3,667£ 7,371£ 2,090£ 6,440£ 6,367£ 0.6 0.3 57.46£ 0.2
E14000826 C99 Morley and Outwood 1.4 2.5 1.5 2.0 0.7 6.0 2.5 4.2 2.8 5,730£ 8,633£ 3,466£ 6,749£ 2,145£ 6,100£ 6,015£ 0.6 0.3 51.31£ 0.2
E14000836 D10 Normanton, Pontefract and Castleford 2.8 3.4 1.8 2.4 1.0 9.0 5.3 5.9 3.6 6,218£ 8,646£ 3,664£ 6,896£ 2,095£ 6,120£ 6,150£ 0.5 0.3 48.74£ 0.2
E14000876 D50 Penistone and Stocksbridge 1.0 2.0 1.2 1.4 0.6 4.9 1.9 3.3 2.5 6,124£ 8,472£ 3,529£ 6,571£ 2,365£ 5,874£ 5,928£ 0.3 0.3 43.39£ 0.2
E14000886 D60 Pudsey 1.0 2.1 1.2 1.6 0.5 4.8 1.9 3.6 2.4 5,818£ 8,842£ 3,574£ 6,924£ 2,377£ 6,274£ 6,175£ 0.5 0.3 49.38£ 0.1
E14000895 D69 Richmond (Yorks) 1.1 2.2 1.5 1.5 0.7 5.4 2.0 3.7 3.2 5,884£ 8,577£ 3,624£ 6,571£ 2,503£ 5,929£ 5,920£ 0.4 0.3 52.42£ 0.2
E14000903 D77 Rother Valley 1.9 2.5 1.5 1.7 0.7 6.6 3.6 4.4 3.0 6,333£ 8,792£ 3,693£ 6,926£ 2,292£ 6,224£ 6,255£ 0.3 0.3 45.49£ 0.2
E14000904 D78 Rotherham 2.9 3.7 1.4 1.9 1.2 9.2 5.9 7.3 2.8 6,604£ 9,546£ 4,088£ 8,063£ 2,290£ 6,998£ 6,872£ 0.3 0.2 50.53£ 0.2
E14000913 D87 Scarborough and Whitby 1.8 3.1 1.4 1.8 1.4 7.6 3.4 5.3 2.8 6,205£ 8,837£ 3,670£ 7,244£ 2,349£ 6,083£ 6,111£ 0.4 0.4 43.45£ 0.3
E14000914 D88 Scunthorpe 2.2 3.1 1.6 1.9 0.9 7.7 4.4 5.6 3.2 6,375£ 8,893£ 3,727£ 7,134£ 2,101£ 6,350£ 6,357£ 0.3 0.2 46.60£ 0.2
E14000917 D91 Selby and Ainsty 1.1 2.0 1.2 1.4 0.6 4.9 2.1 3.5 2.4 5,967£ 8,570£ 3,499£ 6,684£ 2,247£ 6,038£ 6,022£ 0.4 0.3 43.79£ 0.1
E14000919 D93 Sheffield Central 2.1 2.3 0.8 1.2 1.1 6.3 4.2 4.5 1.5 6,625£ 9,606£ 4,012£ 8,219£ 2,381£ 6,679£ 6,661£ 0.3 0.2 58.18£ 0.2
E14000920 D94 Sheffield South East 2.1 3.4 1.5 1.8 0.9 7.9 4.3 6.6 2.9 6,789£ 9,579£ 3,839£ 7,857£ 2,287£ 6,998£ 6,942£ 0.4 0.2 54.63£ 0.2
E14000921 D95 Sheffield, Brightside and Hillsborough 4.6 5.0 1.7 2.5 1.3 12.7 9.6 10.4 3.5 6,787£ 10,011£ 4,205£ 8,532£ 2,198£ 7,476£ 7,225£ 0.5 0.3 64.82£ 0.3
E14000922 D96 Sheffield, Hallam 0.5 1.1 0.7 0.8 0.4 2.6 0.9 1.8 1.5 5,938£ 8,508£ 3,520£ 6,501£ 2,369£ 5,798£ 5,824£ 0.2 0.2 44.71£ 0.1
E14000923 D97 Sheffield, Heeley 2.6 3.0 1.5 2.0 1.0 8.1 4.8 5.2 2.9 6,232£ 8,830£ 3,820£ 7,196£ 2,124£ 6,282£ 6,266£ 0.4 0.3 49.45£ 0.2
E14000925 D99 Shipley 1.3 2.5 1.2 1.7 0.7 5.7 2.4 4.4 2.4 5,924£ 8,902£ 3,583£ 7,167£ 2,272£ 6,410£ 6,298£ 0.5 0.3 53.08£ 0.1
E14000928 E03 Skipton and Ripon 0.8 2.0 1.3 1.3 0.7 4.8 1.4 3.5 2.7 6,012£ 8,702£ 3,596£ 6,690£ 2,475£ 5,933£ 5,946£ 0.3 0.3 45.09£ 0.2
E14000993 E68 Thirsk and Malton 1.0 2.2 1.4 1.3 0.7 5.3 1.9 3.9 2.9 6,072£ 8,731£ 3,683£ 6,762£ 2,514£ 6,038£ 6,044£ 0.3 0.3 43.14£ 0.2
E14001009 E84 Wakefield 2.1 3.2 1.5 1.9 1.0 7.8 4.0 6.0 2.9 6,106£ 9,181£ 3,755£ 7,491£ 2,126£ 6,551£ 6,431£ 0.5 0.2 58.65£ 0.2
E14001028 F04 Wentworth and Dearne 2.6 3.3 1.7 2.1 1.0 8.5 4.9 5.6 3.3 6,237£ 8,778£ 3,797£ 7,098£ 2,315£ 6,286£ 6,271£ 0.4 0.3 55.62£ 0.3
E14001061 F37 York Central 1.5 2.7 1.3 1.8 0.8 6.3 2.8 4.7 2.6 5,957£ 8,701£ 3,511£ 7,007£ 2,111£ 6,182£ 6,128£ 0.5 0.3 47.15£ 0.2
E14001062 F38 York Outer 0.6 1.5 1.1 1.2 0.4 3.6 1.1 2.6 2.2 5,746£ 8,340£ 3,580£ 6,404£ 2,347£ 5,840£ 5,824£ 0.3 0.2 40.07£ 0.1
E15000004 4 EAST MIDLANDS 86.1 131.5 68.8 82.2 39.7 326.1 168.0 237.2 140.5 6,378£ 8,958£ 3,765£ 7,173£ 2,269£ 6,363£ 6,367£ 19.2 12.6 53.41£ 9.2
E14000533 A04 Amber Valley 1.7 2.3 1.4 1.5 0.7 6.1 3.2 4.0 2.9 6,384£ 8,624£ 3,778£ 6,783£ 2,324£ 6,069£ 6,156£ 0.3 0.2 50.22£ 0.2
E14000535 A06 Ashfield 2.5 3.1 1.7 1.9 1.1 8.5 4.9 5.6 3.5 6,454£ 8,985£ 3,769£ 7,119£ 2,388£ 6,225£ 6,293£ 0.4 0.3 55.25£ 0.3
E14000546 A17 Bassetlaw 1.9 3.0 1.7 2.0 1.0 7.6 3.7 5.2 3.4 6,317£ 8,680£ 3,793£ 6,920£ 2,206£ 6,119£ 6,170£ 0.4 0.2 45.26£ 0.3
E14000577 A48 Bolsover 2.1 2.7 1.6 1.6 1.0 7.4 4.0 4.7 3.2 6,195£ 8,603£ 3,659£ 6,754£ 2,279£ 5,921£ 5,999£ 0.3 0.3 45.69£ 0.3
E14000582 A53 Boston and Skegness 2.2 4.2 1.9 2.4 1.7 10.1 4.3 7.3 3.8 6,322£ 8,514£ 3,643£ 6,986£ 2,099£ 5,910£ 6,000£ 0.5 0.4 46.90£ 0.3
E14000583 A54 Bosworth 1.2 2.3 1.5 1.7 0.6 5.6 2.3 4.0 3.0 6,307£ 8,728£ 3,651£ 6,744£ 2,237£ 6,116£ 6,157£ 0.4 0.3 50.21£ 0.2
E14000607 A78 Broxtowe 1.2 2.0 1.1 1.4 0.7 5.1 2.3 3.4 2.2 6,019£ 8,673£ 3,528£ 6,824£ 2,239£ 5,977£ 5,987£ 0.3 0.2 50.96£ 0.2
E14000625 A96 Charnwood 1.0 2.1 1.4 1.5 0.5 5.0 1.9 3.6 2.8 6,142£ 8,757£ 3,492£ 6,664£ 2,177£ 6,056£ 6,074£ 0.4 0.3 49.12£ 0.1
E14000632 B04 Chesterfield 1.9 2.6 1.4 1.6 1.0 6.9 3.5 4.5 2.8 6,073£ 8,588£ 3,735£ 6,880£ 2,412£ 6,022£ 6,036£ 0.3 0.3 49.95£ 0.3
E14000648 B20 Corby 2.2 3.6 1.8 2.5 0.8 8.4 4.2 6.3 3.8 6,253£ 8,944£ 3,783£ 7,181£ 2,048£ 6,490£ 6,428£ 0.6 0.3 57.17£ 0.2
E14000660 B32 Daventry 1.1 1.9 1.2 1.4 0.5 4.7 2.1 3.4 2.5 6,372£ 8,877£ 3,808£ 6,957£ 2,172£ 6,318£ 6,330£ 0.3 0.2 51.40£ 0.1
E14000662 B34 Derby North 2.1 2.9 1.5 1.9 0.9 7.4 4.2 5.2 2.9 6,418£ 8,991£ 3,848£ 7,282£ 2,266£ 6,440£ 6,433£ 0.5 0.3 54.02£ 0.2
E14000663 B35 Derby South 3.7 5.2 1.7 2.5 1.4 12.1 7.9 10.7 3.6 6,767£ 9,770£ 4,177£ 8,395£ 2,336£ 7,375£ 7,188£ 0.6 0.3 61.07£ 0.3
E14000664 B36 Derbyshire Dales 0.7 1.5 0.9 0.9 0.5 3.6 1.3 2.6 1.9 5,949£ 8,629£ 3,627£ 6,735£ 2,534£ 5,962£ 5,959£ 0.2 0.2 39.76£ 0.1
E14000695 B67 Erewash 2.0 2.6 1.6 1.8 0.8 7.0 3.7 4.5 3.0 6,167£ 8,619£ 3,502£ 6,718£ 2,125£ 5,978£ 6,031£ 0.4 0.3 58.08£ 0.2
E14000707 B79 Gainsborough 1.7 2.2 1.3 1.4 0.7 5.9 3.3 3.8 2.7 6,568£ 8,867£ 3,884£ 6,995£ 2,510£ 6,199£ 6,303£ 0.3 0.3 44.58£ 0.2
E14000710 B82 Gedling 1.7 2.6 1.5 1.9 0.8 6.6 3.0 4.5 2.9 6,162£ 8,924£ 3,635£ 7,037£ 2,257£ 6,237£ 6,218£ 0.5 0.3 50.55£ 0.2
E14000714 B86 Grantham and Stamford 1.7 2.9 1.8 2.0 0.8 7.2 3.2 5.0 3.6 6,306£ 8,747£ 3,795£ 6,884£ 2,171£ 6,181£ 6,210£ 0.5 0.4 47.62£ 0.2
E14000728 C01 Harborough 1.2 2.2 1.4 1.5 0.6 5.4 2.3 3.9 2.8 6,241£ 8,737£ 3,560£ 6,748£ 2,229£ 6,099£ 6,130£ 0.4 0.3 51.74£ 0.2
E14000748 C21 High Peak 1.3 2.1 1.3 1.5 0.6 5.4 2.3 3.7 2.7 6,070£ 8,640£ 3,669£ 6,761£ 2,393£ 6,078£ 6,076£ 0.4 0.3 47.92£ 0.2
E14000769 C42 Kettering 1.8 2.7 1.7 1.9 0.5 6.7 3.5 4.9 3.6 6,284£ 8,892£ 3,881£ 6,977£ 2,171£ 6,446£ 6,403£ 0.4 0.3 54.59£ 0.2
E14000782 C55 Leicester East 2.9 6.0 2.2 1.9 1.5 12.6 6.0 11.9 4.3 6,475£ 9,349£ 3,784£ 7,865£ 2,381£ 6,990£ 6,870£ 0.4 0.4 74.75£ 0.2
E14000783 C56 Leicester South 3.1 5.0 1.6 1.8 1.4 11.1 6.7 10.8 3.4 6,743£ 9,910£ 4,178£ 8,531£ 2,397£ 7,470£ 7,264£ 0.4 0.2 68.56£ 0.2
E14000784 C57 Leicester West 4.0 4.6 1.9 2.7 1.3 11.7 8.2 8.7 3.8 6,694£ 9,251£ 3,963£ 7,729£ 2,071£ 6,757£ 6,736£ 0.6 0.3 62.62£ 0.2
E14000792 C65 Lincoln 2.3 3.4 1.7 2.1 1.1 8.6 4.4 5.9 3.5 6,402£ 8,717£ 3,785£ 7,051£ 2,148£ 6,185£ 6,244£ 0.5 0.3 47.61£ 0.3
E14000797 C70 Loughborough 1.4 2.2 1.3 1.4 0.6 5.6 2.7 4.1 2.7 6,374£ 9,037£ 3,832£ 7,114£ 2,174£ 6,367£ 6,369£ 0.3 0.2 52.67£ 0.1
E14000798 C71 Louth and Horncastle 1.7 2.6 1.4 1.4 1.2 6.8 3.3 4.6 2.8 6,414£ 8,842£ 3,802£ 7,074£ 2,651£ 6,078£ 6,162£ 0.3 0.3 45.73£ 0.3
E14000810 C83 Mansfield 2.6 3.4 1.8 2.1 1.3 9.0 4.9 5.8 3.4 6,232£ 8,599£ 3,641£ 6,898£ 2,183£ 5,948£ 6,029£ 0.4 0.3 51.44£ 0.3
E14000814 C87 Mid Derbyshire 0.8 1.6 1.1 1.2 0.5 4.0 1.5 2.8 2.1 6,162£ 8,622£ 3,491£ 6,575£ 2,365£ 5,962£ 6,002£ 0.3 0.2 45.58£ 0.1
E14000829 D03 Newark 1.3 2.3 1.4 1.6 0.6 5.7 2.4 4.0 2.9 6,302£ 8,664£ 3,755£ 6,827£ 2,233£ 6,151£ 6,186£ 0.4 0.3 43.00£ 0.2
E14000843 D17 North East Derbyshire 1.4 2.0 1.3 1.3 0.7 5.5 2.6 3.4 2.6 5,997£ 8,452£ 3,669£ 6,592£ 2,332£ 5,819£ 5,865£ 0.3 0.2 45.34£ 0.2
E14000858 D32 North West Leicestershire 1.4 2.1 1.4 1.4 0.6 5.5 2.6 3.7 3.0 6,359£ 8,724£ 3,826£ 6,732£ 2,394£ 6,110£ 6,172£ 0.3 0.2 48.67£ 0.1
E14000861 D35 Northampton North 2.0 3.0 1.5 2.1 0.6 7.1 4.0 5.4 3.1 6,580£ 9,093£ 3,892£ 7,340£ 2,056£ 6,686£ 6,656£ 0.5 0.3 58.30£ 0.1
E14000862 D36 Northampton South 2.4 3.6 1.6 2.3 0.8 8.4 4.7 6.5 3.3 6,420£ 9,111£ 3,670£ 7,408£ 2,085£ 6,668£ 6,598£ 0.6 0.3 57.66£ 0.2
E14000865 D39 Nottingham East 3.2 3.9 1.1 2.2 1.7 10.0 6.4 7.3 2.1 6,356£ 9,377£ 3,800£ 8,137£ 2,249£ 6,690£ 6,581£ 0.6 0.2 67.09£ 0.3
E14000866 D40 Nottingham North 4.9 4.8 1.7 3.4 1.3 12.6 9.7 8.6 3.3 6,431£ 9,327£ 3,936£ 7,927£ 2,193£ 6,978£ 6,767£ 0.8 0.3 68.01£ 0.3
E14000867 D41 Nottingham South 2.1 3.0 1.1 1.7 1.1 7.4 4.2 5.7 2.2 6,356£ 9,516£ 4,028£ 8,092£ 2,298£ 6,838£ 6,698£ 0.4 0.2 70.64£ 0.2
E14000908 D82 Rushcliffe 0.7 1.6 0.9 1.2 0.5 3.7 1.3 2.7 1.8 6,024£ 8,806£ 3,559£ 6,937£ 2,495£ 6,217£ 6,179£ 0.4 0.2 52.29£ 0.2
E14000909 D83 Rutland and Melton 1.0 1.8 1.4 1.3 0.5 4.7 1.8 3.2 2.9 6,287£ 8,753£ 3,651£ 6,563£ 2,156£ 5,925£ 5,998£ 0.3 0.3 46.30£ 0.1
E14000924 D98 Sherwood 1.8 2.6 1.5 1.7 0.8 6.7 3.5 4.5 3.0 6,472£ 8,854£ 3,819£ 6,992£ 2,377£ 6,240£ 6,304£ 0.4 0.3 53.16£ 0.2
E14000929 E04 Sleaford and North Hykeham 1.3 2.4 1.7 1.6 0.7 6.1 2.5 4.2 3.6 6,455£ 8,823£ 3,751£ 6,717£ 2,404£ 6,094£ 6,169£ 0.4 0.3 45.14£ 0.2
E14000935 E10 South Derbyshire 1.3 2.2 1.4 1.6 0.6 5.6 2.6 4.0 3.1 6,397£ 8,831£ 3,805£ 6,874£ 2,467£ 6,249£ 6,285£ 0.4 0.3 54.96£ 0.2
E14000939 E14 South Holland and The Deepings 1.5 2.9 1.7 1.8 1.0 7.1 2.9 5.1 3.5 6,279£ 8,634£ 3,670£ 6,792£ 2,219£ 5,986£ 6,048£ 0.4 0.3 48.26£ 0.1
E14000940 E15 South Leicestershire 1.0 2.3 1.6 1.7 0.5 5.3 1.9 3.9 3.2 6,078£ 8,725£ 3,605£ 6,637£ 2,297£ 6,115£ 6,108£ 0.4 0.3 48.87£ 0.1
E14000942 E17 South Northamptonshire 0.9 2.0 1.4 1.6 0.4 4.7 1.8 3.6 2.9 6,391£ 8,718£ 3,721£ 6,699£ 2,297£ 6,284£ 6,305£ 0.4 0.2 50.89£ 0.1
E14001025 F01 Wellingborough 2.2 3.2 2.0 2.2 0.8 8.2 4.4 5.8 4.2 6,545£ 9,020£ 3,954£ 7,097£ 2,094£ 6,443£ 6,470£ 0.6 0.3 55.46£ 0.2
Table 3 HMRC] HM Revenue and Customs

Tax Credit Finalised Awards 2014-15: Geographical AnalysisChild and Working Tax Credit Statistics - Finalised annual awards 2012/13
Supplement on payments in 2012/13: Geographical analyses
Table 3: Average number of benefiting families and annual entitlements in each Westminster Parliamentary Constituency, 2014-15
With no
childrenWith no
childrenNew Area Codes 1 Current Area
Codes 2Area names
In-work families (000's)
With children
Receiving CTC only
Total out-of-
work
families
(000's)Couples (number) (000's)
Average weekly
value (£ per week)
Receiving WTC only
Total in
receipt
(out-of-
work and
in-work
families)
Childcare element
Lone parents
(number) (000's)
Total out-
of-work
families Receiving WTC and
CTC
Receiving CTC only
All families with
children
In-work families
Receiving WTC only
Receiving WTC and
CTC
All in-work families
Receiving CTC only
Number of children in recipient
families (000's)
Receiving WTC and
CTC
Of which, lone
parents
Disabled
worker
element
(number)
(000's)
Total in
receipt
(out-of-
work and
in-work
families)
(000's)
Average annualised value (£ per year)
With children
In-work families
Families benefiting from:
Total out-
of-work
families
E15000005 5 WEST MIDLANDS 131.1 175.8 81.6 102.3 46.9 435.4 262.7 337.6 168.1 6,482£ 9,341£ 3,852£ 7,601£ 2,318£ 6,786£ 6,695£ 25.1 14.8 55.56£ 10.4
E14000531 A02 Aldridge-Brownhills 1.3 1.8 1.1 1.2 0.5 4.6 2.5 3.1 2.2 6,104£ 8,636£ 3,646£ 6,726£ 2,225£ 6,091£ 6,095£ 0.3 0.2 49.30£ 0.1
E14000560 A31 Birmingham, Edgbaston 2.7 2.6 0.9 1.8 0.8 6.9 5.2 4.8 1.8 6,320£ 9,523£ 3,872£ 8,023£ 2,171£ 6,972£ 6,718£ 0.6 0.2 66.61£ 0.2
E14000561 A32 Birmingham, Erdington 4.0 4.3 1.6 3.0 1.1 11.0 8.1 8.1 3.2 6,597£ 9,684£ 4,013£ 8,167£ 2,240£ 7,214£ 6,990£ 0.9 0.3 67.24£ 0.3
E14000562 A33 Birmingham, Hall Green 3.9 5.9 1.5 1.6 1.5 12.8 9.3 14.3 3.6 7,459£ 10,839£ 4,911£ 9,660£ 2,607£ 8,485£ 8,170£ 0.4 0.2 69.45£ 0.2
E14000563 A34 Birmingham, Hodge Hill 6.1 8.4 1.8 2.6 1.6 17.9 14.3 21.2 4.3 7,425£ 11,251£ 4,767£ 10,089£ 2,656£ 9,107£ 8,538£ 0.6 0.2 82.24£ 0.3
E14000564 A35 Birmingham, Ladywood 5.9 6.7 1.3 2.8 1.6 15.4 12.7 15.2 2.7 6,771£ 10,780£ 4,415£ 9,771£ 2,280£ 8,491£ 7,832£ 0.8 0.1 92.98£ 0.2
E14000565 A36 Birmingham, Northfield 4.0 3.6 1.5 2.8 0.9 9.9 8.0 6.5 3.0 6,752£ 9,356£ 3,886£ 7,750£ 2,288£ 6,963£ 6,878£ 0.8 0.3 63.93£ 0.3
E14000566 A37 Birmingham, Perry Barr 3.6 5.4 1.8 2.5 1.3 12.0 7.5 11.5 3.7 6,712£ 10,053£ 4,150£ 8,611£ 2,252£ 7,666£ 7,383£ 0.8 0.3 71.60£ 0.2
E14000567 A38 Birmingham, Selly Oak 2.7 2.8 1.2 2.0 0.7 7.5 5.3 5.2 2.5 6,462£ 9,373£ 3,971£ 7,753£ 2,274£ 6,909£ 6,747£ 0.6 0.2 59.72£ 0.2
E14000568 A39 Birmingham, Yardley 4.0 5.3 1.8 2.5 1.2 12.2 8.6 11.4 3.8 6,958£ 10,236£ 4,159£ 8,716£ 2,349£ 7,794£ 7,521£ 0.7 0.3 68.26£ 0.2
E14000605 A76 Bromsgrove 1.0 1.7 1.0 1.4 0.5 4.3 1.8 3.0 2.0 6,111£ 8,625£ 3,650£ 6,784£ 2,301£ 6,083£ 6,090£ 0.4 0.2 50.47£ 0.1
E14000610 A81 Burton 1.8 3.3 1.8 1.8 0.9 7.8 3.4 6.4 3.7 6,243£ 9,162£ 3,891£ 7,337£ 2,345£ 6,566£ 6,493£ 0.4 0.3 53.68£ 0.2
E14000618 A89 Cannock Chase 1.8 2.7 1.6 1.7 0.7 7.0 3.5 4.7 3.3 6,313£ 8,620£ 3,676£ 6,772£ 2,368£ 6,129£ 6,178£ 0.4 0.3 44.84£ 0.2
E14000649 B21 Coventry North East 4.0 5.1 2.0 3.0 1.2 12.3 8.3 9.9 4.1 6,596£ 9,445£ 3,948£ 7,914£ 2,140£ 7,078£ 6,919£ 0.7 0.3 59.73£ 0.2
E14000650 B22 Coventry North West 2.2 3.3 1.6 2.2 0.8 7.9 4.3 6.1 3.2 6,381£ 9,190£ 3,761£ 7,449£ 2,227£ 6,695£ 6,607£ 0.6 0.3 56.16£ 0.2
E14000651 B23 Coventry South 2.4 2.8 1.2 1.9 0.8 7.2 4.8 5.3 2.5 6,504£ 9,377£ 3,858£ 7,725£ 2,174£ 6,848£ 6,733£ 0.5 0.2 58.14£ 0.2
E14000671 B43 Dudley North 2.4 2.6 1.3 1.4 0.8 7.1 4.7 5.1 2.7 6,409£ 9,340£ 3,736£ 7,451£ 2,330£ 6,635£ 6,559£ 0.3 0.2 52.21£ 0.2
E14000672 B44 Dudley South 1.9 2.2 1.3 1.3 0.7 6.1 3.7 4.0 2.7 6,383£ 8,902£ 3,716£ 6,947£ 2,336£ 6,219£ 6,270£ 0.2 0.2 49.99£ 0.2
E14000722 B94 Halesowen and Rowley Regis 2.0 2.6 1.4 1.5 0.7 6.8 4.0 4.8 3.0 6,450£ 9,099£ 3,742£ 7,170£ 2,319£ 6,432£ 6,437£ 0.4 0.2 54.99£ 0.2
E14000743 C16 Hereford and South Herefordshire 1.4 2.7 1.6 1.8 0.8 6.6 2.6 4.7 3.2 6,022£ 8,615£ 3,681£ 6,788£ 2,272£ 6,076£ 6,064£ 0.4 0.4 40.74£ 0.2
E14000767 C40 Kenilworth and Southam 0.6 1.2 0.8 0.9 0.3 2.9 1.2 2.0 1.6 6,278£ 8,647£ 3,751£ 6,696£ 2,384£ 6,137£ 6,167£ 0.2 0.1 47.63£ 0.1
E14000791 C64 Lichfield 1.1 1.8 1.1 1.3 0.5 4.5 2.0 3.2 2.3 6,275£ 8,669£ 3,676£ 6,798£ 2,347£ 6,142£ 6,173£ 0.3 0.2 47.52£ 0.1
E14000799 C72 Ludlow 0.8 1.8 1.1 1.0 0.8 4.5 1.6 3.2 2.3 5,976£ 8,617£ 3,690£ 6,686£ 2,554£ 5,819£ 5,849£ 0.2 0.2 37.67£ 0.1
E14000812 C85 Meriden 2.6 2.9 1.3 2.3 0.7 7.4 4.9 5.0 2.7 6,375£ 9,167£ 3,959£ 7,553£ 2,215£ 6,799£ 6,652£ 0.6 0.2 61.09£ 0.2
E14000818 C91 Mid Worcestershire 1.2 2.1 1.4 1.4 0.6 5.2 2.3 3.6 2.8 6,333£ 8,593£ 3,695£ 6,650£ 2,304£ 6,023£ 6,095£ 0.3 0.2 42.94£ 0.1
E14000834 D08 Newcastle-under-Lyme 1.5 2.3 1.3 1.5 0.7 5.8 2.8 4.0 2.7 6,021£ 8,726£ 3,640£ 6,835£ 2,261£ 6,082£ 6,067£ 0.4 0.4 48.73£ 0.2
E14000847 D21 North Herefordshire 1.0 1.9 1.2 1.1 0.7 4.8 1.9 3.4 2.4 6,214£ 8,643£ 3,761£ 6,799£ 2,601£ 6,021£ 6,060£ 0.2 0.3 41.17£ 0.1
E14000849 D23 North Shropshire 1.4 2.4 1.6 1.4 0.8 6.3 2.8 4.3 3.5 6,156£ 8,716£ 3,764£ 6,685£ 2,480£ 5,974£ 6,016£ 0.3 0.4 40.28£ 0.2
E14000854 D28 North Warwickshire 1.6 2.4 1.4 1.7 0.7 6.1 3.0 4.2 2.9 6,225£ 8,727£ 3,711£ 6,853£ 2,232£ 6,184£ 6,194£ 0.4 0.2 50.07£ 0.2
E14000868 D42 Nuneaton 2.1 2.6 1.5 1.8 0.6 6.9 4.0 4.7 3.2 6,319£ 8,802£ 3,718£ 6,935£ 2,224£ 6,319£ 6,319£ 0.5 0.3 51.26£ 0.2
E14000892 D66 Redditch 1.7 2.7 1.5 1.7 0.7 6.5 3.3 4.8 3.0 6,289£ 8,896£ 3,798£ 7,079£ 2,203£ 6,393£ 6,366£ 0.4 0.3 45.40£ 0.2
E14000905 D79 Rugby 1.4 2.6 1.4 1.9 0.6 6.0 2.7 4.4 2.8 6,243£ 8,770£ 3,685£ 6,973£ 2,165£ 6,329£ 6,309£ 0.5 0.2 53.71£ 0.1
E14000926 E01 Shrewsbury and Atcham 1.4 2.3 1.5 1.6 0.8 5.9 2.6 4.0 3.0 6,194£ 8,680£ 3,656£ 6,732£ 2,360£ 5,993£ 6,040£ 0.4 0.4 42.84£ 0.2
E14000931 E06 Solihull 1.1 1.8 1.0 1.4 0.5 4.4 2.0 3.3 2.1 6,184£ 9,097£ 3,642£ 7,133£ 2,468£ 6,413£ 6,359£ 0.4 0.2 52.87£ 0.2
E14000945 E20 South Staffordshire 1.1 1.8 1.1 1.3 0.5 4.6 2.0 3.1 2.3 5,815£ 8,589£ 3,582£ 6,677£ 2,413£ 6,021£ 5,970£ 0.3 0.2 46.47£ 0.1
E14000965 E40 Stafford 1.2 2.0 1.3 1.5 0.6 5.0 2.3 3.5 2.5 6,178£ 8,720£ 3,516£ 6,708£ 2,283£ 6,057£ 6,086£ 0.4 0.3 47.02£ 0.2
E14000966 E41 Staffordshire Moorlands 0.9 1.6 1.1 1.0 0.7 4.3 1.6 2.9 2.3 5,974£ 8,636£ 3,616£ 6,624£ 2,582£ 5,836£ 5,863£ 0.2 0.3 44.38£ 0.2
E14000972 E47 Stoke-on-Trent Central 2.5 3.1 1.4 1.6 1.0 8.0 4.9 6.0 2.6 6,431£ 9,213£ 3,644£ 7,534£ 2,299£ 6,552£ 6,514£ 0.4 0.3 54.37£ 0.2
E14000973 E48 Stoke-on-Trent North 3.0 3.8 1.7 2.0 1.1 9.5 5.9 7.2 3.3 6,342£ 9,261£ 3,789£ 7,582£ 2,179£ 6,685£ 6,577£ 0.5 0.4 54.03£ 0.2
E14000974 E49 Stoke-on-Trent South 2.3 3.2 1.5 1.8 0.9 7.9 4.7 5.9 3.1 6,429£ 9,155£ 3,806£ 7,411£ 2,388£ 6,628£ 6,569£ 0.5 0.4 54.03£ 0.3
E14000975 E50 Stone 0.7 1.5 1.0 1.0 0.5 3.7 1.3 2.7 2.0 5,966£ 8,753£ 3,664£ 6,785£ 2,483£ 6,077£ 6,055£ 0.3 0.3 48.17£ 0.1
E14000976 E51 Stourbridge 1.6 2.5 1.3 1.3 0.7 6.1 3.1 4.7 2.7 6,201£ 9,204£ 3,682£ 7,277£ 2,340£ 6,468£ 6,399£ 0.3 0.2 50.86£ 0.1
E14000977 E52 Stratford-on-Avon 0.8 1.7 0.9 1.2 0.5 3.9 1.5 3.0 1.9 6,112£ 8,764£ 3,684£ 7,002£ 2,460£ 6,273£ 6,240£ 0.3 0.2 50.75£ 0.1
E14000985 E60 Sutton Coldfield 0.9 1.6 0.9 1.3 0.4 3.8 1.6 2.6 1.8 5,825£ 8,734£ 3,539£ 6,852£ 2,478£ 6,214£ 6,122£ 0.4 0.2 51.94£ 0.1
E14000986 E61 Tamworth 1.8 2.5 1.6 1.8 0.6 6.5 3.4 4.4 3.2 6,422£ 8,793£ 3,869£ 6,926£ 2,191£ 6,293£ 6,328£ 0.4 0.3 49.05£ 0.2
E14000989 E64 Telford 2.9 3.2 1.7 2.0 0.8 8.5 5.7 5.8 3.5 6,544£ 9,011£ 4,055£ 7,319£ 2,218£ 6,601£ 6,582£ 0.5 0.4 50.09£ 0.2
E14000992 E67 The Wrekin 1.5 2.4 1.3 1.5 0.7 5.9 3.0 4.5 2.7 6,415£ 8,953£ 3,801£ 7,163£ 2,358£ 6,419£ 6,418£ 0.3 0.3 47.54£ 0.2
E14001011 E86 Walsall North 3.7 3.5 1.6 1.9 1.0 9.9 7.6 6.7 3.5 6,518£ 9,155£ 4,148£ 7,562£ 2,256£ 6,729£ 6,649£ 0.4 0.2 53.41£ 0.2
E14001012 E87 Walsall South 3.5 4.4 1.5 1.7 1.1 10.4 7.1 9.3 3.2 6,538£ 9,897£ 4,148£ 8,436£ 2,434£ 7,515£ 7,190£ 0.4 0.2 62.39£ 0.2
E14001016 E91 Warley 3.3 4.5 1.6 2.2 1.0 10.3 6.9 9.1 3.1 6,481£ 9,728£ 3,794£ 8,192£ 2,316£ 7,353£ 7,072£ 0.6 0.3 70.14£ 0.2
E14001019 E94 Warwick and Leamington 1.2 1.9 1.1 1.4 0.5 4.7 2.2 3.3 2.1 6,096£ 8,738£ 3,625£ 6,907£ 2,162£ 6,230£ 6,197£ 0.3 0.2 51.53£ 0.1
E14001029 F05 West Bromwich East 2.8 3.6 1.6 2.0 0.9 8.9 5.6 6.8 3.3 6,388£ 9,138£ 3,771£ 7,457£ 2,164£ 6,694£ 6,598£ 0.5 0.2 62.61£ 0.2
E14001030 F06 West Bromwich West 3.3 3.8 1.8 2.0 0.9 9.8 6.4 7.2 3.7 6,345£ 9,103£ 3,928£ 7,439£ 2,130£ 6,681£ 6,569£ 0.4 0.3 62.54£ 0.2
E14001035 F11 West Worcestershire 1.1 1.8 1.1 1.1 0.6 4.6 2.2 3.1 2.2 6,246£ 8,567£ 3,663£ 6,718£ 2,484£ 6,002£ 6,064£ 0.2 0.2 41.73£ 0.1
E14001049 F25 Wolverhampton North East 3.4 3.3 1.5 2.1 0.8 9.0 6.5 5.9 3.1 6,251£ 8,804£ 3,938£ 7,280£ 2,090£ 6,522£ 6,421£ 0.4 0.2 57.58£ 0.1
E14001050 F26 Wolverhampton South East 3.5 3.5 1.6 2.0 0.9 9.6 6.9 6.4 3.3 6,291£ 8,781£ 3,906£ 7,245£ 2,180£ 6,464£ 6,401£ 0.4 0.2 56.49£ 0.2
E14001051 F27 Wolverhampton South West 1.9 2.5 1.1 1.4 0.8 6.3 3.7 4.7 2.1 6,097£ 9,096£ 3,733£ 7,498£ 2,233£ 6,521£ 6,391£ 0.3 0.2 50.62£ 0.1
E14001052 F28 Worcester 1.9 2.7 1.5 1.7 0.7 6.8 3.6 4.9 3.1 6,368£ 8,919£ 3,785£ 7,101£ 2,249£ 6,414£ 6,401£ 0.4 0.3 46.35£ 0.2
E14001058 F34 Wyre Forest 1.8 2.7 1.5 1.6 0.8 6.8 3.5 4.7 3.1 6,291£ 8,726£ 3,716£ 6,891£ 2,317£ 6,154£ 6,191£ 0.3 0.3 43.01£ 0.2
E15000006 6 EAST 100.5 143.0 77.5 93.9 33.3 354.4 193.5 258.3 162.2 6,291£ 8,892£ 3,786£ 7,098£ 2,278£ 6,465£ 6,416£ 18.6 9.8 51.65£ 8.0
E14000544 A15 Basildon and Billericay 2.3 2.3 1.1 1.6 0.5 6.1 4.4 4.1 2.4 6,378£ 8,989£ 3,828£ 7,263£ 2,130£ 6,643£ 6,545£ 0.3 0.1 56.63£ 0.1
E14000552 A23 Bedford 2.5 3.6 1.6 2.1 0.7 8.4 4.8 6.7 3.4 6,258£ 9,122£ 3,808£ 7,475£ 2,103£ 6,835£ 6,664£ 0.5 0.2 56.05£ 0.1
E14000590 A61 Braintree 1.5 2.2 1.4 1.5 0.5 5.6 2.8 4.0 3.0 6,236£ 8,891£ 3,769£ 6,885£ 2,293£ 6,377£ 6,339£ 0.3 0.2 47.40£ 0.1
E14000594 A65 Brentwood and Ongar 1.1 1.6 0.8 1.2 0.3 3.8 2.1 2.6 1.6 5,872£ 8,544£ 3,687£ 6,922£ 2,365£ 6,370£ 6,220£ 0.2 0.1 51.73£ 0.1
E14000603 A74 Broadland 1.0 2.1 1.4 1.4 0.6 5.1 1.9 3.7 2.9 6,024£ 8,566£ 3,705£ 6,615£ 2,265£ 6,013£ 6,015£ 0.3 0.2 40.41£ 0.1
E14000606 A77 Broxbourne 2.0 2.5 1.3 1.8 0.4 6.2 3.7 4.4 2.6 6,044£ 8,684£ 3,718£ 7,036£ 2,345£ 6,553£ 6,391£ 0.4 0.1 62.03£ 0.1
E14000613 A84 Bury St Edmunds 1.3 2.2 1.7 1.6 0.6 5.7 2.5 3.8 3.6 6,385£ 8,681£ 3,575£ 6,431£ 2,427£ 5,929£ 6,033£ 0.4 0.2 44.02£ 0.2
E14000617 A88 Cambridge 1.4 1.9 0.8 1.2 0.5 4.6 2.7 3.3 1.7 6,204£ 8,796£ 3,981£ 7,323£ 2,207£ 6,588£ 6,470£ 0.2 0.1 51.58£ 0.1
E14000622 A93 Castle Point 1.5 1.9 1.0 1.4 0.4 4.8 2.7 3.4 2.1 6,001£ 8,641£ 3,745£ 7,004£ 2,268£ 6,385£ 6,268£ 0.2 0.1 45.81£ 0.1
E14000624 A95 Central Suffolk and North Ipswich 1.2 2.0 1.4 1.3 0.5 5.1 2.4 3.7 3.0 6,517£ 8,986£ 3,823£ 6,859£ 2,423£ 6,293£ 6,346£ 0.2 0.2 42.45£ 0.2
E14000628 A99 Chelmsford 1.6 2.1 1.1 1.6 0.5 5.3 3.1 3.6 2.3 6,168£ 8,714£ 3,752£ 6,966£ 2,235£ 6,372£ 6,309£ 0.4 0.1 51.43£ 0.1
E14000642 B14 Clacton 2.4 2.6 1.1 1.6 0.8 6.8 4.6 4.7 2.3 6,449£ 9,052£ 3,998£ 7,550£ 2,325£ 6,651£ 6,580£ 0.3 0.2 45.26£ 0.2
E14000644 B16 Colchester 2.5 3.2 1.6 2.2 0.7 8.0 4.7 5.5 3.3 6,302£ 8,703£ 3,624£ 6,991£ 2,219£ 6,382£ 6,358£ 0.5 0.2 53.43£ 0.2
E14000693 B65 Epping Forest 1.6 2.0 0.9 1.5 0.4 4.8 2.9 3.4 1.8 5,761£ 8,746£ 3,614£ 7,193£ 2,366£ 6,663£ 6,366£ 0.3 0.1 65.87£ 0.1
E14000717 B89 Great Yarmouth 2.6 3.3 1.5 2.0 1.2 8.6 4.9 5.7 3.1 6,431£ 8,689£ 3,896£ 7,172£ 2,229£ 6,203£ 6,272£ 0.3 0.2 39.58£ 0.2
E14000729 C02 Harlow 2.3 2.9 1.5 2.0 0.5 7.2 4.4 5.2 3.2 6,245£ 8,791£ 3,780£ 7,056£ 2,206£ 6,528£ 6,440£ 0.4 0.2 55.26£ 0.1
E14000734 C07 Harwich and North Essex 1.3 1.8 1.1 1.2 0.4 4.6 2.5 3.3 2.3 6,270£ 8,953£ 3,794£ 7,024£ 2,468£ 6,414£ 6,375£ 0.2 0.1 40.94£ 0.1
E14000739 C12 Hemel Hempstead 1.9 2.4 1.2 1.7 0.4 5.9 3.7 4.2 2.5 6,305£ 8,900£ 3,792£ 7,176£ 2,367£ 6,647£ 6,538£ 0.4 0.2 57.53£ 0.1
E14000744 C17 Hertford and Stortford 1.2 1.8 1.0 1.4 0.4 4.3 2.1 3.0 2.0 5,773£ 8,544£ 3,626£ 6,774£ 2,382£ 6,280£ 6,144£ 0.3 0.1 53.36£ 0.1
E14000745 C18 Hertsmere 1.5 2.1 1.0 1.6 0.4 5.0 2.8 3.8 2.0 5,956£ 9,034£ 3,434£ 7,290£ 2,384£ 6,727£ 6,491£ 0.4 0.1 61.95£ 0.1
E14000749 C22 Hitchin and Harpenden 1.0 1.5 0.8 1.2 0.3 3.6 1.9 2.6 1.6 6,271£ 8,689£ 3,676£ 6,938£ 2,367£ 6,367£ 6,341£ 0.2 0.1 57.54£ 0.1
E14000757 C30 Huntingdon 1.5 2.3 1.6 1.7 0.5 5.9 2.9 4.1 3.3 6,375£ 8,806£ 3,840£ 6,788£ 2,204£ 6,287£ 6,309£ 0.4 0.2 49.12£ 0.1
E14000761 C34 Ipswich 2.6 3.6 1.9 2.3 1.0 9.1 4.9 6.5 3.9 6,256£ 8,775£ 3,781£ 7,085£ 2,181£ 6,325£ 6,305£ 0.4 0.2 46.80£ 0.2
E14000800 C73 Luton North 2.7 4.3 1.7 2.0 0.7 9.4 5.8 9.4 4.0 6,835£ 10,120£ 4,302£ 8,449£ 2,458£ 7,847£ 7,558£ 0.5 0.2 61.92£ 0.1
E14000801 C74 Luton South 3.1 4.9 1.8 2.1 0.9 10.8 6.4 10.4 3.9 6,402£ 9,784£ 4,200£ 8,300£ 2,331£ 7,585£ 7,240£ 0.4 0.2 62.89£ 0.1
E14000806 C79 Maldon 1.1 1.6 0.9 1.1 0.4 4.0 2.0 2.8 1.9 5,943£ 8,682£ 3,649£ 6,871£ 2,395£ 6,306£ 6,204£ 0.2 0.1 45.27£ 0.1
E14000813 C86 Mid Bedfordshire 1.0 1.8 1.2 1.4 0.3 4.3 1.9 3.2 2.5 6,269£ 8,794£ 3,817£ 6,840£ 2,348£ 6,419£ 6,384£ 0.3 0.2 48.50£ 0.1
E14000816 C89 Mid Norfolk 1.2 2.3 1.7 1.4 0.6 5.8 2.4 4.1 3.6 6,423£ 8,682£ 3,778£ 6,576£ 2,319£ 6,017£ 6,103£ 0.2 0.3 40.44£ 0.2
E14000841 D15 North East Bedfordshire 1.4 2.1 1.4 1.6 0.4 5.2 2.7 3.7 2.9 6,299£ 8,935£ 3,626£ 6,808£ 2,254£ 6,373£ 6,353£ 0.4 0.2 50.33£ 0.1
E14000842 D16 North East Cambridgeshire 2.3 3.3 1.9 2.0 1.0 8.4 4.5 5.7 3.9 6,490£ 8,539£ 3,672£ 6,742£ 2,124£ 6,015£ 6,146£ 0.3 0.2 45.85£ 0.2
E14000845 D19 North East Hertfordshire 1.3 1.9 1.1 1.4 0.4 4.7 2.5 3.3 2.4 6,368£ 8,688£ 3,843£ 6,853£ 2,509£ 6,373£ 6,372£ 0.2 0.1 48.76£ 0.1
E14000848 D22 North Norfolk 1.0 2.0 1.2 1.0 0.7 4.9 1.9 3.6 2.5 6,119£ 8,679£ 3,860£ 6,874£ 2,440£ 6,058£ 6,070£ 0.1 0.1 35.81£ 0.2
E14000855 D29 North West Cambridgeshire 2.3 3.4 2.1 2.5 0.7 8.6 4.6 6.0 4.4 6,640£ 8,850£ 3,824£ 6,924£ 2,150£ 6,356£ 6,432£ 0.7 0.4 50.54£ 0.2
E14000859 D33 North West Norfolk 1.8 2.9 1.5 1.8 0.9 7.1 3.4 4.9 3.1 6,393£ 8,468£ 3,712£ 6,803£ 2,227£ 6,033£ 6,124£ 0.2 0.2 42.46£ 0.2
E14000863 D37 Norwich North 1.7 2.6 1.5 1.5 0.7 6.6 3.3 4.6 3.0 6,452£ 8,674£ 3,674£ 6,832£ 2,109£ 6,106£ 6,195£ 0.3 0.2 49.26£ 0.2
E14000864 D38 Norwich South 2.1 2.5 1.2 1.4 0.9 6.7 3.9 4.4 2.4 6,276£ 8,634£ 3,875£ 7,104£ 2,170£ 6,113£ 6,164£ 0.3 0.1 44.86£ 0.2
E14000878 D52 Peterborough 3.5 6.3 2.2 3.2 1.8 13.8 7.3 12.2 4.5 6,671£ 9,401£ 4,019£ 8,011£ 1,972£ 6,972£ 6,894£ 0.6 0.4 56.93£ 0.2
E14000888 D62 Rayleigh and Wickford 1.0 1.7 1.1 1.3 0.4 4.2 1.8 3.0 2.3 5,909£ 8,580£ 3,563£ 6,653£ 2,417£ 6,149£ 6,092£ 0.3 0.1 48.04£ 0.1
E14000899 D73 Rochford and Southend East 3.0 3.3 1.2 2.2 0.9 8.4 5.7 6.0 2.5 6,147£ 9,022£ 3,856£ 7,624£ 2,359£ 6,781£ 6,555£ 0.4 0.2 51.64£ 0.2
E14000910 D84 Saffron Walden 1.0 1.7 1.0 1.3 0.3 4.1 1.8 2.9 2.1 6,016£ 8,715£ 3,640£ 6,768£ 2,478£ 6,292£ 6,224£ 0.2 0.1 50.28£ 0.1
E14000933 E08 South Basildon and East Thurrock 2.4 2.5 1.3 1.7 0.5 6.6 4.6 4.4 2.7 6,429£ 8,838£ 3,935£ 7,152£ 2,203£ 6,546£ 6,504£ 0.3 0.1 53.61£ 0.2
E14000934 E09 South Cambridgeshire 1.0 1.5 1.0 1.2 0.3 3.7 2.0 2.6 2.3 6,581£ 8,608£ 3,648£ 6,536£ 2,399£ 6,160£ 6,270£ 0.3 0.2 44.35£ 0.1
E14000937 E12 South East Cambridgeshire 1.1 1.8 1.4 1.4 0.4 4.7 2.1 3.3 2.9 6,135£ 8,616£ 3,730£ 6,538£ 2,502£ 6,114£ 6,119£ 0.3 0.2 48.34£ 0.1
E14000941 E16 South Norfolk 1.2 2.0 1.4 1.3 0.6 5.2 2.3 3.6 3.0 6,321£ 8,679£ 3,682£ 6,599£ 2,402£ 5,999£ 6,072£ 0.2 0.2 43.85£ 0.1
E14000946 E21 South Suffolk 1.1 1.9 1.2 1.3 0.5 4.7 2.1 3.4 2.5 6,287£ 8,698£ 3,622£ 6,712£ 2,330£ 6,139£ 6,174£ 0.2 0.2 39.57£ 0.1
E14000949 E24 South West Bedfordshire 2.0 2.5 1.5 1.9 0.4 6.4 3.9 4.4 3.2 6,336£ 8,825£ 3,706£ 6,921£ 2,045£ 6,445£ 6,411£ 0.5 0.2 52.58£ 0.1
E14000951 E26 South West Hertfordshire 1.1 1.5 0.9 1.2 0.3 3.8 2.0 2.7 1.8 5,853£ 8,732£ 3,602£ 6,889£ 2,270£ 6,372£ 6,225£ 0.2 0.1 63.42£ 0.1
E14000952 E27 South West Norfolk 1.7 2.6 1.8 1.6 0.8 6.8 3.3 4.6 3.8 6,434£ 8,737£ 3,889£ 6,768£ 2,284£ 6,114£ 6,192£ 0.3 0.3 51.92£ 0.1
E14000957 E32 Southend West 1.4 2.1 1.0 1.4 0.6 5.0 2.5 3.8 2.1 5,971£ 8,880£ 3,805£ 7,293£ 2,336£ 6,535£ 6,379£ 0.3 0.1 49.86£ 0.1
E14000960 E35 St Albans 1.2 1.7 0.7 1.1 0.3 3.9 2.3 3.2 1.5 6,095£ 9,368£ 3,590£ 7,602£ 2,465£ 7,048£ 6,751£ 0.2 0.1 61.60£ 0.1
E14000968 E43 Stevenage 2.0 2.5 1.4 1.8 0.6 6.4 3.9 4.5 2.9 6,493£ 9,000£ 3,907£ 7,189£ 2,320£ 6,570£ 6,546£ 0.4 0.2 58.71£ 0.2
E14000981 E56 Suffolk Coastal 1.2 2.0 1.3 1.3 0.6 5.0 2.2 3.5 2.8 6,311£ 8,749£ 3,797£ 6,815£ 2,426£ 6,164£ 6,198£ 0.2 0.2 44.86£ 0.1
E14000995 E70 Thurrock 3.5 3.9 1.9 2.6 0.6 9.8 6.8 7.0 4.0 6,290£ 9,064£ 3,841£ 7,364£ 2,131£ 6,854£ 6,654£ 0.6 0.2 71.34£ 0.1
E14001021 E96 Watford 1.9 3.0 1.4 1.9 0.5 6.9 3.6 5.6 2.9 6,070£ 8,959£ 3,606£ 7,237£ 2,464£ 6,729£ 6,550£ 0.4 0.2 62.61£ 0.1
E14001022 E97 Waveney 2.3 2.9 1.6 1.7 0.9 7.6 4.4 5.2 3.5 6,526£ 8,840£ 3,968£ 7,075£ 2,327£ 6,320£ 6,381£ 0.2 0.2 44.01£ 0.2
E14001027 F03 Welwyn Hatfield 1.7 2.2 1.2 1.7 0.4 5.6 3.3 4.0 2.5 6,082£ 8,884£ 3,692£ 7,060£ 2,420£ 6,556£ 6,409£ 0.3 0.1 58.65£ 0.1
E14001034 F10 West Suffolk 1.5 2.5 1.8 1.7 0.6 6.3 2.9 4.2 3.7 6,111£ 8,574£ 3,824£ 6,585£ 2,344£ 6,093£ 6,098£ 0.3 0.2 47.27£ 0.2
E14001045 F21 Witham 1.1 1.7 1.1 1.2 0.4 4.3 2.1 2.9 2.4 6,181£ 8,651£ 3,729£ 6,654£ 2,253£ 6,103£ 6,123£ 0.2 0.1 49.39£ 0.1
Table 3 HMRC] HM Revenue and Customs
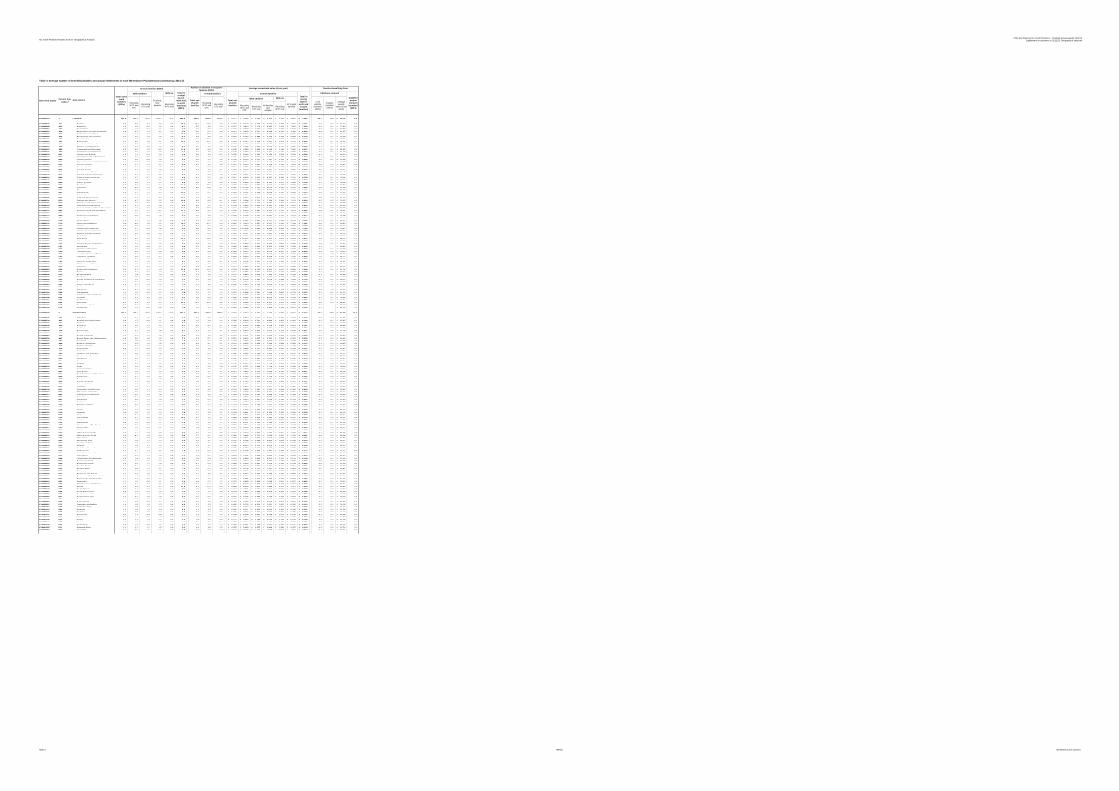
Tax Credit Finalised Awards 2014-15: Geographical AnalysisChild and Working Tax Credit Statistics - Finalised annual awards 2012/13
Supplement on payments in 2012/13: Geographical analyses
Table 3: Average number of benefiting families and annual entitlements in each Westminster Parliamentary Constituency, 2014-15
With no
childrenWith no
childrenNew Area Codes 1 Current Area
Codes 2Area names
In-work families (000's)
With children
Receiving CTC only
Total out-of-
work
families
(000's)Couples (number) (000's)
Average weekly
value (£ per week)
Receiving WTC only
Total in
receipt
(out-of-
work and
in-work
families)
Childcare element
Lone parents
(number) (000's)
Total out-
of-work
families Receiving WTC and
CTC
Receiving CTC only
All families with
children
In-work families
Receiving WTC only
Receiving WTC and
CTC
All in-work families
Receiving CTC only
Number of children in recipient
families (000's)
Receiving WTC and
CTC
Of which, lone
parents
Disabled
worker
element
(number)
(000's)
Total in
receipt
(out-of-
work and
in-work
families)
(000's)
Average annualised value (£ per year)
With children
In-work families
Families benefiting from:
Total out-
of-work
families
E15000007 7 LONDON 204.9 256.7 80.8 159.4 46.4 588.9 390.5 502.5 164.3 6,111£ 9,678£ 3,769£ 8,263£ 2,372£ 7,551£ 7,050£ 39.1 9.4 78.16£ 8.3
E14000540 A11 Barking 5.3 6.5 2.3 4.0 0.9 15.0 10.7 12.9 4.9 6,404£ 9,774£ 3,928£ 8,244£ 2,292£ 7,684£ 7,231£ 1.0 0.3 83.12£ 0.2
E14000549 A20 Battersea 1.9 1.9 0.5 1.5 0.4 4.7 3.5 3.6 1.0 6,077£ 9,810£ 3,774£ 8,493£ 2,413£ 7,642£ 7,018£ 0.4 0.1 77.89£ 0.1
E14000551 A22 Beckenham 1.0 1.3 0.7 1.1 0.2 3.2 1.8 2.2 1.4 5,775£ 8,678£ 3,620£ 6,994£ 2,369£ 6,504£ 6,279£ 0.3 0.1 59.88£ 0.1
E14000553 A24 Bermondsey and Old Southwark 3.8 3.7 1.2 3.2 0.7 9.4 7.0 6.7 2.4 6,012£ 9,470£ 3,721£ 8,098£ 2,327£ 7,382£ 6,828£ 0.9 0.1 81.57£ 0.1
E14000555 A26 Bethnal Green and Bow 4.5 4.7 1.1 1.4 0.7 10.9 9.3 10.9 2.4 6,652£ 10,471£ 4,297£ 9,347£ 2,506£ 8,595£ 7,802£ 0.3 0.1 81.14£ 0.1
E14000558 A29 Bexleyheath and Crayford 2.0 2.0 1.0 1.6 0.3 5.4 3.9 3.7 2.2 6,354£ 9,184£ 3,895£ 7,426£ 2,345£ 6,906£ 6,700£ 0.4 0.1 72.09£ 0.1
E14000591 A62 Brent Central 4.4 6.7 1.6 4.0 1.2 13.9 8.6 13.9 3.2 6,161£ 10,097£ 3,886£ 8,898£ 2,208£ 8,082£ 7,467£ 1.0 0.1 82.33£ 0.1
E14000592 A63 Brent North 2.5 5.0 1.9 2.1 0.8 10.2 4.8 10.2 3.8 6,033£ 9,457£ 3,679£ 7,862£ 2,251£ 7,277£ 6,976£ 0.5 0.1 75.35£ 0.1
E14000593 A64 Brentford and Isleworth 2.5 3.3 1.2 1.9 0.6 7.7 4.8 6.2 2.4 5,953£ 9,193£ 3,657£ 7,692£ 2,281£ 7,045£ 6,686£ 0.4 0.1 68.49£ 0.1
E14000604 A75 Bromley and Chislehurst 1.9 2.0 0.8 1.6 0.3 5.1 3.5 3.5 1.6 6,221£ 9,166£ 3,690£ 7,619£ 2,473£ 7,065£ 6,752£ 0.4 0.1 71.46£ 0.1
E14000615 A86 Camberwell and Peckham 4.5 4.6 1.5 4.0 0.8 11.4 8.5 8.4 3.0 6,105£ 9,580£ 3,869£ 8,196£ 2,249£ 7,463£ 6,927£ 1.1 0.1 85.95£ 0.2
E14000621 A92 Carshalton and Wallington 2.2 2.5 1.2 1.8 0.4 6.3 4.0 4.5 2.4 6,178£ 9,068£ 3,674£ 7,321£ 2,415£ 6,858£ 6,624£ 0.5 0.1 61.98£ 0.1
E14000629 B01 Chelsea and Fulham 1.5 1.3 0.3 1.0 0.3 3.4 2.6 2.4 0.7 5,779£ 9,282£ 3,762£ 8,156£ 2,473£ 7,205£ 6,596£ 0.2 - 68.70£ 0.1
E14000634 B06 Chingford and Woodford Green 1.9 2.3 0.8 1.6 0.4 5.4 3.6 4.2 1.7 6,045£ 9,192£ 3,597£ 7,696£ 2,424£ 7,110£ 6,741£ 0.4 0.1 69.97£ 0.1
E14000636 B08 Chipping Barnet 2.0 2.6 0.9 1.8 0.5 6.0 3.6 4.7 1.6 5,730£ 9,218£ 3,472£ 7,781£ 2,475£ 7,141£ 6,668£ 0.5 0.1 62.68£ 0.1
E14000639 B11 Cities of London and Westminster 1.4 1.2 0.3 0.8 0.3 3.2 2.6 2.1 0.6 5,896£ 9,404£ 3,524£ 8,143£ 2,496£ 7,057£ 6,548£ 0.2 - 73.67£ 0.1
E14000654 B26 Croydon Central 3.5 4.1 1.4 3.2 0.6 9.5 6.7 7.5 2.9 6,257£ 9,530£ 3,987£ 8,139£ 2,338£ 7,602£ 7,113£ 0.9 0.2 76.83£ 0.1
E14000655 B27 Croydon North 4.6 6.4 1.8 4.5 1.0 13.8 8.5 11.8 3.6 5,961£ 9,572£ 3,556£ 8,222£ 2,345£ 7,580£ 7,045£ 1.5 0.2 80.20£ 0.2
E14000656 B28 Croydon South 1.8 2.4 1.0 1.8 0.4 5.6 3.4 4.2 2.1 6,022£ 9,279£ 3,625£ 7,551£ 2,406£ 7,057£ 6,718£ 0.6 0.2 70.27£ 0.1
E14000657 B29 Dagenham and Rainham 3.5 4.0 1.5 2.8 0.6 9.6 6.8 7.7 3.1 6,224£ 9,644£ 3,823£ 8,058£ 2,303£ 7,460£ 7,011£ 0.7 0.2 81.47£ 0.1
E14000673 B45 Dulwich and West Norwood 3.1 3.2 1.0 2.8 0.7 8.0 5.7 5.8 1.8 5,909£ 9,565£ 3,497£ 8,171£ 2,292£ 7,375£ 6,800£ 0.9 0.1 78.06£ 0.1
E14000674 B46 Ealing Central and Acton 2.3 2.7 0.7 1.6 0.7 6.4 4.1 5.2 1.4 5,811£ 9,628£ 3,633£ 8,367£ 2,206£ 7,313£ 6,778£ 0.4 0.1 79.04£ 0.1
E14000675 B47 Ealing North 3.2 5.0 1.7 2.5 0.8 10.8 6.3 9.9 3.5 6,121£ 9,455£ 3,703£ 7,971£ 2,241£ 7,339£ 6,974£ 0.6 0.1 74.40£ 0.1
E14000676 B48 Ealing, Southall 2.3 3.8 1.3 1.4 0.6 8.0 4.6 7.9 2.8 6,252£ 9,669£ 3,951£ 8,182£ 2,261£ 7,580£ 7,194£ 0.3 0.1 79.09£ 0.1
E14000679 B51 East Ham 4.7 8.3 2.3 3.4 1.3 16.5 9.4 17.4 4.9 6,353£ 9,954£ 3,978£ 8,642£ 2,457£ 7,985£ 7,524£ 0.6 0.2 93.50£ 0.2
E14000687 B59 Edmonton 4.9 6.6 1.3 3.9 0.8 13.7 9.5 13.8 2.7 6,091£ 10,109£ 3,761£ 9,042£ 2,325£ 8,432£ 7,589£ 0.9 0.1 82.09£ 0.1
E14000690 B62 Eltham 2.2 2.2 1.0 1.7 0.4 5.8 4.1 4.0 2.1 6,183£ 9,176£ 4,005£ 7,597£ 2,408£ 6,961£ 6,666£ 0.4 0.1 75.37£ 0.1
E14000691 B63 Enfield North 3.9 4.7 1.2 3.2 0.5 10.3 7.3 9.1 2.4 5,993£ 9,745£ 3,688£ 8,538£ 2,379£ 8,058£ 7,274£ 0.8 0.1 74.03£ 0.1
E14000692 B64 Enfield, Southgate 1.7 2.6 0.8 1.5 0.6 5.7 3.0 4.6 1.4 5,622£ 9,091£ 3,467£ 7,826£ 2,433£ 6,998£ 6,582£ 0.4 0.1 70.95£ 0.1
E14000696 B68 Erith and Thamesmead 4.0 4.2 1.7 3.3 0.6 10.5 7.8 8.2 3.7 6,323£ 9,819£ 3,876£ 8,102£ 2,277£ 7,591£ 7,113£ 0.8 0.2 91.33£ 0.1
E14000701 B73 Feltham and Heston 3.4 4.7 2.0 2.5 0.8 10.9 6.9 9.3 4.1 6,410£ 9,394£ 3,731£ 7,706£ 2,296£ 7,153£ 6,920£ 0.5 0.2 70.55£ 0.2
E14000703 B75 Finchley and Golders Green 1.9 2.9 0.7 1.5 0.7 6.2 3.4 6.1 1.7 5,715£ 10,220£ 4,159£ 8,975£ 2,336£ 7,901£ 7,233£ 0.3 0.2 83.77£ 0.1
E14000718 B90 Greenwich and Woolwich 3.6 3.7 1.3 2.8 0.7 9.3 6.9 7.1 2.7 6,109£ 9,682£ 3,943£ 8,187£ 2,397£ 7,501£ 6,957£ 0.7 0.1 87.00£ 0.1
E14000720 B92 Hackney North and Stoke Newington 4.1 6.0 1.1 2.7 1.2 12.3 7.8 15.8 2.5 6,110£ 12,588£ 4,294£ 11,309£ 2,482£ 10,032£ 8,742£ 0.7 0.7 119.07£ 0.1
E14000721 B93 Hackney South and Shoreditch 4.7 4.3 1.1 3.3 1.0 11.1 8.9 8.2 2.3 6,020£ 9,603£ 3,891£ 8,412£ 2,431£ 7,518£ 6,886£ 0.8 0.1 78.46£ 0.1
E14000726 B98 Hammersmith 2.8 2.7 0.7 2.1 0.6 6.8 5.2 5.1 1.5 5,992£ 9,493£ 3,857£ 8,285£ 2,498£ 7,462£ 6,858£ 0.5 0.1 71.81£ 0.1
E14000727 B99 Hampstead and Kilburn 2.5 2.5 0.6 1.6 0.6 6.2 4.6 4.8 1.2 5,939£ 9,799£ 3,642£ 8,587£ 2,374£ 7,573£ 6,914£ 0.4 0.1 75.08£ 0.1
E14000731 C04 Harrow East 1.7 3.4 1.2 1.4 0.5 6.8 3.5 7.3 2.4 6,407£ 9,910£ 3,788£ 8,325£ 2,515£ 7,719£ 7,384£ 0.2 0.1 70.80£ 0.1
E14000732 C05 Harrow West 1.9 3.4 1.0 1.5 0.5 6.9 3.7 6.9 2.0 6,023£ 9,656£ 3,552£ 8,231£ 2,330£ 7,637£ 7,183£ 0.3 0.1 70.32£ 0.1
E14000737 C10 Hayes and Harlington 3.4 4.8 1.8 2.5 0.6 10.7 6.9 10.1 3.9 6,482£ 9,910£ 3,857£ 8,231£ 2,341£ 7,749£ 7,341£ 0.6 0.1 80.82£ 0.1
E14000741 C14 Hendon 2.8 4.8 1.4 2.5 0.8 9.8 5.4 9.8 2.8 6,134£ 9,887£ 3,925£ 8,572£ 2,364£ 7,855£ 7,358£ 0.5 0.2 82.11£ 0.1
E14000750 C23 Holborn and St Pancras 3.5 3.1 0.8 1.8 0.8 8.2 6.9 6.5 1.6 6,414£ 10,006£ 3,960£ 8,828£ 2,506£ 7,765£ 7,187£ 0.4 0.1 74.97£ 0.2
E14000751 C24 Hornchurch and Upminster 1.9 2.2 1.1 1.7 0.4 5.5 3.8 3.9 2.3 6,292£ 8,940£ 3,671£ 7,199£ 2,453£ 6,712£ 6,567£ 0.3 0.1 58.47£ 0.1
E14000752 C25 Hornsey and Wood Green 2.4 3.0 0.8 2.0 0.9 7.1 4.3 5.2 1.4 5,791£ 9,131£ 3,400£ 7,927£ 2,355£ 6,827£ 6,474£ 0.5 0.1 70.70£ 0.1
E14000759 C32 Ilford North 2.0 3.4 1.1 1.9 0.6 7.2 3.9 6.4 2.3 6,083£ 9,262£ 3,571£ 7,843£ 2,471£ 7,203£ 6,884£ 0.4 0.1 77.19£ 0.1
E14000760 C33 Ilford South 3.6 6.2 1.6 2.4 0.9 12.3 7.4 13.0 3.6 6,360£ 10,004£ 3,866£ 8,712£ 2,607£ 8,073£ 7,573£ 0.5 0.2 85.40£ 0.1
E14000763 C36 Islington North 3.2 2.6 0.6 1.9 0.7 7.2 5.9 5.2 1.3 6,032£ 9,894£ 3,812£ 8,703£ 2,561£ 7,639£ 6,925£ 0.5 0.1 69.85£ 0.1
E14000764 C37 Islington South and Finsbury 3.1 2.4 0.7 1.8 0.5 6.7 5.6 4.3 1.3 5,901£ 9,357£ 3,701£ 8,098£ 2,562£ 7,255£ 6,629£ 0.5 0.1 64.94£ 0.2
E14000768 C41 Kensington 1.9 1.6 0.4 1.2 0.5 4.4 3.3 2.9 0.8 5,686£ 9,403£ 3,666£ 8,205£ 2,569£ 7,033£ 6,462£ 0.3 - 69.85£ 0.1
E14000770 C43 Kingston and Surbiton 1.7 2.5 0.9 1.4 0.5 5.6 3.1 4.5 1.9 5,913£ 8,982£ 3,682£ 7,531£ 2,420£ 6,933£ 6,619£ 0.3 0.1 60.29£ 0.1
E14000787 C60 Lewisham East 3.4 3.8 1.2 2.9 0.6 9.0 6.2 6.9 2.4 6,082£ 9,477£ 3,733£ 8,072£ 2,361£ 7,484£ 6,960£ 0.9 0.2 79.72£ 0.1
E14000788 C61 Lewisham West and Penge 3.4 3.6 1.2 3.0 0.6 8.8 6.1 6.2 2.2 5,877£ 9,396£ 3,528£ 7,949£ 2,429£ 7,283£ 6,742£ 1.0 0.2 79.30£ 0.1
E14000789 C62 Lewisham, Deptford 3.7 3.9 1.2 3.2 0.8 9.6 6.8 7.0 2.4 5,950£ 9,663£ 3,822£ 8,258£ 2,412£ 7,476£ 6,890£ 1.0 0.2 85.17£ 0.1
E14000790 C63 Leyton and Wanstead 2.4 3.6 1.2 2.0 0.9 8.2 4.7 6.8 2.5 6,018£ 9,318£ 3,664£ 7,882£ 2,267£ 6,971£ 6,687£ 0.5 0.1 77.76£ 0.1
E14000823 C96 Mitcham and Morden 2.7 4.4 1.6 2.4 0.7 9.4 5.2 8.2 3.1 6,149£ 9,228£ 3,667£ 7,779£ 2,320£ 7,178£ 6,883£ 0.7 0.2 75.36£ 0.1
E14000869 D43 Old Bexley and Sidcup 1.2 1.6 0.8 1.2 0.3 3.8 2.2 2.7 1.6 5,917£ 8,719£ 3,680£ 7,012£ 2,447£ 6,532£ 6,340£ 0.3 0.1 63.41£ 0.1
E14000872 D46 Orpington 1.4 1.6 0.8 1.2 0.3 4.0 2.7 2.8 1.6 6,314£ 9,030£ 3,832£ 7,342£ 2,541£ 6,870£ 6,673£ 0.3 0.1 56.90£ 0.1
E14000882 D56 Poplar and Limehouse 5.0 5.7 1.2 1.9 0.7 12.6 10.4 13.3 2.6 6,559£ 10,586£ 4,259£ 9,502£ 2,417£ 8,864£ 7,939£ 0.3 0.1 81.24£ 0.1
E14000887 D61 Putney 1.7 2.1 0.6 1.2 0.4 4.8 3.4 4.2 1.1 6,411£ 9,855£ 3,731£ 8,563£ 2,343£ 7,792£ 7,288£ 0.3 - 68.63£ 0.1
E14000896 D70 Richmond Park 1.2 1.4 0.5 1.0 0.3 3.5 2.2 2.4 1.1 5,731£ 8,840£ 3,624£ 7,386£ 2,402£ 6,768£ 6,399£ 0.2 0.1 66.88£ 0.1
E14000900 D74 Romford 2.0 2.5 1.1 1.9 0.4 6.1 3.6 4.4 2.3 5,836£ 8,967£ 3,614£ 7,308£ 2,433£ 6,795£ 6,480£ 0.5 0.1 64.60£ 0.1
E14000906 D80 Ruislip, Northwood and Pinner 1.1 1.5 0.6 1.0 0.2 3.5 2.0 2.8 1.3 5,931£ 9,208£ 3,681£ 7,619£ 2,388£ 7,083£ 6,718£ 0.3 0.1 68.22£ 0.1
E14000978 E53 Streatham 2.9 3.5 1.0 2.8 0.9 8.3 5.4 6.2 1.9 5,996£ 9,378£ 3,774£ 8,141£ 2,326£ 7,213£ 6,783£ 0.8 0.1 77.65£ 0.1
E14000984 E59 Sutton and Cheam 1.3 2.1 1.0 1.3 0.3 4.7 2.2 3.6 2.0 5,705£ 8,662£ 3,428£ 6,919£ 2,424£ 6,507£ 6,290£ 0.3 0.1 62.94£ 0.1
E14000998 E73 Tooting 1.9 2.5 0.6 1.5 0.5 5.5 3.6 4.8 1.2 6,001£ 9,813£ 3,770£ 8,629£ 2,471£ 7,798£ 7,173£ 0.4 0.1 80.98£ 0.1
E14001002 E77 Tottenham 5.1 7.1 1.5 4.2 1.6 15.3 9.6 14.6 2.8 6,021£ 10,133£ 3,884£ 9,069£ 2,217£ 7,973£ 7,325£ 0.8 0.3 93.36£ 0.1
E14001005 E80 Twickenham 1.3 1.6 0.6 1.2 0.3 3.8 2.2 2.7 1.2 5,657£ 8,694£ 3,601£ 7,264£ 2,462£ 6,733£ 6,375£ 0.3 0.1 61.55£ 0.1
E14001007 E82 Uxbridge and South Ruislip 1.9 2.4 1.1 1.6 0.3 5.7 3.7 4.5 2.2 6,167£ 9,359£ 3,533£ 7,528£ 2,361£ 7,071£ 6,766£ 0.4 0.1 67.80£ 0.1
E14001008 E83 Vauxhall 3.1 3.3 1.0 2.9 0.7 8.2 5.8 5.9 1.9 5,946£ 9,345£ 3,675£ 8,014£ 2,241£ 7,159£ 6,692£ 0.7 0.1 76.66£ 0.1
E14001013 E88 Walthamstow 3.6 5.0 1.5 2.6 1.0 11.2 7.1 9.7 3.1 6,230£ 9,501£ 3,625£ 8,108£ 2,324£ 7,319£ 6,966£ 0.7 0.2 71.96£ 0.1
E14001032 F08 West Ham 5.2 7.7 2.3 4.4 1.6 16.7 10.2 15.3 4.5 6,214£ 9,639£ 3,724£ 8,301£ 2,261£ 7,482£ 7,087£ 0.9 0.2 85.77£ 0.2
E14001036 F12 Westminster North 3.2 2.7 0.5 1.6 0.5 6.9 6.1 5.4 1.0 6,075£ 9,793£ 3,752£ 8,838£ 2,590£ 8,037£ 7,122£ 0.3 - 73.48£ 0.1
E14001040 F16 Wimbledon 0.9 1.3 0.5 0.8 0.3 2.9 1.6 2.2 1.0 5,752£ 8,787£ 3,717£ 7,375£ 2,403£ 6,691£ 6,400£ 0.2 - 66.23£ 0.1
E15000008 8 SOUTH EAST 131.2 188.1 99.9 129.4 43.0 462.2 251.2 338.4 209.4 6,262£ 8,914£ 3,787£ 7,136£ 2,365£ 6,516£ 6,444£ 27.1 14.3 51.99£ 11.4
E14000530 A01 Aldershot 1.6 2.1 1.5 1.6 0.3 5.6 3.0 3.8 3.2 6,197£ 8,853£ 3,512£ 6,617£ 2,330£ 6,253£ 6,237£ 0.3 0.2 57.56£ 0.1
E14000534 A05 Arundel and South Downs 0.8 1.7 0.9 1.1 0.4 3.8 1.5 2.9 2.0 5,780£ 8,624£ 3,701£ 6,860£ 2,467£ 6,291£ 6,182£ 0.2 0.1 47.97£ 0.1
E14000536 A07 Ashford 2.2 3.1 1.7 2.0 0.7 7.7 4.4 5.5 3.6 6,451£ 8,892£ 3,788£ 7,037£ 2,372£ 6,454£ 6,453£ 0.5 0.3 49.37£ 0.2
E14000538 A09 Aylesbury 1.5 2.6 1.4 1.7 0.5 6.1 3.0 5.2 3.1 6,376£ 9,325£ 3,967£ 7,449£ 2,360£ 6,917£ 6,781£ 0.4 0.2 59.99£ 0.1
E14000539 A10 Banbury 1.6 2.5 1.8 1.8 0.5 6.4 3.1 4.6 3.9 6,235£ 8,846£ 3,835£ 6,784£ 2,415£ 6,327£ 6,304£ 0.4 0.3 51.34£ 0.2
E14000545 A16 Basingstoke 1.8 2.4 1.5 1.9 0.4 6.1 3.4 4.4 3.1 6,419£ 8,922£ 3,844£ 7,022£ 2,154£ 6,549£ 6,511£ 0.5 0.2 54.19£ 0.2
E14000550 A21 Beaconsfield 1.0 1.3 0.7 1.0 0.3 3.1 1.8 2.2 1.4 6,057£ 8,871£ 3,730£ 7,109£ 2,513£ 6,534£ 6,389£ 0.2 0.1 62.51£ 0.1
E14000557 A28 Bexhill and Battle 1.4 2.3 1.2 1.5 0.7 5.5 2.5 4.0 2.5 6,201£ 8,721£ 3,853£ 7,058£ 2,383£ 6,315£ 6,287£ 0.3 0.2 45.93£ 0.2
E14000576 A47 Bognor Regis and Littlehampton 1.8 3.0 1.6 1.9 0.9 7.3 3.3 5.2 3.1 5,872£ 8,432£ 3,637£ 6,792£ 2,033£ 6,015£ 5,979£ 0.3 0.2 46.46£ 0.2
E14000586 A57 Bracknell 1.4 1.9 1.2 1.6 0.3 4.8 2.7 3.4 2.6 6,323£ 8,890£ 3,982£ 6,996£ 2,324£ 6,626£ 6,538£ 0.4 0.1 57.58£ 0.1
E14000597 A68 Brighton, Kemptown 2.0 2.4 1.0 1.6 0.9 6.3 3.8 4.1 2.1 6,191£ 8,802£ 3,938£ 7,336£ 2,589£ 6,369£ 6,312£ 0.3 0.2 44.63£ 0.2
E14000598 A69 Brighton, Pavilion 1.4 2.0 0.9 1.4 1.1 5.3 2.5 3.2 1.7 5,688£ 8,478£ 3,375£ 6,894£ 2,559£ 5,729£ 5,718£ 0.4 0.2 46.99£ 0.2
E14000608 A79 Buckingham 0.8 1.4 0.9 1.0 0.3 3.3 1.6 2.5 1.9 6,369£ 8,866£ 3,741£ 6,884£ 2,450£ 6,373£ 6,372£ 0.2 0.1 50.82£ 0.1
E14000619 A90 Canterbury 1.5 2.1 1.1 1.3 0.6 5.3 3.0 3.7 2.2 6,603£ 8,923£ 3,943£ 7,223£ 2,314£ 6,426£ 6,478£ 0.3 0.2 42.21£ 0.2
E14000626 A97 Chatham and Aylesford 2.7 2.9 1.5 1.9 0.6 7.7 5.3 5.3 3.1 6,496£ 9,088£ 3,789£ 7,306£ 2,234£ 6,671£ 6,610£ 0.4 0.2 52.12£ 0.1
E14000631 B03 Chesham and Amersham 0.8 1.3 0.7 0.9 0.2 3.0 1.5 2.4 1.4 6,120£ 8,892£ 3,533£ 7,087£ 2,496£ 6,581£ 6,458£ 0.2 0.1 55.92£ 0.1
E14000633 B05 Chichester 1.3 2.0 1.1 1.4 0.6 4.9 2.3 3.6 2.3 5,939£ 8,742£ 3,892£ 7,040£ 2,448£ 6,346£ 6,242£ 0.2 0.2 49.67£ 0.1
E14000652 B24 Crawley 2.3 3.4 1.6 2.1 0.5 7.8 4.4 6.4 3.4 6,145£ 9,011£ 3,782£ 7,322£ 2,384£ 6,900£ 6,680£ 0.4 0.2 58.84£ 0.2
E14000659 B31 Dartford 2.0 2.5 1.4 1.9 0.5 6.4 3.7 4.5 2.8 6,146£ 9,017£ 3,714£ 7,178£ 2,354£ 6,647£ 6,490£ 0.4 0.2 63.73£ 0.1
E14000670 B42 Dover 2.2 2.9 1.4 1.8 0.8 7.2 4.3 5.0 2.8 6,375£ 8,767£ 3,696£ 7,119£ 2,302£ 6,358£ 6,364£ 0.3 0.2 39.26£ 0.2
E14000680 B52 East Hampshire 1.0 1.6 1.0 1.1 0.3 3.8 1.8 2.8 2.1 6,150£ 8,822£ 3,763£ 6,847£ 2,423£ 6,372£ 6,316£ 0.2 0.1 53.74£ 0.1
E14000681 B53 East Surrey 1.2 1.8 1.0 1.4 0.3 4.3 2.3 3.1 2.1 6,012£ 8,932£ 3,770£ 7,058£ 2,425£ 6,582£ 6,421£ 0.3 0.1 58.76£ 0.1
E14000682 B54 East Worthing and Shoreham 1.5 2.3 1.4 1.6 0.6 5.8 2.8 4.2 2.9 6,114£ 8,681£ 3,749£ 6,859£ 2,273£ 6,223£ 6,195£ 0.3 0.2 47.06£ 0.2
E14000684 B56 Eastbourne 2.1 3.1 1.5 2.0 0.9 7.7 3.9 5.5 3.2 6,008£ 8,792£ 3,977£ 7,218£ 2,211£ 6,394£ 6,287£ 0.4 0.3 43.07£ 0.2
E14000685 B57 Eastleigh 1.3 2.3 1.4 1.7 0.5 5.5 2.4 4.0 3.0 6,258£ 8,761£ 3,600£ 6,804£ 2,482£ 6,308£ 6,297£ 0.4 0.2 49.51£ 0.2
E14000694 B66 Epsom and Ewell 1.0 1.4 0.8 1.1 0.2 3.4 1.8 2.4 1.6 6,054£ 8,750£ 3,555£ 6,860£ 2,393£ 6,431£ 6,321£ 0.2 0.1 58.30£ 0.1
E14000697 B69 Esher and Walton 1.2 1.5 0.7 1.1 0.2 3.6 2.1 2.5 1.4 6,037£ 8,599£ 3,751£ 7,005£ 2,444£ 6,542£ 6,377£ 0.2 0.1 53.28£ 0.1
E14000699 B71 Fareham 0.9 1.7 1.1 1.4 0.4 4.1 1.6 3.0 2.3 5,950£ 8,804£ 3,702£ 6,851£ 2,455£ 6,366£ 6,275£ 0.3 0.2 50.70£ 0.1
E14000700 B72 Faversham and Mid Kent 1.6 2.0 1.1 1.3 0.5 5.3 3.2 3.6 2.4 6,579£ 8,890£ 3,802£ 7,052£ 2,424£ 6,392£ 6,450£ 0.3 0.2 50.95£ 0.1
E14000704 B76 Folkestone and Hythe 2.3 3.0 1.4 2.0 0.9 7.7 4.6 5.4 2.9 6,453£ 8,969£ 3,782£ 7,321£ 2,338£ 6,506£ 6,490£ 0.4 0.2 43.14£ 0.2
E14000711 B83 Gillingham and Rainham 2.3 2.6 1.5 1.8 0.6 7.0 4.3 4.6 3.1 6,295£ 8,778£ 3,794£ 6,988£ 2,286£ 6,358£ 6,337£ 0.4 0.2 49.30£ 0.2
E14000713 B85 Gosport 1.7 2.4 1.4 1.8 0.6 6.1 3.2 4.3 3.1 6,304£ 8,948£ 3,831£ 7,037£ 2,205£ 6,411£ 6,382£ 0.4 0.2 48.94£ 0.2
E14000715 B87 Gravesham 2.3 2.9 1.4 1.9 0.6 7.2 4.5 5.3 2.9 6,519£ 9,074£ 3,861£ 7,379£ 2,236£ 6,718£ 6,655£ 0.3 0.1 63.50£ 0.1
E14000719 B91 Guildford 1.1 1.4 0.8 1.0 0.3 3.5 2.0 2.4 1.6 6,122£ 8,697£ 3,721£ 6,906£ 2,521£ 6,420£ 6,327£ 0.2 0.1 51.01£ 0.1
E14000735 C08 Hastings and Rye 3.0 3.6 1.6 2.2 1.2 9.4 5.6 6.4 3.1 6,223£ 8,792£ 3,758£ 7,274£ 2,369£ 6,329£ 6,295£ 0.4 0.3 43.74£ 0.3
E14000736 C09 Havant 2.0 2.4 1.3 1.6 0.6 6.3 3.9 4.3 2.9 6,587£ 8,997£ 4,000£ 7,229£ 2,357£ 6,530£ 6,548£ 0.4 0.2 45.22£ 0.2
E14000742 C15 Henley 0.7 1.2 0.8 0.9 0.3 2.9 1.3 2.0 1.7 5,964£ 8,607£ 3,788£ 6,620£ 2,429£ 6,106£ 6,072£ 0.2 0.1 51.89£ 0.1
E14000753 C26 Horsham 0.9 1.6 1.0 1.3 0.3 3.8 1.7 2.8 2.1 6,194£ 8,681£ 3,712£ 6,784£ 2,387£ 6,268£ 6,250£ 0.2 0.1 49.18£ 0.1
E14000755 C28 Hove 1.5 2.4 1.0 1.7 0.9 5.9 2.6 4.1 1.9 5,581£ 8,733£ 3,591£ 7,249£ 2,466£ 6,252£ 6,077£ 0.4 0.2 50.81£ 0.2
E14000762 C35 Isle of Wight 2.6 4.1 2.0 2.4 1.5 10.3 4.7 7.2 4.1 5,989£ 8,692£ 3,826£ 7,085£ 2,450£ 6,181£ 6,132£ 0.5 0.4 36.34£ 0.3
E14000786 C59 Lewes 1.2 1.9 1.0 1.3 0.5 4.7 2.3 3.3 2.2 6,086£ 8,738£ 3,717£ 6,959£ 2,529£ 6,281£ 6,231£ 0.3 0.2 44.99£ 0.1
E14000803 C76 Maidenhead 0.9 1.6 0.8 1.1 0.3 3.5 1.6 3.0 1.7 6,155£ 9,101£ 3,763£ 7,288£ 2,472£ 6,777£ 6,625£ 0.2 0.1 62.28£ 0.1
E14000804 C77 Maidstone and The Weald 1.5 2.3 1.2 1.6 0.6 5.5 2.8 3.9 2.4 5,973£ 8,794£ 3,605£ 7,004£ 2,304£ 6,347£ 6,246£ 0.3 0.2 57.72£ 0.1
E14000811 C84 Meon Valley 0.9 1.6 0.9 1.1 0.4 3.9 1.8 3.0 2.1 6,311£ 8,903£ 3,815£ 7,037£ 2,478£ 6,406£ 6,384£ 0.2 0.2 48.27£ 0.1
E14000817 C90 Mid Sussex 1.0 1.8 1.1 1.4 0.3 4.1 1.8 3.2 2.2 6,157£ 8,598£ 3,725£ 6,800£ 2,464£ 6,349£ 6,305£ 0.3 0.2 47.40£ 0.1
E14000821 C94 Milton Keynes North 2.5 4.1 1.8 2.8 0.7 9.0 5.0 7.9 3.8 6,418£ 9,523£ 3,803£ 7,780£ 2,351£ 7,236£ 7,011£ 0.7 0.3 60.98£ 0.2
E14000822 C95 Milton Keynes South 2.9 4.2 1.9 3.0 0.6 9.6 5.7 8.1 4.0 6,386£ 9,466£ 3,753£ 7,668£ 2,265£ 7,205£ 6,961£ 0.8 0.3 60.04£ 0.2
E14000824 C97 Mole Valley 0.8 1.1 0.7 0.8 0.3 2.9 1.5 2.0 1.4 6,097£ 8,711£ 3,729£ 6,840£ 2,592£ 6,246£ 6,206£ 0.1 0.1 52.70£ 0.1
E14000827 D01 New Forest East 1.2 1.8 1.1 1.3 0.4 4.4 2.2 3.1 2.4 6,231£ 8,798£ 3,666£ 6,804£ 2,587£ 6,339£ 6,310£ 0.2 0.2 48.21£ 0.1
E14000828 D02 New Forest West 0.8 1.5 0.9 1.0 0.4 3.6 1.5 2.6 1.8 5,985£ 8,662£ 3,665£ 6,819£ 2,517£ 6,198£ 6,150£ 0.2 0.1 43.36£ 0.1
E14000830 D04 Newbury 1.2 1.8 1.2 1.4 0.3 4.5 2.3 3.2 2.5 6,468£ 8,844£ 4,013£ 6,946£ 2,219£ 6,523£ 6,508£ 0.3 0.2 58.40£ 0.1
E14000844 D18 North East Hampshire 0.7 1.2 0.8 1.0 0.2 2.9 1.3 2.1 1.6 5,985£ 8,737£ 3,610£ 6,713£ 2,622£ 6,283£ 6,211£ 0.2 0.1 54.13£ 0.1
E14000852 D26 North Thanet 2.2 3.1 1.4 2.0 0.9 7.8 4.3 5.6 2.9 6,332£ 9,008£ 3,826£ 7,381£ 2,383£ 6,531£ 6,474£ 0.4 0.3 45.27£ 0.2
E14000857 D31 North West Hampshire 1.2 1.8 1.3 1.5 0.3 4.6 2.3 3.3 2.7 6,345£ 8,744£ 3,794£ 6,747£ 2,507£ 6,328£ 6,332£ 0.3 0.2 55.69£ 0.1
E14000873 D47 Oxford East 2.3 2.7 1.2 1.8 0.5 6.7 4.7 5.1 2.7 6,569£ 9,266£ 3,965£ 7,598£ 2,335£ 7,025£ 6,867£ 0.4 0.2 56.94£ 0.1
E14000874 D48 Oxford West and Abingdon 1.0 1.4 1.0 1.2 0.3 3.7 1.8 2.4 2.0 6,161£ 8,680£ 3,609£ 6,625£ 2,321£ 6,114£ 6,126£ 0.3 0.1 52.00£ 0.1
E14000883 D57 Portsmouth North 2.1 3.1 1.6 2.2 0.7 7.5 4.2 5.6 3.4 6,429£ 8,944£ 3,760£ 7,178£ 2,195£ 6,558£ 6,521£ 0.5 0.3 50.29£ 0.2
E14000884 D58 Portsmouth South 2.6 3.0 1.1 1.9 0.8 7.5 4.7 5.4 2.2 5,958£ 9,003£ 3,801£ 7,616£ 2,225£ 6,728£ 6,465£ 0.4 0.2 47.39£ 0.2
E14000889 D63 Reading East 1.6 2.1 1.1 1.4 0.4 5.1 3.0 4.0 2.2 6,246£ 9,107£ 3,803£ 7,336£ 2,164£ 6,756£ 6,601£ 0.3 0.1 60.06£ 0.1
E14000890 D64 Reading West 2.2 2.9 1.4 2.1 0.5 7.0 4.4 5.4 3.0 6,452£ 9,128£ 3,776£ 7,361£ 2,222£ 6,864£ 6,734£ 0.5 0.2 59.84£ 0.1
E14000893 D67 Reigate 1.2 1.6 0.9 1.2 0.3 4.0 2.3 2.9 1.9 6,335£ 8,945£ 3,831£ 7,106£ 2,380£ 6,654£ 6,558£ 0.3 0.1 61.11£ 0.1
E14000898 D72 Rochester and Strood 2.2 2.7 1.5 1.9 0.6 7.0 4.1 4.8 3.1 6,271£ 8,942£ 3,903£ 7,158£ 2,320£ 6,557£ 6,467£ 0.4 0.2 52.36£ 0.2
E14000901 D75 Romsey and Southampton North 0.9 1.5 0.8 1.0 0.3 3.5 1.8 2.6 1.7 6,384£ 8,859£ 3,702£ 6,988£ 2,459£ 6,413£ 6,406£ 0.2 0.1 50.71£ 0.1
E14000907 D81 Runnymede and Weybridge 1.1 1.4 0.8 1.1 0.2 3.5 2.1 2.4 1.6 6,248£ 8,685£ 3,648£ 6,867£ 2,328£ 6,406£ 6,355£ 0.2 0.1 54.29£ 0.1
E14000918 D92 Sevenoaks 1.2 1.6 0.8 1.1 0.3 3.9 2.4 2.7 1.7 6,275£ 8,880£ 3,668£ 7,098£ 2,501£ 6,557£ 6,467£ 0.2 0.1 55.53£ 0.1
E14000927 E02 Sittingbourne and Sheppey 3.0 3.1 1.6 2.1 0.8 8.5 5.9 5.7 3.5 6,651£ 9,108£ 4,008£ 7,353£ 2,340£ 6,663£ 6,659£ 0.4 0.2 50.84£ 0.2
E14000930 E05 Slough 3.3 5.4 2.3 2.7 0.9 11.8 6.7 11.2 5.0 6,469£ 9,620£ 3,815£ 7,884£ 2,311£ 7,311£ 7,078£ 0.5 0.2 65.85£ 0.1
E14000948 E23 South Thanet 2.5 3.4 1.3 2.1 1.1 8.4 4.9 6.0 2.7 6,463£ 8,901£ 3,786£ 7,461£ 2,341£ 6,506£ 6,493£ 0.4 0.3 44.94£ 0.2
E14000953 E28 South West Surrey 0.9 1.3 0.7 1.0 0.3 3.2 1.7 2.2 1.6 6,247£ 8,543£ 3,869£ 6,815£ 2,362£ 6,315£ 6,296£ 0.2 0.1 53.06£ 0.1
E14000955 E30 Southampton, Itchen 2.6 3.1 1.5 2.0 0.7 7.8 4.9 5.4 3.1 6,146£ 8,841£ 3,799£ 7,184£ 2,164£ 6,512£ 6,392£ 0.4 0.2 49.82£ 0.2
E14000956 E31 Southampton, Test 2.4 3.4 1.5 1.9 0.8 8.0 4.6 6.3 3.0 6,315£ 9,008£ 3,878£ 7,445£ 2,167£ 6,707£ 6,592£ 0.4 0.2 48.29£ 0.2
E14000959 E34 Spelthorne 1.4 1.7 1.0 1.3 0.2 4.3 2.7 2.9 2.1 6,382£ 8,779£ 3,789£ 6,912£ 2,208£ 6,520£ 6,475£ 0.3 0.1 60.96£ 0.1
E14000983 E58 Surrey Heath 1.1 1.6 0.9 1.2 0.3 3.8 2.0 2.8 1.9 6,235£ 8,750£ 3,718£ 6,946£ 2,357£ 6,518£ 6,438£ 0.2 0.1 56.58£ 0.1
E14000997 E72 Tonbridge and Malling 1.4 1.8 1.0 1.3 0.4 4.6 2.7 3.3 2.1 6,405£ 8,755£ 4,024£ 7,091£ 2,432£ 6,555£ 6,510£ 0.2 0.1 50.28£ 0.1
E14001004 E79 Tunbridge Wells 1.2 1.8 1.0 1.3 0.4 4.4 2.3 3.2 2.0 6,271£ 8,792£ 3,757£ 7,047£ 2,566£ 6,435£ 6,390£ 0.2 0.1 46.35£ 0.2
E14001015 E90 Wantage 1.2 1.8 1.3 1.4 0.3 4.6 2.2 3.2 2.9 6,300£ 8,711£ 3,825£ 6,620£ 2,381£ 6,235£ 6,251£ 0.3 0.2 51.56£ 0.1
E14001023 E98 Wealden 1.1 2.0 1.2 1.3 0.5 4.8 2.2 3.6 2.6 6,036£ 8,840£ 3,873£ 6,930£ 2,395£ 6,328£ 6,258£ 0.2 0.2 45.45£ 0.1
E14001041 F17 Winchester 0.7 1.2 0.8 0.9 0.3 3.1 1.4 2.2 1.7 6,255£ 8,705£ 3,604£ 6,675£ 2,613£ 6,126£ 6,157£ 0.2 0.1 53.78£ 0.1
E14001042 F18 Windsor 0.9 1.4 0.8 1.2 0.2 3.4 1.7 2.4 1.6 5,976£ 8,614£ 3,618£ 6,827£ 2,372£ 6,385£ 6,271£ 0.2 0.1 64.38£ 0.1
E14001046 F22 Witney 1.0 1.7 1.3 1.4 0.4 4.3 1.9 3.0 2.8 6,141£ 8,555£ 3,799£ 6,526£ 2,476£ 6,100£ 6,109£ 0.3 0.2 51.39£ 0.1
E14001047 F23 Woking 1.2 1.9 1.0 1.2 0.3 4.5 2.4 3.7 2.1 6,426£ 9,104£ 4,070£ 7,431£ 2,425£ 6,929£ 6,791£ 0.2 0.1 56.74£ 0.1
E14001048 F24 Wokingham 0.8 1.3 0.8 1.1 0.2 3.2 1.6 2.4 1.7 6,393£ 8,901£ 3,788£ 7,007£ 2,309£ 6,541£ 6,502£ 0.3 0.1 56.76£ 0.1
E14001055 F31 Worthing West 1.3 2.2 1.2 1.5 0.6 5.2 2.4 3.8 2.5 6,075£ 8,680£ 3,675£ 6,899£ 2,390£ 6,267£ 6,220£ 0.3 0.2 47.53£ 0.1
E14001056 F32 Wycombe 1.7 3.0 1.2 1.6 0.6 6.5 3.4 6.0 2.7 6,427£ 9,520£ 4,042£ 7,900£ 2,507£ 7,261£ 7,044£ 0.4 0.2 59.66£ 0.1
Table 3 HMRC] HM Revenue and Customs
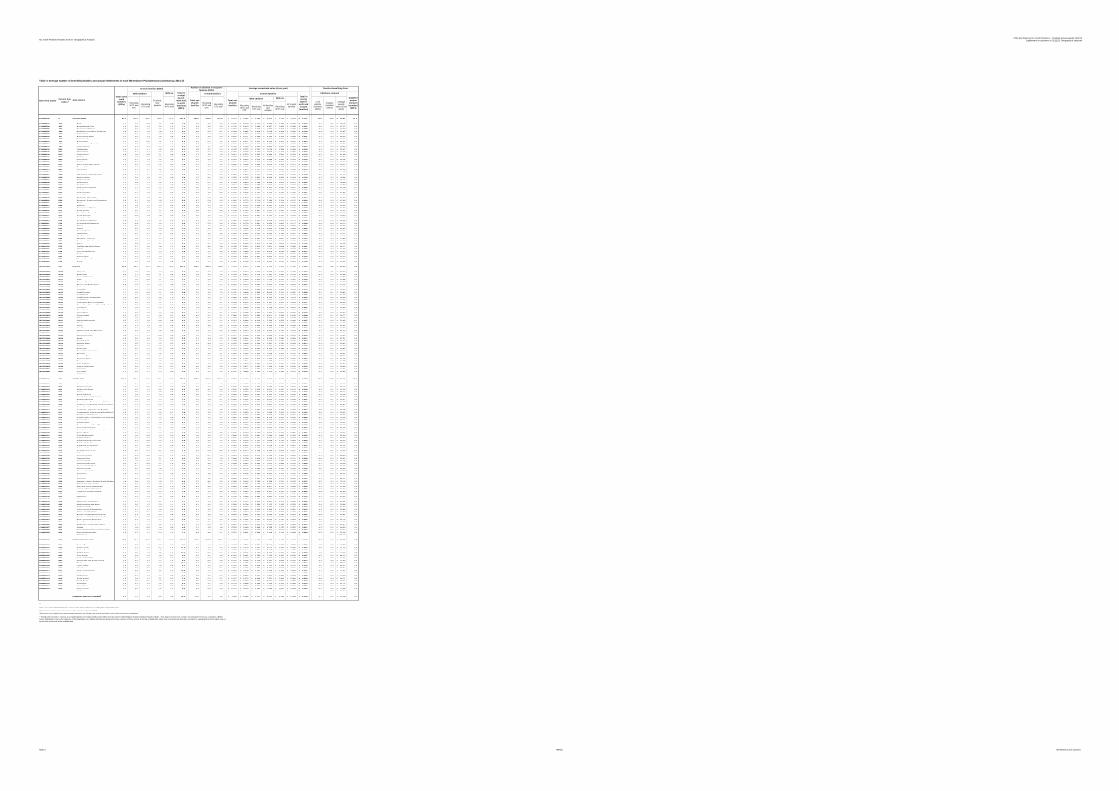
Tax Credit Finalised Awards 2014-15: Geographical AnalysisChild and Working Tax Credit Statistics - Finalised annual awards 2012/13
Supplement on payments in 2012/13: Geographical analyses
Table 3: Average number of benefiting families and annual entitlements in each Westminster Parliamentary Constituency, 2014-15
With no
childrenWith no
childrenNew Area Codes 1 Current Area
Codes 2Area names
In-work families (000's)
With children
Receiving CTC only
Total out-of-
work
families
(000's)Couples (number) (000's)
Average weekly
value (£ per week)
Receiving WTC only
Total in
receipt
(out-of-
work and
in-work
families)
Childcare element
Lone parents
(number) (000's)
Total out-
of-work
families Receiving WTC and
CTC
Receiving CTC only
All families with
children
In-work families
Receiving WTC only
Receiving WTC and
CTC
All in-work families
Receiving CTC only
Number of children in recipient
families (000's)
Receiving WTC and
CTC
Of which, lone
parents
Disabled
worker
element
(number)
(000's)
Total in
receipt
(out-of-
work and
in-work
families)
(000's)
Average annualised value (£ per year)
With children
In-work families
Families benefiting from:
Total out-
of-work
families
E15000009 9 SOUTH WEST 82.7 132.5 78.0 85.8 41.7 334.8 157.0 234.8 161.9 6,216£ 8,786£ 3,758£ 6,923£ 2,448£ 6,183£ 6,191£ 17.6 14.3 45.51£ 11.2
E14000547 A18 Bath 1.1 1.6 0.8 1.1 0.5 4.0 1.9 2.6 1.6 5,842£ 8,430£ 3,710£ 6,889£ 2,489£ 6,095£ 6,027£ 0.2 0.1 49.16£ 0.1
E14000584 A55 Bournemouth East 1.9 3.0 1.3 2.0 1.0 7.1 3.3 4.9 2.6 5,726£ 8,410£ 3,499£ 6,907£ 2,458£ 6,098£ 6,001£ 0.5 0.3 47.22£ 0.3
E14000585 A56 Bournemouth West 1.8 2.5 1.1 1.6 0.8 6.3 3.3 4.3 2.3 6,057£ 8,764£ 3,729£ 7,200£ 2,494£ 6,338£ 6,258£ 0.4 0.2 50.02£ 0.3
E14000595 A66 Bridgwater and West Somerset 1.9 3.2 1.9 1.8 1.3 8.3 3.8 5.9 4.1 6,284£ 8,887£ 3,918£ 7,029£ 2,304£ 6,096£ 6,140£ 0.4 0.3 37.67£ 0.3
E14000599 A70 Bristol East 2.2 2.8 1.5 1.8 0.7 7.2 4.2 5.2 3.0 6,234£ 9,087£ 3,637£ 7,209£ 2,331£ 6,525£ 6,437£ 0.4 0.3 52.47£ 0.2
E14000600 A71 Bristol North West 2.4 2.6 1.3 1.8 0.6 6.8 4.7 4.8 2.7 6,544£ 9,111£ 4,005£ 7,440£ 2,203£ 6,769£ 6,691£ 0.4 0.2 56.77£ 0.2
E14000601 A72 Bristol South 3.3 3.0 1.7 2.1 0.8 8.7 6.7 5.4 3.5 6,531£ 8,832£ 3,813£ 7,055£ 2,337£ 6,388£ 6,442£ 0.4 0.2 50.76£ 0.2
E14000602 A73 Bristol West 2.2 2.5 0.8 1.5 1.3 6.8 4.6 5.0 1.6 6,572£ 9,811£ 3,677£ 8,338£ 2,350£ 6,691£ 6,652£ 0.4 0.2 60.33£ 0.2
E14000616 A87 Camborne and Redruth 1.7 2.8 1.6 1.5 1.0 7.2 3.3 5.0 3.3 6,152£ 8,757£ 3,931£ 6,997£ 2,447£ 6,128£ 6,134£ 0.3 0.3 42.80£ 0.2
E14000623 A94 Central Devon 1.0 2.3 1.4 1.3 1.0 5.7 2.0 4.1 3.0 6,291£ 8,769£ 3,850£ 6,890£ 2,656£ 5,981£ 6,037£ 0.2 0.3 38.89£ 0.2
E14000630 B02 Cheltenham 1.4 2.1 1.1 1.5 0.6 5.3 2.8 3.7 2.3 6,197£ 8,727£ 3,732£ 7,019£ 2,354£ 6,284£ 6,260£ 0.3 0.2 52.47£ 0.2
E14000635 B07 Chippenham 1.3 2.1 1.4 1.5 0.5 5.3 2.5 3.7 2.8 6,318£ 8,769£ 3,759£ 6,818£ 2,437£ 6,300£ 6,304£ 0.3 0.3 44.16£ 0.2
E14000638 B10 Christchurch 0.9 1.6 0.9 1.1 0.4 3.8 1.7 2.8 1.8 5,912£ 8,772£ 3,535£ 6,936£ 2,500£ 6,257£ 6,174£ 0.2 0.1 41.69£ 0.2
E14000665 B37 Devizes 1.1 1.8 1.6 1.3 0.4 4.9 2.1 3.1 3.5 6,302£ 8,636£ 3,684£ 6,286£ 2,464£ 5,919£ 6,007£ 0.3 0.2 52.36£ 0.1
E14000678 B50 East Devon 1.0 2.2 1.3 1.5 0.6 5.2 2.0 4.0 2.7 6,218£ 8,834£ 3,616£ 6,899£ 2,456£ 6,220£ 6,220£ 0.4 0.3 46.06£ 0.2
E14000698 B70 Exeter 1.5 2.7 1.5 1.8 0.9 6.6 2.8 4.6 3.0 6,171£ 8,757£ 3,733£ 6,948£ 2,262£ 6,117£ 6,129£ 0.4 0.3 48.57£ 0.3
E14000702 B74 Filton and Bradley Stoke 1.3 2.0 1.3 1.5 0.4 4.9 2.4 3.4 2.6 5,968£ 8,605£ 3,659£ 6,670£ 2,403£ 6,214£ 6,150£ 0.4 0.2 49.37£ 0.2
E14000705 B77 Forest of Dean 1.2 2.0 1.4 1.2 0.7 5.3 2.3 3.6 2.8 6,106£ 8,690£ 3,585£ 6,644£ 2,487£ 5,963£ 5,996£ 0.2 0.2 40.49£ 0.1
E14000712 B84 Gloucester 2.5 3.7 2.1 2.6 0.8 9.0 5.1 6.7 4.3 6,418£ 8,937£ 3,717£ 7,071£ 2,071£ 6,493£ 6,472£ 0.6 0.4 50.49£ 0.2
E14000774 C47 Kingswood 1.2 2.0 1.3 1.5 0.4 4.9 2.4 3.4 2.7 6,142£ 8,763£ 3,596£ 6,689£ 2,347£ 6,239£ 6,214£ 0.3 0.2 44.85£ 0.2
E14000815 C88 Mid Dorset and North Poole 0.8 1.7 1.1 1.2 0.4 3.9 1.5 2.9 2.2 5,864£ 8,533£ 3,745£ 6,685£ 2,530£ 6,199£ 6,128£ 0.2 0.2 41.29£ 0.2
E14000835 D09 Newton Abbot 1.2 2.4 1.4 1.5 0.8 5.8 2.2 4.2 2.8 5,978£ 8,755£ 3,803£ 6,939£ 2,456£ 6,169£ 6,128£ 0.3 0.3 38.94£ 0.2
E14000837 D11 North Cornwall 1.5 2.8 1.6 1.4 1.1 6.9 2.8 5.2 3.3 6,188£ 8,930£ 3,850£ 7,111£ 2,567£ 6,217£ 6,211£ 0.2 0.3 38.19£ 0.2
E14000838 D12 North Devon 1.3 2.9 1.7 1.6 1.2 7.1 2.5 5.2 3.5 6,209£ 8,840£ 3,788£ 6,958£ 2,564£ 6,071£ 6,097£ 0.3 0.4 38.99£ 0.3
E14000839 D13 North Dorset 1.0 1.9 1.4 1.2 0.5 4.8 2.0 3.4 2.9 6,514£ 8,797£ 3,875£ 6,740£ 2,696£ 6,198£ 6,266£ 0.2 0.2 49.79£ 0.2
E14000846 D20 North East Somerset 1.0 1.7 1.2 1.2 0.4 4.4 2.0 3.1 2.7 6,409£ 8,802£ 3,850£ 6,762£ 2,535£ 6,251£ 6,288£ 0.2 0.2 46.79£ 0.1
E14000850 D24 North Somerset 0.8 1.6 1.1 1.3 0.4 3.9 1.5 2.8 2.3 5,920£ 8,591£ 3,502£ 6,543£ 2,435£ 5,988£ 5,974£ 0.3 0.2 44.40£ 0.1
E14000851 D25 North Swindon 2.0 2.7 1.8 2.0 0.5 7.0 3.8 4.8 3.8 6,190£ 8,698£ 3,704£ 6,726£ 2,284£ 6,290£ 6,261£ 0.5 0.3 52.85£ 0.2
E14000860 D34 North Wiltshire 0.9 1.5 1.1 1.1 0.3 3.8 1.8 2.7 2.3 6,259£ 8,791£ 3,794£ 6,711£ 2,502£ 6,217£ 6,227£ 0.2 0.2 47.86£ 0.1
E14000879 D53 Plymouth, Moor View 2.6 3.2 1.8 2.0 1.0 8.6 5.1 5.8 3.9 6,737£ 8,970£ 4,055£ 7,191£ 2,349£ 6,396£ 6,497£ 0.4 0.3 45.40£ 0.3
E14000880 D54 Plymouth, Sutton and Devonport 2.6 3.1 1.4 1.9 1.3 8.5 4.7 5.4 2.8 6,062£ 8,773£ 3,719£ 7,188£ 2,224£ 6,107£ 6,093£ 0.4 0.3 47.68£ 0.3
E14000881 D55 Poole 1.5 2.3 1.3 1.5 0.6 5.6 2.7 3.9 2.6 6,062£ 8,680£ 3,648£ 6,887£ 2,485£ 6,241£ 6,195£ 0.3 0.2 48.42£ 0.2
E14000912 D86 Salisbury 1.0 1.9 1.2 1.4 0.4 4.6 2.0 3.3 2.5 6,316£ 8,775£ 3,659£ 6,787£ 2,333£ 6,232£ 6,250£ 0.3 0.2 50.25£ 0.1
E14000932 E07 Somerton and Frome 1.3 2.5 1.5 1.6 0.8 6.2 2.5 4.5 3.3 6,383£ 8,826£ 3,824£ 6,940£ 2,512£ 6,199£ 6,237£ 0.2 0.3 41.50£ 0.2
E14000936 E11 South Dorset 1.6 2.6 1.4 1.7 0.8 6.3 2.9 4.5 2.9 6,248£ 8,757£ 3,851£ 7,037£ 2,460£ 6,283£ 6,274£ 0.3 0.2 40.72£ 0.2
E14000938 E13 South East Cornwall 1.4 2.3 1.4 1.3 1.0 6.1 2.6 4.2 2.9 6,132£ 8,931£ 3,811£ 7,024£ 2,458£ 6,068£ 6,083£ 0.2 0.3 45.75£ 0.2
E14000947 E22 South Swindon 2.0 2.8 1.8 1.8 0.6 7.2 3.9 4.9 3.7 6,172£ 8,670£ 3,807£ 6,732£ 2,215£ 6,192£ 6,187£ 0.4 0.2 49.50£ 0.1
E14000950 E25 South West Devon 0.8 1.9 1.4 1.4 0.5 4.7 1.5 3.3 2.8 6,050£ 8,579£ 3,663£ 6,544£ 2,333£ 5,964£ 5,979£ 0.4 0.3 40.69£ 0.2
E14000954 E29 South West Wiltshire 1.5 2.4 1.7 1.6 0.6 6.1 2.9 4.2 3.4 6,456£ 8,627£ 3,762£ 6,638£ 2,343£ 6,121£ 6,204£ 0.3 0.3 45.67£ 0.2
E14000961 E36 St Austell and Newquay 2.0 3.4 1.9 1.9 1.2 8.5 3.7 5.9 3.9 6,021£ 8,720£ 3,861£ 6,959£ 2,462£ 6,117£ 6,094£ 0.4 0.4 43.12£ 0.3
E14000964 E39 St Ives 1.4 2.6 1.4 1.4 1.3 6.7 2.6 4.6 2.7 5,959£ 8,645£ 3,707£ 6,955£ 2,607£ 5,898£ 5,911£ 0.2 0.3 39.91£ 0.3
E14000980 E55 Stroud 1.2 2.0 1.5 1.4 0.6 5.2 2.2 3.6 3.1 6,127£ 8,596£ 3,718£ 6,560£ 2,504£ 5,963£ 5,999£ 0.3 0.2 40.60£ 0.1
E14000988 E63 Taunton Deane 1.5 2.9 1.7 2.0 0.9 7.0 2.9 5.2 3.6 6,147£ 8,753£ 3,708£ 6,879£ 2,433£ 6,175£ 6,169£ 0.5 0.4 42.61£ 0.3
E14000990 E65 Tewkesbury 1.2 2.0 1.4 1.5 0.5 5.1 2.3 3.6 2.8 6,183£ 8,592£ 3,542£ 6,582£ 2,278£ 6,051£ 6,082£ 0.3 0.3 44.77£ 0.1
E14000991 E66 The Cotswolds 0.8 1.6 1.1 1.1 0.4 3.9 1.6 2.8 2.3 6,121£ 8,630£ 3,749£ 6,653£ 2,433£ 6,116£ 6,117£ 0.2 0.2 44.42£ 0.1
E14000994 E69 Thornbury and Yate 0.8 1.5 1.1 1.2 0.3 3.8 1.6 2.7 2.3 6,282£ 8,793£ 3,691£ 6,666£ 2,531£ 6,230£ 6,242£ 0.2 0.2 44.59£ 0.1
E14000996 E71 Tiverton and Honiton 1.2 2.4 1.7 1.4 0.9 6.2 2.2 4.5 3.6 6,129£ 8,788£ 3,820£ 6,742£ 2,413£ 6,002£ 6,026£ 0.2 0.3 43.30£ 0.2
E14000999 E74 Torbay 2.2 3.5 1.6 2.1 1.4 8.8 4.1 6.1 3.3 6,094£ 8,779£ 3,810£ 7,186£ 2,502£ 6,167£ 6,148£ 0.4 0.4 45.06£ 0.4
E14001000 E75 Torridge and West Devon 1.3 2.7 1.6 1.4 1.2 6.9 2.5 4.9 3.4 6,238£ 8,922£ 3,820£ 7,001£ 2,694£ 6,045£ 6,081£ 0.2 0.3 40.17£ 0.3
E14001001 E76 Totnes 1.3 2.4 1.2 1.4 1.1 6.0 2.5 4.2 2.5 6,326£ 8,841£ 3,865£ 7,172£ 2,673£ 6,120£ 6,166£ 0.2 0.2 41.99£ 0.3
E14001003 E78 Truro and Falmouth 1.3 2.3 1.3 1.4 1.0 5.9 2.4 4.1 2.6 6,076£ 8,668£ 3,747£ 6,916£ 2,529£ 5,995£ 6,013£ 0.3 0.3 43.17£ 0.2
E14001026 F02 Wells 1.3 2.5 1.5 1.6 1.0 6.4 2.5 4.3 3.2 5,918£ 8,799£ 3,724£ 6,866£ 2,523£ 5,984£ 5,970£ 0.3 0.3 42.49£ 0.3
E14001031 F07 West Dorset 1.0 2.2 1.3 1.3 0.7 5.1 1.9 3.9 2.7 6,332£ 8,801£ 3,867£ 6,954£ 2,571£ 6,230£ 6,250£ 0.2 0.2 40.72£ 0.2
E14001038 F14 Weston-Super-Mare 2.2 3.0 1.6 2.0 0.8 7.7 4.2 5.3 3.3 6,161£ 8,760£ 3,772£ 7,027£ 2,341£ 6,299£ 6,259£ 0.4 0.3 43.24£ 0.2
E14001060 F36 Yeovil 1.7 2.6 1.9 1.7 0.8 7.0 3.2 4.7 4.0 6,281£ 8,799£ 3,715£ 6,652£ 2,615£ 6,054£ 6,108£ 0.3 0.3 45.36£ 0.3
W08000001 924 WALES 70.8 87.9 43.3 58.2 29.9 232.0 133.6 155.2 87.8 6,198£ 8,824£ 3,788£ 7,162£ 2,392£ 6,276£ 6,252£ 10.9 7.6 52.47£ 8.0
W07000049 W09 Aberavon 2.1 1.9 0.9 1.4 0.6 5.5 3.9 3.2 1.7 6,232£ 8,664£ 3,849£ 7,155£ 2,236£ 6,229£ 6,230£ 0.2 0.1 53.33£ 0.2
W07000058 W18 Aberconwy 0.9 1.7 0.8 1.1 0.8 4.2 1.8 3.0 1.6 6,376£ 8,977£ 3,714£ 7,287£ 2,396£ 6,120£ 6,177£ 0.3 0.2 52.64£ 0.2
W07000043 W03 Alyn and Deeside 1.5 2.2 1.3 1.6 0.6 5.7 3.0 3.7 2.6 6,322£ 8,562£ 3,741£ 6,829£ 2,328£ 6,138£ 6,188£ 0.4 0.2 47.95£ 0.2
W07000057 W17 Arfon 1.1 1.6 0.9 1.1 0.6 4.2 2.1 2.9 1.9 6,116£ 9,059£ 3,940£ 7,218£ 2,327£ 6,281£ 6,238£ 0.3 0.2 53.98£ 0.1
W07000072 W32 Blaenau Gwent 2.3 2.1 1.1 1.4 0.7 6.2 4.1 3.5 2.1 5,860£ 8,244£ 3,550£ 6,646£ 2,258£ 5,904£ 5,888£ 0.2 0.1 57.17£ 0.2
W07000068 W28 Brecon and Radnorshire 0.8 1.8 1.0 1.0 0.8 4.4 1.5 3.1 2.2 5,904£ 8,613£ 3,806£ 6,822£ 2,639£ 5,919£ 5,916£ 0.2 0.2 44.16£ 0.2
W07000073 W33 Bridgend 1.8 2.1 1.1 1.6 0.7 5.7 3.3 3.7 2.1 6,091£ 8,655£ 3,671£ 7,000£ 2,283£ 6,175£ 6,149£ 0.3 0.2 52.00£ 0.2
W07000076 W36 Caerphilly 2.4 2.6 1.4 1.8 0.8 7.2 4.5 4.5 2.8 6,045£ 8,607£ 3,859£ 6,972£ 2,306£ 6,193£ 6,144£ 0.3 0.2 49.42£ 0.3
W07000050 W10 Cardiff Central 1.7 1.9 0.6 1.1 0.6 4.8 3.3 3.6 1.3 6,232£ 9,424£ 3,808£ 8,030£ 2,221£ 6,905£ 6,669£ 0.2 0.1 60.45£ 0.1
W07000051 W11 Cardiff North 1.2 1.7 0.9 1.3 0.4 4.2 2.2 3.0 1.7 6,244£ 8,779£ 3,601£ 7,044£ 2,341£ 6,370£ 6,335£ 0.3 0.1 56.08£ 0.1
W07000080 W40 Cardiff South and Penarth 3.6 3.9 1.3 2.4 1.0 9.7 7.3 7.6 2.7 6,469£ 9,471£ 3,926£ 8,100£ 2,159£ 7,153£ 6,900£ 0.4 0.2 59.59£ 0.2
W07000079 W39 Cardiff West 2.9 3.0 1.0 2.0 0.7 7.6 5.7 5.5 2.1 6,376£ 9,303£ 3,783£ 7,885£ 2,237£ 7,017£ 6,775£ 0.4 0.2 59.89£ 0.2
W07000067 W27 Carmarthen East and Dinefwr 1.2 2.0 1.0 1.1 1.1 5.2 2.3 3.6 2.1 6,239£ 9,017£ 3,842£ 7,261£ 2,741£ 6,073£ 6,111£ 0.2 0.2 53.33£ 0.2
W07000066 W26 Carmarthen West and South Pembrokeshire 1.4 2.2 1.1 1.3 0.9 5.6 2.7 3.9 2.3 6,226£ 8,863£ 3,861£ 7,171£ 2,511£ 6,147£ 6,167£ 0.2 0.2 47.35£ 0.2
W07000064 W24 Ceredigion 1.0 1.9 1.1 1.0 1.2 5.1 1.8 3.5 2.2 6,090£ 8,979£ 3,844£ 7,135£ 2,912£ 5,924£ 5,955£ 0.2 0.2 48.66£ 0.3
W07000062 W22 Clwyd South 1.6 2.2 1.2 1.4 0.7 5.7 2.9 3.8 2.5 6,254£ 8,779£ 3,983£ 7,080£ 2,314£ 6,255£ 6,255£ 0.3 0.3 47.36£ 0.2
W07000059 W19 Clwyd West 1.4 2.0 1.0 1.3 0.8 5.3 2.7 3.7 2.1 6,210£ 9,088£ 3,862£ 7,357£ 2,520£ 6,302£ 6,277£ 0.3 0.3 50.54£ 0.2
W07000070 W30 Cynon Valley 2.5 2.2 1.1 1.6 0.7 6.5 4.5 3.7 2.2 5,966£ 8,519£ 3,694£ 6,917£ 2,208£ 6,100£ 6,049£ 0.2 0.1 59.77£ 0.2
W07000042 W02 Delyn 1.3 1.8 1.0 1.3 0.6 4.7 2.5 3.2 2.1 6,459£ 8,777£ 3,755£ 6,966£ 2,328£ 6,183£ 6,258£ 0.3 0.2 50.48£ 0.2
W07000061 W21 Dwyfor Meirionnydd 0.7 1.7 1.0 0.9 0.8 4.3 1.4 3.2 2.2 6,317£ 8,944£ 4,019£ 7,156£ 2,472£ 6,040£ 6,087£ 0.1 0.2 52.95£ 0.1
W07000046 W06 Gower 1.2 1.8 1.0 1.3 0.6 4.6 2.2 3.1 2.1 6,161£ 8,639£ 3,583£ 6,788£ 2,523£ 6,092£ 6,110£ 0.3 0.2 46.55£ 0.2
W07000077 W37 Islwyn 1.9 2.2 1.3 1.6 0.6 6.0 3.6 3.8 2.5 6,125£ 8,435£ 3,683£ 6,726£ 2,368£ 6,079£ 6,093£ 0.3 0.2 54.74£ 0.2
W07000045 W05 Llanelli 2.1 2.5 1.3 1.6 0.9 6.8 3.9 4.4 2.6 6,269£ 8,757£ 3,908£ 7,123£ 2,496£ 6,235£ 6,246£ 0.3 0.2 49.23£ 0.3
W07000071 W31 Merthyr Tydfil and Rhymney 2.5 2.6 1.2 1.9 0.8 7.2 4.6 4.3 2.3 5,962£ 8,337£ 3,719£ 6,876£ 2,132£ 6,022£ 6,000£ 0.2 0.1 55.22£ 0.2
W07000054 W14 Monmouth 1.0 1.7 0.9 1.1 0.5 4.2 1.9 2.9 1.9 5,967£ 8,650£ 3,731£ 6,934£ 2,513£ 6,185£ 6,130£ 0.2 0.2 50.84£ 0.1
W07000063 W23 Montgomeryshire 0.8 1.7 1.1 0.9 0.9 4.6 1.6 3.2 2.4 6,411£ 8,789£ 4,005£ 6,885£ 2,475£ 5,847£ 5,949£ 0.1 0.2 44.91£ 0.2
W07000069 W29 Neath 1.8 2.0 1.0 1.4 0.7 5.5 3.1 3.4 2.0 5,889£ 8,604£ 3,724£ 6,936£ 2,386£ 6,069£ 6,012£ 0.2 0.1 47.61£ 0.2
W07000055 W15 Newport East 2.3 2.7 1.2 1.7 0.7 6.9 4.6 4.9 2.4 6,328£ 9,031£ 3,781£ 7,418£ 2,349£ 6,676£ 6,557£ 0.3 0.2 56.07£ 0.2
W07000056 W16 Newport West 2.2 2.5 1.1 1.7 0.7 6.5 4.3 4.4 2.2 6,202£ 8,938£ 3,743£ 7,331£ 2,270£ 6,524£ 6,413£ 0.3 0.2 53.42£ 0.2
W07000074 W34 Ogmore 2.2 2.3 1.2 1.6 0.7 6.4 4.1 3.9 2.3 6,176£ 8,583£ 3,716£ 6,926£ 2,309£ 6,166£ 6,170£ 0.2 0.2 49.69£ 0.2
W07000075 W35 Pontypridd 1.7 2.0 1.1 1.5 0.6 5.3 3.1 3.3 2.1 6,317£ 8,435£ 3,632£ 6,745£ 2,299£ 6,070£ 6,147£ 0.2 0.1 48.85£ 0.2
W07000065 W25 Preseli Pembrokeshire 1.4 2.5 1.2 1.3 1.1 6.2 2.7 4.5 2.5 6,328£ 9,073£ 3,930£ 7,371£ 2,646£ 6,259£ 6,275£ 0.3 0.3 50.56£ 0.2
W07000052 W12 Rhondda 2.5 2.2 1.0 1.6 0.8 6.6 4.6 3.8 2.1 6,053£ 8,468£ 3,845£ 7,009£ 2,304£ 6,102£ 6,083£ 0.2 0.1 60.94£ 0.2
W07000048 W08 Swansea East 2.7 3.0 1.3 2.1 0.9 7.8 5.0 5.2 2.5 6,266£ 8,886£ 3,762£ 7,330£ 2,304£ 6,453£ 6,389£ 0.3 0.2 57.88£ 0.3
W07000047 W07 Swansea West 1.6 1.9 0.8 1.2 0.8 5.0 2.8 3.3 1.5 5,957£ 8,783£ 3,625£ 7,290£ 2,351£ 6,155£ 6,094£ 0.2 0.1 53.15£ 0.2
W07000053 W13 Torfaen 2.4 2.5 1.4 1.7 0.6 6.8 4.4 4.3 2.7 6,026£ 8,791£ 3,634£ 6,977£ 2,199£ 6,299£ 6,205£ 0.4 0.2 54.77£ 0.2
W07000060 W20 Vale of Clwyd 2.0 2.3 1.1 1.6 0.8 6.2 4.0 4.2 2.3 6,816£ 9,322£ 3,882£ 7,567£ 2,321£ 6,595£ 6,666£ 0.5 0.4 52.47£ 0.2
W07000078 W38 Vale of Glamorgan 2.2 2.8 1.2 2.0 0.7 6.9 4.0 4.9 2.6 6,144£ 8,877£ 3,835£ 7,339£ 2,305£ 6,628£ 6,476£ 0.4 0.2 58.90£ 0.2
W07000044 W04 Wrexham 1.6 2.1 1.1 1.4 0.7 5.4 3.0 3.5 2.2 6,266£ 8,696£ 3,803£ 7,012£ 2,189£ 6,173£ 6,200£ 0.4 0.2 44.71£ 0.2
W07000041 W01 Ynys Môn 1.4 2.0 1.1 1.3 0.8 5.3 2.6 3.7 2.2 6,231£ 8,965£ 3,793£ 7,173£ 2,455£ 6,221£ 6,224£ 0.3 0.2 56.80£ 0.2
Not Known - - - - - - - - - -£ -£ -£ -£ -£ -£ -£ - -£ -
S15000001 923 SCOTLAND 100.6 128.8 61.2 99.1 48.9 339.5 177.0 211.8 121.2 5,798£ 8,608£ 3,600£ 6,996£ 2,243£ 6,023£ 5,957£ 22.2 10.2 56.48£ 13.3
S14000001 801 Aberdeen North 1.7 2.1 0.9 1.8 0.7 5.5 2.8 3.2 1.8 5,474£ 8,332£ 3,453£ 6,849£ 2,285£ 5,977£ 5,821£ 0.4 0.1 67.03£ 0.3
S14000002 802 Aberdeen South 0.8 1.1 0.5 1.0 0.4 2.7 1.3 1.7 0.9 5,636£ 8,223£ 3,282£ 6,680£ 2,235£ 5,844£ 5,786£ 0.2 0.1 59.18£ 0.1
S14000003 803 Airdrie and Shotts 2.3 2.5 1.2 2.0 0.8 6.9 4.0 4.2 2.4 5,876£ 8,556£ 3,678£ 6,972£ 2,267£ 6,116£ 6,036£ 0.3 0.1 67.03£ 0.3
S14000004 804 Angus 1.5 2.0 1.1 1.5 0.7 5.3 2.6 3.4 2.2 5,984£ 8,653£ 3,726£ 6,945£ 2,090£ 6,067£ 6,044£ 0.3 0.2 55.46£ 0.1
S14000005 805 Argyll and Bute 1.2 1.8 1.1 1.3 0.8 4.9 2.0 3.1 2.3 5,693£ 8,593£ 3,667£ 6,763£ 2,403£ 5,835£ 5,801£ 0.2 0.2 53.16£ 0.2
S14000006 806 Ayr, Carrick and Cumnock 2.1 2.5 1.1 1.8 1.1 6.8 3.6 4.1 2.1 5,560£ 8,531£ 3,618£ 7,051£ 2,064£ 5,901£ 5,795£ 0.3 0.2 56.51£ 0.2
S14000007 807 Banff and Buchan 1.2 1.8 1.0 1.4 0.5 4.5 2.2 2.8 2.1 5,865£ 8,336£ 3,664£ 6,654£ 2,403£ 5,948£ 5,925£ 0.2 0.1 48.51£ 0.2
S14000008 808 Berwickshire, Roxburgh and Selkirk 1.4 2.3 1.5 1.4 0.9 6.0 2.5 3.8 3.0 5,944£ 8,431£ 3,663£ 6,558£ 2,493£ 5,783£ 5,821£ 0.3 0.3 42.03£ 0.2
S14000009 809 Caithness, Sutherland and Easter Ross 1.0 1.3 0.7 0.9 0.5 3.6 2.0 2.2 1.6 6,294£ 8,678£ 3,814£ 6,891£ 2,579£ 5,975£ 6,068£ 0.1 0.1 50.84£ 0.2
S14000010 810 Central Ayrshire 2.1 2.3 1.0 1.8 1.0 6.4 3.6 3.8 2.0 5,593£ 8,464£ 3,466£ 6,930£ 2,169£ 5,846£ 5,765£ 0.3 0.2 57.24£ 0.2
S14000011 811 Coatbridge, Chryston and Bellshill 2.2 2.9 1.3 2.5 1.0 7.4 3.8 4.7 2.5 5,680£ 8,463£ 3,572£ 6,969£ 2,245£ 6,067£ 5,953£ 0.5 0.2 57.05£ 0.3
S14000012 812 Cumbernauld, Kilsyth and Kirkintilloch East 1.8 2.3 1.1 1.9 0.7 5.9 3.2 3.8 2.3 5,937£ 8,683£ 3,731£ 7,068£ 2,203£ 6,231£ 6,142£ 0.4 0.2 63.65£ 0.2
S14000013 813 Dumfries and Galloway 1.7 2.4 1.5 1.5 1.1 6.7 3.0 4.2 3.1 5,909£ 8,683£ 3,778£ 6,820£ 2,295£ 5,821£ 5,843£ 0.3 0.3 48.29£ 0.2
S14000014 814 Dumfriesshire, Clydesdale and Tweeddale 1.2 1.9 1.2 1.2 0.8 5.0 2.1 3.3 2.4 5,981£ 8,566£ 3,692£ 6,719£ 2,481£ 5,834£ 5,868£ 0.2 0.2 43.38£ 0.2
S14000015 815 Dundee East 1.8 2.5 1.1 1.9 0.7 6.1 3.1 4.1 2.2 6,054£ 9,081£ 3,498£ 7,338£ 2,206£ 6,454£ 6,339£ 0.6 0.3 65.61£ 0.2
S14000016 816 Dundee West 2.1 2.4 1.0 1.8 0.9 6.4 3.6 3.9 1.8 5,922£ 8,774£ 3,560£ 7,273£ 2,100£ 6,196£ 6,107£ 0.5 0.2 70.44£ 0.2
S14000017 817 Dunfermline and West Fife 1.7 2.5 1.3 1.9 0.8 6.4 3.1 4.2 2.7 5,860£ 8,535£ 3,662£ 6,831£ 2,101£ 6,008£ 5,968£ 0.4 0.2 54.63£ 0.2
S14000018 818 East Dunbartonshire 0.7 1.2 0.7 1.1 0.4 2.9 1.2 1.9 1.4 5,634£ 8,492£ 3,392£ 6,606£ 2,365£ 5,909£ 5,845£ 0.3 0.1 55.09£ 0.1
S14000019 819 East Kilbride, Strathaven and Lesmahagow 1.7 2.3 1.2 1.9 0.9 6.0 2.9 3.7 2.4 5,864£ 8,619£ 3,513£ 6,833£ 2,210£ 5,913£ 5,899£ 0.4 0.2 59.91£ 0.2
S14000020 820 East Lothian 1.6 2.3 1.4 1.7 0.7 6.0 2.9 3.8 2.8 5,824£ 8,449£ 3,429£ 6,553£ 2,192£ 5,865£ 5,855£ 0.4 0.2 48.21£ 0.2
S14000021 821 East Renfrewshire 1.0 1.6 0.8 1.3 0.5 4.0 1.8 2.8 1.7 5,649£ 8,797£ 3,661£ 7,094£ 2,406£ 6,245£ 6,093£ 0.3 0.1 56.00£ 0.2
S14000022 822 Edinburgh East 1.6 2.2 0.8 1.5 1.0 5.7 2.8 3.5 1.5 5,586£ 8,467£ 3,211£ 7,034£ 2,234£ 5,804£ 5,742£ 0.4 0.2 53.90£ 0.3
S14000023 823 Edinburgh North and Leith 1.6 2.3 0.8 1.4 1.1 5.8 2.6 3.5 1.4 5,512£ 8,370£ 3,141£ 7,008£ 2,134£ 5,694£ 5,645£ 0.4 0.2 60.25£ 0.2
S14000024 824 Edinburgh South 1.0 1.4 0.6 1.0 0.5 3.5 1.9 2.3 1.2 5,965£ 8,780£ 3,584£ 7,162£ 2,342£ 6,213£ 6,140£ 0.3 0.2 57.16£ 0.1
S14000025 825 Edinburgh South West 1.6 2.0 0.9 1.5 0.9 5.4 2.7 3.3 1.7 5,815£ 8,597£ 3,545£ 7,028£ 2,270£ 5,881£ 5,862£ 0.4 0.2 55.75£ 0.2
S14000026 826 Edinburgh West 1.3 1.8 0.9 1.3 0.6 4.5 2.3 2.9 1.7 5,779£ 8,538£ 3,478£ 6,846£ 2,271£ 6,055£ 5,976£ 0.3 0.2 53.78£ 0.2
S14000027 847 Na h-Eileanan an Iar 0.3 0.5 0.4 0.4 0.2 1.3 0.5 0.8 0.8 5,652£ 8,314£ 3,708£ 6,348£ 2,663£ 5,551£ 5,572£ - 0.1 42.30£ 0.1
S14000028 827 Falkirk 2.0 2.6 1.4 2.0 0.9 6.8 3.5 4.2 2.7 6,005£ 8,419£ 3,643£ 6,776£ 2,217£ 5,956£ 5,970£ 0.4 0.2 57.11£ 0.2
S14000029 828 Glasgow Central 2.2 2.7 0.5 1.3 1.3 6.7 4.1 5.1 1.0 6,004£ 9,419£ 3,612£ 8,448£ 2,296£ 6,689£ 6,463£ 0.4 0.1 58.89£ 0.2
S14000030 829 Glasgow East 3.3 3.5 1.1 3.1 1.4 9.3 5.6 5.6 1.9 5,644£ 8,708£ 3,476£ 7,510£ 2,121£ 6,271£ 6,048£ 0.8 0.2 56.82£ 0.4
S14000031 830 Glasgow North 1.4 1.5 0.5 1.1 0.8 4.3 2.4 2.5 0.8 5,477£ 8,793£ 3,357£ 7,544£ 2,295£ 6,000£ 5,823£ 0.3 0.1 61.18£ 0.2
S14000032 831 Glasgow North East 3.3 3.1 0.8 2.7 1.4 8.7 5.7 4.9 1.5 5,649£ 8,567£ 3,592£ 7,527£ 2,098£ 6,150£ 5,958£ 0.7 0.2 55.36£ 0.3
S14000033 832 Glasgow North West 2.6 2.6 0.8 2.1 1.0 6.9 4.4 4.2 1.4 5,774£ 8,709£ 3,508£ 7,512£ 2,176£ 6,299£ 6,104£ 0.6 0.1 53.59£ 0.3
S14000034 833 Glasgow South 2.1 2.6 0.8 1.9 1.1 6.6 3.7 4.5 1.5 5,742£ 9,116£ 3,669£ 7,859£ 2,287£ 6,520£ 6,268£ 0.6 0.2 58.59£ 0.3
S14000035 834 Glasgow South West 3.0 3.6 1.0 2.7 1.3 9.0 5.4 6.0 2.0 5,926£ 8,879£ 3,739£ 7,720£ 2,140£ 6,475£ 6,290£ 0.7 0.2 57.92£ 0.3
S14000036 835 Glenrothes 2.5 2.7 1.3 2.0 0.9 7.4 4.7 4.5 2.7 6,065£ 8,608£ 3,696£ 6,972£ 2,164£ 6,100£ 6,088£ 0.4 0.2 57.27£ 0.2
S14000037 836 Gordon 0.7 1.1 0.7 1.0 0.3 2.8 1.2 1.7 1.6 6,034£ 8,487£ 3,479£ 6,427£ 2,480£ 5,853£ 5,896£ 0.3 0.1 56.41£ 0.1
S14000038 837 Inverclyde 2.1 2.2 0.9 1.9 1.0 6.2 3.4 3.5 1.7 5,567£ 8,416£ 3,671£ 7,068£ 2,314£ 5,890£ 5,783£ 0.3 0.1 55.01£ 0.3
S14000039 838 Inverness, Nairn, Badenoch and Strathspey 1.4 2.4 1.5 1.9 0.7 6.0 2.5 4.0 3.0 6,050£ 8,616£ 3,796£ 6,788£ 2,231£ 6,079£ 6,072£ 0.5 0.3 52.16£ 0.2
S14000040 839 Kilmarnock and Loudon 2.3 2.5 1.2 1.9 1.1 7.0 3.9 4.1 2.3 5,537£ 8,385£ 3,488£ 6,821£ 2,103£ 5,771£ 5,695£ 0.4 0.2 54.72£ 0.2
S14000041 840 Kirkcaldy and Cowdenbeath 2.4 2.6 1.4 1.9 1.0 7.4 4.3 4.4 2.7 5,863£ 8,547£ 3,726£ 6,911£ 2,127£ 5,930£ 5,908£ 0.3 0.2 57.66£ 0.2
S14000042 841 Lanark and Hamilton East 2.0 2.2 1.1 1.8 0.9 6.2 3.4 3.6 2.1 5,664£ 8,500£ 3,584£ 6,890£ 2,287£ 5,946£ 5,855£ 0.3 0.2 56.26£ 0.3
S14000043 842 Linlithgow and East Falkirk 2.2 2.9 1.5 2.2 1.0 7.5 3.9 4.7 3.0 5,732£ 8,647£ 3,609£ 6,921£ 2,152£ 6,049£ 5,955£ 0.5 0.2 57.66£ 0.3
S14000044 843 Livingston 2.3 3.1 1.7 2.3 1.0 8.1 4.2 5.3 3.5 6,092£ 8,701£ 3,668£ 6,906£ 2,323£ 6,125£ 6,116£ 0.4 0.2 60.93£ 0.4
S14000045 844 Midlothian 1.7 2.3 1.2 1.8 0.6 5.8 3.2 3.7 2.5 6,178£ 8,689£ 3,557£ 6,872£ 2,262£ 6,220£ 6,207£ 0.4 0.2 54.73£ 0.2
S14000046 845 Moray 1.2 1.9 1.2 1.4 0.8 5.1 2.1 3.1 2.7 5,705£ 8,603£ 3,593£ 6,604£ 2,257£ 5,706£ 5,706£ 0.3 0.2 54.30£ 0.2
S14000047 846 Motherwell and Wishaw 2.4 2.7 1.2 2.1 1.0 7.4 4.3 4.4 2.3 5,748£ 8,477£ 3,643£ 6,981£ 2,217£ 5,969£ 5,896£ 0.4 0.1 58.95£ 0.3
S14000048 848 North Ayrshire and Arran 2.3 2.6 1.2 2.0 1.1 7.2 4.1 4.3 2.3 5,690£ 8,704£ 3,586£ 7,132£ 2,183£ 6,033£ 5,922£ 0.4 0.2 59.64£ 0.2
S14000049 849 North East Fife 0.8 1.3 0.8 0.9 0.5 3.4 1.4 2.1 1.7 5,732£ 8,477£ 3,721£ 6,605£ 2,307£ 5,785£ 5,772£ 0.2 0.2 51.93£ 0.1
S14000050 850 Ochil and South Perthshire 1.7 2.1 1.2 1.6 0.7 5.8 3.1 3.6 2.5 5,882£ 8,643£ 3,536£ 6,760£ 2,171£ 5,952£ 5,932£ 0.3 0.2 54.86£ 0.2
S14000051 851 Orkney and Shetland 0.4 0.6 0.6 0.5 0.3 1.8 0.7 1.1 1.3 5,930£ 8,514£ 3,971£ 6,334£ 2,782£ 5,718£ 5,761£ 0.1 0.1 47.27£ 0.1
S14000052 852 Paisley and Renfrewshire North 1.7 2.3 1.0 2.0 0.9 6.0 3.0 3.8 2.0 5,903£ 8,661£ 3,460£ 7,075£ 2,346£ 6,032£ 5,996£ 0.5 0.2 54.84£ 0.3
S14000053 853 Paisley and Renfrewshire South 1.8 2.4 0.9 2.0 1.1 6.3 3.1 3.7 1.8 5,648£ 8,503£ 3,498£ 7,076£ 2,283£ 5,874£ 5,807£ 0.5 0.2 57.41£ 0.4
S14000054 854 Perth and North Perthshire 1.3 2.3 1.4 1.7 0.8 5.8 2.3 3.7 2.8 5,858£ 8,495£ 3,694£ 6,655£ 2,275£ 5,868£ 5,865£ 0.4 0.3 55.15£ 0.2
S14000055 855 Ross, Skye and Lochaber 0.8 1.4 1.0 1.0 0.6 3.8 1.5 2.5 2.1 5,902£ 8,537£ 3,735£ 6,621£ 2,517£ 5,794£ 5,817£ 0.2 0.1 49.03£ 0.2
S14000056 856 Rutherglen and Hamilton West 2.5 3.1 1.3 2.6 1.2 8.1 4.2 5.0 2.5 5,654£ 8,632£ 3,545£ 7,094£ 2,188£ 6,069£ 5,942£ 0.6 0.3 60.57£ 0.3
S14000057 857 Stirling 1.2 1.8 0.9 1.4 0.6 4.5 2.1 2.8 1.8 5,674£ 8,360£ 3,549£ 6,738£ 2,175£ 5,876£ 5,821£ 0.3 0.2 49.90£ 0.1
S14000058 858 West Aberdeenshire and Kincardine 0.5 1.0 0.7 1.0 0.3 2.5 0.9 1.7 1.5 6,041£ 8,434£ 3,679£ 6,455£ 2,547£ 5,893£ 5,923£ 0.2 0.1 54.11£ 0.1
S14000059 859 West Dunbartonshire 2.5 2.7 1.1 2.3 1.0 7.3 4.4 4.4 2.1 5,772£ 8,491£ 3,604£ 7,108£ 2,123£ 6,094£ 5,984£ 0.5 0.2 57.28£ 0.3
Not Known - - - - - - - - - -£ -£ -£ -£ -£ -£ -£ - - 135.77£ -
N07000001 922 NORTHERN IRELAND 50.8 58.1 29.2 39.1 19.9 158.0 95.9 104.3 63.5 6,297£ 9,191£ 4,106£ 7,492£ 2,427£ 6,553£ 6,470£ 9.0 5.6 70.78£ 6.3
N06000001 N01 Belfast East 2.3 2.7 1.2 2.2 0.9 7.1 4.2 4.4 2.4 6,189£ 8,720£ 3,720£ 7,180£ 2,205£ 6,253£ 6,232£ 0.5 0.2 62.79£ 0.3
N06000002 N02 Belfast North 4.6 4.3 1.3 3.7 1.4 11.6 8.7 7.2 2.6 6,297£ 9,218£ 4,057£ 8,012£ 2,280£ 6,886£ 6,650£ 0.8 0.2 71.03£ 0.5
N06000003 N03 Belfast South 2.1 2.2 0.9 1.7 0.9 6.1 3.9 3.7 1.7 6,173£ 8,946£ 3,730£ 7,435£ 2,200£ 6,279£ 6,242£ 0.4 0.2 68.49£ 0.3
N06000004 N04 Belfast West 5.2 4.9 1.2 4.5 1.4 12.7 9.7 8.4 2.4 6,410£ 9,471£ 4,139£ 8,440£ 2,334£ 7,292£ 6,929£ 1.0 0.2 77.43£ 0.5
N06000005 N05 East Antrim 1.9 2.4 1.3 1.9 0.7 6.3 3.5 4.1 2.6 6,205£ 9,081£ 3,796£ 7,274£ 2,282£ 6,436£ 6,367£ 0.5 0.2 69.12£ 0.2
N06000006 N06 East Londonderry 2.8 3.1 1.6 1.8 1.2 8.7 5.3 5.8 3.4 6,086£ 9,127£ 4,081£ 7,444£ 2,422£ 6,442£ 6,326£ 0.4 0.3 65.02£ 0.3
N06000007 N07 Fermanagh and South Tyrone 2.3 3.4 2.2 1.7 1.4 9.3 4.5 6.6 4.9 6,371£ 9,326£ 4,279£ 7,341£ 2,648£ 6,425£ 6,412£ 0.3 0.5 71.84£ 0.4
N06000008 N08 Foyle 4.7 4.2 1.4 3.2 2.1 12.4 8.6 7.2 3.0 6,064£ 9,155£ 3,964£ 7,854£ 2,412£ 6,386£ 6,264£ 0.6 0.2 77.13£ 0.6
N06000009 N09 Lagan Valley 1.8 2.6 1.6 1.8 0.8 6.7 3.4 4.5 3.3 6,371£ 9,051£ 3,829£ 7,103£ 2,429£ 6,377£ 6,375£ 0.5 0.3 68.27£ 0.3
N06000010 N10 Mid Ulster 2.5 3.3 2.2 1.6 1.2 9.1 4.9 6.5 5.1 6,551£ 9,633£ 4,574£ 7,636£ 2,862£ 6,801£ 6,733£ 0.4 0.4 78.54£ 0.4
N06000011 N11 Newry and Armagh 3.5 3.8 2.2 2.0 1.3 10.8 6.9 7.4 5.0 6,387£ 9,278£ 4,334£ 7,498£ 2,428£ 6,586£ 6,521£ 0.4 0.4 72.97£ 0.3
N06000012 N12 North Antrim 2.5 3.2 1.9 2.0 1.1 8.7 4.8 5.9 4.1 6,306£ 8,966£ 4,017£ 7,138£ 2,249£ 6,280£ 6,287£ 0.4 0.3 69.18£ 0.3
N06000013 N13 North Down 1.5 2.2 1.2 1.7 0.6 5.5 2.8 3.6 2.4 6,190£ 8,887£ 3,724£ 7,081£ 2,383£ 6,318£ 6,283£ 0.4 0.2 64.09£ 0.2
N06000014 N14 South Antrim 1.9 2.9 1.7 2.1 0.7 7.3 3.6 5.2 3.7 6,327£ 9,275£ 4,084£ 7,357£ 2,459£ 6,699£ 6,600£ 0.6 0.3 69.71£ 0.3
N06000015 N15 South Down 2.8 3.5 2.1 1.9 1.1 9.4 5.5 6.7 4.9 6,554£ 9,482£ 4,455£ 7,604£ 2,571£ 6,788£ 6,718£ 0.5 0.3 74.06£ 0.4
N06000016 N16 Strangford 1.9 2.3 1.4 1.5 0.7 6.3 3.6 4.1 2.9 6,134£ 8,999£ 4,069£ 7,150£ 2,374£ 6,389£ 6,310£ 0.4 0.3 61.14£ 0.2
N06000017 N17 Upper Bann 3.3 4.0 2.4 2.6 1.2 11.0 6.2 7.2 5.2 6,200£ 8,936£ 3,968£ 7,080£ 2,293£ 6,326£ 6,288£ 0.6 0.4 66.55£ 0.4
N06000018 N18 West Tyrone 3.0 3.0 1.7 1.5 1.3 9.0 5.8 5.8 3.8 6,472£ 9,418£ 4,294£ 7,589£ 2,662£ 6,509£ 6,497£ 0.4 0.4 77.89£ 0.4
Not Known - - - - - - - - - -£ -£ -£ -£ -£ -£ -£ - 0.2 68.91£ -
FOREIGN AND NOT KNOWN47.1 1.3 1.2 0.8 0.6 10.3 14.0 2.2 2.8 7,005£ 8,596£ 3,417£ 6,032£ 2,249£ 5,280£ 6,478£ 0.1 0.1 63.09£ 0.1
Footnotes
1 New area codes implemented from 1 January 2011 in line w ith the new GSS Coding and Naming policy.
2 Westminster parliamentary constituency codes operative at 5th April 2010.3 All f igures are rounded to the nearest integer therefore not all totals may exactly equal the sums of their respective components.
4 "Foreign and not know n" consists of a small proportion of recipient families and children w ho do not live w ithin England, Scotland, Northern Island or Wales. They may for instance be a Crow n servant posted overseas, or living in a British
Crow n Dependency. Due to the small size of this population w e combine them into one group w hich also consists of those w hom, at the time of publication, either have a UK postcode that does not match to a geographical off ice region code, or
do not have a postcode in the available data.
Table 3 HMRC] HM Revenue and Customs
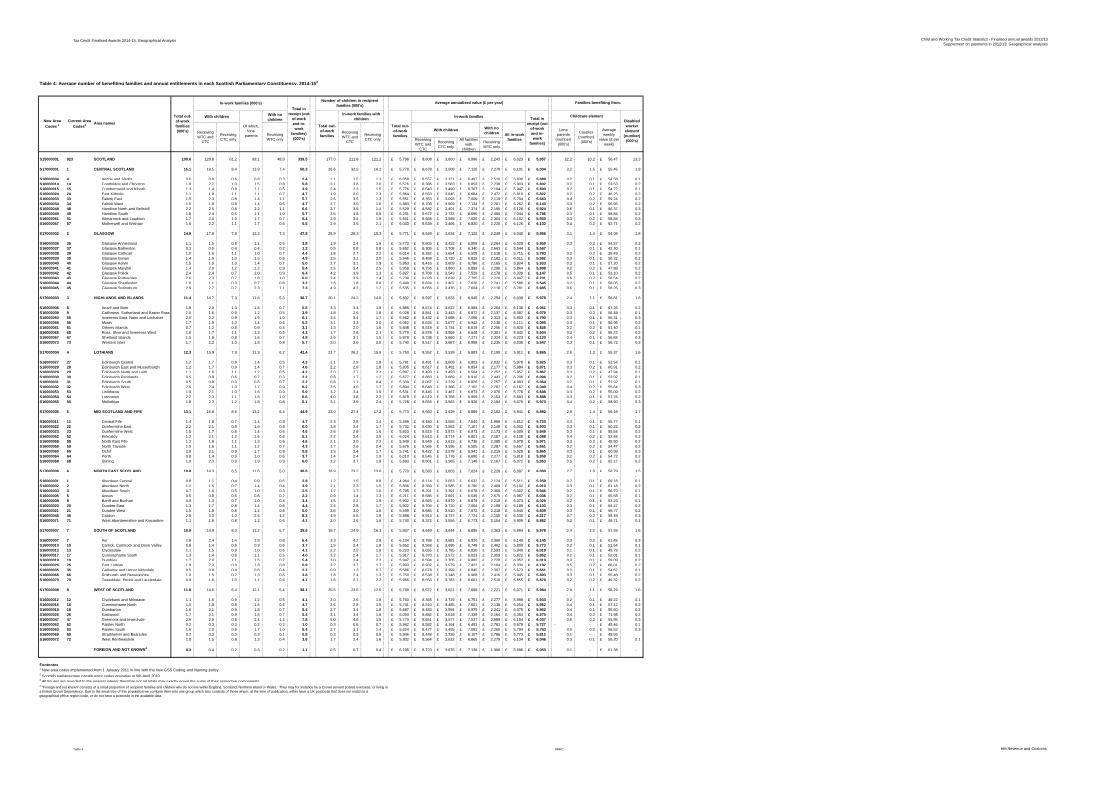
Tax Credit Finalised Awards 2014-15: Geographical Analysis Child and Working Tax Credit Statistics - Finalised annual awards 2012/13
Supplement on payments in 2012/13: Geographical analyses
Table 4: Average number of benefiting families and annual entitlements in each Scottish Parliamentary Constituency, 2014-153
With no
children
With no
children
S15000001 923 SCOTLAND 100.6 128.8 61.2 99.1 48.9 339.5 177.0 211.8 121.2 5,798£ 8,608£ 3,600£ 6,996£ 2,243£ 6,023£ 5,957£ 22.2 10.2 56.47£ 13.3
S17000001 1 CENTRAL SCOTLAND 15.1 19.5 8.4 13.9 7.4 50.3 26.6 32.5 16.2 5,778£ 8,678£ 3,508£ 7,120£ 2,270£ 6,101£ 6,004£ 3.2 1.5 55.45£ 1.9
S16000004 4 Airdrie and Shotts 0.6 0.9 0.6 0.8 0.3 2.4 1.1 1.5 1.3 6,058£ 8,557£ 3,371£ 6,497£ 2,510£ 5,836£ 5,889£ 0.2 0.1 54.58£ 0.1
S16000014 14 Coatbridge and Chryston 1.8 2.2 1.0 1.5 0.8 5.8 3.1 3.6 2.0 5,576£ 8,386£ 3,583£ 6,853£ 2,238£ 5,903£ 5,802£ 0.2 0.1 53.53£ 0.2
S16000015 15 Cumbernauld and Kilsyth 1.3 1.4 0.8 1.1 0.5 3.9 2.4 2.3 1.5 5,776£ 8,543£ 3,499£ 6,767£ 2,104£ 5,947£ 5,890£ 0.2 0.1 54.72£ 0.1
S16000024 24 East Kilbride 1.1 1.8 1.1 1.1 0.7 4.7 1.9 3.0 2.3 5,864£ 8,563£ 3,645£ 6,684£ 2,472£ 5,810£ 5,822£ 0.2 0.2 46.25£ 0.2
S16000033 33 Falkirk East 1.5 2.3 0.8 1.4 1.1 5.7 2.6 3.5 1.3 5,551£ 8,353£ 3,093£ 7,009£ 2,119£ 5,704£ 5,663£ 0.4 0.2 59.24£ 0.2
S16000034 34 Falkirk West 1.5 1.8 0.8 1.4 0.6 4.7 2.7 3.0 1.6 5,883£ 8,708£ 3,669£ 7,134£ 2,261£ 6,262£ 6,140£ 0.3 0.2 56.95£ 0.2
S16000048 48 Hamilton North and Bellshill 2.2 2.5 0.8 2.2 1.1 6.6 3.7 3.9 1.4 5,529£ 8,582£ 3,401£ 7,374£ 2,195£ 6,126£ 5,924£ 0.6 0.1 56.37£ 0.3
S16000049 49 Hamilton South 1.8 2.4 0.5 1.1 1.0 5.7 3.5 4.8 0.9 6,231£ 9,672£ 3,733£ 8,695£ 2,400£ 7,044£ 6,786£ 0.3 0.1 58.84£ 0.2
S16000051 51 Kilmarnock and Loudoun 1.7 2.0 1.0 1.7 0.7 5.4 2.9 3.4 1.9 5,551£ 8,668£ 3,589£ 7,026£ 2,304£ 6,102£ 5,930£ 0.3 0.2 58.84£ 0.3
S16000057 57 Motherwell and Wishaw 1.6 2.2 1.1 1.7 0.6 5.5 2.9 3.5 2.1 6,043£ 8,539£ 3,466£ 6,820£ 2,220£ 6,126£ 6,102£ 0.4 0.2 52.71£ 0.2
S17000002 2 GLASGOW 14.9 17.8 7.8 13.3 7.3 47.8 25.9 29.3 15.3 5,771£ 8,649£ 3,634£ 7,122£ 2,249£ 6,040£ 5,956£ 3.1 1.4 54.09£ 1.8
S16000036 36 Glasgow Anniesland 1.1 1.5 0.8 1.1 0.5 3.8 1.9 2.4 1.6 5,772£ 8,605£ 3,453£ 6,808£ 2,264£ 6,029£ 5,959£ 0.3 0.2 54.57£ 0.2
S16000037 37 Glasgow Baillieston 0.3 0.5 0.4 0.4 0.2 1.3 0.5 0.8 0.8 5,652£ 8,305£ 3,708£ 6,340£ 2,663£ 5,544£ 5,567£ - 0.1 42.30£ 0.1
S16000038 38 Glasgow Cathcart 1.0 1.6 1.1 1.0 0.7 4.4 1.8 2.7 2.2 6,014£ 8,382£ 3,654£ 6,509£ 2,518£ 5,715£ 5,783£ 0.2 0.2 39.49£ 0.2
S16000039 39 Glasgow Govan 1.4 1.9 1.0 1.5 0.6 4.9 2.5 3.1 2.0 5,946£ 8,468£ 3,720£ 6,825£ 2,182£ 6,011£ 5,992£ 0.3 0.1 56.32£ 0.2
S16000040 40 Glasgow Kelvin 1.5 1.9 1.0 1.4 0.7 5.0 2.7 3.1 1.9 5,953£ 8,416£ 3,609£ 6,786£ 2,165£ 5,924£ 5,933£ 0.3 0.1 57.20£ 0.2
S16000041 41 Glasgow Maryhill 1.4 2.0 1.2 1.2 0.9 5.4 2.5 3.4 2.5 5,958£ 8,756£ 3,860£ 6,899£ 2,296£ 5,864£ 5,888£ 0.2 0.2 47.88£ 0.2
S16000042 42 Glasgow Pollok 2.4 2.4 0.7 2.0 0.9 6.4 4.2 3.9 1.3 5,827£ 8,709£ 3,543£ 7,529£ 2,178£ 6,339£ 6,147£ 0.5 0.1 53.10£ 0.2
S16000043 43 Glasgow Rutherglen 2.0 2.3 0.7 1.8 1.0 6.0 3.4 3.9 1.4 5,708£ 9,028£ 3,639£ 7,765£ 2,226£ 6,447£ 6,201£ 0.6 0.2 58.54£ 0.2
S16000044 44 Glasgow Shettleston 1.0 1.1 0.3 0.7 0.8 3.2 1.6 1.8 0.6 5,449£ 8,824£ 3,407£ 7,626£ 2,241£ 5,586£ 5,545£ 0.2 0.1 58.05£ 0.2
S16000045 45 Glasgow Springburn 2.9 2.7 0.7 2.3 1.1 7.3 4.9 4.2 1.2 5,535£ 8,656£ 3,476£ 7,604£ 2,118£ 6,281£ 5,985£ 0.6 0.1 58.26£ 0.3
S17000003 3 HIGHLANDS AND ISLANDS 11.4 14.7 7.3 11.6 5.3 38.7 20.1 24.2 14.6 5,832£ 8,597£ 3,633£ 6,945£ 2,254£ 6,039£ 5,978£ 2.4 1.1 56.81£ 1.6
-
S16000006 6 Argyll and Bute 1.9 2.0 1.0 1.6 0.7 5.5 3.3 3.4 1.9 5,885£ 8,574£ 3,622£ 6,984£ 2,264£ 6,136£ 6,051£ 0.3 0.1 67.26£ 0.2
S16000009 9 Caithness, Sutherland and Easter Ross 1.0 1.6 0.9 1.2 0.5 3.9 1.8 2.6 1.8 6,028£ 8,841£ 3,443£ 6,872£ 2,137£ 6,097£ 6,079£ 0.3 0.2 56.48£ 0.1
S16000050 50 Inverness East, Nairn and Lochaber 2.0 2.2 0.9 1.9 1.0 6.1 3.4 3.4 1.7 5,562£ 8,432£ 3,688£ 7,096£ 2,313£ 5,903£ 5,790£ 0.3 0.1 55.31£ 0.3
S16000056 56 Moray 1.7 1.9 1.0 1.4 0.6 5.2 3.1 3.3 2.0 6,062£ 8,624£ 3,677£ 6,942£ 2,138£ 6,111£ 6,095£ 0.3 0.1 56.95£ 0.2
S16000061 61 Orkney Islands 0.7 1.2 0.8 0.9 0.4 3.1 1.3 2.0 1.6 5,848£ 8,518£ 3,734£ 6,619£ 2,256£ 5,820£ 5,826£ 0.2 0.2 51.40£ 0.1
S16000065 65 Ross, Skye and Inverness West 1.0 1.7 1.1 1.3 0.5 4.3 1.7 2.8 2.1 5,779£ 8,578£ 3,569£ 6,648£ 2,301£ 5,942£ 5,904£ 0.3 0.2 55.23£ 0.2
S16000067 67 Shetland Islands 1.5 1.9 0.8 1.6 0.7 4.9 2.6 3.1 1.5 5,878£ 8,738£ 3,660£ 7,271£ 2,324£ 6,223£ 6,120£ 0.4 0.1 56.84£ 0.3
S16000073 73 Western Isles 1.7 2.2 1.0 1.8 0.8 5.7 3.0 3.6 2.0 5,740£ 8,517£ 3,687£ 6,998£ 2,235£ 6,036£ 5,947£ 0.3 0.1 56.72£ 0.3
S17000004 4 LOTHIANS 12.3 15.9 7.9 11.9 6.2 42.4 21.7 26.2 15.6 5,750£ 8,552£ 3,539£ 6,883£ 2,190£ 5,911£ 5,865£ 2.6 1.3 55.37£ 1.6
S16000027 27 Edinburgh Central 1.2 1.7 0.9 1.4 0.5 4.3 2.1 2.9 1.8 5,781£ 8,491£ 3,609£ 6,803£ 2,032£ 5,978£ 5,925£ 0.3 0.1 52.54£ 0.1
S16000028 28 Edinburgh East and Musselburgh 1.2 1.7 0.9 1.4 0.7 4.6 2.2 2.8 1.8 5,835£ 8,617£ 3,481£ 6,854£ 2,177£ 5,884£ 5,871£ 0.3 0.2 60.91£ 0.2
S16000029 29 Edinburgh North and Leith 1.1 1.6 1.1 1.2 0.5 4.2 2.0 2.7 2.2 5,897£ 8,493£ 3,493£ 6,504£ 2,252£ 5,857£ 5,867£ 0.3 0.2 47.94£ 0.1
S16000030 30 Edinburgh Pentlands 0.5 0.9 0.6 0.7 0.3 2.2 0.8 1.7 1.2 5,677£ 8,863£ 3,669£ 6,916£ 2,443£ 6,206£ 6,096£ 0.2 0.1 53.92£ 0.1
S16000031 31 Edinburgh South 0.5 0.8 0.3 0.6 0.7 2.2 0.8 1.1 0.4 5,339£ 8,067£ 3,229£ 6,826£ 2,257£ 4,983£ 5,064£ 0.2 0.1 51.92£ 0.1
S16000032 32 Edinburgh West 2.0 2.4 1.0 1.7 0.9 6.2 3.5 4.0 1.7 5,804£ 8,648£ 3,366£ 7,162£ 2,287£ 6,162£ 6,049£ 0.4 0.2 55.64£ 0.3
S16000053 53 Linlithgow 1.9 2.1 1.0 1.6 0.9 5.9 3.2 3.4 1.9 5,531£ 8,446£ 3,467£ 6,873£ 2,076£ 5,776£ 5,698£ 0.3 0.2 55.09£ 0.2
S16000054 54 Livingston 2.2 2.3 1.1 1.6 1.0 6.6 4.0 3.8 2.2 5,879£ 8,519£ 3,768£ 6,956£ 2,153£ 5,893£ 5,888£ 0.3 0.1 57.76£ 0.2
S16000055 55 Midlothian 1.8 2.3 1.2 1.8 0.8 6.1 3.1 3.9 2.4 5,728£ 8,656£ 3,563£ 6,926£ 2,194£ 6,070£ 5,970£ 0.4 0.2 58.90£ 0.3
S17000005 5 MID SCOTLAND AND FIFE 13.1 16.8 8.6 13.2 6.4 44.9 23.0 27.4 17.2 5,773£ 8,560£ 3,629£ 6,889£ 2,182£ 5,941£ 5,892£ 2.9 1.4 56.19£ 1.7
- - -
S16000011 11 Central Fife 1.4 1.8 0.7 1.4 0.8 4.7 2.3 2.8 1.4 5,499£ 8,480£ 3,555£ 7,040£ 1,966£ 5,812£ 5,720£ 0.3 0.1 55.77£ 0.1
S16000022 22 Dunfermline East 2.2 2.1 0.9 1.6 0.8 6.0 3.8 3.4 1.7 5,732£ 8,630£ 3,562£ 7,107£ 2,148£ 6,002£ 5,903£ 0.3 0.1 60.22£ 0.2
S16000023 23 Dunfermline West 1.5 1.7 0.8 1.4 0.6 4.6 2.6 2.8 1.6 5,823£ 8,523£ 3,572£ 6,973£ 2,173£ 6,009£ 5,949£ 0.3 0.1 55.54£ 0.2
S16000052 52 Kirkcaldy 1.2 2.1 1.2 1.6 0.6 5.1 2.2 3.4 2.5 6,024£ 8,613£ 3,774£ 6,801£ 2,187£ 6,108£ 6,088£ 0.4 0.2 52.48£ 0.2
S16000058 58 North East Fife 1.2 1.8 1.1 1.3 0.6 4.6 2.1 3.0 2.2 5,949£ 8,649£ 3,613£ 6,736£ 2,285£ 5,978£ 5,971£ 0.3 0.2 49.50£ 0.2
S16000059 59 North Tayside 1.0 1.6 1.1 1.2 0.7 4.3 1.7 2.6 2.4 5,676£ 8,566£ 3,596£ 6,505£ 2,287£ 5,657£ 5,661£ 0.2 0.2 54.47£ 0.2
S16000060 60 Ochil 2.0 2.1 0.9 1.7 0.8 5.8 3.5 3.4 1.7 5,741£ 8,422£ 3,578£ 6,941£ 2,219£ 5,929£ 5,865£ 0.3 0.1 60.99£ 0.3
S16000064 64 Perth 0.8 1.4 0.9 1.0 0.6 3.7 1.4 2.4 1.9 6,010£ 8,545£ 3,776£ 6,690£ 2,277£ 5,818£ 5,859£ 0.2 0.2 54.72£ 0.2
S16000068 68 Stirling 1.9 2.3 0.9 1.9 0.9 6.0 3.2 3.7 1.8 5,693£ 8,601£ 3,565£ 7,146£ 2,167£ 6,072£ 5,953£ 0.5 0.2 62.17£ 0.2
S17000006 6 NORTH EAST SCOTLAND 10.8 14.3 6.5 11.6 5.0 36.6 18.9 23.2 13.0 5,770£ 8,583£ 3,603£ 7,024£ 2,226£ 6,097£ 6,000£ 2.7 1.0 58.79£ 1.5
-
S16000001 1 Aberdeen Central 0.8 1.1 0.4 0.9 0.5 2.8 1.2 1.5 0.8 4,964£ 8,114£ 3,053£ 6,632£ 2,124£ 5,511£ 5,359£ 0.2 0.1 69.18£ 0.1
S16000002 2 Aberdeen North 1.2 1.5 0.7 1.4 0.4 3.9 2.1 2.3 1.5 5,806£ 8,369£ 3,585£ 6,790£ 2,409£ 6,102£ 6,010£ 0.3 0.1 61.18£ 0.2
S16000003 3 Aberdeen South 0.7 1.0 0.5 1.0 0.3 2.5 1.2 1.7 1.0 5,795£ 8,291£ 3,391£ 6,678£ 2,369£ 6,002£ 5,946£ 0.2 0.1 56.79£ 0.1
S16000005 5 Angus 0.5 0.8 0.6 0.8 0.2 2.2 0.9 1.4 1.3 6,211£ 8,585£ 3,691£ 6,539£ 2,575£ 5,987£ 6,036£ 0.2 0.1 55.58£ 0.1
S16000008 8 Banff and Buchan 0.9 1.3 0.7 1.0 0.4 3.4 1.5 2.2 1.6 5,902£ 8,565£ 3,879£ 6,879£ 2,218£ 6,073£ 6,029£ 0.2 0.1 53.23£ 0.1
S16000020 20 Dundee East 1.3 1.7 0.8 1.4 0.6 4.4 2.4 2.8 1.7 5,902£ 8,704£ 3,710£ 7,064£ 2,198£ 6,189£ 6,103£ 0.3 0.1 64.47£ 0.2
S16000021 21 Dundee West 1.5 1.8 0.8 1.4 0.8 5.0 2.6 3.0 1.6 5,599£ 8,685£ 3,510£ 7,072£ 2,218£ 5,945£ 5,839£ 0.3 0.1 59.77£ 0.2
S16000046 46 Gordon 2.8 3.3 1.0 2.6 1.2 8.3 4.9 5.6 1.9 5,898£ 8,913£ 3,737£ 7,724£ 2,155£ 6,530£ 6,317£ 0.7 0.2 58.49£ 0.3
S16000071 71 West Aberdeenshire and Kincardine 1.1 1.6 0.8 1.2 0.6 4.1 2.0 2.6 1.6 5,740£ 8,372£ 3,556£ 6,773£ 2,154£ 5,909£ 5,862£ 0.2 0.1 49.71£ 0.1
S17000007 7 SOUTH OF SCOTLAND 10.9 14.9 8.0 11.2 5.7 39.6 19.7 24.9 16.3 5,937£ 8,649£ 3,644£ 6,895£ 2,363£ 5,994£ 5,978£ 2.4 1.2 57.59£ 1.6
S16000007 7 Ayr 1.8 2.4 1.4 1.9 0.8 6.4 3.3 4.2 2.8 6,134£ 8,788£ 3,681£ 6,920£ 2,360£ 6,149£ 6,145£ 0.3 0.2 61.45£ 0.3
S16000010 10 Carrick, Cumnock and Doon Valley 0.8 1.4 0.8 0.9 0.6 3.7 1.5 2.4 1.8 5,652£ 8,568£ 3,686£ 6,748£ 2,462£ 5,809£ 5,773£ 0.2 0.1 51.64£ 0.1
S16000013 13 Clydesdale 1.1 1.5 0.9 1.0 0.6 4.1 2.2 2.5 1.9 6,223£ 8,655£ 3,785£ 6,830£ 2,593£ 5,940£ 6,019£ 0.1 0.1 49.79£ 0.2
S16000017 17 Cunninghame South 1.3 1.4 0.8 1.1 0.5 4.0 2.2 2.4 1.7 5,917£ 8,370£ 3,572£ 6,623£ 2,359£ 5,822£ 5,852£ 0.2 0.1 52.01£ 0.1
S16000019 19 Dumfries 1.7 2.0 1.1 1.5 0.7 5.4 3.0 3.4 2.2 5,947£ 8,594£ 3,705£ 6,882£ 2,228£ 6,052£ 6,019£ 0.3 0.1 59.09£ 0.2
S16000025 25 East Lothian 1.9 2.3 0.9 1.8 0.8 5.9 3.2 3.7 1.7 5,893£ 8,932£ 3,579£ 7,422£ 2,104£ 6,330£ 6,192£ 0.5 0.2 68.01£ 0.2
S16000035 35 Galloway and Upper Nithsdale 0.5 0.8 0.4 0.6 0.4 2.2 0.9 1.3 0.7 5,586£ 8,578£ 3,399£ 6,845£ 2,307£ 5,673£ 5,651£ 0.2 0.1 54.62£ 0.1
S16000066 66 Roxburgh and Berwickshire 1.0 1.5 0.7 1.3 0.6 3.8 1.8 2.4 1.3 5,750£ 8,538£ 3,348£ 6,908£ 2,416£ 5,945£ 5,893£ 0.3 0.1 55.48£ 0.2
S16000070 70 Tweeddale, Ettrick and Lauderdale 0.9 1.6 1.0 1.1 0.6 4.1 1.6 2.7 2.2 5,966£ 8,553£ 3,783£ 6,661£ 2,510£ 5,855£ 5,878£ 0.2 0.2 49.32£ 0.2
S17000008 8 WEST OF SCOTLAND 11.8 14.6 6.4 12.1 5.4 38.1 20.5 23.5 12.5 5,789£ 8,572£ 3,621£ 7,068£ 2,221£ 6,071£ 5,984£ 2.9 1.1 58.29£ 1.6
- -
S16000012 12 Clydebank and Milngavie 1.1 1.6 0.9 1.2 0.5 4.1 2.0 2.6 1.8 5,760£ 8,365£ 3,729£ 6,751£ 2,277£ 5,999£ 5,933£ 0.2 0.1 49.22£ 0.1
S16000016 16 Cunninghame North 1.5 1.8 0.8 1.6 0.6 4.7 2.6 2.8 1.5 5,741£ 8,510£ 3,485£ 7,001£ 2,138£ 6,054£ 5,952£ 0.4 0.1 57.12£ 0.2
S16000018 18 Dumbarton 1.6 2.1 0.9 1.8 0.7 5.4 2.7 3.4 1.8 5,687£ 8,483£ 3,594£ 6,975£ 2,241£ 6,075£ 5,962£ 0.4 0.1 55.60£ 0.2
S16000026 26 Eastwood 1.7 2.1 0.9 1.6 0.7 5.4 3.1 3.4 1.6 6,093£ 8,882£ 3,618£ 7,339£ 2,164£ 6,354£ 6,270£ 0.4 0.2 71.98£ 0.2
S16000047 47 Greenock and Inverclyde 2.9 2.9 0.8 2.4 1.2 7.8 5.0 4.6 1.5 5,770£ 8,651£ 3,577£ 7,537£ 2,089£ 6,194£ 6,037£ 0.6 0.2 55.95£ 0.3
S16000062 62 Paisley North 0.2 0.3 0.3 0.2 0.2 1.0 0.3 0.6 0.7 5,942£ 8,582£ 4,164£ 6,491£ 2,781£ 5,679£ 5,727£ - - 45.46£ 0.1
S16000063 63 Paisley South 1.6 2.0 0.8 1.7 1.0 5.4 2.7 3.1 1.4 5,624£ 8,477£ 3,455£ 7,081£ 2,260£ 5,794£ 5,743£ 0.5 0.2 56.52£ 0.3
S16000069 69 Strathkelvin and Bearsden 0.2 0.3 0.3 0.3 0.1 0.8 0.3 0.5 0.6 5,946£ 8,448£ 3,726£ 6,157£ 2,786£ 5,773£ 5,812£ 0.1 - 48.93£
S16000072 72 West Renfrewshire 1.0 1.5 0.8 1.3 0.4 3.6 1.7 2.4 1.6 5,802£ 8,564£ 3,632£ 6,865£ 2,279£ 6,134£ 6,046£ 0.3 0.1 59.20£ 0.1
FOREIGN AND NOT KNOWN4
0.3 0.4 0.2 0.3 0.2 1.1 0.5 0.7 0.4 6,195£ 8,723£ 3,676£ 7,136£ 1,996£ 5,996£ 6,050£ 0.1 - 61.38£ -
Footnotes1 New area codes implemented from 1 January 2011 in line with the new GSS Coding and Naming policy.
2 Scottish parliamentary constituency codes operative at 5th April 2010.
3 All figures are rounded to the nearest integer therefore not all totals may exactly equal the sums of their respective components.
New Area
Codes 1
Current Area
Codes2
Area names
In-work families (000's)
With children
Receiving
CTC only
Total out-
of-work
families
(000's)
4 "Foreign and not known" consists of a small proportion of recipient families and children who do not live within England, Scotland, Northern Island or Wales. They may for instance be a Crown servant posted overseas, or living in
a British Crown Dependency. Due to the small size of this population we combine them into one group which also consists of those whom, at the time of publication, either have a UK postcode that does not match to a
geographical office region code, or do not have a postcode in the available data.
Couples
(number)
(000's)
Average
weekly
value (£ per
week)Receiving
WTC only
Total in
receipt (out-
of-work
and in-
work
families)
Childcare element
Lone
parents
(number)
(000's)
Total out-
of-work
familiesReceiving
WTC and
CTC
Receiving
CTC only
All families
with
children
In-work families
Receiving
WTC only
Receiving
WTC and
CTC
All in-work
families
Receiving
CTC only
Number of children in recipient
families (000's)
Receiving
WTC and
CTC
Of which,
lone
parents
Disabled
worker
element
(number)
(000's)
Total in
receipt (out-
of-work
and in-
work
families)
(000's)
Average annualised value (£ per year)
With children
In-work families with
children
Families benefiting from:
Total out-
of-work
families
Table 4 HMRC HM Revenue and Customs
Tax Credit Finalised Awards 2014-15: Geographical Analysis
Appendix A : Technical Note
Using finalised awards data
Interpreting annual entitlement
Their average annualised entitlement (in £) is 365 times the average, taken over all days in the
year, of the aggregate daily entitlement of these families.
1 In accordance with the tax credits system, the income used to taper the award was the 2014-15 income, if that was more than
£5,000 above the 2013-14 income then 2014-15 income will be lowered by £5,000; if the 2014-15 income was less than the 2013-
14 income by more than £2,500 then the 2014-15 income will be enhanced by £2,500.
The figures for 2014-15 in the table are mostly derived from a scan of the tax credits computer
system taken in early April 2015. For each award, the scan contained a record for each sub-
period of the year for which the family's circumstances (adult partners, hours worked, number of
children, childcare costs, disabilities) remained unchanged. For each such sub-period, the scan
revealed the various elements for which the family qualified for the period, and the daily
monetary value of the childcare element. It also revealed the values of the 2013-14 and 2014-15
incomes for each award.
For each award, and for each sub-period, the daily rate of entitlement was then modelled by
summing the various element values to which the family was entitled and tapering the total away
using the income data1. The modelled daily entitlement was then used to establish where on the
plateau - taper profile the family fell for that period. A small number (under 1 per cent) of tax
credits awards were not included in the scan.
For each case covered by the scan, and for each sub-period, it was possible to compare the
modelled entitlement with that held on the computer system. For all but about 0.1 per cent of
cases the discrepancy was at most 2p per day.
The scan did not cover out of work families who received their child support via Income Support
or income-based Jobseeker's Allowance (IS-JSA) rather than CTC. A scan of such families at
August 2008 was obtained from the Department for Work and Pensions. This contained
sufficient information to distinguish single parents from couples. The number and ages of the
children were obtained from the Child Benefit records for these families who were still receiving
their child support through IS-JSA at August 2014. The level of entitlement at August 2014 was
modelled using this information, which however could not include the disabled child or severely
disabled child premium. To produce annual averages to be added to the annual CTC averages,
the August 2014 aggregates were scaled by a factor needed to produce a separately-estimated
overall average for the year. The annualised August 2014 entitlements were also scaled to
agree with the separately known total of expenditure via benefits for these families.
The calculation of the annual entitlement for an award also yields a value of the entitlement for
each day of the year. This can vary within the year as the family's circumstances vary. Also,
awards can end during the year (for example, as couples separate, or as families cease to
satisfy the qualifying conditions listed above), and other awards start during the year. The tables
show annual average numbers of benefiting families with particular characteristics that is, the
average taken over all days in the year.
Their aggregate annual entitlement (in £ million) is the sum, taken over all days in the year, of
the daily entitlements of families with these characteristics on the day.
Appendix A HMRC
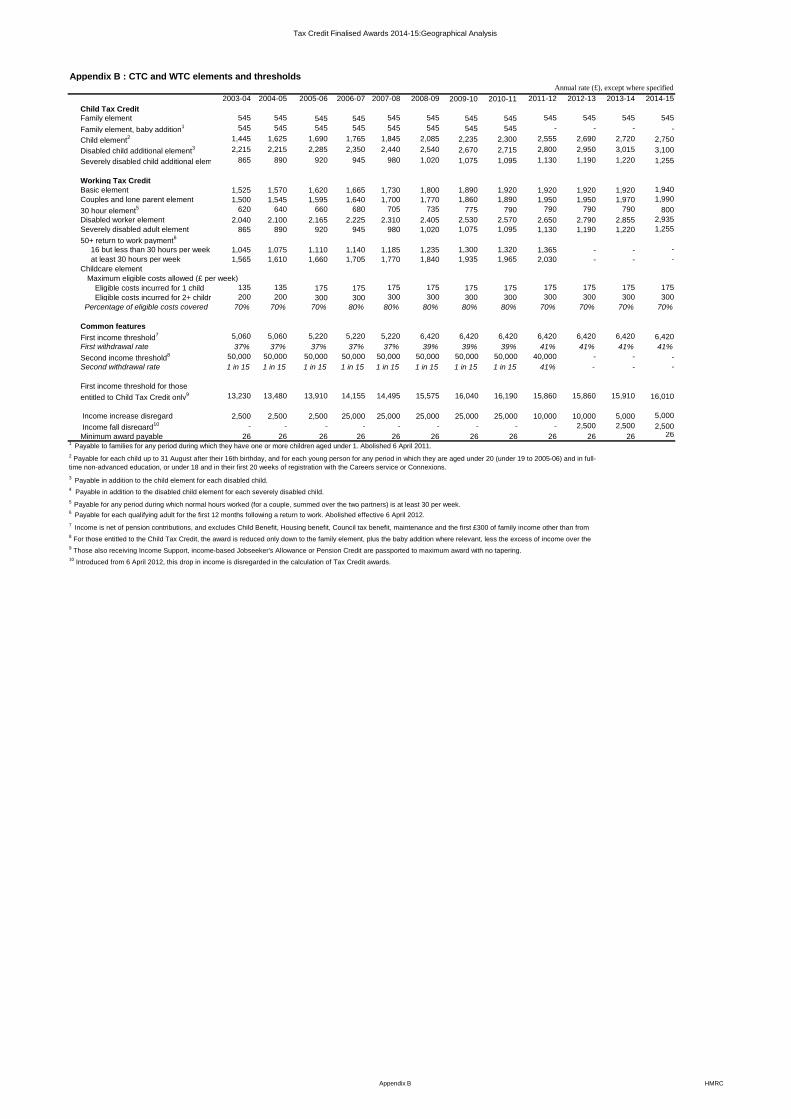
Tax Credit Finalised Awards 2014-15:Geographical Analysis
Appendix B : CTC and WTC elements and thresholds Annual rate (£), except where specified
2003-04 2004-05 2005-06 2006-07 2007-08 2008-09 2009-10 2010-11 2011-12 2012-13 2013-14 2014-15
Child Tax Credit
Family element 545 545 545 545 545 545 545 545 545 545 545 545
Family element, baby addition1 545 545 545 545 545 545 545 545 - - - -
Child element2 1,445 1,625 1,690 1,765 1,845 2,085 2,235 2,300 2,555 2,690 2,720 2,750
Disabled child additional element3 2,215 2,215 2,285 2,350 2,440 2,540 2,670 2,715 2,800 2,950 3,015 3,100
Severely disabled child additional element4 865 890 920 945 980 1,020 1,075 1,095 1,130 1,190 1,220 1,255
Working Tax Credit
Basic element 1,525 1,570 1,620 1,665 1,730 1,800 1,890 1,920 1,920 1,920 1,920 1,940
Couples and lone parent element 1,500 1,545 1,595 1,640 1,700 1,770 1,860 1,890 1,950 1,950 1,970 1,990
30 hour element5 620 640 660 680 705 735 775 790 790 790 790 800
Disabled worker element 2,040 2,100 2,165 2,225 2,310 2,405 2,530 2,570 2,650 2,790 2,855 2,935
Severely disabled adult element 865 890 920 945 980 1,020 1,075 1,095 1,130 1,190 1,220 1,255
50+ return to work payment6
16 but less than 30 hours per week 1,045 1,075 1,110 1,140 1,185 1,235 1,300 1,320 1,365 - - -
at least 30 hours per week 1,565 1,610 1,660 1,705 1,770 1,840 1,935 1,965 2,030 - - -
Childcare element
Maximum eligible costs allowed (£ per week)
Eligible costs incurred for 1 child 135 135 175 175 175 175 175 175 175 175 175 175
Eligible costs incurred for 2+ children 200 200 300 300 300 300 300 300 300 300 300 300
Percentage of eligible costs covered 70% 70% 70% 80% 80% 80% 80% 80% 70% 70% 70% 70%
Common features
First income threshold7 5,060 5,060 5,220 5,220 5,220 6,420 6,420 6,420 6,420 6,420 6,420 6,420
First withdrawal rate 37% 37% 37% 37% 37% 39% 39% 39% 41% 41% 41% 41%
Second income threshold8 50,000 50,000 50,000 50,000 50,000 50,000 50,000 50,000 40,000 - - -
Second withdrawal rate 1 in 15 1 in 15 1 in 15 1 in 15 1 in 15 1 in 15 1 in 15 1 in 15 41% - - -
First income threshold for those
entitled to Child Tax Credit only9 13,230 13,480 13,910 14,155 14,495 15,575 16,040 16,190 15,860 15,860 15,910 16,010
Income increase disregard 2,500 2,500 2,500 25,000 25,000 25,000 25,000 25,000 10,000 10,000 5,000 5,000
Income fall disregard10 - - - - - - - - - 2,500 2,500 2,500
Minimum award payable 26 26 26 26 26 26 26 26 26 26 26 261
Payable to families for any period during which they have one or more children aged under 1. Abolished 6 April 2011.
3 Payable in addition to the child element for each disabled child.
4 Payable in addition to the disabled child element for each severely disabled child.
6 Payable for each qualifying adult for the first 12 months following a return to work. Abolished effective 6 April 2012.
10 Introduced from 6 April 2012, this drop in income is disregarded in the calculation of Tax Credit awards.
2 Payable for each child up to 31 August after their 16th birthday, and for each young person for any period in which they are aged under 20 (under 19 to 2005-06) and in full-
time non-advanced education, or under 18 and in their first 20 weeks of registration with the Careers service or Connexions.
5 Payable for any period during which normal hours worked (for a couple, summed over the two partners) is at least 30 per week.
7 Income is net of pension contributions, and excludes Child Benefit, Housing benefit, Council tax benefit, maintenance and the first £300 of family income other than from
work or benefits. The award is reduced by the excess of income over the first threshold, multiplied by the first withdrawal rate.8 For those entitled to the Child Tax Credit, the award is reduced only down to the family element, plus the baby addition where relevant, less the excess of income over the
second threshold multiplied by the second withdrawal rate. Abolished effective 6 April 2012.9 Those also receiving Income Support, income-based Jobseeker's Allowance or Pension Credit are passported to maximum award with no tapering.
Appendix B HMRC
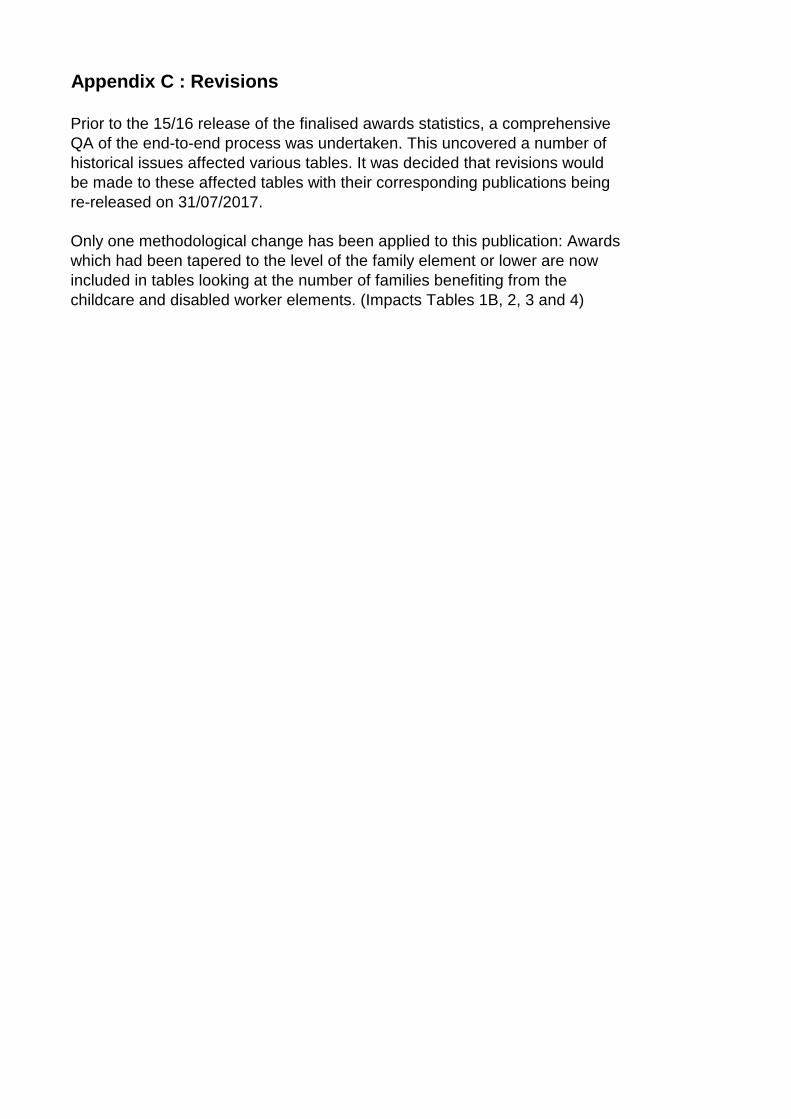
Appendix C : Revisions
Prior to the 15/16 release of the finalised awards statistics, a comprehensive
QA of the end-to-end process was undertaken. This uncovered a number of
historical issues affected various tables. It was decided that revisions would
be made to these affected tables with their corresponding publications being
re-released on 31/07/2017.
Only one methodological change has been applied to this publication: Awards
which had been tapered to the level of the family element or lower are now
included in tables looking at the number of families benefiting from the
childcare and disabled worker elements. (Impacts Tables 1B, 2, 3 and 4)