Socio-economic and Policy Drivers (Algarabulli Dist
288
Bangor University DOCTOR OF PHILOSOPHY Deforestation in Jefara Plain, Libya: Socio-economic and Policy Drivers (Algarabulli District case study) Alsoul, Adnan Award date: 2016 Awarding institution: Bangor University Link to publication General rights Copyright and moral rights for the publications made accessible in the public portal are retained by the authors and/or other copyright owners and it is a condition of accessing publications that users recognise and abide by the legal requirements associated with these rights. • Users may download and print one copy of any publication from the public portal for the purpose of private study or research. • You may not further distribute the material or use it for any profit-making activity or commercial gain • You may freely distribute the URL identifying the publication in the public portal ? Take down policy If you believe that this document breaches copyright please contact us providing details, and we will remove access to the work immediately and investigate your claim. Download date: 11. Feb. 2022
-
Upload
khangminh22 -
Category
Documents
-
view
1 -
download
0
Transcript of Socio-economic and Policy Drivers (Algarabulli Dist

Bangor University
DOCTOR OF PHILOSOPHY
Deforestation in Jefara Plain, Libya: Socio-economic and Policy Drivers (AlgarabulliDistrict case study)
Alsoul, Adnan
Award date:2016
Awarding institution:Bangor University
Link to publication
General rightsCopyright and moral rights for the publications made accessible in the public portal are retained by the authors and/or other copyright ownersand it is a condition of accessing publications that users recognise and abide by the legal requirements associated with these rights.
• Users may download and print one copy of any publication from the public portal for the purpose of private study or research. • You may not further distribute the material or use it for any profit-making activity or commercial gain • You may freely distribute the URL identifying the publication in the public portal ?
Take down policyIf you believe that this document breaches copyright please contact us providing details, and we will remove access to the work immediatelyand investigate your claim.
Download date: 11. Feb. 2022

Deforestation in Jefara Plain, Libya: Socio-economic and Policy
Drivers (Algarabulli District case study)
A thesis submitted for the degree of Doctor of Philosophy
to Bangor University
by
Adnan H K. Alsoul M.Sc.
School of Environment, Natural Resources and Geography
Bangor University
May 2016

Contents Dedication
iv
Dedication
This thesis is dedicated to my beloved parents for their invaluable contribution towards my
success. Also to my beloved wife for her encouragement, understanding, patience, moral and
material support and willingness to share difficulties which I encountered during the tenure of
my study. Additionally it is dedicated to my daughters Razan and Rawan. Thank you all very
much and Allah bless us all.

Contents Acknowledgements
v
Acknowledgements
First and above all, I praise Allah, the almighty for providing me this opportunity and granting me
the capability to proceed successfully. This thesis appears in its current form due to the assistance
and guidance of several people. I would therefore like to offer my sincere thanks to all of them.
I take this opportunity to express my deep gratitude in particular to Dr. Robert M. Brook, my main
research supervisor, for his scholastic guidance, advise, constructive criticism, support,
encouraging insight, and friendship throughout the course of this research. His informed
knowledgeable opinions and advice guided me forward step by step. I do not have enough words
with which to express my feeling of gratitude to him. I am also indebted to Dr Neal Hockley for
informed comment and constructive advice whenever it was required, also with resolving the
effects of political influences affecting my progress along my chosen path of study.
I owe a sincere thanks to Ian Harris and Andrew Packwood at Bangor University for their help and
support with the technological aspects of GIS and RS; to my committee members specially Prof.
Morag McDonald for her constructive comments and advice during my annual committee meeting;
to Dr Amin Kamete who was my original co-supervisor from 2010-2011 prior to moving to
Glasgow University; to my friend Yasir Edowid.
I owe a big thanks to the Agronomist and Forestry expert in the Ministry of Agriculture, Libya, Mr
Faraj Idris who has facilitated my studies from my initial proposals when I was in Libya to the
culmination of my studies here in Bangor.
I would like also to thank the varied individuals in the Ministry of Agriculture who contributed to
my research and thesis in Libya - Adnan Jebriel; Dr Bashir Nwer; Mr Adnan Sbeita and the forestry
expert Khalifa Khatabi who was the administrator of Sand-dune fixation and afforestation
campaigns in Algarabulli District from 1955 to 1973; to Dr Khaled Ben-Mahmoud.
I wish to register my gratitude to Forest Department staff in Algarabulli District for their invaluable
support during my fieldwork, in Libya.
I am very much grateful to all respondents who shared their views and spared their valuable time
in discussing to have their perception of forest and deforestation.
Last, but not least, to Mohammed Idris who helped me in any way he could from my home country
of Libya. It is sad that he did not survive to see the fruits of his efforts and my labour.

Contents Abstract
vi
Abstract Deforestation has many negative effects on the environment. In North Africa the most dramatic
are a loss of habitat for wildlife, desertification, soil erosion, and climate change.
In the Jefara plain, Libya, tree planting was undertaken to combat desertification and stabilize
sand dunes and by 1984, 248,000 ha had been planted. However, these forest now suffer from
severe deforestation, leading to serious encroachment of sand dunes, which now puts at risk
those areas converted to agriculture.
The major objective of this thesis was to understand the real causes of deforestation focussing
mainly on socio-economic and policy drivers in Algarabulli District.
Interviewed respondents stated that deforestation commenced in 1986, the major direct causes
being agricultural expansion, building and road construction, and land trading. However, the
major indirect cause contributing to deforestation was reported to be the change of forest
governance in 1986; this led to an increase in corruption and a decrease in law enforcement,
resulting in many land allocation contracts being issued to officers and government officials
who then cleared forestland for themselves and later by local people. They reported that
deforestation increased dramatically in the study zone after the fall of the Gaddafi regime in
2011, due to the total breakdown in governance.
Interviews were also conducted with 20 government officials (in the Ministry of Agriculture
and legal experts of in administrative and real estate law) Legislation, Forest Department
records and policies were also reviewed. These findings agreed with those from research with
local residents. Officials added that the former regime contributed to destruction of the forests
indirectly by: giving orders to abolish the Ministry of Agriculture several times, encouraging
burning of the Land Registry Centres, and distributing forest land to officials, all of which led
to an increase the corruption and lack of law enforcement. This was despite the de jure
adequacy of forest protection legislation.
Remote sensing, using SPOT imagery was used to estimate the rate of land cover change. The
results of supervised classification and ground truething showed a remarkable degree of
agreement with other two methods (local residents’ estimates and Forest Department records):
27% of total forest area was cleared between 1986 and 2010, but after the fall of the Gaddafi
regime another 35% was cleared between 2011 and 2013. Currently only 36% of the originally
planted forest remains.

Contents Abstract
vii
Finally, a survey was conducted with 43 forest clearers. The results showed that population
growth and density had not contributed to deforestation. Analysis of the characteristics of forest
clearers found that 93% of respondents were educated, 100% were employed and their income
was slightly higher than respondents who had not cleared forests. The main purpose of clearing
forest after the 2011 uprising was to sell the land illegally, due to a tenfold increase in land
prices, which incentivised land speculation and forest clearance as a means of money
laundering.
If deforestation continues at the current rate, all forests will be lost within three years. Due to
the total breakdown in governance, deforestation in Libya nowadays is one of the biggest
environmental challenges.

Contents Table of Contents
viii
Table of Contents
Contents
Declaration ............................................................................................................................................... i
Dedication .............................................................................................................................................. iv
Acknowledgements ................................................................................................................................. v
Abstract .................................................................................................................................................. vi
Table of Contents ................................................................................................................................. viii
List of Tables ........................................................................................................................................ xii
List of Figures ...................................................................................................................................... xiii
List of Abbreviations and Acronyms ................................................................................................... xvi
1 General Introduction .................................................................................................................... 1
1.2 Outline of the study ....................................................................................................................... 3
1.2.1 Context of the research .......................................................................................................... 3
1.2.2 Thesis research questions ....................................................................................................... 3
1.3 Thesis Structure ........................................................................................................................ 4
2 Biophysical and Human context .................................................................................................. 6
2.1 Physical setting of study ............................................................................................................... 6
2.1.1 Location and Geography ........................................................................................................ 6
2.1.2 Geology .................................................................................................................................. 7
2.1.3 Topography .......................................................................................................................... 10
2.1.4 Climate ................................................................................................................................. 11
2.1.5 Soil Resources ...................................................................................................................... 14
2.1.6 Water Resources .................................................................................................................. 16
2.1.7 Land use land cover in Libya ............................................................................................... 19
2.1.7.1 Agricultural Lands ............................................................................................................ 19
2.1.7.2 Range Land ....................................................................................................................... 23
2.1.7.3 Forests ............................................................................................................................... 24
2.1.7.4 Urban area ......................................................................................................................... 28
2.1.7.5 Bare Land and Marshes ..................................................................................................... 29
2.2 Sand Dunes Stabilization in Jefara Plain .................................................................................... 30
2.2.1 Sand dune types in Jefara Plain ............................................................................................ 30
2.2.2 Sand dunes stabilization methods ........................................................................................ 31
2.3 Plantation Forest in Jefara plain .................................................................................................. 37
2.3.1 Turkish occupation ............................................................................................................... 38
2.3.2 Italian occupation ................................................................................................................. 39
2.3.3 British administration ........................................................................................................... 39
2.3.4 After independence 1951 up to recent time. ........................................................................ 39

Contents Table of Contents
ix
2.3.5 The choice of tree species ........................................................................................................ 42
2.3.5.1Acacia: ............................................................................................................................... 42
2.3.5.2 Eucalyptus ......................................................................................................................... 43
2.3.5.3 Pine ................................................................................................................................... 44
2.3.6 Plant nurseries .......................................................................................................................... 45
2.4 Human context ............................................................................................................................ 46
2.4.1 Population ............................................................................................................................ 46
2.4.2 Gender in Libya ................................................................................................................... 47
2.4.3 Economics and political context .......................................................................................... 49
3 Deforestation: Review of Concepts and literature .................................................................. 53
3.1 Concepts ...................................................................................................................................... 53
3.1.1 Arid and semi-arid areas definition ...................................................................................... 53
3.1.2 Forest .................................................................................................................................... 53
3.1.3 Deforestation ........................................................................................................................ 54
3.1.4 Forest degradation ................................................................................................................ 55
3.1.5 Afforestation and Reforestation ........................................................................................... 56
3.2 Current Rates of Deforestation ................................................................................................... 57
3.3 Forest plantations ........................................................................................................................ 58
3.4 Causes of Deforestation .............................................................................................................. 60
3.4.1 Direct Causes of Deforestation ............................................................................................ 62
3.4.2 Indirect Cause of Deforestation ........................................................................................... 65
3.5 Pros of deforestation ................................................................................................................... 67
3.6 The Consequences of Deforestation in Semi-arid lands ............................................................. 69
3.6.1 Socio-economic issues ......................................................................................................... 69
3.6.2 Grazing and fodder extraction patterns ................................................................................ 69
3.6.3 Environmental issues ........................................................................................................... 69
4 Deforestation: Causes and Consequences in Algarabulli District .......................................... 72
4.1 Introduction ................................................................................................................................. 72
4. 2 Methods...................................................................................................................................... 73
4.3 Results and discussion ................................................................................................................ 79
4.3.1 Causes of deforestation in Algarabulli district ..................................................................... 79
4.3.2 History of forest clearing in the region ................................................................................ 95
4.3.3 Consequences of deforestation: ........................................................................................... 98
4.4 Conclusions ............................................................................................................................... 105
5 A remote sensing assessment of land use change ................................................................... 107
5.1 Introduction ............................................................................................................................... 107
5.2 Material and methods ................................................................................................................ 108

Contents Table of Contents
x
5.2.1 Satellite imagery data ......................................................................................................... 108
5.2.2 Map topography ................................................................................................................. 110
5.2.3 Ground truth survey .......................................................................................................... 111
5.2.4 Image pre-processing ......................................................................................................... 111
5.2.5 Fieldwork ........................................................................................................................... 116
5.2.6 Image classification accuracy ............................................................................................ 117
5.3 Results and discussion .............................................................................................................. 120
5.3.1 Land cover (Landsat imagery) ........................................................................................... 120
5.3.2 Land cover change (SPOT imagery) .................................................................................. 121
5.3.3 Deforestation rate ............................................................................................................... 125
5.3.4 Forest degradation .............................................................................................................. 131
5.4 Conclusions ............................................................................................................................... 134
6 The Contribution of Libyan Forest Policy and Management to Forest Cover Change ..... 135
6.1 Introduction ............................................................................................................................... 135
6.2 Methods..................................................................................................................................... 138
6.3. Results and Discussions ........................................................................................................... 139
6.3.1 Libyan forestry law ............................................................................................................ 139
6.3.2. Administrative status of forests in Libya .......................................................................... 144
6.3.3 Property rights and tenure systems .................................................................................... 150
6.3.4 Types of land possession by forest clearer: ........................................................................ 161
6.4 Conclusions ............................................................................................................................... 166
7 Socio-economic drivers of deforestation ................................................................................. 168
7.1 Introduction ............................................................................................................................... 168
7.2 Methods..................................................................................................................................... 172
7.3 Results and discussion .............................................................................................................. 175
7.3.1 Population .......................................................................................................................... 175
7.3.2 Forest clearers compared to others ..................................................................................... 182
7.4 Conclusion ................................................................................................................................ 200
8 General discussion .................................................................................................................... 201
8.1 Summary ................................................................................................................................... 201
8.1.1 Causes of deforestation ...................................................................................................... 201
8.1.2 Quantifying deforestation using multiple methods ............................................................ 204
8.1.3 Limitations ......................................................................................................................... 207
8.1.4 Future challenges ............................................................................................................... 207
8.2 Conclusion ................................................................................................................................ 213
8.3 Recommendations ..................................................................................................................... 215
References ................................................................................................................................... 218

Contents Table of Contents
xi
Appendices ............................................................................................................................................... I

Contents List of Tables
xii
List of Tables
Table 2.1: Formation Suites of Geological map of Algarabulli district. ................................................. 9
Table 2.2: Libyan land area according to the annual rate of rainfall .................................................... 12
Table 2.3: The main orders of soil in Libya. ......................................................................................... 14
Table 2.4: Mechanical chemical analysis of the soil in study area ....................................................... 16
Table 2.5: Hydrographic characteristics of the valleys of Algarabulli District .................................... 17
Table 2.6: The rate of withdrawal of groundwater in the plain of Jefara between 1962-2005 (mm3) .. 18
Table 2.7: Vegetation cover density in Libya 2005 .............................................................................. 27
Table 2.8: Bare Land and Marshes in Libya 2005 ................................................................................ 29
Table 4.1: Distribution of local residents sample within the localities of Algarabulli district .............. 75
Table 5.1:Properties of different Landsat satellite imagery data used during this research ................ 109
Table 5.2: Properties of different SPOT imagery data used during this research ............................... 110
Table 5.3: Landsat spectral bands and their applications .................................................................... 113
Table 5.4: Classes and points collected for accuracy in the study area of forest land ........................ 118
Table 5.5: Area (ha) of each land-cover class and their percentage from 1972 to 2013 ..................... 120
Table 5.6: Area (ha) of each land-cover class in each image and their percentage for 1985, 2010 and
2013 .................................................................................................................................. 122
Table 5.7: Annual rate of forest loss in study zone (ha/year) for 1985, 2010 and 2013 ..................... 125
Table 5.8: Forest density during the years of 1985, 2010 and 2013 ................................................... 131
Table 6.1: All laws have been issued to protect forest in Libya. ........................................................ 139
Table 6.2: Resolutions have been issued to protect forest in Libya .................................................... 141
Table 6.3: International Convention that Libya signed on. ................................................................. 142
Table 6.4: Real Estate Registration in the civil law issued (1969-2011). ........................................... 158
Table 7.1: The number of forest encroachers according to each forest blocks that were selected and
unselected in this study shambling.................................................................................... 174
Table 7.2: Population censuses and population growth in the localities of Algarabulli (1954, 1964,
1973, 1984, 1995, 2006 and 2010).................................................................................... 177
Table 7.3: Population density in Algarabulli localities in 2010 .......................................................... 180
Table 7.4: Household density in the non-forested and deforested areas within Algarabulli’s localities
(2010) ................................................................................................................................ 181

Contents List of Figures
xiii
List of Figures
Figure 2.1: Location of study area from Libya and the Jefara plain. ...................................................... 7
Figure 2.2: Geological map of Algarabulli district . ............................................................................... 9
Figure 2.3:Topographic map of Algarabulli district. ............................................................................ 11
Figure 2.4: Climate regions in Jefara Plain according to De Martonne climate classification ............. 12
Figure 2.5: Average temperature, maximum and minimum range in Algarabulli District of 1990-2010
. ..................................................................................................................................................... 13
Figure 2.6: Monthly Average Rainfall from in Algarabulli District (mm) from 1965-2010 ................ 13
Figure 2.7: Soil Map of Algarabulli district .......................................................................................... 15
Figure 2.8: Soil fertility of Algarabulli district. .................................................................................... 16
Figure 2.9: Libya land cover 2005 ........................................................................................................ 20
Figure 2.10: Cultivable area in Libya in (1960, 1974, 1984, 1995 and 2005) ...................................... 21
Figure 2.11: Area of Wheat and Barley in Libya in ha (1985-2002) .................................................... 22
Figure 2.12: Rangeland area in Libya in (1960, 1974, 1988, 1996, 2001 and 2005) ............................ 24
Figure 2.13: Natural and Man made forest cover in Libya in (1950, 1960, 1988, 1997, 2005 and 2010)
...................................................................................................................................................... 28
Figure 2.14: Urban area in Libya (Thousand ha) for the years of 1966, 1980, 1994 and 2000 ............ 29
Figure 2.15: Sand dunes stabilization using dry plant materials first ................................................... 32
Figure 2.16: Sand dunes stabilization by dry plant materials in second stage ...................................... 32
Figure 2.17: Sand dunes stabilization by dry plant materials third stage . ............................................ 33
Figure 2.18: Sand dunes stabilization by using crude oil ...................................................................... 34
Figure 2.19: Planting Eucalyptus gomphocephala trees ....................................................................... 34
Figure 2.20: Sand dune stabilized in Jefara plain, Libya of 1952-1979................................................ 35
Figure 2.21: Spraying of chemicals from the air in an attempt to sand stabilisation ............................ 36
Figure 2.22: Government officials supervise the process of sand dunes stabilization (02/02/ 1972). .. 41
Figure 2.23: Area of sand dunes planted in Jefara Plain from (1952-1982) ......................................... 41
Figure 2.24: Barren land planted in Jefara plain/ha from 1952 – 1984. ............................................... 42
Figure 2.25: Libyan population and growth rate in censuses of (1954, 1964, 1973, 1984, 1995, 2006
and 2012)…... ............................................................................................................................... 47
Figure 2.26: GDP per capita of Libya, Egypt and Tunisia.................................................................... 50
Figure 3.1: DPSIR Analytical framework on the causes of deforestation. ........................................... 60
Figure 3.2: Framework for analysing proximate and underlying causes deforestation . ...................... 61
Figure 4.1: Respondents’ characteristics .............................................................................................. 76
Figure 4.2: Direct causes of deforestation in Algarabulli district ......................................................... 79
Figure 4.3: Cutting windbreaks for building shops along the main road in study area . ...................... 81

Contents List of Figures
xiv
Figure 4.4:(a,b): The same road within two year period (2011-2013), in comparison shows how roads
inside forest have contributed to deforestation thereby leading to sand dunes encroachments, in
Alataya village, Al-Garabulli District ........................................................................................... 82
Figure 4.5: Illustrates some resorts in Alataya village, Al-Garabulli district. ...................................... 83
Figure 4.6: The main Indirect causes of deforestation .......................................................................... 84
Figure 4.7: Forest encroachment in Alataya locality, Al-Garabulli district ). ...................................... 85
Figure 4.8: Reasons behind recent increase in the deforestation after 2011 ......................................... 93
Figure 4.9: Offering the land for sale (Land trading)............................................................................ 94
Figure 4.10: Index of Forest Cover (respondents’ estimates): 1985–2013 in percentages (standard
deviation in brackets) over the whole study and in each forest block. .......................................... 98
Figure 4.11: Consequences of deforestation in Algarabulli District ..................................................... 99
Figure 4.12: A wall built to prevent sand dunes encroaching, Alkarawh village, Al-Garabulli district
.................................................................................................................................................... 100
Figure 4.13: The impact of desert dust transport from Libya across the Mediterranean Sea ............. 101
Figure 5.1: Flow-diagram processing steps of (SOPT& Landsat) images classification carried out for
derivation of land-cover information from remote-sensed data. ................................................. 115
Figure 5.2: Area (ha) of each land-cover class change in the years 1985, 2010 and 2013 ................. 123
Figure 5.3: Forest cover in the Algarabulli district in 1985 (based on Libya forest map) .................. 123
Figure 5.4: Land cover and land use classification in the Algarabulli district in 2010 ....................... 124
Figure 5.5: Land cover and land use in the Algarabulli district in 2013 ............................................. 124
Figure 5.6: Forest cover in Algarabulli District in 1985, 2010 and 2013 ........................................... 126
Figure 5.7: Remote sensing (SPOT imagery) estimates of the rate of deforestation in percent between
(2010-2013) in all forest blocks. ................................................................................................. 127
Figure 5.8: Location of the localities within the study area. ............................................................... 128
Figure 5.9: Forest area in each forest block for the years of 1985, 2010 and 2013 ............................ 129
Figure 5.10: The development of road networks in the Algarabulli district between 1985 and 2010.130
Figure 5.11: Forest cover and density in Algarabulli forest blocks in 1985. ...................................... 132
Figure 5.12: Forest cover and density in Algarabulli forest blocks in 2010. ...................................... 132
Figure 5.13: Forest cover and density in Algarabulli forest blocks in 2013. ...................................... 133
Figure 6.1: Index of forest clearance in percentage (standard deviation in brackets) in the whole area
and in each forest block. ............................................................................................................. 149
Figure 7.1: Population censuses and population growth in Algarabulli District (1954, 1964, 1973,
1984, 1995, 2006 and 2010)........................................................................................................ 176
Figure 7.2: Population and percentage of forest cover in Algarabulli district (1954, 1964, 1973, 1984,
1995, 2006, 2010 and population estimates of 2013) ................................................................. 178
Figure 7.3: Number of households and family size in Algarabulli (1954, 1964, 1973, 1984, 1995, 2006
and 2010 ...................................................................................................................................... 179

Contents List of Figures
xv
Figure 7.4: Box and whisker plot of area cleared before and after the 2011 uprising by all forest
clearer. ......................................................................................................................................... 182
Figure 7.5: The distribution forest clearers’ among age groups in Algarabulli District ..................... 183
Figure 7.6: Forest clearers’ Educational status in Algarabulli District .............................................. 184
Figure 7.7: Forest clearers’ occupation in Algarabulli District ........................................................... 185
Figure 7.8: Comparison between forest clearers (N = 43) and non-forest clearers (N = 43) in terms of
awareness about forest importance and forestry laws in Algarabulli District. ............................ 186
Figure 7.9: Forest clearers’ awareness about land cover before forest planting ................................. 187
Figure 7.10: Forest clearers’ responses regarding participants in forest planting ............................... 188
Figure 7.11: Forest clearers’ understanding of why forests were planted .......................................... 188
Figure 7.12: Claims to land tenure or proof of ownership by forest clearers ..................................... 193
Figure 7.13: Number of plots of land owned by forest clearers .......................................................... 194
Figure 7.14: Purpose of forest clearance ............................................................................................. 195
Figure 7.15: Real prices of deforested comparing with other land types/ per ha (1990–2013) .......... 198
Figure 8.1: Comparison of the three methods used to estimate, the index of forest cover (1985=100)
for the whole area and in each forest block................................................................................. 205

Contents List of Abbreviations and Acronyms
xvi
List of Abbreviations and Acronyms
ACSAD Arab Centre for the Studies of Arid Zones and Dry Lands
AOI Areas of interest
ASA Arid and semi-arid lands
AVHRR Advanced Very High Resolution Radiometer
BRSC Biruni Remote Sensing Centre
BSC Bureau of Statistics and Census
CAD Council of Agriculture Development
ESRI Environmental Systems Research Institute
ETM+ Enhanced Thematic Mapper plus
FAO Food and Agricultural Organization of the United Nations.
Fig Figure
FRA Global Forest Resources Assessment
GCP Ground Control Points
GEA General Environmental Authority
GMMR Great Man- Made River
GPS Global Positioning System
ha Hectare
HRV High Resolution Visible
ICARDA International Centre for Agricultural Research in the Dry Areas
IR Infrared
ITTO The International Tropical Timber Organization
km2 Square Kilometre
LCC Land Cover Change
LCRSSS Libyan Centre for Remote Sensing and Space Science
LD Libyan Dinar.
LNMC Libya National Meteorology Centre
LULC Land Use Land Cover
m3 Cubic metres

Contents List of Abbreviations and Acronyms
xvii
MLC Maximum Likelihood Classifier
NGO Non Governmental Organization
RS Remote Sensing
SD Standard Deviation
SPOT Satellite Pour L'Observation de la Terre (Satellite for the Observation
of the Earth)
TM Thematic Mapper
UNCCD United Nations Convention to Combat Desertification
UNEP United Nations Environmental Programme
UNFCCC United National Framework for Climate Change Convention
USGS United Sates Geological Service
WCMC World Conservation Monitoring Centre

Chapter 1 General Introduction
1
1 General Introduction
1.1 Background
The world’s total forest area in 2010 was estimated to be over 4 billion ha and occupies more
than a quarter of the world’s land area corresponding to an average of 0.6 ha of forest per capita
(FAO, 2010). About 93% of the total forest cover is natural and 7% is planted forest. However,
the forest area is unevenly distributed with just under half the world's forests in the tropics
(45% of total forest area), about one third in boreal zones (31%) and smaller amounts in
temperate (16%) and subtropical (8%) domains (Lebedys and Yanshu, 2014). Global forest
plantations cover 264 million ha with Asia accounting for 62% of the total, Europe, 17%, North
and Central America, 9%; South America, 6%; Africa, 4%; and Oceania less than 2% (FAO,
2012). These plantations are classified based on their function into productive (40%) and
protective forest (60%) (Fenning, 2014). Industrial plantations are established partly or
completely for the production of wood for industry use, whereas non-industrial plantations are
established partly or wholly for production of ecosystem services (FAO, 2012). The FAO
(2000) reported that in Africa, the majority of forest plantations have been established in South
Africa (1.4 million ha) and in the Mediterranean countries of North Africa (1.7 million ha or
55% of all forest plantation in Africa).
Forests provide many essential goods, such as timber, fuelwood, bush-meat and paper. They
also supply essential services that include: water filtration, erosion control, soil protection,
nutrient storage, carbon sequestration, habitats for numerous animal species and space for
recreation (Emily, 2012).
Deforestation is the conversion of forest to an alternative permanent non-forested land use such
as agriculture, grazing or urban development (Chakravarty, 2012). Deforestation has been
especially serious in the last three decades in developing countries (Miah et al., 2011) with an
estimated deforestation rate of 14.6 Mha per year during the period of 1990 to 2000, mainly
due to conversion to agricultural land (Lindquist et al., 2012). Also, Grinand et al. (2013)
estimated global net loss of forest area has decreased at the rate 5.2 Mha per year between 2000
and 2010, during which about 130 million ha was lost from the world’s forests (FAO, 2012).
The rate of deforestation however, varies from region to region.

Chapter 1 General Introduction
2
In Africa, forests currently cover about 23% of the land and it was reported that 75 million ha
of forest land (10% of the total forest area) was converted to other uses between 1990 and 2010
(FAO, 2012).
Deforestation is a complex process that is driven by the interplay of sets of proximate and
underlying factors that can vary from region to region. These factors include demographic,
economic, political, and institutional drivers (Geist and Lambin, 2002; Lambin et al.,
2003 and Rudel et al., 2005). However, researchers and policy makers agree that agricultural
expansion is the major proximate cause of deforestation globally, particularly the production
of commercial commodities (Fearnside, 2001; McMorrow and Talip, 2001; Miyamoto, 2006 ;
Zak et al., 2008; Motel et al., 2009 and DeFries and Rosenzweig 2010). It is estimated to be
the proximate driver for around 80% of deforestation worldwide followed by infrastructure
development at 72% and wood extraction at 67% (Geist and Lambin, 2002). The underlying
causes of deforestation are not fully understood, and the influence of various factors has been
extensively debated. These include population growth (Jha and Bawa, 2006), poverty
(Sunderlin et al., 2008), economic development (Rudel et al., 2005), insecure land tenure
(Robinson et al., 2014), and weak law enforcement and corruption (Gaveau et al., 2009). In
many African countries, widespread corruption related to weak governance of forest
management is the main, underlying, cause of deforestation (Indufor, 2013). Land-use change
is driven by a combination of synergistic factors: pressures on resources, opportunities created
by markets, policy intervention, vulnerability, and social organization (Lambin et al., 2003).
In Libya, the main forest type is the natural forest, which was estimated to comprise about
500,000 ha in 1950; by 1988, 35% of this land had been converted to agricultural land (Al-
Idrissi et al., 1996). BRSC (2007) in their research, used remote-sensing to study deforestation
around the city of Tripoli during a 10-year-period from 1990 to 2000 and found out that 40%
of the plantation forest had been converted to urban and agricultural land. The underlying
causes of deforestation in these areas were concluded to be population growth and government
mismanagement.
Deforestation has had many negative effects on the environment in Libya. The most dramatic
impact are a loss of habitat for wildlife of species, desertification, soil erosion, and climate
change. In North Africa, climate change and decreasing rainfall are related to deforestation.
The deforestation on the Africa continent is probably a major cause for increased aridity
(Zaimeche, 1994).

Chapter 1 General Introduction
3
Research studies of Ben-Mahmoud et al. (2000); Oune (2006); Saad et al. (2011); El-Tantawi
(2005); Ibrahim (2010); El-Aswed (2009); Saager and Alwahishe (2005) found that
deforestation and natural vegetation degradation is one of the main causes and drivers of
desertification. Therefore, this present study outlines the proximate and underling causes of
deforestation in Algarabulli district, Libya, with a focus mainly on the socio-economic and
policy drivers. The study also illustrates the dynamics of land cover changes and assesses the
magnitude and rate of deforestation.
1.2 Outline of the study
1.2.1 Context of the research
The period of the research was actually five and a half years, during which the following events
took place.
When I started my PhD, Gadhafi was still in power, but after 7 months the uprising started in
Libya and as I could not go to Libya and I was thinking to do something rather different.
The reason for choosing this topic was that I found during the first visit to Libya just after the
fall of the Gaddafi regime while the topic of my study was about desertification causes, I found
that most of local people of my area (Algarabulli district) were very concerned about the issue
of deforestation. Accordingly, I decided to conduct research on the causes of deforestation
(socioeconomic and policy drivers). The area of Algarabulli, Eastern Jefara Plain, was selected,
because in the security context, local knowledge and local familiarity are paramount
considerations, and also this zone is representative in terms of deforestation of the whole area.
Also I am from this area and it was easy for me to deal with local people in light the of lack of
security.
The field work of this research took seven months and was conducted in two stages: the first
being between December 2012 and February 2013, and the second stage was between
December 2013 and April 2014, in Algarabulli district (See fig 2.1) under severe security
constraints.
1.2.2 Thesis research questions
The major objective of this thesis was to understand the true causes of deforestation focussing
mainly on socio-economic and policy drivers in Algarabulli District.

Chapter 1 General Introduction
4
Specific aims of the research focus on providing answers and (approaches utilized given in
brackets) to the following questions:
1- What are the local people’s perceptions of the causes and consequences of deforestation
in Algarabulli district? (Semi-structured interview survey with local people who had
not cleared forest; Chapter 4).
2- Which human activities are contributing to deforestation and to what extent? (Applying
remote sensing and field work observation to detect and quantify the extent of
deforestation and evaluate the dynamics of land cover changes that are taking place,
using SPOT 5&6 imagery; Chapter 5).
3- How have policy factors in Libya contributed to deforestation in this area? (Reviewing
policy, forest laws and forest management and using semi-structured interviews with
government officials in the Ministry of Agriculture and Land Registry Centre; Chapter
6).
4- What are the drivers of deforestation? (Using data on population censuses and
deforestation, and surveys with forest clearers to identify their characteristics and
attitudes towards forests; Chapter 7).
1.3 Thesis Structure
Chapter two describes the study area: human and biophysical context, including the location,
physical setting, population, sand dune stabilization and afforestation.
Chapter three presents a review of deforestation concepts and literature, describing the general
causes and consequences.
Chapter four describes causes and consequences of deforestation specifically in Algarabulli
district. It presents the local people’s (non-forest clearers) perceptions about the causes and the
effects of deforestation.
Chapter five assesses land use change using remote sensing, SPOT imagery data, and estimates
deforestation rate.
Chapter six explains the contribution of Libyan forest policy and management to forest cover
change.

Chapter 1 General Introduction
5
Chapter seven explains the socio-economic drivers of deforestation. It focusses on this in two
ways: firstly to determine whether there is a link between population growth, density and
deforestation; and secondly to understand the characteristics, attitudes and knowledge about
forests and deforestation.
Chapter eight is a general discussion, which includes a summary of the study, major limitations,
future challenges, conclusions, and recommendations.

Chapter 2 Biophysical and Human context
6
2 Biophysical and Human context
This chapter is presented in three sections. The first section sets out the physical setting of the
study area, describing location, geology, topography, climate, soil and water. The second
section describes land cover and land use and population in Libya. The third section describes
the stage of forest plantation in the Jefara Plain.
2.1 Physical setting of study
2.1.1 Location and Geography
Libya is located in North Africa and bounded on the north by the Mediterranean sea (1900 km
coastline), to the east by Egypt (1150 km border) to the west by Tunisia (459 km) and Algeria
(982 km) and to the south by Sudan (383 km), Chad (1055 km) and Niger (354 km). Its area is
approximately 1,676.000 km2 of which more than 95% is desert, and it located between
longitudes 9° 50 E- 25° E and latitudes 18° 45 N 33° N (Almahdawi, 1998).
The Jefara Plain which is one of five major physical identified regions, is the largest and most
important plain and is located in the northwest part of Libya. It forms a triangle between the
Mediterranean Sea and the northern mountain belt of ex-Tripolitania. Its vertex occurs at En-
Neggheza near Ras Elmsan; west of Khoms in the east and its base in parallel with the Libyan
Tunisian border in the west (about 260 km), with a total area of approximately 18,000 km2. It
comprises about half of a natural semi-circular plain (about 37.000 km2) which extends into
Tunisian territory (Al-Hajjaji, 1989).
Due to its more favourable location and high population, the region is of great significance to
the economy of Libya. Since the fall of the Roman Empire, the dominating element in the
economy has been the soil and the primitive agriculture it can sustain. The Jefara plain is the
most prosperous part of the whole country. This plain contains 50% of the total irrigated land
in Libya, produces 60% of all of the agricultural output, and also contains 60% of the
population (El Jadida, 1986).
Algarabulli district (the study area) is located in the eastern part of Jefara plain and bounded
on the north by the Mediterranean sea (29 km), to the east by Wadi Turghat (25 km) to the west
by Wadi R'mel (35 km) and to the south by Series Nafusah Mountains (37 km).

Chapter 2 Biophysical and Human context
7
Its area is approximately 415 km2. which represents 2.1% of the area of Jefara plain and 0.02%
of the area of Libya. It located between longitudes 13°.31.44 E- 13°.49.26 E and latitudes 23°
43.38 N-32°.48.7 N.
Figure 2.1: Location of study area from Libya and the Jefara plain.
2.1.2 Geology
Structurally Libya is part of the Mediterranean foreland formed by the North African shield,
and has a sedimentary section that has been subjected to transgressions and regressions since
the early Paleozoic. The result is a mix of sheets of non-marine sediments (shale and sandstone)
and other shallow marine carbonates that have been deposited all over platforms formed in
local cratonic basins (Imbarek, 2008).

Chapter 2 Biophysical and Human context
8
Anketell and Mriheel (2000) divided Libya into several important structural zones. These are:
(1) southeastern Libya, which includes the Precambrian basement, and the Al-Kufra Basin; (2)
southwestern Libya, which encompasses the Murzuq Basin, and Al-Qarqaf Arch; (3) western
Libya, which comprises the Ghadames Basin, and Naffusah Uplift; (4) central Libya, which
occupies the most significant oil area in the North African plate represented by the Sirt Basin
(5) northeastern Libya including the Cyrenaica Basin and the Al-Jabal Al-Akhdar Uplift; and
(6) northwestern offshore Libya including the Tarabulus Basin, located on the North African
continental shelf (Hallett, 2002).
The Jefara Plain comprises Late Tertiary to Quaternary strata and the deposits of Quaternary
represent the main sediments that covering the Jefara Plain with occurrences of some limestone
outcrops of the Azizia formation. The foot hills strip which represents the southern part
overlaps with the mountain belt, forming the transitional region between the two, and coarser
fluvial sediments have been found. The consolidated aeolian deposits mixed with brownish
silts are the main deposits that occurred in the central part of the Plain. The northern part which
represents the coastal strip is formed of calcarenites underneath the coastal sandstones (Sadeg
and Karahanolu, 2001).
The geology of Algarabulli district is covered by Quaternary deposits as illustrated in
(Figure 2.2 and table 2.1) and formation from aeolian deposits, Jefara Formation and Fiuvio-
eolian representing 90% of all formation.

Chapter 2 Biophysical and Human context
9
Figure 2.2: Geological map of Algarabulli district (Source: Industrial Research Centre, Tripoli,
Libya, 1975, updated 2008).
Table 2.1: Formation Suites of Geological map of Algarabulli district.
Code Formation Suites Period (Age) Lithology
Qw Recent Wadi deposits Holocene gravel, sand and Loam
Qe Eolian deposits sand dunes, sand sheets and sandy loess
Qf Fiuvio-eolian sediments silt and fine sand with occasional caliche bands
QG Gargaresh Formation Pleistocene calcarenite with occasional silt lenses
QJ Jefara Formation silt, sand and conglomerate with occasional gypseous and
calcareous crust
Qh Qasr al Haj formation mostly proluvial cemented and noncemented gravels with
calcareous crust
Tmk Al Khums formation Miocene limestone, algal limestone, lumachelle, calcilutite
calcarenite and clay
KuN Nalut formation Upper
Cretaceous
Limestone, dolomitic limestone to dolomite, with chert
bands and concretions
Kus &
KUS
Sid ass Sid Formation upper part : marly Yafrin Member: lower part ; limestone,
dolomitic to dolomite with occasional quartzite and
quartz sand intercalations –Ayn Tobi Member
TRuS Abu Shaybah Formation Upper Triassic sandstone and clay with minor calcareous intercalations
Source: Geological map of Libya, sheet Al-Khums, NI 33-14, (IRC), Tripoli, Libya, 1975.

Chapter 2 Biophysical and Human context
10
2.1.3 Topography
Landforms of Libya generally consist of barren plains in the north against plateaus and
depressions in the south; the coast land of the Mediterranean Sea and the Sahara desert are the
most prominent natural features. Though there are several highlands, no true mountain ranges
exist except in the southern desert near the Chad border where the Tibesti Massif rises to over
3,000 m. Elsewhere a barren wasteland of rocky plateaus and sand occur which only allow
minimal human habitation and agriculture is possible in a few scattered oases (McMorris,
1979). In Libya the highest point is Bikku Bitti (2,267 m above sea-level) and the lowest point
is Sebkhat Ghuzayil (47 m below sea- level) (El-Tantawi, 2005).
The Jefara Plain is usually described as being flat, but this is a misconception. Actually, this
plain, for the most part and especially in its southern portion, is broad and undulating, for it
contains many hills and sand dunes which rise to considerable heights in relation to the general
level of the area. The number of fixed sand dunes increase southward up to the escarpment of
Jabal Nafusah. The Jefara plain can be divided into three different area; the coastal area, the
central area and the foot of Jabal Nafusah in the south mountain area with area an altitude of
between 450 and 1000 m.
The study area, which is shown in Figure 2.1 is part of the Jefara Plain and comprises an almost
flat area. The gradient of the plain increases from north to south. It starts a very few metres
above sea level, then, after rising about 15 km inland, it is elevated to about 50 m, in the south,
in the foothills of the mountain chain of Tarhunah (Jabal Nafusah), the plain rises to about 200
m, a downhill gradient of about 0.8% (Salem and Talha,1984).

Chapter 2 Biophysical and Human context
11
Figure 2.3: Topographic map of Algarabulli district (Source: ICR, Tripoli, Libya, 1974).
2.1.4 Climate
As many as five different climatic zones have been recognized in Libya, but the dominant
climatic influences are Mediterranean and Saharan. In coastal lowlands, where 80 percent of the
population lives, the climate is Mediterranean, with warm summers and the winter rainfall is
scanty, and the dry climate results in a year-round 98 percent visibility (Al-Hajjaji 1989).
Chapin (2010) stated that, “The weather is cooler in the highlands and frosts occur at maximum
elevations. In the desert interior the climate has very hot summers and extreme diurnal
temperature ranges.”
Ham (2002) stated that “Around 2500 years ago, the historian Herodotus claimed that “in the
upper parts of Libya, it is always summer.” and yet, in winter the weather can be cool and
rainy on the coast between October and March…”
The climate is generally described as arid to semi-arid, with hot and dry summers and moderate
winters with erratic rainfall (Ben-Mahmoud, 2013). The mean annual temperature varies given
the fact that the north of the study area corresponding to the Mediterranean Sea is milder
(16.9°C in Shahat) compared to the south (22.8°C in El Kufra), which is located in the
extremely arid Sahara (Table 2.2) .

Chapter 2 Biophysical and Human context
12
Table 2.2: Libyan land area according to the annual rate of rainfall
Type of land Average
precipitation (mm per
year)
Area of land
(ha/thousands)
Percentage of Libya total
area (%)
Very dry Less than 50 1515 90.4
Arid 50-200 130 7.8
Semi-arid 200-400 26 1.5
Semi-humid More than 400 5 0.3
Total 1676 100
Source: Committee of agriculture policies study, 2003.
The Jefara plain has a Mediterranean climate with moderate temperatures, the average temperature
ranges between 30°C in summer and 10°C in winter. Having said that, hot, very dry and sand-laden
scorching wind (El Ghibli) can raise the temperature up to 40°C; this plain recorded the highest
temperature on Earth (57.8°C) on September 1922 at Al-Azizia City, which is about 50 km west of the
study area. The mean annual relative humidity ranges between 68% and 73% (LNMC, 2012).
The average annual rainfall in the plain, which falls mainly in winter, varies from 370 mm close to the
Mediterranean coastline to less than 100 mm on the southern slope of Jabal Nafusah (Figure 2.4). Rain
usually falls during a short winter period due to the vulnerability of Libya in this season to the prevailing
northern and north-western winds that bring rainstorms (Figure 2.6).
Figure 2.4: Climate regions in Jefara Plain according to De Martonne climate classification (Source:
LNMC, 2012 Tripoli).

Chapter 2 Biophysical and Human context
13
To examine the elements of the climate in the study area, data gathered from the meteorological
station of Qasr Khiyar District, which is located 15 kilometres west of Algarabulli City, were
used, because the study area contains no meteorological station other than a rain gauge.
Temperature is affected by several factors, including: geographic location and proximity or
distance from the sea, and the terrain, and the presence of the area on the coast of the sea. The
sea has a great effect on the heat during the seasons of the year and plays a major role in
moderating the temperature. The highest temperatures occur from June to August with
maximum temperatures over 35°C in August (Figure 2.5).
Figure 2.5: Average temperature, maximum and minimum range in Algarabulli District of 1990-2010
(Source: LNMC, Tripoli 2013).
Figure 2.6: Monthly Average Rainfall from in Algarabulli District (mm) from 1965-2010 (Source:
LNMC, Tripoli 2013).
Air relative humidity is generally high, particularly in the area closest to the coastline, and
tends to reduce toward the south. Mean annual relative humidity is 66.7%.
0
10
20
30
40
50
60
70
80
mm
0
5
10
15
20
25
30
35
40
°C Mean Max
Mean Mix
Mean

Chapter 2 Biophysical and Human context
14
In general, based on the climatological data, the climate of this area can be defined according
to the method of classification of the Mediterranean climate.
2.1.5 Soil Resources
Over the last four decades, foreign companies have carried out extensive soil studies (250
studies) in Libya. These studies have focused on the northern part of Libya and small, scattered
areas in the southern desert. The most recent soil survey reports and maps differ in terms of
content, map type, scale of the mapping classification systems used, method of soil analysis,
and the criteria with which the data have been interpreted. The soil classification systems used
in these reports are the USA Soil Taxonomy, the modern soil classification of Russia, the
French soil classification, and the FAO/UNESCO system (Ben-Mahmoud, 2013).
The main types of soil in Libya are Aridisols, Entisols, Mollisols, Alfisols, Inceptisols and
Vertisols. Aside from the Al-Jabal Al-Akdar and some Jabal Nafusah soils, most are Entisols
and Aridisols (Ben-Mahmoud, 1995). The main categories of Libyan soil are shown in table
2.3.
Table 2.3: The main orders of soil in Libya.
Soil orders
(US Soil Taxonomy)
Russian
Classification
FAO and UNSCO
Classification
Entisols Reddish Brown Arid Regosols
Aridisols Serozems, Desert Soils Luvisols
Alfisols Red Ferrisiallitic Typical Chromic Luvisoils Calcic
Chromic Luvisols
Mollisols (Rendolls) Rendzinas Dark Red Rendzinas Rendzins Leptosols
Inceptisols Siallitic Cinnamonic Cambisols
Source: Nwer, 2005.
The soils of the Jefara plain include: Entisols and Inceptisols (49.1%), Aridisols (11.5%),
Salorthids (10.7%) and sandy soils 3%. Sandy soils bear more developed vegetation with more
regular and greater primary productivity than finer textured soils (Figure 2.7).
Most of the soils in the study area are located within the soil of reddish brown arid category,
which is usually sandy soils, the content of organic matter for these soils is a poor.

Chapter 2 Biophysical and Human context
15
Secondly, the continental sand soil which is mostly found in the northern region near the
Mediterranean Sea, has a weak texture mixed with low content of organic material (Table 2.4).
Commercially cultivated rain-fed olive orchards are grown profitably on deep sandy soils under
as little precipitation as 200 mm/year in the Tripoli area, while this is not possible without an
additional runoff complement on silt soils (El-Tantawi, 2005).
Irrigated soil is prone to salinization and alkalization. These phenomena are common on the
northwestern Jefara Plain, where soils are converted to saline soils due to the high levels of salt
in the groundwater used for irrigation, subpar development schemes such as using salty water
on heavy soils or insufficient drainage (El-Tantawi 2005).
The major soil-related issues in Libya are erosion and salinity. Soil erosion is a major factor
limiting the amount of arable land in Libya, on both the Mediterranean coast and in the southern
desert (Nwer, 2005).
Figure 2.7: Soil Map of Algarabulli district (Source: The Ministry of Agriculture, Department of
mapping 2010.
With regard the soil fertility as shown in figure 2.8 where most of the soil types are moderate,
poor and very poor. Very poor soil represents sand soil or sand dunes.

Chapter 2 Biophysical and Human context
16
Table 2.4: Mechanical chemical analysis of the soil in study area
Soil Sandy soil Loam soil Clay soil and organic
materials
Calcium carbonate
Soil
Percentage 82.6 13.8 3.4 0.2
Source: Commission of studying the coastal road, 1979.
Figure 2.8: Soil fertility of Algarabulli district (Source: The Ministry of Agriculture, Department of
mapping 2010.
2.1.6 Water Resources
Libya is an arid country with an average annual rainfall of less than 100 mm, which falls over
93% of its surface area. There is important potential for groundwater development, but
whereas most of the population, and consequently the water demand, is concentrated within a
narrow strip along the Mediterranean coast, most of the groundwater potential is located to
the south in the desert areas (Pallas, 1980). The discussion below divides water resources into
surface and groundwater components.

Chapter 2 Biophysical and Human context
17
2.1.6.1 Surface water
According to reports from the Ministry of Agriculture, surface water is very limited,
contributing negligibly to overall water consumption. Surface run-off from the seasonal water
stores at Jabal Nafusah, Al-Jabal Al-Akdar and the central region valleys, is estimated to be
about 285 million m3 of water per annum.
Each year, about 60 million m3 additional of water are dammed. Rain water is collected in
underground cisterns and reservoirs constructed in relatively high-rainfall areas. Libya has
more than 450 springs, though these generally contain little water. At most of these springs,
the level of production does not exceed 1 litre/second. The exceptions are: Tawargha, Kaam,
Zayana, Dabussia, and Derna springs. Some of these springs are used for agricultural and
drinking purposes, while plans are currently underway to utilize the rest (Public Authority for
Water, 2008). There are several wadis within study area deeply cut into the escarpment, ranging
to 100 m deep in the Jabal and to 15 m in the plain. All the wadis courses are directed towards
the north and they are flowing as far as the sea. However there are no dams on these wadis to
harvest the water which outflows into the sea. There are some remnants of dams in Wadi Rmel
which indicated that the Roman used these dams for the agriculture activity in this area before.
Table 2.5: Hydrographic characteristics of the valleys of Algarabulli District
Valley Drainage basin area km2 Along the course of valley
Average surface
runoff (mm3)
Ramel 400 85 1.95
Turghat 258 40 3.30
Al-Masida 172 37 2.80
Source: Public Authority for Water. Libya, 2008.
2.1.6.2 Groundwater
Groundwater is the main source of freshwater in Libya as it represents 95% of water resources,
providing a vital supplement to surface water sources. Groundwater availability and quality
are; however, vulnerable both to climate change and over-abstraction, and in regions where the
water table has lowered there has been a consequent impact on agricultural activities (El-
Aswed, 2009).

Chapter 2 Biophysical and Human context
18
The coastal aquifers are the only stores replenished by rainfall, but the need for groundwater
from these aquifers exceeds the annual replenishment. This has caused a severe decline in water
levels and seawater encroachment, which makes the coastal groundwater resources almost
unusable because of their high salinity. Of the total water withdrawal of 4,268 million m3, about
83% is used for agricultural purposes, 14% for domestic use and 3% for industrial use (Ben-
Mahmoud, 2013).
In the Jefara plain which represents more than 80% of the irrigated area in the country, the
early Cretaceous/Triassic formation contains aquifers with varying degrees of discharge and
depth. Water quality ranges from good to saline.
The study of the Public Authority for Water (2008) confirmed that the amount of groundwater
withdrawals exceeded the annual natural renewal ability of the groundwater reservoirs, which
were estimated at 270 million m3 per year. Further, the amount of withdrawals per year is
increasing (shown in table 2.6) and, during the period of 1962–2005, the annual rate of the
decline in the water level was estimated in Jefara Plain as between 0.5 to 2.3 metres (Public
Authority for Water, 2008).
In the study area, people depend mainly on groundwater, which is mainly used from
Quaternary-Miocene aquifers through excavated wells, excavated-drilled wells and drilled
wells (Council For Agricultural Development, 1974). This study examined the rates of
withdrawal of groundwater in the Jefara Plain during 1962–2005 (million cubic metres per
year).
Table 2.6: The rate of withdrawal of groundwater in the plain of Jefara between 1962-
2005 (Mm3)
Use/ years 1956-
1962
1972 1975 1978 1980 1993 2005
Agriculture use 195 313 475 461 483 802 940
Drinking and industrial use 15 65 92 94 91 200 109*
Total 210 378 567 555 574 1002 1049
Source: Public Authority for Water. Libya, 2008.
* Decrease in the rate of consumption due to supplying the city of Tripoli by the Man-Made River
water since 1996.

Chapter 2 Biophysical and Human context
19
2.1.7 Land use land cover in Libya
According to the 2005 Libyan land cover map shown in figure 2.9 which used visual
interpretation and analysis of satellite images (GEOVIS), almost 90% of the total area of Libya
is covered by desert of sand dunes and marsh and the rest is used for agriculture, rangelands,
forestry, natural vegetation lands and urban area. The following figure illustrates Libyan land
use classification according to a land cover classification system (LCCS).
This study which was conducted by the FAO. UNDP with the cooperation on the BRSC, of the
Libyan Centre for Remote Sensing and Space Sciences and a team of National Experts in
Agriculture, Rangeland and Forestry in the Ministry of Agriculture, illustrates that
approximately 9% of the land is covered with vegetation (grasses and bushes), pastoral areas
and natural and man-made forest (Figure 2.9).
2.1.7.1 Agricultural Lands
Agricultural production depends mainly on the private sector, and private farms owned by
individuals are producing the biggest part of the agriculture products. Some government
production projects were established under irrigation in the desert, mainly for cereal and forage
production (Al-Idrissi et al., 1996).
Before the discovery and exporting of oil, the most important economic activity of the
population in Libya consisted of farming and herding. However, in no case did the area planted
with stable agriculture exceed 1% of the total area of the country, and up to 1960, 93% of the
income of Libya came from agricultural production and about 87% of the workforce was
engaged in agricultural activity (Al-Hajjaji 1989). Now, however, 98% of the income comes
from oil (BSCL, 2006 b).

Chapter 2 Biophysical and Human context
20
Figure 2.9: Libya land cover 2005 (Source: FAO and UNDP, 2005).
According to a 1960 agricultural census, agricultural lands were estimated at 1.4 million ha.
However, during the 1970s and 1980s, as a consequence of plans made for social
transformation and economic growth, the share of the agricultural sector in the country
exceeded 17% of total public expenditure and as of 1984 resulted in the addition of about 2.6
million ha under cultivation.
These included cereal crops (865,000 ha), vegetables (39,000 ha), fodder crops (37,000 ha) and
fruit trees (400,000 ha), while some references show that the expansion of fruits and olives was
from 170,000 to 400,000 ha. According to the 1995 agricultural census, agricultural land area
covered 3.3 million ha, which in comparison with 1960 had increased three times.
Chapter 2 Biophysical and Human context
21
In particular, the area under irrigation increased from 468,000 to 1.3 million ha due to the
establishment of some agricultural projects after the Great Man-made River was constructed
which is a network of pipes that supplies water from the Sahara Desert in the south of Libya,
to the coastline in the north. This project is aimed at the delivery of more than 6 million m3 of
water per day. It is the world's largest irrigation project.
In Libya, about 90% of the fruits and vegetables, and more than 60% of grain productions, are
obtained under a variety of irrigation schemes. Because of the prevailing sandy soils in most
of the arable land, sprinkler irrigation is practiced on nearly all the irrigated plots in Libya.
About 99% of irrigation uses groundwater, while the remaining 1% is irrigated by surface water
and treated wastewater (Figure 2.10).
Figure 2.10: Cultivable area in Libya in (1960, 1974, 1984, 1995 and 2005) (Source: Bin Kayal, 1995;
Almahdawi, 1998; BSCL, 1984; BSCL, 1995; FAO and UNDP, 2005)
The main crops produced in the country are barley, wheat, maize and millet as cereal crops;
potatoes as roots; dry beans, broad bean, peas, chickpeas and groundnuts as pulses; tomatoes,
cabbage, cauliflower, pumpkin, squash, cucumber, eggplant, onions, garlic, green peas, carrots,
watermelons, cantaloupes, muskmelons as vegetables; and grapes, dates, olives, apples, pears,
peaches, plums, oranges, lemons, apricots, almonds and tobacco as fruits and industrial crops.
Wheat and barley are the two of the most important cereal crops in Libya and the public and
private sectors play an important role in their production.
0
500
1000
1500
2000
2500
3000
3500
4000
1960 1965 1970 1975 1980 1985 1990 1995 2000 2005 2010
Tho
usa
nd
Hec
tare
s
Years
Irrigated area Rain-fed area Cultivable area

Chapter 2 Biophysical and Human context
22
The public sector produce them in public projects located in the heart of the desert under
permanent irrigation, while private sector individuals produce these grains under rainfed
conditions.
Therefore, the figure 2.10 shows that the area of wheat under rainfed production has decreased
from 104,000/ha in 1985 to 35,000/ha in 2002, due to socio-economic causes and climate
changes, with resultant decreasing rainfall. However, the area of barley under cultivation
remained more stable (The Ministry of Agriculture, 2003) (Figure 2.11).
Figure 2.11: Area of Wheat and Barley in Libya in ha (1985-2002) (Source: The Ministry of
Agriculture report, 2003).
According to the agriculture census of 2001, the number of farmers in the country was 176,658.
Of these, 33.7% (59,566 farmers) practiced only farming work, while the other 66.3% did not
work fully in agriculture and had other businesses (BSCL, 2001).
According to satellite imagery results in 2005, agricultural lands are estimated to be 1.5
million/ha (1% of total area), of which the rainfed area was estimated at 1.13 million ha (71%)
or 0.7% of Libya's total area, and irrigated was estimated at 466,000 ha (29%) or 0.3% of
Libya's total area, with most agricultural lands being located along the coastline of Libya in the
Jefara Plain. This showed that a significant decrease in agricultural area was found from 3.3
million/ha in 1995 to 902,000/ha in 2006. It could be argued that some references indicated
that the agricultural census depended on estimating, which is rather less accurate than using
satellite imagery, which has a very high degree of accuracy.
0
50
100
150
200
250
300
350
400
450
500
19
85
19
86
19
87
19
88
19
89
19
90
19
91
19
92
19
93
19
94
19
95
19
96
19
97
19
98
19
99
20
00
20
01
20
02
Are
a h
a
Years
Wheat
Barley

Chapter 2 Biophysical and Human context
23
However, most of the references indicated that most of the agricultural area has decreased
dramatically due to some environmental issues such as ground water shortage, salinity and soil
degradation.
2.1.7.2 Range Land
Especially in rural areas in Libya, grazing is one of the most important livelihoods, and in 1969
the area of rangeland was estimated at 11 million/ha, which is about 6.7% of Libya's total area.
Since the early seventies, rangelands have been under heavy investment and remarkable
activities of development; about 23 grazing projects on 2.5 million ha were established and 70
million seedlings of shrubs planted, which, as of 1974, led to increasing the area of rangeland
to 14 million ha, which lie along isohyet lines of between 50 mm and 200 mm/yr (Sbeit, 1998).
Later, the area of rangeland in Libya decreased from this level to 11.7 million ha in 2001, due
to a ten-fold increase in the number of livestock flocks within half a century. In 1952, this was
estimated at about 700,000 head and in 2002 had reached to 8.2 million head of sheep, goats
and camels. The decrease in rangeland was also due to agricultural expansion, land degradation
and desertification, as well as the continuing deterioration in the ability of pasture productivity
for reasons of repeated droughts, inappropriate exploitation and overgrazing.
Total production of rangelands was estimated to be about 516 million feed units, which
provides 20% of the total feed requirement of animals (sheep, goats, cows and camels). In some
areas rangelands are private to certain individuals or to the tribes, but in general all rangelands
are subjected to the same situation of overgrazing and deterioration of the plant cover.
The number of animals is very high in rangelands compared to its grazing capacity; sometime
this reaches up to five times in the middle region of Libya ( Almahdawi, 1998). Encroachment
of rangelands with cultivation of barley became practiced on a large scale under rainfed
conditions, especially with good opening rain in some seasons, and with the use of machinery.
The new paved roads helped people to reach all the remote places of rangelands and facilitated
the transfer of machinery, allowing the concentration of feeds and water to animals in any part
of the rangelands.
However, according to the land cover map of Libya in 2005 (Figure 2.9), the rangeland area
was increasing and was estimated at about 14.570 million/ha, which is 8.7% of Libya's total
area. Further, some reports have stated that in recent years the government has played a great
role in the enlargement of rangeland area (Figure 2.12).

Chapter 2 Biophysical and Human context
24
Figure 2.12: Rangeland area in Libya in (1960, 1974, 1988, 1996, 2001 and 2005) (Source: Bin
Kayal, 1995; Almahdawi, 1998; FAO and UNDP, 2005).
2.1.7.3 Forests
In Libya, the forests have been divided into natural and man-made types of forests, as follows:-
1- Natural forests and vegetation
Natural forest occurs only in the Al-Jabal Al-Akdar region in eastern Libya; 90% of the
country's natural forest occurs in this region. Al-Jabal Al-Akdar forest is the only natural forest
in North Africa between Lebanon in the east and Tunisia in the west. Specialists consider these
forests to be remnants of a forest that stretched across North Africa when the climate was more
suitable for the growth of forests and covered an area that is now known as the Libyan Desert
(Al-Zeni and Bayoumi, 2006).
A number of studies have been conducted on Libya’s natural vegetation. These studies began
in 1703 when Lemaire examined archaeological remains in the Cyrenaica region (eastern
Libya) and outlined his vision for the silphium plant, which was later given the name Selfione
(Environment Public Authority 2010).
Although this plant does not currently exist, it was made famous in Al-Jabal Al-Akdar (in the
Cyrenaica region) by ancient civilizations, and was economically important to the country at
that time (Al-Jabal Al-Akdar, Study in Geography 1960). In 1817, Della-Cella collected 260
plant species from Tripoli to the borders of Egypt along the coastline, and this work marked
the beginning of the study of modern plants in Libya (Environment Public Authority, 2010).
0
2
4
6
8
10
12
14
16
1960 1965 1970 1975 1980 1985 1990 1995 2000 2005 2010
Are
a Th
ou
san
d H
ecta
res
years

Chapter 2 Biophysical and Human context
25
In 1821, Lyon introduced a list of plants that were cultivated in the Fezzan region (south
western Libya), and backed it with some information on the natural vegetation of the area.
Dickson had also collected several plants during his stay in Tripoli from 1818 to 1847
(Environment Public Authority, 2010).
Important work in this area was carried out by Rholf in 1871 and it was more accurate and up
to date than the information that had come before it. This work included a study of the
vegetation in Tripoli, Cyrenaica and Fezzan, and also included a list of local plants
(Environment Public Authority, 2010).
In addition to the studies carried out above, many Italian plant experts (such as Bequinot, Borzi,
Corti, Ttotter and Pampanini) have studied Libyan plants from 1910–1942 (Al-Zawam 1995).
The most thorough studies on flora in Libya were conducted by British botanist Keith in 1965.
Although he did not contain full descriptions, they did contain taxonomic information and
information on the use of certain plants and their local names, which are used as references for
Libyan plant experts today.
From 1969–1979, Scholz published a number of research studies on the vegetation in Libya
and described many plants that had not been mentioned previously. From 1976 to 1986, many
experts (both foreign and Libyan) contributed to the Libyan Encyclopaedia of Plants.
Based on previous studies on natural plants, most have indicated that there are 1,750 species in
744 genera of which 118 are endemic species. Also, 75% of these plants grow on the coastal
strip of Libya, which represents only 5.5% of Libya’s area (93,000 km2). This is also the most
fertile area, with rain falling at a rate of 150 to 600 mm per year (Environment Public Authority,
2010). Fifty per cent of all plant species in Libya grow on the Al-Jabal Al-Akdar, and juniper
trees represent 90% of all the trees in this area. In a study done at Omar AlMukhtar University
(2005), it was found that 75 types of these plants grow only in Libya, on Al-Jabal Al-Akdar
area, which represents 4% of all the plants in Libya (Ben-Mahmoud, 2013).
According to the first national report on the state of the environment (2002), the main regions
in Libya about natural plants are as follows:

Chapter 2 Biophysical and Human context
26
1 – The western regions of Libya, which includes Jefara plain, Jabal Nafusah and parts of El-
Hammada Elhamra to the north of the 50-mm isohyet. The most common plants in this region
include shrubs derived from forest plants that used to cover Jabal Nafusah such as: Juniperus
phoenicea, Rhantherium spp, Pistacia khinijuk suaveoters, Cupressus semperucrens,
Calicotome villosa, Stipogrostis pungens, Zizyphus spina-christi, Haloxylon shveinfurthii,
Artemisia tridentate, Stipa fernaccssions, Retamo raetam, Acacia gummifira, and Artemisisia
campestris.
2 – The central region includes areas extending along the Gulf of Sirt and to the north of the
50-mm rainfall line. The coastal area receives little rainfall and is covered by marshes and
saline soil. The main plants are: Retamo raetam, Acacia gummifira, Suaeda vermiculata,
Artemisia campestris, Asphodelas microcurpus, Orginea scilla and Stipa tenacissima
(esparto). Lygeum spartum is found less frequently.
3 – The eastern region covers the area of northeast Libya, including Al-Jabal Al-Akdar, which
is the only naturally forested area in Libya. The Al-Jabal Al-Akdar region constitutes only 1%
of the total area of Libya but hosts biodiversity accounting for more than 50% of all plant
species in the entire country. Approximately 1100 of the 1,750 plant species in Libya are found
in this region. Approximately 75 species of plants grow only in this region of the world,
however, is that encompassing the foothills and plateau to the south of Al-Jabal Al-Akdar. Here
there is a transition from coastal plants and marshes to forest trees and shrubs; dry-land plants
become more common to the south of on Al-Jabl Alakdar area. This region is considered the
richest in terms of plant diversity. The current regional data show 44 endemic species
representing 28 families and 41 genera (El-Darier and El-Mogaspi, 2009).
The most common plants are: Juniperus phoenicea, Pitacia khinijuk, Calicotome villosa,
Cupressus semperucrens, Quercus coccifera, Artemisia tridentata, Arbutus pavary, Pinus
ralepensis, Thymus capitatus, Oleaceae rosmarinus officienalis, Ceratonia siliqua and certain
species used for medicinal purposes.
4 – The only type of plant in the Libyan Desert is grass in wadi bottoms, basins (oases), playas
and marshes. The desert is practically devoid of perennial plants because water is so scarce.
Such a region, of course, has no grazing value whatsoever. However, it is not unusual to find
seeds of rapidly growing annual xerophilic vegetation in sandy or rocky areas.

Chapter 2 Biophysical and Human context
27
However, over the ages these forests have been subjected to the widespread destruction of trees
through the cutting of large sizes for shipbuilding and the use of wood in construction and
special roofs. Al-Jabal Al-Akdar forest was estimated as originally comprising 1 million ha.
while the total area of the forest was about 500,000 ha in 1950, in 1988, 35% of this land was
converted to grow crops. Thus the actual area of this natural forest was about 320,000 ha in
1988 (Ben-Mahmoud , K 2013) Patches of natural forest also remain in Jabal Nafusah in the
southwest portion of Jefara Plain.
Some reports have indicated that natural vegetation was exposed to deterioration during the
Second World War as well as during the War of Italian occupation in Libya (The Ministry of
Agriculture, 2004). Recent studies using satellite images have found that the area of natural
vegetation cover, specifically on the Al-Jabal Al-Akdar area, was 320,000 ha in 1980 and
decreased to 200,000 ha by 2005 (Omar Al Mukhtar University, 2005). All of the natural plants
in Libya is degraded in terms of quality and density as a result of human activity and climate
change (Ben-Mahmoud, 2013).
Therefore, many plants have become extinct or are on the verge of extinction, left to be replaced
by plants that are more resistant to environmental conditions and overgrazing (The Ministry of
Agriculture, 2004). The density of plants is also decreasing sharply in all regions, and in many
areas it is decreasing at a rate of 10%–15%, so neither the soil nor the land can be protected
(Al-Zawam, 1995). Therefore, erosion (particularly soil erosion) is a natural phenomenon in
most areas, decreasing soil depth and fertility, and leading to plant deterioration (Ben-
Mahmoud, 2013).
Table 2.7: Vegetation cover density in Libya 2005
Vegetation cover density Areas (thousand/ha) %
Very high density (more than 65%) 91 0.6
High density (40- more 60%) 276 1.9
Moderate density (15-40%) 4573 31.4
Low density (15-40%) 5760 39.5
Very low density (1-4%) 3870 26.6
Total area 14570 100 Source :Ben-Mahmoud, 2013.

Chapter 2 Biophysical and Human context
28
2- Planted forests
The manmade forest in the western coastal area comprised 248,000 ha as of 1984, which were
planted to combat desertification and stop the movement of sand dunes. But as of 2005 this
forest's area was estimated at 60,000 ha.
However, according to Mapping of Natural Resources for Agricultural Use and Planning
(2005) planted forests area was estimated at 60,000 ha and both types of natural forest and
planted forests areas were estimated at 340,000 ha, which is 0.2% of Libya's total area. Figure
2.13 presents forest area in different periods, including natural forest and reforestation, which
were available and estimated in 2010 at 210,000 ha .
Figure 2.13: Natural and Man made forest cover in Libya in (1950, 1960, 1988, 1997, 2005 and 2010)
*No date has been published to classify forest type in 2010 (Source Bin Kayal, 1995; Almahdawi,
1998; FAO and UNDP, 2005; FAO 2010 b).
2.1.7.4 Urban area
Urban areas increased from 10,000 ha in 1966 to 40,000 ha in 1980, then to 95,000 ha in 1994,
an increase of 850% for the period between 1966 and 1994, which represents an annual increase
of 30% and is due to population growth and improved level of income after oil exports in Libya.
In 2005 urban areas was estimated as 181.000 ha which represents 0.1% of Libya total area, as
shown in Figure 2.14.
0
100
200
300
400
500
600
700
1950 1960 1970 1980 1990 2000 2010
Are
a Th
ou
san
d H
ecta
res
Years
Natural forest Reforestation Total

Chapter 2 Biophysical and Human context
29
Figure 2.14: Urban area in Libya (Thousand ha) for the years of 1966, 1980, 1994 and 2000 (Source:
Bin Kayal, 1995; Almahdawi, 1998; FAO and UNDP, 2005).
2.1.7.5 Bare Land and Marshes
Libyan Desert areas constitute the highest percentage of land cover, which is about 15,001,700
ha or 89.5% of the total area, which represents all kinds of bare land, as shown in table 2.8.
Table 2.8: Bare Land and Marshes in Libya 2005
Bare area type Area % form of
bare land
% total area
Bare soil consolidated 64,274 42.8 38.3
Bare soil unconsolidated 40,667 27.1 24.3
Loose and shifting sand 43,473 29 25.9
Bare soil in Wadi Environment 1,603 1.1 1.0
Total 150,017 100 89.5
Marshes 905 . 0.5 Source: FAO and UNDP, 2005.
0
20
40
60
80
100
120
140
160
180
200
1965 1970 1975 1980 1985 1990 1995 2000 2005
Are
a Th
ou
san
d H
ecta
res
Years

Chapter 2 Biophysical and Human context
30
2.2 Sand Dunes Stabilization in Jefara Plain
Due to the serious problems caused by sand dunes movements or shifting sand dunes, for
example, effects on cities' urban and rural areas, agricultural lands and irrigation land, it is very
important and very necessary to combat sand dunes movement (Fadhil, 2002). Stabilization of
sand sheets and sand dunes is achieved by different means (mechanical, chemical, physical and
biological methods) (Hegazi et al., 2005). Also, it is designed to prevent the movement of sand
long enough to enable either natural or planted vegetation to become established (FAO, 1985).
Activities of sand dune movement control is achieved through maintenance and improvement
of shrub by vegetation cover natural or artificial revegetation.
Sand dunes cover vast areas of Libya, but the largest area of dunes is located within the
sprawling desert areas. However in this study our focus will be on those sand dunes which are
located near the coastline of the Libyan-Tunisian border, to the west to Misratah. These are
mostly located on the Jefara plain which is estimated to be 250,000 ha (Aljduaa, 1970).
2.2.1 Sand dune types in Jefara Plain
On the coastline of Jefara plain there are two types of sand dunes which are:-
2.2.1.1 Maritime Dunes
Maritime dunes are caused by tidal factors. They stretch along the coast, made up of rough
white to pale grey sand, with high calcium carbonate content (ranging from 60-89%) and very
low organic matter content. The ability of this sand to retain moisture is low, and it has
impacted negatively on the adjoining agricultural land onto which it encroaches due to the
north-west winds blowing in winter. Encroaching sand dunes have already covered several
residential houses and surrounding trees. This type of dune makes up 40% of the sand dune
area (Khatabi, 1981).
2.2.1.2 Continental dunes
Continental dunes are found towards the interior of the African continent (Moomen and
Barney, 1981). They are characterized by soft sand with a colour that tends towards orange.
These dunes are fast moving, from south to north, due to the Gibli winds which blow in the
spring and autumn. This sand contains a high proportion of nutrients compared with the
maritime sand, with the proportion of carbonates being only between 5-9%.
Furthermore, the ability of this sand to retain moisture is high compared to the maritime sand.
These dunes have also covered vast areas of previously cultivated land (Khatabi, 1974).
Chapter 2 Biophysical and Human context
31
2.2.2 Sand dunes stabilization methods
Since the early 1960s, serious measures have been taken to combat desertification in Jefara
plain, Libya (Bbn-mahmoud et al., 2000). However some reports (Jibril, 1999) state that sand
dune stabilization in Libya began at the beginning of the twentieth century, during the second
Ottoman reign, when Rajab Pasha contributed greatly to the process of sand dune stabilization
in an attempt to stop sand movement and to combat desertification, particularly in the suburbs
of Tripoli. At first these efforts were not accepted by the local people, because they thought
that it was impossible to stop the movement of the sand dunes, going so far as to say Rajab
Pasha was crazy to try to resist the sand and wind. However, he was successful in stabilizing a
small area of the dunes, estimated to be 2000 ha, over a period of 6 years. According to some
sources, the method used to stabilize sand at this time was by “thatching”, using palm fronds
and dead trees to cover the dunes (Al-Tillisi, 1972).
2.2.2.1 Successful methods
2.2.2.1.1 The traditional method of surface stabilization (dry plant materials).
Mechanical fixation appears to be effective, widely used and has successfully been applied in
most Saharan countries, for instance, Libya (Messines, 1952), Egypt (Ibrahim, 1969) Sudan
(Rapp et al., 1976) Mauritania (Ben Salim, 1991), Niger and Senegal (Grainger, 1990).
In Tunisia, this traditional method used in Tunisia since 1886 to stabilize continental dunes,
dunes stabilization is carried out through establishing vegetation between the dune and the area
to be protected (Swearingen and Bencherifa, 1996).
In Libya, the accepted method of stabilization, until recently, has been to erect low barriers, or
palisades of cut vegetation (Moomen and Barney,1981). This method was first applied in Libya
during the Italian occupation in 1916. After independence, Libya continued to use this method
on a wide scale using local expertise (Ajaj, 1982). The plants used to erect the barriers are the
Imperata cylindrica and Aristida pungens (Khatabi, 1981) see fig 2.16, however in other dry
countries different kinds of plant materials are used (FOA, 1985; Han, 2007; Hegazi et al.,
2005; Fadhil, 2002).
Two sets of narrow, approximately parallel, trenches are laid out at right angles to each other
to form a grid of square, or rectangular, enclosures. The trenches are due to a depth of about
20-30 cm while the sand is still moist following rain. The trenches are about 2 m apart at the
top of the dunes, 3 m apart on the slopes, and 4 m apart at the base of the dunes.

Chapter 2 Biophysical and Human context
32
Stems of the cut plants (at least 50 cm long) are set upright in the trenches which are then filled
(Khatabi, 1981). The quality of the stems is very important: old or decaying stems cannot be
used. The thickness and height of the barriers, and the length of the fixation period, will vary
with local conditions (Moomen and Barney, 1981) as shown in figures 2.15, 2.16 and 2.17.
Figure 2.15: Sand dunes stabilization using dry plant materials first: Illustration of the process of sand
dunes stabilization using Imperata cylindrica and Aristida pungens , Al- Atayah village in Algarabulli
district in 1966 (Ajaj, 1982).
Figure 2.16: Sand dunes stabilization by dry plant materials in second stage: Illustration of
sand dune after stabilized dry plant materials in Al Atayah village in Algarabulli district by
Imperata cylindrica and Aristida pungens 1968 (Ajaj, 1982).

Chapter 2 Biophysical and Human context
33
Figure 2.17: Sand dunes stabilization by dry plant materials third stage: Tree growth within squares
which was stabilized by dry plant materials and planted in Al Atayah village in Algarabulli district
1969 (Ajaj, 1982).
2.2.2.1.2 The modern method of stabilization (using crude oil)
In countries where labour is in short supply the method can prove costly. Moomen and Barney
(1981) reported that rising costs of erecting barriers and heavy use of plant material that also
threaten to denude and accelerate erosion in other areas prompted the search for other methods
of dune stabilization .In 1964, a technique was developed in Libya for the stabilization of dunes
through the use of a bitumen spray (Moomen and Barney, 1981). This is faster and more
economical than the older vegetation method. The first experiment using bitumen in Libya was
conducted in 1961 and 1962. The success of this experiment was such that it was officially
applied on a large scale in 1964, achieving great success, and leading Libya to become known
internationally due to its experience in stabilizing sand dunes. It was subsequently applied in
some other countries, such as Iran and Saudi Arabia (Khatabi, 1981). In Libya a bitumen mulch
is sprayed on some areas before planting (Goor and Barney, 1976). The bitumen is heated to
about to 80°C and then sprayed onto the sand. This is done as soon as possible after good
rainfall in order to reduce evaporation losses, and before trees are planted. The bitumen not
only binds the sand particles and keeps them from moving (Moomen and Barney, 1981), but
also acts as moisture-conserving mulch that helps with the establishment of planted trees. The
bitumen also provides better protection against wind erosion than the grid-type barrier does
(Abo-Khchim, 1995).

Chapter 2 Biophysical and Human context
34
The equipment used in applying the bitumen mulch is quite simple. It consists of a large cubical
tank, on which are mounted four double-nozzle aerial sprayers. The tank capacity is thirteen
m3 of bitumen, which is enough to cover an area of about 4-5 ha (Khatabi, 1981). The
equipment is mounted on a smooth, toboggan-like base so that it can be easily pulled over the
dunes by a bulldozer. A pump provides a pressure of about 7.03 to 8.45kg cm-2 (Moomen and
Barney, 1981).
Figure 2.18: Sand dunes stabilization by using crude oil: The process of sand dunes
stabilization by bitumen spray by a bulldozer which pulled the tank over the dunes ,in Al
Atayah village in Algarabulli district in 1971 (Khatabi, 1981).
Figure 2.19: Planting Eucalyptus gomphocephala trees: Reforestation campaign which comes
after sand dunes by stabilized bitumen spray , in Al Atayah village in Algarabulli district in
1971(Khatabi, 1981).

Chapter 2 Biophysical and Human context
35
In the beginning concerns were expressed about using crude oil to stabilize the dunes, in that
it forms a black layer once sprayed onto the surface of the sand, which potentially causes oil
pollution of both water and soil. However, these concerns dissipated completely after four years
by which time the thin black layer of bitumen had disintegrated and was replaced by biological
stabilization of plantation forests and natural plantings of annuals and perennials that had
invaded the area after the oil was sprayed on. With regard to the water pollution, in the areas
that had been sprayed the groundwater was found to be safe, as it was not close to the soil
surface, and the probability of oil leaking into the soil was very low, because of the density of
the bitumen, and the fact that it contains a waxy substance that prevents leakage.
The conclusion was that there were no side effects causing pollution of the environment, and
so the results of these experiments were that this method is considered to be the best of what
has been achieved so far in the field of materials technology designed to stabilize sands
(Khatabi, 1981). Sand dunes stabilized since 1952 to 1979 were estimated to cover 75,988 ha
in Jefara plain using both above methods (Khatabi, 1981) (Figure 2.20).
Figure 2.20: Sand dune stabilized in Jefara plain, Libya of 1952-1979: Sand dunes stabilized since
1952 to 1979 were estimated to cover 75,988 ha in Jefara plain using dry plant materials and bitumen
spray methods (Khatabi, 1981).
0
1000
2000
3000
4000
5000
6000
7000
19
52
19
53
19
54
19
55
19
56
19
57
19
58
19
59
19
60
19
61
19
62
19
63
19
64
19
65
19
66
19
67
19
68
19
69
19
70
19
71
19
72
19
73
19
74
19
75
19
76
19
77
19
78
19
79
19
80
19
81
Are
a(h
a)
Year
Dunes stabilized
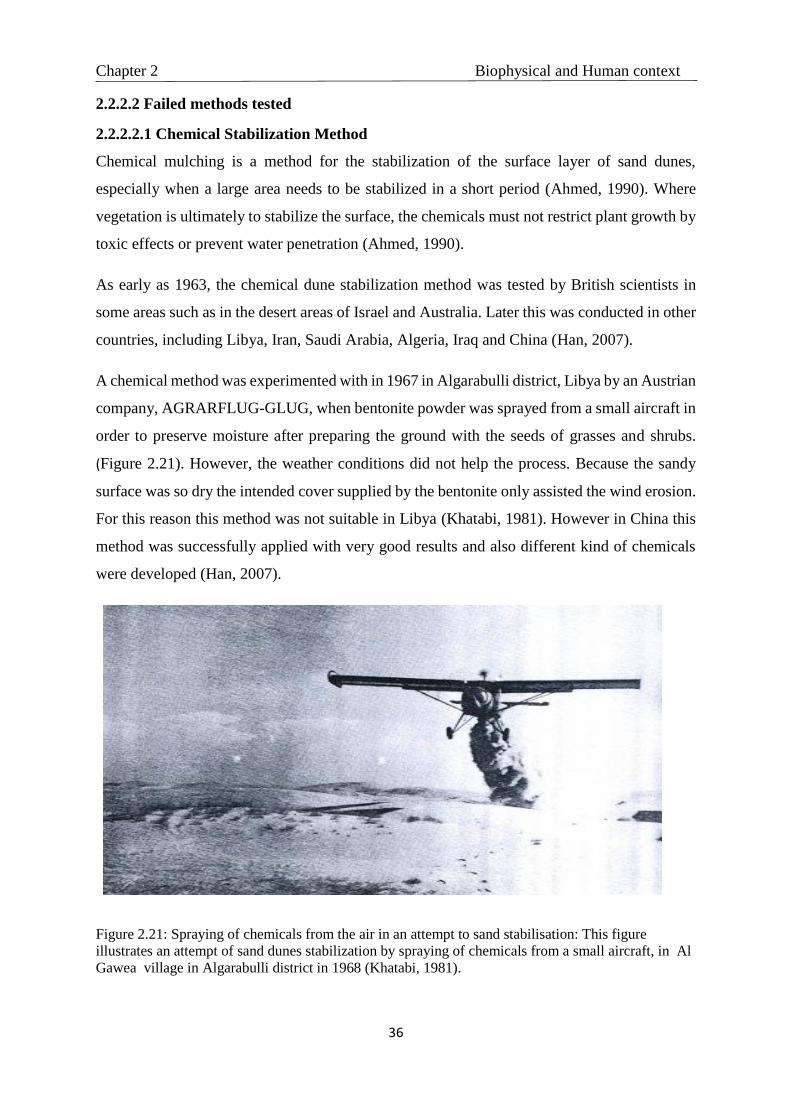
Chapter 2 Biophysical and Human context
36
2.2.2.2 Failed methods tested
2.2.2.2.1 Chemical Stabilization Method
Chemical mulching is a method for the stabilization of the surface layer of sand dunes,
especially when a large area needs to be stabilized in a short period (Ahmed, 1990). Where
vegetation is ultimately to stabilize the surface, the chemicals must not restrict plant growth by
toxic effects or prevent water penetration (Ahmed, 1990).
As early as 1963, the chemical dune stabilization method was tested by British scientists in
some areas such as in the desert areas of Israel and Australia. Later this was conducted in other
countries, including Libya, Iran, Saudi Arabia, Algeria, Iraq and China (Han, 2007).
A chemical method was experimented with in 1967 in Algarabulli district, Libya by an Austrian
company, AGRARFLUG-GLUG, when bentonite powder was sprayed from a small aircraft in
order to preserve moisture after preparing the ground with the seeds of grasses and shrubs.
(Figure 2.21). However, the weather conditions did not help the process. Because the sandy
surface was so dry the intended cover supplied by the bentonite only assisted the wind erosion.
For this reason this method was not suitable in Libya (Khatabi, 1981). However in China this
method was successfully applied with very good results and also different kind of chemicals
were developed (Han, 2007).
Figure 2.21: Spraying of chemicals from the air in an attempt to sand stabilisation: This figure
illustrates an attempt of sand dunes stabilization by spraying of chemicals from a small aircraft, in Al
Gawea village in Algarabulli district in 1968 (Khatabi, 1981).

Chapter 2 Biophysical and Human context
37
2.2.2.2.2 Synthetic rubber (Latex) method
An experiment using synthetic rubber to stabilize the dunes was carried out in 1970/1971. This
involved spraying a mixed emulsion of latex from the rubber industry with mineral oil, where
water made up 96% and the mixture 4%. This mixture was sprayed on the sand, and experience
in the areas of Zahra and Alhacha, North West of the city of Tripoli, showed only a fair level
of success for the method, due to the large amounts of water that would be required for making
wider use of the method in the dry sandy areas (Ajaj, 1982).
Recently, according to the Annual Report of the National Committee for Combatting
Desertification for the period January to December 2009, many experiments were conducted
aimed at sand dune stabilization. Several new methods for stabilizing sand dunes were
conducted in cooperation with Chinese experts within a framework of local capacity building.
This process is still under investigation and there have been no reports to indicate the extent of
any success. One of these methods is the environmentally friendly Eco-mat, which is embedded
in the soil and aims to protect the soil from erosion and dune encroachment. This method is
being applied to the south of Jefara (National Committee to Combat Desertification, 2009).
2.3 Plantation Forest in Jefara plain
Some thousands of years ago, much of the coastal lowland areas of Libya were favourable for
the growth of trees and supported open woodlands of Zizyphus lotus, Acacia tortilis, etc. The
mountainous areas carried a Mediterranean type of forest, consisting of Pinus halepensis,
Juniperus phoenicea, Cupressus sempervirens, Pistacia atlantica, Quercus calliprinus,
Quercus ilex, and possibly Tetraclinis articulata and other species. Many of these species can
only be found in the forests of Al-Jabal Al-Akdar, in the east of Libya (FAO, 1972).
The Greek historian Herodotus, in the fifteenth century BC, wrote that the mountainous belt of
the Jefara plain was covered with evergreen forests, providing shelter and shade for the wild
animals that were living there (Manaa, 1969) Herodotus spoke of visiting the Al-Jufrah district
in central Libya, and said it had a high density of woodlands (Manaa, 1969). However, by 1852,
it is recorded that residents of this district had migrated as a result of sand dune encroachment,
with the advance of the dunes during the second Ottoman reign (Ataiwar, 1991).

Chapter 2 Biophysical and Human context
38
The plain was crossed by dry valleys which during the rainy winter season, channel water
runoff from to the mountains the Mediterranean Sea. Serious destruction of the forests and
woodlands of Libya probably coincided with the advent of the Phoenicians and Romans, and
such forests as survived the onslaughts of those early colonizers have, in the course of centuries,
largely disappeared due to uncontrolled exploitation, shifting cultivation and overgrazing
(FAO, 1972).
2.3.1 Turkish occupation
A period of agricultural revival and urbanization occurred during the Ottoman Period, at the
beginning of the reign of Sultan Mahmud (1808-1839). This flourished even more strongly
during the era of his successors, and at this time thousands of seedlings of willow trees were
imported into to Libya from the Turkish city of Izmir in order to plant them right across the
country. This happened particularly in the Jefara plain, which by now was mostly covered with
sand dunes, due to the cutting down of timber for construction purposes, and to supply poles
for telegraph lines, which were expensive to purchase (Ataiwar, 1991). Besides planting willow
trees, the Turkish government planted Eucalyptus camaldulenis trees, which in August 1909
were described by the Ministry of Agriculture and Minerals in Istanbul as of great benefit in
providing deodorization, and providing timber for various industries.
The Ottomans were the first to introduce the eucalyptus tree into Libya (Khatabi, 1981).
During the second Ottoman rule, afforestation was seen as of increasing importance, both for
the provision of timber and poles for telephone lines, and also as protection from disease. The
planting of forest trees also aimed at protecting the environment through soil stabilization and
protection from erosion. In March 1910, the Ministry of Agriculture and Forestry in Istanbul
issued a declaration regarding the importance of afforestation in the city of Tripoli, and in the
surrounding valleys and mountains, in order to avoid the damage caused by floods.
Turkish officials emphasized the importance of Tripoli increasing its afforestation programs,
and forced employees and officials to plant a certain number of trees each year, depending on
the individual’s income. If they did not, they would be deprived of their jobs in administrative
and military institutions (Ataiwar, 1991).

Chapter 2 Biophysical and Human context
39
2.3.2 Italian occupation
In 1911, when the Italians first occupied the coastal zone of Tripoli, some eight or ten
Eucalyptus trees, species not recorded, where found growing near the city walls (FAO, 1972).
During this period, many thousands of Eucalyptus trees were planted as windbreaks, as
roadside trees along the major roads of Tripoli, and near to outlying towns and villages. These
plantations consisted mainly of Eucalyptus and Acacia, and the following species of Eucalyptus
were introduced into Libya during this period: Eucalyptus camaldulensis, E. cornuta, E.
gomphocephala, E.diversicolor, E.redunca, E.melliodora, E. polyanthemos, E. sideroxglon ,
E. cladocalyx , E. viminalis, E. saligna and E. citriodora, among others (FAO, 1972). Other
reports indicated that more than 70 species were planted (Khatabi, 1974). However these
species grew with varying levels of success, the most successful being the Eucalyptus
camaldulensis and E. gomphocephala (FAO, 1972).
During this period the area under planted forest was estimated at about 4000 ha, but most of
this area was later destroyed during the Second World War, because of cutting firewood due
to the exploitation of the available fuel for the Axis soldiers and also by the local population
(Aljduaa, 1970). By the end of the war reports estimated that the remaining forest covered just
2000 ha (Ajaj, 1973).
2.3.3 British administration
An afforestation programme was started again in 1946 by the British Military administration
in an attempt to remove the sand dunes along the main roads and adjacent to agricultural lands.
The species used were the Eucalyptus spp and Acacia cyanophylla (FAO, 1972). The reports
available from this period indicate that the British administration contributed to afforestation
in small areas of Libya, which were estimated to be 300 ha. However, they also contributed to
the protection of the rest of the forest (Khatabi, 1981).
2.3.4 After independence 1951 up to recent time.
In 1952, after the independence of Libya, and the return of trained forest officers from their
two-years training at the Cyprus Forestry College, the Libyan Forestry Department began
afforestation on a fairly large scale.

Chapter 2 Biophysical and Human context
40
The area planted amounted to about 3,000 ha per annum. The two species used were those
found to be the best suited to the climatic conditions, as well as being fast growing species,
Eucalyptus camaldulenis and Eucalyptus gomphocephala (Aljduaa, 1970).
Some reports estimate that by 1961 the forest area was 43,763 ha. After the discovery of oil
and the start of its export in 1963, five-year plans for afforestation were drawn up to plant
forests on the coastal strip of the Jefara plain. The whole plan consisted of six five year phases,
and was supposed to finish in 1993, with the first five-year plan being 1963-1968 (Aljduaa,
1970). The first five year plan was implemented successfully by the State, with the planting of
about 26824 ha of forests (Aljduaa, 1970). The second plan, for the years 1968-1973 was also
carried out successfully, despite afforestation stopping for four months in 1969 due to the
military coup against the monarchy at that time.
The second plan was then resumed, and most of the coastal area of the Jefara plain was planted
under forest, so that there was no need for an afforestation program after 1973 in the Algarabulli
district (Khatabi, 1981). Some reports stated that the afforestation programs of the former
administration continued in Libya until 1984, but these were not in the form indicated in the
original plan. Between 1952 and 1983 248,104 ha were planted with 220,427,740 seedling trees
(Khatabi, 1981) (Figure 2.23 and 2.24).
From this examination the following conclusions can be drawn: As to the stability of various
large groups of dunes, Khatabi (1981) reported that no overall movement was observed during
the period of 1953 and 1973 and as to the stability of the southern dune group, the rolling dunes
of 1953 were covered in thick forest.

Chapter 2 Biophysical and Human context
41
Figure 2.22: Government officials supervise the process of sand dunes stabilization (02/02/ 1972).
Figure 2.23: Area of sand dunes planted in Jefara Plain from (1952-1982): Sand dunes planted after
stabilized since 1952 to 1982 were estimated to cover 82,744 ha in Jefara plain, Libya (Khatabi,
1985).
0
2000
4000
6000
8000
10000
12000
14000
19
52
19
53
19
54
19
55
19
56
19
57
19
58
19
59
19
60
19
61
19
62
19
63
19
64
19
65
19
66
19
67
19
68
19
69
19
70
19
71
19
72
19
73
19
74
19
75
19
76
19
77
19
78
19
79
19
80
19
81
19
82
19
83
19
84
Are
a (h
a)
Years

Chapter 2 Biophysical and Human context
42
Figure 2.24: Barren land planted in Jefara plain/ha from 1952 – 1984: Barren land planted in Jefara
plain since 1952 to 1984 were estimated to cover 148,868 ha in Jefara plain, Libya (Khatabi, 1985).
2.3.5 The choice of tree species
The choice of tree species for afforestation is perhaps the most important decision which must
be taken before starting afforestation. The choice of tree species depends on the purpose of
plantation. Three quarters were grown for productive purposes (production of wood. fibre, fuel
or non-wood forest production) and one quarter for protective purposes (mainly rehabilitation
of degradation lands, combating desertification or protection of soil and water (Kollert, 2010).
In Libya, plantation forest for productive purposes, tree species were introduced to Libya, but
very few species were planted successfully due to the environmental conditions (GEFLI, 1973).
2.3.5.1 Acacia:
The acacias used in Libya are native to Australian and several Australian acacia species have
become highly invasive in a number of ecologically sensitive areas of Africa (Impson et al.,
2004). In Africa generally Acacia is covering 4.3% of all planted areasd. In Libya, Acacia spp
are the most widely planted covering 55% of all these planted in Jefara plain. Only two Acacia
species were introduced into Libya (Khatabi, 1981).
0
5000
10000
15000
20000
25000
30000
35000
19
52
19
54
19
56
19
58
19
60
19
62
19
64
19
66
19
68
19
70
19
72
19
74
19
76
19
78
19
80
19
82
19
84
19
86
Are
a (h
a)
Years

Chapter 2 Biophysical and Human context
43
- Acacia cyanophylla
Acacia cyanophylla, which also known as Acacia saligna, was introduced to North Africa from
Australia and was planted in 1870 in Algeria, then used extensively in Libya after 1916 for
sand dune fixation and for the same purpose after 1930 in Tunisa (Tiedeman and Johnson 1992)
and as a windbreak to protect cropland. It also provides fuelwood and increases soil nitrogen
by fixation (Tiedeman and Johnson, 1992).
Furthermore, the leaves can be used as animal fodder during the dry period. Acacia cyanophylla
grows in association with Eucalyptus gomphocephala and Acacia cyclops (Goor and Barney,
1976).
It is a tall shrub, up to 7 m in height, which grows on sandy loam on drained and calcareous
soils, and it grows well in plantation in areas where the annual rainfall is less than 300 mm
(Goor and Barney, 1976).
- Acacia cyclops
Acacia cyclops was introduced into Libya in 1954 (Khatabi, 1981) and was widely planted in
the stabilization of the maritime dunes, where it is a very useful species for binding coastal
dunes and planting on difficult sites (Goor and Barney, 1976). It can cope with salt and
exposure to onshore winds and sea spray, which have a detrimental effect on most plants, but
it does not grow under rainfall conditions of less than 150 mm (Khatabi, 1974).
A shrub, up to 3 m, it grows where the annual rainfall ranges from 150-750 mm (Goor and
Barney, 1976). Acacia cyclops originated in south-western Australia and became invasive after
it was introduced into South Africa in the early 1800s (Kotzé et al., 2010), primarily for
stabilisation of sand dunes (Mokotjomela and Hoffmann, 2013).
2.3.5.2 Eucalyptus
Eucalyptus is one of the world's most important and most widely planted genera (Giamakis et
al., 2001). There are over 600 species of eucalypts, almost all of which are native to Australia
and New Guinea, and which dominate about 95 per cent of the forest area of Australia. These
species of eucalyptus grow in a wide variety of climates and soils, from the hot desert to the
cold mountain slopes (Goor and Barney, 1976).
Over 100 different species of eucalyptus have been tried in experimental plantings in different
countries in various savannah types (Laurie, 1974) .

Chapter 2 Biophysical and Human context
44
In Libya, it was mentioned previously that more than 12 species of eucalyptus were introduced
during the Italian occupation, however only two species of eucalyptus have successfully
established which are Eucalyptus gomphocephala and Eucalyptus camaldulenis, particularly
on the continental dunes, while in some areas a mixture of eucalyptus and acacia have been
used to obtain some economic advantages. In Africa eucalyptus is the most widely planted
genus covering 22.4% of all these planted, but in Jefara plain eucalyptus (Eucalyptus
camaldulenis and Eucalyptus gomphocephala), account for 40% of all planted forest (Khatabi,
1981).
- Eucalyptus gomphocephala
A tall, evergreen tree, up to 42 m, and grow on sandy loams and coastal dunes where this
species is frequently used in arid zone afforestation, especially in the southern Mediterranean
Basin (Goor and Barney, 1976). E. gomphocephala is often planted in zones with less than 250
mm rainfall and is a fast-growing species (Kaul, 1970).
This species of eucalyptus was introduced into Algarabulli district in early 1920s by Italian
occupation as windbreaks for their farms (Khatabi, 1981) then used later widely, distributed in
the whole area except coastline, because it cannot grow in soils that contain a high percentage
of salinity.
- Eucalyptus camaldulenis
A tall, evergreen tree, reaching a height of 40 m, growing in regions where rainfall ranges from
200 to 600 mm with up eight dry months (Goor and Barney, 1976) it is fast-growing in
favourable sites. This species has been extensively planted with great success in many semiarid
zones of the world. This species of eucalyptus was introduced into Algarabulli district in early
1950s.
2.3.5.3 Pine
Pines are very valuable introductions to certain arid zones, where pines do not require a high
level of soil fertility (Laurie, 1974). In Africa Pinus is a widely planted genus covering 20.5%
of all planted areas, but in the Jefara plain, pines account for 5% of planted forest. Many of
these species can be found naturally in the forests of the Al-Jabal Al-Akdar in Cyrenaica,
eastern Libya. There are two species of pines, Pinus halepensis and Pinus pinea, used in the
study area as a forest plantation:

Chapter 2 Biophysical and Human context
45
- Pinus halepensis
An evergreen tree, up to 25 m high but usually under 18m and widely distributed in the semiarid
zones of the Mediterranean Basin, from Spain and Morocco to Greece, Libya, and Jordan (Goor
and Barney, 1976). During the twenty century extensive programs in the Mediterranean Basin
have mainly relied on plantations of Pinus halepensis, which now cover thousands of ha. It is
one of the most important tree species in this region.
The main goal behind vast afforestation programs of Pinus halepensis was in many cases
socioeconomic, and implemented for protecting soils, controlling catchment hydrology and
fostering forest productivity. As it is very drought-resistant and grows in area with 250-800
mm of rainfall and seven or eight rainless months (Goor and Barney, 1976). Pinus halepensis
was preferentially chosen due to low-technical requirements for nursery production, high-
resistance to adverse climatic and soil conditions, and because it was considered part of the
climax community, as in extensive areas in Tunisia, Algeria, and Greece (Maestre and Cortina,
2004).
This type of pine is extensively cultivated at higher elevation (Laurie, 1974) . In Algarabulli
district, this species represent only 4 per cent of all planted forest, particularly in clay soil.
- Pinus pinea
A large evergreen tree, up to 24m high requiring an average rainfall between 400 to 800 mm,
it grows on a wide range of soils; best growth is on fixed dunes and sandy loams (Goor and
Barney, 1976). It is one of the most appreciated species in the northern Mediterranean basin
due to the multiple products and functions. It was introduced to Lebanon in the sixteenth
century to prevent the coastal dunes from encroaching on Beirut (Goor and Barney, 1976). In
Tunis, Pinus pinea has been planted since 1907 in reforestation programs, being the most
important specie after Pinus halepensis, occupying about 20,000 ha (Piqué et al., 2013).
However in Libya, this is the least important species that has been planted in Jefara plain where
it represented 1 per cent of all planted forest (Khatabi, 1981).
2.3.6 Plant nurseries
Nine plant nurseries were established in Libya by the Forestry Department to serve the
afforestation programs, and until the year 1971 these produced about 13 million seedlings per
year.

Chapter 2 Biophysical and Human context
46
The most important of these nurseries is the Aljedayeda nursery in the city of Tripoli, which
was established in 1935, and produced 400,000 seedlings annually at that time; by 1971 it was
able to produce about 5.5 million seedlings per year (Khatabi, 1985). It is now able to produce
8 million seedlings a year, of various species, and it is the largest nursery in Libya and in the
Middle East. Also falling within the study area is a plant nursery which was established in 1967
and was then producing about 1,500,000 seedlings per year but is now able to produce 2.5
million per year. However, most of the original nurseries have not functioned for many years
(Khatabi, 1974).
2.4 Human context
2.4.1 Population
In 2006, Libya’s total population was 5.2 million and non-nationals were estimated at 359,540.
In 1995, the Libyan population was 4.3 million with an annual growth rate of 2.8%, a birth rate
of 25.15/1,000/year and a death rate of 3.37/1,000/year (BSCL, 2006a) . Of the total population,
88% is urban.
Overall, the population of Libya is not great, but it is growing at a rapid rate. However, the
period of 1954–1964 was rather low due to the poor state of the country's economy before the
discovery of oil. Also, during the period of 1984–1995, the population growth rate experienced
a decrease due to the passing of the Nationality Law and the abolition of some of the facilities
under which individuals could obtain Libyan nationality (El-Kikhia 1994). However, during
1973–1984, the growth rate increased due to the positive impact of immigration, while during
1984–1995 the growth rate fell significantly as the country had reached the stage of maturity
and stability of the population. When compared to the global average as a whole, the population
growth rate in Libya was one of the highest in the world, standing at 1.67% and then gradually
decreasing (Abo-Ayana 1980).
According to Libya’s population census of 2012, which was conducted one year after the
uprising in Libya, Libya’s population and growth rate were seen to be decreasing. About 831
households were missing and unaccounted for in the census (BSCL, 2012). This is because
they were not found in their houses or cities when censuses were conducted. However, some
of the cities in Libya were abandoned as the occupants became refugees in other countries or
somewhere in Libyan camps, where the census was not permitted to take place (BSCL, 2012).

Chapter 2 Biophysical and Human context
47
Because the population is growing rapidly, the amount of arable land is decreasing. In 1973,
the urban population in Libya was 57.5% of the total population; in 2006, this figure had
increased to 86%. Almost 95% of the population lives in the coastal region in the north, and
the rest in widely scattered oases in mid- and southern Libya.
According to the population distribution in Libya based on a 2006 estimation, people
concentrate in two centres, the first, in the northwest (Jefara Plain), where about 60% of all
Libyans live. This includes Tripoli City – the capital of Libya – where more than one million
people live, and the second centres on north-eastern Libya (Ben-Ghazi Plain). The main reasons
for this concentration are fertile soils and seasonable, moderate climatic conditions.
Figure 2.25: Libyan population and growth rate in censuses of (1954, 1964, 1973, 1984, 1995, 2006
and 2012). Source: Bureau of Statistics and Census Libya, the final results of General Census of
2012.
2.4.2 Gender in Libya
Libyan culture is structured around an Arab Berber tribal system of society. Tribes (qabila)
further consist of sections (bayt), which are then subdivided into larger families that branch
into a number of smaller family groups. Libya has an estimated 140 tribes, only about 30 of
which are viewed as having any real significance (Sehib et al., 2013)
The vast majority of the Libyan population is Sunni Muslim and “religion permeates all facets
of life” (Attir and Al-Azzabi, 2004). In the first half of the 20th century, women in urban Libya
were largely confined to their homes and would not venture out without wearing the veil.
According to tradition, men brought home the greatest proportion of the household income,
0
0.5
1
1.5
2
2.5
3
3.5
4
4.5
5
0
1000000
2000000
3000000
4000000
5000000
6000000
1954 1964 1973 1984 1995 2006 2012
Po
pu
lati
on
gro
wth
rat
e
Lib
yan
po
pu
lati
on
Censuses
Libyan population Population growth rate

Chapter 2 Biophysical and Human context
48
with the contributions of women being difficult to establish. Today, these practices are relaxing
(Attir and Al-Azzabi, 2004).
Libya's constitution is one of the minority of Arab nations that grants women equal rights to
employment, yet women's participation in the labour force remains low (Sehib et al., 2013).
To further illustrate this point, in 2008 women accounted for only 22% of the workforce, a
figure unchanged from 1996 (Attir and Al-Azzabi, 2004). Currently, the vast majority of
working women in Libya (87%) are employed in the public sector, particularly in health and
education (Sehib et al., 2013). Previously, most posts held by women were poorly paid and
rarely within the “professional” sector. Yet, today, women may work in hospitals, some
administrative office posts, and more so in schools and universities, particularly in the cities.
In the countryside however, the strongly traditional views and customs prevail, which includes
the forestry industry that is male dominated (Attir and Al-Azzabi, 2004).
Most national legislation in Libya supports equal rights for men and women, but many legal
provisions that would ensure equality have yet to be effectively enforced. Traditionally, women
have been excluded from the social and political worlds regarded as men’s territory. The social
position of Libyan women is inferior to that of men, and deeply rooted patriarchal values and
traditions still persist. It can be observed, however, that the level of freedom and equality
women experience increases in relation to the social class to which they belong (Sehib et al.,
2013).
Despite the equality between the sexes in law in Libya, de facto inequality persists. Although
this occurs more often in rural areas, there remain practical roadblocks, such as women and
men meeting individually, even for the purpose of conducting interviews. A male is more at
liberty to conduct an interview with an employed woman in her place of work (Attir and Al-
Azzabi, 2004).
Birke (2011) notes that a lack of democratic institutions and freedom of assembly and
expression in Libya continues to limit Libyan women's abilities to lobby for change. This is
mirrored by their comparatively low representation within the work force. Moreover,
traditional and current attitudes and living patterns continue to exist in parallel in Libya,
forming barriers to women’s participation into the political, economic, and social facets of
Libyan life (Attir and Al-Azzabi, 2004). Yet, over time, this situation has seen some changes
due to the views and influence of the younger, educated sector of society.

Chapter 2 Biophysical and Human context
49
However, one consequence of the demise of Gadhafi’s rule has been further restrictions on
women’s rights by the Libyan regime “in power,” as the extremist Islamic sector views equality
of the sexes as a negative Western influence. Emerging ruling tribes also continue to hold
traditional patriarchal views. Although women currently living in Libya have access to
education and medicine (Samia and Sahar, 2015), and working women are treated equally, they
also carry the additional burden of homemakers expected to clean and cook for the entire family
and care for any children.
2.4.3 Economics and political context
With regard to the Libyan income and occupation, in a FAO report on Libya’s economy in
1952, the country was an excellent example of extreme poverty, under which most citizens
lived in destitution and without energy and mineral resources; additionally, the harsh climate
conditions in the region prevented agricultural expansion. The lack of capital, skilled labour
and basic infrastructure exacerbated the already adverse situation (Al-Hajjaji, 1989).
At the time, Libya was regarded by the UN as one of the poorest countries in the world; its
average annual per capita income was US$30, and the national income was about US$45
million, which came from international aid (Abolghemh and Alkazery, 1995).
After Libya acquired independence, the UN extended aid amounting to US$30 million for the
purpose of executing the country’s development plan from 1952 to 1958. The funds were
intended for the development of farmlands and the improvement of the conditions of farmers
(Abolghemh and Alkazery, 1995). Some of the goals realised during this period were the
exploration of arable land, the search for water, the stabilisation of sand dunes, the
establishment of plantation forests and the extension of agriculture and provision of agricultural
services (Abolghemh and Alkazery, 1995).
Before the discovery of oil, agriculture and grazing were key sectors in the Libyan economy.
Amongst the population, 80% lived in rural areas; 70% of the total number of workers were
employed in agriculture, producing 60% of the gross national product of the country (Al-
Hajjaji, 1989).
After the discovery of oil and oil export in the 1960s, revenue from oil production became the
primary source of national income. This development increased the average per capita income
in the country, stabilised the conditions in the region and facilitated the implementation of
development programmes for the agricultural, industrial and residential sectors.

Chapter 2 Biophysical and Human context
50
These programmes included stabilising sand dunes, establishing forest plantations and
fostering awareness of the importance of forests. The discovery of oil and oil exportation
encouraged numerous Libyans to forgo agriculture as a profession and assume posts in the
administrative, service and industrial sectors. These individuals hired Arab or foreign labour
to work on their farms and compensated them through wages or shares in farm production.
In 1954, the service sector in Libya was of a limited scale, with only 16.3% of the total
workforce working in this industry. The country’s expansion initiative, which included
improvements to health, education and administrative services, began attracting a substantial
proportion of the Libyan labour force, thereby rapidly increasing the employment rate to 32%
in 1964, 53% in 1973, 55% in 1984, 60% in 1995 and 63% in 2006. 90% of Libyan labour
force work in the public sector (BSCL, 2010). Figure 2.26 shows the GDP per capita of Libya
in comparison with those of Egypt and Tunisia.
Figure 2.25: GDP per capita of Libya, Egypt and Tunisia (Source: The World Bank, 2015).
Like many countries in Africa, Libya suffers from a “resource curse,” defined by Doraisamy
(2013) as a phenomenon that occurs when countries that have large amounts of natural
resources also have a high poverty rate. The country itself contains the largest oil reserves in
Africa and the ninth largest in the world, but according to the CIA World Factbook, about one-
third of Libyans live beneath the poverty line.
0
2000
4000
6000
8000
10000
12000
14000
16000
1985 1990 1995 2000 2005 2010 2015
GD
P -
per
cap
ita
(US$
)
Years
Egypt
Tunisia
Libya
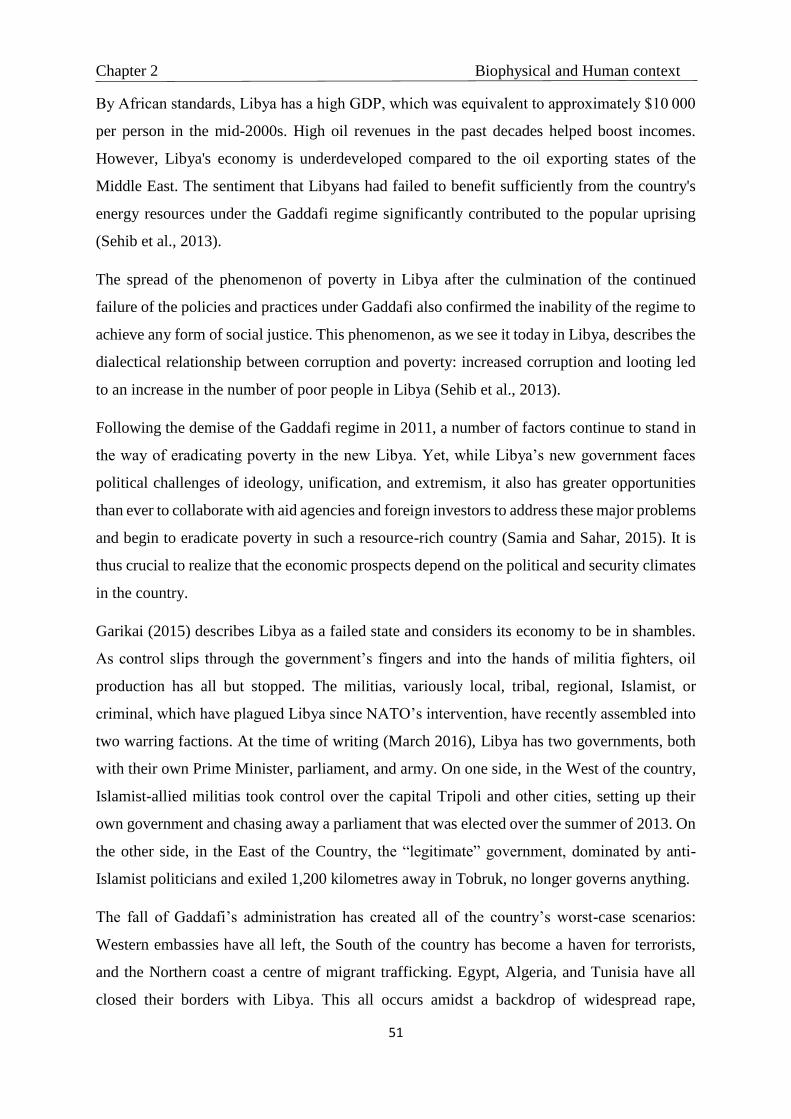
Chapter 2 Biophysical and Human context
51
By African standards, Libya has a high GDP, which was equivalent to approximately $10 000
per person in the mid-2000s. High oil revenues in the past decades helped boost incomes.
However, Libya's economy is underdeveloped compared to the oil exporting states of the
Middle East. The sentiment that Libyans had failed to benefit sufficiently from the country's
energy resources under the Gaddafi regime significantly contributed to the popular uprising
(Sehib et al., 2013).
The spread of the phenomenon of poverty in Libya after the culmination of the continued
failure of the policies and practices under Gaddafi also confirmed the inability of the regime to
achieve any form of social justice. This phenomenon, as we see it today in Libya, describes the
dialectical relationship between corruption and poverty: increased corruption and looting led
to an increase in the number of poor people in Libya (Sehib et al., 2013).
Following the demise of the Gaddafi regime in 2011, a number of factors continue to stand in
the way of eradicating poverty in the new Libya. Yet, while Libya’s new government faces
political challenges of ideology, unification, and extremism, it also has greater opportunities
than ever to collaborate with aid agencies and foreign investors to address these major problems
and begin to eradicate poverty in such a resource-rich country (Samia and Sahar, 2015). It is
thus crucial to realize that the economic prospects depend on the political and security climates
in the country.
Garikai (2015) describes Libya as a failed state and considers its economy to be in shambles.
As control slips through the government’s fingers and into the hands of militia fighters, oil
production has all but stopped. The militias, variously local, tribal, regional, Islamist, or
criminal, which have plagued Libya since NATO’s intervention, have recently assembled into
two warring factions. At the time of writing (March 2016), Libya has two governments, both
with their own Prime Minister, parliament, and army. On one side, in the West of the country,
Islamist-allied militias took control over the capital Tripoli and other cities, setting up their
own government and chasing away a parliament that was elected over the summer of 2013. On
the other side, in the East of the Country, the “legitimate” government, dominated by anti-
Islamist politicians and exiled 1,200 kilometres away in Tobruk, no longer governs anything.
The fall of Gaddafi’s administration has created all of the country’s worst-case scenarios:
Western embassies have all left, the South of the country has become a haven for terrorists,
and the Northern coast a centre of migrant trafficking. Egypt, Algeria, and Tunisia have all
closed their borders with Libya. This all occurs amidst a backdrop of widespread rape,

Chapter 2 Biophysical and Human context
52
assassinations, and torture that complete the picture of a state that is botched to the bone. It
comes as no shock then that most of the Libyan people see NATO’s 2011 intervention in Libya
as an opportunity to loot its material rather than to protect its citizens (Garikai, 2015).

Chapter 3 Literature Review
53
3 Deforestation: Review of Concepts and literature 1
This chapter reviews the concept and literature of deforestation including the direct and
indirect cause of deforestation. Also reviews the pros and cons of deforestation particularly in
arid areas.
3.1 Concepts
3.1.1 Arid and semi-arid areas definition
Drylands zones cover more than 60% of the earth surface (Sunil et al., 2013) and 61% of the
African continent (Edmund, 2014). Drylands are classified climatically as hyper-arid, semi-
arid and dry sub-humid (Jon, 2015) and have the most severe edapho-climate conditions (Sunil
et al., 2013). FAO defined arid and semi-arid areas as areas falling within the rainfall zones of
0-300 mm and 300-600 mm, respectively (FAO, 1987). Arid zones account for 19% of the land
area of the world with Africa having about 46%, and Asia 36% (Fowler, 1986). These areas
have rainfall patterns that are unpredictable and are subject to great fluctuations making them
unsuitable for cultivation (Flagg et al., 2014).
3.1.2 Forest
A recent study of the various definitions of forests (Lund 2008) found that more than 800
different definitions for forests and wooded areas were in use worldwide. However, three major
categories of forest definitions are commonly used: administrative or legal, land use and land
cover.
Watson et al. (2000) observed that the administrative definition of the term forest may be based
primarily upon the legal requirements of the land and does not consider the presence or absence
of vegetation on the land. In this case, any land that is designated as a forest may be defined as
a forest even in the absence of vegetative cover.
Another set of definitions defines forests in terms of land use. This definition is based upon the
primary use to which the land is put. This may include an area managed for the production of
timber or other forest products or maintained as woody vegetation for such indirect benefits as
protection of catchment areas or recreation. Under such a Land Use definition, cleared roads
1 This literature review is based on search of web science (Science Direct and forests), google scholar and
libraries, which includes all information that i need in this study.

Chapter 3 Literature Review
54
or infrastructure within an area used for forestry, or areas within the region that have been
cleared by harvesting, disease or fire may still be considered as forests even if they contain no
trees (Watson et al., 2000).
The third category defines a forest in terms of vegetative land cover. Such definitions typically
define a forest as an area growing trees above some threshold. These thresholds are typically
the number of trees per area (density), the area of ground under the tree canopy (canopy cover)
or the section of land that is occupied by the cross-section of tree trunks (basal area) Watson et
al. (2000).
FAO’s definition states that forest is a ‘vegetal formation or ecosystem with a minimum of
only 10 per cent crown cover trees’. According to the Clean Development Mechanism (CDM)
of the Kyoto Protocol, a ‘forest’ is an area of more than 0.5–1.0 ha with a minimum tree crown
cover of 10–30%, with ‘tree’ defined as a plant with the capability of growing to be more than
2–5 m tall. To date, most countries define forests as having a minimum crown cover of 30%
(DeFries et al., 2007; Sasaki and Puta, 2009).
Under land use definitions, there is considerable variation on where the cut-off points are
between a forest, woodland, and savanna. Under some definitions, forests require very high
levels of tree canopy cover, from 60% to 100% (Mathys, Lukas), excluding savannas and
woodlands in which trees have a lower canopy cover. Other definitions consider savannas to
be a type of forest, and include all areas with tree canopies over 10%. (MacDicken, 2013).
3.1.3 Deforestation
To summarise, most definitions characterize deforestation as the long term (>10 years) or
permanent conversion of land from forest use to other non-forest uses. Under the current United
Nations Framework Convention on Climate Change (UNFCCC) definition, deforestation is the
direct, human induced conversion of forested land to non-forested land (Olander et al., 2008).
The United Nations Research Institute for Social Development (UNRISD) uses a broad
definition of deforestation, which includes not only conversion to non-forest, but also
degradation that reduces forest quality -i.e. the density and structure of the trees, the ecological
services supplied, the biomass of plants and animals, the species diversity and the genetic
diversity, However, FAO uses a narrow definition: the permanent conversion of forest to
another land use or the long-term reduction of tree canopy cover below the 10% threshold (Giri,
2007; Romijn et al., 2013). All definitions can also be grouped into those which refer to
changes in land cover and those which refer to changes in land use. Land cover measurements

Chapter 3 Literature Review
55
often use a percentage of cover to determine deforestation. Land use definitions measure
deforestation by a change in land use.
3.1.4 Forest degradation
Perceptions of forest degradation are many and varied, depending on the driver of degradation
and the goods or services of most interest. In a recent survey, Lund (2009) found more than 50
definitions of forest degradation, formulated for various purposes. FAO (2009) shows that
many such definitions are either very general or their focus is on the reduction of productivity,
biomass or biological diversity.
However, the generic definition of the Second Expert Meeting on Harmonizing Forest-related
Definitions for Use by Various Stakeholders (FAO, 2002b), provides a common framework
for all the international definitions and is also compatible with the ecosystem-services
approach, defines forest degradation as the reduction of the capacity of a forest to provide
goods and services.
Forest degradation has been characterized by a significant reduction in either tree density or
in the proportion of forest cover from closed forests to open or fragmented forests
(Karjalainen et al., 2003; Achard et al., 2004; DeFries et al., 2007).
According to FAO (2011,b) forest degradation is the changes within the forest class which
affect the forest stand, quality or site negatively. Reduction of the tree canopy above the
original threshold of 10% is classified as forest degradation (FAO, 2010). In a more general
sense, forest degradation is the long-term reduction of the overall potential supply of
derivatives from the forest, which includes wood, biodiversity and any other product or service
(Giri, 2007).
CBD (2001, 2005) defined degraded forest as a secondary forest that has lost, through human
activities, the structure, function, species composition or productivity normally associated with
a natural forest type, expected on that site. Hence, a degraded forest delivers a reduced supply
of goods and services from the given site and maintains only limited biological diversity.

Chapter 3 Literature Review
56
IPCC (2003a) defined forest degradation as a direct human-induced long-term loss (persisting
for X years or more) of at least Y% of forest carbon stocks (and forest values) since time T and
not qualifying as deforestation or an elected activity under Article 3.4 of the Kyoto Protocol.
IUFRO (Nieuwenhuis, 2000) defined forest degradation as damage to the chemical, biological
and/or physical structure of a soil (soil degradation) and to the forest itself (forest degradation),
due to incorrect use or management, and which, if not ameliorated, will reduce or destroy the
production potential of a forest ecosystem (in perpetuity). Explanatory note: external factors,
e.g. air pollution, can also contribute.
In the light of the above definitions, it is pertinent to observe that forest degradation has been
described using variables such as changes in canopy and understory tree density, plant or
animal species richness, and/ or carbon stocks as measured against a baseline from apparently
undisturbed conditions (Lambin 1999, Devi and Behera 2003, Harrison 2011).
Furthermore, societal choices largely determine what is considered to be degraded. For
example, a manager who replaces a primary forest with a tree plantation to supply a sustained
yield of wood is unlikely to perceive that forest as degraded. The same plantation, however, is
less capable of providing other goods and services supplied in primary forests because of
reduced biodiversity (e.g., Brockerhoff et al. 2008, Thompson et al. 2009).
3.1.5 Afforestation and Reforestation
Afforestation is the conversion from other land uses into forest, or the increase of the canopy
cover to above the 10% threshold (Giri, 2007).
Terms such as "human made forest" or "artificial forest" were considered synonyms for forest
plantations as defined by The Forest Resources Assessment (FRA, 2000) which are defined as
those forest stands established by planting or/and seeding in the process of afforestation or
reforestation. They are either of introduced or indigenous species which meet a minimum area
requirement of 0.5 ha; tree crown cover of at least 10% of the land cover and average height of
adult trees above 5 m (FAO, 2000; Fenning, 2014).
However, reforestation is the re-establishment of forest formations after a temporary condition
of less than 10% canopy cover due to human-induced or natural perturbations (FAO, 2000),
i.e. Artificial establishment of forest on lands which was occupied by forest earlier.
Chapter 3 Literature Review
57
3.2 Current Rates of Deforestation
Forests provide many important goods, such as timber and paper. They also supply essential
services for example; they filter water, control water runoff, protect soil, regulate climate, cycle
and store nutrients, and provide habitat for countless animal species and space for recreation
(Emily, 2012). The world’s total forest area in 2010 was estimated to be over 4 billion ha, about
93% of the total forest cover is natural forest and 7% is planted forest, covering 31% of the
world’s land surface. This corresponds to an average of 0.6 ha of forest per capita (FAO 2010).
However, the area of forest is unevenly distributed with just under half the world's forests in
the tropics (45% of total forest area), about one third in boreal zones (31%) and smaller
amounts in temperate (16%) and subtropical (8%) domains (Arvydas and Yanshu, 2014).
Brown and Pearce (1994) stated that many deforestation estimates are based on ground surveys
for determining forest area, which in recent years utilize remote sensing techniques. Remote
sensing combined with ground measurements plays a key role in determining loss of forest
cover (Montes et al., 2000; Drake et al., 2002; DeFries et al., 2007).
According to estimations from the FAO, deforestation was at its highest rate in the 1990s, when
each year the world lost on average 16 million ha of forest. At the same time, forest area
expanded in some places, either through planting or natural processes, bringing the global net
loss of forest to 8.3 million ha per year. In the first decade of this century, the rate of
deforestation was slightly lower, 13 million ha were destroyed annually. As forest expansion
remained stable, the global net forest loss between 2000 and 2010 was 5.2 million ha per year,
nearly four times the size of Italy (Emily, 2012).
While deforestation has slowed down in the industrialized countries in recent times, it has
accelerated in the developing economies (Boahene, 1998) and most of the losses of forest
happen in countries in the tropical region (FAO, 2010). The world lost 3% of its total forested
area between 1990 and 2005 (Deng et al., 2011).
Forest in Africa lost 34 million ha from 2000 to 2010 with a rate exceeding 1% per year (Emily,
2012). In the period between 2005 and 2010 Comoros and Togo suffered the highest rate of
deforestation in Africa at 9.71% and 5.75% per year, respectively (Indufor, 2013).
The current forest cover in Africa is about 23%, although African countries reported that 75
million ha of forest land (10% of the total forest area) was converted to other uses between
1990 and 2010 (FAO, 2012).

Chapter 3 Literature Review
58
In comparing the trend in the Libyan city of Tripoli between 1986 and 1993, it can be obseved
that the forests of this city have been subjected to severe deforestation in Al-Hadba Alkhadra
(almost complete loss) and Ein Zara (40% lost) as a result of building construction and other
urban expansion. In the El-Witia area in south-western Jefara Plain, vegetation cover was
reduced by 52% between 1986 and 1996 (Ben-Mahmoud et al., 2000). Moderate destruction at
Elhashan Elgharby (33% remaining) and Tlil (25%) was observed, while the 30% remaining
forests did not experience reductions from 1986–1993 (El-Tantawi, 2005).
3.3 Forest plantations
In term of global forest plantation distribution, Asia accounts for 62% of the total forest
plantations , Europe, 17%, North and Central America, 9%; South America, 6%; Africa, 4%;
and Oceania, less than 2% (FAO, 2000).
The annual rates of forest plantation establishment in tropical and subtropical countries are
reported to be slightly more than 4 million ha per annum (Christopher, 2000). The ownership
of forest plantation is 27% public, private 24%, other 20% and not specified 29% (FAO, 2000).
Forest plantations covered 187 million ha in 2000 (FAO, 2012), which represents 5% of global
forest cover. 48% of forest plantations are industrial, 26% non-industrial and 26% unspecified.
The forest plantation area represents a significant increase from the 1980 estimate of 17.8
million ha to 43.6 million ha in 1990, with an annual planting rate 3 million ha per and increased
to an estimated 124 million ha as of 1995 (FAO, 2012).
In China, which is the country with the highest planted forest area and has the greatest annual
increase in planted forest area in the world, plantations cover 61.7 million ha, representing
31.6% china’s forest area or 23.4% of the world’s planted forest area (Fenning, 2014). This
plantation is classified into 40% productive and 60% protective forest, according to their
function (Fenning, 2014).
The FAO (2000) reported that in Africa, the majority of forest plantations have been established
in South Africa (1.4 million ha) and in the Mediterranean countries of North Africa. In North
Africa the countries with the largest area of forest plantations are: Algeria (0.6 million ha);
Morocco (0.6 million ha); Tunisia (0.3 million ha); and Libya (0.2 million ha). Collectively
these North Africa countries account for 55% of all forest plantations in Africa. Forest
plantations are, nonetheless, widely distributed amongst other countries in Africa, with another
16 countries having more than 0.1 million ha of plantations. The country with the largest

Chapter 3 Literature Review
59
industrial forest plantations in Africa (productive plantation) is the Republic of South Africa,
which accounts for 79% of all industrial forest plantations in Africa (FAO, 2000)
The plantations of North Africa tend to utilise xeric, slow growing species, well suited to arid
and semi-arid conditions. A considerable amount of planting has been carried out in dune
stabilisation projects in an attempt to halt desertification (Christopher, 2000).
Africa has the highest proportion (36%) of non-industrial plantations to total plantations of all
the geographical regions and probably the highest proportion of forest plantations used for
wood fuel production. In particular, Sudan, Ethiopia and Rwanda, are countries with relatively
large areas of forest plantations used for wood fuel, which are mostly planted with Eucalyptus
or Acacia species (Christopher,2000). Other common forest plantation species used in North
African countries include: Pinus halepensis; Pinus brutia; Eucalyptus
camaldulensis; Eucalyptus globulus; Eucalyptus gomphocephala; and many species
of Acacia.

Chapter 3 Literature Review
60
3.4 Causes of Deforestation
According to the DPSIR framework of deforestation around the word, there is a chain of
causal links starting with ‘driving forces’ leading the way through ‘pressures’ to ‘states’ and
ending on ‘impacts’ which all transmits to the ‘responses’. Figure 3.1 shows the diagram of
DPSIR framework of deforestation describing these relationship (Jianhua et al., 2014;
Hengaju, 2015).
Figure 3.1: DPSIR Analytical framework on the causes of deforestation.
In scientific literature, there is a common separation of proximate/direct and underlying/
indirect causes of deforestation (Hosonuma et al., 2012). Sands (2005) suggested that the direct
causes are easy to identify but the indirect causes are not so easily understood. Figure 3.2
illustrates the proximate drivers of deforestation and degradation as mentioned in Geist and
lambin (2002).
Responses
Stakeholders/ governments, NGO, civil societies, researchers, local people, foresters, farmers etc. have
formulated sustainable and unsustainable polices to enhance the management of forest resources in
different nations for over 50 years. The policies in developing world are mostly ineffective and
sustainable compare to the developed nations with strong laws to support the sustainable policies.
Driving Force
Agricultural
Expansion, Policy
failure,
Commercial
Logging,
Unsustainable
land-use Planning,
Population
Growth, Road
construction, Civil
unrest, Poverty,
Mining Activities,
Fuel/charcoal
Production
Pressures
Urbanization and
rural migration,
Unemployment
and livelihood
activities,
Market demand,
Selective Felling
System,
Shifting
Cultivation,
Unsustainable
fuelwood
Production,
Cultural and
biophysical forces
States
Significant loss of
forests cover
overtime,
Increase in
desertification and
land degradation,
Soil erosion,
Loss in
biodiversity
Impacts
Human conflicts,
Reduction in
biodiversity
population,
Protected fauna
species facing
threatened/
extinction,
Reduction in water
resources,
Loss of forest
ecosystem
functions and
services,
Increase in
climatic variability,
Health challenges

Chapter 3 Literature Review
61
Figure 3.2: Framework for analysing proximate and underlying causes deforestation (Turner et al., 1990).
Infrastructure extension
• Transport (roads, railroads, etc.)
• Markets (public and private, for example, sawmills)
• Settlements (rural and urban)
• Public service (water lines, electrical grids, sanitation, etc.)
• Private company (hydropower,
mining, oil exploration)
Agricultural expansion
Permanent cultivation ( largescale vs.
smallholder, subsistence vs.
commercial) • Shifting cultivation (slash and burn vs.
traditional swidden)
• Cattle ranching (large-scale vs. smallholder)
• Colonization (incl. transmigration and
resettlement projects)
Wood extraction
Commercial (state-run, private,
growth coalition, etc.)
• Woodfuel (mainly domestic usage)
• Polewood (mainly domestic usage)
• Charcoal production (domestic and industrial uses)
• Predisposing environmental factors (land
characteristics, for example, soil quality, topography, forest fragmentation, etc.)
• Biophysical drivers (triggers, forexample, fires, droughts, floods, pests)
• Social trigger events (for example, war,
revolution, social disorder, abrupt
displacements, economic shocks, abrupt
policy shifts)
• Natural increment (fertility, mortality)
• Migration (in/out migration • Population density
• Population distribution
• Life cycle features
Market growth and
commercialization
• Economic structures • Urbanization and
industrialization
• Special variables (for
example, price increases,
comparative cost
advantages)
• Agrotechnical change
(for example
in/extensification) • Applications in the
wood sector (for
example, mainly wastage)
• Agricultural production
factors
factors • Formal policies (for
example, on economic development, credits)
• Policy climate (for example, corruption, mismanagement) • Property rights (for
example, land races, titling)
Cultural factors
• Public attitudes, values and beliefs (for example, unconcern about the forest,
frontier mentality)
• Individual and household behavior (for example, unconcern about forests, rent-
seeking, imitation)
Pro
xim
ate
cau
ses
U
nd
erly
ing c
au
ses

Chapter 3 Literature Review
62
3.4.1 Direct Causes of Deforestation
3.4.1.1 Shifting Agriculture and Permanent Crops
Research has identified agricultural land use as the major proximate driver of deforestation
(Pirard and Belna, 2012; Sophia, 2015). Kissinger and Herold (2012) estimated agricultural
activities to be the driver for around 80% of deforestation worldwide. Of this conversion for
agriculture, commercial agriculture (which includes permanent crops) is the most prevalent
deforestation driver, accounting for 40% of deforestation while local/subsistence agriculture
contributes 33% deforestation. Other drivers include urban expansion, fire, excessive logging
to mention a few (Gibbs et al., 2010) reported that in the 1980s and 1990s, about 60% of new
agricultural land in Africa came through clearing intact forests and the land was mostly
converted to small-scale subsistence farming. Brown and Schreckenberg (1998) stated that the
impacts on forest cover and composition of shifting agricultural systems at varying points on
the landscapes are very different. Thrupp et al. (1997) refers to shifting agriculture as being
any temporally and spatially cyclical agricultural system that involves clearing of land - usually
with the assistance of fire - followed by phases of cultivation and fallow periods Shifting
agriculture is estimated to support the livelihoods of some 300-500 million people worldwide
(Brady, 1996). The food crop production system (in most parts of Africa) is based on the
practice of slash-and-burn farming, which, due to population pressure and reduced fallow
cycle, is no longer sustainable (Duguma et al., 2001). Ickowitz (2006) found that not only do
practices differ in shifting agriculture, but the same practices will have different environmental
impacts depending upon: soil type, soil quality, pH level, land use history and vegetation. Also,
according to Kleinman et al. (1995), ‘Inherent soil characteristics define the magnitude and
quality of degradation that may occur as well as the potential productivity of low-input agro-
ecosystems. In Libya, Al-Idrissi's et al. (1996) study found that by 1988, 35% of about 320,000
ha natural forest land in El Jabl–El-Akhdar region was converted to grow crops.
3.4.1.2 Logging and Fuelwood
ITTO (2003) reported that about 70% of log and fuelwood imports are from non-tropical
sources, though fuelwood is the main timber product extracted from the forests of savannahs
and semi-arid lands where deforestation is at its peak. Sands (2005) and Hosonuma et al. (2012)
affirmed that more than 80% of energy consumption in developing regions of Africa is from
fuelwood extraction and logging activities are causing more degradation than deforestation.

Chapter 3 Literature Review
63
Fuelwood gathering is more concentrated in tropical dry forests and degraded forest areas
(Repetto, 1989 and 1990; Rowe et al., 1992). In the semi-arid and arid regions of North Africa,
fuelwood gathering can be a major cause of deforestation and degradation (Chakravarty, 2012).
However, Merlo and Croitoru (2005) reported that the trend of removal of wood from forests
in semi-arid lands declined from 1.5Mm3 in 1991 to less than 0.25Mm3 in the following years.
This is because import of fuelwood was not significant compared to timber wood imports at
25,000 m3, or 31.2% of the total timber consumption. The development an impact on
deforestation rate in arid region in recent times.
3.4.1.3 Fire
Brooks (1999) claimed that fire was historically rare in semi-arid and arid lands, but over the
years, this has changed, primarily due to the invasion of exotic annual grasses onto dry
rangelands.
Exotic grasses can form a near-continuous cover in the normally open spaces between shrubs,
and can become highly flammable as standing dead cover builds up during the arid months of
high air temperatures and low relative humidity (Rogers and Vint, 1987). Desert fires fuelled
by these exotic grasses can be intense and cause widespread mortality of native vegetation.
In Libya, the main forest type is the natural forest occurring in Al-Jabal Al-Akdar. These forests
have been exposed to significant damage mainly through the fires (Eldiabani et al., 2014). The
Joint Research Centre (2014) reported that in 2013 seven minor fires were mapped in Libya.
However, the year before, Libya suffered 34 fires, destroying 3,400ha. Practically all the
damage occurred in May and included a single very large fire of 3,308 ha in the province of
Al-Jabal Al-Akdar.
Americo and Mendes (2005) reported that in 2001, over 800 forests fires occurred in Portugal
of which 95% were discovered to be as result of human interference through negligence such
as bush burning, cigarettes and social outings. Others were accidental ignition of machinery in
the forest areas, conflicts and arson. Cochrane et al. (1999) determined that in the preceding
few years, fire had affected approximately 50% of the standing forests in the Amazons basins.
He went on to suggest that accidental fire-induced deforestation increased by 129% between
1993 and 1995 in the Amazon. If left unchecked, the current fire regime, regardless of the high
or low estimate of the fire cycle, would result in an inevitable transition of the entire area of
the Amazons to either scrub or grassland.

Chapter 3 Literature Review
64
The effects from deforestation caused by fire on climate, biodiversity and the local economy
are likely to be extreme. Unless changes are made in current land management practices, the
entire forest remaining on the globe will be lost (Cochrane et al., 1999; Sands, 2005).
3.4.1.4 Mining and Dam Construction
Although mining in Libya only on a small scale, Mather (1990) and Sands (2005) described
mining to be very intensive and very destructive. The area of land involved is quite small and
it is not seen as a major cause of primary deforestation. Mining is a profitable activity
promoting livelihood improvements which may cause a population increase with consequences
for deforestation (Chakravarty, 2012). Staff (2010) explained that the deforestation rate due to
mining activities in Guyana from 2000 to 2008 increased 2.77 times according to an assessment
by the World Wildlife Fund-Guianas. Sands (2005) explained that the creation of dams for
water supply and electricity generation could flood forestlands. Often dam construction faced
resistance from foresters and individuals or groups that had an interest in ecosystem services
in the tropics and arid lands. Any development claims from mining and dam construction
should be considered in conjunction with environmental consequences, particularly
deforestation, especially during the hydroelectricity power generation that include clearing of
forests for power transmission lines.
3.4.1.5 Urbanisation and Transportation
Urbanisation and road expansion cause significant losses to forest, both in the exploration of
construction materials and as a source of land. While urbanization may reduce direct pressures
on forests by the migration of rural residents to population centres, urban and suburban sprawl
may be damaging when they occur in frontier settlements (Butler, 2012). The construction of
roads, railways and airports and the expansion of cities and towns require land to establish
infrastructure necessary to support growing populations (Sands, 2005).
Although urbanisation and road expansion are very critical for national development with the
population upsurge, they have a very significant effect on the rate of deforestation in the
Amazon and arid areas as they give more access to forests for clearing, construction and
exploitation (Portnov and Safriel, 2004).
Utting (1993) considered that the major factor that led to the loss of forest resources in El
Salvador was that the country had more road and bridge construction than other regions such
as Brazil.

Chapter 3 Literature Review
65
Nedjahi and Zamoum (2005) in valuing the forest resources of Algeria, which is mostly arid
vegetation, stated that deforestation has, as a result of urbanisation, during the last 50 years
reduced the forest area by 37%, if only natural forests are considered, and by less than 10% if
both natural and plantation forests are included.
3.4.2 Indirect Cause of Deforestation
3.4.2.1 Population growth
Sands (2005) described population’s role in deforestation as a very contentious issue. This is
because other factors that lead to deforestation are not necessarily directly linked to population
increase in recent years (Colchester and Lohmann, 1993; Kaimowitz and Angelsen 1998;
Cacho et al., 2014). However, the impact of population growth on deforestation as a result of
road construction and rapid urbanisation is increasing across developing nations in the last four
decades (Palo et al., 2000). In Sub-Saharan Africa, shifting cultivation, subsistence farming
excessive exploitation of fuelwood and poor government policies relating to population
increase and subsistence needs have contributed seriously to deforestation (Kaimowitz and
Angelsen, 1998; Angelsen and Kaimowitz, 2001; Wehkamp et al., 2015). Recent researches
have encouraged the need to focus on country-specific analyses of the costs and relative
mitigation potential of addressing institutional and policy drivers of deforestation after it was
realised that the deforestation drivers include poor policy implementation and corruption
(Karsenty and Ongolo, 2012; Wehkamp et al., 2015).
3.4.2.2 Inequitable land distribution
Omran (2000) stated that 53% of the total forest area in Egypt is publicly owned and serves
several purposes while the remaining 47% is privately owned and serves more as windbreaks.
The legal land owner in Egypt is the tree owner in the ownership and tenure of forest plantation.
Downing et al. (1992); Croitoru and Merlo (2005) reported that farmers at the forest areas do
not have legal ownership over the land in North African countries and are often displaced by
privileged minorities who have political influence thereby pushing the subsistence farmers to
clear new forests for cultivation since they have very poor or no access to loans. This was
further confirmed by Sands (2005) that in most regions of Central America in the 1970’s land
holding size per ha was decreasing among rural families and led to further clearing of the
tropical forests for more agricultural land in the regions.

Chapter 3 Literature Review
66
3.4.2.3 Development Policies
Forestry policy is a subsidiary of the agricultural policy in most countries of North Africa and
the law and institutions to enforce its implementation are usually very weak (Croitoru and
Merlo, 2005). Daly-Hassen and Ben Mansoura (2005) explained the role of forest policy in
Tunisia to include protective ways of banning clearing and cultivation, reforestation
programmes and ensuring the management and use of all forest products must abide by all
forest laws and regulations either private or public. However, policy change as a result of
political influence and corruption has made the laws and forest codes in most African countries
very ineffective (Sands, 2005).
Globalisation has affected the forestry sector and there is a call for more awareness on impacts
on deforestation on livelihoods (UNFF, 2001) to demonstrate the need for international
collaboration and the need for effective policy making as it relates benefits and costs in forestry
sector of African continent (Cacho et al., 2014; Wehkamp et al., 2015). Arvydas and Yanshu
(2014) reported that globally in 2011, the forestry sector employed about 0.4% of the labour
force, contributed about 1.0 percent to GDP and accounted for about 2.4% of global economy.
However, the contribution of the forestry sector to the total economy has steadily declined in
recent years, due to faster growth in other sectors.
3.4.2.4 Corruption
Several researchers have discussed corruption and mismanagement as the problems of most
African countries in the last four decades (Kaimowitz and Angelsen, 1998; Croitoru and Merlo,
2005; Cacho et al., 2014). Frequently, donor funds meant for development of forestry sectors
are not judiciously utilised. Forest plantations are illegally cleared and given to influential
government officials without due process. In addition, unlawful logging is not controlled
(Angelsen and Kaimowitz, 2001; Sands, 2005; Cacho et al., 2014). Ellatifi (2005) estimated
that about 40,000 hunters are found in Moroccan forests. This large number is as a result of
corruption and mismanagement among the forest authorities. Corruption has been reported to
permeate every sector of Libya’s society and institutions, including natural resources
management before and after the Gadaffi regime which, contributed immensely to the
deforestation process in the recent times (Mzioudet, 2014).

Chapter 3 Literature Review
67
3.4.2.5 Forest governance and post conflict
The declines of forest area and degradation of forested land across the globe led to significant
changes in governance and management of forest resources around the world (Mersudin,
2012). At first, the world was more focused on forest lands sustainable management as a
solution to deforestation and degradation. However, in recent times, debates have recognized
the socio-economic value of forests expanded to include ecological, cultural, recreational, and
spiritual aspects to benefit humanity (Mohanty and Sahu, 2012).
Political mobilization of interest groups and individuals in combination with climate change
drivers that led to forest loss and extreme poverty coupled with civil unrest, especially in the
developing world, have resulted in the malfunction in forest management around the world
(RCDC 2004; World Bank, 2009).
In the last 20 years, new forms of forest governance for multifunctional sustainable forest
management evolved around the world (Mersudin, 2012; World Bank, 2009). However, Pascal
(2009) discussed the challenges that results in poor quality of forest governance in Africa from
the power tussle between forest communities and forest administrators to gaps and
contradictions within the legislation, and weak forest administration with inadequate
manpower, and outdated ideas on forest governance. Others are corruption of the forest
administrative staff and sometimes, the NGOs.
Beevers (2015) and Autesserre (2010) discussed that forest governance solutions had a
significant impact on shaping and influencing the direction of forest governance in post-
conflict Liberia and Congo. The peacemakers through political and administrative reforms
promoted better policies and practices that included all the stakeholders (companies,
communities, governments NGOs) in the recovery and reconstruction processes (Beevers,
2015).
3.5 Pros of deforestation
Although deforestation is often thought of negatively, there are some advantages of the
practice; otherwise, it would not be happening. Here are some of the advantages of
deforestation;

Chapter 3 Literature Review
68
3.5.1 Provides Products and Services to the People
Deforestation provides local communities with products and services (Sinare and Gordon,
2015). For instance, consider the ecosystem that is destroyed in the process. Useful resources
like wood-fuel, seeds, and bush-meat can be sold, and used when obtained from the forest
(Sinare and Gordon, 2015). For individuals struggling to stay alive in developing countries,
deforestation is rather a necessity for continued survival as resources acquired are sometimes
used in farming and other local technologies (Adesina and Chianu, 2002). In addition,
deforestation also provided services to the communities including improved transportation
systems and expansion of housing units for the growing population to stimulate small scale
businesses and grow the economy (Sinare and Gordon, 2015).
3.5.2 Provides Locals With Jobs In Struggling Economies
There are many factors that caused deforestation around the world (Ryan et al., 2014).
However, the drivers of deforestation include the people, who create jobs. For struggling
economies, to feed and take care of a family is a difficult task for the locals, destroying the
ecosystem seems to be less relevant to day-to-day survival. As a result, the short-term gains
outweigh the long-term goals of sustaining the forests, even if it is ultimately more beneficial
for the community not take part in deforestation. The individuals affected have no option than
to rely on the deforestation as a means of survival thereby creating employment (Ryan et al
2014; Pfaff et al., 2013).
3.5.3 Provides Export to Struggling Governments.
Deforestation also provides resources to a struggling economy in developing countries as the
products of deforestation are exported to other countries to earn foreign exchange (Runyan et
al., 2015). Although, in timber exporting countries where selective logging is carried out, it
causes more forest degradation than deforestation (Mya et al., 2012). The export of timber and
non-timber products significantly provides useful services to the people, improves the economy
and political stability and sometimes results in good policies on forest management and
sustainability making excessive deforestation unnecessary (Eckert et al., 2011).

Chapter 3 Literature Review
69
3.6 The Consequences of Deforestation in Semi-arid lands
There are many Cons of deforestation. Here the focus is mainly on disadvantages in arid and
semi-arid lands:
3.6.1 Socio-economic issues
Nagothu (2001) explained that fuelwood was still the major source of household energy in the
arid lands of India, and close to 55%, the national average for India. This is similar to earlier
reports from other semi-arid hilly areas in India where fuelwood is the dominant fuel.
Unsurprisingly there is an inverse relationship between fuelwood extraction and distance from
the forest sites (Qureshi and Kumar, 1996). Barnes (1990) reported that the consequences of
deforestation can be ascertained using two main variables; the size of human population and
the area of the remaining forests felled per annum. The collection frequency depends to some
extent the size of the population, the income of the people and proximity to the source of wood.
It would take a longer time to collect with greater distances, and hence people reallocate the
collection time to biomass production on their own farms. This is mostly the case of households
with larger land holdings where biomass production is possible.
3.6.2 Grazing and fodder extraction patterns
Grazing patterns of animals and the relationship between the predator and prey in the forest,
has a significant role in the deforestation rate. This is because the pattern in the system, if
grazing herbivores are not moved on and kept to a sustainable number by predators, they can
damage current forests and eradicate natural regeneration (Struhsaker, 1997; Agyei, 1998).
Nagothu (2001) agreed that the reasons attributed for higher density of herbivores were the
constraints such as limited irrigation sources, shifting agriculture, traditional modes of
livelihoods based on livestock, demand for milk and meat in the nearby market and availability
of grazing land. Ellatifi (2005) discussed maintenance of more buffaloes by large farmers in
arid areas in their herds when compared to the small and marginal farmers and landless kept
small ruminants, helped in sustaining the grasslands and the environment.
3.6.3 Environmental issues
The environmental hazards of deforestation in an arid area are mainly desertification and
climate change. Though distinct, these two phenomena generate positive feedback loops, and

Chapter 3 Literature Review
70
these feedback loops can interact and reinforce each other. Consequently have similar
implications and solutions (Williams, 2003).
3.6.3.1 Desertification
Sutton and Zaimeche (1996) defined desertification as the impoverishment of terrestrial
ecosystems under the impact of man. A UNEP (1992) report considered desertification as a
consequence of deforestation as a result of land degradation over time in arid, semi-arid, and
dry humid areas which was ascribed to various factors such as human activities and climate
change. Benabid (1996) reported that in North African countries including Libya, the ultimate
stage of deforestation and forest degradation is desertification. Deforestation and
desertification involve a drastic change in microclimates. Examples can be linked to felling of
shrubs and trees, exposing the shaded soil to direct sunlight and heat thereby becoming warmer
and drier, and organisms living on or in the soil will change environment by migration or dying
as a result leading to desertification and deforestation. The above ground biomass - dead leaves,
twigs and branches, will be quickly oxidized, the carbon dioxide being carried away (Pachauri
and Kanetkar, 1993). Croitoru and Merlo (2005) reported that over 300,000 ha of forest land
was lost to desertification in Algeria and the value of the affected area in its role of watershed
management was up to €10 per ha. The desertification trend in North Africa has a great
economic effect on the ecosystem services of the region as it adversely affects agricultural
productivity, the health of humans as well as of livestock, and economic activities such as eco-
tourism (Bellot et al., 2001).
3.6.3.2 Climate Change
Climate change decreases water availability and water quality, increases droughts, floods and
salinity leading to a decrease in soil fertility and loss of vegetation threatening food security
(Saad et al., 2011). The consequences of climate change are very difficult to quantify based on
the environmental and financial impacts (Tobin et al., 2014). The tremendous changes in
biodiversity directly involves increase in the cost of management for sustainability (Kiritani,
2007). In other studies, Hamilton et al. (2005) and Merlo and Coitoru (2005) explained the
consequences of climate change to be more complex across the trophic levels on its role in
carbon sequestration leading to more loss of biodiversity and decrease in availability of
nutritional quality of forest products. On the other hand, Grace et al. (2014) confirmed that fire
management is a major concern as climate change can often lead to local decreases of

Chapter 3 Literature Review
71
precipitation which in turn increases the chances of wild fire due to the warm climate and an
extension of the fire season in semi-arid and Mediterranean regions.
Studies have found that high intensity loss of forests leading to desertification were primarily
caused by small-scale agriculture and urbanisation (Geist and Lambin, 2002; Ryan et al., 2014)
and that low intensity losses were caused by a wide range of activities, including illegal logging
and poor management. Efforts to reduce deforestation and forest degradation in this area will
require a broader approach that considers multiple land use management such as agricultural
development alongside forest management such as landscape approaches to REDD+ (DeFries
and Rosenzweig, 2010; Murray et al., 2015).
Climate change and deforestation remain inextricably linked through feedbacks between forest
degradation and variabilities of edaphic factors. Climate change might exacerbate deforestation
and desertification through alteration of trends and patterns in temperature, precipitation, solar
insolation, and winds in arid regions. Conversely, deforestation induces climate change through
the release of CO2 from cleared and dead vegetation and reduction of the carbon sequestration
potential of arid lands (McCarthy, 2001; Druyan, 2005).
In the following chapter, deforestation causes and consequences specifically in Algarabulli
district are described. It attempts to give the local people’s (non-forest clearers) perception
about the causes and the effect of deforestation.

Chapter 4 Deforestation: Causes and Consequences
72
4 Deforestation: Causes and Consequences in Algarabulli District
4.1 Introduction
Forests occupy more than a quarter of the world’s land area and are of three broad types:
Tropical moist and dry, temperate, and degraded. Forests are also one of the most significant
components of the Earth’s biosphere (Lambin et al., 2006). They play a critical role in
regulating the Earth’s surface temperature and precipitation, preserving soil nutrients,
protecting soil from erosion, minimizing flooding and fixing carbon. In addition to serving as
a valuable habitat for wildlife. In spite of these functions, however, forest resources around the
world are being depleted for many reasons. Forest depletion or deforestation is a process of
removal of a forest (Megan, 2012).
According to Johnson and Chenje (2008), deforestation occurs when a once-forested area is
removed for agriculture, pastures, urban development, logging, or wasteland. Forest clearance
has been driven mainly by the expansion of agriculture to meet the needs of a growing global
population (Sands, 2005). Logging for timber, mining and other industrial activities has also
caused substantial deforestation. Underlying drivers of deforestation include poor governance
and lack of secure tenure (Ghazoul, 2013). This conversion from forest to non-forest covers
has contributed to environmental degradation, increased flooding, exacerbated soil erosion and
reduced biodiversity as well as socio-economic problems throughout the world (Megan, 2012).
In addition, conversion of forests in arid and semi-arid lands for agricultural crops and pasture
land are the main cause of the increasing desertification (Malagnoux et al., 2007); Sutton and
Zaimeche, 1996). Also deforestation has been especially serious in the last several decades in
developing countries (Pahari and Murai, 1999).
In Libya, the study of Omar Al Mukhtar University on natural forest in Al-Jabal Al-Akdar
region in 2005 indicated that the main cause of forest degradation and deforestation in eastern
Libya is human activity, including fires, indiscriminate cutting, overgrazing, administrative
problems and the absence of a forest management plan. As a consequence, some of the natural
forest was destroyed (Omar Al Mukhtar University, 2005).
The deforestation is affecting people in many ways; for example, it accelerates soil erosion,
followed by degradation, which is reducing food productivity. Various reports mentioned that

Chapter 4 Deforestation: Causes and Consequences
73
deforestation led to changes in the local climate in Jefara Plain, such as an increase in
temperatures and sharp reduction in precipitation (Ben-Mahmoud et al., 2000).
Studies conducted practically on deforestation of planted forest in Libya have been very scanty
and researchers in that part of the world have prioritised the need to take some action in near
future on deforestation drivers such as land resources degradation (forest), overgrazing, misuse
of water resource, poor land management practices due to lack of adequate knowledge and
information (Ben-Mahmoud, 1995).
The research question for this chapter was; what are the local people’s perceptions of the causes
and consequences of desertification in Algarabulli district? To address this issue, this chapter
analyses the causes and consequences of deforestation in Algarabulli district and identifies
local people's opinions and attitudes about how and why the forest is being cleared, as well as
the consequences using a semi structured interview survey with local people who had not
cleared forest.
4. 2 Methods
Many techniques and methods for data collection can be used during field research, such as a
survey. A survey is used to collect systematic data on people’s actions, thoughts and behaviour
by asking direct questions in natural settings (Angelsen, 2011). Field research is often
necessary to fill an information void related to the problems to be investigated (appendix 1).
Interview
Interviews are one of the most commonly employed methods of data collection in qualitative
research (Bloom and Crabtree, 2006). This is because talking with people is an excellent way
of gathering information (Clifford, 2010). In addition, this method is used when there is very
little or no existing information concerning to be investigated in a given place of topic
(Angelsen, 2011). Therefore, this chapter uses interviews as the chosen form of qualitative
research.
Types of research interview
The first issue to consider is the type of research interview to use to obtain useful information
about this issue. There are many different types of interviews such as structured, unstructured
and semi-structured interviews.

Chapter 4 Deforestation: Causes and Consequences
74
Semi-structured interviews were chosen as the means of data collection. Many researchers
prefer this method because questions can be prepared ahead of time to allow the interviewer to
be prepared and to appear competent during the interview (Barriball, 1994). Also, this method
allows a degree of freedom to explain their thoughts, to highlight issues of particular interest
and expertise regarding complex and sometimes sensitive issues and to provide reliable,
comparable qualitative data (Barriball, 1994).
The semi-structured interview is a verbal interchange or a method of data collection where the
interviewer attempts to elicit information from the respondents by asking questions (Clifford,
2010). They are useful for when the researcher knows something about a topic but want to give
respondents an opportunity to raise new issues and when the researchers are working with a
complex issue because the interviewer can use probes and spontaneous questions to explore,
deepen understanding and clarify answers to questions (Wilson, 2014).
Interview methods and techniques
The semi-structured interviews were one-on-one, which the most common form of semi-
structured or unstructured interview; involving a meeting between one researcher and one
informant (Denscombe, 2003). These types of interviews are popular because they are easy to
arrange. In this type of method, validity and reliability depend on conveying equivalence of
meaning. This equivalence of meaning helps to standardize the semi-structured interview and
facilitate comparability. Also, this method has the potential to overcome the poor response rates
of a questionnaire survey due to using the personal interview (Barriball, 1994). Semi-structured
interviews were used to obtain, detailed responses during the three month period from
December, 2012 to February, 2013. The responses obtained were used to design a questionnaire
survey for forest clearers in the second stage of field work survey. In addition, semi-structured
interviews were conducted with some local officials. Audio recorders, note-taking and video
cameras are the most common methods of recording interview data (Rubin and Rubin, 2012).
All interviews in this research were audio-recorded and transcribed verbatim for descriptive
analysis.
Samples were divided or stratified into five groups based on their locations, as the study site
has five villages. A sample from each group (i.e. village) was then selected based on their
willingness to participate in the interview. Heads of household were interviewed for this
survey. During the interview, several questions were explained in order to gain an accurate

Chapter 4 Deforestation: Causes and Consequences
75
answer with the interview time of the consultation with the head of household set and based on
their available free time.
In addition, semi-structured interviews were conducted with some local officials. These
included the Minister of Agriculture in 2013, the Deputy Minister of Agriculture in 2013, the
mayor of Algarabulli District, the Director of Forestry Department in Algarabulli District, the
Director of Agriculture sector in Algarabulli District, the Director of Land Registry in
Algarabulli District, The Director of Transport sector, the Police Chief of Agriculture in
Algarabulli District, ex-government officials in the Forestry Department (1965–1986) to obtain
their opinion about the problem of deforestation in this area.
One positive aspect of the interview is that the researcher could communicate in the local
language as he is one of them; those questioned felt more comfortable answering the questions
of trying to find solutions after identifying the real causes.
Types of Questions
Interviews can reveal information or surprising answers that the researcher does not know.
Open-ended questions were used in the semi-structured interview to avoid-loaded questions,
double-barrelled questions, leading questions, and (usually) presuming questions (Leech,
2002).
Sample size
The researcher’s design includes the information required to answer the research question and
how these information should be collected. Sampling determines from whom information
needs to be obtained. Simple random sampling was chosen in this study. A group of 50
respondent households were selected at random from all villages, as shown in table 4.1.
Table 4.1: Distribution of local residents sample within the localities of Algarabulli
district
*According to population census of 2010.
Locality Household No* Selected sample
AL-Karawa 2796 17
Al- Ataya 1882 11
Al- Gaweaa 1135 8
Al- Rawajih 1031 7
Al- Kawaleg 720 7
Total 7564 50

Chapter 4 Deforestation: Causes and Consequences
76
Figure 4.1 Respondents’ characteristics (N=50)
Sample (gender issues).
This aspect needs to be considered in light of research contributors and the individuals
interviewed during this investigation as it can be considered to reflect on the results obtained.
The results and relevant contributory information were exclusively obtained from the male
sector of the Libyan population. No females were interviewed as none were encountered
working in this sector (forestry) and at the locations visited during the fieldwork undertaken
for this research. The reasons for lack of contributions from the female sector of the population
is now explained together with the problems women face. As a consequence it was not possible
to disaggregate data by gender.
Issues carrying out research involving women in Libya:
Women wishing to carry out research in Libya would find the following barriers inhibiting
them from working in this area:
0
2
4
6
8
10
Karawa Ataya Gaweaa Rawajih Kawaleg
locality
Res
po
nd
ents
nu
mb
er
Age group
Less than 40 years 40-50 51-65 More than 65 years
0
2
4
6
8
10
Karawa Ataya Gaweaa Rawajih Kawaleg
locality
Res
po
nd
ents
nu
mb
er
Education status
Illiterate Reads and writes Average education Higher education
0
2
4
6
8
10
12
14
Karawa Ataya Gaweaa Rawajih Kawaleg
locality
Res
po
nd
ent
nu
mb
er
Primary occupation
W.Public sector W.Private sector Retired Unemployed

Chapter 4 Deforestation: Causes and Consequences
77
1) Currently in Libya, there is a civil war between two different factions. Consequently, it
would be very dangerous for a female student to work alone in remote war torn areas
where there was no possibility of organisational, statutory agencies (police) or family
support.
2) A female researcher could also currently find herself in danger when interviewing or
collecting field data such as photographs in this area from those illegally clearing trees
and levelling sand dunes with bulldozers. Similarly, this would apply to male
researchers, who were advised by local residents, workers and officials. An example is,
the requirement of taking aerial photographs of the area and withdrawing immediately
when any hostile reaction was perceived such as coming under gunfire or hearing
aggressive shouting.
3) In addition, not all the population have an enlightened view of female researchers. They
would question the accuracy, validity and integrity of any research conducted by a
woman. These individuals would also probably present a hostile non-cooperative
attitude and be very reticent or refuse to cooperate with a female researcher not
providing her with the data requested and essential for the research.
4) Some cultures also are not comfortable with females conducting research involving
strangers, particularly if they are males, on religious grounds. Some hold the extreme
viewpoint that women should not undertake work including “research” and their place
is in the home.
Problems of interviewing women
1) The first is based on females’ previously traditional roles, nature of the education of
most women and the jobs they secure. Currently, women in Libya are not considered
to be aware of environmental issues and currently do not hold key positions of interest
to the researcher and were not encountered during this work.
2) Culturally, it is not accepted, on religious grounds for a “strange” male to approach a
female “stranger” without an intermediary or chaperone to ensure her integrity.
3) It would be acceptable for this male researcher to interview a professional female at her
place of work but completely unacceptable to approach her privately e.g. at her home.
However, none were encountered in a professional role in Forestry in Libya whilst
conducting this research.

Chapter 4 Deforestation: Causes and Consequences
78
Difficulties for women conducting interviews
1) Women have no inherent problems in conducting interviews and are as proficient as
any male. The problems arise when the context, culture and location of these particular
interviews in Libya are considered, as stated above.
2) It is logistically difficult for women researchers to carry out interviews with a lone male
or men as she will need one of her relative with her during the interview as chaperone.
3) Due to lack of security, especially after the uprising 2011, the danger to her personal
safety is very real. Therefore, most women researchers focus on social problems, which
deal with the family or women but not with environmental issues or within male
dominated industries.

Chapter 4 Deforestation: Causes and Consequences
79
4.3 Results and discussion
4.3.1 Causes of deforestation in Algarabulli district
The causes of deforestation have been reported to be divided into two namely; direct or
proximate causes and indirect or underlying causes (drivers). This will be explained in the
following results. However, to identify what is the most serious environmental problem in
Algarabulli district, respondents were asked a general (open) question to determine to what
extent is it a serious concern. It was found that deforestation emerged as topmost of the major
concerns of the community as significant environmental impacts are attributed to it.
The results of the multiple responses shown that 84% of the respondents said deforestation is
the most serious environmental issue in Algarabulli district at present, and 50% of respondents
said groundwater shortage. 44% of the respondents agreed to decrease of crop productivity,
while 30% and 26% of the respondents said degradation of orchard (fruit trees) and the
degradation of natural vegetation respectively.
4.3.1.1 Direct causes of deforestation in Algarabulli district:
The respondents mentioned a combination of direct causes of deforestation in their responses
as shown in figure 4.2 below:
Figure 4.2: Direct causes of deforestation in Algarabulli district (N= 50)
0
10
20
30
40
50
60
70
80
90
100
Agricultural
expansion
Building
construction
Road
construction
Holiday homes land trading
%

Chapter 4 Deforestation: Causes and Consequences
80
4.3.1.1.1 Agricultural expansion
Agriculture expansion is one of the main drivers of deforestation, where 72% of the
respondents indicated that population growth and the increasing demand for agricultural
products led to high prices of land, which led some of them to go into commercial agriculture
because of the high income. However, the Director of Forest Department in Al-Garabulli
district 2 pointed out that agricultural expansion in this area is not due to population growth or
increasing demand, but poor implementation of Libya forest laws by the authorities especially
as it concerns cutting of trees and residents wanted to acquire more lands and were not aware
of the risk of clearing the forest and risks desertification and sand dunes. This is because the
soil is sandy which has, typically have very low water-holding capacities and extremely low in
all essential nutrients making it very limited for agricultural productivity (Ben-Mahmoud,
1995). In addition, the Director of Agriculture sector3 in this district also confirmed that the
most of the agricultural practices in these areas which were converted from forest to farm land
failed due to poor soils for growing crops.
The Al Biruni Remote Sensing Centre (BRSC) (Tripoli, 2008) confirms that clearing forest in
Jefara plain is mainly led by expansion of agricultural activities, thus caused land degradation
in that region.
Barraclough et al. (2000) and Pirard and Belna (2012) also reported that, in most parts of semi-
arid regions of Sub-Saharan Africa, the expansion of agriculture activities into forestland is, to
a great extent, the consequence of poverty, limited alternative employment and inadequate
technology, combination of poor soil management and population growth, and leading to
migration towards forests with richer soils.
4.3.1.1.2 Building Construction
Building construction includes indiscriminate construction of illegal and urban sprawl and this
factor was indicated by 42% of the respondents. The Director of Land Registry in Algarabulli
District4 confirmed that 90% of the buildings were built without building permits which is also
a serious cause of deforestation; one of the unofficial respondents said that buying a plot of
land for building in forest land is cheaper compared with other not forest area which is
documented in Land Registry Centre. However, Libyan building law does not permit clearing
forest to construct buildings. Also one of the official respondents said that some people were
2 Interview Date 01.01.2013, in the field 3 Interview Date 02.01.2013, in the field 4 Interview Date 15.01.2013, in his office in Algarabulli District ,Libya

Chapter 4 Deforestation: Causes and Consequences
81
cutting shade trees meant for travellers during higher temperatures, in order to build shops
along the road (Figure 4.3).
This conforms with the findings that reported the necessity of clearing forest to construct
settlements can be traced to the growth in urban population of the Province that rose sharply
mainly due to migration and the expansion of human settlement has precipitated deforestation
in many parts of the world (Gao and Liu, 2012; Entwisle et al., 2008).
A similar study in Tripoli found that about 40% of forest area was cleared within seven years
between 1986-1993 as a result of building construction or urbanisation (El-Tantawi, 2005).
Figure 4.3: Cutting windbreaks for building shops along the main road in study area (Source:
Picture taken on 05.01.2013 by the researcher).
4.3.1.1.3 Road Construction
40% of the respondents stated that roads contributed to destroying forests and responded that
road construction provides easier access to forest land for conversion and settlement. Road
construction also made the construction of railway lines and man-made rivers easier. The
Director of Transport sector5 in this district said that approximately 70 kilometres of roads were
established in forest interiors which now contributed to providing easy access to forests,
opening up of large areas to deforestation. The Director reported that there is a relationship
between establishment roads and deforestation by building a home as first stage and then the
second stage is the spread of agriculture into forests. Many studies agreed that building and
upgrading roads increases pressure on forests (Deng et al., 2011). Also El-Tantawi (2005)
5 Interview Date 12.01.2013, in his office in Algarabulli District.

Chapter 4 Deforestation: Causes and Consequences
82
reported that due to Urban expansion out of Tripoli, the roads have contributed access to forest
and cleared them for building houses. However, logging activities also contributed to
deforestation, beginning with the construction of roads to gain access to forests for timber (De
Koninck and International Development Research Centre, 1999).
Figure 4.4 A,B: The same road within two year period (2011-2013), in comparison shows how roads
inside forest have contributed to deforestation thereby leading to sand dunes encroachments, in
Alataya village, Al-Garabulli District, picture (a) taken by the researcher on 20.01.2011, picture (b)
was taken by the researcher on 20.01.2013.
A
B

Chapter 4 Deforestation: Causes and Consequences
83
4.3.1.1.4 Holiday Homes and Resorts
24% of the respondents stated that the construction of holiday homes was the first and the
main causes of deforestation in the district when some officers and officials in the Gaddafi
regime obtained forest land illegally. The Director of Forestry Department in Algarabulli
District 6 affirmed that local people were prompted to clear forest after seeing officers destroy
the forests for the purpose of building holiday homes not for an urgent housing need, a
phenomenon which was not seen in other areas.
Forests along the beach in this region have been cleared for resorts since year 2000. The
Director of Planning sector in this district explained that Algrabuil district is known one of
the best area in Jefara plain and has one of the best beaches in Libya. For this reason, most
tourists come from Tripoli and other regions, this in turn at the district level led to clearing of
more forests by the locals who are close the beaches to establish more resorts (Figure 4.5)
exploiting the forests area for profit in light of the absence of stringent regulations and
government control.
Figure 4.5: Illustrates some resorts in Alataya village, Al-Garabulli district (Source: Picture taken on
05.01.2013 by the researcher).
6 Interview Date 05.01.2013, in the field

Chapter 4 Deforestation: Causes and Consequences
84
4.3.1.1.5 Land Trading
22% of respondents stated that people cleared forest for illegal land trading. The land is sold to
buyers by the locals without official documents to support such transaction. There is further
discussion on this factor in chapter 7 where this factor became one of the main direct causes of
deforestation after the fall of the Gaddafi regime in 2011.
4.3.1.2 Indirect causes of deforestation
Figure 4.6 shows the very many and complex factors affecting indirect causes of deforestation
in Libya. All of the respondents agreed that land allocation was the foremost driver in
deforestation of Libyan forest. Though other factors such as change of forest governance and
corruption on the part of government officials also contributed significantly as shown below.
Figure 4.6: The main Indirect causes of deforestation (N=50)
4.3.1.2.1 Land allocation or Usufruct contracts (illegal permits): There was complete agreement among all questionnaire respondents that land allocation was
one of the main indirect causes of deforestation. Where respondents said that this is the process
of allocating forest land to certain people in the first years of giving land allocation (1986-
1990), particularly to some officers and officials from outside the district and in 1990-1991
0
10
20
30
40
50
60
70
80
90
100
%

Chapter 4 Deforestation: Causes and Consequences
85
some of the locals also obtained land allocations letters. In addition, official respondents
reported that there is a relationship between land allocation which is a policy factor and forest
which is an indirect cause of deforestation. Official and unofficial respondents stated that
issuing land allocations affected some socioeconomic factors as reported below:-
- Increase forest encroachment
Respondents explained that issuing land allocation encouraged local people to encroach on
forests, thus becoming a concern in terms of obtaining land, whether from forest neighbours or
people with power in the government at that time. Some respondents reported that land
allocation influenced local people's behaviour toward the forests due to greed and the collapse
of moral values. In addition, land allocation led to lack of appreciation of the value of the forest
and implementation of laws and regulations governing forests was very weak, even among the
officials. All these factors led to more forest encroachment for selling land and other purposes.
Figure 4.7: Forest encroachment in Alataya locality, Al-Garabulli district (Source: Picture
taken on 05.01.2013 by the researcher).

Chapter 4 Deforestation: Causes and Consequences
86
- Conflicts over land ownership
Conflicts between people and between tribes over land ownership occurred as a result of illegal
issuing of land allocations, resulting in many parties to claiming land ownership, respondents
stated. These respondents further explained that no one claimed ownership of the protected
forest land before 1986. However, the Director of Forestry Department in Algarabulli District
7 confirmed that there was no formal proof of land certificates that the land belonged to whoever
was clearing forest areas claimed by the land occupants. It was found that land ownership issue
is as a result of bad governance and corruption. Also, an elderly respondent, 95 years old, said
that whoever claims the ownership of part of forest land is not being truthful, because it was
sand dunes area before afforestation replaced it. This is because the traditional custom gives
certain lands to certain families or tribes except sand dunes due to their non-arable or grazing
land characteristics. One non-official respondents indicated that the wealthy locals, powerful
or aggressive/potentially violent families were taking the land forcefully. The Director of
Forestry Department in Algarabulli District indicated that cases of killings were recorded in
which the purpose was to acquire forest land.
- Land title fraud
Respondents indicated that some of those who encroached upon the forest forged land
ownership certificates, which became widespread in the region apparently.
In this context, the Director of Land Registry in Algarabulli District 8 stated that in the last few
years of the Turkish occupation of Libya which ended in 1911, private land and public lands
in Libya were registered and documented. Libyan courts still accepted the customary titles
which were made during Ottoman rule in Libya as proof of ownership of the land. The Director
of Land Registry in Algarabulli District confirmed that in recent years they had found land
ownership title fraud and confirmed that land tenure and property rights is the biggest issue
now affecting land allocation which leads to more deforestation. Some other respondents blame
the fact that the Libyan government still recognize and accept the Turkish titles.
The Director of Forestry Department in Algarabulli District 9confirmed that the local people,
in the beginning, rejected the allocation of some of the forest land in the region to officers who
7 Interview Date 05.01.2013, in the field 8 Interview Date 15.01.2013, in his office in Algarabulli District ,Libya 9 Interview Date 05.01.2013, in the field

Chapter 4 Deforestation: Causes and Consequences
87
were from outside the region. As some of the officers used brick construction for the purpose
of building holiday homes, the local people stole the bricks at night.
Also, some people could not gain access to land they wished to acquire, so they had to resort
to other methods to get access to the forest land. Officers employed some of the local people’s
sons in government institutions, for maintaining local schools and building some new roads.
By using this approach of patronage and nepotism, they were able to gain otherwise
unobtainable permission to enter the forest, and they became important people in the area.
Further discussion about land allocation or usufruct contracts how and why they were issued
from legal point of view, is presented in chapter 6.
4.3.1.2.2 The lack of law enforcement:
62% of respondents stated that the lack of law enforcement with regard to the forests was one
of the main causes that contributed to deforestation in this area. The Minister of Agriculture10
confirmed that the laws existed, and that they are the most appropriate for protecting forests
and pastures. However, the problem was applying the law properly, as it was only applied to
some people.
In this context, the Police Chief of Agriculture in Algarabulli District11 confirmed that when
they arrest an offender and were taken to prison, the following day they would find them
released. They were often not punished for their infringements because a higher authority
prevented implementation of the law in a improper way, thus encouraging deforestation and
discouraging law enforcement officers as reported by some officials. It was reported that there
was strong law enforcement from 1952 up to the middle period of 1980s and forestry officials
confirmed that there were no recorded breaches. After then, law enforcement was weakened
resulting in law enforcement being affected by corruption and connivance which led to more
forest loss. Therefore the enforcement of the Forest Act is rarely carried out by the Forest
Department and Police of Agriculture and when it is, their attempts were at times frustrated by
higher legal authorities.
In contrast to this, in some forest area in the world, strong law enforcement efforts were found
to reduce deforestation; however, law enforcement efforts were weak in remote areas around
10 Interview Date 24.01.2013, in the Ministry of Agriculture Tripoli ,Libya 11 Interview Date 09.01.2013, in the field

Chapter 4 Deforestation: Causes and Consequences
88
the world thereby achieving social, economic and environmental sustainability (Heeswijk and
Turnhout, 2013; Gaveau et al., 2009).
4.3.1.2.3 Corruption of government institutions
Corruption can be defined as "the unlawful use of public office by politicians or civil servants
for private gain (Koyunen and Yilmaz, 2009) According to this definition, corrupt acts are
illegal acts that are committed intentionally and furtively for private gain, and involve public
officials, property and power. In most of literature corruption is particularly related with the
forest sector (Jawad et al., 2005). Many illegal activities in the forest sector are associated with
corruption. Corruption is a complex political, social and economic phenomenon. It involves
the use of one's position for illegitimate private gains. The FAO has identified forest crime and
corruption as one of the main causes of deforestation in its 2001 report and warned that
immediate attention has to be given to illegal activities (illegalities) and corruption in the
world's forests in many countries (Koyunen and Yilmaz, 2009). Thus, besides the previous
factors identified in deforestation literature, corruption may also play important role in
explanation of deforestation.
44% of the respondents indicated that the corruption of government institutions is one of the
main cause of deforestation in this area either by forestry department or other authorities. In
this context, one of the ex-government officials in the Forestry Department (1965–1986)12
confirmed that although Forestry Department is the key actor in the care and management of
forest land in Libya, this department was abolished then reinstated many times due to
corruption. In Libya corruption is related to many sectors and many authorities as it was
confirmed that mis-using authority. Corruption, particularly, in forest management, is
widespread in developing countries (Jawad et al., 2005). It was found in similar case that
corruption in forestry undermines and weakens broader governance systems in countries where
it occurs and may be a potential driver of illegal logging and poor forest management.
However, corruption in the forestry sector also has broader implications for governance as it
requires the complicity of different sectors to be carried out successfully (Contreras-
Hermosilla, 2002).
4.3.1.2.4 Mismanagement by officials
32% of respondents stated that there was a clear change in forest management particular in the
last three decades. This finding was supported by one of the ex-government officials in the
12 Interview Date 08.01.2013, in his house

Chapter 4 Deforestation: Causes and Consequences
89
Forestry Department (1965–1986) the importance of this factor for deforestation in Libya, he
also said that many officers in important positions in the Ministry of Agriculture were
unqualified, and they brought staffs who had no experience with forests or agriculture.
In fact, some of the experts would not work with them in the decision-making process. This
led some of the experts to resign or retire from work, while others searched for new jobs. He
explained that due to mismanagement by officials.
Forestry Department who was only the key actor in the care and management of forest land in
Libya was formerly administered in a good way by forestry experts in Libya between 1952 to
the late 1980s; however, now the management was poor because there are many actors in forest
also this is linked with widespread of the forms of corruption among officials and employees
in governmental institutions; however, these forms, particularly with regard to relatives and
friends who break the law, all these form of corruption did not exist before in the last three
decades also it was linked with the governance from good to bad.
In addition, the Minister of Agriculture indicated the weakness of the Ministry of Agriculture
compared to some of the ministries supported by the former regime, such as the Ministry of
Defence, as well as the overlapping of authority between ministries in certain areas. For
instance, if the Ministry of Defence planned to build a camp in a forest area, they did not need
to have permission from the Ministry of Agriculture because they had more power and
authority. On the other hand, in 1975 the Ministry of Transport took ten years to get permission
from the Forestry Department in Libya to extend the road between Tripoli city to the airport
which about 35 kilometre. The mismanagement represented as the Deputy Minister of
Agriculture13 stated that the national afforestation program in Algarabulli district was stopped
in 1974, even though there were programs of afforestation in other regions. Even these
programs, however, have not achieved the desired success because of mismanagement by
officials and corruption.
In this context, the Director of Forest Department in Al-Garabulli district14 stated that some of
the officer of previous administration contributed to the destruction of the forests, as they
decided to clear forests because the role of forests was no longer considered vital, and the
forests must be changed to other types of land use.
13 Interview Date 09.02.2013, in the Ministry of Agriculture Tripoli ,Libya 14 Interview Date 08.02.2013, in his house ,Tripoli ,Libya

Chapter 4 Deforestation: Causes and Consequences
90
4.3.1.2.5 Administrative instability
30% of respondents stated that administrative instability was a factor in deforestation, and
according to their point of view, the permanent state of change in the Ministry of Agriculture
was a part of this. For instance, the name of the Ministry of Agriculture changed many times
from the Ministry of Agriculture, to the Ministry of Agriculture and Livestock, to the Ministry
of Agriculture and Livestock and Marine Wealth and this indicates a constant separation and
amalgamation of ministries.
Respondents who indicated this category said that there were changes in the administrative
subordination of this region, from the capital to three other regions, within a 15 year period.
One of the official respondents stated that this region was transferred (administratively) from
the capital to another region which are as remote region and had less awareness about forest
management and was more corrupt.
Also one of official respondents said that administrative corruption was less in the capital than
in remote areas and one of the serious problems which appeared due to this administration
changes, Sheikhs of a tribe became authorities on the issuance of letters of Land Ownership,
where some of these the remote region dealt with customs more than with the law.
In this context, the Deputy of the Ministry of Agriculture15 confirmed that administrative
instability contributed to deforestation also led to a loss of Ministry archives, and specifically
maps of forests, and he also indicated that these actions were intended to destroy the Ministry
archives.
4.3.1.2.6 Population growth and immigration
29% of the respondents stated that population growth and immigration played a significant role
in reducing the forest area in the region. However it could be argued that this result is not
accurate in this area. Some officials stated increasing immigration as the reason behind it.
While the mayor16attributes it to the high cost of housing and rent in Tripoli leading to land
acquisition in this area due to its proximity to the capital.
In this context, the mayor of Algarabulli District 17confirmed that there was no correlation
between the population growth and deforestation of the region through acquiring more plots of
15 Interview Date 09.02.2013, in the Ministry of Agriculture Tripoli ,Libya 16 Interview Date 24.01.2013, in his office in Algarabulli District ,Libya 17 Interview Date 24.01.2013, in his office in Algarabulli District ,Libya

Chapter 4 Deforestation: Causes and Consequences
91
land, because they knew that this land was forest land. However, people from outside the region
were not aware of the former land use, nor of the illegality of buying or selling this land. Also,
the local people are aware of the issue of land fraud.
However, it has been reported by the respondents in the study that immigration is the most
significant factor in global deforestation. It should be understood that demographic growth,
economic growth; an increasing demand for wood are not tied exclusively to population
growth, whether local or global; for instance, it is quite evident that the expansion in the
cultivation of having lands (de Koninck and International Development Research Centre,
1999). More discussions in this matter, chapter 7 investigates deeply whether there is any link
between population growth and deforestation.
4.3.1.2.7 Lack of public awareness of the importance of forests
25% of the respondents stated that the lack of awareness about the importance of forests was a
result of the negligence of the state in educating people through the media, schools and
mosques. According to the elders of the region perception of deforestation, they said were
collecting the timber from some natural plants from long distance for cooking and building
huts, however the period of 1950s, afforestation campaigns were started and we had no idea
about it, some people tried to remove the plants which just were planted, however the
government issued acts to protect forest and did awareness campaigns in this district during
1960s for the importance of forests and became as responsible to protect forest “we supported
the government to plant more forest”. However, when the government by military regime in
an indirect way contributed to clearance of forest in 1980s the moral awareness collapsed and
there was a change in people's behaviour, from positive to negative where now the first concern
for some people is to make money, where some of clearers want to flaunt or to display the size
of land ostentatiously also to sell some plots of the land when needed.
One of the official respondents said that in the 1960s and 1970s there were celebrations of
World Tree Day to educate students about the importance of trees. However, since that period,
there has been no mention of this practice.
4.3.1.2.8 Non-registration of forests
20% of respondents (practically the officials) said this factor is not known among them until
now, while the Minister of Agriculture18confirmed that the forests in question had not been
gazetted as state forests, and therefore had not have protection from squatters. In fact, after the
18 Interview Date 24.01.2013, in the Ministry of Agriculture Tripoli ,Libya

Chapter 4 Deforestation: Causes and Consequences
92
reforestation project in 1979, the Forestry Department contracted the French National
Geographic Institute (IGN) to create a map of the forest and to document the forest on behalf
of the State in the Land Registry to be able to register all of Libya’s forest. However, for
unknown reasons, the state in 1986 rejected the idea of registering the forest after the forest
had been mapped and documented for forest demarcation, which causes many problems in land
ownership where the presiding judge of the agricultural crimes court in Algarabulli District
confirmed that there was no legal basis for state ownership of the forests, and he has helped
some people win lawsuits filed against the state due to a lack of evidence that the forests
belongs to the state and the state of the forest as question.
4.3.1.3 The underlying causes of deforestation after the uprising (2011-2013)
As respondents reported earlier that the rate of deforestation is higher after 2011 comparing
with the period before, to identify why, 50 respondents were questioned what reasons were
responsible for increased deforestation after 2011 and they mentioned the reasons as shown in
figure 4.10.
4.3.1.3.1 Total breakdown in governance
80% of the respondents said that the absence of government led to increased deforestation after
the fall of the former regime. In Libya, in August 2011, a new government appeared in Tripoli
but this government is weak in terms of the presence of arms, and so the focus was on
establishing security and collecting weapons from the people.
In the meantime, some people began to encroach on the forest because of the absence of
regulatory agencies and the policing of agriculture.

Chapter 4 Deforestation: Causes and Consequences
93
Figure 4.8: Reasons behind recent increase in the deforestation after 2011
In this context, the Minister of Agriculture19 indicated that the Ministry was unable to stop the
forest encroachment, and he was fearful of exposing police officers to risk in light of the
proliferation of weapons among the people. This means that there was a violation of the laws
for forest protection and the policing of agriculture could not apply the laws in earnest.
4.3.1.3.2 Large increase in land prices
60% of the respondents indicated the dramatic increase in land prices in recent years due to
population growth and immigration. One of the respondents said that the price per ha of land
in 2013 has risen ten-fold from what it was in 2005. Whereas one of the official respondent
said that increasing land price in non-forested areas which were documented led people to buy
lands of forest where it cheaper rather than other land which undocumented.
4.3.1.3.3 Criminal activity to earn money by selling the land
40% of the respondents indicated that some people were clearing forests and established roads
and then subdividing the land to sell plots. The problem is that people from outside the region
were buying these plots of land, which is undocumented.
19 Interview Date 24.01.2013, in the Ministry of Agriculture ,Tripoli ,Libya
0
10
20
30
40
50
60
70
80
90
100
Total breakdown
in governance
Large increase in
land prices
Criminal activity
oevr the land
Lack of housing
projects for youths
Lack of trust
between citizens
and state
%

Chapter 4 Deforestation: Causes and Consequences
94
Figure 4.9: Offering the land for sale (Land trading): Offering the land which was cleared for sale
which was an illegal action, Sign on electricity pylon says, ‘One hectare for sale’ and the phone
number (but the sign poster does not own the land), In Alataya village, Al-Garabulli district, Libya.
Picture taken, by the researcher on 05.01.2013.
4.3.1.3.4 Lack of housing projects for youths
According to the questionnaire results, 25% of the respondents pointed out that the lack of
housing for youths played a role in deforestation. In this context, The Director of Forestry
Department in Algarabulli District20 indicated that most of people encroaching on the forest
after the 2011 uprising are from the youth category, which is those less than 40 years old,
because this category has weapons. In the past, those who encroached on the forests were
typically from 40–60 years old. The mayor of Algarabulli District 21 mentioned that the lack of
housing projects for youths caused many social problems, such as the delayed age of marriage.
4.3.1.3.5 Lack of trust between the citizens and the state
15% of the respondents indicated that the state, before the uprising, contributed directly or
indirectly to deforestation by allocating land to officials and officers, and that this issue created
feelings of inequality in other citizens. In turn, some of these citizens then exploited the absence
of government to clear forest.
20 Interview Date 05.01.2013, in the field 21 Interview Date 24.01.2013, in his office in Algarabulli District ,Libya

Chapter 4 Deforestation: Causes and Consequences
95
4.3.2 History of forest clearing in the region
The status of the forest clearance in the study area was divided by respondents into three phases;
Before 1986, 1986–2011 and 2011–2013;
4.3.2.1 The status of the forests before 1986:
Respondents indicated that the forests were flourishing and in good condition due to good
governance and good management. In addition, forest encroachment had not been noted in this
region prior to 1986 and forestry officials confirmed that there were no recorded breaches.
With regard to forest protection in this period, respondents were questioned about why forests
were protected before 1986, and they indicated that there were several factors, such as fear of
the law and punishment, respect for the laws, lands were cheap.
In this context, the respondents indicated that it was not possible to cut tree nor clear forest and
there was no nepotism and patronage in the application of the law. Also the Director of then
Forestry Department in Libya22 indicated that the laws and legislation were applied in a good
way. Agricultural police patrols roamed the forest areas at all times and forest encroachment
had not been recorded in this region prior to 1986.
4.3.2.2 The period from 1986–2011.
90% of the respondents and officials confirmed that the beginning of deforestation began in
1986. In terms of the reason why deforestation began in 1986 specifically, 82% of all
respondents indicated the issuance of land allocations, which is the main cause of deforestation
and known by local people as the Forest Disaster ( )النكبة .Also, 10% of the respondents indicated
the abolition of the Ministry of Agriculture in 1986. The last reason indicated by the 8% of
respondents was the burning of the land registry centres.
In this context, the Deputy Minister of Agriculture23 confirmed that in 1986 some things
happened in Libya that contributed to the destruction of the forests. The Ministry of Agriculture
was abolished, and its authority was transferred to the Directors of Agriculture sectors in Libya
regions. Some of the officials in Forestry Department and the Ministry of Agriculture in Libya
22 Interview Date 02.01.2013, in the Ministry of Agriculture Tripoli ,Libya 23 Interview Date 09.02.2013, in the Ministry of Agriculture Tripoli ,Libya

Chapter 4 Deforestation: Causes and Consequences
96
refused to issue land allocations in forest area as they believed that this procedure would
destroy the efforts of many years of planting trees.
Also, instructions of the previous regime were adopted, such as that land does not belong to
anyone, and for this reason the land registry centres were burnt in Libya by the previous regime.
Due to many problems on land rights and land tenure between tribes in Libya, in 1991 the land
registry centres reopened and reported that is why it was not possible to register forests in the
land registry in 1986.
The extent of deforestation between 1986 and 2013 is shown in figure 4.10. Respondents
estimated that 32% of total forest area was cleared between 1986 and 2010, but the rate of
deforestation has increased dramatically after the fall of the Gaddafi regime where another 44%
was cleared between 2011 and 2013 and currently only 24% of the originally planted forest
remains which is also suffering from severe degradation.
4.3.2.3 The period from 2011– 2013
The deforestation index in the last two years is higher than the period before the uprising, which
covers 25 years due to a range of factors such as a total breakdown in governance and a tenfold
increase in land prices. Nevertheless, the respondents expected that deforestation rate will
stabilize after the uprising in Libya because they believe that the policy of the former regime
indirectly destroyed the forest cover.
In addition, respondents stated that people clearing forest before the uprising were some of
government officials, officers and forest neighbours, but with regard to recent clearing of
forest, the respondents indicated three types of people who were doing this: people who claim
ownership of the land including forest neighbours, local non- forest neighbours and armed
gangs.
As shown in figure 4.10 that the most serious deforestation before 2011 occurred in Ataya
forest block (locality). So it is important to understand why the rates of deforestation in these
blocks are different. In order to diagnose the causes behind the higher rate in Ataya,
respondents stated that:

Chapter 4 Deforestation: Causes and Consequences
97
1-The government constructed an official paved road across this forest in 1986, encouraging
more forest encroachment. Later, an unofficial unpaved network of roads was built to link with
this road (see Fig 5.10). Roads usually have a major impact on deforestation (Barber et al.,
2014). Since Libya’s revolution, the rate of deforestation has increased and forest
encroachment has reached the forests located near the major roads.
The construction of paved roads has grown rapidly recently, as are illegal or unofficial roads.
However, major roads (the Tripoli–Benghazi road) are to the south of Ataya forest block, and
the forest here was unaffected by deforestation before the uprising because these forests are
located in front of official and unofficial eyes, but recently, even these forests are deforested
with no care from the official people.
2-The Al-Ataya population allowed officials from outside their village to obtain usufruct
contracts for this block of forest in the late 1980s, before some of the local people obtained the
usufruct contracts as well. In addition, it allowed the village inhabitants to sell land to people
from outside the region. In contrast, the population of the Al-Karawa locality refused to accept
any usufruct contracts from outside the village. It also refused to sell forest land to foreign
interests.
3-All respondents stated that administrative corruption exists in all the villages. However,
administrative corruption in this village is the highest, and the highest number of administrative
certificates stating a right to land ownership of forest area were given by the sheikhs of this
village. In addition to the corruption, forest supervisors and inspectors of this block of forest
cover up forest encroachments and in return for bribes or forest land.

Chapter 4 Deforestation: Causes and Consequences
98
Ataya Forest Block
0
20
40
60
80
100
Karawa Forest Block
Gawea Forest Block
Fo
res
t C
ov
er
(%)
0
20
40
60
80
100
Rawajih Forest Block
Kawaleg Forest Block
1985 1990 1995 2000 2005 2010
0
20
40
60
80
100
All Forest Blocks
Years
1985 1990 1995 2000 2005 2010
Figure 4.10: Index of Forest Cover (respondents’ estimates): 1985–2013 in percentages (standard
deviation in brackets) over the whole study and in each forest block.24
4.3.3 Consequences of deforestation:
As deforestation proceeds, its short-term consequences could be disastrous for the state. Effects
of deforestation are compounding and becoming complex. To identify the consequences of
24 Respondents estimates were based on the Remote Sensing data of 1985 (See appendix 7 for more information
and how this figure was analysed)

Chapter 4 Deforestation: Causes and Consequences
99
deforestation 50 respondents were asked which consequences that have been experienced so
far. The responses are as indicated in the figure 4.11 below.
Figure 4.1: Consequences of deforestation in Algarabulli District
4.3.3.1 Sand dunes encroaching
Jefara Plain experienced vegetation deterioration, settlement expansions and sand dunes
encroachment with over 33,500 ha Jefara plain area been affected by creeping sand dunes (El-
Tantawi, 2005). The mobility of the sand presents a constant menace, affecting Jefara plain,
particularly the areas south and east of Tripoli. A monitoring study on El-Witia area showed
an increase of 227% in sand dunes formation during 10-years from 1986-1996 (Ben-Mahmoud,
el at., 2000).
Of the respondents, 85% indicated encroachment by sand dunes was a serious a problem
affecting farm land and houses as a result of cleared forest in this region. In particular, one of
the respondents indicated that sand dunes appeared when deforestation began and its effects
are clear to all. However, this respondent indicated that people would not stop clearing forests.
0
10
20
30
40
50
60
70
80
90
100
%

Chapter 4 Deforestation: Causes and Consequences
100
Also this respondent said that although people were aware of problems caused by deforestation,
but this is their greed overtook their concern about this issue.
Another respondent, who was affected by the encroaching sand dunes, noted that it is not
possible currently to cultivate the land due to the movement of sand dunes. Additionally, this
respondent said that he built a wall around his farm to prevent sand movement, as shown in
figure 4.12.
Figure 4.2: A wall built to prevent sand dunes encroaching, Alkarawh village, Al-Garabulli district
(Source: Picture taken on 05.01.2013 by the researcher).
4.3.3.2 Climate change
Approximately 82% of respondents indicated climate change which includes as explained by
respondents; wind speed increases and air pollution from dust, lack of and erratic rain and
increases in the temperature. They stated that forest was providing a moderation of wind
velocity, regulation of atmospheric temperature, enhancing precipitation, Maintenance of
humidity and provide places for recreation. They also explained that whenever the rate of
deforestation is increased, the wind speed and air pollution from dust become higher. This was
almost as prominent as encroaching of sand dunes.
The wind moves faster due to clearance of the forests and a lack of trees acting as windbreaks.
The wind carries grains of sand over long distances. The respondents indicated that when the
winds pick up, they must close their windows until the wind stops. Some respondents reported
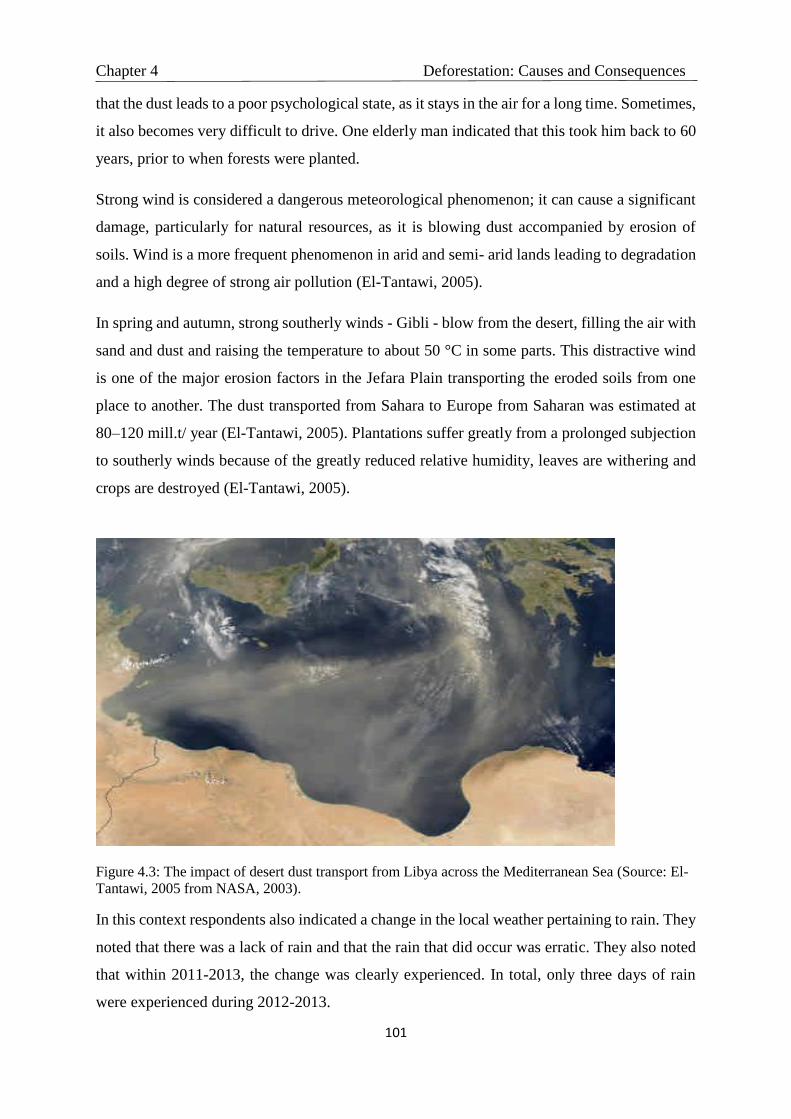
Chapter 4 Deforestation: Causes and Consequences
101
that the dust leads to a poor psychological state, as it stays in the air for a long time. Sometimes,
it also becomes very difficult to drive. One elderly man indicated that this took him back to 60
years, prior to when forests were planted.
Strong wind is considered a dangerous meteorological phenomenon; it can cause a significant
damage, particularly for natural resources, as it is blowing dust accompanied by erosion of
soils. Wind is a more frequent phenomenon in arid and semi- arid lands leading to degradation
and a high degree of strong air pollution (El-Tantawi, 2005).
In spring and autumn, strong southerly winds - Gibli - blow from the desert, filling the air with
sand and dust and raising the temperature to about 50 °C in some parts. This distractive wind
is one of the major erosion factors in the Jefara Plain transporting the eroded soils from one
place to another. The dust transported from Sahara to Europe from Saharan was estimated at
80–120 mill.t/ year (El-Tantawi, 2005). Plantations suffer greatly from a prolonged subjection
to southerly winds because of the greatly reduced relative humidity, leaves are withering and
crops are destroyed (El-Tantawi, 2005).
Figure 4.3: The impact of desert dust transport from Libya across the Mediterranean Sea (Source: El-
Tantawi, 2005 from NASA, 2003).
In this context respondents also indicated a change in the local weather pertaining to rain. They
noted that there was a lack of rain and that the rain that did occur was erratic. They also noted
that within 2011-2013, the change was clearly experienced. In total, only three days of rain
were experienced during 2012-2013.

Chapter 4 Deforestation: Causes and Consequences
102
This was not noted before. Also they had experienced temperature increase recently due to
forest clearance. This result agrees with observation of El-Tantawi (2005) and Tinker et al.
(1996) that change in land use, particularly deforestation, is a direct cause of climate change.
With changes in evapotranspiration, runoff and local climate. The regional effects of
deforestation will be to lower the rainfall volume due to reductions in evapotranspiration as the
vegetation changes from a forest to others land use convective rainfall circulation is reduced
(Neal et al., 1992). However it could be argued that this change in local weather namely lack
of precipitation or increase temperature as a result of deforestation in this area is not accurate
as meteorologists stated that it is difficult to link change with deforestation only where forests
in this area are small but the results are related with long time of deterioration in vegetation
including deforestation in Jefara plain which impact on agriculture activities.
4.3.3.3 Desertification
In total, 70% of the respondents indicated that deforestation contributes to the accelerated
process of desertification, which is becoming clear in this area. Also it has been noted that not
many people know about desertification in meaning and in processes. It was found many
studies have been conducted in Libya because it is experiencing a serious problem of land
degradation and desertification due to human activity and extreme climate variations (Saad et
al., 2011; El-Tantawi, 2005) where deforestation and removal of vegetation is one of the main
anthropogenic factor causing degradation in Libya (Saad et al., 2011). As the main causes of
desertification in Libya are many and vary by regions (Al Farrah et al., 2011).
The plain has experienced a stress on its natural resources (water, soil and vegetation) in recent
decades as a result of heavy population growth and increasing food demand (El-Tantawi,
2005). Another study found that west of the plain has been significantly degraded in quantity
and quality of vegetation where vegetation destruction took place by overgrazing and over
cultivation, both activities being driven by the needs of a rapidly growing population. Clearing
forest which was planted to combat desertification and soil erosion during fifty years led to
desertification phenomena again (Ben-Mahmoud, 2013).
According to remote sensing data 1982 to 2007 estimating vegetation cover change in Arab
countries. The rate of deterioration of vegetation in Libya reached 58% and another estimation
was 24% in irrigated land, 35% in rainfed land, 80% in rangeland (Ben-Mahmoud, 2013).
Deforestation results in a variety of negative environmental, economic and social impact
directly or indirectly (Saad et al., 2011) .

Chapter 4 Deforestation: Causes and Consequences
103
4.3.3.4 Lowering of Groundwater Level
Of the respondents, 60% indicated a lack of an appropriate groundwater level. However, there
was a lack of agreement among respondents about this issue. Some of the 30% respondents
agreed that the decrease in the groundwater level was due to deforestation, but others
respondents did not agree. They indicated that it was due to other causes. However, all
respondents agreed that seawater intrusion as result of deforestation was problematic. In this
context, one of water expert in Algarabulli District indicated that deforestation depletes
aquifers and that deforestation inhibits water recycling. Deforestation or land conversion is
responsible and will affect the climate system, including its impact on local and regional
hydrology (Tinker et al., 1996).
4.3.3.5 Loss of flora and fauna
50% of the respondents said that extinction of natural vegetation which grows naturally among
forest trees and animal species due to the continuous depletion of forests. However, prior to
the afforestation, it was sand dunes and no species living in these dunes, but after afforestation
the species came and adapted to living in the forests over three decades. Some of the
respondents noted that some of the natural plant species, such as Retama retama had appeared
in the forest, which is now extinct. With respect to animal species, foxes and wolves were
reported by respondents to have become extinct.
4.3.3.6 Reduced production of honeybees
35% of respondents indicated that the forest is a habitat for hives in this region. In this context,
the president of the beekeepers’ association in the region confirmed that this region was the
best region in North Libya for producing honey. However, it has been noticed that bees
disappeared following the massive forest clearance. One of the respondents, a beekeeper,
indicated that beekeeping was a source of income and mentioned that beekeepers are most
affected by deforestation.
4.3.3.7 Lack of soil moisture
In total, 30% of the respondents indicated that the soil lacked moisture and destruction of the
forest has been accelerating soil erosion, once steep slopes are left to face the violent monsoon
downpour without any protective vegetation (Neal et al., 1992). One of the soil scientist in
Algarabulli District 25noted that the massive clearance of the forest made the land barren and
25 Interview Date 20.01.2013, in the field

Chapter 4 Deforestation: Causes and Consequences
104
exposed the soil to erosion. Additionally, exposing the soil to direct sunlight with increased
temperatures has led to decreased soil moisture through transpiration. In this context, one of
forestry experts in Algarabulli District26 indicated that the decline in soil moisture would be a
significant problem in the future if the government plans to plant trees. In Jefara Plain
increasing loss of topsoil are mainly due to removal of protective vegetation cover and forest
by overgrazing and poor management practices on agricultural fields. Terrain deformation
plays a smaller role in degraded soils on a large scale; however, it is dominant in some of the
more vegetated regions showing a significant amount of soil degradation (Ben-Mahmoud et
al., 2001).
In Tropical forest, cutting trees can be for the purpose of traditional shifting cultivation, after
which forest is regenerates (Tinker et al., 1996). However, these practices in semi-arid area
practically plantation forest in Libya, it is quite difficult for natural regeneration to occur due
to lack of soil moisture.
4.3.3.8 Spread of diseases
25% of respondents indicated that after forest was cleared, some diseases such as asthma
emerged. As stated earlier that the forests has been decreasing significantly during recent year,
thus consequences of deforestation are reaching and affecting every of human life in this
district, it could be argued that urgently Algarabulli needs more forests with better
managements and good law enforcement, if its people are to survive.
26 Interview Date 20.01.2013, in the field

Chapter 4 Deforestation: Causes and Consequences
105
4.4 Conclusions
The results of the semi-structured interview used in this chapter have shown that deforestation
has direct and indirect causes. Many respondents stated direct causes of deforestation.
Agriculture has been identified has the most important reason for clearing forests; agriculture
is common throughout the world, but in the period of 1986-1990, clearing forests was for
building a holiday home which not common throughout the world.
Many indirect causes contributed significantly to the destruction of forests or increased the
forest encroachments in Libya in general and in the study area specifically. The results shows
underlying causes. They include poor administration, issued land allocation (illegal permits),
the lack of law enforcement, corruption, mismanagement, poor management and land tenure.
Because these indirect causes or factors are very complex, the results of chapter four describe
how these factors led to deforestation. Other social and economic factors were also mentioned
as causes of deforestation. Therefore, chapter five describes the extent to which these factors
led to deforestation.
The respondents in this chapter mentioned the specific time that deforestation commenced
1986. They also estimated forest clearance, showing that the deforestation rate increased
dramatically after the 2011uprising in Libya; 32% of the total forest area was cleared from
1986 to 2010, 41% of the total forest area was cleared between 2011 and 2013. In this context,
chapter five describes the deforestation rate using satellite imagery to check for consistency
with the responses.
This increase in deforestation recently is due to many reasons, which are completely different
from the reasons stated for 1986-2011, such as total breakdown in governance and the spread
of weapons. The government is unable to stop people from clearing forests in light of increased
demand for the purchase of land without official documents.
Government officials and forest neighbours cleared the forest before the uprising. After the
uprising, however, armed militias and other people who claimed ownership of forest land
(forest neighbours and others that did not stay near the forest) began clearing the forest.
The consequences of deforestation in this area has many environmental consequences. As was
stated in the background chapter, the sandy soil was very low in organic matter; originally, the
soil was sand dunes and unsuitable for cropping. Sand dunes appeared again, causing increased
movements of heavy dunes over time, only slight change in the climate elements (rain,
Chapter 4 Deforestation: Causes and Consequences
106
temperature and winds), extinction of species and desertification. Therefore, studies illustrated
that desertification took place in most regions of the Jefara plain.
Based on these findings, the following chapter (chapter 5) focused on land cover change and
for which type of land cover forests were converted into and to determine the extent of
deforestation rate to compare that with the rate of the respondent’s estimates in this chapter
with using remote sensing.

Chapter 5 LUC using R and S
107
5 A remote sensing assessment of land use change
5.1 Introduction
Within Land-Use/Land-Cover Change (LULCC) research, dynamics of land-cover (e.g., the
biophysical attributes of the land surface) and land-use (e.g., the anthropogenic influences on
the land) changes are considered two of the main driving forces of global environmental
change. They have, therefore, received increasing attention from scientists and decision
makers. LULCC expresses social, environmental, institutional and economic processes (Mas
et al., 2014).
Traditionally, LULCC studies have focused on the processes of negative land-cover change
(LCC), primarily deforestation, because examples of positive LCC are uncommon (Calvo-
Alvarado et al., 2009). Landscape managers and policy makers must understand the underlying
relationships of both LCC and deforestation processes in order to design nature conservation
and sustainable management strategies (Brinkmann et al., 2014). The FAO reviewed global
forest clearance and found that between 1990 and 2000, forest loss averaged a rate of 16.1
million ha per year. Of this, 14.6 million ha was lost through deforestation (Lindenmayer and
Burgman, 2005).
According to current estimates (FAO, 2013) 0.38% of the world’s forests were converted to
other land uses (i.e. deforested) every year during the 1990s. The main drivers encouraging the
deforestation and the fragmentation of the remaining forests included large- and small-scale
agriculture, cattle ranching, logging and urban growth (Wyman and Stein, 2010).
In Libya, the main forest type is the natural forest, which was estimated to comprise about
500,000 ha in 1950; by 1988, 35% of this land had been converted to agricultural land (Al-
Idrissi et al., 1996). BRSC (2007) used remote-sensing to study deforestation around the city
of Tripoli during the 10-year-period from 1990 to 2000 and found that 40% of the plantation
forest had been converted to urban and agricultural land.
The research question of this chapter was; which human activities are contributing to
deforestation rate and to what extent? Therefore, to address this, remote sensing was applied
and field work observation to detect and quantify the extent of deforestation and evaluate the
dynamics of land cover changes that are taking place, using Landsat for the whole area land
cover change and using SPOT 5&6 imagery for forest area.

Chapter 5 LUC using R and S
108
This chapter will focus on the processes of LULCC in two stages: Stage one will examine the
whole area using Landsat satellite imagery to identify positive LCC (from sand dunes cover to
forest cover), and stage two will use SPOT 5amd SPOT 6 imagery to examine the ways in
which forested areas have changed, as well as to discuss their rates of deforestation.
5.2 Material and methods
Remote-sensing (RS) technologies and methods have evolved dramatically within the last three
decades to include a suite of sensors operating at a wide range of imaging scales with potential
interest and importance to planners and land managers (Rogan and Chen, 2004). RS
technologies are important in acquiring useful data on the earth or its surface. They also provide
the broad scope and the ability to collect sequential imagery to estimate the trends and the
patterns of LUCC, deforestation rates or other phenomena (Zheng et al., 2014). This chapter
focuses on the processes of LULCC in two stages:
Stage one will examine the whole area using Landsat satellite imagery to identify
positive LCC (from sand dunes’ to forest cover).
Stage two will use SPOT 5& 6 imagery to examine the ways in which forested areas
have changed, as well as discussing their rates of deforestation, addressing the research
question.
5.2.1 Satellite imagery data
Today, satellite images provide a key source of information about the environment and play an
important role in generating accurate and reliable information about forest cover, vegetation
type and land-use changes (Portillo-Quintero et al., 2012). In this study, two different kinds of
satellite imageries and diverse ancillary data were collected in order to identify historical and
recent land cover/land use. Several strategies and techniques allowed the processing of these
input data to efficiently express the desired results.
5.2.1.1 Landsat imagery
The Landsat series of missions, first launched on July 23, 1972, carried on board instruments
to examine the earth's surface. Since then Landsat missions have provided enormous amounts
of data at different spatial, spectral and temporal resolutions.
This study used five types of Landsat imagery (Table 5.1), including from the Landsat1
Multispectral Scanner (MSS) 1972, the Landsat5 Thematic Mapper (TM) 1986, the Landsat5
(TM) 1990, the Landsat7 Enhanced Thematic Mapper (ETM) 2002, and the Landsat8
Operational Land Imager (OLI) and Thermal Infrared Sensor (TIRS) 2013.

Chapter 5 LUC using R and S
109
All imagery used was from dry season in Libya (from May to October) with cloud-free (0%
cloud cover) surface reflectance data in in order to differentiate between LCLUC with a spatial
resolution of 30 m. This Landsat imagery data enabled the study of the landscape’s dynamic
changes and trends to create a time series of LUCC covering 41 years from 1972 to 2013.
ERDAS software was used for the digital image processing techniques of classification and
ratio indices, for the whole Algarabulli District, whether positive or negative for LUCC.
The Landsat images used in this study were provided by Bangor University, Geographical
Information Systems Manager from the United States Geological Service (USGS) at a single
level of processing known as systematic correction (Level 4).
Table 5.1:Properties of different Landsat satellite imagery data used during this
research
Platform Sensor Date of
acquisition
Path/Row Pixel/Ground
resolution (m)
Spectral
resolution
(Bands)
Landsat 1 MSS 04/05/1972 202/37 57 4
Landsat 5 TM 16/10/1986 188/37 30 7
Landsat 4 TM 15/07/1990 188/37 30 7
Landsat 7 ETM 24/06/2002 188/37 30 7
Landsat 8 OLI/TIRS 07/08/2013 188/37 30 11
5.2.1.2 SPOT imagery data
The Satellite Pour L'Observation de la Terre (SPOT) is a commercial high-resolution satellite
system operated by a French consortium since 1985; the SPOT 1, launched February 22, 1986,
has since been withdrawn. The SPOT images used in this study include SPOT 5 (2010), which
was launched on May 4, 2002, and has two high-resolution geometrical (HRG) instruments
that were derived from the High Resolution Visible IR (HRVIR) of SPOT4. The SPOT 5 image
from 2010 was provided by the BRSC. SPOT 6 (2013), also used in this study, was launched
September 9, 2012. This imagery was provided by the Libyan Centre for Remote Sensing and
Space Science (LCRSSS).

Chapter 5 LUC using R and S
110
Table 5.2: Properties of different SPOT imagery data used during this research
Satellite
(platform)
Sensor Date of
acquisition
Path/Row Spatial
resolution
Spectral resolution
(Bands)
SPOT 5 HRGs 05/06/2010 284/71 2.6 m 3
SPOT 6 PSLV-CA 15/02/2013 284/71 1.5 m 3
The purpose of using SPOT imagery is to study the LUCC in forested areas and estimate the
deforestation rate. In Chapter 4, respondents stated that Libya’s deforestation started in 1986,
and they estimated that the deforestation rate rose after the country’s 2011 uprising. It was
difficult to use Landsat imagery to investigate this matter because not all Landsat images from
2009 and 2010 focusing on the area of study were of good quality—some images contained
banding, making it impossible to identify the 2010 forested areas. As a result, a forest map
from 1983, created before deforestation was believed to have started in Libya, the SPOT
imagery existed, was used to measure the deforestation rate in two different periods, as well as
the processes of negative LCC change. The image processing tools used in this chapter include
ERDAS IMAGINE 2013 and ArcMap 10.2 software; therefore, the methods used in obtaining
multispectral classifications were taken from ERDAS software.
5.2.2 Map topography
A series of digital and paper maps were also obtained, as detailed below:
A digital topography map was obtained from the BRSC with a scale of 1:50,000. It was
projected under the geodetic datum ‘WGS84’ and map projection NUTM 33, and the
units are in metres.
A map of land cover with a scale of 1:50,000, prepared by the Army Map Service,
Corps of Engineers, U.S. Army, 1962, was obtained from the LCRSSS. In 1979, it was
updated by POLSERVICE-GEOKART, POLAND from 1976 aerial photographs taken
at a scale of 1:20,000.
A forest map (nine sheets covering the study area) was obtained from the Department
of Mapping of the Libyan Ministry of Agriculture, with a scale of 1:10,000. It was
prepared by the IGN Paris in 1983 from aerial photographs taken by the KLM in 1980
at a scale of 1:20,000, under the supervision of the surveying department of the SPLAJ.

Chapter 5 LUC using R and S
111
5.2.3 Ground truth survey
The decision about where to collect ground sample data is an important step in remote-sensing
ground verification (Muzein, 2006). After completing the preliminary image supervisor
clarification of Landsat 8, 2013 with 100 points in the whole Algarabulli district and SPOT 6,
2013 with 50 points for only the forest and deforested area. Random sampling techniques were
applied and information was collected from the sample plots. Each point was registered using
GPS technology to allow for further integration with spatial data in a geographic information
system (GIS).
5.2.4 Image pre-processing
The image pre-processing of remotely sensed data is essential for image classification. Because
of the direct linkage between the data and biophysical phenomena and features, it requires
several processing steps for better identification of the image features (Akhter, 2006) and
improving the ability to qualitatively and quantitatively interpret image components (Shahabi
et al., 2012). These steps include radiometric, atmospheric and geometric correction.
5.2.4.1 Radiometric and atmospheric correction
It is important to calibrate raw sensor data to meaningful physical units prior to a
postclassification change detection. Radiometric calibration helps to ensure that detected
changes can be taken for real instead of as errors caused by differences in sensor calibration
and sun angles (Coppin et al., 2004).
Atmospheric and radiometric correction applications were essential to the current study for two
reasons. First, the study compared the relationship between field-based data and spectral
information in a time series of the imagery. Second, the imagery was acquired during dates
with different atmospheric conditions and was collected by different types of sensor. Removing
atmospheric effects involves calibration and atmospheric correction. Calibration adjusts the
image by converting raw radiance values of each pixel to top-of-atmosphere absolute
(radiance) or relative (reflectance) values. Atmospheric correction then adjusts these values to
ground radiance or reflectance at each pixel based on sun-ground-sensor geometry and
atmospheric composition (Zakaria, 2010). Radiometric resolution also refers to the ability of a
remote-sensing system to distinguish the subtle disparity in the intensity of the radiant energy
from a target at the sensor.

Chapter 5 LUC using R and S
112
5.2.4.2 Geometric processing
Geometric correction is the process of warping the image to fit a planimetric grid or map
projection (Zakaria, 2010). Additionally, it attempts to address the effects of image distortion
owing to image acquisition, such as sensor movement and topographic variation, and to convert
the raw image coordinate system to a particular coordinate model projection. Researchers
commonly use two geometric correction methods: 1) image-to-map rectification, 2) image-to-
image registration. Image-to-map rectification is used when accurate measurements from
images are required, while image-to-image rectification is usually used when it is unnecessary
to assign each pixel to a unique x, y coordinate in a map projection. In order to determine
accurate measurements from images, this study used the image-to-map rectification method.
For which a set of Ground Control Points (GCPs) is required.
5.2.4.3 Ground control points selection
To transform satellite imagery geometrically to a local map-coordinate system, a set of ground
control points (GCPs) is required. Accordingly, the images of MSS, TM, ETM and OLI/TIRS
were geometrically coregistered to the rectified OLI/TIRS 2013 data (UTM, Zone, 33
projection, WGS84 Datum) and SPOT 6. Georeferencing was provided by grid selecting and
applying GCPs.
Image enhancement techniques include histogram stretching and filtering, for example. These
steps are used to alter the appearance of the data to potentially increase the information content
visible in the image(Mather and Magaly, 2011) .Any pre-processing stage might include all
techniques to prepare the data or just some of them, depending on the level of data acquired
and the application for which it will be used.
Image enhancement involves the mathematical combination of imagery from different dates,
including the subtraction of bands, image regression, principal components analysis, and image
ratioing. Image ratioing is one of the conceptually easier to understand change-detection
methods because the data are ratioed on a pixel-by-pixel basis (Coppin et al., 2004). Data that
have no change will yield a value of one, but pixels from areas that have changed will have a
value of either higher or lower than one.
Image enhancement is valuable for detecting and defining LULC information classes because
they have different spectral characteristics. A proper image enhancement includes
multispectral transformation, false colour composites and vegetation indices, which are
important to achieve information of the area and spectral knowledge. Therefore, image-

Chapter 5 LUC using R and S
113
enhancement techniques were applied in this study in order to improve visual interpretation
and to map land cover and its changes within the research area.
5.2.4.4 Selection of bands used
It is important to use appropriate spectral bands for land-cover classification. The bands used
should achieve the maximum spectral discrimination between different land-cover types,
especially those with similar spectral properties. Previous studies of optical remote sensing
showed that for agricultural studies, broadband sensors such as AVHRR, Landsat MSS,
Landsat TM and SPOT HRV XS and panchromatic data have good spatial resolution, and it is
often possible to visually interpret land cover using textural information (Ghodieh, 2000).
Spectral resolution bands refer to the ability of a remote-sensing system to separate the subtle
differences in reflectance of the same ground object at different wavelengths (Schowengerdt,
2007). The use of more spectral bands is conducive to achieving a higher degree of
classification accuracy, to a certain extent.
Table 5.3: Landsat spectral bands and their applications
Bands No Spectral light Principal application
1 Blue Distinction of soil, water andvegetation
2 Green Distinction of vegetation
3 Red Distinction of vegetation and soils
4 Near infrared Biomass and urban areas
5 Shortwave infrared Distinction of vegetation androcks
6 Thermal infrared Measuring of temperature
7 Shortwave infrared Amount of water in vegetationand soils
8 Panchromatic Distinction of areas
Bands 1,2,3,4 and 5 were selected as false colour composite RGB from TM 5 and 7, with the
exception of band 6 as a thermal band, were based on the optimum index factor (OIF). The OIF
was used in this study to achieve the optimum spectral discrimination between different land-
cover types, especially those with similar spectral properties.

Chapter 5 LUC using R and S
114
5.2.4.5 Image classification
Digital-image classification is a remote-sensing technique intended to categorize all pixels in
a digital image into one of several land-cover classes, or ‘themes’ (Jensen, 2005). This
categorized data may then be used to produce thematic maps of the land cover present in an
image. Normally, multispectral data are used to perform the classification. Image classification
is perhaps the most important part of digital-image analysis (Zakaria, 2010).
Traditional methods of classification encompass two approaches used for agricultural land-
cover mapping, namely unsupervised and supervised classification, which are often called hard
classification (Zakaria, 2010).
Unsupervised classification involves algorithms that examine the unknown pixels in images
and aggregate them into a number of classes based on the natural groupings or clusters present
in the image values (Elhag, 2006). This classification can be applied when the analyst has no
prior knowledge of the study area and has carried out no field-data collection program.
This technique’s advantage, compared to the supervised method, is that it does not require
fieldwork and can be accomplished quickly (Ghodieh, 2000). Supervised classification,
however, does require prior knowledge of the ground cover in the study area and is, therefore,
a more intuitive method for LCC mapping (Rogan and Chen, 2004).
In the supervised approach, calibration pixels are selected for LCC and associated statistics are
generated for the classes of interest (Rogan and Chen, 2004). This classification is preferred by
most researchers because it generally provides more accurate class definitions than
unsupervised approaches (Zakaria, 2010). Therefore, this study used the supervised
classification method to characterise changes in the LCC.
5.2.4.6 Supervised classification
Supervised classification consists of three basic steps; 1) In the training stage, the analyst
identifies representative training areas and develops a numerical description of the spectral
attributes of each land-cover type of interest in the scene; 2) in the classification stage, each
pixel in the image data set is categorized into the land-cover class it most closely resembles. If
the pixel is insufficiently similar to any training data set, it is usually labelled ‘unknown’. The
category label assigned to each pixel in this process is then recorded in the corresponding cell
of an interpreted data set as an output image. Thus, the multidimensional image matrix is used
to develop a corresponding matrix of interpreted land-cover category types; 3) after the entire
data set has been categorized, the results are presented in the output stage (Elhag, 2006). In a
supervised classification, three statistical classifiers are generally used: the parallelepiped

Chapter 5 LUC using R and S
115
method, the minimum distance classifier and the maximum likelihood algorithm (Zakaria,
2010).
Figure 5.1: Flow-diagram processing steps of (SOPT& Landsat) images classification carried out for
derivation of land-cover information from remote-sensed data.
TM
1990
PSLV-CA
2013
TM
1986
ETM
2002 MSS
1972 OLI/TIRS
2013
Atmospheric
Correction
Unsupervised
Classification
Supervised
Classification
Filtering
Accuracy
Assessment
Sampling
ground Survey
Existed land
cover map
Land Cover Map of the whole district
1986 1972 1992 2000 2013
Land Cover Map (forest and
deforested area) 2010 2013
Remotely
sensed
data
Digital
Image
processing
Land cover
Map
Development
Band combination
(image
enhancement)
Spot imagery Landsat
imagery
Geometric
correction
HRGs
2010

Chapter 5 LUC using R and S
116
This study used maximum likelihood classifier in the image analysis. It is commonly used as a
hard classifier because each pixel is treated as statistically independent and allocated only to a
single class. This is one of the traditional parametric approaches widely applied to the
supervised classification of remotely sensed data (McIver and Friedl, 2002). Samples of pixels
are selected based on available ground truth information to represent each class; these steps are
called training areas.
The process in this study began by selecting training areas that are representative and
homogeneous examples of each information category used in the classification stage. The
training areas for the classes were selected, topographic maps and information collected on-
site.
These training areas were chosen by the visual interpretation of Landsat and SPOT and by
locating them in the area. The colour was changed to contrasting combinations to differentiate
and enhance classes. A total of six classes were determined from Landsat 1972, 1986, 1992,
2002 and 2013, as well as SPOT 5 for 2010 and 2013.
5.2.5 Fieldwork
Fieldwork, the process of observing and collecting data about people, cultures and natural
environments, is important for most applications of remote sensing. Lillesand et al. (2004)
pointed out that field-survey data serve three purposes. First, field data can be used to verify,
to evaluate, or to assess the results of remote-sensing investigations. Second, field data can
reliably guide the analytical process, for example, by creating training fields to support
supervised classification. Third, field data can provide information to model the spectral
behaviour of specific landscape features, allowing for a better understanding of the spectral
signatures of various types of land use and land-cover change in the area of study.
In the fieldwork which was conducted during the period between December 2013 and April
2014 in order to examine the patterns of land cover in the study area in different years, a very
good opportunity arose to take video and aerial photographs from the sky by helicopter,
because it was difficult and dangerous to enter some forest patches on foot. For the purposes
of this study, the helicopter obtained video camera and photos of the ground with permission
from the Ministry of Defence on February 21, 2012 (see Appendix 6) in order to show how
people had cleared forest land using bulldozers and weapons after the uprising in Libya in
2011.

Chapter 5 LUC using R and S
117
5.2.6 Image classification accuracy
The classification accuracy assessment of derived land use/land cover maps from remotely
sensed data is the procedure to quantify the reliability of a classified image, which is important
to identify the sources of errors (Ghodieh, 2000). A classification is incomplete until its
accuracy has been assessed (Zakaria, 2010).
Accuracy assessment presented by a confusion error matrix by Kappa coefficient is a common
and typical method (Congalton and Green, 1999). The Kappa coefficient (K) is calculated as
follows:
𝐾 = 𝑁 ∑ 𝑋𝑖𝑖 − ∑ 𝑋𝑖
𝑟𝑖=1 + 𝑋+𝑖
𝑟𝑖=1
𝑁2 − ∑ 𝑋𝑖𝑟𝑖=1 + 𝑋+𝑖
Where:
r = Number of rows/columns in the confusion matrix
Xii = Number of observations in the major diagonal in row i and column i
X+i = Total number of row i
X+I = Total number of column i
N = Number of observations
The Kappa statistic provides a statistically valid assessment of the quality of classification
(Tottrup and Rasmussen, 2004); therefore, it was used in this study to assess overall class of
agreement or accuracy. A Kappa value higher than 0.5 is considered satisfactory for modeling
land-use change (Pontius, 2000). Characterized agreements for the Kappa coefficients are as
follows: values greater than 0.79 are excellent, values between 0.6 and 0.79 are substantial and
values of 0.59 or less indicate moderate or poor agreement (Landis and Koch, 1977).
The overall classification accuracy is the percentage of correctly classified samples of an error
matrix. It is computed by dividing the total number of correctly classified samples by the total
number of reference samples. It can be expressed by:

Chapter 5 LUC using R and S
118
𝑂𝑣𝑒𝑟𝑎𝑙𝑙 𝑎𝑐𝑐𝑢𝑟𝑎𝑐𝑦 (𝑎) =1
𝑁 ∑ 𝑎𝑘𝑘
𝑛
𝑘=1
Where:
A = Individual cell values
k+a = Row total
ka+= Column total
n= Total number of classes
N = Total number of samples
5.2.6.1 Landsat accuracy
Accuracy assessment was applied to all land-cover maps produced from satellite imagery by
comparison with aerial photography and through Kappa coefficient calculation. After using the
methods mentioned previously, the accuracy result for each land-cover map was obtained and
summarized in table 5.4. Post-classification analysis, judged to be the most accurate procedure,
also had the advantage of indicating the nature of the changes that had occurred.
For instance, the classification accuracy obtained from Landsat 8 2013 image classification
was 86%. Classification results were assessed by using the known land-use information
obtained from the field during the training stage and the field-sampling survey.
Table 5.4: Classes and points collected for accuracy in the study area of forest land
Classes Forest Irrigated land Rain-fed land Sand dunes Settlements Total
Forest 50 0 6 0 2 58
Irrigated 0 40 2 0 1 43
Rain-fed land 3 0 30 1 0 34
Sand dunes 0 0 1 40 3 44
Settlements 1 0 0 2 18 21
total 54 40 39 43 24 200
Overall Classification Accuracy = (50+40+30+40+18) / 202 = 178 / 200 = 0.89
Expected Classification Accuracy = 8574 / 40000 = 0. 21
Kappa Statistic = (0.89 – 0.21} / {1 – 0.21) = 0.86 = 86%

Chapter 5 LUC using R and S
119
5.2.6.2 SPOT imagery accuracy
After the fieldwork, including ground truthing, was successfully finished using Landsat time
series data to map LC for the whole area of Algarabulli district, a good opportunity was
presented to use SPOT imagery which are very high resolution for the years 2010 and 2013,
Based on the forest map in 1985, forest maps (nine sheets covering the study area) were used
in this study, The first step was to mosaic these maps into one map with georeferencing, then
digitize the maps as polygons by selecting forested area only, where these area polygons were
projected on SPOT 5 imagery 2010 and SPOT 6 2013 for image classification.
In order to achieve a very good accuracy, SPOT imagery used for forest land and how LCC
took place and evaluated how and for what purpose forest land was cleared and made it possible
to estimate the rate of deforestation.
An accuracy assessment for SPOT 2013 was conducted by using 291 points, which included
five classes: forest high density, forest low density, irrigated land, sand dunes and settlements
to develop land-cover maps for the years 2010 and 2013 based on the forest map in 1985.The
Kappa coefficient took a value of 0.89 and an overall accuracy of 92.1%.
In addition, to estimate annual deforestation rates, this study adopted the method proposed by
the FAO (Souza et al., 2013). The area of forest lost to deforestation is assumed to decrease
over time at an exponential rate, given by:
𝑟(𝑡−1,𝑡) = (1
𝑡2 − 𝑡1) × 𝑙𝑛 (
𝐴𝑡2
𝐴𝑡1)
𝐷𝑡 = 𝐴𝑡−1 × (1 − 𝑒𝑟𝑡−1,𝑡)
For instance, for t = 2001 and t−1 = 200, the annual deforestation rate in the above equation is
obtained by:
𝐷2001 = 𝐴2000 × (1 − 𝑒𝑟2000,2001)

Chapter 5 LUC using R and S
120
5.3 Results and discussion
5.3.1 Land cover (Landsat imagery)
The result of Landsat imagery processing techniques used to produce the land-cover maps for
the five classes of land-cover types was clearly visible and occurred from five Landsat (MSS,
TM, ETM and OLI/TIRS) images from 1972 to 2013. The change in land-cover classes was
not uniform across all classes.
The overall accuracies result of the Landsat classifications of 1972, 1986, 1992, 2002 and 2013
were 82%, 83%, 84%,83% and 86% respectively, with corresponding Kappa statistics of 0.64,
0.65, 0.68, 0.65 and 0.70 respectively. The overall accuracy for each land-cover map was
comparatively high; all of them reached more than 80%. The classification accuracy above
73% is often accepted as mentioned in the remote-sensing literature (Lillesand et al., 2004).
Land-cover classes used in this study, defined from ground-truthing field surveys, included
rain-fed agriculture, irrigated agriculture, sand dunes, forest and settlement (Table 5.5).
Positive and negative changes in land cover were found in these areas, particularly in the forest
area and the sand dunes.
Table 5.5: Area (ha) of each land-cover class and their percentage from 1972 to 2013
Class 1972 1985 1992 2002 2013
Area
(ha)
% Area
(ha)
% Area
(ha)
% Area
(ha)
% Area
(ha)
%
Rain-fed 23,014 59.8 15,556 40.4 12,458 32.3 14,160 36.8 17,190 44.6
Irrigated 218 0.6 11,924 31.0 11,212 29.1 10,580 27.5 9,621 25.0
Sand dunes 10,620 27.6 30 0.1 4,360 11.3 5,505 14.3 7,350 19.1
Forest 4,510 11.7 10,530 27.3 9,950 26.0 7,605 19.7 3,350 8.7
Settlement 138 0.3 460 1.2 520 1.3 650 1.7 989 2.6
5.3.1.1 Rain-fed agriculture
In this class, rain-fed lands include areas characterised by natural and semi-natural vegetation;
shrubs; fruits such as olives, almonds and figs; and wheat and barley, which depend on rain.
This type of land cover comprised 44% of Algarabulli’s total area in 2013.

Chapter 5 LUC using R and S
121
5.3.1.2 Irrigated agriculture
These areas depend on groundwater for crop vegetables and for fruits such as citrus. The area
of irrigation was estimated to be 218 ha in 1972; however, it increased dramatically to 15,556
ha in 1985 due to agricultural development projects and the government’s support of farmers
by supplying equipment and well drilling. However, the area of irrigation then decreased
gradually due to water shortages and seawater intrusion. poor enforcement of groundwater
abstraction regulations during the last three decades allowed people to drill wells and cultivate
any kind of crop they wished, including those that consume a great deal of water, such as
watermelons and potatoes.
5.3.1.3 Sand dunes
Sand dunes which include marine and continental dunes, were estimated to encompass 10,620
ha in 1972. However, due to great efforts by the government to stop sand-dune movement, an
estimated 50 ha of dunes were converted to forest land. However, dunes appeared again in
1992 due to deforestation.
5.3.1.4 Forest
Forest includes both high- and low-density forest. As stated in chapter two, the plantation forest
project started in 1952 in this area and ended in 1974. Planted forests were an estimated 4,510
ha in 1972 and increased to 10,530 ha in 1985 before decreasing gradually due to deforestation
(see further information in section 5.3.2).
5.3.1.5 Settlement
Settlement areas represent the urban areas and buildings distributed in the rural area, which
have increased from 0.3% of total area in 1972 to 2.6% in 2013.
5.3.2 Land cover change (SPOT imagery)
Land-cover conversions constitute the replacement of one cover type by another as in the case
of agricultural expansion, deforestation or changes in the urban extent (Lambin et al., 2006).
The result of the processing techniques used on the SPOT imagery, focused mainly on forests
cover and how forests were converted to other type of land cover and to produce the land-cover
maps for the five classes of land-cover types was clearly visible.

Chapter 5 LUC using R and S
122
An accuracy assessment for SPOT 2013 was conducted by using 291 points, which included
five classes: forest high density, forest low density, irrigated land, sand dunes and settlements
to develop land-cover maps for the years 2010 and 2013 based on the forest map in 1985.The
Kappa coefficient took a value of 0.89 and an overall accuracy of 92.1%.
Table 5.6: Area (ha) of each land-cover class in each image and their percentage for
1985, 2010 and 2013
Class 1985 2010 2013
Area (ha) % Area (ha) % Area (ha) %
Forest 11011 100 7991 72.5 4108 37.3
Rain-fed area 0 0 1580 14.4 3858 35.0
Sand dunes 0 0 1011 9.2 2145 19.5
Irrigated area 0 0 297 2.7 615 5.6
Settlement 0 0 132 1.2 285 2.6
Total 11011 100 11011 100 11011 100
Results indicated that forest cover has been drastically reduced by a conversion to other land
use as a result of agriculture, sand dunes and urban expansion.
In the arid and semi-arid areas, the conversion of desert to productive land has become a
worldwide issue. In Egypt, agriculture is the core goal for any development strategies and
sustainable development planning (Shalaby and Ali, 2010).
It is generally agreed in some region that the world’s extensive forested areas are rapidly being
converted to agricultural and pastoral use, and that agriculture remains the main direct cause
of such deforestation due to an increase in the global food demand (Casse et al., 2004).
Comparing the supervised classifications shown in figure 5.2 helped to determine for which
land use forest was converted. From the period of 1986 to 2010, 28% of the total area of forest
land was converted to another land use, and almost 17.1% was converted to agricultural land
(with an irrigated area of 2.7% and a rain-fed area of 14.4%) 9.2% converted to sand dunes and
1.2% was converted to settlements.
Between 2010 and 2013, more forest was cleared for agricultural land: agricultural land
represented 40.6% (5.6% irrigated land and 35% rain-fed land) of total cleared area.

Chapter 5 LUC using R and S
123
An increase in sand dunes occurred that was not seen in 1985, increased from 9.2% in 2010 to
19.5% of the total area in 2013.
Figure 5.2: Area (ha) of each land-cover class change in the years 1985, 2010 and 2013
Figure 5.3: Forest cover in the Algarabulli district in 1985 (based on Libya forest map)
0
1000
2000
3000
4000
5000
6000
7000
8000
9000
10000
11000
12000
1985 2010 2013
Are
a/h
a
YearsForest Rain-fed Sand dunes Irrigated Settlements

Chapter 5 LUC using R and S
124
Figure 5.4: Land cover and land use classification in the Algarabulli district in 2010
Figure 5.5: Land cover and land use in the Algarabulli district in 2013

Chapter 5 LUC using R and S
125
5.3.3 Deforestation rate
As a result of supervised classifications in this study, the annual deforestation rate was
compared among three different periods (1985–2010 and 2011–2013), which allowed the
annual rate of deforestation within 24 years and 3 years to be determined (see table 5.7).
Table 5.7: Annual rate of forest loss in study zone (ha/year) for 1985, 2010 and 2013
Year Forest
area
(ha)
Forest as
% of total
area
Annual
forest loss
(ha/year)
Annual
percentage rate
of deforestation
(ha/year)
Percent of
forest cover
remaining
Percent of
forest loss
1986 11011 26.5 ----- -------- ----
2010 7991 19.2 142 1.3% 71% 27%
2013 4108 9.8 1295 19.8% 36% 35%
Forest area was estimated to be 11,011 ha in 1985 and was estimated to be 7,991 ha in 2010
(after 24 years). As a result of SPOT imagery classification, the annual rate of forest loss was
estimated to be 142 ha per year (1.3% per year). Therefore, 27% of forest cover was lost by
this time .
In contrast, forests around Tripoli in the northern Jefara Plain were estimated at 14,705 ha in
1986 and were estimated once again at 7,039 ha in 1993 (Kresegh, 2002). The annual rate of
deforestation in this period is estimated to be 1,100 ha per year (7.5% ha per year). Because
these forests surround Tripoli, they were cleared for urban expansion (El-Tantawi, 2005).
The second period compared 2010 and 2013, covering the period of the uprising. Forest cover
was estimated in 2013 at 4,108 ha; as a result, the annual deforestation in this period was very
high— 1295 ha per year (19.8%), by 35% of the forest cover was lost.
Comparing the rate of deforestation in 2013 in the study area, which was estimated to be 1295
ha per year, with the deforestation rate in the whole country of Tunis in 2013, which was 2,050
ha, found that the deforestation rate in this area was higher than the deforestation rate in Tunis
despite the fact that Tunisia witnessed a revolution in 2011, as Libya did.
If the current rate of deforestation (1295 ha per year or 19.8% year) continues, the area could
lose its remaining forest cover by 2016.

Chapter 5 LUC using R and S
126
Figure 5.6: Forest cover in Algarabulli District in 1985, 2010 and 2013

Chapter 5 LUC using R and S
127
Ataya Forest Block
0
20
40
60
80
100
Karawa Forest Block
Gawea Forest Block
Fo
res
t C
ov
er
(%)
0
20
40
60
80
100
Rawajih Forest Block
Kawaleg Forest Block
Years
1985 1990 1995 2000 2005 2010
0
20
40
60
80
100
All Forest Blocks
1985 1990 1995 2000 2005 2010
Figure 5.7: Remote sensing (SPOT imagery) estimates of the rate of deforestation in percent between
(2010-2013) in all forest blocks: the index of forest clearance in percentage in and the standard
deviation the whole area in below figure and forest clearance in percentage in each forest block in
figures above.
In addition, the results of the supervised classification map show a clear difference in
deforestation rates between the forest blocks in the study area. The rate of deforestation varies
from one block to another where each block is located in a different village with a different
administration.

Chapter 5 LUC using R and S
128
When compared to the above satellite image, results of the percent of forest lost in two different
periods (before the fall of Gaddafi regime and after) agree with results from the interviews
reported chapter three.
Figure 5.8: Location of the localities within the study area.
The deforestation rate varied from block to block during these two different periods. In the
first period between 1986 and 2010, the rate of deforestation was higher in the Al-Ataya than
the blocks. It was the biggest block of forest in the study area in 1985, estimated at 4,020 ha,
but decreased to 1,766 ha in 2010, with 2,254 ha lost by this time and with an annual
deforestation rate at 94 ha per year over this period and 643ha in 2013 with an annual
deforestation rate at 374 ha per year between 2010 and 2013.
In other blocks of forest the annual deforestation rate in the period of 2010 was in Alkarawa,
Algawea, Alrawajh and Alkawalig forest block at 12, 7, 8 and 3 ha per year respectively, but
in 2013 the annual deforestation rate was 398, 327, 173 and 22 ha per year respectively.

Chapter 5 LUC using R and S
129
Figure 5.9: Forest area in each forest block for the years of 1985, 2010 and 2013
In addition, figure 5.10 shows the development of road networks in the Algarabulli district
between 1985 and 2010, and how the establishing roads have contributed to more
deforestation particularly in Ataya forest, as discussed in chapter three.
More maps on forest cover, forest density and land use change in Algarabulli District’s
localities are presented in Appendices 4 and 5.
0
500
1000
1500
2000
2500
3000
3500
4000
4500
1985 2010 2013
Are
a in
ha
Al-Ataya Al-Karawa AL-Gawea AL-Rawajh Al-Kawaliq

Chapter 5 LUC using R and S
130
Figure 5.10: The development of road networks in the Algarabulli district between 1985 and 2010

Chapter 5 LUC using R and S
131
5.3.4 Forest degradation
As well as forest clearance, forests also experienced a reduction in density due to forest
degradation. The patterns of forest degradation observed in the field included forest fires,
cutting, overgrazing, the death of the trees over time and, because management was stopped,
diseases and insects.
High density forest is where there are more than 200 trees/ha and low density forest is fewer
than 200 trees/ha (Idris et al., 1993). The results of the supervised classification show the forest
degradation rate in table (5.8), the area of high density forest was estimated in 1985 to be
11,011 ha, but in 2010, the high density forest decreased and was estimated to be 1,215 ha,
while low density forest increased from zero to 5,791 ha. 52% of forest area was degraded from
high to low density between 1985 and 2010. In 2013, low density forest was estimated at 2,182
ha, representing 86% of the total area of the forest and low density forest was estimated at 350
ha. The rate of forest degradation from 1985 to 2010 was estimated at 286 ha per year, or 2.6%
ha per year, and was estimated between 2010 and 2013 at 1,609 ha per year or 28% ha per year.
Table 5.8: Forest density during the years of 1985, 2010 and 2013
Class of forest* 1985 2010 2013
High density forest 11011 1215 350
Low density forest - 5791 2182
Total forest 11011 7006 2532

Chapter 5 LUC using R and S
132
Figure 5.11: Forest cover and density in Algarabulli forest blocks in 1985.
Figure 5.12: Forest cover and density in Algarabulli forest blocks in 2010.

Chapter 5 LUC using R and S
133
Figure 5.13: Forest cover and density in Algarabulli forest blocks in 2013
In general, forest cover continues to be degraded in all regions of Libya in quality and density
(Ben-Mahmoud, 2013). Natural and planted forests alike are under severe pressure due to
cutting, overgrazing and fires. Some reports estimated that forest fires in the natural forest in
the Al-Jabal Al-Akdar region burned 24,905 ha in the period between 1988 and 2005 (Forestry
Department, 2006). Government reports have also found that forest fires increased after 2011.
However, no data has been made available estimating how the forest fires happened or
providing the forest degradation rates in these areas.
On average, 1% of all forests were reported to be significantly affected each year by forest fires
(FAO, 2011a). Forest fires in Tunisia have recently affected a larger surface area compared to
previous years (1,700 ha in 2011 and 2,050 ha in 2012). This acceleration is due to a range of
factors, such as the lack of forest law enforcement and long-term conflicting relationships
between local populations and the forest administration (Daly-Hassen, 2013).
Chapter 5 LUC using R and S
134
5.4 Conclusions
Remote sensing is a powerful tool for the regional mapping of natural resources. Therefore, the
current chapter discusses how land cover was changed using some imagery during the past four
decades and the stages of development it was used to supervise classification.
The result shows that, within this period, the land changed from negative (sand dunes before
1960) to positive (forest cover); however, the land cover experienced other changes, from
positive (forest cover) to negative (sand dunes again).
The results of supervised classification for land use change and deforestation have shown how
the forest land was changed and to which type of land cover forests change.
The deforestation rate of the whole forest area was higher after the 2011-2013 uprising,
estimated at 2017 ha/year. The percent of forest loss was 41% of the total forest area; however,
within the period 1986-2010, the deforestation rate was 198 ha/year and the percent of forest
loss was 37% of the total forest area, where the remaining forest was 22% of total forest area.
In addition, the deforestation rate in each forest block is different.
Comparing the estimated rate of deforestation obtained using remote sensing with the
respondents’ estimated rate deforestation revealed that the two were almost the same.
Currently only 36% of the originally planted forest remains which is also suffering from severe
degradation such as selective cutting and thinning. Forest department records showed that
forest clearers in the study area numbered just 150 people (representing just 2% of all
households) who between them cleared approximately 6907 ha from 1986 to 2013.
If deforestation continues at the current rate, all forest will be lost within three years or by 2016.
Due to the total breakdown in governance, deforestation in Libya nowadays is one of the
biggest environmental challenges.
The following chapter 6 explains the contribution of Libyan forest policy and management to
forest cover change and focused mainly on the forest laws and land laws and why and how
forest governance was changed and contributed to deforestation.

Chapter 6 Forest Policy and Management
135
6 The Contribution of Libyan Forest Policy and Management to
Forest Cover Change
6.1 Introduction
Forestry law encompasses national, regional or international laws, particularly those
concerning the conservation of biological diversity, forest management and resource use rights;
it also considers legislation on property tenure, the rights of indigenous people and labour and
community welfare (Heeswijk and Turnhout, 2013). Forestry legislation comprises specific
laws and their implementing regulations for the sector (Schmithüsen, 1986). In some countries,
forestry legislation is a very complicated issue because of the existence of an excessive number
of laws concerning the same issue (Athanasiadis and Andreopoulou, 2013). Growing concerns
have arisen with regard to illegal activities in the forestry sector, and efforts have been made
towards understanding the causes and consequences of non-compliance with forestry laws
(Foundjem-Tita et al., 2014). In forestry, illegal activities include the degradation of forests
and forest-related goods and services; complying with the laws and regulations that govern
these activities is therefore crucial in achieving good governance in the forestry sector
(Contreras-Hermosilla and Peter, 2005).
Under such laws, illegal forestry activities are defined as spanning a wide range of acts,
amongst which are the occupation of forest lands and the illegal harvesting, transportation and
trading of forest products (Foundjem-Tita et al., 2014). Although illegal forestry activities are
not limited to developing countries, such practices tend to be more widespread and severe in
these regions (Suominen and Hansen, 2012). In these countries, laws are an important part of
a forestry policy framework (Voitleithner, 2002) and land use development law (Sparovek et
al, 2012), which is a product of political processes and an instrument for the implementation
of forestry policy (Voitleithner, 2002).
Human–forest relations, protection, conservation and forest development are approached under
forestry laws with multiple use principles as foundation, with implementation aiming to fulfil
the need to plan on the basis of use values (Coşkun and Gençay, 2011).

Chapter 6 Forest Policy and Management
136
Compliance with laws plays a critical role in ensuring good governance and sustainable
development (Suominen and Hansen, 2012), and ‘compliance’ is defined as all actor
behaviours that respect the prescribed rules that govern specific activities (Foundjem-Tita et
al., 2014). Lack of compliance is associated with illegal activities, corruption, inequality and
unsustainable use of resources.
Globally, long-standing national efforts have been exerted to enhance forestry law compliance,
but this issue has recently elicited increased regional and international attention because of
documented high levels of illegal forest activities in many countries, particularly in developing
nations (Hansen, 2011). The forestry landscape in these countries is characterised by a long
history of non-compliance with forestry law, with violators engaging in extensive
deforestation. For example, numerous Brazilian producers have been undertaking illegal or
illegitimate operations. Producers typically convert forests into agricultural lands, thereby
prompting developed and developing countries to issue forest acts that mandate full compliance
with forestry laws (Sparovek et al., 2012).
In some countries, weak law enforcement, combined with corruption and connivance, has
resulted in tremendous forestry-related losses. In most Mediterranean countries, forestry laws
regulate the management of forest protection services, and this law is particularly strongly
implemented in Bulgaria, Croatia and the former Yugoslav Republic of Macedonia (FAO,
2013); in Brazil, forestry law is the most important legal framework for the conservation of
most of the remaining 367 Mha of forest in the region (Sparovek et al., 2012).
Definition of ‘forest’ is critically important because it delineates the scope of forest science
(Athanasiadis and Andreopoulou, 2013). Libyan forest legislation has no precise definition of
‘forest’, but it defines ‘environment’ in the first chapter of Article 1, Law No. 7 of 1982 under
environment protection. In this chapter, ‘environment’ refers to the realm where humans and
all animate organisms (which include the air, water, soil and trees in residential areas) live,
work or engage in other activities. The definition also includes all other similar places. This
definition indicates that environmental legislation is only a scientific description of any act
(e.g. those that involve the use of chemicals and natural or man-made activities) that may
directly or indirectly affect the environment.

Chapter 6 Forest Policy and Management
137
The government of Libya has been one of the leading developing countries to give due attention
to environmental protection, as confirmed by the inclusion of such protection in several laws,
legislations and regulatory frameworks. Although Libya has no laws that protect genetic plant
resources, it regulates the importation and exportation of plant materials through quarantine
and phytosanitary legislation. All plant materials visibly free from any infection can be
transported to and from Libya. Furthermore, the country is a party to the 1951 Plant Protection
Convention in Rome. The protection laws signed during the convention provide for the
protection of forests and rangelands, agricultural lands and trees.
The policy of forest plantations in Libya is intended to combat desertification, stop sand dune
movement and protect forest resources. Whether preventing illegal logging or clearance, the
government has developed a range of laws and regulations under forest protection legislation
since 1947 and has regulated the management of forests and investments in forest trees. The
latest law that has been issued is Law No. 14 of 1992, which is still in force but has not been
developed or amended.
The research question of this chapter is; how Libyan forest policy and management contributed
to forest cover change. Therefore, to address this, the chapter focuses on Libyan forest policy
and management - primarily on forest protection laws, land ownership and forest governance
summarising relevant laws and decrees issued in Libya. It also evaluates these issues
specifically in relation to whether the increased deforestation in the country over the last three
centuries is the result of the weak forest protection laws issued and enacted by legislative
authorities. These policy-making and regulatory bodies may need to tighten Libyan laws and
regulations or modify forest governance, under which the laws are implemented.
Vulnerabilities in law enforcement or corruption can strongly constrain sustainable forest
management. These problems give rise to an urgent need to control illegal activities or flawed
legal/regulatory implementation through initiatives that improve forestry law enforcement and
governance. Finally, this chapter seeks to identify whether forest land ownership is determined
by law or custom.
To tackle this issue, a review of forest and land laws that were issued with regard to protecting
the forest was undertaken, including the resolution. This was then followed by an evaluation
of these laws and historical forest management. How forest management was changed, based
on interviews with current government officials and legal experts was then investigated.

Chapter 6 Forest Policy and Management
138
6.2 Methods
Semi-structured interviews using open-ended questions and face-to-face interviews were
conducted with 10 government officials, mainly the Minister of Agriculture, the Deputy
Minister of Agriculture, the head of the Forestry Department, the Director of the Environment
Public Authority, the Director of the Public Authority for Combating Desertification, and the
Director of Forestry Department and Agriculture in the study area. All these interviews were
conducted in their offices. Interviews were also conducted with five legal experts in civil law
(forest protection laws, land law and the system of land registration), as well as some judges to
assess the causes of deforestation in Libya, to determine whether Libyan forestry laws are
indeed deficient and to ascertain whether any changes have been applied to forest
administration or governance, (see Appendix 2).
Also informal interviews was conducted with five ex-government officials (from the former
regime and during the period of the Kingdom of Libya) who were in charge of the Forestry
Department from 1951–1969. These interviews were conducted between December 2013 and
March 2014.
All the interviews were conducted in Arabic and the selected quotes were translated to English
for coding and categorizing patterns or themes found in the qualitative data. All the respondents
were guaranteed anonymity.
In addition to interview, archival materials on official reports on forest legislation dating back
to 1947 were consulted. These sources were obtained from the Ministry of Agriculture and
some of forestry experts.

Chapter 6 Forest Policy and Management
139
6.3. Results and Discussions
6.3.1 Libyan forestry law
To prevent encroachment in Libya’s national forests, the legislative and administrative
authorities of the state issued forestry legislation (for natural and planted forests) and protective
measures, followed by decision making on which forests are to be declared as protected areas
(FAO, 1955). The first law was enacted during the Italian colonisation, with Italy issuing a
Royal Decree in 1930 to protect the forests that had been cultivated by the Italian government
in Libya; this law was in effect in Tripolitania state up to 1950 (FAO, 1955).
During the British Administration in 1947, the higher legislative committee of Cyrenaica state
issued the first law regarding forest and pasture protection. The law was considered an
important deviation from legal and legislative versions and was intended to enable the state to
face the challenges presented after the Second World War. These challenges included the
poverty experienced in Libya, especially during the British Administration. The
aforementioned law was in effect in Cyrenaica state up to 1950, at which period the state then
issued Law No. 25 of 1950, another forest and pasture protection law (FAO, 1955). This law
was not enacted for technical reasons (FAO, 1955).
Table 6.1: Laws issued to protect forest in Libya.
Act No Years Title of text Comment
1 1947 Protection of grasslands and forests Abolished in 1950
8 1951 Protection of grasslands and forests Abolished in 1952
12 1956 Protection of grasslands and forests. Abolished in 1971
47 1971 Protection of grasslands and forests Amended with law no75 of 1972
75 1972 Protection of grasslands and forests Abolished in 1982
5 1982 Protection of grasslands and forests Amended with Law No. 14 of 1992
14 1992 Protection of grasslands and forests Still in force
Source: Ministry of Justice /Libya, Information and Documentation Centre.
When the programmes for sand dune stabilisation and forest plantation were initiated, the
government issued Law No. 12 of 1956 for forest protection. The formulation and enactment
of this law highlighted the need for qualified forestry personnel, thereby prompting the
government to establish a forest guardian school in April 1955; the school was later converted
into a forest police centre that is mandated to document meetings, submit such records to the
current jurisdiction and appeal forestry cases in courts (Aljduaa, 1970).

Chapter 6 Forest Policy and Management
140
After the changes of governance system from monarchy to military in 1969, forest protection
Law No. 47 of 1971 was issued and then amended with Law No. 75 of 1972, which was
abolished in 1982. Under Law No. 47, the most important article is Article 4, which mandates
forestry administration and land registry and documentation to compel the registration of forest
lands. The other articles covered by Law No. 47 include those that guarantee protection,
mandate inspection, impose punishments, fines and liabilities and regulate investments. After
Law No. 47 of 1971 was abolished, Law No. 75 of 1972 was issued. Law No. 5 of 1982 was
ratified to identify all the forests and pasture lands (whether public or private) over which Libya
has jurisdiction.
This law comprises 20 articles on punishments and fines. It restricts plant/tree burning and
cutting and the disposal of harmful materials on forests and pasture lands. It also requires land
owners to rehabilitate the sand dunes located within their lands and to preserve soil.
In 1992, Law No. 1427 was amended with Law No. 5 in an attempt to rectify the errors
committed by some officials of the agricultural authorities in certain regions of Libya. These
errors include the issuance of usufruct contracts for forest areas. Article 1 of Law No. 14
stipulates the adaptation of some Law No. 5 articles on the operations of regulatory authorities
and illegally issued usufruct contracts. Article No. 23 of 1992 indicates the following:
1. A Fine of not less than 1000 LD and not more than 3000 LD shall be imposed on those who
disobey the rules stipulated in Articles 6,7, 14, 16, 17 and 22 of this law.
Articles 6 and 7 prohibit investment in forest trees, especially those located in areas that are
declared as conserved forests, without Ministry of Agriculture resolution that outlines
investment conditions. Article 14 prohibits setting fires in forests and pasture lands or in sites
that are less than 200 m away from such lands without obtaining written consent from the
Agricultural Inspection Centre. Article 16 prohibits the cutting, collection, burning, transport
or extraction of forest or pasture materials for production. The article also forbids forest
cleaning, cultivation or ploughing for any reason, as well as the construction of buildings and
the closing, construction or establishment of roads, paths or water canals. Finally, Article 16
prohibits the installation of traps or nets on forest or pasture lands, the use of firearms, toxic
materials or explosives and the discharge of materials that can affect forests or pastures.
27 This law considers that all usufruct contracts that are awarded on forest lands are illegal.

Chapter 6 Forest Policy and Management
141
Article 17 forbids the destruction, removal and transport of forest and pasture materials,
installation of signs or separating fences and installation of information signs or signs that
indicate forest or pasture production on the edges of the lands in question. It also prohibits
modifying or destroying existing marks or signs regarding wood/forest or pasture production.
Article 22 mandates the abolition of activities that negatively affect forest lands, such as the
issuance of usufruct contracts and the revocation of all such registrations. This article also
covers effective packing regulations and the demolition of all buildings and establishments that
are erected on forest lands, with expenses charged to violators. Article 22 can be used as
reference in turning over issuers of usufruct contracts to the jurisdiction of authorities who can
apply sanctions in accordance with the legislation in force. Another specific stipulation in the
article is as follows:
2.A fine of not less than 100 LD but not exceeding 200 LD shall be imposed on anyone
disobeying Article 21 rules, which declare that anybody who wishes to cut or invest in trees
via a forest usufructs should obtain a license from the Ministry of Agriculture. The applicant
should declare his/her reasons for wanting to cut and invest in trees and to outline procedures
that should accord with the regulations indicated in the license. Otherwise, all such activities
will be deemed illegal.
Several other resolutions have been issued by the executive administrative bodies of the state.
These resolutions revolve around forest protection and the prevention of deforestation, for
which the Ministry of Agriculture is the administrative managing body. These resolutions,
which were issued by the General Popular Committee on Agriculture and Land Reform, are as
follows:
Table 6.2: Resolutions issued to protect forest in Libya
Resolution
No
Year Title of text Purpose
3 1984 Forest and Pasture Protection Actions necessary to protect forests and
pastures from fire
127 1990 Forest and Pasture Protection Protection of animals and forest trees
676 1993 Forest and Pasture Protection Stipulates the rectification of harmful
acts imposed on forests lands

Chapter 6 Forest Policy and Management
142
In addition to a series of agreements on environmental protection, the agreement drafted during
the Rio Convention on Biological Diversity was signed by Libya in 1992 and ratified in 2002
(Jibril, 1999). When Libya became highly vulnerable to desertification and land degradation
problems, the government ratified the laws indicated in the United Nations Convention to
Combat Desertification on 22 July 1996 and assigned the People’s Committee of the
Agriculture General Authority as the focal regulatory body (Jibril, 1999).
The Forest Law Enforcement is amongst the recent attempts to combat deforestation and
promote the crucial role of the state in such endeavours; it focuses on law enforcement and
sustainable forest development (Heeswijk and Turnhout, 2013). In some countries, many
forestry laws are unenforced or under-utilised and that non-compliance can be attributed to five
general factors: (i) flawed policy and legal frameworks, (ii) low enforcement capacity, (iii) lack
of information about forest resources and illegal operations, (iv) corruption and (v) high
demand for timber (Hansen, 2011). In Cambodia, for instance, the deficiency of current forestry
laws is one of the factors that contribute to increased deforestation by illegal logging or illegal
occupation of forest lands (Callister, 1999).
Table 6.3: International Convention that Libya signed on
Convention Name Place of
Convention
Date Date of
ratification
Contractor
International Convention
for the Protection of Plants
Rome 06/02/1951 18/05/1972 The Ministry of agriculture
International Convention
on Biological Diversity
Paris 05/06/1992 2001 The Environment Public
Authority
United Nation Convention
to Combat Desertification
Rio de
Janeiro
17/06/1994 22/07/1996 National Committee to
Combat Desertification
Libyan forestry laws have been enacted and conceived as instruments that guide sustainable
forest management, the manner by which forests and forest lands are protected and the
strategies that local people adopt in complying with government-imposed procedures. A
significant finding, however, is that the main causes of increased deforestation are governance
decisions that contradict certain laws. The problem therefore resides not in the legal provisions
per se, but in their application. In Romania, for example, more than 60% of forest areas have
been lost—a decline that began in 1990—not because of controlled exploitation, but because
of forestry-related crimes, of which the most important is corruption (Măgureanu, 2013).

Chapter 6 Forest Policy and Management
143
To assess the forestry laws and resolutions that have been issued to protect the forests in Libya
and still in force and to determine whether they are suitable for application or why they have
not been applied, focus group discussions with five legal experts and five officials in the current
administration were conducted. The legal experts pointed out that all the laws issued are
sufficient measures for forest protection and are continually updated or developed in
accordance with current forest protection legislation. Most of the articles under the current laws
favour the prevention of forest encroachment. However, the government officials stated that
the current laws have not been applied in accordance with the stipulations, especially in terms
of imposing the fines (100–200 LD) and punishment measures indicated in Article 23. The
officials considered the fines to be ineffective because individual incomes have exponentially
increased 100% over 1992 levels. They also stated that the fines cover forest clearing, for which
a clear definition of punishable clearing scope has not been provided. Thus, the punishment for
violators clearing a 1 ha site is the same as that imposed on violators who clear a 15 ha area;
such incommensurability increases the persistence of forest clearing because violators do not
fear sanctions.
Except for the issues discussed above, all the focus group participants agreed that the laws are
sufficient measures for forest protection when ownership is clear. In terms of application,
however, previously effective governance has declined to a poorly implemented approach
given the constant interference of higher authorities in forestry policy making. The respondents
highlighted the need for good governance and the fact that most articles under the act 14 of
1992 has not been applied yet. The current government officials and legal expert respondents
explained that the non-application of this act is due to corruption by some ex-government
officials in the Gaddafi regime era, who have become forest clearers and have illegally obtained
forest lands. These corrupt individuals hinder the application of the laws or violate the
regulations issued by legislative authorities by taking advantage of the contradictions between
governance decisions and the laws. Despite the issuance of several ministerial resolutions that
support their application. The most important article that has been disregarded is Article 4,
which stipulates the following:
- Forest land must be registered in the Land Registry Centre.
- Usufruct contracts issued in forest lands must be abolished.

Chapter 6 Forest Policy and Management
144
6.3.2. Administrative status of forests in Libya
As previously stated, many Libyan laws were enacted to protect the country’s forests, but
application is extremely limited and does not correspond with legal stipulations, that is, with
regulatory and judicial authorities taking active jurisdiction over application. According to the
focus group of law experts and forest officials, changes in forest governance, and not
weaknesses in the laws, are the causes of increased deforestation.
This section explains how forest governance has changed (from effective to ineffective) and
how such change has affected Libya’s forests.
The manner by which forests are governed influences the extent of deforestation that is caused
by various factors (Umemiya et al., 2010). Internationally recognised problems, such as illegal
logging and uncontrolled deforestation, are increasingly attributed to weak governance
structures (Monditoka, 2011),and weak forest governance is regarded as a major constraint in
planning for sustainable management (McNeill et al., 2014).
The issue of governance is gaining importance in the forestry sector. Good governance often
pertains to the desired qualities of governing institutions; these qualities include transparency,
absence of corruption, effectiveness and adherence to forestry rules (Muller and Tuomasjukka,
2010). Forest governance refers to new modes of regulation in the forest sector, such as
decentralized, community-based and market-oriented policy instruments and management
approaches (Arts et al., 2014), and different governance-related problems have been identified.
These problems include corruption, political instability, lack of capacity, lack of transparency,
weakness of institutions and accountability, low motivation, unclear regulations and conflicting
laws (Muller and Tuomasjukka, 2010). Weak governance in the forest sector engenders a
negative image, which in turn, adversely affects the willingness to protect and invest in the
sector (Muller and Tuomasjukka, 2010). Good governance and effective institutions at all
levels of the forestry sector have been particularly recommended as important drivers of
sustainable forest management (Foundjem-Tita et al., 2014).
Before its independence in 1951, Libya was considered to consist of three provinces (or states),
Tripolitania in the northwest, Cyrenaica in the east, and Fezzan in the southwest, each with a
governor and an administrative body. The first forestry department was established in
Cyrenaica during the British Administration in 1946. The role of this department was to protect
natural forests in Al-Jabal Al-Akdar of the state of Cyrenaica .

Chapter 6 Forest Policy and Management
145
After the acquisition of independence, the Ministry of Agriculture was established, thereby
prompting the establishment of forestry departments in Tripoli, Fezzan and Cyrenaica states.
The roles of forestry departments continued to revolve around forest protection, but in Tripoli
state, the forestry department began developing programmes for sand dune stabilisation and
forest plantation to combat desertification. For this purpose, the Tripoli forestry department
sent employees overseas for training on sand dune stabilisation and afforestation. The first
group returned to Libya at the end of 1952. At the time, therefore, the Tripoli Forestry
Department was considered one of the most important administrative bodies in Libya. The
department prepared well respected and authoritative reports and conducted research on sand
dune fixation and afforestation; from the end of the 1950s to the early 1960s, Libya was
regarded as a pioneer in the field of sand dune stabilisation and afforestation (FAO, 1955).
Abolition of the three states and unity was declared in Libya in 1963, during which the country
was renamed the Libyan Kingdom. The Ministry of Agriculture and Animal Wealth was
established with three sub-division, and each deputy was responsible for managing a region in
adherence to the regulations of the main forestry administration in the ministry at Tripoli. The
forestry administration continued to prepare reports and conduct scientific research on sand
dune stabilisation, which was the most significant challenge confronting forest administration
at that time. The Libyan forest experts implemented a number of dune stabilisation methods,
in which new approaches that feature the use of crude oil was adopted. This approach was later
applied in many countries and was globally referred to as the ‘Libyan experience’. A retired
Libyan forest expert indicated that forest management during the period of sand dune
stabilisation and afforestation was extremely difficult (1952–1970). For instance, if the success
percentage of afforestation was less than 80%, the project inspector responsible was
interrogated and severely punished. He also stated that 90% of the reports and studies
conducted by the forestry administrative bodies were carried out before 1986.
In 1972, a new body with functions equivalent to those of the Ministry of Agriculture was
established which is the Agricultural Development Council aimed to increase cultivated areas
by reclaiming land and controlling desertification. As an independent body, the Council
executed its independently developed agricultural schemes, separately from the forestry
department of Ministry of Agriculture, which contributed to the sand dune stabilisation and
afforestation programmes of the 1970s.

Chapter 6 Forest Policy and Management
146
The Agricultural Development Council, which participated in sand dune fixation and
afforestation but did not interfere in forest management affairs, was abolished in 1982. Forest
management was the exclusive domain of the Ministry of Agriculture, which successfully
participated in all activities, economic, legal and social, including scientific and technical
endeavours that were particularly intended for sand dune fixation, afforestation and
organisation of forest protection laws. The Ministry employed forest police, which had
jurisdiction over seizure proceedings and was equipped with a fleet of cars and equipment to
be used for protection. Up to 1986, the forest police used cars, motorcycles and horses in
inspecting and observing encroachments on forests. The Director of Forestry Department in
Algarabulli district indicated that the outcomes of policing were the effective prevention of
forest land encroachment (zero violations recorded, excluding a few cases involving shepherds)
and the delivery of severe punishments. These achievements were possible because unlike the
current context in Libya, the forestry department in office at that time was unencumbered by
the negative effects of nepotism.
Forest administration began experiencing a dangerous decline when higher state authorities
abolished the Ministry of Agriculture in 1986, after which the agricultural sectors in all Libyan
regions were managed by the sector directors. The effectiveness of the desertification measures
that had been implemented for the past 35 years gradually diminished, because the Director of
Agricultural sector in Tripoli municipality (which has, within its boundaries, large forest tracts
that also span the forests of study area) was instructed to issue usufruct contracts for some state
officials. The forest guard, which was the cornerstone of forest protection, was also abolished,
thereby resulting in failed protection efforts.
Considering this context, one of the forest experts in the focus group stated that after the
issuance of usufruct contracts, he and some of his former colleagues in the forestry department
of the Ministry of Agriculture resigned and some transferred to other sectors when they
opposed the newly imposed procedure. The 2013 deputy of the Ministry of Agriculture
indicated that the issuance of usufruct contracts for forest lands was initiated by the Committee
of Military Farms. The Ministry of Defence followed suit, allocating some of the forest lands
by the army in 1986 after the American bombings. Responsibility for the administration of
these forest lands was transferred to the Ministry of Defence, which began granting the lands
to some officers in July 1986. In late 1986, the agricultural sector in Tripoli municipality issued
usufruct contracts for forest lands to some then-serving state officials.

Chapter 6 Forest Policy and Management
147
The 2013 deputy of the Ministry of Agriculture also averred that because of the continual
demands from some organisations and countries, such as Italy and Greece, for Libya to limit
activities that harm forests, the previous regime in 1992 assumed the role of a Libyan patriot
and went by himself to the police centre to report the agricultural sector officials in Tripoli
municipality as having destroyed forests through the issuance of usufruct contracts. A few days
after the report of the previous regime, the Ministry of Agriculture was tasked to immediately
resume work on legislation and issued act No. 14 of 1992. As previously mentioned this law is
devoted to forest and pasture protection, is an amendment of act No.5 of 1982, which remains
in force. The most important article of act No.14 is Article 22, which stipulates the withdrawal
of all forestry-related actions, such as the issuance usufruct contracts. This law inspired hope
amongst forestry employees with regard to rectifying administration errors, regardless of
whether these were intended to destroy Libyan forests. The forestry department also resumed
work, with its employees committed to reviving as many of the previously established efforts
as possible. Despite the advantages presented by Law No. 14, however, the 2014 Director of
Forestry Department indicated that that this law, especially Article 22, has yet to be applied.
One of the forestry experts interviewed stated that technically, Article 22 is currently
inapplicable given that most of the forest areas in Libya have been cleared for other land uses.
Under the act No. 14 of 1992, only Article No. 2 of Article No. 28 has been executed in the
court trials of contract issuers. Nevertheless, even though violators were subjected to court
trials and imprisoned, they were released after a few months. This situation has driven people
to consider such proceedings as superficial shows of implementation, designed only to exhibit
that the Gaddafi regime denounced the forest encroachment caused by usufruct of contract
issuance. Some of the government officials working in the forestry department pointed out that
these actions directly or indirectly facilitated the prevalence of corruption in forest protection
and investment in forest wood. Corruption took on many forms, including bribery.
The 2013 deputy of the Ministry of Agriculture declared that the issuance of usufruct contracts
for forest lands was discontinued for three years (1993–1996), but at the end of 1996, the
Gaddafi regime modified the existing policy into an administrative approach wherein
municipalities and corresponding facilities are to be managed by army officers. This change
was considered a shift from civil administration into military management, under which the
trend of increased forest destruction continued.

Chapter 6 Forest Policy and Management
148
Tripoli municipality’s agricultural sector coordinator, who was a military official from 1997 to
2000, started issuing numerous usufruct contracts and implementing agricultural projects
owned by the state.
The deputy also stated that the Ministry of Agriculture was re-abolished in March 2000 and
authorities were assigned to the respective sectors, which were managed by military officers.
Under this structure, new allocations were apportioned as usufruct contracts, numerous
usufruct contracts were issued and issuance was implemented not only by the Ministry or the
agricultural sectors, but also by state officials. After five years, a ministerial resolution that
reinstates the Ministry of Agriculture was enacted in 2006, but the jurisdiction of military
officers over agricultural liabilities remained in force.
Some of the legal experts participating in the focus group discussions argued that the
administrative and legal contradictions in the manner by which authorities allocated liabilities
were a factor in the destruction of Libyan forests. The experts criticised the creation of an
agricultural policing body through a ministerial resolution under No. 131 of 2006
(encroachment limits) as an erroneous decision given the technical conflicts in liability
allocation between this policing body and police centres. Another contention of the experts was
that reinstating the forest guard would have been a more effective measure.
With regard to forest management in the studied region, these employed for such purpose were
unable to execute their work. Such inability is attributed to the lack of financial and technical
support, such as the provision of cars for monitoring encroachment-prone areas on forest lands.
According to the administrative structure, forest encroachment monitoring must first be
undertaken by the employees of the forestry department. Upon witnessing deforestation
activities, they are to prepare a report, which should include details such as location of
encroachment, name of violator (forest clearer), size of cleared area, duration of clearing and
tools used for clearing. The report should then be submitted to the agricultural policing body.
The manager of the forestry department in Algarabulli district revealed that corruption impedes
the success of this process; the reports that are referred to the agricultural police are
perfunctorily addressed and the claims submitted or the forest clearer in custody is transferred
to another jurisdiction after police officers are bribed. Between 2006 and 2010, the number of
encroachment cases that were recorded and referred by the forestry department in Algarabulli
district was about 40, but only 10 reports were referred by the agricultural police to the
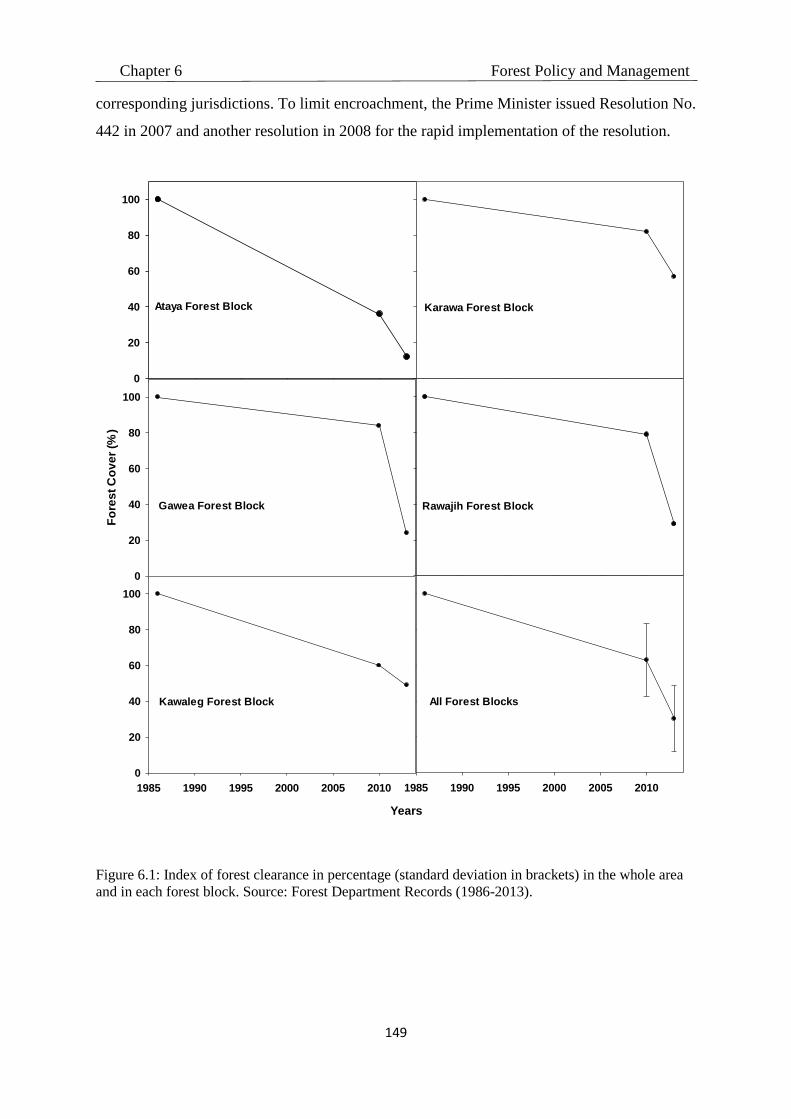
Chapter 6 Forest Policy and Management
149
corresponding jurisdictions. To limit encroachment, the Prime Minister issued Resolution No.
442 in 2007 and another resolution in 2008 for the rapid implementation of the resolution.
Ataya Forest Block
0
20
40
60
80
100
Karawa Forest Block
Gawea Forest Block
Fo
res
t C
ov
er
(%)
0
20
40
60
80
100
Rawajih Forest Block
All Forest Blocks
1985 1990 1995 2000 2005 2010
Kawaleg Forest Block
Years
1985 1990 1995 2000 2005 2010
0
20
40
60
80
100
Figure 6.1: Index of forest clearance in percentage (standard deviation in brackets) in the whole area
and in each forest block. Source: Forest Department Records (1986-2013).

Chapter 6 Forest Policy and Management
150
The decline of governance from being an effective to an adverse approach is influenced by a
number of factors. Under good governance, the forestry administration and the Ministry of
Agriculture successfully implemented the planting of trees in a huge forest area in Jefara plain.
This area was also effectively protected from encroachment through adherence to the rules
stipulated in the then-in effect forestry law and policy.
The World Bank defines ‘corruption’ as the abuse of public office for private gain (Callister,
1999). In the Cambodian forestry sector, for instance, corruption persists because of lack of
transparency and accountability in timber concession allocation policies. The Indonesian sector
similarly suffers from the absence of effective concession management planning for forestry
and regulatory frameworks (Callister, 1999) because of various factors such as widespread
corruption in government institutions and decreased government control over the intensity of
illegal logging after the fall of president Suharto (Heeswijk and Turnhout, 2013). In Bolivia,
illegal forest clearing was extensive but is currently decreasing because of improvements in the
implementation of forest legislation in the country (Pacheco, 2004). On the whole, forest
management in developing countries is confronted with problems that limit these countries’
ability to carry out their mandates.
With regard to the situation faced by the forestry department after the February 2011 uprising
in Libya, the 2014 minister of agriculture stated that despite the disgrace that the forestry
departments and agricultural police attempts conducted by the Ministry, security problems and
the arms spread have restricted control over forest encroachment. The state is currently unable
to effectively protect Libya’s forests.
6.3.3 Property rights and tenure systems
In the recent era, property rights, tenure systems and land usufruct standards in the entirety of
Libya have been grounded on traditions and social morals that are based on Islam. Islamic
values place a premium on supporting friendship and cooperation amongst individuals because
they are the basic entities of society, and the general relations between human beings are
represented by tribal affiliations, which form the backbone of the social structure of Libya
(Jibril, 1999).

Chapter 6 Forest Policy and Management
151
The dry climate conditions of Libya play an important role in the formation of its fragile
environment and natural resources. In turn, these characteristics considerably affect the
economic structure of Libyan society, which is characterised by a long history of herding as
the primary economic profession. To compensate for the decreasing number of pasturable
lands, Libyans maximised the distance that they covered in shepherding by leading nomadic
lifestyles (i.e. they camp out in a given location and move once the resources of this location
are exhausted). This practice was adopted for a long period, eventually becoming a social norm,
with Libyans living their lives as desert inhabitants and creating a unique method of group
ownership. This ownership method was designed to promote understanding and a peaceful co-
existence amongst people, especially with regard to territorial issues; management was carried
out by tribes in accordance with specific conditions that formed the basis of contemporary
usufruct terms and individual ownerships that are determined under the principle of water and
pasture ownership for all (Jibril, 1999).
Libyan legislators have attempted to retain the original stipulations of traditional contracts
whilst incorporating additional restrictions, which then served as reference and the moral basis
of contemporary laws. The decision on which practices to include or exclude depended on
simplicity and flexibility, as reflected in ownership rights and prevailing usufruct patterns.
In many Africa and Southeast Asian countries, most of the forests are owned or directly
controlled by the state (Martinus and Makoto, 2000) and all the forests (even privately owned
forests) are administered by the state. Libya’s Law No. 5 of 1952 states that all natural forests,
esparto grassland, any land covered by plants as may be determined by the Secretary of
Agriculture, stabilised sand dunes or sand dunes slated for stabilisation and government
plantations are owned by the state. Even private forests, which account for 10% of the total
number of plantations, are managed on the basis of the guidelines stipulated in the Forest Law
(FAO, 1993). Forest lands in Libya currently suffer from many problems. Property rights issues
are very common in developing countries, especially in Libya, where such problems are the
most prominently debated (Oram, 1997). Land tenure issues are the main problem in relation
to rangeland development.
Chapter 6 Forest Policy and Management
152
6.3.3.1 Land tenure and property rights during the Ottoman period
The Ottoman state took a series of administrative measures to protect rights and public and
private property through issuing land laws in 1858, and the Al-Hagani28 booklet (a land
register) was prepared in 1864 to regulate land ownership (Bin Kayal, 1995). While the most
important action comprised the formation of a committee to delimit the state lands and tribal
lands in Cyrenaica (Jibril 1999), practical controls were also established to regulate the use of
these lands in line with the prevailing social customs and traditions. Thus, Turks succeeded in
mapping the land in Cyrenaica and then categorising it according to the many different types
of land tenure that existed there, recognised in the land code of 1858 as privately owned land
(mulk), state land (miri or kharaj), religious endowments (waqf), ‘no man’s land’ (matruka)
and dead land (mawat) which all are controlled by the state and the utilization by certain tribes
(Al-Hajjaji, 1989).
The Ottoman land code reflected a mixture of Turkish tribal practice and Islamic law. The
designation of mulk granted full ownership (‘hiaza’ and ‘ragaba’ are terms for full ownership),
whereas kharaj land granted only the right of possession while the state kept the right of tasaruf
(usufruct). The Ottoman land code also included the category of timar, in which the state owned
the land and leased it to a territorial Ottoman cavalry, called sipahi. The sipahi were appointed
by the state to collect taxes from the peasantry, part of which they kept for themselves, and in
return provide supplies and men to the state in times of war. In short, the state recognised
private property, state land (miri), as well as (timar). The Ottoman land code of 1858 was not
applied equally around the empire, however, since ecological and local factors conditioned its
enforcement (Ahmida, 1970).
The main type of land ownership, mulk (privately owned land) referred to land over which an
individual or a family held full rights of ownership and usufruct as a result of succession, sale,
donation or development .Aside from paying taxes in kind to the state, holders were free to sell
or donate their land. Mulk land existed in the settled agricultural area along the Jefara plain
coast of Sahel and Al Manshiyya, the villages of Al Jabal and Al Gharbi, and in the lands of
the Sahara oases of Tripolitania and Fazzan, where semi-feudal relations existed. The landed
merchant class used sharecroppers and tenant-peasants to work the large palm groves of
Fezzan, which provided Libya with most of its dates (Ahmida, 1970).
(الدفتر الخاقاني , الطابو , التسجيل العقاري) 28
Chapter 6 Forest Policy and Management
153
The second type of land ownership was state land, or miri, where the state had direct right of
usufruct, individuals who had leases to cultivate miri land had no right of usufruct. Desert
ecology and the lack of state revenues limited settled agriculture to coastal Tripolitania, the
Jabal and the oases of the Sahara. This situation held true only for the period prior to the 1860s.
The third type of land ownership, waqf or habs (Religious endowments land), was mulk land
donated to Islamic religious foundations, such as mosques, shrines or holy cities in Islam. This
type of land could not be subject to any type of legal alienation. In urban north Africa, the
merchant classes acquired waqf to avoid state confiscation and to provide crucial services to
major cities. Waqf land was not predominant in western and southern Libya, yet the bulk of
agriculture land in Cyrenaica was waqf land, because of strong tribal loyalty to the Senussi.
The Sanusi lodges’ zawaya land was waqf, donated and cultivated by the tribes of Cyrenaica.
This was estimated at 600,000 acres(240,000 ha) at the turn of the century and mostly used for
cereal cultivation and the herding of animals (Ahmida, 1970).
The fourth type of land , matruka or waste land, was that owned by the state but possessed, or
used collectively by a tribe or village. Nevertheless, Libyan tribes regarded certain der valleys
(wadi) as their tribal homeland. This type of land was not irrigated, but cultivated during rainy
seasons with barley and wheat and used as animal pasture. It is essential to note that tribal land
was held in common and could not be alienated for individual use without the consent of the
tribe. Collective ownership of land was most common in the Cyrenaica, but in 1858 the
Ottomans attempted to register land individually and settle tribes as a result of the capitalist
developments within the Ottoman ruling class in Istanbul. This policy enjoyed only partial
success in rural Tripolitania, and none at all in Cyrenaica or Fazzan (Jibril 1999).
The purpose of the land Code of 1858 was to collect taxes efficiently and directly, without
village or tribal heads as intermediaries. Thus, the state administration took over the function
of all tribal councils. By 1902, all tax exemptions were abolished in Libya (Ahmida 1970).
6.3.3.2 Land tenure and property rights during Italian occupation: 1911-1942.
Perhaps the most important aim of Italian colonialism after the occupation of Libya in 1911,
was attesting ownership rights and usufruct regarding its new colonies and encourage Italian
families to inhabit.

Chapter 6 Forest Policy and Management
154
Where Italian embarked on re-titling land which was taken by force or confiscation of the
Libyans lands to newcomers through royal decree No 48 of 1912. This royal decree was
considering that land registry certificates and instruments (property deeds) documents are
recognized, which can be depend on in acquiring land ownership rights, which was in force till
Libyan independence in 1951 (Jibril, 1999).
The Italian Ministry of Colonies began establishing special bodies to execute farms and
inhabiting Italians in, and prepared accurate maps for all Libyan tribal lands that will benefit
especially tribe or more, according to the regions and has taken all necessary measures to
confiscate located them in the range of schemes settlement projects and taken by force from its
owners or beneficiaries according to the expropriation procedures, which carried out in the
manner that they give legalization and legal nature, which ensure that future returns to claim
land or pay appropriate compensation for. However, in regard to the land code, they kept the
same code as the Ottoman state and also the private lands in principle.
Regardless of what happened after that confiscation of private and tribal lands for political
reasons which related to constantly war against the Italians particularly in eastern Libya, but in
general Italian did respect private land and with the beginning of the establishment of farm
settlements in Libya, and people whom their lands was entered within the scope of the Italian
agricultural projects were compensate (Al-Hajjaji, 1989). The area of land which was
expropriated in 1913 was estimated at more than one million ha, and increased by 738,316 ha
in 1938 across Libya and the number of Italian settlers reached 108,405 persons by 1940
(Ahmida 1970).
6.3.3.3 Land tenure and property rights during the British administration 1942-1951:-
After losing the Second World War, Italy evacuated from Libya, although hundreds of Italians
remained settlers in Libyan cities and farms without a government to protect them. Libya was
under British administration and the colonists felt endangered , so they began selling land,
farms and real estate to Libyans (Jibril, 1999).
6.3.3.4 Land tenure and property rights during the Royal Regime (1951–1969)
Since Libya’s independence, property rights, tenure systems and land usufruct standards
became priority issues in planning and in economic and social development. The fundamental
priority items are described as follows:

Chapter 6 Forest Policy and Management
155
a) All tribes were forcefully evicted during the Italian occupation. Consequently, the evicted
tribes sought to return to what they regard as their own lands—a situation that can lead to
conflicts and differences in beliefs or interests between any two tribes. In turn, problems that a
new state may fail to resolve or prevent emerge.
b) The development of the economic and social infrastructure of the country necessitates the
creation of stable societies, which causes dislocation in the social structure. Within this
structure, the first dimensions to be affected are property rights, tenure systems and land
utilisation patterns.
c) The development of certain aspects of life is imposed on individuals who have been living
in accordance with traditions, and new concepts of land-related problems are unfamiliar to
these individuals. Existing customs and traditions are no longer sufficient for identifying
solutions to contemporary problems. This disconnect between tradition and development leads
to the gradual decline of the importance of traditional concepts and roles in the affairs of the
land.
d) The advancement of economic and social development and the establishment of civil society
necessitate the implementation of measures that are greater in scope and effect than are laws
and legislation that govern land use, acceptance of regulations and compliance by the
population.
e) Adhering to the previously enumerated points will not necessarily require incorporation into
appropriate economic and social policies; these policies are designed to maintain the essence
of prevailing norms, customs and traditions regarding development processes and to preserve
relationships amongst groups when it comes to land ownership issues (Jibril, 1999).
To achieve the aforementioned aims and address related issues, a series of comprehensive
social and economic studies were conducted in early 1952; these studies were interlocking,
complex and associated with forest land ownership that resulted in the enactment of Civil Law
No. 1 in 1952. This association is especially evident in Articles 680 and 811 of the law. Under
this law, the restrictions on property systems indicate that all lands that cannot be reclaimed
(e.g. sand dunes, sandy deserts, marshes, mountains and valleys) are owned by the state (this
stipulation remains in effect); the restrictions also stipulate that current forest lands that were
converted from sand dunes are the property of the state (Jibril, 1999).

Chapter 6 Forest Policy and Management
156
Then, Law No. 9 was issued in 1959 to regulate tribal land conflicts and Law No. 4 was issued
in 1963 to establish a national agricultural settlement organisation. This organisation has
implemented some measures for the protection of property rights, amended the land tenure
system developed by the state, determined and implemented conditions and private control
measures for distributed lands and developed usufruct patterns.
Furthermore, the 1965 Law on land registry and documentation systems was issued. This law
is a combination of the laws that were enacted in Libya during an earlier period and some
stipulations of the Land Registry Law of Egypt issued in 1946. The 1965 Law also regulates
investigations into the ownership and registration of estates and registry disputes; the regulation
is carried out by the land registry departments and offices throughout Libya.
6.3.3.5 Land tenure and property rights under the roll system (1969–2011)
The Land Registry Centre continued its work until the roll system was changed in 1969, after
which extensive changes in property ownership legislation occurred. Thus, legislators issued
special basic regulations regarding home ownership and determined the areas of land that are
available for ownership. This development was followed by the confiscation of properties from
some officials of the monarchy and the expropriation of some lands and compartments that are
in excess of the needs of their respective owners. Finally, the state was dispossessed of
numerous properties.
The most important legislation issued in relation to agricultural holdings and real estate
ownership was Law No. 142 of 1970, which pertains to tribal lands that are considered fully
state owned if unregistered in the Land Registry Centre. These lands are recorded as properties
of the state. Under such conditions, the tribes are not compensated for the acquisition. Law No.
142 also exerted the most extensive effects on the Land Registry Centre.
Under this law, however, tribal lands can be used as usufruct items only under the terms set by
the Ministry. Another high-impact legislation was Law No. 123 of 1971, which pertains to
rights regarding the agricultural and reclaimed lands owned by the state. Such lands are to be
managed by a foundation for agricultural land reform.
Some of the interviewed forest officials argued that the previous regime attempted to apply
Italian policy in establishing certain agricultural and settlement projects, which mandate the
demolition of all small farms and the provision of compensation for the residents. In reality,
however, the residents were forcefully evicted and denied compensation. In actuality, the

Chapter 6 Forest Policy and Management
157
establishment of agricultural projects and settlements was a disharmonious process. A good
example of the agricultural and settlement projects that were implemented under the
aforementioned conditions is the Algarabulli agricultural project (within the study area), for
which the number of target farms was estimated at 1200. Each farm was projected to be 25–30
ha in extent and was distributed to Libyan citizens in 1980 via usufruct contracts.
In 1977, a new law governing the ownership of real estate, Law No. 38, was introduced. Article
1 of this law states that laying claim to property, regardless of the date of alleged ownership or
the duration of ownership, is insufficient grounds for owning property, acquiring legitimate
rights to the property, registering property or staking a claim on it. Article 2 stipulates that all
registrations of real estate ownership in the Land Registry Centre that date back to 7 October
1951 for properties acquired through claims or expression of possession shall be revoked
(Jibril, 1999). Article 3 specifies that all grants of ownership issued by occupiers (Italian or
Ottoman) as rewards for workers' loyalty shall be void.
Additionally, all ownership registrations for such properties shall be revoked. These properties
shall belong to the state. One exception is for ownership registered with no evidence or intent
of fraud. Article 6 states that anyone who claims previous ownership of real estate for which
ownership was transferred to the state in accordance with Law No. 38 can sue the state and
request the court to confirm his/her ownership. In this case, the state shall not abate rights or
insist on adherence to the transfer conditions. Claims of ownership shall be based on cause of
ownership and not on the expression of possession or on possession by inheritance.
Implementation of the Real Estate Record law 38 of 1977 was suspended and Law No. 4, which
was developed by the previous regime, was implemented in 1978. The land registry department
maintained cadastres, but on 17 November 1986, land registry offices across Libya were
destroyed by revolutionary committees for fear landowners may someday lay claim to estates.
The records documented all property rights, including those of citizens, the state, embassies,
mosques, cemeteries and other institutions. Individuals attempted to prevent the destruction
and help employees store the documents elsewhere for re-registry, in accordance with the
legislation. These efforts were to no avail.
Complications emerged regarding the 1986 issuance of Law No. 7, which stipulates the
abolition of land ownership. Article 1 of this law indicates that land cannot be owned by anyone
but the state. Some interviewed officials confirmed this decision, made in accordance with the

Chapter 6 Forest Policy and Management
158
instructions of the Gaddafi regime. One factor that motivated this law was the intention of the
previous regime to make it easy for some officials to obtain state land, such as forest land.
Table 6.4: Real Estate Registration in the civil law issued (1969-2011).
Law
No
Year Title of
text
Purpose Comment
142 1970 Regarding
tribal lands
This law pertains to tribal lands that are
considered fully state owned if unregistered
in the Land Registry Centre. These lands are
recorded as properties of the state. Under
such conditions, the tribes are not
compensated for the acquisition. However
tribal lands can be used as usufruct items
only under the terms set by the Ministry.
This law was suspended in
1977
123 1971 Real estate
ownership
This law pertains to rights regarding the
agricultural and reclaimed lands owned by
the state. Such lands are to be managed by a
foundation for agricultural land reform.
This law was suspended in
1977
38 1977 Real estate
ownership
Abolition of all registrations that have been
taken on the lands, based on laying hand or
by possession since 7 of October 1951.
This law was suspended
4 1978 Real estate
ownership
Issued to suspend the law No 38 of 1977
7
1986 Real estate
ownership
Which stipulates the abolition of land
ownership, Article 1 of this law indicates that
land cannot be owned by anyone but the
state.
In this year, 17 November
1986, land registry offices
across Libya were destroyed
by revolutionary committees
for fear landowners may
someday lay claim to estates.
The records documented all
property rights, including
those of citizens, the state,
embassies, mosques,
cemeteries and other
institutions .Also Abolition of
Land Registry in Libya.
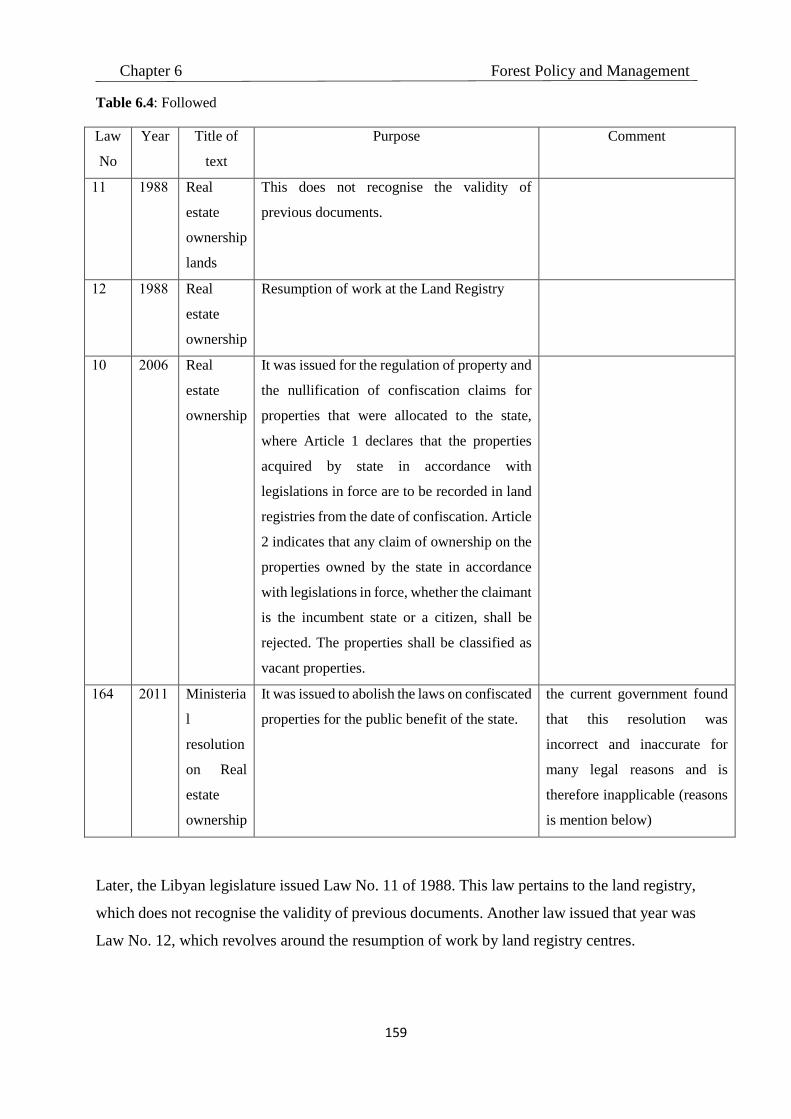
Chapter 6 Forest Policy and Management
159
Table 6.4: Followed
Law
No
Year Title of
text
Purpose Comment
11 1988 Real
estate
ownership
lands
This does not recognise the validity of
previous documents.
12 1988 Real
estate
ownership
Resumption of work at the Land Registry
10
2006 Real
estate
ownership
It was issued for the regulation of property and
the nullification of confiscation claims for
properties that were allocated to the state,
where Article 1 declares that the properties
acquired by state in accordance with
legislations in force are to be recorded in land
registries from the date of confiscation. Article
2 indicates that any claim of ownership on the
properties owned by the state in accordance
with legislations in force, whether the claimant
is the incumbent state or a citizen, shall be
rejected. The properties shall be classified as
vacant properties.
164 2011 Ministeria
l
resolution
on Real
estate
ownership
It was issued to abolish the laws on confiscated
properties for the public benefit of the state.
the current government found
that this resolution was
incorrect and inaccurate for
many legal reasons and is
therefore inapplicable (reasons
is mention below)
Later, the Libyan legislature issued Law No. 11 of 1988. This law pertains to the land registry,
which does not recognise the validity of previous documents. Another law issued that year was
Law No. 12, which revolves around the resumption of work by land registry centres.

Chapter 6 Forest Policy and Management
160
Despite the issuance of these laws, the registration of real property did not proceed in its
intended form because of the confiscation of some real estate properties and their subsequent
allocation to other interested parties by certain state officials. These illegal actions remained
unpunished even with the existence of legislation regarding sanctions against violations.
In 2006, Law. No 10 was issued for the regulation of property and the nullification of
confiscation claims for properties that were allocated to the state. Article 1 of this law declares
that the properties acquired by society (i.e. the state) in accordance with legislations in force
are to be recorded in land registries from the date of confiscation. Article 2 indicates that any
claim of ownership on the properties owned by society in accordance with legislations in force,
whether the claimant is the incumbent state or a citizen, shall be rejected. The properties shall
be classified as vacant properties.
The 2013 Minister of Agriculture stated that in the beginning of the uprising in Libya in
February 2011 the Gaddafi regime attempted to sway the population, especially those affected
by the laws and decisions issued under the regime’s rule. Resolution No. 164 of 2011 was
issued to abolish the laws on confiscated properties for the public benefit of the state.
Nevertheless, some of the interviewed officials stated that although this decision concerns lands
that were confiscated for the public benefit of the state (presumably for the establishment of
agricultural projects and not for the occupation of forest lands, on which planting was
implemented during the monarchic reign), some individuals exploited the decision and
encroached on forest lands. These individuals also staked claims over the lands, using the fact
that these forests were cleared by the individuals as a basis, as recently determined either
through court proceedings or otherwise. Very recently, however, the current government found
that this resolution was incorrect and inaccurate for many legal reasons and is therefore
inapplicable for the following reasons:
1. A resolution issued by the General People’s Committee (Prime Minister) to abolish some
laws issued by the previous General People’s Conference (Parliament) cannot be executed; a
decision cannot abolish law. In application, if the law opposes the decision, the latter is
considered abolished and the law is the applicable regulation. Thus, the high court issued a
statement in 4 February 1986, declaring that state legislation is to be classified under three
categories: basic legislation (third level), normal legislation (i.e. law) and individual legislation
(second level) and executive and organising/seizing declaration (fist level); this categorisation
between legislations in force is intended to enable the reviews of law at the lower level before

Chapter 6 Forest Policy and Management
161
elevation to the higher level. Consequently, Decision No. 164 of 2011, which was issued by
the General Popular Committee as an executive authority, shall be considered void because it
conflicts with Law No. 127 of 1970, which was issued by the same committee.
2. The number of the aforementioned laws regarding the decision does not accord with the
purpose that drove the issuance of the decision, indicating that Decision No. 164 of 2011 was
formulated and issued on the basis of laws that are unrelated to the matter at hand. It was
grounded on Law No. 127 of 1970 as law that mandates the seizure of neglected lands for state
benefit. This law reflects association with the allotment of income to general reserves.
Consequently, this mistake can be regarded as an unconventional act of the General Popular
Committee; such act may result in the failure to recognise or nullify the decision. Even though
the decision was evaluated as void, however, some courts continued to refer to it. For example,
a judge of the Agricultural Crimes Court in Algarablli district said that, in accordance with this
resolution, some lands have recently been returned to citizens who laid claims over properties.
After the fall of the Gaddafi regime after the uprising of 2011, massive deforestation occurred,
with local people occupying forest lands on the basis of expression of possession or documents
confirming that they cleared such forests. Land possession issues were discussed with the 43
interviewees during a survey conducted in 2014 (Chapter 7). The results showed that the types
of land possession were usufruct contracts, property deeds (instruments), certificate sheikh29
(administrative certificates), contracts of sale and claims without proof of land acquisition and
as a consequences illegal felling of trees, deforestation conversion to agriculture land. These
types of possession are illegal because forest lands are owned by the state, as stipulated by law.
The types of land possessions are described in the succeeding sections.
6.3.4 Types of land possession by forest clearer:
6.3.4.1 Usufruct contracts (land allocation)
Usufruct contracts are regarded as land tenure and not ownership which is also an agreement
issued by the state through administrative bodies with individuals claiming to be deserving of
the usufruct. Specific conditions are stipulated in the contract and the individuals are mandated
to commit to protecting the forests and use it in investments in forest trees and beekeeping;
29 A head of a tribe or locality.

Chapter 6 Forest Policy and Management
162
a usufruct can also be referred to as tenure over forest lands, wherein the tenure helps
determine whether local people are willing to participate in the management and protection
forests (Gibson et al., 2000). However, these contracts were issued by bodies that were not
authorised by the state, the Ministry of Agriculture or the agricultural sectors responsible for
management from 1986 to 2006.
These contracts, which are erroneously represented as legal allocations, can be regarded as void
because they violate Law No. 123 of 1970. Despite such violation, the contract versions issued
were based on other contracts that were distributed for certain agricultural projects that people
needed.
The legality or validity of the contracts has therefore become unclear or difficult to ascertain.
Legislators recognised this legal flaw, and to avoid the consequences of such a flaw, they issued
Law No. 14 of 1992, which was amended with Law No. 5 of 1982. The issuance of Law No.
14 meant the abolition of all issued contracts between the state and people in forest lands.
Therefore, land tenure over forest areas is considered illegal, and occupants must evacuate and
turn over tenure to the state. These stipulations are indicated in a number of resolutions that
mandate evacuation.
6.3.4.2 Property deeds (instruments)
An instrument is a document that confirms land ownership agreed upon by two individuals (a
land owner and a beneficiary). Instruments are of many types, depending on type of agreement
(i.e. selling, waiving and Almoarsah30). After the Italians withdrew from Libya in 1942, many
conflicts arose between citizens because of land ownership issues. Everyone alleged that he/she
had cultivated a tree somewhere: such as act makes an individual the rightful owner of the
cultivated land. This situation led to conflicts with regard to utility ownership. As a result, the
King of Libya decided in the early 1950s that everyone with an old agreement (instrument) that
was established during the Turkish period shall be registered in the land registry department
for the instrument holders to obtain a land registry certificate.
No instruments related to the Italian period were drafted because selling, buying, waiving and
inheritance activities were registered in the Italian land registry. These were later turned over
30Almoarsah is the contract for the lease of an orchard. It is only a contract for the agreement entered into by a
land owner and investor. As indicated in this contract, an investor shall plant trees on part or on the entirety of
land for a given period, after which the planted areas shall be owned by the investor, as stipulated in a plantation
contract or instrument. The history of these instruments is related to the Turkish period.
Chapter 6 Forest Policy and Management
163
to the Libyan government after independence. The government then issued Law No. 20 of
1977, which is a civil law that nullifies Almoarsah contracts.
The interviewed legal experts stated that anyone with an instrument that dates back to the
Turkish period but was not recorded during the Italian Administration had to register the land
to prove ownership. Thus, the King issued a law that rejects instruments drafted during the
Turkish period.
Civil Law No. 1 of 1952 was issued for legal plantation forests. This law, as indicated by
Articles 680 and 811, stipulates that all lands that are classified as deserts, sandy dunes,
mountains, valleys, rivers and marshes are owned by the state. In accordance with this law,
therefore, the forestry department planted forest trees on sand dune areas in 1952–1984. One
of the forestry experts, who was the superintendent of the forest plantation programmes in
Algarabulli district (1956–1974), confirmed that although this law stipulates that the sand
dunes are owned by the state, the local residents demanded that the government stabilise the
sand dunes and carry out afforestation in exchange for the citizens giving up their lands. To
execute its plantation programmes and avoid any problems with the population in the future,
the government demanded that local people limit the number of occupants in lands and that
anyone with an ownership instrument, especially for sandy dunes, present such instrument to
the authorities for treatment in relation to the state plantations.
Given the desire of the state to combat desertification by forest plantation and to overcome all
the difficulties that may prevent the achievement of this goal, the government required all
avowed owners to prove ownership of a certain land and a commitment to plant trees on this
land by themselves. In exchange, the state shall freely provide tree seedlings for planting to
prevent desertification. The superintendent also indicated that despite the fact that trees were
planted on only 150 ha of forest land by some families to whom private land ownership in
Algarabulli district was allocated, these forests are protected under Libyan law.
The legal status of these lands is reflected in two different arguments: The first is the argument
proposed by an agricultural jurisdiction judge in Algarabulli district, who presides over conflict
cases related to forest land ownership. The argument indicates that the jurisdiction can resolve
relevant conflicts in accordance with laws regarding land ownership.

Chapter 6 Forest Policy and Management
164
These laws recognise and accept old property deeds (old instruments), and judges decide on
cases in favour of local people or the state, depending on the strength of the documents
presented by each party.
This approach reveals the contradiction between the instruments and the aforementioned laws,
which disregard the validity of instruments. The judge stated that although Law No. 5 of 1982
declares that forests and pasture lands are legally owned by the state (these lands do not include
those that are not typically used by individuals as natural forest areas, lands with esparto
growth, lands forested by the government and sand dunes that have been stabilised by the
government), the law alone is insufficient. Without proof of ownership (i.e. land registry
certificate that indicates ownership by a citizen or by the state), this issue is difficult to resolve.
When documents that confirm state ownership are lacking and when agricultural members fail
to attend court proceedings, a judge rules in favour of the opposing party who presents complete
documents. A preliminary judgment is then provided to the opposing party. If the state presents
documents that convincingly nullify the submitted instruments, the succeeding ruling shall be
considered final because the preliminary judgment cannot be considered the ultimate ruling.
Nevertheless, people clear forests in accordance with preliminary judgments; such acts are
prohibited.
The second argument is that proposed by legal experts in land registry law. These experts
pointed out that the review of the legal possession of forest lands that were sand dunes before
being planted on the ruling regarding land ownership shall be the bases for the granting of land
registry certificates. Old instruments are not to be used as basis in such decisions. Thus, if
somebody has a land registry certificate that proves ownership, the land shall be kept by the
state but the owners are to be compensated even if plantations are intended for public benefit.
In reality, however, no land registry certificates were provided at that time. Forest lands are
therefore regarded as general forests owned by the state, thereby nullifying instruments,
regardless of whether these were recorded for registry.
This difference in opinion, in which the recognition of general forests as owned by the state is
based either on laws or ownership documents from the land registry centres, contributes to the
increased deforestation in Libya. An interviewed land registry manager indicated that most of
the instruments that were claimed as dating back to the Turkish period were inaccurate; the
period at which these instruments originated is a mere estimate. For this reason, the King of
Libya disregarded the instruments dating back to the Turkish period.

Chapter 6 Forest Policy and Management
165
6.3.4.3 Administrative certificates
An administrative certificate is a written document issued by tribal chiefs or quarters as an
official document that declares the holder as the owner of a given property. Some of the legal
experts who participated in the focus group discussion stated that the issuance of this document
was a product of mismanagement. The error created multiple liabilities amongst state bodies.
For instance, when forests were managed by the Forestry Department of the Ministry of
Agriculture. Thus, the forests were assigned under the direct management of the Ministry and
the regional agricultural sectors, with each regulatory body implementing its own decisions.
Contravening resolutions may be related to possession because the Ministry issues conflicting
resolutions in addressing individual possession of certain lands. At the same time, other
agricultural sectors issued another resolution for somebody else.
In many countries, the majority of forest management is centralised (Martinus and Makoto,
2000). The same holds true for Libya before 1986. After 1996, however, improvements to this
approach were implemented to encourage tribal chiefs or quarters to issue administrative
certificates that confirm ownership. At that time, these documents were being issued under
family or social pressure or in return for bribes, thereby prompting the Sheikh to issue
documents that declare land ownership on the basis of heritage and after the guaranteed
attendance of three individuals as witnesses. This document, however, is regarded by law only
as an administrative document and not a record that verifies ownership.
In short, if any individual is required to register land in the land registry centres, a set of
documents should be submitted to acquire official ownership status or initiate a formalisation
process. Four different documents are needed to obtain a formal land registry certificate, but
this study did not find land register certificates for the respondents who have been inhabiting
forest lands that they cleared in different periods. Even the land registry manager stated that
despite years of massive encroachments on forest lands, no land registry certificate has been
awarded to forest clearers. Any such certificate must be forged. Thus, all the processes by
which land was obtained are illegal.

Chapter 6 Forest Policy and Management
166
6.4 Conclusions
In chapter one, it was argued that the real indirect cause that led to deforestation was the change
from good governance to bad governance in 1986 due to the abolition the Ministry of
Agriculture and burning of the land registry centres. Therefore, this chapter focused deeply
why and how forest governance was changed particularly in 1986.
The results, which were obtained through semi-structured interviews and focus group
discussion with government officials, some legal experts and the findings in archives of the
Ministry of Agriculture as well as how these changes in the governance contributed to
deforestation, including the legislation or forest protection laws and administrative and land
tenure laws, showed that deforestation commenced in 1986 and were not recorded before this
time, due to several factors where higher state authorities abolished the Ministry of Agriculture
in 1986, after which the agricultural sectors in all Libyan regions were managed by the
agriculture sectors directors whom were instructed to issue usufruct contracts for some state
officials and military officers in the beginning which encouraged some local people to encroach
the forests. Also, the forest guard, which was the cornerstone of forest protection, was also
abolished, thereby resulting in failed protection efforts.
In addition, the burning of the land registry centres which caused land ownership problems
where forest has not registered in the Land Registry Centre to be officially state-owned,
although for state-owned under the forest act 5 of 1952. Even private forests, which account
for 10% of the total plantations, are managed on the basis of guidelines given in the Forest
Law.
In this context, it was found that legal experts stated that forest is state-owned under the forest
act 5 of 1952, however it was argued by other legal experts stated that the ownership of land
by the law is not enough to recognized as state forest unless be registered in the land registry.
Where some judges have ruled to get forest land back to whom claims the ownership the lands
in other areas in Jefara plain. Therefor forest must be registered in the Land Registry Centre to
be obtained ownership certificate, where there are some people claiming the ownership of
forest land.
Although the Ministry of Agriculture resumed work in 1990 and a new forest act was issued in
1992 to repair what has been destroyed, this act inspired hope amongst forestry employees with
regard to rectifying administration errors, regardless of whether these were intended to destroy

Chapter 6 Forest Policy and Management
167
Libyan forests. The forestry department also resumed work, with its employees committed to
reviving as many of the previously established efforts as possible.
Despite the advantages presented by Law No. 14, of 1992 where some it article declare that
forest land must be registered in the Land Registry Centre and usufruct contracts issued in
forest lands must be abolished, this act has yet to be applied.
Poor forest governance has been prevalent since 1986, and a range of problems have arisen,
including corruption, political instability, lack of capacity, lack of transparency, weakness of
institutions and accountability, unclear regulations and conflicting laws. These factors have
driven locals to continue engaging in forest clearing. Corruption within law enforcement is also
a major cause of deforestation in the area.
The legal instruments and policies are fine, but the real problem with simply floating of policy
and ignoring of the policy (policy Breakdown) where Policy and laws are existed.
As the findings of this chapter showed that the main causes of deforestation is policy issues
that led to change of forest governance. So the following chapter focused on socio-economic
drivers of deforestation that led to deforestation, who and why they cleared forest.

Chapter 7 Socio-economic Drivers of Deforestation
168
7 Socio-economic drivers of deforestation
7.1 Introduction
Increasing pressure from human activities has caused global changes in land cover, particularly
in forest land and other similar expanses of vegetation. Such changes are one of the most
important issues in global change research. This environmental problem has become especially
remarkable in the last few decades, being compounded by population growth that has
contributed to progressive deforestation (Pahari and Murai, 1999).
The role of people in deforestation and the impact of population density on this environmental
problem have been contentious issues (Chakravarty, 2012), but most researchers recognise
population growth as one of the most critical socio-economic factors that alter the patterns of
forest resource use (Giliba et al., 2011). The association between population increase and
deforestation in most developing countries has prompted intensified concern over the clearing
of forests for other land uses (Dilip and Mwchahary, 2012).
The majority of the literature states that the strongest drivers of deforestation include logging,
conversion to agricultural land, wildfires, cutting down of trees for firewood and conflict over
land rights; these practices tend to be occasioned by increased population growth and the
consequent need for more land, mostly for agricultural production (Megan, 2012).
The problem of deforestation in the developing world is often exacerbated by rapid population
growth. Such growth is the primary cause of deforestation in Africa and Madagascar (Megan,
2012). Nevertheless, some argue that increased population is not always the strongest driver of
deforestation, with scholars disagreeing on the exact role played by population growth and
pressure. Some researchers underscore the demographic dimension as the key cause of
deforestation. Under this dimension fall factors such as the increased need for arable land for
the purpose of absorbing excess labour and keeping pace with growing demand for food from
a larger population, as well as the increased fuelwood and timber consumption brought about
by rapid population growth. Scholars who downplay the influence of demographic factors view
deforestation as rooted in political economy and therefore a problem caused primarily by the
uneven distribution of income and land, as well as unbalanced access to credit and capital
(Stonish,1989).

Chapter 7 Socio-economic Drivers of Deforestation
169
The most representative examples of political economy’s effect on deforestation today are the
province of Rondonia in Brazil and the rapid increase in deforestation in Indonesia after 1966,
neither of which stemmed from population pressure. After President Sukarno’s ouster, an issue
that became evident was that the deforestation in the country was a consequence of the
president Suharto’s views on development in general and his administration’s utilisation of
forest resources in particular. Another notable case is the deforestation in Malaysia, which
began around 1960, after the Communist insurgency was defeated. As these cases indicate,
population pressure cannot always explain the rapid initiation of deforestation in various
regions around the world (David, 1992).
Despite the increasing severity of deforestation the world over, the breadth of research devoted
to affected regions is unbalanced. For example, a considerable literature exists on deforestation
in sub-Saharan Africa (Megan, 2012), but little research has been directed towards the specific
circumstances of Libya, particularly on the socio-economic factors that influence deforestation
in the country.
As stated in chapter two (fig 2.15) that according to the census of 1984,1995 and 2006
population growth rate experienced decreasing from 4.2, 2.8 to 1.7% p.a. respectively, as the
country had reached the stage of maturity and stability of the population. Moreover, according
to the Libyan population survey in 2012, which was conducted one year after the 2011 uprising,
the population growth rate had fallen further to 0.4% p.a. because of the war, displacement and
others became refugees in other countries.
With regard the family size, according to the census of 1995 mean family size was 6.9, but in
2006 family size reduced to 6.0, this decline being due to many factors: some families adopted
birth control, a decision considered to be one of the manifestations of urbanisation (BSC, 2006).
Another factor is the increase in the average age of marriage, which is attributed to improved
educational levels and the tendency of numerous women to carry on with their education till
late in adulthood, their mid-to-late 30s (Helen, 2010).
With regard to the age groups in Libya in 2006, the BSC divided them into three group, less
than 15 years represents 31.3% and from 15 to 64 years represents 64.7% and more than 65
years represents 4.2% (BSC, 2006); in contrast in 1995 the first category represented 39.1%
and 57.0% and 3.9% respectively (BSC, 1995).
Other important factors affecting forest use include the specific characteristic of forest clearers,
such as education and income. Libyan education history has been influenced by several

Chapter 7 Socio-economic Drivers of Deforestation
170
different countries but none lasting as long as the Ottoman occupation; this empire occupied
Libya for 360 years (1551–1911). Education in this period received minimal attention, and
even when educational initiatives were actively pursued, these focused on religious matters;
the efforts towards sustaining religious education through instruction in small mosques
(Zawiya) were somewhat disorganised (Moh, 2013). Mosques were more widely spread around
the country than modern educational institutions. As a consequence of this history, the country
bears many characteristics that were forged during the long period of colonisation. In the
subsequent 100 years, Libya was occupied by the Italians, the British and the French before
the country acquired independence (establishment of monarchic rule and rise of the
revolutionary government).
In 1943, Libya became a key battleground in the Second World War, essentially because of its
strategic position in the North African region; as a result, all schools were closed (Moh, 2013).
Thereafter, the British and French administrations that succeeded the Italian government re-
opened the schools and substantially committed to providing education to the Libyan people
and generally improved the weak educational system (Tarhoni, 2011). The British provided all
Libyans with access to education and offered short courses designed to train teachers, as well
as established teacher training institutions for both men and women. The British government
viewed these measures as the only means of achieving economic and social progress. When
the level of illiteracy in the country reached 95%, parents considered sending their sons to the
schools in the southern region of Libya as a more acceptable strategy. The French then
introduced primary education that covered five years of schooling.
In 1951, Libya was granted its independence and established monarchic rule under the kingship
of Idris. During this period, the monarchy acknowledged the need to provide free general
education and build universities. The efforts of the monarchy accelerated the development of
the country.
During the 42-year period spanned by the revolutionary regime initiated by Gaddafi in 1969,
the government substantially expanded educational provision in an effort to elevate
understanding of and commitment to Libyan culture. Education was made available to all
Libyans as schools, institutions and universities were established all over the country, and the
Ministry of Education introduced major changes to improve education and engender significant
benefits to the nation.

Chapter 7 Socio-economic Drivers of Deforestation
171
An example of these measures is the 1975 Law Number 95 on Compulsory Education (Al-
Hajjaji, 1989), which requires parents to register their children (males, females) in primary
education, wherein the children are to study from the age of 6 until they reach the age of 15.
The 2006 census shows that the proportion of Libyan household heads with educational levels
lower than a primary certificate education was estimated at 32 %. The levels of education
recorded were illiterate, read only and read and write levels of individuals. Primary and
secondary school certification or its equivalent was estimated at 48 %. Gaining undergraduate
certification was estimated 19% and for post-graduate level it was estimated as 1%. The same
census indicates that the percentage of enrolment in studies increased from 91.3% in 1995 to
97.1% in 2006 and that the illiteracy rate for adults decreased from 18.7% in 1995 to 11.5% in
2006 (BSCL, 2010).
Some reports in Libya stated, that increasing the knowledge of people about the importance of
forests was through the educational institutions and also increasing their income led to a
reduction in the rate of deforestation, particularly in natural forests in 1970s (The Ministry of
Agriculture, 2004).
The research question of this chapter is; what are the drivers of deforestation? This was
addressed in two ways:
Firstly population growth was investigated - whether there is relationship between
population and deforestation. This was done using historical population deforestation
data to look at whether there is a link between population and deforestation.
Secondly, a comparison of people who cleared forests with other people who had no
such experience was undertaken in two ways:
i) In terms of their basic characteristics (education status, income and
occupation etc.),
ii) By comparing them in terms of attitudes and knowledge they had of
forests and deforestation.
This was done using a survey of people who cleared forests, comparing them with the general
population and looking whether there are specific characteristics that are more prevalent.

Chapter 7 Socio-economic Drivers of Deforestation
172
7.2 Methods
Social research uses various methods to collect both quantitative and qualitative data
(Oppenheim, 1992). This chapter is focused in two parts to address the research question.
The first part of the chapter deals with population and deforestation to determine whether there
is a link between them. The population aspect is based on census information and deforestation
is based on Forest Departmental records.
The second part of this chapter, focuses on forest clearers’ characteristics, knowledge and
attitude (education status, income and occupation etc.) and is compared with those of other
people who had no forest clearance experience. The latter is based on survey data.
Questionnaire survey
To explore the main drivers of deforestation in Libya’s Algarabulli District, in terms the
characteristics and knowledge of forest clearers, a questionnaire survey was conducted between
January and March 2014. Detailed responses were obtained from people who had cleared
forest. The study collected both quantitative and qualitative data, highlighting the main
perceived drivers of deforestation to determine whether there is any significant difference
between forest clearers and non-forest clearers in terms of their education status, income and
occupation and attitude of forest and deforestation This followed on from determining the main
causes of deforestation using semi-structured interviews (open questions) as described in
chapter 4.
7.2.1.1 Questionnaire design and administration
Careful questionnaire design and administration is critical (Lorelle and Meredith, 2000). Before
distributing the questionnaire to the respondents, a pilot research stage was conducted to
determine the expected extent of response. Due to poor postal service in most of Libya, ten
questionnaires were distributed by the drop-and-pick-up method. Only one out of 10
questionnaires was collected afterward due to various reasons; for example, some respondents
said they believed that this questionnaire came from a government institution and could
negatively affect them in the future. Some respondents refused to see the researcher again.
Therefore, to achieve the study’s goals, another method of administering the questionnaire was
used. Although it consumed time and effort, the researcher conducted in-person or face-to-face
interviews, providing more explanation and asking the questions in different ways to elicit

Chapter 7 Socio-economic Drivers of Deforestation
173
answers. When respondents showed dissatisfaction with a question, the researcher adjusted it
in simple ways or changed the topic of conversation to general issues in Libya.
The respondent’s education and culture played a role in administering the questionnaires,
especially because the researcher dealt with citizens who had cleared the forest against the law
(forest clearers). Additionally the researcher filled out some questionnaires for respondents
unable to read or to write.
Finally, some respondents only accepted the questionnaire after the researcher guaranteed that
the study belonged to the researcher and his university and that the individual results would
never be provided to any Libyan institution nor affect the respondents in any way.
7.2.1.2 Type of question
This study used closed questions with respondents (those clearing the forest) who were
expected to refuse the questionnaire. This type of question made it easier to process answers,
compare answers and clarify the meaning of a question for a respondent. Respondents also
found this type of question easier to complete.
The closed questions were designed to have short answers, making them simple to conduct.
These included questions addressing the research problem of this study. Care was taken to
ensure cultural sensitivity. Additionally, closed questions avoided incomplete or poorly
completed answers. All questions were about the characteristics of forest clearers and their
knowledge about deforestation (such as their education status, family size and age group,
income, the purpose of clearing forest etc, (see appendix 3).
7.2.1.3 Sampling
Following certain guidelines reduced the danger in this case, and the fieldwork became more
rewarding, more enjoyable and possibly a little easier. During an in-depth discussion with the
Forestry Department, officials in the Algarabulli District, along with some of the researcher’s
colleagues.
This study used a simple random sample, the most basic form of probability sample (Bryman,
2012).The sample size was selected according to the number of forest clearers that recorded by
the Forest Department in the Algarabulli district since May 1986 when deforestation
commenced until January 1, 2014. The number of forest clearers consisted of only 150 people
in all forest blocks. As many respondents as possible were targeted out of the expectation that

Chapter 7 Socio-economic Drivers of Deforestation
174
some respondents would refuse to participate in the questionnaire. Therefore, 80 respondents,
or forest clearers, were selected after ensuring they posed no threat to me.
This sample represented 53% of the 150 forest clearers in this area. People who were suspect
or who had cleared forest areas recently using weapons were not selected for this research
sample due to the dangers involved (7.1).
Table 7.1: The number of forest encroachers in each forest block selected and
subsequently unselected for the study.
Forest block
& locality
Total in area Selected Deselected for
safety reasons
Refused Interviewed
Ataya 80 46 34 23 23
Karawa 35 17 18 9 8
Gaweaa 16 8 8 3 5
Rawajih 15 7 8 2 5
Kawaleg 4 2 2 0 2
Total 150 80 70 37 43
The questionnaire was administered as planned without any difficulties; 43 out of 80
respondents agreed to fill out the questionnaire and 37 politely refused. The questionnaire was
written in the Arabic language and translated into English.
7.2.2 Documents
Documents are secondary sources and can be treated as a source of data in their own right; in
effect, an alternative to questionnaires, interviews or observation and the source of
documentary data (Denscombe, 2003) In this chapter were used :
1) The Ministry of Agriculture’s reports and Forest Department’s records and census
obtained from Bureau of Statistics and Census Libya, and economic information about
Libya from government institutions.
2) Books or literature that related to the issues of socioeconomic factors and the history of
education etc.

Chapter 7 Socio-economic Drivers of Deforestation
175
7.3 Results and discussion
7.3.1 Population
This section delves into the relationship between deforestation and population (growth and
density) to determine whether the rise in population in the study area contributed to the
destruction of forest cover in the region. This issue is examined first in relation to the entirety
of Algarabulli district, after which deforestation in the district’s localities is analysed. An
important requirement to consider is that quantitative research on deforestation commonly uses
two measures of population pressure: absolute population growth and population density
(David, 1992).
Algarabulli district, which is an extension of Tripoli City, is home to a relatively small
population. In 2010, its population accounted for 0.9% of the total population of Libya. To
study the Algarabulli’s population growth rate, the general population censuses conducted in
the district were reviewed.
7.3.1.1 Population growth
According to the 1954 census, the total population of Algarabulli District was estimated at
9258, which increased to 10,366 by 1964 (Fig 7.1). This increase, which represents a growth
rate of 3.73% p.a., is attributed to the appeal of the district’s high standards of living and to
migration motivated by the distribution of Algarabulli farm development projects to residents
outside the district. The highest population growth rate in this area occurred between 1984 and
1995, with the population rising to 38,857 inhabitants or 4.55% p.a. This growth was a
consequence of increased migration to the area because of the housing projects that were
established in the region, along with intermarriages with non-Algarabulli residents.

Chapter 7 Socio-economic Drivers of Deforestation
176
Figure 7.1: Population censuses and population growth in Algarabulli District (1954, 1964, 1973,
1984, 1995, 2006 and 2010) (Source: BSCL, 2010).
The 1995 was a significant decrease in population growth rate from 4.5% p.a. in 1995 to 0.7%
p.a. in 2006 because of a combination of factors, including the global economic recession in
the mid-eighties, the decrease in oil prices and sales and the economic sanctions against Libya
during the nineties. Because of the sanctions, all the development programmes and projects in
the country were suspended, thereby negatively reflecting on the average age at which Libyan
citizens married and had children. This development also negatively influenced fertility rates
(BSCL, 2010).
In more detail table 7.2 shows the population distribution and population growth rates in
localities of Algarabulli district, which witnessed an increase in growth rates, as indicated in
the 1984–1995 censuses. As stated in the 2006 census, growth rates declined in all the
localities, except for Al-Rawajih, which experienced a slight growth. The 2010 census
registered a rise in growth rates in all the localities, except for Al-Rawajih. Although population
increases are clearly observed, an issue that requires resolution is whether the slight increase
in the population growth rates of all the localities have intensified deforestation in the district.
0
0.5
1
1.5
2
2.5
3
3.5
4
4.5
5
0
5000
10000
15000
20000
25000
30000
35000
40000
45000
50000
1954 1961 1968 1975 1982 1989 1996 2003 2010
Po
pu
lati
on
gro
wth
rat
e
Inh
abit
ants
Census
Males Females Total Population growth rate

Chapter 7 Socio-economic Drivers of Deforestation
177
Table 7.2: Population censuses and population growth in the localities of Algarabulli
(1954, 1964, 1973, 1984, 1995, 2006 and 2010).
Censuses Locality Population Population growth rate From total
district (%)
Male Female Total
1984 Al-Karawa 3954 3810 7764 4.24 33.2
Al-Ataya 2183 2109 4292 4.12 18.3
Al-sharqiya 1882 1751 3633 3.91 15.5
Al-Gawea 1198 1124 2322 2.19 10.0
Al-Rawajih 1739 1638 3377 5.03 14.4
Al-kawaliq 1015 1007 2022 4.59 8.6
Total district 11971 11439 23410 4.24 100
1995 Al-Karawa 6201 6132 12333 4.13 35.5
Al-Ataya 3344 3182 6526 3.75 19.0
Al-sharqiya 2562 2397 4959 2.80 14.3
Al-Gawea 2081 1968 4049 4.93 11.8
Al-Rawajih 1951 1878 3829 1.14 11.1
Al-kawaliq 1433 1455 2888 3.21 8.3
Total district 17572 17012 34584 4.50 100
2006 Al-Karawa 6658 6599 13257 0.65 31.5
Al-Ataya 4600 4411 9011 0.29 21.5
Al-sharqiya 2908 2746 5654 1.19 13.5
Al-Gawea 2542 2476 5018 1.02 11.9
Al-Rawajih 2883 2738 5621 3.44 14.4
Al-kawaliq 1634 1662 3296 1.19 7.2
Total district 21225 20632 41857 1.72 100
2010 Al-Karawa 7423 7352 14775 2.6 32.0
Al-Ataya 5255 5089 10344 3.44 22.5
Al-sharqiya 3231 3046 6277 2.61 13.5
Al-Gawea 2973 2917 5890 3.99 13.0
Al-Rawajih 3045 2855 5900 1.21 13.0
Al-kawaliq 1774 1813 3587 2.11 6.0
Total district 21681 21059 46327 2.53 100
Source: (BSCL, 2010).

Chapter 7 Socio-economic Drivers of Deforestation
178
7.3.1.2 Population and forest cover
Algarabulli’s population grew at a considerably lower pace in previous years than in recent
periods. Figure 7.2 illustrates the proportion of forest cover versus the population in the district.
The percentage of forest cover from 1961 to 1985 increased to a more rapid extent than the rise
in population. Since 1986, however, forest cover has begun gradually diminishing, and in 2010,
it decreased to more drastic proportions than that observed in the district’s population.
Figure 7.2: Population and percentage of forest cover in Algarabulli district (1954, 1964, 1973, 1984,
1995, 2006, 2010 and population estimates of 2013)
7.3.1.3 Family size
The number of households in Algarabulli in 1954 was estimated at 1973 families. This number
gradually increased to an estimated 8706 families in 2010 (see Fig 7.3). Household size in the
district continued to increase. Between the 1954 and 1995 censuses, no regular fluctuations or
decreases in family size were registered. After the discovery of oil in Libya, economic
development and rising standards of living did nothing to reduce family size in Algarabulli. In
Western societies, such economic changes typically reduce household size. The opposite trend
occurred in Algarabulli: the developments increased average family size because of the
strengthening of familial and tribal bonds, early marriages and high birth rates.
Contrastingly, the 1995 and 2006 census indicates that the average household size in
Algarabulli dropped from 6.7 in 1995 to 5.8 in 2006. This decline is due to many factors that
was stated in the chapter introduction.
0
5
10
15
20
25
30
0
5000
10000
15000
20000
25000
30000
35000
40000
45000
50000
1954 1961 1968 1975 1982 1989 1996 2003 2010
Pe
rce
nta
ge o
f fo
rest
co
ver
Inh
abit
ants
Years
population No forest cover %

Chapter 7 Socio-economic Drivers of Deforestation
179
Figure 7.3: Number of households and family size in Algarabulli (1954, 1964, 1973, 1984, 1995, 2006
and 2010 (Source: BSCL, 2010).
7.3.1.4 Population density and deforestation
According to the 2006 census, the population of Libya grew by 1.7% p.a and population density
rose to 3 people/km2. The density is minimal because 95% of Libya’s total land area is
constituted by desert land. Some regions, however, particularly the north, are characterised by
high population densities. An example is Jefara plain, which accounts for 1% of Libya’s total
land area but is home to 60% of the Libyan population.
The population density in Algarabulli District is 111 people/km2, but within the localities,
population densities contrast. Karawa, for instance, has a higher population density because the
urban area of Algarabulli District is situated within this locality; all administrative and financial
services are provided from this centre. The locality with the lowest population density is
Kawaliq (see table 7.3).
0
1
2
3
4
5
6
7
0
1000
2000
3000
4000
5000
6000
7000
8000
9000
10000
1954 1964 1973 1984 1995 2006 2010
Ave
rge
Fam
ily S
ize
Ho
use
ho
ld N
um
ber
Census
household No Average Family Size

Chapter 7 Socio-economic Drivers of Deforestation
180
Table 7.3: Population density in Algarabulli localities in 2010
Locality Area (km2) Density (Population/ km2)
Karawa 79 187
Ataya 78 132
Sharqiya 63 99
Gawea 67 87
Rawajih 73 80
Kawaliq 55 65
Total area 415 111
As was stated in the methodology section, according to the records of forestry departments in
Algarabulli district, 150 heads of household encroached into forests from 1986 to 2013,
clearing about 7643 ha of forest land for other uses. These individuals represent 0.3% of the
total population in the district or 1.7% of the total number of households.
To comprehensively analyse the number of households and the extent of land cleared in the
entire district and within the various enclosed localities (Figure 7.4); it was determined that the
household densities in non-forested and deforested areas that were converted to other land uses
was investigated. Household density was calculated by subtracting the number of forest
clearers (obtained from Forestry Departments) from the total household number indicated in
the 2010 population census. Although the exact number of inhabitants in the deforested areas
is impossible to determine accurately, estimating the population is possible by referring to the
number of households in these regions. As ascertained through the analysis, the densities in
non-forested and deforested areas differ substantially. The density in the non-forest area is 0.3
ha. per household, whereas in deforested areas it is 32 ha/per household. The densities within
Algarabulli’s localities are shown in table 7.4 which supports the observation that there is no
clear strongly between population and deforestation, these findings confirm that there is no
consistency with the findings showed in figure 7.2. However it can be explained that a very
some of household are cleared a very large amount of land per household comparing to the
average of household in the district.

Chapter 7 Socio-economic Drivers of Deforestation
181
Table 7.4: Household density in the non-forested and deforested areas within
Algarabulli’s localities (2013)
Locality Area/ ha Household in non-forested area Household in cleared forest area
Non-
forested
area /ha
Household
(No of
residents)
Household
no/area
per ha
Deforested
area (in
ha)
Household
(No of
forest
clearers)
Household
No/area per
ha
Karawa 7900 4691 2761 0.5 2360 35 67
Ataya 7800 3228 1802 0.5 3959 80 49
Gawea 6700 4948 1119 0.2 1202 16 75
Rawajih 7300 6079 1016 0.1 831 15 55
Kawaliq 5500 5243 716 0.1 127 4 4
Total 37900 24189 7414 0.3 8479 150 32
7.3.1.5 Forest clearer and deforestation rate
As previously stated, household heads cleared the forest land in Algarabulli for conversion into
other land uses. Figure 7.4 compares the forest areas that were cleared before and after the
uprising. The figure shows the forest clearers from the Forest Department records (150
household heads), the forest clearers selected for the questionnaire survey (80 household heads)
and the forest clearers who agreed to participate in the study (43 household heads). The result
shows in figure 7.4 that the sample of clearers interviewed are broadly representative (in terms
of area cleared) of the sample selected and of the population of clearers as a whole.

Chapter 7 Socio-economic Drivers of Deforestation
182
Figure 7.4: Box and whisker plot of area cleared before and after the 2011 uprising by all forest
clearer, those selected as safe enough to interview, and those who participated in the interview. Thick
lines represent medians, upper and lower box limits represent 75th and 25th percentiles respectively.
Numbered outliers are >2 box heights above or below the box (Source: Forestry Department in
Algarabulli district, 2014).
7.3.2 Forest clearers compared to others
The aim of this section is to show characteristics, attitudes and knowledge for forest clearers
comparing to other local people as explained below;
7.3.2.1 Social and demographic characteristics
7.3.2.1.1 Family size of forest clearers
In terms of family size, the results showed that there is no difference between the forest clearers
and other locals, where the average family size of forest clearers is 5.8 and other locals is 6.
Total forest clearers Forest clearers selected Participating forest clearers
accepted

Chapter 7 Socio-economic Drivers of Deforestation
183
7.3.2.1.2 Age group of forest clearers
Figure 7.5 shows that the oldest age group amongst the 43 individuals who cleared the forests
in the study area is 51–65 years, to which 55.8% of respondents belong; 23.3% of respondents
are in the 40–50-year age group; 18.6% of respondents are more than 65 years old; and 2.3%
is less than 40 years old. Also, it was found that the age groups below 51 years represented
25% of the total group populations being responsible for forest cleared after the 2011 uprising.
Figure 7.5: The distribution forest clearers’ among age groups in Algarabulli District (N = 43)
In contrast, age groups in Algarabulli District, based on the 2006 census, shows that 66 % of
the population is in the 15–64 year age group. This age group is an acceptable working age in
Libya. The remaining population consists of 29 % representing those under 15 years and the
other 5% represents people over 65 years.
7.3.2.1.3 Educational status
The result in the figure 7.6 illustrates that many of the forest clearers (17 of 43) hold average
educational attainment, which covers higher than secondary education and lower than a college
degree. Amongst the respondents, 16 have primary and secondary education, 7 hold
undergraduate and post-graduate degrees and 3 have only reading and writing proficiencies. In
summary, 93% of the respondents are educated and 7% are uneducated.
0
2
4
6
8
10
12
14
less than 40 years 40-50 51-65 more than 65 years
Age group
Res
po
nd
ents
nu
mb
er
Al Atayah
Al Rawajih
Al gawea
Al karawa

Chapter 7 Socio-economic Drivers of Deforestation
184
Figure 7.6: Forest clearers’ Educational status in Algarabulli District (N = 43)
Education in Algarabulli district in the past was not available in its current form. Until the late
1960s, students acquired elementary education in the district. Should they desire to continue
their education, they were compelled to travel to large cities where education was more
developed, with an increasing number of schools having been established in the 1970s. The
number of primary and secondary schools, or their equivalent, was one school in 1950. After
5 years there were 10 schools, in 1980 there were 35 schools, with an estimated 65 schools and
one higher Institution by 2010. Some universities also had two branches by this time.
7.3.2.1.4 Occupation of forest clearers
With regard to primary occupation of forest clearers, the results show 39 of the respondents are
employees in the public sector. The occupations were categorised into four types (Fig 7.7):
officials (14 respondents), army and police officers (5), retired employees (3) and currently
employed individuals (17). Amongst the forest clearers, four work in the private sector. As
explained in chapter four, the non-forest clearers stated that deforestation was initiated by army
and police officers and officials of state institutions who held authority acquired from the
previous regime. Ordinary citizens then followed suit. In fact, the records of the forestry
departments confirm that state officials and officers were the ones who initiated forest clearing
in the study area.
The findings also indicate that people who cleared the forests before the uprising live close to
the forest land (forest neighbours) and some government officials and officers from outside the
0
2
4
6
8
10
12
14
Read and write Primary&Secondary Average education Higher education
Education_status
Nu
mb
er o
f re
spo
nd
ents
Al Atayah
Al Rawajih
Al gawea
Al karawa

Chapter 7 Socio-economic Drivers of Deforestation
185
district. However, after the uprising, those who cleared the forests are people who claim
ownership of the land includes forest neighbours, local non- forest neighbours and armed
gangs. These findings agreed with findings of chapter four.
Figure 7.7: Forest clearers’ occupation in Algarabulli District (N = 43)
7.3.2.1.5 Income
To determine if there's a statistically significant difference between the respondents of forest
clearers and respondents of non-forest clearers in their income within the localities.
A two factor ANOVA, examining where the forest clearers and non-forest clearers differed in
income showed no significant interaction between location and land user (F=0.04 p=0.988).
There was no significant effect of location (F=0.670, p=0.573) but the average income of forest
clearers (9860.5 LYD) was significant higher than that of non-forest clearers (8230.2 LYD)
(F=13.78, p<0.001). Residuals were approximately normally distributed with no significant
heterogeneity of variance (levenes statistic 0.690, p= 0.681).
7.3.2.2 Forest clearers: attitudes and knowledge
7.3.2.2.1 Awareness of forest clearers regarding the importance of forests
During the forest plantation campaigns that occurred from 1960 until 1984, the government
made a great effort to raise awareness among the local people of the importance of forests.
0
5
10
15
20
25
AlAtayah
AlRawajih
Al gawea Alkarawa
Nu
mb
er o
f re
spo
nd
ents
Localities
Officials Officers Retired Normal employee Private sector

Chapter 7 Socio-economic Drivers of Deforestation
186
They did this through schools, mosques and NGOs, such as Tree Friends Association.
However, all of these efforts were suspended in 1986.
So, most of the individuals who engaged in forest clearing are educated and should have been
cognizant of the importance of forest land. These individuals also witnessed the suffering that
the residents experienced because of sand dune movements. The problems caused by sand
dunes are what drove forest planting. As the non-forest clearers stated in chapter three, amongst
these forest clearers are officials, officers, teachers and religious leaders, who should have
taken the lead in preventing people from clearing forests. Some of the non-forest clearers also
stated that the unfavourable state policies after 1985 accelerated deforestation. The non-forest
clearers declared that although the forest clearers were aware of all forest protection-relevant
information, whether it be on the importance of such land cover or forestry laws, they ignored
such information because of greed and their desire for land ownership. Figure 7.8 compares
the forest clearers and other local respondents in terms of their awareness of the importance of
this land cover and forestry laws. The forest clearers claimed to be less aware of the importance
of forests and forestry laws than that observed amongst the non-forest clearers. Of the 43 forest
clearers, 41 (95%) stated that they were unaware of the importance of forests, and 26 (60%)
indicated that they were uninformed about forestry laws. By contrast, all the non-forest clearers
(43) stated that they knew of the significant role of forests in environmental health; although
they aware of all the forestry laws and they read some articles about the current state of forest
land and regulations that prohibit cutting and clearing.
Figure 7.8: Comparison between forest clearers (N = 43) and non-forest clearers (N = 43) in terms of
awareness about forest importance and forestry laws in Algarabulli District.
0
20
40
60
80
100
120
aware unaware aware unaware
Forest clearers Non-forest clearers
Per
cen
tage
of
resp
on
den
ts
Forest Importance
Forest Laws

Chapter 7 Socio-economic Drivers of Deforestation
187
The perceptions of forest clearers about the importance of forests are uncertain, but as the non-
forest clearers indicated, most of the forest clearers disregarded the importance of forests and
the laws designed to protect these resources in the name of land ownership. They wanted to
obtain lands for later sale. The non-forest clearers clearly expressed concern over the
consequences of deforestation.
To verify the truthfulness of the responses, we presented additional questions regarding
afforestation, who participated in these initiatives and why. These questions were raised
because they serve as a respite from the investigation into deforestation and were therefore a
strategy intended to assuage the discomfort that the respondents may have begun to experience.
The first question centred on land cover types before afforestation. As presented in figure 7.9,
40 of the 43 forest clearers stated that sand dunes were the dominant land cover type before
forests were planted; 2 identified natural land as the primary land cover type; and 1 indicated
that he had no idea what cover types were dominant before forest planting.
Figure 7.9: Forest clearers’ awareness about land cover before forest planting (N = 43)
The second question revolved around the agents who participated in forest planting. Amongst
the forest clearers, 42 identified the government as an agent and 1 exhibited no awareness of
this issue (Figure 7.10).
0
5
10
15
20
25
Al Atayah Al Rawajih Al gawea Al karawa
Nu
mb
er o
f re
spo
nd
ents
Localities
sand dunes
natural vegetation cover
don not know
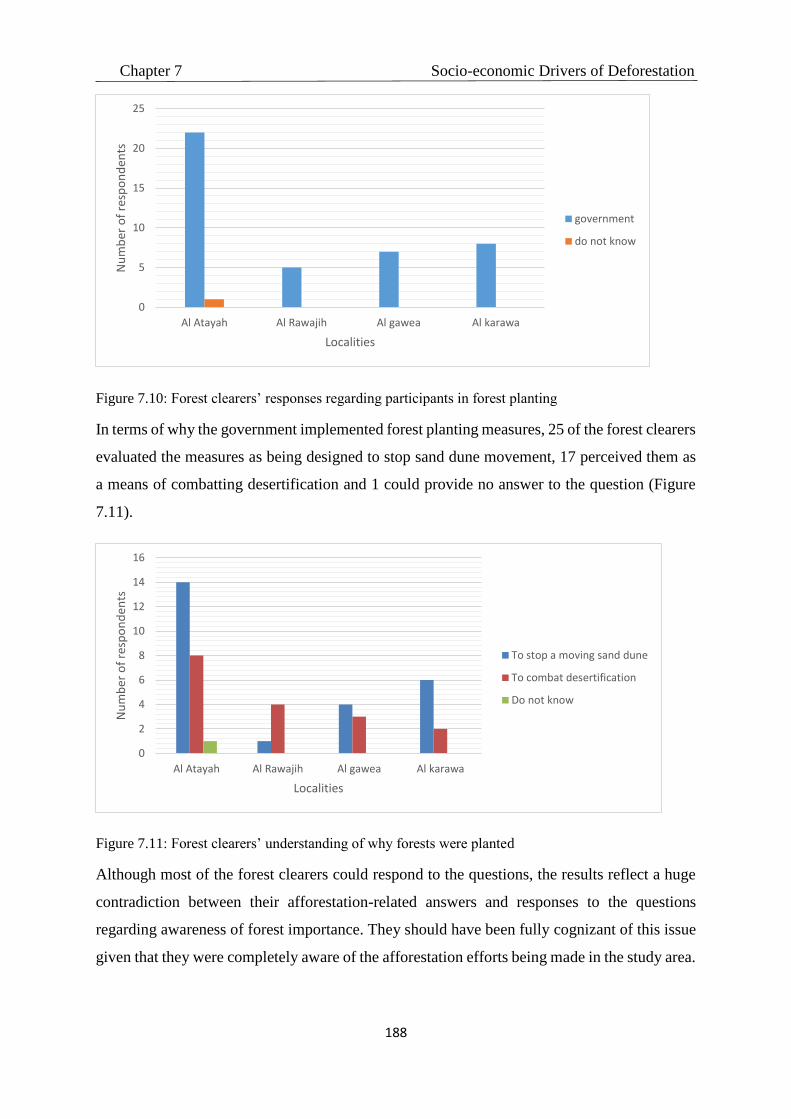
Chapter 7 Socio-economic Drivers of Deforestation
188
Figure 7.10: Forest clearers’ responses regarding participants in forest planting
In terms of why the government implemented forest planting measures, 25 of the forest clearers
evaluated the measures as being designed to stop sand dune movement, 17 perceived them as
a means of combatting desertification and 1 could provide no answer to the question (Figure
7.11).
Figure 7.11: Forest clearers’ understanding of why forests were planted
Although most of the forest clearers could respond to the questions, the results reflect a huge
contradiction between their afforestation-related answers and responses to the questions
regarding awareness of forest importance. They should have been fully cognizant of this issue
given that they were completely aware of the afforestation efforts being made in the study area.
0
5
10
15
20
25
Al Atayah Al Rawajih Al gawea Al karawa
Nu
mb
er o
f re
spo
nd
ents
Localities
government
do not know
0
2
4
6
8
10
12
14
16
Al Atayah Al Rawajih Al gawea Al karawa
Nu
mb
er o
f re
spo
nd
ents
Localities
To stop a moving sand dune
To combat desertification
Do not know

Chapter 7 Socio-economic Drivers of Deforestation
189
In summary, the non-forest clearers understood the value that forests present and exhibited
concern over forest clearing, whereas the forest clearers were unconcerned about the
consequences of deforestation. Their justification for clearing forests was that because no
benefits could be derived from planted forests, these land types had to be cleared for other
purposes.
Moreover, the Director of the Forestry Department in Algarabulli district and other government
officials stated that ignorance does not play an important role in forest clearance. Instead, he
argued that the forest clearers were well aware of the importance of forests, therefore they were
not telling the truth to me. Indeed, there are many sources of information and guidance about
the importance of forests in Libya, including schools, mosques and NGOs. It will be discussed
these below:
7.3.2.2.1.1 Social institutions and their role in forest conservation in Libya
As an important component of a country’s natural resources, forests can contribute to the
economic and social welfare of people. Eckholm (1979) states that the three basic human
resources obtained from forests are food, clothing and shelter.
The FAO (1987) classified forest plantations into two groups, namely, industrial and non-
industrial plantations. Industrial plantations are established partly or completely for the
production of wood for industry use, whereas non-industrial plantations are established partly
or wholly for the production of fuelwood and charcoal and for ecological maintenance
measures, such as soil protection.
Although the primary purpose of forest land is wood production, it can also serve other
purposes that are equally beneficial to socio-economic development processes. The aims of
establishing forest plantations are to satisfy the requirements of an increasing population and
to cater to the needs of specific types of plant species to accelerate their growth and usage in
rapidly expanding industries. In Libya, however, forest plantations were established primarily
to guarantee ecological balance. In this regard, the measures implemented in the country
revolve around catchment protection, soil erosion control and the maintenance and
safeguarding of flora and fauna. All these factors figure importantly in the maintenance of a
viable land use system and environmental equilibrium.
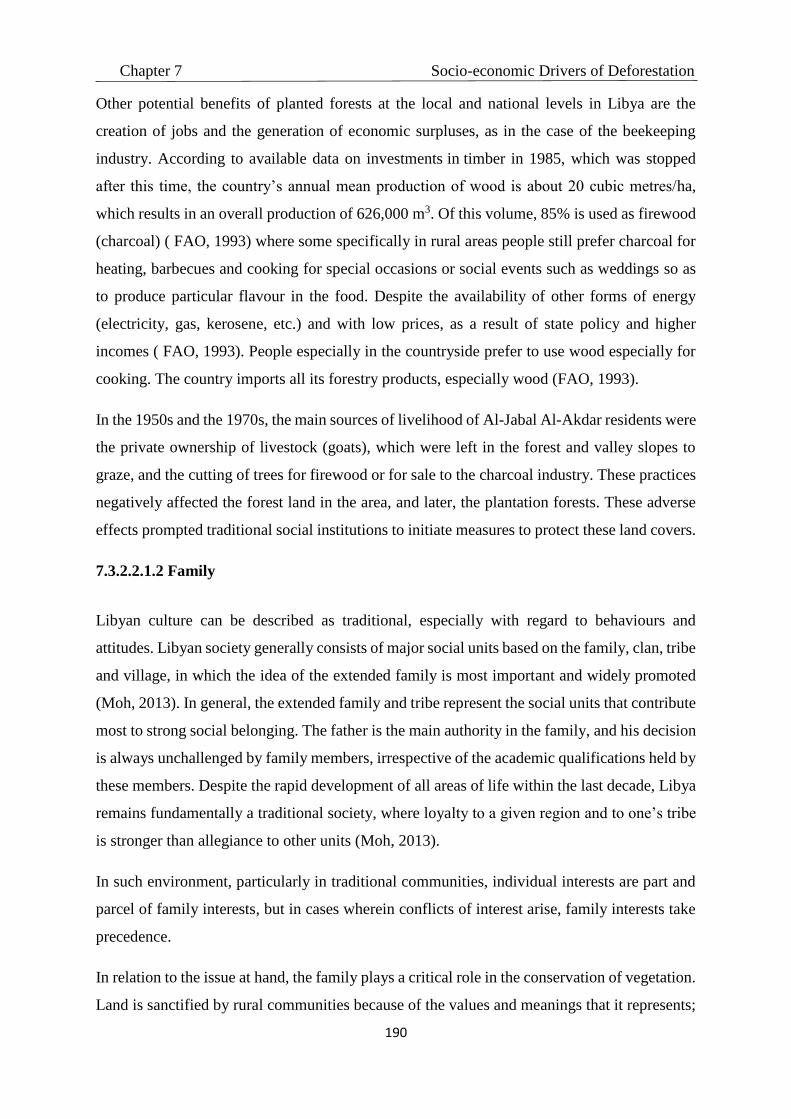
Chapter 7 Socio-economic Drivers of Deforestation
190
Other potential benefits of planted forests at the local and national levels in Libya are the
creation of jobs and the generation of economic surpluses, as in the case of the beekeeping
industry. According to available data on investments in timber in 1985, which was stopped
after this time, the country’s annual mean production of wood is about 20 cubic metres/ha,
which results in an overall production of 626,000 m3. Of this volume, 85% is used as firewood
(charcoal) ( FAO, 1993) where some specifically in rural areas people still prefer charcoal for
heating, barbecues and cooking for special occasions or social events such as weddings so as
to produce particular flavour in the food. Despite the availability of other forms of energy
(electricity, gas, kerosene, etc.) and with low prices, as a result of state policy and higher
incomes ( FAO, 1993). People especially in the countryside prefer to use wood especially for
cooking. The country imports all its forestry products, especially wood (FAO, 1993).
In the 1950s and the 1970s, the main sources of livelihood of Al-Jabal Al-Akdar residents were
the private ownership of livestock (goats), which were left in the forest and valley slopes to
graze, and the cutting of trees for firewood or for sale to the charcoal industry. These practices
negatively affected the forest land in the area, and later, the plantation forests. These adverse
effects prompted traditional social institutions to initiate measures to protect these land covers.
7.3.2.2.1.2 Family
Libyan culture can be described as traditional, especially with regard to behaviours and
attitudes. Libyan society generally consists of major social units based on the family, clan, tribe
and village, in which the idea of the extended family is most important and widely promoted
(Moh, 2013). In general, the extended family and tribe represent the social units that contribute
most to strong social belonging. The father is the main authority in the family, and his decision
is always unchallenged by family members, irrespective of the academic qualifications held by
these members. Despite the rapid development of all areas of life within the last decade, Libya
remains fundamentally a traditional society, where loyalty to a given region and to one’s tribe
is stronger than allegiance to other units (Moh, 2013).
In such environment, particularly in traditional communities, individual interests are part and
parcel of family interests, but in cases wherein conflicts of interest arise, family interests take
precedence.
In relation to the issue at hand, the family plays a critical role in the conservation of vegetation.
Land is sanctified by rural communities because of the values and meanings that it represents;

Chapter 7 Socio-economic Drivers of Deforestation
191
that is, these values bear on the physical and moral perspectives and behaviours of community
residents. The practice of agriculture, for example, is positively reflected in the respectful
expansion of land that is cultivated with various crops and trees.
The family also assumes responsibility for educating succeeding generations in terms of the
need to ensure that forests are treated as national treasures.
7.3.2.2.1.3 Mosque
Religion is always highly valued amongst Libyans, to the extent that it serves as one of the
determinants of social behaviour. Religious values in Libya have been deeply rooted since the
early Ottoman occupation and during the royal era, at which religious leaders governed the
country and stringently oversaw all aspects of life (Moh, 2013). The domination of religious
leaders continued through 1969 (Moh, 2013). The fact that religious leaders were highly
respected by the public and the high social status that they retained afforded them an advantage
over other social groups; these granted them licence to lead society and occupy key positions
in politics, education, administration and the judiciary.
Given this backdrop, Islamic societies revere the mosque as the traditional institution that
guides people’s actions, with particular focus on practices that benefit the public and the
community. People attach considerable importance to Islam as a guiding principle in the
maintenance of vegetation. The Quran itself highlights the importance of trees in many of its
verses, which encourage the planting of trees and the prevention of tree cutting or any form of
damage to vegetation. To illustrate the reverence with which plant life is regarded, three
chapters of the Quran are labelled with the names of trees: the fig, olive and palm trees. The
lessons delivered in mosques play a major role in enlightening community members regarding
the need to preserve vegetation and increase the area of cultivated land. Additionally, booklets
about Islam and the environment elucidate the role of Islam in environmental preservation and
protection, which extends to forests. Sometimes, the information in these booklets is delivered
as speeches in mosques for the young and the elderly, as well as those for men and women.
7.3.2.2.1.4 Schools
Schools are equally significant avenues from which to disseminate information on planting
values and the common good. This information includes principles for maintaining vegetation

Chapter 7 Socio-economic Drivers of Deforestation
192
and measures for educating people regarding the importance of forests and their role in
maintaining ecological balance and creating a beautiful and healthy environment.
In the 1960s to the 1980s, Libya’s Ministry of Agriculture, in collaboration with the Ministry
of Education, initiated efforts to educate people about the importance of forests, their role in
preserving the environment and the ways in which people can protect forests. These issues
were accorded priority in the state’s implementation of environmental policy. Many lectures
were held for school students, youth leagues, scout organisations and citizens to encourage
them to participate in afforestation campaigns.
7.3.2.2.1.5 Government and non-government organisations
Agricultural and forest lands diminished amid economic development, with large sections of
forest cover converted into barren land through burning, cutting and ploughing. Non-
government organisations were therefore established to maintain vegetation cover, increase the
amount of cultivated areas and combat desertification and erosion, as well as the destructive
exploitation of forests and natural resources (soil, water, forests). These organisations were
intended to work towards optimal resource use.
In the domain of national cooperation and education on environmental safety and forest
protection, a number of activities and programmes were designed and developed to raise
environmental consciousness amongst people and educate them about the unfavourable
environmental effects resulting from intentional or unintentional human activities. Guidance
was also broadcast over radio and TV stations to inform people about appropriate forest
management and protection techniques.
Additional measures included authorities’ contribution to local newspaper and magazines in
the form of articles on the environment and forests to raise levels of awareness and interest
amongst the public. In the education sector, a curriculum related to agriculture in general and
forestry in particular was adopted.
The environmental education campaigns and information programmes enabled stakeholders to
achieve the desired degree of progress in enhancing environmental protection across all social
layers. Nevertheless, key informants and recently available reports indicate otherwise. That is,
the measures and initiatives implemented by the government and non-government

Chapter 7 Socio-economic Drivers of Deforestation
193
organisations in schools and mosques were terminated in the mid-80s because of the enactment
of non-complementary state policies after 1985.
These policies negated the early efforts established for the purpose of protecting forests and
plantation forests and directly influenced the manner by which families and mosques engaged
in environmental protection.
7.3.2.2.2 Land tenure
In Libyan society, land is regarded as the source of life. The influence and strength of a family
is measured by how much land it owns. In particular, Bedouins believe that compromising land
translates to compromising one’s dignity. Because of the strong link between morality and
land, land-related conflict always engenders violence, typically in the form of murder (Al-Zeni
and Bayoumi, 2006).
Before the uprising, the people of Algarabulli district were engaged in moderate problems in
relation to the acquisition of forest land, but disputes on forest land acquisition after the
uprising began taking on a more deadly turn, with one case resulting in the murder of a family
member. Each party claimed ownership of a given section of land—a dispute that was
aggravated by other problems arising from the spread of weapons and the absence of state
regulation. Under this situation, land ownership documents were used as grounds for forest
clearing, figure 7.12 shows claims to land tenure or proof of ownership.
Figure 7.12: Claims to land tenure or proof of ownership by forest clearers
0
2
4
6
8
10
12
14
Ataya Rawajih Gawea karawa
Nu
mb
er o
f re
spo
nd
ents
Locality
property deeds
Certificate Sheikh
Without proof
Land Allocation

Chapter 7 Socio-economic Drivers of Deforestation
194
The respondents stated that land rights were reinforced by property deeds or Sheikh certificates.
When the state stabilised the sand dunes and planted trees on them, the respondents and their
parents believed that the goals of the programme were sand dune stabilisation and land
reclamation for agricultural purposes. However, they claimed that the state took the land from
them by the power of the law. Another justification offered for forest clearing was that although
forests facilitate the biocycling process, no tangible benefits can be derived from this land
cover, hence the decision to remove the forests for purposes that were deemed important by
the clearers. This explanation was expected by the respondents who are relatives of the forest
cleaners and by officials who disproved of this practice, regardless of whether it is permitted
by law and custom. These individuals criticised the practice as dishonest and primarily
motivated by the desire to acquire land by any means possible.
As described in a previous chapter (the legal status of these claims to land tenure or proof of
ownership explained in section 6.3.4) the documents that supposedly confirm land ownership
and that were used by the forest clearers as licence for acquiring land are illegal.
The forest clearers were asked about how may plots of land they obtained to identify the
economic status of these respondents. Amongst the participants, 18 indicated that they own
only one plot of land, 19 stated that they own two plots of land, 5 shared that they possess three
plots of land and 1 owns four plots of land (Figure 7.13). These results demonstrate that the
forest clearers are well off and therefore have no need to clear forests.
Figure 7.13: Number of plots of land owned by forest clearers
0
2
4
6
8
10
12
One plots Two plots Three plots Four plots
Res
po
nd
ents
nu
mb
er
Locality
Al Atayah
Al Rawajih
Al gawea
Al karawa

Chapter 7 Socio-economic Drivers of Deforestation
195
7.3.2.2.3 Purpose of forest clearance
The forest clearers were directly asked to explain why they cleared forests even as they suffered
from the effects of deforestation and sand dune movement before forests were planted in the
study area. Most of the respondents (26) mentioned agricultural expansion as justification,
some (10) indicated the need to build houses and the rest (7) raised both these factors as
explanation for their actions (Fig 7.14).
Figure 7.14: Purpose of forest clearance
7.3.2.2.3.1 Agricultural expansion
An important question that arises from this situation is whether the forest clearers were aware
of the positive and negative effects of converting forest land to cropland. Available soil and
water data (see chapter 2) illustrate that forest land is unsuitable for growing crops because it
is composed of sandy soil and poor-quality organic matter. As shared by the non-forest clearers
(see chapter 4), most of the cropping practices over the land failed and dunes were re-
established. We experienced this phenomenon, as well, during the fieldwork. The forest
clearers who engaged in forest removal for the purpose of cropping before the uprising were
asked to share their reasons for engaging in forest clearing. Amongst them, 95% stated that the
decline in agricultural production prompted their decision to clear forests.
0
2
4
6
8
10
12
14
16
18
Al Atayah Al Rawajih Al gawea Al karawa
locality
Nu
mb
er o
f re
spo
nd
ents
Agricultural expansion settlement Both of them

Chapter 7 Socio-economic Drivers of Deforestation
196
7.3.2.2.3.2 Building expansion
The economic development of Libya after the exportation of oil altered some of the cultural
attributes and population patterns in the country. Before the advent of oil production and
export, families resided in small houses with a large number of family members, even until
after sons were married. After the discovery of oil, household size increased to three times the
previous level. Furthermore, upon marriage, family members constructed a separate house
located within the same area on which the ancestral house stands.
Some of the forest clearers identified the lack of housing projects that would have enabled them
to provide housing for their sons as the factor that drove them to clear forests. To determine
the correspondence between the forest clearers’ explanation and actual circumstances, forestry
department data were examined. The records show extensive encroachment of up to hundreds
of ha per person. With this volume, each forest clearer is assumed to have 10 children and to
own a house occupying an average area of 500 m2. For the forest clearers to build houses for
their children, they would need half a hectare. Therefore, if one clears an estimated area of 100
ha for residential purposes, this expanse of land can accommodate more than 2000 houses for
the families.
The forest clearers did not mention clearing forests for the purpose of building a second house,
specifically in areas where forest land neighbours the sea. Some of the respondents identified
housing as a driving factor of forest clearing, but these individuals inhabit the houses only on
weekends, seeing as their employment as officials and officers required residence in the capital.
Some of these officials and officers obtained the lands through allocation contracts.
7.3.2.2.4 Land price
As discussed in Chapter 4, the non-forest clearers identified increasing land price as one of the
important factors that precipitated rising deforestation, particularly after the uprising and the
lack of intervention on the part of the government. To verify this response, land prices before
and after deforestation were obtained from land dealers’ records and compared. Figure (7.15)
shows the average land prices in deforested and non-forested lands, indicating increasing land
prices in the study area. The prices considerably differ between cleared land and land used for
other purposes.
An official in Algarabulli district stated that the land price in deforested area was lower than
that in other land types before the uprising because most people were aware that forest land
was being claimed by the state and that they would be expelled should the law warrant such

Chapter 7 Socio-economic Drivers of Deforestation
197
action. Because deforested lands do not come with official documents, most people preferred
purchasing non-forested lands, for which ownership is validated by official documents.
In addition, land prices from 2005 to 2010 rose because of increased interest in the lands. The
state continued to disregard the behaviours of the forest clearers and the people who bought
these properties.
As stated earlier, that deforestation rate was higher during the uprising than before the conflict.
The primary purpose underlying this practice was land sale. The forest clearers were asked
about whether they have sold parts of their land. A total of 40% have sold sections of their
land, whereas 60% have not. As observed during the field work, however, some of respondents
who declared that they have not sold land had ‘for sale’ signs over their properties. Their
neighbours also confirmed that the respondents sold some plots of lands. Some of the forest
clearers recently cleared land sections and divided these into smaller square segments
(residential schemes) for road paving and electricity projects. These efforts were initiated
without approval from the state or consultation with competent authorities. At the time, the
state was incapable of preventing people from selling land for millions of dinars. Road paving
and electricity provision projects necessitate huge amounts of money; these programmes were
previously carried out by the state but are now initiated by forest clearers.
Forest land prices are higher than those of other types of land, for which ownership is validated
by official papers. The land which had very high price which are located along the coast which
is forest, therefore these properties are therefore priced at more than half a million LD
(£200.000). In spite that buyers who are interested in such lands are also knowledgeable
regarding land documents.

Chapter 7 Socio-economic Drivers of Deforestation
198
Figure 7.15: Real prices of deforested comparing with other land types/ per ha (1990–2013)
Although no official reports are available to explain the increase in land price, the economist
and dean of the Faculty of Economics at the University of Tripoli shared the following insights:
1. The state did not control or impose restrictions on land prices before or after the uprising.
During these periods, land dealers determined price on the basis of supply and demand.
2. After the fall of the Gaddafi regime or the period between 2011 and 2013, a total breakdown
in governance and a tenfold increase in land prices occurred, thereby incentivising land
speculation and forest clearance.
3. After the fall of Gaddafi, some armed militia members stole state funds to buy real estate
(land, buildings) as a means of money laundering.
4. Some people from outside the region, especially displaced citizens and people who require
asylum because of continued armed conflict in their home countries, are interested in
purchasing land in the study area. These individuals perceive ownership as a route towards
stability and regard the study area as relatively safer than other regions. Other motivating
factors include the proximity of Algarabulli District to the capital. To a certain extent, the
procedures and restrictions adopted and imposed by Libyan banks encouraged customers to
withdraw their money from these financial institutions. Additionally, the armed robbery in
0
20000
40000
60000
80000
100000
120000
140000
160000
180000
1990 1995 2000 2005 2010 2013
LYD
Years
Deforested land Other Land cover

Chapter 7 Socio-economic Drivers of Deforestation
199
some banks and the lack of financial liquidity as a result of the suspension of oil exportation in
recent years, led to loss of confidence in banks. Customers, specifically traders, tended to invest
their money in land or buildings because these were regarded as the most stable form of
investment during a period of low security and safety.

Chapter 7 Socio-economic Drivers of Deforestation
200
7.4 Conclusion
On the basis of the population censuses (population growth and density) in the Algarabulli
District and in its localities, it was concluded that population is not a contributory factor to
deforestation in the area. Moreover, all the cleared lands were cleared by only 150 people, all
of whom are heads of household. This number represents 0.3% of the total population and 1.7%
of the total household head population in Algarabulli District. The forest clearers recognised
that the state initiated forest planting as a means of alleviating the suffering originating from
sand dune movements. They also admitted that they were educated by the state educated
regarding the importance of forests and forest protection through school and mosque activities.
From their point of view, however, forests are not as important as they are projected to be, with
some of the respondents attempting to justify their decision to engage in forest clearing. They
argued that they owned the forest lands but that the government forcibly took these from them
given that the property titles that they obtained are illegal (see chapter 5). They also believe
that forests present no value, hence the decision to clear this land cover for other purposes. The
respondents engaged in this practice despite the fact that most of them are educated people
(average or higher education level).
In terms of economics, most of the forest clearers are employed. Another justification offered
in this regard was that forests were cleared for agricultural expansion, even as all the
government reports on soil and water composition indicate the unsuitability of these lands for
cropping. Some of the forest clearers identified decreasing production due to poor soil quality
and water shortage as motivators of forest clearing. Nonetheless, the results show that the main
reason for the rapid progression of deforestation after the uprising is the increase in land prices,
which is due to increased demand from people living outside the district. The individuals
include people who stole funds from the state after the fall of Gaddafi for money laundering or
citizens displaced by continuing war. The findings demonstrate that increased land prices
caused progressive deforestation. Against this backdrop, the principal purpose of forest
clearance is land sale. This problem is exacerbated by the government’s inability to prevent
encroachment into forest land, the buyers’ disregard of forest land as valuable natural resources
and the fact that such land cover belongs to the state. The comparison of incomes between the
forest clearers and non-forest clearers also indicate that the income of the former is slightly
higher than that of the latter.
Chapter 8 General Discussion
201
8 General discussion
8.1 Summary
After Libya gained independence in 1951, priority was given to sand dune stabilization,
regulation of grazing, control of soil erosion, and the growing of drought-resistant species in
arid areas. These measures were taken in order to partially control the process of desertification;
95% of Libya’s total land area is desert.
During the 1960s and 1970s, various measures were taken to combat desertification,
particularly on the Jefara plain. These included sand dune fixation with dry plant residues,
crude oil, which became known internationally as the Libyan Technique for stabilizing sand
dunes and with synthetic rubber. The most effective proved to be tree planting and, by 1984,
248,000 ha of trees had been planted. The forest area in the zone of this study was fairly stable
from 1955 until 1973.
However, these planted areas are now suffering from severe deforestation, which has once
again resulted in serious encroachment by sand dunes. This study found that the deforestation
commenced in 1986, due to a range of direct and indirect causes, and increased dramatically
after the fall of Gaddafi regime in 2011.
8.1.1 Causes of deforestation
The direct causes of deforestation differ between two periods: before the fall of the Gaddafi
regime and after. The direct causes from before the regime’s fall were agricultural expansion,
road construction and building construction, the last of which included homes, holiday homes
and resorts.
As for agricultural expansion, though all reports on the soil and water in study area have stated
that these lands are not suitable for agriculture, it was found in chapter four and chapter seven
that some people had cleared areas of forest for cropping. They stated that their agricultural
production was decreasing—as was noted during the field visit—due to the poor soil, which
contains little organic matter, and suffered from groundwater shortages. However, the
respondents who had not cleared forest areas claimed that the forest-clearing residents were, in
fact, attempting to claim the land for their own by growing other crops, such as fruit trees and
vegetables, upon it.

Chapter 8 General Discussion
202
Building construction was found to be the second most significant cause of deforestation. The
building of the second homes or holiday homes by ex-government officials was the initial
purpose for clearing the forest; later, houses were built by local residents. In recent years, some
people have cleared areas of forest to build resorts, particularly in forests located in the coastal
strip.
Road construction contributed to increased deforestation in the study zone, particularly in the
Ataya block of forest, where the government established a paved road which crossed forest
areas and where people have established other paved roads without government permits.
With regard to the indirect causes of deforestation before the fall of the Gaddafi regime, it was
found that there is a very complex set of causes which are all about the change of governance
of the forest. These include the issuing of illegal permits for land allocation (i.e., usufruct
contracts), the lack of law enforcement, various forms of corruption whether by government
institutions or officials mismanagement by officials, administrative instability and lack of
registration of forest lands. Also involved are immigration and a lack of public awareness of
the importance of forests.
Non-forest- clearing respondents and government officials contended that land allocation (i.e.,
the issuing of illegal permits) was the main cause of deforestation, leading to conflicts over
forest land, increasing land title fraud, and lack of respect for the law.
Given this result, how the governance of forests changed was investigated and why
deforestation commenced in 1986. Respondents among government officials explained that
deforestation commenced in that year because of changes in the Gaddafi regime’s policy
regarding forests. Gaddafi abolished the Ministry of Agriculture, and afterward the agricultural
affairs in all municipalities of Libya were managed by the Directors of Agricultural Sectors,
who issued land allocations or usufruct contracts. For instance, the Agricultural Sector in
Tripoli Municipality issued usufruct contracts for forest lands to some of the state’s officers
and officials, which in turn encouraged some local people to clear parts of the forest.
The Ministry of Agriculture resumed its work in 1990 after four years of suspension. New laws
of forest protection were issued under Law No. 14 of 1992, which made the issuing of usufruct
contracts illegal and required whoever had obtained them to evacuate their forest land.
However, this law has not been applied yet. Moreover, the Ministry of Agriculture was
abolished again for another four years, and more usufruct contracts were issued by the
agricultural sector in Tripoli Municipality.

Chapter 8 General Discussion
203
Though there are very good laws in place to protect forests, as law expert respondents stated,
the corruption of government institutions and officials that followed the issuing of land
allocation has contributed to weakening the enforcement of laws.
Administrative instability and interference by authorities in forest management have also
contributed to deforestation. This instability is indicated by the fact that the name of the
Ministry of Agriculture has changed many times, from the Ministry of Agriculture, to the
Ministry of Agriculture and Livestock, to the Ministry of Agriculture, Livestock and Marine
Wealth. These changes indicate the constant separation and amalgamation of ministries. In
addition, there have been changes in the administrative subordination of forested regions which
have led to the interference of authorities in forest management. The change of administration
in Libya in the 1990s, from civil administration to military administration—from qualified
people to unqualified people—resulted in the sheikhs of various localities holding authority
over forest lands.
Another issue occurred in 1986: the burning of the Land Registry centres in Libya. The result
was that forest lands were no longer registered. In legal terms, forest lands are state-owned, but
the destruction of the registry has led to increased deforestation as various parties may claim
that a given piece of land belongs to them. Some law expert respondents stated that the law is
not enough to establish that forest lands are state-owned—to be truly state-owned, they must
be registered as such in the Land Registry. Other law expert respondents disagreed, saying that
the law as written is enough to consider a forest state-owned. This situation has led to increasing
disputes of land tenure and land ownership. Where sheikhs of various localities hold authority,
they issue certificates of ownership of forest land, though this is illegal.
With regard to population growth, censuses have shown that the population growth rate has
remained low—from 1995 to 2006, the rate of increase was actually decreasing. Records of the
Forestry Department in Algrabouli district showed that the number of people who had cleared
forest was only 150, all of whom were heads of households. This number represented 0.3% of
the total population and 1.7% of the total household head population in Algarabulli District.
Before the fall of the Gaddafi regime, all of the forest clearers were officials, military officers
and people who lived neighbouring the forest. This strongly suggests that population growth is
not an important driver of deforestation.
The underlying causes of deforestation after the fall of the Gaddafi regime in 2011 are many.
They include the total breakdown in governance and a tenfold increase in land prices, which

Chapter 8 General Discussion
204
incentivised land speculation and forest clearance as a means of money laundering. Land prices
increased greatly due to the increasing demand from a number of sources: Displaced people
wanted to move to the forest land, where they would feel more secure. Other people tended to
invest their money in land or buildings because these were regarded as the most stable forms
of investment during a period of low security and safety, during which the procedures and
restrictions adopted and imposed by Libyan banks encouraged customers to withdraw their
money from these financial institutions. Additionally, armed robberies at some banks and the
lack of financial liquidity—the result of the suspension of oil exportation in recent years—led
to loss of confidence in banks , this causes people to put their money into tangible assets rather
than in banks.
It was found that the majority of the forest clearers were aware that the forests were planted
because of sand dune encroachment. All forest clearers were government employees and most
of them were 40–50 years old and had received an average level of education. Despite this,
they have ignored the importance of forests and forest laws.
In terms of economics, all of the forest clearers were employed, and their income was slightly
higher than that of non-forest clearing respondents. They have sizeable plots of land, and their
purpose in clearing the forest was, they claimed, for cropping and building—however, it was
found that most of them had sold some part of their land in the absence of regulatory agencies
and state legislation. All documents used for selling the land are illegal but, nonetheless, there
are people buying these properties.
8.1.2 Quantifying deforestation using multiple methods
Three methods were used to determine the rate of deforestation between 1986 and 2013;
whether taken over a large area or small blocks of forest, they showed a remarkable degree of
agreement31 (see Fig 8.1).
31 See Appendix 9 for the difference between these methods in 2010 and 2013.

Chapter 8 General Discussion
205
Fo
rest
Co
ver
(%)
0
20
40
60
80
100
Local Residents
Remote Sensing
Forest Department Records
1985 1990 1995 2000 2005 2010
0
20
40
60
80
100
Local Residents
Remote Sensing
Forest Department Records
Local Residents
Remote Sensing
Forest Department Records
Gawea Forest Block Rawajih Forest Block
All forest Blocks
Years
1985 1990 1995 2000 2005 2010
Local Residents
Remote Sensing
Forest Department Records
Kawaleg Forest Block
Karawa Forest Block
Local Residents
Remote Sensing
Forest Department Records
Ataya Forest Block
0
20
40
60
80
100
Local Residents
Remote Sensing
Forest Department Records
Figure 8.1: Comparison of the three methods used to estimate, the index of forest cover (1985=100)
for the whole area and in each forest block.32
Twenty-seven per cent of total forest area was cleared between 1986 and 2010, with an annual
forest loss of 142 ha. After the fall of the Gaddafi regime, another 35% was cleared between
2011 and 2013, with 1584 ha of annual loss. Thus, the rate of annual forest loss increased by
more than an order of magnitude after 2011, amounting to a 64% change in forest total area.
32 See Appendix 7 for the raw data of respondent estimations (local residents). Also see Appendix 8 for the raw
data of Forest Department Records).

Chapter 8 General Discussion
206
Of the cleared land, 56% was converted to rain-fed agriculture, 9% to irrigated agriculture and
4% to settlements, whilst 31% reverted to sand dunes.
The war taking place in Libya, combined with the spread of weapons and the complete absence
of government institutions, both security and regulatory, made this study a significant challenge
to conduct. However, with some support, the study was carried out successfully and achieved
its goals using multiple research methods.
Because of the lack of previous studies on the social, economic and political causes of
deforestation in Libya, the highest priority was to determine the local perception of the issue
through a survey using the semi-structured interview method. To this end, 50 respondents—all
non-forest clearers—were interviewed regarding the causes and consequences of deforestation.
These interviews helped to identify which method should be used for a deeper investigation of
the policy issues involved, as local respondents stated that the main cause of deforestation is
the change in governance of the forest. The survey method also brought other significant issues
to the researcher’ attention, such as the measurements of the extent of deforestation.
The second research method used in this study was the examination of satellite imagery, which
was used to determine the extent of deforestation. The challenge was to obtain very high-
resolution imagery with which to compare the rate of deforestation in very small areas before
and after the fall of the Gaddafi regime. This was achieved using SPOT-5 (2010) and SPOT-6
(2013); the results of remote sensing agreed almost exactly with respondents’ estimates. Also,
some maps were created showing which type of land use the deforested areas were used for.
The semi-structured interview method was also applied with a set of current and ex-government
officials who were willing to help tell the real story of how governance of the forest changed
from good to bad and why. The researcher also conducted interviews with Libyan law experts
about forest and land laws.
The final method used was a questionnaire survey administered to the forest clearers
themselves. The biggest challenge was deciding how the subjects should be selected and how
the survey should be conducted? In the end, the researcher asked 80 forest clearers out of the
150 total recorded by the Forest Department from 1986 to 2013. Of these, 43 agreed to
participate, which was a high percentage in light of the region’s lack of security. Later, their
answers were assessed by their neighbours. There was a striking correspondence in the results
obtained by the three methods used as presented in figure8.1. in the case of the Forest

Chapter 8 General Discussion
207
Department has very good records, and forest is not very large area of forest and so it is
relatively easy to monitor any forest encroachments and what is going on in these forests.
Using these three methods, the main objective of this study was achieved successfully: to
determine when, how and why Algarabulli’s forests were cleared, the extent of deforestation,
and the consequences of deforestation on the people.
8.1.3 Limitations
Obviously, there are major limitations in operating in an area with very bad security. These
constraints considerably limited the researcher’s freedom to act. With more time and resources,
the researcher would have expanded the study, including more thorough surveying of the
involved parties and deeper investigation of the forest clearers in terms of land tenure, land
ownership and how the problem could be addressed from their point of view.
8.1.4 Future challenges
With regard to the future challenges, this study has global implications in that it measured
effects which are common in war zones. Natural resources often become the first casualties of
war—there is no time to protect trees when human beings are dying. The battle of sand dunes
with land is common to many desert area in the world, especially in the Mediterranean; hence,
constant vigilance and the continual planting of trees are important. Natural pockets of forest
in the Mediterranean, e.g. those in Libya or neighbouring countries, are under the constant
threat of development. The challenges will be to continue protecting these environments.
Deforestation, especially in the tropics, is of major concern to the global carbon budget and to
biodiversity conservation (Myat Su et al., 2012; Phelps et al., 2010; Laurance et al., 2008). The
patterns and processes that lead to deforestation have been widely analysed using human and
demographic factors, including remote sensing data and geographic information systems (Ryan
et al., 2014; Skutsch et al., 2014; Myat Su et al., 2012).
Deforestation, over the years, has been given some context, and the causes and drivers that
motivate the causes of deforestation are, notably, the most important theme in the deforestation
process. The three most important causes are the expansion of agriculture, wood extraction and
infrastructure development, while the underlying drivers of these causes are summarised by
researchers as the economic status of the community, demographic characteristics, cultural

Chapter 8 General Discussion
208
tendencies, technological advancement and policy and institutional frameworks (DeFries et al.,
2007; Geist and Lambin, 2002; Ryan et al., 2014; Herold et al.,2012).
The fact that environmental degradation leads to conflict is well-known among managers of
natural resources and the international community, and it has dominated the argument over
environmental security (Barnett, 2000). Solinge and Boekhout (2010) relates a case of conflict
in the Amazon thus:
“In May 2008, pictures of a small Amazonian tribe became world news.
They were taken from an airplane flying over the Amazon in the border
area of Brazil and Peru. It showed a dozen tribe members, mostly naked
and painted red, around their thatched huts surrounded by dense
Amazonian jungle. Some of the tribesmen were pointing arrows at the
airplane from which the pictures were taken. Many newspapers and
websites around the globe showed the pictures, usually accompanied by
the news that they showed an undiscovered tribe in the Amazon
rainforest”.
Similar stories have occurred in various parts of the world, from the recent fall of the Gaddafi
regime, which lead to massive deforestation and land degradation, to conflicts among locals in
the Congo, the USA, Mexico and Nigeria (Macias, 2008; Peter and Odjugo, 2010; Al Jazeera
channel, 2012).
Political conflicts and civil unrest have also contributed to escalating deforestation in a number
of countries. For instance, soon after the political revolution in Tunisia in 2011, incidences of
illegal logging, forest fires and forest clearing increased considerably as law enforcement was
lax or absent during that time (Indufor, 2013). However, some approaches were established in
Tunisia to reduce deforestation which helps to understand the conflicts and complementarities
that occur between users of goods and services to develop better coordination and governance
between stakeholders for improved sustainability. To meet these challenges, some
considerations for a sustainable strategy for the sector could be executed which indulging;
Elaborate regional plans of development of forest resources including research, training,
information and forestry and range extension. Also involve local people who are beneficiary
of forest products in the monitoring and develop activities of products transformation or
tourism to increase their income; Moreover, recognize the ecological and environmental
function of forests and promote a proactive policy of protection, rehabilitation and extension

Chapter 8 General Discussion
209
of Tunisian forests, In addition to regenerate deforested lands as a result of population pressure
by introducing suitable tree species (FAO,2013).
The destruction of arid and semi-arid forests around the world raises a number of issues. It
obviously creates much ecological harm and social tension. It not only causes human suffering
but also leads to ecological degradation, destruction and the disappearance of animal and plant
species (El-Tantawi, 2005).
While it seems relatively easy to identify the victims, it is very difficult to identify the
perpetrators responsible for the harm that is being caused. What, and who, are the main causes
and drivers of deforestation? These issues lead to conflicts that sometimes result in years of
hardship and anarchy.
In order to reduce conflict, the environmental and livelihood implications of increasing
deforestation need to be addressed in order to promote sustainable economic development
among the community and the managers of natural resources (Saad et al., 2011).
In Libya, there are many challenges for the future from a Libyan perspective, where the greatest
priority is to restore the rule of law. To protect the forest, the first thing that must be achieved
is, to stop the Libyan civil war. This is an ongoing conflict between two rival organizations
seeking to control Libya. In 2014, the internationally recognized government of the Council of
Deputies was democratically elected. This is also known as the "Tobruk Government"
recognised internationally as the "Libyan Government". However, there is currently an
established rival Islamist government of the new General National Congress based in the
capital Tripoli. This is led by the Muslim Brotherhood, backed by the wider Islamist coalition.
Also existing in some parts of Libya, between these two ‘governments’, is the spread of people
with extremist views that are outside the respective control of the two currently existing
‘governments’.
The protection of forests and regulation relating to this aspect, depends on restoration of the
rule of all laws. This can only be achieved, by the creation of one strong single internationally
recognized government exhibiting integrity and transparency. One of the first tasks of this new
integrated government will be to eliminate terrorism groups. They then need to achieve social
justice by application of the country’s laws. This will only be achieved by taking advantage of
the important advice available from the United Nations envoy appointed to support a new
emerging Libya. This envoy came into office in 2011 to protect civilians and assist the new
Libyan government in legal and administrative areas together with development of appropriate
policies when the war ends. This includes reorganization and reform of the legal protection for

Chapter 8 General Discussion
210
forests by activating the agreements previously set out between Libya and the United Nations.
These agreements aim to protect forests in Libya and combat desertification and other related
issues.
A specific challenge for a new ‘Forestry Department’ of government would be, the planting of
forest areas in the western part of Libya with more suitable tree species rather than using
Eucalyptus and Pines which have proved not to be appropriate for this region.
There are other, better, more suitable, native or exotic plants that should and can be used, such
as:
Pistachia atlantica or P. lentiscus (Battoum), Ceratonia siliquia (Kharoub), Acacia victoreae
(Sant) Acacia farneesiana, Acacia cyanophylla, Acacia legulata, Acacia karoo (Souk), Acacia
salicina, Acacia tortilis (Talh), or local shrubs such as Rhus tripartite (Jdari), Periploca
angustifolia (Halab), Parkinsonia aculeana, Prosopis spp. (Al Ghaf), Tamarix aphylla (Athel),
Zizphus lotus (Seder), Atriplex nummularia, A. halimus (Ghataf) and others.
The initiative suggested above, such as the plantation of more suitable tree species, should be
implemented within a master national forestry development or afforestation plan that integrate
the experiences gained from previous developmental activities.
In addition, there needs to be an increased national awareness raising campaign concerning
forestation, afforestation or reforestation – different terms for the same goal. This is in order to
educate local people and officers within government organizations of the importance of trees
in a country’s landscape. Trees and their roots can contribute to sand dune stabilization and
reduce or prevent encroachment; provide shelter for farm stock and other wild animals;
establish a dominant layer beneath which shrubs and herbs can then colonize additionally
contributing to the sand dune stabilization process. Wood from trees can in future, provide fuel
for cooking, particularly if successional planting regimes are employed and the forests are
managed. Planting of different species may also result in different uses of the wood such as for
building, or for e.g. honey production from bee keeping in areas where suitable eucalyptus trees
species which the bees favour are planted.
The tree planting campaigns should be properly established, to reduce and eventually eradicate
the current use and management of trees by the general population. Instead, implementation of
the criteria within the "Development of Rangelands Community Approach or Participatory
Approach" should be instigated and sustained, in order to ensure the proper establishment of a
range of plants and better use of the rangelands after development. This process may start on
private (farmer) rangelands, later expanding to rangelands owned by the farmers’ respective

Chapter 8 General Discussion
211
families and tribes. (A rangeland being an open area owned by farmers or the state in which
natural vegetation grows). The Rangelands Department is within the government Agriculture
Department and is separate from the Government Forestry Department. The Rangeland
Department has instigated and supported some very good work. A possible future development
could be the amalgamation of the Forestry and Agricultural Departments within the new
government of Libya or at the very least the development of an effective working partnership
between the two departments. Another initiative could be the availability of tree planting grants
to farmers and or communities in key target areas supported by an education campaign for
farmers, the community and government officers of that area. This could then be held up as an
example of good practice as the agricultural afforestation initiative is gradually rolled out over
years within the country.
To increase peoples’ awareness and participation in decision-making in afforestation and
irrigation is very important to the economy. It results in job creation, lumber for industries and
firewood for the population in the forests, thus maintaining local communities of people that
will benefit whilst still living in the countryside.
Distrust of the previous Gaddafi led Government existed in Libya. That government allocated
tribal lands to the people and planted trees on the land using tenant labour. Tenants thought,
that they would be evicted or removed from their holdings by the government, sometime in the
future. As a result, a strange state of affairs developed. This was the planting of trees by
government workers during the day and the removal of those same trees at night by the local
people.
To overcome this issue, during the past fifteen years the Rangeland Department has worked
hard to deal with this issue. The Department adopted the participatory approach, especially in
the tribal lands, where people refuse to plant trees (forests) fearing the taking of the land by the
state later. They cited the example that occurred in some of the Al-Jabal Al-Akhdar and the
Nafusa Mountain areas. To address this problem, the state asked people in this area to plant
various trees "afforestation diverse forests" and fruit trees, to remove the uncertainty or fear
amongst communities that the ownership of the land will revert to the state. This was to
demonstrate they would not be evicted or moved and could have confidence in the government
once again.
The other solution was undertaken in the Al-Jabal Al-Akhdar area where half a million
seedlings from the native olive trees were distributed to the local people without charge. All
Chapter 8 General Discussion
212
the people who received these seedlings were then educated, about how they could be grown,
during presentations held at mosques. After one year, a Committee from Rangeland
Department inspected the state of the young trees. Where the grower had successfully grown
and cared for his seed allocation, the state gave three Libyan dinars for each seedling. This
further ensured their maintenance by the people who continued to look after them and water
them.
Initially, and according to the Rangeland Report (2006) the idea was a great success during the
first three years. However, the committee from Rangeland Department, were thought whether
justly or not, to be corrupt by other government departments. Those who were responsible for
this project and other officials in Rangeland Department were subject to investigation. The
focus was, whom they provided with free seedlings and who did they subsequently award
money for seedling growth and care. The issue was free provision of seedlings, and subsequent
money for plant care, other government officials believing there should be a charge for each
quota. Therefore, this project was suspended and the National Centre of Vegetation Cover
abolished.
Another participatory approach was implemented in the Al-Jabal Al-Akhdar area. In this area,
the population was affected by desertification due to overgrazing. The state decided, after hard
negotiations with the local population, to stop grazing in the Al-Jabal Al-Akhdar area.
Additionally, the state provided the people with feed for their flocks of animals at a nominal
cost for a period of five years. This participatory approach had succeeded in the early years,
but the state refused to continue this program later, due to the high cost of this approach.
All these different approaches were initially successful. The aim is therefore to establish a very
good government with integrity, trust of the communities and no corruption. This can only
occur, of course, with the end of the war. Different departments can then either merge or work
effectively in partnership to deliver practical policies. These policies, can subsequently be
implemented by, the various government officers, community foresters and/or farmers.
Funding for initiatives needs to be secured and allocated in a transparent way so that no charges
of corruption can be made.
The funding stream also needs to be long term, with planning for succession in afforestation,
focusing on prioritisation of sand inundated areas using a set of agreed criteria made known to
all. This can only be achieved, if key individuals within the industry and community leaders
are educated and informed of government strategies and plans, so that they in turn, can facilitate

Chapter 8 General Discussion
213
the education of people in local communities with which they work. Currently, the country
imports its entire allocation of forestry products; especially wood (FAO, 1993). This can and
should change so that Libya produces its entire allocation for wood. At the same time planning
for tree planting to supply the charcoal industry can occur leading to the establishment of small
community, family or tribal businesses. Alongside this, the establishment of stands of tree
species such as Eucalyptus whose flowers are favoured by bees can result in a thriving parallel
bee-keeping, honey producing industry. Fruit trees and fruit production will also prosper
because of an increased bee population. This again highlights the need for education and
training for the agricultural and forestry communities in e.g. beekeeping, tree pruning and care,
fruit based product production such as jam making etc. The other vital goal aimed for is, of
course, stabilisation of sand leading to increased areas available for agriculture, forestry and
the building of homes.
8.2 Conclusion
The forest areas of Algarabulli were fairly stable from 1973 until 1986, when deforestation
commenced. This was due to a range of factors, such as a change in governance of the forest
and all forms of corruption aimed at acquiring the use of land for agriculture and building
whether for temporary accommodation (i.e., second homes), permanent accommodation, or
road expansion.
However, deforestation increased dramatically in the area under study after the fall of the
Gaddafi regime in 2011. This increase was due to the total breakdown in governance and a
tenfold increase in land prices, which incentivised land speculation and forest clearance as a
means of money laundering.
Due to the issuing of illegal permits that allowed the inequitable distribution of forest land to
some government officers and officials, some of the local people began to clear the forest as
well. These actions violated the law of forest land ownership and forest protection law.
The total number of forest clearers is only 150, and all are the heads of households. This number
represents 0.3% of the total population and 1.7% of the total household head population in
study area. Most of the forest clearers are government employees, and the majority are
educated. The forest clearers before the uprising in 2011 were government officials, military
officers and people living near the forest; however, from 2011 to 2013, the forest clearers were
armed militia, people living near the forest and people who claimed ownership of pieces of
forest land.

Chapter 8 General Discussion
214
Although the forest clearers are aware who planted the forests and why they have ignored the
forests’ importance in favour of their own economic purposes. It was discovered during the
fieldwork that they have done this by selling the land.
According to the 2010 census, population growth data does not show a large population
increase, but it seems as if the population has increased in recent years through migration. It is
difficult to restrict (and account for) the migrants when they are registered in their own cities
but do not transfer their registration to the council of Algarabulli District. After the 2011
uprising, the number of migrants seeking permanent or temporary residence increased. This is
because this area is safer than other areas in Libya, it did not witness the war, and it is close to
the capital.
Despite all the illegal documents upon which the forest clearers base their claims of ownership,
in Libya, all natural forests, sand dunes (stabilized or to-be-stabilized) and government
plantations are considered to be state-owned under the Forest Law (5/1952). Even private
forests, which account for 10% of the total plantations, are managed on the basis of guidelines
given in the Forest Law.
Measurements of the extent of deforestation showed that 29% was cleared before the fall of
the Gaddafi regime (1986–2010) and 34% was cleared after the fall of the Gaddafi regime
(2011–2013). Currently, only 36% of the originally planted forest remains. The remainder is
suffering from severe degradation caused by negligence, diseases and insects, lack of
investment and selective cutting and thinning. The consequence of such wholesale
deforestation is the serious encroachment of sand dunes, which puts at risk those areas
converted to agriculture. There are also other issues, such as the spread of dust. If deforestation
continues at the current rate, all forest in the study area will be lost within three years—by
2016. Due to Libya’s total breakdown in governance, deforestation is one of the country’s
biggest environmental challenges.

Chapter 8 General Discussion
215
8.3 Recommendations
Hopefully, peace and stability will one day come to the country. If so, the researcher has
developed some recommendations to the Ministry of Agriculture, the Ministry of Justice, the
NGOs and other international organization policy and actors such as FAO policy that may be
applied to the problem of deforestation. They include the following:
1- Protection
The remaining forest should be protected by enforcing existing laws of protection; legal experts
have stated that these are strong enough to suffice if applied. Meanwhile, the government
should reassess the current forest protection and land laws with an eye to the current situation,
especially in terms of imposing fines on violators.
2- Forest encroachment (i.e., forest clearance)
A national effort and in-depth legal studies are needed to address the issue of forest
encroachment, particularly with regard to the property rights of the land, which is already state-
owned by Law No. 1 of 1951 (articles 878 and 926), and Law No. 5 of 1952. All of the
encroachments made into forested lands were illegal, whether the land was simply claimed or
was obtained through usufruct contracts. Law No. 14 of 1992, which is still in force and which
requires all forest cleaners to evacuate forested lands, has not been developed or amended, and
people still clearing the forest. Therefore, the researcher recommends selecting one of the
following options, which are also recommended by non-forest clearing respondents and official
respondents.
Option one
Evacuate all forest clearers from deforested lands by force of law, even those who bought the
land from forest clearers, because they bought the land with illegal documents. The state should
announce that it will not buy back these lands, and it should remove what has been built. This
will be an example to others who consider attempting to clear the forest in the future. If the
state does not punish the forest clearers, others may feel encouraged to clear forests. As forest
areas are state-owned, this may cause conflict over the land between citizens, such as what
happened in 2013 fighting between families because everyone claimed ownership of the land
In addition, it is unfair that some people obtained land illegally and the state failed to enforce
the law because the people had already settled in these lands and built houses. This will create
many problems or disappointment to non-forest clearers.

Chapter 8 General Discussion
216
Option two
The government should assess whether correct property deeds exist for these lands, and then
the lands should be expropriated by the state, based on Law No. 1 of 1951 (articles 878 and
926) and Law No. 5 of 1952, for the benefit of the public. If they find people who have property
deeds but did not register their land in the Land Registry, the government should expropriate
the land and provide the owners with fair compensation, in accord with the rules of
administrative law. Libyan law experts recommend that forest clearers should pay a fine for
clearing forest without government authorization, even if the lands belong to them; not even
those who own a piece of forest can clear it without government authorization because the
forests are managed on the basis of guidelines given in the Forest Law.
Libya’s government may benefit from some countries’ and NGOs’s experiences with the issue
of forest encroachment and how to address it. They should take note of the international laws
that are applicable to comparable cases.
3- Forest management
Forests must be managed through centralized administration (i.e., the Ministry of Agriculture
and its regional forest departments) and free from interference by any other institutions or
government officials (e.g., mayors or sheikhs of localities). Also, the specifics of forest
jurisdiction, between the agricultural police and the general police force, should be sorted out.
4- Raise awareness of the importance of forests
The government must contribute to raising people’s awareness of the importance of forests and
the risk of infringement on forests. People can learn about the environmental and legal aspects
of this issue through NGOs, schools, or the mass media—radio, television and the distribution
of leaflets, posters and pamphlets.
One Libyan NGO, called Tree Friends Association, was recently established to raise awareness
among school pupils of the importance of forests. These pupils were attending primary and
secondary schools in some areas of the Jefara plain. Despite the critical situation in Libya, this
NGO has contributed to the planting of a huge number of trees. Most of these campaigns were
conducted by the pupils themselves; it was found that pupils were interested in looking after
and irrigating the trees (see appendix 8 and 9).

Chapter 8 General Discussion
217
5- Tree planting campaigns
Because of the alarms being raised by experts over desertification, tree-planting campaigns
should resume in order to combat the phenomena of desertification and soil erosion with good
policies, good management and a good, sustainable approach. Such campaigns would select
suitable types of trees that would be adapted to the local environment; poor choices for this
include Eucalyptus trees, which are locally called by bio pumps, because the root of this type
of tree absorbs the groundwater dramatically in a region that already suffers from water
shortages.
Finally, I made clear this study is useful for both government of Libya and state organization,
but also including local and international researchers in this area.

References
218
9 References
Abo-Ayana, F. (1980). Geographic population of Alexandria. Culture Foundation of
Alexandria: Alexandria , Egypt. (In Arabic).
Abo-Khchim, I. A. (1995). Biospheric. In: Al- Hedi Boalghemh , Saad Aelkezira (ed). Libya
,Study in Geography. First Edition edn. Dar Jamahiriya publishing, distribution and media
, Libya ,Sirte: pp. 235-332.
Abolghemh, A. and Alkazery, S. K (1995). Oil in Libya. In: Shukri Ghanem (ed). Jamahiriya
study in geography. First Edition edn. Dar Jamahiriya publishing, distribution and media
, Libya ,Sirte,: pp. 689-735. (In Arabic).
Achard, F., Eva, H. D., Mayaux, P., Stibig, H. and Belward, A. (2004). Improved estimates of
net carbon emissions from land cover change in the tropics for the 1990s. Global
Biogeochemical Cycles. 18 (2).
Adesina, A.A. & Chianu, J. 2002. Determinants of farmers' adoption and adaptation of alley
farming technology in Nigeria. Agroforestry Systems. 55 (2). pp. 99-112.
Agyei, Y. (1998). Deforestation in Sub-Saharan Africa. African Technology Forum
(Massachusetts Institute of technology). [E-journal]. Available at:
http://web.mit.edu/africantech/www/articles/Deforestation.htm. Accessed: 05/07/2015.
Ahmed, N. B. (eds). (1990). The stabilization of aeolian sand dunes. Doctoral thesis edn.
University of Durham: UK.
Ahmida, A. A. (1970). The making of modern Libya, state formation, colonization and
resistance ,1830-1932. Second edition ed. State University of New York Press: New
York,USA.
Ajaj, M. R. (1982). Sand dunes stabilization and environmental Protection. The Ministry of
Agriculture: Tripoli, Libya. (In Arabic).
Ajaj, M. R. (1973). Stages of afforestation development in Libya. The Ministry of Agriculture
and Agrarian Reform, Agricultural Extension: Tripoli, Libya. (In Arabic).
Akhter, M. (eds). (2006). Remote sensing for developing an operational monitoring scheme for
the Sundarban Reserved Forest, Bangladesh. Doctoral Thesis edn. Technische Universität
Dresden, Germany.
Al Farrah, N., Martens, K. and Walraevens, K. (2011). Hydrochemistry of the Upper Miocene-
Pliocene-Quaternary Aquifer Complex of Jifarah Plain, Nw-Libya. Geologica Belgica. 14
(3-4). pp.159-174.
Al Jazeera channel (May 13, 2012). deforestation in east of Jefara plain after the fall of the
Gadaffi regime. Al Jazeera channel. (In Arabic).

References
219
Al-Hajjaji, S. A. (1989). The new Libya ; the study of geographic, social, economic and
political. Second Edition ed. Al-Fateh University: Tripoli ,Libya. (In Arabic).
Al-Idrissi, M., Sbeita, A., Jebriel, A., Zintani, A., Shreidi, A.,Ghawawi, H. (1996). LIBYA:
Country report to the FAO International Technical Conference On Plant Genetic
Resources. The Ministry of Agriculture: Tripoli, Libya. (In Arabic).
Aljduaa, G. (1970). General information about the forest. The Ministry of Agriculture, Libya:
Tripoli, Libya. (In Arabic).
Almahdawi, M. M. (1998). Human Geography for Libya. Second Edition ed. University of
Benghazi: Benghazi,Libya. (In Arabic).
Al-Tillisi, K. (1972). Libya during the Ottoman period. Second Edition ed. The General
Establishment for Publishing and Distribution and advertising: Tripoli,Libya. (In Arabic).
Al-Zawam, S. (1995). El Jabl–El-Akhdar; Study in Physical Geography. Bangazi University:
Bangazi, Libya. (In Arabic).
Al-Zeni, A., Bayoumi, M. (2006). The important trees and shrubs local and imported in El
Jabl–El-Akhdar region, Libya. Aldar Academy for printing and writing, translation and
publishing.: Tripoli, Libya. (In Arabic).
Americo, M. S., Mendes, C. (2005). Forest in Portugal. In: Merlo, M and Croitoru, L
(eds). Valuing Mediterranean forests :towards total economic valueForest. CABI Pub.:
Wallingford, Oxfordshire, UK; Cambridge, MA. pp. 331-352.
Angelsen, A. (2011). Measuring livelihoods and environmental dependence:methods for
research and fieldwork. Earthscan: London; Washington, DC.
Angelsen, A., Kaimowitz, D. and Center for International Forestry Research
(2001). Agricultural technologies and tropical deforestation. CABI Pub. in association
with Center for International Forestry Research CIFOR: Wallingford, UK; New York.
Anketell, J. and Mriheel, I. (2000). Depositional environment and diagenesis of the Eocene
Jdeir Formation, Gabes-Tripoli Basin, Western Offshore, Libya. Journal of Petroleum
Geology.23 (4). pp. 425-447.
Arts, B., Behagel, J., Turnhout, E., de Koning, J. and van Bommel, S. (2014). A practice based
approach to forest governance. Forest Policy and Economics.49 pp. 4-11.
Ataiwar, M. A. (1991). The history of agriculture during the Ottoman period. First edition ed.
Al-Dar Al-Jamahiriya for publishing, distribution and advertising: Musrata,Libya. (In
Arabic).
Athanasiadis, A. and Andreopoulou, Z. (2013). A Web Information System Application on
Forest Legislation: The Case of Greek Forest Principles. Procedia Technology.8 (0). pp.
292-299.

References
220
Attir, MOa & Al - Azzabi, K 2004. The Libyan Jamahiriya: Country, People, Social and
Political Development. In: Terterov, M, and Wallace, J. (eds.) (ed). Doing business with
Libya. Second ed. Kogan Page Ltd: pp. 6-17.
Autesserre, S. 2010. The trouble with the Congo: local violence and the failure of international
peacebuilding. Cambridge University Press: Cambridge, New York.
Barber, C. P., Cochrane, M. A., Souza Jr, C.M. and Laurance, W. F. (2014). Roads,
deforestation, and the mitigating effect of protected areas in the Amazon. Biological
Conservation. 177.pp. 203-209.
Barnes, R. F. (1990). Deforestation trends in tropical Africa. African Journal of Ecology. 28
(3). pp.161-173.
Barnett, J. (2000). Destabilizing the environment-conflict thesis. Review of International
Studies. 26 (2). pp.271-288.
Barraclough, S.L., Ghimire, K. and United Nations (2000). Agricultural expansion and
tropical deforestation: international trade, poverty and land use. Earthscan: London.
Barriball, K.L. and While, A. (1994). Collecting data using a semi-structured interview: a
discussion paper. Journal of advanced nursing.19 (2). pp. 328-335.
Beevers, M.D. 2016. Forest governance and post-conflict peace in Liberia: Emerging
contestation and opportunities for change? The Extractive Industries and Society. 3 (2).
pp. 320-328.
Bellot, J., Bonet, A., Sanchez, J.R. and Chirino, E. (2001). Likely effects of land use changes
on the runoff and aquifer recharge in a semiarid landscape using a hydrological model.
Landscape and Urban Planning. 55 (1).pp. 41-53.
Ben Salim, B. (1991). Prevention and control of wind erosion in arid regions. unasylva. 42 (1)
pp.33-39.
Benabid, A. (1996). Forest degradation in Morocco. In: Swearingen, W.D. and Bencherifa,
A (eds). The North African environment at risk,. State, culture, and society in Arab North
Africa. Westview Press: Boulder, Colo. pp.175-189.
Ben-Mahmoud, K. (2013). Towards a national strategy for the sustainability of natural
resources and enhancing food security in libya. first ed. The National Library: Benghazi,
Libya. (In Arabic).
Ben-Mahmoud, K. (1995). Libyan soils.First Edition ed. The National Authority for Scientific
Research: Benghazi. Libya,(In Arabic).
Ben-Mahmoud, K. R,. Mansur, S. and Al-Gomati. A . (2000). Land degradation and
desertification in Libya. Desertification in the Third Millennium. Edited by Abdulrahman
S . Alsharhan, A. F,. Andrew, S., Goudie., Eissa, M., Abdellatif , and Warren. W. (ed).12-
15 February 2000. Taylor & Francis: Dubai. pp.339–350.

References
221
Bin Kayal, A.S. (1995). Agriculture and Livestock. In: A. Boalghemh . Aelkezira S (ed).
Libya , Study in Geography. First Edition edn. Dar Jamahiriya publishing, distribution and
media , Libya ,Sirte, First Edition: pp.545-624.
Bird, D.K. (2009). The use of questionnaires for acquiring information on public perception of
natural hazards and risk mitigation - a review of current knowledge and practice. Natural
Hazards and Earth System Sciences. 9 (4). pp.1307-1325.
Boahene, K. (1998). The challenge of deforestation in tropical Africa: Reflections on its
principal causes, consequences and solutions. Land Degradation & Development.9 (3).
pp. 247-258.
Brady, N. C. (1996). Alternatives to slash-and-burn: a global imperative. Agriculture,
Ecosystems & Environment. 58 (1). pp.3-11.
Brinkmann, K., Noromiarilanto, F., Ratovonamana, R.Y. and Buerkert, A. (2014).
Deforestation processes in south-western Madagascar over the past 40 years: what can we
learn from settlement characteristics? Agriculture, Ecosystems & Environment.195. pp.
231-243.
Brockerhoff, E.G., Jactel, H., Parrotta, J.A., Quine, C.P. & Sayer, J. 2008. Plantation forests
and biodiversity: oxymoron or opportunity? Biodiversity & Conservation. 17 (5). pp. 925-
951.
Brooks, M.L. (1999). Alien annual grasses and fire in the Mojave Desert. Madroño.46 (1). pp.
13-19.
Brown, D., Schreckenberg, K. (1998). Shifting Cultivators as Agents of Deforestation:
Assessing the Evidence. Natural Resource Perspectives, 29. [E-journal]. pp.1-4. Available
at: http://dlc.dlib.indiana.edu/dlc/handle/10535/4143. Accessed: 01/07/2015.
Brown, K. and Pearce, D.W. (1994). The causes of tropical deforestation :the economic and
statistical analysis of factors giving rise to the loss of the tropical forests.UCL Press:
London.
BRSC (2007). Land use change of Tipol (1990-2000).Biruni Remote Sensing Centre (BRSC):
Tripoli, Libya. (In Arabic).
Bryman, A. (2012). Social research methods. 4th ed. Oxford University Press: Oxford; New
York.
BSCL (2012). Census of Libya 2012. Bureau of Statistics and Census Libya: Tripoli,Libya. (In
Arabic).
BSCL (2010). Final results of 2010 General Census. Bureau of Statistics and Census: Tripoli,
Libya. (In Arabic).
BSCL (2006b). Economic statistics of Libya, 2005. Bureau of Statistics and Census Libya:
Tripoli, Libya. (In Arabic).

References
222
BSCL (2006a). Census of Libya 2006. Bureau of Statistics and Census Libya: Tripoli. (In
Arabic).
BSCL (2003). Census of Libya. Bureau of Statistics and Census Libya: Tripoli, Libya.(In
Arabic).
BSCL (2001). Agriculture census of 2001. Bureau of Statistics and Census Libya: Tripoli,
Libya.
BSCL (1995). Agriculture Census of 1995. Bureau of Statistics and Census: Tripoli,Libya. (In
Arabic).
BSCL (1984). Agriculture Census of 1984. Bureau of Statistics and Census: Tripoli,Libya. (In
Arabic).
Butler, R. (2012). Urbanisation. [E-journal]. Available at:
http://rainforests.mongabay.com/0813b.htm. Accessed: 14/06/15 .
Cacho, O.J., Milne, S., Gonzalez, R. and Tacconi, L. (2014). Benefits and costs of deforestation
by smallholders: Implications for forest conservation and climate policy. Ecological
Economics. 107 (0).pp. 321-332.
Callister, D.J. (1999). corrupt and illegal activities in the forest sector , Current
Understandings and Implications for the World Bank. World Bank: Washington,USA.
Calvo-Alvarado, J., McLennan, B., Sánchez-Azofeifa, A. and Garvin, T. (2009). Deforestation
and forest restoration in Guanacaste, Costa Rica: Putting conservation policies in context.
Forest Ecology and Management. 258 (6). pp. 931-940.
Casse, T., Milhøj, A., Ranaivoson, S. and Romuald, R. J. (2004).Causes of deforestation in
southwestern Madagascar: what do we know? Forest Policy and Economics. 6 (1). pp. 33-
48.
CBD 2005. Report of the Inter-Sessional (Second) Meeting of the AHTEG on the Review of
Implementation of the Programme of Work on Forest Biological Diversity. Convention
on Biological Diversity: Montreal, Canada.
CBD 12–16 November 2001. Review of the status and trends of, and major threats to, the forest
biological diversity. AHTEG on Forest Biological Diversity. Convention on Biological
Diversity: Montreal, Canada.
Chakravarty, S., Ghosh, S., Suresh, C. and Dey, A.and Shukla,G. (2012). Deforestation: causes,
effects and control strategies. Department of Forestry. pp. 1-28.
Chapin, H. M. (2010). Libya. Kessinger publishing: LaVergne, TN, USA.
Christopher, B. (2000). The global outlook for future wood supply from forest plantations.
FAO: Rome, Italy.

References
223
Clifford, N.J., French, S. and Valentine, G. (2010). Key methods in geography. 2nd ed. Sage:
London.
Cochrane, M., Alencar, A., Schulze, M., Souza, C.J., Nepstad, D.C., Lefebvre, P. and
Davidson, E.A. (1999). Positive feedbacks in the fire dynamic of closed canopy tropical
forests. Science (Washington). 284 (5421).pp. 1832-1835.
Colchester, M. and Lohmann, L. (1993). The Struggle for land and the fate of the forests. World
Rainforest Movement: Penang, Malaysia.
Commission of studying the coastal road. (1979). The final report to studying coastline of-
Tunisian border to Musrata. The Ministry of Agriculture: Tripoli, Libya. (In Arabic).
Committee of agriculture policies study. (2003). Report of natural resource team- General
planning committee. General Planning Council: Tripoli, Libya. (In Arabic).
Congalton, R. and Green, K. (1999). Assessing the Accuracy of Remotely sensed Data;
Principles and Practices. 1th ed. CRC Press Inc.: Florida, U.S.A.
Contreras-Hermosilla, A. (2002). Law Compliance in the Forestry Sector - An overview. The
International Bank for Reconstruction and Development/The World Bank: Washington,
D.C. 20433,U.S.A.
Contreras-Hermosilla, A. and Peter, E. (2005). Best practices for improving law compliance in
the forestry sector (paper 45). FAO: Rome ,Italy.
Coppin, P., Jonckheere, I., Nackaerts, K., Muys, B. and Lambin. E. (2004). Digital change
detection methods in ecosystem monitoring: a review. International journal of remote
sensing. 25 (9). pp. 1565-1596.
Coşkun, A. A. and Gençay, G. (2011). Kyoto Protocol and “deforestation”: A legal analysis
on Turkish environment and forest legislation. Forest Policy and Economics. 13 (5). pp.
366-377.
Council For Agricultural Development. (1974). Water Resources survey for Hydro-Agicultural
Development, Geolology and Hydrogeology For Garabulli Project. Energoprojekt:
Beograd-Yugoslavia,Branch Office Tripoli, Libya. (In Arabic).
Croitoru, L.M. (2005). Mediterranean Forest Values. In: Merlo, M andCroitoru,L
(eds). Valuing Mediterranean forests:towards total economic value. CABI Pub.:
Wallingford, Oxfordshire, UK; Cambridge, MA. pp.37-68.
Daly-Hassen, M. (2013). Financing for Sustainable Forest Management in Tunisia. INDUFOR
forest intelligence: Tunis, Tunis.
Daly-Hassen, M.B., Ben Mansoura, A. (2005). Forest in Tunisia. In: Merlo, M and Croitoru,
L (eds). Valuing Mediterranean forests:towards total economic value. CABI Pub.:
Wallingford, Oxfordshire, UK; Cambridge, MA. pp.105-122.
References
224
David, K.M. (1992). Deforestation in the postwar Philippines. University of Chicago Press:
Chicago, USA.
De Koninck, R. and International Development Research Centre (1999). Deforestation in Viet
Nam. International Development Research Centre: Ottawa, ON.
DeFries, R., Achard, F., Brown, S., Herold, M., Murdiyarso, D., Schlamadinger, B. and de
Souza, C. (2007). Earth observations for estimating greenhouse gas emissions from
deforestation in developing countries. Environmental Science & Policy. 10 (4). pp. 385-
394.
DeFries, R. and Rosenzweig, C. (2010). Toward a whole-landscape approach for sustainable
land use in the tropics. Proceedings of the National Academy of Sciences, USA. 107 (46).
pp. 19627-19632.
Deng, X., Huang, J., Uchida, E., Rozelle, S. and Gibson, J. (2011). Pressure cookers or pressure
valves: Do roads lead to deforestation in China? Journal of Environmental Economics and
Management. 61 (1). pp. 79-94.
Denscombe, M. (2003). The good research guide:for small-scale social research projects. 2nd
ed. Open University Press: Buckingham.
Devi, U. & Behera, N. 2003. Assessment of plant diversity in response to forest degradation in
a tropical dry deciduous forest of Eastern Ghats in Orissa. Journal of Tropical Forest
Science. 15 (1). pp. 147-163.
DiCicco-Bloom, B. and Crabtree, B.F. (2006). The qualitative research interview. Medical
Education. 40 (4). pp.314-321.
Dilip, C. N and Mwchahary,D.D (2012). Population Increase and Deforestation: A Study in
Kokrajhar District of Assam, India. International Journal of Scientific and Research
Publications. 2 pp. 1-12.
Downing, T. E. (1992). Development or destruction : the conversion of tropical forest to
pasture in Latin America / edited by Theodore E. Downing ... [et al.]. Westview
Press:Boulder.co.
Drake, J. B., Dubayah, R. O., Knox, R.G., Clark, D. B. and Blair, J. B. (2002). Sensitivity of
large-footprint lidar to canopy structure and biomass in a neotropical rainforest. Remote
Sensing of Environment.81 (2–3). pp. 378-392.
Druyan, L. M. (2005). The Impact of Climate Change on Drylands: With a Focus on West
Africa. Bulletin of the American Meteorological Society.86 (12). pp. 1815-1816.
Duguma, B., Gockowski, J. and Bakala, J. (2001). Smallholder Cacao (Theobroma cacao
Linn.) cultivation in agroforestry systems of West and Central Africa: challenges and
opportunities. Agroforestry Systems.51 (3). pp. 177-188.

References
225
Eckert, S., Ratsimba, H.R., Rakotondrasoa, L.O., Rajoelison, L.G. & Ehrensperger, A. 2011.
Deforestation and forest degradation monitoring and assessment of biomass and carbon
stock of lowland rainforest in the Analanjirofo region, Madagascar. Forest Ecology and
Management. 262 (11). pp. 1996-2007.
Eckholm, E. P. (1979). Planting for the future :forestry for human needs. Worldwatch
Institute: Washington.
Edmund, B. (2014). Governance: Linchpin of Dryland Natural Resource Management. Africa’s
dryland forests. South African Institute of International Affairs (SAIIA) (ed). May,15-17-
2014. SAIIA and the SADC FANR: South African. pp. 1-4.
El Jadida, H. (1986). Irrigated agriculture and its impact on groundwater depletion in the
northern of Jefara plain. First ed. Al-dar al jamahiriya for publication and distribution and
advertising: Misrata,Libya. (In Arabic).
El-Aswed, T. (eds). (2009). Remote sensing of land cover changes in the Jeffara Plain, North-
West Libya. Doctoral thesis edn. University of Dundee: The UK.
El-Darier, S. M. and El-Mogaspi, F. M. (2009). Ethnobotany and relative importance of some
endemic plant species at El-Jabal El-Akhdar Region (Libya). World Journal of
Agricultural Sciences. 5 (3). pp. 353-360.
Eldiabani, G. S., Hale, W. H. and Heron, C. P (2014). The Effect of Forest Fires on Physical
Properties and Magnetic Susceptibility of Semi-Arid Soils in North-Eastern, Libya.
International Journal of Environmental, Chemical, Ecological, Geological and
Geophysical Engineering. 8 (1). pp.54-60.
Elhag, M. M. (eds). (2006). Causes and Impact of Desertification in the Butana Area of Sudan.
Doctoral thesis edn. University of the Free State: South Africa.
El-Kikhia, M. (1994). The population in Libya , structure and distribution. 1th ed. Benghazi
University: Benghazi , Libya. (In Arabic).
Ellatifi, M. (2005). Forest in Morocco. In: Merlo, M and Croitoru, L (eds). Valuing
Mediterranean forests :towards total economic value. CABI Pub.: Wallingford,
Oxfordshire, UK; Cambridge, MA. pp. 69-87.
El-Tantawi, A. M. (eds). (2005). Climate Change in Libya and Desertification of Jifara Plain
Using Geographical Information System and Remote Sensing Techniques. Doctoral thesis
edn. Der Johannes Gutenberg University: Mainz, Germany.
Emily, E. A. (2012). World Forest Area Still on the Decline. Earth Policy Institute. [E-journal].
(Washington, DC, USA). Available at: http://www.earthpolicy.org/indicators/C56.
Entwisle, B., Rindfuss, R. R., Walsh, S.J. and Page, P. H. (2008). Population growth and its
spatial distribution as factors in the deforestation of Nang Rong, Thailand. Geoforum. 39
(2). pp. 879-897.

References
226
Environment Public Authority. (2010). The fourth national report on the implementation of the
Convention on Biological Diversity. Environment Public Authority: Tripoli, Libya. (In
Arabic).
Fadhil, A. M. (2002). Sand Dunes Fixation in Baiji District, Iraq. Journal of chinal Jniaersity
of Geoscienc. 13 (1). pp. 67-72.
FAO (2013). Mediterranean State of Forests 2013. Food and Agriculture Organization of the
United Nations: Rome, Italy.
FAO (2012). State of the World’s Forests 2012. Food and Agriculture Organization of the
United Nations: Rome, Italy.
FAO (2011;b). Assessing forest degradation (Towards the development of globally applicable
guidelines); Forest Resources Assessment Working Paper 177. Food and Agriculture
Organization of the United Nations: Rome, Italy.
FAO (2010;b). Global Forest Resources Assessment 2010 Country Report Libyan Arab
Jamahiriya. Forestry Department Food and Agriculture Organization of the United
Nations: Rome, Italy.
FAO (2010). Global Forest Resources Assessment 2010 Main report no163. Food and
Agriculture Organization of the United Nations: Rome, Italy.
FAO (2000). Global Forest Resources Assessment 2000, Main report, 140. the Food and
Agriculture Organization of the United Nations: Rome.
FAO (1993). Forestry policees in the Near East region: analysis and synthesis. Food and
Agriculture Organization of the United Nations: Rome,Italy.
FAO (1987). Improving Productivity of Dryland Areas. Committee on Agriculture(Ninth
session). FAO: Rome.
FAO (1982). Tropical Forest Resources, Forestry Paper No. 30. FAO: Rome, Italy.
FAO (1972). Eucalyptus in Libya. Food and Agriculture Organization of the United Nations:
Rome, Italy.
FAO (1955). Report to the Government of Libya on Forestery Activities 1952-1954. Food and
Agriculture Organization of the United Nations: Rome.
FAO.,UNDP., BRSC. and the Ministry of Agriculture, Libya (eds). 2005. Mapping of Natural
Resources for Agricultural Use and Planning, [Lib 00/04/] [2005]). [Lib 00/04/] edn.
Mapping Department,The Ministry of Agriculture.: Tripoli, Libya.
Fearnside, P. M. (2001). Soybean cultivation as a threat to the environment in Brazil.
Environmental Conservation. 28 (1). pp. 23-38.
Fenning, T. (2014). Challenges and opportunities for the world's forests in the 21st century.
Springer: Dordrecht; New York; 4.

References
227
Flagg, C.B., Neff, J.C., Reynolds, R.L. and Belnap, J. (2014). Spatial and temporal patterns of
dust emissions (2004–2012) in semi-arid landscapes, southeastern Utah, USA. Aeolian
Research. 15 pp. 31-43.
Forestry Department. (2006). Forest fires in Al-Gebel Al-Akhdar region. The Ministry of
Agriculture.: Tripoli, Libya. (In Arabic).
Foundjem-Tita, D., Speelman, S., D'Haese, M., Degrande, A., Van Huylenbroeck, G., Van
Damme, P. and Tchoundjeu, Z. (2014). A tale of transaction costs and forest law
compliance: Trade permits for Non Timber Forests Products in Cameroon. Forest Policy
and Economics. 38 (0). pp. 132-142.
Fowler, N. (1986). The role of competition in plant communities in arid and semiarid regions.
Annual review of ecology and systematics. 17 pp. 89-110.
GEFLI. (1973). Wadi R'mel study, Garabuli District. G.E.F.L.I company: Paris, France.
Gao, J. and Liu, Y. (2012). Deforestation in Heilongjiang Province of China, 1896–2000:
Severity, spatiotemporal patterns and causes. Applied Geography. 35 (1–2). pp. 345-352.
Garikai Chengu February 22, 2015. Libya: From Africa’s Richest State Under Gaddafi, to
Failed State After NATO Intervention. Global Research. [E-journal]. pp. 19 October 2014.
Available at: http://www.globalresearch.ca/libya-from-africas-richest-state-under-
gaddafi-to-failed-state-after-nato-intervention/5408740.
Gaveau, D.L., Linkie, M., Suyadi, Levang, P. and Leader-Williams, N. (2009). Three decades
of deforestation in southwest Sumatra: Effects of coffee prices, law enforcement and rural
poverty. Biological Conservation. 142 (3). pp. 597-605.
Geist, H. J. and Lambin, E. F. (2002). Proximate causes and underlying driving forces of
tropical deforestation. Bioscience. 52 (2). pp. 143-150.
Ghazoul, J. (2013). Deforestation and Land Clearing. In: S.A. Levin (ed). Encyclopedia of
Biodiversity (Second Edition). Academic Press: Waltham. pp. 447-456.
Ghodieh, A. R. (eds). (2000). An Evaluation of Satellite Remote Sensing for Crop Area
Estimation in the West Bank, Palestine. Doctoral thesis edn. University of Durham: The
UK.
Giamakis, A., Kretsi, O., Chinou, I. and Spyropoulos, C.G. (2001). Eucalyptus camaldulensis:
Volatiles from immature flowers and high production of 1,8-cineole and (beta)-pinene by
in vitro cultures. Phytochemistry, 58 (2) pp.351-355, 2001.
Gibbs, H. K., Ruesch, A. S., Achard, F., Clayton, M. K., Holmgren, P., Ramankutty, N. and
Foley, J. (2010). Tropical forests were the primary sources of new agricultural land in the
1980s and 1990s. Proceedings of the National Academy of Sciences, USA. 107 (38). pp.
16732-16737.
Gibson, C.C., McKean, M. A. and Ostrom, E. (2000). People and forests :communities,
institutions, and governance. MIT Press: Cambridge, Mass.

References
228
Giliba, R. A., Boon, E. K., Kayombo, C.J., Chirenje, L. and Musamba, E. B. (2011). The
Influence of Socio- economic Factors on Deforestation: A Case Study of the Bereku Forest
Reserve in Tanzania. Journal of Biodiversity. 2 (1). pp. 31-39.
Giri, T. (2007). Manual on Deforestation, Degradation and Fragmentation using remote
sensing and GIS. FAO: Rome.
Goor, A.Y. and Barney, C.W. (1976). Forest tree planting in arid zones. 2dth ed. Ronald Press
Co: New York.
Grace, J. J. and Morison, I. L. and Perks,M. P (2014). Forest, Forestry and Climate Change.
In: Fenning, T (ed). Challenges and opportunities for the world's forests in the 21st
century, Forestry sciences. Springer: Dordrecht; New York; 4. pp. 241-266.
Grainger, A. (1990). The threatening desert: Controlling desertification. Land Degradation &
Development. 2 (2). pp. 158.
Grinand, C., Rakotomalala, F., Gond, V., Vaudry, R., Bernoux, M. and Vieilledent, G. (2013).
Estimating deforestation in tropical humid and dry forests in Madagascar from 2000 to
2010 using multi-date Landsat satellite images and the random forests classifier. Remote
Sensing of Environment. 139 (0). pp. 68-80.
Hallett, D. (2002). Petroleum geology of Libya. Elsevier B.V: Amsterdam, the Netherlands.
Ham, A. (2002). Libya. Romantic ruins, golden sands, medieval medinas. 1st ed. ed. Lonely
Planet: London, The UK.
Hamilton, J. M., Maddison, D. J. and Tol, R.S. (2005). Climate change and international
tourism: A simulation study. Global Environmental Change. 15 (3). pp. 253-266.
Han, Z., Wang, T., Dong, Z., Hu, Y. and Yao, Z. (2007). Chemical stabilization of mobile
dunefields along a highway in the Taklimakan Desert of China. Journal of Arid
Environments. 68 (2). pp. 260-270.
Hansen, C.P. (2011). Forest law compliance and enforcement: The case of on-farm timber
extraction in Ghana. Journal of environmental management. 92 (3). pp. 575-586.
Harrison, R.D. 2011. Emptying the Forest: Hunting and the Extirpation of Wildlife from
Tropical Nature Reserves. Bioscience. 61 (11). pp. 919-924.
Heeswijk, V.L. and Turnhout, E. (2013). The discursive structure of FLEGT (Forest Law
Enforcement, Governance and Trade): The negotiation and interpretation of legality in the
EU and Indonesia. Forest Policy and Economics.32 (0). pp. 6-13.
Hegazi,A. M., Afifi, M.Y., El Shorbagy, M. A. Elwan,A. A. El- Demerdashe,S. (2005).
Egyptian National Action Program To Combat Desertification. Arab Republic of Egypt
Ministry of Agriculture & Land Reclamation, UNCCD, Desert Research Center: Cairo,
Egypt.

References
229
Herold, M., Angelsen, A., Verchot, L.V., Wijaya, A. and Ainembabazi, J.H. (2012). A
stepwise framework for developing REDD+ reference levels. In: Angelsen, A.,
Brockhaus, M., Sunderlin, W.D., Verchot, L.V., Eds. (ed). In Analysing REDD+:
Challenges and Choices; Center for International Forestry Research (CIFOR): Bogor,
Indonesia: pp. 279-299.
Hosonuma, N., Herold, M., De Sy, V., Ruth, S., Brockhaus, M., Verchot, L., Angelsen, A. and
Romijn, E. (2012). An assessment of deforestation and forest degradation drivers in
developing countries. Environmental Research Letters. 7 (4). pp. 044009 (12pp).
Ibrahim, K. M. (1969). the control of drifting sands in the north coastal region of UAR.
Pakistan Journal of forest. 19 (3). pp. 456-471.
Ibrahim, A. A. (eds). (2010). Modelling the Relationship between Climate and Vegetation in
the Tarhuna Region, Libya, Using Spatial Modelling Techniques. Doctoral thesis edn.
University of Reading: The UK.
Ickowitz, A. (2006). Shifting cultivation and deforestation in tropical Africa: critical
reflections. Development and change. 37 (3). pp. 599-626.
Idris, F., Mahdi, A., Aboukran, H. and Gabriel, A. (1993). Estimating the economic value of
forest trees. General Administration of forests , pastures and soil.Agricultural research
center: Tripoli, Libya. (In Arabic).
Imbarek, O. M. (eds). (2008). Evolution of the Eocene Carbonate Ramp Complex, Onshore
Cyrenaica Basin, NE Libya: Analogs For Carbonate Reservoirs, NW Offshore Libya.
MSc edn. University of Dalhousie: Canada.
Impson, F. A., Moran, V.C. and Hoffmann, J. H. (2004). Biological control of an alien tree,
Acacia cyclops, in South Africa: impact and dispersal of a seed-feeding weevil,
Melanterius servulus. Biological Control. 29 (3). pp. 375-381.
Indufor, O. (2013). Background to forest financing in Africa. Indufor.. forest intelligence:
Helsinki, Finland.
ITTO. (2003). Annual review and assessment of the world timber situation: ITTO International
Tropical Timber Organization: Yokohama.
Jawad, A., Benjaminsen, T.A., Hammad, A. A. and Dick, ØB. (2005). The road to
deforestation: An assessment of forest loss and its causes in Basho Valley, Northern
Pakistan. Global Environmental Change. 15 (4). pp. 370-380.
Jensen, J. R. (2005). Introductory Digital Image Processing: A Remote Sensing Perspective.
2nd ed. Prentice Hall: New Jersey, USA.
Jha, S. and Bawa, K.S. (2006). Population Growth, Human Development, and Deforestation in
Biodiversity Hotspots. Conservation Biology. 20 (3). pp. 906-912.
Jibril, A. (1999). History and the reality of property rights and tenure systems and land use
patterns in Libya. Agricultural Research Center,: Tripoli, Libya. (In Arabic).

References
230
Johnson, R. L. and Chenje, M. (2008). Africa; atlas of our changing environment. United
Nations Environment Programme (UNEP): Nairobi, Kenya.
Joint Research Centre (European Commission). (2014). Forest Fires in Europe, Middle East
and North Africa 2013, EUR 26791 EN. Institute for Environment and
Sustainability,European Commission,: Italy.
Jon, P. (2015). Vulnerability and Adaptation to Climate Change in the Semi-Arid Regions of
West Africa. Canada’s International Development Research Centre (IDRC) and the UK’s
Department for International Development (DFID) through the Collaborative Adaptation
Research Initiative in Africa and Asia (CARIAA): Canada.
Kaimowitz, D and Angelsen, A. (1998). Economic Models of Tropical Deforestation A
Review. Center for International Forestry Research: Bogor, Indonesia.
Karjalainen T., Richards G., Hernandez T. (2003). Definitions and Methodological Options to
Inventory Emissions from Direct Human-induced Degradation of Forests and
Devegetation of Other Vegetation Types. The Institute for Global Environmental
Strategies (IGES) for the Intergovernmental Panel on Climate Change (IPCC): Hayama,
Japan.
Karsenty, A, and Ongolo, S (2012). Can “fragile states” decide to reduce their deforestation?
The inappropriate use of the theory of incentives with respect to the REDD mechanism.
Forest Policy and Economics. 18 (0). pp. 38-45.
Kaul, R.N. (1970). Afforestation in arid zones. Junk: The Hague.
Khatabi, K. (1985). Sand stablization afforestation 2. The Ministry of Agriculture: Tripoli,
Libya. (In Arabic).
Khatabi, K. (1981). Sand dunes fixation methods in Libya. The ministry of agriculture, Libya:
Tripoli ,Libya. (In Arabic).
Khatabi, K. (1974). Sands stabilization afforestation. The Ministry of Agriculture and Agrarian
Reform: Tripoli, Libya.
Kiritani, K. (2007). The impact of global warming and land-use change on the pest status of
rice and fruit bugs (Heteroptera) in Japan. Global Change Biology. 13 (8). pp. 1586-1595.
Kissinger, G. M. and Herold, V. D. (2012). Drivers of Deforestation and Forest Degradation
( A Synthesis Report for REDD+ Policymakers). Norwegian Minister of the environment,
Norwegian ministry of foreign affairs. Department for international Development.
Department of Energy & Climate Change.: Vancouver, Canada.
Kleinman, P.J., Pimentel, D. and Bryant, R. B. (1995). The ecological sustainability of slash-
and-burn agriculture. Agriculture, Ecosystems & Environment. 52 (2–3). pp. 235-249.
Kollert, W. (2010). Planted forest in sustainable forest mangement. FAO: Rome,Italy.

References
231
Kotzé, J. D., Beukes, B. H.,Van den Berg, E. C. and Newby, T.S. (2010). National invasive
alien plant survey. Report Number: GW/A/2010/21. Agricultural Research Council:
Pretoria.
Koyunen, C. and Yilmaz, R. (2009). The impact of corruption on deforestation: a cross-country
evidence. The Journal of Developing Areas. 42 (2). pp. 213-222.
Kresegh, A. (eds). (2002). Sand storm and its effects on man and environment in north western
Libya<br />(1965-1997). MSc edn. Elsabea Men April University (El-Zawia University):
El-Zawia, Libya.
Krishna Dev Hengaju (eds). 2015. Analysis on causes of deforestation and forest degradation
of dang district: using application of DPSIR framework. Master Thesis edn. Tribhuwan
University: Bhaktapur, Nepal.
Lambin, E.F. 1999. Monitoring forest degradation in tropical regions by remote sensing: some
methodological issues. Global Ecology and Biogeography. 8 (3-4). pp. 191-198.
Lambin, E. F., Geist, H. and Springer L. (2006). Land-use and land-cover change. Springer:
Berlin; New York.
Lambin, E. F., Geist, H. J. and Lepers, E. (2003). Dynamics of Land-Use and Land-Cover
Change in Tropical Regions. Annual Review of Environment and Resources. 28 pp. 205-
241.
Landis, J. R. and Koch, G. G. (1977). The measurement of observer agreement for categorical
data. Biometrics. 33 (1). pp. 159-174.
Laurance, W. F., Fay, J. M., Parnell, R. J., Sounguet, G., Formia, A. and Lee, M.E. (2008).
Does rainforest logging threaten marine turtles? Oryx. 42 (2). pp. 246-251.
Laurie, M.V. (1974). Tree planting practices in African savannas. Food and Agriculture
Organization of the United Nations: Rome, Italy. 19.
Lebedys, A. and Yanshu, L. (2014). Contribution of the Forestry Sector to National
Economies, 1990-2011. Forest Economics, Policy and Products Division Forestry
Department , Food and Agriculture Organization of the United Nations: Rome, Italy.
Leech, B. L. (2002). Asking Questions: Techniques for Semistructured Interviews. PS:
Political Science & Politics. 35 (4). pp. 665-668.
Li Jianhua and McKay Jr and John S 2014. Analysis on the Causes of Deforestation and Forest
Degradation in Liberia: Application of the DPSIR Framework. Research Journal of
Agriculture and Forestry Sciences. 2 (3). pp. 20-30.
Lillesand, T. M., Kiefer, R.W. and Chipman, J.W. (2004). Remote sensing and image
interpretation. 5th ed. John Wiley and Sons: New York, USA.
Lindenmayer, D. B. and Burgman, M. A. (2005). Practical conservation biology. CSIRO
Publishing: Collingwood, Vic.

References
232
Lindquist, E. J., FAO and EC. (2012). Global forest land-use change, 1990-2005; paper 169.
Food and Agriculture Organization of the United Nations and European Commission;:
Rome, Italy. 169.
LNMC. (2012). Climatic data for Jefara plain .Libyan National Meteorological Centre:
Tripoli, Libya. (In Arabic).
Lorelle, F. and Meredith, L. (2000). Questionnaire design & administration :a practical guide.
Wiley: Brisbane; Chichester.
Lund, H.G. 2009. What is a degraded forest? Forest Information Services: Gainesville, USA.
MacDicken, K. 2013. Forest Resources Assessment Working Paper 180. Food and Agriculture
Organization of the United Nations Forestry Department. Rome, Italy.
Macias, T. (2008). Conflict over forest resources in Northern New Mexico: Rethinking cultural
activism as a strategy for environmental justice. The Social Science Journal. 45 (1). pp.
61-75.
Maestre, F. and Cortina, J. (2004). Are Pinus halepensis plantations useful as a restoration tool
in semiarid Mediterranean areas? Forest Ecology and Management. 198 (1–3). pp. 303-
317.
Măgureanu, I. (2013). The Juridical Protection of the Forest in Romania. Procedia - Social and
Behavioral Sciences. 81 (0). pp. 171-175.
Malagnoux, M., Sène E. L and Atzmon, N. (2007). Forests, trees and water in arid lands: a
delicate balance. In: Perlis, A (ed). Forests and water. 4th edn. Food and Agriculture
Organization of the United Nations, An international journal of forestry and forest
industries (unasylva): Rome, Italy. pp. 24-29.
Manaa, M. A. (1969). The Libyan Sahara. First edition ed. Dar Maktabat Al-fekar:
Tripoli,Libya. (In Arabic).
Martinus, N. and Makoto, I. (2000). Local Forest Management in Indonesia: A Contradiction
Between National Forest Policy and Reality. International Review for Environmental
Strategies. 1 pp. 175-197.
Mas, J. F., Kolb, M., Paegelow, M., Camacho, O., María,T. and Houet, T. (2014). Inductive
pattern-based land use/cover change models: A comparison of four software packages.
Environmental Modelling & Software. 51 (0). pp. 94-111.
Mather, A.S. (1990). Global forest resources. Belhaven: London.
Mather, P. M. and Magaly. K (2011). Computer processing of remotely-sensed images :an
introduction. 4th ed. John Witely and Sons, Ltd: Chichester; New York.
McCarthy, J.J. (2001). Climate change 2001 :impacts, adaptation, and vulnerability :
contribution of Working Group II to the third assessment report of the Intergovernmental

References
233
Panel on Climate Change. Published for the Intergovernmental Panel on Climate Change
by Cambridge University Press: Cambridge, UK; New York.
McIver, D. K. and Friedl, M. A. (2002). Using prior probabilities in decision-tree classification
of remotely sensed data. Remote Sensing of Environment. 81 (2–3). pp. 253-261.
McMorris, D. S. (1979). Society and its environment. In: H.D. Nelson (ed). Libya a country
study ‘foreign area studies’. Third edn. The American University: Washington, USA. pp.
125-153.
McMorrow, J. and Talip, M.A. (2001). Decline of forest area in Sabah, Malaysia: Relationship
to state policies, land code and land capability. Global Environmental Change. 11 (3). pp.
217-230.
McNeill, D., Bursztyn, M., Novira, N., Purushothaman, S., Verburg, R. and Rodrigues-Filho,
S. (2014). Taking account of governance: The challenge for land-use planning models.
Land Use Policy. 37 (0). pp. 6-13.
Megan, C. (2012). Deforestation in Madagascar: Consequences of Population Growth and
Unsustainable Agricultural Processes. Global Majority E-Journal. 3 (1). pp. 61-71.
Merlo, M. and Croitoru, L. (2005). Valuing Mediterranean forests :towards total economic
value. CABI Pub.: Wallingford, Oxfordshire, UK; Cambridge, MA.
Mersudin Avdibegović, Gerard Buttoud, Bruno Marić and Margaret Shannon 2012. Assessing
Forest Governance in a Context of Change: IUFRO Division 9: Forest Policy and
Economics Research Group 9.05.00 – Forest Policy and Governance. IUFRO: Sarajevo.
Messines, J. (1952). Sand dune fixation and afforestation in Libya. Unasyva. 6 (2). pp. 50-58.
Miah, M. D., Masum, M. H., Koike, M. and Akther, S. (2011). A review of the environmental
Kuznets curve hypothesis for deforestation policy in Bangladesh. iForest: Biogeosciences
& Forestry. 4 pp. 16-24.
Miyamoto, M. (2006). Forest conversion to rubber around Sumatran villages in Indonesia:
Comparing the impacts of road construction, transmigration projects and population.
Forest Policy and Economics, 9 (1) pp.1-12,2006.
Moh, K. A. (eds). (2013). The Management of Inclusive Education Practice in Libyan
Universities: Empirical Investigation. Doctoral thesis edn. University of Huddersfield:
The UK.
Mohanty, B. & Sahu, G. 2012. An Empirical Study on Elements of Forest Governance: A Study
of JFM Implementation Models in Odisha. Procedia - Social and Behavioral Sciences. 37
pp. 314-323.
Mokotjomela, T. M. and Hoffmann, J. H. (2013). Removal of post-dispersed seeds in Acacia
cyclops thickets under biological control in South Africa. South African Journal of Botany.
88 pp. 260-264.

References
234
Monditoka, A. K. (2011). Decentralized Forest Governance - A Policy Perspective. Research
Unit for Livelihoods and Natural Resources (RULNR): Begumpet, Hyderabad.
Montes, N., Gauquelin, T., Badri, W., Bertaudiere, V. and Zaoui, E. H. (2000). A non-
destructive method for estimating above-ground forest biomass in threatened woodlands.
Forest Ecology and Management. 130 (1-3). pp. 37-46.
Moomen, S.E. and Barney, C.W. (1981). A modern technique to halt desertification in the
Libyan Jamahiriya. Agricultural Meteorology. 23 (0). pp. 131-136.
Motel, P.C., Pirard, R. and Combes, J. (2009). ANALYSIS: A methodology to estimate
impacts of domestic policies on deforestation: Compensated Successful Efforts for
'avoided deforestation' (REDD). Ecological Economics. 68 (3). pp. 680-691.
Muller, E. and Tuomasjukka, T. (2010). Governance as an elemnt of global political agendas.
In: Tuomasjukka, T (ed). Forest policy and economics in support of good governance. EFI
Proceedings No. 58edn. European Forest Institute: Joensuu, Finland. pp. 25-42.
Murray, J. P., Richard, G., Wunder, S. and Raes, N. and Jones,J.P.G (2015). Spatial patterns
of carbon, biodiversity, deforestation threat, and REDD+ projects in Indonesia.
Conservation Biology. [E-journal]. 00 (0). Available at:
http://onlinelibrary.wiley.com/doi/10.1111/cobi.12500/pdf. Accessed: 10 APR 2015 .
Muzein, B. S. (eds). (2006). Remote Sensing & GIS for Land Cover/ Land Use Change
Detection and Analysis in the Semi-Natural Ecosystems and Agriculture Landscapes of
the Central Ethiopian Rift Valley. Doctoral thesis edn. Technische Universität Dresden:
Germany.
Myat Su Mon, Nobuya, M., Naing Zaw, H. Tsuyoshi, K. & Shigejiro, Y. 2012. Factors
affecting deforestation and forest degradation in selectively logged production forest: A
case study in Myanmar. Forest Ecology and Management. 267 (0). pp. 190-198.
Myat Su, M., Nobuya, M., Naing Zaw, H., Tsuyoshi, K. and Shigejiro, Y. (2012). Factors
affecting deforestation and forest degradation in selectively logged production forest: A
case study in Myanmar. Forest Ecology and Management. 267 (0). pp. 190-198.
Mzioudet, H. (2014). Libya’s Other War: Fighting Corruption for Sustainable Stability
(Attempts at curbing Libya’s culture of corruption). The Sadeq Institute,: Tripoli,
Libya.
Nagothu, U.S. (2001). Fuelwood and fodder extraction and deforestation: mainstream views in
India discussed on the basis of data from the semi-arid region of Rajasthan. Geoforum. 32
(3). pp. 319-332.
Naomi Doraisamy Poverty in Libya. The Borgen Project. [E-journal] July, 2013. Available at:
http://borgenproject.org/poverty-in-libya/.
National Committee to combat desertification. (2009). Annual Report of National Committee
to combat desertification. National Committee to combat desertification: Tripoli, Libya.
(In Arabic).

References
235
Neal, C., Forti, M. C. and Jenkins, A. (1992). Towards modelling the impact of climate change
and deforestation on stream water quality in Amazonia: a perspective based on the
MAGIC model. Science of The Total Environment. 127 (3). pp. 225-241.
Nedjahi, A. and Zamoum, M. (2005). Forest in Algeria. In: Merlo, M and Croitoru, L
(eds). Valuing Mediterranean forests :towards total economic value. CABI Pub.:
Wallingford, Oxfordshire, UK; Cambridge, MA. pp. 89-103.
Nieuwenhuis, M. 2000. Terminology of forest management. IUFRO World Series Volume 9.
International Union of Forestry Research Organizations (IUFRO): Vienna, Austria.
Nwer, B. B. (eds). (2005). The Application of Land Evaluation Technique in the north-east of
Libya. Doctoral thesis edn. Cranfield University: The UK.
Olander, L.P., Gibbs, H. K., Steininger, M., Swenson, J. J. and Murray, B. C. (2008). Reference
scenarios for deforestation and forest degradation in support of REDD: a review of data
and methods. Environmental Research Letters. [E-journal]. 3 (2). pp. 025011(pp11).
Available at: http://stacks.iop.org/ERL/3/025011. Accessed: 9 May 2008.
Omar Al Mukhtar University. (2005). Natural forest in Al-Jabal Al-Akdar region. Al Mukhtar
University: Al Bayda, Libya. (In Arabic).
Omran,T. (2000).Country Forestry Brief for Egypt. FAO: Rome, Italy.
Oppenheim, A.N. and Oppenheim, A. N. (1992). Questionnaire design, interviewing, and
attitude measurement. New ed. Pinter Publishers: London; New York.
Oram, P. (1997). Agricultural Growth, sustainable Resource Management, and poverty
Alleviation in Low Rainfall Area of west Asia and North Africa. Environment and
Production Technology Division International Food Policy Research Institute (IFPRI).
266 (ed). 2-6 september 1997. Food and Agriculture Development (FAD) , International
food policy Research Institute(IFPRI), International Center for Agricultural Research in
the Dry areas (ICARDA): Amman ,Jordan. pp.261.
Oune, O. (eds). (2006). Monitoring desertification in south west Tripoli using multi-temporal
remotely sensing data and GIS. Doctoral thesis edn. University of Dundee: The UK.
Pachauri, R. K. and Kanetkar, R.S. (1993). Deforestation and Desertification in Developing
Countries. United Nations University Environment, Energy, and Economy: Strategies for
Sustainability.Tokyo Conference on Global Environment, Energy, and Economic
Development, Tokyo, Japan (United Nations University Press). pp. 71.
Pacheco, P. (2004). What Lies behind Decentralization? Forest, Powers and Actors in
Lowlands Bolivia. European Journal of Development Research. 16 pp. 90-109.
Pahari, K. and Murai, S. (1999). Modelling for prediction of global deforestation based on the
growth of human population. ISPRS Journal of Photogrammetry and Remote Sensing. 54
(5–6). pp. 317-324.

References
236
Pallas, P. (1980). Water Resources of the Socialist people’s Libyan Arab Jamahiriya.
Secretariat of Dams and Water Resources: Tripoli, Libya. (In Arabic).
Palo, M., Lehto, E and Usivuori, J. (2000). Modelling causes of deforestation with 477
subnational units corrupt and illegal activities in the forest sector. In: Palo, M. and
Vanhanen, H (eds). World forests from deforestation to transition? Kluwer Academic
Publishers: Dordrecht; Boston. pp. 101-124.
Pascal Lopez 2012. Civil society organizations as a key stakeholder to foster good governance
in the forest and environment sector of Madagascar. Proceedings of Abstracts from the
IUFRO Seminar Assessing Forest Governance in a Context of Change. 9th – 11th May,
2012. IUFRO: Sarajevo. pp. 4-5.
Peter, K. and Odjugo, O. (2010). General overview of climate change impacts in Nigeria.
Journal of human ecology. 29 (1). pp. 47-56.
Pfaff, A., Amacher, G.S., Sills, E.O., Coren, M.J., Streck, C. & Lawlor, K. 2013. Deforestation
and Forest Degradation: Concerns, Causes, Policies, and Their Impacts. In: J.F. Shogren
(ed). Encyclopedia of Energy, Natural Resource, and Environmental Economics. Elsevier:
Waltham. pp. 144-149.
Phelps, J., Webb, E. L. and Agrawal, A. (2010). Does REDD+ Threaten to Recentralize Forest
Governance? Science (Washington). 328 (5976). pp. 312-313.
Piqué,Y. M., Ammari, D., Solano, N., Aletà, D., Bono, T. Sghaier, S. Garchi, J., Coello, L. and
Mutke, S. (2013). Mediterranean Stone Pine for Agroforestry (Pinus pinea) of Tunisia.
CIHEAM / FAO / INIA / IRTA / CESEFOR / CTFC.: Madrid ,Spain.
Pirard, R. and Belna, K. (2012). Agriculture and Deforestation: Is REDD+ Rooted In
Evidence? Forest Policy and Economics. 21 (0). pp. 62-70.
Pontius, R. G. (2000). Quantification error versus location error in comparison of categorical
maps. Photogrametric Engineering and Remote Sensing. 66 (8). pp. 1011-1016.
Portillo-Quintero, C. A., Sanchez, A.M., Valbuena, C.A., Gonzalez, Y. Y. and Larreal, J.T.
(2012). Forest cover and deforestation patterns in the Northern Andes (Lake Maracaibo
Basin): A synoptic assessment using MODIS and Landsat imagery. Applied Geography.
35 (1–2). pp. 152-163.
Portnov, B. and Safriel, U. (2004). Combating desertification in the Negev: dryland agriculture
vs. dryland urbanization. Journal of Arid Environments. 56 (4). pp. 659-680.
Public Authority for Water. Libya. (2008). Water resources and Hydropower in Libya. Water
for Agriculture and Energy in Africa: the Challenges of Climate Change.15-17/
December. Sirte, Libyan. pp. 1-13.
Qureshi, M. H. and Kumar, S. (1996). Household energy and common lands in rural Haryana,
India. Environmental Conservation. 23 (4). pp. 343-350.

References
237
Rapp, A., Le Houérou, H. and Lundholm, B. (1976). Can desert encroachment be stopped?
:A study with emphasis on Africa. Swedish Natural Science Research Council: Stockholm.
RCDC 2004. Community Forest Management: Agenda for the Future. RCDC: Bhubaneswar,
Pp.1-5.
Repetto, R. (1990). Deforestation in the Tropics. Scientific American. 262 (4). pp. 36.
Repetto, R. (1989). THE FOREST FOR THE TREES? Government Policies and the Misuse of
Forest Resources. World Resources institute A Center for Policy Research: New York,
USA.
Robinson, B. E., Holland, M. B. and Naughton-Treves, L. (2014). Does secure land tenure save
forests? A meta-analysis of the relationship between land tenure and tropical deforestation.
Global Environmental Change. 29 pp. 281-293.
Rogan, J. and Chen, D. (2004). Remote sensing technology for mapping and monitoring land-
cover and land-use change. Progress in Planning. 61 (4). pp. 301-325.
Rogers, G. F. and Vint, M. K. (1987). Winter precipitation and fire in the Sonoran Desert.
Journal of Arid Environments. 13 (1). pp. 47-52.
Romijn, E., Ainembabazi, J.H., Wijaya, A., Herold, M., Angelsen, A., Verchot, L. and
Murdiyarso, D. (2013). Exploring different forest definitions and their impact on
developing REDD+ reference emission levels: A case study for Indonesia. Environmental
Science & Policy. 33 (0). pp. 246-259.
Rowe, R., Sharma, N. P. and Bowder, J. (1992). Deforestation: problems, causes and concern.
In: Managing the world’s forest: looking for balance between conservationand
development. In: Sharma, N.P. (ed). In: Managing the world’s forest: looking for balance
between conservationand development. Kendall/Hunt Publishing Company Iowa.: pp. 33-
46.
Rubin, H. J.and Rubi,I. S. (2012). Qualitative Interviewing: The Art of Hearing Data. 3th ed.
SAGE: Thousand Oaks CA. USA.
Rudel, T. K., Coomes, O.T., Moran, E., Achard, F., Angelsen, A., Xu, J. and Lambin, E. (2005).
Forest Transitions: Towards a Global Understanding of Land Use Change. Global
Environmental Change. 15 (1). pp. 23-31.
Runyan, C.W., D'Odorico, P. & Shobe, W. 2015. The economic impacts of positive feedbacks
resulting from deforestation. Ecological Economics.120 pp. 93-99.
Ryan, C. M., Berry, N.J. and Neha, J. (2014). Quantifying the causes of deforestation and
degradation and creating transparent REDD+ baselines: A method and case study from
central Mozambique. Applied Geography. 53 (0). pp. 45-54.
Saad, A. M., Shariff, N. M and Gariola, S. (2013). Libya: Reversal of Land Degradation and
Desertification Through Better Land Management. In: Heshmati G.A • Victor R. S

References
238
Editors (ed). Combating Desertification in Asia, Africa and the Middle East. 1th edn.
Springer: London ,UK. pp. 75-89.
Saad, A. M. and Shariff, N. M.and Gariola, S. (2011). Nature and causes of land degradation
and desertification in Libya: Need for sustainable land management. African Journal of
Biotechnology. 10 (63). pp. 13680-13687.
Saager, E. and Alwahishe, A. (2005). Desertification , Study in environmental geography of
the eastern part of the Jefara plain . 1th ed. National Library of Benghazi: Benghazi;
Libya. (In Arabic).
Sadeg, S. and Karahanolu, N., (2001). Numerical assessment of seawater intrusion in Tripoli
region, Libya. Environmental Geology. 40 pp. 1151-1168.
Salem, O. and Talha, A. (1984). An explanatory memorandum to the hydrological map of the
north-western part of Libya. The General Authority for Water: Libya: Tripoli, Libya. (In
Arabic).
Salih, S. A. (1992). Managing Renewable Natural Capital in Africa,Working Papers WP 97.
World Institute for Development Economics Research of the United Nations University (
UNU/WIDER): Stockholm,Finland.
Samia Mansour, Sahar Rad. 2015. African Economic Outlook/ Libya. African Development
Bank (AFDB.
Sands, R. (2005). Forestry in a global context. 1th ed. CABI Pub.: Wallingford, Oxfordshire,
UK; Cambridge, MA.
Sasaki, N. and Putz, F. E. (2009). Critical need for new definitions of "forest" and "forest
degradation" in global climate change agreements. Conservation Letters. 2 (5). pp. 226-
232.
Sbeit, A. (1998). Assessment of Fodder Shrubs Introduction to Grazing Projects in Dry Areas.
ICARDA.: Tripoli, Libya. (In Arabic).
Schmithüsen, F. (1986). Forest legislation in selected African countries :based on the review
and analysis of forest legislation in 11 member countries of the African Timber
Organization. Food and Agriculture Organization of the United Nations: Rome.
Schowengerdt, R.A. (2007). Remote sensing, models and methods for image processing. 3th
ed. Elservier Inc: New York, USA.
Sehib, K., Jackson, E. & Gorton, M. 2013. Gender, social acceptability and the adoption of
supermarkets: evidence from Libya. International Journal of Consumer Studies. 37 (4).
pp. 379-386.
Shahabi, H., Bin Ahmad, B, Mokhtari, M. H and Zadeh,M. A. (2012). Detection of urban
irregular development and green space destruction using normalize difference
vegetation index (NDVI), principal component analysis (PCA) and post classification

References
239
methods: A case study of Saqqez city. International Journal of the Physical Sciences.7
(17). pp. 2587-2595.
Shalaby, A. and Ali, A. (2010). Agricultural land Monitoring in Egypt using NOAA-AVHRR
and SPOT Vegetation Data. National Authority for Remote Sensing and Space Sciences
(NARSS) Cairo, Egypt. 8 (11). pp. 275-275.
Sinare, H. & Gordon, L.J. 2015. Ecosystem services from woody vegetation on agricultural
lands in Sudano-Sahelian West Africa. Agriculture, Ecosystems and Environment. 200
pp. 186-199.
Skutsch, M., Mas, J. F., Bocco, G., Bee, B., Cuevas, G. and Gao, Y. (2014). Deforestation and
land tenure in Mexico: A response to Bonilla-Moheno et al. Land Use Policy.39 pp. 390-
396.
Solinge, V. and Boekhout, T. (2010). Deforestation Crimes and Conflicts in the Amazon.
Critical Criminology. 18 (4). pp. 263-277.
Sophia, C., Merger, E., Essomba, E., Panev, M., Pistorius, T. and Amougou, J. (2015). A
Methodological Framework for Assessing Agents, Proximate Drivers and Underlying
Causes of Deforestation: Field Test Results from Southern Cameroon. Forests. 6 (1). pp.
203-224.
Souza, C. M., Siqueira, J. V., Sales, M. H., Fonseca, A.V., Ribeiro, J. G., Numata, L., Cochrane,
M. A., Barber, C. P. and Roberts, D. A.and Barlow, J. (2013). Ten-Year Landsat
Classification of Deforestation and Forest Degradation in the Brazilian Amazon. Remote
Sensing. 5 (11). pp. 5493-5513.
Sparovek, G., Berndes, G., Barretto,A.G., de Oliveira P. and Klug, I. L. (2012). The revision
of the Brazilian Forest Act: increased deforestation or a historic step towards balancing
agricultural development and nature conservation? Environmental Science & Policy. 16
(0). pp. 65-72.
Staff, S. (2010). Mining deforestation nearly tripled between 2000-08. Archives, Wednesday
October 13 2010. [E-journal]. Available at:
http://www.stabroeknews.com/2010/archives/10/13/mining-deforestation-nearly-tripled-
between-2000-08-%E2%80%93wwf/.
Stonish, S. C.(1989). Processes and environmental destruction: a Central American Case
Study.”. Population and Development Review. 15(2) pp. 269-296.
Struhsaker, T.T. (1997). Ecology of an African rain forest : logging in Kibale and the conflict
between conservation and exploitation. University Press of Florida {a}, Gainesville,
Florida: Florida, USA.
Sunderlin, W.D., Dewi, S., Puntodewo, A., Mueller, D., Angelsen, A. and Epprecht, M.
(2008). Why Forests Are Important for Global Poverty Alleviation: a Spatial
Explanation. Ecology and Society. [E-journal]. 13 (2). pp. 24. Available at:
http://www.ecologyandsociety.org/vol13/iss2/art24/.

References
240
Sunil, N. K., Rao, H., Kaechele, K.V. and Raju, R. S. (2013). Knowledge Systems of Societies
for Adaptation and Mitigation of Impacts of Impacts of Climate. 1th ed. Springer:
Dordrecht; New York.
Suominen, R. S. and Hansen, C. P. (2012). Why some forest rules are obeyed and others
violated by farmers in Ghana: Instrumental and normative perspective of forest law
compliance. Forest Policy and Economics. 23 (0). pp. 46-54.
Sutton, K. and Zaimeche, S. (1996). Desertification and Degradation of Algeria's
Environmental Resources. In: Swearingen, W.D. and Bencherifa, A (eds). The North
African environment at risk (State,culture, and society in Arab North Africa). Westview
Press: Boulder, Colo. pp. 73-91.
Swearingen, W. D. and Bencherifa, A. (1996). The North African environment at risk.
Westview Press: Boulder, Colo.
Tarhoni, D. (eds). (2011). Higher Education & Tribal Identity in Modern Libya . Doctoral
thesis edn. University of Sunderland: The UK.
The Ministry of Agriculture .(2004). The state of natural vegetation in Libya. The Ministry of
Agriculture: Tripoli, Libya. (In Arabic).
The Ministry of Agriculture.(2003). Report on area of wheat and barley in Libya /ha (1985-
2002). The Ministry of Agriculture; Libya: Tripoli, Libya. (In Arabic).
The World Bank. (2015). GDP per capita for Libya,Tunis and Egypt. [Online]. Available at:
http://data.worldbank.org/indicator/NY.GDP.PCAP.CD. Accessed:20/06/5015 .
World Bank 2009. Roots for Good Forest Outcomes: An Analytical Framework for
Governance Reforms, Agriculture and Rural Development Department.Report No. 49572-
GLB. World Bank: Washington DC.
Thompson, I., B. Mackey, S. McNulty, A. Mosseler. 2009. Forest resilience, biodiversity, and
climate change: a synthesis of the biodiversity/resilience/stability relationship in forest
ecosystems
Thrupp, L. A., Hecht, S. and Browder, J. O. (1997). The diversity and dynamics of shifting
cultivation : myths, realities, and policy implications. 1th ed. World Resources Institute:
Washington, DC. USA.
Tiedeman, J. A. and Johnson, D. E. (1992). Acacia cyanophylla for forage and fuelwood in
North Africa. Agroforestry Systems. 17 (2). pp. 169-180.
Tinker, P. B., Ingram, J.S. and Struwe, S. (1996). Effects of slash-and-burn agriculture and
deforestation on climate change. Agriculture, Ecosystems & Environment. 58 (1)pp13-22.
Tobin, P.C. and Dylan, P.and Brian, H. A. (2014). The Influence and Climate Change on
Insect Invasions in Temperate Forest Ecosystems. In: Fenning, T (ed). Challenges and
opportunities for the world's forests in the 21st century, Forestry sciences. Springer:
Dordrecht; New York; 4. pp. 267-296.

References
241
Tottrup, C. and Rasmussen, M.S. (2004). Mapping long-term changes in savannah crop
productivity in Senegal through trend analysis of time series of remote sensing data.
Agriculture, Ecosystems & Environment. 103 (3). pp. 545-560.
Turner, B. L., Kasperson, R. E., Meyer, W. B., Dow, K. M., Golding, D., Kasperson, J. X. and
Mitchell, R.C. (1990). Two Types of Global Environmental Change: Definitional and
Spatial-Scale Issues in Their Human Dimensions. Glob Environ Change. 1 (1). pp. 14.
Umemiya, C., Rametsteiner, E. and Kraxner, F. (2010). Quantifying the impacts of the quality
of governance on deforestation. Environmental Science & Policy.13 (8). pp. 695-701.
UNEP. (1992). Status of desertification and implementation of the United Nations plan of
action to combat desertification / report of the executive officer, Governing Council, third
special session. United Nations Environment Programme: Nairobi, Kenya.
UNFF. (2001). Forest products annual markets review 2000-20001. Timber bulletin volume
live. No.3. United National Economic Commission for Europe and the FAO: New York.
Utting, P. and United Nations Research Institute for Social Development. (1993). Trees,
people and power :social dimensions of deforestation and forest protection in Central
America. Earthscan Ltd: London, The UK.
Voitleithner, J. (2002). The National Forest Programme in the light of Austria's law and
political culture. Forest Policy and Economics. 4 (4). pp. 313-322.
Watson, R.T., Verardo, D.J., Noble, I.R., Bolin, B., Ravindranath, N.H. & Dokken, D.J., eds
2000. Land use, land-use change, and forestr: a special report of the IPCC
(Intergovernmental Panel on Climate Change). 1th ed. Cambridge University Press:
Cambridge.
Wehkamp, J., Aquino, A., Fuss, S. and Reed, E.W. (2015). Analyzing the perception of
deforestation drivers by African policy makers in light of possible REDD+ policy
responses. Forest Policy and Economics. 59 (0). pp.7-18.
Williams, M. (2003). Deforesting the earth : from prehistory to global crisis. University of
Chicago Press: USA.
Wilson, C. (2014). Structured Interviews. In: C. Wilson (ed). Interview Techniques for Ux
Practitioners. Morgan Kaufmann: Boston. pp. 1-21.
Wyman, M.S. and Stein, T.V. (2010). Modeling social and land-use/land-cover change data to
assess drivers of smallholder deforestation in Belize. Applied Geography. 30 (3). pp. 329-
342.
Zaimeche, S. E. (1994). The Consequences of Rapid Deforestation: a North African Example.
Ambio. 23 (2). pp. 136-140.
Zak, M. R., Cabido, M., Cáceres, D. and Díaz, S. (2008). What Drives Accelerated Land Cover
Change in Central Argentina? Synergistic Consequences of Climatic, Socioeconomic, and
Technological Factors. Environmental management. 42 (2). pp. 181-189.

References
242
Zakaria, H. E. A. (eds). (2010). Integration of Remote Sensing and GIS in Studying Vegetation
Trends and Conditions in the Gum Arabic Belt in North Kordofan, Sudan. MSc edn.
Technische University Dresden: Germany.
Zheng, B., Campbell, J. B., Serbin, G. and Galbraith, J. M.(2014). Remote sensing of crop
residue and tillage practices: Present capabilities and future prospects. Soil and Tillage
Research. 138. pp. 26-34.

References
I
Appendices
Appendix I
Semi structured interview (questions) to non- forest clearers respondents
(In chapter 4)
Q1- What is the most serious environmental issue facing Algarabulli District?
Q2- What is the most important direct causes of deforestation?
Q3- What is the indirect causes of deforestation?
Q4- What is the most important underlying causes of deforestation after the fall of the
Gaddafi regime?
Q5- When deforestation started?
Q6- What is your evaluation of forest status before/after deforestation started and after the
fall of the Gaddafi regime?
Q7- What is your estimate of deforestation rate before/after the fall of the Gaddafi regime?
Q8- What is the consequences of deforestation at present?

References
II
Appendix 2
Semi structured interview to Government Officials respondents
(In chapter 6)
1- Name (optional).................
2- Position…………………………
3- When deforestation started
4- Why deforestation started in this time?
5- Have you recorded any forest encroachments before this time?
6- How forest governance was changed?
7- What is your evaluation about forest protections laws?
8- What is your evaluation about forest land laws?
9- What is the solution to address the problem of deforestation ?
10- Do you think that these are possible to apply :Yes ( ) No ( )
If no why?

References
III
Appendix 3
Questionnaire to forest clearers respondents
(In chapter 7)
Name of locality ….......
Section (1) personal information
1- Name (optional).................
2- Age …
3- Number of family members M ( ) F ( ) total ( )
4- Primary Occupation …..................... secondary Occupation…………….
5- Educational status. : Illiterate ( ) reads and writes ( ) primary& secondary schools ( )
6- Average education ( ) Higher education ( ).
7- Length of stay in this farm: less than 4 years ( ) 4- 10 ( ) 10-20 ( ) more than 21 years ( )
8- What is your annual income?
Section (2) Forest clearers’ awareness (Forest importance ) :-
1- Do you know the area cover where you live what it was before 1950 ? Yes ( ) no ( )
2- Do you know who planted forest: family ( ) government ( ) I don’t know ( )
3- Do you know why it was planted trees: because of …..... I don’t know
4- What is the importance of forest?
5- Why you cleared forest?
6- Did you get permission to clear forest? Yes ( ) No ( ) if yes from who……….
7- Are you aware of the forest law? Conscious ( ) Unconscious ( )
8- Are you concerned about the future situation if deforestation is still continue Yes ( ) No ( )
Section (3) Land information (Land tenure)
1- Means of land acquisition?
2- Did you record this land in the land register yes ( ) no ( )
3- How many plots of land do you own … total in hectares…?
5- Did you sale a plot of land recently Yes ( ) No ( )

References
IV
Appendix 4 Land cover change in Algarabulli District’ localities
Forest cover change in the Ataya forest block (1985, 2010, 2013)

References
V
Forest cover change in the Karawa forest block (1985, 2010, 2013)

References
VI
Forest cover change in the Gaweaa forest block (1985, 2010, 2013)

References
VII
Forest cover change in the Rawajih forest block (1985, 2010, 2013)

References
VIII
Forest cover change in the Kawalig forest block (1985, 2010, 2013)

References
IX
Appendix 5 Forest density in Algarabulli District’ localities
Forest cover and density in the Ataya forest block (1985, 2010, 2013)

References
X
Forest cover and density in the Karawa forest block (1985, 2010, 2013)

References
XI
Forest cover and density in the Gaweaa forest block (1985, 2010, 2013)

References
XII
Forest cover and density in the Rawajih forest block (1985, 2010, 2013)

References
XIII
Forest cover and density in the Kawaleg forest block (1985, 2010, 2013)

References
XIV
Ataya forest block in 1985, 2010 and 2013

References
XV
Karawa forest block in 1985, 2010 and 2013)

References
XVI
Gawea forest block in 1985, 2010 and 2013

References
XVII
Rawajh forest block in 1985, 2010 and 2013

References
XVIII
Kawaliq forest block in 1985, 2010 and 2013

References
XIX
Appendix 6: This CD contains video footage of forest clearing operations after the 2011
uprising, filmed by the researcher from helicopter in 02/01/2012

References
XX
Appendix 7
The primary data of local resident estimate (7a) and Forest Department records (7b)
Appendix (7a) the raw data of respondents estimates about defrosted area in percentage
before and after the 2011 uprising in Libya in each block of forests in Algarabulli District and
the researcher worked out the other data to obtained forest cover in hectare and percentage in
2010 and 2013
Table 1: Respondents estimates in Ataya Locality in deforested area in Ataya Forest block
Respondent
No
1985 (based
on RS data) Deforested in
% before 2010
Forest
cover
2010/ha
Forest
cover in
% 2010
Deforested
between
(2011-2013)
Forest
cover
2013/ha
Forest cover
in % 2013
1 4020 50 2010 50 30 402 10
2 4020 55 1809 45 30 271.3 6.7
3 4020 50 2010 50 30 402 10
4 4020 50 2010 50 35 301.5 7.5
5 4020 55 1809 45 30 271.3 6.7
6 4020 60 1608 40 25 241.2 6
7 4020 40 2412 60 45 361.8 9
8 4020 50 2010 50 35 301.5 7.5
9 4020 55 1809 45 25 361.8 9
10 4020 50 2010 50 30 402 10
11 4020 50 2010 50 30 402 10
12 4020 50 2010 50 35 301.5 7.5
13 4020 55 1809 45 25 361.8 9
14 4020 50 2010 50 40 201 5
15 4020 50 2010 50 35 301.5
Average 51.3 1956.4 32 325.6
Sdv
Table 2: Respondents estimates in Karawa Locality in deforested area in Karawa Forest
block
Respondent
No
1985 (based
on RS data) Deforested in
% before 2010
Forest
cover
2010/ha
Forest
cover in
% 2010
Deforested
between
(2011-2013)
Forest
cover
2013/ha
Forest cover
in % 2013
1 3761 20 3008.8 80 30 1504.4 40
2 3761 25 2820.7 75 25 1410.4 37.5
3 3761 15 3196.8 85 30 1758.3 46.7
4 3761 30 2632.7 70 20 1316.3 35
5 3761 15 3196.8 85 30 1758.3 46.7
6 3761 20 3008.8 80 35 1353.9 36
7 3761 20 3008.8 80 30 1504.4 40
8 3761 15 3196.8 85 35 1598.4 42.5
9 3761 20 3008.8 80 30 1504.4 40
10 3761 15 3196.8 85 35 1598.4 42.5
Average 19.5 3027 80.5 30 1530.7 40.7
Sdv 4.97 4.02

References
XXI
Table 3: Respondents estimates in Gawea Locality in deforested area in Gawea Forest
block
Respondent
No
1985 (based
on RS data) Deforested in %
before 2010
Forest
cover
2010/ha
Forest
cover in
% 2010
Deforested
between
(2011-2013)
Forest
cover
2013/ha
Forest cover
in % 2013
1 1752 20 1401.6 80 50 420.48 24
2 1752 10 1576.8 90 60 473.04 27
3 1752 15 1489.2 85 55 446.76 25.5
4 1752 20 1401.6 80 50 420.48 24
5 1752 25 1314 75 45 394.2 22.5
6 1752 15 1489.2 85 50 521.22 29.7
7 1752 25 1314 75 50 328.5 18.7
8 1752 30 1226.4 70 45 306.6 17.5
Average 20 1401.6 80 50.6 413.91 23.6
Sdv 6.54 4.05
Table 4: Respondents estimates in Rawajih Locality in deforested area in Rawajih Forest
block
Respondent
No
1985 (based
on RS data) Deforested in
% before 2010
Forest
cover
2010/ha
Forest
cover in
% 2010
Deforested
between
(2011-2013)
Forest
cover
2013/ha
Forest cover
in % 2013
1 1221 35 793.6 65 45 158.7 13
2 1221 30 854.7 70 40 256.4 21
3 1221 25 915.7 75 40 320.5 26.2
4 1221 25 915.7 75 45 274.7 22.5
5 1221 25 915.7 75 45 274.7 22.5
6 1221 20 976.8 80 50 293 24
7 1221 30 854.7 70 40 256.4 21
Average 27.1 889.6 72.8 43.5 262.1 21.4
Sdv 4.88 4.15
Table 5: Respondents estimates in Kawaleg Locality about deforested area in Kawaleg
Forest block
Respondent
No
1985 (based
on RS data) Deforested in %
before 2010
Forest
cover
2010/ha
Forest
cover in
% 2010
Deforested
between
(2011-2013)
Forest
cover
2013/ha
Forest cover
in % 2013
1 257 20 205.6 80 30 102.8 40
2 257 25 192.7 75 30 86.7 33.7
3 257 30 179.9 70 25 80.9 31.5
4 257 25 192.7 75 20 106.0 41.2
5 257 25 192.7 75 25 96.3 37.5
6 257 30 179.9 70 25 80.9 31.5
Average 257 25.8 190.6 74.17 25.8 35.9
Sdv 3.76 4.27

References
XXII
Appendix 7 b: Forest Department records.
Figure1: Forest loss in Algarabulli forest blocks from 1986-2013
Figure 2: Annual forest loss in Algarabulli forest blocks from 1986 -2013
0
500
1000
1500
2000
2500
3000
3500
4000
4500
5000
1985
1987
1989
1991
1993
1995
1997
1999
2001
2003
2005
2007
2009
2011
2013
Fo
rest
co
ver
/ H
a
Years
Ataya
Karawa
Gaweaa
Rawajih
Kawaleg
0
200
400
600
800
1000
1200
1400
1600
18001
98
6
198
7
198
8
198
9
199
0
199
1
199
2
199
3
199
4
199
5
199
6
199
7
199
8
199
9
200
0
200
1
200
2
200
3
200
4
200
5
200
6
200
7
200
8
200
9
201
0
201
1
201
2
201
3
Are
a/h
a
Year
Ataya Karawa Gaweaa Rawajih Kawaleg

References
XXIII
Appendix 8
The role of Tree Friends Association (NGO) to raise awareness of pupils about the
importance of forests and afforestation in one of study area' schools

Appendices
I
Appendix 9
Pupils taking part in the afforestation campaigns 1970 (above), 2013 (below)

Appendices
II
Appendix 10
The researcher participating with Tree Friends Association in one of the afforestation
campaigns at Alshaavien forest reserve, Msallata on 09.01.2014.

Appendices
III
Appendix 11
Celebrating ‘Tree day’ before 1985 as the sign shows

Appendices
IV
Appendix 12
Some forests are cleared to establish subdivided small plots, with paved roads and electricity for
future sale (without government permits).

Appendices
V
Appendix 13
Forest degradation: The death of some trees as a result of drought, disease and neglect

Appendices
VI
Appendix 14
Converting forest land to irrigated land.

Appendices
I