
Drivers Project Management Education India
386
Drivers of Project Management (PM) Education in India A Research Study Authors Dr. M.G. Korgaonker Dr. Mona N. Shah Dr. J. K. Koner Prof. M.V. Madurwar Prof. Smruti Sanjeevani Sponsored by Project Management Institute ® , India 1
Transcript of Drivers Project Management Education India
Drivers of Project Management(PM) Education in India
A Research Study
Authors Dr. M.G. Korgaonker
Dr. Mona N. Shah
Dr. J. K. Koner
Prof. M.V. Madurwar
Prof. Smruti Sanjeevani
Sponsored by
Project Management Institute®, India
1
October 2010
NATIONAL INSTITUTE OF CONSTRUCTION MANAGEMENT ANDRESEARCH, PUNE, INDIA
Balewadi, Pune – 411 045
ACKNOWLEDGEMENTS
We wish to express our sincere thanks and gratitude to the
Project Management Institute® (PMI®) India for their
sponsorship of the pioneering study at the National Institute
of Construction Management and Research, Pune, India. We would
like to specifically acknowledge the overwhelming support and
encouragement received from Mr. Raj Kalady, Country Director,
Project Management Institute® (PMI®) India, throughout the
duration of the study. We thank him for his unlimited
patience, in accepting the somewhat inevitable time overrun in
the completion of the study and finalization of the report.
The study team deeply acknowledges the valuable guidance
provided by Dr. M.G. Korgaonker, Director General and Project
Director, whose extensive experience in the area of project
management as a researcher and pioneer of the 2 years fulltime
course on Project Engineering and Management in India at
NICMAR, helped the team gain appropriate perspectives about
the field of Project Management. His keen interest and
leadership throughout the study enabled us to remain on track.
We remain indebted to all the respondents to our survey who
gave us huge amounts of time unselfishly, helped us to2
patiently complete the in-depth questionnaires, and hosted our
research team with warmth and concern. If the study has seen a
successful completion, it is in no small measure due to the
vital inputs provided by each one of our institutional
respondents.
We wish to place on record the valuable assistance provided by
Dr. Jonardan Koner, Prof. Mangesh Madurwar and Prof.
Smruti Sanjeevani who as members of the investigating team
worked with enthusiasm and dedication to complete the survey
of institutions, executives and human resource managers and
collate it for analysis. We thank Mr. A.R. Jadhav, Sr.
Librarian at NICMAR, whose unstinted and cheerful support was
always forthcoming throughout the study. We thank Mr.
Rajanikant Sagwekar who helped in the page-setting and layout.
Dr. Mona N. Shah
Principal Investigator
October, 2010
EXECUTIVE SUMMARY
This study is an initial attempt, to investigate the factors
that are responsible in driving the growth of Project
Management Education in India. The study throws light on
specific factors that emerge after studying the available
literature on the subject as well as the responses compiled
from a cross-section of the primary stakeholders namely the
Government, Academic Institutions, Practising Executives and3
Human Resource Managers connected with project management
education and training.
We begin with a discussion on the need for PM education to
take root and grow in India in the interest of its major
stakeholders and users like the government, and industry –
both of whom have enormous investments tied up in a range of
mega, major and medium sized projects. As per Ministry of
Statistics and Programme Implementation (MOSPI), in the year
2009 alone, a total outlay of 607,188 crores ( 6072 billion)
was tied up in 941 Central Government projects alone. In the
private sector, the investment value tied up in projects stood
at over 100 trillion. As per CMIE data, the aggregate
employment in projects sector stood at over 160 million
persons.
In chapter 2, we review the literature using journals and
reports that assess the current status of project management
education at a global level as well as in India. The European,
North American countries, and Australia show tremendous
progress in establishing PM in almost all realms of activity –
governmental, industrial, academic, research and societal,
through myriad initiatives. In case of China, India’s closest
comparable country, PM appears to have taken firm roots since
the 1990s decade, using a systematic ‘top down’ approach. In
India, efforts to promote PM education in a structured mode
appear to have only just begun.
4
Chapter 3 of the study explains the design of the research
study, the hypotheses formulated, the scope and methodology.
The study has made use of primary and secondary data and was
carried out within India. It covered a cross section of
faculty/heads of departments of leading technical and
management academic institutions from eighty one institutes
from all over India. Data was collected using the Personal
Interview Technique. The next set of respondents was the
practising executives from project based organisations. Eighty
eight executives responded to a comprehensive survey
questionnaire that had questions ranging from work experience
and value of projects previously engaged in or currently
working, to their perception on the inclusion of subjects that
enabled them to perform better on projects and in the careers,
as well as other gains that accrued to them after undergoing
PM training. The study raised questions about the factors that
they perceived were important in influencing the growth of PM
in India.
The third set of respondents was drawn from a pool of select
and leading project based companies from a cross section of
construction, power, engineering and IT industries. The
respondents were twenty human resource managers with
considerable experience in designing training programmes for
their companies. Care was taken to ensure that the respondents
were geographically distributed, over India. Statistical tools
used in compiling and analysing the results were Pie charts,
5
Bar and Column Diagrams, Correlation and Regression Analysis,
Factor Analysis and Multiple Regression Analysis.
Chapter 4 presents findings of the survey emerging from
responses received from Academic Institutions. Significant
results were obtained in this analysis. There is a clear case
for strong promotion of PM education in technical and business
schools, with faculty emphatically admitting that the
employability of the students who undergo the PM courses is
significantly improved. Overall the faculty has advocated a
broad based project management subject curricula to be taught
in technical, business, architectural, planning and
infrastructure institutes. However their clear preference was
for the core PM subjects of i) Operations Management, ii)
Project Planning, Execution, Monitoring and Control iii)
Statistical Methods for Project Analysis, iv) Health, Safety
and Environment, v) Operations Research and vi) Accounting
and Control Systems. The faculty suggest that subjects like
Macro Economic Policy, Project Strategy, Risk Management,
Project Financing, Legal, Commercial and Taxation Aspects in
projects should be considered important for curriculum at the
post graduate level. The subject in the Behavioural Sciences
Area, deemed most important was Managerial Skills. All
subjects in the Information Technology Area like Prima Vera,
Microsoft Projects (MSP), engineering software, SPSS etc were
considered to be uniformly important in PM education. The
faculty respondents considered the coverage of sector specific
issues in the curriculum to be very important, but appeared
6
unsure about the relative importance of the sectors of
economic activity where PM teaching should be directly
focused.
The correlation analysis provides very good basis for
structuring courses in all the subject areas considered in the
study. In the Technology and Management area, the results
indicate that the subjects Project Site and Equipment
Management, Project Procurement and Materials Management,
Contract Management, Facilities Engineering and Management and
Process Design / Engineering / Testing / Commissioning are
correlated. This is expected since these issues arise during
project execution and have to be dealt with in a coordinated
manner. Similarly correlation among the subject areas
Logistics and Supply Chain Management, Transportation
Management, Facilities Engineering and Management are also
quite expected and in most projects, these would be dealt with
together. The correlation between subject areas Operations
Management and Operations Research, and also between Project
Formulation and Appraisal and Project Engineering are also
along expected lines. There is also good correlation between
Quality Management and HSE subjects and therefore combining
these into a single course would be quite appropriate. It is
not surprising that in the project management fraternity, the
precise differences among these subject areas are not very
clear.
While most of the subjects grouped in these subject areas are
found to be very important, there is a case for combining some7
of these together, in order to emphasize the importance of
managing projects in a coordinated and integrated manner. A
direct outcome of the correlation analysis is that in
institutions and curricula where it is difficult to introduce
several execution oriented courses, it will be quite adequate
if a single course emphasizing project execution is included.
In the Economics and Strategy area, the subject Social Cost
benefit Analysis is most heavily correlated with other
subjects including Macroeconomic Policy, Project Strategy,
Project Financing, Legal, Commercial and Taxation Aspects.
Thus if this course is included as a separate course, care
must be taken to ensure that the content is not duplicated in
other courses. Alternately the course need not be included, if
other courses reflect the content. There is a case for
combining the courses Project Financial Management and Project
Financing, courses Project Strategy and Macroeconomic Policy,
and courses Legal, Commercial & Taxation Aspects and Project
Joint Ventures, Strategic Alliances & Special Purpose
Vehicles. The correlation analysis provides very good
guidelines on the way courses in this subject area could be
grouped and introduced in the PM curriculum.
In the Behavioural Sciences area, three subjects are
correlated to each other, namely Industrial/ Labour Relations,
Conflict Management and Diversity Management. So from the
point of view of the respondents, these subjects reflect some
common issues and concerns and there is a case for combining
these together to achieve an integrated approach to deal with8
these issues and concerns. The other courses may be taught
independently.
The correlation analysis results provide a useful way of
structuring courses in IT area in the PM curriculum. For
instance, ERP and e – Business Applications courses could be
combined into a single course. Similarly Specialized
Engineering Software and Common Software such as Excel, SPSS,
DBMS could also be structured as a single course, in case
there is difficulty in offering these as separate courses.
Only Project Management Software needs to be taught as a
separate course.
Majority of the sample felt that resources were generally
easily available in the institutes in terms of library, course
materials, classrooms, laboratories, computer labs, qualified
faculty and availability of research facilities. The
respondents also strongly endorsed the existence of management
vision to support PM endeavours. It takes on average about a
year to build the necessary physical resources. On average,
the faculty recruitment and training process takes 14.7
months. The research involvement of the institutions is found
to be quite low and only about 20% institutions reported
funded research.
Chapter 5 presents findings of the survey of practicing
executives from leading project based organisations in India.
The respondents offered their responses on a variety of issues
such as their first systematic exposure to PM training, the
9
ideal PM curricula, from their perspective, the gains from PM
training and the factors that they consider important to
improve PM training at graduate level. Majority of the
practising executives responding to the questionnaire were
from the middle management cadre, from technical institutions
with no prior exposure to PM training. Most of these were
working on projects with value between 200–300 crores using
very elementary PM techniques such as PERT/CPM.
It is interesting to note that ratings assigned to practically
all the subjects in the Management and Technology area by
executives are higher than the corresponding ratings assigned
by the institutions. The courses rated as ‘extremely
important’ include Planning, Scheduling, Monitoring and
Control Techniques; Project Quality Management; Health, Safety
and Environment Management; Cost Estimation and Budgeting;
Quantity Surveying and Estimation; Project Site and Equipment
Management; Project Procurement and Materials Management;
Contract Management. Furthermore, some courses are considered
far more important by executives compared to the institutions.
These are : Contract Management; Project Procurement and
Materials Management; Quantity Surveying and Estimation; Cost
Estimation and Budgeting; Health, Safety and Environment
Management. One possible explanation is that these courses
have a strong ‘execution’ and ‘practical’ bias. Naturally
executives seem to realize their importance far more than the
institutions.
10
In the Behavioural Sciences area, the overall ratings for all
subjects in the area averaged ‘Very Important’, except for
Managerial Skills subject rated ‘extremely important’. This
subject is rated much higher by the executives, while the
other subject ratings in this area are comparable to those
assigned by the institutions. In the IT area, PM Software, ERP
and Excel/DBMS/SPSS are rated ‘extremely important’ and the
other subjects are rated ‘very important’. The ratings
assigned to these subjects are very comparable to those
assigned by institutions, although executives have assigned
slightly lower ratings to Engg Software.
The coverage of all the specific sectors is considered ‘very
important’ by the executives. Sectors like Roadways, Railways,
Urban Infrastructure, Civil Aviation and Mega Property
Developments are considered relatively more important than
others. Chemical Engineering and Defence sectors have
received relatively lower ratings. The executives’ ratings are
generally similar to the institutions’ ratings. However the
executives have assigned somewhat higher ratings to the
Technology, Roadways, Railways, Civil Aviation, Urban
Infrastructure sectors.
In terms of gains derived in developing a better strategic
overview of projects, PM training
‘helped immensely’ in the area of Work Breakdown Structure and
Responsibility Mapping. At the direct project level, training
‘helped immensely’ in Project Planning, Scheduling, Monitoring
and Control. Training ‘helped substantially’ in other areas11
including Contract Management, Costing, HSE, Quality
Management and Communication Skills. The gains derived in
Project Planning, Scheduling, Monitoring and Control are
particularly noteworthy. Thus the executives affirmed that
training has helped them to acquire an integrated view of the
project, role clarity, understand work breakdown structures
and responsibility mapping on projects, and envision the exact
fit of a project in the overall corporate strategy.
In individual career enhancement, executives saw improvement
on two factors, namely improved decision making ability and
improved understanding of human related factors i.e.
interpersonal relations and conflict resolution. Some
experienced higher responsibility coming their way after
completion of PM training. On the whole there appear to be
significant gains in terms of the enrichment and enlargement
aspects of the job. The executives shed light on their
perception of the factors they consider important for the
growth of PM education in India. According to them, the most
important factors inhibiting growth of PM education, in order
of priority are i) the lack of awareness amongst the students
and educators about PM, ii) lack of trained instructors at the
undergraduate and post graduate level and iii) being a
practical field PM cannot be taught in the classroom, iv)
mastery comes only from practical experience and v) prior
knowledge is not a prerequisite for working in this field.
Chapter 6 presents findings of the in depth survey of twenty
Human Resource (HR) managers of leading project based12
organisations on issues such as; the training design, types of
PM training, costs of training, factors affecting PM training,
cadres to whom PM training is to be imparted, and training
efficacy. The HR managers chosen had substantial exposure and
expertise in conceiving, designing and organising PM related
training for executives within their organisations. On the
average, most of the companies have taken steps to initiate PM
training in the past five years. The companies generally
prefer to deploy employees in the managerial cadre for
training. Within this section of employees, the most
frequently chosen are the middle and senior managers for
receiving PM training. The important objective in organising
PM training is to prepare the executives with key skills in
planning, controlling, execution, contracts and such other
areas that would enable them to contribute directly to project
success.
For deputing executives for training, the companies are found
to particularly emphasize the following factors: perceived
gains from PM training, employee retention, career
development, ability to execute complex projects, ability to
monitor and control projects, ability to plan projects,
ability to manage contracts in projects, ability to deliver
projects in right time, costs and quality. Thus project
planning, monitoring & control; execution of complex projects
and employee retention & career development emerge as the key
areas for seeking training inputs.
13
‘In house Training’, ‘On the Job Training’ and ‘On the Job
with Classroom Training’ are the most preferred methods of
training. Given that both skills and knowledge are key
components of competencies, training must clearly aim at
improving skills and knowledge base of executives. The
training levels most preferred for various grades of
executives are: elementary for Operatives, basic for
Supervisory, Advanced for Middle level managers, Strategic for
Senior Level executives. These findings highlight a planned
approach for PM training. Overall the perception amongst the
HR managers is that PM training is quite expensive on various
counts such as trainees’ salaries and time, materials for
training, expenses for trainers, expenses for trainees,
facilities and equipment, lost productivity. However HR
managers do not mind the loss of productivity of executives
during their absence, which they feel will be more than
compensated by the large scale benefits expected from
training.
HR managers view training to be ‘quite benefitial’ on all the
factors considered including : increase in production/
performance, reduction in errors and improvement of safety
standards, employee retention, lesser supervision, ability to
use new skills and capabilities, improved delivery
performance, attitude changes, and growth of business
oportunities. HR managers strongly endorse the benefits
derived from Attitude changes. One factor - Increase in
production / performance, is not viewed as benefitial as other
14
factors. One interpreation is that they look for direct
benefits from training in ‘process improvement’ rather than
‘output improvement’.
Certified franchisee trainers are considered most efficacious
training providers, followed by internationally certified
trainers, independent trainers and academic institutions. This
may be attributed to the flexibility and highly focussed
approach of these trainers. However HR managers highly value
the highly qualified faculty, specialised competence, research
experience, reasonable cost of academic institutions, which
they believe are a great advantage for developing good
training content, even though they may not be able to deliver
highly custom designed training.. The most frequent academic
institutions for PM related training appear to be the
management institutions together as group, followed by in
house trainers and NICMAR. Considering that NICMAR is a single
entity, its share of 11.43% in PM training is most enviable by
comparable industry standards. It is reassuring to know that
the HR managers consider international accreditation to be of
value. But the managers may not be fully aware of the benefits
of international accreditation with respect to their
organisation.
Chapter 7 presents the results of the factor analysis. The
analysis reveals that only 6 subjects (factors) included in
the Management and Technology Area namely (i) Operations
Management for Projects, (ii) Planning/ Scheduling/ Monitoring
and Control Techniques, (iii) Statistical Methods for Project15
Analysis, (iv) Operations Research for Projects, (v) Project
Quality Management, (vi) Health Safety and Environment in
Projects account for the highest proportion of the subjects
(factors) that are absolutely essential to be included in PM
curricula (i.e. 74%). The correlation analysis carried out
earlier helped establish that Operation management and
Operations Research, Quality Management and HSE are strongly
correlated. Therefore in effect, only four subject areas,
suitably combined account for the courses that are ‘absolutely
essential’.
Alternatively this means that the balance 25 subjects account
for only a small fraction of the total PM curricula (26%).
Therefore for the sake of simplification, this can be
interpreted to mean that the top six subjects (four combined)
that emerge from the analysis of academic institutions, are
considered most crucial for inclusion in PM curriculum by the
academics. Similar results are found in other subject areas
also.
An intriguing fact is that only a limited number of subjects
(factors) continue to describe the whole scope of PM curricula
amongst academics in institutions. This could be attributed to
Indian institutions being in the early development stages of
PM. It may also imply that except in the well recognized
Management and Technology Area, in which the above subjects
have been grouped, other subject Areas (and individual
subjects contained therein) such as Behavioural Sciences and
IT, are not yet considered pivotal to PM education in the16
Indian technical and management education system. Viewed with
the actual ratings awarded by the respondents to the Strategy,
Economics and Finance Area, it shows that almost the whole
sample has rated subjects in this Area as ‘Extremely
Important’ and ‘Very Important’.
Multiple regression analysis suggests that the three types of
institutions wherein PM education is essential are Technical,
Management, and Planning & Design. The remaining two namely
architectural institutions and infrastructure management
institutions were not explained by the available data and may
require some other data. Generally Architectural institutions,
barring a few exceptions, are not known to emphasize PM in
their curriculum. Similarly there is probably lack of critical
mass of institutions in infrastructure management capable of
providing full fledged, comprehensive curriculum with enough
emphasis on PM.
The infrastructure related to library, availability of course
material, classrooms and qualified faculty are found to be
important variables in imparting PM education although these
factors alone are not enough. This means that some other
factors are required to explain the relationship of PM
education and the institutes’ infrastructure. Majority of the
institutions were AICTE, university affiliated and accredited
institutions. They are bound by the structured processes of
approval which may take protracted periods of time from
government agencies in the form of receiving sanctions to
introduce courses. Therefore the type of the infrastructure17
currently prevailing is more dictated by the regulatory
requirements rather than the targeted requirements of PM
education.
Further multiple regression analysis suggests that two other
factors namely introduction of PM courses and effect on
employability are also having some impact on the rating of PM
education in India. Thus the type of institutions, the
availability of infrastructure, management support in
introduction of PM courses and employability of graduates
emerge as significant factors impacting the PM education in
India.
In summary, we find that there is a supply gap in capacity for
PM training in the country. The causes can be attributed to
the disinclination of technical and business academic
institutions to introduce and attract students exclusively in
the area of PM. Only a handful of elite institutions in India
appear to have taken concerted steps in this direction.
Executives working in project based companies enter with
little or no prior orientation of project requirements that
are special to project environments. Thus training them to be
‘project ready’ is an imperative for project based
organisations. HR managers are charged with the responsibility
of designing training modules that would bring direct gains to
the project and companies. Currently the options to choose
experts are relatively less and therefore the training costs
are high. Only limited cohorts of ‘project ready’ personnel
available adversely affect the ability of the organisations to18
deliver consistently on projects. This affects the projects
industry as a whole and ultimately the national economy.
Chapter 8 concludes the study by identifying the barriers to
the growth of PM education. The main barriers are; i) the lack
of awareness amongst managements of technical and business
management institutions about the importance and relevance of
teaching PM, ii) lack of systematic curriculum development
with a focussed view to develop PM competencies, iii) low
interest in researching PM related subjects amongst faculty,
iv) lack of trained instructors, v) long winding procedures
for regulatory approvals for introducing approving PM courses,
vi) provision of qualified faculty and infrastructure and vii)
the costs of training that have to be borne by organisations.
Finally we make some recommendations to ensure a more
sustained growth of PM education in India. Concerted efforts
in the area of curriculum development, research, creation of
awareness regarding the application of PM techniques to the
project business are recommended, even resorting to mass media
support. Sustained advocacy at all levels of government is
also strongly recommended. In conclusion we propose some Model
Curricula for PM education and training in technical and
business management institutions as well as for executives in
project based organisations.
19
CONTENTSSr.No.
TOPIC PageNo.
A Acknowledgements 2B Executive Summary 3
Chapter 1 - Introduction1.1 The Government Imperative 161.2 Key Questions raised in the Study 191.3 The Private Sector Imperative in PM 201.4 Key India Level Statistics Of Project
Announcements By Indian Corporations21
1.5 Initiatives of Indian Government and 2320

Industry, in the Promulgation of PMEducation
Chapter 2 - Literature Review of Project Management educationon a global scale
2.1 Introduction 252.2 PM Education in America and Europe 272.3 PM In Academia – A Global Snapshot 282.3.1 PM in other European Countries 282.4 Indian PM Growth 292.4.1 Specific Cases in India 31a) Indian Institutes of Management, MBA
Institutions, Engineering Colleges31
b) National Institute of ConstructionManagement and Research
32
c) Symbiosis Institute of OperationsManagement
32
d) National Institute of Technology andIndustrial Engineering
32
2.5 PM in Research 332.5.1 PM Research in India 352.6 PM in Industry 362.6.1 Training and Development Expenditure in
Indian Projects Industry – A Bird’s EyeView
37
2.7 India and China: Comparison of PMEducation
40
Chapter 3 - Research Design3.1 Basic Approach to the Study 423.2 Objectives of the Study 423.3 Scope of the Study 433.4 Hypotheses 433.5 Methodology 443.6 Academic Institutions 45a) Sources of Data 45b) Data Collection Instrument - Schedules
(Questionnaires)45
c) Data Collection Method - Direct InterviewMethod
45
d) Sampling Procedure 46d.1) Sampling Area 46
21

d.2) Sample Size 46d.3) Sample Unit 46d.4) Sampling Technique 46e) Statistical Tools and Techniques 46f) Analytical Software 46g) Multiple Regression Model 47
3.7 Practicing Executives of Project BasedCompanies
48
a) Sources of Data 48b) Data Collection Method – Indirect Method 48c) Data Collection Instrument 48d) Sampling Procedure 48
d.1) Sampling Area 49d.2) Sample Size 49d.3) Sample Unit 49e) Statistical Tools and Techniques 49f) Analytical Software 493.8 Human Resource Managers of Project- Based
Companies49
a) Sources of Data 49b) Data Collection Method 49c) Data Collection Instrument 50d) Sampling Procedure 50
d.1) Sampling Area 50d.2) Sample Size 50d.3) Sample Unit 50e) Statistical Tools and Techniques 50f) Analytical Software 50
Chapter 4 - Data Analysis of Survey of Technical and BusinessInstitutions in India
4.1 Introduction 524.2 PART I : Respondent’s Particulars And
Details53
4.3 PART II: General Opinion On Existing StateOf PM Education In India
55
4.4 Part III: Curriculum Development 614.5 PART IV – Infrastructure, Management
Support, Regulatory Factors And CurrentStatus Of PM Research In Institute
74
Chapter 5 - Data Analysis Of Survey Of Working Executives
22
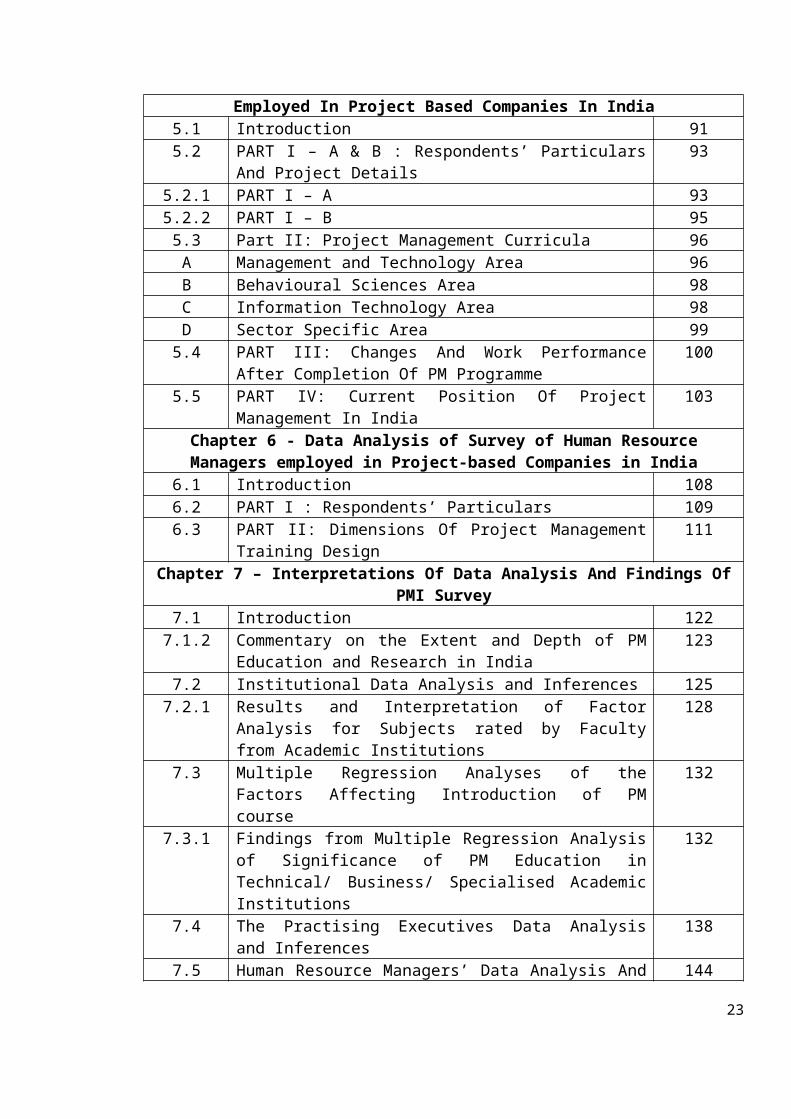
Employed In Project Based Companies In India5.1 Introduction 915.2 PART I – A & B : Respondents’ Particulars
And Project Details93
5.2.1 PART I – A 935.2.2 PART I – B 955.3 Part II: Project Management Curricula 96A Management and Technology Area 96B Behavioural Sciences Area 98C Information Technology Area 98D Sector Specific Area 995.4 PART III: Changes And Work Performance
After Completion Of PM Programme100
5.5 PART IV: Current Position Of ProjectManagement In India
103
Chapter 6 - Data Analysis of Survey of Human ResourceManagers employed in Project-based Companies in India
6.1 Introduction 1086.2 PART I : Respondents’ Particulars 1096.3 PART II: Dimensions Of Project Management
Training Design111
Chapter 7 – Interpretations Of Data Analysis And Findings OfPMI Survey
7.1 Introduction 1227.1.2 Commentary on the Extent and Depth of PM
Education and Research in India123
7.2 Institutional Data Analysis and Inferences 1257.2.1 Results and Interpretation of Factor
Analysis for Subjects rated by Facultyfrom Academic Institutions
128
7.3 Multiple Regression Analyses of theFactors Affecting Introduction of PMcourse
132
7.3.1 Findings from Multiple Regression Analysisof Significance of PM Education inTechnical/ Business/ Specialised AcademicInstitutions
132
7.4 The Practising Executives Data Analysisand Inferences
138
7.5 Human Resource Managers’ Data Analysis And 144
23
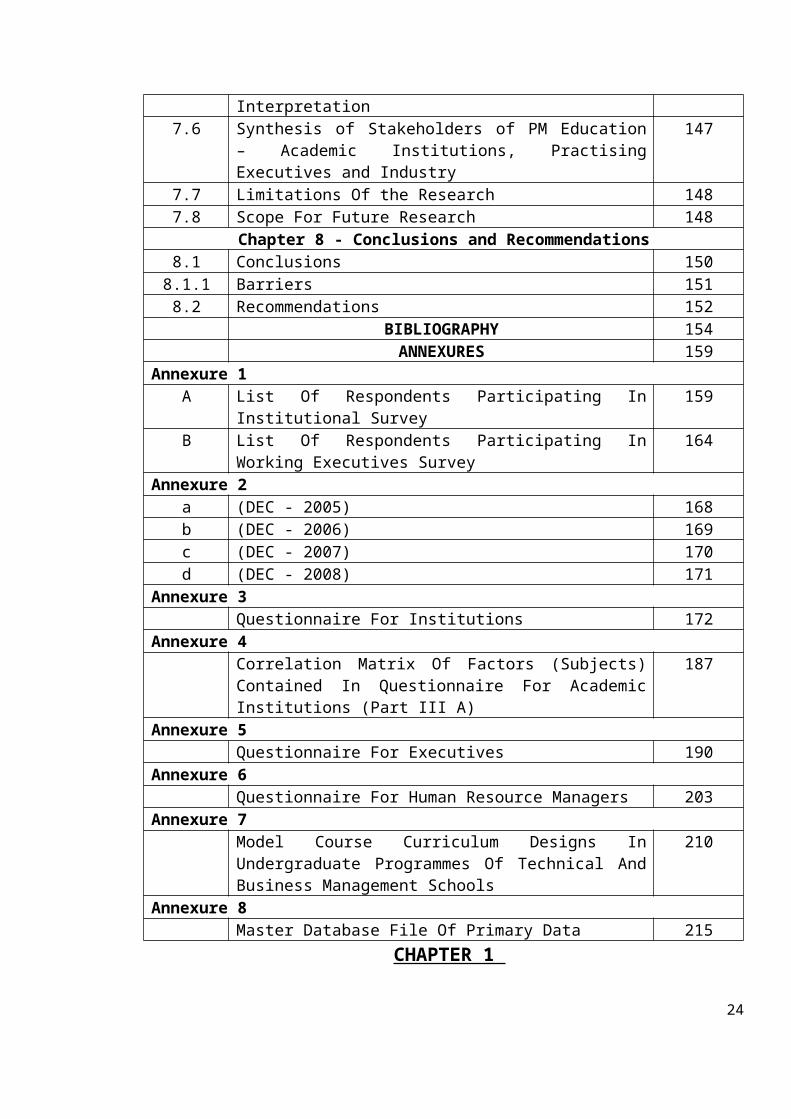
Interpretation7.6 Synthesis of Stakeholders of PM Education
– Academic Institutions, PractisingExecutives and Industry
147
7.7 Limitations Of the Research 1487.8 Scope For Future Research 148
Chapter 8 - Conclusions and Recommendations8.1 Conclusions 1508.1.1 Barriers 1518.2 Recommendations 152
BIBLIOGRAPHY 154ANNEXURES 159
Annexure 1A List Of Respondents Participating In
Institutional Survey159
B List Of Respondents Participating InWorking Executives Survey
164
Annexure 2a (DEC - 2005) 168b (DEC - 2006) 169c (DEC - 2007) 170d (DEC - 2008) 171
Annexure 3Questionnaire For Institutions 172
Annexure 4Correlation Matrix Of Factors (Subjects)Contained In Questionnaire For AcademicInstitutions (Part III A)
187
Annexure 5Questionnaire For Executives 190
Annexure 6Questionnaire For Human Resource Managers 203
Annexure 7Model Course Curriculum Designs InUndergraduate Programmes Of Technical AndBusiness Management Schools
210
Annexure 8Master Database File Of Primary Data 215
CHAPTER 1
24

INTRODUCTION
1.1 The Government Imperative
The promulgation of Project Management education in India has
assumed great significance considering the position in which
India finds herself in this millennium. From the pursuit of
economic liberalization, aligning with the global economy, and
embarking on ambitious projects with the help of
privatisation, India is committed to fulfil the economic
growth targets, fast and furiously. This is seen in the launch
of mega and major projects by the Central Government
departments to cover the historical gap between what is
available and what is required. In addition, the State
Governments and Local Government agencies too, have been given
project targets in order to improve infrastructure and aid
development under various programmes such as Bharat Nirman
Scheme. The estimated investment plan for infrastructure
development stands at $ 514 billion during the Eleventh Plan.
This is more than twice that of $ 217.86 billion allocated
during the Tenth Plan. In the Twelfth Five Year Plan (2012-
2017), it is slated to rise to $ One Trillion (www.
planningcommission.nic.in/plans).
The country faces a challenge in bridging the existing
infrastructure gaps, imperative to maintain the economic
growth rate of around 9%. India plans to increase the gross
capital formation in infrastructure from 5% of its Gross
25
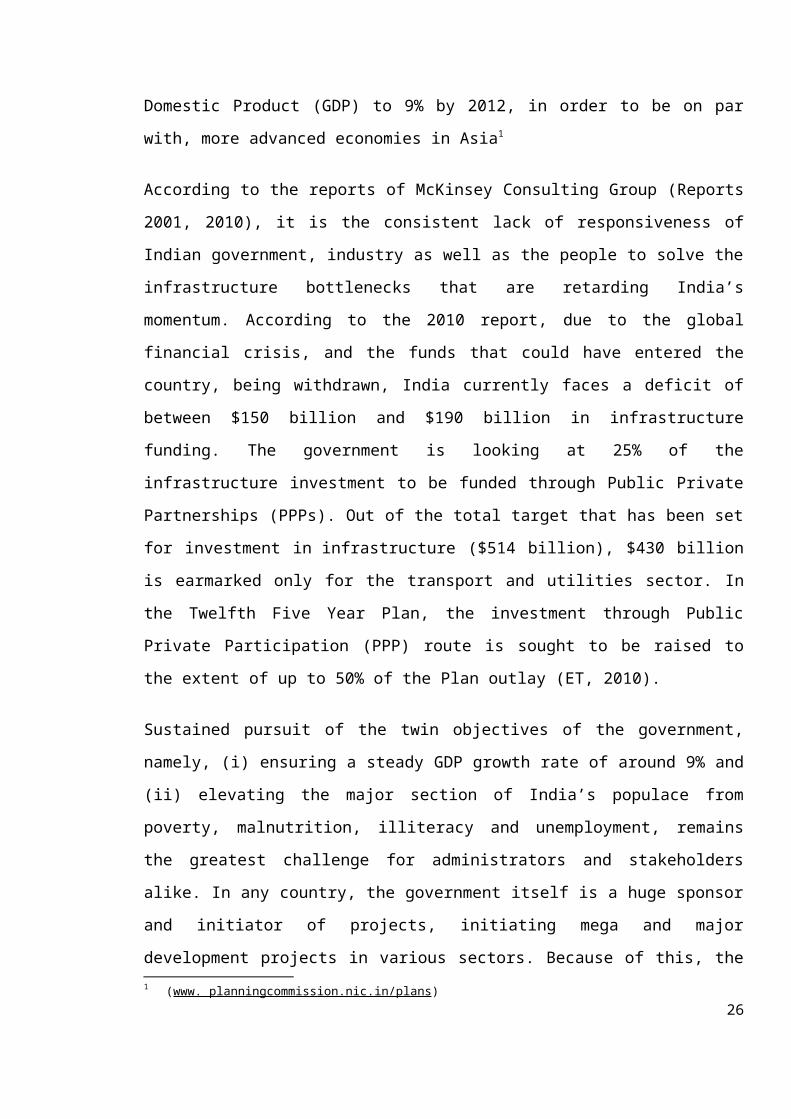
Domestic Product (GDP) to 9% by 2012, in order to be on par
with, more advanced economies in Asia1
According to the reports of McKinsey Consulting Group (Reports
2001, 2010), it is the consistent lack of responsiveness of
Indian government, industry as well as the people to solve the
infrastructure bottlenecks that are retarding India’s
momentum. According to the 2010 report, due to the global
financial crisis, and the funds that could have entered the
country, being withdrawn, India currently faces a deficit of
between $150 billion and $190 billion in infrastructure
funding. The government is looking at 25% of the
infrastructure investment to be funded through Public Private
Partnerships (PPPs). Out of the total target that has been set
for investment in infrastructure ($514 billion), $430 billion
is earmarked only for the transport and utilities sector. In
the Twelfth Five Year Plan, the investment through Public
Private Participation (PPP) route is sought to be raised to
the extent of up to 50% of the Plan outlay (ET, 2010).
Sustained pursuit of the twin objectives of the government,
namely, (i) ensuring a steady GDP growth rate of around 9% and
(ii) elevating the major section of India’s populace from
poverty, malnutrition, illiteracy and unemployment, remains
the greatest challenge for administrators and stakeholders
alike. In any country, the government itself is a huge sponsor
and initiator of projects, initiating mega and major
development projects in various sectors. Because of this, the1 (www. planningcommission.nic.in/plans)
26
government too assumes the role of a key stakeholder (owner)
and therefore is affected by any project related problems and
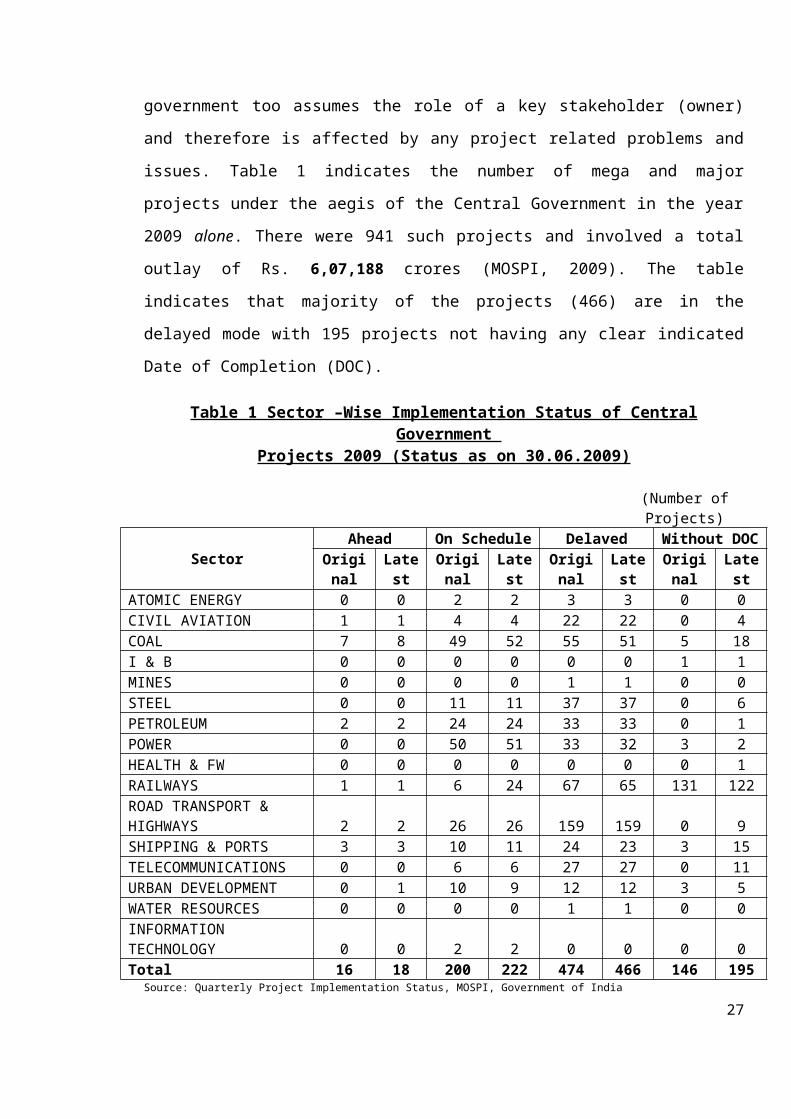
issues. Table 1 indicates the number of mega and major
projects under the aegis of the Central Government in the year
2009 alone. There were 941 such projects and involved a total
outlay of Rs. 6,07,188 crores (MOSPI, 2009). The table
indicates that majority of the projects (466) are in the
delayed mode with 195 projects not having any clear indicated
Date of Completion (DOC).
Table 1 Sector –Wise Implementation Status of CentralGovernment
Projects 2009 (Status as on 30.06.2009)
(Number ofProjects)
SectorAhead On Schedule Delaved Without DOC
Original
Latest
Original
Latest
Original
Latest
Original
Latest
ATOMIC ENERGY 0 0 2 2 3 3 0 0CIVIL AVIATION 1 1 4 4 22 22 0 4COAL 7 8 49 52 55 51 5 18I & B 0 0 0 0 0 0 1 1MINES 0 0 0 0 1 1 0 0STEEL 0 0 11 11 37 37 0 6PETROLEUM 2 2 24 24 33 33 0 1POWER 0 0 50 51 33 32 3 2HEALTH & FW 0 0 0 0 0 0 0 1RAILWAYS 1 1 6 24 67 65 131 122ROAD TRANSPORT & HIGHWAYS 2 2 26 26 159 159 0 9SHIPPING & PORTS 3 3 10 11 24 23 3 15TELECOMMUNICATIONS 0 0 6 6 27 27 0 11URBAN DEVELOPMENT 0 1 10 9 12 12 3 5WATER RESOURCES 0 0 0 0 1 1 0 0INFORMATION TECHNOLOGY 0 0 2 2 0 0 0 0Total 16 18 200 222 474 466 146 195
Source: Quarterly Project Implementation Status, MOSPI, Government of India
27
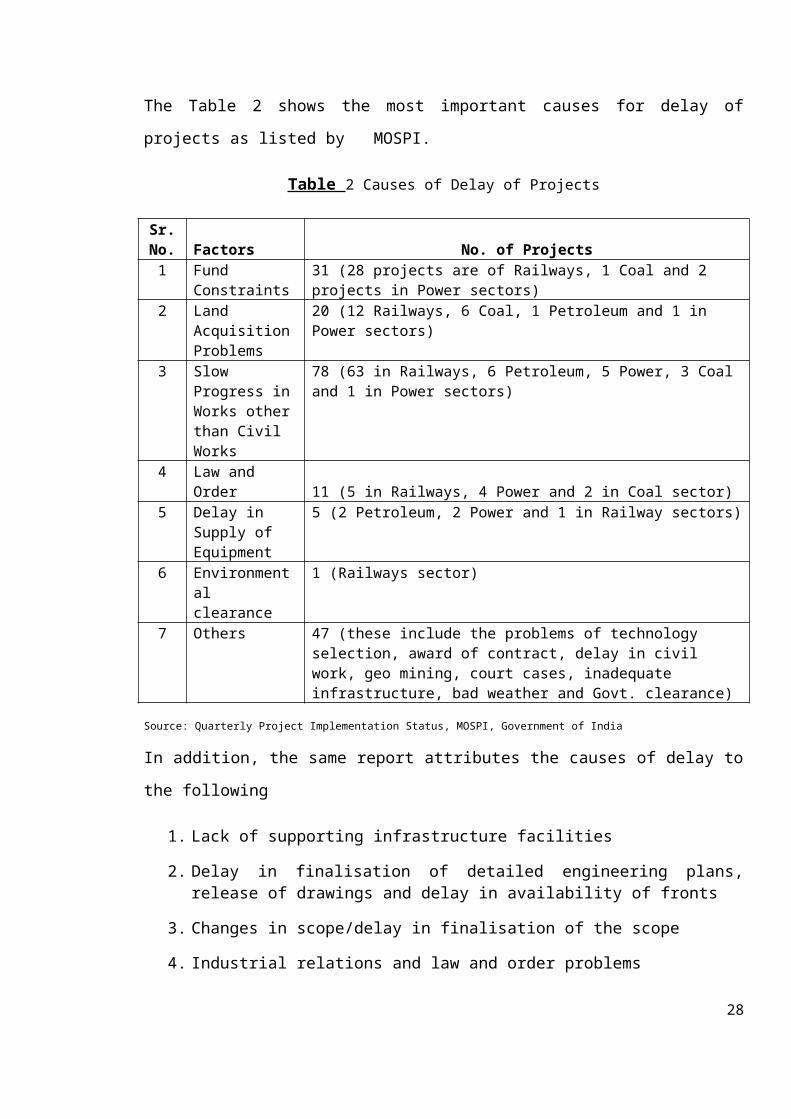
The Table 2 shows the most important causes for delay of
projects as listed by MOSPI.
Table 2 Causes of Delay of Projects
Sr.No. Factors No. of Projects1 Fund
Constraints31 (28 projects are of Railways, 1 Coal and 2 projects in Power sectors)
2 Land AcquisitionProblems
20 (12 Railways, 6 Coal, 1 Petroleum and 1 in Power sectors)
3 Slow Progress inWorks otherthan Civil Works
78 (63 in Railways, 6 Petroleum, 5 Power, 3 Coal and 1 in Power sectors)
4 Law and Order 11 (5 in Railways, 4 Power and 2 in Coal sector)
5 Delay in Supply of Equipment
5 (2 Petroleum, 2 Power and 1 in Railway sectors)
6 Environmental clearance
1 (Railways sector)
7 Others 47 (these include the problems of technology selection, award of contract, delay in civil work, geo mining, court cases, inadequate infrastructure, bad weather and Govt. clearance)
Source: Quarterly Project Implementation Status, MOSPI, Government of India
In addition, the same report attributes the causes of delay to
the following
1. Lack of supporting infrastructure facilities
2. Delay in finalisation of detailed engineering plans,release of drawings and delay in availability of fronts
3. Changes in scope/delay in finalisation of the scope
4. Industrial relations and law and order problems
28

5. Delay and uncertainty in feedstock supply
6. Pre commissioning teething troubles
7. Technology problems
8. Geological surprises
The severity of the lack of project management expertise is
now being felt at the highest level of governance in India.
The Ministry of Statistics and Programme Implementation
( MOSPI ) has felt a strong need to introduce a full time MBA
type programme in Project Management. The National Institute
of Construction Management and Research (NICMAR), has had the
longest running pioneering Post Graduate Programme in Advanced
Construction Management (focussing on construction project
management) in the country. This was followed by another
pioneering two year full time Post Graduate Programme in
Project Engineering and Management for all types of mega and
major projects and their management. The Institute has further
innovated and introduced another two year Post Graduate
Programme, the first of its kind in the country, in the field
of Real Estate and Urban Infrastructure Management. Another
programme, the two year full time Post Graduate Programme in
Infrastructure Finance, Development and Management is due to
be launched from the next academic session in 2011. This
programme too devotes substantial attention to managing
projects in these sectors.
1.2 Key Questions Raised In The Study
29

In view of the burning intensity of this problem, the key
questions that are sought to be investigated and reported in
this study relate to the factors that are affecting the growth
of PM education and training in our country. The study
specifically aims to explore issues from the perspectives of
academic institutions, industry users and industry sponsors of
executive training and development. For instance, we would
like to know :
At present what is the role that educational institutions
are playing in the technical and business education domains
to create capacity?
How is the industry overcoming the problem of skills and
competency deficiency in PM?
To what extent the recipients of PM training and education
find it useful and are able to apply their skills and
knowledge in the real world of managing and executing
projects?
Further, do we have adequate human resources to undertake
and see a series of mega projects through? Is the PM human
resource base expanding?
Is research in PM adequate and of the kind that would help
the industry? Is it solutions driven? Is it helping the
creation of theoretical precepts and is it integrative in
its nature?
30
Globally the demand for Project Management professionals is
increasing and as a result there is a growing interest as well
as availability of PM education at all levels i.e.
undergraduate, postgraduate, advanced / doctoral level
programmes with developed regions like North America, Europe,
Australia and some advanced nations in Asia leading the race
(Turner & Heumann, 2001). The maximum growth in project
management education in the near future is foreseen in the
world’s two most significant countries, namely India and
China, with the objectives of both countries being the same,
i.e. to alleviate poverty through economic development. More
discussion on China’s efforts in spreading PM education is
contained in the next chapter of the report.
1.3 The Private Sector Imperative In PM
A hypothesis may be offered, that the Private Sector has a
better track record in building PM competency as against
Public Sector enterprises, as the former are often contractors
to many governmental projects, face intense competitive
pressure arising out of tight bidding frameworks like ‘lowest
bid’ acceptance criteria, etc. and therefore would require use
of latest and best techniques of managing and completing
projects on time and within the stipulated costs and quality
parameters, to ensure better project returns. Also of
importance is the industry’s desire to be awarded projects
that would fetch them high value and high visibility while
conceptualising and executing complex projects. Inevitably
this would be achieved only under conditions wherein the31
companies have developed prior capabilities in bidding and
executing such complex projects. Therefore it was felt
relevant to study the extent of the effort taken by these
industries in preparing the personnel and staff through
training to meet the above challenges and narrow the existing
competency gaps.
The economic growth model adopted by the Indian government
involves greater use of Public Private Participation in
infrastructure and other development projects, which has
resulted in Build, Operate and Transfer (BOT) model and other
variants such as Build, Own, Operate, Transfer, (BOOT); Build,
Own, Lease, Transfer (BOLT); or Build, Own, Operate and
Maintain (BOOM) being increasingly adopted to award projects
to companies. Such companies or ‘concessionaires’ therefore
find that adoption of superior project management techniques
is fundamental to their success. Any delays in project
completion could result in delayed revenue realisation for the
companies, resulting in future losses and hamper their
business opportunities. According to the Planning Commission’s
targets, public private infrastructure projects are being made
monitorable and achievement oriented, especially for sectors
like roads, power and ports. Thus the private sector views
project management skills as a necessity.
1.4 Key India Level Statistics Of Project Announcements By
Indian Corporations
32
Traditional industries credited with PM practices include:
construction, manufacturing, power and heavy engineering.
Added to these are the IT/ITES/ Telecom companies and service
sector companies. Besides a significant number of large social
development oriented schemes of Government such as in health,
nutrition, family welfare, rural employment, etc. are
implemented through Project / Programme mode. In order to find
out the overall “projects” activity of Indian companies in the
public and private sector, the CMIE database was used. The
Centre for Monitoring of Indian Economy – Capex Data, (CMIE-
Capex) is an authentic information database which catalogues
industry information of Indian companies obtained largely
through companies’ financial reporting. In the basic search
conducted to list the total number of projects announced by
Indian companies in the year 2010, it was revealed that a
total of 16,145, projects had been listed in different stages
of development, viz. 1) announcement stage, 2) under
implementation, or 3) stalled for some reason. Data for 385
projects was ‘Not Available’, though the project name and
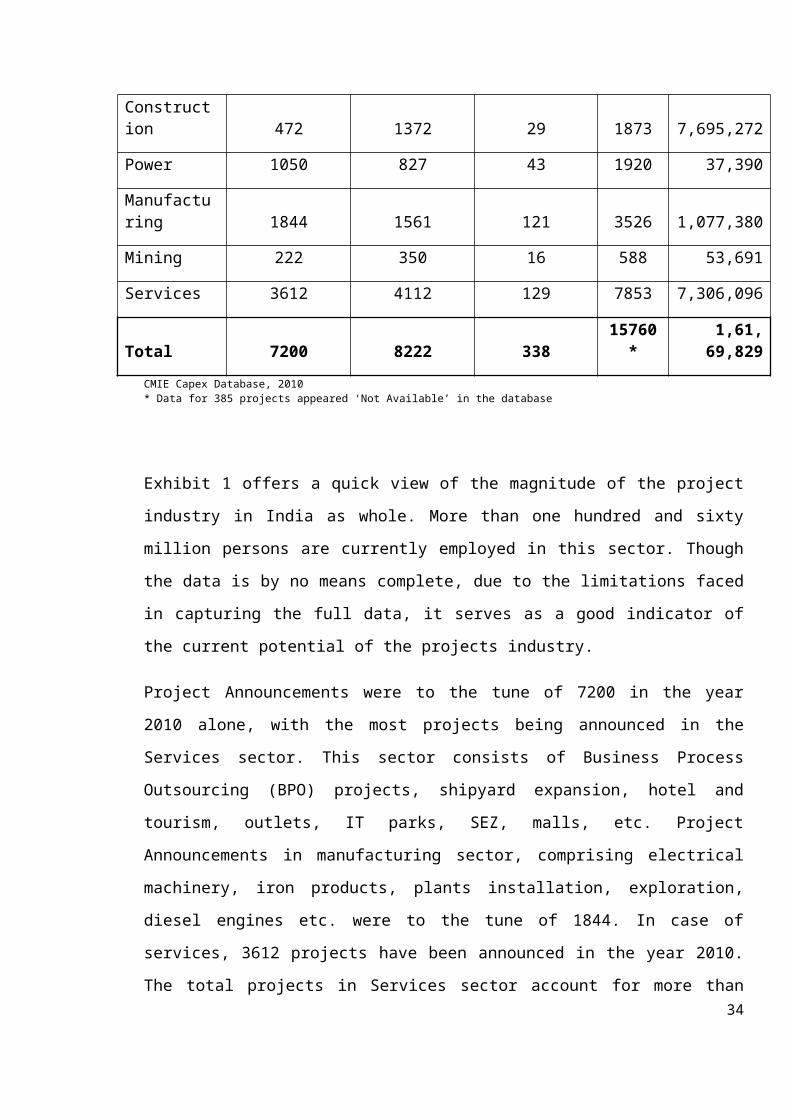
company were listed. Refer Exhibit 1.
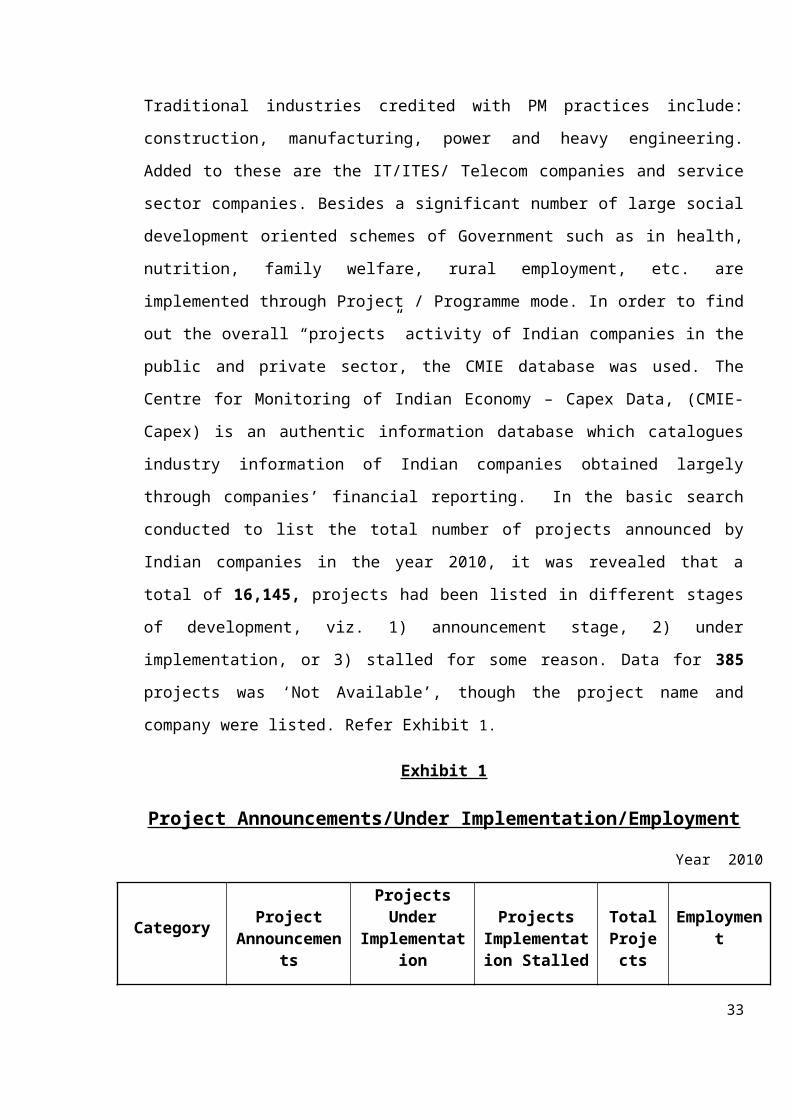
Exhibit 1
Project Announcements/Under Implementation/Employment
Year 2010
Category ProjectAnnouncemen
ts
ProjectsUnder
Implementation
ProjectsImplementation Stalled
TotalProjects
Employment
33
Construction 472 1372 29 1873 7,695,272
Power 1050 827 43 1920 37,390
Manufacturing 1844 1561 121 3526 1,077,380
Mining 222 350 16 588 53,691
Services 3612 4112 129 7853 7,306,096
Total 7200 8222 33815760*
1,61,69,829
CMIE Capex Database, 2010 * Data for 385 projects appeared ‘Not Available’ in the database
Exhibit 1 offers a quick view of the magnitude of the project
industry in India as whole. More than one hundred and sixty
million persons are currently employed in this sector. Though
the data is by no means complete, due to the limitations faced
in capturing the full data, it serves as a good indicator of
the current potential of the projects industry.
Project Announcements were to the tune of 7200 in the year
2010 alone, with the most projects being announced in the
Services sector. This sector consists of Business Process
Outsourcing (BPO) projects, shipyard expansion, hotel and
tourism, outlets, IT parks, SEZ, malls, etc. Project
Announcements in manufacturing sector, comprising electrical
machinery, iron products, plants installation, exploration,
diesel engines etc. were to the tune of 1844. In case of
services, 3612 projects have been announced in the year 2010.
The total projects in Services sector account for more than34
50% of the projects announced. The second highest employment
is seen in this sector with 73, 06, 096 persons being employed
in Service sector projects. Power projects consist of
activities in the area of thermal power projects, transmission
lines, hydro electric, gas based, coal based, and renewable
power projects. Announcements in the year 2010 were as high as
1050. Construction projects included townships, residential,
industrial parks, SEZs construction, processing and logistics;
commercial, etc. Very few projects in construction were in the
‘stalled’ category. The employment generated in this sector is
the highest with almost 76, 95,272 persons employed. The
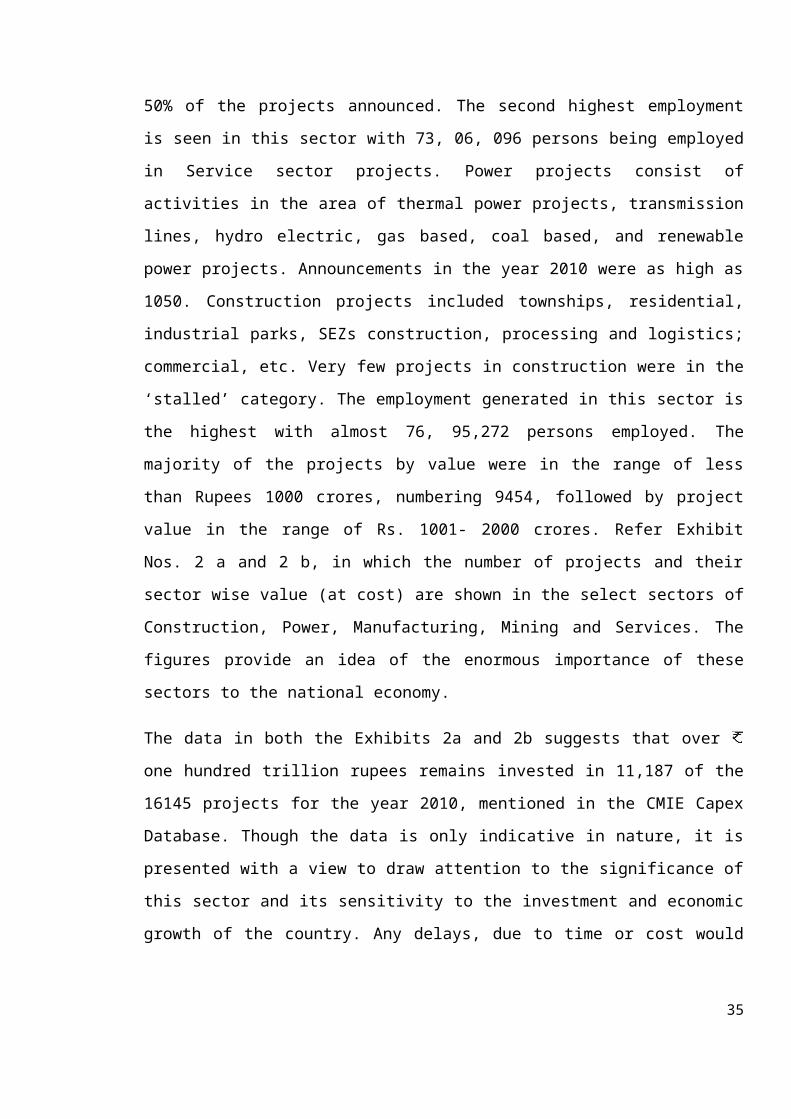
majority of the projects by value were in the range of less
than Rupees 1000 crores, numbering 9454, followed by project
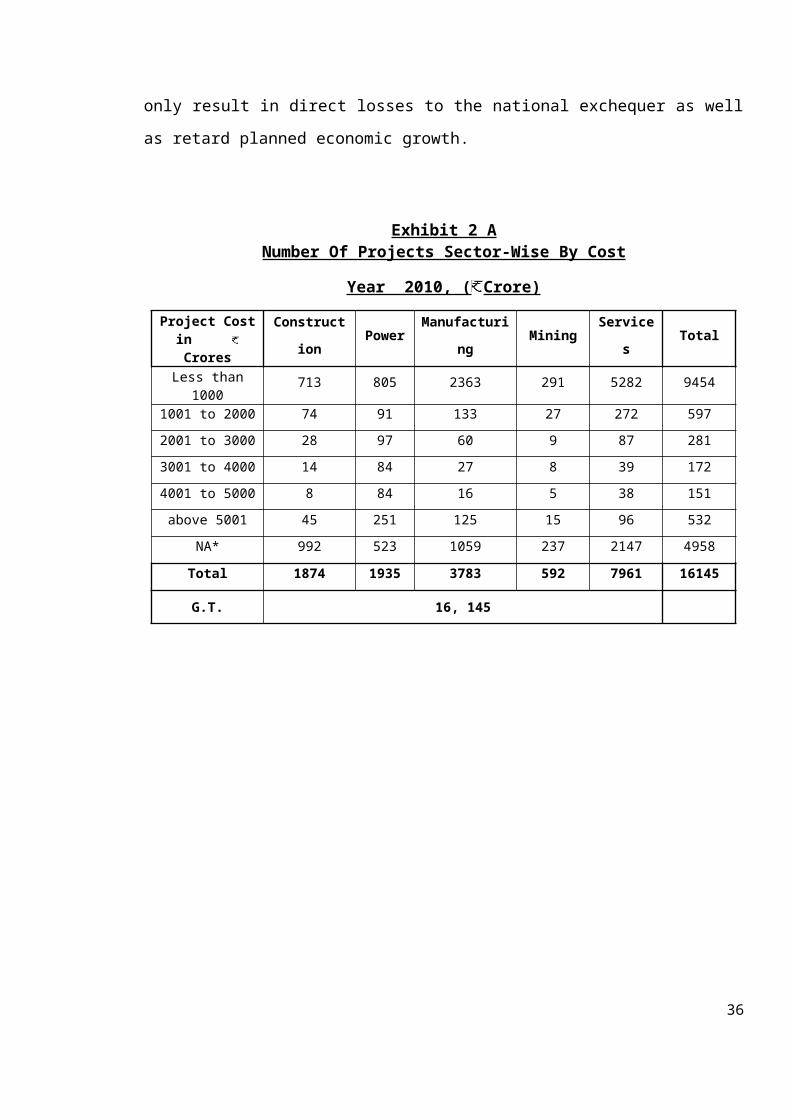
value in the range of Rs. 1001- 2000 crores. Refer Exhibit
Nos. 2 a and 2 b, in which the number of projects and their
sector wise value (at cost) are shown in the select sectors of
Construction, Power, Manufacturing, Mining and Services. The
figures provide an idea of the enormous importance of these
sectors to the national economy.
The data in both the Exhibits 2a and 2b suggests that over
one hundred trillion rupees remains invested in 11,187 of the
16145 projects for the year 2010, mentioned in the CMIE Capex
Database. Though the data is only indicative in nature, it is
presented with a view to draw attention to the significance of
this sector and its sensitivity to the investment and economic
growth of the country. Any delays, due to time or cost would
35
only result in direct losses to the national exchequer as well
as retard planned economic growth.
Exhibit 2 ANumber Of Projects Sector-Wise By Cost
Year 2010, ( Crore)
Project Costin Crores
Construct
ionPower
Manufacturi
ngMining
Service
sTotal
Less than1000
713 805 2363 291 5282 9454
1001 to 2000 74 91 133 27 272 5972001 to 3000 28 97 60 9 87 2813001 to 4000 14 84 27 8 39 1724001 to 5000 8 84 16 5 38 151above 5001 45 251 125 15 96 532
NA* 992 523 1059 237 2147 4958
Total 1874 1935 3783 592 7961 16145
G.T. 16, 145
36
CMIE Capex Database, 2010 *Data for 4958 projects appeared as ‘Not Available’
1.5 Initiatives Of Indian Government And Industry, In The
Promotion Of PM Education
A series of initiatives to promote PM education have been
undertaken by the government as well as industry, in the form
of individual company led initiatives, and/or industry
associations such as Project Management Institute®, (PMI®),
International Project Management Association® (IPMA®) and the
Federation of Indian Chambers of Commerce and Industry
37
Exhibit 2 bSector – wise Project by Value (at cost)
Year2010, Rs‘000 crs
CategoryConstruct
ion PowerManufacturi
ng Mining Services Total<
Rs.1000crs
1,91,915 1,63,251 3,93,963 61,643 7,53,092 15,63,863
Rs.1001to Rs.2000 crs
1,19,111 1,33,556 2,03,261 38,907 4,03,785 8,98,620
Rs.2001to
Rs3000crs
71,163 2,65,437.30 1,52,872 22,514 2,20,427 7,32,41
3
Rs.3001to Rs.4000 crs
50,916 2,74,151.74 98,531 27,611 1,38,370 5,89,58
1
Rs.4001to
Rs.5000crs
38,100 3,88,757.60 73,399 21,708 1,78,508 7,00,47
2
> Rs.5001 crs 6,93,172 26,26,67
1 18,47,308 1,93,014 12,28,236 65,88,4
02
Total 11,64,378 38,51,825 27,69,334 3,65,39
7 29,22,418 1,10,73,351
GrandTotal 2,21,46,703
(FICCI). All the entities mentioned are actively involved with
key government departments such as the Ministry of Statistics
and Programme Implementation, Government of India (MOSPI,
GoI), the Planning Commission of India, etc. to expedite the
efforts in training and education of PM practices. Recent
initiatives by the government include the expressed need by
MOSPI to organise certification level programmes for persons
working at lower and middle levels within the project
industry, as well as full time advanced project management
courses in leading institutions. The Planning Commission has
made project targets ‘monitorable’ to various ministries and
departments of the government, which are linked to the
performance and future fund disbursements to the latter.
Chapter 2, covers this is greater detail.
In order to accurately gauge the current and future efforts
made by stakeholders in the projects industry, a need was felt
to support the secondary data sources with primary studies
covering academic institutions, industry and the recipients of
PM education. In this chapter, the government’s desire and
seriousness to play an active role in ensuring the
contribution of the project sector in expediting national
development goals was sought to be described. The next chapter
takes a closer view of the efforts made by Indian stakeholders
and similar initiatives in other countries as well.
38

CHAPTER 2
LITERATURE REVIEW OF PROJECT MANAGEMENT EDUCATION ONA GLOBAL SCALE
2.1 Introduction
An indicator of the maturity of any profession is the
availability of quality academic programmes that provide the
advantages of research backed teaching and learning. The
greater the research, the better the replication and
standardisation of the process of learning so that Knowledge,
Skills and Attitude – the trinity of any learning are easily
transferred to the student in a systematic manner. This helps
the recipient of training to perform and deliver much faster
on the job.
39
With the rapid growth of ‘projectised’ and project led
companies, organizations are found to be replacing their
traditional management structures, like the corporate
divisional or departmental structures with those that are
leaner and more objective oriented (Bergrenn and Soderlund,
2008). Earlier works based on a survey, documented the
widespread growth of project management and its rising
interest amongst the top managements of companies (Soderlund,
2004). From being a mere ‘add-on’ to a system engineer’s or
civil engineer’s role, project management has grown as a
deliberate choice of career, in many countries. This is
reflected in the growth of the leading professional
association of project management – Project Management
Institute (PMI®), USA which had less than 15,000 members in
1993 has well over 500,000 members in 2010 (AMA Handbook 2005,
PMI, 2010). The AMA quotes that this membership is growing at
the rate of approximately 5000 per month indicating the
‘mainstreaming’ of the project manager’s role in the industry.
In formal bidding processes related to contractual services,
client organizations call for certified project professionals,
thus reaffirming project management’s growing importance as a
discipline.
Globally, apart from academic institutions, four major bodies
are engaged in the provision of standardised instruction in
project management namely PMI® in North America and other
countries, the Project Management Association in England
(PMA), with over 9000 certified project managers), the
40
International Project Management Association (IPMA)
representing over 24 countries in Europe and over 5000
certified project managers and lastly the Australian Institute
of Project Management with over 1000 certified project
managers (AMA Handbook, 2005). In 2010, according to the PMI®,
there were over 500,000 qualified Project Management
Professionals® (PMPs®), (PMI, 2010) worldwide. In 2004, a
large scale survey of around 1000 Registered Education
Providers (REPs) of PMI® worldwide revealed that in 2004 alone,
over 500,000 individuals participated in some form of PM
training or education offered by the REPs and other
educational institutions. The same report asserted that this
was slated to increase in the coming years.
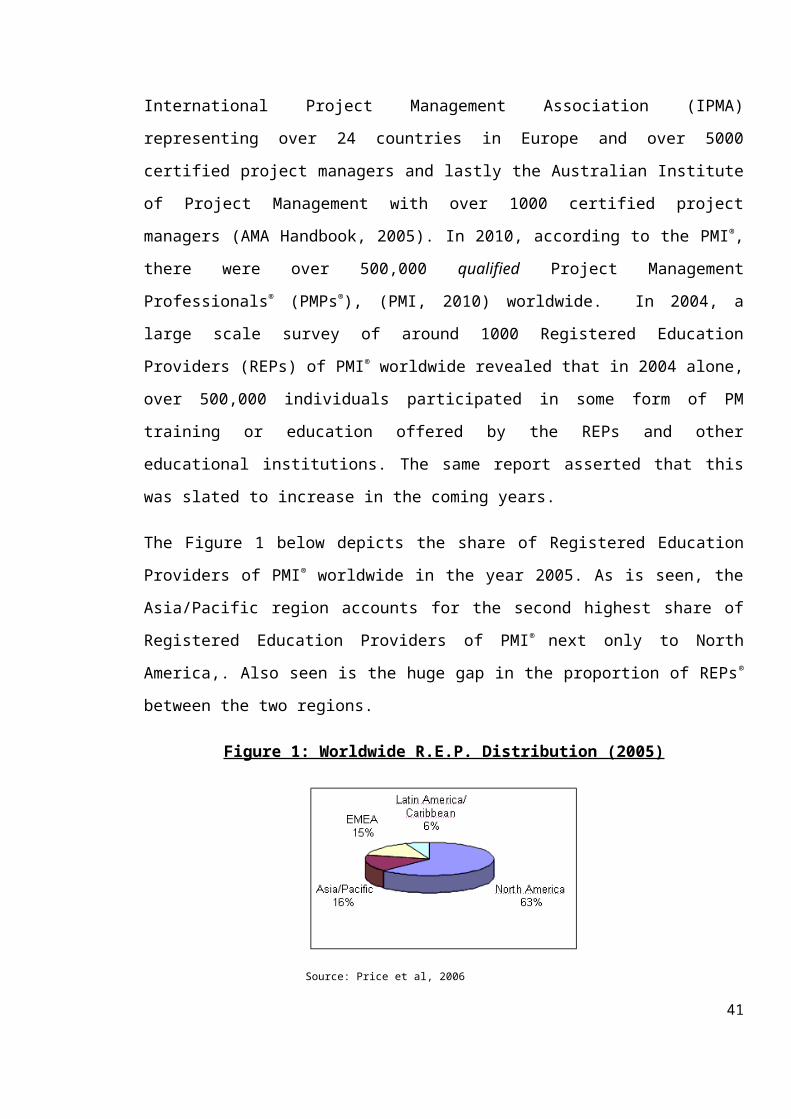
The Figure 1 below depicts the share of Registered Education
Providers of PMI® worldwide in the year 2005. As is seen, the
Asia/Pacific region accounts for the second highest share of
Registered Education Providers of PMI® next only to North
America,. Also seen is the huge gap in the proportion of REPs®
between the two regions.
Figure 1: Worldwide R.E.P. Distribution (2005)
Source: Price et al, 2006
41
However there has been huge growth in degree programmes being
offered in this area, from a mere 10 in 1994 to over 185 in
2006 in the USA and Europe. Most of these programmes are
tailored to suit the IT industry (73.1%) as compared to
sectors like Financial, Business Management, Construction, etc
(Michael Price et al, 2004). There are over 65 degree
programmes in more than 25 academic institutions currently
accredited by the Global Accreditation Centre for Project
Management Programmes of the PMI® in North America. Several
other programmes are at various stages of the accreditation
process (PMI®, 2010).
In contrast in India, one finds a huge demand for training in
PM primarily for Information Technology as well as in
Construction Industry. However the number of listed REP®s in
India is merely 70 in all2. In China, PM education is more
widespread in sectors like construction, oil and gas, power
and so on. The financial services sector in both countries is
yet to fully utilise the importance of PM training. The status
of PM education and skill building in these countries is
further discussed later in this section.
The growth of PM education and training in Asia and Pacific
regions suggests that it is spreading in newer geographies; it
has also been spreading into newer areas of application. In
fact PMI®’s own publication titled Project Management Circa
2025, looks at newer applications of PM in such emerging and
diversified fields like nanotechnology and future energy, new
2 (https://ccrs.pmi.org/Search.aspx)42
frontiers like earth sciences, monitoring of planet, extreme
weather response and climate control. It also gives an insight
into the emerging countries where PM will take roots such as
in India, Spain, China, Asia Pacific and Arabian regions3.
2.2 PM Education In America And Europe
Scientific PM education has its earliest origins in the well
known discipline of Operations Management. Therefore one can
say that the bases of early development can be found in the
works of Frederick Taylor and Henry Gantt, (1915 - 40). Since
the 1950s, the advances in PM as an organised discipline
within management took root in these regions. PM as a
discipline has grown from these roots and is now well
entrenched in the business and research realms worldwide. The
extent and depth of PM education is witnessed more in these
continents than in other parts of the world. In these regions,
PM education has attained such recognition, as to be made
mandatory, and a prerequisite in the procurement and
management of large scale and complex projects either within
the country or internationally. Most of the literature records
the systematic development of this discipline as experienced
in these advanced regions.
In case of developing countries and emerging economies,
especially in India and China, use of formal PM techniques to
acquire and execute projects in an organised manner, appears
to have taken roots only over the last one and a half decade.
A survey of the relevant literature in international journals3 (www.pmi.org/PM2025)
43
focussing on PM reveals relatively less work emanating from
countries like India and efforts to initiate PM programmes in
academics and research.
2.3 PM In Academia – A Global Snapshot
The introduction of project management courses in the
universities and business schools in North America, Europe and
leading Asian countries is on the rise. In 1993, it is
documented that there were only 5 universities that offered
degree programmes in Project Management in North America. Ten
years later, there were 33 such programmes in USA and Canada
alone. In their research, Professors Thomas Mengel, Janice
Thomas (2008), Bill Zwerman (2004), Kent Crawford (2006),
Dinsmore and Cabanis – Brewin (2006) have tried to find
answers to the question of systematizing the study of project
management to offer it as a preferred career option. The
ultimate aim of the Project Management Programmes is to induce
three major competencies in the student – project management
skills, leadership and technical skills. According to Turner
and Huemann (2001), a study of mature project management
societies, such as UK, Australia, New Zealand and Ireland,
revealed that around 10% of the universities offered Masters’
degrees in Project Management. PM education began ‘top down’
in case of United Kingdom, through existing Masters’ degree or
Doctoral programmes in concerned disciplines. For instance, it
is observed that in the United Kingdom, the Master’s Programme
44
in Science or Business Administration exists with PM as a
speciality. It also exists as a specialist degree like in
Construction Project Management. Also it was observed that in
the case of degree courses in Information Technology, no
course by the name ‘Information Systems Project Management’
existed, even though PM subjects are covered within courses
such as Information Systems Management. Later educational
programmes emerged focusing on Project Management. Further,
these ‘percolated’ down from higher level education into the
secondary and even the primary level education.
2.3.1 PM In Other European Countries
In case of other countries in Europe, Turner and Huemann
(2001) observe that in Austria, Switzerland and Germany,
different ways are being adopted to reach a common goal of
making all these into ‘project oriented societies’. In
Austria, PM education began first with taught masters’
degrees, either as programmes specialising in project
management, or with project management as an essential
component of wider programmes. From there, it spread upwards
and downwards to other levels. Austria has also embarked upon
a project to popularise the use of PM in industries and then
take it to the municipalities, students and families under the
‘Programme 1 Austria’ to raise awareness of project management
as a profession. Austria and Germany also offer doctoral level
programmes in PM. Certificates and Diplomas are offered by
professional or other bodies. Vocational qualifications such
45
as in the UK are not available in these countries. Switzerland
has set a goal of becoming a quality competence centre in PM.
2.4 Indian PM Growth
In India, there does not appear to be any clear evidence of
studies covering the growth of PM education and research, in
the public domain. Unlike its European and American
counterparts, there appears to be less focussed attention in
this area of study as compared to Operations Management
wherein Indian academic programmes and research are in an
advanced state. This study attempts to find out the current
state of this emerging field in India.
The scope is limited to the technical and management education
institutions. Given below is the state wise table, listing
the number of approved institutions offering business
engineering/administration/management courses in India. The
list is that of the All India Council of Technical Education
(AICTE) which is an apex government body formed to regulate
technical, professional and management education providers. A
total of 3904 AICTE approved institutions offer afore
mentioned degrees in India. Apart from this, there are many
Central, State and ‘Deemed to be Universities’ as well as
autonomous ones that offer degrees, diplomas and certificates
in management and technical education. (Refer Table No. 3).
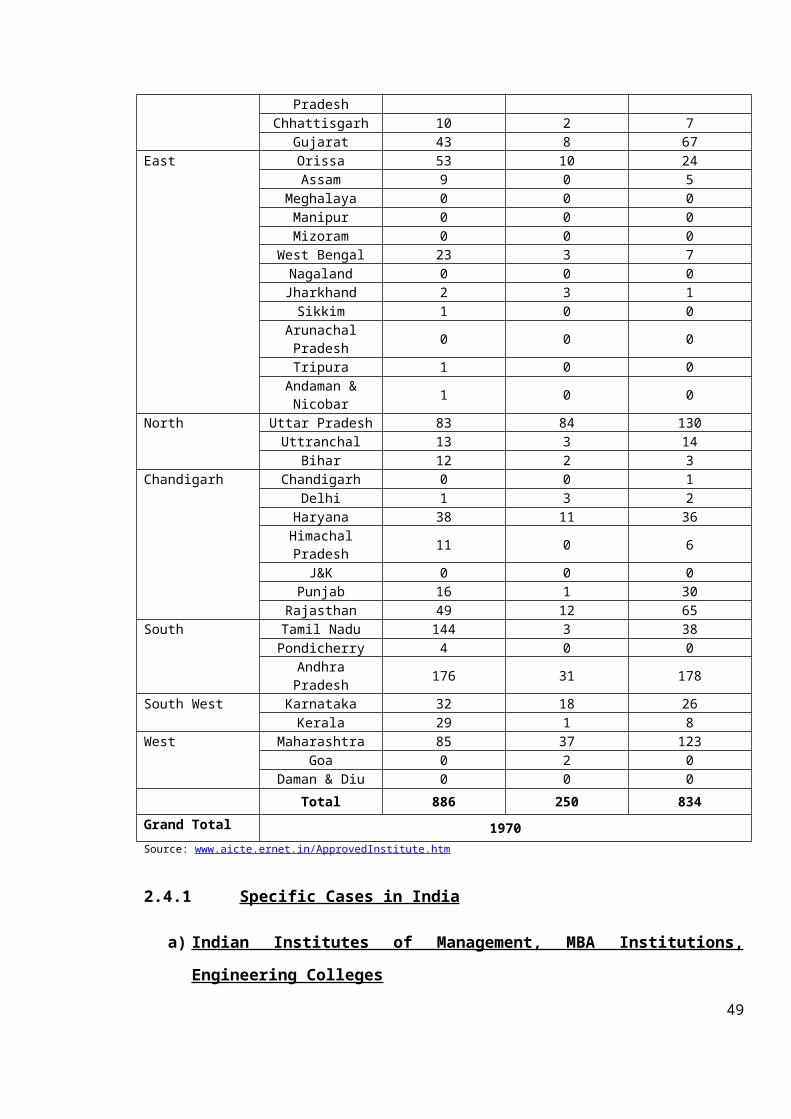
Table No. 4 describes the Number of Proposals received for the
establishment of New Technical Institutes for the Academic
year 2009-2010, upto 31.12.200
46
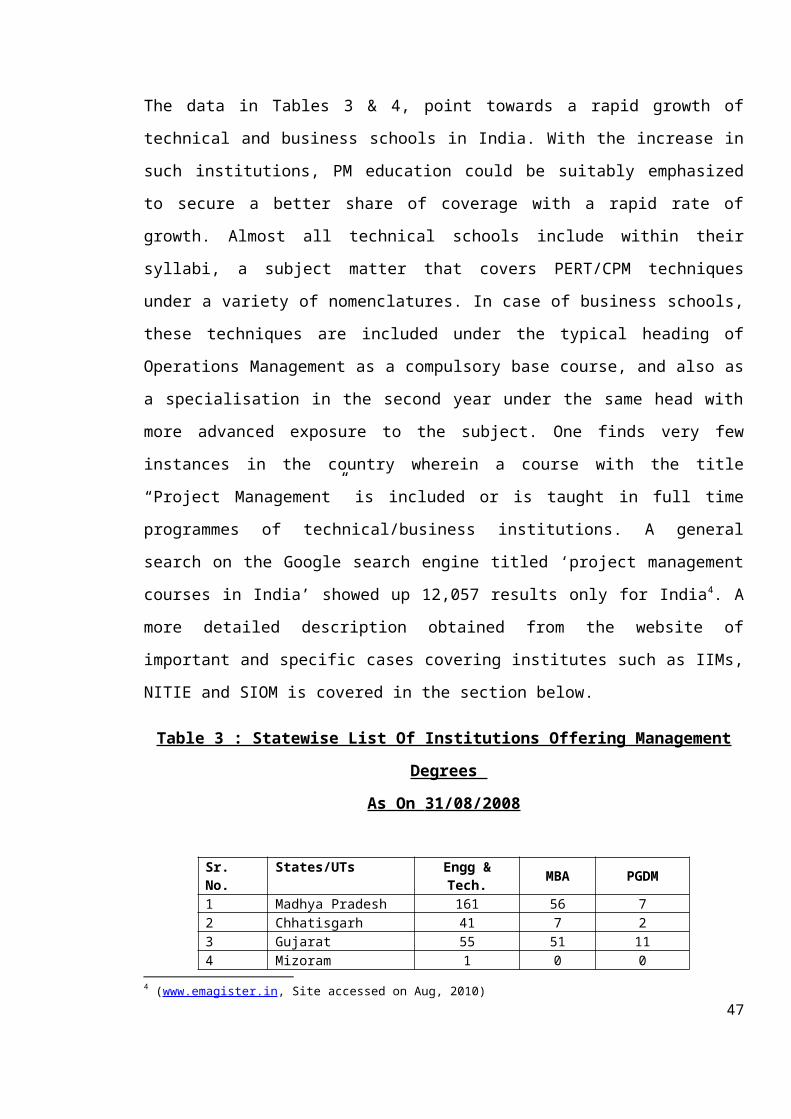
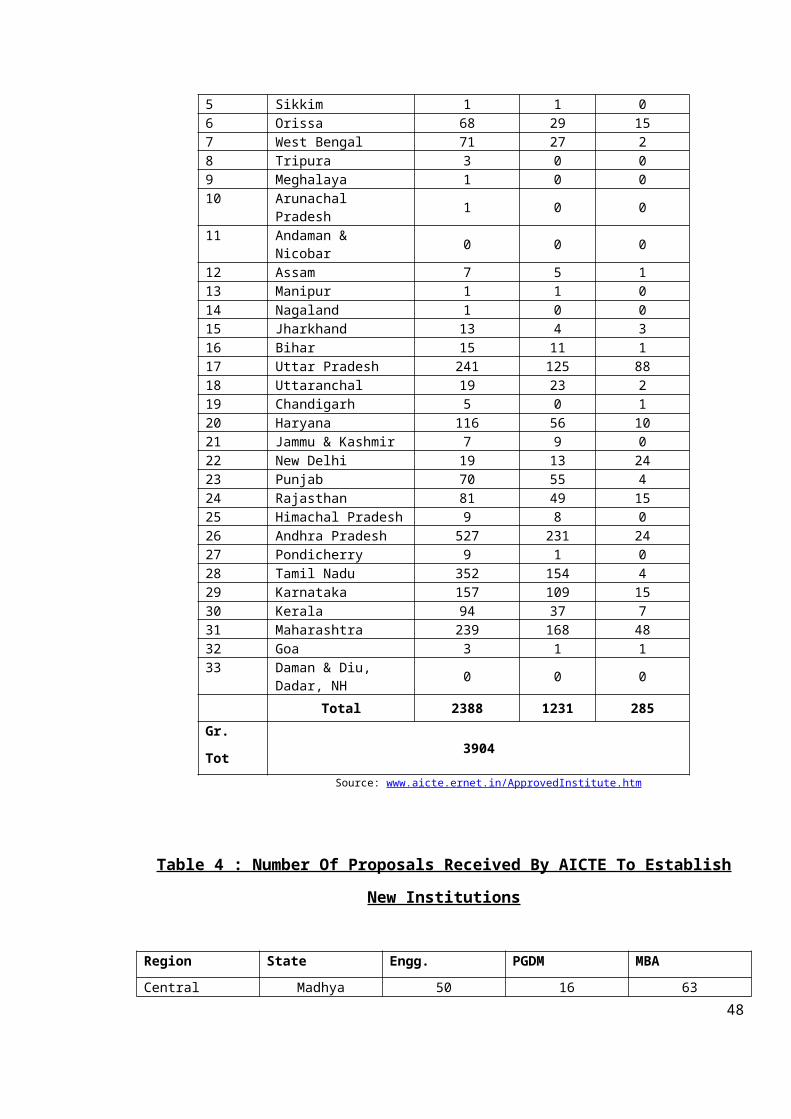
The data in Tables 3 & 4, point towards a rapid growth of
technical and business schools in India. With the increase in
such institutions, PM education could be suitably emphasized
to secure a better share of coverage with a rapid rate of
growth. Almost all technical schools include within their
syllabi, a subject matter that covers PERT/CPM techniques
under a variety of nomenclatures. In case of business schools,
these techniques are included under the typical heading of
Operations Management as a compulsory base course, and also as
a specialisation in the second year under the same head with
more advanced exposure to the subject. One finds very few
instances in the country wherein a course with the title
“Project Management” is included or is taught in full time
programmes of technical/business institutions. A general
search on the Google search engine titled ‘project management
courses in India’ showed up 12,057 results only for India4. A
more detailed description obtained from the website of
important and specific cases covering institutes such as IIMs,
NITIE and SIOM is covered in the section below.
Table 3 : Statewise List Of Institutions Offering Management
Degrees
As On 31/08/2008
Sr. No.
States/UTs Engg &Tech. MBA PGDM
1 Madhya Pradesh 161 56 72 Chhatisgarh 41 7 23 Gujarat 55 51 114 Mizoram 1 0 0
4 (www.emagister.in, Site accessed on Aug, 2010)47
5 Sikkim 1 1 06 Orissa 68 29 157 West Bengal 71 27 28 Tripura 3 0 09 Meghalaya 1 0 010 Arunachal
Pradesh 1 0 0
11 Andaman & Nicobar 0 0 0
12 Assam 7 5 113 Manipur 1 1 014 Nagaland 1 0 015 Jharkhand 13 4 316 Bihar 15 11 117 Uttar Pradesh 241 125 8818 Uttaranchal 19 23 219 Chandigarh 5 0 120 Haryana 116 56 1021 Jammu & Kashmir 7 9 022 New Delhi 19 13 2423 Punjab 70 55 424 Rajasthan 81 49 1525 Himachal Pradesh 9 8 026 Andhra Pradesh 527 231 2427 Pondicherry 9 1 028 Tamil Nadu 352 154 429 Karnataka 157 109 1530 Kerala 94 37 731 Maharashtra 239 168 4832 Goa 3 1 133 Daman & Diu,
Dadar, NH 0 0 0
Total 2388 1231 285Gr.
Tot 3904
Source: www.aicte.ernet.in/ApprovedInstitute.htm
Table 4 : Number Of Proposals Received By AICTE To Establish
New Institutions
Region State Engg. PGDM MBACentral Madhya 50 16 63
48
PradeshChhattisgarh 10 2 7
Gujarat 43 8 67East Orissa 53 10 24
Assam 9 0 5Meghalaya 0 0 0Manipur 0 0 0Mizoram 0 0 0
West Bengal 23 3 7Nagaland 0 0 0Jharkhand 2 3 1Sikkim 1 0 0
ArunachalPradesh 0 0 0
Tripura 1 0 0Andaman &Nicobar 1 0 0
North Uttar Pradesh 83 84 130Uttranchal 13 3 14
Bihar 12 2 3Chandigarh Chandigarh 0 0 1
Delhi 1 3 2Haryana 38 11 36HimachalPradesh 11 0 6
J&K 0 0 0Punjab 16 1 30
Rajasthan 49 12 65South Tamil Nadu 144 3 38
Pondicherry 4 0 0AndhraPradesh 176 31 178
South West Karnataka 32 18 26Kerala 29 1 8
West Maharashtra 85 37 123Goa 0 2 0
Daman & Diu 0 0 0Total 886 250 834
Grand Total 1970Source: www.aicte.ernet.in/ApprovedInstitute.htm
2.4.1 Specific Cases in India
a) Indian Institutes of Management, MBA Institutions,
Engineering Colleges
49
Practically all the IIMs offer some elective courses either
directly named “Project Management” or some other titles
dedicated to the coverage of important themes in project
management. In general management oriented, Master’s in
Business Administration (MBA) programmes, PM related subjects
are included in almost all curricula of management
institutions, but do not always appear specifically in the form
of full length courses. Usually the Operations Management
courses, cover selective subject matter from the PM domain.
Only specialist courses cover a wider gamut of PM subject
content and emphasis, but these are not commonly found in MBA
programmes. Similarly almost all the courses covered in
technical colleges, especially those covering construction,
engineering and information technology include project
management, within their ambit at introductory level, usually
in the form of a module.
b) National Institute Of Construction Management And
Research
The National Institute of Construction Management and Research
(NICMAR), offers the Post Graduate Programmes in Advanced
Construction Management and Real Estate and Urban
Infrastructure that have a host of dedicated subjects covering
the PM domain; yet the term ‘Project’ does not always appear
distinctly in the nomenclature of the said programmes.
However, the institute’s Post Graduate Programme in Project
Engineering and Management, has clear descriptions of subjects
in project domain as defined in the Project Management Body of50
Knowledge® (PMBOK®)5. This two year full time programme is
arguably India’s only course of its type, and combines subject
matter from all the major domain areas i.e. General
Management, Project Management, Behavioural Sciences,
Engineering and Technology and Information Technology.
c) Symbiosis Institute of Operations Management
In case of Symbiosis Institute of Operations Management
(SIOM), a specialist degree, the Masters in Business
Administration in Operations Management (MBA Operations
Management) is offered, which covers subjects such as
Operations, Projects and Resource Planning6.
d) National Institute of Technology and Industrial
Engineering
The National Institute of Technology and Industrial
Engineering (NITIE), Mumbai, runs the Post Graduate Diploma in
Industrial Engineering (PGDIE), Post Graduate Diploma in
Industrial Safety and Environmental Management (PGDISEM), Post
Graduate Diploma in Information Technology Management
(PGDITM), and Post Graduate Diploma in Industrial Management
(PGDIM)7. The PGDIE has such subjects that are of core
importance to industrial operations such as Operations
Planning and Control, Project Management, Work System Design,
5 The PMBOK® includes 5 Process Groups and 12 Knowledge Areas that are covered in the domainof PM, PMI, 4th Edition 2008.
6 (www.siom.in/mba_operations.aspx Site accessed as on August 2010)
7 (http://www.nitie.edu Site accessed as on August 2010)51
Operations Research, Systems Engineering, etc., in addition to
other subjects.
In India, as is observed in the United Kingdom, most of the
post graduate management courses covering the PM domain are
seen sans the ‘Project’ term included in the title of the
course, though the curriculum adequately reflects to varying
degrees the subject matter related to the same.
The exception however, is noticed in the Post Graduate Programme in Project
Engineering and Management offered by NICMAR, wherein the entire ‘Project’ term
is explicitly included in the title of the programme, and provides the most
comprehensive coverage of all the relevant knowledge domains.
2.5 PM in Research
Project Management (PM) has evolved since the sixties as an
area of interest for researchers and academicians alike. Up
until then, PM existed more in the realm of practice than as a
pursuit of systematic study and research. The early evolution
of the discipline could be attributed to the works of
Frederick Taylor and Henry Gantt (1900s – 1920s) which
emphasised the organisation of work in such a way that would
be amenable for scientific analysis, measurement and
improvement as well as its systematic planning and scheduling.
In the decades following World War II, massive reconstruction
work had to be undertaken in the hugely affected areas of
Europe and Japan. Simultaneously the newly independent
countries especially in Asia, began the path of economic
development. In this, businesses and organizations saw great52
opportunity to undertake projects which were complex, unique
and very large in scope. The growing use of energy, fed by
growing economies everywhere, was on the rise, fuelling strong
demand for petroleum products, natural gas, and electric
power. The need for production, processing, and transportation
facilities increased dramatically. New projects began getting
bigger and more venturesome. This was also the time for
nations to prove their prowess over others by launching space
flights, submarines, constructing high rise buildings,
building dams and laying high altitude rail lines and roads.
Obviously the mainstay of all such ventures was the proper
deployment of technology, manpower and resources in a way
that the financial resources committed by the governments
could derive optimum leverage in the face of given
constraints. ‘Managing by Projects’ became a term that gained
prominence at this time. With the protracted success of PM as
a useful discipline in implementing projects, there was
interest amongst researchers to study projects and the
processes adopted that made some projects successful while
others failed to add to the return on investment (Thomas and
Mullaly, 2008). From the early decades of the twentieth
century, the private sector had begun the widespread use of
sophisticated means of deployment of resources to obtain high
levels of productivity in their markets. Thus PM emerged and
was developed as a sub discipline of industrial engineering
and operations management (Crawford et al, 2006).
53
In the 1960s, the formation of Project Management Institute®
(PMI®), in USA, International Project Management Association
(IPMA) in Europe and Australian Institute of Project
Management (established in 1976), gave further impetus to the
study and practice of PM. These associations collaborated with
research scholars and launched publications dedicated to the
theory and practice of PM. It was in the 1960s that
researchers commenced a systematic study of how projects are
conceived and managed and an attempt began to be made to
organise the practice as a discipline. Empirical studies
commenced either as research pursuits of doctoral students or
commissioned research from these associations. Journals such
as the ‘International Journal of Project Management’ (IPMA),
the ‘Project Management Journal®’ (PMI®), the ‘Project
Management Journal’ of Soviet Russian Project Management
Association -SOVNET8, ‘Project Manager’ of Australian Institute
of Project Management, are some examples of the rapid growth
and dissemination of PM related literature. The fast
developing Asian countries have to ‘catch up’ in this area.
Research in the area of PM has continued to evolve steadily
over the past 30 decades. A study was commissioned by the UK
government in 2003, (UK’s Engineering and Physical Sciences
Research Council (EPSRC)) on “Rethinking Project Management”.
It was a bid to extract PM research from mere theoretical
paradigms and relate it to empirical practice. Thus the study
sought to define a research agenda aimed at enriching and
8 (www.pmforum.org/library/journals.htm Site accessed as on August 2010)54

extending the subject of project management beyond its current
conceptual foundations (Crawford et al, 2006). The objectives
of this study were the following :
1) To research Theory about practice of PM. This meant the
effort towards the development of new models and theories
which recognise and illuminate the complexity of the
project and PM at all levels.
2) To develop Theory for practice which meant understanding
projects as a social process, creation of value as the
prime focus of its existence and a broader
conceptualisation of projects to include multi
disciplinary approach, existing for multiple purposes
instead of very narrow definitions of scope and purpose.
3) To develop Theory in practice which meant the creation of
training for PM in such a way as not to restrict the
practitioners to merely following detailed procedures and
techniques, as prescribed by PM methods and tools but to
create ‘reflective practitioners’.
Anbari and Young (2009) mention the work of Kloppenberg and
Opfer whose research identified project management research
published in articles, papers, dissertations, and government
research reports since 1960. They found that the emphasis has
moved from development and use of automated project management
software and tools to risk management, earned value management
and then to human resource aspects. They also determined that
research focus moved from large government defence projects to
55

commercial applications in construction, information systems,
and new product development. They concluded that project
management has extensive current opportunities and a bright
future. In the same paper, Anbari and Young (2009) mention
Bredillet’s conclusions that PM is becoming increasingly
linked with the implementation of organizational strategy.
2.5.1 PM Research In India
The quantum of research generated in India in relation to PM
in its present state remains miniscule. A study of the
publications appearing in one of the most acclaimed journal
showcasing PM dedicated studies and literature i.e. the
International Journal of Project Management (IJPM®) was carried
out. A search was run of the articles contained in this
journal to develop an idea about the number of articles that
included India-centric studies in the period ranging from 1988
– 2010. The Graph 1 shows that the search yielded a total of
only 101 results, in which India features either in the main
title of the article or at times in its contents too. (IJPM®,
1988-2010).
Graph 1: Articles In IJPM Containing India – Centric Content
56
An advanced search was done to arrive at the ‘affiliations’
data i.e. how many of these research papers originated from
India. The search has revealed that only 26 papers in the same
period (1988-2010) have been published by academics and
occasionally by industry practitioners in the journal from
India.
2.6 PM In Industry
A study conducted by the Centre for Business Practices of 53
practitioners at Toronto, Canada, revealed that in 62 - 91% of
organizations, project management training resulted in
moderate to extreme improvement in employee knowledge and
skills, on the job performance, and on schedule performance
(Michael Price et al, 2004). Though the number is too small to
be an indicator of the larger universe, other statistics help
to prove the point.
The growth of PM training could be attributed to the formation
of the PM associations that took great initiative to replicate
the formal learning and training of practitioners to enhance
as well as standardise project performance while ensuring
favourable project outcomes (Soderlund, 2004). Through the
formation of the Bodies of Knowledge along with their
associated certification programmes, these associations have
tried to propagate PM education around the world.
However in the same paper, Soderland argues that the field of
project management has a narrow focus and that though a number
of teaching programmes have been developed, commensurate
57
research in these areas is found wanting. Shenhar and Dvir
(1996) continued in the same vein maintaining that PM suffers
due to a limited theoretical basis and lack of concepts. The
duo has been credited with the ‘Diamond Framework’ for
strategic project management. Other researchers have raised
concerns regarding the level and quality of research that has
been produced in the area of PM. Bibliometric analyses of the
type of research articles and papers published in leading PM
journals such as International Journal of Project Management
(IJPM), Project Management Journal (PMI®) and a host of
conference presentations etc, lament the depth and variety of
research in this area. A study by Crawford et al (2006)
revealed the trends in PM research and the emphasis of
articles in the period 1993-2003 and found that these are
changing. According to her, project management is regularly
facing new challenges as a field of study, as the tools,
methods and approaches to management that comprise the
discipline are applied to different areas, for different ends,
and in different cultures.
Another decade wise bibliometric analysis following the one by
Crawford (2006) by Turner in 2010, revealed that in 1987, the
most popular topics of research were engineering and
construction, computer support, time, execution and control.
Operation and maintenance followed next in importance. Topics
such as life cycle cost, operation and maintenance were not
covered in the next two decades till 1997 or 2007. Interest in
Construction Sector grew, with the number of papers covering
58
the subject going up to 36% of the article contribution. The
next most popular subjects in 1997 were in the area of
computer support, time management and risk management. Risk
Management continued in importance in 2007, but a growing
interest in partnerships and alliances; interest in human
resource management and developing individual competence
gained ground by 2007. The interest in Program Management
appeared in 1997 and Portfolio Management in 2007. The study
helps to understand that the scope of PM study and research
interests has become more diverse and now encompass many more
areas that cover the field of enterprise management as a
whole.
2.6.1 Training And Development Expenditure In Indian
Projects Industry – A Bird’s Eye View
The American Society for Training has estimated training spend
to be in the range of 2-2.5 per cent of company turnover on
employee skill development programmes (Rao, 2009). Some
companies are known to spend up to five per cent of their
turnover on training. In the previous chapter, there was an
attempt to arrive at the magnitude of project industry by
presenting a cross sectional data on the employment figures
and amount of capital invested in this industry in the year
2010 alone. It is necessary to understand the industry’s
efforts in capacity building and development of human
resources. Once again, CMIE Database – Annual Reports 2005-08
data was used to estimate the training and development budgets
of project companies. 59
In order to find out the current state of affairs regarding
the allocation of funds by companies to Training and
Development (T&D) of its personnel, a full search of the
annual reports of project based companies, i.e. construction,
manufacturing, power generation, mining, petrochemicals,
railways etc. was made. The objective was to obtain the
budgetary allocations made by project based companies in PM
related training. An advanced search was conducted to find out
whether the companies had budgets earmarked for ‘training and
development’ or ‘staff training’ expenses so as to draw some
meaningful conclusions about the size of training budgets of
project based companies in India. From among the 16, 145
companies, the search showed up only a total of 1761 companies
who had a category named ‘staff training’ in their annual
financial statements. In the period between 2005- 2008, though
there was a minor increase in the number of companies who had
some allocation under the ‘Staff Training’ or ‘Training and
Development’ (T & D) category, the overall record appears too
minor to mention. In 2008, only around 59.42 crores were
spent by 42 CMIE listed project companies on T&D, a moderate
improvement over the 2005 spend of 31.59 crores by 22 CMIE
listed companies (Refer Annexure 2, a, b, c and d).
This data is insufficient to arrive at any meaningful
conclusion regarding the training budgets of project based
companies related to PM training. However the data helps to
explain some of the difficulties in capturing T&D figures of
project companies. A closer look at the above tables reveals
60
the anomalies wherein the typical industry leaders known for
their training impetus like HCC Ltd., GMR, Simplex Ltd.,
Reliance Industries, Gammon, L&T, GVK, JP Group, and so on,
are consistently missing from the list. These companies have
full fledged training departments and are known to conduct
training at almost all levels of project activity.
To understand the reason behind the inadequate data, the issue
was followed up with a few human resources /training managers
of these companies, and an industry association expert using
the personal discussion method (reference, pp 139). Most HR
managers of project companies corroborated the point that T &
D expenses of project based companies are not reflected in
annual reports but are added primarily in the following ways :
1) Added to the general ‘staff welfare’ expenses and not
listed separately under clear training and development
head in the annual reports. Thus it is difficult to
isolate the exact and actual budgets that are dedicated
by project based companies to this activity (FICCI, HCC)
2) Added to the overall project expenditure and billed
within the ambit of Project related expenses (Gammon,
Simplex)
3) Billed separately in case of in house training, as most
of the resource persons used are from within the
organisation (Gammon, Simplex, HCC)
In software project companies also, the picture is similar.
The most training intensive software companies like Infosys61
and Wipro Technologies do not have ‘T&D’ or ‘Staff Training’
as heads of expenses in their financial statements (Refer Box
No.1).
It is a well known fact that Training and Development
investment contributes to an improved quality of human
resource which in turn contributes to customer satisfaction
and improved financial performance. Senior management’s role
in providing sufficient resources including training, leads to
a high degree of customer satisfaction (Feuss et al, 2004).
Despite the fact that the literature related to the use of PM
by the heavy engineering industry in India is very sparse,
some literature is available for the Information Technology
sector. This again is not surprising, as it is strongly linked
62
Box No.1 INFOSYS TECHNOLOGIES LTD.
A case in point is that of INFOSYS Ltd., the largest
software development transnational organisation in the
country. A section in the annual report, containing ‘Human
Resources Valuation’ attempts to list out the value addition
made by the company’s human resource, in the form of a ratio
(Annual Report, 2009).
The human resource value addition ratio was pegged at 0.19
in 2009, an increase from the earlier year (2008) of 0.15 as
value addition to the company. Also the return on human
value as a percentage of the cost of human resources
(welfare/salaries/wages etc.) grew from 4.7% to 5.9%. A
study of Infosys annual reports from 2005-09, reveals there
to international client requirements and is based almost
entirely upon acquisition and execution of software projects.
However, as found in the former case, no dedicated training
budgets appear in the financial statements of the companies.
Barring a few exceptions, it can be concluded that there is a
lack of clear statistics in the public domain with respect to
the training and development of PM competencies of the public
and private sector. Thus the need for a primary survey of HR
managers was considered essential.
2.7 India and China: Comparison of PM Education
India and China are considered important as the economic
development plans in these two countries require the launch
and successful completion of mega, major and a host of medium
sized projects to cover the historical gap in Infrastructure.
In case of India, the growth of PM education in the form of
certifications is clearly rising, as very often project terms
and conditions mandate certified professionals. According to
PMI®, which is the most active and vigorous organisation in
this arena, in the year 2006, there were around 6000 PMPs® in
India . In the year 2010, this number has grown to 20,000 PMPs®
in management and technical fields (Source: PMI®, India
Office).
In the case of China, the effort to introduce PM was very
systematic and ‘top-down’. It began with the World Bank giving
a grant for training followed by the PMI® stepping in, in the
early 1990s. Other entities like IPMA® etc. followed suit. One
63
such monumental instance of this initiative was that of the
Ministry of Construction (MOC). One hundred and forty
educational institutions or training centres had been
accredited by MOC as project management training providers up
to the end of 1995. During the same period, 321,983 project
managers took the training courses and 297,774 of them were
certified by the MOC. By 2004, 500,000 project managers in
total, were certified by the MOC. Other ministries in China
such as Nuclear, Defence, and Oil & Gas etc too have made
mandatory, the PM certification even to apply for a job with
them (Lu et al, 2004).
Another initiative was undertaken in 1998 by the State
Administration of Foreign Experts Affairs along with the
Project Management Institute®. The first REP® was established
in 1999, the BMMTEC International Education Group became the
first subsidiary in China certified by PMI providing Project
Management Professionals® (PMP®) certification training and
examination services as well as other training and education
on project management. By the year 2004, there were 46 REPs in
China, and about 70,000 people had participated in PMP® training,
4000 persons had been certified as PMPs® by the REPs®.
PMI® has had a longer and stronger presence in China in
promoting its project management standards and certifications
with regional offices in both Beijing and Hong Kong. PMI® had
signed a cooperative accord with the China National Steering
Committee of Professional Education of Master of Engineering
(SCME) on 7 March, 2008. The SCME oversees a national64
consortium of 103 higher education institutions that have been
authorised by the Chinese government to offer Master of
Engineering degree programmes in project management. Due to
the huge projects that China has launched in the construction,
information technology, manufacturing and aeronautics
industries, the government has committed significant resources
to this effort. According to SCME, more than 14,000 students
are enrolled in dedicated engineering master’s degree
programmes in project management in China (Pells, 2009).
In this Chapter, it is seen that the growth of PM towards
being recognised as a discipline has been systematically
driven through the efforts of the government, academic
institutions and associations in the developed nations like
UK, USA, Germany, Australia and Canada. In other nations such
as Russia and China, a lot of structured emphasis has been
given to popularise PM education. In India, modest efforts
have begun in this direction. The next chapter discusses the
research design, scope and methodology adopted to collect
primary data from the stakeholder respondents of PM education.
65
CHAPTER 3
RESEARCH DESIGN
3.1 Basic Approach To The Study
The study is mostly based on primary data and the basic
purpose is to find out the factors inhibiting the wide spread
initiation of Project Management Education in Indian technical
and business academic institutions and to suggest ways to
broaden its present scope in India. The study is restricted to
India, and includes only leading technical/ business
educational institutions. It seeks to find the factors that
aid, and those that inhibit the acceptance of project
management education in such academic institutions.
It simultaneously includes active executives who at
graduation, had not undergone PM education but have
subsequently done so in the course of their employment. The
aim is to obtain their views on the extent of the added
benefits of PM training, in fast tracking their career growth.
Lastly, we have covered a cross section of the select
recruiters (Human Resource Managers) in our study sample and
obtained their views on the efficacy of PM education in
enhancing their executives’ ability to manage projects.
3.2 Objectives Of The Study
The main objectives of the research study are as follows:
66
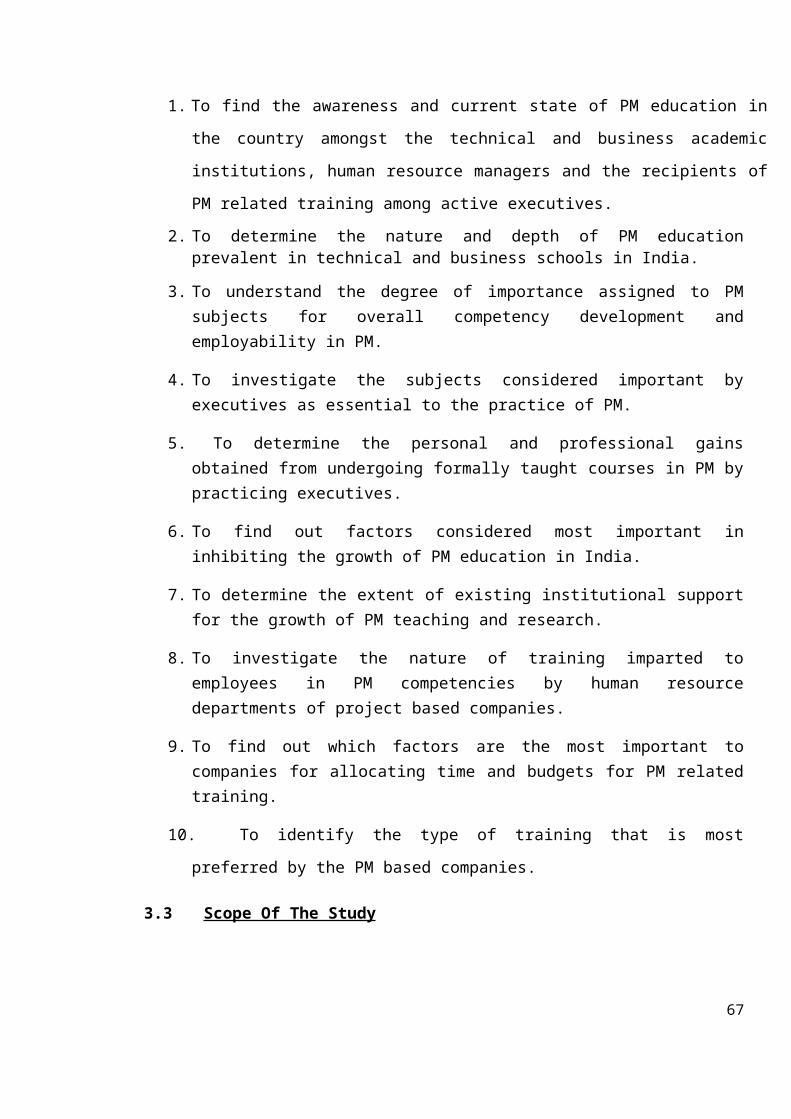
1. To find the awareness and current state of PM education in
the country amongst the technical and business academic
institutions, human resource managers and the recipients of
PM related training among active executives.
2. To determine the nature and depth of PM educationprevalent in technical and business schools in India.
3. To understand the degree of importance assigned to PMsubjects for overall competency development andemployability in PM.
4. To investigate the subjects considered important byexecutives as essential to the practice of PM.
5. To determine the personal and professional gainsobtained from undergoing formally taught courses in PM bypracticing executives.
6. To find out factors considered most important ininhibiting the growth of PM education in India.
7. To determine the extent of existing institutional supportfor the growth of PM teaching and research.
8. To investigate the nature of training imparted toemployees in PM competencies by human resourcedepartments of project based companies.
9. To find out which factors are the most important tocompanies for allocating time and budgets for PM relatedtraining.
10. To identify the type of training that is most
preferred by the PM based companies.
3.3 Scope Of The Study
67
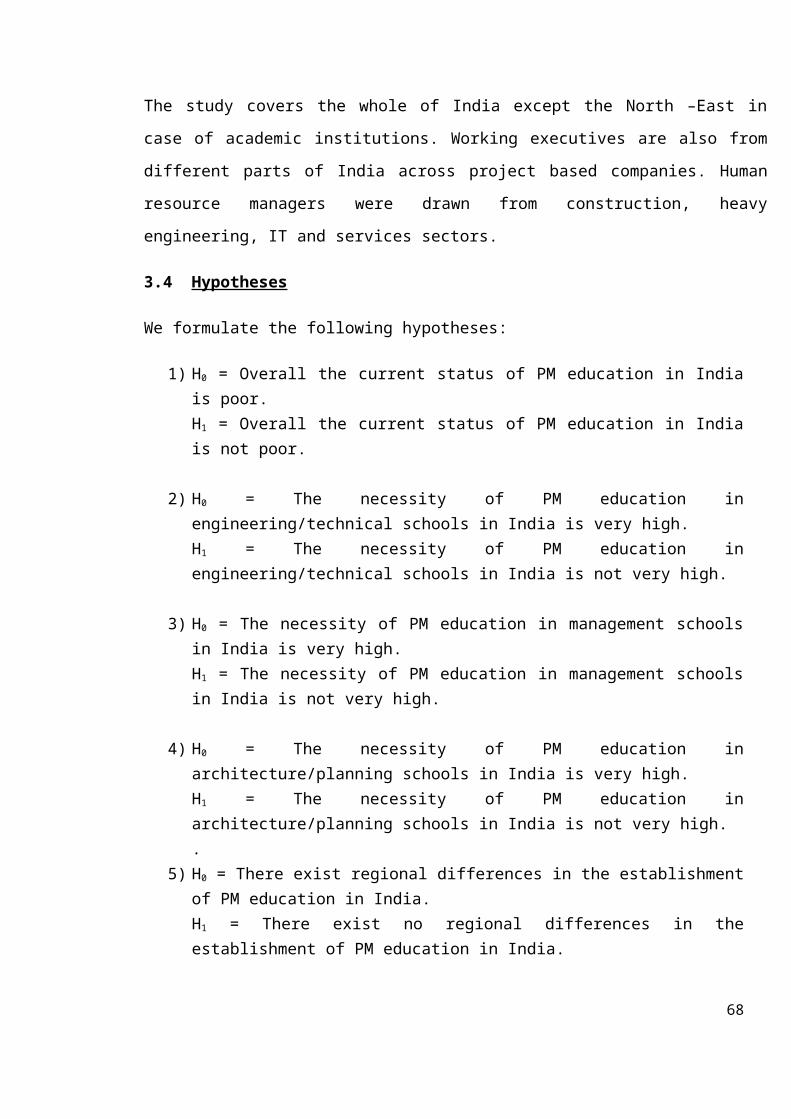
The study covers the whole of India except the North –East in
case of academic institutions. Working executives are also from
different parts of India across project based companies. Human
resource managers were drawn from construction, heavy
engineering, IT and services sectors.
3.4 Hypotheses
We formulate the following hypotheses:
1) H0 = Overall the current status of PM education in Indiais poor.H1 = Overall the current status of PM education in Indiais not poor.
2) H0 = The necessity of PM education inengineering/technical schools in India is very high.H1 = The necessity of PM education inengineering/technical schools in India is not very high.
3) H0 = The necessity of PM education in management schoolsin India is very high.H1 = The necessity of PM education in management schoolsin India is not very high.
4) H0 = The necessity of PM education inarchitecture/planning schools in India is very high.H1 = The necessity of PM education inarchitecture/planning schools in India is not very high..
5) H0 = There exist regional differences in the establishmentof PM education in India.H1 = There exist no regional differences in theestablishment of PM education in India.
68
6) H0 =There exist faculty wise differences in theestablishment of PM education in India.H1 = There exist no faculty wise differences in theestablishment of PM education in India.
7) H0 =There exists a difference in the establishment of PMeducation in India at the under graduate and postgraduate levels.H1 = There exists no difference in the establishment of PMeducation in India at the under graduate and postgraduate levels.
8) H0 = There exists a difference in the understanding of thestrategic role of projects in the overall businesscontext, after undergoing PM related training.H1= There exists no difference in the understanding of thestrategic role of projects in the overall businesscontext, after undergoing PM related training.
9) H0 = There exists a difference in the overallunderstanding of the project context.
H1 = There exists no difference in the overallunderstanding of the project context.
10) H0 = There exists a difference in the level ofremuneration, enhancement of work relatedresponsibilities, and conflict resolution ability ofindividuals.H1 = There exists no difference in the level ofremuneration, enhancement of work relatedresponsibilities, and conflict resolution ability ofindividuals.
11) H0 = Training in Project Management helps to buildthe employee’s competencies.
69

H1 = Training in Project Management does not help to buildthe employee’s competencies.
12) H0 = PM training results in greater accrual ofbenefits as against costs incurred on the training.H1 = PM training results in lesser accrual of benefits asagainst costs incurred on the training.
13) H0 = PM training offered by certified trainers ismore efficacious than that of others.H1 = There is no difference in the efficacy of PM trainingoffered by certified trainers and others.
3.5 Methodology
The research covers a comprehensive search of secondary
literature available in the public domain to determine the
efforts of all stakeholders in promoting PM education. This is
followed by a primary research of academic institutions, HR
managers and active executives of PM based companies. The
analysis is based on statistical tools and techniques. We have
relied more on primary data, a widely accepted technique of
analysis for the purpose of the study. The study is based on
cross sectional data and therefore has made use of the
multiple regression analysis technique to arrive at
conclusions. The main purpose of this technique in some cases,
is to find out the factors necessary to promote the wide
spread initiation of Project Management (PM) Education in
technical and business schools in India. Cases of six
institutions where PM is being taught are described separately
in Chapter 4, Section A covering Academic Institutions’
Analysis, (Refer Chp. 4). A case of an executive who has70
undergone PM training while in active service is included in
Chapter 5.
The study is divided into three sections. In section One, we
analyze and discuss the state of PM education in academic
institutions offering technical and management education. In
sections Two and Three, the findings from the segments of
practicing executives and human resource managers
respectively, have been discussed. The period in which the
survey and primary research work was carried out was March –
May, 2010.
3.6 Academic Institutions
a) Sources of Data: The study uses primary sources of data
obtained from academic institutions.
b) Data Collection Instrument - Schedules (Questionnaires) : A
questionnaire was prepared as a research instrument and was
administered by two means 1) personal in depth interviews 2)
by correspondence (email/courier). A total of 120
questionnaires were printed. The bulk of the survey was
conducted through the personal interviews administered to
faculty employed in engineering and management institutions in
India.
c) Data Collection Method - Direct Interview Method : A total
of 81 units of responses were obtained of which 5 were
received by mail/courier. In the southern region, of the 29
institutions approached, 19 interview responses were obtained.
In the central and eastern zones, a total of 25 institutions71
were approached and 18 responses were received. In the
northern region, 21 institutions were approached and 16
interview responses were received. In the western region, a
total of 25 institutions were approached and the responses
received were 21.
Questionnaires were also sent via email and 2 questionnaires
by courier. Of the 15 questionnaires sent by email, responses
for 7 were received. Thus a total of 81 responses were
received from a mix of government aided, autonomous and
‘deemed to be university’ institutions.
d) Sampling Procedure: The key features of the sampling
procedure are stated below.
d.1) Sampling Area: All India, as per 5 Zones within India
(given below)
d.2) Sample Size: 81 [Eastern India-05, Western India-21,
Northern India-16, Southern-26 and Central India-13.]
d.3) Sample Unit: Academic Institutions
d.4) Sampling Technique: The survey was conducted based on
zone wise proportionate sampling of technical schools in
India. In case of management institutions, it was based on
proportionate as well as convenience sampling technique. Thus
in the sample, western and northern regions have a greater
representation of the business institutions due to their
density as well as the easy access of the researchers to the
same.
72
e) Statistical Tools and Techniques: Pie Charts, Bar Diagrams,
Column Diagrams, Correlation & Regression Analysis, Factor
Analysis and Multiple Regression Analysis have been used.
Using the responses in selected areas such as experience of
faculty, their perceptions of the state of PM education in
India, the essentiality of teaching PM in technical and
management academic institutions, their ratings of subjects
and levels to be included in the PM curricula, impact on
employability, etc. the percentage share of respondents who
opted for a particular rating was derived. This was presented
in the form of graphs. Thereafter the numerical averages were
calculated to arrive at the overall rating assigned by the
respondents.
f) Analytical Software: The software used included MS - Excel,
SPSS and EVIEWS
The study uses descriptive statistics like pie charts, bar
diagrams wherever a simple descriptive data is being sought.
For e.g. in case of the type of academic institutions; years
of service of faculty respondents, their personal PM related
research pursuits, the funding of PM related research in their
institutions or whether the faculty has published papers in
the same, and such type of questions, the data have been
presented using the above mentioned methods.
In order to find out the extent of interrelationship within
the factors, the Correlation Matrix (Multi-Colinearity) was
used, like in the case of subjects that are necessary to be
73
included in PM curricula. Another tool, the multiple
regression analysis was used to find out (1) the factors that
are viewed by respondents from institutions as essential for
introduction of PM courses in technical, architectural and
business management curricula, (2) the importance of PM
education as rated by the faculty respondents and (3) the
resource availability and management support within the
institute. The Multiple Regression Model is discussed below.
g) Multiple Regression Model: The Multiple Regression Model as
described in detail below has been used to find out the
ratings given by the individual respondents to specific
questions related to the subject matter of PM education. In
the study, three models have been attempted.
Model 1:- Multiple Regression Analysis of PM Education Ratings
as Dependent Variable and Essentiality of PM education in
Engineering, Management, Architecture, Planning and Design,
and Infrastructure Management Institutions as Explanatory
Variable (Independent Variable)
Here, the dependent variable is the Overall Rating of PM
Education in India (RPME Ins) and it is on a 5-point scale,
i.e., 1=Poor, 2=Fair, 3=Good, 4-Very Good and 5=Excellent. The
explanatory variables are the same scaled ratings of the
Essentiality of PM education in Engineering (REng), Management
(RMgnt), Architecture (RArch), Planning and Design (RPND), and
Infrastructure Management (RInfra) academic institutions.
Therefore, the regression equation for this part is follows.
74
RPME(Ins) = r1 REng + r2 RMgnt + r3 RArch + r4 RPND + r5 RInfra +
C (I)
Where, RPME(MNT) is the rating of PM Education and r1, r2, r3,r4, r5,
are the regression coefficients of the corresponding ratings
of the Essentiality of PM education in Engineering (REng),
Management (RMgnt), Architecture (RArch), Planning and Design
(RPND), and Infrastructure Management (RInfra) Institutions. C
is the Constant Term.
Model 2: Multiple Regression Analysis of PM Education Ratingsas Dependent Variable and Institute Infrastructure Support asExplanatory Variable (Independent Variable)
The dependent variable is the overall Rating of PM Education
in India (RPME Infra). The explanatory variables are the same
scaled ratings of the Institute Infrastructure Support. The
important infrastructure is Availability of Library and e-
resources (RLib), Course Material (RCM), Classrooms (RCR) and
Qualified Faculty (RQF). C is the Constant Term.
Therefore, the regression equation for this part is follows.
RPME Infra = r1 RLib +r2 RCM + r3 RCR + r4 RQF
(II)
Where RPME Infra is the PM Education rating, r1, r2, r3, r4 are
the regression of the corresponding ratings of the
Availability of Library and e-resources, Course Material,
Classrooms, and Qualified Faculty. C is the Constant Term.
75
Model 3: Multiple Regression Analysis of PM Education Ratings
as Dependent Variable and Management Support as Explanatory
Variable (Independent Variable)
Here, the dependent variable is the Overall Rating of PM
Education in India (RPME Mgmt) and it is on 5-point scale, i.e.,
1=Poor, 2=Fair, 3=Good, 4-Very Good and 5=Excellent. The
explanatory variables are the same scaled ratings of the
Management Support for introducing Courses in PM in the
Institute (RPMCourse) and Effect on Employability of PM
(REPM).
Therefore, the regression equation for this part is follows.
RPME(Mgmt) = r1 RPMCourse + r2 REPM + C
(III)
Where, RPME (Mgmt) is the rating of PM Education and r1, r2, are the
regression coefficients of the corresponding ratings of the
Management Support for introducing Courses in PM in the
Institute (RPM Course) and Effect on Employability of PM
(REPM). C is the Constant Term.
3.7 Practising Executives Of Project Based Companies
a) Sources of Data: The study uses primary sources of data
b) Data Collection Method - Indirect Method : Questionnaires
were handed over to the respondents and they were asked to
fill them out at their own convenience. The research team
member then went back to collect the filled out
questionnaires. 76
c) Data Collection Instrument: Schedules (Questionnaires) were
used for data collection.
d) Sampling Procedure: The Judgment Sampling technique was
used for the executives who have undergone the training as
they were the best prospects to elicit accurate information.
NICMAR is perhaps the only techno – management institute in
the country in PM centric training with the most extensive PM
training programmes being conducted through its School of
Executive Education (SOEE).
d.1) Sampling Area: the sampling are encompassed all India
d.2) Sample Size: The total sample size is 88. The given
sample has been drawn from the executives participating in
NICMAR’s executive training programmes. In the year 2009-2010,
NICMAR has trained a total of 721 executives from 30 different
companies. Out of the total executives trained by SOEE, a
sample of 88 executives was selected. Their distribution is as
follows. Northern India – 7, Southern India – 20, Eastern
India – 4 and Western India fifty – 6 executives. The sample
size represented 12.2% of the population of executives trained
by the SOEE.
d.3) Sample Unit: The sample unit comprised executives from
various large project based organizations who have undergone
training in Project Management at NICMAR.
e) Statistical Tools and Techniques: Pie Charts, Bar Diagrams,
Column Diagrams, Correlation & Regression Analysis, Factor
Analysis and Multiple Regression Analysis.77
Using the responses in selected areas such as experience of
executives, value of projects, ratings of subjects and levels
to be included in the PM curricula, gaining perspectives
related to project strategy, their perceptions as to why PM
education is not taking roots in India, the percentage share
of respondents who opted for a particular rating was derived.
This was presented in the form of graphs. Thereafter the
numerical averages were calculated to arrive at the overall
rating assigned by the respondents.
f) Analytical Software: Software used includes Excel, SPSS and
EVIEWS
The study uses pie charts to show the experience of the
executives in organization. Bar diagrams are used to show the
total size of the projects, major techniques that are used
during the projects and other similar cases.
3.8 Human Resource Managers Of Project Based Companies
a) Sources of Data: The primary sources of data for the study
are human resource managers working in project based
companies.
b) Data Collection Method: Direct Interview Method is used
c) Data Collection Instrument: Schedules (Questionnaires) are
used for data collection.
d) Sampling Procedure: Judgment and Convenience sampling
technique has been used. Over 32 human resource managers had
been approached through personal telephonic appointments for78
interview. In most of the cases, they asked for a copy of the
questionnaire for prior viewing. A follow up via telephone and
email was done. From the northern region, only one respondent,
i.e., a human resource manager from DLF Ltd. responded to the
survey. From the southern region, 5 managers responded, in
case of eastern region, 2 managers, from the western region 9,
and lastly from the central region, 3 managers’ responses have
been taken into consideration. The researchers felt that a
slightly smaller size is adequately representative of the
whole, as this set of persons is responsible for the planning
and deployment of PM related training, company wide. Moreover
the respondents chosen in this sample had considerable
experience in the design of such training programmes around
the year. It was felt that as a result of their continuous
planning and monitoring of PM related training programmes,
they would be appropriate to offer views on the exact nature
of PM training as “experts”. Thus the judgment and convenience
method of sampling was used for the purpose.
d.1) Sampling Area: the sampling are includes all India.
d.2) Sample Size: A total sample of 20 was interviewed from
all over India, drawn from project based companies.
d.3) Sample Unit: The sample unit comprises human resource
managers from leading PM companies in India.
e) Statistical Tools and Techniques: Pie Charts, Bar Diagrams,
Column Diagrams.
79
Using the responses in selected areas such as the inception of
PM training in companies, factors considered essential before
planning PM training programmes, training cost benefits,
training efficacy, the percentage share of respondents who
opted for a particular rating was derived. This was presented
in the form of graphs. Thereafter the numerical averages were
calculated to arrive at the overall rating assigned by the
respondents.
f) Analytical Software: The software used includes Excel, SPSS
and EVIEWS
The study uses pie charts to show the various types of
training imported in the organizations and various bar
diagrams and graphs to highlight the outcome of the training,
and expenditure during the training as given by the
respondents. Annexures 1 – 8 give all the details of
questionnaires designed, institutions, executives and
companies responding to the survey, master database generated
from the research study, etc.
80

CHAPTER 4
DATA ANALYSIS OF SURVEY OF TECHNICAL AND BUSINESSINSTITUTIONS IN INDIA
4.1 Introduction
81

The Questionnaire was designed for eliciting response from
faculty, actively serving in technical and business
institutions on a wide range of issues surrounding PM
education in the respondent’s institution as well as in
his/her general opinion as an important stakeholder in this
arena. The questionnaire was divided into four parts. The
first part asked for the responding faculty’s background
information. The second part aimed at discovering his/her
general opinion on project management (PM) curricula in India.
The third part aimed at identifying any distinguishing factors
that characterize the specific PM curriculum development vis a
vis the usual curriculum. The fourth part dealt with finding
out about the existing educational infrastructure available
with institutions and also management support available to the
institutions to establish new courses. Also covered were
regulatory aspects that affect the institute’s decision in
launching new curricula. For every question, the respondent
was asked to provide a tick/score as per his/her opinion. The
Likert type 5 – point scale was included in order to be able
to quantify the data.
In case of rating of subjects, along with the simple
percentage calculations, numerical average rating scores have
been computed and shown in brackets in front of the ratings of
subjects and levels. The average rating score contained in the
brackets is to be interpreted as follows
0 – 1 : not important
1 – 2 : somewhat important82
2 – 3 : important
3 – 4 : very important
4 – 5 : extremely important.
Using the responses in selected areas such as experience of
faculty, their perceptions of the state of PM education in
India and the essentiality of teaching PM in technical and
management academic institutions, ratings of subjects and
levels to be included in the PM curricula, impact on
employability etc. the percentage share of respondents who
opted for a particular rating was derived. This was presented
in the form of graphs. Thereafter the numerical average rating
scores were calculated to arrive at the overall rating
assigned by the respondents. In subsequent sections, we
discuss the data findings for the technical and business
academic institutions from different zones in India.
4.2 PART I : Respondent’s Particulars And Details
Part I of the Questionnaire was to find out the details of the
respondents chosen for the survey. The questions in this part
were included with a view to elicit the description of the
sample in terms of the region (Fig 3) in which the institution
was located and the average experience of the respondents in
academics. It was also necessary to know the ‘category’ of the
institution (Fig 2). As seen in Fig 2, the majority of
respondents represent private institutions vis a vis
government sponsored institutions.
Figure 2: Category of Institutions
83
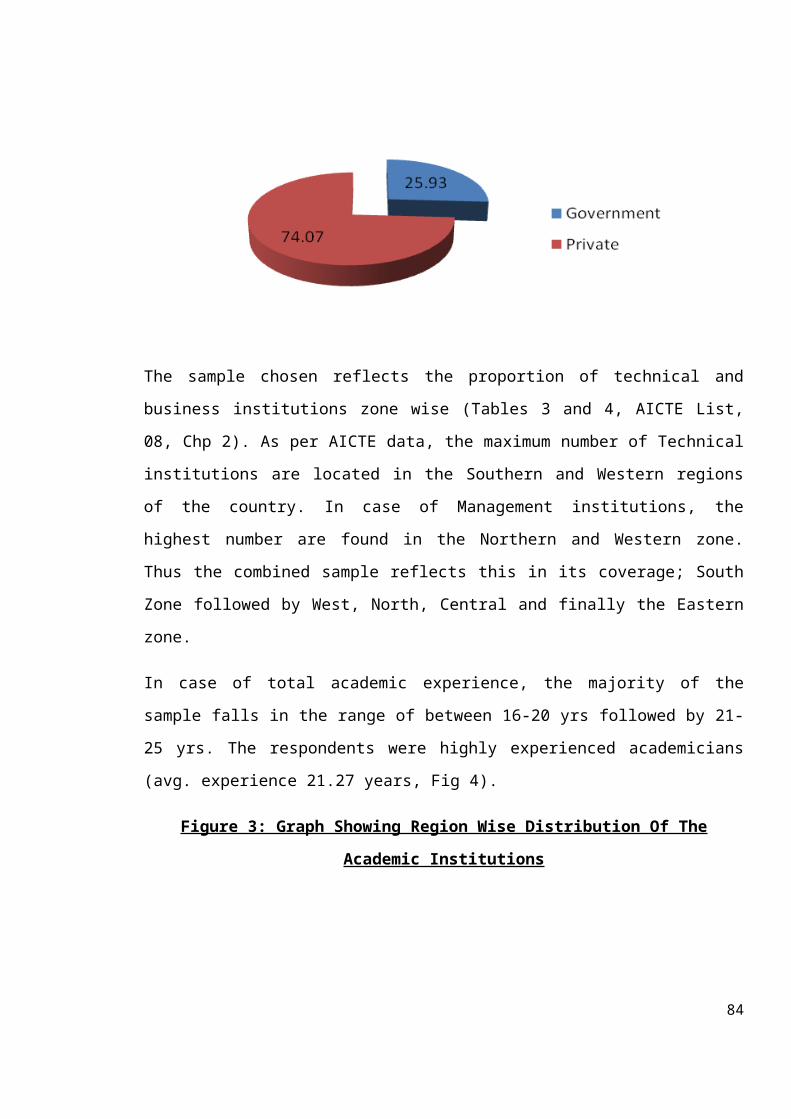
The sample chosen reflects the proportion of technical and
business institutions zone wise (Tables 3 and 4, AICTE List,
08, Chp 2). As per AICTE data, the maximum number of Technical
institutions are located in the Southern and Western regions
of the country. In case of Management institutions, the
highest number are found in the Northern and Western zone.
Thus the combined sample reflects this in its coverage; South
Zone followed by West, North, Central and finally the Eastern
zone.
In case of total academic experience, the majority of the
sample falls in the range of between 16-20 yrs followed by 21-
25 yrs. The respondents were highly experienced academicians
(avg. experience 21.27 years, Fig 4).
Figure 3: Graph Showing Region Wise Distribution Of The
Academic Institutions
84
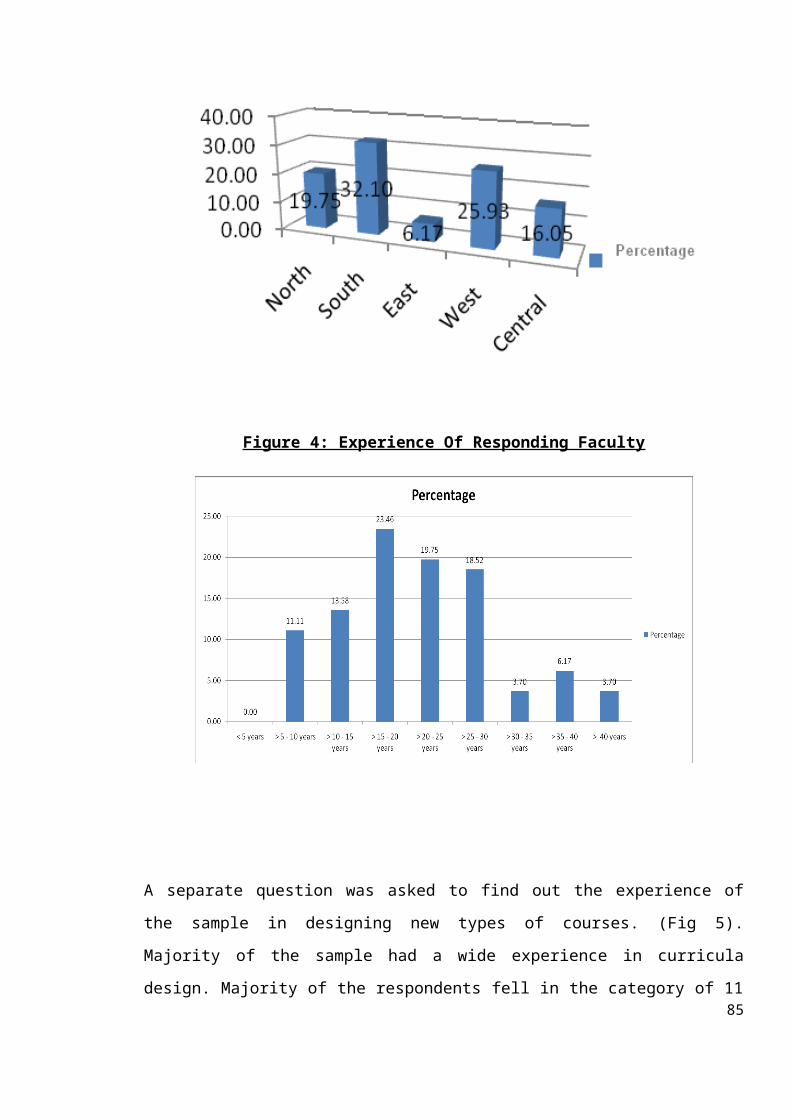
Figure 4: Experience Of Responding Faculty
A separate question was asked to find out the experience of
the sample in designing new types of courses. (Fig 5).
Majority of the sample had a wide experience in curricula
design. Majority of the respondents fell in the category of 1185
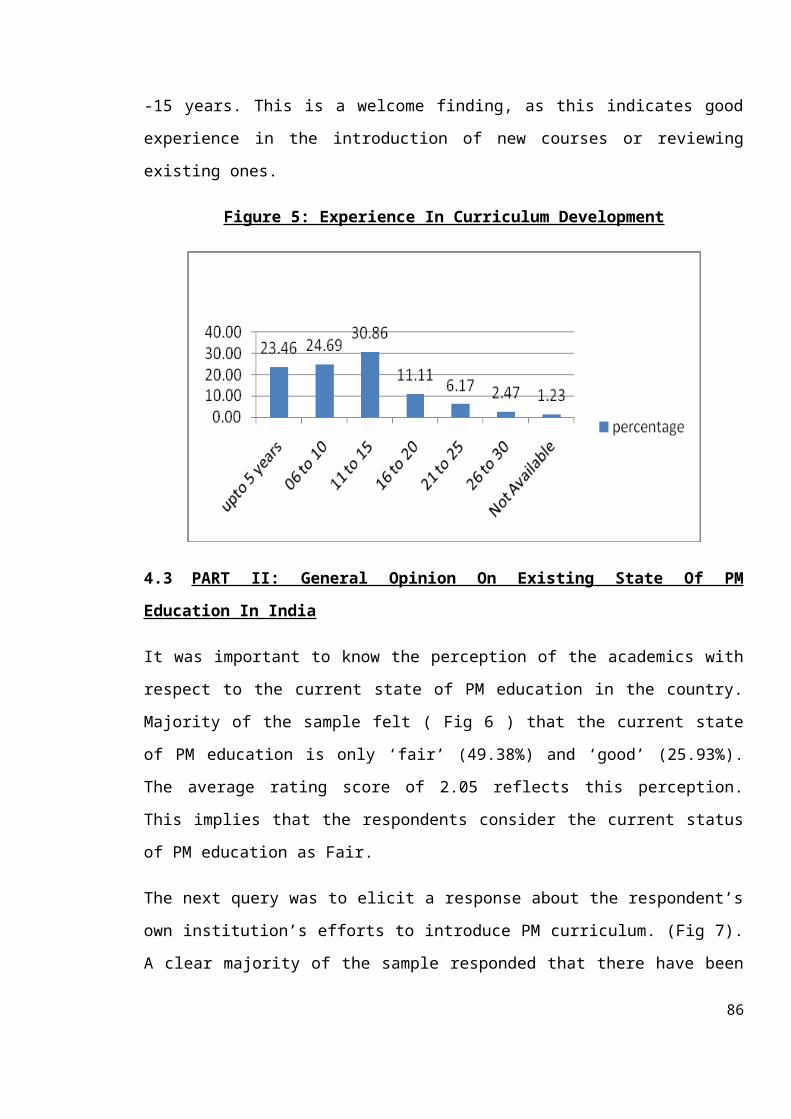
-15 years. This is a welcome finding, as this indicates good
experience in the introduction of new courses or reviewing
existing ones.
Figure 5: Experience In Curriculum Development
4.3 PART II: General Opinion On Existing State Of PM
Education In India
It was important to know the perception of the academics with
respect to the current state of PM education in the country.
Majority of the sample felt ( Fig 6 ) that the current state
of PM education is only ‘fair’ (49.38%) and ‘good’ (25.93%).
The average rating score of 2.05 reflects this perception.
This implies that the respondents consider the current status
of PM education as Fair.
The next query was to elicit a response about the respondent’s
own institution’s efforts to introduce PM curriculum. (Fig 7).
A clear majority of the sample responded that there have been
86
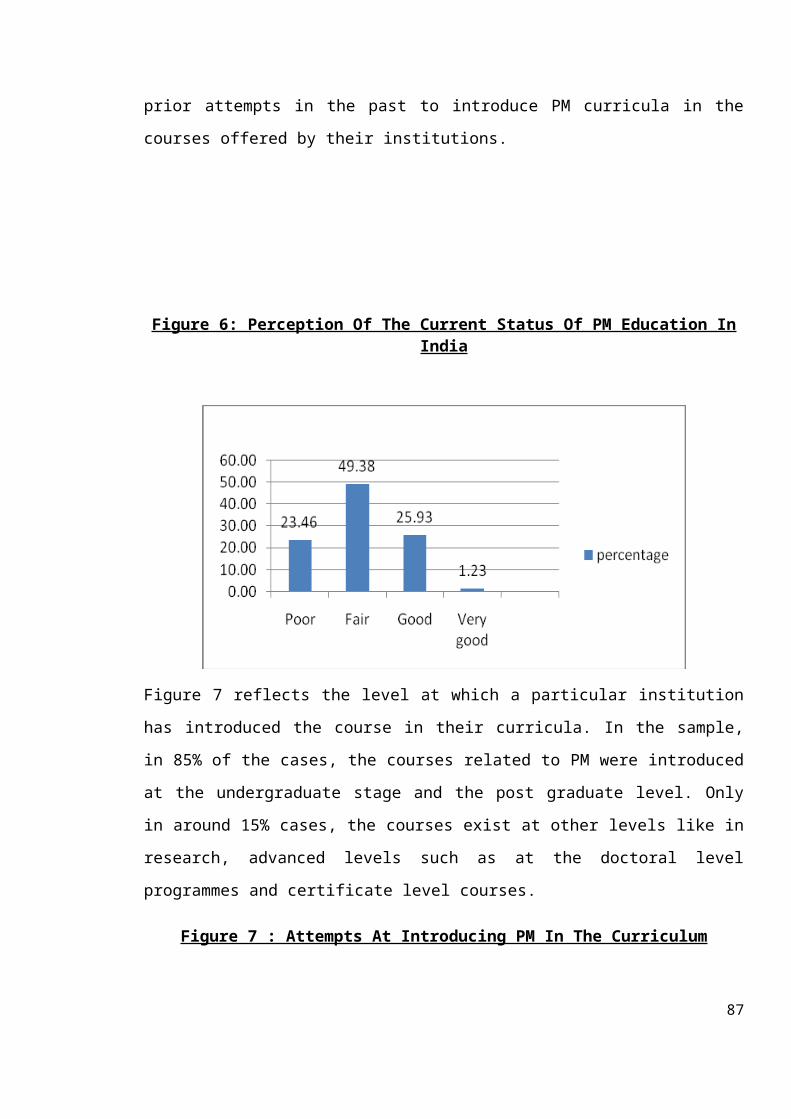
prior attempts in the past to introduce PM curricula in the
courses offered by their institutions.
Figure 6: Perception Of The Current Status Of PM Education InIndia
Figure 7 reflects the level at which a particular institution
has introduced the course in their curricula. In the sample,
in 85% of the cases, the courses related to PM were introduced
at the undergraduate stage and the post graduate level. Only
in around 15% cases, the courses exist at other levels like in
research, advanced levels such as at the doctoral level
programmes and certificate level courses.
Figure 7 : Attempts At Introducing PM In The Curriculum
87
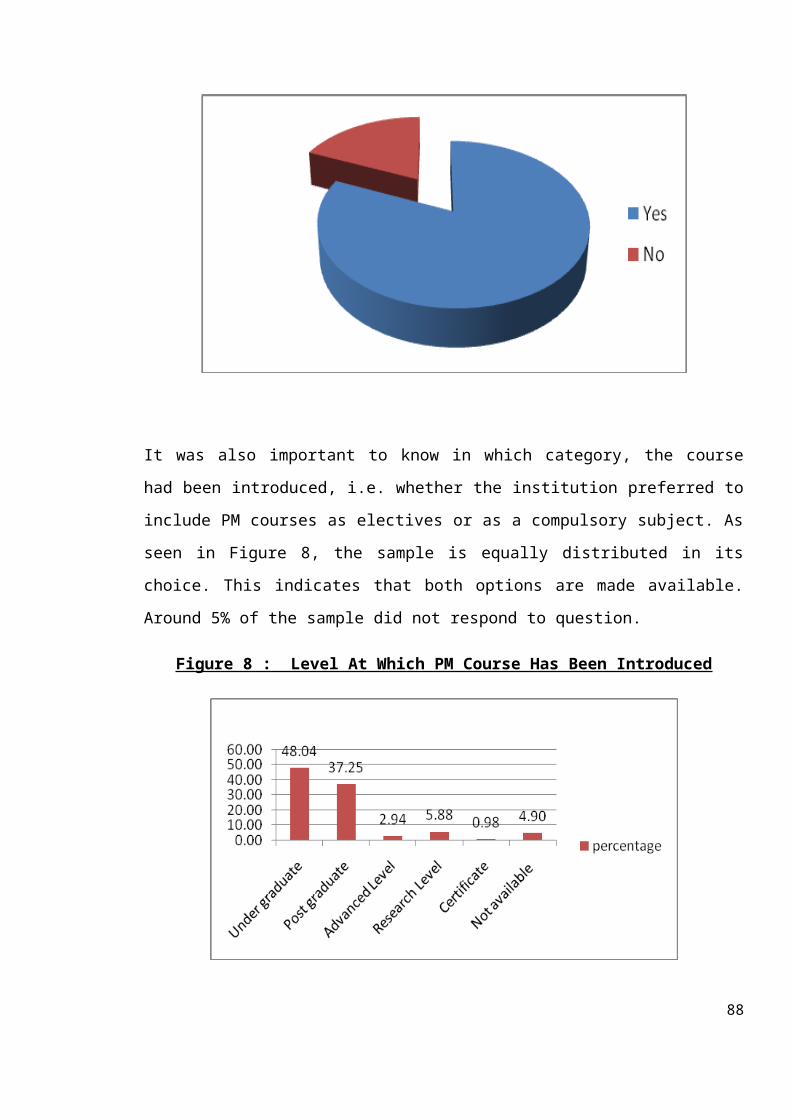
It was also important to know in which category, the course
had been introduced, i.e. whether the institution preferred to
include PM courses as electives or as a compulsory subject. As
seen in Figure 8, the sample is equally distributed in its
choice. This indicates that both options are made available.
Around 5% of the sample did not respond to question.
Figure 8 : Level At Which PM Course Has Been Introduced
88
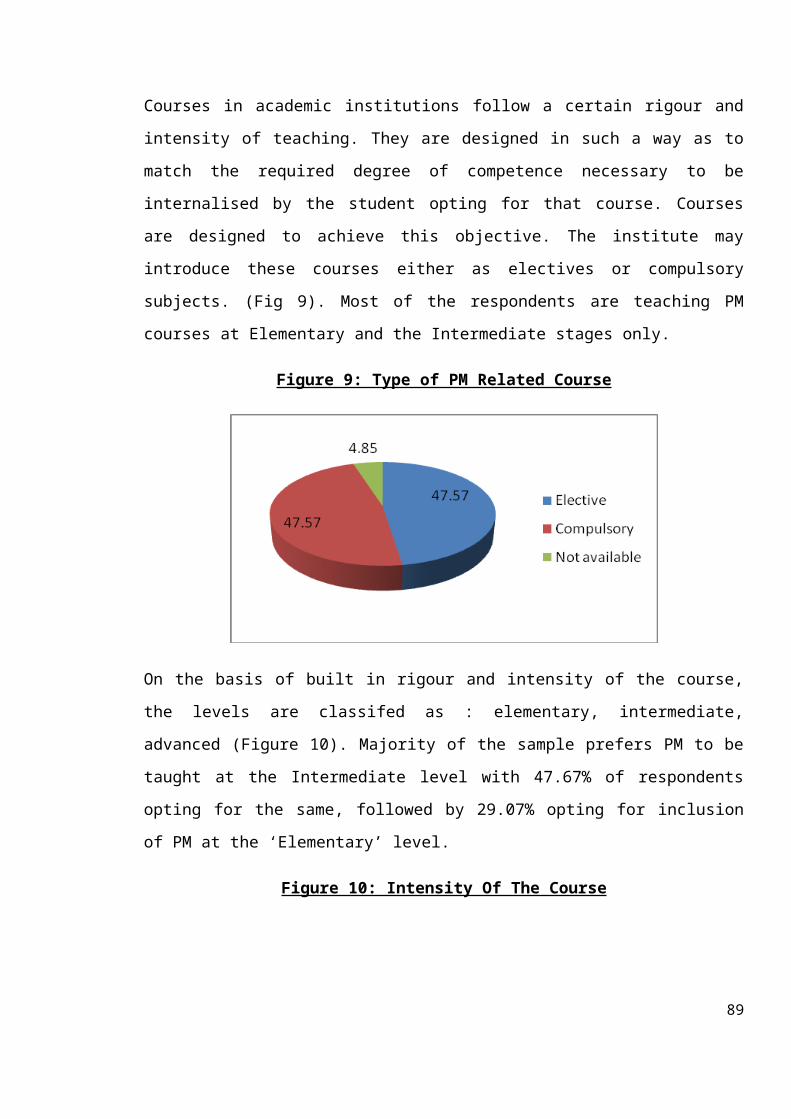
Courses in academic institutions follow a certain rigour and
intensity of teaching. They are designed in such a way as to
match the required degree of competence necessary to be
internalised by the student opting for that course. Courses
are designed to achieve this objective. The institute may
introduce these courses either as electives or compulsory
subjects. (Fig 9). Most of the respondents are teaching PM
courses at Elementary and the Intermediate stages only.
Figure 9: Type of PM Related Course
On the basis of built in rigour and intensity of the course,
the levels are classifed as : elementary, intermediate,
advanced (Figure 10). Majority of the sample prefers PM to be
taught at the Intermediate level with 47.67% of respondents
opting for the same, followed by 29.07% opting for inclusion
of PM at the ‘Elementary’ level.
Figure 10: Intensity Of The Course
89
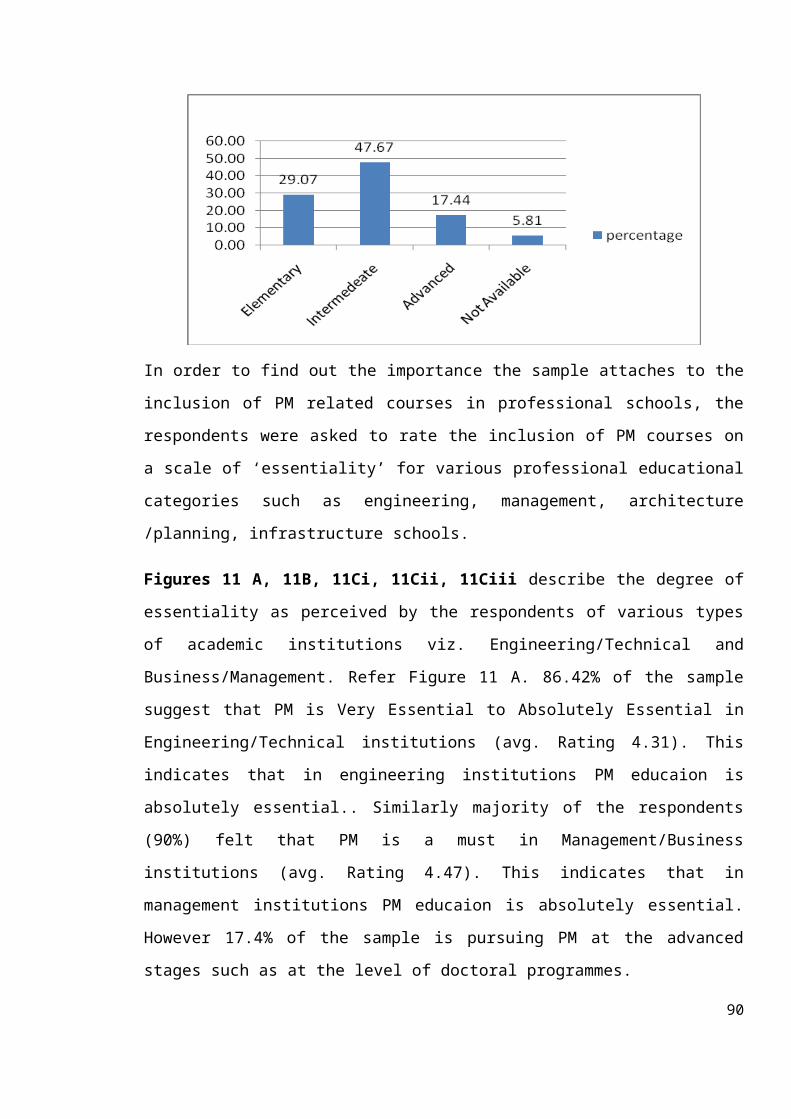
In order to find out the importance the sample attaches to the
inclusion of PM related courses in professional schools, the
respondents were asked to rate the inclusion of PM courses on
a scale of ‘essentiality’ for various professional educational
categories such as engineering, management, architecture
/planning, infrastructure schools.
Figures 11 A, 11B, 11Ci, 11Cii, 11Ciii describe the degree of
essentiality as perceived by the respondents of various types
of academic institutions viz. Engineering/Technical and
Business/Management. Refer Figure 11 A. 86.42% of the sample
suggest that PM is Very Essential to Absolutely Essential in
Engineering/Technical institutions (avg. Rating 4.31). This
indicates that in engineering institutions PM educaion is
absolutely essential.. Similarly majority of the respondents
(90%) felt that PM is a must in Management/Business
institutions (avg. Rating 4.47). This indicates that in
management institutions PM educaion is absolutely essential.
However 17.4% of the sample is pursuing PM at the advanced
stages such as at the level of doctoral programmes.
90
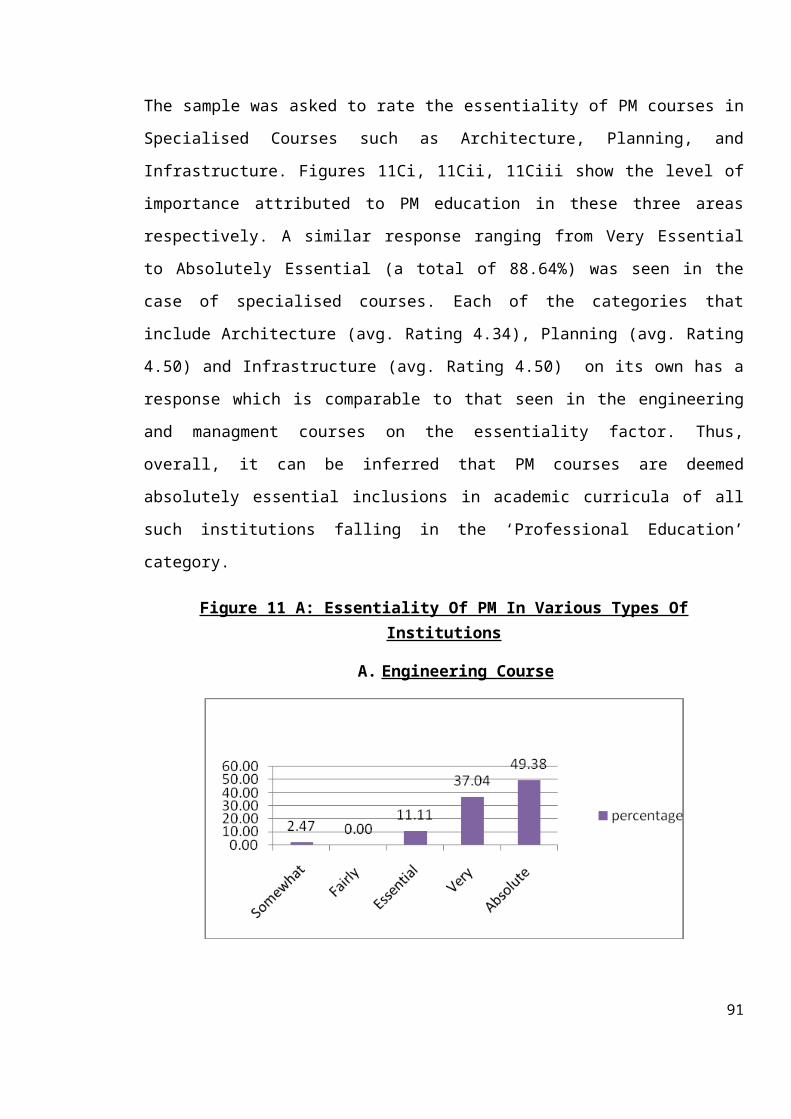
The sample was asked to rate the essentiality of PM courses in
Specialised Courses such as Architecture, Planning, and
Infrastructure. Figures 11Ci, 11Cii, 11Ciii show the level of
importance attributed to PM education in these three areas
respectively. A similar response ranging from Very Essential
to Absolutely Essential (a total of 88.64%) was seen in the
case of specialised courses. Each of the categories that
include Architecture (avg. Rating 4.34), Planning (avg. Rating
4.50) and Infrastructure (avg. Rating 4.50) on its own has a
response which is comparable to that seen in the engineering
and managment courses on the essentiality factor. Thus,
overall, it can be inferred that PM courses are deemed
absolutely essential inclusions in academic curricula of all
such institutions falling in the ‘Professional Education’
category.
Figure 11 A: Essentiality Of PM In Various Types OfInstitutions
A. Engineering Course
91
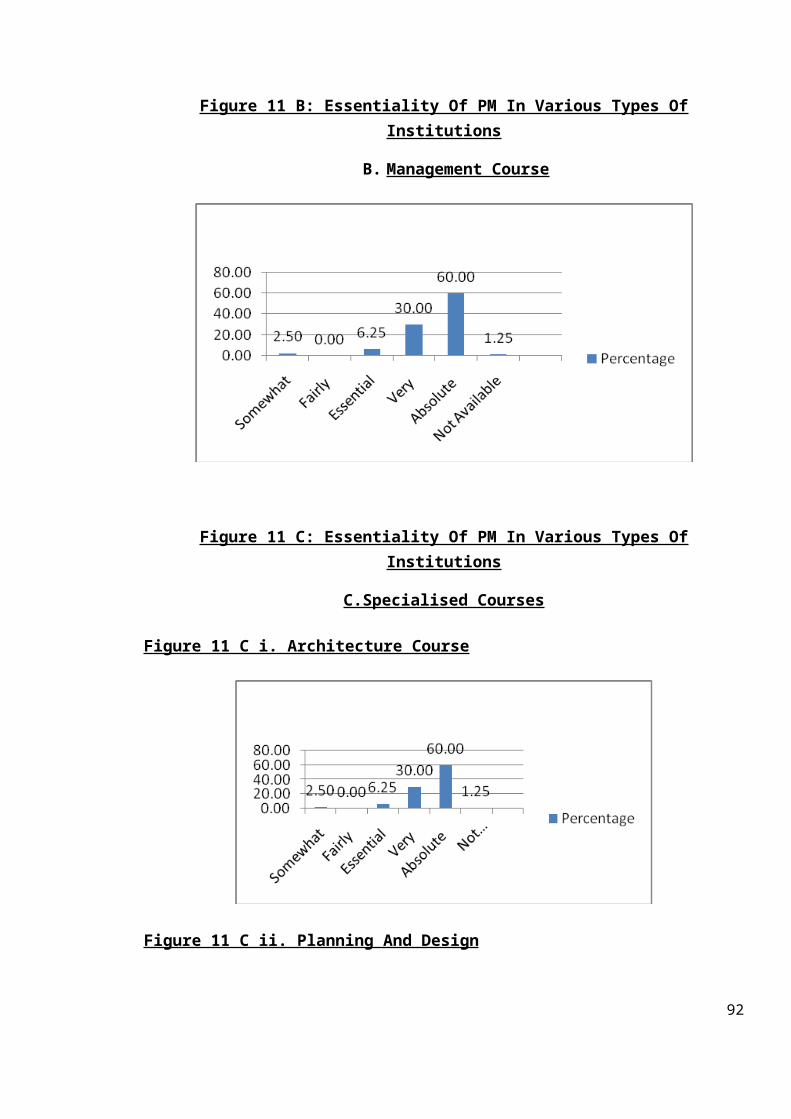
Figure 11 B: Essentiality Of PM In Various Types OfInstitutions
B. Management Course
Figure 11 C: Essentiality Of PM In Various Types OfInstitutions
C.Specialised Courses
Figure 11 C i. Architecture Course
Figure 11 C ii. Planning And Design
92
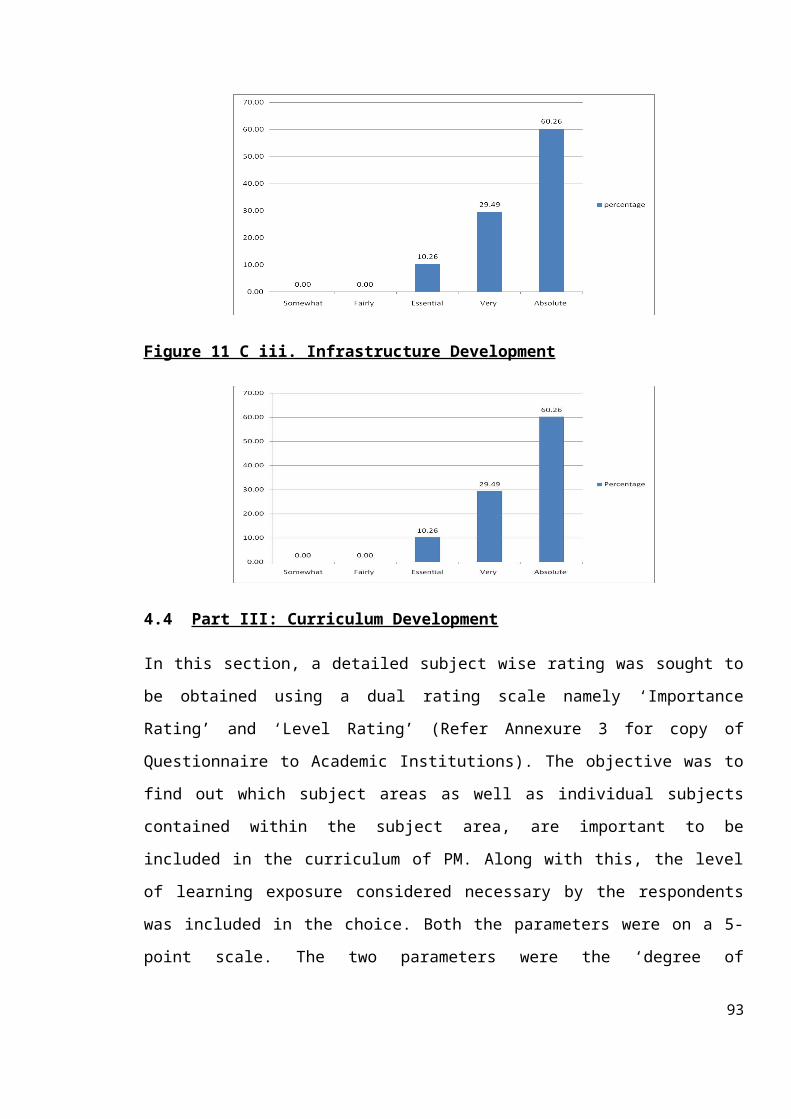
Figure 11 C iii. Infrastructure Development
4.4 Part III: Curriculum Development
In this section, a detailed subject wise rating was sought to
be obtained using a dual rating scale namely ‘Importance
Rating’ and ‘Level Rating’ (Refer Annexure 3 for copy of
Questionnaire to Academic Institutions). The objective was to
find out which subject areas as well as individual subjects
contained within the subject area, are important to be
included in the curriculum of PM. Along with this, the level
of learning exposure considered necessary by the respondents
was included in the choice. Both the parameters were on a 5-
point scale. The two parameters were the ‘degree of
93
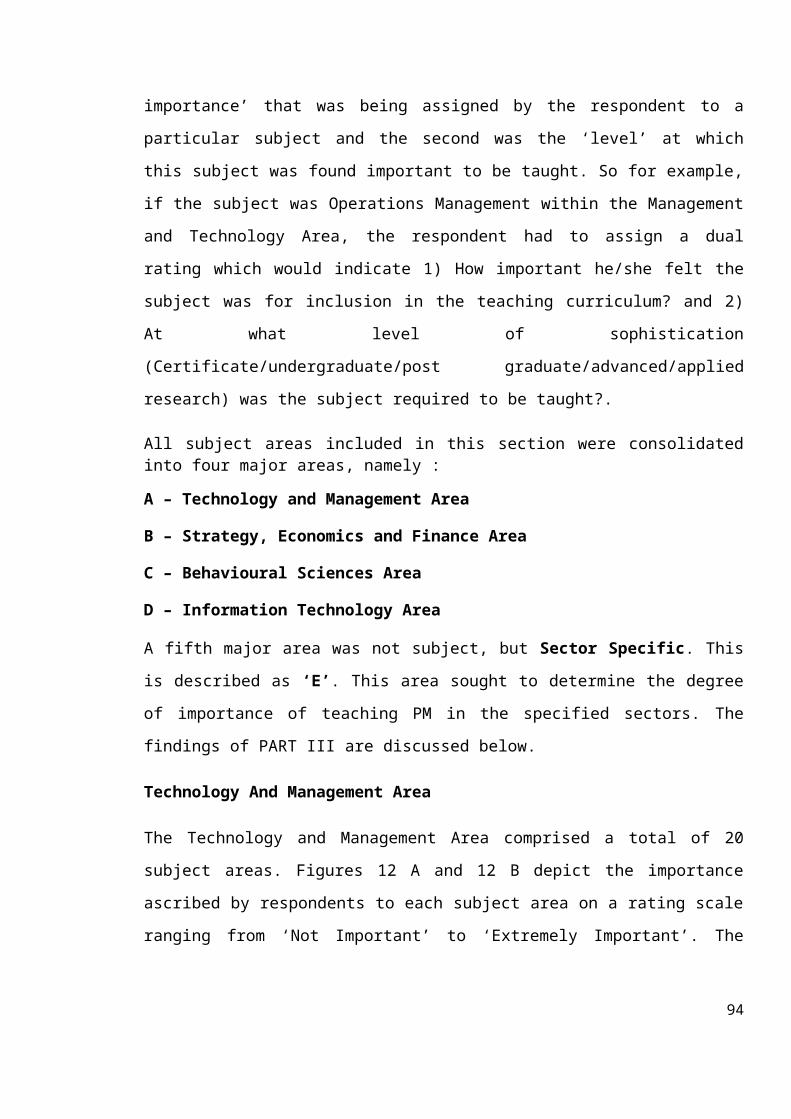
importance’ that was being assigned by the respondent to a
particular subject and the second was the ‘level’ at which
this subject was found important to be taught. So for example,
if the subject was Operations Management within the Management
and Technology Area, the respondent had to assign a dual
rating which would indicate 1) How important he/she felt the
subject was for inclusion in the teaching curriculum? and 2)
At what level of sophistication
(Certificate/undergraduate/post graduate/advanced/applied
research) was the subject required to be taught?.
All subject areas included in this section were consolidatedinto four major areas, namely :
A – Technology and Management Area
B – Strategy, Economics and Finance Area
C – Behavioural Sciences Area
D – Information Technology Area
A fifth major area was not subject, but Sector Specific. This
is described as ‘E’. This area sought to determine the degree
of importance of teaching PM in the specified sectors. The
findings of PART III are discussed below.
Technology And Management Area
The Technology and Management Area comprised a total of 20
subject areas. Figures 12 A and 12 B depict the importance
ascribed by respondents to each subject area on a rating scale
ranging from ‘Not Important’ to ‘Extremely Important’. The
94

average ratings assigned to various subjects in this area are
as follows :
AR1-Operations Management for Projects (3.79); AR2-Planning,
Scheduling, Monitoring and Control Techniques (3.98); AR3-
Statistical Methods for Projects Analysis (3.81); AR4-
Operations Research for Projects (3.87); AR5-Project Quality
Management (3.93); AR6-Health/Safety/Environment in Projects
(3.60); AR7-Cost Estimation and Budgeting (3.74); AR8-
Accounting and Control Systems (3.26); AR9-Quality Surveying
and Estimation (3.43); AR10-Projects Marketing (3.30); AR11-
Project Site and Equipment (3.40); AR12-Project Procurement
& /Materials Management (3.40); AR13-Contract Management
(3.31); AR14-Process Design/Engineering/Testing/Commissioning
(3.48); AR15-Facilities Engineering and Management (3.12);
AR16-Logistics & Supply Chain Management (3.37); AR17-
Transportation Management (3.12); AR18-Technology and
Engineering Management (3.46); AR19-Project Formulation and
Appraisal ( 3.46); AR20-Project Engineering (3.46).
On the basis of average rating scores, it can be inferred that
these subjects are very important and necessary to be included
in the curricula. However importance assigned is higher for
certain subjects including Operations Management; Planning,
Scheduling, Monitoring and Control Techniques; Statistical
methods, Operation research techniques; Project Quality
Management; Cost Estimation and Budgeting; Health, Safety and
Environment Management.
95
It was important to know the Level at which the above
mentioned subjects could be taught. Figure 12 B describes the
same. Majority of the respondents want the courses to be
taught at Undergraduate (47.37%) and Post Graduate (44.21%)
level. Some respondents (3.16%) would like Operations Research
for Projects (avg. Rating 2.72), Contract Management (avg.
Rating 2.76), Project Procurement and Materials Management
(avg. Rating 2.73), Project Formulation and Appraisal (avg.
Rating 2.84) to be included in the Post Graduate and Advanced
teaching also. Some respondents are aware of the importance of
research in areas like Operations Research for Projects,
Technology and Engineering Management (avg. Rating 2.83), and
Project Engineering (avg. Rating 2.78) and have opted for
this. Thus it can be inferred that the academics are well
aware and understand the importance of subjects and the levels
at which they should be included in PM curricula related to
the area of Technology and Management.
Figure 12 A: Ratings Of Subjects In Management And
Technology
96
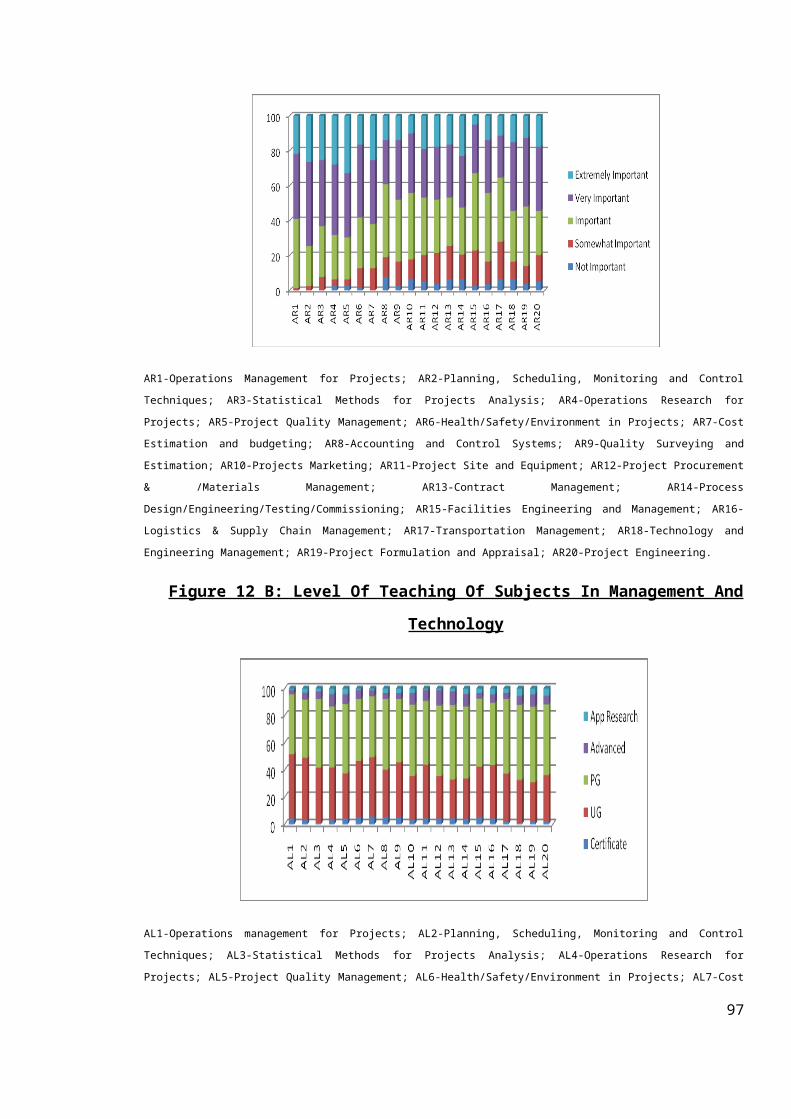
AR1-Operations Management for Projects; AR2-Planning, Scheduling, Monitoring and Control
Techniques; AR3-Statistical Methods for Projects Analysis; AR4-Operations Research for
Projects; AR5-Project Quality Management; AR6-Health/Safety/Environment in Projects; AR7-Cost
Estimation and budgeting; AR8-Accounting and Control Systems; AR9-Quality Surveying and
Estimation; AR10-Projects Marketing; AR11-Project Site and Equipment; AR12-Project Procurement
& /Materials Management; AR13-Contract Management; AR14-Process
Design/Engineering/Testing/Commissioning; AR15-Facilities Engineering and Management; AR16-
Logistics & Supply Chain Management; AR17-Transportation Management; AR18-Technology and
Engineering Management; AR19-Project Formulation and Appraisal; AR20-Project Engineering.
Figure 12 B: Level Of Teaching Of Subjects In Management And
Technology
AL1-Operations management for Projects; AL2-Planning, Scheduling, Monitoring and Control
Techniques; AL3-Statistical Methods for Projects Analysis; AL4-Operations Research for
Projects; AL5-Project Quality Management; AL6-Health/Safety/Environment in Projects; AL7-Cost
97
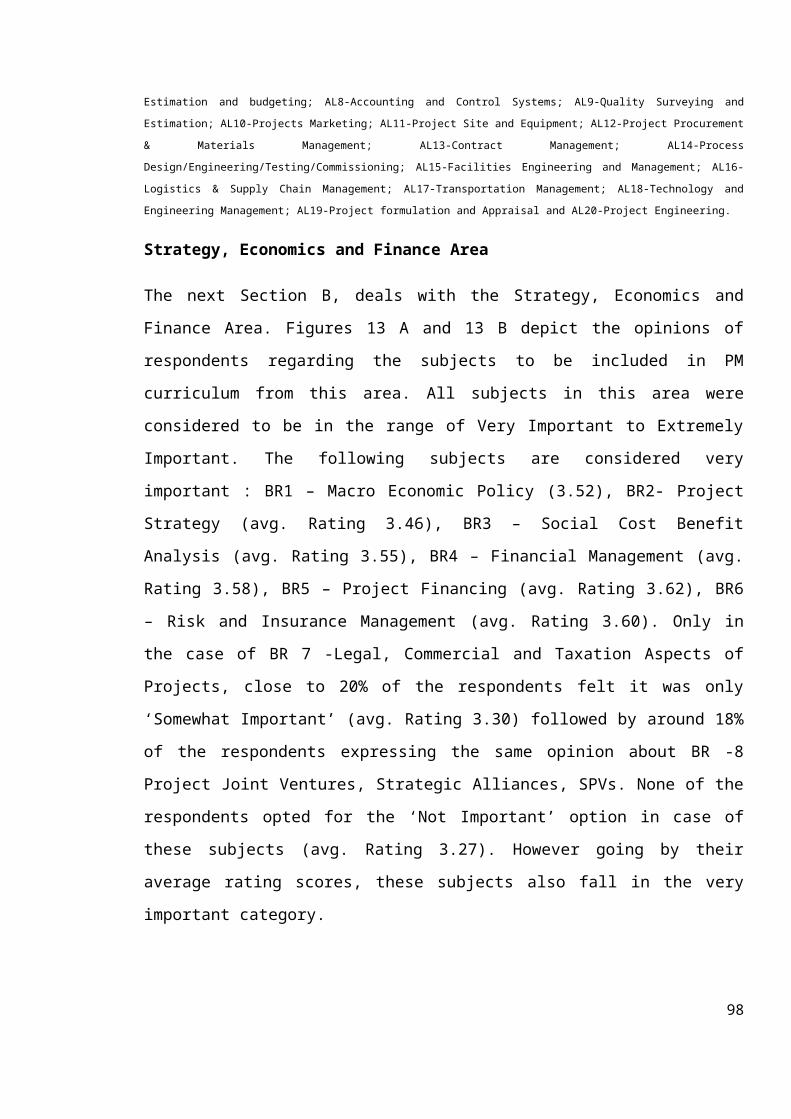
Estimation and budgeting; AL8-Accounting and Control Systems; AL9-Quality Surveying and
Estimation; AL10-Projects Marketing; AL11-Project Site and Equipment; AL12-Project Procurement
& Materials Management; AL13-Contract Management; AL14-Process
Design/Engineering/Testing/Commissioning; AL15-Facilities Engineering and Management; AL16-
Logistics & Supply Chain Management; AL17-Transportation Management; AL18-Technology and
Engineering Management; AL19-Project formulation and Appraisal and AL20-Project Engineering.
Strategy, Economics and Finance Area
The next Section B, deals with the Strategy, Economics and
Finance Area. Figures 13 A and 13 B depict the opinions of
respondents regarding the subjects to be included in PM
curriculum from this area. All subjects in this area were
considered to be in the range of Very Important to Extremely
Important. The following subjects are considered very
important : BR1 – Macro Economic Policy (3.52), BR2- Project
Strategy (avg. Rating 3.46), BR3 – Social Cost Benefit
Analysis (avg. Rating 3.55), BR4 – Financial Management (avg.
Rating 3.58), BR5 – Project Financing (avg. Rating 3.62), BR6
– Risk and Insurance Management (avg. Rating 3.60). Only in
the case of BR 7 -Legal, Commercial and Taxation Aspects of
Projects, close to 20% of the respondents felt it was only
‘Somewhat Important’ (avg. Rating 3.30) followed by around 18%
of the respondents expressing the same opinion about BR -8
Project Joint Ventures, Strategic Alliances, SPVs. None of the
respondents opted for the ‘Not Important’ option in case of
these subjects (avg. Rating 3.27). However going by their
average rating scores, these subjects also fall in the very
important category.
98
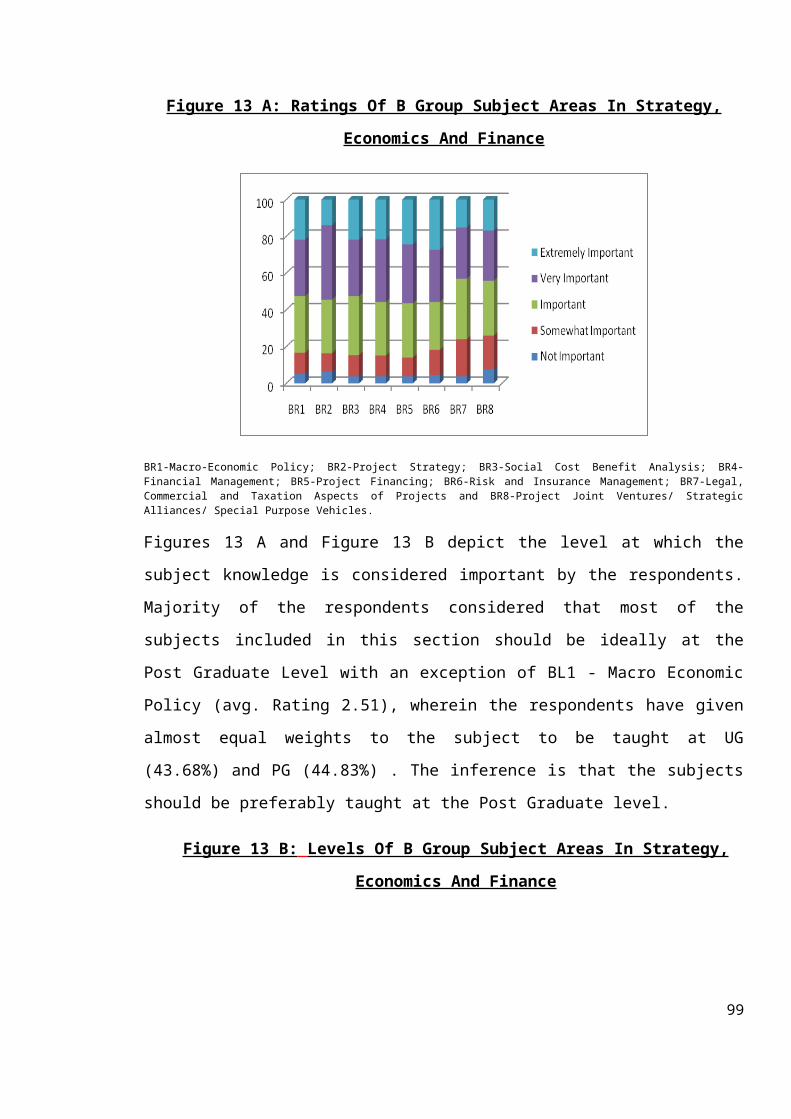
Figure 13 A: Ratings Of B Group Subject Areas In Strategy,
Economics And Finance
BR1-Macro-Economic Policy; BR2-Project Strategy; BR3-Social Cost Benefit Analysis; BR4-Financial Management; BR5-Project Financing; BR6-Risk and Insurance Management; BR7-Legal,Commercial and Taxation Aspects of Projects and BR8-Project Joint Ventures/ StrategicAlliances/ Special Purpose Vehicles.
Figures 13 A and Figure 13 B depict the level at which the
subject knowledge is considered important by the respondents.
Majority of the respondents considered that most of the
subjects included in this section should be ideally at the
Post Graduate Level with an exception of BL1 - Macro Economic
Policy (avg. Rating 2.51), wherein the respondents have given
almost equal weights to the subject to be taught at UG
(43.68%) and PG (44.83%) . The inference is that the subjects
should be preferably taught at the Post Graduate level.
Figure 13 B: Levels Of B Group Subject Areas In Strategy,
Economics And Finance
99
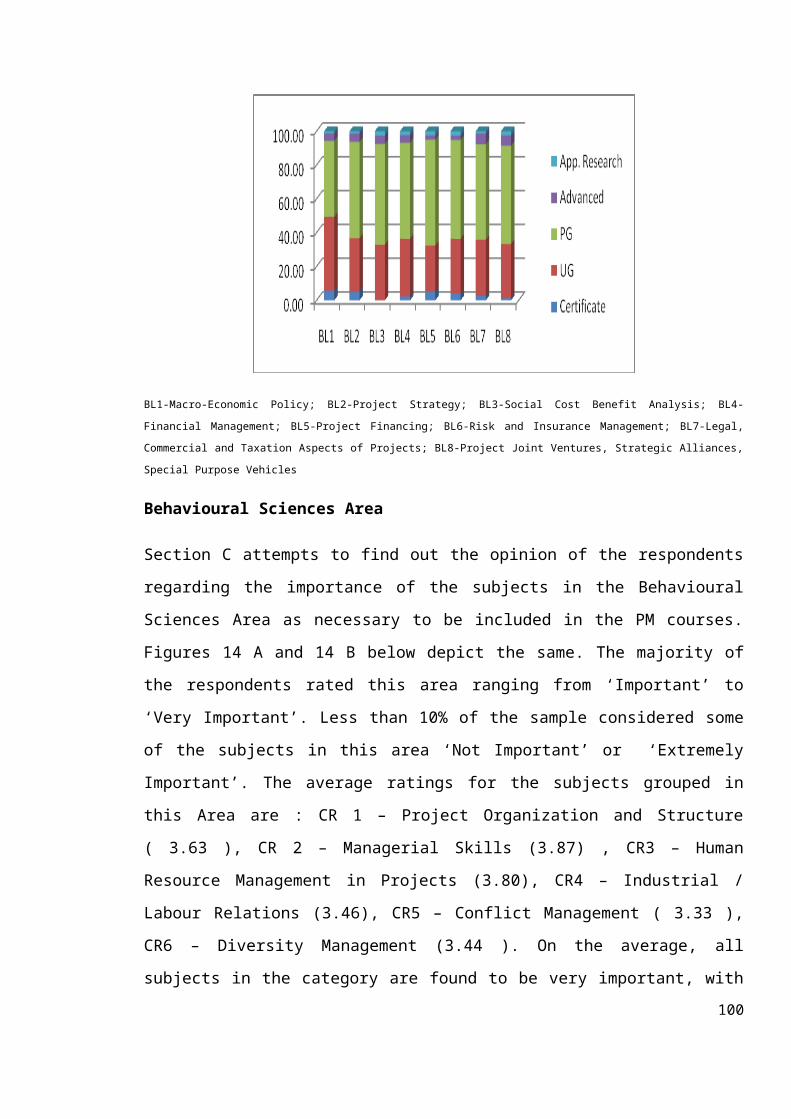
BL1-Macro-Economic Policy; BL2-Project Strategy; BL3-Social Cost Benefit Analysis; BL4-
Financial Management; BL5-Project Financing; BL6-Risk and Insurance Management; BL7-Legal,
Commercial and Taxation Aspects of Projects; BL8-Project Joint Ventures, Strategic Alliances,
Special Purpose Vehicles
Behavioural Sciences Area
Section C attempts to find out the opinion of the respondents
regarding the importance of the subjects in the Behavioural
Sciences Area as necessary to be included in the PM courses.
Figures 14 A and 14 B below depict the same. The majority of
the respondents rated this area ranging from ‘Important’ to
‘Very Important’. Less than 10% of the sample considered some
of the subjects in this area ‘Not Important’ or ‘Extremely
Important’. The average ratings for the subjects grouped in
this Area are : CR 1 – Project Organization and Structure
( 3.63 ), CR 2 – Managerial Skills (3.87) , CR3 – Human
Resource Management in Projects (3.80), CR4 – Industrial /
Labour Relations (3.46), CR5 – Conflict Management ( 3.33 ),
CR6 – Diversity Management (3.44 ). On the average, all
subjects in the category are found to be very important, with100
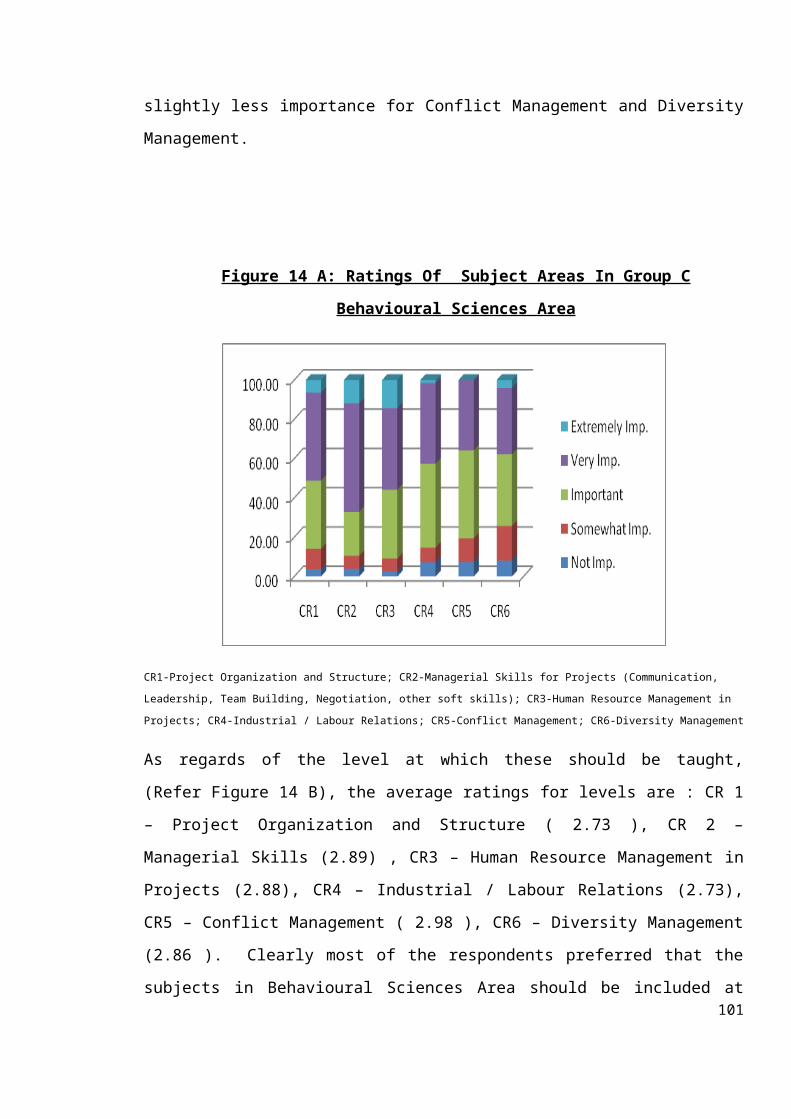
slightly less importance for Conflict Management and Diversity
Management.
Figure 14 A: Ratings Of Subject Areas In Group C
Behavioural Sciences Area
CR1-Project Organization and Structure; CR2-Managerial Skills for Projects (Communication,
Leadership, Team Building, Negotiation, other soft skills); CR3-Human Resource Management in
Projects; CR4-Industrial / Labour Relations; CR5-Conflict Management; CR6-Diversity Management
As regards of the level at which these should be taught,
(Refer Figure 14 B), the average ratings for levels are : CR 1
– Project Organization and Structure ( 2.73 ), CR 2 –
Managerial Skills (2.89) , CR3 – Human Resource Management in
Projects (2.88), CR4 – Industrial / Labour Relations (2.73),
CR5 – Conflict Management ( 2.98 ), CR6 – Diversity Management
(2.86 ). Clearly most of the respondents preferred that the
subjects in Behavioural Sciences Area should be included at101
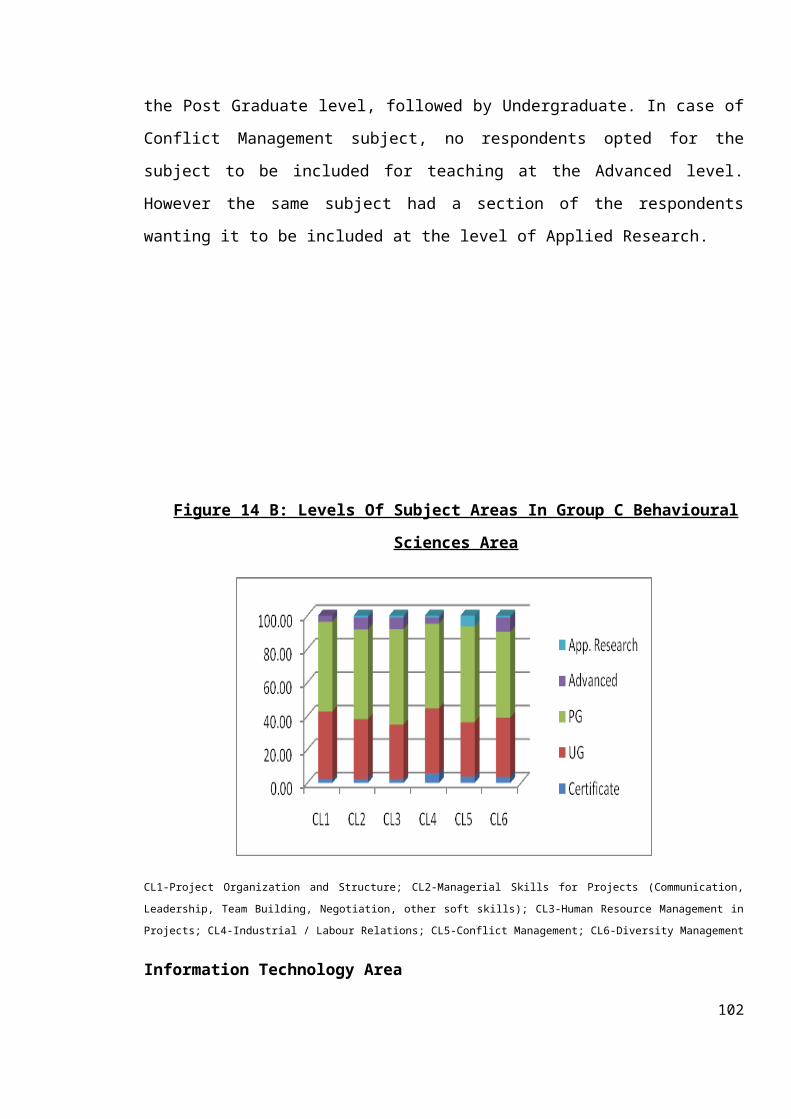
the Post Graduate level, followed by Undergraduate. In case of
Conflict Management subject, no respondents opted for the
subject to be included for teaching at the Advanced level.
However the same subject had a section of the respondents
wanting it to be included at the level of Applied Research.
Figure 14 B: Levels Of Subject Areas In Group C Behavioural
Sciences Area
CL1-Project Organization and Structure; CL2-Managerial Skills for Projects (Communication,
Leadership, Team Building, Negotiation, other soft skills); CL3-Human Resource Management in
Projects; CL4-Industrial / Labour Relations; CL5-Conflict Management; CL6-Diversity Management
Information Technology Area
102
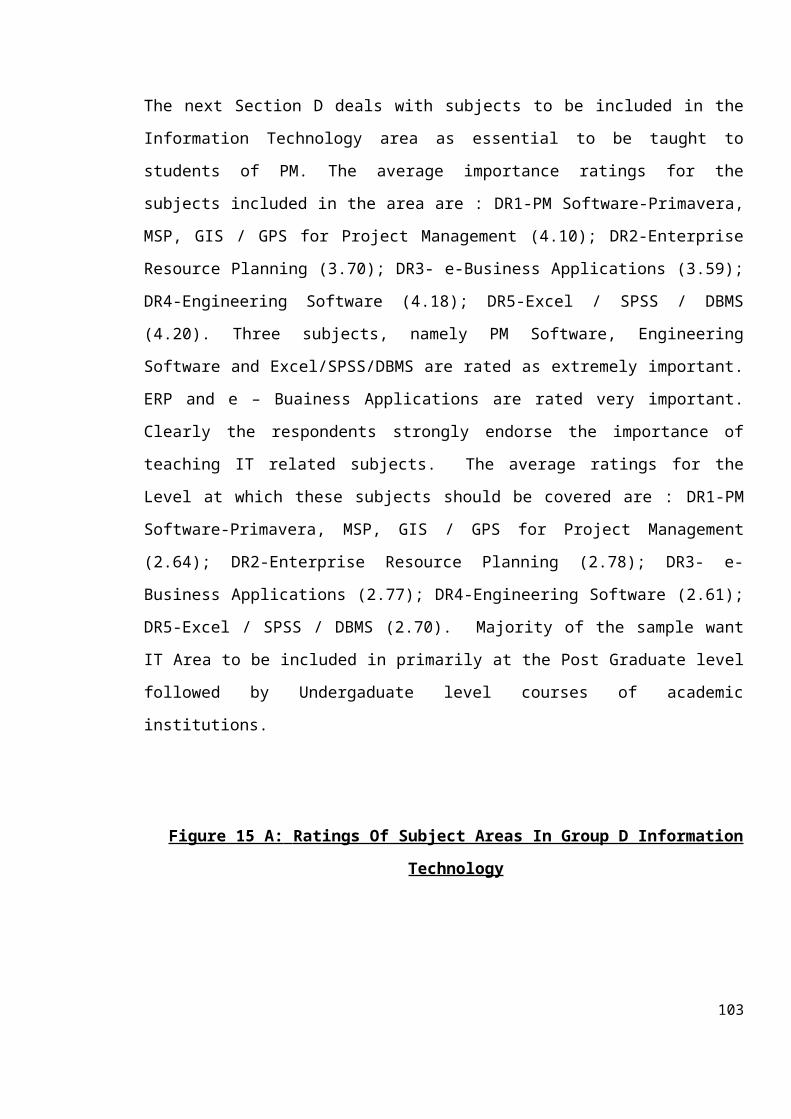
The next Section D deals with subjects to be included in the
Information Technology area as essential to be taught to
students of PM. The average importance ratings for the
subjects included in the area are : DR1-PM Software-Primavera,
MSP, GIS / GPS for Project Management (4.10); DR2-Enterprise
Resource Planning (3.70); DR3- e-Business Applications (3.59);
DR4-Engineering Software (4.18); DR5-Excel / SPSS / DBMS
(4.20). Three subjects, namely PM Software, Engineering
Software and Excel/SPSS/DBMS are rated as extremely important.
ERP and e – Buainess Applications are rated very important.
Clearly the respondents strongly endorse the importance of
teaching IT related subjects. The average ratings for the
Level at which these subjects should be covered are : DR1-PM
Software-Primavera, MSP, GIS / GPS for Project Management
(2.64); DR2-Enterprise Resource Planning (2.78); DR3- e-
Business Applications (2.77); DR4-Engineering Software (2.61);
DR5-Excel / SPSS / DBMS (2.70). Majority of the sample want
IT Area to be included in primarily at the Post Graduate level
followed by Undergaduate level courses of academic
institutions.
Figure 15 A: Ratings Of Subject Areas In Group D Information
Technology
103
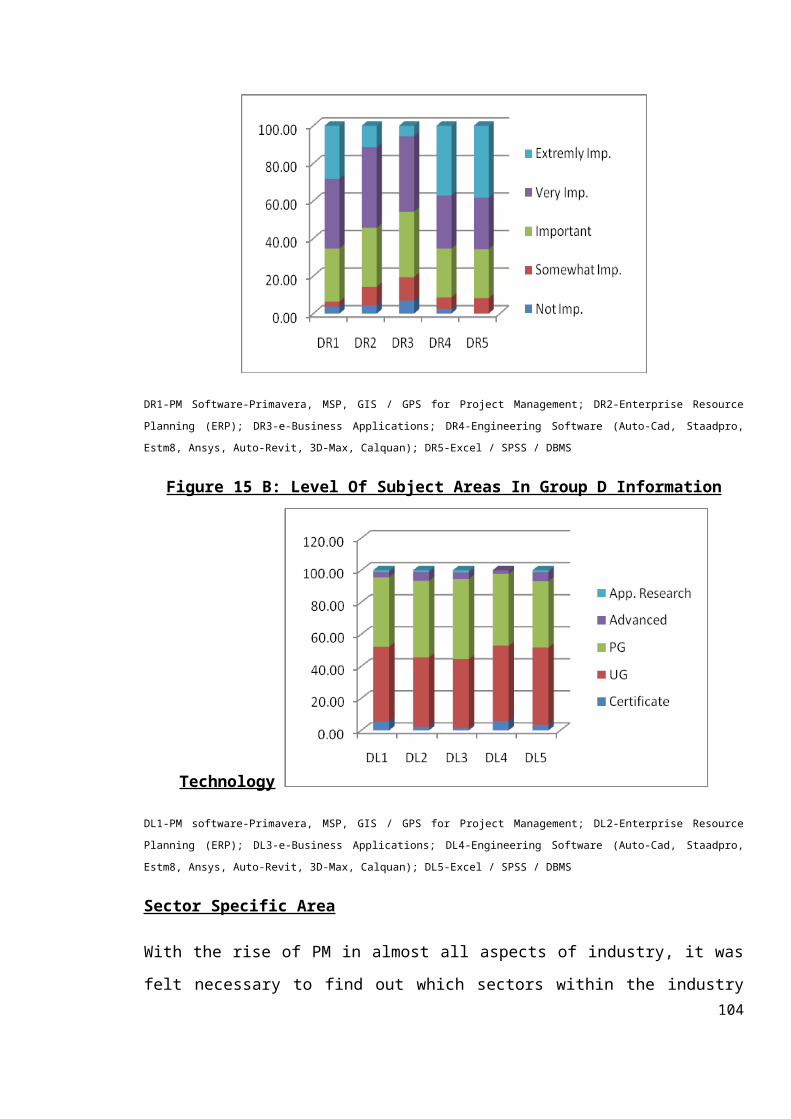
DR1-PM Software-Primavera, MSP, GIS / GPS for Project Management; DR2-Enterprise Resource
Planning (ERP); DR3-e-Business Applications; DR4-Engineering Software (Auto-Cad, Staadpro,
Estm8, Ansys, Auto-Revit, 3D-Max, Calquan); DR5-Excel / SPSS / DBMS
Figure 15 B: Level Of Subject Areas In Group D Information
Technology
DL1-PM software-Primavera, MSP, GIS / GPS for Project Management; DL2-Enterprise Resource
Planning (ERP); DL3-e-Business Applications; DL4-Engineering Software (Auto-Cad, Staadpro,
Estm8, Ansys, Auto-Revit, 3D-Max, Calquan); DL5-Excel / SPSS / DBMS
Sector Specific Area
With the rise of PM in almost all aspects of industry, it was
felt necessary to find out which sectors within the industry104
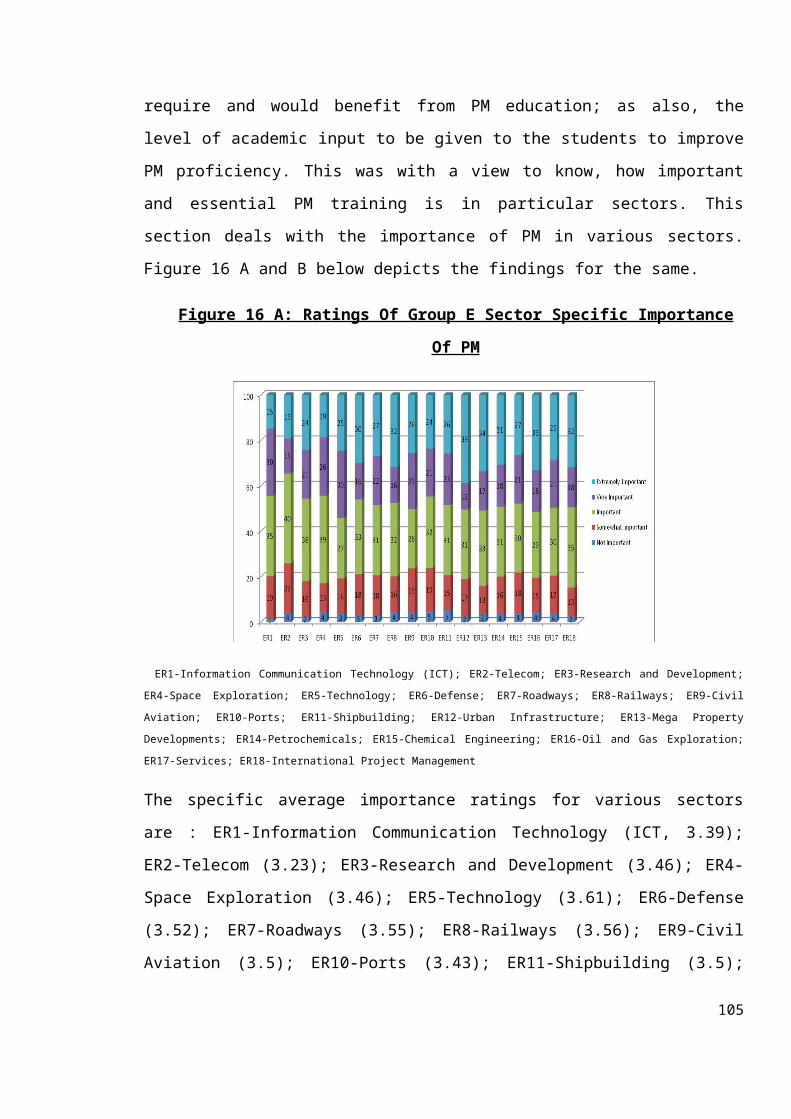
require and would benefit from PM education; as also, the
level of academic input to be given to the students to improve
PM proficiency. This was with a view to know, how important
and essential PM training is in particular sectors. This
section deals with the importance of PM in various sectors.
Figure 16 A and B below depicts the findings for the same.
Figure 16 A: Ratings Of Group E Sector Specific Importance
Of PM
ER1-Information Communication Technology (ICT); ER2-Telecom; ER3-Research and Development;
ER4-Space Exploration; ER5-Technology; ER6-Defense; ER7-Roadways; ER8-Railways; ER9-Civil
Aviation; ER10-Ports; ER11-Shipbuilding; ER12-Urban Infrastructure; ER13-Mega Property
Developments; ER14-Petrochemicals; ER15-Chemical Engineering; ER16-Oil and Gas Exploration;
ER17-Services; ER18-International Project Management
The specific average importance ratings for various sectors
are : ER1-Information Communication Technology (ICT, 3.39);
ER2-Telecom (3.23); ER3-Research and Development (3.46); ER4-
Space Exploration (3.46); ER5-Technology (3.61); ER6-Defense
(3.52); ER7-Roadways (3.55); ER8-Railways (3.56); ER9-Civil
Aviation (3.5); ER10-Ports (3.43); ER11-Shipbuilding (3.5);
105
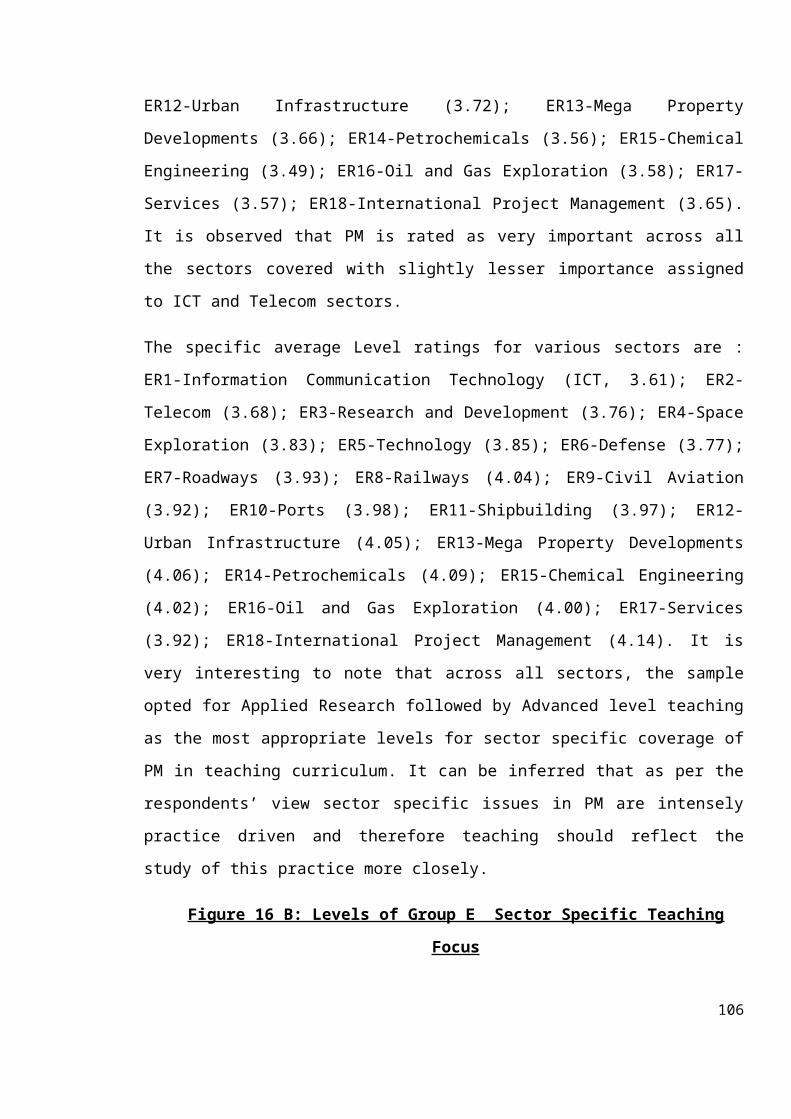
ER12-Urban Infrastructure (3.72); ER13-Mega Property
Developments (3.66); ER14-Petrochemicals (3.56); ER15-Chemical
Engineering (3.49); ER16-Oil and Gas Exploration (3.58); ER17-
Services (3.57); ER18-International Project Management (3.65).
It is observed that PM is rated as very important across all
the sectors covered with slightly lesser importance assigned
to ICT and Telecom sectors.
The specific average Level ratings for various sectors are :
ER1-Information Communication Technology (ICT, 3.61); ER2-
Telecom (3.68); ER3-Research and Development (3.76); ER4-Space
Exploration (3.83); ER5-Technology (3.85); ER6-Defense (3.77);
ER7-Roadways (3.93); ER8-Railways (4.04); ER9-Civil Aviation
(3.92); ER10-Ports (3.98); ER11-Shipbuilding (3.97); ER12-
Urban Infrastructure (4.05); ER13-Mega Property Developments
(4.06); ER14-Petrochemicals (4.09); ER15-Chemical Engineering
(4.02); ER16-Oil and Gas Exploration (4.00); ER17-Services
(3.92); ER18-International Project Management (4.14). It is
very interesting to note that across all sectors, the sample
opted for Applied Research followed by Advanced level teaching
as the most appropriate levels for sector specific coverage of
PM in teaching curriculum. It can be inferred that as per the
respondents’ view sector specific issues in PM are intensely
practice driven and therefore teaching should reflect the
study of this practice more closely.
Figure 16 B: Levels of Group E Sector Specific Teaching
Focus
106
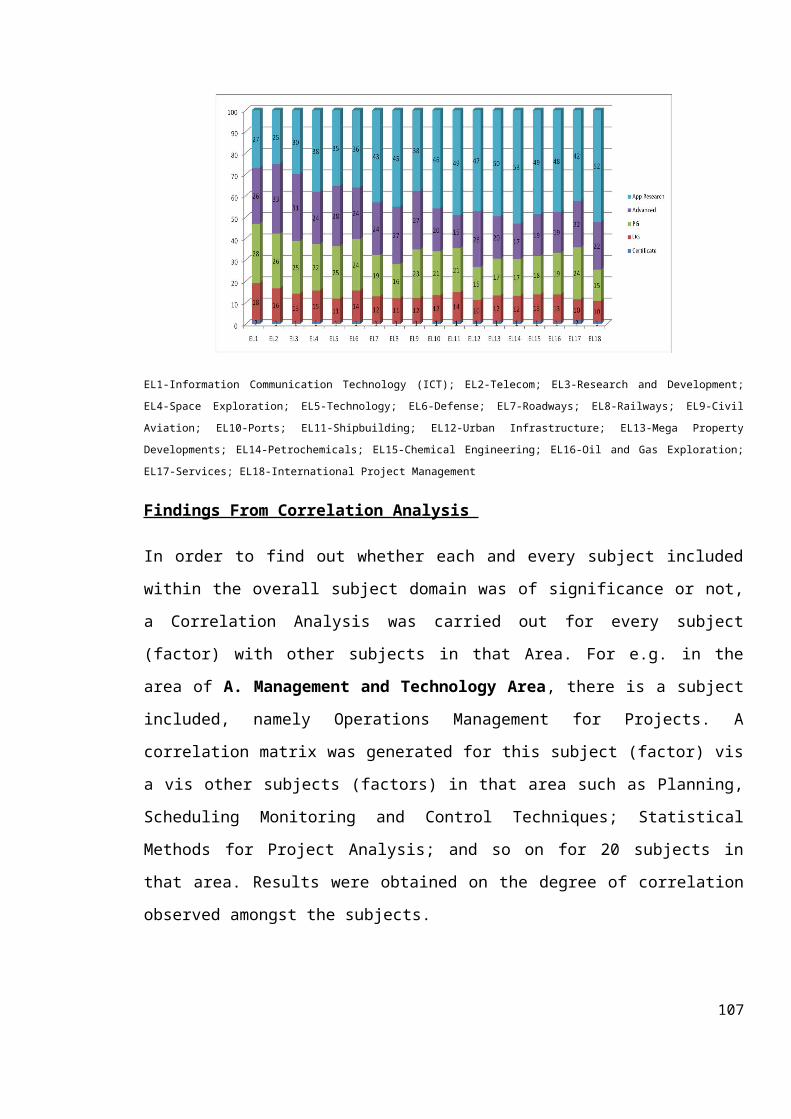
EL1-Information Communication Technology (ICT); EL2-Telecom; EL3-Research and Development;
EL4-Space Exploration; EL5-Technology; EL6-Defense; EL7-Roadways; EL8-Railways; EL9-Civil
Aviation; EL10-Ports; EL11-Shipbuilding; EL12-Urban Infrastructure; EL13-Mega Property
Developments; EL14-Petrochemicals; EL15-Chemical Engineering; EL16-Oil and Gas Exploration;
EL17-Services; EL18-International Project Management
Findings From Correlation Analysis
In order to find out whether each and every subject included
within the overall subject domain was of significance or not,
a Correlation Analysis was carried out for every subject
(factor) with other subjects in that Area. For e.g. in the
area of A. Management and Technology Area, there is a subject
included, namely Operations Management for Projects. A
correlation matrix was generated for this subject (factor) vis
a vis other subjects (factors) in that area such as Planning,
Scheduling Monitoring and Control Techniques; Statistical
Methods for Project Analysis; and so on for 20 subjects in
that area. Results were obtained on the degree of correlation
observed amongst the subjects.
107
In the same way, all individual subjects in the remaining
areas like B. Economics, Finance and Strategy, C. Behavioural
Sciences Area, D. IT Area were put through a similar
correlation analysis. The statistical correlation analysis is
used because it helps in arriving at the strength of
relationships between two factors. The idea in doing this for
all the subjects, was with to understand the uniqueness of
each of the subjects contained within the generalised Area (A.
Management and Technology, B. Economics....., Annex 3) under
which it has been included. Section E has not been included
for correlation analysis as it is Sector Specific and as such
has an in built uniqueness (randomness). A correlation
analysis for this section would therefore be meaningless.
Refer Annexure 4 for a complete result for all areas. The
salient findings using SPSS software are reproduced below9.
Management and Technology Area: This subject area included in
a total of 20 subjects which were considered to have a direct
bearing on the operations and technical aspects of the project
business or project organisation. A detailed list of the
subjects within this area is contained in Figure 12 A. Based
on ratings obtained from the sample, each one of the subjects
was run for correlation with each of the other subjects, to
find out whether the subjects are similar or there is
considerable overlap in their content. The correlation
9 Correlation Analysis generates the Correlation Coefficient. The Correlation Coefficient isthe measure of the covariance of the actual and predicted values of factors. The correlationcoefficient is a number between 0 and 1. If there is no linear relationship between thepredicted values and the actual values the correlation coefficient is 0 or very low (thepredicted values are no better than random numbers).
108
coefficients showed a value less than 0.90. For any factor to
be closely related with another factor, the Correlation
Coefficient should have values tending towards 1. Most of the
values in the Table 5, Annexure 4, Part A, indicate that the
Correlation Coefficient lies in the range of 0.3 to 0.8, thus
indicating weak to moderate positive relationships (Refer foot
note10). However subjects with correlation coefficients greater
than 0.7 would have significantly strong relationship. The
subjects having correlation values of 0.7 or more in this
group are as follows :
Operations Management for Projects AR3 – Operations Research
for Projects AR 4 (0.7), Project Quality Management AR5 –
Health/Safety/Environment in Projects AR6 (0.7), Projects
Marketing AR10 – Facilities Engineering and Management AR15
(0.7), Project Site and Equipment Management AR11 – Project
Procurement & /Materials Management AR 12 (0.8), Project Site
and Equipment Management AR11 – Contract Management AR13
(0.8), Project Site and Equipment Management AR11 – Facilities
Engineering and Management AR15 (0.7), Project Procurement
& /Materials Management AR12 – Contract Management AR13 (0.7),
Contract Management AR13 – Process
Design/Engineering/Testing/Commissioning AR14 (0.7), Contract
Management AR13 – Facilities Engineering and Management AR1510As the strength of the relationship between the predicted values and actual values increasesso does the correlation coefficient. A perfect fit gives a coefficient of 1.0. Thus closerelationships tend towards 1 while weak relationships tend towards 0. Values between 0 and 0.3(0 and -0.3) indicate a weak positive (negative) linear relationship. Values between 0.3 and0.7 (0.3 and -0.7) indicate a moderate positive (negative) linear relationship via a fuzzy-firm linear rule. 0.7 and 0.9 indicates highly positive linear relationship. If it is above0.9 then the two factors can be treated as one and the same because they cannot bedistinguished clearly.
109
(0.7), Facilities Engineering and Management AR15 – Logistics
& Supply Chain Management AR 16 (0.7), Facilities Engineering
and Management AR15 – Transportation Management AR17 (0.7),
Logistics & Supply Chain Management AR16 – Transportation
Management AR17 (0.7), Project Formulation and Appraisal AR19
– Project Engineering AR20 (0.8).
The results indicate that as a group, the subjects Project
Site and Equipment Management, Project Procurement and
Materials Management, Contract Management, Facilities
Engineering and Management and Process Design / Engineering /
Testing / Commissioning are correlated. This is expected
since the issues dealt with in these subject areas arise
primarily during project execution and often times have to be
dealt with in a coordinated manner. Similarly correlation
among the subject areas Logistics and Supply Chain Management,
Transportation Management, Facilities Engineering and
Management are also quite expected and in most projects, these
would be dealt with together. The correlation between subject
areas Operations Management and Operations Research, and also
between Project Formulation and Appraisal and Project
Engineering are also along expected lines. There is also good
correlation between Quality Management and HSE subjects and
therefore combining these into a single course would be quite
appropriate. It is not surprising that in the project
management fraternity, the precise differences among these
subject areas are not very clear.
110
Thus the correlation analysis results strongly validate our
belief that many issues arising during project execution need
to be addressed in an integrated coordinated away. Similarly
many techniques and methods adopted during the project
formulation, appraisal and engineering need to be taken up in
an integrated coordinated manner.
A direct outcome of the correlation analysis is that in
institutions and curricula where it is difficult to introduce
several execution oriented courses, it will be quite adequate
if a single course emphasizing project execution is included.
Similarly Operations Management and Operations Research could
be combined into a single course. Project Formulation and
Appraisal and Project Engineering could also be combined into
a single course.
The results indicate that nearly half of the subjects included
in this area are fairly unique and have their own individual
importance and therefore need to be included in the
curriculum. There is scope for combining course contents of
other courses as suggested above, when there is difficulty in
all of the courses contained in this subject area. Refer Table
5, Annexure 4, Part A for complete results.
Strategy, Economics and Finance Area: In this Area too, it was
observed that all subjects had a correlation coefficient less
than 0.90. Therefore it can be concluded that subjects in this
section too are fairly unique (refer Table 5, Annex 4, Part
B). Here too, subjects with correlation coefficient greater
111
than 0.7 would have strong significant relationship. The
subjects having correlation values of 0.7 or more in this
group are as follows :
Macro Economic Policy BL1 - Project Strategy BL2( 0.73), Macro
Economic Policy BL1 - Social Cost Benefit Analysis BL3 (0.72),
Project Strategy BL2 - Social Cost Benefit Analysis BL3
(0.76), ; Project Strategy BL2 - Financial Management
BL4(0.71), Social Cost Benefit Analysis BL3 - Project
Financing BL5 (0.71); Social Cost Benefit Analysis BL3 -
Legal, Commercial and Taxation Aspects of Projects BL7 (0.72),
Financial Management BL4 - Project Financing BL5 (0.8), Legal,
Commercial and Taxation Aspects of Projects BL7 - Project
Joint Ventures, Strategic Alliances, Special Purpose Vehicles
BL8 (0.86).
The subject Social Cost benefit Analysis is most heavily
correlated with other subjects including Macroeconomic Policy,
Project Strategy, Project Financing, Legal, Commercial and
Taxation Aspects. Thus if this course is included as a
separate course, care must be taken to ensure that the content
is not duplicated in other courses. Alternately the course
need not be included, if other courses reflect the content.
There is a case for combining the courses Project Financial
Management and Project Financing, courses Project Strategy and
Macroeconomic Policy, and courses Legal, Commercial & Taxation
Aspects and Project Joint Ventures, Strategic Alliances &
Special Purpose Vehicles.
112
The correlation analysis provides very good guidelines on the
way courses in this subject area could be grouped and
introduced in the PM curriculum.
Behavioural Sciences Area: In this Area too, it was observed
that all subjects had a correlation coefficient less than
0.90. Therefore it can be concluded that subjects in this
section too are fairly unique. Subjects with correlation
coefficient greater than 0.7 have strong significant
relationship. Refer Table 5, Annexure 4, Part C. The subjects
having correlation values of 0.7 or more in this group are as
follows :
Industrial / Labour Relations CR4 - Conflict Management CR5
(0.79); Industrial / Labour Relations CR4 - Diversity
Management CR6 (0.78); Conflict Management CR5 (0.79) -
Diversity Management CR6 (0.81).
Three subjects are correlated to each other, namely
Industrial/ Labour Relations, Conflict Management and
Diversity Management. So from the point of view of the
respondents, these subjects reflect some common issues and
concerns and there is a case for combining these together to
achieve an integrated approach to deal with these issues and
concerns. The other courses may be taught independently.
Information Technology Area: In this Area also, it was
observed that all subjects had a correlation coefficient less
than 0.90. Therefore it can be concluded that subjects in this
section too are fairly unique. Subjects with correlation
113
coefficient greater than 0.7 have strong significant
relationship. Refer Table 5, Annexure 4, and Part D. The
subjects having correlation values of 0.7 or more in this
group are as follows : Enterprise Resource Planning (ERP) DR2
- e-Business Applications DR3 (0.72), Engineering Software DR4
- Excel / SPSS / DBMS DR5 ( 0.81).
The correlation analysis results provide an useful way of
structuring courses in IT area in the PM curriculum. For
instance, ERP and e – Business Applications courses could
combined into a single course. Similarly Specialized
Engineering Software and Common Software such as Excel, SPSS,
DBMS could also be structured as a single course, in case
there is difficulty in offering these as separate courses.
Only Project Management Software needs to be taught as a
separate course.
4.5 PART IV – Infrastructure, Management Support, Regulatory
Factors And Current Status Of PM Research In Institute
This section of the study was dedicated to finding out the
nature of curriculum development and research that is
currently being supported by the management of institutions in
the area of PM. Along with this, it was also necessary to find
out the extent of departmental and individual interests of the
faculty in this area. Also, the average time taken by
institution managements to introduce new curricula needs to be
studied in order to assess the ‘responsiveness’ factor of
managements to new ideas and curriculum development. The
114
following section analyses the same. Part IV was again divided
into sub sections covering factors like the availability of
infrastructure, management support, regulatory issues and the
current position of PM research in the respondent’s institute.
The findings of the analysis are presented below.
The first question dealt with finding out the extent of
availability of existing infrastructure that was at the
disposal of the institute (See Figure 17). The average ratings
obtained from the survey are : IR1-Avalability of Library and
e-resources (3.87); IR2-Course Material (3.74); IR3-Class
Rooms (4.03); IR4-Laboratories (3.80); IR5-Computer Labs
(3.90); IR6-Qualified Faculties (3.96); IR7-Avalability of
Research Facilities (3.69); IR8-Management Vision (4.03).
Majority of the sample felt that resources were generally
easily available in the institute in terms of library, course
materials, classrooms, laboratories, computer labs, qualified
faculty and availability of research facilities. The
respondents also strongly endorsed the existence of management
vision (avg. rating 4.03) to support PM endeavours. Around 8%
of the sample felt that management vision was lacking and
hence PM education was not very popular in their institutions.
Figure 17: Ratings Of Institute’s Infrastructure
115
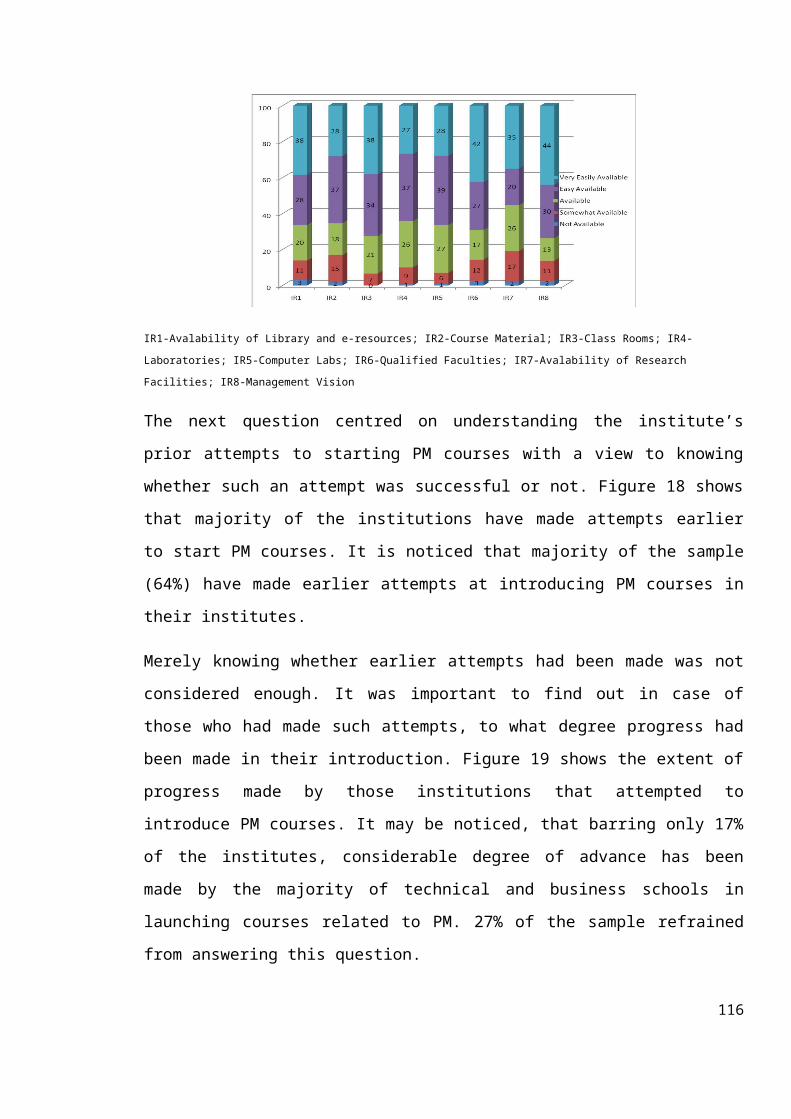
IR1-Avalability of Library and e-resources; IR2-Course Material; IR3-Class Rooms; IR4-
Laboratories; IR5-Computer Labs; IR6-Qualified Faculties; IR7-Avalability of Research
Facilities; IR8-Management Vision
The next question centred on understanding the institute’s
prior attempts to starting PM courses with a view to knowing
whether such an attempt was successful or not. Figure 18 shows
that majority of the institutions have made attempts earlier
to start PM courses. It is noticed that majority of the sample
(64%) have made earlier attempts at introducing PM courses in
their institutes.
Merely knowing whether earlier attempts had been made was not
considered enough. It was important to find out in case of
those who had made such attempts, to what degree progress had
been made in their introduction. Figure 19 shows the extent of
progress made by those institutions that attempted to
introduce PM courses. It may be noticed, that barring only 17%
of the institutes, considerable degree of advance has been
made by the majority of technical and business schools in
launching courses related to PM. 27% of the sample refrained
from answering this question.
116
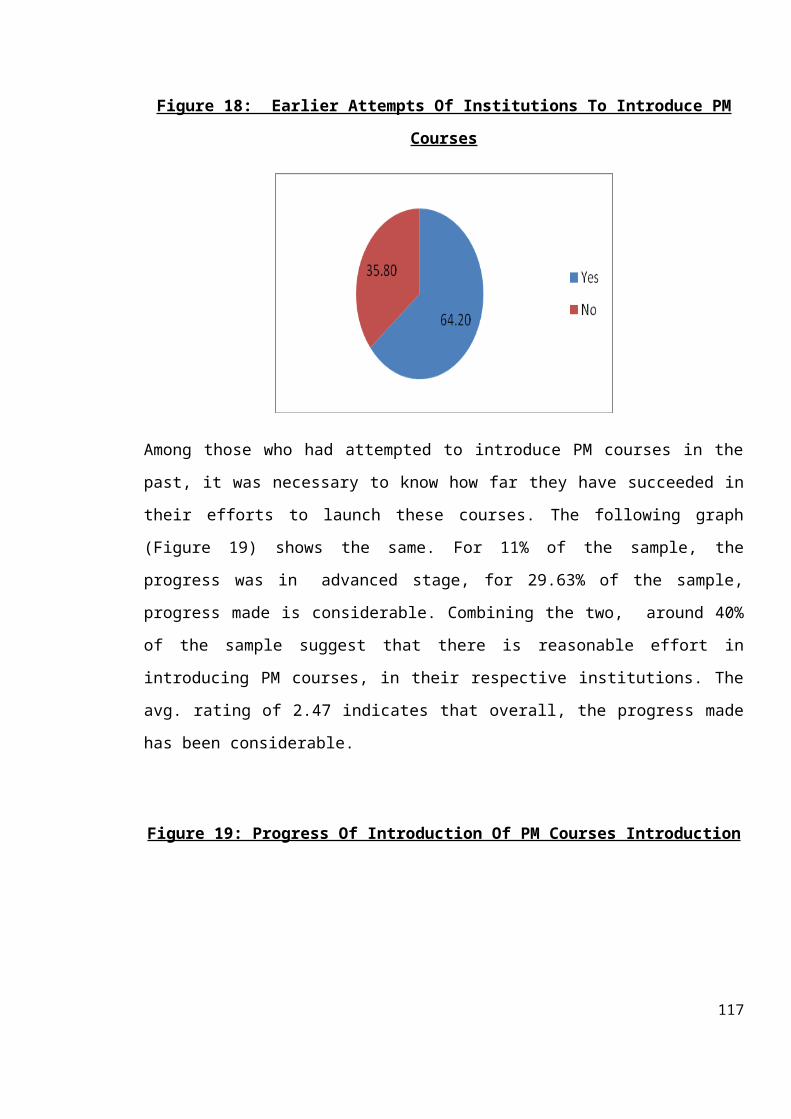
Figure 18: Earlier Attempts Of Institutions To Introduce PM
Courses
Among those who had attempted to introduce PM courses in the
past, it was necessary to know how far they have succeeded in
their efforts to launch these courses. The following graph
(Figure 19) shows the same. For 11% of the sample, the
progress was in advanced stage, for 29.63% of the sample,
progress made is considerable. Combining the two, around 40%
of the sample suggest that there is reasonable effort in
introducing PM courses, in their respective institutions. The
avg. rating of 2.47 indicates that overall, the progress made
has been considerable.
Figure 19: Progress Of Introduction Of PM Courses Introduction
117
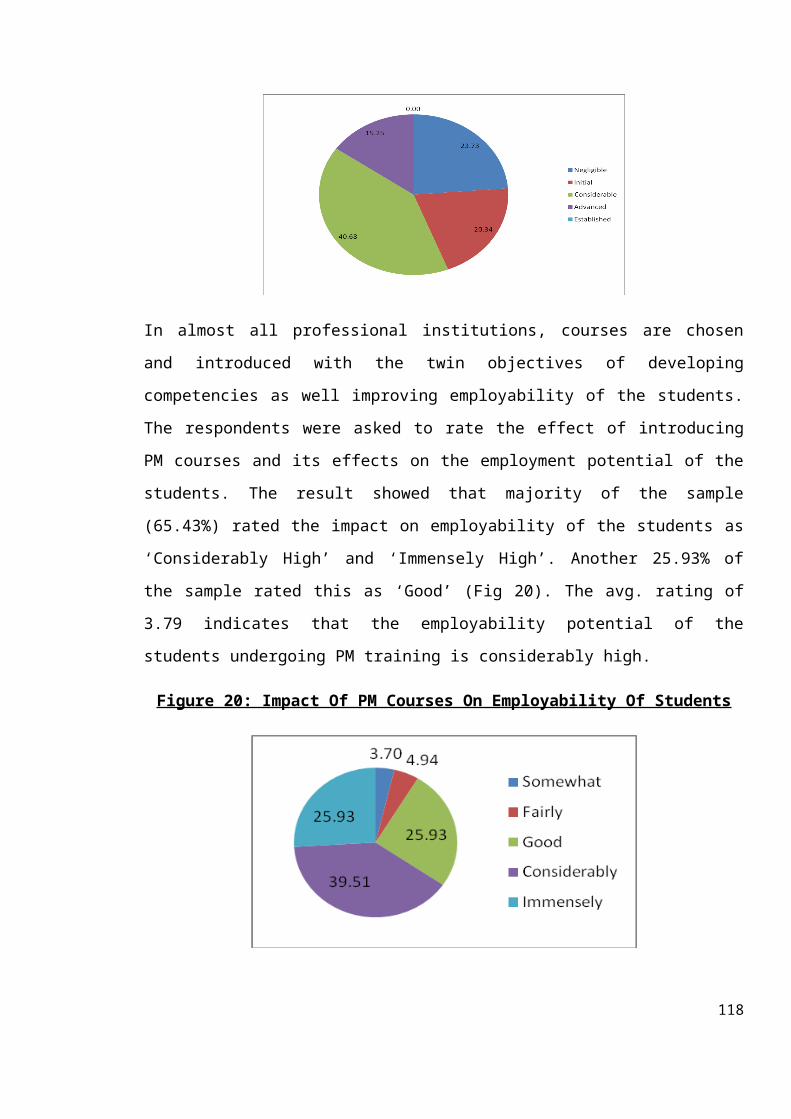
In almost all professional institutions, courses are chosen
and introduced with the twin objectives of developing
competencies as well improving employability of the students.
The respondents were asked to rate the effect of introducing
PM courses and its effects on the employment potential of the
students. The result showed that majority of the sample
(65.43%) rated the impact on employability of the students as
‘Considerably High’ and ‘Immensely High’. Another 25.93% of
the sample rated this as ‘Good’ (Fig 20). The avg. rating of
3.79 indicates that the employability potential of the
students undergoing PM training is considerably high.
Figure 20: Impact Of PM Courses On Employability Of Students
118
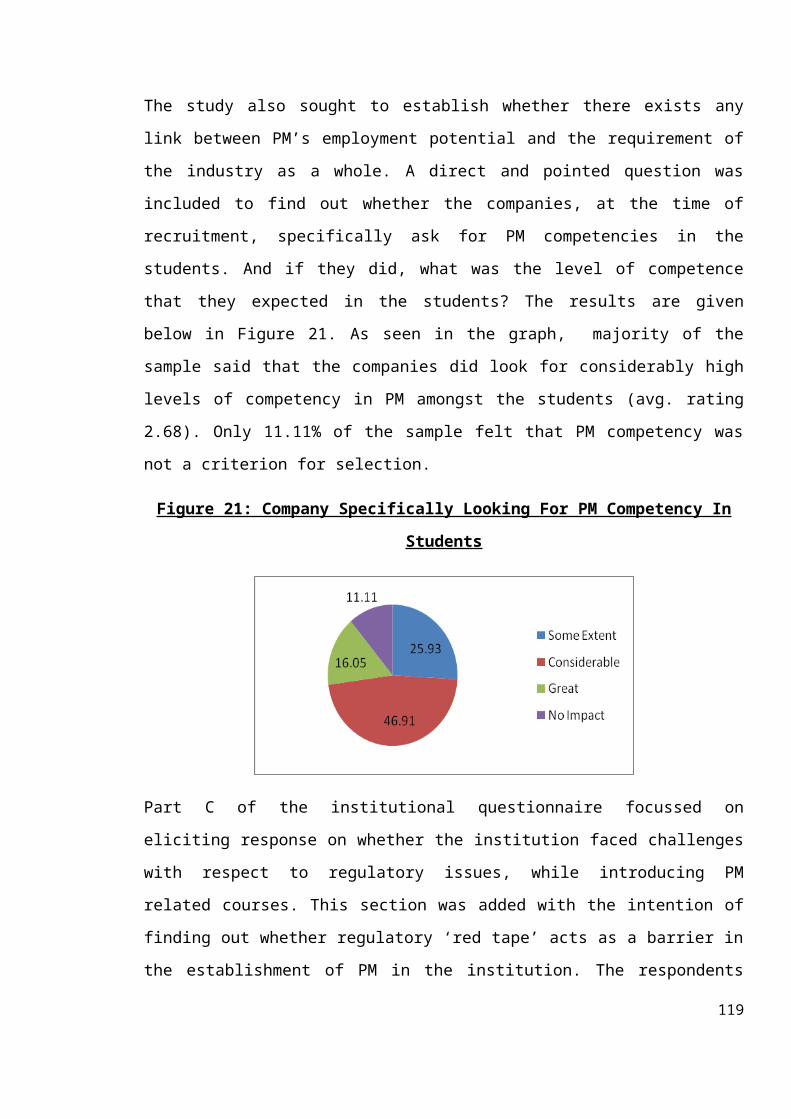
The study also sought to establish whether there exists any
link between PM’s employment potential and the requirement of
the industry as a whole. A direct and pointed question was
included to find out whether the companies, at the time of
recruitment, specifically ask for PM competencies in the
students. And if they did, what was the level of competence
that they expected in the students? The results are given
below in Figure 21. As seen in the graph, majority of the
sample said that the companies did look for considerably high
levels of competency in PM amongst the students (avg. rating
2.68). Only 11.11% of the sample felt that PM competency was
not a criterion for selection.
Figure 21: Company Specifically Looking For PM Competency In
Students
Part C of the institutional questionnaire focussed on
eliciting response on whether the institution faced challenges
with respect to regulatory issues, while introducing PM
related courses. This section was added with the intention of
finding out whether regulatory ‘red tape’ acts as a barrier in
the establishment of PM in the institution. The respondents
119
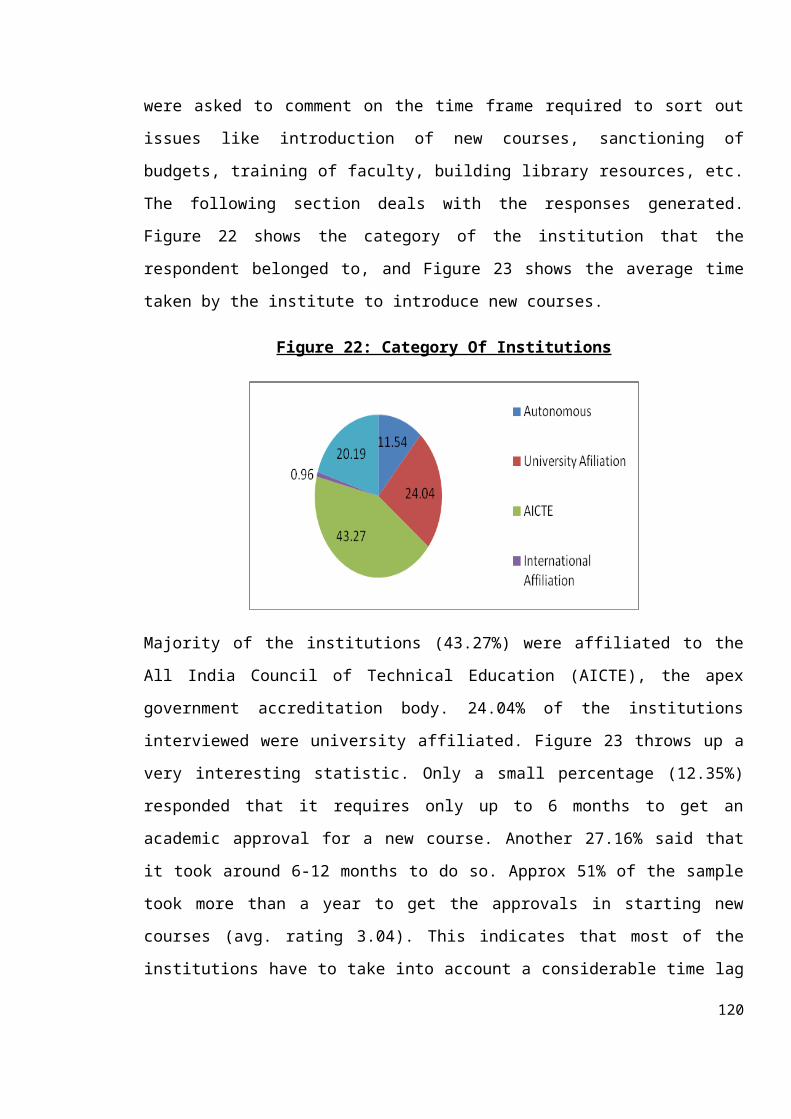
were asked to comment on the time frame required to sort out
issues like introduction of new courses, sanctioning of
budgets, training of faculty, building library resources, etc.
The following section deals with the responses generated.
Figure 22 shows the category of the institution that the
respondent belonged to, and Figure 23 shows the average time
taken by the institute to introduce new courses.
Figure 22: Category Of Institutions
Majority of the institutions (43.27%) were affiliated to the
All India Council of Technical Education (AICTE), the apex
government accreditation body. 24.04% of the institutions
interviewed were university affiliated. Figure 23 throws up a
very interesting statistic. Only a small percentage (12.35%)
responded that it requires only up to 6 months to get an
academic approval for a new course. Another 27.16% said that
it took around 6-12 months to do so. Approx 51% of the sample
took more than a year to get the approvals in starting new
courses (avg. rating 3.04). This indicates that most of the
institutions have to take into account a considerable time lag
120
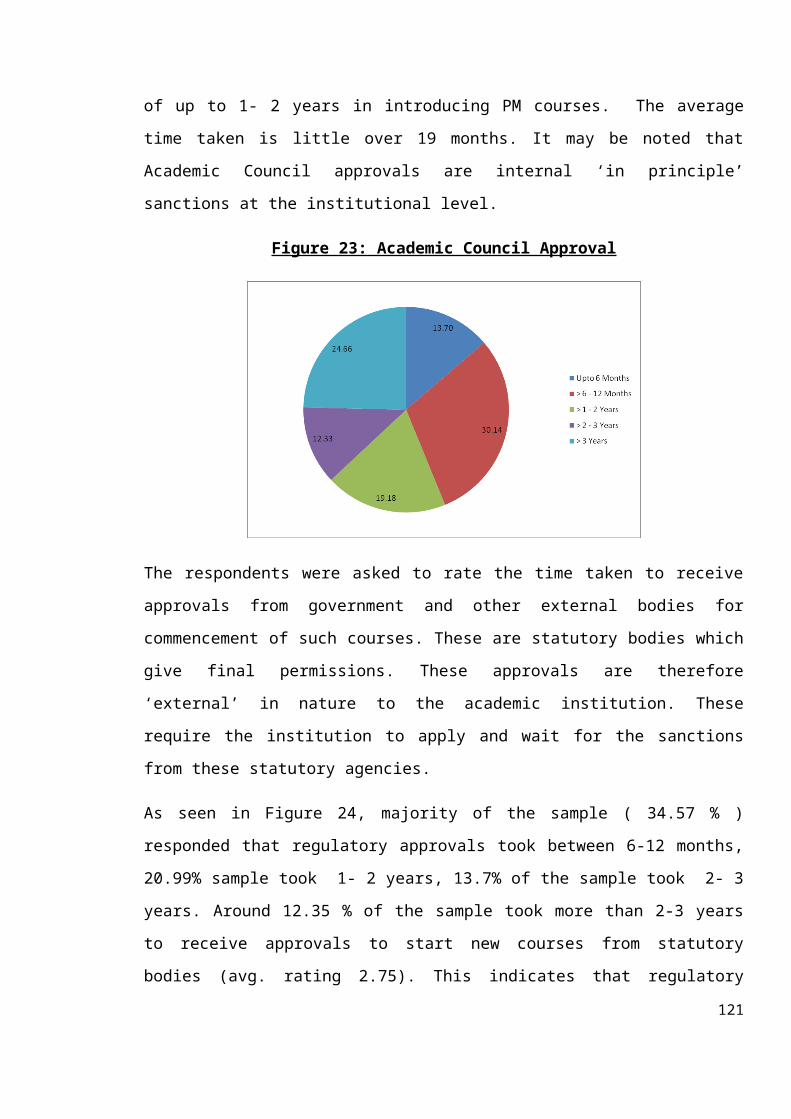
of up to 1- 2 years in introducing PM courses. The average
time taken is little over 19 months. It may be noted that
Academic Council approvals are internal ‘in principle’
sanctions at the institutional level.
Figure 23: Academic Council Approval
The respondents were asked to rate the time taken to receive
approvals from government and other external bodies for
commencement of such courses. These are statutory bodies which
give final permissions. These approvals are therefore
‘external’ in nature to the academic institution. These
require the institution to apply and wait for the sanctions
from these statutory agencies.
As seen in Figure 24, majority of the sample ( 34.57 % )
responded that regulatory approvals took between 6-12 months,
20.99% sample took 1- 2 years, 13.7% of the sample took 2- 3
years. Around 12.35 % of the sample took more than 2-3 years
to receive approvals to start new courses from statutory
bodies (avg. rating 2.75). This indicates that regulatory
121
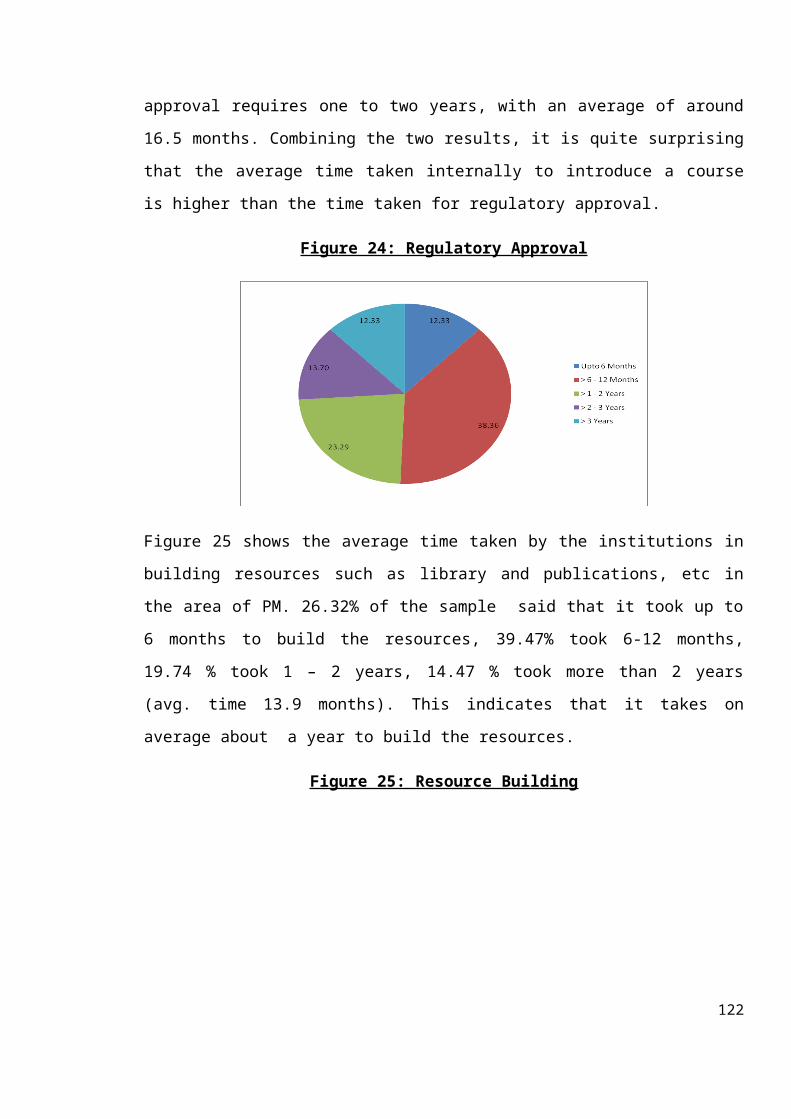
approval requires one to two years, with an average of around
16.5 months. Combining the two results, it is quite surprising
that the average time taken internally to introduce a course
is higher than the time taken for regulatory approval.
Figure 24: Regulatory Approval
Figure 25 shows the average time taken by the institutions in
building resources such as library and publications, etc in
the area of PM. 26.32% of the sample said that it took up to
6 months to build the resources, 39.47% took 6-12 months,
19.74 % took 1 – 2 years, 14.47 % took more than 2 years
(avg. time 13.9 months). This indicates that it takes on
average about a year to build the resources.
Figure 25: Resource Building
122
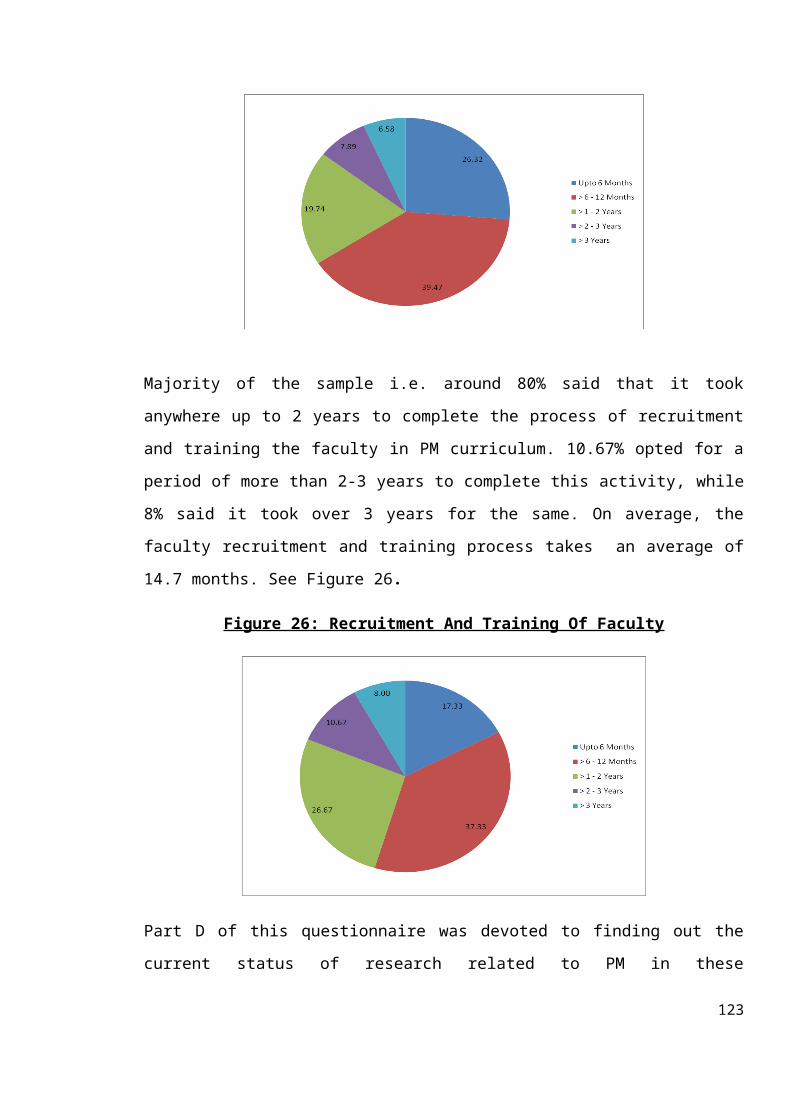
Majority of the sample i.e. around 80% said that it took
anywhere up to 2 years to complete the process of recruitment
and training the faculty in PM curriculum. 10.67% opted for a
period of more than 2-3 years to complete this activity, while
8% said it took over 3 years for the same. On average, the
faculty recruitment and training process takes an average of
14.7 months. See Figure 26.
Figure 26: Recruitment And Training Of Faculty
Part D of this questionnaire was devoted to finding out the
current status of research related to PM in these
123
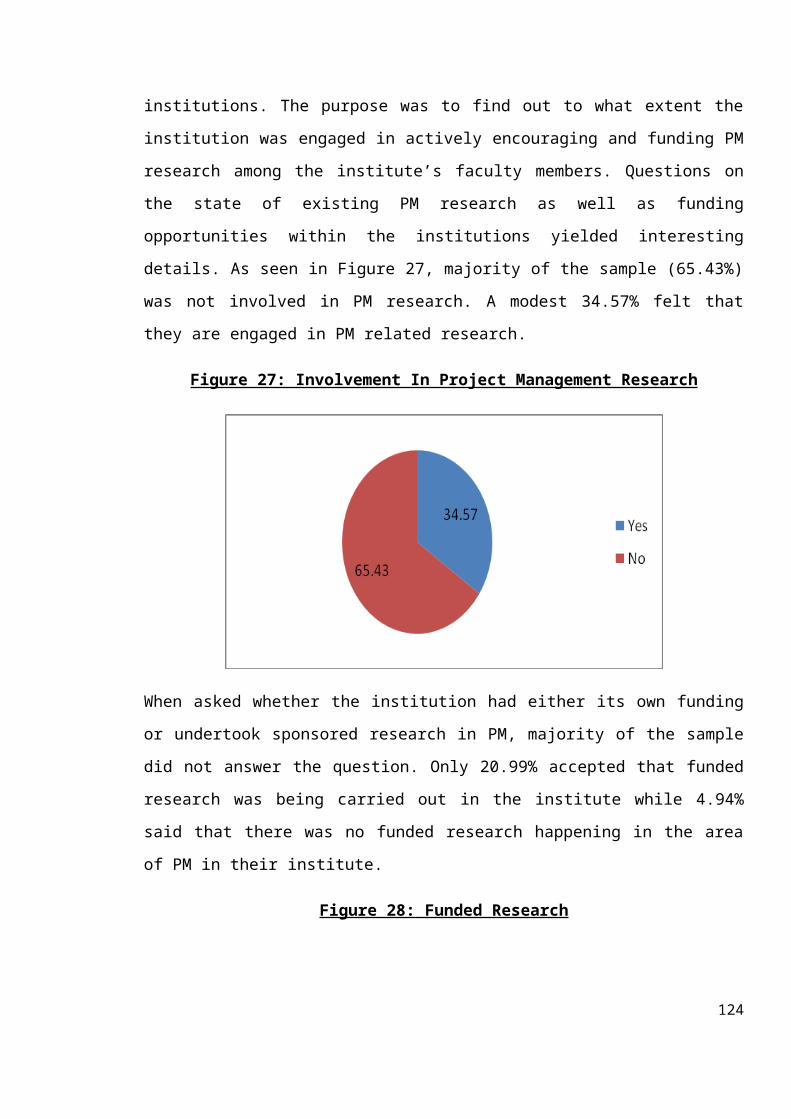
institutions. The purpose was to find out to what extent the
institution was engaged in actively encouraging and funding PM
research among the institute’s faculty members. Questions on
the state of existing PM research as well as funding
opportunities within the institutions yielded interesting
details. As seen in Figure 27, majority of the sample (65.43%)
was not involved in PM research. A modest 34.57% felt that
they are engaged in PM related research.
Figure 27: Involvement In Project Management Research
When asked whether the institution had either its own funding
or undertook sponsored research in PM, majority of the sample
did not answer the question. Only 20.99% accepted that funded
research was being carried out in the institute while 4.94%
said that there was no funded research happening in the area
of PM in their institute.
Figure 28: Funded Research
124
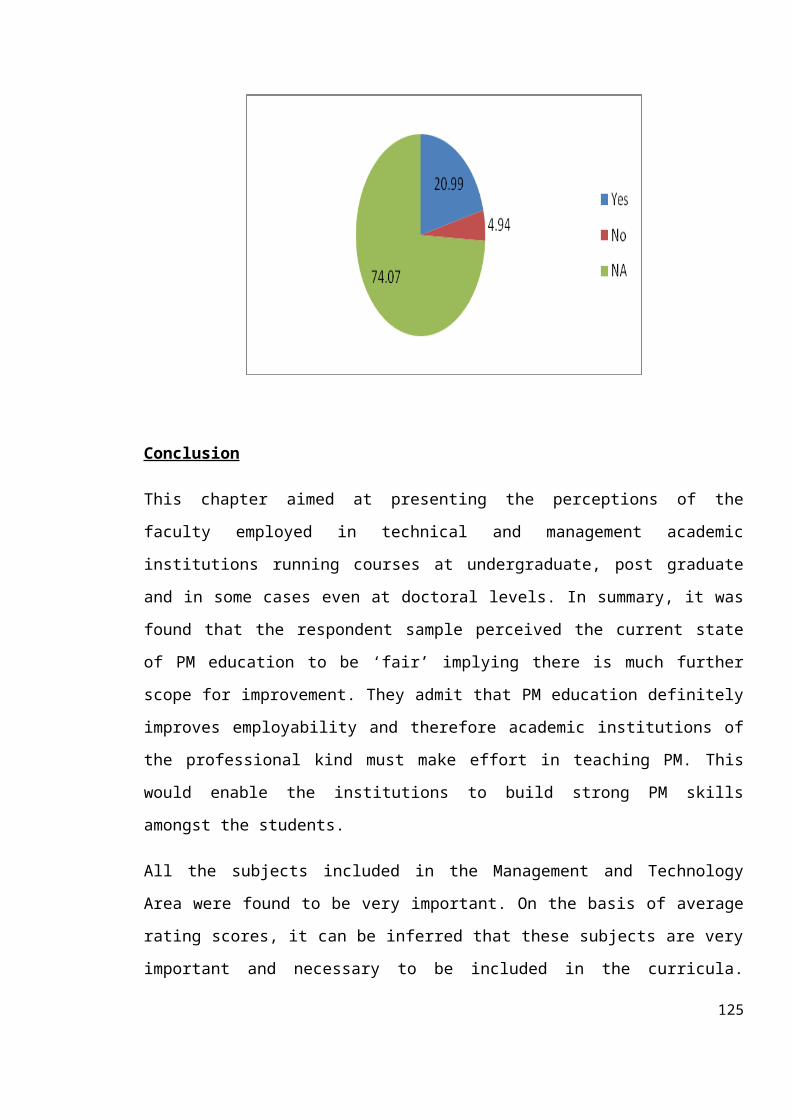
Conclusion
This chapter aimed at presenting the perceptions of the
faculty employed in technical and management academic
institutions running courses at undergraduate, post graduate
and in some cases even at doctoral levels. In summary, it was
found that the respondent sample perceived the current state
of PM education to be ‘fair’ implying there is much further
scope for improvement. They admit that PM education definitely
improves employability and therefore academic institutions of
the professional kind must make effort in teaching PM. This
would enable the institutions to build strong PM skills
amongst the students.
All the subjects included in the Management and Technology
Area were found to be very important. On the basis of average
rating scores, it can be inferred that these subjects are very
important and necessary to be included in the curricula.
125
However importance assigned is higher for certain subjects
including Operations Management; Planning, Scheduling,
Monitoring and Control Techniques; Statistical methods,
Operation research techniques; Project Quality Management;
Cost Estimation and Budgeting; Health, Safety and Environment
Management. Majority of the respondents want the courses to be
taught at Undergraduate and Post Graduate levels.
Most of the subjects in the Strategy, Economics and Finance
Area were considered to be very important at the post graduate
level with the exception of Macroeconomic Policy which could
be taught at undergraduate level. In the Behavioural Sciences
Area, all the subjects were rated as very important and the
subject rated most important was Managerial Skills. In the
Information Technology Area, three subjects, namely PM Software,Engineering Software and Excel/SPSS/DBMS are rated as extremely
important. ERP and e – Buainess Applications are rated very
important. Clearly the respondents strongly endorse the importance
of teaching IT related subjects. There is also strong preferrence
for thse sibjects to be covered at the post graduate level.
Faculty agreed that the effect of PM education on the
employability of the students was very positive and therefore
PM should be strongly encouraged. Coverage of sector specific
issues in PM curriculum was considered very important across
all the sectors included in the study but the respondents
strongly emphasized that such sector specific issues are best
addressed at applied research level or in advanced courses.
126
The correlation analysis provides very good basis for
structuring courses in all the subject areas considered in the
study. In the technology and Management area, the results
indicate that the subjects Project Site and Equipment
Management, Project Procurement and Materials Management,
Contract Management, Facilities Engineering and Management and
Process Design / Engineering / Testing / Commissioning are
correlated. This is expected since these issues arise during
project execution and have to be dealt with in a coordinated
manner. Similarly correlation among the subject areas
Logistics and Supply Chain Management, Transportation
Management, Facilities Engineering and Management are also
quite expected and in most projects, these would be dealt with
together. The correlation between subject areas Operations
Management and Operations Research, and also between Project
Formulation and Appraisal and Project Engineering are also
along expected lines. There is also good correlation between
Quality Management and HSE subjects and therefore combining
these into a single course would be quite appropriate. It is
not surprising that in the project management fraternity, the
precise differences among these subject areas are not very
clear.
While most of the subjects grouped in these subject areas are
found to be very important, there is a case for combining some
of these together, in order to emphasize the importance of
managing projects in a coordinated and integrated manner. A
direct outcome of the correlation analysis is that in
127
institutions and curricula where it is difficult to introduce
several execution oriented courses, it will be quite adequate
if a single course emphasizing project execution is included.
In the Economics and Strategy area, the subject Social Cost
benefit Analysis is most heavily correlated with other
subjects including Macroeconomic Policy, Project Strategy,
Project Financing, Legal, Commercial and Taxation Aspects.
Thus if this course is included as a separate course, care
must be taken to ensure that the content is not duplicated in
other courses. Alternately the course need not be included, if
other courses reflect the content. There is a case for
combining the courses Project Financial Management and Project
Financing, courses Project Strategy and Macroeconomic Policy,
and courses Legal, Commercial & Taxation Aspects and Project
Joint Ventures, Strategic Alliances & Special Purpose
Vehicles. The correlation analysis provides very good
guidelines on the way courses in this subject area could be
grouped and introduced in the PM curriculum.
In the Behavioural Sciences area, three subjects are
correlated to each other, namely Industrial/ Labour Relations,
Conflict Management and Diversity Management. So from the
point of view of the respondents, these subjects reflect some
common issues and concerns and there is a case for combining
these together to achieve an integrated approach to deal with
these issues and concerns. The other courses may be taught
independently.
128

The correlation analysis results provide a useful way of
structuring courses in IT area in the PM curriculum. For
instance, ERP and e – Business Applications courses could be
combined into a single course. Similarly Specialized
Engineering Software and Common Software such as Excel, SPSS,
DBMS could also be structured as a single course, in case
there is difficulty in offering these as separate courses.
Only Project Management Software needs to be taught as a
separate course.
Majority of the sample felt that resources were generally
easily available in the institute in terms of library, course
materials, classrooms, laboratories, computer labs, qualified
faculty and availability of research facilities. The
respondents also strongly endorsed the existence of management
vision to support PM endeavours. It takes on average about a
year to build the necessary physical resources. On average,
the faculty recruitment and training process takes 14.7
months. The research involvement of the institutions is found
to be quite low and only about 20% institutions reported
funded research.
The academic institutions consider the employability potential
of the students undergoing PM training to be considerably
high. They said that the companies did look for considerably
high levels of competency in PM amongst the students. At
present appreciable time is required to obtain internal as
well external regulatory approvals for introducing new
courses. Most of the institutions have to take into account a129
considerable time lag of up to 1-2 years in introducing PM
courses. The average internal lead time is little over 19
months. The regulatory approval requires 1-2 years, with an
average of around 16.5 months. It is quite surprising that the
average time taken internally to introduce a course is higher
than the time taken for regulatory approval.
There is a general agreement that much of the PM curriculum
should be preferrably introduced at the Post Graduate level,
followed by Undergraduate level. On the question of
introducing sector specific coursework in PM curriculum, there
is a strong preference for introducing such curriculum, but
the overwhelming suggestion is that such curriculum is best
introduced at applied research level or in advanced courses.
The present emphasis on research and publications, in
particular sponsored research, is rather low and as a
consequence, PM research and publications are few and
sporadic.
130
Box 2: Project Management Courses In Indian Institute Of
Management, Ahmedabad, (IIM A)
Indian Institute of Management, Ahmedabad was established by
Government of India, Government of Gujarat and Indian industry
as an autonomous institution under the Act XXI of 1860 for the
Registration of literary, scientific and charitable societies.
The Institute functions under the overall administrative
control of Ministry of Human Resources Development, Government
of India. IIMA has evolved from being India's premier
management institute to a notable international school of
management in just five decades. The Institute had initial
collaboration with Harvard Business School. This collaboration
greatly influenced the Institute's approach to education and
teaching methods. Gradually, it emerged as a confluence of the
best of Eastern and Western values. The institute offers Post
Graduate Programmes in Management in which Project Management
is offered as an advanced level elective subject.
The Institute assigns high level of importance to PM related
coursework. The Institute has already made attempts in the
past, and runs elective courses in the area of Project
Management since the last few years. The IIMA’s faculty
believes that the introduction of Project Management courses
131
helps improve the employability of the students to a good
extent.
At an individual level, faculty have research interests in the
area of PM. Many faculty members have published research
papers and addressed seminars and conferences in the area of
PM. The Institute also conducts regularly executive
development programmes/workshops in PM. The Institute has also
provided consultancy services in PM to a variety of
organisations in government, public and private sectors as
well as some international agencies. A few of the research
theses have been written on issues related to PM in the
Institute’s Fellow Programme in Management (FPM).
Source: NICMAR Survey Data, 2010
132
Box 3: Project Management Courses In Indian Institute OfManagement, Calcutta, (IIM C)
The Indian Institute of Management Calcutta (IIMC) was
established as the first National Institute for Post Graduate
Studies and Research in Management by the Government of India
in November 1961 in collaboration with Alfred P. Sloan School
of Management (MIT), the Government of West Bengal, The Ford
Foundation and Indian industry. Over the years, IIMC has grown
into a mature institution with global reputation, imparting
high quality management education. It has been playing a
pioneering role in professionalising Indian management through
its Post Graduate and Doctoral level programmes, executive
training programmes, research and consulting activities.
Today, the institute serves as an autonomous body, continually
evolving to meet its goals in an ever changing business
environment. The vision of the Institute is to emerge as an
International Centre of Excellence in all facets of management
education. Over the past four decades, IIM Calcutta has
blossomed into one of Asia's finest business schools. The
Institute offers various post graduate programmes in
management in which Project Management is offered as an
intermediate level elective subject.
One of the biggest strengths of the Institute is its world
renowned faculty. The faculty members have distinguished
academic achievements in different areas of management and the
related basic disciplines and are actively involved in
133
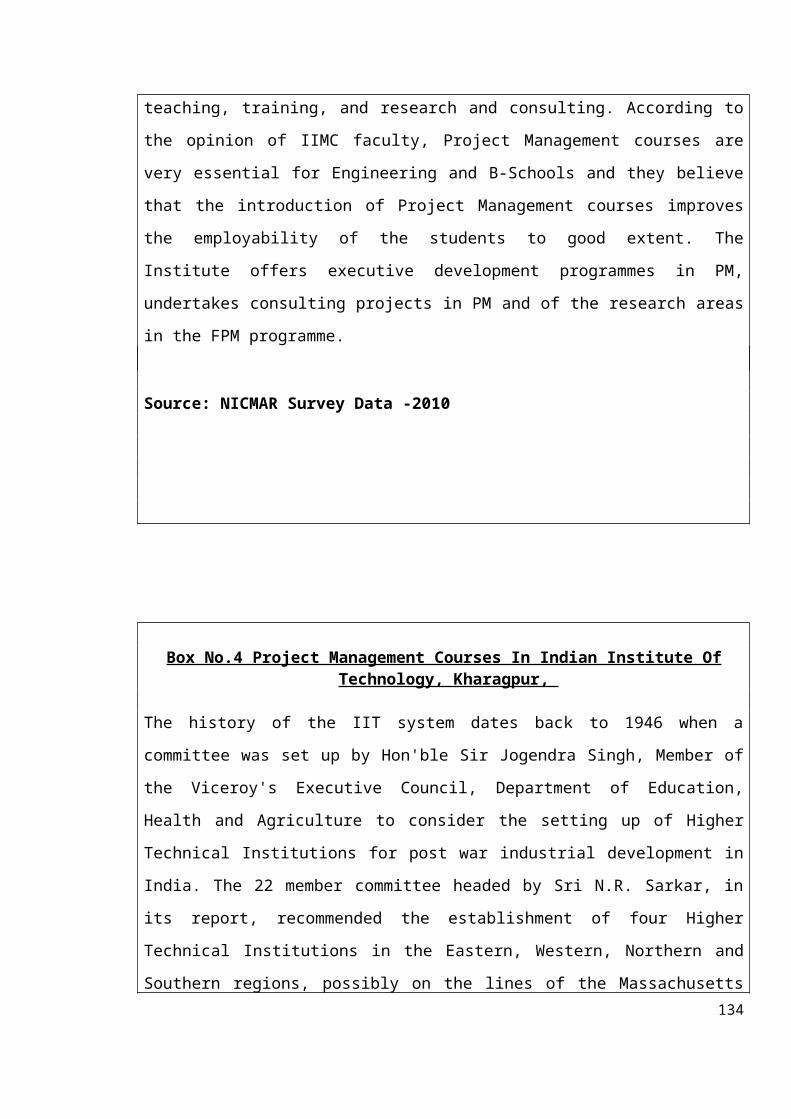
teaching, training, and research and consulting. According to
the opinion of IIMC faculty, Project Management courses are
very essential for Engineering and B-Schools and they believe
that the introduction of Project Management courses improves
the employability of the students to good extent. The
Institute offers executive development programmes in PM,
undertakes consulting projects in PM and of the research areas
in the FPM programme.
Source: NICMAR Survey Data -2010
Box No.4 Project Management Courses In Indian Institute OfTechnology, Kharagpur,
The history of the IIT system dates back to 1946 when a
committee was set up by Hon'ble Sir Jogendra Singh, Member of
the Viceroy's Executive Council, Department of Education,
Health and Agriculture to consider the setting up of Higher
Technical Institutions for post war industrial development in
India. The 22 member committee headed by Sri N.R. Sarkar, in
its report, recommended the establishment of four Higher
Technical Institutions in the Eastern, Western, Northern and
Southern regions, possibly on the lines of the Massachusetts134
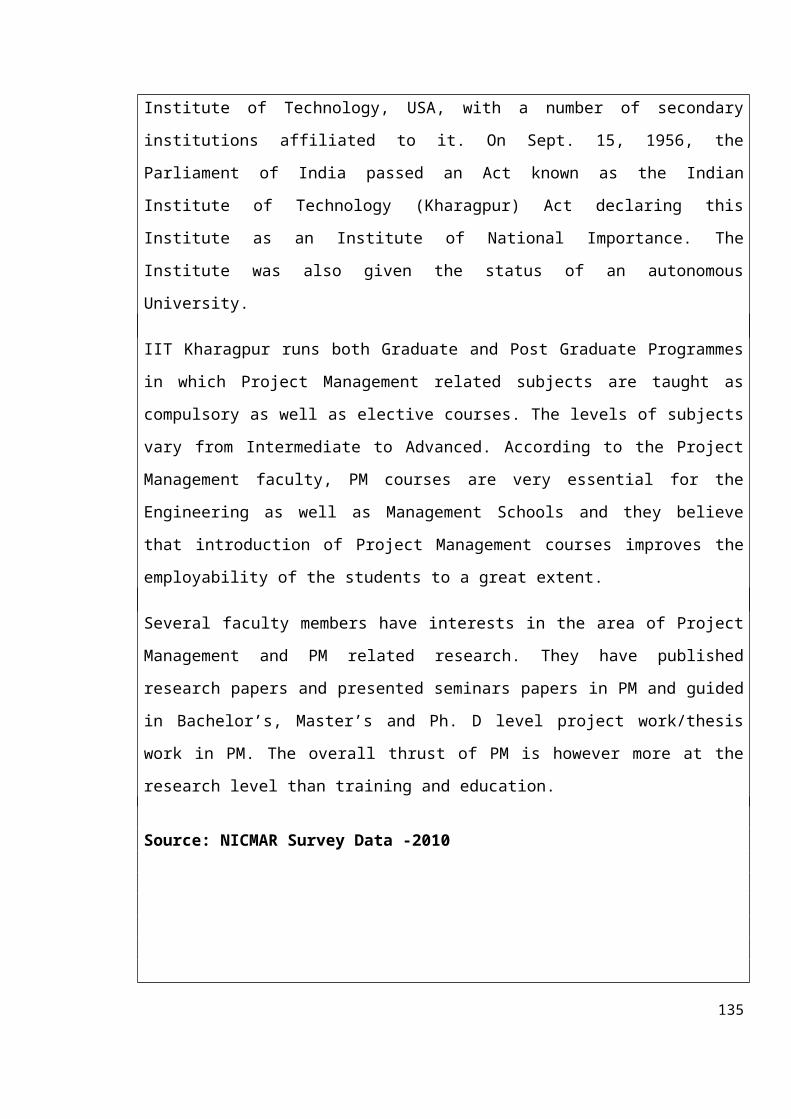
Institute of Technology, USA, with a number of secondary
institutions affiliated to it. On Sept. 15, 1956, the
Parliament of India passed an Act known as the Indian
Institute of Technology (Kharagpur) Act declaring this
Institute as an Institute of National Importance. The
Institute was also given the status of an autonomous
University.
IIT Kharagpur runs both Graduate and Post Graduate Programmes
in which Project Management related subjects are taught as
compulsory as well as elective courses. The levels of subjects
vary from Intermediate to Advanced. According to the Project
Management faculty, PM courses are very essential for the
Engineering as well as Management Schools and they believe
that introduction of Project Management courses improves the
employability of the students to a great extent.
Several faculty members have interests in the area of Project
Management and PM related research. They have published
research papers and presented seminars papers in PM and guided
in Bachelor’s, Master’s and Ph. D level project work/thesis
work in PM. The overall thrust of PM is however more at the
research level than training and education.
Source: NICMAR Survey Data -2010
135

136
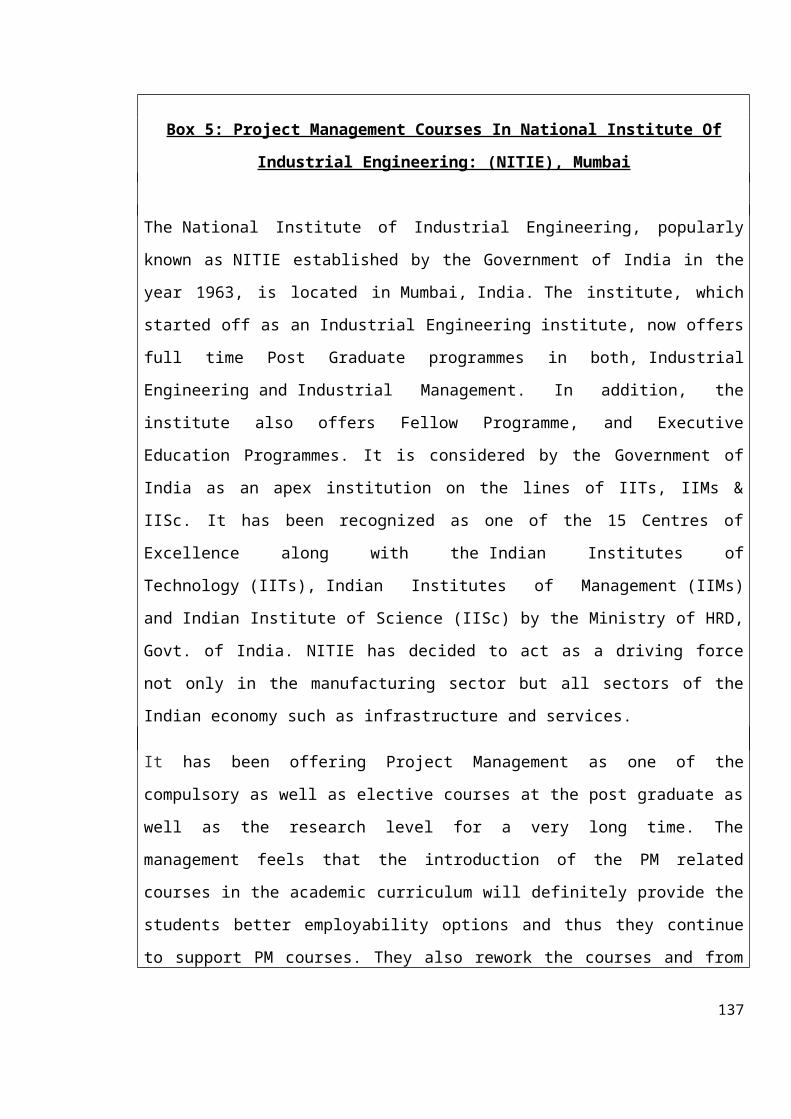
Box 5: Project Management Courses In National Institute Of
Industrial Engineering: (NITIE), Mumbai
The National Institute of Industrial Engineering, popularly
known as NITIE established by the Government of India in the
year 1963, is located in Mumbai, India. The institute, which
started off as an Industrial Engineering institute, now offers
full time Post Graduate programmes in both, Industrial
Engineering and Industrial Management. In addition, the
institute also offers Fellow Programme, and Executive
Education Programmes. It is considered by the Government of
India as an apex institution on the lines of IITs, IIMs &
IISc. It has been recognized as one of the 15 Centres of
Excellence along with the Indian Institutes of
Technology (IITs), Indian Institutes of Management (IIMs)
and Indian Institute of Science (IISc) by the Ministry of HRD,
Govt. of India. NITIE has decided to act as a driving force
not only in the manufacturing sector but all sectors of the
Indian economy such as infrastructure and services.
It has been offering Project Management as one of the
compulsory as well as elective courses at the post graduate as
well as the research level for a very long time. The
management feels that the introduction of the PM related
courses in the academic curriculum will definitely provide the
students better employability options and thus they continue
to support PM courses. They also rework the courses and from
137
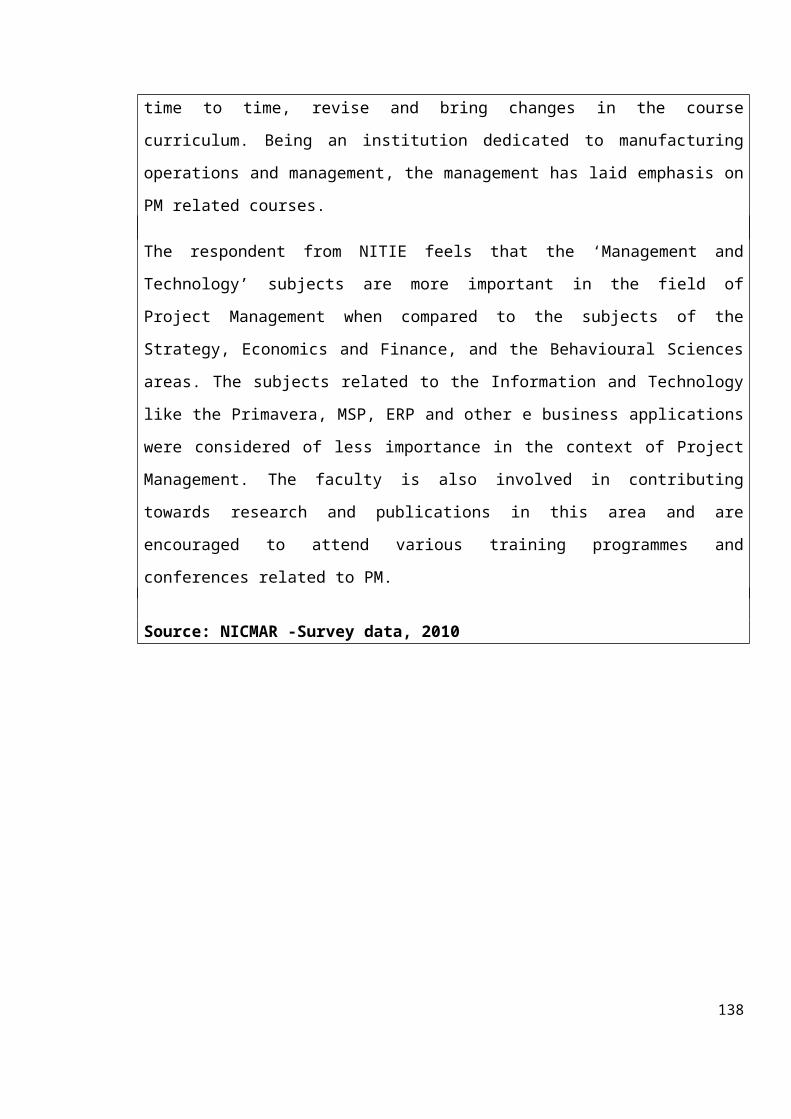
time to time, revise and bring changes in the course
curriculum. Being an institution dedicated to manufacturing
operations and management, the management has laid emphasis on
PM related courses.
The respondent from NITIE feels that the ‘Management and
Technology’ subjects are more important in the field of
Project Management when compared to the subjects of the
Strategy, Economics and Finance, and the Behavioural Sciences
areas. The subjects related to the Information and Technology
like the Primavera, MSP, ERP and other e business applications
were considered of less importance in the context of Project
Management. The faculty is also involved in contributing
towards research and publications in this area and are
encouraged to attend various training programmes and
conferences related to PM.
Source: NICMAR -Survey data, 2010
138
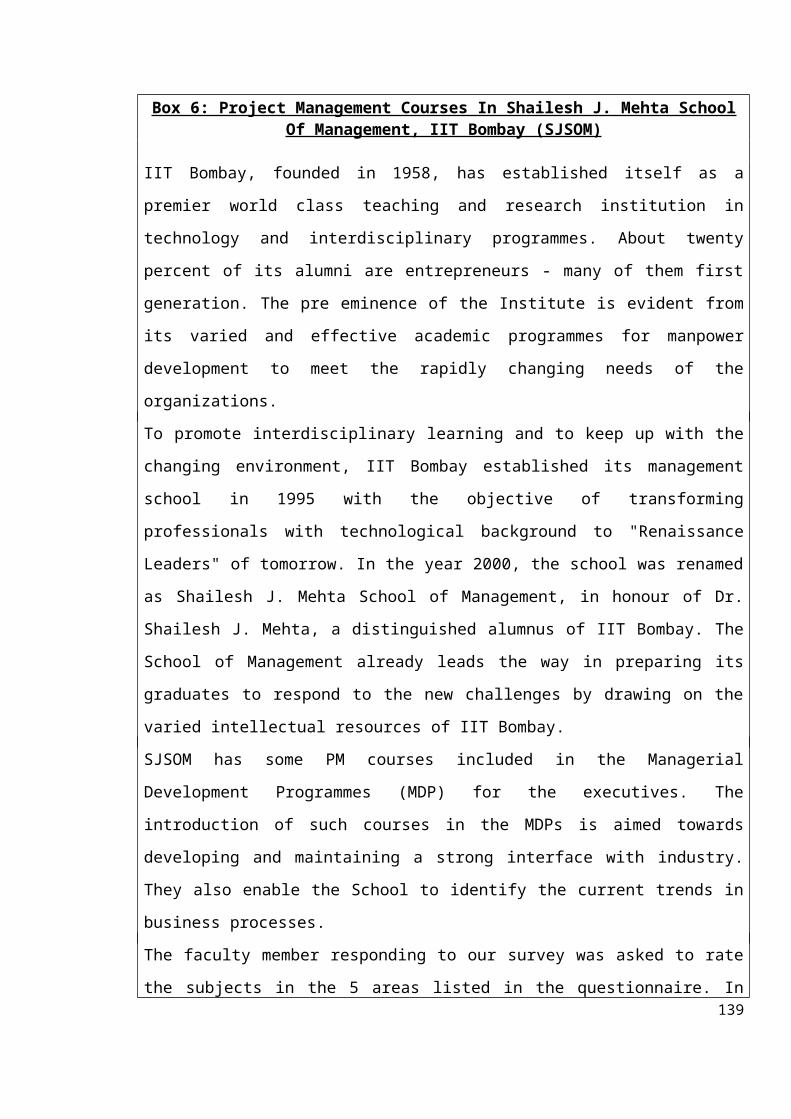
Box 6: Project Management Courses In Shailesh J. Mehta SchoolOf Management, IIT Bombay (SJSOM)
IIT Bombay, founded in 1958, has established itself as a
premier world class teaching and research institution in
technology and interdisciplinary programmes. About twenty
percent of its alumni are entrepreneurs - many of them first
generation. The pre eminence of the Institute is evident from
its varied and effective academic programmes for manpower
development to meet the rapidly changing needs of the
organizations.
To promote interdisciplinary learning and to keep up with the
changing environment, IIT Bombay established its management
school in 1995 with the objective of transforming
professionals with technological background to "Renaissance
Leaders" of tomorrow. In the year 2000, the school was renamed
as Shailesh J. Mehta School of Management, in honour of Dr.
Shailesh J. Mehta, a distinguished alumnus of IIT Bombay. The
School of Management already leads the way in preparing its
graduates to respond to the new challenges by drawing on the
varied intellectual resources of IIT Bombay.
SJSOM has some PM courses included in the Managerial
Development Programmes (MDP) for the executives. The
introduction of such courses in the MDPs is aimed towards
developing and maintaining a strong interface with industry.
They also enable the School to identify the current trends in
business processes.
The faculty member responding to our survey was asked to rate
the subjects in the 5 areas listed in the questionnaire. In139
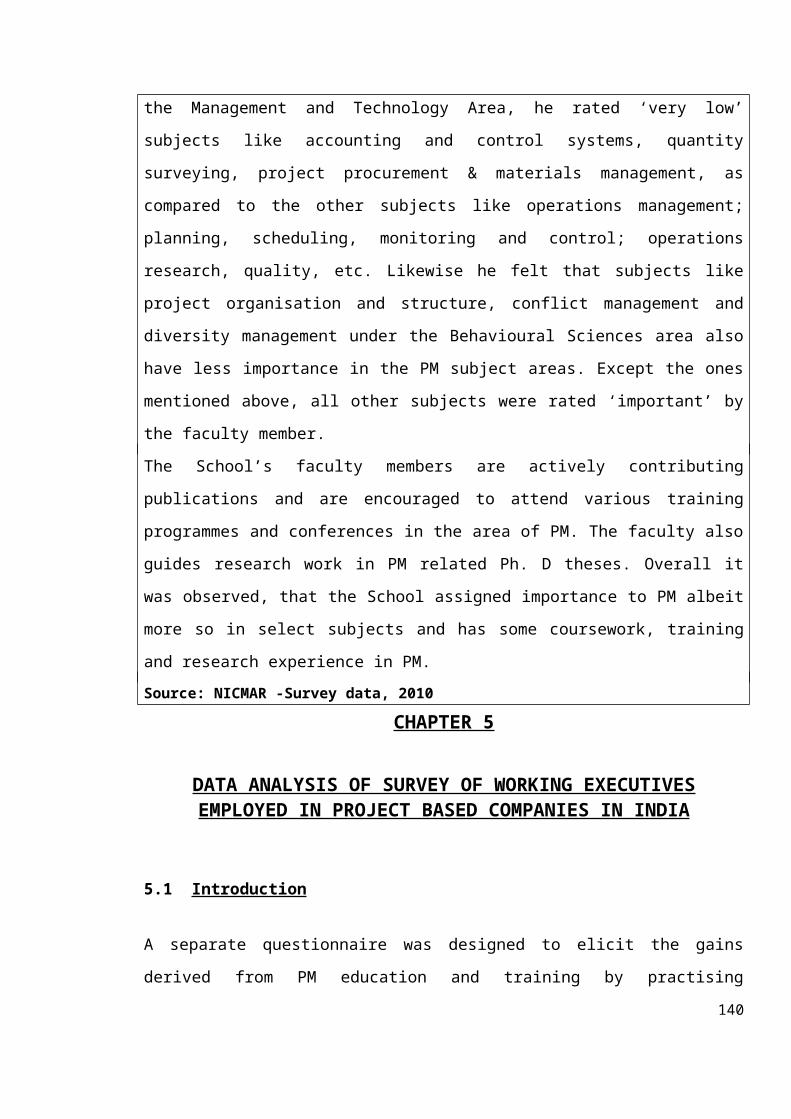
the Management and Technology Area, he rated ‘very low’
subjects like accounting and control systems, quantity
surveying, project procurement & materials management, as
compared to the other subjects like operations management;
planning, scheduling, monitoring and control; operations
research, quality, etc. Likewise he felt that subjects like
project organisation and structure, conflict management and
diversity management under the Behavioural Sciences area also
have less importance in the PM subject areas. Except the ones
mentioned above, all other subjects were rated ‘important’ by
the faculty member.
The School’s faculty members are actively contributing
publications and are encouraged to attend various training
programmes and conferences in the area of PM. The faculty also
guides research work in PM related Ph. D theses. Overall it
was observed, that the School assigned importance to PM albeit
more so in select subjects and has some coursework, training
and research experience in PM. Source: NICMAR -Survey data, 2010
CHAPTER 5
DATA ANALYSIS OF SURVEY OF WORKING EXECUTIVESEMPLOYED IN PROJECT BASED COMPANIES IN INDIA
5.1 Introduction
A separate questionnaire was designed to elicit the gains
derived from PM education and training by practising
140
executives, who are currently employed in project based
organisations, and for the major part of their working life,
have been working on a variety of projects (Refer Annexure 5).
The objective was to find out the efficacy of PM learning in
relation to performance on the projects. The typical sample
chosen comprised graduates in engineering and /or management
who have been working with project based organisations after
their graduation. The study sought to find out whether they
had received any formal PM related training and the extent of
time they were with PM in general. The idea was to determine
the ‘before and after’ effects of undergoing PM training.
The questionnaire consisted of four parts: PART I, II, III and
IV. The first part (PART I A & B) covers the executives’
professional details such as the number of years that they
have been in service, the number of projects in which they
have had experience, in terms of their active involvement, the
value of the project, the particular role of each one of them
in various projects, etc. PART II covered the subjects that
needed to be included as learning modules in PM. Three subject
areas and individual subject contained within these areas in
the questionnaire for practising executives were the same as
those covered in the Academic Institutions’ Questionnaire. The
subject Area of Economics, Finance and Strategy was omitted.
Thus the subject areas included were:
A. Management and Technology Area
B. Behavioural Sciences Area
C. Information Technology Area141
The respondents were asked to rate the importance of
particular subjects on a 5 point scale, in the 3 subject areas
listed above. The subjects contained herein were the same as
those that were included in the questionnaire administered to
the Academic Institutions. The specific objective for this
part was to find out the perception amongst the working
executives about the subjects that were important to them in
PM careers. This was to gain an insight into what the
respondents viewed as necessary knowledge inputs in their
project related jobs. The findings of the study are discussed
later in this chapter.
Section D, was Sector Specific, wherein they were asked to
rate whether teaching PM skills through prior education or
training were important for the variety of sectors listed such
as Oil & Gas, Roads, Petrochemicals, Aerospace, Mega Property
Development, etc.
PART III of the questionnaire was included, to find out the
extent of gains perceived by the respondents after completing
the PM related training. The candidates were asked whether
they had undergone any prior PM related training during their
student graduation as part of their engineering curriculum.
For those who had not, it was necessary to find out whether
the PM related training they had received while in service,
has benefitted them on parameters like improvement of
efficiency and effectiveness at work, career enhancement,
monetary benefits, changed roles and responsibilities, etc.
Questions were also asked to glean information about the142
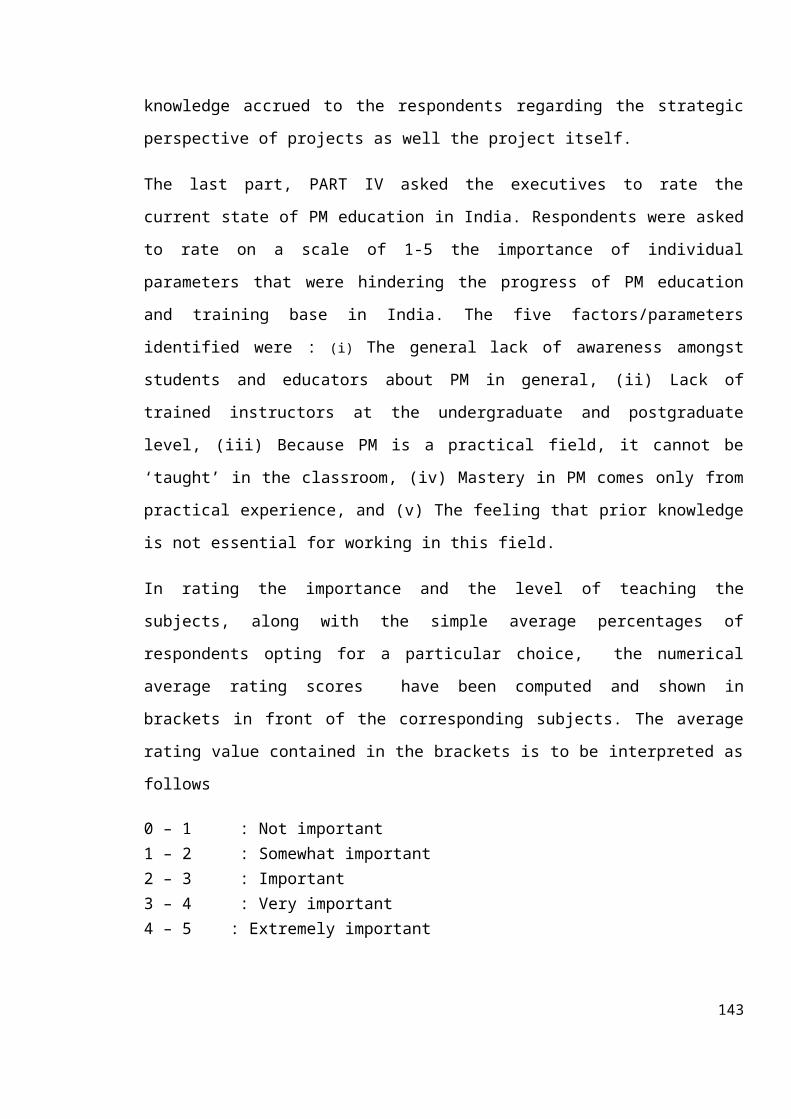
knowledge accrued to the respondents regarding the strategic
perspective of projects as well the project itself.
The last part, PART IV asked the executives to rate the
current state of PM education in India. Respondents were asked
to rate on a scale of 1-5 the importance of individual
parameters that were hindering the progress of PM education
and training base in India. The five factors/parameters
identified were : (i) The general lack of awareness amongst
students and educators about PM in general, (ii) Lack of
trained instructors at the undergraduate and postgraduate
level, (iii) Because PM is a practical field, it cannot be
‘taught’ in the classroom, (iv) Mastery in PM comes only from
practical experience, and (v) The feeling that prior knowledge
is not essential for working in this field.
In rating the importance and the level of teaching the
subjects, along with the simple average percentages of
respondents opting for a particular choice, the numerical
average rating scores have been computed and shown in
brackets in front of the corresponding subjects. The average
rating value contained in the brackets is to be interpreted as
follows
0 – 1 : Not important1 – 2 : Somewhat important2 – 3 : Important3 – 4 : Very important4 – 5 : Extremely important
143
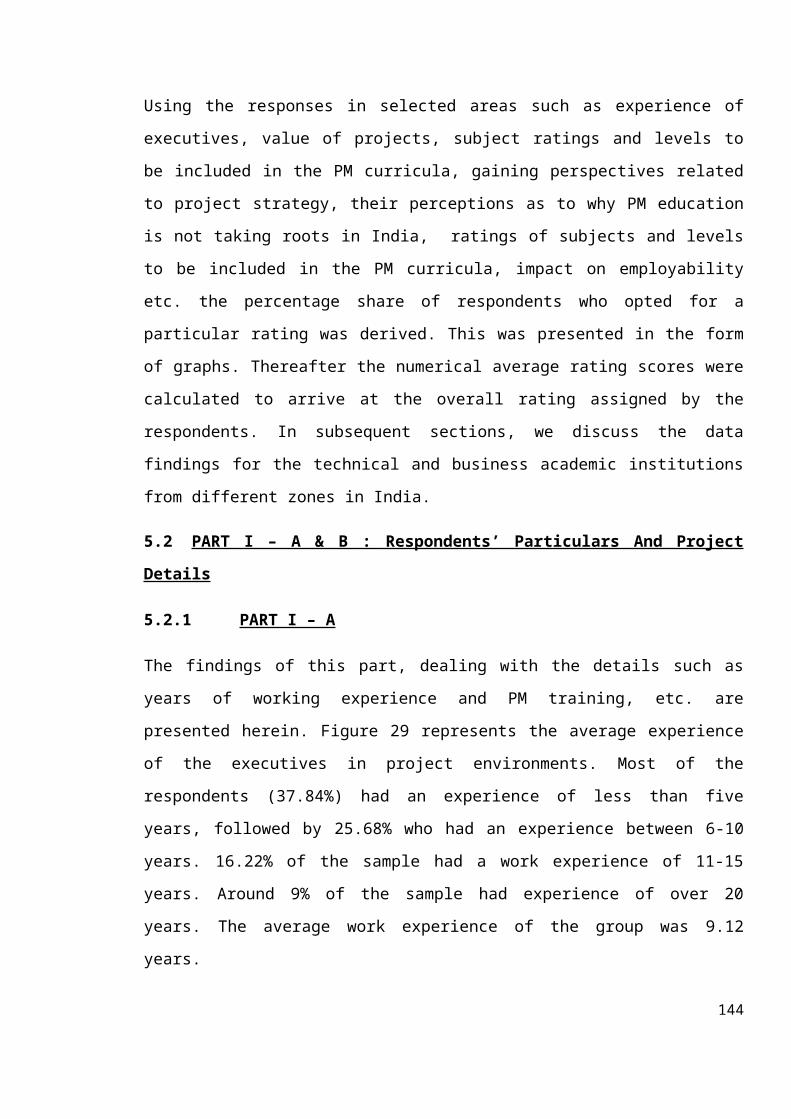
Using the responses in selected areas such as experience of
executives, value of projects, subject ratings and levels to
be included in the PM curricula, gaining perspectives related
to project strategy, their perceptions as to why PM education
is not taking roots in India, ratings of subjects and levels
to be included in the PM curricula, impact on employability
etc. the percentage share of respondents who opted for a
particular rating was derived. This was presented in the form
of graphs. Thereafter the numerical average rating scores were
calculated to arrive at the overall rating assigned by the
respondents. In subsequent sections, we discuss the data
findings for the technical and business academic institutions
from different zones in India.
5.2 PART I – A & B : Respondents’ Particulars And Project
Details
5.2.1 PART I – A
The findings of this part, dealing with the details such as
years of working experience and PM training, etc. are
presented herein. Figure 29 represents the average experience
of the executives in project environments. Most of the
respondents (37.84%) had an experience of less than five
years, followed by 25.68% who had an experience between 6-10
years. 16.22% of the sample had a work experience of 11-15
years. Around 9% of the sample had experience of over 20
years. The average work experience of the group was 9.12
years.
144
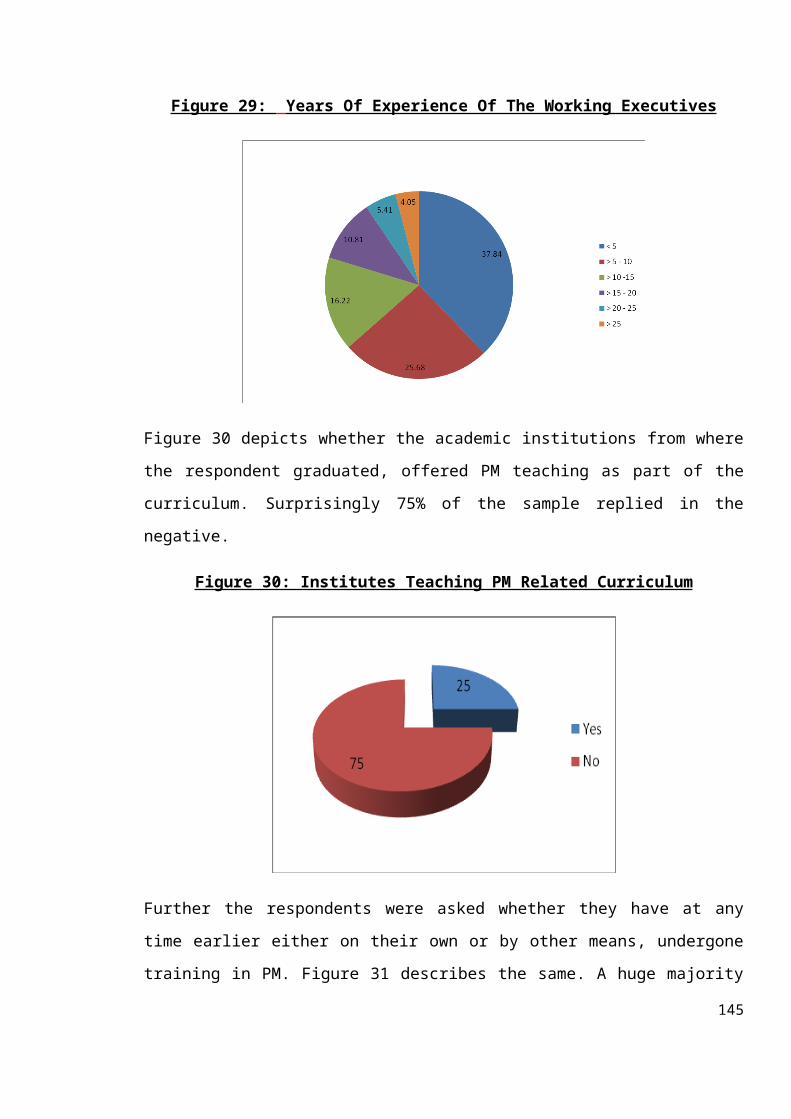
Figure 29: Years Of Experience Of The Working Executives
Figure 30 depicts whether the academic institutions from where
the respondent graduated, offered PM teaching as part of the
curriculum. Surprisingly 75% of the sample replied in the
negative.
Figure 30: Institutes Teaching PM Related Curriculum
Further the respondents were asked whether they have at any
time earlier either on their own or by other means, undergone
training in PM. Figure 31 describes the same. A huge majority
145
(89%) of the respondents admitted to not having undergone
prior training in PM.
Figure 31: Executives With Prior PM Related Training
5.2.2 PART I – B
PART I-B elicits details from the respondents on the value of
the projects in which they have served and the techniques
employed on projects to improve project efficiency. Figures
32 and 33, show the average value of the projects and the
tools and techniques used to make projects more efficient. The
single largest majority of respondents (37.29 %) had worked on
projects ranging between. 100-200 crores. However taken
together, the combined majority of the sample (39%) had worked
on projects whose value ranged between 200 crs to more than
146
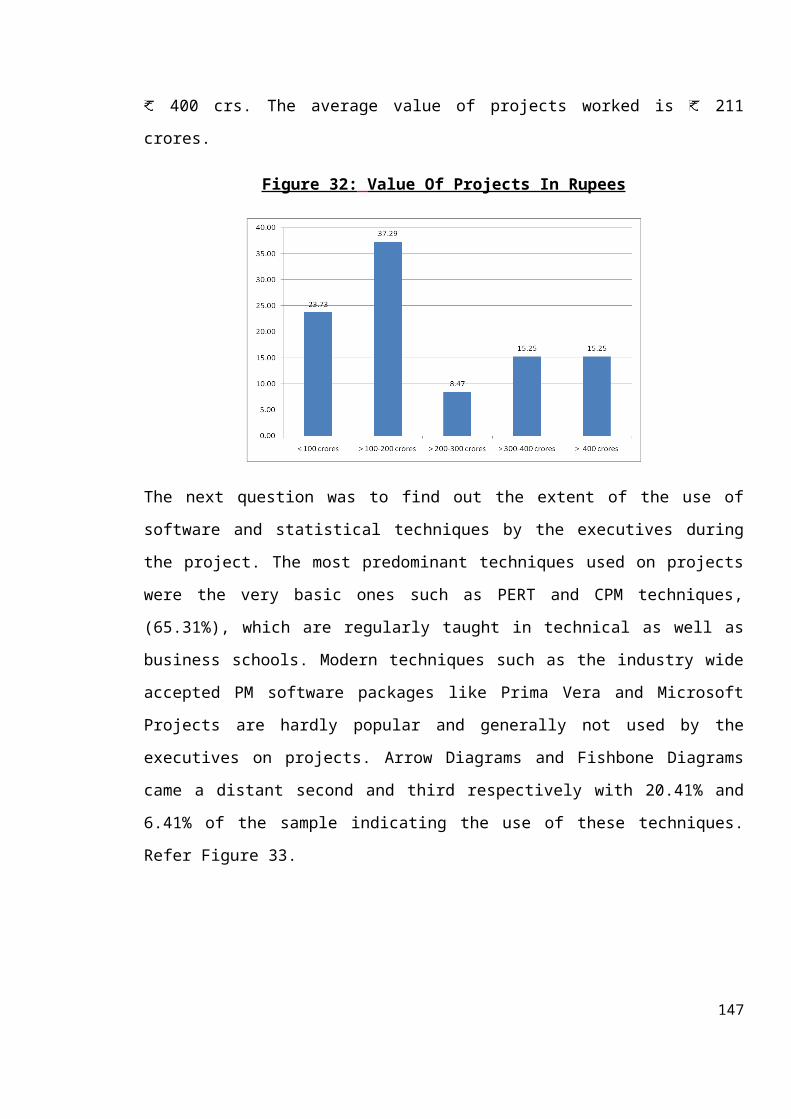
400 crs. The average value of projects worked is 211
crores.
Figure 32: Value Of Projects In Rupees
The next question was to find out the extent of the use of
software and statistical techniques by the executives during
the project. The most predominant techniques used on projects
were the very basic ones such as PERT and CPM techniques,
(65.31%), which are regularly taught in technical as well as
business schools. Modern techniques such as the industry wide
accepted PM software packages like Prima Vera and Microsoft
Projects are hardly popular and generally not used by the
executives on projects. Arrow Diagrams and Fishbone Diagrams
came a distant second and third respectively with 20.41% and
6.41% of the sample indicating the use of these techniques.
Refer Figure 33.
147
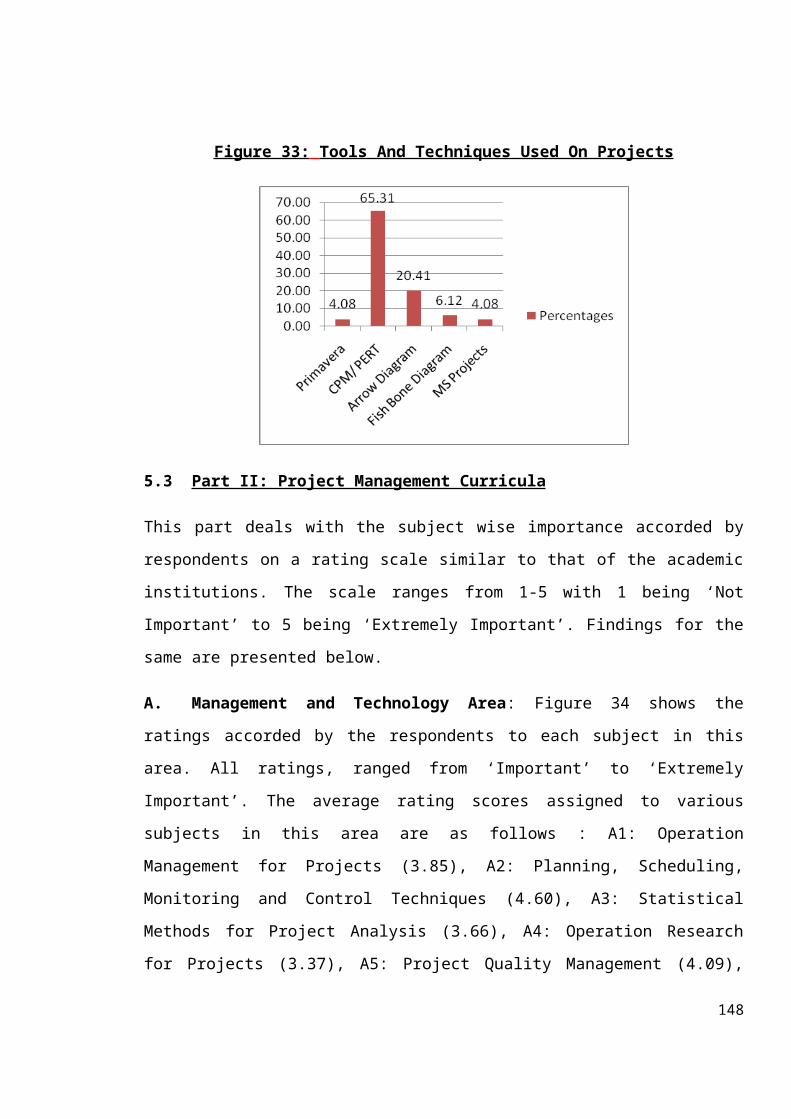
Figure 33: Tools And Techniques Used On Projects
5.3 Part II: Project Management Curricula
This part deals with the subject wise importance accorded by
respondents on a rating scale similar to that of the academic
institutions. The scale ranges from 1-5 with 1 being ‘Not
Important’ to 5 being ‘Extremely Important’. Findings for the
same are presented below.
A. Management and Technology Area: Figure 34 shows the
ratings accorded by the respondents to each subject in this
area. All ratings, ranged from ‘Important’ to ‘Extremely
Important’. The average rating scores assigned to various
subjects in this area are as follows : A1: Operation
Management for Projects (3.85), A2: Planning, Scheduling,
Monitoring and Control Techniques (4.60), A3: Statistical
Methods for Project Analysis (3.66), A4: Operation Research
for Projects (3.37), A5: Project Quality Management (4.09),
148
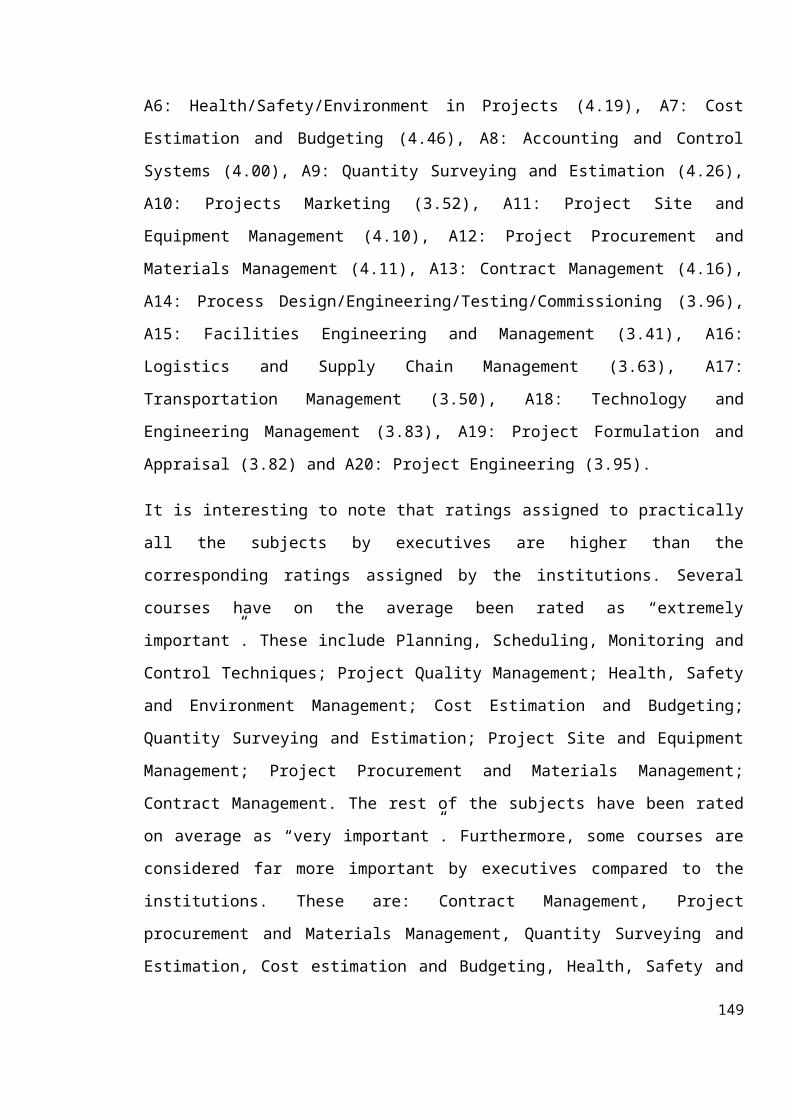
A6: Health/Safety/Environment in Projects (4.19), A7: Cost
Estimation and Budgeting (4.46), A8: Accounting and Control
Systems (4.00), A9: Quantity Surveying and Estimation (4.26),
A10: Projects Marketing (3.52), A11: Project Site and
Equipment Management (4.10), A12: Project Procurement and
Materials Management (4.11), A13: Contract Management (4.16),
A14: Process Design/Engineering/Testing/Commissioning (3.96),
A15: Facilities Engineering and Management (3.41), A16:
Logistics and Supply Chain Management (3.63), A17:
Transportation Management (3.50), A18: Technology and
Engineering Management (3.83), A19: Project Formulation and
Appraisal (3.82) and A20: Project Engineering (3.95).
It is interesting to note that ratings assigned to practically
all the subjects by executives are higher than the
corresponding ratings assigned by the institutions. Several
courses have on the average been rated as “extremely
important”. These include Planning, Scheduling, Monitoring and
Control Techniques; Project Quality Management; Health, Safety
and Environment Management; Cost Estimation and Budgeting;
Quantity Surveying and Estimation; Project Site and Equipment
Management; Project Procurement and Materials Management;
Contract Management. The rest of the subjects have been rated
on average as “very important”. Furthermore, some courses are
considered far more important by executives compared to the
institutions. These are: Contract Management, Project
procurement and Materials Management, Quantity Surveying and
Estimation, Cost estimation and Budgeting, Health, Safety and
149
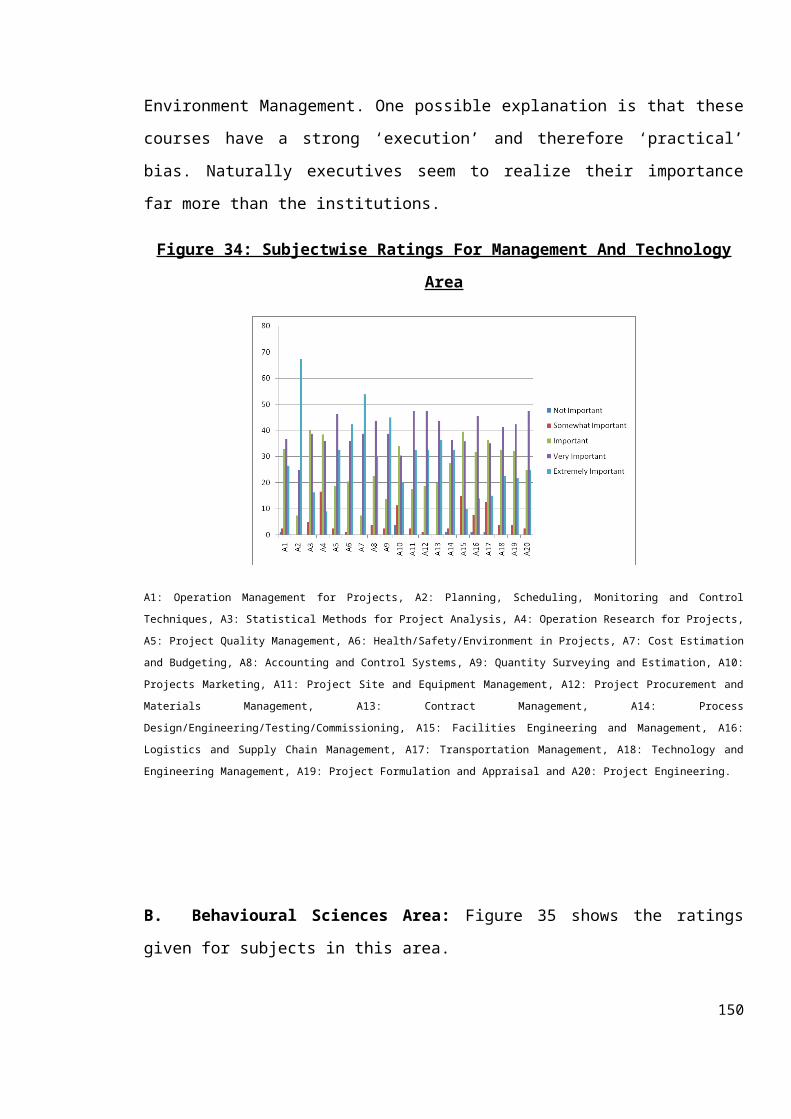
Environment Management. One possible explanation is that these
courses have a strong ‘execution’ and therefore ‘practical’
bias. Naturally executives seem to realize their importance
far more than the institutions.
Figure 34: Subjectwise Ratings For Management And Technology
Area
A1: Operation Management for Projects, A2: Planning, Scheduling, Monitoring and Control
Techniques, A3: Statistical Methods for Project Analysis, A4: Operation Research for Projects,
A5: Project Quality Management, A6: Health/Safety/Environment in Projects, A7: Cost Estimation
and Budgeting, A8: Accounting and Control Systems, A9: Quantity Surveying and Estimation, A10:
Projects Marketing, A11: Project Site and Equipment Management, A12: Project Procurement and
Materials Management, A13: Contract Management, A14: Process
Design/Engineering/Testing/Commissioning, A15: Facilities Engineering and Management, A16:
Logistics and Supply Chain Management, A17: Transportation Management, A18: Technology and
Engineering Management, A19: Project Formulation and Appraisal and A20: Project Engineering.
B. Behavioural Sciences Area: Figure 35 shows the ratings
given for subjects in this area.
150
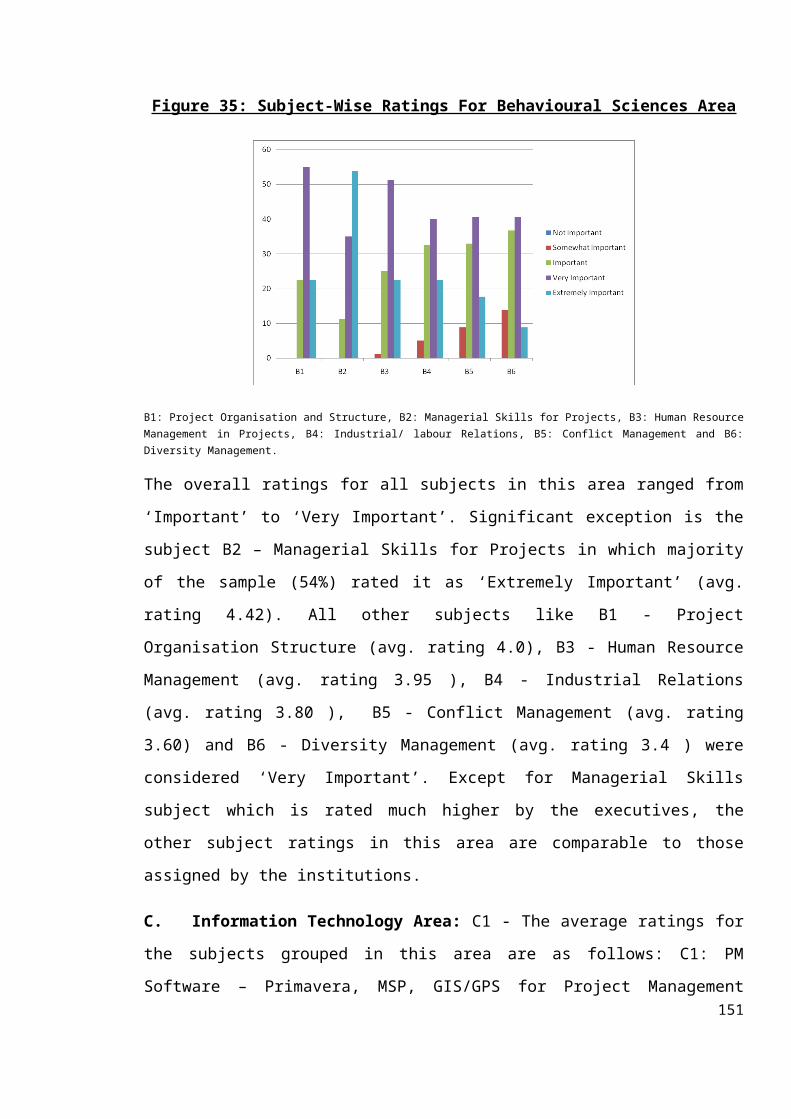
Figure 35: Subject-Wise Ratings For Behavioural Sciences Area
B1: Project Organisation and Structure, B2: Managerial Skills for Projects, B3: Human ResourceManagement in Projects, B4: Industrial/ labour Relations, B5: Conflict Management and B6:Diversity Management.
The overall ratings for all subjects in this area ranged from
‘Important’ to ‘Very Important’. Significant exception is the
subject B2 – Managerial Skills for Projects in which majority
of the sample (54%) rated it as ‘Extremely Important’ (avg.
rating 4.42). All other subjects like B1 - Project
Organisation Structure (avg. rating 4.0), B3 - Human Resource
Management (avg. rating 3.95 ), B4 - Industrial Relations
(avg. rating 3.80 ), B5 - Conflict Management (avg. rating
3.60) and B6 - Diversity Management (avg. rating 3.4 ) were
considered ‘Very Important’. Except for Managerial Skills
subject which is rated much higher by the executives, the
other subject ratings in this area are comparable to those
assigned by the institutions.
C. Information Technology Area: C1 - The average ratings for
the subjects grouped in this area are as follows: C1: PM
Software – Primavera, MSP, GIS/GPS for Project Management151
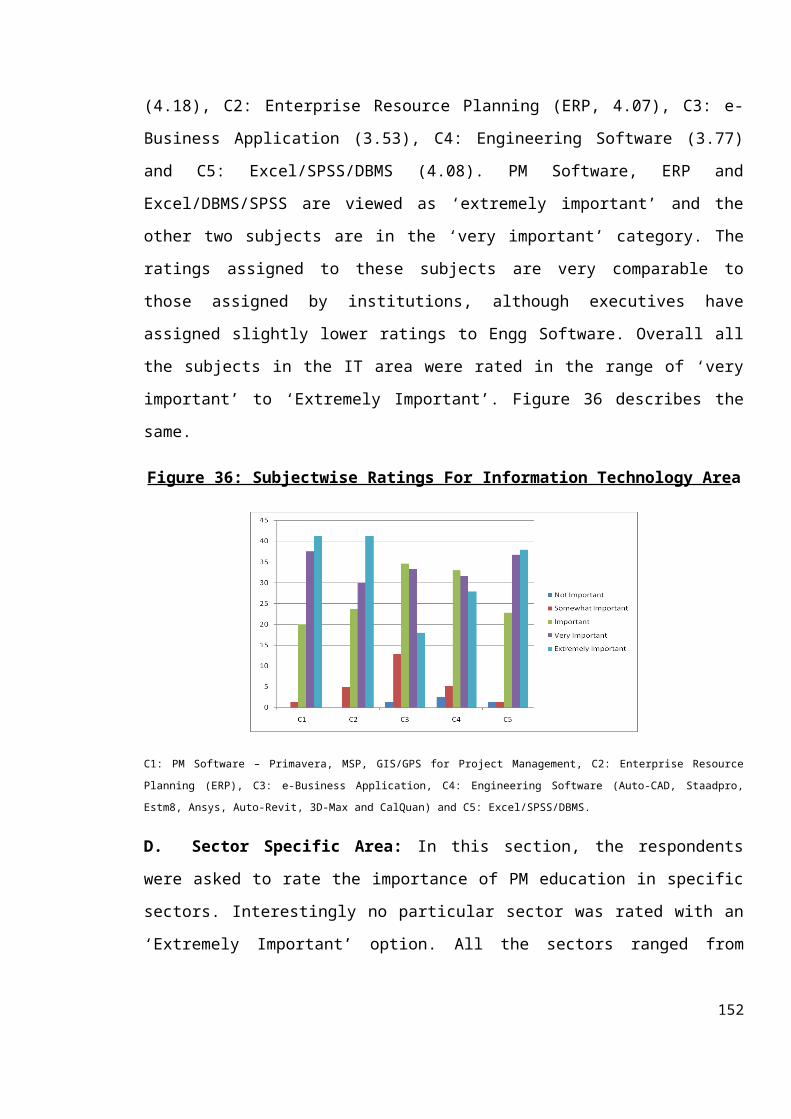
(4.18), C2: Enterprise Resource Planning (ERP, 4.07), C3: e-
Business Application (3.53), C4: Engineering Software (3.77)
and C5: Excel/SPSS/DBMS (4.08). PM Software, ERP and
Excel/DBMS/SPSS are viewed as ‘extremely important’ and the
other two subjects are in the ‘very important’ category. The
ratings assigned to these subjects are very comparable to
those assigned by institutions, although executives have
assigned slightly lower ratings to Engg Software. Overall all
the subjects in the IT area were rated in the range of ‘very
important’ to ‘Extremely Important’. Figure 36 describes the
same.
Figure 36: Subjectwise Ratings For Information Technology Area
C1: PM Software – Primavera, MSP, GIS/GPS for Project Management, C2: Enterprise Resource
Planning (ERP), C3: e-Business Application, C4: Engineering Software (Auto-CAD, Staadpro,
Estm8, Ansys, Auto-Revit, 3D-Max and CalQuan) and C5: Excel/SPSS/DBMS.
D. Sector Specific Area: In this section, the respondents
were asked to rate the importance of PM education in specific
sectors. Interestingly no particular sector was rated with an
‘Extremely Important’ option. All the sectors ranged from
152
‘Important’ to ‘Very Important’. The average ratings assigned
to the coverage of various sectors are as follows :
D1: Information Communication Technology (ICT, 3.60), D2:
Telecom (3.50), D3: Research and Development (3.52), D4: Space
Exploration (3.28), D5: Technology (3.85), D6: Defence (3.29),
D7: Roadways (3.98), D8: Railways (3.91), D9: Civil Aviation
(3.71), D10: Ports (3.64), D11: Shipbuilding (3.41), D12:
Urban Infrastructure (3.84), D13: Mega Property Developments
(3.70), D14: Petrochemicals (3.56), D15: Chemical Engineering
(3.26), D16: Oil and Gas Exploration (3.55), D17: Services
(3.65) and D18: International Project Management (3.78). On
the average, coverage of all the specific sectors is
considered ‘very important’. Sectors like Roadways, Railways,
Urban Infrastructure, Civil Aviation and Mega Property
Developments are considered relatively more important than
others. Chemical Engineering and Defence sectors have
received relatively lower ratings. The executives’ ratings are
generally similar to the institutions’ ratings. However the
executives have assigned somewhat higher ratings to the
Technology, Roadways, Railways, Civil Aviation, Urban
Infrastructure sectors.
Figure 37: Ratings For Importance Of PM Education In Sector
Specific Areas
153
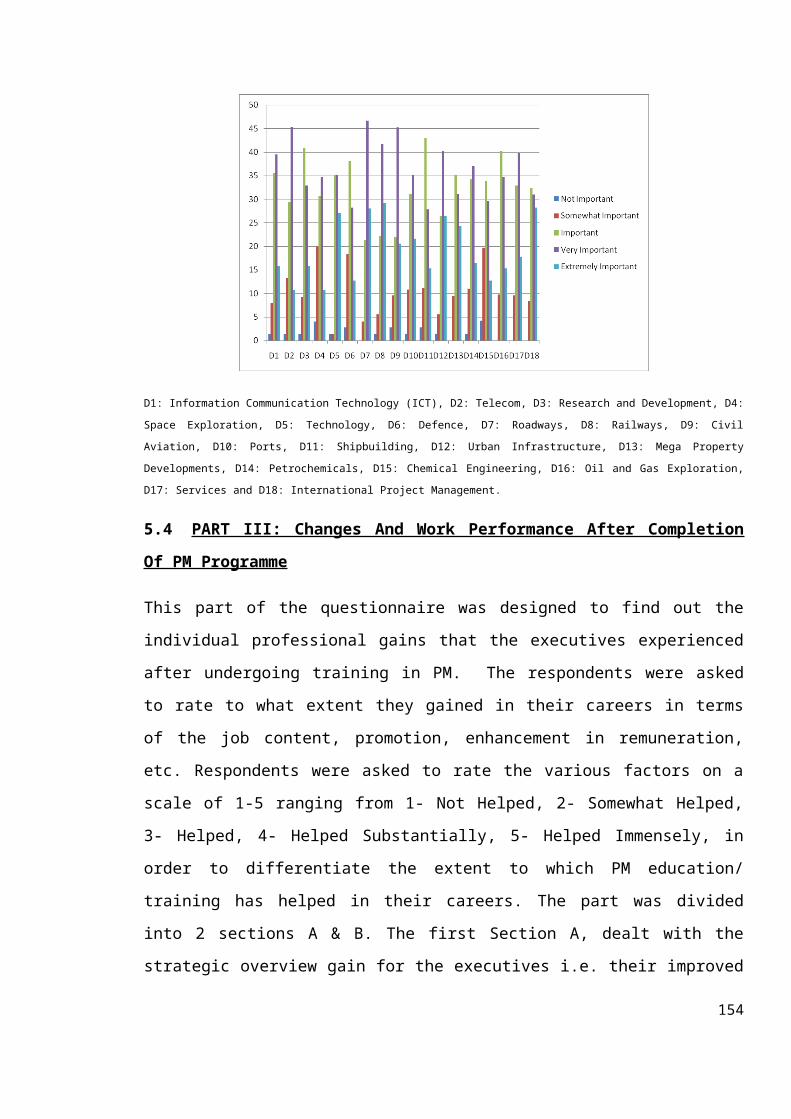
D1: Information Communication Technology (ICT), D2: Telecom, D3: Research and Development, D4:
Space Exploration, D5: Technology, D6: Defence, D7: Roadways, D8: Railways, D9: Civil
Aviation, D10: Ports, D11: Shipbuilding, D12: Urban Infrastructure, D13: Mega Property
Developments, D14: Petrochemicals, D15: Chemical Engineering, D16: Oil and Gas Exploration,
D17: Services and D18: International Project Management.
5.4 PART III: Changes And Work Performance After Completion
Of PM Programme
This part of the questionnaire was designed to find out the
individual professional gains that the executives experienced
after undergoing training in PM. The respondents were asked
to rate to what extent they gained in their careers in terms
of the job content, promotion, enhancement in remuneration,
etc. Respondents were asked to rate the various factors on a
scale of 1-5 ranging from 1- Not Helped, 2- Somewhat Helped,
3- Helped, 4- Helped Substantially, 5- Helped Immensely, in
order to differentiate the extent to which PM education/
training has helped in their careers. The part was divided
into 2 sections A & B. The first Section A, dealt with the
strategic overview gain for the executives i.e. their improved
154
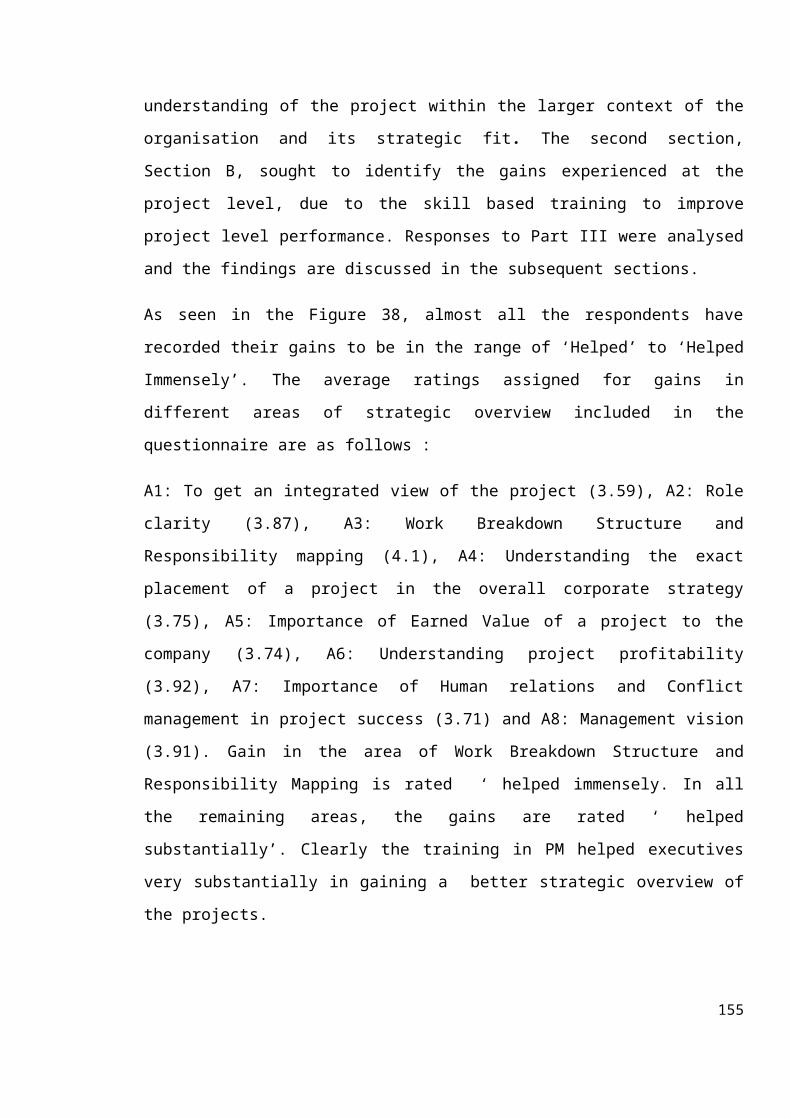
understanding of the project within the larger context of the
organisation and its strategic fit. The second section,
Section B, sought to identify the gains experienced at the
project level, due to the skill based training to improve
project level performance. Responses to Part III were analysed
and the findings are discussed in the subsequent sections.
As seen in the Figure 38, almost all the respondents have
recorded their gains to be in the range of ‘Helped’ to ‘Helped
Immensely’. The average ratings assigned for gains in
different areas of strategic overview included in the
questionnaire are as follows :
A1: To get an integrated view of the project (3.59), A2: Role
clarity (3.87), A3: Work Breakdown Structure and
Responsibility mapping (4.1), A4: Understanding the exact
placement of a project in the overall corporate strategy
(3.75), A5: Importance of Earned Value of a project to the
company (3.74), A6: Understanding project profitability
(3.92), A7: Importance of Human relations and Conflict
management in project success (3.71) and A8: Management vision
(3.91). Gain in the area of Work Breakdown Structure and
Responsibility Mapping is rated ‘ helped immensely. In all
the remaining areas, the gains are rated ‘ helped
substantially’. Clearly the training in PM helped executives
very substantially in gaining a better strategic overview of
the projects.
155
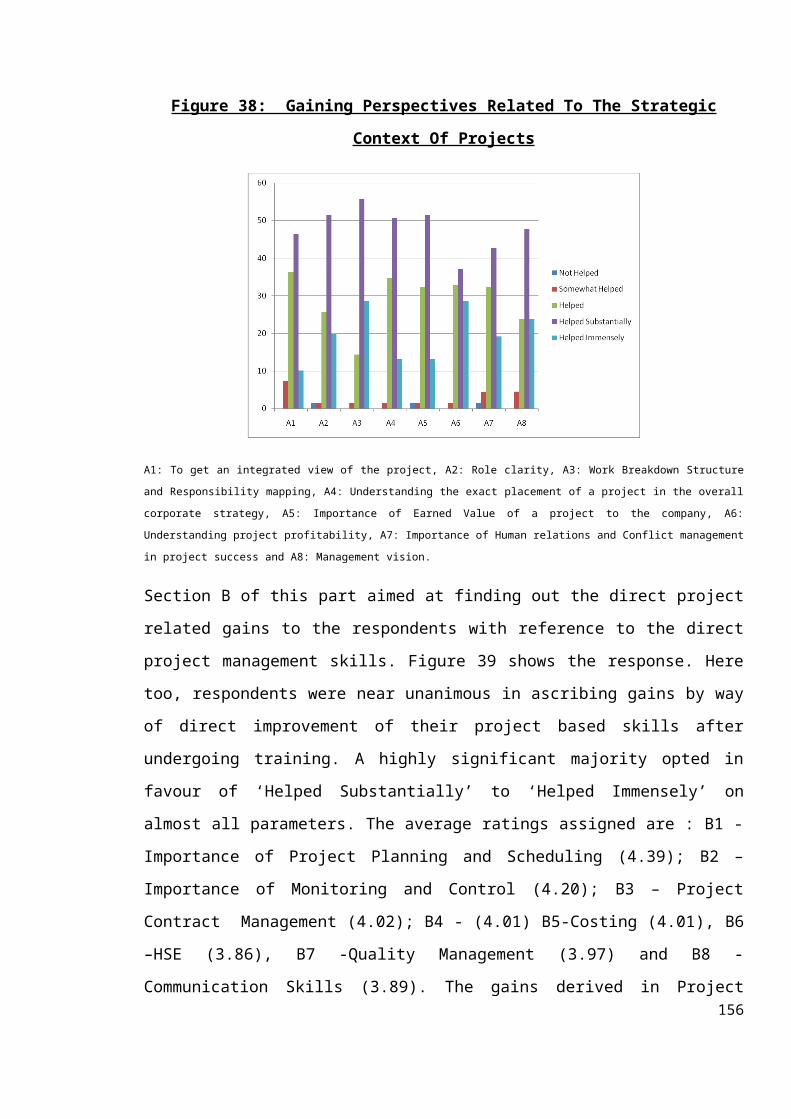
Figure 38: Gaining Perspectives Related To The Strategic
Context Of Projects
A1: To get an integrated view of the project, A2: Role clarity, A3: Work Breakdown Structure
and Responsibility mapping, A4: Understanding the exact placement of a project in the overall
corporate strategy, A5: Importance of Earned Value of a project to the company, A6:
Understanding project profitability, A7: Importance of Human relations and Conflict management
in project success and A8: Management vision.
Section B of this part aimed at finding out the direct project
related gains to the respondents with reference to the direct
project management skills. Figure 39 shows the response. Here
too, respondents were near unanimous in ascribing gains by way
of direct improvement of their project based skills after
undergoing training. A highly significant majority opted in
favour of ‘Helped Substantially’ to ‘Helped Immensely’ on
almost all parameters. The average ratings assigned are : B1 -
Importance of Project Planning and Scheduling (4.39); B2 –
Importance of Monitoring and Control (4.20); B3 – Project
Contract Management (4.02); B4 - (4.01) B5-Costing (4.01), B6
–HSE (3.86), B7 -Quality Management (3.97) and B8 -
Communication Skills (3.89). The gains derived in Project156
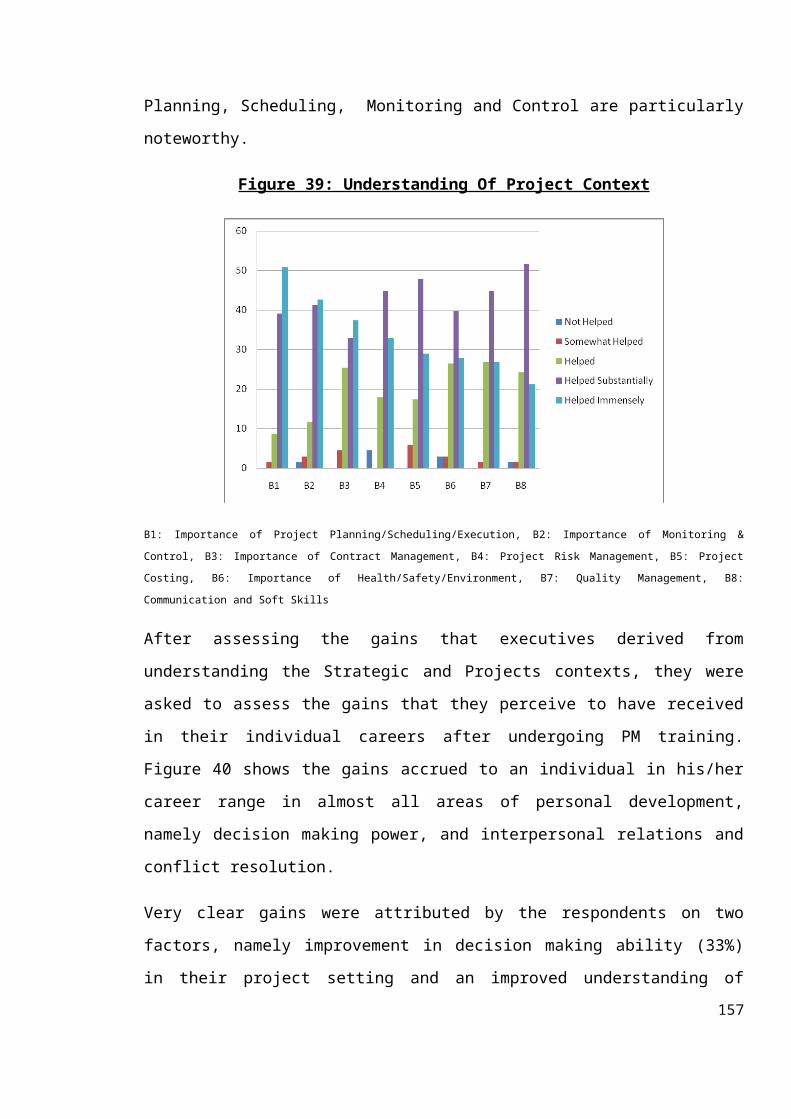
Planning, Scheduling, Monitoring and Control are particularly
noteworthy.
Figure 39: Understanding Of Project Context
B1: Importance of Project Planning/Scheduling/Execution, B2: Importance of Monitoring &
Control, B3: Importance of Contract Management, B4: Project Risk Management, B5: Project
Costing, B6: Importance of Health/Safety/Environment, B7: Quality Management, B8:
Communication and Soft Skills
After assessing the gains that executives derived from
understanding the Strategic and Projects contexts, they were
asked to assess the gains that they perceive to have received
in their individual careers after undergoing PM training.
Figure 40 shows the gains accrued to an individual in his/her
career range in almost all areas of personal development,
namely decision making power, and interpersonal relations and
conflict resolution.
Very clear gains were attributed by the respondents on two
factors, namely improvement in decision making ability (33%)
in their project setting and an improved understanding of157
human related factors i.e. interpersonal relations and
conflict resolution (30%). Interestingly, 25% of the
respondents in the sample claimed that they experienced higher
responsibility coming their way after completion of PM
training. On the whole there appears to be a huge gain in
terms of the enrichment and enlargement aspects of the job
Figure 40: Gains In The Individual’s Career
5.5 PART IV: Current Position Of Project Management In India
This Section attempts to find out the perceptions of the
executives regarding the factors that matter the most in the
systematic establishment of PM education. This was thought to
be necessary since it would enable us to study the executives’
viewpoints regarding the set of factors they think, are
preventing PM education from taking firm roots in India.
Figure 41 summarises the perceptions of these executives in
the form of a bar diagram. The respondents were asked to rate
158
the importance of different factors on scale of 1-5 with 1 –
Not Important; 2 – Somewhat Important; 3 – Important; 4 – Very
Important; 5 – Extremely Important. The average ratings
assigned to the factors considered in this analysis are :
Q1- The Lack Of Awareness Amongst Students And Educators
( 3.70), Q2 -The Importance Of Trained Instructors At
Undergraduate And Post Graduate Levels ( 3.69), Q3 - Being A
Practical Field It Cannot Be ‘Taught’ In The Classroom (3.43),
Q4 - Mastery In PM Is Acquired Only Through Practice (3.62),
Q5 – Importance Of Prior Knowledge In This Field (3.29). From
the responses of the executives, lack of awareness of PM among
students and educators, lack of trained teachers, greater
practice orientation of PM are the key factors emerging as the
main inhibiting factors affecting the growth of PM education.
Figure 41: Factors In Order Of Importance Affecting Growth Of
PM Education
159

Q1- Importance of awareness amongst students and educators, Q2- Importance of trained
instructors at undergraduate and postgraduate levels, Q3- It is more practical so practical
training is required, Q4- Mastery only comes through practical experience,Q 5- Importance of
prior knowledge in the field of PM.
Conclusion
Majority of the practising executives responding to the
questionnaire were from the middle- management cadre, from
technical institutions with no prior exposure to PM training.
Most of these were working on projects with value between
200–300 crores using very elementary PM techniques such as
PERT/CPM.
It is interesting to note that ratings assigned to practically
all the subjects in the Management and Technology area by
executives are higher than the corresponding ratings assigned
by the institutions. Several courses have on the average been
rated as “ extremely important”. These include Planning,
Scheduling, Monitoring and Control Techniques; Project Quality
Management; Health, Safety and Environment Management; Cost160
Estimation and Budgeting; Quantity Surveying and Estimation;
Project Site and Equipment Management; Project Procurement and
Materials Management; Contract Management. The rest of the
subjects have been rated on average as “ very important”.
Furthermore, some courses are considered far more important by
executives compared to the institutions. These are : Contract
Management, Project procurement and Materials Management,
Quantity Surveying and Estimation, Cost estimation and
Budgeting, Health, Safety and Environment Management. One
possible explanation is that these courses have a strong
‘execution’ and therefore ‘practical’ bias. Naturally
executives seem to realize their importance far more than the
institutions.
In the Behavioural Sciences area, the overall ratings for all
subjects in this area averaged ‘Very Important’, except for
Managerial Skills subject rated ‘extremely important’. This
subject w is rated much higher by the executives, while the
other subject ratings in this area are comparable to those
assigned by the institutions.
Overall all the subjects in the IT area were rated in the
range of ‘very important’ to ‘Extremely Important’. PM
Software, ERP and Excel/DBMS/SPSS are rated ‘ extremely
important’ and the other subjects are rated ‘very important’.
The ratings assigned to these subjects are very comparable to
those assigned by institutions, although executives have
assigned slightly lower ratings to Engg Software.
161
On the average, coverage of all the specific sectors is
considered ‘very important’. Sectors like Roadways, Railways,
Urban Infrastructure, Civil Aviation and Mega Property
Developments are considered relatively more important than
others. Chemical Engineering and Defence sectors have
received relatively lower ratings. The executives’ ratings are
generally similar to the institutions’ ratings. However the
executives have assigned somewhat higher ratings to the
Technology, Roadways, Railways, Civil Aviation, Urban
Infrastructure sectors.
In terms of gains derived in developing a better strategic
overview of projects, PM training ‘ helped immensely’ in the
area of Work Breakdown Structure and Responsibility Mapping.
Training ‘ helped substantially’ in all the remaining areas
listed. Clearly the training in PM helped executives very
substantially in gaining a better strategic overview of the
projects.
At the direct project level, training ‘helped immensely’ in
Project Planning, Scheduling, Monitoring and Control.
Training ‘ helped substantially’ in other areas including
Contract Management, Costing, HSE, Quality Management and
Communication Skills. The gains derived in Project Planning,
Scheduling, Monitoring and Control are particularly
noteworthy.
In individual career enhancement, executives saw improvement
on two factors, namely improved decision making ability and
162

improved understanding of human related factors i.e.
interpersonal relations and conflict resolution. Some
experienced higher responsibility coming their way after
completion of PM training. On the whole there appear to be a
significant gains in terms of the enrichment and enlargement
aspects of the job.
From the responses of the executives, lack of awareness of PM
among students and educators, lack of trained teachers and
greater practice orientation of PM are the key factors
emerging as the main inhibiting factors affecting the growth
of PM education.
163
Box No.7 Mr. A.K. Asthana, Asst. General Manager, Afcons Ltd.
Mr. A.K. Asthana enrolled in the Executive Post Graduate
Project Management (EPGPM) Programme at the National Institute
of Construction Management (NICMAR), Pune in the year 2005-06
batch for a period of one year. The EPGPM is designed for
Working Executives, working in the junior and middle
management levels especially at the project sites. This
programme aims at enhancing the skills in project planning,
execution, monitoring, contract management, quality, safety
and technology. Another important component of this is the
enhancement of their communication skills and soft skills for
better interpersonal relations and leadership abilities.
Approximately 270 hours of teaching is imparted to the
participants, and regular examinations on the curriculum,
conducted at intervals.
164
Mr. Asthana recounts the positive changes that he experienced
in his professional career, after undergoing the course at
NICMAR. According to him, the course made a difference in two
major ways a) It changed his perceptions and attitude in
looking at the issues in his professional work life, in all
areas such as contract management, project management,
conflict resolution, better communication vertically as well
as laterally and b) The tremendous confidence that he
experienced after ‘coming out of the process of training’. He
admitted that having adapted the learning in his own way at
the workplace, he became more confident and therefore, it also
helped to achieve recognition in his career.
Further Mr. Asthana admits that the training exposed him to
the concept of continuous improvement and working in a
systematic way. He learnt time management and cultivated a
systematic working style which has overall led him to work
efficiently and also achieve a work life balance. Lastly
Asthana now, leads his teams in a way that all members are
provided a platform to perform to the best of their ability.
He provides result oriented support, training system for
skills development, judges the probable conflict points and
steps in to remove them, in a timely manner.
After the completion of the course at NICMAR, Mr. Asthana was
immediately promoted to Senior Manager and thereafter he is
currently designated Assistant General Manager in a space of
approximately four years at AFCONS.
165
Source: Email to NICMAR faculty.
CHAPTER 6
DATA ANALYSIS OF SURVEY OF HUMAN RESOURCE MANAGERSEMPLOYED IN PROJECT-BASED COMPANIES IN INDIA
6.1 Introduction
It was considered necessary to incorporate the views of the
industry on Project Management (PM) education and training. It
was decided to seek responses from the Human Resource
Departments of project based organisations, as human resource
managers are directly involved in the design and deployment of
PM training and development activities within their
organisations. So, in project based organisations, a cross
section of human resource managers were approached from heavy
engineering industries, construction, information technology
and banking services.
The questionnaire is divided into two Parts. PART I seeks
details about the general information and opinions of the HR
executives and officers on PM training within their
organisations. It also covers information on current and past
initiatives undertaken for training and development of project
related skills and the cadre/s of employees that the company
trains in this area. (Refer Annex 6).
166
Part II, deals with the set of factors that are considered
important by the organisations for imparting PM training and
develop PM competencies amongst their executives. Part II (B)
of the questionnaire, also has questions on the preferred
training methods and the training outcomes considered by the
human resource managers. Part II (C) deals with the level of
training and the grades of the employees for whom PM related
training is directed. Part II (D) deals with the perceptions
of the managers on the extent of costs incurred on the
training. Part II (E) focuses on the perceived benefits that
accrue from the training in PM. Part II (F) deals with the set
of Project Management (PM) related fields essential to develop
PM competencies. Part II (G) is based on the opinions of the
efficacy of PM training in PM imparted by the various training
entities. Part II (H) attempts to find out if the company
values international accreditation extended to executives
undergoing PM training as an added benefit.
All questions within the various parts of this questionnaire
were to be rated on a scale of 1-5 with 1 indicating the least
score accorded to the specific question and 5 being the
highest, by the respondent. Presented below are the findings
from the survey.
In rating the response on various issues like the period of
inception of PM training in companies, factors considered
essential before planning PM training programmes, training
cost benefits, training efficacy, etc. along with the simple
average percentages of respondents opting for a particular167
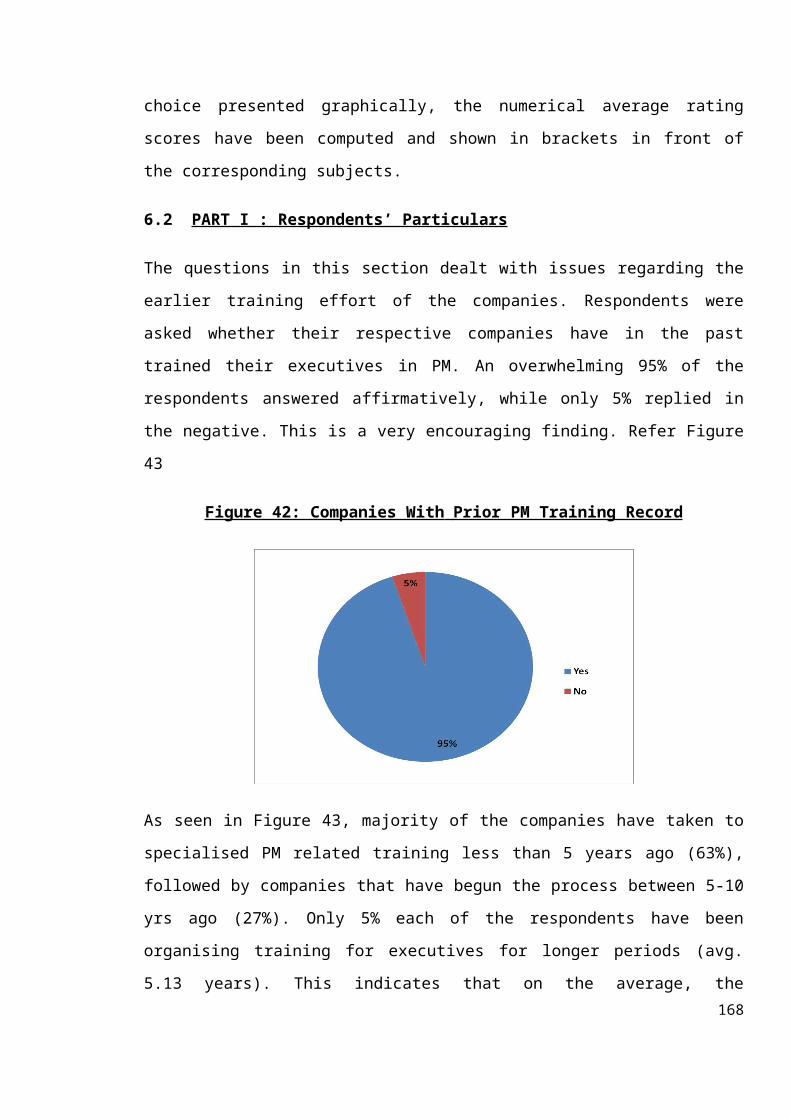
choice presented graphically, the numerical average rating
scores have been computed and shown in brackets in front of
the corresponding subjects.
6.2 PART I : Respondents’ Particulars
The questions in this section dealt with issues regarding the
earlier training effort of the companies. Respondents were
asked whether their respective companies have in the past
trained their executives in PM. An overwhelming 95% of the
respondents answered affirmatively, while only 5% replied in
the negative. This is a very encouraging finding. Refer Figure
43
Figure 42: Companies With Prior PM Training Record
As seen in Figure 43, majority of the companies have taken to
specialised PM related training less than 5 years ago (63%),
followed by companies that have begun the process between 5-10
yrs ago (27%). Only 5% each of the respondents have been
organising training for executives for longer periods (avg.
5.13 years). This indicates that on the average, the168
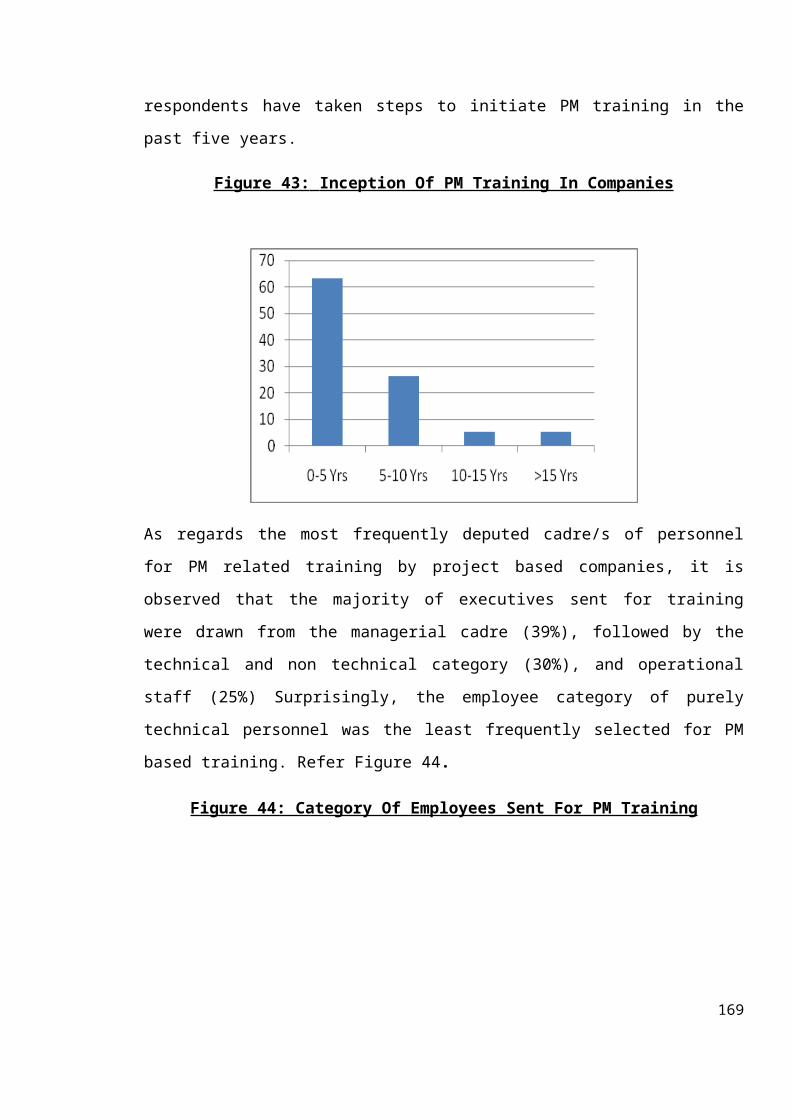
respondents have taken steps to initiate PM training in the
past five years.
Figure 43: Inception Of PM Training In Companies
As regards the most frequently deputed cadre/s of personnel
for PM related training by project based companies, it is
observed that the majority of executives sent for training
were drawn from the managerial cadre (39%), followed by the
technical and non technical category (30%), and operational
staff (25%) Surprisingly, the employee category of purely
technical personnel was the least frequently selected for PM
based training. Refer Figure 44.
Figure 44: Category Of Employees Sent For PM Training
169
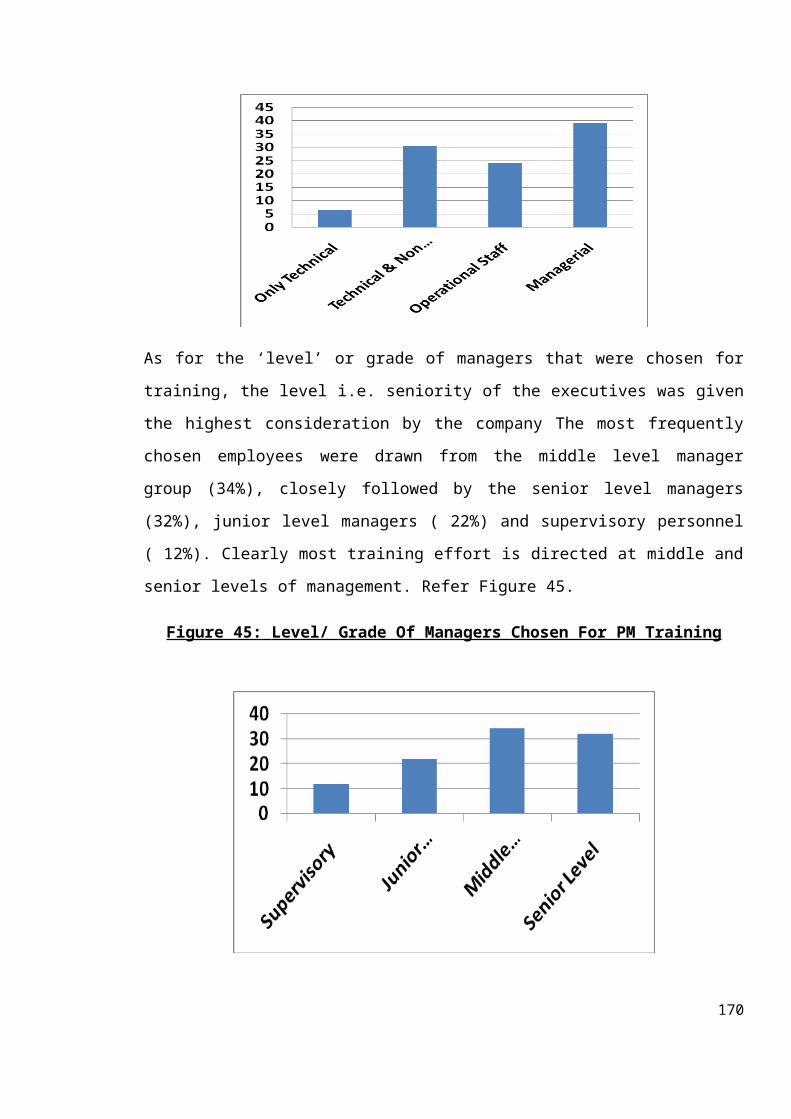
As for the ‘level’ or grade of managers that were chosen for
training, the level i.e. seniority of the executives was given
the highest consideration by the company The most frequently
chosen employees were drawn from the middle level manager
group (34%), closely followed by the senior level managers
(32%), junior level managers ( 22%) and supervisory personnel
( 12%). Clearly most training effort is directed at middle and
senior levels of management. Refer Figure 45.
Figure 45: Level/ Grade Of Managers Chosen For PM Training
170
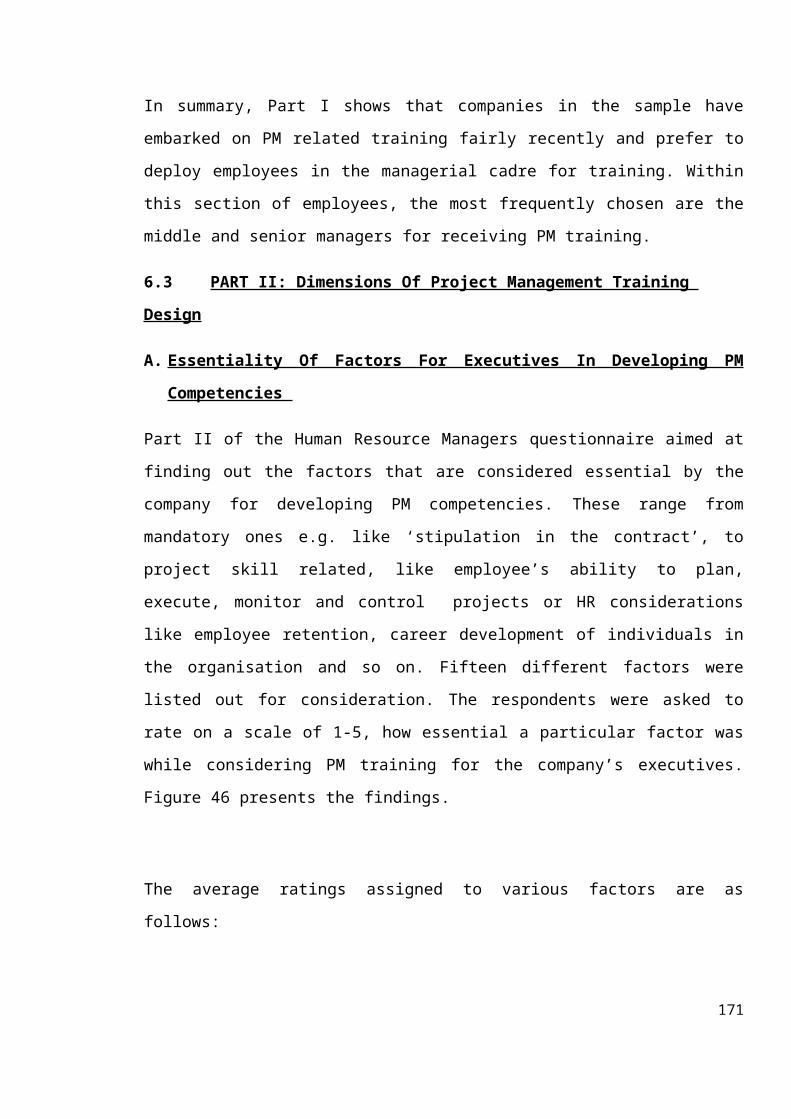
In summary, Part I shows that companies in the sample have
embarked on PM related training fairly recently and prefer to
deploy employees in the managerial cadre for training. Within
this section of employees, the most frequently chosen are the
middle and senior managers for receiving PM training.
6.3 PART II: Dimensions Of Project Management Training
Design
A. Essentiality Of Factors For Executives In Developing PM
Competencies
Part II of the Human Resource Managers questionnaire aimed at
finding out the factors that are considered essential by the
company for developing PM competencies. These range from
mandatory ones e.g. like ‘stipulation in the contract’, to
project skill related, like employee’s ability to plan,
execute, monitor and control projects or HR considerations
like employee retention, career development of individuals in
the organisation and so on. Fifteen different factors were
listed out for consideration. The respondents were asked to
rate on a scale of 1-5, how essential a particular factor was
while considering PM training for the company’s executives.
Figure 46 presents the findings.
The average ratings assigned to various factors are as
follows:
171
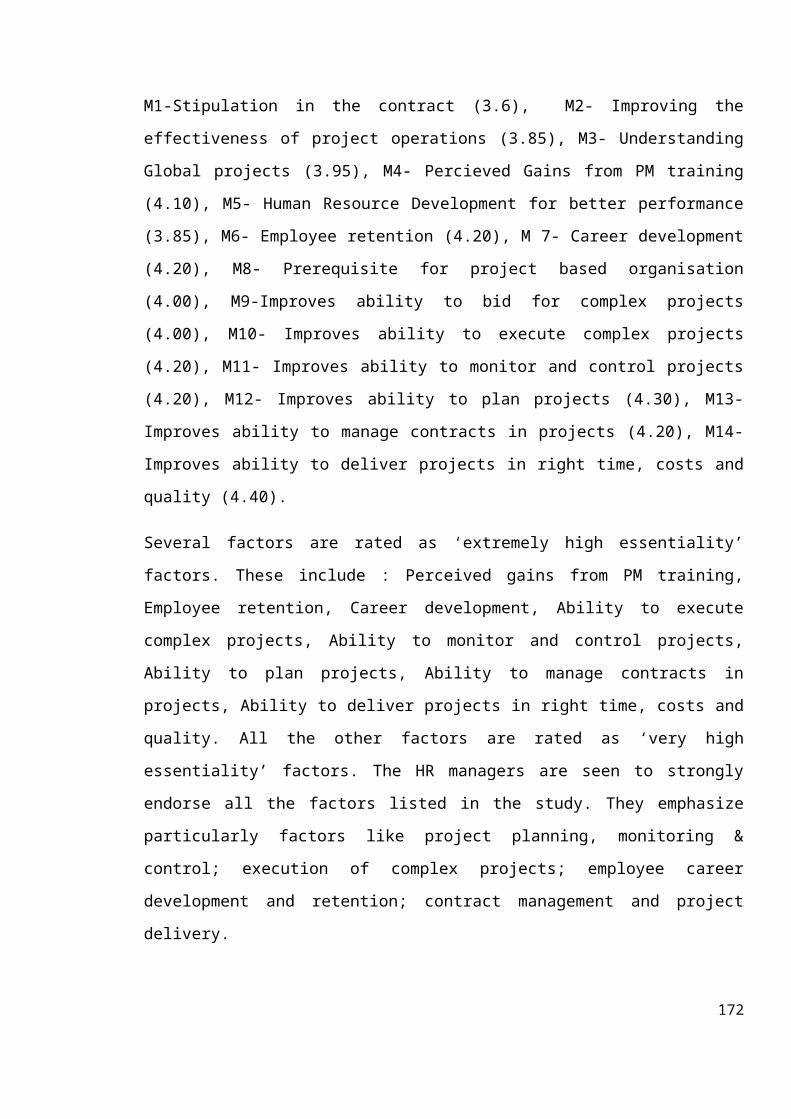
M1-Stipulation in the contract (3.6), M2- Improving the
effectiveness of project operations (3.85), M3- Understanding
Global projects (3.95), M4- Percieved Gains from PM training
(4.10), M5- Human Resource Development for better performance
(3.85), M6- Employee retention (4.20), M 7- Career development
(4.20), M8- Prerequisite for project based organisation
(4.00), M9-Improves ability to bid for complex projects
(4.00), M10- Improves ability to execute complex projects
(4.20), M11- Improves ability to monitor and control projects
(4.20), M12- Improves ability to plan projects (4.30), M13-
Improves ability to manage contracts in projects (4.20), M14-
Improves ability to deliver projects in right time, costs and
quality (4.40).
Several factors are rated as ‘extremely high essentiality’
factors. These include : Perceived gains from PM training,
Employee retention, Career development, Ability to execute
complex projects, Ability to monitor and control projects,
Ability to plan projects, Ability to manage contracts in
projects, Ability to deliver projects in right time, costs and
quality. All the other factors are rated as ‘very high
essentiality’ factors. The HR managers are seen to strongly
endorse all the factors listed in the study. They emphasize
particularly factors like project planning, monitoring &
control; execution of complex projects; employee career
development and retention; contract management and project
delivery.
172
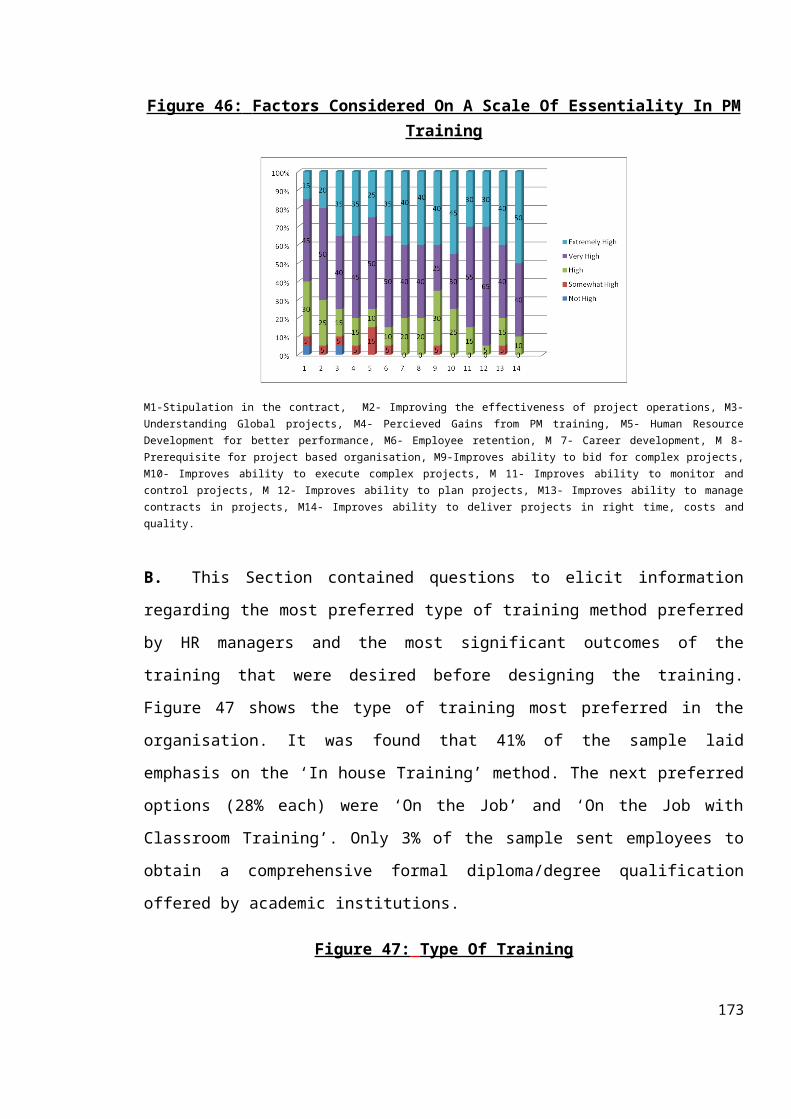
Figure 46: Factors Considered On A Scale Of Essentiality In PM Training
M1-Stipulation in the contract, M2- Improving the effectiveness of project operations, M3-Understanding Global projects, M4- Percieved Gains from PM training, M5- Human ResourceDevelopment for better performance, M6- Employee retention, M 7- Career development, M 8-Prerequisite for project based organisation, M9-Improves ability to bid for complex projects,M10- Improves ability to execute complex projects, M 11- Improves ability to monitor andcontrol projects, M 12- Improves ability to plan projects, M13- Improves ability to managecontracts in projects, M14- Improves ability to deliver projects in right time, costs andquality.
B. This Section contained questions to elicit information
regarding the most preferred type of training method preferred
by HR managers and the most significant outcomes of the
training that were desired before designing the training.
Figure 47 shows the type of training most preferred in the
organisation. It was found that 41% of the sample laid
emphasis on the ‘In house Training’ method. The next preferred
options (28% each) were ‘On the Job’ and ‘On the Job with
Classroom Training’. Only 3% of the sample sent employees to
obtain a comprehensive formal diploma/degree qualification
offered by academic institutions.
Figure 47: Type Of Training
173
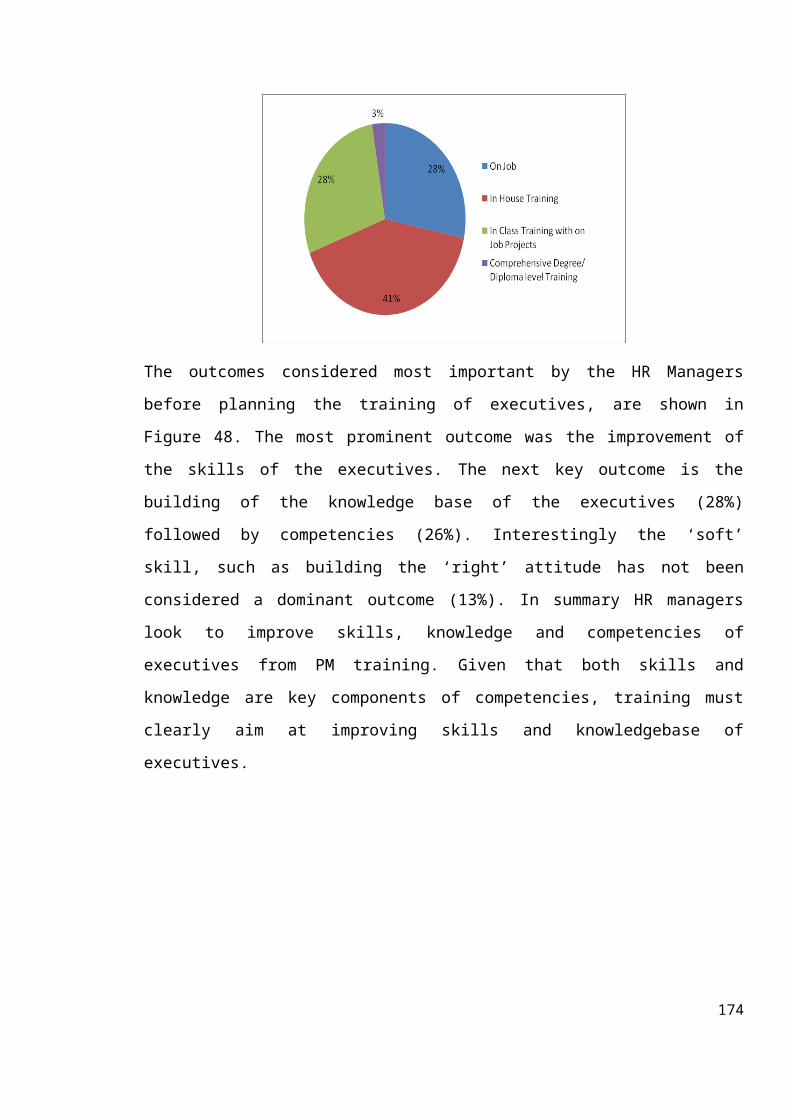
The outcomes considered most important by the HR Managers
before planning the training of executives, are shown in
Figure 48. The most prominent outcome was the improvement of
the skills of the executives. The next key outcome is the
building of the knowledge base of the executives (28%)
followed by competencies (26%). Interestingly the ‘soft’
skill, such as building the ‘right’ attitude has not been
considered a dominant outcome (13%). In summary HR managers
look to improve skills, knowledge and competencies of
executives from PM training. Given that both skills and
knowledge are key components of competencies, training must
clearly aim at improving skills and knowledgebase of
executives.
174
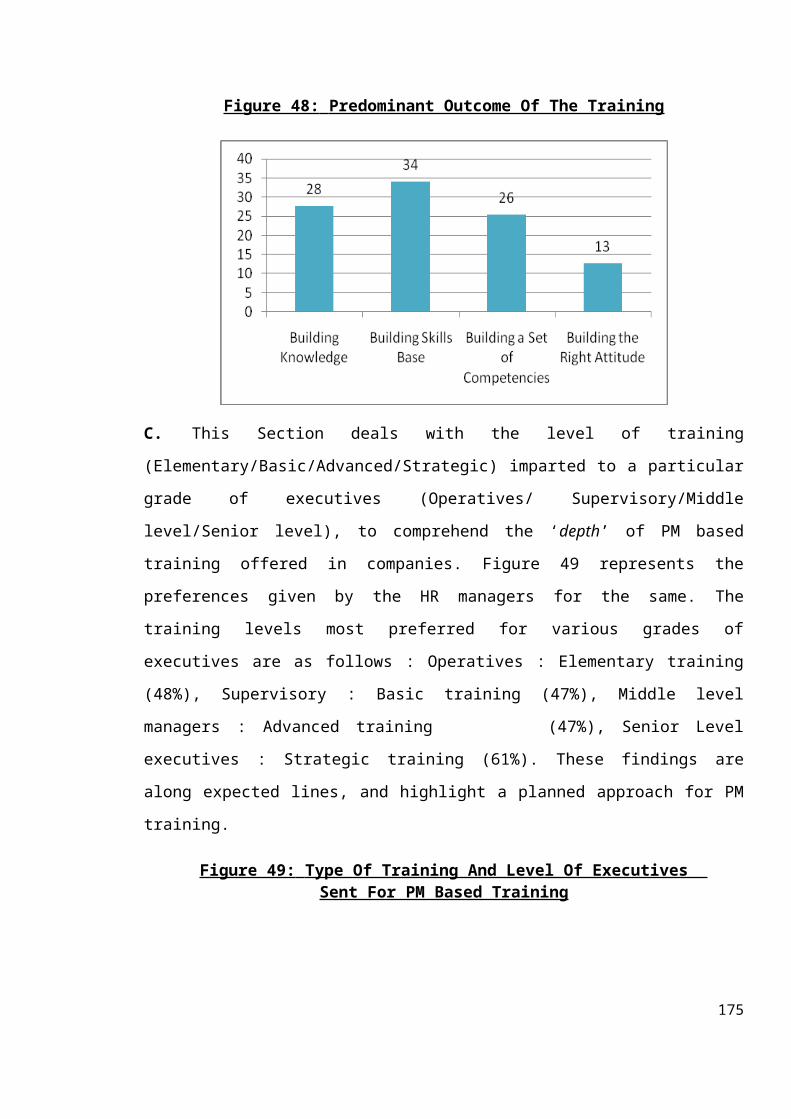
Figure 48: Predominant Outcome Of The Training
C. This Section deals with the level of training
(Elementary/Basic/Advanced/Strategic) imparted to a particular
grade of executives (Operatives/ Supervisory/Middle
level/Senior level), to comprehend the ‘depth’ of PM based
training offered in companies. Figure 49 represents the
preferences given by the HR managers for the same. The
training levels most preferred for various grades of
executives are as follows : Operatives : Elementary training
(48%), Supervisory : Basic training (47%), Middle level
managers : Advanced training (47%), Senior Level
executives : Strategic training (61%). These findings are
along expected lines, and highlight a planned approach for PM
training.
Figure 49: Type Of Training And Level Of Executives Sent For PM Based Training
175
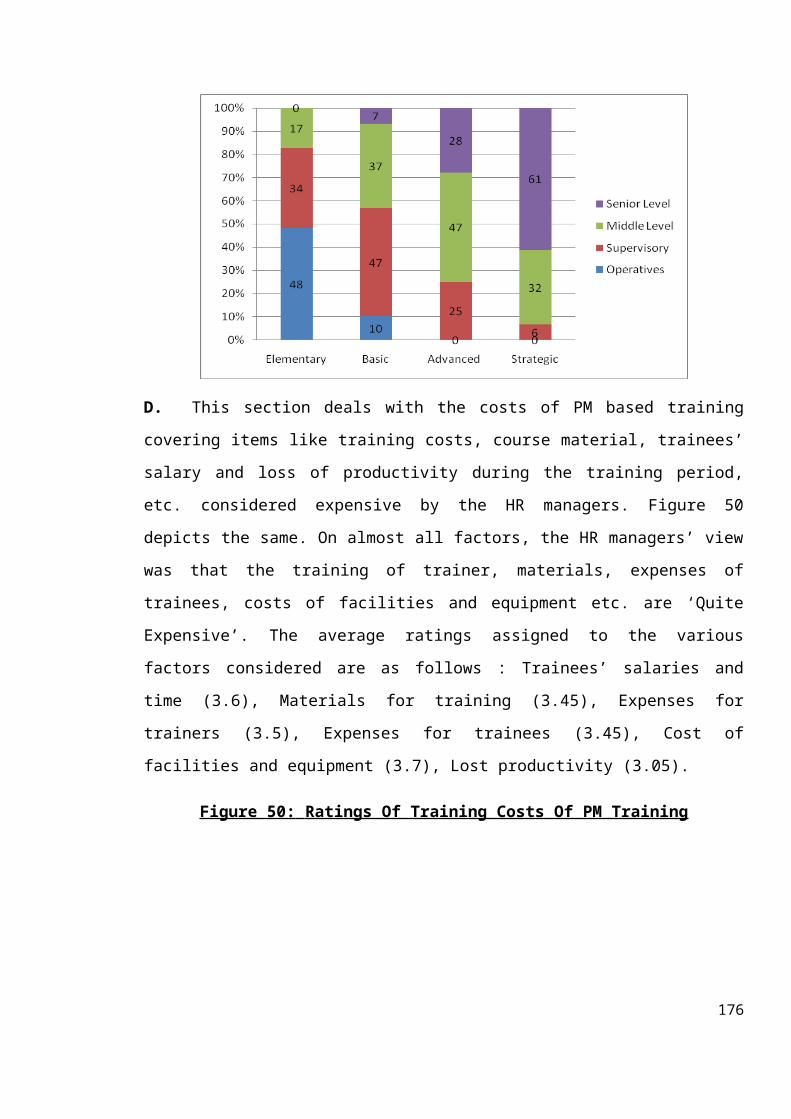
D. This section deals with the costs of PM based training
covering items like training costs, course material, trainees’
salary and loss of productivity during the training period,
etc. considered expensive by the HR managers. Figure 50
depicts the same. On almost all factors, the HR managers’ view
was that the training of trainer, materials, expenses of
trainees, costs of facilities and equipment etc. are ‘Quite
Expensive’. The average ratings assigned to the various
factors considered are as follows : Trainees’ salaries and
time (3.6), Materials for training (3.45), Expenses for
trainers (3.5), Expenses for trainees (3.45), Cost of
facilities and equipment (3.7), Lost productivity (3.05).
Figure 50: Ratings Of Training Costs Of PM Training
176
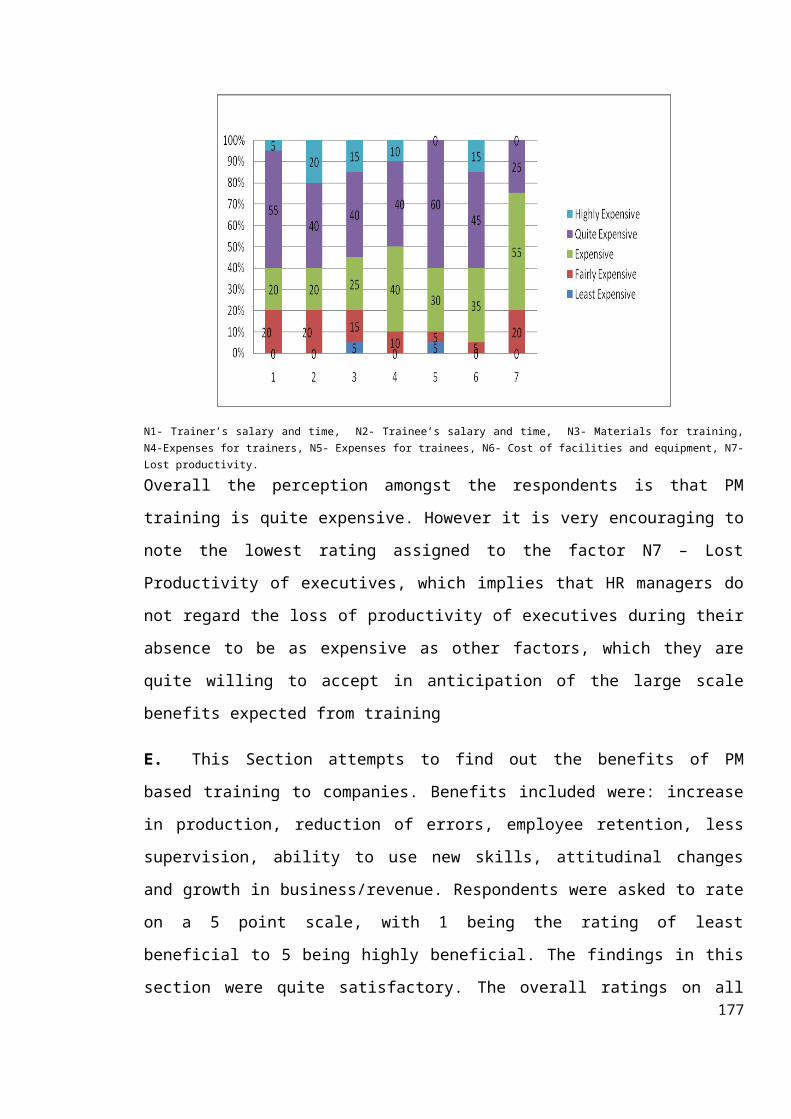
N1- Trainer’s salary and time, N2- Trainee’s salary and time, N3- Materials for training,N4-Expenses for trainers, N5- Expenses for trainees, N6- Cost of facilities and equipment, N7-Lost productivity.
Overall the perception amongst the respondents is that PM
training is quite expensive. However it is very encouraging to
note the lowest rating assigned to the factor N7 – Lost
Productivity of executives, which implies that HR managers do
not regard the loss of productivity of executives during their
absence to be as expensive as other factors, which they are
quite willing to accept in anticipation of the large scale
benefits expected from training
E. This Section attempts to find out the benefits of PM
based training to companies. Benefits included were: increase
in production, reduction of errors, employee retention, less
supervision, ability to use new skills, attitudinal changes
and growth in business/revenue. Respondents were asked to rate
on a 5 point scale, with 1 being the rating of least
beneficial to 5 being highly beneficial. The findings in this
section were quite satisfactory. The overall ratings on all177
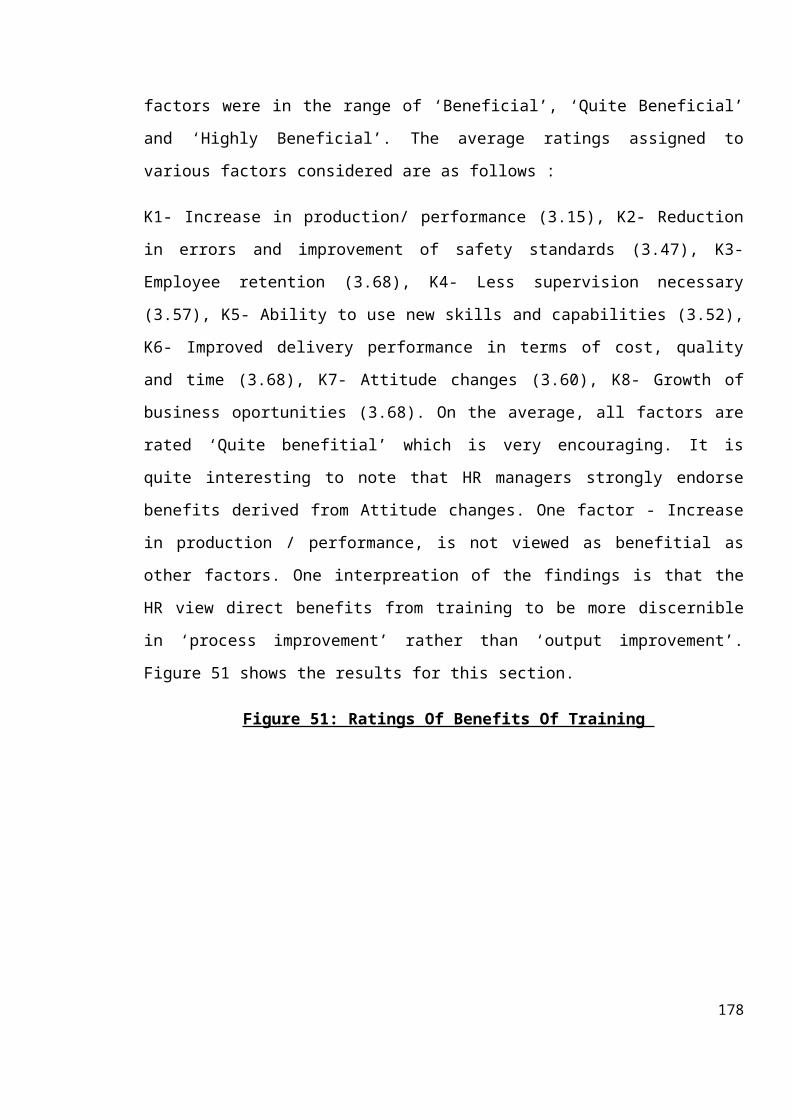
factors were in the range of ‘Beneficial’, ‘Quite Beneficial’
and ‘Highly Beneficial’. The average ratings assigned to
various factors considered are as follows :
K1- Increase in production/ performance (3.15), K2- Reduction
in errors and improvement of safety standards (3.47), K3-
Employee retention (3.68), K4- Less supervision necessary
(3.57), K5- Ability to use new skills and capabilities (3.52),
K6- Improved delivery performance in terms of cost, quality
and time (3.68), K7- Attitude changes (3.60), K8- Growth of
business oportunities (3.68). On the average, all factors are
rated ‘Quite benefitial’ which is very encouraging. It is
quite interesting to note that HR managers strongly endorse
benefits derived from Attitude changes. One factor - Increase
in production / performance, is not viewed as benefitial as
other factors. One interpreation of the findings is that the
HR view direct benefits from training to be more discernible
in ‘process improvement’ rather than ‘output improvement’.
Figure 51 shows the results for this section.
Figure 51: Ratings Of Benefits Of Training
178
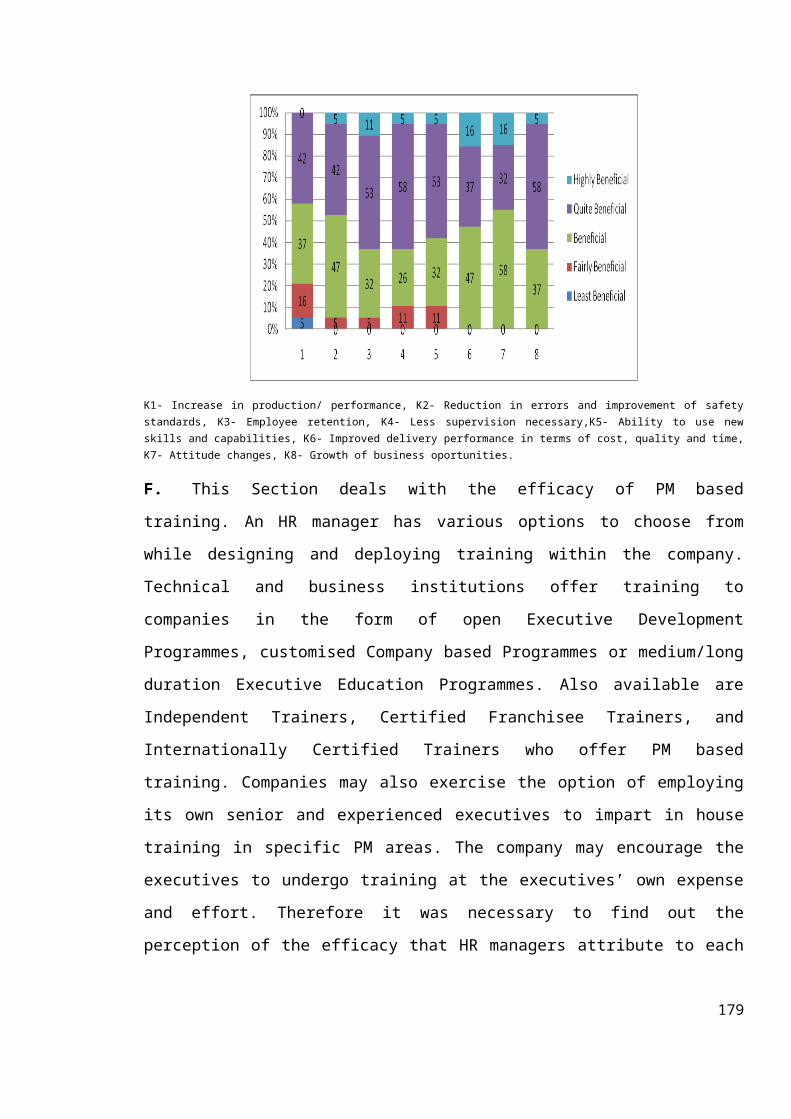
K1- Increase in production/ performance, K2- Reduction in errors and improvement of safetystandards, K3- Employee retention, K4- Less supervision necessary,K5- Ability to use newskills and capabilities, K6- Improved delivery performance in terms of cost, quality and time,K7- Attitude changes, K8- Growth of business oportunities.
F. This Section deals with the efficacy of PM based
training. An HR manager has various options to choose from
while designing and deploying training within the company.
Technical and business institutions offer training to
companies in the form of open Executive Development
Programmes, customised Company based Programmes or medium/long
duration Executive Education Programmes. Also available are
Independent Trainers, Certified Franchisee Trainers, and
Internationally Certified Trainers who offer PM based
training. Companies may also exercise the option of employing
its own senior and experienced executives to impart in house
training in specific PM areas. The company may encourage the
executives to undergo training at the executives’ own expense
and effort. Therefore it was necessary to find out the
perception of the efficacy that HR managers attribute to each
179
of the above mentioned training providers. Figure 52 shows the
ratings accorded by the respondents to the same.
The average ratings obtained by various options are as follows
:
U1-Technical/ Business Institute (3.60), U2- Independent
trainer (3.65), U3- Certified franchisee trainer (3.80), U4-
Internationally certified trainer (3.70), U5- In house
trainers (3.40), U6- Self Training (2.75). The highest average
rating is for Certified Franchisee Trainers, followed by
Internationally Certified Trainers, Independent Trainers and
Academic institutions. In house trainers are not rated as high
on efficacy. The high ratings for certified franchisee
trainers, international certified trainers and independent
trainers may be attributed to the flexibility and highly
focussed approach of these trainers in imparting PM based
training as per the requirements of the company. Self training
Method had the least overall preference, implying that even HR
managers do not prefer to leave PM training to the individuals
per se. Thus most of the options are rated ‘Quite efficacious’
except the Self training Method which is rated just
‘efficacious’.
However it is important to mention that the highest percentage
preference in the ‘Most Efficacious’ category was assigned to
academic institutions, with 20% of the respondents indicating
that Academic Institutions are the ‘Most Efficacious’ medium
of imparting training in PM. It could be inferred that because
180
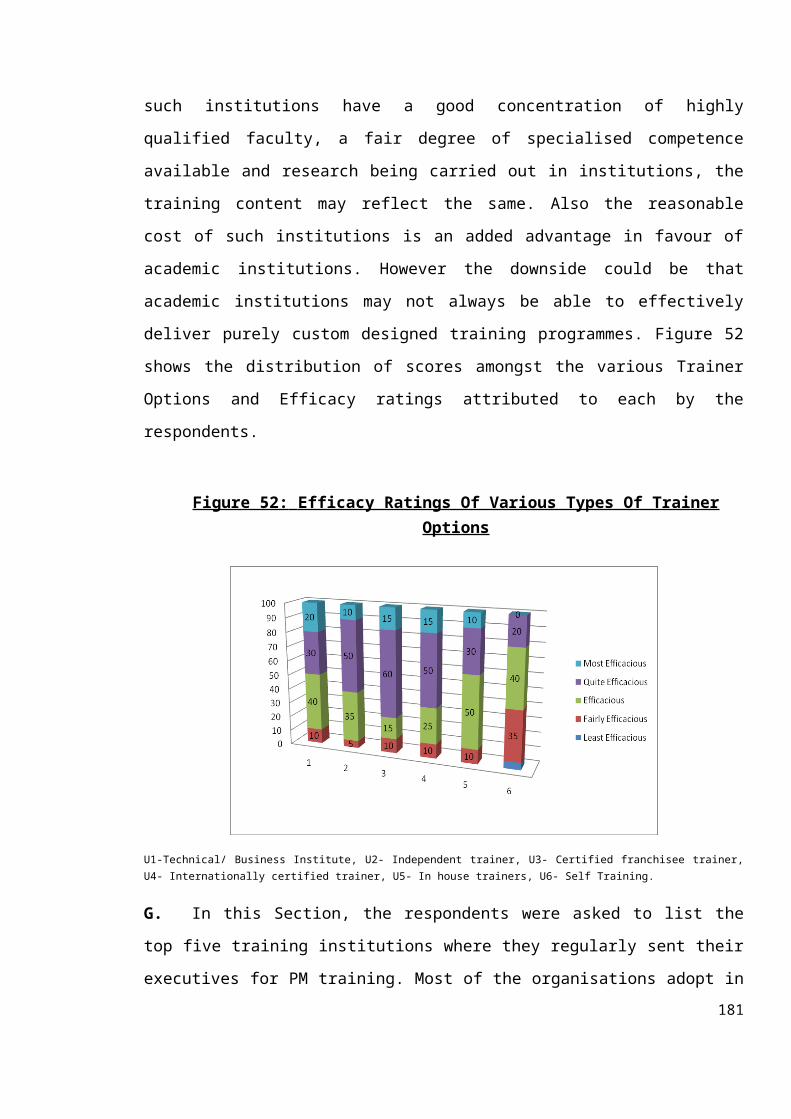
such institutions have a good concentration of highly
qualified faculty, a fair degree of specialised competence
available and research being carried out in institutions, the
training content may reflect the same. Also the reasonable
cost of such institutions is an added advantage in favour of
academic institutions. However the downside could be that
academic institutions may not always be able to effectively
deliver purely custom designed training programmes. Figure 52
shows the distribution of scores amongst the various Trainer
Options and Efficacy ratings attributed to each by the
respondents.
Figure 52: Efficacy Ratings Of Various Types Of Trainer Options
U1-Technical/ Business Institute, U2- Independent trainer, U3- Certified franchisee trainer,U4- Internationally certified trainer, U5- In house trainers, U6- Self Training.
G. In this Section, the respondents were asked to list the
top five training institutions where they regularly sent their
executives for PM training. Most of the organisations adopt in181
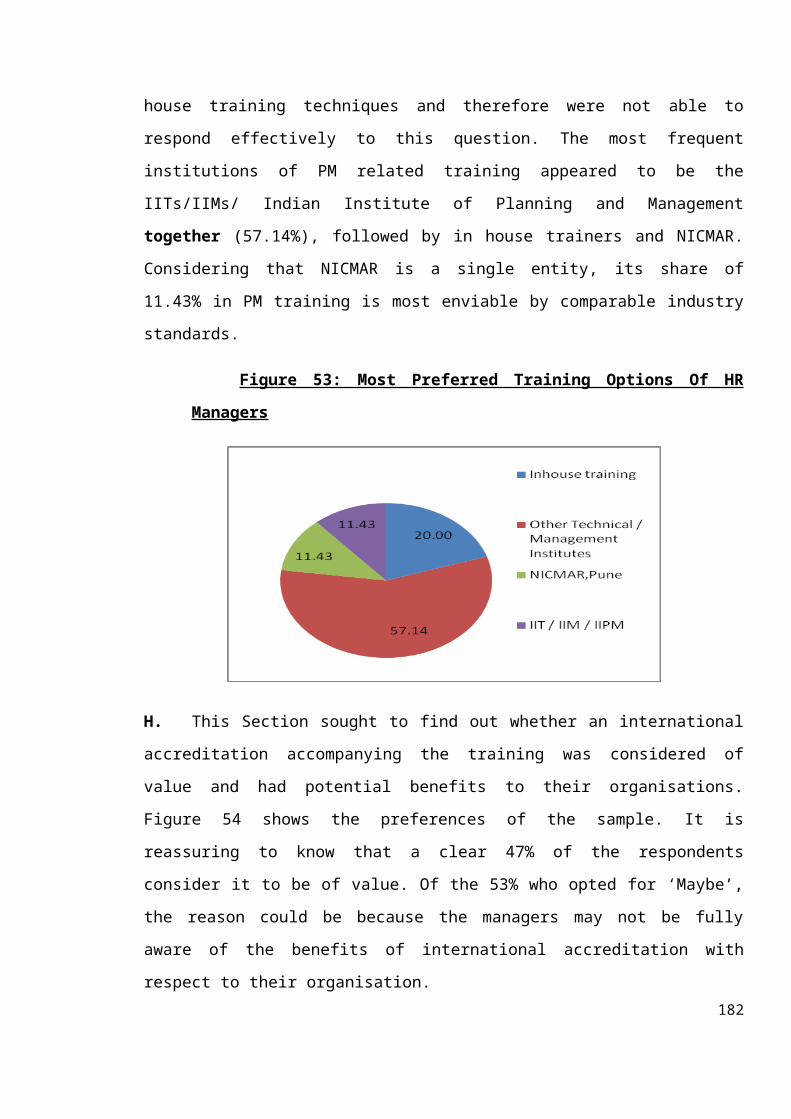
house training techniques and therefore were not able to
respond effectively to this question. The most frequent
institutions of PM related training appeared to be the
IITs/IIMs/ Indian Institute of Planning and Management
together (57.14%), followed by in house trainers and NICMAR.
Considering that NICMAR is a single entity, its share of
11.43% in PM training is most enviable by comparable industry
standards.
Figure 53: Most Preferred Training Options Of HR
Managers
H. This Section sought to find out whether an international
accreditation accompanying the training was considered of
value and had potential benefits to their organisations.
Figure 54 shows the preferences of the sample. It is
reassuring to know that a clear 47% of the respondents
consider it to be of value. Of the 53% who opted for ‘Maybe’,
the reason could be because the managers may not be fully
aware of the benefits of international accreditation with
respect to their organisation.182
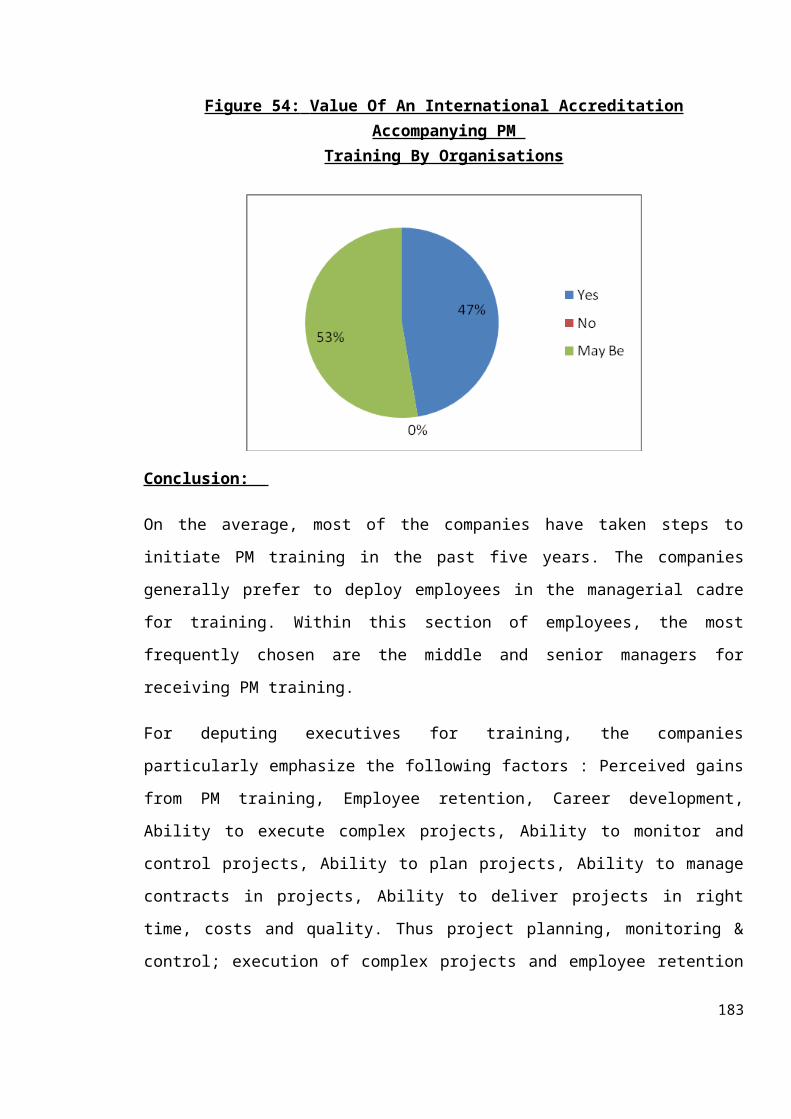
Figure 54: Value Of An International Accreditation Accompanying PM
Training By Organisations
Conclusion:
On the average, most of the companies have taken steps to
initiate PM training in the past five years. The companies
generally prefer to deploy employees in the managerial cadre
for training. Within this section of employees, the most
frequently chosen are the middle and senior managers for
receiving PM training.
For deputing executives for training, the companies
particularly emphasize the following factors : Perceived gains
from PM training, Employee retention, Career development,
Ability to execute complex projects, Ability to monitor and
control projects, Ability to plan projects, Ability to manage
contracts in projects, Ability to deliver projects in right
time, costs and quality. Thus project planning, monitoring &
control; execution of complex projects and employee retention
183
& career development emerge as the key areas for seeking
training inputs.
‘In house Training’, ‘On the Job Training’ and ‘On the Job
with Classroom Training’ are the most preferred methods of
training. Given that both skills and knowledge are key
components of competencies, training must clearly aim at
improving skills and knowledge base of executives. The
training levels most preferred for various grades of
executives are : Operatives : Elementary training, Supervisory
: Basic training, Middle level managers : Advanced training,
Senior Level executives : Strategic training. These findings
highlight a planned approach for PM training.
Overall the perception amongst the HR managers is that PM
training is quite expensive vis a vis majority of the factors
such as : Trainees’ salaries and time, Materials for training,
Expenses for trainers, Expenses for trainees, Cost of
facilities and equipment, Lost productivity. However the
lowest cost rating assigned to the factor ‘Lost Productivity
of executives’ implies that HR managers do not mind the loss
of productivity of executives during their absence, which they
feel will be more than compensated by the large scale
benefits expected from training.
HR managers view training to be ‘quite benefitial’ on all the
factors considered including : Increase in production/
performance, Reduction in errors and improvement of safety
standards, Employee retention, Lesser supervision, Ability to
184
use new skills and capabilities, Improved delivery
performance, Attitude changes, and Growth of business
oportunities. HR managers strongly endorse the benefits
derived from Attitude changes. One factor - Increase in
production / performance, is not viewed as benefitial as other
factors. One interpreation is that they look for direct
benefits from training in ‘process improvement’ rather than
‘output improvement’.
Certified Franchisee Trainers are considered most efficacious
training providers, followed by Internationally Certified
Trainers, Independent Trainers and Academic institutions. This
may be attributed to the flexibility and highly focussed
approach of these trainers. However it is important to mention
that the highest percentage preference in the ‘Most
Efficacious’ category was assigned to academic institutions.
Their good concentration of highly qualified faculty, a fair
degree of specialised competence and research experience are a
great advantage for developing good training content. The
reasonable cost of such institutions is an added advantage.
However the downside is that they may not always be able to
effectively deliver purely custom designed training
programmes. The most frequent academic institutions for PM
related training appear to be the management institutions
together as group, followed by in house trainers and NICMAR.
Considering that NICMAR is a single entity, its share of
11.43% in PM training is most enviable by comparable industry
standards. It is reassuring to know that the HR managers
185

consider international accreditation to be of value. But the
managers may not be fully aware of the benefits of
international accreditation with respect to their
organisation.
186
CHAPTER 7
INTERPRETATIONS OF DATA ANALYSIS AND FINDINGS OF PMISURVEY
7.1 Introduction
All the previous chapters have covered the various aspects of
research study and the findings on PMI education in India. A
literature review in Chapter 2, covering the field of PM
provides the overall status of PM education and research in
India, when compared to the global levels and standards. This
chapter presents the analysis and inferences drawn from the
findings of the secondary literature as well as the primary
survey. Also included, is a statistical analysis of some
important areas that would help highlight some key findings on
PM education in India, using Multiple Regression and Factor
Analysis techniques.
While India’s western counterparts have established the formal
growth and systematic study of PM and created for it a formal
Body of Knowledge (BoK) to stimulate applied and theoretical
research, India appears to be lagging considerably behind.
Drawing a comparison with her closest neighbour China, the
latter appears far ahead in the widespread promotion of PM187
education, training and research, with the government and
industry sponsoring serious initiatives in this area. The
scenario in China appears overwhelmingly in favour of
following a systems driven approach to PM propagation among
the stakeholders, with a view to facilitate the procurement
and execution of large sized projects in core, key and heavy
sectors as well as manufacturing.
On a global scale, it is seen that PM as a discipline has
emerged slowly and steadily from such established disciplines
like Operations Management, long impacting the manufacturing
sector for over a century. Bibliometric studies presented in
the form of research papers in leading journals, namely
‘International Journal of Project Management®’ and ‘Project
Management Journal®’ dedicated solely to PM, reveal the steady
transition of PM research from very limited focus areas of
research interests, such as Project Planning, Scheduling,
Monitoring and Control, Contract Management, Project
Organisation Structure, etc into more universal subject
matters such as Risk Management, Partnerships and Alliances,
Programme Management, Leadership, Team building in cross
cultural project settings, and so on.
In India, the discipline of Operations Management remains in
greater focus and enjoys considerable popularity and
familiarity with steady amount of research being published on
the application of Operations Management techniques in
manufacturing and services sectors. However, issues and
problems surrounding PM are very sparsely researched and188
published by the academic community of technical and business
schools in India. As is well known, for any discipline, to
acquire the status of a formal academic discipline, a
sustained quantum of original research and innovation need to
be undertaken and findings disseminated through forums such as
paper publications, and/or conferences, etc. In fact in India,
very few offer such avenues, with the exceptions like the
NICMAR Journal of Construction Management which supports
empirical and applied research in this area. The earlier
search contained in Chapter 2 (p. 35) points to a very low
generation of international research work emanating directly
from India. On the backdrop of the huge investments in project
works by the public and private sectors, 26 articles in a span
of over 22 years is an issue of grave concern. (p. 35)
7.1.2 Commentary On The Extent And Depth Of PM Education
And Research In India
The general awareness of project management research is not
only modest amongst the educational institutions but also
further exacerbated by the general lack of public or private
funding to carry out research in this area. A construct to
describe this phenomenon is represented in Figure 55, which
shows the position of India compared to other countries vis a
vis PM education and research. The X axis shows the ‘extent of PM’
education and practice prevalent in the country in terms of
the widespread adherence of the discipline amongst academic
institutions and civil society in general (project oriented
society). The Y axis shows the ‘depth of PM’, as signified by the189
evolution of the discipline of PM due to sustained research in
the area. This construct has been arrived at based upon the
secondary literature available and contained in Chapter 2.
As seen in Figure 55, the USA, certain West European
countries, UK, Australia and New Zealand are far ahead in the
penetration of PM as a taught discipline in academic
institutions, in research and practice amongst industry as
well as in society at large. Russia and China are moving
forward quite rapidly to catch up and close the advantage of
these nations. These countries are encouraged by the formal
agencies in the government as well as professional
associations that support and encourage the growth of PM
education. However at the moment they may appear slightly
behind in PM research as compared to the developed nations but
are catching up very fast.
In the category of Business Schools, India has a total of
1,516 institutions that offer Masters in Business
Administration and Post Graduate Diploma in Management
programmes. A sizeable number of institutions, 2,388 in all,
offer technical engineering education at the undergraduate and
post graduate levels. Another 1,970 institutions were awaiting
approval with the apex AICTE approving body as in 2008. (Refer
AICTE data on Page Nos.16 and 17 and Table No. 3 & 4
respectively). This indicates a very high rate of growth in
technical and management education in the Indian polity.
However, the number of schools offering either dedicated
190
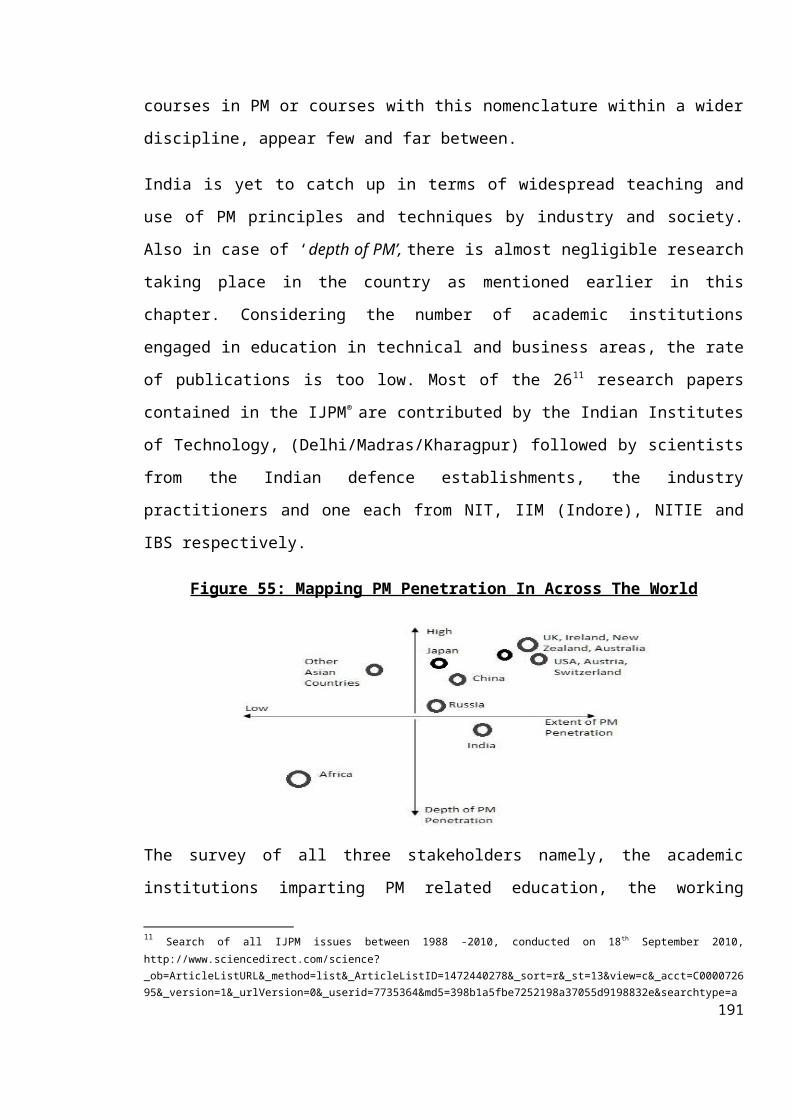
courses in PM or courses with this nomenclature within a wider
discipline, appear few and far between.
India is yet to catch up in terms of widespread teaching and
use of PM principles and techniques by industry and society.
Also in case of ‘depth of PM’, there is almost negligible research
taking place in the country as mentioned earlier in this
chapter. Considering the number of academic institutions
engaged in education in technical and business areas, the rate
of publications is too low. Most of the 2611 research papers
contained in the IJPM® are contributed by the Indian Institutes
of Technology, (Delhi/Madras/Kharagpur) followed by scientists
from the Indian defence establishments, the industry
practitioners and one each from NIT, IIM (Indore), NITIE and
IBS respectively.
Figure 55: Mapping PM Penetration In Across The World
The survey of all three stakeholders namely, the academic
institutions imparting PM related education, the working
11 Search of all IJPM issues between 1988 -2010, conducted on 18th September 2010,http://www.sciencedirect.com/science?_ob=ArticleListURL&_method=list&_ArticleListID=1472440278&_sort=r&_st=13&view=c&_acct=C000072695&_version=1&_urlVersion=0&_userid=7735364&md5=398b1a5fbe7252198a37055d9198832e&searchtype=a
191
executives serving in project based companies in India and the
human resource managers who are engaged in designing and
deploying training related to PM yielded data which has been
presented and analysed using descriptive statistics in the
previous chapters viz. Chapters 4, 5 and 6.
In this chapter we attempt to draw statistical inferences from
the data obtained. Additionally, an in depth analysis of key
issues that require to be treated using advanced statistical
analysis was found necessary to bring out a more precise and
meaningful understanding.
7.2 Institutional Data Analysis And Inferences
The survey coverage was well dispersed geographically and
included fair representation of government run as well as
private academic technical and management institutions. The
inclusion of private institutions in the sample was because a)
These are generally known for their flexibility and
responsiveness in introduction of new courses because it is
perceived as offering a competitive advantage to them, b)
These courses improve the employability of the students, due
their immediate applicability and contemporary nature, c) PM
education and training have wide global acceptance and
mobility. In contrast, government run institutions are
perceived as more ‘rule bound’. The private institutions tend
to use this as an effective ‘leverage’ to attract industry
users.
192
The technical institutions are mostly found in the southern
parts of India and similarly it is reflected in the proportion
of the sample chosen by the researchers. Most of these
institutions are private, self funded ones. The respondents
who took part in the survey were highly experienced, with the
maximum (61.73%) falling in the category of 16-30 years
experience (avg. experience 21.27 years). These individuals
are most likely to have witnessed the radical changes that
have taken place in the economy post liberalisation of 1991,
as well as the burgeoning growth of infrastructure projects,
IT and telecom, ports and shipping, railways and urban
development projects. It can be inferred that the respondents
possessed appropriate experience and credibility to do justice
to the questionnaire.
From the findings, it appears that the respondents consider
the current state of PM education in India to be at best,
‘fair’. Almost all the institutions covered had earlier
introduced courses in PM at the undergraduate or the
postgraduate levels. A very small fraction of the respondents
had introduced these at advanced levels. One can infer that
due to its limited penetration amongst academic institutions
and mostly at undergraduate and graduate levels, PM in India
continues to remain understated. Pursuit of PM at doctoral
level programmes was reported by only 17% of the sample, and a
closer analysis reveals that these were offered only by
India’s elite institutes of technology and management. Our
survey rules in favour of PM education to be made mandatory in
193
engineering, management, architecture, infrastructure and
planning schools as perceived by the experienced faculty.
PM educational curricula must necessarily draw from
established theoretical knowledge as well as focus on
generating new knowledge after researching real time practice.
Thus the classification of subject matter that could be deemed
essential for inclusion in PM curricula was drawn up and
presented for response. The courses were grouped into four
Areas namely, A) Management and Technology Area, B) Strategy,
Economics and Finance Area, C) Behavioural Sciences Area and
D) Information Technology Area.
The subjects to be included in the Management and Technology
Area are highly favoured by the academics for inclusion in the
syllabus at the undergraduate and postgraduate levels.
Subjects such as: (i) Operations Management, (ii) Planning,
Scheduling, Monitoring and Control (iii) Statistical Methods
for Project Analysis, (iv) Operations Research for Projects,
(v) Projects Quality Management and (vi)Health, Safety and
Environment in Projects, (vii) Cost Estimation & Budgeting and
(viii) Accounting and Control Systems are most favoured among
other subjects in this area.
A Factor Analysis (FA) carried out on all the subjects to
obtain the most important subjects, is described further on in
this chapter. In case of Strategy, Finance and Economics Area,
most of the respondents preferred that it be taught at post
graduate levels. In the Behavioural Sciences Area, the
194

academics did not rate the subject area of as much importance
as the executives did. Clearly the perception of the academics
regarding this subject area differs greatly from those of the
practising executives. In case of the Information Technology
Area, the responding faculty unanimously voiced its importance
for inclusion in the curriculum. The same was true for the
practicing executives in this area.
Based on the data obtained in the study, all of the hypotheses
have been accepted as null hypotheses and have been proved,
except Hypothesis 1 which refers to the overall status of PM
education in India ‘being poor’. Data shows that the
alternative hypothesis requires to be accepted. Thus in
Hypothesis No.1, it can be said that the overall status of PM
education in India was found to be ‘not poor’ (p. 43). It can be
inferred that there is already a high potential existing in
India for PM education to grow substantially in the coming
years.
Continuing the discussion on the data obtained on importance
of various Subject Areas, another related issue pertinent to
PM education was the ‘Level’ at which the Areas and the
individual subjects should be taught. The data obtained points
to interesting responses. The academics voted unequivocally in
support of inclusion of the subjects in the Management and
Technology Area at the postgraduate level and even at the
undergraduate level. In case of the Strategy, Economics and
Finance Area, almost all subjects were rated very high in
importance. A small proportion of the sample (20%) gave lower195
importance to subjects like Legal, Commercial & Taxation
Aspects of Projects, Project Joint Ventures, Strategic
Alliances, and SPVs. It could be inferred that the academics
were not sure whether the above subjects required to be
assigned the status of a full course or whether they could be
taught as such within an existing discipline like Legal
Aspects in Projects or International Project Management.
The majority of the respondents rated this area ranging from
‘Important’ to ‘Very Important’. The average ratings for the
subjects grouped in this Area are : On the average, all
subjects in the category namely : Project Organization and
Structure, Managerial Skills, Human Resource Management in
Project, Industrial / Labour Relations, Conflict Management,
Diversity Management are found to be very important, with
slightly less importance for Conflict Management and Diversity
Management.
It is well known in the industry that the following are
crucial areas in projects: Conflicts (at departmental,
project, resource allocation, or interpersonal levels) and
Diversity (of cultures, backgrounds, behavioural processes &
systems). They require systematic understanding and treatment
because project scenarios have distinct characteristics,
contexts and compulsions as compared to traditional
organisational establishments. A section of the academics even
wanted conflict management to be taught at the Applied
Research level and majority at the post graduate level. A very
small percentage opted for Conflict Management to be included196
at the undergraduate level or at a certificate level. The
executives assign high ratings to these areas. The executives
feel that these subjects are ‘Very Important’. From this it
can be inferred that there exists a gap between the academics
and the practicising managers’ views with respect to the
importance of conflict management and diversity. Often, the
practicing managers, at their level have to face the
consequences of conflicts on projects and would therefore like
to learn how to deal with them.
In the Information Technology Area, almost the whole of the
respondent group in academic institutions (both technical and
management oriented), accepted the huge importance of IT
software to enhance overall project performance. The
implication is that the academic institutions strongly endorse
the importance of learning and using sophisticated techniques
that would help efficient performance on projects. Therefore
as a consequence, they also endorse the teaching of software
at undergraduate and postgraduate levels. A very small section
wanted the courses to continue in the advanced and research
programme levels.
The next question was to find out the importance of teaching
PM to select sectors in the economy. The academics considered
the coverage of all the sectors included to be either very
important or extremely important. It is very interesting to
note that across all sectors, the sample opted for Applied
Research followed by Advanced level teaching as the most
appropriate levels for sector specific coverage of PM in197
teaching curriculum. It can be inferred that as per the
respondents’ view, sector specific issues in PM are intensely
practice driven and therefore teaching should reflect the
study of this practice more closely. Academics therfore
strongly endorse the coverage of sector specific issues in PM
curriculum but would rather like these issues to be dealt with
at advanced teaching level or at the level of applied
research.
In the next section we discuss some findings obtained from
Factor Analysis for the Subjects to be included in the
curriculum.
7.2.1 Results And Interpretation Of Factor Analysis For
Subjects Rated By Faculty From Academic Institutions
A Factor Analysis12 was carried out on the subjects rated as
most necessary to be included in the curriculum involving PM.
Out of the four subject Areas mentioned (p. 67), a list of 31
subjects was chosen for analysis. Factor Analysis (FA) was
carried out after determining the factors, from individual
subjects in the 4 areas and their associated Eigenvalues13, and
the percentage of variance determined, along with cumulative
percentages. These results are included in the Table No. 5 and
6.
12 Factor analysis is used to analyze interrelationships among a large number of variables andto explain these variables in terms of their common underlying dimensions (factors). Thestatistical approach involving finding a way of condensing the information contained in anumber of original variables into a smaller set of dimensions (factors) with a minimum loss ofinformation (hair et al., 1992).
13 Eigenvalues explain the Total variance accounted by each factor. The sum of all eigenvalues = total number of variables.198
Refer Table No. 5. It is found that the Eigenvalues of six
‘components’’ are greater than one and after they are
‘extracted’, they can explain the variation upto 74%. This
means that all factors (subjects) that were included in the
questionnaire were rated by the respondents to be important
for inclusion in PM curriculum. For ready reference, their
average ratings are reproduced below.
AR1-Operations Management for Projects (3.79); AR2-Planning, Scheduling,
Monitoring and Control Techniques (3.98); AR3-Statistical Methods for
Projects Analysis (3.81); AR4-Operations Research for Projects (3.87); AR5-
Project Quality Management (3.93); AR6-Health/Safety/Environment in
Projects (3.60); AR7-Cost Estimation and Budgeting (3.74); AR8-Accounting
and Control Systems (3.26); AR9-Quality Surveying and Estimation (3.43);
AR10-Projects Marketing (3.30); AR11-Project Site and Equipment (3.40);
AR12-Project Procurement & /Materials Management (3.40); AR13-Contract
Management (3.31); AR14-Process Design/Engineering/Testing/Commissioning
(3.48); AR15-Facilities Engineering and Management (3.12); AR16-Logistics &
Supply Chain Management (3.37); AR17-Transportation Management (3.12);
AR18-Technology and Engineering Management
However the analysis reveals that only 6 subjects (factors)
included in the Management and Technology Area namely (i)
Operations Management for Projects, (ii) Planning/ Scheduling/
Monitoring and Control Techniques, (iii) Statistical Methods
for Project Analysis, (iv) Operations Research for Projects,
(v) Project Quality Management, (vi) Health Safety and
Environment in Projects account for the highest proportion of
the subjects (factors) that are absolutely essential to be
included in PM curricula (i.e. 74%). The correlation analysis
carried out earlier helped establish that Operation management199
and Operations Research, Quality Management and HSE are
strongly correlated. Therefore in effect, only four subject
areas, suitably combined account for the courses that are
‘absolutely essential’.
Alternatively this means that the balance 25 subjects account
for only a small fraction of the total PM curricula (26%).
Therefore for the sake of simplification, this can be
interpreted to mean that the top six subjects (four combined)
that emerge from the analysis of academic institutions, are
considered most crucial for inclusion in PM curriculum by the
academics.
An intriguing fact is that only a limited number of subjects
(factors) continue to describe the whole scope of PM curricula
amongst academics in institutions. This could be attributed to
Indian institutions being in the early development stages of
PM. It may also imply that except in the well recognized
Management and Technology Area, in which the above subjects
have been grouped, other subject Areas (and individual
subjects contained therein) such as Behavioural Sciences, and
IT, are not yet considered pivotal to PM education in the
Indian technical and management education system. Viewed with
the actual ratings awarded by the respondents to the Strategy,
Economics and Finance Area, it shows that almost the whole
sample has rated subjects in this Area as ‘Extremely
Important’ and ‘Very Important’ (p.62) individual subjects
ratings). Figure 56 below represents the same in graphical
format.200
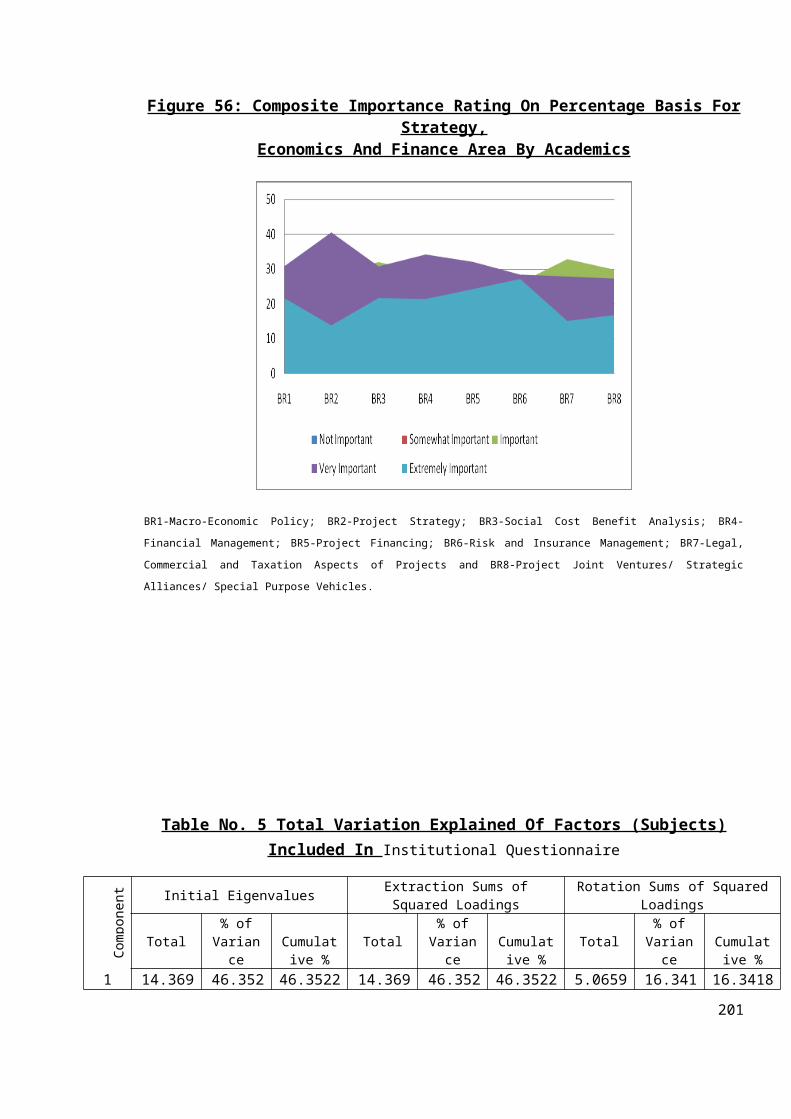
Figure 56: Composite Importance Rating On Percentage Basis ForStrategy,
Economics And Finance Area By Academics
BR1-Macro-Economic Policy; BR2-Project Strategy; BR3-Social Cost Benefit Analysis; BR4-
Financial Management; BR5-Project Financing; BR6-Risk and Insurance Management; BR7-Legal,
Commercial and Taxation Aspects of Projects and BR8-Project Joint Ventures/ Strategic
Alliances/ Special Purpose Vehicles.
Table No. 5 Total Variation Explained Of Factors (Subjects)Included In Institutional Questionnaire
Component Initial Eigenvalues Extraction Sums of
Squared LoadingsRotation Sums of Squared
Loadings
Total% ofVariance
Cumulative %
Total% ofVariance
Cumulative %
Total% ofVariance
Cumulative %
1 14.369 46.352 46.3522 14.369 46.352 46.3522 5.0659 16.341 16.3418
201
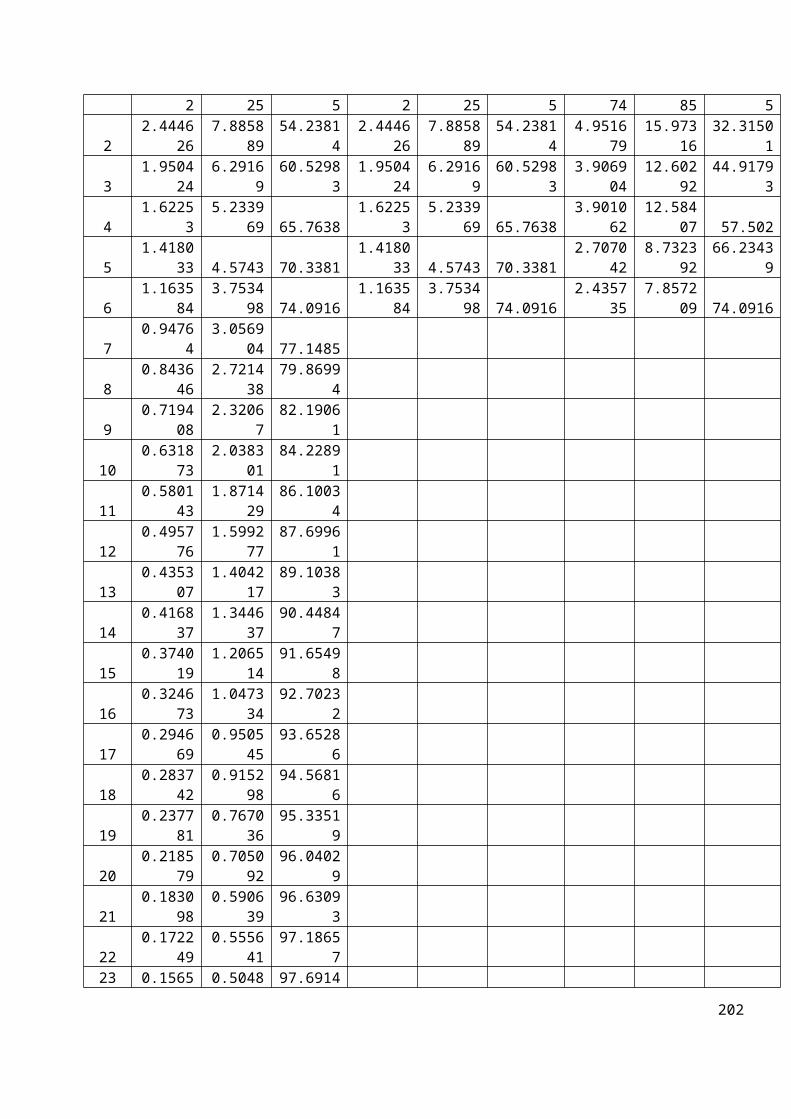
2 25 5 2 25 5 74 85 5
22.4446
267.8858
8954.2381
42.4446
267.8858
8954.2381
44.9516
7915.973
1632.3150
1
31.9504
246.2916
960.5298
31.9504
246.2916
960.5298
33.9069
0412.602
9244.9179
3
41.6225
35.2339
69 65.76381.6225
35.2339
69 65.76383.9010
6212.584
07 57.502
51.4180
33 4.5743 70.33811.4180
33 4.5743 70.33812.7070
428.7323
9266.2343
9
61.1635
843.7534
98 74.09161.1635
843.7534
98 74.09162.4357
357.8572
09 74.0916
70.9476
43.0569
04 77.1485
80.8436
462.7214
3879.8699
4
90.7194
082.3206
782.1906
1
100.6318
732.0383
0184.2289
1
110.5801
431.8714
2986.1003
4
120.4957
761.5992
7787.6996
1
130.4353
071.4042
1789.1038
3
140.4168
371.3446
3790.4484
7
150.3740
191.2065
1491.6549
8
160.3246
731.0473
3492.7023
2
170.2946
690.9505
4593.6528
6
180.2837
420.9152
9894.5681
6
190.2377
810.7670
3695.3351
9
200.2185
790.7050
9296.0402
9
210.1830
980.5906
3996.6309
3
220.1722
490.5556
4197.1865
7 23 0.1565 0.5048 97.6914
202
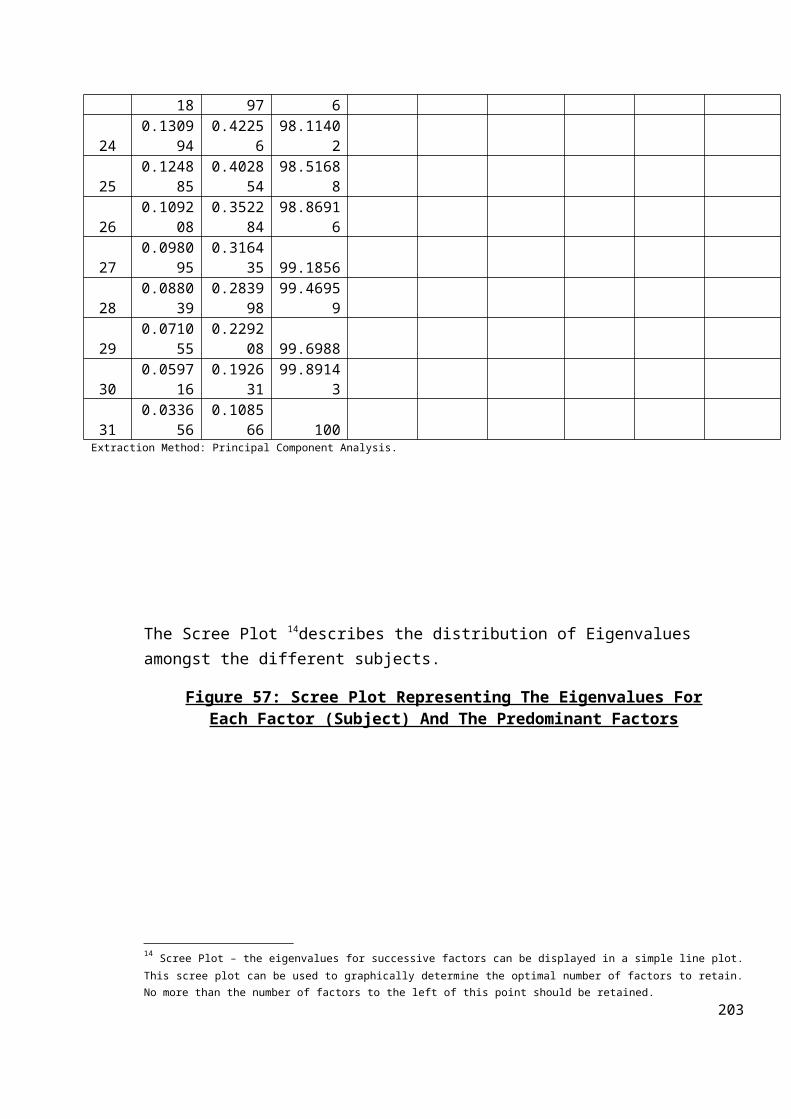
18 97 6
240.1309
940.4225
698.1140
2
250.1248
850.4028
5498.5168
8
260.1092
080.3522
8498.8691
6
270.0980
950.3164
35 99.1856
280.0880
390.2839
9899.4695
9
290.0710
550.2292
08 99.6988
300.0597
160.1926
3199.8914
3
310.0336
560.1085
66 100 Extraction Method: Principal Component Analysis.
The Scree Plot 14describes the distribution of Eigenvalues amongst the different subjects.
Figure 57: Scree Plot Representing The Eigenvalues ForEach Factor (Subject) And The Predominant Factors
14 Scree Plot – the eigenvalues for successive factors can be displayed in a simple line plot.This scree plot can be used to graphically determine the optimal number of factors to retain.No more than the number of factors to the left of this point should be retained.
203
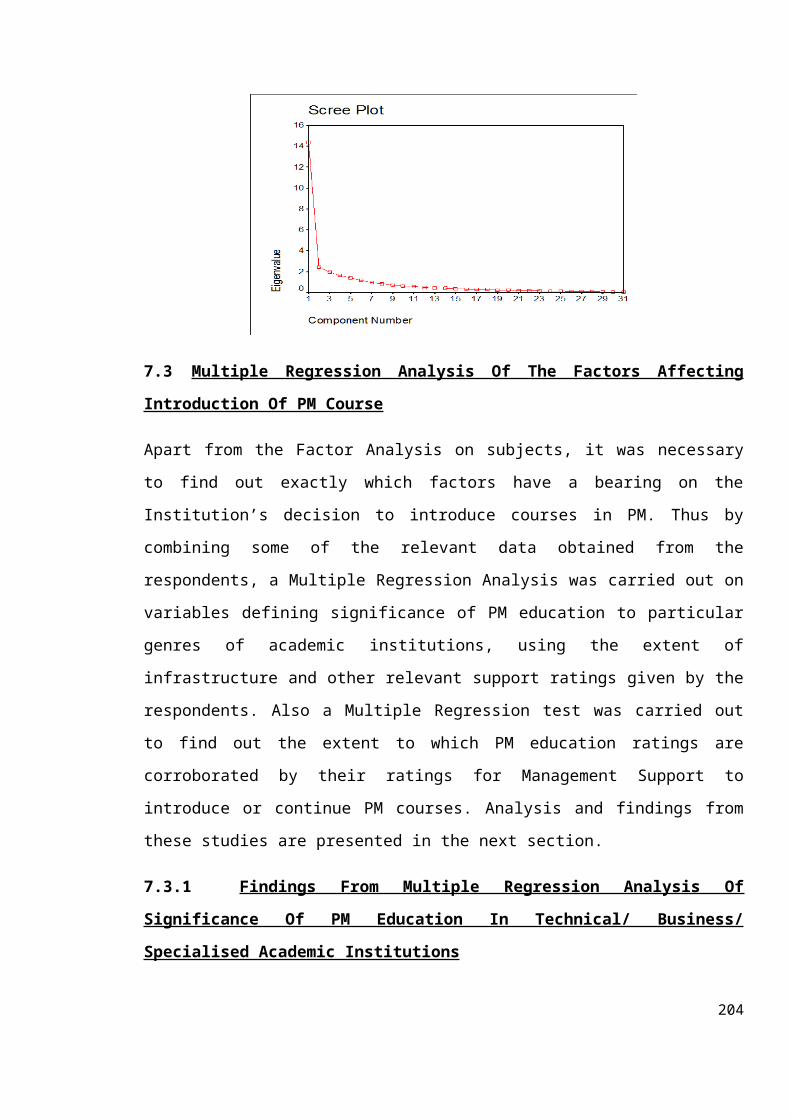
7.3 Multiple Regression Analysis Of The Factors Affecting
Introduction Of PM Course
Apart from the Factor Analysis on subjects, it was necessary
to find out exactly which factors have a bearing on the
Institution’s decision to introduce courses in PM. Thus by
combining some of the relevant data obtained from the
respondents, a Multiple Regression Analysis was carried out on
variables defining significance of PM education to particular
genres of academic institutions, using the extent of
infrastructure and other relevant support ratings given by the
respondents. Also a Multiple Regression test was carried out
to find out the extent to which PM education ratings are
corroborated by their ratings for Management Support to
introduce or continue PM courses. Analysis and findings from
these studies are presented in the next section.
7.3.1 Findings From Multiple Regression Analysis Of
Significance Of PM Education In Technical/ Business/
Specialised Academic Institutions
204
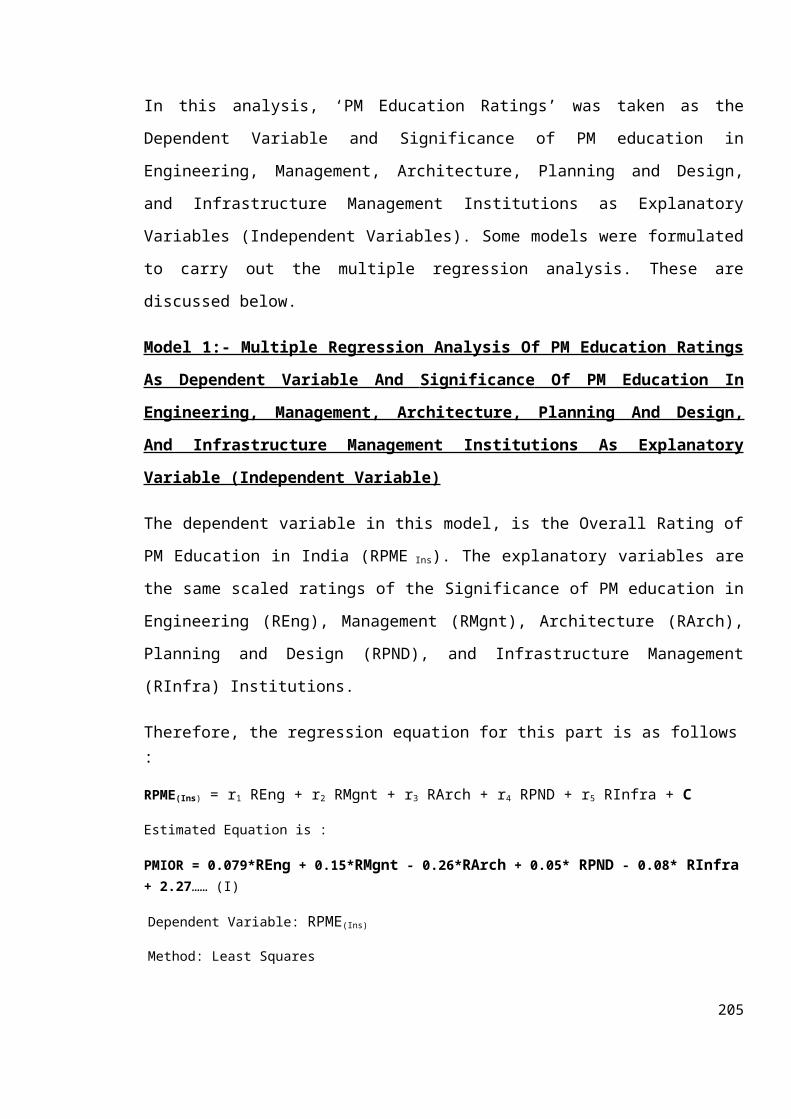
In this analysis, ‘PM Education Ratings’ was taken as the
Dependent Variable and Significance of PM education in
Engineering, Management, Architecture, Planning and Design,
and Infrastructure Management Institutions as Explanatory
Variables (Independent Variables). Some models were formulated
to carry out the multiple regression analysis. These are
discussed below.
Model 1:- Multiple Regression Analysis Of PM Education Ratings
As Dependent Variable And Significance Of PM Education In
Engineering, Management, Architecture, Planning And Design,
And Infrastructure Management Institutions As Explanatory
Variable (Independent Variable)
The dependent variable in this model, is the Overall Rating of
PM Education in India (RPME Ins). The explanatory variables are
the same scaled ratings of the Significance of PM education in
Engineering (REng), Management (RMgnt), Architecture (RArch),
Planning and Design (RPND), and Infrastructure Management
(RInfra) Institutions.
Therefore, the regression equation for this part is as follows:
RPME(Ins) = r1 REng + r2 RMgnt + r3 RArch + r4 RPND + r5 RInfra + C
Estimated Equation is :
PMIOR = 0.079*REng + 0.15*RMgnt - 0.26*RArch + 0.05* RPND - 0.08* RInfra+ 2.27…… (I)
Dependent Variable: RPME(Ins)
Method: Least Squares
205
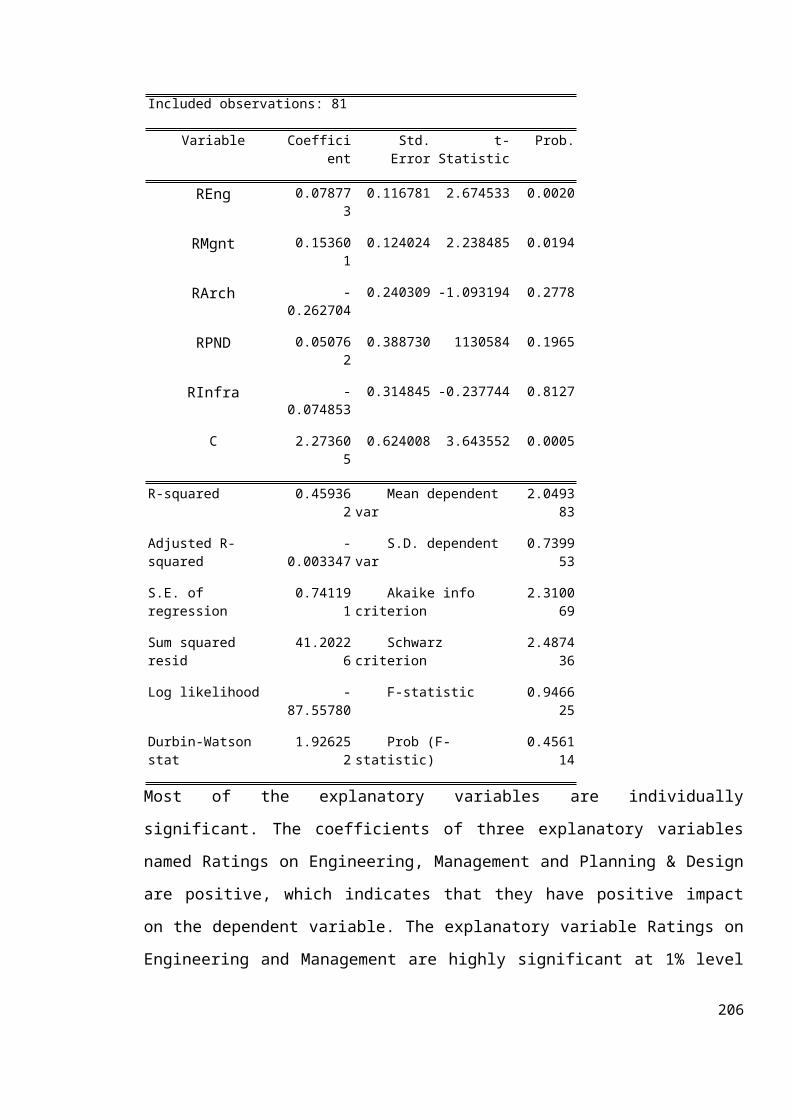
Included observations: 81
Variable Coefficient
Std.Error
t-Statistic
Prob.
REng 0.078773 0.116781 2.674533 0.0020
RMgnt 0.153601 0.124024 2.238485 0.0194
RArch -0.262704
0.240309 -1.093194 0.2778
RPND 0.050762 0.388730 1130584 0.1965
RInfra -0.074853
0.314845 -0.237744 0.8127
C 2.273605 0.624008 3.643552 0.0005
R-squared 0.459362 Mean dependent var
2.049383
Adjusted R-squared
-0.003347
S.D. dependent var
0.739953
S.E. of regression
0.741191 Akaike info criterion
2.310069
Sum squared resid
41.20226 Schwarz criterion
2.487436
Log likelihood -87.55780
F-statistic 0.946625
Durbin-Watson stat
1.926252 Prob (F-statistic)
0.456114
Most of the explanatory variables are individually
significant. The coefficients of three explanatory variables
named Ratings on Engineering, Management and Planning & Design
are positive, which indicates that they have positive impact
on the dependent variable. The explanatory variable Ratings on
Engineering and Management are highly significant at 1% level
206
(Two Tailed Test), as their t-statistics are high and p values
are near 0. Similarly, the explanatory variable Rating on
Planning & Design is also significant at 10 % level (Two
Tailed Test).
The R-squared value of 0.46 indicates that the explanatory
variables are able to explain the variation of dependent
variable to the extent of 46 %. The Durbin-Watson statistics
is 1.93, which indicates that there is no autocorrelation
among explanatory variables.
Explanation: The 3 types of institutions wherein PM education
is essential are Technical (REng), Management (RMgnt), and
Planning and Design (RPND). The remaining two namely
Architecture and Infrastructure Management were not explained
by the available data and may require some other data.
Generally Architectural institutions, barring a feqw
exceptions, are not known to emphasize PM in their
curriculum. Similarly there is probably lack of critical mass
of institutions in infrastructure management capable of
providing full fledged, comprehensive curriculum with enough
emphasis on PM.
Model 2: Multiple Regression Analysis Of PM Education RatingsAs Dependent Variable And Institute Infrastructure Support AsExplanatory Variable (Independent Variable)
The dependent variable is the overall Rating of PM Education
in India (RPME Infra). The explanatory variables are the same
scaled ratings of the Institute Infrastructure Support. The
important infrastructure considered is Availability of Library207
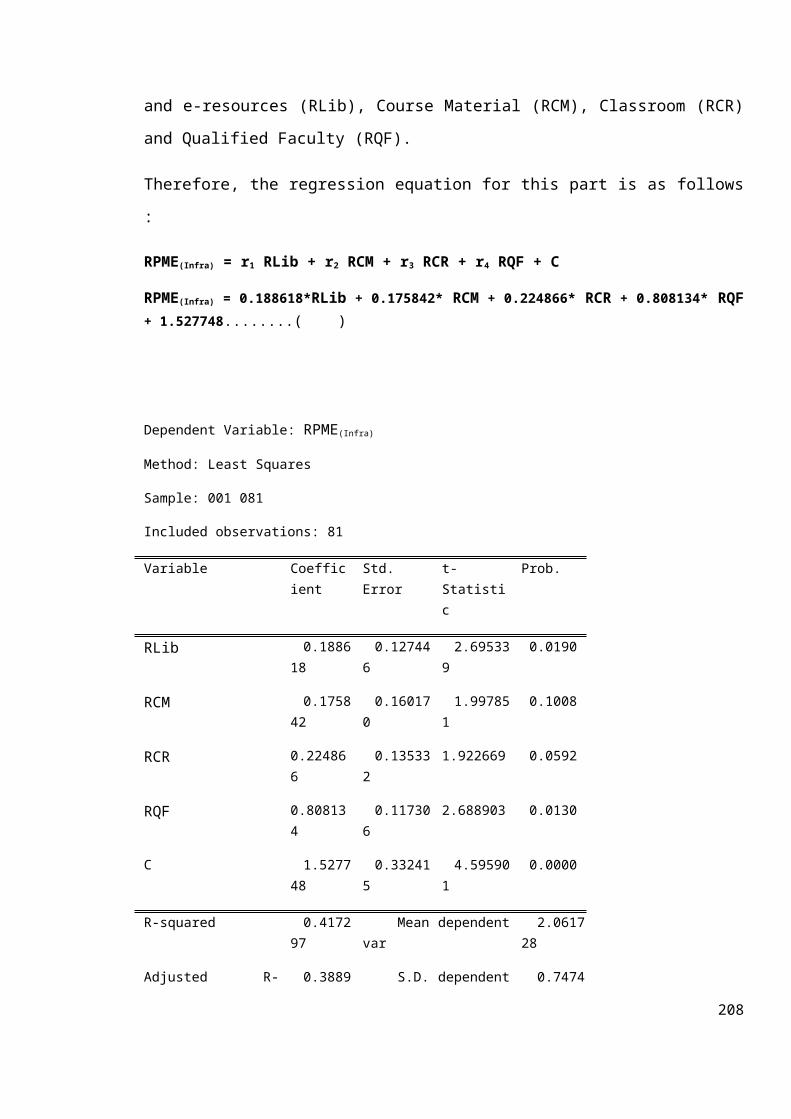
and e-resources (RLib), Course Material (RCM), Classroom (RCR)
and Qualified Faculty (RQF).
Therefore, the regression equation for this part is as follows
:
RPME(Infra) = r1 RLib + r2 RCM + r3 RCR + r4 RQF + C
RPME(Infra) = 0.188618*RLib + 0.175842* RCM + 0.224866* RCR + 0.808134* RQF+ 1.527748........( )
Dependent Variable: RPME(Infra)
Method: Least Squares
Sample: 001 081
Included observations: 81
Variable Coefficient
Std.Error
t-Statistic
Prob.
RLib 0.188618
0.127446
2.695339
0.0190
RCM 0.175842
0.160170
1.997851
0.1008
RCR 0.224866
0.135332
1.922669 0.0592
RQF 0.808134
0.117306
2.688903 0.0130
C 1.527748
0.332415
4.595901
0.0000
R-squared 0.417297
Mean dependentvar
2.061728
Adjusted R- 0.3889 S.D. dependent 0.7474
208
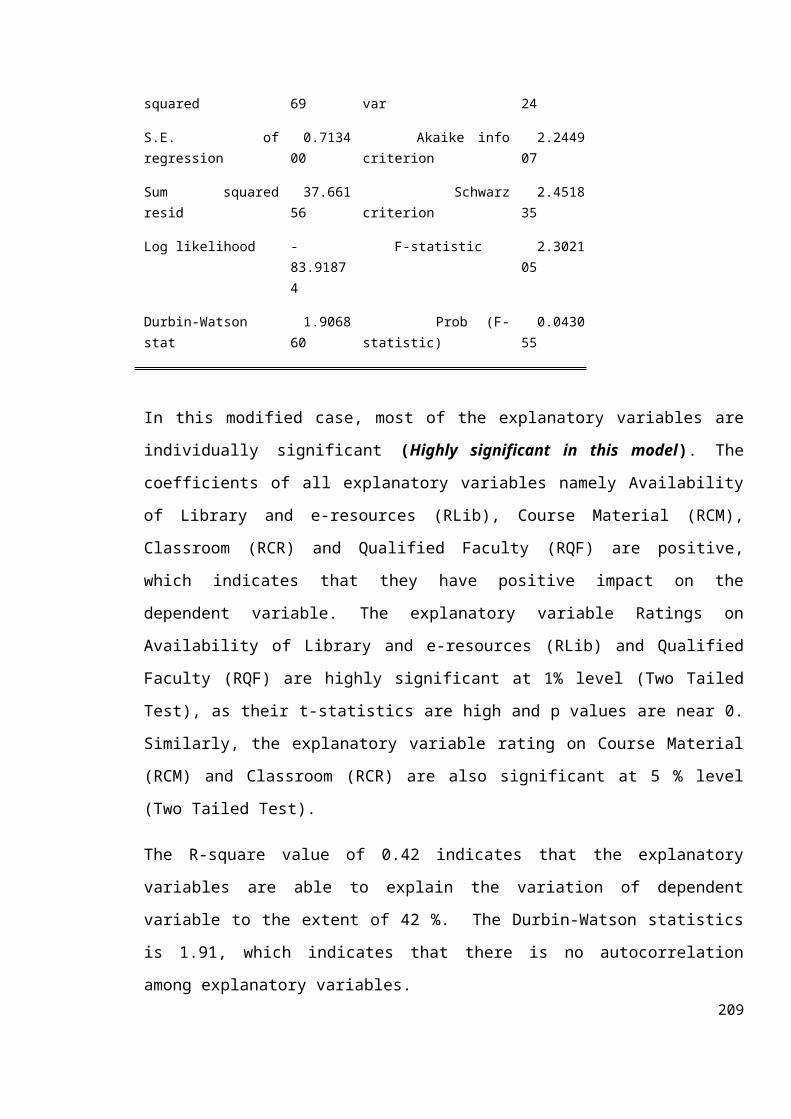
squared 69 var 24
S.E. ofregression
0.713400
Akaike infocriterion
2.244907
Sum squaredresid
37.66156
Schwarzcriterion
2.451835
Log likelihood -83.91874
F-statistic 2.302105
Durbin-Watsonstat
1.906860
Prob (F-statistic)
0.043055
In this modified case, most of the explanatory variables are
individually significant (Highly significant in this model). The
coefficients of all explanatory variables namely Availability
of Library and e-resources (RLib), Course Material (RCM),
Classroom (RCR) and Qualified Faculty (RQF) are positive,
which indicates that they have positive impact on the
dependent variable. The explanatory variable Ratings on
Availability of Library and e-resources (RLib) and Qualified
Faculty (RQF) are highly significant at 1% level (Two Tailed
Test), as their t-statistics are high and p values are near 0.
Similarly, the explanatory variable rating on Course Material
(RCM) and Classroom (RCR) are also significant at 5 % level
(Two Tailed Test).
The R-square value of 0.42 indicates that the explanatory
variables are able to explain the variation of dependent
variable to the extent of 42 %. The Durbin-Watson statistics
is 1.91, which indicates that there is no autocorrelation
among explanatory variables.209
Explanation: The infrastructure related to library,
availability of course material, classrooms and qualified
faculty are important variables which explain the variation in
the dependent variable to the extent of 42 % . This means that
some other factors are required to explain the relationship of
PM education and the institutes’ infrastructure. These results
could be seen along with the results of the Type of
Institutions (p.58) of which only 11.54% of the respondents
were autonomous institutions. 87.15% were AICTE, University
Affiliated and Accredited Institutions. The latter are bound
by structured processes of approval which may take protracted
periods of time from government agencies in the form of
receiving sanctions to introduce courses. Therefore the type
of the infrastructure currently prevailing is more dictated by
the regulatory requirements rather than the targeted
requirements of PM education. Such factors along with the
limited data size may be the reason why the equation is
explained to the extent of 42%.
Model 3:- Multiple Regression Analysis Of PM Education Ratings
As Dependent Variable And Management Support As Explanatory
Variable (Independent Variable)
The dependent variable is the overall Rating of PM Education
in India (RPME Mgmt). The explanatory variables are the same
scaled ratings of the Management Support for introducing
Courses in PM in the Institute (RPMCourse) and Effect on
Employability of PM (REPM).
210
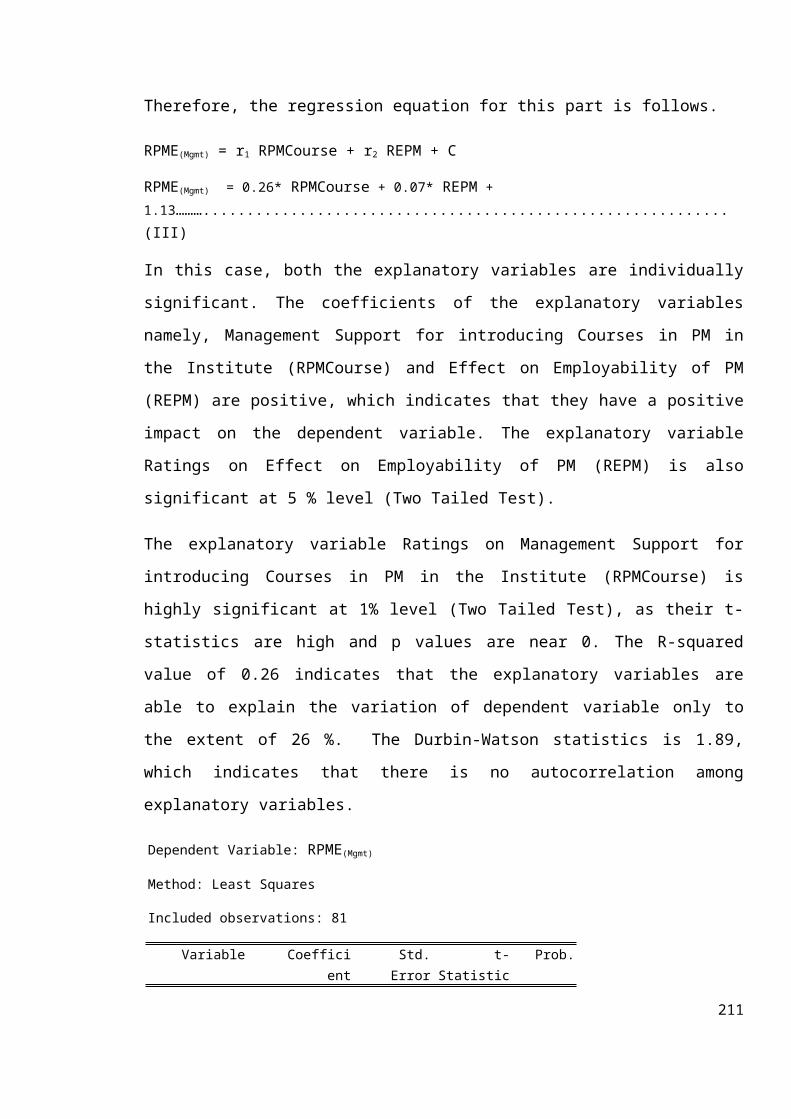
Therefore, the regression equation for this part is follows.
RPME(Mgmt) = r1 RPMCourse + r2 REPM + C
RPME(Mgmt) = 0.26* RPMCourse + 0.07* REPM + 1.13………............................................................(III)
In this case, both the explanatory variables are individually
significant. The coefficients of the explanatory variables
namely, Management Support for introducing Courses in PM in
the Institute (RPMCourse) and Effect on Employability of PM
(REPM) are positive, which indicates that they have a positive
impact on the dependent variable. The explanatory variable
Ratings on Effect on Employability of PM (REPM) is also
significant at 5 % level (Two Tailed Test).
The explanatory variable Ratings on Management Support for
introducing Courses in PM in the Institute (RPMCourse) is
highly significant at 1% level (Two Tailed Test), as their t-
statistics are high and p values are near 0. The R-squared
value of 0.26 indicates that the explanatory variables are
able to explain the variation of dependent variable only to
the extent of 26 %. The Durbin-Watson statistics is 1.89,
which indicates that there is no autocorrelation among
explanatory variables.
Dependent Variable: RPME(Mgmt)
Method: Least Squares
Included observations: 81
Variable Coefficient
Std.Error
t-Statistic
Prob.
211
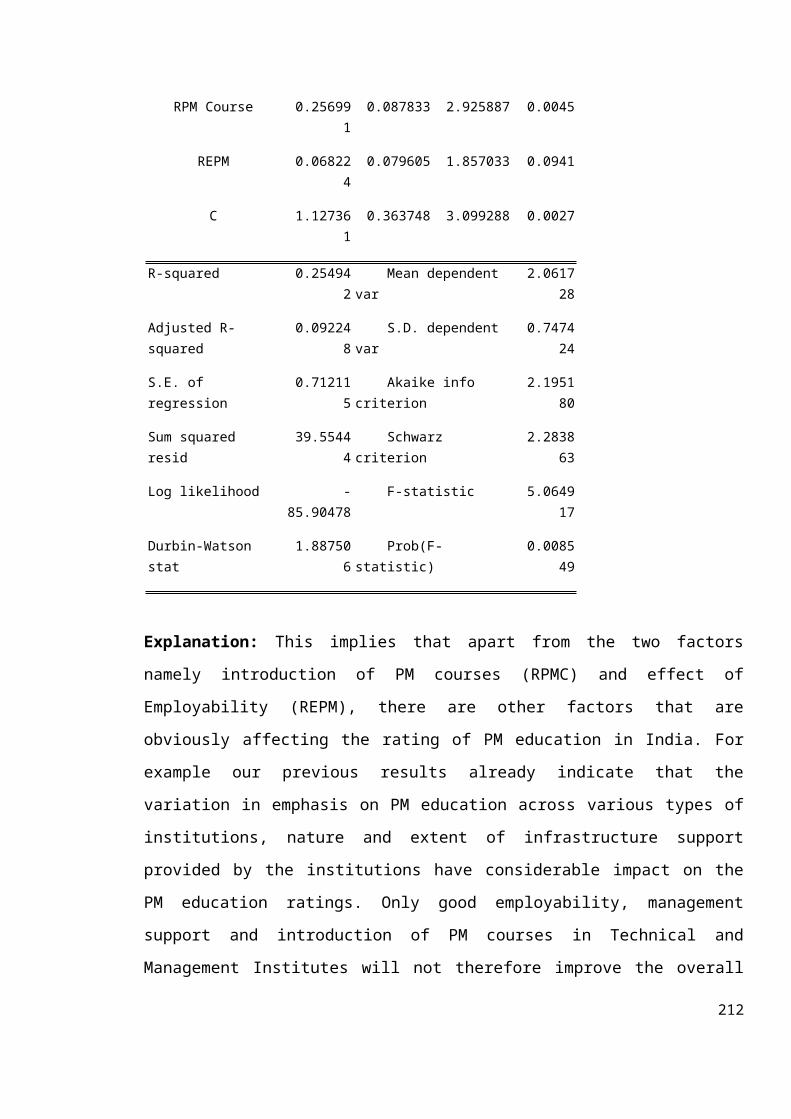
RPM Course 0.256991 0.087833 2.925887 0.0045
REPM 0.068224 0.079605 1.857033 0.0941
C 1.127361 0.363748 3.099288 0.0027
R-squared 0.254942 Mean dependent var
2.061728
Adjusted R-squared
0.092248 S.D. dependent var
0.747424
S.E. of regression
0.712115 Akaike info criterion
2.195180
Sum squared resid
39.55444 Schwarz criterion
2.283863
Log likelihood -85.90478
F-statistic 5.064917
Durbin-Watson stat
1.887506 Prob(F-statistic)
0.008549
Explanation: This implies that apart from the two factors
namely introduction of PM courses (RPMC) and effect of
Employability (REPM), there are other factors that are
obviously affecting the rating of PM education in India. For
example our previous results already indicate that the
variation in emphasis on PM education across various types of
institutions, nature and extent of infrastructure support
provided by the institutions have considerable impact on the
PM education ratings. Only good employability, management
support and introduction of PM courses in Technical and
Management Institutes will not therefore improve the overall
212
rating of PM Education. Some other variables like awareness
and importance of PM education amongst the institutes’ faculty
and management, the academic and physical infrastructure of
the institutions will also be equally important.
7.4 The Practising Executives Data Analysis And Inferences
The next set of responses was drawn from practising
executives, so as to find out their views and perceptions
regarding project management learning. The sample consisted of
executives who had not undergone prior training in PM before
joining the course at NICMAR, but are employed with PM based
organisations and particularly deployed on projects. Majority
of the executives had upto 10 years of experience, they are
young and have very few years working in the field. The
practising executives responding to the questionnaire were
from the middle management cadre. Most of these were working
on projects with value between 200–300 crores. This assumes
significance against the backdrop that India has been riding
on a high growth path, with enormous public and private funds
riding on the back of the projects industry. The executives
claim that academic institutions have not provided them with
PM competencies at graduation level before they entered the
world of employment. This also corroborates the data obtained
from faculty respondents regarding their perception of overall
PM education in India which was rated as only ‘Fair’.
According to the respondents, the skills learnt in the
technical institutions were limited to PERT/CPM techniques,
with Arrow and Fishbone techniques coming in a distant second213
and third respectively. Dedicated project management softwares
like Primavera and Microsoft Projects came last.
The ratings assigned to practically all the subjects in the
Management and Technology area by executives are higher than
the corresponding ratings assigned by the institutions.
Several courses have on the average been rated as “ extremely
important”. These include Planning, Scheduling, Monitoring and
Control Techniques; Project Quality Management; Health, Safety
and Environment Management; Cost Estimation and Budgeting;
Quantity Surveying and Estimation; Project Site and Equipment
Management; Project Procurement and Materials Management;
Contract Management. Furthermore, some courses are considered
far more important by executives compared to the institutions.
These are : Contract Management, Project procurement and
Materials Management, Quantity Surveying and Estimation, Cost
estimation and Budgeting, Health, Safety and Environment
Management. These courses have a strong ‘execution’ and
therefore ‘practical’ bias. Naturally executives seem to
realize their importance far more than the institutions.
In the Behavioural Sciences area, the overall ratings for all
subjects averaged ‘Very Important’, except for Managerial
Skills subject rated ‘extremely important’. This subject is
rated much higher by the executives, while the other subject
ratings in this area are comparable to those assigned by the
institutions. Overall all the subjects in the IT area were
rated in the range of ‘very important’ to ‘Extremely
Important’. The ratings assigned to these subjects are very214
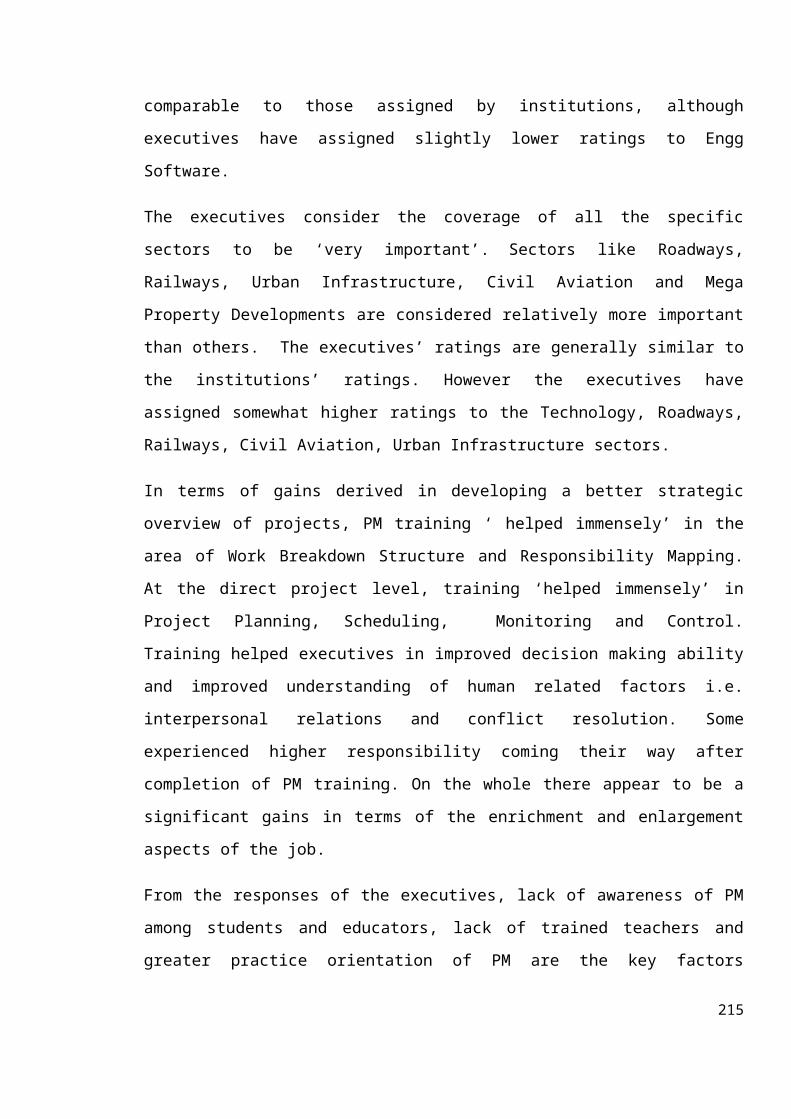
comparable to those assigned by institutions, although
executives have assigned slightly lower ratings to Engg
Software.
The executives consider the coverage of all the specific
sectors to be ‘very important’. Sectors like Roadways,
Railways, Urban Infrastructure, Civil Aviation and Mega
Property Developments are considered relatively more important
than others. The executives’ ratings are generally similar to
the institutions’ ratings. However the executives have
assigned somewhat higher ratings to the Technology, Roadways,
Railways, Civil Aviation, Urban Infrastructure sectors.
In terms of gains derived in developing a better strategic
overview of projects, PM training ‘ helped immensely’ in the
area of Work Breakdown Structure and Responsibility Mapping.
At the direct project level, training ‘helped immensely’ in
Project Planning, Scheduling, Monitoring and Control.
Training helped executives in improved decision making ability
and improved understanding of human related factors i.e.
interpersonal relations and conflict resolution. Some
experienced higher responsibility coming their way after
completion of PM training. On the whole there appear to be a
significant gains in terms of the enrichment and enlargement
aspects of the job.
From the responses of the executives, lack of awareness of PM
among students and educators, lack of trained teachers and
greater practice orientation of PM are the key factors
215
emerging as the main inhibiting factors affecting the growth
of PM education. When faculty respondents were asked to
evaluate their progress in introducing PM related courses in
India, majority of the responses were in the category of
Negligible, Initial and Considerable. Only 11% of the sample
admitted to the efforts being in the ‘Advanced’ stage. Also
the multiple regression results point to factors like
institute infrastructure in terms of library, course
materials, and existence of management vision and lastly
management support as crucial to the introduction of the PM
courses in the institutes. Data collected on both counts point
to the fact that there appears to be a clear gap in the
present curriculum of technical and business schools and the
actual skill requirements of the industry.
Furthermore when viewed with the systematic efforts taken by
the Chinese government within the government ministries, as
well as in the educational system, the efforts of the Indian
technical and business educational institutions remains far
short of the ideal. This appears to be even more acute when
the average quantum of project value that the executives have
served in the past or are currently serving in, is considered.
When so much finance and scarce resources are at stake, the
performance of the operational and project human resource does
assume strategic importance. In fact existence of project
skills and competencies can turn the fortunes in favour of the
business and industry as a whole.
216
Once again the Factor Analysis (FA) method was used to extract
subjects (factors) that they consider important for inclusion.
In order to maintain parity with the Institutional Factor
Analysis, the same factors contained in the former are
selected for analysis in the case of executives. After
determining the factors and their associated Eigenvalues, the
percentage of variance was determined, alongwith cumulative
percentages. In Table 6, all the estimated parameters are
presented.
It is found that the Eigenvalues of ‘components’ are greater
than one and when extracted, explain the variation up to 71%.
This means that all factors (subjects) that were included in
the questionnaire are rated by the respondents to be important
for inclusion in PM curriculum. However 8 subjects included in
the Management and Technology Area, namely (i) Operations
Management for Projects, (ii) Planning / Scheduling /
Monitoring and Control Techniques, (iii) Statistical Methods
for Project Analysis, (iv) Operations Research for Projects,
(v) Project Quality Management, (vi) Health Safety and
Environment in Projects, (vii) Cost Estimation and Budgeting
and (viii)Accounting and Control Systems, formed the highest
proportion of the factors (i.e. 71%).
Alternatively this means that the balance 23 subjects form a
small component of only 29% of the total PM curricula. The top
8 subjects that emerge from the analysis are considered most
crucial for inclusion in PM curriculum by the executives. Two
of the top 8 subjects not figuring among the top 6 subjects217
rated by the academics are : Cost Estimation and Budgeting and
Accounting & Control Systems. Obviously executives consider
the issues related to cost management and control to be of
much greater importance than the academics. Table 6 shows the
Eigenvalues and Total Variance explained.
A further analysis was conducted to find out in which of the
sectors the executives perceive that prior education in PM is
necessary to build PM competencies. It is found that the
Eigenvalues of 3 ‘components’’ are greater than one when
extracted, and can explain the variation upto 69%. These three
sectors are: Information & Communication Technology, Telecom
and Research and Development. The Space Exploration Sector
follows very closely with 0.949 (almost 1), which implies even
this sector is considered very important for PM education.
Surprisingly, for the Sector –International Project
Management, eigenvalue was as low as 0.087, which shows the
general lack of awareness among practicing executives of the
importance of building project management competencies to
handle international projects at the degree level and perhaps
even after.
218
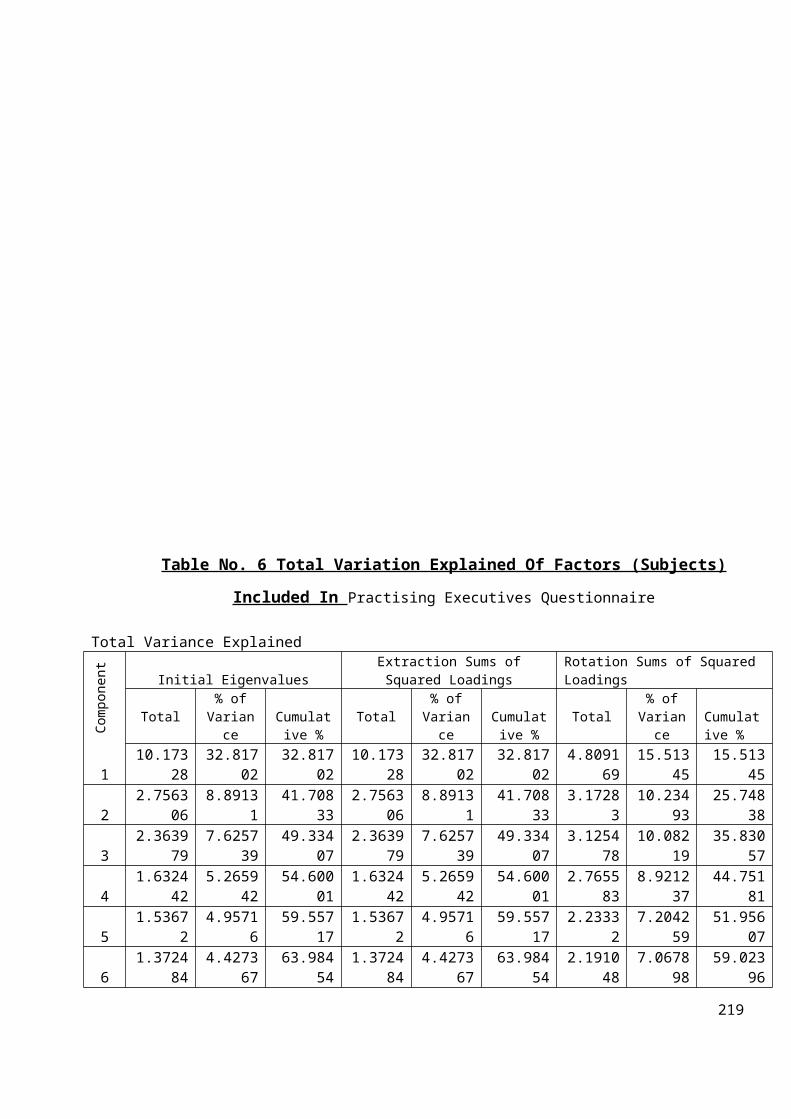
Table No. 6 Total Variation Explained Of Factors (Subjects)
Included In Practising Executives Questionnaire
Total Variance Explained
Component
Initial EigenvaluesExtraction Sums ofSquared Loadings
Rotation Sums of Squared Loadings
Total% ofVariance
Cumulative %
Total% ofVariance
Cumulative %
Total% ofVariance
Cumulative %
110.173
2832.817
0232.817
0210.173
2832.817
0232.817
024.8091
6915.513
4515.513
45
22.7563
068.8913
141.708
332.7563
068.8913
141.708
333.1728
310.234
9325.748
38
32.3639
797.6257
3949.334
072.3639
797.6257
3949.334
073.1254
7810.082
1935.830
57
41.6324
425.2659
4254.600
011.6324
425.2659
4254.600
012.7655
838.9212
3744.751
81
51.5367
24.9571
659.557
171.5367
24.9571
659.557
172.2333
27.2042
5951.956
07
61.3724
844.4273
6763.984
541.3724
844.4273
6763.984
542.1910
487.0678
9859.023
96
219
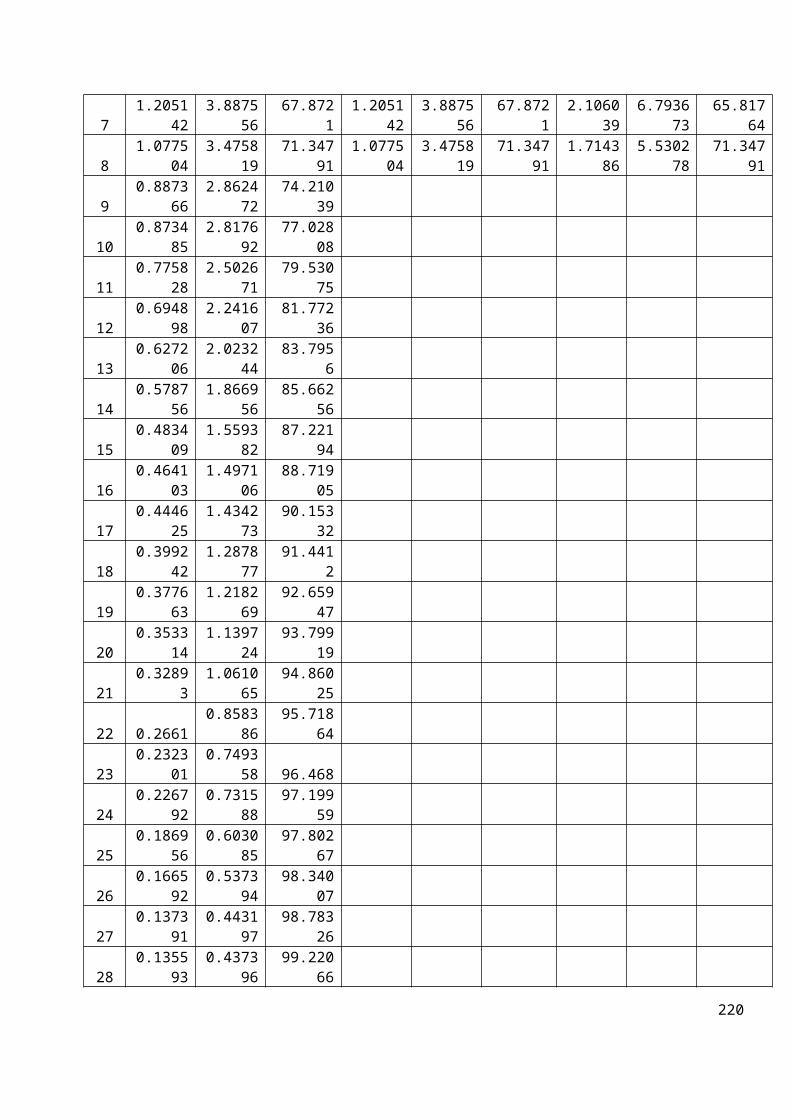
71.2051
423.8875
5667.872
11.2051
423.8875
5667.872
12.1060
396.7936
7365.817
64
81.0775
043.4758
1971.347
911.0775
043.4758
1971.347
911.7143
865.5302
7871.347
91
90.8873
662.8624
7274.210
39
100.8734
852.8176
9277.028
08
110.7758
282.5026
7179.530
75
120.6948
982.2416
0781.772
36
130.6272
062.0232
4483.795
6
140.5787
561.8669
5685.662
56
150.4834
091.5593
8287.221
94
160.4641
031.4971
0688.719
05
170.4446
251.4342
7390.153
32
180.3992
421.2878
7791.441
2
190.3776
631.2182
6992.659
47
200.3533
141.1397
2493.799
19
210.3289
31.0610
6594.860
25
22 0.26610.8583
8695.718
64
230.2323
010.7493
58 96.468
240.2267
920.7315
8897.199
59
250.1869
560.6030
8597.802
67
260.1665
920.5373
9498.340
07
270.1373
910.4431
9798.783
26
280.1355
930.4373
9699.220
66
220
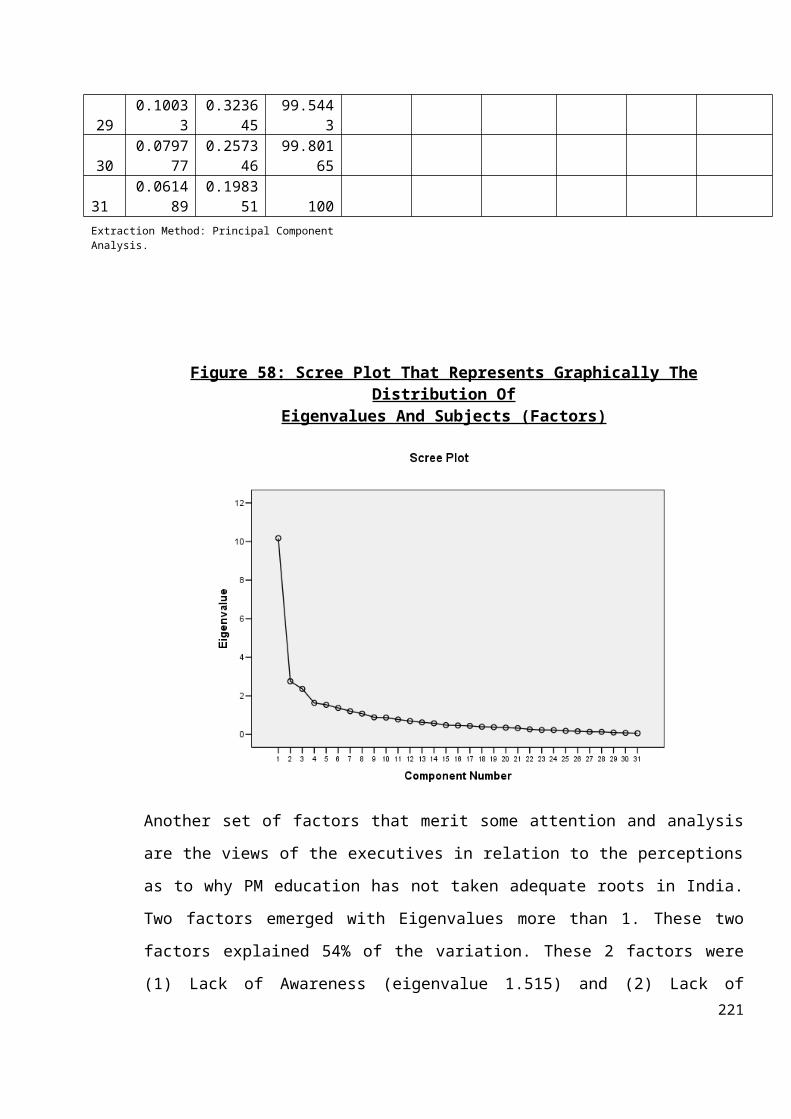
290.1003
30.3236
4599.544
3
300.0797
770.2573
4699.801
65 31
0.061489
0.198351 100
Extraction Method: Principal ComponentAnalysis.
Figure 58: Scree Plot That Represents Graphically TheDistribution Of
Eigenvalues And Subjects (Factors)
Another set of factors that merit some attention and analysis
are the views of the executives in relation to the perceptions
as to why PM education has not taken adequate roots in India.
Two factors emerged with Eigenvalues more than 1. These two
factors explained 54% of the variation. These 2 factors were
(1) Lack of Awareness (eigenvalue 1.515) and (2) Lack of221
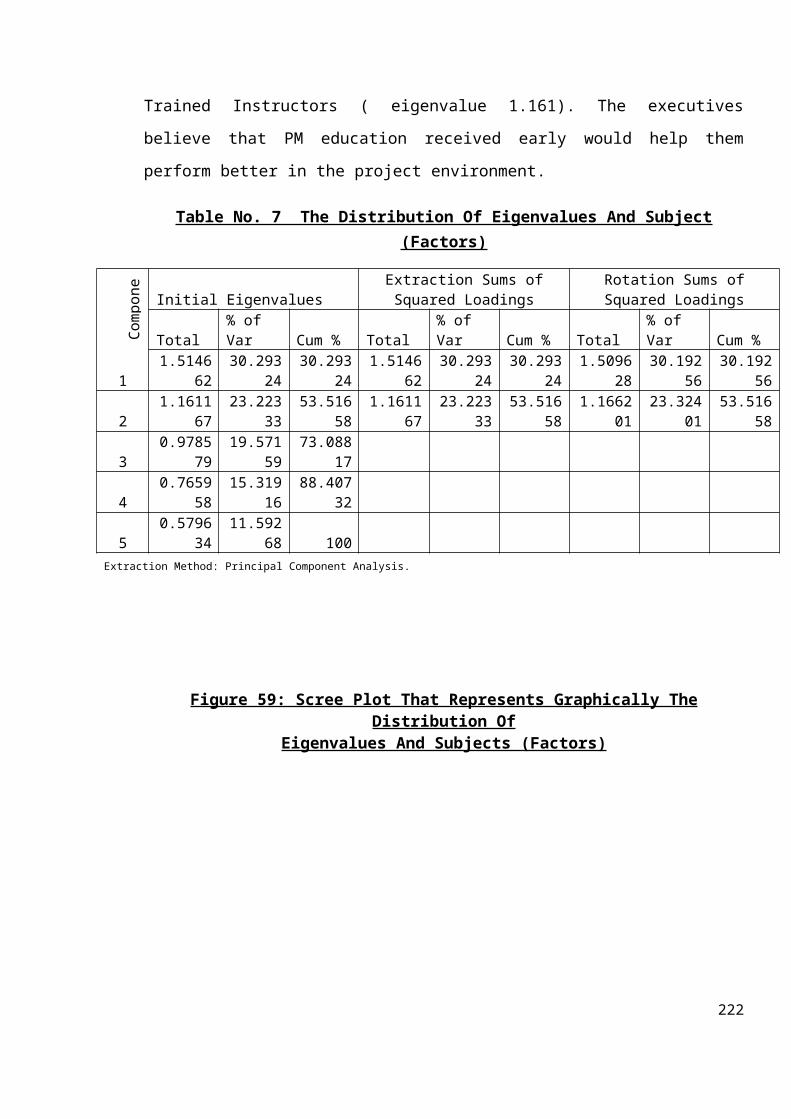
Trained Instructors ( eigenvalue 1.161). The executives
believe that PM education received early would help them
perform better in the project environment.
Table No. 7 The Distribution Of Eigenvalues And Subject(Factors)
Compon
e
Initial EigenvaluesExtraction Sums ofSquared Loadings
Rotation Sums ofSquared Loadings
Total% of Var Cum % Total
% of Var Cum % Total
% of Var Cum %
11.5146
6230.293
2430.293
241.5146
6230.293
2430.293
241.5096
2830.192
5630.192
56
21.1611
6723.223
3353.516
581.1611
6723.223
3353.516
581.1662
0123.324
0153.516
58
30.9785
7919.571
5973.088
17
40.7659
5815.319
1688.407
32
50.5796
3411.592
68 100 Extraction Method: Principal Component Analysis.
Figure 59: Scree Plot That Represents Graphically TheDistribution Of
Eigenvalues And Subjects (Factors)
222
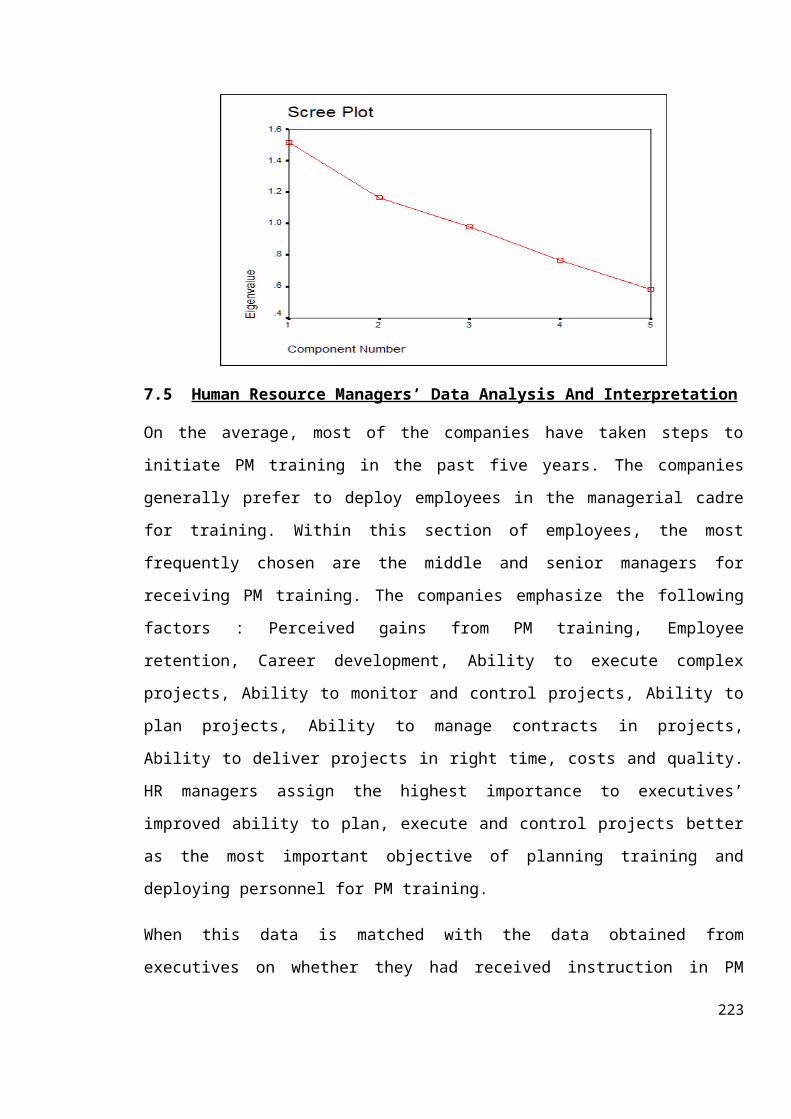
7.5 Human Resource Managers’ Data Analysis And Interpretation
On the average, most of the companies have taken steps to
initiate PM training in the past five years. The companies
generally prefer to deploy employees in the managerial cadre
for training. Within this section of employees, the most
frequently chosen are the middle and senior managers for
receiving PM training. The companies emphasize the following
factors : Perceived gains from PM training, Employee
retention, Career development, Ability to execute complex
projects, Ability to monitor and control projects, Ability to
plan projects, Ability to manage contracts in projects,
Ability to deliver projects in right time, costs and quality.
HR managers assign the highest importance to executives’
improved ability to plan, execute and control projects better
as the most important objective of planning training and
deploying personnel for PM training.
When this data is matched with the data obtained from
executives on whether they had received instruction in PM
223
related subjects while in college, a clear majority have
answered in the negative. Also majority of the executives
interviewed have work experience ranging from less than 5
years up to 10 years. Therefore the HR managers have to
arrange PM related training in order to make the executives
‘project ready’ and ensure a certain degree of parity with
other project personnel such as project managers, operations
executives, purchase managers, etc. The companies believe that
the direct benefits from training accrue to middle and senior
managerial cadres the most, as executives in these two
categories are directly involved in driving projects, taking
decisions and overall project responsibility. From the
responses of the executives, it is apparent that the objectives
of the HR managers has been fulfilled since the executives
feel that their most direct gains are in their improved
ability to plan, execute, monitor and control projects better.
‘In house Training’, ‘On the Job Training’ and ‘On the Job
with Classroom Training’ are the most preferred methods of
training. ‘In house’ may be preferred as it is considered more
cost effective compared to the residential training
programmes. This was also confirmed by the top training and HR
managers (See Refer ref no. 48, Bib) when they stated that most of the
times, companies preferred this method, because it formed an
integral component of a very large ongoing project, and
therefore training of the executives had to be completed
within available timeframes. The training levels most
preferred for various grades of executives are : Elementary
224
for Operatives, Basic for Supervisors, Advanced for Middle
level managers, Strategic for Senior Level executives. The
scope and complexity of training content must match the grades
and responsibilities at various levels in the organisational
hierarchy. HR managers are seen to keep this in mind when
importing PM training. The findings highlight a planned
approach for PM training.
Overall the perception amongst the HR managers is that PM
training is quite expensive vis a vis majority of the factors
such as : Trainees’ salaries and time, Materials for training,
Expenses for trainers, Expenses for trainees, Cost of
facilities and equipment, Lost productivity. The high training
costs can be attributed to the fact that PM training
penetration and availability of specialist PM trainers in
India, are still very low and less ubiquitous compared to
other training themes in technical and management arena. HR
managers do not mind the loss of productivity of executives
during their absence, which they feel will be more than
compensated by the large scale benefits expected from
training.
HR managers view training to be ‘quite benefitial’ on all the
factors considered including : Increase in production/
performance, Reduction in errors and improvement of safety
standards, Employee retention, Lesser supervision, Ability to
use new skills and capabilities, Improved delivery
performance, Attitude changes, and Growth of business
225
oportunities. They look for direct benefits from training in
‘process improvement’ rather than ‘output improvement’.
Certified Franchisee Trainers are considered most efficacious
training providers, followed by Internationally Certified
Trainers, Independent Trainers and Academic institutions. This
may be attributed to the flexibility and highly focussed
approach of these trainers. However it is important to mention
that the highest percentage preference in the ‘Most
Efficacious’ category was assigned to academic institutions.
Their good concentration of highly qualified faculty, a fair
degree of specialised competence, research experience and
reasonable cost are a great advantage for developing good
training content. However they may not always be able to
deliver purely custom designed training programmes. The most
frequent academic institutions for PM related training are the
management institutions together as group, followed by in
house trainers and NICMAR. Considering that NICMAR is a single
entity, its share of 11.43% in PM training is most enviable by
comparable industry standards.
It is reassuring to know that the HR managers consider
international accreditation to be of value. But the managers
may not be fully aware of the benefits of international
accreditation with respect to their organisation. The share of
Registered Education Providers® (REP®s) in the Asia – Pacific
region is very low at 16 percent compared to North America.
Particularly in India, there are only 70 PMI® accredited REP®s
(PMI, 2010). Thus the relatively lower awareness combined with226
very low penetration of PM training accreditation and its
benefits among the HR community of project based organisations
could be the most plausible causes why HR managers are not
clear about the value from International accreditation.
The training is predominantly designed to develop the project
skill base followed by the knowledge and competency base.
Building the right attitude is not a clearly defined outcome.
This could be due to the fact that soft skills competence is
built into the normal PM training design. This matches with
the responses of the executives on their improved
understanding of human related factors especially,
interpersonal relations and conflict resolution as the second
highest area of gain next only to improved decision making
ability. Moreover, the executives have assigned high
importance to subjects like Project Organisation Structure,
Human Resource Management, Industrial Relations, Conflict
Management and Diversity Management. Therefore it is inferred
that attitude competency can be viewed as an essential subset
of the overall ‘hard’ skills that are required on projects.
Thus there remains a much greater and direct emphasis on the
development of ‘hard’ skills.
7.6 Synthesis Of Stakeholders Of PM Education – Academic
Institutions, Practising Executives And Industry
227
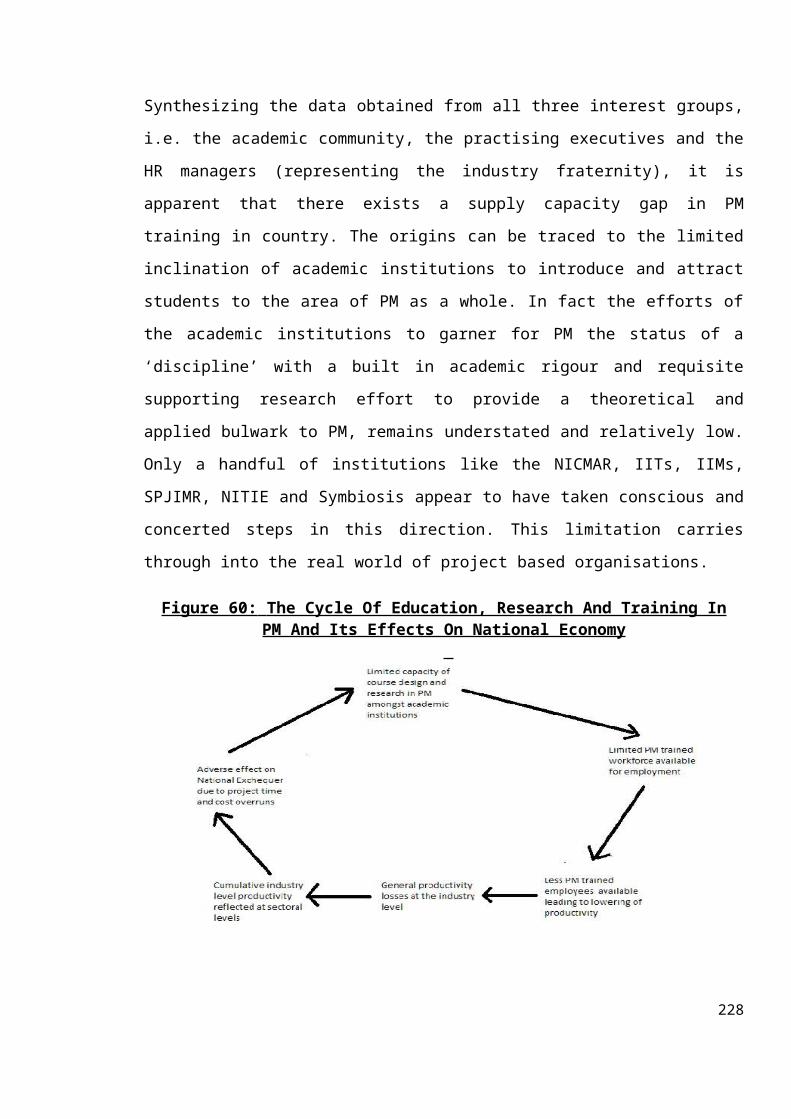
Synthesizing the data obtained from all three interest groups,
i.e. the academic community, the practising executives and the
HR managers (representing the industry fraternity), it is
apparent that there exists a supply capacity gap in PM
training in country. The origins can be traced to the limited
inclination of academic institutions to introduce and attract
students to the area of PM as a whole. In fact the efforts of
the academic institutions to garner for PM the status of a
‘discipline’ with a built in academic rigour and requisite
supporting research effort to provide a theoretical and
applied bulwark to PM, remains understated and relatively low.
Only a handful of institutions like the NICMAR, IITs, IIMs,
SPJIMR, NITIE and Symbiosis appear to have taken conscious and
concerted steps in this direction. This limitation carries
through into the real world of project based organisations.
Figure 60: The Cycle Of Education, Research And Training In PM And Its Effects On National Economy
228
Executives working in project based companies enter with
little or no prior orientation of project requirements that
are special and unique to their industry. With very limited
tools such as PERT/CPM, etc. they find it difficult to
comprehend holistically, the distinct requirements of
operating in project based organisations. They are therefore
required to be trained to bring out their best potential while
in employment. HR managers are then charged with the
responsibility of designing dedicated PM training modules that
would bring direct gains to the project and company. With very
few options to choose experts due to the general paucity of
experts and recognised PM trainers, in academic institutions,
and REP®s, the training costs increase considerably. At the
same time the benefits of PM training are not fully utilised.
The net loser in this is the industry and eventually the
country as a whole which pays for the delayed projects and
higher costs to the National Exchequer. Figure 60 depicts the
above as a construct.
7.7 Limitations Of The Research
This research is one of the few studies of its kind in India.
Therefore as is common with such early efforts, the challenges
faced are commensurate with the advantages. A few of these are
described here. The first challenge lay in determining the
sample size as well as the type. Questions regarding the ideal
size and type of institutions i.e. government run, autonomous,
private etc and their academic rankings as appearing in
leading media were taken into consideration to arrive at the
229
best possible sample mix. Only those institutions offering
technical and management programmes at undergraduate and post
graduate levels have been included in the study.
The second limitation is that of time availability, as data
had to be collected just before the close of annual academic
year (months of April - May) in order to avoid the closure of
institutions for annual vacation. In case of executives, they
were curious to know more about PM education, but were unable
to devote much time due to the academic year closure
constraints. Thirdly the industry perspective could have been
further researched for the type and depth of PM training, in
house trainers and their approach to PM training etc. However
budgetary constraints did not make this feasible. Future
studies should address this issue in greater depth. Fourthly
the government though a major stakeholder as well as promoter
of new educational initiatives, has not been directly
approached in this study. The views of the government with
regard to PM, in either its user departments or its education
arm, have not been researched to obtain a wider understanding
of PM and its benefits.
7.8 Scope For Future Research
The future scope of study could include awareness in other
types of institutions such as Industrial Training Institutes,
graduate business management colleges, and in house corporate
training centres.
230
The governmental departments that initiate new projects as
Clients, such as Urban Development, Housing, Roads, Railways,
Ports, Irrigation, Airports, Rural Development, Healthcare,
Education, Defence, Space, Science and Technology, etc. need
to be researched more to understand their perspectives on PM
in general, especially against the backdrop of increased
Public Private Participation mode of investment. At the
Central Government level, Ministry of Statistics and Programme
Implementation (MOSPI) provides detailed and voluminous data
on projects executed in the Central Sector. No such elaborate
data is available at the State Government level. In both
cases, there is no data on training activity undertaken as
part of execution of projects. It should be relatively easy to
undertake separate study on training and developmental
activities in projects being monitored by MOSPI, with support
from the Ministry.
Furthermore, the government’s role in initiating and advancing
the PM approach through systematic top down channels such as
Ministry of HRD, Ministry of Statistics and Programme
Implementation also needs to be studied. Lastly the existing
awareness and view of students as stakeholders and investors
will be a good study on PM education and its effects on their
career prospects. The next chapter derives conclusions and
recommendations for improving PM education in India.
231
CHAPTER 8
CONCLUSIONS AND RECOMMENDATIONS
The study began by asking a few pertinent questions regarding
the status of PM education in India especially compared to its
global counterparts in more advanced ‘projectised’ societies.
These were
Why is project management as a profession not yet
adequately recognized in India?
Is India still found wanting in being classified as a
‘project oriented society’?
Why have the technical institutes, some of which are many
decades old, not introduced PM modules in their
curricula?
232
What inhibits leading business schools from introducing a
PM curriculum in their course offerings?
Should the PM education in technical/business schools be
knowledge based or competency based; which leads to the
problem of availability and competence of the faculty and
instructors required for teaching the discipline?
What is the role played by professional
associations/societies in promoting PM education amongst
the industry and government?
To what extent is the regulatory authority’s role
conducive or insidious in the promulgation of PM
education?
In the course of the study, the questions above were answered
in a number of ways that helped the researchers to arrive at
some key conclusions. Based on them, we make some
recommendations.
8.1 Conclusions
From the analysis of the secondary literature on the state of
PM in India as compared to global standards, we conclude that,
in its current state, India needs to initiate and sustain
greater effort in propagating the benefits of PM to all
stakeholders. It appears that in its current state, PM is yet
to be understood as a subject of such universal application
and versatility that encompasses all types of businesses and
organisations and across almost all sectors of the economy.
Viewed from the perspective of the global standards, India
233
appears far behind what can be considered as an acceptable
threshold level of practice of PM. Compared to our immediate
neighbour China, India’s efforts in propagating the PM mindset
and methodology of accomplishing organisational and national
goals remain substantially behind compared to other developed
countries.
Against the backdrop of the enormous amount of money invested
in projects and the quantum of upcoming investments in public
as well as private initiatives, the entrenchment of PM
principles in project procurement, planning, implementation
and control is of utmost significance. However, it appears
from the study that the significance does not appear to have
been completely absorbed by the decision makers from the
industry, government and even by the majority of the academic
world. All this is reflected in the current status of PM
education in India being assessed as ‘below par’ especially
when compared against existing global standards. However there
exists a huge untapped potential for the widespread
establishment of PM in India with a section of the faculty,
executives and organisations realising the need for the same.
It is obvious from the study, that PM training is considered
directly beneficial to the practitioners as well as the
organisations in terms of better project planning and
implementation. PM training has resulted in direct gains to
both, the companies as well as the executives.
8.1.1 Barriers
234
The most prominent barriers to the propagation of PM education
in India are found to be the following
There exists a lack of awareness amongst the managements
of technical and management institutions, about the
importance and relevance of teaching PM for capacity
building of the technical and professional graduates.
Systematic curriculum development with a focussed view to
develop PM competencies is found quite absent at graduate
and post graduate levels of technical and management
schools.
In majority of the cases, it was found that if at all PM
interests are pursued by faculty, it is more as a
consequence of their individual interest and not so much
arising out of an institutional vision to encourage these
pursuits (except in the cases of a handful of the
institutions such as, NICMAR, IITs, IIMs, NITIE, S.P.
Jain, Symbiosis etc).
The lack of trained instructors in the educational
institutions.
Lack of research and publications, with only the leading
institutions of national repute producing limited
original research in the area of PM.
Regulatory approvals took anywhere from more than a year
upto 3 years with average of 16.5 months to introduce new
curriculum. The average internal lead time is found to be
even higher at 19 months. Viewed against the response
time of a year or more, to build institutional capacity
235
in terms of qualified faculty, library and other
infrastructure, the overall delays have tended to
magnify. When most of the faculty have admitted that the
companies that come for recruitment do look specifically
for PM competencies amongst the students, the response
time in introducing PM courses on the part of the
institution assumes utmost importance due to the
‘employability’ enhancement feature of PM education. Thus
institutions should take active steps to cover this need
gap.
Though working executives are clearly in favour of
gaining PM competencies at the time of graduation, the
limiting factors are the lack of awareness, inadequate
availability of faculty, training and instruction
material in the technical and business schools as well as
in the Indian system as a whole.
Though efficacious, training in PM is still considered
more expensive as compared to training in other fields by
the HR departments of project organisations.
8.2 Recommendations
Curriculum development related to PM requires to be more
competency focused rather than just knowledge based. Overall
it is recommended that Project Management and Technology Area
subjects should be taught to develop project level
competencies. Curricula in Strategy, Economics & Finance Area
and Behavioural Sciences area should focus on generic
knowledge and skill based competencies. Our specific236
recommendations stemming from the detailed research findings
are as follows:
Train the Trainers initiatives and the accreditation of
Registered Education Providers®s (REP®s) like PMI need to
be pursued vigorously, by all major stakeholders:
Government, Industry and Academic Institutions
Academic institutions should patronise and encourage
research in PM at the faculty and students level, in a
phased manner to cover a wider net of institutions that
are also regionally distributed all over India. Sustained
efforts are needed on the part of academic institutions
to obtain research funding support from national funding
agencies and the private sector
PM research pursuits have to be more broad based and
penetrate all fields where its benefits are palpable
There is an urgent need to improve awareness through mass
media coverage about the PM and the application of PM
techniques to business. This will be an important area
for joint academia-industry initiative
Arrange seminars and symposia to deliberate on PM at the
national, state and local levels, covering academic
institutions, government officials and industry
Sustained advocacy of PM in different forums such as
industry, academia and government needs to be understood
as an essential component of organisational success
Based on the research study, we recommend model curricula
covering introductory level project management courses in237
general management programmes, and undergraduate engineering
programmes that can be offered to students in their final
year. Shorter duration courses suited for middle management
and senior management professionals and finally a course
specially designed for Project Leaders would be helpful.
Annexure No.7 suggests the Model Course Curricula for the
courses mentioned above in longer duration as well short
duration modes.
BIBLIOGRAPHY
1. Shenhar A., and Dvir D., ‘Toward a Typological Theory of
Project Management’, Research Policy, 25, pp. 607-632,
1996.
238
2. Turner R. and Heumann M., ‘Project Management Education
in Project-oriented Societies’, Project Management –
International Project Management Journal, 2001.
3. Zwerman, Bill L. and Thomas, Janice L. et al,
‘Professionalization of Project Management: Exploring the
Past to Map the Future’, Project Management Institute,
2004.
4. Soderlund J., ‘On the broadening scope of the research
on projects: a review and a model for analysis’,
International Journal of Project Management 26, 2004.
5. Lu, You Jie, Wang, Qing S, Project Management in China,
Southeast Asia Construction, pp. 158-163, Issue Sept/Oct 2004.
6. Crawford K., Project Management Maturity Model, Center
for Business Practice, 2nd Edition, 2006.
7. Dinsmore P., Cabanis – Brewin J., Handbook of Project
Management, AMA, 2006.
8. Price M., Zerby J., Deguire M., Cable J., The Global
State of Project Management Education and Training, PM
Global Congress Toronto, Published on Thursday, January
26, 2006.
9. Crawford L, Morris P, Thomas J, Winter M. Practitioner
development: from trained technicians to reflective
practitioners. International Journal of Project
Management, 2006.
239
10. Kumar M., ‘The Importance of Project Management in
Organizations’, Oct 29, 2007.
11. Thomas J. and Mengel T., ‘Preparing Project Managers
to deal with Complexity – Advanced Project Management
Education’, International Journal of Project Management
26, pp. 304-315, 2008.
12. Berggren C. and Soderlund J., ‘Rethinking project
management education: Social twists and knowledge co-
production’, International Journal of Project Management
26, pp. 286-296, 2008.
13. Thomas J., Mullaly M., Researching the Value of
Project Management Project Management, Conference Paper,
Warsaw, Poland, July 14, 2008.
14. Thomas J., Mullaly M., Researching the Value of
Project Management Project Management, Conference Paper,
Warsaw, Poland, July 14, 2008.
15. Anbari F., Young H, Analyzing project management
research: Perspectives from Top Management Journals,
International Journal of Project Management, Vol. 27
(2009) 435–446.
16. Pells D, Project Management as a National
Competence- How Modern Program & Project Management can
Strengthen Organizations, Industries and Economies, Vol
XI, Issue III, PM World Today March 2009.
17. Eleventh Five Year Plan Document Chapter-wise
2007-12,
240
http://www.planningcommission.nic.in/plans/planrel/fiveyr
/welcome.html; Accessed on June 25, 2010.
18. Project Implementation Status Report, Ministry of
Statistics and Programme Implementation
http://mospi.gov.in/mospi_pi_status_report.htm
19. Private Sector to contribute $ 500 billion for infra
in 12th Plan, 29 Mar 2010
http://economictimes.indiatimes.com/news; Accessed on
June 25, 2010
20. PMI to Focus on India and Develop Education
Programmes suited to Indian Industry, May 7, 2006,
http://www.pminorthindia.org/newsRoom_default.asp
21. Continuing Certification Requirements System,
https://ccrs.pmi.org/Search.aspx; Accessed on September
2010.
22. MOSPI Press Release, Government of India (Ministry
of Statistics & Program Implementation) is organizing a
National Consultative Meet on Wednesday, June 23, 2010,
at Vigyan Bhavan, New Delhi.
23. Wheatley M., The Importance of Project Management,
Project Smart, 4/4/2005
http://www.projectsmart.co.uk/the-importance-of-project-
management.html, accessed on 12/6/2010.
24. http://www.pmi.org/AboutUs/Pages/FactSheet.aspx
241

25. http://www.pmi.org/PDF/PM2025_TOCPreface_FINAL.pdf
26. http://www.articlesbase.com/leadership-articles/the-
importance-of-project-management-in-organizations-
246928.html, accessed on 12/6/2010
27. Guidelines for India Infrastructure Project
Development Fund, GoI, 2008,
http://www.urbanindia.nic.in/programme/uwss/Guideline_Sch
eme_IIPDF.pdf
28. Thom W., The Advantages of the Project Management
Process, 11th March, 2009,
http://www.projectsmart.co.uk/the-corporate-advantages-
of-a-project-management-process.html
29. http://www.allpm.com/modules.php?
op=modload&name=News&file=article&sid=1479&mode=thread&or
der=0&thold=0
30. Cleland D., and Bopaya B., Project Management Circa
2025, PMI, ISBN: 978-1-933890-96-8 2009,
http://www.pmi.org/PDF/PM2025_TOCPreface_FINAL.pdf
31. Virzi A. M., Project Managers Surge, in Number and
Stature"
Baseline, March 28, 2007 North Western University –
Distance Learning Course in PM,
http://www.scs.northwestern.edu/pdp/npdp/projectmanagemen
t/
242
32. http://www.projectsmart.co.uk/pdf/brief-history-of-
project-management.pdf
33. Pemberton-Pigott J, India Infrastructure Forum 2010
Tuesday, February 02, 2010 from 9:00 AM - 7:00 PM (GMT)
London, Greater London http://iif2010.eventbrite.com/
34. http://planningcommission.nic.in/data/dataf.htm
35. http://planningcommission.nic.in/plans/planrel/
plansf.htm
36. Unni Krishnan, Santosh Kumar, India Plans $11
Billion Road Fund to Narrow China Gap May 14, 2010 08:17 EDT
http://www.bloomberg.com/apps/news?
pid=20601087&sid=aH5i3F2s4wb4
37. Sinha O., Govt mulls new panel on infra funding,
Government mulls new panel on infrastructure spending,
May 13, 2010, New Delhi,
http://beta.profit.ndtv.com/news/show/govt-mulls-new-
panel-on-infra-funding-43191?cp
38. http://www.spjimr.org/
39. List of Approved Post Graduate Education and Research
institutions upto 30th September, 2004 (M.E/M.Tech)
http://www.aicte.ernet.in/ApprovedInstitute.htm
40. http://en.wikipedia.org/wiki/
Industrial_training_institute
243
41. Gasskov, ILO Report,
http://www.oitcinterfor.org/public/english/region/ampro/c
interfor/news/gasskov.pdf
42. Syllabus for the Trade of Mechanical (Electrical
Power Drives), under Apprencticeship Training Scheme,
GoI, Ministry of Labour and Employment, DG E&T,
http://dget.nic.in/lisdapp/Trade/syllabus/pdf/TTMEP.pdf,
website accessed on 8th Jun, 2010.
43. Michael Hatfield, PMP, on March 3, 2010 1:21 PM
http://blogs.pmi.org/blog/voices_on_project_management/pr
oject-failure/
44. http://www.iimcal.ac.in/faculty/courses.asp?
FacultyGroupID=11
45. http://www.c2clive.com/latestnewsdetail.php?id=803
46. Feuss W., Harmon J., Wirtenberg J., Wides J., The
Journal of Cost Management, January/February 2004,
Vol.18, No.1
www.jeanawirtenbergandassoc.com/uploads/Linkagespart1.pdf
47. Prayag A., Training India Inc Copyright © 2006, The
Hindu Business Line
http://www.thehindubusinessline.com/manager/2006/10/09/st
ories/2006100900771000.htm
48. http://www.infosys.com/investors/reports-filings/
annual- report/annual/Documents/AR-2005/start.htm
244
http://www.infosys.com/investors/reports-filings/annual-%20report/annual/Documents/AR-2005/start.htm
49. www.infosys.com/.../reports-filings/annual-report/
annual/.../Infosys-AR-09.pdf
50. Personal Discussions (PD) / Telephonic Discussion
(TD)
a) Purandare Hemant DGM Training, (June 12, 2010), 10.30
am, PD
b) Alok Kesari Sr. Assistant Director, (July 16, 2010),
3.10 pm PD
c) Mr. Jayachandran, General Manager HR, Gammon India
(July 21, 2010), Time: 2.45 pm, TD
d) Mr. Pramod Mishra, Sr. Manager HR & Training, Simplex,
TD (July 21, 2010), 6.30 pm,
51. India emerging to surging Report, McKinsey Quarterly
Country Reports, Archives
http://www.mckinseyquarterly.com/Economic_Studies/Country
_ReportsTD
52. India’s Urban Awakening: Building Inclusive Cities,
and Sustaining Economic Growth, Report Copyright McKinsey
and Company® 2010.
53. Andrews E., Key Aspects of Project Management,
Presentation delivered to Students and Faculty of NICMAR,
Pune, on 2/12/09, 10.30 am to 1.00 pm.
245

ANNEXURE 1
A. List Of Respondents Participating In Institutional Survey
Sr.No.
Name of TheInstitute City Respondents
Details Designation
1 JaypeeInstitute ofInformation
Noida Samir Dev Gupta AssociateDean
246
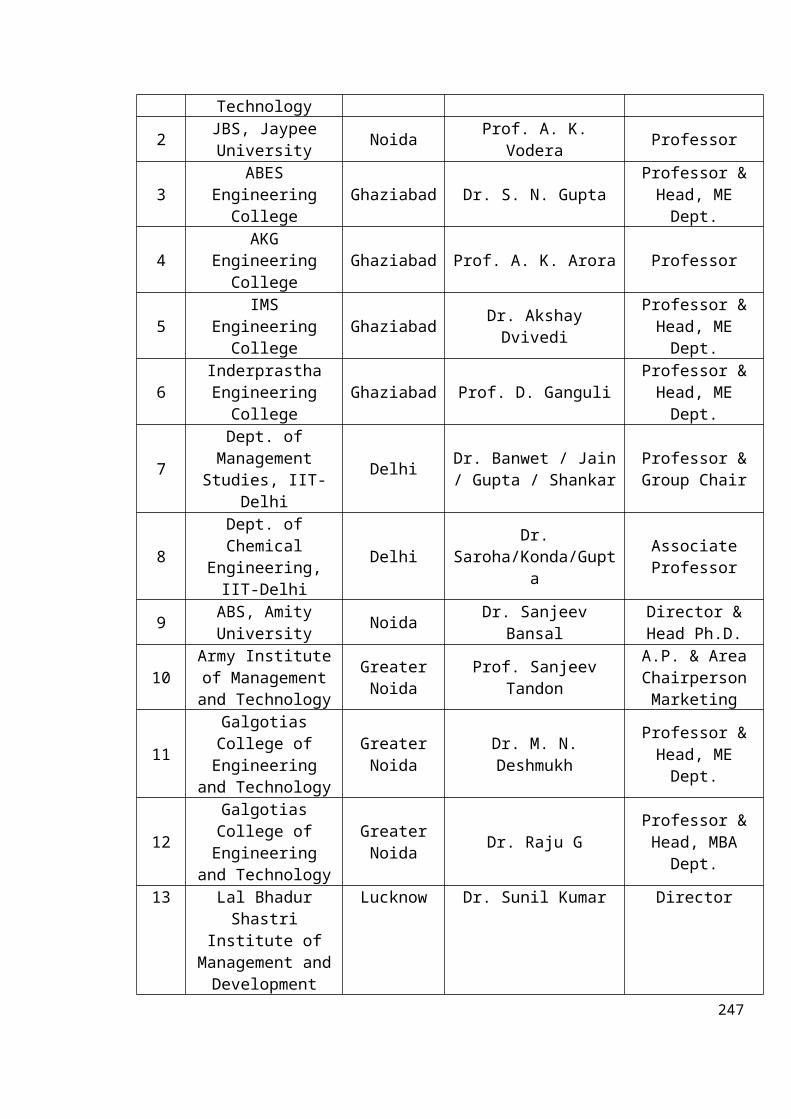
Technology
2 JBS, JaypeeUniversity Noida Prof. A. K.
Vodera Professor
3ABES
EngineeringCollege
Ghaziabad Dr. S. N. GuptaProfessor &Head, MEDept.
4AKG
EngineeringCollege
Ghaziabad Prof. A. K. Arora Professor
5IMS
EngineeringCollege
Ghaziabad Dr. AkshayDvivedi
Professor &Head, MEDept.
6InderprasthaEngineering
CollegeGhaziabad Prof. D. Ganguli
Professor &Head, MEDept.
7
Dept. ofManagement
Studies, IIT-Delhi
Delhi Dr. Banwet / Jain/ Gupta / Shankar
Professor &Group Chair
8
Dept. ofChemical
Engineering,IIT-Delhi
DelhiDr.
Saroha/Konda/Gupta
AssociateProfessor
9 ABS, AmityUniversity Noida Dr. Sanjeev
BansalDirector &Head Ph.D.
10Army Instituteof Managementand Technology
GreaterNoida
Prof. SanjeevTandon
A.P. & AreaChairpersonMarketing
11
GalgotiasCollege ofEngineering
and Technology
GreaterNoida
Dr. M. N.Deshmukh
Professor &Head, MEDept.
12
GalgotiasCollege ofEngineering
and Technology
GreaterNoida Dr. Raju G
Professor &Head, MBADept.
13 Lal BhadurShastri
Institute ofManagement andDevelopment
Lucknow Dr. Sunil Kumar Director
247
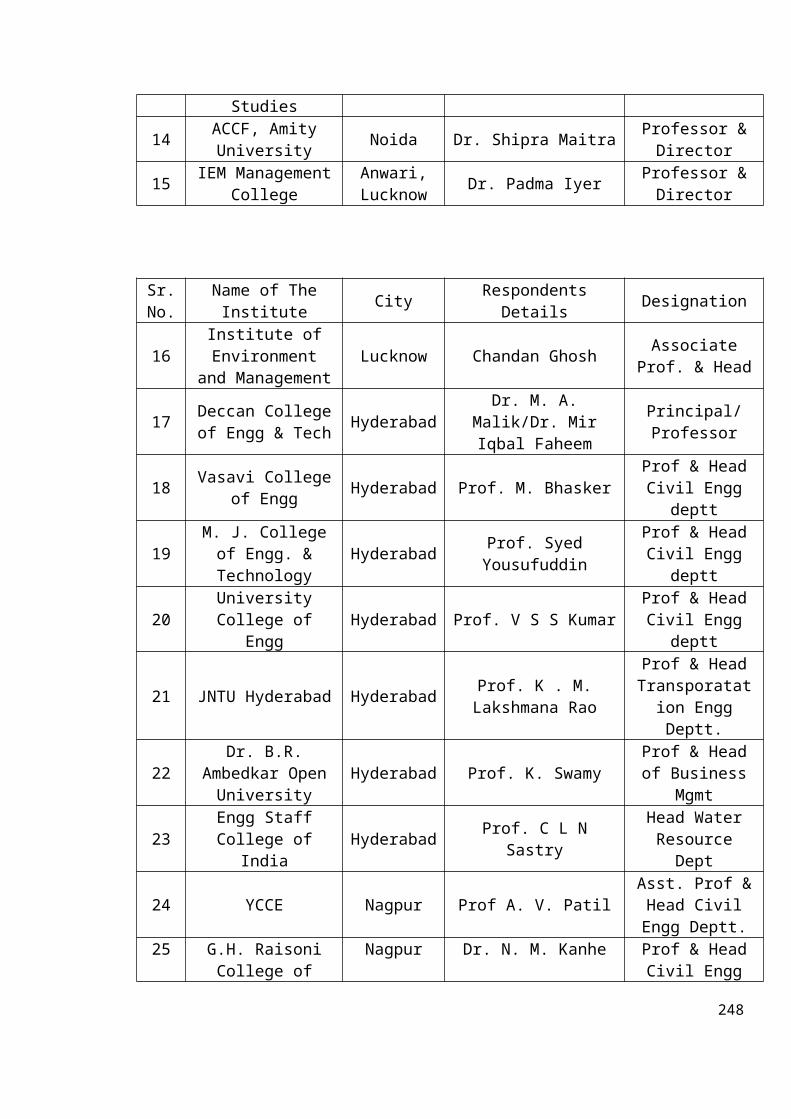
Studies
14 ACCF, AmityUniversity Noida Dr. Shipra Maitra Professor &
Director
15 IEM ManagementCollege
Anwari,Lucknow Dr. Padma Iyer Professor &
Director
Sr.No.
Name of TheInstitute City Respondents
Details Designation
16Institute ofEnvironment
and Management Lucknow Chandan Ghosh Associate
Prof. & Head
17 Deccan Collegeof Engg & Tech Hyderabad
Dr. M. A.Malik/Dr. MirIqbal Faheem
Principal/Professor
18 Vasavi Collegeof Engg Hyderabad Prof. M. Bhasker
Prof & HeadCivil Engg
deptt
19M. J. Collegeof Engg. &Technology
Hyderabad Prof. SyedYousufuddin
Prof & HeadCivil Engg
deptt
20UniversityCollege of
EnggHyderabad Prof. V S S Kumar
Prof & HeadCivil Engg
deptt
21 JNTU Hyderabad Hyderabad Prof. K . M.Lakshmana Rao
Prof & HeadTransporatat
ion EnggDeptt.
22Dr. B.R.
Ambedkar OpenUniversity
Hyderabad Prof. K. SwamyProf & Headof Business
Mgmt
23Engg StaffCollege of
IndiaHyderabad Prof. C L N
Sastry
Head WaterResourceDept
24 YCCE Nagpur Prof A. V. PatilAsst. Prof &Head CivilEngg Deptt.
25 G.H. RaisoniCollege of
Nagpur Dr. N. M. Kanhe Prof & HeadCivil Engg
248
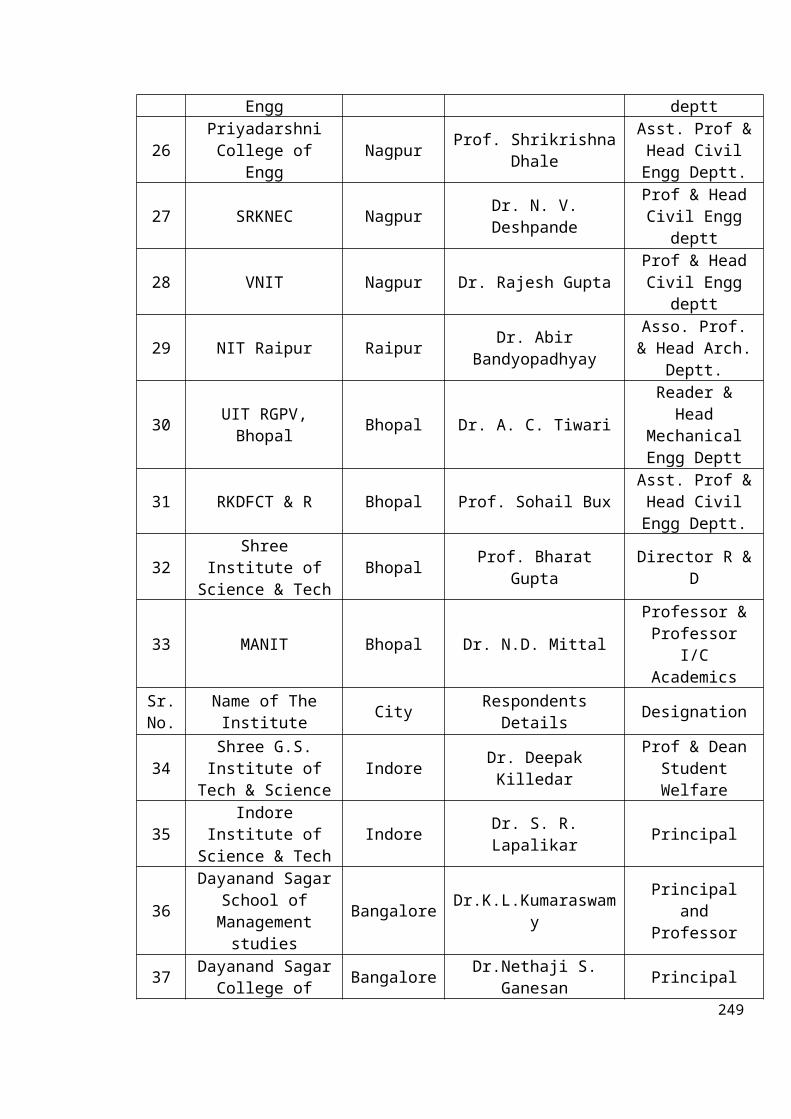
Engg deptt
26PriyadarshniCollege of
EnggNagpur Prof. Shrikrishna
Dhale
Asst. Prof &Head CivilEngg Deptt.
27 SRKNEC Nagpur Dr. N. V.Deshpande
Prof & HeadCivil Engg
deptt
28 VNIT Nagpur Dr. Rajesh GuptaProf & HeadCivil Engg
deptt
29 NIT Raipur Raipur Dr. AbirBandyopadhyay
Asso. Prof.& Head Arch.
Deptt.
30 UIT RGPV,Bhopal Bhopal Dr. A. C. Tiwari
Reader &Head
MechanicalEngg Deptt
31 RKDFCT & R Bhopal Prof. Sohail BuxAsst. Prof &Head CivilEngg Deptt.
32Shree
Institute ofScience & Tech
Bhopal Prof. BharatGupta
Director R &D
33 MANIT Bhopal Dr. N.D. Mittal
Professor &Professor
I/CAcademics
Sr.No.
Name of TheInstitute City Respondents
Details Designation
34Shree G.S.Institute of
Tech & ScienceIndore Dr. Deepak
Killedar
Prof & DeanStudentWelfare
35Indore
Institute ofScience & Tech
Indore Dr. S. R.Lapalikar Principal
36
Dayanand SagarSchool ofManagementstudies
Bangalore Dr.K.L.Kumaraswamy
Principaland
Professor
37 Dayanand SagarCollege of Bangalore Dr.Nethaji S.
Ganesan Principal249
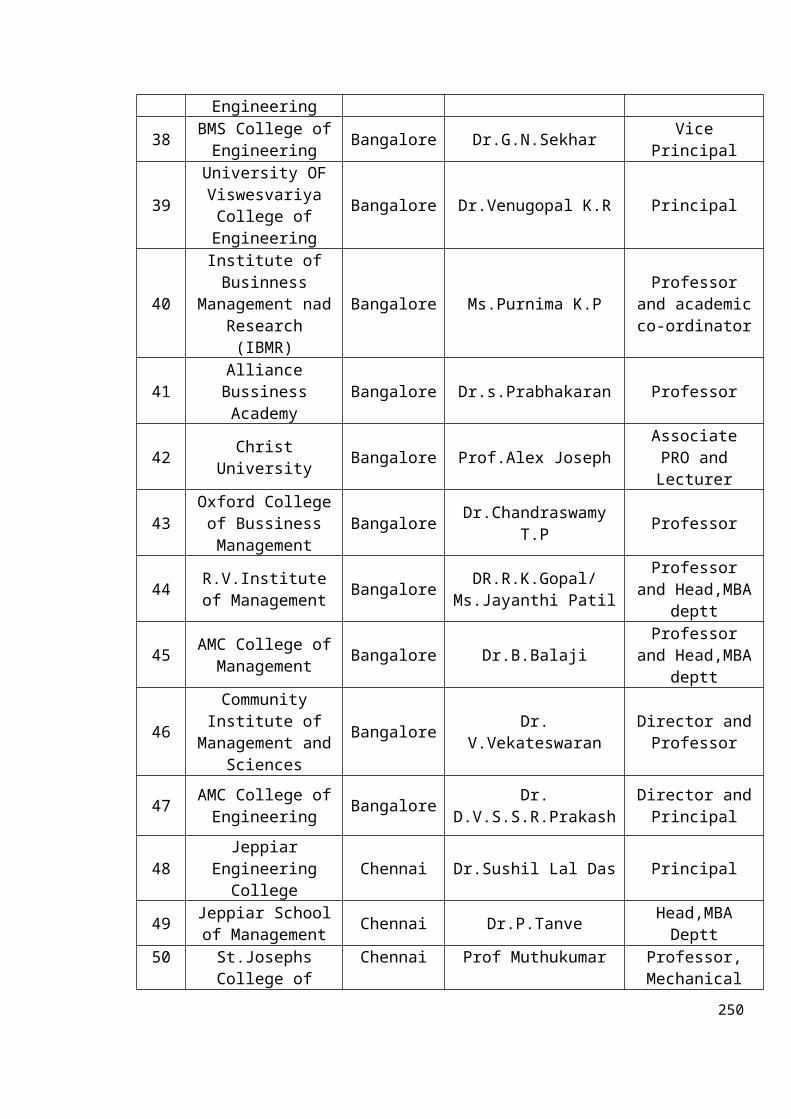
Engineering
38 BMS College ofEngineering Bangalore Dr.G.N.Sekhar Vice
Principal
39
University OFViswesvariyaCollege ofEngineering
Bangalore Dr.Venugopal K.R Principal
40
Institute ofBusinness
Management nadResearch(IBMR)
Bangalore Ms.Purnima K.PProfessor
and academicco-ordinator
41AllianceBussinessAcademy
Bangalore Dr.s.Prabhakaran Professor
42 ChristUniversity Bangalore Prof.Alex Joseph
AssociatePRO andLecturer
43Oxford Collegeof BussinessManagement
Bangalore Dr.ChandraswamyT.P Professor
44 R.V.Instituteof Management Bangalore DR.R.K.Gopal/
Ms.Jayanthi Patil
Professorand Head,MBA
deptt
45 AMC College ofManagement Bangalore Dr.B.Balaji
Professorand Head,MBA
deptt
46
CommunityInstitute of
Management andSciences
Bangalore Dr.V.Vekateswaran
Director andProfessor
47 AMC College ofEngineering Bangalore Dr.
D.V.S.S.R.PrakashDirector andPrincipal
48Jeppiar
EngineeringCollege
Chennai Dr.Sushil Lal Das Principal
49 Jeppiar Schoolof Management Chennai Dr.P.Tanve Head,MBA
Deptt50 St.Josephs
College ofChennai Prof Muthukumar Professor,
Mechanical250
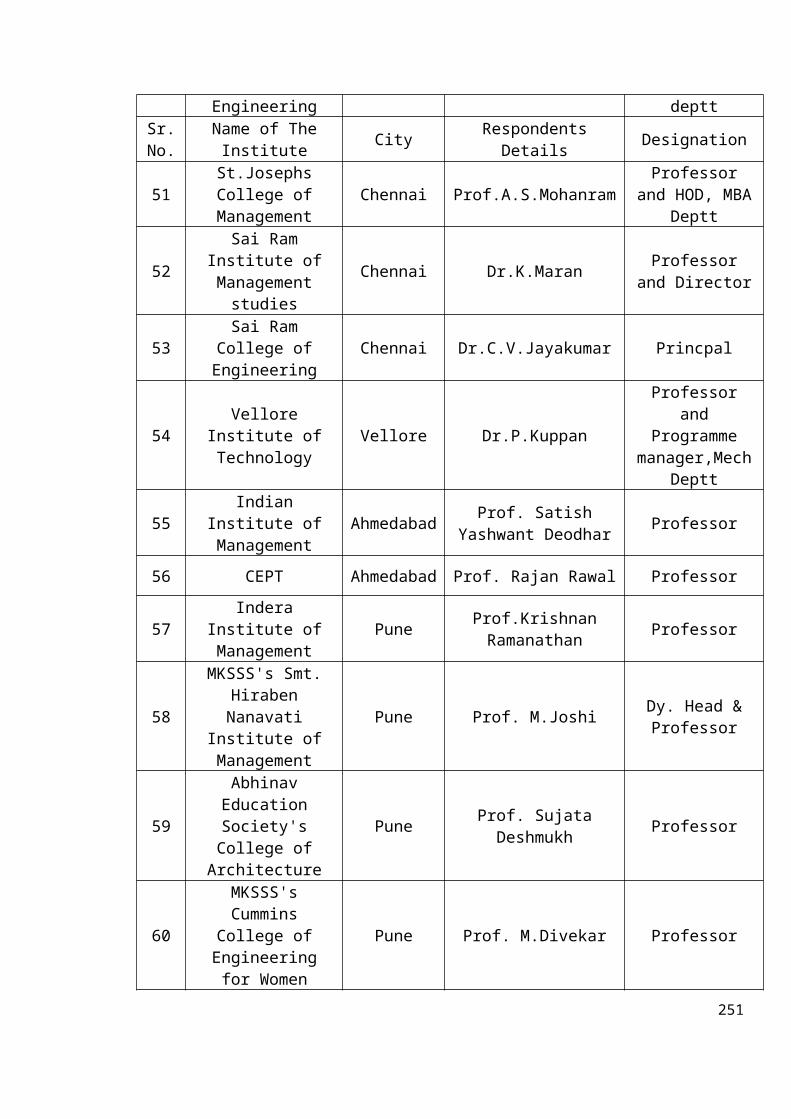
Engineering depttSr.No.
Name of TheInstitute City Respondents
Details Designation
51St.JosephsCollege ofManagement
Chennai Prof.A.S.MohanramProfessor
and HOD, MBADeptt
52
Sai RamInstitute ofManagementstudies
Chennai Dr.K.Maran Professorand Director
53Sai Ram
College ofEngineering
Chennai Dr.C.V.Jayakumar Princpal
54Vellore
Institute ofTechnology
Vellore Dr.P.Kuppan
Professorand
Programmemanager,Mech
Deptt
55Indian
Institute ofManagement
Ahmedabad Prof. SatishYashwant Deodhar Professor
56 CEPT Ahmedabad Prof. Rajan Rawal Professor
57Indera
Institute ofManagement
Pune Prof.KrishnanRamanathan Professor
58
MKSSS's Smt.HirabenNanavati
Institute ofManagement
Pune Prof. M.Joshi Dy. Head &Professor
59
AbhinavEducationSociety'sCollege ofArchitecture
Pune Prof. SujataDeshmukh Professor
60
MKSSS'sCummins
College ofEngineeringfor Women
Pune Prof. M.Divekar Professor
251
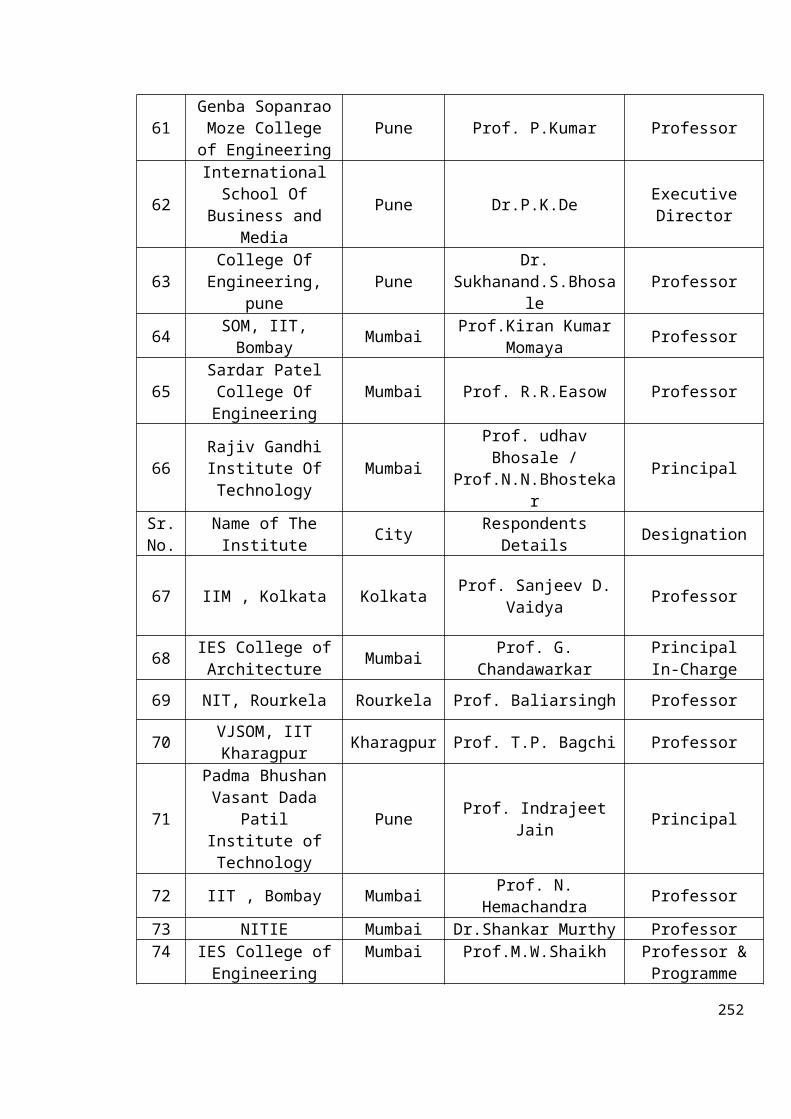
61Genba SopanraoMoze College
of EngineeringPune Prof. P.Kumar Professor
62
InternationalSchool Of
Business andMedia
Pune Dr.P.K.De ExecutiveDirector
63College OfEngineering,
punePune
Dr.Sukhanand.S.Bhosa
leProfessor
64 SOM, IIT,Bombay Mumbai Prof.Kiran Kumar
Momaya Professor
65Sardar PatelCollege OfEngineering
Mumbai Prof. R.R.Easow Professor
66Rajiv GandhiInstitute OfTechnology
Mumbai
Prof. udhavBhosale /
Prof.N.N.Bhostekar
Principal
Sr.No.
Name of TheInstitute City Respondents
Details Designation
67 IIM , Kolkata Kolkata Prof. Sanjeev D.Vaidya Professor
68 IES College ofArchitecture Mumbai Prof. G.
ChandawarkarPrincipalIn-Charge
69 NIT, Rourkela Rourkela Prof. Baliarsingh Professor
70 VJSOM, IITKharagpur Kharagpur Prof. T.P. Bagchi Professor
71
Padma BhushanVasant Dada
PatilInstitute ofTechnology
Pune Prof. IndrajeetJain Principal
72 IIT , Bombay Mumbai Prof. N.Hemachandra Professor
73 NITIE Mumbai Dr.Shankar Murthy Professor74 IES College of
EngineeringMumbai Prof.M.W.Shaikh Professor &
Programme
252
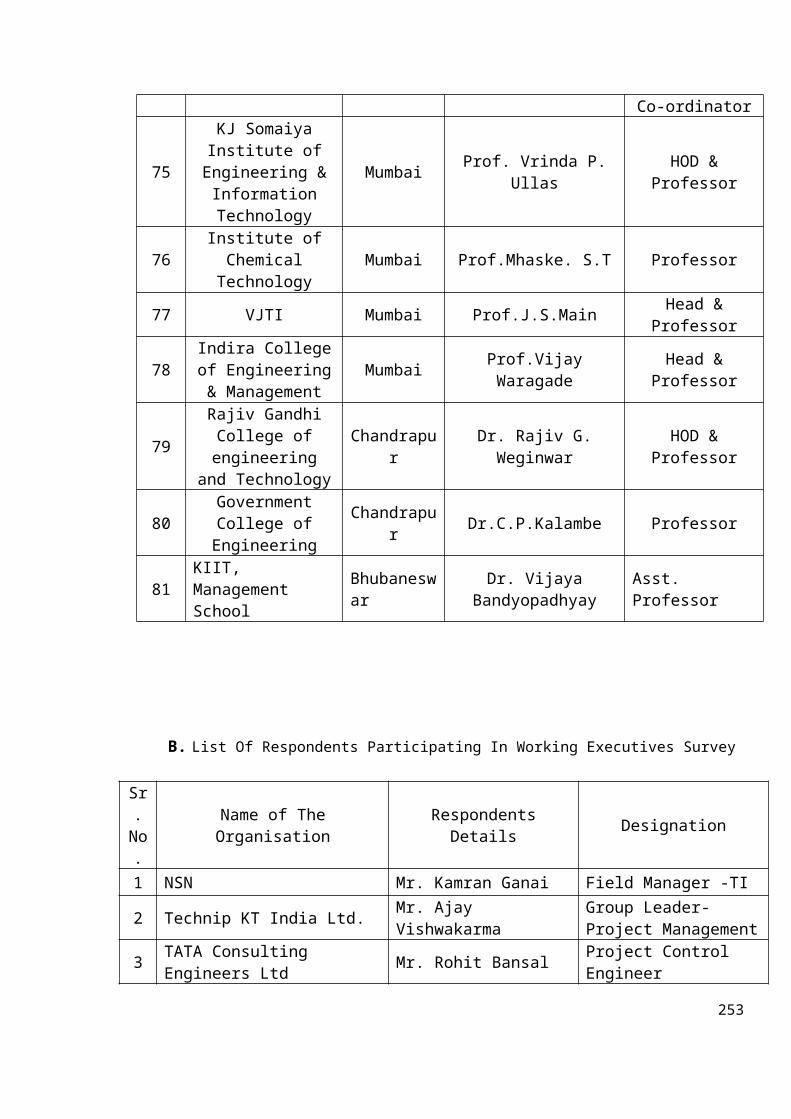
Co-ordinator
75
KJ SomaiyaInstitute ofEngineering &InformationTechnology
Mumbai Prof. Vrinda P.Ullas
HOD &Professor
76Institute ofChemicalTechnology
Mumbai Prof.Mhaske. S.T Professor
77 VJTI Mumbai Prof.J.S.Main Head &Professor
78Indira Collegeof Engineering& Management
Mumbai Prof.VijayWaragade
Head &Professor
79
Rajiv GandhiCollege ofengineering
and Technology
Chandrapur
Dr. Rajiv G.Weginwar
HOD &Professor
80GovernmentCollege ofEngineering
Chandrapur Dr.C.P.Kalambe Professor
81KIIT, Management School
Bhubaneswar
Dr. VijayaBandyopadhyay
Asst. Professor
B. List Of Respondents Participating In Working Executives Survey
Sr.No.
Name of TheOrganisation
RespondentsDetails Designation
1 NSN Mr. Kamran Ganai Field Manager -TI
2 Technip KT India Ltd. Mr. Ajay Vishwakarma
Group Leader- Project Management
3 TATA Consulting Engineers Ltd Mr. Rohit Bansal Project Control
Engineer
253
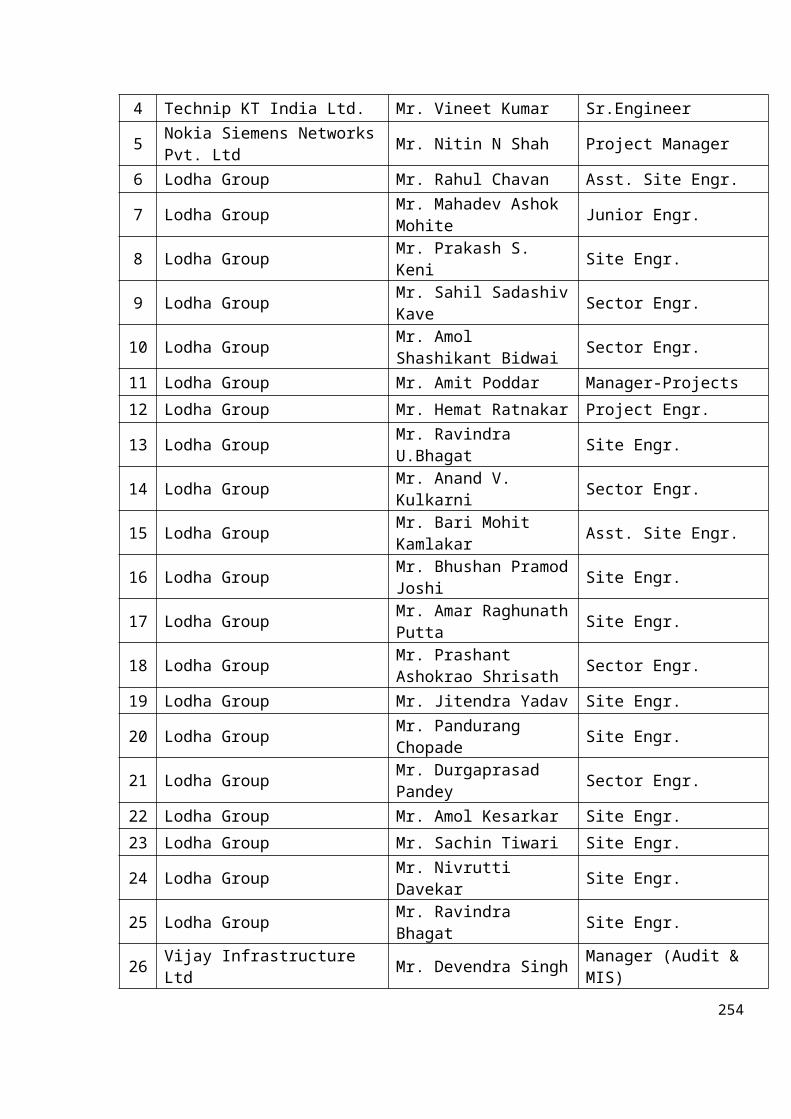
4 Technip KT India Ltd. Mr. Vineet Kumar Sr.Engineer
5 Nokia Siemens NetworksPvt. Ltd Mr. Nitin N Shah Project Manager
6 Lodha Group Mr. Rahul Chavan Asst. Site Engr.
7 Lodha Group Mr. Mahadev Ashok Mohite Junior Engr.
8 Lodha Group Mr. Prakash S. Keni Site Engr.
9 Lodha Group Mr. Sahil SadashivKave Sector Engr.
10 Lodha Group Mr. Amol Shashikant Bidwai Sector Engr.
11 Lodha Group Mr. Amit Poddar Manager-Projects12 Lodha Group Mr. Hemat Ratnakar Project Engr.
13 Lodha Group Mr. Ravindra U.Bhagat Site Engr.
14 Lodha Group Mr. Anand V. Kulkarni Sector Engr.
15 Lodha Group Mr. Bari Mohit Kamlakar Asst. Site Engr.
16 Lodha Group Mr. Bhushan PramodJoshi Site Engr.
17 Lodha Group Mr. Amar RaghunathPutta Site Engr.
18 Lodha Group Mr. Prashant Ashokrao Shrisath Sector Engr.
19 Lodha Group Mr. Jitendra Yadav Site Engr.
20 Lodha Group Mr. Pandurang Chopade Site Engr.
21 Lodha Group Mr. Durgaprasad Pandey Sector Engr.
22 Lodha Group Mr. Amol Kesarkar Site Engr.23 Lodha Group Mr. Sachin Tiwari Site Engr.
24 Lodha Group Mr. Nivrutti Davekar Site Engr.
25 Lodha Group Mr. Ravindra Bhagat Site Engr.
26 Vijay Infrastructure Ltd Mr. Devendra Singh Manager (Audit &
MIS)254
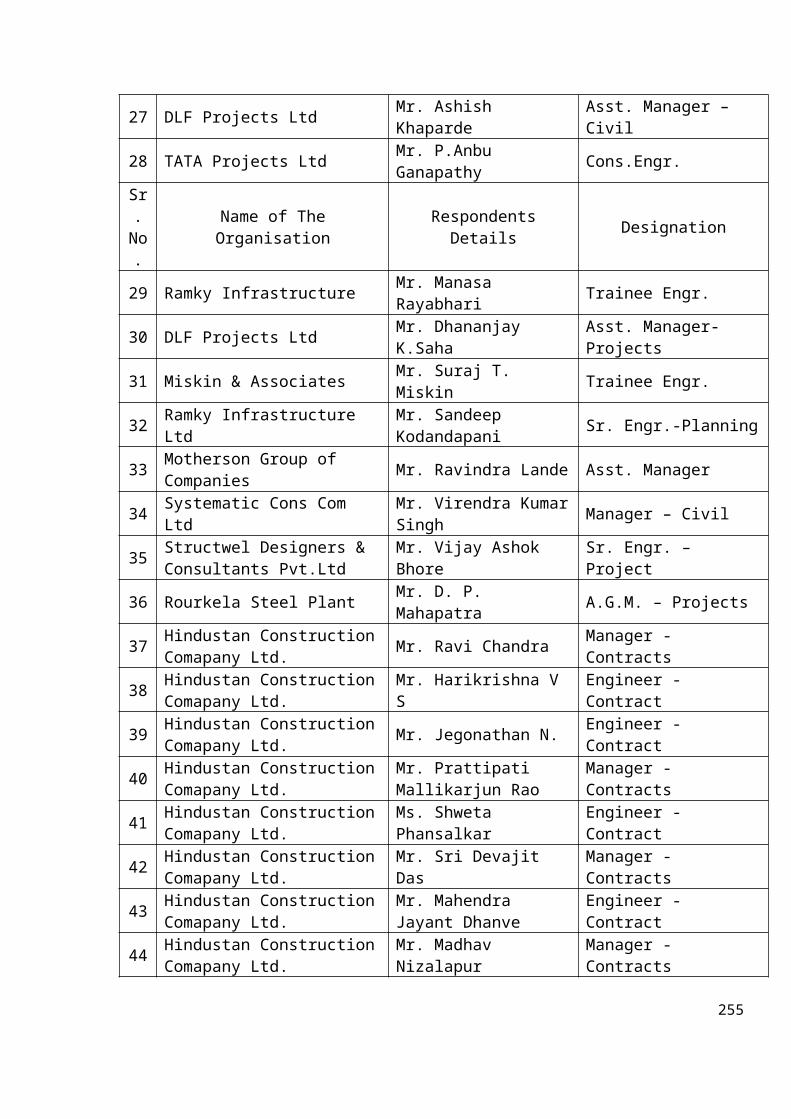
27 DLF Projects Ltd Mr. Ashish Khaparde
Asst. Manager – Civil
28 TATA Projects Ltd Mr. P.Anbu Ganapathy Cons.Engr.
Sr.No.
Name of TheOrganisation
RespondentsDetails Designation
29 Ramky Infrastructure Mr. Manasa Rayabhari Trainee Engr.
30 DLF Projects Ltd Mr. Dhananjay K.Saha
Asst. Manager-Projects
31 Miskin & Associates Mr. Suraj T. Miskin Trainee Engr.
32 Ramky Infrastructure Ltd
Mr. Sandeep Kodandapani Sr. Engr.-Planning
33 Motherson Group of Companies Mr. Ravindra Lande Asst. Manager
34 Systematic Cons Com Ltd
Mr. Virendra KumarSingh Manager – Civil
35 Structwel Designers & Consultants Pvt.Ltd
Mr. Vijay Ashok Bhore
Sr. Engr. – Project
36 Rourkela Steel Plant Mr. D. P. Mahapatra A.G.M. – Projects
37 Hindustan ConstructionComapany Ltd. Mr. Ravi Chandra Manager -
Contracts
38 Hindustan ConstructionComapany Ltd.
Mr. Harikrishna V S
Engineer - Contract
39 Hindustan ConstructionComapany Ltd. Mr. Jegonathan N. Engineer -
Contract
40 Hindustan ConstructionComapany Ltd.
Mr. Prattipati Mallikarjun Rao
Manager - Contracts
41 Hindustan ConstructionComapany Ltd.
Ms. Shweta Phansalkar
Engineer - Contract
42 Hindustan ConstructionComapany Ltd.
Mr. Sri Devajit Das
Manager - Contracts
43 Hindustan ConstructionComapany Ltd.
Mr. Mahendra Jayant Dhanve
Engineer - Contract
44 Hindustan ConstructionComapany Ltd.
Mr. Madhav Nizalapur
Manager - Contracts
255
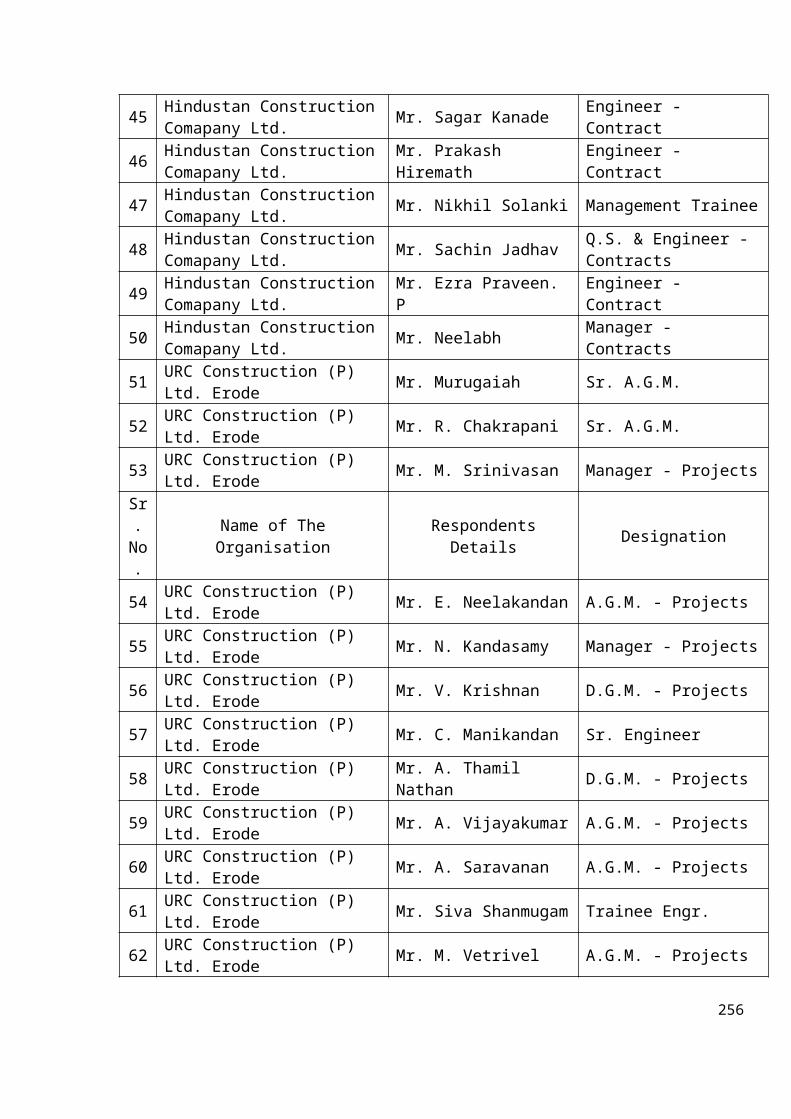
45 Hindustan ConstructionComapany Ltd. Mr. Sagar Kanade Engineer -
Contract
46 Hindustan ConstructionComapany Ltd.
Mr. Prakash Hiremath
Engineer - Contract
47 Hindustan ConstructionComapany Ltd. Mr. Nikhil Solanki Management Trainee
48 Hindustan ConstructionComapany Ltd. Mr. Sachin Jadhav Q.S. & Engineer -
Contracts
49 Hindustan ConstructionComapany Ltd.
Mr. Ezra Praveen. P
Engineer - Contract
50 Hindustan ConstructionComapany Ltd. Mr. Neelabh Manager -
Contracts
51 URC Construction (P) Ltd. Erode Mr. Murugaiah Sr. A.G.M.
52 URC Construction (P) Ltd. Erode Mr. R. Chakrapani Sr. A.G.M.
53 URC Construction (P) Ltd. Erode Mr. M. Srinivasan Manager - Projects
Sr.No.
Name of TheOrganisation
RespondentsDetails Designation
54 URC Construction (P) Ltd. Erode Mr. E. Neelakandan A.G.M. - Projects
55 URC Construction (P) Ltd. Erode Mr. N. Kandasamy Manager - Projects
56 URC Construction (P) Ltd. Erode Mr. V. Krishnan D.G.M. - Projects
57 URC Construction (P) Ltd. Erode Mr. C. Manikandan Sr. Engineer
58 URC Construction (P) Ltd. Erode
Mr. A. Thamil Nathan D.G.M. - Projects
59 URC Construction (P) Ltd. Erode Mr. A. Vijayakumar A.G.M. - Projects
60 URC Construction (P) Ltd. Erode Mr. A. Saravanan A.G.M. - Projects
61 URC Construction (P) Ltd. Erode Mr. Siva Shanmugam Trainee Engr.
62 URC Construction (P) Ltd. Erode Mr. M. Vetrivel A.G.M. - Projects
256
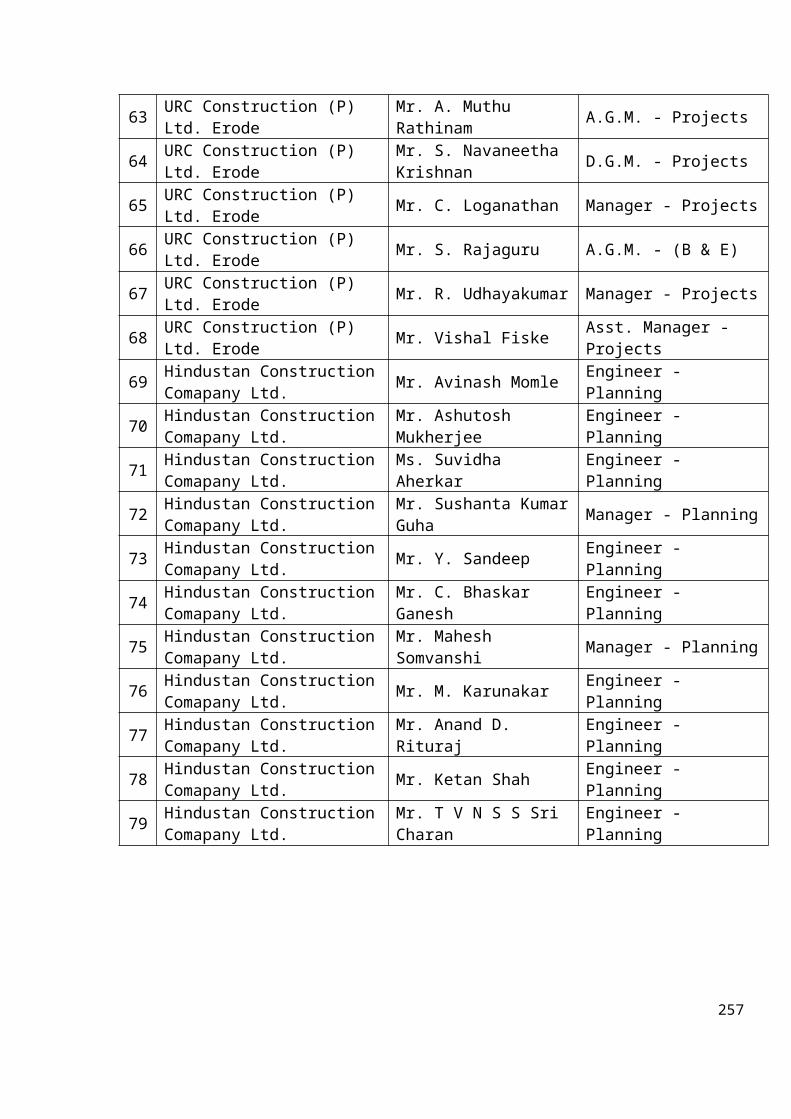
63 URC Construction (P) Ltd. Erode
Mr. A. Muthu Rathinam A.G.M. - Projects
64 URC Construction (P) Ltd. Erode
Mr. S. Navaneetha Krishnan D.G.M. - Projects
65 URC Construction (P) Ltd. Erode Mr. C. Loganathan Manager - Projects
66 URC Construction (P) Ltd. Erode Mr. S. Rajaguru A.G.M. - (B & E)
67 URC Construction (P) Ltd. Erode Mr. R. Udhayakumar Manager - Projects
68 URC Construction (P) Ltd. Erode Mr. Vishal Fiske Asst. Manager -
Projects
69 Hindustan ConstructionComapany Ltd. Mr. Avinash Momle Engineer -
Planning
70 Hindustan ConstructionComapany Ltd.
Mr. Ashutosh Mukherjee
Engineer - Planning
71 Hindustan ConstructionComapany Ltd.
Ms. Suvidha Aherkar
Engineer - Planning
72 Hindustan ConstructionComapany Ltd.
Mr. Sushanta KumarGuha Manager - Planning
73 Hindustan ConstructionComapany Ltd. Mr. Y. Sandeep Engineer -
Planning
74 Hindustan ConstructionComapany Ltd.
Mr. C. Bhaskar Ganesh
Engineer - Planning
75 Hindustan ConstructionComapany Ltd.
Mr. Mahesh Somvanshi Manager - Planning
76 Hindustan ConstructionComapany Ltd. Mr. M. Karunakar Engineer -
Planning
77 Hindustan ConstructionComapany Ltd.
Mr. Anand D. Rituraj
Engineer - Planning
78 Hindustan ConstructionComapany Ltd. Mr. Ketan Shah Engineer -
Planning
79 Hindustan ConstructionComapany Ltd.
Mr. T V N S S Sri Charan
Engineer - Planning
257
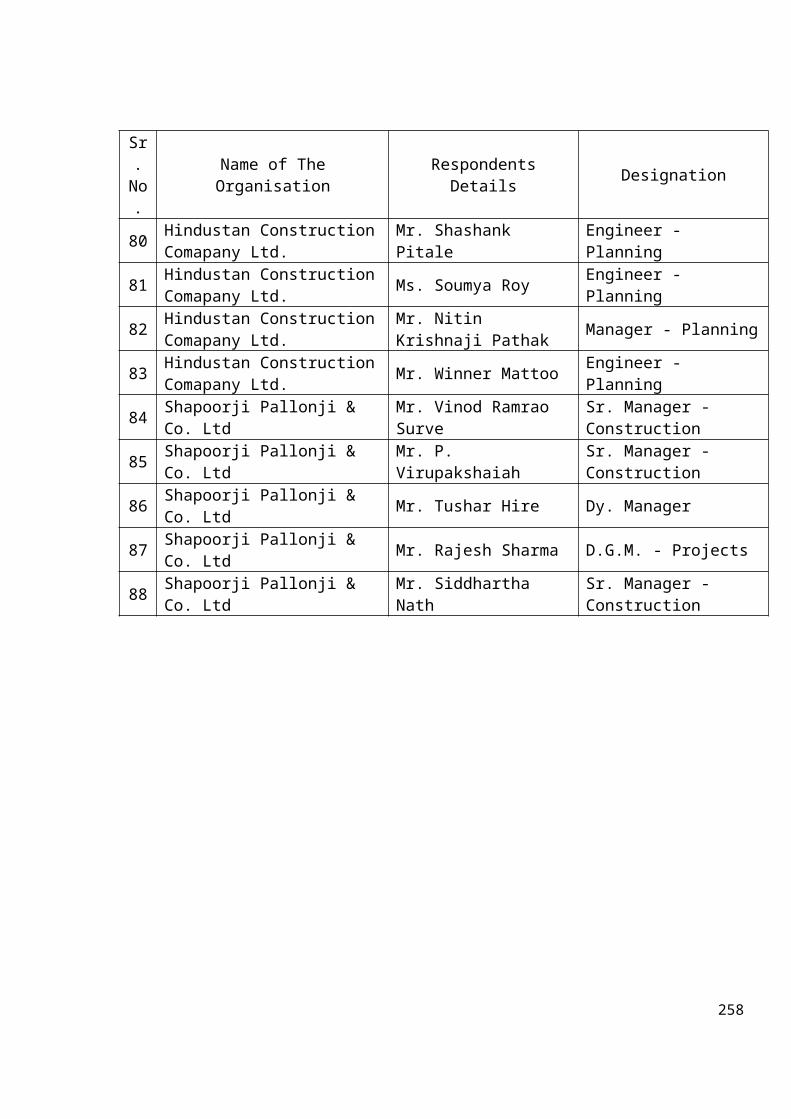
Sr.No.
Name of TheOrganisation
RespondentsDetails Designation
80 Hindustan ConstructionComapany Ltd.
Mr. Shashank Pitale
Engineer - Planning
81 Hindustan ConstructionComapany Ltd. Ms. Soumya Roy Engineer -
Planning
82 Hindustan ConstructionComapany Ltd.
Mr. Nitin Krishnaji Pathak Manager - Planning
83 Hindustan ConstructionComapany Ltd. Mr. Winner Mattoo Engineer -
Planning
84 Shapoorji Pallonji & Co. Ltd
Mr. Vinod Ramrao Surve
Sr. Manager - Construction
85 Shapoorji Pallonji & Co. Ltd
Mr. P. Virupakshaiah
Sr. Manager - Construction
86 Shapoorji Pallonji & Co. Ltd Mr. Tushar Hire Dy. Manager
87 Shapoorji Pallonji & Co. Ltd Mr. Rajesh Sharma D.G.M. - Projects
88 Shapoorji Pallonji & Co. Ltd
Mr. Siddhartha Nath
Sr. Manager - Construction
258
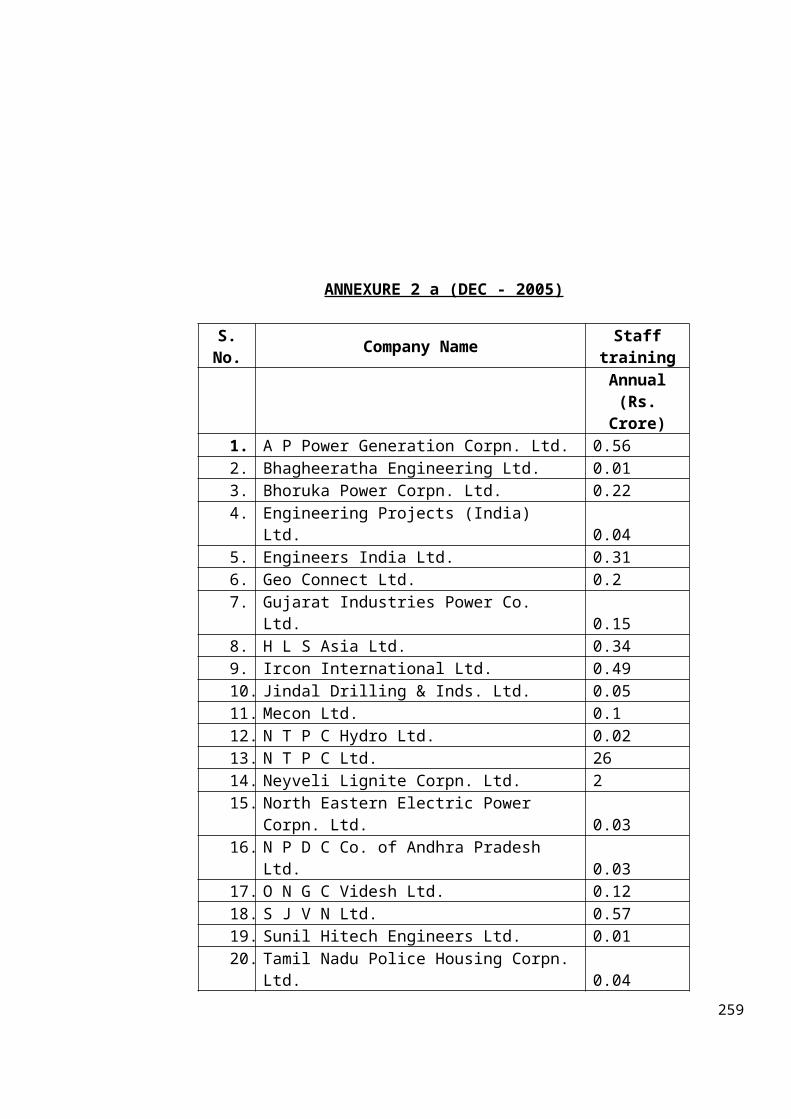
ANNEXURE 2 a (DEC - 2005)
S.No. Company Name Staff
trainingAnnual(Rs.Crore)
1. A P Power Generation Corpn. Ltd. 0.562. Bhagheeratha Engineering Ltd. 0.013. Bhoruka Power Corpn. Ltd. 0.224. Engineering Projects (India)
Ltd. 0.045. Engineers India Ltd. 0.316. Geo Connect Ltd. 0.27. Gujarat Industries Power Co.
Ltd. 0.158. H L S Asia Ltd. 0.349. Ircon International Ltd. 0.4910. Jindal Drilling & Inds. Ltd. 0.0511. Mecon Ltd. 0.112. N T P C Hydro Ltd. 0.0213. N T P C Ltd. 2614. Neyveli Lignite Corpn. Ltd. 215. North Eastern Electric Power
Corpn. Ltd. 0.0316. N P D C Co. of Andhra Pradesh
Ltd. 0.0317. O N G C Videsh Ltd. 0.1218. S J V N Ltd. 0.5719. Sunil Hitech Engineers Ltd. 0.0120. Tamil Nadu Police Housing Corpn.
Ltd. 0.04259
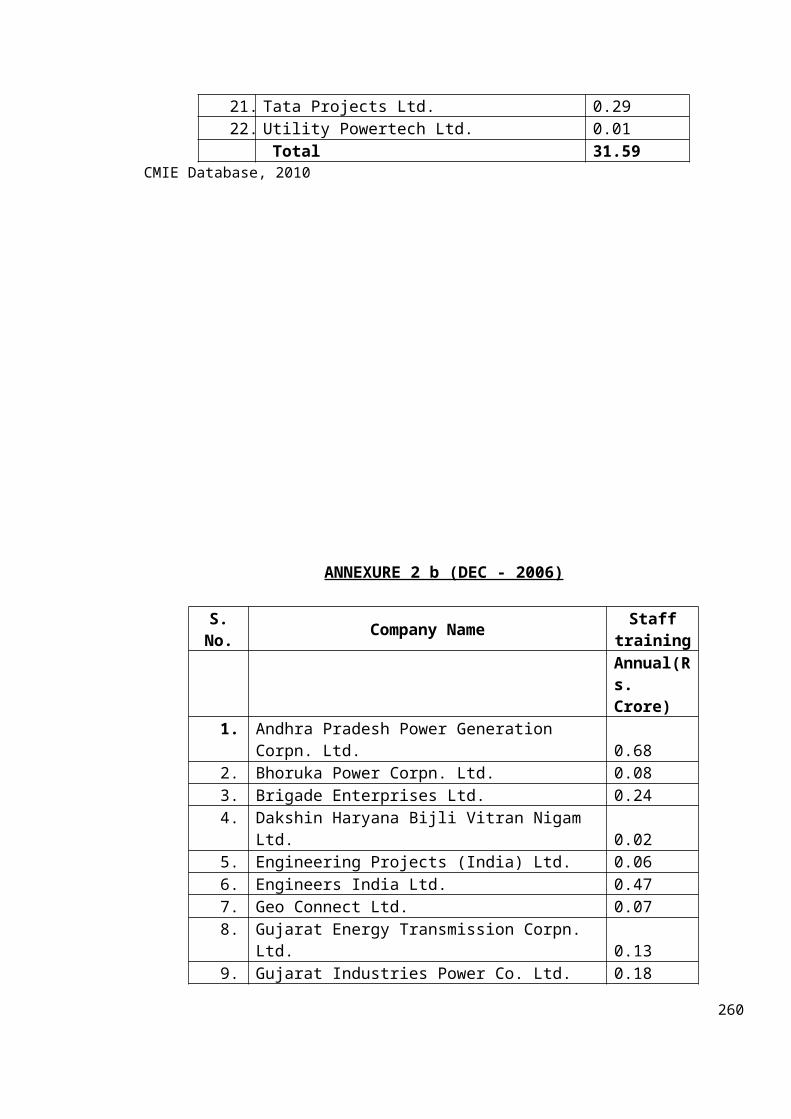
21. Tata Projects Ltd. 0.2922. Utility Powertech Ltd. 0.01
Total 31.59CMIE Database, 2010
ANNEXURE 2 b (DEC - 2006)
S.No. Company Name Staff
training
Annual(Rs. Crore)
1. Andhra Pradesh Power Generation Corpn. Ltd. 0.68
2. Bhoruka Power Corpn. Ltd. 0.083. Brigade Enterprises Ltd. 0.244. Dakshin Haryana Bijli Vitran Nigam
Ltd. 0.025. Engineering Projects (India) Ltd. 0.066. Engineers India Ltd. 0.477. Geo Connect Ltd. 0.078. Gujarat Energy Transmission Corpn.
Ltd. 0.139. Gujarat Industries Power Co. Ltd. 0.18
260
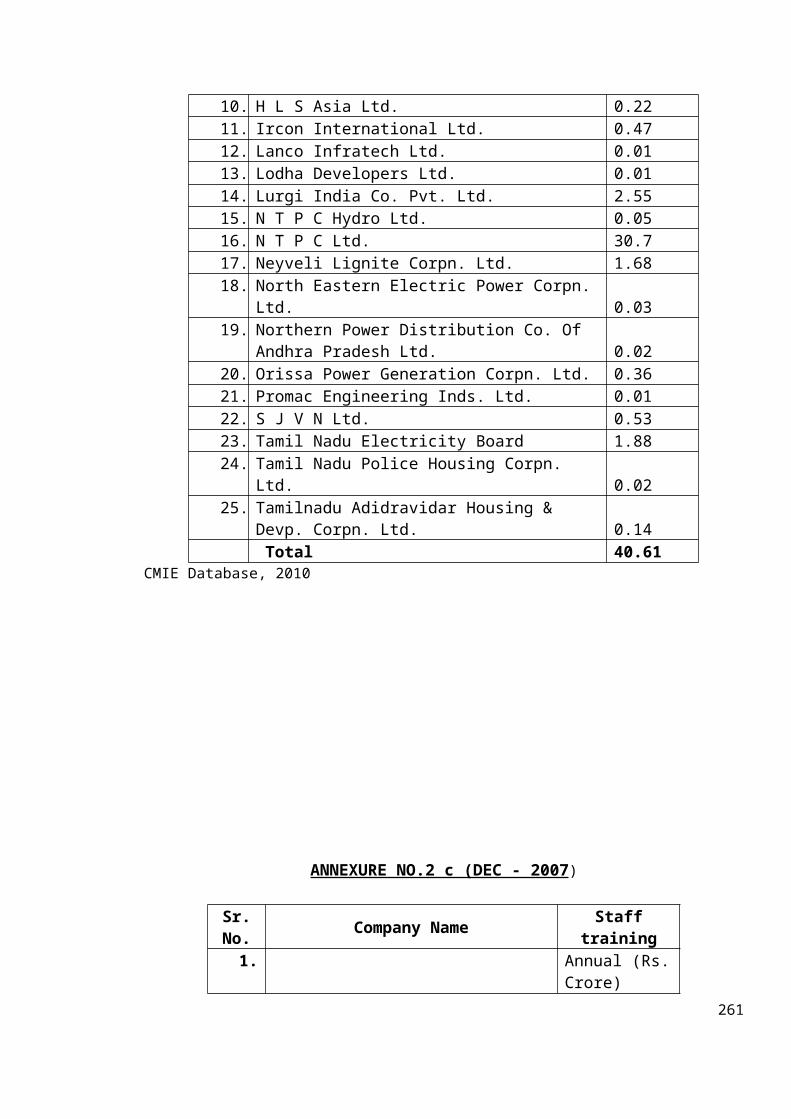
10. H L S Asia Ltd. 0.2211. Ircon International Ltd. 0.4712. Lanco Infratech Ltd. 0.0113. Lodha Developers Ltd. 0.0114. Lurgi India Co. Pvt. Ltd. 2.5515. N T P C Hydro Ltd. 0.0516. N T P C Ltd. 30.717. Neyveli Lignite Corpn. Ltd. 1.6818. North Eastern Electric Power Corpn.
Ltd. 0.0319. Northern Power Distribution Co. Of
Andhra Pradesh Ltd. 0.0220. Orissa Power Generation Corpn. Ltd. 0.3621. Promac Engineering Inds. Ltd. 0.0122. S J V N Ltd. 0.5323. Tamil Nadu Electricity Board 1.8824. Tamil Nadu Police Housing Corpn.
Ltd. 0.0225. Tamilnadu Adidravidar Housing &
Devp. Corpn. Ltd. 0.14 Total 40.61
CMIE Database, 2010
ANNEXURE NO.2 c (DEC - 2007)
Sr.No. Company Name Staff
training1.
Annual (Rs.Crore)
261
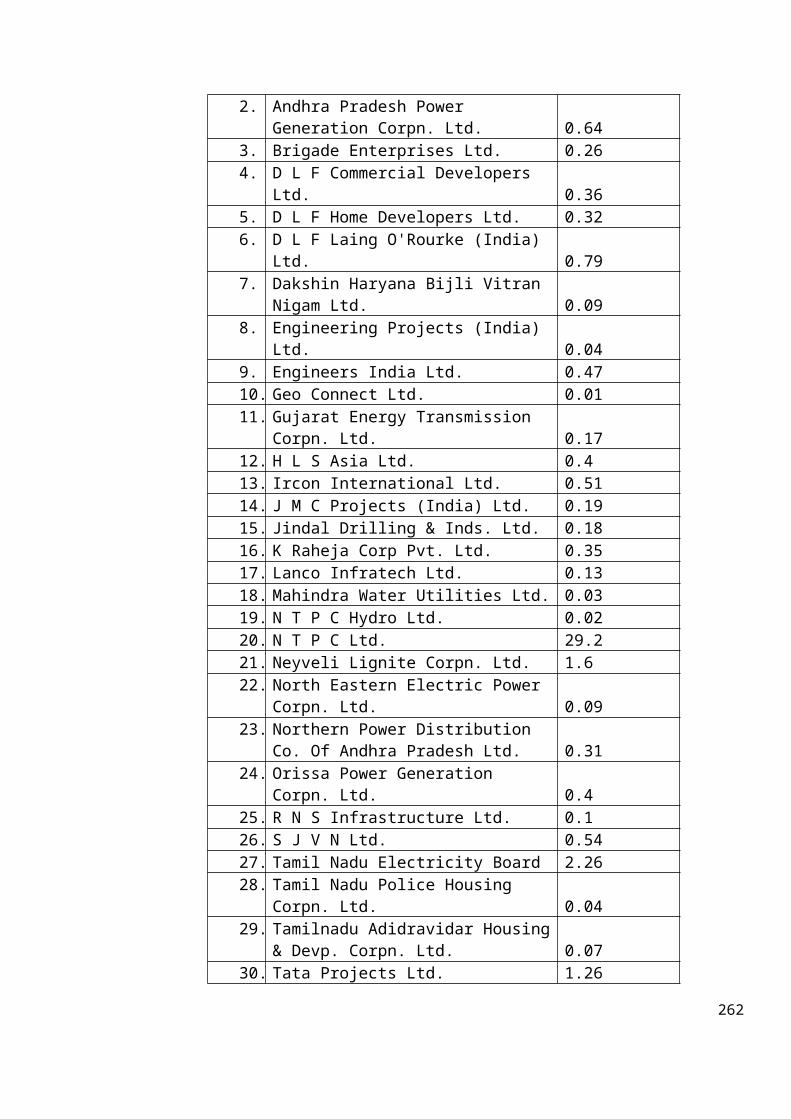
2. Andhra Pradesh Power Generation Corpn. Ltd. 0.64
3. Brigade Enterprises Ltd. 0.264. D L F Commercial Developers
Ltd. 0.365. D L F Home Developers Ltd. 0.326. D L F Laing O'Rourke (India)
Ltd. 0.797. Dakshin Haryana Bijli Vitran
Nigam Ltd. 0.098. Engineering Projects (India)
Ltd. 0.049. Engineers India Ltd. 0.4710. Geo Connect Ltd. 0.0111. Gujarat Energy Transmission
Corpn. Ltd. 0.1712. H L S Asia Ltd. 0.413. Ircon International Ltd. 0.5114. J M C Projects (India) Ltd. 0.1915. Jindal Drilling & Inds. Ltd. 0.1816. K Raheja Corp Pvt. Ltd. 0.3517. Lanco Infratech Ltd. 0.1318. Mahindra Water Utilities Ltd. 0.0319. N T P C Hydro Ltd. 0.0220. N T P C Ltd. 29.221. Neyveli Lignite Corpn. Ltd. 1.622. North Eastern Electric Power
Corpn. Ltd. 0.0923. Northern Power Distribution
Co. Of Andhra Pradesh Ltd. 0.3124. Orissa Power Generation
Corpn. Ltd. 0.425. R N S Infrastructure Ltd. 0.126. S J V N Ltd. 0.5427. Tamil Nadu Electricity Board 2.2628. Tamil Nadu Police Housing
Corpn. Ltd. 0.0429. Tamilnadu Adidravidar Housing
& Devp. Corpn. Ltd. 0.0730. Tata Projects Ltd. 1.26
262
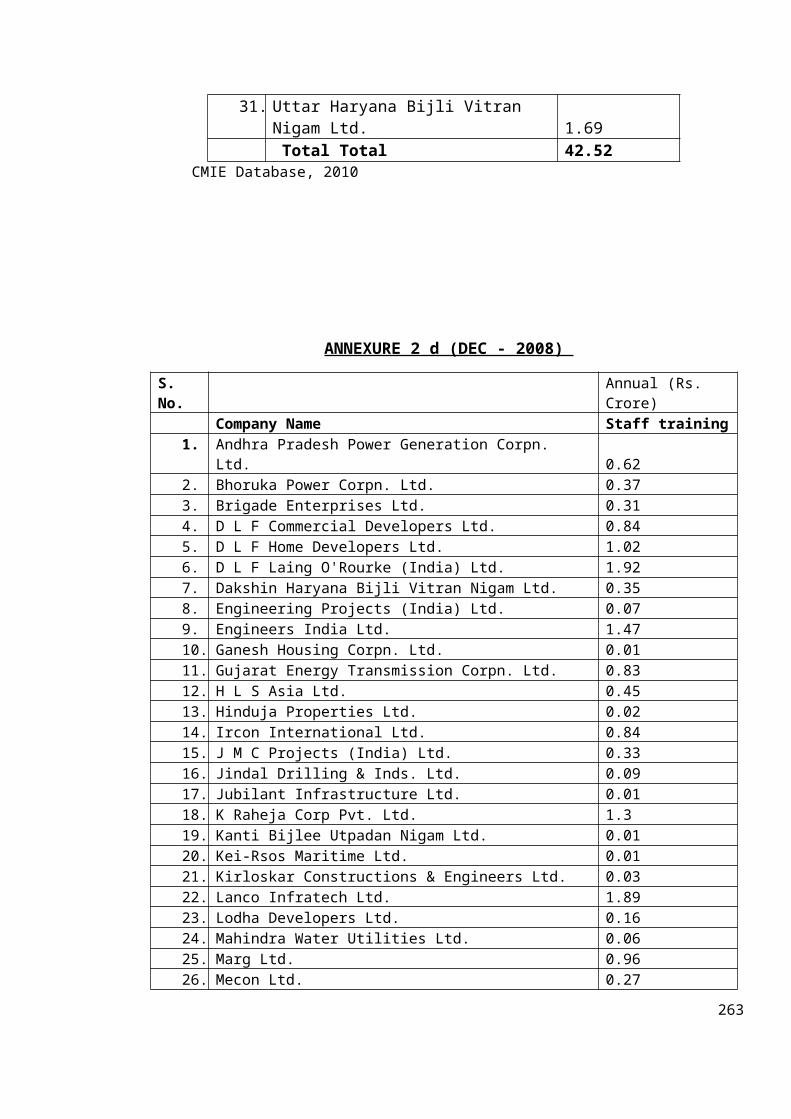
31. Uttar Haryana Bijli Vitran Nigam Ltd. 1.69 Total Total 42.52
CMIE Database, 2010
ANNEXURE 2 d (DEC - 2008)
S. No.
Annual (Rs. Crore)
Company Name Staff training1. Andhra Pradesh Power Generation Corpn.
Ltd. 0.622. Bhoruka Power Corpn. Ltd. 0.373. Brigade Enterprises Ltd. 0.314. D L F Commercial Developers Ltd. 0.845. D L F Home Developers Ltd. 1.026. D L F Laing O'Rourke (India) Ltd. 1.927. Dakshin Haryana Bijli Vitran Nigam Ltd. 0.358. Engineering Projects (India) Ltd. 0.079. Engineers India Ltd. 1.4710. Ganesh Housing Corpn. Ltd. 0.0111. Gujarat Energy Transmission Corpn. Ltd. 0.8312. H L S Asia Ltd. 0.4513. Hinduja Properties Ltd. 0.0214. Ircon International Ltd. 0.8415. J M C Projects (India) Ltd. 0.3316. Jindal Drilling & Inds. Ltd. 0.0917. Jubilant Infrastructure Ltd. 0.0118. K Raheja Corp Pvt. Ltd. 1.319. Kanti Bijlee Utpadan Nigam Ltd. 0.0120. Kei-Rsos Maritime Ltd. 0.0121. Kirloskar Constructions & Engineers Ltd. 0.0322. Lanco Infratech Ltd. 1.8923. Lodha Developers Ltd. 0.1624. Mahindra Water Utilities Ltd. 0.0625. Marg Ltd. 0.9626. Mecon Ltd. 0.27
263
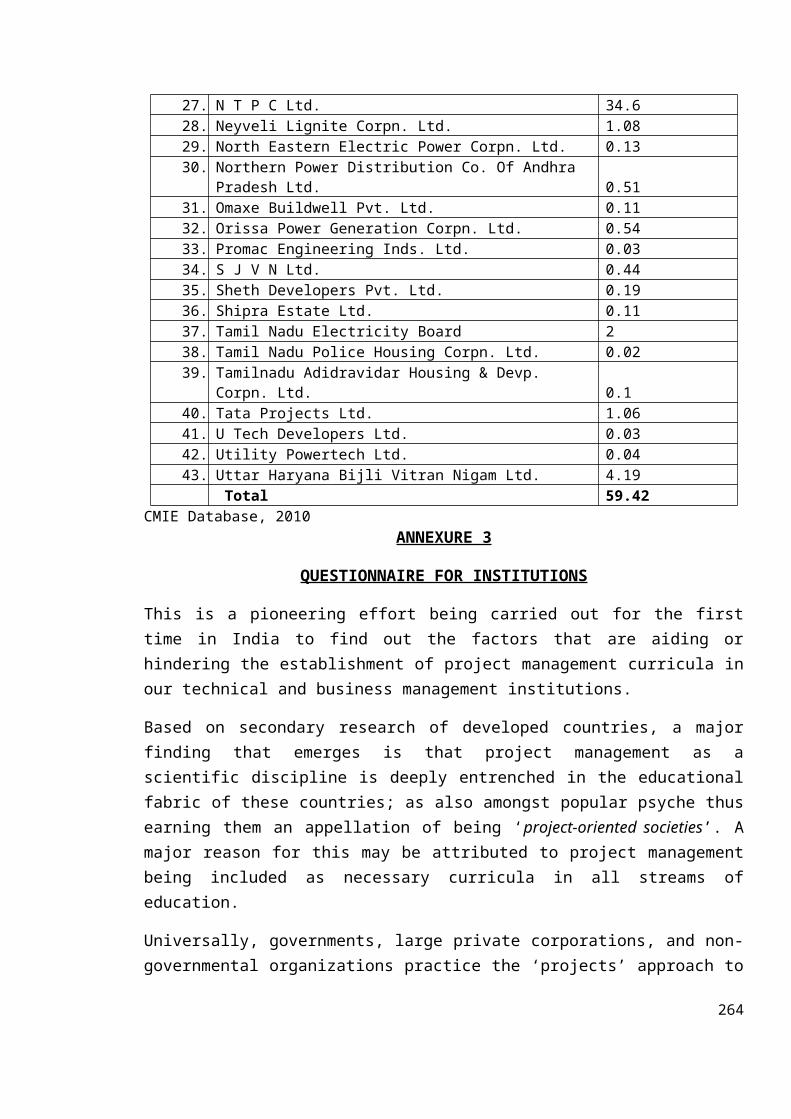
27. N T P C Ltd. 34.628. Neyveli Lignite Corpn. Ltd. 1.0829. North Eastern Electric Power Corpn. Ltd. 0.1330. Northern Power Distribution Co. Of Andhra
Pradesh Ltd. 0.5131. Omaxe Buildwell Pvt. Ltd. 0.1132. Orissa Power Generation Corpn. Ltd. 0.5433. Promac Engineering Inds. Ltd. 0.0334. S J V N Ltd. 0.4435. Sheth Developers Pvt. Ltd. 0.1936. Shipra Estate Ltd. 0.1137. Tamil Nadu Electricity Board 238. Tamil Nadu Police Housing Corpn. Ltd. 0.0239. Tamilnadu Adidravidar Housing & Devp.
Corpn. Ltd. 0.140. Tata Projects Ltd. 1.0641. U Tech Developers Ltd. 0.0342. Utility Powertech Ltd. 0.0443. Uttar Haryana Bijli Vitran Nigam Ltd. 4.19
Total 59.42CMIE Database, 2010
ANNEXURE 3
QUESTIONNAIRE FOR INSTITUTIONS
This is a pioneering effort being carried out for the firsttime in India to find out the factors that are aiding orhindering the establishment of project management curricula inour technical and business management institutions.
Based on secondary research of developed countries, a majorfinding that emerges is that project management as ascientific discipline is deeply entrenched in the educationalfabric of these countries; as also amongst popular psyche thusearning them an appellation of being ‘project-oriented societies’. Amajor reason for this may be attributed to project managementbeing included as necessary curricula in all streams ofeducation.
Universally, governments, large private corporations, and non-governmental organizations practice the ‘projects’ approach to
264
fulfill their targets and goals. If so be the case, projectmanagement as a discipline would have had a much higheracceptance by the industry and Project Management (PM) courseswould have been taught in India’s technical and businessschools. The study from the point of view of educationalinstitutions is to determine the factors that affect theinclusion of project management curricula.
Survey Instructions
The survey is divided into four parts. The first part asks foryour background information. The second part aims atdiscovering your general opinion on project management (PM)curricula. The third part aims to identify any distinguishingfactors that characterize the specific PM curriculumdevelopment. The fourth part deals with finding out about theexisting educational infrastructure available withinstitutions and also management support available to theinstitutions to establish new courses. Also covered areregulatory aspects that affect the decision-making and launchof new curricula. For every question, you are asked to providea tick/score as per your opinion.
This research does not involve any sensitive issues. It isdesigned to gather information based on your personalexperience, knowledge and opinion alone. It will not be takento represent or reflect your institution’s view-points. Theinformation provided will be kept strictly confidential andwill be used solely for the purposes of this research. If youhave any comments or enquiries, please contact Dr. Mona N.Shah at [email protected] or 020 27291342/ 65102745.
Thank you for your interest.
265
PART I
RESPONDENT'S PARTICULARS
Name
Name of
Institution
Designation
Address of
institution
Tel (O):
Mobile No.
Fax (O):
Email Office
Persona
l
How many years
of work/research
experience do
you have in
academics?
Years:
How many years Years:
266
of experience do
you have in
curriculum/sylla
bus development?
Would you agree
if we
acknowledge you
in our report
for your
contribution and
assistance in
the survey? If
yes, kindly give
Personal name:
Organization’s name:
Please indicate
whether you
would like to
receive a
summary of the
report upon
completion of
this research
Yes:
No:
267

PART II
GENERAL OPINION ON EXISTING STATE OF PM EDUCATION IN INDIA
1. What in
your
opinion is
the current
status of
PM
education
in India?
Poor Fair Good Very
Good
Excellen
t
2. Has your
institute
considered
introducing
PM in
curricula
of any
programme ?
Yes: No:
3. If yes,
at what
level has
this been
considered?
Please also
mention the
Under
Graduate
:
Post-
Graduate
:
Advanced
Level:
Research
Level:
Certific
ate
268
name of the
programme
4. Which
type of PM
related
courses do
you run?
Please also
mention the
name of the
course
Elective Course: Compulsory Course:
5. Of what
intensity
is the
course?
Elementary: Intermediat
e:
Advanced:
6. In your
opinion how
essential
is it to
teach PM in
1.
Engineering
Colleges?
2.
Management
Institution
Somewhat
Essentia
l
Fairly
Essentia
l
Essentia
l
Very
Essential
Absolute
ly
Essentia
l
269
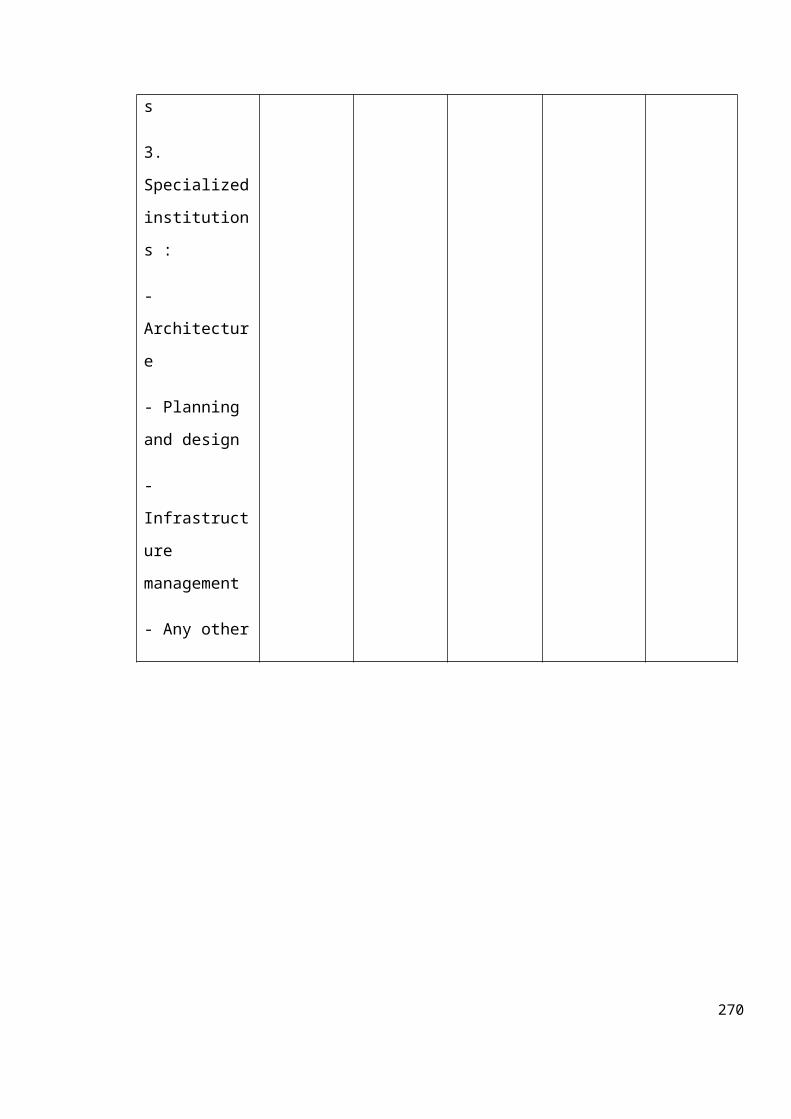
s
3.
Specialized
institution
s :
-
Architectur
e
- Planning
and design
-
Infrastruct
ure
management
- Any other
270
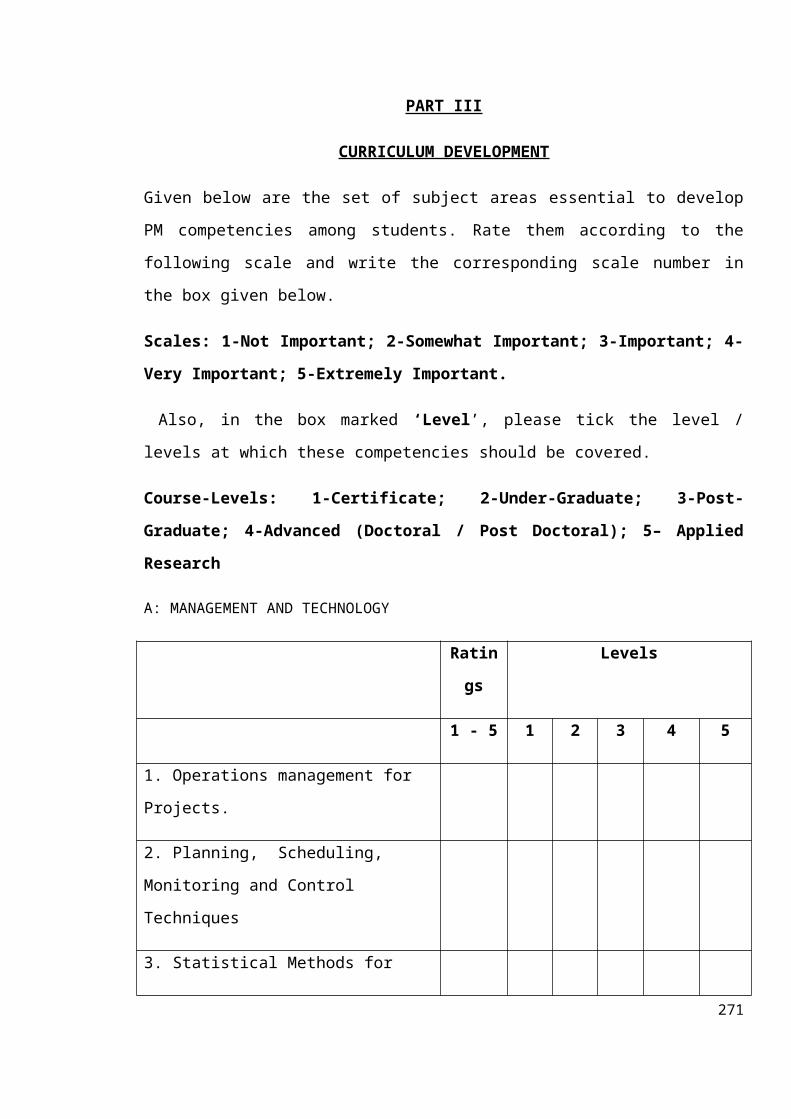
PART III
CURRICULUM DEVELOPMENT
Given below are the set of subject areas essential to develop
PM competencies among students. Rate them according to the
following scale and write the corresponding scale number in
the box given below.
Scales: 1-Not Important; 2-Somewhat Important; 3-Important; 4-
Very Important; 5-Extremely Important.
Also, in the box marked ‘Level’, please tick the level /
levels at which these competencies should be covered.
Course-Levels: 1-Certificate; 2-Under-Graduate; 3-Post-
Graduate; 4-Advanced (Doctoral / Post Doctoral); 5– Applied
Research
A: MANAGEMENT AND TECHNOLOGY
Ratin
gs
Levels
1 - 5 1 2 3 4 5
1. Operations management for
Projects.
2. Planning, Scheduling,
Monitoring and Control
Techniques
3. Statistical Methods for
271
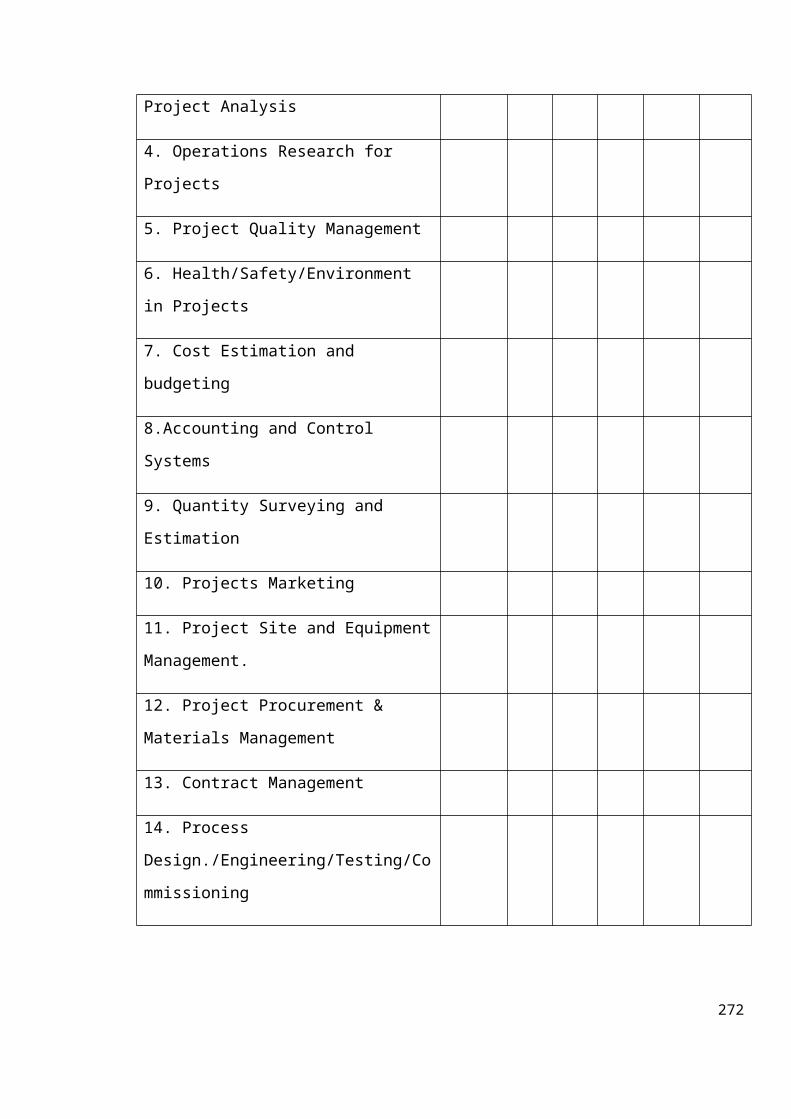
Project Analysis
4. Operations Research for
Projects
5. Project Quality Management
6. Health/Safety/Environment
in Projects
7. Cost Estimation and
budgeting
8.Accounting and Control
Systems
9. Quantity Surveying and
Estimation
10. Projects Marketing
11. Project Site and Equipment
Management.
12. Project Procurement &
Materials Management
13. Contract Management
14. Process
Design./Engineering/Testing/Co
mmissioning
272
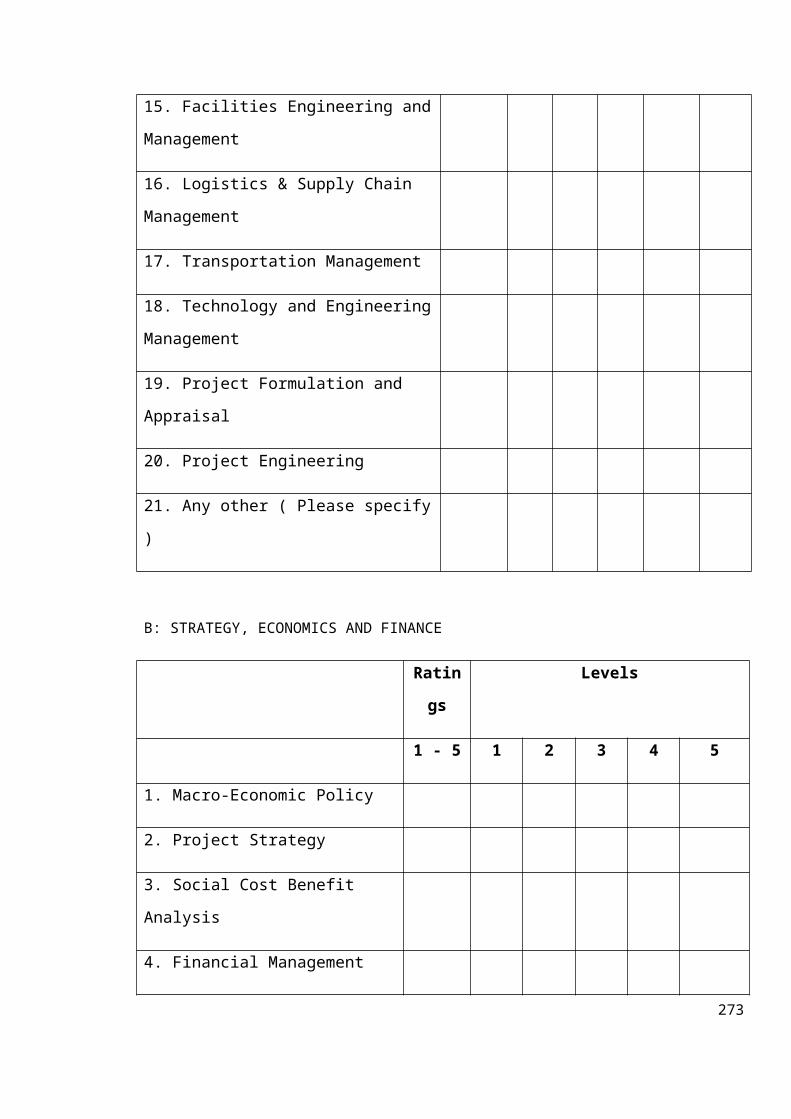
15. Facilities Engineering and
Management
16. Logistics & Supply Chain
Management
17. Transportation Management
18. Technology and Engineering
Management
19. Project Formulation and
Appraisal
20. Project Engineering
21. Any other ( Please specify
)
B: STRATEGY, ECONOMICS AND FINANCE
Ratin
gs
Levels
1 - 5 1 2 3 4 5
1. Macro-Economic Policy
2. Project Strategy
3. Social Cost Benefit
Analysis
4. Financial Management
273

5. Project Financing
6. Risk and Insurance
Management
7. Legal, Commercial and
Taxation Aspects of
Projects
8. Project Joint Ventures,
Strategic Alliances,
Special Purpose Vehicles
9. Any other ( Please
specify )
B: BEHAVIOURAL SCIENCES AREA
Rating
s
Levels
1 2 3 4 5
1. Project Organization
and Structure
2. Managerial Skills for
Projects (Communication,
Leadership, Team Building,
Negotiation, other soft
skills)
274
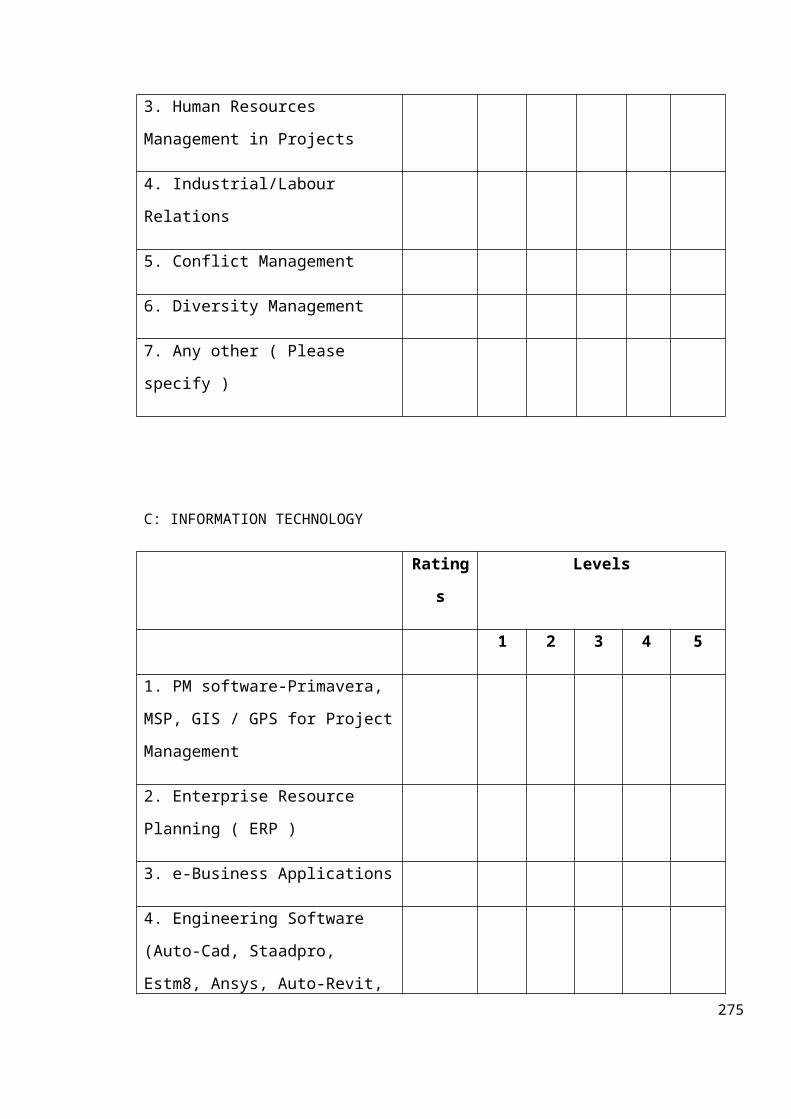
3. Human Resources
Management in Projects
4. Industrial/Labour
Relations
5. Conflict Management
6. Diversity Management
7. Any other ( Please
specify )
C: INFORMATION TECHNOLOGY
Rating
s
Levels
1 2 3 4 5
1. PM software-Primavera,
MSP, GIS / GPS for Project
Management
2. Enterprise Resource
Planning ( ERP )
3. e-Business Applications
4. Engineering Software
(Auto-Cad, Staadpro,
Estm8, Ansys, Auto-Revit, 275
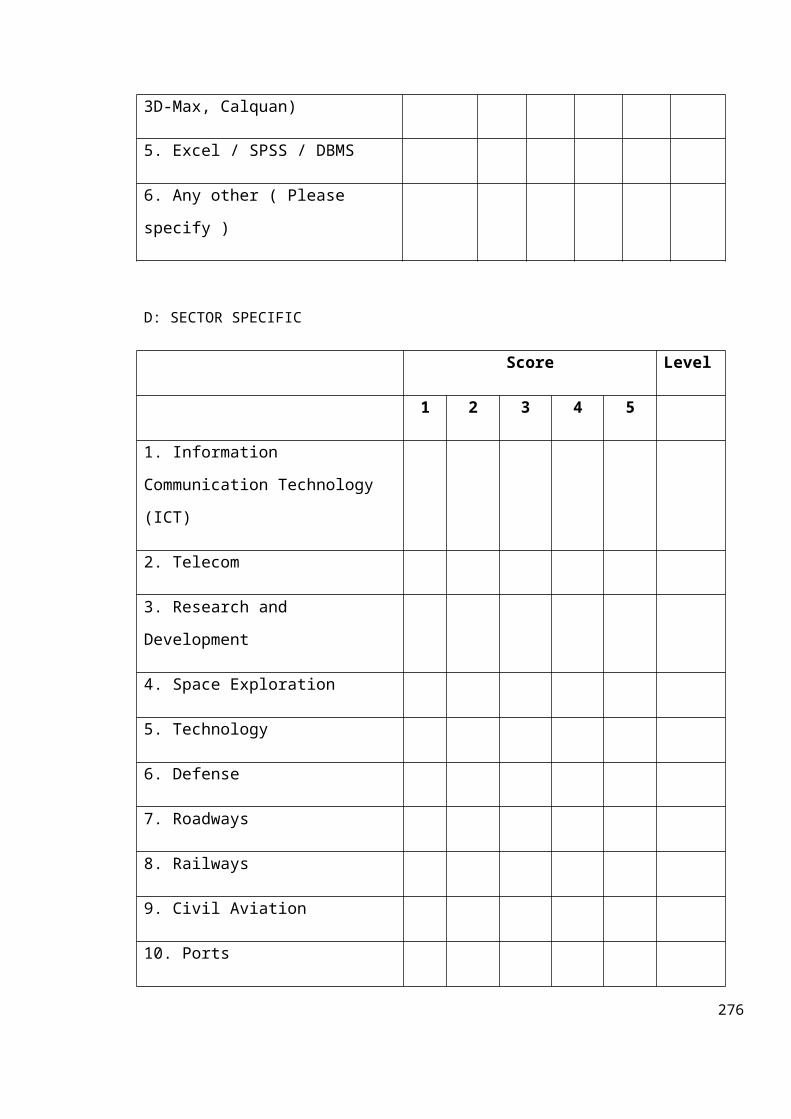
3D-Max, Calquan)
5. Excel / SPSS / DBMS
6. Any other ( Please
specify )
D: SECTOR SPECIFIC
Score Level
1 2 3 4 5
1. Information
Communication Technology
(ICT)
2. Telecom
3. Research and
Development
4. Space Exploration
5. Technology
6. Defense
7. Roadways
8. Railways
9. Civil Aviation
10. Ports
276

11. Shipbuilding
12. Urban Infrastructure
13. Mega Property
Developments
14. Petrochemicals
15. Chemical Engineering
16. Oil and Gas
Exploration
17. Services
18. International Project
Management
19. Any other ( Please
specify )
277
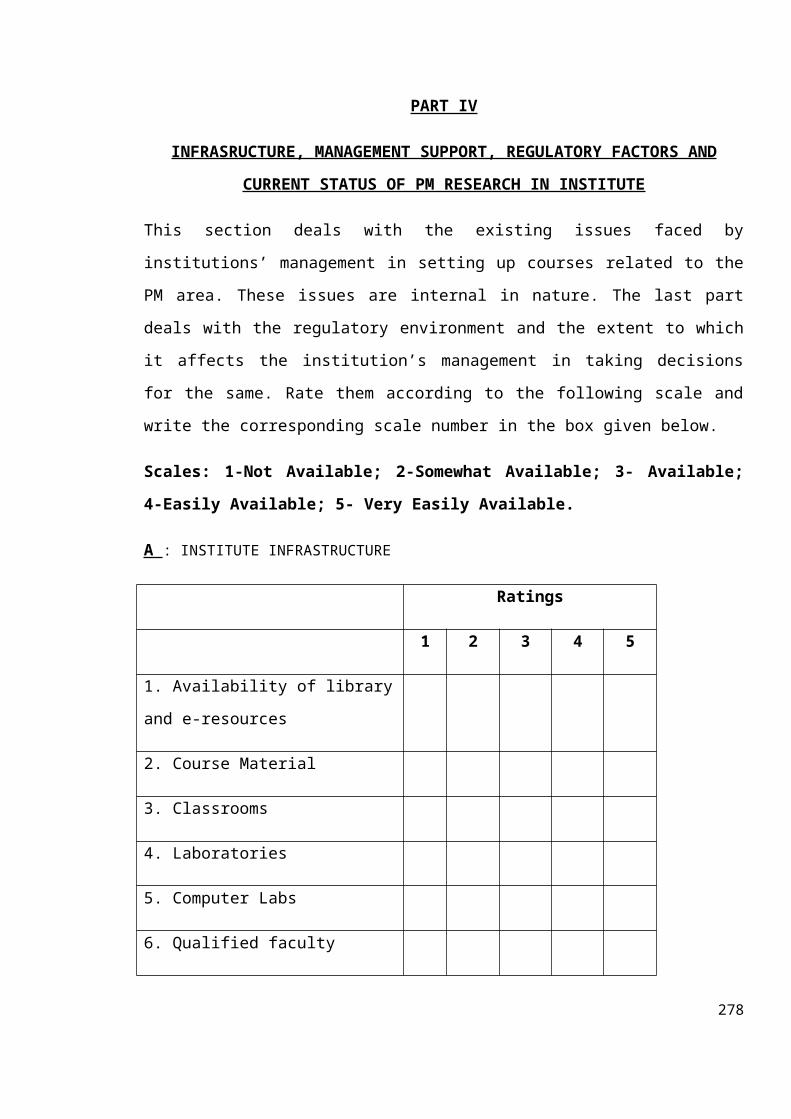
PART IV
INFRASRUCTURE, MANAGEMENT SUPPORT, REGULATORY FACTORS AND
CURRENT STATUS OF PM RESEARCH IN INSTITUTE
This section deals with the existing issues faced by
institutions’ management in setting up courses related to the
PM area. These issues are internal in nature. The last part
deals with the regulatory environment and the extent to which
it affects the institution’s management in taking decisions
for the same. Rate them according to the following scale and
write the corresponding scale number in the box given below.
Scales: 1-Not Available; 2-Somewhat Available; 3- Available;
4-Easily Available; 5- Very Easily Available.
A : INSTITUTE INFRASTRUCTURE
Ratings
1 2 3 4 5
1. Availability of library
and e-resources
2. Course Material
3. Classrooms
4. Laboratories
5. Computer Labs
6. Qualified faculty
278
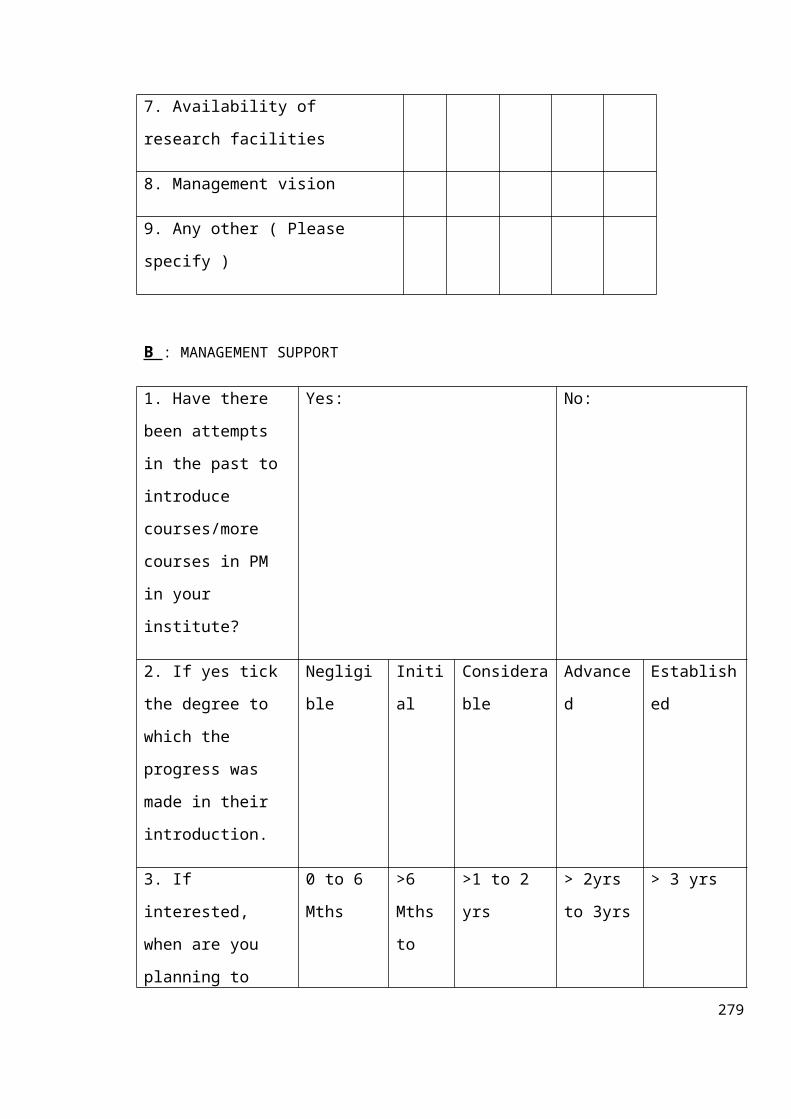
7. Availability of
research facilities
8. Management vision
9. Any other ( Please
specify )
B : MANAGEMENT SUPPORT
1. Have there
been attempts
in the past to
introduce
courses/more
courses in PM
in your
institute?
Yes: No:
2. If yes tick
the degree to
which the
progress was
made in their
introduction.
Negligi
ble
Initi
al
Considera
ble
Advance
d
Establish
ed
3. If
interested,
when are you
planning to
0 to 6
Mths
>6
Mths
to
>1 to 2
yrs
> 2yrs
to 3yrs
> 3 yrs
279
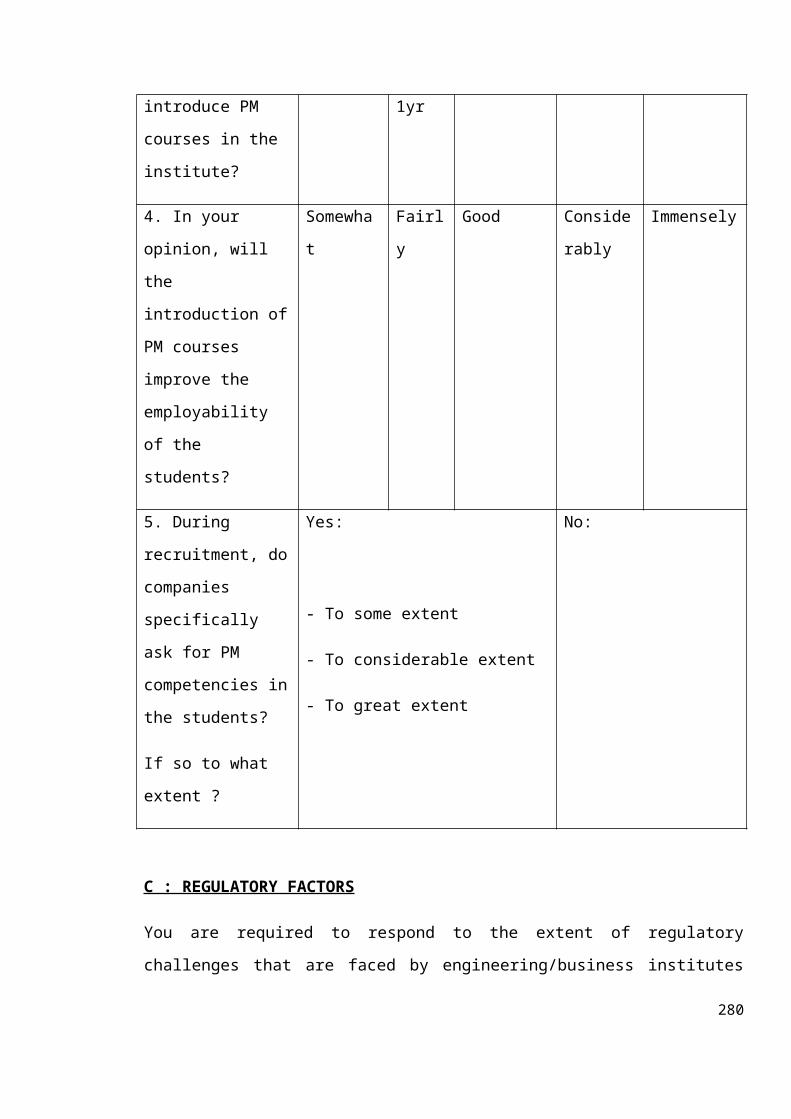
introduce PM
courses in the
institute?
1yr
4. In your
opinion, will
the
introduction of
PM courses
improve the
employability
of the
students?
Somewha
t
Fairl
y
Good Conside
rably
Immensely
5. During
recruitment, do
companies
specifically
ask for PM
competencies in
the students?
If so to what
extent ?
Yes:
- To some extent
- To considerable extent
- To great extent
No:
C : REGULATORY FACTORS
You are required to respond to the extent of regulatory
challenges that are faced by engineering/business institutes
280
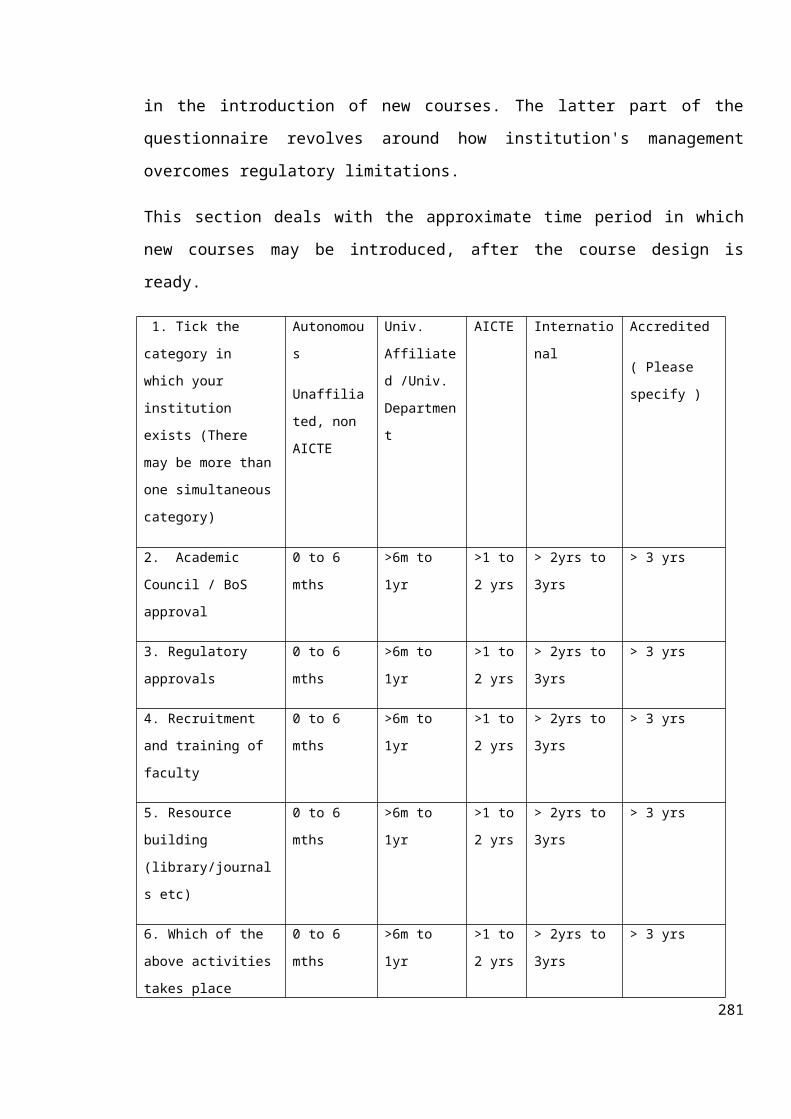
in the introduction of new courses. The latter part of the
questionnaire revolves around how institution's management
overcomes regulatory limitations.
This section deals with the approximate time period in which
new courses may be introduced, after the course design is
ready.
1. Tick the
category in
which your
institution
exists (There
may be more than
one simultaneous
category)
Autonomou
s
Unaffilia
ted, non
AICTE
Univ.
Affiliate
d /Univ.
Departmen
t
AICTE Internatio
nal
Accredited
( Please
specify )
2. Academic
Council / BoS
approval
0 to 6
mths
>6m to
1yr
>1 to
2 yrs
> 2yrs to
3yrs
> 3 yrs
3. Regulatory
approvals
0 to 6
mths
>6m to
1yr
>1 to
2 yrs
> 2yrs to
3yrs
> 3 yrs
4. Recruitment
and training of
faculty
0 to 6
mths
>6m to
1yr
>1 to
2 yrs
> 2yrs to
3yrs
> 3 yrs
5. Resource
building
(library/journal
s etc)
0 to 6
mths
>6m to
1yr
>1 to
2 yrs
> 2yrs to
3yrs
> 3 yrs
6. Which of the
above activities
takes place
0 to 6
mths
>6m to
1yr
>1 to
2 yrs
> 2yrs to
3yrs
> 3 yrs
281
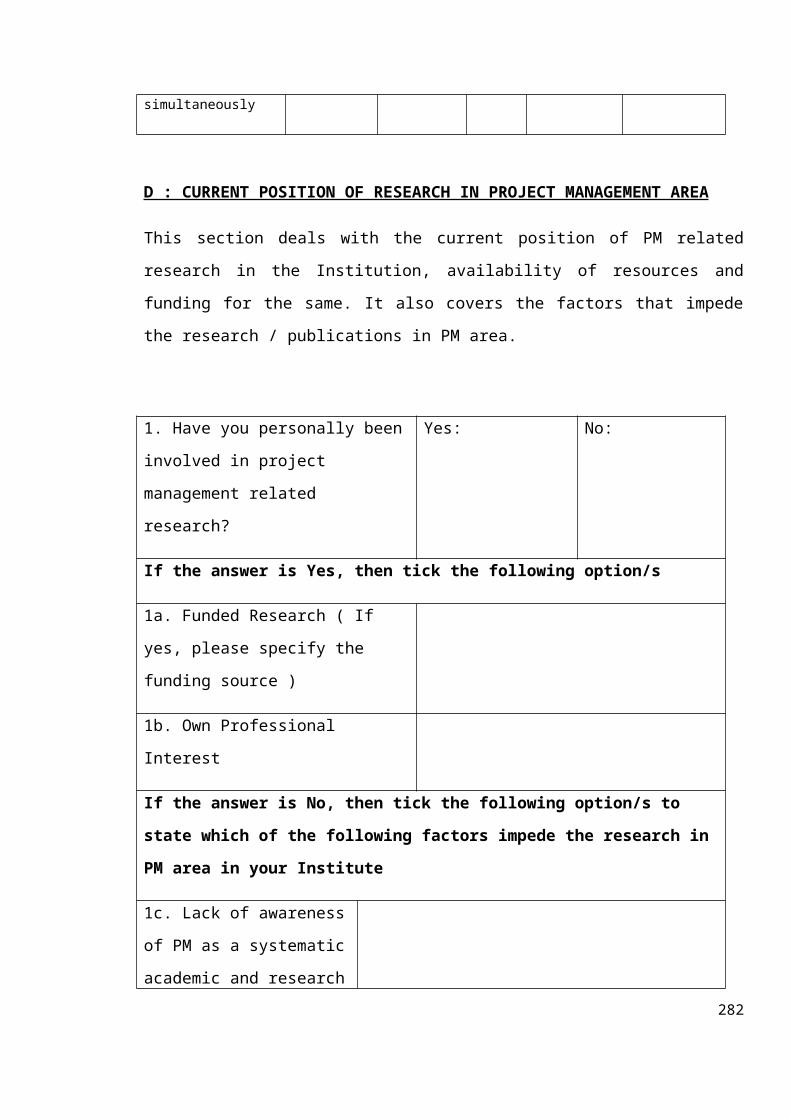
simultaneously
D : CURRENT POSITION OF RESEARCH IN PROJECT MANAGEMENT AREA
This section deals with the current position of PM related
research in the Institution, availability of resources and
funding for the same. It also covers the factors that impede
the research / publications in PM area.
1. Have you personally been
involved in project
management related
research?
Yes: No:
If the answer is Yes, then tick the following option/s
1a. Funded Research ( If
yes, please specify the
funding source )
1b. Own Professional
Interest
If the answer is No, then tick the following option/s to
state which of the following factors impede the research in
PM area in your Institute
1c. Lack of awareness
of PM as a systematic
academic and research282
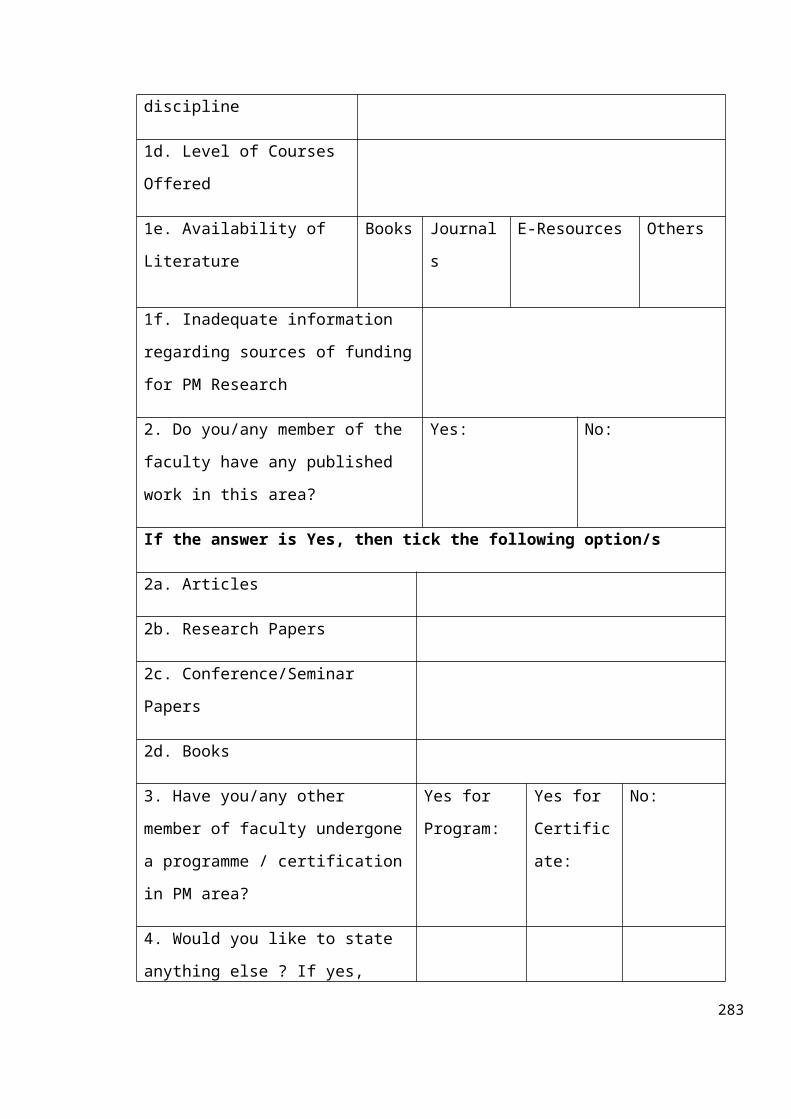
discipline
1d. Level of Courses
Offered
1e. Availability of
Literature
Books Journal
s
E-Resources Others
1f. Inadequate information
regarding sources of funding
for PM Research
2. Do you/any member of the
faculty have any published
work in this area?
Yes: No:
If the answer is Yes, then tick the following option/s
2a. Articles
2b. Research Papers
2c. Conference/Seminar
Papers
2d. Books
3. Have you/any other
member of faculty undergone
a programme / certification
in PM area?
Yes for
Program:
Yes for
Certific
ate:
No:
4. Would you like to state
anything else ? If yes,
283

please specify
INTERVIEWER’S DETAILS
Name:
Signature:
Date:
Time:
284
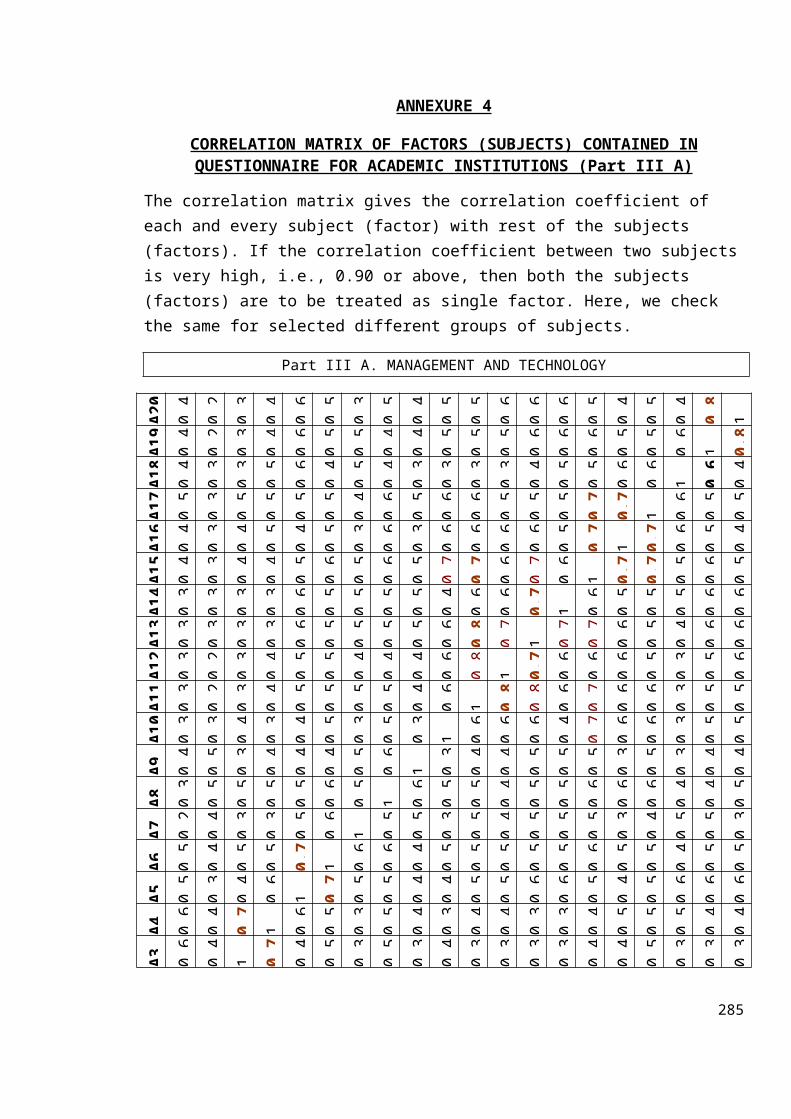
ANNEXURE 4
CORRELATION MATRIX OF FACTORS (SUBJECTS) CONTAINED INQUESTIONNAIRE FOR ACADEMIC INSTITUTIONS (Part III A)
The correlation matrix gives the correlation coefficient of each and every subject (factor) with rest of the subjects (factors). If the correlation coefficient between two subjectsis very high, i.e., 0.90 or above, then both the subjects (factors) are to be treated as single factor. Here, we check the same for selected different groups of subjects.
Part III A. MANAGEMENT AND TECHNOLOGY
A20
0.4
0.2
0.3
0.4
0.6
0.5
0.3
0.5
0.4
0.5
0.5
0.6
0.6
0.6
0.5
0.4
0.5
0.4
0.8
1
A19
0.4
0.2
0.3
0.4
0.6
0.5
0.5
0.4
0.4
0.5
0.5
0.5
0.6
0.6
0.6
0.5
0.5
0.6
1 0.8
A18
0.4
0.3
0.3
0.5
0.6
0.4
0.5
0.4
0.3
0.3
0.3
0.3
0.4
0.5
0.5
0.6
0.6
1 0.6
0.4
A17
0.5
0.3
0.5
0.5
0.5
0.5
0.4
0.6
0.5
0.6
0.6
0.5
0.5
0.5
0.7
0.7
1 0.6
0.5
0.5
A16
0.4
0.3
0.4
0.5
0.4
0.5
0.3
0.6
0.3
0.6
0.6
0.6
0.6
0.5
0.7
1 0.7
0.6
0.5
0.4
A15
0.4
0.3
0.4
0.4
0.5
0.6
0.5
0.6
0.5
0.7
0.7
0.6
0.7
0.6
1 0.7
0.7
0.5
0.6
0.5
A14
0.3
0.3
0.3
0.3
0.6
0.5
0.5
0.5
0.5
0.4
0.6
0.6
0.7
1 0.6
0.5
0.5
0.5
0.6
0.6
A13
0.3
0.3
0.3
0.3
0.6
0.5
0.5
0.5
0.5
0.6
0.8
0.7
1 0.7
0.7
0.6
0.5
0.4
0.6
0.6
A12
0.3
0.2
0.3
0.4
0.5
0.5
0.4
0.4
0.4
0.6
0.8
1 0.7
0.6
0.6
0.6
0.5
0.3
0.5
0.6
A11
0.3
0.2
0.3
0.4
0.5
0.5
0.5
0.5
0.4
0.6
1 0.8
0.8
0.6
0.7
0.6
0.6
0.3
0.5
0.5
A10
0.3
0.3
0.4
0.3
0.4
0.5
0.3
0.5
0.3
1 0.6
0.6
0.6
0.4
0.7
0.6
0.6
0.3
0.5
0.5
A9 0.4
0.5
0.3
0.4
0.4
0.4
0.5
0.6
1 0.3
0.4
0.4
0.5
0.5
0.5
0.3
0.5
0.3
0.4
0.4
A8 0.3
0.5
0.5
0.5
0.5
0.6
0.5
1 0.6
0.5
0.5
0.4
0.5
0.5
0.6
0.6
0.6
0.4
0.4
0.5
A7 0.2
0.4
0.3
0.3
0.5
0.6
1 0.5
0.5
0.3
0.5
0.4
0.5
0.5
0.5
0.3
0.4
0.5
0.5
0.3
A6 0.5
0.4
0.5
0.5
0.7
1 0.6
0.6
0.4
0.5
0.5
0.5
0.5
0.5
0.6
0.5
0.5
0.4
0.5
0.5
A5 0.5
0.3
0.4
0.6
1 0.7
0.5
0.5
0.4
0.4
0.5
0.5
0.6
0.6
0.5
0.4
0.5
0.6
0.6
0.6
A4 0.6
0.4
0.7
1 0.6
0.5
0.3
0.5
0.4
0.3
0.4
0.4
0.3
0.3
0.4
0.5
0.5
0.5
0.4
0.4
A3 0.6
0.4
1 0.7
0.4
0.5
0.3
0.5
0.3
0.4
0.3
0.3
0.3
0.3
0.4
0.4
0.5
0.3
0.3
0.3
285
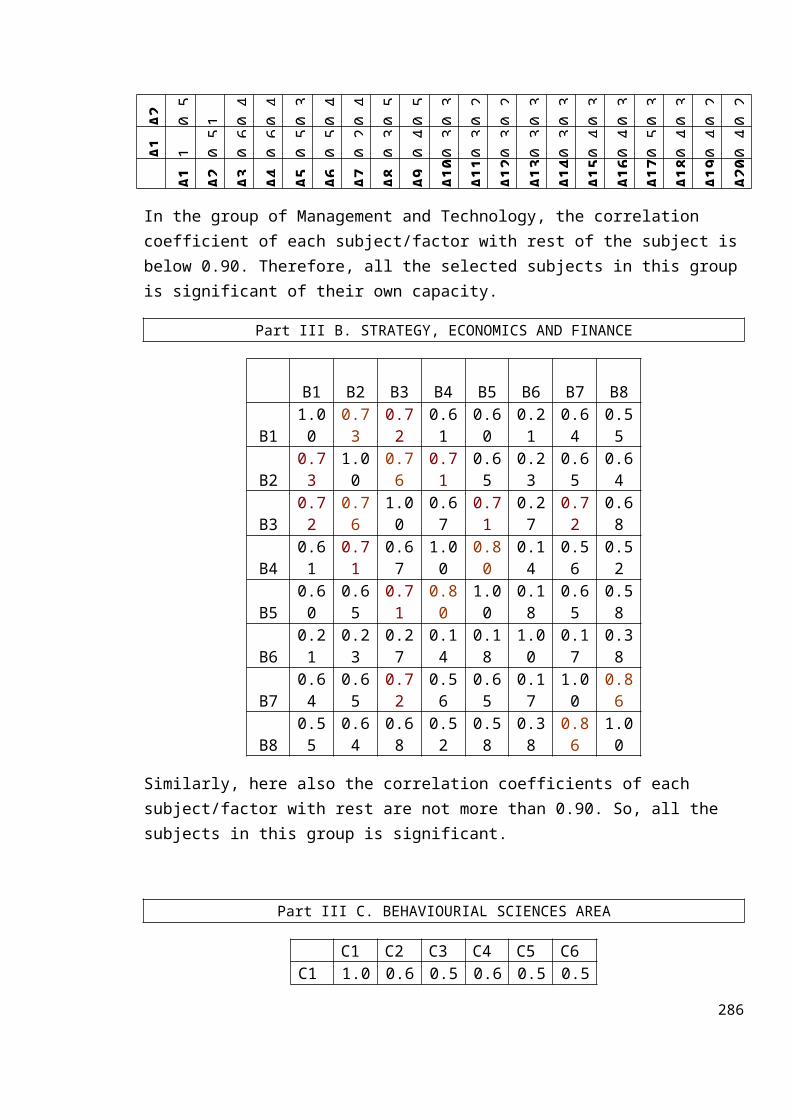
A2 0.5
1 0.4
0.4
0.3
0.4
0.4
0.5
0.5
0.3
0.2
0.2
0.3
0.3
0.3
0.3
0.3
0.3
0.2
0.2
A1 1 0.5
0.6
0.6
0.5
0.5
0.2
0.3
0.4
0.3
0.3
0.3
0.3
0.3
0.4
0.4
0.5
0.4
0.4
0.4
A1 A2 A3 A4 A5 A6 A7 A8 A9 A10
A11
A12
A13
A14
A15
A16
A17
A18
A19
A20
In the group of Management and Technology, the correlation coefficient of each subject/factor with rest of the subject isbelow 0.90. Therefore, all the selected subjects in this groupis significant of their own capacity.
Part III B. STRATEGY, ECONOMICS AND FINANCE
B1 B2 B3 B4 B5 B6 B7 B8
B11.00
0.73
0.72
0.61
0.60
0.21
0.64
0.55
B20.73
1.00
0.76
0.71
0.65
0.23
0.65
0.64
B30.72
0.76
1.00
0.67
0.71
0.27
0.72
0.68
B40.61
0.71
0.67
1.00
0.80
0.14
0.56
0.52
B50.60
0.65
0.71
0.80
1.00
0.18
0.65
0.58
B60.21
0.23
0.27
0.14
0.18
1.00
0.17
0.38
B70.64
0.65
0.72
0.56
0.65
0.17
1.00
0.86
B80.55
0.64
0.68
0.52
0.58
0.38
0.86
1.00
Similarly, here also the correlation coefficients of each subject/factor with rest are not more than 0.90. So, all the subjects in this group is significant.
Part III C. BEHAVIOURIAL SCIENCES AREA
C1 C2 C3 C4 C5 C6C1 1.0 0.6 0.5 0.6 0.5 0.5
286
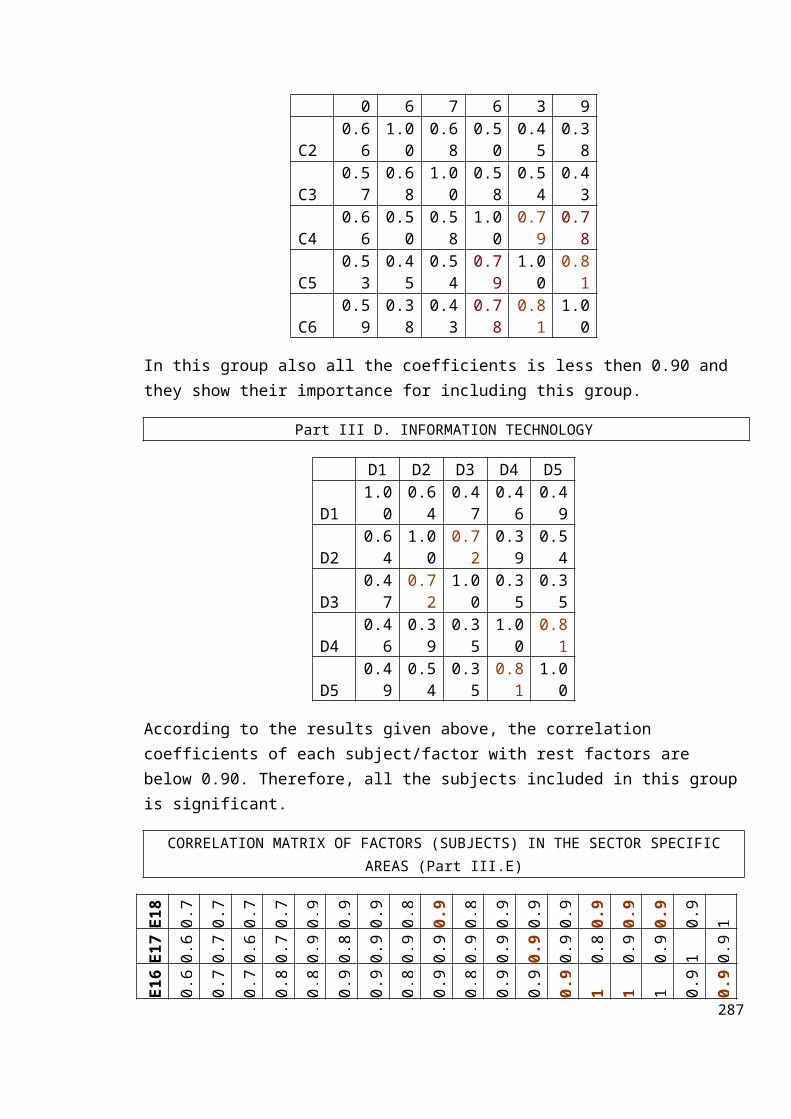
0 6 7 6 3 9
C20.66
1.00
0.68
0.50
0.45
0.38
C30.57
0.68
1.00
0.58
0.54
0.43
C40.66
0.50
0.58
1.00
0.79
0.78
C50.53
0.45
0.54
0.79
1.00
0.81
C60.59
0.38
0.43
0.78
0.81
1.00
In this group also all the coefficients is less then 0.90 and they show their importance for including this group.
Part III D. INFORMATION TECHNOLOGY
D1 D2 D3 D4 D5
D11.00
0.64
0.47
0.46
0.49
D20.64
1.00
0.72
0.39
0.54
D30.47
0.72
1.00
0.35
0.35
D40.46
0.39
0.35
1.00
0.81
D50.49
0.54
0.35
0.81
1.00
According to the results given above, the correlation coefficients of each subject/factor with rest factors are below 0.90. Therefore, all the subjects included in this groupis significant.
CORRELATION MATRIX OF FACTORS (SUBJECTS) IN THE SECTOR SPECIFICAREAS (Part III.E)
E18
0.7
0.7
0.7
0.7
0.9
0.9
0.9
0.8
0.9
0.8
0.9
0.9
0.9
0.9
0.9
0.9
0.9
1
E17
0.6
0.7
0.6
0.7
0.9
0.8
0.9
0.9
0.9
0.9
0.9
0.9
0.9
0.8
0.9
0.9
1 0.9
E16
0.6
0.7
0.7
0.8
0.8
0.9
0.9
0.8
0.9
0.8
0.9
0.9
0.9
1 1 1 0.9
0.9
287
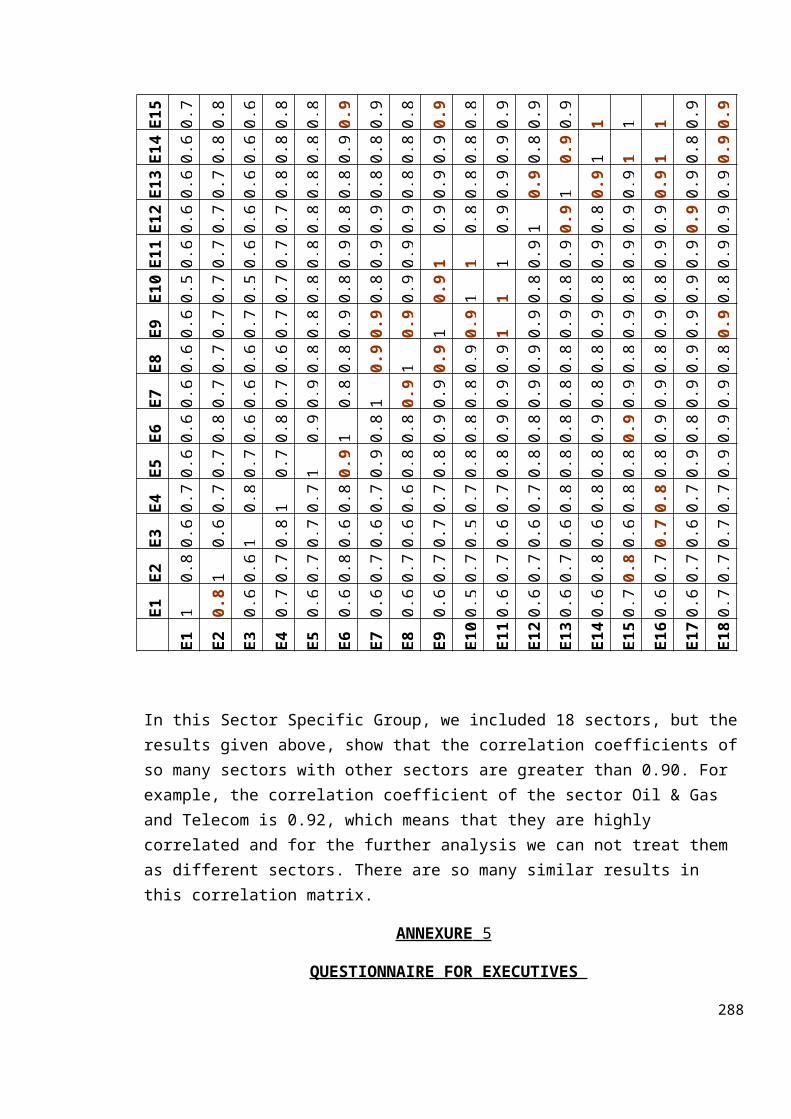
E15
0.7
0.8
0.6
0.8
0.8
0.9
0.9
0.8
0.9
0.8
0.9
0.9
0.9
1 1 1 0.9
0.9
E14
0.6
0.8
0.6
0.8
0.8
0.9
0.8
0.8
0.9
0.8
0.9
0.8
0.9
1 1 1 0.8
0.9
E13
0.6
0.7
0.6
0.8
0.8
0.8
0.8
0.8
0.9
0.8
0.9
0.9
1 0.9
0.9
0.9
0.9
0.9
E12
0.6
0.7
0.6
0.7
0.8
0.8
0.9
0.9
0.9
0.8
0.9
1 0.9
0.8
0.9
0.9
0.9
0.9
E11
0.6
0.7
0.6
0.7
0.8
0.9
0.9
0.9
1 1 1 0.9
0.9
0.9
0.9
0.9
0.9
0.9
E10
0.5
0.7
0.5
0.7
0.8
0.8
0.8
0.9
0.9
1 1 0.8
0.8
0.8
0.8
0.8
0.9
0.8
E9 0.6
0.7
0.7
0.7
0.8
0.9
0.9
0.9
1 0.9
1 0.9
0.9
0.9
0.9
0.9
0.9
0.9
E8 0.6
0.7
0.6
0.6
0.8
0.8
0.9
1 0.9
0.9
0.9
0.9
0.8
0.8
0.8
0.8
0.9
0.8
E7 0.6
0.7
0.6
0.7
0.9
0.8
1 0.9
0.9
0.8
0.9
0.9
0.8
0.8
0.9
0.9
0.9
0.9
E6 0.6
0.8
0.6
0.8
0.9
1 0.8
0.8
0.9
0.8
0.9
0.8
0.8
0.9
0.9
0.9
0.8
0.9
E5 0.6
0.7
0.7
0.7
1 0.9
0.9
0.8
0.8
0.8
0.8
0.8
0.8
0.8
0.8
0.8
0.9
0.9
E4 0.7
0.7
0.8
1 0.7
0.8
0.7
0.6
0.7
0.7
0.7
0.7
0.8
0.8
0.8
0.8
0.7
0.7
E3 0.6
0.6
1 0.8
0.7
0.6
0.6
0.6
0.7
0.5
0.6
0.6
0.6
0.6
0.6
0.7
0.6
0.7
E2 0.8
1 0.6
0.7
0.7
0.8
0.7
0.7
0.7
0.7
0.7
0.7
0.7
0.8
0.8
0.7
0.7
0.7
E1 1 0.8
0.6
0.7
0.6
0.6
0.6
0.6
0.6
0.5
0.6
0.6
0.6
0.6
0.7
0.6
0.6
0.7
E1 E2 E3 E4 E5 E6 E7 E8 E9 E10
E11
E12
E13
E14
E15
E16
E17
E18
In this Sector Specific Group, we included 18 sectors, but theresults given above, show that the correlation coefficients ofso many sectors with other sectors are greater than 0.90. For example, the correlation coefficient of the sector Oil & Gas and Telecom is 0.92, which means that they are highly correlated and for the further analysis we can not treat them as different sectors. There are so many similar results in this correlation matrix.
ANNEXURE 5
QUESTIONNAIRE FOR EXECUTIVES
288
This is a pioneering effort being carried out for the firsttime in India to find out the factors that are aiding orhindering the establishment of project management curricula inour technical and business management institutions.
Based on secondary research of developed countries, a majorfinding that emerges is that project management as ascientific discipline is deeply entrenched in the educationalfabric of these countries; as also amongst popular psyche thusearning them an appellation of being ‘project-oriented societies’. Amajor reason for this may be attributed to project managementbeing included as necessary curricula in all streams ofeducation.
Universally, governments, large private corporations, and non-governmental organizations practice the ‘projects’ approach tofulfill their targets and goals. If so be the case, projectmanagement as a discipline would have had a much higheracceptance by the industry and Project Management (PM) courseswould have been taught in India’s technical and businessschools. The study from the point of view of educationalinstitutions is to determine the factors that affect theinclusion of project management curricula.
Survey Instructions
The survey is divided into four parts. The first part asks foryour background information. The second part aims atdiscovering your general opinion on project management (PM)curricula. The third part aims to identify any distinguishingfactors that characterize the specific PM curriculumdevelopment. The fourth part deals with finding out about theexisting educational infrastructure available withinstitutions and also management support available to theinstitutions to establish new courses. Also covered areregulatory aspects that affect the decision-making and launchof new curricula. For every question, you are asked to providea tick/score as per your opinion.
289

This research does not involve any sensitive issues. It isdesigned to gather information based on your personalexperience, knowledge and opinion alone. It will not be takento represent or reflect your institution’s view-points. Theinformation provided will be kept strictly confidential andwill be used solely for the purposes of this research. If youhave any comments or enquiries, please contact Dr. Mona N.Shah at [email protected] or 020 27291342/ 65102745.
Thank you for your interest.
290
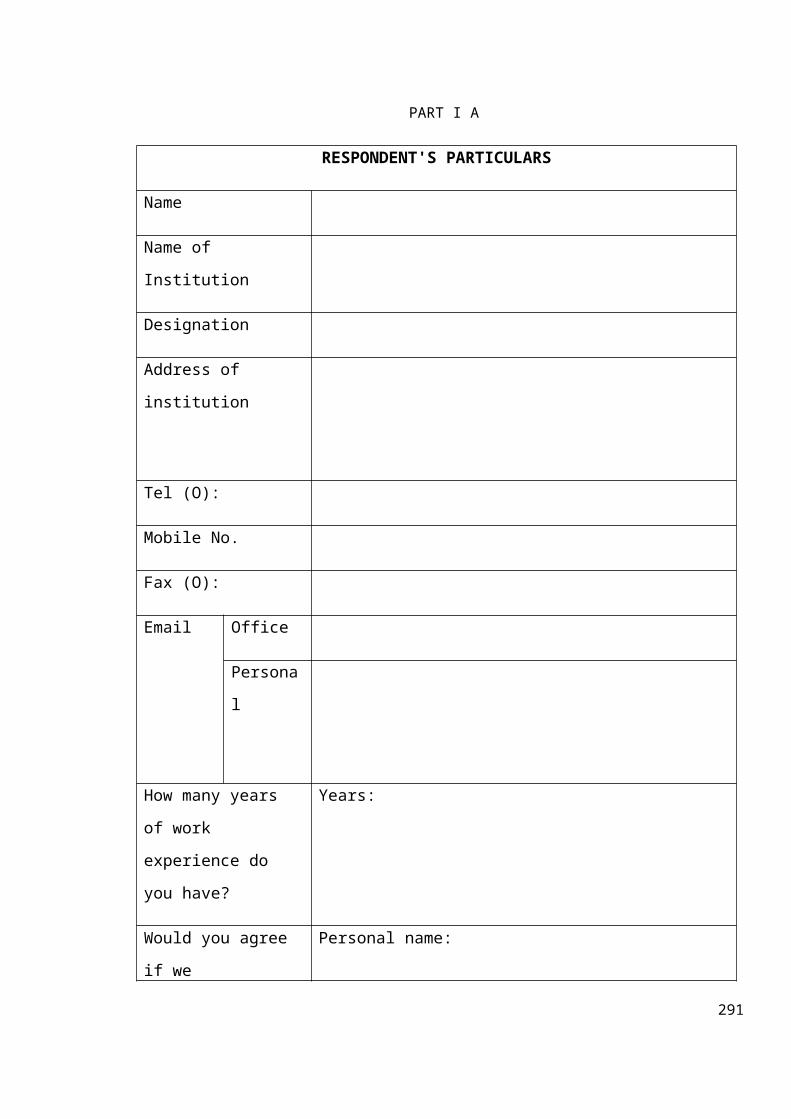
PART I A
RESPONDENT'S PARTICULARS
Name
Name of
Institution
Designation
Address of
institution
Tel (O):
Mobile No.
Fax (O):
Email Office
Persona
l
How many years
of work
experience do
you have?
Years:
Would you agree
if we
Personal name:
291
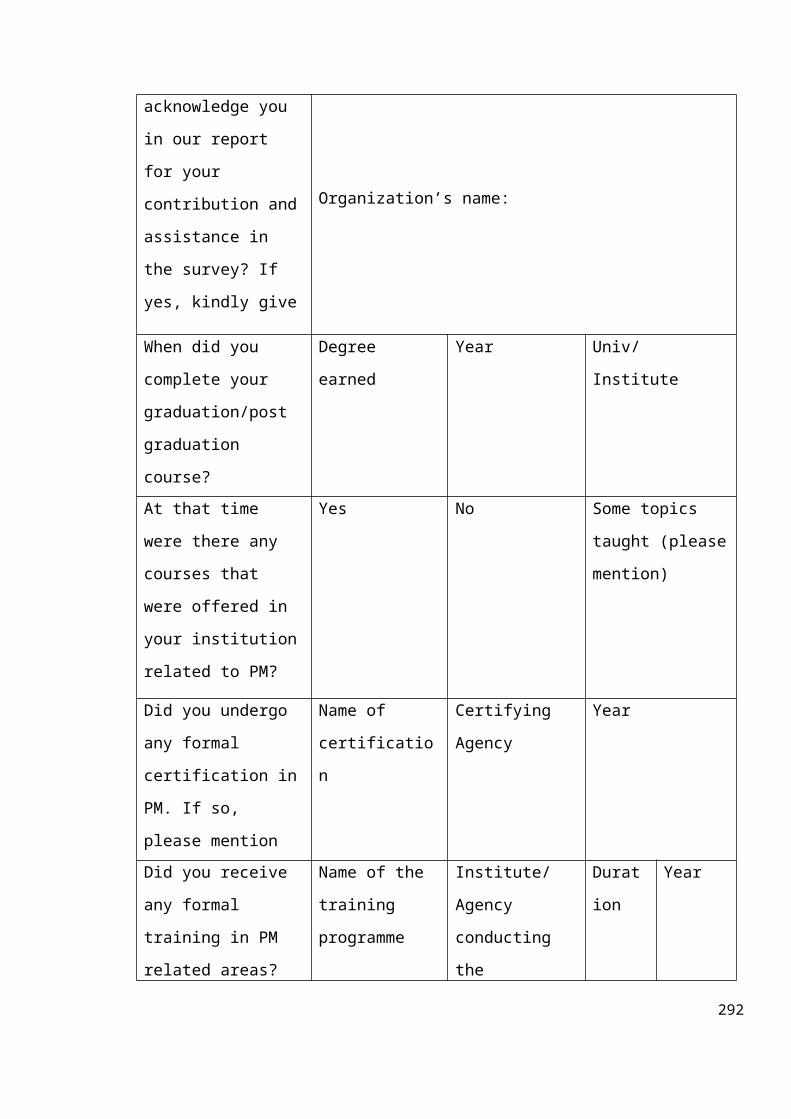
acknowledge you
in our report
for your
contribution and
assistance in
the survey? If
yes, kindly give
Organization’s name:
When did you
complete your
graduation/post
graduation
course?
Degree
earned
Year Univ/
Institute
At that time
were there any
courses that
were offered in
your institution
related to PM?
Yes No Some topics
taught (please
mention)
Did you undergo
any formal
certification in
PM. If so,
please mention
Name of
certificatio
n
Certifying
Agency
Year
Did you receive
any formal
training in PM
related areas?
Name of the
training
programme
Institute/
Agency
conducting
the
Durat
ion
Year
292

If so please
mention.
programme
PART IB
Have you been involved as aproject team member/leader in
a project in any of thefollowing areas? (Tick the
appropriate choice)
Conceptualisation
Design
Planning
Engineering
Execution
Commissioning
Please state the
1) name of project2) size in rupees3) year of starting4) year of completion5) client 6) your role in the project
team7) period of involvement in
project8) major techniques you used
for e.g. PERT/CPM/Decision tree/ Fish bone/Arrow Diagram
9) major skills you found useful
For more than one project, please fill out the rest of the
details in the space provided at the end of the form.
PART IC
Have you been invited to
teach Project Management by
any college /institute /In-
house management training
centre If so, please mention
1) Course/ Module taught:
2) College/Institute/In-house
MDP centre:
3) Class for which taught:
293

4) Year of teaching:
5) No. of sessions taught:
6) If any test/evaluation was
conducted after teaching:
For more than one institution/module/course, please fill out the rest of the details in the space provided at the end of the form.
294
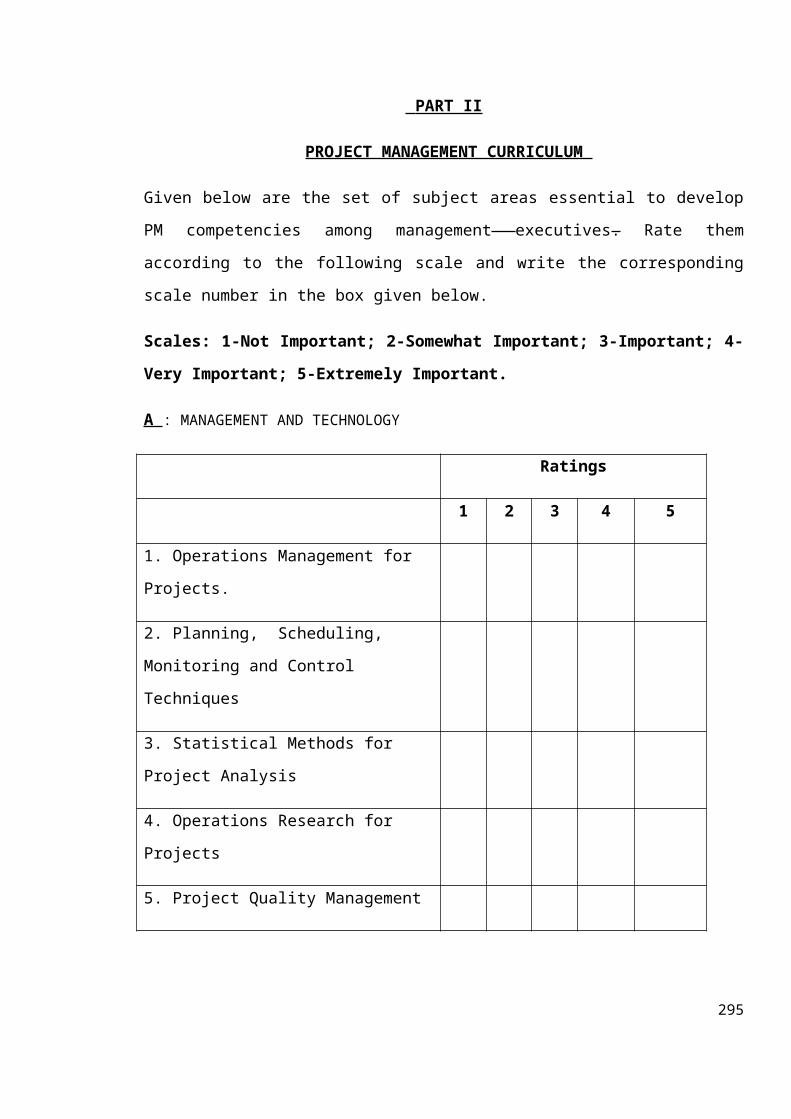
PART II
PROJECT MANAGEMENT CURRICULUM
Given below are the set of subject areas essential to develop
PM competencies among management executives. Rate them
according to the following scale and write the corresponding
scale number in the box given below.
Scales: 1-Not Important; 2-Somewhat Important; 3-Important; 4-
Very Important; 5-Extremely Important.
A : MANAGEMENT AND TECHNOLOGY
Ratings
1 2 3 4 5
1. Operations Management for
Projects.
2. Planning, Scheduling,
Monitoring and Control
Techniques
3. Statistical Methods for
Project Analysis
4. Operations Research for
Projects
5. Project Quality Management
295

6. Health/Safety/Environment
in Projects
7. Cost Estimation and
budgeting
8.Accounting and Control
Systems
9. Quantity Surveying and
Estimation
10. Projects Marketing
11. Project Site and Equipment
Management.
12. Project Procurement &
Materials Management
13. Contract Management
14. Process
Design./Engineering/Testing/Co
mmissioning
15. Facilities Engineering and
Management
16. Logistics & Supply Chain
Management
17. Transportation Management
296

18. Technology and Engineering
Management
19. Project Formulation and
Appraisal
20. Project Engineering
21. Any other ( Please specify
)
B: BEHAVIOURAL SCIENCES AREA
Ratings
1 2 3 4 5
1. Project Organization
and Structure
2. Managerial Skills for
Projects (Communication,
Leadership, Team Building,
Negotiation, other soft
skills)
3. Human Resources
Management in Projects
4. Industrial/Labour
Relations
297
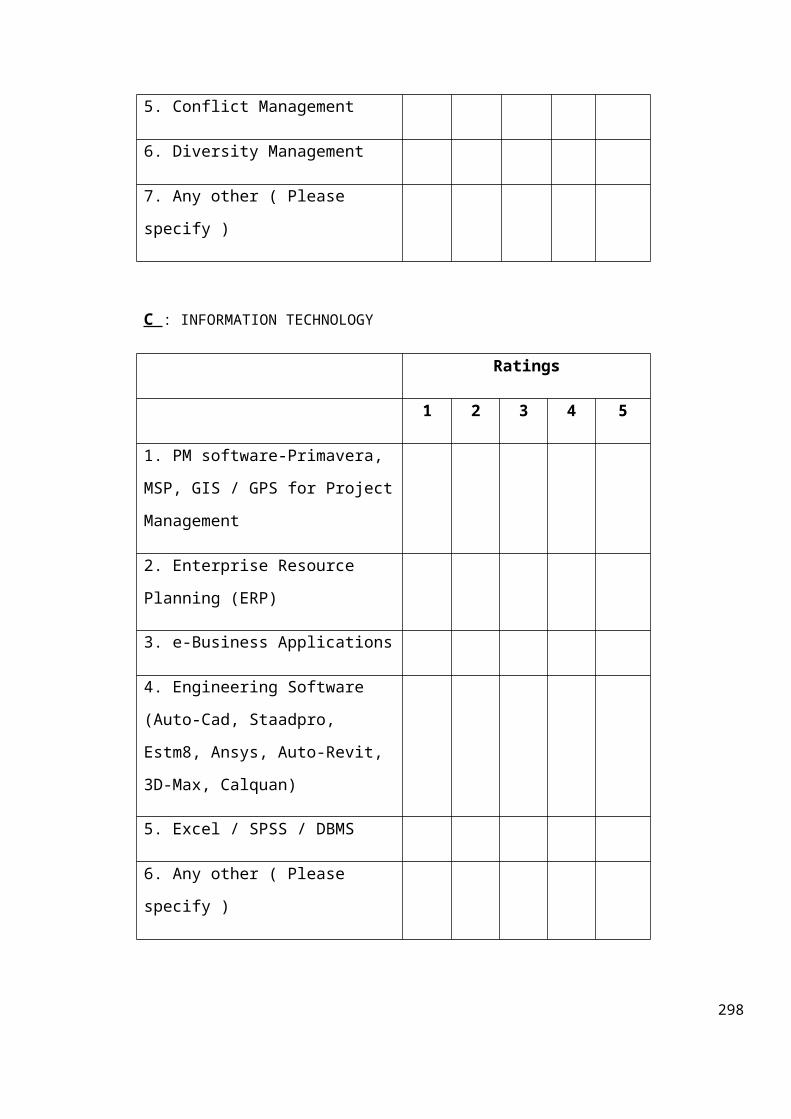
5. Conflict Management
6. Diversity Management
7. Any other ( Please
specify )
C : INFORMATION TECHNOLOGY
Ratings
1 2 3 4 5
1. PM software-Primavera,
MSP, GIS / GPS for Project
Management
2. Enterprise Resource
Planning (ERP)
3. e-Business Applications
4. Engineering Software
(Auto-Cad, Staadpro,
Estm8, Ansys, Auto-Revit,
3D-Max, Calquan)
5. Excel / SPSS / DBMS
6. Any other ( Please
specify )
298
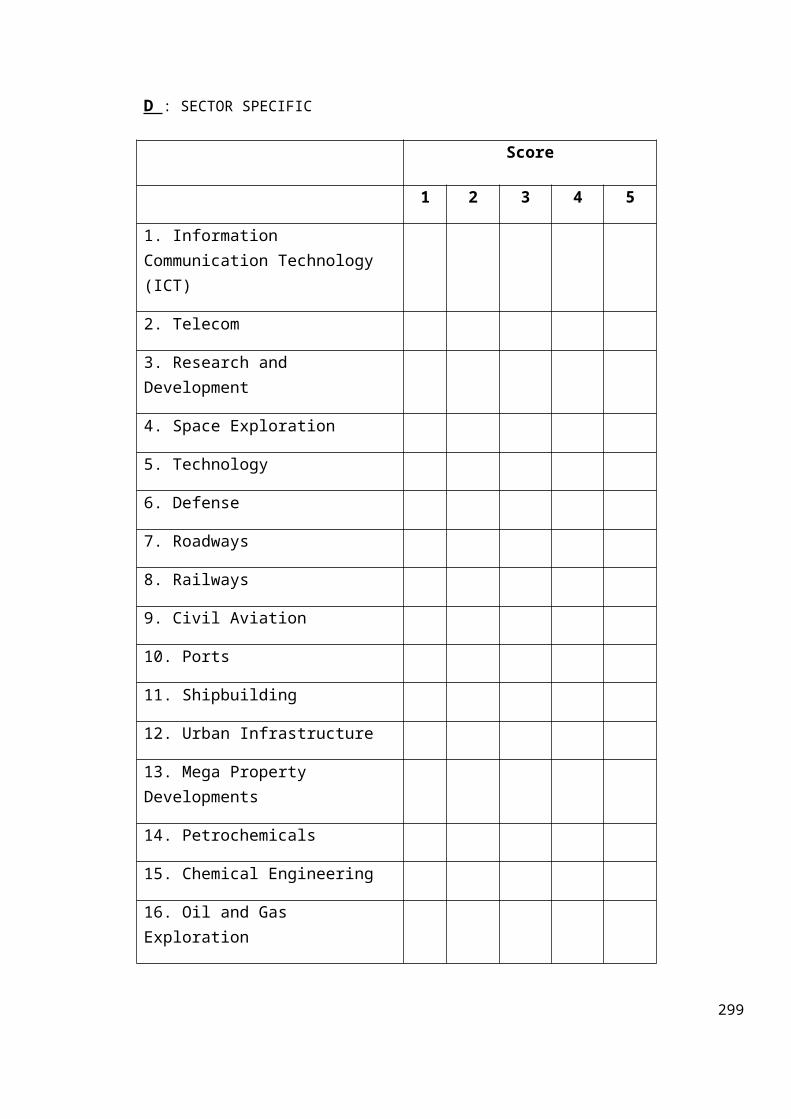
D : SECTOR SPECIFIC
Score
1 2 3 4 5
1. Information Communication Technology (ICT)
2. Telecom
3. Research and Development
4. Space Exploration
5. Technology
6. Defense
7. Roadways
8. Railways
9. Civil Aviation
10. Ports
11. Shipbuilding
12. Urban Infrastructure
13. Mega Property Developments
14. Petrochemicals
15. Chemical Engineering
16. Oil and Gas Exploration
299

17. Services
18. International Project Management
19. Any other ( Please specify )
300
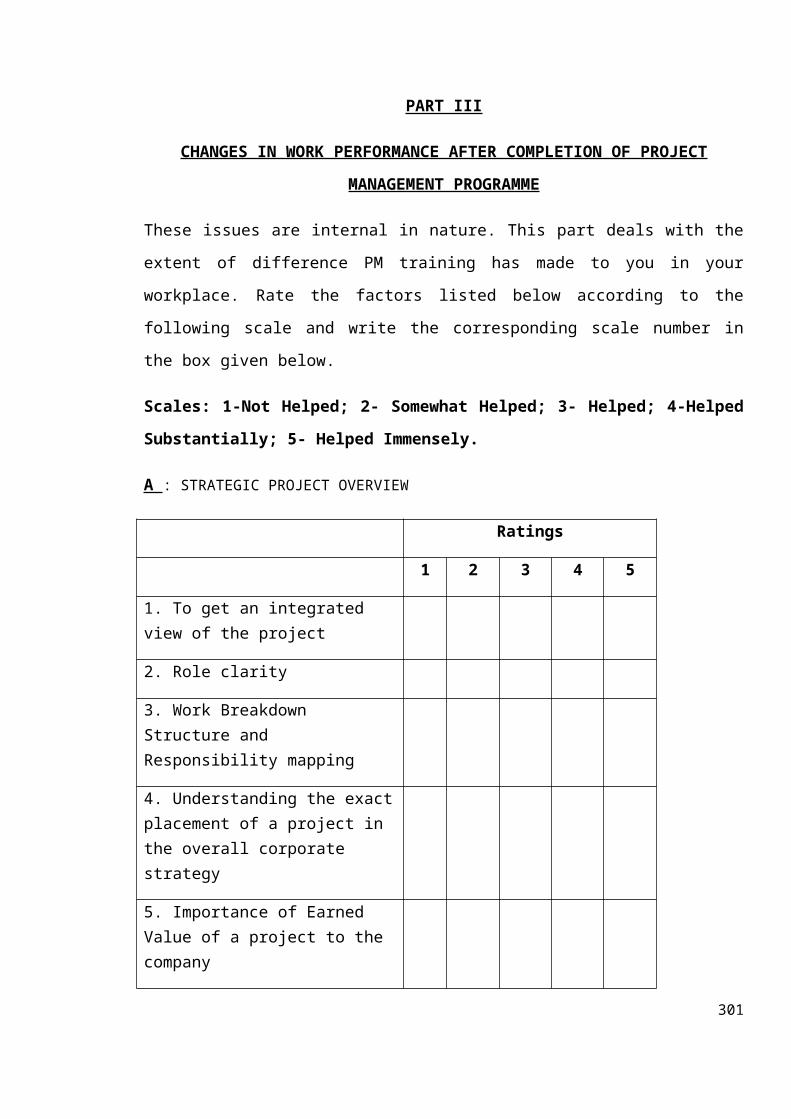
PART III
CHANGES IN WORK PERFORMANCE AFTER COMPLETION OF PROJECT
MANAGEMENT PROGRAMME
These issues are internal in nature. This part deals with the
extent of difference PM training has made to you in your
workplace. Rate the factors listed below according to the
following scale and write the corresponding scale number in
the box given below.
Scales: 1-Not Helped; 2- Somewhat Helped; 3- Helped; 4-Helped
Substantially; 5- Helped Immensely.
A : STRATEGIC PROJECT OVERVIEW
Ratings
1 2 3 4 5
1. To get an integrated view of the project
2. Role clarity
3. Work Breakdown Structure and Responsibility mapping
4. Understanding the exactplacement of a project in the overall corporate strategy
5. Importance of Earned Value of a project to the company
301
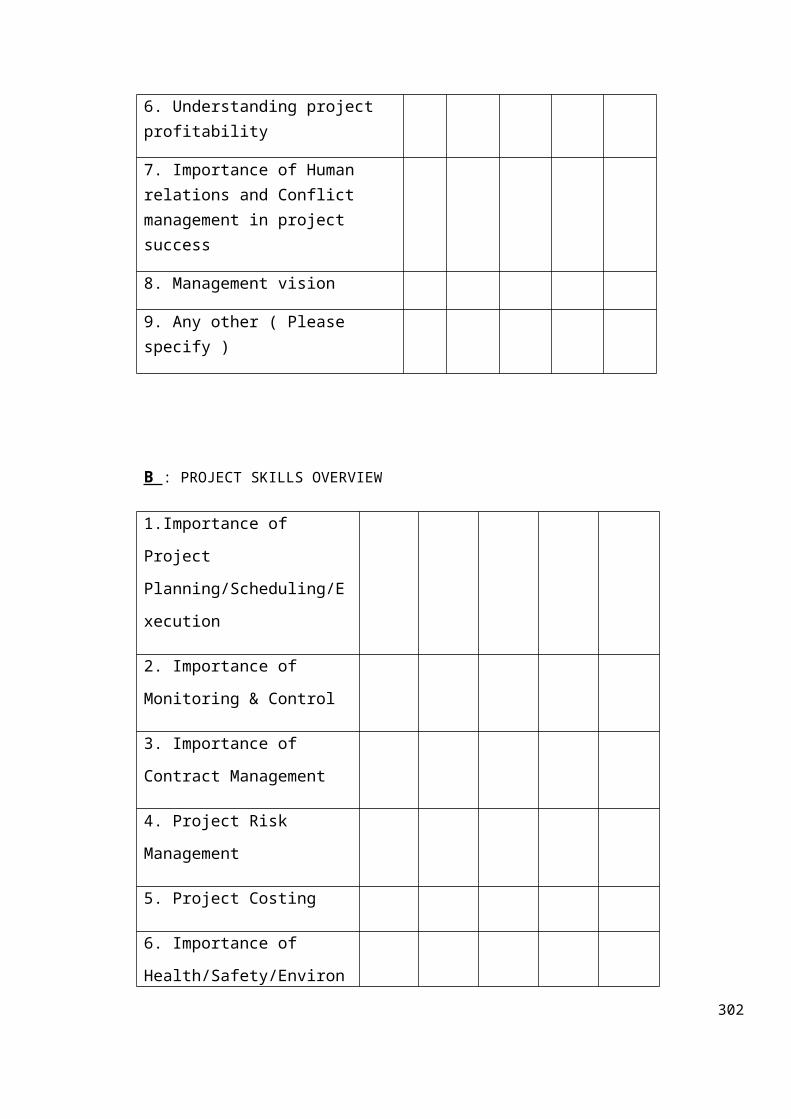
6. Understanding project profitability
7. Importance of Human relations and Conflict management in project success
8. Management vision
9. Any other ( Please specify )
B : PROJECT SKILLS OVERVIEW
1.Importance of
Project
Planning/Scheduling/E
xecution
2. Importance of
Monitoring & Control
3. Importance of
Contract Management
4. Project Risk
Management
5. Project Costing
6. Importance of
Health/Safety/Environ
302
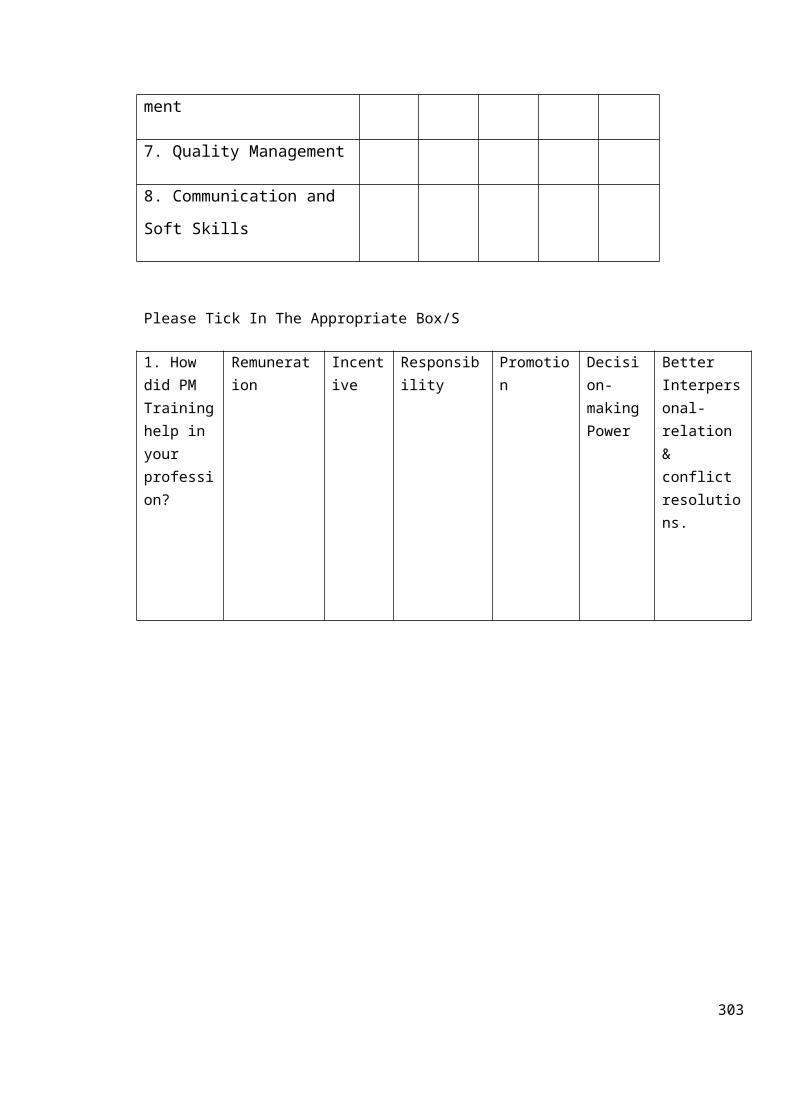
ment
7. Quality Management
8. Communication and
Soft Skills
Please Tick In The Appropriate Box/S
1. How did PM Traininghelp in your profession?
Remuneration
Incentive
Responsibility
Promotion
Decision-makingPower
Better Interpersonal-relation & conflict resolutions.
303

PART IV
CURRENT POSITION OF PROJECT MANAGEMENT IN INDIA
This section deals with your opinion regarding the current
position of PM related education offered in the academic
institutions.
To what extent in your opinion are the factors given below
affecting PM education from taking root in India. Rate them
according to the following scale and write the corresponding
scale number in the box given below.
Scales: 1-Not Important; 2-Somewhat Important; 3-Important; 4-
Very Important; 5-Extremely Important.
Ratings
1 2 3 4 5
1. Lack of awareness amongststudents and educators.
2. Lack of trained instructors at the undergraduateand postgraduate level.
3. Being a practical field it cannot be ‘taught’ in the classroom.
4. Mastery comes only from
304

practical experience.
5. Prior knowledge not essential in working in this field.
INTERVIEWER’S DETAILS
Name:
Signature:
Date:
Time:
PART IB
305
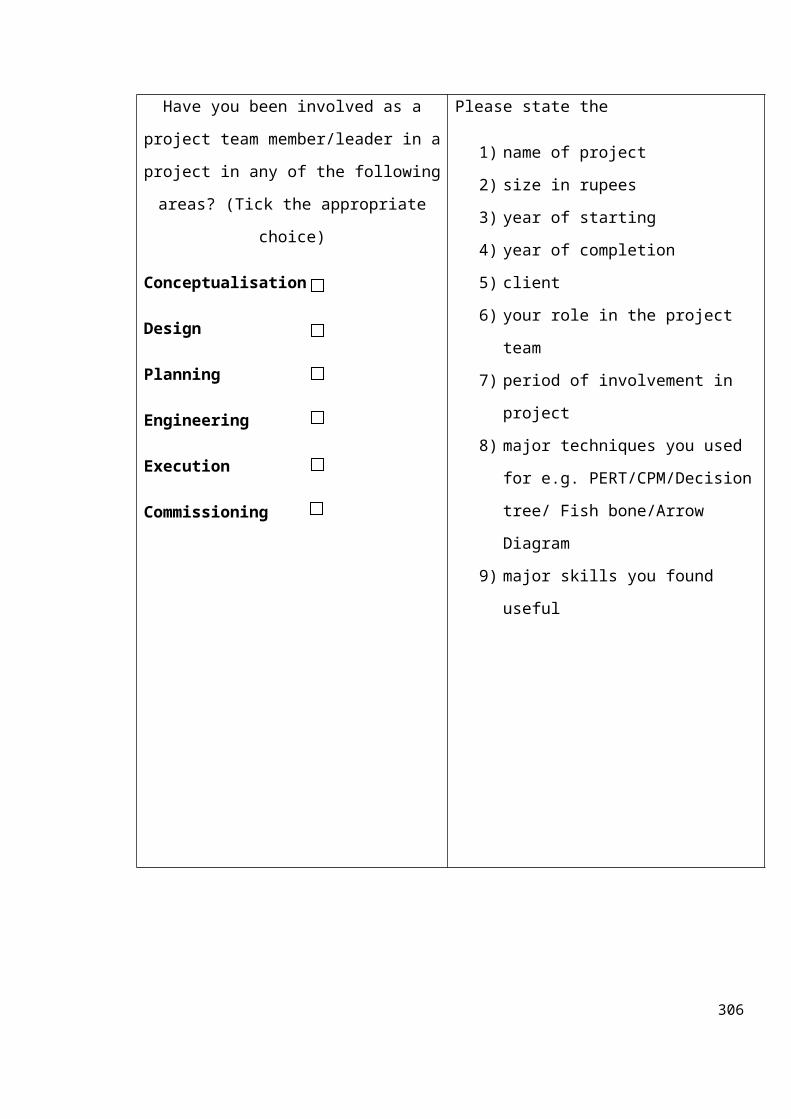
Have you been involved as a
project team member/leader in a
project in any of the following
areas? (Tick the appropriate
choice)
Conceptualisation
Design
Planning
Engineering
Execution
Commissioning
Please state the
1) name of project
2) size in rupees
3) year of starting
4) year of completion
5) client
6) your role in the project
team
7) period of involvement in
project
8) major techniques you used
for e.g. PERT/CPM/Decision
tree/ Fish bone/Arrow
Diagram
9) major skills you found
useful
306

PART IC
Have you been invited to
teach Project Management by
any college /institute /In-
house management training
centre. If so, please
mention
1) Course/ Module taught:
2) College/Institute/In house MDP
centre:
3) Class for which taught:
4) Year of teaching:
5) No. of sessions taught:
6) If any test/evaluation was
conducted after teaching:
307

ANNEXURE 6
QUESTIONNAIRE FOR HUMAN RESOURCE MANAGERS
This is a pioneering effort being carried out for the first time in India to find out the factors that are aiding or hindering the establishment of project management curricula inour technical and business management institutions.
Based on secondary research of developed countries, a majorfinding that emerges is that project management as ascientific discipline is deeply entrenched in the educationalfabric of these countries; as also amongst popular psyche thusearning them an appellation of being ‘project-oriented societies’. Amajor reason for this may be attributed to project managementbeing included as necessary curricula in all streams ofeducation.
Universally, governments, large private corporations, and non-governmental organizations practice the ‘projects’ approach tofulfill their targets and goals. If so be the case, projectmanagement as a discipline would have had a much higheracceptance by the industry and Project Management (PM) courseswould have been taught in India’s technical and businessschools. The study from the point of view of educationalinstitutions is to determine the factors that affect theinclusion of project management curricula.
Survey Instructions
The survey is divided into four parts. The first part asks foryour background information. The second part aims atdiscovering your general opinion on project management (PM)curricula. The third part aims to identify any distinguishingfactors that characterize the specific PM curriculumdevelopment. The fourth part deals with finding out about theexisting educational infrastructure available withinstitutions and also management support available to theinstitutions to establish new courses. Also covered are
308

regulatory aspects that affect the decision-making and launchof new curricula. For every question, you are asked to providea tick/score as per your opinion.
This research does not involve any sensitive issues. It isdesigned to gather information based on your personalexperience, knowledge and opinion alone. It will not be takento represent or reflect your institution’s view-points. Theinformation provided will be kept strictly confidential andwill be used solely for the purposes of this research. If youhave any comments or enquiries, please contact Dr. Mona N.Shah at [email protected] or 020 27291342/ 65102745.
Thank you for your interest.
309
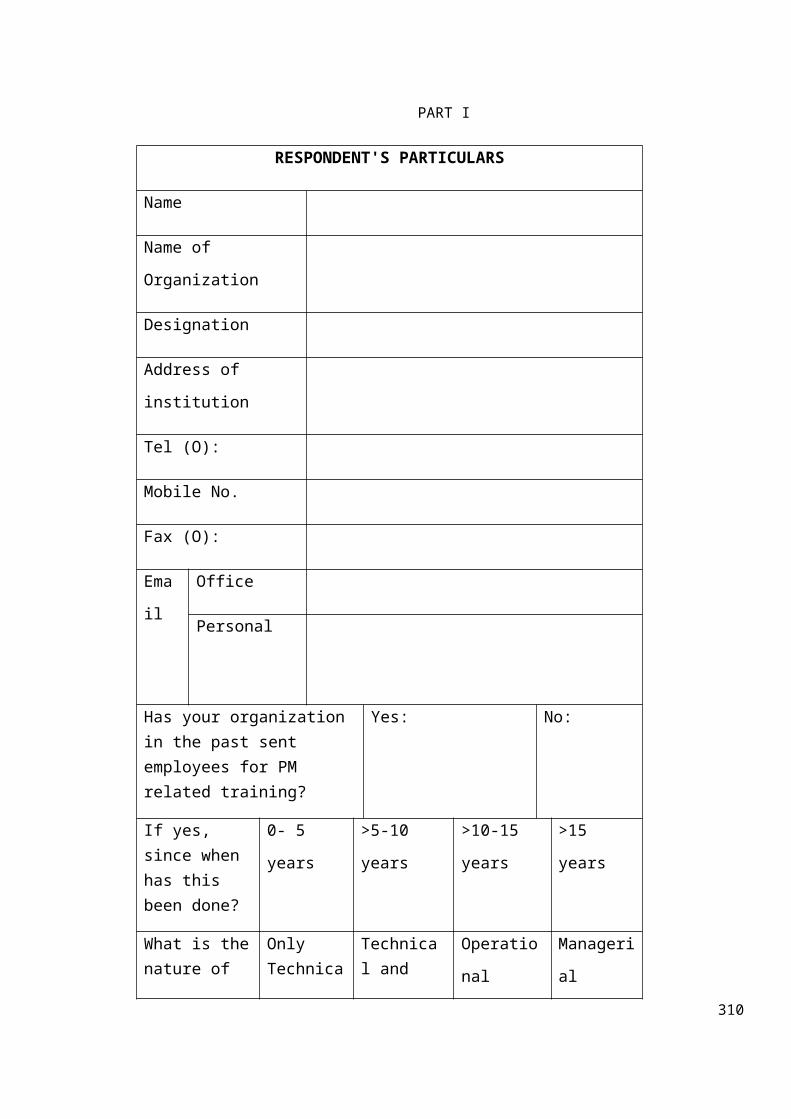
PART I
RESPONDENT'S PARTICULARS
Name
Name of
Organization
Designation
Address of
institution
Tel (O):
Mobile No.
Fax (O):
Ema
il
Office
Personal
Has your organization in the past sent employees for PM related training?
Yes: No:
If yes, since when has this been done?
0- 5
years
>5-10
years
>10-15
years
>15
years
What is thenature of
Only Technica
Technical and
Operatio
nal
Manageri
al
310
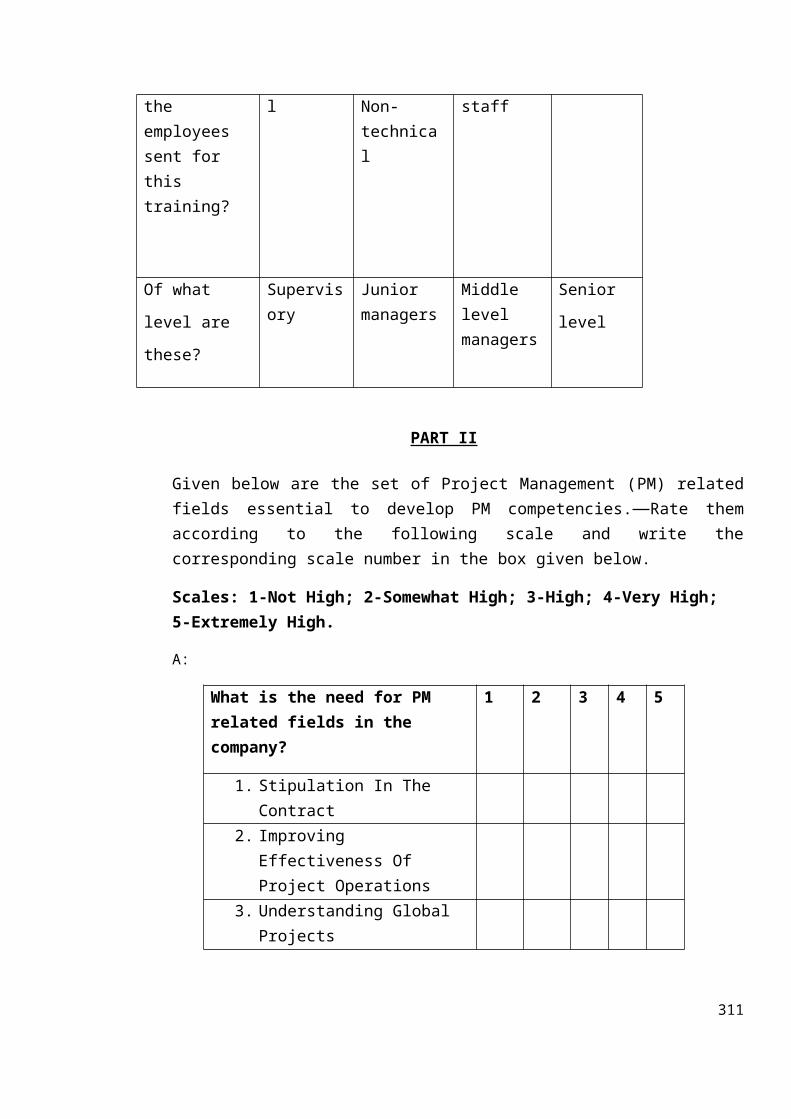
the employees sent for this training?
l Non-technical
staff
Of what
level are
these?
Supervisory
Junior managers
Middle level managers
Senior
level
PART II
Given below are the set of Project Management (PM) relatedfields essential to develop PM competencies. Rate themaccording to the following scale and write thecorresponding scale number in the box given below.
Scales: 1-Not High; 2-Somewhat High; 3-High; 4-Very High; 5-Extremely High.
A:
What is the need for PM related fields in the company?
1 2 3 4 5
1. Stipulation In The Contract
2. Improving Effectiveness Of Project Operations
3. Understanding Global Projects
311
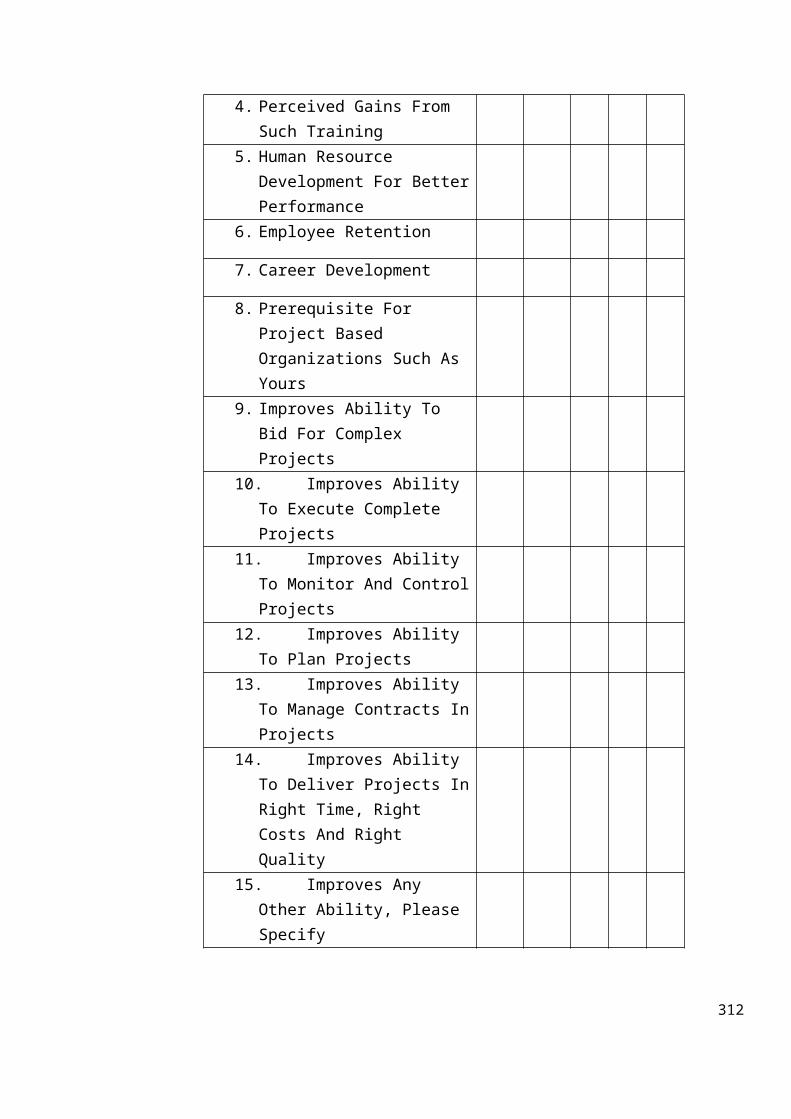
4. Perceived Gains From Such Training
5. Human Resource Development For BetterPerformance
6. Employee Retention
7. Career Development
8. Prerequisite For Project Based Organizations Such As Yours
9. Improves Ability To Bid For Complex Projects
10. Improves Ability To Execute Complete Projects
11. Improves Ability To Monitor And ControlProjects
12. Improves Ability To Plan Projects
13. Improves Ability To Manage Contracts InProjects
14. Improves Ability To Deliver Projects InRight Time, Right Costs And Right Quality
15. Improves Any Other Ability, Please Specify
312
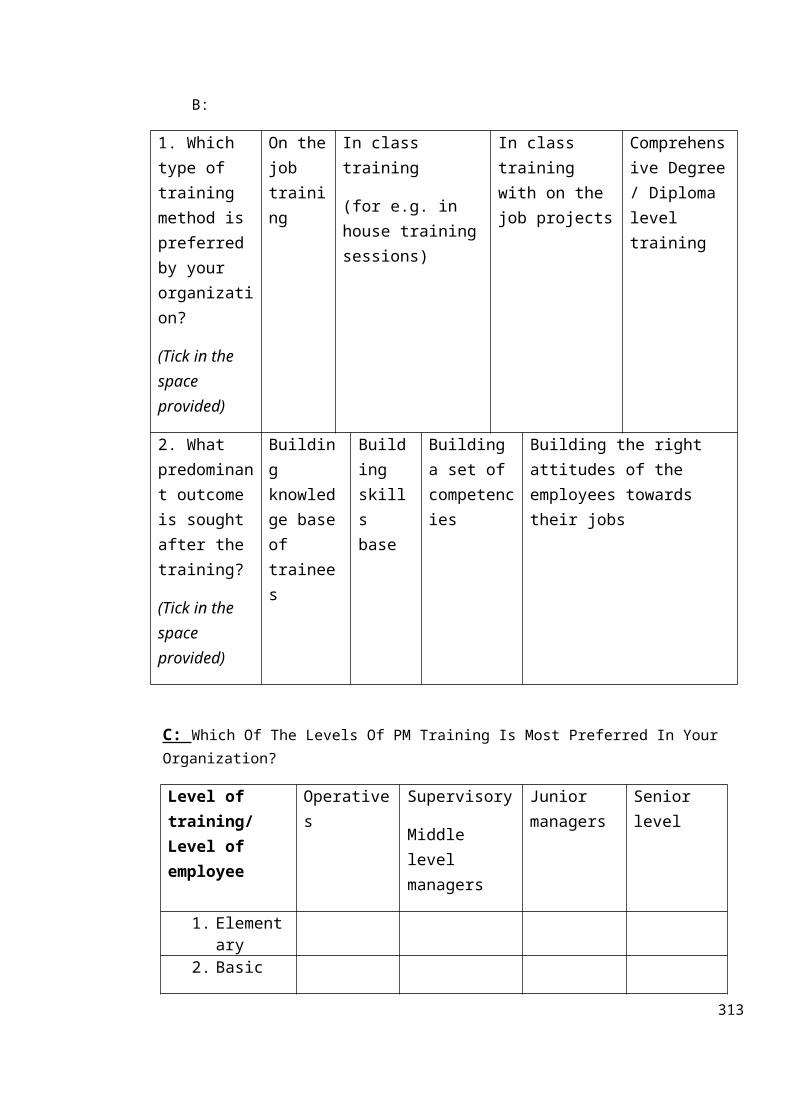
B:
1. Which type of training method is preferred by your organization?
(Tick in the space provided)
On thejob training
In class training
(for e.g. in house trainingsessions)
In class training with on the job projects
Comprehensive Degree/ Diploma level training
2. What predominant outcome is sought after the training?
(Tick in the space provided)
Building knowledge baseof trainees
Building skills base
Building a set of competencies
Building the right attitudes of the employees towards their jobs
C: Which Of The Levels Of PM Training Is Most Preferred In Your Organization?
Level of training/ Level of employee
Operatives
Supervisory
Middle level managers
Junior managers
Senior level
1. Elementary
2. Basic
313
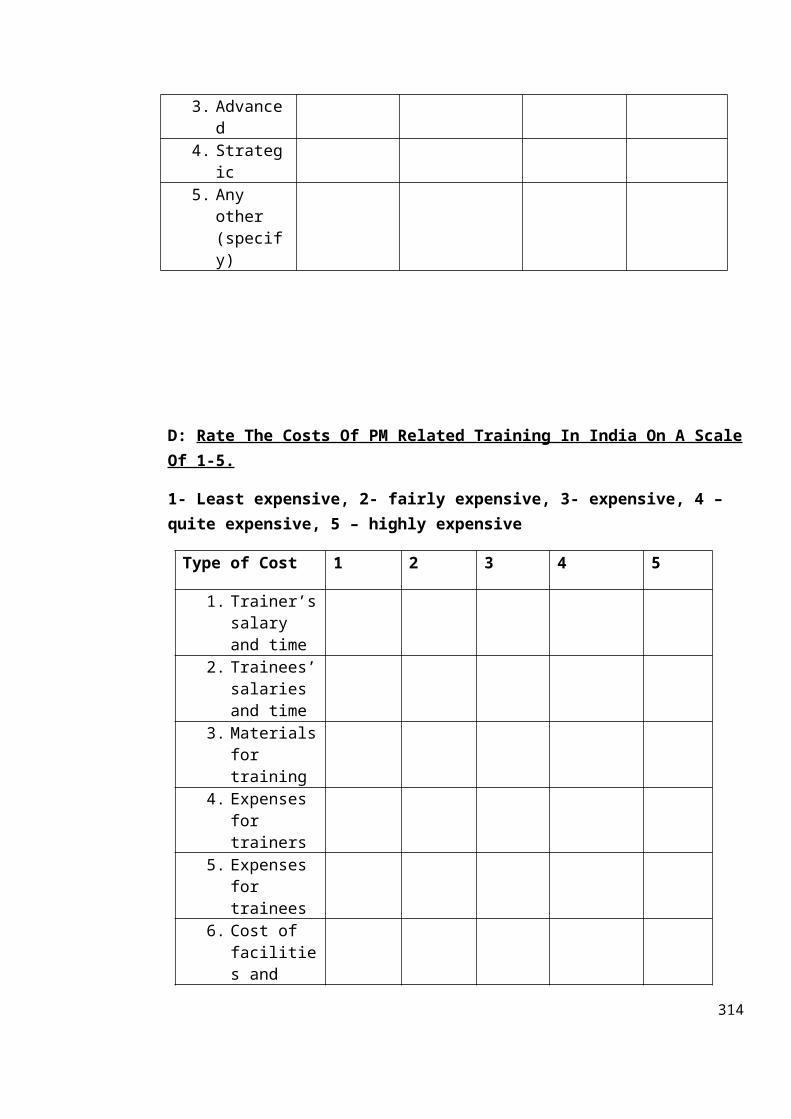
3. Advanced
4. Strategic
5. Any other (specify)
D: Rate The Costs Of PM Related Training In India On A ScaleOf 1-5.
1- Least expensive, 2- fairly expensive, 3- expensive, 4 – quite expensive, 5 – highly expensive
Type of Cost 1 2 3 4 5
1. Trainer’ssalary and time
2. Trainees’salaries and time
3. Materialsfor training
4. Expenses for trainers
5. Expenses for trainees
6. Cost of facilities and
314

equipment7. Lost
productivity
E: Rate The Benefits Of PM Related Training In India On A Scale Of 1-5. 1- Least beneficial, 2- fairly beneficial, 3- beneficial,, 4 –quite beneficial, 5 – highly beneficial
Benefits 1 2 3 4 5
1. Increase in production/performance
2. Reduction in errors and improvement of safety standards
3. Employee Retention
4. Less supervision necessary
5. Ability to use new skills and capabilities
6. Improved delivery performance in terms of cost, time and quality
7. Attitude changes
8. Growth of business opportunities
F: Express Your Opinion On The Efficacy Of Training Imparted By The Following Training Entities On Scale Of 1-5.
315
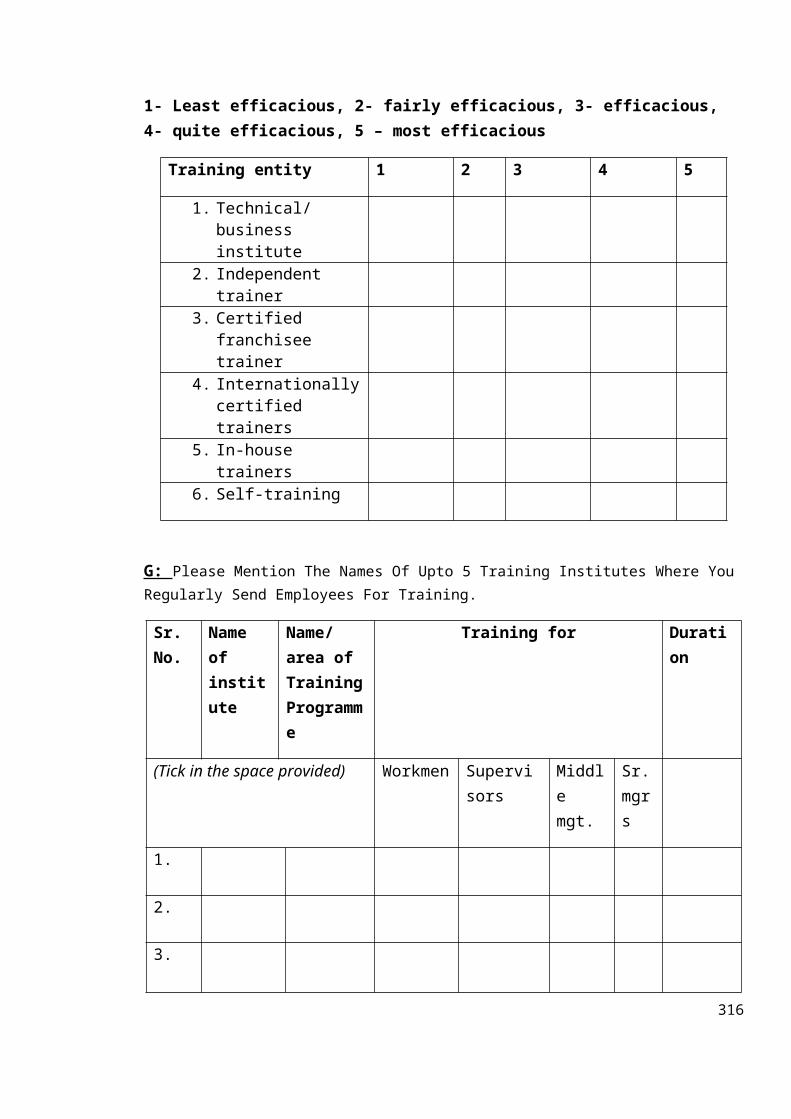
1- Least efficacious, 2- fairly efficacious, 3- efficacious, 4- quite efficacious, 5 – most efficacious
Training entity 1 2 3 4 5
1. Technical/business institute
2. Independent trainer
3. Certified franchisee trainer
4. Internationallycertified trainers
5. In-house trainers
6. Self-training
G: Please Mention The Names Of Upto 5 Training Institutes Where You Regularly Send Employees For Training.
Sr. No.
Name of institute
Name/area of TrainingProgramme
Training for Duration
(Tick in the space provided) Workmen Supervisors
Middle mgt.
Sr.mgrs
1.
2.
3.
316

4.
5.
H: If PM Training Of Your Employees Was Accompanied By An International Accreditation Would It Be More Valuable And Beneficial To Your Organization?
□ Yes
□ No
□ Maybe
INTERVIEWER’S DETAILS
Name:
Signature:
Date:
Time:
317

ANNEXURE 7
MODEL COURSE CURRICULUM DESIGNS IN UNDERGRADUATE PROGRAMMES OFTECHNICAL AND BUSINESS MANAGEMENT SCHOOLS
In this section some suggested outlines and curricula for
offering PM courses at various levels like Basic, Advanced and
Proficiency, for engineering, general management and working
executives have been described. Various degrees of experience
and prior exposure to PM of the students have been considered
to arrive at the model course outlines.
1. PROJECT MANAGEMENT ESSENTIALS IN ENGINEERING
Course Objective: To introduce the engineering students
to the discipline of PM in industry and application of PM
skills to improve performance on projects.
Student Profile: This is suggested as an Introductory
(Level 1) course and the target audience is students
undergoing engineering courses having no formal
background in project management
318

Course Mix: All compulsory with a total of 10 subjects to becovered over an annual academic calendar
S. No. Subject Description
1 Role of PM Department in EngineeringCompanies
2 Project Planning, Network Scheduling,and Monitoring Techniques
3 Introduction to Project Management Software
4 Basics in Procurement, Tendering, Bidding, Contracting
5 Project Equipment Purchase, Stores and Inventory Management
6 Project Quality
7 Project Safety, Health and Environment
8 Project Site Management and Control
9 Basics of Project Cost Accounting
10 Integrated Project Workshop - Assignments
11 Tests and assessments
Course Duration: One academic calendar year.2. PROJECT MANAGEMENT ESSENTIALS IN GENERAL MANAGEMENT
Course Objective: The objective of this course is to
provide all students with essential PM skills that can
be applied across all sectors to plan, schedule,
implement and control projects.
319

Student Profile: This is suggested as an Introductory
(Level 1) course, and the target audience is students
undergoing General Management Programmes with some or
no prior work experience.
Course Mix: A mix of compulsory and electives subjects witha total of 10 courses based upon the educational background
of the student i.e. non-technical and technical.
S. No. Subject Description1 Key People Skills for Project Managers2 Role of PM in Organisations
3 Project Costing & Funds Management
4 Project Planning, Scheduling, Monitoring and Controlling
5 Introduction to Project Management Software
6 Organising for Project Management
7 Project Safety Management
8 Project Quality Management
9Basics of Tendering, Bidding, Contracting, Procurement and Claims Management
10* Project Site Management and Control
11* Equipment Management
12* Role of PM Department in Engineering Companies
13 Legal and Taxation Aspects of Projects
14 Innovation and Managing Project Life Cycle
15 Project Portfolio Management320
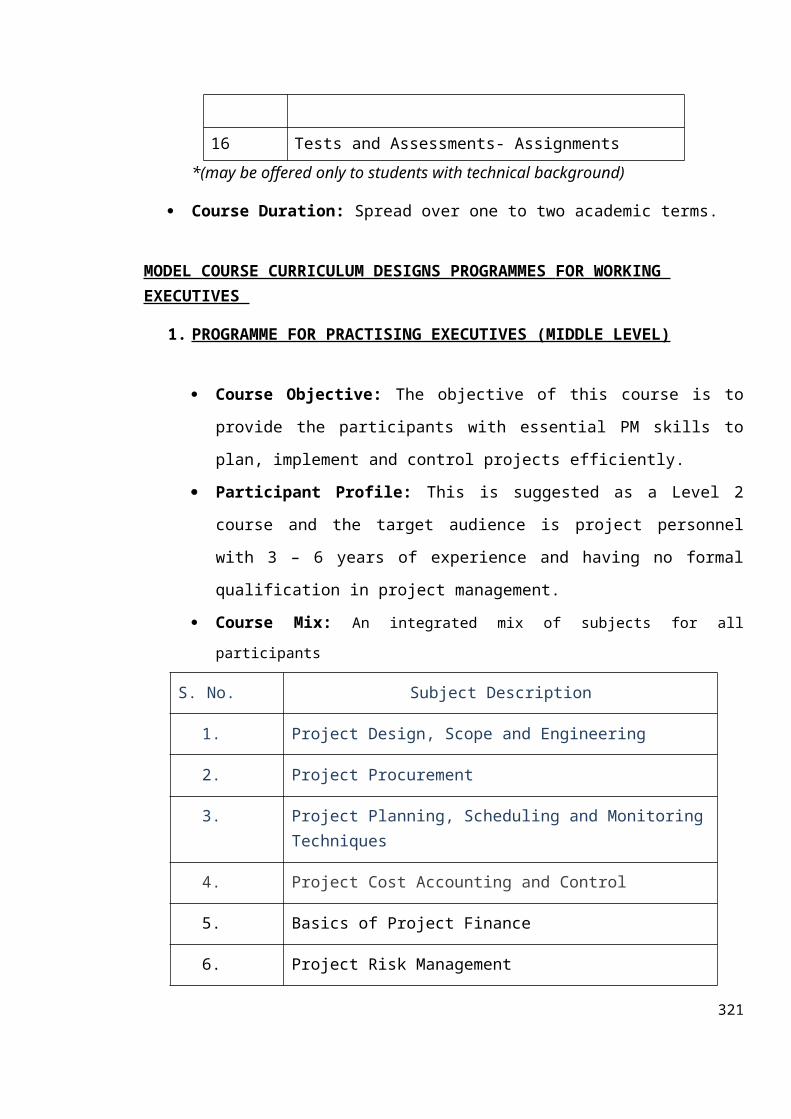
16 Tests and Assessments- Assignments *(may be offered only to students with technical background)
Course Duration: Spread over one to two academic terms.
MODEL COURSE CURRICULUM DESIGNS PROGRAMMES FOR WORKING EXECUTIVES
1. PROGRAMME FOR PRACTISING EXECUTIVES (MIDDLE LEVEL)
Course Objective: The objective of this course is to
provide the participants with essential PM skills to
plan, implement and control projects efficiently.
Participant Profile: This is suggested as a Level 2
course and the target audience is project personnel
with 3 – 6 years of experience and having no formal
qualification in project management.
Course Mix: An integrated mix of subjects for all
participants
S. No. Subject Description
1. Project Design, Scope and Engineering
2. Project Procurement
3. Project Planning, Scheduling and MonitoringTechniques
4. Project Cost Accounting and Control
5. Basics of Project Finance
6. Project Risk Management
321
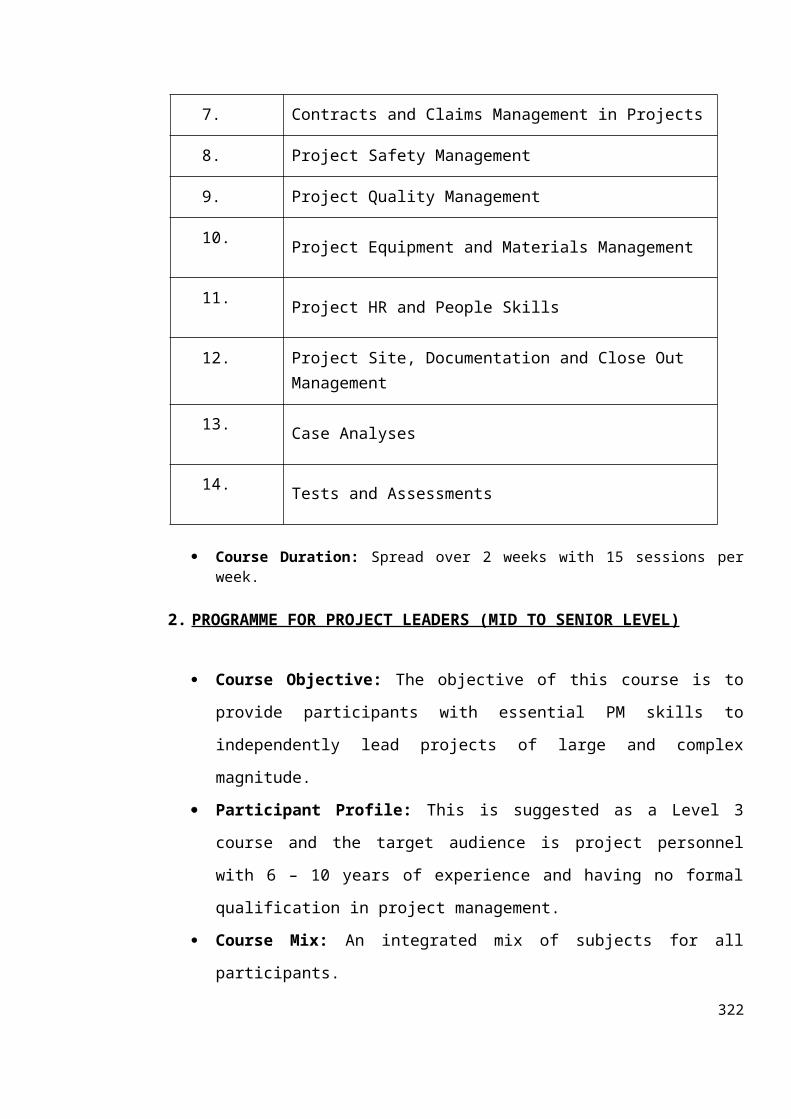
7. Contracts and Claims Management in Projects
8. Project Safety Management
9. Project Quality Management
10. Project Equipment and Materials Management
11. Project HR and People Skills
12. Project Site, Documentation and Close Out Management
13. Case Analyses
14. Tests and Assessments
Course Duration: Spread over 2 weeks with 15 sessions perweek.
2. PROGRAMME FOR PROJECT LEADERS (MID TO SENIOR LEVEL)
Course Objective: The objective of this course is to
provide participants with essential PM skills to
independently lead projects of large and complex
magnitude.
Participant Profile: This is suggested as a Level 3
course and the target audience is project personnel
with 6 – 10 years of experience and having no formal
qualification in project management.
Course Mix: An integrated mix of subjects for all
participants.
322
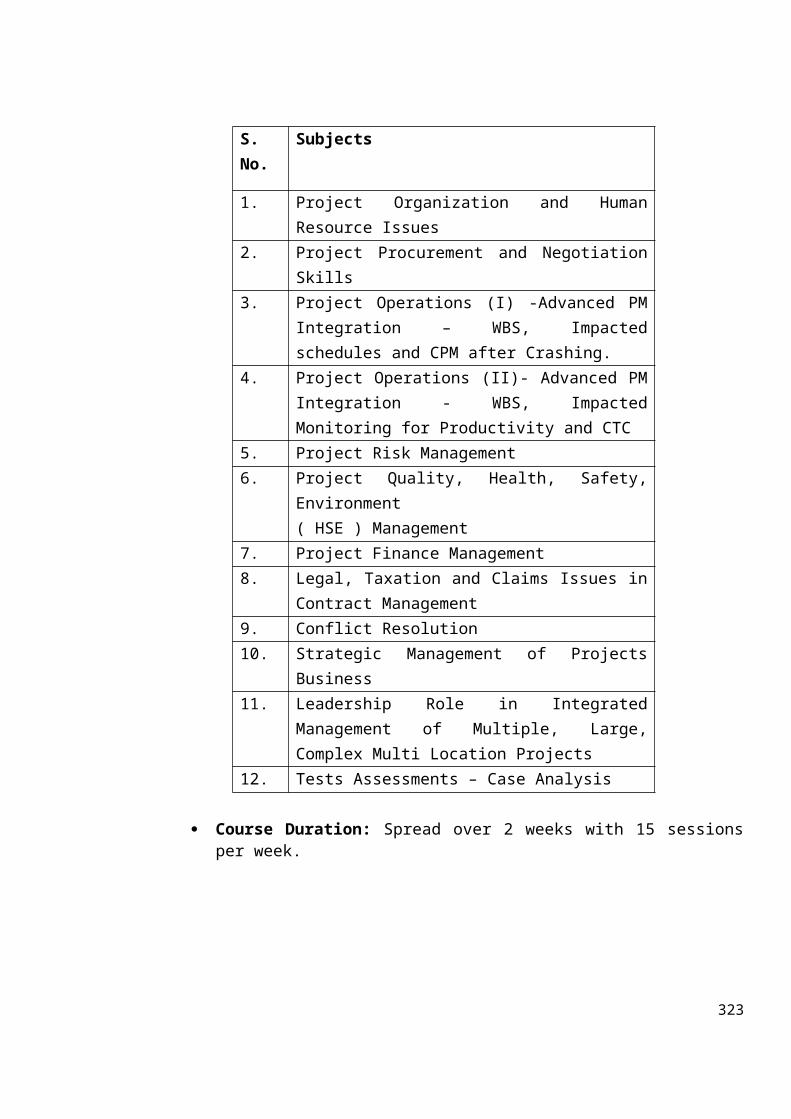
S.No.
Subjects
1. Project Organization and HumanResource Issues
2. Project Procurement and NegotiationSkills
3. Project Operations (I) -Advanced PMIntegration – WBS, Impactedschedules and CPM after Crashing.
4. Project Operations (II)- Advanced PMIntegration - WBS, ImpactedMonitoring for Productivity and CTC
5. Project Risk Management 6. Project Quality, Health, Safety,
Environment ( HSE ) Management
7. Project Finance Management8. Legal, Taxation and Claims Issues in
Contract Management 9. Conflict Resolution10. Strategic Management of Projects
Business11. Leadership Role in Integrated
Management of Multiple, Large,Complex Multi Location Projects
12. Tests Assessments – Case Analysis
Course Duration: Spread over 2 weeks with 15 sessionsper week.
323

3. PROGRAMME FOR SENIOR LEVEL EXECUTIVES OF PROJECT COMPANIES
Course Objective: To enable participants to appreciate
the strategic business contexts of projects and
formulate plans for growth, expansion and
diversification for project based companies.
Participant Profile: This is suggested as a Level 4
course and the target audience is project personnel
with more than 6 – 10 years of experience and having no
formal qualification in project management.
Course Mix: An integrated mix of subjects for all
participants.
S.No.
Subject Description
1. Leadership in Project Organisations2. Public Policy and Macro-Economic
Environment3. Advanced Project Operations
Management4. International Project Management –
Issues in multi-country projects5. Project Risk Management6. Global Procurement, SCM and
Technology Management for Projects7. Project Finance Management8. Conflict Resolution9. Project Portfolio Analysis10. Innovation and New Project
324
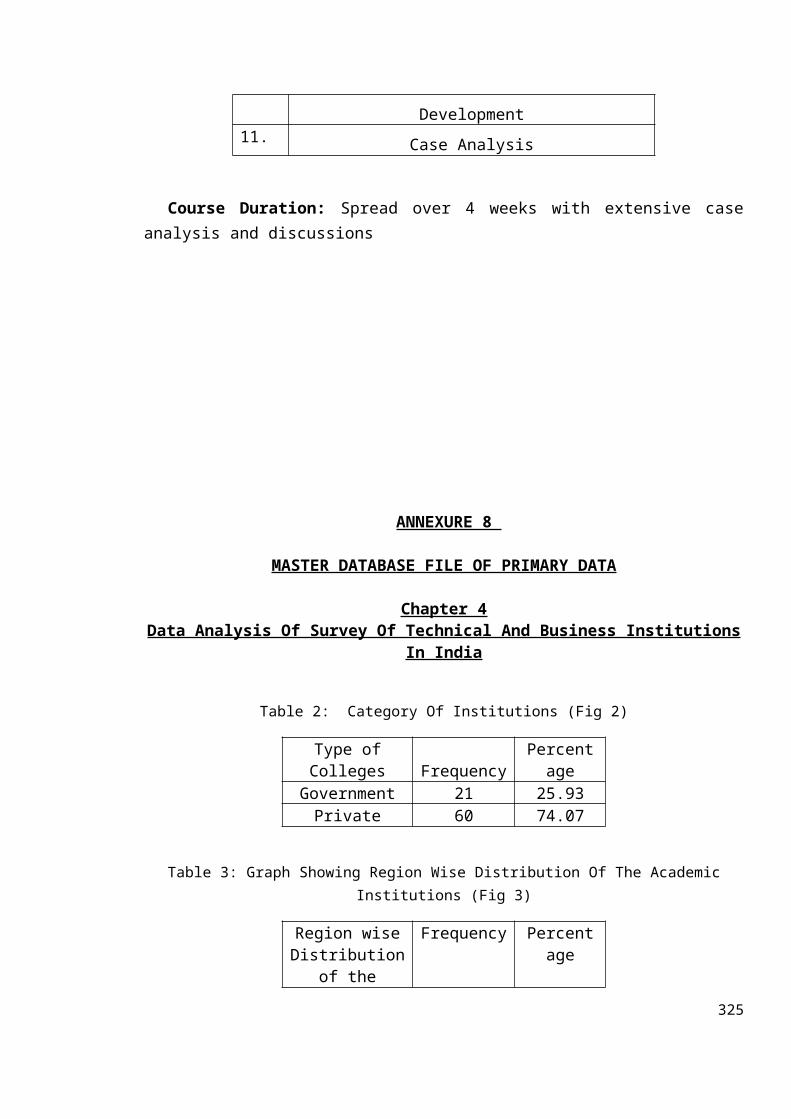
Development11. Case Analysis
Course Duration: Spread over 4 weeks with extensive caseanalysis and discussions
ANNEXURE 8
MASTER DATABASE FILE OF PRIMARY DATA
Chapter 4Data Analysis Of Survey Of Technical And Business Institutions
In India
Table 2: Category Of Institutions (Fig 2)
Type ofColleges Frequency
Percentage
Government 21 25.93Private 60 74.07
Table 3: Graph Showing Region Wise Distribution Of The AcademicInstitutions (Fig 3)
Region wiseDistribution
of the
Frequency Percentage
325
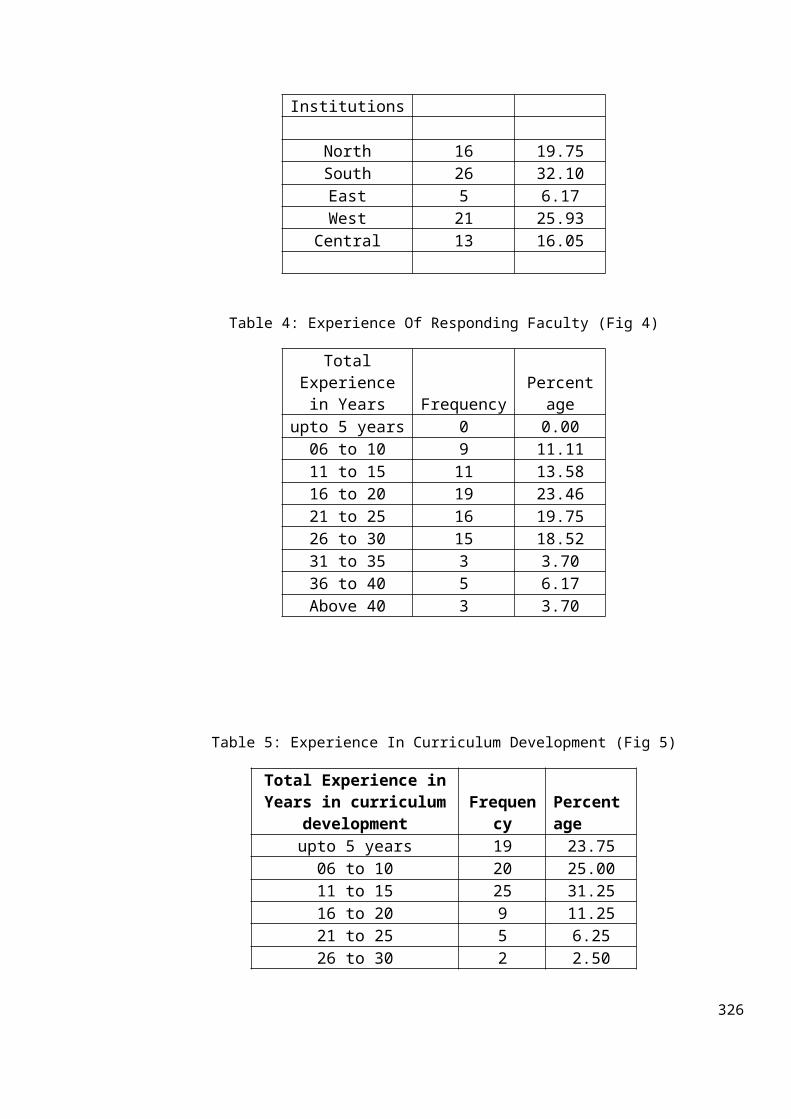
Institutions
North 16 19.75South 26 32.10East 5 6.17West 21 25.93
Central 13 16.05
Table 4: Experience Of Responding Faculty (Fig 4)
TotalExperiencein Years Frequency
Percentage
upto 5 years 0 0.0006 to 10 9 11.1111 to 15 11 13.5816 to 20 19 23.4621 to 25 16 19.7526 to 30 15 18.5231 to 35 3 3.7036 to 40 5 6.17Above 40 3 3.70
Table 5: Experience In Curriculum Development (Fig 5)
Total Experience inYears in curriculum
developmentFrequen
cyPercentage
upto 5 years 19 23.7506 to 10 20 25.0011 to 15 25 31.2516 to 20 9 11.2521 to 25 5 6.2526 to 30 2 2.50
326
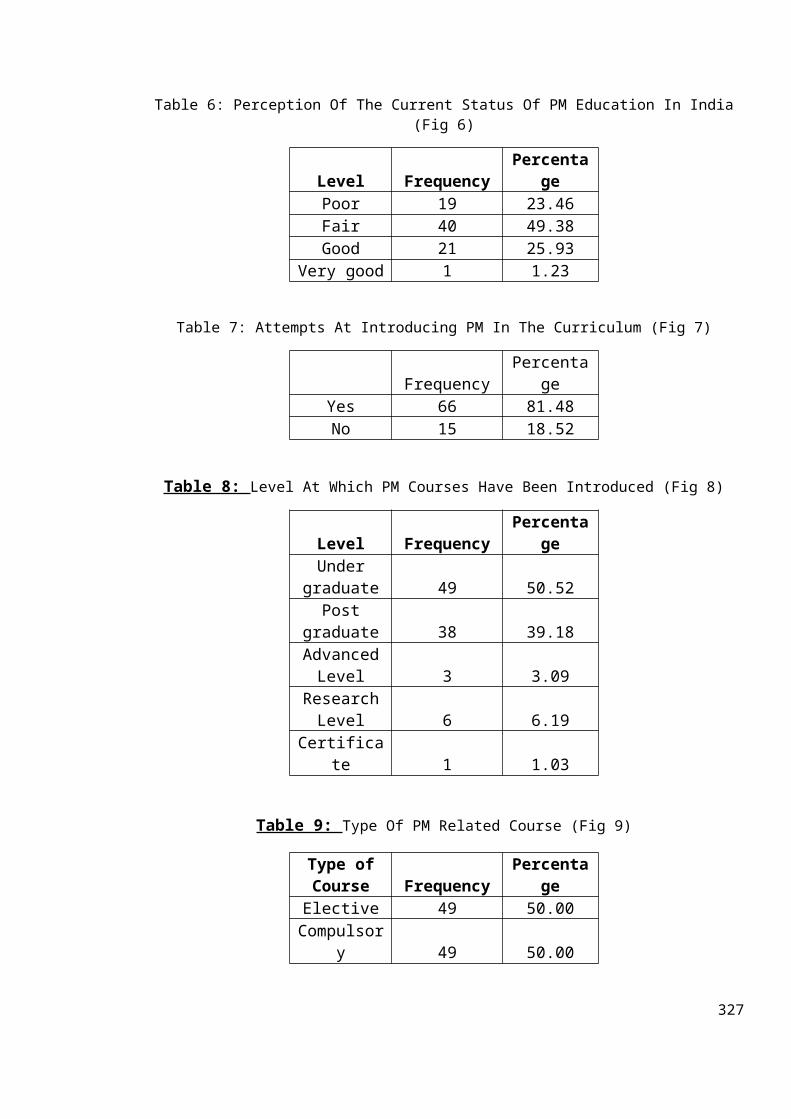
Table 6: Perception Of The Current Status Of PM Education In India(Fig 6)
Level Frequency Percenta
gePoor 19 23.46Fair 40 49.38Good 21 25.93
Very good 1 1.23
Table 7: Attempts At Introducing PM In The Curriculum (Fig 7)
FrequencyPercenta
geYes 66 81.48No 15 18.52
Table 8: Level At Which PM Courses Have Been Introduced (Fig 8)
Level FrequencyPercenta
geUnder
graduate 49 50.52Post
graduate 38 39.18AdvancedLevel 3 3.09
ResearchLevel 6 6.19
Certificate 1 1.03
Table 9: Type Of PM Related Course (Fig 9)
Type ofCourse Frequency
Percentage
Elective 49 50.00Compulsor
y 49 50.00
327
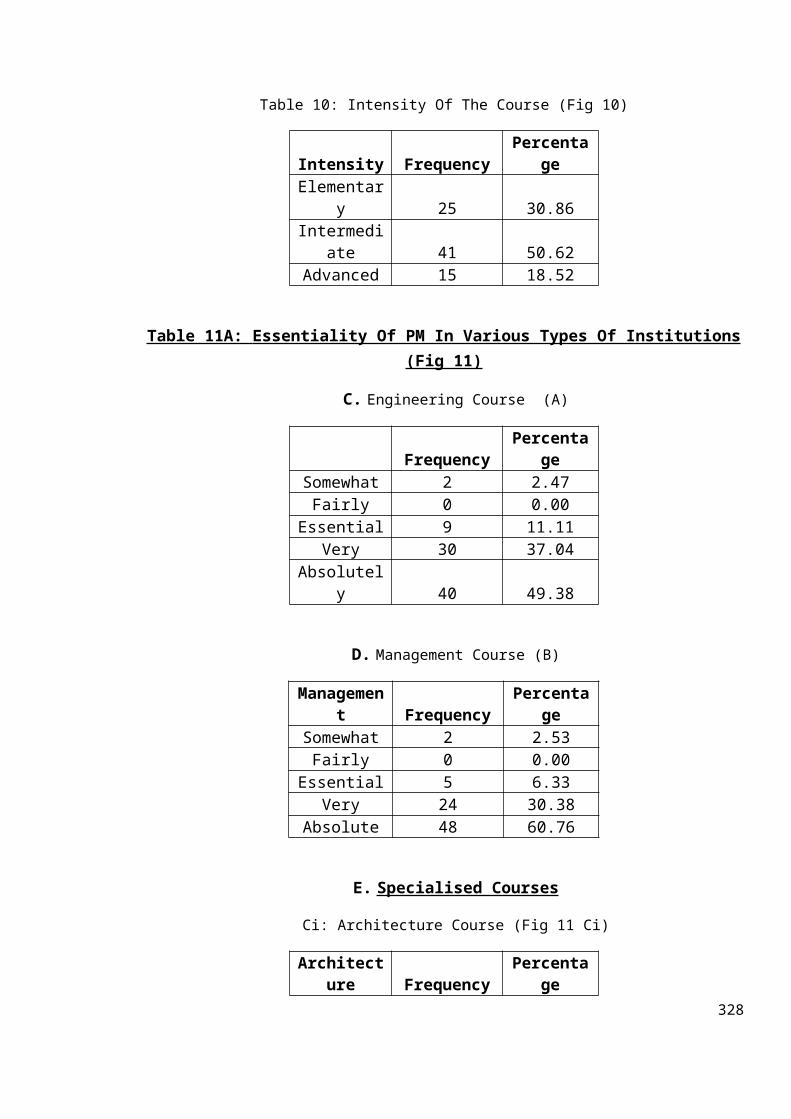
Table 10: Intensity Of The Course (Fig 10)
Intensity FrequencyPercenta
geElementar
y 25 30.86Intermedi
ate 41 50.62Advanced 15 18.52
Table 11A: Essentiality Of PM In Various Types Of Institutions (Fig 11)
C. Engineering Course (A)
FrequencyPercenta
geSomewhat 2 2.47Fairly 0 0.00
Essential 9 11.11Very 30 37.04
Absolutely 40 49.38
D. Management Course (B)
Management Frequency
Percentage
Somewhat 2 2.53Fairly 0 0.00
Essential 5 6.33Very 24 30.38
Absolute 48 60.76
E. Specialised Courses
Ci: Architecture Course (Fig 11 Ci)
Architecture Frequency
Percentage
328
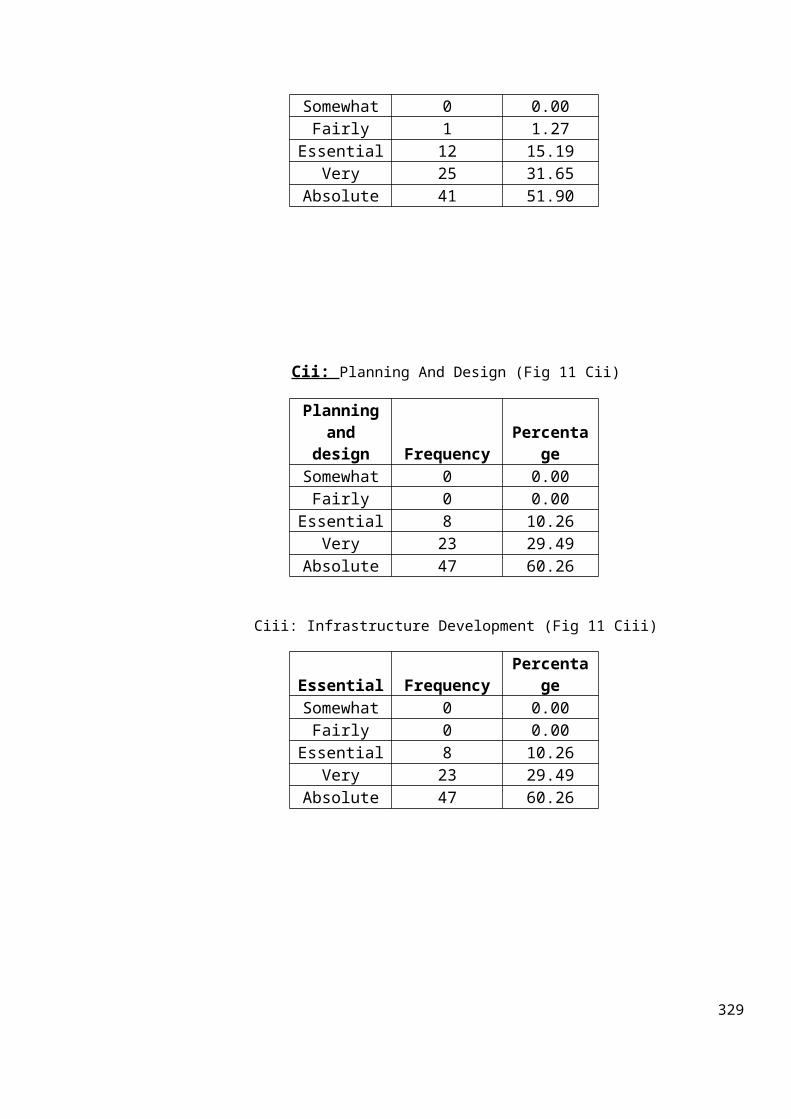
Somewhat 0 0.00Fairly 1 1.27
Essential 12 15.19Very 25 31.65
Absolute 41 51.90
Cii: Planning And Design (Fig 11 Cii)
Planningand
design FrequencyPercenta
geSomewhat 0 0.00Fairly 0 0.00
Essential 8 10.26Very 23 29.49
Absolute 47 60.26
Ciii: Infrastructure Development (Fig 11 Ciii)
Essential FrequencyPercenta
geSomewhat 0 0.00Fairly 0 0.00
Essential 8 10.26Very 23 29.49
Absolute 47 60.26
329
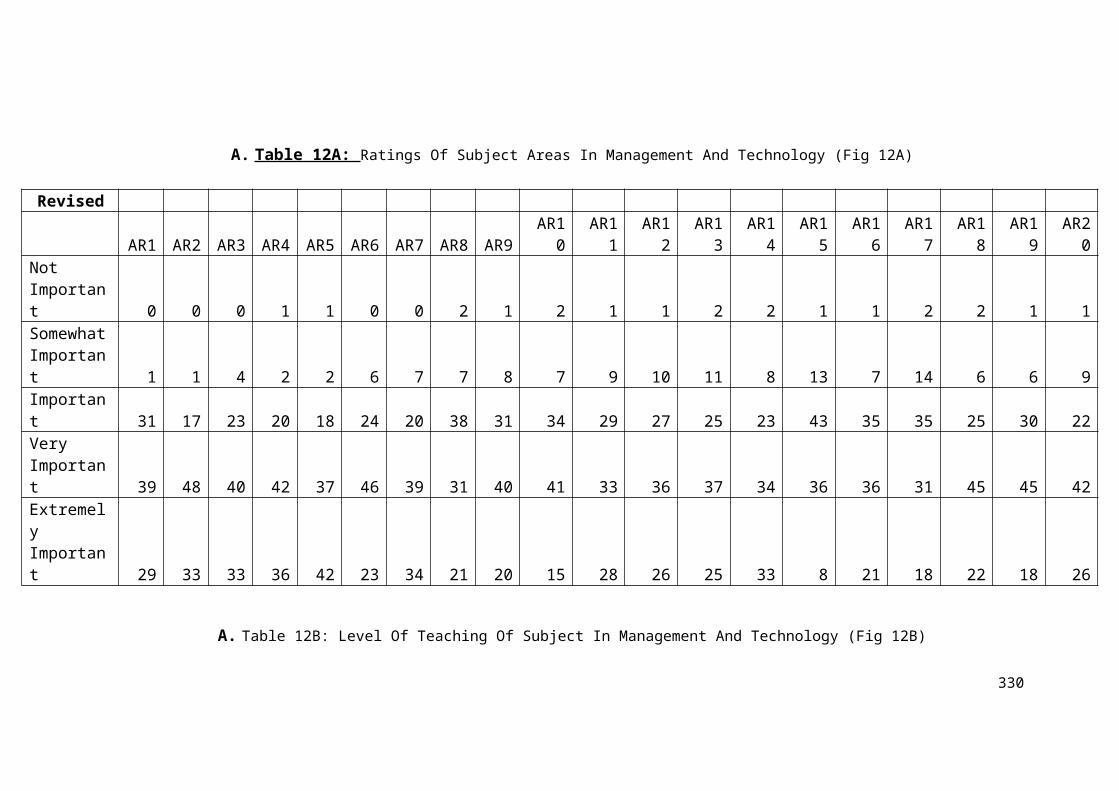
A. Table 12A: Ratings Of Subject Areas In Management And Technology (Fig 12A)
Revised
AR1 AR2 AR3 AR4 AR5 AR6 AR7 AR8 AR9AR10
AR11
AR12
AR13
AR14
AR15
AR16
AR17
AR18
AR19
AR20
Not Important 0 0 0 1 1 0 0 2 1 2 1 1 2 2 1 1 2 2 1 1SomewhatImportant 1 1 4 2 2 6 7 7 8 7 9 10 11 8 13 7 14 6 6 9Important 31 17 23 20 18 24 20 38 31 34 29 27 25 23 43 35 35 25 30 22Very Important 39 48 40 42 37 46 39 31 40 41 33 36 37 34 36 36 31 45 45 42Extremely Important 29 33 33 36 42 23 34 21 20 15 28 26 25 33 8 21 18 22 18 26
A. Table 12B: Level Of Teaching Of Subject In Management And Technology (Fig 12B)
330
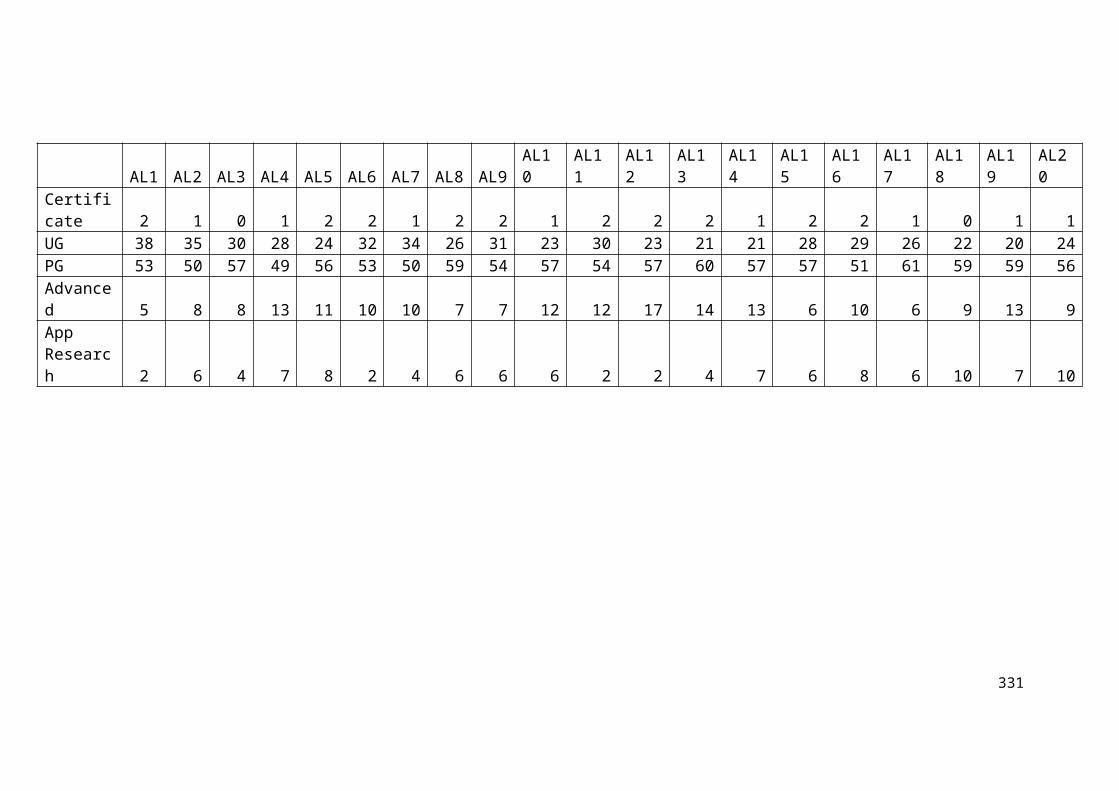
AL1 AL2 AL3 AL4 AL5 AL6 AL7 AL8 AL9AL10
AL11
AL12
AL13
AL14
AL15
AL16
AL17
AL18
AL19
AL20
Certificate 2 1 0 1 2 2 1 2 2 1 2 2 2 1 2 2 1 0 1 1UG 38 35 30 28 24 32 34 26 31 23 30 23 21 21 28 29 26 22 20 24PG 53 50 57 49 56 53 50 59 54 57 54 57 60 57 57 51 61 59 59 56Advanced 5 8 8 13 11 10 10 7 7 12 12 17 14 13 6 10 6 9 13 9App Research 2 6 4 7 8 2 4 6 6 6 2 2 4 7 6 8 6 10 7 10
331
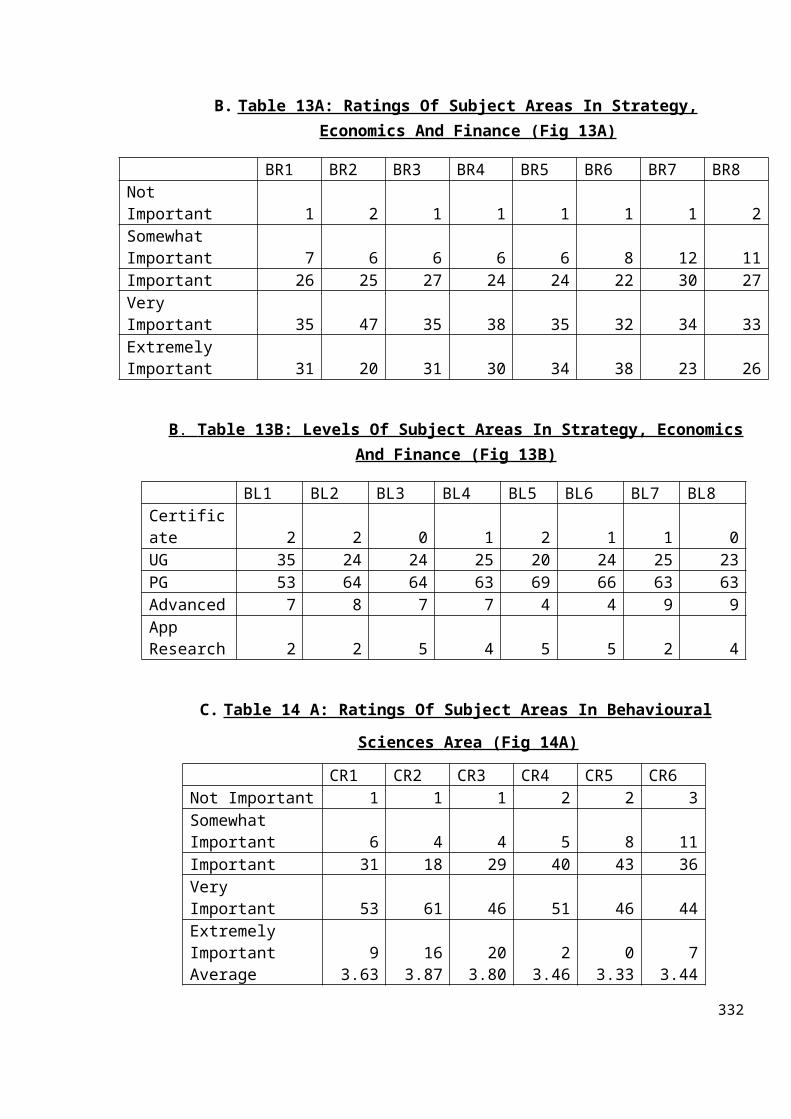
B. Table 13A: Ratings Of Subject Areas In Strategy, Economics And Finance (Fig 13A)
BR1 BR2 BR3 BR4 BR5 BR6 BR7 BR8Not Important 1 2 1 1 1 1 1 2Somewhat Important 7 6 6 6 6 8 12 11Important 26 25 27 24 24 22 30 27Very Important 35 47 35 38 35 32 34 33Extremely Important 31 20 31 30 34 38 23 26
B . Table 13B: Levels Of Subject Areas In Strategy, Economics And Finance (Fig 13B)
BL1 BL2 BL3 BL4 BL5 BL6 BL7 BL8Certificate 2 2 0 1 2 1 1 0UG 35 24 24 25 20 24 25 23PG 53 64 64 63 69 66 63 63Advanced 7 8 7 7 4 4 9 9App Research 2 2 5 4 5 5 2 4
C. Table 14 A: Ratings Of Subject Areas In Behavioural
Sciences Area (Fig 14A)
CR1 CR2 CR3 CR4 CR5 CR6Not Important 1 1 1 2 2 3Somewhat Important 6 4 4 5 8 11Important 31 18 29 40 43 36Very Important 53 61 46 51 46 44Extremely Important 9 16 20 2 0 7Average 3.63 3.87 3.80 3.46 3.33 3.44
332
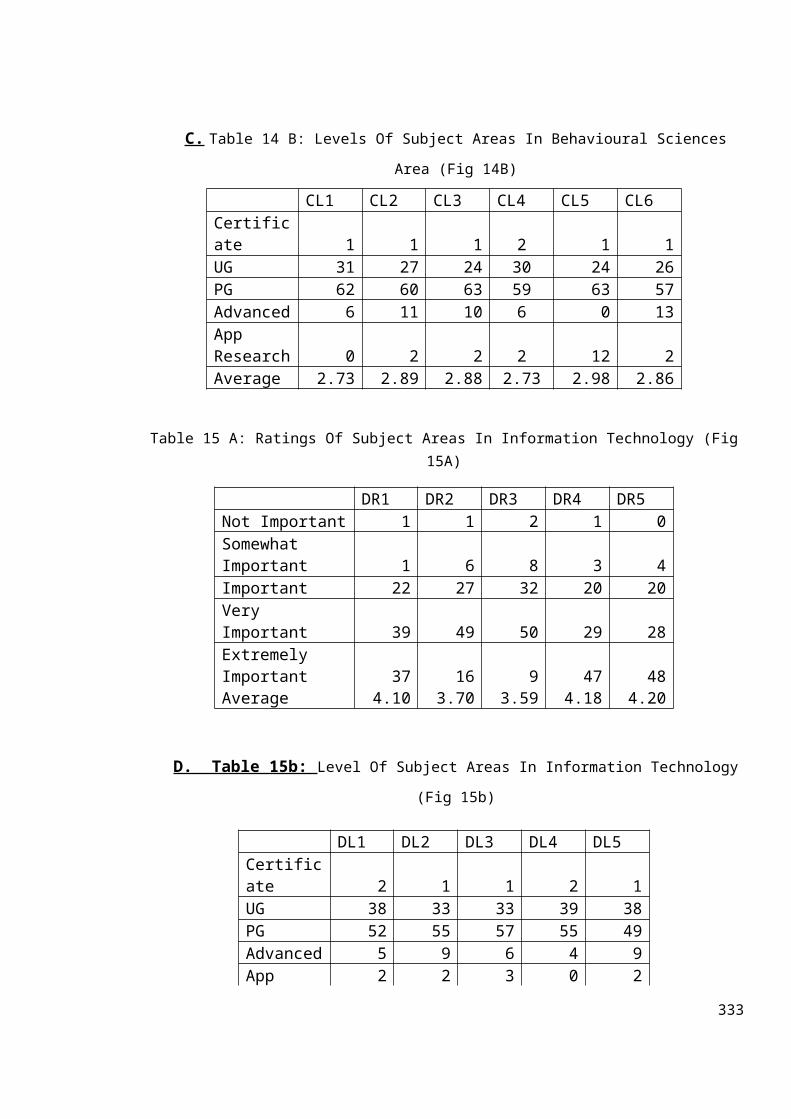
C. Table 14 B: Levels Of Subject Areas In Behavioural Sciences
Area (Fig 14B)
CL1 CL2 CL3 CL4 CL5 CL6Certificate 1 1 1 2 1 1UG 31 27 24 30 24 26PG 62 60 63 59 63 57Advanced 6 11 10 6 0 13App Research 0 2 2 2 12 2Average 2.73 2.89 2.88 2.73 2.98 2.86
Table 15 A: Ratings Of Subject Areas In Information Technology (Fig15A)
DR1 DR2 DR3 DR4 DR5Not Important 1 1 2 1 0Somewhat Important 1 6 8 3 4Important 22 27 32 20 20Very Important 39 49 50 29 28Extremely Important 37 16 9 47 48Average 4.10 3.70 3.59 4.18 4.20
D. Table 15b: Level Of Subject Areas In Information Technology(Fig 15b)
DL1 DL2 DL3 DL4 DL5Certificate 2 1 1 2 1UG 38 33 33 39 38PG 52 55 57 55 49Advanced 5 9 6 4 9App 2 2 3 0 2
333

ResearchAverage 2.64 2.78 2.77 2.61 2.70
334
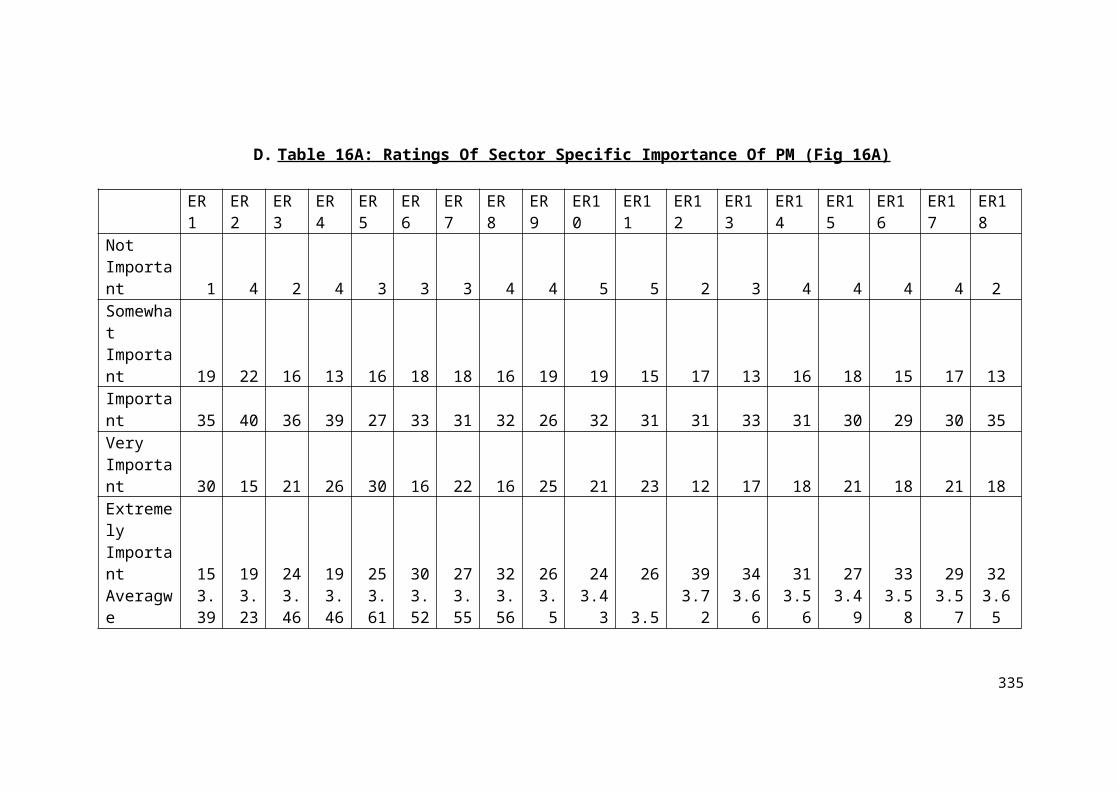
D. Table 16A: Ratings Of Sector Specific Importance Of PM (Fig 16A)
ER1
ER2
ER3
ER4
ER5
ER6
ER7
ER8
ER9
ER10
ER11
ER12
ER13
ER14
ER15
ER16
ER17
ER18
Not Important 1 4 2 4 3 3 3 4 4 5 5 2 3 4 4 4 4 2Somewhat Important 19 22 16 13 16 18 18 16 19 19 15 17 13 16 18 15 17 13Important 35 40 36 39 27 33 31 32 26 32 31 31 33 31 30 29 30 35Very Important 30 15 21 26 30 16 22 16 25 21 23 12 17 18 21 18 21 18Extremely Important 15 19 24 19 25 30 27 32 26 24 26 39 34 31 27 33 29 32Averagwe
3.39
3.23
3.46
3.46
3.61
3.52
3.55
3.56
3.5
3.43 3.5
3.72
3.66
3.56
3.49
3.58
3.57
3.65
335
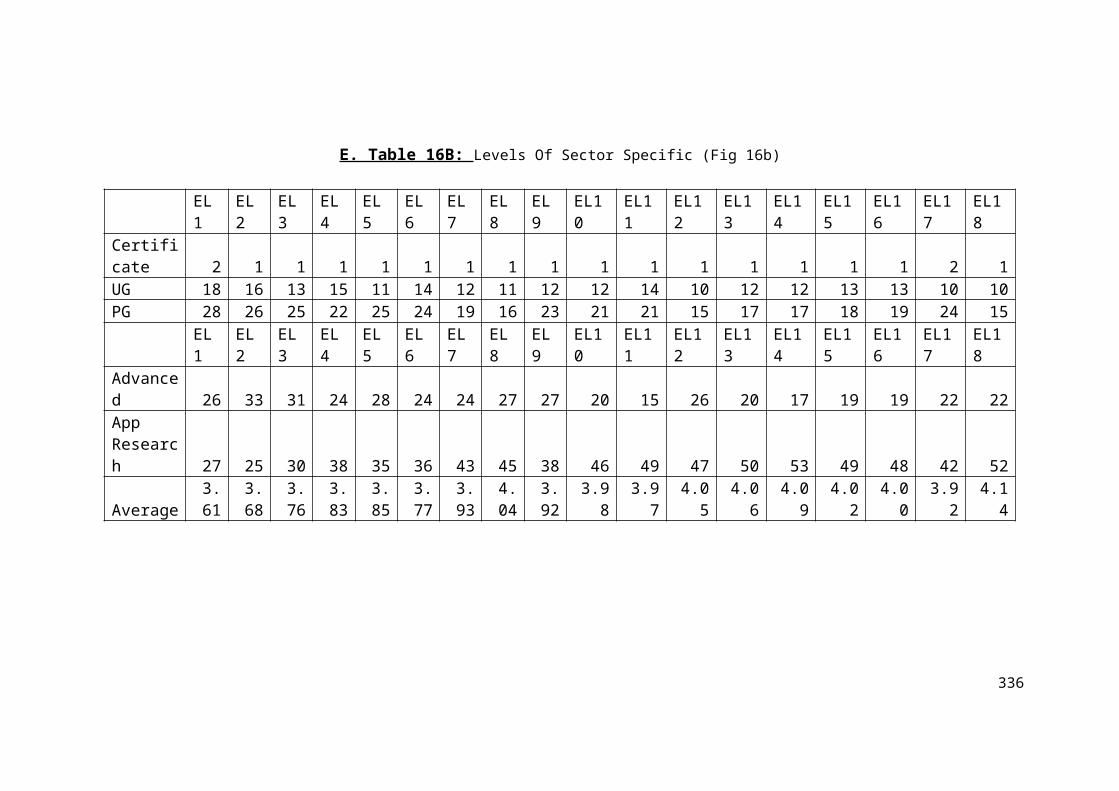
E. Table 16B: Levels Of Sector Specific (Fig 16b)
EL1
EL2
EL3
EL4
EL5
EL6
EL7
EL8
EL9
EL10
EL11
EL12
EL13
EL14
EL15
EL16
EL17
EL18
Certificate 2 1 1 1 1 1 1 1 1 1 1 1 1 1 1 1 2 1UG 18 16 13 15 11 14 12 11 12 12 14 10 12 12 13 13 10 10PG 28 26 25 22 25 24 19 16 23 21 21 15 17 17 18 19 24 15
EL1
EL2
EL3
EL4
EL5
EL6
EL7
EL8
EL9
EL10
EL11
EL12
EL13
EL14
EL15
EL16
EL17
EL18
Advanced 26 33 31 24 28 24 24 27 27 20 15 26 20 17 19 19 22 22App Research 27 25 30 38 35 36 43 45 38 46 49 47 50 53 49 48 42 52
Average3.61
3.68
3.76
3.83
3.85
3.77
3.93
4.04
3.92
3.98
3.97
4.05
4.06
4.09
4.02
4.00
3.92
4.14
336
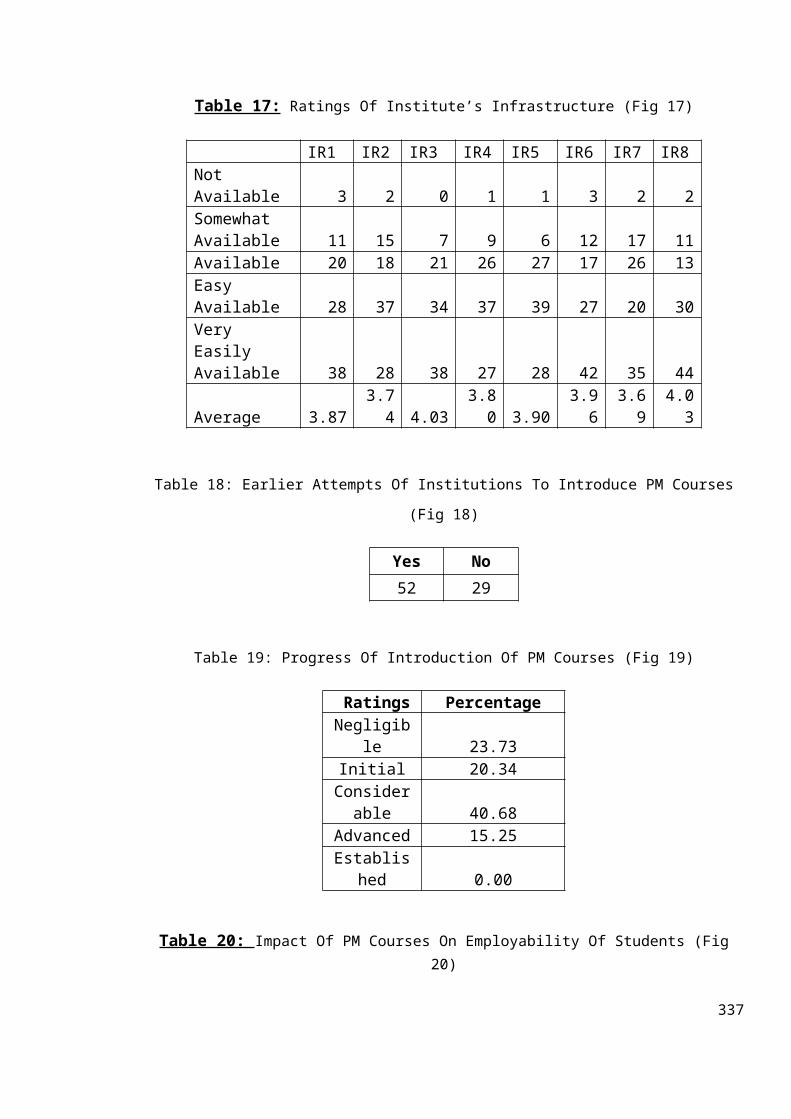
Table 17: Ratings Of Institute’s Infrastructure (Fig 17)
IR1 IR2 IR3 IR4 IR5 IR6 IR7 IR8Not Available 3 2 0 1 1 3 2 2Somewhat Available 11 15 7 9 6 12 17 11Available 20 18 21 26 27 17 26 13Easy Available 28 37 34 37 39 27 20 30Very Easily Available 38 28 38 27 28 42 35 44
Average 3.873.74 4.03
3.80 3.90
3.96
3.69
4.03
Table 18: Earlier Attempts Of Institutions To Introduce PM Courses
(Fig 18)
Yes No52 29
Table 19: Progress Of Introduction Of PM Courses (Fig 19)
Ratings PercentageNegligib
le 23.73Initial 20.34Considerable 40.68
Advanced 15.25Establis
hed 0.00
Table 20: Impact Of PM Courses On Employability Of Students (Fig20)
337
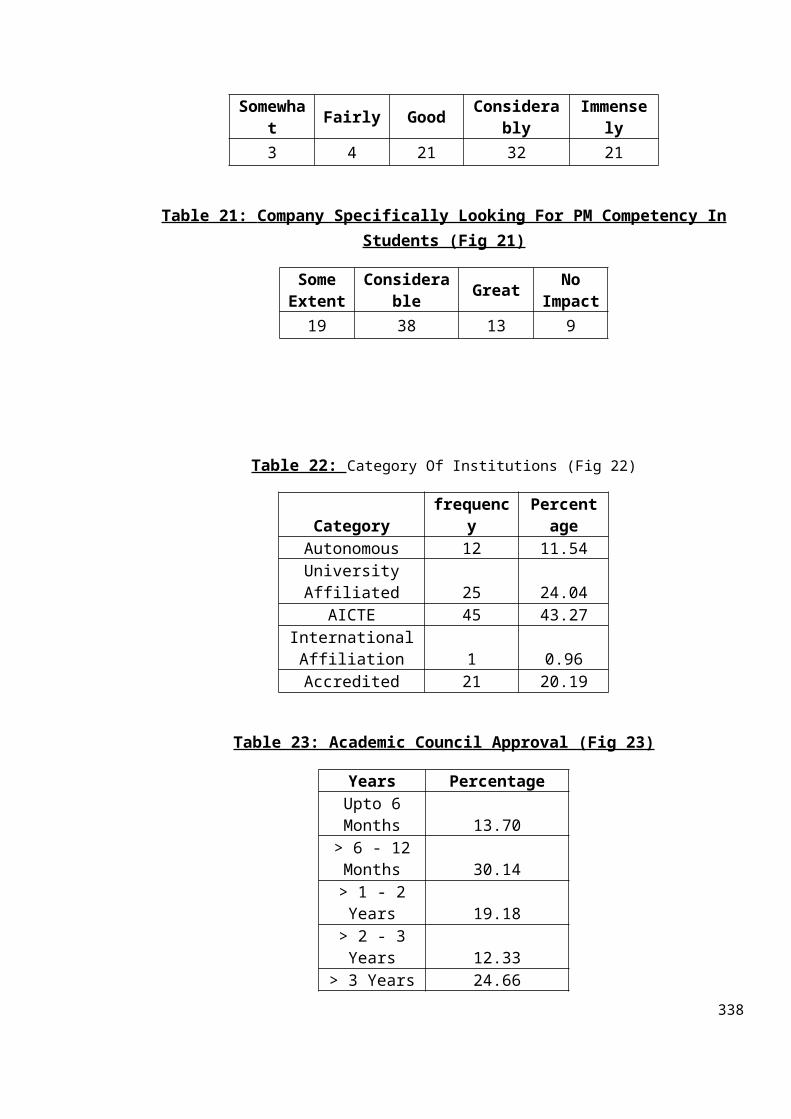
Somewhat Fairly Good Considera
blyImmense
ly3 4 21 32 21
Table 21: Company Specifically Looking For PM Competency In Students (Fig 21)
SomeExtent
Considerable Great No
Impact19 38 13 9
Table 22: Category Of Institutions (Fig 22)
Categoryfrequenc
yPercent
ageAutonomous 12 11.54UniversityAffiliated 25 24.04
AICTE 45 43.27InternationalAffiliation 1 0.96Accredited 21 20.19
Table 23: Academic Council Approval (Fig 23)
Years PercentageUpto 6Months 13.70
> 6 - 12Months 30.14> 1 - 2Years 19.18> 2 - 3Years 12.33
> 3 Years 24.66338
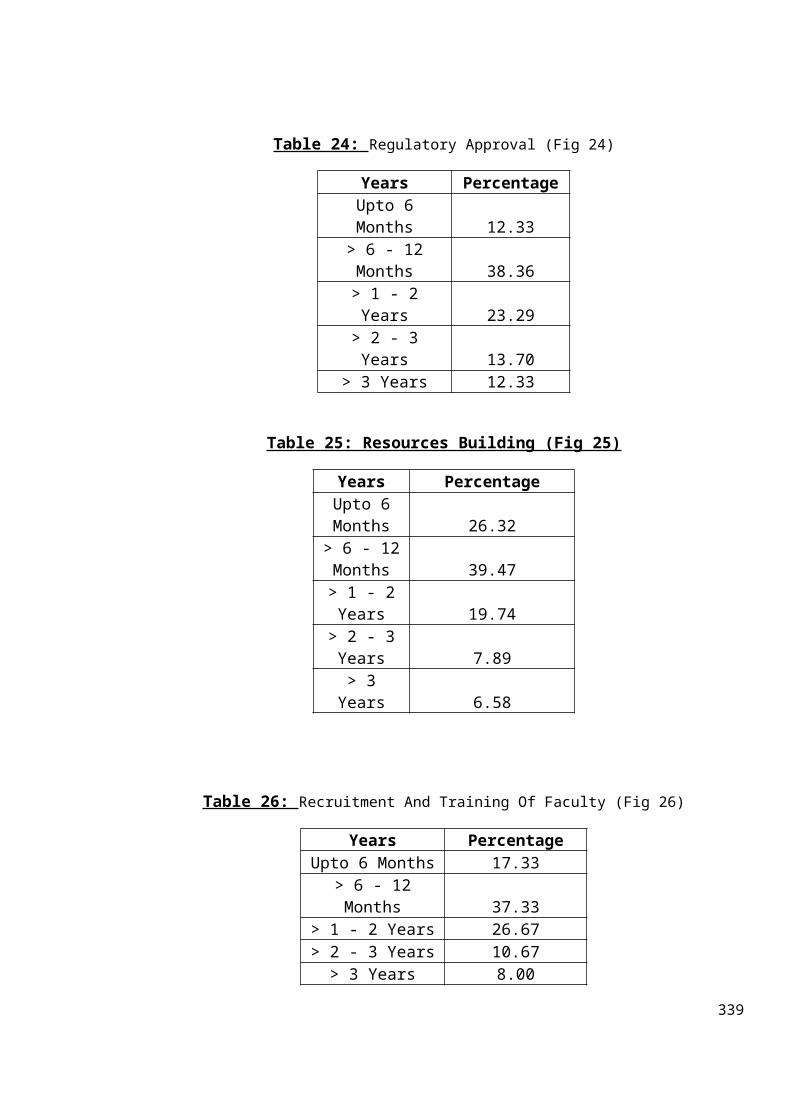
Table 24: Regulatory Approval (Fig 24)
Years PercentageUpto 6Months 12.33
> 6 - 12Months 38.36> 1 - 2Years 23.29> 2 - 3Years 13.70
> 3 Years 12.33
Table 25: Resources Building (Fig 25)
Years PercentageUpto 6Months 26.32> 6 - 12Months 39.47> 1 - 2Years 19.74> 2 - 3Years 7.89> 3Years 6.58
Table 26: Recruitment And Training Of Faculty (Fig 26)
Years PercentageUpto 6 Months 17.33
> 6 - 12Months 37.33
> 1 - 2 Years 26.67> 2 - 3 Years 10.67> 3 Years 8.00
339
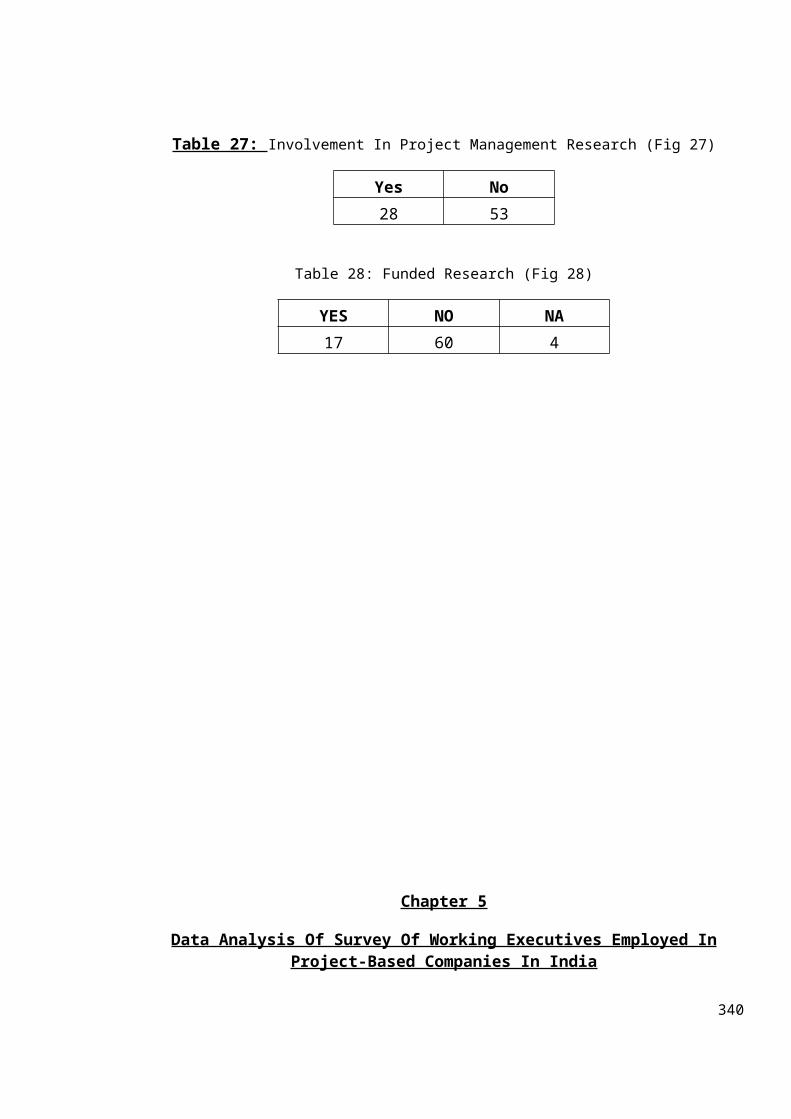
Table 27: Involvement In Project Management Research (Fig 27)
Yes No28 53
Table 28: Funded Research (Fig 28)
YES NO NA17 60 4
Chapter 5
Data Analysis Of Survey Of Working Executives Employed InProject-Based Companies In India
340
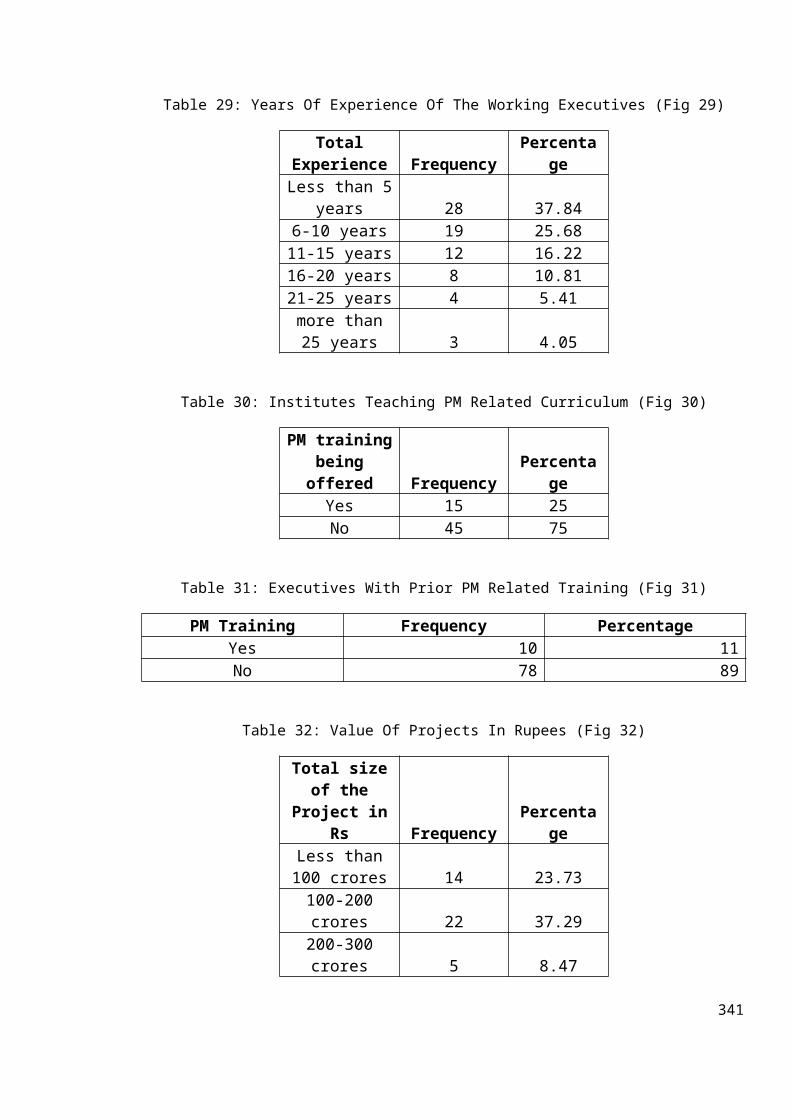
Table 29: Years Of Experience Of The Working Executives (Fig 29)
TotalExperience Frequency
Percentage
Less than 5years 28 37.84
6-10 years 19 25.6811-15 years 12 16.2216-20 years 8 10.8121-25 years 4 5.41more than25 years 3 4.05
Table 30: Institutes Teaching PM Related Curriculum (Fig 30)
PM trainingbeingoffered Frequency
Percentage
Yes 15 25No 45 75
Table 31: Executives With Prior PM Related Training (Fig 31)
PM Training Frequency PercentageYes 10 11No 78 89
Table 32: Value Of Projects In Rupees (Fig 32)
Total sizeof the
Project inRs Frequency
Percentage
Less than100 crores 14 23.73100-200crores 22 37.29200-300crores 5 8.47
341
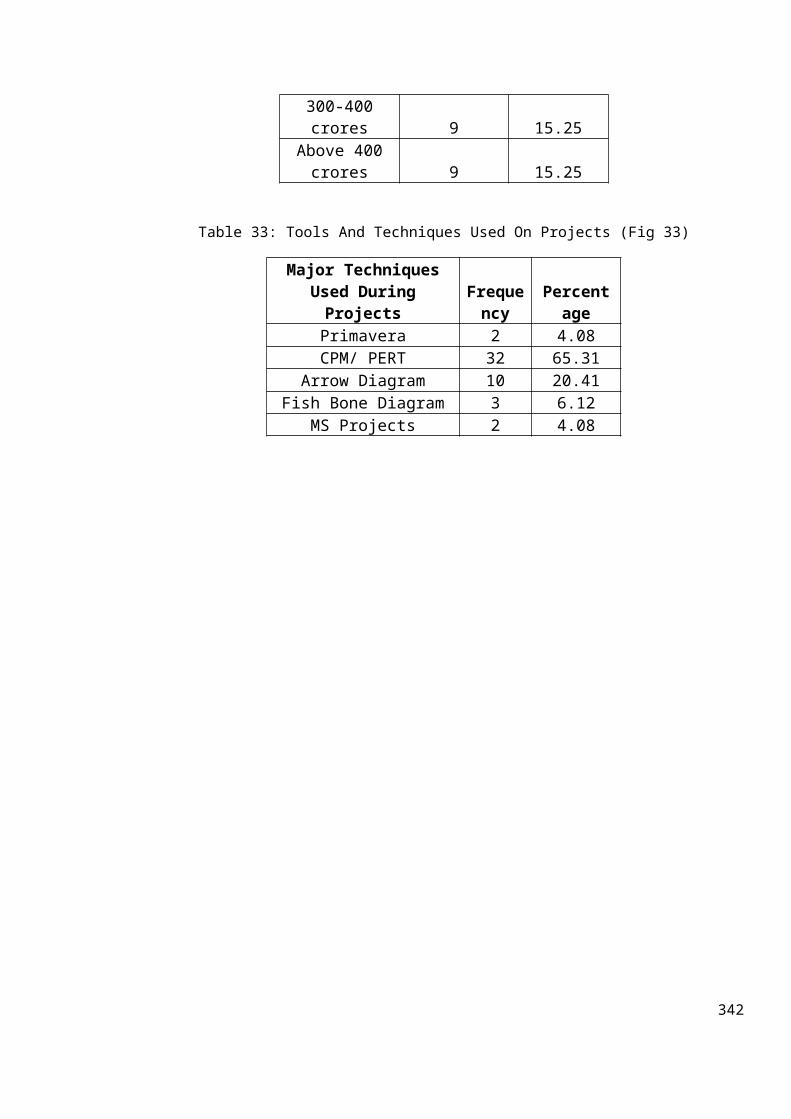
300-400crores 9 15.25
Above 400crores 9 15.25
Table 33: Tools And Techniques Used On Projects (Fig 33)
Major TechniquesUsed DuringProjects
Frequency
Percentage
Primavera 2 4.08CPM/ PERT 32 65.31
Arrow Diagram 10 20.41Fish Bone Diagram 3 6.12
MS Projects 2 4.08
342
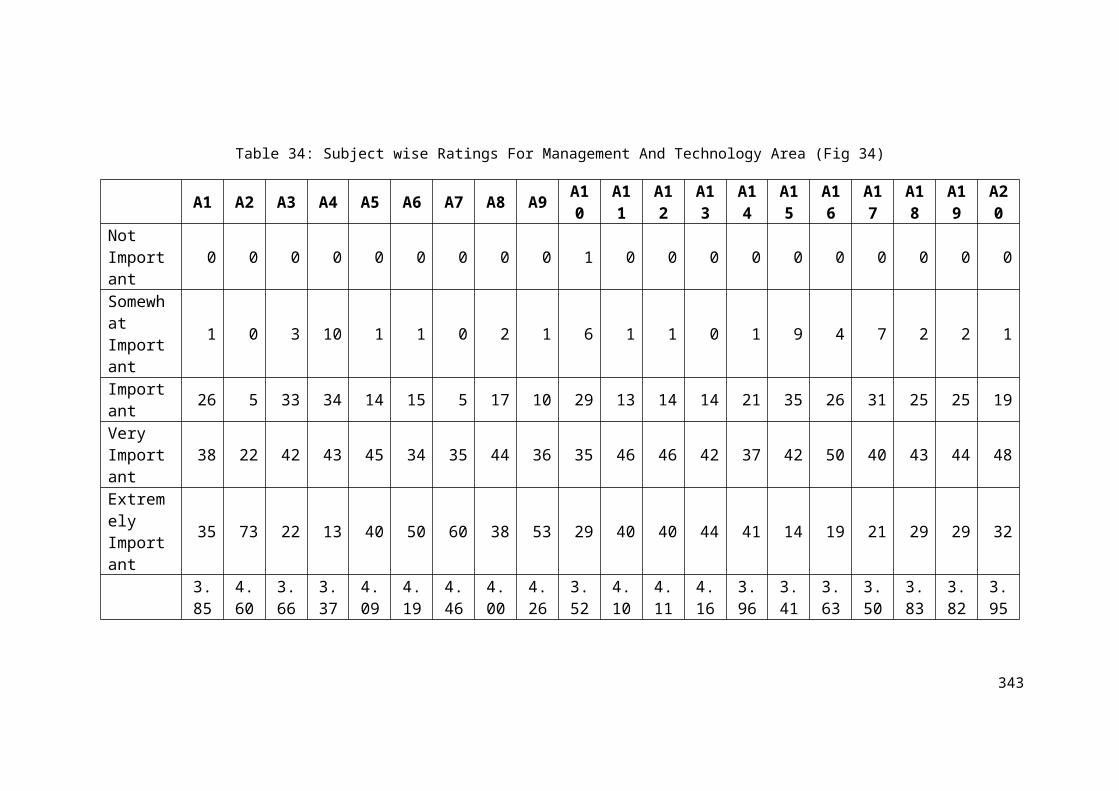
Table 34: Subject wise Ratings For Management And Technology Area (Fig 34)
A1 A2 A3 A4 A5 A6 A7 A8 A9 A10
A11
A12
A13
A14
A15
A16
A17
A18
A19
A20
Not Important
0 0 0 0 0 0 0 0 0 1 0 0 0 0 0 0 0 0 0 0
Somewhat Important
1 0 3 10 1 1 0 2 1 6 1 1 0 1 9 4 7 2 2 1
Important 26 5 33 34 14 15 5 17 10 29 13 14 14 21 35 26 31 25 25 19
Very Important
38 22 42 43 45 34 35 44 36 35 46 46 42 37 42 50 40 43 44 48
Extremely Important
35 73 22 13 40 50 60 38 53 29 40 40 44 41 14 19 21 29 29 32
3.85
4.60
3.66
3.37
4.09
4.19
4.46
4.00
4.26
3.52
4.10
4.11
4.16
3.96
3.41
3.63
3.50
3.83
3.82
3.95
343
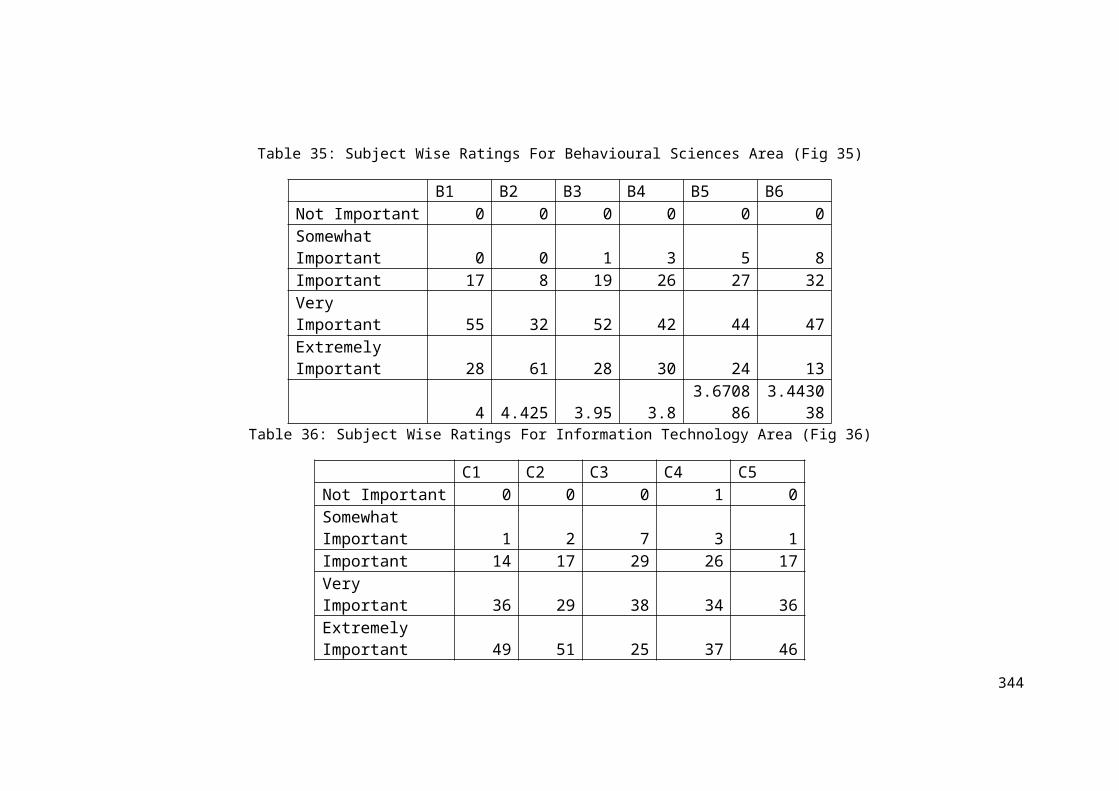
Table 35: Subject Wise Ratings For Behavioural Sciences Area (Fig 35)
B1 B2 B3 B4 B5 B6Not Important 0 0 0 0 0 0Somewhat Important 0 0 1 3 5 8Important 17 8 19 26 27 32Very Important 55 32 52 42 44 47Extremely Important 28 61 28 30 24 13
4 4.425 3.95 3.83.6708
863.4430
38Table 36: Subject Wise Ratings For Information Technology Area (Fig 36)
C1 C2 C3 C4 C5Not Important 0 0 0 1 0Somewhat Important 1 2 7 3 1Important 14 17 29 26 17Very Important 36 29 38 34 36Extremely Important 49 51 25 37 46
344
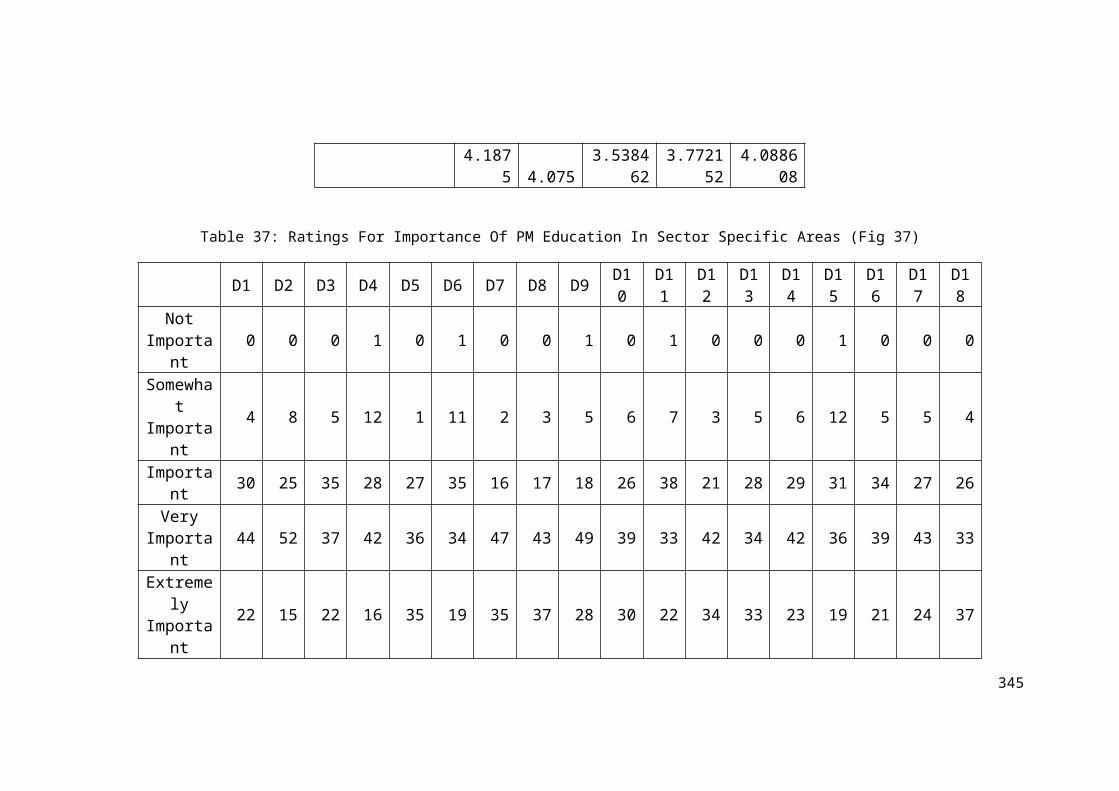
4.187
5 4.0753.5384
623.7721
524.0886
08
Table 37: Ratings For Importance Of PM Education In Sector Specific Areas (Fig 37)
D1 D2 D3 D4 D5 D6 D7 D8 D9 D10
D11
D12
D13
D14
D15
D16
D17
D18
NotImporta
nt0 0 0 1 0 1 0 0 1 0 1 0 0 0 1 0 0 0
Somewhat
Important
4 8 5 12 1 11 2 3 5 6 7 3 5 6 12 5 5 4
Important 30 25 35 28 27 35 16 17 18 26 38 21 28 29 31 34 27 26
VeryImporta
nt44 52 37 42 36 34 47 43 49 39 33 42 34 42 36 39 43 33
Extremely
Important
22 15 22 16 35 19 35 37 28 30 22 34 33 23 19 21 24 37
345

3.61
3.51
3.53
3.28
3.85
3.30
3.99
3.92
3.71
3.65
3.42
3.85
3.70
3.56
3.27
3.56
3.66
3.79
346
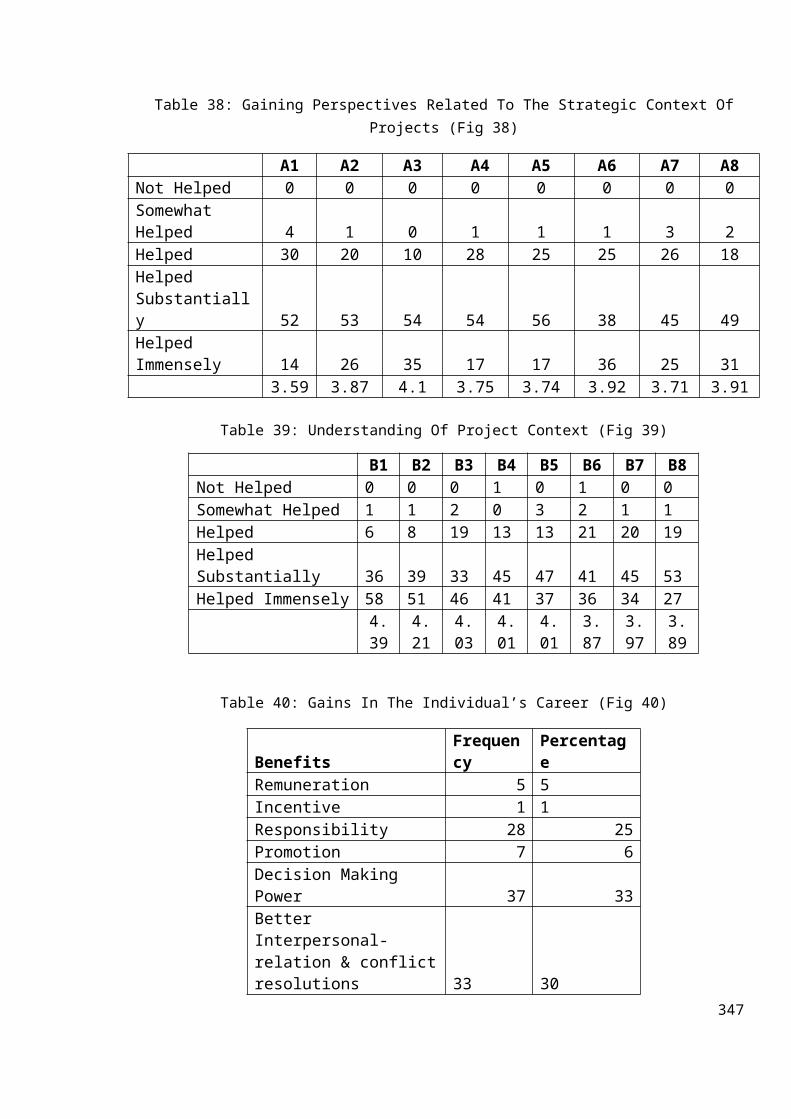
Table 38: Gaining Perspectives Related To The Strategic Context OfProjects (Fig 38)
A1 A2 A3 A4 A5 A6 A7 A8Not Helped 0 0 0 0 0 0 0 0Somewhat Helped 4 1 0 1 1 1 3 2Helped 30 20 10 28 25 25 26 18Helped Substantially 52 53 54 54 56 38 45 49Helped Immensely 14 26 35 17 17 36 25 31 3.59 3.87 4.1 3.75 3.74 3.92 3.71 3.91
Table 39: Understanding Of Project Context (Fig 39)
B1 B2 B3 B4 B5 B6 B7 B8Not Helped 0 0 0 1 0 1 0 0Somewhat Helped 1 1 2 0 3 2 1 1Helped 6 8 19 13 13 21 20 19Helped Substantially 36 39 33 45 47 41 45 53Helped Immensely 58 51 46 41 37 36 34 27
4.39
4.21
4.03
4.01
4.01
3.87
3.97
3.89
Table 40: Gains In The Individual’s Career (Fig 40)
BenefitsFrequency
Percentage
Remuneration 5 5Incentive 1 1Responsibility 28 25Promotion 7 6Decision Making Power 37 33Better Interpersonal-relation & conflictresolutions 33 30
347
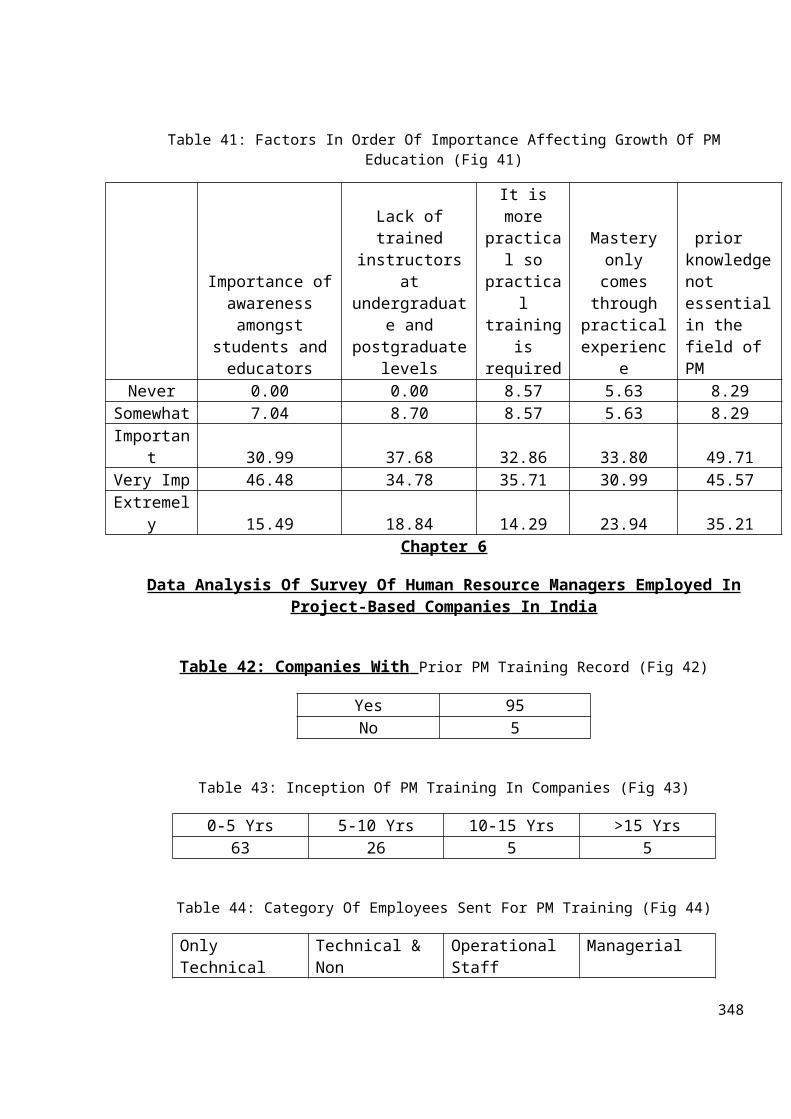
Table 41: Factors In Order Of Importance Affecting Growth Of PMEducation (Fig 41)
Importance ofawarenessamongst
students andeducators
Lack oftrained
instructorsat
undergraduate and
postgraduatelevels
It ismore
practical so
practical
trainingis
required
Masteryonlycomes
throughpracticalexperienc
e
prior knowledgenot essentialin the field of PM
Never 0.00 0.00 8.57 5.63 8.29Somewhat 7.04 8.70 8.57 5.63 8.29Importan
t 30.99 37.68 32.86 33.80 49.71Very Imp 46.48 34.78 35.71 30.99 45.57Extremel
y 15.49 18.84 14.29 23.94 35.21Chapter 6
Data Analysis Of Survey Of Human Resource Managers Employed InProject-Based Companies In India
Table 42: Companies With Prior PM Training Record (Fig 42)
Yes 95No 5
Table 43: Inception Of PM Training In Companies (Fig 43)
0-5 Yrs 5-10 Yrs 10-15 Yrs >15 Yrs63 26 5 5
Table 44: Category Of Employees Sent For PM Training (Fig 44)
Only Technical
Technical & Non
Operational Staff
Managerial
348
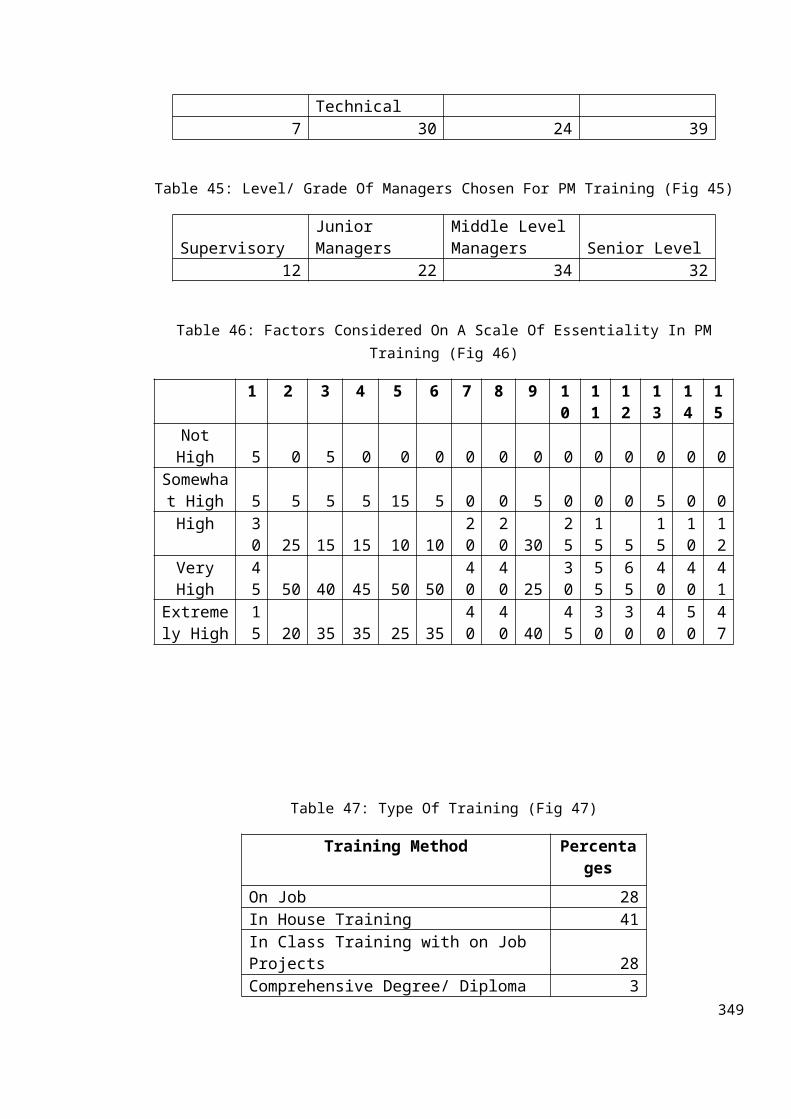
Technical7 30 24 39
Table 45: Level/ Grade Of Managers Chosen For PM Training (Fig 45)
SupervisoryJunior Managers
Middle LevelManagers Senior Level
12 22 34 32
Table 46: Factors Considered On A Scale Of Essentiality In PMTraining (Fig 46)
1 2 3 4 5 6 7 8 9 10
11
12
13
14
15
NotHigh 5 0 5 0 0 0 0 0 0 0 0 0 0 0 0
Somewhat High 5 5 5 5 15 5 0 0 5 0 0 0 5 0 0High 3
0 25 15 15 10 1020
20 30
25
15 5
15
10
12
VeryHigh
45 50 40 45 50 50
40
40 25
30
55
65
40
40
41
Extremely High
15 20 35 35 25 35
40
40 40
45
30
30
40
50
47
Table 47: Type Of Training (Fig 47)
Training Method Percentages
On Job 28In House Training 41In Class Training with on Job Projects 28Comprehensive Degree/ Diploma 3
349
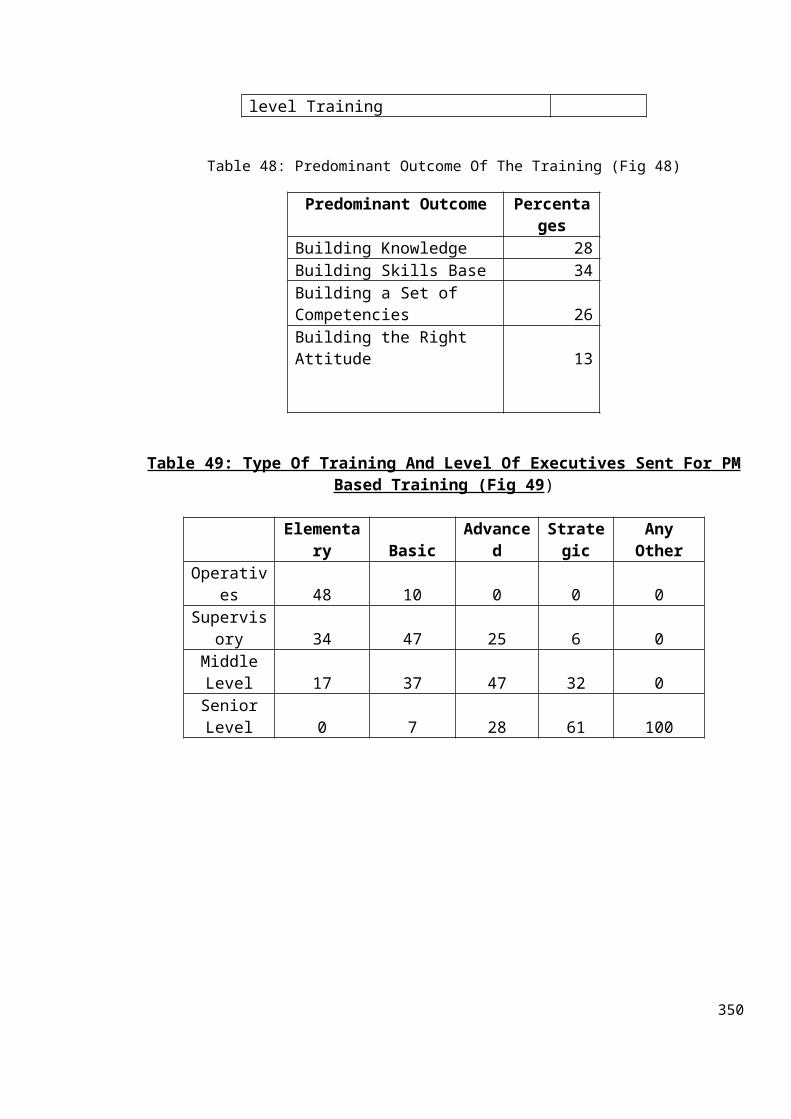
level Training
Table 48: Predominant Outcome Of The Training (Fig 48)
Predominant Outcome Percentages
Building Knowledge 28Building Skills Base 34Building a Set of Competencies 26Building the Right Attitude 13
Table 49: Type Of Training And Level Of Executives Sent For PMBased Training (Fig 49)
Elementary Basic
Advanced
Strategic
AnyOther
Operatives 48 10 0 0 0
Supervisory 34 47 25 6 0
MiddleLevel 17 37 47 32 0SeniorLevel 0 7 28 61 100
350
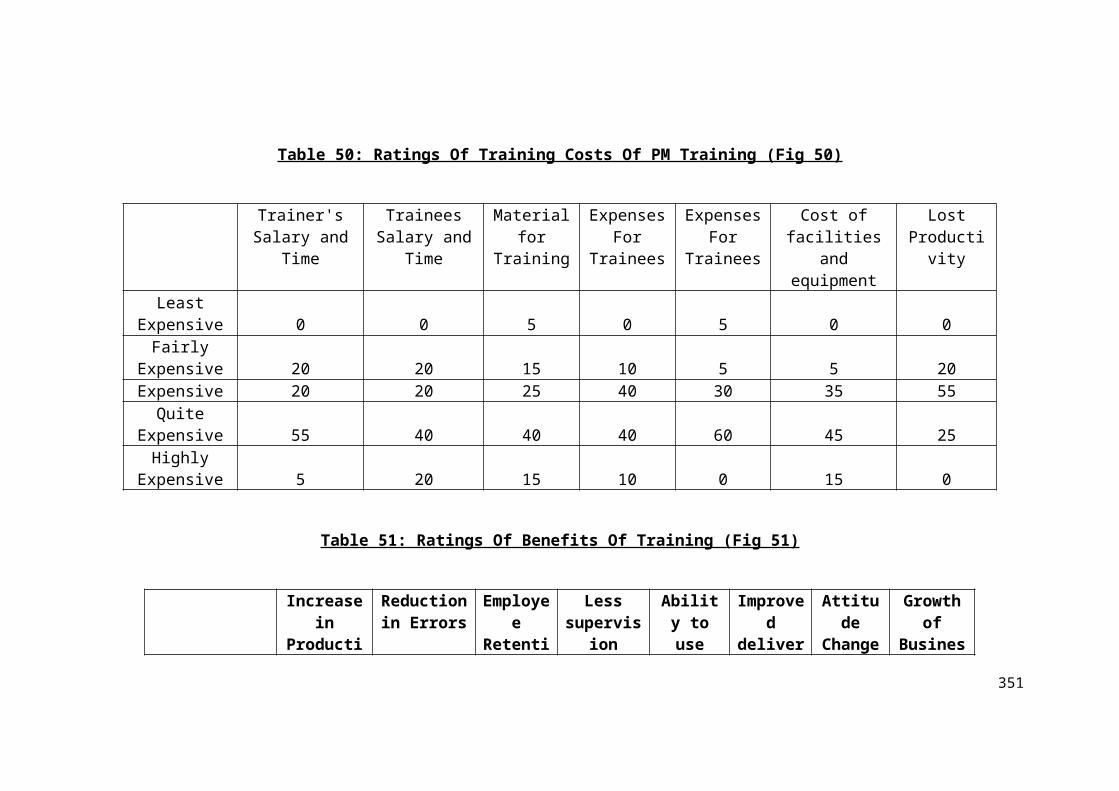
Table 50: Ratings Of Training Costs Of PM Training (Fig 50)
Trainer'sSalary and
Time
TraineesSalary and
Time
Materialfor
Training
ExpensesFor
Trainees
ExpensesFor
Trainees
Cost offacilities
andequipment
LostProducti
vity
LeastExpensive 0 0 5 0 5 0 0Fairly
Expensive 20 20 15 10 5 5 20Expensive 20 20 25 40 30 35 55
QuiteExpensive 55 40 40 40 60 45 25Highly
Expensive 5 20 15 10 0 15 0
Table 51: Ratings Of Benefits Of Training (Fig 51)
Increasein
Producti
Reductionin Errors
Employee
Retenti
Lesssupervis
ion
Ability touse
Improved
deliver
Attitude
Change
Growthof
Busines
351
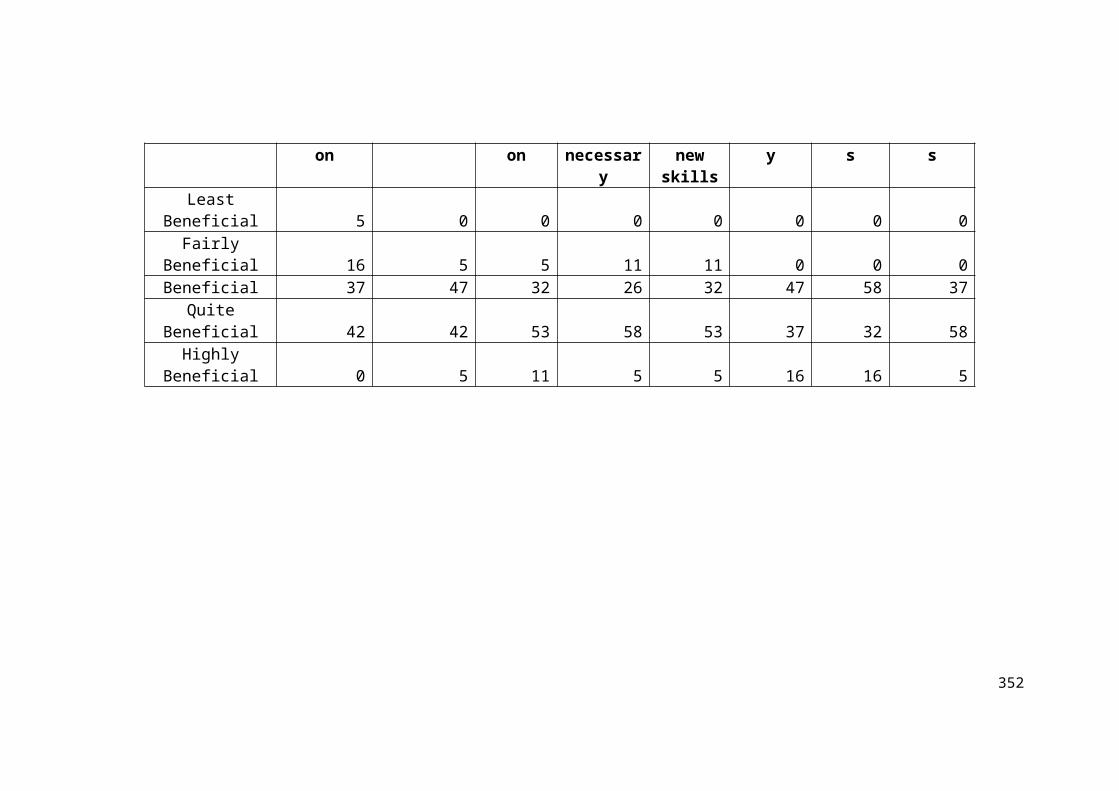
on on necessary
newskills
y s s
LeastBeneficial 5 0 0 0 0 0 0 0Fairly
Beneficial 16 5 5 11 11 0 0 0Beneficial 37 47 32 26 32 47 58 37
QuiteBeneficial 42 42 53 58 53 37 32 58Highly
Beneficial 0 5 11 5 5 16 16 5
352

Table 52: Efficacy Ratings Of Various Types Of Trainer Options(Fig 52)
Technical
Business Ins.
Independent
Trainer
Certified
Franchisee
trainer
Internationally
Certifiedtrainers
Inhouse
Trainer
SelfTraini
ng
LeastEfficaciou
s 0 0 0 0 0 5Fairly
Efficacious 10 5 10 10 10 35
Efficacious 40 35 15 25 50 40
QuiteEfficaciou
s 30 50 60 50 30 20Most
Efficacious 20 10 15 15 10 0
Table 53: Most Preferred Training Options Of HR Managers (Fig53)
Type oftraining
Frequency
Percentage
Inhousetraining 7 20.00Other
Technical /ManagementInstitutes 20 57.14NICMAR, Pune 4 11.43IIT / IIM /
IIPM 4 11.43
353
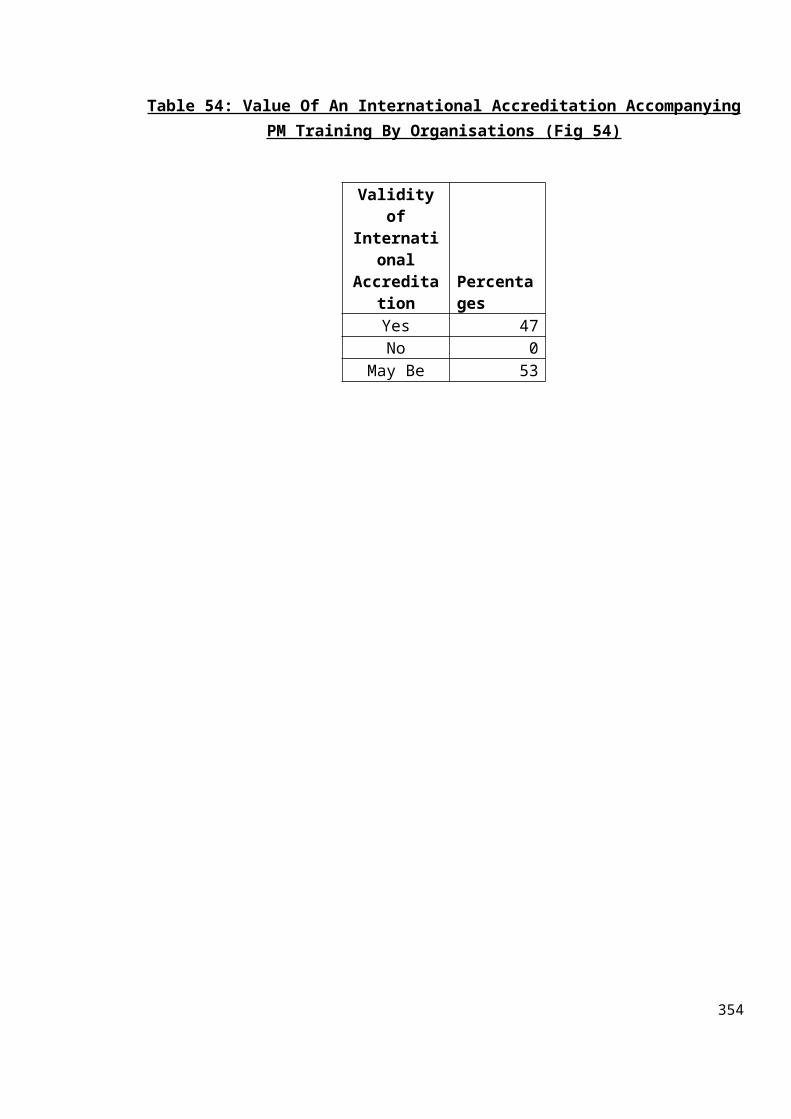
Table 54: Value Of An International Accreditation AccompanyingPM Training By Organisations (Fig 54)
Validityof
International
Accreditation
Percentages
Yes 47No 0
May Be 53
354
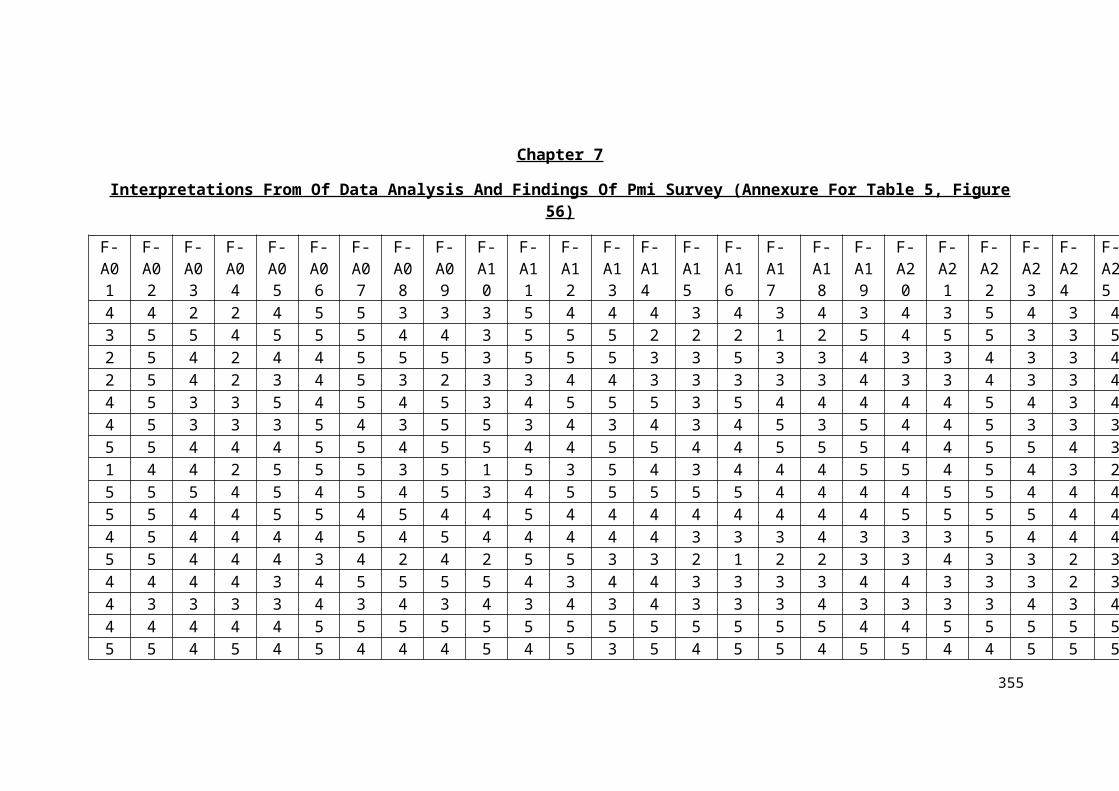
Chapter 7
Interpretations From Of Data Analysis And Findings Of Pmi Survey (Annexure For Table 5, Figure56)
F-A01
F-A02
F-A03
F-A04
F-A05
F-A06
F-A07
F-A08
F-A09
F-A10
F-A11
F-A12
F-A13
F-A14
F-A15
F-A16
F-A17
F-A18
F-A19
F-A20
F-A21
F-A22
F-A23
F-A24
F-A25
4 4 2 2 4 5 5 3 3 3 5 4 4 4 3 4 3 4 3 4 3 5 4 3 43 5 5 4 5 5 5 4 4 3 5 5 5 2 2 2 1 2 5 4 5 5 3 3 52 5 4 2 4 4 5 5 5 3 5 5 5 3 3 5 3 3 4 3 3 4 3 3 42 5 4 2 3 4 5 3 2 3 3 4 4 3 3 3 3 3 4 3 3 4 3 3 44 5 3 3 5 4 5 4 5 3 4 5 5 5 3 5 4 4 4 4 4 5 4 3 44 5 3 3 3 5 4 3 5 5 3 4 3 4 3 4 5 3 5 4 4 5 3 3 35 5 4 4 4 5 5 4 5 5 4 4 5 5 4 4 5 5 5 4 4 5 5 4 31 4 4 2 5 5 5 3 5 1 5 3 5 4 3 4 4 4 5 5 4 5 4 3 25 5 5 4 5 4 5 4 5 3 4 5 5 5 5 5 4 4 4 4 5 5 4 4 45 5 4 4 5 5 4 5 4 4 5 4 4 4 4 4 4 4 4 5 5 5 5 4 44 5 4 4 4 4 5 4 5 4 4 4 4 4 3 3 3 4 3 3 3 5 4 4 45 5 4 4 4 3 4 2 4 2 5 5 3 3 2 1 2 2 3 3 4 3 3 2 34 4 4 4 3 4 5 5 5 5 4 3 4 4 3 3 3 3 4 4 3 3 3 2 34 3 3 3 3 4 3 4 3 4 3 4 3 4 3 3 3 4 3 3 3 3 4 3 44 4 4 4 4 5 5 5 5 5 5 5 5 5 5 5 5 5 4 4 5 5 5 5 55 5 4 5 4 5 4 4 4 5 4 5 3 5 4 5 5 4 5 5 4 4 5 5 5
355

5 5 4 3 5 5 4 4 4 4 4 5 4 5 4 4 4 5 4 4 4 5 4 4 44 5 4 4 5 5 4 3 3 4 5 4 4 4 4 4 4 4 3 3 4 4 4 4 44 4 4 4 4 4 4 4 4 4 4 4 4 4 4 4 4 4 4 4 4 4 5 5 54 4 4 4 4 4 4 4 4 4 4 4 4 4 4 4 4 4 4 4 4 5 4 4 44 4 4 4 4 4 4 4 4 4 4 4 4 4 4 4 4 4 4 4 4 4 4 4 4F-A01
F-A02
F-A03
F-A04
F-A05
F-A06
F-A07
F-A08
F-A09
F-A10
F-A11
F-A12
F-A13
F-A14
F-A15
F-A16
F-A17
F-A18
F-A19
F-A20
F-A21
F-A22
F-A23
F-A24
F-A25
4 4 4 4 4 4 4 4 4 4 4 4 4 4 4 4 4 4 4 4 4 4 5 5 54 4 4 4 4 4 4 4 4 4 4 4 4 4 4 4 4 4 4 4 4 5 4 4 44 4 4 4 4 4 4 4 4 4 4 4 4 4 4 4 4 4 4 4 4 4 4 4 44 4 4 4 4 4 4 4 4 4 4 4 4 4 4 4 4 4 4 4 4 4 5 5 54 4 4 4 4 4 4 4 4 4 4 4 4 4 4 4 4 4 3 5 4 5 4 4 45 5 5 5 5 5 5 5 5 5 5 5 5 5 5 5 5 5 5 5 4 4 4 4 45 5 3 4 5 5 5 5 4 4 5 5 5 5 3 3 3 5 5 4 4 5 4 3 23 5 5 4 4 3 5 4 4 3 3 3 4 5 3 3 3 5 3 3 4 5 3 4 45 5 3 3 4 5 5 5 5 5 5 5 5 5 4 4 3 3 4 4 5 5 4 4 34 5 5 3 5 4 4 3 4 4 4 4 4 3 3 3 3 4 4 4 4 5 4 4 53 5 5 3 4 2 3 5 4 3 5 5 4 3 4 4 3 4 3 3 3 3 4 3 33 3 3 3 3 3 4 3 3 4 3 4 3 4 3 3 3 3 4 5 5 5 2 4 44 5 4 4 4 4 4 3 4 3 4 3 4 5 3 4 3 3 4 3 4 4 4 4 43 5 3 3 4 5 4 4 4 4 4 4 3 5 4 4 4 4 5 4 4 5 3 3 34 4 4 4 4 4 4 4 4 4 4 4 4 4 4 4 4 4 3 3 3 3 3 3 3
356

4 5 4 4 5 5 5 5 4 2 2 3 5 5 2 3 2 5 3 3 5 5 4 4 53 3 2 2 2 3 4 2 4 1 3 2 4 2 2 2 2 3 3 3 3 4 3 2 35 5 4 4 5 4 5 4 5 4 4 4 5 3 2 3 3 5 5 5 5 4 4 5 53 3 3 3 3 3 4 3 3 3 3 3 4 3 3 3 3 3 4 3 3 4 4 4 53 4 3 3 4 4 4 3 4 3 4 4 5 5 3 4 4 5 5 5 3 5 4 5 45 5 5 5 5 4 5 4 5 4 4 5 5 4 5 4 4 4 5 5 4 5 5 4 45 5 4 5 5 5 5 5 5 5 5 5 5 5 5 5 5 5 5 5 5 5 5 5 55 5 5 5 5 5 5 5 5 5 5 5 5 5 5 5 5 5 5 5 5 5 5 5 54 5 4 3 3 4 4 3 3 3 3 4 5 4 3 3 3 3 3 3 5 4 3 4 45 5 4 4 5 5 5 5 5 4 5 4 5 5 4 4 4 5 4 4 4 5 4 3 3F-A01
F-A02
F-A03
F-A04
F-A05
F-A06
F-A07
F-A08
F-A09
F-A10
F-A11
F-A12
F-A13
F-A14
F-A15
F-A16
F-A17
F-A18
F-A19
F-A20
F-A21
F-A22
F-A23
F-A24
F-A25
4 4 3 3 4 3 4 4 4 3 4 4 4 4 3 3 3 4 3 4 5 4 4 4 35 5 3 3 4 4 5 5 5 2 4 4 5 3 3 3 4 3 4 4 4 5 4 3 34 5 3 4 3 3 3 3 3 5 5 5 4 3 4 4 3 3 4 4 4 5 4 3 45 5 5 5 4 4 5 5 5 3 4 5 5 5 4 4 4 4 4 4 4 4 4 4 44 5 4 4 4 5 5 5 5 4 5 5 5 5 5 5 5 5 5 5 4 4 4 4 43 5 3 3 5 5 5 5 5 4 5 4 4 3 4 4 5 4 4 4 4 4 5 4 43 4 3 2 4 5 5 4 5 4 4 4 3 3 3 4 4 3 3 4 4 4 4 5 23 4 3 2 3 5 5 4 5 4 4 4 3 3 3 4 4 3 3 4 4 4 4 5 23 4 3 2 2 3 4 4 5 4 4 4 4 3 3 4 5 5 4 4 4 5 5 5 44 5 4 4 5 5 5 5 5 5 4 4 5 5 4 4 4 4 4 4 5 5 5 5 4
357

3 4 3 2 5 3 3 3 4 3 3 3 3 3 2 2 3 3 3 4 3 5 3 5 33 5 4 3 3 3 5 5 5 5 4 4 4 5 4 4 4 4 5 5 4 5 5 4 44 4 4 3 4 4 4 3 4 5 4 4 5 4 4 4 4 4 4 4 4 4 4 4 43 5 4 3 4 4 4 4 5 3 4 4 4 4 3 3 4 5 4 4 4 5 3 4 44 4 3 3 3 3 4 4 5 2 4 4 4 3 3 3 2 3 3 3 3 4 3 3 33 5 3 4 5 4 5 5 5 5 4 4 4 4 4 4 4 4 4 4 4 5 4 5 53 4 4 4 4 4 4 4 4 3 4 3 4 4 3 3 4 4 4 3 4 4 4 3 33 5 3 3 4 3 3 3 4 3 3 3 3 3 3 3 3 3 3 4 5 4 4 4 43 5 3 3 4 5 5 4 4 2 2 4 3 1 2 2 2 3 3 4 4 5 4 3 23 5 3 3 5 5 5 5 5 4 5 4 4 3 4 4 5 4 4 4 4 5 5 5 45 5 3 4 4 4 4 4 4 3 5 5 4 5 4 4 4 5 4 4 4 4 5 4 54 5 4 4 4 3 4 4 4 3 4 4 3 4 4 4 4 4 3 4 3 3 3 3 34 5 5 4 4 4 5 4 4 2 4 4 4 4 4 4 3 3 4 4 3 4 4 4 33 4 2 3 3 4 4 4 3 3 4 3 4 4 3 3 3 3 4 5 4 5 4 3 35 5 4 4 3 3 3 4 4 3 5 5 5 5 4 4 3 4 4 5 4 4 5 5 4F-A01
F-A02
F-A03
F-A04
F-A05
F-A06
F-A07
F-A08
F-A09
F-A10
F-A11
F-A12
F-A13
F-A14
F-A15
F-A16
F-A17
F-A18
F-A19
F-A20
F-A21
F-A22
F-A23
F-A24
F-A25
3 3 4 3 4 4 4 4 3 3 4 3 3 3 3 3 3 4 4 4 4 4 3 3 34 5 3 2 4 4 5 5 5 4 4 4 5 4 2 2 2 3 3 4 5 5 4 3 34 5 3 3 3 3 4 3 3 3 5 5 4 3 3 4 3 4 4 5 4 3 3 2 24 4 2 2 4 4 4 2 4 1 4 3 4 3 2 4 2 3 2 2 4 3 3 3 23 5 5 4 4 4 5 4 4 3 4 3 4 4 4 5 3 5 5 5 3 5 4 4 3
358

4 4 3 3 3 3 4 5 3 2 3 4 3 4 2 2 2 3 4 3 4 4 4 3 35 5 3 3 5 5 5 4 4 4 5 4 3 4 4 3 4 3 3 4 4 4 4 4 35 5 5 5 5 5 5 5 5 5 5 5 5 5 4 5 4 5 5 5 4 5 5 5 55 5 4 4 4 5 5 4 4 4 5 5 5 4 4 4 4 4 4 4 5 4 4 4 45 5 4 4 5 4 5 4 4 4 4 5 4 5 5 4 5 4 5 4 4 5 5 5 44 5 5 5 5 5 5 5 5 5 5 5 5 5 5 5 5 5 3 5 5 4 4 3 44 5 3 3 4 5 4 4 5 3 3 4 4 4 3 4 3 3 3 3 4 4 3 4 33 3 3 3 4 4 4 4 5 2 3 5 5 3 3 3 2 2 2 3 3 5 5 5 43 4 3 2 4 5 5 3 4 2 3 3 3 3 2 3 2 3 2 2 4 5 4 3 44 4 3 2 4 5 5 5 5 3 4 4 4 4 4 3 3 4 4 5 5 5 4 5 53 5 3 3 5 5 5 3 5 5 5 5 5 5 4 4 4 4 4 5 4 5 4 4 5
359

Table No.6 Total Explained Of Factors (Subjects) Included In Practicing Executives
F01
F02
F03
F04
F05
F06
F07
F08
F09
F10
F11
F12
F13
F14
F15
F16
F17
F18
F19
F20
F21
F22
F23
F24
F25
F26
3 5 5 5 3 5 5 5 3 4 3 3 3 4 3 4 3 3 5 5 4 4 4 4 4 45 5 5 5 5 4 5 5 5 3 5 5 5 5 4 4 5 4 4 5 4 4 4 4 5 45 4 4 4 5 5 3 3 3 4 3 3 3 4 4 3 2 4 4 5 4 4 4 4 4 45 5 5 5 5 5 5 5 5 5 5 5 5 5 4 5 4 4 4 4 4 4 4 4 4 43 3 3 3 5 4 5 3 3 5 5 5 5 3 3 2 2 3 5 5 3 4 4 3 5 44 4 4 4 3 2 2 3 2 5 5 5 5 5 4 5 5 3 3 5 4 4 4 4 4 45 5 5 5 5 5 5 5 5 5 5 5 5 5 5 5 5 5 5 5 4 4 4 4 4 45 5 5 5 5 4 4 4 4 4 5 5 5 5 5 5 5 5 5 5 4 4 4 4 4 45 5 5 5 5 5 4 4 4 4 4 5 4 4 4 5 5 4 5 5 4 5 5 5 5 54 4 4 4 5 4 4 4 4 5 4 4 4 3 3 5 5 5 4 4 3 4 4 4 4 45 5 5 5 5 5 5 4 5 4 5 5 4 4 4 4 4 4 4 4 4 5 4 4 4 45 5 5 5 5 5 5 5 5 4 4 4 5 5 4 5 5 5 5 5 4 4 4 4 4 45 5 5 5 4 5 5 5 4 4 5 5 5 5 3 5 4 4 4 4 4 4 4 4 4 43 3 4 4 4 4 5 4 3 3 3 3 5 4 3 3 3 4 5 4 4 5 4 4 5 45 5 5 5 5 4 4 3 5 4 5 5 5 5 4 4 4 5 5 5 5 4 5 4 5 55 4 5 5 5 5 5 5 5 5 5 5 5 5 5 5 5 4 5 5 4 4 5 4 4 54 4 4 4 5 5 4 3 4 3 5 5 4 5 3 3 3 3 4 4 4 5 5 3 3 24 4 4 4 4 4 5 5 5 4 5 4 5 4 4 5 4 4 4 4 4 4 3 4 4 43 5 4 4 4 4 5 3 3 4 3 4 4 5 4 3 4 4 4 4 4 5 4 5 3 43 4 2 5 5 3 3 2 2 2 2 2 3 2 2 2 2 4 2 2 1 2 2 1 1 1
360
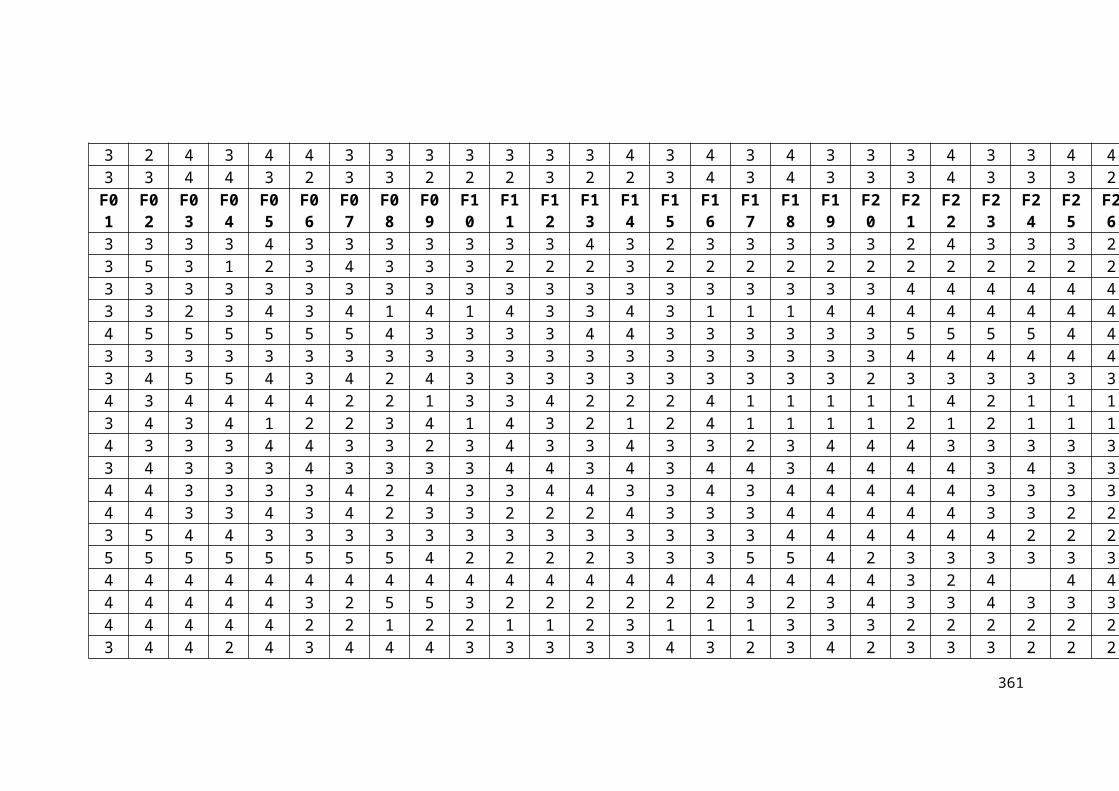
3 2 4 3 4 4 3 3 3 3 3 3 3 4 3 4 3 4 3 3 3 4 3 3 4 43 3 4 4 3 2 3 3 2 2 2 3 2 2 3 4 3 4 3 3 3 4 3 3 3 2F01
F02
F03
F04
F05
F06
F07
F08
F09
F10
F11
F12
F13
F14
F15
F16
F17
F18
F19
F20
F21
F22
F23
F24
F25
F26
3 3 3 3 4 3 3 3 3 3 3 3 4 3 2 3 3 3 3 3 2 4 3 3 3 23 5 3 1 2 3 4 3 3 3 2 2 2 3 2 2 2 2 2 2 2 2 2 2 2 23 3 3 3 3 3 3 3 3 3 3 3 3 3 3 3 3 3 3 3 4 4 4 4 4 43 3 2 3 4 3 4 1 4 1 4 3 3 4 3 1 1 1 4 4 4 4 4 4 4 44 5 5 5 5 5 5 4 3 3 3 3 4 4 3 3 3 3 3 3 5 5 5 5 4 43 3 3 3 3 3 3 3 3 3 3 3 3 3 3 3 3 3 3 3 4 4 4 4 4 43 4 5 5 4 3 4 2 4 3 3 3 3 3 3 3 3 3 3 2 3 3 3 3 3 34 3 4 4 4 4 2 2 1 3 3 4 2 2 2 4 1 1 1 1 1 4 2 1 1 13 4 3 4 1 2 2 3 4 1 4 3 2 1 2 4 1 1 1 1 2 1 2 1 1 14 3 3 3 4 4 3 3 2 3 4 3 3 4 3 3 2 3 4 4 4 3 3 3 3 33 4 3 3 3 4 3 3 3 3 4 4 3 4 3 4 4 3 4 4 4 4 3 4 3 34 4 3 3 3 3 4 2 4 3 3 4 4 3 3 4 3 4 4 4 4 4 3 3 3 34 4 3 3 4 3 4 2 3 3 2 2 2 4 3 3 3 4 4 4 4 4 3 3 2 23 5 4 4 3 3 3 3 3 3 3 3 3 3 3 3 3 4 4 4 4 4 4 2 2 25 5 5 5 5 5 5 5 4 2 2 2 2 3 3 3 5 5 4 2 3 3 3 3 3 34 4 4 4 4 4 4 4 4 4 4 4 4 4 4 4 4 4 4 4 3 2 4 4 44 4 4 4 4 3 2 5 5 3 2 2 2 2 2 2 3 2 3 4 3 3 4 3 3 34 4 4 4 4 2 2 1 2 2 1 1 2 3 1 1 1 3 3 3 2 2 2 2 2 23 4 4 2 4 3 4 4 4 3 3 3 3 3 4 3 2 3 4 2 3 3 3 2 2 2
361
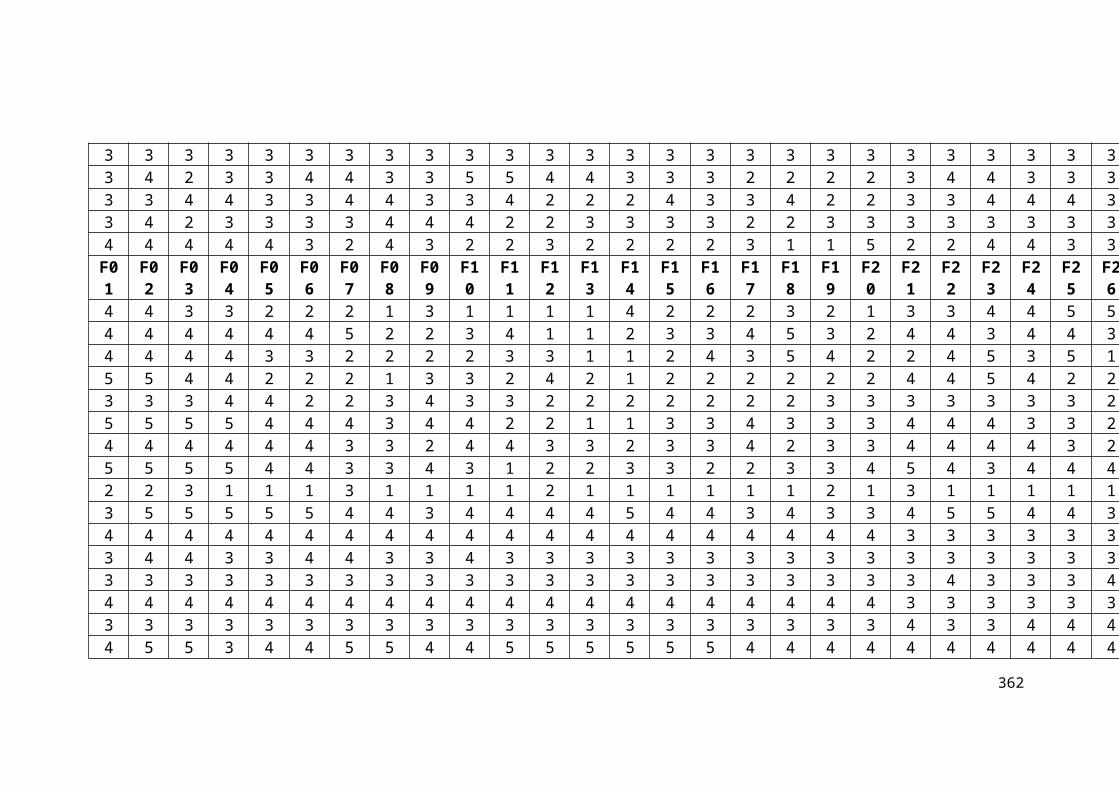
3 3 3 3 3 3 3 3 3 3 3 3 3 3 3 3 3 3 3 3 3 3 3 3 3 33 4 2 3 3 4 4 3 3 5 5 4 4 3 3 3 2 2 2 2 3 4 4 3 3 33 3 4 4 3 3 4 4 3 3 4 2 2 2 4 3 3 4 2 2 3 3 4 4 4 33 4 2 3 3 3 3 4 4 4 2 2 3 3 3 3 2 2 3 3 3 3 3 3 3 34 4 4 4 4 3 2 4 3 2 2 3 2 2 2 2 3 1 1 5 2 2 4 4 3 3F01
F02
F03
F04
F05
F06
F07
F08
F09
F10
F11
F12
F13
F14
F15
F16
F17
F18
F19
F20
F21
F22
F23
F24
F25
F26
4 4 3 3 2 2 2 1 3 1 1 1 1 4 2 2 2 3 2 1 3 3 4 4 5 54 4 4 4 4 4 5 2 2 3 4 1 1 2 3 3 4 5 3 2 4 4 3 4 4 34 4 4 4 3 3 2 2 2 2 3 3 1 1 2 4 3 5 4 2 2 4 5 3 5 15 5 4 4 2 2 2 1 3 3 2 4 2 1 2 2 2 2 2 2 4 4 5 4 2 23 3 3 4 4 2 2 3 4 3 3 2 2 2 2 2 2 2 3 3 3 3 3 3 3 25 5 5 5 4 4 4 3 4 4 2 2 1 1 3 3 4 3 3 3 4 4 4 3 3 24 4 4 4 4 4 3 3 2 4 4 3 3 2 3 3 4 2 3 3 4 4 4 4 3 25 5 5 5 4 4 3 3 4 3 1 2 2 3 3 2 2 3 3 4 5 4 3 4 4 42 2 3 1 1 1 3 1 1 1 1 2 1 1 1 1 1 1 2 1 3 1 1 1 1 13 5 5 5 5 5 4 4 3 4 4 4 4 5 4 4 3 4 3 3 4 5 5 4 4 34 4 4 4 4 4 4 4 4 4 4 4 4 4 4 4 4 4 4 4 3 3 3 3 3 33 4 4 3 3 4 4 3 3 4 3 3 3 3 3 3 3 3 3 3 3 3 3 3 3 33 3 3 3 3 3 3 3 3 3 3 3 3 3 3 3 3 3 3 3 3 4 3 3 3 44 4 4 4 4 4 4 4 4 4 4 4 4 4 4 4 4 4 4 4 3 3 3 3 3 33 3 3 3 3 3 3 3 3 3 3 3 3 3 3 3 3 3 3 3 4 3 3 4 4 44 5 5 3 4 4 5 5 4 4 5 5 5 5 5 5 4 4 4 4 4 4 4 4 4 4
362
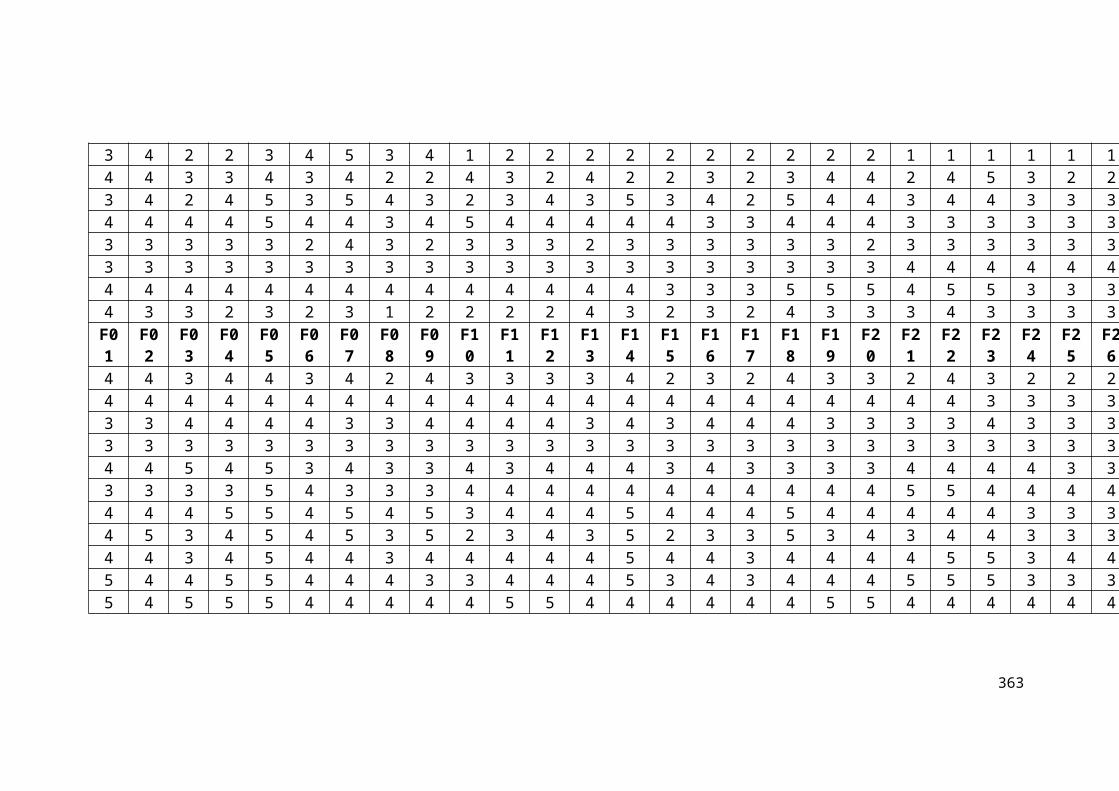
3 4 2 2 3 4 5 3 4 1 2 2 2 2 2 2 2 2 2 2 1 1 1 1 1 14 4 3 3 4 3 4 2 2 4 3 2 4 2 2 3 2 3 4 4 2 4 5 3 2 23 4 2 4 5 3 5 4 3 2 3 4 3 5 3 4 2 5 4 4 3 4 4 3 3 34 4 4 4 5 4 4 3 4 5 4 4 4 4 4 3 3 4 4 4 3 3 3 3 3 33 3 3 3 3 2 4 3 2 3 3 3 2 3 3 3 3 3 3 2 3 3 3 3 3 33 3 3 3 3 3 3 3 3 3 3 3 3 3 3 3 3 3 3 3 4 4 4 4 4 44 4 4 4 4 4 4 4 4 4 4 4 4 4 3 3 3 5 5 5 4 5 5 3 3 34 3 3 2 3 2 3 1 2 2 2 2 4 3 2 3 2 4 3 3 3 4 3 3 3 3F01
F02
F03
F04
F05
F06
F07
F08
F09
F10
F11
F12
F13
F14
F15
F16
F17
F18
F19
F20
F21
F22
F23
F24
F25
F26
4 4 3 4 4 3 4 2 4 3 3 3 3 4 2 3 2 4 3 3 2 4 3 2 2 24 4 4 4 4 4 4 4 4 4 4 4 4 4 4 4 4 4 4 4 4 4 3 3 3 33 3 4 4 4 4 3 3 4 4 4 4 3 4 3 4 4 4 3 3 3 3 4 3 3 33 3 3 3 3 3 3 3 3 3 3 3 3 3 3 3 3 3 3 3 3 3 3 3 3 34 4 5 4 5 3 4 3 3 4 3 4 4 4 3 4 3 3 3 3 4 4 4 4 3 33 3 3 3 5 4 3 3 3 4 4 4 4 4 4 4 4 4 4 4 5 5 4 4 4 44 4 4 5 5 4 5 4 5 3 4 4 4 5 4 4 4 5 4 4 4 4 4 3 3 34 5 3 4 5 4 5 3 5 2 3 4 3 5 2 3 3 5 3 4 3 4 4 3 3 34 4 3 4 5 4 4 3 4 4 4 4 4 5 4 4 3 4 4 4 4 5 5 3 4 45 4 4 5 5 4 4 4 3 3 4 4 4 5 3 4 3 4 4 4 5 5 5 3 3 35 4 5 5 5 4 4 4 4 4 5 5 4 4 4 4 4 4 5 5 4 4 4 4 4 4
363
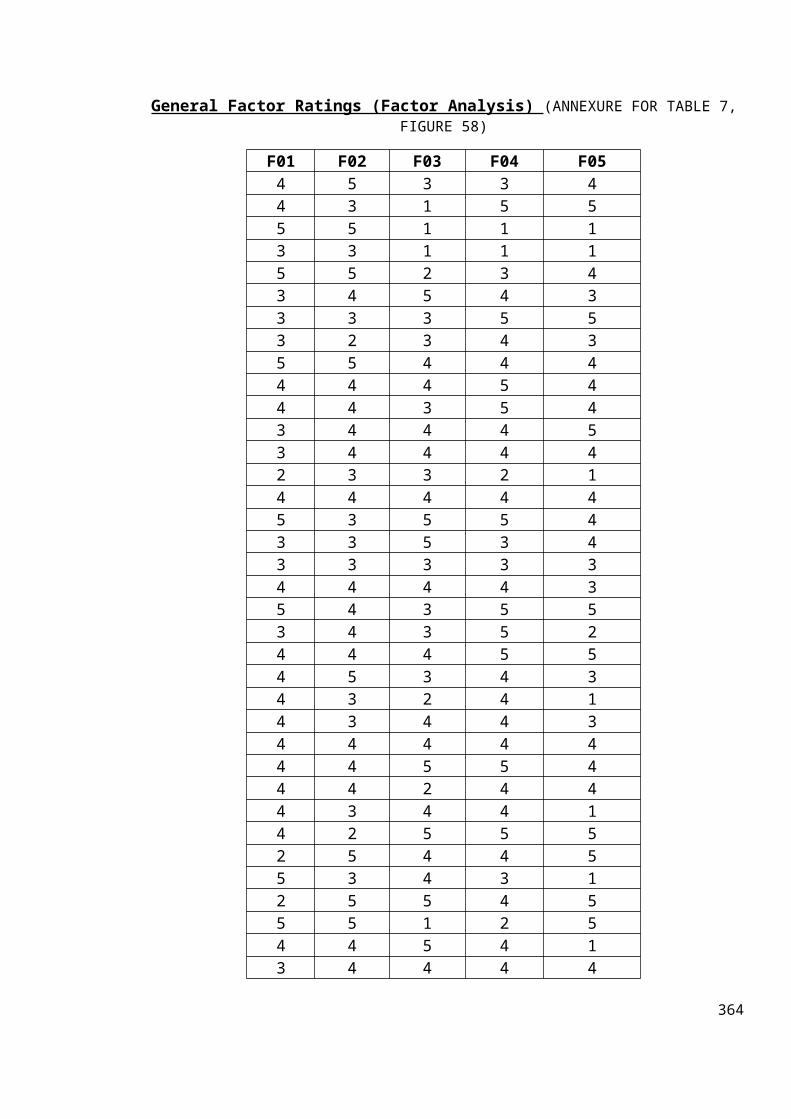
General Factor Ratings (Factor Analysis) (ANNEXURE FOR TABLE 7,FIGURE 58)
F01 F02 F03 F04 F054 5 3 3 44 3 1 5 55 5 1 1 13 3 1 1 15 5 2 3 43 4 5 4 33 3 3 5 53 2 3 4 35 5 4 4 44 4 4 5 44 4 3 5 43 4 4 4 53 4 4 4 42 3 3 2 14 4 4 4 45 3 5 5 43 3 5 3 43 3 3 3 34 4 4 4 35 4 3 5 53 4 3 5 24 4 4 5 54 5 3 4 34 3 2 4 14 3 4 4 34 4 4 4 44 4 5 5 44 4 2 4 44 3 4 4 14 2 5 5 52 5 4 4 55 3 4 3 12 5 5 4 55 5 1 2 54 4 5 4 13 4 4 4 4
364
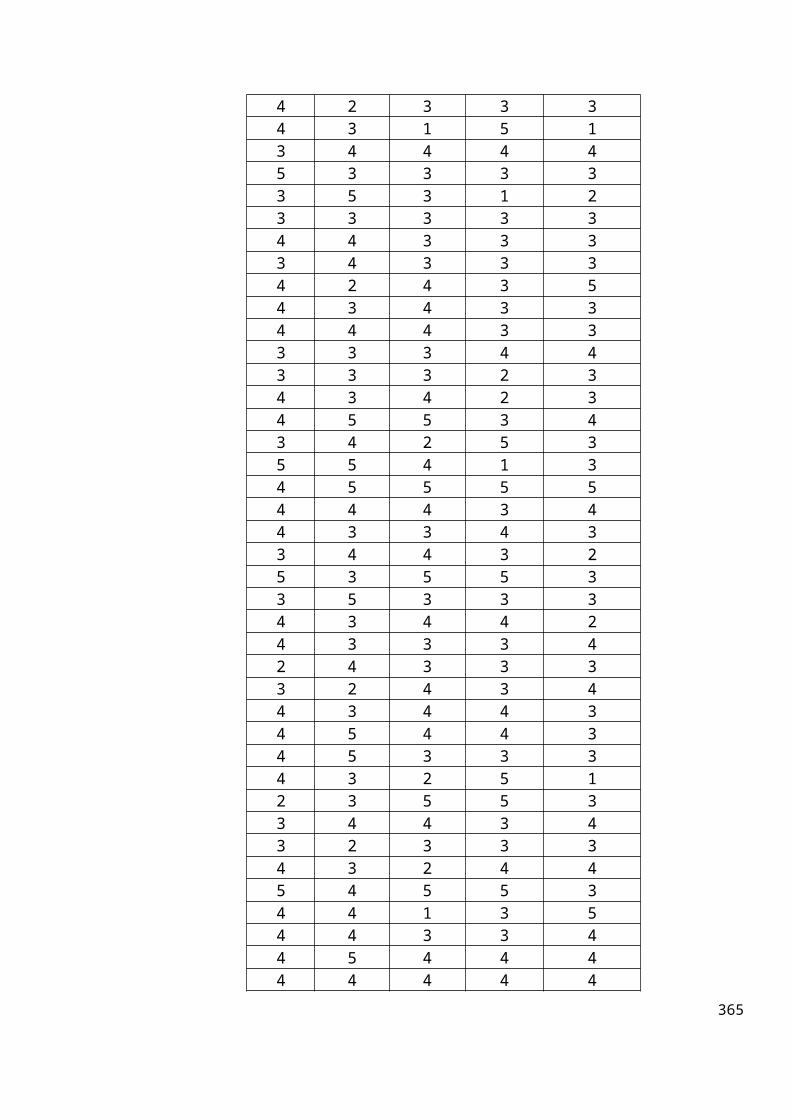
4 2 3 3 34 3 1 5 13 4 4 4 45 3 3 3 33 5 3 1 23 3 3 3 34 4 3 3 33 4 3 3 34 2 4 3 54 3 4 3 34 4 4 3 33 3 3 4 43 3 3 2 34 3 4 2 34 5 5 3 43 4 2 5 35 5 4 1 34 5 5 5 54 4 4 3 44 3 3 4 33 4 4 3 25 3 5 5 33 5 3 3 34 3 4 4 24 3 3 3 42 4 3 3 33 2 4 3 44 3 4 4 34 5 4 4 34 5 3 3 34 3 2 5 12 3 5 5 33 4 4 3 43 2 3 3 34 3 2 4 45 4 5 5 34 4 1 3 54 4 3 3 44 5 4 4 44 4 4 4 4
365
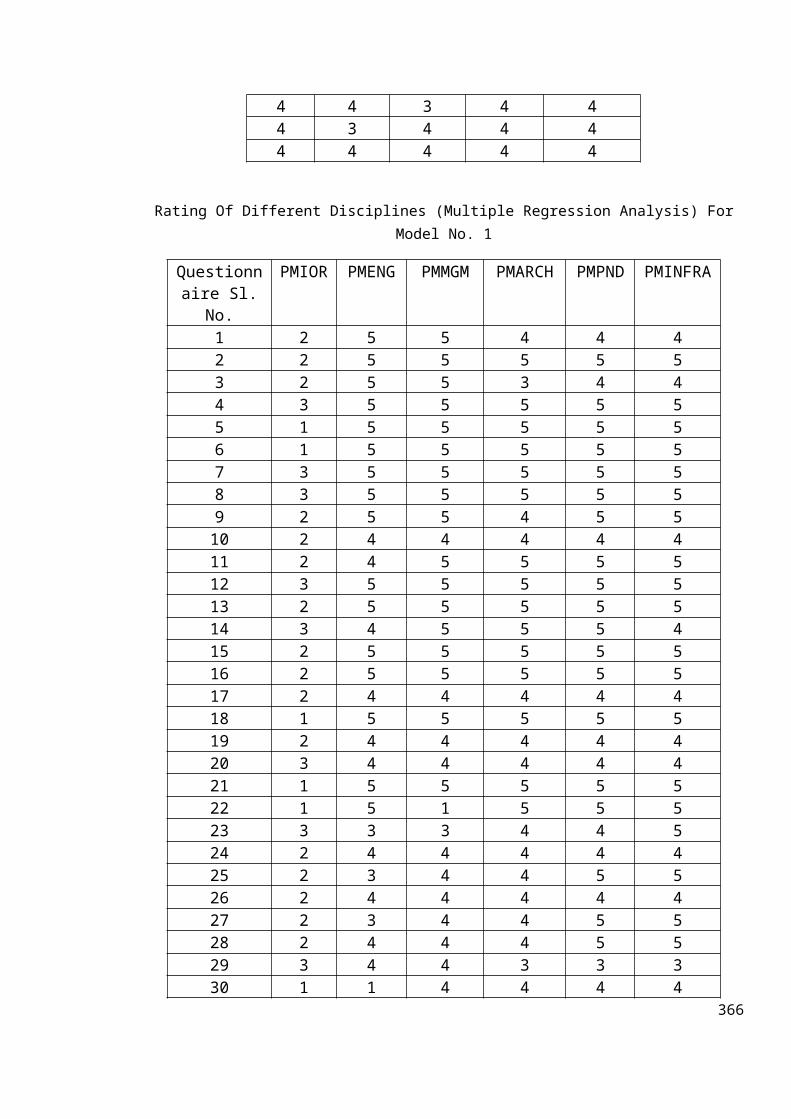
4 4 3 4 44 3 4 4 44 4 4 4 4
Rating Of Different Disciplines (Multiple Regression Analysis) ForModel No. 1
Questionnaire Sl.
No.
PMIOR PMENG PMMGM PMARCH PMPND PMINFRA
1 2 5 5 4 4 42 2 5 5 5 5 53 2 5 5 3 4 44 3 5 5 5 5 55 1 5 5 5 5 56 1 5 5 5 5 57 3 5 5 5 5 58 3 5 5 5 5 59 2 5 5 4 5 510 2 4 4 4 4 411 2 4 5 5 5 512 3 5 5 5 5 513 2 5 5 5 5 514 3 4 5 5 5 415 2 5 5 5 5 516 2 5 5 5 5 517 2 4 4 4 4 418 1 5 5 5 5 519 2 4 4 4 4 420 3 4 4 4 4 421 1 5 5 5 5 522 1 5 1 5 5 523 3 3 3 4 4 524 2 4 4 4 4 425 2 3 4 4 5 526 2 4 4 4 4 427 2 3 4 4 5 528 2 4 4 4 5 529 3 4 4 3 3 330 1 1 4 4 4 4
366
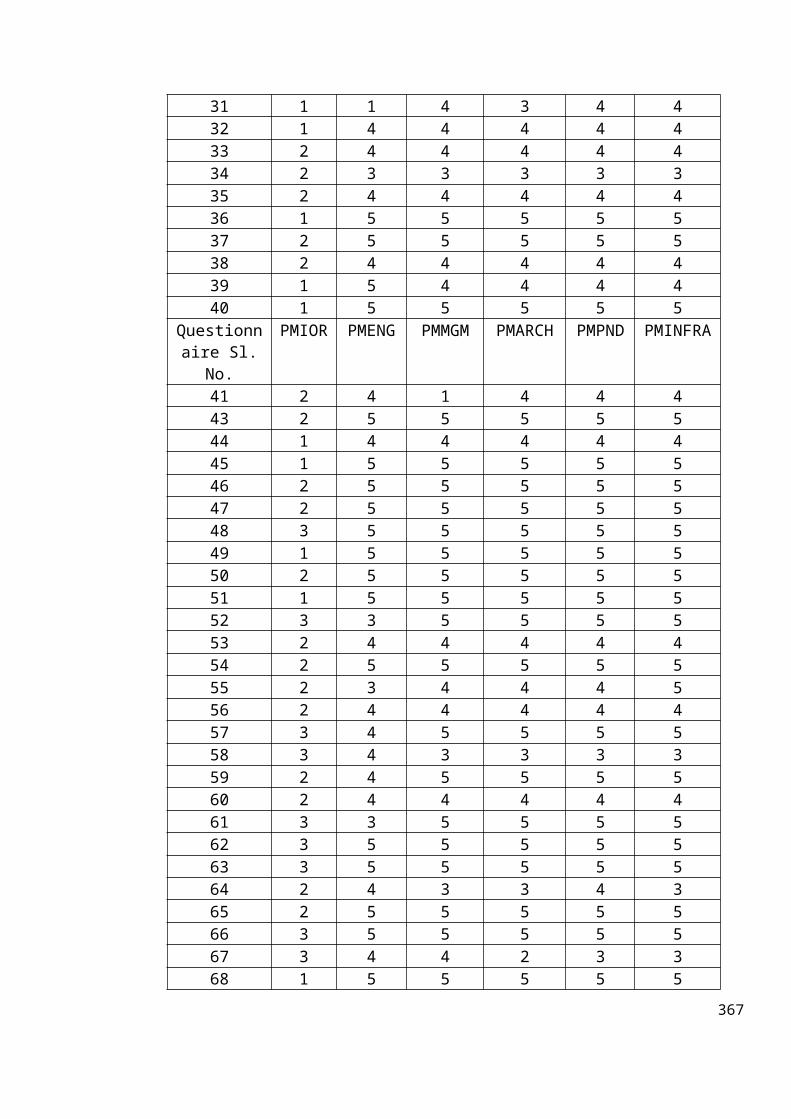
31 1 1 4 3 4 432 1 4 4 4 4 433 2 4 4 4 4 434 2 3 3 3 3 335 2 4 4 4 4 436 1 5 5 5 5 537 2 5 5 5 5 538 2 4 4 4 4 439 1 5 4 4 4 440 1 5 5 5 5 5
Questionnaire Sl.
No.
PMIOR PMENG PMMGM PMARCH PMPND PMINFRA
41 2 4 1 4 4 443 2 5 5 5 5 544 1 4 4 4 4 445 1 5 5 5 5 546 2 5 5 5 5 547 2 5 5 5 5 548 3 5 5 5 5 549 1 5 5 5 5 550 2 5 5 5 5 551 1 5 5 5 5 552 3 3 5 5 5 553 2 4 4 4 4 454 2 5 5 5 5 555 2 3 4 4 4 556 2 4 4 4 4 457 3 4 5 5 5 558 3 4 3 3 3 359 2 4 5 5 5 560 2 4 4 4 4 461 3 3 5 5 5 562 3 5 5 5 5 563 3 5 5 5 5 564 2 4 3 3 4 365 2 5 5 5 5 566 3 5 5 5 5 567 3 4 4 2 3 368 1 5 5 5 5 5
367
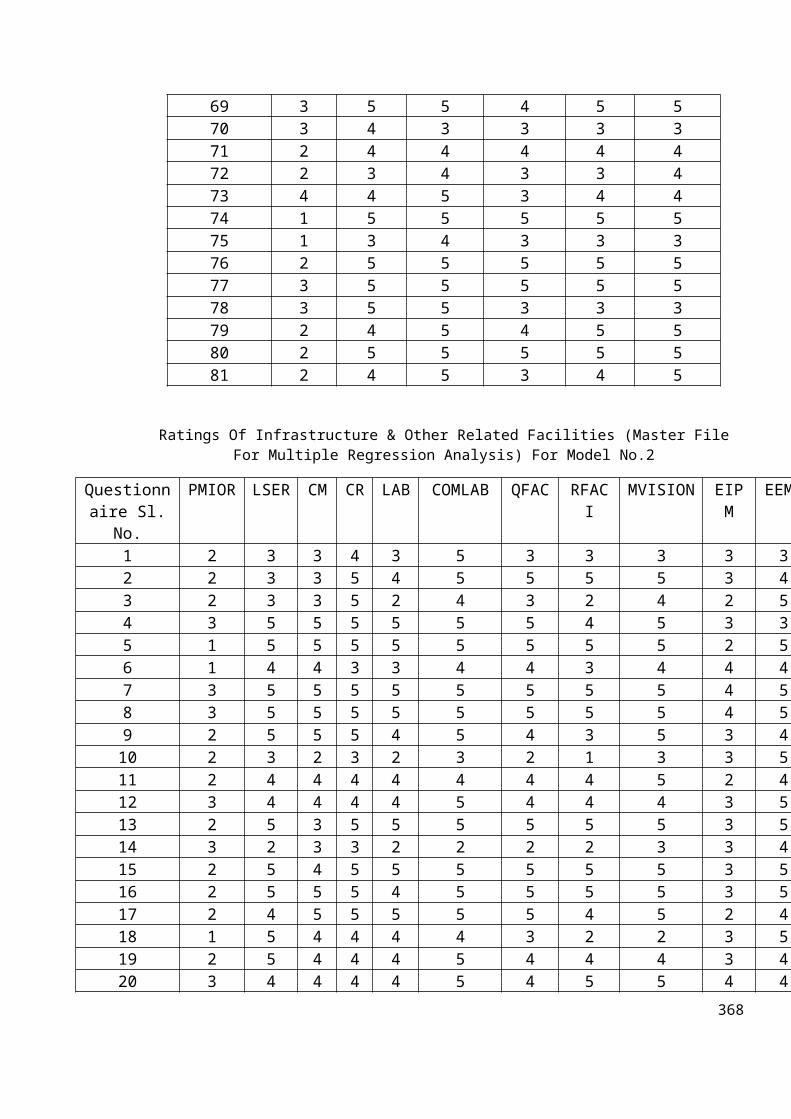
69 3 5 5 4 5 570 3 4 3 3 3 371 2 4 4 4 4 472 2 3 4 3 3 473 4 4 5 3 4 474 1 5 5 5 5 575 1 3 4 3 3 376 2 5 5 5 5 577 3 5 5 5 5 578 3 5 5 3 3 379 2 4 5 4 5 580 2 5 5 5 5 581 2 4 5 3 4 5
Ratings Of Infrastructure & Other Related Facilities (Master FileFor Multiple Regression Analysis) For Model No.2
Questionnaire Sl.
No.
PMIOR LSER CM CR LAB COMLAB QFAC RFACI
MVISION EIPM
EEMP
1 2 3 3 4 3 5 3 3 3 3 32 2 3 3 5 4 5 5 5 5 3 43 2 3 3 5 2 4 3 2 4 2 54 3 5 5 5 5 5 5 4 5 3 35 1 5 5 5 5 5 5 5 5 2 56 1 4 4 3 3 4 4 3 4 4 47 3 5 5 5 5 5 5 5 5 4 58 3 5 5 5 5 5 5 5 5 4 59 2 5 5 5 4 5 4 3 5 3 410 2 3 2 3 2 3 2 1 3 3 511 2 4 4 4 4 4 4 4 5 2 412 3 4 4 4 4 5 4 4 4 3 513 2 5 3 5 5 5 5 5 5 3 514 3 2 3 3 2 2 2 2 3 3 415 2 5 4 5 5 5 5 5 5 3 516 2 5 5 5 4 5 5 5 5 3 517 2 4 5 5 5 5 5 4 5 2 418 1 5 4 4 4 4 3 2 2 3 519 2 5 4 4 4 5 4 4 4 3 420 3 4 4 4 4 5 4 5 5 4 4
368
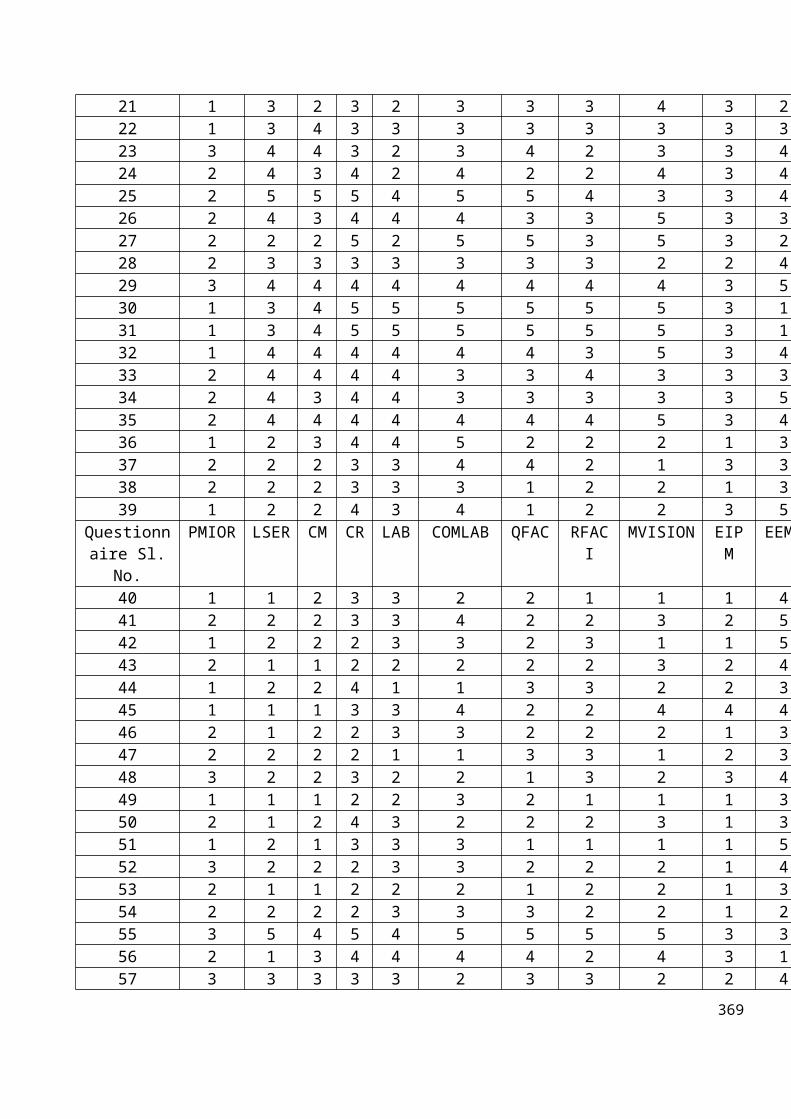
21 1 3 2 3 2 3 3 3 4 3 222 1 3 4 3 3 3 3 3 3 3 323 3 4 4 3 2 3 4 2 3 3 424 2 4 3 4 2 4 2 2 4 3 425 2 5 5 5 4 5 5 4 3 3 426 2 4 3 4 4 4 3 3 5 3 327 2 2 2 5 2 5 5 3 5 3 228 2 3 3 3 3 3 3 3 2 2 429 3 4 4 4 4 4 4 4 4 3 530 1 3 4 5 5 5 5 5 5 3 131 1 3 4 5 5 5 5 5 5 3 132 1 4 4 4 4 4 4 3 5 3 433 2 4 4 4 4 3 3 4 3 3 334 2 4 3 4 4 3 3 3 3 3 535 2 4 4 4 4 4 4 4 5 3 436 1 2 3 4 4 5 2 2 2 1 337 2 2 2 3 3 4 4 2 1 3 338 2 2 2 3 3 3 1 2 2 1 339 1 2 2 4 3 4 1 2 2 3 5
Questionnaire Sl.
No.
PMIOR LSER CM CR LAB COMLAB QFAC RFACI
MVISION EIPM
EEMP
40 1 1 2 3 3 2 2 1 1 1 441 2 2 2 3 3 4 2 2 3 2 542 1 2 2 2 3 3 2 3 1 1 543 2 1 1 2 2 2 2 2 3 2 444 1 2 2 4 1 1 3 3 2 2 345 1 1 1 3 3 4 2 2 4 4 446 2 1 2 2 3 3 2 2 2 1 347 2 2 2 2 1 1 3 3 1 2 348 3 2 2 3 2 2 1 3 2 3 449 1 1 1 2 2 3 2 1 1 1 350 2 1 2 4 3 2 2 2 3 1 351 1 2 1 3 3 3 1 1 1 1 552 3 2 2 2 3 3 2 2 2 1 453 2 1 1 2 2 2 1 2 2 1 354 2 2 2 2 3 3 3 2 2 1 255 3 5 4 5 4 5 5 5 5 3 356 2 1 3 4 4 4 4 2 4 3 157 3 3 3 3 3 2 3 3 2 2 4
369
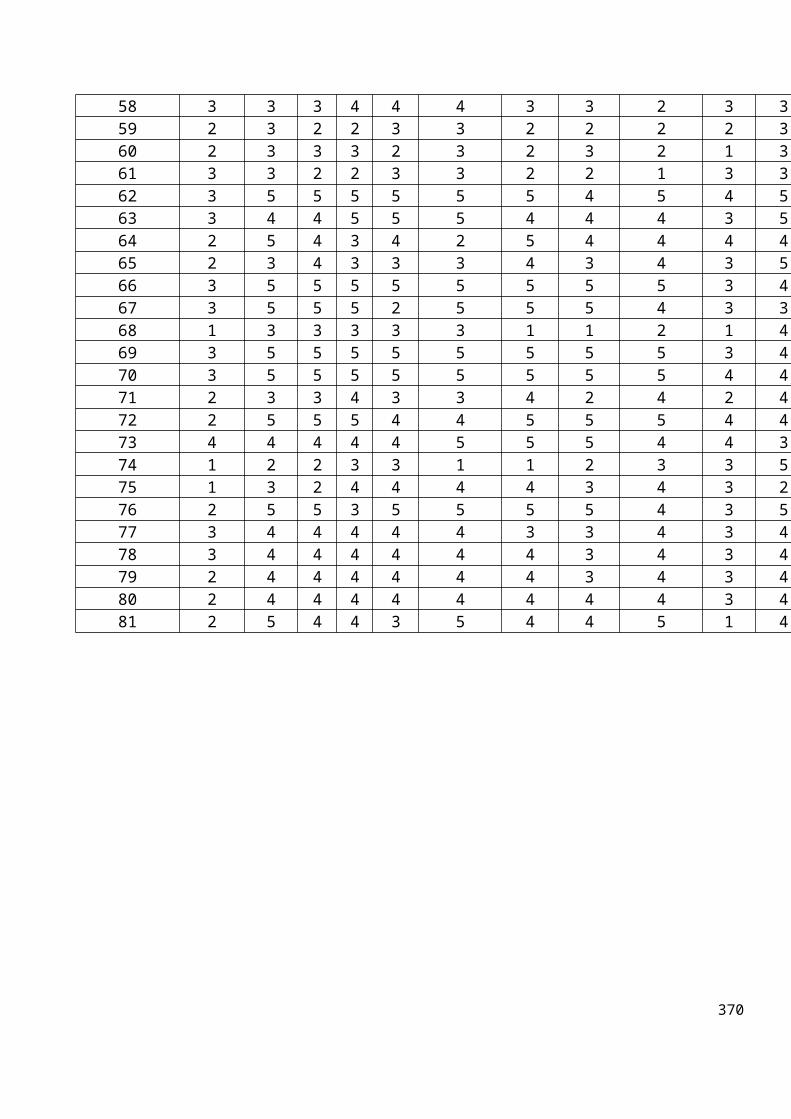
58 3 3 3 4 4 4 3 3 2 3 359 2 3 2 2 3 3 2 2 2 2 360 2 3 3 3 2 3 2 3 2 1 361 3 3 2 2 3 3 2 2 1 3 362 3 5 5 5 5 5 5 4 5 4 563 3 4 4 5 5 5 4 4 4 3 564 2 5 4 3 4 2 5 4 4 4 465 2 3 4 3 3 3 4 3 4 3 566 3 5 5 5 5 5 5 5 5 3 467 3 5 5 5 2 5 5 5 4 3 368 1 3 3 3 3 3 1 1 2 1 469 3 5 5 5 5 5 5 5 5 3 470 3 5 5 5 5 5 5 5 5 4 471 2 3 3 4 3 3 4 2 4 2 472 2 5 5 5 4 4 5 5 5 4 473 4 4 4 4 4 5 5 5 4 4 374 1 2 2 3 3 1 1 2 3 3 575 1 3 2 4 4 4 4 3 4 3 276 2 5 5 3 5 5 5 5 4 3 577 3 4 4 4 4 4 3 3 4 3 478 3 4 4 4 4 4 4 3 4 3 479 2 4 4 4 4 4 4 3 4 3 480 2 4 4 4 4 4 4 4 4 3 481 2 5 4 4 3 5 4 4 5 1 4
370
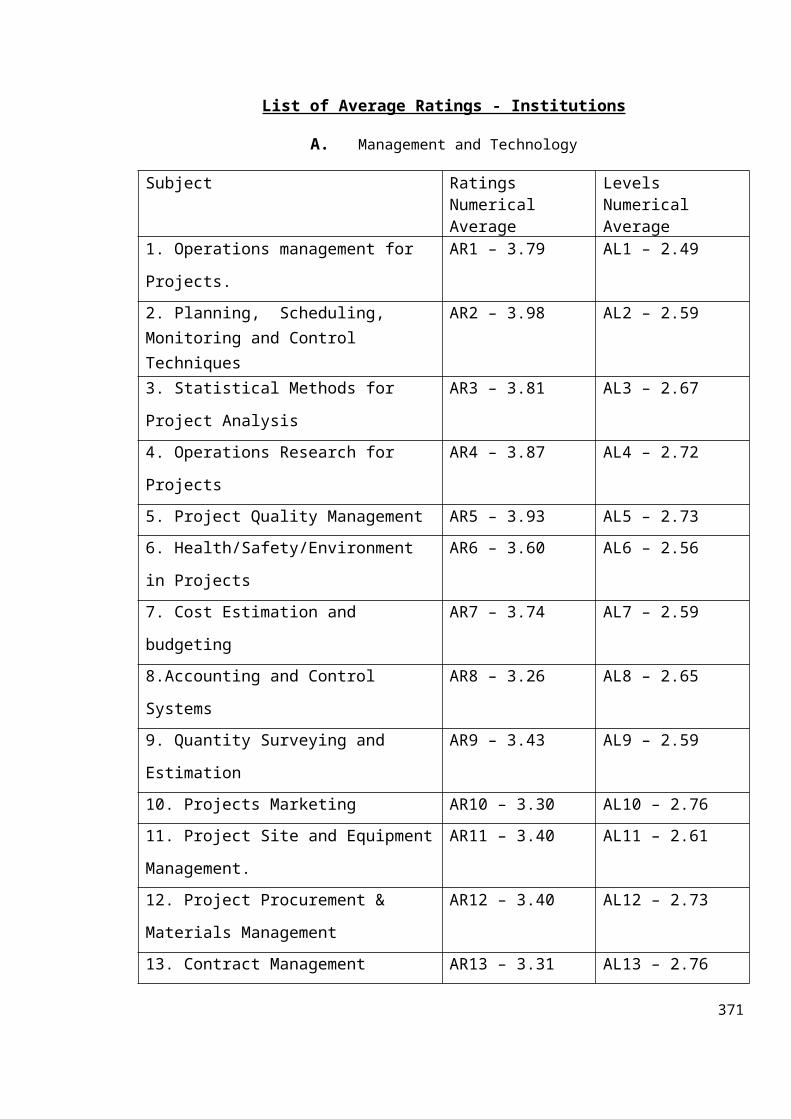
List of Average Ratings - Institutions
A. Management and Technology
Subject Ratings Numerical Average
Levels Numerical Average
1. Operations management for
Projects.
AR1 – 3.79 AL1 – 2.49
2. Planning, Scheduling, Monitoring and Control Techniques
AR2 – 3.98 AL2 – 2.59
3. Statistical Methods for
Project Analysis
AR3 – 3.81 AL3 – 2.67
4. Operations Research for
Projects
AR4 – 3.87 AL4 – 2.72
5. Project Quality Management AR5 – 3.93 AL5 – 2.736. Health/Safety/Environment
in Projects
AR6 – 3.60 AL6 – 2.56
7. Cost Estimation and
budgeting
AR7 – 3.74 AL7 – 2.59
8.Accounting and Control
Systems
AR8 – 3.26 AL8 – 2.65
9. Quantity Surveying and
Estimation
AR9 – 3.43 AL9 – 2.59
10. Projects Marketing AR10 – 3.30 AL10 – 2.7611. Project Site and Equipment
Management.
AR11 – 3.40 AL11 – 2.61
12. Project Procurement &
Materials Management
AR12 – 3.40 AL12 – 2.73
13. Contract Management AR13 – 3.31 AL13 – 2.76
371
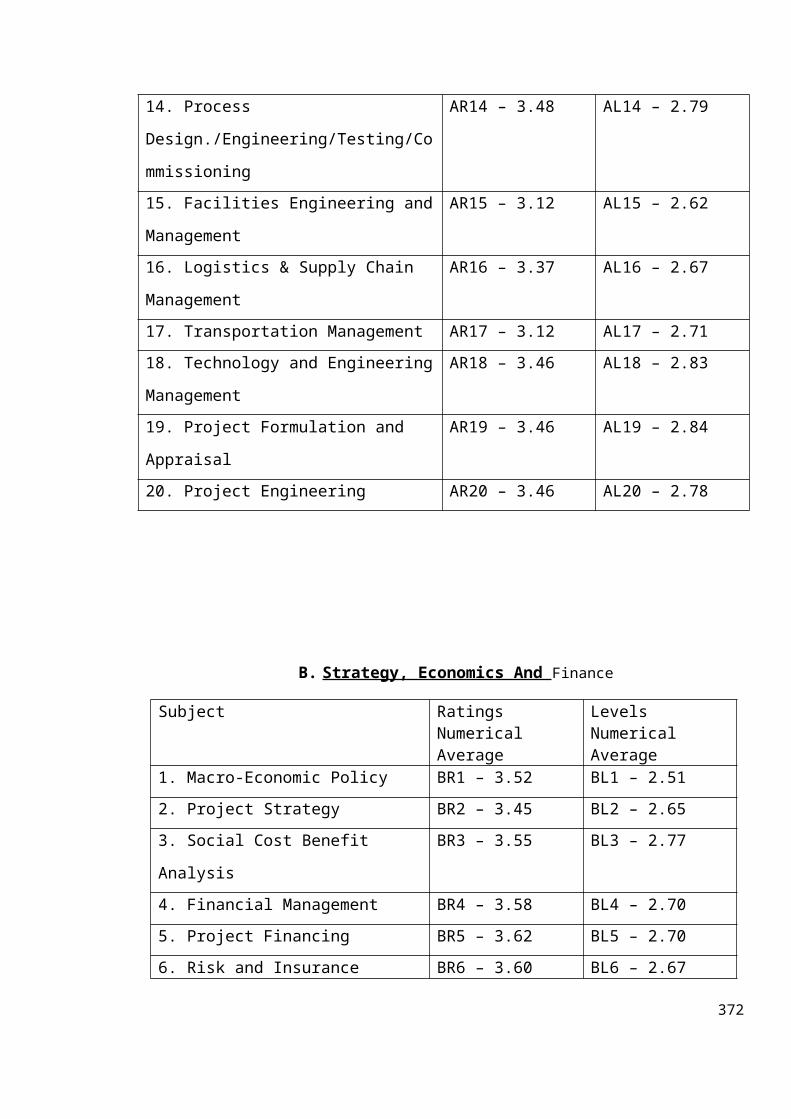
14. Process
Design./Engineering/Testing/Co
mmissioning
AR14 – 3.48 AL14 – 2.79
15. Facilities Engineering and
Management
AR15 – 3.12 AL15 – 2.62
16. Logistics & Supply Chain
Management
AR16 – 3.37 AL16 – 2.67
17. Transportation Management AR17 – 3.12 AL17 – 2.7118. Technology and Engineering
Management
AR18 – 3.46 AL18 – 2.83
19. Project Formulation and
Appraisal
AR19 – 3.46 AL19 – 2.84
20. Project Engineering AR20 – 3.46 AL20 – 2.78
B. Strategy, Economics And Finance
Subject Ratings Numerical Average
Levels Numerical Average
1. Macro-Economic Policy BR1 – 3.52 BL1 – 2.512. Project Strategy BR2 – 3.45 BL2 – 2.653. Social Cost Benefit
Analysis
BR3 – 3.55 BL3 – 2.77
4. Financial Management BR4 – 3.58 BL4 – 2.705. Project Financing BR5 – 3.62 BL5 – 2.706. Risk and Insurance BR6 – 3.60 BL6 – 2.67
372
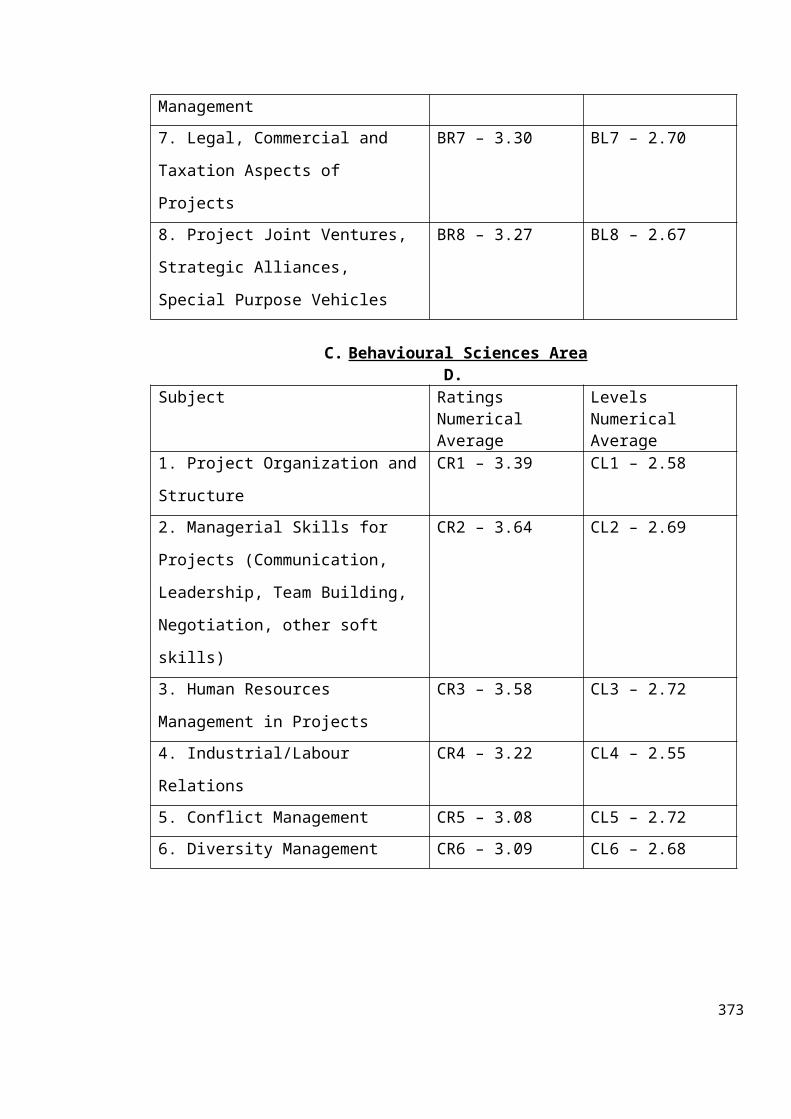
Management7. Legal, Commercial and
Taxation Aspects of
Projects
BR7 – 3.30 BL7 – 2.70
8. Project Joint Ventures,
Strategic Alliances,
Special Purpose Vehicles
BR8 – 3.27 BL8 – 2.67
C. Behavioural Sciences Area D.
Subject Ratings Numerical Average
Levels Numerical Average
1. Project Organization and
Structure
CR1 – 3.39 CL1 – 2.58
2. Managerial Skills for
Projects (Communication,
Leadership, Team Building,
Negotiation, other soft
skills)
CR2 – 3.64 CL2 – 2.69
3. Human Resources
Management in Projects
CR3 – 3.58 CL3 – 2.72
4. Industrial/Labour
Relations
CR4 – 3.22 CL4 – 2.55
5. Conflict Management CR5 – 3.08 CL5 – 2.726. Diversity Management CR6 – 3.09 CL6 – 2.68
373

E. Information Technology
Subject Ratings Numerical Average
Levels Numerical Average
1. PM software-Primavera,
MSP, GIS / GPS for Project
Management
DR1 – 3.83 DL1 – 2.47
2. Enterprise Resource
Planning ( ERP )
DR2 – 3.47 DL2 – 2.60
3. e-Business Applications DR3 – 3.25 DL3 – 2.614. Engineering Software
(Auto-Cad, Staadpro, Estm8,
Ansys, Auto-Revit, 3D-Max,
Calquan)
DR4 - 3.91 DL4 – 2.44
5. Excel / SPSS / DBMS DR5 – 3.95 DL5 – 2.53
F. Sector Specific
Subject Ratings Numerical Average
Levels Numerical Average
1. Information Communication Technology (ICT)
ER1 – 3.03 EL1 – 3.17
2. Telecom ER2 – 2.80 EL2 – 3.273. Research and Development ER3 – 3.07 EL3 – 3.394. Space Exploration ER4 – 2.97 EL4 – 3.405. Technology ER5 – 3.08 EL5 – 3.496. Defense ER6 – 3.03 EL6 – 3.36
374
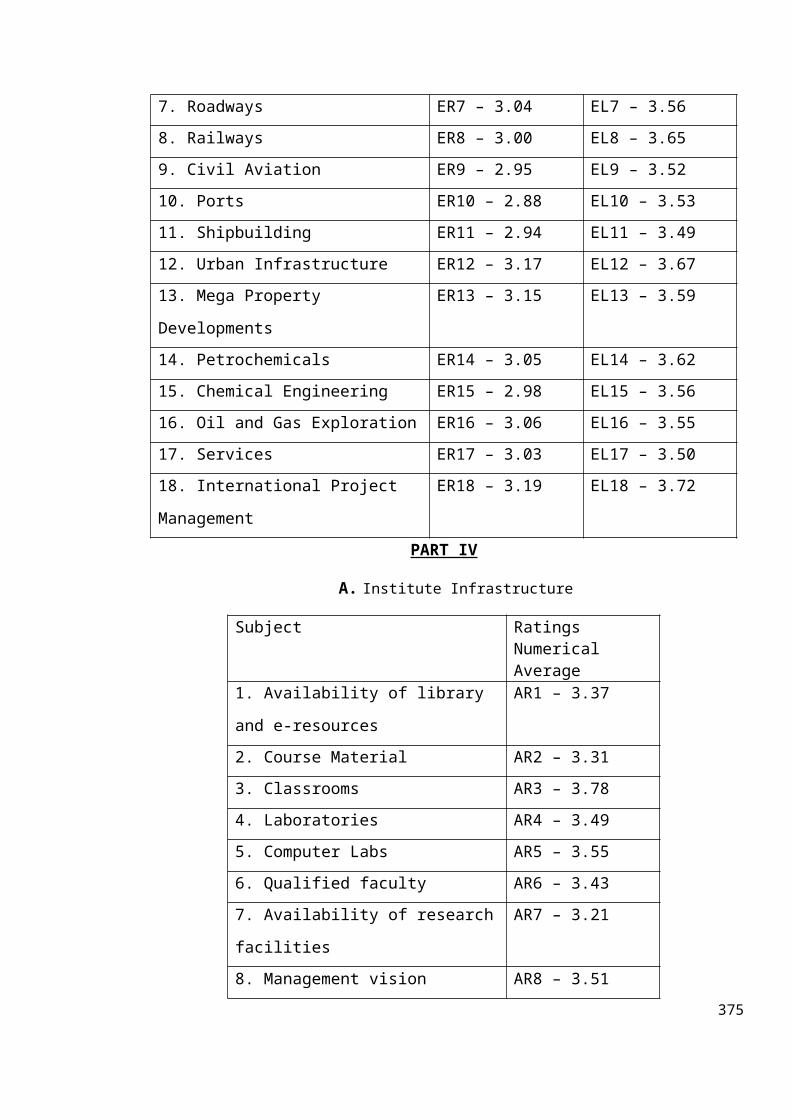
7. Roadways ER7 – 3.04 EL7 – 3.568. Railways ER8 – 3.00 EL8 – 3.659. Civil Aviation ER9 – 2.95 EL9 – 3.5210. Ports ER10 – 2.88 EL10 – 3.5311. Shipbuilding ER11 – 2.94 EL11 – 3.4912. Urban Infrastructure ER12 – 3.17 EL12 – 3.6713. Mega Property
Developments
ER13 – 3.15 EL13 – 3.59
14. Petrochemicals ER14 – 3.05 EL14 – 3.6215. Chemical Engineering ER15 – 2.98 EL15 – 3.5616. Oil and Gas Exploration ER16 – 3.06 EL16 – 3.5517. Services ER17 – 3.03 EL17 – 3.5018. International Project
Management
ER18 – 3.19 EL18 – 3.72
PART IV
A. Institute Infrastructure
Subject Ratings Numerical Average
1. Availability of library
and e-resources
AR1 – 3.37
2. Course Material AR2 – 3.313. Classrooms AR3 – 3.784. Laboratories AR4 – 3.495. Computer Labs AR5 – 3.556. Qualified faculty AR6 – 3.437. Availability of research
facilities
AR7 – 3.21
8. Management vision AR8 – 3.51375

Chapter V
List of Average Ratings - Executives
A. Management and Technology
Subject Ratings Numerical Average
1. Operations management for
Projects.
AR1 – 3.84
376
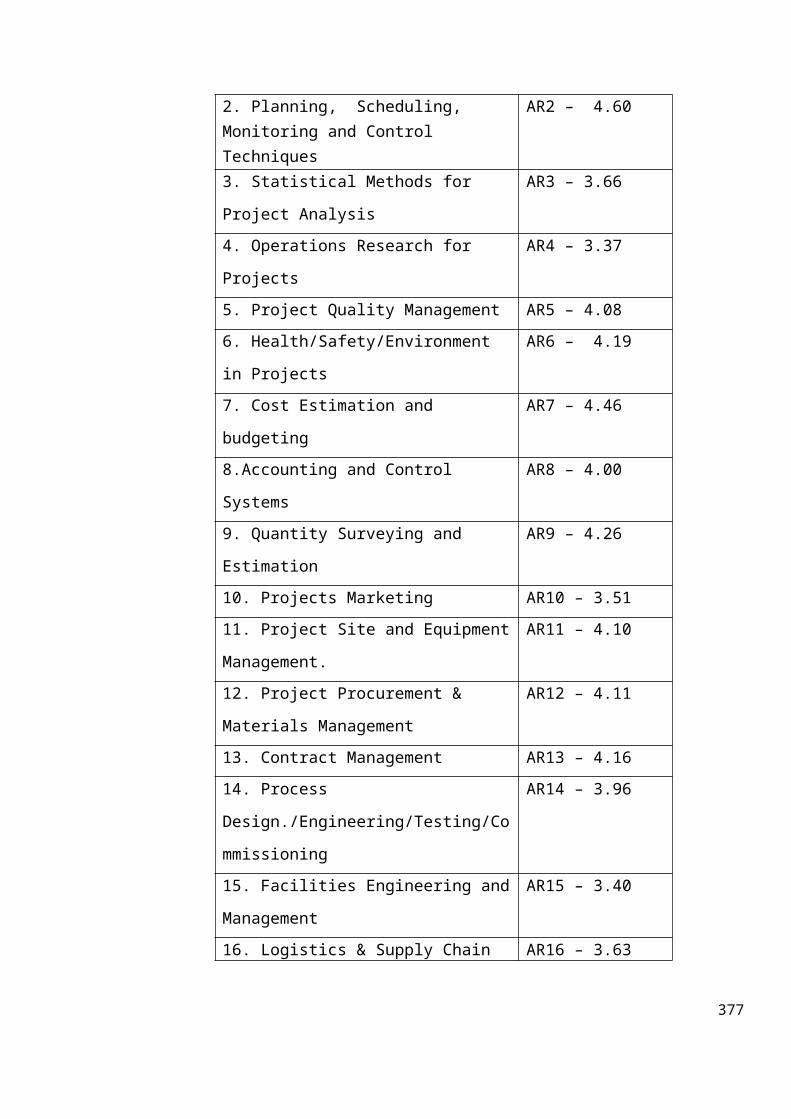
2. Planning, Scheduling, Monitoring and Control Techniques
AR2 – 4.60
3. Statistical Methods for
Project Analysis
AR3 – 3.66
4. Operations Research for
Projects
AR4 – 3.37
5. Project Quality Management AR5 – 4.086. Health/Safety/Environment
in Projects
AR6 – 4.19
7. Cost Estimation and
budgeting
AR7 – 4.46
8.Accounting and Control
Systems
AR8 – 4.00
9. Quantity Surveying and
Estimation
AR9 – 4.26
10. Projects Marketing AR10 – 3.5111. Project Site and Equipment
Management.
AR11 – 4.10
12. Project Procurement &
Materials Management
AR12 – 4.11
13. Contract Management AR13 – 4.1614. Process
Design./Engineering/Testing/Co
mmissioning
AR14 – 3.96
15. Facilities Engineering and
Management
AR15 – 3.40
16. Logistics & Supply Chain AR16 – 3.63
377
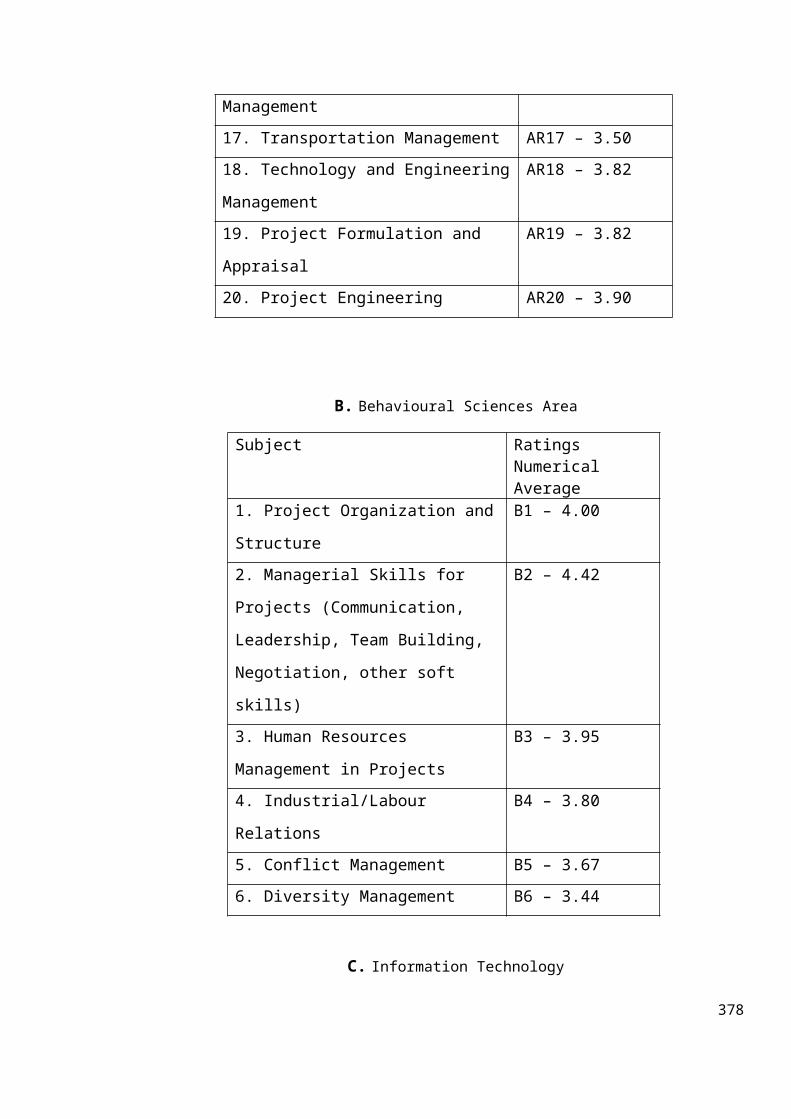
Management17. Transportation Management AR17 – 3.5018. Technology and Engineering
Management
AR18 – 3.82
19. Project Formulation and
Appraisal
AR19 – 3.82
20. Project Engineering AR20 – 3.90
B. Behavioural Sciences Area
Subject Ratings Numerical Average
1. Project Organization and
Structure
B1 – 4.00
2. Managerial Skills for
Projects (Communication,
Leadership, Team Building,
Negotiation, other soft
skills)
B2 – 4.42
3. Human Resources
Management in Projects
B3 – 3.95
4. Industrial/Labour
Relations
B4 – 3.80
5. Conflict Management B5 – 3.676. Diversity Management B6 – 3.44
C. Information Technology
378
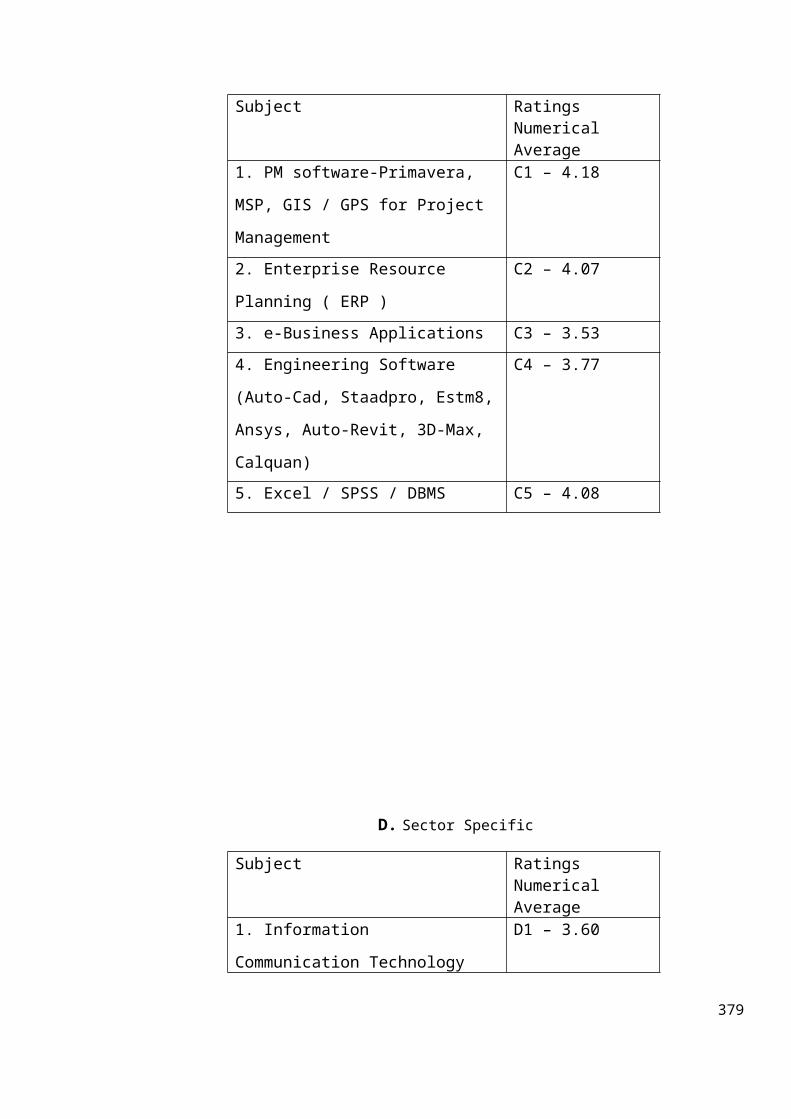
Subject Ratings Numerical Average
1. PM software-Primavera,
MSP, GIS / GPS for Project
Management
C1 – 4.18
2. Enterprise Resource
Planning ( ERP )
C2 – 4.07
3. e-Business Applications C3 – 3.534. Engineering Software
(Auto-Cad, Staadpro, Estm8,
Ansys, Auto-Revit, 3D-Max,
Calquan)
C4 – 3.77
5. Excel / SPSS / DBMS C5 – 4.08
D. Sector Specific
Subject Ratings Numerical Average
1. Information
Communication Technology
D1 – 3.60
379
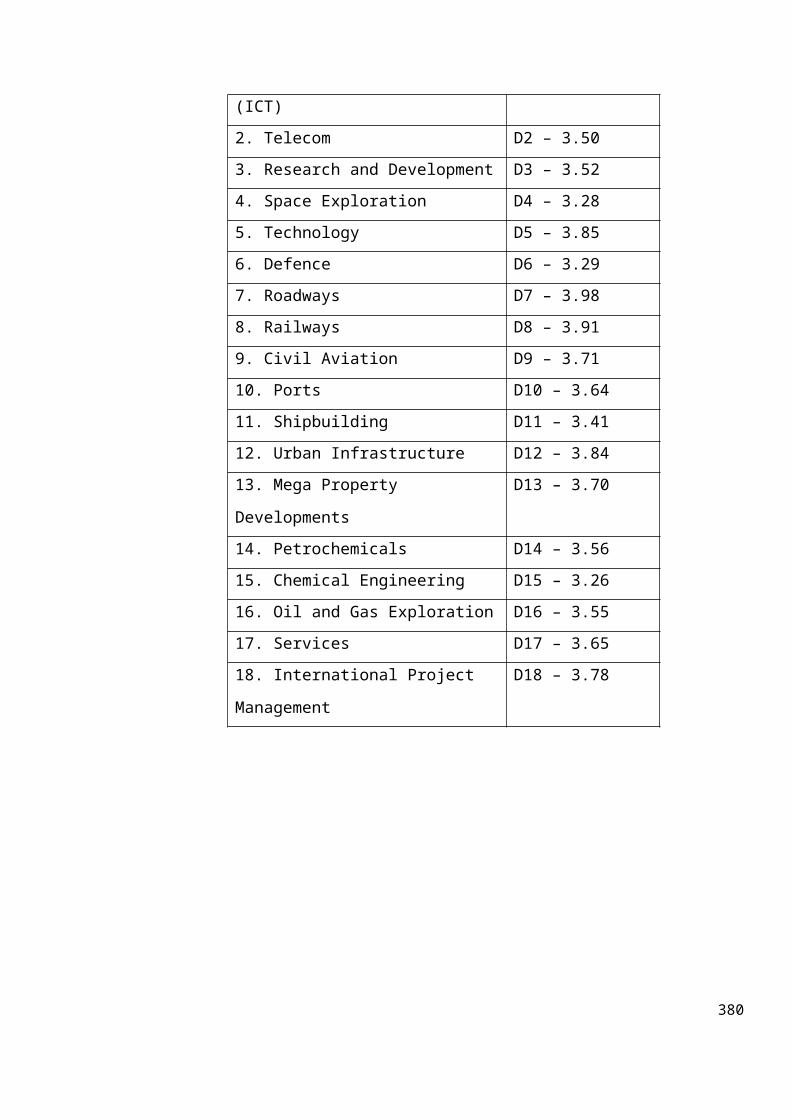
(ICT)2. Telecom D2 – 3.503. Research and Development D3 – 3.524. Space Exploration D4 – 3.285. Technology D5 – 3.856. Defence D6 – 3.297. Roadways D7 – 3.988. Railways D8 – 3.919. Civil Aviation D9 – 3.7110. Ports D10 – 3.6411. Shipbuilding D11 – 3.4112. Urban Infrastructure D12 – 3.8413. Mega Property
Developments
D13 – 3.70
14. Petrochemicals D14 – 3.5615. Chemical Engineering D15 – 3.2616. Oil and Gas Exploration D16 – 3.5517. Services D17 – 3.6518. International Project
Management
D18 – 3.78
380
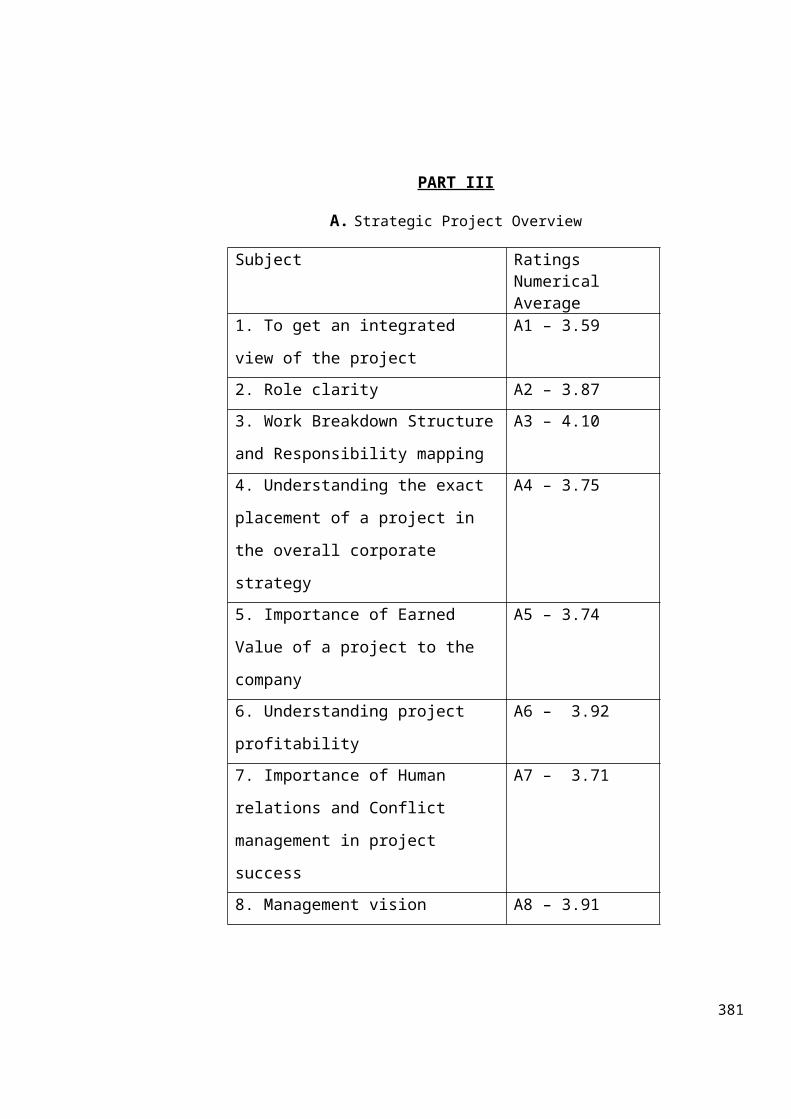
PART III
A. Strategic Project Overview
Subject Ratings Numerical Average
1. To get an integrated
view of the project
A1 – 3.59
2. Role clarity A2 – 3.873. Work Breakdown Structure
and Responsibility mapping
A3 – 4.10
4. Understanding the exact
placement of a project in
the overall corporate
strategy
A4 – 3.75
5. Importance of Earned
Value of a project to the
company
A5 – 3.74
6. Understanding project
profitability
A6 – 3.92
7. Importance of Human
relations and Conflict
management in project
success
A7 – 3.71
8. Management vision A8 – 3.91
381
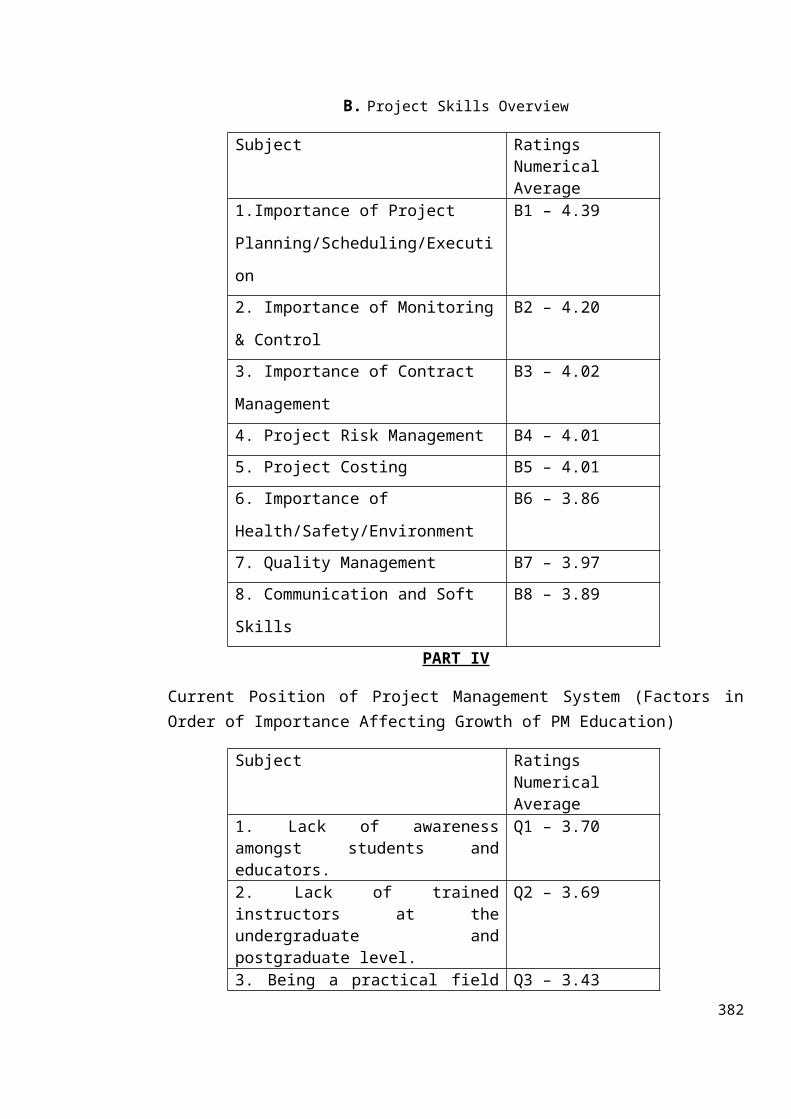
B. Project Skills Overview
Subject Ratings Numerical Average
1.Importance of Project
Planning/Scheduling/Executi
on
B1 – 4.39
2. Importance of Monitoring
& Control
B2 – 4.20
3. Importance of Contract
Management
B3 – 4.02
4. Project Risk Management B4 – 4.015. Project Costing B5 – 4.016. Importance of
Health/Safety/Environment
B6 – 3.86
7. Quality Management B7 – 3.978. Communication and Soft
Skills
B8 – 3.89
PART IV
Current Position of Project Management System (Factors inOrder of Importance Affecting Growth of PM Education)
Subject Ratings Numerical Average
1. Lack of awarenessamongst students andeducators.
Q1 – 3.70
2. Lack of trainedinstructors at theundergraduate andpostgraduate level.
Q2 – 3.69
3. Being a practical field Q3 – 3.43382

it cannot be ‘taught’ inthe classroom.4. Mastery comes only frompractical experience.
Q4 – 3.62
5. Prior knowledge notessential in working inthis field.
Q5 – 3.29
Chapter VI
List of Average Ratings – Human Resources Management
PART II383
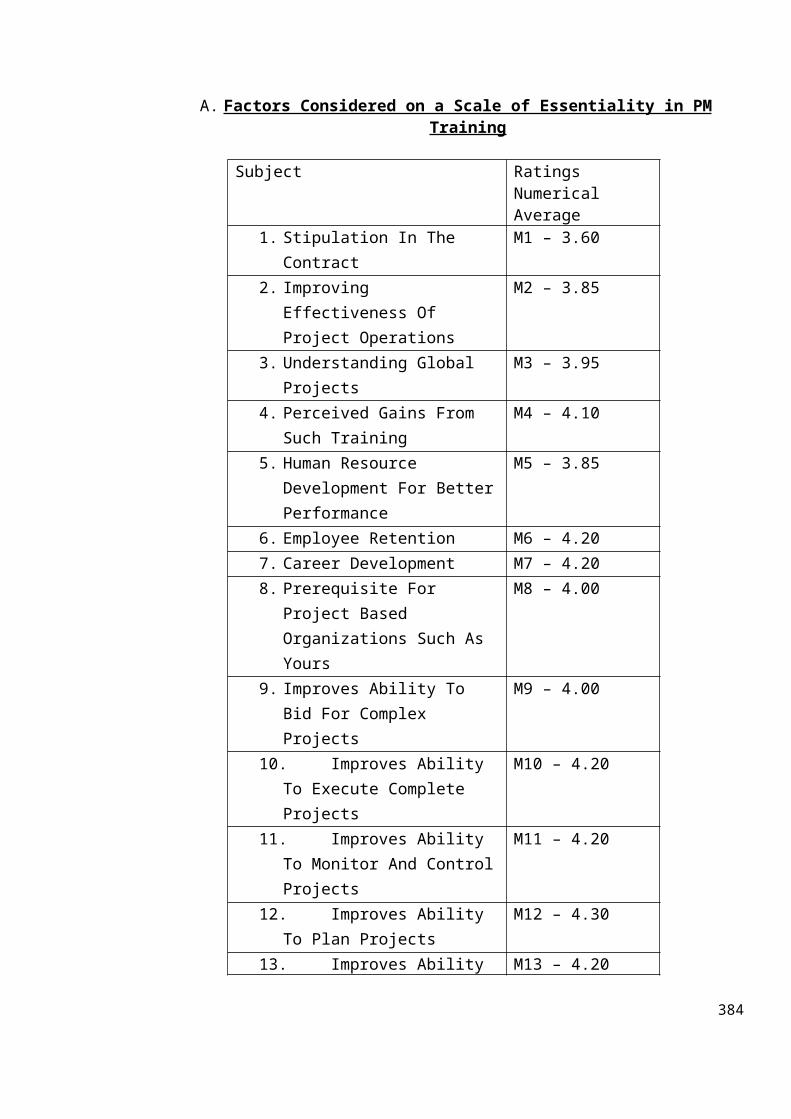
A. Factors Considered on a Scale of Essentiality in PM Training
Subject Ratings Numerical Average
1. Stipulation In The Contract
M1 – 3.60
2. Improving Effectiveness Of Project Operations
M2 – 3.85
3. Understanding Global Projects
M3 – 3.95
4. Perceived Gains From Such Training
M4 – 4.10
5. Human Resource Development For BetterPerformance
M5 – 3.85
6. Employee Retention M6 – 4.207. Career Development M7 – 4.208. Prerequisite For
Project Based Organizations Such As Yours
M8 – 4.00
9. Improves Ability To Bid For Complex Projects
M9 – 4.00
10. Improves Ability To Execute Complete Projects
M10 – 4.20
11. Improves Ability To Monitor And ControlProjects
M11 – 4.20
12. Improves Ability To Plan Projects
M12 – 4.30
13. Improves Ability M13 – 4.20
384
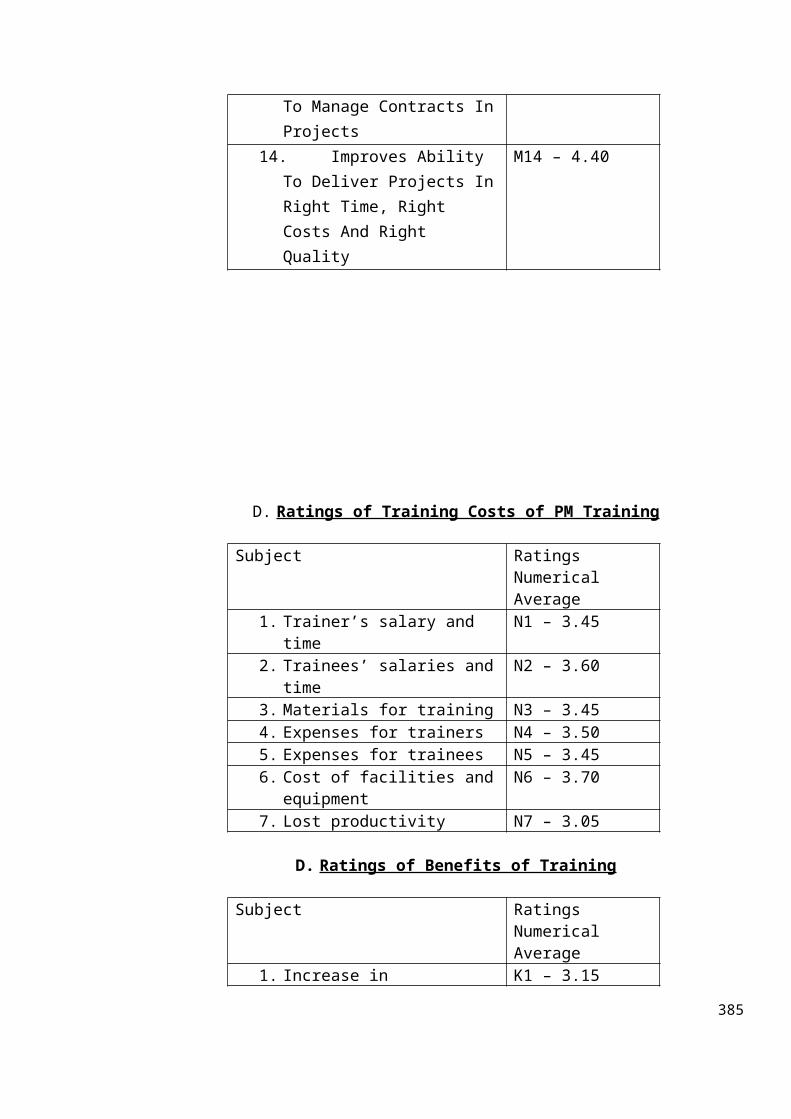
To Manage Contracts InProjects
14. Improves Ability To Deliver Projects InRight Time, Right Costs And Right Quality
M14 – 4.40
D. Ratings of Training Costs of PM Training
Subject Ratings Numerical Average
1. Trainer’s salary and time
N1 – 3.45
2. Trainees’ salaries andtime
N2 – 3.60
3. Materials for training N3 – 3.454. Expenses for trainers N4 – 3.505. Expenses for trainees N5 – 3.456. Cost of facilities and
equipmentN6 – 3.70
7. Lost productivity N7 – 3.05
D. Ratings of Benefits of Training
Subject Ratings Numerical Average
1. Increase in K1 – 3.15
385
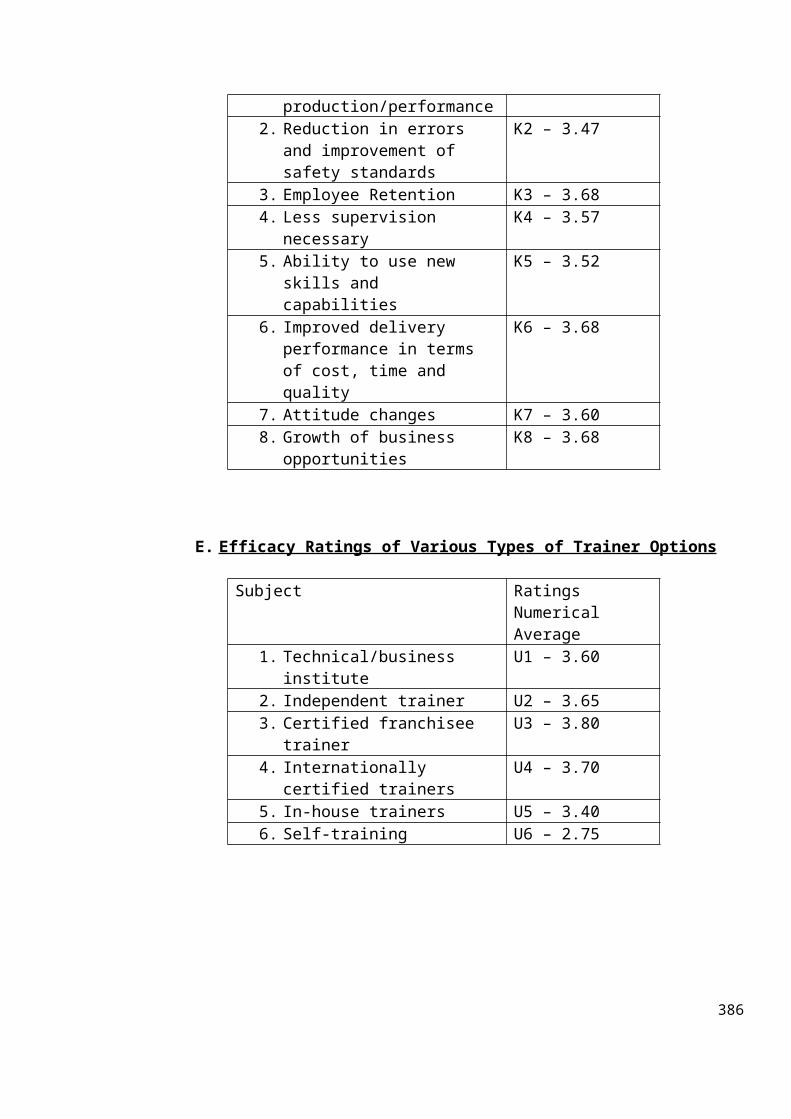
production/performance2. Reduction in errors
and improvement of safety standards
K2 – 3.47
3. Employee Retention K3 – 3.684. Less supervision
necessaryK4 – 3.57
5. Ability to use new skills and capabilities
K5 – 3.52
6. Improved delivery performance in terms of cost, time and quality
K6 – 3.68
7. Attitude changes K7 – 3.608. Growth of business
opportunitiesK8 – 3.68
E. Efficacy Ratings of Various Types of Trainer Options
Subject Ratings Numerical Average
1. Technical/business institute
U1 – 3.60
2. Independent trainer U2 – 3.653. Certified franchisee
trainerU3 – 3.80
4. Internationally certified trainers
U4 – 3.70
5. In-house trainers U5 – 3.406. Self-training U6 – 2.75
386