India: Appraisal of Second Foodgrain Storage Project - World ...
175
FILE COPY Report No.1643a-IN India: Appraisal of Second Foodgrain Storage Project November3, 1977 South Asia Projects Department AgricultureD Division FOR OFFICIAL USE ONLY Document of the World Bank This cocument hasa restricted distributionarJ maybe used by recipients in: i Ehe Performance of their official duties. 1's contentsmaynot utnerv&ise be disclcsed without World Hank authurization Public Disclosure Authorized Public Disclosure Authorized Public Disclosure Authorized Public Disclosure Authorized Public Disclosure Authorized Public Disclosure Authorized Public Disclosure Authorized Public Disclosure Authorized
-
Upload
khangminh22 -
Category
Documents
-
view
0 -
download
0
Transcript of India: Appraisal of Second Foodgrain Storage Project - World ...

FILE COPYReport No. 1643a-IN
India: Appraisal of Second FoodgrainStorage Project
November 3, 1977
South Asia Projects DepartmentAgriculture D DivisionFOR OFFICIAL USE ONLY
Document of the World Bank
This cocument has a restricted distribution arJ may be used by recipientsin: i Ehe Performance of their official duties. 1's contents may not
utnerv&ise be disclcsed without World Hank authurization
Pub
lic D
iscl
osur
e A
utho
rized
Pub
lic D
iscl
osur
e A
utho
rized
Pub
lic D
iscl
osur
e A
utho
rized
Pub
lic D
iscl
osur
e A
utho
rized
Pub
lic D
iscl
osur
e A
utho
rized
Pub
lic D
iscl
osur
e A
utho
rized
Pub
lic D
iscl
osur
e A
utho
rized
Pub
lic D
iscl
osur
e A
utho
rized

CURRENCy EQUIVALENTS
US$1.00 = Rupees (Rs) 8.7Rs 1.00 = US$0.11Rs 1 million = US$114.286
WEIGHTS AND MEASURES (METRIC SYSTEM)
1 metric ton = 1,000 kilograms (kg)1 grain bag = About 100 kg Wheat
- About 57 kg PaddyAbout 75 kg Rice
ABBREVIATIONS
ASCI - Administrative Staff College of India, HyderabadCAP - Cover and plinth (bagged grain placed on brick
plinth and covered with polyethylene sheets)CSS - Central Storage CommitteeCWC - Central Warehousing CorporationFCI - Food Corporation o' IndiaGOI - Government of IndiaIR - Indian RailwaysMICB - Management Information and Control Branch - of FCIPID - Project Implementation Division - of FCI
Indian Fiscal Year
April 1 - March 31
FOR OanUCL UQ ONLY
INDIA
SECOND FOODGRAIN STORAGE PROJECT
Table of Contents
Pala No.
SUMMARY AND CONCLUSIONS . ...................... ....... i - iii.
A. General *......*.... *******t*e.*****
B. Background ........... c
tI. FOODG.AINS IT INDIA .................................... 2
III. FOOD CORPORATION OF INDIA .'............................ 6
A. General *..*o ......... . ......*............ IB. Analysis of Operations ........ ................... . 7C. Review of Wheat Storage Project (Credit 267-lN) ... 9
IV. THE PROJECT ................................ ..... ***so 9
A. General *................. 9B. Detailed Features ........ * ... .*............ 10C. Iupleeutatiou Schedule............................ 14 -
D. Cost Estimates ........... . ....................... 14E. Proposed Financing ...................... 16Fe Procurement ............. 16Go Disbursement ........ **.**e ..*..17
V. O GANIZATION AND MANAGEMENT ............. ............ ... 18
A. General .................................... *.... 18B. Project Implementation Divlsios ................... 18C. Accoumets and Audit .................o.................. 20D. Youitoring and Evaluation ........ . .......-.... 20
VI. ECONOMIC BENEFITS AND JUSTIFICATION *........o.*oo*%.o 21
VII. RECOMMENDATIONS ...... ....... .o ........ ooo ...... 22
l Tbi document hae a tricted dwuUte am v wed by Po, Go igk the pwrmace0f thei ocal dutio Iu contents my s oehui be eni wihw Werd dsk B"*ihoinion.
Table of Contents (Cont'd)
ANNEXES
1. Review of First Wheat Storage Prolect (Cr. 267-IN)
2. Foodgrain Production, Consumption and Prolections
A. Gross Foodgrain ProductionB. Projections of Foodgrain ProductionC. Foodgrain ConsumptionD. Projection of Foodgrain Consumption
3. Government FoodRrain Policies and Practices
A. ObjectivesB. Instruments of Foodgrain PolicyC. Government Programs of Procurement, Distribution and
ImportsD. Buffer Stock Operations
4. The Food Corporation of India
A. BackgrountdB. Organization and ManagementC. FunctionsD. Financial ManagementE. TrainingF. Analysis of FCI OperationsC. Construction and Maintenance of Storage Facilities
5. Foodgrain Resources and Needs
A. Without the ProjectB. With the Project
Appendix A - Location and Type of Existing Grain Storage WarehousesOwned by FCI
Appendix B - Criteria for Site Selection and Type of Storage
Appendix C - Location and Capacity of Conventional StorageStructures to be Expanded
Appendix D - Locations, Type and Storage Capacity of Storage Structuresto be Constructed
6. Resources for Transporting Foodgrains
Table of Contents (Cont'd)
7. Description and Specifications for Grain Storage Warehousesand Model Complexes
A. GeneralB. Specifications for Model A Warehouse ComplexC. Specifications for Model B Warehouse ComplexD. Specifications for Model C Circular BinsE. Specifications for Model D Hopper Bottom Flat Bulk WarehouseF. Specifications for Port SilosG. Relative Merits of Each Type of Model Warehouse ComplexH. Rural Grain Procurement Centers
Figure 1 - Model A Warehouse Complex LayoutFigure 2 - Model B Warehouse Complex LayoutFigure 3 - Model C Circular Bin Complex LayoutFigure 4 - Model D Warehouse Complex Layout
8. ProJect Organization and Management
A. GeneralB. Project Implementation DivisiouC. ProcurementD. Accounts and AuditsE. Monitoring and Evaluation
9. Estimated Prolect Costs
10. Project Implementation Schedule
11. Estimated Disbursement Schedule
12. Economic and Financial Analysis
A. GeneralB. Economic AnalysisC. Economic Rate of ReturnD. Financial Rate of Return
IBRD Map 12880 - Showing Location of Existing and Proposed Storage Sites


INDIA
SECOND FOODGRAIN STORAGE PROJECT
SUMMARY AND CONCLUSIONS
i. Agriculture, the largest sector in the Indian economy, accountsfor over 40% of GNP and about 70% of total employment. Foodgrains, partic-ularly cereals, are the most important crops grown, accounting for about 75%of total cultivated area. Foodgrain production increased at 2.3% annuallyfrom 1953/54 to 1975/76, about the same rate as population increase. Food-grain imports have taken place all these years to meet shortfalls in domesticsupply even though self-sufficiency has been a major economic goal of thegovernment since independence in 1947. Since the mid-1960's foodgrain pro-duction has increased at the higher rate of 2.8% per annum, resulting mainlyfrom the successful green revolution in wheat. It appears that this higherrate can be maintained or even increased, given the continuing extension ofirrigation and use of the new seed-fertilizer technology. Although importsmay continue through the 1980s, self-sufficiency can be attained gradually.The weather remains the main determinant of the annual fluctuations in food-grain production.. Recently, favourable monsoons have led to good harvestsin 1975-76 and 1976-77 and to record foodgrain stock levels (reported at 20.7million tons in July 1977).
ii. India's foodgrain policy has three major objectives: (a) self-sufficiency in production; (b) price stability; and (c) equitable foodgraindistribution. Food pclicy is the responsibility of both the Central andState governments. In 1964-65, the Government of India (GOI) establishedthe Food Corporation of India (FCI) to serve as the agency responsible forimplementing national food procurement and distribution programs. Instrumentsof policy have included the use of food zones to regulate inter-district andinterstate trade; support, procurement and issue price regulations; procure-ment, storage and distribution of seasonal and buffer stocks; imports offoodgrains and rationing of public sector procured supplies to eligible con-sumers at concessional prices. Foodgrain prices have been regulated to (i)ensure reasonable prices to producers; (ii) procure a sizeable portion ofmarketed foodgrains on behalf of GOI and State governments; (iii) releasefoodgrains through the public distribution system in order to protect lowincome groups; (iv) minimize seasonal and interregional price variations,and (v) build up sizeable buffer stocks to protect consumers from widevariations in production caused by irregular and untimely monsoons.
iii. FCI operates with a Board of twelve government appointed Directorsunder the general direction of the Ministry of Food and Agriculture. A re-gular staff of about 60,000 are engaged in procuring foodgrains at over 2,500market centers and operating warehouses at 1,700 locations throughout India.In recent years, FCI has procured annually 3.0 to 10.0 million tons, or 10 to35% of foodgrains marketed, in addition to handling grain imports of 3.5 to7.5 millicn tons per annum. FCI's distribution of grains at concessionalprices has ranged from 8.0 million tons to 14.0 million tons per annum.
- ii,-
iv. About 18.5 million tons of storage space is available for storingfoodgrains in India, with 10.5 million tons in the public sector. FCI ownswarehouses and silos with 5.5 million tons storage capacity, has under con-struction facilities for an additional 0.4 million tons, and rents about 5.5million tons of storage space but only 2.0 million tons of these are of ac-ceptable standard. Because of the acute shortage of space, it stores over7.0 million tons in the open under polyethylene covers and stacked on plinthbases (CAP storage). The shortage of storage facilities of acceptable qualityhas increased grain storage losses significantly.
v. Current GOI policy is to procure and distribute 12.0 to 13.0 milliontons of cereal foodgrains annually and to build up a buffer stock of 12.0 mil-lion tons by 1980-81. FCI's share of this procurement and distribution activ-ity would be about 9.6 million tons, with a peak load requirement of 7.5 mil-lion tons. Without going into the arguments about the 12.0 million ton figure,it would appear that a contingency stock of about 4.0 million tons would benecessary to meet unforeseen immediate needs (see para 4.02). Given that FCIwould own only 5.9 million tons of storage capacity by the end of 1977, andwould be able to rent only another 2.0 million tons storage of acceptablestandard, the project's proposed 3.5 million tons of additional storagecapacity for FCI can be regarded as barely sufficient to meet its projectedrequirements by 1980-81.
vi. The ongoing Wheat Storage Project (Credit 267-IN), jointly financedwith Sweden, provides for the construction of 90,000 tons conventional ware-houses (grain stored in bags) and 100,000 tons of silo storage (grain storedin bulk). Construction of conventional warehouses was completed in 1974.Silo construction, the remaining component, is expected to be completed byMarch 1978, three years behind appraisal estimate, owing to the initialdelays by FCI in employing engineering consultants and acquiring projectsites. Despite the delays, the project is achieving its basic objective ofproviding needed storage facilities and has given experience to FCI thatshould be valuable in carrying out the proposed project.
vii. The proposed project, the second of its type with FCI, would assistGOI to implement its program of constructing storage facilities required forpublic sector foodgrain procurement and distribution operations. The projectwould finance the construction of about 3.5 million tons additional storagecapacity - 2.5 million tons of conventional warehouses for grain stored inbags, 1.0 million tons of flat warehouses for grain stored in bulk, and75,000 tons of port silos at Madras and Baldia for handling imported grain.The project would also finance ancillary facilities for grain handling andtransport, technical assistance, operations research studies and training ofkey staff. With these additions, FCI would own warehouses and silos for acombined capacity of about 9.4 million tons.
viii. The Ministry of Agriculture and Irrigation would have over-allresponsibility for project implementation. The Secretary for Food and theCentral Storage Committee within the Ministry would coordinate actions amongthe various GOI and State government agencies. Within FCI, a Project Imple-mentation Division would be established under the charge of a chief engineer.

- iii -
FCI's engineering sections would be strengthened and would be assisted byengineering consultants, including 60 man-months of internationally recruitedgrain storage engineers.
ix. Project costs over a four and a half year disbursement period areestimated at US$215.5 million, including US$16.1 million in foreign exchangecost. Storage facilities would require US$156.7 million, auxiliary itemsUS$17.9 million, and contingencies US$40.9 million.
x. The proposed IDA Credit of US$107.0 million would cover 50% ofproject costs, net of taxes and duties (estimated to be about US$2.0 million).This is equivalent to the foreign exchange cost plus about 42% of local costs.GOI would be the borrower and would use US$2.4 million of the Credit to pur-chase railwagon equipment, to be owned and operated by Indian Railways. GOIwould onlend the remaining US$104.6 million Credit proceeds to FCI at an annualinterest of 10.5%, to be repaid in not more than 20 years including 4 years'grace for principal and with 0.25% interest rebate for timely repayment.GOI would finance the remaining US$108.5 million project cost in the form ofequity investment in FCI.
xi. Civil works contracts for the two port silos (US$8.1 million) andthe bulk warehouse complexes (US$24.5 million) would be awarded on the basisof international competitive bidding. Civil works contracts for bag warehousecomplexes (US$75.5 million) and rural procurement centers (US$0.9 million)would be procured through competitive bidding following national and statewideadvertising. For railway sidings (US$18.4 million), civil works contractswould be with the Indian Railways since the work is highly specializedand requires close coordination with the existing railway system. Orders formajor equipment items would be bulked into orders of US$100,000 or more audtendered for internationl competitive bidding. Equipments not lending them-selves to bulking and/or which cost less than US$100,000 when bulked would beprocured by nationally advertised tender while prudent shopping would be usedfor items costing less than US$10,000. Vehicles would be procured on thebasis of nationally advertised competitive bidding from suppliers who wouldbe able to provide spare parts and maintenance services. Equipment costs,including vehicles, are estimated at US$33.2 million.
xii. At full development, savings from the reduction in operating costsand grain storage losses would be about US$57.0 million annually. The projectwould enable GOI to implement its national foodgrain policies more efficiently,thus benefiting farmers with marketable cereal grains, and consumers throughmore stable foodgrain supplies and prices. The estimated economic rates ofreturn are about 19% for the warehouse component, about 24% for the port silos,and about 20% for the entire project investment.
xiii. The project is suitable for an IDA Credit of US$107.0 million.


INDIA
SECOND FOODGRAIN STORAGE PROJECT
I. INTRODUCTION
A. General
1.01 The Government of India (GOI) has requested IDA assistance for theexpansion of foodgrain storage and handling facilities to be owned and oper-ated by the Food Corporation of India (FCI). The proposed project would bethe Bank Group's second foodgrain storage project in India. The first, theongoing Wheat Storage Project (Credit 267-IN), financed jointly with theKingdom of Sweden, provided for 90,000 tons of conventional bag storage and100,000 tons of silo storage and is expected to be completed in FY78 (Annex 1).The proposed project would provide additional storage for about 3.5 milliontons of foodgrains.
1.02 The project was prepared by a GOI committee which included represen-tatives from the Ministries of Agriculture and Irrigation, Railways and Financeand from the Planning Commission, FCI and the Central Warehousing Corporation(CWC). This report is based on the findings of an appraisal mission comprisingMessrs. Dorris D. Brown and Kok Peng Teh (IDA), and H.J. Barre, F.E. Bender andT.G. Burke (Consultants), who visited India in February/March 1977.
B. Background
1.03 The General Economq. India's population of over 600 million isgrowing at an annual rate of 2.3%. National income grew in real terms atabout 3.7% per annum between 1950-51 and 1975-76 and per capita GNP reachedUS$150 in 1975-76. Per capita consumption.of cereal grains averaged 133 kgduring the 1950's, increased to 144 kg during the 1960's and is expected toexceed 150 kg by 1980-85. Since 1950, annual per capita availability of cerealgrains has varied from 119 kg to 154 kg. GOI has imported cereal grains,ranging from 2 to 16% of net consumption all these years, to provide for basicnutritional requirements and maintain reasonable prices.
1.04 Although nationaL income has increased, there has been only a minorimprovement in the living standards of the urban and rural poor, who make upabout one-third of the population. During years of low grain production,prices increase rapidly, beyond the means of low-income families. Duringsevere famines, masses of people suffer malnutrition. To alleviate thissituation, GOI and the respective State governments established ad hoc systemsof price ceilings at the primary market and consumer levels in the 1950s andearly 1960s, attempted various types of procurement from surplus areas fortransfer to controlled distribution areas, and established foodgrain zones to

-2-
control interstate or inter-district grain shipments. Foodgrains were alsoimported to relieve scarcity conditions. As public involvement in the food-grain sector increased, GOI established FCI in 1964 to operate a public sectorfoodgrain procurement and distribution program designed to stabilize consumerprices and assure an equitable distribution of the national foodgrain supply.
1.05 The Agricultural Sector. Agriculture's share of net domestic pro-duct ranges from 40 to 49%, about 2-1/2 times greater than the industrialsector. Foodgrain production, particularly rice and wheat, dominates theagricultural sector and is the dominant focus of India's agricultural devel-opment policy. About 75% of total cropped area is devoted to foodgrains.Likewise, about 75% of labor, fertilizer and irrigation utilized inagriculture is for foodgrain production.
1.06 A basic problem of the economy is the low annual growth rate inagricultural production, especially foodgrains, which has merely kept pacewith the 2.3% rate of population increase. However, with near ideal rainfallconditions, foodgrain production increased more rapidly in 1975-76 and 1976-77,providing a growth rate of 2.8% per annum. Most of the increase has been inwheat production although rice production also increased substantially in1975-76 (Annex 2).
II. FOODGRAINS IN INDIA
2.01 Production Characteristics. Over 80% of India's foodgrain pro-duction, i.e. cereals and pulses, is concentrated in 10 of the larger States.About 67% of the rice production is concentrated in A.P., Bihar, Orissa, TamilNadu, U.P. and West Bengal and over 80% of the wheat is produced in Bihar,Haryana, M.P., Punjab, Rajasthan and U.P. In recent years wheat and riceproduction has increased most rapidly in the northern and eastern Stateswhere the combination of new varieties and added irrigation and fertilizershas been highly profitable for farmers.
2.02 A major characteristic of foodgrain production in India is its widefluctuations from trend, due mostly to the time and amount of monsoon rainsreceived. Variations of 15 to 20% from trend have been experienced about onceevery 5 years (See Annex 2, Figure 1). With production expanding at 2.3% to2.8% per annum, a poor crop-year means famine conditions for millions of peopleunless foodgrains are held over from the good crop-years as buffer stocks orimported and distributed in the famine areas. Other major factors influencingincreased production include the introduction of more responsive varieties,use of more fertilizers and expansion of area irrigated.
2.03 Marketing Practices. Only 30% to 35% of foodgrains produced entercommercial marketing channels; about 65Z of production is consumed by theproducer families or used for feed and seed in the villages. About 38% ofwheat and 30% of the rice crop are marketed. Typically, farmers operatingless than 1 ha of irrigated land or 2.5 ha unirrigated land market very little,
-3-
if any, grain of their own production. Indeed, they may have to buy foodgrainfor family requirements. Price incentive programs benefit only those farmerswho market foodgrains.
2.04 Typically, in Punjab and Haryana, wheat is harvested in April,threshed and delivered to a Regulated Market Yard in bulk form for sale inApril, May or June. At the market yard the wheat is displayed, auctioned,cleaned, bagged, weighed and delivered to the buyer under the supervision ofgovernment market regulatory agents. A 1% charge against sales value coverscosts of operating the regulated market system. In other States, where aRegulated Market Act has not been enacted, buyers usually negotiate for thewheat with each farmer and take delivery from the threshing floor or as agreed.Paddy marketing practices are similar to wheat except that in some areas onlypolished rice is marketed. In these cases the paddy is milled and the ricebagged before delivery.
2.05 Storage Practices and Losses. Farmers usually store grains re-served for family consumption in traditional grain bins or gunny bags. Food-grain merchants store their grains in bags in their own warehouses and ricemills or in space rented from the Central and State Warehousing Corporations.They may buy grain from the farmer and have him store it until needed. Co-operatives store grain only on account for the State government or the FoodCorporation of India (FCI) or for their own current sales.
2.06 Storage losses depend on the moisture content and the type ofgrain stored, type of storage, duration of storage, location and storagemanagement. Immediately after threshing, wheat has 10% to 12% moisture andcan be stored successfully. Paddy usually contains excessive moisture andcannot be stored successfully without drying to below 14% moisture. Forwheat, losses under CAP storage are estimated to range from 3.8% for 6 monthsstorage to 19% for 36 months. For bag storage in-conventional warehouses, therange is 1.9% for 6 months to 7.8% for 36 months, while for bulk storage insimilar warehouses, the range is 0.5% for 6 months to 2.0% for 36 months.Losses are minimal in the low rainfall and low humidity regions of northernIndia and high in the high rainfall, high humidity regions of eastern andsouthern India. Finally, the regularity and quality of fumigration of grainsand maintenance of storage facilities determine losses from insects, rodentsand birds.
2.07 StoraRe Resources. In 1975/76, India's warehouse storage capacitysuitable for grain was estimated to be about 18.48 million tons, withA0.48million tons in the public sector and 8.0 million tons in the private sector.These figures have remained generally unchanged in early 1977. A matrix ofgrain storage use and ownership for 1975/76 is shown as follows:

-4-
Grain StoraRe Use (owned and hired)Private-
Grain Storage Ownership FCI CWC SG SWC Co-op Sector- Total_ - __- million tons
Food Corporation of India (FCI) 5.47 - - - - - 5.47Central Warehousing Corp. (CWC) 0.88 0.36 - - - - 1.24State Govt. (SG) 0.71 0.02 1.11 - - - 1.84State Warehousing Corp. (SWC) 0.85 - - 0.05 - - 0.90Cooperatives - - - - 1.03 - 1.03Private Sector 1.30 0.34 1.20 0.88 0.82 3.46 8.00
Total 9.21 0.72 2.31 0.93 1.85 3.46 18.48
2.08 FCI owns warehouses and silos with about 5.5 million tons storagecapacity and has under construction 100,000 tons of silo type storage and about300,000 tons of conventional warehouses for bag storage. When these are com-pleted FCI will ovn about 5.9 illlion tons of storage capacity. In addition,FCI rented 3.7 million tons in 1975/76, which increased to about 5.5 milliontons in March 1977. Of this 5.5 million tons, only 2.0 million tons can beconsidered of acceptable standard in a normal situation; the other 3.5 milliontons is hired only because of present storage shortage. Another 7.0 milliontons of FCI grain stocks are now stored in the open under polyethylene coversand stacked on plinth bases (CAP). The project would replace CAP and rentedstorage with safer bag or bulk conventional warehouse storage. When theproject is completed in 1981, FCI would own about 9.4 million tons of accept-able quality grain storage space. Other than FCI, there are five main cate-gories of entities which together own grain storage of about 13.0 milliontons: CWC which owns 1.24 million tons of storage, leases most of it to FCI;State governments have 1.8 million tons, most of which they require for theirown grain storage; SWCs have 0.9 million tons and virtually all are leased toFCI; Cooperatives own 1.0 million tons which are inadequate for their ownrequirements; and the private sector owns 8.0 million tons, much of which issub-standard for storing grains. It is projected that Cooperatives would add
--about 1.0 million tons by 1980/81 to meet their own requirements and theprivate sector would construct another 1.0 million tons, most of which wouldreplace existing dilapidated warehouses. Thus, there is no major grain storageconstruction program projected by entities other than FCI itself for the nextseveral years which might raise questions about the appropriateness of thescale of construction program proposed for the project.
2.09 Transportation Resources and Practices. Most foodgrains transportedmore than 150 km from the primary market center move by railwagon. The IndianRailways (IR), a public sector agency, owns and operates the nation's 60,000km railway system. IR transports between 200 and 250 million tons of goodsannually. Foodgrain freight has varied from 14.0 to 16.0 million tons peryear in recent years, and mostly in unit trains carrying only grain. Theaverage haul distance is 920 kilometers. Details of the railway network aregiven in Annex 6 and shown on IBRD Map 12880.
2.10 Whilst foodgrain transport has a high priority in obtaining rail-wagon space, a number of constraints operate to increase the transportationcosts of shippers such as FCI. First, the maximum gross train load capacityis about 4,500 tons because of the type of hook or coupling used between rail-wagons. Train length is limited to 600 meters in most switch yards. Movementis slow as round trip time varies between 12 and 15 days per 1,000 km distance.The grain must be carried in gunny bags due to lack of grain-tight railwagondoors and bulk loading and unloading equipment. A shift to the transportationof wheat in bulk and larger capacity unit trains would reduce shippers' costs.
2.11 Foodgrain movement by truck is generally limited to distances ofless than 150 km but occasionally up to 300 km. Most truck transportationis from a primary procurement market yard or port to a nearby warehouse andfrom the warehouse to a railwagon or nearby consumer market. Transportationby truck is of bagged grains.
2.12 Consumer Demand and Proiections. Per capita foodgrain consumptionhas been about 145 kg and is expected to increase to over 150 kg by 1985.Production has ranged from about 84S to 98% of consumption, with the gapsupplied from imports, mostly of wheat. Projections (Annex 2, Table 14)indicate a relatively higher rate of growth of foodgrain production than ofconsumption, thus reducing the current 3.0 million ton annual import require-ment to about 0.6 million by 1985-86. Current production at 115.0 to 120.0million tons per year is expected to expand to about 145.0 million tons by1985-86. With currently available storage resources fully utilized (Annex 5),additional storage capacity would be needed to protect the expected incrementin foodgrain production and safeguard consumers from wide seasonal and annualvariations in supplies and prices.
2.13 Foodgrain Policies and Practices. GOI foodgrain policy has threemajor objectives: (a) self-sufficiency in production; (b) price stability;and (c) an equitable foodgrain distribution to low income consumers. Throughthe annually announced procurement price (which usually functions as the sup-port price as well), backed by a readiness to purchase any amount of grainat that price, it is intended to assure foodgrain producers of a stable,reasonably attractive price in order to encourage increases in foodgrain pro-duction, leading to self-sufficiency. The production effect of the procure-ment price depends on the price elasticity of supply and whether the pricecovers the cost of production. A recent Bank-sponsored study has shown thatwheat and paddy production in India is quite price responsive. 1/ This priceresponsiveness of supply is thought to be more pronounced where the technologyof high yielding varieties is involved because its success depends cruciallyon the provision of associated outlays, which the farmers would be reluctantor unable to incur unless assured of attractive prices for their produce. TheBank-sponsored study also showed that, broadly speaking, the procurement priceduring the past decade did cover the cost of production. The present procure-ment price of Rs 1,100 per ton for wheat appears to provide an adequate incen-tive for increasing production; this may not be the case for paddy, whose
1/ Raj Krishna and G.S. Ray Chandhuri, "'Some Aspects of Wheat PricePolicy in India", and "Some Aspects of Rice Price Policy in India",(mimeographed), University of Delhi, Delhi, India, January 1977.
-6-
procurement price is Rs 740 per ton. Market prices have more often been aboveprocurement prices so that, until April 1977, food zones were used, in whichgrain surplus areas were cordoned off to restrict private grain trade, in orderto facilitate government procurement. The government distribution of domesticand imported grains at concessional prices is intended to safeguard the in-terests of low income consumers. Although the ration cards entitling theirholders to government distributed foodgrain are issued to all those living inthe urban areas regardless of their income, it appears that the location ofthe Fair Price Shops, the queues, the limits on quantities available, and thelower quality of publicly distributed grain effectively ration it to lowerincome groups. Following the foodgrain shortages of 1973 and 1974, the govern-ment decided on the policy of building up 12.0 million tons of buffer stocks.This policy is under review, the situation having changed completely; twosuccessive good harvests in subsequent years have resulted in foodgrain stocklevels being report 1 d at 20.7 million tons in July 1977.
2.14 Both Central and State governments are involved in establishingand implementing food policy. GOI's Agricultural Prices Commission issuesfoodgrain policy papers every year recommending procurement prices andtargets for consideration by the Minister of Agriculture and other cabinetmembers. A meeting is then held of Chief Ministers and other State officersto discuss and agree upon policy recommended by GOI for the coming season.Implementation, in the form of grain procurement and distribution, is carriedout in each State by the departments of Civil Supply or FCI or both. FCI,in addition, stores the grains it procures and arranges transportation ofgrains procured from surplus States and imported grains for distribution indeficit States. About 80% of public procurement of wheat and rice is handledby FCI (India's foodgrain policies and practices are detailed and evaluatedin Annex 3).
III. FOOD CORPORATION OF INDIA
A. General
3.01 FCI was established in 1964-65 by GOI to implement more effectivelyits national food policies. It is required to undertake the purchase, storage,transport, distribution and sale of foodgrains and other foods as decided byGOI. In recent years, FCI has procured annually 3.0 to 10.0 million tons offoodgrains (about 1OZ to 352 of the total marketed by farmers) and importedanother 3.5 to 7.5 million tons. The volume procured generally varies withproduction and the relative differential between procurement and market priceswhile the volume imported has tended to be highest during and after droughtyears.
3.02 Management. Under the general direction of the Ministry of Foodand Agriculture, FCI operates with a Board of twelve Directors appointed byGOI. The Board selects an Executive Committee from its members, including theChairman and Managing Director who are responsible for day-to-day managementand operations.
-7 -
3.03 Staff. A staff of about 60,000 on a regular basis operate 4 zonaloffices, 19 regional offices, 140 district offices and 5 port offices. Food-grains are procured at over 2,500 market centers and stored in warehouses at1,700 locations. Details are given in Annex 5 and IBRD Map 12880.
3.04 Financial Management. FCI's financial and accounting systems arecentrally controlled from its headquarters. The general books of account(ledgers, cash books and journals) and annual financial statements, includingprofit and loss account and balance sheets, are prepared in accordance withcommercial principles. Detailed records are maintained at the zonal, regionaland port offices. Periodical returns are furnished from these offices to theheadquarters where the budgets, cost accounts and other financial statementsare consolidated. FCI's finance department is adequately staffed and includesfive specialized divisions - budget and cost control, accounting, finance,internal audit and physical verification. Independent audits of FCI's annualaccounts are carried out jointly by two firms of chartered accountants. Inaddition there are several other firms of chartered accountants functioningas independent auditors of FCI's regional offices. Supplementary audits arealso performed by the Comptroller and Auditor General. Accounts for 1976/77have been audited and passed by the Board.
3.05 Operating funds are made available in the form of GOI owned equitycapital, GOI loans, commercial bank loans and overdrafts, depreciation reservesand GOI deficit budget allocations. Assets currently in excess of Rs 21,000million (US$2,400 million) are held mostly in the form of foodgrain inven-tories. Details are given in Annex 4, Tables 2 and 3.
B. Analysis of Operations
3.06 Costs and deficit financing. FCI, as a large, national publicsector business organization, is constrained by GOI policy from operatingprofitably. GOI determines both domestic procurement and issue prices offoodgrains marketed by FCI. Procurement prices are set at levels to assurefoodgrain producers of a stable and reasonably attractive price; issueprices are concessional, intended to benefit low income consumers. Becauseof these overriding policy requirements, PCI has never been managed as aprofit oriented institution, but has instead played an important role inprice stabilization and in ensuring some degree of equity in the provisionof foodgrains. For example, in 1976-77, the procurement price for wheat wasRs 1,050 per metric ton and the issue price was Rs 1,250 per metric ton, adifference of Rs 200 per metric ton. But PCI's operating costs 1/ alone, forwheat stored in bags in a conventional warehouse up to 12 months, was Rs 337per ton. If the length of storage increases to 24 months, the operating costsbecome Rs 550 per ton. Thus, GOI has had to grant an annual subsidy to FCI
1/ i.e., excluding depreciation, operating costs are defined here toinclude cost of procurement (excluding procurement price) and deliveryto storage, cost of storage and cost of delivery to State governmentsfor distribution.

- 8 -
which, in 1976-77 (a year of very high stocks), amounted to Rs 4,500 million(US$514.3 m..Llion). FCI's deficit financing is inevitable, given GOI's -policyobjectives, and is not an indicator, one way or another, of efficiency. Infact, it may be argued that FCI, in helping to fulfill GOI's food policy,generates social benefits which are not reflected in its financial statements,and the subsidy may be regarded as the price GOI is willing to pay for thesebenefits.
3.07 Inventory Management. FCI's Management Information and ControlBranch (MICB) collects and analyzes information received from the 1,700 ware-house centers and uses it to assist management in determining grain movements.Monthly, GOI advises FCI on the quantity and kind of foodgrain to be issuedto each State. FCI's operational division managers meet and, with the datacompiled by MICB, determine grain movements needed to fill requests. Time-liness and accuractv f information appear to be satisfactory but there aredelays in receivide data from the field. Movement planning becomes morecomplex as the grain volume and number of locations involved increase. Acomputerized scheduling program could be useful in helping FCI's inventorymanagement.
3.08 Quality Control. Stocks received for storage are analyzed by FCI'squality control staff to determine moisture content and insect infestation.Fortnightly, stocks are re-examined to determine grain condition and presenceof insects. Fumigation is undertaken if stocks show signs of infestation.Prophylactic treatment is given to prevent cross infestation. Rodent poisonprocedures are maintained. However, birds are not effectively controlled.Training sessions are frequently held for the quality control staff at alllevels to exchange experiences in storing grain and to disseminate new infor-mation. Within the resources available, FCI has done a fine job in qualitycontrol, especially given the present large stocks and in particular, thosein open CAP which require intensive care.
3.09 Construction and Maintenance of Grain Storage Structures. FCIhas two divisions dealing with the construction and maintenance of grainstorage structures. Each division is under the charge of a Senior ManagingEngineer. One division, with a staff of 787 engineers and draftsmen, isresponsible for designing and constructing new conventional bag storage ware-houses and maintaining existing ones. It also hires engineering servicesof the grain storage division of the Central Public Works Department (CPWD)to design and supervise a part of the new construction. The other division,with a professional staff of 246, is responsible for the design, constructionand maintenance of bulk grain storage facilities. It engages engineeringconsultants to assist in the design, in tender documentation and evaluation,and supervision of new construction. In the construction of new warehouses,civil works and electrical and mechanical equipment contracts are usuallyprocured by nationally advertised tenders.
- 9 -
C. Review of Wheat Storage Project (Credit 267-IN)
3.10 The ongoing Wheat Storage Project, costing US$15.9 million, and -
financed jointly with Sweden, originally consisted of 200,000 tons silostorage and 100,000 tons of conventional warehouses for storing grain inbags, training silo personnel and a study of India's foodgrain storage anddistribution. Credit agreement was signed in August 1971 but credit effec-tiveness was delayed until November 1972 due to the difficulties FCI and GOIhad in engaging engineering consultants to assist in the design and construc-tion of silos using the slip form method which was new to Indian contractors.Land acquisition was more time-consuming than anticipated during appraisalbecause, for some of the sites selected, land acquisition proved to belegally difficult while for other sites, the locations were found to be un-suitable with regard to grain receipt and distribution, and transport facil-ities. Implementation was further delayed by the time required by FCI andthe engineering consultants to prepare and execute documentation for civilworks and equipment, and the requirement that the contract for coustructionof the silos should be bulked and on a turn-key basis. This procurementprocedure was not practical and was subsequently abandoned.
3.11 The conventional warehouses were completed by 1974 and have storedfoodgrains since then. The India foodgrain distribution study was completedby October, 1976 and provided valuable information for this appraisal report.The silos are still under construction but are expected to be completed andused for wheat storage by April, 1978, and the training of silo personnel isunderway. Despite the frustrating delays, the project is achieving its basicobjective of providing needed grain storage facilities. The experieucesgained, particularly in procurement and land acquisition, should stand FCIin good stead in implementing the proposed project.
IV. TEE PROJECT
A. General
4.01 The project would assist GOI in carrying out its program of construc-ting storage facilities required for foodgrain procurement and distributionoperations and improving foodgrain handling practices including bulk handlingactivities planned for implementation during the next four and half yearsbeginning July 1977. The project would comprise: (i) construction of 3.5million tons of foodgrain storage consisting of 2.5 million tons bag, 1 mil-lion tons bulk, and 75,000 tons port silos for grain loading and unloading;(ii) ancillary facilities for grain handling and transport; and (iii) tech-nical assistance for project implementation; operations research; and trainingof management and key technical staff. With project completion in 1981, FCIwould have storage of its own of about 9.4 million tons of foodgrains - 7.7million tons in bags and 1.7 million tons in bulk. The proposed facilitieswould be used for storage of wheat, paddy, rice and other foodgrains.

- 10 -
4.02 From 1980/81 onwards, annual public procurement and distributionof wheat and rice is expected to be about 12.0 million tons and more (seeAnnex 3, Table 12). Since its share of this activity is expected to beabout 80%, FCI would be handling 9.6 million tons by 1980/81. The peakstorage requirement, occuring in June (see Annex 3, Table 13), for this 9.6million tons would be 6.0 million tons. (Procurement would be concentratedduring the harvest months while the off-take would be more evenly distributed).>At any given peak, there would be some storage facilities that cannot be fullyloaded because they are located in pockets of poor harvest or are temporarilyinaccessible or because there is imperfect substitution between wheat and ppaddy storage. Taking these factors into account, it is estimated that atpeak, the storage facilities on average would be only 80% loaded, so that7.5 million tons of storage capacity would be necessary to handle FCI'sprojected June peak of 6.0 million tons. The above calculations assume noyear-to-year fluctuations in procurement and demand on the public distribu-tion system. In fact, fluctuations do occur in such a way that procurementis high when offtake from the public distribution system is low, resultingin rapid stock buildup, as occurred in 1975/76 when peak stocks rose to 18.0million tons. Rapid stock drawdown can occur when procurement is low at thesame time demand is high, and maintaining supplies to vulnerable groups thenrequires iarger than normal quantities of grain. GOI's policy is to buildthe capacity to hold 12.0 million tons of grain in addition to those neededfor normal operations purpose; FCI's requirement would then be about 20.0million tons. With this project FCI would own 9.4 million tons of capacityby 1980/81. FCI would continue to make use of storage space rented fromother public and private entities; but only about 2.0 million tons of the5.5 million tons currently rented is of acceptable statdard; the substandardremainder is being hired because it is better than open, CAP storage. After1980/81, FCI will have access to 11.4 million tons of secure storage capacity,about 4 million tons above that needed simply for operations in a normal yearbut 8.0 million tons less than needed to fulfill GOI's buffer stocking goals.Stock accumulations above 11.4 million tons will have to be accommodated insubstandard rented storage or CAP storage. After the current building programis completed, the GOI will have the opportunity to decide upon another trancheof FCI's expansion program, either reaffirming current goals for Government-owned storage or altering these goals in response to changed policies.
B. Detailed Features
ProJect Area
4.03 The 3.5 million tons of storage would be constructed in the Statesof Andhra Pradesh, Assam, Bihar, Gujarat, Haryana, Jammu and Kashmir, Karnataka,Kerala, Maharashtra, Madhya Pradesh, Orissa, Punjab, Rajasthan, Tamil Nadu,Uttar Pradesh and West Bengal at the critical grain procurement and distribu-tion centers. Criteria for selecting each location (town), site and type ofstorage structure have included: (i) existing and projected procurement and

distribution; (ii) type, capacity and location of existing grain storage facil-ities in relation to existing and projected procurement/distribution at theproposed sites; (iii) transportation facilities serving the locale; and (iv)climatic conditions (which determine duration of storage). Locations arelisted in Annex 5, Appendices C & D. Proposed locations are shown on IBRD Map12880. All sites would have road and rail access. Civil works would includewarehouses, office buildings, on-site road improvements and connecting railsidings. The two silo units would be constructed only at port side and wouldbe equipped to receive, store and handle imported grain. During negotiations,the proposed locations and type of storage complexes to be built were agreedwith GOI and FCI. Since land acquisition for all project sites would be alengthy process (as evidenced by the first storage project), to enable theproject to get underway without delay, yet ensuring GOI's and FCI's commit-ment to it, it was made a condition of Board presentation that land wouldhave been acquired for 28 or more project sites. During negotiations, GOIprovided evidence that 50 project sites had been acquired, so the conditionwas easily met.
Storage Buildings
4.04 The project would finance construction of the following:
unit Number of TotalModel Type Capacity Units Capacity
(000 tons) (000 tons)
A Bag 5 to 50 119 2,500.0B Bulk (or Bag) 52.5 11 577.5c Bulk 52.5 4 210.0D Bulk 52.5 3 157.5D Bulk 55.0 1 55.0Port Silo Bulk 50.0 1 50.0Port Silo Bulk 25.0 1 25.0RuralProcurement Centers 6
Total 146 3,575.0
Designs and specifications are detailed in Annex 7. Detailed cost estimatesfor each type of storage complex are given in Annex 9, Tables 1 to 7.
4.05 Models A and B warehouses would be of identical dimensions: 21.8 mwidth, 127.6 m length and 6.35 m height from floor to eaves. Model A is theFCI conventional warehouse constructed with reinforced concrete columns, cur-tain brick and mortar walls and concrete floor. It would have a rated staticstorage capacity of 5,000 tons wheat in gunny bags and would be built in com-plexes ranging from 5,000 to 50,000 tons. The Model B warehouse would be con-structed with reinforced concrete floors and walls. Each building would in-clude tunnel and aeration ducts used for grain handling, aeration, drying andfumigation. A grain conveying system, work bins and bagging machines would be

- 12 -
added. Bulk-head type doors facilitate grain storage in bulk or bag. Eachwarehouse would have a static storage capacity of 12,500 tons wheat in bulk or5,000 tons in gunny bags. Model B would be built in a complex of 52,500 tonscapacity including 2,500 tons of work bin space. The Model C circular binswould store only bulk grain. Each complex would have a capacity of 52,500tons, including 2,500 tons of work bin space. This model would be designedfor locations where groundwater conditions prevent construction of tunnels andelevator pits at depths of over 5 m. The entire structure would be of rein-forced concrete. An aeration system and conveying equipment would be provided.The Model D hopper-bottom warehouse would handle and store bulk grain. Itwould be constructed in complexes which store 52,500 tons of wheat, including2,500 tons of work bins. Port silos would be constructed at Haldia and Madras,where grain imports have ranged from 250,000 to over 1.0 million tons annually.The slip form or other superior method of construction would be used, sincethis method is less costly, results in stronger walls and has a lower likeli-hood of leaks. The costs of a complex of 50,000 tons of wheat storage capacityare estimated to be Rs 18.4 million for Model A, Rs 20.5 million for Model B,Rs 22.2 milliion for Model C and Rs 19.0 million for Model D.
Project Warehouse Configuration
4.06 Although the estimated investment costs of a standard 50,000 tonscomplex are higher for Models B, C and D than Model A, the operating costand grain losses of these bulk warehouses would be lower (Annex 4, Tables 5and 6, and Annex 9, Table 11), and their estimated economic rates of returnhigher. The project warehouse configuration, however, consists predominantlyof Model A for the following three principal considerations: (i) flat bulkstorage would not be suitable at most of the project sites because the match-ing bulk transportation and handling facilities would not be available forsome time; (ii) many of the project depots would have throughputs not largeenough to warrant bulk handling; and (iii) flat bulk storage is still rela-tively untried in India and should be regarded as a pilot development.
Rural Grain Procurement Centers
4.07 The project would finance two large and four small grain procure-ment centers, equipped with facilities for-mechanical handling of the procuredgrain (including temporary storage in some cases), and portable grain handlingequipment (cost US$1.7 million), for about fifty primary grain markets in thestates of Punjab, Haryana, Uttar Pradesh, Andhra Pradesh and Tamil Nadu.Under existing practice, most farmers deliver their grain (wheat) in bulk tothe primary market where the grain is placed in a heap on the market floor,priced, cleaned, bagged, weighed, purchased by FCI (or other buyers) and thendelivered to the warehouse. The facilities to be provided by the proposedprocurement centers would eliminate the need for bagging; the grain would beprocured in bulk and transferred to the center. Alternatively, the grain maybe delivered directly by the farmer to the procurement center, bypassingthe primary market. At the procurement center, the grain would be graded,weighed, and conveyed into elevated steel hopper bins where it is kept until

- 13 -
trucks transport it to a larger warehouse for storage or to the railways forshipment to points of distribution. It is estimated that these centers wouldreduce FCI's handling and transport costs by about Rs 33 per ton of grain(see Annex 9, Table 7).
Grain Transport Equipment
4.08 Trucks equipped to transport grain in bulk would be provided toFCI for delivery to storage facilities or from storage to flour mills. Papergrain door retainers for existing modified railwagons and new special grainrailwagons would be provided to transport grain by rail in unit trains fromexisting storage facilities and those to be financed under the project.Details are given in Annex 6 and in Annex 9, Table 8.
Technical Assistance
4.09 FCI engineers and contractors have had considerable experience inthe constructiou of the Model A warehouse complex, having built it at morethan 1,500 locations. The layout, design and auxiliary units have been stan-dardized and are acceptable to IDA. Nevertheless, FCI would need the assis-tance of hired engineering services to construct 2.5 million tons of suchstorage within four years. Hence, the grain storage engineering services ofCWC and the Central Public Works Department (CPWD) would be engaged to assistin the preparation of designs and tender documents and supervision of con-struction. FCI engineers and Indian engineering services have had limitedexperience in the design and construction of flat bulk grain storage ware-houses and silos. Domestic consultants and 60 man months of internationallyrecruited consultants would therefore be engaged to assist FCI prepare layoutplans, designs, tender documents, bid evaluations and to supervise construc-tion for the Models B, C and D complexes and port silos. During negotiations,assurances were obtained that GOI and FCI would engage engineering servicesand consultants, under arrangements and terms acceptable to IDA, not laterthan March 31, 1978.
Designs Development and Operations Research
4.10 The project would provide Rs 4.0 million (US$457,000) for FCI tostrengthen its Planning and Research Unit and develop designs for specialrailway wagons and modification to existing railway wagons, and conduct ope-rations research studies to ascertain comparative costs of receiving, hand-ling, storing and transporting grain in bag and bulk. These studies wouldreview relative costs and benefits of the different classes of warehouses -Models A, B, C and D warehouse complexes as well as CAP storage - when usedin different centers 1/ and for varying periods of storage. Similarly,alternative transport facilities and usage would be evaluated. Bag transportwould be compared with bulk transport using conventional trucks, specialgrain trucks, paper grain retention doors on railwagons and hopperbottom
1/ at (i) primary procurement centers; (ii) intermediate storage centers;(iii) urban distribution centers.

- 14 -
grain wagons. Such studies would be financed to obtain much more detailedinformation concerning the costs and benefits of the system of bulk handling,storage and transportation of grain (which would be provided under the projectas a pilot scheme), as compared to existing bag system, in order that the useof existing storage facilities may be optimized, and the planning and designof future storage projects be made more effective. Assurance was obtainedfrom GOI that plans acceptable to IDA would be prepared for carrying out suchoperations research studies by December 31, 1978.
4.11 Training. FCI would need additional staff, trained in grain hand-ling including bulk transportation, quality control and accounting to managethe new grain storage complexes. The project would provide Rs 3.5 million(US$400,000) for both domestic and overseas training of experts for thesepurposes (Annex 9, Table 9). During negotiations, agreement was obtainedfrom GOI and FCI that plans for training acceptable to IDA would be preparedby June 30, 1978.
C. Implementation Schedule
4.12 Implementation of the project is expected to take four and a halfyears, starting July 1, 1977 (with retroactive financing - see para. 4.15).Expenditures for each of the fiscal years are estimated as follows (Rs mil-lion): FY78 - 240.0; FY79 - 220.0; FY80 - 600.0; FY81 - 575.0; FY82 (6 months)- 251.0. The detailed time implementation schedule for the various projectcomponents is given in Annex 10.
D. Cost Estimates
4.13 Total cost of the project, including that of land acquisition andcontingencies, is estimated at Rs 1,886 million (US$215.5 million). Theforeign exchange component of Rs 139.7 million (US$16.1 million) representsabout 7% of total costs and includes grain handling equipment, expatriateengineering services and training not available in India. Costs are basedon contract rates competitively awarded in mid-1977 for similar items. Phy-sical contingencies for civil works have been calculated at 5% for Model A,10Z for Models B, C and D and 15% for port silos. Physical contingencies forequipment have been calculated at 10% for all models and port silos. Pricecontingencies have been provided for at 7% per annum. Taxes and duties areestimated to be about US$2.0 million for the whole project. The followingtable presents a summary of the cost estimates:

- 15 -
Rupees US$ Equivalent %Foreign Foreign Foreign
Local Exchange Total Local Exchange Total Exchange- _ -(Millions)-
1. Expansion at67 Sites Modified.Model A - 645,000tons @ Rs 288/ton 185.6 - 185.6 21.2 - 21.2 -
2. Model A - BagStorage 1.855 mil.tons @ Rs 350/ton 649.3 - 649.3 74.2 - 74.2 -
3. Model B - 630,000tons @ Rs 374/ton 211.4 24.3 235.7 24.1 2.8 26.9 10
4. Model C - Cir-cular Bins 157,500tons @ Rs 405/ton 57.0 6.8 63.8 6.5 0.8 7.3 11
5. Model D - HopperBottom 212,500 tons@ Rs 349/ton 68.1 6.1 74.2 7.8 0.7 8.5 8
6. Port Silos (2)75,000 tons @Rs 2,165/ton 118.4 44.4 162.8 13.5 5.1 18.6 27
7. Rural Procure-ment Centers 13.2 1.6 14.8 1.5 0.2 1.7 12
8. TransportEquipment 40.1 14.6 54.7 4.6 1.7 6.3 27
9. Training-OpResearch 3.9 3.6 7.5 0.5 0.4 0.9 44
10. TechnicalAssistance:EngineeringServices 61.0 - 61.0 6.9 - 6.9 -
Consultants 15.0 3.6 18.6 1.7 0.4 2.1 19
Total 1, 423.0 105.0 1,528.0 162.5 12.1 174.6 7
11. Contingencies:Physical -a) C. Works 73.2 - 73.2 8.4 - 8.4
b) Equipment @ 10% 13.4 9.6 23.0 1.5 1.1 2.6Price - 7% per
annum 236.9 25.1 262.0 27.0 2.9 29.9
Sub-Total 323.5 34.7 358.2 36.9 4.0 40.9
12. Grand Total 1,746.5 139.7 1,886.2 199.4 16.1 215.5

- 16 -
E. Proposed Financing
4.14 It is proposed that IDA provide US$107.0 million (Rs 936.0 million)to finance 50% of the project cost, net of taxes and duties. IDA credit wouldbe to GOI and GOI would use US$2.4 million of the credit to purchase railwagonequipment, to be owned and operated by Indian Railways. GOI would on-lend theremaining US$104.6 million credit proceeds to FCI for a term not exceeding 20years, including a four year grace, at an annual interest of 10.5%, with a0.25% interest rebate for timely repayment. The remaining US$108.5 millionproject cost would be provided by GOI as GOI equity in FCI. The 10.5% interestrate, with 0.25% rebate is the standard formula that GOI uses for loans tosimilar public sector undertakings at the present time. GOI would pay in itsequity contribution in annual installments in equivalent of US$15.0 millionfor FY78, US$20.0 million for FY79, US$36.5 million for FY80, US$25.0 millionfor FY81, and US$12.0 million for FY82.
4.15 In 1976-77, to alleviate the sudden acute shortage of grain storagespace resulting from a good monsoon harvest, FCI began construction of 900,000tons of additional warehouse capacity, estimated to cost Rs 259.0 million(US$29.6 million). At that time, preparation of the proposed Second FoodgrainStorage Project was already close to completion, and the 900,000 tons capacityof warehouse construction was included in the proposal. However, GOI felt thatit had to act quickly to meet urgent storage needs rather than wait for theproject to be appraised and approved. By July 1, 1977, about Rs 73.5 million(US$8.4 million) of construction cost had been expended or tendered. Theremaining Rs 185.5 million (US$21.2 million) would be tendered after July 1,1977, and it is proposed to include this under the project in the light ofthe exceptional circumstances described above. It is proposed that expendi-tures made prior to credit signing against awards be made eligible for retro-active financing up to a maximumvof US$5.0 million, on the basis of standard50% financing formula for India.
F. Procurement 1/
4.16 All procurement, including employment of consultants, would be inaccordance with Bank guidelines. In all international competitive bidding,domestic bidders would be given a 7.5% preference on civil works. A 15%preference on equipment, based on the c.i.f price of each item or the actualtariff applicable, whichever is lower, would be granted to the domesticbidders. FCI would prequalify all domestic and foreign bidders for civilworks.
1/ Procurement costs are given inclusive of engineering services but exclu-sive of contingency provisions.

-17-
4.17 Civil Works for Bulk Storage Facilities: All civil works contractsfor bulk storage facilities (US$24.5 million) and the two port silos (US$8.1million) would be awarded on the basis of international competitive bidding.To the extent practical, these contracts would be bulked.
4.18 Civil Works for Conventional Storage Facilities and RuralProcurement Centers: Although in the aggregate the total cost of the bagstorage facilities would be very large (US$75.5 million), international com-petitive bidding would not be suitable because the construction sites wouldbe scattered across the country, the value of each contract relatively small,and Indian contractors are considered highly competitive. Civil works con-tracts for these facilities, therefore, together with those for rural procure-ment centers (US$0.9 million) would be awarded on the basis of competitivebidding advertised nationally and statewide under procedures satisfactory toIDA. Tenders would be in packages of three or more contracts, except instates with few storage facilities to be constructed. Contractors would beable to bid for any one contract individually or for a combination of con-tracts or for the entire lot.
4.19 Civil Works for Railway Sidings: Civil works contracts for railwaysidings (US$18.4 million) are highly specialized, and need to be coordinatedclosely with the existing railway system. Competitive bidding would not beappropriate, and civil works contracts for each location would be awardedby FCI (giving regard to economy and efficiency) to Indian Railways uaderprocedures satisfactory to IDA.
4.20 Malor Equipment Items: Procurement of weighbridges, temperatureindicator systems, aeration fans and ducts, railway scales, passenger ele-vators and railwagon movers for all sites, and material handling systems(grain conveyors, bucket elevators, truck dumpers, grain reclaimers, grainvalves, spouts) for all sites would be on the basis of international com-petitive bidding. To the extent practical, these equipment would be bulked.The special railwagons and paper grain door retainers would be packagedseparately and also awarded on the basis of international competitive bidding.
4.21 Miscellaneous Equipment Items: Miscellaneous items not lendingthemselves to bulking or expected to cost less than US$100,000 when bulkedwould be procured by tenders advertised nationally, and prudent shopping wouldbe used for items which individually or when bulked cost less than US$10,000.
4.22 Trucks. The 50 grain trucks would be procured on the basis ofnationally advertised competitive bidding from suppliers able to providespare parts and maintenance services. (Equipment costs, including trucks,are estimated to be about US$33.2 million).
G. Disbursement
4.23 The Credit would be disbursed against eligible expenditures asfollows: (i) 40% of civil works (US$59.0 million); (ii) for equipment
- 18 -
(US$38.0 million), 100% of foreign expenditures or 100% of local expenditures(ex-factory), for orders awarded under ICB or 50% of other locally procuredorders; and (iii) 100% of expenditures for engineering consultant services,training, designs development, and operations research (US$10.0 million).Expenditures incurred on the project after July 1, 1977, but prior to Creditsigning would be eligible for disbursement up to a limit of US$5.0 millionequivalent provided procurement procedures employed are determined by IDA ashaving been satisfactory. Disbursements would be made against appropriatedocumentation and would be exclusive of land. The estimated disbursementschedule is given in Annex 11.
V. ORGANIZATION AND MANAGEMENT
A. General
5.01 The Ministry of Agriculture and Irrigation would have overallresponsibility for the project. Within the Ministry, the Secretary for Foodand the Central Storage Committee (CSC) would be responsible for achievingcoordination of action among the various agencies within GOI and between GOIand the respective State governments. FCI would be responsible for imple-menting the project.
B. Prolect Implementation Division
5.02 FCI would establish a Project Implementation Division (PID), underthe direction of the Managing Director, which would be responsible fordetailed execution of the project. PID would be under the charge of a chiefengineer with at least 10 years experience of grain storage construction. Itwould have three sections: (i) Conventional Storage Section, to be respon-sible for the construction of all Model A bag warehouses; (ii) Bulk StorageSection, to be responsible for the construction of all Models B, C and D bulkwarehouses, port silos and rural procurement centers; and (iii) Finance andAdministration section, to be responsible for the accounts and audits, per-sonnel and legal matters of the project. The chief engineer would also super-vise the preparation and conduct of the designs development, operationsresearch and training programs.

- 19 -
5.03 The current staffing of the two existing engineering sections andthat proposed for PID are smmarized below:
No. of PersonsProject
Present Addition Total
Chief of PID 1 1Consultants 60 man-months
Conventional Storage SectionSenior Engineering Manager 1 - IEngineering Manager - I IJoint Engineering Manager 11 7 18Other Professional Staff 775 261 1,036Supporting Staff 280 708 988
Subtotal 1,067 2,044
Bulk Storage SectionEngineering Manager 1 1 2Joint Engineering Manager 2 16 18Other Professional Staff 61 380 441Supporting Staff 30 221 251
Subtotal 94 618 712
Finance and Administration SectionFinance Manager - 1 1Joint Manager 2 4 6Other Professional Staff 45 148 193Supporting Staff 550 936 1,486
Subtotal 597 1,089 1,686
Grand Total 1,758 2,685 4.443
Qualifications for the professional engineering and finance staff range fromthe equivalent of a graduate or Master's Degree and 5 or more years of ex-perience in their relevant fields to a Diploma and 1 or 2 years' experience(details on pattern and qualifications of staffing are shown in Annex 8,Appendix A).
5.04 The Conventional Storage Section of PID would not be adequatelystaffed to execute the construction of 2.5 million tons of Model A warehousesand to maintain existing ones. FCI would therefore enter into engineeringservice contracts with the grain storage engineering sections of CWC andCPWD for assistance in preparing designs and tender documents, evaluatingbids and supervising construction. Nonetheless, PID would be completelyin charge of the construction of about 1.5 million tons at 67 sites in 10states.

- 20 -
5.05 The establishment of PID, and posting of the chief engineer and thethree Managers of the Sections, under arrangements terms and staff qualifica-tions acceptable to IDA, would be a condition of credit effectiveness. Duringnegotiations, assurances were obtained that terms and conditions of the CWCand CPWD engineering service arrangements would be acceptable to IDA.
5.06 The implementation plan is shown in Annex 10. GOI and FCI haveprepared full details of the plan, which was finalized and agreed uponduring negotiations.
C. Accounts and Audits
5.07 FCI would maintain separate accounts for expenditures under thisproject. The annual budgets and accounts prepared by FCI should distinguishproject activities from its other operations. FCI'seannual accounts wouldbe audited by independent auditors acceptable to IDA. Assurances wereobtained from GOI and FCI on these actions. Assurances were also obtainedthat copies of these documents would be submitted to IDA as follows:
Annual budgets not later than one month prior to thebeginning of FCI's financial year;
Quarterly progress reports within one month of theclose of each quarter; and
Audited final accounts of the project within four monthsof the close of FCI's financial year.
D. Monitoring and Evaluation
5.08 On the basis of the detailed project implementation plan, the Chiefof PID (or, preferably, an assistant in charge of monitoring and reportingto him) would monitor and compare actual project progress with that planned.Problems could then be identified or foreseen, evaluated and action takento solve them to avoid slippage. IDA, through the receipt of a quarterlyprogress report from PID (on land acquisition, tendering, bid awards, pro-curement, disbursement, construction, training etc.) and periodic supervisionmissions, would help to ensure the adequacy of the monitoring and evaluationbeing carried out and to solve the problems that occur. During negotiations,assurances were obtained that FCI would establish a monitoring and evaluationsystem for the project by June 30, 1978.
5.09 The operations research studies described in para 4.10, to befinanced under the project, would constitute an em-post evaluation of therelative costs and benefits of the various types of warehouses, and moregenerally, of the system of bulk handling, storage and transportation ofgrain. This would help in the planning and design of future projects inIndia.

- 21 -
VI. ECONOMIC BENEFITS AND JUSTIFICATION
6.01 Without the warehouse storage component, FCI procured foodgrain wouldhave to be stored in the open, under cover and plinth (CAP), and grain storagelosses would be extensive. The economic benefit of the warehouse componentwould therefore be the reduction in grain storage losses and in the significantsavings on operating costs. The reduction in grain storage losses would havethe benefit of a saving on grain imports and therefore on foreign exchange.lowever, grain trade will continue and the port silo component of the projectis provided to reduce the cost of handling such grain.
6.02 Project facilities would enable FCI to reduce storage losses by180,000 tons of wheat and paddy per year valued at about Rs 200 million(US$22.9 million) and to save on operating cost by about Rs 300 million(US$34.3 million). The estimated economic rate of return is about 20% forthe entire project investment; it is about 19% for the warehouse componentand 24% for the port silos (see Annex 12 for underlying assumptions andanalytic procedures). The rates of return on wheat and paddy storage forthe various project components based on duration of storage are given below:
Wheat PaddyModel Model Model Model Model Model Model Model
A B C D A B C D
1. 6 Months in Storage 19.7 25.9 25.8 28.4 9.5 17.8 17.6 19.7Sensitivity test:
I turnover per year(i) Increase capital
Cost - 15% 16.8 22.7 22.6 25.0 7.8 15.4 15.2 17.1(ii) Increase Oper.
Cost - 10% 11.1 20.1 20.2 22.4 2.9 14.0 14.0 15.7(iii) Increase grain
Loss - 10% 18.6 24.6 25.3 27.8 9.0 17.5 17.3 19.4
2. 24 Months in Storage 29.1 34.3 33.6 36.7 16.1 20.9 20.0 22.3Sensitivity test:
(i) Increase capitalCost - 15% 25.1 30.3 29.6 32.5 13.7 18.1 17.4 19.4
(ii) Increase Oper.Cost - 10% 23.8 30.8 30.1 33.0 12.3 18.5 17.8 19.8
(iii) Increase grainLoss - 10% 27.7 33.5 32.3 35.8 13.4 20.6 19.7 21.9
6.03 As can be seen, the bulk storage warehouses (Models B, C and D) havehigher rates of return than bag warehouses (Model A). Additional benefitswould arise from the resulting greater effectiveness of GOI's food procurementand distribution operations, which would induce increased grain production,enhance the welfare of producers and improve the real income of low incomeconsumers.
- 22 -
Project Risks
6.04 The major risk is the possibility of excess storage capacity,-dueto low procurement and low imports. It is, however, unlikely that the FoodCorporation's operational storage capacity would be much underutilized fora prolonged period because the circumstances leading to stock depletion -harvest shortfalls, high market prices, low public procurement and rapidofftake of grain - also would lead to increased imports as the GOI triesto maintain or increase levels of Governmental distribution of grain. Thechances that the relatively small capacity to hold contingency stocks wouldnot be used as planned are remote since weather induced fluctuations inharvest size, price, and therefore in GOI procurement and distribution arelikely to continue.
VII. RECOMMENDATIONS
7.01 During negotiations, IDA obtained assurances from GOI and FCIon the following:
(a) procurement would be in accordance with procedures statedin paras 4.16 and 4.22;
(b) IDA would be informed on at least a quarterly basis ofprogress in project execution (para 5.07);
(c) accounting and auditing procedures would be as set out inpara 5.07;
(d) a plan for developing designs and conducting operationsresearch by December 31, 1978 (para 4.10) and for stafftraining by June 30, 1978 (para 4.11), acceptable to IDA,would be prepared (para 5.08);
(e) a monitoring and evaluation system for the project would beestablished by June 30, 1978; and
(f) the employment of engineering services and consultantsunder arrangements and terms acceptable to IDA, byMarch 31, 1978 (para 4.09).
7.02 As a condition of Credit effectiveness, GOI and FCI would haveestablished the PID together with the posting of the chief engineerand the heads of the three sections (para 5.05).
7.03 With the above assurances, the proposed project is suitable for anIDA Credit of US$107.0 million to GOI.

ANNEX 1Page 1
INDIA
SECOND FOODGRAIN STORAGE PROJECT
Review of First Wheat Storage Project (Cr-267-IN)
1. The project, costing US$15.9 million, and financed jointly withSweden, originally consisted of: (a) constructing and equipping ten silosof 20,000 tons each and ten bag storage units of 10,000 tons each to providea total capacity of 300,000 tons; (b) training silo personnel; and (c) a studyof India's foodgrain storage and distribution. The project was intended tohelp meet urgent storage needs resulting from rapid increases in wheat pro-duction in Northern India in the late 1960's and to provide the basis fordeveloping a more effective nationwide system of grain storage and distri-bution.
2. The Food Corporation of India (FCI) was responsible for implement-ing the bulk of the project - construction and operation of storage facili-ties and training of silo personnel. The Credit agreement was signed inAugust 1971, but did not become effective until November 1972. Numerousfurther delays occurred after credit effectiveness, so that the project isnot expected to be completed until mid-1978, three years behind the appraisalestimate. Reasons for the delays both before and after credit effectivenessare discussed below in relation to implementation of project components.Despite the frustrating delays, the project is achieving its basic objectiveof providing needed grain storage facilities. The experiences gained, par-ticularly in procurement and land acquisition, should stand FCI in good steadin implementing the proposed project.
Silo Construction
3. The Credit Agreement provided, as one of the conditions of effec-tiveness, for the appointment by FCI of an engineering consultant acceptableto IDA, for the design and supervision of silo construction using the slipform method. This appointment took a long time because of FCI's unfamiliar-ity with IDA's procedure for the appointment of consultants, and FCI'sinternal administrative procedures. In accordance with IDA's procedure, PCIhad invited offers from three approved consulting firms to give particularsonly of their qualifications and experience. On this basis, one firm wasselected, and negotiations with this firm began. When the negotiations be-came prolonged as a result of difficulty in reaching an acceptable price,PCI called for offers with price quotations from the second and third firms,explaining that the offers would not be open until negotiations with the firstfirm had failed. This was considered by IDA to be a breach of procedure andaccordingly, FCI was requested to re-open negotiations with the first firm.

ANNEX 1Page 2
Negotiations continued to proceed slowly and were complicated by the involve-ment of negotiating and reviewing committees and administrative clearanceprocedures within FCI and the Food Department. It was not until nine monthslater that agreement was reached with the firm on November 10, 1972. TheCredit was declared effective four days later.
4. The Credit Agreement also required FCI to acquire all the 20 siloand godown sites as a condition of effectiveness. Difficulties were en-countered in the acquisition of these sites. In the end, when only one silosite remained to be acquired, and when agreement with the consultant hadbeen reached, IDA waived the site acquisition requirement.
5. Initial implementation difficulties encountered included a lackof knowledge of the silo component requirements by FCI's key engineeringstaff owing to lack of access to the project appraisal report and documents.This was quickly remedied. Next and more importantly, the Joint FinancingAgreement stipulated a single-bid requirement for all ten silos and anotherfor all ten godowns. Implicit was the assumption that the civil engineer-ing design and construction would be identical. Preliminary site surveys,however, showed varying soil conditions between sites, requiring individualfoundation designs, entailing in turn different bin heights and diameters toensure economic construction. In addition, several of the proposed silo siteswere found to be unsuitable because of inability to acquire land, bad sitelocation with regard to receiving and distributing grains, and unavailabilityof railway sidings and usable access roads. FCI therefore requested waivingof the requirements for a single bid for 10 silo units in favor of multipleinvitation to bid for construction of those silos whose sites were suitableand foundation designs completed. The request was agreed to by IDA in January1974.
6. During the delays caused by the above problems, costs, particu-larly for silo constructiou, escalated and the project was reappraised inearly 1975. The number of silos were reduced to keep costs at the originalappraisal estimates. As revised, the project finances the constructionof nine 10,000 ton flat storage godowns, five 20,000 ton silos (at Khurja,Lucknow, Moga, Jagraon and Modi Gobingarh), four bulk grain handlingfacilities, staff training and an All-India Grain Storage Study.
7. In March 1977, piling and foundation work had been completed atall silo sites. Concrete work for the conveying system and headhouse wasabout 20% completed at Khurja and Lucknow and ready to start at the otherthree sites. Concrete work for the headhouse and silos was expected tobe completed by July 1977. Overall, about US$7.0 million worth of contractsfor civil works and about US$2.0 million for electrical/mechanical equipmentshad been signed. All the silos are scheduled to be completed and ready toreceive grain by April 1978.
Warehouse Construction
8. In its construction of warehouses, FCI ignored the single-bid re-quirement long before it was waived, inviting separate bids and sub-contracts,
ANNEX IPage 3
and awarding contracts for construction grouped by regions, as and when suit-able sites became available. GOI pointed out that bulking into a single-b"idrequirement would reduce competition to only a few large firms who couldmanage such a large construction job. GOI maintained that as a result ofseparate regional bids, it was able to obtain much better prices because ofgreater competition from a larger number of small firms. Owing again to itsunfamiliarity with IDA's requirements, FCI neglected IDA's procurement proce-dures with regard to prequalification of civil works contractors, documenta-tion of tenders, evaluation of bids, awarding contracts, and approval by IDAof tender documents prior to issue and proposed award of bids. These problemsremained throughout the implementation of this component. Nevertheless, fulldisbursement was finally made for 9 warehouses; disbursement was not made onone which was excluded from the revised project. Apart from this however,warehouse construction proceeded speedily. At the end of 1973, five had beencoustructed and by early 1975, the remaining four were completed.
Staff Training
9. The overseas training program for FCI's middle management techni-cians who would be responsible for operating the silos under constructionwas delayed but is now underway. FCI's Managing Director has agreed toprovide IDA with a proposed plan, including selection of the appropriateoverseas institutions.
All-India Grain Storage and Distribution Study
10. This study, undertaken by the Administrative Staff College ofIndia, Hyderabad, was completed in October 1976. Copies of the main reportand 17 supporting studies were provided to GOI and IDA. The study providedvaluable information for this appraisal report.
June 3, 1977

ANNEX 2Page 1
INDIA
SECOND FOODGRAIN STORAGE PROJECT
Foodgrain Production, Consumption, and Prolections
A. GROSS FOODGRAIN PRODUCTION
1. Although agriculture's share of net domestic product (measured in1960/61 prices) has declined from 49% in 1960/61 to 42Z in 1970/71, and fur-
ther to 40% in 1975/76, it remains by far the post important sector, beingtwo and one-half times larger than industry in 1975/76. Foodgrains, parti-
cularly rice and wheat, dominate the agricultural sector, and occupy aboutthree-quarters of the cultivated land area. India's agricultural development
policy is largely focused on foodgrain production.
2. The major determinant of year-to-year foodgrain production in India(as in the rest of monsoon Asia) is the weather. Although the extension of
irrigation and greater use of improved technology (in wheat in particular)have given India greater immunity to the vagaries of the weather, and may
have imparted a steeper upward trend to production, fluctuations in outputremain best explained by the weather. The good crop years of 1953/54, 1958/59,1960/61, 1964/65, 1967/68, 1970/71 and 1975/76 were all characterized by good
monsoon rainfall, leading to a significant production increase over the pre-vious year. New high yielding varieties and fertilizer aided in the produc-tion increases of 1967/68 and 1970/71. Similarly, the poor crop years of1957/58, 1965/66, 1966/67 and the early 1970's were due to droughts of vary-
ing severity. Since 1972/73, fertilizer shortages and high petroleum priceshave compounded bad weather in poor crop years.
3. Total foodgrain production grew at 2.3% annually from 1953/54 to1975/76. The rate of increase was significantly higher in the more recentsub-period, 1964/65 to 1975/76, at 2.8%, than from 1953/54 to 1964/65, at 1.9%.Examining the rates of increase for rice, wheat and other foodgrains for thesame sub-period, it will be seen that the much higher rate for wheat production
increase was mainly responsible for the higher growth of foodgrain productionfrom 1964/65 to 1975/76; rice, in fact, experienced a slightly lower growthrate 1/ (see Table 1). This reflection of the success of the green revolutionin wheat since the latter half of 1960s, and the relative lack of it in riceand other foodgrains can also be observed in Table 2. The growth in yield ofwheat more than doubled in 1964/65-1975/76 from 1953/54-1964/65, as a resultof the complementary inputs of higher yielding varieties, fertilizer and
1/ The base and terminal years of 1953/54, 1964/65 and 1975/76 were chosenbecause they were all similar, good weather years, thus allowing abetter comparison of the trend.

ANNEX 2Page 2
irrigated land. The growth of area under wheat also increased significantly,indicating the profitability of shifting from less profitable crops to wheatand bringing land under irrigated cultivation with the new seed-fertilizertechnology. By contrast, rice experienced a lower growth rate in both yieldand area in 1964/65-1975/76 than 1953/54-1964/65. The picture for the otherfoodgrains as a whole is somewhere in between so that for total foograins, therate of increase in area has remained the same while the rate of increase inyield is somewhat higher in the recent period.
4. A recent study 1/ attempted to divide increased foodgrain productioninto components attributable to specific inputs - unirrigated land, irrigatedland, additional labor, and fertilizer - from 1949/50 to 1973/74. It showedthat the increase in acreage of unirrigated land was the primary source ofproduction growth from 1949/50 to 1956/57 (46%), remained a significant sourcefrom 1956/57 to 1960/61 (20%) and then receded to insignificance in the laterperiods. The increase in irrigated acreage increased in importance during theperiod 1964/65 to 1970/71 (accounting for 29% of production growth), thendeclined somewhat in the 1970/71 to 1973/74 period (22%). Fertilizer wasinsignificant up to 1960/61, then accounted for 38% of the production increasefrom 1960/61 to 1964/65 and 59% from 1964/65 to 1970/71, but dropped to 38%from 1970/71 to 1973/74. Estimates for additional labor was more tentative.Its contribution to production increase, though significant at all periods, wasrather variable, probably reflecting in part the changing importance of otherinputs.
5. The State-wise production of wheat, rice, other foodgrains andtotal foodgrains are shown for selected years, 1968/69, 1971/72, and 1975/76,in Table 3. Uttar Pradesh has the highest foodgrain production for all theyears shown. In 1975/76, the share of the top nine states - Uttar Pradesh,Madhya Pradesh, Andhra Pradesh, Maharashtra, Bihar, Punjab, West Bengal,Rajasthan and TamiU Nadu - accounted for about 76% of total foodgra$n produc-tion. Rice production is largely concentrated in the eastern and southern partof the country, with West Bengal, Andhra Pradesh, Tamil Nadu, Bihar, Orissa andUttar Pradesh accounting for nearly 60% of total rice production in 1975/76.Wheat predominates in the northern regions, and in 1975/76, two States, UttarPradesh and Punjab, produced nearly 50% of the total and with Madhya Pradesh,Bihar, Baryana and Rajasthan the share increases to over 80%. Some states havediversified their foodgrain production rapidly. Punjab and Haryana have morethan doubled their rice production in the last decade and West Bengal,Maharashtra and Gujarat have similarly increased wheat production.
B. Projections of Foodgrain Production
6. The Administrative Staff College of India (ASCI) in their report,"All-India Grain Storage and Distribution Study" used the ordinary least square
1/ John W. Mellor, Food and Rural Poverty - Some observation with Respect toIndia and South Asia, (mineographed), January 31, 1976, pp. 8-11.

ANNEX 2Page 3
method to estimate trend equations for rice, wheat and total cereals (foodgrainsminus pulses), based on two spans of time for their projections: (i) the fullspan prolections, based on the period from 1954/55 to 1974/75, and (ii) thehalf span prolections, based on the period from 1962/63 to 1974/75. Thehalf span projections were intended to reflect technological changes that tookplace in agriculture in the 1960s. Projections were prepared for All-Indiaand for individual States. One of the two span projections was selected foreach State, depending on its relative explanatory power. Final projectionsselected for rice, wheat and cereals were based mostly on half-span trends,and are shown in Tables 4, 5 and 6, respectively. Projections for cerealproduction were further adjusted by ASCI to take account of the likely expan-sion in irrigation in the different States. The All-India total remains thesame but the projections for each State were marginally altered. The adjustedprojections for three selected years, 1975/76, 1980/1 and 1985/86, are pre-sented in Table 7.
7. A medium-term forecast up to 1978/79 for foodgrain production was
made in the World Bank India Economic Report of 1976, using past input-outputrelationships. 1/ A regression analysis relating foodgrain production toirrigated and non-irrigated (rainfed) areas, using data for 14 States, for theperiod 1964/65 to 1971/72 was carried out, yielding figures for average irri-
gated yield (1.364 tons/ha), average rainfed yield (0.389 tons/ha), and annualaverage increase in irrigated yield (0.079 tons per year). It was assumedthat figures measuring the effect of additional irrigated area also measuredthe impact of fertilizers or high yielding varieties. Using the above figures,and on the basis of past input-output relationships, it was estimated that theeffect on foodgrain production of the addition of one hectare of irrigated landwould be a net increase of 1.4 tons, taking into account the proportion ofirrigated land likely to be used for crops other than foodgrains. Next,the various elements of the Draft Fifth Plan irrigation target were examinedand led to the conclusion that the most likely increase in the total irrigatedcrop area during the plan period (1973/74 to 1978/79) would be between 9.5 and10.0 million ha, against the plan target of 11.2 million ha. At the rate of1.4 tons/ha, this would represent a production increase of between 13.3 and14.0 million tons due to irrigation over the five year period.
8. For projecting production increase due to fertilizer, an estimate bythe Fertilizer Association of India of 1.4 million tons increase in nutrient
consumption over the Five Year Plan period was used, and assuming that theproportion of fertilizer applied to foodgrain crops would be about 66Z (basedon NCAER estimate for 1971/72), an additional application of 0.92 million tonsof nutrients on foodgrains was projected. In the calculation of the impact ofadditional irrigation, account was already taken of the additional fertilizerlikely to be used on newly irrigated land; this totalled 0.275 million tons,leaving 0.645 million tons of nutrients for use on existing irrigated orrainfed foodgrains or new rainfed foodgrains. Estimates of the increased
1/ Economic Situation and Prospects in India, The World Bank, Report No.1073-IN, March 29, 1976, pp. 26-42.
ANNEX 2Page 4
foodgrain output that can be obtained from one kg of nutrient range from 6.5kg to 13.0 kg depending on crop, variety and growing conditions. GOI used aratio of 7.33 kg foodgrain per kg of nutrient. At this rate, 0.645 milliontons of added nutrients would result in an additional production of 4.73 mil-lion tons of foodgrains from 1973/74 to 1978/79. Finally, a further 1.8million tons were assumed to come from the additional area put under rainfedcultivation and 0.8 million tons from soil conservation. Altogether then,the projected foodgrain production increase was 21 million tons, from 104million tons in 1973/74 to 125 million tons in 1978/79 (3.75% per annum),assuming a major effort to expand irrigated area and to increase the com-plementary inputs.
9. To make the ASCI and the World Bank projections comparable, twoadjustments were made. First, because the ASCI projection is for cerealsrather than foodgrains, it was assumed that the underlying annual growthrate projections of 2.8% for cereal production from 1973/74 to 1980/81 and2.9% from 1980/81 to 1985/86 holds t*ue for foodgrain production as well.Second, the World Bank's projected growth rate for foodgrain, wheat and riceproduction of 3.75%, 4.8% and 3% per annum respectively from 1973/74 to 1978/79 is assumed to continue up to 1985/86. Table 8 shows the result. The ASCIprojection yields slightly higher wheat production but considerably lowerrice production estimates than the World Bank projections. The ASCI projec-tions are more conservative for 1980/81 and 1985/86 and will be used inthis report. Thus, the estimated foodgrain production to be used is about127 million tons in 1980/81 and about 146 million tons in 1985/86.
C. Foodgrain Consumption
10. Net availability of foodgrains equals total production minus 12.5%for feed, seed and waste plus net imports plus net stock depletion or minusnet stock addition and this amount is presumed to be available for consump-tion during the year. On this basis, Table 9 shows the net production, imports,net stock changes and net consumption of wheat, rice, other foodgrains andtotal foodgrains from 1953/54 to 1975/76. Net production is simply calculatedfrom gross production figures (see Table 1), deducting for feed, seed require-ments and wastage (see footnote of Table 9). Net imports are the differencebetween imports and exports. There--oes not appear to be any pattern of totalfoodgrain imports over the years, judging from total foodgrain imports as apercentage of total foodgrain consumption. However, imports have been highestduring and after years of severe drought and have been less than 10% of con-sumption. With regard to various foodgrain imports, wheat by far has been themost important since the mid-1950s while the rice import volume has decreasedconsiderably since the early 1970s. Net stock changes reflect the combinedeffects of fluctuations in net production, imports and consumption. Again,there does not appear to be any disceruable pattern of net stock changes offoodgrains, apart from such changes-tending to be of greater magnitude in the1970s.
ANNEX 2Page 5
11. Foodgrain consumption grew at 2.1% from 1953/54 to 1975/76. - Con-sumption growth in the recent sub-period, 1964/65 to 1975/76, has been sig-nificantly lower, at 1.6%, compared to 2.6% for the earlier sub-period,1953/54 to 1964/65. This is caused by the reduced consumption growth of bothwheat and rice; the consumption growth of other foodgrains has remained moreor less constant. Throughout, wheat consumption has grown at a much higherrate than rice. The result is that wheat consumption as a share of foodgrainconsumption has increased from 15% in the 19509 to 20% in the 1960s, and toabout 25Z in the 1970s, while the share of rice has remained around 40% overthe period.
D. Prolection of Foodgrain Consumption
12. ASCI, in its projections of cereal (rice, wheat and other cereals)consumption in each State as well as All-India for the next decade, firstestimated the per capita availability in 1973/74 (taken as the base year);again, this was taken to represent per capita consumption, and the results ofthe first and final approximations are shown in Table 2 for each State andAll-India. It then calculated or assumed values for factors it consideredcritical in forecasting consumption demand 1/. These factors were nationaland State income growth, national and State population growth (from whichnational and State per capita income and their percentage increases can becomputed), and income elasticity of consumption demand for cereals, all pro-jected up to 1985/86. For each State and for All-India, the percentageincrease in per capita income, multiplied by the income elasticity of con-sumption demand for cereals determine the coefficient or rate at which baseyear per capita consumption of cereals will increase annually. The productof this coefficient and the base year consumption, on further multiplicationwith the estimated population for the coming years, projects consumptiondemand for those years.
13. For national income growth, ASCI used two alternative rates of3.6% and 3.8%, partly because these were closer to past rates but mainly
because its supply. forecasts also were based on past trend. For individualStates, the past growth rates ranged between 9.5% for Haryana to about 2% forBihar, and it was assumed that the same trend would continue, subject to theconstraint of the All-India growth rate being 3.6% and 3.8%. On nationalpopulation growth, ASCI assumed a rate of 1.95% for the period 1975/76 to1980/81 and a lower rate of 1.85% for the period 1980/81 to 1985/86. Theserates lie between the higher actual rates of the past and the lower ratesestlmated by the Planning Commission and the Registrar General. Similarassumptions were made about State population growth rates, subject to thesame constraint that the weighted averages conform to the assumed rates forthe country.
1/ See All-India Grain Storage and Distribution, Main Report, Administra-tive Staff College of India, October 1976, Chapter 4 and SupportingStudy 2.

ANNEX 2Page 6
14. Using consumption data gathered during the 25th round of NationalSample Surveys (1970-71), ASCI calculated the income elasticities of consump-tion demand for wheat, rice and other cereals, both for All-India and theindividual States. The All-India estimates of rural income elasticities are0.53, 0.91, and -0.05 for rice, wheat and other cereals respectively; thecorresponding figures for urban income elasticities are 0.13, 0.39 and -0.81.
15. Finally, ASCI calculated ratios of urban population to total popu-lation for each State during the census years from 1931 to 1961 and used theleast squares method to project urbanization rates. This enabled the ruraland urban population for each State to be estimated during the forecast period.Since income elasticities of rice, wheat and other cereals for both rural andurban sectors were available, the consumption demand for each of them could becomputed for each sector using the estimated population. Consumption demandfor cereals for each State, and hence for All-India, could therefore be obtainedaccordingly.
16. Projections of consumption demand for cereals up to 1985/86 are shownin Tables 11 and 12, for alternative annual national income growth of 3.6% and3.8% respectively. Again, in order to obtain the consumption projections forfoodgrain, it is assumed that year-to-year growth rates for projected cerealconsumption holds true for foodgrain consumption as well. Foodgrain consump-tion figures thus derived are shown in the last row of Tables 3 and 4.
17. Table 13 compares the derived consumption figures from ASCI projec-tions with those calculated by India's National Council of Agriculture (NCA)for 1985/86. The derived total foodgrain consumption from the ASCI projectionis very close to the corresponding lower estimate of the NCA projection. Inall cases, ASCI projections fall between the lower and upper estimates of NCAprojections.
Food Balance
18. The projected net food balance - the difference between projectednet production and projected net consumption - of wheat, rice and all food-grains from 1976/77 to 1985/86 is shown in Table 14. Wheat is projected tohave an increasing positive net balance and rice to have an increasing nega-tive net balance. Total foodgrains are projected to have a negative netbalance throughout but decreasingly so over time. Assuming that the negativebalance would be met by imports, foodgrain imports are then projected toaverage about 2.6 million tous annually from 1976/77 to 1980/81 and about 1.2million tons annually from 1981/82 to 1985/86. Moreover, on projected trends,it would appear that self-sufficiency in foodgrains would be reached some timeat the end of the 1980s. Obviously, the result is dependent on assumptionsregarding production growth, national income growth, income demand elasticityand population growth. The result does not seem particularly sensitive toassumptions within the feasible range regarding income growth or income elasti-city. The crucial assumptions are production and population growth rates. TheASCI projection of foodgrain production is quite conservative, when comparedwith the World Bank's, while the projected population growth rates are lower

ANNEX 2Page 7
than those projected by the Planning Commission or the Registrar-General.Thus, self-sufficiency would appear attainable, provided the Indian Govern-ment continues to attach high priority to foodgrain production (this assump-tion was also made by the World Bank projections) and to reducing populationgrowth from rates attained in the past.
June 3, 1977

INDIA
SECOND FOODIRAIN STORAGE PROJECT-
.-.. Jndlq Foodgrale Actual Production and Tre!&d
J26 ~ ~ .
Pi F' 7AK'41 4 R 5if ( VALE 7E
so~ ~ ~ ~~ ~~~~~~~~~~~~~~~~~~~~~~o
40
20
49 5i 59 64 ~~~~~~~~~~~69 74sl~~~ 5 ') #0 ~~~ (Year) 15!7) 75

AM= 2
MIA Table 1
SECOND FOODGRAIN STORAGE PROJECT
Gross Production of Foodgrains
(million tons)
Z ChangeOther Total from previoua
Rice Wheat Foodgrains Foodgrains Year _
1953/54 29.78 8.11 34.30 72.18
1954/55 26.56 9.15 34.90 70.61 -2.2
1955/56 28.67 8.87 31.67 69.21 -2.0
1956/57 30.23 9.50 32.60 72.33 4.3
1957/58 26.54 8.01 31.96 66.51 -8.1
1958/59 32.04 9.96 36.69 78.69 18.3
1959/60 31.69 10.32 34.69 76.70 -2.5
1960/61 34.57 11.00 36.45 82.02 6.9
i961/62 35.66 12.07 34.97 82.70 0.8
1962/63 33.22 10.78 36.16 80.16 -3.1
1963/64 37.00 9.85 33.79 80.64 0.6
1964/65 39.03 12.30 37.67 89.00L .10.4 _
1965/66 30.66 10.42 - 30.95 --- 72.03 -19.-I -
1966/67 30.44 11.39 32.40 74.23 3.1
1967/68 37.61 16.54 40.90 95.05 28.1
1968/69 39.76 18.65 35.60 94.01 -1.1
1969/70 40.43 20.09 38.98 99.50 5.8
1970/71 42.23 23.83 42.36 108.42 9.0
1971/72 43.07 26.41 35.69 105.17 -3.0
1972/73 39.25 24.73 33.05 97.03 -7.7
1973/74 44.05 21.78 38.80 104.63 7.8
1974/75 40.25 24.24 36.57 - - -101.06 -3.-5
1975/76 49.46 28.34 43.04 120.83 21.OAverage Annual Growth Rate
1953/54 to1975/76 2.3 5.6 1.0 2.3
1953/54 to1964/65 2.5 3.9 0.9 1.9
1964/65 to1975/76 2.2 7.9 1.2 2.8
Source: Ministry of Agriculture, Directorate of Economics and Statistics,and various issues of Estimates of Area and Production ofPrincipal Crops in India, and Economic Survey.

ATNEX 2
INDILA Table 2
SECOND FOODGRAIN STORAGE PROJECT
Cultivated Area and Yield for Rice, Wheat and Total Foodgrains
INDIA, 1953/54 to 1975/76
--- Rice-- -Wheat--- -Total FoodgrainsGross Area Yield/Hectare Gross Area Yield/hectare Gross Area Yield/hectare(thousand (in Kgs) (thousand (in Kgs) (thousand (in Kgs)
Year hectares) hectares) hectares)
1953/54 31,289 902 10,681 750 109,065 6401954/55 30,764 820 11,259 803 107,858 6311955/56 31,521 874 12,367 708 110,560 6051956/57 32,277 800 13,524 695 111,136 6291957/58 32,298 790 11,730 682 109,480 5871958/59 33,172 930 12,617 789 114,764 67219591/60 33,820 937 13,380 772 115,823 6621960/61 34,128 1,013 12,927 851 115,581 7101961/62 34,694 1,028 13,570 890 117,232 7051962/63 35,695 931 13,590 793 117,844 6801963/64 35,809 1,033 13,499 730 117,421 6871964/65 36,462 1,078 13,422 913 118,112 7571965/66 35,470 862 12,572 827 115,103 6291966/67 35,251 863 12,838 887 115,302 6441967/68 36,437 1,032 14,998 1,103 121,421 7831968/69 36,967 1,076 15,958 1,169 120,430 7811969/70 37,680 1,073 16,626 1,209 123,570 8051970/71 37,592 1,123 18,241 1,307 124,316 8721971/72 37,758 1,141 19,139 1,380 122,623 8581972/73 36,688 1,070 19,464 1,271 119,277 8131973/74 38,286 1,151 18,583 1,172 126,538 8271974/75 37,922 1,061 18,108 1,338 121,616 8311975/76 39,688 1,246 20,112 1,409 128,187 943
Average Annual Growth Rate (%)
1953/54 to1975/76 1.1 1.5 2.9 2.9 0.7 1.8
1953/54 to1964/65 1.4 1.6 2.1 ' 1.8 0.7 1.5
1964/65 to1975/76 0.8 1.3 3.7 4.0 0.7 2.0
Source: i) Estimates of Area and Production of Principal Crops in India, 1974-75, Directorateof Economics and Statistics, blinistry of Agriculture and Irrigation, Government ofIndia, 1976 for 1953/54 to 1974/75.
ii) QuarterlY Grain and Feed Report, February 7, 1977, IN-7009, U.S.Dept. of Agriculture, Foreign Agriculture Service for 1975/76(based on official estimates from the Government of India).
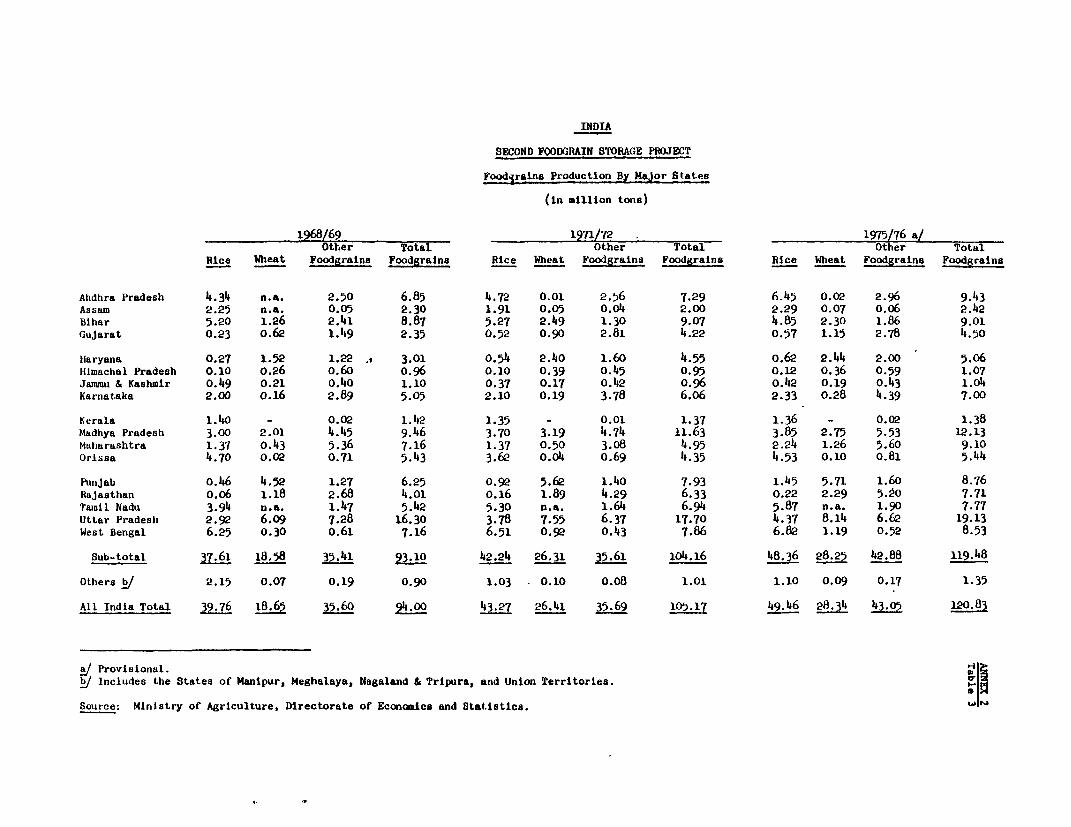
INDIA
SECOND FOODGRAIN STORAaE PROJECT
Foodjrsins Production By Major States
(in million tons)
1968/69 1971/72 1975/76 a/Other Total Other Total Other Total
RIce Wheat Foodgrains Foodgrains Rice Wheat Foodgrains Foodgraina Rice Wheat Foodgrains Foodgrains
Ahdhra Pradesh 4.34 n.a. 2.50 6.85 4.72 0.01 2.56 7.29 6.45 0.02 2.96 9.43Assam 2.25 n.a. 0.05 2.30 1.91 0.05 0.04 2.00 2.29 0.07 0.06 2.42Bihar 5.20 1.26 2.41 8.87 5.27 2.49 1.30 9.07 4.85 2.30 1.86 9.01Gujarat 0.23 0.62 1.149 2.35 0.52 0.90 2.81 4.22 0.57 1.15 2.78 4.50
liaryana 0.27 1.52 1.22 , 3.01 0.54 2.40 1.60 4.55 o.62 2.44 2.00 5.o6illmachal Pradesh 0.10 0.26 o.60 o.96 0.10 0.39 0.45 0.95 0.12 0.36 0.59 1.07Jswmu & Kashmir o.49 0.21 0.40 1.10 0.37 0.17 0.142 0.96 0.42 0.19 0.43 1.04Karnataka 2.00 o.i6 2.89 5.05 2.10 0.19 3.78 6.06 2.33 0.28 4.39 7.00
Kerala 1.40 - 0.02 1. 42 1.35 - 0.01 1.37 1.36 - 0.02 1.38Madhya Pradesh 3.00 2.01 4.45 9.46 3.70 3.19 4.74 11.63 3.85 2.75 5.53 12.13Maharashtra 1.37 o.43 5.36 7.16 1.37 0.50 3.08 4.95 2.24 1.26 5.60 9.10Orissa 4.70 0.02 0.71 5.43 3.62 0.04 0.69 4.35 4.53 0.10 0.81 5.44
Punjab o.46 4.52 1.27 6.25 0.92 5.62 1.40 7.93 i.45 5.71 1.60 8.76Rajasthan o.o6 1.18 2.68 4.01 0.16 1.89 4.29 6.33 0.22 2.29 5.20 7.71Tamil Nadu 3.94 n.a. 1.147 5.42 5.30 n.a. 1.64 6.94 5.87 n.a. 1.90 7.77Uttar Pradesh 2.92 6.09 7.28 16.30 3.78 7.55 6.37 17.70 4.37 8.14 6.62 19.13West Bengal 6.25 0.30 o.61 7.16 6.51 0.92 0.43 7.86 6.82 1.19 0.52 8.53
Sub-total 37.61 18.58 35.41 93.10 42.24 26.31 35.61 104.16 48.36 R8-M 42.88 119.48
Others / 2.15 0.07 0.19 0.90 1.03 0.10 0.08 1.01 1.10 0.09 0.17 1.35
All India Total 39.76 it.65 35.60 14.0 43.27 26.41 35.69 105117 49.46 28.34 435 120.83
al Provisionial.
/ Includes the States of Manipur, Meghalaya, Nagaland & Tripura, and Union Territories. a,
Source: Ministry of Agriculture, Directorate of Economics and Statistics. w t
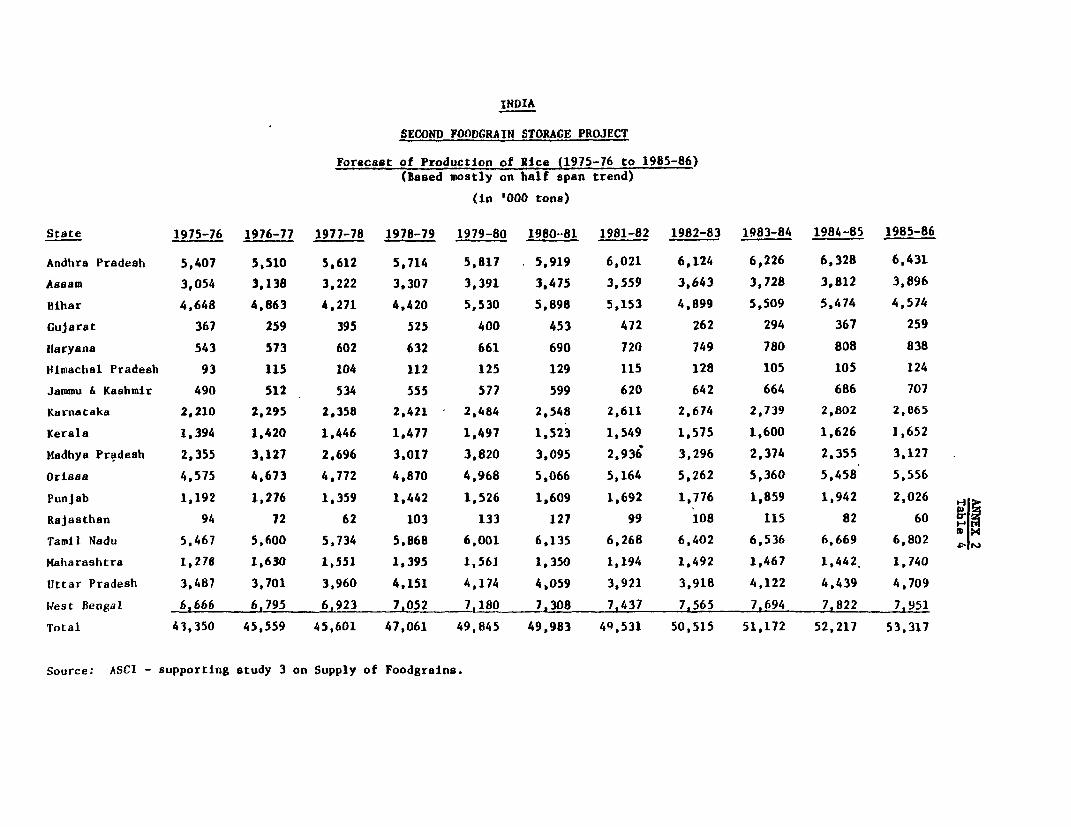
INDIA
SECOND FOODGRAIN STORAGE PROJECT
Forecast of Production of Rlice (1975-76 to 1985-86)(Based mostly on half span trend)
(in '000 tons)
State 1975-76 1976-77 1977-78 1978-79 1979-80 1980--81 1981-82 1982-83 1983-84 1984-85 1985-86
Andhra Pradesh 5,407 5,510 5,612 5,714 5,817 . 5,919 6,021 6,124 6,226 6,328 6,431
Assam 3,054 3,138 3,222 3,307 3,391 3,475 3,559 3,643 3,728 3,812 3,896Blhar 4,648 4,863 4,271 4,420 5,530 5,898 5,153 4,899 5,509 5,474 4,574
Cujarat 367 259 395 525 400 453 472 262 294 367 259
llaryana 543 573 602 632 661 690 720 749 780 808 838limachal Pradesh 93 115 104 112 125 129 115 128 105 105 124
Jammu & Kashmir 490 512 534 555 577 599 620 642 664 686 707
Karnataka 2,210 2,295 2,358 2,421 - 2,484 2,548 2,611 2,674 2,739 2,802 2,865
Kerala 1,394 1,420 1,446 1,477 1,497 1,523 1,549 1,575 1,600 1,626 1,652
Madhya Pradesh 2,355 3,127 2,696 3,017 3,820 3,095 2,936 3,296 2,374 2,355 3,127
Orissa 4,575 4,673 4,772 4,870 4,968 5,066 5,164 5,262 5,360 5,458 5,556
Punjab 1,192 1,276 1,359 1,442 1,526 1,609 1,692 1,776 1,859 1,942 2,026
Rajasthan 94 72 62 103 133 127 99 108 115 82 60
Tamil Nadu 5,467 5,600 5,734 5,868 6,001 6,135 6,268 6,402 6,536 6,669 6,802 > ,
Kaharashtra 1,278 1,630 1,551 1,395 1,561 1,350 1,194 1,492 1,467 1,442. 1,740
Uttar Pradesh 3,487 3,701 3,960 4,151 4,174 4,059 3,921 3,918 4,122 4,439 4,709
West 8engal 6,666 6,795 6,923 7,052 7,180 7,308 7,437 7,565 7,694 7,822 7,951
Total 43,350 45,559 45,601 47,061 49,845 49,983 49,531 50,515 51,172 52,217 53,317
Source: ASCI - supporting study 3 on Supply of Foodgrains.

INDIA
SECOND FOODGRAIN STORAGE PROJECT
Forecast of Production - Wheat (1975-76 - 1985-86)
(Based mostly on half span trend)
(In '000 tons)
States 1975-76 1976-77 1977-78 1978-79 1979-80 1980-81 1981-82 1982-83 1983-84 1984-85 1985-86
Bihar 2,534 2,721 2,908 3,095 3,283 3,480 3,657 3,844 4,031 4,218 4,405
Cujarat 929 972 1,014 1,057 1,099 1,142 1,183 1,226 1,268 1,311 1,353
Haryana 2,638 2,787 2,936 3,085 3,234 3,383 3,532 3,681 3,830 3,979 4,128
Hlimachal Pradesh 363 377 390 404 417 431 444 458 471 485 498
Jammu & Kashmir 195 201 207 213 219 225 231 237 243 249 256
Karnataka 215 227 239 251 263 276 288 300 312 324 336
Madhya Pradesh 1,238 1,803 2,606 2,541 3,364 2,889 2,053 1,296 1,044 1,461 2,358
Orissa 73 79 86 92 98 104 111 117 123 129 136
Punjab 6,180 6,856 7,232 7,608 7,984 8,360 8,736 9,111 9,487 9,863 10,239
Rajasthan 2,015 2,108 2,202 2,295 2,389 2,482 2,576 2,669 2,763 2,856 2,949
Haharashtra 544 476 479 534 497 490 586 633 588 505 540 ^ I
Uttar Pradesh 9,666 10,201 10,734 11,268 11,802 12,333 12,869 13,403 13,937 14,470 15,005 I s
West Bengal 956 1.039 1,122 1,205 1,288 1.371 1,454 1,537 1,620 1,703 1,786
Total 27,846 29,847 32,173 32,648 35,937 36,956 37,720 38,512 39,717 41,553 43,989
Source: ASCI - supporting study 3 on Supply of Foodgrains.

INDIA
SECOND FOODGRAIN STORAGE PROJECT
Forecast of Production of Cereals (1975-76 - 1985-86)
(Based on mostly half span trend)
(In '000 tons)
State 1975-76 1976-77 1977-78 1978-79 1979-80 1980-81 1981-82 1982-83 1983-84 1984-85 1985-86
Andhra Pradesh 7,865 7,967 8,069 8,171 8,273 8,375 8,477 8,579 8,681 8,783 8,886
Assam 3,243 3,349 3,456 3,582 3,669 3,775 3,882 3,899 4,095 4,201 4,308
Bihar 8,227 8,421 8,615 8,809 9,003 9,197 9,391 9,585 9,779 9,973 10,167
Gujarat 3,820 4,145 4,165 4,435 4,699 4,550 4,645 4,828 4,742 5,005 5,364
Haryana 4,055 4,258 4,460 4,663 4,866 5,068 5,271 5,473 5,676 5,879 6,081
Himachal Pradesh 1,067 1,102 1,137 1,172 1,207 1,241 1,276 1,311 1,346 1,381 1,416
Jammu & Kashmir 1,110 1,154 1,198 1,243 1,288 1,332 1,376 1,420 1,465 1,509 1,553
Karnataka 5,919 6,102 6,286 6,469 6,652 6,835 7,018 7,201 7,384 7,567 7,750
Yerala 1,430 1,457 1,487 1,516 1,545 1,573 1,602 1,630 1,659 1,688 1,716
Madhya Pradesh 9,565 9,420 7,450 8,917 8,899 8,022 9,491 8,451 10,103 11,006 10,086
Orissa 4,983 5,101 5,219 5,337 5,456 5,574 5,692 5,810 5,928 6,047 6,165
Punjab 8,982 9,492 10,003 10,514 11,024 11.535 12,046 12,556 13,067 13,577 14,088
Rajasthan 4,018 5,249 4,456 4,628 6,091 5,298 5,238 6,325 5,158 4,865 5,952 ,
Tamil Nadu 6,604 6,695 6,786 6,877 6,968 7,059 7,150 7,241 7,332 7,423 7,514 X
1aharashtra 6,164 6,253 5,891 5,291 4,803 4,713 5,075 5,676 6,164 6,253 5,891 N
tUttar Pradesh 18,198 18,883 19,567 20,250 20,934 21.618 22,302 22,986 23,670 24,355 25,037
West Bengal 7,708 7,925 8,142 8.360 8,577 8,794 9.011 9,228 9,446 9,663 9.888
Total 102,958 106,972 106,387 110,234 113,954 114,559 118,943 122,288 125,695 129,175 131,854
Source: ASCI - supporting study 3 on Supply of Foodgrains.
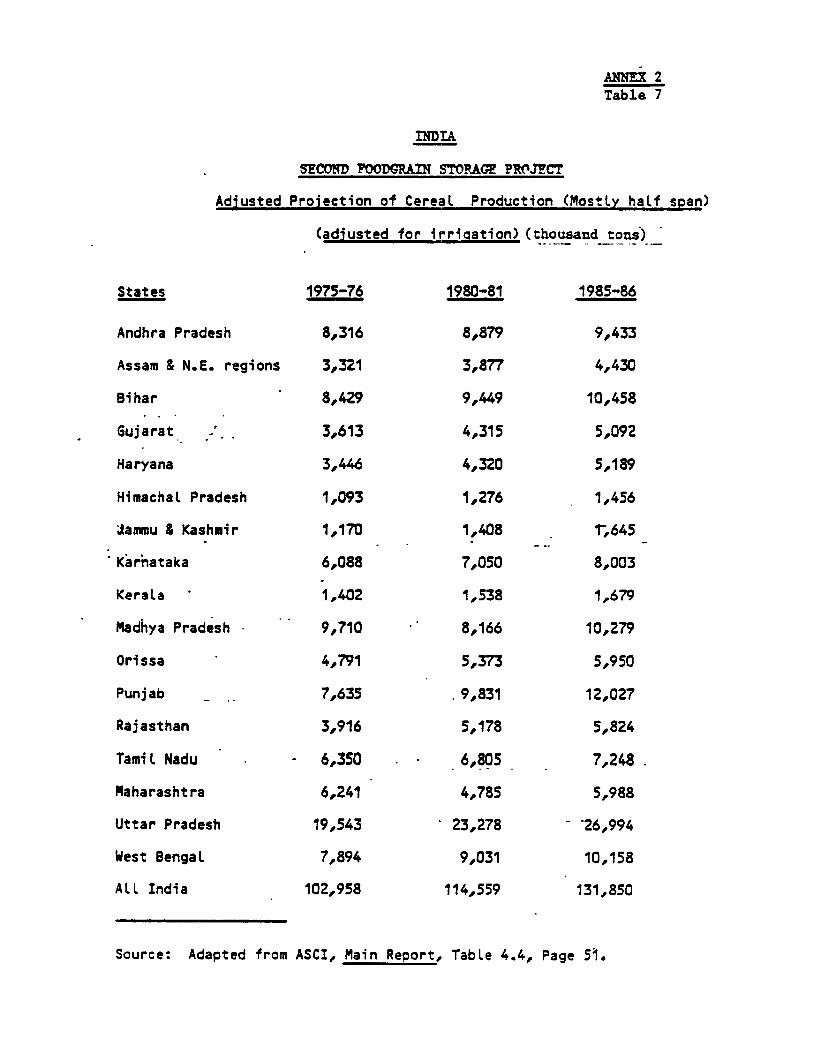
ANNEX 2Table 7
IN~DIA
S!COMD POODTJAIN STOPAGE PROJECT
Adiusted Proiection of Cereal Production (MostLy half sDan)
(adiusted for irrigation) (thousand tons)-
States 1975-76 1980-81 1985-86
Andhra Pradesh 8,316 8,879 9,433
Assam & N.E. regions 3,321 3,877 4,430
Bihar 8,429 9,449 10,458
Gujarat 3,613 4,315 5,092
Haryana 3,446 4,320 5,189
Himachal Pradesh 1,093 1,276 1,456
Jammu & Kashmir 1,170 1,408 T,645
Karnataka 6,088 7,050 8,003
Kerala 1,402 1,538 1,679
Madhya Pradesh 9,710 8,166 10,279
Orissa 4,791 5,373 5,950
Punjab 7,635 9,831 12,027
Rajasthan 3,916 5,178 5,824
Tamil Nadu - 6,350 . 6,805 7,248
Maharashtra 6,241 4,785 5,988
Uttar Pradesh 19,543 23,278 - 26,994
West BengaL 7,894 9,031 10,158
ALL India 102,958 114,559 131,850
Source: Adapted from ASCI, Main Report, TabLe 4.4, Page 51.
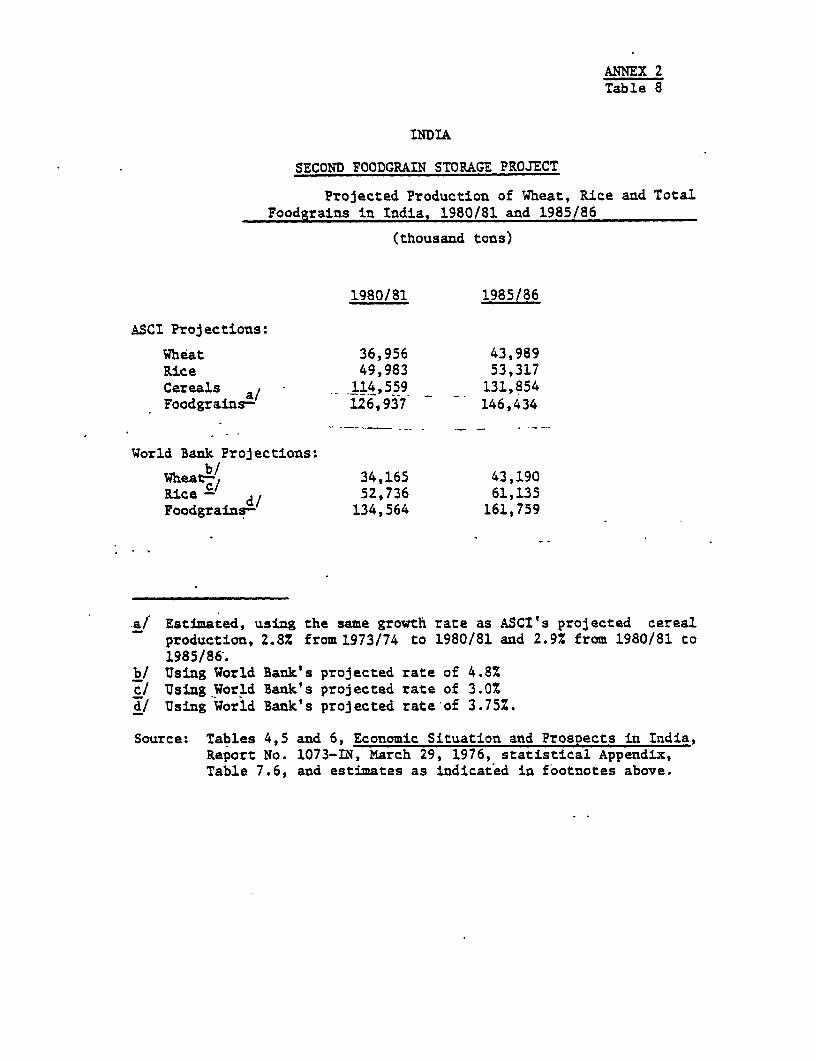
ANNEX 2Table 8
INDIA
SECOND FOODGRAIN STORAGE PROJECT
Projected Production of Wheat, Rice and TotalFoodgrains in India, 1980/81 and 1985/86
(thousand tons)
1980/81 1985/86
ASCI Projections:
Wheat 36,956 43,989Rice 49,983 53,317Cereals a/ _114,559 131,854Foodgrains- 126,937 146,434
World Bank Projections:
hea b/ 34,165 43,190
lice c d/ 52,736 61,135doodgrains- 134,564 161,759
-a/ Estimated, using the same growth rate as ASCI's projected cerealproduction, 2.8% from 1973/74 to 1980/81 and 2.9% from 1980/81 to1985/86.
b/ Using World Bank's projected rate of 4.8%c/ Using World Bank's projected rate of 3.0%d/ Using World Bank's projected rate of 3.75%.
Source: Tables 4,5 and 6, Economic Situation and Prospects in India,Report No. 1073-IN, March 29, 1976, statistical Appendix,Table 7.6, and estimates as indicated in footnotes above.
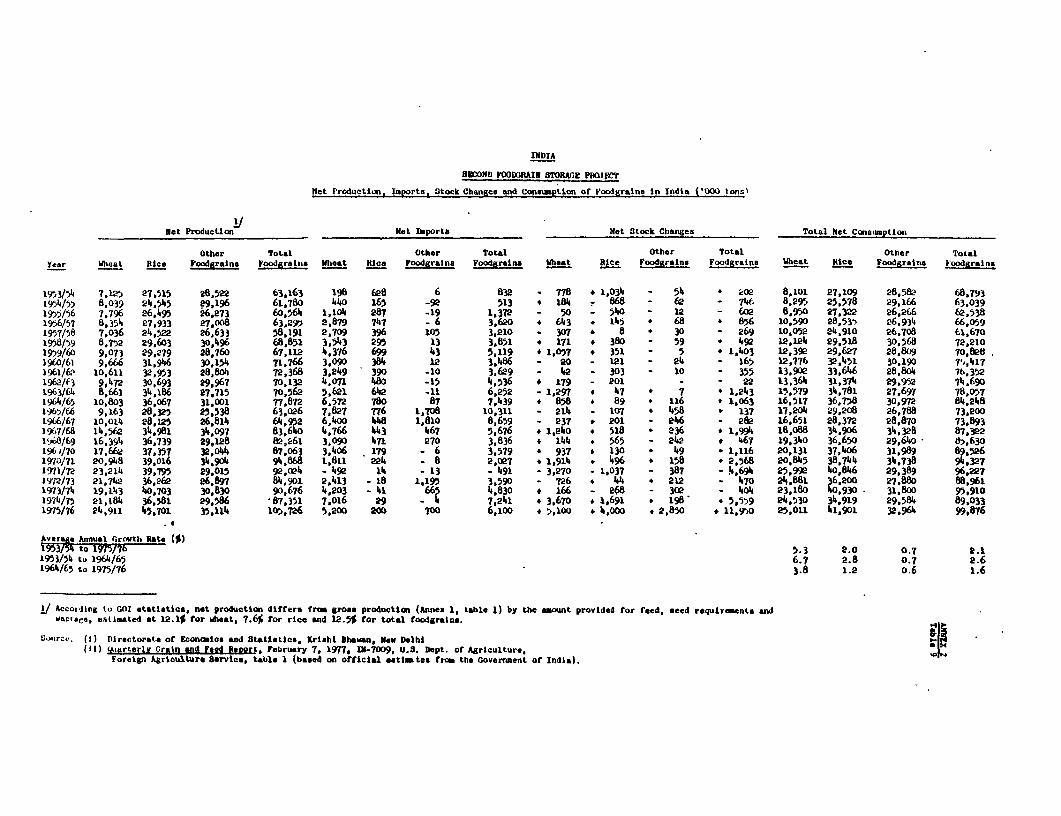
INDIA
SECOND FOODGRAIN STORAOE PROJVCT
Net Production, Imports, Stock Changes end Consumpt1on of Faacgraina in India ('OOO tons'
net Production Net Imports Net Stock Changes Total Met Consumption
Other Total Other total Other Total Other TotalYear Wheat Rice Foodgraine ?oodgraeits Wheat Nlce ?oodgraina Foodgraine Wheat Rice Foodgrains Foodgrains Wheat Rice Foodgrains loodgralns
1953/54 7,125 27,515 28,522 63,163 198 628 6 832 * 778 * 1,034 - 54 * 200 8,101 27,109 28,582 68,7931954/ 5 a 039 24,545 29,196 61,780 14140 165 -92 513 * 1a4 - 868 - 62 - 714. 8,295 25,578 29,166 63,0391955/56 7.796 26.495 26,273 60,564 1,1o4 287 19 1,372 - 50 540 - 12 602 8,950 27,322 26,266 62,5381956/57 8,354 27,933 27,008 63,295 2,879 747 6 3,620 * 643 . 145 * 68 * 856 10,590 28,535 26,934 66,0591957/58 7,036 24,522 26,633 58,191 2,709 396 105 3,210 - 307 * 8 * 30 - 269 10 052 24,910 26,708 61,6701958/159 8,752 29,603 30,496 68,851 3,543 295 13 3,851 * 171 . 380 - 59 . 492 12,124 29 518 30,568 72,2101959/60 9,073 29,279 28,760 67,112 4,376 699 43 5 ,19 * 1,057 . 351 - 5 * 1,403 12,392 29,627 28,809 70,828196o/61 9,666 31,946 30 154 71,766 3 090 384 12 3,486 - 2o - 121 - 24 - 165 12,776 32,451 30,190 79,,4171961/&- 10,611 32,953 28s804 72,368 3,249 390 -10 3.629 - 2 - 303 - 10 - 355 13,902 33,646 28,804 76,3521962/#3 9 472 30,693 29,967 70,132 4,071 480 -15 4,536 * 179 - 201 - - 22 13,364 31,374 29,952 714,690t963/64 8,661 34,186 27,715 70,562 5,621 642 -11 6,252 -1,297 * 47 * 7 1,243 15,579 34,781 27,697 78,0571964/65 10,803 36,067 31,001 77,872 6,572 780 87 7,439 * 858 * 89 * 116 * 1,063 16,517 36,758 30,972 84,2481965/66 9,163 28,325 25,538 63,026 7,827 776 1,708 10 311 - 214 - 107 * 458 * 137 17,204 29,208 26,788 73,2001966/67 10,014 28, 25 26,814 64,952 6,400 w48 1,810 8,659 - 237 . 201 - 246 - 282 16,651 28,372 28,870 73,8931967/68 14,562 34,981 34,097 83,640 4,766 1143 467 5 676 * 1,240 * 518 * 236 * 1,994 18,o88 34,906 314,32B 87,322196i/69 16,394 36,739 29,128 82,261 3,090 471 270 3,836 i 144 . 565 - 242 . 467 19,340 36,650 29,640 * t,63o1960/70 17,662 37,357 32,044 87,063 3,406 179 - 6 3,579 * 937 . 130 * 49 * 1,116 20,131 37,406 31,989 89,5261970/71 20,948 39,016 34,90A 94 868 1,811 224 - 8 2,007 .1,9114 . 496 * 158 * 2,568 20,845 38,744 34,738 94,3271971/72 23,214 39,795 29,015 92,024 - 492 14 - 13 - 491 - 3,270 1,037 - 387 - .4,694 25,992 40,846 29,389 96.2271972/73 21,742 36,262 26,897 84,901 2,413 - 18 1,195 3 590 - 726 a 44 * 212 - 470 241,881 36,200 27,880 88,9611973/74 19,143 40,703 30,830 90,676 4,203 41 665 4,830 . 166 268 - 302 - 404 23,180 40,930 31,800 95,9101974/75 2,1814 36,581 29,s56 -87,351 7,016 29 - 4 7,241 a 3,670 a 1,691 198 * .,559 24 530 34,919 29,5814 89,0331975/76 24,911 45,701 35,114 105,726 5,200 200 700 6,100 . 5,100 a 4,000 . 2,850 * 11,950 25,011 41,901 32,961 99,876
Average Annual Growth Rate (M,953ver to 1975/7r 5.3 2.0 0.7 2.11953/54 to 1964/65 6.7 2.8 0.7 2.61964/65 to 1975/76 3.8 1.2 o.6 1.6
l Accoiling to CO0 statistics, not production differa trco groen production (Annex 1, table 1) by the amount provided tor feed, aeed requirament andwactaLe, estimated at 12.1% for Aheat, 7.6% for rice and 12.5% for total foodgralns.
SoUrCe. (1) Directorate of Econcaice and Statistics, KIrihl Dhahan, Now Delhi(il) (iAarterly Crain ann Feed Renort, February 7, 1977, IN-7009, U.S. Dept. or Agriculture.
Foreign kariculture Service, table 1 (based on officlal eatii tee from the Government of India).

ANNEX 2Table 10
INDIA
SECOND FOODGRAIN STORAGE PROJECT
State-wise Per Capital Net Availability of Cerealsand Base Year Per Capita Consumption
(Base Year 1973-74)
(In Kgs)All Cereals All Cereals
States (first approx.) (final approx.)
Andhra Pradesh 140.5 140.20
Assar 158.3 153.81
Bihar 133.1 153.56
Gujarat 132.9 129.88
Hiaryana 228.1 202.88
Himachal Pradesh 241.2 203.23
Jammu & Kashmir 193.7 192.90
Karnataka 160.9 146.30
Kerala 91.5 85.83
Madhya Pradesh 175.0 176.43
Orissa 182.1 165.30
Punjab 227.5 195.01
Rajasthan 168.0 170.72
Tamil Nadu 137.7 128.78
Maharashtra 116.1 116.86
Uttar Pradesh 139.3 158.39
West Bengal 170.2 146.50
All India 147.9 147.90
Source: ASCI, Main Report, Table 4.7, page 58.
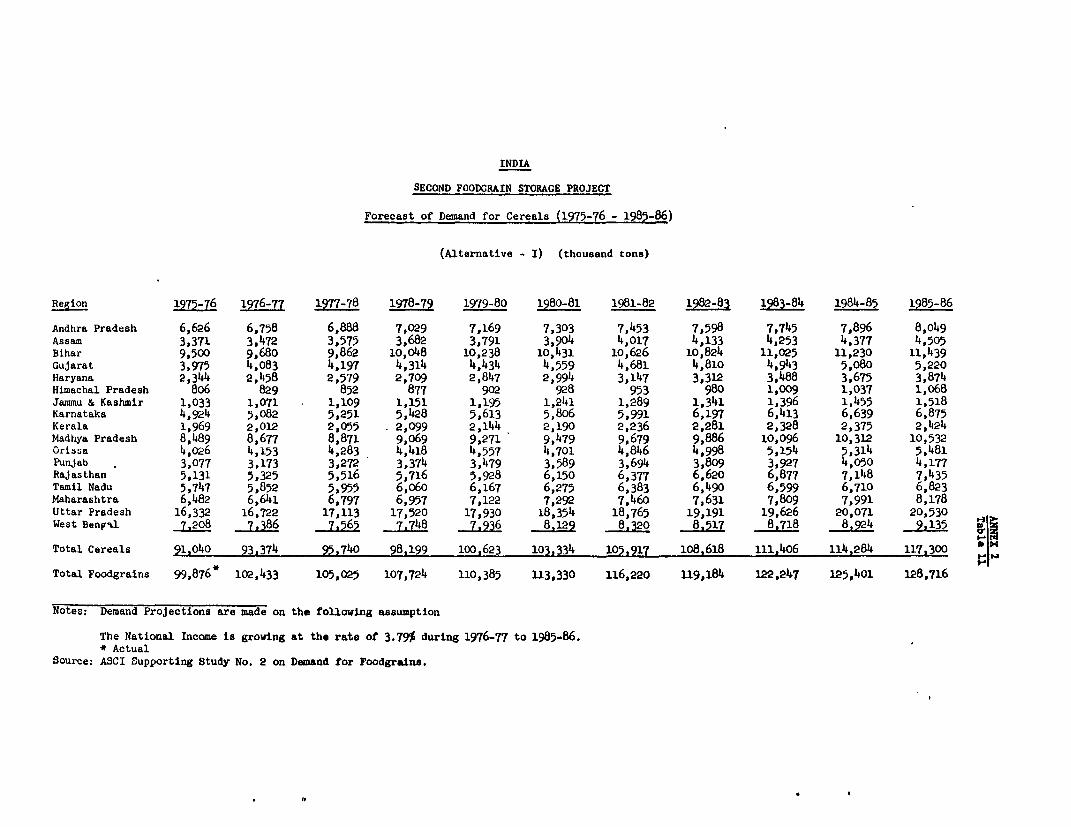
INDIA
SECOND FOODCRAIN STORAGE PROJECT
Forecast of Demand for Cereals (1975-76 - 1985-86)
(Alternative - I) (thousand tons)
Region 1975-76 1976-77 1977-78 1978-79 1979-80 1980-81 1981-82 1982-83 1983-84 1984-85 1985-86
Andhra Pradesh 6,626 6,758 6,888 7,029 7,169 7,303 7,453 7,598 7,745 7,896 8,0149Assam 3,371 3,472 3,575 3,682 3,791 3,904 4,017 4,133 4,253 4,377 4,505Bihar 9,500 9,680 9,862 10,048 10,238 10o431 10,626 10,824 11,025 11,230 11,439Gujarat 3,975 4,083 4,197 4,314 4,434 4,559 4,681 4,810 4,943 5,080 5,220Haryana 2,344 2,458 2,579 2,709 2,847 2,994 3,147 3,312 3,488 3,675 3,874Himachal Pradesh 806 829 852 877 902 928 953 980 1,009 1,037 1,068Jamu & Kashmir 1,033 1,071 1,109 1,151 1,195 1,241 1,289 1,341 1,396 1,455 1,518Karnataka 4,924 5,082 5,251 5,428 5,613 5,806 5,991 6,197 6,413 6,639 6,875Kerala 1,969 2,012 2,055 2,099 2,144 2,190 2,236 2,281 2,328 2,375 2,424Madhya Pradesh 8,489 8,677 8,871 9,o69 9,271 9,479 9,679 9,886 10,096 10,312 10,532Orissa 4,026 4,153 4,283 4,418 4,557 4,701 4,846 4,998 5,154 5,314 5,481Punjab 3,077 3,173 3,272 3,374 3,479 3,589 3,694 3,809 3,927 4,050 4,177Rajasthan 5,131 5,325 5,516 5,716 5,928 6,150 6,377 6,620 6,877 7,148 7,435Tamil Nadu 5,747 5,852 5,955 6,o60 6,167 6,275 6,383 6,490 6,599 6,710 6,823Maharashtra 6,482 6,641 6,797 6,957 7,122 7,292 7,460 7,631 7,809 7,991 8,178Uttar Pradesh 16,332 16,722 17,113 17,520 17,930 18,354 18,765 19,191 19,626 20,071 20,530West Bengal 7,208 7,386 7,565 7,748 7.936 8,129 8,320 8.517 8.718 8,924 9,135
Total Cereals 91,040 93,374 95,740 98,199 100,623 103,334 105,917 108,618 111,406 114,284 117,300
Total Foodgrains 99,876 102,433 105,025 107,724 110,385 U13,330 116,220 119,184 122,247 125,401 128,716
Notes: Demand Projections are made on the following assumption
The National Income is growing at the rate of 3.79% during 1976-77 to 1985-86.* Actual
Source; ASCI Supporting Study No. 2 on Demand for Foodgrains.

INDIA
SECOND FOODORAIN STORACG PROJECT
Forecast of Demand for Cereals (1975-76 - 1985-86)
(Alternative II) (thousand tons)
Region 197S-76 1976-77 1977-78 1978-79 1979-80 180_81 1981-82 1982-83 1983-84 1984 85 1985-86
Andhra Dradesh . 6,626 6,745 6,867 6,990 7,095 7,244 7,370 7,498 7,629 7,761 7,896Assam 3,371 3,475 3,581 3,691 3,802 3,919 4,035 4,155 4,278 4,406 4,537Bihar 9,500 9,681 9,863 10,048 10,238 10,431 10,626 10,824 11,025 11,230 11,439
,Gujarat 3,975 4,o74 4,117 4,282 4,391 4,502 4,618 4,726 4,842 4,963 5,086:Haryana 2,344 2,464 2,592 2,730 2,877 3,035 3,200 3,378 3,570 3,774 3,993
11imachal Pradesh 806 830 857 884 912 941 969 999 1,031 1,064 1,098Jammu & Kashmir 1,033 1,062 1,091 1,121 1,152 1,183 1,215 1,248 1,282 1,317 1,353Karnataka 4,924 5,065 5,213 5,369 5,529 5,696 5,854 6,029 6,209 6,398 6,593Kerala 1,969 2,011 2,053 2,097 2,141 2,186 2,230 2,274 2,320 2,366 2,415
Madhya Pradesh 8,489 9,677 8,870 9,069 9,271 9,1477 9,678 9,883 10,094 10,309 10,529Orissa 4,o26 4,159 4,296 4,438 4,584 4,735 4,889 5,049 5,214 5,385 5,562
Punjab 3,077 3,186 . 3,298 3,416 3,538 3,665 3,789 3,924 4,064 4,210 4,363
Rajasthan 5,131 5,306 5,475 5,652 5,836 6,027 6,220 6,424 6,638 6,861 7,094
!Tamil Nadu 5,747 5,852 5,955 .6,059 6,116 6,275 6,383 ,490 6,599 6,711 6,824
Maharashtra 6,482 6,634 6,783 6,935 7,090 7,250 7,409 4,567 7,730 7,897 8,o67
Uttar Pradesh 16,332 16,727 17,126 17,533 17,954 18,384 18,802 £9,234 19,621 20,133 20,599
,west Bengal 7.208 7.396 7.586 7,780 7,980 8,185 8,339 8599 8.814 9,o036 9,263
|Total Cereals 91,040 93,344 95,681 98,093 100,526 103,135 105,676 108,301 110,960 113,821 116.711
Total Foodgrains 99,876* 102,403 104,963 107,608 110,277 113,144 115,927 118,802 121,725 124,866 128,038
Notes: Demand projections have been made using base year per capita consumption.
The actual and the anticipated growth rates of incone at All-India level for the year 1974-75 and 1975-76 respectively have been taken into
account. The growth rates of national incaoe assumed for the period 1976-77 to 1985-86 is 3.59 per cent per anaum.
* ActualSource: ASCI Study No. 2 on Denand for Foodgrains.
,- >.
0$

ANNEX 2INDIA Table 13
SECOND FOODGRAIN STORAGE PROJECT
Comparison of Projected Consumption of Rice, Wheat, TotalCereals and Total Foodgrains
(million tons)
1985 1985/86Lower Higher
Estimates Estimates Alternative I Alternative II
ASCI Projections:Rice 53.82 53.32Wheat 35.53 35.24
Total Cereals a/ 117.30 116.71Total Foodgrains- 128.72 128.04
NCA Projections:Rice 52.40 56.60Wheat 29.60 33.39
Total Cereals 112.93 120.72Total Foodgrains 127.76 138.45
a/ Estimated, using the same growth rates as ASCI's projected totalcereal production (refer text)Alternative I - 3.8% national income growth rateAlternative II - 3.6% national income growth rate.
Source: i) ASCI Supporting Study No. 2.ii) All India Foodgrain Storage Project, Project Report,
Part 1, Food Corporation of India, December 1976 page 17,for National Council of Agriculture (NCA) Projectionfigures.

INDIA
SECOND FOODGRAIN STORAGE PROJECT
Net Production, Net Consumption, and Net Food Balanceof Wheat, Rice and Total Foodgrains ('000 tons)
Net Production-/ Net Consumption-b Net Food BalanceTotal Total Total
Wheat Rice Foodgrains Wheat Rice Foodgrains Wheat Rice Foodgrains
1976/77 26,236 42,097 99,461 26,529 42,390 102,433 - 293 - 293 -2,9721977/78 28,280 42,135 102,244 27,396 43,521 105,025 + 884 -1,386 -2,7811978/79 28,678 43,484 105,105 28,290 44,689 107,724 + 338 -1,205 -2,6191979/80 31,589 46,057 108,045 29,227 45,894 110,385 +2,362 + 163 -2,3401980/81 32,484 46,184 111,064 30,195 47,148 113,330 +2,289 - 964 -2,2661981/82 33,156 45,767 114,285 31,171 48,400 116,220 +1,985 -2,633 -1,9351982/83 33,852 46,676 117,599 32,195 49,697 119,184 +1,657 -3,021 -1,5851983/84 34,912 47,283 121,009 33,327 51,026 122,247 +1,587 -3,743 -1,2381984/85 36,525 48,249 124,519 34,372 52,409 125,401 +2,153 -4,160 - 8821985/86 38,666 49,265 128,130 35,528 53,825 128,716 * +3,138 -4,560 - 586
a/ Calculated from gross production figures, allowing for feed, seed requirements and wastage,estimated at 12.1% for wheat, 7.6% for rice and 12.5% for total foodgrains.
b/ Alternative I - assuming 3.8% national income growth - is used.
Source: ASCI Supporting Studies 2 and 3, Annex 1, table 8 and Annex 2, table 2.
I ID 'H

ANNEX 3Page 1
INDIA
SECOND FOODGRAIN STORAGE PROJECT
GOVERNMENT FOODGRAIN POLICIES AND PRACTICES
A. Objectives and Instruments of Foodarain Policy
Obiectives
1. Foodgrain policy in India has three main objectives: (a) self-sufficiency in foodgrain production; (b) price stability; and (c) assuranceof an equitable distribution. These objectives are often restated as ensuringthat consumer prices are stabilized, that the interests of low income consumersare safeguarded, and that producers receive reasonable prices with an adequateincentive for increasing production. These objectives have been reiteratedin various forms since about 1870, with virtually no change since the Bengalfamine of 1943. However, a variety of policy instruments have been tried.
2. Food policy is both a Central government and State subject inIndia; implementation of policy requires concurrence by the State involved.On the other hand, interstate trade and the import and export of foodgrainsare regulated by GOI. Thus, the complexity faced by any nation in developingand implementing food policy has an added dimension in India's federal-statestructure.
B. Instruments of Foodarain Policy
3. Food Zones. A food zone as an instrument of policy is created bycordoning off a State or a group of States. Restricted cereal grains from onefood zone cannot be moved to another except on government account or undergovernment license. States can control movement of grain both within andacross state borders.
4. The primary purpose of the use of food zones is to isolate areasof surplus production. Since farmers and grain merchants are unable to selllegally outside the zone, the market price is driven down to the level of thegovernment procurement price (see para 8). If large differences exist in themarket price between food zones, black market activities and smuggling ariseto circumvent government policy.
5. The use of food zones discourages production in currently surplusareas and encourages production in deficit areas. Carried to an extreme,the continued use of food zones could result in each State becoming self-
ANNEX 3Page 2
sufficient in foodgrain production. To the degree that some areas are insurplus due to comparative advantage, the use of food zones is detrimentalto the national welfare since it results in a continuing misallocation ofresources by encouraging production in inefficient areas. Furthermore, bydepressing the market price in surplus areas tends to encourage greater con-sumption than would occur with higher market prices. In addition, sincedomestically procured grain is sold at subsidized prices, this action tendsto encourage expanded consumption in those areas with access to public sectorgrain distribution.
6. In years when a short crop exists, food zones tend to becomesmaller in order to isolate pockets of surplus production. During yearsof good harvest, there is a tendency to mare food zoues larger and to permitthe private trade to play a larger role in the marketing of foodgrains. OnApril 12, 1977, GOI announced the abolition of wheat food zones. That is,there is no longer any movement restriction within India on either wheat orvraeat products. However, roller flour mllls must continue to purchase wheatsupplies from government stocks. Whether this foreshadows a new policydirection or simply reflects an attempt by GOI to reduce its own procurementwhen large stocks are on hand and public distribution is reduced, remains tobe seen.
7. Support Price. The concept of a support price whereby the govern-ment agrees to buy all grain of fair average quality offered at a fixed pricehas long been recoguized by 001. The primary purpose of such a support priceis to protect farm income in years of a favorable harvest. However, in thelast 12 years, open market prices have never sunk as low as the minimum supportprice. Since 1969, GOI has stopped Announcing a minimum support price beforecrop planting dates and has relied upon a procurement price announced priorto crop harvest and marketing to play a support function in addition to itsprimary purpose.
8. Procurement Price. In order to procure domestic supplies of grainfor public distribution, GOI announces a fixed price which becomes the basisfor purchase by the Food Corporation of India (FCI) or State government inthose States where FCI is not permitted to procure directly from local farmers.In most years the procurement price has been below the market price. Theprocurement price is determined by GOI and cleared after discussions withChief Ministers from each State. This determination usually relies heavilyupon recommendations of the Agricultural Prices Commission (APC) discussedin para 12.
9. Issue Price. This term refers to the price at which grain fromthe Central Pool is issued and dispatched to a State government for conces-sional distribution through its Fair Price Shops. Throughout this Annex,the term issue price will be used with reference to sale from FCI to theState governments. During the 19609 when a large proportion of publicdistribution grain was imported wheat obtained on concessional terms, thisinexpensive grain Was used to help keep the issue price low. During recent

ANNEX 3Page 3
years when imported grain has cost more than domestically procured grain,the issue price has not reflected higher costs of imported grain.
10. Although it is the stated intention of GOI that the public distri-bution system be self-supporting, this has not been true since the timeimports were obtained at concessional prices. At the same time that foodzones were eliminated, the procurement price for wheat was increased fromRs 1,050 per ton (US$120.0) to Rs 1,100 per ton (US$125.70). In the samepolicy statement, the issue price for wheat was left unchanged at Rs 1,250per ton (US$142.86). Again the question arises as to whether this fore-shadows a new policy direction by separating the procurement and issueprices and thereby abandoning the idea that public distribution is a 'noprofit-no loss" operation or whether this action is simply a short-runexpediency.
11. Food Corporation of India (PCI). This organization was establishedin 1964 (see Annex 4 for details). PCI is the primary agency of GOI toachieve its stated foodgrain policies. FCI procures foodgrains domesticallythrough its own agents or from the respective State governments in thoseStates which do not permit FCI to procure directly from farmers or grainmerchants. In addition, FCI imports foodgrains to augment domestic supplies.Stocks held by PCI are referred to as Central Pool stocks. Issues from theCentral Pool go to State governments who turn them over to their Departmentsof Civil Supply or in some cases directly to Fair Price Shops for publicdistribution. FCI has the responsibility of procuring,, storing and trans-porting to each State government foodgrains in the amount needed to effec-tuate national policy. In addition, FCI handles sugar, oil and other commod-ities on a modest scale (see Annex 4).
12. Agricultural Prices Commission (APC). This agency was establishedin 1965. The APC draws up policy papers recommending procurement prices andtarget quantities. When a minimum support price was utilized, APC also recom-mended its specific value. Its price recommendations are based on cost ofproduction, size of harvest, probable demand, price of foodgrains relativeto competing crops, trend in open market prices and general economic condi-tions. The APC attempts to synthesize a single All-India procurement pricefor each grain based on the available economic data and consistent with GOIpolicy objectives.
13. State Departments of Civil Suppl. Each State has a Departmentof Civil Supply or an equivalent agency responsible for implementing foodpolicy within the State. It procures, stores and distributes foodgrainswithin the State. The Department receives grain from FCI and issues it toFair Price Shops. In addition, the Department issues ration cards whenthey are used.
14. Fair Price Shops. The Fair Price Shop is the final step betweenthe producer and the consumer in the public distribution chain. In 1975,there were 240,210 Fair Price Shops serving a population of 469 millionpotential consumers or 78% of India's population. Fair Price Shops are

ANNEX 3Page 4
operated by private traders and cooperatives under license by the Stategovernment. Nearly all licensees were engaged in business -- usuallyretailing -- before they started operating a Fair Price Shop.
15. A licensed Fair Price Shop may sell ouly government issued items.However, the license holder often has a second shop selling other items.In areas and times when formal rationing is in effect, a Fair Price Shopmay sell only to ration cardholders. When informal rationing is in effect,Fair Price Shops may sell to anyone who wishes to purchase. However, itappears that such factors as the location of the Fair Price Shops, thelong queues, the limits on quantities available, and the lover quality ofpublicly distributed grain act as a form of rationing with higherincome consumers going to open-market shops.
C. Government Prosrams of Procurement. Distribution and Imports
Producer Price Policy
16. Currently, a single price is used to serve as both the procurementprice and the minimum support price. As a minimum support price, its roleis to provide a floor for producer prices in surplus years. As a procurementprice, it must be sufficient to purchase needed quantities or else thegOvernment mwat resort to coercion or imports in order to obtain targetedquantities. To be effective, a minimum support price needs to be announcedprior to planting. However, the procurement price is announced only shortlybefore the harvest begins, reducing its effectiveness as a minimum supportprice to influence farmer decision-making.
17. Since the grain acquired through government procurement is forthe public distribution system which is intended to be a "no profit-no loss"operation, the procurement price influences the issue price of public grain.The policy statement by GOI of April 12, 1977, which increased the procure-ment price for wheat from Rs 1,050 per ton to Rs 1,100 per ton while leavingthe issue price unchanged at Rs 1,250 per ton, means that the government sub-sidy will increase by Is 50 per ton. With public distribution of wheat ap-proximately 8,000,000 tons per year or over 60% of the wheat marketed byfarmers, this narrowing of the margin between procurement price and issueprice means that GOI will incur an increased subsidy of Rs 400 million(US$45.7 million) per year. It is this linkage between the issue price andthe procurement price vhich exerts a continuing downward pressure on theprocurement price. The use of food zones and producer levies enables PCIto procure target quantities at the lowest possible procurement price.
18. One aspect of current price policy that exacerbates storage andhandling problems for FCI is the use of a single procurement price nationvideand during the year without seasonal adjustments. Since price is constantthroughout the year, there is no incentive for farmers or grain merchants

ANNEX 3Page 5
to hold grain for rising seasonal prices. Since the farmer will receivethe same price immediately after harvest as well as several months later, al-most all grain is sold as soon as it is harvested thus greatly increasing thedemAnd for off-farm storage and handling facilities. In contrast, a pricewhich rose during the year to reflect storage costs would permit farmers orgrain merchants to hold grain if their storage costs were lower than thoseexperienced by the government and reflected in a seasonally rising procure-ment price. Such a revised policy could result in a sharply reduced peakin government procurement. This would mean a decreased need for storage andhandling facilities since the flow of grain would be distributed over alonger period.
19. Admittedly such a policy could make it more difficult to procuretargeted qijantities since it would authorize greater holdings of grain stocksin private hands. In addition, smuggling of foodgrains across food zones (seeparas 3 to 6) might become more of a problem with larger quantities in pri-vate hands.
20. As shown in Table 1, wholesale prices of both rice and wheat havemore than doubled in the last ten years. Prices for these foodgrains haverisen slightly faster than the general price level for all agriculturalcommodities. Table 2 shows procurement, issue and open market prices forwheat and rice. In general, the procurement price has lagged behind buthas followed the upward trend in open market prices.
Domestic Procurement
21. As shown in Table 3, GOI procures less than 10% of total foodgrainproduction. However, this represents about one-third of the marketed surplussince nearly 70% of foodgrains do not move through commercial channels. 1/Domestic procurement has increased since the establishment of FCI both interms of total quantity and as a percent of production as shown in Table 3.All imports and about 75% of domestic procurement is handled by FCI. As aresult, more than 80% of public distribution is channeled through FCI.
22. As shown in Table 4, wheat and rice are the primary foodgrainsprocured' domestically. Nearly all of the wheat was procured for the CentralPool (i.e., FCI). In contrast, approximately half of the rice was procuredby and for State governments. Tables 5 and 6 show procurement by State forwheat and rice. Procurement of both wheat and rice for the Central Pool(i.e., FCI) comes primarily from Haryana, Punjab, Rajasthan, Uttar Pradeshand Andhra Pradesh. These five States supplied more than 95% of the grainprocured domestically for the Central Pool in 1974 and 1975.
1/ Moore, J.R. et. al. Indian Foodrrain Marketin2, Prentice Hall of India,New Delhi, 1973, p. 34.
ANNEX 3Page 6
Proiections of Procurement
23. Two sets of procurement projections are available: (1) FCI proj-ections and (2) Administrative Staff College of India (ASCI) projections.The FCI projections were made assuming a GOI policy of rapid expausion inprocurement and public distribution and are given as ranges. In contrastthe ASCI estimates assume a moderate growth in procurement and public dis-tribution. Furthermore, the ASCI projections are point estimates. Table 7shows a comparison of these projections. Given current GOI policy, theASCI assumption is considered more realistic.
24. In addition to the basic assumption concerning GOI policy on pro-curement and public distribution, the ASCI projections are built upon aseries of assumptions and estimated relationships. Using regression analysiswhich incorporated a trigonometric function to reflect weather cycles, pro-duction was estimated. Procurement was estimated with a regression equationthat included production as an explanatory variable. Consequently, ASCIprocurement projections incorporate anticipated shortfalls in productionwith reduced procurement. Procurement projections through 1986 are reportedin Table 12 where they are contrasted with projected public distribution todetermine implied import requirements.
Distribution of Foodgrains
25. Public distribution of foodgrains has grown modestly since theestablishment of FCI in 1964 (see Table 3). Peak distribution occurred inthe short crop years of 1966 (14.1 million tons) and 1967 (13.2 million tons).Although public distribution has been as much as 22% of total domestic pro-duction, in recent years public distribution has varied between 10 to 12% ofdomestic production. Approximately 80% of public distribution is channeledthrough PCI. The remaining 20% never enters the Central Pool. It remainswithin the respective States.
26. Table 8 shows public distribution of wheat, rice and other food-grains. Tables 9 and 10 show state-wise distribution of wheat and rice.As shown in Table 9, Maharashtra and West Bengal are the two most importantrecipients of wheat from the Central Pool. During 1974 and 1975 these twoStates plus Bihar, Uttar Pradesh and New Delhi accounted for more than 60%of the wheat whilst Kerala, Maharashtra and West Bengal accounted for over2/3 of the rice distributed.
Prolections of Public Distribution
27. As with procurement, two sets of projections of public distributionare available: FCI and ASCI projections. Again, the ASCI projections assumea moderate expansion of the public distribution systems consistent with cur-rent GOI policy.

ANNEX 3Page 7
28. Using regression analysis, the ASCI study included time trend,
availability of open market grain and whether or not the year was a pre-
election year as explanatory variables. The data indicated that during pre-election years, public distribution increased, ceteris paribus. Using these
regression equations, public distribution was projected incorporating pro-
duction projections which reflected weather cycles and the GOI policy of
expanding public distribution in years of decreased production. Projectionsof public distribution through 1986 are reported in Table 12 where they are
contrasted with projected procurement to determine implied imports.
Import of Foodgrains
29. As shown in Table 3, imports have been used to alleviate the impactof shortfalls in total production of foodgrains. Imports were greatest during
the shiO crop years of 1966 when imports were 10.4 million tons and 1967 when
imports were 8.7 million tons. There is considerable year to year variation in
quantity imported. It is difficult to determine any meaningful trend; however,
there does not appear to be any long term trend toward increasing imports.In fact, comparing the ASCI projections of domestic procurement and publicdistribution shown in Table 12, indicates a general reduction in wheat importsleading to self-sufficiency by 1982-83. Projections for rice indicate thatrice imports would not exceed 0.5 million tons during the next decade.
D. Buffer Stock Operations
Objectives of a Buffer Stock
30. As discussed in para 1, one of the coutinuing objectives of Indianfoodgrain policy is price stability for both consumers and producers. An-
other major objective is protecting low income consumers against the possi-
bility of food shortages. The primary function of a buffer stock is to helpattain both of these objectives. The basic concept is that, in years of
short production, the buffer provides a reserve to draw against until next
year's crop is available. On the other hand, in years of surplus production,the buffer is intended to absorb and store the surplus and thereby preventa collapse in farm prices.
31. In other words, the basic idea of foodgrain buffer stock is compar-able to building a damr that will be used to provide both flood control in wetyears and irrigation water in dry years. If we are more concerned about wetyears, the dam would be kept empty to provide maximum flood control. If weare more concerned about dry years, the dam would be kept full to provideirrigation water when needed. In a similar manner, GOI has been more con-cerned with the possibility of short crops than with the problems that wouldensue from food surpluses. Certainly, the experience of the last 30 yearsindicates that short crops are more likely than large surpluses.

ANNEX 3Page 8
32. Given these objectives (i.e., to even out year to year variations inprice and quantity available), buffer stocks represent grain held in storagefor more than 12 months. In contrast, operational stocks represent inventorycarried less than 12 months in order to even out the seasonal differencesbetween procurement and distribution. In practice, buffer and operationalstocks are interchangeable. However, conceptually it is useful to distin-guish between the two in order to determine storage needs.
GOI Analysis of Buffer Stock Requirements
33. From time to time, GOI has announced the need for a buffer stockof foodgrains to help achieve its basic food policy objectives. The most re-cent analysis calls for a buffer stock of 12 million tons. 1/ This analysisutilized data on production, consumption and imports for the period 1960-61to 1975-76 to determine the buffer stock required.
34. Figure 1 illustrates the underlying logic for the GOI analysis.As Figure 1 shows, both demand for and production of foodgrains grow over time.However, there is a continuing gap that is satisfied with imports. For theperiod analyzed the average annual production-consumption gap was 4.625 milliontons. Since there were variations in both production and consumption, thestandard deviation of the production-consumption gap was 4.591 million tons.As shown in Figure 1, a bumper crop would result in self-sufficiency for thatyear while a short crop would require substantial imports or the utilization ofgrain reserves (i.e., buffer stocks).
35. The analysis continued by choosing the mean plus 1 standard devia-tion as a reasonable level of protection, the implication being that thiswould provide protection for two years in three against the combination ofbeing unable to import plus a short crop. Since this represents a one-tailedprobability (i.e., the only concern is with short crops), the level of protec-tion is not 68% but rather 84%.
36. Recognizing that average production for the period analyzed was76.1 million tons, GOI determined that the chosen buffer stock level of themean plus 1 standard deviation (9.2 - 4.6 * 4.6) was 12.1% of average pro-duction. With current production of approximately 100 million tons, it wasconcluded that a buffer stock of 12 million tons provided the desired pro-tection against a short crop two out of three years.
37. Using the same logic but correcting the probability to reflect theone-tailed nature of the problem as illustrated in Figure 1, the 67% level ofprotection requires a buffer stock equal to the mean plus 0.44 standard devia-tions or 6.6 million tons (4.625 plus (0.44 x 4.591)). This represents 8.7%of average production for the period analyzed and would imply a needed bufferstock of 8.7 million tons with current levels of production. However, both
1/ Report of the Technical Group on Buffer Stock of Foodgrains, Directorateof Economics and Statistic, Ministry of Agriculture, New Delhi, unpub-lished Memo. December, 1976.

ANNEX 3Page 9
GOI analyses assume that imports will grow to approximately 6 million tonsper year and that the unavailability of imports is part of the need for thebuffer stock. Since the ASCI projections shown in Table 12 and the mission'sprojections in Annex 2, Table 14 indicate that the need for imports would beexpected to decline below current levels, one of the basic assumptions of theGOI analysis is open to criticism.
ASCI Analysis of Buffer Stock Requirements
38. As a part of its overall study of India's grain storage require-ments, ASCI evaluated a series of buffer stocking strategies utilizing acomputer simulator. 1/ The study combined buffer and operational stocksinto a total stock requirement. This was done in recognition of the factthat peak storage requirements last less than three months but that someoperational stocks are held for more than three months. Operational stocksheld more than three months plus buffer stocks create the requirement forpermanent storage facilities.
39. Several variations of the ASCI model were considered. One varianthad as its objective function the minimization of the discounted cost ofbuffer stock operations covering purchase, sale, stocking and imports overan 11 year time horizon. The objective of the second variant was to mini-mize price variations during the 11 year time horizon. The third versioncombined these two objectives. Further refinements included projected pro-duction, procurement and consumption which included the impact of weathercycles and the cost of transporting grain from surplus to deficit areas.The ASCI study concludes that, for current levels of production and con-sumption, total stocks (i.e., buffer plus operational stocks) should be 12million tons.
40. The GOI analysis requires total stocks of 16 million tons on handApril 1 of each year (12 million ton buffer plus 4 million operational stocks).Correcting the GOI analysis to consider the one-tailed nature of the problemimplies a total requirement of 13 million tons on hand April 1 of each year(9 million buffer plus 4 million operational stocks). The ASCI analysiswhich combines buffer and operational stocks develops a total requirementof 12 million tons on hand on April 1 of each year. The next section of thisannex utilizes a 7 million ton buffer stock and a 4 million ton operationalstock on April 1 to illustrate projected grain flows and storage requirements.
Appropriate Size of a Buffer Stock
41. FCI indicates that in order to operate the current public distribu-tion system, a minimum inventory of 4 million tons is required as pipelinestock. Given the location and transportation difficulties faced by FCI, thisappears to be a reasonable level of operational stocks. Due to the seasonalnature of procurement and distribution these stocks are based on April 1inventory of 1.25 million tons of wheat and a November 1 inventory of 650,000
1/ ASCI Supporting Study No. 8 Models of Buffer Stocks, Hyderabad, 1976.

ANNEX 3Page 10
tons of rice. Using monthly data on procurement and distribution for wheatand rice during 1974 and 1975, monthly indexes were developed. Table 13 showsmonthly grain flow and operational stock required to operate the public dis-tribution system of India at about the current level. The primary differencebetween Table 13 and actual practice is that Table 13 assumes no imports(i.e., public distribution is accomplished entirely with domestic procurement).Table 13 represents a steady-state situation with neither a buildup nor adepletion of stocks.
42. As can be readily seen in Table 13, storage requirements for opera-tional stocks (i.e., for intra-year variation with perfect knowledge and nomistakes) is 7.5 million tons if storage is perfectly located and utilizedand there is perfect substitution between wheat and rice. On the other hand,if wheat storage and rice storage are located in separate areas or otherwisenot perfectly meshed, peak storage requirements are 8.3 million tons (i.e.the wheat peak of 6.0 million tons plus the rice peak of 2.3 million tons).Since these figures represent operational stocks, any buffer stock - to beheld more than 12 months - adds to this storage requirement. For example,a 7 million ton buffer would require a peak capacity between 14.5 and 15.3million tons.
43. During a short crop year, procurement declines and public distri-bution increases. Such counter-cyclical action lies at the core of usinga buffer stock to attain the objectives of price stability and protectinglow income consumers. Table 14 illustrates hypothetical grain flows whenprocurement is reduced and public distribution is increased such that a7 million ton buffer stock is just exhausted. Without imports, a 7 millionton buffer stock could be dissipated in a single bad crop year. Because wheatand rice harvests occur at different seasons, Table 14 uses a two year hori-zon to illustrate the depletion of a buffer stock.
44. Table 14 starts with stocks of 11,606,000 tons of grain (i.e.,the 4,606,000 tons of operational stocks from Table 13 plus a 7,000,000 tonbuffer). In Table 14, a short wheat crop and increased wheat distributionare experienced from April of the first year to March of the second year.The remaining months are identical to the steady-state figures reported inTable 13. For rice, a short crop and increased distribution occur fromNovember of the first year to October of the second year. The remainingmonths are identical to the steady-state figures reported in Table 13. Inthis simple example, it is readily apparent that a single bad year couldresult in depletion of stocks and considerable unused warehouse space.
45. Although security is the more common objective, the concept of abuffer stock also deals with absorbing and storing surplus production ingood years. During surplus years, more than normal would be procured whileless than normal would be distributed. Table 15 illustrates a hypotheticalyear in which procurement increases to 15 million tons and distribution fallsto 9 million tons. Again a two year horizon is used for this illustrationbecause of the difference in wheat and rice harvest seasons. Table 15 begins

ANNEX 3Page 11
with an initial stock of 11,606,000 tons (i.e., 4,606,000 tons of operationalstock from Table 13 plus a 7,000,000 ton buffer). As a result of this hypo-thetical bumper crop, storage requirements peak at 20 million tons.
Cost of a Buffer Stock
46. Table 16 shows a simple comparison between holding a 12 millionton buffer stock versus an 8 million ton buffer stock. As shown in Table 16,a 12 million ton buffer stock requires an additional investment of Rs 5.9billion (US$674 million). Furthermore, the cost of holding the added 4 mil-lion tons of buffer stock is Rs 2.4 billion (US$274 million) per year. Thebenefit of this additional 4 million tons of buffer stock, using the GOImodel discussed in paras 33-37, is to protect against a short crop one yearin five. (Additional detail regarding FCI financial losses are reported,,in Annex 4, para 33).
47. In summary, the storage requirements of the current system of publicdistribution are substantial. It is reasonable to assume that a buffer stockof not less than 7 or 8 million tons up to 12 million tons should be held.The specific size depends upon the cost of holding, the benefits of havingfoodgrain available when needed, ready availability and cost of imports andmany other factors. From the standpoint of the current storage project, anApril 1 carry over of 7 million tons buffer plus 4 million tons operationalstocks impose storage requirements beyond the currently available facilitiesand planned construction.
June 3, 1977

INDIA
SECOND FOODGRAIN STORAGE PROJECT
Demand for Foodgrains
MillionsofBuprCo
Tons ~~~~~~~~~~~~roduction of Foodrains
Typical Years
Year
Illustration of the G01 Concept of Buffer Stock Requirements.
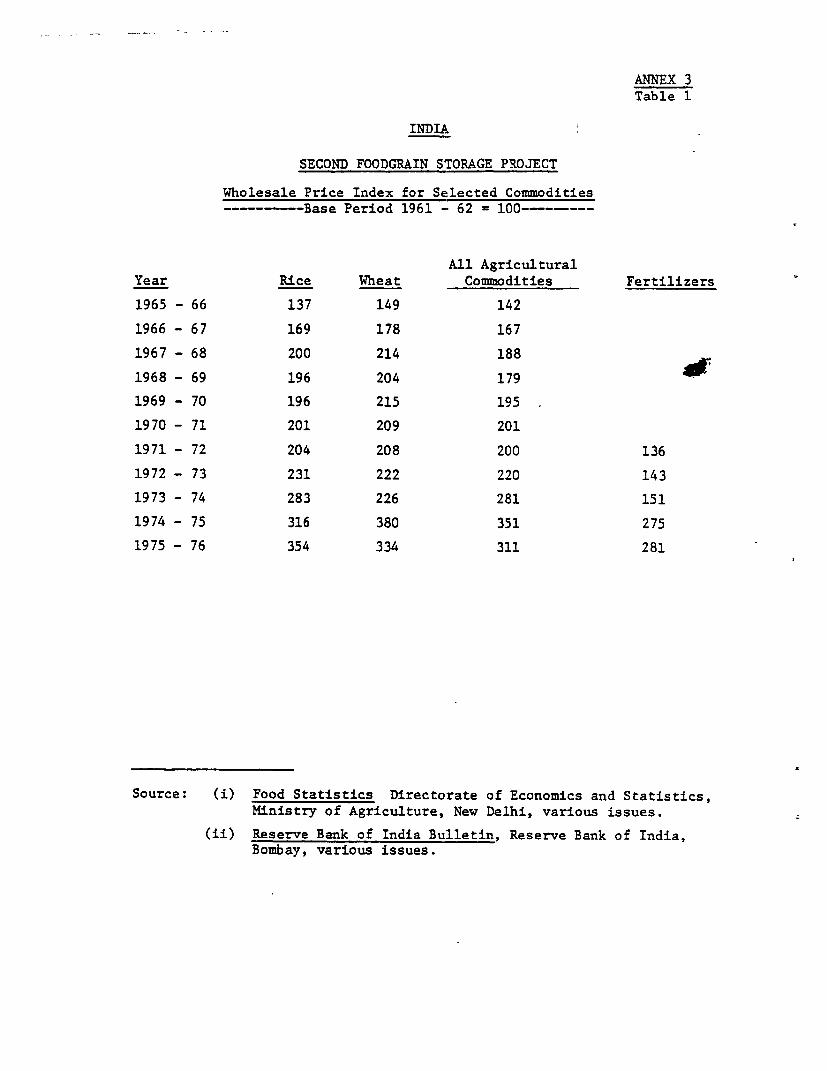
ANNEX 3Table 1
INDIA
SECOND FOODGRAIN STORAGE PROJECT
Wholesale Price Index for Selected Commodities-- -- -- Base Period 1961 - 62 - 100-------
All AgriculturalYear Rice Wheat Commodities Fertilizers
1965 - 66 137 149 142
1966 - 67 169 178 167
1967 - 68 200 214 188
1968 - 69 196 204 179
1969 - 70 196 215 195
1970 - 71 201 209 201
1971 - 72 204 208 200 136
1972 - 73 231 222 220 143
1973 - 74 283 226 281 151
1974 - 75 316 380 351 275
1975 - 76 354 334 311 281
Source: (i) Food Statistics Directorate of Economics and Statistics,Ministry of Agriculture, New Delhi, various issues.
(ii) Reserve Bank of India Bulletin, Reserve Bank of India,Bombay, various issues.

ANNEX 3Table 2
INDIA
SECOND FOODGRAIN STORAGE PROJECT
Selected Prices for Wheat and Rice, 1965 to 1975
in Rs. per 100 Kg
Wheat RiceProcurement Issue Open Mark7t Procurement Issue Open Mar t
Year Price Price Price- Price Price Price-(for Paddy) -
1965-66 52.00-56.00 70.00 57.12 39.88 126
1966-67 59.,5-63-350 70.00 67.73 48.15 100 166
1967-68 74 50-8l.00 70.00 88.89 52.50 100 124
1968-69 76.50-82.00 90.00 82.79 52.69 100 118
1969-70 76.08 85.00 85.24 52.52 100 126
1970-71 76i0 78.00 88.86 53.63 100 112
1971-72 76 00 78.00 84.94 53.88 100 124
1972-73 _ '__ 0-00 78.00 78.44 54.84 100 157
1973-74 105.00 90.00 112.87 70.88 125 202
1974-75 105.00 123.00 111.58 74.00 135 220
a/ Open market price prevailing in Punjab at wholesale.
b/ Open market price for rice at wholesale.

INDIA
Sl;COND FOODGRAIN STOUAGH PRIOJNCT
Productlon. Public Procurement. Importes 6tocks and Diltribution of Foodgrainh
Food Corporction ot india State GovernmentslDomestic Procurement Ilewrts Public Distribution or. _ b_-MDistribution
As A Percent As A Percent As A Percent Procure- As A Percent Procure- As A PercentFodgrein or of Public of ment of Total Closing Kent of Closlng
Year Production Quantity Production 4jPenl Diatribution Q Production piniy 4&tity Distribution Stocks tt 5uny Distribution StocksN Tons N Tons -F~i tiiPercelt -Ton P*rentF -w¶f-ni Percent WHT-n ITo-iT Percent R-Yon- -WT6ns W'6ii_n __erc__T k o
i964 1.4 6.3 72 8.7 0.7 8.3 91. 0.5 0.7 0.4 5 0.516^5 76.9 4.0 5.2 7.5 74 10.1 13.1 1.7 8.3 82 1.1 2.4 1.8 18 1.019b6 62.2 4.0 6.4 10.I 74 14.1 22.7 0.7 11.5 82 0.9 3.3 2.6 18 1.31967 65.9 4.5 6.8 8.7 66 13.2 20.0 1.0 10.1 77 0.5 3.5 3.1 23 1.4i968 82.9 6.8 8.2 5.7 56 10.2 12.3 3.2 7.6 75 2.0 3.6 2.6 25 2.01969 83.6 6.4 7.7 3.9 41 9.4 11.2 3.6 6.9 73 2.9 2.7 2.5 27 1.51970 99'5 6.7 6.7 3.6 h1 8.8 8.8 4.5 6.9 78 3.9 2.2 1.9 22 1.71971 108.4 8.9 8.2 2.1 27 7.8 7.2 7.4 6.4 82 6.6 1.5 1.1 18 1.'1972 105.2 7.7 7.3 0.4 t4 10.5 10.0 6.5 9.8 93 2.5 1.1 0.7 7 1.o1973 97.0 8.4 8.7 3.6 32 11.4 11.8 6.2 9.8 86 2.0 2.2 1.6 I 4 1.297.4 104.7 s.6 5.3 4.9 45 10.8 10.3 3.3 8.5 79 1.6 2.4 *.3 21 1.1
I*n,) 101.1 9.6 9.5 7.6 67 11.3 11.2 6.3 9.2 81 5.6 3.2 2.1 19 2.6n976 102.6 MA KA 4.2 MA KA MA 10.4 8.0 NA 16.4. NA KA NA KA
Source; Fool Statistics. Dlrectorate of Economics and Statistics, Ninistry of Agriculture, New Delhi. 1976.
,. *

INDIA
SECOND FOODGRAIN STORAGE PROJECT
Domestic Procurement of Wheat, Rice and Other Foodgraina- ------- --in 1,000 metric tons -- ----------
Wheat Rice Other Foodgrain. Total Procurement
FnY State For Central For State For Central For State For Central For State For Central
Year Government Pool _ Government Pool Total Government Pool Total Government Pool Total
1971 217 4,871 5.088 1,245 2,217 3,462 29 278 307 1,491 7,336 8.857
1972 32 4,992 5,024 1,068 1,482 2,550 24 67 91 1,124 6,541 7,665
1973 284 4,247 4,531 1,675 1.787 3,462 260 171 431 2,219 6,205 8,424
1974 214 1,671 1,885 1,937 1,545 3,482 229 49 278 2,380 3,265 5,645
1975 272 3,826 4,098 2,556 2,486 5,042 394 29 423 3.222 6,341 9,563
Source: Food Statistics, Directorate of Economics and Statistics, winiatry of Agriculture, New Delhi, 1976.
IX

ANNEX 3Table 5
INDIA
SECOND FOODGRAIN STORAGE PROJECT
Domestic Procurement of Wheat for Selected States- ________ in -,000 metric ton-
1974 1975For State For Central For State For Central
State Government Pool Total Government Pool Total
- 249 249 - 433 433Haryana
Madhya Pr*desh 122 - 122 139 - 139Madhya Pradesh
Punjab - 1,025 1,025 - 2,419 2,419
Rajasthan - 127 127 - 183 183
42 268 310 11 771 782Uttar Pradesh--
Other States 50 2 52 122 20 142
Total 412 1,671 1,885 272 3,826 4,098
Source: Food Statistics, Directorate of Economics and Statistics,Rinistry of Agriculture, New Delhi, 1976.

ANNEX 3T-abl=e6
INDIA
SECOND FOODGRAIN STORAGE PROJECT
Domestic Procurement of Rice for Selected Statesin 1,000 metric tons-
1974 1975For State For Central For State For Central
State Government Pool Total Government Pool Total
Andhra Pradesh 339 370 709 464 499 963
Assam 96, - 96 182 8 190
Bibha 60 - 60 69 - 69
Earyaua 33 250 283 61 370 431
Karnataka 94 - 94 151 - 151
lMadhya Erade8h 107 40 147 183 9 192
Orissa 121 35 156 98 - 98
Punjab 188 657 845. 27 1,295 1,322
Tamil Nadu 294. 31 325 629 - 629
Uttar Pradesh 242 159 401 239 286 525
West Bengal 164 - 164 241 - 241
Other States 199 3 202 212 19 231
Total 1,937 1,545 3,482 2,556 2,486 5,042
Source: Food Statistics Directorate of Economics and Statistics,Ministry of Agriculture, New Delhi, 1976.

ANNEX 3Table 7
INDIA
SECOND FOODGRAIN STORAGE PROJECT
Forecasts of Domestic Procurement of Wheat and Rice- in 1,000 metric tons ------
1976-77 1978-79 1980-81State ASCI FCI ASCI FCI ASCI FCI
Range Range RangeRice Procurement
Andhra Pradesh 1,121 435- 585 940 482- 649 1,378 534- 719
Madhya Pradesh 393 694- 934 345 769-1,035 259 853-1,140
Orissa 272 274- 368 286 303- 409 345 336- 453
Punjab 553 820-1,000 637 906-1,219 721 1,005-1,355
Tamil Nadu 609 192- 258 578 212- 286 666 235- 301
All India 4,636 4,788-6,444 4,653 5,304-7,140 5,300 5,880-7,920
Wheat Procurement'Haryana 812 1,170-1,292 941 1,148-1,368 1,071 1,216-1,-452
Punjab 3,123 3,534-3,900 3,450 3,567-4,129 3,778 3,670-4,3827
Uttar Pradesh 1,617 1,786-1,972 1,926 1,752-2,088 2,236 1,856-2,216
All India 5,927 8,932-9,860 6,758 8,758-10,440 7,458 9,28G-11,080
Source: ASCI Supporting Study No. 5 Procurement and Public. Distribution,Hyderabad, 1976.

INDIA
SECOND FOODGRAIN STORAGE PROJFCT
Domestic Distribution of Wheat, Rice and Other Foodgrains-- ---- -------- in 1,000 metric tons ------ - -------
Wheat Rice Other Foodgrains Total Distribution
By State From Central By State From Central By State From Central My State From Central
Year Government Pool Total Government Pool Total Government Pool Total Government Pool Total
1971 172 4,283 4,455 1,180 2,050 3,230 69 62 131 1,421 6,395 7,816
1972 -418a 7,026 6 608 1,183 2,403 3,586 -79a 372 293b 686 9 ,801b 10,487
+805 +805 +102 +102 +2 +2 +909 +909
1973 82 7,048 7,130 1,491 1,715 3,206 38 1,040 1,078 1,611 9,803 11,414
1974 -56 5,725 6,669 1,925 1,828 3,753 408 960 1,368 2,277 8,513 10,790
1975 134 7,411 7,545 1,701 1,510 3,211 240 257 497 2,075 9,178 11,253
a. Apparent change In inventory,
b. Quantity supplied to Bangladesh.
Source: Food Statistics, Directorate of Economics and Statistics, Hinistry of Agriculture, New Delhi 1976
'-I~~~~~~~~~
o.tz

INDIA
SECOND FOODGRAIN STORAGE PROJECT
Domestic Distribution of Wheat for Selected States
…-------- in 1,000 metric tons--
1974 1975State or By State-' From Central By State-' From CentralUnion Territory Governments Pool Total Governments Pool Total
Andhra Pradesh - 100 100 137 137Assam - 141 141 - 196 196Bihar -74 482 408 68 428 496Gujarat -18 400 382 -26 590 564Haryana 12 120 132 32 65 97Jammn & Kashmir 13 134 147 6 167 173Karnataka 23 103 126 54 155 209Kerala - 242 242 - 514 514Madhya Pradesh -7 98 91 98 111 209Naharashtra 9 994 1,003 -56 1,419 1,363Orissa -21 148 127 -12 239 227Punjab -8 176 168 13 63 76Rajasthan -1 146 145 9 205 214Tamil Nadu -2 115 113 -21 624 603Uttar Pradesh 15 465 480 -47 403 356West Bengal - 1,080 1,080 - 1,290 1,290Delhi - 432 432 _ 463 463Others 3 349 352 16 342 358
Total -56 5,725 5,669 134 7,411 7,545
a/ Negative values indicate apparent change in inventory. 0 4
Source; Food Statistics, Directorate of Economics and Statistics, Ministry of Agriculture, New Delhi, 1976.

ANNEX 3Table 10
INDIA
SECOND FOODGRAIN STORAGE PROJECT
Domestic Distribution of Rice for Selected Statesin 1,000 metric tons
1974 1975State or By State From Central By State From CentralUnion Territory Government Pool Total Government Pool Total
Andhra Psadesh 240 - 240 253 - 253
Assam 97 5 102 115 1 116
Bihar 34 _ 34 59 _ 59
Gujarat 24 26 50 1 40 41
Jammu and Kashuir 34 52 86 31 60 91
Karn4taka 156 - 156 205 - 205
Kerala 42 744 786 29 510 539
Madhya Pradesh 140 _ 140 71 _ 71
Maharashtra 157 179 336 105 112 2.17
Orissa 168 2 170 39 23 62
Tamil Nadu 317 - 317 403 185 588
Uttar Pradesh 292 - 292 161 - 161
West Bengal 167 458 625 195 223 418
Delhi - 40 40 - 39 39
Others 57 322 -. 379 34 317 351
Total 1,925 1,828 i 3,753 1,701 1,510 3,211
Source: Food Statistics, Directorate of Economics and Statistics,Ministry of Agriculture, New Delhi, 1976.
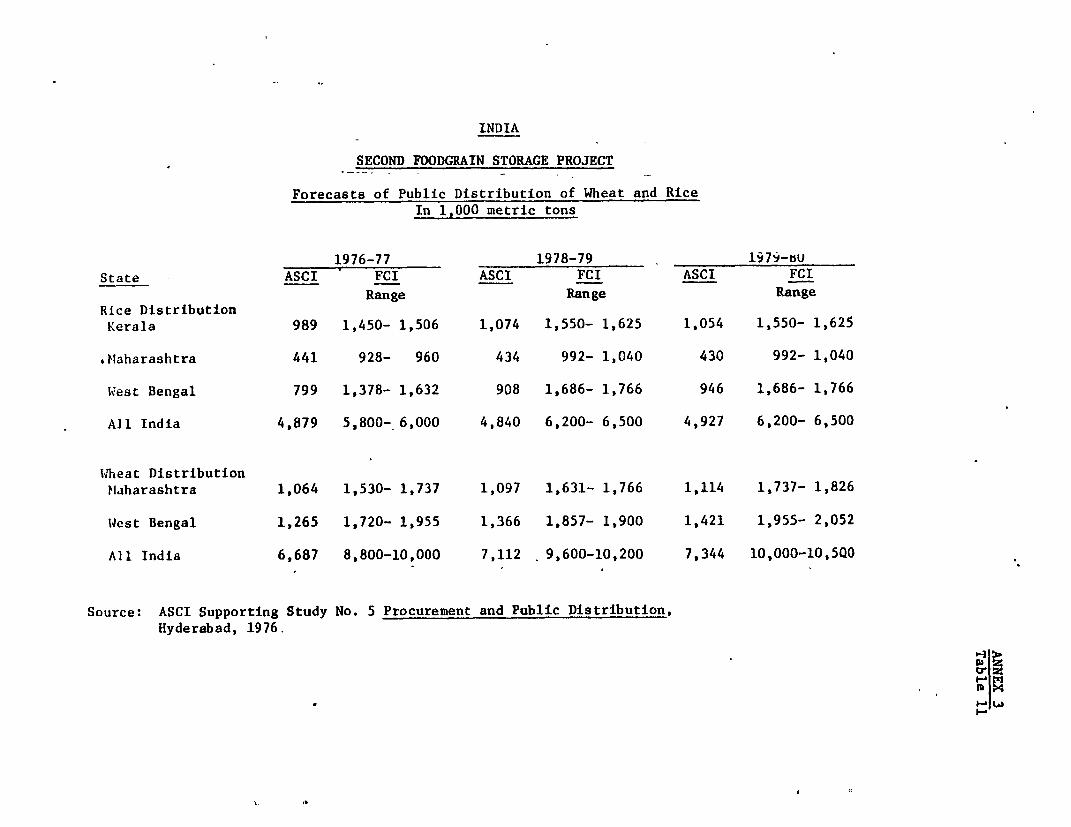
INDIA
SECOND FOODGRAIN STORAGE PROJECT
Forecasts of Public Distribution of Wheat and RiceIn 1,000 metric tons
1976-77 1978-79 1979-iuState - ASCI FCI ASCI FCI ASCI FCI
Range Range RangeRice DistributionKerala 989 1,450- 1,506 1,074 1,550- 1,625 1,054 1,550- 1,625
*Maharashtra 441 928- 960 434 992- 1,040 430 992- 1,040
West Bengal 799 1,378- 1,632 908 1,686- 1,766 946 1,686- 1,766
All India 4,879 5,800- 6,000 4,840 6,200- 6,500 4,927 6,200- 6,500
Wlheat DistributionHlaharashtra 1,064 1,530- 1,737 1,097 1,631- 1,766 1,114 1,737- 1,826
W4est Bengal 1,265 1,720- 1,955 1,366 1,857- 1,900 1,421 1,955- 2,052
All India 6,687 8,800-10,000 7,112 9,600-10,200 7,344 10,000-10,500
Source: ASCI Supporting Study No. 5 Procurement and Public Distribution,Hyderabad, 1976.
p L4)
Ib3d
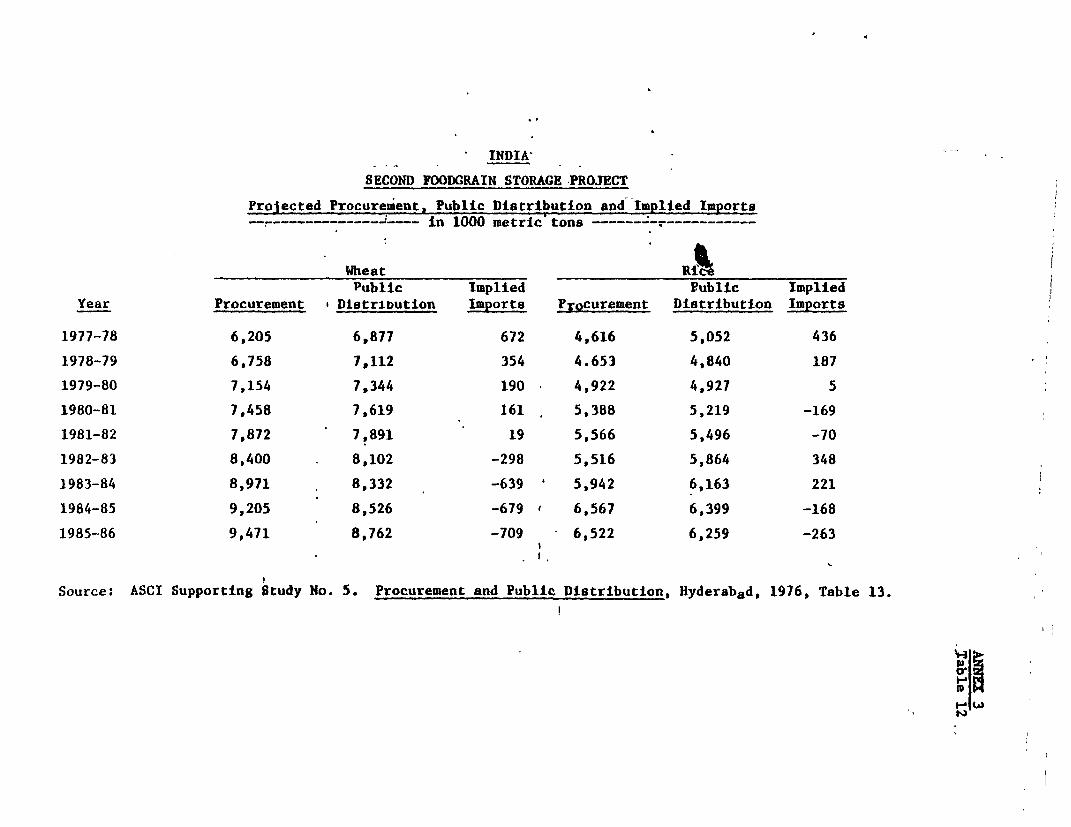
INDIA
SECOND FOODGRAIN STORAGE PROJECT
Projected Procurement, Public bistribution and Implied Imports---- -_--_____I___ in 1000 metric tons --------------------
Wheat RitPublic Implied Public Implied
Year Procurement ' Distribution Imports Procurement Distribution Imports
1977-78 6,205 6,877 672 4,616 5,052 436
1978-79 6,758 7,112 354 4.653 4,840 187
1979-80 7,154 7,344 190 4,922 4,927 5
1980-81 7,458 7,619 161 5,388 5,219 -169
1981-82 7,872 7,891 19 5,566 5,496 -70
1982-83 8,400 8,102 -298 5,516 5,864 348
1983-84 8,971 8,332 -639 5,942 6,163 221
1984-85 9,205 8,526 -679 6,567 6,399 -168
1985-86 9,471 8,762 -709 6,522 6,259 -263
Source: ASCI Supporting Study No. 5. Procurement and Public Distribution, Hyderabad, 1976, Table 13.
'i'm

INDIA
SrCOND FOODGRAIN STORAGE PROJFCT
Projected Monthly Grain Flow and Operational Stocksa----… ----------------in 1000 metric tons-----------
Wheat Rice TotalOperationalu Operational Operational
Month Procurementb Distributionc Closing stocks Procurementa DlatributionC Closing Stockse Closing Stocks
January 9.6 648.8 2,543.6 762.4 339.6 2,062.4 4,606.0
February 9.6 683.2 1,870.0 499.2 317.2 2,244.4 4,114.4
March 56.0 676.0 1,250.0 342.4 332.0 2,254.8 3,504.8
April 273.6 635.2 888.4 174.4 350.8 2,078.4 2,966.8
May 3,960.0 624.8 4,223.6 158.4 350.4 1,886.4 6,110.0
June 2,279.2 640.0 5,862.8 100.4 334.8 1,652.0 7,514.8
July 754.4 629.6 5,987.6 74.0 371.2 1,354.8 7,342.4
August 299.2 678.4 5,608.4 50.8 366.0 1,039.6 6,678.0
September 134.4 732.8 5,010.0 38.0 326.4 751.2 5,761.2
October 116.8 695.2 4,431.6 206.4 307.6 650.0 5,081.6
November 65.6 690.4 3,806.8 674.4 301.6 1,022.8 4,829.6
December 41.6 665.6 3,182.8 919.2 302.4 1,639.6 4,822.4
Total 8,000.0 8,000.0 4,000.0 4,000.0
a Throughput and stocks based on the assumption of equal domestic procurement and distribution. Bufferstock requirements must be added to these operational stock figures.
b Monthly procurement index derived from reported monthly procurement, calendar 1974 and 1975.
c Monthly distribution index derived from reported monthly distribution, calendar 1974 and 1975. ,§
d Closing stock calculations were begun with an April 1 Inventory of 1,250,000 tons.
e Closing stock calculations were begun'wilth a November I inventory of 650,000 tons.

ANNEX 3Table 14
SECOND FOODGRAIN STORAGE PROJECTProjected Monthly, Grain Flow and Stocks During Buffer Stock Depletion a
- -- In 1,00 metric Tons --------------- _=------
wheat Riceb tRcCCloslg closing Total Foodgrain
Item Procurement Distributionc Stocks Procurementb Distribution Stocks Stocks
First YearJanuary 9.6 648.8 7,543.6 762.4 339.6 4,062.4 11,606.oFebruary 9.6 683.2 6,870.0 499.2 317.2 4,244.4 11,114.4March 56.o 676.o 6,250.0 342.4 332.0 4.254.8 10,504.8April m73.o0 794.0 5,627.0 174.4 350.8 4,078.4 9,705.4May 2,475.C 781.0 7,321.0 158.4 - 350.4 3,886.4 11,207.4June 1,424.5 800.0 7,945.5 '100.4 334.8 3,652.0 11,597.5July 471.5 787.0 7,630.0 74.0 371.2 3,354.8 10,9i34.3August 187.0 848.o 6,969.0 50.8 366.o 3,039.6 10,008.6September 84.o 9K6.0 6,137.0 38.0 326.4 2,751.2 8,888.2Octocer 73.0 869.0 5,341.0 206.4 307.6 2,650.0 7,991.0November 141.0 863.0 4,519.0 505.8 377.0 2,778.8 7,297.8December 26.0 832.0 3,713.0 689.4 :78.0 3,090.2 6,803.2
Second YearJanuary 6.0 811.0 2,908.0 571.8 424.5 3,237.5 6,145.5February 6.0 854.0 2,060.0 374.4 396.5 3,215.4 5,275.4March 35.0 845.0 1,250.0 256.8 415.0 3,057.2 4,307.2April 273.6 635.2 888.4 130.8 438.5 2,749.5 3,637.9may 3,960.0 624.8 4,223.6 U18.8 438.0 2,430.3 6,653.9June 2i279.2 640.o . 5,862.8 75.3 418.5 2,087.1 7,949.9July 754.4 629.6 5,987.6 55.5 464.o 1,678.6 7,666.2August 299.2 678.4 5,608.4 38.1 457.5 1,259.2 6,867.6September ..34.4 732.3 5,010.0 28.5 408.0 879.7 5,889.7October 116.8 695.2 4,431.6 154.8 384.5 650.0 5,061.6November 65.6 690.4 3,806.8 674.4 301.6 1,022.8 4,829.6December 141.6 665.6 3,182.8 919.2 302.4 1,639.6 4,822.4
Two Year Total 13,000.0 18,000.0 7,000.0 9,000.0
wheat procuremenit assumed to be 5,000,000 tonts with wheat distribution of 10,000,000 tons :rom April. ofthe first year to March of the second year. Rice procurement assu:ad to be 3,000,000 tons with rice dis-tribution of 5,000,000 tons frm Novenber of the first year to October of the second year. During theremaining months procurenent and distribution are the same as reported in Table 12. These joint assump-tions just exhaust a 7,000,000 ton buffer stock.
/ Monthly procurement index derived fron reported monthly procurement, calendar 1974 and 1975.
i Monthly distribution index derived from reported monthly distribution, calendar 1974 and 1973.
/ Closing stock calculations were begun with a January 1 inventory of 7,543,600 tons based on operatingstocks calculated in Table 12 plus a 5,000,000 toe bWfer stock.
! Closing stock calculations were begun with a January 1 inventory of 4,062,400 tons based on operatingstocks calculated in Table 12 plus a 2,000,000 too buffer stock.

ANNE 3
.nMA Table 15
SECOND FOODGRAIN STORAGE PROJECT
Projected Monthly, Grain Flow and Stocks During Buffer Stock Buildupa
Wheat RiceClosingd b c Closing 0 Total Foodgrain
Item Procurenentb Distributionc Stocks Procurement Distribution Stocks Stocka
First YearJanuary 9.6 648.8 7,543.6 762.4 339.,6 4,062.4 11,606.0February 9.6 683.2 6,870.o 499.2 317.2 4,244.4 11,1314.4March 56.0 676.o 6,28O.0 342.4 332.0 4,254.8 10,5C4.8April 342.0 476.4 6,115.6 174.4 350.8 4,o78.4 10,194.0May 4,950.0 468.6 * 0,597.0 158.4 350.4 3,886.4 14,1483.4June 2,849.0 48o0.o 12,966.0 100.4 334.8 3,652.0 16,618.0July 943.0 472.2 13,436.8 74.0 371.2 3,354.8 16,791.6August 374.0 508.8 13,302.0 50.8 366.0 3,039.6 16,341.6Septenber 168.o 549.6 12,920.4 38.0o 326.4 2,731.2 15,671.6October .146.0 521.4 12,545.0 206.4 307.6 2,650.0 15,195.0November 82.0 517.8 12,109.2 843.0 226.2 3,266.8 15,376.0December 52.0 499.2 11,662.0 1,149.0 226.8 4,189.0 15,851.0
Second YearJanuary 12,0 486.6 L1,187.4 953.0 254.7 4,887.3 16,074.7February 12.0 512.4 10,687.0 624.0 237.9 5,273.4 15,960.4March 70.0 507.0 10,250.0 428.0 249.0 5,452.4 15,702.4April 273.6 635.2 9,8880.4 218.0 263.1 5,407.3 15,295.7rar 3,960.0 624.8 13,223.6 198.0 262.8 5,342.5 18,566.1June 2,279.2 640.o 14,862.8 125.5 251.1 5,216.9 20,079.7July 754.4 629.6 14,987.6 92.5 278.4 5,031.0 20,018.6August 299.2 678.4 14,608.4 63.5 274.5 4,820.0 19,428.4September 134.4 732.8 14,010.0 47.5 244.8 4,622.7 18,632.7October 1.16.8 695.2 13,431.6 258.0 230.7 4,650.0 18,081.6November 65.6 690.4 12,806.8 674.4 301.6 5,022.8 17,829.6Decusber 41.6 665.6 12,182.8 919.2 302.4 5,639.6 17,822.4
Two Year Total 18,000.0 i14,000.0 9,000.0 7,000.0
wheat procure_ent assumed to be 10,000,000 tons with wheat distribution of 6,000,000 tons froc April of the firstyear to March of the second year. Rice procurement assued to be 5,000,000 tons with rice distribution of 3,000,000tons fron November of the first year to October of the second year. During the remaining months procurement anddistribution are the same as reported In Table 12. These joint assumptiona result In an increase in inventory of6,000,000 tons.
/ Monthly procurement index derived from reported monthly procurement, calendar 1974 and 1975.
a/ Monthly distribution index derived frcm reported monthly distribution, calenda 1974 and 1975.
/ Closing stock calculation were begun vith a Tanuary I inventory of 7,543,600 tons based on operating stockscalculated in Table 12 plus a 5,000,000 ton buffer stock.
e/ Closing stock calculatiom were begun with a January 1 inventory of 4,062,400 tons based on operating stockscalculated in Table 12 plus a 2,000,000 ton buffer stock.

ANNEX 3Table 16
INDIA
SECOND FOODGRAIN STORAGE PROJECT
Comparison of 8 million ton buffer stockwith 12 million ton buffer stock
Change due to8 million ton 12 million ton increase in
Physical Relationships buffer stock buffer stock buffer stock
Storage requirement foroperational stock a/ 7.5 million tons 7.5 million tons
Storage requirement for bufferstock 8.0 " 12., " 4.0 million tonsTotal storage requirement: 15.5 million tons 19.5 million tons 4.0 million tons
April 1 stock position(operational stock plusbuffer stock) 12.0 million tons 16.0 million tons 4.0 million tons
Issue per year 12.0 million tons 12.0 million tons
Probable level of protectionagainst a short crop b/ 62% 84% 22%
Financial Relationships
Investment in storage capacity@ Rs 375/ton Rs 5.8 billion Rs 7.3 billion Rs 1.5 billionInvestment in April 1 carryover @ Rs 1100/ton Rs 13.2 billion Rs 17.6 billion Rs 4.4 billion
Cost of carrying grain procuredand issued within the year@ Rs 400/ton c/ Rs 4.8 billion Rs 4.8 billion
Cost of carrying grain more than12 months @ Rs 600/ton Rs 4.8 billion Rs 7.2 billion Rs 2.4 billion
a/ Operational stock of 4,000,000 tons results in storage requirement of 7.5 milliontons as shown in Table 13.
b/ Using the GOI analysis illustrated in Figure 1 and discussed in paras 33-37.c/ For purposes of this analysis, it is assumed that 12 million tons is procured
and issued each year. The cost of Rs 400/ton/year is determined in Annex 9 Table 11and includes administrative cost of procurement, transportation, storage, etc.
d/ Grain held more than 12 months is the April 1 stock. The cost was determined inAnnex 9 Table 11.
ANNEX 4Page 1
INDIA
SECOND FOODGRAIN STORAGE PROJECT
The Food Corporation of India
A. Background
1. The Food Corporation of India (FCI) was established by an Act ofParliament in 1964, and started functioning early in 1965. The primaryduties of the Corporation are to undertake the purchase, storage, movement,transport, distribution and sale of foodgrains and other foodstuffs as aninstrument of public policy. The Corporation, with previous approval ofGovernment of India (GOI) may also (a) promote by such means as it thinksfit the production of foodgrains and other foodstuffs; (b) set up, or assistin setting up rice mills, flour mills and other undertakings for processingfoodgrains and other foodstuffs; (c) discharge such other functions as maybe prescribed or as are supplemental, incidental or consequential to any ofthe functions conferred on it under the Act.
2. FCI operates primarily to safeguard the interests of producers andconsumers. Specific objectives are to (a) ensure reasonable prices to pro-ducers; (b) procure and acquire a sizeable portion of marketed foodgrainson behalf of GOI for issue to State governments; (c) ensure timely releasesof stocks through the public distribution system in order to protect the in-terests of vulnerable sections of society; (d) minimize inter-seasonal andinter-regional price variations; and (e) build up sizeable buffer stocksof foodgrains from internal procurement and imports.
B. Organization and Manaaement
3. Board of Directors. General direction and management of FCI isvested in a Board of Directors consisting of a Chairman, three directorsrepresenting GOI, Managing Director of the Central Warehousing Corporation(CWC), Managing Director of FCI, and six other directors. All directorsare appointed by GOI.
4. The Executive Committee, constituted by the Board of Directors,is authorized by the Act to deal with any matter within the competence ofthe Corporation. In March 1977, the Executive Committee consisted of: (a)Shri R.N. Chopra, Chairman of the Board of Directors; (b) Shri A.K. Dutt,Managing Director, FCI; (c) Shri R. Balasubrumanian, Additional Secretary,Department of Food; (d) Shri S.R. Kaiwar; and (e) Shri P.L. Tandon.

ANNEX 4Page 2
5. PCI operates under the jurisdiction of the Department of Food,Ministry of Food, Agriculture and Irrigation. Its head office (NDO) is inNew Delhi. It also maintains 4 zonal offices, 19 regional offices, 5 portoffices, 140 district offices and warehouses at 1,700 locations. It hiresabout 60,000 employees on a regular basis. The NDO employs 1,700 personsand is organized along functional lines: Purchase Division, ProcurementDivision, Quality Control Division, Storage and Contracting DivisiQn,Engineering Projects Division, Movement Division and Finance Division.There is a similar functional structure at the zonal and regional offices(Organization Chart, Figure 1).
6. Zonal and regional officers are responsible for control and super-vision of operations in all districts and depots within the area of theirjurisdictions. Port officers handle imported foodgrains and fertilizers.They make arrangements at the port of discharge for clearance of cargo.A list of zonal, port and regional offices is given in Table 1. Districtofficers are in charge of purchase operations, movement of foodgrains toand from storage warehouses, disbursing funds, billings, collections, ac-counting and reporting. Staff at the warehouse sites maintain qualitycontrol over stocks, issue stocks when required, and maintain accounts ofreceipts and issues.
C. Functions
7. Procurement of Foodgrains - Procurement is performed by FCI underdifferent methods suiting local conditions of market shortages or surpluses,specific cereals, etc. In certain States, the State government procures fromfarmers or grain merchants and offers the grain to FCI. In other States, FCIgoes into the local market and procures. The quantities procured are shownin Annex 3, Table 3. Some of the alternative modes of procurement are:
(a) Price Support Purchases - During the years of bumper crops,as in 1975/76, open market prices tend to go below thelevel of procurement prices. To prevent prices receivedby farmers from falling below the procurement price, pur-chases are made by public agencies;
(b) Levy on Farmers - In this system a progressively increasingrate of levy linked with the size of holding is enforced.A farmer, on the basis of his landholdings is required tosell a part of his total produce to the government agency.This system has been used to procure paddy or rice intimes of scarcity;
(c) Levy on Millers/Traders - To overcome the operationaldifficulties of producer levies, a levy on rice millersand traders is generally imposed. Rice millers delivera certain proportion of their processed rice to the publicagency at the procurement price; and

ANNEX 4Page 3
(d) Purchase under Pre-emption Rights and Requistion - The gav- -
ernment may at times use pre-emption rights in buying wheatand other cereals in the markets but this is rarely done.
8. Imports. FCI is responsible for receiving and off-loading importedgrain, paying ocean freight, handling, storage, transportation and distribu-tion to a tate government. Imports for the past 10 years are shown inAnnex 3, Table 3.
9. HandlinR. Certain charges are incurred at the point of procure-ment for delivery either to the railhead or the varehouse for indigenousgrains. These include marketing commissions and fees, State government ad-ministrative charges, purchase/sales tax, gunny cost, transportation etc.As the bulk of procurement is made by State government and their agenciesfor FCI these charges are paid to these agencies according to agreed rates.
10. Quality Control. Stocks received for storage are analyzed todetermine moisture content and insect infestation. Fortnightly, stocksare re-examined to determine condition and presence of insects. Fumigationis undertaken if stocks shov signs of infestation. Prophylactic treatmentis given to prevent cross infestation. During 1975/76, FCI had 108 labora-tories engaged in analyzing samples. Field research has helped determineeffective fumigants. Training sessions are frequently held for the qualitycontrol staff at all levels of organizational structure to exchange experiencesin storing grain and to dissiminate nev information.
11. Transportation. Foodgrains are normally transported by truck fordistances less than 150 kilometers, and by rail beyond this distance. Inrecent years the annual movement of 12 to 20 million tons of foodgrains rep-resented less than 102 of the total railwagon transportation of goods. Al-though the percentage is small, high priority and subsidized freight rateshave been established for foodgrains (Annex 6).
12. Storage. Grain, mostly wheat and paddy or rice, is stored in ware-houses and silos owned or rented by FCI. The storage function also includesreceipt in storage, stacking, inspection, preservation, building maintenance,and other activities associated with preservation. The recent increase ininventory has necessitated a significant increase in required storage capa-city (see Table 2, Annex 5).
13. Distribution and Sale. FCI issues wheat or rice to a State government on orders from GOt and receipt of payment from the State. The respectiveState governments operate the public distribution system through Pair PriceShops, licensed and operated by retail traders in urban and rural areas.Quantities distributed are shown in Annex 3, Table 3.
14. Other Activities. In addition to the purchase, storage and saleof foodgrains, FCI is engaged in other activities as follows:

ANNEX 4Page 4
(a) Fertilizer. FCI handles imported fertilizer. This includesimportation, storage and sale to State goveruments or theirnominees from the Central Fertilizer Pool at the pool issueprice fixed by GOI. During 1976-77 about 2 million tonsof materials were imported;
(b) Rice Mills. Twenty-five modern rice mills have been builtby FCI with a rated capacity of 369,000 tons. Actual pro-duction for 1976-77 was about 229,000 tons or a utilizationrate of 62%;
(c) Solvent Extraction Plant. FCI operates one plant to producevegetable oil and edible grade groundnut flour. During 1975-76,26,276 tons were processed;
(d) Maize Mill. Produced 2,631 tons maize flour during 1975-76;
(e) Milled Pulses. Produced 2,004 tons split pulses for thearmy during 1975-76;
(f) Rice Bran Oil Plant. Processed 1,886 tons of the rice branfrom four FCI rice mills and produced edible oil and ricebran extraction used for livestock feed;
(g) Balahar Production. FCI produces a highly nutritious foodideal for pre-school children above one year. The ingre-dients include vegetable protein, cereal grains and gramsenriched with vitamins and minerals; 32,631 tons were pro-duced during 1975-76; and
Ch) Sugar. In certain States, FCI has the responsibility forprocurement and distribution of levy sugar. During 1976-77,purchases were estimated at 1.4 million tons valued atRs 2,859 million.
This operation is expected to result in a deficit of Rs 88.7 million. Stockson hand on March 31, 1977 of these commodities were 177,000 tons valued atRs 349.7 million.
D. Financial Mana2ement
15. FCI has a centralized financial management system based on a de-centralized accounting system. The chart of accounts, accounting policy pro-cedure and reporting requirements are determined by NDO staff. The FinanceDivision has these administrative Sections: Budget and Cost Control, Accounts,Finance, Internal Audit and Physical Verifications.
ANNEX 4Page 5
16. Budget and Cost Control. Performance budgeting has been used since1969. Budgets are formulated by activity and function for each responsibilitycenter and the actual performance is compared with the budget. Variationsare monitored and analyzed. Standard costs are established for budget pur-poses, and standard inventory costs are used for accounting purposes. Storageand related costs were not shown separately between CAP, bag storage and silostorage. Under the project, it is proposed to build storage structures whichcan be used for either bag or bulk. For evaluation purposes, to determinewhich type of storage is the most economical, it would be helpful if storagecosts, including storage losses, were segregated by type of storage structure.
17. Accounts. The general ledger is maintained, using a standardchart of accounts, at each district office. Cash receipts and disbursementsare accounted for in the distrls offices but the NDO controls the cash posi-tion, does necessary reconcili'ion with the accounts and performs financingfunctions.
18. Inventory transfers between districts are recorded only when thenotice of arrival is received by the issuing district office. This neces-sity of exchange of paper work sometimes delays recording of transfers andpreparation of reports.
19. A system of prepayment has been adopted for foodgrains dispatchedby FCI to each State government. Payment must be received by FCI beforethe district manager is authorized to ship the grain. This practice hassubstantially reduced receivables. Prior to the nev system State govern-ments were billed after delivery and there was much dispute over the quantityand quality of grain actually delivered and the quantity and quality billed.Payment was withheld until the dispute vas resolved. FCI operates on behalfof GOI and in accordance with its policy directions. These operations resultin losses which are funded from the GOI annual budget.
20. A trial balance is prepared each quarter at the district officeand forwarded to the region. Each regional office summarizes districtoffice reports, adds regional office transaction and sends its report tothe zonal office. Each zonal office summarizes regional transactions, addsits own transactions and forwards the report to the NDO. The NDO sumarizeszonal reports, adds its own transactions and prepares certain status reportsto evaluate performance.
21. Annually, the NDO staff prepares the Balance Sheet and Profit andLoss Statement. Details are given in Tables 2 and 3. The accounts are thenaudited by independent chartered accountants. The audit and accounting re-ports plus the annual report is submitted to the FCI Board. In 1975-76,this process took 5-1/2 months after the close of the financial year,March 31, 1976 and in 1976/77, it was 3 1/2 months. In prior years it hastaken up to one year. The annual report is then submitted to Parliament.Parliamentary approval often takes three years.

ANNEX 4Page 6
22. Finance. Fund requirements have increased significantly in thepast two years as inventory stocks have increased. FCI uses various meansto finance its operations:
(i) Capital: Under Section 5 of the Food Corporation Act,1964, capital is contributed by GOI;
(ii) Loans: Loans are made available from GOI and commercialbanks. The interest rate charged is the cost of raisingmoney at the time of the loan plus administrative charges.It has ranged from 6 to 12% per annum with the latestrate at 8% from GOI for long term investments and 12%from commercial banks for purchase of grain;
(iii) Overdraft: PCI has made arrangements with the State Bankof India as a leader of a consortium of banks to provideoperating capital needed to maintain the foodgrain inven-tory. Seventy-five percent of the loan value is backedby collateral of hypothecated grain stocks and 25% isguaranteed by GOI. A quarterly statement of forwardfinancing requirements is prepared and an agreed uponoverdraft limitation is set. Cash receipts and disburse-ments from inventory operations are charged to the FCIcentral credit account at the State Bank of India. FCIpays interest at 12% per annum on the outstanding balance;
(iv) Internal Resources: This primarily represents depreciationreserves; and
(v) Trade Credits: Trade credits are the imports received andrecorded into inventory but the corresponding payment hasnot been made to GOI.
23. During FY76 and FY77 sources and uses of funds were as follows:
Source of Funds Use of FundsFY76 FY77 FY76 FY77
(Rs Millions)
Govt. Equity 1,950 3,950 Book Debts &Govt. Loans 2,110 2,160 Subsidy Dues - 1,600Life Ins. Corp. Loan - 100 Fixed Assets 1,490 1,610Bank Overdrafts 18,130 23,480 InventoryInternal Resources 440 460 Stocks 25,090 26,940Trade Credit (Net) 3.950 -
Total 26,580 30,150 26,580 30,150

ANNEX 4Page 7
24. Internal Audit and Physical Verification. Internal audits areperformed on records at headquarters and field offices and physical verifica-tion of inventory stocks are made during surprise checks. In addition, inde-pendent chartered accountants audit the accounts as provided for in the Act.A supplementary audit is also performed by the Comptroller and Auditor Generalof India.
E. Training
25. FCI operates a Central Training Institute which provides in-servicetraining for officers. Outside training is also provided to officers inmodern management techniques. Some of the professional staff attend meetingsof their organizations in the country. Forty officers have studied abroadin various subjects. Quality control seminars are held for employees of thisdiscipline. Management meetings are held regularly to simulate plans andreview progress. Because of the decentralization of accounting activities,it is difficult to maintain experienced and highly qualified accountingpersonnel at 140 district offices. Additional in-service training would beuseful. It also would appear fruitful for FCI financial managers to reviewsimilar financial management systems in other countries that are carryingout national farm programs, for example, Commodity Credit Corporation inthe USA and FCI have similar purposes and operations.
F. Analysis of FCI Operations
26. Operating Costs. Approximately one-third of FCI's operationalcost is for freight. Another 25% to 30% is for interest on operating capi-tal. Salaries, wages and allowances represent 15 to 20% of total expendi-tures. Details are as follows:
Expenditures as a Percentage of Total Operating Cost
1975-76 1974-75 1973-74 1972-73 1971-72
%
Freight 33.5 30.6 34.0 29.9 26.9Handling Charges 7.3 7.7 6.2 7.9 7.3Salaries, Wages,Allowances 14.7 20.5 19.2 16.9 15.8
Godown Handling 6.4 7.6 9.2 7.6 6.2Godown Rent 2.7 3.3 4.5 5.9 6.0Depreciation 3.3 2.4 2.0 1.9 2.2Other Over-head 2.5 7.9 3.9 3.9 3.6
Interest 29.6 20.0 26.9 26.9 32.0
Total 100.0 100.0 100.0 100.0 100.0
ANNEX 4Page 8
27. Operating costs per ton of wheat stored in bags in conventionalwarehouses was as follows (Details are given in Table 4).
1976-77 1975-76 1974-75Wheat Rice Wheat Rice Wheat Rice
Rs per Tou
1 to 12 months
To procure and deliverto warehouse 189 84 195 81 89 72
Storage, transport anddistribution 148 148 165 165 146 146
Total 1 to 12 months 337 232 360 246 235 218
Added Cost to Store
12 to 24 months 213 213 238 238
Total - 24 months 550 445 598 584
28. FCI does not have detailed operating costs for grain stored in CAP,flat bulk or silos. However, for up to 12 months in CAP storage it is esti-mated that Rs 380 per ton would be required for wheat and Rs 280 per ton forpaddy. Bulk handling and storage costs for up to 12 months in flat bulkwarehouses and silos were estimated at Rs 260 per ton for wheat and Rs 160 forpaddy.
Quality Control and Storaze Losses
29. The value of storage losses have not been included in the abovecosts. Storage losses vary with moisture content and type of grain stored,type of storage, location, length of time in storage and storage management.Losses for 6 to 36 months storage will be the least for wheat below 12% mois-ture stored in a silo in north India. On the other hand storage losses willbe highest when wheat, paddy or rice of over 12% moisture is held in CAPstorage in east or south India for up to 36 months.
30. FCI quality control experts inspect each warehouse and take grainsamples to determine storage conditions each fortnight. Hand spraying andfumigation are performed as indicated by laboratory tests. Rodent poisonprocedures are maintained. However birds are not effectively controlled.Adequate data to measure storage losses were not available. However, dataavailable from two States, 1971-72 through 1975-76, and based on in and outbag count rather than weight show 1.76% loss for wheat and 3.25Z loss forpaddy stored for an average of 7 months. Information on insect damage tograin that reduces nutritional value was not segregated. Losses can besevere in foodgrains stored more than 8 months without adequate protection.

ANNEX 4Page 9
31. Using available data and relying on considered opinions of experts
with extensive field experience, estimates were made of wheat and paddy stor-
age and handling losses based on cause of loss, type of storage, locationand length of storage. The results are summarized as follows (details are
given in Tables 5 and 6):
Z Loss Based on Weight of Grain Placed in Storage
(Type of Storage)
FlatNo. Months in Storage CAP Bas Bulk Silo
Paddy6 months 5.69 3.63 2.78 2.6012 months 7.31 4.63 3.30 2.9324 months 11.13 5.50 3.63 3.1336 months 16.13 6.13 4.00 3.38
Wheat6 months 3.81 8.89 0.53 0.3012 months 5.50 3.33 0.80 0.3724 months 11.38 5.09 1.37 0.7736 months 19.25 7.80 2.00 1.22
32. Storage and handling losses are the least with wheat and paddystored in a silo or a bulk flat warehouse and the most when stored in CAP
stacks. It is particularly important to note that for storage of more than
12 months duration, losses in conventional bag warehouses and CAP are costly.For example, 7.0 million tons of wheat stored 24 months would have lost about
350,000 tons weight valued at Rs 420.0 million (US$48.0 million) if storedin bags and conventional warehouses. If this wheat were stored in bulk flatwarehouses for 24 months, the storage loss would be about 96,000 tons valued
at Rs 115.0 million (US$13.0 million).
33. Deficit Financins. FCI as a large, national public sector business
organization exists under certain constraints that prevent its management fromoperating as a profit motivated agency. First, GOI determines both domesticprocurement and issue prices for foodgrains handled by FCI and without refer-ence to full cost recovery. Whilst this constraint is consistent with publicpolicy objectives, it has resulted in annual budget deficits for FCI of aboutRs 583 (US$66.63) per ton in 1976-77. Costs not recovered from consumerswere about Rs 3,000 million (US$343.00 million) in 1975-76, Rs 4,500 million(US$512.0 million) in 1976-77 and are expected to increase to nearly Rs 5,000million (US$571.0 milion) in 1977/78.
ANNEX 4Page 10
34. State governments receive FCI grain freight prepaid at the issueprice, handle and store the grain and distribute it to licensed Fair PriceShops and flour mills. They determine the retail price. Consumers eligiblefor concessional priced grain are issued ration cards. In some States allconsumers in the area (the State of West Bengal, city of New Delhi, etc.)receive ration cards; in other areas only the poorest of the urban poorreceive ration cards. In many States the rural poor do not receive rationcards. The margin between cost of grain to the State government and itsretail price seldom covers costs for handling, storage and distribution.For example, wheat received by Government of West Bengal costs Rs 1,250 perton delivered to the railway depot. GOWB charged consumers Rs 1,400 per ton(Rs 1.40 per kg) for the wheat. However, its operating costs exceed Rs 250per ton; i.e. it operated at a loss of over Rs 100 per ton of grain distri-buted. Similar losses were reported by State governments in Tamil Nadu,Maharashtra, Bihar and Kerala.
35. Costs of these magnitudes are a function of national and Stategovernment policies and can be reduced by: (a) removal of zones and reductionof restrictions on interstate private trade; (b) appropriate adjustments inprocurement, issue and distribution prices; (c) reducing annual carry-overstocks (as of April 1st) to, say, 7 to 10 million tons rather than 12 to 18million tons; (d) restricting concessional distribution to the poorest of thepoor; and (e) reducing costs of operation for FCI and the respective Stategovernments. The project concentrates on item (e) by providing facilitiesdesigned to reduce unit costs of handling, storing and transporting foodgrains.
36. Inventory Management. FCI's Management Information and ControlBranch (MICB) collects and analyzes information received from the 1,700 ware-house centers and use it to assist management determine grain movements.Data are prepared at each of the centers and collated at the district level,regional office and zonal office for transmittal to the NDO. The MICB com-piles the data as:
Nature of Information Frequency Sources
Procurement position Daily Regional officeStorage/issue of stocks Weekly " iStorage space position " Storage divisionStock position Fortnightly Regional officeSurvey report on food-grain production orconsumption situation it
37. Fortnightly, GOI advises FCI concerning the quantity and kind offoodgrain to be issued to each State. FCI operational division managers meetand with the data compiled by MICB as given above, determine grain movementsneeded to fill requests. They consider location of stocks and transportationcosts, availability of railwagons by location, supply and distribution pat-tern and quality of stocks.

ANNEX 4Page 11
38. Timeliness and accuracy of information appears to be satisfactoryalthough there are delays in receiving data from the field. The problem ofmovement planning also becomes more complex as volume and number of locationsinvolved increases and quality of grain deteriorates with longer storageperiods. A larger and larger amount of high level managerial time is re-quired. A computerized scheduling program available in,India could helpsolve FCI's inventory management problems and improve efficiency, accuracyand timeliness of the operation.
39. Subsidiar_y Business Operations. As described in para 14 FCIhandles imported fertilizers and processes and distributes rice, rice branoil, maize, flour and dal. These subsidiary businesses all operate at asmall profit.
G. Construction and Maintenance of Storage Facilities
40. Two engineering divisions within FCI, each under the charge of aManaging Engineer, supervise the construction of new and maintenance of exist-ing foodgrain storage facilities. The first division, with a staff of 787engineers, draftsmen and financial officers, is responsible for conventional(bag) storage structures. It also contracts with the grain storage divisionof the Central Public Works Department (CPWD) to design warehouses, documenttenders and works contracts, and supervise construction of conventional stor-age facilities. CNWD developed the Model A design proposed for this projectand has had extensive experience in its construction. The second division,with a staff of 171, is responsible for the design, construction and main-tenance of bulk flat and silo storage structures.
June 3, 1977
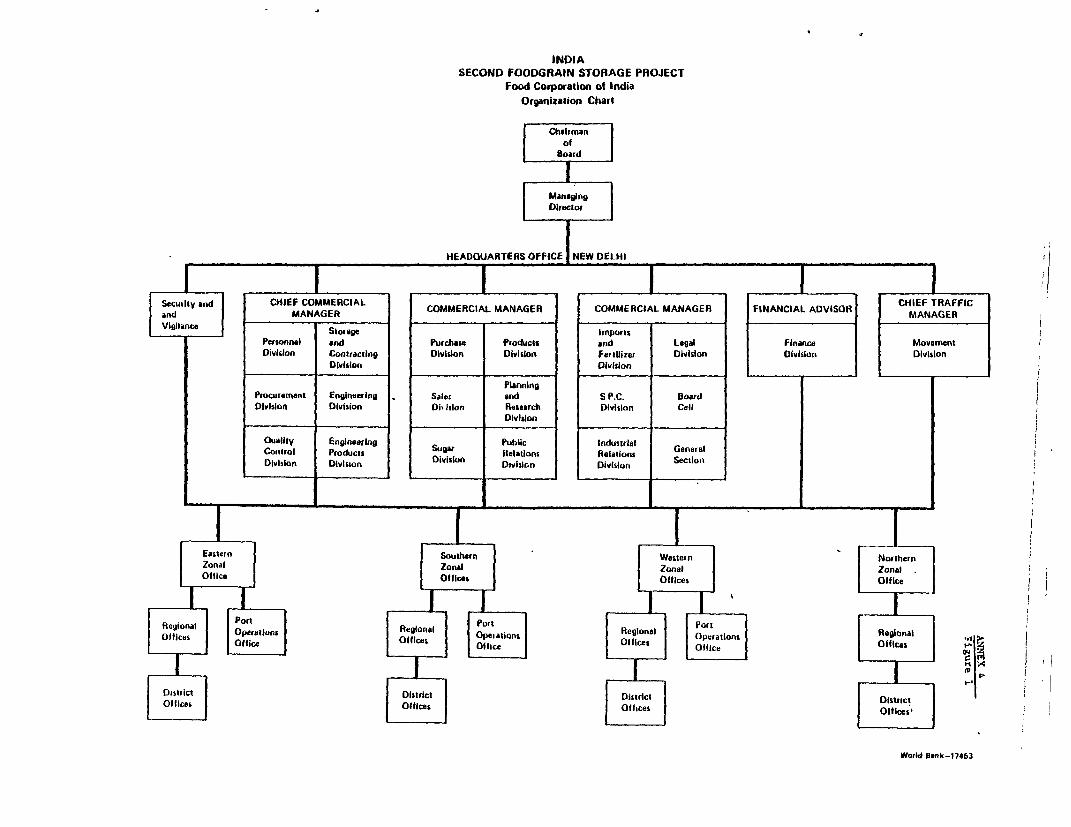
INDIASECOND FOODGRAIN STORAGE PROJECT
Food Corporation of India
Organization Chart
Chairmanof
Board
ManagngDlne tor
HEADQUARTERS OFFICE NEW DELHI 'I
SecurI ty and CHIEF COMMERCIAL COMMERCIAL MANAGER COMMERCIAL MANAGER FINANCIAL ADVISOR CHIEF TRAFFICand ~~~~~~~~MANAGER MANAGER
Vigilance Storage Imports
Personnel and Purchase Products ard Legal Finance MovementDivision Contracting Division Division Fertilizer Division Division Division
DivisIon Division
PlanningProcurement Engineer lug Sales and S P.C. BoardDlvlslon Dlvision Dlf Islon Research Division Cell
Division
Quality Engineering Public IndustrialControl Products Suar Relations Relations GeneralDivision Division Division Dsvision Division Secthn
Eastern outhern Western Nthern
Zonal Zonla Zonal
Oflice 01i1ces OOHIies O Ice
Regiorkal PsReReIonalal PortaOlfices Opera~tions Oflistpiesons Reinl Oerations eioa
OfficeOsficefOffcee Ollices
District DIstrIct DistriCt
| Ollices |011OffIces Olices |
World bank-174b3

ANNEX 4Table 1
INDIA
SECOND FOODGRAIN STORAGE PROJECT
Location of Zonal and Regional Offices (FCI)
Zonal and Regional Offices
Northern Zonal Office New DelhiH.P. Region SimlaPunjab Region ChandigarhHaryana Region ChandigarhDelhi Region New DelhiRajasthan Region JaipurU.P. Region LucknowJ & K Region Jammu
Western Zonal Office BombayMaharastra Region BombayGujarat Region AhmedabadM.P. Region Bhopal
Southern Zonal Office MadrasTamil Nadu Region MadrasMysore Region BangaloreA.P. Region HyderabadKerala Region Trivendrum
Eastern Zonal Office CalcuttaOrissa Region BhubaneshwarBihar Region PatnaW. Bengal Region Calcutta
Assam Region GawhatiNorth Eastern. Region Shillong
Port Operations
BombayCalcuttaKandlaMadrasVisakhapatnam

INDIA
SFcfon FOnA(WbATM STAlAn( pPAJFrT
PROGRESSIVE BALANCE S1IEET
FOOD CORPORATION OF INDIA
As of As of As of As of As of3-31-76 3-31-75 3-31-74 3-31-73 3-31-72
LIABILITIES (Rs Millions)
Subscribed Capital 1,903.6 846.0 837.1 828.6 763.8Capital Advances - - - -Reserves 83.8 74.5 61.7 54.8 52.6Secured Loans 12,194.2 3,978.0 2,876.3 2,842.2 2,935.1Unsecured Loans 1,956.0 1,583.5 1,569.6 1,568.1 2,640.0Current Liabilities 4,948.5 3,480.3 4,495.4 2,253.2 2,589.0Provision for Taxation 40.2 22.2 8.9 26.3 21.5
-21,126. 9,984.5 9,549.0 7,573.2 9,002.0
ASSETS
Fixed Assets 882.8 878.7 813.5 804.8 672.6*Investment at Cost - - - - -
Loans and Advance for Purchase ofFood Grains Against Security 5.9 5.4 26.6 111.5 45.0
Other Advances 68.8 86.9 112.6 77.5 107.5Claims Receivable 113.6 97.8 78.4 54.1 44.2Deposits 230.0 268.8 291.6 350.6 267.0Interest Receivable - - - - M
Stocks (including building materials) 17,311.7 5,674.2 5,075.8 3,235.8 5,707.8 X
Book Debts 2,434.0 2,403.2 2,626.5 2,452.8 1,733.6Cash and Bank Balances 79.5 569.5, 524.0 485.4 424.3
21,126.3 9,984.5 9,549.0 7,573.2 9,002.0
* Less than .1 million.
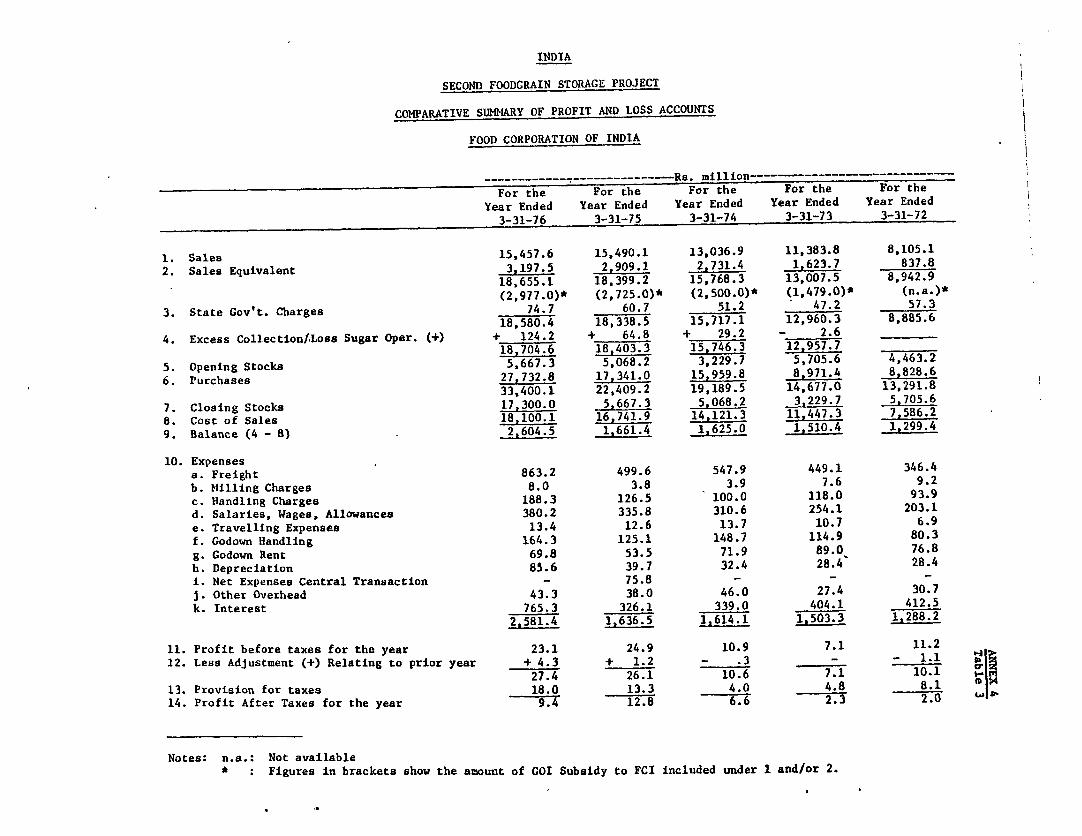
INDIA
SECOND FOODGRAIN STORAGE PROJECT
COMPARATIVE SUM11ARY OF PROFIT AND LOSS ACCOUNTS.
FOOD CORPORATION OF INDIA
…R---------- --------------Rs. million--------------------------For the For the For the For the For the
Year Ended Year Ended Year Ended Year Ended Year Ended_ 3-31-76 3-31-75 3-31-74 3-31-73 3-31-72
1. Sales 15,457.6 15,490.1 13,036.9 11,383.8 8,105.12. Sales Equivalent 3,197.5 2,909.1 2,731.4 1,623.7 837.8
18,655.1 18,399.2 15,768.3 13,007.5 8,942.9(2,977.0)* (2,725.0)* (2,500.0)* (1,479.0)* (n.a.)*
3. State Gov't. Charges 74.7 60.7 51.2 47.2 57.318,580.4 18,338.5 15,717.1 12,960.3 8,885.6
4. Excess CollectionlLoss Sugar Oper. (+) + 124.2 + 64.8 + 29.2 - 2.618,7046. 18,403.3 15,746.3 12,957.7
5. Opening Stocks 5,667.3 5,068.2 3,229.7 5,705.6 4,463.26. Purchases 27,732.8 17,341.0 15,959.8 8,971.4 8,828.6
33,400.1 22,409.2 19,189.5 14,677.0 13,291.87. Closing Stocks 17,300.0 5,667.3 5,068.2 3,229.7 5,705.68. Cost of Sales 18,100. 16,741.9 14.121.3 11,447.3 7,586.29. Balance (4 - 8) 2,604.5 1,661.4 1.625.0 1_510.4 1,299.4
10. Expensesa. Freight 863.2 499.6 547.9 449.1 346.4b. ttilling Charges 8.0 3.8 3.9 7.6 9.2c. Handling Charges 188.3 126.5 100.0 118.0 93.9d. Salaries, Wages, Allowances 380.2 335.8 310.6 254.1 203.1e. Travelling Expenses 13.4 12.6 13.7 10.7 6.9f. Godown Handling 164.3 125.1 148.7 114.9 80.3g. Godown Rent 69.8 53.5 71.9 89.0 76.8h. Depreciation 85.6 39.7 32.4 28.4 28.4i. Net Expenses Central Transaction - 75.8 - _ _J. Other Overhead 43.3 38.0 46.0 27.4 30.7k. Interest 765.3 326.1 339.0 404.1 412.5
2,581.4 1,636.5 1,614.1 1,503.3 1,288.2
11. Profit before taxes for the year 23.1 24.9 10.9 7.1 11.212. Less Adjustment (+) Relating to prior year + 4.3 + 1.2 - .3 - - 1.1
27.4 26.1 10.6 7110.113. Provision for taxes 18.0 13.3 4.0 4.8 8.114. Profit After Taxes for the year 9.4 12.8 6.6 2.3 2 ' >
Notes: n.a.: Not available* : Figures in brackets shov the amount of GO0 Subsidy to FCI included under 1 and/or 2.

ANNEX 4Table 4
INDIA
SECOND FOODGRAIN STORAGE PROJECT
FCI Operational Costs - Grain in Bags(6 to 12 months storage)
Wheat Rice1976-77 1975-76 1974-75 1976-77 1975-76 1974-75
Rs Per Ton
A. ProcurementTo Storage
Market Yard Charges 29.7 29.5 6.0 8.2 8.6 8.2Labor 8.2 9.0 6.1 0. X 0.2 -Temp. Storage 3.6 7.7 2.8 - - -Transport toWarehouse 22.5 21.3 13.6 9.5 7.7 7.7Administration 10.6 11.0 8.8 4.5 4.3 0.9Interest 14.9 27.0 8.0 2.2 - -Gunny Bags 46.4 40.1 35.6 42.8 46.0 44.3Purchase Tax 52.3 48.5 8.0 15.0 13.2 10.8Bank Commission 0.2 0.2 0.1 - - -Dead Stock 1.0 0.7 0.4 0.6 0.6 0.2Sub-Total 189.4 195.0 89.4 83.5 80.6 72.1
B. Storage, Transportand Distribution
Freight NA 61.1 38.0 NA 61.1 38.0Transit Loss 20.6 33.1 20.6 33.1Handling Labor 12.1 9.8 12.1 9.8Labor to Maintain Stocks 16.3 8.9 16.3 8.9Interest 35.8 25.6 35.8 *25.6Administration 19.5 30.3 19.5 30.3Sub-Total 148.2 165.4 145.7 148.2 165.4 145.7
Total 337.6 360.4 235.1 231.7 246.0 217.8
C. Added Cost to Hold inStorage 12 to 24 Months
Labor to Maintain Stocks 22.6 68.3Interest 169.1 150.7Administration 21.6 19.5
Total 213.3 238.5
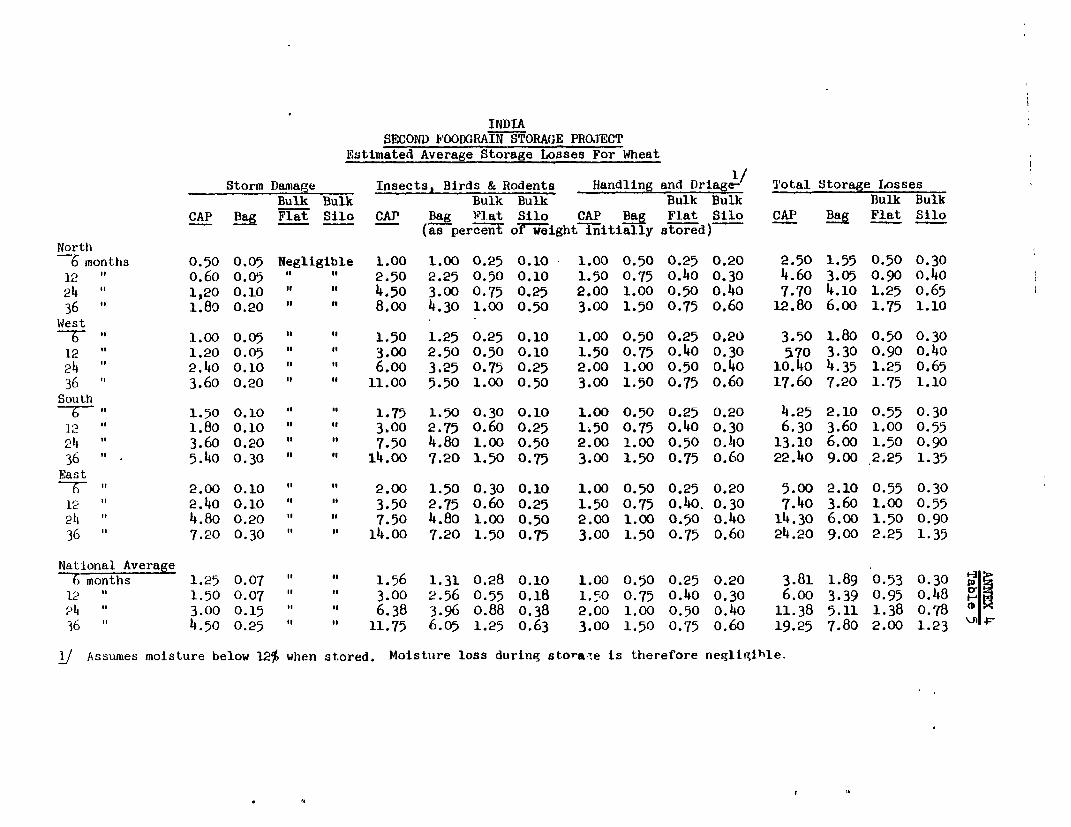
INDIASECOND FOODGRAIN STORAGE PROJECT
Estimated Average Storage Losses For Wheat
Storm Damage Insects, Birds & Rodents Handling and Driage-/ T'otal Storage LossesBulk Bulk Bulk Bulk Bulk Bulk Bulk Bulk
CAP Bag Flat Silo CAP Bag flat Silo CAP Bag Flat Silo CAP Bag Flat Silo(as percenT of weight initially stored)
North6 months 0.50 0.05 Negligible 1.00 1.00 0.25 0.10 1.00 0.50 0.25 0.20 2.50 1.55 0.50 0.3012 " o.60 o.o05 2.50 2.25 0.50 0.10 1.50 0.75 0.40 0.30 4.60 3.05 o.go o.4o24 " 1,20 0.10 4 " .50 3.00 0.75 0.25 2.00 1.00 o.5o o.4o 7.70 4.10 1.25 0.6536 " 1.80 0.20 " 8.oo 4.30 1.00 0.50 3.00 1.50 0.75 o.60 12.80 6.oo 1.75 1.10West
-- h- 8t 1.00 0.05 " 1.50 1.25 0.25 0.10 1.00 0.50 0.25 0.20 3.50 1.80 0.50 0.3012 " 1.20 0.05 " 3.00 2.50 0.50 0.10 1.50 0.75 0.40 0.30 570 3.30 0.90 0.4024 " 2.4o0 o.1o " 6.00 3.25 0.75 0.25 2.00 1.00 0.50 o.40 10.40 4.35 1.25 o.6536 " 3.60 0.20 " ' 11.00 5.50 1.00 0.50 3.00 1.50 0.75 o.60 17.60 7.20 1.75 1.10South
6 l l.ro1.50 0.10 1.75 1.50 0.30 0.10 1.00 0.50 0.25 0.20 4.25 2.10 0.55 0.3012 " 1.80 o.1o " 3.00 2.75 0.60 0.25 1.50 0.75 0.40 0.30 6.30 3.60 1.00 0.5524 " 3.60 0.20 " 7.50 4.80 1.00 0.50 2.00 1.00 0.50 0.40 13.10 6.0o 1.50 o.go36 * 5.40 0.30 " " 14.00 7.20 1.50 0.75 3.00 1.50 0.75 0.60 22.40 9.00 2.25 1.35East
Ei 2.00 0.10 " 2.00 1.50 0.30 0.10 1.00 0.50 0.25 0.20 5.00 2.10 0.55 0.12 2.4o0 o.10 o 3.50 2.75 o.60 0.25 1.50 0.75 0.40. 0.30 7.40 3.60 1.00 0.55211 " 4.80 0.20 " 7.50 4.80 1.00 0.50 2.00 1.00 0.50 o.40 14.30 6.oo 1.50 0.9036 " 7.20 0.30 i 4 11.00 7.20 1.50 0.75 3.00 1.50 0.75 o.60 24.20 9.00 2.25 1.35
National Average6 months 1.25 0.07 1.56 1.31 0.28 0.10 1.00 0.50 0.25 0.20 3.81 1.89 0.53 0.30 A 12 1.50 0.07 3.00 2.56 0.55 0.18 1.5o 0.75 0.40 0.30 6.00 3.39 0.95 o.48 'd 4 3.00 0.15 6.38 3.96 o.88 0.38 2.00 1.00 0.50 0.40 11.38 5.11 1.38 o.7836 14.50 0.25 " 11.75 6.05 1.25 0.63 3.00 1.50 0.75 o.60 19.25 7.80 2.00 1.23
j Assumes moisture below 12% when stored. Moisture loss during stora-te is therefore negliqihle.

INDIASECOND FOODGRAIN STORAGE PROJECT
Estimated Average Storage Losses For Paddy
Storm Damage Insects, Birds & Rodents Handling and Driage! Total Storage Losses&?Bulk Bulk Bulk Bulk Bulk Bulk Bulk Bulk
CAP B Flat Silo CAP B Flat Silo CAP Bag Flat Silo CAP Bag Flat Silo(As % of Weight Initially Stored)
North6 months 0.50 Neg. Neg. Neg. 1.00 1.00 0.25 0.10 3.00 2.50 2.50 2.50 2.50 1.50 0.75 o.6012 to o.60 0.10 " i 2.00 i.65 0.50 0.10 3.25 2.75 2.75 2.75 3.85 2.50 1.25 0.85211 " 1.20 0.15 " " 4.00 2.10 0.75 O.P5 3.50 3.00 2.75 2.75 6.70 3.25 1.50 1.0036 1.80 0.20 " 6.50 2.55 1.00 0.50 3.75 3.00 2.75 2.75 10,05 3.75 1.75 1.25
West6 " 1.00 Neg. " 1.25 1.00 0.25 0.10 3.00 2.50 2.50 2.50 3.25 1.50 0.75 0.60
12 " 1.20 0.10 " 2.25 1.65 0.50 0.10 3.25 2.75 2.75 2.75 4.70 2.50 1.25 0.&)24 2.40 0.15 " .50 2.10 0.75 0.25 3.50 3.00 2.75 2.75 8.40 3.25 1.50 1.0036 " 3.60 0.20 " 7.00 2.55 1.00 0.50 3.75 3.00 2.75 2.75 12.35 3.75 1.75 1.25
South6 " 1.50 0.10 " 1.75 1.15 0.30 0.10 3.00 2.50 2.50 2.50 4.25 1.75 0.80 0.6012 " 1.80 0.15 " 3.00 1.85 o.60 0.25 3.25 2.75 2.75 2.75 6.o5 2.75 1.35 1.0024 " 3.60 0.20 " " 5.00 2.55 1.00 0.50 3.50 3.00 2.75 2.75 10.10 3.75 1.75 1.2536 ". 5.40 0.30 " 9.00 2.95 1.50 0.75 3.75 3.25 2.75 2.75 16.15 4.50 2.25 1.50
East6 " 2.00 0.10 " 1.75 1.15 0.30 0.10 3.00 2.50 2.50 2.50 4.75 1.75 0.80 0.6012 " 2.40 0.15 " " 3.00 1.85 o.60 0.25 3.25 2.75 2.75 2.75 6.65 2.75 1.35 1.002)1 " i4.80 0.20 " 5.00 2.55 1.00 0.50 3.50 3.00 2.75 2.75 11,30 3.75 1.75 1.2536 "1 7.20 0.30 " 9.00 2.95 1.50 0.75 3.75 3.25 2.75 2.75 17.95 4.50 .2.25 1.50
National Average6 months 1.25 0.05 " 1.44 1.08 0.28 0.10 3.00 2.50 2.50 2.50 3.69 1.63 0.78 0.6012 " 1.50 0.13 " 2.56 1.75 0.55 0.18 3.25 2.75 2!75 2.75 5.31 2.63 1.30 0.93
3.00 0.18 " 14.63 2.33 0.88 0.38 3.50 3.00 2.75 2.75 9.13 3.50 1.63 1.13 p
36 " 14.50 0.25 " 7.88 2.75 1.25 o.63 3.75 3.13 2.75 2.75 14.13 4.13 2.00 1.38
I/ Assumes 15% moisture when stored and driage to 13%. Paddy with over 15% moisturewill spoil unless dried before or during storage.
E/ Excl"lde 2% moisture loss, which is not an economic loss.

ANNEX 5Page 1
INDIA
SECOND FOODGRAIN STORAGE PROJECT
Foodgrain Storage Resources and Needs
A. Without the Pro1ect
1. Total storage caDacity available with public agencies and coop-eratives for storing foodgrains is estimated to be about 10.48 million tonsfor 1975/76. The private sector is estimated to an additional 8.0 milliontons. A matrix of storage use and ownership is given in Table 1.
2. FCI has increased its ownership of storage capacity in silos andwarehouses from 2.0 million tons transferred to it by the GOI Department ofFood in 1965-66 to 5.5 million tons in 1975/76. FCI also has about 100,000tons of silo storage and 300,000 tons of conventional bag storage warehousesunder construction. When these are completed at the end of 1977, FCI willhave 700,000 tons of bulk storage capacity and 5.2 million tons of conventionalwarehouse storage capacity. In addition it now operates hired storage spacefor 5.5 million tons. Because of the shortage of varehouse space, about 7.0million tons of foodgrains are stored out in the open under polyethylene coversand stacked on a plinth base (CAP). Details concerning the type and location ofexisting FCI storage are given in Appendix A and IBRD Map 12880.
3. Analysis of FCI Grain Storage Capacity. For bulk grain, staticstorage capacity has been calculated on the basis of 769 kgs wheat per cubicmeter, mhus a grain storage warehouse 21 m by 125 m by 6.2 m contains1,6275 m and has She capacity to store 12,500 tons of wheat. Paddy weighsonly 577 kgs per m ; the same building would have the capacity to store 9,375tons of paddy.
4. Hovever, most FCI warehouses are designed and utilized for storageof grain in gunny bags. A warehouse with the same dimensions as above israted at 5,000 ton static storage capacity for wheat in bags. This capacityis based on a stacking plan designed to hold 100 bags of 100 kgs each perlayer, 15 bags high or 150 tons per stack, and 36 stacks in the building.Alleyways of 1.2 m by 0.75 m enable workers to fumigate, load and unloadany stack without moving other stacks. This arrangement provides for 5,400tons wheat storage which is adjusted to 5,000 tons because the bags usuallycontain slightly less than 100 kgs each and a small working space is reservedfor staff engaged in quality control and record keeping.
5. At 15 bags stacking, a working space of 1.7 m is available aboveeach stack. It is possible to store additional grain by having more than15 layers of bags in the stacks. Each layer above 15 would add 360 tons to
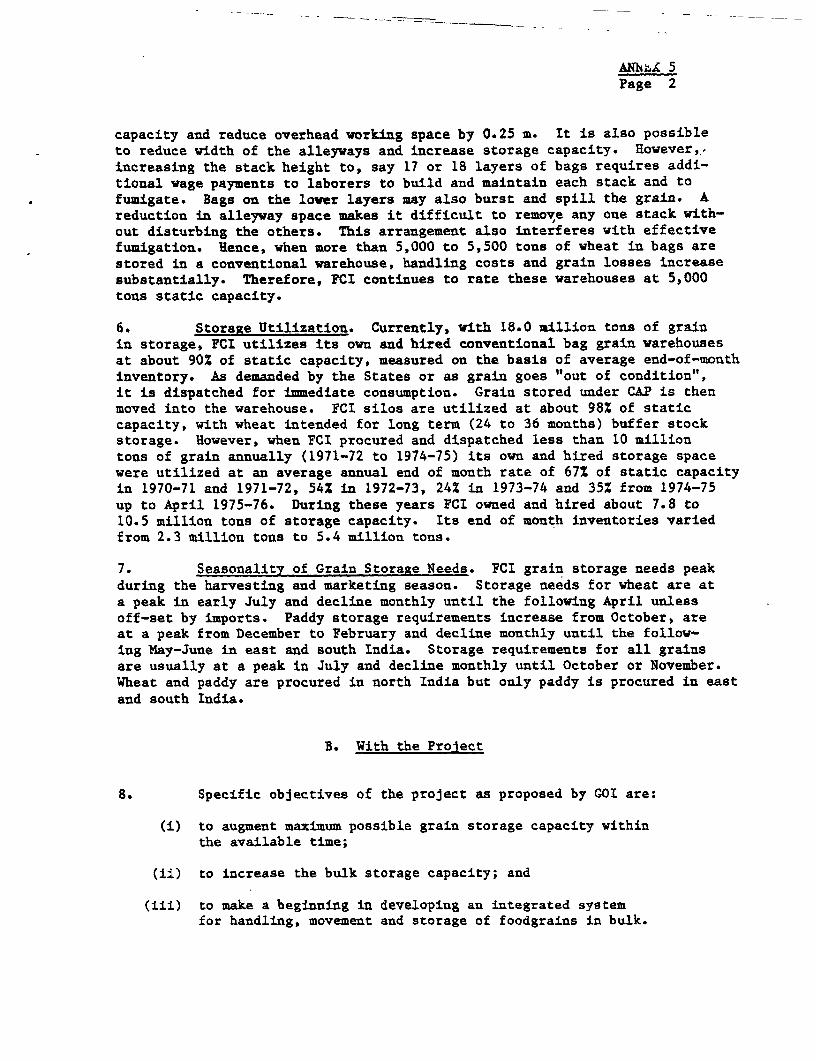
ANNL. 5Page 2
capacity and reduce overhead working space by 0.25 a. It is also possibleto reduce width of the alleyways and increase storage capacity. However,.increasing the stack height to, say 17 or 18 layers of bags requires addi-tional wage payments to laborers to build and maintain each stack and tofumigate. Bags on the lover layers may also burst and spill the grain. Areduction in alleyway space makes it difficult to remov,e any one stack with-out disturbing the others. This arrangement also interferes with effectivefumigation. Hence, when more than 5,000 to 5,500 tons of wheat in bags arestored in a conventional warehouse, handling costs and grain losses increasesubstantially. Therefore, PCI continues to rate these warehouses at 5,000tons static capacity.
6. Storage Utilization. Currently, with 18.0 million tons of grainin storage, FCI utilizes its own and hired conventional bag grain warehousesat about 90% of static capacity, measured on the basis of average end-of-monthinventory. As demanded by the States or as grain goes "out of condition",it is dispatched for immediate consumption. Grain stored under CAP is thenmoved into the warehouse. FCI silos are utilized at about 98% of staticcapacity, with wheat intended for long term (24 to 36 months) buffer stockstorage. However, when FCI procured and dispatched less than 10 milliontons of grain annually (1971-72 to 1974-75) its own and hired storage spacewere utilized at an average annual end of month rate of 67% of static capacityin 1970-71 and 1971-72, 54% in 1972-73, 24% in 1973-74 and 352 from 1974-75up to April 1975-76. During these years FCI owned and hired about 7.8 to10.5 million tons of storage capacity. Its end of month inventories variedfrom 2.3 million tons to 5.4 million tons.
7. Seasonality of Grain Storage Needs. PCI grain storage needs peakduring the harvesting and marketing season. Storage needs for wheat are ata peak in early July and decline monthly until the following April unlessoff-set by imports. Paddy storage requirements increase from October, areat a peak from December to February and decline monthly until the follow-ing May-June in east and south India. Storage requirements for all grainsare usually at a peak in July and decline monthly until October or November.Wheat and paddy are procured in north India but only paddy is procured in east
and south India.
B. With the Prolect
8. Specific objectives of the project as proposed by GOI are:
(i) to augment maximum possible grain storage capacity withinthe available time;
(ii) to increase the bulk storage capacity; and
(iii) to make a beginning in developing an integrated systemfor handling, movement and storage of foodgrains in bulk.

ANNEX 5Page 3
To achieve these objectives the project would finance the construction.ofconventional bag storage warehouses (Model A complexes) with a total capacityof 2.5 million tons, bulk-cum-bag warehouses (Model B, C and D complexes) witha capacity of 1.0 million tons bulk storage and 75,000 tons of port silostorage, adding to a total of about 3.5 million tons. Detailed specifi-cations are given in Annex 7. Cost data are given in Annex 9. In addition,the project would finance rural procurement centers, rail and highway trans-port equipment to receive, handle and transport grain in bulk form (Annex 6),training and operations research and engineering consultants.
9. Estimates of storage requirements based on buffer stocks werecalculated by the "All-India Grain Storage and Distribution Study" group bya special GOI committee and published in their "Report of the Technical Groupon Buffer Stocks of Foodgrains" in November 1976 and by FCI. The results for1980-81 are summarized as:
Maximum Minimum(July) (April)
----- illion Tons-
To store and distribute 12 to 13 milliontons operational stocks annually 8.0 to 8.6 3.3 to 3.6
April 1 Buffer stock carryover 12 12Storage capacity needed 21 16Plus remote area pipeline stocks 2 2
Sub-total 23 18
Less existing warehouse storage with FCI 10 10
Total 13 8
Less hired storage (planned) 3 3
Storage gap 10 5Less Temporary CAP (planned) 3 3
To be constructed 7
10. From 1980/81 onwards, public procurement and distribution of wheatand rice is expected to be about 12.0 million tons and more (see Annex 3,Table 12). Since its share of this activity is expected to be about 80%,FCI would be handling 9.6 millions by 1980/81. The peak storage requirement,occurring in June (see Annex 3, Table 13), for this 9.6 million tons would be6.0 million tons. (Procurement would be concentrated during the harvestmonths while the off-take would be more evenly distributed). At any givenpeak, there would be some storage facilities that cannot be fully loadedbecause they are located in pockets of poor harvest or are temporarilyinaccessible or because there is imperfect substitution between wheat and
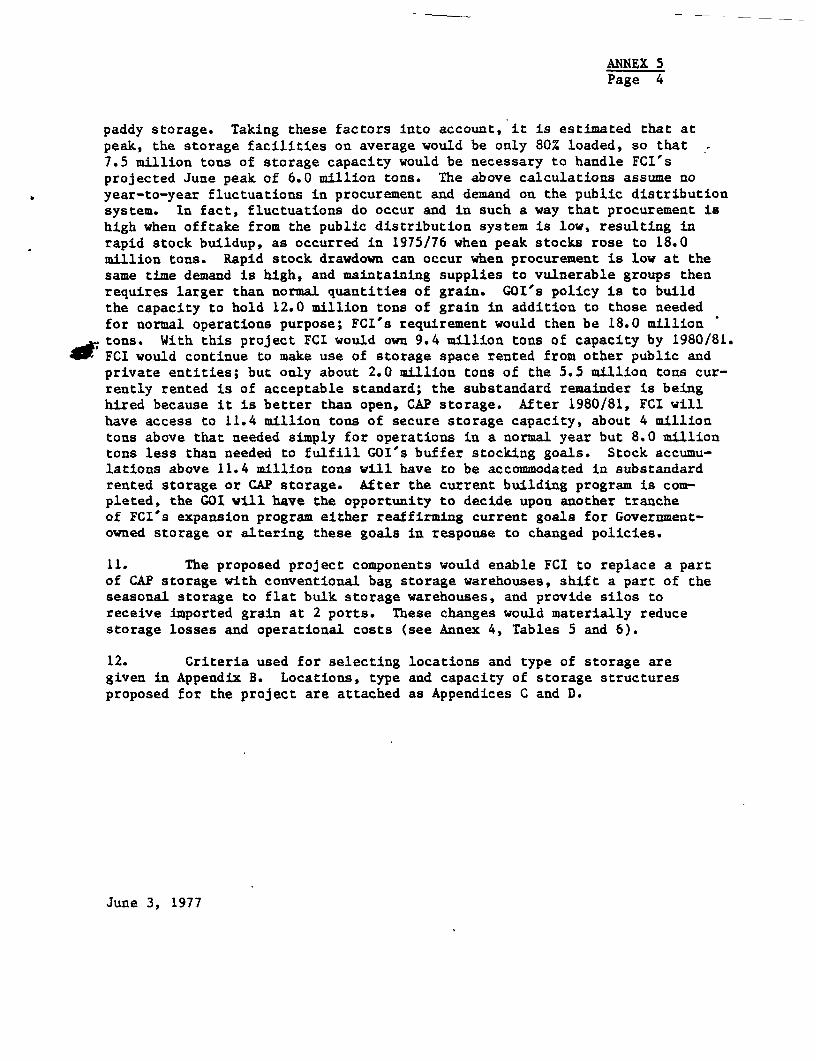
ANNEX 5Page 4
paddy storage. Taking these factors into account, it is estimated that atpeak, the storage facilities on average would be only 80% loaded, so that7.5 million tons of storage capacity would be necessary to handle FCI'sprojected June peak of 6.0 million tons. The above calculations assume noyear-to-year fluctuations in procurement and demand on the public distributionsystem. In fact, fluctuations do occur and in such a way that procurement ishigh when offtake from the public distribution system is low, resulting inrapid stock buildup, as occurred in 1975/76 when peak stocks rose to 18.0million tons. Rapid stock drawdown can occur when procurement is low at thesame time demand is high, and maintaining supplies to vulnerable groups thenrequires larger than normal quantities of grain. GOI's policy is to buildthe capacity to hold 12.0 million tons of grain in addition to those neededfor normal operations purpose; FCI's requirement would then be 18.0 milliontons. With this project FCI would own 9.4 million tons of capacity by 1980/81.
01F FCI would continue to make use of storage space rented from other public andprivate entities; but only about 2.0 million tons of the 5.5 million tons cur-rently rented is of acceptable standard; the substandard remainder is beinghired because it is better than open, CAP storage. After 1980/81, FCI willhave access to 11.4 million tons of secure storage capacity, about 4 milliontons above that needed simply for operations in a normal year but 8.0 milliontons less than needed to fulfill GOI's buffer stocking goals. Stock accumu-lations above 11.4 million tons will have to be accommodated in substandardrented storage or CAP storage. After the current building program is com-pleted, the GOI will have the opportunity to decide upou another trancheof FCI's expansion program either reaffirming current goals for Government-owned storage or altering these goals in response to changed policies.
11. The proposed project components would enable FCI to replace a partof CAP storage with conventional bag storage warehouses, shift a part of theseasonal storage to flat bulk storage warehouses, and provide silos toreceive imported grain at 2 ports. These changes would materially reducestorage losses and operational costs (see Annex 4, Tables 5 and 6).
12. Criteria used for selecting locations and type of storage aregiven in Appendix B. Locations, type and capacity of storage structuresproposed for the project are attached as Appendices C and D.
June 3, 1977

ANNEX 5Appendix A
-NDIA Page 1
SECOND FOODGRAIN STORAGE PROJECT
Location and Type of Existing Grain Storage Warehouses Owned bY FCI
(with capacity of 10,000 tons or more)
Conventional ConventionalLocation-State Warehouse Silos Location-State Warehouse Silos
(Bags) (Bulk) (BagsJ (Bulk)
(000 tons) -
Assam 8ihar
Gauhati 25 Danapur 30
Hajai 10 Digaghat 23
Mokameh 41
Andhra Pradesh Gaya 40 32
Hyderabad 43 Dhanbad 10
Mirialguda 12 6 Kat±har 10
Ti-ancherta 20 Saharsa 12
Krishna Canal 12 Jamshedpur 10
Vijayawadi 10
Biccavole 10 Guiarat
Ongoli 10 Palapur 20
Elluru 10 Salarmati 62
Akividu 10 Ahmedabad 62
Tadapadaguddem 10 6 Viramgam 10
Bhimavaram 15 Godhra 15
Nidadovale 10 Baroda 10
Kaklnada 12

ANNEX 5Appendix APage 2
Conventional Conventional -Location-State Warehouse Silos Location-State Warehouse Silos
(Bags) (Bulk) (Bags) (Bulk)
Hlaryana Maharashtra
Naraina 86 22 Manmad 329 84Faridabad 20 20 Borivle 243 104Hlissar 20 Pune 26Sonipat 10 Nagpur 61Bhimani 14 Sholapur 10Rohtak 19Elanabad 10 OrissaTohara 10Hattu 20 ihrakud 10Fatesabad 10 uhuroa Road 10Karnal 19 Dujhorapalli 10Torori 15 Rourkela 10Kaital 12 Bhubaneshwar 10Pehoma 13Ambala 10
Karnataka
Hubli 10Bangalore 10Krishnapuram 40
Kerala
Calicut 29Cochin 45Mallagunnathokave 29Lavakat 20Muzahappilaged 10Neuilakaka 10Quilon 12Chingavaram 10
Madhya Pradesh
Bhopal 25Bilaspur 28Durg 30Raipur 20 6Guiailor 13Ashok Nagar 10Vidisha 10Jakalpur 10Balaghat 10Naila 10Mahasamand 19Rajum 10

ANNEX 5Appendix APage 3
Conventional ConventionalLocation-State Warehouse Silos Location-State Warehouse Silos
(Bags) (Bulk) (Bags) (Bulk)
Punjab Rajastan
Dhariwal 31 Jaipur 20Amritsar 21 Bikaner 15Kapurthalla 25 Jodhpur 23Jullundar 20 Marwar 10Navranshar 35 Udaipur 25Moga 25 20 Ajmer 15Jagraon 29 20 Sawai Madhopur 10Ludhiana 29 Jhunjhunu 15Khanna 47 Hanumangarh 10Modi Gobindgarh 10 20KotKdpura 24 Tamil NaduSirhind 35Avd14Dhuri 35 Egadi 143
Nobha pur 20 Arkonam 25Sangrur 20 Coimbatore 4Patiala 25 Porto Nova 6
Gurdaspur 10 Samabanrkail 6
Pasuya 10 Thanjavur 50Pacsuiarr 16 Mannargudi 50 6H°shiarpur 16 Tutikorin 10Taran Taran 10 Tirchuirapalli 50Lodhi Hapampur 10Banga 12Phaswari 14Gunnaur 10Balachar 10Kuralu 11Machhivara 12Faridkot 13Talwar Bhai 11Fazilka 10Malaut 10Bhatinda 13Mansa 11Wandi Sabu 10Bubhlapa 10Saman 10Rajpura 12Bancear 10Chowapar 11

ANNEX 5Appendix APage 4
Conventional ConventionalLocation-State Warehouse Silos Location-State Warehouse Silos
(Bags) (Bulk) (Bags) (Bulk)
Uttar Pradesh West Bengal
Hapur 55 100 Siliguri 41Khurja 20 Suri 20Bakfilly 30 Kalyani 43Rudrapur 22 Calcutta 127 100Haravaganj 56 MaldaAgra 42Lucknow 29 20Shapur 20K.anpur 176 72Barelli 30Allahabad 35Varanasi 43Meerut 10Bulandshar 1QKhurja 10 20Moradabad 10Shahjahanpur 10Hatras 10Etah 10Orai 10Hardai 10Mahoba 10Kheri 10Bara Banki 15Fatzabad 23Azamgarh 15
ANNEX 5Appendix BPage 1
INDLA
SECOND FOODGRAIN STORAGE PROJECT
Criteria Used for Site Selection and Type of Storage
A. Warehouses
1. The following factors have been considered in selecting each loca-tion (town) and site (specific plot of land) and type of structure (bag orbulk) for each warehouse storage complex:
(a) Local supply and demand situation and existing and projectedprocurement and/or distribution for each type of grain;
(b) Type, capacity and location of existing grain storage (FCIand others) relative to existing and projected procurementin and near the proposed site;
(c) Transportation resources serving the locale including roadand rail network, and feasibility of a railway siding to thesite (a railway siding would be included in each projectcomplex); and
(d) Storage and distribution strategies and logistics such asprobably moisture content of grain to be procured locally,probable proportion to be procured in bag and bulk, prob-able length of storage, probable direction and distance offlow to intermediate and consumer storage and issue centers,and transportation resources to be used.
2. Guidelines for site selection and type of warehouse have included:(a) storage of operations and buffer stocks of wheat in and near procurementtowns; (b) need for aeration facilities to dry grain and keep it in good con-dition; and (c) use of Models B, C and D for storage of wheat or paddy in bulkfor 12 to 36 months, or (d) use of the Model A warehouses where paddy and ricedo not need drying and for bag handling and storage.

ANNEX 5Appendix BPage 2
B. Port Silos
3. Each silo unit would be located adjacent to a dock where shipscarrying grain can be received and unloaded. Dock sites and facilitiesshould be capable of receiving and off-loading ships of at least 20,000 toncapacity directly into the silo bulk grain conveying system. Docks areselected where annual receipts of more than 300,000 tons of imported grainwould be expected for a silo with 25,000 tons storage capacity and morethan 600,000 tons receipts for a silo with 50,000 tons storage capacity.A railway siding would be included in each complex.
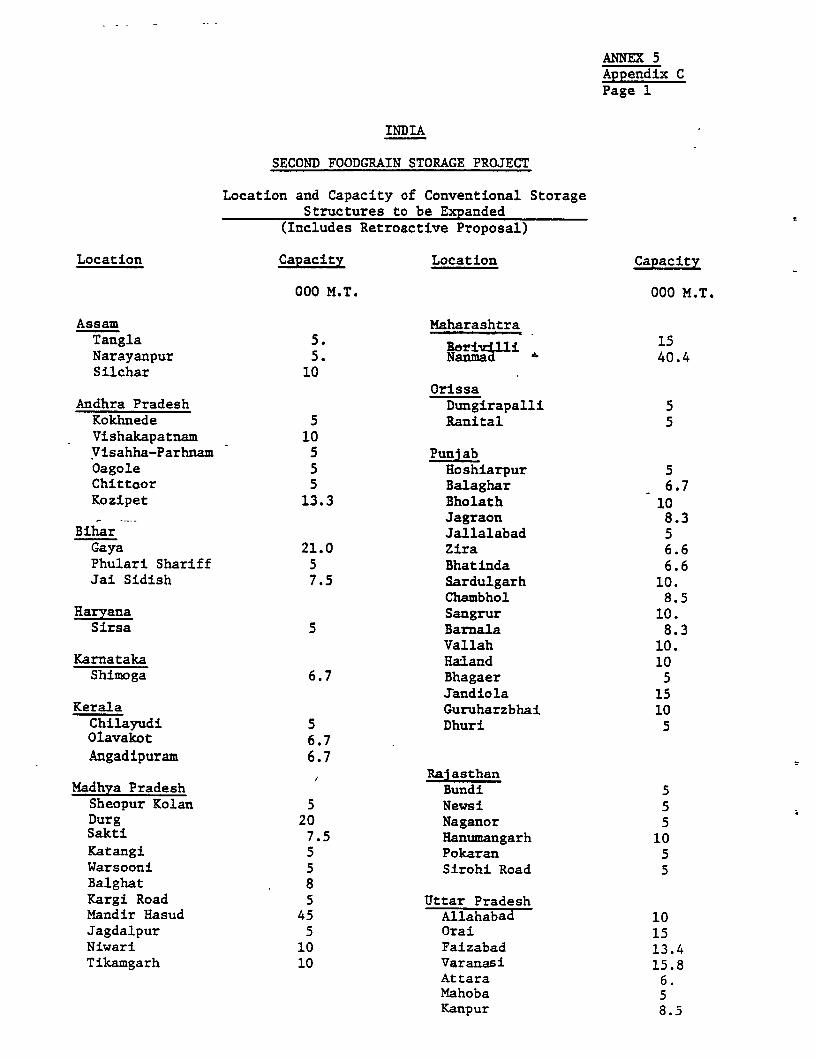
ANNEX 5Appendix CPage 1
INDIA
SECOND FOODGRAIN STORAGE PROJECT
Location and Capacity of Conventional StorageStructures to be Expanded
(Includes Retroactive Proposal)
Location Capacity Location Capacity
000 M.T. 000 M.T.
Assam MaharashtraTangla 5. 15Narayanpur 5. Nanm U 40.4Silchar 10
OrissaAndhra Pradesh Dungirapalli 5Kokhnede 5 Ranital 5Vishakapatnam 10Visahha-Parhnam 5 PunjabOagole 5 Hoshiarpur 5Chittoor 5 Balaghar 6.7Kozipet 13.3 Bholath 10
Jagraon 8.3Bihar Jallalabad 5Gaya 21.0 Zira 6.6Phulari Shariff 5 Bhatinda 6.6Jai Sidish 7.5 Sardulgarh 10.
Chambhol 8.5Haryana Sangrur 10.
Sirsa 5 Barnala 8.3Vallah 10.
Karnataka Ha-land 10Shimoga 6.7 Bhagaer 5
Jandiola 15Kerala Guruharzbhai 10
Chilayudi 5 Dhuri 5Otavakot 6.7Angadipuram 6.7
/ ,Raj asthanMadhya Pradesh Bundi 5Sheopur Kolan 5 Newsi 5Durg 20 Naganor 5Sakti 7.5 Hanumangarh 10Katangi 5 Pokaran 5Warsooni 5 Sirohi Road 5Balghat 8Kargi Road 5 Uttar PradeshMandir Hasud 45 Allahabad 10Jagdalpur 5 Orai 15Niwari 10 Faizabad 13.4Tikamgarh 10 Varanasi 15.8
Attara 6.Mahoba 5Kanpur 8.5

ATNEX 5Appendix CPage 2
Location Capacity
Tamil NaduT.V. Koil 13.5Madras (bulk) 40
Jammu and KashmirTavi 10
New Delhi (Okhla) 10
Manipur 5
Grand Total 645
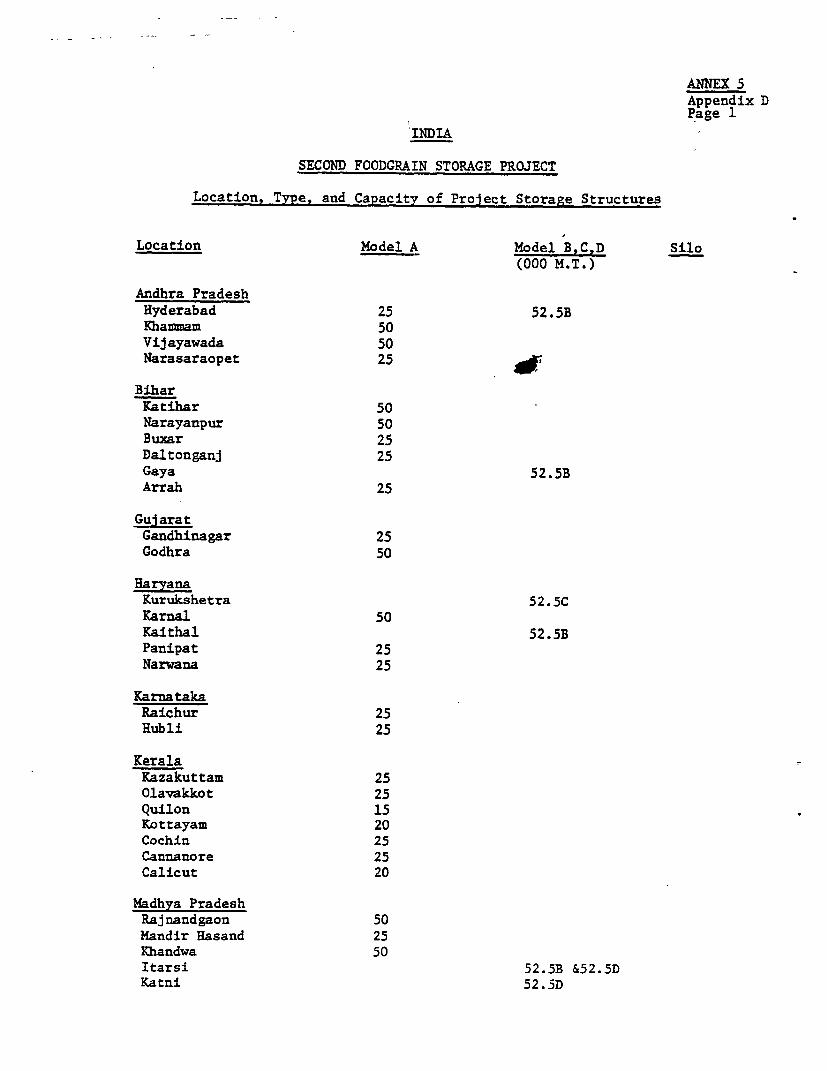
ANNEX 5Appendix DPage 1
INDIA
SECOND FOODGRAIN STORAGE PROJECT
Location, Type, and Capacity of Project Storage Structures
Location Model A Model B,C;D Silo(000 M.T.)
Andhra PradeshHyderabad 25 52.5BKhaumam 50Vijayawada 50Narasaraopet 25
BiharKatihar 50Narayanpur 50Buxar 25Daltonganj 25Gaya 52.5BArrah 25
GuijaratGandhinagar 25Godhra 50
HaryanaKurukshetra 52.5CKarnal 50Kaithal 52.5BPanipat 25Narwana 25
KarnatakaRaichur 25Rubli 25
KeralaKazakuttam 25Olavakkot 25Quilon 15Kottayam 20Cochin 25Cannanore 25Calicut 20
Madhya PradeshRajnandgaon 50Mandir Hasand 25Khandwa 50Itarsi 52.5B &52.5DKatni 52.5D

ANNEX 5Appendix DPage 2
Location Model A Model B,C,D Silo -(000 M.T.)
MaharashtraMiraj 50Wardha 25 52.5D & 52.5BPanvel 50 55.ODBhusaval (25,000 MT alternative centre of Wardha)
OrissaSambalpur 25Jharsuguda 25Berhampur 25
PuniabKotkapura 50 52.5BDhuri 50Sanewal 50 52.5CPathankot 50Patiala 50Raipura 52.5BPathaukot 50
RajasthanSurajtgarh 50Kota 25
Tamil Nadu 150Coimbatore 50Salem 50Katpadi 50Madras Port 25
Uttar PradeshTundla 25 52.5BBarabanki 25 52.5BBasti 25 52.5BMainpuri 25 52.5BSaharanpur 50Muzaffarnagar 50Varanasi (Vyasnagar) 52.5B
West BengalAdra 50 52.5CSiliguri 50Dhankuni 50Haldia 50
Grand Total 1,905 1,000 75

INDIA
SECOND FOODGRAIN STORAGE PROJECT
Grain Storage Use and Ownership Matrix, 1975/76 (million tons)
Grain Storage Use (owned and hired)Grain Storage Food Corporation Central Warehousing State State Warehousing Private
Ownership of India Corporation Govt. Corporation Co-operatives Sector Total
Food Corporation of India 5.47 _ - 5.47Central Warehousing Corp. 0.88 0.36 - _ - 1.24State Govt. 0.71 0.02 1.11 - - 1.84State Warehousing Corp. 0.85 - - 0.05 - - 0.90Co-operatives - - - 1.03 - 1.03Private Sector 1.30 0.34 1.20 0.88 0.82 3.46 8.00
Total 9.21 0.72 2.31 0.93 1.85 3.46 18.48
Sources: (i) All India Foodgrain Storage Project, Project Report, Part I, Food Corporation of India, Annexure XXXV.(ii) ASCI Supporting Study 4, Tables 4 and 5.
Hn

ANNEX 5Table Z
flTDIA
SECOND FOODGRAIN STORAGE PROJECT
FCI Storage Capacit= - Foodgrains
Storage Capacity - Food Grains
Est. Est.3/31/76 4/30/76 3/31177 3/31/78
(Million Tons)Owned 5.47 5.61 6.64 7.45
HiredCWC (conventional) .88 .99 1.22 1.22SWC .85 1.20 1.30 1.30State Govt. .71 .90 .90 .90Private 1.30 2.24 2.24 4.31
CAPowned 1.08 1.75 2.45 2.45
HiredAir Strips - 2.05 3.25 9.00Other .91 1.62 1.62 .60CWC - Plunts - - .41 .41
TOTAL 11.20 16.34 20.02 19.44
FCI Stocks
wheat 5.70 - 10.35 9.36Rice 3.61 5.61 6.41Other Food .86 - .66 .39TOTAL 10.17 14.91 16.62 16.16


ANNEX 6Page 1
INDIA
SECOND FOODGRAIN STORAGE PROJECT
Resources for Transporting Foodtrains
1. Transportation is FCI's largest category of operating cost, account-ing for one third of such costs. Over 70% of FCI's domestic wheat and riceshipments originate in Punjab, Haryana and Western Uttar Pradesh and are movedby rail toward N. Delhi, Patna, Calcutta and Bombay. Imported grains, mostlywheat, are received in bulk at Bombay, Madras, Calcutta, Vizag, Khandla andother ports. They are bagged and moved by trucks to warehouses in or near theport city or by rail if dispatched up country. At some warehouses, the bagsare emptied and the grain is stored in bulk. Details are given in Table 1.
2. Indian Railways (IR) operate more than 60,000 route-kms of railvwaylines throughout India (See IBRD Map 12880). More than 7,000 locomotives areused to pull 19,000 passenger coaches and 290,000 railwagons. Unit trainsloaded with only one comuodity move most of the bulky goods such as foodgrains,fertilizers, iron ore and coal. More than Rs 52.0 billion (US$6.0 billion) isinvested in the system that provides employment for 1.7 sillion people.
3. Since 1965-66, IR has transported 200.0 to 250.0 million tons offreight per year. FCI has moved 7 to 15 million tons of foodgrains with IReach year. The typical unit train locomotive pulls about 75 4-wheeler wagonsor about 35 bogie (8-wheeler) wagons filled with wheat or rice in bags. Thedesign of the hook coupling of 4 wheeler wagons, and siding length limitsthe gross train load to about 2,500 tons. The bogie wagons which are fittedwith central buffer couplers can, however, be handled in trains with grossloads of 45 tons. It requires 6 to 8 days for a unit train to load and delivergrain 100 km. The wagons which are common purpose are diverted for othertraffic after unloading. The current rail-tariff rates on grain transportare the same for private and public agencies. These rates, estimated at about70% of cost, are subsidized.
4. IR and FCI at present have limited experience in railwagon move-ment of wheat in bulk form. Changes required to make rail transport in bulkrather than in bag technically and economically feasible include:
Alternative A. Use of a grain retention door on existing modifiedbogie (8 wheeler) railwagons. The grain door is made from rein-forced corrugated paper. It is used for one trip and discarded.The door jamb on the existing railwagon would need a wooden stripor special hooks added to hold the supplementary door. Themodifications to a bogie (8 wheeler) wagon having 4 doors would

ANNEX 6Page 2
cost about Rs 5,000 per wagon. The paper door costs aboutRs 96. The use of paper doors on modified existing wagonswould enable bulk transportation of grain to reduce handlingcost and enable a unit train operation on a round trip basis.
Alternative B. Replace the existing bogie wagon (8 wheeler)with a specially designed grain wagon. This special type ofrailwagon is used extensively in western Europe, Canada and USA.A special car of 80 ton capacity would cost about Rs 350,000(US$40,000). These wagons can also be used for other types ofbulky and free flowing goods if properly cleaned before loadingwith grain.
5. Truck Transportation. FCI hires commercial truckers to move grainprocured from grain dealers in the Regulated Market Yard, from the farmer'sthreshing floor, from a rice mill to a nearby warehouse and from the ware-house to the railway station. Occasionally the grain will be moved by trucksfrom the storage warehouses to issue market warehouses or flour mills fordistances of up to about 150 kms. Trucks are used to move imported grainfrom portside to nearby warehouses. In all cases the grain is carried inbags, usually 100 kg each in weight and 5 to 6 tons per truck. On arrivalfor storage in bulk warehouses or silos, the bags are opened and dumped.Transport changes vary with distance, road conditions and quantity to behauled and range from Rs 10.0 per ton for up to 10 kms to Rs 30.0 per tonfor 100 kms.
6. Bulk Grain Handling and Transportation. FCI has experimentedwith receiving and transporting wheat or paddy in bulk. Conclusions reachedindicate reduction in costs when equipment and procedures for certain criticalfactors are provided including (a) bulk weighing equipment at the regulatedgrain market; (b) grain tight truck bodies; (c) improved mobility of trucksin the market yard; (d) equipment such as mobile augurs or elevators to loadgrain into the truck; and (e) availability of truck lifting and bulk grainreceiving equipment at the receiving warehouse, silo, flour mill or ricemill. More than 90% of the wheat and paddy received in North Indian markets(over 75% of FCI receipts of domestic grain) are delivered in bulk form bythe farmer in a tractor trolley or truck to the market yard. Providingthe needed equipment at the market yard or by-passing the market yardwith direct delivery by farmers to the FCI warehouse where scales andunloading equipment are installed would be likely to reduce FCI operatingcosts.
7. At this time, FCI owns (including ongoing construction) bulk grainwarehouses and silos with a storage capacity exceeding 500,000 tons at 15locations. The project would add another 1.0 million tons bulk grain storagewarehouses and silos at about 25 locations, and would also provide equipmentsand facilities for receiving, handling and transporting grain in bulk form.
June 3, 1977
ANNEX 6Page 3
7. At this time, FCI owns (including ongoing construction) bulk grainwarehouses and silos with a storage capacity exceeding 500,000 tons at 15locations. The project would add another 1.0 million tons bulk grain storagewarehouses and silos at about 25 locations, and would also provide equipmentsand facilities for receiving, handling and transporting grain in bulk form.
June 3, 1977

INDIA
SECOND FOODGRAIN STORAGE PROJECT
FCI Transportation of Foodgrains by Rail
Rice 1974-75
WestFrom/To Bengal Assam Kerala Maharashtra Others Total
(000 Tons)
Andhra Pradesh 17.3 3.9 225.9 25.2 7.6 279.9Tamil Nadu 23.4 - 93.2 - 1.5 118.1Haryana 32.5 13.9 127.3 7.7 42.7 224.1Punjab 287.0 78.3 136.0 125.9 187.2 814.4Uttar Pradesh 42.2 15.4 12.7 13.0 1.6 84.9Others 21.7 - 14.0 3.1 8.6 '47.4
Total 424.1 111.5 609.1 174.9 249.2 1,568.8
Wheat 1973-74
WestFrom/To Bengal Maharashtra Gujarat Delhi Bihar Others Total
(000 Tons)
Haryana 29 58 39 90 22 114 352Punjab 580 689 170 186 176 837 2638 ^Uttar Pradesh 133 5 - 8 64 72 282 PLBombay Port 3 865 19 47 - 97 1031 ' Madras Port 56 107 107 - 28 230 528 0 NCalcutta Port 747 - - 9 18 774Vizag Port 73 - - - 125 198 396Others 27 33 215 126 26 796 1223
Total 1648 1757 550 457 450 2362 7224
Source: ASCI Supporting Study No. 6.
April 21, 1977
1 s
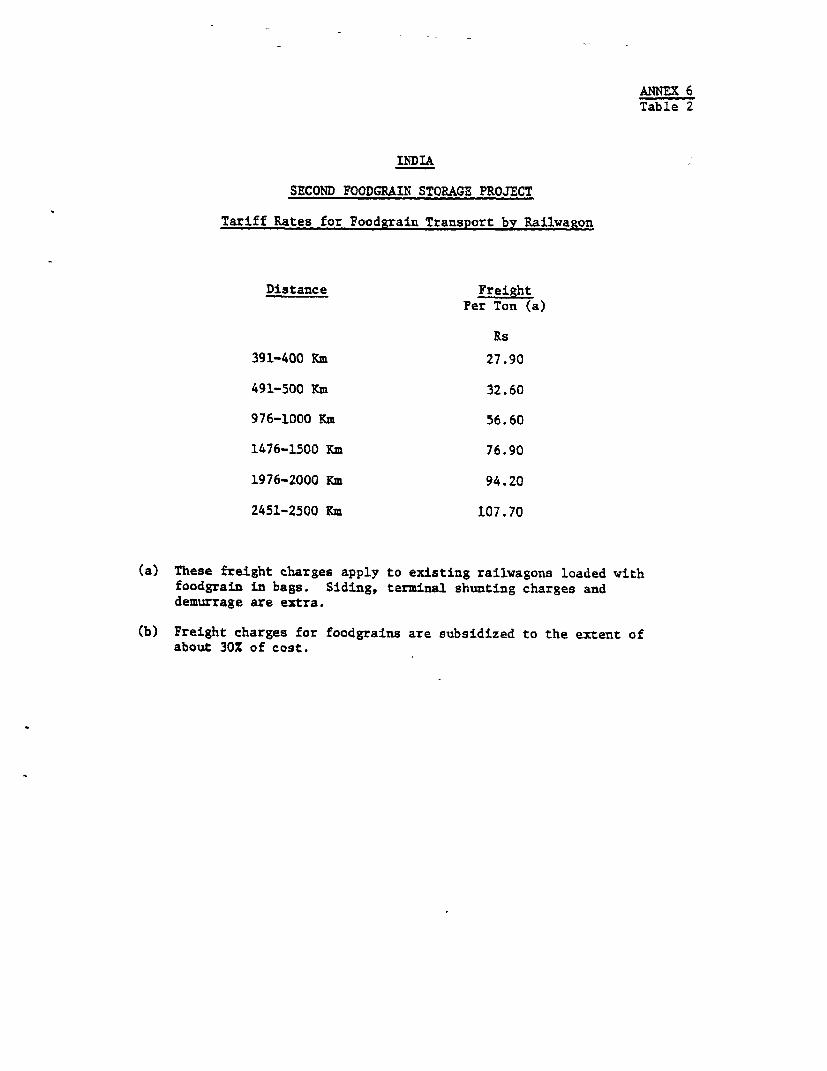
ANNEX 6Table 2
INDIA
SECOND FOODGRAIN STORAGE PROJECT
Tariff Rates for Foodgrain Transport by Railwagon
Distance FreightPer Ton (a)
Rs
391-400 Km 27.90
491-500 Km 32.60
976-1000 Km 56.60
1476-1500 Km 76.90
1976-2000 Km 94.20
2451-2500 Km 107.70
(a) These freight charges apply to existing railwagons loaded withfoodgrain in bags. Siding, terminal shunting charges anddemurrage are extra.
(b) Freight charges for foodgrains are subsidized to the extent ofabout 30% of cost.

ANNEX 7Page 1
INDIA
SECOND FOODGRAIN STORAGE PROJECT
Description and Specifications for Grain Storage Warehousesand Model Complexes
A. General
1. Description and specification are given for several model storagecomplexes for the storage of wheat and paddy under Indian conditions. Theseare:
(a) Model A Warehouse Complex Layout for Bag Storage (Fig 1);
(b) Model B Bulk cum Bag Warehouse Complex Layout (Fig. 2);
(c) Model C Circular Bin Complex (Fig. 3);
(d) Model D Hopper Bottom Bulk Warehouse Complex (Fig. 4); and
(e) Port silos for handling imported grain.
2. The technical specifications outlined in this Annex serve onlyto provide basic requirements. It would be essential that detailed designsand specifications are drawn up for each site. Since FCI has a limited en-gineering staff and limited experience in the construction of warehousesand silos for bulk grain storage, consultants of proven proficiency in thisfield would assist FCI's Project Implementation Section and Technical En-gineering Department.
3. Proposed site locations are shown in Annex 5 and on IBRD map 12880.As soon as specific sites are selected and title to them acquired, completesurveys would be needed to delineate exact boundaries and topographicalfeatures. General soil conditions at each site would be investigated by acompetent soils engineer to determine the best foundation and floor design.Preliminary indications are that piles would be required at most silo loca-tions. If soil investigation for any particular site indicate unusual con-ditions or an undue lack of uniformity, additional surveys would be made ofthe areas within the site boundaries on which the structures could be built.
5. Before inviting tenders, it would be necessary to draw up separateprequalifications for prospective bidders for warehouse and silo construction.Tender documents would be prepared by the FCI Technical Engineering Depart-ment, assisted by consultants. Tenders would define in detail the work

ANNEX 7Page 2
to be executed and would serve as a basis for preparation of working drawingsby the successful tenderer.
6. Tenders received from prequalified contractors would be evaluatedby the technical staff of FCI, with the assistance of the consultants, todetermine conformity with tender invitations. Successf,ul tenders would beawarded construction contracts in conformity with official procedures.
7. Supervision of construction and equipment installation of all unitsto assure conformity with all tender requirements would be provided by FCIassisted by the engineering consultants.
B. Specifications for Motel.A Warehouse Complex (Fig 1)
(50,000 tons Bag Storage)
8. General. The layout of the complex and construction of warehousesare based upon receipt and issue of grain in bags by bullock cart, tractortrailer, truck and railway wagon. The dimensions for each warehouse are21.8 m by 127.6 m by 6.35 m. Each warehouse would be divided by solid par-titions into three equal compartments. The rated capacity for wheat perbuilding is 5,000 tons when the bags are stacked 15 layers high. A typicalarrangement of ten warehouses with a total storage capacity of 50,000 tonsis shown in Fig. 1. Detailed costs are given in Annex 9, Table 2.
Construction Details
9. (a) Footings for the walls and platform are of plain concrete (1:5:10mix) with a thickness of 23 cm. The width and depth of the footings belowgrade is to be in accordance with Drawing No. FCI/FGG/CP VII/2. (b) Thefootings for the columns would be, of reinforced concrete (1:2:4 mix) withdimensions and reinforcing bars for each type of column in accordance withthe drawing referred to above. The columns, bands, beams, lintels and otherreinforced concrete building components would also be in accord with thesame drawing. (c) All floors including those for the platforms would be ofplain concrete 18 cm (8 in) thick (1:2:4 mix) poured in one course over awell compacted fill. A moisture barrier in the form of a polyethylene plas-tic 1.5 mm thick would be placed over the fill to prevent moisture transferthrough the concrete in vapor form from the damp fill underneath. The heightof the top of the floor would be 75 cm (about 30 in) above grade. Controljoints would be constructed in the floors at columns as shown in Fig. 1. Seereferences on concrete floor construction. 1/ (d) A continuous platform 3meters wide would be constructed on the railway side of the warehouse. Indi-vidual platforms would be built on the roadside in front of each door opening.
1/ Slab Thickness Design for Industrial Concrete Floor on grade 1976.Portland Cement Association. Joints for floor on ground 1961.Portland Cement Association.

ANNEX 7Page 3
(e) Wall panels between the reinforced columns and in the gable part ofthe end walls and partitions would be of conventional brick construction.A cement plaster 12 mm thick would be applied to each side of the wall.Two coats of a suitable masoury paint would be applied to the outside wall.(f) Shop fabricated steel tubular trusses giving an unobstructed floor space
within the warehouse would be used for supporting the roof. Cement asbestoscorrugated sheets (7 mm thick) would be used for roofing. (g) Manually oper-ated doors of the rolling shutter type would be provided for each door. Suit-able sliding screen doors would be provided to retard the entry of birdsand rodents. (h) Suitable vall ventilators and screened windows would besupplied in each side wall panel between columns, as shown in the drawingreferred to in (a) above.
C. Specifications for Model B Warehouse Complex (Fig. 2)
(50,000 ton bulk grain storage, 20,000 ton bag storage)
General
10. A complex of four warehouses of the same dimensions as in Model Awould be arranged as shown in Fig. 2. When used for bag storage the ratedcapacity would be 20,000 tons. When used for bulk storage the rated capacitywould be 50,000 tons. The walls would be of reinforced concrete to carry theload imposed by bulk grain. Ventilators and windows would be omitted but doorsare provided. In addition the floor would be constructed to support the addedweight of bulk grain. Additional facilities include five work bins, an officebuilding, weighbridge, railway siding and roads. Electric service for lightingand power, together with water and sanitary facilities would be provided.Detailed costs are given in Annex 9, Table 3.
Construction Detail
11. Building dimensions are the same as for Model A: 21.8 m by 127.6 mby 6.35 m. The walls, columns, footings and tunnel would be of reinforcedconcrete of such design as to resist the loads imposed by bulk grain.
12. The top ends of the columns in the end walls and partitions aretied to columns in the side walls by tie rods as shown on the floor plan inFig. 2. (a) The floor would be of plain concrete 23 cm thick (9 in) placedon a well 2ompacted fll2 adequate for supporting a distributed load of4,900 kg/M (1,000 lb/ft ). 1/ Adequate reinforcement would be provided in
1/ Refer to "Slab Thickness Design for Industrial Concrete Floors onGrade" by the Portland Cement Association, 1976.

ANNEX 7Page 4
the walls, footings and ceiling of the tunnel. A 1.5 mm (6 mil) polyethy-lene plastic would be placed between the compacted fill and the concreteto prevent moisture transfer through the floor. Control joints are to beprovided as shown in Pig 2. (b) Shop fabricated tubular trusses for sup-porting the roof and to provide unobstructed space within the warehouse wouldbe provided. Corrugated asbestos cement sheets (7 mm thick) would serve asthe roofing. (c) Two aeration ducts 610 cm wide (277), one on each side ofthe tunnel would be constructed in the floor of each compartment midway bet-ween the tunnel and the side wall. These would run nearly the full lengthof the compartment to within 1 meter of the wall or partition. These arecounected to the tunnel by an underfloor duct 61.0 cm x 91.5 cm (2 x 3 ft)as shown in Fig. 2. The depth or height of the aeration duct is the sameas the air supply duct, but may taper to a depth of only about 10 cm at theouter end. The aeration duct would be provided with a specially fabricatedcover which would permit air flow throughbit and which would support thedistributed and concentrated floor loads mentioned above. Steel bars 0.5 cmx 6.35 cm s 91.5 cm (3/16 x 2-1/2 x 36") spaced 7.5 cm (3 in) apart would bewelded together with 2 rows of 2 cm diameter spaces pipe between the bars.A 3 x 25.4 mm bar (1/8 x 1 in) welded across each end of the bars forms asteel frame 90 cm x 250 cm (3 x 8 ft). To the top side of this frameworka 1.33 mm (18 Ga) galvanized steel sheet with 2.5 mm diameter perforationswould be spot welded. The uniformly distributed perforations provide a totalnet opening of 20% to 25% of the gross area. The assembly is placed in therecess on each side of the aeration duct to make it flush with the floor sur-face. (d) An aeration and access tunnel would be constructed under the centerfor the full length of each warehouse. Although not needed when the ware-houses are used for bag storage, the tunnels would house the belt conveyorsand serve as air supply ducts for aeration when warehouses are used for stor-ing grain in bulk. The tunnels are interconnected between the two warehousespermitting two fans to be used for aerating the grain in either warehouse.(e) Partitions would be of reinforced concrete construction. A door openingwould be provided in the center bay for movement of trucks and self-propelledscrew conveyors. For bulk storage partitions would be optional. (f) Suitablebulkheads would be provided for all doors when the warehouses are used forbulk storage. They are optional for the door opening in the partition,unless the lots of grains in adjacent compartments are to be kept separate.(g) A coutinuous platform would be constructed on the railway side of thewarehouse. A single platform at each door on the roadside of the warehousewould be constructed. (h) Openings at the eaves and ventilators in theridge of the roof would be installed to provide overspace ventilation vhenwarehouses are used for bulk storage. Both the openings and ventilatorswould be needed when the aeration fans are operated for cooling or fordrying in storage. The aeration system may also be used for ventilating thewarehouse when used for bag storage. All openings and ventilators would bescreened to exclude birds and rodents.
13. Work bins (2,500 tons capacity) constructed of RCC or steel wouldbe used to bag grain for dispatch by truck or rail. A grain cleaner wouldbe optional and could be installed later.

ANNEX 7Page 5
14. Equipment. Belt conveyors are to be installed for conveying graininto and out of storage. Each of these is stationary with the exception ofthose used for loading the warehouses which would be of the shuttle type witha reversible belt. The shuttle conveyor is slightly longer than the length ofone warehouse. Its supporting frame would be mounted on suitable rollers sothat it can be positioned to discharge the grain off the end of the belt at anypoint in either warehouse. The reversible belt would be powered and loaded ata convenient point between the two warehouses where a dead weight also wouldmaintain the required belt tension at all times. Each belt unloading grainfrom the tunnel must discharge through a suitable spout through the tunnel thewall and into the cross conveyor. The spout is provided with an air gate whichwould be closed to make the tunnel air-tight while operating the aerationsystem. In addition the conveyor from the dump pit must be enclosed in an airtight housing where it passes through the tunneX to maintain air tightness ofthe tunnel. Two bucket elevators are required'to elevate grain either of thetwo surge bins for loading into railwagons or to -ither shuttle conveyor forloading the warehouse. Suitable 2-way valves operated from floor level controlthe direction of flow. Crossbracing of the elevator legs, and guy wiressufficient to resist wind loads would be supplied. A suitable ladder andplatform for servicing the elevator head would be i stalled with each elevator.Four 15-hp fans are required, each to supply 680 m /min (24,000 CFM) againsta static pressure of not less than 4.5 smm Hg (2.5 inches in water). One fanwould provide an air flow rate of 0.156 m /min ton (0.15 CFM/bu) to a fullyloaded compartment. A suitable temperature monitoring system would be in-stalled to permit reading the grain temperature at each of 80 locations in thegrain bulk in each warehouse. Copper construction thermocouples would be usedas sensing devices. These would be located at two depths: one-half at a depthof about one meter above the floor and the other a similar distance below thegrain surface. A set of two couples (bottom and top) would be located at everyother roof truss at a distance of 5.8 m (18 feet) from the side walls, and oneat alternate roof trusses in the center of the warehouse. Two 23 cm (9 inch)open screw conveyors would be provided for each warehouse for spreading thegrain as the warehouse is being loaded and for reclaiming it during unloading.Each conveyor would move the grain away from the center of the building whereit is being discharged by the shuttle conveyor. It would be suspended fromthe roof truss and would move on rollers by a suitable drive. When loadingthe conveyor would be in the up position. When unloading grain into the centertunnel it would be lowered by a suitable winch and disconnected entirely formaximum mobility.
D. Specifications for Model C Circular Bins (Figure 3)(50,000 tons bulk grain storage; 2,500 tons work bins)
General
15. A complex of 12 circular bins would be constructed either as illus-trated in figure 3 or according to an alternative layout plan of 3 bins oneach side of a central junction tower, rail siding and work bins. Additionalfacilities would include an office building, weighbridge, rail siding, dump
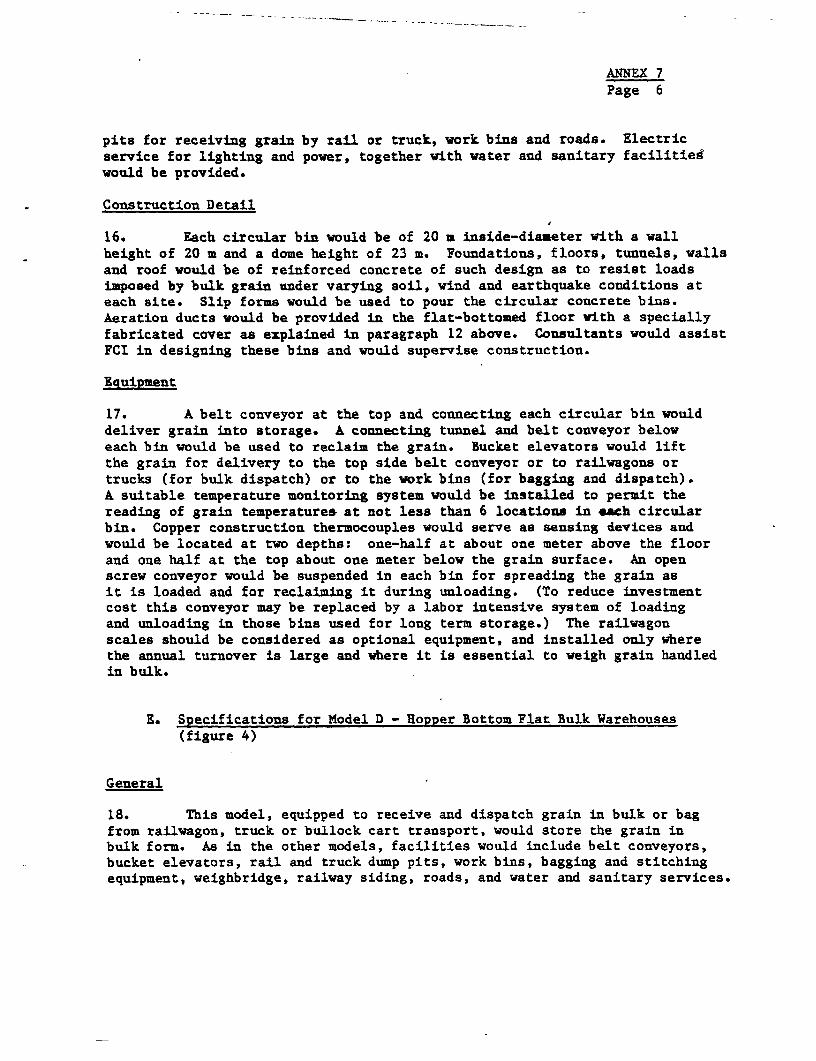
ANNEX 7Page 6
pits for receiving grain by rail or truck, work bins and roads. Electricservice for lighting and power, together with water and sanitary facilitieswould be provided.
Construction Detail
16. Each circular bin would be of 20 m inside-diameter with a wallheight of 20 m and a dome height of 23 m. Foundations, floors, tunnels, wallsand roof would be of reinforced concrete of such design as to resist loadsimposed by bulk grain under varying soil, wind and earthquake conditions ateach site. Slip forms would be used to pour the circular concrete bins.Aeration ducts would be provided in the flat-bottomed floor with a speciallyfabricated cover as explained in paragraph 12 above. Consultants would assistFCI in designing these bins and would supervise construction.
Equipment
17. A belt conveyor at the top and connecting each circular bin woulddeliver grain into storage. A connecting tunnel and belt conveyor beloweach bin would be used to reclaim the grain. Bucket elevators would liftthe grain for delivery to the top side belt conveyor or to railwagons ortrucks (for bulk dispatch) or to the work bins (for bagging and dispatch).A suitable temperature monitoring system would be installed to permit thereading of grain temperatures at not less than 6 locations in each circularbin. Copper construction thermocouples would serve as sensing devices andwould be located at two depths: one-half at about one meter above the floorand one half at the top about one meter below the grain surface. An openscrew conveyor would be suspended in each bin for spreading the grain asit is loaded and for reclaiming it during unloading. (To reduce investmentcost this conveyor may be replaced by a labor intensive system of loadingand unloading in those bins used for long term storage.) The railwagonscales should be considered as optional equipment, and installed only wherethe annual turnover is large and where it is essential to weigh grain handledin bulk.
E. Specifications for Model D - Hopper Bottom Flat Bulk Warehouses(figure 4)
General
18. This model, equipped to receive and dispatch grain in bulk or bagfrom railwagon, truck or bullock cart transport, would store the grain inbulk form. As in the other models, facilities would include belt conveyors,bucket elevators, rail and truck dump pits, work bins, bagging and stitchingequipment, weighbridge, railway siding, roads, and water and sanitary services.

ANNEX 7Page 7
Construction Detail
19. The warehouse may follow the layout plan as given in figure 4 or,alternatively, be arranged in four separate warehouses around a centraljunction tower and work bins adjacent to the railway siding. Constructionis of reinforced concrete designed to carry the grain load factor adjustedfor soil conditions at each site. The hopper bottom, sloped to be entirelyself-cleaning, would be placed below ground level. Width, height of the walland length of the warehouse in either one, two or four structures would be ad-justed to provide 50,000 tons of wheat storage capacity. Consultants wouldassist FCI in designing these warehouses and would supervise construction.
Equipment
20. With a self-cleaning hopper bottom and high roof line, Model Ddoes not need the tunnel and internal grain reclaiming system provided forModels B and C. Temperature monitoring devices and an aeration system wouldbe provided. Belt conveyors, top and bottom, bucket elevators, work binsand bag-stitching machines would be installed. Railwagon scales are optional.A grain cleaning system could be installed later. Throughput capacity forthe conveying equipment would be determined in collaboration with the con-sultant.
F. Specifications for Port Silos
General
21. For silo design, it is assumed that grain, mostly wheat, would bereceived in bulk from boats of 20,000 tons to 40,000 tons capacity. Mostdispatches would be in bulk form by railwagon or truck. However, baggingfacilities would be needed to facilitate local direct dispatches. Railwaysiding adequate to handle a unit train would be provided.
Construction Detail
22. Silos would be constructed in a 50,000 ton unit at Haldia, WestBengal and a 25,000 ton unit at Madras, Tamil Nadu. Each unit would belocated adjacent to the dockside where grain-laden ships are moored foroff-loading. Based on soil-bearing conditions at site, bins would be de-signed with a diameter and height to provide approximately 2,000 tons ofwheat storage space each. Interstitial spaces would be utilized as work-bins and for storage by constructing an overhead cover and connecting walls.Hopper type bottoms should be included in each interstice (to save on re-claiming equipment) and would be optional for the silo bins.
23. Cost estimates have been based on the assumption that the foundationwould be a slab supported by piles. Silos would be constructed of reinforced
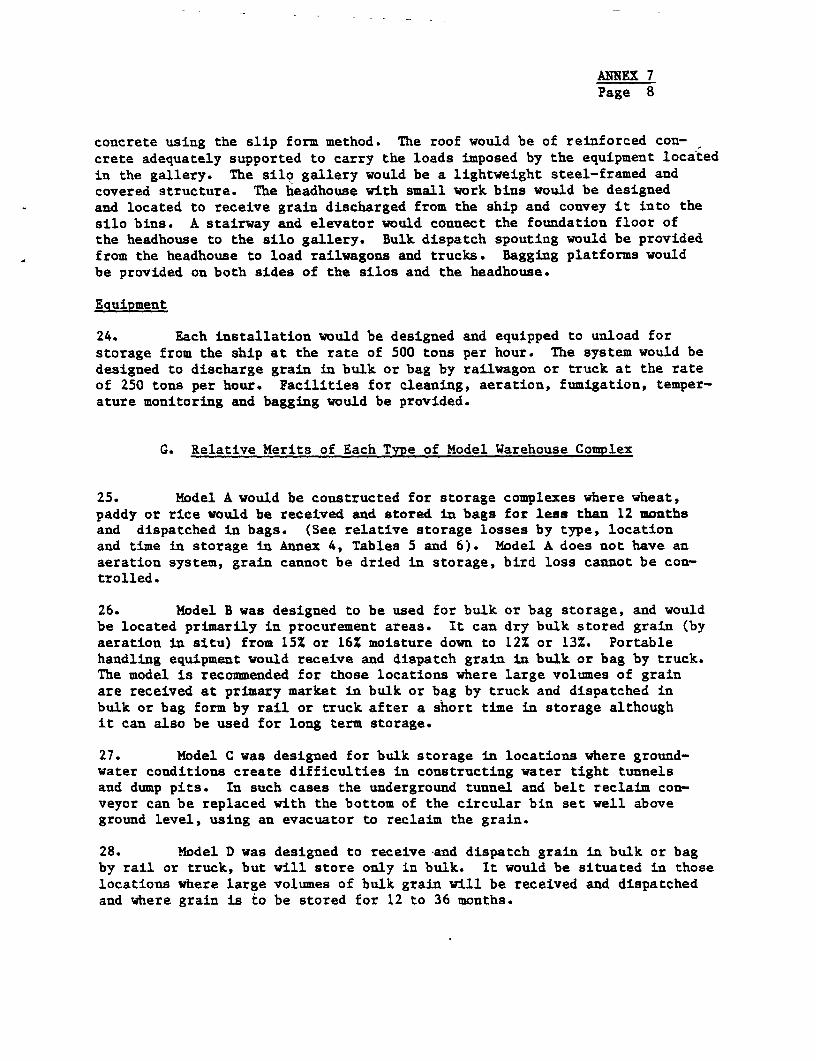
ANNEX 7Page 8
concrete using the slip form method. The roof would be of reinforced con-crete adequately supported to carry the loads imposed by the equipment locatedin the gallery. The silo gallery would be a lightweight steel-framed andcovered structure. The headhouse with small work bins would be designedand located to receive grain discharged from the ship and convey it into thesilo bins. A stairway and elevator would connect the foundation floor ofthe headhouse to the silo gallery. Bulk dispatch spouting would be providedfrom the headhouse to load railwagons and trucks. Bagging platforms wouldbe provided on both sides of the silos and the headhouse.
Equipment
24. Each installation would be designed and equipped to unload forstorage from the ship at the rate of 500 tons per hour. The system would bedesigned to discharge grain in bulk or bag by railwagon or truck at the rateof 250 tons per hour. Facilities for cleaning, aeration, fumigation, temper-ature monitoring and bagging would be provided.
G. Relative Merits of Each Type of Model Warehouse Complex
25. Model A would be constructed for storage complexes where wheat,paddy or rice would be received and stored in bags for less than 12 monthsand dispatched in bags. (See relative storage losses by type, locationand time in storage in Annex 4, Tables 5 and 6). Model A does not have anaeration system, grain cannot be dried in storage, bird loss cannot be con-trolled.
26. Model B was designed to be used for bulk or bag storage, and wouldbe located primarily in procurement areas. It can dry bulk stored grain (byaeration in situ) from 15% or 16% moisture down to 12% or 13%. Portablehandling equipment would receive and dispatch grain in bulk or bag by truck.The model is recommended for those locations where large volumes of grainare received at primary market in bulk or bag by truck and dispatched inbulk or bag form by rail or truck after a short time in storage althoughit can also be used for long term storage.
27. Model C was designed for bulk storage in locations where ground-water conditions create difficulties in constructing water tight tunnelsand dump pits. In such cases the underground tunnel and belt reclaim con-veyor can be replaced with the bottom of the circular bin set well aboveground level, using an evacuator to reclaim the grain.
28. Model D was designed to receive and dispatch grain in bulk or bagby rail or truck, but will store only in bulk. It would be situated in thoselocations where large volumes of bulk grain will be received and dispatchedand where grain is to be stored for 12 to 36 months.

ANNEX 7Page 9
H. Rural Grain Procurement Centers
29. Grain procurement centers are to be established at each of severalprocurement markets in Punjab, Haryana, Uttar Pradesh, Andhra Pradesh and TamilNadu and with all the facilities required for mechanical handling of theprocured grain, including temporary storage in some cases. The grain would betransferred in bulk from the market yard to the center by truck or it may bedelivered directly by the farmer with his tractor trailer, bullock cart, ortruck. In both cases, the grain is sampled, weighed, dumped and conveyed intoelevated steel hopper bins where it is kept until transported by truck to alarger FCI warehouse complex for storage or for shipment by rail to points ofdistribution. The grain may also be cleaned as part of the operations.
30. Two large and four small procurement-centers are to be established,the principal difference being the rate of handling and the total amount whichcan be stored at one time. Estimated costs and equipment components for bothsizes are given in Annex 9, Table 7.
LarRe Centers (2)
31. A storage capacity of 3,000 tons for bulk grain would be providedby ten 300 ton steel hopper bins. The required capacity of handling would bedetermined by the frequency with which loads of grain are dumped. Assumingthat each truck dump will handle ten 5-ton loads per hour, conveying capacitywould be 200 tons per hour. Therefore, the capacity of each of the two beltconveyors from the truck dumps to the elevator legs would be 100 tons perhour and each of the four elevators 50 tons per hour. Each of the two beltsserving the storage bins also need to be of 100-ton-per-hour capacity.
32. If cleaning is required, the grain from one elevator would be runthrough the cleaner at a rate of 50 tons per hour, the cleaned grain beingfed into a second elevator for conveying to the storage bins. The cleaningswould either discharge into a truck or into a small hopper bin adapted forloading out into a truck. Two cleaners may be needed, depending on theamount of grain to be cleaned, but the handling capacity would be reducedto one-half or 100 tons per hour.
33. An optional 1,000-ton warehouse could provide for storing and hand-ling bagged grain and fertilizer.
Small Centers (4)
34. The storage capacity of a small center would be 500 tons, providedby five 100-ton hopper bins and with a handling rate only one-half that ofthe large center. The arrangement for cleaning would be the same. A 500-tonwarehouse could provide for bag storage.

ANNEX 7Page 10
Other Equipment
35. The project also would finance about 50 portable surge bins (1 to10 ton capacity) with portable weighing scales and loading elevators, 50sweep conveyors to load trucks and 50 sets of laboratory equipment. Theseitems would be placed in 10 to 20 rural Regulated Market Yards where wheatand paddy are procured by FCI and transported to its warehouse complexes forstorage and on-shipment.
June 3, 1977

A.'EX 7
INDIA Figure .SECOND FOOOGRAIN STORAGE PROJECT
Model A . Warehouse Complex LayoutTotal Capacity 50,000 T Bag Storage (No Bulk)
Iry < /~~~~~~~~~~21.8 12>6 635 (10 unnvs)
Future Addrcno
L !
LAYOUT PLAN
W..ghfldq
OWesotnq
I! SPanztiot,s Wd
3 _ PletWn_ i t I 7~~~~~~~~~~~~~ -1 r / ~~~~Cenc. Floor
-~ Pluto.-
A .R. S-dmw
FLOOR PLAN CROSS SECT.
i~ ~ ~ ~~~~~F -F-|§ S55QI - -I __,
END ELEV. SIDE ELEV.
World Bak - 17449

ANNEX 7
INDIA Figure ZASECONO FOOOGRAIN STORAGE PROJECT
Models B - Bulk, Cum Bag Warehouse Complex Layout50,000 T in Bulk - 20,000 T in Bags
2,500 T' Work Bins
Wqao Shod of RLY Tr,,C
5 FtC C .as- SOO T Ead C5nflvw @Z2OTIH
FLAT STORAGE C C 5001_
Too Conveyor 200 TimIottom/ CofiWyor 200 TIN
2 ftr.9r MIC5 p ll \ ewtu Prrore,n Irfr Grwn OCalqr _\Mos.ie RA,.wa-
Ra cwOr MECHANISEO FLAT BULK STORE
' WF4. 8-D141 gum v Re \ WITH OIfRATIONAL BINS
MOOEL_-'
__ £ 7r_ZZiF_ Rwno~~~~~~~~~~~~~~~Ocoo
CROSS SECTION FLOOR PLAN
VYtok Bk - 17727
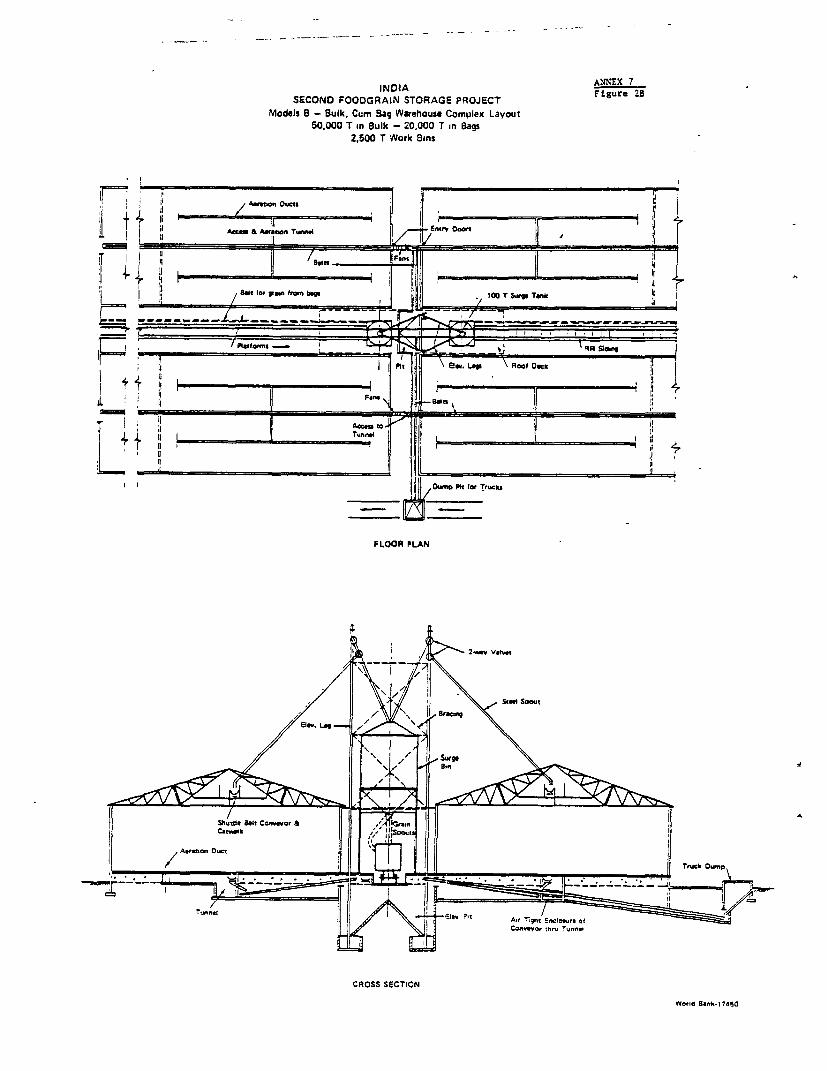
INDIA ANNEX 7SECOND FOOOGRAIN STORAGE PROJECT Figure 2B
Models B - Bulk, Cum Bag Warehouse Complex Layout50,000 T in Bulk - 20,000 T in Bags
2,500 T Work Bins
A.u tUAeOw ts Ii __ __Own
;;~~- / f .5,4 1, I ! ,$ X ib,. ,. fw ,,.-& fw bo i,1,00* T Surge Tank
t-uL-E- zL- ;fr_i f __ _ _____ _ _ _
2eevPi for T, k
/~ -\ T ' ~I ' FLOORi PLAN
/ pU
Swel Scout
" / S/ 1 ESue
I / 9ura0on ouct I ¢ I I ] TrWk Oumo
.,l ...F -of
Convero, tnu Tunn.
CROSS SECTION
World Bnk.1 7450
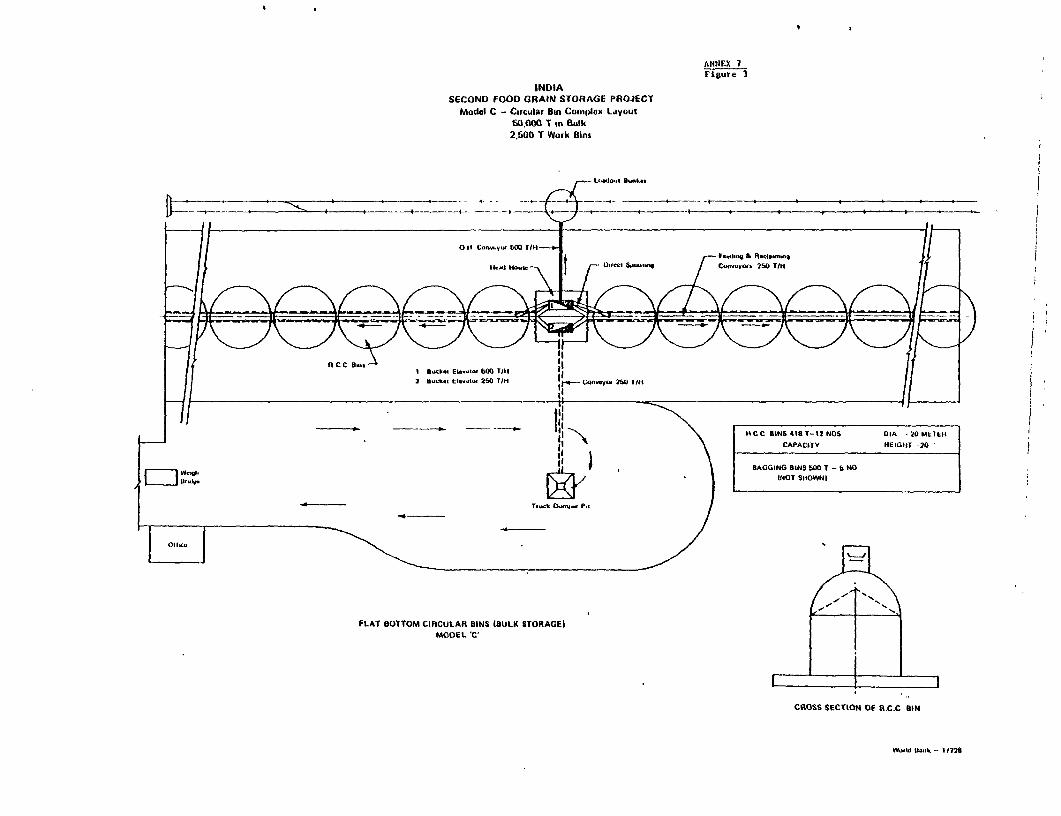
ANNEX IFigure 3
INDIASECOND FOOD GRAIN STORAGE PROJECT
Model C - Circular Bin Complex LdV°utfi0,00 T in Bulk2,500 T Wofk Bins
Loada.u Banc W
I-Ol E16-t 4.6O0 TIN
|| 011~~~~~~~~~~~~~~i.a Hqa nue bO,n -I_t ||a.yn 2 I
2 fianl u .Ck .. uu250 T/i Cq'my 250 T/HW} F y iii~~~~~~~~~~~~~~~~~~~~~~~~~~~~~~~~~~~~~~~i
| i 1 N A C C BINS 4sA T- 12 NOS DIA 20 METEII
II ~~~~~~~~~~~CAPACITY HEIGHT -20
BAGGING BINS 500T -b NO
[i H Fi~ 7 INOT SHONWNI
Tua-k Oumu P./
fLAT BOTTOM CiFtCULAi BINS (BULK STORAGEIMODEL 'C'
CRSOSS SECTION OF a.C: BIN - 12
~~~~~~~~W, --.~ 1--1728
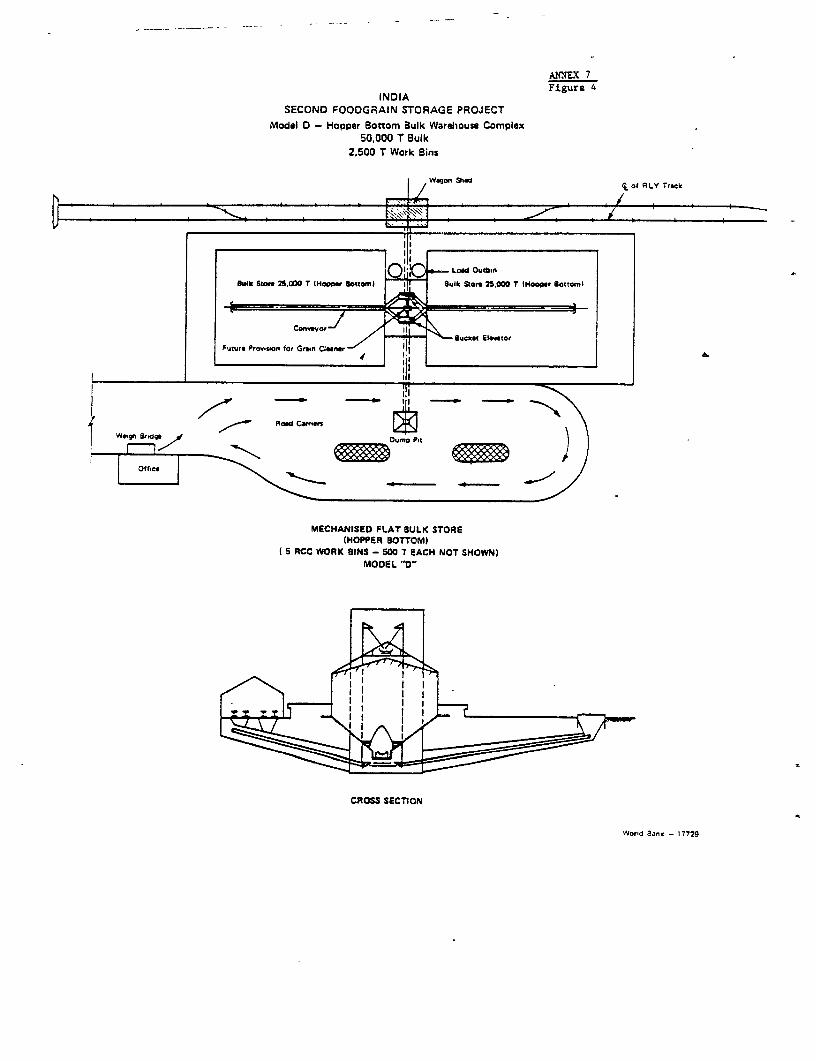
ANNEX 7
Figure 4INOIA
SECOND FOODGRAIN STORAGE PROJECTModel 0 - Hopper Bottom Bulk Warelhouse Complex
50,000 T Bulk2,500 T Work Sins
WqO.t Shad ( of FILY Track
O! _ LoWt Ourthn _k Stm 2300T(HppeBottom)Sulk Store 25.000 T lHoo.r eottornl
Convevor- IIBucket SI.wtor
Future Prowt.uon for Gran Clner
I A.~~~~~~~~~~~~~~~~~~~~I
..- ~Road Ct.rnrn
Sid9 Oftir A z_
MECHANISEO FLAT SULK STORE(HOPPER 80TTOM)
I5 RCC WORK SINS - SW T EACH NOT SHOWN)MODEL "D"
CROSS SECTION
Worid San. - 17729

AANNEX 8Page 1
INDIA
SECOND FOODGRAIN STORAGE PROJECT
Prolect Organization and Management
A. General
1. 'The Ministry of Agriculture and Irrigation would have overall res-ponsibility for organization and management of the project. The Secretaryfor Food and the Central Storage Committee (CSC) of the Ministry would beresponsible for achieving coordination of actions among the various componentagencies within GOI and between GOI and the respective State governments.Members of CSC include the Additional Secretary for Food Chairman of FCI,Chairman of Central Warehousing Corporation and representatives from theFinance Ministry, Railway Ministry and Planning Commission. FCI would beresponsible for implementing the project.
B. Prolect Implementation Division
2. A Project Implementation Division (PID) within FCI would be respon-sible for project execution under the direction of its chairman and the CentralStorage Committee (CSC). The two engineering sections now operating in FCI(Annex 4, para 40) together with a new section, would make up PID which wouldbe placed in the charge of a chief engineer with 10 years or more experiencein the design and construction of grain storage facilities. The PID therefore,would have three sections: the first would be responsible for the constructionof Model A conventional warehouses; the second for the construction of theModels B, C and D bulk warehouses and port silos; and the third for financeand administration. The heads of each section would have the equivalent ofMasters Degree in their professions and a minimum of 5 to 12 years experience.FCI's current staff of about 850 engineers and draftsmen would go up to about1,500 and there would be an increase of about 150 officers with training inadministration and accounting. Details of the existing and proposed patternand qualifications for staffing are given in Appendix A.
3. The Conventional Storage Section would be constructing 2.5 mil-lion tons of bag storage at 119 sites. It would engage the engineeringservices of the Central Warehouse Corporation (CWC) and the Central PublicWorks Department (CPWD) to execute a part of their construction program.Both CWC and CPWD currently perform site studies, prepare and execute tenderdocuments and contracts, and supervise construction work on behalf of FCI,mostly on a "turn key" basis. They would continue to perform these functionswith the project under the supervision of the Conventional Storage Section.

ANNEX 8Page 2
CWC would concentrate its work on about 500,000 tons of storage capacity atabout 25 construction sites in Rajasthan, Orissa, the eastern part of AndhraPradesh, and one or two selected locations in Karnataka, Maharashtra, MadhyaPradesh, Uttar Pradesh and Punjab. CPWD would also supervise construction ofover 500,000 tons at about 20 sites in Uttar Pradesh, Bihar, Madhya Pradeshand Punjab. The Conventional Storage Section itself would be directly incharge of constructing the remaining 1.5 million tons at 74 sites in 10 states.
4. The Bulk Storage Section, assisted by domestic and expatriateconsultants, would evaluate sites, prepare building designs and layout plans,determine specifications, prepare tender documents, evaluate bids and super-vise construction of the 1.0 million tons of bulk storage and port silos.It would also be responsible for the construction of the rural grain procure-ment centers.
5. The Finance and Administration Section would be responsible formaintaining detailed accounts of all project fund commitments and expendi-tures, separate from FCI's other activities. It would also maintain separateproject personnel registrars and contract documentation, engage in landacquisition, and execute all contract documents required for the project.This Section would be responsible for preparing monthly, quarterly and annualreports of project activities. These reports would be provided to the ChiefExecutive Officer, FCI management, CSC and IDA.
6. The Chief Executive Engineer would supervise the overall imple-mentation of the project (including the operations research and trainingprograms) and the monitoring of its progress.
7. Transport Equipment. The project provides FCI with especiallydesigned trucks and funds for rehabilitation of existing private trucks hiredto transport bulk grain (Annex 9, Table 8). The project also provides hopperbottom railwagons, enough for I unit train; and paper grain retention doors,enough for 12 unit trains, for 3 years operations. FCI would store the grainretention doors at the silos and bulk warehouses for installation in rail-wagons used to transport grain in bulk. The Railways would operate one unittrain with about 45 special railwagons and 12 unit trains with paper retentiondoors to transport about 500,000 tons of grain in bulk each year for FCI.
8. Designs Development and Operations Research. The project wouldprovide Rs 3.9 million (US$457,000) for FCI to develop designs for specialrailway wagons and modification to existing railway wagons, and conductoperations research studies to ascertain comparative costs of receiving,handling, storing and transporting grain in bag and bulk. These studieswill review relative costs and benefits of the different classes of ware-houses - Model A, B, C and D warehouse complexes as well as CAP storage -

ANNEX 8Page 3
when used in different centers 1/ and for varying periods of storage. Simi-larly, alternative transport facilities and usage would be evaluated. Bag-transport would be compared with bulk transport using conventional trucks,special grain trucks, paper grain retention doors on railwagons and hopper-bottom grain wagons. Such studies are being financed to obtain much moredetailed information concerning the costs and benefits o,f the system of bulkhandling, storage and transportation of grain (which would be provided underthe project as a pilot scheme), as compared to existing bag system, in orderthat the use of existing storage facilities may be optimized, and the planningand design of future storage projects be made more effective. Assurance wouldbe sought from GOI that plans acceptable to IDA would be prepared for carryingout such operations research studies.
9. Training. FCI operates its own training program on administrationand quality control and also uses other agencies for in-service training of itsstaff. The project would increase substantially the need for additional stafftrained in grain procurement, handling, transport, storage, drying and qualitycontrol, as well as in accounting and management. The project would thereforeprovide Rs 3.5 million (US$400,000) to finance (a) the expansion of FCI's cur-rent training program, including provision of more adequate training facili-ties; and (b) overseas travel and study tours for about staff members. Theoverseas training program would concentrate on the training of experts inbulk grain handling, storage, transport and quality control and would trainstaff members for posting to the new bulk grain storage warehouses and portsilos. These staff members would also participate as teachers in local train-ing programs at the All-India Grain Storage Training Institute at Hapur. TheChairman or Managing Director would designate an especially qualified trainingofficer to be responsible for planning and organizing both the domestic andoverseas training program. PCI would prepare terms of reference for thetraining program for IDA's review and comment.
C. Procurement
10. All procurement would be in accordance with the World Bank guide-lines. In all international competitive bidding, domestic bidders would begiven a 7-1/2% preference on civil works, and a 15Z preference on equipments,based on the c.i.f. price of each item or the actual tariff applicable,whichever is lower.
11. Civil Works. FCI would prequalify all domestic and foreign biddersfor civil works. On that part of bag (Model A) construction program begun byGOI and proposed for inclusion under the project and in part for retroactivefinancing, presentation of tender documentation for civil works is already inprogress at several of the sites and contract awards are expected to be com-pleted by Board presentation. For the other sites, since construction wouldbe scattered, the value of ecah contract relatively small (most are expected
1/

ANNEX 8Page 4
to cost less than US$200,000 each) and Indian contractors are competitive inthis kind of construction, international competitive bidding would not besuitable. Instead, tenders would be nationally advertised in packages ofthree or more contracts, except in states where only one or two structuresare to be built. Contractors would be able to bid for any one contractindividually or for any combination of contracts or for the entire package(total cost US$21.2 million).
12. For the new construction of new bag storage warehouse (Model A),international competitive bidding would again not be suitable for the samereasons as given above. Instead, for each site, tenders for civil works,auxiliary buildings, electricals, and site improvement would be let in onecontract, and the railvay sidings would be let in a separate contract. Totalcost is estimated at US$56.3 million. Tenders would be packaged and adver-tised nationally and state wide as sites become available. Bid procedureand evaluatiou would be the same as described in para 11.
13. Civil works (US$24.0 million, at 19 sites in 9 states) for bulkstorage (Models B, C and D) warehouse complexes would be grouped in packagesof three or more contracts and awarded on the basis of international compe-titive bidding. Civil works for the two port silos (US$7.5 million) wouldbe combined into one contract and awarded on the basis of internationalcompetitive bidding.
14. Civil work contracts for railway sidings (US$18.2 million) rangefrom US$200,000 to US$300,DOO each. The work at 73 sites is highly specia-lized, and needs to be coordinated closely with the existing railway system.Competitive bidding therefore would not be appropriate, and civil work con-tracts for each location would be awarded by FCI to the Railway Board subjectto review and approval by IDA.
15. Electrical/Mechanical Ecuipments. Separate tenders will be pre-pared for weighbridges, temperature indicator systems, aeration fans andducts, railway scales, passenger elevators and railwagon movers for all sites,bulked to the extent practical, and awarded on the basis of internationalcompetitive bidding. Miscellaneous equipment items not lending themselvesto bulking or expected to cost less than US$100,000 when bulked would beprocured by nationally advertised tenders, and prudent shopping would beused for items costing less than US$10,000. Tenders for material handlingsystems, i.e. grain conveyors, bucket elevators, truck dumpers, grainreclaimers, grain valves and spouts for all the sites would be packagedto the extent practical and awarded on the basis of international compe-titive bidding. The hopper-bottom railwagons and paper grain door retainerswould be packaged separately and awarded on the basis of international com-petitive bidding on a one-time basis. The 50 grain trucks would be pro-cured on the basis of nationally advertised competitive bidding fromsuppliers able to provide spare parts and maintenance services.
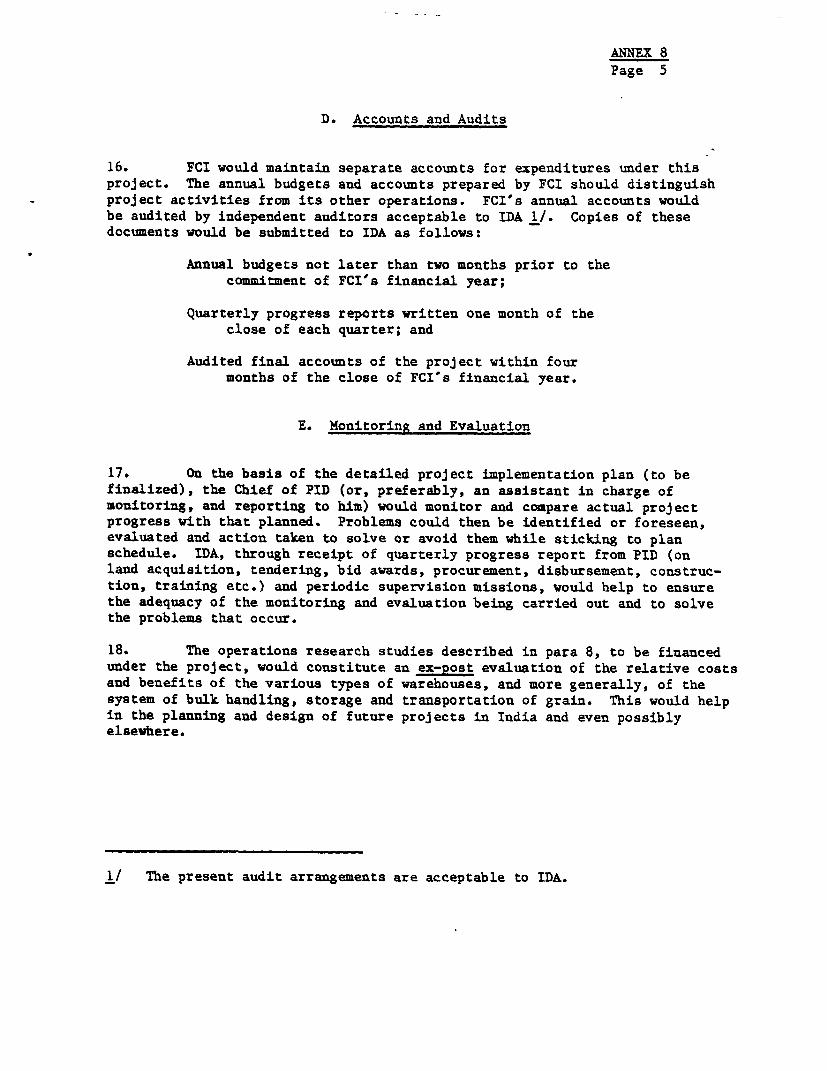
ANNEX 8Page 5
D. Accounts and Audits
16. FCI would maintain separate accounts for expenditures under thisproject. The annual budgets and accounts prepared by FCI should distinguishproject activities from its other operations. FCI's annual accounts wouldbe audited by independent auditors acceptable to IDA 1/. Copies of thesedocuments would be submitted to IDA as follows:
Annual budgets not later than two months prior to thecommitment of FCI's financial year;
Quarterly progress reports written one month of theclose of each quarter; and
Audited final accounts of the project within fourmonths of the close of FCI's financial year.
E. Monitoring and Evaluation
17. On the basis of the detailed project implementation plan (to befinalized), the Chief of PID (or, preferably, an assistant in charge ofmonitoring, and reporting to him) would monitor and compare actual projectprogress with that planned. Problems could then be identified or foreseen,evaluated and action taken to solve or avoid them while sticking to planschedule. IDA, through receipt of quarterly progress report from PID (onland acquisition, tendering, bid awards, procurement, disbursement, construc-tion, training etc.) and periodic supervision missions, would help to ensurethe adequacy of the monitoring and evaluation being carried out and to solvethe problems that occur.
18. The operations research studies described in para 8, to be financedunder the project, would constitute an ex-post evaluation of the relative costsand benefits of the various types of warehouses, and more generally, of thesystem of bulk handling, storage and transportation of grain. This would helpin the planning aud design of future projects in India and even possiblyelsewhere.
1/ The present audit arrangements are acceptable to IDA.

- ~ - InflIA A_X 8Apenidix A
PeR'rT Dt4ltF4PNTATToN rVITO -TU FCI
arISTIt AND r1NR)fED S'TA"T%G I'ATTM
lo. of Personsto r tion To Be AddeJ Total ;zaitications and Experience
Cbief of MD * 1 1 Graduate or Mster Degree Zag.10 yeas experience in gran storaeo
Co.esdtmU 60 mn-goat"a Internatiale experienee In designing' d enatructing grain atorae atructurga
Section I - Conventional Storage Structurea
Senior giane.ring Manager 1 1 Graduate or eater Degree Eng.5 yeors or more experi.nce in grain stCage
Engineering Manager 1 1 Graduate Eg. 5 yeaa experience
Joint ftg. MInr 57 i Graduate Mg. > years experience
Deputr Log. Manager - 7 25 72 Degree og. 1 year experience
Assistant g. Manager 268 62 330 Degee kg 2 ye*s experience
Junior Log. Manager 44g 159 608 Degree ft. 1 yar experience
Hewd Zrsfls 1 - 1 Diplom g. 5 year experience
Draftsmen 10 15 25 _ Mpl^ g. 2 year experience
Supporting Staff 280 7 9S3
Subtotal 1.067 977 2.04
Section I! BuLk Flat Storage uad ilo Strueture.
Engioering Manar 1 1 2 Graduate or Meeter Degree EN.5 years or acri experience grain atorage
Jo.nt Ehg. Manager 2 16 18 Graduate in !ng. with 5 years experienceas Deputy Mgr. Eng.
Deputy og. Manager 10 32 42 Degree in Eng. with 5 years experiencea Assistant Kgr. Eng.
Assiatant lbg. Anager 14 93 107 Degree in Eng. 2 year. experience
,Tunior Manager 31 209 240 Degree or Dploa in Log. 1 year experience
Need Drattsmen . 4 4 Diplcr in Eng. with 5 years experience
Draftin 5 39 44 Diplona In Log 2 year experience
Tracer 1 3 4 Matriculate Technical training indrawing and 2 year. expertence
Snppmting Staff 221 2.1
Subtotal 94 618 712
Section III Finance and Adminitration
Finance Manager - 1 1 Charted Account&nt/AXCWA/ACA with 2ini-n12 yeas includlag 4 year as Joint Manageraccainte
Joint Manager (Accounts) 2 4 6 Chartered Aect. with 8 yeaen experience
Deuty Yanager (Accunte) 6 16 22 Chartered Acet. wlth 5 year. experience
Deuty }anaer (General) 1 4 5 Graduate Dlpleoa in ala. Mgt.5 year. experience
Deputy MAnager (Legal) 1 2 3 Degree in Law 5 years experience withPUblic Sector Undertaking
Assistant Mnger (Accounts) 33 lO0 137 Chartered Acct. with 3 Yea" experience
Aaaistant Manar (reneral) 4 22 26 Grad. Dipla Dua. Mgt. 3 year. experience
Supeprting St" 550 936 1. 486
SubtotSl 597 1,089 1 f,f
Gre,r1 Total 1,7)1 2,685 4,441
R/1/77

ANMNTable1
INDIASECOND FOODGRAIN STORAGE PROJECT
Comparative Estimated Cost for Grain Storage Warehouses 1/
Model A Model B - Model C Model DConventional Bag Bulk Cum Bag 12 Circular Bins Flat Bulk Store
Flat Bottom Flat Bottom Flat Bottom
(Rs Millions)1. Land 1.50 1.00 1.00 1.00
2. Civil WorksWarehouses-Bins 10.50 -6.00 6.80 5.40Work Bagging Bins (2500T.) 1.25 ,1.25 1.25Junction Tower-Tunnels, etc. 1.50 '1.70 1.50Auxiliary Bldgs. 1.15 1.15 1.15 l lSRoads-Site Imp. 1.00 0.50 0.50 0.50
Railway Siding 3.00 2.25 2.25 2.25Sub-Total 15.65 12 .65 13.65 12.05
3 Electrical-Mech. EquipmentElectricals-Installed 0.15 0.77 0.80 0.77Conveyor System 1.35 1.87 1.35Bucket Elevators 0.65 0.65 0.65Truck Dumper 0.20 0.20 0.20Weighbridge 0.20 0.20 0.20 0.20Tezperature Indicator System 0.20 0.20 0.20Bagging-Stitching Machine 0.24 0.24 0.24
Aeration Fans-Ducts 0.20 0.20 0.20
Reclaiming System 0.70 0.70 -
Railwagon Scales 0.50 O05 0.50Grain Values-Spouts, etc. 0.20 0.20 0.20
Installation Q 151 0.05 0.78 0.86 o.68Sub-Total 0.40 5.99 6.62 5.19
4. Total 17.55 19.64 21.27 18.24
5, Engineering Services
051 Ca Works Equipment 0.80 0.82 0.90 0,75
(exccludiug railimy sidings) -6. Gram Total 18.35 20.46 22.17 18.99
Capital Cost Per Ton Storage
Bag 367 1023
Bulk 390 423 362
1/ 50,000 tons storage capacity each plus 2,500 tons working bin capacity for Models B, C, and D.
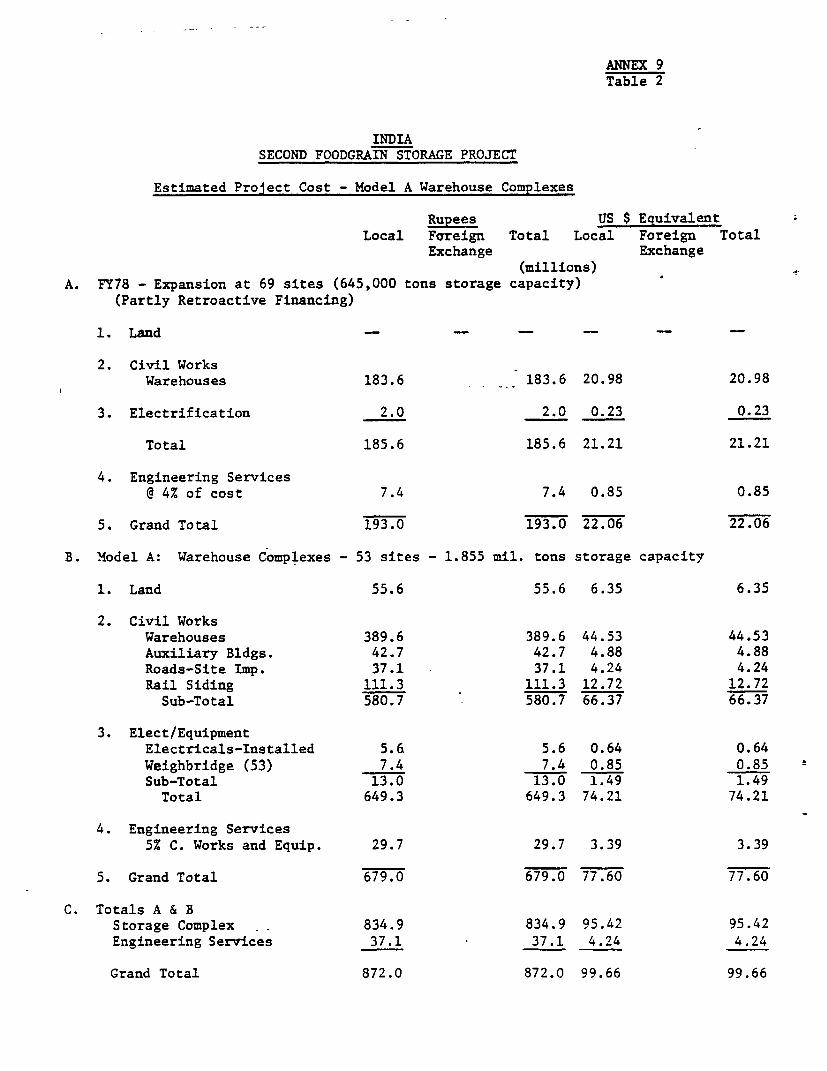
ANNEX 9Table 2
INDIASECOND FOODGRAIN STORAGE PROJECT
Estimated Project Cost - Model A Warehouse Complexes
Rupees US $ EquivalentLocal Foreign Total Local Foreign Total
Exchange Exchange(millions)
A. FY78 - Expansion at 69 sites (645,000 tons storage capacity)(Partly Retroactive Financing)
1. Land - - - -
2. Civil WorksWarehouses 183.6 183.6 20.98 20.98
3. Electrification 2.0 2.0 0.23 0.23
Total 185.6 185.6 21.21 21.21
4. Engineering Servicest 4% of cost 7.4 7.4 0.85 0.85
5. Grand Total 193.0 193.0 22.06 22.06
B. Model A: Warehouse Complexes - 53 sites - 1.855 mil. tons storage capacity
1. Land 55.6 55.6 6.35 6.35
2. Civil WorksWarehouses 389.6 389.6 44.53 44.53Auxiliary Bldgs. 42.7 42.7 4.88 4.88Roads-Site Imp. 37.1 37.1 4.24 4.24Rail Siding 111.3 111.3 12.72 12.72Sub-Total 580.7 580.7 66.37 66.37
3. Elect/EquipmentElectricals-Installed 5.6 5.6 0.64 0.64Weighbridge (53) 7.4 7.4 0.85 0.85Sub-Total 13.0 13.0 1.49 1.49Total 649.3 649.3 74.21 74.21
4. Engineering Services5% C. Works and Equip. 29.7 29.7 3.39 3.39
5. Grand Total 679.0 679.0 77.60 77.60
C. Totals A & BStorage Complex . 834.9 834.9 95.42 95.42Engineering Services 37.1 37.1 4.24 4.24
Grand Total 872.0 872.0 99.66 99.66
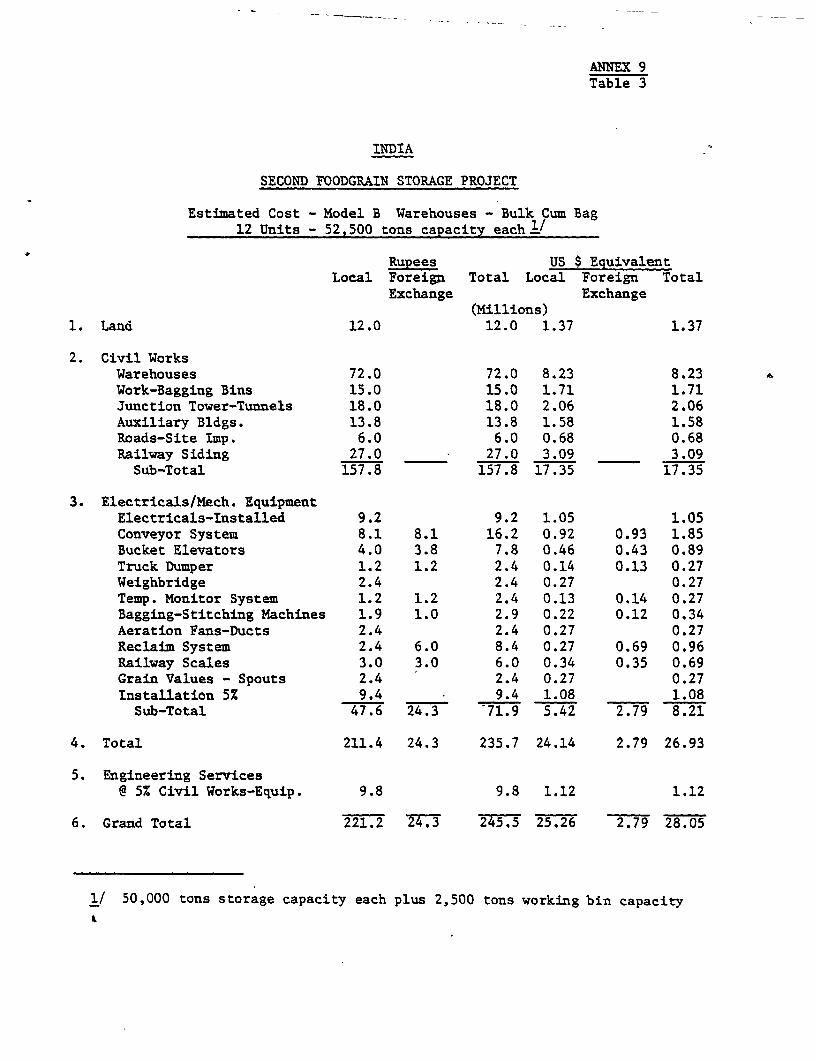
ANNEX 9Table 3
INDIA
SECOND FOODGRAIN STORAGE PROJECT
Estimated Cost - Model B Warehouses - Bulk Cum Bag12 Units - 52,500 tons capacity eachl/
Rupees US $ EquivalentLocal Foreign Total Local Foreign Total
Exchange Exchange(Millions)
1. Land 12.0 12.0 1.37 1.37
2. Civil WorksWarehouses 72.0 72.0 8.23 8.23Work-Bagging Bins 15.0 15.0 1.71 1.71Junction Tower-Tunnels 18.0 18.0 2.06 2.06Auxiliary Bldgs. 13.8 13.8 1.58 1.58Roads-Site Imp. 6.0 6.0 0.68 0.68Railway Siding 27.0 27.0 3.09 3.09Sub-Total 157.8 157.8 17.35 17.35
3. Electricals/Mech. EquipmentElectricals-Installed 9.2 9.2 1.05 1.05Conveyor System 8.1 8.1 16.2 0.92 0.93 1.85Bucket Elevators 4.0 3.8 7.8 0.46 0.43 0.89Truck Dumper 1.2 1.2 2.4 0.14 0.13 0.27Weighbridge 2.4 2.4 0.27 0.27Temp. Monitor System 1.2 1.2 2.4 0.13 0.14 0.27Bagging-Stitching Machines 1.9 1.0 2.9 0.22 0.12 0.34Aeration Fans-Ducts 2.4 2.4 0.27 0.27Reclaim System 2.4 6.0 8.4 0.27 0.69 0.96Railway Scales 3.0 3.0 6.0 0.34 0.35 0.69Grain Values - Spouts 2.4 2.4 0.27 0.27Installation 5% 9.4 9.4 1.08 1.08Sub-Total 47.6 24.3 71.9 5.42 2.79 8.21
4. Total 211.4 24.3 235.7 24.14 2.79 26.93
5. Engineering Services@ 5% Civil Works-Equip. 9.8 9.8 1.12 1.12
6. Grand Total 221.2 2,3 245.5 25.26 2.79 28.05
1/ 50,000 tons storage capacity each plus 2,500 tons working bin capacity
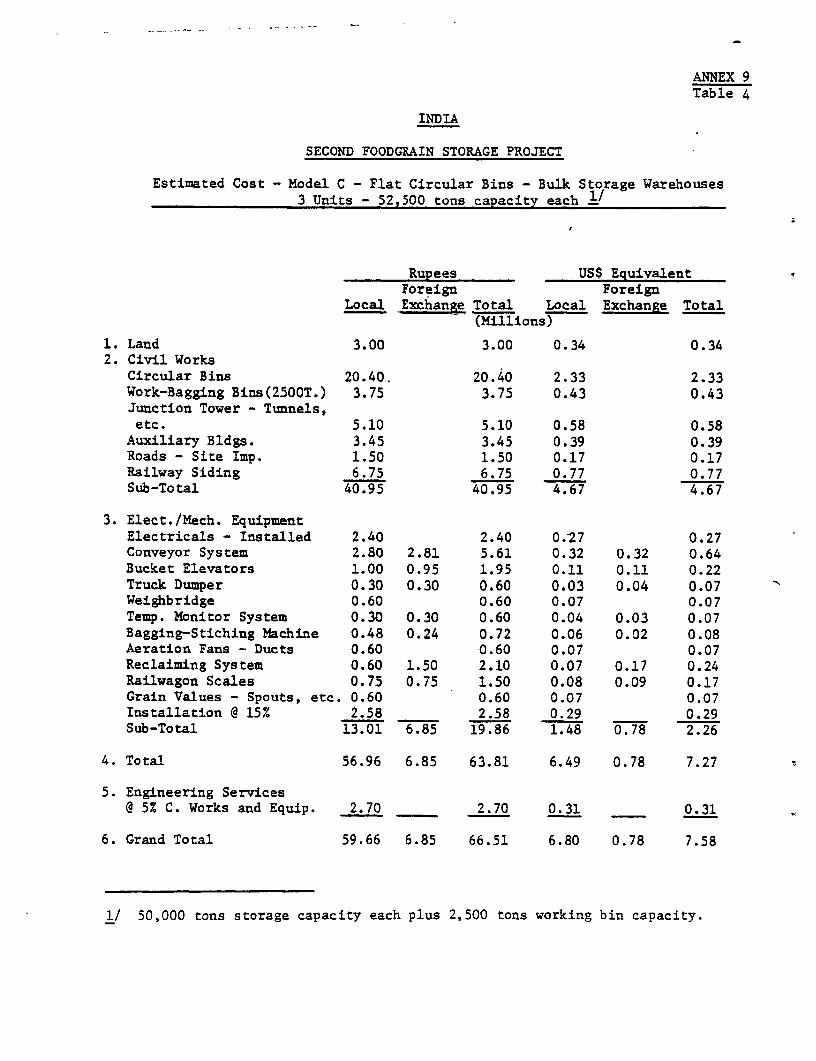
ANNEX 9Table 4
INDIA
SECOND FOODGRAIN STORAGE PROJECT
Estimated Cost - Model C - Flat Circular Bins - Bulk Storage Warehouses3 Units - 52,500 tons capacity each
Rupees US$ EquivalentForeign Foreign
Local Exchange Total Local Exchange Total(Millions)
1. Land 3.00 3.00 0.34 0.342. Civil Works
Circular Bins 20.40. 20.40 2.33 2.33Work-Bagging Bins(2500T.) 3.75 3.75 0.43 0.43Junction Tower - Tunnels,etc. 5.10 5.10 0.58 0.58Auxiliary Bldgs. 3.45 3.45 0.39 0.39Roads - Site Imp. 1.50 1.50 0.17 0.17Railway Siding 6.75 6.75 0.77 0.77Sub-Total 40.95 40.95 4.67 4.67
3. Elect./Mech. EquipmentElectricals - Installed 2.40 2.40 0.27 0.27Conveyor System 2.80 2.81 5.61 0.32 0.32 0.64Bucket Elevators 1.00 0.95 1.95 0.11 0.11 0.22Truck Dumper 0.30 0.30 0.60 0.03 0.04 0.07Weighbridge 0.60 0.60 0.07 0.07Temp. Monitor System 0.30 0.30 0.60 0.04 0.03 0.07Bagging-Stiching Machine 0.48 0.24 0.72 0.06 0.02 0.08Aeration Fans - Ducts 0.60 0.60 0.07 0.07Reclaiming System 0.60 1.50 2.10 0.07 0.17 0.24Railwagon Scales 0.75 0.75 1.50 0.08 0.09 0.17Grain Values - Spouts, etc. 0.60 0.60 0.07 0.07Installation @ 15% 2.58 2.58 0.29 0.29Sub-Total 13.01 6.85 19.86 1.48 0.78 2.26
4. Total 56.96 6.85 63.81 6.49 0.78 7.27
5. Engineering Services@ 5% C. Works and Equip. 2.70 2.70 0.31 - 0.31
6. Grand Total 59.66 6.85 66.51 6.80 0.78 7.58
1/ 50,000 tons storage capacity each plus 2,500 tons working bin capacity.
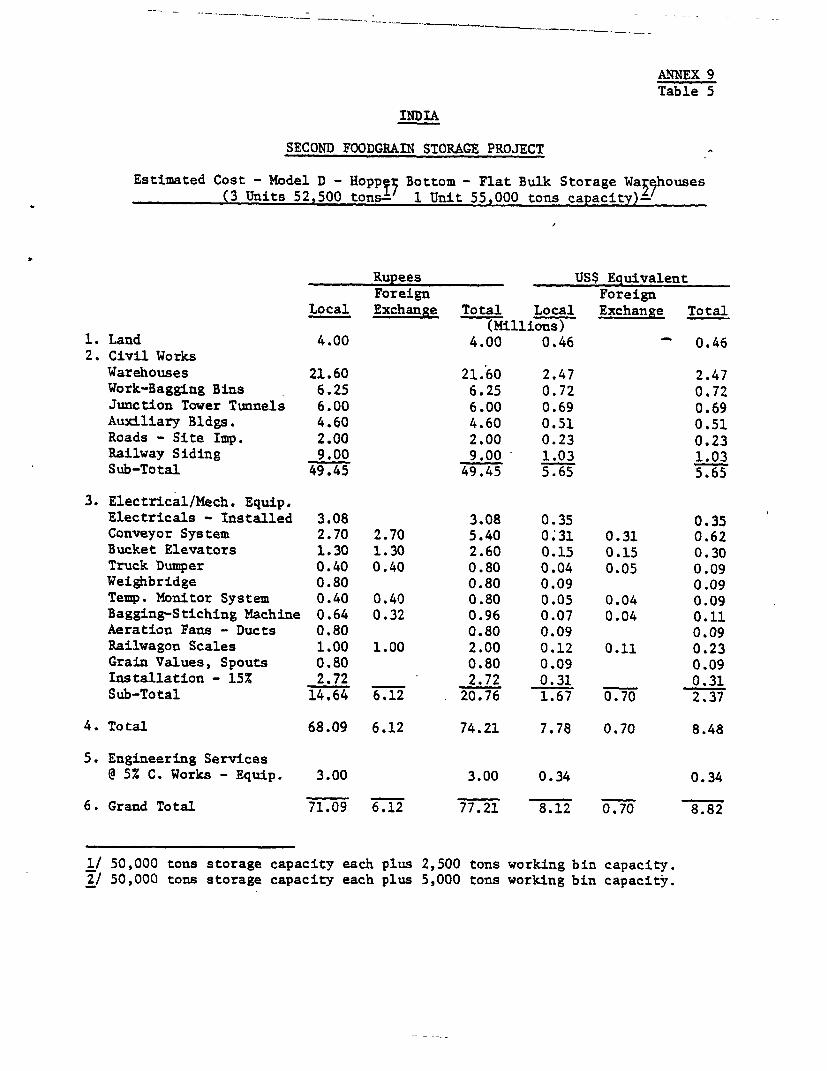
ANNEX 9Table 5
INDIA
SECOND FOODGRAIN STORAGE PROJECT
Estimated Cost - Model D - Hoppt7 Bottom - Flat Bulk Storage Wal7houses(3 Units 52,500 tons- 1 Unit 55,000 tons capacity)-
Rupees US$ EquivalentForeign Foreign
Local Exchange Total Local Exchange Total(Millions)
1. Land 4.00 4.00 0.46 0.462. Civil Works
Warehouses 21.60 21.60 2.47 2.47Work-Bagging Bins 6.25 6.25 0.72 0.72Junction Tower Tunnels 6.00 6.00 0.69 0.69Auxiliary Bldgs. 4.60 4.60 0.51 0.51Roads - Site Imp. 2.00 2.00 0.23 0.23Railway Siding 9.00 9.00 1.03 1.03Sub-Total 49.45 49.45 5.65 5.65
3. Electrical/Mech. Equip.Electricals - Installed 3.08 3.08 0.35 0.35Conveyor System 2.70 2.70 5.40 O;31 0.31 0.62Bucket Elevators 1.30 1.30 2.60 0.15 0.15 0.30Truck Dumper 0.40 0.40 0.80 0.04 0.05 0.09Weighbridge 0.80 0.80 0.09 0.09Temp. Monitor System 0.40 0.40 0.80 0.05 0.04 0.09Bagging-Stiching Machine 0.64 0.32 0.96 0.07 0.04 0.11Aeration Fans - Ducts 0.80 0.80 0.09 0.09Railwagon Scales 1.00 1.00 2.00 0.12 0.11 0.23Grain Values, Spouts 0.80 0.80 0.09 0.09Installation - 15% 2.72 - 2.72 0.31 0.31Sub-Total 14.64 6.12 20.76 1.67 0.70 2.37
4. Total 68.09 6.12 74.21 7.78 0.70 8.48
5. Engineering Services@ 5% C. Works - Equip. 3.00 3.00 0.34 0.34
6. Grand Total 71.09 6.12 77.21 8.12 0.70 8.82
1/ 50,000 tons storage capacity each plus 2,500 tons working bin capacity.2/ 50,000 tons storage capacity each plus 5,000 tons working bin capacity.

INDIA
SECOND FOODGRAIN STORAGE PROJECT
Estimated Project Cost - Port Silos(millions)
-----------Rupees ----- -----US$ Equivalent-Foreign Foreign
Local Exchange Total Local Exchange Total
1. Land 1.5 1.5 0.17 0.172. Civil Works
Main structure 51.3 51.3 5.86 5.86Auxiliary Bldgs. 10.3 10.3 1.18 1.18Railway Siding 4.9 4.9 0.56 0.56Roads - Site Imp. 1.0 1.0 0.11 0.11Sub-Total 67.5 67.5 7.71 7.71
3. Elect/Mech. EquipmentGrain Unloaders 14.0 24.0 38.0 1.60 2.74 4.34Conveyors 4.4 8.8 13.2 0.50 1.01 , 1.51Bucket Elevators 2.0 2.0 4.0 0.23 0.23 0.46Weighing System - J. Tower 2.5 2.5 5.0 0.29 0.28 0.57Dust Control - Aeration 1.1 1.1 2.2 0.12 0.13 0.25Bagger - Stickers (25) 1.1 2.0 3.1 0.12 0.23 0.35Grain Values, Spouting 2.4 2.4 0.27 0.27Passenger Elevator (2) 0.3 0.3 0.03 0.03Temp. Indicator System 0.5 1.0 1.5 0.06 0.11 0.17Weighbridge (3) 0.6 0.6 0.07 0.07Grain Cleaners (4) 0.6 1.0. 1.6 0.07 0.11 0.18Installation -15% of above 10.6 10-.6 1.21 1.21Electricals (install. included) 8.7 8.7 1.00 1.00Railwagon Mover (2) 2.0 2.0 0.23 0.23Sub-Total 49.4 44.4 93.2 5.57 5.07 10.64
Total 118.4 44.4 162.2 13.45 5.07 18.52 trEngineering Services x5% C. Works and Equip. 5.9 2.0 7.9 0.67 0.23 0.90
Grand Total ]26.3 44.4 170.1 14.35 5.07 19. 42
I~~~~~~~~~~~~~~~~~~~~~~~~~~~~~. 4

ANNEX 9Table 7
INDTA
SECOND FOODGRAIN STOEAGE PROJECT
Estimated Proiect Cost
VI Rural Grain Procurement Centers
Rupees US$ EquivalentForeign Foreign
Local Exchange Total Local ExchanRe Total- --- - ------------------------ __ _ __- _ (ilos--- - ------
A. Lar2e Size Centers - 2 Unit
1. Land 0.10 0.10 0.11 0.112. Civil Works
10-300 Ton Metal Bins/Unit 2.4 2.4 0.27 0.271- ,000 Ton Warehouse/U B 0.8 0.8 0.09 0.09Road*-Sits Imp_ 0.1 0.1 0.01 0.01Sub-Total 3.3 3.3 0.37 0.37
3. Elect/Meeh. EquipnentElectricals 0.1 0.1 0.01 0.01Weighbridge (2) 0.4 0.4 0.05 0.05Conveyor System 0.1 0.1 0.2 0.01 0.01 0.02Bucket Elevators 0.1 0.1 0.2 0.01 0.01 0.02Grain Cleaners 0.1 0.1 0.01 0.01Truck Dump 0.2 0.2 0.02 0.02Spouting and Valves 0.1 0.1 0.01 0.01Installation (157) 0.2 0.2 0.02 0.02Sub-Total 1.3 0.2 1.5 0.05 0.02 0.07
4. Engineering Services5% Civil Works and Equip. 0.2 0.2 0.02 0.02
Total 4.9 5. 1 0.56 0.02 0.58
B. Small Size Centers 4 Units
1. Land 0.1 0.1 0.01 0.012. Civil Works
5-100 Ton Bins/Unit 4.0 4.0 0.46 0.461-500 Ton Warehouse/Unit 0.4 0.4 0.05 0.05Roads-Site Imp. 0.2 0.2 0.02 0.02Sub-Total 4.6 4.6 0.53 0.53
3. Elect. Mech. EquipmentElectricala 0.1 0.1 0.01 0.01Weighbridge (4) 0.8 0.8 0.09 0.09Conveying System 0.3 0.2 0.5 0.04 0.02 0.06Truck Dump 0.4 0.4 0.05 0.05Spouting- and Valves 0.1 0.1 0.01 0.01
Installation 0.3 0.3 0.03 0.03Sub-Total 2.0 0.2 2.2 0.23 0.02 0.25
4. Engineering Services57 Civil Works and Equip. 0.3 0.3 0.03 0.03
Total 7.0 0. 7.2 8-0 0 02 -Z.8F
C. Portable Grain Randling Ecuipment
50 Portable surge bins withloading elevator 0.3 0.3 0.03 0.0350 Sweep Conveyors to load trucks 1.3 1.2 2.5 0.15 0.14 0.2950 Laboratory sets 0.2 0.2 0.02 0.02
Total 1.8 1.2 3.0 0.20 0.14 0.34

INDIA
SECOND FOODGRAIN STORAGE PROJECT
Estimated Project Cost
VII Grain Transport Equipment
Rupees US$ EquivalentForeign Foreign
Local Exchange Total Local Exchange Total…--------------------------…---_-_-----…(Millions)------------
A. Truck Equipment
50-Trucks with hydraulic liftand grain body 6.8 6.8 0.78 0.78100 Grain bodies for local trucks 0.5 0.5 0.06 0.06Sub-Total 7.3 7.3 0.84 0.84
B. Railwagon Equipment
1. 60-40 ton hopper bottom grain bogies 10.5 10.5 21.0 1.20 1.20 2.402. Paper grain door retainers, 150,000 1.5 3.0 4.5 0.17 0.34 0.51Sub-Total 12.0 , 13.5 25.5 1.37 1.54 2.91
C. Installation of Railway Siding Bulkloading and unloading facilities - 10Units1. Civil Works
@ Rs 100,000 per unit 1.0 1.0 0.11 0.112. Elect/Mech. EquipmentElectrification 1.0 1.0 *).11 0.11'Bucket elevators 1.1 1.1 2.2 0.12 0.13 0.25Surge Bins 14.0 14.0 1.60 1.60Bagger-Stichers 1.0 1.0 0.11 0.11 Installation (152/.) 2.7 2.7 0.31 0.31 fSub-Total 20.8 1.1 21.9 2.36 0.13 2.49 X
Total 40.1 14.6 54.7 4.57 1.67 6.24 G %

INDIA
SECOND FOODGRAIN STORAGE PROJECT
Estimated Project Cost
VIII Training and Operations Research
Rupees US$ EquivalentForeign Foreign
Local Exchangb Total Local Exchange Total
…. Trainig --------------------------- (Millions) ---------A. Training
1. Overseas travel and study tours (20) 1.75 1.75 - 0.20 0.20
2. Intensive training local staff (4 yrs) 1.31 0.44 1.75 0.15 05 0.20
Sub-Total 1.31 2.19 3.50 0.15 0.25 0.40
B. Operations Research
Staff 1.00 0.10 1.10 0.11 0.01 0.12
Equipment 1.00 0.87 1.87 0,11 0.10 0.21
Operations 0.59 0.44 1.03 0.07 0.05 0.12
Sub-Total 2.59 1.41 4.00 0.29 0.16 0.45
Total 3.90 3.60 7.50 0.44 0.41 0.85
(Di~ !.4o
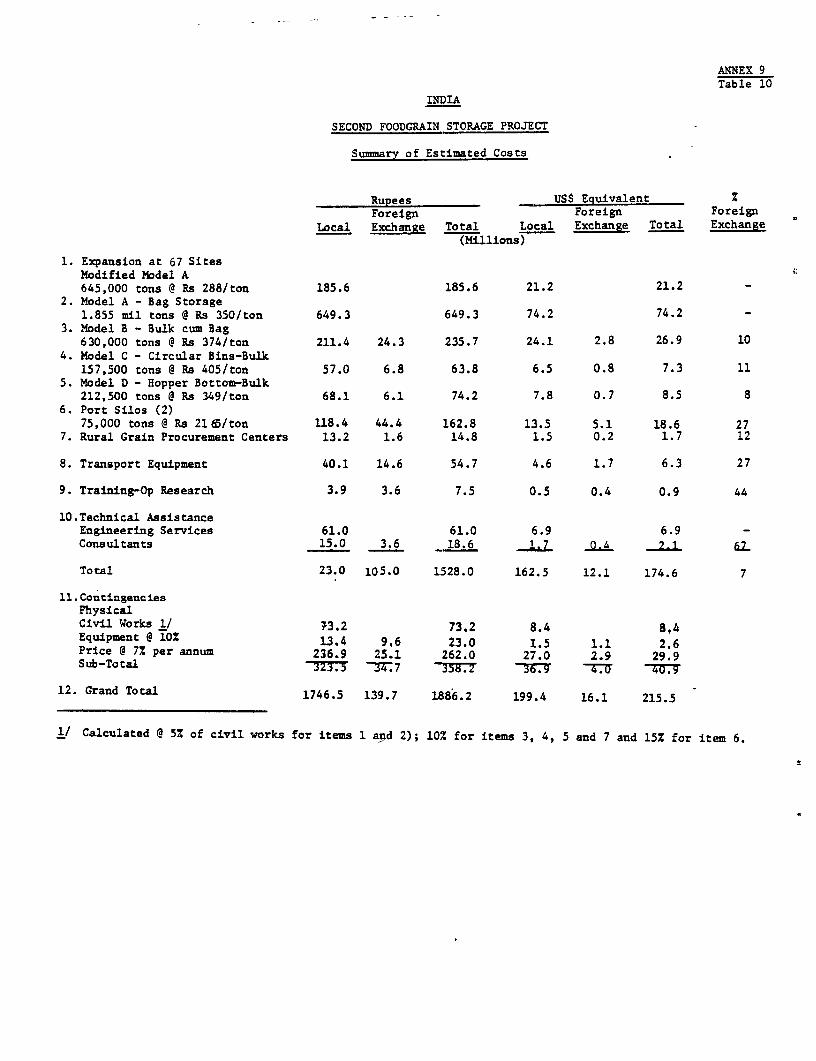
ANNEX 9Table 10
INDIA
SECOND FOODGRAIN STORAGE PROJECT
Summary of Estimated Costs
Rupees US$ EquivalentForeign Foreign Foreign
Local Exchange Total Local Exchange Total Exchange(Millions)
1. Expansion at 67 SitesModified Model A645,000 tons @ Rs 288/ton 185.6 185.6 21.2 21.2 -
2. Model A - Bag Storage1.855 mil tons @ Rs 350/ton 649.3 649.3 74.2 74.2 -
3. Model B - Bulk cum Bag630,000 tons @ Rs 374/ton 211.4 24.3 235.7 24.1 2.8 26.9 10
4. Model C - Circular Bins-Bulk157,500 tons @ Rs 405/ton 57.0 6.8 63.8 6.5 0.8 7.3 11
5. Model D - Hopper Bottom-Bulk212,500 tons @ Rs 349/ton 68.1 6.1 74.2 7.8 0.7 8.5 8
6. Port Silos (2)75,000 tons @ Rs 2165/ton 118.4 44.4 162.8 13.5 5.1 18.6 27
7. Rural Grain Procurement Centers 13.2 1.6 14.8 1.5 0.2 1.7 12
8. Transport Equipment 40.1 14.6 54.7 4.6 1.7 6.3 27
9. Training-Op Research 3.9 3.6 7.5 0.5 0.4 0.9 44
10.Technical AssistanceEngineering Services 61.0 61.0 6.9 6.9 -Consultants 15.0 3.6 18.6 1.7 0.4 2-1 6.2
Total 23.0 105.0 1528.0 162.5 12.1 174.6 7
11.ContingenciesPhysicalCivil Works 1/ 73.2 73.2 8.4 8,4Equipment @ 10Z 13.4 9,6 23.0 1.5 1.1 2.6Price @ 7% per annum 236.9 25.1 262.0 27.0 2.9 29.9Sub-Total _=3Z5 Z7 _358. 36.97 4
12. Grand Total 1746.5 139.7 1886.2 199.4 16.1 215.5
1/ Calculated @ 5% of civil works for items 1 and 2); 10% for items 3, 4, 5 and 7 and 15% for item 6.

S9OND FOOLEI;AIG 8TOHAOiE P4OJI rT
Projected Annual Operating Costs
CAP Nodel Nodal5 C D Model B CAP Model models C,D Model pA L Without P.C With P.C Without P.C Wltb P.C A Wihout I'.C Wlth r.c Wlthout P C with P.C
(Bag) (Bag) (Bulk) (Bulk) (bulk) (Bulk) (Bag) (bag) (bulk) (Bulk) (Bulk) (Bulk)---- Rc Per Ton Wheat---- ---------- Hs Per Ton Paddy -_
A. Procureent Into Stor gePurchase tax (51) 55 55 55 38 la 8 311 38Market yard fees (3%) 33 33 33 33 33 33 22 2? 22 22 YTransport to 8toraga 21 21 21 16 21 16 21 21 21 16 21 16Labor Into Storage 17 17 8 V 8 5 17 17 8 8 5aunnw Baga 45 '49 20 - 20 45 45 20 20 -Adminitration 12 12 8 6 8 6 16 16 11 t 11 8 ITransit losses 11 11 6 4 6 4 8 8 5 * 5 Sub-Total I; 13 13 151 1 167 RT 125 9 25 92
B. 8tre -6Honth iIH turnov pr yr)
Labor to Maintain Stocks 30 24 6 6 6 6 22 18 5 5 5Fumigants - Dunnag 7 5 1 1 1 1 6 h4 1 1 I 1Energy - Maintain Equip. Bdg. 10 8 12 12 16 16 8 6 9 9 12 1'security 1i 2 1 1 1 1 5 3 1 1 1 1GunnY BSag 20 15 - - - 20 15 - - - -
AdhinitrLtion 24 18 12 12 12 12 30 23 15 15 15 15Interest on Inventory 72 748 48 h4 48 48 48Sub-Total 167 144 104 1s 139 ITT -79 |
C. 8tor -12 months(I turnover per year)Labor to taintain Stocks 50 40 9 9 9 9 38 30 6 6 6 6Futigants - Dunnage 10 7 2 2 2 2 8 5 2 2 2 2Energy - MaintAin Equip Bldg. 15 12 15 15 20 20 12 9 12 12 16 16Security 7 4 2 2 2 2 8 5 3 3 3 3Gunny Bage - P. Cover 45 .20 - - - - 45 20 - - -
Administration 26 20 14 14 14 14 32 25 18 18 18 idInterest on Inventory 144 1144 1144 1 144 14 144 9 96 96Sub-Total l- 191 191 239 137 13 Ui
D. trag 2M Honth(i turnover per yr)Labor to Maintain Stocks 70 60 14 14 14 14 54 36 9 9 9 9Fumigants - Dunnage 15 10 3 3 3 3 12 8 3 3 3 3Energy - Maintain Equip Bldg. 23 20 24 24 30 30 20 14 20 20 h4 '4Security 11 6 3 3 3 3 14 8 5 5 5Gunny Begs - P. Cover 65 30 - -_ 65 30 - -
Admintitration 52 40 28 28 28 28 64 ^ 36 36 3b 36latereat on Inventory 288 288 288 288 288 ea 14 192 1 MISub-TOtal 5214 C3I- 34 21 33N 25
e. bespatch to State Govt. (Bice Equivalent)
Guny Bgs 45 45 45Loading Ballwagons 25 15 15 15 15 5 25 15 15 15 15 15Freight - 1000 Km 60 60 60 60 60 0 60 60 60 60 60 60Sub-Total 1 75 125 75 105 5 W 105
F. Total Costs - Procurement to State Goverument Issue Wn-th- Storage
A plus B plus - '446 413 375 343 379 282 391 369 309 276 312 27912 Month StorageA plus C plus 3 576 501 457 425 462 365 491 442 367 334 371 33824 Nonth StorageA plus D plus E 803 723 631 599 637 540 673 ' 49 1462 4 6f
Assume* operating at full capacity (50.000 toeS wheat and 37,500 tons paddy.P.C. xAans Rural Procur_ ent Center
3/ For purpose of purchase tax and market yard fees wheat has been valued at Rs 1100 per ton and paddy at Ha 750 per ton. Interest has beencharged at the rate or Rs 12.0 por month tor wheat and Rs 8.00 per ton for paddy.

INDIA
SECOND FOODGRAIN STORAGE PROJECT
Estimated Operating Cost - Current Port Operations (without project) and75,000 N.T. Capacity Port Silos (with project)
Annual Throughput (H.T.)
75,000 300,000 450,000 900,000 1,800,000 3,6061000Without With Without With Without With Without With Without With Without WithProject Project Project Project Project Project Project Project Project Project Project Project
(Rs Per Ton Wheat)Administration 16.0 16.0 12.0 4.0 10.0 3.0 8.0 2.0 6.0 1.5 N.P. 1.0
MaintenanceCivil Works (2%) 6.0 18.0 .4.0 4.5 3.0 3.0 3.0 1.5 3.0 0.8 " 0.4Equipment (10% and 6%) 4.0 72.0 1.0 18.0 0.8 12.0 1.0 6.0 1.0 3.0 " 1.5OperationsEnergy 45.0 18.0 40.0 16.0 37.5 15.0 37.5 15.0 37.5 15.0 15.0Equipment 10.0 7.0 8.0 6.0 6.0 5.0 6.0 5.0 5.0 4.5 4.0LaborTo Unload ships 3 32.0 3.0 130.0 3.0 | 28.0 3.0 | 28.0 2.0 1 30.0 2.0 2.0To Store - lIandle] 3.0 1 3.0 3 3.0 1 2.0 ] 2.0 2.0Gunny Bags 45.0 45.0 45.0 45.0 45.0 45.0 45.0 45.0 45.0 45.0 45.0
Transport - 25 Km 30.0 30.0 30.0 30.0 30.0 30.0 30.0 30.0 30.0 .30.0 30.0
Total 188.0 212.0 168.0 129.5 160.3 119.0 158.5 108.5 157.5 103.8 100.9
H.P. G Not possible without project.
trD '

54
INDIASECOND FOODGRAIN STORAGE PROJECT
IMPLEMENTATION SCHEDULEIBY MONTHS: JULY 1977 TO DECEMBER 1981)
D 1977 1978 1979 1980 1981 ut
ACT1VITY -- -
Month! 21 3 4 1 ! 9110111121314151611131920212212242 521212890313 349 7 48 8 50 51 525354
GENERAL
Organize Staff PlD
Hire Consultants
EXPANSION COMPONENT
Tender & Contract
Construct Warehouses _ * _ * * _ _ _ * _ _ 5
BJAG STORAGE COMPONENT
Select & Survey Sites _
Complete Design & Layout _ mm
Tender Civil Works
Construct Warehouses
BULK STORAGE AND R P C
Select & Survey Sites _ I
Complete Design & Ulvout
Tender Civil Works
Construct Structures
Tender Equipment Contracts
Install & Commission Equipment * *
Tender Transport Equipment m | | | |
initiate Research & Development
PORT SILOS
Survey Sites
Complete Design & Layout
Tender Civil Works
Civil Construction
Tender Equipment Contracts
Install & Commitsion Equipment
TRAINING PROGRAM
Develop, Plan
initiate Overseas Training B
Initiate Local Training
World Bank - 18004
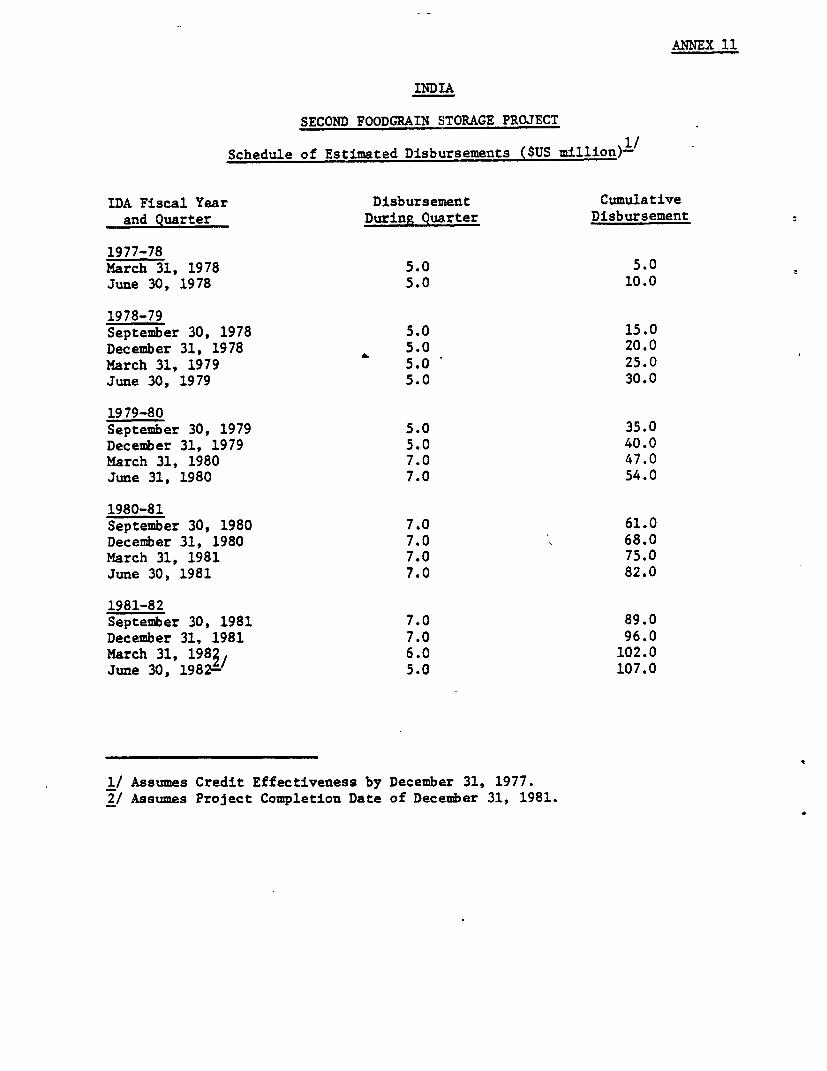
ANNEX 11
INDIA
SECOND FOODGRAIN STORAGE PROJECT
Schedule of Estimated Disbursements ($US million)-/
IDA Fiscal Year Disbursement Cumulativeand Quarter During Quarter Disbursement
1977-78March 31, 1978 5.0 5.0June 30, 1978 5.0 10.0
1978-79September 30, 1978 5.0 15.0December 31, 1978 5.0 20.0March 31, 1979 5.0 25.0June 30, 1979 5.0 30.0
1979-80September 30, 1979 5.0 35.0December 31, 1979 5.0 40.0March 31, 1980 7.0 47.0June 31, 1980 7.0 54.0
1980-81September 30, 1980 7.0 61.0December 31, 1980 7.0 V 68.0March 31, 1981 7.0 75.0June 30, 1981 7.0 82.0
1981-82September 30, 1981 7.0 89.0December 31, 1981 7.0 96.0March 31, 198i/ 6.0 102.0June 30, 1982- 5.0 107.0
1/ Assumes Credit Effectiveness by December 31, 1977.2/ Assumes Project Completion Date of December 31, 1981.

ANNEX 12Page 1
INDIA
SECOND FOODGRAIN STORAGE PROJECT
Economic Benefits and Justification
A. General
1. The purpose of the project is to assist GOI in carrying out itsprogram of constructing storage facilities required to implement its foodgrainprocurement and distribution policy. This policy is discussed in detail inAnnex 3. It's objectives are, through procurement and/or support price, toassure foodgrain producers of a stable, reasonably attractive price in orderto encourage continuing increases in foodgrain production, leading to self-sufficiency, and, through the distribution of procured and imported foodgrains,to safeguard the interests of low income consumers.
B. Economic Analysis
2. Without the warehouse storage component of the project, and with theprocurement and distribution of wheat and rice in the projected quantitiesshown in Annex 3, Tables 7 and 11, the wheat and rice so procured will have tobe stored in the open, under cover and plinth (CAP). In fact, about 7 milliontons of foodgrains are under such storage as a result of high procurementconsequent upon two successive good harvests. The economic benefit of thewarehouse component would be the reduction in operating costs and in grainlosses from storing procured grain in the various warehouses proposed in theproject, compared to open CAP storage. The reduction in grain losses isequivalent to a reduction in imports (since India is a grain importer), andhence a saving on foreign exchange. Since-grain trade (imports and, possiblyin the future, exports) will continue, the port silo component of the projectis provided to reduce the cost of handling such grain. The economic rates ofreturn calculated below is therefore based on the stream of savings in costsbetween the 'with' and 'without project' situation.
3. The following assumptions about prices and costs are made, withexplanations provided, where necessary: (i) Exchange rate. The officialexchange rate prevailing in February/March 1977, during appraisal, of US$1-8.75 Rs, is used for traded goods. (ii) Base year prices. The investment andoperating costs of the project are estimated during 1976/77 and are expressedin 1976/77 constant rupees. The price of wheat and rice used is the projected1985 international price (see below), expressed in 1977 constant dollars, andconverted to rupees at the official exchange rate. The reason is that sincethe project will not be completed until 1981, and has an estimated 25 yeareconomic life, the greater part of benefits will take place after 1985, the

ANNEX 12Page 2
latest year for which projections are available. (iii) Investment and opera-ting costs. All the inputs and factors in these costs are estimated at marketprices (see Annex 9). Taxes and duties have been estimated to be negligibleand are therefore ignored. Physical contingencies at the rates shown inAnnex 9, Table 10 are included in the costs. No attempt is made to calculatethe shadow wage for the direct and indirect labor cost components. Shadow wagerates for most of the 112 proposed project sites, located all over India, wouldbe different, and their calculation would pose an immense task. (iv) Wheat andrice price. The wheat price used was Canadian No. 1, CWRs in store, ThunderBay. The rice price used was Thai, 25%-35: broke, f.o.b. Bangkok. The proj-ected 1985 price of wheat and rice, expressed in 1977 constant dollars, was$187/metric ton and $207/metric ton respectively. 1/ Shipping costs wereestimated at US$30/MT for wheat and US$15/MT for rice. Port handling plus railfreight costs from ports to warehouses were estimated to average US$10/MT forboth wheat and rice. Therefotg, values of 227/MT for wheat and $233/MT forrice were used in calculati4tthe project's reduction in grain losses. Toobtain the rice - equivalent value of paddy, the conversion ratio of 66% wasused, yielding $153/MT of paddy.
4. Warehouse Component. Table 1 shows three 25-year cost streams -capital, operating and grain loss - in the 'without project' situation of CAPstorage of wheat and paddy under the assumptions of (i) six months storage andone turnover annually (i.e. 50% capacity utilization annually); and (ii) twoyears storage and one turnover every two years (i.e. 100% capacity utilizationannually). These two assumptions vere made to approximate the respectivestorage requirements of operational stocks and annual carry-over contingencystocks. Tables 2, 3, 4 and 5 show the same cost streams under the same as-sumptions in the 'with project' situation for Models A, B, C and D warehousecomplexes. These cost streams are based on 50,000 MT storage capacity forwheat and 37,500 MT for paddy.
5. Some explanation of the cost streams is necessary. The annualcapital cost stream pertains only to the storage stage and is the initialcapital cost incurred and the subsequent maintenance or replacement costs.The annual operating cost stream pertains to three stages: procurement intostorage, storage, and distribution to State Governments. This is becauseoperating costs were estimated to be lower at all three stages as a resultof the project. 2/ Obviously, in the two year storage case, operating costsare higher in the year grain is turned over. For convenience, an annualaverage was used. Finally, the annual grain loss stream pertains to thestorage stage. Again, in the two year storage case, the annual average grainloss was used. For simplicity too, it was assumed that there would be nograin loss in year 1, when the capital costs for the warehouses and CAP stor-age are being incurred. Also, since Models B, C and D are estimated to taketwo years to construct, it is assumed that operating costs and grain loss
1/ See Annual Review of Commodity Price Forecasts, memorandum, April 11, 1977and attached annexes by the Economic Analysis and Projections Department.
2/ Operating Costs of Models B, C and D are estimated to be further reducedby the project's provision of procurement centers, grain trucks andrailway equipment. See Annex 9, Table 11.
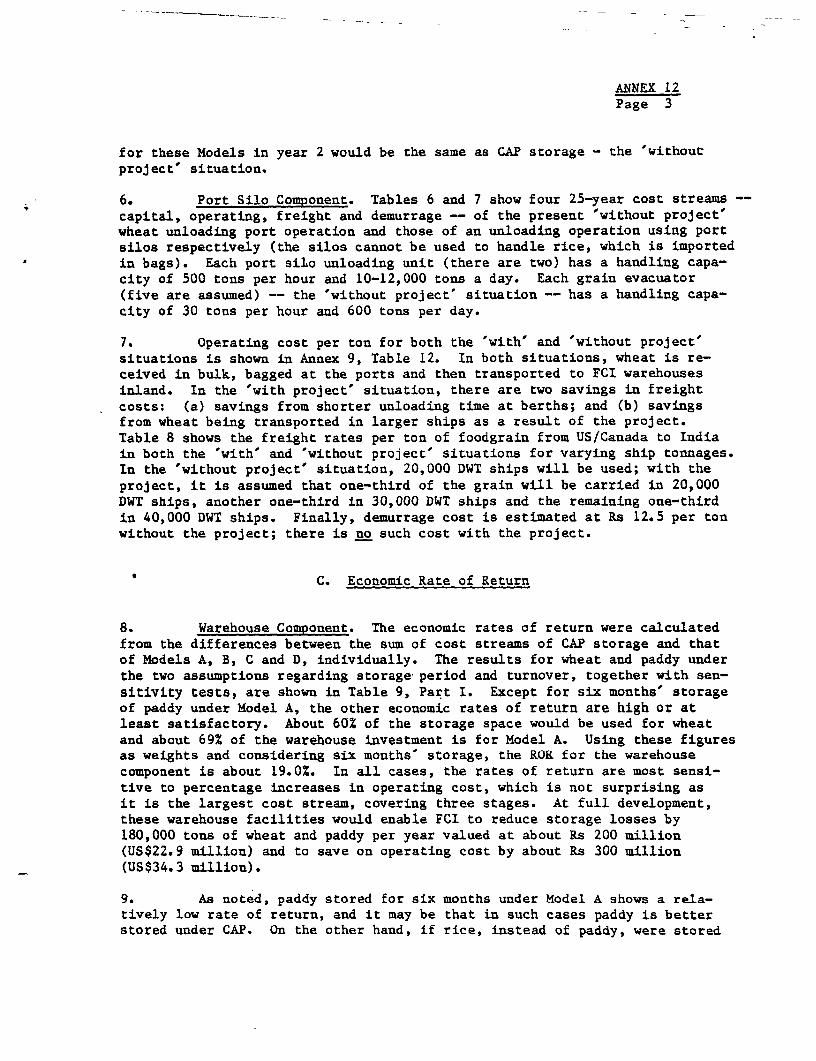
ANNEX 12Page 3
for these Models in year 2 would be the same as CAP storage - the 'withoutproject' situation.
6. Port Silo Component. Tables 6 and 7 show four 25-year cost streams --capital, operating, freight and demurrage - of the present 'without project'wheat unloading port operation and those of an unloading operation using portsilos respectively (the silos cannot be used to handle rice, which is importedin bags). Each port silo unloading unit (there are two) has a handling capa-city of 500 tons per hour and 10-12,000 tons a day. Each grain evacuator(five are assumed) -- the 'without project' situation -- has a handling capa-city of 30 tons per hour and 600 tons per day.
7. Operating cost per ton for both the 'with' and 'without project'situations is shown in Annex 9, Table 12. In both situations, wheat is re-ceived in bulk, bagged at the ports and then transported to FCI warehousesinland. In the 'with project' situation, there are two savings in freightcosts: (a) savings from shorter unloading time at berths; and (b) savingsfrom wheat being transported in larger ships as a result of the project.Table 8 shows the freight rates per ton of foodgrain from US/Canada to Indiain both the 'with' and 'without project' situations for varying ship tonnages.In the 'without project' situation, 20,000 DWT ships will be used; with theproject, it is assumed that one-third of the grain will be carried in 20,000DWT ships, another one-third in 30,000 DWT ships and the remaining one-thirdin 40,000 DWT ships. Finally, demurrage cost is estimated at Rs 12.5 per tonwithout the project; there is no such cost with the project.
0 C. Economic Rate of Return
8. Warehouse Component. The economic rates of return were calculatedfrom the differences between the sum of cost streams of CAP storage and thatof Models A, B, C and D, individually. The results for wheat and paddy underthe two assumptions regarding storage period and turnover, together with sen-sitivity tests, are shown in Table 9, Part I. Except for six months' storageof paddy under Model A, the other economic rates of return are high or atleast satisfactory. About 60% of the storage space would be used for wheatand about 69% of the warehouse investment is for Model A. Using these figuresas weights and considering six months' storage, the ROR for the warehousecomponent is about 19.0%. In all cases, the rates of return are most sensi-tive to percentage increases in operating cost, which is not surprising asit is the largest cost stream, covering three stages. At full development,these warehouse facilities would enable FCI to reduce storage losses by180,000 tons of wheat and paddy per year valued at about Rs 200 million(US$22.9 million) and to save on operating cost by about Rs 300 million(US$34.3 million).
9. As noted, paddy stored for six months under Model A shows a rela-tively low rate of return, and it may be that in such cases paddy is betterstored under CAP. On the other hand, if rice, instead of paddy, were stored

ANNEX 12Page 4
for six months under Model A, the rate of return would be higher, probablyabout 15%, since more rice (40,000 MT) can be stored than paddy (37,500 MT)and since rice losses under CAP storage would be higher.
10. Despite the high returns shown for Models B, C and D, Model A consti-tutes the greater part of the project for three reasons: (i) bulk flat storageis still untried in India, and the provision of it under the project may beregarded as a pilot scheme; (ii) the unavailability of sufficient matchingbulk handling and transportation capacity in the near future; and (iii) thereare areas where the volume of procurement and/or distribution is small and bulkhandling, transport and storage may not be feasible.
11. Port Silo Component. The economic rates of return are again cal-culated from the streams of savings in cost, particularly in freight costs.The rates for 300,000 M.T. and 450,000 M.T. annual throughputs, together withthe sensitivity tests, are shown in Table 9, Part II. It would seem that theport silos need to handle only 0.3 million tons of wheat a year to obtain amore than satisfactory rate of return. Between 1970/71 and 1975/76, Indiaimported on average 3.36 million tons of wheat a year. However, the pro-jections in Annex 2, Table 14 show that India will reach a self-sufficiencyin wheat by the end of the 1970s and have an increasing surplus thereafter.The projections also show an increasing rice deficit. But it is unlikelythat India will be able to import rice at the amounts projected for the dif-ference between rice production and consumption (4.56 million tons in 1985-86,constituting about 35% of the international rice trade in 1985, projected at13.0 million tons) without pushing up its price significantly. This, in turn,is likely to cause substitution of wheat for rice, causing wheat imports tobe greater than projected. In any case, even if the projections hold, andIndia attains a consistent surplus in wheat production (amounting to 1.3 mil-lion tons in 1985-86), the silos can equally well be used to export wheat andachieve similar handling cost reductions.
D. Financial Rate of Return
12. The only difference between financial and economic costs for thewarehouses is the addition of the respective purchase tax (5%) and interestcost on inventory holding to the economic operating costs of CAP and the fourwarehouse storages. The annual financial operating costs of the differentstorages are shown in brackets at the bottom of the economic operating costcolumns of Tables 1 to 4. Table 6 shows the financial rates of return forthe warehouses calculated under the same two assumptions, with sensitivitytest performed only for operating costs. As in the case of economic rates,with same one exception, the financial rates of return are high or satis-factory. The financial rate shows even greater sensitivity to changes inoperating costs, because the financial operating costs are substantially largerthan the corresponding economic operating costs for all storage types. Thereis no difference between the economic and the financial rate of return in thecase of the port silos.
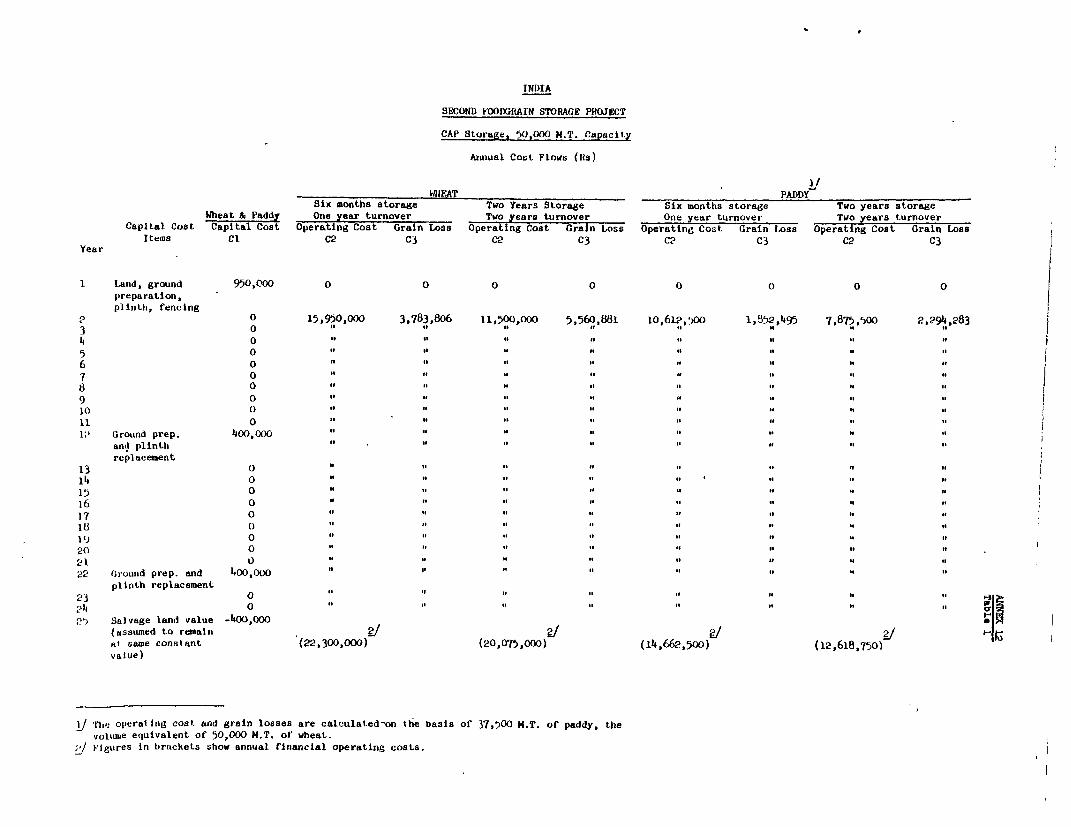
INDIA
SECOND EOODWRAIN STORACE PHOJLCT
CAP Storage, 50,000 N.T. Capacity
Annual Cost Flows (RIs)
WhEAT PADD
Six months storage Two Years Storage Six months storage Two years storage
Wheat & Paddy One year turnover Two years turnover One year turnover Two years turnover
Capital Cost Capital Cost Operating Cost Grain Loss Operating Cost Grain Loss Operating Cost Grain Loss Operating Cost Grain Loss
Items Cl C2 C3 C2 C3 CP C3 C2 C3
Year
I Land, ground 950,000 0 0 0 0 0 0 0 0
preparation,
pilnib, fencingOI2 0 15,950,000 3,783,806 11,500,000 5,560,881 i0,6lP,-0o 1,852,495 7,875,500 2,294,283
3 o If .. I .. ..3 0
5 0 c3
6 0 3 33 .. .. .. 3
7 0
8 0 , .9 0 3!
10 033311 031:' Ground prep. 4 o00,000 "o* * ., ,,
and plinth " .
replacement13 0
°~~~~~~~~~~~~~~~~~~~~~~~~~~~~~~~~~~~~~~~~~~~~~~~~~~~~~~~~~~~~3 " *-3-*** 15 00
i6 o .. ,, ,,17 018 0 * 63 ..
19 0 " U *- 3.
20 021 o I ..
22 Ground prep. and 400,000 *- * *. ..
plLnth replacement 0
23 0
(asue to remain "" t-
2) Salvage land value -400,000(assumed to remain 21 2- -Ue
at same constant (22,300,000) (20,075,000) (14,662,500) (12,618,75o)
value)
n. operating cost and grain losses are calculated-on the basis of 37,500 M.T. of paddy, the
volutme equivalent of 50,000 M.T. ot wheat.
j Figures in brackets show annual financial operating costs.

INDIA
SECflOND I) o1X1111A1N :;TsHAGE PHtJ.CT
Model A lhag Storage, 50,0X0 M.T. Capacity
AnnuavLI Cost Flowa (Rs )
WiiAI' PADDYSix months storage Two years storage Six months storage Two yeare storage -
Wheat & Paddy One year turnovet Two yes turnover _Ove year turnoer T2_y,rs turn3overCa,pital Cost Operating Cc t Grain l.s Operating Co.t Grain Loss Operuting Cost Grain loss Operating C,X't Grain L.o-
Yrar Capilal CosL Items Cl C3 CQ Cj C2 C3 C2 c3
I l.alLnd, ' lvIl works, engineering 19,170,f)(ji 0 0 0 0 0 0& iaeliianical equipment, andenginererinig services
0 14,300,"00 i, tIf,( )6 9,4oo0,00 ,',4;,400 9,7387',.o 818,311 6.337 Of t3^5>)
0
1 hl Had Toppinlg 50 W1i 0 n
Ii ~~~~~~~~~~~01' hia.t ropping 5)00,000ii 0 ' .. 33 33
11 0 . , " ." ",
1, 1rty or E. & M. Equipmeent 40,313 " "
17 load Topping 500,0() . .,
19 0 " " 20 0 "" " "
21 0 ""22 hoedirf Topping 500,000 " *- .*-2j 0 '3
2p4 0 **25 -'Sivage Valuie -7,1.j,30O *- *-
(OI3in at sume contstant,aLtue plus l/j of ottier ]/# /> oritinal oapital ...jtA) (20,650,000) (18,075,000) (13,8q, "00) (11,062,5001
I See f ootnriMe 1, Table 1..4-e fooIn,Ate ?, Table 1.
S,

INDlAA
SECOND FOODYHAIN STORAGE PROJECT
Model B Bulk Storage, 50,000 M.T. Capacity,
Annual Cost Flows (aa)
WIUWAT PASDYSix uonths storage Two years storage Six months storage Two years storage
Wheat _ PaddY One year turnover Two years turnover One year turnover Two years turnoverYear Capital Cost Itema Caprjit Cost Operating Cost Grain LosB Operating Cost Grain Loss Operating Cost Grain Loss Operating Cost Grain Loss
Ci CB C3 c2 C3 C2 C3 c2 C3
I Land, civil worka and l5,540,000 0 0 0 0 0 0 0 0engineering services
2 Electrical/mechanical 6,890,000 15,950,000 3,783,806 11,500,000 5,65o,881 10,612,500 1,852,495 7,875,500 2,294,283equipment and Eng. Services
3 0 12,600,00o 526,356 7,3JO,000 685,ooo 7,650,000 391585 14,6s0,ooo 409,1560 i2,r6oo.oo: o i,3Y3,o00 * 7,650,000 7, 54,60,000..
0 12,600,000 7,350,000 , 7,650,000 , 4,6,0o,o0o6 o i2,6oo,ooo 7,350,000 7,650,000 ,, 4,650,000{~~ ~ ~~~~~ 1 2,600,000 " 73o00"7,650,000 * 14,65O,ooo .
8 Road Topping 350,000 12,700,00076,oo 46so,30o 12,600,ooo 7,350,000 " 7,6,0,000 ,, h,650,000
o0 0 12,600,000 7,350,000 7,650,000 ,, 4,6s0,ooo11 12,600,000 , 7,350,000 7,650,000 , 4,60,000,,12 0 12,6o0,ooo 7,350,000 , 7 ,65o,ooo12 0 12,6o0,000h60.(13 Road Topping 350,000 12,600,000 7,350,000 7,650,000 6n 4o6ooooo6500I114 0 12,600,000 " 7,350,000 7,650,ooo 4,6¶0,ooo15 33% of E. & M. Equlpment 1,793,300 12,600,000 7,350,000 7,65Q,000 ' 4650,ooo0,,16793300 12,6oo,ooo " 7,350,000 7,650,000 ,, 4,6so,oo.16 0 12,6o0,oo006000
0 12,600,000 7,350,000 ' 7,650,000 ,, 4,650,ooolo oaed Topping 350,000 12,600,000 o 7,350,000 7,65o,ooo ,, 4,65o,ooo19 0 12,600,000 " 7,350,000 ,, 7,650,000 H 4,650,ooo,20 0 12,6oo,ooo 7,350,000 , 7,650,000 ,
4,670,ooo20 0 12,600,00 ooo6s,o
21 ~~~ ~~0- 12,600,000 7,5,0 7,60o,000oo 14.6!o,ooo23 load Topping 350,000 12,600,000 7,350,000 7,,, ,650,oo '000
O 12,6oo,ooo ~5 o ,1,5,025 -Salvage Value -3,282,000 12,600,000 u 750,7 00 ,, .4,650,o00
([.and at eame constant 7,350,000 7,650,000 14,65o,oOoisle plu 1/5 o other 2 2original capital cost) (18.950,000) (l6,o7s5oool (11,700,003 (9,375,5001
See fooLihote 1, Table 1.See footnote 2, Table 1.

INDIA
SECONI) EOOD(RAIN 81hAGE PROJECT
Model C Suilk Storage, 50,000 M.T. Capacity
Annual Cost b'lows (Hs)
WIIEAT WHEAT PADDY& Six months storage Two years storage Six months storage Two years storage
PADDY One year turnover Two years turnover One year turniover Two years turnoverCapital Cost Operating Cost Grain Loss Operating Coat Grain Loas Operatinir Cost Grain Loss Operati,, Cost Grain Losa
Yea, Capital Cost Items Cl C2 C3 C2 C3 C2 C3 C2 C3
I Land, e)vii wui,-, andengliwering services 15,690,000 0 0 0 0 ( 0 0 0
? Elec./meckh. equipment &egigtneering aervices 7,610,000 15,950o000 3.783,806 11,500,000 7,670,118l 10,612,500 1,8),2,495 7,875,500 2,2911,283
3 0 12,400,000 526,356 7,275,000 685,286 7,5j7, .00 391,585 4,575,000 1409,1'60 ..0
6 07 0 ' .a Roa.l toppillr 350,000 '
9 010 0it 0
12 0 '13 HoaQd tOpping 350,000 ° ' ',14 015 33% of E.&M. equipment 2,206,70016 0 O17 0 "18 Road topping 350,00019 020 0 ,21 0 " " " 22 023 Hoad toppllig 350,000 N ,, .ph 0 r ..
- Salvage value -5,460o,000(Land at same constantvalue plus 1/5 of otheror),-inal capital cost) (18,950,000) (15,925,000) (11,587,5001 (9,281,250)
/ ee footnote 1, Table Ice rootnole 2, Table I
(t
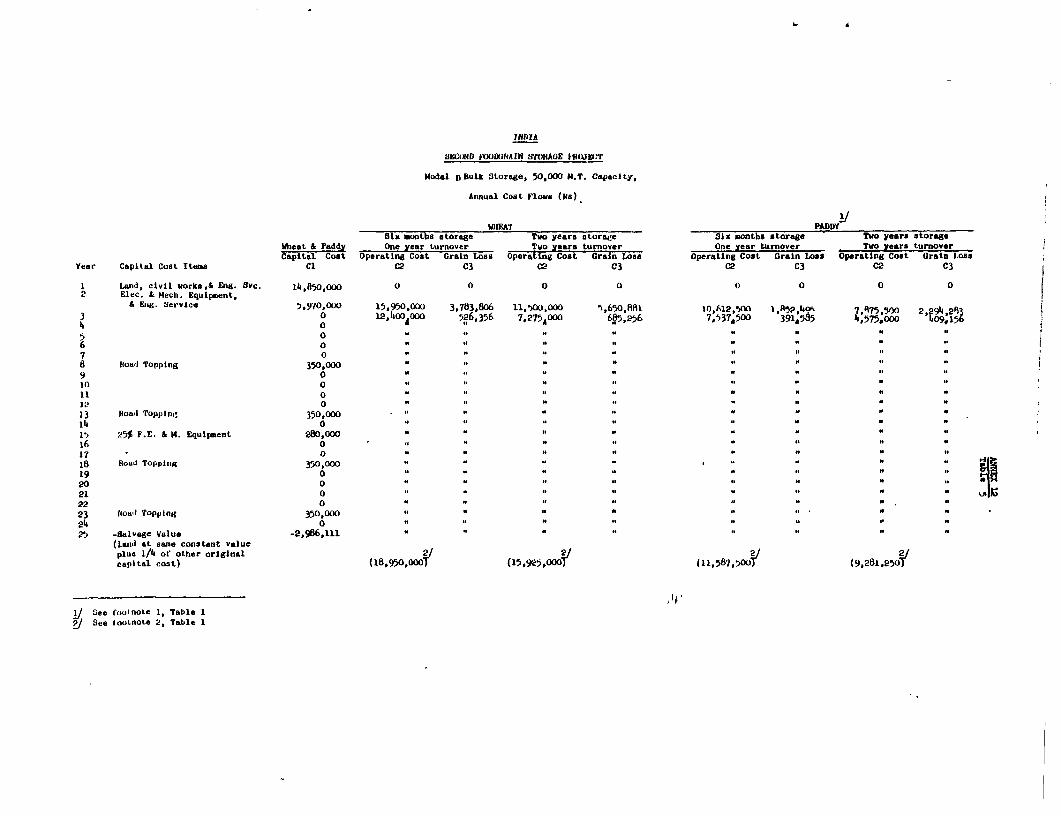
INDIA
SECOND FWoDURJIATN SrORAGE PRfOJWr
Model D BUlk Storage, 50.000 N.T. Capacity,
Annual Co(st Flows (Rs)
In(EAT PADDYSix months storage Two years atorag'e Six months storage Two years storage
Wheat A& Paddy One year turnover Two years turnover One year turnover Two years turnoverCap tal Cost Operating Coat Grain Losa Operating Cost Grain Lose Operating Cost Grain Loss Operating Cost Grain Loss
Year Capital Cost Items C1 C2 C3 C2 C3 C2 C3 C2 C3
I Land, civil worka & Eng. Svc. 14,850,OO 0 0 0 0 0 0 0 02 Elec. & Mech. Equipment,
& FLug. Service 7,970,000 15,950,000 3,783,806 11,500,000 -5,650.881l 10,612,500 j1R,p I4a- 17,'5,500 2,t9hi,2Rj3 6ne Sevle 5s ? 1 950 12,IOOROOO 526,356 7 ' 2 7 5
;0 0 0
6,5,256 7h537l500 391,5A5 Z4575.000 015*14 0
06 0
Hoad Topping 350,0oo9 0
13 Road Toppin, 350,000 ""
15 25$ FE. & M. Equipment 280,000 - N
16 0 n u u u°
17 0 n18 Road Topping 350,000 " ° " ° N "i219 O
20 3 ° 3 . . I, X21 022 0
23 ftoad Topping 350,000 3 N .
24 0 n u25 -salvage Value -2,986,111 i
(land at same constant valueplus 1/h4 o other original 2/ 2/capital cost) (18,950,000) (15,925,000) (11587,500} (9,2831,2501
See foo note 1, Table 1See footnote 2, Table 1
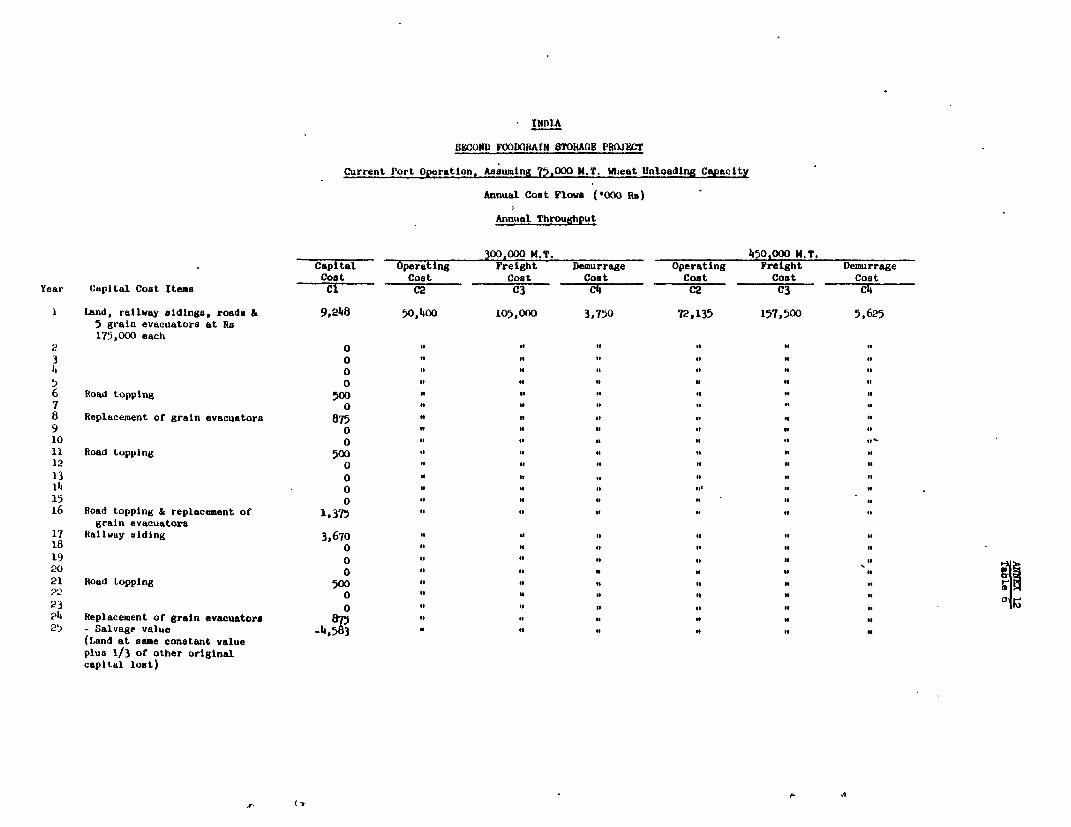
INDIA
SECOND FOODCRAIN STORAGE PROJECT
Current Port Operation, Assuming 75,000 H.T. Wheat Unloading Capacity
Annual Coat Flows ('000 Ra)
Annual Throughput
300,000 H.T. 450,000 H.T.Capital Operating Freight Demurrage Operating Freight DemurrageCost Cost Cost Cost Cost Cost Cost
Year Capital Cost Items C0 C2 03 C Co2 C3 C4
1 Land, railway sidings, roads & 9,248 50,400 105,000 3,750 72,135 157,500 5,6255 grain evacuatora at Ra175,000 each
2 0 " 3 0 " " "
5 ~~~~~~~~~~~~06 Road topping 507 0 ' ""8 Replacement of grain evacuators 875 I 99 9 n9 0 9 " " "910 011 Road topping 50012 013 H15 0 " 9 916 Road topping & replacement of 1,375 "
grain evacuators17 Railway aiding 3,670 ,,18 0 " 19 0 9 99 *920 0 9
21 Road topping 500 " , 9922 0 1
23 0 " " 99214 Replacement of grain evacuators25 - Salvage value -4,8 " a "
(Land at same constant valueplus 1/3 of other originalcapital lost)
?.

MIA
SECOND FOODGRAIN STORAGE PROJECT
Port Silos, 75,000 M.T. Total Static Capacity
Annual Cost Flows (000 RB)
Annual Throughput
300,000 H.T. 450,000 M.T.
Capital Operating Freight Demurrage Operating Freight Demurrage
Year Capital Cost Items Cost Cost Cost Cost Cost Cost Cost
Cl C2 C3 C4 C2 C3 C4
1 11$ of capital cost 20,156 50,400 105,000 3,750 72,135 157,500 5,265
2 25% of capital cost 45,810 of
3 64$ of capital cost 117,274 ""
4 0 38,850 71,900 0 53,550 107,850 0
5 0 "I " "5 to
6 Road topping 500 " " " ""
7 0 t of
a 0 tos
9 0 of
10 0 to
11 Road topping 500 of " " " "5
12 00
14 E & M equipment 90,400 S *.
15 0 " " 5 ,. .
16 Road topping 5°° n ii , we
17 0 " ""
18 0 nn
19 Railway sidlng 3,675 " ,,
20 o 0*
21 Road topping 500 * In22 0
23 o ""
24 E & H equipment 90,400 . .. .. .. ..
25 - Salvage value -62,o80 o " " "
(Land at same constant value
plus 1/3 of other original
capital cost)
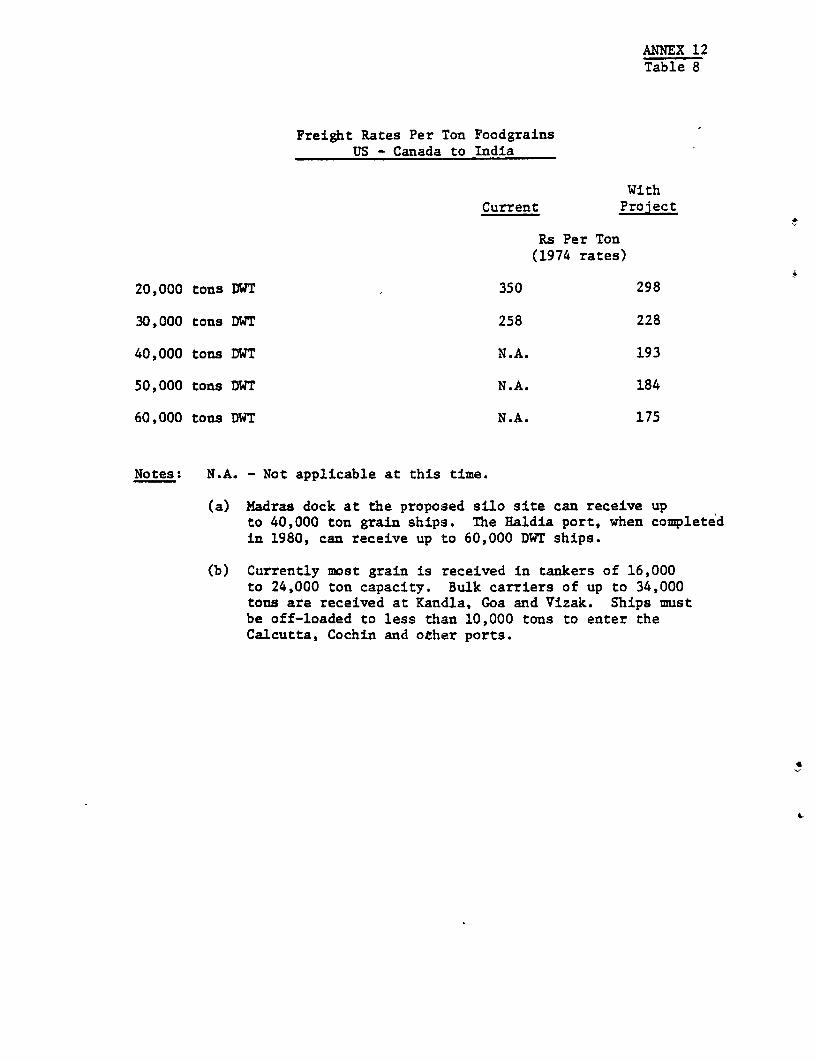
ANNEX 12Table 8
Freight Rates Per Ton FoodgrainsUS - Canada to India
WithCurrent Project
Rs Per Ton(1974 rates)
20,000 tons DWT 350 298
30,000 tons DWT 258 228
40,000 tons DWT N.A. 193
50,000 tons DWT N.A. 184
60,000 tons DWT N.A. 175
Notes: N.A. - Not applicable at this time.
(a) Madras dock at the proposed silo site can receive upto 40,000 ton grain ships. The Haldia port, when completedin 1980, can receive up to 60,000 DWT ships.
(b) Currently most grain is received in tankers of 16,000to 24,000 ton capacity. Bulk carriers of up to 34,000tons are received at Kandla, Goa and Vizak. Ships mustbe off-loaded to less than 10,000 tons to enter theCalcutta, Cochin and other ports.
4-

INDIA
SECOND FOODGRAIN STORAGE PROJECT
Economic Rates of Return
WHEAT PADDYI. Warehouse Component Model A Model B Model C Model D Model A Model B Model C Model D
1. Six months storage,One year turnover 19.7 25.9 25.8 28.4 9.5 17.8 17.6 19.7
Sensitivity Test:i) increase Cl (Capital
Cost) by 15% 16.8 22.7 22.6 25.0 7.8 15.4 15.2 17.1ii) increase C2 (Operating
Cost) by 10% 11.1 20.1 20.2 22.4 2.9 14.0 14.0 15.7iii) increase C3 (grainl
loss) by 10% 18.6 24.6 25.3 27.8 9.0 17.5 17.3 19.4
2. Two years storage,Two years turnover 29.1 34.3 33.6 36.7 16.1 20.9 20.0 22.3
Sensitivity test:i) increase Cl (Capital
Cost) by 15% 25.1 30.3 29.6 32.5 13.7 18.1 17.4 19.4ii) increase C2 (Operating --
Cost) by 10% 23.8 30.8 30.1 33.0 12.3 18.5 17.8 19.8iii) increase C3 (grain loss)
by 10% 27.7 33.5 32.3 35.8 13.4 20.6 19.7 21.9
II. Port Silo Component 300,000 M.T. Annual Throughput 450,000 M.T. Annual Throughput
75,000 M.T. Port Silos 24.1 36.7
ISensitivity test:i) increase Cl (Capital
Cost) by 15% 20.5 31.8 &ii) increase C2 (Operating w I
Cost) by 10% 20.0 30.1iii) increase C3 (Freight
Cost) by 10% 16.6 24.3iv) increase C4 (Demurrage
Cost) by 10% 23.9 36.3
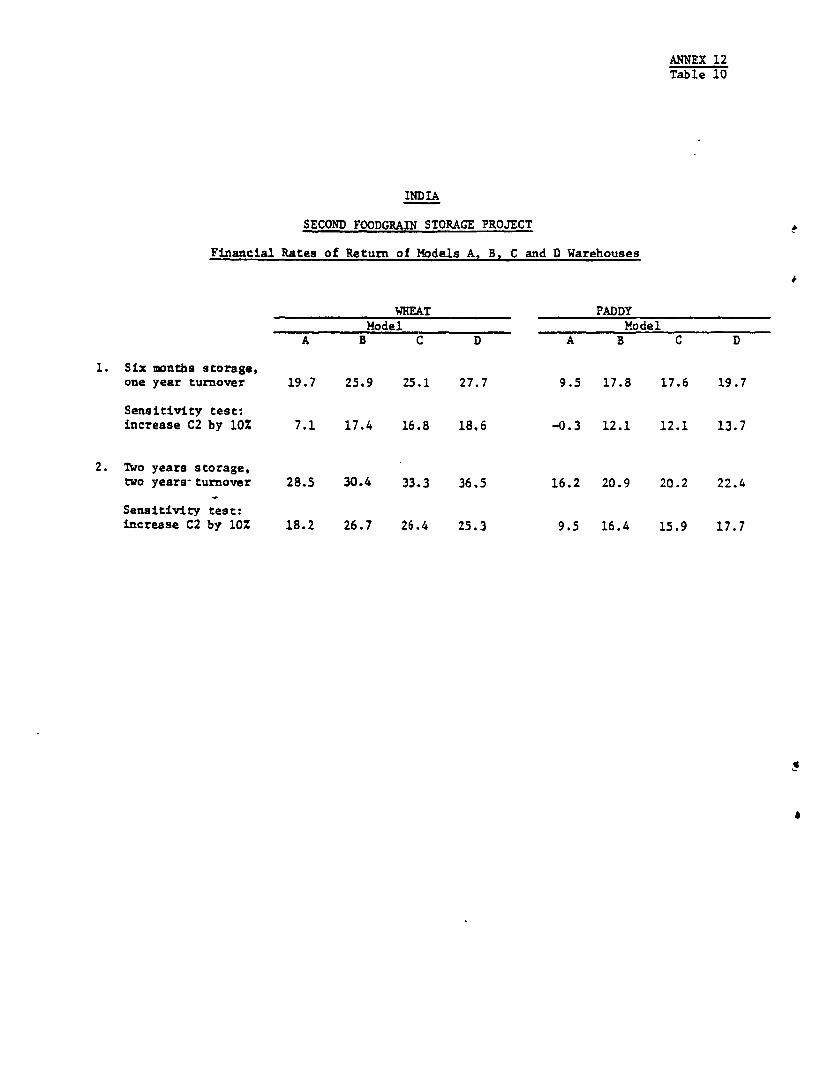
ANNEX 12Table 10
INDIA
SECOND FOODGRAIN STORAGE PROJECT
Financial Rates of Return of Models A, B. C and D Warehouses
WHEAT PADDYModel Model
A B C D A B C D
1. Six months storage,one year turnover 19.7 25.9 25.1 27.7 9.5 17.8 17.6 19.7
Sensitivity test:increase C2 by 10% 7.1 17.4 16.8 18.6 -0.3 12.1 12.1 13.7
2. Two years storage,two years-turnover 28.5 30.4 33.3 36.5 16.2 20.9 20.2 22.4
Sensitivity test:increase C2 by 10% 18.2 26.7 26.4 25.3 9.5 16.4 15.9 17.7
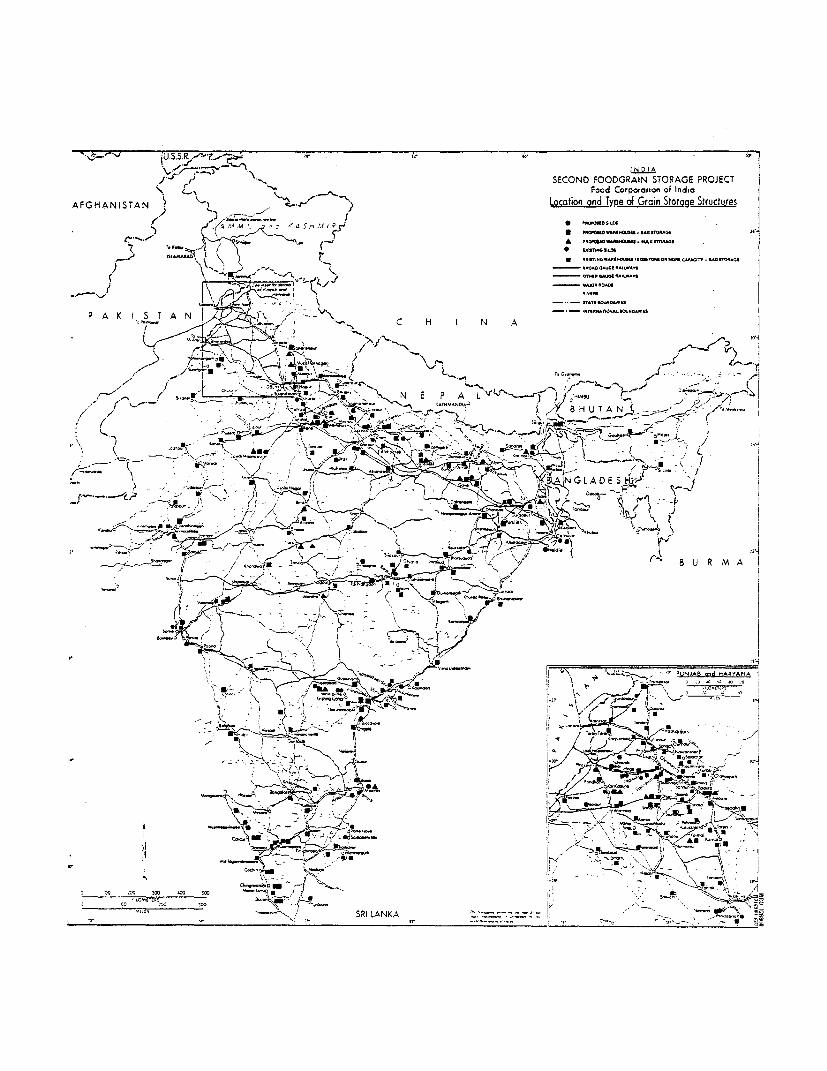
N ~~~~~~~~~~~~~~~~~~~~~~~~~~~~~~~~~~~~~~I NO)IA
XJ- /} o ~~~~~~~~~~~~~~~~~~~~SECOND FOOOGRAiN STORAGE PROJECT\ Co < __ ~~~~~~~~~~~~~~~~~~~~~~food Corporation of India
AfGHANISTAN 5 t, t2Location and Type of Grain Storage StructureS
.} D.,-
P A K I. S TA_s {J , v U 'r! i ^'4 5 r .'.s~c I N A >
__f~~~~~~~~~~~~~~~~~~~~~Z 1 H U T. A,N
:. ~~~Z 7q- Jr £X)
/ 2M 2m OJ' Sm'_'G. -r_
"'ss'
, ~ ~ ~ ~ ~ ~ ~ ~ ~~~~~~R LANKA#{ / "_ _ ' :W,"9( 3