appraisal report - Hudson River Park
170
APPRAISAL REPORT of 200,000 Square Feet of Air Rights Generated by Hudson River Park Pier 40 For Use by 550 Washington Street New York, New York SUBMITTED TO Hudson River Park Trust c/o Judith M. Gallent, Esq. Bryan Cave LLP 1290 Avenue of the Americas New York, New York 10104
-
Upload
khangminh22 -
Category
Documents
-
view
0 -
download
0
Transcript of appraisal report - Hudson River Park
APPRAISAL REPORT
of
200,000 Square Feet of Air Rights
Generated by Hudson River Park Pier 40
For Use by 550 Washington Street
New York, New York
SUBMITTED TO
Hudson River Park Trust
c/o Judith M. Gallent, Esq.
Bryan Cave LLP
1290 Avenue of the Americas
New York, New York 10104
April 29, 2016
Hudson River Park Trust
c/o Judith M. Gallent, Esq.
Bryan Cave LLP
1290 Avenue of the Americas
New York, New York 10104
Re: 200,000 Square Feet of Air Rights
Generated by Hudson River Park Pier 40
Block 656, Lot 1
New York, New York
For Use by 550 Washington Street
Block 596, Lot 1
New York, New York
Dear Ms. Gallent:
In accordance with your request, we have prepared an appraisal report of the above captioned
200,000 square feet of air rights, henceforth referred to as the “subject property air rights.” This
report has been prepared in accordance with the Uniform Standards of Professional Appraisal
Practice and Code of Ethics of the Appraisal Institute.
The air rights that are the subject of this report are those air rights generated by Pier 40, legally
identified as Block 656 Lot 1 on the NYC Assessor’s map, and available to be transferred to those
eligible properties located along West Street including 550 Washington Street. The client of this
report, the Hudson River Park Trust (HRPT), may enter into negotiations to transfer air rights from
Pier 40 to 550 Washington Street. Based on our review of the eligible receiving sites under the
Hudson River Park Act, as later detailed within this appraisal, only 550 Washington Street would
be eligible to receive a transfer of air rights. Therefore, this appraisal considers an analysis whereby
the air rights generated by Pier 40 are sold to 550 Washington Street for use in enhancing the
proposed development.
The receiving site at 550 Washington Street, legally identified as Block 596, Lot 1, and located in
Hudson Square, Manhattan, New York can legally be improved with approximately 1.51 million
square feet of zoning floor area based solely on a proposed rezoning map change and certain other
approvals. However, plans call for development with approximately 1.71 million square feet of
zoning floor area, consisting of residential condominiums, market rate residential rentals, affordable
housing, affordable senior housing, commercial/retail and a hotel.
LETTER OF TRANSMITTAL 2
There will be a shortfall of 200,000 square feet on the zoning lot which is to be provided to the site
via transfer of air rights from Pier 40 in conjunction with a proposed amendment to the text of the
zoning resolution and approval of a special permit. Moreover, we have been informed that the
proposed rezoning map change, approval of a special permit, and certain other actions, will be
treated together as a single set of approvals, and that these approvals may not proceed without the
purchase of the Pier 40 air rights.
The rezoning and special permit will require that the proposed development include both a senior
affordable component and a low-income affordable housing component. There will be no other
requirements as to what is developed with respect to residential and/or commercial uses. Therefore
our value of the fee development rights considers the pro rata share of the required affordable
components only, with the remaining development rights valued as per their highest and best use.
We have valued the remainder of the development rights based on their highest and best use, which
we have determined to be residential condominium. As a result, the highest and best use of the
market rate residential space is different than from what is planned with respect to condominium
development vs market rate rental development.
It is noted that the developer’s planned development, inclusive of a rental component was designed
to take advantage of the now-expired 421-a Partial-Tax Abatement Program (“421-a”). A rental
component is not a requirement under the project’s ULURP application, and it has been determined
from the analyses contained in this report that without 421-a, the highest and best use of the market
rate components of the development are solely for condominium development.
Valuation Methodology
The appraisal of the subject property air rights considers the blended residential uses proposed for
the receiving site’s fee development rights, solely giving weight to residential uses located on the
North and Center locations, to be rezoned C6-4 and C6-3, respectively. The South location is to be
rezoned an M1-5 zone, and no residential will be permitted. Because the project site (including
North, Center and South) comprises a single zoning lot, ZFA can be shifted among uses and
locations, and the air rights can likewise be applied to any location and use within the zoning lot.
The residential zoning floor area and space type generated by the North and Center sites is as
follows:
Use Total SF
% of
Total SF
Market Rate Residential (Condo) 960,300 74.50%
Senior Affordable 110,000 8.53%
Affordable 218,700 16.97%
Total Residential 1,289,000 100%
The value of air rights to be transferred is based upon two factors: (1) the value of the underlying
fee interest of the proposed development receiving site at 550 Washington Street, after considering
the highest and best use of the planned uses subject to the affordable requirements for the proposed
LETTER OF TRANSMITTAL 3
development, and (2) the ratio between the sales prices of air rights and the underlying fee interest
for comparable air rights transactions that we have observed in the market. The applicable ratio for
air rights transfers in NYC is generally less than 1.00 both because the market for unused air rights
is typically constrained, often to a single purchaser, and because the air rights do not include any
additional land to enlarge the development footprint and thereby allow greater flexibility in
configuring the built space. The value of air rights is therefore generally less than fee value.
The addenda to this report contains a valuation based on a hypothetical condition in which the now-
expired 421-a program is in place as of the appraisal date. The hypothetical valuation also considers
the proposed development with respect to a market rate rental component, rather than all
condominiums.
Market value is defined as the most probable price as of a specified date, in cash, or in terms
equivalent to cash, or in other precisely revealed terms for which the specified property rights
should sell after a reasonable exposure in a competitive market under all conditions requisite to a
fair sale, with the buyer and seller each acting prudently, knowledgeably, and for self-interest and
assuming neither is under undue duress.
The intended user of this appraisal is the client, The Hudson River Park Trust c/o Judith M. Gallent,
Esq. The intended use of the appraisal is to provide information in connection with a potential
disposition of air rights generated by Pier 40 of the Hudson River Park. The interest appraised is the
fee simple interest, and the effective date of the appraisal is April 1, 2016.
Given the nature of this assignment, a hypothetical condition and a series of extraordinary
assumptions, described below, are necessary to develop credible assignment results. The
hypothetical condition employed in this valuation is that the proposed rezoning and special permit
have been granted through a successful ULURP as of the effective date of value of this appraisal
with the receiving site incorporating the air rights purchased from HRPT into the development.
Therefore, our analysis proceeds in two parts: first consideration of the development rights as part
of the fee parcel, and second the market relationship, expressed as a ratio, between the value of the
air rights and the value of the underlying fee parcel. The market value of subject property air rights
equals the value of the allocable portion of the fee interest multiplied by this ratio.
A hypothetical condition is defined as, “That which is contrary to what exists, but is supposed for
the purpose of the analysis. Hypothetical conditions assume conditions contrary to known facts
about physical, legal, or economic characteristics of the subject property; or about conditions
external to the property, such as market conditions or trends, or about the integrity of data used in
an analysis.” 1 The hypothetical condition is necessary to produce credible assignment results.
An extraordinary assumption is defined as, “An assumption, directly related to a specific
assignment, which, if found to be false, could alter the appraiser’s opinions or conclusions.
Extraordinary assumptions presume as fact otherwise uncertain information about physical, legal,
1 Appraisal Institute, The Dictionary of Real Estate Appraisal, 5th Ed., (Illinois: Appraisal Institute, 2010), page 97
LETTER OF TRANSMITTAL 4
or economic characteristics of the subject property; or about condition external to the property such
as market conditions or trends; or about the integrity of data used in an analysis.”2
The extraordinary assumptions made in this appraisal are summarized as follows:
1. That the outline of North and Center of the planned development will be generally
comprised of the following Zoning Floor Area (ZFA):
- 960,300 square feet of market rate residential development
- 110,000 square feet of affordable senior housing rentals
- 218,700 square feet of affordable residential rentals
2. That, as per the client based on information provided by NYCDCP, the affordable
components will not be eligible to generate off-site Inclusionary Housing bonuses to be
sold to qualifying sites, which departs from prior programs for affordable housing
development in New York City.
3. That the developer will elect to utilize 60% Area Median Income (AMI) for the Senior
Affordable Rental Apartment (SARA) program, in order for this component of the
project to be eligible for 4% Low Income Housing Tax Credits (LIHTC). It was reported
by HPD that 80% AMI is the maximum AMI requirement for the SARA component.
If any of the extraordinary assumptions are found to be materially different than what is assumed
for this assignment, the appraisal may require revision.
The following report sets forth all available data and methodology utilized in arriving at our value
conclusion and should be read in its entirety. The appraisal is subject to the Underlying
Assumptions and Contingent Conditions set forth on the following pages.
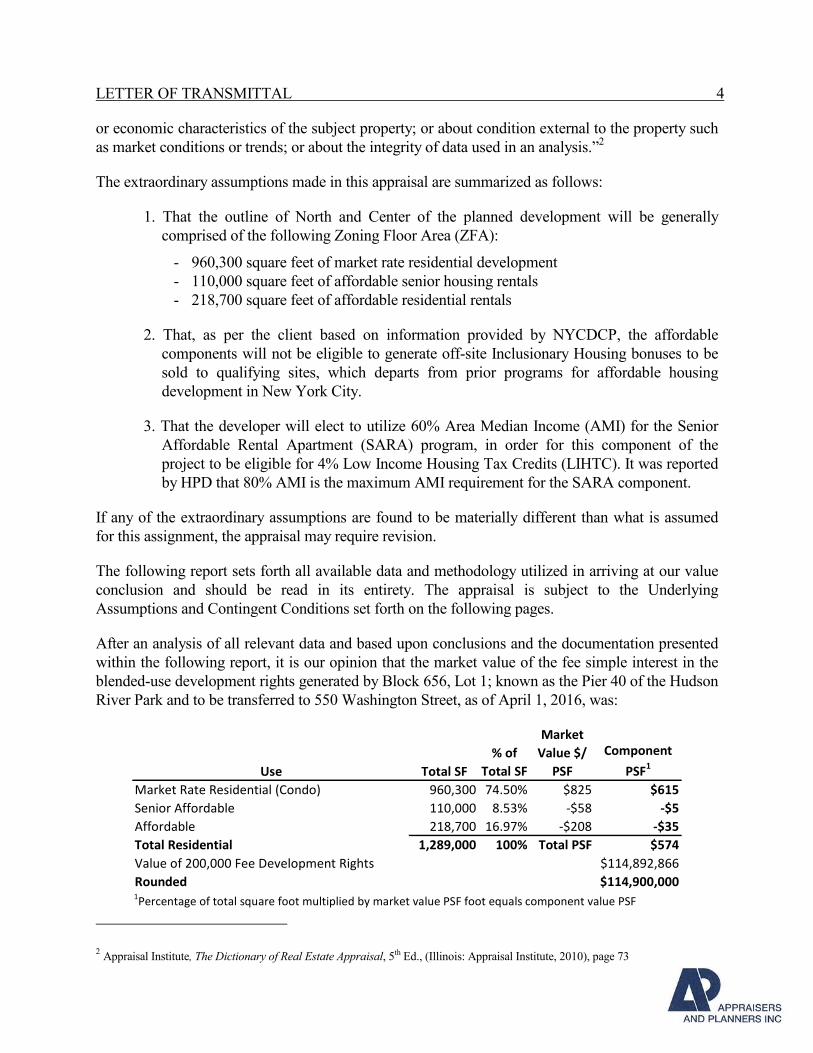
After an analysis of all relevant data and based upon conclusions and the documentation presented
within the following report, it is our opinion that the market value of the fee simple interest in the
blended-use development rights generated by Block 656, Lot 1; known as the Pier 40 of the Hudson
River Park and to be transferred to 550 Washington Street, as of April 1, 2016, was:
Use Total SF
% of
Total SF
Market
Value $/
PSF
Component
PSF1
Market Rate Residential (Condo) 960,300 74.50% $825 $615
Senior Affordable 110,000 8.53% -$58 -$5
Affordable 218,700 16.97% -$208 -$35
Total Residential 1,289,000 100% Total PSF $574
Value of 200,000 Fee Development Rights $114,892,866
Rounded $114,900,0001Percentage of total square foot multiplied by market value PSF foot equals component value PSF
2 Appraisal Institute, The Dictionary of Real Estate Appraisal, 5th Ed., (Illinois: Appraisal Institute, 2010), page 73
LETTER OF TRANSMITTAL 5
The senior affordable and the low-income affordable components produce negative values,
indicating that development of these components costs more to develop than their appraised value
indicates. As part of the ULURP process NYCDCP has made it a requirement that these
components be constructed, as opposed to donating the land, which is sometimes observed for
mixed-rate components in NYC. As a result, the development of these components, or the
developer’s requirement to cause these components to be developed, is reflected in the blended
value.
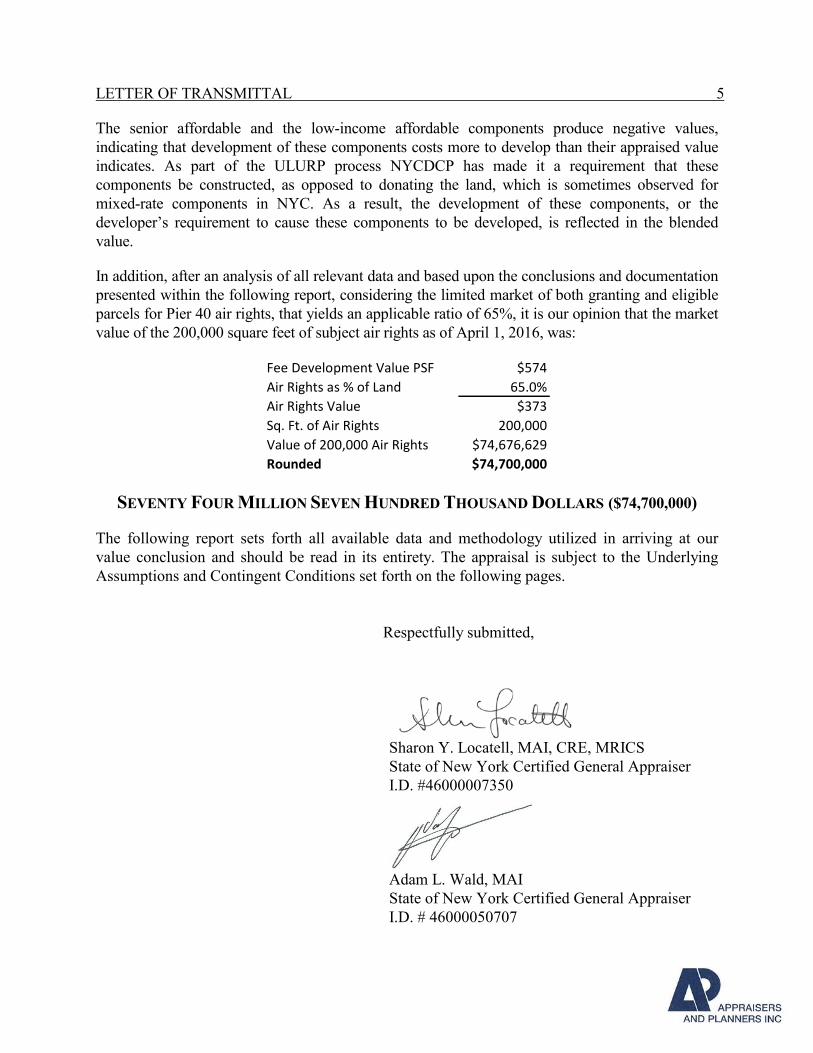
In addition, after an analysis of all relevant data and based upon the conclusions and documentation
presented within the following report, considering the limited market of both granting and eligible
parcels for Pier 40 air rights, that yields an applicable ratio of 65%, it is our opinion that the market
value of the 200,000 square feet of subject air rights as of April 1, 2016, was:
Fee Development Value PSF $574
Air Rights as % of Land 65.0%
Air Rights Value $373
Sq. Ft. of Air Rights 200,000
Value of 200,000 Air Rights $74,676,629
Rounded $74,700,000
SEVENTY FOUR MILLION SEVEN HUNDRED THOUSAND DOLLARS ($74,700,000)
The following report sets forth all available data and methodology utilized in arriving at our
value conclusion and should be read in its entirety. The appraisal is subject to the Underlying
Assumptions and Contingent Conditions set forth on the following pages.
Respectfully submitted,
Sharon Y. Locatell, MAI, CRE, MRICS
State of New York Certified General Appraiser
I.D. #46000007350
Adam L. Wald, MAI
State of New York Certified General Appraiser
I.D. # 46000050707
LETTER OF TRANSMITTAL 6
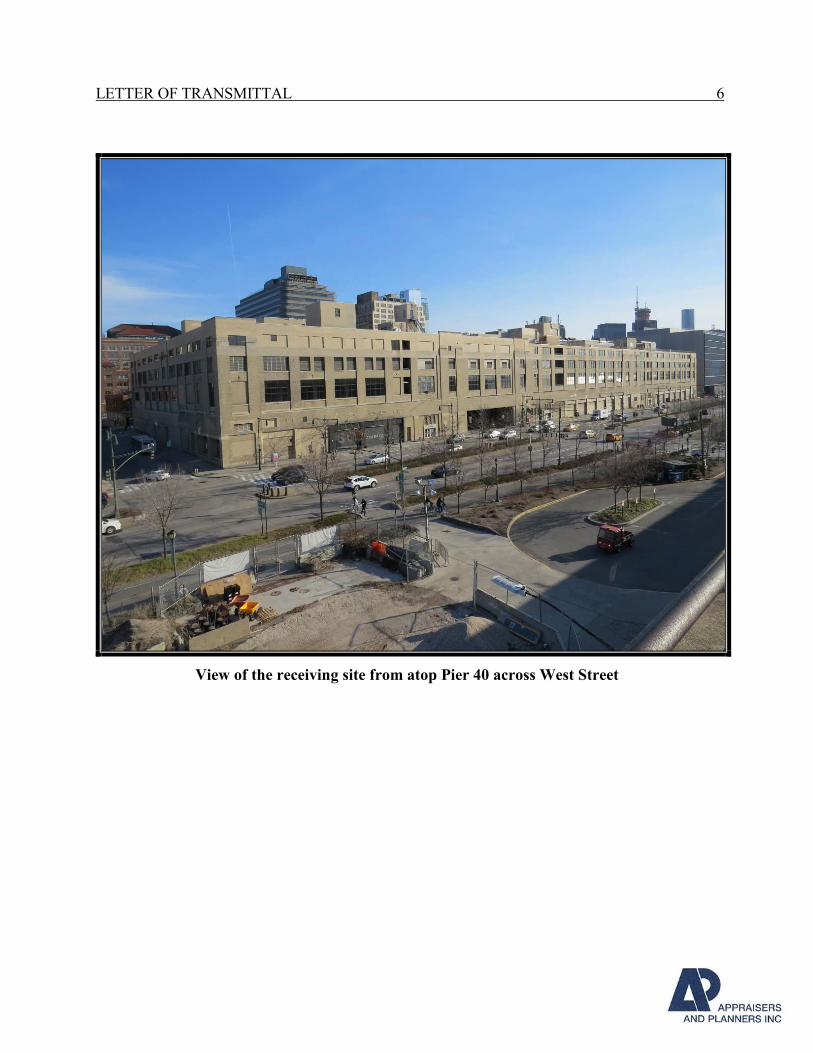
View of the receiving site from atop Pier 40 across West Street
TABLE OF CONTENTS 7
APPRAISAL REPORT
of
200,000 Square Feet of Air Rights
Generated by Hudson River Park Pier 40
Block 656, Lot 1
For Use by 550 Washington Street
Block 596, Lot 1
New York, New York
TABLE OF CONTENTS
UNDERLYING ASSUMPTIONS AND CONTINGENT CONDITIONS ........................................ 9
SUMMARY OF SALIENT FACTS AND CONCLUSIONS ........................................................... 11
INTRODUCTION ............................................................................................................................... 14
Scope of the Appraisal .................................................................................................................................. 14
Identification of Subject Property ................................................................................................................. 15
Purpose of the Appraisal ............................................................................................................................... 15
Intended Use of the Appraisal ..................................................................................................................... 15
Effective Appraisal Dates ............................................................................................................................. 15
Intended User ................................................................................................................................................. 15
Property Rights Appraised ............................................................................................................................ 16
Ownership History ........................................................................................................................................ 16
Exposure Time............................................................................................................................................... 16
Definition of Market Value ........................................................................................................................... 17
DESCRIPTIVE DATA ....................................................................................................................... 18
Regional Analysis .......................................................................................................................................... 19
Location Analysis .......................................................................................................................................... 28
Hudson Square – Subject Neighborhood ...................................................................................................... 35
Residential Market Analysis ......................................................................................................................... 42
Manhattan Development Land Market ......................................................................................................... 53
Real Estate Assessed Valuation and Tax Data ............................................................................................. 61
Zoning Analysis ............................................................................................................................................. 65
Site and Improvement Data ........................................................................................................................... 71
HIGHEST AND BEST USE ANALYSIS ......................................................................................... 74
VALUATION ...................................................................................................................................... 78
Appraisal Process .......................................................................................................................................... 78
Sales Comparison Approach – Market Rate Housing .................................................................................. 81
Discussion of Adjustments to Comparable Sales – Condominium Sites .................................................... 89
Comparable Sales Adjustment Grid – Condominium Sites ......................................................................... 95
Conclusion of Value – Condominium Sites ................................................................................................. 96
Residual Land Approach – Senior Affordable and Affordable Components .............................................. 97
Residual Land Approach – Introduction ....................................................................................................... 97
TABLE OF CONTENTS 8
Estimated Income .......................................................................................................................................... 98
Construction Cost Estimates ....................................................................................................................... 106
Discount and Capitalization Rates .............................................................................................................. 107
Low Income Housing Tax Credits (LIHTC) Value ................................................................................... 109
Land Residual – Senior Affordable Component ........................................................................................ 111
Land Residual – Low Income Affordable Component .............................................................................. 112
RECONCILIATION AND VALUE CONCLUSION – FEE DEVELOPMENT RIGHTS ........... 114
Exposure Time – Air rights ......................................................................................................................... 118
Definition of Market Value – Air Rights .................................................................................................... 119
Overview of Air Rights Transaction Mechanisms in New York City ....................................................... 120
Development Site Sales and Corresponding Air Rights Transactions ...................................................... 123
Conclusion of Air Rights Value .................................................................................................................. 127
RECONCILIATION AND VALUE CONCLUSION – AIR RIGHTS ........................................... 130
ADDENDA – ALTERNATIVE VALUATION SCENARIOS ...................................................... 135
Market Rent Analysis .................................................................................................................................. 135
Discussion of Adjustments to Comparable Sales – Market Rate Rental Sites .......................................... 146
Comparable Sales Adjustment Grid – Market Rate Rental Sites .............................................................. 150
Conclusion of Value – Market Rate Rental Sites ....................................................................................... 151
The 421-a Tax Abatement – For Alternative Valuation ............................................................................ 152
Residual Analyses – Market Rate Rental and Low-Income Affordable Components .............................. 157
Reconciliation – Alternative Valuation ...................................................................................................... 165
CERTIFICATION ............................................................................................................................. 167
STATEMENT OF QUALIFICATIONS .......................................................................................... 168
UNDERLYING ASSUMPTIONS AND CONTINGENT CONDITIONS 9
UNDERLYING ASSUMPTIONS AND CONTINGENT CONDITIONS
For the purpose of this appraisal, except as otherwise stated in the appraisal report, it is assumed:
1. That the legal description is correct.
2. That the title to the property is legally sufficient.
3. That there are no encumbrances or defects of title.
4. That the property is free and clear of all liens.
5. That the property will be efficiently managed and properly maintained.
6. That there are no structural conditions which are not apparent.
7. That there are no sub-surface soil conditions which would cause extraordinary
development costs.
The appraisal is made subject to the following contingent conditions:
1. That no liability is assumed because of inaccuracies or errors in information furnished by
others.
2. That no liability is assumed as a result of matters of legal character affecting the property,
such as title defects, encroachments, liens, overlapping boundaries, party wall
agreements, and easements.
3. Unless otherwise stated in this report, the existence of hazardous material, which may or
may not be present on the property, was not observed by the appraiser, and the appraiser
has no knowledge of the existence of such materials on or in the property. The appraiser,
however, is not qualified to detect such substances. The presence of substances such as
asbestos, urea-formaldehyde foam insulation, or other potentially hazardous materials
may affect the value of the property. Except as the otherwise stated in the appraisal
report, the value indication is predicated on the assumption that there is no such material
on or in the property that would cause a loss in value. No responsibility is assumed for
any such conditions, or for any expertise or engineering knowledge required to discover
them. The client is urged to retain an expert in this field, if desired.
4. This appraisal is to be used in whole and not in part. The appraisal is invalid if used in
part.
5. That no survey, structural or sub-surface soil investigation was made of the property by
the appraiser.
6. The appraiser herein by reason of this appraisal is not required to give testimony in court
with reference to the subject property unless otherwise previously arranged.
UNDERLYING ASSUMPTIONS AND CONTINGENT CONDITIONS 10
7. Possession of this report, or copy thereof, does not carry with it the right of publication,
nor may it be used for any purpose by anyone but the applicant without the previous
written consent of the appraiser.
8. This appraisal was made for the purpose stated and should not be used for any unrelated
purpose.
9. Each finding, prediction, assumption or conclusion contained in the appraisal report is the
appraiser's personal opinion and is not an assurance that an event will or will not occur.
Except as otherwise stated in the appraisal report, we assume that there are no conditions
relating to the real estate, sub-soil or structures located on the real estate which would
affect appraiser's analyses, opinions or conclusions with respect to the real estate that are
not apparent.
10. Appraisers and Planners, Inc. has not made a specific compliance survey and analysis of the
property to determine whether or not it is in conformity with the various detailed
requirements of the Americans with Disabilities Act (ADA, effective January 16, 1992). It
is possible that a compliance survey of the property and a detailed analysis of the ADA
requirements may reveal that the property is not in compliance with one or more
requirements. If so, this fact might have a negative effect upon the value of the property.
Appraisers and Planners, Inc. is not an ADA expert and has no direct evidence relating to
this issue. This report does not reflect possible non-compliance with the ADA or its
potential negative effect on the concluded value herein.
SUMMARY OF SALIENT FACTS AND CONCLUSIONS 11
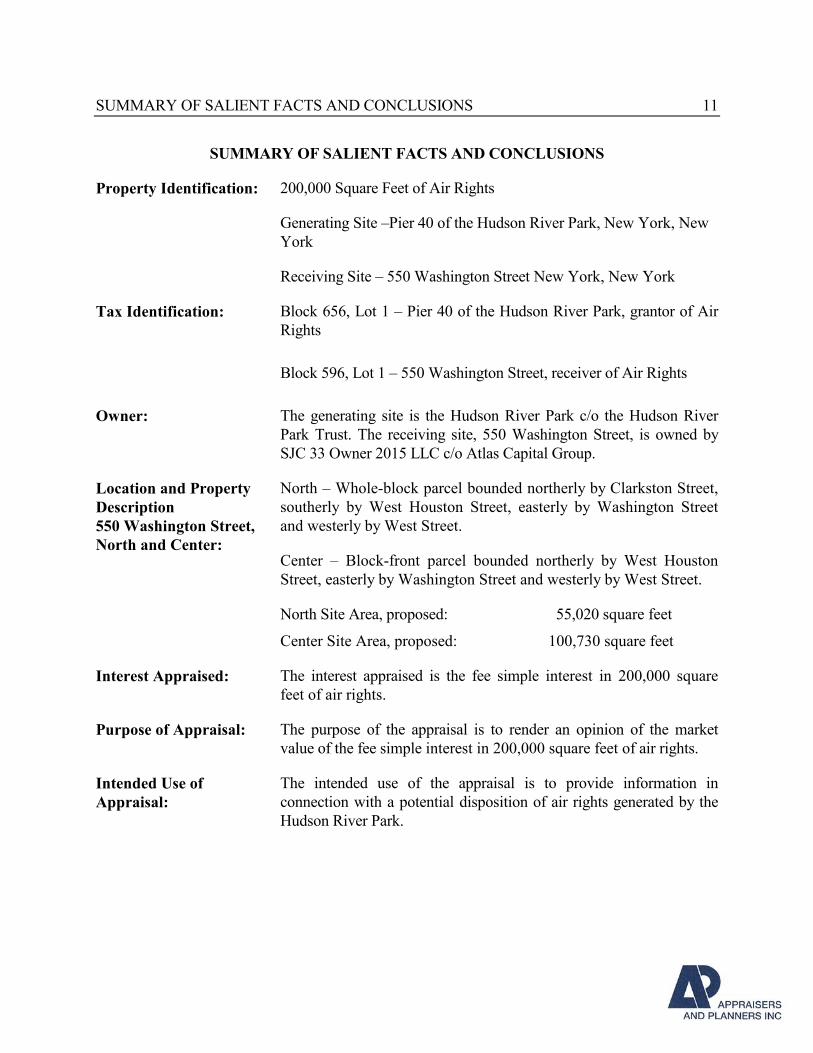
SUMMARY OF SALIENT FACTS AND CONCLUSIONS
Property Identification: 200,000 Square Feet of Air Rights
Generating Site –Pier 40 of the Hudson River Park, New York, New
York
Receiving Site – 550 Washington Street New York, New York
Tax Identification: Block 656, Lot 1 – Pier 40 of the Hudson River Park, grantor of Air
Rights
Block 596, Lot 1 – 550 Washington Street, receiver of Air Rights
Owner: The generating site is the Hudson River Park c/o the Hudson River
Park Trust. The receiving site, 550 Washington Street, is owned by
SJC 33 Owner 2015 LLC c/o Atlas Capital Group.
Location and Property
Description
550 Washington Street,
North and Center:
North – Whole-block parcel bounded northerly by Clarkston Street,
southerly by West Houston Street, easterly by Washington Street
and westerly by West Street.
Center – Block-front parcel bounded northerly by West Houston
Street, easterly by Washington Street and westerly by West Street.
North Site Area, proposed: 55,020 square feet
Center Site Area, proposed: 100,730 square feet
Interest Appraised: The interest appraised is the fee simple interest in 200,000 square
feet of air rights.
Purpose of Appraisal: The purpose of the appraisal is to render an opinion of the market
value of the fee simple interest in 200,000 square feet of air rights.
Intended Use of
Appraisal:
The intended use of the appraisal is to provide information in
connection with a potential disposition of air rights generated by the
Hudson River Park.
SUMMARY OF SALIENT FACTS AND CONCLUSIONS 12
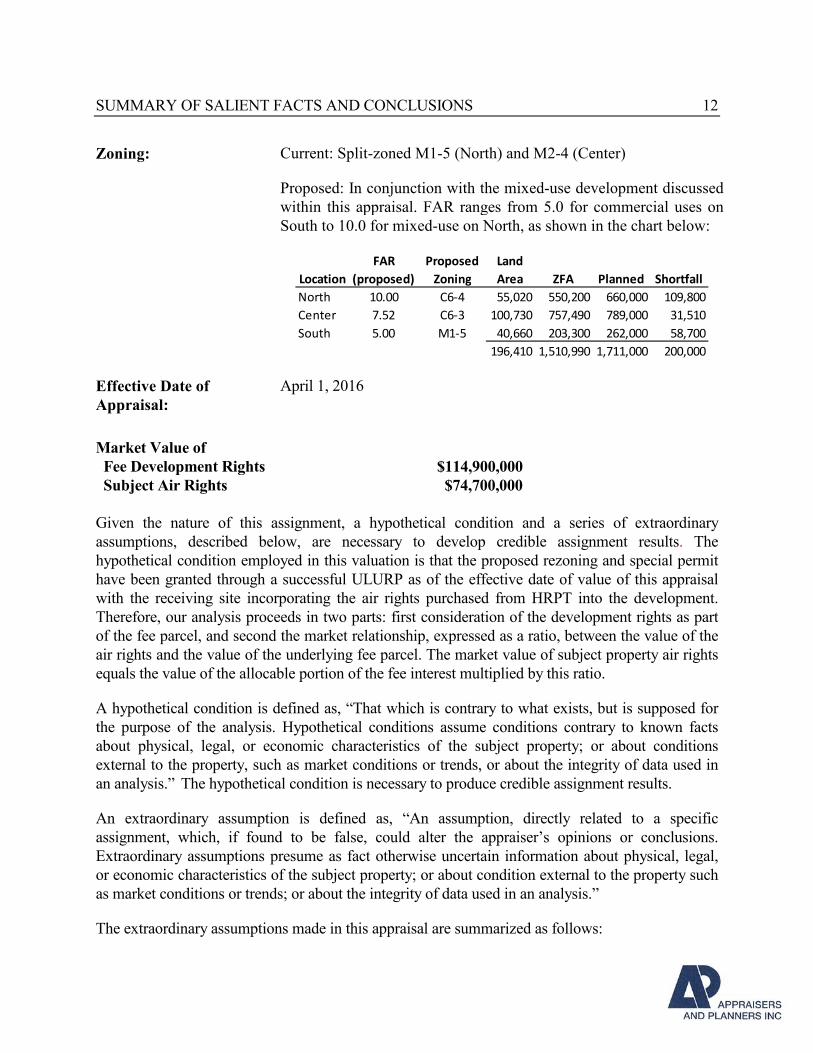
Zoning: Current: Split-zoned M1-5 (North) and M2-4 (Center)
Proposed: In conjunction with the mixed-use development discussed
within this appraisal. FAR ranges from 5.0 for commercial uses on
South to 10.0 for mixed-use on North, as shown in the chart below:
Location
FAR
(proposed)
Proposed
Zoning
Land
Area ZFA Planned Shortfall
North 10.00 C6-4 55,020 550,200 660,000 109,800
Center 7.52 C6-3 100,730 757,490 789,000 31,510
South 5.00 M1-5 40,660 203,300 262,000 58,700
196,410 1,510,990 1,711,000 200,000
Effective Date of
Appraisal:
April 1, 2016
Market Value of
Fee Development Rights
Subject Air Rights
$114,900,000
$74,700,000
Given the nature of this assignment, a hypothetical condition and a series of extraordinary
assumptions, described below, are necessary to develop credible assignment results. The
hypothetical condition employed in this valuation is that the proposed rezoning and special permit
have been granted through a successful ULURP as of the effective date of value of this appraisal
with the receiving site incorporating the air rights purchased from HRPT into the development.
Therefore, our analysis proceeds in two parts: first consideration of the development rights as part
of the fee parcel, and second the market relationship, expressed as a ratio, between the value of the
air rights and the value of the underlying fee parcel. The market value of subject property air rights
equals the value of the allocable portion of the fee interest multiplied by this ratio.
A hypothetical condition is defined as, “That which is contrary to what exists, but is supposed for
the purpose of the analysis. Hypothetical conditions assume conditions contrary to known facts
about physical, legal, or economic characteristics of the subject property; or about conditions
external to the property, such as market conditions or trends, or about the integrity of data used in
an analysis.” The hypothetical condition is necessary to produce credible assignment results.
An extraordinary assumption is defined as, “An assumption, directly related to a specific
assignment, which, if found to be false, could alter the appraiser’s opinions or conclusions.
Extraordinary assumptions presume as fact otherwise uncertain information about physical, legal,
or economic characteristics of the subject property; or about condition external to the property such
as market conditions or trends; or about the integrity of data used in an analysis.”
The extraordinary assumptions made in this appraisal are summarized as follows:
SUMMARY OF SALIENT FACTS AND CONCLUSIONS 13
1. That the outline of North and Center of the planned development will be generally
comprised of the following Zoning Floor Area (ZFA):
- 960,300 square feet of market rate residential development
- 110,000 square feet of affordable senior housing rentals
- 218,700 square feet of affordable residential rentals
2. That, as per the client based on information provided by NYCDCP, the affordable
components will not be eligible to generate off-site Inclusionary Housing bonuses to be
sold to qualifying sites, which departs from prior programs for affordable housing
development in New York City.
3. That the developer will elect to utilize 60% Area Median Income (AMI) for the Senior
Affordable Rental Apartment (SARA) program, in order for this component of the
project to be eligible for 4% Low Income Housing Tax Credits (LIHTC). It was reported
by HPD that 80% AMI is the maximum AMI requirement for the SARA component.
If any of the extraordinary assumptions are found to be materially different than what is assumed
for this assignment, the appraisal may require revision.
INTRODUCTION 14
SCOPE OF THE APPRAISAL
Appraisers and Planners, Inc. has been retained by The Hudson River Park Trust c/o Judith M.
Gallent, Esq., to prepare an appraisal of the fee simple interest in 200,000 square feet of air rights
generated by Pier 40 of the Hudson River Park.
This report has been prepared in accordance with the Uniform Standards of Professional
Appraisal Practice and Code of Ethics of the Appraisal Institute. To accomplish this assignment,
the following scope of services was undertaken:
• Inspected the Hudson River Park in the vicinity of the Hudson Square neighborhood, and
made an exterior inspection of 550 Washington Street.
• Analyzed demographic trends in the vicinity of the subject property: Regional, area and
neighborhood data are based on published sources, the files and library of Appraisers and
Planners, Inc. and our discussions with knowledgeable sources.
• Analyzed current zoning regulations applicable to the subject property and all comparable
development site sales: Zoning information is based upon the City of New York Zoning
Resolution. We have also analyzed the proposed rezoning of the receiving site in
conjunction with mixed-use development proposed for the site.
• Developed an opinion of highest and best use for the receiving site in conformity with
NYC’s space program requirements for low-income affordable housing, and senior
affordable housing.
• For the addendum to the report, considered an alternate valuation scenario in which the
project is developed in accordance with the developer’s proposed plans, and the 421-a
program is reinstated. The potential tax savings generated by a 421-a exemption to be
applied to the market rate rental and low-income affordable rental components were
analyzed.
• Conducted a study of development land market conditions in the subject market area:
Market information is based upon published studies, sales information sources such as
PropertyShark and CoStar, NYC Department of Buildings, the files and library of
Appraisers and Planners, Inc. and our discussions with active participants and lenders in the
marketplace.
• Considered all approaches to value with sole reliance placed upon the Sales Comparison
Approach in the valuation of the subject property’s condominium component. A residual
land technique through an income approach was developed for the senior low-income
affordable units and low-income affordable units.
INTRODUCTION 15
• Provided a value conclusion for the development rights based upon the data and
methodology set forth within the appraisal report. Final market value conclusions are based
on the weighted average of the subject development rights considering the blended
residential uses comprising the highest and best uses proposed for the site.
• Analyzed transactions of blocks of air rights.
• Analyzed the percentage relationship between the value of fee development sites and
air rights transactions in understanding the relationship between fee development site
transactions and air rights sales.
• Provided a value conclusion for the subject air rights based upon the data and
methodology set forth within the appraisal report.
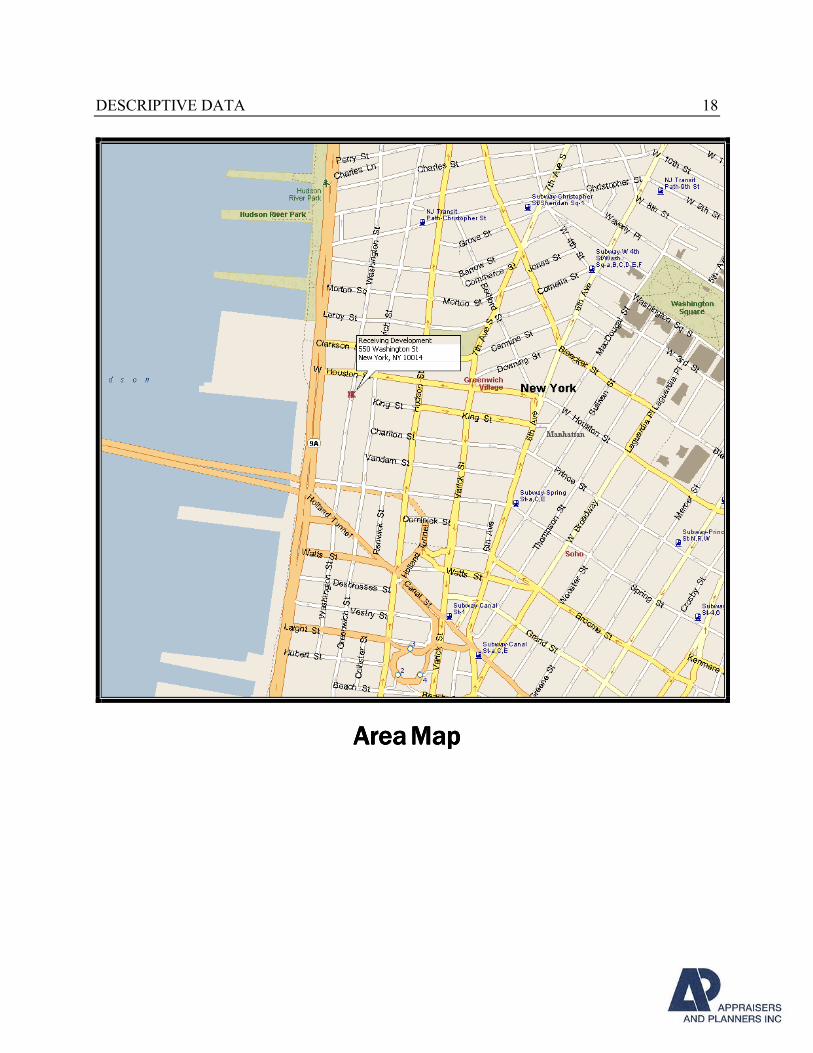
IDENTIFICATION OF SUBJECT PROPERTY
The generating site of the subject air rights is the Hudson River Park and the proposed receiving
site is the multi-phase development legally identified as Block 596, Lot 1 on the City of New
York Tax Assessment Maps. North Site is the whole-block parcel bounded northerly by
Clarkston Street, southerly by West Houston Street, easterly by Washington Street and westerly
by West Street. Center Site is a block-front parcel bounded northerly by West Houston Street,
easterly by Washington Street and westerly by West Street.
PURPOSE OF THE APPRAISAL
The purpose of the appraisal is to render an opinion of the market value of the fee simple interest in
200,000 square feet of subject air rights.
INTENDED USE OF THE APPRAISAL
The intended use of the appraisal is to provide information in connection with a potential
disposition of air rights generated by the Hudson River Park.
EFFECTIVE APPRAISAL DATE
The effective appraisal date is April 1, 2016.
INTENDED USER
The intended user of the report is the The Hudson River Park Trust c/o Judith M. Gallent, Esq.,
the client.
INTRODUCTION 16
PROPERTY RIGHTS APPRAISED
The property rights being appraised are those of the Fee Simple Estate. According to the Dictionary
of Real Estate Appraisal, Fifth Edition (2010), a publication of the Appraisal Institute, the interests
are defined as follows:
Fee Simple Estate is defined as:
“Absolute ownership unencumbered by any other interest or estate, subject only to the
limitations imposed by the governmental powers of taxation, eminent domain, police
power, and escheat.”
OWNERSHIP HISTORY
Records indicate ownership of the receiving site, 550 Washington Street, is held by SJC 33
Owner 2015 LLC c/o Atlas Capital Group (Atlas and Westbrook). The property has been acquired
in phases over the past number of years, with the most recent transfer occurring in August 2015.
This transaction, reportedly, represents a 50% partial interest transaction and the price has not
been confirmed by either party. A December 28, 2012 acquisition of 50.1% of the property was
transacted for an indicated purchase price of $270,956,000, based on transfer tax paid, and
translates into a full value of $540,829,842 per the RP-5217 NYS Real Property Transfer Tax
Report attached to the deed filed on New York City’s Automated City Register Information
System (ACRIS).
EXPOSURE TIME
Exposure time is defined as:
“The estimated length of time the property interest being appraised would have
been offered on the market prior to the hypothetical consummation of a sale at
market value on the effective date of the appraisal; a current estimate based upon
an analysis of past events assuming a competitive and open market. Exposure time
is always presumed to occur prior to the effective date of the appraisal.”3
In estimating the appropriate exposure time applicable to the interest in the subject property we
have considered marketing periods for similar type properties based on a survey of property
listings as well as sales data and interviews with market participants. In addition, when the
information was available, we have considered the exposure time of the development site sales
contained within this appraisal. It is our opinion that a reasonable exposure time applicable to the
interest in the subject property as of the effective appraisal date is six (6) to nine (9) months.
3 The Dictionary of Real Estate Appraisal, 5th Ed., (Illinois: Appraisal Institute, 2010), page 73
INTRODUCTION 17
DEFINITION OF MARKET VALUE
Market value is defined as follows:
“The most probable price which a property should bring in a competitive and open market
under all conditions requisite to a fair sale, the buyer and seller each acting prudently and
knowledgeably, and assuming the price is not affected by undue stimulus. Implicit in this
definition is the consummation of a sale as of a specified date and the passing of title from
seller to buyer under conditions whereby:
1. Buyer and seller are typically motivated;
2. Both parties are well informed or well advised, and acting in what they consider their own
best interests;
3. A reasonable time is allowed for exposure in the open market;
4. Payment is made in terms of cash in U.S. dollars or in terms of financial arrangements
comparable thereto; and
5. The price represents the normal consideration for the property sold unaffected by special or
creative financing or sales concessions granted by anyone associated with the sale.” 4
4 Appraisal Institute, The Appraisal of Real Estate, 13th Edition, (Illinois: Appraisal Institute, 2008), page 24-25.
DESCRIPTIVE DATA 18
AreaAreaAreaArea MapMapMapMap
DESCRIPTIVE DATA 19
REGIONAL ANALYSIS
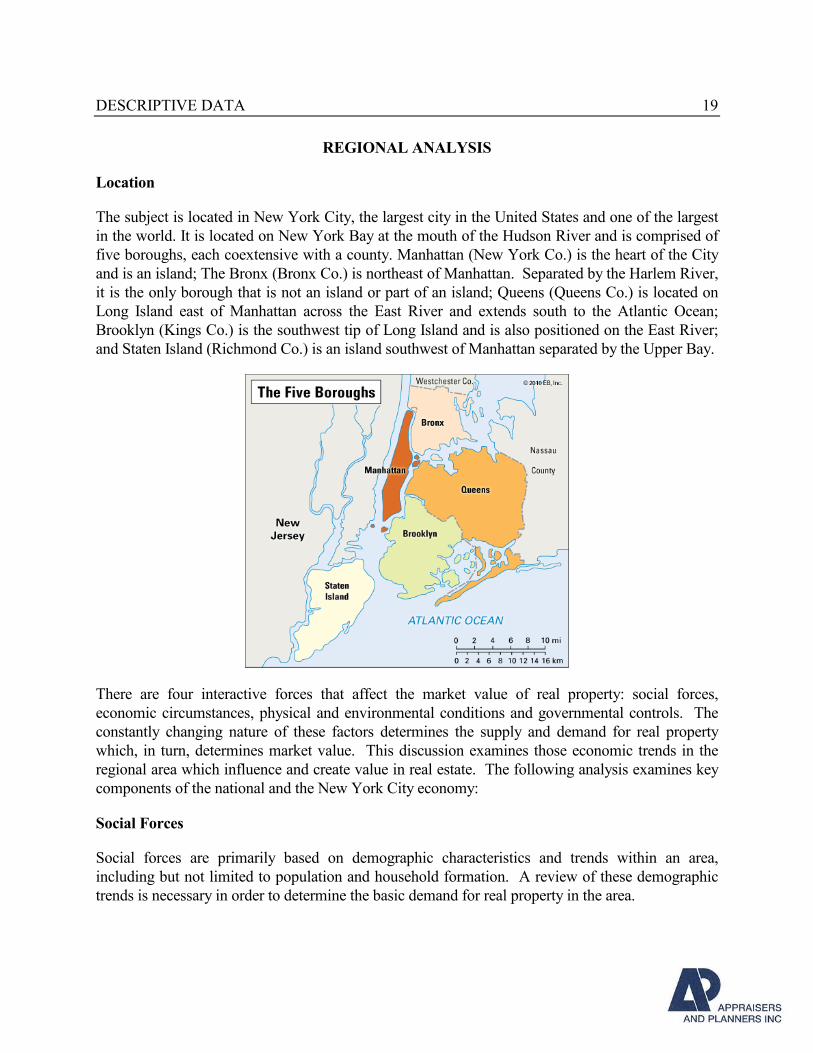
Location
The subject is located in New York City, the largest city in the United States and one of the largest
in the world. It is located on New York Bay at the mouth of the Hudson River and is comprised of
five boroughs, each coextensive with a county. Manhattan (New York Co.) is the heart of the City
and is an island; The Bronx (Bronx Co.) is northeast of Manhattan. Separated by the Harlem River,
it is the only borough that is not an island or part of an island; Queens (Queens Co.) is located on
Long Island east of Manhattan across the East River and extends south to the Atlantic Ocean;
Brooklyn (Kings Co.) is the southwest tip of Long Island and is also positioned on the East River;
and Staten Island (Richmond Co.) is an island southwest of Manhattan separated by the Upper Bay.
There are four interactive forces that affect the market value of real property: social forces,
economic circumstances, physical and environmental conditions and governmental controls. The
constantly changing nature of these factors determines the supply and demand for real property
which, in turn, determines market value. This discussion examines those economic trends in the
regional area which influence and create value in real estate. The following analysis examines key
components of the national and the New York City economy:
Social Forces
Social forces are primarily based on demographic characteristics and trends within an area,
including but not limited to population and household formation. A review of these demographic
trends is necessary in order to determine the basic demand for real property in the area.
DESCRIPTIVE DATA 20
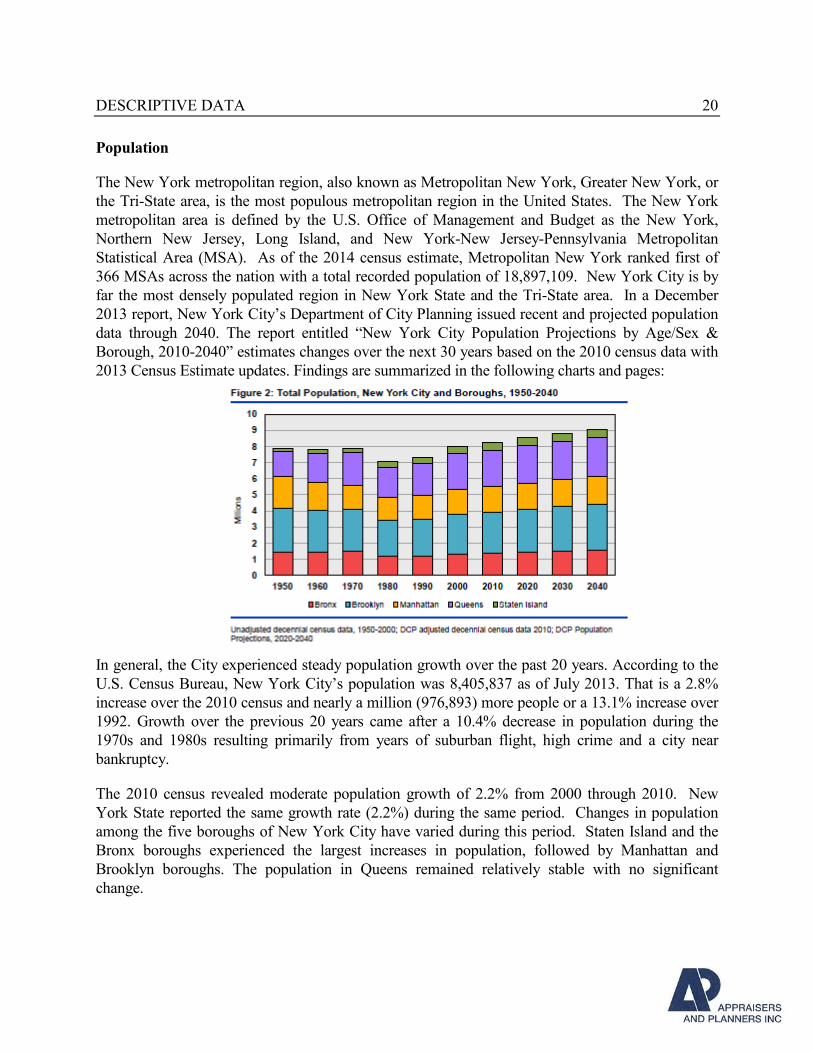
Population
The New York metropolitan region, also known as Metropolitan New York, Greater New York, or
the Tri-State area, is the most populous metropolitan region in the United States. The New York
metropolitan area is defined by the U.S. Office of Management and Budget as the New York,
Northern New Jersey, Long Island, and New York-New Jersey-Pennsylvania Metropolitan
Statistical Area (MSA). As of the 2014 census estimate, Metropolitan New York ranked first of
366 MSAs across the nation with a total recorded population of 18,897,109. New York City is by
far the most densely populated region in New York State and the Tri-State area. In a December
2013 report, New York City’s Department of City Planning issued recent and projected population
data through 2040. The report entitled “New York City Population Projections by Age/Sex &
Borough, 2010-2040” estimates changes over the next 30 years based on the 2010 census data with
2013 Census Estimate updates. Findings are summarized in the following charts and pages:
In general, the City experienced steady population growth over the past 20 years. According to the
U.S. Census Bureau, New York City’s population was 8,405,837 as of July 2013. That is a 2.8%
increase over the 2010 census and nearly a million (976,893) more people or a 13.1% increase over
1992. Growth over the previous 20 years came after a 10.4% decrease in population during the
1970s and 1980s resulting primarily from years of suburban flight, high crime and a city near
bankruptcy.
The 2010 census revealed moderate population growth of 2.2% from 2000 through 2010. New
York State reported the same growth rate (2.2%) during the same period. Changes in population
among the five boroughs of New York City have varied during this period. Staten Island and the
Bronx boroughs experienced the largest increases in population, followed by Manhattan and
Brooklyn boroughs. The population in Queens remained relatively stable with no significant
change.
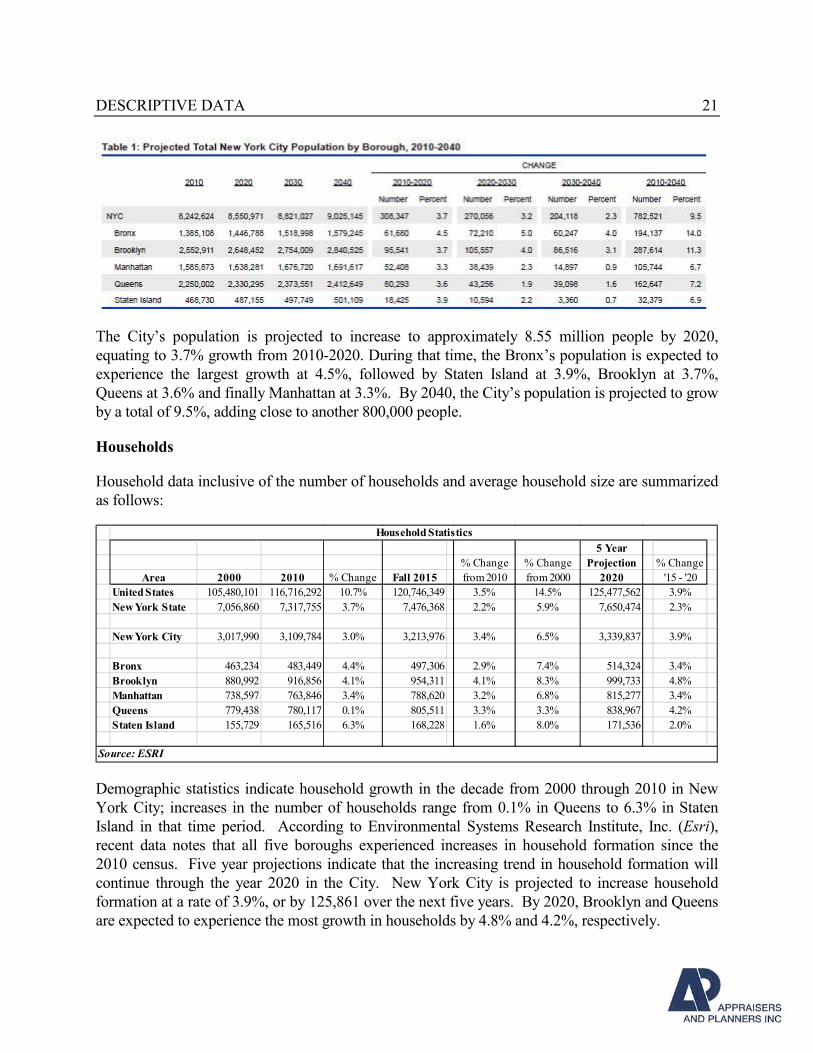
DESCRIPTIVE DATA 21
The City’s population is projected to increase to approximately 8.55 million people by 2020,
equating to 3.7% growth from 2010-2020. During that time, the Bronx’s population is expected to
experience the largest growth at 4.5%, followed by Staten Island at 3.9%, Brooklyn at 3.7%,
Queens at 3.6% and finally Manhattan at 3.3%. By 2040, the City’s population is projected to grow
by a total of 9.5%, adding close to another 800,000 people.
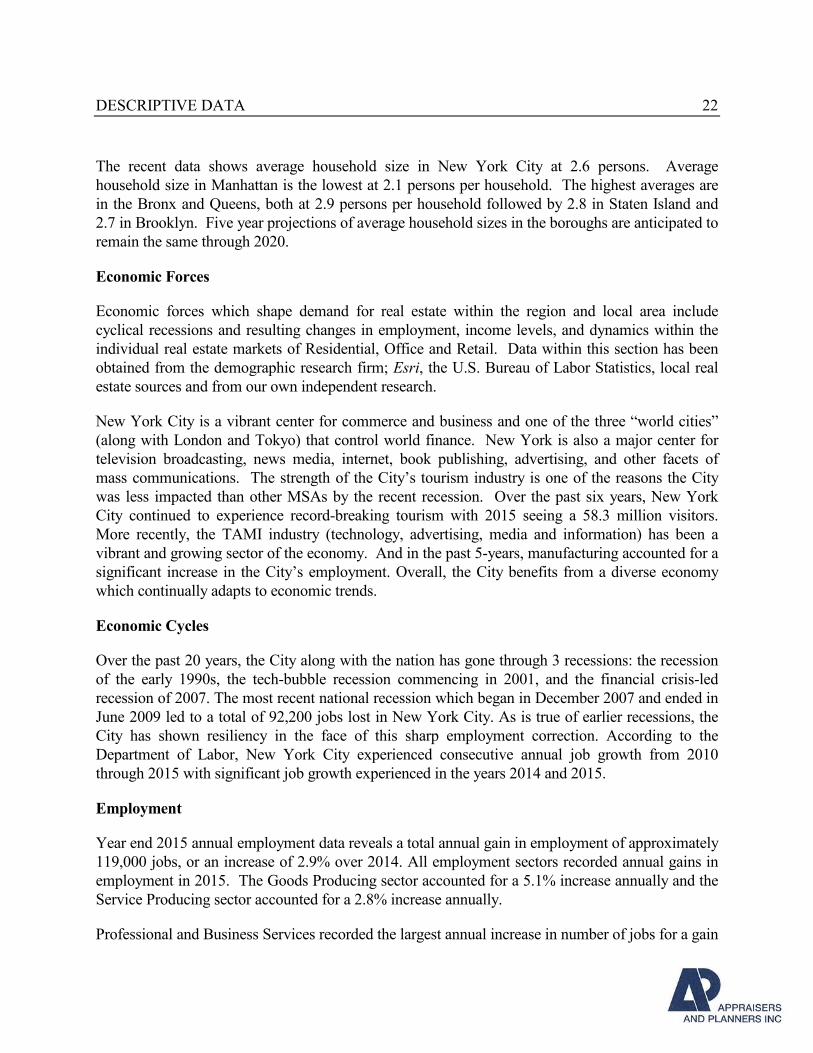
Households
Household data inclusive of the number of households and average household size are summarized
as follows:
5 Year
% Change % Change Projection % Change
Area 2000 2010 % Change Fall 2015 from 2010 from 2000 2020 '15 - '20
United States 105,480,101 116,716,292 10.7% 120,746,349 3.5% 14.5% 125,477,562 3.9%
New York State 7,056,860 7,317,755 3.7% 7,476,368 2.2% 5.9% 7,650,474 2.3%
New York City 3,017,990 3,109,784 3.0% 3,213,976 3.4% 6.5% 3,339,837 3.9%
Bronx 463,234 483,449 4.4% 497,306 2.9% 7.4% 514,324 3.4%
Brooklyn 880,992 916,856 4.1% 954,311 4.1% 8.3% 999,733 4.8%
Manhattan 738,597 763,846 3.4% 788,620 3.2% 6.8% 815,277 3.4%
Queens 779,438 780,117 0.1% 805,511 3.3% 3.3% 838,967 4.2%
Staten Island 155,729 165,516 6.3% 168,228 1.6% 8.0% 171,536 2.0%
Household Statistics
Source: ESRI
Demographic statistics indicate household growth in the decade from 2000 through 2010 in New
York City; increases in the number of households range from 0.1% in Queens to 6.3% in Staten
Island in that time period. According to Environmental Systems Research Institute, Inc. (Esri),
recent data notes that all five boroughs experienced increases in household formation since the
2010 census. Five year projections indicate that the increasing trend in household formation will
continue through the year 2020 in the City. New York City is projected to increase household
formation at a rate of 3.9%, or by 125,861 over the next five years. By 2020, Brooklyn and Queens
are expected to experience the most growth in households by 4.8% and 4.2%, respectively.
DESCRIPTIVE DATA 22
The recent data shows average household size in New York City at 2.6 persons. Average
household size in Manhattan is the lowest at 2.1 persons per household. The highest averages are
in the Bronx and Queens, both at 2.9 persons per household followed by 2.8 in Staten Island and
2.7 in Brooklyn. Five year projections of average household sizes in the boroughs are anticipated to
remain the same through 2020.
Economic Forces
Economic forces which shape demand for real estate within the region and local area include
cyclical recessions and resulting changes in employment, income levels, and dynamics within the
individual real estate markets of Residential, Office and Retail. Data within this section has been
obtained from the demographic research firm; Esri, the U.S. Bureau of Labor Statistics, local real
estate sources and from our own independent research.
New York City is a vibrant center for commerce and business and one of the three “world cities”
(along with London and Tokyo) that control world finance. New York is also a major center for
television broadcasting, news media, internet, book publishing, advertising, and other facets of
mass communications. The strength of the City’s tourism industry is one of the reasons the City
was less impacted than other MSAs by the recent recession. Over the past six years, New York
City continued to experience record-breaking tourism with 2015 seeing a 58.3 million visitors.
More recently, the TAMI industry (technology, advertising, media and information) has been a
vibrant and growing sector of the economy. And in the past 5-years, manufacturing accounted for a
significant increase in the City’s employment. Overall, the City benefits from a diverse economy
which continually adapts to economic trends.
Economic Cycles
Over the past 20 years, the City along with the nation has gone through 3 recessions: the recession
of the early 1990s, the tech-bubble recession commencing in 2001, and the financial crisis-led
recession of 2007. The most recent national recession which began in December 2007 and ended in
June 2009 led to a total of 92,200 jobs lost in New York City. As is true of earlier recessions, the
City has shown resiliency in the face of this sharp employment correction. According to the
Department of Labor, New York City experienced consecutive annual job growth from 2010
through 2015 with significant job growth experienced in the years 2014 and 2015.
Employment
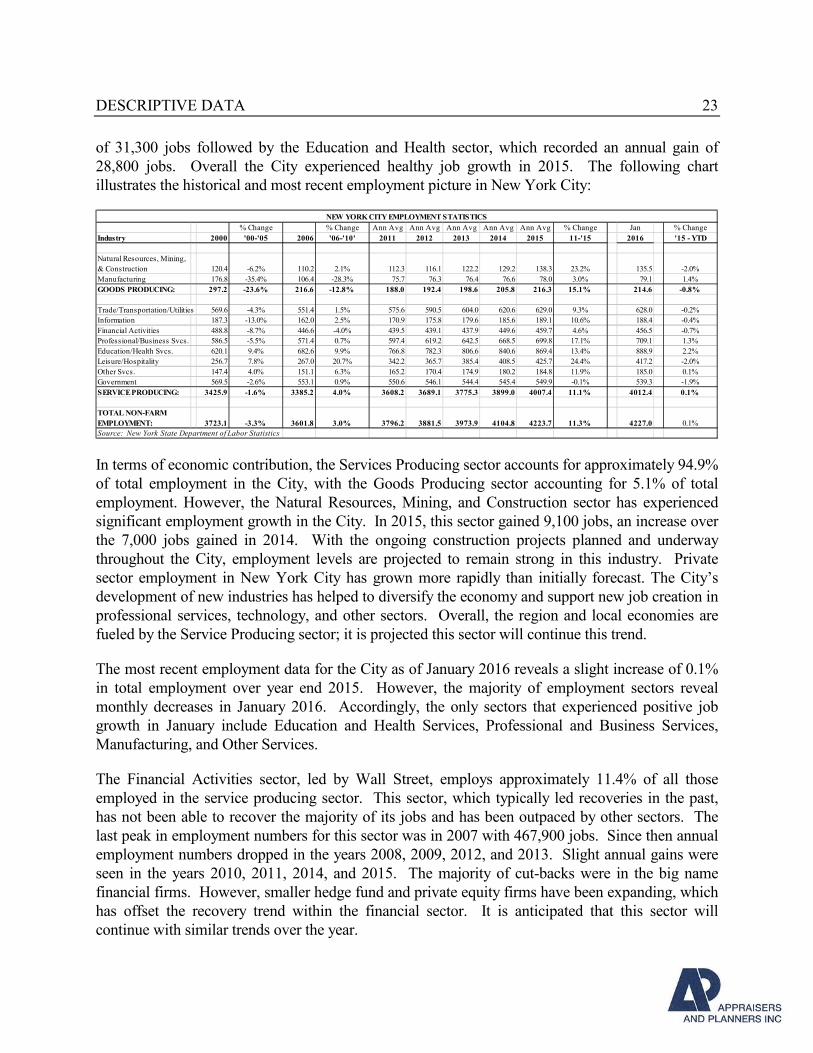
Year end 2015 annual employment data reveals a total annual gain in employment of approximately
119,000 jobs, or an increase of 2.9% over 2014. All employment sectors recorded annual gains in
employment in 2015. The Goods Producing sector accounted for a 5.1% increase annually and the
Service Producing sector accounted for a 2.8% increase annually.
Professional and Business Services recorded the largest annual increase in number of jobs for a gain
DESCRIPTIVE DATA 23
of 31,300 jobs followed by the Education and Health sector, which recorded an annual gain of
28,800 jobs. Overall the City experienced healthy job growth in 2015. The following chart
illustrates the historical and most recent employment picture in New York City:
% Change % Change Ann Avg Ann Avg Ann Avg Ann Avg Ann Avg % Change Jan % Change
Industry 2000 '00-'05 2006 '06-'10' 2011 2012 2013 2014 2015 11-'15 2016 '15 - YTD
Natural Resources, Mining,
& Construction 120.4 -6.2% 110.2 2.1% 112.3 116.1 122.2 129.2 138.3 23.2% 135.5 -2.0%
Manufacturing 176.8 -35.4% 106.4 -28.3% 75.7 76.3 76.4 76.6 78.0 3.0% 79.1 1.4%
GOODS PRODUCING: 297.2 -23.6% 216.6 -12.8% 188.0 192.4 198.6 205.8 216.3 15.1% 214.6 -0.8%
Trade/Transportation/Utilities 569.6 -4.3% 551.4 1.5% 575.6 590.5 604.0 620.6 629.0 9.3% 628.0 -0.2%
Information 187.3 -13.0% 162.0 2.5% 170.9 175.8 179.6 185.6 189.1 10.6% 188.4 -0.4%
Financial Activities 488.8 -8.7% 446.6 -4.0% 439.5 439.1 437.9 449.6 459.7 4.6% 456.5 -0.7%
Professional/Business Svcs. 586.5 -5.5% 571.4 0.7% 597.4 619.2 642.5 668.5 699.8 17.1% 709.1 1.3%
Education/Health Svcs. 620.1 9.4% 682.6 9.9% 766.8 782.3 806.6 840.6 869.4 13.4% 888.9 2.2%
Leisure/Hospitality 256.7 7.8% 267.0 20.7% 342.2 365.7 385.4 408.5 425.7 24.4% 417.2 -2.0%
Other Svcs. 147.4 4.0% 151.1 6.3% 165.2 170.4 174.9 180.2 184.8 11.9% 185.0 0.1%
Government 569.5 -2.6% 553.1 0.9% 550.6 546.1 544.4 545.4 549.9 -0.1% 539.3 -1.9%
SERVICE PRODUCING: 3425.9 -1.6% 3385.2 4.0% 3608.2 3689.1 3775.3 3899.0 4007.4 11.1% 4012.4 0.1%
TOTAL NON-FARM
EMPLOYMENT: 3723.1 -3.3% 3601.8 3.0% 3796.2 3881.5 3973.9 4104.8 4223.7 11.3% 4227.0 0.1%
Source: New York State Department of Labor Statistics
NEW YORK CITY EMPLOYMENT STATISTICS
In terms of economic contribution, the Services Producing sector accounts for approximately 94.9%
of total employment in the City, with the Goods Producing sector accounting for 5.1% of total
employment. However, the Natural Resources, Mining, and Construction sector has experienced
significant employment growth in the City. In 2015, this sector gained 9,100 jobs, an increase over
the 7,000 jobs gained in 2014. With the ongoing construction projects planned and underway
throughout the City, employment levels are projected to remain strong in this industry. Private
sector employment in New York City has grown more rapidly than initially forecast. The City’s
development of new industries has helped to diversify the economy and support new job creation in
professional services, technology, and other sectors. Overall, the region and local economies are
fueled by the Service Producing sector; it is projected this sector will continue this trend.
The most recent employment data for the City as of January 2016 reveals a slight increase of 0.1%
in total employment over year end 2015. However, the majority of employment sectors reveal
monthly decreases in January 2016. Accordingly, the only sectors that experienced positive job
growth in January include Education and Health Services, Professional and Business Services,
Manufacturing, and Other Services.
The Financial Activities sector, led by Wall Street, employs approximately 11.4% of all those
employed in the service producing sector. This sector, which typically led recoveries in the past,
has not been able to recover the majority of its jobs and has been outpaced by other sectors. The
last peak in employment numbers for this sector was in 2007 with 467,900 jobs. Since then annual
employment numbers dropped in the years 2008, 2009, 2012, and 2013. Slight annual gains were
seen in the years 2010, 2011, 2014, and 2015. The majority of cut-backs were in the big name
financial firms. However, smaller hedge fund and private equity firms have been expanding, which
has offset the recovery trend within the financial sector. It is anticipated that this sector will
continue with similar trends over the year.
DESCRIPTIVE DATA 24
New York City has experienced consecutive positive employment growth annually since 2010.
Current data indicates continued increases in the City’s employment numbers through year end
2015. However, the significant growth is not anticipated to continue at such an increasing pace.
Analysts are projecting that the positive trend in job growth may have reached a cyclical peak and is
projected to remain stable through 2016.
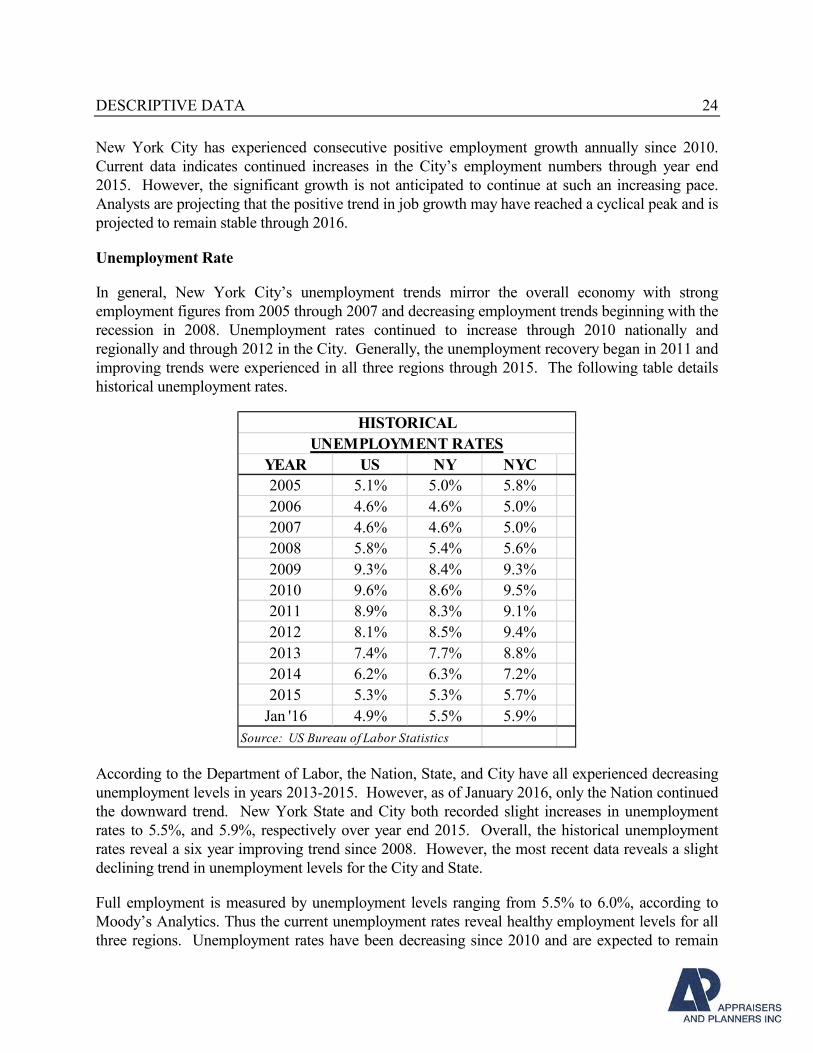
Unemployment Rate
In general, New York City’s unemployment trends mirror the overall economy with strong
employment figures from 2005 through 2007 and decreasing employment trends beginning with the
recession in 2008. Unemployment rates continued to increase through 2010 nationally and
regionally and through 2012 in the City. Generally, the unemployment recovery began in 2011 and
improving trends were experienced in all three regions through 2015. The following table details
historical unemployment rates.
YEAR US NY NYC
2005 5.1% 5.0% 5.8%
2006 4.6% 4.6% 5.0%
2007 4.6% 4.6% 5.0%
2008 5.8% 5.4% 5.6%
2009 9.3% 8.4% 9.3%
2010 9.6% 8.6% 9.5%
2011 8.9% 8.3% 9.1%
2012 8.1% 8.5% 9.4%
2013 7.4% 7.7% 8.8%
2014 6.2% 6.3% 7.2%
2015 5.3% 5.3% 5.7%
Jan '16 4.9% 5.5% 5.9%
Source: US Bureau of Labor Statistics
HISTORICAL
UNEMPLOYMENT RATES
According to the Department of Labor, the Nation, State, and City have all experienced decreasing
unemployment levels in years 2013-2015. However, as of January 2016, only the Nation continued
the downward trend. New York State and City both recorded slight increases in unemployment
rates to 5.5%, and 5.9%, respectively over year end 2015. Overall, the historical unemployment
rates reveal a six year improving trend since 2008. However, the most recent data reveals a slight
declining trend in unemployment levels for the City and State.
Full employment is measured by unemployment levels ranging from 5.5% to 6.0%, according to
Moody’s Analytics. Thus the current unemployment rates reveal healthy employment levels for all
three regions. Unemployment rates have been decreasing since 2010 and are expected to remain
DESCRIPTIVE DATA 25
healthy. It should be noted that, these positive trends in unemployment rates were not expected this
soon. Moody’s previously forecasted full employment levels to be reached in the fall of 2016. In
addition, they estimate the Nation will experience a labor shortage in the second half of the decade
(2015–2020) due to baby boomers retiring and opting for early retirement.
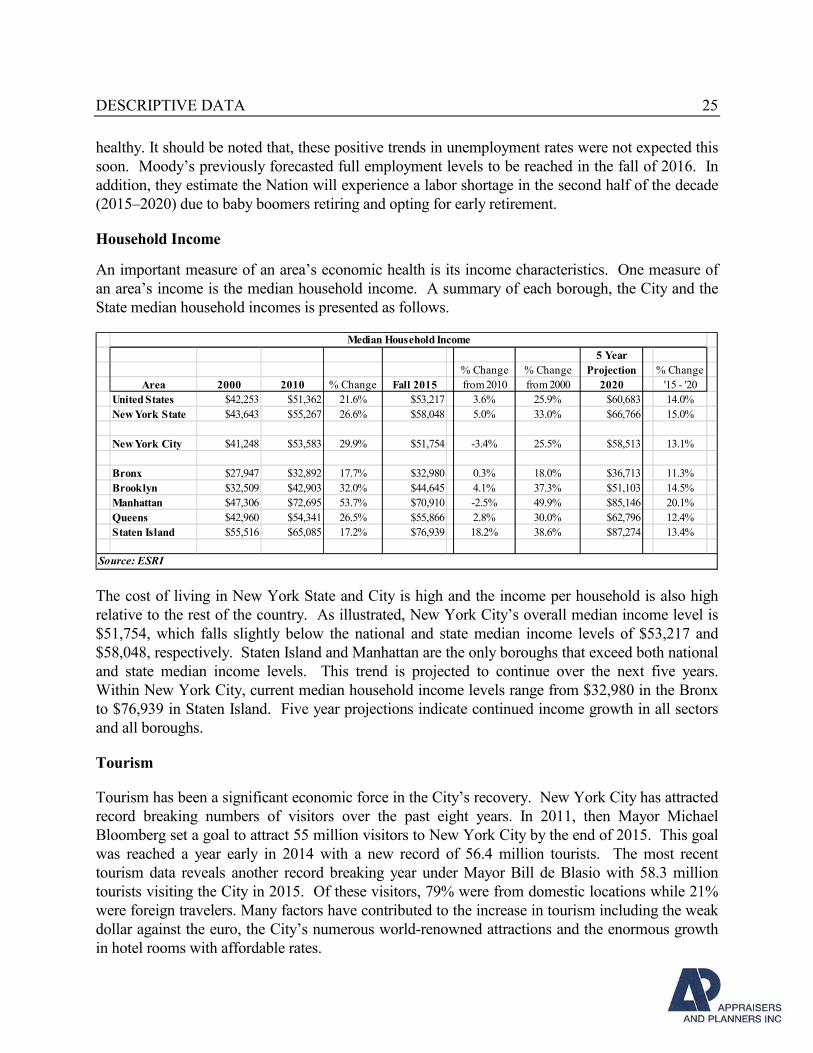
Household Income
An important measure of an area’s economic health is its income characteristics. One measure of
an area’s income is the median household income. A summary of each borough, the City and the
State median household incomes is presented as follows.
5 Year
% Change % Change Projection % Change
Area 2000 2010 % Change Fall 2015 from 2010 from 2000 2020 '15 - '20
United States $42,253 $51,362 21.6% $53,217 3.6% 25.9% $60,683 14.0%
New York State $43,643 $55,267 26.6% $58,048 5.0% 33.0% $66,766 15.0%
New York City $41,248 $53,583 29.9% $51,754 -3.4% 25.5% $58,513 13.1%
Bronx $27,947 $32,892 17.7% $32,980 0.3% 18.0% $36,713 11.3%
Brooklyn $32,509 $42,903 32.0% $44,645 4.1% 37.3% $51,103 14.5%
Manhattan $47,306 $72,695 53.7% $70,910 -2.5% 49.9% $85,146 20.1%
Queens $42,960 $54,341 26.5% $55,866 2.8% 30.0% $62,796 12.4%
Staten Island $55,516 $65,085 17.2% $76,939 18.2% 38.6% $87,274 13.4%
Median Household Income
Source: ESRI
The cost of living in New York State and City is high and the income per household is also high
relative to the rest of the country. As illustrated, New York City’s overall median income level is
$51,754, which falls slightly below the national and state median income levels of $53,217 and
$58,048, respectively. Staten Island and Manhattan are the only boroughs that exceed both national
and state median income levels. This trend is projected to continue over the next five years.
Within New York City, current median household income levels range from $32,980 in the Bronx
to $76,939 in Staten Island. Five year projections indicate continued income growth in all sectors
and all boroughs.
Tourism
Tourism has been a significant economic force in the City’s recovery. New York City has attracted
record breaking numbers of visitors over the past eight years. In 2011, then Mayor Michael
Bloomberg set a goal to attract 55 million visitors to New York City by the end of 2015. This goal
was reached a year early in 2014 with a new record of 56.4 million tourists. The most recent
tourism data reveals another record breaking year under Mayor Bill de Blasio with 58.3 million
tourists visiting the City in 2015. Of these visitors, 79% were from domestic locations while 21%
were foreign travelers. Many factors have contributed to the increase in tourism including the weak
dollar against the euro, the City’s numerous world-renowned attractions and the enormous growth
in hotel rooms with affordable rates.
DESCRIPTIVE DATA 26
Economic Projections
It is anticipated that New York City’s economy will continue to remain strong with City tourism
expected to remain on track, helping to fuel the local economy. In 2015, New York City increased
employment by almost 119,000, representing a 2.9% annual gain. Although positive, this growth is
down from the 3.3% annual gain experienced in 2014. Job growth leads to increases in City
revenues through consumer spending and additional income and sales tax resulting in positive
effects on the local economy. Overall the City’s economy has been consistently strong. However,
the quarterly performance in 2015 of most sectors reveal a softening in the second half of 2015.
Further, employment data for 2016 also reveals a very slight growth over year end 2015, suggesting
more of a stable market.
According to Cushman & Wakefield, overall investment sales in the City have hit record highs and
cap rates have hit record lows in the past two years. Reportedly, investment sales in New York City
reached $74.5 billion, accounting for 5,083 transaction. However, the number of transactions is
down from 2014 which recorded an all-time record high of 5,533 transactions. Overall, the 2015
quarter by quarter analysis shows prices per square foot falling and cap rates rising. Analysts
project that both number of transactions and total dollar volume will reduce in 2016; it is
anticipated that 2016 will be a transitional year.
GOVERNMENTAL FORCES
The City of New York is governed by the Mayor and the City Council. Each borough has a
Borough President and Council persons who represent individual districts within each borough.
Local city officials implement land use policies through the Department of City Planning and City
Planning Commission. Most proposed projects must also be reviewed by the Community Boards,
and/or Borough Boards. The City of New York provides public transportation, schools, health care,
police, and fire protection.
Uniform Land Use Review Procedure - ULURP
Governmental forces directly impacting the subject air rights and the proposed development for 550
Washington Street include the undertaking a rezoning and other actions through a process known as
The Uniform Land Use Review Procedure (ULURP). According to the NYC Department of
Planning, “ULURP is a standardized procedure whereby applications affecting the land use of the
city would be publicly reviewed. The Charter also established mandated time frames within which
application review must take place. Key participants in the ULURP process are now the
Department of City Planning (DCP) and the City Planning Commission (CPC), Community
Boards, the Borough Presidents, the Borough Boards, the City Council and the Mayor.”
ULURP can proceed in 215 days or less, or just over seven months, from Certification. However,
depending on the size and complexity of the application, and the nature of the action, the pre-
certification period may be relatively extensive. It is explicitly assumed in the hypothetical
condition of this appraisal that the approvals for ULURP have been granted to 550 Washington as
DESCRIPTIVE DATA 27
of the date of appraisal, facilitating the transfer of air rights to be incorporated within the
development.
Conclusion
Population growth, household formation and median income trends in New York City are positive
and the City continued to experience positive employment growth through 2015. However recent
January 2016 data reveals inconsistent growth among the employment sectors and an overall
increase in the City’s unemployment rate.
New York City has performed better than most markets for the past six years and in terms of
recovering from the recent recession, and all demographics researched point to an economically
viable and highly affluent local economy. However, the significant and record breaking gains
experienced in recent years are not anticipated to continue. Investors are anticipating that the City’s
economy has hit a cyclical high and that market indicators will soften over the year. However, due
to the region’s historical positive characteristics, we believe New York City’s economy will, over
the long term, remain solid.
DESCRIPTIVE DATA 28
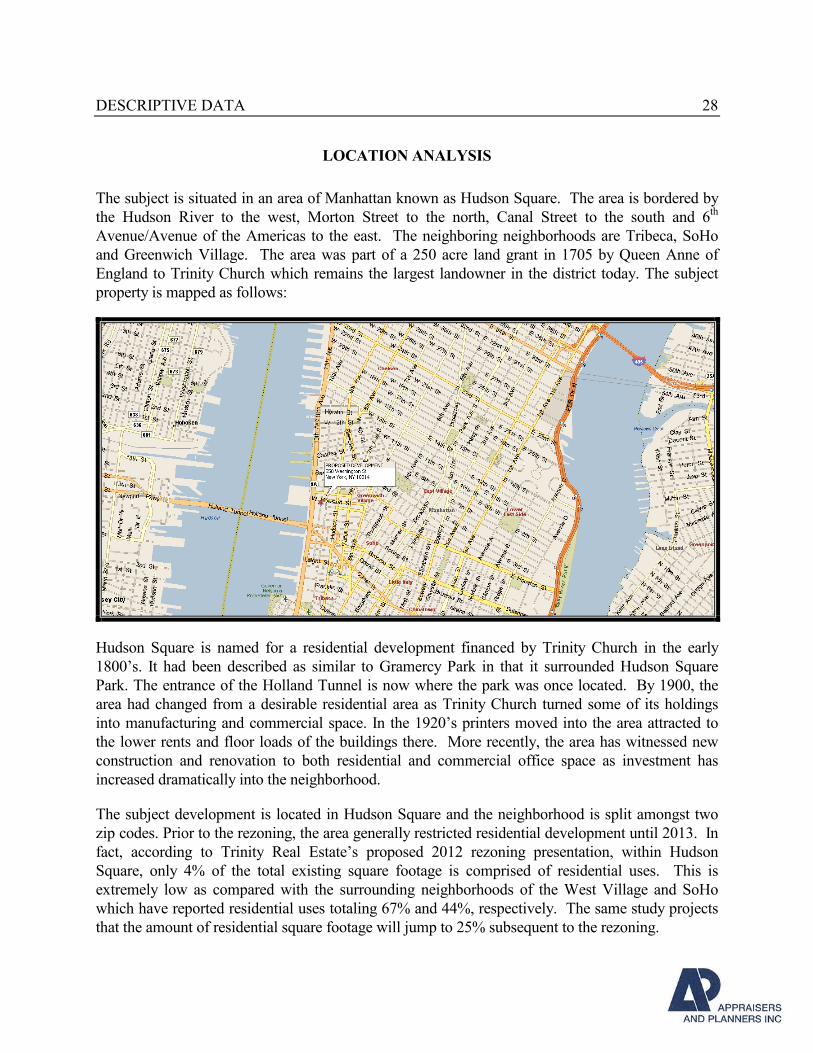
LOCATION ANALYSIS
The subject is situated in an area of Manhattan known as Hudson Square. The area is bordered by
the Hudson River to the west, Morton Street to the north, Canal Street to the south and 6th
Avenue/Avenue of the Americas to the east. The neighboring neighborhoods are Tribeca, SoHo
and Greenwich Village. The area was part of a 250 acre land grant in 1705 by Queen Anne of
England to Trinity Church which remains the largest landowner in the district today. The subject
property is mapped as follows:
Hudson Square is named for a residential development financed by Trinity Church in the early
1800’s. It had been described as similar to Gramercy Park in that it surrounded Hudson Square
Park. The entrance of the Holland Tunnel is now where the park was once located. By 1900, the
area had changed from a desirable residential area as Trinity Church turned some of its holdings
into manufacturing and commercial space. In the 1920’s printers moved into the area attracted to
the lower rents and floor loads of the buildings there. More recently, the area has witnessed new
construction and renovation to both residential and commercial office space as investment has
increased dramatically into the neighborhood.
The subject development is located in Hudson Square and the neighborhood is split amongst two
zip codes. Prior to the rezoning, the area generally restricted residential development until 2013. In
fact, according to Trinity Real Estate’s proposed 2012 rezoning presentation, within Hudson
Square, only 4% of the total existing square footage is comprised of residential uses. This is
extremely low as compared with the surrounding neighborhoods of the West Village and SoHo
which have reported residential uses totaling 67% and 44%, respectively. The same study projects
that the amount of residential square footage will jump to 25% subsequent to the rezoning.
DESCRIPTIVE DATA 29
The subject property is therefore in, what is effectively, a new residential neighborhood, given the
recent rezoning, as well as the current and planned land uses in the area. The areas surrounding
Hudson Square have long-established residential bases, and it is expected that the Hudson Square
neighborhood will draw residents from these nearby neighborhoods or those future residents
looking towards SoHo, West Village and Tribeca and will likely view Hudson Square as a viable
alternative. The three surrounding neighborhoods are some of the most desirable and expensive
areas to reside in Manhattan.
Therefore, based upon this information and our understanding of the local and surrounding markets,
it is our opinion that upon rezoning and redevelopment, the subject’s market area will consist of the
three abutting neighborhoods, along with the subject neighborhood which comprise zip codes
10013 and 10014. Data from both are presented on aggregate, where available, and historical data
from 2000-2010 is presented for 10013 and 10014, separately. Data was not available for 10013
and 10014 on a combined basis for 2000-2010.
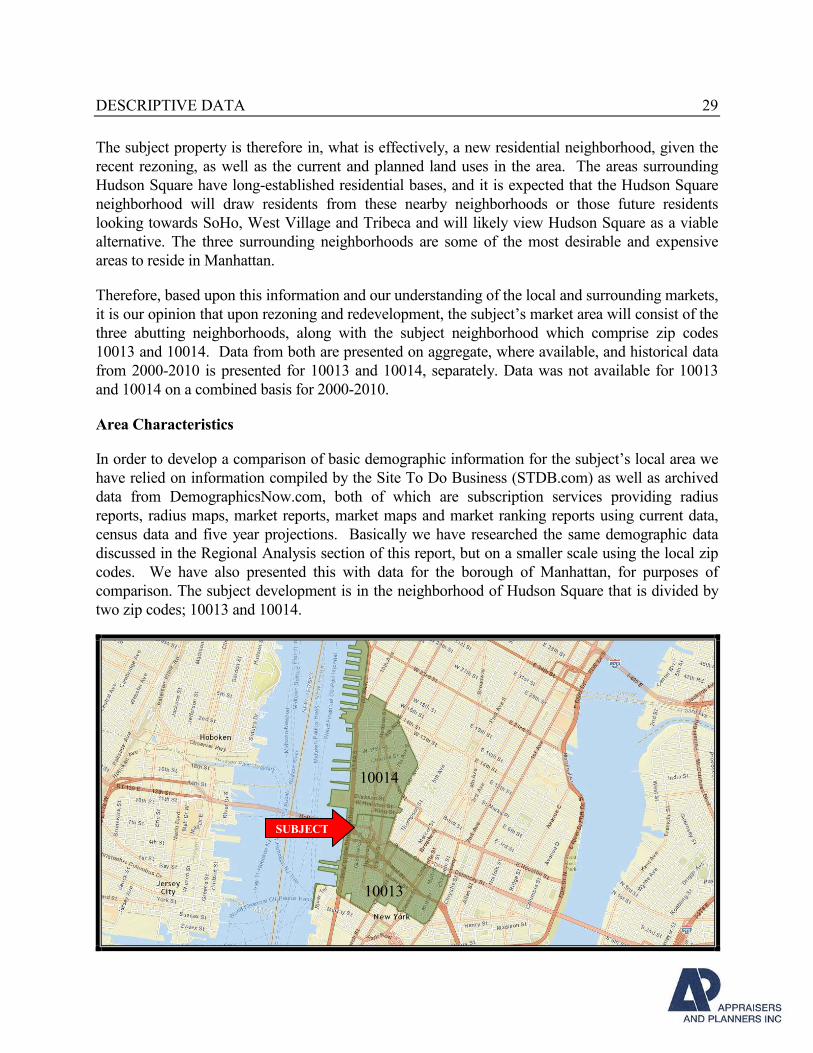
Area Characteristics
In order to develop a comparison of basic demographic information for the subject’s local area we
have relied on information compiled by the Site To Do Business (STDB.com) as well as archived
data from DemographicsNow.com, both of which are subscription services providing radius
reports, radius maps, market reports, market maps and market ranking reports using current data,
census data and five year projections. Basically we have researched the same demographic data
discussed in the Regional Analysis section of this report, but on a smaller scale using the local zip
codes. We have also presented this with data for the borough of Manhattan, for purposes of
comparison. The subject development is in the neighborhood of Hudson Square that is divided by
two zip codes; 10013 and 10014.
10013
SUBJECT
10014
DESCRIPTIVE DATA 30
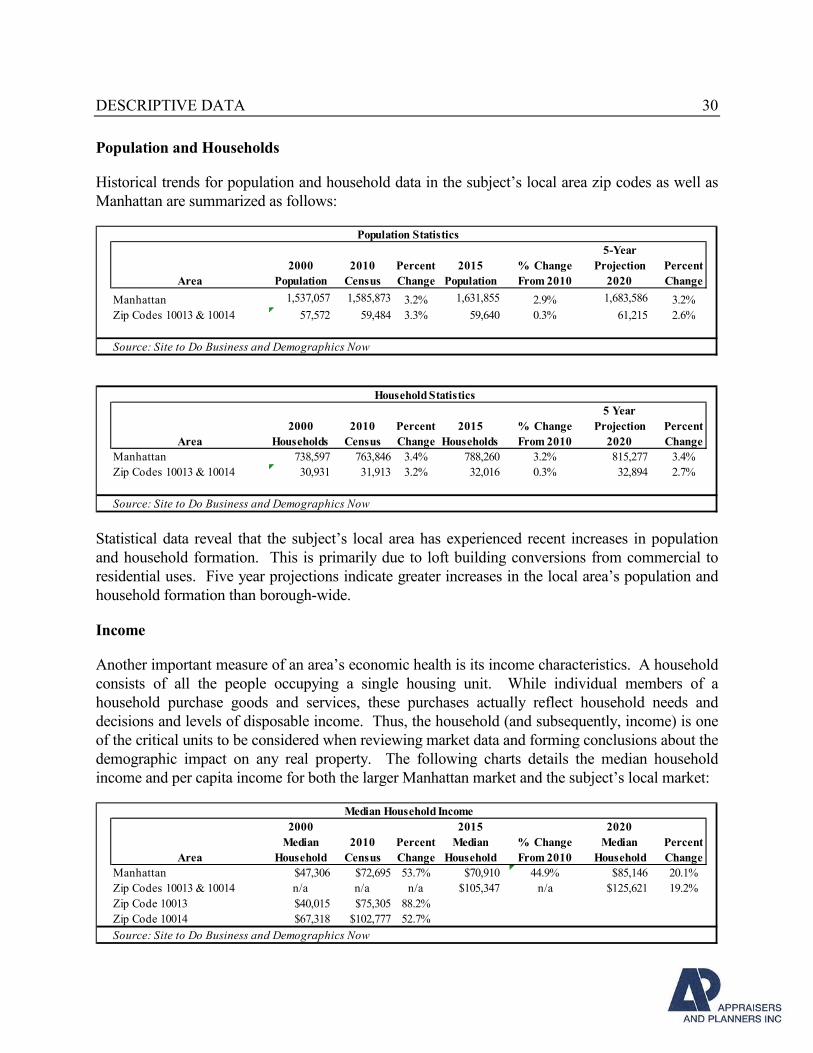
Population and Households
Historical trends for population and household data in the subject’s local area zip codes as well as
Manhattan are summarized as follows:
5-Year
2000 2010 Percent 2015 % Change Projection Percent
Area Population Census Change Population From 2010 2020 Change
Manhattan 1,537,057 1,585,873 3.2% 1,631,855 2.9% 1,683,586 3.2%
Zip Codes 10013 & 10014 57,572 59,484 3.3% 59,640 0.3% 61,215 2.6%
Source: Site to Do Business and Demographics Now
5 Year
2000 2010 Percent 2015 % Change Projection Percent
Area Households Census Change Households From 2010 2020 Change
Manhattan 738,597 763,846 3.4% 788,260 3.2% 815,277 3.4%
Zip Codes 10013 & 10014 30,931 31,913 3.2% 32,016 0.3% 32,894 2.7%
Source: Site to Do Business and Demographics Now
Population Statistics
Household Statistics
Statistical data reveal that the subject’s local area has experienced recent increases in population
and household formation. This is primarily due to loft building conversions from commercial to
residential uses. Five year projections indicate greater increases in the local area’s population and
household formation than borough-wide.
Income
Another important measure of an area’s economic health is its income characteristics. A household
consists of all the people occupying a single housing unit. While individual members of a
household purchase goods and services, these purchases actually reflect household needs and
decisions and levels of disposable income. Thus, the household (and subsequently, income) is one
of the critical units to be considered when reviewing market data and forming conclusions about the
demographic impact on any real property. The following charts details the median household
income and per capita income for both the larger Manhattan market and the subject’s local market:
2000 2015 2020
Median 2010 Percent Median % Change Median Percent
Area Household Census Change Household From 2010 Household Change
Manhattan $47,306 $72,695 53.7% $70,910 44.9% $85,146 20.1%
Zip Codes 10013 & 10014 n/a n/a n/a $105,347 n/a $125,621 19.2%
Zip Code 10013 $40,015 $75,305 88.2%
Zip Code 10014 $67,318 $102,777 52.7%
Source: Site to Do Business and Demographics Now
Median Household Income
DESCRIPTIVE DATA 31
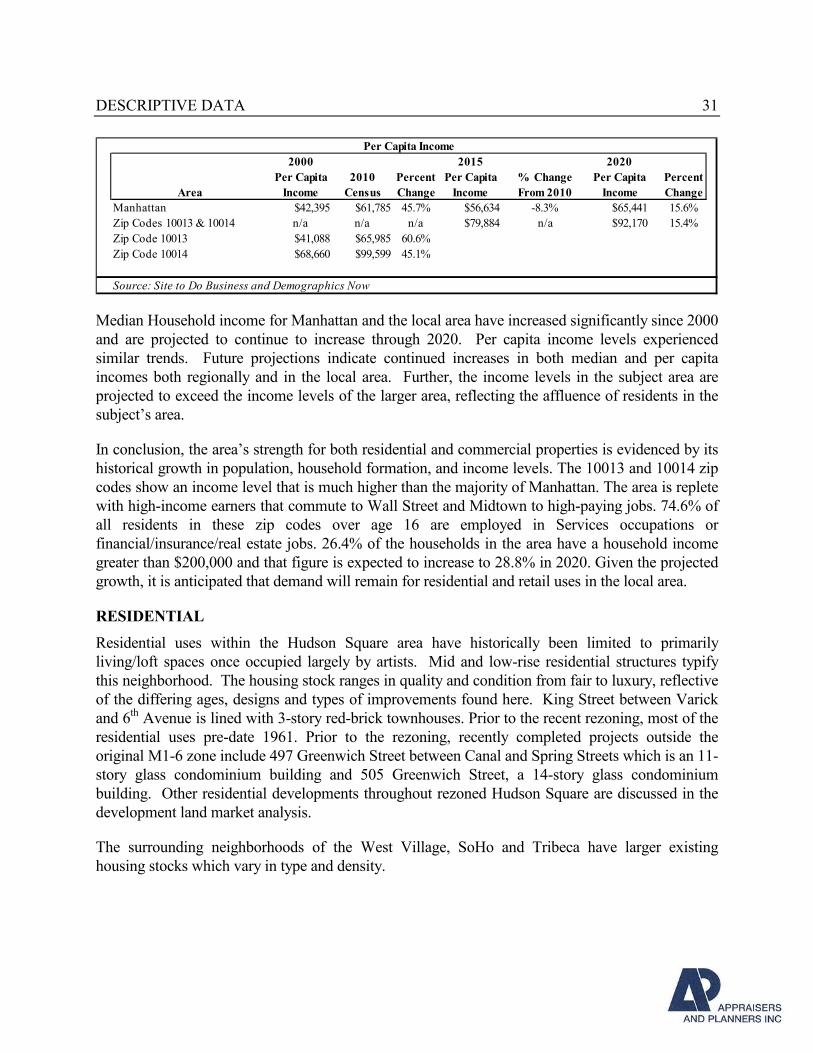
2000 2015 2020
Per Capita 2010 Percent Per Capita % Change Per Capita Percent
Area Income Census Change Income From 2010 Income Change
Manhattan $42,395 $61,785 45.7% $56,634 -8.3% $65,441 15.6%
Zip Codes 10013 & 10014 n/a n/a n/a $79,884 n/a $92,170 15.4%
Zip Code 10013 $41,088 $65,985 60.6%
Zip Code 10014 $68,660 $99,599 45.1%
Source: Site to Do Business and Demographics Now
Per Capita Income
Median Household income for Manhattan and the local area have increased significantly since 2000
and are projected to continue to increase through 2020. Per capita income levels experienced
similar trends. Future projections indicate continued increases in both median and per capita
incomes both regionally and in the local area. Further, the income levels in the subject area are
projected to exceed the income levels of the larger area, reflecting the affluence of residents in the
subject’s area.
In conclusion, the area’s strength for both residential and commercial properties is evidenced by its
historical growth in population, household formation, and income levels. The 10013 and 10014 zip
codes show an income level that is much higher than the majority of Manhattan. The area is replete
with high-income earners that commute to Wall Street and Midtown to high-paying jobs. 74.6% of
all residents in these zip codes over age 16 are employed in Services occupations or
financial/insurance/real estate jobs. 26.4% of the households in the area have a household income
greater than $200,000 and that figure is expected to increase to 28.8% in 2020. Given the projected
growth, it is anticipated that demand will remain for residential and retail uses in the local area.
RESIDENTIAL
Residential uses within the Hudson Square area have historically been limited to primarily
living/loft spaces once occupied largely by artists. Mid and low-rise residential structures typify
this neighborhood. The housing stock ranges in quality and condition from fair to luxury, reflective
of the differing ages, designs and types of improvements found here. King Street between Varick
and 6th Avenue is lined with 3-story red-brick townhouses. Prior to the recent rezoning, most of the
residential uses pre-date 1961. Prior to the rezoning, recently completed projects outside the
original M1-6 zone include 497 Greenwich Street between Canal and Spring Streets which is an 11-
story glass condominium building and 505 Greenwich Street, a 14-story glass condominium
building. Other residential developments throughout rezoned Hudson Square are discussed in the
development land market analysis.
The surrounding neighborhoods of the West Village, SoHo and Tribeca have larger existing
housing stocks which vary in type and density.
DESCRIPTIVE DATA 32
West Village
The West Village is bounded on the north by 14th Street, by Broadway to the east, by Houston
Street to the south and by the Hudson River to the West. The neighborhood was designated the
Greenwich Village Historic District in 1969 which has helped to protect its many charming blocks.
Since then additional areas of landmarking have extended west and south nearly covering the entire
neighborhood within one of three historic districts. As a result, there are very few sites available for
development within the West Village and all of Greenwich Village. Consisting mostly of brick row
houses, low-rise apartments, and hidden courtyards, the tree-lined streets in the West Village
provide for a unique mostly low rise environment with limited development potential given its
landmarked status. The side streets are dominated by low-rise pre-war apartment buildings,
brownstones and townhouses. In recent years, new construction in the Far West Village resulting in
some of the most desirable and expensive housing in New York City has occurred. There are
several new developments that benefit from views of the Hudson River; inclusive of the newly
constructed Richard Meier buildings along Charles Street, West Street and Perry Street; and
Superior Ink located on West 12th Street, to name a few. These buildings have helped to attract
significant investment to the West Village for development of high-end condominiums like 150
Charles Street.
SoHo
The SoHo district consists of approximately 26 blocks and 500 buildings and is designated as a
New York City Landmark district known as the SoHo-Cast Iron Historic District. Many of the
improvements are comprised of 4-6 story loft buildings with cast iron architectural elements and
oversized windows, originally built in the early 1900s as factories and offices but have since been
converted to live/work loft spaces and expansive apartments. SoHo has experienced demand for
residential and retail uses and has witnessed new construction and redevelopment of properties to
very high value residential uses over the 2 decades. SoHo is one of the City’s retail tourist
destinations notable for being the location of many artists' lofts and art galleries, and also, more
recently, for the wide variety of retail stores and shops ranging from trendy boutiques to outlets of
upscale national and international chain stores. Larger condominium complexes are generally
located along the east/west bound streets and along Broadway within the district. The main retail
arteries in the district include Broadway, West Broadway, Spring Street, and Prince Street.
However, the entire district has retail tenants spread throughout the smaller side streets as well.
Tribeca
Tribeca was historically a manufacturing and warehouse district primarily improved with large cast-
iron loft buildings. The area is now a mixed-use neighborhood with large concentrations of
residential and retail uses interspersed with some office uses. Over the past 20 years many loft
buildings have been converted into high-end luxury residential condominiums. The Tribeca
neighborhood has been become one of Manhattan’s most desirable neighborhoods for loft-type
living. More recently over the past 12+ years there has been substantial new development and
DESCRIPTIVE DATA 33
conversion development within Tribeca, as the neighborhood became more and more desirable as a
24/7 live work neighborhood.
Broadway and Church Street within Tribeca are improved with a mix of larger scale commercial
and some residential buildings with retail uses at grade level. The side streets of Tribeca are
primarily improved with low to mid rise loft buildings which are occupied by a mix of
commercial/retail tenants at grade level and residential uses above-grade. Residential uses in
Tribeca primarily consist of mid-rise, tenement and loft-type dwellings. During the 1980’s and
1990’s, the area experienced some gentrification in the form of new and rehabilitated housing.
From 2000, demand for housing within Tribeca increased substantially. The land uses and scale of
development in Hudson Square closely mirror the scale of Tribeca. It is our opinion that the recent
rezoning will aid to transform Hudson Square into a similar live-work neighborhood that is
currently seen in Tribeca.
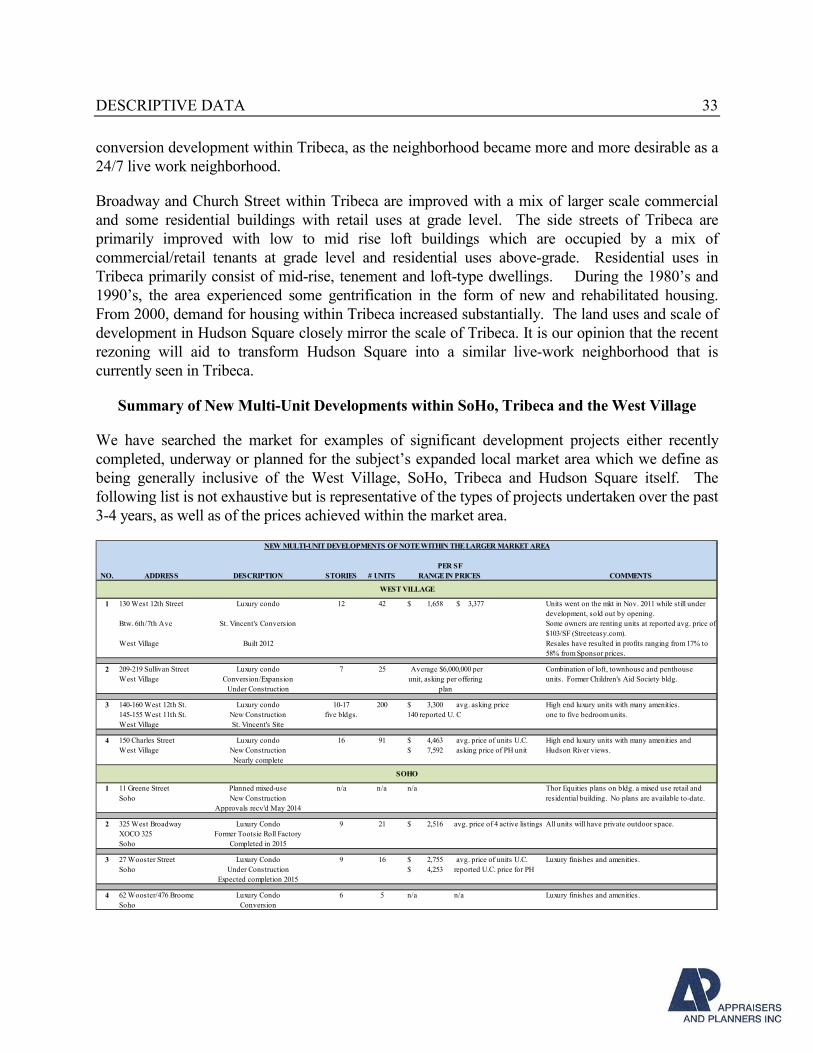
Summary of New Multi-Unit Developments within SoHo, Tribeca and the West Village
We have searched the market for examples of significant development projects either recently
completed, underway or planned for the subject’s expanded local market area which we define as
being generally inclusive of the West Village, SoHo, Tribeca and Hudson Square itself. The
following list is not exhaustive but is representative of the types of projects undertaken over the past
3-4 years, as well as of the prices achieved within the market area.
PER SF
NO. ADDRESS DESCRIPTION STORIES # UNITS RANGE IN PRICES COMMENTS
1 130 West 12th Street Luxury condo 12 42 1,658$ 3,377$ Units went on the mkt in Nov. 2011 while still under
development, sold out by opening.
Btw. 6th/7th Ave St. Vincent's Conversion Some owners are renting units at reported avg. price of
$103/SF (Streeteasy.com).
West Village Built 2012 Resales have resulted in profits ranging from 17% to
58% from Sponsor prices.
2 209-219 Sullivan Street Luxury condo 7 25 Combination of loft, townhouse and penthouse
West Village Conversion/Expansion units. Former Children's Aid Society bldg.
Under Construction
3 140-160 West 12th St. Luxury condo 10-17 200 3,300$ avg. asking price High end luxury units with many amenities.
145-155 West 11th St. New Construction five bldgs. 140 reported U. C one to five bedroom units.
West Village St. Vincent's Site
4 150 Charles Street Luxury condo 16 91 4,463$ avg. price of units U.C. High end luxury units with many amenities and
West Village New Construction 7,592$ asking price of PH unit Hudson River views.
Nearly complete
1 11 Greene Street Planned mixed-use n/a n/a n/a Thor Equities plans on bldg. a mixed use retail and
Soho New Construction residential building. No plans are available to-date.
Approvals recv'd May 2014
2 325 West Broadway Luxury Condo 9 21 2,516$ avg. price of 4 active listings All units will have private outdoor space.
XOCO 325 Former Tootsie Roll Factory
Soho Completed in 2015
3 27 Wooster Street Luxury Condo 9 16 2,755$ avg. price of units U.C. Luxury finishes and amenities.
Soho Under Construction 4,253$ reported U.C. price for PH
Expected completion 2015
4 62 Wooster/476 Broome Luxury Condo 6 5 n/a n/a Luxury finishes and amenities.
Soho Conversion
NEW MULTI-UNIT DEVELOPMENTS OF NOTE WITHIN THE LARGER MARKET AREA
SOHO
WEST VILLAGE
Average $6,000,000 per
unit, asking per offering
plan
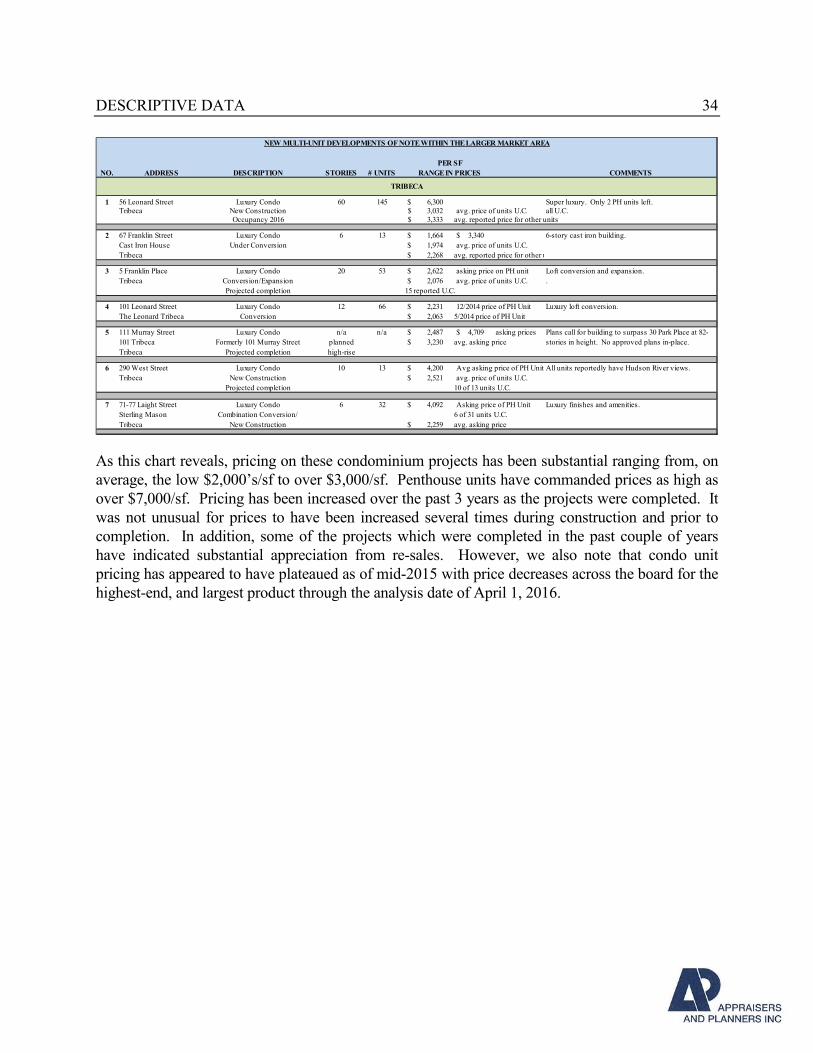
DESCRIPTIVE DATA 34
PER SF
NO. ADDRESS DESCRIPTION STORIES # UNITS RANGE IN PRICES COMMENTS
1 56 Leonard Street Luxury Condo 60 145 6,300$ Super luxury. Only 2 PH units left.Tribeca New Construction 3,032$ avg. price of units U.C. all U.C.
Occupancy 2016 3,333$ avg. reported price for other units
2 67 Franklin Street Luxury Condo 6 13 1,664$ 3,340$ 6-story cast iron building.
Cast Iron House Under Conversion 1,974$ avg. price of units U.C.
Tribeca 2,268$ avg. reported price for other units
3 5 Franklin Place Luxury Condo 20 53 2,622$ asking price on PH unit Loft conversion and expansion.
Tribeca Conversion/Expansion 2,076$ avg. price of units U.C. .
Projected completion 15 reported U.C.
4 101 Leonard Street Luxury Condo 12 66 2,231$ 12/2014 price of PH Unit Luxury loft conversion.
The Leonard Tribeca Conversion 2,063$ 5/2014 price of PH Unit
5 111 Murray Street Luxury Condo n/a n/a 2,487$ 4,709$ asking prices Plans call for building to surpass 30 Park Place at 82-
101 Tribeca Formerly 101 Murray Street planned 3,230$ avg. asking price stories in height. No approved plans in-place.
Tribeca Projected completion high-rise
6 290 West Street Luxury Condo 10 13 4,200$ Avg asking price of PH UnitsAll units reportedly have Hudson River views.
Tribeca New Construction 2,521$ avg. price of units U.C.
Projected completion 10 of 13 units U.C.
7 71-77 Laight Street Luxury Condo 6 32 4,092$ Asking price of PH Unit Luxury finishes and amenities.
Sterling Mason Combination Conversion/ 6 of 31 units U.C.
Tribeca New Construction 2,259$ avg. asking price
TRIBECA
NEW MULTI-UNIT DEVELOPMENTS OF NOTE WITHIN THE LARGER MARKET AREA
As this chart reveals, pricing on these condominium projects has been substantial ranging from, on
average, the low $2,000’s/sf to over $3,000/sf. Penthouse units have commanded prices as high as
over $7,000/sf. Pricing has been increased over the past 3 years as the projects were completed. It
was not unusual for prices to have been increased several times during construction and prior to
completion. In addition, some of the projects which were completed in the past couple of years
have indicated substantial appreciation from re-sales. However, we also note that condo unit
pricing has appeared to have plateaued as of mid-2015 with price decreases across the board for the
highest-end, and largest product through the analysis date of April 1, 2016.
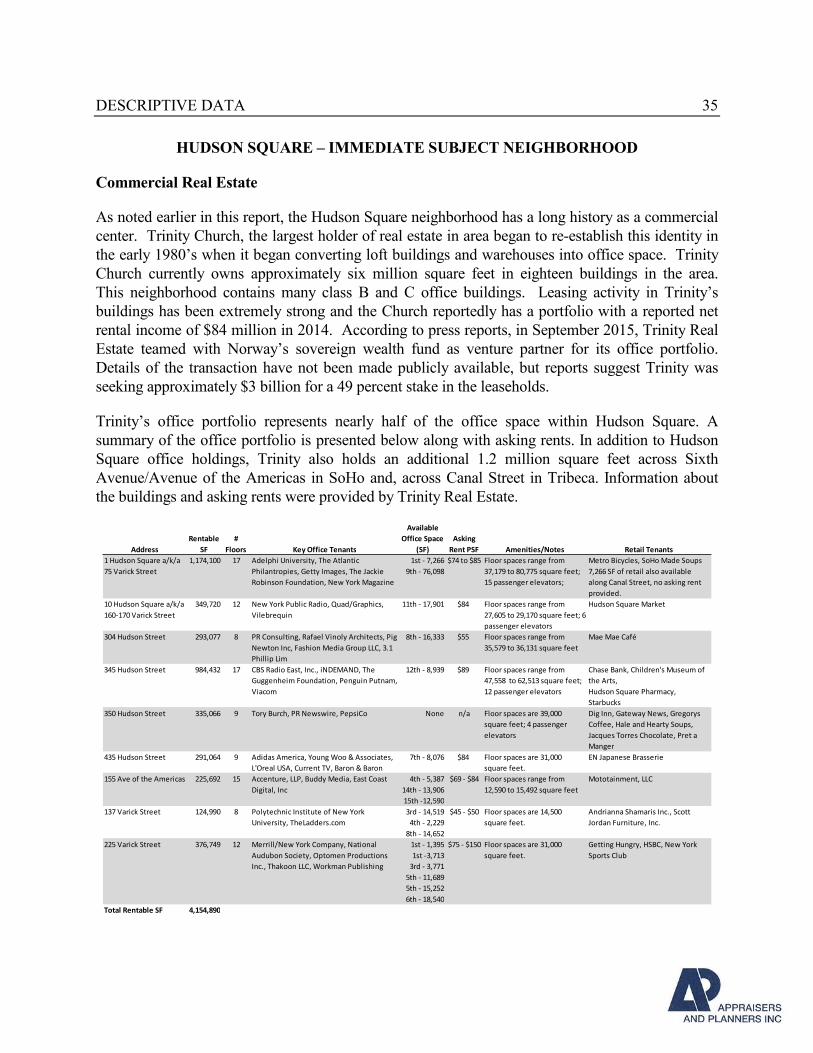
DESCRIPTIVE DATA 35
HUDSON SQUARE – IMMEDIATE SUBJECT NEIGHBORHOOD
Commercial Real Estate
As noted earlier in this report, the Hudson Square neighborhood has a long history as a commercial
center. Trinity Church, the largest holder of real estate in area began to re-establish this identity in
the early 1980’s when it began converting loft buildings and warehouses into office space. Trinity
Church currently owns approximately six million square feet in eighteen buildings in the area.
This neighborhood contains many class B and C office buildings. Leasing activity in Trinity’s
buildings has been extremely strong and the Church reportedly has a portfolio with a reported net
rental income of $84 million in 2014. According to press reports, in September 2015, Trinity Real
Estate teamed with Norway’s sovereign wealth fund as venture partner for its office portfolio.
Details of the transaction have not been made publicly available, but reports suggest Trinity was
seeking approximately $3 billion for a 49 percent stake in the leaseholds.
Trinity’s office portfolio represents nearly half of the office space within Hudson Square. A
summary of the office portfolio is presented below along with asking rents. In addition to Hudson
Square office holdings, Trinity also holds an additional 1.2 million square feet across Sixth
Avenue/Avenue of the Americas in SoHo and, across Canal Street in Tribeca. Information about
the buildings and asking rents were provided by Trinity Real Estate.
Address
Rentable
SF
#
Floors Key Office Tenants
Available
Office Space
(SF)
Asking
Rent PSF Amenities/Notes Retail Tenants
1 Hudson Square a/k/a
75 Varick Street
1,174,100 17 Adelphi University, The Atlantic
Philantropies, Getty Images, The Jackie
Robinson Foundation, New York Magazine
1st - 7,266
9th - 76,098
$74 to $85 Floor spaces range from
37,179 to 80,775 square feet;
15 passenger elevators;
Metro Bicycles, SoHo Made Soups
7,266 SF of retail also available
along Canal Street, no asking rent
provided.
10 Hudson Square a/k/a
160-170 Varick Street
349,720 12 New York Public Radio, Quad/Graphics,
Vilebrequin
11th - 17,901 $84 Floor spaces range from
27,605 to 29,170 square feet; 6
passenger elevators
Hudson Square Market
304 Hudson Street 293,077 8 PR Consulting, Rafael Vinoly Architects, Pig
Newton Inc, Fashion Media Group LLC, 3.1
Phillip Lim
8th - 16,333 $55 Floor spaces range from
35,579 to 36,131 square feet
Mae Mae Café
345 Hudson Street 984,432 17 CBS Radio East, Inc., iNDEMAND, The
Guggenheim Foundation, Penguin Putnam,
Viacom
12th - 8,939 $89 Floor spaces range from
47,558 to 62,513 square feet;
12 passenger elevators
Chase Bank, Children's Museum of
the Arts,
Hudson Square Pharmacy,
Starbucks
350 Hudson Street 335,066 9 Tory Burch, PR Newswire, PepsiCo None n/a Floor spaces are 39,000
square feet; 4 passenger
elevators
Dig Inn, Gateway News, Gregorys
Coffee, Hale and Hearty Soups,
Jacques Torres Chocolate, Pret a
Manger
435 Hudson Street 291,064 9 Adidas America, Young Woo & Associates,
L'Oreal USA, Current TV, Baron & Baron
7th - 8,076 $84 Floor spaces are 31,000
square feet.
EN Japanese Brasserie
155 Ave of the Americas 225,692 15 Accenture, LLP, Buddy Media, East Coast
Digital, Inc
4th - 5,387
14th - 13,906
15th -12,590
$69 - $84 Floor spaces range from
12,590 to 15,492 square feet
Mototainment, LLC
137 Varick Street 124,990 8 Polytechnic Institute of New York
University, TheLadders.com
3rd - 14,519
4th - 2,229
8th - 14,652
$45 - $50 Floor spaces are 14,500
square feet.
Andrianna Shamaris Inc., Scott
Jordan Furniture, Inc.
225 Varick Street 376,749 12 Merrill/New York Company, National
Audubon Society, Optomen Productions
Inc., Thakoon LLC, Workman Publishing
1st - 1,395
1st -3,713
3rd - 3,771
5th - 11,689
5th - 15,252
6th - 18,540
$75 - $150 Floor spaces are 31,000
square feet.
Getting Hungry, HSBC, New York
Sports Club
Total Rentable SF 4,154,890
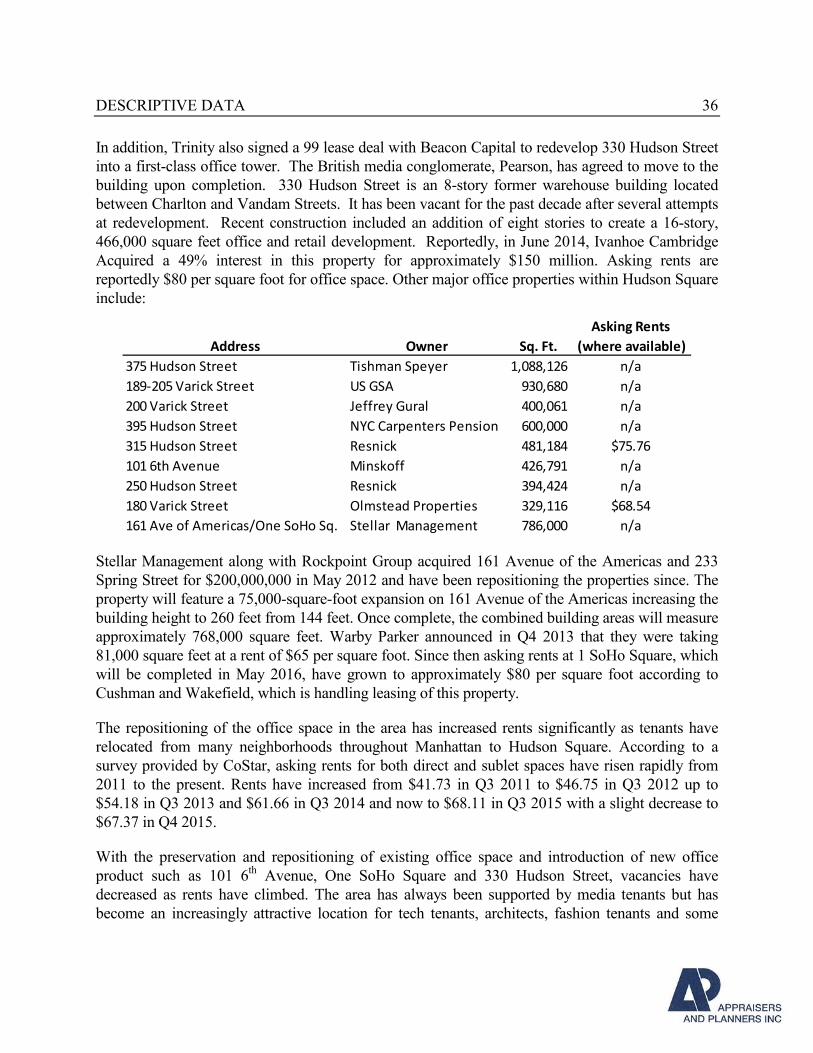
DESCRIPTIVE DATA 36
In addition, Trinity also signed a 99 lease deal with Beacon Capital to redevelop 330 Hudson Street
into a first-class office tower. The British media conglomerate, Pearson, has agreed to move to the
building upon completion. 330 Hudson Street is an 8-story former warehouse building located
between Charlton and Vandam Streets. It has been vacant for the past decade after several attempts
at redevelopment. Recent construction included an addition of eight stories to create a 16-story,
466,000 square feet office and retail development. Reportedly, in June 2014, Ivanhoe Cambridge
Acquired a 49% interest in this property for approximately $150 million. Asking rents are
reportedly $80 per square foot for office space. Other major office properties within Hudson Square
include:
Address Owner Sq. Ft.
Asking Rents
(where available)
375 Hudson Street Tishman Speyer 1,088,126 n/a
189-205 Varick Street US GSA 930,680 n/a
200 Varick Street Jeffrey Gural 400,061 n/a
395 Hudson Street NYC Carpenters Pension 600,000 n/a
315 Hudson Street Resnick 481,184 $75.76
101 6th Avenue Minskoff 426,791 n/a
250 Hudson Street Resnick 394,424 n/a
180 Varick Street Olmstead Properties 329,116 $68.54
161 Ave of Americas/One SoHo Sq. Stellar Management 786,000 n/a
Stellar Management along with Rockpoint Group acquired 161 Avenue of the Americas and 233
Spring Street for $200,000,000 in May 2012 and have been repositioning the properties since. The
property will feature a 75,000-square-foot expansion on 161 Avenue of the Americas increasing the
building height to 260 feet from 144 feet. Once complete, the combined building areas will measure
approximately 768,000 square feet. Warby Parker announced in Q4 2013 that they were taking
81,000 square feet at a rent of $65 per square foot. Since then asking rents at 1 SoHo Square, which
will be completed in May 2016, have grown to approximately $80 per square foot according to
Cushman and Wakefield, which is handling leasing of this property.
The repositioning of the office space in the area has increased rents significantly as tenants have
relocated from many neighborhoods throughout Manhattan to Hudson Square. According to a
survey provided by CoStar, asking rents for both direct and sublet spaces have risen rapidly from
2011 to the present. Rents have increased from $41.73 in Q3 2011 to $46.75 in Q3 2012 up to
$54.18 in Q3 2013 and $61.66 in Q3 2014 and now to $68.11 in Q3 2015 with a slight decrease to
$67.37 in Q4 2015.
With the preservation and repositioning of existing office space and introduction of new office
product such as 101 6th Avenue, One SoHo Square and 330 Hudson Street, vacancies have
decreased as rents have climbed. The area has always been supported by media tenants but has
become an increasingly attractive location for tech tenants, architects, fashion tenants and some
DESCRIPTIVE DATA 37
legal tenants. With the increased level of services coming to the neighborhood to cater to these
tenants, this location will continue to benefit.
Due to the lack of housing, the area is much like the Financial District in the early 2000s and
Tribeca in the 1990s was before residential development overtook many of the older, outmoded
office properties. The 2013 rezoning created an environment for housing to be redeveloped while
also preserving the existing office inventory by precluding redevelopment of any office building
over 70,000 square feet in favor of residential.
Retail
Because of the scale of some of the office properties in Hudson Square, the neighborhood lacks true
connected “retail corridors” whereby retail tenants can benefit from neighboring spaces in attracting
a variety of shoppers. Retail in the area is a mixture of newer storefronts and older storefronts and
center around the north-south strips of Varick Street and Hudson Street. There are clubs and
restaurants and local retail such as bank branches and drug stores. The trendy retail tenants include
Jacques Torres Chocolates, Todd Hase Furniture, Scott Jordan Furniture, Arrojo full service hair
salon, Starbucks, Hudson Coffee Bar, Regeneration, SoHo Made Soups, Jazzy’s Night Club, and
several trendy restaurants including 508, Pao, Kana, Mae Mae Café, and Cody’s Bar & Grill.
Hotels
Hotel development within Hudson Square is somewhat limited given the amount of nearby office
space. Within the area specifically designated as Hudson Square, the hotel inventory is comprised
of the following properties:
• Courtyard by Marriot located at 181 Varick Street: This 19-story hotel was constructed in
2010 and features 120 guestrooms. On-site amenities include a fitness center, snack bar,
restaurant and 24-hour business center.
• Hampton Inn located at 54 Watts Street: This 18-story hotel was constructed in 2006 and
features 160 guestrooms. On-site amenities include a bar/lounge, fitness center, rooftop
terrace, business center and conference space.
• Sheraton Four Points located at 66 Charlton Street: This 20-story hotel was constructed in
2006 and features 150 guestrooms. On-site amenities include a 24-hour business center,
restaurant and bar/lounge and a fitness center.
• Trump SoHo located at 246 Spring Street: This 46-story steel and glass hotel-condominium
project is the tallest, most prominent structure in the neighborhood. The property was
constructed prior to the current rezoning which governed, amongst many items, maximum
heights for new developments. Constructed as a hotel-condominium in 2008, the 391 units
within the building can be privately owned but cannot be occupied continuously. The hotel
DESCRIPTIVE DATA 38
is a luxury property featuring a restaurant and pool bar, rooftop terrace, business center,
fitness center, full-service space, valet parking and conference/wedding venue.
• April 2014 saw the opening of the Hotel Hugo located at 525 Greenwich Street. The site
was sold in 2011 $12.75 million or $212/SF of zoning floor area and has been developed
into a 20-story, 122- room hotel featuring a 90 seat restaurant. Other amenities include a
fitness center and 24-hour business center.
Planned hotels for the area include 2 Renwick/503 Canal Street/231 Hudson Street. The Metropolis
Group is developing the project. According to approved permits, the entirety of the development
will total nearly 100,000 square feet and will house 325 guestrooms. The development is in two
abutting structures of 11 and 10 stories.
According to press reports, a third hotel could be coming to the area at the corner of Canal Street
and Hudson Street at the address of 219 Hudson Street. Two former soccer stars, Paolo Maldini and
Christian Vieri were intending to bring a 30,000 square-foot Luxury Brand Hotel to this location,
but in September 2015, this site was sold to developer Joel Braver for $13,250,000. It is unknown
whether Braver will maintain the original design of the site, or will go a different route.
152 Leroy Street, an M1-5 zoned commercial development site, could house a hotel development of
approximately 28,000 square feet. This site sits abutting a FedEx facility just northeast of the
subject property development. This site was acquired in December 2012 for an indicated purchase
price of $10,250,000 or $366 per square foot. No building permits have been filed on the site, and it
was excluded from the variance for residential development recently granted to 160 Leroy
Street/357 West Street.
Institutional/Recreational Real Estate
Other developments that shape the neighborhood are the institutions in the area. These include the
Greenwich Street Theatre, Chelsea Vocational High School, the Little Red Schoolhouse, Our Lady
of Vilnius Church and the Department of State Passport Services. In addition, the area is also
served by several galleries and is home to the Children’s Museum of the Arts at 103 Charlton
Street. The New York City Fire Museum is at 278 Spring Street, and the Jackie Robinson Museum
at 75 Varick Street.
The subject development site sits opposite the Hudson River Park (HRP) across West Street/NYS
Route 9A. The Hudson River Park runs along and under the Hudson River from West 59th Street
south to its terminus at the northern bulkhead of Battery Park City. The Tribeca section of HRP to
the west and south of the subject development includes two piers and an improved park / waterfront
esplanade. The West Village section to the west and north of the subject development includes
three reconstructed piers, an improved esplanade, a display fountain, and expansive lawns and
plantings. The HRP offers a wide variety of activities including, and not limited to, basketball
courts, batting cages, bicycling and bike rental, boat building, dog runs, soccer fields, mini golf, ice
skating, kayaking, moorings, rowing, sailing, tennis and trapeze. Nearly 400 of the 550 acres of the
DESCRIPTIVE DATA 39
park are located in the Hudson River, but a number of piers extend out into the river and provide an
assortment of entertainment and recreational options.
Recent proposals to improve some of the decaying piers include an effort spearheaded by the Diller-
von Furstenberg Family Foundation for Pier 54, located off West 13th Street, in cooperation with
HRPT. Plans for Pier 54 entail a 2.7-acre park with a 700-seat amphitheater, two pedestrian
walkways and open lawns. Youngwoo Associates and RXR have commenced with a $300+ million
re-development of Pier 57 off West 15th Street into an office and marketplace structure with retail.
Plans for other piers in the Hudson River Park exist, such as Pier 26, located just south of the
subject development site, which will include, “… a restaurant, historic boats and a variety of active
and passive recreation opportunities. The upland area just north of Pier 26 features a dog run with
separate areas for small dogs and big dogs, habitat planting zones, lawns, seating areas and
overlooks.”5
Pier 40, the granting site of the subject air rights that are the subject of this report, is the largest
commercial pier in the Park, totaling 15-acres. It houses a multi-story parking garage, athletic fields,
administrative offices of the HRPT and is home to the Hornblower Cruises and Events, which
launches from Pier 40. According to HRPT, Pier 40’s steel piles supporting the pier must be
repaired and roof, building systems and facilities are in need of near term upgrades.
Trinity Church – In addition to the vast office portfolio owned by Trinity Church in the subject
neighborhood, Trinity Church holds a number of development sites that, subsequent to the 2013
rezoning effort spearheaded by Trinity Church, allow for dense residential development for as much
as 3,100 new units throughout the rezoned area. On the five parcels owned by Trinity Church, plans
are to develop projects that will house a combined 1,062 residential units and a 444-seat school for
grades Kindergarten through fifth grade. The sites are summarized below:
• Subdistrict A Building - 431 Canal Street - Block 227, Lots 63, 69, 70 and 76 (with 75,000
square foot school to house 444 seats. Conveyance of the school unit is by lease for $1 per
annum. Press reports indicate this development will total 300,000 square feet and reach 430
feet in height.
• Projected Development Site 2 – 131 Avenue of the Americas – Block 491, Lot 3
• Projected Development Site 3 – 278 Spring Street – Block 579, Lots 60, 68, 70 and 74
• Projected Development Site 4 – 341 Hudson Street - Block 598, Lots 42 and 48
• Projected Enlargement Site 1 – 78 Vandam Street - Block 579, Lot 47
5 https://www.hudsonriverpark.org/explore-the-park/locations/pier-26
DESCRIPTIVE DATA 40
Proposed Subject Development and Immediate Surrounding Area
The proposed development is to be located on the blocks bounded northerly by Clarkson Street,
westerly by West Street/NYS Route 9A and easterly by Washington Street. West Houston Street
runs east-west through the existing development and will serve as the southerly border for North.
Along the subject’s frontage, West Street/NYS 9A is a busy street with scattered traffic lights.
Along West Street near the subject property, a number of nearby residential developments enjoy
similar views such as 1 Morton Square, 290 West Street, 150 Charles Street, 160 Leroy Street, and
the upper floors of the Urban Glass House located at 330 Spring Street.
The proposed development is surrounded by a number of unique land uses that could impact the
development of the property at the lower levels. Abutting the southerly end of the property is the
recently-completed 140-foot tall Department of Sanitation of New York (DSNY) truck parking
facility. Approximately 25 feet of open lot area separates the existing structure on the subject
development from the northerly end of this DSNY facility. Opposite the development site across
Washington Street is a large facility operated by United Parcel Service (UPS). This 500,000 square
foot facility extends from the southerly boundary of West Houston Street to the northerly side of
Spring Street; nearly 1,000 feet in length. The facility has truck entrances for nearly 135 vehicles
along both Washington Street and Greenwich Street.
Opposite the northern end of the proposed development site is a collection of small properties that
are under development for the aforementioned 160 Leroy Street project. According to press reports,
Richard Mack entered into a co-development agreement with Ian Schrager to construct a 15-story
mixed-use, primarily residential development at this location. The property is zoned M1-5, and the
developers have received a zoning variance that maintains the M1-5 FAR of 5.0, but is in line with
uses permitted in the M1-5/R7X-rezoned portions of the neighborhood. Abutting this proposed
development to the east, also opposite the subject property’s northern boundary is a Federal Express
(FedEx) facility. Although commercial and industrial/distribution uses remain in the immediate
neighborhood of the subject property, developers are actively constructing mixed-use development,
primarily residential in character, where sites permit. The rezoning of the area immediately east of
the subject property has allowed a change in used to old, out-moded buildings and has invited in
those willing to capitalize on the strong demand for residential units in Manhattan.
Transportation
The area is well served by public transportation including the No. 1 subway line which stops at
Houston Street and Canal Street, the C and E line, which stop at Spring Street. Buses inlcude the
M21 cross town bus and the M20 Eighth Avenue bus. There is easy access to the Holland Tunnel
and the West Side Highway which in turn connect the area to New Jersey, the Financial District and
Brooklyn.
DESCRIPTIVE DATA 41
Conclusion
The immediate location abuts a number of unique land uses, such as the DSNY facility and UPS
building, that could impact the development of the property at the lower levels; however, the
proposed development will enjoy excellent views in all directions above the heights of these
abutting properties. Northerly and easterly, a number of planned developments should enhance the
blocks near the subject development.
The larger area of Hudson Square is a mature retail and commercial neighborhood which benefits
from good access to major traffic arteries and public transportation. Land uses in the area are
diverse but consist primarily of retail/commercial uses. At the time of our inspection we observed
redevelopment nearby, and are aware of the plans for a number of the underutilized sites. We
observed very little grade retail available for lease. The commercial market appears very strong,
and we anticipate the market for residential space within this area to increase given the recently
approved rezoning plan
The recovery, in combination with the area’s rezoning, have resulted in positive trends for
redevelopment and desirability for the subject property’s submarket. The subject area’s architecture
and location is attractive to the creative professions and to new media. Further, as long as there is a
shortage of office space in Midtown, there will be a market for affordable attractive space in other
areas. It is our opinion that nearly all real estate markets in this region will remain desirable over
the long term given the underlying strength of New York City despite the current uncertainties.
Indications are that it should continue to be successful in the long run in supporting local residential
and commercial uses such as those proposed for the subject property.
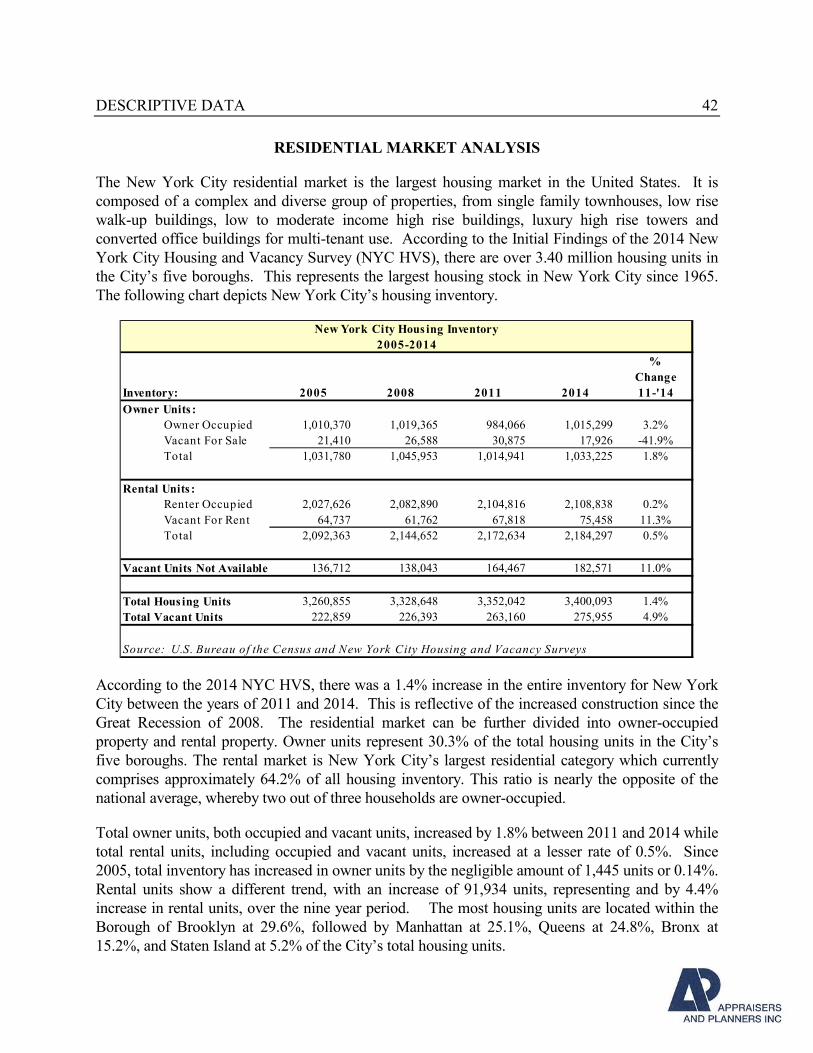
DESCRIPTIVE DATA 42
RESIDENTIAL MARKET ANALYSIS
The New York City residential market is the largest housing market in the United States. It is
composed of a complex and diverse group of properties, from single family townhouses, low rise
walk-up buildings, low to moderate income high rise buildings, luxury high rise towers and
converted office buildings for multi-tenant use. According to the Initial Findings of the 2014 New
York City Housing and Vacancy Survey (NYC HVS), there are over 3.40 million housing units in
the City’s five boroughs. This represents the largest housing stock in New York City since 1965.
The following chart depicts New York City’s housing inventory.
%
Change
Inventory: 2005 2008 2011 2014 11-'14
Owner Units :
Owner Occupied 1,010,370 1,019,365 984,066 1,015,299 3.2%
Vacant For Sale 21,410 26,588 30,875 17,926 -41.9%
Total 1,031,780 1,045,953 1,014,941 1,033,225 1.8%
Rental Units :
Renter Occupied 2,027,626 2,082,890 2,104,816 2,108,838 0.2%
Vacant For Rent 64,737 61,762 67,818 75,458 11.3%
Total 2,092,363 2,144,652 2,172,634 2,184,297 0.5%
Vacant Units Not Available 136,712 138,043 164,467 182,571 11.0%
Total Hous ing Units 3,260,855 3,328,648 3,352,042 3,400,093 1.4%
Total Vacant Units 222,859 226,393 263,160 275,955 4.9%
Source: U.S. Bureau of the Census and New York City Housing and Vacancy Surveys
New York City Hous ing Inventory
2005-2014
According to the 2014 NYC HVS, there was a 1.4% increase in the entire inventory for New York
City between the years of 2011 and 2014. This is reflective of the increased construction since the
Great Recession of 2008. The residential market can be further divided into owner-occupied
property and rental property. Owner units represent 30.3% of the total housing units in the City’s
five boroughs. The rental market is New York City’s largest residential category which currently
comprises approximately 64.2% of all housing inventory. This ratio is nearly the opposite of the
national average, whereby two out of three households are owner-occupied.
Total owner units, both occupied and vacant units, increased by 1.8% between 2011 and 2014 while
total rental units, including occupied and vacant units, increased at a lesser rate of 0.5%. Since
2005, total inventory has increased in owner units by the negligible amount of 1,445 units or 0.14%.
Rental units show a different trend, with an increase of 91,934 units, representing and by 4.4%
increase in rental units, over the nine year period. The most housing units are located within the
Borough of Brooklyn at 29.6%, followed by Manhattan at 25.1%, Queens at 24.8%, Bronx at
15.2%, and Staten Island at 5.2% of the City’s total housing units.
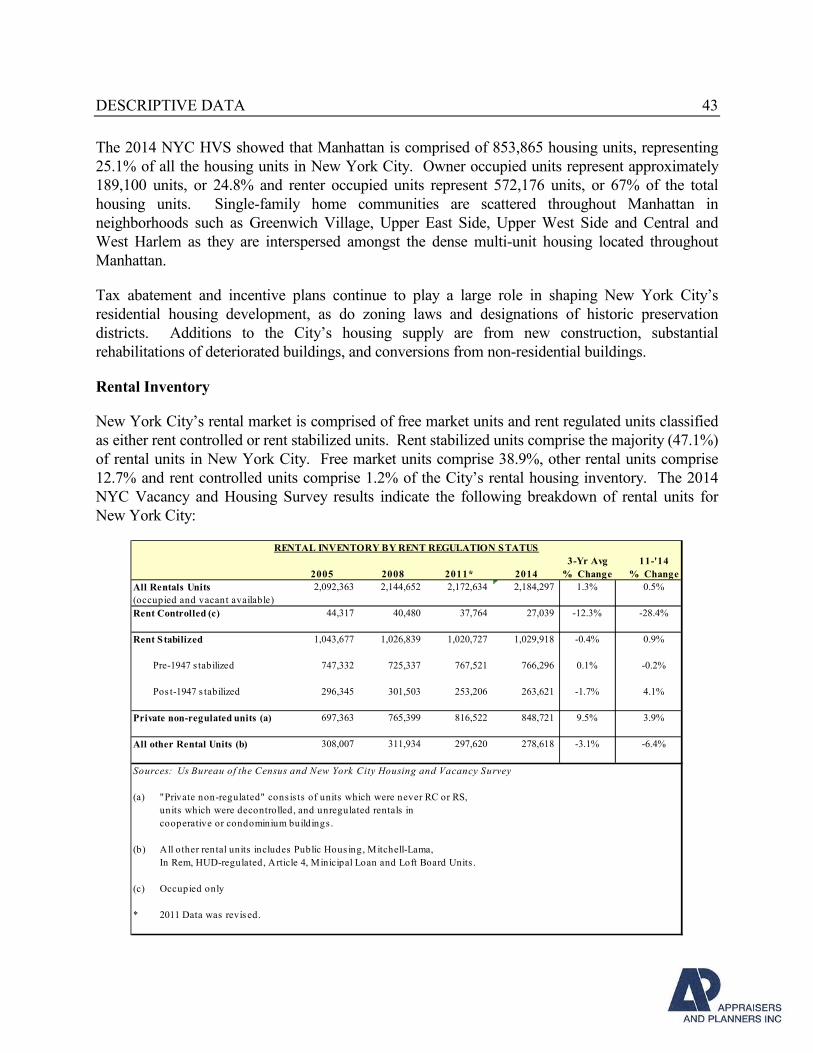
DESCRIPTIVE DATA 43
The 2014 NYC HVS showed that Manhattan is comprised of 853,865 housing units, representing
25.1% of all the housing units in New York City. Owner occupied units represent approximately
189,100 units, or 24.8% and renter occupied units represent 572,176 units, or 67% of the total
housing units. Single-family home communities are scattered throughout Manhattan in
neighborhoods such as Greenwich Village, Upper East Side, Upper West Side and Central and
West Harlem as they are interspersed amongst the dense multi-unit housing located throughout
Manhattan.
Tax abatement and incentive plans continue to play a large role in shaping New York City’s
residential housing development, as do zoning laws and designations of historic preservation
districts. Additions to the City’s housing supply are from new construction, substantial
rehabilitations of deteriorated buildings, and conversions from non-residential buildings.
Rental Inventory
New York City’s rental market is comprised of free market units and rent regulated units classified
as either rent controlled or rent stabilized units. Rent stabilized units comprise the majority (47.1%)
of rental units in New York City. Free market units comprise 38.9%, other rental units comprise
12.7% and rent controlled units comprise 1.2% of the City’s rental housing inventory. The 2014
NYC Vacancy and Housing Survey results indicate the following breakdown of rental units for
New York City:
3-Yr Avg 11-'14
2005 2008 2011* 2014 % Change % Change
All Rentals Units 2,092,363 2,144,652 2,172,634 2,184,297 1.3% 0.5%
(occupied and vacant available)
Rent Controlled (c) 44,317 40,480 37,764 27,039 -12.3% -28.4%
Rent Stabilized 1,043,677 1,026,839 1,020,727 1,029,918 -0.4% 0.9%
Pre-1947 s tabilized 747,332 725,337 767,521 766,296 0.1% -0.2%
Pos t-1947 s tabilized 296,345 301,503 253,206 263,621 -1.7% 4.1%
Private non-regulated units (a) 697,363 765,399 816,522 848,721 9.5% 3.9%
All other Rental Units (b) 308,007 311,934 297,620 278,618 -3.1% -6.4%
Sources: Us Bureau of the Census and New York City Housing and Vacancy Survey
(a) "Private non-regulated" consis ts of units which were never RC or RS,
units which were decontrolled, and unregulated rentals in
cooperative or condominium buildings .
(b) All other rental units includes Public Hous ing, Mitchell-Lama,
In Rem, HUD-regulated, Article 4, Minicipal Loan and Loft Board Units .
(c) Occupied only
* 2011 Data was revised.
RENTAL INVENTORY BY RENT REGULATION STATUS
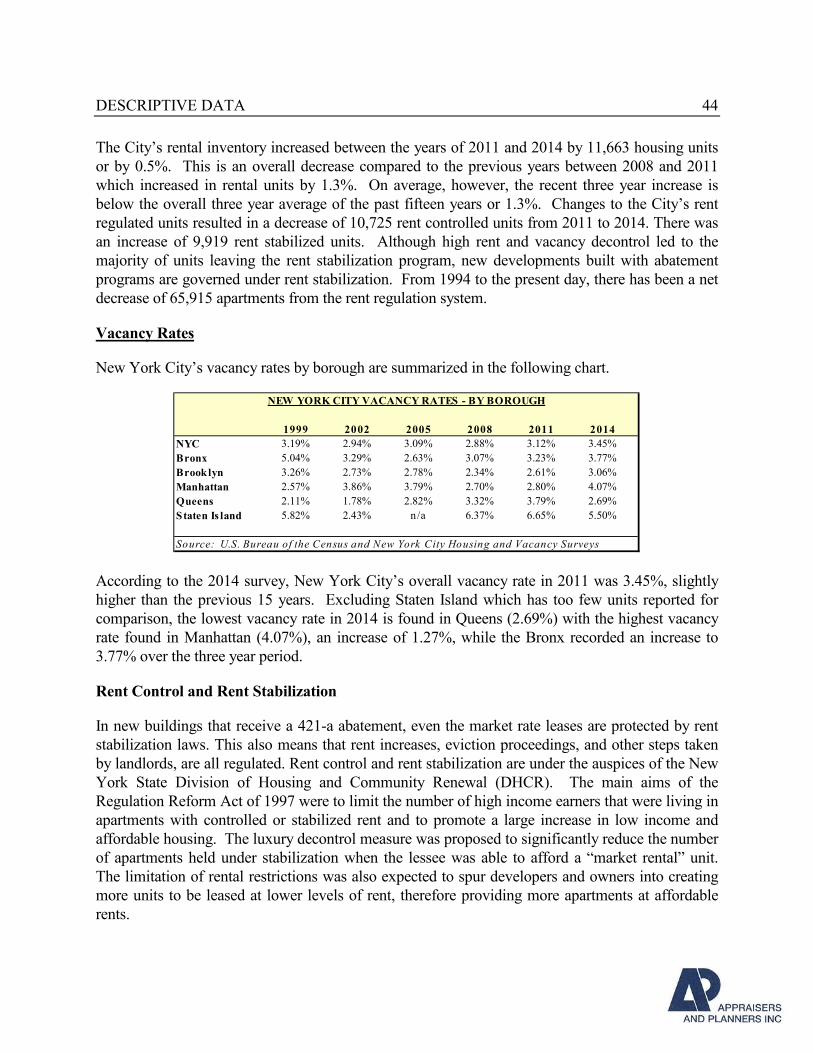
DESCRIPTIVE DATA 44
The City’s rental inventory increased between the years of 2011 and 2014 by 11,663 housing units
or by 0.5%. This is an overall decrease compared to the previous years between 2008 and 2011
which increased in rental units by 1.3%. On average, however, the recent three year increase is
below the overall three year average of the past fifteen years or 1.3%. Changes to the City’s rent
regulated units resulted in a decrease of 10,725 rent controlled units from 2011 to 2014. There was
an increase of 9,919 rent stabilized units. Although high rent and vacancy decontrol led to the
majority of units leaving the rent stabilization program, new developments built with abatement
programs are governed under rent stabilization. From 1994 to the present day, there has been a net
decrease of 65,915 apartments from the rent regulation system.
Vacancy Rates
New York City’s vacancy rates by borough are summarized in the following chart.
1999 2002 2005 2008 2011 2014
NYC 3.19% 2.94% 3.09% 2.88% 3.12% 3.45%
Bronx 5.04% 3.29% 2.63% 3.07% 3.23% 3.77%
Brooklyn 3.26% 2.73% 2.78% 2.34% 2.61% 3.06%
Manhattan 2.57% 3.86% 3.79% 2.70% 2.80% 4.07%
Queens 2.11% 1.78% 2.82% 3.32% 3.79% 2.69%
Staten Is land 5.82% 2.43% n/a 6.37% 6.65% 5.50%
Source: U.S. Bureau of the Census and New York City Housing and Vacancy Surveys
NEW YORK CITY VACANCY RATES - BY BOROUGH
According to the 2014 survey, New York City’s overall vacancy rate in 2011 was 3.45%, slightly
higher than the previous 15 years. Excluding Staten Island which has too few units reported for
comparison, the lowest vacancy rate in 2014 is found in Queens (2.69%) with the highest vacancy
rate found in Manhattan (4.07%), an increase of 1.27%, while the Bronx recorded an increase to
3.77% over the three year period.
Rent Control and Rent Stabilization
In new buildings that receive a 421-a abatement, even the market rate leases are protected by rent
stabilization laws. This also means that rent increases, eviction proceedings, and other steps taken
by landlords, are all regulated. Rent control and rent stabilization are under the auspices of the New
York State Division of Housing and Community Renewal (DHCR). The main aims of the
Regulation Reform Act of 1997 were to limit the number of high income earners that were living in
apartments with controlled or stabilized rent and to promote a large increase in low income and
affordable housing. The luxury decontrol measure was proposed to significantly reduce the number
of apartments held under stabilization when the lessee was able to afford a “market rental” unit.
The limitation of rental restrictions was also expected to spur developers and owners into creating
more units to be leased at lower levels of rent, therefore providing more apartments at affordable
rents.
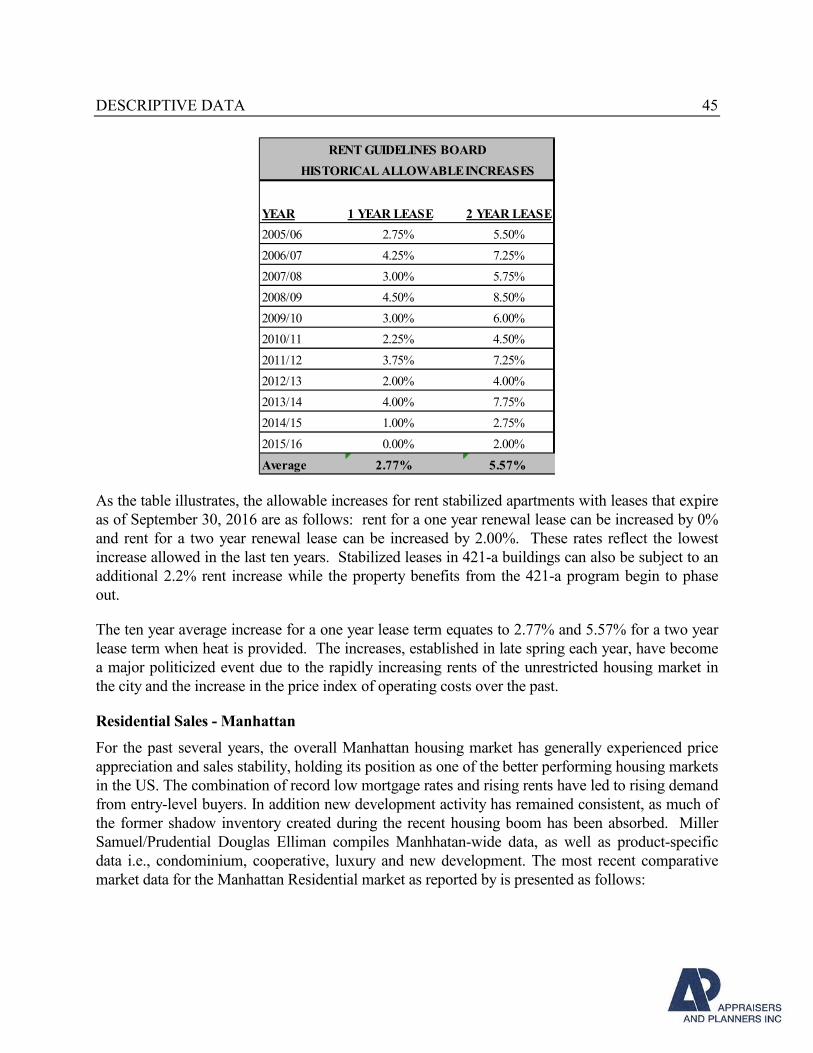
DESCRIPTIVE DATA 45
YEAR 1 YEAR LEASE 2 YEAR LEASE
2005/06 2.75% 5.50%
2006/07 4.25% 7.25%
2007/08 3.00% 5.75%
2008/09 4.50% 8.50%
2009/10 3.00% 6.00%
2010/11 2.25% 4.50%
2011/12 3.75% 7.25%
2012/13 2.00% 4.00%
2013/14 4.00% 7.75%
2014/15 1.00% 2.75%
2015/16 0.00% 2.00%
Average 2.77% 5.57%
RENT GUIDELINES BOARD
HISTORICAL ALLOWABLE INCREASES
As the table illustrates, the allowable increases for rent stabilized apartments with leases that expire
as of September 30, 2016 are as follows: rent for a one year renewal lease can be increased by 0%
and rent for a two year renewal lease can be increased by 2.00%. These rates reflect the lowest
increase allowed in the last ten years. Stabilized leases in 421-a buildings can also be subject to an
additional 2.2% rent increase while the property benefits from the 421-a program begin to phase
out.
The ten year average increase for a one year lease term equates to 2.77% and 5.57% for a two year
lease term when heat is provided. The increases, established in late spring each year, have become
a major politicized event due to the rapidly increasing rents of the unrestricted housing market in
the city and the increase in the price index of operating costs over the past.
Residential Sales - Manhattan
For the past several years, the overall Manhattan housing market has generally experienced price
appreciation and sales stability, holding its position as one of the better performing housing markets
in the US. The combination of record low mortgage rates and rising rents have led to rising demand
from entry-level buyers. In addition new development activity has remained consistent, as much of
the former shadow inventory created during the recent housing boom has been absorbed. Miller
Samuel/Prudential Douglas Elliman compiles Manhhatan-wide data, as well as product-specific
data i.e., condominium, cooperative, luxury and new development. The most recent comparative
market data for the Manhattan Residential market as reported by is presented as follows:
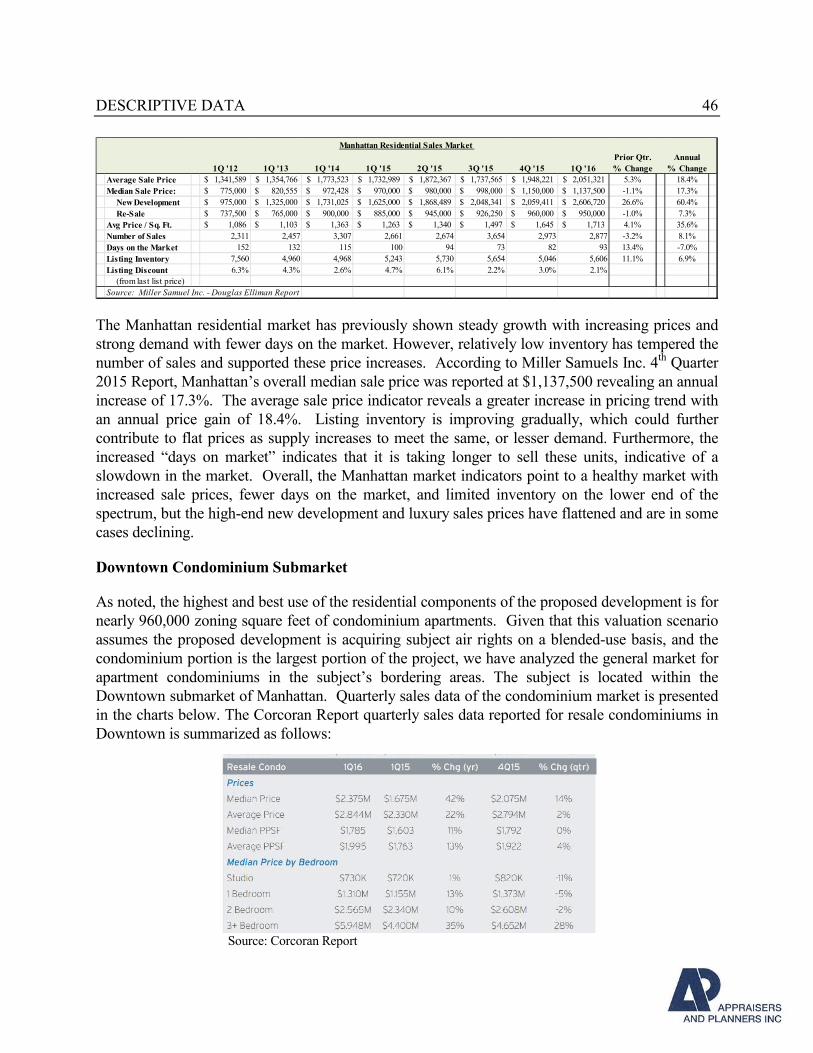
DESCRIPTIVE DATA 46
Prior Qtr. Annual
1Q '12 1Q '13 1Q '14 1Q '15 2Q '15 3Q '15 4Q '15 1Q '16 % Change % Change
Average Sale Price 1,341,589$ 1,354,766$ 1,773,523$ 1,732,989$ 1,872,367$ 1,737,565$ 1,948,221$ 2,051,321$ 5.3% 18.4%
Median Sale Price: 775,000$ 820,555$ 972,428$ 970,000$ 980,000$ 998,000$ 1,150,000$ 1,137,500$ -1.1% 17.3%
New Development 975,000$ 1,325,000$ 1,731,025$ 1,625,000$ 1,868,489$ 2,048,341$ 2,059,411$ 2,606,720$ 26.6% 60.4%
Re-Sale 737,500$ 765,000$ 900,000$ 885,000$ 945,000$ 926,250$ 960,000$ 950,000$ -1.0% 7.3%
Avg Price / Sq. Ft. 1,086$ 1,103$ 1,363$ 1,263$ 1,340$ 1,497$ 1,645$ 1,713$ 4.1% 35.6%
Number of Sales 2,311 2,457 3,307 2,661 2,674 3,654 2,973 2,877 -3.2% 8.1%
Days on the Market 152 132 115 100 94 73 82 93 13.4% -7.0%
Listing Inventory 7,560 4,960 4,968 5,243 5,730 5,654 5,046 5,606 11.1% 6.9%
Listing Discount 6.3% 4.3% 2.6% 4.7% 6.1% 2.2% 3.0% 2.1%
(from last list price)
Source: Miller Samuel Inc. - Douglas Elliman Report
Manhattan Residential Sales Market
The Manhattan residential market has previously shown steady growth with increasing prices and
strong demand with fewer days on the market. However, relatively low inventory has tempered the
number of sales and supported these price increases. According to Miller Samuels Inc. 4th Quarter
2015 Report, Manhattan’s overall median sale price was reported at $1,137,500 revealing an annual
increase of 17.3%. The average sale price indicator reveals a greater increase in pricing trend with
an annual price gain of 18.4%. Listing inventory is improving gradually, which could further
contribute to flat prices as supply increases to meet the same, or lesser demand. Furthermore, the
increased “days on market” indicates that it is taking longer to sell these units, indicative of a
slowdown in the market. Overall, the Manhattan market indicators point to a healthy market with
increased sale prices, fewer days on the market, and limited inventory on the lower end of the
spectrum, but the high-end new development and luxury sales prices have flattened and are in some
cases declining.
Downtown Condominium Submarket
As noted, the highest and best use of the residential components of the proposed development is for
nearly 960,000 zoning square feet of condominium apartments. Given that this valuation scenario
assumes the proposed development is acquiring subject air rights on a blended-use basis, and the
condominium portion is the largest portion of the project, we have analyzed the general market for
apartment condominiums in the subject’s bordering areas. The subject is located within the
Downtown submarket of Manhattan. Quarterly sales data of the condominium market is presented
in the charts below. The Corcoran Report quarterly sales data reported for resale condominiums in
Downtown is summarized as follows:
Source: Corcoran Report
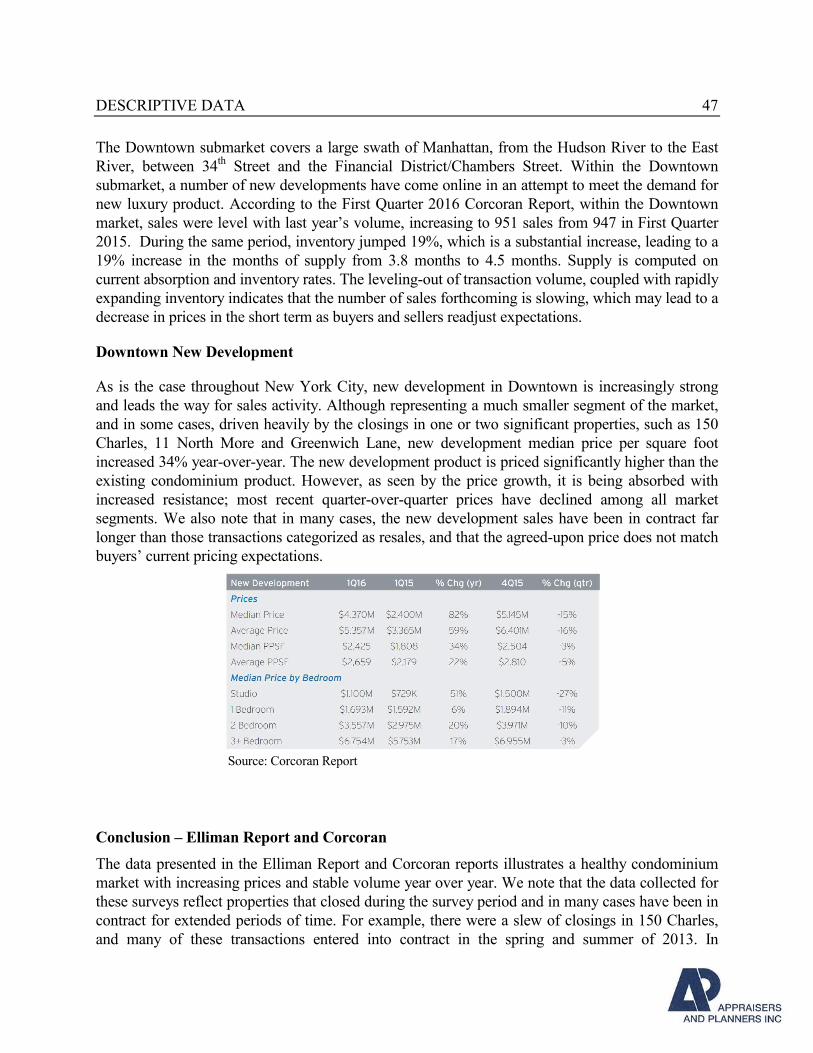
DESCRIPTIVE DATA 47
The Downtown submarket covers a large swath of Manhattan, from the Hudson River to the East
River, between 34th Street and the Financial District/Chambers Street. Within the Downtown
submarket, a number of new developments have come online in an attempt to meet the demand for
new luxury product. According to the First Quarter 2016 Corcoran Report, within the Downtown
market, sales were level with last year’s volume, increasing to 951 sales from 947 in First Quarter
2015. During the same period, inventory jumped 19%, which is a substantial increase, leading to a
19% increase in the months of supply from 3.8 months to 4.5 months. Supply is computed on
current absorption and inventory rates. The leveling-out of transaction volume, coupled with rapidly
expanding inventory indicates that the number of sales forthcoming is slowing, which may lead to a
decrease in prices in the short term as buyers and sellers readjust expectations.
Downtown New Development
As is the case throughout New York City, new development in Downtown is increasingly strong
and leads the way for sales activity. Although representing a much smaller segment of the market,
and in some cases, driven heavily by the closings in one or two significant properties, such as 150
Charles, 11 North More and Greenwich Lane, new development median price per square foot
increased 34% year-over-year. The new development product is priced significantly higher than the
existing condominium product. However, as seen by the price growth, it is being absorbed with
increased resistance; most recent quarter-over-quarter prices have declined among all market
segments. We also note that in many cases, the new development sales have been in contract far
longer than those transactions categorized as resales, and that the agreed-upon price does not match
buyers’ current pricing expectations.
Source: Corcoran Report
Conclusion – Elliman Report and Corcoran
The data presented in the Elliman Report and Corcoran reports illustrates a healthy condominium
market with increasing prices and stable volume year over year. We note that the data collected for
these surveys reflect properties that closed during the survey period and in many cases have been in
contract for extended periods of time. For example, there were a slew of closings in 150 Charles,
and many of these transactions entered into contract in the spring and summer of 2013. In
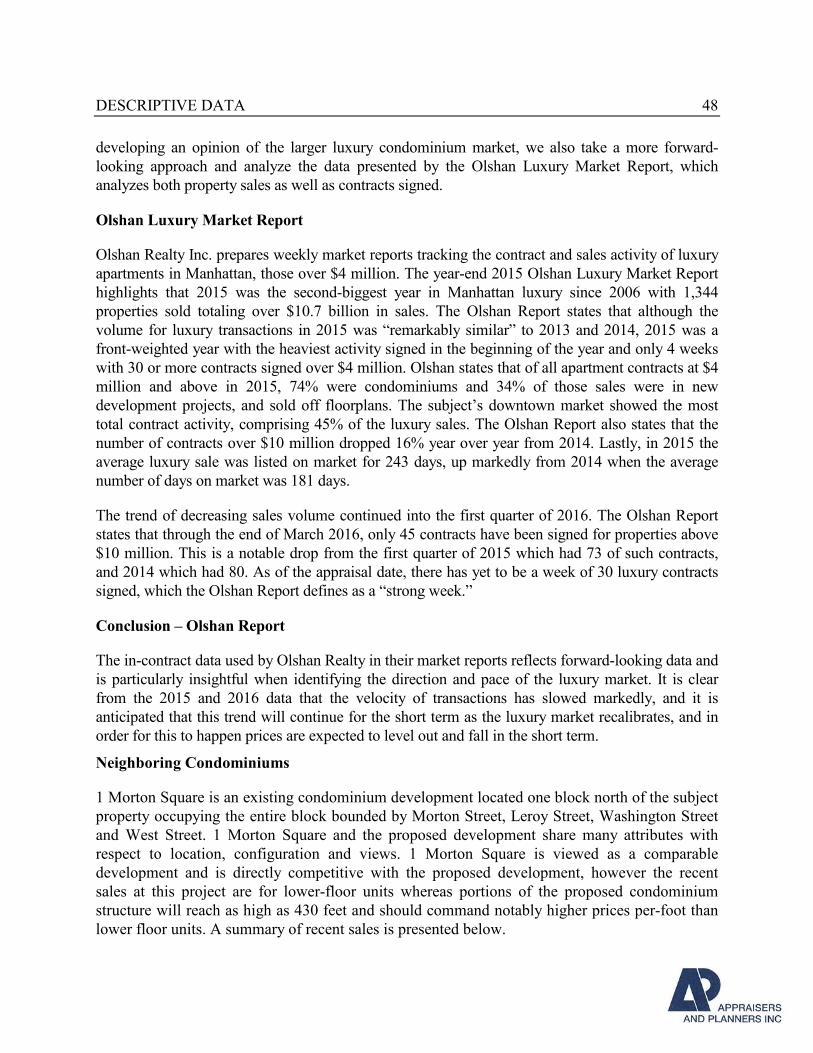
DESCRIPTIVE DATA 48
developing an opinion of the larger luxury condominium market, we also take a more forward-
looking approach and analyze the data presented by the Olshan Luxury Market Report, which
analyzes both property sales as well as contracts signed.
Olshan Luxury Market Report
Olshan Realty Inc. prepares weekly market reports tracking the contract and sales activity of luxury
apartments in Manhattan, those over $4 million. The year-end 2015 Olshan Luxury Market Report
highlights that 2015 was the second-biggest year in Manhattan luxury since 2006 with 1,344
properties sold totaling over $10.7 billion in sales. The Olshan Report states that although the
volume for luxury transactions in 2015 was “remarkably similar” to 2013 and 2014, 2015 was a
front-weighted year with the heaviest activity signed in the beginning of the year and only 4 weeks
with 30 or more contracts signed over $4 million. Olshan states that of all apartment contracts at $4
million and above in 2015, 74% were condominiums and 34% of those sales were in new
development projects, and sold off floorplans. The subject’s downtown market showed the most
total contract activity, comprising 45% of the luxury sales. The Olshan Report also states that the
number of contracts over $10 million dropped 16% year over year from 2014. Lastly, in 2015 the
average luxury sale was listed on market for 243 days, up markedly from 2014 when the average
number of days on market was 181 days.
The trend of decreasing sales volume continued into the first quarter of 2016. The Olshan Report
states that through the end of March 2016, only 45 contracts have been signed for properties above
$10 million. This is a notable drop from the first quarter of 2015 which had 73 of such contracts,
and 2014 which had 80. As of the appraisal date, there has yet to be a week of 30 luxury contracts
signed, which the Olshan Report defines as a “strong week.”
Conclusion – Olshan Report
The in-contract data used by Olshan Realty in their market reports reflects forward-looking data and
is particularly insightful when identifying the direction and pace of the luxury market. It is clear
from the 2015 and 2016 data that the velocity of transactions has slowed markedly, and it is
anticipated that this trend will continue for the short term as the luxury market recalibrates, and in
order for this to happen prices are expected to level out and fall in the short term.
Neighboring Condominiums
1 Morton Square is an existing condominium development located one block north of the subject
property occupying the entire block bounded by Morton Street, Leroy Street, Washington Street
and West Street. 1 Morton Square and the proposed development share many attributes with
respect to location, configuration and views. 1 Morton Square is viewed as a comparable
development and is directly competitive with the proposed development, however the recent
sales at this project are for lower-floor units whereas portions of the proposed condominium
structure will reach as high as 430 feet and should command notably higher prices per-foot than
lower floor units. A summary of recent sales is presented below.
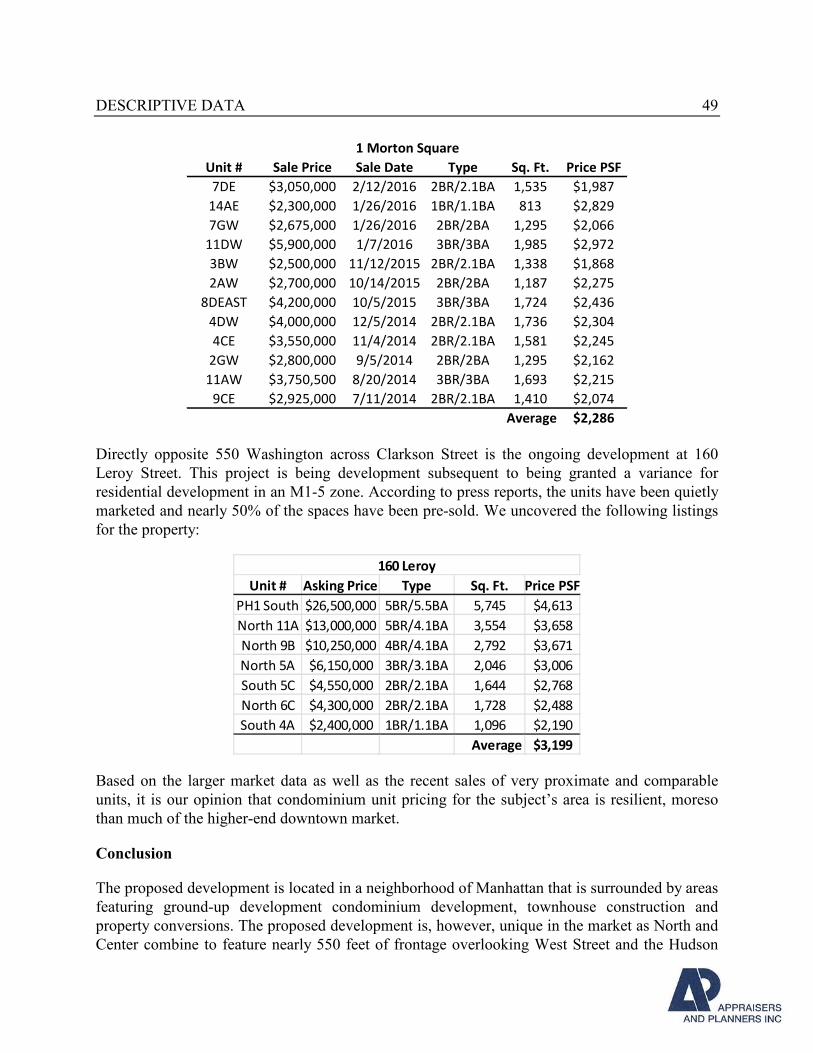
DESCRIPTIVE DATA 49
Unit # Sale Price Sale Date Type Sq. Ft. Price PSF
7DE $3,050,000 2/12/2016 2BR/2.1BA 1,535 $1,987
14AE $2,300,000 1/26/2016 1BR/1.1BA 813 $2,829
7GW $2,675,000 1/26/2016 2BR/2BA 1,295 $2,066
11DW $5,900,000 1/7/2016 3BR/3BA 1,985 $2,972
3BW $2,500,000 11/12/2015 2BR/2.1BA 1,338 $1,868
2AW $2,700,000 10/14/2015 2BR/2BA 1,187 $2,275
8DEAST $4,200,000 10/5/2015 3BR/3BA 1,724 $2,436
4DW $4,000,000 12/5/2014 2BR/2.1BA 1,736 $2,304
4CE $3,550,000 11/4/2014 2BR/2.1BA 1,581 $2,245
2GW $2,800,000 9/5/2014 2BR/2BA 1,295 $2,162
11AW $3,750,500 8/20/2014 3BR/3BA 1,693 $2,215
9CE $2,925,000 7/11/2014 2BR/2.1BA 1,410 $2,074
Average $2,286
1 Morton Square
Directly opposite 550 Washington across Clarkson Street is the ongoing development at 160
Leroy Street. This project is being development subsequent to being granted a variance for
residential development in an M1-5 zone. According to press reports, the units have been quietly
marketed and nearly 50% of the spaces have been pre-sold. We uncovered the following listings
for the property:
Unit # Asking Price Type Sq. Ft. Price PSF
PH1 South $26,500,000 5BR/5.5BA 5,745 $4,613
North 11A $13,000,000 5BR/4.1BA 3,554 $3,658
North 9B $10,250,000 4BR/4.1BA 2,792 $3,671
North 5A $6,150,000 3BR/3.1BA 2,046 $3,006
South 5C $4,550,000 2BR/2.1BA 1,644 $2,768
North 6C $4,300,000 2BR/2.1BA 1,728 $2,488
South 4A $2,400,000 1BR/1.1BA 1,096 $2,190
Average $3,199
160 Leroy
Based on the larger market data as well as the recent sales of very proximate and comparable
units, it is our opinion that condominium unit pricing for the subject’s area is resilient, moreso
than much of the higher-end downtown market.
Conclusion
The proposed development is located in a neighborhood of Manhattan that is surrounded by areas
featuring ground-up development condominium development, townhouse construction and
property conversions. The proposed development is, however, unique in the market as North and
Center combine to feature nearly 550 feet of frontage overlooking West Street and the Hudson
DESCRIPTIVE DATA 50
River and Park, and there are few available developments offering those two features near the
proposed property development. Given the potential development’s width, depth, configuration
and location it is suitable to house a large, fully-amenitized condominium development. As
illustrated above, and further discussed in the new development market analysis, the demand for
condominiums in the subject’s neighborhood is high as prices continue to maintain current
trends. New projects offering high-end product have only added to the neighborhood’s mix of
property types and have helped to bring a rise in prices to the neighborhood as a whole.
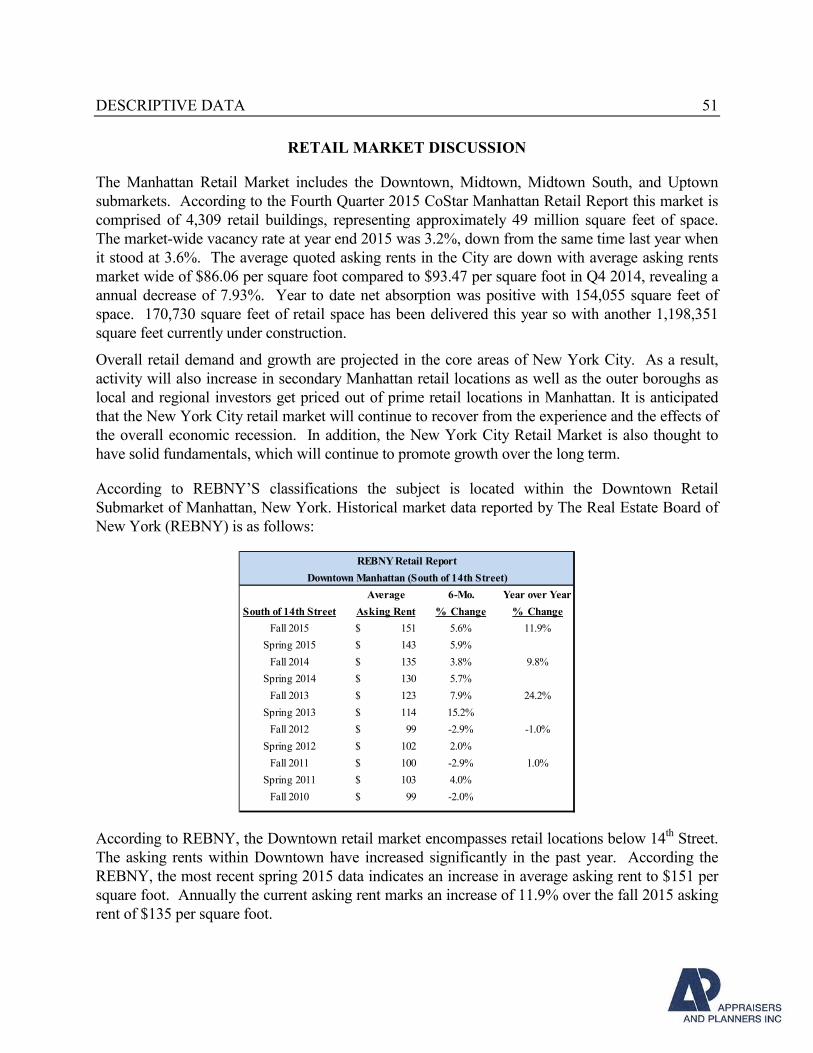
DESCRIPTIVE DATA 51
RETAIL MARKET DISCUSSION
The Manhattan Retail Market includes the Downtown, Midtown, Midtown South, and Uptown
submarkets. According to the Fourth Quarter 2015 CoStar Manhattan Retail Report this market is
comprised of 4,309 retail buildings, representing approximately 49 million square feet of space.
The market-wide vacancy rate at year end 2015 was 3.2%, down from the same time last year when
it stood at 3.6%. The average quoted asking rents in the City are down with average asking rents
market wide of $86.06 per square foot compared to $93.47 per square foot in Q4 2014, revealing a
annual decrease of 7.93%. Year to date net absorption was positive with 154,055 square feet of
space. 170,730 square feet of retail space has been delivered this year so with another 1,198,351
square feet currently under construction.
Overall retail demand and growth are projected in the core areas of New York City. As a result,
activity will also increase in secondary Manhattan retail locations as well as the outer boroughs as
local and regional investors get priced out of prime retail locations in Manhattan. It is anticipated
that the New York City retail market will continue to recover from the experience and the effects of
the overall economic recession. In addition, the New York City Retail Market is also thought to
have solid fundamentals, which will continue to promote growth over the long term.
According to REBNY’S classifications the subject is located within the Downtown Retail
Submarket of Manhattan, New York. Historical market data reported by The Real Estate Board of
New York (REBNY) is as follows:
Average 6-Mo. Year over Year
South of 14th Street Asking Rent % Change % Change
Fall 2015 151$ 5.6% 11.9%
Spring 2015 143$ 5.9%
Fall 2014 135$ 3.8% 9.8%
Spring 2014 130$ 5.7%
Fall 2013 123$ 7.9% 24.2%
Spring 2013 114$ 15.2%
Fall 2012 99$ -2.9% -1.0%
Spring 2012 102$ 2.0%
Fall 2011 100$ -2.9% 1.0%
Spring 2011 103$ 4.0%
Fall 2010 99$ -2.0%
REBNY Retail Report
Downtown Manhattan (South of 14th Street)
According to REBNY, the Downtown retail market encompasses retail locations below 14th Street.
The asking rents within Downtown have increased significantly in the past year. According the
REBNY, the most recent spring 2015 data indicates an increase in average asking rent to $151 per
square foot. Annually the current asking rent marks an increase of 11.9% over the fall 2015 asking
rent of $135 per square foot.
DESCRIPTIVE DATA 52
Planned Retail Development in Proposed Property
According to proposed development outline supplied by the client, the retail space component will
comprise four spaces on the ground floor in North totaling 29,800 square feet and a second floor
space in North targeted for possible occupancy by a grocery store totaling 38,800 square feet. In
Center, the total retail space is scheduled to comprise over 100,000 square feet with a big-box
proposal. The square footages summarized above fall short of the stated square footage for retail
space in the overall development plan, however this is assumed to be accounted for by loading
areas and non-useable space.
DESCRIPTIVE DATA 53
MANHATTAN DEVELOPMENT LAND MARKET
In general, we have observed that land prices in Manhattan, especially for residential, mixed-use
and hotel development, rose from 2003 and continuing through to late 2007 to early 2008 leading
into the recession. Given that land pricing is a function of the demand for built space coupled with
the availability of acquisition financing, construction financing, and construction costs, until the
recession, the demand was greater than the costs to construct the supply. As the recession of 2008
approached, acquisition financing and construction financing became more expensive, and lenders
were unwilling to finance new development. Coupling increasing development costs with a drop in
demand due to declining job growth and stagnant wages, demand for space, especially residential
space, slowed as compared with the pace of 2003-2008. Few development site transactions closed
in the latter third of 2008 and 2009, as the appetite for new development, both from an equity and
debt side, was, for all intents and purposes, gone.
Coming out of the recession, development site sales picked up in both price and volume, beginning
in 2010, as national, and local, employment grew; population increased to NYC; and financing
increasingly became available at low rates. Additionally, investors and developers looking to
capitalize on depressed property values, and foreclosed sites, were well-positioned to strike.
Beginning in 2010 and continuing to 2011, land prices rose steadily. Beginning at the end of 2011
towards early 2012, the local economy further strengthened, interest rates reached new lows, and
financing became available for real estate acquisitions, and in particular, lenders became
increasingly willing to finance new development. As a result, from early 2012 to mid-2015 and
prices rose to record levels, far surpassing previous highs. The rate of appreciation in this 3+-year
period was unprecedented, with some properties doubling in value in a 2-year span from 2011 to
2014 and into 2015. Beginning with the second quarter of 2015, we have observed in some markets
a softening in price, as measured by reduced asking prices for development parcels and an increased
availability of sites, signaling some developers’ preference to shirk development risk and capitalize
on the recent appreciation.
The driving force of development site sales during the recent run-up had been for residential
condominium development, yet investors were also paying record prices for hotel and mixed-use
projects throughout the prime neighborhoods in Manhattan. The strong prices for new luxury
condominiums, in certain buildings such as 432 Park Avenue, 157 West 57th Street, and 15 Central
Park West have reached close to $10,000 per square foot for upper-floor units. A number of other
new luxury developments in Midtown West, West Chelsea and Upper West Side command close to
$3,000 per square foot, and prices of $10,000,000 per apartment for new four- and five-bedroom
apartments are not uncommon. These record condominium prices helped to buoy the land prices as
well as put upward pressure on rental rates. As apartment prices for new developments reached all-
time highs, land prices rose rapidly in neighborhoods where high-end luxury developments never
previously existed such as the West 50s and far West 30s. Demand for buildable sites has been so
strong that in some cases developers were willing to buy occupied improved properties, negotiate
tenant buyouts and demolish the existing improvements in favor of new development even when, in
some cases, the new developments are only somewhat larger than the existing structures.
DESCRIPTIVE DATA 54
Beginning in the second quarter of 2015 and through the fourth quarter of 2015, we have observed
developers’ apprehension at purchasing land for luxury condominium development, and through
the April 2016 appraisal date, we have observed a disconnect between buyers and sellers that we
believe will lead to decreasing land prices. Concern about the strength of the high end
condominium market weighs heavily on development land prices, as the condominium sellouts
seen in 2013 and 2014 appear less likely of being achieved for developments in 2016 and 2017. The
slowdown is evident in a number of notable developments around Manhattan. One data point is the
average number of days that condominiums are on market, which according to the Elliman Report,
authored by Miller Samuel, increased 47% between Q4 2014 and Q4 2015, from 102 days to 150
days. Furthermore, according to the Elliman report, price per foot in Q4 2015 has decreased in the
Luxury category by -6.4%, year over year. This is powerful evidence pointing to a decreased
demand for new, high-priced condominium development.
As a result of the decreased demand for high-end condominium product, a number of developments
have reduced projected total condominium sellout prices, such as Extell Development’s
$207,325,100 price cut (from $2,080,075,100) at One Manhattan Square/225 Cherry Street. Other
developments, such as 10 Sullivan Street, have turned to dividing larger units to increase the
velocity of transactions. At 10 Sullivan, an 8,359 square foot triplex penthouse initially asked
$45,000,000 but now will be separated into two new units: a full-floor, 3,000-square-foot unit for
$11 million, and a 5,400-square-foot duplex that will ask $29 million. Other developers have
entirely abandoned development plans. One such project is 1 Park Lane, where the Steve Witkoff-
led joint venture has, for now, discontinued plans to demolish the Park Lane Hotel and construct a
1,210-foot tall ultra-luxury condominium building.
Given that pricing on condominium developments has weakened, many developers are taking a
“wait and see” attitude, as are lenders for these luxury condominium projects. Michael Stoler, a
managing director at Madison Realty Capital was quoted as saying, “Everyone’s a little
worried…With anything at $2,500 (per square foot) or more, lenders are very cautious.”[1] As such,
a decrease in the number of development site sales, and permit filings indicates a slowdown in
forthcoming development as there is palpable disconnect between buyer and sellers in the market
for development sites, especially those for which condominium development is the highest and best
use.
Broader Market Data – Development Site Sales
Massey Knakal Realty Services (now known as Cushman and Wakefield) publishes market reports
tracking transactions of real estate throughout New York City. The market reports cover a variety of
asset classes and are generally well-regarded as a reliable source for general market data. For the
asset type discussed here - development/conversion sites - the Massey Knakal reports started to
track and present the data in 2009, with full-year data available in reports beginning in 2010. The
[1] http://therealdeal.com/2016/02/04/lenders-losing-interest-in-financing-high-end-condo-projects/
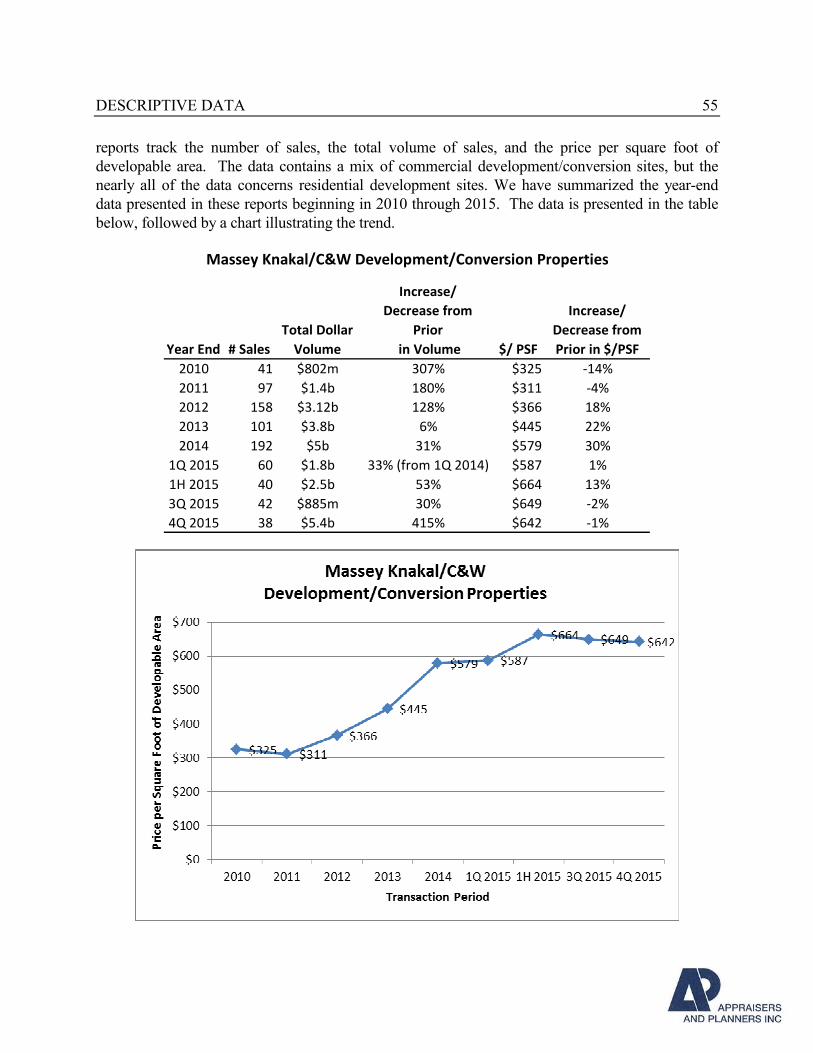
DESCRIPTIVE DATA 55
reports track the number of sales, the total volume of sales, and the price per square foot of
developable area. The data contains a mix of commercial development/conversion sites, but the
nearly all of the data concerns residential development sites. We have summarized the year-end
data presented in these reports beginning in 2010 through 2015. The data is presented in the table
below, followed by a chart illustrating the trend.
Year End # Sales
Total Dollar
Volume
Increase/
Decrease from
Prior
in Volume $/ PSF
Increase/
Decrease from
Prior in $/PSF
2010 41 $802m 307% $325 -14%
2011 97 $1.4b 180% $311 -4%
2012 158 $3.12b 128% $366 18%
2013 101 $3.8b 6% $445 22%
2014 192 $5b 31% $579 30%
1Q 2015 60 $1.8b 33% (from 1Q 2014) $587 1%
1H 2015 40 $2.5b 53% $664 13%
3Q 2015 42 $885m 30% $649 -2%
4Q 2015 38 $5.4b 415% $642 -1%
Massey Knakal/C&W Development/Conversion Properties
DESCRIPTIVE DATA 56
Summary – Massey Knakal Market Reports
The Massey Knakal reports indicate that, beginning with the year 2011, the volume of
development/conversion property sales in Manhattan increased dramatically. From 2010 to 2014,
annual volume increased from $802 million to $5 billion, representing a 523% increase. Just from
2011 to 2012, total volume increased 123%. Increased sales volume has also been coupled with
rapid price appreciation in the same periods analyzed. Total price appreciation for full-year 2011
data to full-year 2014 is 86%. One observation to be made is the velocity with which the prices
have increased. From 2011 to 2012, prices show a reported increase of 18%, followed by a 22%
increase to 2013, and an even higher increase of 30% to 2014. The increase to first half 2015 is
13% in price per square foot and 53% in volume from first half 2014. However, this is not an
“apples to apples” comparison, as it represents only a partial year’s data. The Massey Knakal data
suggests that, following the recession, there was rapid price appreciation for development sites, and
that the capital deployed towards development properties increased significantly as market
conditions created a development-friendly environment. Although transaction volume concluded at
an all-time in 2015, pricing decreased as the year came to a close, reflecting the market observation
that all-time high land prices are not sustainable given the increased riskiness and prolonged
absorption periods for the luxury condominium product – the source of the rapid demand rise from
2012 through mid-2015.
Hudson Square Residential Development
Prior to the Hudson Square rezoning in early 2013, there were relatively few residential
development site transactions in the neighborhood. Since the rezoning, a number of residential
development sites have transacted. Some of the more prominent transactions and assemblages in
the neighborhood include the following:
New and Planned Residential Development in Hudson Square
1. 68-74 Charlton – In May 2013, Extell Development sold a 90% interest in the leasehold
for $52,000,000 to Angelo, Gordon & Co., which translates into a full value of nearly
$58,000,000 for the leasehold development site. Press reports indicate that Extell initially
intended on developing a hotel on the site, but now that this parcel (along with many others
in Hudson Square) has been rezoned to accommodate residential development, plans call
for 22-story development comprised of 25 affordable units and 91 market rate cooperative
units, marketed as condops. Of the affordable units, 22 are planned to be two-bedroom
apartments and three would be studios, with initial rents ranging from $830 to $1,080 per
month. Asking prices range from $995,000 for a one-bedroom unit measuring 756 square
feet, up to $7,130,000 for a 2,486 square foot 14th-floor four-bedroom unit. In developing
this project, Extell secured 421-a benefits. The project is underway and will reportedly be
complete by the end of 2016.
2. 15 Renwick Street – Designed by ODA-Architecture, the 31-unit building features a
unique mix of 3 town homes with private yards, 4 Penthouse duplexes, and 2- and 3-
bedrooms. Amenities include optional private parking, a fitness center and boxing gym, 24-
DESCRIPTIVE DATA 57
hour doorman, roof deck and zen garden. Completion is set for 2015, with sales ongoing.
According to Streeteasy.com, 25 of the 31 units are being actively marketed with 22 of the
25 reported as in contract. Asking prices range from $2,100,000 for an 8th-floor, 1,028-
square-foot one-bedroom unit to $8,150,000 for a 2,859-square-foot, three-bedroom
penthouse with two terraces totaling 1,344 square feet. On a per-square-foot basis, asking
prices range from $2,027 per square foot to $2,859 per square foot.
3. 108-110 Charlton Street and 537-545 Greenwich Street – The acquisition of these
parcels by Cape Advisors is a comparable development site sale included in the valuation
section of this report. Although plans have not been announced, the site can accomodate a
development of over 120,000 square feet. Along Greenwich Street, this site overlooks the
UPS facility. No plans have been finalized and no building permits have been filed on either
of the sites, but subsequent to the acquisition of the initial land, the developer has purchased
two blocks of air rights.
4. 627 Greenwich Street – The acquisition of this parcel by Brack Capital is a comparable
development site sale within this valuation. Although plans have not been announced, the
existing 106,400-square-foot commercial building can accommodate a conversion for
residential development, given its M1-5/R7X zoning in northern Hudson Square. This
corner property offers good light and air on all sides and is appropriate for a condominium
development. Building permits filed through an Alt-1 indicate a development of 35 units in
117,594 square feet of ZFA. This development also includes a commercial component
measuring 9,257 square feet.
5. 22 Renwick Street – Completed in 2013, this development designed by Philip Johnson
Alan Ritchie Architects features 17 apartments spread over 12 floors. In addition to on-site
amenities such as doorman, private storage and bicycle storage, this development enjoys a
421-a tax exemption. The three most recent transactions in this development occurred in
July 2015, $1,925 per square foot, and one unit is presently listed for $1,888 per square foot.
6. 100 Varick Street/565 Broome Street – The acquisition of this parcel by a group of
developers including Halpern Real Estate Ventures and Bizzi & Partners represents the
largest ongoing project in the neighborhood. Although plans have not been finalized, due to
the increasing project footprint, the site can house a development of over 270,000 square
feet. This corner property offers good light and air on all sides and is appropriate for a
condominium development. The developers have continued to expand the footprint of this
project, and its total ZFA has seen a number of iterations. The most recent transaction
concerned the purchase of a portion of the abutting condominium building at 121 6th
Avenue, a building from which the JV already purchased air rights in 2013.
7. One Vandam (180 Sixth Avenue) – This development is technically located in SoHo, on
the easterly side of Sixth Avenue/Avenue of Americas; nonetheless it is a good example of
new condominium development being introduced to the neighborhood. Under development
by Quinlan Development, this project offers 25 units spread across 14 floors. The
development is architecturally unique to the surrounding area and provides for good light
and air to all units. The building amenities include an outdoor terrace, fitness center, private
DESCRIPTIVE DATA 58
storage and full-time doorman service. According to a summary of listings on
Streeteasy.com, 16 units are in contract to be sold. Asking prices range widely from a
$1,540,000 for a 737-square-foot 3rd-floor one-bedroom apartment to as high as
$28,000,000 for a 5,286-square-foot, 4-bedroom, 5.5-bath triplex penthouse with a total of
1,996 square feet of terrace space. The asking prices on available units range from $2,090 to
$5,297 per square foot.
8. 10 Sullivan Street – Similar to One Vandam above, this development is technically located
in SoHo, situated on the easterly side of Sixth Avenue/Avenue of Americas at its
intersection with Sullivan Street. The development is jointly developed by Madison
Equities and Property Markets Group and is comprised of 19 units spread over 16 stories in
addition to four 25-foot-wide, four-story over English basement townhouses measuring
approximately 4,700 square feet. Building amenities include stroller and bicycle storage,
private storage, fitness center and 24-hour doorman. According to listing information
provided by Streeteasy.com, 19 condominium units are available for sale with all but four in
contract. Asking prices range from $2,550,000 for a 4th floor, 982-square-foot one-bedroom
to an 8,359 square foot triplex penthouse initially asked $45,000,000 but now will be
separated into two new units: a full-floor, 3,000-square-foot unit for $11 million, and a
5,400-square-foot duplex that will ask $29 million.
9. 270 West Street /33-35 Debrosses Street – This future development is located four (4)
blocks south of the southern end of the subject property along West Street, technically
located within the neighborhood of Tribeca. This location shares many features with the
subject development with respect to overall location, exposure and nearby amenities.
Related Development acquired a portion of these properties from Ponte Equities in March
2014 for a reported $115.3 million. However, the RP-5217 transfer tax report on this
transaction shows a full sale price of $80,343,977. We have confirmed with a reliable
source involved in this transaction that this acquisition represents the full value of a joint
venture contribution agreement between Related Development and Ponte Equities and is
not representative of an arms-length sale of real estate. As a result, it cannot be used as
evidence of a development site sale in this valuation as the true consideration is unclear.
The development can, reportedly house over 150,000 square feet of residential development
as-of-right. Although plans have not been released, a filing on the NYS Attorney General
Real Estate Finance bureau indicates a projected sellout of $697,755,000 for 47 units, or
over $14.8 million per unit.
10. 156 Leroy/357 West Street – Opposite the northern end of the subject development site is
a collection of small properties long held by Richard Mack. According to press reports,
Mack entered into a co-development agreement with Ian Schrager to construct a 12-story
mixed-use, primarily residential development at this location.6 The property is zoned M1-5,
and the developers received a BSA variance on March 11, 2014 under application number
6 ny.curbed.com/archives/2014/03/11/starchitect_firm_likely_designing_12story_west_street_condo.phop
DESCRIPTIVE DATA 59
192-13-BZ. The proposed residential use will be in line with the M1-5-/R7X-rezoned
portions of the neighborhood. The planned, and approved project, will contain 77 residential
units and 12 accessory parking spaces all located within a 12-story 141,815 square foot
development. The pricing averages nearly $3,200 per square foot for all listed spaces.
11. 465-469 Washington – This future development is located just south of the southern end of
the subject property along Washington Street, technically located within the neighborhood
of Tribeca. This location shares many features with the subject development with respect to
overall location, and nearby amenities. This development represents an augmentation to an
existing mixed-use building. After selling for $6,114,796 in October 2012 following a
foreclosure proceeding, the new owners have applied to add a five-story addition. DOB
permits indicate plans to add two duplexes and a full-floor unit. Certain spaces have to be
deeded back to current occupants following the renovations. Configurations and pricing
have not been released for this development, which will total 7 units.
12. 82 King Street – Acquired by Toll Brothers in December 2012, prior to the neighborhood-
wide rezoning. This site can house a development nearing 400,000 square feet, as-of-right.
No permits have been filed and no action has been taken on the site since the acquisition.
Reportedly, Verizon occupies the property through 2017 and has, to this point, precluded
development.
13. 527-531 Greenwich/92-100 Vandam – This development site is owned by investor Jeff
Greene and was recently offered for sale for $175,000,000 by Massey Knakal Realty
Services, before being taken off the market in favor of redevelopment by Greene. According
to the listing, the parcels consist of 12,170 square feet of land area as well as 26,805 square
feet of air rights previously assembled from 305-307 Spring Street. The property consists of
92-94 Vandam Street, presently occupied by a six-story, 14,700 square foot building and
100 Vandam Street, presently occupied by a six-story, 40,600 square foot building.
According to permits filed, the property will be built to a total ZFA of 156,629 square feet
as-of-right, housing 62 units and 2,311 square feet of commercial space.
14. 111 Varick Street – This development site comprises a six-storyparking garage that has
been long-owned by Robal Parking Corporation. Robal has filed to develop a condominium
development at this location following the purchase of 12,256 square feet of air rights from
32 Dominick Street for $3,500,000 or $285 per square foot, and a recent acquisition of
14,519 square feet of air rights for $6,000,000 or $413 per square foot from abutting 117
Varick Street. Total ZFA assembled for this project totals 78,211 square feet, and can be
slightly enhanced with any commercial bonus rights if the developer selects to do retail or
commercial space in this development.
DESCRIPTIVE DATA 60
New Residential Rental Development
1. 460 Washington Street – currently under constructed by Bridge Land West LLC c/o
Related Development, DOB filings indicate this rental development will total 140,990
square feet in 10 stories and house 107 units. According to NYC Land Records, the
property is subject to a regulatory agreement with NYC Housing Development Corporation
(HDC) which dictates that 22 of the 107 units will be “affordable to Low Income Tenants”
and held within an Affordable Condo Unit. Projected rents for the affordable units will be
$800 for five (5) studio apartments, $860 for six (6) one-bedroom units and $1,041 for 11
two-bedroom units.
2. 261 Hudson Street – currently under constructed by Bridge Land Hudson LLC c/o Related
Development, DOB filings indicate this 80/20 rental development will total 168,264 square
feet spread over 12 stories and will house 201 units, 41 of which will be affordable.
According to NYC Land Records, the property is subject to a regulatory agreement with
NYC Housing Development Corporation (HDC) which dictates that 41 units will be
“affordable to Low Income Tenants” and held within an Affordable Condo Unit. Projected
rents for the affordable units will be $833 for 16 studio apartments, $895 for 16 one-
bedroom units and $1,082 for nine (9) two-bedroom units.
Conclusion
The neighborhood-wide rezoning has spurred an assortment of new residential development within
Hudson Square. As evidenced by the number of new condominium projects planned for the area
and, with the exception of 80/20 properties that receive favorable tax treatment, the lack of rental
projects planned, the economics to develop ownership units far outpaces the econonmics for
development of market rate rentals units. As a consequence, land prices for residential development
have continued to rise. In many of the surrounding areas, neighborhoods such as SoHo and the
West Village were rental neighborhoods, but nearly all new development within these
neighborhoods has been for condominium development as land acquisition for rental development
is currently infeasible. Where development sites exist, few builders can “pencil out” rental
developments given both land and construction costs and most builders see condominium
development as the best way to realize a lower-risk and short term return on investment.
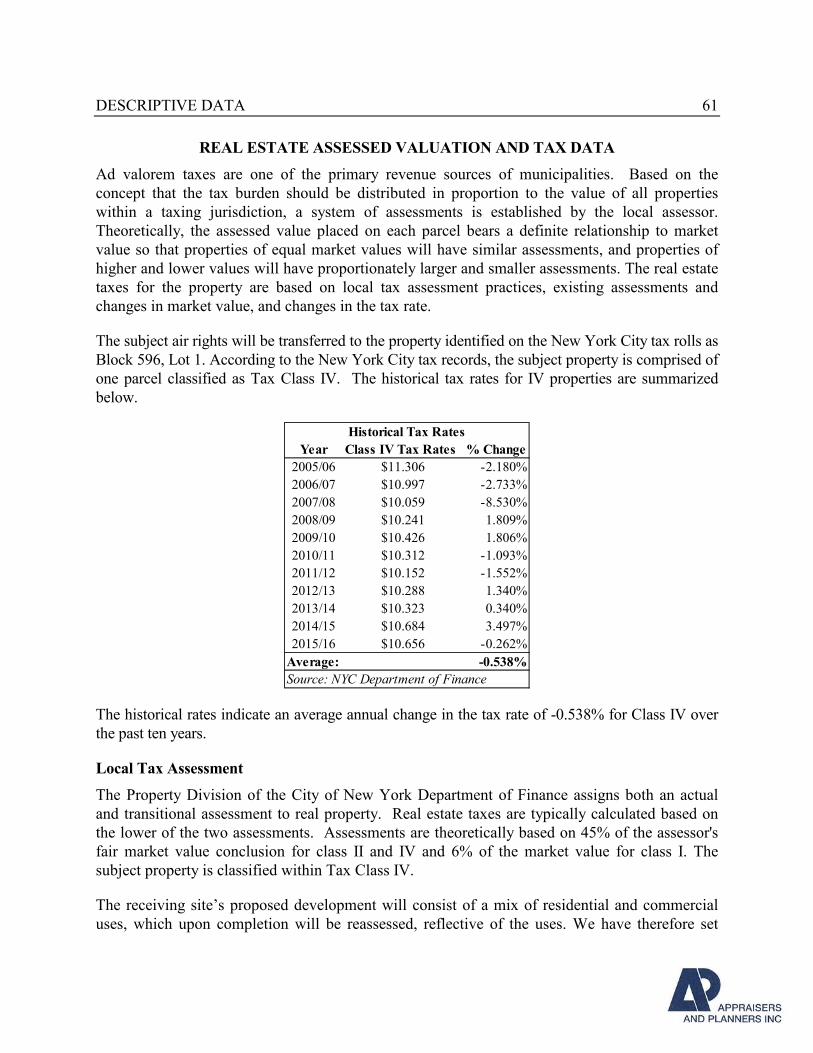
DESCRIPTIVE DATA 61
REAL ESTATE ASSESSED VALUATION AND TAX DATA
Ad valorem taxes are one of the primary revenue sources of municipalities. Based on the
concept that the tax burden should be distributed in proportion to the value of all properties
within a taxing jurisdiction, a system of assessments is established by the local assessor.
Theoretically, the assessed value placed on each parcel bears a definite relationship to market
value so that properties of equal market values will have similar assessments, and properties of
higher and lower values will have proportionately larger and smaller assessments. The real estate
taxes for the property are based on local tax assessment practices, existing assessments and
changes in market value, and changes in the tax rate.
The subject air rights will be transferred to the property identified on the New York City tax rolls as
Block 596, Lot 1. According to the New York City tax records, the subject property is comprised of
one parcel classified as Tax Class IV. The historical tax rates for IV properties are summarized
below.
Year Class IV Tax Rates % Change
2005/06 $11.306 -2.180%
2006/07 $10.997 -2.733%
2007/08 $10.059 -8.530%
2008/09 $10.241 1.809%
2009/10 $10.426 1.806%
2010/11 $10.312 -1.093%
2011/12 $10.152 -1.552%
2012/13 $10.288 1.340%
2013/14 $10.323 0.340%
2014/15 $10.684 3.497%
2015/16 $10.656 -0.262%
Average: -0.538%
Source: NYC Department of Finance
Historical Tax Rates
The historical rates indicate an average annual change in the tax rate of -0.538% for Class IV over
the past ten years.
Local Tax Assessment
The Property Division of the City of New York Department of Finance assigns both an actual
and transitional assessment to real property. Real estate taxes are typically calculated based on
the lower of the two assessments. Assessments are theoretically based on 45% of the assessor's
fair market value conclusion for class II and IV and 6% of the market value for class I. The
subject property is classified within Tax Class IV.
The receiving site’s proposed development will consist of a mix of residential and commercial
uses, which upon completion will be reassessed, reflective of the uses. We have therefore set
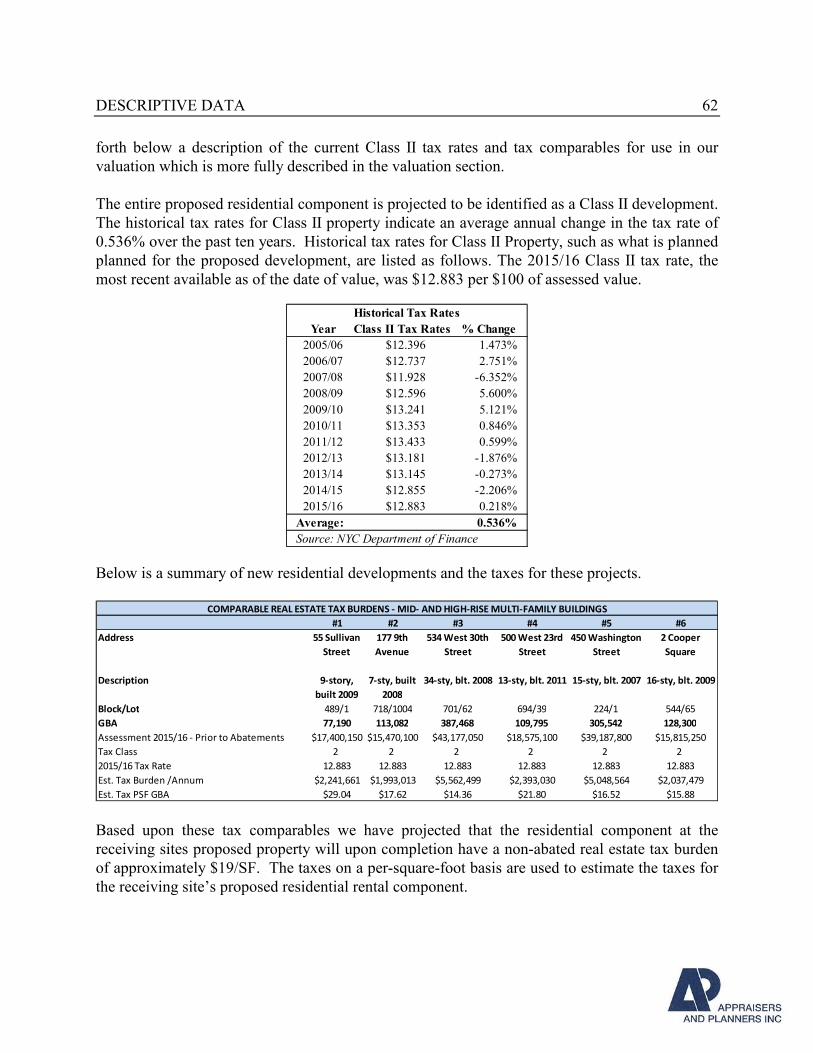
DESCRIPTIVE DATA 62
forth below a description of the current Class II tax rates and tax comparables for use in our
valuation which is more fully described in the valuation section.
The entire proposed residential component is projected to be identified as a Class II development.
The historical tax rates for Class II property indicate an average annual change in the tax rate of
0.536% over the past ten years. Historical tax rates for Class II Property, such as what is planned
planned for the proposed development, are listed as follows. The 2015/16 Class II tax rate, the
most recent available as of the date of value, was $12.883 per $100 of assessed value.
Year Class II Tax Rates % Change
2005/06 $12.396 1.473%
2006/07 $12.737 2.751%
2007/08 $11.928 -6.352%
2008/09 $12.596 5.600%
2009/10 $13.241 5.121%
2010/11 $13.353 0.846%
2011/12 $13.433 0.599%
2012/13 $13.181 -1.876%
2013/14 $13.145 -0.273%
2014/15 $12.855 -2.206%
2015/16 $12.883 0.218%
Average: 0.536%
Source: NYC Department of Finance
Historical Tax Rates
Below is a summary of new residential developments and the taxes for these projects.
#1 #2 #3 #4 #5 #6
Address 55 Sullivan
Street
177 9th
Avenue
534 West 30th
Street
500 West 23rd
Street
450 Washington
Street
2 Cooper
Square
Description 9-story,
built 2009
7-sty, built
2008
34-sty, blt. 2008 13-sty, blt. 2011 15-sty, blt. 2007 16-sty, blt. 2009
Block/Lot 489/1 718/1004 701/62 694/39 224/1 544/65
GBA 77,190 113,082 387,468 109,795 305,542 128,300
Assessment 2015/16 - Prior to Abatements $17,400,150 $15,470,100 $43,177,050 $18,575,100 $39,187,800 $15,815,250
Tax Class 2 2 2 2 2 2
2015/16 Tax Rate 12.883 12.883 12.883 12.883 12.883 12.883
Est. Tax Burden /Annum $2,241,661 $1,993,013 $5,562,499 $2,393,030 $5,048,564 $2,037,479
Est. Tax PSF GBA $29.04 $17.62 $14.36 $21.80 $16.52 $15.88
COMPARABLE REAL ESTATE TAX BURDENS - MID- AND HIGH-RISE MULTI-FAMILY BUILDINGS
Based upon these tax comparables we have projected that the residential component at the
receiving sites proposed property will upon completion have a non-abated real estate tax burden
of approximately $19/SF. The taxes on a per-square-foot basis are used to estimate the taxes for
the receiving site’s proposed residential rental component.
DESCRIPTIVE DATA 63
Current Taxes and Assessment – Receiving Site
The receiving site has a transitional land assessment of $19,980,450 and a transitional total
assessment of $82,348,169, and is classified as Tax Class IV. Current total taxes are $8,775,021
using. It is important to note that the receiving site contains more land area than will house the
subject excess rights and is presented for informational purposes, as upon redevelopment, the
property will be re-assessed commensurate with the scheduled development.
420-c Tax Incentive Program
The proposed senior affordable housing component will enjoy tax benefits generated by the 420-
c Tax Incentive program. We have been informed by NYC HPD that this specific component of
the project will be eligible for a 100% tax exemption for a period of 60 years.
421-a Partial-Tax Abatement Program (“421-a”)
The 421-a program has expired as of the appraisal date and the subject property cannot enjoy the
benefits of the program. The addenda of this report develops an alternative valuation in which the
421-a program in its most recent iteration is available for the rental components of the subject
receiving site.
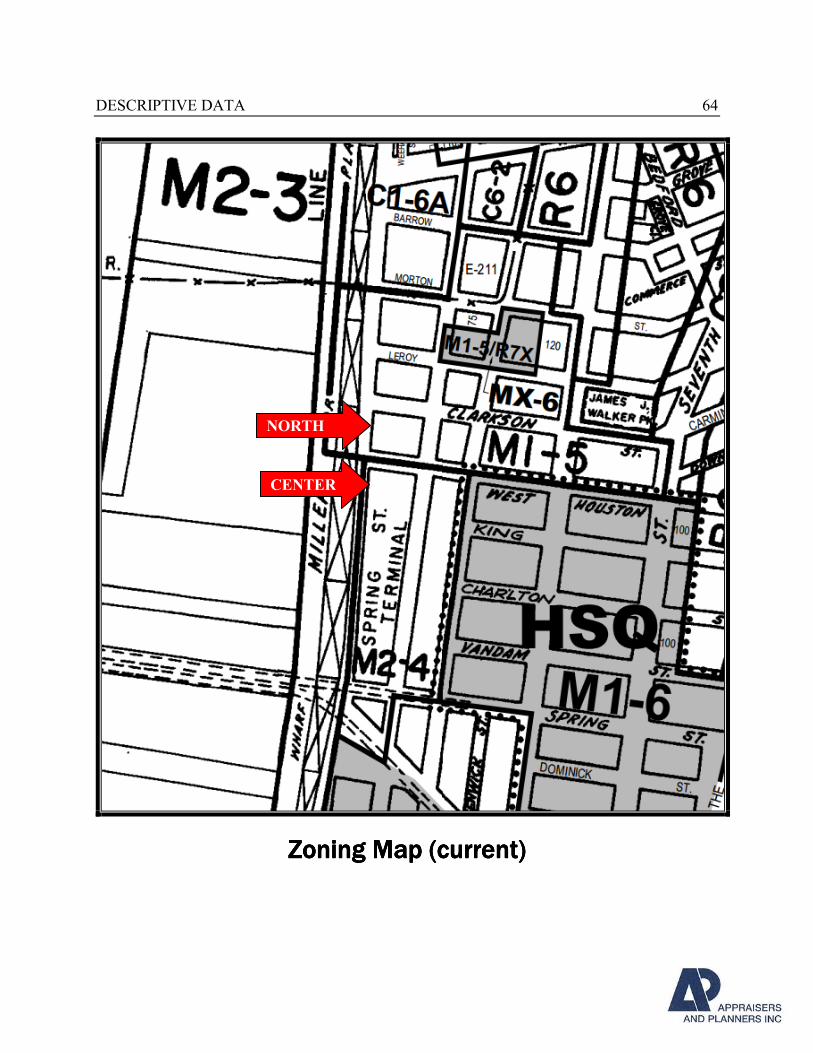
DESCRIPTIVE DATA 64
Zoning MapZoning MapZoning MapZoning Map (current)(current)(current)(current)
CENTER
NORTH
DESCRIPTIVE DATA 65
ZONING ANALYSIS
Current Zoning
As discussed under site data, the current improvements on the receiving lot span West Houston
Street. In analyzing the potential development of the site both as-of-right and in conjunction with
the proposed rezoning, the following site areas have been provided to us by the client: North –
55,020 square feet; Center – 100,730 square feet.
M1-5 (North) - North of the receiving site is located in a zoning district classified as M1-5, Light
Manufacturing District. These districts are, “designed for a wide range of manufacturing and
related uses which can conform to a high level of performance standards. Manufacturing
establishments of this type, within completely enclosed buildings, provide a buffer between
Residence (or Commercial) Districts and other industrial uses which involve more objectionable
influences.” New residential development is excluded from these districts. M1 districts typically
include light industrial uses, such as woodworking shops, repair shops, and wholesale service and
storage facilities. Nearly all industrial uses are allowed in M1 districts if they meet the stringent M1
performance standards. Offices, hotels and most retail uses are also permitted. Certain community
facilities, such as hospitals, are allowed in M1 districts only by special permit, but houses of
worship are allowed as-of-right.
Permitted Use Groups with M1-5 districts include:
Community Facility:
Retail & Commercial:
Recreation:
General Service:
Manufacturing:
Group 4
Group 5-11
Groups 12-14
Group 16
Group 17
Bulk regulations are as follows:
Maximum Floor Area Ratio (FAR):
Commercial:
Community Facility:
5.0
6.50
Minimum Yard Requirement:
Rear Yard:
Side Yard:
Front Yard:
20.0'; None for corner lot
None
None
Initial Setback:
Narrow Street:
Wide Street:
20'
15'
Height above street: 85'
Maximum height for M1-5 development is governed by sky exposure plane
DESCRIPTIVE DATA 66
M2-4 (Center)
Center of the receiving site is located in a zoning district classified as M2-4, Medium
Manufacturing District. This district is designed “…for manufacturing and related activities which
can meet a medium level of performance standards. Enclosure of such activities is not normally
required except in areas along the boundary of a Residence District.” No new residences or
community facilities are permitted.
Permissible uses in the M2-4 zoning district include manufacturing, printing establishments,
parking lots, parking garages, health facilities, retail and service establishments, business and trade
schools and public service establishments.
Permitted Use Groups with M2-4 districts include:
Retail and Commercial:
Recreation:
General Service:
Manufacturing:
Groups 6 through 11
Groups 11 through 14
Group 16
Group 17
The following bulk regulations apply to the subject:
Maximum Floor Area Ratio:
Commercial:
Manufacturing:
5.0
5.0
Minimum Yard Requirement:
Side Yard:
Rear Yard:
Initial Setback:
8 feet
20 feet
15 feet
Maximum Height of Front Wall: 85 feet (total height above set back governed by
sky exposure plane)
The maximum building area permitted, if the site was vacant and available for development to its
Highest and Best Use, is as follows:
Development
Phase
Plot
Square
Feet FAR
Maximum Total
Building Area
North 55,020 x 5.0 = 275,100 sq. ft.
Center 100,730 x 5.0 = 501,850 sq. ft.
155,750 x 5.0 = 778,750 sq. ft.
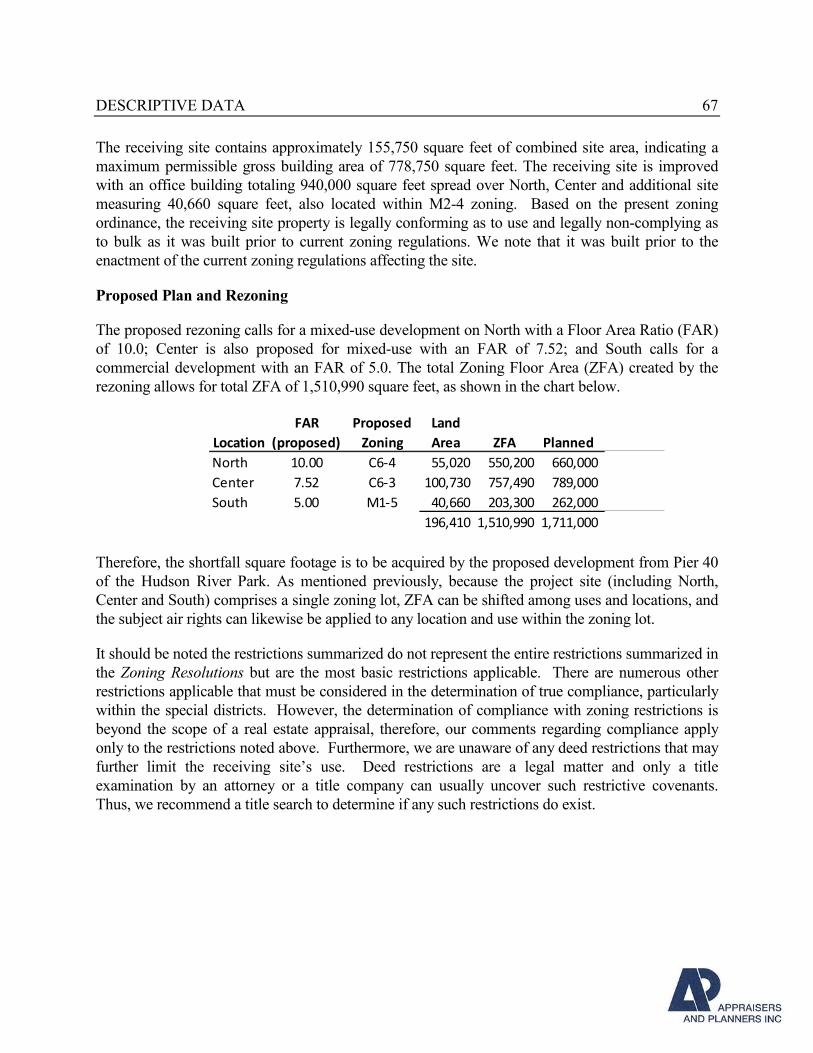
DESCRIPTIVE DATA 67
The receiving site contains approximately 155,750 square feet of combined site area, indicating a
maximum permissible gross building area of 778,750 square feet. The receiving site is improved
with an office building totaling 940,000 square feet spread over North, Center and additional site
measuring 40,660 square feet, also located within M2-4 zoning. Based on the present zoning
ordinance, the receiving site property is legally conforming as to use and legally non-complying as
to bulk as it was built prior to current zoning regulations. We note that it was built prior to the
enactment of the current zoning regulations affecting the site.
Proposed Plan and Rezoning
The proposed rezoning calls for a mixed-use development on North with a Floor Area Ratio (FAR)
of 10.0; Center is also proposed for mixed-use with an FAR of 7.52; and South calls for a
commercial development with an FAR of 5.0. The total Zoning Floor Area (ZFA) created by the
rezoning allows for total ZFA of 1,510,990 square feet, as shown in the chart below.
Location
FAR
(proposed)
Proposed
Zoning
Land
Area ZFA Planned
North 10.00 C6-4 55,020 550,200 660,000
Center 7.52 C6-3 100,730 757,490 789,000
South 5.00 M1-5 40,660 203,300 262,000
196,410 1,510,990 1,711,000
Therefore, the shortfall square footage is to be acquired by the proposed development from Pier 40
of the Hudson River Park. As mentioned previously, because the project site (including North,
Center and South) comprises a single zoning lot, ZFA can be shifted among uses and locations, and
the subject air rights can likewise be applied to any location and use within the zoning lot.
It should be noted the restrictions summarized do not represent the entire restrictions summarized in
the Zoning Resolutions but are the most basic restrictions applicable. There are numerous other
restrictions applicable that must be considered in the determination of true compliance, particularly
within the special districts. However, the determination of compliance with zoning restrictions is
beyond the scope of a real estate appraisal, therefore, our comments regarding compliance apply
only to the restrictions noted above. Furthermore, we are unaware of any deed restrictions that may
further limit the receiving site’s use. Deed restrictions are a legal matter and only a title
examination by an attorney or a title company can usually uncover such restrictive covenants.
Thus, we recommend a title search to determine if any such restrictions do exist.
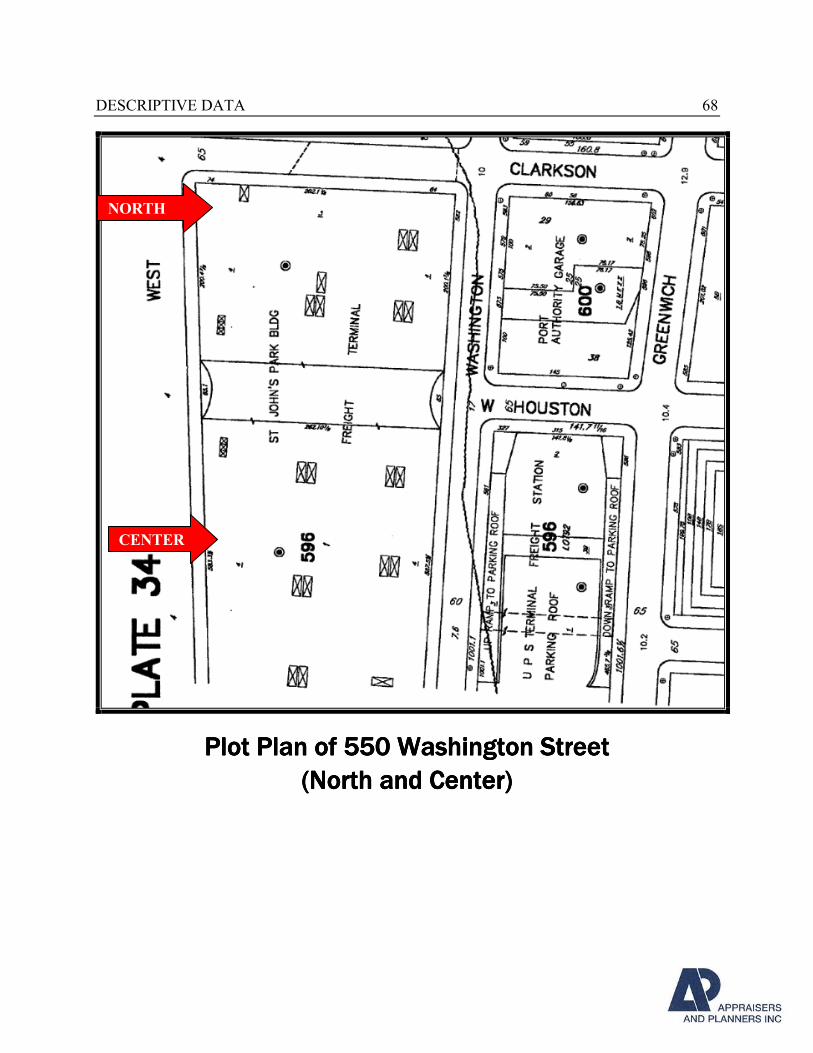
DESCRIPTIVE DATA 68
Plot PlanPlot PlanPlot PlanPlot Plan oooof 550 Washingtonf 550 Washingtonf 550 Washingtonf 550 Washington StreetStreetStreetStreet
((((NorthNorthNorthNorth and and and and CenterCenterCenterCenter))))
NORTH
CENTER
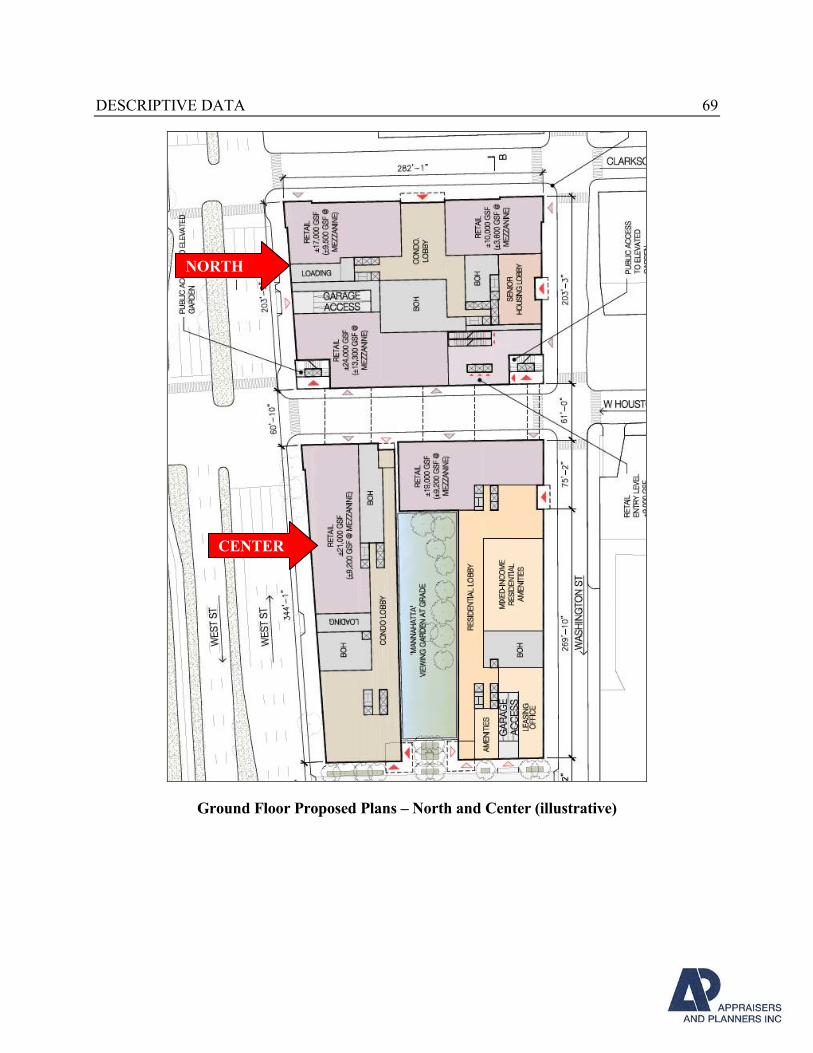
DESCRIPTIVE DATA 69
Ground Floor Proposed Plans – North and Center (illustrative)
CENTER
NORTH
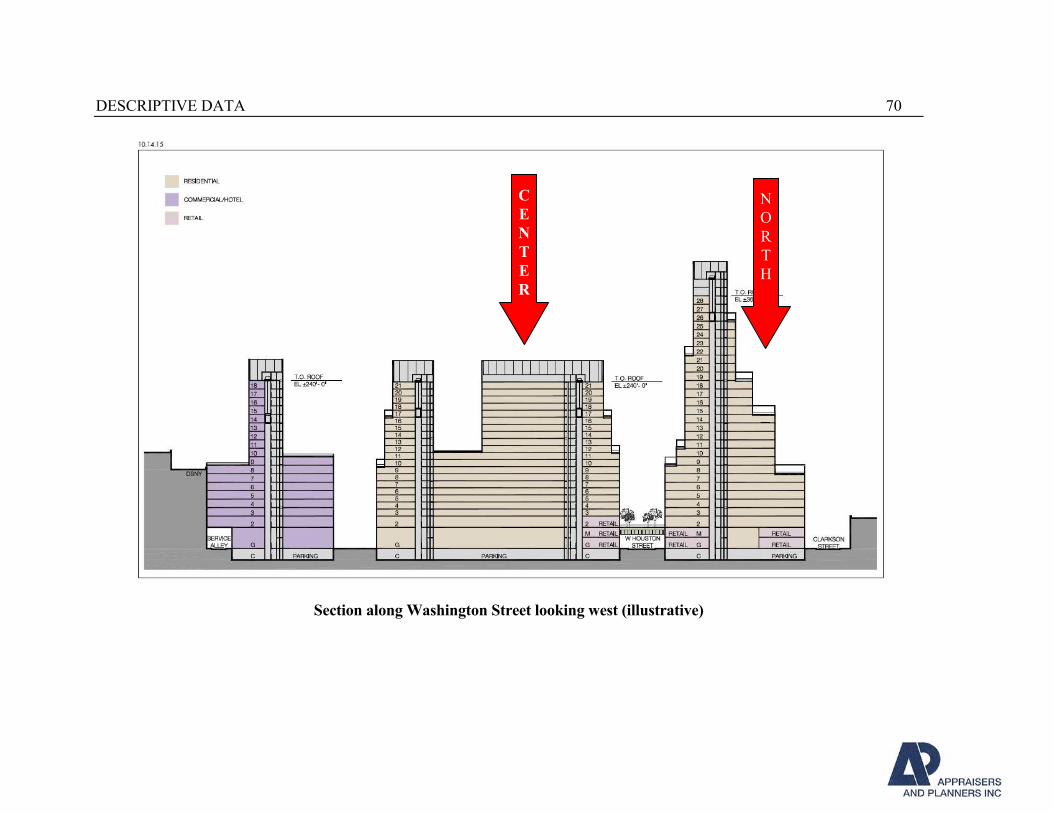
DESCRIPTIVE DATA 70
Section along Washington Street looking west (illustrative)
N
O
R
T
H
C
E
N
T
E
R
DESCRIPTIVE DATA 71
SITE AND IMPROVEMENT DATA – RECEIVING SITE
Location: The proposed development site is comprised of a whole-block parcel
and block-front parcel generally bounded by Clarkson Street, West
Street and Washington Street. The parcels are described in detail below.
The receiving site property is identified on the New York City
Assessor’s Map as part of Block 596, Lot 1.
Site Measurement:7 North – Whole-block parcel; frontages are 282 feet along the southerly
side of Clarkson Street; 203 feet along the westerly side of Washington
Street; 203 feet along the easterly side of West Street and 270 feet
along the northerly side of West Houston Street
Center – Block-front parcel; frontages are 263 feet along the southerly
side of West Houston Street; 406 feet along the westerly side of
Washington Street; 407 feet along the easterly side of West Street
Total Land Area: North – 55,020 square feet
Center – 100,730 square feet
Zoning: Split-zoned M1-5 and M2-4.
Topography: The site is generally level along all street frontages.
Flood Zone: According to FEMA Flood Panel Map 3604970182F dated September
5th, 2007, the property is located within the confines of FEMA Zone
AE: areas determined to be within the 0.2 percent Annual Chance
Flood Hazard area. The property is situated in NYC Hurricane
Evacuation Zone 1, which is the highest risk level.
Utilities Available: Utilities available to the site are telephone, provided by Verizon and
others; gas and electric provided by Consolidated Edison; water and
sewer provided by the City of New York.
Municipal Services: Street lighting, sanitation, street maintenance, police and fire protection
are provided by the City of New York.
Ingress/Egress: Ingress and egress to the site are by means of West Houston Street,
Washington Street and West Street.
7 Based on lot areas provided by client
DESCRIPTIVE DATA 72
Traffic Nuisance Along West Street/NYS Route 9A, there are a number of traffic lights,
including one located at the intersection of West Street and Clarkson
Street. West Street is a major north-south thoroughfare in Manhattan.
Potential Hazards/
Subsoil Conditions:
Appraisers and Planners, Inc. is not aware of any potential hazards
affecting the site. Soil conditions are assumed to be adequate to
support the existing structure and the proposed development.
Receiving Site’s Current
Improvements:
We did not make an interior inspection of the improvements. The
summary of improvement below is based on information gleaned from
a variety of sources. The property is presently improved with a four-
story office building measuring nearly 800 feet in width and totaling
940,000 square feet of gross building area according to NYC
assessment records. The building was constructed in 1933, and altered
in 1965. The main entrance is at 570 Washington Street which is
accessed via a set of concrete stairs which lead to a revolving door. In
addition there are entrances at 330, 340 and 350 West Street. The
building is tan masonry and features a number of drive-in doors along
both West Street and Washington Street. Extensive HVAC equipment
and fans can be observed on the building’s roof. The former
loft/manufacturing floors have been converted to office use. Merrill
Lynch, which occupied over 50% of the building, vacated their space
in 2007. The space remains vacant and requires a substantial tenant
installation. Bloomberg LP occupies approximately 40% of the
building. Reportedly, a good amount of the former Merrill space
features outdated raised flooring. Due to the large floor plates, a
significant amount of the space within the building is interior space
with little light and air. While there is exposure to the Hudson River
along the westerly building wall, views from the lower floors are
partially obstructed by Pier 40.
A unique feature of the existing improvements is that the building
spans West Houston Street allowing traffic to pass “through” the
building, below the 2nd through 4th floors above West Houston Street.
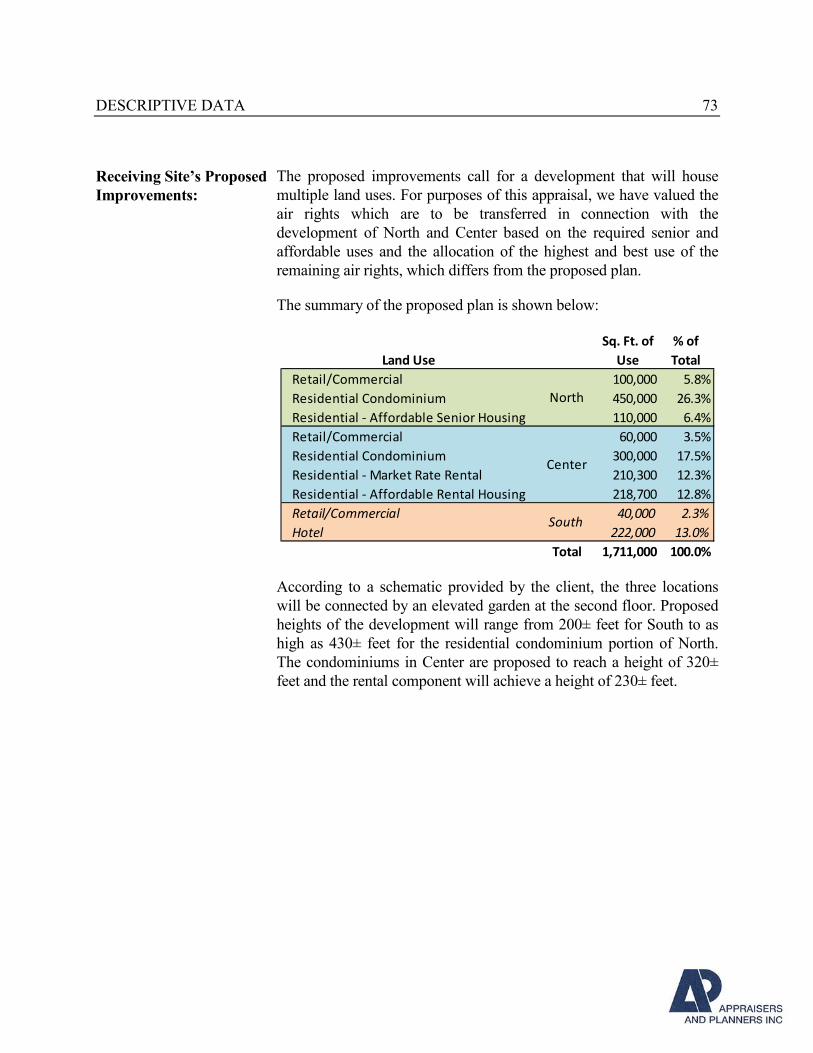
DESCRIPTIVE DATA 73
Receiving Site’s Proposed
Improvements:
The proposed improvements call for a development that will house
multiple land uses. For purposes of this appraisal, we have valued the
air rights which are to be transferred in connection with the
development of North and Center based on the required senior and
affordable uses and the allocation of the highest and best use of the
remaining air rights, which differs from the proposed plan.
The summary of the proposed plan is shown below:
Land Use
Sq. Ft. of
Use
% of
Total
Retail/Commercial 100,000 5.8%
Residential Condominium 450,000 26.3%
Residential - Affordable Senior Housing 110,000 6.4%
Retail/Commercial 60,000 3.5%
Residential Condominium 300,000 17.5%
Residential - Market Rate Rental 210,300 12.3%
Residential - Affordable Rental Housing 218,700 12.8%
Retail/Commercial 40,000 2.3%
Hotel 222,000 13.0%
Total 1,711,000 100.0%
South
North
Center
According to a schematic provided by the client, the three locations
will be connected by an elevated garden at the second floor. Proposed
heights of the development will range from 200± feet for South to as
high as 430± feet for the residential condominium portion of North.
The condominiums in Center are proposed to reach a height of 320±
feet and the rental component will achieve a height of 230± feet.
HIGHEST AND BEST USE 74
HIGHEST AND BEST USE ANALYSIS
The highest and best use analysis and conclusions for a particular property provide the basis upon
which the market value is predicated. The purpose of the highest and best use analysis is to identify
the use of a property that is expected to produce the highest overall return.
According to the Appraisal Institute, highest and best use is defined as:
"The reasonably probable and legal use of vacant land or an improved property that is
physically possible, appropriately supported, financially feasible, and that results in highest
value."8
The highest and best use analysis involves examination of the highest and best use of the subject
property first as if vacant and unimproved and second, as improved.
In determining the highest and best use, the four tests of highest and best use are examined.
• Legally Permissible: The initial test or criterion of highest and best use considers what
uses are legally permissible. This relates to designated zoning,
bulk regulations, restrictions applicable to a lease, environmental
regulations, easements or other restrictions. For the purposes of
this appraisal we have considered the permissible uses and
regulations as per the proposed rezoning and special permit.
• Physically Possible: The second test of highest and best use considers the size, shape,
area and terrain or topography of a parcel of land that can affect
the use of that parcel. This test also takes into account utility of
the parcel based on frontage and depth measurements.
• Financially Feasible: The financial feasibility criterion refers to that use of the
physically possible, legally permissible uses that is likely to
produce a positive return to the owner.
• Maximally Productive: The fourth and final test of highest and best use is determining
which of the financially feasible uses provides the highest net
return to the investor.
The definition above applies specifically to the highest and best use of land. It is to be recognized
that in cases where a site has an existing improvement on it, the highest and best use may be
determined to be different from the improved use. The existing use will continue, however, unless
and until land value in its highest and best use exceeds the total value of the property in its existing
use.
8 Appraisal Institute, The Dictionary of Real Estate Appraisal, 5th Ed., (Illinois: Appraisal Institute, 2010), page 93
HIGHEST AND BEST USE 75
Given that we are valuing the subject develop rights assuming they are part of the fee development
of the receiving site identified as 550 Washington Street, this highest and best use analysis
considers the highest and best use of the development rights transferred to the zoning lot
comprising 550 Washington Street. In addition, this highest and best use analysis considers uses
permissible under the rezoning and special permit which include residential, commercial retail, and
hotel. Required uses include the senior affordable and low-income affordable components. Because
the project site (including North, Center and South) comprises a single zoning lot, ZFA can be
shifted among uses and locations, and the subject air rights can likewise be applied to any location
and use within the zoning lot.
We have made an investigation of the property uses in the neighborhood and their relation to the
subject air rights and the proposed receiving site’s development. The subject property is currently
split-zoned M1-5 and M2-4 by the City of New York. The property's location on Washington
Street, West Street and Clarkson Street in Manhattan’s Hudson Square neighborhood is appropriate
for a mix of uses. There are several surrounding high-density commercial, industrial and residential
uses, when/if rezoned. The recent neighborhood rezonings in have spurred changes to land use in
the immediate area.
As Vacant
This receiving development property at 550 Washington Street must meet four criteria in the
analysis of its highest and best use as though vacant or improved. First, the highest and best use
must be legally permissible. This refers mainly to zoning, private restrictions, building codes, etc.
This property is currently split-zoned M1-5 and M2-4 by the City of New York. These districts
permit commercial, hotel and industrial uses which would be in context with some surrounding
properties within the neighborhood. As evidenced by the efforts to rezone the proposed
development, the area would benefit from a greater mix of uses including a residential component.
Second, the highest and best use must be physically possible. In other words, it must have a size,
topography, availability of utilities, etc., in order for any proposed development to be possible.
Because the size of North and Center is approximately 155,750 square feet, there are several
potential uses from a mixed-use standpoint. The two sites are suitably shaped, have City utilities, a
relatively level topography, and good access and visibility to a number of thoroughfares. It is our
opinion that the receiving site can be physically improved with a variety of uses.
Third, the highest and best use must be financially feasible. This refers to the abilities of the use to
provide a positive return. Potential income, operating expenses, and the percentage of vacancy are
important factors. If the revenue projected is not capable of satisfying a required rate of return, the
use may not be financially feasible. A mix of uses with a large residential component could easily
produce a positive return if they are constructed in a functional manner. There is ample evidence of
developers constructing residential and mixed-use developments on similarly-sized lots near the
proposed receiving site. Demand for this type of use in the area exists, taking into consideration its
population, income level, etc. Retail, or other commercial uses, may be financially feasible for
HIGHEST AND BEST USE 76
portions of the first and second floors given the well-occupied status of nearby retail properties in
Hudson Square.
The fourth criterion is that the highest and best use must be maximally productive. Of the uses that
are physically possible, legally permissible, and financially feasible, the use that produces the
highest price or value is the highest and best use. As illustrated in the development site sales in the
Sales Comparison Approach, a number of developers are purchasing large parcels in nearby
locations and are redeveloping them in favor of a variety of uses. As shown by the results of the
Sales Comparison Approach, the highest and best use of the subject property development rights
are for use as market rate residential units upon rezoning from M1-5 and M2-4 zoning to more
favorable zoning that permits a wider variety of uses and densities.
As Improved
As improved, the property at 550 Washington Street consists of an office building. The property is
legally permissible, physically possible; and it may be considered to be financially feasible. We
have not been provided with the income and expenses for the property; however, the assumption is
that the property is not financially feasible given the plans to redevelop the property. The current
use, as improved, is not considered to be maximally productive, as evidenced by the rezoning
efforts being undertaken by current ownership of 550 Washington Street.
The scope of the assignment requires a valuation of air rights to be assigned to a specific
development. The value of the subject air rights represents a blending of uses for North and Center
for planned development that includes residential condominiums, affordable rentals, and affordable
rentals for senior housing, the latter two components are required by the ULURP. South is not
included within this analysis as, according to information provided by the client, South concerns
only a potential separate special permit application and is not planned to be a recipient of any air
rights.
In addition, a hypothetical condition has been employed in this valuation as we have assumed
that the proposed rezoning and special permit have been granted through a successful ULURP as of
the effective date of value of this appraisal with the receiving site incorporating the air rights
purchased from HRPT into the development.
Consequently, given that the project site (including North, Center and South) comprises a single
zoning lot, and ZFA can be therefore be shifted among uses and locations, it is concluded that the
highest and best use of the subject air rights is for construction of the required affordable residential
uses that will be provided for as per the ULURP and the market rate residential uses. The valuation
of residential use is the higher than office, retail, office or hotel for this property.
The developer currently proposes to construct the receiving site with a market rate rental
component to be included with the required SARA and low-income affordable components. During
the planning process of this development, the underlying economics of the market rate rental
components have changed. First, the renegotiated 421-a program of June 2015 disallowed benefits
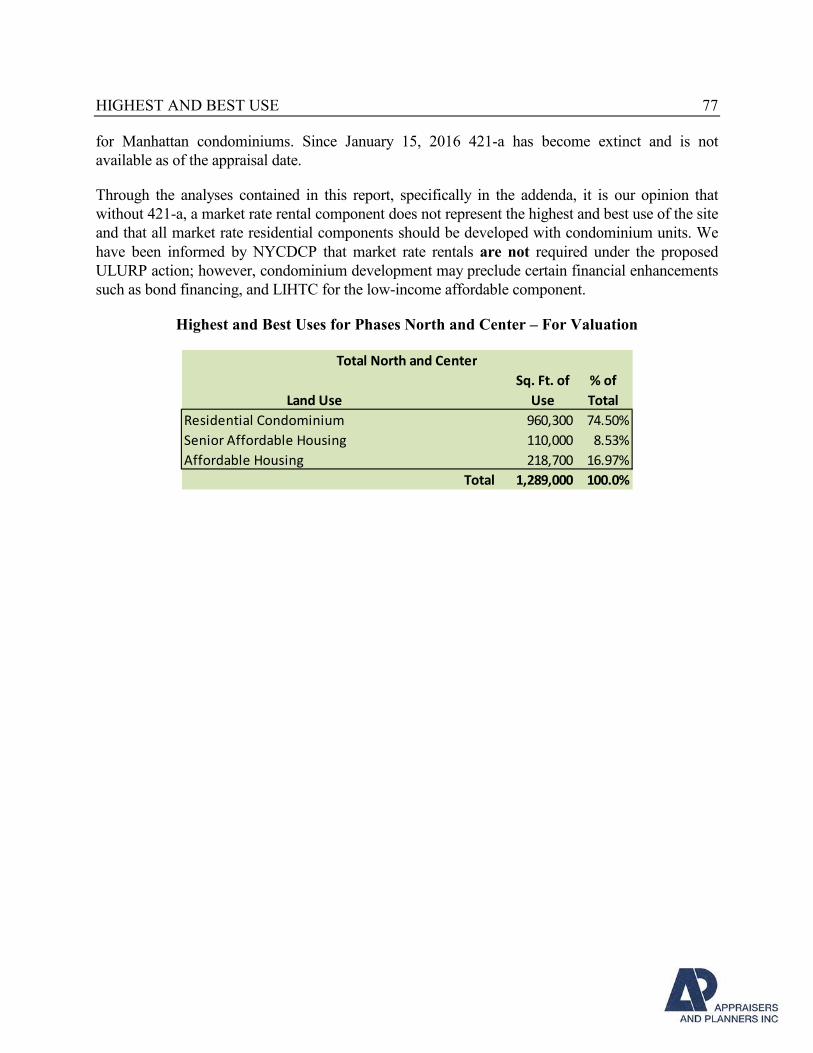
HIGHEST AND BEST USE 77
for Manhattan condominiums. Since January 15, 2016 421-a has become extinct and is not
available as of the appraisal date.
Through the analyses contained in this report, specifically in the addenda, it is our opinion that
without 421-a, a market rate rental component does not represent the highest and best use of the site
and that all market rate residential components should be developed with condominium units. We
have been informed by NYCDCP that market rate rentals are not required under the proposed
ULURP action; however, condominium development may preclude certain financial enhancements
such as bond financing, and LIHTC for the low-income affordable component.
Highest and Best Uses for Phases North and Center – For Valuation
Land Use
Sq. Ft. of
Use
% of
Total
Residential Condominium 960,300 74.50%
Senior Affordable Housing 110,000 8.53%
Affordable Housing 218,700 16.97%
Total 1,289,000 100.0%
Total North and Center
VALUATION 78
APPRAISAL PROCESS
The appraisal process is the orderly program in which the data used to provide an opinion of the
market value of the subject property is acquired, classified, analyzed and presented. The first
step is defining the appraisal problem, i.e., identification of the real estate, establishing the
effective date of the value estimate, addressing the property rights being appraised and the type of
value sought. Once this has been accomplished, the appraiser considers all the factors that affect
the value of the subject property. This study includes Area and Neighborhood Analyses, Site and
Improvement Analyses, Highest and Best Use Analysis and the application of the three
approaches to rendering an opinion of the property’s value. The three traditional approaches to
value real property are: the Cost Approach, the Sales Comparison Approach, and the Income
Capitalization Approach.
The Cost Approach is used to arrive at a market value developed by computing the current cost
of replacing a property and deducting any accrued depreciation resulting from one or more of the
following factors: physical deterioration, functional obsolescence and external obsolescence.
The resultant figure, combined with an adequate return for the entrepreneurial effort, is added to
the land value to arrive at an indication of value for the whole property. Generally, the land
value is obtained through the Sales Comparison Approach. The Cost Approach is often best
suited to new or recently constructed properties with a minimum amount of accrued depreciation.
The Sales Comparison Approach is based on the principle of substitution since a prudent
purchaser would pay no more for a particular property than the price necessary for the acquisition
of a substitute property which offers equal utility. The appraiser gathers data on sales of
comparable properties and analyzes the nature and condition of each sale, making logical
adjustments for dissimilar characteristics. Typically, a common denominator is found. For land
value, this is usually either a price per square foot or price per acre; for improved properties, the
common denominator may be price per square foot, price per unit, or a gross rent multiplier. The
Sales Comparison Approach gives a good indication of value when sales of similar properties are
available.
The Income Capitalization Approach is predicated on the assumption that there is a definite
relationship between the amount of cash flow a property may generate and its value. The
anticipated annual cash flow of the subject property is processed to produce an indication of
value. This approach is based on the principle that value is created by the expectation of benefits
derived in the future. The Income Capitalization Approach encompasses two different
techniques: discounted cash flow analysis and direct capitalization. In this appraisal, the
discounted cash flow analysis via a land residual technique is used to derive land value for
certain components of the subject property. In the discounted cash flow technique, the benefits to
equity of annual cash flow and sale proceeds over a reasonable holding period are converted into
a value estimate using current costs of equity capital. Rates of return are derived from yields
anticipated by recent buyers of similar real estate. Factors such as risk, time, interest on the
capital investment, and recapture of the depreciating asset are considered in the selection of rates.
VALUATION 79
In the direct capitalization technique, the cash flow for the first stabilized year is converted into
an indication of value by using an overall capitalization rate.
A final step in the appraisal process is the Reconciliation of the value indications. In the
reconciliation the appraiser considers the relative applicability of each of the three approaches,
examines the range between the value indications and places major emphasis on the approach
that appears to produce the most reliable solution to the specific appraisal problem. The purpose
of the appraisal, the type of property and the adequacy and reliability of the data are analyzed,
and appropriate weight is given to each of the approaches to value. In analyzing the three
approaches to value, it can be readily observed that most of the information pertaining to the fair
market value of the subject property must be derived from the marketplace because the appraiser
anticipates the actions of buyers and sellers in the market.
Applicability to Subject Property:
Overview
The subject property of this appraisal is the air rights generated by Pier 40 of the Hudson River Park
to be incorporated within a proposed development on 550 Washington Street, which is legally
identified as Block 596, Lot 1. The receiving site development is proposed to include residential
condominiums, market rate residential rentals, affordable rentals and affordable senior housing.
This appraisal considers the value of only the air rights to be incorporated into this proposed
development and, it is our understanding that the proposed rezoning and special permit are being
granted on the condition that the receiving site purchase the air rights from the HRPT.
It is our opinion that without 421-a in effect, the proposed rental component of the development
does not reflect the highest and best use of the site, and therefore the highest and best use of the
subject air rights. Consequently, this appraisal values the subject air rights to their highest and best
use, as governed by NYC HPD and DCP requirements for senior affordable and low-income
affordable housing components, which are required components of the ULURP. There is no
requirement that the development of market rate residential space be allocated to either
condominium development or residential development, and we have considered condominium
development as the highest and best use of the subject property air rights.
We have therefore analyzed development site sales in nearby and comparable neighborhoods in
Manhattan for residential condominium uses. The affordable housing and senior affordable housing
programs will be eligible for different programs. The prices paid for these types of developments
considers the benefits an affordable housing developer can realize with respect to generating
inclusionary housing bonuses, 60+-year full tax abatement, equity funding through Low Income
Housing Tax Credits, favorable acquisition and construction financing, etc.
The Income Approach via discounted cash flow analysis was developed by a land residual
technique to value certain components of the proposed development to be incorporated at 550
Washington Street. There exists a paucity of recent arms-length sales transactions of development
VALUATION 80
sites for low-income affordable rental housing and senior affordable housing. This approach was
also developed as an additional valuation methodology to value the market rate housing included in
the addenda to this report. Therefore, this was the primary methodology to value these components
wherein we have considered the income to be generated by these components, costs to construct
these components of the development and expenses to operate them. Additionally, LIHTC value
was considered for the eligible components of the senior affordable and affordable rental programs.
The Sales Comparison Approach was developed as the primary method of valuation for the
condominium component. The receiving site’s fee development rights were valued by analyzing
other transactions of development sites. In developing an opinion of value for the receiving site’s
fee development rights, we have been guided by the client with respect to the amount of residential
Zoning Floor Area and uses that might be allowed subsequent to the rezoning and issuance of the
special permit. It is our understanding that the client has received this information from NYCDCP.
The sales comparison approach was unable to be developed to value the senior affordable and low
income affordable components of the proposed development. Our research revealed that all recent
arms-length sales where the developer planned affordable housing, was purchased for alternative
uses to maximize value that are not available at the subject property. The two most crucial aspects
the subject affordable components will not enjoy are the typical HPD subsidies, and the ability to
transfer excess development rights to bonus properties off site. In this active development
environment, we observed that in some cases, the purchasers of small affordable housing sites were
able to generate excess air rights bonuses of more than three times the sale price using the 3.5x
bonus transfer mechanism. Since this is not available at the subject property, and this was the main
driver of activity for the development site sales, we were unable to develop the sales comparison
approach for either of the affordable components of the subject receiving site.
The Cost Approach was not developed as the subject of this appraisal is solely comprised of the
development rights associated with a proposed development, although elements of the cost
approach are crucial steps in developing the residual land valuation. The current improvements on
550 Washington Street are to be demolished or reconfigured in favor of new mixed-use
development.
VALUATION 81
SALES COMPARISON APPROACH – MARKET RATE HOUSING
The Sales Comparison Approach provides an indication of market value of a particular property
through comparison of recent sales and offerings of similar properties. This approach is built upon
the premise that value is directly related to prices of comparable and competitive properties.
Implied within this premise is the principle of substitution, wherein a prudent investor would pay
no more for a particular property than the cost to acquire a similar substitute, equal in desirability
and utility. This principle also implies that the reliability of the Sales Comparison Approach is
directly related to the comparability of sales available. When recent similar sales have occurred,
this approach provides a reliable indication of value. When sufficient income and expense data is
available for sales of income-producing properties, the Sales Comparison Approach can also
provide overall rates, income and expense ratios and gross income multipliers.
The concept of highest and best use must be recognized in the development of the Sales
Comparison Approach. When selecting comparable sales, the appraiser must consider the highest
and best use of both the subject property, as vacant and as improved, as well as the comparables'
highest and best use.
The systematic procedure for the development of the Sales Comparison Approach is outlined as
follows:
1. Research the market for information on sales transactions, listings, and offers to purchase or
sell involving properties that are similar to the subject property in terms of characteristics such
as property type, date of sale, size, physical condition, location and zoning.
2. Verify the information by confirming that the data obtained are factually accurate and that the
transactions reflect arm's length, market considerations. Verification may elicit additional
information about the market.
3. Select relevant units of comparison (e.g., price per acre, price per square foot, price per front
foot) and develop a comparative analysis for each unit.
4. Compare comparable sale properties with the subject property using the elements of
comparison and adjust the price of each comparable to the subject property or eliminate the
sale property as a comparable.
5. Reconcile the various value indications produced from the analysis of comparables into a
single value indication or a range of values. In an imprecise market subject to varying
occupancies and economies, a range of values may be a better conclusion than a single value
indication.
VALUATION 82
The Sales Comparison Approach is most applicable when recent sales of similar properties exist.
This approach may not provide a reliable value indication when too few sales exist or when sales
reflect strong differences in market conditions due to dated transactions. Omission of this approach
altogether may sometimes be necessary when sufficient data does not exist such is the case with the
senior affordable and low-income affordable components of this development.
In determining comparability of the sales, they should be recent bona-fide, arms-length
transactions which reflect similarity to the subject property. Dissimilarities to the subject are
usually adjusted based upon, but not limited to, the following elements of comparison:
1. Real property rights conveyed
2. Financing terms
3. Conditions of sale
4. Expenditures made immediately after purchase
5. Market Conditions
6. Location
7. Physical characteristics (size, frontage, corner influence, utility)
8. Economic characteristics
9. Use (zoning)
10. Non-Realty components of value
Various analytical techniques may be used to identify and measure adjustments. Comparative
analysis includes the consideration of both quantitative and qualitative factors. Quantitative
adjustments are developed as either dollar or percentage amounts. Factors that cannot be
quantified are dealt with by using qualitative analysis. Quantitative analysis includes the
application of paired data analysis, grouped data analysis, statistical analysis, graphic analysis,
sensitivity analysis and trend analysis. Qualitative analysis includes the application of relative
comparison analysis, ranking analysis and personal interviews.
Summary: This sales comparison approach values the underlying land values for one of the
three components of the development. For the condominium use there is an active market for
development sites in which developers acquire land and develop the properties for profit. In the
case of the affordable housing development and senior housing developments, given the
increasing land prices in Manhattan, developers typically do not realize profit on the operation of
affordable developments and typically these projects are developed for the additional benefits
generated from their construction such as real estate tax exemptions and air rights bonuses
generated upon completion. As such, the comparable data reflects a different highest and best use
as the subject affordable components, and this approach is not used to value the two affordable
components of the proposed development.
.
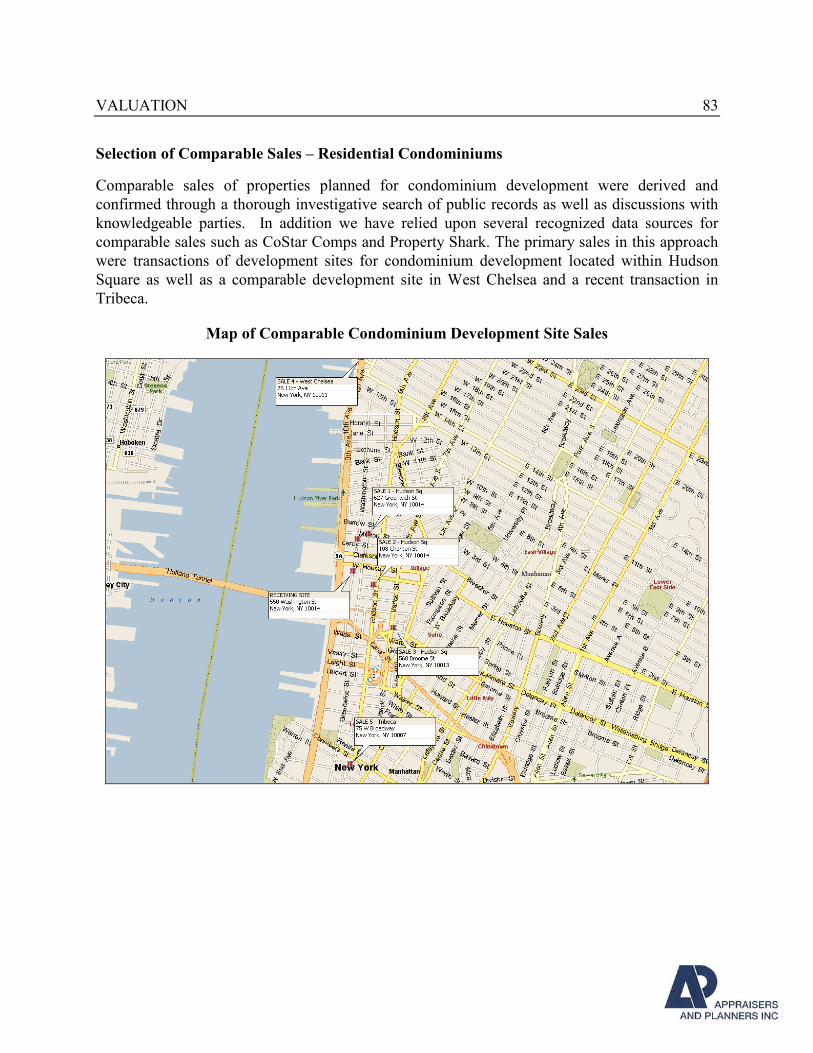
VALUATION 83
Selection of Comparable Sales – Residential Condominiums
Comparable sales of properties planned for condominium development were derived and
confirmed through a thorough investigative search of public records as well as discussions with
knowledgeable parties. In addition we have relied upon several recognized data sources for
comparable sales such as CoStar Comps and Property Shark. The primary sales in this approach
were transactions of development sites for condominium development located within Hudson
Square as well as a comparable development site in West Chelsea and a recent transaction in
Tribeca.
Map of Comparable Condominium Development Site Sales
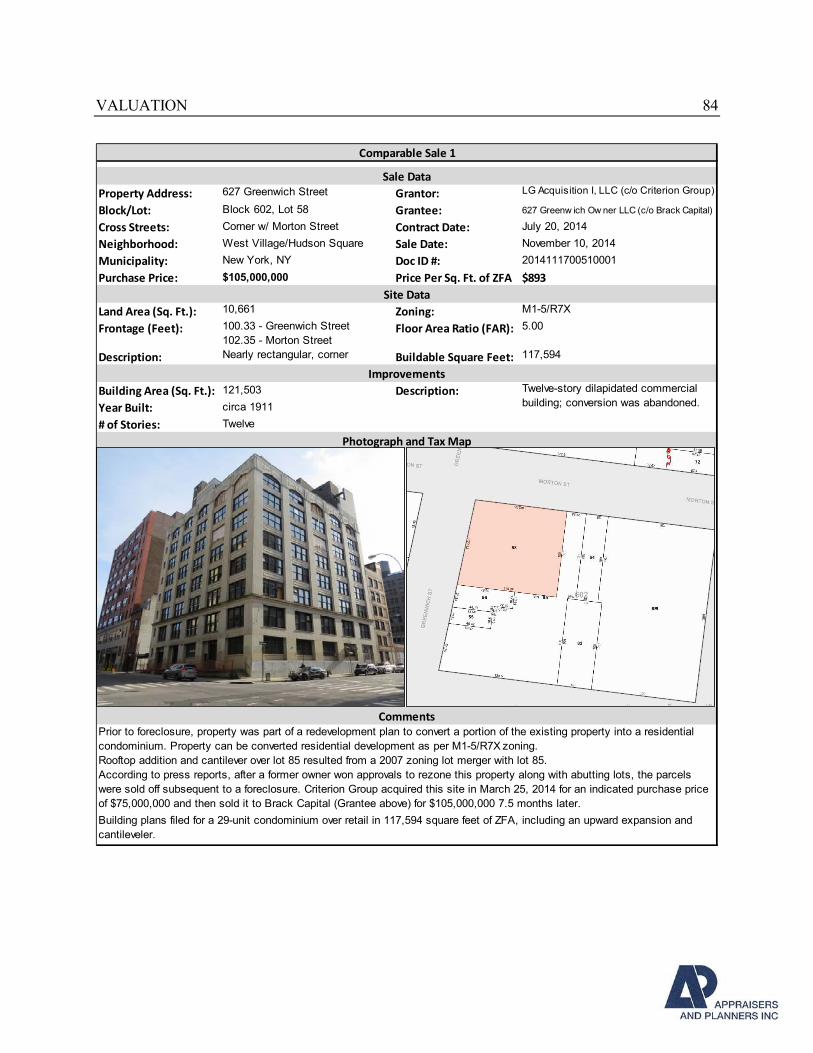
VALUATION 84
Property Address: 627 Greenwich Street Grantor: LG Acquisition I, LLC (c/o Criterion Group)
Block/Lot: Block 602, Lot 58 Grantee: 627 Greenw ich Ow ner LLC (c/o Brack Capital)
Cross Streets: Corner w/ Morton Street Contract Date: July 20, 2014
Neighborhood: West Village/Hudson Square Sale Date: November 10, 2014
Municipality: New York, NY Doc ID #: 2014111700510001
Purchase Price: $105,000,000 Price Per Sq. Ft. of ZFA $893
Land Area (Sq. Ft.): 10,661 Zoning: M1-5/R7X
Frontage (Feet): 100.33 - Greenwich Street
102.35 - Morton StreetFloor Area Ratio (FAR): 5.00
Description: Nearly rectangular, corner Buildable Square Feet: 117,594
Building Area (Sq. Ft.): 121,503 Description:
Year Built: circa 1911
# of Stories: Twelve
Building plans filed for a 29-unit condominium over retail in 117,594 square feet of ZFA, including an upward expansion and
cantileveler.
Photograph and Tax Map
Comparable Sale 1
Sale Data
Site Data
Improvements
According to press reports, after a former owner won approvals to rezone this property along with abutting lots, the parcels
were sold off subsequent to a foreclosure. Criterion Group acquired this site in March 25, 2014 for an indicated purchase price
of $75,000,000 and then sold it to Brack Capital (Grantee above) for $105,000,000 7.5 months later.
Twelve-story dilapidated commercial
building; conversion was abandoned.
Comments
Prior to foreclosure, property was part of a redevelopment plan to convert a portion of the existing property into a residential
condominium. Property can be converted residential development as per M1-5/R7X zoning.
Rooftop addition and cantilever over lot 85 resulted from a 2007 zoning lot merger with lot 85.
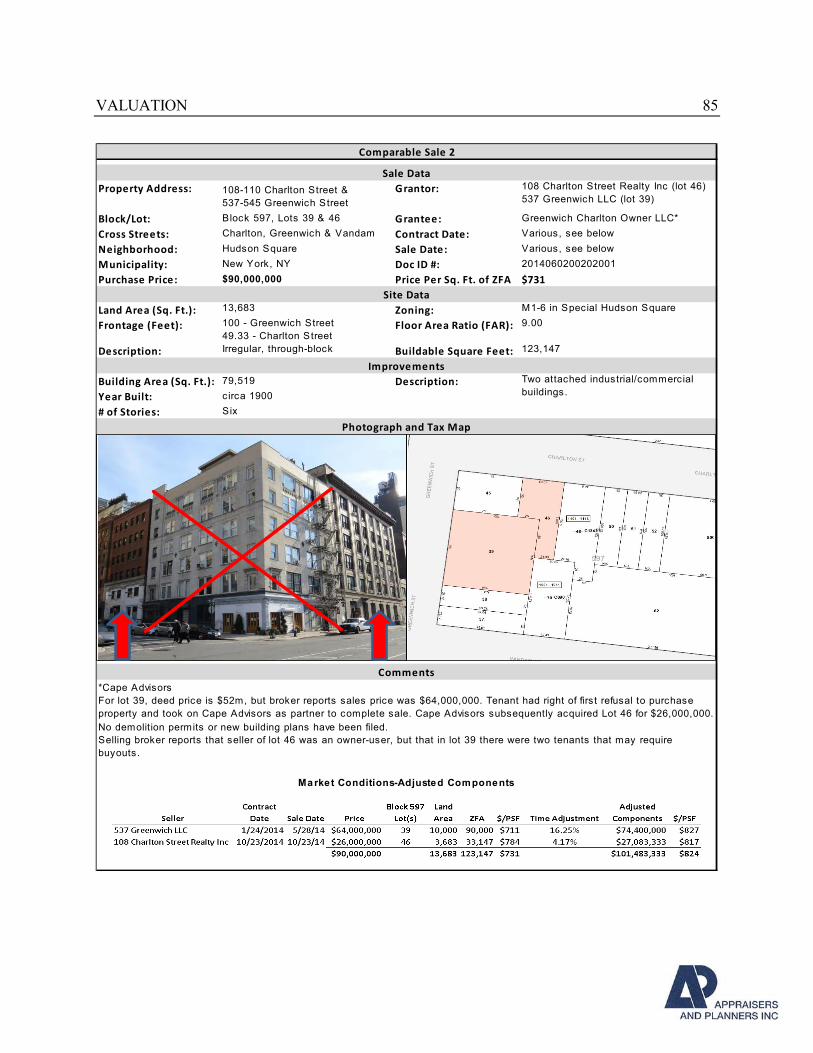
VALUATION 85
Property Address: Grantor:
Block/Lot: Block 597, Lots 39 & 46 Grantee: Greenwich Charlton Owner LLC*
Cross Streets: Charlton, Greenwich & Vandam Contract Date: Various, see below
Neighborhood: Hudson Square Sale Date: Various, see below
Municipality: New York, NY Doc ID #: 2014060200202001
Purchase Price: $90,000,000 Price Per Sq. Ft. of ZFA $731
Land Area (Sq. Ft.): 13,683 Zoning: M1-6 in Special Hudson Square
Frontage (Feet): 100 - Greenwich Street
49.33 - Charlton StreetFloor Area Ratio (FAR): 9.00
Description: Irregular, through-block Buildable Square Feet: 123,147
Building Area (Sq. Ft.): 79,519 Description:
Year Built: circa 1900
# of Stories: Six
*Cape Advisors
For lot 39, deed price is $52m, but broker reports sales price was $64,000,000. Tenant had right of first refusal to purchase
property and took on Cape Advisors as partner to complete sale. Cape Advisors subsequently acquired Lot 46 for $26,000,000.
No demolit ion permits or new building plans have been filed.
Selling broker reports that seller of lot 46 was an owner-user, but that in lot 39 there were two tenants that may require
buyouts.
Market Conditions-Adjusted Components
ImprovementsTwo attached industrial/commercial
buildings.
Photograph and Tax Map
Comments
Comparable Sale 2
Sale Data
108-110 Charlton Street &
537-545 Greenwich Street
108 Charlton Street Realty Inc (lot 46)
537 Greenwich LLC (lot 39)
Site Data
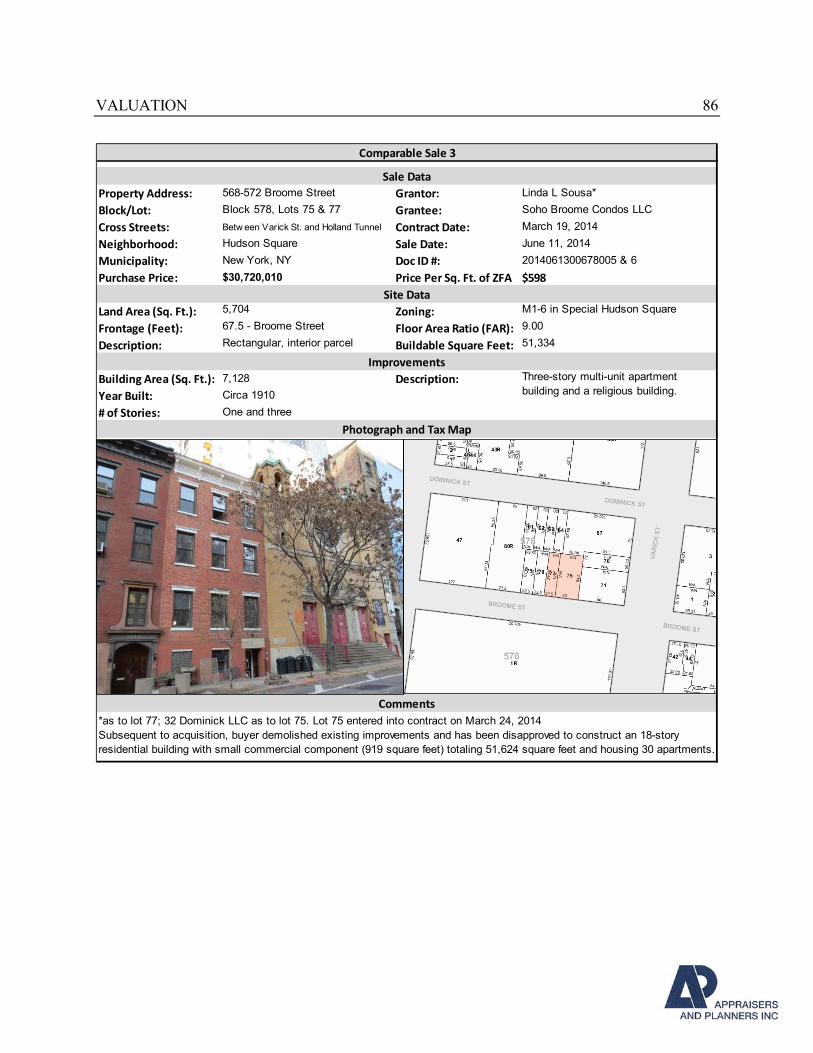
VALUATION 86
Property Address: 568-572 Broome Street Grantor: Linda L Sousa*
Block/Lot: Block 578, Lots 75 & 77 Grantee: Soho Broome Condos LLC
Cross Streets: Betw een Varick St. and Holland Tunnel Contract Date: March 19, 2014
Neighborhood: Hudson Square Sale Date: June 11, 2014
Municipality: New York, NY Doc ID #: 2014061300678005 & 6
Purchase Price: $30,720,010 Price Per Sq. Ft. of ZFA $598
Land Area (Sq. Ft.): 5,704 Zoning: M1-6 in Special Hudson Square
Frontage (Feet): 67.5 - Broome Street Floor Area Ratio (FAR): 9.00
Description: Rectangular, interior parcel Buildable Square Feet: 51,334
Building Area (Sq. Ft.): 7,128 Description:
Year Built: Circa 1910
# of Stories: One and three
Photograph and Tax Map
Comments
*as to lot 77; 32 Dominick LLC as to lot 75. Lot 75 entered into contract on March 24, 2014
Subsequent to acquisition, buyer demolished existing improvements and has been disapproved to construct an 18-story
residential building with small commercial component (919 square feet) totaling 51,624 square feet and housing 30 apartments.
Comparable Sale 3
Sale Data
Site Data
ImprovementsThree-story multi-unit apartment
building and a religious building.
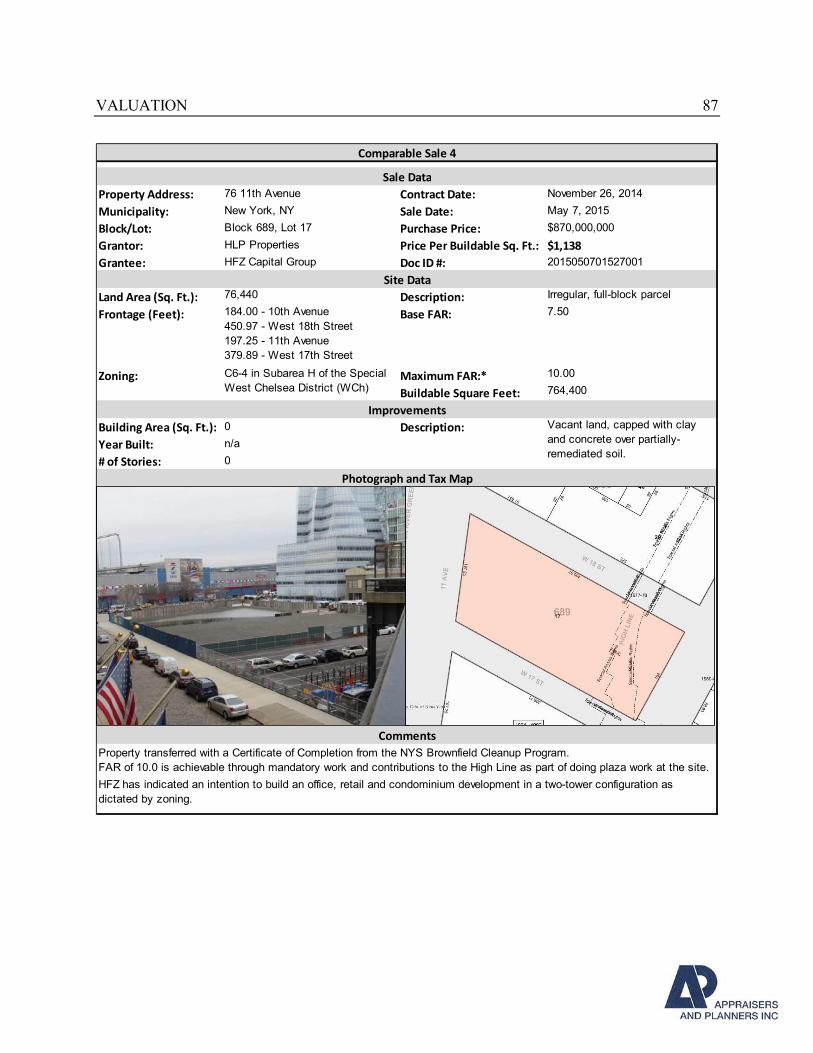
VALUATION 87
Property Address: 76 11th Avenue Contract Date: November 26, 2014
Municipality: New York, NY Sale Date: May 7, 2015
Block/Lot: Block 689, Lot 17 Purchase Price: $870,000,000
Grantor: HLP Properties Price Per Buildable Sq. Ft.: $1,138
Grantee: HFZ Capital Group Doc ID #: 2015050701527001
Land Area (Sq. Ft.): 76,440 Description: Irregular, full-block parcel
Frontage (Feet): 184.00 - 10th Avenue
450.97 - West 18th Street
197.25 - 11th Avenue
379.89 - West 17th Street
Base FAR: 7.50
Zoning: Maximum FAR:* 10.00
Buildable Square Feet: 764,400
Building Area (Sq. Ft.): 0 Description:
Year Built: n/a
# of Stories: 0
Comparable Sale 4
Sale Data
Site Data
C6-4 in Subarea H of the Special
West Chelsea District (WCh)
ImprovementsVacant land, capped with clay
and concrete over partially-
remediated soil.
Photograph and Tax Map
Comments
Property transferred with a Certificate of Completion from the NYS Brownfield Cleanup Program.
FAR of 10.0 is achievable through mandatory work and contributions to the High Line as part of doing plaza work at the site.
HFZ has indicated an intention to build an office, retail and condominium development in a two-tower configuration as
dictated by zoning.
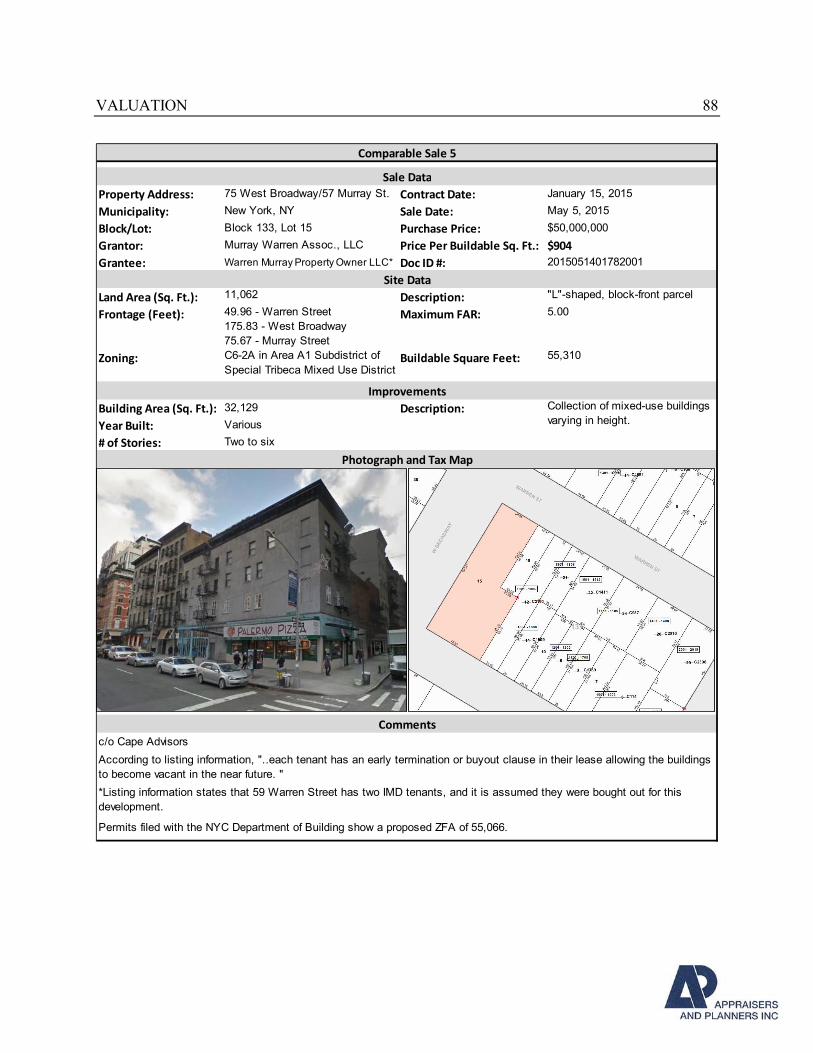
VALUATION 88
Property Address: 75 West Broadway/57 Murray St. Contract Date: January 15, 2015
Municipality: New York, NY Sale Date: May 5, 2015
Block/Lot: Block 133, Lot 15 Purchase Price: $50,000,000
Grantor: Murray Warren Assoc., LLC Price Per Buildable Sq. Ft.: $904
Grantee: Warren Murray Property Owner LLC* Doc ID #: 2015051401782001
Land Area (Sq. Ft.): 11,062 Description: "L"-shaped, block-front parcel
Frontage (Feet): 49.96 - Warren Street
175.83 - West Broadway
75.67 - Murray Street
Maximum FAR: 5.00
Zoning: C6-2A in Area A1 Subdistrict of
Special Tribeca Mixed Use DistrictBuildable Square Feet: 55,310
Building Area (Sq. Ft.): 32,129 Description:
Year Built: Various
# of Stories: Two to six
Comments
c/o Cape Advisors
According to listing information, "..each tenant has an early termination or buyout clause in their lease allowing the buildings
to become vacant in the near future. "
*Listing information states that 59 Warren Street has two IMD tenants, and it is assumed they were bought out for this
development.
Permits filed with the NYC Department of Building show a proposed ZFA of 55,066.
Comparable Sale 5
Sale Data
Site Data
ImprovementsCollection of mixed-use buildings
varying in height.
Photograph and Tax Map
VALUATION 89
DISCUSSION OF ADJUSTMENTS TO COMPARABLE SALES – CONDOMINIUM
SITES
Intangible/Transactional Adjustments for all sales are discussed below
Property Rights: All comparable sales, other than sales 2 and 5 represent the sale of the fee
simple interest, or a leased fee interest with short term leases remaining, which is tantamount to fee
simple for valuation purposes. For purposes of this valuation, the fee simple estate is the interest
assumed and no adjustments were made to sales 1, 3 or 4. Sale 2 was adjusted upward to reflect a
lease encumbrance; the selling broker reports two commercial tenants remain in this development
subsequent to the sale and buyouts may be required before the site can be developed. Sales 5 was
also upward adjusted to reflect the encumbrance presented by the two IMD tenants in place at time
of sale.
Financing: No adjustments are made for financing; all sales were typically financed or required no
financing.
Conditions of Sale: No atypical motivations were detected and no adjustments were made to any
of the sales.
Market Conditions (time): Sales of development sites in Manhattan through May 2015 increased
over prior quarters as financing for the sites remained favorable and demand for new residential
product was high. As discussed, the appetite for development land in prime areas had been by all
measures unprecedented. Demand came not only from well-capitalized local developers but from
investors from around the world.
The sale dates of the comparable sales analyzed range from November 2013 to May 2015. In some
submarkets around New York City, land with zoning that allows residential development has more
than doubled during that period. Below is a summary of residential, mixed-use and commercial
development sites that sold, and then re-sold between mid-2010 and June 2015. The demand for
well-located development sites has been unprecedented in recent years causing a number of sites to
resell for significant increases over a recent transaction. In general, the demand for residential sites
that are slated for condominium development commanded the largest increase, as is evidenced
below. There are a number of commercial sites that have resold with large increases, but not at the
same rate as the residential condominiums sales.
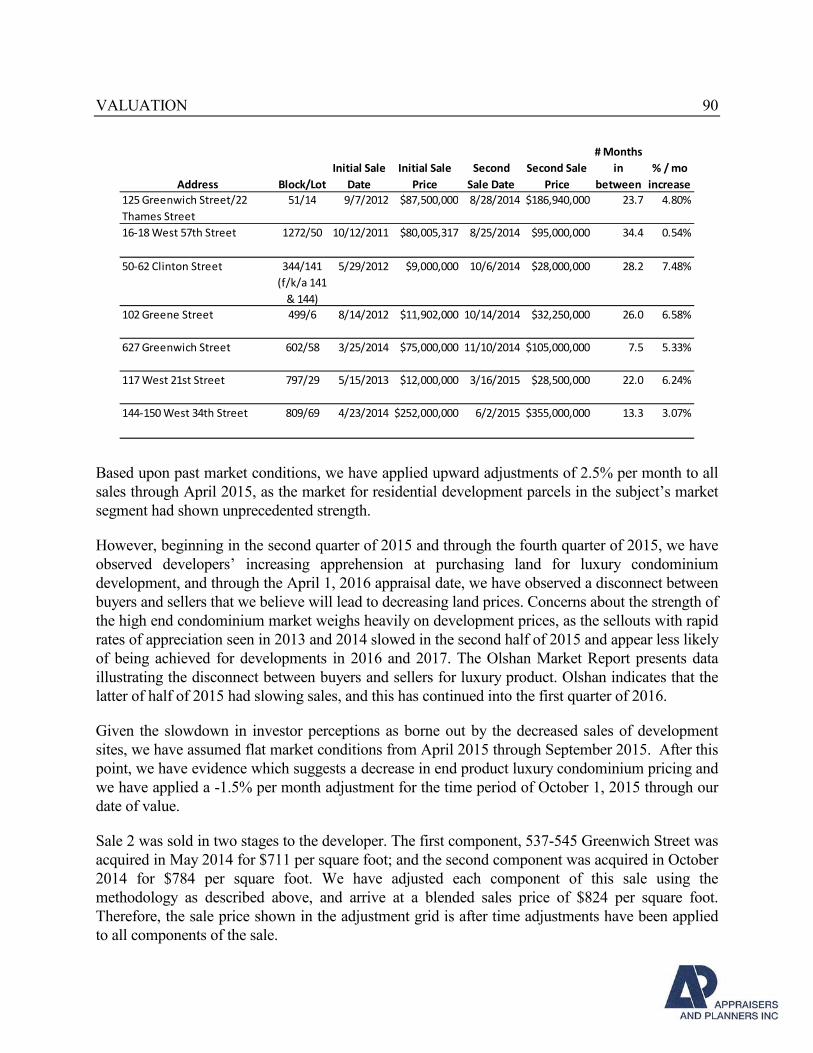
VALUATION 90
Address Block/Lot
Initial Sale
Date
Initial Sale
Price
Second
Sale Date
Second Sale
Price
# Months
in
between
% / mo
increase
1-3 East 35th Street 865/5 2/14/2004 $10,700,000 2/25/2005 $18,200,000 12.4 5.67%125 Greenwich Street/22
Thames Street
51/14 9/7/2012 $87,500,000 8/28/2014 $186,940,000 23.7 4.80%
16-18 West 57th Street 1272/50 10/12/2011 $80,005,317 8/25/2014 $95,000,000 34.4 0.54%
50-62 Clinton Street 344/141
(f/k/a 141
& 144)
5/29/2012 $9,000,000 10/6/2014 $28,000,000 28.2 7.48%
102 Greene Street 499/6 8/14/2012 $11,902,000 10/14/2014 $32,250,000 26.0 6.58%
627 Greenwich Street 602/58 3/25/2014 $75,000,000 11/10/2014 $105,000,000 7.5 5.33%
117 West 21st Street 797/29 5/15/2013 $12,000,000 3/16/2015 $28,500,000 22.0 6.24%
144-150 West 34th Street 809/69 4/23/2014 $252,000,000 6/2/2015 $355,000,000 13.3 3.07%
Based upon past market conditions, we have applied upward adjustments of 2.5% per month to all
sales through April 2015, as the market for residential development parcels in the subject’s market
segment had shown unprecedented strength.
However, beginning in the second quarter of 2015 and through the fourth quarter of 2015, we have
observed developers’ increasing apprehension at purchasing land for luxury condominium
development, and through the April 1, 2016 appraisal date, we have observed a disconnect between
buyers and sellers that we believe will lead to decreasing land prices. Concerns about the strength of
the high end condominium market weighs heavily on development prices, as the sellouts with rapid
rates of appreciation seen in 2013 and 2014 slowed in the second half of 2015 and appear less likely
of being achieved for developments in 2016 and 2017. The Olshan Market Report presents data
illustrating the disconnect between buyers and sellers for luxury product. Olshan indicates that the
latter of half of 2015 had slowing sales, and this has continued into the first quarter of 2016.
Given the slowdown in investor perceptions as borne out by the decreased sales of development
sites, we have assumed flat market conditions from April 2015 through September 2015. After this
point, we have evidence which suggests a decrease in end product luxury condominium pricing and
we have applied a -1.5% per month adjustment for the time period of October 1, 2015 through our
date of value.
Sale 2 was sold in two stages to the developer. The first component, 537-545 Greenwich Street was
acquired in May 2014 for $711 per square foot; and the second component was acquired in October
2014 for $784 per square foot. We have adjusted each component of this sale using the
methodology as described above, and arrive at a blended sales price of $824 per square foot.
Therefore, the sale price shown in the adjustment grid is after time adjustments have been applied
to all components of the sale.
VALUATION 91
Traffic Nuisance:
Sale No. 1 (627 Greenwich Street): This is the sale of a corner lot measuring 10,661 square feet
and improved with a 106,400-square-foot dilapidated commercial building shell. The property
has frontages along the southerly side of Morton Street and the easterly side of Greenwich Street.
The property entered into contract on July 20, 2014 and sold on November 10, 2014 for an
indicated purchase price of $105,000,000 or $893 per square foot of ZFA. The sale property is
zoned M1-5/R7X, which has a base FAR for residential development of 5.0; however the zoning
allows for conversion of existing buildings for residential use, even if overbuilt. One of the
previous owners filed plans to convert the property in favor of residential use before abandoning
the project. In order to bring the property to a prepped conversion site, interior demolition costs
for the existing building are estimated at $15 per square foot and have been added to the sale
price, bringing the total price to $106,822,545 or $908 per square foot of ZFA. The potential to
utilize the existing shell in redevelopment of this property exists, although the costs associated
with adapting to and living with the existing layout, etc. typically outweigh any benefits to
reusing the shell, as it can be more expensive to adapt a shell then it is for ground-up
construction, which also allows for greater flexibility in design. Overall, we have applied a slight
downward adjustment to the transaction for its existing shell, which is more fully discussed
below.
Sale No. 2 (537-545 Greenwich Street and 108-110 Charlton Street): This is the sale of two
tax lots totaling 13,683 square feet. The lots combine to form an irregular, through-block parcel
with frontages along the southerly side of Charlton Street and the easterly side of Greenwich
Street. The 537-545 Greenwich Street component of the property – Block 597, Lot 39 – was
entered into contract on January 24, 2014 and sold on May 28, 2014 for a reported purchase price
of $64,000,000 or $711 per square foot of ZFA. Following the initial land purchase, the buyer
completed the property with the acquisition of Lot 46 on October 23, 2014 for $26,000,000 or
$784 per square foot of ZFA. The sale property is zoned M1-6 within the Special Hudson Square
District, which has a base FAR for residential development of 9.0. This sale involves two
components at differing intervals. For purposes of analysis, we have time-adjusted each
component and input the total adjusted price in the adjustment grid. The time-adjusted sales price
equates to $101,483,333 for a total of 123,147 square feet of buildable area, or $824 per square
foot. Demolition costs for 79,519 square feet in two buildings are estimated at $30 per square
foot and are added to the time-adjusted sale price, bringing the total price to $103,868,903 or
$843 per square foot of ZFA.
Sale No. 3 (568-572 Broome Street): This is the sale of two tax lots totaling 5,704 square feet.
The lots combine to form a rectangular, interior parcel with frontage along the northerly side of
Broome Street, located between Varick Street and the Holland Tunnel entrance. The properties
were acquired in two deeds from two separate buyers, closing on the same date of June 11, 2014.
The sale property is zoned M1-6 within the Special Hudson Square District, which has a base
FAR for residential development of 9.0. The combined sales price total $30,720,010 for
buildable area of 51,334 square feet, or $598 per square foot. Demolition costs for 7,128 square
VALUATION 92
feet in the two buildings are estimated at $30 per square foot and are added to the sale price,
bringing the total price to $30,933,850 or $603 per square foot of ZFA.
Sale No. 4 (76 11th Avenue): This the sale of a full-block parcel bounded by West 17th Street,
West 18th Street, 10th Avenue and 11th Avenue in West Chelsea. The property contains a total lot
area of 76,440 and a total ZFA of 764,400 square feet. The property is zoned C6-4 in Subarea H
of the Special West Chelsea District, allowing for a base FAR of 7.5, and maximum FAR of 10.0
However, it is assumed that the 10.0 FAR is achieved, as the developer cannot finalize the
development without making the necessary park improvements and High Line contributions, but
those contributions and improvements increase the FAR to 10.0. The property is to be improved
with a condominium apartment building, retail component and it was recently announced that
there will also be an office component included as part of the development, taking advantage of
the successful office market near the property. The property entered into contract on November
26, 2014 and sold on May 7, 2015 for an indicated purchase price of $870,000,000 or $1,138 per
square foot of ZFA. There are no demolition costs at the site, but additional High Line park costs
of approximately $12,000,000 were estimated by the developer in order to achieve the full 10.0
FAR and were added to the sales price.
Sale No. 5 (75 West Broadway): This is the sale of a block-front parcel in Tribeca bounded by
West Broadway, Murray Street and Warren Street. The property contains a total lot area of
11,062 square feet. The the total ZFA analyzed is 55,310 using the FAR of 5.0 in Area A1
Subdistrict of the Special Tribeca Mixed Use District. The property entered into contract on
January 15, 2015 and closed on May 5, 2015 for an indicated purchase price of $50,000,000 or
$904 per square foot of analyzed ZFA. Demolition costs for the 32,129 square foot building is
estimated at $30 per square foot and are added to the sale price, bringing the total price to
$50,963,870 or $921 per square foot of ZFA.
Physical/Locational Adjustments
Location: The receiving site is located along West Street/NYS Route 9A and abutted southerly
by a NYC Sanitation parking garage. Along West Street/9A, there are a number of traffic lights,
including one located at the intersection of West Street and Clarkson Street. While none of the
comparable development site sales are directly impacted by West Street/9A traffic issues, sale3
sits along an access points to/from the Holland Tunnel, and Sale 4 also fronts along a busy
stretch of 9A in West Chelsea. Traffic can collect at these locations like it does by the receiving
site’s property, and it is a nuisance and detractor to value for these sales.
Opposite the site across Washington Street is a 500,000 square foot UPS facility, and opposite
the subject across West Houston Street is a FedEx facility. Although a number of the surrounding
properties are judged to be a nuisance and are burdened by truck traffic, the structures are mid-
rise and would not block views from the potential development above 142 feet in elevation, the
height of the sanitation facility. Despite the surrounding nuisances, the development will have
direct water views to the west, an amenity not shared by all comparable sales.
VALUATION 93
Considering the above, Comparable sale 1 is judged to be in superior location to the receiving
site and was adjusted downward. Comparable sale 2 is located on the other side of the UPS
facility from the receiving site and does not have direct water views like the receiving site,
therefore this sale was adjusted upward. Comparable sale 3 has proximity to Holland Tunnel
traffic and is judged to be in an inferior location, and was therefore adjusted upward. Comparable
sale 4 is a full-block parcel with direct water views in West Chelsea; it is by all measures a
superior location and was adjusted downward. Comparable sale 5 is located in the southerly
portion of Tribeca surrounded by a mix of uses. This sale will not benefit from water views, but
is in a superior location to the receiving site. Overall, the location of this sale is judged to be
superior to the receiving site and was given a small downward adjustment.
Frontage/Configuration: The receiving site development site will be comprised of two block-
front parcels with ample frontages on four streets, and the receiving site’s development rights are
a portion of the site. Furthermore, the configuration adjustment also considers the difference in
size between the sales and the subject property. All sales other than sale 4 offer a similar scale
development to the portion of the market rate component of the development. Sale 4 offers a
substantially larger development than the subject and other comparable sales, yet the size of the
development gives it advantages unique in the market, in that is a full block parcel fronting both
along the High Line Park, but also has direct water views to the west. Sales 1 and 5 are corner or
block-front sites and were not adjusted. Sale 2 is a through-block site with an awkward
configuration and was adjusted upward. Comparable sale 3 is a mid-block site and was also
adjusted upward. Comparable sale 4 comprises a full block and was adjusted downward.
Existing Structure: This valuation considers the development rights to be incorporated into a
proposed development and considers land value as the element of comparison. All comparable
sales, other than sale 1 are development sites where the current improvements are to be
demolished in favor of new development. Comparable sale 1 is to be converted to residential use
from its existing commercial use and the current structure is built to nearly double the allowable
ZFA as-of-right for a residential development, as vacant. Although it is more costly to develop
within the constraints of an existing structure, there is an advantage for a developer to possess a
building envelope that is greater than the as-of-right ZFA. Therefore, sale 1 was adjusted
downward to reflect the enhanced developable area created by the existing structure.
Retail Component: This component of the valuation considers prices paid for development land
for residential condominium development. Some of the development sites selected include retail
components. Comparable sales with filed plans that allocate space for retail space, or that can
house a successful retail space, were adjusted downward accordingly. All sales except for
comparable sale 4 were adjusted downward. The degree of adjustments was based on the
percentage of the development envelope that can house a retail component, while also accounting
for the reduction in community/amenity space that grade-level retail would consume.
Zoning/Use: Comparable sales 2 and 3 share the same zoning as is assumed for the receiving site
property subsequent to rezoning and were not adjusted. Comparable sale 1 is overbuilt, but

VALUATION 94
within an M1-5/R7X district that permits conversion to residential; no adjustment is made for
zoning. Comparable sale 4 has FAR of 10.0 and a height cap of 390 feet for its tallest
component, both of these are similar to what is proposed for the receiving site and no adjustment
was made to sale 4. The Special District zoning of sale 5 was adjusted upward, as this district has
a height cap, limiting upward development.
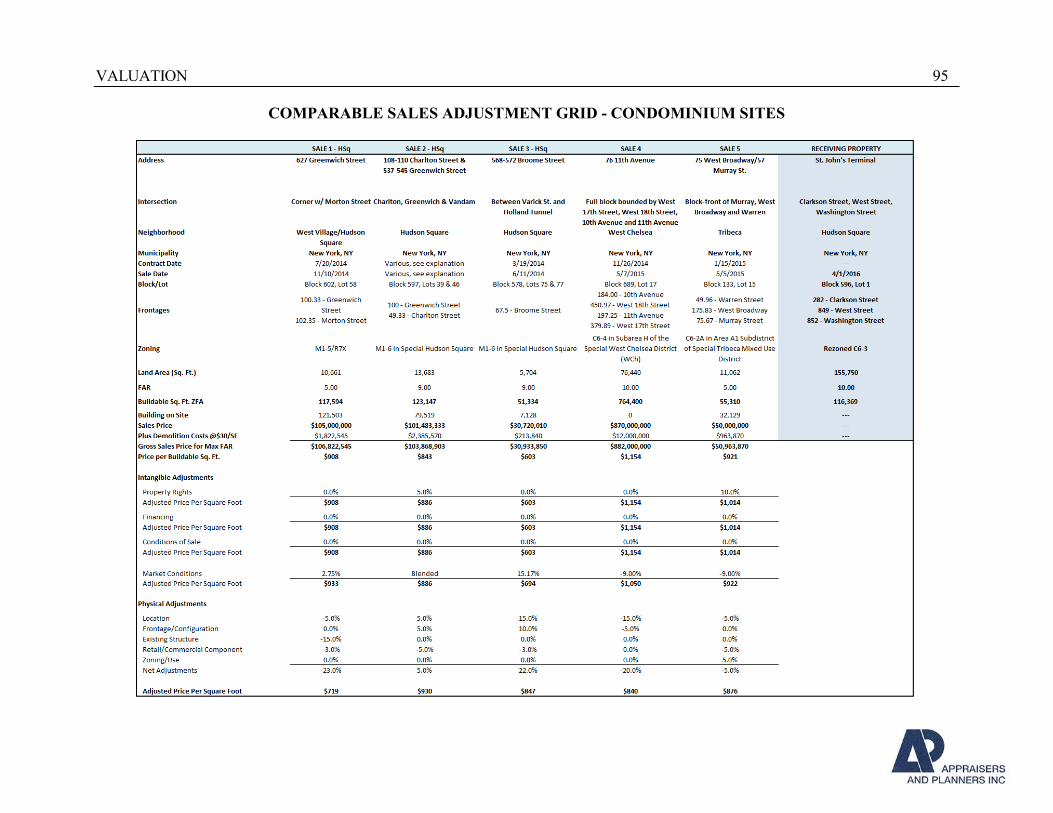
VALUATION 95
COMPARABLE SALES ADJUSTMENT GRID - CONDOMINIUM SITES
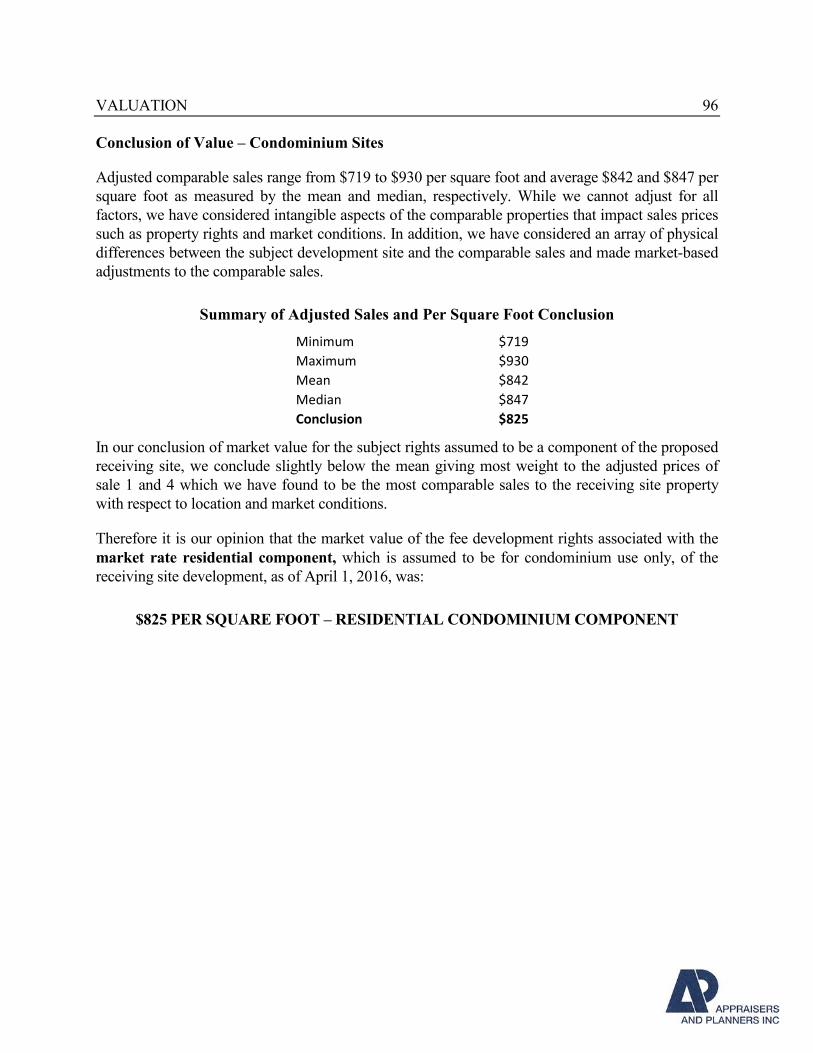
VALUATION 96
Conclusion of Value – Condominium Sites
Adjusted comparable sales range from $719 to $930 per square foot and average $842 and $847 per
square foot as measured by the mean and median, respectively. While we cannot adjust for all
factors, we have considered intangible aspects of the comparable properties that impact sales prices
such as property rights and market conditions. In addition, we have considered an array of physical
differences between the subject development site and the comparable sales and made market-based
adjustments to the comparable sales.
Summary of Adjusted Sales and Per Square Foot Conclusion
Minimum $719
Maximum $930
Mean $842
Median $847
Conclusion $825
In our conclusion of market value for the subject rights assumed to be a component of the proposed
receiving site, we conclude slightly below the mean giving most weight to the adjusted prices of
sale 1 and 4 which we have found to be the most comparable sales to the receiving site property
with respect to location and market conditions.
Therefore it is our opinion that the market value of the fee development rights associated with the
market rate residential component, which is assumed to be for condominium use only, of the
receiving site development, as of April 1, 2016, was:
$825 PER SQUARE FOOT – RESIDENTIAL CONDOMINIUM COMPONENT
VALUATION 97
RESIDUAL LAND APPROACH – SENIOR AFFORDABLE AND AFFORDABLE
COMPONENTS
Introduction
Although there has been adequate market activity and available data from which to draw
conclusions about underlying land value for the condominium development sites, data for
affordable rental sites is scarcer. Moreover, given the unique circumstances at the receiving site
with respect to the lack of available NYC Housing and Preservation and Development (HPD)
and NYC Housing Development Corporation (HDC) subsidies and the inability to transfer excess
bonused rights, the site is atypical as compared to other affordable housing site transactions.
Other arms-length transactions for senior affordable, and comparable low-income affordable
development sites are few and far between, and when they do occur they are typically purchased
to generate bonus air rights, or to compensate a planned market development. This valuation
scenario requires that we analyze the underlying land values of the various rental components,
and given the lack of comparable sales data, we have developed and relied upon residual analyses
as the best method of valuation.
In valuing the affordable components of the receiving site, a residual valuation of the property
via discounted cash flow analysis is performed in which the property’s capital expenses are spent
to construct the development, the property is leased up and the stabilized cash flows, inclusive of
a reversion, are discounted to present value. The residual value of the property is the remaining
value after all capital expenses and cash flows are considered. The term selected for valuation
purposes is four (4) years following the appraisal date, which is after the property is constructed,
achieves stabilized income and is assumed to be sold as the reversion. We have also applied this
valuation technique in determining the value of the site’s market rent housing in the addenda.
INCOME CAPITALIZATION APPROACH - LAND RESIDUAL TECHNIQUE
This technique is based on the principle of balance and the related concept of contribution, which
are concerned with equilibrium among the agents of production- ie, labor, capital, coordination and
land. A version of the land residual technique involves first establishing the appropriate
development for the site as if vacant. Then the stabilized, annual net operating income of the
property is estimated from market rents and operating expenses as of the date of the appraisal. This
income is then capitalized at the appropriate rate to provide an estimate of the property value. From
this amount, the total cost of constructing the improvements is subtracted with the resulting amount
representing the residual income attributable to the land.
Our valuation analysis sets forth an estimate of the value of the (1) SARA senior affordable rentals
and (2) low-income affordable rentals as of April 1, 2016. As per information supplied by HPD and
HDC our valuation assumes the components are developed with 178 senior affordable units,
comprised of 134 studios and 44 one bedroom units, and 168 affordable rental units at 130% of
Area Median Income (AMI) and 112 units at 60% AMI; both of these are comprised of 25%
VALUATION 98
studios, 25% one-bedrooms and 50% two-bedroom units. In order to estimate the land value as per
these terms we have undertaken the following steps:
• In conjunction with information supplied by HPD and HDC as to the affordable units, we
considered the likely development to be constructed with the subject ZFA in terms of
number of units, average unit size, amenities, etc.;
• Projected the likely timing and holding period involved in such construction, lease-up and
sale;
• Estimated the projected income and expenses available for the proposed improvements;
• Determined the reversionary or sale value of the proposed residential project upon
completion and stabilization via applying the appropriate capitalization rate to the projected
NOI;
• Estimated necessary capital costs inclusive of hard and soft costs, as well as profit to be
incurred in completing and stabilizing the projected property;
• Discounted both the annual cash flows and reversion to net present value (NPV) at the
appropriate rates; and
• Determined the current underlying land value the market rate rental, senior affordable and
low-income affordable share of the fee development rights
Holding Period
We have made a projection as to the timing involved in constructing the proposed development
which includes architectural & engineering and permitting period, construction period, leasing
period and sale. It is estimated that due to the ULURP process required for the subject property,
the total construction timeline is 36 months, and the property achieves stabilized income in the
fourth year, which is the reversion, or sale year.
INCOME
Senior Affordable Rental Apartments (SARA) Program: For the rental components of the
development, the client reports that it has been advised by HPD that the total planned project will
include 178 senior affordable units under the Senior Affordable Rental Apartments (SARA)
Program. The following income guidelines have been provided, courtesy of HPD’s figures. The
SARA program requires 80% AMI, however it is our opinion that 60% AMI will be sought for
this program in order to qualify for Low Income Housing Tax Credits (LIHTC). A table of the
estimated income for the SARA component is presented below:
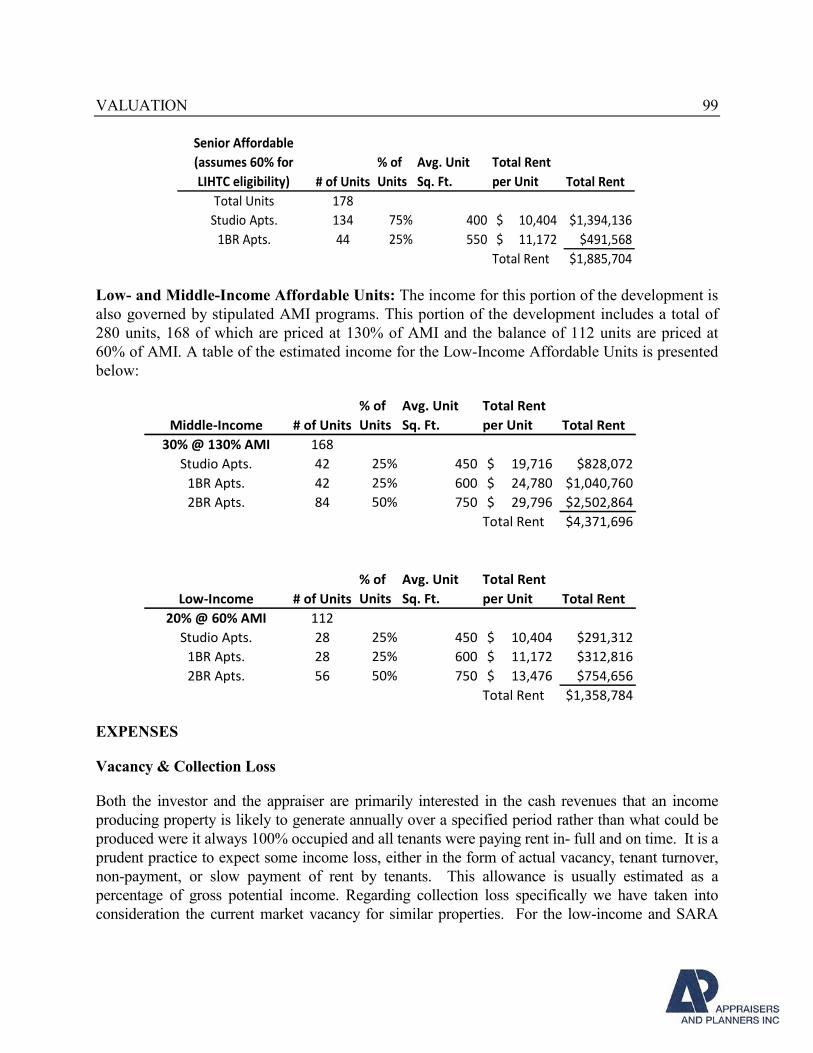
VALUATION 99
Senior Affordable
(assumes 60% for
LIHTC eligibility) # of Units
% of
Units
Avg. Unit
Sq. Ft.
Total Rent
per Unit Total Rent
Total Units 178
Studio Apts. 134 75% 400 10,404$ $1,394,136
1BR Apts. 44 25% 550 11,172$ $491,568
Total Rent $1,885,704
Low- and Middle-Income Affordable Units: The income for this portion of the development is
also governed by stipulated AMI programs. This portion of the development includes a total of
280 units, 168 of which are priced at 130% of AMI and the balance of 112 units are priced at
60% of AMI. A table of the estimated income for the Low-Income Affordable Units is presented
below:
Middle-Income # of Units
% of
Units
Avg. Unit
Sq. Ft.
Total Rent
per Unit Total Rent
30% @ 130% AMI 168
Studio Apts. 42 25% 450 19,716$ $828,072
1BR Apts. 42 25% 600 24,780$ $1,040,760
2BR Apts. 84 50% 750 29,796$ $2,502,864
Total Rent $4,371,696
Low-Income # of Units
% of
Units
Avg. Unit
Sq. Ft.
Total Rent
per Unit Total Rent
20% @ 60% AMI 112
Studio Apts. 28 25% 450 10,404$ $291,312
1BR Apts. 28 25% 600 11,172$ $312,816
2BR Apts. 56 50% 750 13,476$ $754,656
Total Rent $1,358,784
EXPENSES
Vacancy & Collection Loss
Both the investor and the appraiser are primarily interested in the cash revenues that an income
producing property is likely to generate annually over a specified period rather than what could be
produced were it always 100% occupied and all tenants were paying rent in- full and on time. It is a
prudent practice to expect some income loss, either in the form of actual vacancy, tenant turnover,
non-payment, or slow payment of rent by tenants. This allowance is usually estimated as a
percentage of gross potential income. Regarding collection loss specifically we have taken into
consideration the current market vacancy for similar properties. For the low-income and SARA
VALUATION 100
components, where demand in Manhattan outpaces supply by as much as 500:1 for these desirable
low-income units, vacancy and collection loss is estimated at 1% of potential gross income.
Operating Expenses
Operating expenses for the three components are derived from comparable data within our files,
projected expenses for affordable and 80/20 projects, as well as HDC standards and guidelines for
maintenance and operating expenses to underwrite the affordable projects.
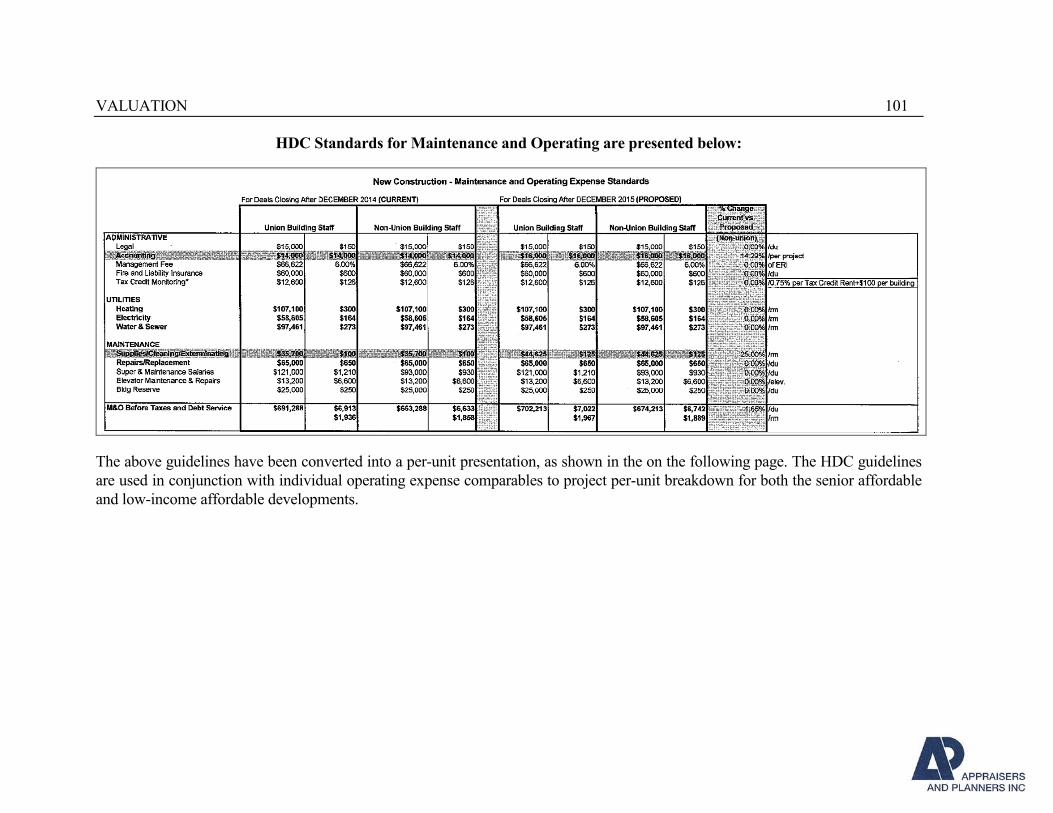
VALUATION 101
HDC Standards for Maintenance and Operating are presented below:
The above guidelines have been converted into a per-unit presentation, as shown in the on the following page. The HDC guidelines
are used in conjunction with individual operating expense comparables to project per-unit breakdown for both the senior affordable
and low-income affordable developments.
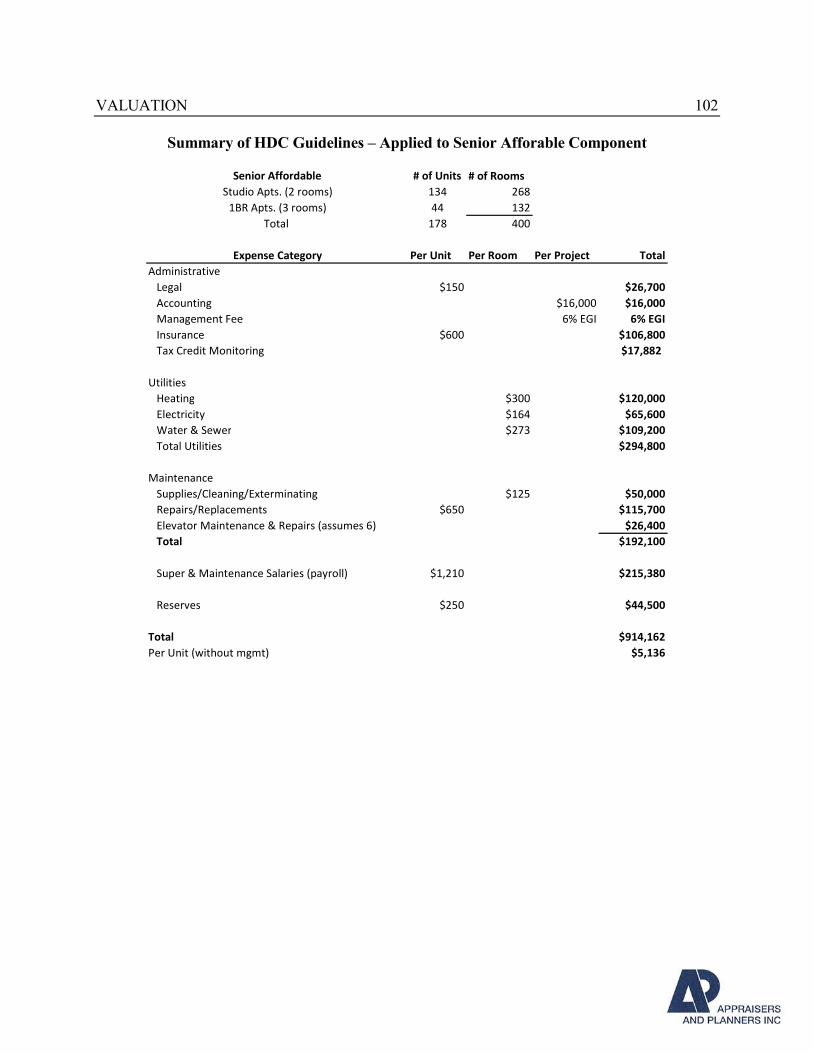
VALUATION 102
Summary of HDC Guidelines – Applied to Senior Afforable Component
Senior Affordable # of Units # of Rooms
Studio Apts. (2 rooms) 134 268
1BR Apts. (3 rooms) 44 132
Total 178 400
Expense Category Per Unit Per Room Per Project Total
Administrative
Legal $150 $26,700
Accounting $16,000 $16,000
Management Fee 6% EGI 6% EGI
Insurance $600 $106,800
Tax Credit Monitoring $17,882
Utilities
Heating $300 $120,000
Electricity $164 $65,600
Water & Sewer $273 $109,200
Total Utilities $294,800
Maintenance
Supplies/Cleaning/Exterminating $125 $50,000
Repairs/Replacements $650 $115,700
Elevator Maintenance & Repairs (assumes 6) $26,400
Total $192,100
Super & Maintenance Salaries (payroll) $1,210 $215,380
Reserves $250 $44,500
Total $914,162
Per Unit (without mgmt) $5,136
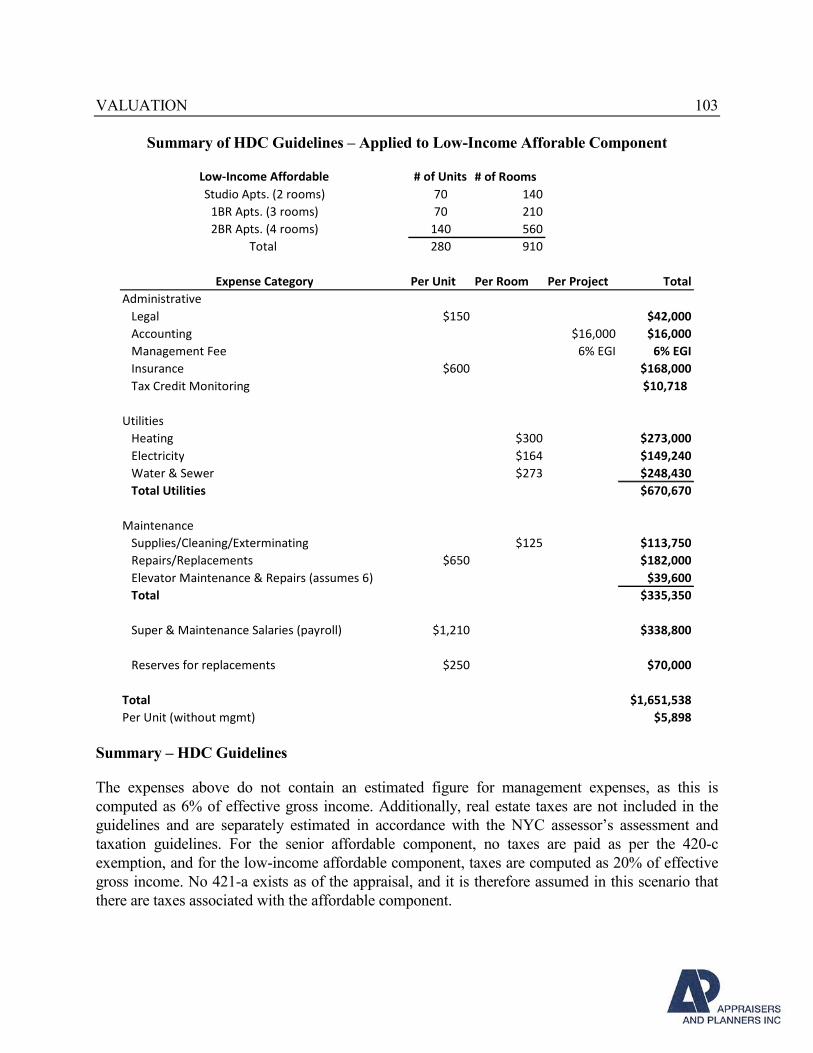
VALUATION 103
Summary of HDC Guidelines – Applied to Low-Income Afforable Component
Low-Income Affordable # of Units # of Rooms
Studio Apts. (2 rooms) 70 140
1BR Apts. (3 rooms) 70 210
2BR Apts. (4 rooms) 140 560
Total 280 910
Expense Category Per Unit Per Room Per Project Total
Administrative
Legal $150 $42,000
Accounting $16,000 $16,000
Management Fee 6% EGI 6% EGI
Insurance $600 $168,000
Tax Credit Monitoring $10,718
Utilities
Heating $300 $273,000
Electricity $164 $149,240
Water & Sewer $273 $248,430
Total Utilities $670,670
Maintenance
Supplies/Cleaning/Exterminating $125 $113,750
Repairs/Replacements $650 $182,000
Elevator Maintenance & Repairs (assumes 6) $39,600
Total $335,350
Super & Maintenance Salaries (payroll) $1,210 $338,800
Reserves for replacements $250 $70,000
Total $1,651,538
Per Unit (without mgmt) $5,898
Summary – HDC Guidelines
The expenses above do not contain an estimated figure for management expenses, as this is
computed as 6% of effective gross income. Additionally, real estate taxes are not included in the
guidelines and are separately estimated in accordance with the NYC assessor’s assessment and
taxation guidelines. For the senior affordable component, no taxes are paid as per the 420-c
exemption, and for the low-income affordable component, taxes are computed as 20% of effective
gross income. No 421-a exists as of the appraisal, and it is therefore assumed in this scenario that
there are taxes associated with the affordable component.
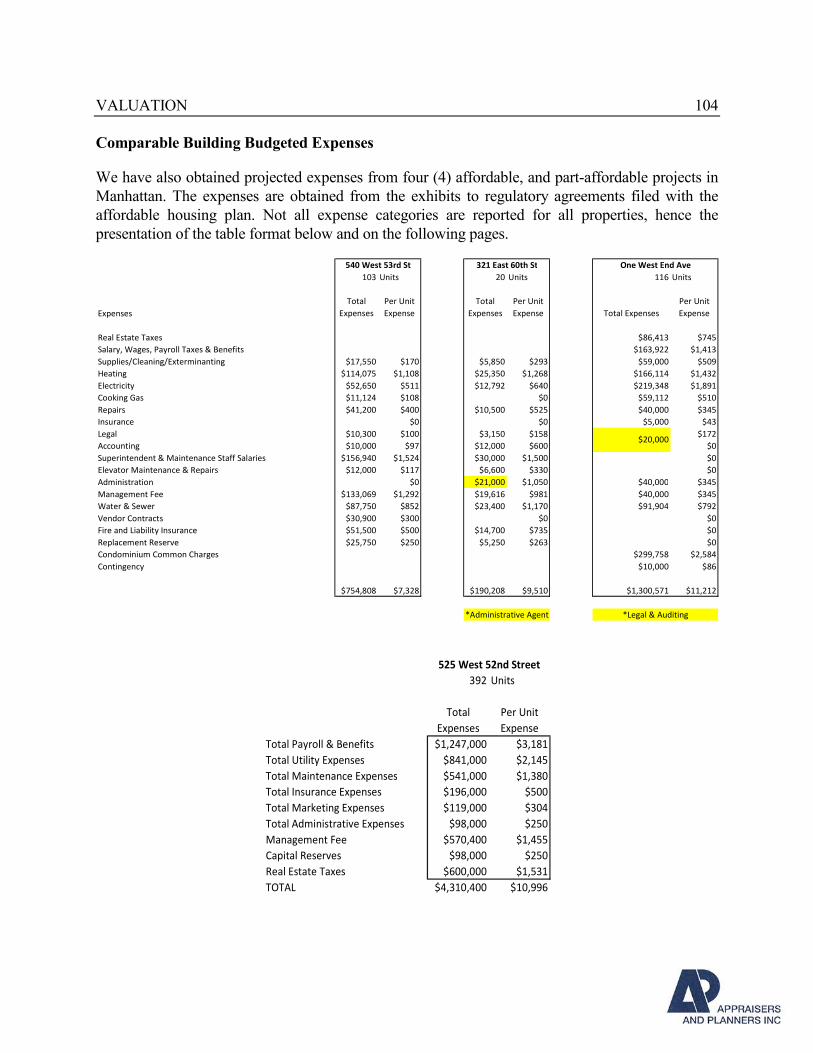
VALUATION 104
Comparable Building Budgeted Expenses
We have also obtained projected expenses from four (4) affordable, and part-affordable projects in
Manhattan. The expenses are obtained from the exhibits to regulatory agreements filed with the
affordable housing plan. Not all expense categories are reported for all properties, hence the
presentation of the table format below and on the following pages.
103 Units 20 Units 116 Units
Expenses
Total
Expenses
Per Unit
Expense
Total
Expenses
Per Unit
Expense Total Expenses
Per Unit
Expense
Real Estate Taxes $86,413 $745
Salary, Wages, Payroll Taxes & Benefits $163,922 $1,413
Supplies/Cleaning/Exterminanting $17,550 $170 $5,850 $293 $59,000 $509
Heating $114,075 $1,108 $25,350 $1,268 $166,114 $1,432
Electricity $52,650 $511 $12,792 $640 $219,348 $1,891
Cooking Gas $11,124 $108 $0 $59,112 $510
Repairs $41,200 $400 $10,500 $525 $40,000 $345
Insurance $0 $0 $5,000 $43
Legal $10,300 $100 $3,150 $158 $172
Accounting $10,000 $97 $12,000 $600 $0
Superintendent & Maintenance Staff Salaries $156,940 $1,524 $30,000 $1,500 $0
Elevator Maintenance & Repairs $12,000 $117 $6,600 $330 $0
Administration $0 $21,000 $1,050 $40,000 $345
Management Fee $133,069 $1,292 $19,616 $981 $40,000 $345
Water & Sewer $87,750 $852 $23,400 $1,170 $91,904 $792
Vendor Contracts $30,900 $300 $0 $0
Fire and Liability Insurance $51,500 $500 $14,700 $735 $0
Replacement Reserve $25,750 $250 $5,250 $263 $0
Condominium Common Charges $299,758 $2,584
Contingency $10,000 $86
$754,808 $7,328 $190,208 $9,510 $1,300,571 $11,212
540 West 53rd St 321 East 60th St One West End Ave
$20,000
*Legal & Auditing*Administrative Agent
392 Units
Total
Expenses
Per Unit
Expense
Total Payroll & Benefits $1,247,000 $3,181
Total Utility Expenses $841,000 $2,145
Total Maintenance Expenses $541,000 $1,380
Total Insurance Expenses $196,000 $500
Total Marketing Expenses $119,000 $304
Total Administrative Expenses $98,000 $250
Management Fee $570,400 $1,455
Capital Reserves $98,000 $250
Real Estate Taxes $600,000 $1,531
TOTAL $4,310,400 $10,996
525 West 52nd Street
VALUATION 105
Conclusion:
Based upon the expense comparables, the expenses within our files and the HDC guidelines for
operating and expenses, we estimate the following expenses for each component, inflated 3% per
annum. The expense estimates are generally consistent and in line with both the HDC figures and
the expense comparables with the exception of the following:
Payroll: For the low-income affordable development it is not assumed to be staffed with desk or
doorman service, therefore we conclude nearer to the HDC figures. For the SARA component, it is
assumed that this has the typical supportive housing staffing inclusive of a full-time security desk.
For the market rate rental component, it is assumed to be fully staffed with doorman service, porters
and on-site superintendents and we have been informed by HPD that there will be a common
entrance and doorman service for both components. Therefore, our estimated payroll expense is
commensurate with the expenses observed in market rate luxury rental buildings, as allocated
among the combined occupancies.
Repairs and Maintenance: This category of expense typically includes the costs associated with
building repairs including such items as plumbing and electrical repairs, boiler and roof repairs,
HVAC, elevator and pest control contracts, among other items. It also includes general apartment
repairs, such as maintenance to the heating and cooling mechanicals typically included in individual
units.
Management: The basis of the management expense is 6% for the low-income affordable
component. The senior affordable has the highest management expense of 7%, inclusive of
management for tax credit monitoring.
Utilities: These expenses include fuel expenses for domestic hot water and heating the entire
building, water and sewer charges, landlord electric for the operation of the elevators, any outside
lighting and the lighting of the common building areas and the cooking gas for the apartment units.
Real Estate Taxes: The senior affordable component will have a 420-c benefit, fully exempting
this component from any real estate tax liability. Both the market rate and low-income affordable
components pay real estate taxes commensurate with a percentage of effective gross income, and in
conjunction with the comparable expenses. For the low-income affordable component, this
percentage is 20% of effective gross income, which is in line with assessment guidelines published
by the City of New York.
Operating expenses determined thusly are estimated for senior affordable and affordable
components as follows:
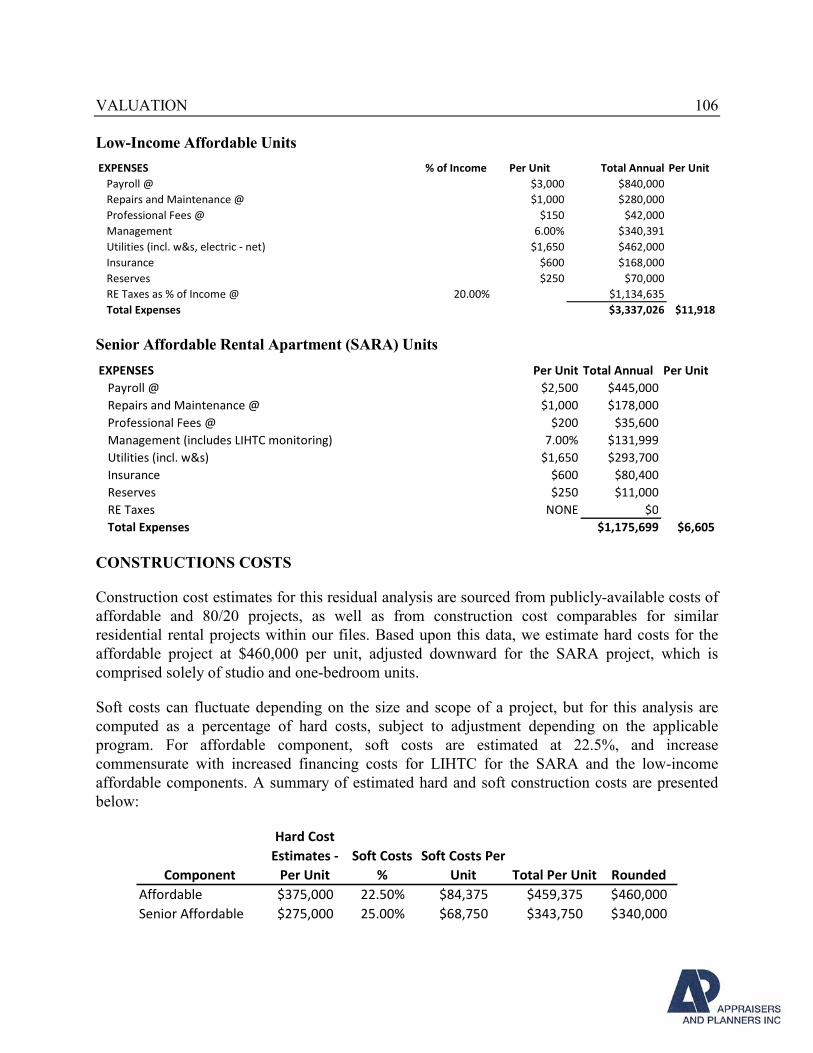
VALUATION 106
Low-Income Affordable Units
EXPENSES % of Income Per Unit Total Annual Per Unit
Payroll @ $3,000 $840,000
Repairs and Maintenance @ $1,000 $280,000
Professional Fees @ $150 $42,000
Management 6.00% $340,391
Utilities (incl. w&s, electric - net) $1,650 $462,000
Insurance $600 $168,000
Reserves $250 $70,000
RE Taxes as % of Income @ 20.00% $1,134,635
Total Expenses $3,337,026 $11,918
Senior Affordable Rental Apartment (SARA) Units
EXPENSES Per Unit Total Annual Per Unit
Payroll @ $2,500 $445,000
Repairs and Maintenance @ $1,000 $178,000
Professional Fees @ $200 $35,600
Management (includes LIHTC monitoring) 7.00% $131,999
Utilities (incl. w&s) $1,650 $293,700
Insurance $600 $80,400
Reserves $250 $11,000
RE Taxes NONE $0
Total Expenses $1,175,699 $6,605
CONSTRUCTIONS COSTS
Construction cost estimates for this residual analysis are sourced from publicly-available costs of
affordable and 80/20 projects, as well as from construction cost comparables for similar
residential rental projects within our files. Based upon this data, we estimate hard costs for the
affordable project at $460,000 per unit, adjusted downward for the SARA project, which is
comprised solely of studio and one-bedroom units.
Soft costs can fluctuate depending on the size and scope of a project, but for this analysis are
computed as a percentage of hard costs, subject to adjustment depending on the applicable
program. For affordable component, soft costs are estimated at 22.5%, and increase
commensurate with increased financing costs for LIHTC for the SARA and the low-income
affordable components. A summary of estimated hard and soft construction costs are presented
below:
Component
Hard Cost
Estimates -
Per Unit
Soft Costs
%
Soft Costs Per
Unit Total Per Unit Rounded
Affordable $375,000 22.50% $84,375 $459,375 $460,000
Senior Affordable $275,000 25.00% $68,750 $343,750 $340,000
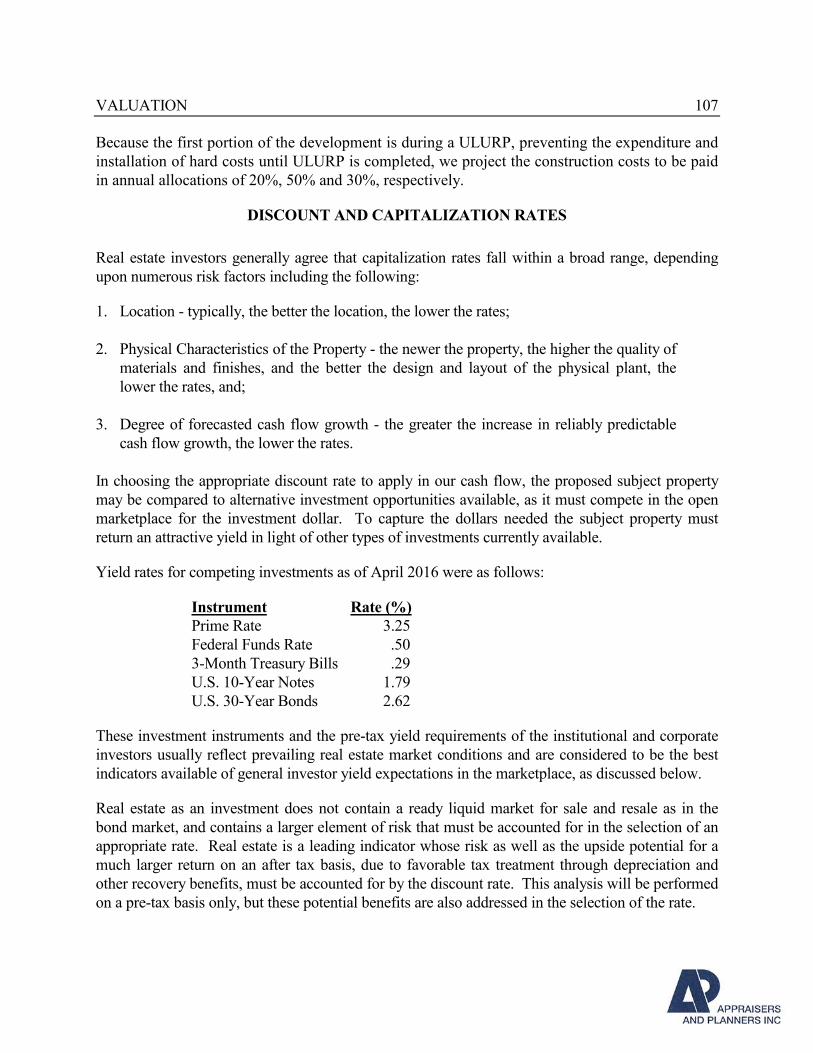
VALUATION 107
Because the first portion of the development is during a ULURP, preventing the expenditure and
installation of hard costs until ULURP is completed, we project the construction costs to be paid
in annual allocations of 20%, 50% and 30%, respectively.
DISCOUNT AND CAPITALIZATION RATES
Real estate investors generally agree that capitalization rates fall within a broad range, depending
upon numerous risk factors including the following:
1. Location - typically, the better the location, the lower the rates;
2. Physical Characteristics of the Property - the newer the property, the higher the quality of
materials and finishes, and the better the design and layout of the physical plant, the
lower the rates, and;
3. Degree of forecasted cash flow growth - the greater the increase in reliably predictable
cash flow growth, the lower the rates.
In choosing the appropriate discount rate to apply in our cash flow, the proposed subject property
may be compared to alternative investment opportunities available, as it must compete in the open
marketplace for the investment dollar. To capture the dollars needed the subject property must
return an attractive yield in light of other types of investments currently available.
Yield rates for competing investments as of April 2016 were as follows:
Instrument Rate (%)
Prime Rate 3.25
Federal Funds Rate .50
3-Month Treasury Bills .29
U.S. 10-Year Notes 1.79
U.S. 30-Year Bonds 2.62
These investment instruments and the pre-tax yield requirements of the institutional and corporate
investors usually reflect prevailing real estate market conditions and are considered to be the best
indicators available of general investor yield expectations in the marketplace, as discussed below.
Real estate as an investment does not contain a ready liquid market for sale and resale as in the
bond market, and contains a larger element of risk that must be accounted for in the selection of an
appropriate rate. Real estate is a leading indicator whose risk as well as the upside potential for a
much larger return on an after tax basis, due to favorable tax treatment through depreciation and
other recovery benefits, must be accounted for by the discount rate. This analysis will be performed
on a pre-tax basis only, but these potential benefits are also addressed in the selection of the rate.
VALUATION 108
The subject property receiving site, as per its highest and best use, is the residential components of
the mixed-use development. We have therefore included rates from the First Quarter 2016 Korpacz
Investor Survey. The National Apartment Market has IRR, or discount rates, ranging from 5% to
10% with an average of 7.28%. We select a discount rate towards the lower end of the range of the
overall rates, at 6%.
Issues that must be considered in the selection of an appropriate discount rate to apply to the subject
property’s projected cash flows are:
Issues that tend to lower the discount rate:
1. The subject’s somewhat convenient location in Hudson Square.
2. The strong economic conditions in New York City.
3. The fact that the Manhattan residential markets have proven to be one of the strongest and
most resilient in the country.
4. The historically strong investor demand for well-located Manhattan residential properties.
5. The continued demand for affordable housing, and senior affordable housing.
Issues that tend to raise the discount rate:
1. The fact that investors typically require a higher rate of return on speculative developments.
2. The uncertainties that are beginning to culminate regarding the continued levels of financing
of affordable housing projects in New York State.
3. That the typical cash subsidies provided by HDC and HPD are not available for this project.
To balance these factors, we have concluded to a discount rate of 6.0% which is appropriately
toward the lower end of the range exhibited in national survey data for institutional Manhattan
apartment properties.
Resale – Reversion Calculation
At the end of fourth year of the cash flow projection, the property is assumed to be resold based on
the fifth years’ net operating income, capitalized at 3.0% for both affordable components. This rate
is also appropriately toward the lower end of the range exhibited in the national surveys. Costs
associated with the sale have been estimated at 4.0% of the gross sales proceeds.
Terminal, or overall cap rates range from 3.5% to 8.5% and average 5.35% and residual cap rates
range from 4.25% to 8.25% with an average of 5.86%. In selecting the terminal capitalization rates,
we give weight to the survey data and also consider current capitalization rates for elevator
apartment buildings in Manhattan and assign a small load to develop the terminal rate.
VALUATION 109
Cushman and Wakefield Property Sales Report states that in-place capitalization rates for
Manhattan elevator apartment buildings averaged 3.58% in Q4 2015, and 3.62% in Q3 2015. The
subject product will consist of highly-desirable, and low-vacancy, affordable and senior-affordable
apartments that would command a lower cap rate than the market rate components, justifying a
terminal capitalization rate of 3.0%. The development will be new construction, and will benefit
from lower operating expense ratios than existing competing development. Although upside rent
potential is limited at these properties, the income is judged to be secure and the equity
capitalization rate of 3.0% is 121 basis points above the 10-year treasury rate, the comparable safe
rate.
Low Income Housing Tax Credits (LIHTC) Value
The Low Income Housing Tax Credit (LIHTC) program is a subsidy used to finance construction
(and rehabilitation) of low-income affordable rental housing. The LIHTC provides investors and
developers with a direct reduction in tax liability in exchange for providing financing to develop
affordable rental housing. The equity investment into affordable housing, which is rented to lower-
income tenants at below market rates, generates the tax credits that are paid in annual installments
over a 10 year period. The tax credits are available as both “4% credits” or “9% credits.” HPD has
stated that his project will not be able to seek 9% credits, and will instead use 4% credits. The 4%
credits are re-priced monthly as per the Applicable Federal Rates and the most recent rate for 4%
credits is March 2016’s rate of 3.19%. The applicable federal rate is multiplied by the adjusted
qualifying cost basis in order to determine the annual credit, which can be later syndicated and sold
to investors through a limited partnership, in which the developer retains 99.99% of the partnership
structure.
The qualifying cost basis is determined by multiplying the construction costs for the project by the
percent qualifying. In the case of the SARA units, 100% of the units qualify, but not all 100% of the
construction costs are assumed to qualify, such as certain financing costs and other soft costs. We
estimate that 95% of the costs would qualify in this scenario. The qualifying cost basis is also
further adjusted with a 30% bonus, which is available to those properties in Qualified Census Tracts
which have been determined to be Difficult to Develop Areas. The subject receiving site is in a
DDA and receives a 30% bonus to compute the adjusted, and Total Qualifying Cost Basis.
We have been informed by NYCDCP that if the subject property were to be developed in with the
current developer’s proposed plans, of a 50/30/209 - style unit mix rental building, the 112 low-
income affordable units would also be eligible for LIHTC. However, since this appraisal has
determined that the highest and best use of the subject receiving site’s residential components is for
condominium development in conjunction with the required affordable programs, only the SARA
units are eligible for LIHTC.
9 HDC’s 50/30/20 Mixed-Income Program – 50% of units for market rate tenants, 30% for middle-income tenants,
and 20% for low-income tenants.
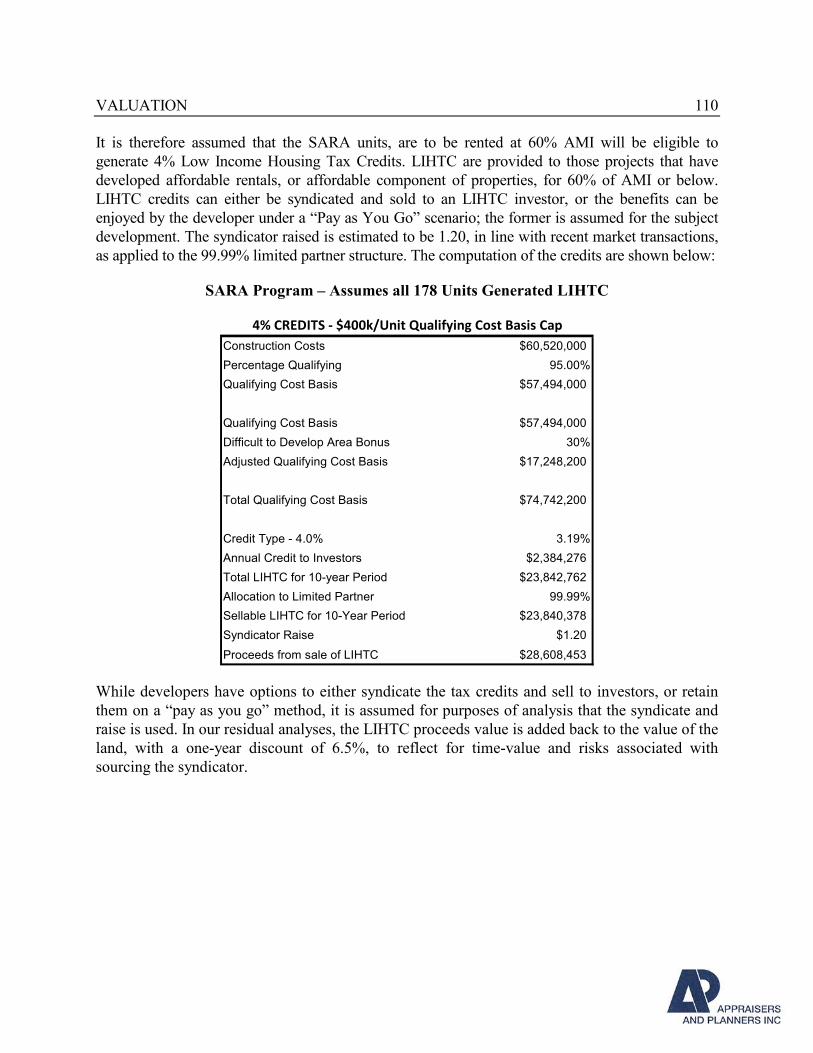
VALUATION 110
It is therefore assumed that the SARA units, are to be rented at 60% AMI will be eligible to
generate 4% Low Income Housing Tax Credits. LIHTC are provided to those projects that have
developed affordable rentals, or affordable component of properties, for 60% of AMI or below.
LIHTC credits can either be syndicated and sold to an LIHTC investor, or the benefits can be
enjoyed by the developer under a “Pay as You Go” scenario; the former is assumed for the subject
development. The syndicator raised is estimated to be 1.20, in line with recent market transactions,
as applied to the 99.99% limited partner structure. The computation of the credits are shown below:
SARA Program – Assumes all 178 Units Generated LIHTC
Construction Costs $60,520,000
Percentage Qualifying 95.00%
Qualifying Cost Basis $57,494,000
Qualifying Cost Basis $57,494,000
Difficult to Develop Area Bonus 30%
Adjusted Qualifying Cost Basis $17,248,200
Total Qualifying Cost Basis $74,742,200
Credit Type - 4.0% 3.19%
Annual Credit to Investors $2,384,276
Total LIHTC for 10-year Period $23,842,762
Allocation to Limited Partner 99.99%
Sellable LIHTC for 10-Year Period $23,840,378
Syndicator Raise $1.20
Proceeds from sale of LIHTC $28,608,453
4% CREDITS - $400k/Unit Qualifying Cost Basis Cap
While developers have options to either syndicate the tax credits and sell to investors, or retain
them on a “pay as you go” method, it is assumed for purposes of analysis that the syndicate and
raise is used. In our residual analyses, the LIHTC proceeds value is added back to the value of the
land, with a one-year discount of 6.5%, to reflect for time-value and risks associated with
sourcing the syndicator.
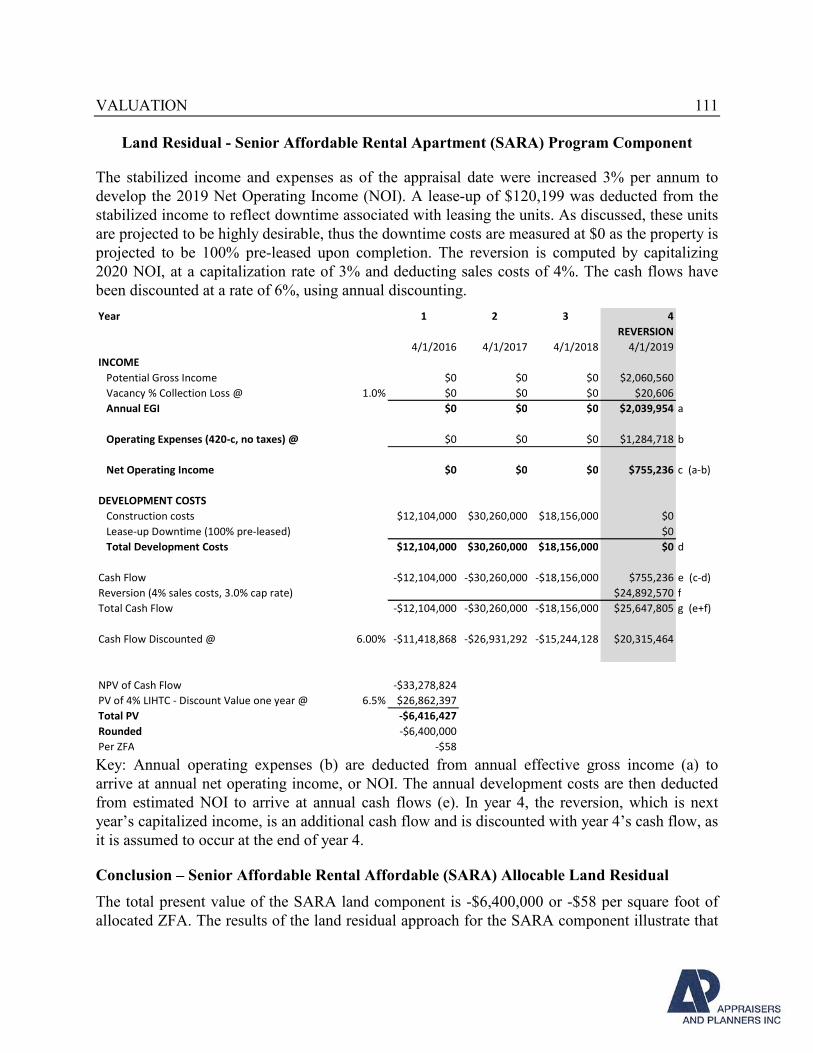
VALUATION 111
Land Residual - Senior Affordable Rental Apartment (SARA) Program Component
The stabilized income and expenses as of the appraisal date were increased 3% per annum to
develop the 2019 Net Operating Income (NOI). A lease-up of $120,199 was deducted from the
stabilized income to reflect downtime associated with leasing the units. As discussed, these units
are projected to be highly desirable, thus the downtime costs are measured at $0 as the property is
projected to be 100% pre-leased upon completion. The reversion is computed by capitalizing
2020 NOI, at a capitalization rate of 3% and deducting sales costs of 4%. The cash flows have
been discounted at a rate of 6%, using annual discounting.
Year 1 2 3 4
REVERSION
4/1/2016 4/1/2017 4/1/2018 4/1/2019
INCOME
Potential Gross Income $0 $0 $0 $2,060,560
Vacancy % Collection Loss @ 1.0% $0 $0 $0 $20,606
Annual EGI $0 $0 $0 $2,039,954 a
Operating Expenses (420-c, no taxes) @ $0 $0 $0 $1,284,718 b
Net Operating Income $0 $0 $0 $755,236 c (a-b)
DEVELOPMENT COSTS
Construction costs $12,104,000 $30,260,000 $18,156,000 $0
Lease-up Downtime (100% pre-leased) $0
Total Development Costs $12,104,000 $30,260,000 $18,156,000 $0 d
Cash Flow -$12,104,000 -$30,260,000 -$18,156,000 $755,236 e (c-d)
Reversion (4% sales costs, 3.0% cap rate) $24,892,570 f
Total Cash Flow -$12,104,000 -$30,260,000 -$18,156,000 $25,647,805 g (e+f)
Cash Flow Discounted @ 6.00% -$11,418,868 -$26,931,292 -$15,244,128 $20,315,464
NPV of Cash Flow -$33,278,824
PV of 4% LIHTC - Discount Value one year @ 6.5% $26,862,397
Total PV -$6,416,427
Rounded -$6,400,000
Per ZFA -$58
Key: Annual operating expenses (b) are deducted from annual effective gross income (a) to
arrive at annual net operating income, or NOI. The annual development costs are then deducted
from estimated NOI to arrive at annual cash flows (e). In year 4, the reversion, which is next
year’s capitalized income, is an additional cash flow and is discounted with year 4’s cash flow, as
it is assumed to occur at the end of year 4.
Conclusion – Senior Affordable Rental Affordable (SARA) Allocable Land Residual
The total present value of the SARA land component is -$6,400,000 or -$58 per square foot of
allocated ZFA. The results of the land residual approach for the SARA component illustrate that
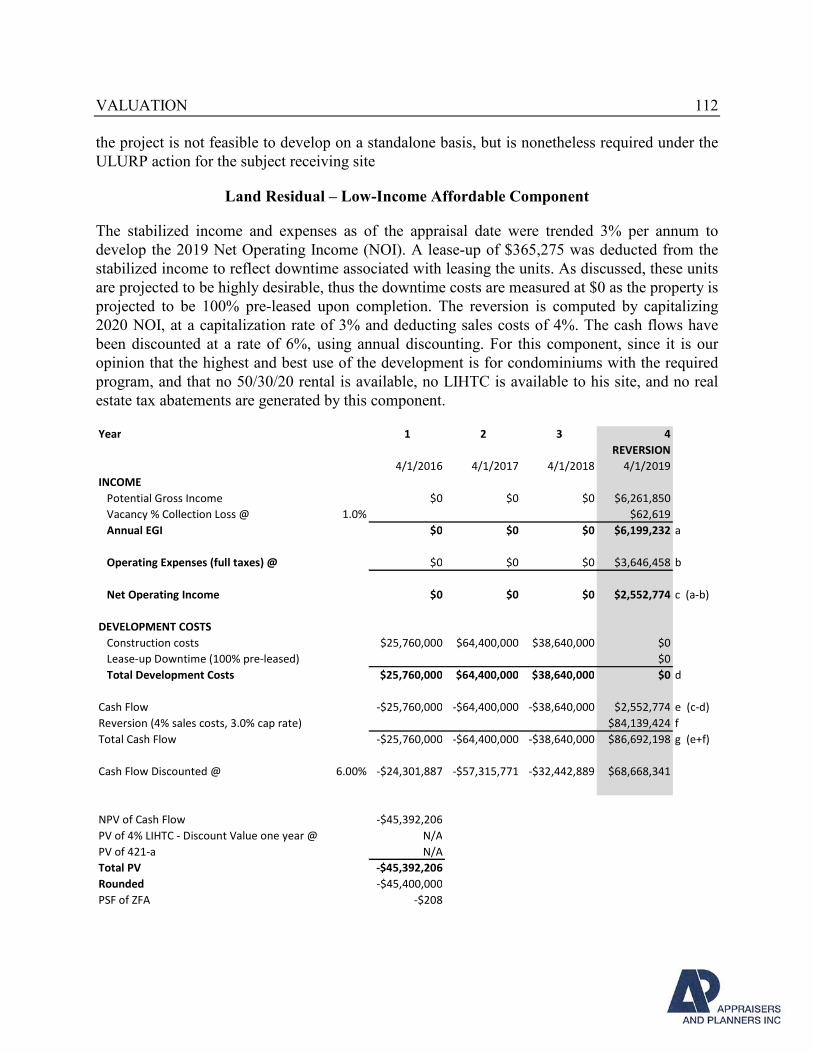
VALUATION 112
the project is not feasible to develop on a standalone basis, but is nonetheless required under the
ULURP action for the subject receiving site
Land Residual – Low-Income Affordable Component
The stabilized income and expenses as of the appraisal date were trended 3% per annum to
develop the 2019 Net Operating Income (NOI). A lease-up of $365,275 was deducted from the
stabilized income to reflect downtime associated with leasing the units. As discussed, these units
are projected to be highly desirable, thus the downtime costs are measured at $0 as the property is
projected to be 100% pre-leased upon completion. The reversion is computed by capitalizing
2020 NOI, at a capitalization rate of 3% and deducting sales costs of 4%. The cash flows have
been discounted at a rate of 6%, using annual discounting. For this component, since it is our
opinion that the highest and best use of the development is for condominiums with the required
program, and that no 50/30/20 rental is available, no LIHTC is available to his site, and no real
estate tax abatements are generated by this component.
Year 1 2 3 4
REVERSION
4/1/2016 4/1/2017 4/1/2018 4/1/2019
INCOME
Potential Gross Income $0 $0 $0 $6,261,850
Vacancy % Collection Loss @ 1.0% $62,619
Annual EGI $0 $0 $0 $6,199,232 a
Operating Expenses (full taxes) @ $0 $0 $0 $3,646,458 b
Net Operating Income $0 $0 $0 $2,552,774 c (a-b)
DEVELOPMENT COSTS
Construction costs $25,760,000 $64,400,000 $38,640,000 $0
Lease-up Downtime (100% pre-leased) $0
Total Development Costs $25,760,000 $64,400,000 $38,640,000 $0 d
Cash Flow -$25,760,000 -$64,400,000 -$38,640,000 $2,552,774 e (c-d)
Reversion (4% sales costs, 3.0% cap rate) $84,139,424 f
Total Cash Flow -$25,760,000 -$64,400,000 -$38,640,000 $86,692,198 g (e+f)
Cash Flow Discounted @ 6.00% -$24,301,887 -$57,315,771 -$32,442,889 $68,668,341
NPV of Cash Flow -$45,392,206
PV of 4% LIHTC - Discount Value one year @ N/A
PV of 421-a N/A
Total PV -$45,392,206
Rounded -$45,400,000
PSF of ZFA -$208
VALUATION 113
Key: Annual operating expenses (b) are deducted from annual effective gross income (a) to
arrive at annual net operating income, or NOI. The annual development costs are then deducted
from estimated NOI to arrive at annual cash flows (e). In year 4, the reversion, which is next
year’s capitalized income, is an additional cash flow and is discounted with year 4’s cash flow, as
it is assumed to occur at the end of year 4.
Conclusion – Low Income Affordable Rental Allocable Land Residual
The total present value of the low income affordable land component is -$45,400,000 or -$208
per square foot of allocated ZFA. The results of the land residual approach for the low-income
affordable component illustrate that the project is not feasible to develop on a standalone basis,
but is nonetheless required under the ULURP action for the subject receiving site.
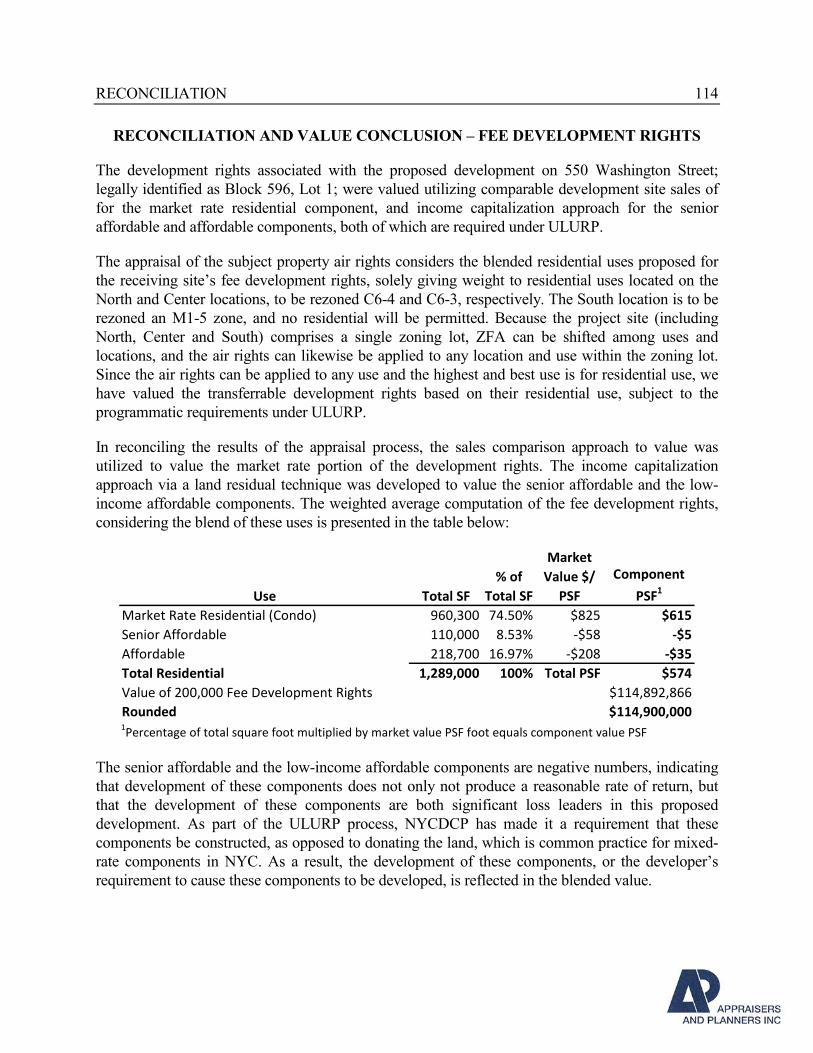
RECONCILIATION 114
RECONCILIATION AND VALUE CONCLUSION – FEE DEVELOPMENT RIGHTS
The development rights associated with the proposed development on 550 Washington Street;
legally identified as Block 596, Lot 1; were valued utilizing comparable development site sales of
for the market rate residential component, and income capitalization approach for the senior
affordable and affordable components, both of which are required under ULURP.
The appraisal of the subject property air rights considers the blended residential uses proposed for
the receiving site’s fee development rights, solely giving weight to residential uses located on the
North and Center locations, to be rezoned C6-4 and C6-3, respectively. The South location is to be
rezoned an M1-5 zone, and no residential will be permitted. Because the project site (including
North, Center and South) comprises a single zoning lot, ZFA can be shifted among uses and
locations, and the air rights can likewise be applied to any location and use within the zoning lot.
Since the air rights can be applied to any use and the highest and best use is for residential use, we
have valued the transferrable development rights based on their residential use, subject to the
programmatic requirements under ULURP.
In reconciling the results of the appraisal process, the sales comparison approach to value was
utilized to value the market rate portion of the development rights. The income capitalization
approach via a land residual technique was developed to value the senior affordable and the low-
income affordable components. The weighted average computation of the fee development rights,
considering the blend of these uses is presented in the table below:
Use Total SF
% of
Total SF
Market
Value $/
PSF
Component
PSF1
Market Rate Residential (Condo) 960,300 74.50% $825 $615
Senior Affordable 110,000 8.53% -$58 -$5
Affordable 218,700 16.97% -$208 -$35
Total Residential 1,289,000 100% Total PSF $574
Value of 200,000 Fee Development Rights $114,892,866
Rounded $114,900,0001Percentage of total square foot multiplied by market value PSF foot equals component value PSF
The senior affordable and the low-income affordable components are negative numbers, indicating
that development of these components does not only not produce a reasonable rate of return, but
that the development of these components are both significant loss leaders in this proposed
development. As part of the ULURP process, NYCDCP has made it a requirement that these
components be constructed, as opposed to donating the land, which is common practice for mixed-
rate components in NYC. As a result, the development of these components, or the developer’s
requirement to cause these components to be developed, is reflected in the blended value.
RECONCILIATION 115
Therefore, it is our opinion that the market value of the 200,000 square feet of blended-use fee
development rights, as of April 1, 2016, was:
ONE HUNDRED FOURTEEN MILLION NINE HUNDRED THOUSAND DOLLARS
($114,900,000)
Given the nature of this assignment, a hypothetical condition and a series of extraordinary
assumptions, described below, are necessary to develop credible assignment results. The
hypothetical condition employed in this valuation is that the proposed rezoning and special permit
have been granted through a successful ULURP as of the effective date of value of this appraisal
with the receiving site incorporating the air rights purchased from HRPT into the development.
Therefore, our analysis proceeds in two parts: first consideration of the development rights as part
of the fee parcel, and second the market relationship, expressed as a ratio, between the value of the
air rights and the value of the underlying fee parcel. The market value of subject property air rights
equals the value of the allocable portion of the fee interest multiplied by this ratio.
A hypothetical condition is defined as, “That which is contrary to what exists, but is supposed for
the purpose of the analysis. Hypothetical conditions assume conditions contrary to known facts
about physical, legal, or economic characteristics of the subject property; or about conditions
external to the property, such as market conditions or trends, or about the integrity of data used in
an analysis.” The hypothetical condition is necessary to produce credible assignment results.
An extraordinary assumption is defined as, “An assumption, directly related to a specific
assignment, which, if found to be false, could alter the appraiser’s opinions or conclusions.
Extraordinary assumptions presume as fact otherwise uncertain information about physical, legal,
or economic characteristics of the subject property; or about condition external to the property such
as market conditions or trends; or about the integrity of data used in an analysis.”
The extraordinary assumptions made in this appraisal are summarized as follows:
1. That the outline of North and Center of the planned development will be generally
comprised of the following Zoning Floor Area (ZFA):
- 960,300 square feet of market rate residential development
- 110,000 square feet of affordable senior housing rentals
- 218,700 square feet of affordable residential rentals
2. That, as per the client based on information provided by NYCDCP, the affordable
components will not be eligible to generate off-site Inclusionary Housing bonuses to be
sold to qualifying sites, which departs from prior programs for affordable housing
development in New York City.
3. That the developer will elect to utilize 60% Area Median Income (AMI) for the Senior
Affordable Rental Apartment (SARA) program, in order for this component of the
RECONCILIATION 116
project to be eligible for 4% Low Income Housing Tax Credits (LIHTC). It was reported
by HPD that 80% AMI is the maximum AMI requirement for the SARA component.
If any of the extraordinary assumptions are found to be materially different than what is assumed
for this assignment, the appraisal may require revision.
VALUATION – AIR RIGHTS 117
VALUATION – AIR RIGHTS
The following valuation of the air rights incorporates by reference the analysis developed earlier in
this report, and develops an opinion measuring the relationship between fee development rights and
air rights value. In undertaking this valuation, we have performed the following scope of work:
• Analyzed current zoning regulations applicable to the subject property and all comparable
development site sales: Zoning information is based upon the City of New York Zoning
Resolution. We have also analyzed the proposed rezoning of the receiving site in
conjunction with mixed-use development proposed for the site.
• Conducted a study of development land market conditions in the subject market area:
Market information is based upon published studies, sales information sources such as
PropertyShark and CoStar, NYC Department of Buildings, the files and library of
Appraisers and Planners, Inc. and our discussions with active participants and lenders in
the marketplace.
• Provided a conclusion, based upon the data and methodology set forth within the
appraisal report. The conclusion is based on the percentage relationship of air rights to fee
value, after considering the weighted average of the subject development rights
considering the blended residential uses proposed for the site at 550 Washington Street
• Applied the above-sought percentage to the value derived in the preceding Development
Rights analysis to conclude at a value of the subject air rights.
ELIGIBLE SITE ANALYSIS
We have been guided by the Client to consider the potential eligibility of sites opposite Pier 40 to
receive air rights. In determining the eligibility of sites to receive the air rights, we look to those
properties within the block across West Street that are feasible development sites. We are guided by
the Hudson River Park Act, and 2013 amendment (“the Act”) in evaluating which sites, physically,
can be recipients of the air rights. The Act states in Chapter 517 of the Laws of New York that the
Hudson River Park Trust (HRPT) shall have the right to “…transfer by sale any unused
development rights as may be available for transfer to properties located up to one block east of the
boundaries of the park along the west side of Manhattan, if and to the extent designated and
permitted under local zoning ordinances provided however that revenues derived from the transfer
of air rights from pier 40 must be used in the first instance for the repair of pier 40 infrastructure
including piles and roof, after which any excess revenues may be used by the trust for other uses
permitted by this act…”
In addition, we have been informed by the Client that the proposed amendment to the zoning text
will limit the potential transfers to be within a nexus to be defined by the Department of City
Planning (DCP).
VALUATION – AIR RIGHTS 118
For the proposes of this appraisal we have been guided by the Client in the interpretation of this
clause, and have determined that the following four (4) parcels in the following two (2) blocks may
be eligible for Pier 40 air rights (subject to further stipulation to be established by DCP):
Block 601, Lots 10, 12 and 13 – 357 West Street, 152 Leroy Street and 584 Washington Street
Block 601, Lot 10 was recently granted a use variance to construct a residential development in an
M1-5 zoning district. The development is underway and condominium listings have recently been
made available. It is not suspected that subsequent to the granting of a variance and construction of
a condominium building that this property can achieve additional residential air rights. Lots 12 and
13 remain zoned M1-5 and are not judged to be able to receive the air rights generated by Pier 40
for residential development. Both parcels are underbuilt and already contain substantial untapped
potential for redevelopment that have thus far gone unrealized.
Block 596, Lot 1 – 550 Washington Street
This site is judged as the only site available to receive the air rights generated by Pier 40 for
enhancement of a proposed residential development. It is a hypothetical condition in this appraisal
that 550 Washington has been granted all the rezoning and special permits in conjunction with the
propose development, therefore availing the property as a receiver of air rights generated by Pier 40.
Because the property will be underbuilt subsequent to the rezoning, it can supplement the proposed
development with the purchase of air rights from Pier 40, to be used to enhance the residential
portions of the site. Therefore, only 550 Washington can receive the air rights, and this valuation of
the relationship between the value of air rights to fee land value is done in accordance with the
planned residential uses for 550 Washington Street.
EXPOSURE TIME – AIR RIGHTS
Exposure time is defined as:
“The estimated length of time the property interest being appraised would have
been offered on the market prior to the hypothetical consummation of a sale at
market value on the effective date of the appraisal; a current estimate based upon
an analysis of past events assuming a competitive and open market. Exposure time
is always presumed to occur prior to the effective date of the appraisal.”10
In estimating the appropriate exposure time applicable to the interest in the air rights, we have
considered marketing periods for similar type properties based on a survey of property listings as
well as sales data and interviews with market participants. In addition, when the information was
available, we have considered the exposure time of the development site sales contained within
10 The Dictionary of Real Estate Appraisal, 5th Ed., (Illinois: Appraisal Institute, 2010), page 73
VALUATION – AIR RIGHTS 119
this appraisal. It is our opinion that a reasonable exposure time applicable to the interest in the air
rights analyzed herein, as of the effective appraisal date, is six (6) to nine (9) months.
DEFINITION OF MARKET VALUE – AIR RIGHTS
Market value is defined as follows:
“The most probable price which a property should bring in a competitive and open market
under all conditions requisite to a fair sale, the buyer and seller each acting prudently and
knowledgeably, and assuming the price is not affected by undue stimulus. Implicit in this
definition is the consummation of a sale as of a specified date and the passing of title from
seller to buyer under conditions whereby:
1. Buyer and seller are typically motivated;
2. Both parties are well informed or well advised, and acting in what they consider their own
best interests;
3. A reasonable time is allowed for exposure in the open market;
4. Payment is made in terms of cash in U.S. dollars or in terms of financial arrangements
comparable thereto; and
5. The price represents the normal consideration for the property sold unaffected by special or
creative financing or sales concessions granted by anyone associated with the sale.” 11
For purposes of this appraisal, we have provided the market value of the air rights, after considering
the relationship between land value and air rights, incorporating by reference the value of the
underlying fee development at 550 Washington Street, as set forth earlier in this appraisal. For
example, if air rights are valued at 60% of corresponding land value, when a parcel of land for
residential development is valued at $100 per square foot of Zoning Floor Area (ZFA), air rights
that can be transferred to that parcel, to enhance the aforementioned residential development, are
valued at $60 per square foot of ZFA.
11 Appraisal Institute, The Appraisal of Real Estate, 13th Edition, (Illinois: Appraisal Institute, 2008), page 24-25.
VALUATION – AIR RIGHTS 120
Overview of Air Rights Transaction Mechanisms in New York City
This appraisal measures the relationship between land value and air rights value, expressed as a
percentage of underlying land value. Air rights are transferred by three basic mechanisms in New
York City: Zoning Lot Merger, TDR Programs and Landmark Transfers. Each program is discussed
below.
Zoning Lot Merger
In Manhattan, the most common vehicle for air rights transfers is through the use of a Zoning Lot
Development Agreement (ZLDA), which merges the zoning lots of contiguous parcels and allows
for a receiving site to increase as-of-right Floor Area Ratio (FAR) by utilizing excess development
rights from the granting parcel. This is the most common way in which air rights are transferred,
and many development sites are assembled.
TDR Programs
Another way in which properties in certain districts of New York City may increase FAR is through
the transfer of air rights through various district-wide TDR programs. Properties situated within
certain zoning districts within Manhattan, such as the Theater Subdistrict or High Line Transfer
Corridor in West Chelsea may benefit from an increase in FAR through the utilization of
Transferable Development Rights from those sites generating excess development rights. In the
case of the Theater District, landmark theaters generate the TDRs, and in West Chelsea, those
zoning lots lying within the High Line Transfer Corridor generate the TDRs. In both cases the
receiving site must identify a granting site, from which to receive TDRs and privately negotiate the
price for these TDR rights. Included in this transaction is typically a fee to be paid to the Theater
Subdistrict Fund. Unlike transfers from landmark properties, as discussed below, the TDR sales in
the Theatre Subdistrict, although subject to review, are not subject to the depth of public review
associated with the Uniform Land Use Review Process (ULURP) and are made similar to an
inclusionary housing transfer or zoning lot merger.
Landmark Transfers
The Zoning Resolution (Section 74-79) provides a special transfer process to some of the
landmarks designated by the LPC. This transfer provision allows individual landmarks within or in
mid- and high-density zoning districts to transfer unused development rights not only to adjacent
lots, but also to lots across the street or, if the landmark is on a corner, to any lot on another corner
that faces the same intersection. Owners seeking to transfer TDRs through the landmark program
rather than a zoning lot merger, however, must secure a special permit from the City Planning
Commission, which, in turn, requires a report of the LPC and public review through ULURP and
City Environment Quality Review (CEQR). The ULURP process can take over one year and can
cost, at a minimum of $500,000 in legal and professional fees to guide the process; this deters some
owners from transferring air rights this way.
VALUATION – AIR RIGHTS 121
Conclusion – Air Rights Overview
For the purposes of this valuation, although the air rights are to be transferred from Pier 40, across
West Street to 550 Washington Street, similar to a typical Transferable Development Right (TDR)
program such as seen in the Theater District or West Chelsea, for purposes of analysis, the sale of
these rights is analyzed as if it were a sale done through a Zoning Lot Merger (ZLM). It is viewed
as a ZLM as there is only one grantor of air rights, and only one recipient; a bilateral monopoly.
Therefore the subject is considered most similar to the sales of air rights through ZLM and we have
therefore considered and analyzed ZLM’s to estimate the percentage relationship between land
value and air rights value.
The Approaches to Value
The Income Approach was not developed to value the subject air rights or the percentage
relationship between the underlying land value and the air rights to be added to the development.
For purposes of analysis, the property is assumed to be vacant of improvements and the air rights
are assumed to be transferred to enhance the residential portion of the development.
The Sales Comparison Approach was developed as the primary method of valuation. The
relationship between land value and air rights value through ZLM was analyzed by researching
recent development site transactions that involved the purchase of vacant land, or an under-
utilized site, and a subsequent and sometimes simultaneous transaction of air rights through a
zoning lot merger. While development site transactions occur often in the recent economic
climate in New York City, and air rights transactions also occur regularly, the sales do not always
happen in a similar timeframe. We uncovered a number of assemblages that were put together
piece-by-piece over time, but because it is difficult to adjust each component for market
conditions, and enhanced motivation seen with assemblages, those transactions were not used.
Furthermore, this analysis concentrates on sales of land and corresponding air rights for
residential purposes, in accordance with the hypothetical condition in this appraisal whereby the
air rights are to be transferred subsequent to ULURP approval. Because hotel, retail and office
uses can be accommodated as-of-right within the planned development, these uses are not included
as part of this appraisal as the transferred air rights are not necessary for development of these uses.
The Cost Approach was not developed as the subject of this appraisal is solely comprised of the
air rights associated it with a proposed development.
VALUATION – AIR RIGHTS 122
Summary: The development site sales and corresponding zoning lot mergers researched and
uncovered concern an array of Manhattan development sites occurring between August 2012 to
June 2015. The sales reflect those developers’ willingness to expand their existing development
scale through the purchase of air rights from an abutting property. In some instances, the
transactions involved the sale of one parcel and one air rights purchase. In other transactions
presented herein, one fee land parcel can be purchased, and can be significantly expanded by a
developer who traverses the block assembling a development envelope, piece by piece. In nearly all
instances, the acquisition of the air rights through ZLM, is between the land purchaser and the only
likely grantor of air rights, or the only eligible party willing to permanently part with the excess
development rights appurtenant to their site.
Furthermore, of the dozens of air rights transactions that have occurred in Manhattan since 2012,
we have selected this sampling of nine (9) sales, as they satisfy the above criteria, but this group
of sales concerns transactions wherein the land and the air were purchased under the same, or
similar market conditions. When deriving the percentage relationship between the two
components, if the same market conditions are utilized, then this further speaks to the strength of
the underlying relationship between the components.
There does exist instances in the market where a ZLM is fully necessary for a developer to
achieve the as-of-right FAR, otherwise the parcel may be limited to 45 feet in frontage, and the
parcel would be deemed a sliver parcel. Without a lot merger, these parcels can often only be
developed to the height that is equivalent to the fronting street width. However; if a ZLM of a
narrow parcel were to occur with a parcel wide enough to provide a zoning lot width of at least
45 feet, then height limitations, especially in R10 or R-10 equivalent zones, would not be limited.
Because of these practices, ZLM’s happen with regularity, especially in high-density areas where
the more air rights assembled means the taller the development.
Selection of Comparable Fee and Air Rights Sales
Comparable sales of properties planned were derived and confirmed through a thorough
investigative search of public records as well as discussions with knowledgeable parties. In
addition we have relied upon several recognized data sources for comparable sales such as
CoStar Comps, New York City Department of Buildings, ACRIS and Property Shark.
We undertook an exhaustive search and relied upon the following transactions as most similar to
the subject property as these sales are some of the most recent sales, represent the acquisition for
residential developments without high-value retail, and in the cases of these sales, the
acquisitions of air rights significantly added to the feasibility of the project. A summary of the
transactions followed by a discussion of the data is found on the following pages.
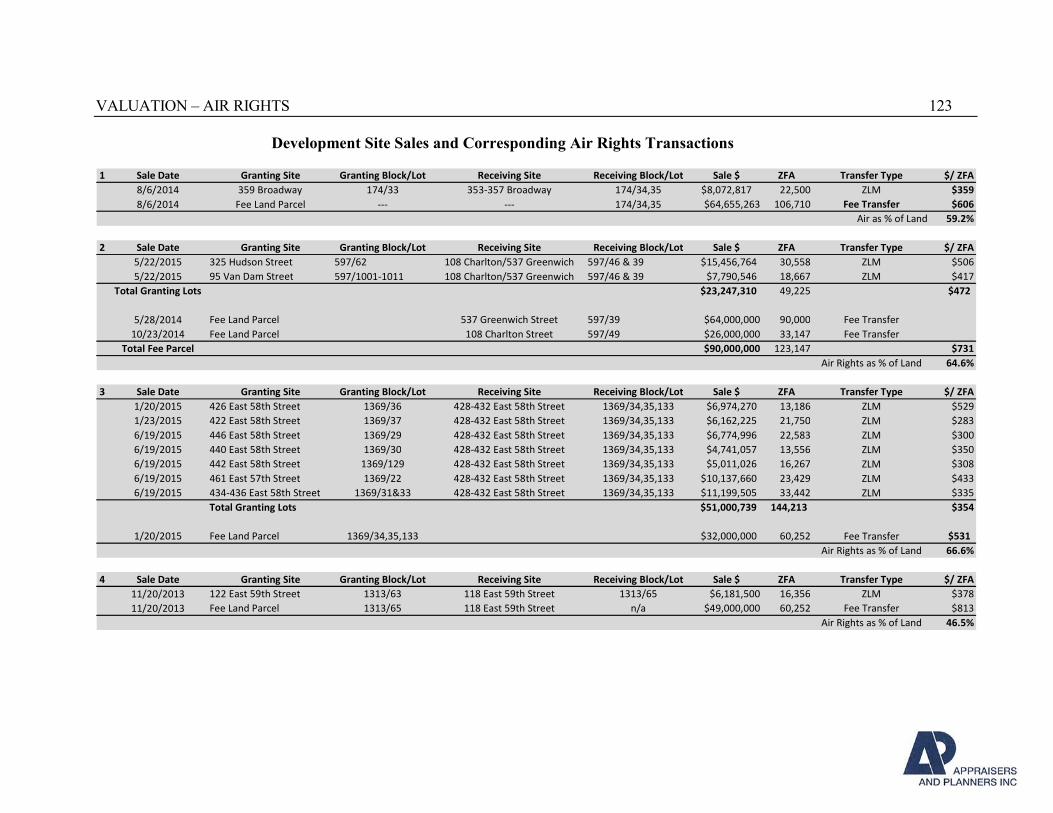
VALUATION – AIR RIGHTS 123
Development Site Sales and Corresponding Air Rights Transactions
1 Sale Date Granting Site Granting Block/Lot Receiving Site Receiving Block/Lot Sale $ ZFA Transfer Type $/ ZFA
8/6/2014 359 Broadway 174/33 353-357 Broadway 174/34,35 $8,072,817 22,500 ZLM $359
8/6/2014 Fee Land Parcel --- --- 174/34,35 $64,655,263 106,710 Fee Transfer $606
59.2%
2 Sale Date Granting Site Granting Block/Lot Receiving Site Receiving Block/Lot Sale $ ZFA Transfer Type $/ ZFA
5/22/2015 325 Hudson Street 597/62 108 Charlton/537 Greenwich 597/46 & 39 $15,456,764 30,558 ZLM $506
5/22/2015 95 Van Dam Street 597/1001-1011 108 Charlton/537 Greenwich 597/46 & 39 $7,790,546 18,667 ZLM $417
Total Granting Lots $23,247,310 49,225 $472
5/28/2014 Fee Land Parcel 537 Greenwich Street 597/39 $64,000,000 90,000 Fee Transfer
10/23/2014 Fee Land Parcel 108 Charlton Street 597/49 $26,000,000 33,147 Fee Transfer
Total Fee Parcel $90,000,000 123,147 $731
Air Rights as % of Land 64.6%
3 Sale Date Granting Site Granting Block/Lot Receiving Site Receiving Block/Lot Sale $ ZFA Transfer Type $/ ZFA
1/20/2015 426 East 58th Street 1369/36 428-432 East 58th Street 1369/34,35,133 $6,974,270 13,186 ZLM $529
1/23/2015 422 East 58th Street 1369/37 428-432 East 58th Street 1369/34,35,133 $6,162,225 21,750 ZLM $283
6/19/2015 446 East 58th Street 1369/29 428-432 East 58th Street 1369/34,35,133 $6,774,996 22,583 ZLM $300
6/19/2015 440 East 58th Street 1369/30 428-432 East 58th Street 1369/34,35,133 $4,741,057 13,556 ZLM $350
6/19/2015 442 East 58th Street 1369/129 428-432 East 58th Street 1369/34,35,133 $5,011,026 16,267 ZLM $308
6/19/2015 461 East 57th Street 1369/22 428-432 East 58th Street 1369/34,35,133 $10,137,660 23,429 ZLM $433
6/19/2015 434-436 East 58th Street 1369/31&33 428-432 East 58th Street 1369/34,35,133 $11,199,505 33,442 ZLM $335
Total Granting Lots $51,000,739 144,213 $354
1/20/2015 Fee Land Parcel 1369/34,35,133 $32,000,000 60,252 Fee Transfer $531
Air Rights as % of Land 66.6%
4 Sale Date Granting Site Granting Block/Lot Receiving Site Receiving Block/Lot Sale $ ZFA Transfer Type $/ ZFA
11/20/2013 122 East 59th Street 1313/63 118 East 59th Street 1313/65 $6,181,500 16,356 ZLM $378
11/20/2013 Fee Land Parcel 1313/65 118 East 59th Street n/a $49,000,000 60,252 Fee Transfer $813
Air Rights as % of Land 46.5%
Air as % of Land
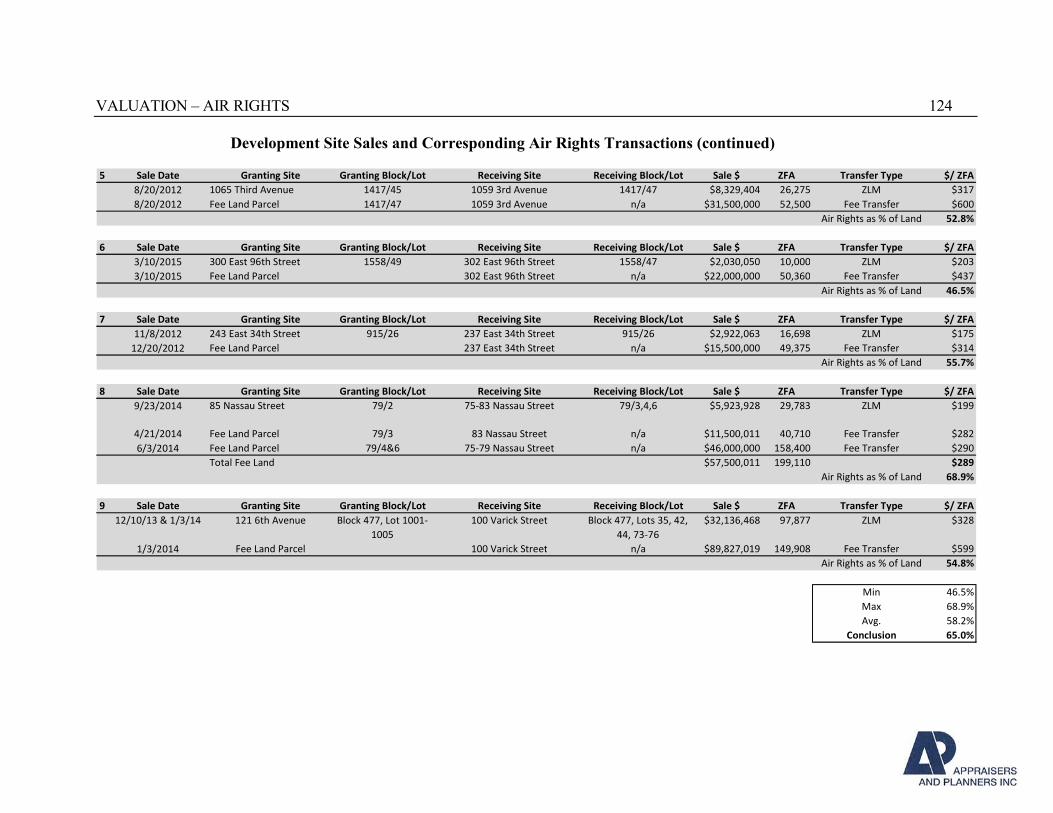
VALUATION – AIR RIGHTS 124
Development Site Sales and Corresponding Air Rights Transactions (continued)
5 Sale Date Granting Site Granting Block/Lot Receiving Site Receiving Block/Lot Sale $ ZFA Transfer Type $/ ZFA
8/20/2012 1065 Third Avenue 1417/45 1059 3rd Avenue 1417/47 $8,329,404 26,275 ZLM $317
8/20/2012 Fee Land Parcel 1417/47 1059 3rd Avenue n/a $31,500,000 52,500 Fee Transfer $600
Air Rights as % of Land 52.8%
6 Sale Date Granting Site Granting Block/Lot Receiving Site Receiving Block/Lot Sale $ ZFA Transfer Type $/ ZFA
3/10/2015 300 East 96th Street 1558/49 302 East 96th Street 1558/47 $2,030,050 10,000 ZLM $203
3/10/2015 Fee Land Parcel 302 East 96th Street n/a $22,000,000 50,360 Fee Transfer $437
Air Rights as % of Land 46.5%
7 Sale Date Granting Site Granting Block/Lot Receiving Site Receiving Block/Lot Sale $ ZFA Transfer Type $/ ZFA
11/8/2012 243 East 34th Street 915/26 237 East 34th Street 915/26 $2,922,063 16,698 ZLM $175
12/20/2012 Fee Land Parcel 237 East 34th Street n/a $15,500,000 49,375 Fee Transfer $314
Air Rights as % of Land 55.7%
8 Sale Date Granting Site Granting Block/Lot Receiving Site Receiving Block/Lot Sale $ ZFA Transfer Type $/ ZFA
9/23/2014 85 Nassau Street 79/2 75-83 Nassau Street 79/3,4,6 $5,923,928 29,783 ZLM $199
4/21/2014 Fee Land Parcel 79/3 83 Nassau Street n/a $11,500,011 40,710 Fee Transfer $282
6/3/2014 Fee Land Parcel 79/4&6 75-79 Nassau Street n/a $46,000,000 158,400 Fee Transfer $290
Total Fee Land $57,500,011 199,110 $289
Air Rights as % of Land 68.9%
9 Sale Date Granting Site Granting Block/Lot Receiving Site Receiving Block/Lot Sale $ ZFA Transfer Type $/ ZFA
12/10/13 & 1/3/14 121 6th Avenue Block 477, Lot 1001-
1005
100 Varick Street Block 477, Lots 35, 42,
44, 73-76
$32,136,468 97,877 ZLM $328
1/3/2014 Fee Land Parcel 100 Varick Street n/a $89,827,019 149,908 Fee Transfer $599
Air Rights as % of Land 54.8%
Min 46.5%
Max 68.9%
Avg. 58.2%
Conclusion 65.0%
VALUATION 125
Discussion of Sales and Relationship of Air to Land Value
Comparable Sale 1
This sale represents the acquisition of two side-by-side lots and abutting air rights along
Broadway in Tribeca. The sales occurred simultaneously and represent a relationship of 59.2% of
air rights value to land value. In this transaction, only the abutting parcel presented a logical
source of air rights. The fee sale parcels are largely located in C6-4A zoning, which is an R10A
equivalent zone. In C6-4A, the maximum height is 210 feet. Accordingly a large assemblage of
air rights would not be possible, and there were only two sites from which to source air rights;
the abutting lot 33, or lot 36, the latter of which was subsequently purchased by the developer,
however this transaction was not at market as it included a seller’s option to acquire the retail
component to the seller. The 59.2% relationship between the air and fee parcels represents the
transaction of air rights similar to what is assumed to take place at 550 Washington Street, and
this percentage is good evidence of what can be expected for the subject air rights.
Comparable Sale 2
Comparable sale 2 represents the sale of two fee parcels and two blocks of air rights. This sale is
located two blocks due east of the subject property, and is the closest to the subject of any of the
sales analyzed. The sales do represent the most time between fee acquisition and air rights
acquisition in the data array, however there is evidence to suggest that the air rights were under
negotiation as the second components of the fee sale was closing, therefore an adjustment for
market conditions may not be warranted.12 The relationship between fee and air rights in this
transaction is 64.6%, and like the sale above, represent air rights acquisitions from available
parcels on the block in a height-capped zoning district where maximum height is 185 feet for
market-rate development, but can be increased with inclusionary depending on the block
configuration and fronting streets.
Comparable Sale 3
Comparable sale 3 is unique in this data as it concerns the acquisition of one parcel and then an
assemblage of air rights from an additional seven (7) parcels. The first air lot purchased was done
so at nearly the same price per square foot as the initial sale price, with each subsequent purchase
at a lower price. In all, the sum of the air rights sales averages to be 66.6% of the initial fee sale.
12 An air rights survey is referenced in the ZLDA as dated November 6 2014, two weeks after the close of the sale
of 108 Charlton Street.
VALUATION 126
Comparable Sale 4
Comparable sale 4 is the simultaneous acquisition of both fee land and air from two separate
parties. The property is located at the northerly portion of Midtown East, along East 59th Street,
in a desirable residential and increasing retail location. The purchase of the fee considers both the
high retail value here as well as the residential value. The air rights purchase is computed to be
46.5% of the land acquisition, per square foot. The land lot is 50 feet, and is wide enough to
maximize the FAR of 12.0 on the site, and this assemblage of air rights allowed the upper floors
to have Central Park views, notably enhancing the development. However, given the value of the
underlying retail at this location, the percentage relationship here is given the least weight of the
comparable sales.
Comparable Sale 5
Like comparable sale 4, comparable sale 5 also represents the simultaneous transaction of both
land and air rights. This property is located along Third Avenue at East 63rd Street, and there is
also high-value retail at this location, albeit less than comparable sale 4. This transaction
occurred in August 2012, and is the most dated of the comparable sales, but the relationship
between fee land per square foot and air is 52.8%.
Comparable Sale 6
Comparable sale 6 represents a recent transaction of land and fee from the same seller to the
same buyer. The land at 302 East 96th was initially purchased by the seller, as it abutted a long-
owned property. The seller then packaged the air rights over 300 East 96th Street with the
recently-acquired land and sold them together to the current owner. In this transaction, the air
rights as a percentage of land value is 46.5%, but this is not the best data point as the location is
vastly inferior to the subject, and it is assumed that the buyer was willing to pay a certain price
for this envelope of Zoning Floor Area.This may be an allocation of the unit prices amongst the
components.
Comparable Sale 7
This represents two of the three pieces of a rental development along East 34th Street; the third
piece of this development concerns additional land that was acquired in December 2013 and is
not considered part of this air rights to land value analysis. The air rights acquisition in this
transaction represents 55.7% of the underlying land value, per square foot. We note that similar
to sales 4 and 5, this property is located in a busy retail location along East 34th Street, and less
weight is placed upon the relationship established in this sale.
Comparable Sale 8
This transaction represents the assembly of land and air rights for a high-rise development in the
Financial District at Nassau Street. The sale is comprised of two land parcels and an air rights
VALUATION 127
parcel acquired three months following the acquisition of the second land parcel. This transaction
represents the highest percentage relationship of all the comparable sales, at 68.9% and the block
of air rights is one of the largest analyzed in this appraisal. The acquisition of these air rights
enables the developer to notably extend upward the development envelope, which is of
significance in the Financial District, where narrow streets and dense development reduce the
light and air available to lower floors. Given the observed need to acquire air rights to increase
the feasibility of the development, this sale is judged to be comparable to the subject’s air rights.
Comparable Sale 9
This transaction represents the assembly of land and air rights for a high-rise development in the
subject’s Hudson Square neighborhood. The sale is comprised of seven (7) land parcels and an
air rights parcel acquired simultaneously from a commercial and community facility
condominium building. This transaction represents the largest transaction13 and the block of air
rights is the largest analyzed in this appraisal. A 54.8% percentage relationship is established in
this sale. The acquisition of these air rights enables the developer to notably extend upward the
development envelope, which is of significance in this portion of the Hudson Square, where one
of the premier developments in the neighborhood, 565 Broome is planned. We note that this
project was expanded twice beyond this initial set of transactions; however, for analysis purposes
to measure the land to air rights relationship, this transaction is essential. Given the observed
need to acquire air rights to increase the feasibility of the development, this sale is judged to be
comparable to the subject’s air rights.
Conclusion of Air Rights Value
The comparable sales establish a relationship in the market between air rights and land value for the
same development. The air rights are all assembled through zoning lot mergers, whereby
neighboring parcels transfer rights to the developer site. The relationship reflects that in many cases
the air rights are a bonus to the development. Moreover, as is seen in the sales above, many of the
acquisitions concern the assemblage of air rights from either the only, or the most likely source
available on the developer parcel block. In our conclusion, we have considered the sales which we
found to represent the most similar air rights transactions for valuing the subject property’s air
rights to 550 Washington Street. The percentage relationship established in comparable sales range
from 46.5% to 68.9% of fee land value, and average 58.2%. We have considered the range and
average of the comparable sales and have given most weight to sales 1, 2, and 8 in our conclusion;
these sales are some of the most recent sales, represent the acquisition for residential developments
without high-value retail, and in the cases of these sales, the acquisitions of air rights significantly
added to the feasibility of the project.
13 ZLDA references a maximum ZFA transferred of 101,217, however we have confirmed with the developer that
an effective 9.67 FAR is used on this property, therefore slightly less than the maximum was transferred.
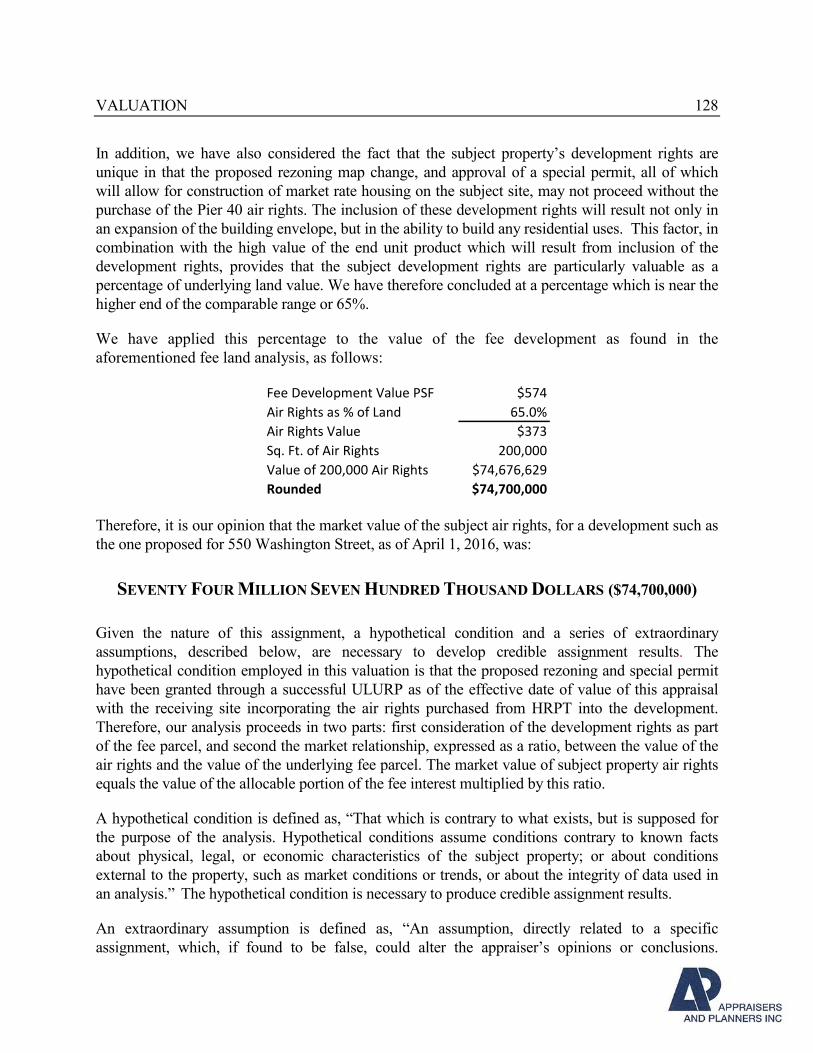
VALUATION 128
In addition, we have also considered the fact that the subject property’s development rights are
unique in that the proposed rezoning map change, and approval of a special permit, all of which
will allow for construction of market rate housing on the subject site, may not proceed without the
purchase of the Pier 40 air rights. The inclusion of these development rights will result not only in
an expansion of the building envelope, but in the ability to build any residential uses. This factor, in
combination with the high value of the end unit product which will result from inclusion of the
development rights, provides that the subject development rights are particularly valuable as a
percentage of underlying land value. We have therefore concluded at a percentage which is near the
higher end of the comparable range or 65%.
We have applied this percentage to the value of the fee development as found in the
aforementioned fee land analysis, as follows:
Fee Development Value PSF $574
Air Rights as % of Land 65.0%
Air Rights Value $373
Sq. Ft. of Air Rights 200,000
Value of 200,000 Air Rights $74,676,629
Rounded $74,700,000
Therefore, it is our opinion that the market value of the subject air rights, for a development such as
the one proposed for 550 Washington Street, as of April 1, 2016, was:
SEVENTY FOUR MILLION SEVEN HUNDRED THOUSAND DOLLARS ($74,700,000)
Given the nature of this assignment, a hypothetical condition and a series of extraordinary
assumptions, described below, are necessary to develop credible assignment results. The
hypothetical condition employed in this valuation is that the proposed rezoning and special permit
have been granted through a successful ULURP as of the effective date of value of this appraisal
with the receiving site incorporating the air rights purchased from HRPT into the development.
Therefore, our analysis proceeds in two parts: first consideration of the development rights as part
of the fee parcel, and second the market relationship, expressed as a ratio, between the value of the
air rights and the value of the underlying fee parcel. The market value of subject property air rights
equals the value of the allocable portion of the fee interest multiplied by this ratio.
A hypothetical condition is defined as, “That which is contrary to what exists, but is supposed for
the purpose of the analysis. Hypothetical conditions assume conditions contrary to known facts
about physical, legal, or economic characteristics of the subject property; or about conditions
external to the property, such as market conditions or trends, or about the integrity of data used in
an analysis.” The hypothetical condition is necessary to produce credible assignment results.
An extraordinary assumption is defined as, “An assumption, directly related to a specific
assignment, which, if found to be false, could alter the appraiser’s opinions or conclusions.
VALUATION 129
Extraordinary assumptions presume as fact otherwise uncertain information about physical, legal,
or economic characteristics of the subject property; or about condition external to the property such
as market conditions or trends; or about the integrity of data used in an analysis.”
The extraordinary assumptions made in this appraisal are summarized as follows:
1. That the outline of North and Center of the planned development will be generally
comprised of the following Zoning Floor Area (ZFA):
- 960,300 square feet of market rate residential development
- 110,000 square feet of affordable senior housing rentals
- 218,700 square feet of affordable residential rentals
2. That, as per the client based on information provided by NYCDCP, the affordable
components will not be eligible to generate off-site Inclusionary Housing bonuses to be
sold to qualifying sites, which departs from prior programs for affordable housing
development in New York City.
3. That the developer will elect to utilize 60% Area Median Income (AMI) for the Senior
Affordable Rental Apartment (SARA) program, in order for this component of the
project to be eligible for 4% Low Income Housing Tax Credits (LIHTC). It was reported
by HPD that 80% AMI is the maximum AMI requirement for the SARA component.
If any of the extraordinary assumptions are found to be materially different than what is assumed
for this assignment, the appraisal may require revision.
RECONCILIATION 130
RECONCILIATION AND VALUE CONCLUSION – AIR RIGHTS RELATIONSHIP
The Sales Comparison Approach was employed to value the relationship between air rights and
land value, expressed as a percentage of underlying fee land value. The resulting indications of
value are as follows:
COST APPROACH: N/A
SALES COMPARISON APPROACH: $74,700,000
INCOME CAPITALIZATION APPROACH: N/A
The Income Approach was not developed to value the subject air rights or the percentage
relationship between the underlying land value and the air rights to be added to the development.
For purposes of analysis, the property is assumed to be vacant of improvements and the air rights
are assumed to be transferred to enhance the residential portion of the development.
The Sales Comparison Approach was developed as the primary method of valuation. The
relationship between land value and air rights value through ZLM was analyzed by researching
recent development site transactions that involved the purchase of vacant land, or an under-
utilized site, and a subsequent and sometimes simultaneous transaction of air rights through a
zoning lot merger. While development site transactions occur often in the recent economic
climate in New York City, and air rights transactions also occur regularly, the sales do not always
happen in a similar timeframe. We uncovered a number of assemblages that were put together
piece-by-piece over time, but because it is difficult to adjust each component for market
conditions, and enhanced motivation seen with assemblages, those transactions were not used.
Furthermore, this analysis concentrates on sales of land and corresponding air rights for
residential purposes, in accordance with the hypothetical condition in this appraisal whereby the
air rights are to be transferred subsequent to ULURP approval. Because hotel, retail and office
uses can be accommodated as-of-right within the planned development, these uses are not included
as part of this appraisal as the air rights are not necessary for development of these uses.
The Cost Approach was not developed as the subject of this appraisal is solely comprised of the
air rights associated it with a proposed development.
We have placed sole reliance on the Sales Comparison Approach to value the relationship between
land value and air rights value for the proposed development at 550 Washington Street
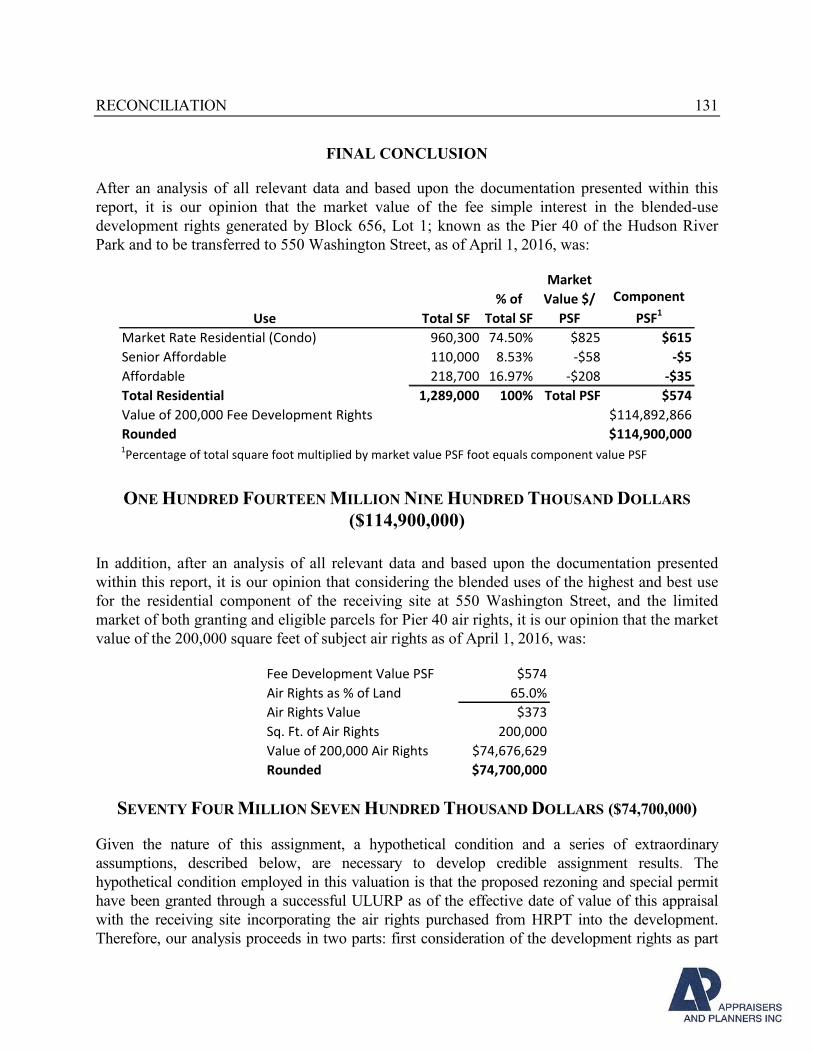
RECONCILIATION 131
FINAL CONCLUSION
After an analysis of all relevant data and based upon the documentation presented within this
report, it is our opinion that the market value of the fee simple interest in the blended-use
development rights generated by Block 656, Lot 1; known as the Pier 40 of the Hudson River
Park and to be transferred to 550 Washington Street, as of April 1, 2016, was:
Use Total SF
% of
Total SF
Market
Value $/
PSF
Component
PSF1
Market Rate Residential (Condo) 960,300 74.50% $825 $615
Senior Affordable 110,000 8.53% -$58 -$5
Affordable 218,700 16.97% -$208 -$35
Total Residential 1,289,000 100% Total PSF $574
Value of 200,000 Fee Development Rights $114,892,866
Rounded $114,900,0001Percentage of total square foot multiplied by market value PSF foot equals component value PSF
ONE HUNDRED FOURTEEN MILLION NINE HUNDRED THOUSAND DOLLARS
($114,900,000)
In addition, after an analysis of all relevant data and based upon the documentation presented
within this report, it is our opinion that considering the blended uses of the highest and best use
for the residential component of the receiving site at 550 Washington Street, and the limited
market of both granting and eligible parcels for Pier 40 air rights, it is our opinion that the market
value of the 200,000 square feet of subject air rights as of April 1, 2016, was:
Fee Development Value PSF $574
Air Rights as % of Land 65.0%
Air Rights Value $373
Sq. Ft. of Air Rights 200,000
Value of 200,000 Air Rights $74,676,629
Rounded $74,700,000
SEVENTY FOUR MILLION SEVEN HUNDRED THOUSAND DOLLARS ($74,700,000)
Given the nature of this assignment, a hypothetical condition and a series of extraordinary
assumptions, described below, are necessary to develop credible assignment results. The
hypothetical condition employed in this valuation is that the proposed rezoning and special permit
have been granted through a successful ULURP as of the effective date of value of this appraisal
with the receiving site incorporating the air rights purchased from HRPT into the development.
Therefore, our analysis proceeds in two parts: first consideration of the development rights as part
RECONCILIATION 132
of the fee parcel, and second the market relationship, expressed as a ratio, between the value of the
air rights and the value of the underlying fee parcel. The market value of subject property air rights
equals the value of the allocable portion of the fee interest multiplied by this ratio.
A hypothetical condition is defined as, “That which is contrary to what exists, but is supposed for
the purpose of the analysis. Hypothetical conditions assume conditions contrary to known facts
about physical, legal, or economic characteristics of the subject property; or about conditions
external to the property, such as market conditions or trends, or about the integrity of data used in
an analysis.” The hypothetical condition is necessary to produce credible assignment results.
An extraordinary assumption is defined as, “An assumption, directly related to a specific
assignment, which, if found to be false, could alter the appraiser’s opinions or conclusions.
Extraordinary assumptions presume as fact otherwise uncertain information about physical, legal,
or economic characteristics of the subject property; or about condition external to the property such
as market conditions or trends; or about the integrity of data used in an analysis.”
The extraordinary assumptions made in this appraisal are summarized as follows:
1. That the outline of North and Center of the planned development will be generally
comprised of the following Zoning Floor Area (ZFA):
- 960,300 square feet of market rate residential development
- 110,000 square feet of affordable senior housing rentals
- 218,700 square feet of affordable residential rentals
2. That, as per the client based on information provided by NYCDCP, the affordable
components will not be eligible to generate off-site Inclusionary Housing bonuses to be
sold to qualifying sites, which departs from prior programs for affordable housing
development in New York City.
3. That the developer will elect to utilize 60% Area Median Income (AMI) for the Senior
Affordable Rental Apartment (SARA) program, in order for this component of the
project to be eligible for 4% Low Income Housing Tax Credits (LIHTC). It was reported
by HPD that 80% AMI is the maximum AMI requirement for the SARA component.
If any of the extraordinary assumptions are found to be materially different than what is assumed
for this assignment, the appraisal may require revision.
ADDENDA – ALTERNATIVE VALUATION AS PROPOSED 133
ADDENDA
Alternative Valuation under Developer’s Proposed Plan with 421-a Assumption
As discussed earlier in the report, the proposed development concerns a proposed mixed-use project
with an assortment of components, most notably a 1,289,000 square foot, mixed-income residential
component. Within the 1,289,000 square feet of ZFA, the developer proposes to construct 960,300
square feet of market rate residential product, 750,000 square feet of which is for condominiums,
and the balance of 210,300 square feet is for market rate rentals. It is our understanding that the
plans for this project were originally conceived when 421-a benefits could be applied to a mixed
condominium or rental project so long as the affordable components satisfied the requirements.
With the June 2015 change in the 421-a law to exclude Manhattan condominiums, and now the
January 15, 2016 expiration of the law in its entirety, the 210,300 square feet of market rate rental
component is not the highest and best use of the market rate residential space and we have therefore
not valued any of the development rights based on this proposed use.
However, in accordance with the client’s request, we have provided an alternate valuation of the
subject receiving site, and subject property air rights under the following assumptions:
• That the proposed rental component is included in the development;
• That 421-a is available to the subject receiving site, and that the benefits are generated by,
and are applicable to the low-income affordable component and the market rate rental
component; and
• As part of developing a rental component, the low-income affordable development will be
eligible to receive LIHTC associated with the 112 units being developed for 60% AMI.
In undertaking this analysis we incorporate by reference the analyses and valuation of the
condominium component of the development and the senior affordable component. This alternative
valuation develops a land residual valuation of the affordable component, as enhanced with the
421-a benefits, and the same for an assumed market rate rental component, also enjoying the
benefits of an assumed 421-a benefit. Furthermore, the low-income component is enhanced by
LIHTC eligibility.
This analysis incorporates a hypothetical condition which is necessary to value the subject property
air rights under this scenario. The hypothetical condition, which we know to be false, but is
assumed for purposes of analysis is that on the date of appraisal the 421-a program exists in its
most recent form prior to expiration.
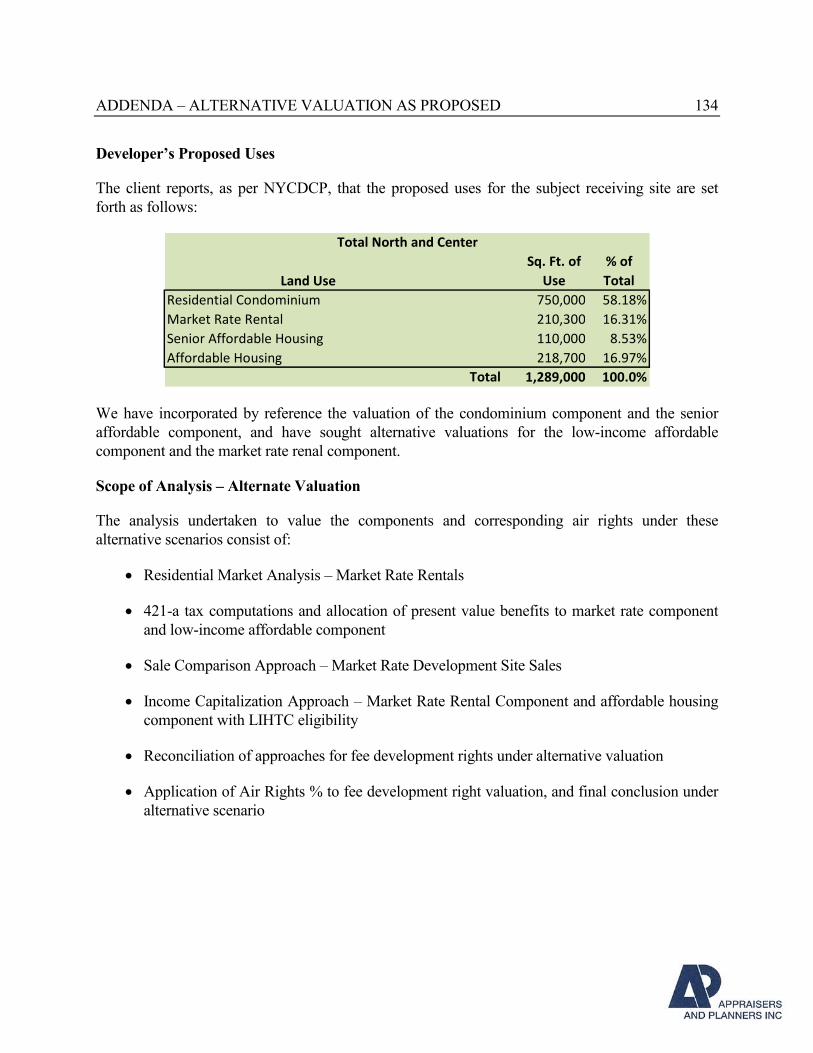
ADDENDA – ALTERNATIVE VALUATION AS PROPOSED 134
Developer’s Proposed Uses
The client reports, as per NYCDCP, that the proposed uses for the subject receiving site are set
forth as follows:
Land Use
Sq. Ft. of
Use
% of
Total
Residential Condominium 750,000 58.18%
Market Rate Rental 210,300 16.31%
Senior Affordable Housing 110,000 8.53%
Affordable Housing 218,700 16.97%
Total 1,289,000 100.0%
Total North and Center
We have incorporated by reference the valuation of the condominium component and the senior
affordable component, and have sought alternative valuations for the low-income affordable
component and the market rate renal component.
Scope of Analysis – Alternate Valuation
The analysis undertaken to value the components and corresponding air rights under these
alternative scenarios consist of:
• Residential Market Analysis – Market Rate Rentals
• 421-a tax computations and allocation of present value benefits to market rate component
and low-income affordable component
• Sale Comparison Approach – Market Rate Development Site Sales
• Income Capitalization Approach – Market Rate Rental Component and affordable housing
component with LIHTC eligibility
• Reconciliation of approaches for fee development rights under alternative valuation
• Application of Air Rights % to fee development right valuation, and final conclusion under
alternative scenario
ADDENDA – ALTERNATIVE VALUATION AS PROPOSED 135
Rental Market Analysis – Proposed Subject Market Rate Rentals
The market rate rental portion of the development at the receiving site, 550 Washington Street, is
scheduled to contain 210,300 square feet of ZFA. For purposes of estimating net rentable area, we
assume a 5% increase from ZFA to above-grade Gross Floor Area, and have assumed a 82.5%
efficiency, leaving the rental portion with a net rentable area of 182,172 square feet. Using an
average apartment size consistent with HPD requirements of 650 rentable square feet, we assume
this will hold 280 units of varying configurations. Competition to any proposed rental development
on the subject property comes from nearby condominium owners that rent their units to tenants and
these units are typically larger than the units in many new rental developments. It is assumed that
the hypothetical improvements in the market rate residential apartments would include high-end
finishes including hardwood floors, tile bathrooms and kitchens with stainless steel appliances,
wood cabinets, and granite counters.
Near the subject, new rental developments include:
- Truffles Tribeca – One of the largest rental developments in the neighboring area, this 291-unit
property was developed in 2007. This property features a parking garage, retail, amenity and lobby
on the ground floor under 291 units ranging from studios to three-bedrooms. Property amenities
include a roof garden with direct water views, courtyard with gated entrance, house staff, screening
room, game room and industrial finishes throughout. According to a description provided by
management, “all apartments have space saving wall flush heating and AC units, dark-brown hard
wood floors, granite counters, generous double barred closets. Kitchens are complete with grey
thermofoil cabinets, blackboard backsplash, GE Profile appliance package including: side by side
stainless steel fridge, gas range with middle warming tray, dishwasher, and turntable microwave.”
Recent one-bedroom rentals show a wide range of monthly rents from $3,795 to $4,995; two-
bedrooms range from $4,895 to $6,995 and the most recent three-bedroom rentals range from
$7,500 to $9,995.
- 55 Thompson – This property was completed in 2011. It features grade level retail space, lobby
and amenity space under 38 apartments. The total building is approximately 77,000 square feet.
Rents in this building are some of the highest in the area. One-bedroom units ask as high as $9,095
per month and two-bedroom penthouse units recently asked $17,500.
- 600 Washington Street – This building houses 136 rental units. A survey of the most recent rentals
in this property produced an average rent of $89 per square foot. Units in this building are on the
smaller side, typical of rental developments throughout Manhattan.
In addition, we have researched and analyzed rents from buildings deemed comparable to the
proposed development at 550 Washington Street. A summary of the rental rates of these buildings
since January 1, 2015 is presented below and on the following pages:
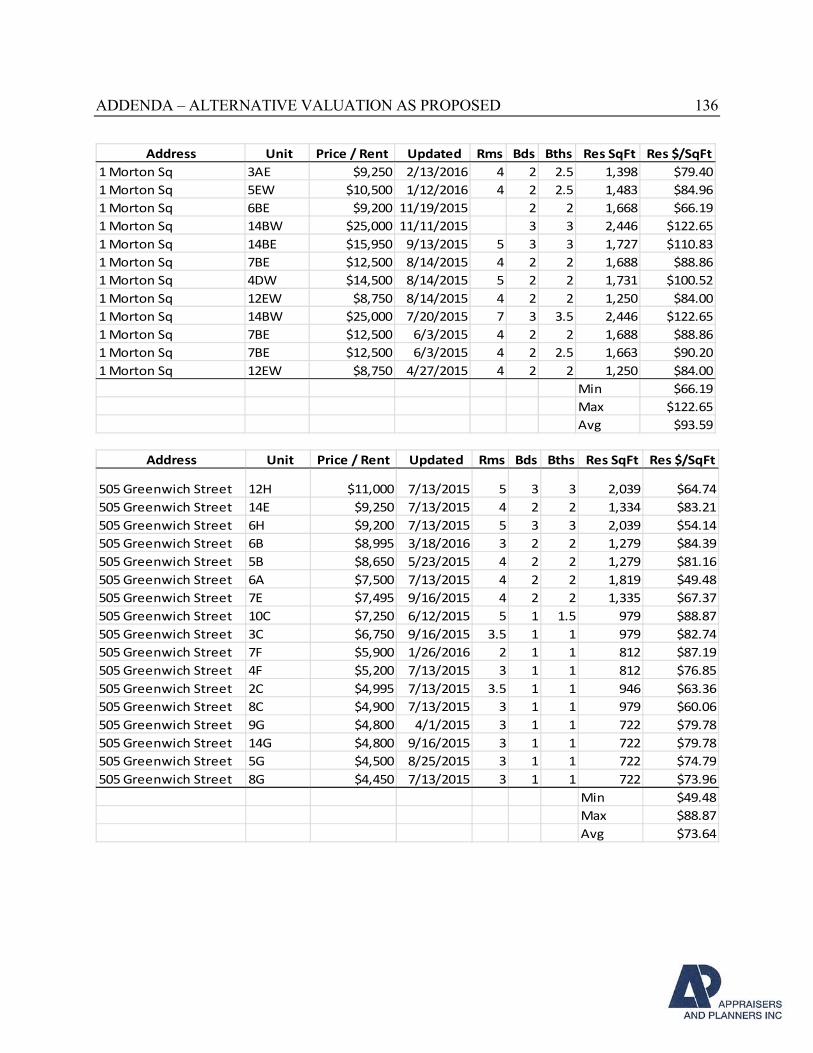
ADDENDA – ALTERNATIVE VALUATION AS PROPOSED 136
Address Unit Price / Rent Updated Rms Bds Bths Res SqFt Res $/SqFt
1 Morton Sq 3AE $9,250 2/13/2016 4 2 2.5 1,398 $79.40
1 Morton Sq 5EW $10,500 1/12/2016 4 2 2.5 1,483 $84.96
1 Morton Sq 6BE $9,200 11/19/2015 2 2 1,668 $66.19
1 Morton Sq 14BW $25,000 11/11/2015 3 3 2,446 $122.65
1 Morton Sq 14BE $15,950 9/13/2015 5 3 3 1,727 $110.83
1 Morton Sq 7BE $12,500 8/14/2015 4 2 2 1,688 $88.86
1 Morton Sq 4DW $14,500 8/14/2015 5 2 2 1,731 $100.52
1 Morton Sq 12EW $8,750 8/14/2015 4 2 2 1,250 $84.00
1 Morton Sq 14BW $25,000 7/20/2015 7 3 3.5 2,446 $122.65
1 Morton Sq 7BE $12,500 6/3/2015 4 2 2 1,688 $88.86
1 Morton Sq 7BE $12,500 6/3/2015 4 2 2.5 1,663 $90.20
1 Morton Sq 12EW $8,750 4/27/2015 4 2 2 1,250 $84.00
Min $66.19
Max $122.65
Avg $93.59
Address Unit Price / Rent Updated Rms Bds Bths Res SqFt Res $/SqFt
505 Greenwich Street 12H $11,000 7/13/2015 5 3 3 2,039 $64.74
505 Greenwich Street 14E $9,250 7/13/2015 4 2 2 1,334 $83.21
505 Greenwich Street 6H $9,200 7/13/2015 5 3 3 2,039 $54.14
505 Greenwich Street 6B $8,995 3/18/2016 3 2 2 1,279 $84.39
505 Greenwich Street 5B $8,650 5/23/2015 4 2 2 1,279 $81.16
505 Greenwich Street 6A $7,500 7/13/2015 4 2 2 1,819 $49.48
505 Greenwich Street 7E $7,495 9/16/2015 4 2 2 1,335 $67.37
505 Greenwich Street 10C $7,250 6/12/2015 5 1 1.5 979 $88.87
505 Greenwich Street 3C $6,750 9/16/2015 3.5 1 1 979 $82.74
505 Greenwich Street 7F $5,900 1/26/2016 2 1 1 812 $87.19
505 Greenwich Street 4F $5,200 7/13/2015 3 1 1 812 $76.85
505 Greenwich Street 2C $4,995 7/13/2015 3.5 1 1 946 $63.36
505 Greenwich Street 8C $4,900 7/13/2015 3 1 1 979 $60.06
505 Greenwich Street 9G $4,800 4/1/2015 3 1 1 722 $79.78
505 Greenwich Street 14G $4,800 9/16/2015 3 1 1 722 $79.78
505 Greenwich Street 5G $4,500 8/25/2015 3 1 1 722 $74.79
505 Greenwich Street 8G $4,450 7/13/2015 3 1 1 722 $73.96
Min $49.48
Max $88.87
Avg $73.64
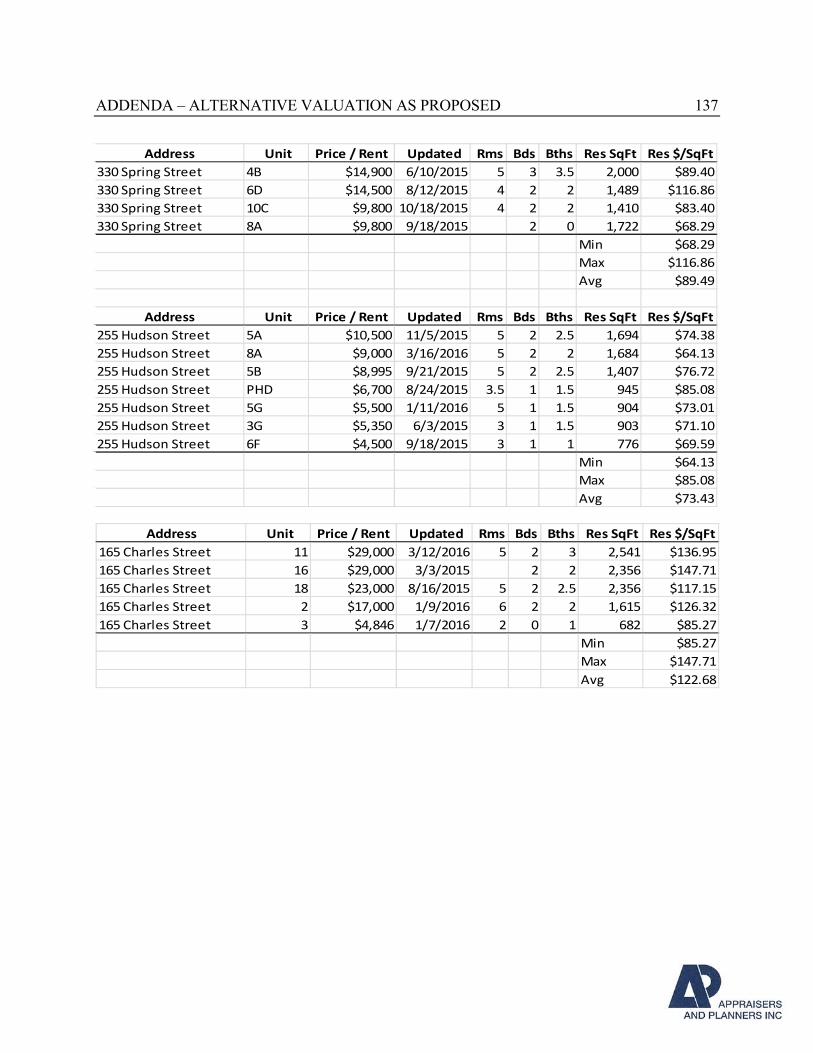
ADDENDA – ALTERNATIVE VALUATION AS PROPOSED 137
Address Unit Price / Rent Updated Rms Bds Bths Res SqFt Res $/SqFt
330 Spring Street 4B $14,900 6/10/2015 5 3 3.5 2,000 $89.40
330 Spring Street 6D $14,500 8/12/2015 4 2 2 1,489 $116.86
330 Spring Street 10C $9,800 10/18/2015 4 2 2 1,410 $83.40
330 Spring Street 8A $9,800 9/18/2015 2 0 1,722 $68.29
Min $68.29
Max $116.86
Avg $89.49
Address Unit Price / Rent Updated Rms Bds Bths Res SqFt Res $/SqFt
255 Hudson Street 5A $10,500 11/5/2015 5 2 2.5 1,694 $74.38
255 Hudson Street 8A $9,000 3/16/2016 5 2 2 1,684 $64.13
255 Hudson Street 5B $8,995 9/21/2015 5 2 2.5 1,407 $76.72
255 Hudson Street PHD $6,700 8/24/2015 3.5 1 1.5 945 $85.08
255 Hudson Street 5G $5,500 1/11/2016 5 1 1.5 904 $73.01
255 Hudson Street 3G $5,350 6/3/2015 3 1 1.5 903 $71.10
255 Hudson Street 6F $4,500 9/18/2015 3 1 1 776 $69.59
Min $64.13
Max $85.08
Avg $73.43
Address Unit Price / Rent Updated Rms Bds Bths Res SqFt Res $/SqFt
165 Charles Street 11 $29,000 3/12/2016 5 2 3 2,541 $136.95
165 Charles Street 16 $29,000 3/3/2015 2 2 2,356 $147.71
165 Charles Street 18 $23,000 8/16/2015 5 2 2.5 2,356 $117.15
165 Charles Street 2 $17,000 1/9/2016 6 2 2 1,615 $126.32
165 Charles Street 3 $4,846 1/7/2016 2 0 1 682 $85.27
Min $85.27
Max $147.71
Avg $122.68
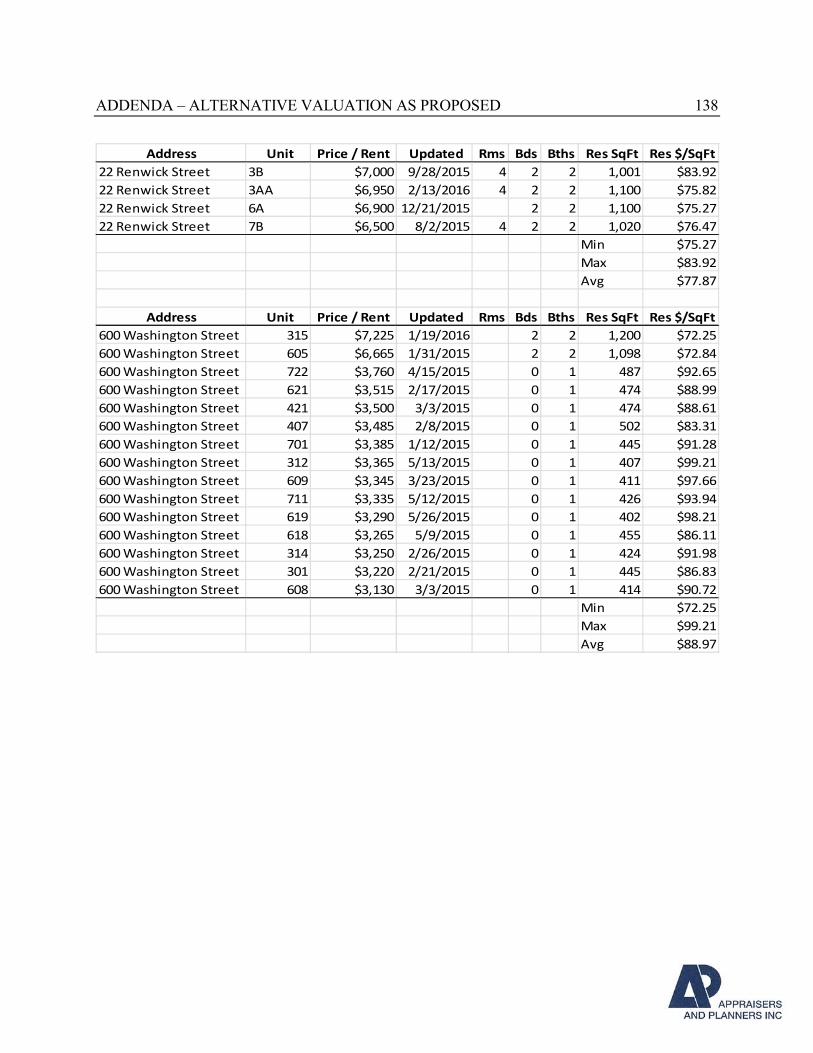
ADDENDA – ALTERNATIVE VALUATION AS PROPOSED 138
Address Unit Price / Rent Updated Rms Bds Bths Res SqFt Res $/SqFt
22 Renwick Street 3B $7,000 9/28/2015 4 2 2 1,001 $83.92
22 Renwick Street 3AA $6,950 2/13/2016 4 2 2 1,100 $75.82
22 Renwick Street 6A $6,900 12/21/2015 2 2 1,100 $75.27
22 Renwick Street 7B $6,500 8/2/2015 4 2 2 1,020 $76.47
Min $75.27
Max $83.92
Avg $77.87
Address Unit Price / Rent Updated Rms Bds Bths Res SqFt Res $/SqFt
600 Washington Street 315 $7,225 1/19/2016 2 2 1,200 $72.25
600 Washington Street 605 $6,665 1/31/2015 2 2 1,098 $72.84
600 Washington Street 722 $3,760 4/15/2015 0 1 487 $92.65
600 Washington Street 621 $3,515 2/17/2015 0 1 474 $88.99
600 Washington Street 421 $3,500 3/3/2015 0 1 474 $88.61
600 Washington Street 407 $3,485 2/8/2015 0 1 502 $83.31
600 Washington Street 701 $3,385 1/12/2015 0 1 445 $91.28
600 Washington Street 312 $3,365 5/13/2015 0 1 407 $99.21
600 Washington Street 609 $3,345 3/23/2015 0 1 411 $97.66
600 Washington Street 711 $3,335 5/12/2015 0 1 426 $93.94
600 Washington Street 619 $3,290 5/26/2015 0 1 402 $98.21
600 Washington Street 618 $3,265 5/9/2015 0 1 455 $86.11
600 Washington Street 314 $3,250 2/26/2015 0 1 424 $91.98
600 Washington Street 301 $3,220 2/21/2015 0 1 445 $86.83
600 Washington Street 608 $3,130 3/3/2015 0 1 414 $90.72
Min $72.25
Max $99.21
Avg $88.97
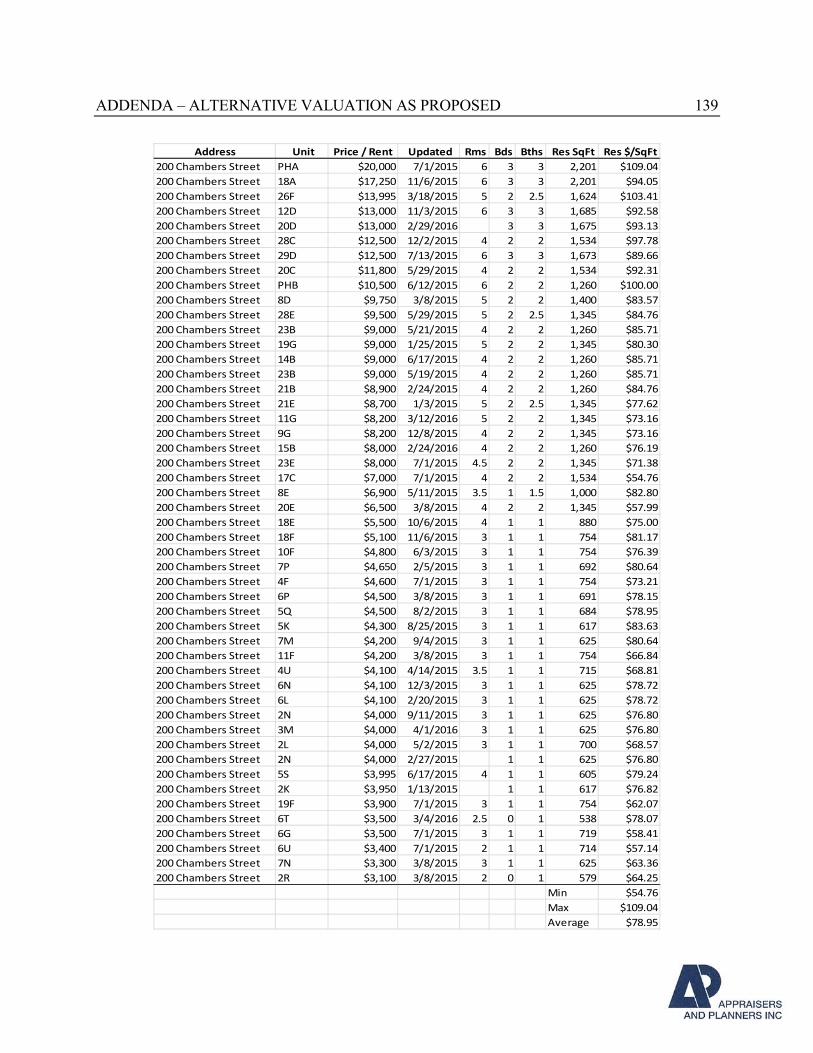
ADDENDA – ALTERNATIVE VALUATION AS PROPOSED 139
Address Unit Price / Rent Updated Rms Bds Bths Res SqFt Res $/SqFt
200 Chambers Street PHA $20,000 7/1/2015 6 3 3 2,201 $109.04
200 Chambers Street 18A $17,250 11/6/2015 6 3 3 2,201 $94.05
200 Chambers Street 26F $13,995 3/18/2015 5 2 2.5 1,624 $103.41
200 Chambers Street 12D $13,000 11/3/2015 6 3 3 1,685 $92.58
200 Chambers Street 20D $13,000 2/29/2016 3 3 1,675 $93.13
200 Chambers Street 28C $12,500 12/2/2015 4 2 2 1,534 $97.78
200 Chambers Street 29D $12,500 7/13/2015 6 3 3 1,673 $89.66
200 Chambers Street 20C $11,800 5/29/2015 4 2 2 1,534 $92.31
200 Chambers Street PHB $10,500 6/12/2015 6 2 2 1,260 $100.00
200 Chambers Street 8D $9,750 3/8/2015 5 2 2 1,400 $83.57
200 Chambers Street 28E $9,500 5/29/2015 5 2 2.5 1,345 $84.76
200 Chambers Street 23B $9,000 5/21/2015 4 2 2 1,260 $85.71
200 Chambers Street 19G $9,000 1/25/2015 5 2 2 1,345 $80.30
200 Chambers Street 14B $9,000 6/17/2015 4 2 2 1,260 $85.71
200 Chambers Street 23B $9,000 5/19/2015 4 2 2 1,260 $85.71
200 Chambers Street 21B $8,900 2/24/2015 4 2 2 1,260 $84.76
200 Chambers Street 21E $8,700 1/3/2015 5 2 2.5 1,345 $77.62
200 Chambers Street 11G $8,200 3/12/2016 5 2 2 1,345 $73.16
200 Chambers Street 9G $8,200 12/8/2015 4 2 2 1,345 $73.16
200 Chambers Street 15B $8,000 2/24/2016 4 2 2 1,260 $76.19
200 Chambers Street 23E $8,000 7/1/2015 4.5 2 2 1,345 $71.38
200 Chambers Street 17C $7,000 7/1/2015 4 2 2 1,534 $54.76
200 Chambers Street 8E $6,900 5/11/2015 3.5 1 1.5 1,000 $82.80
200 Chambers Street 20E $6,500 3/8/2015 4 2 2 1,345 $57.99
200 Chambers Street 18E $5,500 10/6/2015 4 1 1 880 $75.00
200 Chambers Street 18F $5,100 11/6/2015 3 1 1 754 $81.17
200 Chambers Street 10F $4,800 6/3/2015 3 1 1 754 $76.39
200 Chambers Street 7P $4,650 2/5/2015 3 1 1 692 $80.64
200 Chambers Street 4F $4,600 7/1/2015 3 1 1 754 $73.21
200 Chambers Street 6P $4,500 3/8/2015 3 1 1 691 $78.15
200 Chambers Street 5Q $4,500 8/2/2015 3 1 1 684 $78.95
200 Chambers Street 5K $4,300 8/25/2015 3 1 1 617 $83.63
200 Chambers Street 7M $4,200 9/4/2015 3 1 1 625 $80.64
200 Chambers Street 11F $4,200 3/8/2015 3 1 1 754 $66.84
200 Chambers Street 4U $4,100 4/14/2015 3.5 1 1 715 $68.81
200 Chambers Street 6N $4,100 12/3/2015 3 1 1 625 $78.72
200 Chambers Street 6L $4,100 2/20/2015 3 1 1 625 $78.72
200 Chambers Street 2N $4,000 9/11/2015 3 1 1 625 $76.80
200 Chambers Street 3M $4,000 4/1/2016 3 1 1 625 $76.80
200 Chambers Street 2L $4,000 5/2/2015 3 1 1 700 $68.57
200 Chambers Street 2N $4,000 2/27/2015 1 1 625 $76.80
200 Chambers Street 5S $3,995 6/17/2015 4 1 1 605 $79.24
200 Chambers Street 2K $3,950 1/13/2015 1 1 617 $76.82
200 Chambers Street 19F $3,900 7/1/2015 3 1 1 754 $62.07
200 Chambers Street 6T $3,500 3/4/2016 2.5 0 1 538 $78.07
200 Chambers Street 6G $3,500 7/1/2015 3 1 1 719 $58.41
200 Chambers Street 6U $3,400 7/1/2015 2 1 1 714 $57.14
200 Chambers Street 7N $3,300 3/8/2015 3 1 1 625 $63.36
200 Chambers Street 2R $3,100 3/8/2015 2 0 1 579 $64.25
Min $54.76
Max $109.04
Average $78.95
ADDENDA – ALTERNATIVE VALUATION AS PROPOSED 140
Conclusion:
We have analyzed the rental data on a per square foot basis. The comparable rentals represent
relatively recent leases of rental and condominium developments near the subject receiving site in
Hudson Square. These developments are most similar to the subject hypothetical rental
development with respect to size, amenities, location and assumed construction quality. They are all
located in Tribeca, West Village, Hudson Square or SoHo and represent directly competitive rental
rates to what is supposed for 550 Washington Street. The average building rentals range from a low
of $73 per square foot per annum to a high of $123 per annual square foot. The average rent for all
unit types in all buildings is $87 per annual square foot. We note that the proposed development
will have high ceilings, on-site amenities and that the projected rents in the property are judged to
be greater than most competing Hudson Square properties. In estimating rent for the subject units,
we therefore conclude an average above the comparable rentals. Therefore our conclusion of market
rent is $90 per square foot, which gives most weight to the data from 1 Morton Square and abutting
600 Washington Street; these properties lie opposite the subject property across Leroy Street.
ADDENDA – ALTERNATIVE VALUATION AS PROPOSED 141
SALES COMPARISON APPROACH –
MARKET RATE RENTAL DEVELOPMENT SITES
We incorporate by reference the explanation of the sales comparison approach to value and the
appraisal methodology for developing and analyzing the data to produce results via this approach.
Selection of Comparable Sales – Market Rate Rental Development Sites
Condominium vs. Market Rate Rental Development
Most new developments in Manhattan are for condominiums as, given the rapid rise in land prices
over the past three years, the cost of financing and developing rentals has become less feasible for
most developers. Nearly all new recent and ongoing market rate rental developments in core
Manhattan are being undertaken by developers that have long held their property, or were able to
obtain properties via atypical conditions of sale such as through foreclosure or through favorable
terms such as a ground lease. Rental developments are also occurring on rezoned properties
whereby as a condition of the rezoning, a portion of the new project is to include affordable as well
as market rate rental housing. Other than the aforementioned situations, it is now very rare to find
any arms-length transactions of market rate residential rental development sites and only a small
group, scattered throughout Manhattan, were uncovered for this alternate valuation. As a result, a
search for recent (through 1st Q 2016) land transactions in core Manhattan where the developer
planned rentals produced only three results, as mapped below.
Comparable sales of properties planned for market rate residential development were derived and
confirmed through a thorough investigative search of public records as well as discussions with
knowledgeable parties. In addition we have relied upon several recognized data sources for
comparable sales such as CoStar Comps and Property Shark.
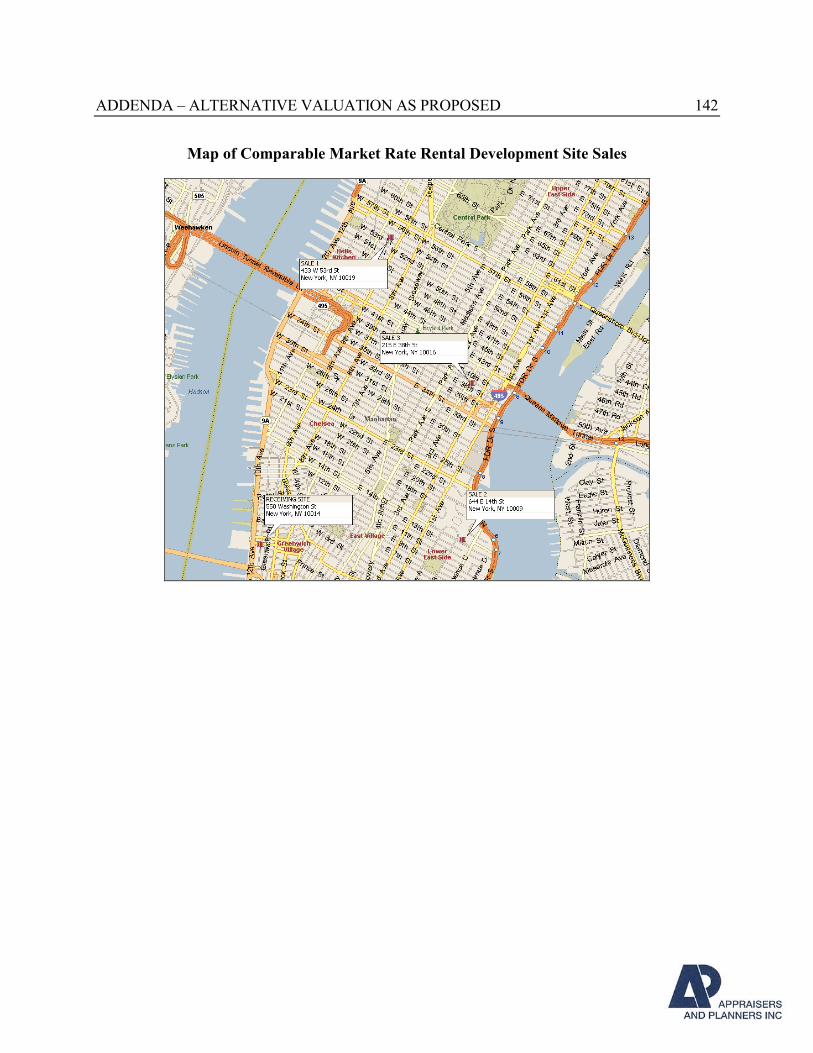
ADDENDA – ALTERNATIVE VALUATION AS PROPOSED 142
Map of Comparable Market Rate Rental Development Site Sales
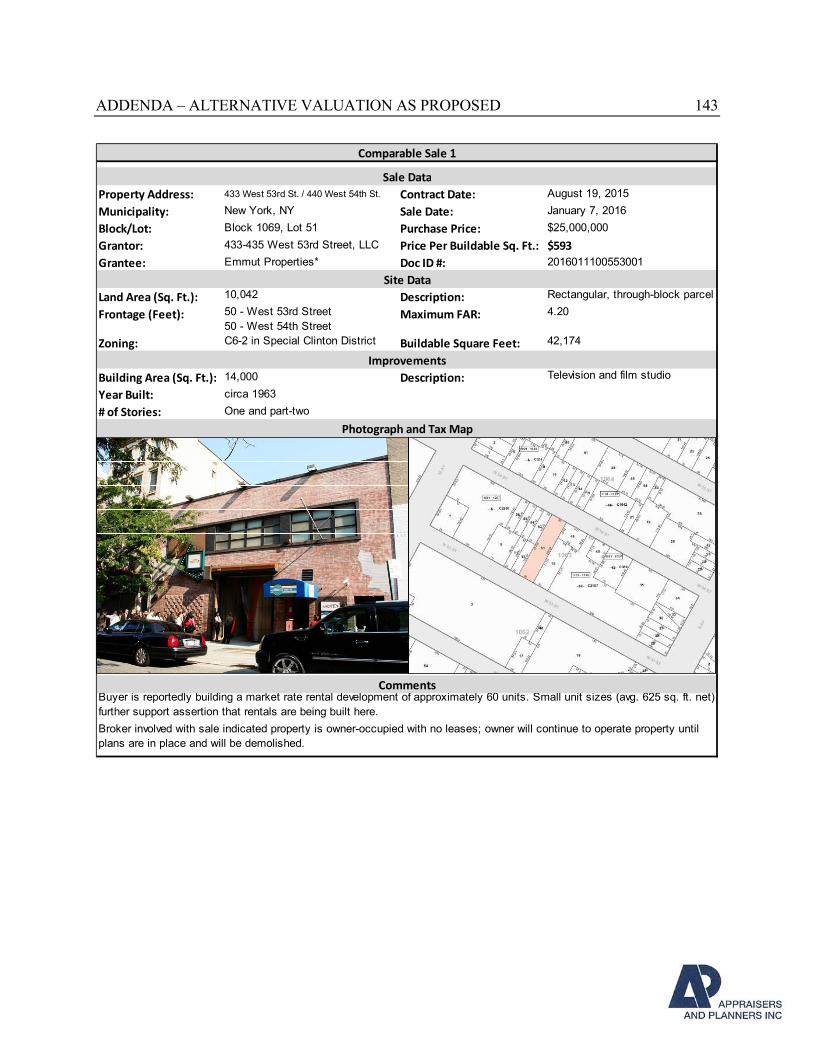
ADDENDA – ALTERNATIVE VALUATION AS PROPOSED 143
Property Address: 433 West 53rd St. / 440 West 54th St. Contract Date: August 19, 2015
Municipality: New York, NY Sale Date: January 7, 2016
Block/Lot: Block 1069, Lot 51 Purchase Price: $25,000,000
Grantor: 433-435 West 53rd Street, LLC Price Per Buildable Sq. Ft.: $593
Grantee: Emmut Properties* Doc ID #: 2016011100553001
Land Area (Sq. Ft.): 10,042 Description: Rectangular, through-block parcel
Frontage (Feet): 50 - West 53rd Street
50 - West 54th StreetMaximum FAR: 4.20
Zoning: C6-2 in Special Clinton District Buildable Square Feet: 42,174
Building Area (Sq. Ft.): 14,000 Description:
Year Built: circa 1963
# of Stories: One and part-two
Comparable Sale 1
Sale Data
Site Data
ImprovementsTelevision and film studio
Photograph and Tax Map
Buyer is reportedly building a market rate rental development of approximately 60 units. Small unit sizes (avg. 625 sq. ft. net)
further support assertion that rentals are being built here.
Comments
Broker involved with sale indicated property is owner-occupied with no leases; owner will continue to operate property until
plans are in place and will be demolished.
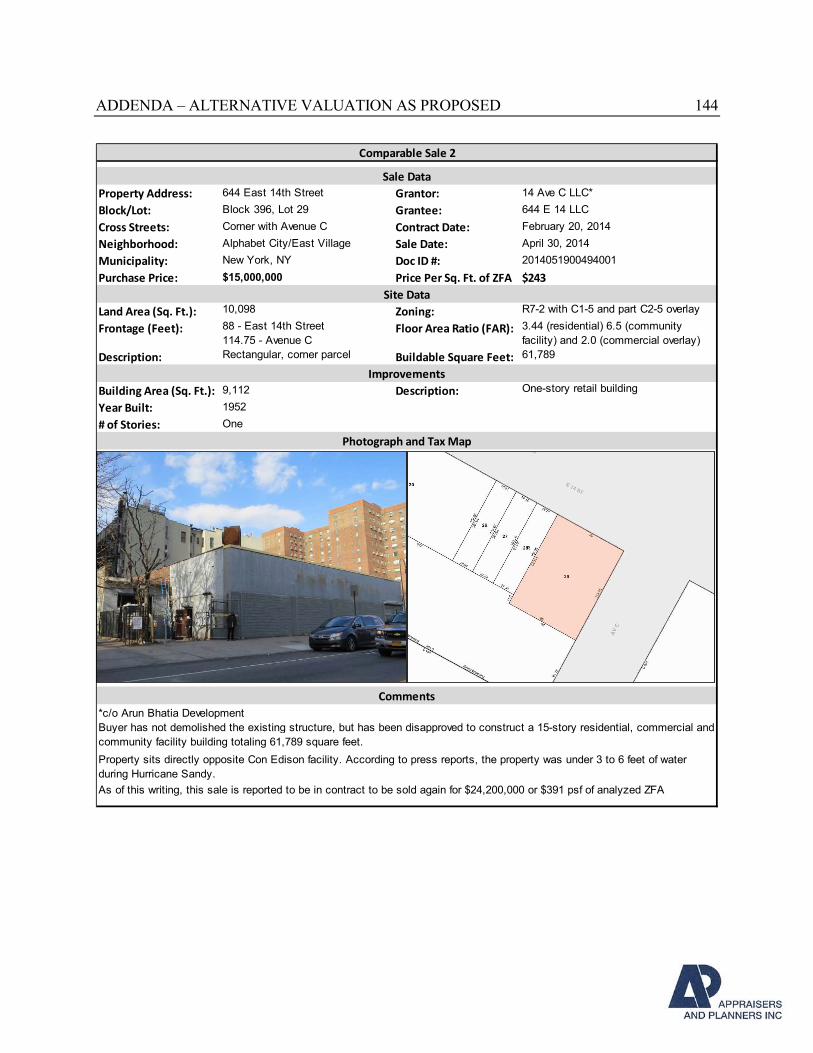
ADDENDA – ALTERNATIVE VALUATION AS PROPOSED 144
Property Address: 644 East 14th Street Grantor: 14 Ave C LLC*
Block/Lot: Block 396, Lot 29 Grantee: 644 E 14 LLC
Cross Streets: Corner with Avenue C Contract Date: February 20, 2014
Neighborhood: Alphabet City/East Village Sale Date: April 30, 2014
Municipality: New York, NY Doc ID #: 2014051900494001
Purchase Price: $15,000,000 Price Per Sq. Ft. of ZFA $243
Land Area (Sq. Ft.): 10,098 Zoning: R7-2 with C1-5 and part C2-5 overlay
Frontage (Feet): 88 - East 14th Street
114.75 - Avenue CFloor Area Ratio (FAR): 3.44 (residential) 6.5 (community
facility) and 2.0 (commercial overlay)
Description: Rectangular, corner parcel Buildable Square Feet: 61,789
Building Area (Sq. Ft.): 9,112 Description:
Year Built: 1952
# of Stories: One
Comments
*c/o Arun Bhatia Development
Buyer has not demolished the existing structure, but has been disapproved to construct a 15-story residential, commercial and
community facility building totaling 61,789 square feet.
Property sits directly opposite Con Edison facility. According to press reports, the property was under 3 to 6 feet of water
during Hurricane Sandy.
As of this writing, this sale is reported to be in contract to be sold again for $24,200,000 or $391 psf of analyzed ZFA
Comparable Sale 2
Sale Data
Site Data
ImprovementsOne-story retail building
Photograph and Tax Map
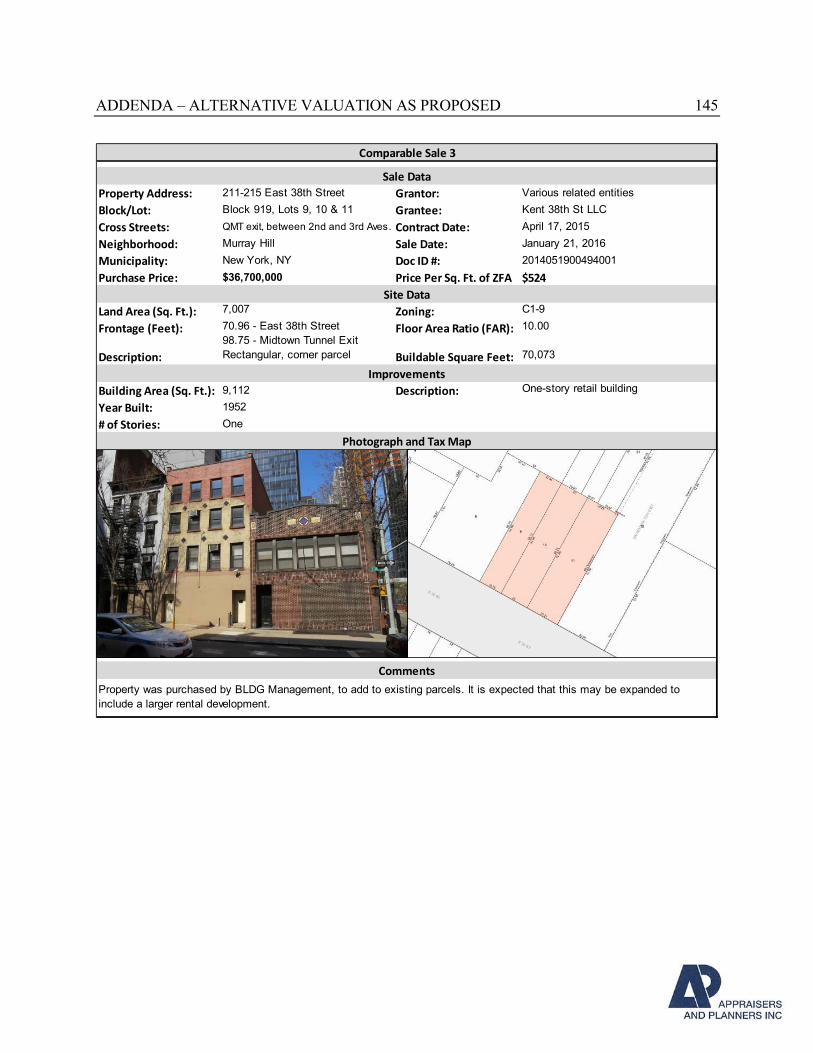
ADDENDA – ALTERNATIVE VALUATION AS PROPOSED 145
Property Address: 211-215 East 38th Street Grantor: Various related entities
Block/Lot: Block 919, Lots 9, 10 & 11 Grantee: Kent 38th St LLC
Cross Streets: QMT exit, between 2nd and 3rd Aves. Contract Date: April 17, 2015
Neighborhood: Murray Hill Sale Date: January 21, 2016
Municipality: New York, NY Doc ID #: 2014051900494001
Purchase Price: $36,700,000 Price Per Sq. Ft. of ZFA $524
Land Area (Sq. Ft.): 7,007 Zoning: C1-9
Frontage (Feet): 70.96 - East 38th Street
98.75 - Midtown Tunnel ExitFloor Area Ratio (FAR): 10.00
Description: Rectangular, corner parcel Buildable Square Feet: 70,073
Building Area (Sq. Ft.): 9,112 Description:
Year Built: 1952
# of Stories: One
Comparable Sale 3
Sale Data
Site Data
ImprovementsOne-story retail building
Photograph and Tax Map
Comments
Property was purchased by BLDG Management, to add to existing parcels. It is expected that this may be expanded to
include a larger rental development.
ADDENDA – ALTERNATIVE VALUATION AS PROPOSED 146
DISCUSSION OF ADJUSTMENTS TO COMPARABLE SALES
Intangible/Transactional Adjustments for all sales are discussed below
Property Rights: All comparable sales represent the sale of the fee simple interest, or a leased fee
interest with short term leases remaining, which is tantamount to fee simple for valuation purposes
and no adjustments were made.
Financing: No adjustments are made for financing; all sales were typically financed or required no
financing.
Conditions of Sale: No atypical motivations were detected and no adjustments were made to any
of the sales.
Market Conditions (time): Sales of development sites in Manhattan through May 2015 increased
over prior quarters as financing for the sites remained favorable and demand for new residential
product was high. As discussed, the appetite for development land in prime areas had been by all
measures unprecedented. Demand came not only from well-capitalized local developers but from
investors from around the world.
The sale dates of the comparable sales analyzed range from April 2014 to a property reported to be
in contract as of the date of appraisal. In some submarkets around New York City, land with
zoning that allows residential development has more than doubled in the last few quarters. Based
upon past and current market conditions, we have applied upward adjustments to all sales
equivalent to 2.0% per month as the market for residential development parcels in the subject’s
market segment has shown increasing strength; however the demand has been generated by
condominium development as opposes to rental development, where there is less demand for sites
at these price levels. A number of indications point to a reduction in the appreciation for land
values, and the market conditions adjustment is applied through June 2015, where afterwards it has
become apparent that the market for new development projects, both rental and condominium, has
softened. Since then, flattening rental rates suggest a decrease in pricing and we have applied a
-1.5% per month adjustment for the time period of October 1, 2015 through our date of value.
Sale No. 1 (443 West 53rd Street): This is the sale of a 10,042 square foot, through-block
development site located between Ninth and Tenth Avenues in Clinton. The property is to be
developed with a fully-market rate rental apartment building. The property is zoned C6-2 in the
Special Clinton District and FAR is 4.2, therefore a development of 42,174 can be achieved on
the site. The property entered into contract on approximately October 1, 2015 and was in contract
as of the appraisal date, and has reportedly closed as of this writing (first week of January 2016)
for a price of $25,000,000 or $593 per square foot. Demolition costs for the existing 14,000
square-foot structure is estimated at $30 per square foot and is added to the sale price, bringing
the total price to $24,420,000 or $603 per square foot of ZFA.
ADDENDA – ALTERNATIVE VALUATION AS PROPOSED 147
Sale No. 2 (644 East 14th Street): This is the sale of a 10,098 square-foot, rectangular corner
development site located along the southeasterly corner of East 14th Street and Avenue C. The
property entered into contract on February 20, 2014 and sold on April 30, 2014 for an indicated
purchase price of $15,000,000. The property is zone R7-2 with a split commercial overlay of C1-
5 and C2-5. Maximum FAR for residential development in this zone is 3.44, however with a mix
of uses, including community facility, an FAR of 6.50 can be achieved. The grantee has applied
to construct a 61,789-square-foot mixed-use project on the site comprised of residential,
commercial and community facility to an FAR of 6.11. Given other site constraints, the
developer is maximizing FAR on this site and therefore the 61,789 square feet is the unit of
comparison for this sale; thus, the sale price is $243 per square foot. Demolition costs for the
existing 9,112 square-foot structure is estimated at $30 per square foot and is added to the sale
price, bringing the total price to $15,273,360 or $247 per square foot of ZFA. It has been
reported that after drawing plans and seeking to obtain approvals to build, this property is
currently in contract for $24,200,000, or $396 per square foot, including estimated demolition
costs.
Sale No. 3 (211-215 East 38th Street): This is the sale of a 7,007 square-foot rectangular corner
parcel located along East 38th Street and the Queens Midtown Tunnel exit, between Second and
Third Avenues. The property is zoned C1-9 and has a base FAR of 10.0, with the ability to
expand to 12.0 with inclusionary housing. The buyer owns other parcels along East 38th Street
and this is a component of a larger development opportunity. The property entered into contract
on April 17, 2015 and sold on January 21, 2016 for an indicated purchase price of $36,700,000 or
$524 per square foot of ZFA at a 10.0 FAR. The properties were delivered with 120-day
termination notices, so no buyout costs are estimated. Demolition costs to raze the existing 9,112
square feet of improvements are estimated at $30 per square foot, and is added to the sale price,
bringing the total price to $528 per square foot.
Physical/Locational Adjustments
Location: The receiving site is located along West Street/NYS Route 9A and abutted southerly
by a NYC Sanitation parking garage. According to the NYS Traffic Data Viewer, a daily average
of nearly 59,000 cars pass in front of the subject property along West Street, some of which drive
at high speeds. Additionally, at this part of West Street/9A, there are a number of traffic lights,
including one located at the intersection of West Street and Clarkson Street. Opposite the
property across Washington Street is a 500,000 square foot UPS facility, and opposite the
receiving site across West Houston Street is a FedEx facility. Although a number of the
surrounding properties are judged to be a nuisance and are burdened by truck traffic, the
structures are mid-rise and would not block views from the potential development above 142 feet
in elevation, the height of the sanitation facility. Despite the surrounding nuisances, the receiving
development will have direct water views to the west, an amenity not shared by all comparable
sales. All comparable sales were adjusted upward for location as their locations in Alphabet City,
Clinton, and Murray Hill are judged to be inferior locations than the subject development
location.
ADDENDA – ALTERNATIVE VALUATION AS PROPOSED 148
Flooding: Comparable sale 2 has a recent history of flooding and is located in flood zones; this
sale was adjusted upward. No other sales experience the same flood issues as these sales and
were not adjusted.
Frontage/Configuration: The receiving site will be comprised of two block-front parcels with
ample frontages on four streets. Comparable sale 1 is a through-block site with frontage on two
streets, which is inferior to a corner development, and an upward adjustment was made.
Comparable sales 2 and 3 are corner development sites and do not require adjustment for
configuration.
Community Facility/Affordable: At this stage in the valuation of the development rights, we
are concerned with the value of the market rate rental component of the development and have
adjusted sales that include other uses within the development. In order to maximize development
potential, and qualify for tax abatements/exemptions, sale 2 was built with community facility
and was adjusted upward to reflect the impact on value that on-site community facilities have as
compared to fully market-rate projects. Where allowed by zoning, community facilities are
typically included in developments in order to maximize FAR of the commercial and residential
components. Depending on their location within a development, community facilities typically
do not generate the rent of commercial or residential spaces, which is judged to be the case with
this comparable sale. Therefore, the inclusion of lower-value community facility space averages
down the sale price on a per-square-foot basis, and an upward adjustment was made to reflect
this.
421-a Adjustment: For the hypothetical valuation in which the proposed plans are undertaken
and the 421-a abatement program is in place, we consider the contributory value of this benefit to
the market rate rental portion of the land. As solved for in the income approach in this addenda,
the 421-a program adds approximately $161 per square foot of value, or 27% of the value of this
approach. There is risk to realizing the benefit, largely associated with the construction of the
improvements, as the full present value of the benefit is not realized until the property is built and
leased up for occupancy. Accordingly this adjustment of 20% will not produce a dollar-for-
dollar, adjustment but represents the majority of the value of the benefit to the proposed projects.
None of the comparable sales have sought 421-a as of this writing and all are adjusted upward.
Retail Component: This component of the valuation considers prices paid for development land
for rental development. Comparable sale 2 will include retail components, but it is expected to
achieve similar income as the residential portion and no adjustment was required.
Zoning/Use: The uses for the comparable developments are similar to what is assumed for the
receiving development, once rezoned. However, the density and height limits of the proposed
rental component of the receiving site is greater than what is achieved on the comparable
development sites 1 and 2. The receiving site rental component is projected to reach a height of
230 feet, which far exceeds the allowable height for the sale developments 1 and 2, and both are

ADDENDA – ALTERNATIVE VALUATION AS PROPOSED 149
adjusted upwards. There is no height limit for sale 3, and the 10.0 FAR as of right is superior to
the subject receiving site, and a downward adjustment was applied.
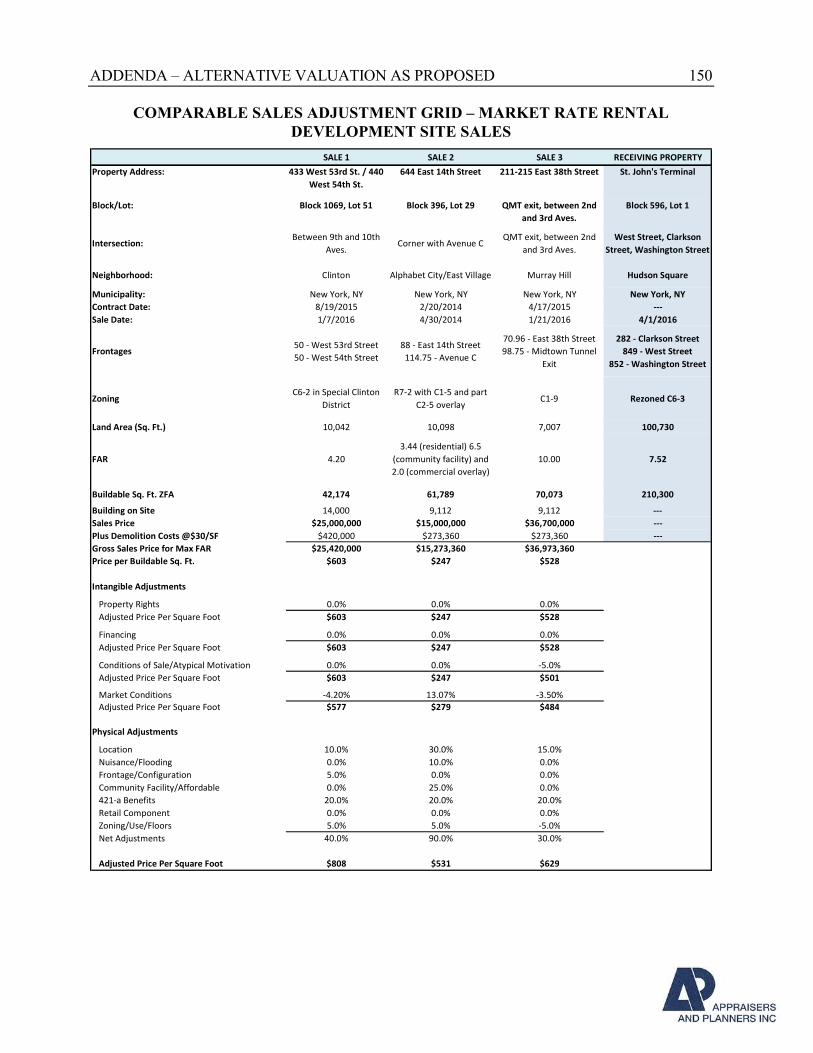
ADDENDA – ALTERNATIVE VALUATION AS PROPOSED 150
COMPARABLE SALES ADJUSTMENT GRID – MARKET RATE RENTAL
DEVELOPMENT SITE SALES
SALE 1 SALE 2 SALE 3 RECEIVING PROPERTY
Property Address: 433 West 53rd St. / 440
West 54th St.
644 East 14th Street 211-215 East 38th Street St. John's Terminal
Block/Lot: Block 1069, Lot 51 Block 396, Lot 29 QMT exit, between 2nd
and 3rd Aves.
Block 596, Lot 1
Intersection:Between 9th and 10th
Aves.Corner with Avenue C
QMT exit, between 2nd
and 3rd Aves.
West Street, Clarkson
Street, Washington Street
Neighborhood: Clinton Alphabet City/East Village Murray Hill Hudson Square
Municipality: New York, NY New York, NY New York, NY New York, NY
Contract Date: 8/19/2015 2/20/2014 4/17/2015 ---
Sale Date: 1/7/2016 4/30/2014 1/21/2016 4/1/2016
Frontages50 - West 53rd Street
50 - West 54th Street
88 - East 14th Street
114.75 - Avenue C
70.96 - East 38th Street
98.75 - Midtown Tunnel
Exit
282 - Clarkson Street
849 - West Street
852 - Washington Street
ZoningC6-2 in Special Clinton
District
R7-2 with C1-5 and part
C2-5 overlayC1-9 Rezoned C6-3
Land Area (Sq. Ft.) 10,042 10,098 7,007 100,730
FAR 4.20
3.44 (residential) 6.5
(community facility) and
2.0 (commercial overlay)
10.00 7.52
Buildable Sq. Ft. ZFA 42,174 61,789 70,073 210,300
Building on Site 14,000 9,112 9,112 ---
Sales Price $25,000,000 $15,000,000 $36,700,000 ---
Plus Demolition Costs @$30/SF $420,000 $273,360 $273,360 ---
Gross Sales Price for Max FAR $25,420,000 $15,273,360 $36,973,360
Price per Buildable Sq. Ft. $603 $247 $528
Intangible Adjustments
Property Rights 0.0% 0.0% 0.0%
Adjusted Price Per Square Foot $603 $247 $528
Financing 0.0% 0.0% 0.0%
Adjusted Price Per Square Foot $603 $247 $528
Conditions of Sale/Atypical Motivation 0.0% 0.0% -5.0%
Adjusted Price Per Square Foot $603 $247 $501
Market Conditions -4.20% 13.07% -3.50%
Adjusted Price Per Square Foot $577 $279 $484
Physical Adjustments
Location 10.0% 30.0% 15.0%
Nuisance/Flooding 0.0% 10.0% 0.0%
Frontage/Configuration 5.0% 0.0% 0.0%
Community Facility/Affordable 0.0% 25.0% 0.0%
421-a Benefits 20.0% 20.0% 20.0%
Retail Component 0.0% 0.0% 0.0%
Zoning/Use/Floors 5.0% 5.0% -5.0%
Net Adjustments 40.0% 90.0% 30.0%
Adjusted Price Per Square Foot $808 $531 $629
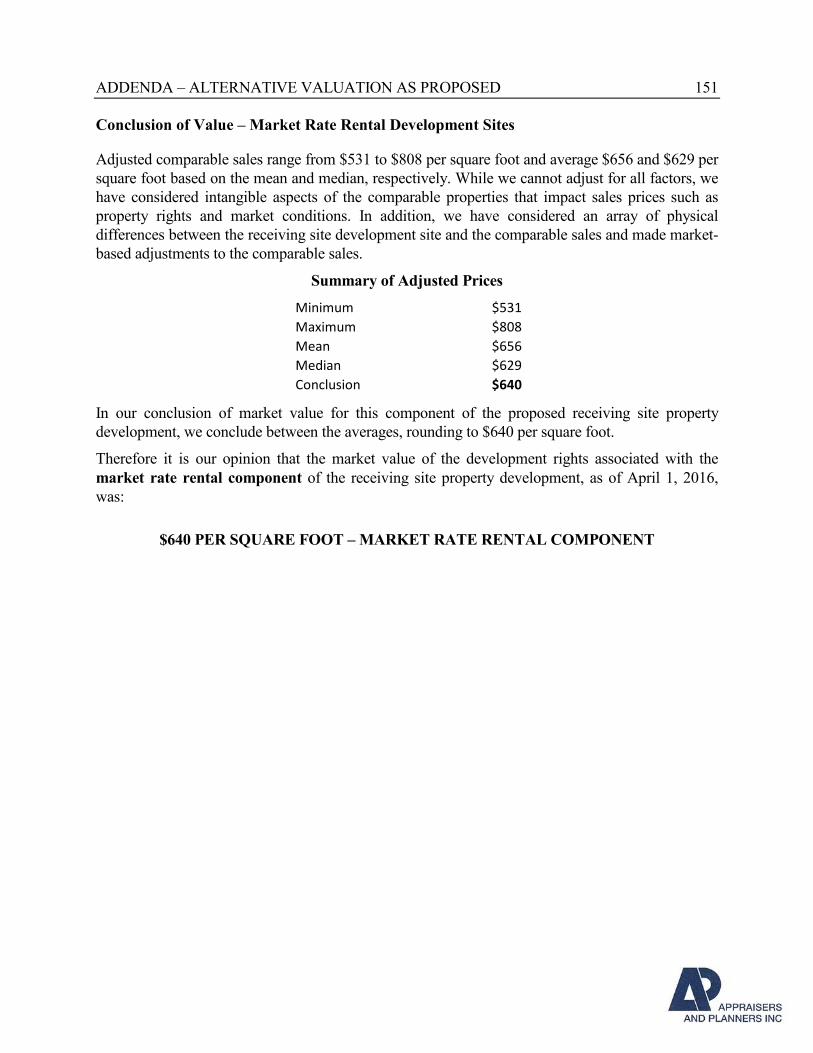
ADDENDA – ALTERNATIVE VALUATION AS PROPOSED 151
Conclusion of Value – Market Rate Rental Development Sites
Adjusted comparable sales range from $531 to $808 per square foot and average $656 and $629 per
square foot based on the mean and median, respectively. While we cannot adjust for all factors, we
have considered intangible aspects of the comparable properties that impact sales prices such as
property rights and market conditions. In addition, we have considered an array of physical
differences between the receiving site development site and the comparable sales and made market-
based adjustments to the comparable sales.
Summary of Adjusted Prices
Minimum $531
Maximum $808
Mean $656
Median $629
Conclusion $640
In our conclusion of market value for this component of the proposed receiving site property
development, we conclude between the averages, rounding to $640 per square foot.
Therefore it is our opinion that the market value of the development rights associated with the
market rate rental component of the receiving site property development, as of April 1, 2016,
was:
$640 PER SQUARE FOOT – MARKET RATE RENTAL COMPONENT
ADDENDA – ALTERNATIVE VALUATION AS PROPOSED 152
421-a Tax Abatement – For Alternative Valuation Scenario
Under the hypothetical condition of this alternative valuation, when developed with affordable
housing components under the rental scenarios, the market rate rental and the low-income
affordable housing components within the receiving site’s proposed development will be eligible
for 421-a benefits. The 421-a program was most recently available for new housing developments
with three or more units, located on sites that were vacant, underutilized, or had a “nonconforming”
zoning use, and that either sit outside the 421-a Geographic Exclusion Area (GEA), or include on-
site affordable. The program has been a controversial issue on both the NY State and NYC levels
and has been revisited and renegotiated on a number of occasions, most recently in June 2015,
when a new version of the abatement program was created. Under the program, owners are exempt
from paying the increase in property taxes that result from the new construction. Under its later
iteration, 421-a was available for condominium developments under 35 units in the outer-boroughs
or for rental developments with on-site affordable housing and outside the GEA.
As per the hypothetical condition requested by the client whereby we have been requested to
incorporate an analysis of 421-a benefits into this valuation, the length of the benefits assumed
under the alternative scenario in this appraisal reflect the 35-year schedule. In the 35-year schedule
the improvement assessment is abated for 25 years and is reduced for the final 10 years by the
percentage of affordable dwellings in the development. The subject valuation scenario assumes a
50% affordable scenario, known as Option B of the most recent 421-a, with the requirement that
30% of the units must be affordable: at least 10% at up to 70% of AMI and 20% at up to 130% of
AMI. The proposed project calls for a 50/30/20 mixed-income structure in which 20% of the units
are priced at 60% AMI and 30% are priced at 130% AMI.
Based on historical trends of similar properties, taxes on properties such as what is proposed for
the receiving site’s proposed development can expect to increase on average at 1% per year.
Additionally, assessments for this property type can be expected to increase in the range of 3% to
8% per year, on average. The 421-a exemption is applied to the development, post-construction,
which is assumed to be three years following the appraisal date. We discount to present value
the per-square-foot tax savings generated by the 421-a exemption. In computing the present value
of the tax savings, we estimate that the proposed taxes would increase 3% per annum and the
savings are discounted at the relatively low rate of 6%, reflective of the risk level associated with
these savings.
Mini-Tax – Real Estate Taxes During Construction of 421-a Project
The 421-a benefits are computed on the improvements, less the applicable mini-tax during the
development, and we deduct the estimated pro-rata share of the mini-tax as of the date of
appraisal from the taxable improvements that generate the 421-a benefits. The mini-tax is
computed by using the assessment in effect during the tax year prior to commencement of
construction. In this analysis the allocable mini-tax is computed by allocating the pro-rata share
of the rental and affordable rental components from the total proposed development, and
applying that ratio to current taxes. The market rate rental and the affordable components total
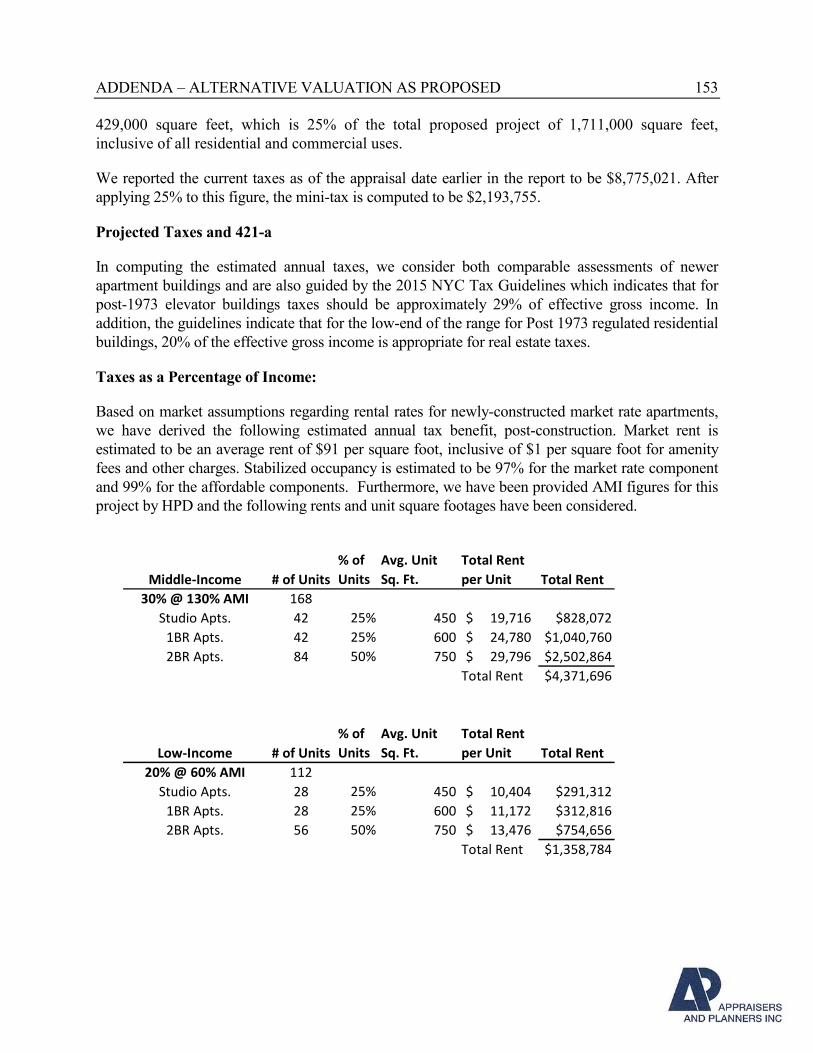
ADDENDA – ALTERNATIVE VALUATION AS PROPOSED 153
429,000 square feet, which is 25% of the total proposed project of 1,711,000 square feet,
inclusive of all residential and commercial uses.
We reported the current taxes as of the appraisal date earlier in the report to be $8,775,021. After
applying 25% to this figure, the mini-tax is computed to be $2,193,755.
Projected Taxes and 421-a
In computing the estimated annual taxes, we consider both comparable assessments of newer
apartment buildings and are also guided by the 2015 NYC Tax Guidelines which indicates that for
post-1973 elevator buildings taxes should be approximately 29% of effective gross income. In
addition, the guidelines indicate that for the low-end of the range for Post 1973 regulated residential
buildings, 20% of the effective gross income is appropriate for real estate taxes.
Taxes as a Percentage of Income:
Based on market assumptions regarding rental rates for newly-constructed market rate apartments,
we have derived the following estimated annual tax benefit, post-construction. Market rent is
estimated to be an average rent of $91 per square foot, inclusive of $1 per square foot for amenity
fees and other charges. Stabilized occupancy is estimated to be 97% for the market rate component
and 99% for the affordable components. Furthermore, we have been provided AMI figures for this
project by HPD and the following rents and unit square footages have been considered.
Middle-Income # of Units
% of
Units
Avg. Unit
Sq. Ft.
Total Rent
per Unit Total Rent
30% @ 130% AMI 168
Studio Apts. 42 25% 450 19,716$ $828,072
1BR Apts. 42 25% 600 24,780$ $1,040,760
2BR Apts. 84 50% 750 29,796$ $2,502,864
Total Rent $4,371,696
Low-Income # of Units
% of
Units
Avg. Unit
Sq. Ft.
Total Rent
per Unit Total Rent
20% @ 60% AMI 112
Studio Apts. 28 25% 450 10,404$ $291,312
1BR Apts. 28 25% 600 11,172$ $312,816
2BR Apts. 56 50% 750 13,476$ $754,656
Total Rent $1,358,784
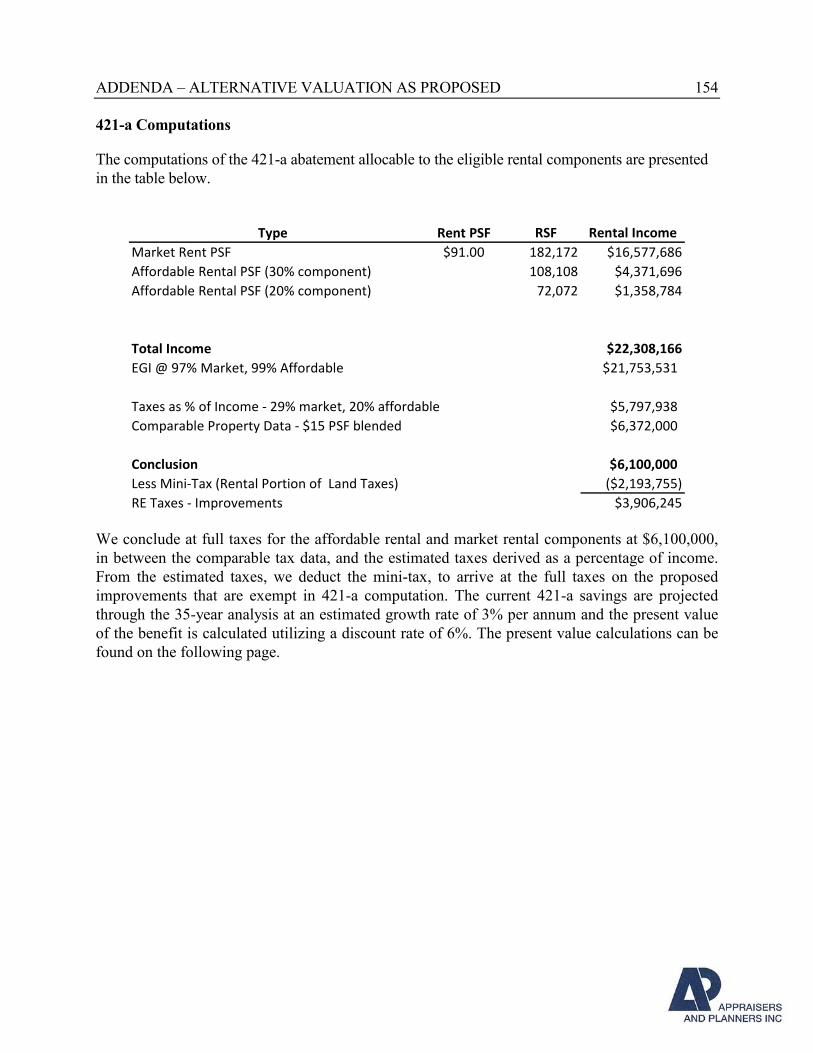
ADDENDA – ALTERNATIVE VALUATION AS PROPOSED 154
421-a Computations
The computations of the 421-a abatement allocable to the eligible rental components are presented
in the table below.
Type Rent PSF RSF Rental Income
Market Rent PSF $91.00 182,172 $16,577,686
Affordable Rental PSF (30% component) 108,108 $4,371,696
Affordable Rental PSF (20% component) 72,072 $1,358,784
Total Income $22,308,166
EGI @ 97% Market, 99% Affordable $21,753,531
Taxes as % of Income - 29% market, 20% affordable $5,797,938
Comparable Property Data - $15 PSF blended $6,372,000
Conclusion $6,100,000
Less Mini-Tax (Rental Portion of Land Taxes) ($2,193,755)
RE Taxes - Improvements $3,906,245
We conclude at full taxes for the affordable rental and market rental components at $6,100,000,
in between the comparable tax data, and the estimated taxes derived as a percentage of income.
From the estimated taxes, we deduct the mini-tax, to arrive at the full taxes on the proposed
improvements that are exempt in 421-a computation. The current 421-a savings are projected
through the 35-year analysis at an estimated growth rate of 3% per annum and the present value
of the benefit is calculated utilizing a discount rate of 6%. The present value calculations can be
found on the following page.
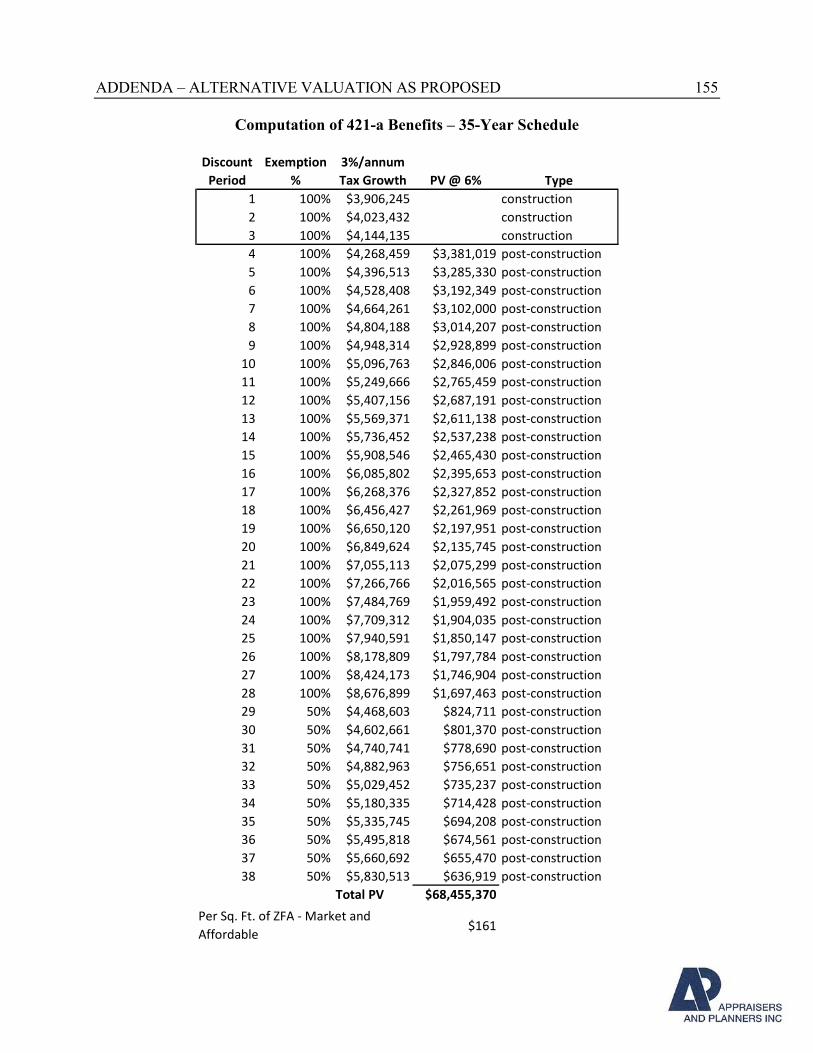
ADDENDA – ALTERNATIVE VALUATION AS PROPOSED 155
Computation of 421-a Benefits – 35-Year Schedule
Discount
Period
Exemption
%
3%/annum
Tax Growth PV @ 6% Type
1 100% $3,906,245 construction
2 100% $4,023,432 construction
3 100% $4,144,135 construction
4 100% $4,268,459 $3,381,019 post-construction
5 100% $4,396,513 $3,285,330 post-construction
6 100% $4,528,408 $3,192,349 post-construction
7 100% $4,664,261 $3,102,000 post-construction
8 100% $4,804,188 $3,014,207 post-construction
9 100% $4,948,314 $2,928,899 post-construction
10 100% $5,096,763 $2,846,006 post-construction
11 100% $5,249,666 $2,765,459 post-construction
12 100% $5,407,156 $2,687,191 post-construction
13 100% $5,569,371 $2,611,138 post-construction
14 100% $5,736,452 $2,537,238 post-construction
15 100% $5,908,546 $2,465,430 post-construction
16 100% $6,085,802 $2,395,653 post-construction
17 100% $6,268,376 $2,327,852 post-construction
18 100% $6,456,427 $2,261,969 post-construction
19 100% $6,650,120 $2,197,951 post-construction
20 100% $6,849,624 $2,135,745 post-construction
21 100% $7,055,113 $2,075,299 post-construction
22 100% $7,266,766 $2,016,565 post-construction
23 100% $7,484,769 $1,959,492 post-construction
24 100% $7,709,312 $1,904,035 post-construction
25 100% $7,940,591 $1,850,147 post-construction
26 100% $8,178,809 $1,797,784 post-construction
27 100% $8,424,173 $1,746,904 post-construction
28 100% $8,676,899 $1,697,463 post-construction
29 50% $4,468,603 $824,711 post-construction
30 50% $4,602,661 $801,370 post-construction
31 50% $4,740,741 $778,690 post-construction
32 50% $4,882,963 $756,651 post-construction
33 50% $5,029,452 $735,237 post-construction
34 50% $5,180,335 $714,428 post-construction
35 50% $5,335,745 $694,208 post-construction
36 50% $5,495,818 $674,561 post-construction
37 50% $5,660,692 $655,470 post-construction
38 50% $5,830,513 $636,919 post-construction
Total PV $68,455,370
$161Per Sq. Ft. of ZFA - Market and
Affordable
ADDENDA – ALTERNATIVE VALUATION AS PROPOSED 156
Conclusion
Using both the projected income for the subject property’s rental portion, coupled with the
comparable tax data we have estimated that the total present value of the 421-a benefits under the
current program result in a benefit of $68,455,370 or $161 per square foot of all low-income
affordable and market rental square footage, area which can enjoy benefits generated by 421-a.
In the residual analyses, the benefit to each of the two components is allocated on the basis of
pro-rata tax liability. The total non-abated taxes for the market rate rental component is estimated
to be $4,663,303 and the total non-abated taxes for the low-income affordable component is
estimated to be $1,134,635. The market rate component therefore should enjoy 81% of the total
benefit, or $55,058,907, and the balance of $16,655,975 it attributable to the low-income
affordable component.
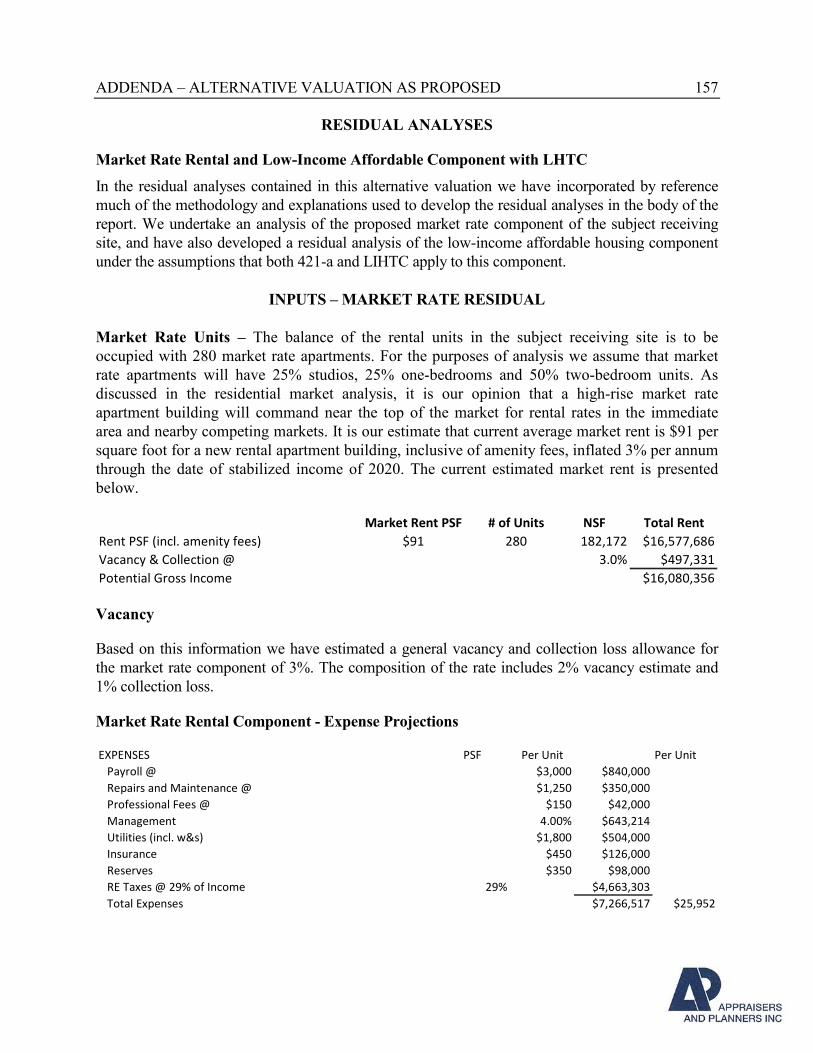
ADDENDA – ALTERNATIVE VALUATION AS PROPOSED 157
RESIDUAL ANALYSES
Market Rate Rental and Low-Income Affordable Component with LHTC
In the residual analyses contained in this alternative valuation we have incorporated by reference
much of the methodology and explanations used to develop the residual analyses in the body of the
report. We undertake an analysis of the proposed market rate component of the subject receiving
site, and have also developed a residual analysis of the low-income affordable housing component
under the assumptions that both 421-a and LIHTC apply to this component.
INPUTS – MARKET RATE RESIDUAL
Market Rate Units – The balance of the rental units in the subject receiving site is to be
occupied with 280 market rate apartments. For the purposes of analysis we assume that market
rate apartments will have 25% studios, 25% one-bedrooms and 50% two-bedroom units. As
discussed in the residential market analysis, it is our opinion that a high-rise market rate
apartment building will command near the top of the market for rental rates in the immediate
area and nearby competing markets. It is our estimate that current average market rent is $91 per
square foot for a new rental apartment building, inclusive of amenity fees, inflated 3% per annum
through the date of stabilized income of 2020. The current estimated market rent is presented
below.
Market Rent PSF # of Units NSF Total Rent
Rent PSF (incl. amenity fees) $91 280 182,172 $16,577,686
Vacancy & Collection @ 3.0% $497,331
Potential Gross Income $16,080,356
Vacancy
Based on this information we have estimated a general vacancy and collection loss allowance for
the market rate component of 3%. The composition of the rate includes 2% vacancy estimate and
1% collection loss.
Market Rate Rental Component - Expense Projections
EXPENSES PSF Per Unit Per Unit
Payroll @ $3,000 $840,000
Repairs and Maintenance @ $1,250 $350,000
Professional Fees @ $150 $42,000
Management 4.00% $643,214
Utilities (incl. w&s) $1,800 $504,000
Insurance $450 $126,000
Reserves $350 $98,000
RE Taxes @ 29% of Income 29% $4,663,303
Total Expenses $7,266,517 $25,952
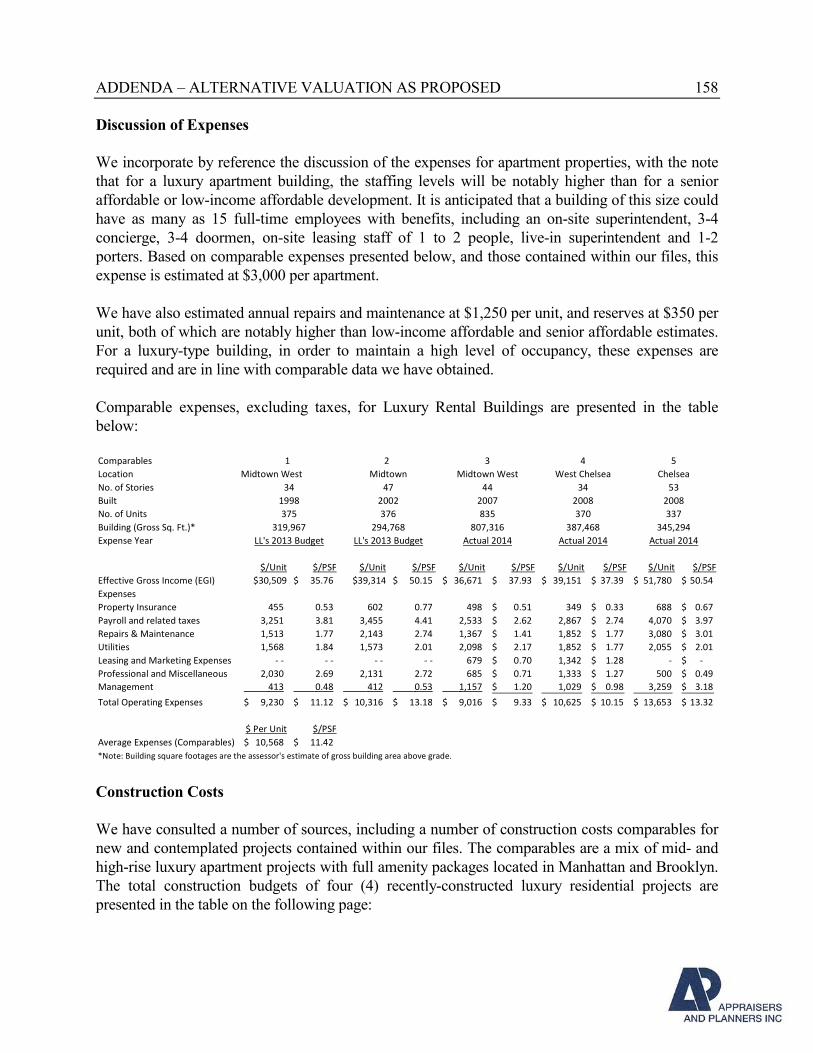
ADDENDA – ALTERNATIVE VALUATION AS PROPOSED 158
Discussion of Expenses
We incorporate by reference the discussion of the expenses for apartment properties, with the note
that for a luxury apartment building, the staffing levels will be notably higher than for a senior
affordable or low-income affordable development. It is anticipated that a building of this size could
have as many as 15 full-time employees with benefits, including an on-site superintendent, 3-4
concierge, 3-4 doormen, on-site leasing staff of 1 to 2 people, live-in superintendent and 1-2
porters. Based on comparable expenses presented below, and those contained within our files, this
expense is estimated at $3,000 per apartment.
We have also estimated annual repairs and maintenance at $1,250 per unit, and reserves at $350 per
unit, both of which are notably higher than low-income affordable and senior affordable estimates.
For a luxury-type building, in order to maintain a high level of occupancy, these expenses are
required and are in line with comparable data we have obtained.
Comparable expenses, excluding taxes, for Luxury Rental Buildings are presented in the table
below:
Comparables 1 2 3 4 5
Location Midtown West
No. of Stories 34 47 44 34 53
Built 1998 2002 2007 2008 2008
No. of Units 375 376 835 370 337
Building (Gross Sq. Ft.)* 319,967 294,768 807,316 387,468 345,294
Expense Year LL's 2013 Budget LL's 2013 Budget Actual 2014 Actual 2014 Actual 2014
$/Unit $/PSF $/Unit $/PSF $/Unit $/PSF $/Unit $/PSF $/Unit $/PSF
Effective Gross Income (EGI) $30,509 35.76$ $39,314 50.15$ 36,671$ 37.93$ 39,151$ 37.39$ 51,780$ 50.54$
Expenses
Property Insurance 455 0.53 602 0.77 498 0.51$ 349 0.33$ 688 0.67$
Payroll and related taxes 3,251 3.81 3,455 4.41 2,533 2.62$ 2,867 2.74$ 4,070 3.97$
Repairs & Maintenance 1,513 1.77 2,143 2.74 1,367 1.41$ 1,852 1.77$ 3,080 3.01$
Utilities 1,568 1.84 1,573 2.01 2,098 2.17$ 1,852 1.77$ 2,055 2.01$
Leasing and Marketing Expenses - - - - - - - - 679 0.70$ 1,342 1.28$ - -$
Professional and Miscellaneous 2,030 2.69 2,131 2.72 685 0.71$ 1,333 1.27$ 500 0.49$
Management 413 0.48 412 0.53 1,157 1.20$ 1,029 0.98$ 3,259 3.18$
Total Operating Expenses 9,230$ 11.12$ 10,316$ 13.18$ 9,016$ 9.33$ 10,625$ 10.15$ 13,653$ 13.32$
$ Per Unit $/PSF
Average Expenses (Comparables) 10,568$ 11.42$
*Note: Building square footages are the assessor's estimate of gross building area above grade.
Midtown Midtown West West Chelsea Chelsea
Construction Costs
We have consulted a number of sources, including a number of construction costs comparables for
new and contemplated projects contained within our files. The comparables are a mix of mid- and
high-rise luxury apartment projects with full amenity packages located in Manhattan and Brooklyn.
The total construction budgets of four (4) recently-constructed luxury residential projects are
presented in the table on the following page:
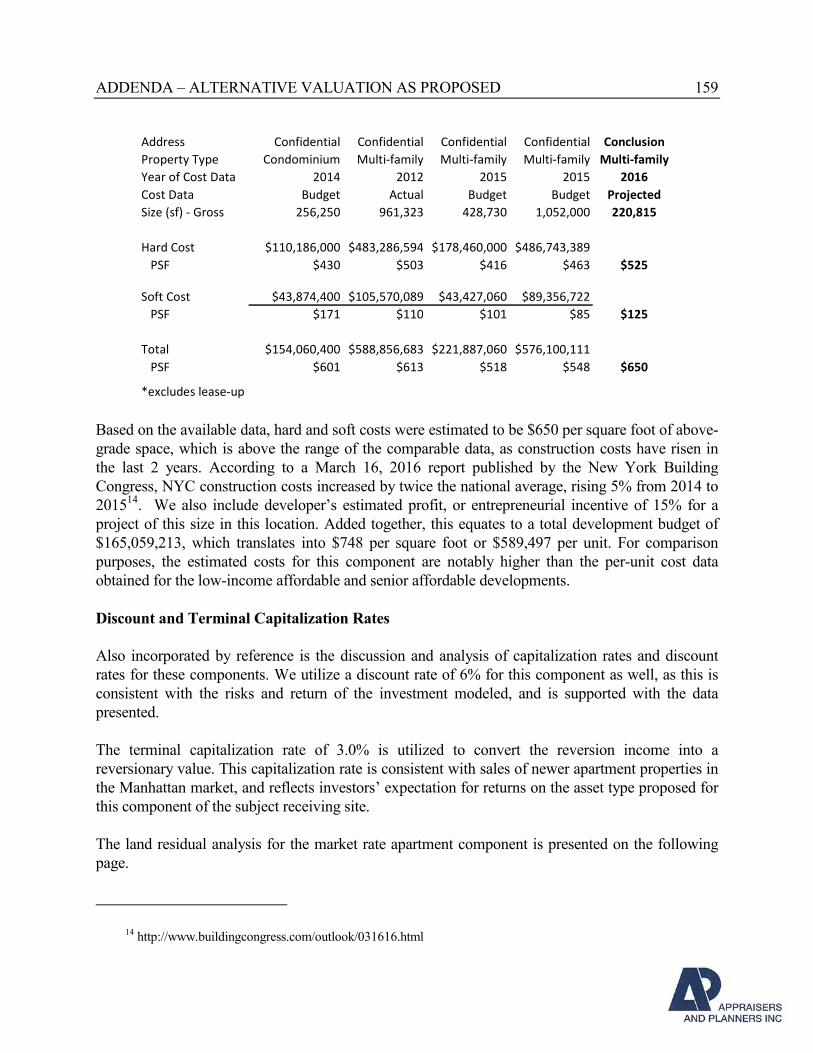
ADDENDA – ALTERNATIVE VALUATION AS PROPOSED 159
Address Confidential Confidential Confidential Confidential Conclusion
Property Type Condominium Multi-family Multi-family Multi-family Multi-family
Year of Cost Data 2014 2012 2015 2015 2016
Cost Data Budget Actual Budget Budget Projected
Size (sf) - Gross 256,250 961,323 428,730 1,052,000 220,815
Hard Cost $110,186,000 $483,286,594 $178,460,000 $486,743,389
PSF $430 $503 $416 $463 $525
Soft Cost $43,874,400 $105,570,089 $43,427,060 $89,356,722
PSF $171 $110 $101 $85 $125
Total $154,060,400 $588,856,683 $221,887,060 $576,100,111
PSF $601 $613 $518 $548 $650
*excludes lease-up
Based on the available data, hard and soft costs were estimated to be $650 per square foot of above-
grade space, which is above the range of the comparable data, as construction costs have risen in
the last 2 years. According to a March 16, 2016 report published by the New York Building
Congress, NYC construction costs increased by twice the national average, rising 5% from 2014 to
201514. We also include developer’s estimated profit, or entrepreneurial incentive of 15% for a
project of this size in this location. Added together, this equates to a total development budget of
$165,059,213, which translates into $748 per square foot or $589,497 per unit. For comparison
purposes, the estimated costs for this component are notably higher than the per-unit cost data
obtained for the low-income affordable and senior affordable developments.
Discount and Terminal Capitalization Rates
Also incorporated by reference is the discussion and analysis of capitalization rates and discount
rates for these components. We utilize a discount rate of 6% for this component as well, as this is
consistent with the risks and return of the investment modeled, and is supported with the data
presented.
The terminal capitalization rate of 3.0% is utilized to convert the reversion income into a
reversionary value. This capitalization rate is consistent with sales of newer apartment properties in
the Manhattan market, and reflects investors’ expectation for returns on the asset type proposed for
this component of the subject receiving site.
The land residual analysis for the market rate apartment component is presented on the following
page.
14 http://www.buildingcongress.com/outlook/031616.html
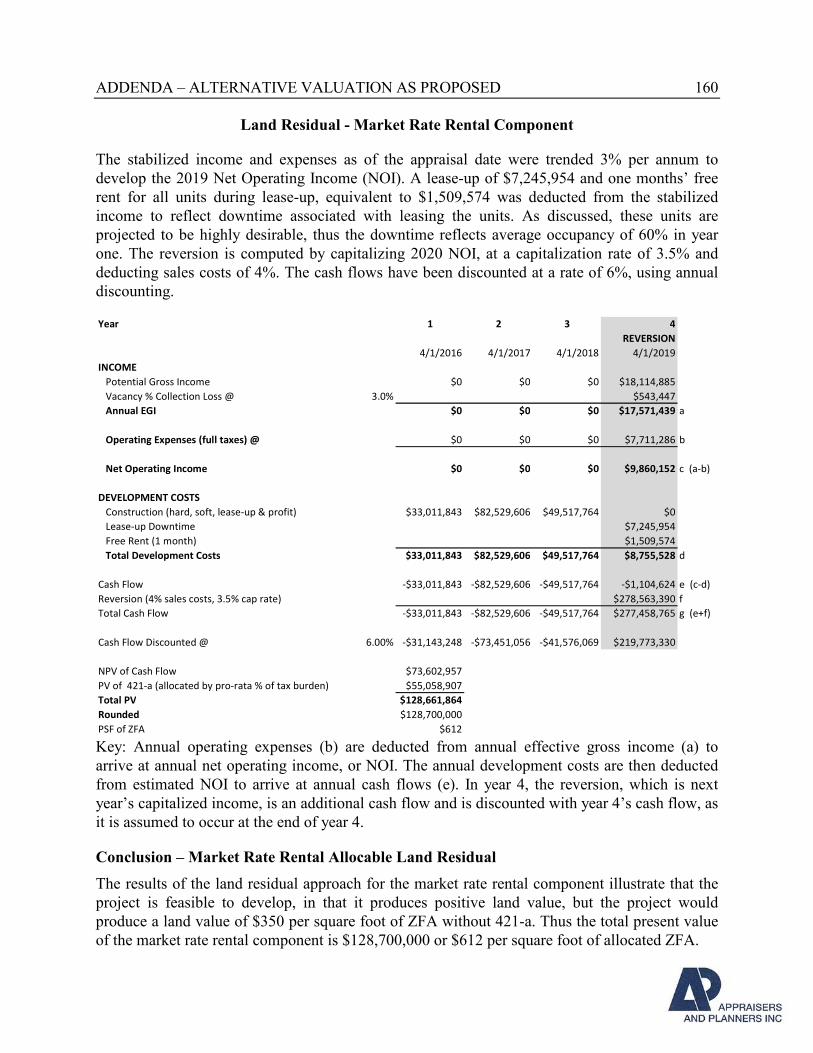
ADDENDA – ALTERNATIVE VALUATION AS PROPOSED 160
Land Residual - Market Rate Rental Component
The stabilized income and expenses as of the appraisal date were trended 3% per annum to
develop the 2019 Net Operating Income (NOI). A lease-up of $7,245,954 and one months’ free
rent for all units during lease-up, equivalent to $1,509,574 was deducted from the stabilized
income to reflect downtime associated with leasing the units. As discussed, these units are
projected to be highly desirable, thus the downtime reflects average occupancy of 60% in year
one. The reversion is computed by capitalizing 2020 NOI, at a capitalization rate of 3.5% and
deducting sales costs of 4%. The cash flows have been discounted at a rate of 6%, using annual
discounting.
Year 1 2 3 4
REVERSION
4/1/2016 4/1/2017 4/1/2018 4/1/2019
INCOME
Potential Gross Income $0 $0 $0 $18,114,885
Vacancy % Collection Loss @ 3.0% $543,447
Annual EGI $0 $0 $0 $17,571,439 a
Operating Expenses (full taxes) @ $0 $0 $0 $7,711,286 b
Net Operating Income $0 $0 $0 $9,860,152 c (a-b)
DEVELOPMENT COSTS
Construction (hard, soft, lease-up & profit) $33,011,843 $82,529,606 $49,517,764 $0
Lease-up Downtime $7,245,954
Free Rent (1 month) $1,509,574
Total Development Costs $33,011,843 $82,529,606 $49,517,764 $8,755,528 d
Cash Flow -$33,011,843 -$82,529,606 -$49,517,764 -$1,104,624 e (c-d)
Reversion (4% sales costs, 3.5% cap rate) $278,563,390 f
Total Cash Flow -$33,011,843 -$82,529,606 -$49,517,764 $277,458,765 g (e+f)
Cash Flow Discounted @ 6.00% -$31,143,248 -$73,451,056 -$41,576,069 $219,773,330
NPV of Cash Flow $73,602,957
PV of 421-a (allocated by pro-rata % of tax burden) $55,058,907
Total PV $128,661,864
Rounded $128,700,000
PSF of ZFA $612 Key: Annual operating expenses (b) are deducted from annual effective gross income (a) to
arrive at annual net operating income, or NOI. The annual development costs are then deducted
from estimated NOI to arrive at annual cash flows (e). In year 4, the reversion, which is next
year’s capitalized income, is an additional cash flow and is discounted with year 4’s cash flow, as
it is assumed to occur at the end of year 4.
Conclusion – Market Rate Rental Allocable Land Residual
The results of the land residual approach for the market rate rental component illustrate that the
project is feasible to develop, in that it produces positive land value, but the project would
produce a land value of $350 per square foot of ZFA without 421-a. Thus the total present value
of the market rate rental component is $128,700,000 or $612 per square foot of allocated ZFA.
ADDENDA – ALTERNATIVE VALUATION AS PROPOSED 161
LAND RESIDUAL – LOW-INCOME AFFORDABLE COMPONENT
WITH 421-A and LIHTC
We have incorporated by reference the entirety of the analysis and discussion of this component
found in the body of the report with the following two exceptions:
• The component, under this hypothetical alternative valuation, is eligible to benefit from its
pro-rata share of 421- tax savings; and
• This component is eligible to participate in LIHTC program and generate allocable credit
value
The real estate tax savings generated by a hypothetical 421-a tax abatement program are computed
using both comparable property tax data, as well as a computation utilizing a percentage of income
in accordance with estimated percentages of the NYC Finance department assessment guidelines.
LIHTC benefits are assumed to be applicable to the low-income affordable component, as this
alternative valuation assumes the 50/30/20 model of development. LIHTC benefits are computed
based on qualifying construction costs, subject to per-unit caps.
421-a Tax Savings
We have allocated to the low-income component of the development, its pro-rata share of tax
savings, as derived from its share of the current estimated tax burden as generated by this
component and the market rate component. The total non-abated taxes for the market rate rental
component is estimated to be $4,663,303 and the total non-abated taxes for the low-income
affordable component is estimated to be $1,134,635. The market rate component therefore should
enjoy 81% of the total benefit, or $55,058,907, and the balance of $16,655,975 it attributable to the
low-income affordable component.
LIHTC
The alternate valuation is developed under the premise that the 210,300 square foot, non-
condominium portion of the market rate residential development is constructed for market rate
rentals. According to NYCHPD, by developing a market rate rental, the project is considered a
50/30/20 project, thereby availing the portion of the low-income component priced below 60%
AMI to generate LIHTC. In the base case/highest and best use scenario analyzed within the body of
this report, where all market rate residential components are developed as condominiums,
NYCDCP stated that the low-income component would not be eligible for LIHTC.
We have incorporated by reference the discussion and analysis of LIHTC found in the body of the
report, with alterations to the qualifying cost basis and percentage qualifying. The estimated
development costs of the affordable component total $128,800,000, 40% of which is for apartments
priced at 60% AMI. Since 40% is eligible to generate LIHTC, we estimated that 34.75% of the
construction costs would be eligible for the qualifying cost basis. This assumes that approximately
87% of the development costs allocated to the affordable component have qualifying costs. This
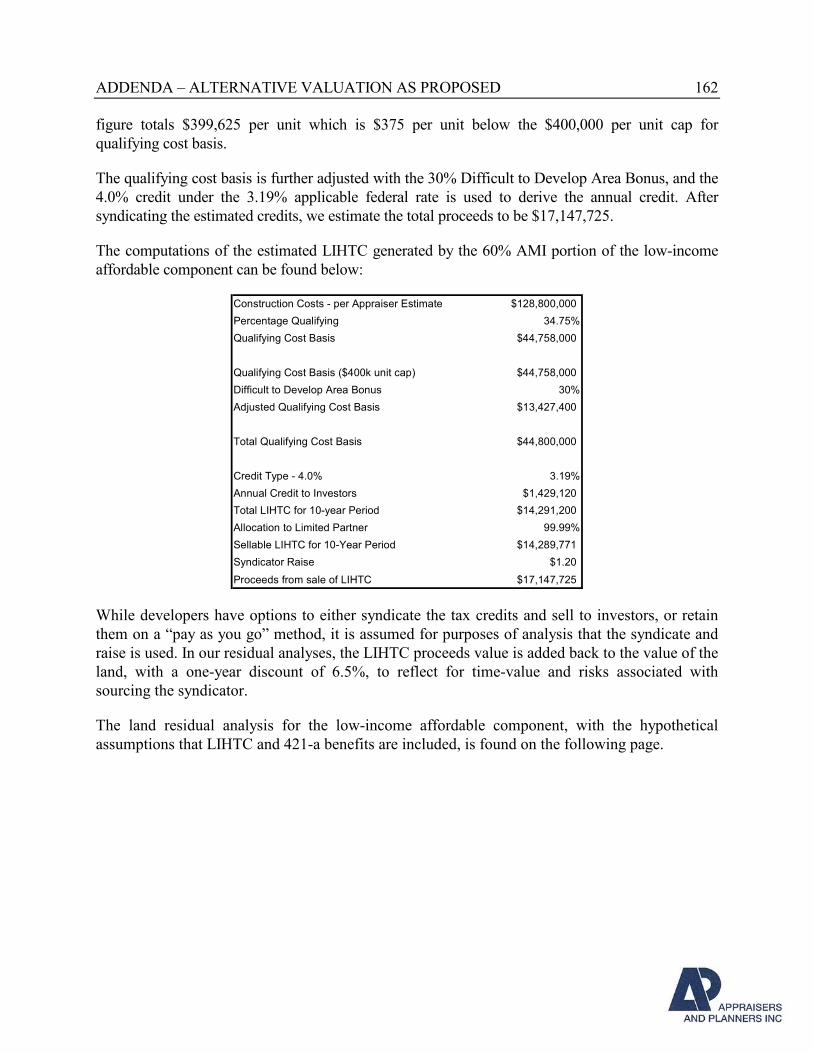
ADDENDA – ALTERNATIVE VALUATION AS PROPOSED 162
figure totals $399,625 per unit which is $375 per unit below the $400,000 per unit cap for
qualifying cost basis.
The qualifying cost basis is further adjusted with the 30% Difficult to Develop Area Bonus, and the
4.0% credit under the 3.19% applicable federal rate is used to derive the annual credit. After
syndicating the estimated credits, we estimate the total proceeds to be $17,147,725.
The computations of the estimated LIHTC generated by the 60% AMI portion of the low-income
affordable component can be found below:
Construction Costs - per Appraiser Estimate $128,800,000
Percentage Qualifying 34.75%
Qualifying Cost Basis $44,758,000
Qualifying Cost Basis ($400k unit cap) $44,758,000
Difficult to Develop Area Bonus 30%
Adjusted Qualifying Cost Basis $13,427,400
Total Qualifying Cost Basis $44,800,000
Credit Type - 4.0% 3.19%
Annual Credit to Investors $1,429,120
Total LIHTC for 10-year Period $14,291,200
Allocation to Limited Partner 99.99%
Sellable LIHTC for 10-Year Period $14,289,771
Syndicator Raise $1.20
Proceeds from sale of LIHTC $17,147,725
While developers have options to either syndicate the tax credits and sell to investors, or retain
them on a “pay as you go” method, it is assumed for purposes of analysis that the syndicate and
raise is used. In our residual analyses, the LIHTC proceeds value is added back to the value of the
land, with a one-year discount of 6.5%, to reflect for time-value and risks associated with
sourcing the syndicator.
The land residual analysis for the low-income affordable component, with the hypothetical
assumptions that LIHTC and 421-a benefits are included, is found on the following page.
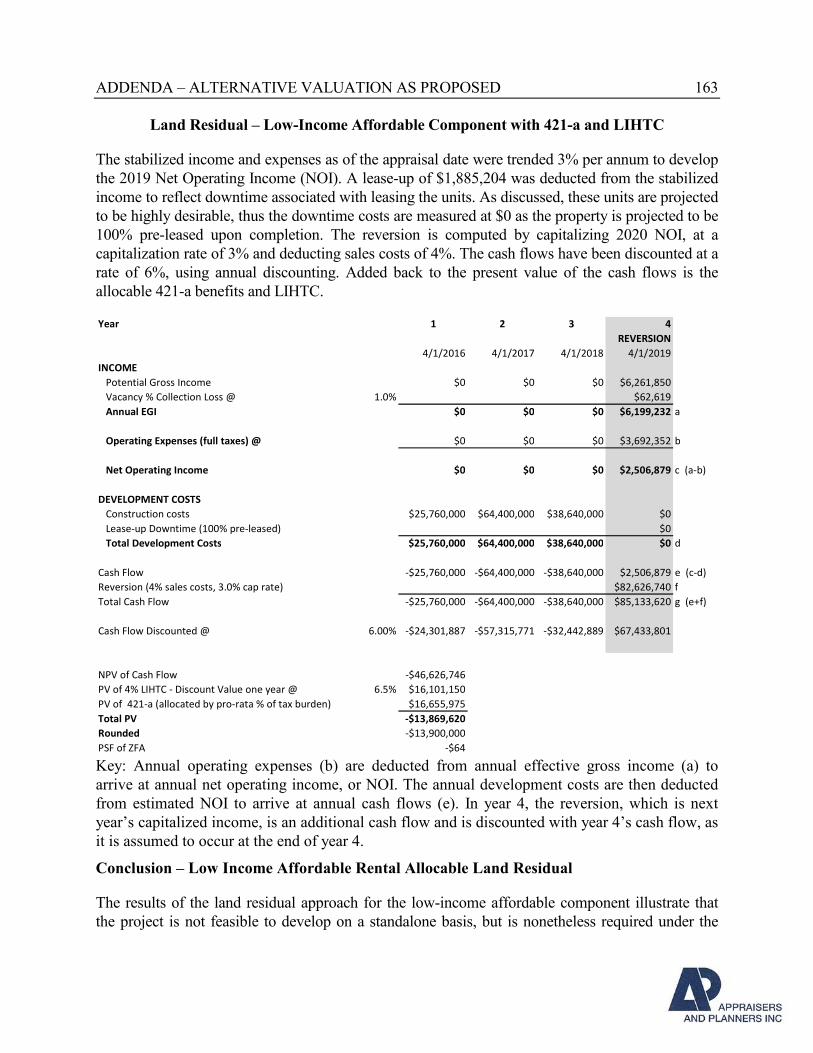
ADDENDA – ALTERNATIVE VALUATION AS PROPOSED 163
Land Residual – Low-Income Affordable Component with 421-a and LIHTC
The stabilized income and expenses as of the appraisal date were trended 3% per annum to develop
the 2019 Net Operating Income (NOI). A lease-up of $1,885,204 was deducted from the stabilized
income to reflect downtime associated with leasing the units. As discussed, these units are projected
to be highly desirable, thus the downtime costs are measured at $0 as the property is projected to be
100% pre-leased upon completion. The reversion is computed by capitalizing 2020 NOI, at a
capitalization rate of 3% and deducting sales costs of 4%. The cash flows have been discounted at a
rate of 6%, using annual discounting. Added back to the present value of the cash flows is the
allocable 421-a benefits and LIHTC.
Year 1 2 3 4
REVERSION
4/1/2016 4/1/2017 4/1/2018 4/1/2019
INCOME
Potential Gross Income $0 $0 $0 $6,261,850
Vacancy % Collection Loss @ 1.0% $62,619
Annual EGI $0 $0 $0 $6,199,232 a
Operating Expenses (full taxes) @ $0 $0 $0 $3,692,352 b
Net Operating Income $0 $0 $0 $2,506,879 c (a-b)
DEVELOPMENT COSTS
Construction costs $25,760,000 $64,400,000 $38,640,000 $0
Lease-up Downtime (100% pre-leased) $0
Total Development Costs $25,760,000 $64,400,000 $38,640,000 $0 d
Cash Flow -$25,760,000 -$64,400,000 -$38,640,000 $2,506,879 e (c-d)
Reversion (4% sales costs, 3.0% cap rate) $82,626,740 f
Total Cash Flow -$25,760,000 -$64,400,000 -$38,640,000 $85,133,620 g (e+f)
Cash Flow Discounted @ 6.00% -$24,301,887 -$57,315,771 -$32,442,889 $67,433,801
NPV of Cash Flow -$46,626,746
PV of 4% LIHTC - Discount Value one year @ 6.5% $16,101,150
PV of 421-a (allocated by pro-rata % of tax burden) $16,655,975
Total PV -$13,869,620
Rounded -$13,900,000
PSF of ZFA -$64 Key: Annual operating expenses (b) are deducted from annual effective gross income (a) to
arrive at annual net operating income, or NOI. The annual development costs are then deducted
from estimated NOI to arrive at annual cash flows (e). In year 4, the reversion, which is next
year’s capitalized income, is an additional cash flow and is discounted with year 4’s cash flow, as
it is assumed to occur at the end of year 4.
Conclusion – Low Income Affordable Rental Allocable Land Residual
The results of the land residual approach for the low-income affordable component illustrate that
the project is not feasible to develop on a standalone basis, but is nonetheless required under the

ADDENDA – ALTERNATIVE VALUATION AS PROPOSED 164
ULURP action for the subject receiving site. Thus the total present value of the low income
affordable land component is -$13,900,000 or -$64 per square foot of allocated ZFA.
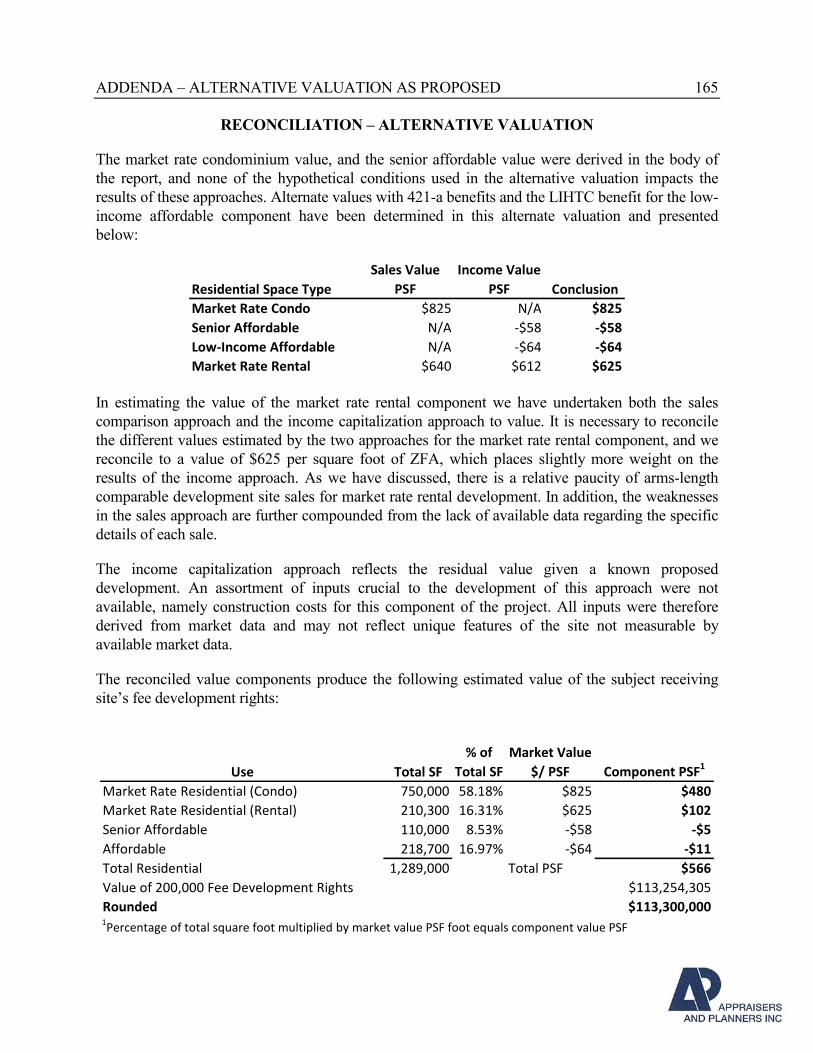
ADDENDA – ALTERNATIVE VALUATION AS PROPOSED 165
RECONCILIATION – ALTERNATIVE VALUATION
The market rate condominium value, and the senior affordable value were derived in the body of
the report, and none of the hypothetical conditions used in the alternative valuation impacts the
results of these approaches. Alternate values with 421-a benefits and the LIHTC benefit for the low-
income affordable component have been determined in this alternate valuation and presented
below:
Residential Space Type
Sales Value
PSF
Income Value
PSF Conclusion
Market Rate Condo $825 N/A $825
Senior Affordable N/A -$58 -$58
Low-Income Affordable N/A -$64 -$64
Market Rate Rental $640 $612 $625
In estimating the value of the market rate rental component we have undertaken both the sales
comparison approach and the income capitalization approach to value. It is necessary to reconcile
the different values estimated by the two approaches for the market rate rental component, and we
reconcile to a value of $625 per square foot of ZFA, which places slightly more weight on the
results of the income approach. As we have discussed, there is a relative paucity of arms-length
comparable development site sales for market rate rental development. In addition, the weaknesses
in the sales approach are further compounded from the lack of available data regarding the specific
details of each sale.
The income capitalization approach reflects the residual value given a known proposed
development. An assortment of inputs crucial to the development of this approach were not
available, namely construction costs for this component of the project. All inputs were therefore
derived from market data and may not reflect unique features of the site not measurable by
available market data.
The reconciled value components produce the following estimated value of the subject receiving
site’s fee development rights:
Use Total SF
% of
Total SF
Market Value
$/ PSF Component PSF1
Market Rate Residential (Condo) 750,000 58.18% $825 $480
Market Rate Residential (Rental) 210,300 16.31% $625 $102
Senior Affordable 110,000 8.53% -$58 -$5
Affordable 218,700 16.97% -$64 -$11
Total Residential 1,289,000 Total PSF $566
Value of 200,000 Fee Development Rights $113,254,305
Rounded $113,300,0001Percentage of total square foot multiplied by market value PSF foot equals component value PSF
ADDENDA – ALTERNATIVE VALUATION AS PROPOSED 166
We have applied the percentage of air rights to fee value for the subject receiving site to the value
of the fee development as found in the accompanying fee land analysis, as follows:
Fee Development Value PSF $566
Air Rights as % of Land 65.0%
Air Rights Value $368
Sq. Ft. of Air Rights 200,000
Value of 200,000 Air Rights $73,611,618
Rounded $73,600,000
Therefore, after an analysis of all relevant data and based upon the assumptions, hypothetical
conditions and conclusions presented within the alternative value of this report, it is our opinion
that considering the blended uses of the proposed development for 550 Washington Street, and
the limited market of both granting and eligible parcels for Pier 40 air rights, it is our opinion that
the market value of the 200,000 square feet of subject air rights under the alternative scenarios as
of April 1, 2016, was:
SEVENTY THREE MILLION SIX HUNDRED THOUSAND DOLLARS ($73,600,000)
CERTIFICATION 167
We certify that, to the best of our knowledge and belief:
• The statements of fact contained in this report are true and correct.
• The reported analyses, opinions and conclusions are limited only by the reported assumptions
and limiting conditions and are our personal, impartial, and unbiased professional analyses,
opinions, and conclusions.
• We have no present or prospective interest in the property that is the subject of this report and
no interest with respect to the parties involved.
• We have not performed services as an appraiser, or in any other capacity, regarding the
property that is the subject of this report within the three-year period immediately preceding
acceptance of this assignment.
• We have no bias with respect to the property that is the subject of this report or to the parties
involved with this assignment.
• Our engagement in this assignment was not contingent upon developing or reporting
predetermined results.
• Our compensation for completing this assignment is not contingent upon the development or
reporting of a predetermined value or direction in value that favors the cause of the client, the
amount of the value opinion, the attainment of a stipulated result, or the occurrence of a
subsequent event directly related to the intended use of this appraisal.
• The reported analyses, opinions, and conclusions were developed, and this report has been
prepared in conformity with the requirements of the Code of Professional Ethics and
Standards of Professional Practice of the Appraisal Institute, which include the Uniform
Standards of Professional Appraisal Practice.
• The use of this report is subject to the requirements of the Appraisal Institute relating to
review by its duly authorized representatives.
• Sharon Y. Locatell and Adam L. Wald, made an exterior inspection of the property
development that is the subject of this report.
• No one provided real property appraisal assistance to the persons signing this report.
• As of the date of this report, Sharon Y. Locatell, MAI and Adam L. Wald, MAI have
completed the continuing education program of the Appraisal Institute.
_________________
Adam L. Wald, MAI
________________________________
Sharon Y. Locatell, MAI, CRE, MRICS
STATEMENT OF QUALIFICATIONS 168
SHARON LOCATELL, MAI, CRE, MRICS - PRESIDENT
APPRAISERS & PLANNERS, INC.
Sharon Locatell is President of Appraisers & Planners, Inc. headquartered in New York City. She
is the former Executive Director of Brown Harris Stevens Appraisal & Consulting, LLC, where she
headed the division for 18 years. Appraisers & Planners is a general appraisal and consulting
business. Ms. Locatell has nearly 25 years’ experience in real estate valuation and consulting with a
diversified background in terms of property type, and services offered. She is actively involved in
market value appraisals, consulting assignments, arbitration proceedings, purchase price allocation
studies, estate work, litigation support and expert witness testimony, and investment advisory
consultation.
Sharon Locatell has acted as real estate appraiser and/or consultant to Rudin Management
Company, Cord Meyer Development LLC , Jack Resnick & Sons, Inc., The LeFrak Organization
Inc., The Shubert Organization, Richemont, New York Racing Association, Inc., Titan Capital,
Emerald Creek Capital, Piaget, Roman Catholic Archdiocese of New York, Yeshiva University,
Lord & Taylor, Wien & Malkin, Consolidated Edison, Friedman LLP, Rockefeller Center, GAP
Inc., General Accident, as well as other institutions, corporations and individuals. Her valuations
have also included Rockefeller Center and the MesseTurm in Frankfurt, Germany, one of Europe’s
tallest office buildings.
Sharon Locatell has testified as an expert witness in Federal District Court on numerous occasions,
and in various local and state courts. She is also active as an arbitrator.
Ms. Locatell has experience in both consultation and valuation of all types of properties including
commercial, residential, retail, industrial, vacant land, as well as lease analysis, and feasibility
studies.
EDUCATION
Gettysburg College Bachelor of Arts (BA)
Gettysburg, Pennsylvania (1984-1988)
University of Florida Masters Degree (MA)
Graduate School of Business Real Estate and Urban Analysis
Administration (1988-1990)
PROFESSIONAL AFFILIATIONS
Member of Appraisal Institute MAI
Immediate Past President and Board Member of the New York Metropolitan Chapter
Counselor of Real Estate - CRE
Member – Royal Institution of Chartered Surveyors - MRICS
Member - Real Estate Board of New York
New York State Certified General Real Estate Appraiser #46000007350
New Jersey State Certified General Real Estate Appraiser #42RG00196800
Connecticut State Certified General Real Estate Appraiser #RCG0001066
STATEMENT OF QUALIFICATIONS 169
ADAM L. WALD, MAI
PROFESSIONAL EXPERIENCE
8/2015 to Present: Vice President - Appraisers and Planners, Inc.
1/2014 – 8/2015: Senior Staff Appraiser – Appraisers and Planners, Inc.
2012 – 2013: Associate Staff Appraiser – Appraisers and Planners, Inc.
2005 - 2012: Staff Appraiser - Sterling Appraisals, Inc.
Tuckahoe, New York
EDUCATION
Bachelor of Arts – Brandeis University
Major in Economics
Minor in International Business
New York University School of Continuing Professional Studies:
R1 – Introduction to Real Estate Appraisal
R2 – Valuation Principles and Procedures
G1 – Introduction to Income Property Valuation
G2 – Principles of Income Property Appraising
G3 – Applied Income Property Valuation
AQ-1 – Fair Housing, Fair Lending and Environmental Issues
15-Hour USPAP – Nation Uniform Standards of Professional Appraisal Practice
Appraisal Institute – Designation Education:
Business Practices and Ethics
Advanced Market Analysis and Highest and Best Use
Advanced Income Capitalization
Quantitative Analysis
General Appraiser Report Writing and Case Studies
Advanced Concepts and Case Studies
PROFESSIONAL AFFILIATIONS
Designated Member, Appraisal Institute
CURRENT LICENSE
State of New York - Certified General Appraiser #46000050707
APPRAISAL EXPERIENCE
As a staff appraiser for Appraisers & Planners, Inc. and Sterling Appraisals, Inc., Adam has worked
exclusively in commercial real estate appraisal and consulting services and has amassed nearly 10
years’ experience in real estate valuation and consulting. Property types appraised include multi-family,
retail, industrial, manufacturing, office, institutional and land. Appraisal assignments include multi-
tenant, single tenant, owner-occupied properties, leased fee and leasehold assignments. Appraisals have
been prepared for an assortment of uses including estate and gift tax, tax certiorari, purchase and sale
negotiations, litigation and condemnation.