STATUS OF TRUCK DRIVERS IN INDIA - SaveLIFE Foundation
124
STATUS OF TRUCK DRIVERS IN INDIA FEBRUARY 2020 Based on a National Study conducted for SaveLIFE Foundation by Marketing and Development Research Associates (MDRA)
-
Upload
khangminh22 -
Category
Documents
-
view
0 -
download
0
Transcript of STATUS OF TRUCK DRIVERS IN INDIA - SaveLIFE Foundation

STATUS OF TRUCK DRIVERSIN INDIAFEBRUARY 2020
Based on a National Study conducted for SaveLIFE Foundation by Marketing and Development Research Associates (MDRA)

This document has been produced by SaveLIFE Foundation with the support of Mahindra & Mahindra Ltd. (M&M) through their CSR Program. The contents of this document are the sole responsibility of the authors and can under no circumstances be regarded as reflecting the positions of Mahindra & Mahindra Ltd.
STUDY ON THE STATUS OF TRUCK DRIVERS IN INDIA
©SaveLIFE Foundation, February 2020
Content owned and maintained by SaveLIFE Foundation. All Rights Reserved.
STATUS OF TRUCK DRIVERS IN INDIA
Based on a National Study conducted for SaveLIFE Foundation byMarketing and Development Research Associates (MDRA)
www.savelifefoundation.org

5
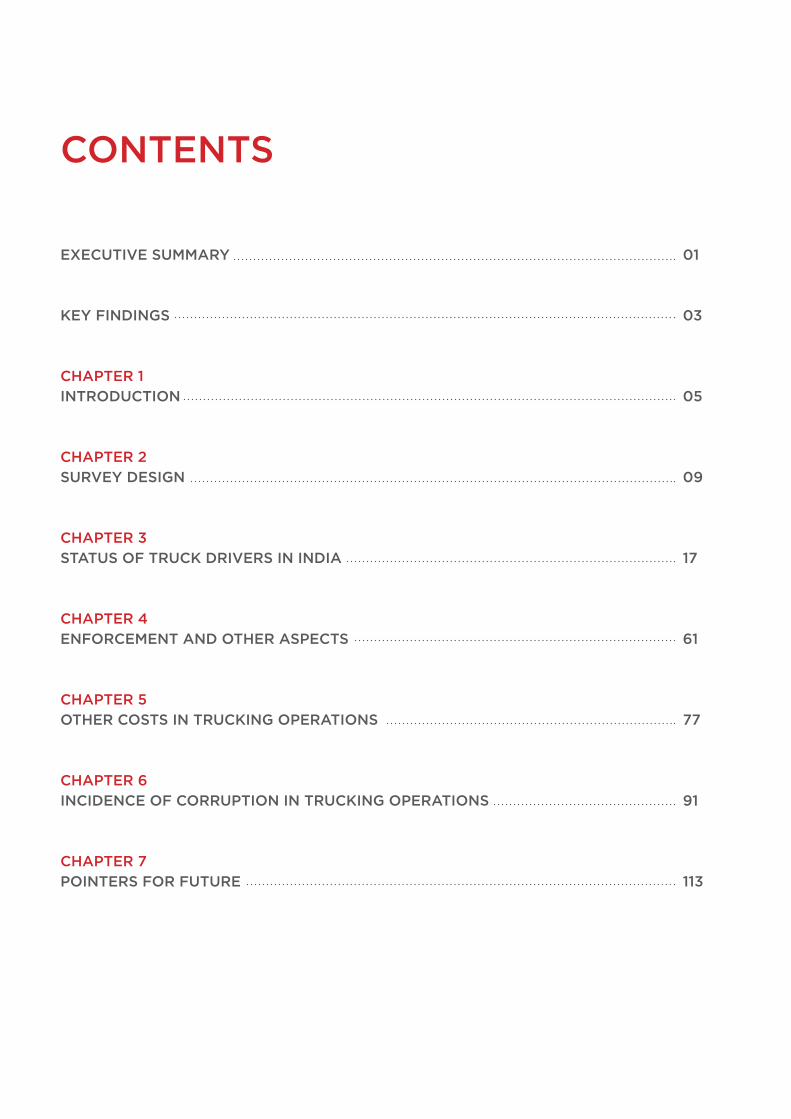
CONTENTS
EXECUTIVE SUMMARY 01
KEY FINDINGS 03
CHAPTER 1INTRODUCTION 05
CHAPTER 2SURVEY DESIGN 09
CHAPTER 3STATUS OF TRUCK DRIVERS IN INDIA 17
CHAPTER 4ENFORCEMENT AND OTHER ASPECTS 61
CHAPTER 5OTHER COSTS IN TRUCKING OPERATIONS 77
CHAPTER 6INCIDENCE OF CORRUPTION IN TRUCKING OPERATIONS 91
CHAPTER 7POINTERS FOR FUTURE 113
1 STUDY ON THE STATUS OF TRUCK DRIVERS IN INDIA
EXECUTIVE SUMMARY
Road crashes claim 1.35 million lives each year globally. However, the burden of road crash deaths remains disproportionately high among low and middle income countries. India tops the world in road crash deaths. The situation is alarming because in 2018 itself, road crashes claimed the lives of over 1.5 lakh people in the country. Out of this, over 15,000 road crash victims have been truck and lorry drivers. In terms of vehicle category, trucks and lorries are involved in over 57,000 crashes. Other additional factors like overloading and load protrusion increase the exposure to risk for other road users. Despite being a serious traffic offence, overloading of trucks has contributed to 12% of total road crash deaths.
This study explores two crucial aspects in the lives of truck drivers - their professional, health and financial status, and the extent of corruption in the trucking industry. With an aim to understand Knowledge, Attitude, Behaviour, and Practices (KABP) of truck drivers with regard to their profession, peers and trucking operations at large in India, SaveLIFE Foundation (SLF), an independent, non-governmental organization committed to improving road safety and emergency medical care across India entered into a partnership with Mahindra & Mahindra (M&M), a multinational car manufacturing corporation headquartered in Mumbai. A multi-city nationwide study was conducted to understand
both these aspects related to the quality of life and professional hazards faced by truck drivers.
Marketing and Development Research Associates (MDRA) was engaged to conduct a detailed mixed-methodology study. The study uses quantitative research to survey 1217 truck drivers and 101 fleet owners (1318 total) in 10 cities across India. These cities have been selected on the basis of reported crashes caused by HMVs and the number of HMVs in operation and include Delhi-NCR, Greater Mumbai, Chennai, Kolkata, Bangalore, Jaipur, Ahmedabad, Guwahati, Kanpur and Vijayawada.
Qualitative tools including Focus Group Discussions (FGDs) with drivers were also conducted. The survey includes 21 In Depth Interviews (IDIs) with Fleet owners/ Associations and 1 Focus Group Discussion (FGD) with truck drivers among various stakeholders. Thus, a total sample of 1318 F2F (face-to-face) interviews, 21 IDIs and 1 FGD (10 participants), has been covered during the survey. Additionally, 663 media reports of crashes involving trucks have been analysed to understand the exposure to risk for truck drivers while commuting on Indian roads.
Truck drivers form the backbone of the logistics sector. They are the most important stakeholder in ensuring smooth transportation of goods over
2
long distances, yet remain vulnerable due to the fragmented and informal nature of the trucking industry. This study reveals that more than half of the respondent truck drivers are dissatisfied with their profession. 84% of the respondents said they will not recommend trucking to their family members or relatives. Two-third of the drivers feel the profession is unattractive due to the lack of security and safety on the road.
53% of the drivers earn between INR 10,000 to INR 20,000 per month. Their living conditions are abysmal with no standardisation in wages, lack of social security and incentives to complete a trip on time. Most drivers do not own their vehicles. They often suffer from driver fatigue due to long working hours. On an average, each driver drives for about 11.9 hours in a day. In terms of average distance covered, a truck driver covers about 417 km daily. 49% of the respondent drivers said they drive vehicles even if they are feeling fatigued or sleepy.
The study reveals that truck drivers suffer from various health issues like backaches, joint/muscle pain and gastro-intestinal problems. 95% of respondents said they eat roadside dhaba food. Overall, more than two-third (67.1%) of respondents truck drivers stated that they are overburdened with assignments, and thus resort to speeding to deliver
their assignments on time. 9 out of 10 drivers did not undergo any formal training before getting a driving license.
Exploitation and corruption by enforcement authorities clubbed with poor condition of road infrastructure makes truck driving a challenging profession. One of the most important objectives of the study has been to quantify corruption in the trucking industry. The study estimates Rs.47,852.28 crore per year as the bribe amount in the trucking business at present. Through this study, we aim to shed light on the status of truck drivers in India and hope to offer relevant recommendations that will make their lives better and safer.
3 STUDY ON THE STATUS OF TRUCK DRIVERS IN INDIA
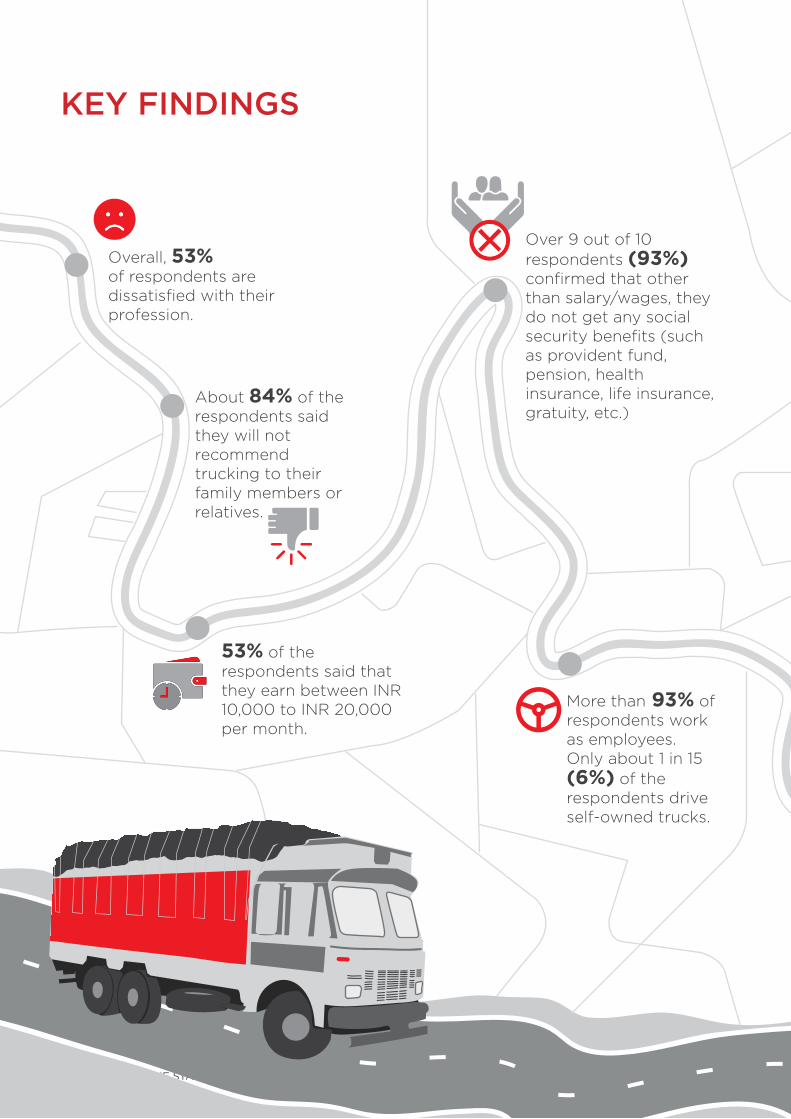
Overall, 53% of respondents are dissatisfied with their profession.
About 84% of the respondents said they will not recommend trucking to their family members or relatives.
53% of the respondents said that they earn between INR 10,000 to INR 20,000 per month.
Over 9 out of 10 respondents (93%) confirmed that other than salary/wages, they do not get any social security benefits (such as provident fund, pension, health insurance, life insurance, gratuity, etc.)
More than 93% of respondents work as employees. Only about 1 in 15 (6%) of the respondents drive self-owned trucks.
On an average,respondents drive for nearly 12 hours in a day and cover a distance of 417 km daily.
Almost 50% of the respondents said they drive vehicles even if they are feeling fatigued or sleepy.
More than 1 in 5 (22%) respondents said they take some kind of drugs during trips.
More than 6 out of 10 (62%) respondents felt unsafe while driving on the roads.
At present,Rs. 47,852.28 crore (approx. 6.7 billion USD) per year is the estimated bribe amount in the trucking operations. This is higher than the reported figure of Rs. 22,048.20 crore in 2006-07.
9 out of 10 respondents confessed they did not undergo any formal training before getting a driving license.
KEY FINDINGS

4
Overall, 53% of respondents are dissatisfied with their profession.
About 84% of the respondents said they will not recommend trucking to their family members or relatives.
53% of the respondents said that they earn between INR 10,000 to INR 20,000 per month.
Over 9 out of 10 respondents (93%) confirmed that other than salary/wages, they do not get any social security benefits (such as provident fund, pension, health insurance, life insurance, gratuity, etc.)
More than 93% of respondents work as employees. Only about 1 in 15 (6%) of the respondents drive self-owned trucks.
On an average,respondents drive for nearly 12 hours in a day and cover a distance of 417 km daily.
Almost 50% of the respondents said they drive vehicles even if they are feeling fatigued or sleepy.
More than 1 in 5 (22%) respondents said they take some kind of drugs during trips.
More than 6 out of 10 (62%) respondents felt unsafe while driving on the roads.
At present,Rs. 47,852.28 crore (approx. 6.7 billion USD) per year is the estimated bribe amount in the trucking operations. This is higher than the reported figure of Rs. 22,048.20 crore in 2006-07.
9 out of 10 respondents confessed they did not undergo any formal training before getting a driving license.

5 STUDY ON THE STATUS OF TRUCK DRIVERS IN INDIA
INTRODUCTION
The transport sector is the backbone of the Indian economy. Between the two main modes of transport, i.e., road and rail, road transport controls 90% of passenger traffic and 67% of freight in the country.1 Truck drivers play a significant role in transporting India’s freight. The unorganised nature of trucking prohibits drivers from getting their due share compared to other industrial counterparts. Additionally, there is a shortage of truck drivers in India. There are 20 lakh truck drivers at present and the driver to truck ratio is below 750 per 1000.2 This means approximately 25% to 30% of India’s trucks lie idle at any given point of time and those employed in the sector are overworked. Long trips are the norm and drivers work irregular shifts without relief on long hauls. Truck drivers often undergo harsh working conditions, health issues and unscheduled working hours that contribute to road crashes and fatalities.
Trucks fall under the heavy goods vehicle category. The Motor Vehicles Act describes heavy goods vehicle as “any goods carriage the gross vehicle weight of which, or tractor or a road-roller the unladen weight of either of which, exceeds 12,000 kilograms.” 3
As per the Ministry of Transport and Highways (MoRTH) data, in the category of impacting vehicles, truck/lorry has the third highest share (12.3%) of total crashes.4 It caused 57,441 crashes, 23,868 deaths and 51,166 injuries in 2018. Among road-user categories, truck/lorry makes up the third highest share of deaths at 10%, claiming 15,150 lives in 2018. With
1
1 Road Transport Year Book (2015-16). In terms of contribution to the economy, road transport contributes about 3.3 per cent of Gross Value Addition (GVA) against the total transport sector contribution of 5 per cent in the GVA.
2 The All India Transporters Welfare Association data - In 1982, that number was 1,300 drivers, which dropped to
Truck/lorry had the thirdhighest share of total crashes
in the category ofimpacting vehicles
Among road-usercategories, truck/lorry
makes up the third highestshare of deaths at
Trucks withloads protruding/
hangingpose a serioussafety hazard
claiming
12.3%
crashes57,441
15,150
deaths23,868
2018
injuries51,166
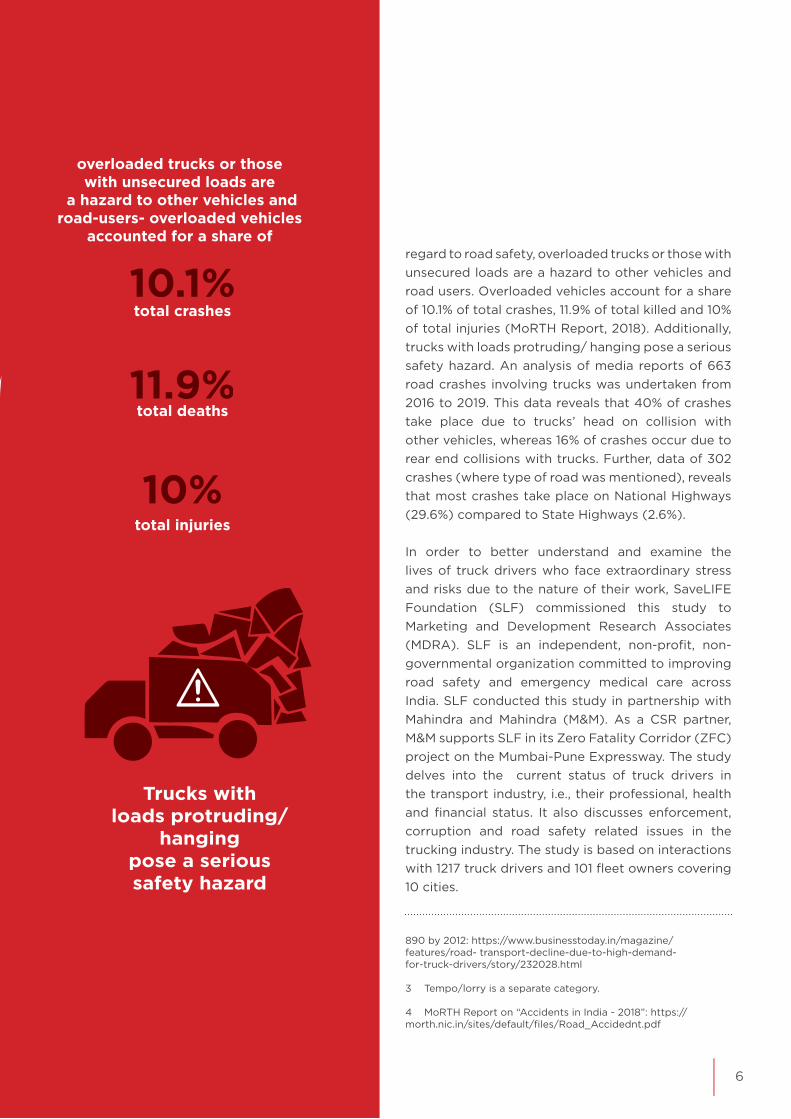
10.1%
overloaded trucks or thosewith unsecured loads are
a hazard to other vehicles androad-users- overloaded vehicles
accounted for a share of
total crashes
11.9%total deaths
10%total injuries
10%
6
regard to road safety, overloaded trucks or those with unsecured loads are a hazard to other vehicles and road users. Overloaded vehicles account for a share of 10.1% of total crashes, 11.9% of total killed and 10% of total injuries (MoRTH Report, 2018). Additionally, trucks with loads protruding/ hanging pose a serious safety hazard. An analysis of media reports of 663 road crashes involving trucks was undertaken from 2016 to 2019. This data reveals that 40% of crashes take place due to trucks’ head on collision with other vehicles, whereas 16% of crashes occur due to rear end collisions with trucks. Further, data of 302 crashes (where type of road was mentioned), reveals that most crashes take place on National Highways (29.6%) compared to State Highways (2.6%).
In order to better understand and examine the lives of truck drivers who face extraordinary stress and risks due to the nature of their work, SaveLIFE Foundation (SLF) commissioned this study to Marketing and Development Research Associates (MDRA). SLF is an independent, non-profit, non-governmental organization committed to improving road safety and emergency medical care across India. SLF conducted this study in partnership with Mahindra and Mahindra (M&M). As a CSR partner, M&M supports SLF in its Zero Fatality Corridor (ZFC) project on the Mumbai-Pune Expressway. The study delves into the current status of truck drivers in the transport industry, i.e., their professional, health and financial status. It also discusses enforcement, corruption and road safety related issues in the trucking industry. The study is based on interactions with 1217 truck drivers and 101 fleet owners covering 10 cities.
890 by 2012: https://www.businesstoday.in/magazine/ features/road- transport-decline-due-to-high-demand- for-truck-drivers/story/232028.html
3 Tempo/lorry is a separate category.
4 MoRTH Report on “Accidents in India - 2018”: https:// morth.nic.in/sites/default/files/Road_Accidednt.pdf
Truck/lorry had the thirdhighest share of total crashes
in the category ofimpacting vehicles
Among road-usercategories, truck/lorry
makes up the third highestshare of deaths at
Trucks withloads protruding/
hangingpose a serioussafety hazard
claiming
12.3%
crashes57,441
15,150
deaths23,868
2018
injuries51,166
10.1%
overloaded trucks or thosewith unsecured loads are
a hazard to other vehicles androad-users- overloaded vehicles
accounted for a share of
total crashes
11.9%total deaths
10%total injuries
10%
7 STUDY ON THE STATUS OF TRUCK DRIVERS IN INDIA
INTRODUCTION
1
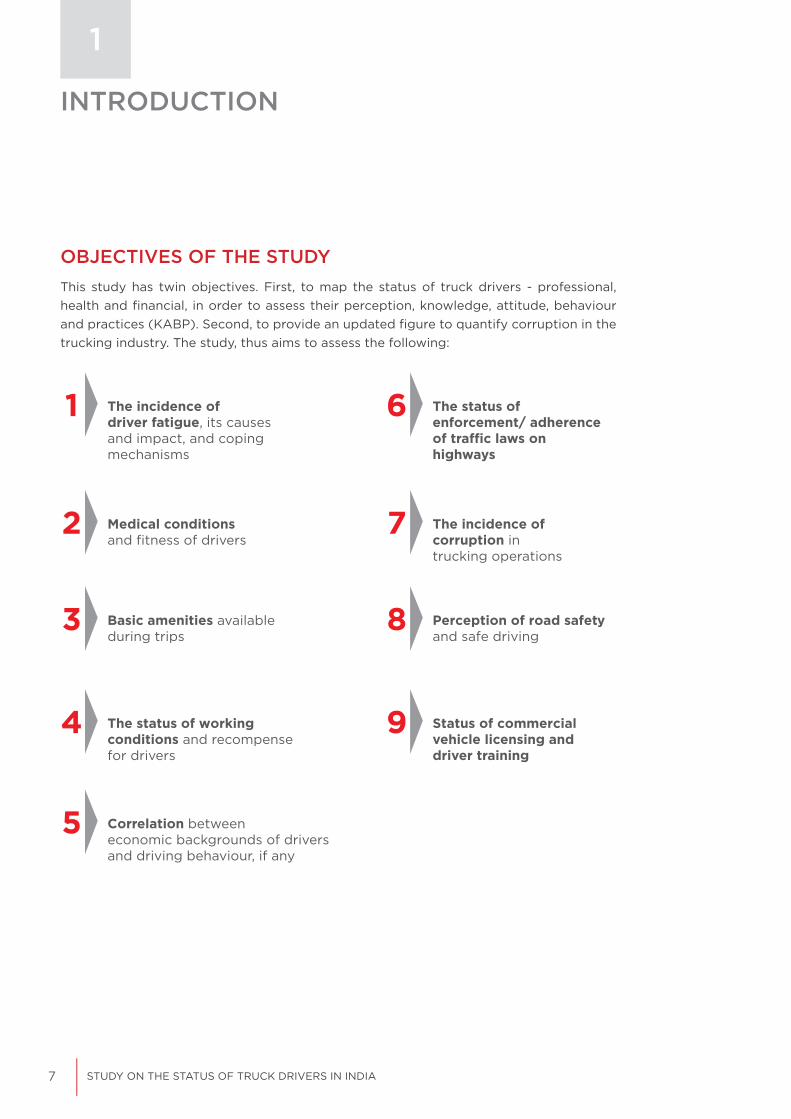
This study has twin objectives. First, to map the status of truck drivers - professional, health and financial, in order to assess their perception, knowledge, attitude, behaviour and practices (KABP). Second, to provide an updated figure to quantify corruption in the trucking industry. The study, thus aims to assess the following:
OBJECTIVES OF THE STUDY
1 The incidence ofdriver fatigue, its causesand impact, and copingmechanisms
2 Medical conditionsand fitness of drivers
3 Basic amenities availableduring trips
4 The status of working conditions and recompensefor drivers
6 The status ofenforcement/ adherence of tra�c laws on highways
7 The incidence ofcorruption intrucking operations
8 Perception of road safetyand safe driving
9 Status of commercial vehicle licensing anddriver training
5 Correlation betweeneconomic backgrounds of drivers and driving behaviour, if any

8
These objectives help assess the various types of challenges faced by truck drivers before and during their trips. They also reveal how these challenges affect their physical, mental and emotional well-being, and the ways in which they cope with it. It gives us an insight into their attitudes and beliefs towards their profession and peers.
Finally, it is hoped that the recommendations that come out of this study will improve the quality of lives of truck drivers.
Truck parked at a truck rest stop
9 STUDY ON THE STATUS OF TRUCK DRIVERS IN INDIA
SURVEY DESIGN
2
2.1. RESPONDENT PROFILE:
For the survey, three main categories of respondents were selected:
1. Truck Drivers 2. Fleet Owners/Operators 3. Associations
Truck Drivers:Truck drivers across 10 selected cities were interviewed for the survey. Respondents were interviewed at transport hubs and highways. Since the study revolves around the status of truck drivers
in India, they were the biggest respondent category in the Survey. A total of 1217 truck drivers were covered in the study.
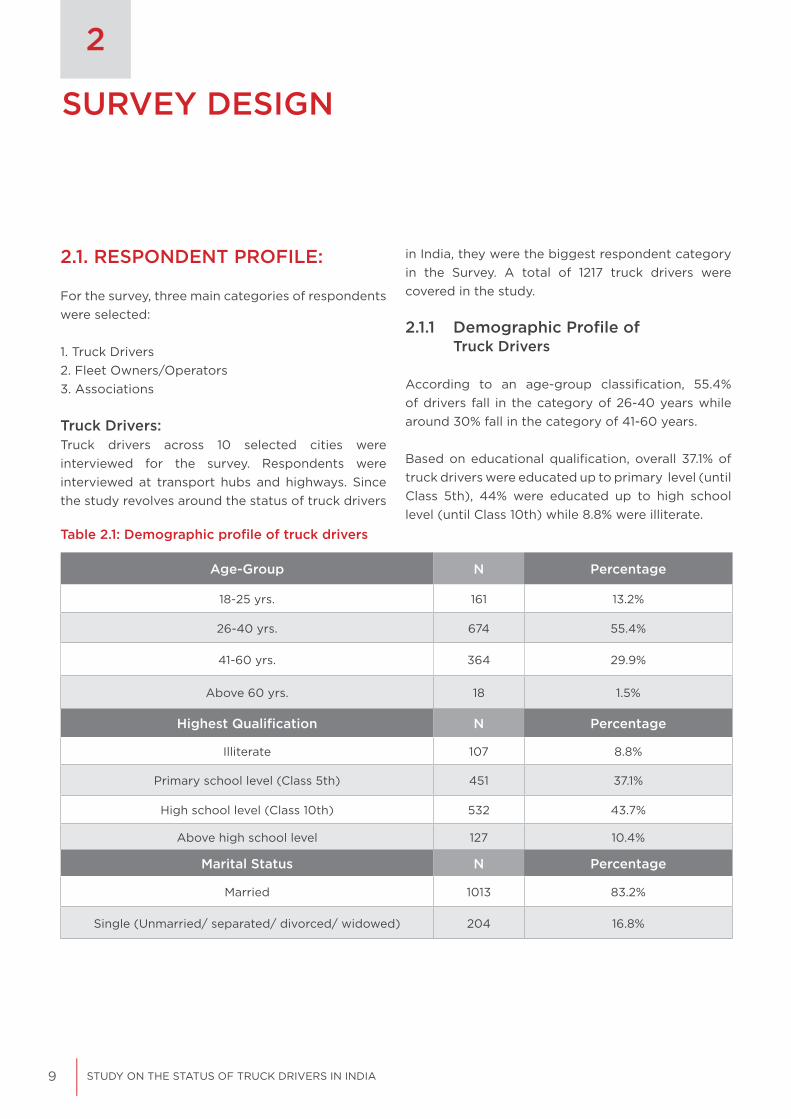
2.1.1 Demographic Profile of Truck Drivers
According to an age-group classification, 55.4% of drivers fall in the category of 26-40 years while around 30% fall in the category of 41-60 years.
Based on educational qualification, overall 37.1% of truck drivers were educated up to primary level (until Class 5th), 44% were educated up to high school level (until Class 10th) while 8.8% were illiterate.
Table 2.1: Demographic profile of truck drivers
Age-Group N Percentage
18-25 yrs. 161 13.2%
26-40 yrs. 674 55.4%
41-60 yrs. 364 29.9%
Above 60 yrs. 18 1.5%
Highest Qualification N Percentage
Illiterate 107 8.8%
Primary school level (Class 5th) 451 37.1%
High school level (Class 10th) 532 43.7%
Above high school level 127 10.4%
Marital Status N Percentage
Married 1013 83.2%
Single (Unmarried/ separated/ divorced/ widowed) 204 16.8%
10
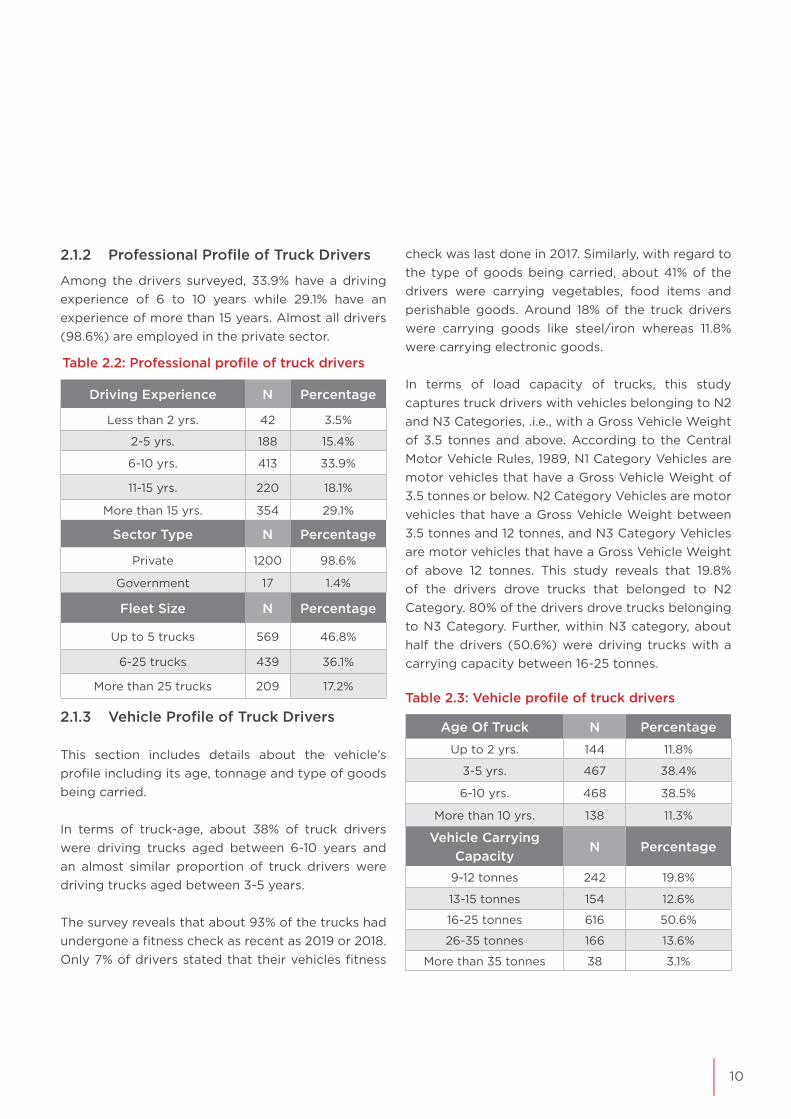
2.1.2 Professional Profile of Truck Drivers
Table 2.2: Professional profile of truck drivers
Driving Experience N Percentage
Less than 2 yrs. 42 3.5%
2-5 yrs. 188 15.4%
6-10 yrs. 413 33.9%
11-15 yrs. 220 18.1%
More than 15 yrs. 354 29.1%
Sector Type N Percentage
Private 1200 98.6%
Government 17 1.4%
Fleet Size N Percentage
Up to 5 trucks 569 46.8%
6-25 trucks 439 36.1%
More than 25 trucks 209 17.2%
2.1.3 Vehicle Profile of Truck Drivers
This section includes details about the vehicle’s profile including its age, tonnage and type of goods being carried.
In terms of truck-age, about 38% of truck drivers were driving trucks aged between 6-10 years and an almost similar proportion of truck drivers were driving trucks aged between 3-5 years.
The survey reveals that about 93% of the trucks had undergone a fitness check as recent as 2019 or 2018. Only 7% of drivers stated that their vehicles fitness
Among the drivers surveyed, 33.9% have a driving experience of 6 to 10 years while 29.1% have an experience of more than 15 years. Almost all drivers (98.6%) are employed in the private sector.
check was last done in 2017. Similarly, with regard to the type of goods being carried, about 41% of the drivers were carrying vegetables, food items and perishable goods. Around 18% of the truck drivers were carrying goods like steel/iron whereas 11.8% were carrying electronic goods.
In terms of load capacity of trucks, this study captures truck drivers with vehicles belonging to N2 and N3 Categories, .i.e., with a Gross Vehicle Weight of 3.5 tonnes and above. According to the Central Motor Vehicle Rules, 1989, N1 Category Vehicles are motor vehicles that have a Gross Vehicle Weight of 3.5 tonnes or below. N2 Category Vehicles are motor vehicles that have a Gross Vehicle Weight between 3.5 tonnes and 12 tonnes, and N3 Category Vehicles are motor vehicles that have a Gross Vehicle Weight of above 12 tonnes. This study reveals that 19.8% of the drivers drove trucks that belonged to N2 Category. 80% of the drivers drove trucks belonging to N3 Category. Further, within N3 category, about half the drivers (50.6%) were driving trucks with a carrying capacity between 16-25 tonnes.
Table 2.3: Vehicle profile of truck drivers
Age Of Truck N Percentage
Up to 2 yrs. 144 11.8%
3-5 yrs. 467 38.4%
6-10 yrs. 468 38.5%
More than 10 yrs. 138 11.3%
Vehicle Carrying Capacity
N Percentage
9-12 tonnes 242 19.8%
13-15 tonnes 154 12.6%
16-25 tonnes 616 50.6%
26-35 tonnes 166 13.6%
More than 35 tonnes 38 3.1%

11 STUDY ON THE STATUS OF TRUCK DRIVERS IN INDIA
SURVEY DESIGN
2
Fleet Operators / Owners:Fleet Owners/Operators were also interviewed for the Study. Large fleet owners with more than 25 trucks, medium fleet owners with trucks in the range of 6 to 25 trucks and small fleet owners with upto 5 trucks were included in the respondent mix. Due to the highly fragmented and unorganised nature of trucking, small truck owners make up the majority of the trucking business. Thus, it is important to record their views.
2.1.4 Demographic Profile of Fleet Owners
During the survey, 6 out of 10 respondents were fleet owners while the remaining were managers. In terms of age, more than half of the fleet owners were aged 26-40 years followed by 40-60 years (41.6%).
More than 70% of fleet owners had been working in the trucking industry for over 10 years.
Category of respondent N Percentage
Fleet owners 63 62.4%
Managers 38 37.6%
Age-group N Percentage16-25 yrs. 4 4.0%
26-40 yrs. 52 51.5%
40-60 yrs. 42 41.6%
Above 60 yrs. 3 3.0%
Work experience N Percentage
Less than 5 yrs. 9 8.9%
6-10 yrs. 20 19.8%
11-15 yrs. 27 26.7%
16-20 yrs. 21 20.8%
More than 20 yrs. 24 23.8%
Table 2.4: Demographic profile of fleet owners
2.1.5 Business Profile of Fleet Owners
According to the firm type, 59% of fleet owners have a single-firm entity and the remaining 41% have multiple establishments across India. Further, 55% of fleet owners are sole proprietors of their firms while 36% have private limited firms.
The average fleet size is 20. Each fleet owner employs about 23 drivers, out of which, 16 are permanent while 7 are temporary drivers.
Firm type N PercentageSingle 60 59.4%
Multi-establishment 41 40.6%
Firm type N Percentage
Proprietorship firm 55 54.5%
Pvt limited company 36 35.6%
Partnership firm 10 9.9%
Fleet size N MeanAvg. Fleet Size 101 19.9
Avg. self-owned trucks 101 16.5
Avg. leased trucks 101 3.4
Truck drivers employed N Mean
Avg. drivers employed 101 23.2
Avg. permanent drivers 101 16.0
Avg. temporary drivers 101 7.2
Table 2.5 : Business profile of fleet owners
Associations: In-depth interviews were conducted with the representatives of various Transport Associations including All India Motor Transport Congress, All India Transporters Welfare Association and All India Road Transport Workers’ Federation. Their perspectives on the trucking business and its challenges have been recorded in this study.
12
2.2: SAMPLING AND SAMPLE SIZE
A robust sampling design has been formulated in order to ensure representative coverage, especially since the respondent categories are heterogeneous and diverse. Based on the objectives of the study, a unique 3 ‘S’ sampling criteria of Selection, Spread and Size is followed to ensure representation, randomness and robustness – the 3 ‘R’s.
The above sampling yields a ± 2.70% margin of error at 95% confidence level, which is quite sufficient in view of the objectives of this study.
In order to select locations for conducting the study, two factors were shortlisted:
1. Top geographic locations in terms of crashes caused by HMVs2. Top locations in terms of registration and existing number of HMVs in operation.
Based on Ministry of Road Transport and Highways’ data for the top states in terms of crashes caused by HMVs, the cities were selected for the survey. Further, latest available data for cities in terms of the highest number of registered multi-axle/articulated vehicles/trucks and lorries was considered. This also includes cities where registrations are low but the actual number of HMVs in operation is higher.
2.3: SAMPLE COVERED
2.3.1: Quantitative Survey
Based on the above, the study is conducted across 10 key transportation hubs of India - Delhi-NCR, Greater Mumbai, Chennai, Kolkata, Bangalore, Jaipur, Ahmedabad, Guwahati, Kanpur and Vijayawada.
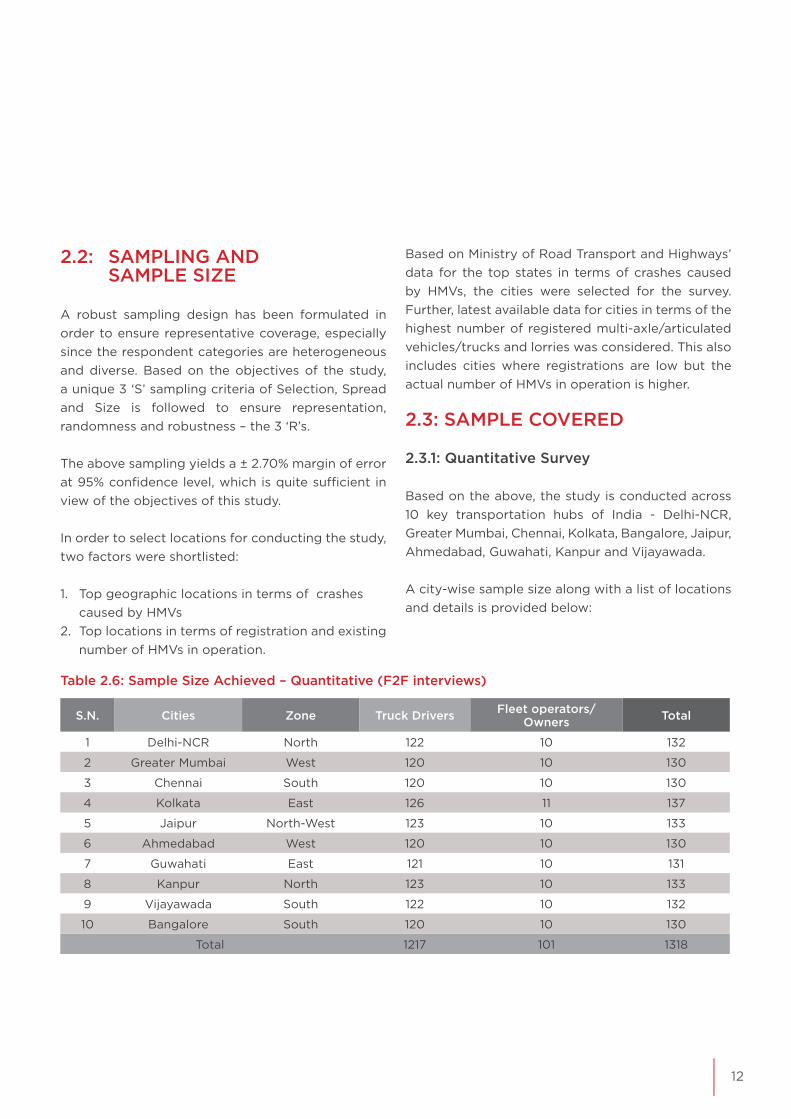
A city-wise sample size along with a list of locations and details is provided below:
Table 2.6: Sample Size Achieved – Quantitative (F2F interviews)
S.N. Cities Zone Truck Drivers Fleet operators/ Owners Total
1 Delhi-NCR North 122 10 132
2 Greater Mumbai West 120 10 130
3 Chennai South 120 10 130
4 Kolkata East 126 11 137
5 Jaipur North-West 123 10 133
6 Ahmedabad West 120 10 130
7 Guwahati East 121 10 131
8 Kanpur North 123 10 133
9 Vijayawada South 122 10 132
10 Bangalore South 120 10 130
Total 1217 101 1318
13 STUDY ON THE STATUS OF TRUCK DRIVERS IN INDIA
2
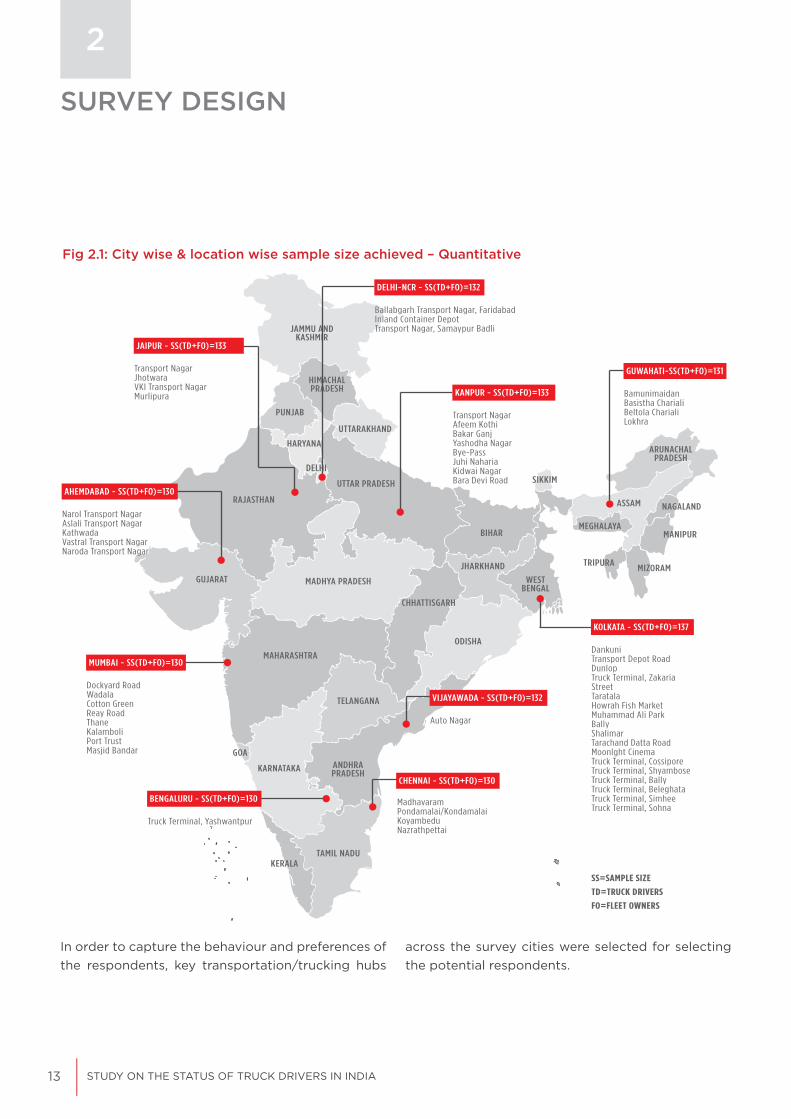
Fig 2.1: City wise & location wise sample size achieved – Quantitative
KOLKATA - SS(TD+FO)=137
JAMMU ANDKASHMIR
HIMACHALPRADESH
HARYANA
DELHI
UTTAR PRADESH
RAJASTHAN
GUJARAT MADHYA PRADESH
MAHARASHTRA
KARNATAKA
KERALA TAMIL NADU
TELANGANA
ODISHA
CHHATTISGARH
JHARKHAND
BIHAR
SIKKIM
ASSAM
MEGHALAYA
MIZORAMTRIPURA
NAGALAND
MANIPUR
ARUNACHALPRADESH
WESTBENGAL
ANDHRAPRADESH
GOA
PUNJAB
UTTARAKHAND
DankuniTransport Depot RoadDunlopTruck Terminal, Zakaria StreetTaratalaHowrah Fish MarketMuhammad Ali ParkBallyShalimarTarachand Datta RoadMoonlght CinemaTruck Terminal, CossiporeTruck Terminal, ShyamboseTruck Terminal, BallyTruck Terminal, BeleghataTruck Terminal, SimheeTruck Terminal, Sohna
KANPUR - SS(TD+FO)=133
Transport NagarAfeem KothiBakar GanjYashodha NagarBye-PassJuhi NahariaKidwai NagarBara Devi Road
DELHI-NCR - SS(TD+FO)=132
Ballabgarh Transport Nagar, FaridabadInland Container DepotTransport Nagar, Samaypur Badli
JAIPUR - SS(TD+FO)=133
Transport NagarJhotwaraVKI Transport NagarMurlipura
VIJAYAWADA - SS(TD+FO)=132
CHENNAI - SS(TD+FO)=130
Auto Nagar
MadhavaramPondamalai/KondamalaiKoyambeduNazrathpettai
GUWAHATI-SS(TD+FO)=131
BamunimaidanBasistha CharialiBeltola CharialiLokhra
AHEMDABAD - SS(TD+FO)=130
Narol Transport NagarAslali Transport NagarKathwadaVastral Transport NagarNaroda Transport Nagar
MUMBAI - SS(TD+FO)=130
Dockyard RoadWadalaCotton GreenReay RoadThaneKalamboliPort TrustMasjid Bandar
BENGALURU - SS(TD+FO)=130
Truck Terminal, Yashwantpur
SS=SAMPLE SIZE
TD=TRUCK DRIVERS
FO=FLEET OWNERS
In order to capture the behaviour and preferences of the respondents, key transportation/trucking hubs
across the survey cities were selected for selecting the potential respondents.
SURVEY DESIGN

14
2.3.2: Qualitative Survey
The survey also includes 21 In Depth Interviews (IDIs) with fleet owners/ associations and 1 Focus Group Discussion (FGD) with truck drivers among various stakeholders.
The achieved sample breakup of IDIs is given below:
Table 2.7: Sample Size Achieved – Qualitative
Method Segment Target Group Sample
IDIsFleet operators/ owners
Large fleet owners (having >25 trucks) 6
Medium fleet owners (having 6-25 trucks) 5
Small Fleet Owners (having up to 5 trucks) 2
Associations Officials of transporters association 8
Total 21
FGD Truck drivers Truck drivers 1
Total sample of 1318 F2F (Face- to- Face) interviews, 21 IDIs and 1 FGD (10 participants), were covered during the survey. Additionally, 663 media reports of crashes involving trucks have been analysed to understand the exposure to risk for truck drivers while commuting on roads in India.
15 STUDY ON THE STATUS OF TRUCK DRIVERS IN INDIA
2
2.4. RESEARCH METHODOLOGY
2.4.1 Research Approach
The key objectives of the study are to map the status of truck drivers, to assess their Knowledge, Attitude, Behaviour and Practices (KABP) and to quantify the corruption in the trucking industry in order to provide recommendations for improvement in the trucking sector. The study recognises the various methodologies for estimating the quantity of corruption in a country and also understands that each method has limitations. Truly accurate information cannot be calculated as the focus is on corruption. Considering the quantity and quality of data, the authors are of the opinion that, within the limitations, the methodology adopted in this study gives the closest representation of the real-world scenario in India.
Based on the objectives, the research methodology for this study is divided into two phases:
1. Exploratory Research2. Descriptive Research
Phase I Exploratory Research for Survey Design
Step I: Desk Research
Desk research was conducted to get a thorough understanding of the major transport hubs in the
country, heavy vehicle traffic count data, and the pattern in crash typologies.A review of earlier survey reports, road crash cases and other related documents, was done in order to examine specific challenges affecting drivers on the road which might contribute to an increase in road crashes.
Step II: Qualitative Research
Qualitative Research including in-depth interviews with truck fleet owners and truck owners’/drivers’ association members were conducted. About 40% of the interviews (out of about 20) were conducted in exploratory phase. A Focus Group Discussion (FGD) with truck drivers was conducted at Sanjay Gandhi Transport Nagar, Delhi to understand the challenges faced by them. This FGD helped in determining the behavioural, infrastructural and policy aspects that lead to road crashes. During this FGD, 6 key parameters were evaluated:
1. Driver Fatigue and Medical Conditions2. Lack of facilities during transit3. Overloading/ Carrying Protruding Rods4. Corruption in Trucking Operations5. Licensing, Commercial Driver Training6. Fitness Testing for Vehicle
Step III: Pilot Survey
The proposed survey mechanisms and research topics were piloted among 20 respondents across all the categories in different localities of Delhi-NCR. Face-
SURVEY DESIGN
16
to-face (F2F) interviews were conducted with the help of structured questionnaires in real conditions (i.e. not staged). Interviews with fleet owners and truck drivers were conducted in Ballabgarh, Haryana and Sanjay Gandhi Transport Nagar, New Delhi. Based on the outcomes/learnings of the pilot survey, the instruments for the final survey were fine-tuned. This included making changes in the ease of administering the questionnaires, the sequence and relevance of questions etc.
Phase 2Descriptive Research
Step I: Quantitative Survey
During this phase, quantitative and qualitative research techniques were employed to collect primary information. The survey was conducted through face-to-face structured interviews among target groups.
The key stakeholders in the quantitative survey were:
1. Truck drivers2. Fleet owners
Step II: Qualitative Study
In-depth interviews (IDIs) of fleet owners/driver’s association members were completed in this phase of the report.
Step III: Analysis of Media Reports
An analysis of media reports on HMV crashes was undertaken as part of secondary research. A total of 663 news articles on road crashes involving HMVs during the last 4 yeas (2016-2019) were studied. The data obtained was analysed to collect information about the timing, location, vehicle type and reasons stated for the crash. Further, cross-tabulation and frequency analysis were employed to discuss the findings mentioned in this report.

17 STUDY ON THE STATUS OF TRUCK DRIVERS IN INDIA
STATUS OF TRUCK DRIVERSIN INDIA
Road Freight Transport is essential to the Indian economy, contributing approximately 4.5% of the GDP. Roads carry roughly 67% of the freight volume in India, much higher than rail, sea or air combined.6 With the growth of e-tail sector, trucking operations have been instrumental in distribution of goods across the country. From moving daily needs items to industrial goods, truck drivers play a pivotal role in everybody’s life directly or indirectly. However, truck drivers face high exposure to risk. As per the Ministry of Transport and Highways (MoRTH), over 15,000, truck and lorry users died in road crashes on Indian roads in 2018.
One of the studies conducted by ILO on Road Freight Transport through “decent work” lens, acknowledges driver conditions and driver fatigue as the key factors contributing to road crash deaths.7
3
The report further highlights how ‘in many instances, crashes involving trucks can be directly linked to the drivers’ working conditions.’ This chapter therefore looks at the quality of life and work of truck drivers in India. It broadly covers the following themes:
5 http://www.in.kpmg.com/pdf/logistics.pdf6 https://morth.nic.in/sites/default/files/Road_Transport_Year_Book_2015_16_reduce.pdf7 https://www.ilo.org/wcmsp5/groups/public/---asia/---ro-bangkok/---sro-bangkok/documents/event/wcms_655538.pdf
Truck drivers form the backbone of the road freight industry and
ironically, also comprise the most neglected set
of workers in the logistics sector.
-KPMG, ‘Skill Gaps in the Indian Logistics Sector’, 20075
“
“ Truck-driving profession, quality of life and social status1
2
3
4
5
Earnings and economic condition
Other work-related aspects
Health related aspects
Safety related aspects

18
3.1. PROFESSIONAL STATUS OF TRUCK DRIVERS
The following section records opinions of the respondents on various aspects related to the truck driving profession such as the satisfaction levels with their profession, social status, quality of life, and so on.
Fig 3.1: Drivers satisfaction with the driving profession
Satisfied
Neutral
Dissatisfied
27.4% 19.2% 53.4%
57.5% 32.5% 10%
55% 13.3% 31.6%
45.3% 15.1% 39.7%
36.1% 4.9% 59%
34.9% 35.8% 29.3%
13.3 % 17.5% 69.2%
10.8% 18.2% 71%
10.6% 35.8% 53.7%
9.8% 18% 72.1%
0.8% 0.8% 98.3%
0 20 40 60 80 100 120Mumbai (N=120)
Delhi-NCR (N=122)
Kanpur (N=123)
Guwahati (N=121)
Ahmedabad (N=120)
Jaipur (N=123)
Vijayawada (N=122)
Kolkata (N=126)
Bangalore (N=120)
Chennai (N=120)
Overall (N=1217) 27.4% 19.2% 53.4%
57.5% 32.5% 10.0%
55.0% 13.3% 31.6%
45.3% 15.1% 39.7%
36.1% 4.9% 59.0%
34.9% 35.8% 29.3%
13.3% 17.5% 69.2%
10.8% 18.2% 71.0%
10.6% 35.8% 53.7%
9.8% 18.0% 72.1%
0.8% 0.8% 98.3%
3.1.1. Satisfaction with the Truck Driving Profession
The respondents were asked to rate their satisfaction level with their profession on a 3 point scale. Only 27.4% of the drivers said they were satisfied with their profession. However, more than half the truck drivers interviewed in Chennai (57.5%) and Bangalore (55%) said they were satisfied with their profession.
Truck drivers who said they were satisfied with their vocation (N=334) were subsequently asked to list the reasons for their satisfaction. The top three reasons listed by drivers were: easy money (55.7%),
requirement of low educational qualification or technical knowledge (47.9%) and freedom of work (44.3%). Drivers also mentioned that low levels of education and lack of skills make it difficult for them to find alternative employment options. Hence, truck driving becomes an obvious choice they can fall upon to earn a livelihood.
Conversely, a majority of truck drivers said they were dissatisfied or neutral about working in the sector (N=883). Despite the profession offering easy money, 71% of drivers said they were not happy driving a truck. Unscheduled working hours leave them with little or no time to spend with their families. Moreover, there is a high risk of death/injury on the job owing

19 STUDY ON THE STATUS OF TRUCK DRIVERS IN INDIA
STATUS OF TRUCKDRIVERS IN INDIA
3
to road crashes and the lack of safety on highways.
Other reasons for dissatisfaction with the profession include harassment by police/RTO officials and local groups during trips (40%), lack of job security (25.4%), lack of respect in society (15%), and so on.
From the in-depth interviews with transport association members that work for truck driver welfare, it was revealed that drivers are not paid adequately for the number of hours they put in. This eventually affects their quality of life, standard of living, household expenses, etc. In addition, they
Fig 3.2: Reasons for driver dissatisfaction with the driving profession[N = 883, Open ended]
do not have a proper work-life balance. All these reasons thus lead to dissatisfaction.
The same question about job-satisfaction was asked to the fleet owners. It was ascertained that more than three-fourth (75.2%) of the fleet owners are not satisfied with their profession.
Fleet owners were also asked about the reasons for their satisfaction or dissatisfaction with their profession. Among the fleet owners who said they were satisfied with their profession (N=25), 20% preferred it for the opportunity to make extra money
0 10 20 30 40 50 60 70 80
Theft Issues
Difficult work conditions to work
Road related issues, traffic jam, congestion, etc.
Health risk due to stressful job & unhealthy food
Lack of proper sleep/ rest
Lack of social security [PF, insurance, pension etc.]
Lack of respect in society
No job security/ temporary job
Unscheduled working hours
Risk of life due to accidents
Less time to spend with family
Harassment from police/ RTO/ goons
Low/ irregular income
0 10 20 30 40 50 60 70 80
Theft Issues
Difficult work conditions to work
Road related issues, trafficjam, congestion, etc.
Health risk due to stressfuljob & unhealthy food
Lack of proper sleep/ rest
Lack of social security[PF, insurance, pension etc.]
Lack of respect in society
No job security/ temporary job
Unscheduled working hours
Risk of life due to accidents
Less time to spend with family
Harassment from police/ RTO/ local groups
Low/ irregular income 70.8%
40.2%
27.6%
27.2%
26.8%
25.4%
15.2%
12.0%
8.9%
8.2%
6.2%
3.6%
0.6%
20
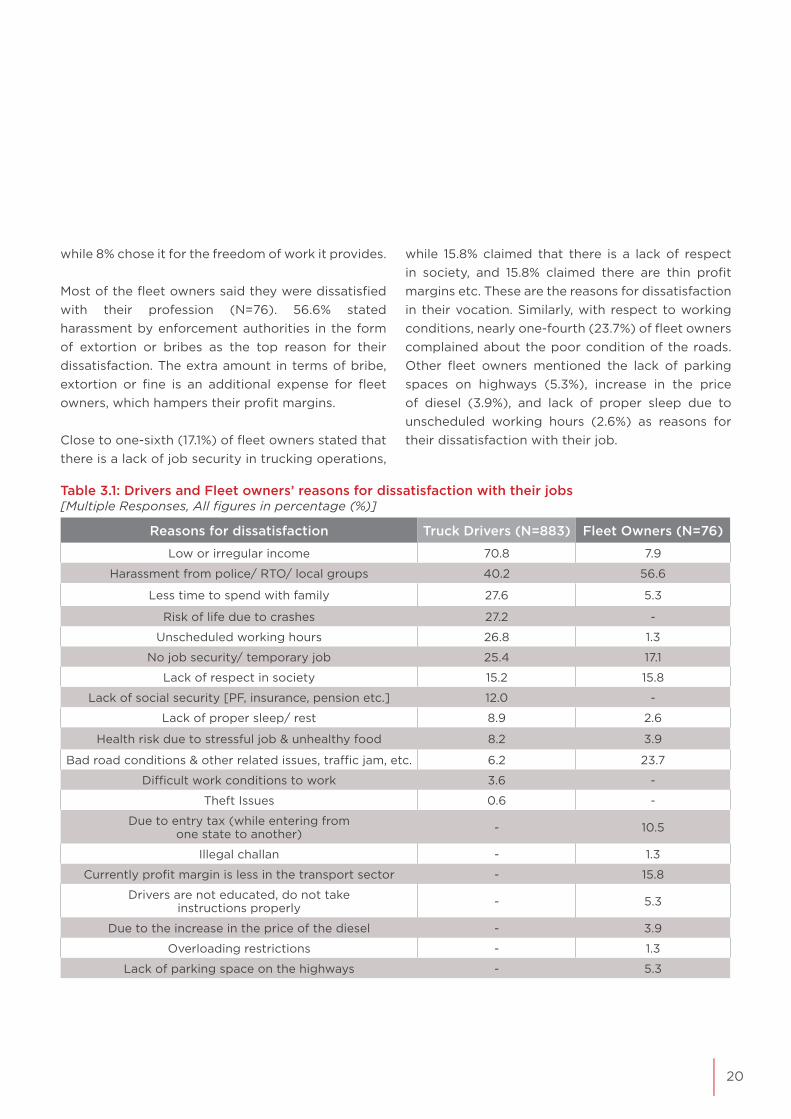
Table 3.1: Drivers and Fleet owners’ reasons for dissatisfaction with their jobs
Reasons for dissatisfaction Truck Drivers (N=883) Fleet Owners (N=76)
Low or irregular income 70.8 7.9
Harassment from police/ RTO/ local groups 40.2 56.6
Less time to spend with family 27.6 5.3
Risk of life due to crashes 27.2 -
Unscheduled working hours 26.8 1.3
No job security/ temporary job 25.4 17.1
Lack of respect in society 15.2 15.8
Lack of social security [PF, insurance, pension etc.] 12.0 -
Lack of proper sleep/ rest 8.9 2.6
Health risk due to stressful job & unhealthy food 8.2 3.9
Bad road conditions & other related issues, traffic jam, etc. 6.2 23.7
Difficult work conditions to work 3.6 -
Theft Issues 0.6 -
Due to entry tax (while entering from one state to another) - 10.5
Illegal challan - 1.3
Currently profit margin is less in the transport sector - 15.8
Drivers are not educated, do not take instructions properly - 5.3
Due to the increase in the price of the diesel - 3.9
Overloading restrictions - 1.3
Lack of parking space on the highways - 5.3
while 8% chose it for the freedom of work it provides.
Most of the fleet owners said they were dissatisfied with their profession (N=76). 56.6% stated harassment by enforcement authorities in the form of extortion or bribes as the top reason for their dissatisfaction. The extra amount in terms of bribe, extortion or fine is an additional expense for fleet owners, which hampers their profit margins.
Close to one-sixth (17.1%) of fleet owners stated that there is a lack of job security in trucking operations,
while 15.8% claimed that there is a lack of respect in society, and 15.8% claimed there are thin profit margins etc. These are the reasons for dissatisfaction in their vocation. Similarly, with respect to working conditions, nearly one-fourth (23.7%) of fleet owners complained about the poor condition of the roads. Other fleet owners mentioned the lack of parking spaces on highways (5.3%), increase in the price of diesel (3.9%), and lack of proper sleep due to unscheduled working hours (2.6%) as reasons for their dissatisfaction with their job.
[Multiple Responses, All figures in percentage (%)]

21 STUDY ON THE STATUS OF TRUCK DRIVERS IN INDIA
STATUS OF TRUCKDRIVERS IN INDIA
3
3.1.2. Change In Truck Drivers’ Quality Of Life in the Last 10 Years
Based on the truck drivers’ experience in trucking operations, the drivers were asked if the quality of their life has improved in the last 10 years. Overall, only 16.5% of the truck drivers confirmed that their quality of life has improved in the last decade whereas 53% claimed that the quality of life has deteriorated.
In a city-wise analysis, the quality of life of the
truck drivers interviewed in Chennai, Kanpur and Kolkata is better than those of Mumbai, Ahmedabad and Delhi-NCR, where, the condition seems to have deteriorated, as stated by more than 80% respondents in Mumbai and Ahmedabad and almost 59% in Delhi-NCR.
Similarly, when the same question was asked to the fleet owners, about one-fourth of them (26.7%) stated that the quality of life of truck drivers has improved in the last 10 years, while about 40.6% admitted that it has deteriorated.
Fig 3.3: Change in truck drivers’ quality of life in the last 10 years
0 20 40 60 80 100
Ahmedabad (N=120)
Mumbai (N=120)
Jaipur (N=123)
Delhi-NCR (N=122)
Vijayawada (N=122)
Guwahati (N=121)
Bangalore (N=120)
Kolkata (N=126)
Chennai (N=120)
Kanpur (N=123)
Overall (N=1217) 16.5% 53.0% 30.5%
27.6% 44.7% 27.6%
27.5% 24.2% 48.3%
22.2% 46.0% 31.7%
18.3% 40.8% 40.8%
14.9% 47.1% 38.0%
14.8% 51.6% 33.6%
13.1% 58.2% 28.7%
10.6% 52.8% 36.6%
8.3% 84.2% 7.5%
7.5% 80.8% 11.7%
Improved
Deteriorated
Same
22
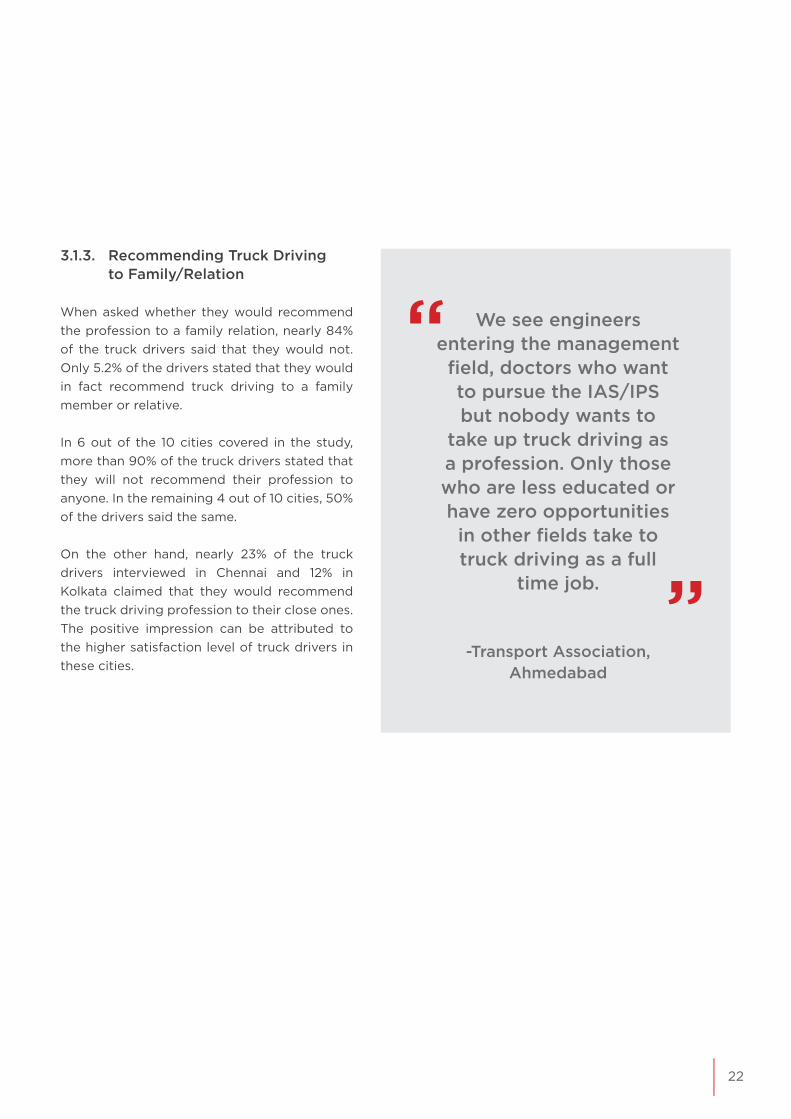
3.1.3. Recommending Truck Driving to Family/Relation
When asked whether they would recommend the profession to a family relation, nearly 84% of the truck drivers said that they would not. Only 5.2% of the drivers stated that they would in fact recommend truck driving to a family member or relative.
In 6 out of the 10 cities covered in the study, more than 90% of the truck drivers stated that they will not recommend their profession to anyone. In the remaining 4 out of 10 cities, 50% of the drivers said the same.
On the other hand, nearly 23% of the truck drivers interviewed in Chennai and 12% in Kolkata claimed that they would recommend the truck driving profession to their close ones. The positive impression can be attributed to the higher satisfaction level of truck drivers in these cities.
We see engineers entering the management field, doctors who want to pursue the IAS/IPS but nobody wants to
take up truck driving as a profession. Only those who are less educated or have zero opportunities
in other fields take to truck driving as a full
time job.
“
“-Transport Association,
Ahmedabad

23 STUDY ON THE STATUS OF TRUCK DRIVERS IN INDIA
STATUS OF TRUCKDRIVERS IN INDIA
3
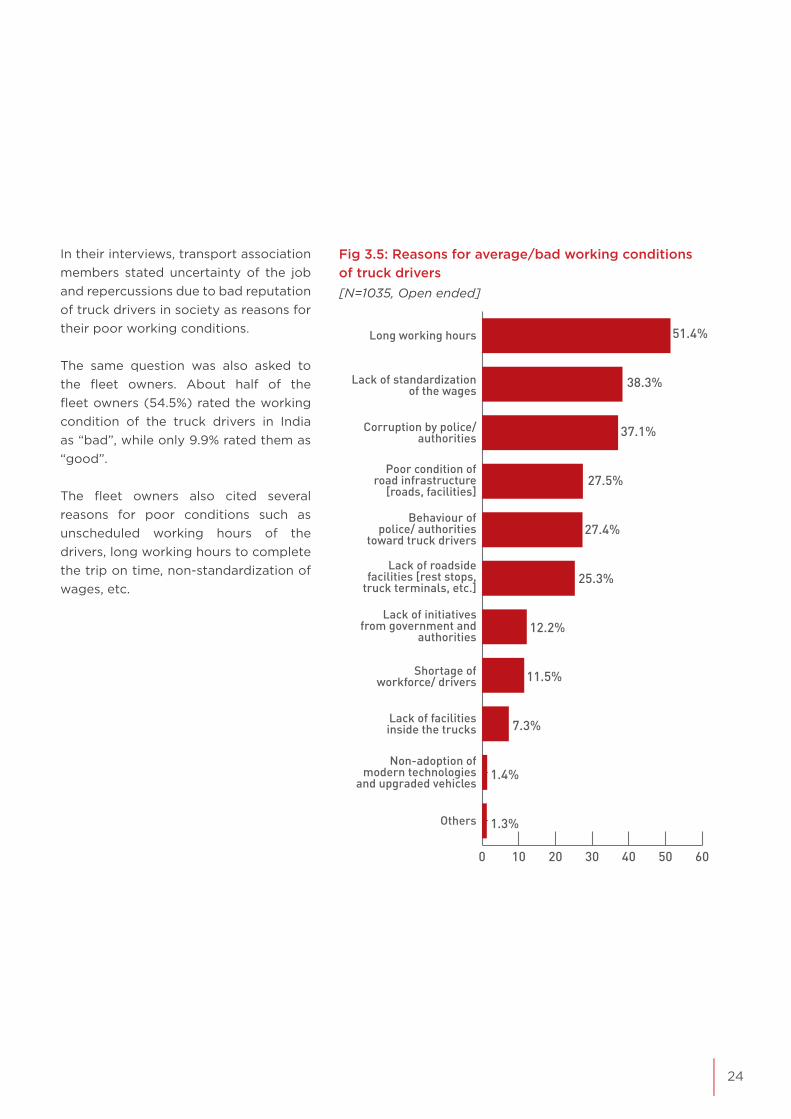
3.1.4. Opinion about Working Conditions of Truck Drivers
The respondent truck drivers were asked to rate their working conditions on a 3-points scale i.e. Good, Average and Bad. Overall, 48% of the respondent truck drivers rated their working conditions as “bad”, while only 15% of the truck drivers mentioned that their working conditions are good. In a citywise analysis, about 30% of the drivers interviewed in Kolkata, Bangalore and Chennai said that their working conditions are “good”. On the other hand, about 94% of the truck drivers interviewed in Mumbai, 85% of the truck drivers interviewed in
Ahmedabad, 73% of the drivers interviewed in Delhi-NCR, and 54.5% of the drivers in Kanpur mentioned that their working conditions are “bad”.
Truck drivers who were dissatisfied with their working conditions (N=1035) were subsequently asked to list out their reasons for dissatisfaction. The top five reasons reasons for dissatiscation were: long working hours (51.4%), no fixed salaries or standardization in wages (38.3%), exploitation and corruption by enforcement authorities (37.1%), poor condition of road infrastructure (27.5%) and behaviour of the police towards truck drivers(27.4%).
Fig 3.4: Opinion about working conditions of truck drivers
0 20 40 60 80 100 120Jaipur (N=123)
Chennai (N=120)
Bangalore (N=120)
Kolkata (N=126)
Guwahati (N=121)
Vijayawada (N=122)
Kanpur (N=123)
Delhi-NCR (N=122)
Ahmedabad (N=120)
Mumbai (N=120)
Overall (N=1217) 48.0% 37.1% 15.0%
94.2% 3.3% 2.5%
85.0% 15.0%
73.0% 23.8% 3.3%
54.5% 45.5%
45.9% 41.8% 12.3%
43.0% 49.6% 7.4%
40.5% 24.6% 34.9%
31.7% 34.2% 34.2%
6.7% 64.2% 29.2%
6.5% 68.3% 25.2%
Bad
Average
Good
24
In their interviews, transport association members stated uncertainty of the job and repercussions due to bad reputation of truck drivers in society as reasons for their poor working conditions.
The same question was also asked to the fleet owners. About half of the fleet owners (54.5%) rated the working condition of the truck drivers in India as “bad”, while only 9.9% rated them as “good”.
The fleet owners also cited several reasons for poor conditions such as unscheduled working hours of the drivers, long working hours to complete the trip on time, non-standardization of wages, etc.
0 10 20 30 40 50 60 70 80
Theft Issues
Difficult work conditions to work
Road related issues, traffic jam, congestion, etc.
Health risk due to stressful job & unhealthy food
Lack of proper sleep/ rest
Lack of social security [PF, insurance, pension etc.]
Lack of respect in society
No job security/ temporary job
Unscheduled working hours
Risk of life due to accidents
Less time to spend with family
Harassment from police/ RTO/ goons
Low/ irregular income
0 10 20 30 40 50 60
Others
Non-adoption ofmodern technologies
and upgraded vehicles
Lack of facilitiesinside the trucks
Shortage ofworkforce/ drivers
Lack of initiativesfrom government and
authorities
Lack of roadsidefacilities [rest stops,
truck terminals, etc.]
Behaviour ofpolice/ authorities
toward truck drivers
Poor condition ofroad infrastructure
[roads, facilities]
Corruption by police/authorities
Lack of standardizationof the wages
Long working hours 51.4%
38.3%
37.1%
27.5%
27.4%
25.3%
12.2%
11.5%
7.3%
1.4%
1.3%
[N=1035, Open ended]
Fig 3.5: Reasons for average/bad working conditionsof truck drivers
25 STUDY ON THE STATUS OF TRUCK DRIVERS IN INDIA
STATUS OF TRUCKDRIVERS IN INDIA
3
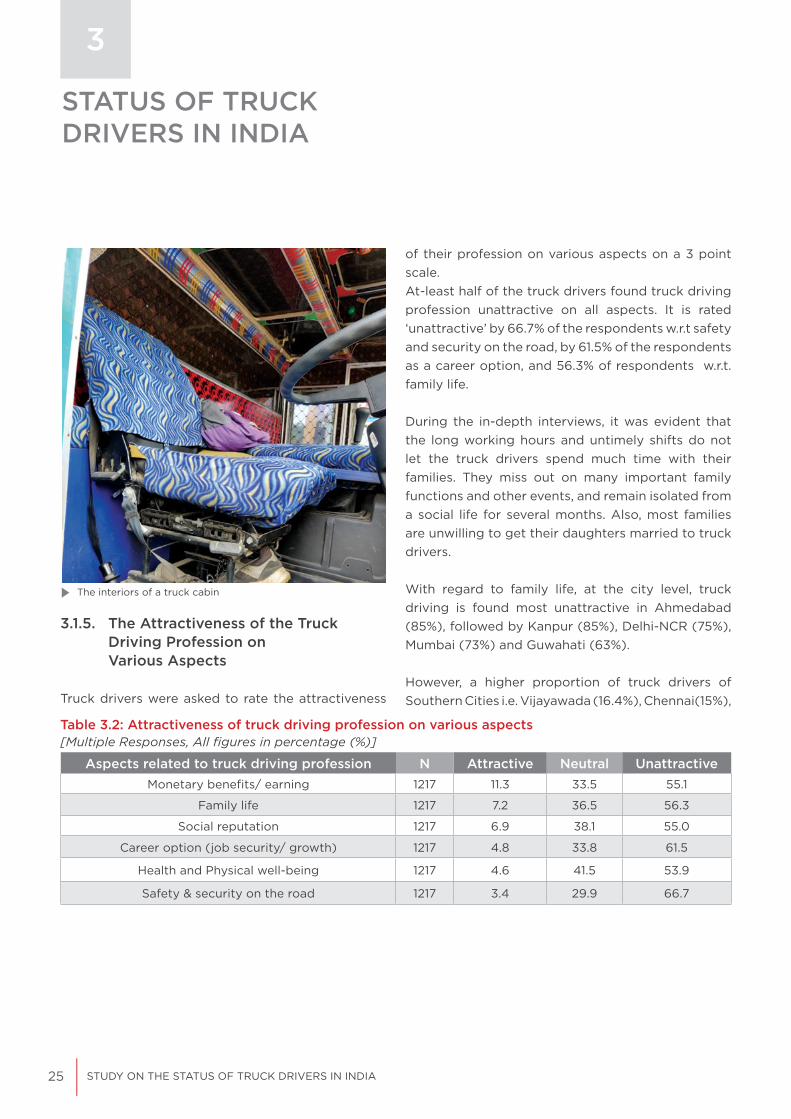
3.1.5. The Attractiveness of the Truck Driving Profession on Various Aspects
Truck drivers were asked to rate the attractiveness
Table 3.2: Attractiveness of truck driving profession on various aspects
Aspects related to truck driving profession N Attractive Neutral UnattractiveMonetary benefits/ earning 1217 11.3 33.5 55.1
Family life 1217 7.2 36.5 56.3
Social reputation 1217 6.9 38.1 55.0
Career option (job security/ growth) 1217 4.8 33.8 61.5
Health and Physical well-being 1217 4.6 41.5 53.9
Safety & security on the road 1217 3.4 29.9 66.7
of their profession on various aspects on a 3 point scale.At-least half of the truck drivers found truck driving profession unattractive on all aspects. It is rated ‘unattractive’ by 66.7% of the respondents w.r.t safety and security on the road, by 61.5% of the respondents as a career option, and 56.3% of respondents w.r.t. family life.
During the in-depth interviews, it was evident that the long working hours and untimely shifts do not let the truck drivers spend much time with their families. They miss out on many important family functions and other events, and remain isolated from a social life for several months. Also, most families are unwilling to get their daughters married to truck drivers.
With regard to family life, at the city level, truck driving is found most unattractive in Ahmedabad (85%), followed by Kanpur (85%), Delhi-NCR (75%), Mumbai (73%) and Guwahati (63%).
However, a higher proportion of truck drivers of Southern Cities i.e. Vijayawada (16.4%), Chennai(15%),
The interiors of a truck cabin
[Multiple Responses, All figures in percentage (%)]

26
Fig 3.6: Opinion about the driving profession based on family life
Bangalore (10.8%), along with Kolkata (13.5%) and Jaipur (11.4%) have found the driving profession attractive in terms of family life.
Similarly, 54.5% of the fleet owners rated the profession as unattractive based on family life, 40.6% rated it as neutral and only 5.5% rated it as attractive.
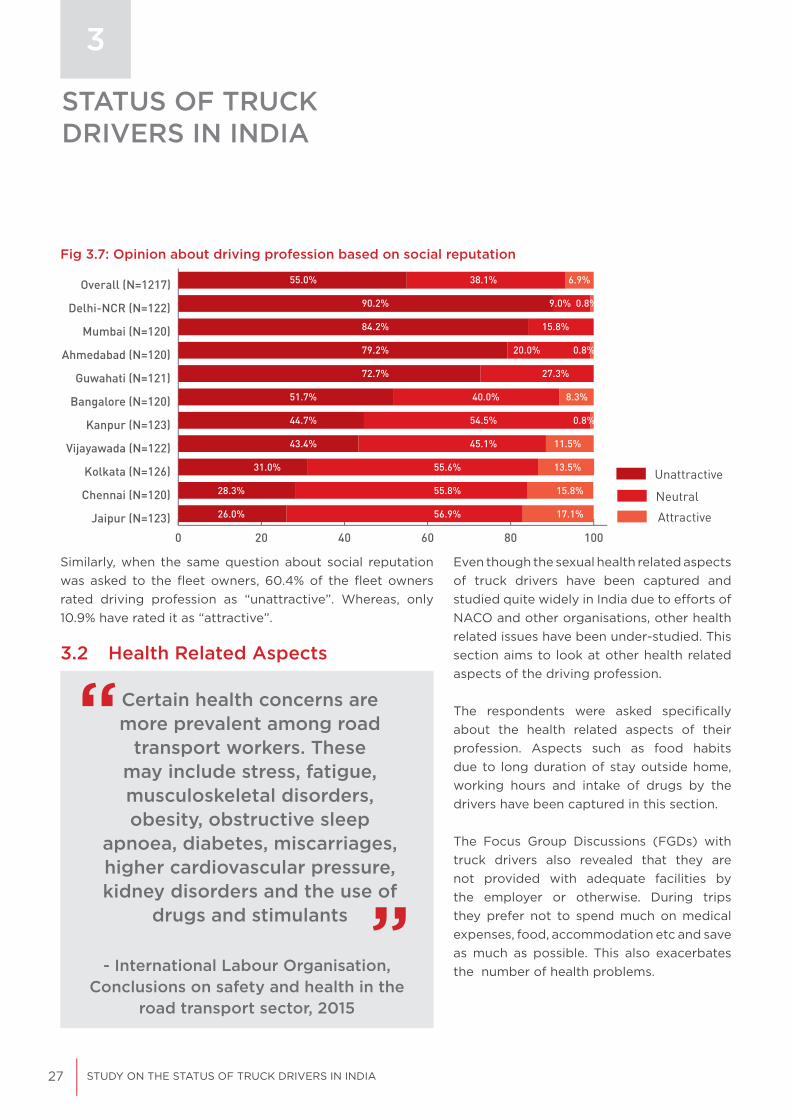
With respect to social reputation, more than half of the drivers (55%) rated their profession as “unattractive” while 7% rated it as “attractive” and 38% rated it as “neutral”.
At least 7 out of 10 truck drivers in Delhi-NCR, Mumbai, Ahmedabad and Guwahati find their profession “unattractive”. A deeper analysis shows
0 20 40 60 80 100
Chennai (N=120)
Vijayawada (N=122)
Kolkata (N=126)
Bangalore (N=120)
Jaipur (N=123)
Guwahati (N=121)
Mumbai (N=120)
Delhi-NCR (N=122)
Kanpur (N=123)
Ahmedabad (N=120)
Overall (N=1217) 56.3% 36.5% 7.2%
85.0% 15.0%
84.6% 15.4%
75.4% 23.8% 0.8%
73.3% 25.8% 0.8%
62.8% 33.9% 3.3%
55.3% 33.3% 11.4%
50.0% 39.2% 10.8%
34.1% 52.4% 13.5%
24.6% 59.0% 16.4%
18.3% 66.7% 15.0%
Bad
Average
Good
that that a larger proportion of truck drivers that find their social reputation “unattractive” belong to the middle age groups (up to 40 years) rather than younger age groups (below 25 years). However, a large proportion of truck drivers of older ages (up to 60 years) rated the profession as “neutral”.
27 STUDY ON THE STATUS OF TRUCK DRIVERS IN INDIA
STATUS OF TRUCKDRIVERS IN INDIA
3
Fig 3.7: Opinion about driving profession based on social reputation
Similarly, when the same question about social reputation was asked to the fleet owners, 60.4% of the fleet owners rated driving profession as “unattractive”. Whereas, only 10.9% have rated it as “attractive”.
3.2 Health Related Aspects
Even though the sexual health related aspects of truck drivers have been captured and studied quite widely in India due to efforts of NACO and other organisations, other health related issues have been under-studied. This section aims to look at other health related aspects of the driving profession.
The respondents were asked specifically about the health related aspects of their profession. Aspects such as food habits due to long duration of stay outside home, working hours and intake of drugs by the drivers have been captured in this section.
The Focus Group Discussions (FGDs) with truck drivers also revealed that they are not provided with adequate facilities by the employer or otherwise. During trips they prefer not to spend much on medical expenses, food, accommodation etc and save as much as possible. This also exacerbates the number of health problems.
0 20 40 60 80 100 120
Jaipur (N=123)
Chennai (N=120)
Kolkata (N=126)
Vijayawada (N=122)
Kanpur (N=123)
Bangalore (N=120)
Guwahati (N=121)
Ahmedabad (N=120)
Mumbai (N=120)
Delhi-NCR (N=122)
Overall (N=1217) 55.0% 38.1% 6.9%
90.2% 9.0% 0.8%
84.2% 15.8%
79.2% 20.0% 0.8%
72.7% 27.3%
51.7% 40.0% 8.3%
44.7% 54.5% 0.8%
43.4% 45.1% 11.5%
31.0% 55.6% 13.5%
28.3% 55.8% 15.8%
26.0% 56.9% 17.1%
Unattractive
Neutral
Attractive
“
“
- International Labour Organisation, Conclusions on safety and health in the
road transport sector, 2015
Certain health concerns are more prevalent among road
transport workers. These may include stress, fatigue, musculoskeletal disorders, obesity, obstructive sleep
apnoea, diabetes, miscarriages, higher cardiovascular pressure, kidney disorders and the use of
drugs and stimulants
28
Table 3.3: Key Health Problems faced by Truck Drivers
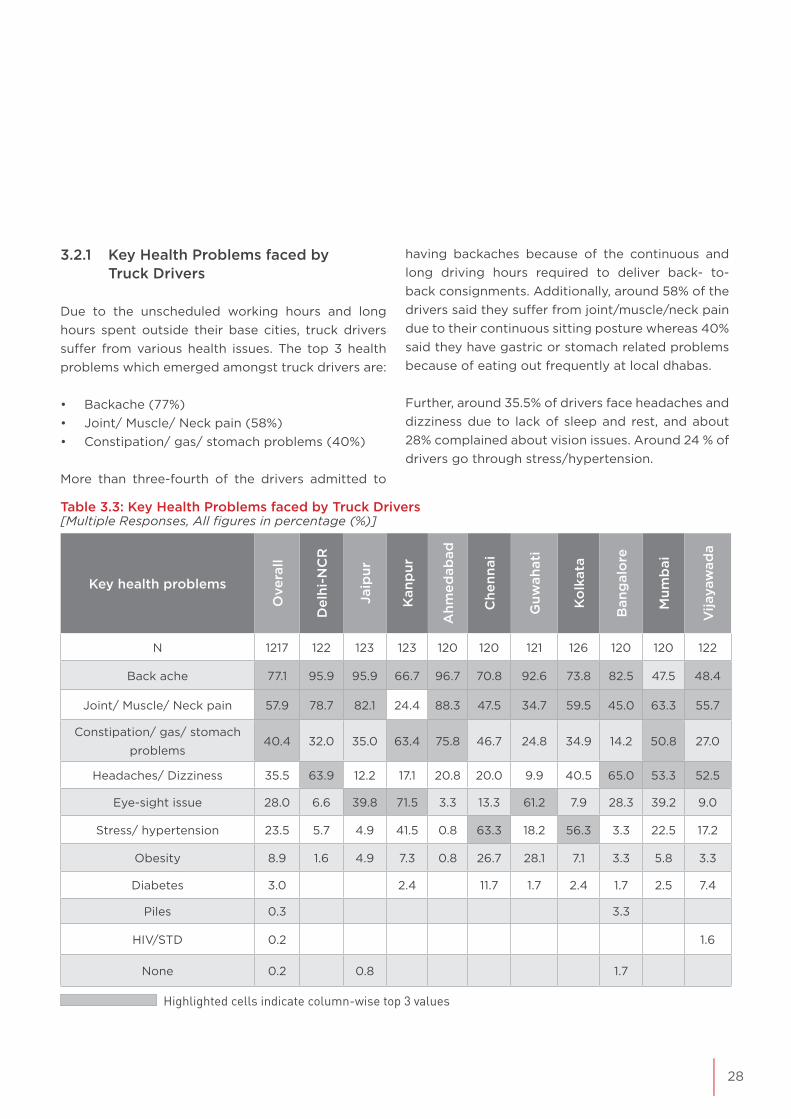
3.2.1 Key Health Problems faced by Truck Drivers
Due to the unscheduled working hours and long hours spent outside their base cities, truck drivers suffer from various health issues. The top 3 health problems which emerged amongst truck drivers are:
• Backache (77%)• Joint/ Muscle/ Neck pain (58%)• Constipation/ gas/ stomach problems (40%)
More than three-fourth of the drivers admitted to
having backaches because of the continuous and long driving hours required to deliver back- to- back consignments. Additionally, around 58% of the drivers said they suffer from joint/muscle/neck pain due to their continuous sitting posture whereas 40% said they have gastric or stomach related problems because of eating out frequently at local dhabas.
Further, around 35.5% of drivers face headaches and dizziness due to lack of sleep and rest, and about 28% complained about vision issues. Around 24 % of drivers go through stress/hypertension.
Key health problems
Ove
rall
Del
hi-N
CR
Jaip
ur
Kan
pur
Ahm
edab
ad
Che
nnai
Guw
ahat
i
Ko
lkat
a
Ban
gal
ore
Mum
bai
Vija
yaw
ada
N 1217 122 123 123 120 120 121 126 120 120 122
Back ache 77.1 95.9 95.9 66.7 96.7 70.8 92.6 73.8 82.5 47.5 48.4
Joint/ Muscle/ Neck pain 57.9 78.7 82.1 24.4 88.3 47.5 34.7 59.5 45.0 63.3 55.7
Constipation/ gas/ stomach
problems40.4 32.0 35.0 63.4 75.8 46.7 24.8 34.9 14.2 50.8 27.0
Headaches/ Dizziness 35.5 63.9 12.2 17.1 20.8 20.0 9.9 40.5 65.0 53.3 52.5
Eye-sight issue 28.0 6.6 39.8 71.5 3.3 13.3 61.2 7.9 28.3 39.2 9.0
Stress/ hypertension 23.5 5.7 4.9 41.5 0.8 63.3 18.2 56.3 3.3 22.5 17.2
Obesity 8.9 1.6 4.9 7.3 0.8 26.7 28.1 7.1 3.3 5.8 3.3
Diabetes 3.0 2.4 11.7 1.7 2.4 1.7 2.5 7.4
Piles 0.3 3.3
HIV/STD 0.2 1.6
None 0.2 0.8 1.7
Highlighted cells indicate column-wise top 3 values
[Multiple Responses, All figures in percentage (%)]

29 STUDY ON THE STATUS OF TRUCK DRIVERS IN INDIA
STATUS OF TRUCKDRIVERS IN INDIA
3
Additionally, the truck drivers were asked about the reasons behind their health issues. Truck drivers were asked to assign points between “0” and “10” for each of the problems where “10” means that the problem is highly prevalent and “0” means problem is not prevalent at all. Based on this, overall, the top prevalent problems which were rated above 7 are:
• Unhealthy/unhygienic food• Dirty water to drink• Erratic meal timings• Lack of sleep• Continuous sitting/driving
About 95% of the truck drivers admitted to eating at the roadside dhabas. As the consignments require days to deliver, it is extremely difficult to carry home cooked food along with them. The drivers are given a specific amount of money for daily meals which is generally deducted from their daily wages. Almost a similar trend was seen across all the 10 cities covered during the survey. Only Kanpur recorded the highest number of truck drivers (around 19%) who managed to cook the food themselves.
Table 3.4: Rating of reasons (mean average) for health issues among truck drivers
Reasons for health problems
Ove
rall
Del
hi-N
CR
Jaip
ur
Kan
pur
Ahm
edab
ad
Che
nnai
Guw
ahat
i
Ko
lkat
a
Ban
gal
ore
Mum
bai
Vija
yaw
ada
N 1217 122 123 123 120 120 121 126 120 120 122
Unhealthy/ unhygienic food 7.4 8.5 5.3 8.2 7.9 9.3 5.3 6.8 7.7 8.5 6.6
Dirty water to drink 7.3 8.2 5.4 7.5 8.3 9.3 5.3 6.4 7.6 8.8 6.5
Erratic meal timings 7.3 8.1 6.6 7.2 8.4 9.1 5.3 6.7 7.2 8.6 6.3
Lack of sleep 7.2 8.1 6.4 7.7 7.7 9.1 3.9 6.7 7.6 8.5 6.4
Continuous sitting/ driving 7.1 7.8 6.0 7.1 8.2 8.8 4.8 6.1 7.7 8.3 6.4
Addiction to alcohol/ drugs 6.8 7.6 5.2 7.5 5.5 8.3 7.0 6.3 5.7 8.5 6.3
Unsafe sex 5.7 7.3 5.0 7.0 6.0 7.0 2.4 5.8 5.0 5.6 5.7
30
Cities NAvg. km drive per
day
Avg. round
trips per month
Overall 1217 417 5.3
Vijayawada 122 496 5.3
Jaipur 123 450 3.7
Guwahati 121 439 3.3
Bangalore 120 425 6.9
Delhi-NCR 122 419 3.2
Kolkata 126 418 3.9
Kanpur 123 407 3.7
Ahmedabad 120 380 4.1
Chennai 120 379 5.8
Mumbai 120 351 13.0
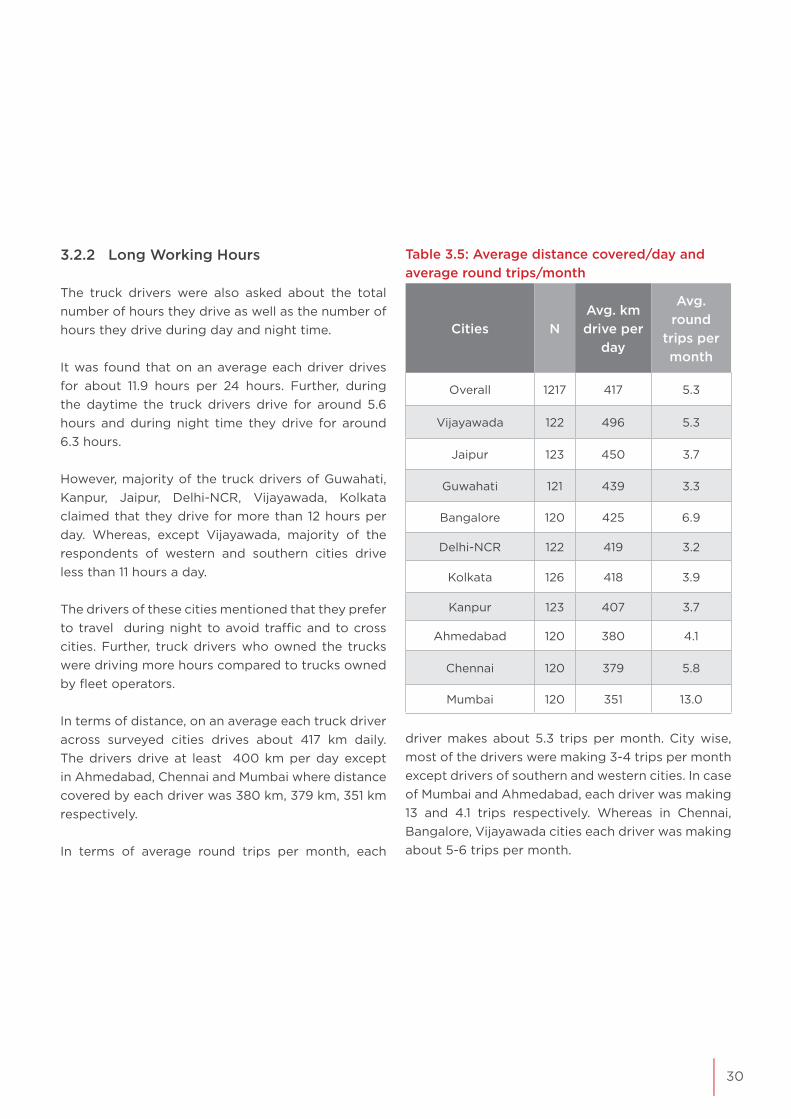
3.2.2 Long Working Hours
The truck drivers were also asked about the total number of hours they drive as well as the number of hours they drive during day and night time.
It was found that on an average each driver drives for about 11.9 hours per 24 hours. Further, during the daytime the truck drivers drive for around 5.6 hours and during night time they drive for around 6.3 hours.
However, majority of the truck drivers of Guwahati, Kanpur, Jaipur, Delhi-NCR, Vijayawada, Kolkata claimed that they drive for more than 12 hours per day. Whereas, except Vijayawada, majority of the respondents of western and southern cities drive less than 11 hours a day.
The drivers of these cities mentioned that they prefer to travel during night to avoid traffic and to cross cities. Further, truck drivers who owned the trucks were driving more hours compared to trucks owned by fleet operators.
In terms of distance, on an average each truck driver across surveyed cities drives about 417 km daily. The drivers drive at least 400 km per day except in Ahmedabad, Chennai and Mumbai where distance covered by each driver was 380 km, 379 km, 351 km respectively.
In terms of average round trips per month, each
Table 3.5: Average distance covered/day and average round trips/month
driver makes about 5.3 trips per month. City wise, most of the drivers were making 3-4 trips per month except drivers of southern and western cities. In case of Mumbai and Ahmedabad, each driver was making 13 and 4.1 trips respectively. Whereas in Chennai, Bangalore, Vijayawada cities each driver was making about 5-6 trips per month.
31 STUDY ON THE STATUS OF TRUCK DRIVERS IN INDIA
STATUS OF TRUCKDRIVERS IN INDIA
3
Cities N
Average duration of each round trip (Days)
Average length of each
round trip (KMs)
Avg. hours driving/
day (hrs.)
Overall 1217 7.4 1870 11.9
Delhi-NCR 122 11.2 2818 12.6
Kolkata 126 10.3 2401 12.3
Guwahati 121 10.2 2477 14.0
Jaipur 123 10.2 2258 13.0
Kanpur 123 8.0 1754 13.1
Ahmedabad 120 6.7 1530 10.6
Vijayawada 122 5.5 1752 12.5
Bangalore 120 4.8 1505 11.2
Chennai 120 4.5 1387 11.2
Mumbai 120 2.5 762 8.2
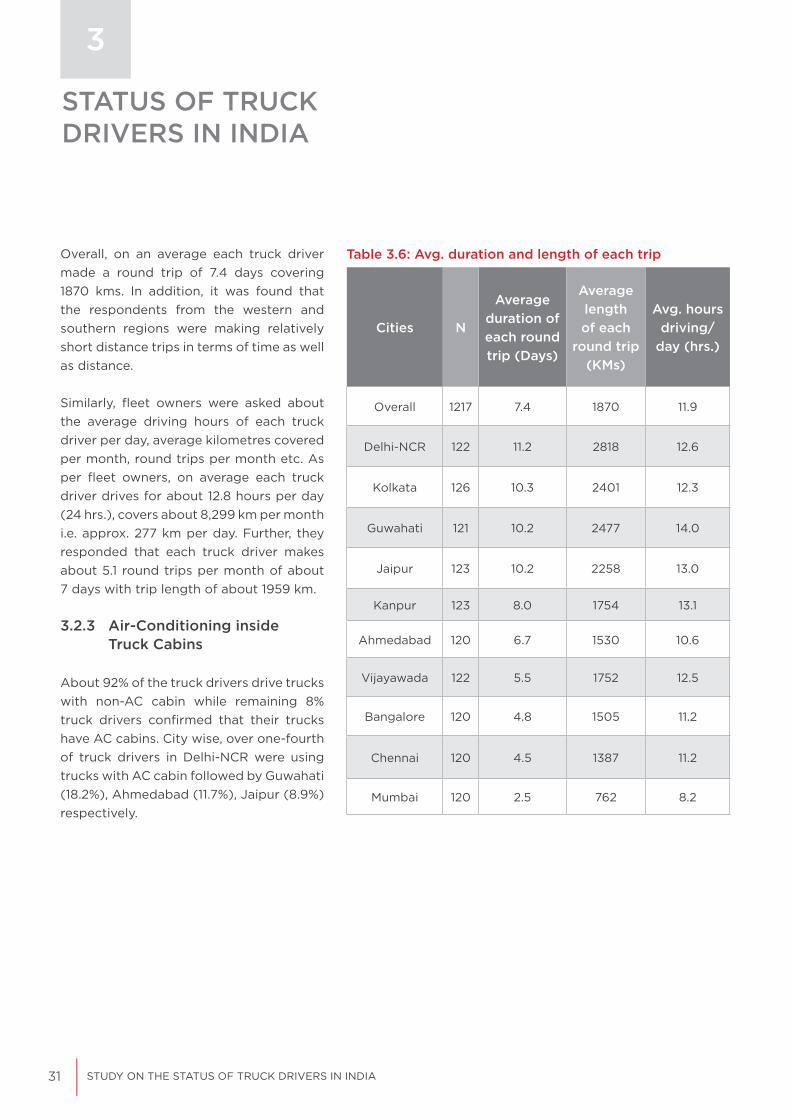
Overall, on an average each truck driver made a round trip of 7.4 days covering 1870 kms. In addition, it was found that the respondents from the western and southern regions were making relatively short distance trips in terms of time as well as distance.
Similarly, fleet owners were asked about the average driving hours of each truck driver per day, average kilometres covered per month, round trips per month etc. As per fleet owners, on average each truck driver drives for about 12.8 hours per day (24 hrs.), covers about 8,299 km per month i.e. approx. 277 km per day. Further, they responded that each truck driver makes about 5.1 round trips per month of about 7 days with trip length of about 1959 km.
3.2.3 Air-Conditioning inside Truck Cabins
About 92% of the truck drivers drive trucks with non-AC cabin while remaining 8% truck drivers confirmed that their trucks have AC cabins. City wise, over one-fourth of truck drivers in Delhi-NCR were using trucks with AC cabin followed by Guwahati (18.2%), Ahmedabad (11.7%), Jaipur (8.9%) respectively.
Table 3.6: Avg. duration and length of each trip

32
3.2.4 Drug-Intake amongst Truck Drivers
Truck-drivers generally take drugs to ease fatigue and sleepiness. Drivers were asked about the drug usage behaviour amongst truck driver community. About 22% of drivers confirmed that truck drivers use drugs while on a trip. City-wise, proportion of such drivers was high in Kolkata, Kanpur and Delhi-NCR where almost half of the truck drivers confirmed the same.
0 20 40 60 80 100
Mumbai (N=120)
Vijayawada (N=122)
Kanpur (N=123)
Chennai (N=120)
Bangalore (N=120)
Kolkata (N=126)
Jaipur (N=123)
Ahmedabad (N=120)
Guwahati (N=121)
Delhi-NCR (N=122)
Overall (N=1217) 8.1% 91.9%
27.0% 73.0%
18.2% 81.8%
11.7% 88.3%
8.9% 91.1%
6.3% 93.7%
3.3% 96.7%
2.5% 97.5%
1.6% 98.4%
1.6% 98.4%
100.0%
Fig 3.8: Trucks having air-conditioned cabin
Fig 3.9: Intake of drugs by truck drivers during the trip
Yes
Yes
No
No0 20 40 60 80 100
Ahmedabad (N=120)Jaipur (N=123)
Mumbai (N=120)Guwahati (N=121)
Vijayawada (N=122)Bangalore (N=120)
Chennai (N=120)Delhi-NCR (N=122)
Kanpur (N=123)Kolkata (N=126)
Overall (N=1217) 21.8% 78.2%
59.5% 40.5%
51.2% 48.8%
50.8% 49.2%
30.0% 70.0%
12.5% 87.5%
5.7% 94.3%
3.3% 96.7%
1.7% 98.3%
0.8% 99.2%
100.0%
As per in-depth discussions, drivers have mentioned that they do not use AC in their trucks as it has a direct impact on fuel mileage and then on their saving/ earning. Therefore, drivers prefer to use trucks with non-AC cabins or if it is available, they avoid using AC. Instead of AC, they generally use small overhead fans.
33 STUDY ON THE STATUS OF TRUCK DRIVERS IN INDIA
Highlighted cells indicate column-wise top 3 values
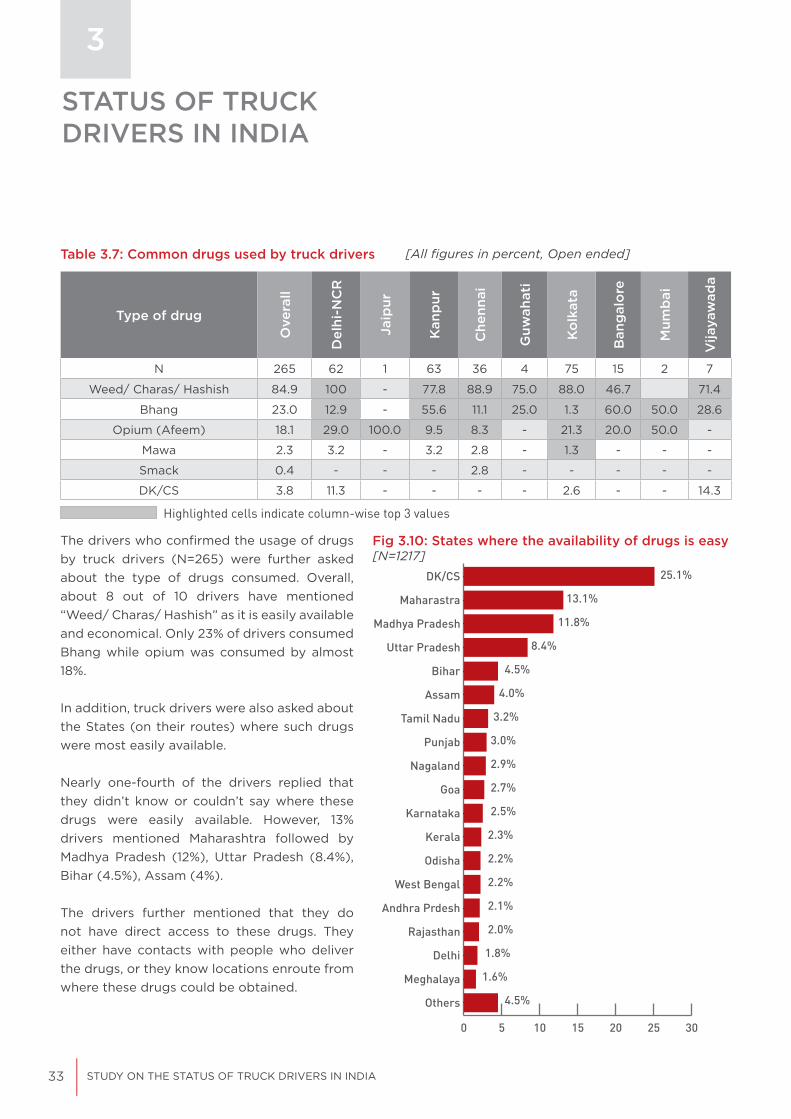
The drivers who confirmed the usage of drugs by truck drivers (N=265) were further asked about the type of drugs consumed. Overall, about 8 out of 10 drivers have mentioned “Weed/ Charas/ Hashish” as it is easily available and economical. Only 23% of drivers consumed Bhang while opium was consumed by almost 18%.
In addition, truck drivers were also asked about the States (on their routes) where such drugs were most easily available.
Nearly one-fourth of the drivers replied that they didn’t know or couldn’t say where these drugs were easily available. However, 13% drivers mentioned Maharashtra followed by Madhya Pradesh (12%), Uttar Pradesh (8.4%), Bihar (4.5%), Assam (4%).
The drivers further mentioned that they do not have direct access to these drugs. They either have contacts with people who deliver the drugs, or they know locations enroute from where these drugs could be obtained.
Table 3.7: Common drugs used by truck drivers [All figures in percent, Open ended]
Type of drug
Ove
rall
Del
hi-N
CR
Jaip
ur
Kan
pur
Che
nnai
Guw
ahat
i
Ko
lkat
a
Ban
gal
ore
Mum
bai
Vija
yaw
ada
N 265 62 1 63 36 4 75 15 2 7
Weed/ Charas/ Hashish 84.9 100 - 77.8 88.9 75.0 88.0 46.7 71.4
Bhang 23.0 12.9 - 55.6 11.1 25.0 1.3 60.0 50.0 28.6
Opium (Afeem) 18.1 29.0 100.0 9.5 8.3 - 21.3 20.0 50.0 -
Mawa 2.3 3.2 - 3.2 2.8 - 1.3 - - -
Smack 0.4 - - - 2.8 - - - - -
DK/CS 3.8 11.3 - - - - 2.6 - - 14.3
STATUS OF TRUCKDRIVERS IN INDIA
3
Fig 3.10: States where the availability of drugs is easy[N=1217]
0 5 10 15 20 25 30
Others
Meghalaya
Delhi
Rajasthan
Andhra Prdesh
West Bengal
Odisha
Kerala
Karnataka
Goa
Nagaland
Punjab
Tamil Nadu
Assam
Bihar
Uttar Pradesh
Madhya Pradesh
Maharastra
DK/CS 25.1%
13.1%
11.8%
8.4%
4.5%
4.0%
3.2%
3.0%
2.9%
2.7%
2.5%
2.3%
2.2%
2.2%
2.1%
2.0%
1.8%
1.6%
4.5%
34
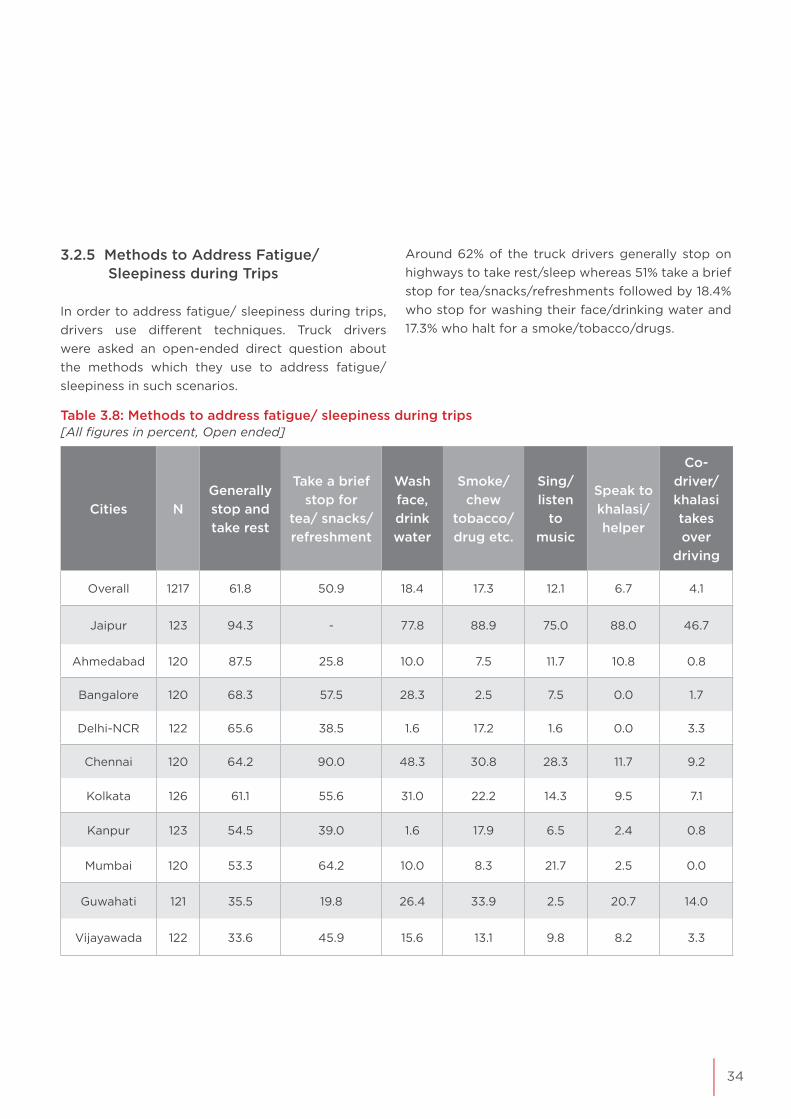
3.2.5 Methods to Address Fatigue/ Sleepiness during Trips
In order to address fatigue/ sleepiness during trips, drivers use different techniques. Truck drivers were asked an open-ended direct question about the methods which they use to address fatigue/ sleepiness in such scenarios.
Around 62% of the truck drivers generally stop on highways to take rest/sleep whereas 51% take a brief stop for tea/snacks/refreshments followed by 18.4% who stop for washing their face/drinking water and 17.3% who halt for a smoke/tobacco/drugs.
Table 3.8: Methods to address fatigue/ sleepiness during trips[All figures in percent, Open ended]
Cities NGenerally stop and take rest
Take a brief stop for
tea/ snacks/ refreshment
Wash face, drink water
Smoke/ chew
tobacco/ drug etc.
Sing/ listen
to music
Speak to khalasi/ helper
Co-driver/ khalasi takes over
driving
Overall 1217 61.8 50.9 18.4 17.3 12.1 6.7 4.1
Jaipur 123 94.3 - 77.8 88.9 75.0 88.0 46.7
Ahmedabad 120 87.5 25.8 10.0 7.5 11.7 10.8 0.8
Bangalore 120 68.3 57.5 28.3 2.5 7.5 0.0 1.7
Delhi-NCR 122 65.6 38.5 1.6 17.2 1.6 0.0 3.3
Chennai 120 64.2 90.0 48.3 30.8 28.3 11.7 9.2
Kolkata 126 61.1 55.6 31.0 22.2 14.3 9.5 7.1
Kanpur 123 54.5 39.0 1.6 17.9 6.5 2.4 0.8
Mumbai 120 53.3 64.2 10.0 8.3 21.7 2.5 0.0
Guwahati 121 35.5 19.8 26.4 33.9 2.5 20.7 14.0
Vijayawada 122 33.6 45.9 15.6 13.1 9.8 8.2 3.3

35 STUDY ON THE STATUS OF TRUCK DRIVERS IN INDIA
STATUS OF TRUCKDRIVERS IN INDIA
3
3.3: FINANCIAL STATUS OF TRUCK DRIVERS
Earning and Economic ConditionThe truck driving profession involves rigorous working hours with irregular timings. Truck drivers are required to be patient and attentive throughout their trips. In addition, the fleet owners/operators’ efforts to take care of the truck drivers and bring efficiency in their work are quite limited, especially since majority of the operators have small-scale operations.
3.3.1. Attractiveness of the Driving Profession as a Career Option
When asked to rate truck driving as a career option, more than 61% of the truck drivers find the job “unattractive”.
City wise, at-least 80% of the drivers in Delhi-NCR, Mumbai and Ahmedabad find their profession “unattractive”. Similarly, more than 50% of the truck drivers in Kanpur, Kolkata, Bangalore, Guwahati and Jaipur share the same opinion. For Chennai and Vijayawada, about 30% of the truck drivers find their profession “unattractive”.
In the drivers’ opinion, there is no career growth. This is because truck drivers are less educated. Hence, even after many years, they are left with only driving skills. Even drivers who have more than 15 years of experience claimed that there is no upward mobility for them, since they have limited experience in anything other than driving. Additionally, drivers claimed that there is no job security.
Similarly, when fleet owners were asked about truck driving as a career option, about 57% of them also rated it an unattractive option.
Fig 3.11: Opinion about driving profession based on career option
0 20 40 60 80 100 120Vijayawada (N=122)
Chennai (N=120)
Jaipur (N=123)
Guwahati (N=121)
Bangalore (N=120)
Kolkata (N=126)
Kanpur (N=123)
Ahmedabad (N=120)
Mumbai (N=120)
Delhi-NCR (N=122)
Overall (N=1217) 61.5% 33.8% 4.8%
88.5% 10.7% 0.9%
85.0% 14.2% 0.8%
83.3% 16.7%
63.4% 36.6%
60.3% 36.5% 3.2%
58.3% 32.5% 9.2%
57.0% 39.7% 3.3%
55.3% 33.3% 11.4%
33.3% 54.2% 12.5%
30.3% 63.1% 6.6%
Unattractive
Neutral
Attractive

36
Unattractive
Neutral
Attractive
Fig 3.12: Opinion about the driving profession based on monetary benefits/ earnings
3.3.2. Attractiveness of the Driving Profession Based on Monetary Benefits/ Earning:
In terms of earnings i.e. salary/ wages or incentives, truck driving as a profession was rated as “unattractive” by over 50% of drivers. The trucking profession is rated “unattractive” for monetary benefits by majority of respondents in 6 out of 10 cities. These include Ahmedabad, Mumbai, Delhi-
0 20 40 60 80 100 120
Chennai (N=120)
Kolkata (N=126)
Jaipur (N=123)
Vijayawada (N=122)
Bangalore (N=120)
Guwahati (N=121)
Kanpur (N=123)
Delhi-NCR (N=122)
Mumbai (N=120)
Ahmedabad (N=120)
Overall (N=1217) 55.1% 33.5% 11.3%
81.7% 18.3%
71.7% 28.3%
68.0% 31.1% 0.8%
61.8% 36.6% 1.6%
58.7% 36.4% 5.0%
55.8% 21.7% 22.5%
44.3% 44.3% 11.5%
42.3% 52.0% 5.7%
41.3% 17.5% 41.3%
26.7% 49.2% 24.2%
NCR, Kanpur, Guwahati and Bangalore. However, a relatively higher proportion of truck drivers of Southern Cities i.e. Chennai, Vijayawada along with Kolkata find the truck driving profession “attractive” in terms of monetary benefits and earnings.
In addition, 40.6% of the fleet owners rated truck driving profession as “unattractive”.
37 STUDY ON THE STATUS OF TRUCK DRIVERS IN INDIA
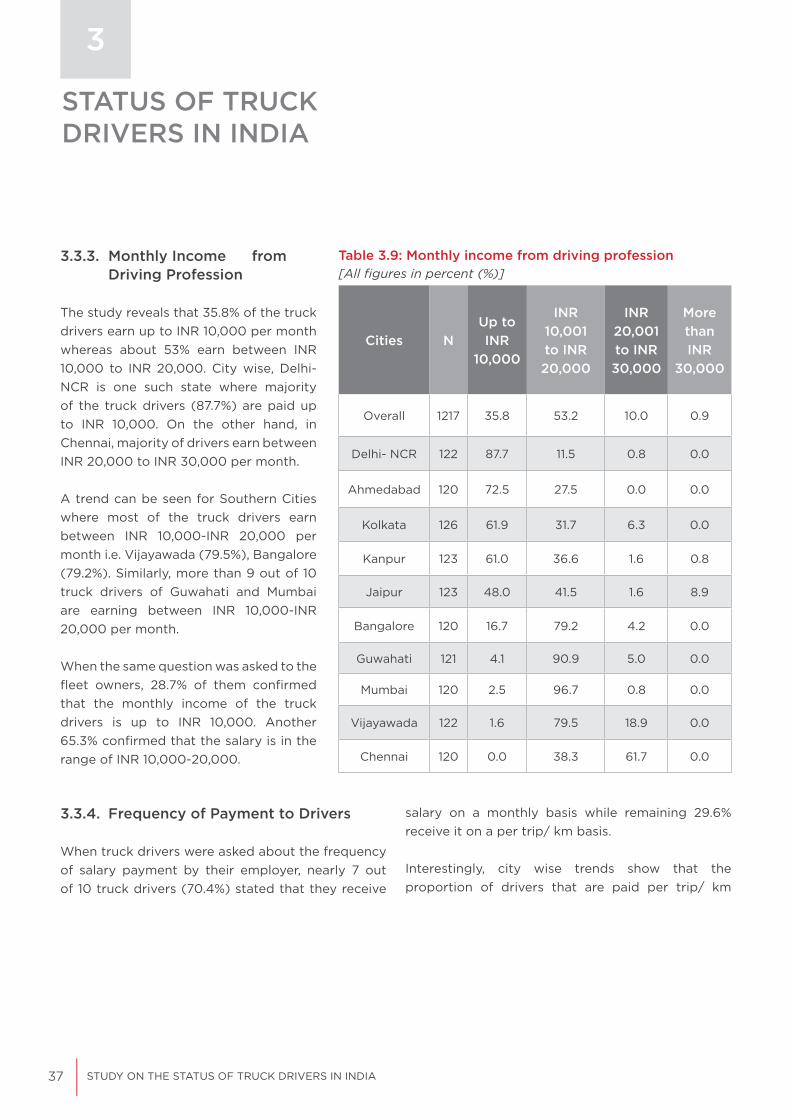
3.3.3. Monthly Income from Driving Profession
The study reveals that 35.8% of the truck drivers earn up to INR 10,000 per month whereas about 53% earn between INR 10,000 to INR 20,000. City wise, Delhi-NCR is one such state where majority of the truck drivers (87.7%) are paid up to INR 10,000. On the other hand, in Chennai, majority of drivers earn between INR 20,000 to INR 30,000 per month.
A trend can be seen for Southern Cities where most of the truck drivers earn between INR 10,000-INR 20,000 per month i.e. Vijayawada (79.5%), Bangalore (79.2%). Similarly, more than 9 out of 10 truck drivers of Guwahati and Mumbai are earning between INR 10,000-INR 20,000 per month.
When the same question was asked to the fleet owners, 28.7% of them confirmed that the monthly income of the truck drivers is up to INR 10,000. Another 65.3% confirmed that the salary is in the range of INR 10,000-20,000.
STATUS OF TRUCKDRIVERS IN INDIA
3
Table 3.9: Monthly income from driving profession[All figures in percent (%)]
Cities NUp to INR
10,000
INR 10,001 to INR 20,000
INR 20,001 to INR 30,000
More than INR
30,000
Overall 1217 35.8 53.2 10.0 0.9
Delhi- NCR 122 87.7 11.5 0.8 0.0
Ahmedabad 120 72.5 27.5 0.0 0.0
Kolkata 126 61.9 31.7 6.3 0.0
Kanpur 123 61.0 36.6 1.6 0.8
Jaipur 123 48.0 41.5 1.6 8.9
Bangalore 120 16.7 79.2 4.2 0.0
Guwahati 121 4.1 90.9 5.0 0.0
Mumbai 120 2.5 96.7 0.8 0.0
Vijayawada 122 1.6 79.5 18.9 0.0
Chennai 120 0.0 38.3 61.7 0.0
3.3.4. Frequency of Payment to Drivers
When truck drivers were asked about the frequency of salary payment by their employer, nearly 7 out of 10 truck drivers (70.4%) stated that they receive
salary on a monthly basis while remaining 29.6% receive it on a per trip/ km basis.
Interestingly, city wise trends show that the proportion of drivers that are paid per trip/ km

38
is high in the cities of South India i.e. Bangalore (51.7%), Vijayawada (82.8%) and Chennai (84.2%). In the rest of the cities (Mumbai, Guwahati, Delhi-NCR, Ahmedabad, Kanpur, Jaipur and Kolkata), a larger proportion of the truck drivers are paid on a monthly basis.
Incidentally, majority of the truck drivers that are paid on a per trip/km basis are experienced drivers. Similarly, a higher proportion of drivers who drive self-owned trucks are paid per trip/km basis, compared to the proportion of drivers who drive fleet owned/ company-owned trucks.
Table 3.10: Timely payment of salary/wages to truck drivers[All figures in percent (%)]
Cities N Always Mostly Sometimes Never
Overall 1217 59.2 23.4 10.6 6.7
Vijayawada 122 89.3 3.3 3.3 4.1
Bangalore 120 82.5 9.2 8.3 0.0
Guwahati 121 76.9 31.7 6.3 0.0
Ahmedabad 120 69.2 14.2 5.8 10.8
Chennai 120 62.5 19.2 0.0 18.3
Jaipur 123 55.3 20.3 23.6 0.8
Mumbai 120 53.3 42.5 4.2 0.0
Kolkata 126 53.2 35.7 10.3 0.8
Kanpur 123 36.6 30.1 25.2 8.1
Delhi-NCR 122 14.8 37.7 23.0 24.6
3.3.5. Timely Payment of Salary/Wages
In terms of timely payment of salary/ wages, overall, more than 8 out of 10 drivers (82.6%) confirmed that they are paid on time (always and mostly). Whereas, about 6.7% of drivers said that they are never paid on time.
City wise, the proportion of drivers who said that they are paid on time (always and mostly) is lowest among Northern Cities i.e. Delhi-NCR (52.5%), Kanpur (66.7%) and Jaipur (75.6%).

39 STUDY ON THE STATUS OF TRUCK DRIVERS IN INDIA
STATUS OF TRUCKDRIVERS IN INDIA
3
When it comes to the frequency of payment to drivers, the survey revealed that drivers of Southern Cities, who are mostly paid on a kilometre basis, receive payments well on time, whereas drivers of Northern Cities, who are paid mostly on a monthly basis, do not receive payments on time. It is also revealed that with an increase in the ages of the truck drivers, tendency of timely payment (always) reduces. This means that it is more likely to get timely payment if the driver is younger in age rather than older.
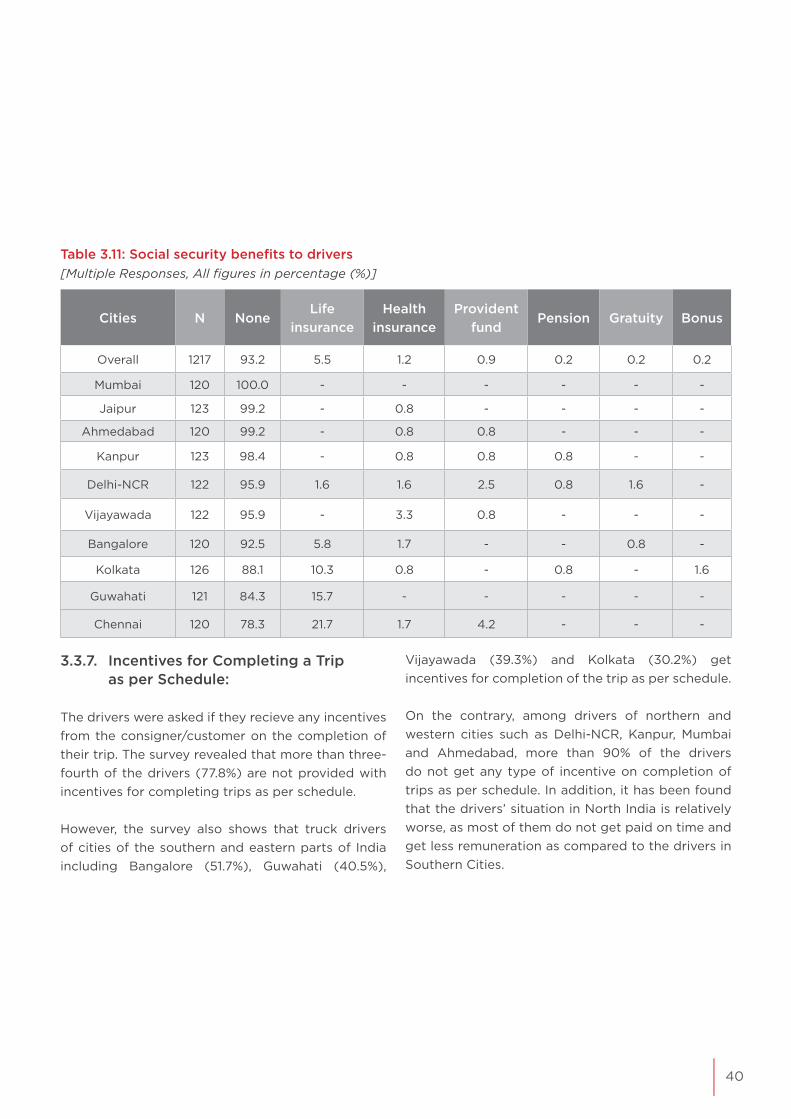
3.3.6. Social Security Benefits to Drivers
Considering the challenging conditions in which truck drivers work, it is important to note that the majority of the drivers are not provided with any social security benefits including the vital ones. Among all truck drivers in the study, about 93% said that they do not get any social security benefits at all, while 5.5% mentioned that they get benefits by way of life insurance followed by health insurance (1.2%) and provident fund (0.9%).
As per an in-depth discussion with transport association members, such a situation prevails due to lack of awareness as well as the fact that drivers are not educated enough to ask for such social benefits from their employers. The unorganised-sector employers do not care about spending extra money on social benefits and are least bothered to get their drivers insured for medical ailments.
The proportion of truck drivers who receive social security benefits like health insurance, provident fund or pension is extremely small. The number of truck drivers that get life insurance is maximum in the following three cities: Chennai (21.7%), Guwahati (15.7%) and Kolkata (10.3%).
Majority of the drivers that have both life and medical insurances are aged between 26-40 years and have more than 6 years of experience in truck driving.
When fleet owners were asked about the social security benefits that they provide to their drivers, majority (83.2%) confirmed that they do not provide any such social security benefits to their drivers. About 10% of fleet owners stated that they provide life insurance to the drivers, about 9% provide health insurance, and about 7% provide provident funds to their drivers.
In India, there are cases where the truck is
insured, goods loaded are insured but the
truck drivers are never insured. In case an
accident takes place during a trip, the driver has to use his savings to pay for his medical
expenses.
““
-Transport Association, Delhi
40
Table 3.11: Social security benefits to drivers[Multiple Responses, All figures in percentage (%)]
Cities N NoneLife
insuranceHealth
insuranceProvident
fundPension Gratuity Bonus
Overall 1217 93.2 5.5 1.2 0.9 0.2 0.2 0.2
Mumbai 120 100.0 - - - - - -
Jaipur 123 99.2 - 0.8 - - - -
Ahmedabad 120 99.2 - 0.8 0.8 - - -
Kanpur 123 98.4 - 0.8 0.8 0.8 - -
Delhi-NCR 122 95.9 1.6 1.6 2.5 0.8 1.6 -
Vijayawada 122 95.9 - 3.3 0.8 - - -
Bangalore 120 92.5 5.8 1.7 - - 0.8 -
Kolkata 126 88.1 10.3 0.8 - 0.8 - 1.6
Guwahati 121 84.3 15.7 - - - - -
Chennai 120 78.3 21.7 1.7 4.2 - - -
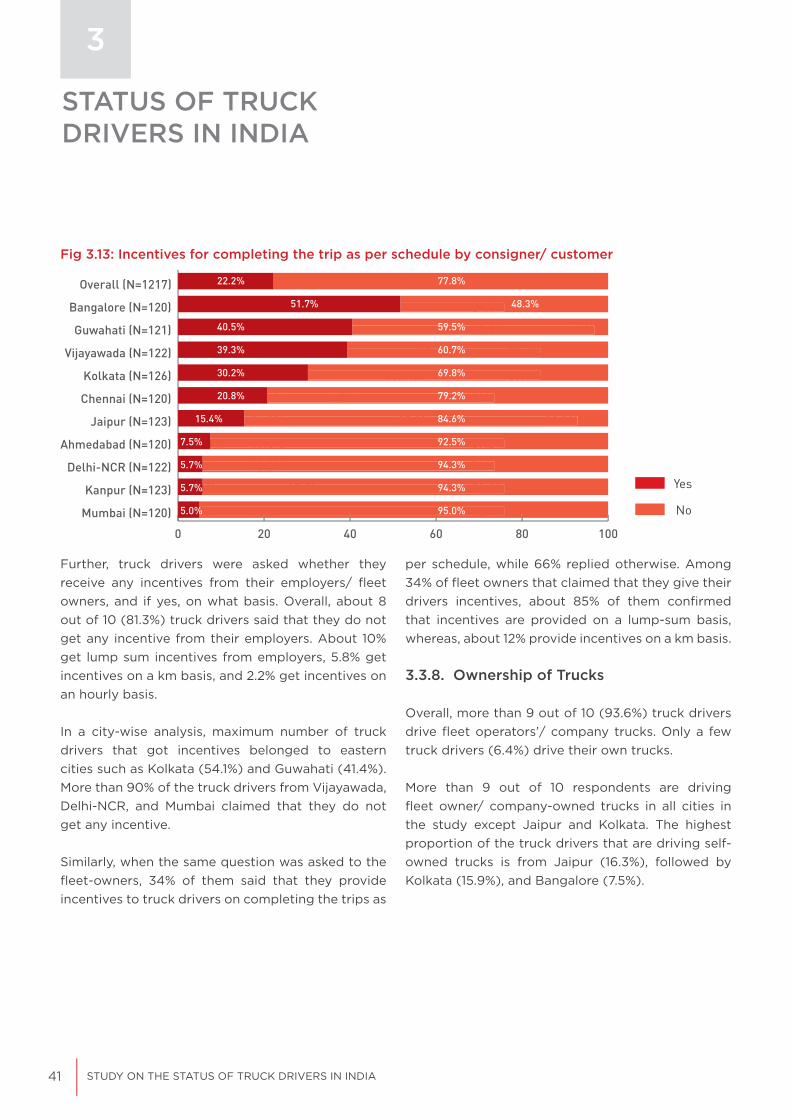
3.3.7. Incentives for Completing a Trip as per Schedule:
The drivers were asked if they recieve any incentives from the consigner/customer on the completion of their trip. The survey revealed that more than three-fourth of the drivers (77.8%) are not provided with incentives for completing trips as per schedule.
However, the survey also shows that truck drivers of cities of the southern and eastern parts of India including Bangalore (51.7%), Guwahati (40.5%),
Vijayawada (39.3%) and Kolkata (30.2%) get incentives for completion of the trip as per schedule.
On the contrary, among drivers of northern and western cities such as Delhi-NCR, Kanpur, Mumbai and Ahmedabad, more than 90% of the drivers do not get any type of incentive on completion of trips as per schedule. In addition, it has been found that the drivers’ situation in North India is relatively worse, as most of them do not get paid on time and get less remuneration as compared to the drivers in Southern Cities.
41 STUDY ON THE STATUS OF TRUCK DRIVERS IN INDIA
STATUS OF TRUCKDRIVERS IN INDIA
3
Fig 3.13: Incentives for completing the trip as per schedule by consigner/ customer
27.4% 19.2% 53.4%
57.5% 32.5% 10%
55% 13.3% 31.6%
45.3% 15.1% 39.7%
36.1% 4.9% 59%
34.9% 35.8% 29.3%
13.3 % 17.5% 69.2%
10.8% 18.2% 71%
10.6% 35.8% 53.7%
9.8% 18% 72.1%
0.8% 0.8% 98.3%0 20 40 60 80 100
53.4%
32.5% 10%
13.3% 31.6%
15.1% 39.7%
1% 4.9% 59%
34.9% 35.8% 29.3%
3 % 17.5% 69.2%
8% 18.2% 71%
6% 35.8% 53.7%
% 18% 72.1% Mumbai (N=120)
Kanpur (N=123)
Delhi-NCR (N=122)
Ahmedabad (N=120)
Jaipur (N=123)
Chennai (N=120)
Kolkata (N=126)
Vijayawada (N=122)
Guwahati (N=121)
Bangalore (N=120)
Overall (N=1217) 22.2% 77.8%
51.7% 48.3%
40.5% 59.5%
39.3% 60.7%
30.2% 69.8%
20.8% 79.2%
15.4% 84.6%
7.5% 92.5%
5.7% 94.3%
5.7% 94.3%
5.0% 95.0%
Yes
No
Further, truck drivers were asked whether they receive any incentives from their employers/ fleet owners, and if yes, on what basis. Overall, about 8 out of 10 (81.3%) truck drivers said that they do not get any incentive from their employers. About 10% get lump sum incentives from employers, 5.8% get incentives on a km basis, and 2.2% get incentives on an hourly basis.
In a city-wise analysis, maximum number of truck drivers that got incentives belonged to eastern cities such as Kolkata (54.1%) and Guwahati (41.4%). More than 90% of the truck drivers from Vijayawada, Delhi-NCR, and Mumbai claimed that they do not get any incentive.
Similarly, when the same question was asked to the fleet-owners, 34% of them said that they provide incentives to truck drivers on completing the trips as
per schedule, while 66% replied otherwise. Among 34% of fleet owners that claimed that they give their drivers incentives, about 85% of them confirmed that incentives are provided on a lump-sum basis, whereas, about 12% provide incentives on a km basis.
3.3.8. Ownership of Trucks
Overall, more than 9 out of 10 (93.6%) truck drivers drive fleet operators’/ company trucks. Only a few truck drivers (6.4%) drive their own trucks.
More than 9 out of 10 respondents are driving fleet owner/ company-owned trucks in all cities in the study except Jaipur and Kolkata. The highest proportion of the truck drivers that are driving self-owned trucks is from Jaipur (16.3%), followed by Kolkata (15.9%), and Bangalore (7.5%).
42
3.4. SAFETY AND OTHER RELATED ASPECTS
Poor logistics in the trucking sector often lead to unsafe practices such as overloading of trucks, carriage of protruding loads on trucks etc. Such practices compromise the road safety of both the truck drivers as well as other road users. As per the Ministry of Transport and Highways (MoRTH) data, in the category of impacting vehicles, trucks/lorries have the third highest share (12.3%) of total crashes, causing a total of 57,441 crashes, 23,868 deaths and 51,166 injuries in 20188. Among road-user categories, truck/lorry makes up the third highest share of deaths at 10%, claiming 15,150 lives in 2018. With regard to road safety, overloaded trucks or those with ‘hanging’ or protruding loads are a hazard to other vehicles and road-users. Overloaded vehicles and vehicles with hanging loads accounted for around 18,000 road crash deaths in 2018. The following section summarises the opinions of truck drivers on safety and other related aspects.
3.4.1 Attractiveness of the Truck Driving Profession Based on Safety & Security on the Road
When asked to rate the safety and security of truck drivers on the road, nearly two-third (66.7%) of the drivers found their profession “unattractive”. In a city-wise analysis, none of the drivers rated their profession as “attractive” in Ahmedabad, Mumbai and Delhi-NCR whereas 80% of them rated it as “unattractive” in these cities. A relatively higher proportion of truck drivers of Southern Cities of India i.e. Vijayawada (13.1%), Bangalore (7.5%) and Chennai (5.8%) found their profession “attractive” in terms of safety. Similarly, when fleet owners were asked to rate the driving profession based on road safety, 65.3% rated it as “unattractive”.
8 MoRTH Report on “Accidents in India - 2018”: https://morth.nic.in/sites/default/files/Road_Accidednt.pdf

43 STUDY ON THE STATUS OF TRUCK DRIVERS IN INDIA
STATUS OF TRUCKDRIVERS IN INDIA
3
Fig 3.14: Safety status of truck drivers on roads
0 20 40 60 80 100 120Vijayawada (N=122)
Guwahati (N=121)
Bangalore (N=120)
Chennai (N=120)
Kolkata (N=126)
Jaipur (N=123)
Kanpur (N=123)
Mumbai (N=120)
Ahmedabad (N=120)
Delhi-NCR (N=122)
Overall (N=1217) 61.5% 33.9% 4.5%
87.7% 12.3%
87.5% 12.5%
85.8% 14.2%
77.2% 22.8%
55.3% 32.5% 12.2%
53.2% 46.8%
50.0% 46.7% 3.3%
49.2% 36.7% 14.2%
47.9% 41.3% 10.7%
22.1% 73.0% 4.9%
Unsafe
Neutral
Safe
3.4.2. Opinion about the Safety on Roads
Truck drivers were asked about how safe they felt on the roads. Overall, a little above 6 out of 10 (61.5%) truck drivers felt unsafe. In a city wise analysis, a large proportion of truck drivers in Delhi-NCR (87.7%), Ahmedabad (87.5%), Mumbai (85.8%) and Kanpur (77.2%) felt unsafe on roads. It was also found that two-third (66.7%) of the truck drivers who drove alone felt unsafe followed by those who were driving with a helper (57.7%) and those who were driving
with a co-driver (53.3%).
Truck drivers were further asked about the reasons behind the occurrence of crashes involving trucks. Approximately 42% of the drivers stated that over-speeding is the major cause, followed by fatigue and sleepiness (39%) and driving under the influence of alcohol/ drugs (30%).Among vehicular factors, 9.4% of the respondents stated poor road design, and 9% stated lack of vehicle maintenance/ tyre burst as the major causes for crashes.

44
Fig 3.15: Reasons for crashes involving truck drivers
0 10 20 30 40 50
Others
Sudden stopping of vehiclesby traffic police
Due to the fault of other drivers
Due to fog/ bad weather
Sharp curves/ turns
Narrow roads
Bad quality/ condition of roads/ potholes
Lack of vehicle maintenance/ tyre burst
Poor road design
Improper/ wrong parking on highway
Due to overloading of trucks
Usage of mobile phone while driving
Rash/ aggressive/ negligent driving
Drunk driving/ under theinfluence of drugs
Fatigue & sleepiness
Over-speeding 41.7%
38.7%
30.3%
23.7%
9.9%
8.2%
2.7%
9.4%
9.0%
9.0%
5.3%
4.0%
7.2%
7.1%
2.2%
10.5%
Dri
ving
Fac
tors
Veh
icul
ar
fact
ors
Ro
ad In
fra
rela
ted
Oth
ers
[N=1217, Open ended]
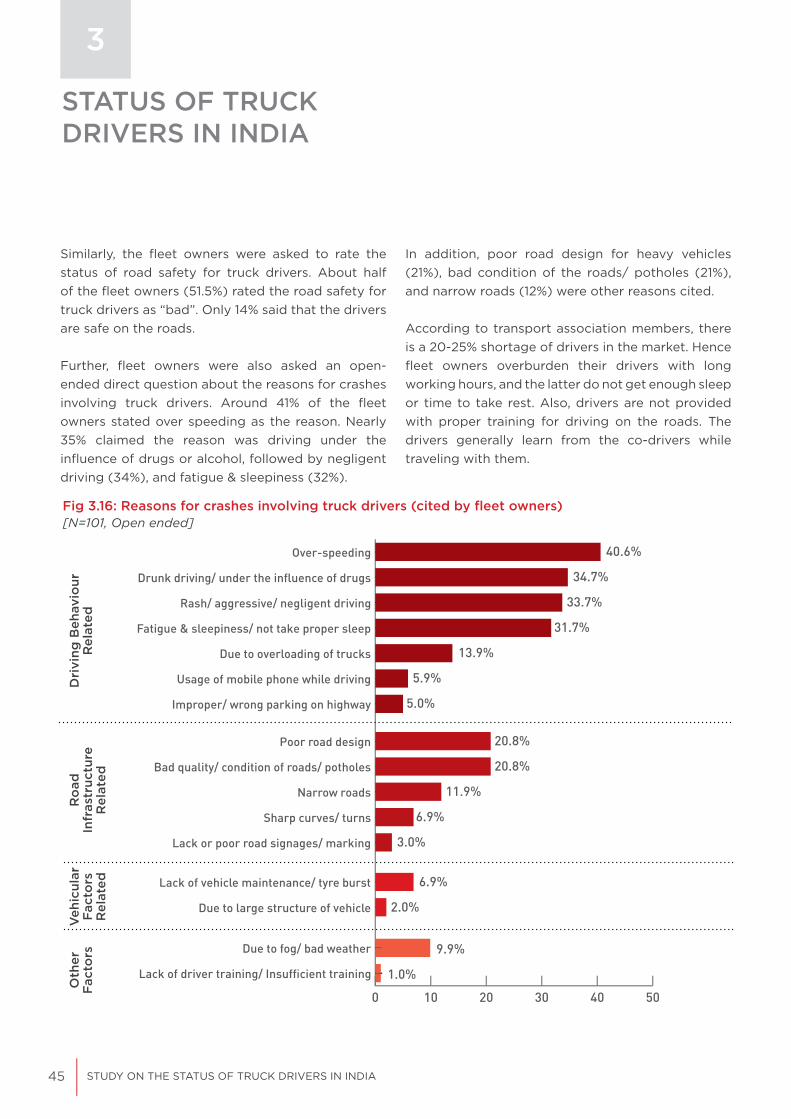
45 STUDY ON THE STATUS OF TRUCK DRIVERS IN INDIA
STATUS OF TRUCKDRIVERS IN INDIA
3
Similarly, the fleet owners were asked to rate the status of road safety for truck drivers. About half of the fleet owners (51.5%) rated the road safety for truck drivers as “bad”. Only 14% said that the drivers are safe on the roads.
Further, fleet owners were also asked an open-ended direct question about the reasons for crashes involving truck drivers. Around 41% of the fleet owners stated over speeding as the reason. Nearly 35% claimed the reason was driving under the influence of drugs or alcohol, followed by negligent driving (34%), and fatigue & sleepiness (32%).
In addition, poor road design for heavy vehicles (21%), bad condition of the roads/ potholes (21%), and narrow roads (12%) were other reasons cited.
According to transport association members, there is a 20-25% shortage of drivers in the market. Hence fleet owners overburden their drivers with long working hours, and the latter do not get enough sleep or time to take rest. Also, drivers are not provided with proper training for driving on the roads. The drivers generally learn from the co-drivers while traveling with them.
Fig 3.16: Reasons for crashes involving truck drivers (cited by fleet owners)[N=101, Open ended]
0 10 20 30 40 50
Lack of driver training/ Insufficient training
Due to fog/ bad weather
Due to large structure of vehicle
Lack of vehicle maintenance/ tyre burst
Lack or poor road signages/ marking
Sharp curves/ turns
Narrow roads
Bad quality/ condition of roads/ potholes
Poor road design
Improper/ wrong parking on highway
Usage of mobile phone while driving
Due to overloading of trucks
Fatigue & sleepiness/ not take proper sleep
Rash/ aggressive/ negligent driving
Drunk driving/ under the influence of drugs
Over-speeding 40.6%
34.7%
33.7%
31.7%
13.9%
5.9%
5.0%
20.8%
20.8%
11.9%
6.9%
3.0%
6.9%
2.0%
9.9%
1.0%
Dri
ving
Beh
avio
ur
Rel
ated
Ro
ad
Infr
astr
uctu
re
Rel
ated
Veh
icul
ar
Fact
ors
R
elat
ed
Oth
er
Fact
ors
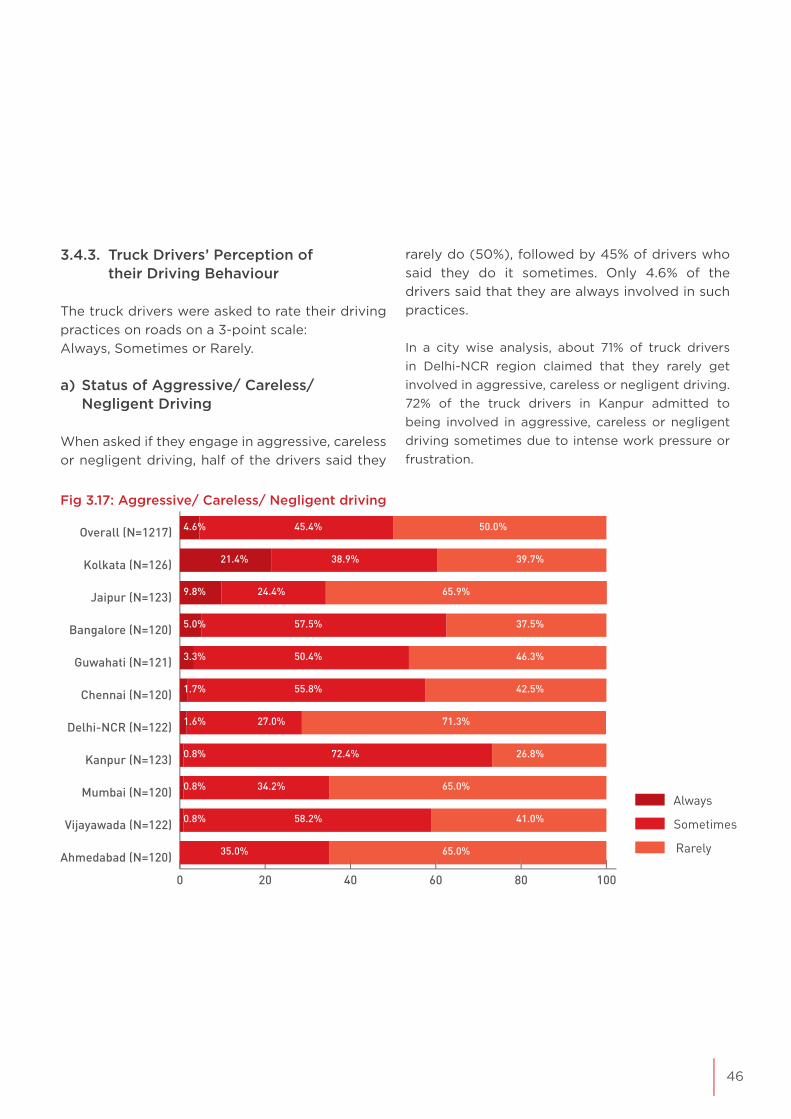
46
3.4.3. Truck Drivers’ Perception of their Driving Behaviour
The truck drivers were asked to rate their driving practices on roads on a 3-point scale: Always, Sometimes or Rarely.
a) Status of Aggressive/ Careless/ Negligent Driving
When asked if they engage in aggressive, careless or negligent driving, half of the drivers said they
rarely do (50%), followed by 45% of drivers who said they do it sometimes. Only 4.6% of the drivers said that they are always involved in such practices.
In a city wise analysis, about 71% of truck drivers in Delhi-NCR region claimed that they rarely get involved in aggressive, careless or negligent driving. 72% of the truck drivers in Kanpur admitted to being involved in aggressive, careless or negligent driving sometimes due to intense work pressure or frustration.
Fig 3.17: Aggressive/ Careless/ Negligent driving
0 20 40 60 80 100 120
Ahmedabad (N=120)
Vijayawada (N=122)
Mumbai (N=120)
Kanpur (N=123)
Delhi-NCR (N=122)
Chennai (N=120)
Guwahati (N=121)
Bangalore (N=120)
Jaipur (N=123)
Kolkata (N=126)
Overall (N=1217) 4.6% 45.4% 50.0%
21.4% 38.9% 39.7%
9.8% 24.4% 65.9%
5.0% 57.5% 37.5%
3.3% 50.4% 46.3%
1.7% 55.8% 42.5%
1.6% 27.0% 71.3%
0.8% 72.4% 26.8%
0.8% 34.2% 65.0%
0.8% 58.2% 41.0%
35.0% 65.0%
Always
Sometimes
Rarely
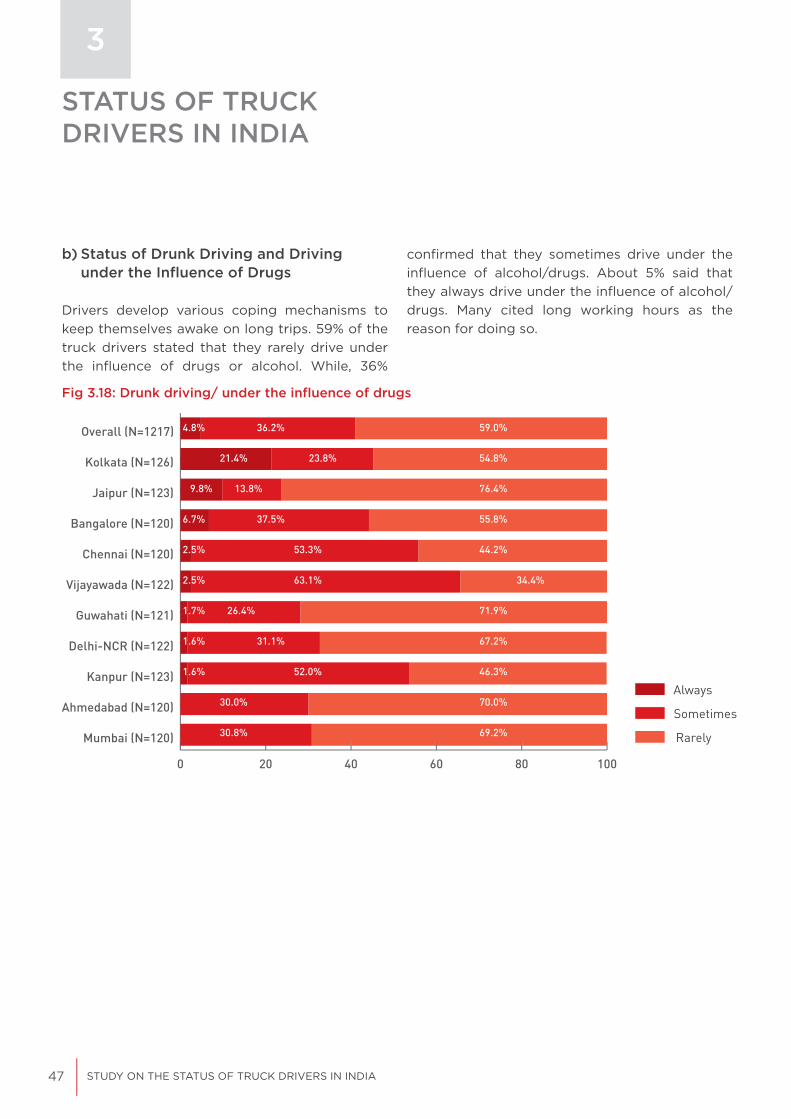
47 STUDY ON THE STATUS OF TRUCK DRIVERS IN INDIA
b) Status of Drunk Driving and Driving under the Influence of Drugs
Drivers develop various coping mechanisms to keep themselves awake on long trips. 59% of the truck drivers stated that they rarely drive under the influence of drugs or alcohol. While, 36%
confirmed that they sometimes drive under the influence of alcohol/drugs. About 5% said that they always drive under the influence of alcohol/drugs. Many cited long working hours as the reason for doing so.
Fig 3.18: Drunk driving/ under the influence of drugs
STATUS OF TRUCKDRIVERS IN INDIA
3
0 20 40 60 80 100
Mumbai (N=120)
Ahmedabad (N=120)
Kanpur (N=123)
Delhi-NCR (N=122)
Guwahati (N=121)
Vijayawada (N=122)
Chennai (N=120)
Bangalore (N=120)
Jaipur (N=123)
Kolkata (N=126)
Overall (N=1217) 4.8% 36.2% 59.0%
21.4% 23.8% 54.8%
9.8% 13.8% 76.4%
6.7% 37.5% 55.8%
2.5% 53.3% 44.2%
2.5% 63.1% 34.4%
1.7% 26.4% 71.9%
1.6% 31.1% 67.2%
1.6% 52.0% 46.3%
30.0% 70.0%
30.8% 69.2%
Always
Sometimes
Rarely

48
Always
Sometimes
Rarely
Fig 3.19: Overloading of vehicles
c) Status of Driving Overloaded Vehicles
Respondents were asked if truck drivers in general overload their vehicles while on trips. Overall, about 51% of drivers said that they rarely overload their vehicles, whereas 44% admitted that they overload sometimes. Only 4.1% admitted that truck drivers always overload their vehicles.
On a discussion with the truck drivers, it was revealed that some drivers did not have the fear of paying fines when caught for overloading, as consigners/ fleet owners reimburse them for the fines, and overloading of vehicles gives them the opportunity to earn extra money.
0 20 40 60 80 100
Mumbai (N=120)
Chennai (N=120)
Kanpur (N=123)
Delhi-NCR (N=122)
Guwahati (N=121)
Vijayawada (N=122)
Bangalore (N=120)
Jaipur (N=123)
Kolkata (N=126)
Ahmedabad (N=120)
Overall (N=1217) 4.1% 44.5% 51.4%
12.5% 75.0% 12.5%
11.1% 54.0% 34.9%
7.3% 29.3% 63.4%
5.8% 41.7% 52.5%
2.5% 45.9% 51.6%
1.7% 13.2% 85.1%
40.2% 59.8%
56.9% 43.1%
56.7% 43.3%
32.5% 67.5%
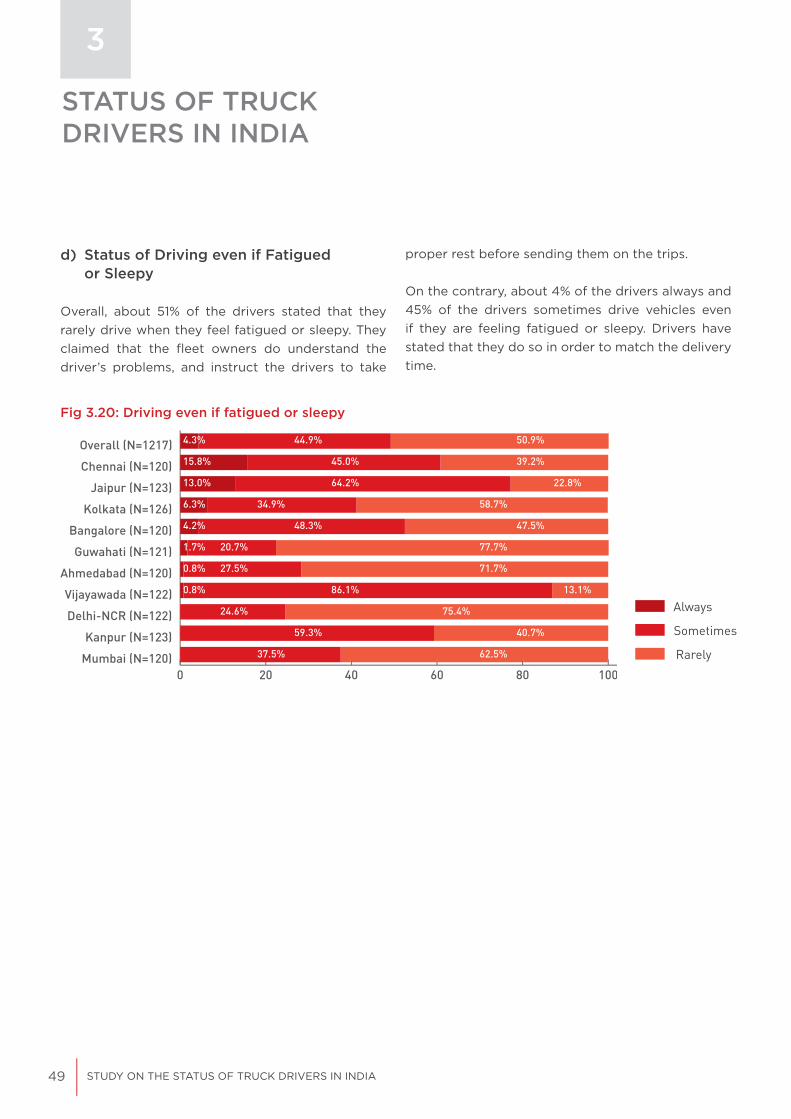
49 STUDY ON THE STATUS OF TRUCK DRIVERS IN INDIA
STATUS OF TRUCKDRIVERS IN INDIA
3
d) Status of Driving even if Fatigued or Sleepy
Overall, about 51% of the drivers stated that they rarely drive when they feel fatigued or sleepy. They claimed that the fleet owners do understand the driver’s problems, and instruct the drivers to take
Fig 3.20: Driving even if fatigued or sleepy
0 20 40 60 80 100 120Mumbai (N=120)
Kanpur (N=123)
Delhi-NCR (N=122)
Vijayawada (N=122)
Ahmedabad (N=120)
Guwahati (N=121)
Bangalore (N=120)
Kolkata (N=126)
Jaipur (N=123)
Chennai (N=120)
Overall (N=1217) 4.3% 44.9% 50.9%
15.8% 45.0% 39.2%
13.0% 64.2% 22.8%
6.3% 34.9% 58.7%
4.2% 48.3% 47.5%
1.7% 20.7% 77.7%
0.8% 27.5% 71.7%
0.8% 86.1% 13.1%
24.6% 75.4%
59.3% 40.7%
37.5% 62.5%
Always
Sometimes
Rarely
proper rest before sending them on the trips.
On the contrary, about 4% of the drivers always and 45% of the drivers sometimes drive vehicles even if they are feeling fatigued or sleepy. Drivers have stated that they do so in order to match the delivery time.
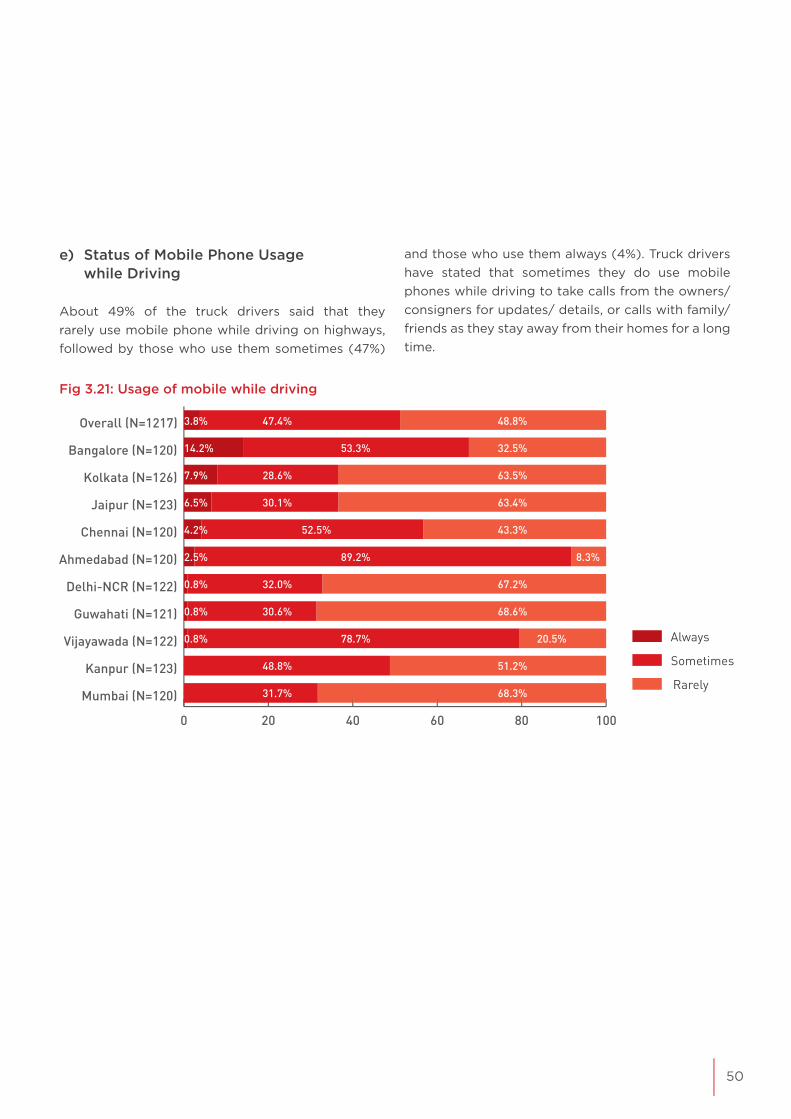
50
Always
Sometimes
Rarely
Fig 3.21: Usage of mobile while driving
0 20 40 60 80 100
Mumbai (N=120)
Kanpur (N=123)
Vijayawada (N=122)
Guwahati (N=121)
Delhi-NCR (N=122)
Ahmedabad (N=120)
Chennai (N=120)
Jaipur (N=123)
Kolkata (N=126)
Bangalore (N=120)
Overall (N=1217) 3.8% 47.4% 48.8%
14.2% 53.3% 32.5%
7.9% 28.6% 63.5%
6.5% 30.1% 63.4%
4.2% 52.5% 43.3%
2.5% 89.2% 8.3%
0.8% 32.0% 67.2%
0.8% 30.6% 68.6%
0.8% 78.7% 20.5%
48.8% 51.2%
31.7% 68.3%
e) Status of Mobile Phone Usage while Driving
About 49% of the truck drivers said that they rarely use mobile phone while driving on highways, followed by those who use them sometimes (47%)
and those who use them always (4%). Truck drivers have stated that sometimes they do use mobile phones while driving to take calls from the owners/ consigners for updates/ details, or calls with family/ friends as they stay away from their homes for a long time.
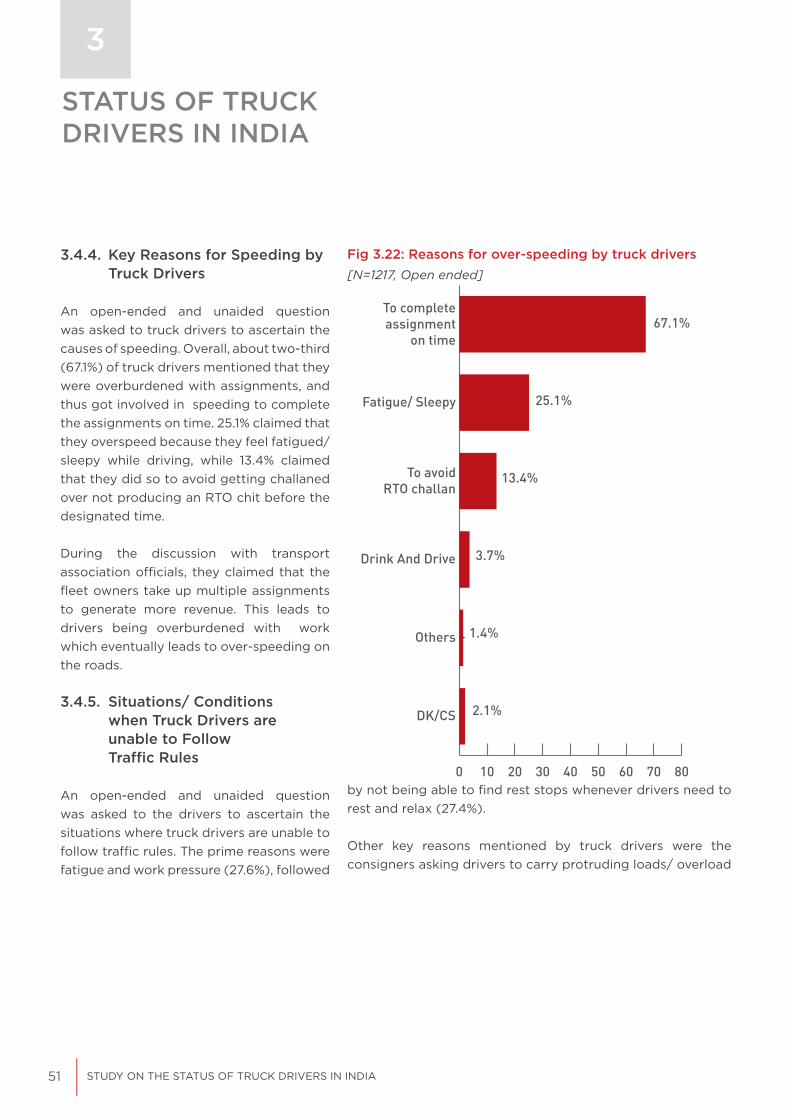
51 STUDY ON THE STATUS OF TRUCK DRIVERS IN INDIA
STATUS OF TRUCKDRIVERS IN INDIA
3
Fig 3.22: Reasons for over-speeding by truck drivers[N=1217, Open ended]
0 10 20 30 40 50 60 70 80
DK/CS
Others
Drink And Drive
To avoidRTO challan
Fatigue/ Sleepy
To completeassignment
on time 67.1%
25.1%
13.4%
3.7%
1.4%
2.1%
3.4.4. Key Reasons for Speeding by Truck Drivers
An open-ended and unaided question was asked to truck drivers to ascertain the causes of speeding. Overall, about two-third (67.1%) of truck drivers mentioned that they were overburdened with assignments, and thus got involved in speeding to complete the assignments on time. 25.1% claimed that they overspeed because they feel fatigued/ sleepy while driving, while 13.4% claimed that they did so to avoid getting challaned over not producing an RTO chit before the designated time.
During the discussion with transport association officials, they claimed that the fleet owners take up multiple assignments to generate more revenue. This leads to drivers being overburdened with work which eventually leads to over-speeding on the roads.
3.4.5. Situations/ Conditions when Truck Drivers are unable to Follow Traffic Rules
An open-ended and unaided question was asked to the drivers to ascertain the situations where truck drivers are unable to follow traffic rules. The prime reasons were fatigue and work pressure (27.6%), followed
by not being able to find rest stops whenever drivers need to rest and relax (27.4%).
Other key reasons mentioned by truck drivers were the consigners asking drivers to carry protruding loads/ overload

52
Table 3.12: Availability of safety devices (Reported by fleet owners)
their vehicle (19.5%), and to avoid getting fined for traffic rules violation which they have committed unintentionally (13%).
During the discussion with drivers, they stated that most of the time perishable goods were required to be delivered in a specified period of time. In order to deliver such goods, they have to overlook traffic rules. Additionally, sometimes, they are not able to see or notice the traffic signs properly and thus violate traffic rules unintentionally.
3.4.6. Availability of Safety Devices (Rear Under-Run Protection Device)
Section 124(1A) in the Central Motor Vehicle Rules (CMVR) provides for Rear Under-Run Protection Devices in vehicles. The IS: 14812: 2005 “Automotive Vehicles: Rear Under-Run Protection Device” specifies the general and technical requirements with regard to RUPD. It states a heavy vehicle (N2, N3, T3 and T4 categories) must be equipped with a special under-run protective device. The truck drivers were asked whether the trucks are equipped with a “rear under-run protection device” to offer safety. Approximately 82% of the truck drivers confirmed that they have rear under run safety devices in their vehicles. In a city- wise analysis, close to 8 out of 10 drivers from all cities except Mumbai and Bangalore confirmed the availability of the rear under run safety devices in their vehicles.
Proportion of fleet with RUPDProportion
of fleet owners -Yes
N 101
100 percent of the fleet 60.4%
76-99 percent fleet 3.0%
51-75 percent fleet 14.9%
25-50 percent fleet 16.8%
Up to 25 percent fleet 4.0%
None 1.0%
On the other hand, in Mumbai (52.5%) and Bangalore (48.3%), about half of the truck drivers admitted that their vehicles are not equipped with rear under run safety devices.
Similarly, fleet owners were asked about the availability of the rear under-run safety device in their fleet. About 6 out of 10 fleet owners confirmed that their entire fleet was equipped with safety devices.

53 STUDY ON THE STATUS OF TRUCK DRIVERS IN INDIA
Road amenities Good Average Bad
Restaurants/ dhabas 24.1% 51.2% 24.7%
Terminals/ parking
spaces to rest/ sleep17.7% 51.1% 31.1%
Mechanic/ repair
shop14.6% 52.8% 32.5%
Toilets/ Washrooms/
Bathroom12.9% 39.5% 47.6%
Emergency vehicle/
ambulance/ etc.10.7% 44.5% 44.9%
Hospital/ trauma
centre/ medical
store
8.1% 43.9% 48.1%
3.4.7 Other Work-Related Aspects
There are other work-related aspects which influence the quality of life of truck drivers. They require certain amenities on the roads in order to proceed with their work efficiently. Some of these amenities are listed below:
3.4.8. Availability of Restaurants and Dhabas
Overall, about one-fourth (24.1%) of the truck drivers rated availability of restaurants or dhabas as “good” while 24.7% of the drivers rated it as “bad”. About half (51.2%) of the truck drivers rated the availability as “average”.
In a city-wise analysis, availability of restaurants and dhabas was rated as “poor” by 63.3% of the drivers of Mumbai followed by the drivers of Delhi (30.3%), Bangalore (29.2%). On the other hand, the availability of restaurants and dhabas was rated as “good” by a higher proportion of drivers of Eastern Cities i.e. Guwahati (54.5%), Kolkata (44.4%).
3.4.9. Availability of Terminals, Parking Spaces to Rest or Sleep
With regard to the availability of terminals and parking spaces to rest/ sleep, about 3 out of 10 (31.1%) drivers rated the availability as “poor” while
STATUS OF TRUCKDRIVERS IN INDIA
3
Table 3.13: Availability of roadside amenities
17.7% rated it as “good”, and the remaining 51.1% rated as average.
In a city-wise analysis, availability of terminals and parking spaces to rest/ sleep was rated bad by
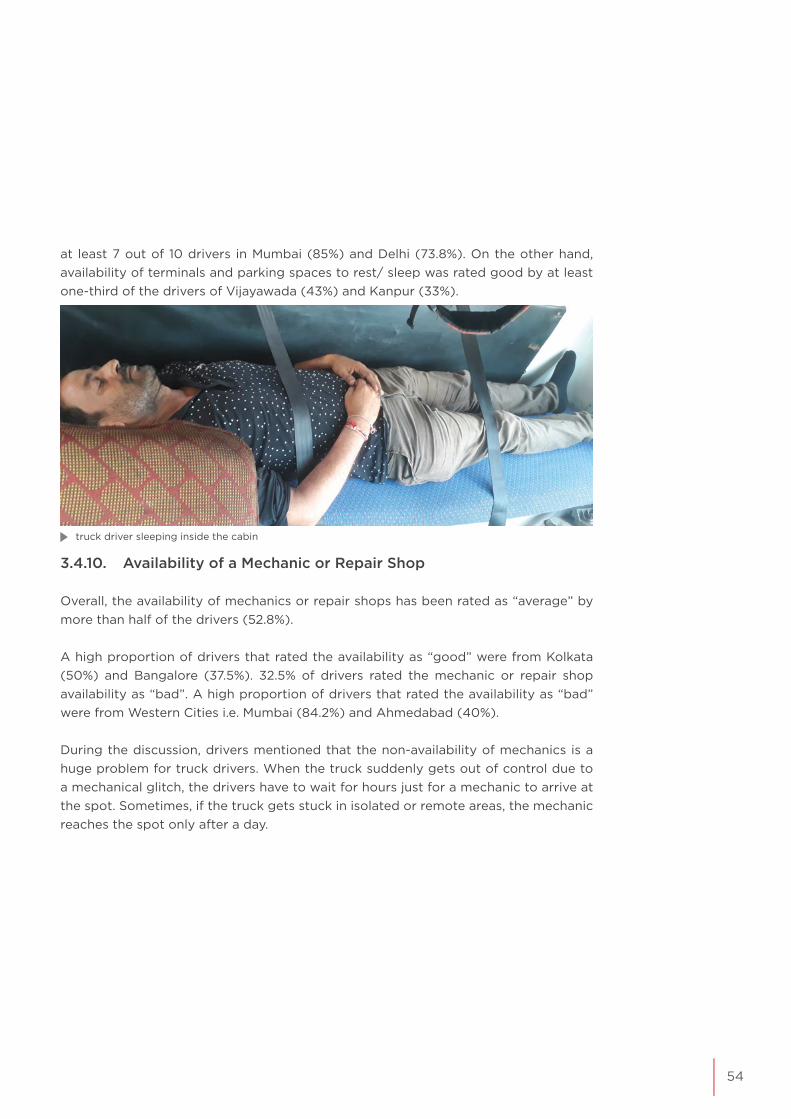
54
3.4.10. Availability of a Mechanic or Repair Shop
Overall, the availability of mechanics or repair shops has been rated as “average” by more than half of the drivers (52.8%).
A high proportion of drivers that rated the availability as “good” were from Kolkata (50%) and Bangalore (37.5%). 32.5% of drivers rated the mechanic or repair shop availability as “bad”. A high proportion of drivers that rated the availability as “bad” were from Western Cities i.e. Mumbai (84.2%) and Ahmedabad (40%).
During the discussion, drivers mentioned that the non-availability of mechanics is a huge problem for truck drivers. When the truck suddenly gets out of control due to a mechanical glitch, the drivers have to wait for hours just for a mechanic to arrive at the spot. Sometimes, if the truck gets stuck in isolated or remote areas, the mechanic reaches the spot only after a day.
at least 7 out of 10 drivers in Mumbai (85%) and Delhi (73.8%). On the other hand, availability of terminals and parking spaces to rest/ sleep was rated good by at least one-third of the drivers of Vijayawada (43%) and Kanpur (33%).
truck driver sleeping inside the cabin

55 STUDY ON THE STATUS OF TRUCK DRIVERS IN INDIA
STATUS OF TRUCKDRIVERS IN INDIA
3
3.4.11. Availability of Toilets, Washrooms or Bathrooms
The truck drivers were asked to rate the availability of toilets, washrooms and such facilities while on trips. Nearly half of the drivers (47.6%) rated such facilities as “bad”, while only 12.9% of the drivers have rated it as “good”.
In a city- wise analysis, availability of toilets was rated as “bad” by at least 7 out of 10 drivers of the Western Cities i.e. Mumbai (71%) and Ahmedabad (71%) followed by Delhi NCR (65%) and Chennai (52%). On the other hand, the availability of toilets was rated as “good” by about 3 out of 10 drivers of Vijayawada (33.6%) and Bangalore (29.2%).
3.4.12. Availability of Emergency Vehicles or Ambulances
44.9% of the drivers rated the availability of emergency vehicles as “bad” and 44.5% rated it as “average”. 10.7% of the drivers rated the availability as “good”.
The availability of emergency vehicles or ambulance is rated bad by a relatively higher proportion of drivers (at least 47%) from Western and Southern Cities of India. On the other hand, the largest proportion of drivers that rated the availability of emergency vehicles or ambulance as “good” were from Northern and Eastern cities of India.
Fig 3.23: Availability of emergency vehicle/ ambulance
0 20 40 60 80 100 120
Mumbai (N=120)
Chennai (N=120)
Ahmedabad (N=120)
Vijayawada (N=122)
Bangalore (N=120)
Guwahati (N=121)
Delhi-NCR (N=122)
Kanpur (N=123)
Jaipur (N=123)
Kolkata (N=126)
Overall (N=1217) 10.7% 44.5% 44.9%
31.7% 42.1% 26.2%
14.6% 75.6% 9.8%
14.6% 56.9% 28.5%
13.9% 53.3% 32.8%
13.2% 39.7% 47.1%
9.2% 30.0% 60.8%
4.9% 44.3% 50.8%
3.3% 30.0% 66.7%
52.5% 47.5%
19.2% 80.8%
Good
Average
Bad

56
Good
Average
Bad
3.4.13. Availability of Hospital, Trauma Centre or Medical Store
Approximately half (48.1%) of the truck drivers have rated the availability of medical facilities as “bad”. The proportion of drivers that rated the availability as “bad” is especially high in Western Cities i.e. Mumbai (75.8%) and Ahmedabad (69.2%). While
43.9% of the drivers rated it as “average”.
A very small proportion of drivers (8.1%) have rated the availability of medical facilities as “good”. This proportion is highest in Eastern Cities i.e. Kolkata (23.8%) and Guwahati (12.4%), as well as Delhi-NCR (16.4%).
Fig 3.24: Availability of hospital/ trauma centre/ medical store
0 20 40 60 80 100 120
Mumbai (N=120)
Kanpur (N=123)
Vijayawada (N=122)
Ahmedabad (N=120)
Jaipur (N=123)
Chennai (N=120)
Bangalore (N=120)
Guwahati (N=121)
Delhi-NCR (N=122)
Kolkata (N=126)
Overall (N=1217) 8.1% 43.9% 48.1%
23.8% 62.7% 13.5%
16.4% 45.9% 37.7%
12.4% 29.8% 57.9%
9.2% 30.0% 60.8%
7.5% 50.0% 42.5%
4.9% 55.3% 39.8%
3.3% 27.5% 69.2%
1.6% 50.0% 48.4%
0.8% 61.8% 37.4%
24.2% 75.8%

57 STUDY ON THE STATUS OF TRUCK DRIVERS IN INDIA
STATUS OF TRUCKDRIVERS IN INDIA
3
3.4.14. Adequate Time to Complete the Trip
The respondent truck drivers were asked about how often they were given adequate time by consigners/owners to complete trips. Around 46.8% of the truck drivers stated that the time provided by the consigners/ owners to complete the trip is always adequate. One third of the truck drivers (35.2%) mentioned that they are provided with adequate time only sometimes. 18% of drivers claimed that they were never provided with adequate time by the consigner to complete the trip.
During the focus group discussion, truck drivers mentioned that irrespective of the time given to
complete the trip, their driving behaviour is generally based on actual scenarios related to road conditions, distance, traffic and other factors.
All drivers were further asked about the repercussions of not being able to deliver assigned goods on time. About 47% of the truck drivers claimed that there are no consequences at all. Further, about one-fifth (19.3%) of the drivers said that such cases reduce their credibility. 15.5% of the respondents said that they need to wait long hours at the destination when the assigned goods are not delivered on time as the customers schedule a later time for unloading.Some fleet owners/consigners also delay the truck drivers’ salary/wages for late delivery.
Table 3.14: Consequences faced by truck drivers when goods not delivered on time[Multiple Responses, All figures in percent]
Cities N NilReduces
credibility of driver
Needs to pay penalty
Needs to wait for long at
destination
Results in low
business/ income
Consigner gets angry/
abusive
Overall 1217 47.2 19.3 18.7 15.5 15.3 0.1
Ahmedabad 120 87.5 0.8 5.0 5.0 1.7 0.0
Guwahati 121 82.6 5.8 5.0 6.6 11.6 0.0
Kanpur 123 71.5 0.0 22.0 23.6 0.8 0.0
Delhi-NCR 122 50.8 6.6 42.6 0.8 1.6 0.8
Mumbai 120 40.0 23.3 6.7 35.0 32.5 0.0
Jaipur 123 38.2 0.8 42.3 18.7 0.0 0.0
Kolkata 126 34.1 12.7 46.8 42.9 32.5 0.0
Chennai 120 33.3 34.2 3.3 15.8 13.3 0.0
Bangalore 120 25.0 43.3 10.8 3.3 19.2 0.0
Vijayawada 122 9.8 66.4 0.0 2.5 39.3 0.0

58
Steps taken to complete the trip on time
An open-ended, direct question was asked to the drivers about the steps that they take to complete the trip on time. About 37% of the truck drivers said that they reduce their rest time/sleep time to complete the trip on time. About 32% of the truck drivers increase the speed of their vehicle, 11.7% of the drivers skip stops for food, and 10.2% of the drivers take short cuts/detours from highways.
Table 3.15: Steps taken by drivers to finish the trip on time[All figures in percent, Open ended]
Cities N
I reduce my rest time/ sleep time
I generally catch up by
increasing the speed of vehicle
I do nothing
and keep on driving as per
my pace
I skiptaking
unsche-duled stops/
for food
I take short cuts/
detour from
highway
I take co-driver/
khalasi who can drive interchan-
geably
Nil
Overall 1217 37.0 32.0 27.1 11.7 10.2 6.6 1.1
Chennai 120 76.7 51.7 8.3 35.0 18.3 9.2 0.0
Jaipur 123 68.3 17.9 17.1 1.6 13.0 3.3 1.6
Guwahati 121 47.9 19.0 18.2 1.7 7.4 11.6 4.1
Delhi-NCR 122 36.1 6.6 55.7 0.8 0.8 0.8 0.0
Bangalore 120 28.3 35.0 28.3 25.0 6.7 3.3 0.0
Kanpur 123 26.8 23.6 39.8 4.1 6.5 19.5 0.0
Mumbai 120 25.0 61.7 16.7 8.3 22.5 2.5 0.0
Vijayawada 122 23.8 45.9 4.9 18.0 10.7 6.6 0.0
Kolkata 126 19.8 42.1 21.4 19.8 11.9 1.6 4.8
Ahmedabad 120 17.5 17.5 60.8 2.5 4.2 7.5 0.0

59 STUDY ON THE STATUS OF TRUCK DRIVERS IN INDIA
STATUS OF TRUCKDRIVERS IN INDIA
3
Table 3.16: Problems faced by truck drivers during trips[All figures in percent, Open ended]
Problems faced during the trips
Ove
rall
Del
hi
Jaip
ur
Kan
pur
Ahm
edab
ad
Che
nnai
Guw
ahat
i
Ko
lkat
a
Ban
gal
ore
Mum
bai
Vija
yaw
ada
N 1217 122 123 123 120 120 121 126 120 120 122
Fatigue/ lack of sleep 58.3 56.6 62.6 55.3 64.2 80.8 65.3 46.8 30.0 74.2 47.5
Frequently stopped by Traffic police/
RTO and issuing challans53.4 58.2 63.4 55.3 75.8 55.0 48.8 74.6 42.5 15.0 44.3
Health issues like back ache, neck ache
or stomach upset etc.36.7 36.9 15.4 48.8 40.8 31.7 48.8 37.3 6.7 52.5 48.4
Lack of cheap and good quality meals/
access to water33.8 14.8 26.0 73.2 15.0 54.2 8.3 29.4 25.0 60.0 32.0
Safety and security of life and property 21.4 24.6 8.9 24.4 10.8 38.3 0.8 43.7 14.2 30.0 17.2
Stopped by informal local groups for
illegal challans12.2 14.8 5.7 29.3 5.0 2.5 14.0 11.9 25.8 12.3
Lack of parking space 1.6 3.3 0.8 1.7 0.8 9.2
Others 5.4 7.4 2.4 2.4 12.4 12.5 8.2 0.0 6.6 0.8 0.0
3.4.15. Other Problems faced by Truck Drivers During Trips
An open-ended direct question was asked to the truck drivers about the problems they face during the trips.
More than half of the truck drivers mentioned fatigue/lack of sleep (58%) as the biggest problem. Due to the shortage of drivers in the transport sector, existing drivers have to work for long hours without taking proper rest. Further, the working hours of drivers are not fixed, and they could be called for duty any time of the day.
About 53% of the drivers have said that they are frequently stopped by Traffic Police/RTO
department for issuing challans. Further, more than one third (36.7%) of the drivers said that they face health issues such as backaches, neck aches etc. Close to one-fifth of drivers (21.4%) mentioned the lack of safety and security on highways and the threat to their life and goods. During the FGD, the truck drivers claimed that they have to be extra cautious in remote areas as thefts are more rampant there.
3.4.16. Driving Assistance by Co-Driver/ Helper
When asked whether they travel alone or with a helper/co-driver, 44.5% of the truck drivers claimed that they drive alone, while almost a similar proportion (44.3%) of drivers drive along with a helper/khalasi.

60
Fig 3.25: Driver accompaniment during the journey
0 20 40 60 80 100 120
Vijayawada (N=122)
Chennai (N=120)
Kanpur (N=123)
Kolkata (N=126)
Jaipur (N=123)
Bangalore (N=120)
Ahmedabad (N=120)
Mumbai (N=120)
Guwahati (N=121)
Delhi-NCR (N=122)
Overall (N=1217) 44.5% 11.3% 44.3%
89.3% 6.6% 4.1%
77.7% 8.3% 14.0%
52.5% 4.2% 43.3%
50.8% 14.2% 35.0%
48.3% 9.2% 42.5%
40.7% 13.0% 46.3%
36.5% 31.7% 31.7%
22.0% 4.9% 73.2%
21.7% 18.3% 60.0%
5.7% 1.6% 92.6%
Alone
With Co-driver
With helper/Khalasi
Only 11% of the drivers drive with co-drivers.
During the in-depth discussion with fleet owners, the fleet owners claimed that they face difficulties in finding new drivers to ply their vehicles. Further, they have mentioned that due to the continuous shortage of drivers and helpers, the government has relaxed a few clauses for driving the vehicle e.g. the vehicle needs to have co-driver, minimum education qualification, etc.
Also, the drivers stated that their daily wages include helper/ khalasi expenses as well. Now, if they drive with helper/ khalasi, they need to pay for their expenses. This directly impacts their savings/ earnings. However, for long journeys, driving with a helper/khalasi is beneficial if any intermediate help is required.
About 9 out of 10 (89.3%) of the truck drivers from Delhi-NCR drive alone while on trips, followed by Guwahati (78%), Mumbai (52.5%), Ahmedabad (51%). On the contrary, 9 out of 10 drivers of Vijayawada (92.6%) drive along with a helper/ khalasi while they are on a trip followed by Kanpur (73%), Chennai
(60%) Jaipur (46%).
Category wise, a relatively high proportion of drivers that drive alone are either in the youngest category(18-25 years) or in the oldest category (above 60 years).
Similarly, in terms of driving experience, the proportion of truck drivers driving with helper/ khalasi initially increases with an increase in the number of years of experience (till 11-15 years) and then declines for drivers who have experience of more than 15 years.
Fleet owners were also questioned about whether their drivers drive alone or with helpers/ co drivers. About 48% stated that truck drivers drive alone, while almost 38% said that drivers drive with a helper. They also mentioned that the helpers take care of the truck and other related aspects such as food, medicine, cleanliness, maintenance of truck etc. Only about 15% said that the drivers drive along with co-drivers.

61 STUDY ON THE STATUS OF TRUCK DRIVERS IN INDIA
ENFORCEMENT AND OTHER ASPECTS
4
The rapid growth in the population of India has fuelled a demand for various kinds of goods. This has led to an increase in transportation of goods on highways through trucks and other heavy motor vehicles. Unfortunately, this has also led to an increase in road crashes involving heavy motor vehicles. The number of road crash fatalities has increased by 26.32% in the past eleven years (since 2008)9. In fact, there has been a 2.4% increase in deaths from 2017 to 2018. Further, in 2018, a total of 23,868 road crash fatalities occurred due to crashes where trucks were the impacting vehicles. There has been a 1.6% increase in the road crash fatalities in crashes involving trucks from 2017 to 2018. In 2018, a total of 94,626 road crash fatalities occurred on National and State highways alone.
The Central Government is taking a number of initiatives to improve the condition of road safety in the country. The recently passed Motor Vehicles (Amendment) Act, 2019 has increased penalties for road traffic violations. This has led to road users taking extra precaution, and has thus led to an increase in rule adherence.
During the in-depth discussion with transport association members, it was suggested that implementing heavy fines should be clubbed with ensuring good road infrastructure and enforcing the relevant laws. The transport association members were of the opinion that any improvement in road conditions lasts for only about three seasons. There are various infrastructural flaws such as potholes, heightened speed breakers, damaged roads, etc., as well as implementation issues such as theft, exploitation by authorities etc. The Government has
the capacity to effectively address such issues.
This chapter discusses the opinions of the respondent truck drivers and fleet owners on various aspects of road safety, awareness levels, and implementation of relevant provisions of the Motor Vehicles Act.
4.1 ENFORCEMENT ASPECTS
Enforcement agencies play a vital role in maintaining rules and regulations on roads. Strong enforcement enhances the safety of road users and is thus essential for the prevention of road crashes. The truck drivers were asked to rate the enforcement agencies on a number of parameters using a 3-points scale with the following ratings: Good, Average, or Bad.
4.1.1. Patrolling on Highways
Overall, only close to 1 out of 10 (9.4%) truck drivers mentioned that the authorities efficiently patrol the highways. These drivers claimed that the police continuously patrol the highways and protect road users (including truck drivers) from theft, mishaps etc. Additionally, it was found that a large proportion of drivers that rated the enforcement as “good” belonged to Kolkata and Ahmedabad. However, about 42.5% rated the patrolling as “bad”. Further, at least half of the truck drivers of Guwahati (69%), Delhi-NCR (61.5%), Mumbai (60%), Chennai (55%) and Bangalore (50%) claimed that patrolling on the highways is inefficient. Close to half of the truck drivers (48%) stated that the status of patrolling on the highways is “average”(neither too good nor too bad).
9 Ministry of Road transport and Highways Report, ‘Road Accidents in India – 2008, 2017 & 2018’

62
Fig 4.1: Status of enforcement of traffic laws by authorities
4.1.2. Enforcement of Traffic Laws by Authorities
Overall, only about 8.5% of the drivers have rated the enforcement of traffic laws by the authorities as “good”. In a city wise analysis, enforcement of traffic laws is rated as “good” by a relatively large proportion of truck drivers in Kolkata (31%).
About 41.7% of the truck drivers have claimed that the enforcement of traffic laws is “bad”. In a city- wise analysis, at least half of the respondents of Mumbai (65%), Delhi-NCR (59%) and Vijayawada (57%) have stated that enforcement of traffic laws is inefficient and have rated it as “bad”.
4.1.3. Traffic Management on Highways
Efficient traffic management is an important component for ensuring road safety. However, most of the respondents do not view the traffic management on Indian highways as efficient. About 45% rated the traffic management on highways as “bad”, while about 49% of the drivers have rated it as “average”. Further, traffic management of highways was rated as “bad” by more than half of the drivers from Mumbai (69%), Delhi (68%), Guwahati (59%), Bangalore (57%) and Kanpur (51%).
However, a relatively large proportion of drivers from Kolkata (25%) and Jaipur (12%) rated the traffic management as “good”.
0 20 40 60 80 100 120Ahmedabad (N=120)
Kanpur (N=123)
Kolkata (N=126)
Guwahati (N=121)
Chennai (N=120)
Jaipur (N=123)
Bangalore (N=120)
Vijayawada (N=122)
Delhi-NCR (N=122)
Mumbai (N=120)
Overall (N=1217) 41.7% 49.7% 8.5%
65.0% 33.3% 1.7%
59.0% 39.3% 1.6%
56.6% 38.5% 4.9%
48.3% 45.0% 6.7%
47.2% 35.0% 17.9%
45.8% 51.7% 2.5%
40.5% 48.8% 10.7%
29.4% 39.7% 31.0%
17.9% 78.9% 3.3%
8.3% 87.5% 4.2% Good
Average
Bad
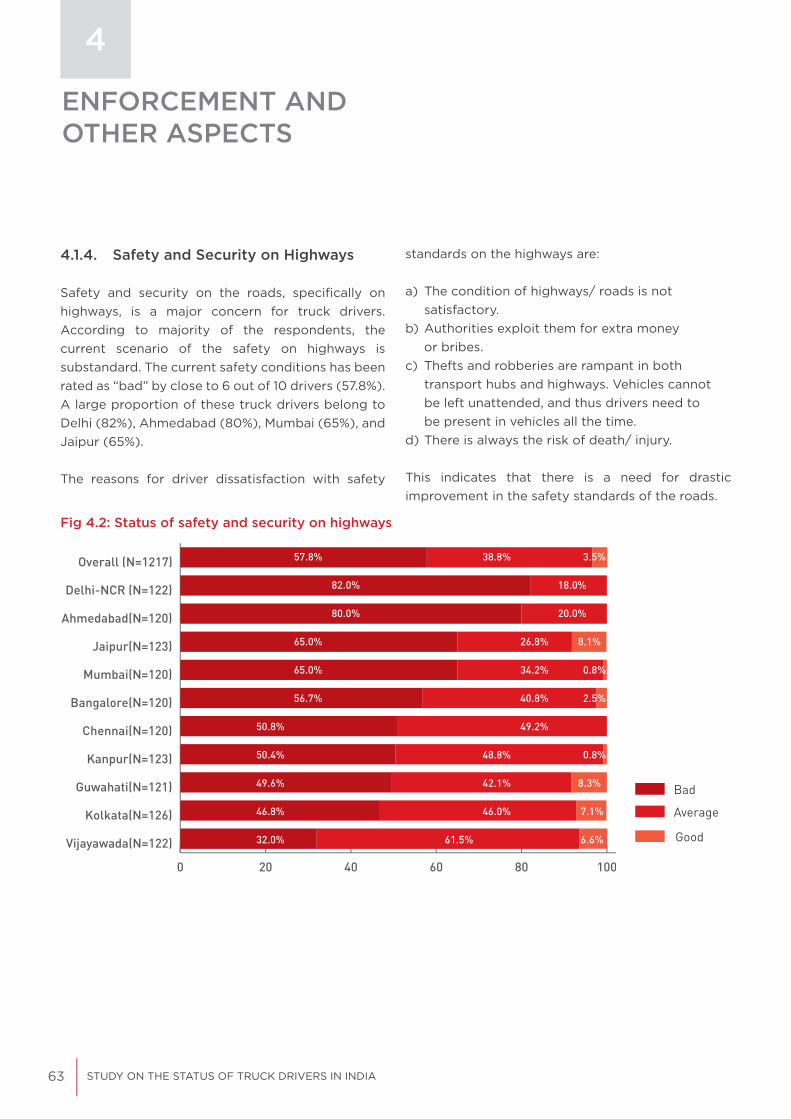
63 STUDY ON THE STATUS OF TRUCK DRIVERS IN INDIA
ENFORCEMENT AND OTHER ASPECTS
4
4.1.4. Safety and Security on Highways
Safety and security on the roads, specifically on highways, is a major concern for truck drivers. According to majority of the respondents, the current scenario of the safety on highways is substandard. The current safety conditions has been rated as “bad” by close to 6 out of 10 drivers (57.8%). A large proportion of these truck drivers belong to Delhi (82%), Ahmedabad (80%), Mumbai (65%), and Jaipur (65%).
The reasons for driver dissatisfaction with safety
standards on the highways are:
a) The condition of highways/ roads is not satisfactory.b) Authorities exploit them for extra money or bribes.c) Thefts and robberies are rampant in both transport hubs and highways. Vehicles cannot be left unattended, and thus drivers need to be present in vehicles all the time.d) There is always the risk of death/ injury.
This indicates that there is a need for drastic improvement in the safety standards of the roads.
Fig 4.2: Status of safety and security on highways
0 20 40 60 80 100 120
Vijayawada(N=122)
Kolkata(N=126)
Guwahati(N=121)
Kanpur(N=123)
Chennai(N=120)
Bangalore(N=120)
Mumbai(N=120)
Jaipur(N=123)
Ahmedabad(N=120)
Delhi-NCR (N=122)
Overall (N=1217) 57.8% 38.8% 3.5%
82.0% 18.0%
80.0% 20.0%
65.0% 26.8% 8.1%
65.0% 34.2% 0.8%
56.7% 40.8% 2.5%
50.8% 49.2%
50.4% 48.8% 0.8%
49.6% 42.1% 8.3%
46.8% 46.0% 7.1%
32.0% 61.5% 6.6% Good
Average
Bad
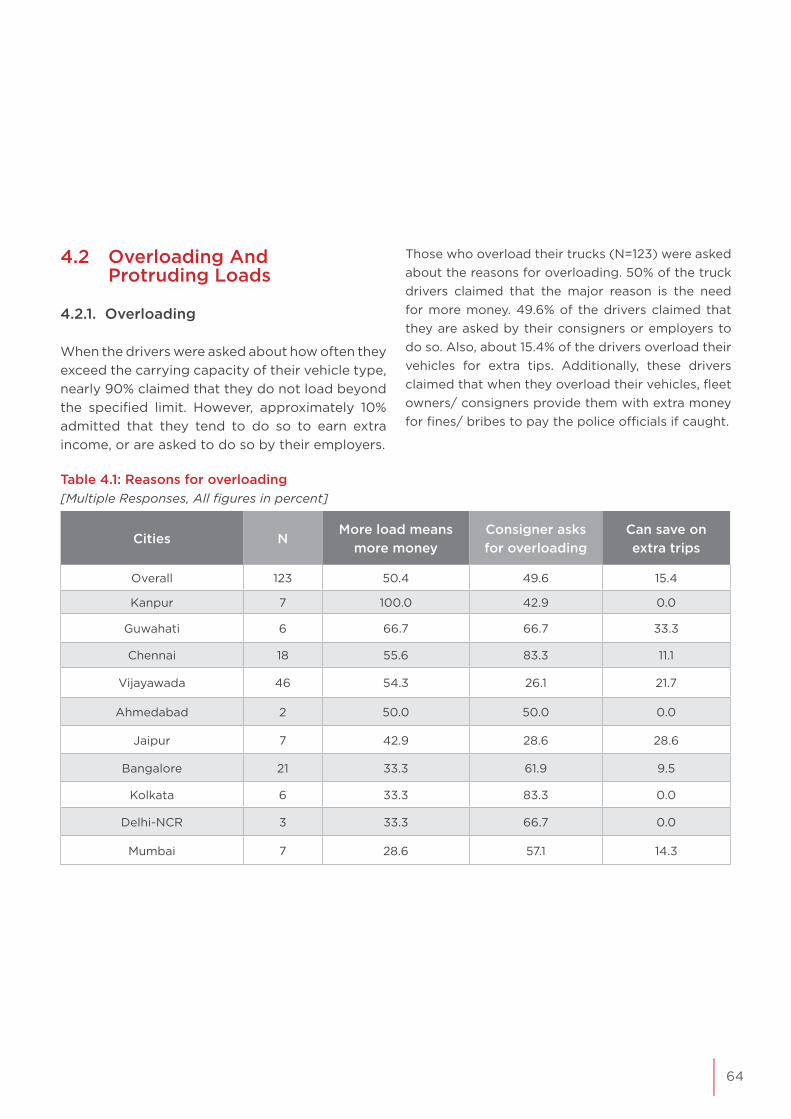
64
4.2 Overloading And Protruding Loads
4.2.1. Overloading
When the drivers were asked about how often they exceed the carrying capacity of their vehicle type, nearly 90% claimed that they do not load beyond the specified limit. However, approximately 10% admitted that they tend to do so to earn extra income, or are asked to do so by their employers.
Those who overload their trucks (N=123) were asked about the reasons for overloading. 50% of the truck drivers claimed that the major reason is the need for more money. 49.6% of the drivers claimed that they are asked by their consigners or employers to do so. Also, about 15.4% of the drivers overload their vehicles for extra tips. Additionally, these drivers claimed that when they overload their vehicles, fleet owners/ consigners provide them with extra money for fines/ bribes to pay the police officials if caught.
Table 4.1: Reasons for overloading[Multiple Responses, All figures in percent]
Cities NMore load means
more moneyConsigner asks for overloading
Can save on extra trips
Overall 123 50.4 49.6 15.4
Kanpur 7 100.0 42.9 0.0
Guwahati 6 66.7 66.7 33.3
Chennai 18 55.6 83.3 11.1
Vijayawada 46 54.3 26.1 21.7
Ahmedabad 2 50.0 50.0 0.0
Jaipur 7 42.9 28.6 28.6
Bangalore 21 33.3 61.9 9.5
Kolkata 6 33.3 83.3 0.0
Delhi-NCR 3 33.3 66.7 0.0
Mumbai 7 28.6 57.1 14.3

65 STUDY ON THE STATUS OF TRUCK DRIVERS IN INDIA
ENFORCEMENT AND OTHER ASPECTS
4
4.2.2. Awareness of the Ban on Carrying Protruding Items
In 2014, the Government banned the carrying of protruding loads on vehicles. 87% of the respondent truck drivers are aware of this ban. The awareness levels are particularly high in Jaipur, Ahmedabad, Vijayawada and Mumbai, where more than 90% of the drivers are aware of the ban. The awareness levels are the lowest in Guwahati followed by Bangalore, Chennai and Kolkata.
4.2.3. Trucks Carrying Hanging/ Protruding Items
As per the Central Motor Vehicle Rules, carrying hanging/protruding loads is not allowed in India. However, a significant number of the respondent truck drivers admitted that they still occasionally
carry protruding items. During the survey, truck drivers were asked whether they carry protruding items in their trucks. Almost 97% claimed they do not. A large proportion of truck drivers that admitted to carrying protruding items belonged to Kanpur, Chennai, Jaipur and Guwahati.
The drivers who claimed that they carry hanging/ protruding items in their vehicle (N=42) were further asked for related reasons. More than three fourth (76.2%) of them stated that they are asked by their employer or consigners to carry such items. One-third (35.7%) claimed that the load of the items to be delivered is larger than the vehicles’ capacity, thus resulting in the items protruding out. Few others have mentioned that they have never been stopped by police, and hence continue to carry such items. None of the drivers from Mumbai carried protruding items.
Table 4.2: Reasons for carrying hanging/protruding items[Multiple Responses, All figures in percentage]
Cities NConsigner
asks me to do soLoad exceeds
vehicle capacityI have never beenstopped by Police
Do not seethe problem in
doing so
Overall 42 76.2 35.7 14.3 2.4
Delhi-NCR 2 100 0.0 0.0 0.0
Jaipur 4 100 0.0 0.0 0.0
Ahmedabad 2 100 0.0 0.0 0.0
Kolkata 1 100 0.0 0.0 0.0
Bangalore 1 100 0.0 0.0 0.0
Kanpur 18 77.8 38.9 16.7 5.6
Guwahati 4 75.0 100.0 50.0 0.0
Chennai 7 57.1 28.6 14.3 0.0
Vijayawada 3 33.3 66.7 0.0 0.0

66
Fig 4.3: Caught by enforcement authorities for carrying hanging/protruding items
Table 4.3: Manner of dealing with authorities when caught for protruding items[All figures in percentage, Open ended]
Cities NPaid challan for load protusion
Paidbribe for load
protusion
I have not beenstopped by
Police
Overall 33 51.5 48.5 0.0
Delhi-NCR 2 100.0 0.0 0.0
Jaipur 4 50.0 50.0 0.0
Kanpur 17 58.8 41.2 0.0
Chennai 3 66.7 33.3 0.0
Guwahati 4 25.0 75.0 0.0
Vijayawada 3 0.0 100.0 0.0
Those who admitted to carrying protruding items (N=42), were also asked whether they have been caught by enforcement authorities. About 79% of the drivers confirmed that they have been caught.
When the drivers were asked about how they deal with a situation where they are caught (N=33), about 52% of the drivers claimed that they pay the challan for overloading while 49% of the drivers claimed that they pay a bribe to the Police.
0 20 40 60 80 100
Bangalore (N=1)
Kolkata (N=1)
Ahmedabad (N=2)
Chennai (N=7)
Kanpur (N=18)
Vijayawada (N=3)
Guwahati (N=4)
Jaipur (N=4)
Delhi-NCR (N=2)
Overall (N=42) 78.6% 21.4%
100.0%
100.0%
100.0%
100.0%
94.4% 5.6%
42.9% 57.1%
100.0%
100.0%
100.0% No
Yes
67 STUDY ON THE STATUS OF TRUCK DRIVERS IN INDIA
ENFORCEMENT AND OTHER ASPECTS
4
4.3 Truck Drivers’ Interaction With Authorities During Trip
The following section records the responses of the truck drivers on their encounters with highway authorities. The drivers were asked about the various authorities that they encounter during trips. Close to 9 out of 10 (87.8%) drivers stated that they have to deal with the traffic or highway police on highways. Similarly, close to two-thirds (65.2%) of truck drivers claimed that they deal with RTO officials on highways. About one-fifth (22.4%) claimed that they encounter local groups while 15.2% of the drivers claimed that they encounter tax officials.
Majority of the truck drivers claimed that they need to deal with the traffic police most often. However, the respondents from Bangalore and Vijayawada stated that they need to deal with RTO officials more often than with traffic police.
4.3.1. Stopped/ Challaned By Police/RTO During The Trip
The respondent truck drivers were asked whether they have been stopped or challaned by the Police or the RTO officials during trips. Almost 58% stated that they have. Majority of such truck drivers were from Guwahati, Ahmedabad, Vijayawada, Delhi-NCR, Bangalore and Chennai, where more than half of the respondents were stopped/ challaned by Police/RTO.
Those truck drivers who claimed that they were stopped/challaned by Police/RTO (N=710) were also asked about the reasons for getting challaned. About 19% of the drivers stated that they are stopped without a mention of any reason by the officials. Further, 17% claimed that they are stopped/challaned because they do not carry the essential documents such as driving license, registration certificate or vehicle insurance, 14% claimed that they are stopped/challaned for overloading, 12% claimed that they are stopped/challaned for over speeding etc.

68
Table 4.4.: Reasons for being stopped/challaned by police/RTO[N=710, All figures in percentage]
Stopped/ challaned by Police/ RTOO
vera
ll
Del
hi
Jaip
ur
Kan
pur
Ahm
edab
ad
Che
nnai
Guw
ahat
i
Ko
lkat
a
Ban
gal
ore
Mum
bai
Vija
yaw
ada
N 710 80 49 57 99 65 100 57 76 39 88
No reason mentioned 19.4 8.8 28.6 5.3 25.3 29.2 52.0 22.8 6.6 - -
No documents (DL/ RC/ Vehicle
Insurance etc.)17.2 7.5 6.1 1.8 - 12.3 3.0 33.3 55.3 - 45.5
Overloading 13.9 15.0 2.0 15.8 6.1 1.5 9.0 12.3 32.9 15.4 26.1
Over-speeding 12.0 16.3 4.1 8.8 3.0 12.3 16.0 3.5 3.9 64.1 9.1
Not wearing seatbelt (driver) 9.6 38.8 14.3 - 25.3 - 3.0 1.8 - - 1.1
Wrong parking 9.3 7.5 10.2 7.0 7.1 13.8 8.0 22.8 2.6 20.5 4.5
Stopped but not challaned 7.9 - 2.0 26.3 9.1 21.5 - 5.3 2.6 2.6 12.5
For no Entry 6.1 6.3 14.3 17.5 21.2 - - - 1.3 - -
Drunk driving 3.5 2.5 - 8.8 1.0 - 3.0 3.5 2.6 2.6 10.2
Improper turn / Lane changing 2.7 - 4.1 1.8 - 6.2 5.0 3.5 - 12.8 -
Using mobile phone while driving 2.7 1.3 - 5.3 2.0 3.1 2.0 10.5 2.6 - 1.1
For not wearing uniform 2.0 12.5 4.1 1.8 - - - - 1.3 - -
Driving in the wrong lane 1.8 1.3 1.8 7.1 1.5 1.0 - 1.3 - 1.1
Violating traffic rules (red light jump, high beam light, honking, etc.)
1.5 - 14.3 1.8 - - - - 2.6 2.6 -
Co-Driver was not present 1.1 3.8 6.1 1.8 - - - - 1.3 - -
Others 1.8 3.8 - - 1.0 4.6 - 3.5 5.2 - -

69 STUDY ON THE STATUS OF TRUCK DRIVERS IN INDIA
ENFORCEMENT AND OTHER ASPECTS
4
4.4 Driving License Status and Related Aspects
All truck drivers were asked whether they have undergone any driving test before procuring their licenses. Overall, about 37% of truck drivers admitted that they have not taken any tests before procuring a license.
In a city wise analysis, a huge proportion of truck drivers from Guwahati (88%) confirmed that they did not take any tests before procuring their driving licenses followed by the drivers from Vijayawada (71%), Kanpur (67%), Delhi-NCR (49%) respectively.
On the other hand, more than 9 out of 10 truck
Fig 4.4: Undergone driving test before procuring license
0 20 40 60 80 100Guwahati (N=121)
Vijayawada (N=122)
Kanpur (N=123)
Delhi-NCR (N=122)
Kolkata (N=126)
Bangalore (N=120)
Jaipur (N=123)
Ahmedabad (N=120)
Chennai (N=120)
Mumbai (N=120)
Overall (N=1217) 62.5% 37.5%
99.2% 0.8%
98.3% 1.7%
96.7% 3.3%
87.8% 12.2%
62.5% 37.5%
57.1% 42.9%
50.8% 49.2%
33.3% 66.7%
28.7% 71.3%
12.4% 87.6% No
Yes
drivers of Mumbai (99.2%), Chennai (98.3%), and Ahmedabad (96.7%) have taken a test before procuring their driving license.
Additionally, a little above one-third of the truck drivers (37%) confirmed that they have undergone medical fitness tests before the issuance of a driver’s license.
In a city wise analysis, this proportion is relatively higher for Ahmedabad, Vijayawada, Bangalore, Chennai, Delhi-NCR, where more than 8 out of 10 truck drivers have undergone medical fitness tests. On the contrary, this proportion is low in cities like Mumbai, Kanpur, Guwahati and Kolkata.
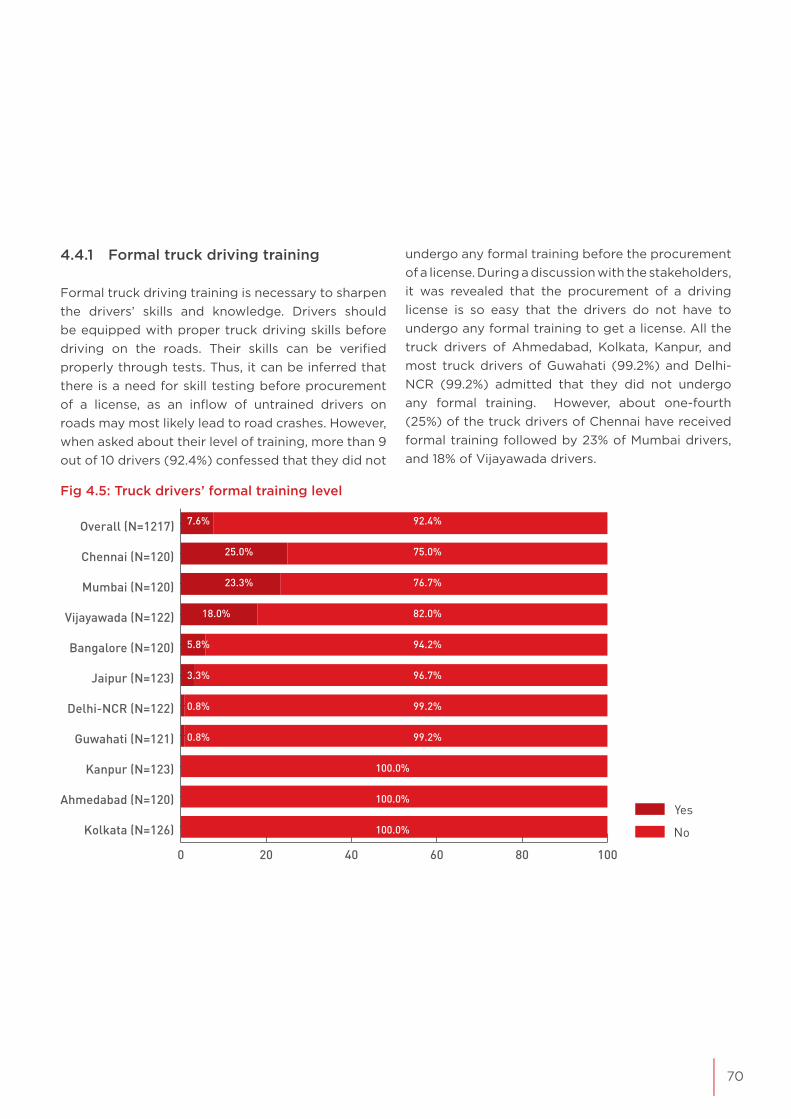
70
Fig 4.5: Truck drivers’ formal training level
4.4.1 Formal truck driving training
Formal truck driving training is necessary to sharpen the drivers’ skills and knowledge. Drivers should be equipped with proper truck driving skills before driving on the roads. Their skills can be verified properly through tests. Thus, it can be inferred that there is a need for skill testing before procurement of a license, as an inflow of untrained drivers on roads may most likely lead to road crashes. However, when asked about their level of training, more than 9 out of 10 drivers (92.4%) confessed that they did not
0 20 40 60 80 100
Kolkata (N=126)
Ahmedabad (N=120)
Kanpur (N=123)
Guwahati (N=121)
Delhi-NCR (N=122)
Jaipur (N=123)
Bangalore (N=120)
Vijayawada (N=122)
Mumbai (N=120)
Chennai (N=120)
Overall (N=1217) 7.6% 92.4%
25.0% 75.0%
23.3% 76.7%
18.0% 82.0%
5.8% 94.2%
3.3% 96.7%
0.8% 99.2%
0.8% 99.2%
100.0%
100.0%
100.0% No
Yes
undergo any formal training before the procurement of a license. During a discussion with the stakeholders, it was revealed that the procurement of a driving license is so easy that the drivers do not have to undergo any formal training to get a license. All the truck drivers of Ahmedabad, Kolkata, Kanpur, and most truck drivers of Guwahati (99.2%) and Delhi-NCR (99.2%) admitted that they did not undergo any formal training. However, about one-fourth (25%) of the truck drivers of Chennai have received formal training followed by 23% of Mumbai drivers, and 18% of Vijayawada drivers.

71 STUDY ON THE STATUS OF TRUCK DRIVERS IN INDIA
ENFORCEMENT AND OTHER ASPECTS
4
Table 4.5: Awareness of MVA Act 2019 (Fleet owners)
4.5. Awareness of MVA Act 2019
4.5.1. Awareness of the Minimum Education Qualification Clause:
The new Motor Vehicles (Amendment) Act 2019 has omitted the Minimum Education Qualification Clause.
The respondent truck drivers were asked if they are aware of this development. Interestingly, a relatively higher proportion of drivers in southern cities i.e. Chennai (92.5%), Vijayawada (91%), and Bangalore (89.2%), and western cities i.e. Mumbai (99.2%), Ahmedabad (80.0%) and Jaipur (80.5%) are aware of the same.
It was also found that the drivers who generally drive alone are less aware (61%) of the clause compared to those who travel with a co-driver (65%) as well as
those who travel with a helper (76%). Similarly, it is observed that an increase in education qualification of the drivers leads to an increase in the awareness levels.
When the drivers were asked whether they support the abolition of the minimum education qualification clause under the Motor Vehicles (Amendment) Act 2019, about three-fourth (74.4%) of the drivers claimed that they support the move.
4.5.2. Awareness of MVA Act 2019 among Fleet Owners
The provisions of the new Motor Vehicles (Amendment) Act, 2019 came into effect from September 1, 2019. The fleet owners were asked whether they are aware of this Act. About 94% claimed that they are aware of it, while nearly 6% claimed that they are not.
Category N Yes No
Fleet owners 101 94.1% 5.9%

72
4.6 FLEET OWNERS: OTHER ASPECTS
4.6.1 Top Regulations Which Impact Trucking Business
The fleet owners were asked an open-ended question about the regulations or practices that impact the business directly or indirectly. Nearly 53% of the fleet owners said that loading restrictions hamper their revenue, about 46% said that corrupt practices affect their business, and 34.7% claimed that the large number of checkpoints are a hindrance to their business.
The majority of fleet owners across cities have mentioned that due to loading restrictions they have to assign additional trucks for extra goods or sometimes lose out on consignments, which is a loss to them.
Other regulations that impact trucking business mentioned by fleet owners were banning of 10 year old trucks (32%), shortage of manpower (26%), financing/ loans for purchasing trucks (15%), and the no entry window for crossing the cities (15%).
Fig 4.6: Top regulations that impact trucking business
0 10 20 30 40 50 60
Others
Emission norms
High toll rates
Implementationof GST
No entry window forcrossing/entering in city
Financing/loans forpurchasing trucks
Shortage of manpower(drivers/assistant/khalasi)
Ban on 10-year-old trucks
Large number of police check points
Corruption byauthorities/police
Over-loading restrictions 52.5%
45.5%
34.7%
31.7%
25.7%
14.9%
14.9%
5.9%
4.0%
3.0%
6.0%
[N=101, Open ended]

73 STUDY ON THE STATUS OF TRUCK DRIVERS IN INDIA
ENFORCEMENT AND OTHER ASPECTS
4
Further, fleet owners were asked for their suggestions to overcome challenges related to regulations that impact the trucking business.
Overall, over one-third of the fleet owners suggested
Fig 4.7: Suggestions to overcome regulations which impact trucking business[Open ended, N=101]
0 5 10 15 20 25 30 35 40
DK/CS
Others
Online system
Social security benefits should beprovided to the truck drivers
Increase wages/ trip rate of the drivers
The loan should be available at lowinterest rate for truck purchase
Relaxation on out dated vehicle
Trucks should be given relaxationfor diesel price and toll taxes
good quality roads should be constructed
Relaxation in overloading restrictions
CCTV cameras should be there at every tollbooth to check corruption
Check points on highways should be reduced
GST rate should be reduced
Fines should be charged fromthe corrupt police officers
37.6%
11.9%
10.9%
9.9%
8.9%
7.9%
7.9%
6.9%
5.9%
4.0%
2.0%
2.0%
5.0%
11.9%
imposing fines on corrupt officials. About 12% mentioned reducing the GST rate for the trucking business, and about 11% suggested that the number of checkpoints on highways should be reduced.

74
[Open ended, N=101]
4.6.2 Fleet equipped with Technologies
In recent days, trucks are equipped with various modern technologies, and high-tech equipment for smooth operation and monitoring. The fleet owners were asked whether their trucks had such technologies.
Overall, 67.3% of the fleet owners confirmed that their trucks are equipped with GPS, about 35% confirmed that their trucks had Fast tags and RFIDs, and 29.7% claimed that their trucks had a fleet/fuel card. As trips require truck drivers to travel for long hours or days, the technology advancement in trucks is beneficial for them, as well as for the fleet owners to keep track of everything.
All fleet owners of Delhi-NCR confirmed that their trucks are equipped with GPS followed by Jaipur (90%), Bangalore and Mumbai (80% each). About 90% of the fleet owners of Delhi-NCR said that their fleets are equipped with E-tags and RFIDs. All fleet owners in Guwahati stated that they have fuel cards in their trucks.
Table 4.6: Fleet equipped with technologies
Category N GPSE-tags - Fast
Tag, RFIDFleet/ fuel
cardDK/CS None
Fleet owners 101 67.3 34.7 29.7 6.9 4.0
Fast tags and tech used in trucks

75 STUDY ON THE STATUS OF TRUCK DRIVERS IN INDIA
ENFORCEMENT AND OTHER ASPECTS
4
4.6.3 Crash Cases of Trucks in Last 3 Years (Fleet Owners)
The fleet owners were asked about the frequency of crashes in their fleet in last 3 years.
Almost, one fourth of the fleet owners said that there has not been any crash involving their fleet in past 3 years, whereas, three-fourth of the fleet owners confirmed that their trucks were involved in crashes. Over 60% said that the crashes occurred 1-3 times in the last 3 years, and only about 7% said that crashes occurred 4-6 times (7%) in the last 3 years.
According to the fleet owners, there has been a decrease in frequency of crashes in last decade due to dedicated lanes for trucks on highways, improved infrastructure and implementation of modern technologies in trucks such as power steering (hydraulic system) and power brakes (air brakes).
Further, fleet owners who have confirmed (N=75) that their trucks were involved in crashes were asked about the issues or problems that they faced after crashes. About 60% of them said that they were harassed by the police authorities or RTO officials. Further, 28% of the fleet owners said that the major problem that they faced was the late delivery of consignments, where they had to bear a pay cut from the payment.
Fig 4.8: Involvement of trucks in crashes in last 3 years
Fig 4.9: Problems faced by fleet owners in crashes involving their fleet.
[N=101]
[N=75, Open ended]
0 10 20 30 40 50 60 70 80
7-10 times
More than 10 times
4-6 times
1-3 times
None 25.7%
60.4%
6.9%
5.0%
2.0%
0 10 20 30 40 50 60
DK/CS
Drivers run away after crashand leave the truck on spot
Parking of truckafter crash
Local people thrash driverand vehicle both
Getting insurance claimagainst repairing of vehicle
Police investigate, arrestdriver and seize vehicle
Delay in delivery of consignment
Harassment by police/ RTO;they do not file an FIR 60.0%
28.0%
20.0%
12.0%
8.0%
2.7%
1.3%
1.3%
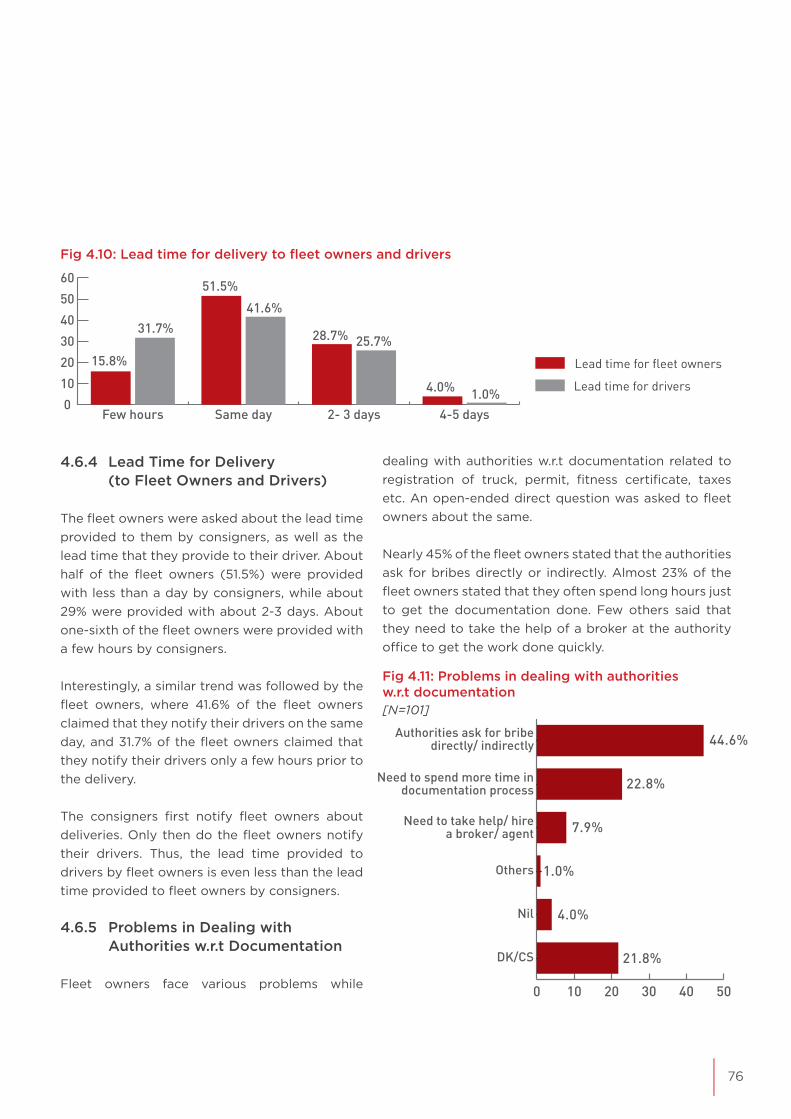
76
4.6.4 Lead Time for Delivery (to Fleet Owners and Drivers)
The fleet owners were asked about the lead time provided to them by consigners, as well as the lead time that they provide to their driver. About half of the fleet owners (51.5%) were provided with less than a day by consigners, while about 29% were provided with about 2-3 days. About one-sixth of the fleet owners were provided with a few hours by consigners.
Interestingly, a similar trend was followed by the fleet owners, where 41.6% of the fleet owners claimed that they notify their drivers on the same day, and 31.7% of the fleet owners claimed that they notify their drivers only a few hours prior to the delivery. The consigners first notify fleet owners about deliveries. Only then do the fleet owners notify their drivers. Thus, the lead time provided to drivers by fleet owners is even less than the lead time provided to fleet owners by consigners.
4.6.5 Problems in Dealing with Authorities w.r.t Documentation
Fleet owners face various problems while
Fig 4.10: Lead time for delivery to fleet owners and drivers
Fig 4.11: Problems in dealing with authorities w.r.t documentation
dealing with authorities w.r.t documentation related to registration of truck, permit, fitness certificate, taxes etc. An open-ended direct question was asked to fleet owners about the same.
Nearly 45% of the fleet owners stated that the authorities ask for bribes directly or indirectly. Almost 23% of the fleet owners stated that they often spend long hours just to get the documentation done. Few others said that they need to take the help of a broker at the authority office to get the work done quickly.
0
10
20
30
40
50
60
4-5 days2- 3 daysSame dayFew hours
15.8%
51.5%
28.7% 25.7%
4.0% 1.0%
41.6%31.7%
Lead time for drivers
Lead time for fleet owners
0 10 20 30 40 50
DK/CS
Nil
Others
Need to take help/ hirea broker/ agent
Need to spend more time indocumentation process
Authorities ask for bribedirectly/ indirectly 44.6%
22.8%
7.9%
1.0%
4.0%
21.8%
[N=101]
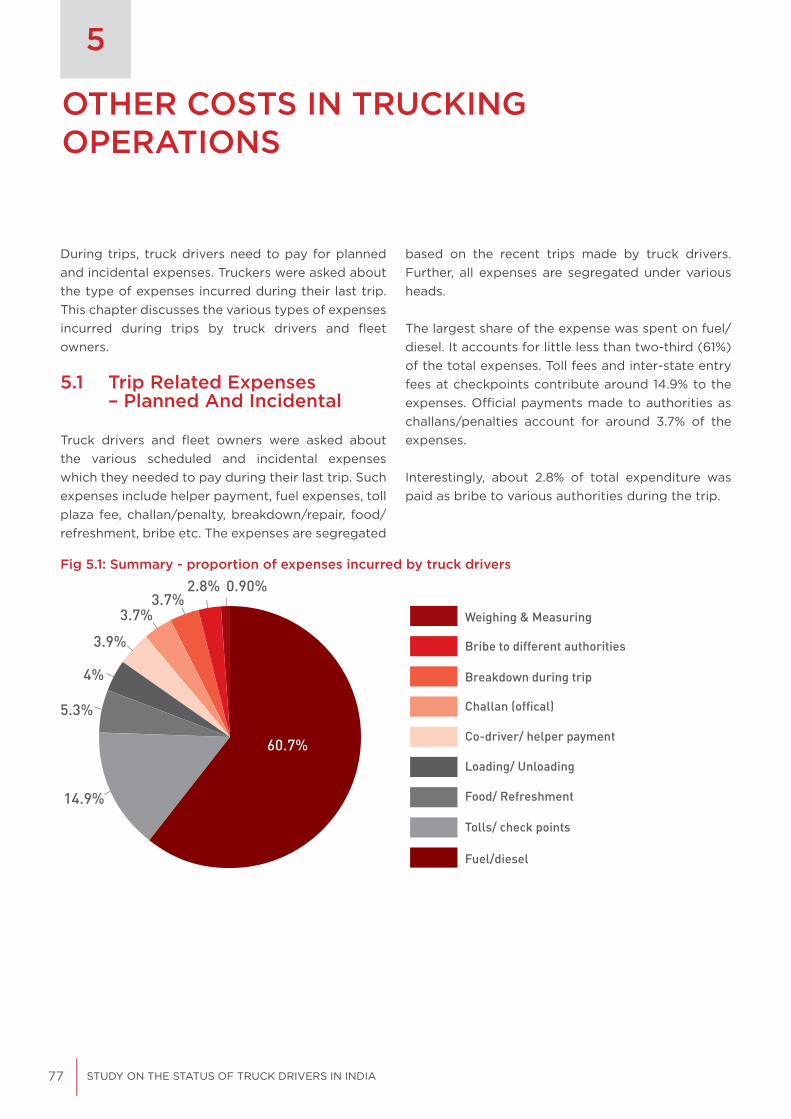
77 STUDY ON THE STATUS OF TRUCK DRIVERS IN INDIA
OTHER COSTS IN TRUCKING OPERATIONS
5
During trips, truck drivers need to pay for planned and incidental expenses. Truckers were asked about the type of expenses incurred during their last trip. This chapter discusses the various types of expenses incurred during trips by truck drivers and fleet owners.
5.1 Trip Related Expenses – Planned And Incidental
Truck drivers and fleet owners were asked about the various scheduled and incidental expenses which they needed to pay during their last trip. Such expenses include helper payment, fuel expenses, toll plaza fee, challan/penalty, breakdown/repair, food/ refreshment, bribe etc. The expenses are segregated
Fig 5.1: Summary - proportion of expenses incurred by truck drivers
Weighing & Measuring
Bribe to different authorities
Breakdown during trip
Challan (offical)
Co-driver/ helper payment
Loading/ Unloading
Food/ Refreshment
Tolls/ check points
Fuel/diesel
0.90%
60.7%
14.9%
5.3%
4%
3.9%
3.7%3.7%
2.8%
based on the recent trips made by truck drivers. Further, all expenses are segregated under various heads.
The largest share of the expense was spent on fuel/ diesel. It accounts for little less than two-third (61%) of the total expenses. Toll fees and inter-state entry fees at checkpoints contribute around 14.9% to the expenses. Official payments made to authorities as challans/penalties account for around 3.7% of the expenses.
Interestingly, about 2.8% of total expenditure was paid as bribe to various authorities during the trip.

78
Table 5.1: Trip related expenses - truck drivers and fleet owners
Expense Type
Truck driver Fleet owners
Avg. expense (Rs.)
Proportion of expenses
Avg. expense (Rs.)
Proportion of expenses
Overall 44791 100% 45040 100%
Fuel/ diesel 27172 60.7% 27297 60.6%
Tolls/ check points 6681 14.9% 6978 15.5%
Food/ refreshment 2382 5.3% 1936 4.3%
Loading/ Unloading 1803 4.0% 1336 3.0%
Co-driver/helper payment 1762 3.9% 2557 5.7%
Challan by police (official) 1669 3.7% 1150 2.6%
Breakdown during trip 1649 3.7% 791 1.8%
Bribe to different authorities 1257 2.8% 1280 2.8%
Weighing & measuring 416 0.9% 431 1.0%
Broker’s commission 0 0.0% 1284 2.9%

79 STUDY ON THE STATUS OF TRUCK DRIVERS IN INDIA
OTHER COSTS IN TRUCKING OPERATIONS
5
Based on segregation of expenses, it was found that each truck driver has spent about Rs.44,791 on about 1751 km and 6.8 days long round trip. This means that the per kilometre operating cost of each truck is about Rs. 25.58. To put things in perspective, the operating cost of each truck per km was Rs.10.75 in 2006-07.
Similarly, as per the reported expenses by fleet owners, total expense for each trip of average length 1666 km and duration of 6 days was Rs.45,040. Again, the largest share of the expense was spent on fuel/diesel i.e. less than two-third (60.6%) of the total expenses. Toll fees and inter-state entry fees at checkpoints account for around 15.5% of the expenses. Official payments made to authorities as challans/penalties make around 2.6% of the expenses.
Fig 5.2: Summary - proportion of expenses incurred by fleet owners
2.9%1%2.8%1.8%
2.6%
5.7%
3%
4.3%
15.5%
Broker's commission
Weighing & Measuring
Bribe to different authorities
Breakdown during trip
Challan (offical)
Co-driver/ helper payment
Loading/ Unloading
Food/ Refreshment
Tolls/ check points
Fuel/diesel
60.6%
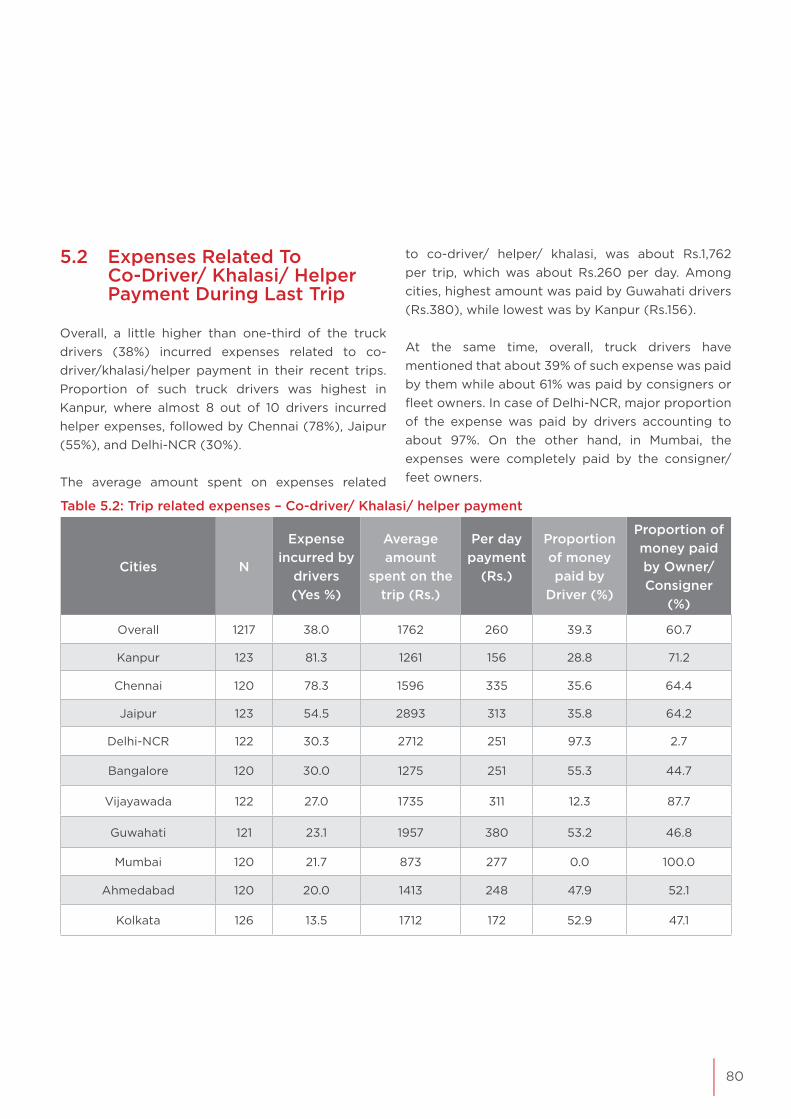
80
5.2 Expenses Related To Co-Driver/ Khalasi/ Helper Payment During Last Trip
Overall, a little higher than one-third of the truck drivers (38%) incurred expenses related to co-driver/khalasi/helper payment in their recent trips. Proportion of such truck drivers was highest in Kanpur, where almost 8 out of 10 drivers incurred helper expenses, followed by Chennai (78%), Jaipur (55%), and Delhi-NCR (30%).
The average amount spent on expenses related
to co-driver/ helper/ khalasi, was about Rs.1,762 per trip, which was about Rs.260 per day. Among cities, highest amount was paid by Guwahati drivers (Rs.380), while lowest was by Kanpur (Rs.156).
At the same time, overall, truck drivers have mentioned that about 39% of such expense was paid by them while about 61% was paid by consigners or fleet owners. In case of Delhi-NCR, major proportion of the expense was paid by drivers accounting to about 97%. On the other hand, in Mumbai, the expenses were completely paid by the consigner/ feet owners.
Table 5.2: Trip related expenses – Co-driver/ Khalasi/ helper payment
Cities N
Expense incurred by
drivers(Yes %)
Average amount
spent on the trip (Rs.)
Per day payment
(Rs.)
Proportion of money paid by
Driver (%)
Proportion of money paid by Owner/ Consigner
(%)
Overall 1217 38.0 1762 260 39.3 60.7
Kanpur 123 81.3 1261 156 28.8 71.2
Chennai 120 78.3 1596 335 35.6 64.4
Jaipur 123 54.5 2893 313 35.8 64.2
Delhi-NCR 122 30.3 2712 251 97.3 2.7
Bangalore 120 30.0 1275 251 55.3 44.7
Vijayawada 122 27.0 1735 311 12.3 87.7
Guwahati 121 23.1 1957 380 53.2 46.8
Mumbai 120 21.7 873 277 0.0 100.0
Ahmedabad 120 20.0 1413 248 47.9 52.1
Kolkata 126 13.5 1712 172 52.9 47.1
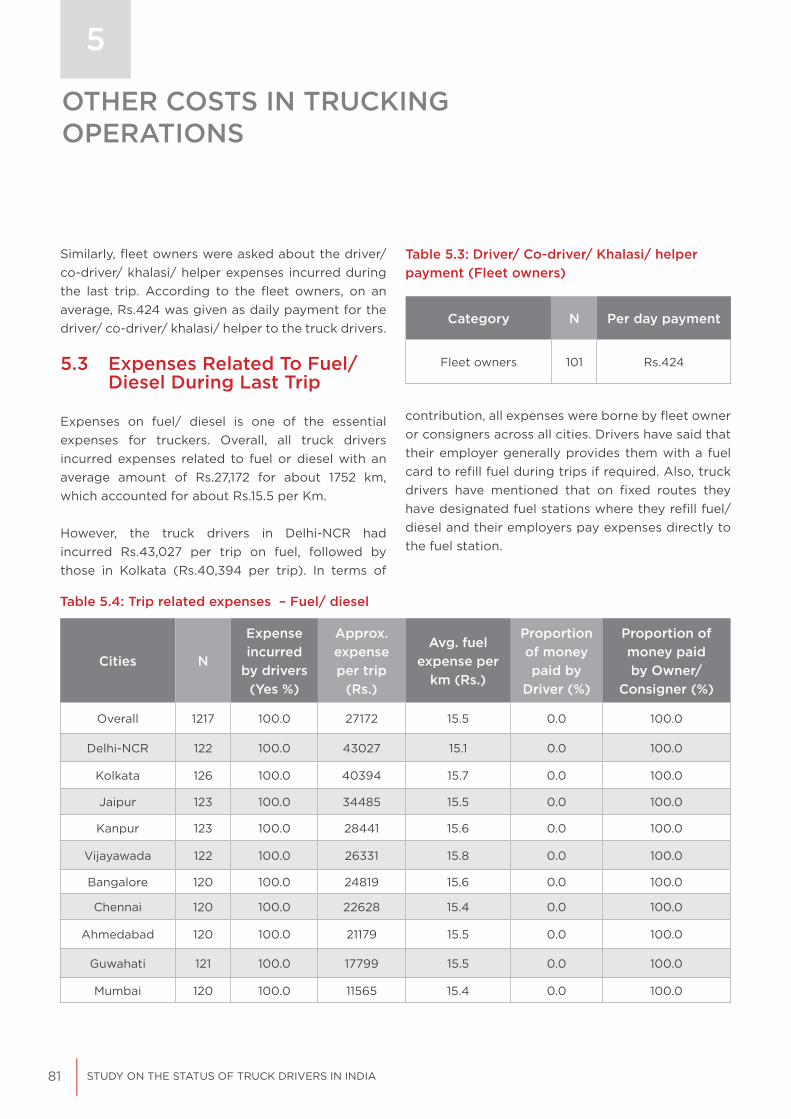
81 STUDY ON THE STATUS OF TRUCK DRIVERS IN INDIA
5
Similarly, fleet owners were asked about the driver/ co-driver/ khalasi/ helper expenses incurred during the last trip. According to the fleet owners, on an average, Rs.424 was given as daily payment for the driver/ co-driver/ khalasi/ helper to the truck drivers.
5.3 Expenses Related To Fuel/ Diesel During Last Trip
Expenses on fuel/ diesel is one of the essential expenses for truckers. Overall, all truck drivers incurred expenses related to fuel or diesel with an average amount of Rs.27,172 for about 1752 km, which accounted for about Rs.15.5 per Km.
However, the truck drivers in Delhi-NCR had incurred Rs.43,027 per trip on fuel, followed by those in Kolkata (Rs.40,394 per trip). In terms of
Category N Per day payment
Fleet owners 101 Rs.424
Table 5.3: Driver/ Co-driver/ Khalasi/ helper payment (Fleet owners)
Cities N
Expense incurred
by drivers (Yes %)
Approx. expense per trip
(Rs.)
Avg. fuel expense per
km (Rs.)
Proportion of money paid by
Driver (%)
Proportion of money paid by Owner/
Consigner (%)
Overall 1217 100.0 27172 15.5 0.0 100.0
Delhi-NCR 122 100.0 43027 15.1 0.0 100.0
Kolkata 126 100.0 40394 15.7 0.0 100.0
Jaipur 123 100.0 34485 15.5 0.0 100.0
Kanpur 123 100.0 28441 15.6 0.0 100.0
Vijayawada 122 100.0 26331 15.8 0.0 100.0
Bangalore 120 100.0 24819 15.6 0.0 100.0
Chennai 120 100.0 22628 15.4 0.0 100.0
Ahmedabad 120 100.0 21179 15.5 0.0 100.0
Guwahati 121 100.0 17799 15.5 0.0 100.0
Mumbai 120 100.0 11565 15.4 0.0 100.0
Table 5.4: Trip related expenses – Fuel/ diesel
contribution, all expenses were borne by fleet owner or consigners across all cities. Drivers have said that their employer generally provides them with a fuel card to refill fuel during trips if required. Also, truck drivers have mentioned that on fixed routes they have designated fuel stations where they refill fuel/ diesel and their employers pay expenses directly to the fuel station.
OTHER COSTS IN TRUCKING OPERATIONS
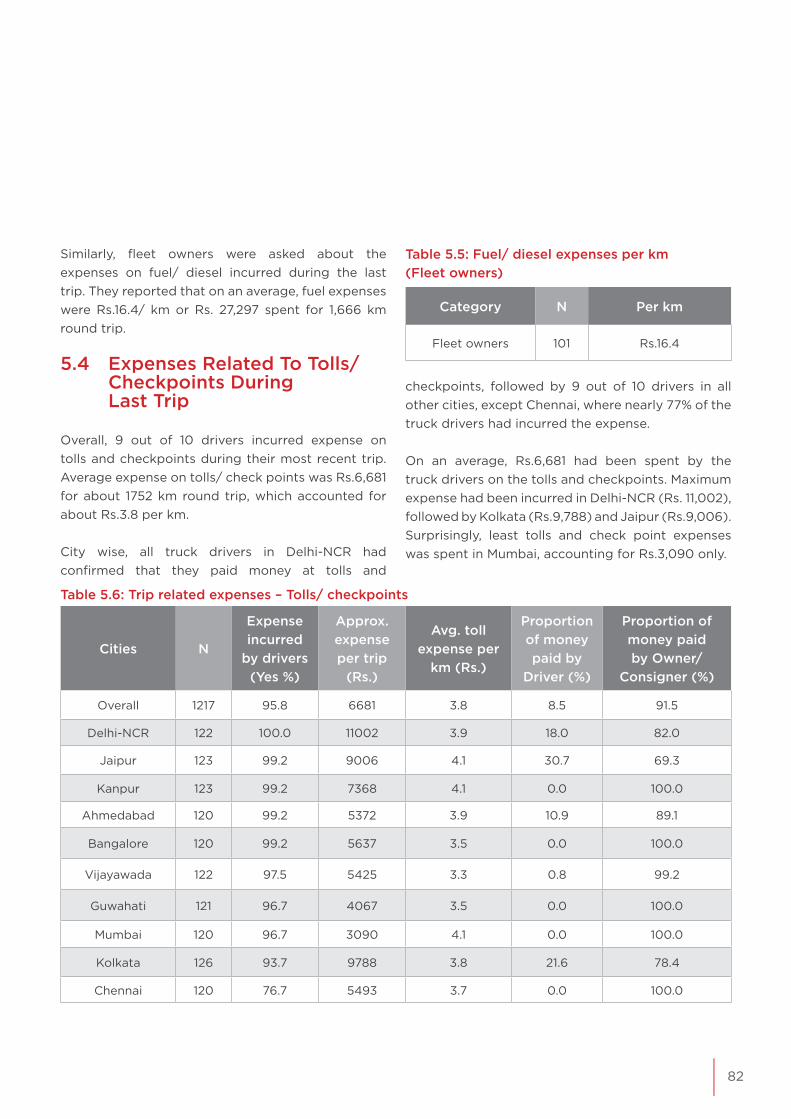
82
Category N Per km
Fleet owners 101 Rs.16.4
Cities N
Expense incurred
by drivers (Yes %)
Approx. expense per trip
(Rs.)
Avg. toll expense per
km (Rs.)
Proportion of money paid by
Driver (%)
Proportion of money paid by Owner/
Consigner (%)
Overall 1217 95.8 6681 3.8 8.5 91.5
Delhi-NCR 122 100.0 11002 3.9 18.0 82.0
Jaipur 123 99.2 9006 4.1 30.7 69.3
Kanpur 123 99.2 7368 4.1 0.0 100.0
Ahmedabad 120 99.2 5372 3.9 10.9 89.1
Bangalore 120 99.2 5637 3.5 0.0 100.0
Vijayawada 122 97.5 5425 3.3 0.8 99.2
Guwahati 121 96.7 4067 3.5 0.0 100.0
Mumbai 120 96.7 3090 4.1 0.0 100.0
Kolkata 126 93.7 9788 3.8 21.6 78.4
Chennai 120 76.7 5493 3.7 0.0 100.0
Table 5.6: Trip related expenses – Tolls/ checkpoints
Similarly, fleet owners were asked about the expenses on fuel/ diesel incurred during the last trip. They reported that on an average, fuel expenses were Rs.16.4/ km or Rs. 27,297 spent for 1,666 km round trip.
5.4 Expenses Related To Tolls/ Checkpoints During Last Trip
Overall, 9 out of 10 drivers incurred expense on tolls and checkpoints during their most recent trip. Average expense on tolls/ check points was Rs.6,681 for about 1752 km round trip, which accounted for about Rs.3.8 per km.
City wise, all truck drivers in Delhi-NCR had confirmed that they paid money at tolls and
Table 5.5: Fuel/ diesel expenses per km (Fleet owners)
checkpoints, followed by 9 out of 10 drivers in all other cities, except Chennai, where nearly 77% of the truck drivers had incurred the expense.
On an average, Rs.6,681 had been spent by the truck drivers on the tolls and checkpoints. Maximum expense had been incurred in Delhi-NCR (Rs. 11,002), followed by Kolkata (Rs.9,788) and Jaipur (Rs.9,006). Surprisingly, least tolls and check point expenses was spent in Mumbai, accounting for Rs.3,090 only.

83 STUDY ON THE STATUS OF TRUCK DRIVERS IN INDIA
5
Similarly, fleet owners were asked about the expenses on toll gates/ checkpoints that they pay to their truck drivers. According to them, the average expense on toll gate/checkpoints was Rs.4/km or Rs. 6,978 for a 1,666 km round trip.
5.5 Expenses Related To Loading/ Unloading During Last Trip
83.5% of the drivers incurred an out of pocket expense for loading and unloading of goods. At least, 9 out of 10 drivers incurred the expense in Bangalore, Jaipur, Vijayawada, Kolkata and Ahmedabad. Only 35% truck drivers in Mumbai had spent on loading and unloading of goods.
Overall, approx. Rs.1,803 was spent on loading and
Category N Per km
Fleet owners 101 Rs.16.4
Table 5.7: Toll gate/checkpoints expenses per km (Fleet owners)
Cities NExpense
incurred by drivers (Yes %)
Approx. expense per
trip (Rs.)
Proportion of money paid by
Driver (%)
Proportion of money paid by Owner/
Consigner (%)
Overall 1217 83.5 1803 13.6 86.4
Bangalore 120 96.7 1578 0.9 99.1
Jaipur 123 95.9 2557 61.9 38.1
Vijayawada 122 95.9 2476 0.0 100.0
Kolkata 126 95.2 1826 21.7 78.3
Ahmedabad 120 94.2 1758 4.0 96.0
Kanpur 123 86.2 1762 0.9 99.1
Chennai 120 85.0 1360 13.2 86.8
Delhi-NCR 122 75.4 1233 19.6 80.4
Guwahati 121 74.4 1725 1.1 98.9
Mumbai 120 35.0 1071 0.0 100.0
Table 5.8: Trip related expenses – Loading/unloading
unloading of goods. Such expenses were maximum in Jaipur (Rs.2,557) and Vijayawada (Rs.2,476).
Almost 14% of money was paid by drivers on loading and unloading of goods, and the rest was paid by fleet owners or consigners. The major proportion (61.9%) of the loading/unloading expense was paid by truck drivers in Jaipur, whereas in Vijayawada and Mumbai, all expense was paid by the fleet owners or consigners.
OTHER COSTS IN TRUCKING OPERATIONS

84
Category N Per round trip
Fleet owners 101 Rs.1,336
Table 5.9: Loading/unloading expenses (Fleet owners)
Cities NExpense
incurred by drivers (Yes %)
Approx. expense per
trip (Rs.)
Proportion of money paid by
Driver (%)
Proportion of money paid by Owner/ Consigner (%)
Overall 1217 39.3 1669 25.1 74.9
Chennai 120 70.0 717 21.4 78.6
Mumbai 120 60.8 1906 0.0 100.0
Kanpur 123 58.5 1813 0.3 99.7
Kolkata 126 46.8 1761 54.2 45.8
Delhi-NCR 122 46.7 1592 52.6 47.4
Guwahati 121 43.0 1524 1.9 98.1
Ahmedabad 120 32.5 1753 35.1 64.9
Jaipur 123 22.0 4281 77.8 22.2
Bangalore 120 8.3 810 30.0 70.0
Vijayawada 122 4.1 416 20.0 80.0
Table 5.10: Trip related expenses – Challan/penalty
Similarly, fleet owners were asked about the expenses incurred on loading/ unloading. According to them, on an average, loading/ unloading expenses were Rs.1336 per round trip.
5.6 Expenses Related To Challan/ Penalty By Police (Official) During Last Trip
Overall, about 4 out of 10 truck drivers had paid challan to the authorities. Maximum drivers in Chennai (70%) paid challans followed by nearly 61% in Mumbai, and 59% in Kanpur. Least percentage of drivers (4%) in Vijayawada paid challans to the officials.
An average amount of Rs.1,669 was spent on penalties or challans and the highest was recorded in Jaipur (Rs. 4281). The truck drivers in all three southern cities had incurred the least expenses on
penalties or challans - Vijayawada (Rs.416), Chennai (Rs.717) and Bangalore (Rs.810).
On overall basis, one-fourth of the amount had been borne by the truck drivers for penalties or challans. However, more than three-fourth of the expense in Jaipur, was paid by the drivers from their own pocket. A substantial proportion of amount paid by the drivers can be seen in Kolkata and Delhi-NCR, where more than half of the challan amount was paid by drivers. In case of Mumbai, all expense for challans was paid by the fleet owners or consigners.
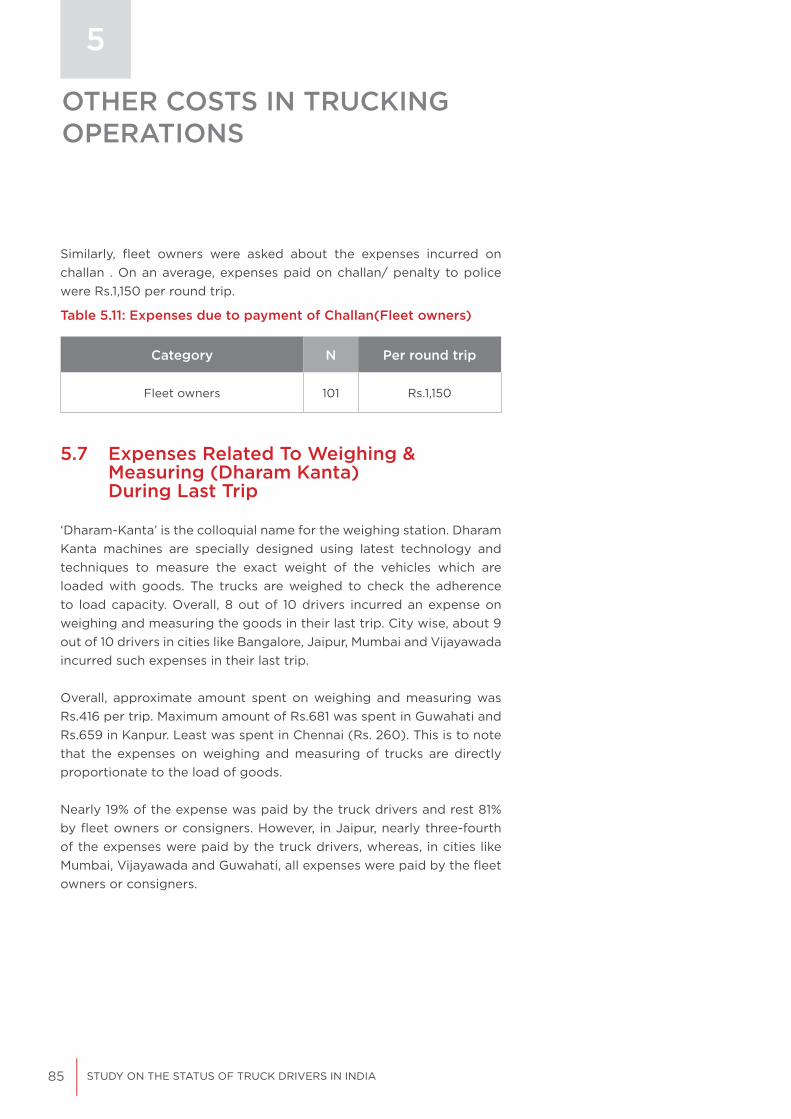
85 STUDY ON THE STATUS OF TRUCK DRIVERS IN INDIA
5
Similarly, fleet owners were asked about the expenses incurred on challan . On an average, expenses paid on challan/ penalty to police were Rs.1,150 per round trip.
Table 5.11: Expenses due to payment of Challan(Fleet owners)
Category N Per round trip
Fleet owners 101 Rs.1,150
5.7 Expenses Related To Weighing & Measuring (Dharam Kanta) During Last Trip
‘Dharam-Kanta’ is the colloquial name for the weighing station. Dharam Kanta machines are specially designed using latest technology and techniques to measure the exact weight of the vehicles which are loaded with goods. The trucks are weighed to check the adherence to load capacity. Overall, 8 out of 10 drivers incurred an expense on weighing and measuring the goods in their last trip. City wise, about 9 out of 10 drivers in cities like Bangalore, Jaipur, Mumbai and Vijayawada incurred such expenses in their last trip.
Overall, approximate amount spent on weighing and measuring was Rs.416 per trip. Maximum amount of Rs.681 was spent in Guwahati and Rs.659 in Kanpur. Least was spent in Chennai (Rs. 260). This is to note that the expenses on weighing and measuring of trucks are directly proportionate to the load of goods.
Nearly 19% of the expense was paid by the truck drivers and rest 81% by fleet owners or consigners. However, in Jaipur, nearly three-fourth of the expenses were paid by the truck drivers, whereas, in cities like Mumbai, Vijayawada and Guwahati, all expenses were paid by the fleet owners or consigners.
OTHER COSTS IN TRUCKING OPERATIONS

86
Table 5.12: Trip related expenses – Weighing & Measuring
Cities NExpense
incurred by drivers (Yes %)
Approx. expense per
trip (Rs.)
Proportion of money paid by
Driver (%)
Proportion of money paid by
Owner/ Consigner (%)
Overall 1217 81.7 416 18.7 81.3
Bangalore 120 99.2 370 8.5 91.5
Jaipur 123 96.7 393 75.6 24.4
Mumbai 120 95.8 466 0.0 100.0
Vijayawada 122 94.3 380 0.0 100.0
Kolkata 126 87.3 384 28.6 71.5
Kanpur 123 84.6 659 1.0 99.0
Ahmedabad 120 84.2 330 15.8 84.2
Chennai 120 79.2 260 13.7 86.3
Delhi-NCR 122 74.6 437 26.9 73.1
Guwahati 121 20.7 681 0.0 100.0

87 STUDY ON THE STATUS OF TRUCK DRIVERS IN INDIA
5
Similarly, fleet owners were asked about the expenses incurred on weighing and measuring the goods. On an average, expenses on weighing and measuring the goods were Rs.431 per round trip.
Category N Per round trip
Fleet owners 101 Rs. 431
Table 5.13: Weighing and measuring expenses (Fleet owners)
5.8 Expenses Related To Breakdown/ Repair During Last Trip
Overall, nearly 36% truck drivers had incurred an expense on breakdown or repairing of the vehicle during their last trip. While 64.2% of the drivers in Jaipur shelled out money for repairing their vehicles, a meagre 4.2% of the drivers did so in Ahmedabad.
The average amount spent was accounted at Rs.1,649, whereas maximum was incurred in Ahmedabad, accounting for Rs.2,860. In southern cities, Bangalore (Rs.360), Chennai (Rs.582) and Vijayawada (Rs.648), the truck drivers had spent relatively less on breakdown as compared to other cities.
Among all cities in the study, the truck drivers of Jaipur bore the highest expense on breakdown or repairing of the vehicle during the trip. Whereas, all expenses were incurred by the fleet owners or consigners in Kanpur and Vijayawada.
OTHER COSTS IN TRUCKING OPERATIONS
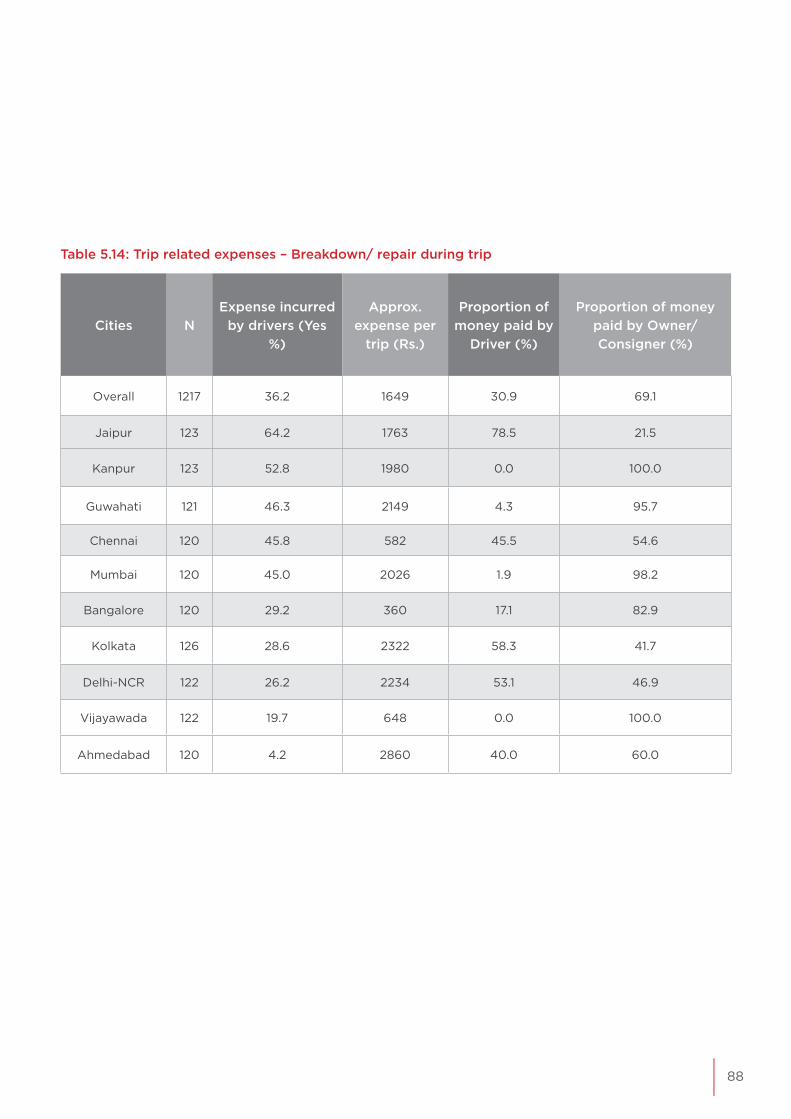
88
Cities NExpense incurred
by drivers (Yes %)
Approx. expense per
trip (Rs.)
Proportion of money paid by
Driver (%)
Proportion of money paid by Owner/ Consigner (%)
Overall 1217 36.2 1649 30.9 69.1
Jaipur 123 64.2 1763 78.5 21.5
Kanpur 123 52.8 1980 0.0 100.0
Guwahati 121 46.3 2149 4.3 95.7
Chennai 120 45.8 582 45.5 54.6
Mumbai 120 45.0 2026 1.9 98.2
Bangalore 120 29.2 360 17.1 82.9
Kolkata 126 28.6 2322 58.3 41.7
Delhi-NCR 122 26.2 2234 53.1 46.9
Vijayawada 122 19.7 648 0.0 100.0
Ahmedabad 120 4.2 2860 40.0 60.0
Table 5.14: Trip related expenses – Breakdown/ repair during trip

89 STUDY ON THE STATUS OF TRUCK DRIVERS IN INDIA
5
5.9 Expenses Related To Bribe Paid To The Authorities
The truck drivers were also asked about the bribe that they have paid during last trip to various authorities. Overall, Rs. 1,257 was the amount paid as bribe to various authorities.
City-wise, Guwahati topped the list for paying highest bribe to various authorities (Rs.2,360), followed by Jaipur (Rs.1,803). Compared to other cities, proportion of bribe amount was low in the southern cities of India along with Delhi-NCR.
5.10 Method of Paying Trip Expenses & Average Money Carried by Drivers for Incidental Expenses
Fleet owners were asked about their method of paying trip expense to truck drivers. About 70% fleet owners mentioned that they pay drivers a particular amount for expenditure prior to commencement of the trip, nearly 18% said that they reimburse the expenditure while almost 9% include it as part of truck driver salary.
Table 5.15: Amount paid as bribe for each round trip
Table 5.16: Method of paying trip related expenses to truck drivers (Fleet owners)
Cities N Amount (Rs.)
Overall 518 1257
Guwahati 30 2360
Jaipur 107 1803
Kolkata 72 1433
Ahmedabad 44 1294
Kanpur 70 1020
Mumbai 9 1000
Bangalore 62 863
Delhi-NCR 52 853
Chennai 68 696
Vijayawada 4 425
Category N
Fleet owner
pays them particular amount
Fleet owner reimburses
the expenditure
It is part of truck
driver’s salary
Fleet
owners101 73.3% 17.8% 8.9%
OTHER COSTS IN TRUCKING OPERATIONS

90
Table 5.17: Money carried by drivers on trips
Cities NMoney carried
per trip
Overall 1217 13341
Jaipur 123 21489
Chennai 120 20956
Kolkata 126 18507
Kanpur 123 17224
Mumbai 120 13480
Vijayawada 122 11939
Ahmedabad 120 11649
Bangalore 120 9023
Guwahati 121 4875
Delhi-NCR 122 3957
Further, truck drivers were asked about the money they carry for incidental expenses during the trips. As per survey findings, each truck driver carried about Rs.13,341 per trip for incidental expenses. The highest amount was carried by drivers in Jaipur (Rs.21,489), followed by Chennai and Kolkata. Drivers in Delhi-NCR were carrying the least amount (Rs.3,957) per trip.
Age-group wise, drivers aged between 26-40 yrs. carried highest amount for incidental expenses while such amount decreased with increase in age of driver. Similarly, compared to drivers who were driving fleet owner trucks, truck drivers of self-owned trucks were carrying higher amounts of incidental expenses.
Further, drivers who were driving alone were carrying lower amount (Rs.10,425) compared to those who were driving with helpers (Rs.15,229), and driving with co-driver (Rs.17,320)
91 STUDY ON THE STATUS OF TRUCK DRIVERS IN INDIA
INCIDENCE OF CORRUPTION IN TRUCKING OPERATIONS
6
This chapter aims to quantify the estimated corruption in the trucking sector in India. There are many financial and non-financial strains on the logistics sector due to corruption. The World Bank had estimated that truck delays at checkpoints cost the Indian economy between Rs. 9 billion to Rs.23 billion.’10 The report, which was released in 2005,
On a trans-national journey, they (trucks)
are stopped at multiple checkpoints for
inspections, payments of tolls and taxes and
so forth. It is well-acknowledged that
many of these payments have no legal founding, and unjustly add to the
transportation costs.
“
“-India Transport Report, National
Transport Development Policy Committee, 2013.
further stated that the “Facilitation Payments” made at the checkpoints to circumvent various regulations have been in the range of Rs.9 billion to Rs.72 billion. The report further states that, “While these unofficial payments, being transfers, are not directly a loss to the economy, they probably result in revenue and other losses, to the Government and the economy, far in excess of the monies actually paid.”11 Another study12 released by Transparency International in February 2007 exclusively looked at “Corruption in Trucking Operation in India in 2006”. The study conducted by MDRA presented an estimate of the extent of corruption in monetary terms. The field study aimed to assess the extent and nature of corruption in the trucking operations. The main finding of the report was that “the trucks plying on roads pay anywhere between Rs. 211 and Rs.266 as bribe money per day depending upon the route. Based on this estimate, Rs. 79,920 was paid as bribe by a commercial truck during a year. With around 36 lakh trucks operational in the country, the bribe amount floating in the trucking operations has been worked out to be more than Rs. 22,000 crore a year after adjusting the trucks’ age and inter and intra-state operations”.
The present study aims to provide an updated figure on the extent of corruption in monetary terms. It employs the same methodology to quantify corruption and to compare the 2006 figure with 2019 figure.
10 http://siteresources.worldbank.org/INTSARREGTOPTRANSPORT/PublicationsandReports/20747263/Final_ version03NOV2005.pdf11 ibid 12 https://www.transparency.org/files/content/pressrelease/Exec_Summary__2_.pdf

92
In the trucking business, truckers need to engage with officials of various departments for many reasons starting from vehicle registration, periodic renewal of permits and fitness certificates to daily encounters with traffic/ highway police, etc. Truckers pay bribe to such officials at one or another stage of trucking operation either due to fear, to get away with structural hurdles, or to avoid business losses or for mutual benefits.
The following flow chart depicts various stages in trucking operations where truckers pay bribe to various departments/ officials:
Purchase of Vehicle
Fitness Certificate Vehicle Registration Permit Issuance/ Renew
On RoadTax o�cials
Checkposts onhighways,city limits,
state entry, etc.
Localgroups
extortion
Tra�c/Highway
PoliceRTO
O�cials
Issuance/ Renewal of Driving License
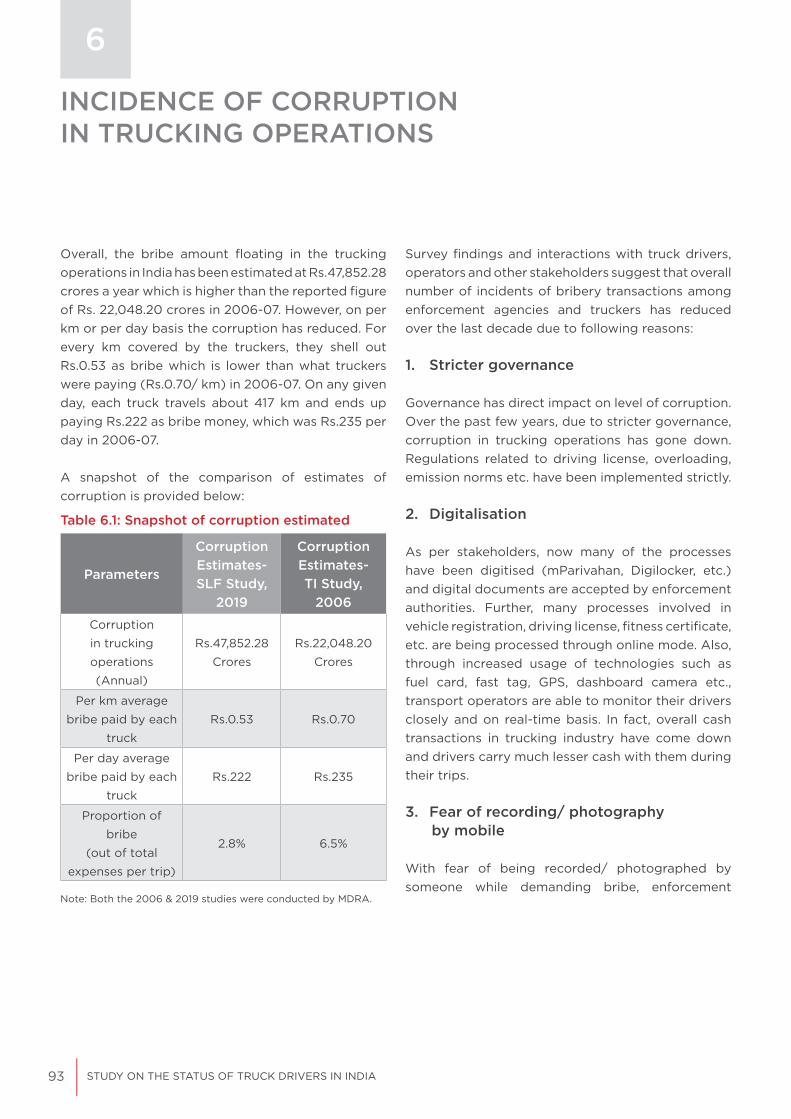
93 STUDY ON THE STATUS OF TRUCK DRIVERS IN INDIA
Overall, the bribe amount floating in the trucking operations in India has been estimated at Rs.47,852.28 crores a year which is higher than the reported figure of Rs. 22,048.20 crores in 2006-07. However, on per km or per day basis the corruption has reduced. For every km covered by the truckers, they shell out Rs.0.53 as bribe which is lower than what truckers were paying (Rs.0.70/ km) in 2006-07. On any given day, each truck travels about 417 km and ends up paying Rs.222 as bribe money, which was Rs.235 per day in 2006-07.
A snapshot of the comparison of estimates of corruption is provided below:
INCIDENCE OF CORRUPTION IN TRUCKING OPERATIONS
6
Table 6.1: Snapshot of corruption estimated
Parameters
Corruption Estimates- SLF Study,
2019
Corruption Estimates- TI Study,
2006
Corruption
in trucking
operations
(Annual)
Rs.47,852.28
Crores
Rs.22,048.20
Crores
Per km average
bribe paid by each
truck
Rs.0.53 Rs.0.70
Per day average
bribe paid by each
truck
Rs.222 Rs.235
Proportion of
bribe
(out of total
expenses per trip)
2.8% 6.5%
Survey findings and interactions with truck drivers, operators and other stakeholders suggest that overall number of incidents of bribery transactions among enforcement agencies and truckers has reduced over the last decade due to following reasons:
1. Stricter governance
Governance has direct impact on level of corruption. Over the past few years, due to stricter governance, corruption in trucking operations has gone down. Regulations related to driving license, overloading, emission norms etc. have been implemented strictly.
2. Digitalisation
As per stakeholders, now many of the processes have been digitised (mParivahan, Digilocker, etc.) and digital documents are accepted by enforcement authorities. Further, many processes involved in vehicle registration, driving license, fitness certificate, etc. are being processed through online mode. Also, through increased usage of technologies such as fuel card, fast tag, GPS, dashboard camera etc., transport operators are able to monitor their drivers closely and on real-time basis. In fact, overall cash transactions in trucking industry have come down and drivers carry much lesser cash with them during their trips.
3. Fear of recording/ photography by mobile
With fear of being recorded/ photographed by someone while demanding bribe, enforcement
Note: Both the 2006 & 2019 studies were conducted by MDRA.

94
officials generally avoid asking for money upfront. Regular reporting in mainstream media and social media along with some sting operations of officials taking bribe in the past has reduced the practice of taking bribes.
4. GST/ e-way bill
After introduction of GST, it has become difficult for truck operators to evade
Transport Department Road Level
Registration of vehicles Getting new/ renewing road permitGetting new/ renewal of commercial driving licenseGetting fitness certificate
Tra�c/ highway policeRTO o�cialsToll gates/ inter-state borders/ checkpointsTax o�cials/ flying squadLocal groups (extortion)
taxes. Now, instead of paying several indirect taxes and completing related documentation, truckers pay GST and adhere to related compliances. Further, e-way bill facilitates the contact- less movement of goods.
As per the discussion with stakeholders, corruption in trucking operations was found at following two levels:

95 STUDY ON THE STATUS OF TRUCK DRIVERS IN INDIA
6
6.1 Assumptions and Considerations Made for the Estimation of Corruption
1. All registered trucks were considered for estimation of corruption in trucking operation. As per the Ministry of Transport and Highways, till 31st March 2016, about 59,03,370 trucks were registered in India, out of which about 49,76,530 trucks were in use (as per permit valid on 31st March 2016) and plying on inter-state or national permits.
2. Further, during 2016, total 3,64,815 new trucks were registered in India. Therefore, in order to estimate total bribe, other means of bribe collection at authority offices for different purposes, e.g. vehicle registration, new/ renewal of permit, fitness certificate, driving licence were also considered.
3. As trucking industry is fragmented and unorganized, for estimation of corruption in getting new/renewing license, an assumption was made that total number of drivers are equal to total number of trucks registered in India.
Table 6.2: Total number of trucks registered
Particular Number
Total trucks registered in India (as on 31st March 2016) 59,03,370
Approx. new trucks registered during 2015-16 3,64,815
Table 6.3: Frequency of new/ renewing documents
Particular FrequencyVehicle registration Once for every new truck
Fitness certificateIssued for new vehicle for 2 years and subsequently
renewed every year
New/ renew permit Every 5 years
Commercial driving licence Every 3 years
As per survey findings, many of trucks are plying locally without permit. Considering this number offsets any increase in number of trucks plying over last 3 years, the number of all registered trucks was taken for estimation of bribe.
INCIDENCE OF CORRUPTION IN TRUCKING OPERATIONS

96
S.N. Proportion of journey on NH/SH NProportion of
drivers
1 100% journey on NH 954 78%
2 90-99% journey on NH and remaining on SH 228 19%
3 80-89% journey on NH and remaining on SH 22 2%
4 Up to 80% journey on NH and remaining on SH 13 1%
Total 1217 100%
4. The estimate of corruption is based on the payments made during the driver’s latest trip. The drivers were also asked the route of the latest trip. Most of the drivers were plying on National Highways (NH), while others were using NH and State Highways (SH). Based on the segregation, it would be safe to say that the estimated corruption is for trucks plying on National Highways in India.
Table 6.4: Segregation based on usage of NH & SH
6.2 Bribery & Corruption Estimates reported by Truck Drivers
Corruption and harassment are some of the key issues that truck drivers face during trips. Drivers need to deal with various authorities including, traffic police, RTO, local groups.
During the survey, truck drivers were asked about the bribe that they had to pay directly/ indirectly to various authorities.

97 STUDY ON THE STATUS OF TRUCK DRIVERS IN INDIA
6
6.2.1 Bribe paid to traffic/highway police
Overall, approximately two-third of the truck drivers have paid bribes to the traffic or highway police. 9 out of 10 truck drivers interviewed in Guwahati have paid bribe, followed by Chennai (89%) and Delhi-NCR (84%). The least proportion of drivers that paid bribe to traffic or highway police were from Vijayawada (17%).
Table 6.5: Bribe paid to traffic/ highway police
Cities NProportion of truck drivers that paid bribe to traffic/highway police (%)
Avg. amount paid (Rs. Round trip)
Overall 1217 66.8 849
Guwahati 121 97.5 1608
Chennai 120 89.2 381
Delhi-NCR 122 84.4 557
Ahmedabad 120 75.0 683
Jaipur 123 74.8 1125
Kolkata 126 66.7 1054
Kanpur 123 65.0 630
Bangalore 120 53.3 438
Mumbai 120 45.0 1135
Vijayawada 122 17.2 452
The average amount paid to traffic/ highway police was Rs.849.
The truck drivers who mentioned they had paid bribe (N=813) to traffic or highway police were asked about the reasons for the same. Nearly 41% of drivers stated that traffic/highway police did not mention any reason for taking bribe. As stated by the drivers, traffic or highway police do not let the
INCIDENCE OF CORRUPTION IN TRUCKING OPERATIONS
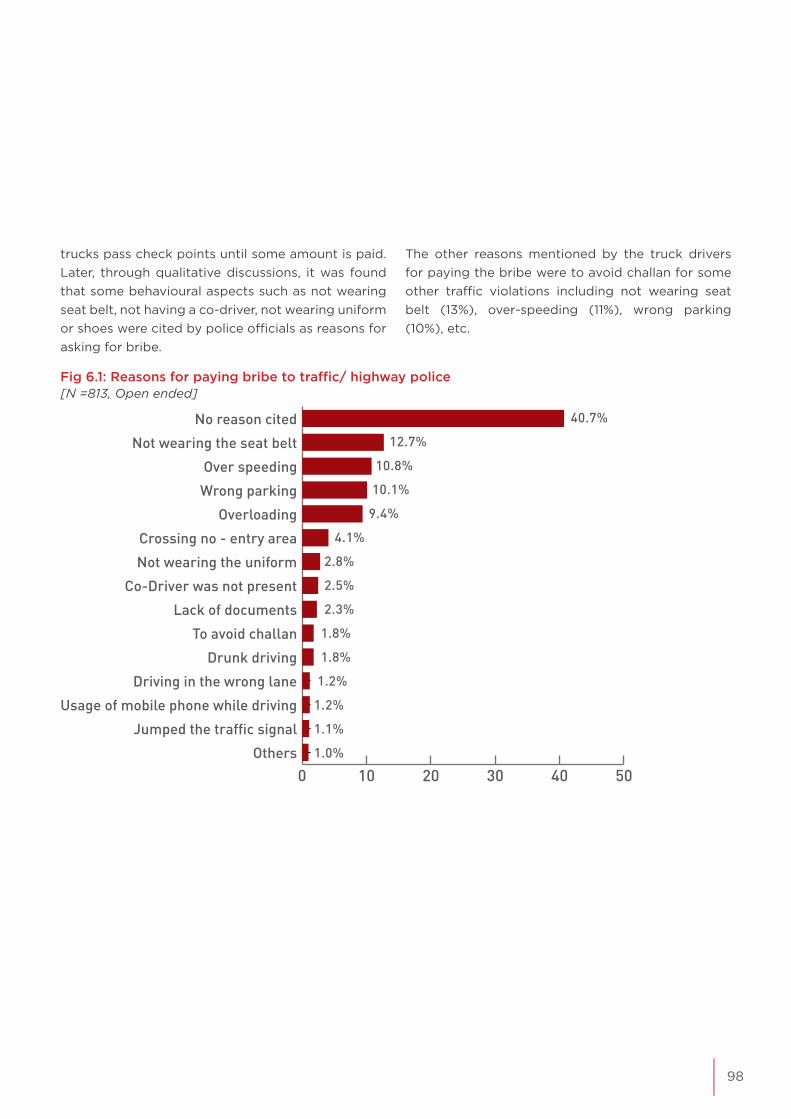
98
Fig 6.1: Reasons for paying bribe to traffic/ highway police[N =813, Open ended]
trucks pass check points until some amount is paid. Later, through qualitative discussions, it was found that some behavioural aspects such as not wearing seat belt, not having a co-driver, not wearing uniform or shoes were cited by police officials as reasons for asking for bribe.
The other reasons mentioned by the truck drivers for paying the bribe were to avoid challan for some other traffic violations including not wearing seat belt (13%), over-speeding (11%), wrong parking (10%), etc.
0 10 20 30 40 50Others
Jumped the traffic signal
Usage of mobile phone while driving
Driving in the wrong lane
Drunk driving
To avoid challan
Lack of documents
Co-Driver was not present
Not wearing the uniform
Crossing no - entry area
Overloading
Wrong parking
Over speeding
Not wearing the seat belt
No reason cited 40.7%
12.7%
10.8%
10.1%
9.4%
4.1%
2.8%
2.5%
2.3%
1.8%
1.8%
1.2%
1.2%
1.1%
1.0%
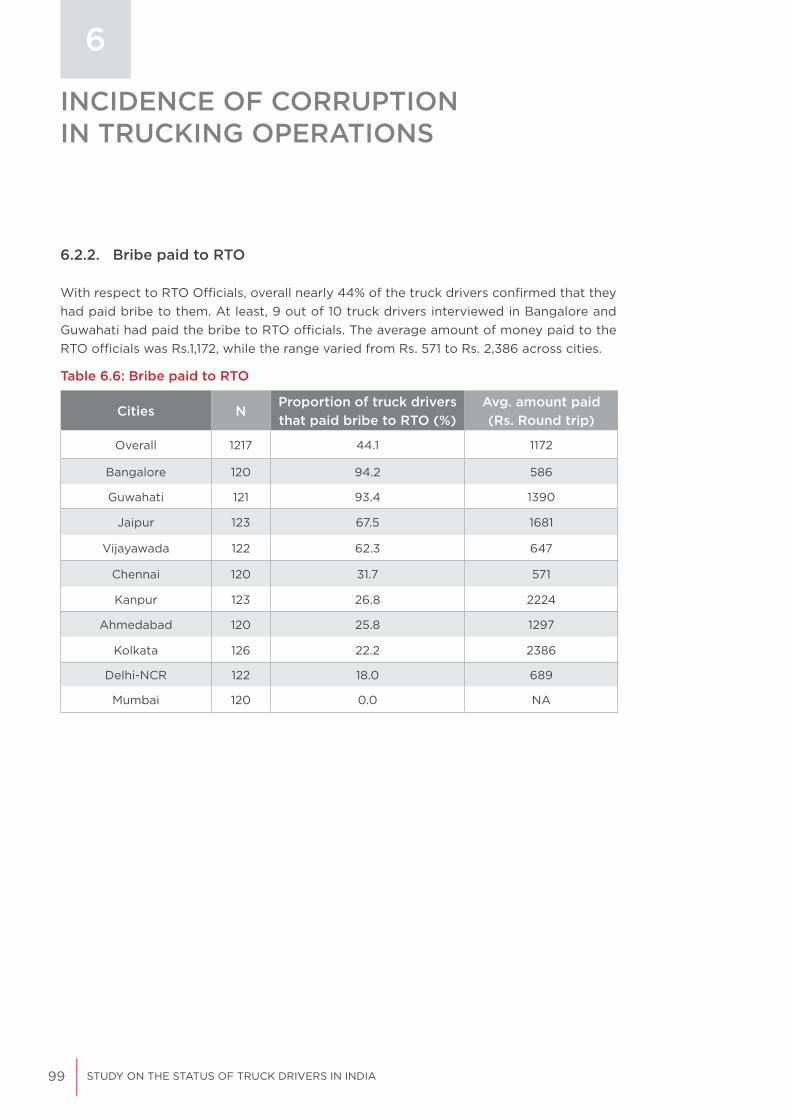
99 STUDY ON THE STATUS OF TRUCK DRIVERS IN INDIA
6.2.2. Bribe paid to RTO
With respect to RTO Officials, overall nearly 44% of the truck drivers confirmed that they had paid bribe to them. At least, 9 out of 10 truck drivers interviewed in Bangalore and Guwahati had paid the bribe to RTO officials. The average amount of money paid to the RTO officials was Rs.1,172, while the range varied from Rs. 571 to Rs. 2,386 across cities.
6
Table 6.6: Bribe paid to RTO
Cities NProportion of truck drivers that paid bribe to RTO (%)
Avg. amount paid (Rs. Round trip)
Overall 1217 44.1 1172
Bangalore 120 94.2 586
Guwahati 121 93.4 1390
Jaipur 123 67.5 1681
Vijayawada 122 62.3 647
Chennai 120 31.7 571
Kanpur 123 26.8 2224
Ahmedabad 120 25.8 1297
Kolkata 126 22.2 2386
Delhi-NCR 122 18.0 689
Mumbai 120 0.0 NA
INCIDENCE OF CORRUPTION IN TRUCKING OPERATIONS

100
The truck drivers (N=537) who had admitted to paying a bribe to RTO officials were asked about the reasons for doing so. Almost 28% of the truck drivers did not cite any reason for paying bribe. The rest cited over-loading (17.3%), crossing the state border (10.6%) and negligent driving (9.3%) as reasons for paying bribe.
Fig 6.2: Reasons for paying bribe to RTO[N =537, Open ended]
0 5 10 15 20 25 30Others
Jumped the traffic signal
Not wearing the seat belt
Was not wearning uniform
Lack of document
Wrong parking
Overspeeding
Neglignet driving
For crossing the state border
Overloading
No reason cited 27.8%
17.3%
10.6%
9.3%
6.0%
6.0%
5.8%
5.4%
3.9%
2.6%
7.0%

101 STUDY ON THE STATUS OF TRUCK DRIVERS IN INDIA
6
6.2.3 Bribe paid to tax officials/flying squad
Overall, approximately 2% of the truck drivers have paid bribe to tax officials or flying squad. Guwahati is the only city where, nearly 19% of the truck drivers had paid bribe, followed by Bangalore (2%), whereas, no truck driver has paid bribe to the tax officials or flying squad in Jaipur, Ahmedabad, Kolkata, Mumbai and Vijayawada. An average amount of Rs.850 was paid as a bribe to tax officials/ flying squads.
The truck drivers (N=28) who have paid bribe to tax officials or flying squad were asked about the related reasons. About two-third of truck drivers said they were not given any reason for bribe, followed by the most common reason as checking of goods and over-speeding, as stated by nearly 14% of the truck drivers.
Table 6.7: Bribe paid to tax officials/flying squad
Cities NProportion of truck
drivers that paid bribe to tax officials (%)
Avg. amount paid (Rs.
Round trip)
Overall 1217 2.3 850
Guwahati 121 19.0 848
Bangalore 120 1.7 1600
Chennai 120 0.8 300
Delhi-NCR 122 0.8 500
Kanpur 123 0.8 300
Jaipur 123 0.0 0
Ahmedabad 120 0.0 0
Kolkata 126 0.0 0
Mumbai 120 0.0 0
Vijayawada 122 0.0 0
Fig 6.3: Reasons for paying bribe to tax officials/flying squad[N = 28]
0 10 20 30 40 50 60 70 80
Wrong Parking
Over-speeding
Checking Of Goods
No reason cited 67.8%
14.3%
14.3%
3.6%
INCIDENCE OF CORRUPTION IN TRUCKING OPERATIONS

102
Table 6.8 : Money extorted by local groups
Cities NMoney extorted by
local groups (Yes %)
Avg. amount paid (Rs.
Round trip)
Overall 1217 25.8 608
Guwahati 121 90.1 985
Kolkata 126 45.2 359
Vijayawada 122 39.3 332
Delhi-NCR 122 28.7 748
Ahmedabad 120 24.2 141
Bangalore 120 24.2 469
Chennai 120 3.3 400
Mumbai 120 0.8 300
Jaipur 123 0.8 1000
Kanpur 123 0.8 500
Fig 6.4: Reasons for paying extortion to local groups[N = 314]
6.2.4. Extortion paid to local groups
Overall, about one-fourth of the truck drivers have paid extortion to local groups. Nearly 90% of the truck drivers interviewed in Guwahati confirmed that they paid extortion money, followed by those interviewed in Kolkata (45%) and Vijayawada (39%).
The average extortion amount paid to the local groups was Rs.608. The highest amount was paid by the drivers in Jaipur (Rs. 1,000) followed by Guwahati (Rs. 985).
Among those drivers that have paid extortion to local groups (N=314), nearly 46% stated that they were not given any reason for the same. Almost 34% stated a donation in the name of “Mata ka Jaagran” as a reason followed by fear of robbery of goods/life risk (13%).
The local groups do not let the trucks pass specific areas without getting some amount of money, especially in Guwahati and Kolkata during Durga Pooja, as stated by the truck drivers. 0 10 20 30 40 50
State border crossing
Extortion (Manmani)
‘Tax’ imposed by groups
Fear of robbery of goods
Donations (Mata Kaa Jagran)
No reason cited 45.9%
33.8%
13.0%
3.8%
2.5%
1.6%
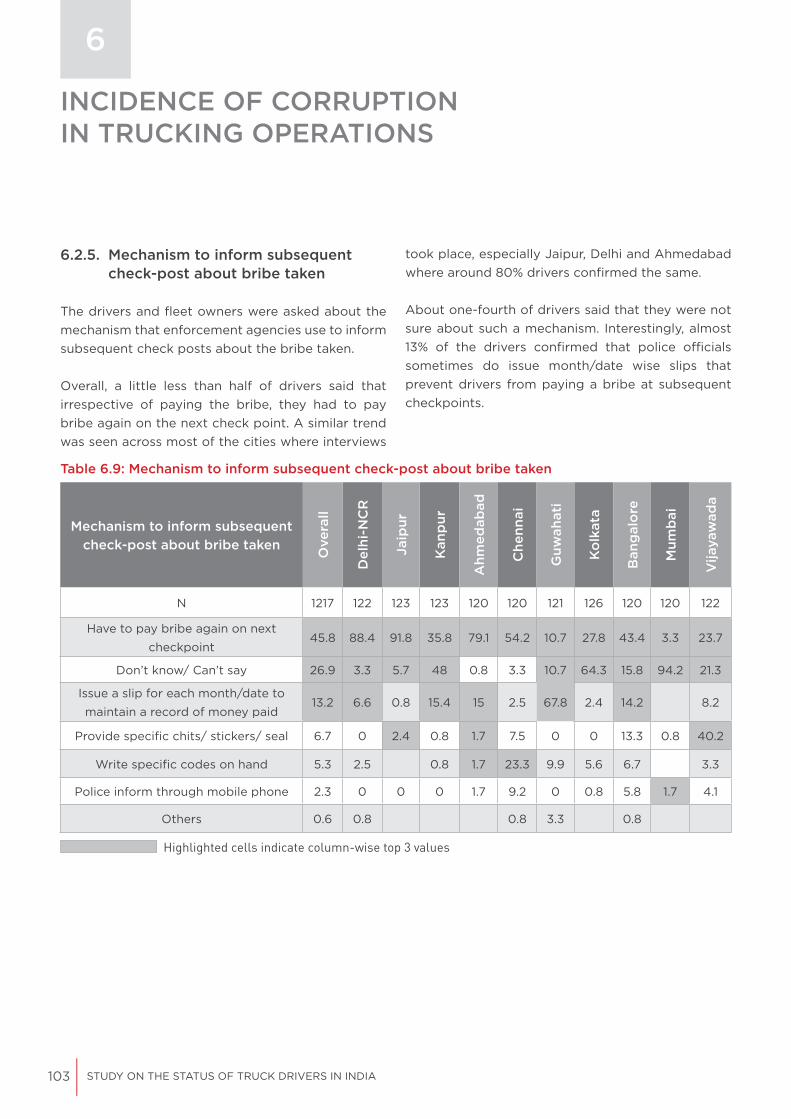
103 STUDY ON THE STATUS OF TRUCK DRIVERS IN INDIA
6
6.2.5. Mechanism to inform subsequent check-post about bribe taken
The drivers and fleet owners were asked about the mechanism that enforcement agencies use to inform subsequent check posts about the bribe taken.
Overall, a little less than half of drivers said that irrespective of paying the bribe, they had to pay bribe again on the next check point. A similar trend was seen across most of the cities where interviews
took place, especially Jaipur, Delhi and Ahmedabad where around 80% drivers confirmed the same.
About one-fourth of drivers said that they were not sure about such a mechanism. Interestingly, almost 13% of the drivers confirmed that police officials sometimes do issue month/date wise slips that prevent drivers from paying a bribe at subsequent checkpoints.
Table 6.9: Mechanism to inform subsequent check-post about bribe taken
Mechanism to inform subsequent check-post about bribe taken
Ove
rall
Del
hi-N
CR
Jaip
ur
Kan
pur
Ahm
edab
ad
Che
nnai
Guw
ahat
i
Ko
lkat
a
Ban
gal
ore
Mum
bai
Vija
yaw
ada
N 1217 122 123 123 120 120 121 126 120 120 122
Have to pay bribe again on next
checkpoint45.8 88.4 91.8 35.8 79.1 54.2 10.7 27.8 43.4 3.3 23.7
Don’t know/ Can’t say 26.9 3.3 5.7 48 0.8 3.3 10.7 64.3 15.8 94.2 21.3
Issue a slip for each month/date to
maintain a record of money paid13.2 6.6 0.8 15.4 15 2.5 67.8 2.4 14.2 8.2
Provide specific chits/ stickers/ seal 6.7 0 2.4 0.8 1.7 7.5 0 0 13.3 0.8 40.2
Write specific codes on hand 5.3 2.5 0.8 1.7 23.3 9.9 5.6 6.7 3.3
Police inform through mobile phone 2.3 0 0 0 1.7 9.2 0 0.8 5.8 1.7 4.1
Others 0.6 0.8 0.8 3.3 0.8
Highlighted cells indicate column-wise top 3 values
INCIDENCE OF CORRUPTION IN TRUCKING OPERATIONS

104
Images of slips issued to truck drivers with codes/date and month-wise stamps
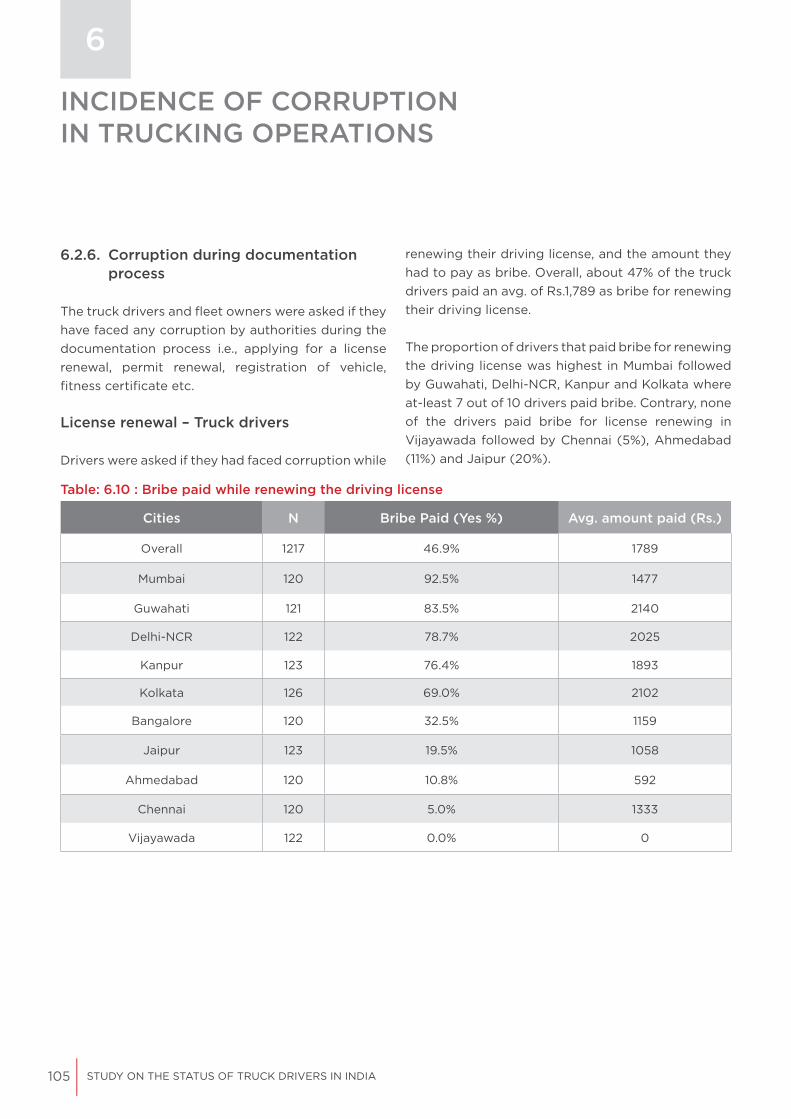
105 STUDY ON THE STATUS OF TRUCK DRIVERS IN INDIA
6
6.2.6. Corruption during documentation process
The truck drivers and fleet owners were asked if they have faced any corruption by authorities during the documentation process i.e., applying for a license renewal, permit renewal, registration of vehicle, fitness certificate etc.
License renewal – Truck drivers
Drivers were asked if they had faced corruption while
renewing their driving license, and the amount they had to pay as bribe. Overall, about 47% of the truck drivers paid an avg. of Rs.1,789 as bribe for renewing their driving license.
The proportion of drivers that paid bribe for renewing the driving license was highest in Mumbai followed by Guwahati, Delhi-NCR, Kanpur and Kolkata where at-least 7 out of 10 drivers paid bribe. Contrary, none of the drivers paid bribe for license renewing in Vijayawada followed by Chennai (5%), Ahmedabad (11%) and Jaipur (20%).
Table: 6.10 : Bribe paid while renewing the driving license
Cities N Bribe Paid (Yes %) Avg. amount paid (Rs.)
Overall 1217 46.9% 1789
Mumbai 120 92.5% 1477
Guwahati 121 83.5% 2140
Delhi-NCR 122 78.7% 2025
Kanpur 123 76.4% 1893
Kolkata 126 69.0% 2102
Bangalore 120 32.5% 1159
Jaipur 123 19.5% 1058
Ahmedabad 120 10.8% 592
Chennai 120 5.0% 1333
Vijayawada 122 0.0% 0
INCIDENCE OF CORRUPTION IN TRUCKING OPERATIONS

106
6.2.7 Corruption during documentation process - Fleet Owners
Similarly, fleet owners were asked if they have paid bribe for official documentation process to various authorities. Among all fleet owners, about 43% of them have stated that they had to pay bribe during registration process for their fleet.
Among those fleet owners that have paid bribe, Rs.1,816 was paid as bribe for registration of vehicle, Rs.1,360 for new or renewal of permit and Rs.1,292 for fitness certificate.
6.3. Mathematical Model for Estimation of Corruption
The mathematical procedure and model for estimating the value of corruption is given below.13
where:C.T.I.= Corruption value in Trucking IndustryA.D.= T.T.D* A.A.B.• A.D.=AmountgiventodifferentDepartment/authorities• T.T.D.=TotalTruckspayingbribetoparticularDepartment• A.A.B.=AverageAmountofbribetotheDepartment
13 This model was used to estimate reported corruption w.r.t trucking operations in 2006 study as well
C.T.I.= A.D1 + A.D2 + A.D3+…A.Dn
CategoryRegistration of
vehicle (Rs.)
Getting new/ renew permit
(Rs.)
Getting fitness certificate
(Rs.)
N Avg. Amt. N Avg. Amt. N Avg. Amt.
Fleet owners 34 1816 35 1360 36 1292
Table 6.11: Avg. bribe paid during documentation process (fleet owners)
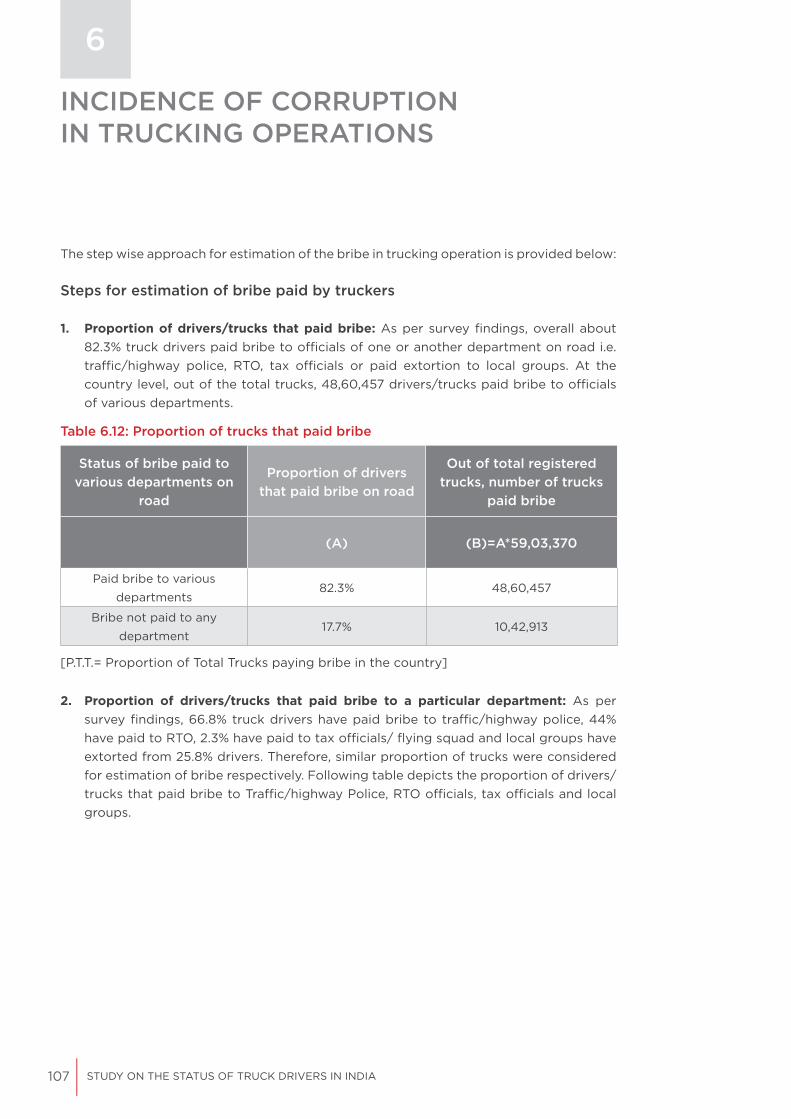
107 STUDY ON THE STATUS OF TRUCK DRIVERS IN INDIA
The step wise approach for estimation of the bribe in trucking operation is provided below:
Steps for estimation of bribe paid by truckers
1. Proportion of drivers/trucks that paid bribe: As per survey findings, overall about 82.3% truck drivers paid bribe to officials of one or another department on road i.e. traffic/highway police, RTO, tax officials or paid extortion to local groups. At the country level, out of the total trucks, 48,60,457 drivers/trucks paid bribe to officials of various departments.
2. Proportion of drivers/trucks that paid bribe to a particular department: As per survey findings, 66.8% truck drivers have paid bribe to traffic/highway police, 44% have paid to RTO, 2.3% have paid to tax officials/ flying squad and local groups have extorted from 25.8% drivers. Therefore, similar proportion of trucks were considered for estimation of bribe respectively. Following table depicts the proportion of drivers/trucks that paid bribe to Traffic/highway Police, RTO officials, tax officials and local groups.
6
Table 6.12: Proportion of trucks that paid bribe
Status of bribe paid to various departments on
road
Proportion of drivers that paid bribe on road
Out of total registered trucks, number of trucks
paid bribe
(A) (B)=A*59,03,370
Paid bribe to various
departments82.3% 48,60,457
Bribe not paid to any
department17.7% 10,42,913
[P.T.T.= Proportion of Total Trucks paying bribe in the country]
INCIDENCE OF CORRUPTION IN TRUCKING OPERATIONS
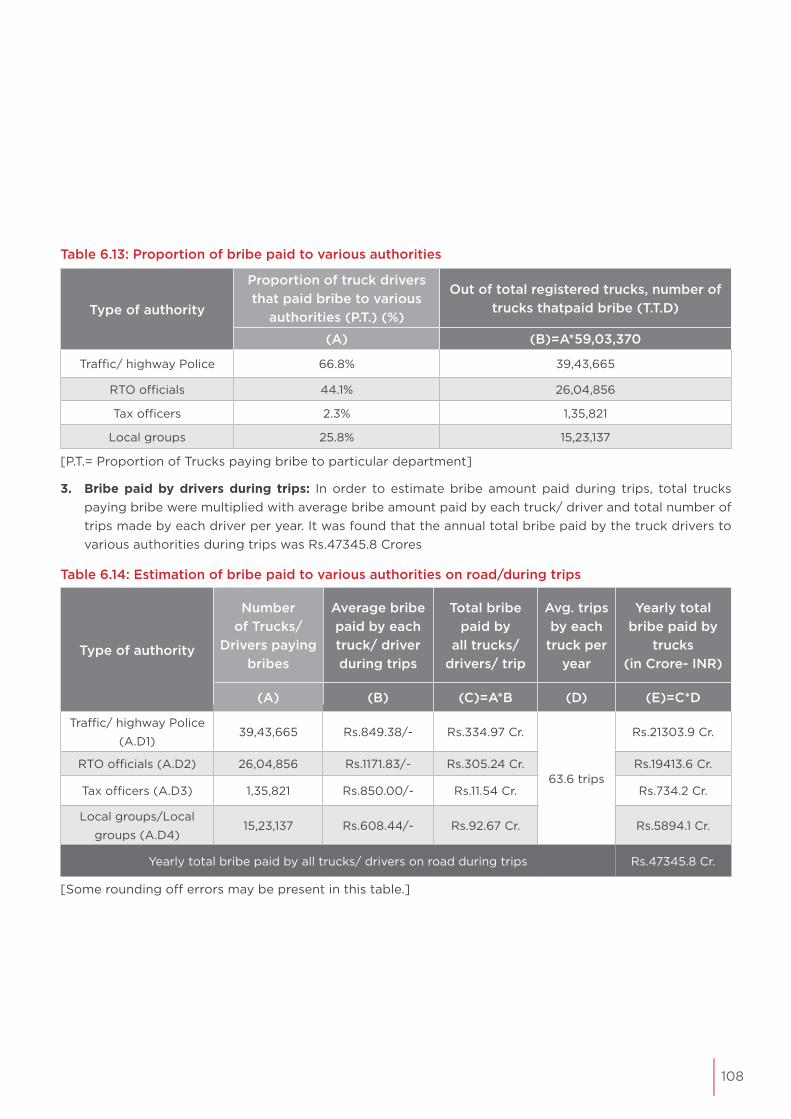
108
Table 6.13: Proportion of bribe paid to various authorities
Table 6.14: Estimation of bribe paid to various authorities on road/during trips
Type of authority
Proportion of truck drivers that paid bribe to various
authorities (P.T.) (%)
Out of total registered trucks, number of trucks thatpaid bribe (T.T.D)
(A) (B)=A*59,03,370
Traffic/ highway Police 66.8% 39,43,665
RTO officials 44.1% 26,04,856
Tax officers 2.3% 1,35,821
Local groups 25.8% 15,23,137
Type of authority
Number of Trucks/
Drivers paying bribes
Average bribe paid by each truck/ driver during trips
Total bribe paid by
all trucks/ drivers/ trip
Avg. trips by each
truck per year
Yearly total bribe paid by
trucks(in Crore- INR)
(A) (B) (C)=A*B (D) (E)=C*D
Traffic/ highway Police
(A.D1)39,43,665 Rs.849.38/- Rs.334.97 Cr.
63.6 trips
Rs.21303.9 Cr.
RTO officials (A.D2) 26,04,856 Rs.1171.83/- Rs.305.24 Cr. Rs.19413.6 Cr.
Tax officers (A.D3) 1,35,821 Rs.850.00/- Rs.11.54 Cr. Rs.734.2 Cr.
Local groups/Local
groups (A.D4)15,23,137 Rs.608.44/- Rs.92.67 Cr. Rs.5894.1 Cr.
Yearly total bribe paid by all trucks/ drivers on road during trips Rs.47345.8 Cr.
[Some rounding off errors may be present in this table.]
[P.T.= Proportion of Trucks paying bribe to particular department]
3. Bribe paid by drivers during trips: In order to estimate bribe amount paid during trips, total trucks paying bribe were multiplied with average bribe amount paid by each truck/ driver and total number of trips made by each driver per year. It was found that the annual total bribe paid by the truck drivers to various authorities during trips was Rs.47345.8 Crores

109 STUDY ON THE STATUS OF TRUCK DRIVERS IN INDIA
4. Bribe at authority offices: Apart from bribe paid on road during trips, collection of bribes was reported at authority offices for registration of vehicle, vehicle fitness certificate, new/ renewing permit and driving license, etc. It was found that the total annual bribe paid by truck drivers to various authorities for documentation purposes was Rs. 506.5 Crores.
Table 6.15: Estimation of bribe paid at authority offices for various documentations
Type of authority
Proportion of trucks/ drivers paid bribe (P.T)
Total drivers/ trucks paid bribe
(T.T.D)
Average bribe by each truck/ driver (A.A.B)
Total bribe paid by all
trucks/ drivers
(A) (B) (C) (D)=B*C
New/ renewing of driving
license every 3 years (AD5)46.9%
59,03,370*46.9%)/3
= 9,22,894Rs.1789/- Rs.165.1 Cr.
Registration of vehicle
(AD6)33.7%
(3,64,815*33.7%)
= 1,22,809Rs.1816/- Rs.22.3 Cr.
New/ renewing permit of
vehicle every 5 years (AD7)34.7%
59,03,370*34.7%)/5
= 4,09,144Rs.1360/- Rs.55.6 Cr.
Fitness certificate for old
vehicles every year (AD8)35.6%
5,38,555*35.6%)
= 19,74,138 Rs.1292/- Rs.255.1 Cr.
Fitness certificate for new
vehicles after 2 years (AD9)
,64,815*35.6%)/2
= 65,017 Rs.1292/- Rs.8.4 Cr.
Yearly total bribe paid by all trucks/ drivers at authority offices Rs.506.5 Cr.
[Based on 59,03,370 trucks registered till 31 March 2019; out of which 3,64,815 were registered in 2015-16][Some rounding off errors may be present in this table.]
6
INCIDENCE OF CORRUPTION IN TRUCKING OPERATIONS

110
Table 6.16: Estimation of total bribe in trucking operations
5. Total bribe paid (on road during trips and at authority offices): Based on above calculation, truckers pay about Rs. 47,852.3 crores on annual basis as bribe to different departments/ authorities. As each truck covers about 417 km per day, hence per km bribe paid is Rs.0.53. This study estimates that the total annual bribe paid by truck drivers stands at Rs. 47,852.3 Crores. This means that on an average, every truck driver pays RS. 222.08 as per day bribe and Rs. 0.53 as per Km bribe to various authorities.
Bribe paid by trucks/ drivers Bribe Amount
Total bribe paid during trips on road to various officials (A.D1 to AD4) Rs.47,345.8 cr.
Total bribe paid at authority offices (A.D5 to AD9) Rs.506.5 cr.
Total bribe paid by all trucks per year (C.T.I) Rs.47,852.3 crore
Per day bribe paid by each truck on an average Rs.222.08
Per km bribe paid by each truck on an average Rs.0.53
111 STUDY ON THE STATUS OF TRUCK DRIVERS IN INDIA
6.4 More about the Mathematical Model used for Estimation of Corruption
The above mathematical model simply uses additive, multiplicative and average (arithmetic mean) properties of arithmetic. It also uses extrapolative technique to estimate a value on entire population based on a sample survey carried out among limited but statistically representative set of respondents.
This model was especially developed in consultation with several experts and stakeholders for similar study conducted by MDRA in 2006-07 for Transparency International and is widely circulated and quoted. The figures had been validated by several reputed publications and is a base for several reports by the World Bank and other institutions.
Advantages
This model is easy to understand, avoids complex algorithms and any changes in input values can be quickly replicated to estimate final values of corruption. While many of the leading organizations globally rely on perception surveys to estimate corruption, this study uses experience-based reported data (that too for most recent trips) where accuracy levels are much higher.
Limitations
The major limitation of such model is that the corruption estimations are for very large population size based on responses of limited number (but random, representative and statistically robust) of respondents taken during sample surveys. However, following techniques have been used to mitigate any anomalies:
• The sampling design adopted was multi-stage sampling (selection of zones, followed by selection of cities/ transport hubs and then randomly selecting truck drivers) which is a form of queuing theory where randomization is in-built in the process.
• The total sample size taken is statistically robust so that margin of error is very low (+ 2.70%) at a high confidence-interval (95%).
• The sampling was done in a way that all types of population and transportation hubs are covered adequately and from different geographies, hence representative.
• Comprehensive approach was adopted to estimate overall corruption including corruption at road (during trips) as well as authority level.
6
INCIDENCE OF CORRUPTION IN TRUCKING OPERATIONS
112
• In order to triangulate the findings, several in-depth interviews were conducted and key figures used for estimations were verified from other set of respondents, i.e. fleet-owners. The results were almost similar.
• Any possible response-bias was eliminated by taking the respondents in full-confidence about the purpose of the survey.
• All logical-checks have been done to ensure that the reported figures are within valid-range.
• The population/ universe size has been taken on the basis of most recent government data which is considered highly reliable.
• The interrelatedness of each variable used to estimate corruption was validated and it was ensured that any aspect is neither omitted nor repeated during calculations.
To sum up, this estimation has all the limitations that come up with any estimation based on sample surveys on the basis of reported data. However, enough precautions have been taken to reduce errors at various steps.
113 STUDY ON THE STATUS OF TRUCK DRIVERS IN INDIA
POINTERS FOR FUTURE
7
7.1 Suggestions – Truck Drivers, Fleet owners & other stakeholders
This study was conducted to better understand the status of truck drivers in the country on various parameters like quality of life, health, safety and security on the road, economic stability, corruption and harassment faced by authorities etc.
Apart from the quantitative survey among truck drivers and fleet owners, opinions of the stakeholders were documented through qualitative interviews in the form of in-depth discussions and a focus group discussion. 21 in-depth interviews were conducted with fleet owners and transport associations while an FGD was conducted in Sanjay Gandhi Transport Nagar, Delhi.
Based on discussions with truck drivers, association members and fleet owners, suggestions are being offered for improving truck drivers’ quality of life. These suggestions are segregated at government level, authorities level, and transport associations and fleet owners’ level.
Government level
1. Truck drivers should be grouped under a formal remuneration structure along with mandatory social security benefits including insurance, provident fund, etc. 9 out of 10 truck drivers’ monthly salary is only up to Rs. 20,000 and almost 93% of the truck drivers do not get any social security benefit.
2. The norms with respect to working hours of truck drivers should be implemented as per the Motor Transport Workers Act, 1961. Truck drivers generally work for long hours, and in some situations, where the consignment has to reach at distant locations, they have to drive for days as well. Long working hours not only hamper their health and physique but make them vulnerable to road crashes.
3. An audit of transporters should be done on a regular basis to ensure that they are following guidelines as per the Motor Transport Workers Act, 1961.

114
4. The Government and related authorities should take care of the roadside facilities i.e. availability of good quality food, toilets/ bathrooms, rest places, secure parking spaces etc. Fatigue is a major concern for both the health and safety of truck drivers. Studies have shown that driver fatigue is a major cause for road crashes. The lack of proper rest also leads to a number of ailments for truck drivers. Thus, well designed rest stops can improve the health of truck drivers as well as improve road safety. Clean and hygienic truck terminals, resting rooms or ‘dharmshalas’ should be built in collaboration with local community groups, NGOs or private firms under their CSR initiatives.
5. There are multiple taxes which are being taken from truckers in the form of green tax, toll tax, road tax, parking tax etc. A portion of such taxes should be used to make a fund for introducing welfare schemes for truck drivers. Such a fund could be used to provide social security benefits, better roadside amenities, improving quality of life of truckers, etc.
6. As per the survey findings, the facilities at many existing transport terminals are not up to the mark. The Government along with respective authorities needs to provide better facilities at transport terminals, where truck drivers could take rest and park their vehicles safely.
7. Establish truck driving training schools especially in key cities so that new drivers are well trained, and they are aware of their rights and responsibilities.
8. The Government should implement strict enforcement of laws related to corruption, bribery and extortion. Strict vigilance and regular patrolling on highways should be made mandatory for enforcement of laws.
9. Create awareness and sensitize department officials against corruption and illegal practices.

115 STUDY ON THE STATUS OF TRUCK DRIVERS IN INDIA
Authorities level
1. The process of documentation (i.e. new/ renewal of driving license and permit, fitness certificate, registration of vehicle etc.) should be made online.
2. In order to monitor enforcement officials’ behaviour and corrupt practices on highways, each official should wear a camera while checking vehicles on checkpoints or issuing challans.
3. At various checkpoints and toll gates, CCTV cameras should be installed to keep an eye on corrupt officials.
4. Corruption by local groups should be checked. Regular patrolling on highways should be ensured to reduce corruption and theft of goods from trucks.
5. Authorities should provide a dedicated helpline number for truck drivers where corruption or bribery-related complaints could be registered. Such a helpline number should be displayed prominently on highways.
6. The relevant provisions of the Motor Vehicles (Amendment) Act 2019, along with important
traffic rules, should be displayed on highways, checkpoints, toll plazas etc. to inform and educate truck drivers and fleet owners about these provisions, and to inculcate safe driving behaviour.
Transport Associations & Fleet Owners’ level
1. Associations should conduct regular workshops and programs to educate truck drivers and fleet owners about safe driving behaviour, traffic rules and regulations, maintaining work-life balance, etc.
2. Health care awareness campaigns should be undertaken at transport hubs or workplace of large truck operators to educate drivers about possible health risks associated with driving profession.
3. Conduct medical camps along with other stakeholders for providing better and easy access to health care services to truck drivers.
4. Transport associations along with Government and corporates should help in providing better amenities (healthy food, rest places, secure parking, washroom facilities, etc.) for truck drivers on highways.
7
POINTERS FOR FUTURE

116
5. Fleet owners should encourage truck drivers to participate in road safety awareness workshops to make them aware of responsible driving behaviour and other traffic rules and regulations.
6. Fleet owners should avoid pressurizing their drivers w.r.t quick delivery of consignment and driving for long hours. Instead, drivers should be instructed and trained to follow traffic rules and regulations.
7. Fleet owners should ensure that their drivers are getting sufficient rest after completion of long trips.

117 STUDY ON THE STATUS OF TRUCK DRIVERS IN INDIA

118
119 STUDY ON THE STATUS OF TRUCK DRIVERS IN INDIA
SaveLIFE Foundation D-10, First Floor, Nizamuddin East New Delhi - 110013, IndiaTelephone: 011 410 91 911Email: [email protected]
www.savelifefoundation.org
savelifefoundation
@savelifeindia
Mahindra & Mahindra Limited (M&M)Gateway Building, Apollo BunderMumbai, Maharashtra 400 001, IndiaTelephone: 022 2490 1441
www.mahindra.com
Mahindra Rise
@MahindraRise