
Barriers to Truck Drivers' Healthy Eating: Environmental Influences and Health Promotion Strategies
24
This article was downloaded by: [University of North Carolina] On: 26 February 2012, At: 12:54 Publisher: Routledge Informa Ltd Registered in England and Wales Registered Number: 1072954 Registered office: Mortimer House, 37-41 Mortimer Street, London W1T 3JH, UK Journal of Workplace Behavioral Health Publication details, including instructions for authors and subscription information: http://www.tandfonline.com/loi/wjwb20 Barriers to Truck Drivers' Healthy Eating: Environmental Influences and Health Promotion Strategies Yorghos Apostolopoulos PhD a b c , Sevil Sönmez PhD d c , Mona Shattell PhD, RN e , Lauren Haldeman PhD f , Robert Strack PhD a & Victoria Jones BsC a a Department of Public Health Education, University of North Carolina at Greensboro, Greensboro, North Carolina, USA b Emory University School of Medicine, Atlanta, Georgia, USA c Transportation Health Services, Inc., Greensboro, North Carolina, USA d Department of Recreation, Tourism, and Hospitality Management, University of North Carolina at Greensboro, Greensboro, North Carolina, USA e School of Nursing, University of North Carolina at Greensboro, Greensboro, North Carolina, USA f Department of Nutrition, University of North Carolina at Greensboro, Greensboro, North Carolina, USA Available online: 17 May 2011 To cite this article: Yorghos Apostolopoulos PhD, Sevil Sönmez PhD, Mona Shattell PhD, RN, Lauren Haldeman PhD, Robert Strack PhD & Victoria Jones BsC (2011): Barriers to Truck Drivers' Healthy Eating: Environmental Influences and Health Promotion Strategies, Journal of Workplace Behavioral Health, 26:2, 122-143 To link to this article: http://dx.doi.org/10.1080/15555240.2011.573754 PLEASE SCROLL DOWN FOR ARTICLE Full terms and conditions of use: http://www.tandfonline.com/page/terms-and-conditions This article may be used for research, teaching, and private study purposes. Any substantial or systematic reproduction, redistribution, reselling, loan, sub-licensing, systematic supply, or distribution in any form to anyone is expressly forbidden. The publisher does not give any warranty express or implied or make any representation that the contents will be complete or accurate or up to date. The accuracy of any
Transcript of Barriers to Truck Drivers' Healthy Eating: Environmental Influences and Health Promotion Strategies
This article was downloaded by: [University of North Carolina]On: 26 February 2012, At: 12:54Publisher: RoutledgeInforma Ltd Registered in England and Wales Registered Number: 1072954 Registeredoffice: Mortimer House, 37-41 Mortimer Street, London W1T 3JH, UK
Journal of Workplace Behavioral HealthPublication details, including instructions for authors andsubscription information:http://www.tandfonline.com/loi/wjwb20
Barriers to Truck Drivers' Healthy Eating:Environmental Influences and HealthPromotion StrategiesYorghos Apostolopoulos PhD a b c , Sevil Sönmez PhD d c , MonaShattell PhD, RN e , Lauren Haldeman PhD f , Robert Strack PhD a &Victoria Jones BsC aa Department of Public Health Education, University of NorthCarolina at Greensboro, Greensboro, North Carolina, USAb Emory University School of Medicine, Atlanta, Georgia, USAc Transportation Health Services, Inc., Greensboro, North Carolina,USAd Department of Recreation, Tourism, and Hospitality Management,University of North Carolina at Greensboro, Greensboro, NorthCarolina, USAe School of Nursing, University of North Carolina at Greensboro,Greensboro, North Carolina, USAf Department of Nutrition, University of North Carolina atGreensboro, Greensboro, North Carolina, USA
Available online: 17 May 2011
To cite this article: Yorghos Apostolopoulos PhD, Sevil Sönmez PhD, Mona Shattell PhD, RN, LaurenHaldeman PhD, Robert Strack PhD & Victoria Jones BsC (2011): Barriers to Truck Drivers' HealthyEating: Environmental Influences and Health Promotion Strategies, Journal of Workplace BehavioralHealth, 26:2, 122-143
To link to this article: http://dx.doi.org/10.1080/15555240.2011.573754
PLEASE SCROLL DOWN FOR ARTICLE
Full terms and conditions of use: http://www.tandfonline.com/page/terms-and-conditions
This article may be used for research, teaching, and private study purposes. Anysubstantial or systematic reproduction, redistribution, reselling, loan, sub-licensing,systematic supply, or distribution in any form to anyone is expressly forbidden.
The publisher does not give any warranty express or implied or make any representationthat the contents will be complete or accurate or up to date. The accuracy of any

instructions, formulae, and drug doses should be independently verified with primarysources. The publisher shall not be liable for any loss, actions, claims, proceedings,demand, or costs or damages whatsoever or howsoever caused arising directly orindirectly in connection with or arising out of the use of this material.
Dow
nloa
ded
by [
Uni
vers
ity o
f N
orth
Car
olin
a] a
t 12:
54 2
6 Fe
brua
ry 2
012
Barriers to Truck Drivers’ HealthyEating: Environmental Influences and
Health Promotion Strategies
YORGHOS APOSTOLOPOULOS, PhDDepartment of Public Health Education, University of North Carolina at Greensboro,
Greensboro, North Carolina; Emory University School of Medicine, Atlanta, Georgia; and
Transportation Health Services, Inc., Greensboro, North Carolina, USA
SEVIL SONMEZ, PhDDepartment of Recreation, Tourism, and Hospitality Management, University of North
Carolina at Greensboro, Greensboro, North Carolina; and Transportation Health Services,
Inc., Greensboro, North Carolina, USA
MONA SHATTELL, PhD, RNSchool of Nursing, University of North Carolina at Greensboro,
Greensboro, North Carolina, USA
LAUREN HALDEMAN, PhDDepartment of Nutrition, University of North Carolina at Greensboro, Greensboro,
North Carolina, USA
ROBERT STRACK, PhD and VICTORIA JONES, BsCDepartment of Public Health Education, University of North Carolina at Greensboro,
This article presents an assessment of 25 trucking work settingsdesigned to examine whether the environmental attributes of thesesettings influence eating patterns of truckers who are at risk forexcess weight gain. Findings corroborate evidence that these worksettings represent healthy food deserts. From restaurants and vend-ing machines to the social=information environments and theirsurrounding communities, only meager opportunities exist forhealthful eating practices. This article aims to place underserved
Address correspondence to Yorghos Apostolopoulos, PhD, Associate Professor, Depart-ment of Public Health Education, School of Health and Human Sciences, University of NorthCarolina at Greensboro, PO Box 26170, Greensboro, NC 27402-6170, USA. E-mail: [email protected]
Journal of Workplace Behavioral Health, 26:122–143, 2011Copyright # Taylor & Francis Group, LLCISSN: 1555-5240 print=1555-5259 onlineDOI: 10.1080/15555240.2011.573754
122
Greensboro, North Carolina
Dow
nloa
ded
by [
Uni
vers
ity o
f N
orth
Car
olin
a] a
t 12:
54 2
6 Fe
brua
ry 2
012
truckers and warehousing-sector employees firmly within the dis-course of workplace health promotion and calls for multistake-holder wellness strategies that encompass the intertwined riskfactors linked with the transportation work environment.
KEYWORDS environmental barriers, healthy food options, truckingwork settings
Eating behavior is highly complex and results from the interplay of multipleinfluences across different contexts. Considering that overweight=obesity havereached a combined 70% among U.S. adults (Flegal, Carroll, Ogden, & Curtin,2010) it is important to recognize the potential of social environments suchas workplaces to influence the epidemic’s trajectory. With about 65% of thepopulation in the workforce (Bureau of Labor Statistics [BLS], 2010a, 2010b),worksites have a critical bearing on employees’ dietary and physical-activitypatterns, all of which are important determinants of excess weight gain. Work-places can provide employees with resources, opportunities, and exposuresthat can significantly influence their eating behaviors. The confluence of work-place food environments, related institutional=commercial policies, and prac-tices involved in food production, preparation, and consumption canpotentially create either barriers to or opportunities for healthful diets (Barnettet al., 2007).Over the past decade, there has been increasing recognition of fac-tors in the social and physical environments that influence weight gain, poornutrition, and physical inactivity—all important precursors of obesity (French,Story, & Jeffery, 2001; Richter et al., 2000). The negative health effects of theseenvironments are particularly significant for the commercial transport sector.
Trucking comprises several diverse but intertwined subsectors withoccupations ranging from truckers, dispatchers, and manual laborers toadministrative support, maintenance, and management. Among millions ofindividuals working in the broad trucking sector, more than three milliontruckers operate within a multilayered transportation environment and canbe categorized as full truckload (FTL), less than truckload (LTL), andparcel-carrier drivers (BLS, 2010a, 2010b). This transportation environmentincludes government regulations, trucking operations, corporate policiesfor trucking settings, and the trucking built-environment, with multicompo-nent trucking work settings (Apostolopoulos, Sonmez, Shattell, & Belzer,2010). This occupational context exerts far-reaching influences on, amonga multitude of others, truckers’ food-purchasing choices and eating beha-viors, the number of hours they sleep, the quality of air they breathe, andtheir opportunities for physical activity. Within a highly sedentary environ-ment, about 80% of truckers have unhealthful eating patterns as a result ofpoor food choices, only 8% exercise regularly because fitness resourcesare few and far in between, about 85% are overweight or obese, 44% are
Environmental Influences on Healthy Eating 123
Dow
nloa
ded
by [
Uni
vers
ity o
f N
orth
Car
olin
a] a
t 12:
54 2
6 Fe
brua
ry 2
012
hypertensive, and many suffer from hypercholesterolemia, cardiovasculardisease (CVD), and type-2 diabetes (Bigert et al., 2003; Krueger, Brewster,Dick, Inderbitzen, & Staplin, 2007; Mackie, 2008; Martin, Church, Bonnell,Ben-Joseph, & Borgstadt, 2009; Robinson & Burnett, 2005; Wood,Hegmann, Murtaugh, & Thiese, 2007). Not surprisingly, the life expectancyof unionized drivers is 63 years and 55.7 for members of the Owner-OperatorIndependent Drivers Association (Salzman & Belzer, 2007).
This article aims to include the trucking sector in the dialogue of work-place health promotion and is focused primarily on underserved truckerswho consistently use several components of trucking work settings, and sec-ondarily on the sector’s other employees who work in these settings (BLS,2010b). Within this context, this article (a) examines how trucking work set-tings’ environmental attributes influence the food choices and eating patternsof truckers who are at high risk for excess weight gain and obesity, and (b)introduces a workplace health-promotion paradigm grounded in a multista-keholder approach that incorporates occupational safety and health withhealth promotion strategies.
METHOD
Instrument Development
Grounded in ecosocial models (Krieger, 1994; McMichael, 1999; Susser, 1996),and based on existing tools that assess healthy eating and active-living envi-ronments (i.e., Checklist of Health Promotion Environments at Worksites[CHEW]: Krieger, 1994; Nutrition Environment Measures Survey in Stores[NEMS-S]: McMichael, 1999; Swift Worksite Assessment and Translation=Toolfor Observing Worksite Environments [SWAT=TOWE]: Susser, 1996), theHealthy Trucking Work-settings Audit Instrument (HEATWAI) was designed:(Glanz, Sallis, Saelens, & Frank, 2007). It is a 250-item instrument that usesobservation to measure the presence of corporate, social, andbuilt-environment attributes of trucking work settings that positively influencefood choices=eating behaviors and physical=recreational activities of truckersand other transportation=warehousing-sector employees. The interraterreliability analysis resulted in kappa¼ .87 (p< .001), 95% Confidence Interval(CI) [0.760, 0.980] (HEATWAI development details can be found in otherworks) (Apostolopoulos et al., in press). The five HEATWAI componentsare briefly described below (Table 1), with particular elaboration on theassessment of healthy food environments.
HEATWAI Summary Scales
Through a series of five subscales, the Healthy Food Environment (HEFE)measures the presence of healthful food options and resources in
124 Y. Apostolopoulos et al.
Dow
nloa
ded
by [
Uni
vers
ity o
f N
orth
Car
olin
a] a
t 12:
54 2
6 Fe
brua
ry 2
012
restaurants=cafeterias, vending machines, convenience stores, break rooms,drivers’ lounges, and picnic areas. The presence and condition of amenitiessuch as microwave ovens, refrigerators, and water coolers as well as thenumber of eating venues and food outlets are also recorded. This 128-itemhealthy food environment includes Subscale 1 with 25 items for restaurantswith waiters, cafeteria-style, or canteen venues; Subscale 2 with 18 itemsfor fast-food restaurants; Subscale 3 with 50 items for vending machines(nonrefrigerated snacks, refrigerated=frozen food, cold=hot drinks); Subscale4 with 21 items for convenience stores and=or minimarts; and Subscale 5 with14 items for lunch or break rooms or driver’s lounges and picnic areas.Examples of healthful food items that can be scored include low-fat=nonfatsalad dressing, fresh or dried fruits, a-la-carte items priced competitivelyagainst combo=value meals, salad dishes, and low-fat items advertised at
TABLE 1 Healthy Trucking Work-Settings Audit Summary Scales and Subscales
Summary scales and subscales Items
Healthy Food Environment (HEFE) (128 items total). HEFE Subscale 1: Healthy Menu Items in Restaurants withWaiters=Cafeteria Style
25 items
. HEFE Subscale 2: Healthy Menu Items in Fast Food Restaurants 18 items
. HEFE Subscale 3: Healthy Items in Vending Machines 50 items
. HEFE Subscale 4: Healthy Items in Convenience Stores=Mini Marts 21 items
. HEFE Subscale 5: Healthy Diet Supportive Resources inLunch=Break Rooms=Driver Lounges=Picnic Areas
14 items
Health Supportive Social Environment (HESSE) (15 items total). HESSE Subscale 1: Supportive Social Environment for Physical andRecreational Activity
7 items
. HESSE Subscale 2: Social Support for Healthful Food Options 8 items
Health Supportive Community Environment (HESCE) (24 items total). HESCE Subscale 1: Physical and Recreational Activity Amenitiesand Opportunities in Community
13 items
. HESCE Subscale 2: Healthful Food Options in Community 11 items
Health Information Environment (HEIE) (11 items total). HEIE Subscale 1: Evidence of Physical and Recreational ActivityPromotion
5 items
. HEIE Subscale 2: Evidence of Promotion of Healthful FoodChoices and Eating Behaviors
6 items
Active Living Environment (ALE) (65 items total). ALE Subscale 1: Support for Physical and Recreational Activity inNatural Environments and Surrounding Grounds
13 items
. ALE Subscale 2: Support for Physical and Recreational Activity inBuilt Environment
14 items
. ALE Subscale 3: Resources and Facilities that Encourage Physicaland Recreational Activity
19 items
. ALE Subscale 4: Exercise and Fitness Facilities that SupportPhysical Activity
19 items
Environmental Influences on Healthy Eating 125
Dow
nloa
ded
by [
Uni
vers
ity o
f N
orth
Car
olin
a] a
t 12:
54 2
6 Fe
brua
ry 2
012
point-of-purchase, labels with visible nutritional values, and whole-graincrackers=pretzels. The total HEFE score represents an aggregate score of128 items broken down into the summary subscales.
The Health-Supportive Social Environment (HESSE) scale measures theorganizational, social, and policy environment related to food, physical=recreational activity, and weight management at trucking work settings.Examples of resources that support a healthy diet include appealing,low-cost, healthful food options offered at work settings, or opportunitiesfor physical=recreational activities (e.g., basketball, table tennis). TotalHESSE points of 15 include Subscale 1 with seven items for physical=recreational activities and Subscale 2 with eight items for healthful food=eating.
The Health-Supportive Community Environment (HESCE) scale mea-sures work settings’ surrounding vicinities that are critical for truckers’ foodand physical activity–related decisions. Community is defined as surroundingneighborhoods of work settings usually up to a two- to three-block radius.Two subscales are used to measure a total of 24 HESCE points: Subscale 1with 11 items for a community that promotes healthy eating via easily access-ible produce-markets, greengrocers, or food stores selling unprocessed,healthy carryout items, and Subscale 2 with 13 items for a community thatpromotes physical=recreational activity via fitness facilities or walking-designated areas around the immediate proximity of the work setting. Itemson the area’s overall safety and cleanliness, as well as its walkability are alsoincluded.
The Health Information Environment (HEIE) scale includes all visiblehealth-related print media at trucking work settings with potential to mot-ivate healthful eating and physical activity, to which truckers are exposed.All publicly visible bulletin boards, notices, postings, brochures, and flierswith informative messages are recorded and assigned points. Total HEIEpoints of 11 include Subscale 1 with six items for healthful food=eatingand Subscale 2 with five items for physical=recreational activity.
The Active Living Environment (ALE) scale assesses the extent towhich trucking work settings promote involvement in physical=recreationalactivities. ALE examines the availability of resources that support physicalactivity as follows: Subscale 1 with 13 items is used to asses if and howthe natural environment=surrounding grounds support physical activity;Subscale 2 with 14 items is used to assess the built environment; Subscale3 with 19 items is used to measure resources=facilities that encouragephysical activity; and Subscale 4 with 19 items is used to measure the pres-ence of exercise=fitness facilities. In addition, the number of buildings,floors, stairs, and elevators along with the condition of fitness equipmentare assessed, and sedentary environments (e.g., presence of movielounge=theater) are noted. Results of our assessment using ALE are outsidethe scope of this article, and therefore are not discussed, they are the sub-ject of another article.
126 Y. Apostolopoulos et al.
Dow
nloa
ded
by [
Uni
vers
ity o
f N
orth
Car
olin
a] a
t 12:
54 2
6 Fe
brua
ry 2
012
HEATWAI Scoring
Environmental characteristics with presumed positive effects on food choicesand eating behaviors as well as physical=recreational activities are measuredby HEATWAI, and resources are recorded in terms of their number and con-dition. Scoring involves assigning points to each category as environmentalcharacteristics are encountered that are considered to promote healthful foodchoices and physical=recreational activity. A scorecard was created to permita total score for the entire work setting as well as scores for summary scalesand subscales. Subsequently, an overall rating is developed to indicate thelevel of support for healthy living. When a particular work setting scores90% to 100% of the maximum possible points, that setting is assessed asbeing fully supportive of healthy living; a 75% to 89.9% score is consideredmostly supportive; a 50% to 74.9% is considered partially supportive; a 35%to 49.9% is considered scarcely supportive; and less than 35% is consideredto be not-at-all supportive of healthy living. In other words, the higher thescore a work setting receives the more health promotive it is rated.
Data Collection and Analysis
Following Institutional Review Board approval of the study, data were col-lected on healthful eating and physical activity opportunities at truckingwork settings. Only those results from our assessment of the food environ-ment of trucking work settings and surrounding communities are reportedin this article. Data were collected in south-central North Carolina, in closeproximity to interstate highways I-85 and I-40, from eight truck stops, eighttrucking terminals, seven warehouses, and two highway rest areas. Informaldiscussions were carried out with truckers regarding the types of foods thatcould be found in their truck cabs. Drivers corroborated that the foods theycarry along with them in their cabs, whether perishables stored in minirefri-gerators or nonperishables, are purchased from truck stops, therefore we didnot collect food-related data from truck cabs because these data were alreadydirectly collected from truck stops. Research sites were chosen to representgeographic (rural vs. urban=suburban) and corporate (national=regional vs.small=local) characteristics, size of work setting (primarily trucker traffic),proximity to highways, and their importance as trucking work settings—determined by the amount of time drivers spend there and opportunitiesfor healthful eating and physical=recreational activities. Onsite observationwas conducted during daylight hours and lasted an average of 75 minutesranging from highway rest areas where they were the shortest, to truck stopswhere they were the longest. Not all HEATWAI dimensions were present orapplicable at every type of work setting; for example there are no restaurants,convenience stores, or mini-marts at highway rest areas, trucking terminals,or warehouses. Data analysis included descriptive statistics and interrater
Environmental Influences on Healthy Eating 127
Dow
nloa
ded
by [
Uni
vers
ity o
f N
orth
Car
olin
a] a
t 12:
54 2
6 Fe
brua
ry 2
012
correlation analysis to establish key psychometric attributes of HEATWAI asan environmental measure.
RESULTS AND DISCUSSION
Trucking Work Settings
Trucking terminals, warehouses, truck stops, highway rest areas, and truckcabs constitute the broader trucking work setting (Table 2) as well as theskeleton of the transportation=warehousing sector. Although it is difficultto classify any of these components as conventional workplaces for truckers,when combined, they represent the trucking work environment. These set-tings are disproportionately used by truckers, depending on driver type.FTL and national LTL drivers use predominantly truck stops, rest areas, andwarehouses and spend the majority of their time in their truck cabs—whichrepresent their primary workplace. Conversely, local=regional LTL and pack-age drivers (e.g., UPS) are heavy users of trucking terminals and do notspend nearly as much time as FTL=national LTL drivers at truck stops, restareas, or inside their trucks, which are not equipped in the same manneras long-haul truckers’ cabs are (Apostolopoulos et al., in press). When FTLand national LTL truckers are not driving, they load=unload, rest, eat, sleep,shower, do laundry, communicate with their families, fuel, shop, socialize,and complete paperwork in these settings. At truck stops, drivers stock upon food and beverage supplies that are stored in their truck cabs’ until theycan stop for a hot meal. In a sense, their work and personal lives are inextri-cably linked so that they spend nearly all of their time at one or anothercomponent of their broader work settings. The total daily number of hoursthat a trucker spends in such settings can range from about 30 minutes towell over 30 hours and can vary by type of work setting, phase of trip,and time of day—such as when a driver waits for a load at a truck stop orwarehouse over several hours. Even when truckers are not driving (whichis the essence of the job), they spend substantial amounts of their time attheir work settings. Unlike employees in other occupations who are ableto go home after work, truckers (e.g., FTL, national LTL) who may be awayfrom their home base for weeks at a time find themselves spending eventheir leisure time at or around these settings until they are able to get backto their homes for brief periods each month. The health effects of the occu-pation and worksite environments are highly unique due to this distinctiveaspect of trucking.
Because federal law restricts driving hours to 11 in one 24-hour period,long-haul truckers may snack all day and wait to consume one large meal atthe end of their shift with the goal of maximizing their driving time. Giventhis, the emotional satisfaction attached to bingeing on a hot meal atthe end of a long and tiring day of nonstop driving in isolation cannot be
128 Y. Apostolopoulos et al.
Dow
nloa
ded
by [
Uni
vers
ity o
f N
orth
Car
olin
a] a
t 12:
54 2
6 Fe
brua
ry 2
012
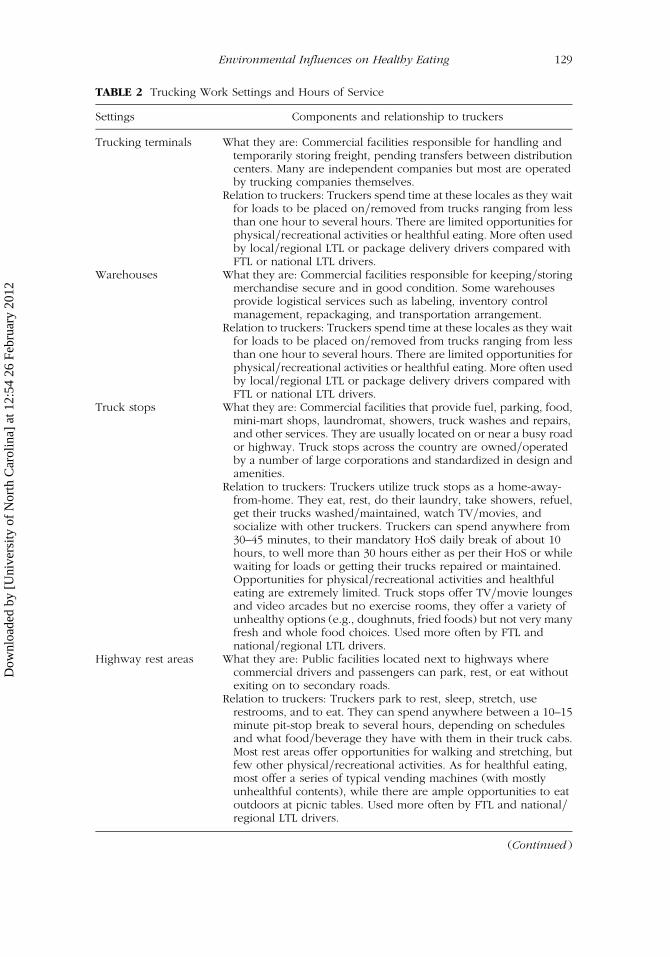
TABLE 2 Trucking Work Settings and Hours of Service
Settings Components and relationship to truckers
Trucking terminals What they are: Commercial facilities responsible for handling andtemporarily storing freight, pending transfers between distributioncenters. Many are independent companies but most are operatedby trucking companies themselves.
Relation to truckers: Truckers spend time at these locales as they waitfor loads to be placed on=removed from trucks ranging from lessthan one hour to several hours. There are limited opportunities forphysical=recreational activities or healthful eating. More often usedby local=regional LTL or package delivery drivers compared withFTL or national LTL drivers.
Warehouses What they are: Commercial facilities responsible for keeping=storingmerchandise secure and in good condition. Some warehousesprovide logistical services such as labeling, inventory controlmanagement, repackaging, and transportation arrangement.
Relation to truckers: Truckers spend time at these locales as they waitfor loads to be placed on=removed from trucks ranging from lessthan one hour to several hours. There are limited opportunities forphysical=recreational activities or healthful eating. More often usedby local=regional LTL or package delivery drivers compared withFTL or national LTL drivers.
Truck stops What they are: Commercial facilities that provide fuel, parking, food,mini-mart shops, laundromat, showers, truck washes and repairs,and other services. They are usually located on or near a busy roador highway. Truck stops across the country are owned=operatedby a number of large corporations and standardized in design andamenities.
Relation to truckers: Truckers utilize truck stops as a home-away-from-home. They eat, rest, do their laundry, take showers, refuel,get their trucks washed=maintained, watch TV=movies, andsocialize with other truckers. Truckers can spend anywhere from30–45 minutes, to their mandatory HoS daily break of about 10hours, to well more than 30 hours either as per their HoS or whilewaiting for loads or getting their trucks repaired or maintained.Opportunities for physical=recreational activities and healthfuleating are extremely limited. Truck stops offer TV=movie loungesand video arcades but no exercise rooms, they offer a variety ofunhealthy options (e.g., doughnuts, fried foods) but not very manyfresh and whole food choices. Used more often by FTL andnational=regional LTL drivers.
Highway rest areas What they are: Public facilities located next to highways wherecommercial drivers and passengers can park, rest, or eat withoutexiting on to secondary roads.
Relation to truckers: Truckers park to rest, sleep, stretch, userestrooms, and to eat. They can spend anywhere between a 10–15minute pit-stop break to several hours, depending on schedulesand what food=beverage they have with them in their truck cabs.Most rest areas offer opportunities for walking and stretching, butfew other physical=recreational activities. As for healthful eating,most offer a series of typical vending machines (with mostlyunhealthful contents), while there are ample opportunities to eatoutdoors at picnic tables. Used more often by FTL and national=regional LTL drivers.
(Continued )
Environmental Influences on Healthy Eating 129
Dow
nloa
ded
by [
Uni
vers
ity o
f N
orth
Car
olin
a] a
t 12:
54 2
6 Fe
brua
ry 2
012
overlooked. In fact, a high-calorie meal may actually be the highlight of one’sday or at least bring a significant level of comfort. Some cabs have refrigera-tors that can hold limited supplies, but perishable foods must be purchaseden route. Efforts to do so, however, are thwarted by parking restrictions setfor large vehicles by grocery stores where food can be purchased, and dri-vers often find little choice but to eat at truck stop restaurants instead. Resultsof our assessment of the various components of the trucking work setting areoffered in Tables 3 and 4 as total scores, maximum possible scores, andhealth-supportive ratings.
Food Venues
Restaurants with waiters, cafeteria-style establishments, and fast-food restau-rants make up the core of venues that sell food at these settings, which havean average of about 3.4 food venues per setting. Because truckers—particularly those designated as FTL or national LTL—eat the predominantpercentage of their meals at truck stops, these settings acquire a critical rolein truckers’ nutritional intake and weight management. Our evaluation ofhealthful-food options was carried out at trucking terminals, warehouses,
TABLE 2 Continued
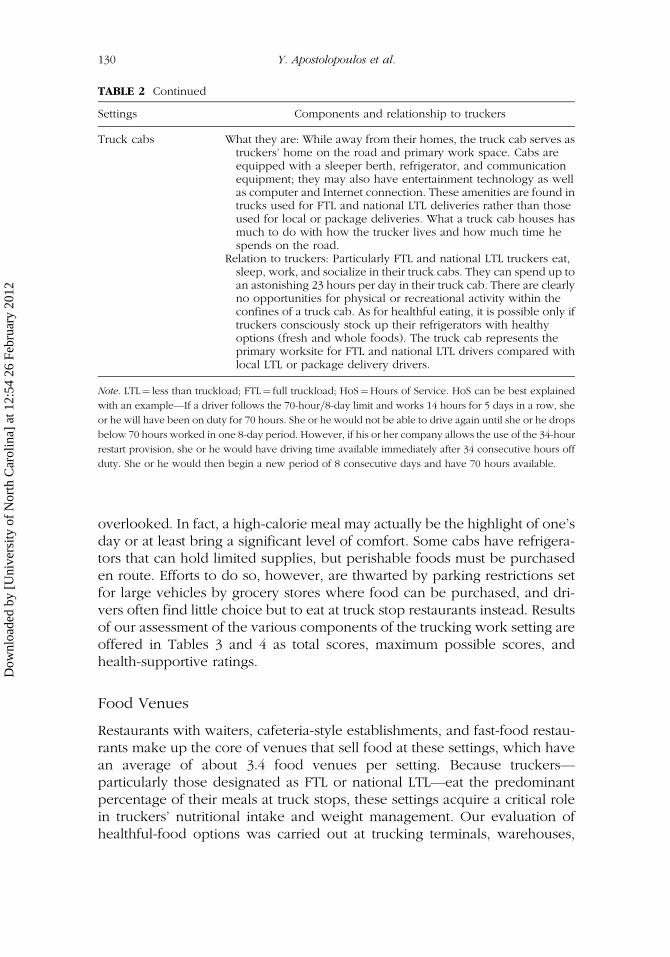
Settings Components and relationship to truckers
Truck cabs What they are: While away from their homes, the truck cab serves astruckers’ home on the road and primary work space. Cabs areequipped with a sleeper berth, refrigerator, and communicationequipment; they may also have entertainment technology as wellas computer and Internet connection. These amenities are found intrucks used for FTL and national LTL deliveries rather than thoseused for local or package deliveries. What a truck cab houses hasmuch to do with how the trucker lives and how much time hespends on the road.
Relation to truckers: Particularly FTL and national LTL truckers eat,sleep, work, and socialize in their truck cabs. They can spend up toan astonishing 23 hours per day in their truck cab. There are clearlyno opportunities for physical or recreational activity within theconfines of a truck cab. As for healthful eating, it is possible only iftruckers consciously stock up their refrigerators with healthyoptions (fresh and whole foods). The truck cab represents theprimary worksite for FTL and national LTL drivers compared withlocal LTL or package delivery drivers.
Note. LTL¼ less than truckload; FTL¼ full truckload; HoS¼Hours of Service. HoS can be best explained
with an example—If a driver follows the 70-hour=8-day limit and works 14 hours for 5 days in a row, she
or he will have been on duty for 70 hours. She or he would not be able to drive again until she or he drops
below 70 hours worked in one 8-day period. However, if his or her company allows the use of the 34-hour
restart provision, she or he would have driving time available immediately after 34 consecutive hours off
duty. She or he would then begin a new period of 8 consecutive days and have 70 hours available.
130 Y. Apostolopoulos et al.
Dow
nloa
ded
by [
Uni
vers
ity o
f N
orth
Car
olin
a] a
t 12:
54 2
6 Fe
brua
ry 2
012
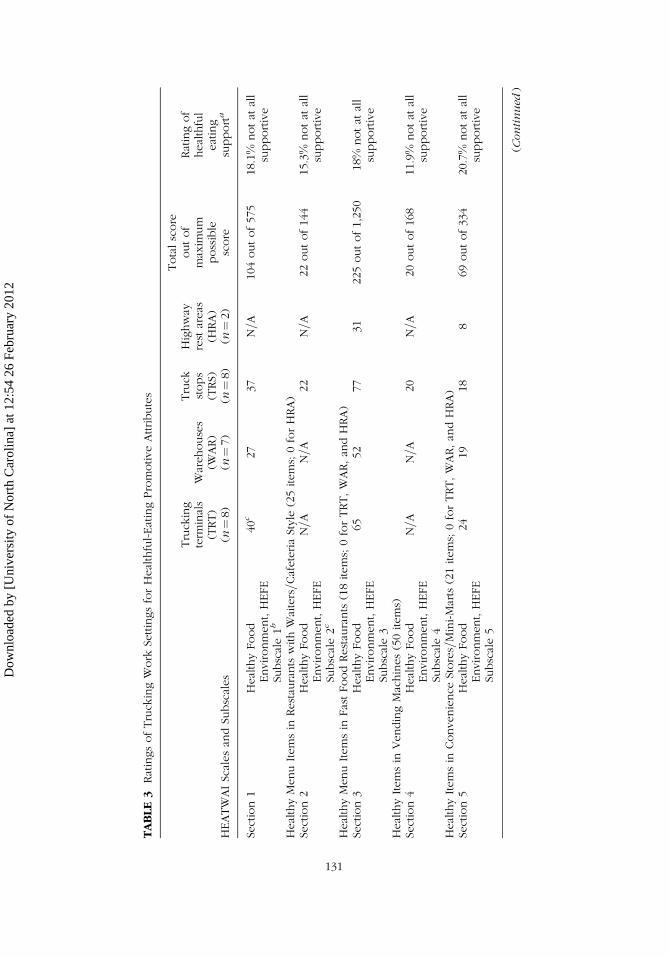
TABLE3
RatingsofTruckingWork
SettingsforHealthful-EatingPromotiveAttributes
HEATWAIScalesan
dSu
bscales
Trucking
term
inals
(TRT)
(n¼8)
Warehouses
(WAR)
(n¼7)
Truck
stops
(TRS)
(n¼8)
Highway
rest
areas
(HRA)
(n¼2)
Totalscore
outof
maxim
um
possible
score
Ratingof
healthful
eating
supporta
Section1
HealthyFood
Environment,HEFE
Subscale1b
40c
27
37
N=A
104outof575
18.1%
notat
all
supportive
HealthyMenuItemsin
Restau
rants
withWaiters=CafeteriaStyle
(25items;0forHRA)
Section2
HealthyFood
Environment,HEFE
Subscale2c
N=A
N=A
22
N=A
22outof144
15.3%
notat
all
supportive
HealthyMenuItemsin
FastFoodRestau
rants
(18items;0forTRT,WAR,an
dHRA)
Section3
HealthyFood
Environment,HEFE
Subscale3
65
52
77
31
225outof1,250
18%
notat
all
supportive
HealthyItemsin
VendingMachines(50items)
Section4
HealthyFood
Environment,HEFE
Subscale4
N=A
N=A
20
N=A
20outof168
11.9%
notat
all
supportive
HealthyItemsin
Convenience
Stores=Mini-Marts
(21items;0forTRT,WAR,an
dHRA)
Section5
HealthyFood
Environment,HEFE
Subscale5
24
19
18
869outof334
20.7%
notat
all
supportive
(Continued
)
131
Dow
nloa
ded
by [
Uni
vers
ity o
f N
orth
Car
olin
a] a
t 12:
54 2
6 Fe
brua
ry 2
012
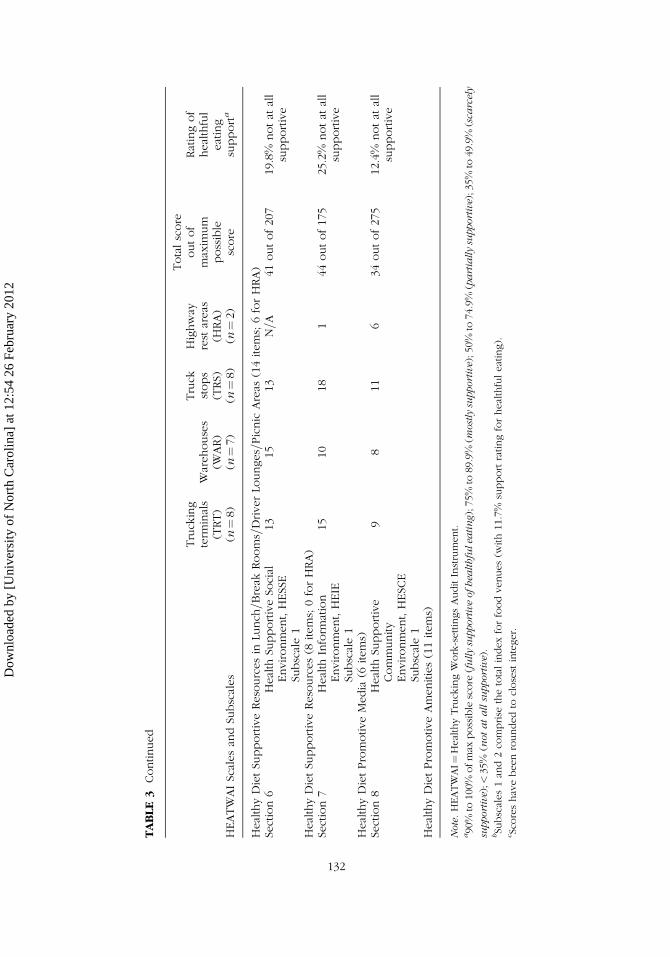
TABLE3
Continued
HEATWAIScalesan
dSu
bscales
Trucking
term
inals
(TRT)
(n¼8)
Warehouses
(WAR)
(n¼7)
Truck
stops
(TRS)
(n¼8)
Highway
rest
areas
(HRA)
(n¼2)
Totalscore
outof
maxim
um
possible
score
Ratingof
healthful
eating
supporta
HealthyDietSu
pportiveResourcesin
Lunch
=Break
Rooms=DriverLo
unges=Picnic
Areas
(14items;6forHRA)
Section6
Health
SupportiveSo
cial
Environment,HESSE
Subscale1
13
15
13
N=A
41outof207
19.8%
notat
all
supportive
HealthyDietSu
pportiveResources(8
items;0forHRA)
Section7
Health
Inform
ation
Environment,HEIE
Subscale1
15
10
18
144outof175
25.2%
notat
all
supportive
HealthyDietPromotiveMedia
(6items)
Section8
Health
Supportive
Community
Environment,HESC
ESu
bscale1
98
11
634outof275
12.4%
notat
all
supportive
HealthyDietPromotiveAmenities(11items)
Note.HEATWAI¼
HealthyTruckingWork-settingsAuditInstrument.
a90%
to100%
ofmax
possible
score
(fullysupportiveofhealthfuleating);75%
to89.9%
(mostlysupportive);50%
to74.9%
(partiallysupportive);35%
to49.9%
(sca
rcely
supportive);<
35%
(notatallsupportive).
bSu
bscales1an
d2co
mprise
thetotalindex
forfoodvenues
(with11.7%
supportratingforhealthfuleating).
cScoreshavebeenroundedto
closest
integer.
132
Dow
nloa
ded
by [
Uni
vers
ity o
f N
orth
Car
olin
a] a
t 12:
54 2
6 Fe
brua
ry 2
012
and truck stops only, because highway rest areas do not have restaurants,and truck cabs mainly contain food that drivers purchase from truck stops.The assessment of restaurants with waiters or cafeteria-style eateries resultedin a rating of 104 points for the presence of healthy items out of a maximumof 575 possible points; which represents only 18.1% of total support forhealthful eating. Out of 23 trucking work environments with this type of foodvenue that were evaluated, few healthful food options (i.e., vegetariandishes, 100% natural juice, reduced portions at prices lower than thosecharged for full portions) and prompts (i.e., visible nutritional informationon menus, visible signs featuring or encouraging healthy menu items, sumprice of a-la-carte items comparable to cheaper combination ‘‘value’’ meals)were recorded. When assessing fast-food restaurants, which are only presentat truck stops, the presence of healthy items received only 22 points out of amaximum of 144 possible points. In other words, fast-food restaurantsreceived a very low rating of 15.3% in terms of their support for healthful eat-ing. The evaluation of fast-food restaurants at eight truck stops revealed veryfew healthful food options (i.e., salads, vegetable-based soups, reducedcalorie=fat-free condiments) or prompts (i.e., point-of-purchase advertise-ments for combo meals with vegetables and nonsoda beverages, healthy sub-stitutes for fries offered at no extra cost). The overall index for food venuesresulted in a disheartening rating of 11.7% (not-at-all supportive of healthfuleating) (Table 3, Sections 1 and 2).
Vending Machines
Vending machines are convenient, located in various settings, and can con-tribute significantly to truckers’ nutritional intake. Their offerings include avariety of snacks that drivers can use to tide them over their long work-days—sometimes reaching 14 hours—until they can stop for a hot meal,be it at home, a truck stop restaurant, or fast-food restaurant. Especially in
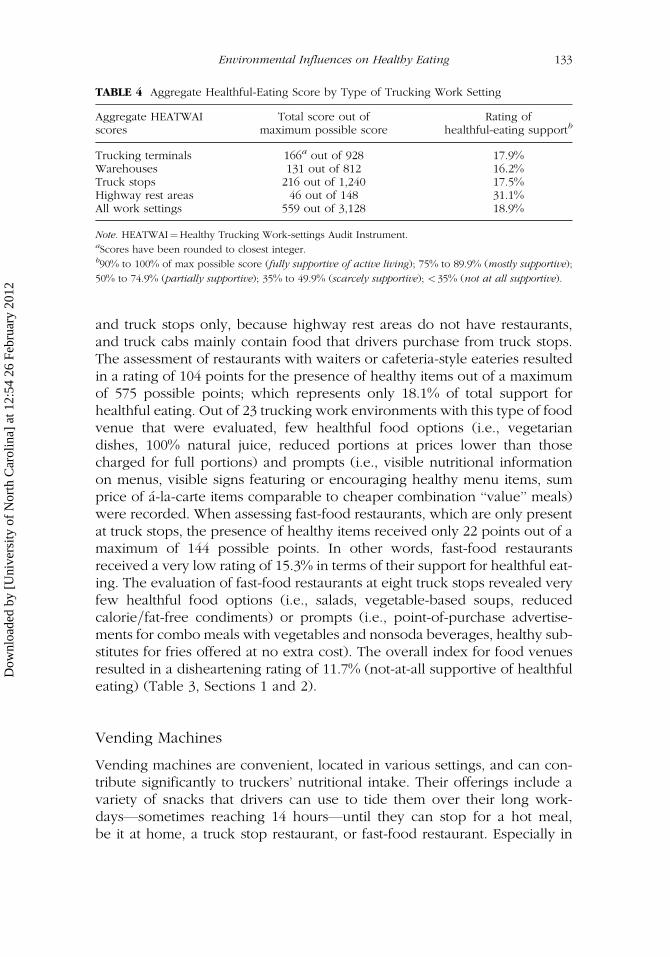
TABLE 4 Aggregate Healthful-Eating Score by Type of Trucking Work Setting
Aggregate HEATWAIscores
Total score out ofmaximum possible score
Rating ofhealthful-eating supportb
Trucking terminals 166a out of 928 17.9%Warehouses 131 out of 812 16.2%Truck stops 216 out of 1,240 17.5%Highway rest areas 46 out of 148 31.1%All work settings 559 out of 3,128 18.9%
Note. HEATWAI¼Healthy Trucking Work-settings Audit Instrument.aScores have been rounded to closest integer.b90% to 100% of max possible score (fully supportive of active living); 75% to 89.9% (mostly supportive);
50% to 74.9% (partially supportive); 35% to 49.9% (scarcely supportive); < 35% (not at all supportive).
Environmental Influences on Healthy Eating 133
Dow
nloa
ded
by [
Uni
vers
ity o
f N
orth
Car
olin
a] a
t 12:
54 2
6 Fe
brua
ry 2
012
those settings where restaurants are unavailable, vending machines are veryimportant. Our evaluation yielded an average number of 3.1 vendingmachines at truck stops, 5.2 at trucking terminals, 4.7 at warehouses, and7.5 at highway rest areas, where they offer the only source of food and bev-erage. From a total of 50 healthful options available in vending machinesrepresenting a maximum of 1,250 possible points, the actual availability ofhealthful options was rated only 225 points, or a rating of 18% (not-at-all sup-portive of healthful eating) (Table 3, Section 3). Examples of healthful fooditems included 100% fresh juice, fruit smoothies, low-fat milk and yogurt,nuts=seeds, trail mix, whole fruits or fruit salads, ready to eat vegetables,and signs featuring healthy items. Sodas comprised more than 75% of all colddrinks whereas only 23% of nonrefrigerated snacks could be consideredhealthful.
Food Stores and Mini-Marts
The presence of food stores and more importantly the availability of healthfulfood options in these stores are important contributors to patterns of healthyeating and overall health for communities (Glanz & Yaroch, 2004). Con-venience stores or mini-marts selling food products were located only attruck stops, with an average of 1.7 stores per truck stop. From the eight truckstops that were assessed, more than 85% of the items carried in themini-marts were deemed extremely unhealthy options (i.e., sodas, hot dogs,nachos=cheese, candies, and donuts). The cumulative score of healthfulitems (i.e., fresh fruit, nuts, wheat crackers, 100% fresh juice) available forpurchase was only 20 out of a possible score of 168 points. This performanceprovided the lowest support rating among all eight assessment categories, of11.9% or not-at-all supportive of healthful eating (Table 3, Section 4).
Lunch-Break Rooms and Driver Lounges
The food environment in lunch-break rooms, driver lounges, and picnicareas was captured with 18 items. Examples of items promoting healthful eat-ing included the presence of microwave ovens, refrigerators, filtered watercoolers, seating areas, and dietary information notices. The presence of itemspromoting healthy eating achieved 69 points out of a maximum of 334 pos-sible points; in other words a rating of 20.7% (not-at-all supportive of health-ful eating). These amenities were found to be more readily available attrucking terminals and warehouses, but much less often at truck stops.Although the availability of such amenities does contribute positively tomaintaining healthful dietary patterns in general, truckers are restricted forlogistic reasons from carrying home-cooked food with them or preparingfood on the road (Apostolopoulos & Sonmez, 2006). As a result, these
134 Y. Apostolopoulos et al.
Dow
nloa
ded
by [
Uni
vers
ity o
f N
orth
Car
olin
a] a
t 12:
54 2
6 Fe
brua
ry 2
012
amenities are used at best to keep or heat frozen dinners or other processedfood items (Table 3, Section 5).
Social Environment and Media Promoting Healthy Eating
If healthy foods can be made available, the workplace can be an ideal settingto provide direct support for healthful-eating habits. The workplace can alsoserve as an ideal setting in which to develop a friendly and supportiveenvironment for health promotion and for fostering a culture of health.The perceived and actual support for healthful eating, from the social dimen-sion of the workplace, remains among the strongest independent predictorsfor eating healthfully (French, Harnack, Toomey, & Hannan, 2007). Work-place policies, colleagues, friends at work, and other supportive social net-works are critical in defining health behaviors (Barnett et al., 2007) as wellas affecting negative eating behaviors (Barabasi, 2007). Our assessment oftrucking work settings revealed the complete absence of organized onsitehealth-promotion activities for nutrition, wellness committees, committeesto oversee healthy eating programs, free preventive=wellness screenings,free or discounted health screenings, and health risk appraisals from all 23evaluated trucking contexts (excluding highway rest areas). The health sup-portive social environment for truckers and other employees received a rat-ing of 41 out of a maximum possible 207 points, or 19.8% which isconsidered not-at-all supportive of healthful eating (Table 3, Section 6).
The presence of print and other forms of health promotion and infor-mation media is important to healthful eating because they have the poten-tial to educate and influence eating-related behaviors. Therefore, truckingsettings were evaluated in terms of their health information environmentand all bulletin boards, notices, postings, posters, brochures, and fliers witheducational messages on nutrition=diet and weight management wererecorded. Health information environments of work settings evaluatedreceived a total score of 44 out of a maximum possible 175 points, or only25.5% which is considered not-at-all supportive of healthful eating (Table 3,Section 7).
Surrounding Communities Promoting Healthy Eating
The presence of food stores carrying affordable healthful products is a fun-damental contributor to the overall health of neighborhood residents (Glanz &Yaroch, 2004); however, lower-income=minority neighborhoods often havecomparatively fewer supermarkets that sell foods needed to maintain ahealthy diet, but many more fast-food chain restaurants than theirhigher-income counterparts (Macintyre, 2007), which has prompted the termfood deserts. This situation is unfortunately mirrored in broader truckingwork settings. Although healthful food choices available within the
Environmental Influences on Healthy Eating 135
Dow
nloa
ded
by [
Uni
vers
ity o
f N
orth
Car
olin
a] a
t 12:
54 2
6 Fe
brua
ry 2
012
boundaries of trucking work settings can significantly influence truckers’nutritional intake, the broader neighborhoods that surround such work set-tings can offer vital complementary resources and opportunities. Quite thereverse, communities immediately surrounding trucking warehouses andterminals, or truck stops offer exceedingly limited opportunities as a resultof their location in either heavily commercial areas or depressed urban areaswith closed down businesses, abandoned buildings, vacant lots, and visibleevidence of vandalism and crime. Similarly, highway rest areas, which aremore often than not geographically and socially isolated, offer next to noth-ing. None of the trucking settings provided easy access to healthful foodoptions (i.e., easily accessible healthy carry-out items). Furthermore, the lackof perceived safety linked to overt signs of crime and homelessness at severallocales made any attempt to seek out food stores in the surrounding com-munities highly unattractive and unfeasible. The total score for this dimen-sion of HEATWAI was 34 out of a maximum of 275 possible points.Overall community support was rated only 12.4%, a not-at-all supportiveenvironment for healthful eating (Table 3, Section 8).
Opportunities for Healthful Eating: Trucking VersusOther Occupations
Although environmental supports for healthful eating were found to beextremely poor, differences across various types of trucking work settingsare critical for the design and prioritization of future interventions, especiallyin light of implications for potential health promotion at such work contexts.Even from the small sample of highway rest areas assessed in the currentstudy, it is evident that this trucking work setting provides the most suppor-tive environment to truckers for healthful eating, especially when viewed incomparative terms. Given that none of the four contexts evaluated providedany substantive support for healthful eating, rest areas earned a healthful-eating support rating of 31.1% (in some cases more than twice as high asother settings), whereas trucking terminals received a 17.9%, truck stops17.5%, and warehouses only 16.2% (Table 4). Collectively, these 25 truckingwork settings, with an overall rating of 18.9% (not-at-all supportive), do notemerge as work contexts that encourage healthful eating.
These findings further corroborate our hypothesis that the trucking sec-tor remains an overall underserved workplace, which can be linked to theblue-collar nature of its employees (Centers for Disease Control and Preven-tion [CDC], 2005). Although this explanation remains nothing more than aworking assumption, it is indirectly supported by ample empirical evidencedocumenting that minority=working-class occupational segments generallyremain underserved in terms of access to health care and healthful resources(e.g., grocery stores), and consequently linked to a higher burden of disease(Krieger, 2010; Larson, Story, & Nelson, 2009; Macintyre, 2007).
136 Y. Apostolopoulos et al.
Dow
nloa
ded
by [
Uni
vers
ity o
f N
orth
Car
olin
a] a
t 12:
54 2
6 Fe
brua
ry 2
012
Truckers are classified as one of the highest-risk occupational segmentsdue to their elevated occupational hazards; however, as our findings support,they are also deprived of those organizational=institutional supports criticalto personal health (e.g., lack of healthful food choices and obesity risk)and public safety (e.g., links between elevated body mass index (BMI),stress, sleep apnea, and increased accidents=crashes) (Taylor & Dorn,2006; Wiegand, Hanowski, & McDonald, 2009). As such, trucking work set-tings should be identified as healthy food deserts, particularly because theseratings provide additional explanation in terms of truckers’ exceedingly highmorbidity=mortality rates. Although this article does not suggest causal linksbetween trucking settings’ poor level of environmental supports for healthfulbehaviors (e.g., few health-promotive resources) and adverse health out-comes (e.g., elevated morbidities), our findings do offer further evidence thatthe trucking sector and its various settings where truckers work or spendlarge segments of their days are not conducive to healthful behaviors.Although direct support for healthy food options might be logistically restric-tive or even cost prohibitive for small-scale work settings, larger firms andnational truck stop chains privy to greater resources are definitely missinga significant social marketing opportunity by not providing them.
Results from assessments at other blue-collar worksites have beenequally revealing. One national health-promotion survey of worksitesrecorded the presence of nutrition=weight management programs in 23%of the cases and of healthy-food choices labeled in cafeterias 38% of thecases (Linnan et al., 2008; Whitfield-Jacobson, Prawitz, & Lukaszuk, 2007).An assessment of four bus garages in Minnesota determined the presenceof few foodstores=restaurants within sight of each garage and further notedthat only 15% of foods and 26% of beverages available from vendingmachines met criteria for healthful choices (Shimotsu, French, Gerlach, &Hannan, 2007). Thirty hotels were assessed to determine associationsbetween employee obesity and the presence of weight managementresources, however, none of the environmental variables (e.g., availabilityof low-fat food choices) were found to be related to BMI (Nigg, Albright,Williams, & Nichos, 2010). Studies from diverse worksites have indicated thatthe majority of foods and beverages in vending machines are low innutritional value but high in calories, fat, and sugar, and that their presencein these environments may lead to excessive energy intake and weight gain(French et al., 2001; Samuels and Associates, 2005; Wiecha, Finkelstein,Troped, Fragala, & Peterson, 2006). Comparative assessments of other truck-ing work settings do not exist; however, foregoing studies indicate thatthough policies and resources of many workplaces do not fully supporthealthy eating, there are disparities among different work environments, withtrucking work environments ranking particularly very low. With Americanseating out more frequently and consuming more calories than ever beforeat away-from-home establishments, and the number of food establishments
Environmental Influences on Healthy Eating 137
Dow
nloa
ded
by [
Uni
vers
ity o
f N
orth
Car
olin
a] a
t 12:
54 2
6 Fe
brua
ry 2
012
nearly doubling over the past three decades (Keystone Center, 2006), truck-ers’ available food choices are important, mainly in the context of alarmingshifts in nutrition-related morbidities.
An Integrative Paradigm for Healthier Trucking Work Settings
Given truckers’ high morbidity rates, the low performance of trucking worksettings in terms of their support for healthful eating is hardly surprising.Truckers work about 14 hours a day under stringent conditions and oftenfind meager resources at various work settings, but particularly at truck stops,where long-haul and regional truckers are confined for much of their down-times. In these environments, truckers find mostly unhealthy food items(Lawrence, Boyle, Craypo, & Samuels, 2009), scant opportunities for physicalactivity (Wood et al., 2007), absence of wellness programs (Samuels andAssociates, 2005), and no access to healthcare (Wiecha et al., 2006). This isoftentimes because these work settings are located in isolated places with lit-tle to no access to public transit systems, or in socioeconomically depressedareas with limited health-supportive choices and numerous risk-laden oppor-tunities (Glanz & Yaroch, 2004). Because individual factors alone are insuf-ficient to explain increases in obesity rates, and environmental factors thatencourage increased energy intake and decreased energy expenditures playa growing role in the epidemic (Apostolopoulos & Sonmez, 2006), the urgentneed for environmental-level interventions at trucking work settings isincontrovertible.
Although the workplace has been identified as a promising setting forimplementing health promotion programs, no more than one in five work-sites with a minimum of 50 employees across the United States offers ahealth-promotion program that combines physical activity, healthy eating,and weight management (Shimotsu et al., 2007). Worksite health promotion(WHP) programs focusing on physical activity and nutrition have consistentlybrought about positive effects on fitness levels, lipids, anthropometric mea-sures, work attendance, and stress (French et al., 2007; Whitfield-Jacobsonet al., 2007). There is evidence to support that significant employer expendi-tures on healthcare can be lowered as a result of WHP programs (Davis et al.,2007). Numerous benefits of investing in WHP programs include enhancedworker productivity, improved workplace morale, positive changes to work-place culture, reduced absenteeism, improved staff retention, and reducedwork-related injuries and medical costs (Apostolopoulos & Sonmez, 2007;Hill & Peters, 1998; Perry & Garratt, 2010; Solomon, Doucette, Garland, &McGinn, 2004).
A review of wellness programs in the trucking sector yields only a fewthat have been implemented over the past two decades, which are relativelysmall scale, oddly compartmentalized, inefficiently run, and mostly under-funded (French et al., 2001). In the 1990s, a number of trucking companies
138 Y. Apostolopoulos et al.
Dow
nloa
ded
by [
Uni
vers
ity o
f N
orth
Car
olin
a] a
t 12:
54 2
6 Fe
brua
ry 2
012
had initiated various forms of wellness programs for their employees andachieved relatively good results in improving individual health while reduc-ing health care costs and increasing productivity; however, some have sinceinexplicably discontinued these programs (Linnan et al., 2008). The rationalebehind these decisions might be rooted in the fact that driver turnover ratescan reach over 130% and drivers may work for a particular trucking companyfor a few months only (Suzuki, Crum, & Pautsch, 2009), bringing into ques-tion the value of WHP; however, these efforts combined with others have thepotential to be used to actually combat high turnover rates by creating betterwork conditions for drivers. In light of truckers’ costly fatal crashes and spec-ulations on underlying causes, the Federal Motor Carrier Safety Administra-tion—in its efforts to provide supporting evidence for the preventivefunction of wellness programs—cosponsored the ‘‘Gettin’ in Gear’’ programto address risks associated with commercial driving (U.S. Department ofHealth and Human Services, 2000). Along these lines, the National Institutefor Occupational Safety and Health (NIOSH) has recently planned a nationalbaseline assessment on whether and how occupational exposures canexplain truckers’ elevated morbid conditions and crashes (Conn, Hafdahl,Cooper, Brown, & Lusk, 2009).
The foregoing discussion and the current study’s findings support theneed for comprehensive WHP programs focusing not only on minimizingfood deserts and improving the active-living environment of trucking set-tings, but on promoting an overall healthier work environment for the truck-ing sector. The current paradigm (Conn et al., 2009; Pratt et al., 2007), whichentails mostly an occupational safety approach with a primary focus on acci-dents and crashes or small-scale, individual-focused wellness programs(Linnan et al., 2008), has become obsolete. There is strong evidence to sup-port that WHP programs could be significantly more effective if they integrateoccupational safety with health promotion, thereby collectively enhancingthe health and safety of working people (Hunnicutt, 2009). In the case ofthe trucking sector, this paradigm would have a comprehensive scopethat integrates occupational health and health promotion, with multiplelevels of influence, including the individual, the interpersonal, and theorganizational=institutional=ecological levels. This holistic and multicompo-nent approach to promoting healthier living would target a wide range of riskfactors (i.e., unhealthy hours of service, total work hours and needed manda-tory breaks, limited access to healthful foods at truck stops, smoking, lack offitness facilities at truck stops) at several intertwined levels: the individualtrucker’s lifestyle practices, federal government regulations, trucking-sectoroperations, corporate policies affecting trucking work contexts, the truckingbuilt-environment (including ergonomic truck cab design), and the full spec-trum of the trucking work environment (Mackie, 2008). As per this approach,trucking stakeholders, such as union leaders, CEOs of trucking companiesand truck stops, health insurance firms, NIOSH, and the Federal Motor
Environmental Influences on Healthy Eating 139
Dow
nloa
ded
by [
Uni
vers
ity o
f N
orth
Car
olin
a] a
t 12:
54 2
6 Fe
brua
ry 2
012
Carrier Safety Administration (FMCSA) would be made coresponsible forcomprehensive and evolving worksite health promotions with integratedmonitoring and evaluation components. The main thrust of this rationaleincorporates the fact that WHP and occupational safety and health providetwo parallel pathways for promoting trucker health, which will be signifi-cantly strengthened when they are coordinated and integrated rather thanseparate and independent (Hunnicutt, 2009).
CONCLUSIONS
This first assessment of the trucking sector’s environmental barriers forhealthful eating has corroborated accumulating evidence that supports thattrucking work settings remain not only healthful food=eating deserts butoverall highly unhealthy places. An assessment of the physical, social, andinformation environments of trucking work settings and surroundingcommunities revealed very limited opportunities for healthy food and eatingchoices. It is especially surprising that truck stops in particular remain com-pletely detached from the vital needs of their primary customer base and bla-tantly miss opportunities to not only increase their competitive edge andrevenues but to vastly improve their customers’ satisfaction.
These findings should not surprise those immersed in the trucking sec-tor, particularly because the alarmingly high morbidities of truckers lend cre-dence to results. This occupational segment along with several millionpeople employed by the commercial transport sector have been inexplicablyneglected by the federal government, business leaders, and public-healthprofessionals. The time is ripe for comprehensive multistakeholder health-promotion interventions that simultaneously target the plethora of inter-twined risk factors that are associated with trucking occupational milieux.A multistakeholder, multilevel approach that incorporates WHP and OSH,and goes beyond individual trucker lifestyles is an imperative public-healthneed in the context of severe occupational health disparities.
REFERENCES
Apostolopoulos, Y., Shattell, M., Sonmez, S., Strack, R., Haldeman, L., & Jones, V. (Inpress). Active living in the trucking sector: Environmental barriers and healthpromotion strategies. Journal of Physical Activity and Health.
Apostolopoulos, Y., & Sonmez, S. (2006). Trucker risk networks, drug use, andtransmission of STIs=BBIs: Preliminary findings from the first epidemiologicalinvestigation in North America. Atlanta, GA: Emory University School of Medi-cine, Mobility and Population Health Unit.
140 Y. Apostolopoulos et al.
Dow
nloa
ded
by [
Uni
vers
ity o
f N
orth
Car
olin
a] a
t 12:
54 2
6 Fe
brua
ry 2
012
Apostolopoulos, Y., & Sonmez, S. (2007). Tracing the diffusion of infectious diseasesin the transport sector. In Y. Apostolopoulos & S. Sonmez (Eds.), Populationmobility and infectious disease (pp. 131–156). New York, NY: Springer.
Apostolopoulos, Y., Sonmez, S., Shattell, M., & Belzer, M. H. (2010). Worksite-induced morbidities of truck drivers in North America: A research meta-analysisof an underserved population. American Association of Occupational HealthNurses Journal, 58(7), 285–296.
Barabasi, A. L. (2007). Network medicine—From obesity to the diseasome. NewEngland Journal of Medicine, 357(4), 404–407.
Barnett, E., Anderson, T., Blosnich, J., Menard, J., Halverson, J., & Casper, M. (2007).Heart healthy and stroke free: A social environment handbook. Atlanta: U.S. Depart-ment of Health and Human Services, Centers for Disease Control and Prevention.
Bigert, C., Gustavsson, P., Hallqvist, J., Hogstedt, C., Lewne, M., Plato, N., . . .Scheele, P. (2003). Myocardial infarction among professional drivers. Epidemi-ology, 14(3), 333–339.
Bureau of Labor Statistics. (2010a). Employment situation summary. Retrieved fromhttp://www.bls.gov/news.release/empsit.nr0.htm
Bureau of Labor Statistics. (2010b). Occupational outlook handbook 2010–11 edi-tion: Truck drivers and driver=sales workers. Retrieved from http://www.bls.gov/oco/ocos246.htm
Centers for Disease Control and Prevention. (2005). SWAT tool for observing worksiteenvironments (TOWE). Retrieved from http://www.cdc.gov/nccdphp/dnpao/hwi/downloads/swat/SWAT_observing_worksite_environment.pdf
Conn, V. S., Hafdahl, A. R., Cooper, P. S., Brown, L. M., & Lusk, S. L. (2009).Meta-analysis of workplace physical activity interventions. American Journalof Preventive Medicine, 37(4), 330–339.
Davis, M. E., Smith, T. J., Laden, F., Hart, J. E., Blicharz, A. P., Reaser, P., & Garshick,E. (2007). Driver exposure to combustion particles in the US trucking industry.Journal of Occupational and Environmental Hygiene, 4(11), 848–854.
Flegal, K. M., Carroll, M. D., Ogden, C. L., & Curtin, L. R. (2010). Prevalence andtrends in obesity among U.S. adults, 1999–2008. Journal of the AmericanMedical Association, 303(3), 235–241.
French, S. A., Harnack, L. J., Toomey, T. L., & Hannan, P. J. (2007). Associationbetween body weight, physical activity, and food choices among metropolitantransit workers. International Journal of Behavioral Nutrition and PhysicalActivity, 4(52), 52–64. doi:10.1186=1479-5868-4-52.
French, S. A., Jeffrey, R.W., Story,M., Breitlow, K. K., Baxter, J. S., Hannan, P., & Snyder,M. P. (2001). Pricing and promotion effects on low-fat vending snack purchases:The CHIPS study. American Journal of Public Health, 91(1), 112–117.
French, S. A., Story, M., & Jeffery, R. W. (2001). Environmental influences on eatingand physical activity. Annual Review of Public Health, 22, 309–335.
Glanz, K., Sallis, J. F., Saelens, B. E., & Frank, L. D. (2007). Nutrition environmentmeasures survey in stores (NEMS-S). American Journal of Preventive Medicine,32(4), 282–289.
Glanz, K. G., & Yaroch, A. L. (2004). Strategies for increasing fruit and vegetableintake in grocery stores and communities: Policy, pricing, and environmentalchange. Preventive Medicine, 39(2), 75–80.
Environmental Influences on Healthy Eating 141
Dow
nloa
ded
by [
Uni
vers
ity o
f N
orth
Car
olin
a] a
t 12:
54 2
6 Fe
brua
ry 2
012
Hill, J. O., & Peters, J. C. (1998). Environmental contributions to the obesity epi-demic. Science, 280, 1371–1374.
Hunnicutt, D. (2009). The cost of wellness: A WELCOA expert interview with Dr RonGoetzel. Absolute Advantage, 7(10). Retrieved from http://www.absoluteadvantage.org/article/?article=277
The Keystone Center. (2006). The keystone forum on away-from-home-foods: Finalreport. Washington, DC: Author.
Krieger, N. (1994). Epidemiology and the web of causation: Has anyone seen thespider? Social Science and Medicine, 39, 887–903.
Krieger, N. (2010). Workers are people too: Societal aspects of occupational healthdisparities: An ecosocial perspective. American Journal of Industrial Medicine,53, 104–115.
Krueger, G. P., Brewster, R. M., Dick, V. R., Inderbitzen, R. E., & Staplin, L.(2007). Health and wellness programs for commercial drivers (Commercialtruck and bus safety, Synthesis 15). Washington, DC: Transportation ResearchBoard.
Larson, N., Story, M. T., & Nelson, M. C. (2009). Neighborhood environments: Dis-parities in access to healthy foods in the US. American Journal of PreventiveMedicine, 36, 74–81.
Lawrence, S., Boyle, M., Craypo, L., & Samuels, S. (2009). The food and beveragevending environment in health care facilities participating in the healthy eating,active communities program. Pediatrics, 123(5), S287–S292.
Linnan, L., Bowling, M., Childress, J., Lindsay, G., Blakey, C., Pronk, S., . . . Royall, P.(2008). Results of the 2004 national worksite health promotion survey.American Journal of Public Health, 98, 1503–1509.
Macintyre, S. (2007). Deprivation amplification revisited; or, is it always true thatpoorer places have poorer access to resources for healthy diets and physicalactivity? International Journal of Behavioral Nutrition and Physical Activity,4, 32–38.
Mackie, H. (2008). The health and fitness of log truck drivers: An evaluation of theindustry and recommendations for action. Auckland, New Zealand: Log Trans-port Safety Council and Transport Engineering Research New Zealand Limited.
Martin, B. C., Church, T. S., Bonnell, R., Ben-Joseph, R., & Borgstadt, T. (2009). Theimpact of overweight and obesity on the direct medical costs of truck drivers.Journal of Occupational and Environmental Medicine, 51(1), 180–184.
McMichael, A. J. (1999). Prisoners of the proximate: Loosening the constraints on epi-demiology in an age of change.American Journal of Epidemiology, 149, 887–897.
Nigg, C. R., Albright, C., Williams, R., & Nichols, C. (2010). Are physical activity andnutrition indicators of the checklist of the health promotion environments atworksites (CHEW) associated with employee obesity among hotel workers?Journal of Occupational and Environmental Medicine, 52, S4–S7.
Perry, B., & Garratt, B. L. (2010). Driver health: Roadmap to wellness (RoadsideMedical White Paper). Retrieved from http://www.roadsidemed.com/Portals/0/Roadside%20%20ATA%20Driver%20Health.pdf
Pratt, C. A., Lemon, S. C., Fernandez, I. D., Goetzel, R., Beresford, S. A., French, S. A.,. . . Webber, L. S. (2007). Design characteristics of worksite environmental inter-ventions for obesity prevention. Obesity, 15(9), 2171–2180.
142 Y. Apostolopoulos et al.
Dow
nloa
ded
by [
Uni
vers
ity o
f N
orth
Car
olin
a] a
t 12:
54 2
6 Fe
brua
ry 2
012
Richter, K. P., Harris, K. J., Paine-Andrews, A., Fawcett, S. B., Schmid, T. L.,Lankenau, B. H., & Johnston, J. (2000). Measuring the health environment forphysical activity and nutrition among youth: A review of the literature and appli-cations for community initiatives. Preventive Medicine, 31(2), S98–S111.
Robinson, C., & Burnett, C. A. (2005). Truck drivers and heart disease in theUnited States, 1979–1990. American Journal of Industrial Medicine, 47(2),113–119.
Salzman, G. M., & Belzer, M. H. (2007). Truck driver occupational safety and health:2003 conference report and selective literature review (NIOSH Publication no.2007-120). Atlanta, GA: Centers for Disease Control and Prevention, NationalInstitute for Occupational Safety and Health.
Samuels and Associates. (2005). Selling obesity: Beverage vending machines inCalifornia high schools. Los Angeles, CA: California Endowment.
Shimotsu, S. T., French, S. A., Gerlach, A. F., & Hannan, P. J. (2007). Worksiteenvironment physical activity and health food choices: Measurement of theworksite food and physical activity environment at fours metropolitan bus gar-ages. International Journal of Behavioral Nutrition and Physical Activity, 4(17),17–25. doi:10.1186=1479-5868-4-17.
Solomon, A. J., Doucette, J. T., Garland, E., & McGinn, T. (2004). Healthcare and thelong haul: Long-distance truckers—A medically underserved population.American Journal of Industrial Medicine, 46(5), 463–471.
Susser, M. (1996). Choosing a future for epidemiology: From black boxes to Chineseboxes and eco-epidemiology. American Journal of Public Health, 86, 674–677.
Suzuki, Y., Crum, M., & Pautsch, G. R. (2009). Predicting truck driver turnover.Transportation Research Part E: Logistics and Transportation Review, 45(4),517–666.
Taylor, A. H., & Dorn, L. (2006). Stress, fatigue, health and risk of road traffic acci-dents among professional drivers: The contribution of physical inactivity.Annual Review of Public Health, 27, 371–391.
U.S. Department of Health and Human Services. (2000). Healthy people 2010: Under-standing and improving health (2nd ed.). Washington, DC: U.S. GovernmentPrinting Office.
Whitfield-Jacobson, P. J., Prawitz, A. D., & Lukaszuk, J. M. (2007). Long-haul truckdrivers want healthful meal options at truck-stop restaurants. Journal of theAmerican Dietetic Association, 107(12), 2125–2129.
Wiecha, J. L., Finkelstein, D., Troped, P. J., Fragala, M., & Peterson, K. E. (2006).School vending machine use and fast food restaurant use are associated withsugar-sweetened beverage intake in youth. Journal of the American DieteticAssociation, 106(10), 1624–1630.
Wiegand, D. M., Hanowski, R. J., & McDonald, S. E. (2009). Commercial drivers’health: A naturalistic study of body mass index, fatigue, and involvement insafety-critical events. Traffic Injury Prevention, 10, 573–579.
Wood, E. M., Hegmann, K. T., Murtaugh, M., & Thiese, M. S. (2007, April). Lifestylerisk factors in commercial drivers. In D. S. Bloswick, K. T. Hegmann, & R. F.Sesek, (Eds.), Proceedings of the 5th Annual Regional National OccupationalResearch Agenda (NORA) Young=New Investigators Symposium (pp. 155–164).Salt Lake City, Utah.
Environmental Influences on Healthy Eating 143
Dow
nloa
ded
by [
Uni
vers
ity o
f N
orth
Car
olin
a] a
t 12:
54 2
6 Fe
brua
ry 2
012