
TACR: India: National Capital Region Planning Board Project
257
Technical Assistance Consultant’s Report This consultant’s report does not necessarily reflect the views of ADB or the Government concerned, and ADB and the Government cannot be held liable for its contents. (For project preparatory technical assistance: All the views expressed herein may not be incorporated into the proposed project’s design. Project Number: 41598 April 2010 India: National Capital Region Planning Board Project (Financed by the Japan Special Fund) Prepared by: Sheladia Associates, Inc. USA For National Capital Region Planning Board
-
Upload
khangminh22 -
Category
Documents
-
view
1 -
download
0
Transcript of TACR: India: National Capital Region Planning Board Project

Technical Assistance Consultant’s Report
This consultant’s report does not necessarily reflect the views of ADB or the Government concerned, and ADB and the Government cannot be held liable for its contents. (For project preparatory technical assistance: All the views expressed herein may not be incorporated into the proposed project’s design.
Project Number: 41598 April 2010
India: National Capital Region Planning Board Project (Financed by the Japan Special Fund)
Prepared by:
Sheladia Associates, Inc.
USA
For National Capital Region Planning Board

TA 7114-IND
NATIONAL CAPITAL REGION PLANNING BOARD PROJECT
Medium Term Strategic Evolution and
Borrowers Assessment
MAIN REPORTMAIN REPORT
Asian Development Bank
National Capital Region Planning Board
Sheladia Associates Inc, USAPrepared By :
Submitted To :
April 2010
Final Report : VOLUME - I

TA 7114-IND National Capital Region Planning Board Project
Final Report
Sheladia Associates, Inc. USA i
Volume 1 – Main Rep
ort
TABLE OF CONTENTS
VOLUME 1 : MAIN REPORT I. RATIONALE AND CONTEXT................................................................................................................................................1
A. Background and Context ....................................................................................................................................................... 1
1. Institutional Framework and Objectives........................................................................................ 1
2. Planning: Performance and Prospects ......................................................................................... 1
B. Financing: Performance and Prospects ................................................................................................................................ 4
1. Typology of Infrastructure and Debt Demands............................................................................. 6
C. Debt Demand: Long list and Short list Analysis..................................................................................................................... 8
D. Sources of Supply and Institutional Positioning..................................................................................................................... 9
1. NCRPB Medium Term Objectives - debt and grant fund ........................................................... 12
E. The Project .......................................................................................................................................................................... 14
F. Pre-Project Actions.............................................................................................................................................................. 14
G. Organization of the Report .................................................................................................................................................. 15
II. AN OVERVIEW OF THE ECONOMY AND STATE FINANCES .........................................................................................16 A. Background ......................................................................................................................................................................... 16
1. India: The Macroeconomic Situation .......................................................................................... 17
2. Rapid Urbanization ..................................................................................................................... 18
3. Urban Infrastructure.................................................................................................................... 19
4. National Capital Territory (NCT) – Delhi: Rapid Growth and Allied Problems ........................... 21
5. Economic Growth of NCT Delhi.................................................................................................. 22
6. NCT Delhi – The Problem of Migration....................................................................................... 23
7. Transport .................................................................................................................................... 25
8. Power.......................................................................................................................................... 26
9. Solid Waste Management .......................................................................................................... 26
10. Water Supply .............................................................................................................................. 27
B. The National Capital Region (NCR): Way Forward for Balanced Regional Development .................................................. 27
1. Regional Plan 2021 .................................................................................................................... 30
2. Increasing Investments in NCR .................................................................................................. 30
3. High level of Industrialization...................................................................................................... 31
C. Haryana, Rajasthan and Uttar Pradesh – An overview ....................................................................................................... 32
1. State Domestic Product .............................................................................................................. 32
2. Structure of the Economies ........................................................................................................ 34
3. Investments in the NCR States .................................................................................................. 36
4. Social Infrastructure.................................................................................................................... 37
5. Physical Infrastructure ................................................................................................................ 38
D. Fiscal Management of the NCR States ............................................................................................................................... 41
1. Revenue and Capital Receipts of the NCR Region.................................................................... 42
2. FRBM Targets and Achievements.............................................................................................. 44
3. Debt Position of the NCR States ................................................................................................ 47
III. POSITIONING NCRPB AS A FINANCIAL INSTITUTION...................................................................................................54 A. Objectives............................................................................................................................................................................ 54
B. NCRPB’s Current Status: Legal Framework, Business Model and Outcomes.................................................................... 54
1. Legal Framework ........................................................................................................................ 54
2. Business Model and Project Outcomes...................................................................................... 55
3. Current Business Model: Capital and Pricing............................................................................. 56
4. Current Business Model: Security Mechanisms......................................................................... 57
5. Current Business Model and Organization:................................................................................ 58
6. NCRPB’s financing: Lending Terms and Procedures ................................................................ 58
C. Strategic Options ................................................................................................................................................................. 59
1. Option 1: Normative Planning and Demand Driven Financing................................................... 59
2. Option 2: Strategic Planner and Financier of Relevance ........................................................... 59
3. Option 3 – Planning and Full Fledged Financial Institution ........................................................ 60

TA 7114-IND National Capital Region Planning Board Project
Final Report
Sheladia Associates, Inc. USA ii
Volume 1 – Main Report
4. Financial Evaluation of Suggested Options................................................................................ 61
D. Financial Intermediation from the Regions Perspective ...................................................................................................... 66
IV. INSTITUTIONAL ASSESSMENT AND OPTIONS TO ENHANCE CAPACITIES...............................................................71 A. Background and Motivation ................................................................................................................................................. 71
1. IA Institutional Categories and NCRPB’s Materiality.................................................................. 71
2. Policy Frameworks ..................................................................................................................... 72
3. Capacity...................................................................................................................................... 73
B. Assessment of Financial Management Systems:................................................................................................................ 74
C. e-Governance Assessment in Implementing Agencies (IAs): ............................................................................................. 87
1. An Overview and Best Practices ................................................................................................ 87
2. General Observations................................................................................................................. 90
D. Procurement: ....................................................................................................................................................................... 90
E. Project management ........................................................................................................................................................... 99
F. Social Safeguards ............................................................................................................................................................. 101
1. The Process.............................................................................................................................. 101
2. The Structure ............................................................................................................................ 102
3. ADB Safeguard Requirements ................................................................................................. 103
4. Gaps ......................................................................................................................................... 103
5. Compliance Requirements ....................................................................................................... 104
G. Environmental safeguards................................................................................................................................................. 105
1. Existing scenario....................................................................................................................... 105
2. Management of Process........................................................................................................... 106
3. ADB Pipeline............................................................................................................................. 106
H. Technical Assistance Loan / Project Development Facility ............................................................................................... 107
1. Indicative TA Needs.................................................................................................................. 107
2. The Process.............................................................................................................................. 109
3. Overview of project development, procurement and management by NCR and Borrowers......................................................................................................................................... 110
I. Rationale ........................................................................................................................................................................... 112
1. TA Loan Objectives .................................................................................................................. 114
2. The TA Process ........................................................................................................................ 115
3. Size and Sustainability ............................................................................................................. 116
V. SUB PROJECT SUMMARY ..............................................................................................................................................117 A. Sub Project Descriptions ................................................................................................................................................... 117
1. Selection o f Investment Components...................................................................................... 117
2. Component Selection Criteria................................................................................................... 117
3. Financial Criteria....................................................................................................................... 118
4. Economic Criteria ..................................................................................................................... 118
5. Economic Analysis of the Sector and Subprojects................................................................... 118
6. Overall Project Costs ................................................................................................................ 120
B. PATAUDI WATER SUPPLY PROJECT ............................................................................................................................ 129
C. SEWERAGE SUB-PROJECT – PATAUDI........................................................................................................................ 150
D. FINANCIAL AND ECONOMIC ANALYSIS OF PATAUDI WATER SUPPLY AND SEWERAGE PROJECTS ................. 172
E. DEVELOPMENT OF MULTI-MODEL TRANSIT CENTRE AT ANAND VIHAR, NCTD .................................................... 185
F. DEVELOPMENT OF MULTI-MODEL TRANSIT CENTRE AT SARAI KALE KHAN, NCTD............................................. 201
G. BADLI BYPASS................................................................................................................................................................ 216
H. CONSTRUCTION OF VARIOUS ROADS IN SONEPAT DISTRICT. ............................................................................... 223
I. REHABILITATION OF 13 ROADS IN JHAJJAR DISTRICT.............................................................................................. 230
VI. SAFEGUARDS, RISKS AND ASSUMPTIONS .................................................................................................................242
VOLUME 1A : APPENDICES TO MAIN REPORT VOLUME 2: ENVIRONMENTAL AND SOCIAL MANAGEMENT SYSTEMS REPORT VOLUME 2A: INITIAL POVERTY AND SOCIAL ASSESSMENT REPORT

TA 7114-IND National Capital Region Planning Board Project
Final Report
Sheladia Associates, Inc. USA iii
Vo
lum
e 1
– M
ain
Rep
ort
VOLUME 3: SITUATION ANALYSIS REPORT VOLUME 4: REPORTS ON SUB PROJECTS VOLUME 5: SHORT AND FULL RESETTLEMENT PLANS VOLUME 6: ENVIRONMENT ASSESSMENT REPORTS – SUB PROJECTS VOLUME 7: ECONOMIC AND FINANCIAL ANALYSIS

TA 7114-IND National Capital Region Planning Board Project
Final Report
Sheladia Associates, Inc. USA iv
Volume 1 – Main Rep
ort
ABBREVIATIONS 74th CAA 74th Constitutional Amendment Act
ADB Asian Development Bank
AG Auditor General
C&AG Comptroller and Auditor General
AIFC Average Incremental Financial Cost
BoQ Bill of Quantity
BOT Build Operate and Transfer
BR Buildings and Roads
CDP City Development Plan
CGWB Central Ground Water Board
CI Cast Iron
CPHEEO Central Public Health Engineering Organization
CVC Central Vigilance Commission
DE Debt Equity
DIMTS Delhi Integrated Multi-model Transit System Ltd
DMRC Delhi Metro Rail Corporation
DSV Design Service Volume
EIA Environmental Impact Assessment
EIL Engineers India Limited
EIRR Economic Internal Rate of Return
EMP Environmental Management Plan
EOCC Economic Opportunity Cost of Capital
EOI Expression of Interest
ESMS Environment and Social Management System
FDI Foreign Direct Investments
FIL Financial Intermediation Loan
FIRR Financial Internal Rate of Return
FOCC Financial Opportunity Cost of Capital
FRBM Fiscal Responsibility and Budget Management Act 2003
GDP Gross Domestic Product
GI Galavanized Iron
GIS Geographic Information System
GNTCD Government of the National Capital Territory Delhi
GoH Government of Haryana
GOI Government of India
GoR Government of Rajasthan
GoUP Government of Uttar Pradesh
GPS Global Positioning System
GSDP Gross State Domestic Product

TA 7114-IND National Capital Region Planning Board Project
Final Report
Sheladia Associates, Inc. USA v
Volume 1 – Main Rep
ort
GST Beneral Sales Tax
HSRDC Haryana State Road Development Corporation
HUDA Haryana Urban Development Authority
HUDCo Housing and Urban Development Corporation
IA Implementing Agency
IDBI Industrial Development Bank of India
IDFC Infrastructuer Fiannce Development Corporation
IEE Initial Environmental Examination
IIFCL India Infrastructure Finance Corporation Limyed
ILFS Infrastructure Leasing and Financial Services
IPP Indegenous Peoples Plan
IR Involuntary Resettlement
IRC Indian Roads Congress
IRR Internal Rate of Return
ISBT Inter State Bus Terminal
IT Information Technology
ITES Information Technology Enabled Services
JNNURM Jawaharlal Nehru National Urban Renewal Mission
LAN Local Area Network
MCF Municipal Corporation Faridabad
MLD Million Litres Per Day
MMTC Multi Modal Transit Centre
MoEF Ministry of Environment and Forests
MoF Ministry of Finance
MoU Memorandum of Understanding
MOUD Ministry of Urban Development
NBFC Non Banking Financial Institutions
NCR National Capital Region
NCRPB National Capital Region Planning Board
NEERI National environmental Engineering research Institute
NeGP National eGovernance Plan
NHAI National Highway Authorityt India
NIUA National Institure for Urban Affairs
NPV Net Present Value
ODR Other District Roads
OM Operation Manual
OP Operating Policies
PA Price Adjustment
PFC Power Finance Corporation
PFDF Pooled Finance Development Facility

TA 7114-IND National Capital Region Planning Board Project
Final Report
Sheladia Associates, Inc. USA vi
Volume 1 – Main Rep
ort
PHED Public Health Engineering Department
PPP Public Private Partnership
PQ Pre Qualification
PRI Panchayat Raj Institution
PSP Private Sector Participation
PWD Public Works Department
RF Resettlement Framework
RIDCOR Rajasthan Infrastructure Development Corporation
RIICO Rajasthan Industrial Infrastructure Development Corporation
RITES Rail India technical and Economic Services
ROE Return on Equity
ROI Return on Investments
ROW Right of Way
RP Resettlement Plan
RP 2021 Regional Plan 2021
SADA Special Area Development Authority
SEBI Securities and Exchange Board of India
SEZ Special Economic Zone
SFC State Finance Commission
SH State Highways
SRP Short Resettlement Plan
SWAN State Wide Area Network
TA Technical Assistance
TNUDF Tamil Nadu Urban Development Fund
UDA Urban Development Authorty
UFW Unaccounted for Water
UIDSMT Urban Integrated Development of Small and Medium Towns
UIT Urban Improvement Trust
ULB Urban Local Body
VOC Vehicle Operating Cost Components and Time Costs
WACC Weighted Average Cost of Capital
WAPCOS Water and Power Consultancy Services
NRW Non Revenue Water
WAN Wide Area Network

TA 7114-IND National Capital Region Planning Board Project
Final Report
Sheladia Associates, Inc. USA 1
Volume 1 – Main Rep
ort
I. RATIONALE AND CONTEXT
A. Background and Context 1. Since the mid 1980’s, the NCR in India has been a major driver of economic
growth in India. The regional character of this modern growth process is not surprising and has been a defining feature nationally and internationally – the Shanghai region in China, the Gauteng region in South Africa, the Pune – Nasik belt in India. In the NCR, this growth has been driven by high rates of private investment (domestic and foreign) facilitated by the major structural reforms in the 1990’s. As a consequence, the region has witnessed major trend changes in output composition (rising shares of manufacturing and service incomes), employment (shift away from agriculture) and land use. Further still, rapid growth has also generated huge demands on both environmental infrastructures as well as growth promoting infrastructure. The supply of these public goods would need support both in the form of planning as well as financing ensuring that regional impacts of growth are maximised from the standpoint of competitiveness and environmental sustainability. Further, since most of these infrastructure demands require coordination – wastewater does not have municipal boundaries – a regional approach is needed to minimise geographic and functional fragmentation. This coordination needs a financial backing. This is the primary motivation of the NCRPB’s creation by an Act of Parliament and is the basis of the proposed NCRPB business plan. This chapter provides an overview of the current situation, the proposed business strategy and the rationale for an ADB support through a line of credit for this agenda.
1. Institutional Framework and Objectives
2. National Capital Region Planning Board (NCRPB) was set up as a statutory body
by an Act of Parliament in 1985 with two major objectives, namely, spatial planning in the NCR region consisting of 33,000 sq. kms situated in 3 states of Uttar Pradesh (UP), Rajasthan, Haryana and Delhi and second, reduce migration into Delhi. The Act also provides for NCRPB to provide financing for projects. By mandate NCRPB is a planner and facilitates the financing of the investments identified in the plan (Appendix 4).
2. Planning: Performance and Prospects
3. In 2003, NCRPB formulated the Regional Plan (Regional Plan 2021) in the core
sectors of transportation, power, water and sanitation and solid waste with an investment requirement of INR 1937520 Million. The Regional Plan is itself not a detailed investment plan but has identified normative investment needs and provides guidance on development norms and potential infrastructure necessary from both a growth (transport, power) and an environmental perspective (water and sanitation, solid waste)

TA 7114-IND National Capital Region Planning Board Project
Final Report
Sheladia Associates, Inc. USA 2
Volume 1 – Main Rep
ort

TA 7114-IND National Capital Region Planning Board Project
Final Report
Sheladia Associates, Inc. USA 3
Volume 1 – Main Rep
ort
Table 1.1 Regional Plan Investment Needs
SECTOR Rs in Million
2002-07 2007-12 2012-17 2017-21 TOTAL Share
Transport 100000 91410 191410 9.88%
Power 293350 165690 505700 552690 1517430 78.32%
Water 26370 39550 39550 26370 131840 6.80%
Sewerage 12480 29130 24970 16640 83220 4.30%
Solid waste 5450 3410 2720 2040 13620 0.70%
Total 1937520 100.00%
4. Based on the Regional Plan (2021) the Sub regional plans are under preparation
and only on finalization will provide an overview of the manner in which the RP has been translated in terms of regional development actions and implementable investments. However, the Teams’ understanding is that sub projects will emerge from sectoral plans, city level Master Plans and City Development Plans1. This implies that the traditionally larger borrowers of NCRPB such as Urban Development Authorities will have limited planning functions at the city level, while the relatively smaller borrowers like municipalities or possibly special area development authorities/ project agencies, could be expected to have greater planning roles devolved. This institutional shift would be an important determinant of NCRPB’s goals as both a planner and financier. Since the input studies in formulating the Regional Plan, NCR Planning Board, in 2009 has progressed substantially in developing a Transport Sector Plan (2009) and as well as a Water Supply and its Management (2009). Institutionally it is committed to converting the norms set out in the RP to an active stream of investments with a systemic access to financing. The Project Development Fund which would support this process is described in Chapter 4.
5. Beyond the preparation of Regional Plan (RP) and coordinating special studies,
the NCRPB’s current planning (including the Regional Cells) activities include the scrutiny of the development projects posed for its financing conform to the RP. This compliance check is expected to be carried out by the NCR Cell in the States and a certificate from the borrower. This scrutiny does not however track the investments made with other sources of finance by States and other national agencies such as NHAI or central power agencies within the region. Further, as it is not mandatory for the States to communicate the nature of investments made in the region there are no records of assets created nor an updated estimate of the physical gap with reference to the norms laid out in the RP. To address the monitoring efficiencies of its planning process, NCRPB would benefit from a selected base line studies which track the coherence of investments by measurable indicators. This baseline updated information system is expected to

TA 7114-IND National Capital Region Planning Board Project
Final Report
Sheladia Associates, Inc. USA 4
Volume 1 – Main Rep
ort
Sector wise Infrastructure Projects Financed in terms of Loan Sanctioned
(Rs. in Cr.)- March 2009
Others, 335.94, 6%
Power, 1386.38,
23%
Transport, 1484.35,
25%
Water Supply,
770.96, 13%
Sewerage/ SWM
etc., 342.36, 6%
Land Development,
1675.54, 27%
provide an overview of annual targets and performances of asset creation, both in order to bring greater relevance for future planning as well as reporting back to stakeholders on the entity’s progress in reaching its objectives. This tracking activity which could assist the plan process is a component of the TA Loan described in Chapter 4
B. Financing: Performance and Prospects
6. As a financier, NCRPB is to facilitate financing of the investments in the region, and in pursuance of this, the Board has provided loans to 230 projects (part of the regional plan) at a cost of Rs 59950 Million (Sanctioned). These loans have been advanced out of grants received from GOI, Delhi Govt, internal accruals and market borrowings. The loans are either guaranteed by states, banks or escrowed and are advanced at a concessional interest rate of about 100-200 bps below states borrowing costs. The interest rates need to be approved by MOUD. The projects themselves are demand driven and range from environmental infrastructure (water, sanitation and solid waste) to connectivity (major roads) as well as industrial estates and townships.
7. Since 1985 when it was set up, most projects financed are towards land
development, power and transport (See the list of projects financed in Appendix 16). More recently as alternate sources have developed, NCRPB has reduced its exposure to land development based projects and is moving towards relatively underserved entities such as smaller municipalities and in sectors such as water and sanitation which impact directly on quality of life in the region.
8. As for geographical distribution of investments, Haryana accounts for (67%) while Rajasthan (7.3%) Delhi (11%) and UP (12 %). This is related to relative areas, populations and readiness for project execution.

TA 7114-IND National Capital Region Planning Board Project
Final Report
Sheladia Associates, Inc. USA 5
Volume 1 – Main Rep
ort
Table 1.2: Distribution of Financing By States (as on March 30 2009)
State Area (sq. Km)
% to total
Loans used (incl repaid INR Million)
% of total
Loans Disbursed INR in Millions (Ongoing)
% of total
NCT – Delhi 1483 4.42 3100 7.64 3100 10.66 Haryana 13413 39.95 25370 62.53 19480 67.01 Rajasthan 7829 23.32 3400 8.38 2140 7.36 Uttar Pradesh 10853 32.32 6940 17.11 3390 11.66 Punjab/MP (CMA) 1760 4.34 960 3.31 Total 33578 100 40570 100 29070 100
9. Since many loans are covered by State (Bank) guarantees or based on state budgets for repayments, detailed financial appraisals are not undertaken. Repayments of NCRPB loans have been strong, with no default. As regards delay, it is negligible in terms of number and value (See Table 1.3 for the current loans outstanding). NCRPB has raised INR from the debt market on private placement basis at an average of 100 to 150 bps over GOI securities on the basis of an AAA rating.
Table 1.3 Loan Outstanding as on March end 2009 Name of State Amount (Rs Million) Uttar Pradesh 1952.6 Haryana 15749.1 Rajasthan 2108.9 Madhya Pradesh 137.9 Delhi 2405.4 TOTAL 22353.9
10. The NCRPB is not a financial intermediary regulated by RBI guidelines for an NBFC (See Annex 2) nor is regulated by SEBI under the company’s act. It is primarily a fund which blends GOI grants (not accounted for as equity or contribution) with market borrowings and lends out to the state governments. NCRPB is already moving away from uniform interest rates and tenors – recognizing that environmental infrastructure would need a longer tenor given the lumpy nature of these investments and long life of these assets. The proposed ADB line of credit with a longer tenor (if possible 20 years) would allow NCRPB to blend longer term capital with shorter domestic sources to support investments in this sector and avoid asset-liability mismatches in its balance sheet..
11. If NCRPB is to expand in size through market borrowings, its weighted cost of
funds would increase and hence not be superior in tenor or pricing to competitive sources. As a consequence, NCRPB would attempt in the medium term to move towards relying on revenue streams from borrowers rather than limit its resource raising capacity to the guarantee umbrella. This could be in the form of securitising

TA 7114-IND National Capital Region Planning Board Project
Final Report
Sheladia Associates, Inc. USA 6
Volume 1 – Main Rep
ort
its debt through pooled offerings taking advantage of GOI fiscal incentives and other mechanisms such as the PFDF. These financing strategies are described more fully in Chapter 3 and Appendix 13.
12. Towards the objective of a sustainable financial intermediary, NCRPB would need
to provide, on the one hand, sufficient security to its potential lenders (possible insurance and pension funds) and on the other, a systemic, cost-effective, repeated-access source of debt for smaller environmental investments. Towards the objective of being a planner of relevance NCRPB would need to transform the broad goals of the RP into an active sectoral investment plan and seek to catalyze these investments with the concessional finance it receives from the national budget as well the loan from Asian Development Bank (ADB).
13. This twin business proposition is the subject of this situation analysis – its
principal motivation is to identify the opportunities and constraints for making efficient planning and intermediation and planning possible in the NCR region. Accordingly, an assessment has been done of the demand for debt finance in the region, the competitive positioning of NCRPB over a medium term period of 5 years and the business strategy to be adopted to position itself as a planner of relevance.
1. Typology of Infrastructure and Debt Demands
14. A study of the RP suggests that there are three types of infrastructure required - first, regional level large investments in power, highways etc, second, inter state connectivity and the environment investments and third city level urban investments. These have been estimated as INR 1937520 Million. While this is macro assessment, NCR as well as the States have defined sectoral investments needs. Prominent among them include the Sector Plan for Water by PHED Haryana, Water Investment for the region by NCRPB (2009) and a Transport Sector Plan for NCR by NCRPB (2009).
15. In this category, NCRPB is, at best, likely to be a co financier in the power and
highway sector (Regional) although it would need to monitor and strengthen its facilitating role as a planner (Table 1.4).
Table 1.4 Possible Sectoral Financing Options Regional Sub Regional Local
Areas Planning
Financing
Planning
Financing
Planning
Financing
Investment Program 1 Highway H L H L 2 Power Generation L L L L 3 Transmission and Distribution L L L L
4 Regional development- DMIC and other regional initiatives H L H L
Infrastructure

TA 7114-IND National Capital Region Planning Board Project
Final Report
Sheladia Associates, Inc. USA 7
Volume 1 – Main Rep
ort
Regional Sub Regional Local
Areas Planning
Financing
Planning
Financing
Planning
Financing
Investment Program Common Industrial Infrastructure Logistics Hub 5 Water Resource/ Conservation H L H H 6 Waste Water Management-Domestic L L H H 7 Waste Water Management-Industrial H L H H Collection Transfer Treatment Disposal 8 Water Supply H L M H Source Development Transmission Distribution 9 Solid Waste Management H M M H Collection Transfer Treatment Disposal 10 Other Municipal Services H M M H 11 Urban Transport H M M H
Network-Roads, Footpath, and Lighting
Signalling Area Traffic Control Bridges and other Grade separators Terminals- Truck, Bus, Multi Modal Parking Specific Elements of Metro/ Railways 12 Information Technology M L H H H H Network-WAN and LAN Hardware Application Software Design 12 Policy/ Activities
A Regional Water Resources Conservation H H
B Regional Transport Policy/ Access/ Connectivity/ Barriers H H H
C Regional Waste Water Management H H
D Regional Municipal Solid Waste Management- Disposal H H H
E Regional Municipal Industrial Waste H H H

TA 7114-IND National Capital Region Planning Board Project
Final Report
Sheladia Associates, Inc. USA 8
Volume 1 – Main Rep
ort
Regional Sub Regional Local
Areas Planning
Financing
Planning
Financing
Planning
Financing
Investment Program Management- Disposal
F Pooled Financing H H H
G Regional development- DMIC and other regional initiatives H H H
H Sub regional/ City Master Plans and City Development Plans H H H
I Transaction Advisory for PPP H H H
J All Sub Project, Planning, Design, Supervision and Management H H H
16. Regarding the second category, namely inter-state connectivity (Sub Regional)
and environmental investments it would appear from the regional plan that NCRPB’s role would be more significant as a financier, incentivising investments by various states to achieve coherence in the region. State roads which connect across states, aquifer and green belt protection investments would be typical examples requiring both detailed planning as well as substantial investments.
17. In terms of city level investments – environment enhancing as well as growth
promoting – where the materiality of NCRPB financing is expected to be high and planning relatively medium to high, especially after the 74th CA. These small and medium sized environment projects would include; wastewater (pumping stations, branch and main sewers, sludge and slurry treatment) water (trunk and distribution pipelines, pumping stations, treatment), solid waste management (collection, transfer stations and landfills), disposal of biomedical wastes, hazardous waste and minor afforestation and parks. The use of State budget as a fall back would be appropriate in this context, given the externality argument.
C. Debt Demand: Long list and Short list Analysis
18. Demand for debt for all three categories are estimated by using NCR’s plans for environmental investment from 2009 to 2011 (NCR and SFC estimates) and selected projects from the three sample municipalities where the demand study was conducted. (Ghaziabad, Faridabad and Meerut). These municipal projects are included as it is expected that they would receive priority grant support from JNURM. For example, based on Haryana’s plan for augmenting water and Sanitation, the requirements for NCR area would be $ 10 Million per year. There has been a demand for investments in priority infrastructure and this adds to $ 645 Million. This excludes the ongoing demands for Transport and Water related investments being defined as part of NCR’s initiatives for the region. This includes the ongoing efforts as part of Part B of an ongoing TA which involves preparation of a Master Plan and DPR for select sub project. However, it is expected that NCRPB will also build a pipeline of projects using TA resources in areas where

TA 7114-IND National Capital Region Planning Board Project
Final Report
Sheladia Associates, Inc. USA 9
Volume 1 – Main Rep
ort
NCR is of relevance (Category II) as well as responding to development plan based needs at the municipal / Panchayat level and pooling viable bodies and promote sub regional infrastructure.
19. In any event, it appears that given NCRPB current levels of operation demand is
unlikely to be a constraint. The challenge would be to ensure investment coherence at the planning stage, by a concrete multi-sectoral investment plan for the region with an identified means of finance and detailing the tariff and grant covenants for the implementation. This is expected to be NCRPB’s niche role – something which private sector financiers would have little incentive or authority to put in place and which pure planning entities have no authority to ensure an investment follow up
D. Sources of Supply and Institutional Positioning
20. To recall, the kind of debt these small projects need are long tenor from an affordable fee point of view. However, long repayment periods would tend to limit equity, unless the interest rates are low. Given these demand features, we examine if there are other sources of finance which provide a systemic access for this kind of debt for suburban municipalities in the NCR region.
21. It would appear from Table 1.5, NCRPB is well placed, only State Bonds being
more attractive on pricing and NCRPB at least as competitive as HUDCO. Cursory analyses of the alternative sources allow the following inferences:
Table 1.5 Comparative Financing Options Financial Institution Interest Rates Remarks PFC 11% to 11.50%
per annum All Loans are subject to a reset clause (ie. PFC has a right to review the interest rate after 3 years
HUDCO 9.50% to 11.25% depending on rating
Floating rate linked to Base Rate (Now BR is 12.50% )
HUDCO 10.50% to 12.25% Fixed Rate NCRPB 8.25% Priority infrastructure projects viz. Water supply,
sewerage, sanitation, drainage, storm water drain, and Roads, ROBs and Flyovers
NCRPB 9.50% Land development for residential/industrial/Commercial projects and other Infrastructure Projects
State Bonds 8.05% 10 year State Development Loans 22. HUDCO does provide similar tenor loans, but its average loan size appears large
relative to smaller environment projects debt needs. The transaction costs for HUDCO of these smaller projects with a project cost size of INR 100-200 million might be high.

TA 7114-IND National Capital Region Planning Board Project
Final Report
Sheladia Associates, Inc. USA 10
Volume 1 – Main Rep
ort
23. Other GOI institutions include IIFCL, which has a focus on PPP’s. It would appear that there are strong analytical and practical reasons as to why PPP’s would be difficult in this sector. The presence of externalities, low initial tariffs and limited size of small and medium towns would inhibit equity returns, especially if the concession periods and the tenor of the debt are similar. JNURM currently advocates equity PPP’s for financing both environmental and growth infrastructure at the city level. This institutional setting of financing local infrastructure through high-equity project companies with limited returns is likely to be a constraint for local governments.
24. State bonds also have low financing cost but these are allocated on an adhoc
basis and do not represent a systemic access for municipalities governments for smaller projects for capital investments and are indeed a source for states to fulfil its SFC obligations Further still, it is unlikely that environmental infrastructure can predominantly be financed by this method. There is some ambiguity on the strength of the commercial banks in this market; anecdotal evidence suggests that most municipalities’ governments do not access banks. In any event, most commercial banks do not lend long, and also seek credible guarantees.
25. There is a robust demand for debt financing for smaller environment and
connectivity projects of around INR 400000 Million (RP-2001) and a defined pipeline of $ 645 Million. These projects need long tenor financing on account of inability of higher user charges at initial stages of asset operation and limits on availability of current taxes. However, longer repayment periods reduce the potential for equity if returns are not guaranteed in the pricing The governmental sources of debt are limited and adhoc, while commercial sources face the same limitations as NCRPB - dependency on municipalities or governments for repayments with little appraisal of the same, and the lack of credible project equity sponsors. In addition, commercial banks or specialised institutions except for IIFCL would appear more focussed on financing and refinancing PPP’s.
Table 1.6 NCR Project Pipeline- Short Term Sector Share in Mill $ Solid Waste Management 4.2 27.23 Sewerage and Drainage 4.4 28.51 Water Supply 11.9 76.88 Urban Transportation 22.7 146.54 Regional Transportation 22.7 146.61 Power Distribution and Transmission 9.5 61.20 Land Development and Housing 24.6 158.86 Total 100.00 645.83
26. The prospects for financing this class of infrastructure could definitely improve, if
low equity- high debt projects, can be financed by pooling these demands (reducing transaction costs and risks) by an intermediary with access to long term

TA 7114-IND National Capital Region Planning Board Project
Final Report
Sheladia Associates, Inc. USA 11
Volume 1 – Main Rep
ort
insurance and pension funds. The steps needed for NCRPB to fill this gap, is discussed in Chapter 3.
Sector Issues
27. Given that NCRPB is seeking to move towards a greater balance in financing city and regional environmental infrastructure the main constraints as identified by evaluations of past interventions include the following.
i. Sector master plan to be the basis for phasing and definition of components, move
away from. incremental or adhoc approaches ii. Project component sequencing; works should be sequenced post shifting of
utilities is substantially complete before contracts are awarded. iii. Completion of land acquisition and resettlement prior to award of contract iv. Inclusion of experienced line departments /corporations /agencies as
Implementing Agencies with assistance of consultants in design/ project management quick project implementation
v. Incorporated into loan processing Capacity building for O&M of assets including management contracts
28. These typical urban sector issues – land acquisition and resettlement, utilities
shifting and functional and geographical fragmentation of authority affect not only financing in terms of cost and time overruns but also erode asset maintenance and service delivery quality. NCRPB’s goal as a planner and facilitator of finance is to provide a framework for asset creation, maintenance and payment for its use over time. Hence the need to support the borrowers improve delivery by grant assistance for project preparation, accounting for to land and utility issues as well as competitive comprehensive contracting rather than piece meal contracts for a single asset which results in poor project outcomes from an end user perspective. The TA loan addresses these issues in the proposed ADB project design and is detailed in Chapter 3 including the potential for management contracts for O&M.

TA 7114-IND National Capital Region Planning Board Project
Final Report
Sheladia Associates, Inc. USA 12
Volume 1 – Main Rep
ort
Fig 1.1: NCRPB Investment Process
1. NCRPB Medium Term Objectives - debt and grant fund
29. To address the twin business propositions – planner of relevance and a strategic
financier, - the ADB line of credit comprises of both an investment loan USD 140 million and a TA component of USD 10 million. The investment component has identified the (See Chapter 5 Table 5.1) of about USD 315 million. While The $ 150 million loan will be provided in two tranches, NCRPB and borrowers will finances the balance pipeline of projects.
30. These projects are typical of regions needs –small town water and sanitation,
connectivity investments and transport infrastructure which provides multi modal transport linkages. They are typical in at least three distinguishing ways. First, they would be difficult to finance on an equity PPP mode, second, they would be unable to find private market finance on a standalone basis and third they would all benefit from technical support for DSM as well as O and M,
31. To elaborate the above, the reasons why equity PPP’s would be difficult to
structure are:

TA 7114-IND National Capital Region Planning Board Project
Final Report
Sheladia Associates, Inc. USA 13
Volume 1 – Main Rep
ort
(i) The projects described in the above table were examined from a PPP perspective
– namely whether they could have been structured as an equity PPP wherein a private sponsor invests in these assets with sole recourse to project cash flows and any up front or life time grants.
(ii) The prospects for equity PPP improve when • There is a clear regulatory framework • the revenue streams from the project are clear and assignable (including freedom
to adjust tariffs) • there is sufficient tail in the concession so that equity can earn returns after the
debt is serviced (iii) As a general point, in many urban situations, the above three conditions do not
always prevail – the Municipal Acts generally do not permit joint equity investments, tariff are constrained by low income population and concession periods needed to make these projects give return on equity would need to be large. Therefore international experience indicates that most of these urban infrastructure projects are not financed by equity PPP’s at least in major developed economies such as the US or emerging countries like China where the BOT operator ( if in place) is usually state owned.
(iv) Given the huge demand for infrastructure however, private debt for financing
publicly owned infrastructure is essential and construction contracts which improve efficiency in maintenance would be a preferred outcome. It would also be less costly than equity PPP’s and would leverage private sector managerial efficiencies.
(v) Based on these considerations. the projects were examined from an equity PPP
basis by using a simple PPP filter developed for NCRPB. The main findings are tabulated in (Chapter 5 Table 5.1) To summarize the approach, the analysis was conducted by asking what tariff and grant levels are needed to support a 16% return on capital for 30 year BOT concession. In the case of Harpur and Pataudi, the tariffs (or viability gap funding) required increased from current levels by at least 3 -4 times. This demonstrates the well known proposition that equity BOT’s need more money from municipal sources and cannot be an escape route for low cash generation in the system. However, options of management contracts/ extended O&M agreements are possible. These would ensure quality O&M of assets.
(vi) In the case of a potentially revenue stable project the bus terminals– it is seen
that if it were a publically financed service project it would approximately cost INR 60 with a debt service of INR 60 Million per annum. On the other hand if it were structured as a PPP the rentals from real estate and hotels would need to constitute more than 50 % of debt service. Clearly most private investors would

TA 7114-IND National Capital Region Planning Board Project
Final Report
Sheladia Associates, Inc. USA 14
Volume 1 – Main Rep
ort
not find these risks manageable or attractive especially when pure construction contracts are available in the NCR region with less risk.
E. The Project
32. The Plan aims to promote growth and balanced development of the whole region through providing economic base in the identified major settlements (Metro Centres/Regional Centres) for absorbing economic development impulse of Delhi, efficient transport network, development of physical infrastructure, rational land use pattern, improved environment and quality of life. In line with the objectives of the Regional Plan, the primary objective of this project are to improve quality of life and well-being of urban residents in the National Capital Region (NCR): This will be achieved by of support to various agencies in the constituent States through NCRPB a line of credit to compliment the ongoing efforts of NCRPB in financing the regional Plan priorities and technical assistance to improve quality of planning, design and management interventions in the region (Appendix 1). The design draws experiences on intermediation from various ongoing projects (Appendix 15) and various private partnership initiatives (Appendix 13).
F. Pre-Project Actions
33. NCRPB, in line with positioning discussed above is:
i. streamlining the loan process to incorporate an initial screening process (See Fig 1.1) to support development of ideas and concepts to the next level of DPR and implementable packages. This would also involve supervision by NCR or agency for high value complex projects and monitoring during project and post project output/outcome assessment;
ii. in the process of creating a project development facility to support project development and implementation
iii. facilitating a seamless travel across the region through simplified travel permit requirements for commercial vehicles and
iv. promoting State specific regional investment programs in the areas of water supply and waste management
34. The States/ Implementing/ borrowers have also embarked on policy decisions to:
i. seek NCRPB’s investment support for areas falling within NCRPB ii. integrate infrastructure across states, wherever it is of regional significance and iii. seek technical assistance support for project and management improvements

TA 7114-IND National Capital Region Planning Board Project
Final Report
Sheladia Associates, Inc. USA 15
Volume 1 – Main Rep
ort
G. Organization of the Report
35. The Report is organized into seven volumes and 30 appendices to Volume I. The content of the volumes is presented below.
Volume 1- Main Report
Chapter
1 Background and Rationale
2 NCR Economy, Growth and Investment Plan
3 Positioning NCR PB as an FI
4 Institutional Assessment and structure of Technical Assistance Component
5 Over View of Tranche 1 Sub Projects 6 Summary Social Safeguards
7 Summary IEE
Volume 2- ESMS
Volume 3- NCR Situation Analysis
Volume 4-Sub Project Reports
1 Pataudi Water Supply
2 Pataudi Sewerage
3 Multi Modal Transport Centre - Anand Vihar
4 Multi Modal Transport Centre -Sarai Khale Khan
5 Baldi Bypass
6 Haryana – Sonepat Roads 7 Haryana- Jhajjar District Roads
Volume 5- Short and Full Resettlement Plans Volume 6- Initial Environment Examination and Management Plans
Volume 7- Economic, Financial Management and Financial Analysis

TA 7114-IND National Capital Region Planning Board Project
Final Report
Sheladia Associates, Inc. USA 16
Volume 1 – Main Rep
ort
II. An overview of the economy and State Finances
A. Background
36. As elsewhere, urban regions in India are growth centres, attracting migrants and capital This growth process is often uneven within a region, but invariably creates external effects – both backward and forward linkages – of which demand for infrastructure is a key outcome. In this chapter, we explore the macro and micro factors which contribute to rate and spread of this growth in the NCR and identify the financing and planning challenges and opportunities this brings for NCRPB.
37. Concentration of population in the urban areas creates demand of infrastructure in
these areas. Besides, it also creates growth in demand for environmental services: water distribution service, sanitation-sewerage and solid waste management services Simultaneously, the urban design of the country is now facing an additional challenge because of the predicted climate variability - urban centres are now being identified as most vulnerable hotspots. Given this set of complex problems, the country, in the short term has to manage additional stress and challenge on urban infrastructure and in the long term plan for expansion of its share of urban areas.
38. International and national experience indicates that growth induced urbanization
has occurred in various regions round the world such as the Pearl River Valley and the Mexico-Texas border in USA, Pune-Nasik belt and Hosur-Bangalore region in India are some of the examples. The National Capital Region (NCR) is no exception to this trend. The phenomenal growth of the economy in and around Delhi has attracted population from various parts of India. Also, the region has seen an increasing number of visitors – professionals, job-hunters, tourists, etc. The influx of population and the fulfilment of the growth objectives of the region necessitates a planned supply of infrastructure. For example, development of a road-rail network is absolutely important in the context of the NCR. The region is land-locked and, hence, the way the road and rail network is developed will determine the volume of trade and movement of people in the region. Development of effective infrastructure is one of the main objectives of National Capital region Planning Board (NCPRB).
39. Here our primary purpose is to identify the pace and spread of growth in the NCR.
This would help in ascertaining the infrastructure demand-supply gaps that can be used by the NCRPB to help the participating states to identify fiscal and other measures through which these gaps can be bridged. We would also try to assess the efficacy of the magnet town strategy of the NCRPB so that stakeholders can address the question as to whether this is a viable strategy or if there are fundamental economic reasons which make this a difficult task for a public sector entity to undertake.

TA 7114-IND National Capital Region Planning Board Project
Final Report
Sheladia Associates, Inc. USA 17
Volume 1 – Main Rep
ort
1. India: The Macroeconomic Situation
40. The Indian economy is emerging as one of the fastest growing economies and
would continue to be so through the next two or three decades. Between 2003-04 and 2007-08, the economy registered an average annual growth of 8.8% p.a. (MoF, 2009)2. The worldwide economic recession of 2007-08, however, has taken a toll on the growth rate and in 2008-09, the economic growth declined to 6.7% p.a. (MoF, 2009). However, despite the increasing tendency of risk aversion in the international financial markets, investment has remained relatively buoyant vis-à-vis the GDP growth. The ratio of fixed investment to GDP increased from 31.6% in 2007-08 to 32.2% in 2008-09 (MoF, 2009).
41. One of the major thrust areas of investment in the country is the infrastructure
sector. Infrastructure development enables efficient connectivity of producers and markets through a good network of roads, rail, ports, airports, and waterways. Reliable energy supply is essential to foster growth in agriculture, industry, and services. International and Indian experience shows that good, reliable infrastructure is necessary for high growth performance of the economy. The 11th Five Year Plan budgeted an investment of Rs. 20561500 Million (at 2006-07 prices) in infrastructure development (Planning Commission, 2008)3. The major share of this investment will take place in the electricity sector (32.42%), followed by roadways (15.28%), telecommunications (12.57%), railways (12.73%), irrigation (12.32%), water supply and sanitation (6.99%), ports (4.28%), airports (1.51%), storage (1.09%) and gas (0.82%).
42. The economy – in 2008-09 witnessed growth deceleration across all sectors
except mining and quarrying and community, social and personal services. The growth in agriculture and allied activities declined from 4.9% p.a. in 2007-08 to 1.6% p.a. in 2008-09. Manufacturing, electricity and construction sectors grew at 2.4% p.a., 3.4% and 7.2% p.a. respectively in 2008-09. The corresponding growth rates in these sectors were 8.2%, 5.3% and 10.1% p.a. respectively in 2007-08. The slowdown in manufacturing can be attributed to fall in demand rising costs of input and the cost of credit. The electricity sector faces capacity constraints and the availability of coal particularly during the first half of the year.
43. Increased input prices and interest costs also affects the construction sector4. In
the recent years the construction industry had been witnessing a rapid growth fuelled by the speculative bubble related to the crunch in land supply in the urban areas. Rising interest rates and slowdown in housing loans moderated the demand and the construction sector showed signs of correction. The fall in liquidity
2 Ministry of Finance (2009): “Economic Survey”, Government of India, New Delhi 3 Planning Commission – Government of India (2008): “Agriculture, Rural Development, Industry, Services and Physical Infrastructure: Eleventh Five Year Plan 2007-12” vol, III, Oxford University Press, New Delhi 4 The construction industry consists of different sectors like housing, infrastructure, industrial construction, commercial real estate, etc.

TA 7114-IND National Capital Region Planning Board Project
Final Report
Sheladia Associates, Inc. USA 18
Volume 1 – Main Rep
ort
(in mid-September, 2008) further aggravated the situation precipitating a sharp downturn in the construction sector.
44. The high growth in community, social and personal services, during 2008-09, can
be attributed to an expansionary fiscal policy (with high growth in government consumption expenditure)n that is reflected in the demand side of GDP.
2. Rapid Urbanization
45. Davis (1965)5 views urbanization as an index of transformation of regional rural
economies to a modern industrial economy. In 2001, about 285 million people (about 29% of the total population) lived in urban areas in India and the country had the second largest urban population in the world. The number of number of urban agglomerations/towns have grown from 1827 (1901) to 5161 (2001). Table 2.1 illustrates the composition of urban population growth in India, during the period 1961 – 2001
Table 2.1 Composition of Urban Population Growth in India (1961 – 2001)
Particulars 1961-71 1971-81 1981-91 1991-2001 Increase in Urban Population (in Millions) 30.18 49.45 56.45 67.81 Out of which
(a) Natural Increase (in Millions)
(b) Net Rural-Urban Migration (in Millions)
(c) Residual Component (in Millions)
19.68
(65.20%)
5.91 (18.70%)
4.59
(16.10%)
25.56
(51.30%)
9.83 (19.60%)
14.06
(29.10%)
35.37
(61.30%)
12.76 (20.70%)
8.32
(18.00%)
40.17
(59.40%)
14.32 (20.90%)
13.32
(19.70%) Source: Vaidya (2009)6
46. According to the estimates published by the Registrar General of India, 67% of the total population growth in India till 2026 is expected to take place in the urban areas (Vaidya, 2009). The projections are represented in Table 2.2.
5 Davis, K. (1965): “The Urbanization of the Human Population”, Scientific American, 213(3), pp. 41-53 6 Vaidya, C (2009): Urban Issues, Reforms and Way Forward in India, Working Paper No. 4/2009-DEA, Department of Economic Affairs, Ministry of Finance, Government of India

TA 7114-IND National Capital Region Planning Board Project
Final Report
Sheladia Associates, Inc. USA 19
Volume 1 – Main Rep
ort
Table 2.2 Projection of Urban Population in India (2001 – 2026) Particulars 2001 2011 2021 2026 Total Population (Millions) 1028.61 1192.50 1339.74 1399.83 Urban Population (Millions) 286.12 357.94 432.61 534.80 Urban Population/Total Population (%) 27.82% 30.02% 32.29% 38.21% Annual Exponential Growth Rate of the Population (%) 1.48% 1.32% 1.23% 1.16% Annual Exponential Growth Rate of the Urban Population (%)
2.24% 2.07% 2.50% 1.89%
47. An important point to note, the annual growth rate of the urban population is much
higher than the growth rate of the total population. This means that the country has to plan proactively for meeting the demands of this rising urban population. It is estimated that by 2030 India is expected to have 41% of its population living in urban areas. However, this rapid increase of urban population is not without problems. Datta (2006)7 observes that the problems facing India are lopsided urbanization, faulty urban planning and urbanization with poor economic base. There are basic problems like housing, slums, transport water supply and sanitation, water pollution and air pollution, inadequate provision for social infrastructure (schools, hospitals, etc.).
48. Despite the rapid growth in the urban population the urban governance and
management of the services is less than satisfactory in the country. In this context, the Government of India has launched a reform linked urban investment programme Jawaharlal Nehru National Urban Reforms Mission (JNNURM) in December 2005. The objective of this programme is to meet the challenges of growing urbanization and enable Indian cities to attain development levels that are at par with global standards.
49. One of the key features of the Indian urbanization has been the concentration of
the urban population in larger cities. According to the 2001 census, the number of cities in the country with a population of over 1 million was 35. These cities housed about 37% of the population of the country. The decadal growth of urban population during 1991-2001 was about 31.2%, 19-21% of which was contributed to by rural-urban migration.
3. Urban Infrastructure
50. Local governance in India is assigned to the states under entry 5 of the State List.
Most types of urban infrastructure - public health and sanitation, hospital and dispensaries, roads, bridges, ferries and other means of communication including municipal tramways, ropeways, and traffic, water supplies, drainage, land, industries, gas and gas works, markets and fairs, theatres, cinemas, entertainment and amusements, etc. are state list subjects. Most of the service sector GDP in the country originates in urban area and goes to the factors of production residing in
7 Datta, P. (2006): “Urbanization in India”, paper presented at The European population Conference

TA 7114-IND National Capital Region Planning Board Project
Final Report
Sheladia Associates, Inc. USA 20
Volume 1 – Main Rep
ort
urban areas. The burgeoning urban population has led to the rapid increase in demand for urban infrastructure. There is a tremendous pressure on civic infrastructure systems like water supply, power, sewerage and drainage, solid waste management, transport, etc. Available data suggest that urban infrastructure services in the public sector like water, electricity, sewerage, roads have not responded to meet the growing demand for quantity and quality of service. Data shows that water supply is available for 2.9 hours per day across cities and towns in the country. The non-revenue water that includes physical and revenue losses account for 40-60 percent of total water supply. About 30 to 50 percent households do not have sewerage connections and less than 20 % of total waste water is treated. Solid waste systems are severally stressed. Most of the cities in India face severe transport problem that affect the mobility of the people and economic growth of the urban areas. These problems are due to prevailing imbalance in modal split; inadequate transport infrastructure and its sub-optimal use; lack of integration between land use and transport planning; and no or little improvement in city bus service, which encourage a shift to personalized modes of transport. Power is another area of grave concern in urban India. Even though large scale investments in the power sector have been undertaken throughout the country, demand has consistently outstripped supply. The annual per capita consumption, at about 580 kWh is among the lowest in the world. As per the 2001 census, 82% of urban households have access to electricity. Those who have access to electricity, reliability and quality are matters of grave concern. The reasons behind this dismal condition include inadequate power generation capacity, lack of optimum utilization of the existing generation capacity, inadequate inter- regional transmission links, inadequate and ageing sub-transmission & distribution network leading to power cuts and local failures/faults, T&D losses, large scale theft and skewed tariff structure, inefficient use of electricity by the end consumer and lack of grid discipline. Communication infrastructure, however, has expanded substantially due to the participation of the private sector (See Appendix 5).
51. Future projections indicate that 67% of the total population growth in India will take
place in urban areas during the period 2001-2026. In the states of Andhra Pradesh, Delhi, Gujarat, Haryana, Karnataka, Madhya Pradesh, Maharashtra, Punjab, Tamil Nadu and West Bengal, 51% of the population will be urban by 2026, and these states will account for 69% of the total urban population in the country. During the 25 year period (2001-2026), the growth of urban India will continue to concentrate around large cities and agglomerations with a population of over 1 million. The number of these cities is expected to increase from 35 to 61 during the period 2001-2026. Eleven of these cities - Ahmedabad, Bangalore, Kolkata, Chennai, Hyderabad, Mumbai, Pune, Surat, Jaipur, Kanpur and Delhi will have a population of over 4 million each by 2025.
52. The demand for urban infrastructure is therefore expected to increase manifold in
the coming decades. As already noted public enterprise alone has failed to supply the current demand for urban services like water supply, power, waste

TA 7114-IND National Capital Region Planning Board Project
Final Report
Sheladia Associates, Inc. USA 21
Volume 1 – Main Rep
ort
management, etc. Realizing this, the Government of India has been promoting the infrastructure development policies that promote private sector participation through PPPs. In the past, public sector has been the main provider of infrastructure in India. However, public financing alone will not be able to generate the needed level of investment ($475 billion). Accordingly, the Government’s priorities for bridging the infrastructure deficit includes revising policies and regulations for enhancing PSP including through PPPs; strengthening the capacity at all levels of promoting PPPs; and enabling arrangements for bridging the enormous deficit in infrastructure financing especially for long-term funds through all possible sources. Some of the key projects being considered by the government of India under the PPP scheme include roads & bridges, railways, seaports, airports, inland waterways, other transportation projects, power, urban transport, water supply, sewerage, solid waste management, and other physical infrastructure in urban areas, gas pipelines, infrastructure projects in special economic zones (SEZs), etc.
4. National Capital Territory (NCT) – Delhi: Rapid Growth and Allied Problems
53. NCT Delhi forms the heart of the National Capital Region (NCR). According to the
2001 census, the city of Delhi has a population of 13.85 million people with a population density of 9340 people per sq. km. Delhi ranks third among the most populous metropolitan cities after Mumbai and Kolkata. Delhi also exhibits a rapid trend of urbanization. Table 2.3 shows the pace at which urbanization is taking place in Delhi.
Table 2.3 Growth of Urban Population in NCT Delhi
Year Urban Area (in Sq. Km.)
Urban Area/Total Area (%)
Urban Population Millions
Urban Population/Total Population (%)
1961 326.54 22.00 1.43 88.72 1981 591.90 40.00 2.35 92.73 1991 700.23 47.00 8.47 89.94 2001 924.68 62.00 12.90 93.18
Source: Economic Survey of Delhi, 2007-08
54. Data published by the UN-Habitat (2008)8 shows that by 2025, 11 cities in India will have population more than 4.0 Million. The figures are presented in Table 2.4. These cities (Mega cities) together will house 127 million (over 24% of the total urban population).
8 UN-Habitat (2008): Reports of the World Urban Forum, Nanjing, China, 2008

TA 7114-IND National Capital Region Planning Board Project
Final Report
Sheladia Associates, Inc. USA 22
Volume 1 – Main Rep
ort
Table 2.4: Megacities in India: Projected Population in 2025 Population (in Millions) City
2001 2025 Mumbai 16.36 26.38 Ahmedabad 4.51 7.73 Pune 3.75 6.79 Surat 2.81 5.70 Chennai 6.42 10.12 Bangalore 5.68 9.71 Hyderabad 5.53 9.09 Delhi 12.79 22.49 Kanpur 2.69 4.60 Jaipur 2.32 4.29 Kolkata 13.21 20.56 Total 76.07 127.49
55. Given the above figures, by 2025, Delhi is expected to become the second most populous city in the country.
5. Economic Growth of NCT Delhi
56. Between 2000 and 2001 the Gross State Domestic Product (GSDP) of NCT Delhi
grew at a CAGR of 10.27% p.a. to reach a figure equivalent to US$ 105.38 billion. The high growth rate of the GSDP in the state has resulted in a very high per capita income of Rs 61776. This income is much higher than the national average of Rs 25716. The poverty ratio in the state is also quite low. Only 14.07% of the population in the state lives below the poverty line while the corresponding all-India figure stands at 27.5%.
57. In Delhi, most of the growth in the GSDP is contributed to by the secondary and
tertiary. The tertiary sector is the second fastest growing sector in the region. The manufacturing sector in Delhi contributes to about 12% to the GSDP, while the tertiary sector has a share of 79% in the GSDP. There has been a phenomenal growth of small scale industries (SSI) in Delhi in the last 4 decades. Between 1961 and 200-01, the number of SSI Units registered a sharp increase from 17,000 units to 1.29 lakh units. It is important to note that this increase has mostly been witnessed in the unorganized sector, as the planned industrial area in Delhi has only 25,000 to 30,000 plots housing the industrial units. In the arena of industrial employment, Delhi contributes to about 4.12% of the total employment in the country. The rapid urbanization in Delhi has had a negative impact on the share of the primary sector in the GSDP. In 1960-61 the share of the primary sector was 7.10%. In 2005-06, the share has declined to 1.06%9.
9 Source: Economic Survey of Delhi, 2007-08

TA 7114-IND National Capital Region Planning Board Project
Final Report
Sheladia Associates, Inc. USA 23
Volume 1 – Main Rep
ort
58. The NCT-Delhi has a strong social infrastructure base in the form education and healthcare. The literacy rate in the state is as high as 81.67% (compared to a national average 65%). The state houses some of the leading technical, medical, management, and legal institutions in the country. This facilitates availability of knowledge workers that are required for promoting and fostering the planned knowledge-based economic activities. In the healthcare sector, Delhi boasts of 815 hospitals and 8 primary health centers and the state exhibits better health ratios than the rest of the country.
59. In India, Delhi has one of the best infrastructures for collection of savings and
disbursal of credit. During the FY 2006-07, the Credit-Deposit ratio for all banks in the state was 87% and the average population served by a bank office in the state is 10,027, as compared to the national average of 16,152.
60. On the whole NCT Delhi represents an economic situation characterized by high
growth and prosperity. The growth of the state has attracted population from various places in India who have migrated into Delhi in search of a better standard of living.
6. NCT Delhi – The Problem of Migration
61. Rapid in-migration has been a dominant problem facing Delhi. Attracted by the
economic growth of the state, every year, a large number of people from all over India migrate to Delhi. The Economic Survey of Delhi, 2007-08 lists some of the predominant reasons for in-migration in Delhi (Table 2.5).
Table 2.5: Predominant Reasons for Migration in NCT Delhi Reasons for Migration % Migrants (1981-91) % Migrants (1991-2001) Employment 31.29 37.60 Business 4.07 0.50 Education 2.28 2.70 Family Related Reasons 41.45 36.80 Marriage 15.62 13.80 Natural Calamities 0.13 - Others 5.16 8.60 Total 100.00 100.00 Source: Economic Survey of Delhi, 2007-08
62. From the above figures it is apparent that the increasing employment opportunities in Delhi offer an incentive for people from other states to migrate to this region. However, the above figures pertain to permanent migrants. In addition there is a huge influx of “daily commuters” or “floating populations” who commute to Delhi every day for various reasons – work, medical care, education, sports, etc.

TA 7114-IND National Capital Region Planning Board Project
Final Report
Sheladia Associates, Inc. USA 24
Volume 1 – Main Rep
ort
63. Majority of the migration occurs from states like Uttar Pradesh, Haryana and Bihar. Table 2.6 illustrates the percentage of migrants as per their place of last residence.
Table 2.6 :Origin of Migrants in NCT Delhi Place of Last Residence % Migrants (1981-91) % Migrants (1991-2001) Uttar Pradesh 48.25 40.05 Haryana 11.51 7.87 Bihar 10.69 19.09 Uttaranchal - 5.11 Rajasthan 6.00 4.06 Punjab 5.28 2.16 West Bengal 2.72 3.88 Madhya Pradesh 2.64 1.82 Others 12.91 15.96 Total 100.00 100.00 Source: Economic Survey of Delhi, 2007-08
64. The migrants consist of both economically affluent groups and economically weaker sections. While the educated and economically affluent section finds employment in the growing secondary and tertiary sector of the state, the economically weaker groups become daily wage earners. The 58th Round Survey conducted by the National Sample Survey (NSS)10 specifies that during 2002 a total of 33234 households had migrated to Delhi. Out of this 84.90% of the households were permanent migrants while 15.11% moved to Delhi on seasonal basis. According to the 2001 Census there were 22.54 Lakh households in Delhi compared to 18.62 Lakh in 1991 – reflecting a growth by 37.17%. The rapid in-migration to Delhi exerts tremendous pressure on the existing infrastructure. It is a challenge for the local government of Delhi to handle this huge influx of migrant population.
65. Continuous migration to Delhi on one hand and lack of adequate developed land
(at affordable prices) has led to the emergence of unplanned settlements. Figures presented in the status report published by the Delhi Urban Environment and Infrastructure Improvement Project, 2001 (DUEIIP) reveals that only 23.7% of the total population of Delhi resides in planned colonies. Table 2.7 lists the types of settlements in Delhi (as in 2000):
1. 10 This round was conducted during July and December, 2002

TA 7114-IND National Capital Region Planning Board Project
Final Report
Sheladia Associates, Inc. USA 25
Volume 1 – Main Rep
ort
Table 2.7 Types of Settlements in NCT Delhi
Sl. No.
Type of Settlement Estimated Population Residing in the Settlement (in Million)
% of the Total Population
1 Planned Colonies 3.3 23.70 2 Slum Designated Areas 2.6 19.10 3 JJ Clusters11 2.1 14.80 4 JJ Resettlement Colonies 1.8 12.70 5 Regularised-Unauthorized Colonies 1.8 12.70 6 Urban Villages 0.9 6.40 7 Rural Villages 0.7 5.30 8 Unauthorized Colonies 0.7 5.30
66. The emergence of the unplanned settlements poses an enormous challenge to the capital territory. Not only managing the unplanned settlement is a problem but also the costs incurred by the government in making the settlements habitable are also huge.
67. The Government of Delhi plans to undertake considerable expansion in both the
industrial and urban infrastructure of the state. The government has focused on promoting industries that are based on imagination, knowledge, content, innovation and creation. The strategy is to promote hi-tech, sophisticated and high value added industries. Emphasis is being given to service industries like banking, insurance, financing, accountancy, health care, computer software development, entertainment and tourism.
68. At the same time, the state faces enormous pressure from the rapid influx of
population and hence has to accord great importance towards development of the urban infrastructure. The plans aim at reducing the demand-supply gap so as to provide better living conditions to the population residing in Delhi.
7. Transport
69. The transport sector in Delhi is quiet well developed. Delhi is well connected by rail
network to other parts of India. A significant part of Delhi’s trade depends on its rail link with other commercial centers. The Delhi Metro Rail Corporation (DMRC) is the world’s only UN-certified green railway. It is also the only metro network in the world to be ISO 18001 OHSAS12 certified.
70. The international airport at Delhi - one of the busiest in the world, is being
upgraded by a private consortium to handle more flights and passengers. By 2021, the airport is expected to handle 100 million passengers per annum.
11 JJ Refers to Jhuggi Jhopri 12 OHSAS stands for Occupational Health and Safely Advisory Services. The ISO 18001 OHSAS standards prescribe norms that minimizes the health hazards and risks.

TA 7114-IND National Capital Region Planning Board Project
Final Report
Sheladia Associates, Inc. USA 26
Volume 1 – Main Rep
ort
71. Delhi’s total road length is over 30923 km. Despite a good transport infrastructure,
the need for more improvements to handle the huge human traffic through the state has prompted the state government to provide the highest budgetary allocation to the sector in the Finance Bill 2008. The outlay on transport sector has been Rs.22700.00 million in 2008, as against Rs. 14140.00 Million in 2007. The major projects undertaken for the improvement of the transport sector in the state include the Golden Quadrilateral project of the National Highway Authority of India that will connect Delhi to other parts of the country, up gradation of the existing networks and construction of freeways and highways along key routes in the NCR. Action is also underway to operationalise the Delhi Integrated Multi Modal Transport Systems (DIMTS) that will spruce up the public transport system in NCT-Delhi.
8. Power
72. Delhi has an installed power capacity of 994500 KW. To meet demand, an
additional 13416 MW of power is purchased from the neighbouring states. In 2006-07, the total consumption of power in the state was 21977 MW. However, the demand for power in Delhi is growing at the rate of 7-8% per annum. To meet the growing demand a 1000 MW Combined Cycle Gas-Based Power Project is expected to be set up at Bawana at an estimated cost of Rs. 450000 Million through NTPC by 2010.
73. The 2001 Census reveals that electricity was available to 92.86% of the
households, while, 7.14% of the households depended on other forms of energy – kerosene, solar energy, etc.
9. Solid Waste Management
74. Delhi ranks poorly in Solid Waste Management (SWM) compared to other metro
cities in the country. As per the 2001 Census, toilet facility was available to about 11.61 lakhs households (46.00%). The government is planning to invest sufficient funds (in its Annual Plans) to provide sewerage network in non-sewered localities and also for construction of public toilets in the localities where houses are without the toilet facilities.
75. The municipal waste production in NCT Delhi is approximately 7000 Metric Ton
(MT) per day. Growing at a rate of 6-8% per annum, it is projected that by 2021 the volume of waste production per day would be between 17000 - 25000 tonnes. Even if it was possible to provide the maximum reduction of waste through composting and incineration, there would still be a minimum 20% residue of 4000 – 5000 tonnes per day that would have to be landfilled by 2021. There is therefore a projected requirement of 800 ha land by 2021. Though there is no shortage of public land, but there are competing demands for that land. This might require the setting up of joint ventures for municipal waste disposal outside the NCT. Further,

TA 7114-IND National Capital Region Planning Board Project
Final Report
Sheladia Associates, Inc. USA 27
Volume 1 – Main Rep
ort
SWM requires strict environmental monitoring and regulations. PPP projects, as applied in various other metros, can be used effectively to attain cost and service efficiency in SWM.
10. Water Supply
76. Raw water demand in Delhi was 2700 mld13 in 2001. It is expected to increase to
4700 mld by 2021. Reports suggest that there is an inequity in the supply of treated raw water in Delhi. Some areas receive water far in excess of the approved norms, while 10% of the population has no piped water supply and 30% has no access to safe drinking water. It is estimated that 40% of the water is lost or unaccounted for due to leaking pipes. As per the 2001 Census, piped water was available to only 19.24 Lakh households (i.e. 75.34% of the total households). 18.68% of the households depended on hand pumps.
77. Rapid urbanization has led to a grave imbalance between water demand and
supply in the region. As a consequence, unsustainable exploitation of groundwater is taking place that has led to the depletion of groundwater levels and increase in salinity. There is therefore need to improve the water supply infrastructure though strategies that should include reduction in unaccounted for water, introduction of water harvesting and waste water re-use techniques, development of water sources and development facilities, systematic expansion of water distribution network and coordinated planning and development of the water sector for future urban growth.
B. The National Capital Region (NCR): Way Forward for Balanced Regional Development
78. The Economic Survey of Delhi, 2007-08 observes that “the National Capital
Region is characterized by a surge of physical and economic growth of Delhi and relative underdevelopment of the rest of the area. This is primarily a problem of relationship rather than a problem of scarcity leading to a lopsided development of the region where a part of economic surplus of the periphery, which is primarily rural and agriculture based, is extracted by the core and whatever development takes place in the periphery mostly reflects the expanding need of the core.” On a closer scrutiny of the problems faced by Delhi because of its rapid growth, it appears that the solutions of many of the problems lie beyond Delhi. In the event that the region around Delhi can be developed in a similar fashion, not only it will absorb a part of the increasing population in Delhi but will also create a synergy that will foster rapid economic growth of the region. There is a definite need for a regional approach of planned development. The concept of National Capital Region (NCR) and the allied plans uphold the idea of this regional approach to planned development.
13 Million Liters Per Day

TA 7114-IND National Capital Region Planning Board Project
Final Report
Sheladia Associates, Inc. USA 28
Volume 1 – Main Rep
ort
79. The NCR comprises Delhi and sub-regions of the states of Haryana (7 districts)14,
Rajasthan (1 district)15 and Uttar Pradesh (5 districts)16. The materiality of each of these states in the context of the NCR is depicted in Table 2.8.
Table 2.8: Materiality of the States in the NCR Region
State
NCR Area in Sq. Km. (% of the Total NCR Area)
NCR Population in
Millions (2001)
Projected NCR Population in
Millions (2021)
GSDP (Rs.
Millions) at
Current Prices (2006-07)*
GSDP Growth Rate over
Previous Year*
IEM17 (2008-09)
– Propose
d Investme
nt (Rs.
Millions)*
State Literacy Rate
(2001)*
% Population Below Poverty Line (1999-200)*
Delhi 1483 (4.00%)
13.70 23.00 1252820.00
18.40% 0.00 82% 8.23%
Haryana 13413 (40.00%)
8.70 16.00 1264750.00
18.88% 480.00 67.91% 8.74%
Uttar Pradesh
10853 (32.00%)
11.60 19.80 3128320.00
11.82% 4460.00 57.36% 31.15%
Rajasthan 7829 (23.00%)
3.00 4.80 1420360.00
14.34% 1940.00 60.41% 15.28%
(*) For the entire state
80. NCT-Delhi is the predominant growth centre in the entire NCR in terms of manufacturing/trading activity as well as concentration of employment. It is seen from the above table that a considerable portion of the population in Uttar Pradesh and Rajasthan live below the poverty line. This is attributable to over dependence on agriculture, seasonal employments and lack of industries in the state. With the proposed development of the districts (in these states) within the NCR, it is expected that economic activities will be diversified and industrialization will receive a boost. The economic benefits are expected to spill over the NCR boundaries and reach other corners of the states – correcting the economic inequality. Similarly, with economic activities being decentralized, it is expected that there will be improvements in the social infrastructure thus increasing the literacy level in the area.
81. The genesis of the National Capital Region lies in the recommendations of the first
Master Plan for Delhi (MPD) notified in 1962 wherein, a broad area consisting of the Union Territory of Delhi and a few ring towns around it was conceived for being developed as a metropolitan region to reduce the population pressure on Delhi. The unprecedented growth of population especially during the post independence
14 Districts in Haryana: Faridabad, Gurgaon, Rohtak, Rewari, Jhajjar, Mewat, Sonipat and Panipat 15 District in Rajasthan: Alwar 16 Districts in Uttar Pradesh: Meerut, Ghaziabad, Gautam Buddha Nagar, Bulandshahr and Baghpat 17 IEM implies Industrial Entrepreneurs Memorandum, implemented in 2008-09

TA 7114-IND National Capital Region Planning Board Project
Final Report
Sheladia Associates, Inc. USA 29
Volume 1 – Main Rep
ort
years and the consequent haphazard development (of the region) had been putting severe pressures on the infrastructure of Delhi. Therefore, it was suggested through various planning exercises beginning from 1956, that serious consideration should be given for a planned decentralization to outer areas and even outside the Delhi region. Finally in 1985, the Parliament enacted the Planning Board Act in 1985 with the concurrence of the constituent States of Haryana, Rajasthan and Uttar Pradesh (Delhi being only a Union Territory at that time). The Schedule to the Act has defined the region consisting of NCT Delhi and parts of the adjoining States which covers a total area of 33578 sq km. The main guidelines of the policy for a sustainable development of the NCR are18:
• Only such new Central Government offices, which directly serve the Ministries
of the Government of India, be located in Delhi • Existing offices of the public sector undertakings within Delhi should be
encouraged to shift, whereas new offices of the public sector undertakings, to the extent possible within their operational areas should be set up outside Delhi
• Industrial growth in Delhi should be restricted – with stress on units which requires less of manpower and energy and are non-polluting and clean
• Legal and Fiscal measures are to be adopted to restrict the employment in industries and distributive trade (in Delhi)
• Major regional transport corridors and communication network be strengthened to enhance economic development within the region and decentralization of distributive trade
• Development of rural areas must be accorded top priority, with improved conditions of employment, healthcare, education and living standards
• Development of rural areas will help reduce migration to cities • Smaller and medium sizes towns within the NCR must be developed to induce
shifts in employment generation. • Network systems in the NCR such as water bodies, trails, heritage structures,
employment centres, service areas, infrastructure etc. must be developed in a comprehensive manner
• Economic restructuring of the region must be based on a comprehensive vision
82. According to the 2001 census, the total population of NCR was 37.1 million and the average gross density of population is 1,104 persons per sq. km. By 2021, the population in the NCR is expected to grow to 64 million. The level of urbanization in the region is as high as 56%. The most prominent and fast growing urban centres are Delhi and its adjacent areas.
83. In addition to the NCR, the NCR Planning Board has identified the Gwalior
(Madhya Pradesh State); Patiala (Punjab); Hissar (Haryana); Kota (Rajasthan); and Bareilly (Uttar Pradesh) as Counter Magnet Areas (CMA) where development
18 For a more detailed discussion, see article: National Capital Region of Delhi – A Roadmap to Sustainable Development by Mr. A.K. Jain, Commissioner (Planning), Delhi Development Authority (available at http://www.ashahabitat.com/knowledgebase/pdf/delhi93.pdf)

TA 7114-IND National Capital Region Planning Board Project
Final Report
Sheladia Associates, Inc. USA 30
Volume 1 – Main Rep
ort
strategies need to be implemented in order to ease the projected population pressure on NCT-Delhi. These CMAs have been identified after consultation with the respective state governments regarding their location, population and potential growth prospects.
1. Regional Plan 2021
84. For the sustainable and integrated development of the NCR, a Regional Plan- 2021 has been formulated. The Plan aims at promoting growth and balanced development in the area through planning, related regulations and infrastructure based intervention. The major thrust areas under the Plan include:
• Identification and development of regional settlements – counter magnet towns capable of absorbing the demographic and economic development pressure on NCT-Delhi.
• Development of a rail-road network that is well integrated with the land use patterns, to support balanced regional development.
• Minimize the adverse environmental impact that the development of the National Capital Region might engender.
• Develop quality urban services in the NCR
• Introduce rational land use schemes in order to protect and preserve the good agricultural land in the region and utilize unproductive land for urban uses.
• Promote sustainable development in the region to improve quality of life.
• Improve the efficiency of existing methods of resource mobilisation and adopt innovative methods of resource mobilization.
• Facilitate, attract and guide private investment in desired direction.
85. Therefore the Regional Plan 2021 aims at ensuring the socio-economic and environmental sustainability of the NCR. Economically the importance of the region is immense. The NCR recorded an average annual growth of 3.6 % during the period 1991-2001. The highest growth rates have been reported by Delhi (4.7%) and Haryana (3.0%). It is ranked as one of the most profitable investment areas in the country and is currently ranked right after the Mumbai region. The area currently attracts 17% of the Foreign Direct Investments (FDI) in the country.
2. Increasing Investments in NCR
86. An analysis of projects and investments being planned in the country reveals that
the Mumbai Metropolitan Region (MMR) led by Mumbai in the west and the National Capital Region (NCR) led by Delhi in the north are going to attract a significant investment in the near future. To increase synergy between these two future economic hubs in the country, plans are on to build a high investment Delhi-Mumbai Industrial Corridor (DMIC). The proposed DMIC, connecting NCR and

TA 7114-IND National Capital Region Planning Board Project
Final Report
Sheladia Associates, Inc. USA 31
Volume 1 – Main Rep
ort
MMR (Mumbai Metropolitan Region) will lie within 150 km of the Indian Railways’ Dedicated Railway Freight Corridor and will run through the states of Delhi, Haryana, Uttar Pradesh, Rajasthan, Madhya Pradesh, Gujarat and Maharashtra. The DMIC is expected to create a strong economic base with world–class infrastructure that will promote local industry and attract foreign investment. The proposed development includes creation of investment regions /industrial areas and critical infrastructure along the corridor. The total investment in infrastructure in DMIC is expected to be around USD 90-100 billion. The project would have the potential to generate employment of around 3 million mainly in the manufacturing/processing sectors. This corridor also boasts of the largest number of proposals for multiproduct SEZs. Out of the 91 Multi-product SEZs (at various stages of approval) proposed to be established in the country, about 60% fall in the states that comprise the ‘Delhi-Mumbai Industrial Corridor’.
87. Besides the Delhi-Mumbai Industrial Corridor, two Dedicated Freight Corridors by
the Indian Railways – Delhi-Mumbai (Western) and Delhi-Howrah (Eastern), are expected to contribute to the growth of the region. Approved for implementation by the Committee of Infrastructure in February 2006, the corridors would require an investment of at least Rs 2250000 Million and almost 5 years to complete. These corridors would be constructed, operated and maintained by a corporate entity on commercial principles, and relying on efficient technological solutions. Scarce budgetary resources would be leveraged for raising debt from the markets, based on a sound business plan. The proposed corporate entity would provide the rail infrastructure, but would not itself engage in freight business, thus providing non-discriminatory track access on payment of haulage charges by train operators. It is expected that the freight corridors would attract large scale investments in the region and also competition in freight operations.
3. High level of Industrialization
88. As already noted, NCT-Delhi represents the centre of growth in the NCR.
Currently, industrialization in NCR is concentrated in the sub-regions of Uttar Pradesh (General Manufacturing), Haryana (Automobile, Electronics, Handloom) and Rajasthan (Marble, Leather, Textile). The region accounts for a substantial part of the country’s production of cars (60%), motor cycles (55%) and tractors (25%). Industrialization in and around NCR is expected to receive further boost through the proposed creation of Special Economic Zones (SEZs)/Industrial Zones. In future Delhi is expected to attract huge investment in services and the hi-tech sector, while the rest of the NCR would attract manufacturing and other green field projects. For the comprehensive development of the NCR, the Regional Plan envisages an infrastructure investment of around USD 25.2 billion by 2021. The largest share of this investment will be in the power sector (USD 12.5 billion) followed by transport (USD 7.2 billion), water (USD 3.2 billion), sewerage (USD 2 billion) and solid waste management (USD 0.3 billion).

TA 7114-IND National Capital Region Planning Board Project
Final Report
Sheladia Associates, Inc. USA 32
Volume 1 – Main Rep
ort
C. Haryana, Rajasthan and Uttar Pradesh – An overview
89. Haryana, covering a total area of 44212 sq. km., has a population of 21.08 million. Urban population in the state constitutes 29% of the population. Economically it is one of the middle income states in the country which traditionally depended on agriculture as the main source of livelihood. Rajasthan, lying on the western border of India has an area of 342239 sq km. As per the 2001 census, the state has a population of about 69.7 million, 81% of whom live in urban areas. Economically, it is one of the fastest growing states in the country. Uttar Pradesh, on the other hand, covering an area of 240928 sq km, is one of the most populous states in the country. According to the 2001 census, it has a population of 166 million and a population density of 689 persons per sq km.
1. State Domestic Product
90. NCT Delhi and the other NCR states assume a considerable position of
importance in the Indian economy. On an average, the region contributes to about 20% of the Indian GDP. The performance of the individual states is presented in table 2.9.
91. When all the states and the union territories of the country are ranked according
to their share in the total GDP of India (on the basis of the figures for the fiscal 2006-07), Uttar Pradesh ranks second after Maharashtra. Rajasthan and Haryana have ranks of 8 and 11 respectively. NCT Delhi, though small in size, assumes 13th position among all the states and union territories in the country. The above figures demonstrate the importance the region has with respect to the economic performance of the country as a whole.
Table 2.9: Gross State Domestic Product of NCR States at 1999-2000 Constant Prices (Figures in Rs. Millions)
State/Union Territory
1999-2000
2000-01 2001-02 2002-03 2003-04 2004-05 2005-06 2006-07
Uttar Pradesh
1751600 1790200 1828880 1895980 1994130 2078260 2195540 2360700
Rajasthan 827200 810600 898690 809740 1041890 1022580 1091210 1169460
Haryana 512780 554770 598500 636590 693880 756760 826040 920530
Delhi 549750 571980 593210 637660 664580 735580 799160 894870
All India GDP 17865250 18643000 197260600 20482870 22227580 23883840 26128470 28643090
Source: Compiled from Data published by Central Statistical Organisation
92. During 1999-2000 and 2006-07, the Compounded Annual Growth Rate (CAGR) of the Indian GDP was approximately 6.98% per annum. Both Haryana and Delhi witnessed intense economic activity during this period and registered a CAGR of

TA 7114-IND National Capital Region Planning Board Project
Final Report
Sheladia Associates, Inc. USA 33
Volume 1 – Main Rep
ort
8.72% p.a. and 7.21% p.a. respectively, which was substantially higher than the national average. During the period Rajasthan and Uttar Pradesh demonstrated a CAGR below the national average with CAGR of 5.07% and 4.35% p.a. respectively.
93. In terms of the Net State Domestic Product (NSDP) at constant prices, both Delhi
and Haryana shows considerable growth during the period 1999-2000 to 2006-07 (Table 2.10). For both NCT Delhi and the state of Rajasthan, the per capita NSDP is well above the NNP per capita of the Indian economy as a whole. During the fiscal 2005-06 Delhi ranked third among all the states and the union territories in terms of the NSDP. The corresponding rank of Haryana was 5. The above figures demonstrate the importance the region has with respect to the economic performance of the country as a whole.
Figure 2.1 Growth Rate (%) of GSDP at Current Prices (Base: 1999 – 2000)
Table 2.10 Net State Domestic Product Per Capita at 1999-2000 Constant Prices (Rs.) State/Union Territory 1999-2000 2000-01 2001-02 2002-03 2003-04 2004-05 2005-06 2006-07
Haryana 23121 24328 25557 26622 28484 30502 32724 35779
Rajasthan 13619 12840 13933 12054 15579 14908 15543 16401
Uttar Pradesh
9719 9700 9651 9780 10080 10250 10605 11188
Delhi 38673 38623 38627 40492 40898 43745 46239 50565
India (NNP per Capita)
15881 16172 16764 17101 18317 19325 20858 22553
Source: Compiled from Data published by Central Statistical Organisation

TA 7114-IND National Capital Region Planning Board Project
Final Report
Sheladia Associates, Inc. USA 34
Volume 1 – Main Rep
ort
2. Structure of the Economies
94. Figure 2.2 demonstrates the structure of the economies of the NCR states. The
economy of NCT Delhi is primarily a non agricultural economy with almost 99% of its GSDP being generated by activities in Industry and service sector.
95. For the other states in the NCR region, agriculture contributes substantially to the
GSDP. For all these states the contribution of agriculture is well above the national average. In all these states Industrial activities also play a crucial role and approximately 25% of the GSDP is contributed by the industrial activities. It is interesting to note that that the contribution by the service sector in these states is about 40% and below the national average of 50.60%
Figure 2.2 Structure of the Economy in NCR: Share of Sectors in the GSDP (2001-02 to 2003-
04)
96. The above figures indicate that the economies of Haryana, Uttar Pradesh and Rajasthan are balanced economies with significant contributions from all the three sectors of the economy. However, during the recent years the portion of the states near to the NCT Delhi is witnessing a rapid increase concerning the activities in the industry and service sector. Many national and multinational companies are establishing their operations in the NCR region. A recent study by NASSCOM and

TA 7114-IND National Capital Region Planning Board Project
Final Report
Sheladia Associates, Inc. USA 35
Volume 1 – Main Rep
ort
A.T. KEARNEY19 shows NCR as a LEADER20 among 50 cities selected for the study. The leader cities are significantly ahead of the rest of the cities in terms of availability and quality of employable workforce.
97. In Haryana, over the past decade, a growing manufacturing and services sector
has fuelled rapid real estate and infrastructure growth and a shift away from agriculture in the composition of the economy. This tertiary sector of the state grew at a CAGR of 11.8% p.a. during the period. The tertiary sector growth has mostly been driven by the IT and the ITES sectors. This sector contributes to about 44.3% of the GSDP. During the same period, the secondary sector, which has a share of 32.4% in the GSDP, recorded a CAGR of 8.1%. The secondary sector growth has been driven by manufacturing in sub-sectors like automobile components, auto light engineering and textiles. The per capita income of the state is US$ 862.9 and the state has the minimum urban-rural prosperity gap in the country.
98. The state of Haryana produces 66.67% of the passenger cars, 50.00% of the
tractors, 60.00% of the motor cycles, 50.00% of the refrigerators and other white goods and 25% of the sanitary-ware manufactured in the country. The robust SSI sector in the state provide repair services for capital goods and is mostly into manufacturing of metal products, leather and fur products, wooden furniture, food processing, etc.
99. Between 2002-03 and 2007-08, Rajasthan’s GSDP grew at a rate of 12.85% p.a.
Though a 21% p.a. CAGR in agriculture during this period contributed greatly to the growth, the tertiary sector has the largest share in the GDSP. The tertiary sector, driven by subsectors like trade, hotels & restaurants and real estate, has a share of over 40% in the GDSP. The CAGR of the tertiary sector during the period 2002-03 to 2007-08 was 9.3%. Real estate, with a share of 46%, is the major growth driver in the tertiary sector. The secondary sector, driven by construction and having a CAGR of 12.73% during the mentioned 5 year period, has a 29.1% share in the GDSP. During the same period, the construction sector - contributing a 50 per cent share to the secondary sector, had a CAGR of 23%.
100. The industrial performance of Rajasthan is mostly driven by Micro Small and
Medium Enterprises (MSME). The small and medium scale units generate seven times the employment generated by the medium and large industries. The key industries in the state include agro industries, cement products, ceramic, food processing, hand tools, handicraft, handmade paper, gems & jewellery, marble, oil industry and stone quarrying.
101. After Maharashtra, UP is the second largest economy in the country, contributing
8.17% of the Indian GDP. Though primarily an agrarian economy, the tertiary sector contributes more than 40% of the states domestic product. The primary
19 NASSCOM – A.T. Kearney Study (2008): Location Roadmap for IT-BPO Growth – Assessment of 50 Leading Cities 20 The study classifies cities in four categories – LEADERS, CHALLENGERS, FOLLOWERS and ASPIRANTS.

TA 7114-IND National Capital Region Planning Board Project
Final Report
Sheladia Associates, Inc. USA 36
Volume 1 – Main Rep
ort
sector contributes to about 34% of the GSDP, with agriculture contributing to 66% of the primary sector share. The high share of the tertiary sector in the state’s GSDP can be attributed to tourism. One of the top tourist destinations in the country, the state draws about 25% of all tourists visiting India.
102. The secondary sector in the state is largely driven by office machinery, sugar,
cotton fabrics and agro-based industries. The state has the largest share of SSI units in the country (12%). It is also the fourth largest software exporter. Despite the smallest share in the GSDP, the robust industrial activities in the state can be attributed to the presence of strong industrial infrastructure. U.P. boasts of 15 industrial areas, 12 specialized parks, 3 growth centres, Industrial Infrastructure Development Centres (IIDCs) and 12 notified Special Economic Zones (SEZ) with world class infrastructure. Most of these SEZs are located in the NCR region falling in the state. The Greater Noida region, that forms the heart of the NCR in UP, has 19% land reserved for industrial use. An integrated agro-food processing zone is proposed at Hapur lying in the Ghaziabad district. 40 IT-ITEs parks, a knowledge park and two Biotech zones are also proposed. An Integrated Logistics Hubs (Free Trade Warehousing Zone) have also been proposed in collaboration between IL&FS, Mineral and Mining Trading Corporation and Mitsui (Japan), under the DMIC project.
3. Investments in the NCR States
103. Haryana is known for its investor friendly policies. As on March 2008, the state has
received about US$ 71.72 billion in investments, of which 65% is under implementation. Maximum investments have come in the construction sector (59.6%, mainly real estate and road construction), followed by electricity (19.2%), services (12.1%), manufacturing (11.3%) and irrigation (0.2%). Panipat, Gurgaon, Faridabad and Bhiwani (key NCR centers) are the major centers of growth in the state. These districts together contribute to 61.9% of the total production in Haryana.
104. In the recent years, the manufacturing sector in Rajasthan has witnessed a strong
inflow of investment. In June 2008, the total outstanding investment in Rajasthan stood at US$ 27.31 billion, an impressive increase from the US$ 13.3 billion outstanding in June 2007. 38.3% of this investment was made in construction, followed by electricity (27.4%), mining (14.6%), manufacturing (11.3%), services (9%) and irrigation (1.1%). The district of Alwar, falling in the NCR, is one of the top most industrialized districts in the state. Bone china crockery, caustic soda, cement, ceramic tiles, dyes and chemicals, edible oil, electronics, engineering machines, GI and CI pipes, granite slabs and tiles, hand tools and marble are some of the prominent industries of the district.

TA 7114-IND National Capital Region Planning Board Project
Final Report
Sheladia Associates, Inc. USA 37
Volume 1 – Main Rep
ort
4. Social Infrastructure
105. Haryana has well developed education and health care facilities. The state boasts
of 4 universities, 61 engineering colleges, 34 MCA and 56 MBA colleges, 27 Pharmacy colleges, 76 polytechnics, 355 undergraduate and 75 post graduate colleges. As far as medical infrastructure is concerned, the state has about 50 hospitals, 133 dispensaries, 85 community health centres, 420 primary health centres, 2,299 sub centres and 20 tuberculosis centres. The per capita expenditure on health in the state has increased from US$ 4.11 in 2004-05 to US$ 5.74 in 2007-08.
106. Haryana has one of the best infrastructures for collection of savings and disbursal
of credit in the country. In 2006-07, the credit to deposit ratio in the state was 65 per cent and it achieved 107.4 per cent of the set target of the annual credit plan.
107. Rajasthan has achieved significant progress in improving its social infrastructure
over the years reflected in the 9th rank as per the Human Development Index (2001). Rajasthan's education network consists of 9 universities and over 250 colleges, along with 55,000 primary and 7,400 secondary schools. The state has 41 engineering colleges, 23 polytechnics and 152 Industrial Training Institutes (ITIs), providing vocational training to students. The state has 7 medical institutes, 28 pharmacy institutes and 26 management institutes. The network of health facilities in the state comprises 126 hospitals and 1,800 health centers. In order to strengthen the social infrastructure, with private partnership, the State encourages investment in health sector. As a result, the state has witnessed tremendous growth in terms of healthcare facilities and infrastructure over recent years.
108. Banking infrastructure in Rajasthan has improved in the recent years. By the third
quarter of 2006, the credit-deposit ratio in the state was 78.12% as against the all India figure of 72.99%. The outstanding scheduled commercial bank credit in Rajasthan grew from US$ 9.4 billion as on March 31, 2006 to US$ 12.8 billion as on March 31, 2007 - an increase of 37.2 per cent.
109. In UP, the education and health infrastructure in the state is quite well developed.
UP is one of the few states in the country that has successfully implemented the “education for all” policy. The state has 38 universities, 95 polytechnic institutes, 179 industrial training institutes, 95 engineering and 16 medical colleges. Some of the leading engineering colleges and management institutes in the country are located in the state. In the health sector the state has 74 district hospitals, 3660 primary health centers, 386 community health centers and several alternative medical units like ayurvedic, unani, etc.

TA 7114-IND National Capital Region Planning Board Project
Final Report
Sheladia Associates, Inc. USA 38
Volume 1 – Main Rep
ort
5. Physical Infrastructure
110. The transport sector in Haryana is quite well developed. It is one of the few states
in the country which has 100% metalled road connectivity in the country. It has 23871 km of road and 1462 km of national highway. The state boasts of one of the biggest state road transport undertakings in the country. The state is well connected to the Indian Railways network. Gurgaon lies in close proximity to the international airport in New Delhi while a domestic airport is located at Chandigarh, the state capital. There are civil aerodromes at Pinjore, Karnal, Hisar, Bhiwani and Narnaul.
111. Haryana’s power sector is grappling with the twin challenges of serving a growing
and commercially vibrant urban and industrial customer base while also managing the supply of scarce electricity to the state’s traditional economic communities in rural areas. Haryana was among pioneer states in terms of initiating legal, structural, regulatory and institutional reforms in the power sector. The critical challenges facing Haryana’s power sector include shortages, below cost-recovery tariffs, and limited capacity of service providers and other key stakeholders.
112. The state has seen power shortages grow in recent years, with peak-time deficits
of 1200-1500 MW and off-peak deficits of 400-600 MW. This translates to 10-30% of the installed capacity of 4680 MW. These shortages have resulted in costly coping strategies adopted by consumers who could afford them (oil-based captive generation by industry, commercial entities, and wealthier households). Annual electricity demand growth forecast for the 2007-12 period ranges from 9 to 14%, with the possibility of the recent economic downturn dampening this demand growth. With rising costs and deteriorating services, state authorities have found it difficult to raise tariffs. The cost of power supply in Haryana is higher than in other states because of its long distance from primary fuel sources, old and inefficient state power generation capacity, and difficulty in securing long-term supply from non-state owned power plants on competitive terms (due to the general power shortage in the country).
113. The rapid industrialization and a steep rise in population in the state of Haryana,
has placed enormous burden on the civic amenities in the towns. Various schemes are being planned for the beautification and decongestion of these towns so as to ensure their planned future growth. The Urban Local Bodies Department of Haryana proposes to construct sanitary landfill and compost plants for the disposal of municipal solid waste by grouping 2-3 towns with bigger towns in neighbourhoods where land is available. So far 19 urban centers for 38 towns have been identified for the disposal of municipal solid waste. The Union Government has proposed an allocation of Rs 4550 Million for the project for a period of 2005-10, but this amount is far from being adequate.
114. Rajasthan's road density is 41.2 km per 100 square km which is significantly less
than the national average of 76.8. The low road density can be attributed to the

TA 7114-IND National Capital Region Planning Board Project
Final Report
Sheladia Associates, Inc. USA 39
Volume 1 – Main Rep
ort
large proportion of desert area in the state. Rajasthan has a total road length of 180,000 km. Of these, 5,655 km are national highways, 11,615 km are state highways and 7,340 km are major district roads. Through various schemes like the Missing Link project and Central Road Fund, new roads are constructed to link all villages in the state. Under the state's Mega Highways Project, over 1000 km of roads joining national highways are being upgraded into expressways, providing better and quicker connectivity. The state government has introduced the Road Infrastructure Development Company of Rajasthan Ltd (RIDCOR) to improve the state’s road infrastructure. RIDCOR is a public limited company constituted as a 50:50 joint venture between the government of Rajasthan and Infrastructure Leasing and Financial Services Ltd (IL&FS). Rajasthan has benefitted significantly from the ongoing highway development programme including the DMIC. The state has also been a pioneer in promoting private investment in development of highways, with implementation of projects on Build-Operate-Transfer (BOT) basis. Rajasthan is also well connected with the rest of a the country by a rail network with a route length of about 5900 km. 65% of this network is under broad gauge. Besides road and rail transport, the airways connection of the state is also quite adequate. The state has an international airport at Jaipur and a domestic airport at Jodhpur and Udaipur.
115. The power infrastructure of Rajasthan though developed is yet not adequate. In
2005-06, the per capita consumption of electricity in the state is 572.2 kWh which is lower than the national average of 631.41 kWh. In March 2007, the state had an installed capacity of 6335 MW. By 20121 the Government of Rajasthan plans to increase the existing capacity by 3180 MW. Three new power plants have already been commissioned – one at Giral in Barmer district and two in Dholpur district. Six new plants are being constructed in Giral, Dholpur, Chhabra, Kota, Suratgarh and Barsinger. These six plants would add 1180 MW to the state’s capacity. The government is exploring non-traditional energy options like biomass, solar energy and wind power. In 2004 the state government announced a policy for promoting generation of electricity through non-conventional energy sources. The aim of this policy is to encourage private investment in the renewable energy sector. Wind power projects having a total capacity of 450 MW have already been commissioned in the state. Biomass power projects with a total capacity of 46.3 MW have already been commissioned by the state. Two other similar projects with a total capacity of 15.5 MW are under construction. In Mathania near Jodhpur, a 140 MW solar plant has also come up to tap solar energy. More projects are being undertaken to increase the state’s non-conventional energy capacity.
116. Water is one of the scarcest resources in Rajasthan. Almost 66% of the state is
arid and 30% is semi-arid (Govt. of Rajasthan, 2005)21. Besides this natural feature, a fast growing population and injudicious policies have resulted in a situation where demand vastly outstrips supply. Accepted international standards deem that if water availability per person in any region is below 1000 cu m per
21 Govt. Of Rajasthan (2005): Report of the Expert Committee on Integrated Development of Water Resources, (http://www.solutionexchange-un.net.in/food/cr/res25070705.pdf)

TA 7114-IND National Capital Region Planning Board Project
Final Report
Sheladia Associates, Inc. USA 40
Volume 1 – Main Rep
ort
year, then the region is water stressed. In Rajasthan, the water availability per person per year is only 809 cu m. It is expected that over time the domestic and industrial demand for water in the state will increase substantially in the near future particularly in the industrialized districts of Alwar, Kota, Jodhpur and Jaipur. To review the situation, the state government formed a committee in 2004 under the chairmanship of Prof. V. S. Vyas to suggest strategies to develop the state’s water resources. Based on its observations, the committee suggested an integrated water resource management policy that is based on stakeholder participation in planning and management. However, the privatization experience of Rajasthan’s surface water resources has not been encouraging. Unresolved public policy issues in the environment and social spheres hinder large-scale private investment.
117. UP is well connected through air, road and rail. It has three domestic airports - one
each in Lucknow, Varanasi and Agra and the NCR region is well connected to the rest of the world through the international airport at Delhi. Efforts are underway to introduce air services in Allahabad and Gorakhpur. With a rail route length of 8546 km (2006), U.P. has the largest network in the country. Most of this route is under broad gauge. All major cities and towns in the state is linked through railways. The road connectivity in the state is second only to Maharashtra. With 1027 Km of road length per 1000 sq km in 2002, U.P. has the seventh largest road density in the country. It is well connected with the rest of the country through 37 national highways. As on 2002, the total road length in the state was 248481 km, 67% of which was surfaced. The state also boasts of the largest surfaced urban road network in the country – 50721 km.
118. Power infrastructure in the state though developed is yet inadequate. The state
has an installed power generation capacity of 4706 MW as on 2006. However, this capacity is not enough to meet the power demand in the state. The increasing population, urbanization and industrialization have led to rapid increase in power demand in recent years. The demand is likely to rise further in the future. To meet this demand the state government announced a new power sector policy in 2003 that was aimed at attracting private investment in the sector. Consequent to which, several major private projects such as Dadri power project of Reliance Energy Generation Limited and Roza Power Project of the Birla Group, have been implemented. Proposed projects include a 1750 MW power plant at Dadri in the Gautam Buddha Nagar district, another 740 MW gas based power plant also at Dadri and a 250 MW gas based power plant at Greater Noida. Besides encouraging private participation, the government is also offering lucrative tax benefits to prospective investors in order to improve the power sector in the state. The main aim of the government power policy is to provide additional power capacity, modernize existing plants and improve transmission facilities.
119. Like the rest of the NCR, Uttar Pradesh lies in an area which is likely to face
severe water crisis in the future. Though the state receives adequate monsoon rains and is fed by several Himalayan rivers, scientific studies predict that

TA 7114-IND National Capital Region Planning Board Project
Final Report
Sheladia Associates, Inc. USA 41
Volume 1 – Main Rep
ort
unsustainable over exploitation is likely to deplete the water resources in the state leading to water stress. The worst affected region will be western U.P. which houses the NCR area. To ensure economically and environmentally sustainable water resource management, the Uttar Pradesh Water Management and Regulatory Commission Act was passed in 2008. As per the National Water Policy 2002, there is scope for private participation in developing infrastructure for water management in the state. Private participation helps in introducing innovative ideas, generating financial resources, introducing corporate management, and improving service efficiency and accountability to users.
D. Fiscal Management of the NCR States
120. Efficient fiscal management by governments imparts robustness to an economy and paves the way for macroeconomic stability. Strong, consistent fiscal position signals the strength of the economy to survive financial crises and ensure economic growth. Deteriorating fiscal health as signified by year wise mounting budget deficits often indicate financial weakness and destroy investor confidence. Therefore to ensure economic vigour, budgetary sustainability and safeguard future growth, the Government of India introduced the Fiscal Responsibility and Budget Management Act 2003. Accordingly the union government is committed to:
• a reduction in revenue deficit by 0.5% or more of GDP at the end of each financial year beginning with 2004-05
• an annual reduction in fiscal deficit by 0.3% or more of GDP beginning with 2004-05
• A maximum liability (including external debt at current prices) of 9% of GDP for the financial year 2004-05 and a progressive reduction of this limit by at least 1% point of GDP in each subsequent year.
• No guarantees in excess of 0.5% of GDP in any financial year starting with 2004-05.
121. As per the Act therefore the central government sought to bring down the revenue
deficit to zero by 2009-10 and reduce the fiscal deficit to 3% of the GDP by 2009-1022. Introduced as a union government budget management tool, the individual state governments were entitled to frame their respective FRBM policies using the central FRBM Act as their guidelines. Accordingly, the states of Haryana, Rajasthan and Uttar Pradesh have enacted their own FRBM Acts which have set targets similar to the central government FRBM target. Compliance with the FRBM targets entitles the states to debt relief in terms of consolidation, rescheduling and lowering of interest rates. The FRBM thus seeks to enforce fiscal prudence and efficiency through fiscal discipline, planning and implementation.
122. In the face of the recent global meltdown, the achievement of the FRBM targets
has proved to be difficult by both the central and state governments. Consequently
22 http://www.financialexpress.com/news/finmin-seeks-amendment-to-frbm-act/462199/

TA 7114-IND National Capital Region Planning Board Project
Final Report
Sheladia Associates, Inc. USA 42
Volume 1 – Main Rep
ort
revisions in the targets have been proposed both by the Ministry of Finance, India, the Reserve Bank of India and several state governments. A severe reservation against the FRBM mandate as stated by the Planning Commission has been that caps on fiscal deficit deter states with fiscal surplus to undertake investments as it adversely affect their fiscal deficit. Most of these problems are however not insolvable and can be successfully addressed through specific relaxations of the FRBM norms, efficient expenditure management and proper regulation of macroeconomic parameters like tax norms, subsidies, etc. The FRBM targets are necessary to ensure the financial solvency of the government – both state and the centre, and thus pave the way for future growth.
1. Revenue and Capital Receipts of the NCR Region
123. The ensuing discussion focuses on the income generation potential of the state
included in the NCR together with the all India scenario. Mostly budget estimates of the corresponding financial years have been employed to maintain parity in the data set. Wherever budget estimates have been unavailable, revised estimates or actual accounts data have been used as substitute. Unavailability of actual accounts data, particularly in the recent years i.e. the period 2005-06 to the latest has deterred the extensive use of actual account figures in the following analysis. GSDP data used has been enumerated at current prices since all other data has been evaluated at current prices without adjusting for rupee value appreciation or depreciation.
124. Tables 2.11 – 2.15 illustrate the revenue and capital receipts of India and the NCR
states. The revenue receipts in the NCR compare favourably with the rest of India showing a steady increase over the years – though the increase is not as sharp as all India taken together. A state government’s revenue receipt includes its tax revenues, non-tax revenues, share of union taxes/duties and grants from the government of India. The major share of the revenue receipts is contributed to by the states own tax revenue collection and hence the government’s income stream is to a large extent guided by its success in framing efficient tax policies and their implementation. All the states included in the NCR and the NCT-Delhi have registered steady increases in the total revenue receipts. Income from state taxes has also increased steadily over the period for Haryana and the NCT-Delhi. The underlying trend for tax revenues in Rajasthan and Uttar Pradesh is also increasing but the increase has not been as steady as in Haryana and Delhi. This underlines some breaches in the collection system of the states which when breached can plug the leakages in revenue generation. Consequent to the variability in tax collection variability is also noticed in the total receipts per period for the states of Uttar Pradesh and Rajasthan particularly during the period 2000-01 to 2002-03. Total receipts is the sum total of revenue receipts and total capital receipts per accounting period. In contrast to the fluctuating revenue receipts and total receipts data in Uttar Pradesh and Rajasthan, the data on total revenue receipt as a percentage of GSDP has been continuously rising in these states. The

TA 7114-IND National Capital Region Planning Board Project
Final Report
Sheladia Associates, Inc. USA 43
Volume 1 – Main Rep
ort
underlying trend in Haryana and Delhi is also positive thereby verifying the robustness of the economies vis-à-vis income generation.
Table 2.11-Revenue and Capital Receipts: All India
Year
Tax Revenue (in Rs Million)
Non Tax Revenue (in Rs. Million)
Total Revenue Receipts (in Rs Million)
Total Revenue
Receipts as a % of GSDP
Total Receipts (in Rs Million)
Total Receipts as a % of GSDP
2007 - 08 4038720 825500 4864220 27.33 6805210 38.24
2006 - 07 3272050 762600 4034650 12.02 5639910 16.80 2005 - 06 2734660 777340 3512000 10.72 5143440 15.70 2004 - 05 2339060 754160 3093220 10.75 4778290 16.60 2003 - 04 1841690 697660 2539350 10.00 4387950 17.29 2002 - 03 1729650 721400 2451050 10.84 4103090 18.14 2001 - 02 1630310 687140 2317450 11.05 3752230 17.89 2000 - 01 1462090 574640 2036730 10.58 3384870 17.58
Source: India Budget – Government of India, www.indiastat.com Table 2.12 Revenue and Capital Receipts – NCT Delhi
Year
Tax Revenue (in Rs Million)
Non Tax Revenue (in Rs Million)
Total Revenue Receipts (in Rs Million)
Total Revenue Receipts as a % of GSDP
Total Receipts (in Rs Million)
Total Receipts as a % of GSDP
2007 - 08 121250.00 16990.00 110990.00 133450 2006 - 07 88840.00 13170.00 90520.70 9.39 115000 11.29 2005 - 06 73930.00 16590.70 73780.05 8.89 127800 11.30 2004 - 05 65210.50 8560.55 72720.40 8.21 97000 14.21 2003 - 04 61140.00 11580.40 63690.72 9.23 88500 12.31 2002 - 03 58540.00 5150.72 62530.71 8.96 75110 12.45 2001 - 02 48960.75 8760.06 54430.99 9.69 67990 9.69 2000 - 01 44000.62 5480.35 110990.00 9.11 133450 9.11
Source: Comptroller and Auditor General of India Report, www.indiastat.com Note: Blank cells signify the unavailability of GSDP data
Table 2.13:Revenue and Capital Receipts: Haryana
Year
Tax Revenue (in Rs Million)
Non Tax Revenue (in Rs Million)
Total Revenue Receipts (in Rs Million)
Total Revenue Receipts as a % of GSDP
Total Receipts (in Rs Million)
Total Receipts as a % of GSDP
2007 - 08 135941.00 43232.50 179173.50 12.14 197148.00 12.14 2006 - 07 106858.50 30608.00 137466.50 10.87 158686.90 10.87 2005 - 06 92384.40 27988.30 120372.70 11.31 145471.90 11.31

TA 7114-IND National Capital Region Planning Board Project
Final Report
Sheladia Associates, Inc. USA 44
Volume 1 – Main Rep
ort
2004 - 05 75180.70 32733.30 107914.00 11.53 123907.30 11.53 2003 - 04 69520.20 28586.00 98106.20 11.90 115912.00 11.90 2002 - 03 61083.70 28167.40 89251.10 12.30 104019.40 12.30 2001 - 02 56781.40 22811.20 79592.60 12.15 93757.30 12.15 2000 - 01 47121.80 20437.50 67559.30 11.63 83037.30 11.63
Source: Haryana Budget- Government of Haryana, www.indiastat.com Table 2.14 -Revenue and Capital Receipts – Uttar Pradesh
Year
Tax Revenue (in Rs Million)
Non Tax Revenue (in Rs Million)
Total Revenue
Receipts(in Rs Million)
Total Revenue
Receipts as a % of GSDP
Total Receipts (in Rs Million)
Total Receipts as a % of GSDP
2007 - 08 249590 58160 686720 691210 2006 - 07 229980 65330 606000 19.37 609560 19.49 2005 - 06 188580 29300 453490 16.21 459340 16.42 2004 - 05 156930 27200 376170 15.25 378950 15.37 2003 - 04 136010 22820 316380 13.93 441360 19.44 2002 - 03 127670 19130 278210 13.43 777570 37.55 2001 - 02 245300 55990 301290 15.81 432920 22.72 2000 - 01 198260 72120 270390 14.89 407940 22.47
Source: Comptroller and Auditor General of India Report, www.indiastat.com Table 15: Revenue and Capital Receipts - Rajasthan
Year
Tax Revenue (in Rs Million)
Non Tax Revenue (in Rs Million)
Total Revenue Receipts (in Rs Million)
Total Revenue Receipts as a % of GSDP
Total Receipts (in Rs Million)
Total Receipts as a % of GSDP
2007 – 08 129130.26 33840.29 285990.49 17.16 253320.76 15.20 2006 – 07 109320.12 27010.89 239910.35 16.89 247520.31 17.43 2005 – 06 95980.83 24610.57 205380.33 15.86 325900.42 25.16 2004 – 05 84150.00 21460.00 177630.00 15.15 178880.00 15.25 2003 – 04 72460.00 20720.00 154240.00 13.82 155880.00 13.97 2002 – 03 62530.00 15690.00 130820.00 14.77 132070.00 14.91 2001 – 02 95440.11 36450.01 131890.12 14.37 192770.61 21.01 2000 – 01 77580.64 34630.93 112220.57 13.61 253320.76 20.78
Source: Rajasthan Budget- Government of Rajasthan, www.indiastat.com
2. FRBM Targets and Achievements
125. Fiscal prudence, as mentioned earlier, led to the formulation of the FRBM Act by
the central government in 2003. The FRBM targets that seek to reduce fiscal and revenue deficits through fiscal discipline have been difficult to achieve by the union government. Starting from 2004-05, it was stipulated that a steady decline of 0.5%

TA 7114-IND National Capital Region Planning Board Project
Final Report
Sheladia Associates, Inc. USA 45
Volume 1 – Main Rep
ort
per annum would reduce revenue deficit to zero by 2009-10. However, it is not expected that the government would be able to achieve these targets by 2009-10. In 2007-08 the central revenue deficit stood at around 4% of the GDP. Simultaneously, fiscal deficit was about 8.5% of the GDP in the same year. The union government does not expect to attain the FRBM targets within the stipulated period owing to the recent worldwide recessionary trend and inefficient fiscal management. In contrast the FRBM norms appear within reach of the NCR states, particularly Haryana which hss already achieved the targets.
126. State governments of Haryana, Rajasthan and Uttar Pradesh as per the stipulated
guidelines had defined their individual FRBM Acts after the central FRBM Act 2003. All the states, in accordance with the union government FRBM targets, seek to wipe out their revenue deficits and bring down their fiscal deficit to about 3% of their respective GSDP within a stipulated period of time.
127. According to the Haryana FRBM Act, the state government was required to reduce
their revenue deficit to zero and reduce their fiscal deficit to 3% of the state GSDP by 2008-09. The state government has been able to achieve both the targets well in advance and in fact has become a revenue surplus state since 2006-07.
128. The Rajasthan Fiscal Responsibility and Budget Management Act 2005, also
seeks to reduce revenue deficit to zero by 2008-09 and decrease fiscal deficit to 3% of the GSDP by 2008-09 through a minimum reduction 0.4% in the fiscal deficit GSDP ratio per annum. Like Haryana the state has been able to attain both the targets well in advance.
129. Following the same guidelines as Haryana and Rajasthan, Uttar Pradesh too has
been able to generate revenue surplus, instead of a deficit, in recent years. Its fiscal deficit targets are however yet to be fully achieved, though the fiscal position of the state in 2007-08 was much better than the all India status.
130. The NCT-Delhi like the participating states of Haryana, Uttar Pradesh and
Rajasthan has been able to attain revenue surplus throughout. However, the attainment revenue surplus by Delhi since 2000-01 can be attributed to the special facilities that are enjoyed by it due to its unique administrative status. Delhi however has been able to generate fiscal discipline necessary to attain the central FRBM norms, as is evident from its fiscal deficit GDP ratio. In fact in 2206-07 Delhi registered a fiscal surplus which however could not be sustained into 2007-08 due to an increase in interest payment by over Rs 50000 Million.
131. FRBM targets when achieved ensures fiscal sustainability of individual
governments, making them self sufficient in undertaking developmental projects as together with budgetary robustness they also attract debt waivers from the union government. This strengthens the financial position of the state and sustains the future economic growth. Achieving the FRBM norms can, however, prove to be detrimental to the state’s current financial position as fiscal prudence makes it

TA 7114-IND National Capital Region Planning Board Project
Final Report
Sheladia Associates, Inc. USA 46
Volume 1 – Main Rep
ort
necessary to curtail certain necessary expenditure that generates social welfare. Thus often strict imposition of the FRBM targets calls for a trade-off between fiscal/budgetary discipline and welfare.
Table 2.16 FRBM – All India
Year Tax-GSDP Ratio
Revenue Deficit (in Rs
Million)
Revenue Deficit-GDP Ratio
Fiscal Deficit (in Rs Million)
Fiscal Deficit- GSDP Ratio
2007 – 08 0.227 551840 0.040 1509480 0.085 2006 – 07 0.097 714780 0.025 1486860 0.044 2005 – 06 0.083 847270 0.029 1511440 0.046 2004 – 05 0.081 953120 0.026 1374070 0.048 2003 – 04 0.073 761710 0.044 1536370 0.061 2002 – 03 0.076 1122920 0.042 1355240 0.060 2001 – 02 0.078 953770 0.038 1163140 0.055 2000 - 01 0.076 788210 0.040 1112750 0.058
Source: India Budget- Government of India, www.indiastat.com Table 2.17-FRBM – NCT Delhi
Year Tax-GSDP Ratio
Revenue Deficit (in Rs
Million)
Revenue Deficit-GSDP Ratio
Fiscal Deficit (in Rs Million)
Fiscal Deficit- GSDP Ratio
2007 - 08 -51418.60 20409.0 2006 - 07 0.0751 -44381.30 -0.0375 4104.10 0.0035 2005 - 06 0.0726 -43281.40 -0.0425 -2451.40 -0.0024 2004 - 05 0.0725 -27351.50 -0.0304 14831.80 0.0165 2003 - 04 0.0776 -22610.00 -0.0287 24387.20 0.0309 2002 - 03 0.0824 -20677.40 -0.0291 23964.30 0.0337 2001 - 02 0.0758 -12095.70 -0.0187 17330.30 0.0268 2000 - 01 0.0737 -17475.10 -0.0293 16096.60 0.0269
Source: Comptroller and Auditor General of India Report, www.indiastat.com
Table 2.18-FRBM - Haryana
Year Tax-GSDP Ratio
Revenue Deficit (in Rs
Million)
Revenue Deficit-GSDP Ratio
Fiscal Deficit (in Rs Million)
Fiscal Deficit- GSDP Ratio
2007 - 08 0.092 -22240.00 -0.015 16404.10 0.011 2006 - 07 0.084 -15900.00 -0.013 18483.30 0.015 2005 - 06 0.087 -12130.00 -0.011 23227.30 0.022 2004 - 05 0.080 2580.00 0.003 17474.00 0.019 2003 - 04 0.084 2740.00 0.003 21353.50 0.026 2002 - 03 0.084 6850.00 0.009 26176.50 0.036 2001 - 02 0.087 10559.50 0.016 25250.10 0.039 2000 - 01 0.081 13412.70 0.023 28655.70 0.049
Source: Haryana Budget- Government of Haryana, Comptroller and Auditor General of India Report, www.indiastat.com

TA 7114-IND National Capital Region Planning Board Project
Final Report
Sheladia Associates, Inc. USA 47
Volume 1 – Main Rep
ort
Table 2.19 FRBM – Uttar Pradesh
Year Tax-GSDP Ratio
Revenue Deficit (in Rs
Million)
Revenue Deficit-GSDP Ratio
Fiscal Deficit (in Rs Million)
Fiscal Deficit- GSDP Ratio
2007 - 08 -34490 137940 2006 - 07 0.074 -49010 -0.016 96150 0.031 2005 - 06 0.067 12680 0.005 100780 0.036 2004 - 05 0.064 69930 0.028 129970 0.053 2003 - 04 0.060 185830 0.082 166470 0.073 2002 - 03 0.062 51180 0.025 94970 0.046 2001 - 02 0.129 61950 0.033 93930 0.049 2000 - 01 0.109 123580 0.068
Source: Comptroller and Auditor General of India Report www.indiastat.com Table 20 FRBM - Rajasthan
Year Tax-GSDP Ratio
Revenue Deficit (in Rs
Million)
Revenue Deficit-GSDP Ratio
Fiscal Deficit (in Rs Million)
Fiscal Deficit- GSDP Ratio
2007 - 08 0.077 -16530 -0.010 34080 0.020 2006 - 07 0.077 -6380 -0.004 39700 0.028 2005 - 06 0.074 6600 0.005 51500 0.040 2004 - 05 0.072 21430 0.018 61460 0.052 2003 - 04 0.065 34240 0.031 73670 0.066 2002 - 03 0.071 39340 0.044 61140 0.069 2001 - 02 0.104 37960 0.041 57490 0.063 2000 - 01 0.094
Source: Comptroller and Auditor General of India Report, www.indiastat.com
3. Debt Position of the NCR States
132. Most state governments in India rely on debt to finance the revenue deficits. The
governments of the NCR states are not an exception to this general rule. The reliance on debt to finance deficits in the budgets has caused a steady accumulation of the outstanding liabilities in the books of the all the state governments. Given that the proposed infrastructure development in the NCR states will be financed through an additional debt, it becomes imperative to assess the debt position of the governments of the NCR states.
133. For the purpose of our analysis, we deploy two measures – Debt to GSDP Ratio
and Interest Payment (IP) to Revenue Receipts (RR) Ratio. These ratios are used by the Reserve Bank of India (RBI) to analyze the indebtedness of the state governments. As per the guidelines issued by the Twelfth Finance Commission (TFC), all states are required to adhere to the target levels of these ratios –

TA 7114-IND National Capital Region Planning Board Project
Final Report
Sheladia Associates, Inc. USA 48
Volume 1 – Main Rep
ort
30.80% (Debt to GSDP) and 15.00% (IP to RR)23. Infact, the guidelines of TFC stipulates that all state governments are required to adhere to these benchmarks by the end of the fiscal 2010.
134. Table 2.21 shows the position of the total outstanding liabilities (TOL) for the NCR
states. The TOL comprises of internal debt of the state, loans and advances from the centre, deposits in public accounts and contingency funds.
Table 2.21: Total Outstanding Liabilities of the NCR States (Figures in Rs. Millions)
As at 31st March
State 2004 2005 2006 2007 2008 2009
Rajasthan 531090 599680 662390 711730 770990 830510
Haryana 224500 249000 269790 286450 295070 320620
Uttar Pradesh 1240630 1362730 1540610 1677760 1741380 1881970
Delhi 141490 158360 215670 255690 253390 249530
Source: State Finances, RBI – various issues
135. During the period 2003-04 to 2008-09, TOL of NCT Delhi grew at a CAGR of
about 12% p.a. This is the highest rate of growth of TOL among the NCR states. Haryana registered the lowest CAGR (7.39%) in the TOL during the above period. The states of Rajasthan and UP witnessed a CAGR of 9.35% and 8.69% per annum with respect to the growth in the TOL.
Table 2.22 TOL-GSDP Ratio for the NCR States
State 2004-07 (Avg) % 2007-08 (RE) %
Delhi 19.8 18.9 Haryana 24.9 20.0
Rajasthan 51.8 46.3
Uttar Pradesh 54.7 50.3
Source: State Finances: A Study of Budgets of 2008-09, RBI
136. While the position of both Delhi and Haryana are favourable in terms of the target set by the TFC, both Rajasthan and Uttar Pradesh are far away from the target. Incidentally, among all the states and union territories, as per the revised estimates (RE) for the fiscal 2007-08, NCT Delhi registers the lowest TOL-GSDP ratio. It is also important to note that among the states in the non-special category, Haryana has the lowest ratio. The ratio for all states in the country, as per the revised estimates, is 28.3. Thus, both Haryana and Delhi are below the national average.
23 RBI (2009): State Finances: A Study of Budgets of 2008-09, Reserve Bank of India, Mumbai

TA 7114-IND National Capital Region Planning Board Project
Final Report
Sheladia Associates, Inc. USA 49
Volume 1 – Main Rep
ort
Table 2.23 Interest Payment to Revenue Receipts Ratio for the NCR States State 2003-04 2004-05 2005-06 2006-07 2007-08 2008-09
Rajasthan 0.27 0.25 0.20 0.18 0.16 0.16
Haryana 0.17 0.16 0.12 0.09 0.08 0.09
Uttar Pradesh 0.30 0.30 0.19 0.16 0.12 0.11
Delhi 0.07 0.09 0.04 0.08 0.06 0.03
Source: State Finances: A Study of Budgets of 2008-09, RBI
137. The ratio, Interest Payment (IP) to Revenue Receipts (RR) for the NCR states during the period financial years 2003-04 to 2008-0924 are presented in table 2.23. For the purpose of our calculation, we have used the net interest payment. Net Interest payment is arrived at after deducting the interest receipts from the gross interest payments. The details of the net interest payments for the NCR states are shown in figure 2.3.
138. During the aforementioned period, for Delhi and Haryana, the net interest
payments grew at a CAGR of about 2.00% p.a. For Rajasthan, the growth rate of net interest payments was close to 6% p.a. Uttar Pradesh recorded the lowest growth in the net interest payments – less than 1% per annum.
Figure 2.3 Net Interest Payment by the NCR States
139. For the purpose of calculation of the RR, as per the guidelines of the TFC and RBI
we have considered both tax and non-tax revenues. The detailed revenue receipts of the 4 states are shown in Figure 2.4.
24 Budget estimates (BE) are used for the financial year 2008-09 while revised estimates (RE) are used for the financial year 2007-08.

TA 7114-IND National Capital Region Planning Board Project
Final Report
Sheladia Associates, Inc. USA 50
Volume 1 – Main Rep
ort
Figure 2.4 Revenue Receipts by the NCR States
Source: State Finances: A Study of Budgets, various issues, RBI
140. For both Rajasthan and Haryana, about 72% of the total revenue receipt during
the period (FY 2003-04 to 2008-09) was in the form of tax revenue. For Delhi and UP around 77% of the total revenue receipt was due to tax related revenue. In terms of growth in the tax revenue, Delhi ranked highest with tax revenues growing at a CAGR of 33% per annum. For the other states the growth rate of tax revenue ranged from 18% - 20% per annum. The impressive growth in tax related revenue in Delhi can be attributed to the rapid expansion of business activities in and around Delhi and the efficacy of the tax collection mechanism in the state. Delhi also registered the highest growth rate (42.30% p.a.) in the non-tax revenues among the NCR states. In the case of Uttar Pradesh the non tax revenues grew at a rate of 32% per annum, while, for both Rajasthan and Haryana the growth rate was restricted to 13.00% - 14.00% per annum.
141. In 2008-09, the IP-RR ratio for all the states in the NCR region was impressive.
While Haryana, Uttar Pradesh and Delhi had IP-RR ratio below the benchmark stipulated by the TFC, Rajasthan was marginally over the benchmark. It is also important to note that all the four NCR states consistently improved their IP-RR ratio over the years under consideration. The improvement is significant in case of Rajasthan and Gujarat.

TA 7114-IND National Capital Region Planning Board Project
Final Report
Sheladia Associates, Inc. USA 51
Volume 1 – Main Rep
ort
Debt Position of the NCR States in the Presence of the ADB Loan
142. It is important to check the behaviour of the indicators denoting the debt position of the NCR states in the presence of the ADB Loan. In this section, we undertake this analysis. The assumptions underlying the analysis are:
i. For each state a loan of USD 200 MIO (Rs. 94000.00 Million)25 has been
considered ii. The loan is assumed to be apportioned equally over a period of 5 years (FY 2010-
11 to FY 2014-15) iii. A moratorium of 5 years with respect to the principal repayment is considered, i.e.
the repayment starts from the FY 2015-16 iv. Interest servicing is yearly v. Interest is applied at annual rests vi. An interest rate of 8.50% p.a. is considered for the loan from ADB
143. We further assume that during the period 2010-11 to 2014-15, the total
outstanding liabilities of each state will grow at the same CAGR as applicable during the period 2003-04 to 2008-09. However, the projected TOL, assuming this growth rate is exclusive of the additional liability created due to the ADB loan. Table 2.24 and Table 2.25 respectively represent the projected TOL of the NCR states with and without the liability of the ADB loan.
Table 2.24 Total Outstanding Liabilities (Projected) of the NCR States excluding the Additional Liability Created out of the ADB Loan TOL (Rs. Millions) As at 31st March
State 2010 2011 2012 2013 2014 2015
Rajasthan 908197.30 993151.60 1086053.0 1187644.0 1298738.0 1420224.0
Haryana 344306.70 369743.30 397059.10 426393.0 457893.90 491722.10
Uttar Pradesh 2045534.0 2223314.00 2416545.0 2626570.0 2854849.0 3102967.0
Delhi 279513.10 313098.90 350720.40 392862.30 440068.0 492945.80
Table 2.25: Total Outstanding Liabilities (Projected) of the NCR States Including the Additional Liability Created out of the ADB Loan TOL (Rs. Millions) As at 31st March
State 2011 2012 2013 2014 2015
Rajasthan 995031.60 1089813.0 1193284.0 1306258.0 1429624.0
Haryana 371623.30 400819.10 432033.0 465413.90 501122.10
Uttar Pradesh 2225194.0 2420305.0 2632210.0 2862369.0 3112367.0
Delhi 314978.90 354480.40 398502.30 447588.0 502345.80
25 For the purpose of calculation 1 USD = INR 47.00 has been considered

TA 7114-IND National Capital Region Planning Board Project
Final Report
Sheladia Associates, Inc. USA 52
Volume 1 – Main Rep
ort
144. Since we have assumed a moratorium period of 5 years with respect to the repayment of the principal amount, for each NCR state there is a gradual buildup of an incremental liability of Rs. 94000.00 Million during the period FY 2010-11 to FY 2014-1526.
145. Next, with respect to the GSDP, the GSDP (at Current Prices) of each state has
been considered for the period 1999-2000 to 2006-07. It is assumed that the CAGR of the GSDP of each state during this period will continue in future and, accordingly, projections have been made concerning the GSDP of the NCR states during the period 2010-11 to 2014-15. Table 2.26 presents the projected GSDP (at current prices) of the 4 NCR states during the period 2010-11 to 2014-15.
Table 2.26 : GSDP (Projected) of the NCR States during FY 2010-11 to FY 2014-15 GSDP (Rs. Millions)
State 2010-11 2011-12 2012-13 2013-14 2014-15
Rajasthan 19344740.0 2089797.0 2257591.0 2438857.0 2634678.0
Haryana 2118589.0 2410223.0 2742002.0 3119452.0 3548860.0
Uttar Pradesh 4357531.0 4733940.0 5142865.0 5587112.0 6069735.0
Delhi 1831560.0 2043315.0 2279552.0 2543101.0 2837120.0
146. The ratio TOL-GSDP, in presence of the additional liability created due to the ADB loan, for the NCR states is presented in Figure 2.5. For the entire period 2010-11 to 2014-15, both NCT Delhi and Haryana are consistently below the stipulated benchmark of 30.8%. On the other hand, the ratio is close to 50% for both UP and Rajasthan. However, when the figures are compared with the present situation 2007-08, there appears to be no drastic worsening of situation, even for UP and Rajasthan.
147. The other key ratio IP-RR for the NCR states in presence of the loan of Rs.
94000.00 Million from ADB is displayed in Figure 2.6. None of the states cross the threshold limit of 15% during any of the 5 years even in presence of the additional debt burden of Rs. 94000.00 Million with an interest rate of 8.50% p.a. and interest being serviced annually. Infact, for all the states the ratio improves as the growth in revenue receipts outweighs the growth in interest payment. However, it is important to recognize the fact that the figures have been arrived at after assuming that the revenue receipts grow at an anticipated growth rate. Thus, for this ratio to behave favourably in presence of the interest serving of the ADB loan, it is important that revenue collection machinery of the states achieve the desired efficiency.
26 Note that for each state an additional liability of Rs. 188.00 Million is created each year, as we have assumed that the loan is disbursed equally over the period of these 5 years.

TA 7114-IND National Capital Region Planning Board Project
Final Report
Sheladia Associates, Inc. USA 53
Volume 1 – Main Rep
ort
Figure 2.5 TOL-GSDP Ratio for the NCR States (in presence of the ADB Loan) during 2010-11 to 2014-15
Figure 2.6 IP-RR Ratio for the NCR States (2010-11 to 2014-15) in presence of the ADB Loan

TA 7114-IND National Capital Region Planning Board Project
Final Report
Sheladia Associates, Inc. USA 54
Volume 1 – Main Rep
ort
III. Positioning NCRPB as a Financial Institution
A. Objectives
148. We address two questions in this chapter. First, can NCRPB evolve into a Planning Authority and Financial Intermediary of relevance for the region, and, if so the practical reform steps given institutional and market challenges? Second, from a regional perspective, are coherence in planning and sustainable financial intermediation needed, and if so, what would be an appropriate design from the region and state governments standpoint. Based on the findings of the previous chapter, it is clear that there is and likely to be an increasing demand for financing environmental and growth infrastructure. It is also apparent that for financing these infrastructure demands, scarce budgetary resources would need to be leveraged efficiently, if the deficits are to be addressed in a systemic and sustainable manner. The subject of this chapter is the action steps for NCRPB to position itself as a financial intermediary. Apart from the financing, our situation analysis of NCRPB and IA’s suggest the need for greater coherence in planning and hence we attempt to outline in this chapter a means of financing a coherent regional planning strategy.
B. NCRPB’s Current Status: Legal Framework, Business Model and Outcomes
1. Legal Framework
149. To recall, NCRPB is a statutory body under an Act of Parliament. In terms of its
primary function of planning, its authority flows from the Act and has been upheld as binding on states and local authorities by the Supreme Court. As regards its financing function, the Fund is neither a NBFC regulated by the RBI nor a company within SEBI’s supervision. As such, issues of capital adequacy, provisioning norms and pricing restrictions do not apply as with other lenders in the private sector (IDFC) nor ones in the public sector (HUDCO, IDBI, IIFCL)
150. As the NCRPB does not have share capital (company format) or contribution
(Trust format) grants received from GOI are accounted for as and lent out along with reflows. Up till March 31, 2009 the entity has lent out INR 40570 million (around $ 850 Million) and has no default. The lending is usually on a State or bank guarantee mode with little financial appraisal of the repayment capacities of the borrowers or projects. The need for a state guarantee from non state government entity (such as a UDA) is required by the Rules under the Act. The entity has also structured third party no default escrows with Banks as additional security measures.

TA 7114-IND National Capital Region Planning Board Project
Final Report
Sheladia Associates, Inc. USA 55
Volume 1 – Main Rep
ort
2. Business Model and Project Outcomes
151. A study of its financing business show the following stylised facts:
i. High variability in its annual lending – both sanctions and disbursements, which suggests
that demand for financing is not emanating from sub regional plans which have been operationalized into a detailed sectoral investment plan but on demand driven fashion.
ii. Sectoral composition: NCRPB’s lending has been to sectors such as Power (where one would have expected its materiality to be low in the context of the capital financing) and also to UDA’s which have been primarily public sector real estate land banks, where once again the materiality of NCRPB’s financing would have been low. On the other hand sectors such as water and sanitation or even roads, which promote connectivity in the region, the lending has been low, sectors where the expectation of the materiality of the financing would have been high.
Table 3.1 Sectoral Share In NCRPB’s aggregate Loan Disbursement
Sector As of March 31, 2009
Loans INR Million Share
Power 9840.1 24%
Water & Transport 11817.6 29%
Land & Others 18901.7 47%
Total 40559.4 100%
iii. State wide disbursements: presents wide variation with Haryana accounting for (67%) followed by Uttar Pradesh (12%). These variations even adjusted for the area or population in the region belonging to each state does suggest that investments have not been even.
iv. Pricing and tenor of the loans: The entity itself has priced its loans with an average spread of 250 basis points over the last three years and these rates would probably compare with states borrowing rates.
v. Leverage: The entity has a capital adequacy in excess of 100% as compared with industry standards of 15% and RBI requirements of 12% applicable for a FI, indicating an extremely underleveraged balance sheet and with little additionality for the budgetary resources which are being ploughed in by GOI.
vi. Legal framework arising out of the 74th CAA: Several traditional borrowers, namely the UDA’s could be expected to lose their relevance with respect to city development planning and NCRPB will have to work with a new set of clients to ensure coordination in investments, especially environmental ones across states.
vii. Effectiveness of the counter magnet strategy: Available NSS data shows that net migration is of the order of 37.1% during the last decade that NCRPB has been in place, a rate that cannot be judged as having slowed due to development of magnets. In this context, NCRPB

TA 7114-IND National Capital Region Planning Board Project
Final Report
Sheladia Associates, Inc. USA 56
Volume 1 – Main Rep
ort
might like to re-look at its counter magnet strategy and the attendant role of Delhi within its lending policies.
152. The above seven stylised facts would suggest that NCRPB has tended to respond to demand driven projects without an underlying analysis of the regional impacts and tended to mimic private sector lenders in securing it’s lending by strong credit enhancements and maintaining its spreads. This lending model is unlinked to its core RP where an investment trajectory would be focussed on generating the maximum backward and forward linkages (both in terms of growth and environment infrastructure).The question of relevance is then is an appropriate lending cum planning model and is it sustainable? If not, then from a regional standpoint, it is important to identify potential medium-term strategic options including a larger role for NCRPB as a project developer of regional significance.
153. Financial Analysis of NCRPB: Before looking at various options available to
NCRPB in deciding its future course, an analysis of NCRPB’s finances and compliance with various requirements of RBI and ADB has been carried out. The coverage includes its appropriate capital structure, pricing, the associated lending policies and procedures, and security mechanisms. The analysis also has used ADB OM (D6/BP) read with (H1/OP) so that NCRPB and ADB can determine key components of the line of credit in a manner which aids the institutional development of NCRPB and an effective implementation of the Regional Plan.
3. Current Business Model: Capital and Pricing
154. At present, NCRPB, draws up its expected investment needs for a 5 year horizon
based on its expected pipeline and seeks resources (much like other GOI entities) through the planning commission and subsequently approved in the GOI budget for MOUD. This process is described in Office Memorandum No. F/No. 2(1) Pers/E-Coord/OB/2005 dated December 12, 2006. The Board submits the revised budget estimates for the current year and budget estimates for the next financial year by around mid-September of each year. NCRPB’s admin costs are about INR 25.0 Million and these are met separately.
155. As for pricing, on receipt of grant funds from Government of India and Government
of Delhi, which are considered to be free of cost, pricing of loans continues to be based on the rates approved by GOI. Thus the current interest rates of 8.25% for Water supply, sewerage, roads, etc. and 9.50% for power, transport and land development have been fixed on the aforesaid basis. While these lending rates do provide NCRPB with a revenue surplus, this is only due to the fact that grant funds have not been costed for fixing the interest rates. A comparison of the lending rates of NCRPB, Power Finance Corporation (PFC) and Housing & Urban Development Corporation Limited (HUDCO) would indicate that the current rates of NCRPB are the cheapest in the market. Based on these features of its current business model, a financial model has been developed. The key features of current practice are:

TA 7114-IND National Capital Region Planning Board Project
Final Report
Sheladia Associates, Inc. USA 57
Volume 1 – Main Rep
ort
i. Continued interest rate subsidies from GOI through Grant Financing without return
expectations ii. Administered Pricing at sub market unrelated to States borrowing costs or
calculation of ERR to justify the subsidy at a sub project level iii. Support for a pipeline of demand driven projects with State Budgets as the
predominant recourse for repayments
4. Current Business Model: Security Mechanisms
156. As part of its guidelines, NCRPB is empowered to sanction loans to State
Governments, to State Governments with a counter magnet area and the local authorities, urban development authorities, housing boards and such other authorities of the State Government responsible for implementing the sub-regional plans and project plans or for developing the counter magnet area. It is seen that NCRPB lends a substantial part of its funds to State Governments (which do not need any security), while NCRPB does take security for lending to parastatals. It could in the nature of State Government guarantee, escrow account or mortgage of assets, etc. However, as per the Capital Adequacy Ratio (CAR) norms of RBI, different securities would trigger different risk weightings for assessment of capital requirements.
157. Considering that most of the loans of NCRPB are to State Governments, the CAR
of NCRPB as of date is much more than that stipulated by RBI. The table below gives the current CAR
Table 3.2 NCRPB Statement As Per March 31, 2009 Rs in million
Borrower Exposure Risk Risk
Weight (A) Weight (B)
Loans To State Govt - No Gty Required 8747.1 0.00 0.00 0.00 0.00
State Government Guaranty 193.2 0.20 38.6 0.20 38.6
State Government Guaranty & Escrow 3055.1 0.20 611.0 0.20 611.0
Escrow Agreement 10259.7 1.00 10259.7 0.20 2051.9
Mortgage 98.8 1.00 98.8 0.20 19.8
Cash & Bank Balances
Risk Weighted Assets 22353.9 11008.2 2721.0
A Total Capital 20337.3
Risk Weighted Assets 11008.2
CRAR 185%
B Total Capital 20337.3
RISK WEIGHTED ASSETS 2721.36
CRAR 747%
TA 7114-IND National Capital Region Planning Board Project
Final Report
Sheladia Associates, Inc. USA 58
Volume 1 – Main Rep
ort
158. The above table shows that, as against the RBI minimum CAR of 12% which is to be maintained by a Financial Institution, NCRPB’s CAR is at least 185% and at most 747%. This indicates a situation of abnormal prudence, indicating under leverage of scarce central government grants.
5. Current Business Model and Organization:
159. In this section we identify the current finance functions being performed and
comment on some process changes which may be required if the business volumes are expected to grow in volumes and quality. We comment on four major finance functions:
• NCRPB accounting and audit • Sub Project Financial Appraisals • Project Loan Accounting and Repayments • Risk management resources and investments.
160. It is seen that there is modest appraisal of projects from a financial perspective
and very rarely are project DCF’s or risk assessments worked out. This is to be expected, as most loans repayments are based on State budgets and there is little purpose in carrying out detailed project level cash flows when little depend upon them. If however NCRPB moves to a capital structure of limited liability and relies more on resource rising based on pooled revenue streams of different borrowers, then the appraisal function needs to incorporate standard financial analysis.
161. Current staffing indicates paucity of capacity in the project appraisal, monitoring
and financing areas. This has put pressure on NCRPB’s capacity to handle the increasing project proposals. Consequently, the initial appraisal of projects brought by various borrowers to NCRPB for financing has been outsourced to external agencies like Engineers India Limited (EIL), NEERI, etc. While it may be prudent to use external agencies for project evaluation during the past few years, in future, when NCRPB’s scale of operations are expected to increase further, it would be beneficial for NCRPB to develop in house capacity to manage the borrowers end to end, i.e., project appraisal, documentation, project monitoring, project financing, etc. Such an approach would also provide fiduciary comfort. Considering NCRPB’s borrowing programme, internal capacity building to manage projects across various sectors is essential for its effective performance of its lending function.
6. NCRPB’s financing: Lending Terms and Procedures
162. Currently, NCRPB extends term loans of 10 years tenor with a 2 year moratorium.
NCRPB’s loans are fixed for the tenure of the loan and interest is charged at annual rest.

TA 7114-IND National Capital Region Planning Board Project
Final Report
Sheladia Associates, Inc. USA 59
Volume 1 – Main Rep
ort
163. During the past few years, NCRPB’s borrowings and lending have been on fixed rate interest basis. This coupled with the availability of own funds, NCRPB has been lending to its borrowers on a fixed rate basis. If NCRPB is to move towards a market based intermediary, there is an increasing possibility that a substantial portion of incremental borrowing would be on a floating rate basis. In such a scenario, NCRPB also needs to move away from fixed rate lending to floating rate lending to its borrowers. The floating rate may be fixed based on the yield curve of ten year Government of India Securities. The rate may be an average of three months or six month yield of 10 year G-Sec s. This move to floating rates would protect NCRPB against any adverse movement of the interest rate on its borrowings. The loan documents need to incorporate a clause for reset of interest rates after a certain number of years. (NCRPB’s bonds also have a put and call option at the end of 7 years). The borrower should also be liable to pay over due interest in case of default in payment of interest or principal on time.
164. A detailed analysis of NCRPB’s finances and its organisational structure are
provided in Appendix 9.
C. Strategic Options
165. For NCRPB to perform it’s planning and lending functions there appear to be at least three strategic options:
i. to continue its current normative planning approach mixed with state guarantee
backed financing; ii. become an institution of relevance for the region, both from a planning and
financing perspective and iii. evolve into a FI (Corporate Lender) along with its role of a planner.
1. Option 1: Normative Planning and Demand Driven Financing
166. The first option, namely continue the existing business model with marginal
improvements in its planning and financing role. This would involve expediting the sub-regional plans, moving towards appraisal based lending with a mix of guarantees and recourse to revenues and taxes and on the institutional side strengthening the regional networks. The ADB line of credit would essentially support the continuance of NCRPB as supplier of lower cost credit allowing blends of tenor and pricing with GOI grants.
2. Option 2: Strategic Planner and Financier of Relevance
167. A second option is to use the ADB line of credit to attempt to transform into a
proactive creator of planned and sustainable infrastructure by leveraging on its strengths and identifying its niche market both as a planner (project developer) and as a financier. NCRPB’s two core strengths are first, the strength of its

TA 7114-IND National Capital Region Planning Board Project
Final Report
Sheladia Associates, Inc. USA 60
Volume 1 – Main Rep
ort
regulatory framework, mandate from an Act of Parliament, subsequent conformity by states and a representative high level management structure. Second, it’s under leveraged balance sheet which allows considerable flexibility in its financial operation, both in terms of pricing and tenor.
168. Given these strengths, NCRPB’s niche market is in position to develop a strong
pipeline of coordinated investments across sectors in the region, (given its strengths) and also tie up a means of financing these investments over the medium term. This financing strategy would use the typology developed earlier be varying degrees of planner and financier across investments type. For example, in the NH, power and railway sectors (Category I) , NCRPB would be the planner which identifies strong economic impacts due to complementarities of multi sector investment and leave the major share of financing to specialized financial intermediaries ( such as PFC, REC, IRFC etc) currently operating in the sector. At the other end of the spectrum, NCRPB would be less of a planner, use the CDP’s at the city level but function more of a financier blending its debt finance with other grants such as JNNURM and eventually pooling these demands into marketable debt instruments. In the case of Category II, namely interstate connectivity – both environmental and transport (ground water, multimodal transport etc) NCRPB would play a significant planning role in identifying this investment and an equally strong role in facilitating finance.
169. From a sustainability perspective, NCRPB would have to eventually depend on
domestic sources of debt to finance infrastructure demands of the regional plan. Towards this objective NCRPB could use the ADB line of credit (and the TA Loan) to position itself as a link between domestic debt markets and regional demands by moving away from an unlimited GOI liability and State Government budget backed program to a structure leveraging GOI grants more efficiently through a debt service fund as in Pooled Financing Structures.
3. Option 3 – Planning and Full Fledged Financial Institution
170. A third option would be to continue the Guided Planning Approach and enlarge its
financial sophistication, both in terms of products as well as its internal capital structure. For example, NCRPB could continue the mandate of finalizing its sub regional plans while moving towards standardized structures of an FI.
171. The key points to consider would be the competitive positioning of this approach. It
could be argued that even if NCRPB adopts a more conventional legal structure for lending – namely as an NBFC or even under the Trust Act, without recourse to GOI there appears little comparative advantages. There is also an issue of treating grants made by Delhi in case of such capital structuring. Further, in the event that NCRPB does focus on this option, there would be little advantages accruing to the NCRPB. Most lenders, including IIFCL would be willing to offer a wider range of products and it would appear a modified NCRPB would be in no better position than national level entities with respect to the cost of funds.

TA 7114-IND National Capital Region Planning Board Project
Final Report
Sheladia Associates, Inc. USA 61
Volume 1 – Main Rep
ort
172. To sum up, NCRPB might like to consider these strategic choices and decide on
its present business model – access criteria, pricing – for NCRPB to be an institution of relevance. On the other hand, given the relative small size of NCRPB’s operations in relation to the estimated demands, it is worthwhile to consider the design of efficient intermediation from the regions perspective.
4. Financial Evaluation of Suggested Options
173. The key findings of evaluation of the three options are as follows:
i. Option III (Financial Institution) results in additional costs to the company (Income Tax,
Loan loss provision, etc.). Consequently, with the cumulative disbursements remaining
almost the same across options, net income would come down drastically as compared to
other options (due to additional costs). In 2019-20, while Income over Expenditure in case
of Option I (O I) is Rs 6818 mn and Option II (O II) it is Rs 5599 mn, in case of Option III (
O III) it is only Rs 2347 mn.
ii. The reduced net income, in turn, would result in increased borrowings (to meet the same
disbursements) leading to increased D:E ratio. In 2019-20, D:E ratio for O I is 2.99:1, and
for O II it is 4.74 :1(as more than 5 times leveraging of net owned funds though pooled
funds route) :, in case of O III, it is 4.31:1.
iii. While there is no concept of Earnings Per Share (EPS) for options O I and O II, in case of
O-III, the EPS goes up from Rs 0.44 per share of Rs 10 in 2010-11, to only Rs 1.17 per
share of Rs 10 in 2019-20. All other financial ratios are also uniformally worse in case of
O-III as compared to O I and O II. Thus, from an investors viewpoint, this is very low and
consequently, there is no distinct advantage in converting into a Company (and a
Financial Institution)
iv. A comparison of O I and O II indicates that reason for the difference between the
two options is only the business principle with O I following the existing business
model (of being primarily demand driven and increased lending rates for power
and land development, which sectors also have a higher proportion of lending)
whereas in case O II, a proactive role in following a sectoral approach with a shift
of 70% lending to water, waste water, transport and sanitation sectors at a
competitive lending rate with the balance of 30% being lent to power and land
development sectors.
v. In such a situation, where more lending to water and related sectors is done at a
cheaper interest rate, while the various financial indicators are marginally lower in
case of O II as compared to O I, as the objective is to transform NCRPB into a
proactive creator of planned and sustainable infrastructure by leveraging on its
strengths and identifying its niche market both as a planner and as a financier,
option O II is the business model to adopt.

TA 7114-IND National Capital Region Planning Board Project
Final Report
Sheladia Associates, Inc. USA 62
Volume 1 – Main Rep
ort
vi. As indicated earlier, in Option II, NCRPB’s focus is to create sustainable
infrastructure by creating a Debt Service Reserve and act as a facilitator and
arranger of funds under the pooled financing approach while moving away from a
GOI guaranteed lender to a limited liability organisation. This model would result in
NCRPB being a lender of consequence in developing of base level infrastructure
in water, waste water and transport sectors. Consequently, the preferred option for
NCRPB is to follow the Option II model.
vii. While adopting O II as the model, it would however be appropriate if NCRPB
attempts to benchmark itself with other leading FIs while also adhering to the
relevant regulatory guidelines, even though technically, NCRPB may not need to
follow these guidelines.
viii. While adopting O II as the model, it would however be appropriate if NCRPB
attempts to benchmark itself with other leading FIs while also adhering to the
relevant regulatory guidelines, even though technically, NCRPB may not need to
follow these guidelines.
ix. The ABD could also participate in the development of the pooled finance market
by providing a partial credit guarantee in raising of these monies. This would go a
long way in developing this product.
x. Considering that all the borrowers of NCRPB have revenues only in Rupees,
NCRPB would need to swap the Fx loan being provided by ADB to be in a position
to onlend in Rupees to the borrowers. However, ADB could probably consider
lending to NCRPB as Rupee loans through its Domestic Currency loans. This
would go a long way in reducing costs for NCRPB.

TA 7114-IND National Capital Region Planning Board Project
Final Report
Sheladia Associates, Inc. USA 63
Volume 1 – Main Rep
ort
Table 3.3 Summary of financial projections for all three options: FINANCIAL YEAR ENDED MARCH 31, 2011 2020 2011 2020 2011 2020 Rupees In Millions Option I Option I Option II Option II Option III Option III Business as
usual Business as
usual Regional
Player Regional Player
Financial Intermediary
Financial Intermediary
Balance Sheet Capital (Including Free Reserves) 25372.5 71590.9 25072.4 56511.5 24412 53669.3 Total Debt 10500.0 214300 17667.3 267758.2 11000 231200.0 Total Liabilities 35872.5 285890.9 42739.7 324269.7 35412.0 284869.3 Total Loans Outstanding 34468.3 284589.6 35990.0 270412.2 34468.3 284589.6 Fixed Assets & Investments 24.6 24.6 5691.9 49936.2 24.6 24.6 Closing Balance Of Cash And Equivalents 1379.6 1276.7 1057.8 3921.2 919.1 255 Total Assets 35872.5 285890,9 42739.7 324269.7 35412.0 284869.3 Income And Expenditure Statement Interest Income 2220.2 21557.9 2055.9 21750.7 2209.4 21275.8 Interest Income On Surplus 88.9 94.7 84.9 105.7 64.7 35.2 Total Income 2309.0 21637.7 2140.8 21856.4 2274.1 21311.0 Interest Expense 539.3 14477.6 539.3 16099.3 539.3 15684.1 Expenditure Incurred On Raising Borrowing 22.5 242.5 30.0 0.0 25.0 257.5 Overheads 0.00 0.00 68.6 57.3 6.86 575.6 Loan Loss Reserve 0.00 0.00 0.00 0.00 140.7 1086.6 Tax 0.00 0.00 0.00 0.00 510.0 1260.0 Transfer To Grant Fund 100.0 100.0 100.0 100.0 100.0 100.0 Total Expenditure 661.8 14820.1 737.8 16256.6 1383.6 18963.9 Net Income Over Expenditure 1647.3 6817.6 1403.0 5599.8 890.5 2347.0 Debt : Equity Ratio 0.41 2.90 0.41 3.29 0.45 4.23 Capital Adequacy Ratio 736% 257% 735% 234% 708% 192%

TA 7114-IND National Capital Region Planning Board Project
Final Report
Sheladia Associates, Inc. USA 64
Volume 1 – Main Rep
ort
EARNINGS PER SHARE Of Rs 10 Each (On 200.52 Cr Shares)
0.44 1.27
Interest Spread Ratio 0.36% 0.80% 0.20% 0.29% 0.50% 0.66% Earnings Spread Ratio 5.41% 2.82% 5.26% 2.15% 5.36% 2.20% Gross Interest Margin 311.04% 50.72% 302.20% 37.53% 303.03% 36.23% Net Margin 248.92% 49.68% 241.43% 36.60% 101.94% 14.64% Average Cost Of Borrowings 8.05% 7.48% 8.05% 7.48% 8.05% 7.51% Average Gross Return On Loans 7.17% 8.37% 7.01% 7.87% 7.14% 8.26% Less: Average Cost Of Funds 1.74% 5.55% 1.74% 5.72% 1.77% 6.06% Less: Other Costs As % Of Total Funds 0.31% 0.04% 0.31% 0.04% 2.57% 1.21% Net Return On Capital Employed (Assets) 5.10% 2.78% 4.95% 2.11% 2.79% 0.99% Return On Equity 6.85% 10.39% 6.65% 8.60% 3.81% 4.88% WEIGHTED AVERAGE COST OF BORROWING (Post Tax)
8.52% 8.53% 8.52% 8.53% 5.63% 5.64%
Weighted Average Cost Of Capital (Post Tax)
7.48% 8.15% 7.48% 8.19% 6.61% 5.91%
Weighted Average Lending Rate 9.36% 9.36% 8.80% 8.80% 9.24% 9.24% Loan Loss Reserve (As A % Of Loan Outstanding)
0.00% 0.00% 0.00% 0.00% 2.00% 2.00%
Income Tax Rate 0.00% 0.00% 0.00% 0.00% 33.99% 33.99% Sectoral Break Up Of Disbursement % OF Interest % OF Interest % OF Interest TOTAL TOTAL TOTAL Sewerage/Solid Waste 4% 8% 10% 6% 10% 6% Water Supply 7% 8% 15% 7% 15% 6% Transport 14% 10% 15% 9% 15% 10% Power 41% 10% 40% 9% 40% 10% Land Development & Others 34% 10% 20% 11% 20% 11%

TA 7114-IND National Capital Region Planning Board Project
Final Report
Sheladia Associates, Inc. USA 65
Volume 1 – Main Rep
ort
1.00 9.36% 1.00 8.80% 1.00 9.24% ADB Loan Assumptions ADB Loan Tenor 20 YEARS Moratorium 5 YEARS Years Of Repayment 15 YEARS Interest 7.50% PA Government Of India G Sec 10 Year Rate 7.05% Required Lending Margin 2.00% Minimum Weighted Average Lending Rate 9.05%

TA 7114-IND National Capital Region Planning Board Project
Final Report
Sheladia Associates, Inc. USA 66
Volume 1 – Main Rep
ort
D. Financial Intermediation from the Regions Perspective
174. The demand analysis shows the high unmet debt demands for both large and small scale growth and environmental infrastructure, capital intensive investments such as power, transportation as well as water and waste water treatment. There is also the need for smaller investments in connection systems, solid waste collection. Further, a study of existing sources of debt in the region confirm the premise that existing institutions would be unable to meet the demands of planned coordinated investments across sectors and states in a manner which is as effective as what NCRPB’s management and GOI grants policy enables NCRPB to do if it chooses.
175. Given this situation, the design of intermediation has two primary objectives, low
cost finance for small and medium environment infrastructure, and planning coherence which maximizes backward and forward linkages in the region. The basic considerations for the design are:
i. Specialization: A study of international experience suggests that both developed
and developing economies have designed specialized intermediaries. The possible reasons for this could be on account of the nature of lending itself – non collateral based, high transaction cost, and the dependence of debt service from a variety of sources – taxes, fees and grants. This type of lending activity is not the main line of business for commercial banks – usually collateral based, short term lending. International experience in using commercial banks for municipal lending have also not made headway from an open access point of view – the Land bank in Philippines, Caixa in Brazil, etc. Therefore the first decision point would perhaps be whether NCR needs a specialized intermediary, with a primary focus on small and medium size environment projects in its lending and large projects which promote growth in its planning.
ii. If a specialized intermediary is a preferred option, then the question of ownership.
From an outreach and open access perspective, international experience would suggest that stronger state supported structures such as the US Bond Banks, or even partial ownership such as TNUDF, would tend to provide stronger security structures such as escrows and intercepts. It is seen that NCRPB’s structures themselves have many of these built in. A well designed mechanism should be able to attract longer term domestic capital- insurance and pension funds.
iii. Cost of credit: State ownership in specialized intermediaries tend to eliminate
dividend expectations and hence make possible infrastructure at lower costs, relevant for communities where income levels constrain the ability to pay.
iv. Fourth is the emerging policy environment in India (especially the PFDF) regarding
local government borrowing. The advantages of a low equity base and recourses limited to local governments and project revenue streams would tend to mitigate the often perceived risks of directed lending which state owned institutions are

TA 7114-IND National Capital Region Planning Board Project
Final Report
Sheladia Associates, Inc. USA 67
Volume 1 – Main Rep
ort
prone to. Given these factors, it would appear that the evaluation of NCRPB options could be an opportunity to define an intermediation design for the region which is self sustaining.
176. From an operational perspective, Option 2 (Financier of relevance) is
recommended for adoption by NCRPB for its way forward. Some of the next steps in this regard are:
• Ownership and capitalization (low equity-strong security versus strong balance
sheets subject to standard regulatory requirements on capital adequacy, provisioning)
• Planning – Normative Guided Planning versus Investment Plans with a Means of Finance
• Debt and Grant Funds: Policies and Procedures (Policies moving from Guarantee towards Credit enhancements and Rate covenants)
• Role of Multilaterals (on lending of lines of credit versus partial credit guarantees for potential market borrowing of the entity)
177. A more detailed analysis of the various options is presented in Appendix 11 and a
detailed note on the way forward for NCRPB to become a Financier of Relevance is presented in Appendix 12.
178. The implication of the proposed structure involves a change in the processes of
NCRPB, Staffing and movement towards intermediation as a along term goal of NCRPB. IN the interim as suggested as part of Option II is in terms of systemic improvements and more importantly perform the role of a planner effectively and as a proactive project developer and financier. A major step in this regards the proposed allocation of resources towards various technical assistance activities to achieve the goals of the Regional Plan and the current project.
179. Implications of Options on NCR’s Processes and Structure is
a. adopt an eligibility and sub project selection ( Appendix 29) b. is the need to strengthen the staffing as per the table attached below. These could
be on a short term hire basis or as permanent staff:
Position Function Specific Responsibilities Educational Qualification
Projects Officer
Project Development
Project Development Drafting and Finalizing TORs for project consultancies and Concept documents Appraisal of project concept Support entities in Procurement and Management of consultant assignments, Project monitoring and project structuring in various formats, Coordination of review meetings,
Masters in Planning or Bachelors in Civil Engineering / Architecture/. M.B.A Finance/ ICWAI/CA. At least 10 years experience in

TA 7114-IND National Capital Region Planning Board Project
Final Report
Sheladia Associates, Inc. USA 68
Volume 1 – Main Rep
ort
Position Function Specific Responsibilities Educational Qualification
Preparation of Board approval notes and Initiation of projects in the Board Notes, Preparation of bids for consultancies of NCRPB / IA’s Follow up advertisements for consultancy opportunities Marketing and additional line of activity.
development / appraisal of infrastructure projects and Technical Assistance
Project Analyst
Project financial Analysis
Analysis of Balance Sheets of IA’s / sub project attaining Financial Closures, Preparation of Financial Statements such as Operating Plans, Cash Flows, Initial Screening Report and Recommendation for Board Notes. Coordinate Drafting Loan Agreements and Consultancy Agreements for Grants. Drafting Terms of Reference for consultants to be appointed for preparation of appraisal notes Preparation of disbursement memos to disburse payments to consultants after review of the reports. Study of the Detailed Project Report submitted by Consultants to understand the project proposed, specifically from the financial viewpoint. Monitoring progress of consultancy works
ICWAI/ CA / MBA Finance with at least 7 years experience in analysis of infrastructure projects.
Procurement Officer
Procurement of works, Equipment and consultancy
Coordinate all project procurement related activities in NCRPB Review of procurement plans submitted by entity Preparation of Bid documents for Selection and Employment of consultants for preparation of DPR for various sub Projects/ transaction advisory services as envisioned in the PDF Participate in Evaluation of Technical and Financial Proposals received from the consultants, Procurement Review of Reports furnished by the consultants at various stages, Review of Bid documents and bid evaluation reports for various projects submitted by IA’s and coordinate with ADB on approvals Monitoring progress for ongoing projects, Preparation of Post Review formats for procurement of goods, works and consultancy assignments for review by ADB Mission/INRM/NCRPB.
BE preferably Civil. At least 10 years experience in management of procurement processes as part of ADB/ WB Projects.
Safeguards Officer
Ensure compliance of sub projects with ESMS
• Maintain and keep uptodate the environmental aspects of the ESMS – environmental policies and procedures (screening categorization, environmental appraisal and others) - on a day-to-day basis.
• Monitor the portfolio of projects financed by NCRPB on environmental safeguards, prepare status reports on a periodic basis and work with the IAs in ensuring that environmental safeguard compliance.
Masters in Planning/ Environmental Sciences with at least 10 years experience in design, review and appraisal of safeguard compliance as

TA 7114-IND National Capital Region Planning Board Project
Final Report
Sheladia Associates, Inc. USA 69
Volume 1 – Main Rep
ort
Position Function Specific Responsibilities Educational Qualification
compliance. • Provide the required information to the
multilateral agencies based on their requirements.
• Engage in training and capacity-building initiatives to build awareness, knowledge and skills of IAs and agencies associated with them
• Provide support and co-operation to the external ESMS auditors for the conduct of the annual audit.
• See whether the IA has taken efforts to avoid or minimize IR and impacts to IP during the pre-planning stage;
• Screening of project proposals to verify whether the safeguard documents – commensurate to the significance of the impacts - have been prepared and submitted along with the loan application.
• Ensure that the IA fulfils the required planning process for addressing social safeguards issue, including the planning for IR and IP, consultations and disclosures, the implementation of RP and IPP, and redressal of grievance.
• Ensure that disbursement decision of the NCRPB takes into account the successful completion of the RP and IPP implementation.
• Setting of loan conditionality to include social safeguards covenant
• Carry out periodic review of the progress on RP and IPP implementation and ensure that the progress reports are submitted in a timely manner.
• Provide the required information to the multilateral agencies based on their requirements.
• Provide support and co-operation on social safeguards to the external ESMS auditors for the conduct of the annual audit.
part of ADB/World Bank projects
Fund Manager
Management of Funds including Foreign Exchange
Management of funds Coordinating with banks and financial institutions for
hedging against foreign exchange fluctuation risk
Prepare / update the interest rate to be charged on
FCA / MBA Finance At least 5 years experience in management of funds, hedging of

TA 7114-IND National Capital Region Planning Board Project
Final Report
Sheladia Associates, Inc. USA 70
Volume 1 – Main Rep
ort
Position Function Specific Responsibilities Educational Qualification
Risks
loans to sub-borrowers in relation to cost of capital
Monitor the repayments including interest payments by borrowers on regular basis
Mobilisation of funds from financial institutions, banks, markets and other funding agencies to meet the requirement of funds
Apprise senior management with regard to debt service obligation of NCRPB
funds to cover foreign exchange fluctuation risk, co-ordinating with funding agencies.
Project MIS and Monitoring Manager
Project Management Information System and Monitoring
Design of the Management Information System (MIS) and Project Monitoring System (PMS);
Work closely with the computerization team for the implementation of the MIS and PMS
Prepare the user manual for the MIS and PMIS in consultation with the Computerization team
Train the staff in the preparation of MIS and PMS reports
Review the MIS and PMS reports generated by the System
Participate in the Senior Management Review Meetings
MCA/ CA with IT qualification with at least 7 years experience in design and management of MIS and PMS.
Internal Auditor (either in house or outsourced)
Internal Audit of NCRPB operations
Prepare the internal audit work plan and discuss with the Director (A&F)
Conduct internal audit of all activities in NCRPB Review the compliance to internal control systems
and procedures Preparation of draft report on internal audit findings Discuss the audit findings with the concerned section
/ department Prepare the action plan for implementation of
recommendations arising out of internal audit Ensure compliance to the action plan for remedial /
mitigation measures.
Qualified Chartered Accountant. At least 10 years experience in internal audit of organisations in both public as well as private sector.

TA 7114-IND National Capital Region Planning Board Project
Final Report
Sheladia Associates, Inc. USA 71
Volume 1 – Main Rep
ort
IV. Institutional Assessment and Options to enhance capacities
A. Background and Motivation
180. NCRPB is one of the financiers of infrastructure in the region. NCR’s role as a financier of significance is determined by the capacities of the Implementing Agencies (IA). In this context, an assessment of select borrowers were carried out with the objective of identifying key planning, development and financing constraints for the implementation of the RP 2021 and sub projects.. The ultimate objective of this effort and project section is to define technical assistance requirements of the implementing agencies.
181. For this purpose, a sample of Institutional Assessment (IA’s) which is
representative of NCRPB sectoral financing –Power (Rajasthan Transmission and Distribution Company), State Highways (Haryana State Road Development Corporation), Water and Sanitation (Haryana Public Health Engineering Department, Special Area Development Authority-SADA Gwalior), area development agencies (Urban Improvement Trust, Alwar, and Haryana State Industrial Infrastructure Corporation) and Urban Local Body (Faridabad Municipal Corporation-FMC) were covered as part of the analysis. Attempts to include agencies from Uttar Pradesh (UP) is on but some of the lessons based on discussions with select agencies in UP has been incorporated.
182. This situation analysis is not a standalone note; it is linked to the situation analysis
of NCRPB. Accordingly the analysis attempts to answer first, how material is NCRPB financing to the chosen IA’s, second, are there major policy changes which the IA’s are going through which NCRPB is affecting and affected by, and third, are there IA capacity constraints which would hinder NCRPB functioning.
1. IA Institutional Categories and NCRPB’s Materiality
183. Firstly, with regard to materiality of NCRPB as a planner and financier, to recall,
Infrastructure projects were classified into three categories. The first, guided by National policy environments and entities that have access to national financing institutions – for example Power- The power finance corporation (PFC) and rural electrification corporation (REC), or national highway (NH). Second are the state level investments such as state roads and multi city water supply water projects where financing and planning is done at the state level and third, are local level planning and investments– such as urban development authorities and urban local bodies.
184. From the IA of the 10 chosen, it is clear that NCRPB as a financier is least relevant
for category I. The share of NCRPB in the Rajasthan Power budget is less than 5% and even in Alwar around 12%. On the other hand planning issues regarding

TA 7114-IND National Capital Region Planning Board Project
Final Report
Sheladia Associates, Inc. USA 72
Volume 1 – Main Rep
ort
stability in regional power supply where NCRPB as a planner could be expected to have a major role appears to be an institutional gap. The proposal for a regional distribution company (DISCOM) appears to have been under discussion for quite a while. A similar situation prevails with respect to industrial parks as our report on HSSIDC suggests – namely alternate sources of finance providing strong
185. On the other hand, in category 3, namely local level planning, NCRPB’s role as a
financier appears material (in FMC the NCRPB has sanctioned INR 630 million which is s 20% share of the proposed JNURM investments) while its role as a planner is limited- the CDP has had limited inputs from NCRPB.
186. In category 2, state level projects, where NCRPB’s role has been significant at
least in Haryana, several opportunities exist which if pursued could create a regional impact. To name a few, Haryana Government has a policy which links on priority roads which links with those going through the region to Rajasthan. If a similar policy had been initiated through the NCRPB in Rajasthan - both planning for and financing- the multiplier effects would be high for the region. Similarly the effluent from Rajasthan’s industrial estates contaminates Haryana groundwater; Planning and financing a treatment facility would undeniably create regional economic and environment impacts.
187. From our IA situational analysis, three main findings emerge:
• The potential declining materiality of NCRPB financing in Category 1,
especially if the grant financing ratio into NCRPB diminishes • The rising potential of NCRPB financing in category 3, which might
repositioning of current business model which relies on state guarantees rather than direct client relationship with local authorities
• The gap in regional environmental projects which NCRPB can position itself to address
2. Policy Frameworks
188. In all three categories of infrastructure there have been significant policy changes
which has implications for NCRPB as a planner and financier and we outline some of these changes which could impact on NCRPB current business model in the medium term
189. First with respect to National Level infrastructure, significant changes include the
unbundling in the Power sector, the NH program in the roads and railways based on PPP’s. The unbundling implies increasing demand on state budgets for losses in transmission and distribution companies given the current tariff structures, especially in agriculture. It is difficult to visualize NCRPB as a major financier in

TA 7114-IND National Capital Region Planning Board Project
Final Report
Sheladia Associates, Inc. USA 73
Volume 1 – Main Rep
ort
this sector. Further with respect to NH, the PPP framework would suggest that NCRPB would have a limited role.
190. Second with respect to state level investments based on budgets for repayments,
most states have been obliged to follow FRBM limits and the prospects for financing would depend on future buoyancy of tax revenues of which the major source is across states – sales taxes. The proposed movement towards GST by April 1st 2010 would also be needed to take into account unless the GST is revenue neutral or compensations are available from GOI
191. Third with respect to Municipalities, there is considerable functional and
geographic fragmentation with respect to the implementation of the 74th and JNNURM has not addressed these issues. In this context NCRPB would have to deal with financing city infrastructure through parastatals which do not take credit risk. Further, traditional NCRPB borrowers such as UDA’s would have little role to play within the city and in the region as several private sector landbanks have begun to emerge and Delhi itself has launched land developments with private sector real estate for joint ventures as evidenced for the ensuing commonwealth games. There is also the issue as to why subsidized GOI grants through NCRPB would need to finance UDA’s which are essentially middle class housing with short gestation periods.
3. Capacity
192. A recurrent theme in this situation analysis is the need for capacity building. Lack
of capacity has often been identified as a major cause for underinvestment and poor implementation in public goods, especially at lower levels of governments. This presumption would probably discount traditional causes of poor implementation such as uncertain means of financing, execution delays relating to land issues and utility shifting and poor contracting process. Granting the premise, then the course of action would be to make available through TA, best practice information about process, better training, and improved documents.
193. Available evidence in India and elsewhere would suggest that local knowledge
combined with information have generally resulted in quick adoption of innovations as long as underlying responsibilities and rights are well defined. In the municipal sector, stable fiscal devolution and transfer of both rights and responsibilities show high correlation with increased infrastructure spending. At a more micro level, several small municipalities have serviced finance raised from markets and recovered user charges once responsibility and authority have been made clear. Further still, these small local governments (including town panchayats) have used multilateral bidding documents without much difficulty, preparing project documents which lenders require. These actions have usually been aided by project preparation funds with ownership vesting with the borrowers rather than

TA 7114-IND National Capital Region Planning Board Project
Final Report
Sheladia Associates, Inc. USA 74
Volume 1 – Main Rep
ort
consultant driven. The design of such TA is one of the outputs of this study and we hope to incorporate in that design that learning also comes from doing.
194. If the primary cause of underinvestment is low capacity then NCRPB as regional
planner would not be in a particularly advantageous position to impart capacity at a state level. If on the other hand, much learning can be acquired by doing, and assistance for project preparation (well defined investment packages rather than broad vision documents) would make a difference in a sustainable pipeline.
B. Assessment of Financial Management Systems:
195. The Institutions in the NCR are of two broad categories, State departments and Autonomous Bodies/ Corporations. The State departments including local governments operate on cash based system of accounting and the State Corporations such as power, Industries and independent implementing agencies such as road development corporations or Joint ventures on an accrual format. The systems of transaction in either format are pronounced, and are based on accepted accounting norms as adopted by the State or as per the ICAI norms.
196. Financial Planning and Budgeting: Being agencies linked to State departments,
the financial planning is on an annual basis. While for departments it is based on budgetary allocation as part of the State’s budgeting process, the Development Authorities or local governments draw up budgets. These Local Government budgets are not based on plans or ability to raise resources to meet O&M. CDP based initiatives are recent in nature and the local body need capacity enhancement to link investment plans with adequate financial planning. This would address the issues of resource availability for implementation of projects and will not be a factors for implementation delays. Similarly there is also need to link budgets with physical plans to provide adequate information on physical and financial progress. At the macro level, there is a need to prepare a detailed implementation as well as a procurement plan for projects.
197. The quality of staff varies with the nature of agencies. While staff in the
departments are not qualified accounting staff, there progression in the accounting function is based on completion of internal accounting tests. State Corporations have qualified accounting staff. The issue with the departmental staff is the limited exposure to accrual system / ADB project accounting systems and this will need to be addressed by NCRPB as well as the TA facility.
198. The capacities are weak in the local governments, especially when it comes to
managing project financials of size. However urban local entities implementing national urban programs are in the process of movement towards accrual system of accounting as mandated by their reform agreements. The Project could support the upgrade to new systems and can also target willing local governments in this process.

TA 7114-IND National Capital Region Planning Board Project
Final Report
Sheladia Associates, Inc. USA 75
Volume 1 – Main Rep
ort
199. One of the concerns includes insufficient safeguards over assets. This will need
improvement, records need to be kept up to date, periodical physical verification and reconciliation to be carried out and all assets (after completion). While this will be an element of overall financial management aspect, this needs special mention and be ensured under the project.
200. Entities as mentioned earlier do not link investments with cost recovery. This is
also due to political processes. There are some indications of moving towards cost recovery and the sub projects would address a gradual movement towards cost recovery.
201. Technical support options under the project includes:
i. Support local governments in switchover to accrual systems of accounting
including computerization of accounts ii. Training of implementation unit staff in project accounting and financial
management systems; iii. Provide external support to ensure timely audit of investments made
under the project and iv. Support in costing and pricing of services.

TA 7114-IND National Capital Region Planning Board Project Final Report
Sheladia Associates, Inc. USA 76
Volume 1 – Main Rep
ort
Table 4.1 Summarized Response on Financial Management
Particulars SADA / UIT Alwar DIMTS, HSRDC, RRVPNL, JVVNL
PHED MCF Remarks
Implementing Agency
• Legal Status: Special autonomous bodies under State’s Statute.
• Similar Project Experience: No prior experience.
• Reporting requirements: Monthly Accounts, Demand Collection Balance (DCB) Statement and Annual Financial Statement.
• Independent Governing Body: Yes. Independent board is responsible for management. Report to Urban Development Department (UDD) of respective state.
• Legal Status: Body corporate registered under Companies Act, 1956
• Similar Project Experience: No prior experience for DIMTS and HSRDC. RRVPNL and JVVNL have executed projects financially assisted by World Bank
• Reporting requirements: Monthly Accounts, Quarterly Results, Annual Financial Statement.
• Independent Governing Body: Independent Board of Directors managing day to day affairs of respective companies.
• Legal Status: Haryana State Government Department
• Similar Project Experience: No prior experience.
• Reporting requirements: Monthly Accounts, Demand Collection Balance (DCB) Statement and Annual Financial Statement.
• Independent Governing Body: No. A State Government Department.
• Legal Status: Urban local body (ULBs) constituted under Municipal Act of Haryana.
• Similar Project Experience: No prior experience.
• Reporting requirements: Monthly Accounts, Demand Collection Balance (DCB) Statement and Annual Financial Statement.
• Independent Governing Body: No. Directorate of Local Bodies under Urban Development Department (UDD) of GoH governs ULB.
• Lacks experience handling similar funded project.
• IA staff lacks experience, technical knowledge to undertake such a large sized project

TA 7114-IND National Capital Region Planning Board Project Final Report
Sheladia Associates, Inc. USA 77
Volume 1 – Main Rep
ort
Particulars SADA / UIT Alwar DIMTS, HSRDC, RRVPNL, JVVNL
PHED MCF Remarks
Funds Flow Arrangements
• No previous experience of ADB disbursements.
• Counterpart funding will be provided for in the SADA, Gwalior and UIT, Alwar’s Budgets.
• No previous experience of ADB disbursements.
• Counterpart funding will be provided for in the respective Company’s annual budgets.
• No previous experience of ADB disbursements.
• Counterpart funding will be provided for in the PHED's annual budgets.
• No previous experience of ADB disbursements.
• Counterpart funding will be provided for in the GoH's and ULBs' annual budgets.
• Past experience of IAs in carrying out developmental works was non-availability of funds on timely basis.
Staffing
• Present staff not trained in ADB procedures and are recruited through respective State services / directly recruited.
• Staffing not adequate in case of SADA, Gwalior.
• Present staff is permanent and are transferable within SADAs / UITs.
• Present staff not trained in ADB procedures and are recruited through State Services / directly.
• Staffing adequate except in the case of HSRDC.
• All present ULB staff is permanent except in the case of HSRDC.
• Present staff not trained in ADB procedures and are recruited through State Services.
• Staffing not adequate.
• All present staff is permanent and are transferable within State.
• Present staff not trained in ADB procedures and are recruited through State Municipal Services.
• Staffing not adequate.
• All present ULB staff is permanent and are transferable within ULBs.
• Present staffing at IAs, excepting DIMTS, RRVPNL and JVVNL not adequate, not properly qualified, trained and lacks ability and capacity to handle a project of this size.
• Training and capacity building is to be provided.
• Project financial management and

TA 7114-IND National Capital Region Planning Board Project Final Report
Sheladia Associates, Inc. USA 78
Volume 1 – Main Rep
ort
Particulars SADA / UIT Alwar DIMTS, HSRDC, RRVPNL, JVVNL
PHED MCF Remarks
accounting system modules and manual to be developed for training of project finance and accounting staff.
Accounting Policies and Procedures
• Cash based accounting system, plan to switch over to double entry (accrual) based system Project will use accrual based accounting system;
• Controls are in place for the authorization / approvals, recording of transactions, payments and recording of payments in cash book in accordance with the budget heads approved;
• Accounting records are retained on a
• All have adopted double entry accrual based accounting system;
• Controls are in place for the authorization / approvals, recording of transactions, payments and recording of payments in cash book in accordance with the budget heads approved;
• Accounting records are retained on a permanent basis as per requirement.
• Cash based accounting system; Project will use accrual based accounting system;
• Controls are in place for the authorization / approvals, recording of transactions, payments and recording of payments in cash book in accordance with the budget heads approved;
• Accounting records are retained on a permanent basis as per requirement.
• Cash based accounting system, plan to switch over to double entry (accrual) based system; Project will use accrual based accounting system;
• Controls are in place for the authorization / approvals, recording of transactions, payments and recording of payments in cash book in accordance with the budget heads approved;
• Accounting records are retained on a
SADA Gwalior, UIT Alwar, PHED and MCF will need assistance, capacity building and handholding in implementation of financial reforms.

TA 7114-IND National Capital Region Planning Board Project Final Report
Sheladia Associates, Inc. USA 79
Volume 1 – Main Rep
ort
Particulars SADA / UIT Alwar DIMTS, HSRDC, RRVPNL, JVVNL
PHED MCF Remarks
retained on a permanent basis as per requirement.
retained on a permanent basis as per requirement.
Segregation of Duties
• Adequate internal checks and controls are in place with respect to authorization, recording of transaction, custody of assets, order, receipt & accounting of goods and services etc.
Adequate internal checks and controls are in place with respect to authorization, recording of transaction, custody of assets, order, receipt & accounting of goods and services etc.
Adequate internal checks and controls are in place with respect to authorization, recording of transaction, custody of assets, order, receipt & accounting of goods and services etc.
Adequate internal checks and controls are in place with respect to authorization, recording of transaction, custody of assets, order, receipt & accounting of goods and services etc.
Budgeting System
• Accounts Officer is responsible for the preparation of the annual budget. Accounts Officer is responsible for presentation of the budget before Board for approval. Further it is sent to Urban Development Department in State Government for approval.
• Explanatory
• Accounts / Budget Officer is responsible for the preparation of the annual budget. Accounts / Budget Officer is responsible for presentation of the budget before Board for approval. HSRDC does not have a budgeting system.
• Explanatory notes to the budget provide sufficient details. Financial
• Accounts Officer is responsible for the preparation of the annual budget. Accounts Officer is responsible for presentation of the budget before SE’s Office for approval. Final approval at State Level.
• Explanatory notes to the budget provide sufficient details.
• Accounts Officer is responsible for the preparation of the annual budget. Accounts Officer is responsible for presentation of the budget before Municipal Board for approval.
• Explanatory notes to the budget provide sufficient details. Financial ceilings prescribed in the
• Clear targets not defined; the Project targets and budget for project activities should be well defined and based on realistic and valid assumption.
• Variance analysis on regular basis to be provided for under the

TA 7114-IND National Capital Region Planning Board Project Final Report
Sheladia Associates, Inc. USA 80
Volume 1 – Main Rep
ort
Particulars SADA / UIT Alwar DIMTS, HSRDC, RRVPNL, JVVNL
PHED MCF Remarks
notes to the budget provide sufficient details. Financial ceilings prescribed in the budget are adhered to. All variations or excess expenditure over budget requires prior approval.
• Adequate procedures to plan and budget developmental activities.
ceilings prescribed in the budget are adhered to. All variations or excess expenditure over budget requires prior approval.
• Adequate procedures to plan and budget developmental activities.
Financial ceilings prescribed in the budget are adhered to. All variations or excess expenditure over budget requires prior approval.
• Adequate procedures to plan and budget developmental activities.
budget are adhered to. All variations or excess expenditure over budget requires prior approval.
• Adequate procedures to plan and budget developmental activities.
project.
• HSRDC should also adopt budgeting system.
Payment Systems
• Procedures in respect of payments of invoices, bills etc is adequate.
• Pre-audit system in place ensuring all the checks are carried out before payments are made.
• All invoices, bills etc are stamped paid and duly checked, reviewed and approved prior to payment.
• Procedures in respect of payments of invoices, bills etc is adequate.
• Pre-audit system in place ensuring all the checks are carried out before payments are made.
• All invoices, bills etc are stamped paid and duly checked, reviewed and approved prior to payment.
• Procedures in respect of payments of invoices, bills etc is adequate.
• Pre-audit system in place ensuring all the checks are carried out before payments are made.
• All invoices, bills etc are stamped paid and duly checked, reviewed and approved prior to payment.
• Procedures in respect of payments of invoices, bills etc is adequate.
• Pre-audit system in place ensuring all the checks are carried out before payments are made.
• All invoices, bills etc are stamped paid and duly checked, reviewed and approved prior to payment.

TA 7114-IND National Capital Region Planning Board Project Final Report
Sheladia Associates, Inc. USA 81
Volume 1 – Main Rep
ort
Particulars SADA / UIT Alwar DIMTS, HSRDC, RRVPNL, JVVNL
PHED MCF Remarks
Policies And Procedures
• Cash basis of accounting being followed.
• Accounting rules & standards as laid down by the Act / State Government is being followed.
• Government orders, circulars etc supplement the accounting rules.
• The extant rules define conflict of interest and related party transactions and provide adequate safeguards.
• Accrual basis of accounting being followed.
• Accounting rules & standards as laid down by the Acts are being followed.
• The extant rules define conflict of interest and related party transactions and provide adequate safeguards.
• Cash basis of accounting being followed.
• Accounting rules & standards as laid down by the Act / GoH is being followed.
• Government orders, circulars etc supplement the accounting rules.
• The extant rules define conflict of interest and related party transactions and provide adequate safeguards.
• To change over to Double Entry / Accrual System.
Cash and Bank • SADA – Joint signatory – Chief Executive Officer and Accounts Officer.
• UIT Alwar – Upto Rs. 1 Million, Secretary UIT. More than Rs. 1 Million, joint signatories – Secretary and Chairman of UIT
• DIMTS – Joint signatory – Senior Vice President (F&A), Vice President (F&A), Vice President (Human Resources) – any two out of above.
HSRDC – Joint signatory – DGM 1 and DGM 2 for expenditure upto Rs. 1 Lakh;
• PHED – authorized signatory - Drawing and Disbursing Officers of the Divisions of PHED –a) for Works – Executive Engineer b) for Salary – Superintending Engineer and for Head Office –
• Municipal Board – Joint signatory – Financial Controller and Municipal Commissioner.
• Cash book generally up to date, receipts/deposits & payments generally recorded on timely basis;
Backlog in bank reconciliation should be cleared and reconciliation should be completed upto date.

TA 7114-IND National Capital Region Planning Board Project Final Report
Sheladia Associates, Inc. USA 82
Volume 1 – Main Rep
ort
Particulars SADA / UIT Alwar DIMTS, HSRDC, RRVPNL, JVVNL
PHED MCF Remarks
• Cash book generally up to date, receipts/deposits & payments generally recorded on timely basis;
• Bank / Treasury reconciliation statements are prepared and cash is reconciled regularly.
Managing Director and DGM (mostly 1) for expenditure more than Rs. 1 lakh and transfer of funds to Division (Ex.Engr) offices
• RRVPNL – a) At Head Office: Single authorized signatory- Chief Accounts Officer (CAO) or Senior Accounts Officer (Sr. AO); b) At Circle Office: Single authorized signatory – Accounts Officer (AO)
• JVVNL – Joint signatory – Same as for RRVPNL
• Cash book generally up to date, receipts/ deposits & payments generally recorded on timely basis;
• Bank reconciliation statements are
Registrar as delegated by the Engineer in Chief
• Cash book generally up to date, receipts/deposits & payments generally recorded on timely basis;
• Bank / Treasury reconciliation statements are prepared and cash is reconciled regularly.
• Bank reconciliation statements are prepared and cash is reconciled regularly. There is huge backlog in bank reconciliation.

TA 7114-IND National Capital Region Planning Board Project Final Report
Sheladia Associates, Inc. USA 83
Volume 1 – Main Rep
ort
Particulars SADA / UIT Alwar DIMTS, HSRDC, RRVPNL, JVVNL
PHED MCF Remarks
prepared and cash is reconciled regularly. In HSRDC there is some backlog in Bank Reconciliation
Safeguard over Assets
• Physical control over assets is provided by the existing systems & procedures through maintenance of register.
• Financial records for assets are not being maintained.
• Physical verification and reconciliation with the register not carried out.
• Assets, excepting vehicles, are not insured.
• Physical control over assets is provided by the existing systems & procedures through maintenance of register.
• Financial records for assets are being maintained.
• Physical verification and reconciliation with the register carried out.
• Assets, excepting vehicles, are not insured.
• Physical control over assets is provided by the existing systems & procedures through maintenance of register.
• Financial records for assets are not being maintained.
• Physical verification and reconciliation with the register not carried out.
• Assets, excepting vehicles, are not insured.
• Physical control over assets is provided by the existing systems & procedures through maintenance of register.
• Financial records for assets are not being maintained.
• Physical verification and reconciliation with the register not carried out.
• Assets, excepting vehicles, are not insured.
• Insufficient safeguards over assets, needs improvement, records need to be kept up to date, periodical physical verification & reconciliation to be carried out and all assets (after completion) to be insured under the project.
Other Offices and Implementing Entities
• No, there are no other offices in case both SADA and UIT;
• No, there are no other offices;
• In case of HSRDC, RRVPNL and JVVNL – Circle / Division offices -
• Yes, Circle / Division offices - Presently there are established procedures & controls for flow of funds, financial information,
• No, there are no other offices;
• To be covered under the Project depending on the decision of State with respect to financing and

TA 7114-IND National Capital Region Planning Board Project Final Report
Sheladia Associates, Inc. USA 84
Volume 1 – Main Rep
ort
Particulars SADA / UIT Alwar DIMTS, HSRDC, RRVPNL, JVVNL
PHED MCF Remarks
Presently there are established procedures & controls for flow of funds, financial information, reconciliations, accountability & audits in relation to these offices.
information, reconciliations, accountability & audits in relation to these offices.;
financing and implementation issues.
Other • Advice for reporting of frauds etc to appropriate authority under the project not specified.
• Advice for reporting of frauds etc to appropriate authority under the project not specified.
• Advice for reporting of frauds etc to appropriate authority under the project not specified.
• Advice for reporting of frauds etc to appropriate authority under the project not specified.
• To be provided for.
Internal Audit • SADA – outsourced to a firm of Chartered Accountants.
• UIT - At present no internal audit.
• DIMTS – outsourced to a firm of Chartered Accountants.
• HSRDC – Outsourced to a Chartered Accountant from FY2010.
• RRVPNL and JVVNL – In-house Internal Audit department carried out internal audit.
• At present no internal audit. However, in-house pre-audit exists.
• At present no internal audit. However, in-house pre-audit exists.
External Audit • Director of Local Fund is the Statutory Auditor
• Independent firm of Chartered Accountants is
• Accountant General (Audit)'s office also carries
• Director of Local Fund is the Statutory Auditor
• Separate audit of project financial

TA 7114-IND National Capital Region Planning Board Project Final Report
Sheladia Associates, Inc. USA 85
Volume 1 – Main Rep
ort
Particulars SADA / UIT Alwar DIMTS, HSRDC, RRVPNL, JVVNL
PHED MCF Remarks
and performs the audit as per standards laid down by the CAG of India.
• In addition, Accountant General (Audit)'s office also carries out the audit on annual basis for SADA.
• Audit reports issued.
• Separate audit of project financial statements proposed.
the Statutory Auditor and performs the audit as per standards laid down by the ICAI of India.
• In addition, Accountant General (Audit)'s office also carries out special audit as and when required as provided u/s 619 of Companies Act.
• Audit reports issued.
• Separate audit of project financial statements proposed.
out the audit on annual basis.
• Audit reports issued.
• Separate audit of project financial statements proposed.
and performs the audit as per standards laid down by the CAG of India.
• In addition, Accountant General (Audit)'s office also carries out the audit on annual basis.
• Audit reports issued.
• Separate audit of project financial statements proposed.
statements in accordance with the accepted auditing standards proposed.
Reporting & Monitoring
• Present reporting system inadequate to meet project reporting requirements, with only financial figures being reported against the budget allotments.
• Present reporting system adequate to meet project reporting requirements excepting in case of HSRDC.
• Present reporting system inadequate to meet project reporting requirements, with only financial figures being reported against the budget allotments.
• Present reporting system inadequate to meet project reporting requirements, with only financial figures being reported against the budget allotments.
• To be provided for under the Project.
Information Systems
• No. Process of • Computerized • No. Process of • No. Process of • To be provided

TA 7114-IND National Capital Region Planning Board Project Final Report
Sheladia Associates, Inc. USA 86
Volume 1 – Main Rep
ort
Particulars SADA / UIT Alwar DIMTS, HSRDC, RRVPNL, JVVNL
PHED MCF Remarks
Systems computerization of accounting records in the initial stages.
• Present system not adequate to generate project financial reports.
• Inadequate training of present staff of SADA and UIT.
• Inadequate safeguard of the confidentiality, integrity and availability of data.
accounting records are maintained, excepting in case of HSRDC where it is outsourced.
• Present system adequate to generate project financial reports.
• Adequate training of present staff of IAs, excepting in case of HSRDC.
• Adequate safeguard of the confidentiality, integrity and availability of data.
computerization of accounting records in the initial stages.
• Present system not adequate to generate project financial reports.
• Inadequate training of present staff of PHED.
• Inadequate safeguard of the confidentiality, integrity and availability of data.
computerization of accounting records in the initial stages.
• Present system not adequate to generate project financial reports.
• Inadequate training of present staff of ULB.
• Inadequate safeguard of the confidentiality, integrity and availability of data.
for under the Project.

TA 7114-IND National Capital Region Planning Board Project
Final Report
Sheladia Associates, Inc. USA 87
Volume 1 – Main Rep
ort
C. e-Governance Assessment in Implementing Agencies (IAs):
202. Information and Communication Technology (ICT) plays central role in converging the means of processing, transmission and display of information, thus providing the uniform platform for organizations to strengthen their capabilities in disseminating the required information at appropriate levels and also address the grievances of the public and consumers. The major benefits apart from performance monitoring, also enables dissemination of information on the entities projects and performance. Over the past decade, there have been several initiatives in the IT segment in the country, at National, State, District, and even Panchayat level. Some of these applications are highly successful thus creating the way forward for making an all out effort for designing the e-Governance applications. Based on these experiences, the Government of India (GOI) has framed up a robust plan, i.e. National eGovernance Plan (NeGP) at the national level, and provided the guidelines and directions for formulation and implementation of state level and district level Plans. The NeGP was approved in May 2006 and subsequently, several initiatives were taken up by GOI in strengthening the infrastructure and IT capacities of the State governments. One of the important developments is the State Wide Area Network (SWAN), the network infrastructure backbone connecting all district headquarters and important towns within the state. National agencies like NIC, NISG and NICSI etc have been actively serving the central government and state departments and agencies in setting up the IT infrastructure, rolling out IT applications along with the help of industry.
1. An Overview and Best Practices
203. The IA’s were reviewed in terms of hardware / software and IT services and have
been rated accordingly. The level of IT application varies between departments, autonomous corporations and local governments. The autonomous corporations have a better level of IT applications and hardware as against State Departments or local governments. The level of ITES is primarily substantially focused on internal business requirements than towards citizen centered services. However, institutions are moving towards ITE enabled services and one of the missing link is a mechanism to convert their needs into action.
204. Amongst the IA’s select organizations have already made efforts to streamline the
operations and have installed web enabled systems in both intra-organizational and public domain segments. Agencies are also in the process of establishing state of the art systems in place and take up IT projects. Some of the online (web based) systems developed with the help of NIC and the IT Industry are noteworthy. At HSRDC:

TA 7114-IND National Capital Region Planning Board Project
Final Report
Sheladia Associates, Inc. USA 88
Volume 1 – Main Rep
ort
� an online Quality control system exists to assess quality and quantities of the material used at various stages of construction work to check the pilferage of material on fictitious testing of materials and work.
� GPS based vehicle tracking for each vehicle to check the routes at all times � Online testing of quality parameters at the site and uploading on to the web
site on prescribed formats along with GPS data, digital photographs of the location and staff working on it.
� A computerized Measurement Book (MB) has been designed to facilitate the creation of project wise MBs online with selection of different rates like HSR/MORTH etc and complete information of the individual work for processing the bills.
205. PHED, Haryana has introduced web based:
� Inventory management system for stores and project sites � Utilities management system � contracts accounts management system � civil contacts works monitoring system � Property Tax application submission and utility payments
206. In Rajasthan power corporations, systems provide for Online Power utility
payments and grievances and an Online Stock Management System. A blue print aimed at upgrade IT capabilities of the organization is under way. The IT enablement in the Department is mainly organization centric and services are required to be enabled for supervising the works of contractors. There is a specific division catering for IT services, with Executive Engineer is coordinating the requirements of IT systems and processes. The department depends on National Informatics Centre (NIC) in developing the relevant applications. Already, the department has developed several applications such as Works monitoring software, Inventory management system, Accounts managements system, Utilities and tools for office functions that are online and working. The department has specific staff for IT services identified to co-ordinate at various levels All the departmental locations for stores etc across the state are connected online and the data flows for processing the bills and payments. The department has the required servers and about 100 desktop machines connected on LAN and the storage solutions for backup and recovery are in place. Broadband is available and used extensively in the departmental functions like letter transactions, and other circulars.

TA 7114-IND National Capital Region Planning Board Project Final Report
Sheladia Associates, Inc. USA 89
Volume 1 – Main Rep
ort
Table 4.2: Qualitative Assessment of IT Infrastructure and IT Capacity of Implementing Agencies
IT Infrastructure IT Services S.N Organization Category IT Division
HW/SW Internet Organ. level Public Domain
IT Capacity
1 HSRDC Haryana State level No Moderate Broadband Moderate NA Good
2 PHED Haryana State level Yes Good Broadband Good NA Good
3 FMC Haryana Urban-City level No Moderate Broadband Moderate Moderate Moderate
4 RVPN Rajasthan State level Yes Very good Broadband Good NA Good
5 JVVN Jaipur Division level Yes Very good Broadband Good Very good Good
6 UIT Alwar Urban-City level No Poor Broadband Poor Poor Poor
7 SADA Gwalior Urban-City level No Poor Broadband Poor Poor Poor
8 DIMTS Delhi Transport-City level Yes Very good Leased line Good Good Very good

TA 7114-IND National Capital Region Planning Board Project
Final Report
Sheladia Associates, Inc. USA 90
Volume 1 – Main Rep
ort
2. General Observations
207. Overall assessment reveals that IAs intend installing and utilizing IT systems and
e-governance practices as well as internal capacities both in terms of infrastructure and human resources. While the state governments have IT Policies in place, it is a matter of defining the needs and converting them into implementable actions. While the larger institutions have the capacity, they lack resources to implement action actions. The local governments lack resources and capacities in defining and installing systems. Essentially the TA support required would be in the form of:
i. Assessment of IT systems and requirements including definition of
applications primarily for citizen services ii. Design of procurement packages for design of application and
procurement of hardware- The key areas are: Revenue assessment and collection Accounting and Budgeting Customer services Planning (GIS) and Design Monitoring
iii. Support for Testing and audit of application software and iv. Definition of training needs
D. Procurement:
208. The overall objective of the procurement, is to get an economic product, defined as product that meets the utility requirement and delivered at right time with specified quality, at a reasonable cost. The procurement assessments carried out are in relation to the basic principles laid down by the ADB policy as well as best practices in relation to systems in practice at the IA level.
209. As per the present processes and mandate, NCRPB reviews the implementation
schedule and procurement plans are not a requirement. The borrowers follow respective State procedures for invitation of Bids for goods, works and services. It is proposed that NCR anchor review of procurement plans and packages of borrowers. This would involve strengthening the staffing to include a procurement specialist to coordinate and review all procurement aspects under the project.
210. A review of the Country Procurement Assessment by the World Bank, indicates
that the principles of procurement are based on broad principles of financial propriety in incurring government expenditures including expenditure in the procurement of goods and services and the procuring agencies expand these into detailed rules and procedures, primarily the PWD’s and other’s depending on

TA 7114-IND National Capital Region Planning Board Project
Final Report
Sheladia Associates, Inc. USA 91
Volume 1 – Main Rep
ort
needs. Even the Tender Transparency Act’s broadly lay down the principles than specific documents or procedures in tendering. Agencies such as Planning Commission and NHAI have evolved model documents.
211. The basic framework of rules and procedures require open tenders, open to all
qualified firms without discrimination, use of non discriminatory tender documents, public bid opening and selection of the most advantageous tender taking all factors (preferably pre-disclosed) into consideration. Restricted or limited tenders are permitted if the value is small or only limited suppliers are available and single tenders are permitted in the case of urgency, small value, and proprietary and in other exceptional circumstances. In this respect, the basic procedural framework is no different from Bank Guidelines and other good models of public procurement. The issue is that as many agencies handle public procurement, most of them have added or modified the same, some consistent with the basic philosophy of non discriminatory open tendering, but many bending the basic principles to an uncomfortable degree. The Bank’s view is that since the genesis is the ‘finance rules’ and not a law, nothing prevents them in this exercise, nor has the auditor anything to say unless it finds fraud or malpractice or impropriety.
212. Some of the issues in the States, negotiation is practiced routinely and contracts
are divided up among many or all the bidders resulting in quality and integration issues. The basic tool of procurement planning at the design stage is absent. Use of annual ‘rate contracts which get extended year after year on some excuse or other is common. While the system of two covers exist, beyond negotiations and need for registration, the key issue is in delay of opening of financial bids and in decision making, resulting the contract being unviable for the contractors.
213. A review of procurement carried out in the States (for the IA’s) and the quality of
procurement varies with the departments. The Power sector has a centralized procurement cell where as the in case of other State departments the procurement is delegated to different levels within the department based on State Financial Rules. Interestingly the PWD of Haryana, the owner of State Roads has transferred the design and implementation function to the State Roads and Bridge Corporation. This agency has implemented projects using ICB procedures. However some of the key observations are no clear procurement plan.
214. There are basically three critical issues with regard to compliance with ADB
requirements. First and foremost is that, the agencies:
i. Accept bids from registered contractors only ii. Follow a two cover system with separate technical and financial offers and iii. Permit negotiations iv. From a process point of view a major constraints are
a. disclosure is an issue

TA 7114-IND National Capital Region Planning Board Project
Final Report
Sheladia Associates, Inc. USA 92
Volume 1 – Main Rep
ort
b. procurement planning- which forms the basis of packaging and invitation methodology. Procurement planning is absent in entities as they are linked to, acquisition of land for activities, resource allocation and more importantly approvals of procurement. While there exists a practice of delegation within departments, they are low compared to the size of projects that are being proposed (See Appendix 18 Procurement Assessments). This is under the assumptions that the contracts are efficient.
215. In general, there is an awareness of the procurement requirements of ADB and
the World Bank, especially at the central level and interest in applying such methods. The basic requirement is in terms of awareness and training in the use of ADB procurement systems. Based on initial discussions, an approach to procurement has been designed and appended to Appendix 18.
216. A summary of key parameters reviewed for sample IA’s are as follows.

TA 7114-IND National Capital Region Planning Board Project Final Report
Sheladia Associates, Inc. USA 93
Volume 1 – Main Rep
ort
Table 4.3 Summary Procurement Assessment Aspect ADB’s Procurement Principle Assessment Transparency Open competition:
In most cases, international competitive bidding (ICB), properly administered, and with the allowance for preferences for domestically manufactured goods as provided for in the financing agreement.
Transparency Though there are no rules for transparency fixed by the Government there are guidelines issued for publication in news papers. Moreover notifications are made on Government Web Site and publication of Notice Inviting Tender (NIT) in the website is commonly practiced. e- Tendering is not yet an established procedure in any of the IA. On transparency ie on wide publicity of NIT, is well established and secondly, information on the schedule of rates for the items. For works of value up to Rs 100 Mn, single cover Government Departments and undertakings adopt the % tender system making known the estimated rates for the item and the total estimate value put to tender. For larger value of works item rate tender only adopted. But the contractor generally understands the estimated value through EMD amount requested for. The areas of concern are: non publishing the results of the award including non award or making known the looser Bidders the reason for the same, providing opportunity to the Bidders to complain through established procedure for grievance redress before and after the tender, forum to register complaints on the discriminating behavior between the Bidders. If the above grievances of the Bidders not attended it may invite litigation in the Court of Law. Faridabad- Works costing more than Rs 50 Million will need to be advertised in the papers, communicate to registered contractors and display in the website.

TA 7114-IND National Capital Region Planning Board Project Final Report
Sheladia Associates, Inc. USA 94
Volume 1 – Main Rep
ort
Aspect ADB’s Procurement Principle Assessment Eligibility Any conditions for participation shall be limited to those
that are essential to ensure the bidder’s capability to fulfil the contract in question. ADB does not permit a borrower to deny the participation of a bidder for reasons unrelated to its capability and resources to successfully perform the contract.
The eligibility criteria are found to be evenly poised to provide opportunity to the target market. There are some subjective criteria which could be refined are made quantifiable. The present system of eligibility is based on registration. However the IA’s are aware ADB’s system of open bids.
Fraud and Corruption
ADB’s anticorruption policy requires borrowers (including beneficiaries of ADB financed activity), as well as bidders, suppliers, and contractors under ADB-financed contracts to observe highest standard of ethics to be anti corruptive.
There is generally a clause for Fraud and Corruption. The description on fraud and corrupt practices as per ADB guidelines is not found
Procurement Plan As part of the preparation of the project the borrower shall prepare and, before loan negotiations, furnish to ADB for its approval a procurement plan.
The procurement planning is totally absent. Though IA’s are aware of the list of activities the need for planning has not been felt. Reasons for plans not being followed are due to non availability of resources in a timely manner and delays in approval of works and packages.
Two-Stage Bidding
In the case of turnkey contracts or contracts for large complex facilities or works of a special nature or complex information and communication technology, it may be undesirable or impractical to prepare complete technical specifications in advance. In such a case, a two-stage bidding procedure may be used, under which un- priced The borrower has the option to use the two-envelope procedure with single-stage or two-stage bidding. In the single-stage, two-envelope procedure.
In the case of turnkey contracts or contracts for large complex facilities or works of a special nature the two stage systems are adopted with Lump Sum Contract pricing. Other than Government Departments the Two Envelop system is followed irrespective of the value of Tender. Higher value of Purchases by Electricity corporation especially for equipments like Transformers is based on Two Cover System.
Timely notification
Timely notification of bidding opportunities is essential in competitive bidding.
Timely notifications are provided for and the Bids are issued on the prescribed dates as far information gathered.
Prequalification of Bidders
Prequalification may be necessary for large or complex works, or in any other circumstances in which the high costs of preparing detailed bids could discourage
Pre qualification criteria are fixed following guidelines prescribed by Govt or concerned authorities and that is suggested by the Central Vigilance commission, This

TA 7114-IND National Capital Region Planning Board Project Final Report
Sheladia Associates, Inc. USA 95
Volume 1 – Main Rep
ort
Aspect ADB’s Procurement Principle Assessment competition. requires fine tuning.
CVC issues Guide Line Memorandums to be Central Govt. and undertakings based on the discrimination complaints on the Procurement Entity. One such Memo dated 17-12-2002 provides guidelines on various Pre Qualification Criteria and another memo Dtd. 7-5-2004 says that they shall not be restrictive to prevent fair competition
Post qualification of Bidders
If bidders have not been prequalified, the borrower shall determine whether the bidder whose bid has been determined to offer the lowest evaluated cost has the capability and resources to effectively carry out the contract as offered in the bid. The criteria to be met shall be set out in the bidding documents, and if the bidder does not meet them, the bid shall be rejected. In such an event, the borrower shall make a similar determination for the next lowest evaluated bidder.
Post qualification of Bidders If bidders have not been pre qualified. This is not followed, as in the case of single cover system the tenders are issued to registered contractors only. The practice of issuing tenders only to the registered contractors is to be dispensed with. The list is meant to provide information on the known number of Contractors /Suppliers/Consultants only. The qualification criteria targeting the required market have to be in the Tender. Whether it is single cover or two cover bid the responsiveness of the Tender has to be decided before comparing the Price for the determination of the Lowest Bid price. Otherwise though there is openness in tender call there is a limiting factor in issuing the Tender to the prospective Bidders.
Same information to all
All prospective bidders shall be provided the same information, and shall be assured of equal opportunities to obtain additional information on a timely basis.
This is generally made available.
Unit Price or Lump Sum
Bidders for civil works contracts shall be required to quote unit prices or lump sum prices for the performance of the works, and such prices shall include all duties, taxes and other levies. Bidders shall be allowed to obtain all inputs (except for unskilled labor)
The Bid prices called for as unit price or % Premium / Discount This type of Tender is called for by Govt. Departments In this tender the estimate rate of BOQ Item is given and the bidder quotes the overall premium/discount on the total

TA 7114-IND National Capital Region Planning Board Project Final Report
Sheladia Associates, Inc. USA 96
Volume 1 – Main Rep
ort
Aspect ADB’s Procurement Principle Assessment value put to Tender Lump Sum tender is practiced only for Turn- key System tenders. The other for of Tender generally called is Item Rate Tender. In this the Bidder is to quote the rates for all the Items of BOQ and the cost of item for the given quantity. The sum total of the items cost is the price of the Bid
Price Adjustment The bidding documents shall clearly indicate whether price adjustments are allowed in the event changes occur in major cost components of the contract such as labor, equipment Materials
In higher valued Tender this clause is provided for. The latest CPWD Procedure is best suited for this purpose. The PA clause is to provide compensation amount payable to or discount by the Contractor consequent to the increase/decrease of Market price of Material, Labor and fuel. By this provision the contractor will be able to quote at current market price without any provision for future escalation which he has to do on educated guess. The variation is generally based on price index variation between the quarterly rate prevailing on the date of tender and the period of actual execution. However the payment has to be paid as per agreed program period rather than actual execution
Liquidated Damages and Bonus Clauses
2.41 Provisions for liquidated damages or similar provisions in an appropriate amount shall be included in the conditions of contract when delays in the delivery of goods, completion of works or failure of the goods or works to meet performance requirements would result in extra cost, or loss of revenue or loss of other benefits to the borrower.
Liquidated damages Clause is adequately provided for in the high value procurement contract conditions. Compensation event and bonus are to be provided for to make the conditions on even platform for the Client and the Contactor / Supplier as well.
Force Majeure The conditions of contract shall stipulate that failure on the part of the parties to perform their obligations under the contract will not be considered a default if such failure is the result of an event of force majeure as
At present it is there as a formality in the high value procurement

TA 7114-IND National Capital Region Planning Board Project Final Report
Sheladia Associates, Inc. USA 97
Volume 1 – Main Rep
ort
Aspect ADB’s Procurement Principle Assessment defined in the conditions of contract.
Applicable Law and Settlement of Disputes
The conditions of contract shall include provisions dealing with the applicable law and the forum for the settlement of disputes.
Arbitration Clause is normally provided for
Bid Evaluation The borrower shall prepare a detailed report on the evaluation and comparison of bids setting forth the specific reasons on which the recommendation is based for the award of the contract.
Detailed report is found to be absent in many cases.
Domestic Preferences
At the request of the borrower, and under conditions to be agreed under the financing agreement and set forth in the bidding documents, a margin of preference may be provided in the evaluation of bids
Post qualification of Bidders
If bidders have not been prequalified, the borrower shall determine whether the bidder whose bid has been determined to offer the lowest evaluated cost has the capability and resources to effectively carry out the contract as offered in the bid. The criteria to be met shall be set out in the bidding documents, and if the bidder does not meet them, the bid shall be rejected. In such an event, the borrower shall make a similar determination for the next lowest evaluated bidder.
Award of Contract The borrower shall award the contract, within the period of the validity of bids, to the bidder who meets the appropriate standards of capability and resources and whose bid has been determined (i) to be substantially responsive to the bidding documents and (ii) to offer the lowest evaluated cost.
Specified
Publication of the Award of Contract
Within two weeks of receiving ADB’s “no objection” to the recommendation of contract award, the borrower shall publish in 38 Referred to as “lowest evaluated bidder” and “lowest evaluated bid,” respectively, an English language newspaper or well-known and freely
This is not done by any of the IA. As a matter of transparency this has to be mandatory.

TA 7114-IND National Capital Region Planning Board Project Final Report
Sheladia Associates, Inc. USA 98
Volume 1 – Main Rep
ort
Aspect ADB’s Procurement Principle Assessment accessible website
Lack of Competition
Lack of competition shall not be determined solely on the basis of the number of bidders. Even when only one bid is submitted, the bidding process may be considered valid, if the bid was satisfactorily advertised and prices are reasonable in comparison to market values
In as much as the wide publicity of NIT is established. As per ADB guide lines Single tender can be considered so long as quoted rates are reasonable as compared to the market rate .
Community Participation in Procurement
3.17 Where, in the interest of project sustainability, or to achieve certain specific social objectives of the project, it is desirable in selected project components to (a) call for the participation of local communities and/or nongovernmental organizations (NGOs) in the delivery of services, or (b) increase the utilization of local knowhow and materials, or (c) employ labor-intensive and other appropriate technologies.
Negotiation
Left to the desecration of the Borrower Generally the Implementing Agencies resort to negotiation with L1 except HSRBDC following WB procedure. The CVC Memo Dtd 3rd March, 2007 States “As post tender negotiations could often be a source of corruption, it is directed that there should be no post-tender negotiations with L-1, except in certain exceptional situations”. Still there is hesitancy to stop negotiation on the fear that the contractor may form a cartel and quote more..

TA 7114-IND National Capital Region Planning Board Project
Final Report
Sheladia Associates, Inc. USA 99
Volume 1 – Main Rep
ort
E. Project management
217. Project Management revolves around Tools, People and Systems. Good tools, competent people and clearly understood system are a prerequisite to efficient project management. Tools could be scheduling software, schedule of rates, risk analysis, computers, design aids, machinery, workshops, communication equipment etc. They facilitate people and system towards increased productivity. Systems comprise of the ways rules of behaviour and decision making at various levels of the project team interact to achieve objectives.
218. The nature of IA’s inn NCR can be classified into three categories- State
Departments, Autonomous corporations performing the functions of planning, design and implementation and urban local bodies. The nature of project management varies with the entities. In Haryana, HSRDC is responsible for planning, design and execution of projects on behalf of PWD. HSRDC’s structure and regulations enable them focus on delivery of outputs by engaging consultants to perform certain tasks. The only activity PWD continues to be responsible for is Land Acquisition and coordination.
219. In case of DIMTS, a Joint Venture between Delhi Government and IDFC, the
relationship between DIMTS and Delhi is an activity based MOU for transport projects and the scope of work largely includes from “concept to commissioning”. Of works/ business processes/ systems. In the State Departments, generally the executive engineers are responsible for project identification, formulation and implementation. Project management division is not distinct and the function is performed by the concerned executive engineer under whose division the work is being implemented. It is also to be noted that it is the same division/unit which carries out the pre-award bid appraisal, etc.
220. The local governments have a limited role in service delivery in the States
concerned as most works are carried out by the State departments, except for internal roads, buildings and waste management. In case of SADA and UIT, the staff generally are on deputation from the departments and the issue is not of capacity but: mismatch between Implementation Plan and procurement plans (in available limited form) as they do not factor relate time decisions and the activities on the critical path are land acquisition and shifting of utilities/ inter departmental clearances. While the contracts have methods of settlement of disputes, key issues in contract management is poor safety and risk management practices.

TA 7114-IND National Capital Region Planning Board Project
Final Report
Sheladia Associates, Inc. USA 100
Volume 1 – Main Rep
ort
221. Generally the departments do not have customized manual on project
management but it is an evolved a system wherein the concerned superintending engineer at the circle office level provides strategic project supervision inputs on a monthly basis and the concerned chief engineer assesses the progress of the works on quarterly basis. However, entities such as PHED and HSRDC in Haryana have moved towards web based monitoring system, information flow on physical and financial progress of works to the concerned officials is regular on which enables necessary action/interventions at appropriate levels. As a result of introduction of this monitoring system, it is reported that now almost 75% of the projects of PHED are completed within the stipulated time and budget. Nonetheless, project cost variation typically between 5-25% is experienced on account of price escalation, quantity variation, etc. The department also follows the system of submission of monthly audit notes from the field offices to the headquarters which helps in tracking expenditure on capital works, establishment, operation and maintenance, etc. In the case of the NCRPB supported projects, it is understood that the Engineer-in-Chief’s office submits a quarterly progress report for the specific works which enables the lending agency to effectively monitor the project.
222. Project Management beyond designs and approvals (delegation of powers is an
issue but manageable), key issues relate to an implementation and procurement plan. While a plan is drawn up for implementation, the key factors most agencies encounter is Land Acquisition and shifting of utilities. While there is limited documentation of factors, discussions reveal that land is a major factor for delay followed by shifting of utilities and more importantly as a result of allocation of resources for shifting. Project management is more by learning and doing than through certified programs or use of project management and scheduling tools or linking them with web based information systems. This is one area of improvement required to ensure on time completion of project.
Project Management Lessons from ADB’s Projects Major lessons from various ADB financed projects and discussions with the Implementing Agencies (IA’s) are.
i. Sector master plan to be the basis for phasing and definition of components, move away from. incremental or adhoc approaches
ii. Project component sequencing; works should be sequenced post shifting of utilities is substantially complete before contracts are awarded..
iii. Completion of land acquisition and resettlement prior to award of contract iv. Inclusion of experienced line departments /corporations /agencies as Implementing
Agencies with assistance of consultants in design/ project management quick project implementation
v. Incorporated into loan processing Capacity building for O&M of assets. Especially when capacity of entities to operate and maintain the assets created under projects is limited and will need support in exploring options such as an O&M linked construction contract. State

TA 7114-IND National Capital Region Planning Board Project
Final Report
Sheladia Associates, Inc. USA 101
Volume 1 – Main Rep
ort
223. NCRPB as part of the process of improving loan disbursal and utilization took the first step by Mandating a DPR for projects and in the recent past links approvals to completion of land acquisition (also a DEA requirement) , need for an implementation plan and procurement packaging and a plan. With basic frameworks in place, it provides a basis for review of delays and utilization of approved loans.
F. Social Safeguards
224. An assessment of Implementing Agencies (IA) was carried out to ascertain the process adopted by these agencies in addressing matters concerning land acquisition and the resultant involuntary resettlement and impacts to indigenous peoples. The assessment provided an insight into the present national/state policies/acts complied with and the process adopted in addressing social safeguard issues and its compliance with ADB safeguard requirements. The ADB safeguard requirements (Safeguard Policy Statement, 2009) provide a structured process for impact assessment, planning and mitigation to address the adverse effect of projects throughout the project cycle.
1. The Process
225. The IAs, as far as possible, site the project components in government land and
when suitable government land is not available acquire private land. The acquisition of private land is governed by the Land Acquisition (LA) Act 1894. The acquisition is usually as per the provisions of LA Act and ordinarily it takes about 2 years to complete land acquisition and with regular follow-up and coordination between the requiring body and the acquiring authority, the land acquisition takes about one-year. For water supply and sewerage projects, the land is acquired invoking the emergency clause (Sec 17 of LA Act) and the competent authority takes possession of the land before the award is pronounced on the expiration of fifteen days from the publication of notice under Section 9(1) of LA Act. When land is acquired invoking this provision, the requiring body deposits eighty percent of the compensation (as per the provisions of amendment to Section 17 by Act LXVIII of 1984) as estimated by the competent authority before taking possession of the land. This process enables the IA to acquire the land in 6 months time.
226. In UIT, Alwar and SADA, Gwalior, the land owner is given an option of going in for
a negotiated settlement and own developed land in lieu of compensation or receive compensation for land under LA Act. Land acquisition through negotiations is preferred by most land owners as they get developed land that can be traded in the open market. The procedures for negotiations are governed by government acts and policies. While in UIT, Alwar the landowners gets 20 percent developed residential land and 5 percent developed commercial land, in SADA, they get 20 percent developed land.

TA 7114-IND National Capital Region Planning Board Project
Final Report
Sheladia Associates, Inc. USA 102
Volume 1 – Main Rep
ort
227. While compensation for land is as per the provisions of LA Act the matters considered in determining the compensation (as per Sec 23 of LA Act) are: (i) market value of land on the date of 4(1) notification; (ii) damage to crops or trees; (iii) damage sustained due to severance of land; (iv) damage sustained by other property on account of acquisition; (v) incidental expenses for relocation; (vi) twelve percent per annum on market value (Sec. 23(1-A)) from the date of 4(1) notification to date of award; and (viii) provides for thirty percent solatium on the market value of the land (Sec. 23(2)), in consideration of the compulsory nature of the acquisition.
228. In the State of Haryana, the government has fixed a minimum floor rate of
Rs.16,00,000/- per acre (excluding 30 percent solatium and 12 percent interest) for sub-urban areas of Haryana in National Capital Region and the market value of land determined by the competent authority can not be lower than the minimum floor rate. Further, Haryana pays Rs.15,000/- per acre per annum as annuity for 33 years and there is an increment of Rs.500/- every year on the annuity. Both the compensation and annuity for 33 years is paid as a lump sum when the award is pronounced.
229. No other assistances are provided for land acquired from titleholders. None of the
IAs recognises non-titleholders and therefore does not provide for any assistance to non-titleholders.
2. The Structure
230. Once administrative sanction is obtained for a project, the project proponent /
implementing agency initiates the land acquisition process, if private land is required. Land acquisition request are made to the concerned district administration and the district administration sends the proposal along with approval for 4(1) notification to the appropriate government for approval. The preparation of land plan schedule, 4(1) notification, declaration under Sec 6, award enquiry and pronouncement of award including payment of compensation to landowners is carried out by the jurisdictional SDM/DRO assisted by the revenue staff and facilitated by the IA project staff. Some IAs have dedicated land acquisition cell/staff to facilitate and expedite the LA process. UIT, Alwar, has a dedicated land acquisition cell headed by an officer of Rajasthan Administrative Cadre on deputation and supported by revenue staff and engineering staff. PWD (B&R) have a fulltime Patwari on their roles to facilitate land acquisition matters.
231. The Detailed Project Report (DPR) for most projects are prepared by consultants
hired by the IA and the DPRs provide details of: (1) extent required; (ii) project component for which land is required; (iii) type of land, whether private or government; and (iv) budgetary provisions made for acquisition of private land. However, details about the use of land is not available to ascertain if it involves displacement and where government / municipal corporation land is said to be

TA 7114-IND National Capital Region Planning Board Project
Final Report
Sheladia Associates, Inc. USA 103
Volume 1 – Main Rep
ort
available, information about whether there are any encroachments or it is free from encumbrance are absent.
232. The DPR are appraised by National Institutions and the scope of work given to
these institutions by NCRPB include the safeguard requirements that needs to be verified for compliance. It clearly states that the appraisal should review DPRs for their social impact and measures for their mitigation. Further, the review has to look into the provisions for the services to the poor and the vulnerable including those requiring to be resettled. However, information of whether the project involves involuntary resettlement (IR) or impact to indigenous peoples (IP) is absent in the DPRs and also in National Institution’s appraisal report.
3. ADB Safeguard Requirements
233. The safeguard requirements for managing involuntary resettlement are: (i) avoid
involuntary resettlement wherever possible; (ii) minimize involuntary resettlement by exploring project and design alternatives; (iii) enhance, or at least restore, the livelihoods of all displaced persons in real terms relative to pre-project levels; and (iv) improve the standards of living of the displaced poor and other vulnerable groups.
234. The safeguard requirements for managing impacts to indigenous people is to
design and implement projects in a way that fosters full respect for Indigenous Peoples’ identity, dignity, human rights, livelihood systems, and cultural uniqueness as defined by the Indigenous Peoples themselves so that they (i) receive culturally appropriate social and economic benefits, (ii) do not suffer adverse impacts as a result of projects, and (iii) can participate actively in projects that affect them.
235. Further, the social safeguard policy of ADB recognizes persons who lose the land
they occupy in its entirety or in part who have neither formal legal rights nor recognized or recognizable claims to such land. Such persons will have to be compensated for the loss of assets other than land, such as dwellings, and also for other improvements to the land, at full replacement cost.
4. Gaps
236. The procedure adopted by IAs in compensating for land, structure and in not recognising non-titleholders are in variance with ADBs social safeguard requirements. The key differences are given in the following table.

TA 7114-IND National Capital Region Planning Board Project
Final Report
Sheladia Associates, Inc. USA 104
Volume 1 – Main Rep
ort
Table 4.4: Compliance of IA Procedures with ADB Requirements
SNo IA Procedures ADB Requirement Remarks
1 Land compensated as per guideline/past registered (sale statistics) value along with 30% solatium and 12% interest
Land to be compensated at replacement cost
Minimum floor price fixed for land in sub-urban areas of NCR in Haryana
2 Structure compensated with depreciation
Structure to be compensated at replacement cost without depreciation
-
3 Non-title holders are not eligible for compensation for loss of assets
Non-title holders are entitled for compensation for loss of assets (not for land)
-
4 No assistance for livelihood loss
Livelihood assistance for loss of livelihood (land / commercial)
In Haryana, loss of livelihood for landowners is provided as an annuity (Rs.15,000 per acre per annum for 33 years with Rs.500 increment every year)
5 No assistance for vulnerable Additional assistance for vulnerable
-
6 No specific provision for Land Acquisition through Negotiation
Safeguard Requirements-2 on Involuntary Resettlement does not apply to Negotiated Land Acquisition
UIT- Alwar and SADA-Gwalior have specific provisions for Negotiated Land Acquisition
5. Compliance Requirements
237. Recognizing the environmental and social issues that can arise in infrastructure
projects, NCRPB has prepared a Draft Environmental and Social Management Systems (ESMS) in line with ADBs safeguard requirements for Financial Intermediaries (FIs).
238. The ESMS provides an overall management system to NCRPB to identify, assess,
and mitigate environmental and social issues that are likely to arise in projects financed by NCRPB and implemented by Implementing Agencies (IAs). The ESMS outlines the policies, methods of assessments and procedures that will enable NCRPB to ensure that a project that it funds is developed in accordance with ESMS and is adequately protected from associated risks.

TA 7114-IND National Capital Region Planning Board Project
Final Report
Sheladia Associates, Inc. USA 105
Volume 1 – Main Rep
ort
239. IAs will have to comply with the ESMS conditions while submitting their loan application. The IA staff currently overseeing project preparation and land acquisition have the required capabilities in adhering to ESMS safeguard requirements. They will require training on ESMS safeguard requirement to enable them: screen projects for involuntary resettlement impacts and impacts to indigenous peoples; prepare safeguard documents; and oversee RP/IPP implementation.
G. Environmental safeguards
1. Existing scenario
240. Preparation: Implementing agencies (IAs) prepare their projects through their Projects / Engineering divisions with support from external consultants. These projects are prepared using standard technical guidance provided by organizations such as the Central Public Health and Environmental Engineering Organization (CPHEEO) and the Indian Roads Congress (IRC). On environmental issues, these projects are prepared in compliance to national legal requirements. In most projects, environmental clearances are required either from the Centre or the State. In cases where the project uses forest areas, forest clearances are also required. IAs are dependent on external consultants for their technical expertise in conducting the environmental assessments and in obtaining the environmental and forest clearance processes. Generally, IAs obtain the required clearances prior to commencing implementation. Apart from the legal requirements, IAs do not explicitly focus on good environmentally responsible construction practices on their own accord and do not ensure their integration in the contract / bid documents. However, if these aspects are covered in the environmental and forests clearances, these become a part of the contractor’s conditions to be adhered.
241. Implementation: In most projects during the construction phase, contractors are
required to obtain consents to establish and to operate from the State Pollution Control Board (SPCB). These consents are normally given along with a set of conditions that the contractors need to follow. In addition, if the project has obtained environmental and/or forest clearances, the contractors need to abide with those conditions as well. While it is mandatory of the contractors to follow these conditions, the monitoring / supervision of the implementation of these conditions is not done in a formal, documented manner by the IAs. In the operational phase, IAs are to adhere to the environmental and forest clearance conditions, if there are any. Here again, the IAs do not verify the compliance to these conditions in a formal manner.

TA 7114-IND National Capital Region Planning Board Project
Final Report
Sheladia Associates, Inc. USA 106
Volume 1 – Main Rep
ort
2. Management of Process
242. IAs manage environmental issues as an overall part of the project planning, design
and implementation. Environmental issues are not dealt with through a separate, dedicated Environmental Cell or Unit. As most of the projects have only minor and reversible environmental inputs, IAs have not found the need for having such a separate unit. The Engineering or Projects staff, who are involved with the planning and design, coordinate environmental and forest clearance issues with the support of external consultants.
3. ADB Pipeline
243. There are altogether five projects in the pipeline. These projects will be classified
as B (ADB categorization) and E2 (NCRPB ESMS categorization). None of these projects pass through eco-sensitive areas or cause irreversible environmental damage.
244. Gaps: In relation to these projects, the ADB requirements are as follows:
• Preparation: (1) Initial Environmental Examination (IEE) as these will be Category B projects; and (2) Inclusion of an environmental management plan (EMP), covering good construction management practices, in the contract documents.
• Implementation: (1) Implementing safeguard requirements, (2) Monitoring environmental safeguards compliance (including legal compliance) and (3) Reporting the progress periodically.
245. From this perspective, the following gaps pertaining to mainstreaming safeguards
in the IA processes needs to be done:
• Staff capacity to plan, design and implement environmental safeguards in its project cycle. TORs for engaging consultants to support on various tasks in line with ADB's safeguard requirements are required.
• If projects already under implementation have to be supported by ADB retroactively, then a project-level environmental audit of the designs and ongoing implementation has to be done. As an outcome, an EMP needs to be prepared. This EMP should adequately reflect ADB's safeguard requirements. Those relevant to the construction stage should be included as a variation to the construction contracts.
• Those pertaining to tasks in the operational stage or tasks for the IA should be done, e.g. monitoring, through separate contracts with external agencies.
• Periodic EMP progress reports need to be submitted by the contractors to the IAs and by the respective IAs to NCRPB.

TA 7114-IND National Capital Region Planning Board Project
Final Report
Sheladia Associates, Inc. USA 107
Volume 1 – Main Rep
ort
H. Technical Assistance Loan / Project Development Facility
1. Indicative TA Needs
246. Based on discussions during the field visit with IAs, following initial list of
consulting and advisory support classified into 4 areas as listed above are requested by IAs and are shown in Tables 4.5 and 4.6. This includes a combination of generic activities related to project such as design, supervision and management, and activities such transaction advisory. The list is only indicative and is based on a preliminary discussion with a few IAs. However, the listing gives an idea of the nature and variety of problems which impact project implementation and are being faced by the IAs. DIMTS being a nodal agency for transport initiatives has presented a request for a larger scale TA support from NCRPB and the project (Appendix 23)
Table 4.5: Indicative areas of TA and Costs
A Assumptions
1 US$ Rs 47
Value in Million $ < 10 10-20 20-30 30+ Average
% to Cost
Design 1 0.7 0.6 0.5 0.7
Supervision and Management 3 2 2 2 2.25
Appraisal 0.1
Monitoring and Evaluation 0.2
B Estimates
Costs in Million
Rs $ %
Target Investment 3 Years 14100 300
Technical Assistance Costs
A Design 98.7 2.1 11.6
B Supervision Costs 317.3 6.8 37.4
C Appraisal 14.1 0.3 1.7
D IT Applications
Local Body 5
Target Bodies 5
Overall 25 0.5 2.9
E GIS and MIS
Cost / Entity 11.80
Target Number of entities 3
Overall 35.40 0.8 4.2
F Other TA Requests 105.5 2.2 12.4

TA 7114-IND National Capital Region Planning Board Project
Final Report
Sheladia Associates, Inc. USA 108
Volume 1 – Main Rep
ort
B Estimates
Costs in Million
Rs $ %
G DIMTS 149.5 3.2 17.6
H Monitoring and Evaluation 28.2 0.6 3.3
G Transaction Advisory- Others 75 1.6 8.8
Total 849 18.1 100.0
% to total 6.02
Table 4.6 : Indicative TA requirements and Estimates Sl. No.
Entity Consultancy Requirement
Brief TOR Indicative Cost
A State level policies or criteria based projectization Rs Million PHED
Haryana Feasible options to alleviate drinking water shortage in Mahendragarh, Rewari, Jhajjar districts
Technical feasibility for groundwater recharge vis a vis agri / industrial demand, river or canal based regional water supply schemes & reverse osmosis, prefeasibility of these and recommendations.
2.5
Solution to high Fluoride in groundwater in Mahendragarh, Rewari, Jhajjar & Gurgaon districts
Study, recommendations and pilot projects by technical consulting firm. Sustainability of technology, operation and maintenance of defluoridation systems and cost recovery will be areas of major focus for the study.
2.5
Sustainability of pumped water supply systems
. State has made major investments on groundwater pumping and booster stations in both urban and rural areas for ensuring drinking water supply. In the absence of coherent policies of O & M and cost recovery, the equipment deteriorate rapidly leading to quicker replacement of pumping machinery. A technical and management options study leading to concrete implementable recommendations is required.
2.5
Training needs assessment and training plan for PHED
PHED intends to change into a corporate entity from the present department of state government it is. The Training Needs Assessment and training schedule developed will need to support and enable the institutional change being proposed.
1.0
FMC Faridabad
Revision of property title act and computerization of property title certification process
As has been achieved in some of the southern states, it has become necessary to revise the property title act and recommend modus operandi of implementation of computerized process for property title certification.
5.0
Rajasthan Solar power systems A close look at current technology levels in 5.0

TA 7114-IND National Capital Region Planning Board Project
Final Report
Sheladia Associates, Inc. USA 109
Volume 1 – Main Rep
ort
Sl. No.
Entity Consultancy Requirement
Brief TOR Indicative Cost
Power India and outside, feasibility, market, pricing and policy framework. The study by a consultant should come out with concrete step by step approach to increase solar power usage in the state.
B Regional level linkages which enhance infrastructure effectiveness HSRDCL
Haryana Expediting planning & implementation of Haryana’s East-West & North – South road corridors
Management & financial advise including source of funds, PPP, tools, people & system to achieve the objective including transaction advisory services
25.0
C Design & supervision monitoring of city level subprojects FMC
Faridabad Slum redevelopment
Support design of slum improvement programs as done in Mumbai and international best practices.
2.5
Use of recycled water; both domestic & industrial
Scoping, phasing, financing and pilot projects
4.0
Accounting reforms within FMC
Conversion to double entry , accounting handholding and implementation support
2.5
Water leakage audit & recovery plan
Leak & waste (NRW) technical audit, O & M and PPP proposals
5.0
DIMTS Delhi
TA for design / supervision / QA
Development of design / supervision / QA training modules and hands on training over a period of one year
80.0
UIT Alwar Review of the 2021 city development master plan being prepared by Town Planning Department on behalf of UITB
Urban planning consultant to review the development plan before finalization and recommend improvements, with special focus on how to integrate industrial development with city development
1.5
Construction of mini secretariat at Alwar
Design and quality assurance services for mini secretariat
10.0
105.5
2. The Process
247. Loan Processing: The present process of financing investments by NCRPB is demand driven. Typical process in NCR includes a request from the States for financing along with detailed project report (DPR) through the State Level NCR cells; appraisal of proposals by one of the NCRPB empanelled agencies and approval of projects by the Project Sanctioning and Monitoring Group (PSMG) I or II depending on the size of the project.
248. Disbursements are periodic and the first advance is made on signing of the loan
agreements and security documents, and subsequent disbursements are linked to

TA 7114-IND National Capital Region Planning Board Project
Final Report
Sheladia Associates, Inc. USA 110
Volume 1 – Main Rep
ort
progress as per DPR and on submission of ‘Utilization Certificate”. NCRPB monitors the progress of the projects by visiting respective sites before release of subsequent instalments and the process requires a completion certificate from the borrower.
249. Technical Assistance: Since inception of financing by NCR, there has been a
change in the processes and requirements. A major shift is in the need for a DPR with the loan application. This responsibility of preparation of DPR is with the borrowers and essentially agencies that have resources for preparation of DPR are in a better position to access the funds.
250. NCRPB on other hand supports development of strategic plans to an extent either
for in-house purposes or on request from State Level NCR Cells. Presently the sub regions are preparing the sub regional plan and other major TA’s of regional significance include the Transport Sector Plan, Water Resources Management Study, Counter Magnet Strategy and an in house assessment of drainage.
3. Overview of project development, procurement and management by NCR and Borrowers
251. The DPR’s prepared are structured to meet the requirements and initial
assessments reflect limited assessment of preparedness in terms of compliance and approvals with regard to environment, progress on land acquisition, and larger project management issues in terms of procurement packaging and/ or shifting of utilities. As per the present processes and mandate, NCRPB reviews the implementation schedule and procurement plans are not a requirement. The borrowers follow respective State procedures for invitation of Bids for goods, works and services. This is primarily due to the absence of a comprehensive lending policy that reflects the agencies requirements on these front as well as feed-back on quality of work through supervision or management reports.
252. NCRPB as such is a not a proactive project developer. The constraint being
limited manpower27 and resources, which is reflected in the spend on project development or support. It might also be related to the lack of follow up since 2003 to the RP with Sub regional plans – in effect NCRPB has no template except the relatively normative RP to pursue proactively. This approach of NCRPB might be a constraint for smaller borrowers or even agencies that could do better in terms of service delivery through technical assistance.
253. While delays are common in terms of use of subsequent tranches, NCRPB has
not attempted a comprehensive review of implementation delays. However, the key constrains are linked to Land Acquisition, environmental clearances, shifting of
27
The Joint Director (Planning) is responsible for technical appraisal and the base for his appraisal also includes the review report submitted by external consultants. As with social safeguards, It is the clients responsibility to comply with requirements and clearances are not mandatory for placing the project before the PMSG for approval.

TA 7114-IND National Capital Region Planning Board Project
Final Report
Sheladia Associates, Inc. USA 111
Volume 1 – Main Rep
ort
utilities and more importantly staff to monitor. While the Power Companies have streamlined processes for project design and implementation, other entities are constrained by clearances and more importantly basic safeguards and utility shifting. The issue is also in terms of delegation of powers but States such as Haryana have designated special officers for The NCR Region and agencies such as Haryana State Roads and Bridges Development Corporation use external services from concept to commissioning. Presently all safeguards and clearances are borrower’s responsibilities and lending conditionalities beyond DPR and its compliance is limited. The major issues in managing urban/ regional infrastructure investments are:
Development
i. Limited focus on converting plans into project with absence of sector plans in most
cases. ii. Limited investments in design and more importantly supervision, except in case of
autonomous corporations and ‘ iii. Dependence on available manpower in terms of management of works.
Safeguards
i. Land acquisition and resettlement, is dealt by parent department or the collection
and ii. Environmental and forest related are prioritized but not put on the critical path.
254. Overall there is a need to recognize the fact that planning and implementing
development projects is inherently complex and requires intensive efforts in coordinating people, properties, processes and institutions. While clients are trained and have capacities, there is a need to compliment their effort in the process by updation of skills relating to technology and adequate support in design and project management.
255. In this regard, the Technical Assistance (TA) window of NCRPB is to respond to the internal needs of NCRPB and the borrowers in terms of enhancing, planning, design, implementation and management capabilities. The facility is based on discussion of needs with NCRPB, and implementing agencies (IA’s) on their approach to project development and response to NCRPB’s requirements.
256. Being positioned as a regional planner and a financial intermediary, NCRPB
intends to function by strengthening its internal capacity on its core functions rather than operate as a multi-speciality PMU separate from the institution. Essentially :
i. As under present circumstances, NCRPB would outsource most of the functions or
manage with the help of consultants;

TA 7114-IND National Capital Region Planning Board Project
Final Report
Sheladia Associates, Inc. USA 112
Volume 1 – Main Rep
ort
ii. NCRPB will be the PMU and the borrowers will implement the project through normal implementation channels and
iii. Demand for consulting services will be need based and would require both NCRPB and the Borrowers to manage the process of consultants selection
257. This section broadly outlines the rational and processes and areas of support and
detailed terms of reference for activities. Staffing needs of NCRPB to manage the process and consulting services is presented in Chapter 3. It is also recommended that since the potential applications of the TA Loan (described more fully in Section 5 below) are more in the nature of grants rather than debt, the use of this facility be structured as a separate fund from the debt fund. This recommendation is based on at least two reasons: first, as NCRPB positions itself as a financing intermediary it would be useful to keep its accounts separate from grant making activities and second, separateness would enable the possibility of other development partners with similar interests (CDIA, CA, PPIAF, SNTA etc) to participate. In terms of the modifications required in the Rules framed under the Act, it is recommended for the advantages stated above that NCRPB examine the need for rule amendment.
I. Rationale
258. Review of NCRPBs mandate as per the Act, financing levels, technical support as a planner and its positioning in the context of the proposed loan indicates that of NCRPB’s best position will be that of a financier of relevance and planner of significance. The significance being of being a Planner of significance or a “Strategic Intermediary” will be in terms of being a proactive planner of relevance (See Matrix) across regional, sub regional local level and a financier of relevance in where NCRPB will be critical in terms of fostering growth and in advancing the regional development agenda. In other words, focus on implementation of the Regional Plan 2021 (RP 2021).
259. RP 2021 has defined an investment need of around Rs. 194000 Million. Excluding
power the demand is Rs. 420090 Million. While NCRPB has been financing
Actions Points In terms of processes, the action points in this regard include:
i. The Board will need to adopt a two stage process as part of PSMG actions- One of an initial screening enables defining the TA requirements and technical assessment based on a concept note
ii. Board delegate the Initial Screening Approval Powers to an Internal committee headed by the MS, CRP, FD and Technical specialists/ Experts;
iii. upfront empanelment of consultants for a variety of project development, supervision, monitoring and transaction advisory services;
iv. Design and approval of generic Scope of Work and v. Definition of thresholds for NCRPB and ADB

TA 7114-IND National Capital Region Planning Board Project
Final Report
Sheladia Associates, Inc. USA 113
Volume 1 – Main Rep
ort
investment over the years, NCRPB is in the process of repositioning itself. The basic vision of NCRPB is in terms of being a financier of relevance and planner of significance. The business plan and model developed for NCRPB reviewed three options and the recommended option (Option 2- See Chapter 3) is in terms of
i. Planner of relevance in Category I entities and Financier of relevance in Category
3 of entities (Table 4.7) ii. Move from Unlimited Liability, administered credit pricing and low leverage iii. Fills an Institutional Vacuum and provides niche market for NCRPB
Table 4.7 : Position of NCRPB in relation to Planning and Financing Objectives
Areas Planning Fianncing Planning Fianncing Planning Fianncing
Invetsment Program
1 Highway H L H L
2 Power Genration L L L L
3 Transmission and Distribution L L L L
4 Regional development- DMIC and other regional initiatives H L H L
5 Water Resource/ Conservation H L H H
6 Waste Water Management-Domestic L L H H
7 Waste Water Management-Industrial H L H H
8 Water Supply H L M H
9 Soild Waste Management H M M H
10 Other Municipal Services H M M H
11 Urban Transport H M M H
12 Information Technology M L H H H H
12 Policy/ Activities
a Regional Water Resources Conservation H H
b Regional Transport Policy/ Access/ Connectivity/ Barriers H H H
c Regional Waste Water Management H H
d Regional Municipal Solid Waste Management- Disposal H H H
e Regional Municipal Industrial Waste Management- Disposal H H H
f Pooled Financing H H H
g Regional development- DMIC and other regional initiatives H H H
h Sub regional/ City Master Plans and City Development Plans H H H
i Transaction Advisory for PPP H H H
j All Sub Project, Planning, Design, Supervision and Management H H H
Regional Sub Regional Local
260. Agencies Preparedness: NCRPB, in line with positioning itself as a financial and strategic intermediary:
261. has from the point of view of being a proactive planner, intends streamlining the
loan process to incorporate an initial screening process (See Fig 1) to support development of ideas and concepts to the next level of DPR and implementable packages. This would also involve supervision by NCR or agency for high value complex projects and monitoring during project and post project output/outcome assessment;
i. is in the process of creating a project development facility to support project development and implementation;
ii. is facilitating a seamless travel across the region through simplified travel permit requirements for commercial vehicles and
iii. promoting State specific regional investment programs in the areas of water supply and waste management

TA 7114-IND National Capital Region Planning Board Project
Final Report
Sheladia Associates, Inc. USA 114
Volume 1 – Main Rep
ort
iv. The States/ Implementing agencies have also embarked on policy decisions to:
v. seek NCRPB’s investment support for areas falling within NCRPB vi. integrate infrastructure across states, wherever it is of regional significance
and vii. seek technical assistance support for project and management improvements
262. While NCRPB will not be in a position to advance sector reform agenda through its
investment, NCRPB envisions use of TA and Loan to improve project and financial management systems in the medium term.
1. TA Loan Objectives
263. The objectives of the PDF/ TA Loan are to finance activities that would enable
NCRPB and the IA’s in better planning, design and management of infrastructure investment in the region and enhance management of service delivery Specifically the focus will be on the following but not limited to:
264. Support preparation of sector/ functional plans
i. Sub regional, Master/ Area and City Development Plans ii. Sector Master Plans for city/ region iii. Detailed Development Plans iv. City Development Plans
265. Support preparation of pre construction activities
v. Preparation of the Feasibility Studies (Initial/Detailed) vi. Preparation of Detailed Project Reports, vii. Preparation of bid documents and procurement packages viii. Support implementation of resettlement plans ix. Support shifting of utilities
266. Support project implementation
x. Supervision and management of investments, and xi. Monitoring of sub-projects.
267. Support post project completion reporting requirements
xii. Completion Reports xiii. Environment and Social Audits
268. Support institutional development, access to livelihood and advocacy on issues of
regional significance xiv. Measures to improve delivery of services / facilities through
management studies, -business process reengineering, regional

TA 7114-IND National Capital Region Planning Board Project
Final Report
Sheladia Associates, Inc. USA 115
Volume 1 – Main Rep
ort
approaches, IT applications etc., xv. Transaction costs relating to Market Access, PPP initiatives xvi. Training, Research and skill upgradation xvii. Poverty reduction through livelihood programs and xviii. Community based service delivery arrangements
269. Generic terms of reference for standard activities such as Design, management or
supervision is listed as part of Appendix 23 and an outline for other key areas.
2. The TA Process
270. Request: The process as described below will operate on two modes, either the
borrower or NCRPB could initiate the process and if the borrower is constrained, NCRPB could manage the process including reviews if required.
271. Responsibility: The overall responsibility of review and appraisal of demand will
be with the Joint Director –projects at NCR PB with support from a management consultant. The scope of the Management Consultant (funded by TA) will be to support the JD in review of TOR, budgets and appraisal of request and in defining specialist requirement given the nature of TA loan. For routine activities such as design, supervision or management, NCRPB will seek upfront clearance from ADB the TOR’s and list of empanelled agencies.
272. Based on request, decision making will be by the Project Appraisal Committee
(PAC) and need not necessarily be placed before the PSMG unless it has regional ramification. The PAC will consist of the Member Secretary, the Chief Regional Planner Director (Finance) and Technical experts based on project needs. The performance of the facility would be reviewed by the NCRPB Board with reference to standard parameters used for such funds –namely the percentage of grants converted into projects, development of newer financial instruments other than state guarantees etc sample metrics which are indicated in the Figure 4.1 below.
273. Eligible Entities: All public entities including NCRPB, involved in delivery or
management of service/ Development Management functions in NCR. The activities of the entity should be in line with the expected outcomes of the Regional Plan 2021 of fostering growth and improvement in quality of life.
274. Eligible Activities: Activities that would enable investments to meet the RP 2021
objective or measures to improve quality of life or access to livelihood by the poor will be eligible.
275. Procurement: It is proposed that NCR anchor review of procurement plans and
packages of borrowers. This would involve strengthening the staffing to include a procurement specialist to coordinate and review all procurement aspects under the project. The Specialist will function under the Joint Director Projects.

TA 7114-IND National Capital Region Planning Board Project
Final Report
Sheladia Associates, Inc. USA 116
Volume 1 – Main Rep
ort
Fig 4.1 NCRPB TA Process
276. Consultant Selection Process: Given the diverse nature of borrowers and possible specific nature of demands, NCRPB will shortlist agencies for activities and in case of complicated TA/ Sub projects empanelment will be carried out separately.
3. Size and Sustainability
277. The initial size of the TA loan is expected to be $ 13 million (probably in two
tranches) by way of an initial Loan/Grant from ADB/KfW and on annual basis a certain share of on-lending spreads will be transferred to the PDF so that it could sustain beyond the line of credit. This transfer would be decided by the NCRPB board based on the needs of the grant facility. An indicative list of activities and their share are presented earlier. These are based on discussions with NCRPB and the IA’s and TOR’s for select activities are listed in Appendix 23.

TA 7114-IND National Capital Region Planning Board Project
Final Report
Sheladia Associates, Inc. USA 117
Volume 1 – Main Rep
ort
V. SUB PROJECT SUMMARY
A. Sub Project Descriptions
1. Selection o f Investment Components
278. The objective of the following sections is to present the approach adopted for the identification and selection of sample projects. The selection is based on the criteria for financial assistance to borrowers (Appendix 29). It includes technical choices, in the selection of standards and alternative technology options and more importantly - it covers policy choices on the type and level of services and the management of such services.
279. The central strategic development objective of infrastructure projects is to provide
adequate environmental and institutional conditions that will permit and encourage sustainable economic growth and targeted development in the region. Based on the current conditions, these guiding principles have led to the identification of a set of project components. The cost implications of these designs have been reviewed against what the government (finances) and households can afford, according to a range of financing options. In some cases, this assessment may indicate a need to scale down investments, or consider other financing options. In parallel with the investment program, corresponding Institutional development and capacity building activities have been be defined, some of which could start in the pre-investment period before project implementation commences.
280. Table 5.2 presents an overview of the sub projects and the compliance with regard to basic requirements such as Master Plan/ Sector Master Plan and their relevance in advancing the objectives of the Regional Plan and Fig 1 presents the location of the Sub-projects in the NCR. The sub projects were also subjected to possible PSP options. In all, the pipeline consists of 14 sub projects and a possible immediate of about 5 sub projects. The detailed description of first tranche sub project is presented in Volume 4.
281. The overall immediate pipeline and TA requirements is placed at for NCR is
estimated $ 315 million and the MFF for the Project is $ 150 Million. While the overall pipeline as well as MFF pipeline are well prepared with certain covenants attached, this pipeline would offer flexibility to NCRPB in terms of financing projects better prepared. Summary costs for the MFF based on priority projects are listed below in Table 5.1.
2. Component Selection Criteria
282. Being a loan similar to a Financial Intermediary (FI), the projects are demand
driven, though with the TA under the project NCRPB will be in a position to balance sector and regional focus. While the investments are linked to basic levels of services or goals as set by the Sector/ City Master Plans, the size is linked to

TA 7114-IND National Capital Region Planning Board Project
Final Report
Sheladia Associates, Inc. USA 118
Volume 1 – Main Rep
ort
their ability to service debts and meet O&M costs. Overall, project component selection is influenced by need, affordability and implementation capacity, rather than total loan size.
283. In the interest of integrated development, another criterion considered in project
component selection has been to ensure inter-sector linkages and optimization. For instance, water supply, sanitation and sewerage have been seen as a composite sector and not in isolation from each other.
3. Financial Criteria
284. The sample projects for the purpose of financial analysis have been categorized
as Service, Cost Recovery and Remunerative. The pipeline consists of: service and cost recovery projects. As a policy NCRPB will not finance remunerative projects as part of the Loan.
285. The financial analysis of sample subprojects follows a slightly different approach. This is primarily driven by the fact that user charges are not very widespread in the states and the property tax system is very basic. Consequently, there will be resistance for a sharp hike in user charges/property taxes. Delivery of public utilities is primarily run on government subsidies. Though select entities are moving towards full recovery of O&M costs due to support from National Programs. Therefore subprojects need to be financially viable against a benchmark cost of capital. There exists no comparative rate/ tenor combination as offered by ADB, and the closest market rate for medium tenor funds (10-15 years) is around 10%. With the current rate of inflation in the region of 5%, a benchmark FIRR of 4%-5 is the figure the projects should aim for. All service projects have been assessed as part of the State/ Municipal balance sheets and cost recovery through project based cash flows and proposals form State department based on a State fiscal assessment.
4. Economic Criteria
286. Economic Analysis has been carried out at two levels. A sector economic analysis
based on the State’s development agenda (Chapter 2) and, the relevance of the sector and the policy changes required. The second level analysis is in terms of sub project level economic analysis as described below:
5. Economic Analysis of the Sector and Subprojects
287. Introduction and Scope: The primary objective of the project is to promote
economic growth in the States through focused interventions in the primary cities and strengthen capacities of the urban sector to manage growth. The fact that urban areas in India are net contributors to GDP is a fact to support this approach. Contribution of urban centres to the GDP is of the order of 50% to 60%, well above the level of urbanization of 28% of the population and the estimated per capita

TA 7114-IND National Capital Region Planning Board Project
Final Report
Sheladia Associates, Inc. USA 119
Volume 1 – Main Rep
ort
productivity ratio between urban and rural populations in India is 7:2. The other economic rationale of the Project is to improve access to basic urban services and environmental and living conditions at acceptable levels, not only for social development but also to enable access to economic opportunities (i.e. income and employment), particularly by the poor.
288. While there are no specific urban level indicators of income, the expanding service
industry and construction sector is a reflector of the urban centric growth in the States and the emergence of urban service sector is reflects the growth trends.
289. The analytical framework for determining whether resources are being used in an
efficient and sustainable manner is based on the following Asian Development Bank’s (ADB) publications: Guidelines for the Economic Analysis of Projects (1997), Handbook for the Economic Analysis of Water Supply Projects - Guidelines, Handbooks, and Manuals (1999) and Framework for the Economic and Financial Appraisal of Urban Development Sector Projects (1994). The present project is being prepared as a FI Loan on a MFF format
290. The main objective of subproject evaluation is to determine various aspects of
economic feasibility including an analysis of rational use of resources and the expected benefits. In principle, following aspects of the proposed subprojects have been considered:
(i) Consistency of the subprojects with the Regional Plan 2021, state sector policies and priorities and within the overall infrastructure development plan for the entity;
(ii) Consistency with the overall broad strategies of the Bank (ADB) in environmental protection and social protection in urban development sectors;
(iii) Review of proposed investments, life-cycle cost, phasing, implementation schedules and determination of economic costs;
(iv) Analysis of potential economic benefits; and (v) Overall economic cost-benefit analysis.
291. The economic analysis was based on information from the Socio-Economic
Household Baseline Surveys undertaken as part of the study, on the engineering, environmental, social, financial and other investigations and on economic evaluation parameter values relevant to the Project location gathered from secondary sources and informal discussions. Data were obtained in the following areas:
(i) Capital costs of improvement; (ii) Annual operating and maintenance (O&M) costs of the improved infrastructure; (iii) Forecasts of demand for/usage of infrastructure services; and (iv) Supply characteristics of infrastructure networks and services delivery.

TA 7114-IND National Capital Region Planning Board Project
Final Report
Sheladia Associates, Inc. USA 120
Volume 1 – Main Rep
ort
6. Overall Project Costs
Cost Estimates and Financing Plan
292. The overall investment outlay for the Plan (2021) is Rs 1937 billion and the major
investment needs and the functional plans for water resources sector and urban transport are of the order of at Rs. 8 billion and Rs 1750 billion respectively. Based on the city development plans, ongoing ADTA’s of ADB, City Master Plans and functional plans, the investment pipeline for NCR is worth $ 680 Million. The projects are at various stages of readiness and the pipeline for this project is of the order of Rs 15 billion ($315 Million) including taxes and contingencies. This includes a TA facility to be financed as part of the project (Appendix 22).
293. The total cost of the investment project is estimated at $214 million, inclusive taxes, duties, and interest and other charges on the loan during construction. Indicative cost estimates for the Project are shown in Table 5.1. below. Two options have been worked out one for a loan size of $150 million but overall project costs of $214 Million and $ 315 million. The purpose is linked to the possible ADB loan and or co financing. In case of Option II, it is assumed that other forms of financing by NCR may include KfW Line. :

TA 7114-IND National Capital Region Planning Board Project
Final Report
Sheladia Associates, Inc. USA 121
Volume 1 – Main Rep
ort
Table 5.1: Option I Project Cost Estimates and Financing Plan (Rupees Million) (US$ Million)
ADB NCRPB Total ADB NCRPB Total Local
(Excl. Duties &
Amount Amount Amount Amount Amount Amount % Taxes) Taxes
A. Sanitation
1. Environmental Sanitation - Sewerage
a. Sewerage and Sanitation
Pataudi - Sewerage and Sanitation 108.0 17.4 125.4 2.3 0.4 2.7 1.2 2.3 0.3
SADA Gwalior - Sewerage and Sanitation 190.7 27.2 218.0 4.1 0.6 4.6 2.2 4.1 0.6
Subtotal Sewerage and Sanitation 298.7 44.7 343.4 6.4 1.0 7.3 3.4 6.4 0.9
2. Environmental Sanitation - Solid Waste
Ghaziabad - Solid Waste Management 522.3 162.9 685.2 11.1 3.5 14.6 6.8 12.8 1.7
3. Environmental Sanitation - Drainage
Hapur Drainage 140.5 20.1 160.5 3.0 0.4 3.4 1.6 3.0 0.4
Sonepat Drainage 192.7 27.5 220.2 4.1 0.6 4.7 2.2 4.1 0.6
Subtotal Environmental Sanitation - Drainage 333.1 47.6 380.7 7.1 1.0 8.1 3.8 7.1 1.0
Subtotal Sanitation 1,154.1 255.1 1,409.3 24.6 5.4 30.0 14.0 26.4 3.6
B. Water Supply
1. Water Supply
Pataudi - Water Supply 721.5 119.8 841.2 15.4 2.5 17.9 8.4 15.8 2.1
Panipat - Water Supply 1,520.0 285.9 1,805.9 32.3 6.1 38.4 18.0 33.8 4.6
Subtotal Water Supply 2,241.5 405.7 2,647.1 47.7 8.6 56.3 26.4 49.6 6.8
C. Transport
1. Transport
a. Urban Transportation
Multi Modal Transit Centre - Anand Vihar 1,613.5 350.3 1,963.7 34.3 7.5 41.8 19.5 36.8 5.0
b. Regional Transportation
Badli Byepass - 5.70 Km 347.0 216.8 563.8 7.4 4.6 12.0 5.6 11.0 1.0
Development of Roads 1,284.3 183.5 1,467.7 27.3 3.9 31.2 14.6 27.5 3.7
Subtotal Regional Transportation 1,631.3 400.2 2,031.5 34.7 8.5 43.2 20.2 38.5 4.8
Subtotal Transport 3,244.7 750.5 3,995.2 69.0 16.0 85.0 39.8 75.2 9.8
E. Project Implementation Technical Assistance
1. Technical Assistance
a. Design of Projects
Design Support 68.5 23.6 92.1 1.5 0.5 2.0 0.9 1.7 0.2

TA 7114-IND National Capital Region Planning Board Project
Final Report
Sheladia Associates, Inc. USA 122
Volume 1 – Main Rep
ort
(Rupees Million) (US$ Million)
ADB NCRPB Total ADB NCRPB Total Local
(Excl. Duties &
Amount Amount Amount Amount Amount Amount % Taxes) Taxes
b. Construction Supervision
Supervision of Projects 114.1 38.2 152.3 2.4 0.8 3.2 1.5 2.9 0.4
c. Appraisal of Projects
Project Appraisal 12.3 3.1 15.3 0.3 0.1 0.3 0.2 0.3 0.0
d. Information Technology Applications
IT Applications 20.7 6.8 27.5 0.4 0.1 0.6 0.3 0.5 0.1
e. GIS and MIS
GIS and MIS in IAs 27.6 12.7 40.4 0.6 0.3 0.9 0.4 0.8 0.1
f. Other Technical Assistance Requests
Other TA requests 38.3 9.6 47.9 0.8 0.2 1.0 0.5 0.9 0.1
h. Monitoring and Evaluation
Monitoring and Evaluation of Projects 24.5 6.1 30.7 0.5 0.1 0.7 0.3 0.6 0.1
i. Transaction Advisory - Others
Transaction Advisory - Others 65.3 16.3 81.6 1.4 0.3 1.7 0.8 1.5 0.2
j. Training and Capacity Building
Capacity Building and Training 21.8 5.4 27.2 0.5 0.1 0.6 0.3 0.5 0.1
Subtotal Technical Assistance 393.0 121.9 514.9 8.4 2.6 11.0 5.1 9.6 1.3
2. Resettlement Package and Land
Rehabilitation and Resettlement Package - 10.6 10.6 - 0.2 0.2 0.1 0.2 0.0
Land Acquisition - 738.6 738.6 - 15.7 15.7 7.4 15.7 -
Subtotal Resettlement Package and Land - 749.2 749.2 - 15.9 15.9 7.5 15.9 0.0
Subtotal Project Implementation Technical Assistance 393.0 871.1 1,264.1 8.4 18.5 26.9 12.6 25.6 1.3
Total PROJECT COSTS 7,033.3 2,282.4 9,315.7 149.6 48.6 198.2 92.7 176.7 21.5
Interest During Implementation - 716.3 716.3 - 15.2 15.2 7.1 - -
Commitment Charges - 13.9 13.9 - 0.3 0.3 0.1 - -
Total Disbursement 7,033.3 3,012.6 10,045.9 149.6 64.1 213.7 100.0 176.7 21.5 a In 2009 prices b Physical contingency computed at 10% for civil works, equipment and materials, price contingency computed based on ADB projected local currency inflation rates and foreign exchange inflation rates. c Include interest and commitment charges.

TA 7114-IND National Capital Region Planning Board Project
Final Report
Sheladia Associates, Inc. USA 123
Volume 1 – Main Rep
ort
Table 5.1: Option II Project Cost Estimates and Financing Plan
Million US$
Total ADB ADB NCRPB /
IAs NCRPB /
IAs Category
Cost Loan % %
I. Base Costs
A. Sanitation 18.4 10.5 57.1 7.9 43.0
1. Sewerage and Sanitation 1.9 1.1 57.1 0.8 43.0
2. Solid Waste 10.6 6.0 57.1 4.6 43.0
3. Drainage 5.9 3.4 57.1 2.5 43.0
B. Water Supply 41.5 23.7 57.1 17.8 43.0
1. Water Supply 41.5 23.7 57.1 17.8 43.0
Subtotal (B)
C. Transport 137.8 78.6 57.1 59.2 43.0
1. Urban Transport 80.0 45.7 57.1 34.4 43.0
2. Regional Transport 57.8 33.0 57.1 24.8 43.0
D. Project Implementation Technical Assistance
1. Technical Assistance
a. Design 1.8 1.4 75.6 0.5 24.4
b. Supervision 3.0 2.2 75.6 0.7 24.4
c. Appraisal 0.3 0.2 75.6 0.1 24.4
d. IT Applications 0.5 0.4 75.6 0.1 24.4
e. GIS & MIS 0.7 0.5 75.6 0.2 24.4
f. Other Technical Assistance Requests 0.8 0.6 75.6 0.2 24.4
g. Support to DIMTS 3.7 2.8 75.6 0.9 24.4
h. Monitoring and Evaluation 0.5 0.4 75.6 0.1 24.4
i. Transaction Advisory - others 1.4 1.1 75.6 0.3 24.4
j. Training and Capacity Building 0.5 0.4 75.6 0.1 24.4
Sub - Total 1 Technical Assistance 13.2 10.0 3.2
2. Land and Rehabilitation and Resettlement Package
a. Rehabilitation and Resettlement 0.3 0.0 0.0 0.3 100.0
b. Land 14.3 0.0 0.0 14.3 100.0
Sub - Total 2 Land and R&R package 14.6 0.0 14.6
Total Base Costs 225.5 122.8 54.4 102.7 45.56
E. Taxes and Duties 28.8 0.0 0 28.8 100.0
Subtotal 254.3 122.8 131.5
2. Contingencies
Physical 22.5 12.8 57.1 9.7 43.0
Price 25.2 14.4 57.1 10.8 43.0
3. Financing Charges During Implementation 13.8 0.0 13.8 100.0
Total Project Cost 315.8 150.0 47.5% 165.8 52.5%

TA 7114-IND National Capital Region Planning Board Project
Final Report
Sheladia Associates, Inc. USA 124
Volume 1 – Main Rep
ort

TA 7114-IND National Capital Region Planning Board Project Final Report
Sheladia Associates, Inc. USA 125
Volume 1 – Main Rep
ort
Table 5.2 Potential Subprojects to be Considered Under Proposed Project S.N
State Sub Sector
Town/ Project
Link with Regional Plan
Status of DPR
Schedule of DPR
Safeguards Category
Land Status
Possibility of Private Sector Participation
Environment
Social
1 U.P. Sewerage
Hapur - Sewerage and Sanitation
DPR confirms to: (i)Hapur-Philkua Development Plan - 2011; and (ii) Sewerage Master Plan of Hapur (prepared under the TA)
Draft DPR Submitted in September 2009
Final DPR Dec-2009
E2 S2 Acquisition to be completed
Possibility of PPP in financing and construction on a BOOT basis is not very positive. However, once constructed, the project can be awarded to a private contractor for O&M ( Initially, even the construction contractor of the WTP and also the sewerage treatment plant could be required to maintain the facility for an initial 5 years)
2 Haryana
Sewerage
Pataudi - Sewerage and Sanitation
Draft DPR Submitted in September 2009
E2 S2 Acquisition Notified
Possibility of PPP in financing and construction on a BOOT basis is not very positive. However, once constructed, the project can be awarded to a private contractor for O&M ( Initially, even the construction contractor of the WTP and also the sewerage treatment plant could be required to maintain the facility for an initial 5 years)
3 M.P. Sewerage
SADA Gwalior - Sewerage and Sanitation
As per SADA Master Plan
DPR Submitted to NCR
E2 S2 Acquired Possibility of PPP in financing and construction on a BOOT basis is not very positive. However, once constructed, the project can be awarded to a private contractor for O&M ( Initially, even the construction contractor of the WTP and also the sewerage treatment plant could be required to maintain the facility for an initial 5 year

TA 7114-IND National Capital Region Planning Board Project Final Report
Sheladia Associates, Inc. USA 126
Volume 1 – Main Rep
ort
S.N
State Sub Sector
Town/ Project
Link with Regional Plan
Status of DPR
Schedule of DPR
Safeguards Category
Land Status
Possibility of Private Sector Participation
4 U.P. Solid Waste
Ghaziabad - Solid Waste Management
DPR confirms to: (i) Ghaziabad Development Plan-2011; and (ii) SWM Master Plan for Ghaziabad (prepared under the TA)
Draft DPR Submitted in September 2009 (landfill & compost designs however are not site specific as no site is available; guideline designs and GADs are developed in DPR)
Final DPR Dec-2009
(E2) - considering that the site will be identified based CPHEEO guidelines
(S3) - To be notified
The possibility of PPP based land fill is possible but will need a tipping fee to be paid the Urban Local Body. Small scale composting is possible but the market demand issue would remain as one of the outlet for Delhi's compost is in Western UP.
5 UP Drainage
Hapur Drainage
DPR confirms to: (i)Hapur-Philkua Development Plan - 2011; and (ii) Drainage Master Plan of Hapur (prepared under the TA)
Draft DPR Submitted in September 2009
Final DPR Dec-2009
E2 S2 To be notified
Extended O&M contracts is possible.
6 Haryana
Drainage
Sonepat Drainage
Draft DPR to be submitted in December 2009
Final DPR Dec-2009
E2 S2 To be initiated
Extended O&M contracts is possible.
7 Haryana
Water Supply
Pataudi - Water Supply
Draft DPR to be submitted in December 2009
E2 S2 To be notified
Possibility of PPP in financing and construction on a BOOT basis is not very positive. However, once constructed, the project can be awarded to a private contractor for O&M (

TA 7114-IND National Capital Region Planning Board Project Final Report
Sheladia Associates, Inc. USA 127
Volume 1 – Main Rep
ort
S.N
State Sub Sector
Town/ Project
Link with Regional Plan
Status of DPR
Schedule of DPR
Safeguards Category
Land Status
Possibility of Private Sector Participation
Initially, even the construction contractor of the WTP and also the sewerage treatment plant could be required to maintain the facility for an initial 5 years)
8 Haryana
Water Supply
Panipat - Water Supply
DPR confirms to: (i) Panipat Development Plan - 2011; and (ii) Water Supply Master Plan of Panipat (prepared under the TA)
Draft DPR to be submitted in November 2009
Final DPR Dec-2009
E2 S2 To be notified
Possibility of PPP in financing and construction on a BOOT basis is not very positive. However, once constructed, the project can be awarded to a private contractor for O&M ( Initially, even the construction contractor of the WTP and also the sewerage treatment plant could be required to maintain the facility for an initial 5 years)
9 Delhi Urban transport
Multi Modal Transit Centre - Sarai Kale Khan
Part of Delhi's Master Plan and Transport Priority
DPR Submitted to NCRPB
E2 S2 Land in procession
DIMTS is A Joint Venture between IDFC and Delhi Government. The MoU's are sub project specific. The Hotel segment is already proposed as a private project. With the MMTC segment relying heavily on commercial rental, there may not be much interest for PPP. O&M has been awarded to DIMMTS, and the performance benchmarks are under preparation
10 Delhi Urban transport
Multi Modal Transit Centre - Anand Vihar
Part of Delhi's Master Plan and Transport Priority
DPR Submitted to NCRPB
E2 S2 Land in pocession
DIMTS is A Joint Venture between IDFC and Delhi Government. The MoU's are sub project specific. The Hotel segment is already proposed as a private project. With the MMTC segment relying heavily on commercial rental, there may not

TA 7114-IND National Capital Region Planning Board Project Final Report
Sheladia Associates, Inc. USA 128
Volume 1 – Main Rep
ort
S.N
State Sub Sector
Town/ Project
Link with Regional Plan
Status of DPR
Schedule of DPR
Safeguards Category
Land Status
Possibility of Private Sector Participation
be much interest for PPP. O&M has been awarded to DIMMTS, and the performance benchmarks are under preparation
11 U.P. Urban transport
Traffic Ghaziabad
Activities proposed linked to City Master Plan
Draft DPR to be submitted in November/December 2009
Final DPR Dec-2009
E2 S2 To be notified
Possibility of Parking can be examined in PPP / Management contract format.
12 Haryana
Regional transport
Development of State Highways- Sonepat District
Part of State's policy to improve access to villages major markets
DPR Submitted to NCRPB
E2 S2 No Land Acquisition
Construction could be on a Annuity mode but as with other service projects, extended O&M contracts is possible.
13 Haryana
Regional transport
Badli Byepass - 5.70 Km
Part of State's policy to improve access to villages major markets
DPR Submitted to NCRPB
E2 S2 Acquisition Notification Issued
Being a short stretch BOT will not be viable but extended O&M could be an option
14 Haryana
Regional transport
Development of Roads- Jhajjar District
Part of State's policy to improve access to villages major markets
DPR Submitted to NCRPB
E2 S2 No Land Acquisition
Construction could be on a Annuity mode but as with other service projects, extended O&M contracts is possible.
BOOT = build own operate and transfer, BOT = build-operate-transfer, CPHEEO = Central Public Health and Environmental Engineering Organization, DIMTS = Delhi Integrated Multimodal Transport , DPR = detailed project report, GAD = gender and development, IDFC = Infrastructure Development Financing Company , MMTC = Mineral and Metal Trading Company, NCRPB = National Capital Region Planning Board, O&M = operation and maintenance, PPP = public-private partnership, SADA = Special Area Development Authority, SWM = solid waste management, TA = technical assistance, UP = Uttar Pradesh, WTP = water treatment plant Source: NCRPB

TA 7114-IND National Capital Region Planning Board Project
Final Report
Sheladia Associates, Inc. USA 129
Volume 1 – Main Rep
ort
B. PATAUDI WATER SUPPLY PROJECT
1. Project Background
294. Pataudi is a small Tehsil town in the Gurgaon District with current (2009) estimated population of around 22,000 (16,085 as per Census 2001). It is located on the Gurgaon – Rewari road at a distance of 25 km from Gurgaon and about 58 km from Delhi. Because of its proximity to the rapidly growing city of Gurgaon, being a part of the NCR, having good connectivity with other towns in the region, and expected growth on account of the upcoming special economic zone (SEZ), it assumes significance as an affordable option for absorbing future urban growth. In recognition of this potential of the town, the Government of Haryana has identified Pataudi for strengthening of, among others, water supply and wastewater management infrastructure and thereby to offer improved quality of life to the existing and prospective residents.
295. Besides the entire population of Pataudi, the project envisage coverage of another
adjoining town of Haily Mandi and seven villages which fall en route the rising main. The total population for which the system has been designed is 1,12,380 which corresponds to year 2040 and a design period of 30 years. The system has been designed considering service levels of 135 litres/capita/day (lpcd) for the urban population and 70 lpcd for the rural population.
296. The present water supply systems for the towns of Pataudi and Hailey Mandi are
entirely based on groundwater, which in recent years have been experiencing declining yields and deteriorating water quality. As per the available records of pumping stations, the average service level in Pataudi is determined to be 59 lpcd, which is as low as 43% of the prescribed level of 135 lpcd as per the Regional Plan-2021.
297. In this context, the sub-project has been proposed by the PWD – PHED, GoH with
the objectives to:
(a) Improve infrastructural facilities and help create durable assets and quality oriented services in the identified towns.
(b) Provide potable water supply at the prescribed service level. (c) Reduce or eliminate dependence on groundwater, and (d) Introduce an effective water supply management system at the level of small
towns.
298. The new system will draw raw water from the Gurgaon Canal which is part of the Western Yamuna Canal System and carries copious flows round the year. The system is designed for gross demand of 16.3 mld at the distribution end corresponding to the intermediate year of 2025 while the intake works and transmission system are designed for the gross demand of 19.3 mld

TA 7114-IND National Capital Region Planning Board Project
Final Report
Sheladia Associates, Inc. USA 130
Volume 1 – Main Rep
ort
corresponding to the ultimate design year of 2040 respectively. The total project cost is estimated to be Rs. 740.6 Million(04/2009).
Population growth pattern and projections
299. Over the last four census decades the two towns of Pataudi and Hailey Mandi
have grown from average size villages to small towns with 2001 population of 16,085 and 17,081 respectively. The census data over this period reveals average compounded annual growth rates (CAGR) of 3.7% and 6.6% respectively. While the growth of Pataudi has been uniform, it is noted that Hailey Mandi recorded unprecedented growth at a CAGR of over 16% during the 1971-81 decade, which subsequently declined to modest levels of around 2.7%.
300. Population projections have been made as per the ‘declining growth rate’ method
evolved by the PWD-PHED which has considered an initial CAGR of 4% for the 9 year period of 2001-2010, followed by 2.7% and 1.2% for the subsequent two phases of 15 years each. The method assumes that the small towns can not continue to grow at historically determined rates along geometrical progression but will follow declining growth rates. Accordingly the populations estimates for the intermediate and ultimate design years have been made.
Table 5.3 Population Growth Pattern And Projections Pataudi Hailey Mandi Remarks Year Population CAGR Population CAGR 1961 3,788 1,340 1971 6,045 4.8 2,252 5.3 1981 8,422 3.4 10,140 16.2 Unprecedented growth
recorded at Hailey Mandi 1991 11,278 3.0 13,263 2.7 2001 16,085 3.6 17,081 2.6 3.7% and 6.6% of
preceding 4 decades 2010 22,894 4.0 24,312 4.0 CAGR assumed @ 4% 2011 23,521 2.7 24,978 2.7 2021 30,822 2.7 32,730 2.7 2025 34,341 2.7 36,467 2.7 50% increase over 2010 2031 36,939 1.2 39,226 1.2 2040 41,209 1.2 43,761 1.2 80% increase over 2010
301. In the case of the seven villages which are proposed to be included in the sub-
project and which had a combined population of around 14,600 in census year 2001, the departmental approach adopts lower CAGRs of 2.5% for the first nine year period of 2001-2010, followed by 1.76% and 0.96% respectively for the subsequent two phases of 15 years each. As per this, the rural population is projected to go up to 23,755 by 2025 and to 27,400 by 2040. The combined final projections for both the urban and rural areas as per the departmental approach are presented in Table 1.1. The latter set of data is considered for the design of

TA 7114-IND National Capital Region Planning Board Project
Final Report
Sheladia Associates, Inc. USA 131
Volume 1 – Main Rep
ort
the sub-project, according to which the intermediate stage population is around 94,500 and the ultimate stage population is 1,12,400 respectively.
Table 5.4: Population Projections For The Rural Areas
Village Census year 2001
Base year 2010
Intermediate stage 2025
Ultimate stage 2040
Remarks
Jund Sarai 1,570 1,961 2,549 2,942 Babra Bakipur 1,445 1,805 2,347 2,708 Johri 2,405 3,004 3,905 4,506 Jamalpur 2,989 3,733 4,853 5,600 Janaula 2,477 3,093 4,021 4,640 Sampka 1,459 1,822 2,369 2,733 Rampur 2,286 2,855 3,712 4,283
CAGRs ‘01-‘10 : 2.5%; ‘10-‘25 : 1.76%; ‘25-’40 : 0.96%
Total 14,631 18,273 23,755 27,410
Sources and production
302. Currently both the urban areas and all of the rural habitations are dependent on ground water as the source of supply. In the case of Pataudi the system comprises 13 odd tube wells with combined yield of about 1.9 million litres per day (mld) considering 16 hours of pumping. In the case of Hailey Mandi the number of tube wells is 14 and the combined production is around 2 mld.
303. From the point of view of water quality, it is found that both in Pataudi and Hailey
Mandi this is an area of increasing concern. Pataudi is experiencing increasing levels of dissolved solids. On the other hand, in several wells in Hailey Mandi, besides salinity, the hardness and fluoride levels are found to be almost at the rejection limits. However, groundwater is supplied without any treatment.
304. It is worth mentioning at this point that the Central Ground Water Board (CGWB)
has declared Pataudi and the surrounding area as highly water scarce zone. In view of this deteriorating ground water quality, there is a need for developing alternate surface water based supply system for these towns.
Demand supply situation
305. Corresponding to the estimated population of 2010 and a service level of 135 lpcd,
the gross net water demand (including 15% UAW, 20% floating population and fire demand) for the urban areas of Pataudi and Hailey Mandi are 4.75 mld and 5 mld respectively. With respective to these, the corresponding production values are only 40% indicating a grossly under-served community. The average net service level is determined to be around 58 lpcd which is around 44% of the prescribed level of 135 lpcd as per the CPHEEO Manual and Regional Plan 2021

TA 7114-IND National Capital Region Planning Board Project
Final Report
Sheladia Associates, Inc. USA 132
Volume 1 – Main Rep
ort
Distribution system
306. There is one booster station at Motidungri which has one underground service
reservoir of 1 million litres and an elevated service reservoir of 0.36 million litres capacity. However, the former is not in operation.The distribution system in Pataudi comprises CI, AC and GI pipes of 80 – 300 mm diameter aggregating about 15 km in length. The pipes are more than 30 years old and as a result the distribution system is characterised by high leakages and high head losses, leading to low head at the point of supply. The leakages are estimated to be of the order of 30% of gross supply. The coverage through house connections said to be around 80% while the rest of the population comprising unauthorised settlements is dependent on either stand posts or private sources. The water is supplied for 3 hours in the morning and 3 hours in the evening every day.
Expenditure
Table 5.5.Expenditure On Water Supply In The Sub-Project Towns Particulars Pataudi - Rs.Mill Hailey Mandi Rs. Mill 2006-07 2007-08 2008-09 2006-07 2007-08 2008-09 Establishment costs 2.2 2.5 2.7 2.4 2.7 3.0 Electricity 3.1 3.4 1.3 2.1 2.4 1.4 Consumables 0.23 0.26 0.4 0.2 0.30 0.35 Mechanical and electrical repairs
0.41 0.51 0.6 0.4 0.5 .05
Total 5.94 6.67 5.0 5.1 5.9 4.8
307. It is noted that the expenditure on electricity as shown above for both the towns is corresponding to the actual payment made to the utility. However, the actual electricity cost of operation is estimated be in the range of Rs. 0.4 and Rs. 0.3 million respectively. This inconsistency arises due to the practice of cash accounting followed by the PWD-PHED. In view of this, the annual cost of operation in Pataudi and Hailey Mandi for 2008-09 is estimated to be in the range of Rs. 0.73 and Rs. 0.66 Millions respectively.
Revenue
308. The tariff for domestic connections is charged at flat rate of Rs. 25/month, for
commercial connections at a rate of Rs. 2/kilo litres and for industrial connections at a rate of Rs. 2.5/kilo litres.
309. The level of billing and collection is reported to be satisfactory. However, the
annual revenue from water supply in both the towns is found to be under of Rs. 0.7 million. The actual collection over the four year period of 2005-06 to 2008-09 is presented below.

TA 7114-IND National Capital Region Planning Board Project
Final Report
Sheladia Associates, Inc. USA 133
Volume 1 – Main Rep
ort
Table 5.6 Revenue Collection In The Sub-Project Towns Pataudi Hailey Mandi
Financial year
No. of connections
Revenue collected, Rs. Million
No. of connections
Revenue collected, Rs. Million
2005-06 1,773 0.7 NA NA 2006-07 1,807 0.6 2,080 0.6 2007-08 1,849 0.7 2,208 0.8 2008-09 1,917 0.5 2,241 0.6
310. The revenue is found to be only around an average of 10% of the expenditure. The deficit is normally provided by the GoH under non-plan fund.
Institutional arrangements
311. The entire responsibility of raw water abstraction/production and managing the
distribution system is vested with the PWD – PHED. The department is also responsible for billing and revenue collection.
312. Water supply works are developed and managed/operated under the overall
supervision of the Executive Engineer, Sohana Division. A Sub-Divisional Engineer, Pataudi is responsible for the day to day activities at both Pataudi and Hailey Mandi. The latter is assisted by 3 Junior Engineers who manage various operations and logistics aspects for both the towns. Currently the team of engineers at Pataudi office is exclusively responsible for managing water supply operations, however in due course of time it will also be given the responsibility of implementation and managing operations of sewerage network and sewage treatment plant when work on another sub-project is commenced. In that regard, depending on the work load, if need be, additional posts for Junior Engineers would be created.
`

TA 7114-IND National Capital Region Planning Board Project
Final Report
Sheladia Associates, Inc. USA 134
Volume 1 – Main Rep
ort
Layout plan 2. Sub-Project Description
Introduction
313. Based on the discussions with the PWD-PHED, Gurgaon, the coverage under the sub-project ‘Augmentation of Water Supply for Pataudi Town’ under the ADB funding was agreed upon. This section presents the feasibility analysis and prioritises the components for inclusion based on economic and financial analysis and integration of social and environmental safeguards.
Coverage
314. The sub-project will cover the entire population of Pataudi, Hailey Mandi towns
and seven adjoining village. Total population to be served in the ultimate stage of the project is of the order of 112,000.
Basis of process design
315. The sub-project takes 2010 as the base year and adopts a design period of 30 years which corresponds to 2040. Two phases of 15 years each are envisaged for development of the infrastructure corresponding to the demand forecast for 2025 and 2040 respectively.
316. A schematic of the overall project is presented in Figure 5.2

TA 7114-IND National Capital Region Planning Board Project
Final Report
Sheladia Associates, Inc. USA 135
Volume 1 – Main Rep
ort
Fig 5.2 Schematic Of The Proposed Water Supply Scheme
317. Selected critical components e.g., intake works, rising mains, clariflocculator, etc. are designed corresponding to the ultimate design period while the rest of the components, e.g., pumping machinery, storage ponds, service reservoirs, etc. which can be implemented in a modular approach have been designed for the intermediate stage of 2025.
Water demand
318. The water supply service levels for the urban and rural populations have been
considered at 135 and 70 lpcd respectively. Total production demand for urban areas has been calculated considering 20% floating population, fire fighting requirements and 15% unaccounted for water (UFW). For the rural areas separate provision for only the UFW at 15% is made. The combined production demand estimates corresponding to various stages of the sub-project are presented in the table below.

TA 7114-IND National Capital Region Planning Board Project
Final Report
Sheladia Associates, Inc. USA 136
Volume 1 – Main Rep
ort
Table 5.7 Estimates Of Water Demand At Production Stage Demand (million litres/day) Present
2010 Intermediate 2025
Ultimate 2040
Remarks
Urban Pataudi 4.74 6.98 8.32 Hailey Mandi 5.02 7.40 8.32 Sub-total 9.76 14.38 16.64 Rural, all 7 villages
1.47 1.91 2.21
Grand total 11.23 16.29 19.35 Table 5.8 Estimates Of Raw Water Requirement At Intake Particulars Unit Production Input to WTP Withdrawal at intake Losses % 2 25
mld 16.29 16.62 20.77 Demand (2025) cumecs 0.19 0.19 0.24 mld 19.35 19.74 24.67 Demand (2040) cumecs 0.22 0.23 0.29
Note : cumecs – cum/sec computed considering 24 hour operations.
319. The ultimate stage raw water demand of the sub-project at the intake works is projected to be around 25 mld.
Source of raw water
320. The Gurgaon Water Supply Channel (GWSC), an existing canal which is part of
the Western Yamuna canal network has been identified as the raw water source for the sub-project. It is a 70 km long channel which takes off from the Delhi Branch at Kakroi in District Sonepat. It was constructed in 1993-94 as a dedicated source of supply for domestic and industrial water requirements of Gurgaon, Manesar industrial township and Bahadurgarh.
321. Present discharge capacity of GWSC is 331 mld (3.83 cumecs), however the
Department of Irrigation GoH has proposed to augment its conveyance capacity in Phase II to 784 mld (9.07 cumecs) to serve the increasing demand in the above mentioned three areas as well as to meet the demands of various urban and rural schemes proposed by the PWD-PHED in Gurgaon and Jhajhar districts. PWD-PHED had made budget allocation in the sub-project capital cost towards meeting the proportionate cost of capacity augmentation of the GWSC.
Intake works
322. Intake works will be located near village Budhera which is about 30 km from
Pataudi and access from the Gurgaon Farukh Nagar road. The works will

TA 7114-IND National Capital Region Planning Board Project
Final Report
Sheladia Associates, Inc. USA 137
Volume 1 – Main Rep
ort
comprise intake pipe, road crossing, storage tank with 1 day detention capacity, suction well, raw water pumping station, staff quarters, boundary walls, internal roads etc. Provision towards the proportionate cost of construction of the Gurgaon Canal (capacity increase) to the extent of Rs. 93 Million has been made under this line item.
323. Total land area required for construction of the intake work is 5 acres. This land is
proposed to be acquired and budget provision to this effect has been made in line with the current policies of the GoH.
Raw water transmission
324. Raw water transmission from Budhera intake works to the water works at Janaula
will comprise a 26.5 km long, 600 mm diameter rising main. The pipeline will be laid underground and will follow the existing road alignment. The latter 3/4th part will be laid along the Gurgaon-Pataudi Road.
325. As per the original DPR the pipeline material specification was ductile iron.
However, this item in particular and the long length of the rising main in general is found to be leading to significant increase in the overall cost of the sub-project. In order to optimise the cost, an alternate option of pre-stressed concrete rising main is recommended. This change of specification of rising main material will result in a reduction of about Rs. 65 million, which amounts to 20% of the cost of sub-works no. 2 and about 9% of the original sub-project cost.
Water treatment plant
326. Water works will be located near Januala on the side of the Gurgaon-Pataudi
Road which is about 3 km ahead of Pataudi town. It will comprise raw water storage corresponding to 6 days of average production demand, a conventional treatment plant involving clariflocculation, rapid sand filtration and chlorination, clear water storage and pumping arrangements, etc. The backwash from the rapid sand filters is proposed to be brought back into the raw water storage tanks, thereby avoiding the problem of its disposal into surface water bodies or on land. This is a progressive approach which has been adopted by PWD-PHEd in almost all its water works and which helps in conserving a substantial quantity (about 2-3%) of raw water.
327. From the process point of view, the original scheme has not provided for sludge
drying beds which will be required for safe treatment and disposal of the sludge that will be generated in the clariflocculators. The capital cost estimates provided in this feasibility report have made adequate provisions for this component, however the same have to be incorporated in the DPR and the scheme of works need to be suitably adapted.

TA 7114-IND National Capital Region Planning Board Project
Final Report
Sheladia Associates, Inc. USA 138
Volume 1 – Main Rep
ort
328. Other works comprise the usual internal roads, staff quarters, landscaping, plantation and construction of a boundary wall. Over and above these components proposed in the original DRP, it is recommended to include a water testing laboratory at the Janaula Water Works so as to provide means for quality control and assurance/monitoring. Provision to this effect is proposed in the subsequent TA loan component.
Bulk transmission of treated water
329. The Original DPR has proposed clear water transmission to only Pataudi town. As
per the design, the system comprises 4.15 km long rising main from Janaula Water Works to Zone-1 booster station at Pataudi which will be a ductile iron pipe of 400 mm dia. Another branch rising main out of the above line is 1.4 km long which will be a ductile iron pipe of 300 mm dia.
330. Besides these two rising mains, it is recommended to include additional rising
mains for Hailey Mandi town and the seven villages in the overall scheme of the sub-project. Accordingly provision for the additional works has been made and the capital cost of the sub-project stands modified.
Treated water storage, service reservoirs and booster stations
331. Treated water storage will be provided at various locations. Two ground level
service reservoirs (GLSR) with combined capacity of 9.7 million litres are proposed at the Janaula Water Works which corresponds to half day demand of the ultimate design year.
332. Besides the existing booster station at Motidungri, another booster station is
proposed at Shamshanghat. The existing and proposed storage capacities of GLSRs and elevated service reservoirs (ESR) at the two booster stations in Pataudi is presented in the table ** below. The capacities of GLSRs and ESRs correspond to half and one fourth the daily demand in the respective distribution zones.
Table 5.8 Existing And Proposed Storage Capacity At Booster Stations
Booster Station 1 (Moti Dungri) Million litres
Booster Station 2 (Shamshan Ghat) Million litres Type of
reservoir Existing Proposed Total Existing Proposed Total GLSR 1.00 2.03 3.03 0 1.82 1.82 ESR 0.36* 0.64 1.00 0 1.08 1.08 Total 1.36 2.69 4.03 0 2.90 2.90
333. The existing ESR at Motidungri is presently dysfunctional and it is recommended to revive it so as to help in improving service levels in zone 1, particularly during power cuts.

TA 7114-IND National Capital Region Planning Board Project
Final Report
Sheladia Associates, Inc. USA 139
Volume 1 – Main Rep
ort
334. At Hailey Mandi there are two existing underground water reservoirs of 0.5 and 0.35 million litre capacity respectively. These reservoirs and the installed pumping machinery will continue to serve the existing distribution system.
Water metering
335. Electromagnetic flow meters are proposed at all key locations, e.g., outlets of the
raw water pumping station, and the inlets and outlets of treatment plant, booster pumping stations, etc. All these meters will have data loggers which will be able to record flows on a continuous basis. The data thus collected will be downloaded to computers on a regular basis. As a part of this component under the sub-project PWD-PHED will procure necessary compatible hardware and software for managing and processing the data and will arrange for training of concerned staff.
336. From the point of view of moving towards volumetric billing and water
conservation, PWD-PHED will encourage domestic and commercial consumers to install dry dial mechanical water meters of appropriate sizes. The cost is proposed to be borne by the consumers and therefore no provision on this account has been made in the sub-project capital cost.
Treated water distribution system
337. The distribution system has been designed for considering the demand of year
2040, a peak factor of 3 and tail end pressure of 17 m of water column.
338. It is proposed to lay about 22 km of distribution pipelines varying from 100 to 400 mm in diameter. With regard to the material of pipes, as per the GoH orders, the sub-project proposes to use only ductile iron pipes for the distribution network. This policy has been adopted in view of the past experience of using PVC pipes which where found to be prone to tempering for unauthorised connection, damage and intrusion of wastewater.
339. Evidently use of ductile iron pipes in distribution network, particularly in small
towns is a rather expensive option. While the costs estimates presented hereunder correspond to this option, it is recommended to explore a cheaper alternative which is technically appropriate from the point of views of preventing tempering, damage and wastewater intrusion.
Power supply
340. Power supply at the raw water intake works will be made from Makrola
independent feeder which will take off from the existing Harsaru feeder. Power supply at the water treatment plant will be made from another independent feeder which will be tapped from Pataudi, involving a distance of 3 km. At both locations a substation, transformer, building, etc. will be provided. Adequate provision to this in the sub-project capital cost has been made.

TA 7114-IND National Capital Region Planning Board Project
Final Report
Sheladia Associates, Inc. USA 140
Volume 1 – Main Rep
ort
Operation and maintenance arrangements
341. The raw water withdrawal, pumping and treatment operations will be on 24 hour
basis while the supply to the consumers will be for four hours daily, 2 hours in morning and evening each. The supply arrangements will involve direct pumping into the distribution network as is the current practice. However, the proposed ESRs will also provide a back up support in case of power cuts.
342. One the whole, the Executive Engineer, Sohana Division of PWD-PHED will be
responsible for supervising the operations of the entire water supply scheme. The entire system will be operated and maintained under the direct responsibility of the Sub-Divisional Engineer (Assistant Engineer) PWD-PHED, Pataudi. He will be assisted by 3 or more Junior Engineers for managing the daily operations.
343. The team at the intake works will comprise a supervisor and 9 regular staff
including a pump operator, electricians, fitters, plumbers, helpers, etc. Five daily wage labours are proposed to be employed at this location.
344. At the water works at Janaula, the composition of the team will be on the same
lines. However, it is also recommended to include a chemist for the water testing laboratory.
345. At each of the booster pumping stations the team will comprise one pump operator
assisted by electricians, fitters and helpers, etc. One daily wage labour at each booster station will be engaged.
346. At the sub-division office level, besides the administrative staff the team will
comprise an office superintendent, a head draftsman, an accountant and a store keeper. This staff will provide all the necessary administrative support to the Sub-Divisional Engineer including billing and revenue collection, etc. For managing the distribution network for each town a team of one key man, one patrol man, one beldar and one helper has been proposed.
347. Cost of all the above described staff and daily wage labour including those for the
increased positions for Hailey Mandi has been included in the O&M cost of the sub-project which is presented in a subsequent section.
348. PWD-PHED will lay down a policy for taking new connection and specify an initial
charge of Rs. 1000 for domestic consumers. It will also adopt the system of licensing fitters/plumbers who will be authorised to make new connections for various categories of consumers.
349. With regard to flow measurements, electromagnetic flow meters with data loggers
are being proposed at critical locations. Concerned officials/ staff will trained in operating, inspecting these meters and downloading of data at regular intervals.

TA 7114-IND National Capital Region Planning Board Project
Final Report
Sheladia Associates, Inc. USA 141
Volume 1 – Main Rep
ort
The same staff will be given the responsibility of processing the data and generating reports on a regular interval which will be submitted to the Executive Engineer, Sohana.
Project capital cost estimates
350. The base capital cost of the sub-project including the additional components of
rising mains to Hailey Mandi and other seven enroute villages, land acquisition and R&R but excluding contingencies is estimated to be Rs. 794.6 Million. Component wise break up is presented in Table below.
Table 5.9 Estimates Of Capital Cost Of The Sub-Project Project component Amount, Rs. Million
Raw water intake works and pumping station at Budhera 109.9
Raw water rising main from Budhera to Janaula 322.9
Water treatment plant at Janaula. 91.1
Clear water rising mains from Janaula to 2 boosting stations in Pataudi. 30.1
Clear water rising mains from Janaula to Hailey Mandi and other villages 70.0 Booster pumping station at Zone-I and Zone-II, Pataudi 29.0 Augmentation and rehabilitation of the distribution system in Pataudi. 38.7 Procurement and installation of water meters and instrumentation works. 4.6 Provision for independent electric feeder connection. 67 Land acquisition 87.5 R & R cost 4.1 Base cost 794.6
351. It is to be noted that the cost of land acquisition is determined considering a rate of Rs. 25 Lakh per acre. However, this could change in view of the recent policy of the GoH which considers minimum floor rate for land in NCR region and payment of annuity at a rate of Rs. 15,000 per acre over a period of 33 years with annual increment of Rs. 500. Moreover, as the land acquisition process is yet to commence, details of land holding pattern are not available and therefore resettlement and rehabilitation costs are only broad estimates.
352. Furthermore, with the objective of optimising the capital costs, PWD-PHED has
proposed changing specification for the raw water rising main from ductile iron to pre-stressed concrete (PSC), excluding the proportionate cost of construction+ of the Gurgaon Canal and the cost of land access to be paid to the forest department. In this way it is possible to reduce the capital cost of the sub-project by Rs. 157 Million. However, in view of quality and leakage concerns pertaining to PSC pipes, it is recommended that the specification for the raw water rising main should be retained to DI.

TA 7114-IND National Capital Region Planning Board Project
Final Report
Sheladia Associates, Inc. USA 142
Volume 1 – Main Rep
ort
353. The sub-project does not include the components of augmenting the capacity of the existing booster stations and strengthening of the distribution network in Hailey Mandi. Apparently the existing system is considered to be adequate to meet the present requirements. Neither does it include the service storage and internal supply arrangements within the 7 villages. PWD-PHED proposes to take up these components separately at a later stage.
Project operating cost estimates
354. The total annual cost of operation and maintenance of the entire water supply
project is estimated to be Rs. 22.74 Million. Over and above the original estimates provided in the DPR, additional costs correspond to :
• Chlorination at Janaula • Electrical cost for pumping clear water to Hailey Mandi and other seven villages • Corresponding increase in mechanical and electrical repairs cost, and • Manpower for managing distribution network in Haily Mandi
355. An itemised break-up of O&M costs is presented in Table 5.10
Table 5.10 Estimates Of O&M Costs For The Sub-Project SL. NO. Particulars Annual costs, Rs. Million A. Manpower 1. Regular staff 3.52 2. Daily wage labour 0.67 B. Electrical charges 10.4 C. Consumables 4.7 D. Repairs (mechanical and electrical) 1.8 E. Repairs (civil works) 1.5
Total 22.59
Implementation schedule
356. The sub-project will be implemented by the PWD-PHED over a period of 4 years
from the date of release of loan. A detailed activity wise schedule of implementation/bar chart is presented in Appendix 21. The pre-project phase includes selection of ‘project management consultant’ and ‘design and supervision consultant’, preparation of revised DPR, land acquisition, rehabilitation of project affected people, preparation of bid documents, prequalification and selection of bidders for various construction packages and preparation of ‘Shifting of Utilities Plan’ and procuring of ‘Letter of Approval for Shifting’ from concerned agencies. This phase is expected to take around 10-12 months.
357. For the implementation phase, the bar chart shows activities according to the sub-
works proposed in the DPR i.e., intake works, raw water rising main, treatment

TA 7114-IND National Capital Region Planning Board Project
Final Report
Sheladia Associates, Inc. USA 143
Volume 1 – Main Rep
ort
plant, clear water rising mains, booster stations at various locations, installation of bulk water meters and finally laying of distribution network. Under each sub-work, activities have been split along civil, electrical and mechanical works. Key components of this phase is expected to take between 24 month for completion and commissioning of water supply to Pataudi town. The components for Hailey Mandi and the seven villages will be implemented in the following 12 months.
Procurement plan
358. The procurement plan for goods and works considers seven different packages as
presented in Table ** below. This is based on the current practice of PHED for clubbing works such that one contractor is responsible all the way from intake of raw water to its delivery at the water treatment plant; another contractor is responsible all the way from treatment to delivery at the booster stations; another contractor is responsible for booster stations and laying of distribution network. Considering special nature of work involved in construction of elevated service reservoirs, this has been proposed as a separate package. As per the current policy of PWD-PHED, procurement of DI pipes for all major pipeline components e.g., raw and clear water rising mains and distribution network is proposed to be carried out by the department as per the PWD/DGS&D procurement norms.
Table 5.11 Contract Packages For The Pataudi Water Supply Project
Cost Package No.
Description
Rs. Million US $, million
Remarks
I Intake works at Budhera and raw water rising main including: - All civil works, installation of pumping machinery, electrical fittings. - Laying and jointing of raw water rising main from Budhera to Janaula. - Procurement and installation of bulk water meters.
496.58 1.06 Cost of Sub-works No-1 less the proportionate cost of canal construction. Cost of Sub-works No-2 less land cost and pipe cost. Procurement cost of DI pipes for the raw water rising main is not included. If its specification is changed to PSC pipe then the package cost will have to be increased as pipe procurement will then be the responsibility of the contractor.
II Procurement of DI pipes by PWD-PHED for raw and clear water rising mains and the distribution network.
3926.41 8.35 Based on cost of all DI pipes for the raw and clear water rising mains to Pataudi, Hailey Mandi and all seven villages. In case PSC pipe is used for raw water transmission, then it will be procured under Package I by the contractor and the costs of Package I increase and that of Package II will reduce accordingly.

TA 7114-IND National Capital Region Planning Board Project
Final Report
Sheladia Associates, Inc. USA 144
Volume 1 – Main Rep
ort
Cost Package No.
Description
Rs. Million US $, million
Remarks
III Water works at Janaula and the clear water rising mains to Pataudi including: - All civil works. - Installation of clear water pumping machinery, electrical fittings, instrumentation, etc. - Laying and jointing of clear water rising mains to the two booster stations in Pataudi town. - Procurement and installation of bulk water meters.
959.85 2.04 Cost of Sub-works No.-3 plus laying and jointing of the two rising mains to Pataudi town. Pump house for Hailey Mandi and 7 villages is to be provided under this package while pumping machinery will be provided under package ** along with the rising mains.
IV Construction of booster pumping stations at Pataudi excluding elevated reservoirs but including all other civil works, installation of pumping machinery, electrical fittings, etc.; and including augmenting and strengthening of the distribution network in Pataudi town.
220.76 0.47 Sub work no. 5, less cost of elevated service reservoir. Sub work no. 6, less cost of procurement of DI pipes.
V Construction of elevated service reservoirs at the two booster stations in Pataudi.
137.44 0.29
VI Installation of independent electric
feeder connections at Budhera and Janaula.
67.20 0.14 Sub work no. 8
VII Installation of pumping machinery and laying, jointing, etc. for clear water rising mains to Hailey Mandi and the seven villages, including procurement and installation of bulk water meters.
184.87 0.39 Cost of laying R/M to Hailey Mandi and 7 villages.
Total 5993.11 12.75
359. However, our procurement specialist has expressed the following views:
a. By splitting the entire sub-project works into seven packages, the average cost of
a package is becoming rather low and therefore bigger size competent bidders would not show interest.
b. More number of small contractors will lead to problems of project management during implementation, leading to delays.
c. Procurement of DI pipes, as proposed to be done internally by the Department, will have to adhere to PWD/DGS&D or ADB procurement norms.
d. However, departmental procurement of pipes will further reduce the cost of the respective packages and make them less interesting for a bigger contractors.

TA 7114-IND National Capital Region Planning Board Project
Final Report
Sheladia Associates, Inc. USA 145
Volume 1 – Main Rep
ort
e. Departmental procurement of pipes can also get delayed for a variety of factors e.g., limited suppliers, wide fluctuation in market rates, etc. which could in turn delay the implementation.
f. The option of using PSC pipe for the raw water rising main is not preferred. The present specification of DI pipe is considered to be appropriate and should be retained.
3. Technical Analysis and Recommendations
360. On the whole, the sub-project is found to have been structured well and on the lines of the recommendations of CPHEEO Manual and the Regional Plan 2021. It has adopted a regional perspective by including adjoining urban and rural habitations and thereby avoiding any possibility of future conflict with under-served population in the surrounding areas. Population projections have been carried out based on the declining growth rate method which the department has validated internally on small towns over last three decades and found to be acceptable.
361. The domestic demand for urban and rural areas has been derived by considering
service levels of 135 and 70 lpcd which are in conformity with the RP2021. The demands for production and raw water intake stages have been developed appropriately by considering losses at various stages and requirements for fire fighting and floating population in urban areas.
362. On the whole, the proposed source for raw water can be considered safe, reliable
and dependable. Adequate allocation of water has been made by the concerned water resources department and the sub-project has proposed to make budgetary allocation towards its capacity augmentation. The source will also help in addressing the deteriorating groundwater quality issue, primarily salinity and fluorides.
363. With regard to the existing sources of water, i.e., the numerous tube wells located
in and around both the towns and the pumping machinery, it is recommended that PWD-PHED must continue to operate and maintain them on a regular basis so that they can be used in emergency or as and when required. It is recommended that the revised DPR must provide a plan to this effect and make appropriate provision in the O&M cost.
364. On the whole the system comprising intake works, the storage ponds, the
treatment scheme and the transmission and distribution system are found to be designed as per the established engineering practice and are in order. However it is noted that the following capital works have not been considered in the original DPR and it is recommended that provision to that effect should be included in the capital cost of the sub-project in the revised DPR:
� A pumping station and a rising main (pre-stressed concrete) to Hailey Mandi
town.

TA 7114-IND National Capital Region Planning Board Project
Final Report
Sheladia Associates, Inc. USA 146
Volume 1 – Main Rep
ort
� Pumping machinery and rising mains to the seven villages envisaged to be covered in the project.
� Sludge drying beds at the Janaula Water Works to be linked to the clariflocculator.
365. Further, it is recommended to assess the requirements for augmenting the
capacity of the two existing booster stations (including storage reservoirs) and strengthening of the distribution network in Hailey Mandi. This should be developed as a separate sub-project in due course of time.
366. It is recommended to retain the material specification for the raw water rising main
to ductile iron considering its robustness and high reliability. The alternative of PSC pipes which was considered by the department should not be adopted in view of the quality and eventual leakage concerns.
367. To optimise the capital cost of the sub-project, PWD-PHED has proposed to
exclude the proportionate cost of construction of the Gurgaon Canal and the cost of land access to be paid to the forest department. Although these two items will constitute a reduction of about Rs. 103.7 Million, they are considered essential and would have to be paid in one way or another. Accordingly PWD-PHED must provide documentary evidence of alternate sources of financing or waivers before showing their exclusion in the revised DPR.
368. The DPR has made provision for installation of electromagnetic bulk water meters
and domestic meters with the objective of bringing an element of measurement of supply at various levels. This is a progressive feature which will help in demonstrating good management practices for a small scale water supply system in the state and the region. This sub-work has to be spread over different packages. It is recommended that adequate training to operate data loggers, download the data and process the same, generate MIS reports, etc. must be provided to the concerned technical staff.
369. With regard to the cost estimates for operation and maintenance of the sub-project
it is recommended to revalidate the original figure of Rs. 17,6 million which is quoted in the original DPR. Provision for following additional items must be incorporated:
� Salaries and wages of site staff for distribution system in Hailey Mandi. � Electrical costs for operation of pumping system (at Janaula) for Hailey Mandi
and other seven towns. � Repairs (mechanical and electrical) for the additional equipment to be included
for the pumping system (at Janaula) for Hailey Mandi and other seven towns. � Consumables towards chlorination of filtered water at Janaula water treatment
works.

TA 7114-IND National Capital Region Planning Board Project
Final Report
Sheladia Associates, Inc. USA 147
Volume 1 – Main Rep
ort
370. From the point of views of water quality control, quality assurance and monitoring, it is recommended to include a water testing laboratory at the Janaula Water Works. Although at this stage provision is not made in the cost estimates, the same will be provided in the subsequent TA loan component to be developed in due course.
371. It is recommended that PWD-PHED must develop a separate DPR on priority for
augmenting the capacity of the existing booster stations and strengthening of the distribution network in Hailey Mandi; as well as creating adequate service storage and internal supply arrangements within the 7 villages.
372. The DPR does not provided a detailed implementation schedule for the sub-
project covering procurement of goods, works and services, execution of works, etc. However, as per the fund requirement schedule it is determined that the entire project will be implemented over a period of 4 years. The revised DPR must include a realistic activity bar chart as presented in this report for ease in sub-project management and monitoring during execution.
373. Finally from the point of view of a decision maker, there is a need to restructure
the DPR, streamline the content and develop focus on the issues of importance. The DPR can be strengthened by, among others, consolidating the information in relevant sections, including objectively verifiable information on water quality, current service levels, current and projected expenditure and revenue figures, etc.
4. Safeguards
Social - Land Acquisition, Involuntary Resettlement and Impact to Indigenous Peoples
374. The project involves acquisition of private agricultural land measuring 30 acres for
siting the Water Treatment Plant (STP) and 5 acres at the intake point. Water will be drawn from the Gurgaon water Supply Canal at Budhera village where an intake station is proposed in private land measuring 5 acres. From the intake station water will be transferred through 600mm dia transmission main to Janaula village where a water treatment plant is proposed in private land measuring 30 acres. The 26.5km long transmission main will be laid along road margins and will not involve any land acquisition but will cause temporary disruption to residences and business establishment along the transmission main alignment. Both boosting stations proposed are being sited in existing Municipality land. Water from WTP to boosting station will be transferred through 400/300mm dia transmission main that will be laid along the road margins and will not involve any land acquisition. In all, the project envisages acquisition of 35 acres of private agricultural land.
375. The acquisition of 35 acres of private agricultural land will cause loss of income to
the 27 landowners from whom land is proposed to be acquired. The water

TA 7114-IND National Capital Region Planning Board Project
Final Report
Sheladia Associates, Inc. USA 148
Volume 1 – Main Rep
ort
transmission mains are likely to cause temporary disruption to commercial establishment and residences along the alignment. Involuntary resettlement impacts are not significant and the census and socio-economic surveys in the project area have revealed that there are no IP amongst the landowners or among agricultural labourers and hence the project will not require any IPP. However, after the 4(1) notification under LA Act and preparation of land plan schedule, if any IP is identified, the project will address the same in line with the Draft ESMS of NCRPB.
376. The project will impact 27 households who would lose their cultivable land. The
project does not impact any common property resources.
377. In line with the Draft ESMS of NCRPB, projects funded by NCRPB will require a resettlement plan and/or an indigenous peoples plan commensurate with the significance28 of impact. Providing Water Supply to Pataudi Town will come under S-2 category for involuntary resettlement and S-3 category for indigenous peoples as per NCRPB’s social categorization.
378. A short resettlement plan has been prepared in line with the Draft ESMS
requirements. The summary of resettlement impacts is given in the following table. Table 5.12: Summary of Resettlement Impacts
Impact Providing Water Supply for Pataudi Town Permanent Land Acquisition (ha) 35.0 acres
Temporary Land Acquisition (ha) 0
Affected Households (AHs) 27 a
Affected Persons (APs) 157
Titled Aps 157
Non-titled APs (Encroachers) 0
Female-headed AH 0
IP/ST-headed AH 0
BPL AH 0
28
As per the Draft ESMS projects are categorized based on the significance of involuntary resettlement and impact to indigenous
peoples. Involuntary resettlement categories are (a) Category S-1 (Significant Impact): means 200 or more people will experience major impacts, which are defined as (i) being physically displaced from housing, or (ii) losing 10% or more of their productive assets (income generating). Category S-1 projects require a full resettlement plan; (b) Category S-2 (Not Significant). Category S-2 projects include involuntary resettlement impacts that are not deemed significant and require a short resettlement plan; and (c) Involuntary Resettlement Category S-3: There is no involuntary resettlement impacts and hence does not require any action. Indigenous Peoples categories are (a) S-I Significant impacts are those projects that directly or indirectly affect the dignity, human rights, livelihood systems, or culture of indigenous peoples or affect the territories or natural or cultural resources that Indigenous peoples own, use, occupy or claim as their ancestral domain. Category S-1 projects will require a indigenous peoples plan; (b) S-2 Not Significant are projects where the indigenous peoples are the sole or the overwhelming majority of project beneficiaries, and when only positive impacts are identified. Category S-2 projects will require a summary note on IP in project document; and (c) S-3 are projects where no impacts on indigenous peoples are envisaged and hence does not require any action.

TA 7114-IND National Capital Region Planning Board Project
Final Report
Sheladia Associates, Inc. USA 149
Volume 1 – Main Rep
ort
Impact Providing Water Supply for Pataudi Town Affected Structures 0
Affected Trees/Crops 0
Affected Common Property Resources 0
Average Family Size 5.8
Average Household Income Rs.6,333/- p.m.
a The 27 households losing their cultivable land will face significant impact.
379. Pataudi water supply sub-project, comprising improvements in the production,
treatment and distribution systems of the current water supply systems has been categorized as Category E-2, and accordingly an Initial Environmental Examination (IEE) and an Environmental Management Plan (EMP) prepared by PHED. The Environmental Information Format for Screening, as laid down in the ESMS is provided in the IEE. Location impacts pertaining to siting of alignment within or in the vicinity of environmentally sensitive areas are not envisaged, and Sultanpur birds’ sanctuary and Aravalli hills are the sensitive sites located within 50km of the town, and impacts on these areas are not likely. The proposed project components are sited within the Government lands and within the available RoW, with the exception of the WTP and intake points, which involve acquisition of 35 ha private lands. Clearance of trees (mostly eucalyptus and acacia species) along the WTP and intake points is envisaged and shall be addressed through compensatory plantation activities carried out in line with the ESMS provisions, after clearances from the Forest Department.
380. Given the magnitude of civil works, there would be typical construction related
impacts, and could be mitigated by appropriate mitigation measures and adoption of good construction practices. These have been put forth in the EMP. The construction impacts include impacts associated with laying of networks / pipelines in the vicinity of settlements, and associated temporary disruption to the businesses and communities along these networks. The EMP provides for measures to address the environmental conditions and safety of the residents and construction workers during the construction period. The effective implementation of the measures proposed will be ensured with the technical expertise of an Environmental Specialist as part of the Supervision Consultants. The environmental impacts during operation of the system are limited and shall include potential leakage and breakages in the system leading to contamination of supplied water apart from handling of chemicals at the WTP etc, towards which monitoring, management and maintenance is proposed. Further, the environmental monitoring plans prepared as part of the EMP will provide adequate opportunities towards course correction to address any residual impacts during construction or operation stages.
381. Pataudi is a small Tehsil town in the Gurgaon District with current (2009)
estimated population of around 22,000 (16,085 as per Census 2001). It is located

TA 7114-IND National Capital Region Planning Board Project
Final Report
Sheladia Associates, Inc. USA 150
Volume 1 – Main Rep
ort
on the Gurgaon – Rewari road at a distance of 25 km from Gurgaon and about 58 km from Delhi. Because of its proximity to one of the major growth centres of Gurgaon, being a part of the NCR, having good connectivity with other towns in the region, and expected growth on account of the upcoming special economic zone (SEZ), it assumes significance as an affordable option for absorbing future urban growth. In recognition of this potential of the town, the Government of Haryana has identified Pataudi for strengthening of, among others, water supply and wastewater management infrastructure and thereby to offer improved quality of life to the existing and prospective residents.
C. SEWERAGE SUB-PROJECT – PATAUDI 1. Sub-Project Background
382. Pataudi is a small Tehsil town in the Gurgaon District with current (2009) estimated population of around 22,000 (16,085 as per Census 2001). It is located on the Gurgaon – Rewari road at a distance of 25 km from Gurgaon and about 58 km from Delhi. Because of its proximity to one of the major growth centres of Gurgaon, being a part of the NCR, having good connectivity with other towns in the region, and expected growth on account of the upcoming special economic zone (SEZ), it assumes significance as an affordable option for absorbing future urban growth. In recognition of this potential of the town, the Government of Haryana has identified Pataudi for strengthening of, among others, water supply and wastewater management infrastructure and thereby to offer improved quality of life to the existing and prospective residents.
383. The sub-project also includes part of the adjoining town of Haily Mandi-Jatauli
which is just about 4 km on north-west of Pataudi and due to its natural slope being towards the site proposed for sewage treatment plant (STP).
2. Situation Assessment
384. This section provides a description of the existing situation and lays the basis for development of the sub-project for wastewater management in Pataudi and Hailey Mandi towns.
Current sanitation arrangements
385. Both the towns are characterized by the practice of on-site sanitation. Given the
rural/ agrarian setting, it is also likely that a fair part of the population, especially the poorest may also be resorting to open defecation. Most households having latrines are connected to individual septic tanks and the overflow is let out into open road side drains. Very few houses have septic tanks connected to soak pits or drainage fields. The practice of direct discharge of wastewater into open drains is also prevalent, especially in those houses where space is limited and which are

TA 7114-IND National Capital Region Planning Board Project
Final Report
Sheladia Associates, Inc. USA 151
Volume 1 – Main Rep
ort
located along large open drains. In monsoon the wastewater from these drains overflows onto roads and at times enters residences, causing a serious threat to public health.
386. In the case of Hailey Mandi, interceptor sewers were laid several years back to
check wastewater discharges from open drains serving about 25% of the town area. However, in absence of maintenance support, these sewers have become dysfunctional and need to be restored or replaced. From wastewater management point of view the situation in Hailey Mandi-Jatauli is a bit complex because of the presence of a railway line which divides the two habitations. Hailey Mandi comprising 60% of the combined population is located on the southern side of the line while Jatuali comprising the balance 40% population is located on the northern side. The southern part drains southward towards Pataudi while the northern part drains northward.
3. Sub Project Description
387. In response to the growing population, expected increase in water supply, rising aspirations of the residents for a better quality of life and to protect environment and public health, this sub-project has been developed for improving the level of sanitation in the towns of Pataudi and Hailey Mandi. As of now the towns are characterised by household discharge of sewage and sullage into road side open drains and final disposal of untreated sewage on the outskirts. The sub-project pertains to providing underground conventional sewerage and setting up a sewage treatment plant. Salient features of the sub-project are described in the paragraphs that follow.
Objectives
388. The sub-project for providing and strengthening infrastructure for wastewater/
sewage management in the two towns has been prepared with the objectives to (a) safeguard environment and public health, (b) offer an improved quality of life such that they can emerge as alternate urban growth centres in the region, and thereby (c) reduce pressure of urbanisation in the larger cities e.g., Delhi and Gurgaon.
Design Period
389. The sub-project has adopted design period of 30 years and intermediate stage of
15 years. Considering 2010 as the base year, the ultimate design year is 2040 and the intermediate stage corresponds to 2025. Certain parts/components of the project such as civil works, etc will be designed corresponding to ultimate stage while others e.g., mechanical and electrical components will be designed for intermediate stage. Prospect of developing treatment capacity in two phases has also been explored. These aspects are further elaborated under the heading of phasing and implementation schedule later in this report.

TA 7114-IND National Capital Region Planning Board Project
Final Report
Sheladia Associates, Inc. USA 152
Volume 1 – Main Rep
ort
Coverage
390. The sub-project will cover entire population of Pataudi and about 63% population
of Hailey Mandi-Jatauli which is residing on the southern side of the railway line and where the general slope of the ground is towards the proposed location of the sewage treatment plant. Although Hailey Mandi is about 3-4 km away, the sub-project has adopted the strategy of including part of its population in order to get the benefit of natural flow pattern and scale, and avoid difficult elements of intermediate pumping and a railway crossing.
391. It is to be noted that the coverage as proposed in the DPR is only for the municipal
areas. The areas which are to be developed as residential sectors, as per the proposal under the Development Plan prepared by the Dept. of Town and Country Planning, the sewerage infrastructure, among others, will be provided by Haryana Urban Development Authority (HUDA).
Components of the Sub-Project
392. The sub-project will include (a) laying of branch sewers, laterals, mains and trunk
sewers for the entire population of Pataudi, (b) a trunk sewer for the combined flows of the two towns, (c) a pumping station, (d) a sewage treatment plant (e) and a pumping station and outfall for final disposal of the treated sewage. It is noted that under the sub-project the components of laying of sewer lines in the southern and northern parts of Hailey Mandi-Jatauli, outfall sewer from Hailey Mandi to Pataudi and construction of a treatment plant for the sewage flows being generated in the northern part are not included. These components are proposed to be developed under a separate sub-project which is being prepared by PWD-PHED.
393. Household Connections: The connection from the household will be made
through the inspection chamber, which will be constructed outside the premises and will be funded under the sub-project. Such connections from 3-4 houses will be made in to a common inspection chamber which shall be connected to the manhole on the sewer on the road. Construction of inspection chambers will minimize road cutting while making house connections. As per the policy of the GoH while sewer connection charges are likely to be waived, the cost of labour and materials will be borne by the house owners.
Sewerage Zones
394. The sub-project can be characterised to be broadly having two sewerage zones –
one for the whole of Pataudi and the second for that part of Hailey Mandi-Jatauli which is on the southern side of the railway line and which is nearer to and sloping towards Pataudi. Zone one, i.e., entire area of Pataudi is predominantly sloping southward whereby all the sewage flows by gravity to one point without involving

TA 7114-IND National Capital Region Planning Board Project
Final Report
Sheladia Associates, Inc. USA 153
Volume 1 – Main Rep
ort
excessive depth of excavation and without entailing provision of intermediate pumping stations. However, this zone can be sub-divided into 5 or 6 sub-zones according to the existing pattern of the habitation. The population distribution over an area of 250 hectare is considered to be uniform, and the population densities for the present and the design year work out to be 91 and 165 persons/ha respectively.
395. As mentioned earlier, primary sewerage network for zone two, representing Hailey
Mandi-Jatauli area is not included in the sub-project. In due course of time the combined sewage flows generated in this area will be routed through an outfall sewer into the proposed sewer network in Pataudi at junction point X/10. The depth of excavation at this point is determined to be 5.7m which makes it feasible to convey the combined flows of the two towns to the treatment plant site by gravity without entailing excavation deeper than 8m.
Design Criteria
396. The design criteria for the sewerage network and sewage pumping station are
summarised in Table 5.13 as follows. Table 5.13 Design Criteria Adopted For The Sewerage Network. Parameter Criteria
Average flow 80% of water supply level which is considered to be 135 lpcd.
Infiltration As per CPHEEO recommendation.
Peak factor 3
Velocity friction formula Manning’s formula : V = (1/n) x R2/3 x S1/2
Value of Manning’s ‘n’ 0.015
Depth of flow at peak flow in all size sewers
0.8 D
Minimum pipe diameter 200 mm.
Velocity in sewers 0.6 m/s in initial years and 0.9 at ultimate stage peak flow.
Pipe material
- Diameter < 400 mm
- Diameter > 400 mm
Salt glazed stone ware pipes
RCC NP3 pipes
Maximum depth of excavation 8 m.
Note: The criteria is as per the recommendations of the Manual on sewerage and sewage treatment (second edition), CPHEEO, Ministry of Urban Development, Govt. of India, 1993. Table 5.14 Design Criteria Adopted For The Sewage Pumping Station Parameter Criteria

TA 7114-IND National Capital Region Planning Board Project
Final Report
Sheladia Associates, Inc. USA 154
Volume 1 – Main Rep
ort
Detention time in wet well 5 minutes.
Number of pumps 5 working + 1 standby.
Type of pumps Centrifugal horizontal assembly in dry well.
Screen Manually operated coarse screen of 40 mm openings ahead of the pumping station.
Sewerage Network Components
397. Total length of the sewerage network as per the available design lay out for the
Pataudi town alone works out to close to 31 km. Out of this, almost 91% length comprises pipes of least diameter i.e., 200 mm which are generally used as primary branch sewers and laterals. Balance 9% length comprises pipes of various sizes ranging from 250 mm to 700 mm. The depth of excavation varies from less than 1m to up to 8 m, however almost 85% of this will be under 3m and less than 10% involves excavation from 5 to 8m depth.
398. All the sewers less than or equal to 400mm in diameter will be salt glazed stone
ware pipes while all other large diameter sewers will be RCC NP3 pipes. The laterals shall be of 200 mm to 400 mm and would be connected through manholes or connecting chambers. All laterals shall have inner cement mortar lining.
399. Sewage flows from Hailey Mandi will join at the junction point no. X/10 on the
western side of Pataudi. From there on the combined sewage will flow through RCC pipes of 500-700mm upto the sewage pumping station. The depth of excavation in the tail end of this stretch is in the range of 7-8m. The pumping station is to be constructed at the same site where the sewage treatment plant is proposed and therefore the length of the rising main will be very small. The rising main comprise 300mm dia K9 class DI pipes.
400. All necessary appurtenances such as manholes, ventilating shafts, intercepting
chambers shall be provided as per the standard practice of sewer construction. Manholes-cum-connecting chambers will be constructed on the sewer lines to facilitate house connections as well as inspection of sewer lines. Manholes will be provided at every junction, change of diameter, and for house connections. The manholes will be of Brick Masonary with SR cement mortar and plaster at all places except in water logged area and RCC ( with SR cement ) cast-in-situ structures for water logged area. It is however advised that looking to the limitations of time for execution, pre-cast manholes should be considered under the sub-project.
Flushing in upper ends
401. The upper ends of the sewerage network are expected to face the problem of low
flows and therefore chance of deposition of solids/sludge. In this regard, it is understood that PWD-PHED has already procured a sewer cleaning cum rodding

TA 7114-IND National Capital Region Planning Board Project
Final Report
Sheladia Associates, Inc. USA 155
Volume 1 – Main Rep
ort
machine for its operations in Sohana town where a sewerage network has been recently commissioned. The same machine will be used on a fortnightly basis for flushing of branch sewers in areas where such problems are expected to be encountered.
Sewage Volumes
402. The estimates of sewage flows for the present period and the intermediate and ultimate design stages are presented in table ** below. The estimate for the present stage is determined considering supply level of 70 lpcd while those for the intermediate and ultimate design stages are determined considering supply rate of 135 lpcd. Sewage generation ratio is considered 80%. However, these estimates do not consider contribution from floating population and ground water infiltration, etc. Further, the peak flows for determining the installed capacity for pumping and to cross check hydraulic loading on the treatment plant are determined by considering a relatively lower peak factor of 2.25.
Table 5.15 Estimates Of Sewage Volumes Expected At The Treatment Plant
Contributing population Average/Dry weather flow Peak flow
Year Pataudi HM-J MLD cum/sec cum/sec 2010 22,894 15,222 2.1 0.02 0.06 2025 34,341 22,833 6.2 0.07 0.16 2040 41,209 27,400 7.4 0.09 0.19
403. It is to be noted that the present water supply rate is very low which is resulting in very low volumes of sewage generation, almost one third of the intermediate stage estimates. However, after the implementation of a new water supply scheme which is under consideration (and for which a sub-project proposal is structured), the sewage volumes are expected to increase in 3-4 years.
Phasing of capacity creation
404. In view of the large difference of 250% between the present and the ultimate
design stage dry weather flows (DWF), it is decided to create sewage pumping capacity and treatment capacity in two phases. This approach will prevent under-loading of the system and help optimize investments. Moreover considering that there isn’t much difference between the intermediate stage and ultimate stage design flows, and the uncertainty in water supply levels, it is proposed to adopt first phase capacity for only 50% of the ultimate stage DWF and then take up implementation of the second phase as and when the first phase works are found to be fully loaded. Works for the second phase may therefore have to be taken up earlier than 2025.
405. In accordance with the above considerations, the pumping and treatment
capacities will be created in two phases of 3.75 mld each. The DWF for the first and second phases will be taken as 3.75 mld and 7.5 mld respectively.

TA 7114-IND National Capital Region Planning Board Project
Final Report
Sheladia Associates, Inc. USA 156
Volume 1 – Main Rep
ort
Sewage Pumping Station
406. The sewage pumping station is required at the tail end of the sewerage network
and just ahead of the sewage treatment plant. It will essentially work as a lift station as its main objective is to take the combined sewage from a depth of around 8 m and put it in the inlet chamber of the treatment plant.
407. The pump configuration is proposed to comprise five working pumps and one
standby pump, each having discharge capacity of 0.5 dry weather flow (DWF) (=75 m3/hr). In normal period only two pumps will operate which will provide a discharge capacity of 1 DWF. In times of diurnal peak flow, all five working pumps will operate, offering a discharge capacity of 2.5 DWF and thereby adequately taking care of the increased hydraulic loads. The pumps will work against a total head of 16 m of water column.
Table 5.16`: Configuration Of The Sewage Pumping Machinery Working pumps Stand-by Pump No. Unit 1 2 3 4 5 6 Disc. Capacity DWF 0.5 0.5 0.5 0.5 0.5 0.5 Cumulative discharge cap DWF 0.5 1.0 1.5 2.0 2.5 - m3/hr 75 150 225 330 375 -
408. The rising main is proposed to be of 300 mm diameter K9 DI pipe. In view of the location of the pumping station being within the treatment plant complex, the length of the rising main will also be very limited.
Quality Of Wastewater And The Discharge Standards
409. As per the sampling carried out in the month of October 2009, the quality of raw
sewage as found at the existing outfall is presented in the following table. The corresponding wastewater quality discharge standards as per the Environment Protection Act, 1986 are also presented alongside.
Table 5.17 Quality Of Raw Sewage And Effluent Discharge Standard. Sl. No. Parameter Unit Raw
sewage Discharge standards
Water body land 1. pH - 6.82 7 - 8.5 7 - 8.5 2. Total suspended solids
(TSS) mg/l 213 < 50 < 200
3. Biological Oxygen Demand (BOD)
Mg/l 196 < 30 < 100
4. Chemical Oxygen Demand (COD)
Mg/l 410 < 100 -
5. Faecal Coliforms MPN/

TA 7114-IND National Capital Region Planning Board Project
Final Report
Sheladia Associates, Inc. USA 157
Volume 1 – Main Rep
ort
Sl. No. Parameter Unit Raw sewage
Discharge standards
(restricted irrigation) 100 ml - Desirable NA - 1,000 - Max. Permissible NA - 10,000 Note : Faecal coliform norms correspond to treated effluent to be used for irrigation of edible crops which are usually not eaten raw.
410. In view of large difference between the quality of raw sewage and the discharge standards and to comply with the requirements of the pollution control authority, it is essential to provide for treatment of sewage and accordingly this component has been included in the overall scheme under the sub-project. Further, although the treated wastewater is proposed to be used for irrigation for most part of the year, it will also have to be disposed of directly into a water body during monsoon and therefore the treatment scheme will have to conform to a comparatively stringent criteria as provided in the Table ** above. The subsequent section deals with the relevant aspects of treatment, available technology options, etc.
Treatment Technology Options
411. Seven different available and proven technology options for sewage treatment
have been evaluated on a rigorous criteria involving diverse parameters e.g., process performance/efficiency, stability, liability of sludge treatment and disposal, level of mechanisation, energy consumption, land requirement, skill requirement, capital and operating costs, etc. The options comprise (a) conventional activated sludge process (b) UASB followed by a polishing pond (c) extended aeration (d) conventional trickling filter (e) waste stabilisation pond (f) facultative aerated lagoon, and (g) ‘Moving Bed Bio-reactor’ (MBBR). This comparison is presented in Table **.
Table 5.18 Comparison Of Available Sewage Treatment Technology Options Parameter ASP UASB
+FPU Ex. Aeration
FAL Trickling filter
WSP MBBR
Foot print (ha/mld)
0.2 0.3 0.15 0.3 0.3 2.8 0.1
Treatment efficiency (%)
85-92 < 75 > 95 85 90 90 >95
Power consumption (Lakh units/mld/yr)
1.2 0.05 1.8 1.2 0.7 0 0.9
Sludge liability High Low Low Low Medium Low Low Skill required High Medium Medium Low High Low Medium Life cycle cost (Rs. Lakh/mld)
141 78 155 141 129 173 113

TA 7114-IND National Capital Region Planning Board Project
Final Report
Sheladia Associates, Inc. USA 158
Volume 1 – Main Rep
ort
412. Based on this evaluation, the sub-project has decided in favour of MBBR, a compact system which offers the key advantages of low foot print, relatively lower power requirement, least liability of sludge treatment (no digestion required) and disposal, significantly higher treatment efficiency, high process flexibility, stability and robustness, simple and reliable operation, absence of odour and emission of corrosive gases, improved aesthetics, and finally the second lowest life cycle costs. The key deciding aspect has been the low foot print entailing lower land acquisition and lower land costs.
Treatment Scheme
413. MBBR is a hybrid technology which involves maintaining a very high population of
active bacteria in attached and suspended form in the reactor. The bacteria are kept attached on small plastic rings and the bed of rings is kept in fluidized form / suspension through vigorous mixing of compressed air. As a result of this arrangement while the technology does not require sludge recirculation but at the same time it enables operation on a very low ‘food to micro-organism’ (F/M) ratio.
414. As shown in the process flow sheet above, the treatment scheme will comprise
preliminary treatment in the form of screening at two stage i.e., prior to pumps and then after the pumps and a grit chamber. The scheme does not involve primary sedimentation, instead the wastewater will be directly let into MBBR reactor for biological treatment. There are two such reactors in series, each with a detention time of 45 minutes. On account of operation on low F/M ratio, the sludge that is produced is stabilized/digested and therefore the scheme also does not require the step of sludge digestion.
415. The technology is proven and available in common domain as there are several
providers in north India alone. Thus the selection of this technology is found to be appropriate under the given situation.
416. Subsequent step involves clarifier which will help in removal of the bio-flocks.
Typically a tube settler is provided because of its low foot print and high efficiency. Tertiary treatment will only involve chlorination so as to ensure compliance with the discharge norms on faecal coliforms.

TA 7114-IND National Capital Region Planning Board Project
Final Report
Sheladia Associates, Inc. USA 159
Volume 1 – Main Rep
ort
Fig 5.2: Flow sheet Of MBBR Technology For Sewage Treatment
Capacity and Phasing of the Treatment Plant
417. As described in a preceding section on flow estimates, the capacity of the sewage treatment plant in the first phase is kept at 3.75 mld. Although the intermediate design stage is considered as 2025, but depending on the growth of population, water consumption and sewage generation, the second module of equal capacity can be created earlier to meet the increased loads.
418. Based on these considerations, the STP will be constructed in two
modules/phases, while the land acquisition will correspond to the full requirement. As explained earlier, the pumping capacity will also be developed in phases.
Siting of the Treatment Plant
419. The STP is proposed to be located within 2 km from Pataudi town on the Gurgaon-
Rewari Road. As shown in Figure **, the proposed site is an agriculture field which is on the side of the road and also close to a local rivulet called Indori River. This rivulet eventually joins Sahibi river which is a tributary of River Yamuna and joins the latter in the Delhi stretch via the Najafgarh drain. The sub-project involves acquisition of about 2.04 hectare of land for construction of STP and pumping station.
Screen Grit
chamber Tank 1
Lamella
settler
Filter press/
Sludge drying beds
Thickener
Chlorinator
(Cl2 / Hypo
Soln)
☼
Blower
Tank 2

TA 7114-IND National Capital Region Planning Board Project
Final Report
Sheladia Associates, Inc. USA 160
Volume 1 – Main Rep
ort
Disposal of Treated Sewage
420. The treated sewage will be discharged either into the Indori River or used for
irrigation in the agriculture fields in the vicinity. PWD-PHED proposes to auction the rights for use of treated wastewater on an annual basis. Past experience shows that farmers prefer to use treated effluent during dry season and are typically prepared to pay a price of Rs. 100 per million litre. In view of this possible use, it becomes all the more necessary to include chlorination as the final treatment step.
421. In order to help dispose off the treated effluent to agriculture fields in the vicinity,
the sub-project includes the component of a final pumping station after the STP and a short channel for 17 mld upto the Indori Drain, approximately 60m long. However, based on field investigations it is perceived that the Indori Drain does not have adequate discharge capacity at or near the proposed point of disposal and it can lead to formation of a lagoon near the culvert/road embankment and inundation of adjoining agriculture fields.
422. However as shown in the Figure **, the Indori River is found to widen about 2 km
on downstream and offers fairly adequate discharge capacity. In view of this, it is suggested to consider inclusion of additional works viz., (a) a pond of 6 hour holding capacity within the STP compound (b) a small overflow weir, and (c) a channel of about 2 km until it joins wider section of the drain downstream. These measures will completely address the concern on inadequate discharge capacity of Indori River on one hand while enabling use of water for irrigation as well as contribute to natural recharge.
Difficulties Anticipated in Implementation
423. Pataudi being a small town with rural and agrarian background, some of the areas
are going to be congested and unplanned. In such areas, excavation of trenches and laying of sever lines can be difficult. In very small stretches the depth of excavation is seen to be relatively deep, going as much as 7 to 8 m. In all these cases appropriate methods and scheduling will have to be adopted to avoid inconvenience to the residents or disrupt commercial or other usual activities in the town. All additional expenses to be incurred towards such working conditions have been taken in to consideration while estimating the cost of project.
424. Slow pace during monsoon season: work is expected to proceed at a slow pace
during the monsoon season, which is spread from June to September. This will be applicable for both, the sewer laying as well as construction of treatment plant.
425. Interception of sewage flows from Hailey Mandi : In absence of a conventional
sewerage network in Hailey Mandi, it likely that the estimated sewage volumes from this town may not be reaching the STP and the latter may remain under-

TA 7114-IND National Capital Region Planning Board Project
Final Report
Sheladia Associates, Inc. USA 161
Volume 1 – Main Rep
ort
loaded. A separate sub-project for providing sewerage network in Hailey Mandi needs to be developed to maximize achievement of the objectives of protecting public health.
426. Land acquisition for the STP could be a long drawn process and could delay the
implementation. However, given the new policy of the GoH which offers liberal compensation, there will be less resistance in giving the land.
Cost Estimates
427. The cost of the sub-project is estimated to be Rs. 120.6 Million / US$ 2.57 Million.
A break up of various components is provided in the Table ** below. This cost estimate is arrived at after carrying out a detailed appraisal of the original proposal, discussions with the PWD-PHED officials and consultants and reflect the changes that have been suggested by the TA consultant. This cost estimate therefore represents the revised estimate.
Table 5.19 Capital Costs Of The Sub-Project Total Component Rs., Million US $, Million Sewers in Pataudi and common trunk sewers up to the sewage treatment plant
55.60 1.18
Sewage Pumping Station 9.90 0.21 Sewage Treatment Plant and all associated works including independent electric feeder.
15.70 0.33
Utilities at the STP 4.80 0.10 Land acquisition 26.10 0.56 Disposal works 8.5.0 0.18 Total 120.60 2.57
428. Costs of an independent power feeder, a standby generator set; and disposal works comprising a sump of 6 hour holding capacity, on overflow weir and a 2 km long drainage channel are included. However, the above estimate does not include the costs of laying sewer lines in Hailey Mandi and an outfall sewer upto Pataudi. These and the components for the northern part of the Hailey Mandi-Jatauli town will be taken up under a separate sub-project.
Operating and maintenance cost estimates
429. The total annual cost of operation and maintenance of the entire scheme
comprising sewerage network, pumping stations and the sewage treatment plant is estimated to be Rs. 5.48 Lakh. An itemized break-up is presented in Table **.

TA 7114-IND National Capital Region Planning Board Project
Final Report
Sheladia Associates, Inc. USA 162
Volume 1 – Main Rep
ort
Table 5.20 Abstract Of The Operation And Maintenance Cost SL. NO. Particulars Annual costs, Rs. Million A. Manpower 1.69 B. Electrical charges 2.07
C. Consumables 0.75 D. Repairs & Maintenance 0.00 - Civil works 0.30 - Mechanical and electrical 0.52 - Sewerage network 0.14
Total 5.47
Prioritisation
430. At the very outset and upon approval of the project, the process of acquisition of
land for the STP and the disposal works will commence. Laying of sewer lines in habitations will be taken up on priority according to sub-zones. Work of trunk sewers will be taken up in parallel and in accordance with laying of branch sewers and laterals. In the mean time, the PWD-PHED will mobilize the local municipal council to pass a local by-law/resolution for all residents to connect to the sewerage network. In this regard, it is reiterated that the GoH had already adopted the policy of waiving connection charges.
431. Work of sewage pumping station and the treatment plant will be taken up towards
the later part of the sub-project. The disposal works e.g., a pond, a weir and an outfall channel will be implemented in parallel towards the later phase of implementation of STP.
Implementation Schedule
432. The sub-project will be implemented by the PWD-PHED over a period of 3 years
from the date of release of loan. A detailed activity wise schedule of implementation/bar chart is presented in Appendix 21. The pre-project phase includes selection of ‘project management consultant’ and ‘design and supervision consultant’, preparation of revised DPR, land acquisition, rehabilitation of project affected people, preparation of bid documents, prequalification and selection of bidders for various construction packages and preparation of ‘Shifting of Utilities Plan’ and procuring of ‘Letter of Approval for Shifting’ from concerned agencies. This phase is expected to take around 10-12 months.
433. For the implementation phase, the bar chart shows activities according to the sub-
works proposed in the DPR i.e. sewer lines, raw sewage pumping station and sewage treatment plant. Two relatively larger items of independent electric feeder and effluent disposal works are also shown separately for ease in project planning and execution.

TA 7114-IND National Capital Region Planning Board Project
Final Report
Sheladia Associates, Inc. USA 163
Volume 1 – Main Rep
ort
Procurement plan
434. As shown in Table 5.21 the procurement plan for goods and works considers only
two packages, first for laying of the sewer network and second for the construction of sewage treatment plant and all related works. It is proposed that the contractor / technology provide who will carry out turn key execution of the treatment plant package will also be given the responsibility of trial run, commissioning and operation and maintenance of the STP for at least two years. The corresponding costs are included in the Package II.
Table 5.21 Procurement Packages For Goods And Works
Cost Package No.
Description Rs. Lakh US $, million
Remarks
I Laying of sewer lines in Pataudi town including branch, lateral and trunk sewers and all appurtenances.
55.60 1.18 Sewer lines in Hailey Mandi will be taken up under a separate sub-project.
II Construction of sewage treatment plant including raw and treated sewage pumping stations, electric feeder line and disposal works (pond, weir and disposal channel), M&E components, etc.; trial runs, commissioning and; two years of operation and maintenance.
76.10 1.62 A ball park estimate for the annual O&M cost for the entire scheme is Rs. 54.85 Lakh/ US$ 0.12 Million.
Total 131.00 2.80
435. In addition, there will be two separate procurement packages for services viz., engagement of a project management consultant (PMC) and a design and supervision consultant respectively. A detailed procurement plan for all packages is provided in Appendix 28.
3. Technical Analysis and Recommendations
436. This section provides a set of comments and observations based on an appraisal
of the original DPR which was submitted by the PWD-PHED to the NCRPB. These comments and observations have already been discussed with the PWD-PHED and appropriate modifications in the technical design of the sub-project have been incorporated. The scheme described in the preceding sections and the cost estimates correspond to the modified design after incorporating all the suggested

TA 7114-IND National Capital Region Planning Board Project
Final Report
Sheladia Associates, Inc. USA 164
Volume 1 – Main Rep
ort
changes. However, for the sake of completeness and for ease in revision of the original DPR, the comments and observations are reproduced in the paragraphs that follow.
437. The original DPR is rather comprehensive from technical and costing point of
views. However based on a rapid appraisal of the DPR it is determined that additional information is required to strengthen the proposal and establish a case for the project. The required information is elucidated in the paragraphs that follow.
Design period
438. Design period for sewerage network, pumping station and sewage treatment plant is considered as 30 years. A longer design period of this order is acceptable for sewerage network, however the same is not justified for the pumping station and the sewage treatment plant, especially when the ultimate design population is not more than 100,000.
439. In the case of pumping station, ideally the civil works should correspond to full 30
years while the pumping machinery at the outset should be for 15 years. In the case of sewage treatment plant in such a small town, generally a modular design approach should be adopted wherein the first module is for an intermediate period of 15 years and second module for an equal period is provided in the second phase. This modular/phased approach will ensure reasonably adequate hydraulic loading of the STP and also offer economy in resource deployment. However, it should be noted that land acquisition should correspond to ultimate requirement.
440. In view of the above arguments, it is recommended that the design of sewage
treatment plant, the pumping station and the corresponding cost estimates should be revised considering 15 year period for Phase-I.
Flow estimates
441. The estimated sewage flows which are based on the assumption of water being
available at a rate of 135 litre/capita/day (lpcd) must be justified, while the current water supply level is reported to be only 70 lpcd.
442. Based on the available data it is estimated that the present flow will be only about
28% of the proposed capacity of STP. In order to assess the risk of low hydraulic loading and establish case for construction in two phases, an analysis of the average and peak sewage flows for the present year, intermediate (15) year and the design (30) year should be provided.
443. The DPR must explain how the cost of sewer connection and the connection
deposit will be met. It must bring out the latest policy of the GOH which offers a waiver in small towns for connection deposit. The DPR must also provide a

TA 7114-IND National Capital Region Planning Board Project
Final Report
Sheladia Associates, Inc. USA 165
Volume 1 – Main Rep
ort
quarterly schedule of connections and time frame by when 100% household could be expected to be covered.
Schematic key diagram
444. An index map showing locations of the three towns relative to New Delhi, Gurgaon
and nearest highway, etc. must be provided. This will provide a synoptic view and proper perspective of the project to the decision makers. Similarly a schematic diagram showing connectivity of sewerage networks of Pataudi and Haily Mandi, location of sewage pumping station, STP, channel for disposal of treated sewage, receiving water bodies, potential areas for irrigation with treated sewage and other geographical features of the area should be provided..
Pumping station and rising main
445. Engineering design calculations for the sewage pumping station and the rising
main must be provided. The DPR has arbitrarily taken size of 350 mm for the rising main.
446. The pump assembly should ideally be reconfigured corresponding to the dry
weather flow (DWF) projections for 15 year period and according to the recommendations of the CPHEEO manual. According to the latter, an ideal pump assembly would comprise 1 pump each of 1DWF, 2DWF and 3DWF respectively with one standby of 1 DWF corresponding to an intermediate stage in year 2025.
447. The DPR must categorically specify the level of key water quality parameters e.g.,
BOD, suspended solids (SS), COD and DO to which the sewage will be treated. For discharge into Indori nalla/river, the treated stream should correspond to discharge standards for disposal into an inland water body. If the treated effluent is to be used exclusively for irrigation, then it should comply with discharge standards corresponding to disposal on land, which entails much lesser degree of treatment.
448. In order to avoid the possibility of stagnation of treated effluent near the
culvert/road embankment and inundation of adjoining agriculture fields, it is recommended to include additional works of (a) a pond of 6 hour holding capacity within the STP compound (b) a small overflow weir, and (c) a channel of about 2 km until it joins wider section of the Indori River downstream. These measures will make it convenient for the farmers in the vicinity to lift the treated effluent for irrigation.
Technology for sewerage network
449. The DPR proposes conventional sewerage technology, which is a norm of sort.
Conventional sewerage requires minimum flow velocity and involves deep

TA 7114-IND National Capital Region Planning Board Project
Final Report
Sheladia Associates, Inc. USA 166
Volume 1 – Main Rep
ort
excavation. In view of the uncertainty involved in water supply service levels and sewage flows that could be available, large difference between the initial and ultimate stage flows, the minimum velocity of flow in small towns such as Pataudi may not be assured all the time. From that point of view, the DPR should either make provision for equipment that may be required for flushing of sewer lines in the upper end of the network; of it should clearly state availability of such equipment with the PHED.
450. The DPR must address current weakness in the area of solid waste management
which can adversely affect performance of the sewerage network. An independent component on SWM by the local municipality addressing some of the related issues would enhance sustainability of the proposed system.
Technology for sewage treatment
451. The DPR must establish reasons for not considering the simple sewage treatment
technology of waste stabilisation ponds and availability of the selected option of MBBR technology in the common domain. A broad design criteria of the MBBR technology should be provided and measures to overcome the problem of unreliable power supply must be explained.
Exclude tertiary treatment
452. It is also noted that a tertiary treatment component is included in the detailed cost
estimates of the STP which are provided in the annexure part the report, however it is not described or justified in the main section where the project component or strategy are covered.
453. In view of the stated disposal options of treated sewage either going in to a natural
rivulet or used for irrigation, a tertiary treatment component (comprising coagulation and rapid sand filter) represents an ‘over design’. A tertiary component represents a rather advanced level of treatment which is usually required for very high end reuse application (e.g., industrial) or when the receiving water body demands very high quality effluent because of its sensitive nature. Evidently under the given setting neither of these considerations applies and therefore the tertiary component is not necessary. Accordingly it is recommended that STP capital cost should be reduced by Rs. 7.5 million.

TA 7114-IND National Capital Region Planning Board Project
Final Report
Sheladia Associates, Inc. USA 167
Volume 1 – Main Rep
ort
Institutional aspects
454. The DPR must establish that the sewerage charges will be collected by PHED from both the towns toward meeting the operating costs of the STP.
455. Experience of the department in construction of STPs and particularly the
operation experience of MBBR technology based plants must be elaborated and established. Also provide PHED experience of O&M of sewerage networks and explain how it will take care of this component.
456. An organisation structure of PHED at the circle and division levels should be
provided to establish availability of required expertise for construction, supervision and O&M of the STP. In addition, the DPR must explain possible institutional risks to the project, e.g., availability of budget for O&M of the sewerage network, pumping station, STP, etc.
Project Costs and Financial Matters
457. The information on capital cost of the project, O&M cost related to sewage
treatment plant, financing arrangement, and available options for revenue generation, etc. is presented at different places in the DPR. There is a need to consolidate this information from the point of view of the decision makers.
Capital costs
458. With regard to the cost of land, the DPR must elaborate on the current policy of
the GOH for acquisition and establish the rates which have been used in the estimates. There is a need to justify the rate adopted for land acquisition which is noted to be Rs. 860/sqm.
459. The capital cost estimates of the sub-project need to be revised in view of the
comments made in the preceding paragraphs, i.e.,:
i. Reduced capacity of the STP and sewage pumping station corresponding to the first phase of 15 years.
ii. Exclusion of the tertiary treatment component.
460. Further, the DPR must consider total cost of all works proposed under the sub-project and should not request funding for only that part of the cost that is apportioned to Pataudi while excluding the cost apportioned to Hailey Mandi. By adopting the apportioning approach, the implementing agency will not be able to complete the critical works e.g., pumping station and STP, etc.

TA 7114-IND National Capital Region Planning Board Project
Final Report
Sheladia Associates, Inc. USA 168
Volume 1 – Main Rep
ort
O&M costs
461. Information on the O&M costs provided in the main report is incomplete and needs to be quality assured in relation to what has been provided in the annexure on STP cost estimates. The O&M cost computations provided as sub-work 6 in the referred annexure cover expenses related to establishment/manpower, energy, consumables and repairs and maintenance. Total O&M cost is estimated to be Rs. 5.48 million per annum. Although the original DPR has made a provision of two years of O&M costs for funding, the latter must be excluded and a separate proposal to that effect must be made or it must be arranged from internal resources.
Replacement costs
462. The DPR does not discuss the crucial issue of replacement cost for mechanical
and electrical equipment which in sewage pumping and treatment works is typically incurred every 8-10 years on account of wear and tear and corrosion. The financial analysis needs to take these costs into account and suitable provisions would need to be made to sustain the plant operation over the entire duration of the design period. The sources of fund for meeting the replacement costs must be explained.
Revenue generation
463. Revenue projection has been carried out for the 30 year design period, however
the analysis covers only the population of Pataudi town while the STP will also be serving almost 60% population of Haily Mandi and Jatauli towns.
464. The revenue analysis considers possible income from sale of sludge (@ Rs. 1/kg),
treated sewage as irrigation water (@ Rs. 0.1/ kilo litre) and user charges (@ Rs. 6/ water closet). It is determined that the annual revenue from all these sources is very low compared to the annual O&M costs and the DPR makes the case for levying of sewerage charges at a rate of 70-80% of the water charges, however it does not comment on willingness on the part of the users and feasibility to implement this measure. The difficulty in increasing revenue from such streams is acknowledged which makes the case for budgetary allocation for O&M costs from the state government.
465. The DPR must provide a feasibility analysis of the option of selling treated sewage
for irrigation and establish willingness of farmers in the vicinity of the STP site to use the treated sewage for irrigation and pay for the facility at an assumed rate of Rs. 0.1 per kilo litre.

TA 7114-IND National Capital Region Planning Board Project
Final Report
Sheladia Associates, Inc. USA 169
Volume 1 – Main Rep
ort
Phasing
466. The rational of phasing expenditure/fund requirements in the ration of 27%, 48% and 25% over the three year period must be explained and adequately justified.
Implementation plan
467. The DPR must provide assumptions, qualifying remarks and explanations about
feasibility and / or risks of completion of the project in a period of 33 months, highlighting critical items. It must provide a quarterly programme of laying pipelines and upon completion a programme of giving connections to residents.
4. Safeguards
Social - Land Acquisition, Involuntary Resettlement and Impact to Indigenous Peoples
468. The project involves acquisition of private agricultural land measuring 30 acres for
siting the Water Treatment Plant (STP) and 5 acres at the intake point. Water will be drawn from the Gurgaon water Supply Canal at Budhera village where an intake station is proposed in private land measuring 5 acres. From the intake station water will be transferred through 600mm dia transmission main to Janaula village where a water treatment plant is proposed in private land measuring 30 acres. The 26.5km long transmission main will be laid along road margins and will not involve any land acquisition but will cause temporary disruption to residences and business establishment along the transmission main alignment. Both boosting stations proposed are being sited in existing Municipality land. Water from WTP to boosting station will be transferred through 400/300mm dia transmission main that will be laid along the road margins and will not involve any land acquisition. In all, the project envisages acquisition of 35 acres of private agricultural land.
469. The acquisition of 35 acres of private agricultural land will cause loss of income to
the 27 landowners from whom land is proposed to be acquired. The water transmission mains are likely to cause temporary disruption to commercial establishment and residences along the alignment. Involuntary resettlement impacts are not significant and the census and socio-economic surveys in the project area have revealed that there are no IP amongst the landowners or among agricultural labourers and hence the project will not require any IPP. However, after the 4(1) notification under LA Act and preparation of land plan schedule, if any IP is identified, the project will address the same in line with the Draft ESMS of NCRPB.
470. The project will impact 27 households who would lose their cultivable land. The
project does not impact any common property resources.

TA 7114-IND National Capital Region Planning Board Project
Final Report
Sheladia Associates, Inc. USA 170
Volume 1 – Main Rep
ort
471. In line with the Draft ESMS of NCRPB, projects funded by NCRPB will require a resettlement plan and/or an indigenous peoples plan commensurate with the significance29 of impact. Providing Water Supply to Pataudi Town will come under S-2 category for involuntary resettlement and S-3 category for indigenous peoples as per NCRPB’s social categorization.
472. A short resettlement plan has been prepared in line with the Draft ESMS
requirements. The summary of resettlement impacts is given in the following table. Table 5.22 Summary of Resettlement Impacts
Impact Providing Water Supply
for Pataudi Town Permanent Land Acquisition (ha) 35.0 acres
Temporary Land Acquisition (ha) 0
Affected Households (AHs) 27 a
Affected Persons (APs) 157
Titled APs 157
Non-titled APs (Encroachers) 0
Female-headed AH 0
IP/ST-headed AH 0
BPL AH 0
Affected Structures 0
Affected Trees/Crops 0
Affected Common Property Resources 0
Average Family Size 5.8
Average Household Income Rs.6,333/- p.m.
a The 27 households losing their cultivable land will face significant impact.
29
As per the Draft ESMS projects are categorized based on the significance of involuntary resettlement and impact to indigenous
peoples. Involuntary resettlement categories are (a) Category S-1 (Significant Impact): means 200 or more people will experience major impacts, which are defined as (i) being physically displaced from housing, or (ii) losing 10% or more of their productive assets (income generating). Category S-1 projects require a full resettlement plan; (b) Category S-2 (Not Significant). Category S-2 projects include involuntary resettlement impacts that are not deemed significant and require a short resettlement plan; and (c) Involuntary Resettlement Category S-3: There is no involuntary resettlement impacts and hence does not require any action. Indigenous Peoples categories are (a) S-I Significant impacts are those projects that directly or indirectly affect the dignity, human rights, livelihood systems, or culture of indigenous peoples or affect the territories or natural or cultural resources that Indigenous peoples own, use, occupy or claim as their ancestral domain. Category S-1 projects will require a indigenous peoples plan; (b) S-2 Not Significant are projects where the indigenous peoples are the sole or the overwhelming majority of project beneficiaries, and when only positive impacts are identified. Category S-2 projects will require a summary note on IP in project document; and (c) S-3 are projects where no impacts on indigenous peoples are envisaged and hence does not require any action.

TA 7114-IND National Capital Region Planning Board Project
Final Report
Sheladia Associates, Inc. USA 171
Volume 1 – Main Rep
ort
Environmental
473. Pataudi sewerage sub-project, comprising improvements in the sewerage systems to the towns of Pataudi and Hailey mandi, has been categorized as Category E-2, and accordingly an Initial Environmental Examination (IEE) and an Environmental Management Plan (EMP) prepared by PHED. The Environmental Information Format for Screening, as laid down in the ESMS is provided in the IEE. Location impacts pertaining to siting of alignment within or in the vicinity of environmentally sensitive areas are not envisaged, and Sultanpur birds’ sanctuary and Aravalli hills are the sensitive sites located within 50km of the town, and impacts on these areas are not likely. The proposed project components are sited within the Government lands and within the available RoW, with the exception of the STP and intake points, which involve acquisition of 2.04 ha private lands. Clearance of trees (mostly eucalyptus and acacia species) along the STP is envisaged and shall be addressed through compensatory plantation activities carried out in line with the ESMS provisions, after clearances from the Forest Department.
474. Given the magnitude of civil works, there would be typical construction related
impacts, and could be mitigated by appropriate mitigation measures and adoption of good construction practices. These have been put forth in the EMP. The construction impacts include impacts associated with laying of networks / pipelines in the vicinity of settlements, and temporary disruption to the businesses and communities along these networks. Potential impacts due to inadequate discharge capacity near the proposed point of disposal in Indori Drain leading to formation of a lagoon near the culvert/road embankment and inundation of adjoining agriculture fields, have been addressed in the design through inclusion of the following measures in the design viz., (a) a pond of 6 hour holding capacity within the STP compound (b) a small overflow weir, and (c) a channel of about 2 km until it joins wider section of the drain downstream. Apart from the good engineering practices to be adopted during construction of the project components, the EMP provides for measures to address the environmental conditions and safety of the residents and construction workers during construction. The effective implementation of the measures proposed will be ensured with the technical expertise of an Environmental Specialist as part of the Supervision Consultants. The environmental impacts during operation of the system are limited and shall include potential leakage in the system leading to contamination of supplied water etc, towards which monitoring, management and maintenance is proposed. Further, the environmental monitoring plans prepared as part of the EMP will provide adequate opportunities towards course correction to address any residual impacts during construction or operation stages.

TA 7114-IND National Capital Region Planning Board Project
Final Report
Sheladia Associates, Inc. USA 172
Volume 1 – Main Rep
ort
D. FINANCIAL AND ECONOMIC ANALYSIS OF PATAUDI WATER SUPPLY AND SEWERAGE PROJECTS
1. Financial Analysis
General
475. Detailed financial analyses were conducted to examine the financial viability of the revenue generating subprojects. The analyses were undertaken in accordance with ADB's Framework for the Economic and Financial Appraisal of Urban Development Sector Projects. Financial Internal Rates of Return and Average Incremental Financial Costs were calculated and sensitivity analyses were carried out for each subproject. The proposed tariff levels were assessed to ascertain their affordability to the beneficiaries, in particular the low-income group and poor households, i.e. those below the poverty line. PHED of Government of Haryana will implement the Water Supply and Sewerage projects in Pataudi. Financial projections for the PHED division were also performed to determine the financial capability of the MC to implement and operate the subprojects on a sustainable basis.
Assumptions Used in Financial Projections
476. Financial projections performed for the division of PHED consist of projected revenue receipts and revenue expenditures during the assumed implementation period (FY 2010-11 to FY 2012-13) plus 20 years after project completion. The projected revenue receipts include water and sewerage connection and user charges. Government of Haryana (GoH) will provide grants-in-aid in case of shortfall in revenue. The projected revenue expenditures include all recurrent expenditures, including those of the subprojects, to be met from revenue receipts. The financial projections also include the PHED’s (GoH’s) assumed equity contribution to be met from its own resources in accordance with the financing plan.
Cost Recovery
477. Water Supply - Under the existing tariff, PHED operation is highly subsidized by the State Government. The revenues collected from water sales represent only about 15% of operation and maintenance cost. Water tariff increase proposed in volumetric basis from end of project implementation year @ Rs. 15 per KL in FY 2014. Further 20% increase has been proposed in FY2019 and thereafter every four years. The analysis shows that the average tariff, for the water supply fully cover incremental O&M costs with their average tariffs higher than AIFC for O&M. Minimum tariff required to recover the full O&M cost is INRs.1.5/KL (at 2009 prices) in FY2014. Under recovery of cost due to constraints in increasing tariff will have to be subsidised by GoH.
478. Sewerage - Presently, PHED levies monthly charge of Rs. 6 per closet seat
wherever sewerage system is present. This is too low to cover the operation cost of operations. Proposed sewerage is @30% surcharge on water charges and a

TA 7114-IND National Capital Region Planning Board Project
Final Report
Sheladia Associates, Inc. USA 173
Volume 1 – Main Rep
ort
connection fee of Rs. 2250 per connection. Like water supply, sewerage operation is subsidized by the State Government. In Pataudi and Haily Mandi towns there is no sewerage system and hence no revenue.
Financial Internal Rate of Return
479. The financial viability of a subproject is assessed by comparing the subproject’s Financial Internal Rate of Return (FIRR) with the Financial Opportunity Cost of Capital (FOCC). As proxy for the FOCC, the Weighted Average Cost of Capital (WACC) of the subprojects in real terms is used. FIRR is the discount rate that equalizes the present values of costs and revenues over the subproject life while the WACC represents the cost incurred by the MC to implement the subprojects.
480. The WACC of the subprojects is 5% (real terms). The calculation of the WACC is
shown in the table that follows. Table 5.23 : Weighted Average Cost of Capital
Particulars Loan Equity Total
Weight (%) 75.00% 25.00% 100.00%
Nominal Cost (%) 9.00% 10.00%
Tax Rate (%) 0.00% 0.00%
Tax Adjusted Nominal Cost (%) 9.00% 10.00%
Inflation Rate (%) 5.00% 5.00%
Real Cost (%) 3.81% 4.76%
Weighted Component of WACC (%) 2.86% 1.19% 4.05%
Weighted Average Cost of Capital (Real) 4.05%
481. FIRR was calculated for the revenue generating water supply and sewerage
projects. The assumptions and approach used in the calculation of the FIRR include: i) all revenues and costs are stated at constant November 2009 prices; ii) all revenues and costs are calculated on an incremental basis, i.e. difference between “with project” and “without project” situations; iii) project capital expenditures are recognized at the time they are incurred; and iv) equipment replacement costs have been included every 15 years.
482. Sensitivity analyses were also carried out to determine the possible effects of
adverse changes on the subprojects. The adverse changes are: i) 10% increase in capital costs; ii) 10% increase in O&M costs; iii) 10% decrease in revenues; and iv) one year delay in benefits.
483. The results of the FIRR calculation and sensitivity analyses are summarized in the
table below. The details of the calculation and analyses are in Annex 1.1 to 1.3

TA 7114-IND National Capital Region Planning Board Project
Final Report
Sheladia Associates, Inc. USA 174
Volume 1 – Main Rep
ort
Table 5.24 Summary of Financial Evaluation
Component NPV @ 4% Rs. Million
FIRR, SI & SV
Base Case
Capital Costs + 10%
O&M Costs + 10%
Revenues - 10%
Benefits Delay by One Year
Water 247.5 FIRR (%)
6.3 5.4 6.1 5.1 4.2
1.6 0.4 2.4
SV (%) 61 253 41
Sewerage (14.5) FIRR
(%) 3.2 2.4 2.7 1.9 2.3
SI 3.1 1.5 6.6
SV (%) 33 66 15
Water and Sewerage 233.0 FIRR (%) 5.9 4.7 5.4 4.7 5.3
2.5 1.0 2.7
SV (%) 41 99 38
NPV = Net Present Value
SI = Sensitivity Indicator (ratio of percentage change in NPV to the percentage change in a variable)
SV = Switching Value (percentage change in a variable required for the NPV to become zero)
Average Incremental Financial Cost and Subsidy
484. In setting the tariff, the appropriate target level to achieve subproject financial adequacy and sustainability is the long run marginal (LRM) cost which includes both the incremental investment and O&M costs. The Average Incremental Financial Cost (AIFC) is regarded as an approximation of the LRM cost. The AIFC for each project was calculated by dividing the present value of the incremental subproject costs streams (capital and O&M) by the present value of the incremental volume of wastewater flow. The costs and quantity streams were both discounted at the WACC of 4%.
485. The following table summarizes the calculation of the AIFC, its relation with the
average tariff and the resultant financial subsidy. Table 5.25 Average Incremental Financial Cost
Particulars Water Sewerage Water +
Sewerage
PV of Project Costs @ 4% (Rs. Million)
1,166.46 200.23 1,343.58
PV of Project Revenues @ 4% (Rs. Million)
802.96 193.24 1,443.71

TA 7114-IND National Capital Region Planning Board Project
Final Report
Sheladia Associates, Inc. USA 175
Volume 1 – Main Rep
ort
PV of Quantity* @ 4% 33 17.31 28.66
AIFC** 35.56 11.57 46.88
AIFC (Rs./KL) for O&M 9.61 4.30 10.59
Average Tariff** 24.48 11.17 50.38
Financial Surplus (Subsidy)** (11.08) (0.40) 3.49
AIFC Recovery (%) 69% 97% 107%
486. The average tariff of the sewerage subproject could not cover fully all its costs.
2. Economic Analysis
Water Supply
487. As per the vision outlined in the DPR, the specific goals of the sub-project for
augmenting water supply in Pataudi and Hailey Mandi in particular are to:
• Raise water supply service level at the consumer end from the present 58 lpcd to 135 lpcd.
• Eliminate dependence on groundwater as the only source of supply considering the concerns on deteriorating quality and declining yield.
• Strengthen and refurbishing existing distribution network to minimise UAW and chances of contamination during supply.
• Install bulk water meters at strategic locations to ensure measurements and effective management of the augmented water supply system.
• Encourage residents to install domestic water meters for gradual shift towards consumption based user charges and thereby increasing service quality.
Economic Cost:
488. From the cost estimate discussed in Section of this report, the ‘base’ project
financial cost is estimated to Rs. 794.6 million. Considering the contingency and allowances of additional 10% for Physical contingency, the total project financial cost was worked out to Rs 874 million and this is phased during the three year construction period as follows:
� 2010-11 – 20% � 2011-12 – 60% � 2012-13 – 20%
489. For the analysis purpose the tax element of 12% included in the above financial
cost has been excluded. Considering the standard procedures recommended for

TA 7114-IND National Capital Region Planning Board Project
Final Report
Sheladia Associates, Inc. USA 176
Volume 1 – Main Rep
ort
economic feasibility analysis, the above financial cost was converted into economic cost for the analysis.
Project Benefits:
490. The main project rationale lies for the rehabilitation of the water supply system for
Pataudi Town in filling the demand – supply gap resulted from
• Lack of coverage and • Inefficient functioning of the existing system
491. Incremental Benefit: This component has a positive effect on the total consumption
due to the proposed subproject. The benefit has been evaluated by using the willingness to pay (WTP) for additional consumption in the present analysis30.
492. The average amount each HH is willing to pay for water supply is Rs.60.26 per
month. The average amount each HH willing to pay from among those who are willing to pay some amount is Rs.69.48. Twelve percent are willing to pay Rs.150 per month for water supply followed by 5 percent who are willing to pay Rs.100 and 8 percent had stated that they are willing to pay Rs.75. In all one-fourth are willing to pay Rs.100 and above. Sixty one percent had stated that they are willing to pay Rs.50 and the average amount that the households desire to pay is Rs.60. However, amongst those who are willing to pay some amount, the average amount that the households are willing to pay is Rs.70.
30
The survey adopted Contingent Valuation method to elicit the willingness to pay of the households on water supply and sewerage services since the households are not exposed to the type of services proposed. The samples were distributed in both the municipalities and a few villages. The population was stratified based on income levels of people with input from PHED officials and within each strata samples were chosen randomly proportion to the size of the strata.
Cumulative HH Distribution
0
20
40
60
80
100
120
150 100 75 50 0
Amount willing to Pay
Per
cent
age
of H
H

TA 7114-IND National Capital Region Planning Board Project
Final Report
Sheladia Associates, Inc. USA 177
Volume 1 – Main Rep
ort
493. Non-incremental Benefit / (Loss). This is evaluated by the differential price paid by the new households, presently drawing water from other sources of water and standposts, availing the water service connection. Other non-increment benefit in the form of resource cost savings are: (a) tanker water purchase cost saving; (b) storage tank cost saving; (c) water purification cost saving; and (d) time savings. Time savings resulting from water collection, which is more acute in the dry season and is quantified using the opportunity cost of unskilled urban women laborers. Valuation of resource cost savings time savings; water purification cost saving, storage tank cost saving and tanker water purchase cost saving was done by using data and information available for a) time taken to fetch water; b) amount spent on purification of water; c) cost of storage tank and d) amount paid for purchasing water through tanker from the Socio-Economic survey, secondary data and physical enquiries was used.
494. Exclusions. The following benefits of water supply project have not been quantified
for want of adequate data and quantification techniques. These qualitative benefits along with the quantifiable benefits discusses above, the proposed water supply system will tend to provide better living condition in the project town.
(i) Public cost of treating water borne diseases due to poor environmental sanitation; (ii) Effects on businesses and industries, such as aquaculture and fisheries,
agriculture and washing; and (iii) Effects on tourism and tourist-related businesses.
Economic Feasibility Analysis
495. The analysis period of the project is taken as 24 years from the base year 2009-10
as follows: • Base Year 2009-10 • Construction period – 2010-11 to 2012-13 • Project opened start year – 2013-14 • End of the analysis period –2032-33
496. Number of operating years after project improvement, considered for economic
analysis – 20 years. Thus, 20 years of operation, in effect, from the operation start of the proposed project i.e. 2013-14, has been considered for economic evaluation for the project road.
497. The cost – benefit analysis is carried out by using the discounted cash flow (DCF)
technique to obtain the economic internal rate of return (EIRR) and economic net present value (ENPV) for the proposed investments and the likely quantified project benefits linked with the project during the defined project analysis period
498. Economic Opportunity Cost of Capital (EOCC) - Given the complexity of
estimating country-specific economic opportunity cost of capital (EOCC), a discount rate of 12% in constant economic prices is generally used as a proxy for

TA 7114-IND National Capital Region Planning Board Project
Final Report
Sheladia Associates, Inc. USA 178
Volume 1 – Main Rep
ort
EOCC in the economic analysis of ADB-financed projects. The EIRR must be compared with the economic opportunity cost of capital, for interpretation purpose of project feasibility. Results of the analysis are presented in Table below.
Table 5.26 Economic Cost-Benefit Analysis for Water Supply Component, Pataudi Town Details Present Value (Rs. million) a/
Costs Capital costs 484 O&M costs 121 Economic cost for alternate use of water for irrigation purpose 2 Total costs 607 Benefits Total Resource Cost Benefits 435 -time savings 291 Incremental Benefits 79 Total benefits 805 Economic Return Measures Net present value (Rs. Million) 198 EIRR (%) 15.4 In 2009-10 prices. Discounted to 2009-10 at 12% real discount rate.
Source: Analysis
Sensitivity Analysis
499. Sensitivity analysis was carried out to their economic feasibility results for the following scenarios: • Capital cost increase by 20% • O&M costs increased by 20% • Target beneficiaries reduced by 20% • Delay in accrual of benefit by 1 year • Combined adverse condition
500. Results of the sensitivity analysis for the proposed project are summarized below
in Table 5.27 Table 5.27 : Sensitivity Analysis for Water Supply Component (EIRR)
Details EIRR Switching Value c/
Main Evaluation (Base Case) a/ 15.4%
Capital Cost Overrun b/ 13.2% 70.8%
O&M Cost Overrun d/ 15.0% 431.9%
Decrease in Project Benefits e/ 12.6% 54.7%
One Year Delay in Implementation 15.2%
All Four Tests Combined 10.4%

TA 7114-IND National Capital Region Planning Board Project
Final Report
Sheladia Associates, Inc. USA 179
Volume 1 – Main Rep
ort
a/ From Table 5.26. b/ 20% increase in capital cost estimates. c/ Calculated as the percentage change in a variable required for EIRR to reduce to 12%. d/ 20% increase in O&M cost. e/ 20% decrease in project benefits Source: Analysis
501. Of the four sensitivity scenarios (cost overrun, O&M cost increase, reduced beneficiaries, delay in implementation) reduced benefits is the most vulnerable to EIRR, followed by cost overrun. Considering the more sensitiveness of these variables, following implementation arrangements need to be focused more so as minimize the project risk:
• Ensuring adequate project coverage of beneficiaries through advance
commitment from HHs for individual connections or making mandatory for all individual connections through project design;
• Timely implementation of the project through appropriate procurement method in which incentive for early completion may be included;
• Adequate focus for LA and utility shifting related project components so as to avoid project delay
Sewerage Project
Project Benefits: 502. The survey results indicate that the potential beneficiaries are prepared to pay for
the improved services of Sewerage services. The economic benefits considered are:
• Savings in septic tank capital cost; • Savings in septic tank maintenance cost; • Savings in days lost due to sickness and reduction in household expenditure on
treatment of water borne diseases both considered based on discussions with PHED and Government of Haryana officials and other similar projects;
• Savings in cost of flooding (covering population in Haily Mandi including Jatauli town); and
• User charges
503. Avoided Economic Cost: The Socio Economic Survey collected information from sample households and the information collected from secondary sources are used to estimate the economic costs that would be avoided with improved infrastructure services for the project beneficiaries and they include: expenditure on disposing of wastewater; expenditure on treating environmental sanitation related diseases.
504. Exclusion For non-availability of adequate data the benefits arising out of reduced
pollution, reduction in the incidence of diseases and morbidity, improved

TA 7114-IND National Capital Region Planning Board Project
Final Report
Sheladia Associates, Inc. USA 180
Volume 1 – Main Rep
ort
environment due to cleaner city and the like are not included in this analysis as these could not be quantified and valued.
Economic Feasibility Analysis
505. The analysis period of the project is taken as 24 years from the base year 2009-10
as follows:
• Base Year 2009-10 • Construction period – 2010-11 to 2012-13 • Project opened start year – 2013-14 • End of the analysis period –2032-33
506. Number of operating years after project improvement, considered for economic
analysis – 20 years. Thus, 20 years of operation, in effect, from the operation start of the proposed project i.e. 2013-14, has been considered for economic evaluation for the project road.
Economic Feasibility criteria:
507. The cost – benefit analysis is carried out by using the discounted cash flow (DCF)
technique to obtain the economic internal rate of return (EIRR) and economic net present value (ENPV) for the proposed investments and the likely quantified project benefits linked with the project during the defined project analysis period
Economic Opportunity Cost of Capital (EOCC).
508. Given the complexity of estimating country-specific economic opportunity cost of
capital (EOCC), a discount rate of 12% in constant economic prices is generally used as a proxy for EOCC in the economic analysis of ADB-financed projects. The EIRR must be compared with the economic opportunity cost of capital, for interpretation purpose of project feasibility. Results of the analysis are presented in Table 5.28.

TA 7114-IND National Capital Region Planning Board Project
Final Report
Sheladia Associates, Inc. USA 181
Volume 1 – Main Rep
ort
Table 5.28: Economic Cost-Benefit Analysis for Sewerage Project, Pataudi Town Details Present Value (Rs. million) a/
Costs Capital costs 96 O&M costs 29 Total costs 125 Benefits Total Resource Cost Benefits 128 -time savings 4 Incremental Benefits 22 Total benefits 154 Economic Return Measures Net present value (Rs. Million) 29 EIRR (%) 15.9 a/ In 2009-10 prices. Discounted to 2009-10 at 12% real discount rate.
Source: Analysis
Sensitivity Analysis
509. Sensitivity analysis was carried out to their economic feasibility results for the following scenarios:
• Capital cost increase by 20% • O&M costs increased by 20% • Target beneficiaries reduced by 20% • Delay in accrual of benefit by 1 year • Combined adverse condition
510. Results of the sensitivity analysis for the proposed project are summarized below
in Table 5.29. Table 5.29 : Sensitivity Analysis for Sewerage Project (EIRR)
Details EIRR Switching Value c/
Main Evaluation (Base Case) a/ 15.9%
Capital Cost Overrun b/ 13.0% 54.0%
O&M Cost Overrun d/ 15.1% 228.9%
Decrease in Project Benefits e/ 11.7% 32.8%
One Year Delay in Implementation 15.8%
All Four Tests Combined 8.9%
a/ From Table 5.28 b/ 20% increase in capital cost estimates. c/ Calculated as the percentage change in a variable required for EIRR to reduce to 12%. d/ 20% increase in O&M cost. e/ 20% decrease in project benefits Source: Analysis

TA 7114-IND National Capital Region Planning Board Project
Final Report
Sheladia Associates, Inc. USA 182
Volume 1 – Main Rep
ort
511. Of the four sensitivity scenarios (cost overrun, O&M cost increase, reduced
beneficiaries, delay in implementation) reduced benefits is the most vulnerable to EIRR, followed by cost overrun. Considering the more sensitiveness of these variables, following implementation arrangements need to be focused more so as minimize the project risk:
• Ensuring adequate project coverage of beneficiaries through advance commitment from HHs for individual connections or making mandatory for all individual connections through project design;
• Timely implementation of the project through appropriate procurement method in which incentive for early completion may be included;
• Adequate focus for LA and utility shifting related project components so as to avoid project delay
Distribution of Project Benefits 512. Distributional analysis, which leads into calculation of the Poverty Impact Ratio
(PIR) i.e., the proportion of project net benefits accruing to the poor, is presented in the table below..
513. Assumptions followed in the analysis include:
• The financial effects statement for the water supply and sewerage subprojects has been adjusted by non-monetized outputs and resource cost savings. Appropriate factors for converting financial prices of resource cost savings and user charge revenue to economic prices have been used (to adjust to taxes, unskilled labour wage rate and shadow exchange rate);
• Economic values have been expressed in domestic price;
• The effect of subproject financing has been excluded;
• The effects of loss of access and other types of disruption to residents and business due to works during the construction have been excluded; and
• All values are presented in the net present value (NPV) at 12 percent discount rate and calculated for the year 2009-10.
514. Main features of the distribution analysis for Pataudi Town are presented in table and indicate;
• The financial effect statement indicates that the financial results for the Project are with a net gain of Rs. 298 million in NPV terms;
• The economic effect statement indicates that the economic results for the subproject are with a net gain of Rs. 231 million in NPV terms;
• The net economic benefits of the sub project exceeded the net financial benefits by Rs. 298 million in NPV terms;
• The main beneficiaries of the subproject are Households in Pataudi (Rs. 294

TA 7114-IND National Capital Region Planning Board Project
Final Report
Sheladia Associates, Inc. USA 183
Volume 1 – Main Rep
ort
million in net present value terms discounted at 12 percent).
• Other gainers are unskilled laborers engaged during construction and maintenance (Rs. 19 million, in net present value terms discounted at 12 percent).
515. The assumptions used to estimate the poor proportion of each group identified in
table are detailed in footnotes to the table. Poor households have been defined in terms of those living Below Poverty Line (BPL) and Poor. The analysis shows that the Poverty Impact Ratio (PIR) for the subproject in Pataudi is 65 percent.
Notes: a/ 12% for Water Supply and Sewerage Components. b/ Collection time savings c/ Resource cost savings from overhead tank capital cost and non-incremental benefit d/ Adjusts for taxes (12%) for local costs. e/ Adjusts for taxes at local costs and shadow wage rate. f/ Calculated as Total Benefits - Total Costs. g/ Calculated as sum of gains and losses h/ Considers only Poor of Socio-economic categories whose monthly HH income is less than
Rs. 2500
Househo
lds
Unskill
ed
labour
ULB Govern
ment Tota
Benefits
Non-monetised Outputs b/
294 294 294 294 Resource Cost Savings
c/563 0.94
e/530 (34) (34) (34)
User Charges
101 1.00 101 Total
664 925 261 - Costs - Capital Cost - Unskilled labour 67 0.72
f/ 48 (19) 19 19
Capital Cost - Land
Capital Cost - Other costs 514 0.97 499 (15) 15 15 O&M - Unskilled labour 0.72
f/ - - - -
O&M - Other costs 150 0.98 147 (3) 3 3 Total
731 694 (37) - Net Benefits
f/ (67) 231 298 -
Gains & Losses g/
294 19 - (15) 298
Calculation of Poverty Impact Ratio
46% 100% 46% 18%
134 19 - (2.7) 150
231 65%
Table 2.35: Distribution of Project Benefits and Calculation of Poverty Impact Ratio ( Present Value at 12% Discount Rate a/, Rs. Million) - Subprojects,
Details
Financial
Effects
Conversion
Factor
Economic
Effects
Economic
minus
Financial
Distribution of Project
Percentage of Poor h/
Benefits to poor
Total benefits to
Total project
Poverty Impact Ratio

TA 7114-IND National Capital Region Planning Board Project
Final Report
Sheladia Associates, Inc. USA 184
Volume 1 – Main Rep
ort
Conclusion
516. The main evaluation has indicated that the proposed water supply sub project for
Pataudi, Haily Mandi Town including seven villages and sewerage sub project for Pataudi Town and Haily Mandi (63% population connected to Trunk Sewer) town was found to be economically viable, with the calculated EIRR values exceeding the economic opportunity cost of capital. The sensitivity analysis has demonstrated the robustness of this result.
517. Furthermore, for the proposed water supply subproject, the calculated EIRR value
is considered minimum estimates of economic return, as there are a number of economic benefits of reduced water pollution related issues, improvement in sanitation, tourism benefits and a cleaner city that have not been quantified.
518. Going forward this method of financing sewerage is unsustainable and NCRPB as
a planner and financier could attempt helping smaller towns develop a coherent investment plan. This investment plan would consist of two charges – a one- time fixed connection charge (around INR 5000-8000) and a tariff combined with the water bill. This method of financing has been used successfully by smaller towns on the edge of a metro – Alandur near Chennai, Municipalities’ around Bangalore. It may also be worthwhile for NCRPB to assist states in developing a priority list based on population and potential regional environmental damage to the groundwater by non-treatment.

TA 7114-IND National Capital Region Planning Board Project
Final Report
Sheladia Associates, Inc. USA 185
Volume 1 – Main Rep
ort
E. DEVELOPMENT OF MULTI-MODEL TRANSIT CENTRE AT ANAND VIHAR, NCTD
1. Rationale for Subproject
519. To de-congest Delhi road network, and to provide an integrated transit solution, Government of NCT of Delhi has decided to provide ISBT on the outskirts of Delhi with a range of modes (local bus, metro, railways, auto rickshaws, etc.) connecting these with rest of the Delhi. At present an Inter state bus terminal (ISBT) is functioning at Anand Vihar, which is focusing on the requirement of interstate bus traffic and associated transport needs. The local buses also operate from the terminal providing access to the ISBT from various parts of the city. There is a need for improving the transport infrastructure to keep pace with the rapid development and to achieve this goal, Government of NCT of Delhi has proposed to develop/redevelop/upgrade Inter State Bus Terminals (ISBTs) in Delhi and the same is also to act as Multi Modal Transit Center (MMTC). It is proposed to upgrade the ISBT at Anand Vihar to a MMTC as it provides an ideal location with Anand Vihar metro rail station and Anand Vihar railway station located next to each other. A proper integration of all four modes of public transport which is servicing from Anand Vihar viz. Interstate bus, Local bus, Rail and Delhi Metro is essential to achieve objective to have an integrated multi-modal network of mass transit systems.
520. The MMTC planned at Anand Vihar will facilitate seamless integration of the inter-
city and intra city transit options in the area and largely benefit inter modal transfer by transit passengers with reduced transfer times and improved comfort. This will also have significant impact on the utilization of transit services as transfer between local bus to metro rail and interstate bus/train services become very convenient. The metro station is under construction and will be operational in 2010. Also the Anand Vihar railway terminal will become a main boarding/ alighting station for trains towards ---. These two developments will have major impact on the transfers from/to local buses at Anand Vihar and a convenient transfer will have a positive impact on the utilization of the mode combination thus reducing personal modes for access to the metro and train services. Also this will have a positive effect on the metro rail ridership thus further reducing the traffic on the road. The single ticket scheme being developed for bus and metro rail use will further help in this aspect. The passengers will also benefit from the pedestrian friendly design for the MMTC which will improve the safety of passengers and improved environmental comfort. The proposed MMTC will thus provide significant community benefits and will have a positive impact on the transport movement in the area.
2. Scope and Components;
521. The development of Anand Vihar ISBT into a Multi Model Transit Centre (MMTC) will involve the following:

TA 7114-IND National Capital Region Planning Board Project
Final Report
Sheladia Associates, Inc. USA 186
Volume 1 – Main Rep
ort
• Redevelop the existing ISBT as Multi Modal Transit Center (MMTC). • Facilitate an effective multi-modal changeover by integrating the existing ISBT
with the Anand Vihar Gate Metro station and Railway Station. • Provide a state-of-the-art Multi Modal Transit Center that is user friendly, catering
to varied passengers’ comfort, pedestrian-friendly, ecologically sustainable, handicapped-friendly, and aided with facilities as per best international practices.
522. Broad project components are set out below.
Inter-State Bus Terminal (State and Private) • Bus Bays[ • Boarding / Aligning Platforms • Washing/Workshops • Booking / Ticketing Counters Local Bus Terminal • Bus Bays • Boarding / Aligning Platforms Administration/ Terminal Office • ISBT Administration • CCTV Security Room • Maintenance Office • Office For DTC and Roadways Other Offices • DTTDC, Tour Operators Hotel
Pedestrian Connectivity with • Metro • Railway station Connectivity • Airport • Railway station Passengers Facilities • Dormitories • Waiting Hall • Toilet • Cloak Room • Restaurant/ Cafeteria Parking Facility • Auto, taxi, rickshaw, etc. • Personal Vehicles
3. Technical Description and Analysis;
523. The plan for MMTC is developed considering the basic requirement of MMTC such as conflict free traffic circulation, easy pedestrian movement, minimum disturbance to the operation of the present ISBT, facilities for passengers and crews, park and drop facilities, energy efficient and environment friendly design etc. Various component of the concept plan is discussed briefly in following sub sections.
524. Design Standards and specification followed in the DPR report have been taken
from the Time Saver Standards Space Requirement and Neufert Architect’s Data handbook. Indian Standard specification is followed for the design of various structural elements. Design also considered special requirement of seismic zone.
525. Demand Assessment:: The demand for bus ways, pedestrian facilities and parking
were estimated based on detailed traffic surveys at the terminal and projected requirements. The provision made for these based on estimated demand are 34

TA 7114-IND National Capital Region Planning Board Project
Final Report
Sheladia Associates, Inc. USA 187
Volume 1 – Main Rep
ort
bus bays for local buses, 127 bus bays for inter city buses (30 for alighting and 97 for boarding), 46 bus bays for layover of intercity buses and 473 car parking spaces.
Table 5.30 A summary of the traffic study and foot-falls for Anand Vihar MMTC S. No: Service Provider Number of Trips
(as Given) Observed on April 13, 2008
Observed on April 15, 2008
Inter state buses 1 UP Roadways 750 893 967 2 Uttarakhand 110 78 81 3 DTC (Interstate) 90 55 62 4 Punjab - 0 1 5 Other Pvt - 6 7 Total Intercity Buses
950 1032 1118
Local Buses 6 DTC (Local) 500 668 698 7 Pvt (on permit of STA 1000 755 888 8 Pvt (Garh route, on
permit of STA) 35 10 11
Total Intercity buses
1535 1433 1597
Total Buses 2485 2465 2715 Occupancy of buses:
526. The vehicle data observed at various ISBTs has been analyzed for average occupancy of buses. The following table summarizes the average occupancies observed at the Anand Vihar ISBT and estimates of footfalls. This footfall is the basis for design of retail space in the MMTC.
Particulars Occupancy Number of buses Foot-fall
Anand Vihar 17.4 2715 94279
527. Commercial Space: Based on the above, the project includes development of commercial and office spaces which will be leased out and generate revenue for the operation of MMTC. The space to be developed include 3500 sq.ft of kiosk area, 58,000 sq. ft of retail area and 107,600 sq.ft of office space.
528. Layout Plan: Layout plan effectively utilizes the available space and located the
main ISBT building with bus parking bays located on southern side of the plot which gives the best connectivity from the ISBT to Metro station and Anand Vihar Railway Station. The commercial site earmarked for ISBT Hotel is segregated from the MMTC and provided separate entry. Auto and Taxi stands are provided on the main road with separate entry.

TA 7114-IND National Capital Region Planning Board Project
Final Report
Sheladia Associates, Inc. USA 188
Volume 1 – Main Rep
ort
529. Traffic Circulation: Traffic circulation of the ISBT designed with conflict free unidirectional movement. Separate entry is provided for Railway station, city buses and interstate buses on the left side of the layout. Exit for all is provided on the right side and hence avoiding the entry and exit conflict and ensure smooth flow of traffic inside.
530. Separate parking space for taxi and auto is provided with unidirectional circulation.
The suggested circulation ensures searching the all the parking lots in single circulation.
531. Grade separated U turn movement facilities are planned on main road on both
ends of the MMTC and this will ensure smooth exit and entry of vehicles. The construction of this grade separated U turn facilities is not included as part of MMTC development program but is planned to be constructed by Delhi PWD. Construction of this facility on time needs to be ensured for the smooth functioning of the MMTC.
532. Pedestrian Network: Integrated pedestrian network is designed to ensure safe and
efficient movement of pedestrian. The proposed pedestrian network includes foot over bridges, escalators, lift etc.
Table 5.31 Land Distribution: Area statement of Anand Vihar development Description Unit Detail A Land for ISBT owned by Transport Dept of GNCTD Hectare 10.2 B Land area under Metro Hectare 1 C Balance are for ISBT (A-B) Hectare 9.2 D Ground Coverage 25% of (C) AS per DDA Notification Hectare 2.273 E Permissible (FAR = 100) SqM 92000 F FAR for ISBT including operational Structures 70% of D SqM 64400 G FAR for Hotel 30% of D SqM 27600 Proposed Covered Area Statement for ISBT 1 Basement Sq.M 54241.3 2 Floors (Ground and I to 8) SqM 34787 3 Achieved Ground Coverage (10515.321/64400*100) Excluding
basement % 16.33
4 Achieved FAR (34787/64400*100) % 54 5 Total Covered Area including Basement and MUMTY SqM 89455.64
(138.9%)
533. Road Geometry and Cross section: The entry and exit to terminal is provided from Gazipur – Dilshad Garden Road which is a divided road. Grade separated U-turn facilities are planned for both end of the MMTC. However the construction of this arrangement is not included in the MMTC contract. The turning radius provided varies from 15m to 42m and width of the of the circulation area between the bays

TA 7114-IND National Capital Region Planning Board Project
Final Report
Sheladia Associates, Inc. USA 189
Volume 1 – Main Rep
ort
ranges from 18 to 20m. The geometry provided satisfies the minimum turning radius for buses.
534. Viability and sustainability: The project is designed as a public facility cum
commercial venture to generate sufficient revenues to recover the investment and sustain the operation and maintenance in the long run. Efficient operation and timely maintenance is essential for achieving the long term objective. The project is designed to generate revenue through payments from the Hotel provision and substantial rental income. The organizational set up is that of a public-private partnership that will ensure efficient operation and management of the MMTC and is supported by revenue stream to ensure long term sustainability.
4. Sub-project Selection Criteria:
535. The proposed project is an important component of the integrated multi-modal
network of mass transit system being developed by the GNTCD to meet the growing travel demand and is identified as one of the priority projects. This fits within the overall transport integration and development priority of Delhi. The economic and financial analysis has indicated that the project is justified in social cost benefit analysis and financially sustainable. Thus the sub project meets all the criteria of a priority transit investment.
5. Cost Estimates
536. The quantification of building works, site development, utilities, pedestrian facilities, parking facilities and landscaping items were calculated by the DPR consultant from the floor plans and layout plans. Plinth area based item rate

TA 7114-IND National Capital Region Planning Board Project
Final Report
Sheladia Associates, Inc. USA 190
Volume 1 – Main Rep
ort
estimate based on PAR-CPWD-2007 was adopted for cost estimate and the escalated cost on June 2009 was worked out by adding CPWD approved cost index of 13%. The construction items covered in cost estimates are: buildings, site development; services; rehabilitation and reconstruction, cost implication of green certified building and cost of sale/demolishing. The cost estimates also consider market rate for the Basement Floors, and all the items considered in annexure 2 to3. The project cost summary is shown below.
Table 5.32 Project Cost Summary
Particulars Amount (Rs in mn) Civil works 1030.95 Plumbing works 38.93 Electrical works 250.03 Sub-station 96.11 Fire Fighting 27.41 HVAC works 99.74 Development site 21.23 Elevators & Escalators 69.35 Miscellaneous incl. S.Teel Works, strutting/shoring/dewatering etc. 24.56
Total construction cost 1658.30 Design & Construction management 126.03 Contingency @10% 178.43 Total Construction Cost 1962.76 Interest during Construction 87.40 Total Project Cost 2050.17
6. Project Implementation and Schedule
537. The project implementation arrangement as presented in the DPR is described here. Transport Department, GNCTD shall be the nodal agency implementing the Project. It has appointed DIMTS as the Project Management Consultant for implementing the project. It is envisaged that the funds released by NCRPB/lenders to GNCTD shall be provided to Transport Department for implementation of the Project. The above funds shall be transferred to Project Account (which will be established and maintained by DIMTS) for meeting the capital expenditure. The Transport Department shall undertake bid process management for identification of developer/operator for development of Hotel and receive upfront amount and the same shall be utilized for implementation of the Project. DIMTS is also proposed to be appointed as the Asset Management Entity for Operation, Maintenance and Management of MMTC after competing the construction.

TA 7114-IND National Capital Region Planning Board Project
Final Report
Sheladia Associates, Inc. USA 191
Volume 1 – Main Rep
ort
538. The PPTA consultant hasn’t reviewed the contractual arrangement between the
GNTCD and DIMTS. It is assumed that the agreement ensures performance by the Project Management Consultant and includes proper risk management. Under the assumption, project implementation arrangement is efficient. The operation and maintenance through an Asset Management Company such as DIMTS will ensure the functional efficiency to be maintained. Also the revenue generation components will ensure sufficient funding for operation and maintenance.
539. The implementation of the project (construction phase) shall be completed over a fifteen month period.
7. Economic Analysis
540. The MMTC planned at Anand Vihar will facilitate seamless integration of the inter-city and intra city transit options in the area and largely benefit inter modal transfer by transit passengers with reduced transfer times and improved comfort. This will also have significant impact on the utilization of transit services as transfer between local bus to metro rail and interstate bus/train services become easy and comfortable which are important for encouraging more private vehicle users to shift to transit. The metro station is under construction and will be operational in

TA 7114-IND National Capital Region Planning Board Project
Final Report
Sheladia Associates, Inc. USA 192
Volume 1 – Main Rep
ort
2010. Also the Anand Vihar railway terminal will become a main boarding/ alighting station for trains towards East. These two developments will have major impact on the transfers from/to local buses at Anand Vihar and a convenient transfer will have a positive impact on the utilization of the mode combination thus reducing personal modes for access to the metro and train services. The single ticket scheme being developed for bus and metro rail use will further help in this aspect. The ISBT is already operational and local buses are serving the transfer at present and therefore no significant transfer benefits are anticipated for those passengers transferring between interstate bus passengers transferring to local buses. However, those passengers will also benefit from the pedestrian friendly design for the MMTC which will improve the safety of passengers and improved environmental comfort. The proposed MMTC will thus provide significant community benefits and will have a positive impact on the transport movement in the area. An economic analysis of the proposed MMTC at Anand Vihar has been undertaken to determine its economic viability.
541. The proposed development plan includes major commercial development also in order to recover the cost of implementation and to generate sufficient revenue for operation and maintenance. The project implementation plan also includes public-private participation for management of project implementation and operation and maintenance. The overall project design thus ensures efficiency in implementation, operation and maintenance and a dedicated funding source which will ensure the long term sustainability of the project objectives of providing attractive public transport option.
542. Economic Cost – The financial cost estimates prepared based on the project report has been converted into economic costs by excluding taxes and duties, as well as price contingencies, and using conversion factors where appropriate. For the analysis purpose the tax element of 12% included in the financial cost has been excluded. Considering the standard procedures recommended for economic feasibility analysis, the financial cost was converted into economic cost for the analysis. The O&M cost for the bus terminal is taken in the first full year of operation based on the detailed estimates made for financial analysis. The project is expected to be completed in 15 months with construction costs distributed 30% in 2010 and 70% in 2011. All costs are expressed in 2009 constant prices.
543. The major economic benefits comprise (i) vehicle operating cost saving for passengers shifting from private modes to public transport with upgrading of ISBT, (ii) time savings for passengers with easy transfer between different transit modes, (iii) improved circulation with well maintained roads compared to deteriorated roads at present, and (iv) additional employment. Other benefits are envisaged to accrue but have not been quantified. These include transit passenger satisfaction with significant environmental improvement; environment and health benefits due to reduced emissions and reduced conflict; improved ridership on metrorail with better connectivity etc.

TA 7114-IND National Capital Region Planning Board Project
Final Report
Sheladia Associates, Inc. USA 193
Volume 1 – Main Rep
ort
544. The benefits included in the calculation are those which can be estimated reasonably with the survey information and some assumptions.
545. The benefit streams considered in the economic analysis are estimated based on
the following:
• The construction of MMTC will increase the use of local bus to access the rail and metro at Anand Vihar. Currently, the access to the Anand Vihar terminal is by personal or para-transit modes by about 40% of trips and 60% access by local bus. It is assumed that the provision of an integrated terminal and integrated ticketing will result in increasing the share of local bus use to access to/from the terminal to 80% and reduce the share of private/para-transit modes to 20%. The resultant reduction in trips by car, taxi, auto-rickshaw and two-wheeler to access to/from MMTC will result in vehicle operating cost saving. The savings in vehicle operating cost of private/para-transit modes to access to/from the MMTC have been estimated and included in the benefits. However, no time saving is considered for the passengers for shifting the mode of access as total time taken by local bus or private/para-transit modes may be in similar magnitude with high local bus frequency.
• Well designed pedestrian circulation including elevators is assumed to reduce the passenger transfer time significantly. Also the integration will facilitate easy transfer for metro rail users and faster access by local buses from nearby areas rather than walking. Overall for the analysis, it is assumed that passengers using local bus and ISBT will save on an average 6 minutes and those using the rail and bus modes will save 10 minutes and is valued as per transit passenger travel time of Rs. 21 per hour (estimated based on per capita income of Delhi).
• Passenger and bus traffic increase is taken as per traffic forecast. It is also assumed that atleast 60% of the metro rail passengers will come by local buses and this will mostly be served by increased occupancy on the local buses but also will increase the number of local buses serving the MMTC. For the analysis, a 12% increase in local buses is assumed.
• The buses using the terminal will benefit from vehicle operating costs savings (VOC) due to improved road condition, conflict free movement and well laid out roads. The benefit is calculated for circulation length of 1.5 km for the estimated number of buses with a VOC of Rs. 19.34/km with the project and Rs. 30.44/km without the project. The roadway condition is represented by assuming a roughness index of 2.5 average with the project and 5.0 without the project. Also assumed is a speed increase of 10 kmph for conflict free movement with the project.
• The net value addition from provision of advertising spaces, parking and shopping area has been calculated and added.
546. Based on the above considerations, the economic cost and benefit streams over the analysis period have been worked out. A 25 year analysis period has been used. To be acceptable for implementation, the proposed investments have to result in an EIRR of at least equal to the opportunity cost of capital, which is set at 12 percent. NPV is calculated using opportunity cost of capital as the discount rate.

TA 7114-IND National Capital Region Planning Board Project
Final Report
Sheladia Associates, Inc. USA 194
Volume 1 – Main Rep
ort
547. The economic analysis indicates a robust economic rate of return which is well above the acceptable rate of return of 12%.
548. The cost and benefit estimates involve uncertainties. Sensitivity analysis has been carried out by changing cost and benefit estimates. The results of the sensitivity analysis are given in Table below. The results indicate that even with significant adverse variation in benefits, the rate of return is above 12%. The analysis do not include the value of the overall environmental improvement and the wider impact of an integrated urban multi-modal terminal due to the difficulty in quantifying the benefits but is considered to be large enough to compensate for any adverse variation in benefit estimates included and thus the proposed MMTC at Anand Vihar is justified in social cost benefit terms.
Scenario
Base case
Cost
increase
by 15%
Benefit
decrease
by 15%
Cost increase by 15% & Benefit
decrease by 15%
Construction delayed by one year
Project
EIRR (%) EIRR (%) EIRR (%) EIRR (%) EIRR (%)
Anand Vihar MMTC 17.7 15.7 14.9 13.1 17.3
549. The economic analysis indicates an economic rate of return above the acceptable
rate of return of 12% even with adverse variation in costs and benefits. The proposed MMTC at Anand Vihar fulfils a social need, have a wider impact in alleviating the traffic congestion, improving the financial sustainability of public transport operation, reducing environmental pollution and will improve and maintain the level of service for the public transit users and is therefore recommended for implementation.
8. Financial Analysis
550. Financial analysis has been carried out to assess the viability of the proposed
project investment for MMTC at Anand Vihar based on the capacity of MMTC to generate sufficient incremental revenues with project implementation to cover the capital and operating costs of the project. The analysis was carried out on an incremental basis using the discounted cash flow methodology, and measuring the internal rate of return of the project. The analysis is based on the following assumptions: • The estimated project cost of the proposed redevelopment of Anand Vihar MMTC is
given earlier in Table 3.7.
• Construction Schedule: The construction activity has been envisaged over a period of fifteen months. Construction is tentatively assumed to commence in February 2010 and the redeveloped structure is scheduled to start operating from May, 2011. The

TA 7114-IND National Capital Region Planning Board Project
Final Report
Sheladia Associates, Inc. USA 195
Volume 1 – Main Rep
ort
table below gives the capex programme.
Particulars Deadline
Project start date January 2010 Construction Start January 2010 Construction Period 15 Construction End March 2011 Commencement of Operations April 2011 Capex phasing - Year 1 (3 months) 20% Capex phasing - Year 2 (12 months) 80%
551. The assumptions relating to means of finance for the project are described below:
Equity: GNCTD is expected to contribute Rs 578.10 million (including internal accruals during project construction phase from bidding out of the hotel.
Lenders: The balance amount is expected to be borrowed from NCRPB and other lenders. The total debt expected to be raised is Rs 1472.07 million. The indicative details of the debt are given below:
Total project cost : 2050.17 Debt : 1472.07 Own funds : 578.10 D:E ratio : 2.55:1 Loan period : 10 years Moratorium : 2 years Repayment period : 8 years Rate of Interest : 9.5% p.a.
Each drawdown has its own repayment schedule
• The construction period is 15 months, starting January 2010 and ending March 2011. Hence Interest During Construction has been worked for 3 months in 2009-10 and 12 months during 2010-2011.
552. Financial analysis:
i. Substantial reliance has been placed on income from hotel and real estate (contributing 79% of revenue). Consequently, any impact of economic downturn leading to reduction in such income would greatly affect the viability of the project.
ii. Also, a sum of Rs 285 million has been taken as inflow from the hotel developer (initial premium of Rs 190 million and first year’s contribution of Rs 95 million) for funding the capital expenditure. Any delay or reduction in these amounts would impact the funds availability for the project. Government of Delhi would need to meet any shortfall in the funds availability if required.

TA 7114-IND National Capital Region Planning Board Project
Final Report
Sheladia Associates, Inc. USA 196
Volume 1 – Main Rep
ort
iii. DIMTS is expected to be appointed as the Asset Manager and is expected to be paid a fees linked to operating surplus, prior to debt service. Any shortfall in cash flows for meeting debt service due to such payment to DIMTS is to be made up by the Delhi Government
iv. While the project financials show cash generation from day one, in the event any of the revenue profiles does not perform as per projection, there could a cash shortfall in meeting debt service. Consequently, any shortfall in meeting various commitments would need to be met by the Delhi Government.
553. Based on the financial analysis carried out, the Financial Internal Rate of Return
(FIRR) is estimated at 11.64% for the Base Case. Further a sensitivity analysis of the Base case have been carried out to test the impact of adverse changes in cost and revenue assumptions on the financial rate of return and the results are given below:
Sensitivities Project Cost Project FIRR (%)
Base Case (1) 2050.17 11.64 Project Cost Increase 10% (2) 2255.18 9.30 Rental income from real estate – Less by 10% (3) 2050.17 10.68 Hotel income – Less by 50% (4) 2050.17 5.96 Hotel income gets postponed by 1 year (5) 2050.17 10.15 Combined impact (2) + (3) + (5) 2255.18 7.02
554. A review of the sensitivity analysis indicates that :
i. With the Project FIRR being only 11.64% p.a., the project economics is extremely sensitive to any variation in project cost and revenues.
ii. While individual sensitivity analysis enumerated above shows the impact of each
scenario separately, a combination of increase in project cost by 10%, decrease in rental income by 10% and a postponement of hotel income by one year has a major impact on the project financials leading to a reduction in FIRR from 11.64% p.a. (in Base Case) to 7.02% p.a.
iii. In view of the above, it is essential that NCRPB ensures budgetary support of the
Government of Delhi as additional security apart from the security of assets created. This would provide additional comfort to NCRPB that the project would be able to meet its debt service obligations, irrespective of the performance of the project

TA 7114-IND National Capital Region Planning Board Project
Final Report
Sheladia Associates, Inc. USA 197
Volume 1 – Main Rep
ort
9. Safeguards
Social - Land Acquisition, Involuntary Resettlement and Impact to Indigenous Peoples
555. Redevelopment of Anand Viahr ISBT does not involve any land acquisition and
there is no involuntary resettlement impact and impact to indigenous peoples. All improvement works are proposed within the ISBT campus in land owned by Government of National Capital Territory of Delhi (GNCTD).
556. However, the project will involve relocation of 33 licensed vendors, including 7
government undertaking and cooperatives, to the transit ISBT from where the inter state buses will ply during the construction of MMTC. These licensed vendors are on a one-year lease and thereafter the continuance of a vendor depends upon if he/she is successful in the open bid for the shop/stall/PCO booth. The transit ISBT will accommodate these licensed vendors until the end of their license period and thereafter they will have to take part in the annual bid process.
557. The relocation of the licensed vendors to the transit ISBT will be done overnight
without affecting their livelihood and with minimum disturbance to the passengers. Further, the construction is being carried out in a phased manner to minimise impact to passengers and shopkeepers. Consultations with stakeholders and census and socio-economic surveys have reaffirmed that there will be no impact on the livelihood of the shopkeepers in the transit ISBT and the transit arrangement is acceptable to the shopkeepers.
558. In line with the Draft ESMS of NCRPB, projects funded by NCRPB will require a
resettlement plan and/or an indigenous peoples plan commensurate with the significance31 of impact. Redevelopment of ISBT at Anand Vihar will come under S-2 category for involuntary resettlement and S-3 category for indigenous peoples as per NCRPB’s social categorization.
559. A short resettlement plan has been prepared in line with the Draft ESMS
requirements. The summary of resettlement impacts is given in the following table.
31
As per the Draft ESMS projects are categorized based on the significance of involuntary resettlement and impact to indigenous
peoples. Involuntary resettlement categories are (a) Category S-1 (Significant Impact): means 200 or more people will experience major impacts, which are defined as (i) being physically displaced from housing, or (ii) losing 10% or more of their productive assets (income generating). Category S-1 projects require a full resettlement plan; (b) Category S-2 (Not Significant). Category S-2 projects include involuntary resettlement impacts that are not deemed significant and require a short resettlement plan; and (c) Involuntary Resettlement Category S-3: There is no involuntary resettlement impacts and hence does not require any action. Indigenous Peoples categories are (a) S-I Significant impacts are those projects that directly or indirectly affect the dignity, human rights, livelihood systems, or culture of indigenous peoples or affect the territories or natural or cultural resources that Indigenous peoples own, use, occupy or claim as their ancestral domain. Category S-1 projects will require a indigenous peoples plan; (b) S-2 Not Significant are projects where the indigenous peoples are the sole or the overwhelming majority of project beneficiaries, and when only positive impacts are identified. Category S-2 projects will require a summary note on IP in project document; and (c) S-3 are projects where no impacts on indigenous peoples are envisaged and hence does not require any action.

TA 7114-IND National Capital Region Planning Board Project
Final Report
Sheladia Associates, Inc. USA 198
Volume 1 – Main Rep
ort
Table 5.34 Summary of Resettlement Impacts
Impact Redevelopment of ISBT at Anand Vihar
Permanent Land Acquisition (ha) 0
Temporary Land Acquisition (ha) 0
Affected Households (AHs) 0
Affected Persons (APs) 0
Titled APs 0
Non-titled APs (Leaseholders/Renters and Workers/Employees) 0
Licensed private vendors facing minimal disruption 26a
Licensed government/cooperative owned outlets 7
Female-headed AH 3
IP/ST-headed AH 0
BPL AH 0
Affected Structures 0
Affected Trees/Crops 0
Affected Common Property Resources 8b
Average Family Size 5.0
Average Household Income Rs.11,244/- p.m. a These 26 households will only face minimal disruption during one overnight shifting to the transit ISBT b The 4 each public toilets and drinking water points are being replaced in adequate number in the transit ISBT
Environment
560. The Anand Vihar MMTC sub-project has been categorized as Category E-2, and accordingly an Initial Environmental Examination (IEE) and an Environmental Management Plan (EMP) prepared by DIMTS. The Environmental Information Format for Screening, as laid down in the ESMS is provided in the IEE. All improvement works are proposed within the Anand Vihar ISBT campus in lands owned by Government of National Capital Territory of Delhi (GNCTD), and location impacts pertaining to siting of components within or in the vicinity of environmentally sensitive areas are not envisaged. Given the magnitude of civil works, there would be typical construction related impacts, and could be mitigated by appropriate mitigation measures and adoption of good construction practices. To address environmental impacts associated with increased consumption of water and energy, increase, waste generation during operation of the MMTC, the proposed designs incorporate environmentally friendly techniques incorporating principles of energy conservation, resource minimization, rain water harvesting, energy efficient building designs, and include reuse of water, dual water use systems and energy management.
561. Clearance of trees within the proposed site is envisaged and shall be addressed
through compensatory plantation activities carried out in line with the ESMS

TA 7114-IND National Capital Region Planning Board Project
Final Report
Sheladia Associates, Inc. USA 199
Volume 1 – Main Rep
ort
provisions, after clearances from the Forest Department. The mitigation measures in the construction stage proposed in the EMP include management of wastes, measures to address environmental and safety issues during construction etc. Given that the ISBT shall be operational during the construction period, management of traffic to avoid inconvenience to the passengers during construction, through a traffic management plan during construction is proposed. Safe dismantling, transportation and disposal of asbestos sheets (from the existing terminal) under the supervision of the environmental specialist of the Engineer is proposed.
562. The effective implementation of the measures proposed will be ensured with the
technical expertise of an Environmental Specialist as part of the Supervision Consultant. Further, the environmental monitoring plans prepared as part of the EMP will provide adequate opportunities towards course correction to address any residual impacts during construction or operation stages.
563. The Implementation Schedule: The DPR provides limited information on the implementation schedule, which should consist of:
Status of administrative and technical sanction and other statutory approvals
Anand Vihar requires approvals from Delhi Government and other agencies
Issue of advertising for bidding included as part of the procurement plan Finalization of tender included as part of the procurement plan Site clearance and site development included in the implementation schedule Procurement Included as part of the procurement plan
10. Risk and Uncertainties
Risk Risk Level Mitigation Measure Project Completion Risk
Moderate � Implementation Schedule and Procurement Plan to be confirmed
� Budgetary provision for counterpart contribution and any shortfall in meeting project expenditure
� Obtain necessary clearances for utility shifting priori to release
� Short Resettlement Plan based management of project affected persons
� Support in supervision and management of project from project development facility
� Contractor Selection based on ICB procedures Financial Risk 1 Hotel income not being achieved
High Need budgetary support of Government of Delhi for debt servicing
2 Income from rentals – Retail space, offices
High Need budgetary support of Government of Delhi for debt servicing
3 Inadequate cash High Need budgetary support of Government of Delhi for debt

TA 7114-IND National Capital Region Planning Board Project
Final Report
Sheladia Associates, Inc. USA 200
Volume 1 – Main Rep
ort
flows during the initial years for debt servicing
servicing
Increase in O&M expenses
Low Increase in tariff
Technology Low � Traditional
Recommendation: Conditions of lending
564. By End December 2009, Borrower to provide
i. Submit Final IEE - Completed ii. Submit Final Short Resettlement Plan to NCRPB-Completed iii. Completion of design and updated costs- Completed iv. A procurement plan and implementation schedule for the project- Completed v. Draft Bid Documents confirming to ADB document for Review by NCRPB/ADB-
Finalized by March 2010 vi. Executed O&M contract and performance benchmarks – Benchmarks under
preparation and finalized by March 2010
By March 2010 vii. Utility shifting plan and Certificate of clearance from agencies for shifting of utility viii. Budget Provision of counterpart contribution of at least 25 % of project cost
565. To conclude, since this project is being financed on a non-guarantee mode, and
the expectation is that project revenues covers debt service, it would be prudent for NCRPB to review (in consultation with Delhi Government) the performance contracts in terms of standard metrics such as O and M benchmarks, auction milestones and ensure standard protection clauses such as step-in–rights etc.

TA 7114-IND National Capital Region Planning Board Project
Final Report
Sheladia Associates, Inc. USA 201
Volume 1 – Main Rep
ort
F. DEVELOPMENT OF MULTI-MODEL TRANSIT CENTRE AT SARAI KALE KHAN, NCTD
1. Rationale for Subproject
566. To de-congest Delhi road network, and to provide an integrated transit solution,
Government of NCT of Delhi has decided to provide Inter State Bus Terminus (ISBT) on the outskirts of Delhi with a range of modes (local bus, metro, railways, auto rickshaws, etc.) connecting these with rest of the Delhi. At present, three Inter state bus terminals (ISBT) are functioning at Kashmere Gate, Sarai Kale Khan and Anand Vihar which are focusing on the requirement of interstate bus traffic and associated transport needs. The local buses also operate from these terminals providing access to the ISBT from various parts of the city. There is a need for improving the transport infrastructure to keep pace with the rapid development and to achieve this goal, Government of NCT of Delhi has proposed to develop/redevelop/upgrade Inter State Bus Terminals (ISBTs) in Delhi and the same is also to act as Multi Modal Transit Center (MMTC). The ISBT at Sarai Kale Khan (SKK) is proposed for redevelopment to an MMTC and is considered for funding by the NCRPB.
567. The ISBT at Sarai Kale Khan provides an ideal location with Hazrat Nizamudin
railway station located close to it. A proper integration of all three modes of public transport which are servicing from SKK viz. Interstate bus, Local bus and Rail is essential to achieve objective to have an integrated multi-modal network of mass transit systems. It is reported that Delhi Metro is planning to connect SKK and hence MMTC should have proper integration with Metro rail also.
568. The MMTC planned at SKK will facilitate seamless integration of the inter-city and
intra city transit options in the area and largely benefit inter modal transfer by transit passengers with reduced transfer times and improved comfort. This will also have significant impact on the utilization of transit services as transfer between local bus to interstate bus/train services become very convenient. The passengers will also benefit from the pedestrian friendly design for the MMTC which will improve the safety of passengers and improved environmental comfort. The proposed MMTC will thus provide significant community benefits and will have a positive impact on the transport movement in the area.
2. Scope and Components;
569. The development of SSK ISBT into a Multi Model Transit Centre (MMTC) will
involve the following: • Redevelop the existing ISBT as Multi Modal Transit Center (MMTC).
• Facilitate an effective multi-modal changeover by integrating the existing ISBT with the Hazarath Nizamudin Railway Station.

TA 7114-IND National Capital Region Planning Board Project
Final Report
Sheladia Associates, Inc. USA 202
Volume 1 – Main Rep
ort
• Provide a state-of-the-art Multi Modal Transit Center that is user friendly, catering to varied passengers’ comfort, pedestrian-friendly, ecologically sustainable, handicapped-friendly, and aided with facilities as per best international practices.
570. Broad project components are set out below.
Inter-State Bus Terminal (State and Private) • Bus Bays[ • Boarding / Aligning Platforms • Washing/Workshops • Booking / Ticketing Counters Local Bus Terminal • Bus Bays • Boarding / Aligning Platforms Administration/ Terminal Office • ISBT Administration • CCTV Security Room • Maintenance Office • Office For DTC and Roadways Other Offices • DTTDC, Tour Operators Hotel
Pedestrian Connectivity with • Metro • Railway station Connectivity • Airport • Railway station Passengers Facilities • Dormitories • Waiting Hall • Toilet • Cloak Room • Restaurant/ Cafeteria Parking Facility • Auto, taxi, rickshaw, etc. • Personal Vehicles
3. Technical Description and Analysis;
571. The concept plan for MMTC is developed considering the basic requirement of MMTC such as conflict free traffic circulation, easy pedestrian movement, minimum disturbance to the operation of the present ISBT, facilities for passengers and crews, park and drop facilities, energy efficient and environment friendly design etc. Various component of the concept plan is discussed briefly in following sub sections.
572. Design Standards and specification followed in the DPR report have been taken
from the Time Saver Standards Space Requirement and Neufert Architect’s Data handbook.Indian Standard specification is followed for the design of various structural elements. Design also considered special requirement of seismic zone.
573. Demand Assessment:: The demand for busways, pedestrian facilities and parking
were estimated based on detailed traffic surveys at the terminal and projected requirements. The provision made for these based on estimated demand are 17 bus bays for local buses, 101 bus bays for interstate buses (16 for alighting and 85

TA 7114-IND National Capital Region Planning Board Project
Final Report
Sheladia Associates, Inc. USA 203
Volume 1 – Main Rep
ort
for boarding), 33 bus bays for layover of intercity buses and 300 car parking spaces.
Table 5.35 Summary Of The Traffic Study And Foot-Falls For Sarai Kale Khan MMTC S. No: Service Provider Number of Trips
(as Given) Observed on April 13, 2008
Observed on April 15, 2008
1 DTC 58 137 142 2 Haryana 300 97 101 3 U.P. 157 144 149 4 RSRTC 250 125 129 5 J & K 2 2 2 6 MPSRTC 15 4 4 7 Mewat (Pvt) 16 14 15 8 Kamal (Pvt) 33 0 0 9 CBS (Pvt) 41 0 0
10 Gaziabad (Pvt) 90 50 52 11 Garh-Ganga (Pvt) 5 0 0 12 Punjab 4 4 13 Chandigarh 4 4 14 Others (Pvt) 3 3
TOTAL 967 584 605 Occupancy of buses:
574. The vehicle data observed at various ISBTs has been analyzed for average occupancy of buses. The following table summarizes the average occupancies observed at the Sarai Kale Khan ISBT and estimates of footfalls. This footfall and expected future growth is the basis for design of retail space in the MMTC.
Particulars Occupancy Number of buses Foot-fall
Sarai Kale Khan 18.8 605 22731
575. Commercial Space: The project includes development of commercial and office spaces which will be leased out and generate revenue for the operation of MMTC. The space to be developed include 4760 sq.ft of kiosk area, 30816 sq. ft of retail area and 157371 sq.ft of office space.
576. Layout Plan: Layout plan effectively utilizes the available space and located the
main ISBT building with bus parking bays located on southern side of the plot as the southern side of the plot is wider. However the Nizamudin Railway station is on the northern side and hence walking distance from the ISBT to other modes are high. ISBT terminal are designed in such a way that arrival and departure is segregated. All the bus bays are accommodated on the sides on the terminal by designing multi face terminal building.

TA 7114-IND National Capital Region Planning Board Project
Final Report
Sheladia Associates, Inc. USA 204
Volume 1 – Main Rep
ort
577. Traffic Circulation: Traffic circulation of the ISBT designed with conflict free unidirectional movement. Grade separated entry from south side is provided for interstate buses. Common exit for both local and interstate buses is provided on the right side and hence avoiding the entry and exit conflict and ensure smooth flow of traffic inside. The entry of right turning buses from the inner ring road to the ISBT is not clearly shown in the circulation plan. This aspect needs to be further reviewed and if necessary addition links to provided to enable right turn entry from the inner ring road to the ISBT.
578. Separate parking space for taxi and auto is provided with unidirectional circulation.
The suggested circulation ensures searching the all the parking lots in single circulation. However exit point to main road is very close to junction and this needs to be changed.
579. Drop area is proposed on the terminal side of the Taxi/Auto parking area which
ensures easy pedestrian access from drop off area to terminal building
580. Pedestrian Network: Integrated pedestrian network is designed to ensure safe and efficient movement of pedestrian. The proposed pedestrian network consists of foot over bridges, escalators, lift, travelators etc.
581. As all the bus bays are provided on the sides of a single multi faced terminal
building, movement of passengers from one bay to another is possible without climbing foot over bridges.
582. Travelators are proposed to connect the transferees from ISBT to Nizamudin
railway station. But no pedestrian connection is proposed to metro station as the plan of metro is not finalized yet. The travelators proposed as part of the project is not included in the project cost as this facility is falling outside the ISBT land. Installation of the travelators along with the completion of MMTC is one of the essential requirements of the smooth functioning of the MMTC.
583. Land Distribution
Table 5.36 Area statement of Sarai Kale Khan development Detail Unit Values A Land for ISBT owned by Transport Dept of GNCTD Sqm 113594 B Area proposed for MMTC development Sqm 100000 C Ground Coverage 25% of (B) Sqm 25000 D FAR for ISBT including operational Structures 70% of B Sqm 70000 E FAR for Hotel 30% of B Sqm 30000 Proposed Covered Area Statement for ISBT A Basement Sqm 12210 B Floors (Ground and I to 7) including passage Sqm 42548 C Achieved Ground Coverage (12210/70000 *100) Excluding basement 17.4 D Achieved FAR (42548/70000*100) 60.78

TA 7114-IND National Capital Region Planning Board Project
Final Report
Sheladia Associates, Inc. USA 205
Volume 1 – Main Rep
ort
584. Road Geometry and Cross section: The minimum radius for buses to turn is 15m
and that needs to be ensured in the layout.
585. Viability and sustainability: The project is designed as a public facility cum commercial venture to generate sufficient revenues to recover the investment and sustain the operation and maintenance in the long run. Efficient operation and timely maintenance is essential for achieving the long term objective. The project is designed to generate revenue through payments from the Hotel provision and substantial rental income. The organizational set up is that of a public-private partnership that will ensure efficient operation and management of the MMTC and is supported by revenue stream to ensure long term sustainability.
4. Sub-Project Selection Criteria
586. The proposed project is an important component of the integrated multi-modal network of mass transit system being developed by the GNTCD to meet the growing travel demand and is identified as one of the priority projects. The economic and financial analysis has indicated that the project is justified in social cost benefit analysis and financially sustainable. Thus the sub project meets all the criteria of a priority transit investment.
5. Cost Estimates
587. The quantification of building works, site development, utilities, pedestrian
facilities, parking facilities and landscaping items were calculated by the DPR consultant from the floor plans and layout plans. Plinth area based item rate estimate based on PAR-CPWD-2007 was adopted for cost estimate and the current cost was worked out by adding CPWD approved cost index of 19%. The construction items covered in cost estimates are: buildings, site development; services; rehabilitation and reconstruction, cost implication of green certified building and cost of sale/demolishing. The cost estimates consider market rate for escalators, electric substation, air conditioning and for superior finishes. The project cost summary is shown below.
Table 5.37 Project Cost Summary Particulars Amount (Rs in mn) Civil works 1113.26 Plumbing works 42.05 Electrical works 162.95 Sub-station 65.40 Fire Fighting 44.51 HVAC works 110.00 Development site 34.78 Elevators & Escalators 56.96 Miscellaneous incl. S.Teel Works, strutting/shoring/dewatering etc. 58.59

TA 7114-IND National Capital Region Planning Board Project
Final Report
Sheladia Associates, Inc. USA 206
Volume 1 – Main Rep
ort
Total construction cost 1688.50 Design & Construction management 149.43 Contingency @10%(3% physical contingency and 7% price contingency) 183.79 Total Construction Cost 2021.72 Interest during Construction 84.63 Total Project Cost 2106.35
6. Project Implementation and Schedule
588. The project implementation arrangement as presented in the DPR is described
here. Transport Department, GNCTD shall be the nodal agency implementing the Project. It has appointed DIMTS as the Project Management Consultant for implementing the project. It is envisaged that the funds released by NCRPB/lenders to GNCTD shall be provided to Transport Department for implementation of the Project. The above funds shall be transferred to Project Account (which will be established and maintained by DIMTS) for meeting the capital expenditure. The Transport Department shall undertake bid process management for identification of developer/operator for development of Hotel and receive upfront amount and the same shall be utilized for implementation of the Project. DIMTS is also proposed to be appointed as the Asset Management Entity for Operation, Maintenance and Management of MMTC after competing the construction.
589. Implementation structure: The proposed structure for implementation of the
project is same as given for Anand Vihar MMTC
590. The PPTA consultant hasn’t reviewed the contractual arrangement between the GNTCD and DIMTS. It is assumed that the agreement ensures performance by the Project Management Consultant and includes proper risk management. Under the assumption, project implementation arrangement is efficient. The operation and maintenance through an Asset Management Company such as DIMTS will ensure the functional efficiency to be maintained. Also the revenue generation components will ensure sufficient funding for operation and maintenance.
591. The implementation of the project (construction phase) shall be completed over a fifteen-month period once the contract is awarded.
7. Economic Analysis
592. The MMTC planned at Sarai Kale Khan will facilitate integration of the inter-city and intra city transit options in the area and largely benefit inter modal transfer by transit passengers with reduced transfer times and improved comfort. This will also have significant impact on the utilization of transit services as transfer between local bus and interstate bus/train services as well as the planned metro rail in future become easy and comfortable which are important for encouraging more private vehicle users to shift to transit. An ISBT is in operation at SKK as well

TA 7114-IND National Capital Region Planning Board Project
Final Report
Sheladia Associates, Inc. USA 207
Volume 1 – Main Rep
ort
as the Nizamudeen railway station is nearby and some transfer is taking at present but the poor condition and lack of properly designed facilities makes it less attractive for commuters who have a choice between various modes including private modes. With sub-urban train operation from rail station, planned metro rail connection, local and intercity bus operation from this area make it an ideal location to develop an integrated MMTC thus creating an environment for increased public transport utilization. This is especially important in the current scenario of increasing vehicle ownership and the heavy traffic congestion, which will deteriorate much faster without acceptable public transport alternatives.
593. The Government of Delhi has included major public transport improvements including development of MMTC in its Transport Policy as explained earlier and is taking up the development of three MMTC’s this year at Kashmere Gate, Anand Vihar and Sarai Kale Khan. The proposed development of MMTC at Sarai Kale Khan is part of the larger effort by the Government of Delhi to provide improved public transport alternatives to encourage increased usage of public transport alternatives.
594. The proposed development plan includes major commercial development also in order to recover the cost of implementation and to generate sufficient revenue for operation and maintenance. The project implementation plan also includes public-private participation for management of project implementation and operation and maintenance. The overall project design thus ensures efficiency in implementation, operation and maintenance and a dedicated funding source which will ensure the long term sustainability of the project objectives of providing attractive public transport option.
595. Economic Cost – The financial cost estimates prepared based on the project report has been converted into economic costs by excluding taxes and duties, as well as price contingencies, and using conversion factors where appropriate. For the analysis purpose the tax element of 12% included in the financial cost has been excluded. Considering the standard procedures recommended for economic feasibility analysis, the financial cost was converted into economic cost for the analysis. The O&M cost for the bus terminal is taken in the first full year of operation based on the detailed estimates made for financial analysis. The project is expected to be completed in 15 months with construction costs distributed 30% in 2010 and 70% in 2011. All costs are expressed in 2009 constant prices.
596. The major economic benefits comprise (i) vehicle operating cost saving for
passengers shifting from private modes to public transport with upgrading of ISBT, (ii) time savings for passengers with easy transfer between different transit modes, (iii) improved circulation with well maintained roads compared to deteriorated roads at present, and (iv) additional employment. Other benefits are envisaged to accrue but have not been quantified. These include transit passenger satisfaction with significant environmental improvement; environment and health benefits due

TA 7114-IND National Capital Region Planning Board Project
Final Report
Sheladia Associates, Inc. USA 208
Volume 1 – Main Rep
ort
to reduced emissions and reduced conflict; improved ridership on metrorail with better connectivity etc.
597. The benefits included in the calculation are those which can be estimated reasonably with the survey information and some assumptions.
598. The benefit streams considered in the economic analysis are estimated based on
the following:
• The construction of MMTC will increase the use of local bus to access the rail and metro at Sarai Kale Khan. Currently, the access to the Anand Vihar terminal is by personal or para-transit modes by about 30% of trips and 70% access by local bus. It is assumed that the provision of an integrated terminal and integrated ticketing will result in increasing the share of local bus use to access to/from the terminal to 85% and reduce the share of private/para-transit modes to 15%. The resultant reduction in trips by car, taxi, auto-rickshaw and two-wheeler to access to/from MMTC will result in vehicle operating cost saving. The savings in vehicle operating cost of private/para-transit modes to access to/from the MMTC have been estimated and included in the benefits. However, no time saving is considered for the passengers for shifting the mode of access as total time taken by local bus or private/para-transit modes may be in similar magnitude with high local bus frequency.
• Well designed pedestrian circulation including elevators is assumed to reduce the passenger transfer time significantly. Also the integration will facilitate easy transfer for metro rail users and faster access by local buses from nearby areas rather than walking. Overall for the analysis, it is assumed that passengers using local bus and ISBT will save on an average 8 minutes and those using the rail and bus modes will save 15 minutes (shuttle bus is planned for transfer to Nizamudeen station) and is valued as per transit passenger travel time of Rs. 21 per hour (estimated based on per capita income of Delhi).
• Passenger and bus traffic increase is taken as per traffic forecast.
• The buses using the terminal will benefit from vehicle operating costs savings (VOC) due to improved road condition, conflict free movement and well laid out roads. The benefit is calculated for circulation length of 1.5 km for the estimated number of buses with a VOC of Rs. 19.34/km with the project and Rs. 30.44/km without the project. The roadway condition is represented by assuming a roughness index of 2.5 average with the project and 5.0 without the project. Also assumed is a speed increase of 10 kmph for conflict free movement with the project.
• The net value addition from provision of advertising spaces, parking and shopping area has been calculated and added.
599. Based on the above considerations, the economic cost and benefit streams over the analysis period have been worked out. A 25 year analysis period has been used. To be acceptable for implementation, the proposed investments have to result in an EIRR of at least equal to the opportunity cost of capital, which is set at 12. NPV's are calculated using opportunity cost of capital as the discount rate.

TA 7114-IND National Capital Region Planning Board Project
Final Report
Sheladia Associates, Inc. USA 209
Volume 1 – Main Rep
ort
The economic analysis indicates an economic rate of return of 12.7%, which is above the acceptable rate of return of 12%.
600. The cost and benefit estimates involve uncertainties. Sensitivity analysis has been
carried out by changing cost and benefit estimates. The results of the sensitivity analysis are given in below. The results indicate that with adverse variation in benefits or costs, the rate of return falls below 12%. The analysis do not include the value of the overall environmental improvement and the wider impact of an integrated urban multi-modal terminal due to the difficulty in quantifying the benefits but is considered to be large enough to compensate for any adverse variation in benefit estimates included.
Summary of Sensitivity Analysis Scenario
Base
case
Cost
increase
by 15%
Benefit
decrease
by 15%
Cost increase by 15% & Benefit
decrease by 15%
Construction delayed by one year
Project
EIRR (%) EIRR (%) EIRR (%) EIRR (%) EIRR (%)
Sarai Kale Khan MMTC 12.7 12.1 10.3 9.1 12.3
601. The economic analysis indicates an economic rate of return above the acceptable rate of return of 12% in the base case but with adverse variation in costs and benefits, the rate of return falls well below 12%. The proposed MMTC at Sarai Kale Khan fulfils a social need, have a wider impact in alleviating the traffic congestion, improving the financial sustainability of public transport operation, reducing environmental pollution and will improve and maintain the level of service for the public transit users and is therefore recommended for implementation.
8. Financial Analysis
602. Financial analysis has been carried out to assess the viability of the proposed
project investment for MMTC at Sarai Kale Khan based on the capacity of MMTC to generate sufficient incremental revenues with project implementation to cover the capital and operating costs of the project. The analysis was carried out on an incremental basis using the discounted cash flow methodology, and measuring the internal rate of return of the project. The analysis is based on the following assumptions:
• The estimated project cost of the proposed redevelopment of Sarai Kale Khan MMTC is given earlier in Table 4.8.
• Construction Schedule: The construction activity has been envisaged over a period of fifteen months. Construction is tentatively assumed to commence in January 2010 and the redeveloped structure is scheduled to start operating from April, 2011. The table below gives the capex programme.

TA 7114-IND National Capital Region Planning Board Project
Final Report
Sheladia Associates, Inc. USA 210
Volume 1 – Main Rep
ort
Particulars Deadline Project start date February 01, 2010 Construction Start February 01, 2010 Construction Period 15 Construction End April 30, 2011 Commencement of Operations May 1, 2011 Capex phasing – 2009-2010 (2 months) 10% Capex phasing – 2010-2011 (12 months) 80% Capex phasing – 2011-2012 (1 month) 10%
603. The assumptions relating to means of finance for the project are described below:
Equity: GNCTD is expected to contribute Rs 590.06 million (including internal accruals during project construction phase from bidding out of the hotel.
Lenders: The balance amount is expected to be borrowed from NCRPB and other lenders. The total debt expected to be raised is Rs 1516.29 million. The indicative details of the debt are given below:
Total project cost : 2106.35 Debt : 1516.29 Own funds : 590.06 D:E ratio : 2.57:1 Loan period : 10 years Moratorium : 2 years Repayment period : 8 years Rate of Interest : 9.5% p.a.
Each drawdown has its own repayment schedule
604. The construction period is 15 months, starting February 2010 and ending April
2011. Hence Interest During Construction has been worked for 2 months for 2009-10, 12 months during 2010-2011 and 1 month during 2011-12.
605. Financial analysis:
i. Substantial reliance has been placed on income from hotel and real estate
(contributing 90% of revenue). Consequently, any impact of economic downturn leading to reduction in such income would greatly affect the viability of the project.
ii. Also, a sum of Rs 100 million and Rs 119 million have been taken as inflow from the hotel developer towards initial premium for funding the capital expenditure. Any delay or reduction in this amount would impact the funds availability for the project. Government of Delhi would need to meet any shortfall in the funds availability if required.
iii. DIMTS is expected to be appointed as the Asset Manager and is expected to be paid a fees linked to operating surplus, prior to debt service. Any shortfall in cash

TA 7114-IND National Capital Region Planning Board Project
Final Report
Sheladia Associates, Inc. USA 211
Volume 1 – Main Rep
ort
flows for meeting debt service due to such payment to DIMTS is to be made up by the Delhi Government
iv. While the project generates operating income, it is however not sufficient to meet the debt service obligations once the repayment of debt commences.
v. The base case of the project financials shows a cumulative cash surplus only in the year 2021 and consequently, any shortfall in meeting various commitments would need to be met by the Delhi Government.
606. Financial Analysis: Based on the financial analysis carried out, the Financial
Internal Rate of Return (FIRR) is estimated at 10.07% for the Base Case. Further a sensitivity analysis of the Base case have been carried out to test the impact of adverse changes in cost and revenue assumptions on the financial rate of return and the results are given below:
Sensitivities Project Cost Project FIRR (%) Base Case (1) 2106.35 10.07 Project Cost Increase 10% (2) 2316.99 7.83 Rental income from rentals – Less by 10% (3) 2106.35 9.15 Hotel income – Less by 50% (4) 2106.35 2.89 Hotel income gets postponed by 1 year (5) 2106.35 8.15 Combined impact (2) + (3) + (5) 2316.99 4.59
607. A review of the sensitivity analysis indicates that
i. With the Project FIRR being only 10.07% p.a., the project economics is extremely sensitive to any variation in project cost and revenues.
ii. While individual sensitivity analysis enumerated above shows the impact of each
scenario separately, a combination of increase in project cost by 10%, decrease in rental income by 10% and a postponement of hotel income by one year has a major impact on the project financials leading to a reduction in FIRR from 10.07% p.a. (in Base Case) to 4.59% p.a.
iii. In view of the above, it is essential that NCRPB ensures budgetary support of the
Government of Delhi as additional security apart from the security of assets created. This would provide additional comfort to NCRPB that the project would be able to meet its debt service obligations, irrespective of the performance of the project.

TA 7114-IND National Capital Region Planning Board Project
Final Report
Sheladia Associates, Inc. USA 212
Volume 1 – Main Rep
ort
9. Safeguards
Social - Land Acquisition, Involuntary Resettlement and Impact to Indigenous Peoples
608. Redevelopment of Sarai Khale Khan ISBT does not involve any land acquisition
and there is no involuntary resettlement impact and impact to indigenous peoples. All improvement works are proposed within the ISBT campus in land owned by Government of National Capital Territory of Delhi (GNCTD).
609. However, the project will involve relocation of 9 licensed vendors, including 1
government undertaking, to the transit ISBT from where the inter state buses will ply during the construction of MMTC. These licensed vendors are on a one-year lease and thereafter the continuance of a vendor depends upon if he/she is successful in the open bid for the shop/stall/PCO booth. The transit ISBT will accommodate these licensed vendors until the end of their license period and thereafter they will have to take part in the annual bid process.
610. The relocation of the licensed vendors to the transit ISBT will be done overnight
without affecting their livelihood and with minimum disturbance to the passengers. Further, the construction is being carried out in a phased manner to minimise impact to passengers and shopkeepers. Consultations with stakeholders and census and socio-economic surveys have reaffirmed that there will be no impact on the livelihood of the shopkeepers in the transit ISBT and the transit arrangement is acceptable to the shopkeepers.
611. In line with the Draft ESMS of NCRPB, projects funded by NCRPB will require a
resettlement plan and/or an indigenous peoples plan commensurate with the significance32 of impact. Redevelopment of ISBT at Sarai Khale Khan will come under S-2 category for involuntary resettlement and S-3 category for indigenous peoples as per NCRPB’s social categorization.
612. A short resettlement plan has been prepared in line with the Draft ESMS
requirements. The summary of resettlement impacts is given in the following table. ‘ 32
As per the Draft ESMS projects are categorized based on the significance of involuntary resettlement and impact to indigenous
peoples. Involuntary resettlement categories are (a) Category S-1 (Significant Impact): means 200 or more people will experience major impacts, which are defined as (i) being physically displaced from housing, or (ii) losing 10% or more of their productive assets (income generating). Category S-1 projects require a full resettlement plan; (b) Category S-2 (Not Significant). Category S-2 projects include involuntary resettlement impacts that are not deemed significant and require a short resettlement plan; and (c) Involuntary Resettlement Category S-3: There is no involuntary resettlement impacts and hence does not require any action. Indigenous Peoples categories are (a) S-I Significant impacts are those projects that directly or indirectly affect the dignity, human rights, livelihood systems, or culture of indigenous peoples or affect the territories or natural or cultural resources that Indigenous peoples own, use, occupy or claim as their ancestral domain. Category S-1 projects will require a indigenous peoples plan; (b) S-2 Not Significant are projects where the indigenous peoples are the sole or the overwhelming majority of project beneficiaries, and when only positive impacts are identified. Category S-2 projects will require a summary note on IP in project document; and (c) S-3 are projects where no impacts on indigenous peoples are envisaged and hence does not require any action.

TA 7114-IND National Capital Region Planning Board Project
Final Report
Sheladia Associates, Inc. USA 213
Volume 1 – Main Rep
ort
Table 5.38: Summary of Resettlement Impacts
Impact Redevelopment of Sarai Khale Khan
ISBT Permanent Land Acquisition (ha) 0
Temporary Land Acquisition (ha) 0
Affected Households (AHs) 0
Affected Persons (APs) 0
Titled APs 0
Non-titled APs (Leaseholders/Renters and Workers/Employees) 0
Licensed private vendors facing minimal disruption 8a
Licensed government/cooperative owned outlets 1
Female-headed AH 0
IP/ST-headed AH 0
BPL AH 1
Affected Structures 0
Affected Trees/Crops 0
Affected Common Property Resources 6b
Average Family Size 6.3
Average Household Income Rs.6,698/- p.m.
a These 8 households will only face minimal disruption during one overnight shifting to the transit ISBT b The 6 public toilets are being replaced in adequate number in the transit ISBT
Environment
613. The Sarai Kale Khan MMTC sub-project has been categorized as Category E-2, and accordingly an Initial Environmental Examination (IEE) and an Environmental Management Plan (EMP) prepared by DIMTS. The Environmental Information Format for Screening, as laid down in the ESMS is provided in the IEE. All improvement works are proposed within the existing Sarai Kale Khan ISBT campus in land owned by Government of National Capital Territory of Delhi (GNCTD), and location impacts pertaining to siting of components within or in the vicinity of environmentally sensitive areas are not envisaged. Given the magnitude of civil works, there would be typical construction related impacts, and could be mitigated by appropriate mitigation measures and adoption of good construction practices. To address environmental impacts associated with increased consumption of water and energy, increase, waste generation during operation of the MMTC, the proposed designs incorporate environmentally friendly techniques incorporating principles of energy conservation, resource minimization, rain water harvesting, energy efficient building designs, and include reuse of water, dual water use systems and energy management.

TA 7114-IND National Capital Region Planning Board Project
Final Report
Sheladia Associates, Inc. USA 214
Volume 1 – Main Rep
ort
614. Clearance of trees within the proposed site is envisaged and shall be addressed through compensatory plantation activities carried out in line with the ESMS provisions, after clearances from the Forest Department. The mitigation measures in the construction stage proposed in the EMP include management of wastes, measures to address environmental and safety issues during construction etc. Given that the ISBT shall be operational during the construction period, management of traffic to avoid inconvenience to the passengers during construction, through a traffic management plan during construction is proposed. Safe dismantling, transportation and disposal of asbestos sheets at the existing terminal under the supervision of the environmental specialist of the Engineer is proposed.
615. The effective implementation of the measures proposed will be ensured with the technical expertise of an Environmental Specialist as part of the Supervision Consultants. Further, the environmental monitoring plans prepared as part of the EMP will provide adequate opportunities towards course correction to address any residual impacts during construction or operation stages.
616. The Implementation Schedule: The DPR provides limited information on the
implementation schedule, which should consist of:
Status of administrative and technical sanction and other statutory approvals
Sarai Kale Khan has required approvals from Delhi Government
Issue of advertising for bidding Included as part of the procurement plan Finalization of tender Included as part of the procurement plan Site clearance and site development Schedule Included in the implementation
schedule Procurement Procurement plan Finalized
10. Risk and Uncertainties
Risk Risk Level Mitigation Measure Project Completion Risk
Moderate Implementation Schedule and Procurement Plan to be finalized upfront Budgetary provision for counterpart contribution and any shortfall in meeting project expenditure Obtain necessary clearances for utility shifting priori to release Short Resettlement Plan based management of project affected persons Support in supervision and management of project from project development facility Contractor Selection based on ICB procedures
Financial Risk 1 Hotel income not being achieved
High Need budgetary support of Government of Delhi for debt servicing
2 Income from High Need budgetary support of Government of Delhi for debt

TA 7114-IND National Capital Region Planning Board Project
Final Report
Sheladia Associates, Inc. USA 215
Volume 1 – Main Rep
ort
rentals – Retail space, offices
servicing
3 Inadequate cash flows during the initial years for debt servicing
High Need budgetary support of Government of Delhi for debt servicing
Increase in O&M expenses
Low Increase in tariff
Technology Low Traditional
617. Conditions of lending: The suggested actions by NCRPB and current status are as follows
By End December 2009, Borrower to provide
i. Submit Final IEE – Completed ii. Submit Final Short Resettlement Plan to NCRPB-Completed iii. Completion of design and updated costs- Completed iv. A procurement plan and implementation schedule for the project- Completed v. Draft Bid Documents confirming to ADB document for Review by NCRPB/ADB-
Due by Feb 2010 vi. Executed O&M contract and performance benchmarks- Draft Contract due by
March 2010 By March 2010,
vii. Utility shifting plan and Certificate of clearance from agencies for shifting of utility viii. Budget Provision of counterpart contribution of 25% ix. Delhi Government Guarantee for Debt Servicing
618. To conclude, since this project is being financed on a non-guarantee mode, and
the expectation is that project revenues covers debt service, it would be prudent for NCRPB to review (in consultation with Delhi Government) the performance contracts in terms of standard metrics such as O and M benchmarks, auction milestones and ensure standard protection clauses such as step-in–rights etc.

TA 7114-IND National Capital Region Planning Board Project
Final Report
Sheladia Associates, Inc. USA 216
Volume 1 – Main Rep
ort
G. BADLI BYPASS
1. Rationale for Subproject
619. The State of Haryana envelops the NCT on three sides and acts as a major entry point to National Capital Region. The rapid growth in the region is putting pressure on the main road network and especially the towns along these routes with the narrow width and heavy urban traffic. One such town is Badli in Jhajjar district of Haryana where about 8 roads cross the town and large number of trucks transporting material for the bitumen plants located on the north-east of Badli town. The material is transported from all around Badli town and the output from the bituminous plants mostly transported to various parts of NCTD. In addition, large regional traffic also travel through Badli town resulting in congestion in the town and there is little scope for widening the road through the town. In orde to mitigate the transport situation in and around Badli, it is proposed to develop a Bypass to cater to all through traffic which has no buisiness in the town.
620. The traffic studies described later indicate that more than 50% of the traffic
currently going through Badli town is bypassable. This will have a major positive impact on the traffic situation in the town and improve the traffic safety. The savings to the society in terms of vehicle operating with reduced congestion is large enough as can be seen from the economic rate of return of the project and is therefore highly justified in social cost benefit terms.
2. Scope and Components
621. The proposed Badli Bypass starts from Km 16/550 of Gurgaon – Bahadurgarh
road and its joins the same road at Km 18/580 and will be 5.68 km long connecting 8 roads converging in Badli town. The road is designed as a 4 lane divided carriageway and in the first phase two lane carriageway with paved shoulders will be constructed. The proposal also involves rehabilitation of existing road section of Gurgaon – Bahadurgarh road from Km 16/550 to Km 18/580 and about 1.3 km length of cross roads.
3. Technical Description and Analysis
622. The Badli Bypass, starts from Km 16/550 of Gurgaon – Bahadurgarh road and
joins back the same road at Km 18/580. The entire project alignment is traversing through plain terrain and the project corridor is predominantly passing through agricultural land. The subgrade soil is generally silty clay and the entire alignment is proposed on embankment. As the project road alignment is passing through agricultural fields and on embankment, adequate provision of balancing culverts are required to avoid any chance of flooding on one side on the road. The project road alignment in true sense will act as a ring road to Badli town along with Gurgaon – Bahadurgarh road and it crosses six other roads and hence effectively

TA 7114-IND National Capital Region Planning Board Project
Final Report
Sheladia Associates, Inc. USA 217
Volume 1 – Main Rep
ort
preventing the through traffic from those roads entering to the town center. The lists of cross roads which will cross the bypass alignment are given in Table below. The proposed alignment is not crossing any railway line or river. It is also noted that present day traffic does warrant any signalized junctions.
Table 5.39 List of Cross Roads
S No Crossing Road 1 Rohad Road 2 Goelakalan Road 3 Kheri Road 4 Jhajjar Road 5 Munimpur Road 6 Yakubpur Road
623. The construction of Palwal-Manesar-Kundli Expressway is in progress which is
crossing the Gurgaon – Bahadurgarh road at 100m before the start of the proposed Badli Bypass alignment and again it is crossing the alignment about 100m after the end of bypass. Presently grade separated junction without any connection to Bahadurgarh road is planned at the crossings of the expressway.

TA 7114-IND National Capital Region Planning Board Project
Final Report
Sheladia Associates, Inc. USA 218
Volume 1 – Main Rep
ort
624. Classified traffic volume counts and origin-destination surveys were carried out to
assess the likely traffic demand on the proposed bypass. The average daily traffic observed on all roads entering the Badli town is estimated at 15997 vehicles as per DPR of which about 50% is constituted by trucks. The bypassable traffic assessment indicate a volume of 9757 vehicles consisting of about 45 % goods vehicles and 55% passenger vehicles.
625. A right of way of 60 m is proposed. The entire right of way is to be acquired as the
proposed alignment is totally new. The carriage width proposed is 7.0 m for two lane traffic with 1.5 m paved shoulders and 1.5 m earthen shoulders on either side. The average embankment height works out to 1.6 m. The road pavement is designed for the projected traffic over 10 years. The road layout is planned such that it is constructed on one half of the right of way and the second carriageway to be constructed on the other half in future. Provisions are made for all road furniture, covered drain as needed and other measures as per MORTH requirements.

TA 7114-IND National Capital Region Planning Board Project
Final Report
Sheladia Associates, Inc. USA 219
Volume 1 – Main Rep
ort
626. The provisions also include strengthening of the existing Gurgaon – Bahadurgarh
road section thus completing a full circle around Badli town. Also at crossing roads, reconstruction is proposed for an additional 60 to 535 m along the crossroads. There is also provision for covered drain for a length of 2 km.
4. Sub-Project Selection Criteria
627. The proposed project is provides relief from severe congestion in Badli town. Also
the truck and through traffic is provided with an almost free flow condition thus significantly benefiting all traffic with vehicle operating cost savings and improved road safety. The project has been selected based on the benefit to the traffic and the improvement in road network connectivity it provides.
Table 5.40 Cost estimates and financing plan Base Cost (Rupees Million) 2010 2011 2012 Total I. Investment Costs A. Civil Works 1. Land Land Acquisition 15.2 83.5 53.2 151.9 2. Civil Works Site Clearance 0.1 0.3 0.2 0.6 Earthwork 4.4 23.9 15.2 43.5 Sub-base and Base Course 7.0 38.2 24.3 69.5 Bituminous Course 13.3 73.3 46.6 133.2 Bridges, Culverts and Causeways 1.8 10.0 6.4 18.2 Traffic Safety & Road Appurtenances 1.4 7.7 4.9 14.0 Drainage & Protection Works 4.2 22.9 14.6 41.6 Shifting of Utilities 0.3 1.6 1.0 2.8 Removal of Trees and Compulsory Afforestation 0.4 2.2 1.4 4.0 Subtotal Civil Works 32.8 180.1 114.6 327.5 Total 47.9 263.7 167.8 479.4
628. The financial appraisal of Badli Byepass (and also Sonepat and Jhajjar roads) have not been carried as these projects do not have revenue earning potential. As the cost recovery would be done through administered taxes by the Haryana Government, an analysis of the financials of Haryana Government is provided in a subsequent section.
5. Project Operation and Maintenance
629. The operation and maintenance of the proposed facility will be the responsibility of
HSRDC. The funds needed for the maintenance need to be allocated by the state government from its budgetary resources. The resource constraints of the state government may affect the timely maintenance of the facility.

TA 7114-IND National Capital Region Planning Board Project
Final Report
Sheladia Associates, Inc. USA 220
Volume 1 – Main Rep
ort
6. Economic Analysis
630. An economic analysis of the proposed Badli Bypass has been undertaken to determine its economic viability.
631. The major economic benefits comprise (i) Vehicle operating cost savings to
diverted traffic with improved surface and free flow traffic situation, (ii) Vehicle operating cost savings to traffic on traffic on road through the town with improved surface and reduced congestion with traffic diversion and, (iii) travel time savings to all traffic with improved speeds. Other benefits are envisaged to accrue but have not been quantified. These include reduced emissions due to reduced congestion and improved road safety in the town sections with diversion of all truck traffic.
632. Based on the above considerations, the economic cost and benefit streams over
the analysis period have been worked out. A 20 year analysis period has been used. A residual value of 40% is assumed as the land acquisition cost comprise of 30% of the cost. To be acceptable for implementation, the proposed investments have to result in an EIRR of at least equal to the opportunity cost of capital, which is set at 12 percent. NPV's are calculated using opportunity cost of capital as the discount rate. The results of economic analysis for the Badli Bypass are summarized in Table below.
633. The economic analysis indicates a robust economic rate of return well above the
acceptable rate of return of 12%. The proposed Badli Bypass will relieve serious traffic congestion at Badli town and has an acceptable economic rate of return and is therefore recommended for implementation.
Scenario
Base case Cost increase by 15%
Benefit decrease by 15%
Cost increase by 15% & Benefit decrease by 15%
Construction delayed by one year
Project
EIRR (%) EIRR (%) EIRR (%) EIRR (%) EIRR (%)
Badli Bypass, Haryana 25.2 22.6 22.2 19.8 24.3
634. The cost and benefit estimates involve uncertainties. Sensitivity analysis has been carried out by changing cost and benefit estimates. The results of the sensitivity analysis are given in Table below. The results indicate that with adverse variation in benefits or costs, the rate of return is still above the acceptable rate of return.
Project Net Present Value (NPV) (Million INR)
Net Present Value by Cost Ratio
Internal Rate of Return (EIRR)
(%)
Badli Bypass, Haryana 617.5 1.4 25.2

TA 7114-IND National Capital Region Planning Board Project
Final Report
Sheladia Associates, Inc. USA 221
Volume 1 – Main Rep
ort
7. Safeguards
a) Social
Land Acquisition, Involuntary Resettlement and Impact to Indigenous Peoples
635. The proposed bypass is a new formation and involves land acquisition. The first
2.570 km falls under Bahadurgarh Division and the remaining 3.110km falls under Jhajjar Division. Private agricultural land measuring 63.15 acres will be required for the formation of the bypass.
636. The Sec 4(1) notification is yet to be pronounced and the land plan schedule will
be prepared only after 4(1) notification. However, the sample surveys carried out in the project area indicate that the project will cause significant impact to 31 households and the impact on another 96 households will be not significant. There are no impacts to indigenous peoples.
637. The acquisition of 63.15 acres of private agricultural land will cause loss of income
to the landowners from whom land is proposed to be acquired. The sample socio-economic surveys indicate that the involuntary resettlement impacts are expected to be not significant as the acquisition is linear. Preliminary discussions and consultations have revealed that there are no IP amongst the landowners or among agricultural labourers and hence the project will not require any IPP. However, during the census survey after Sec 4(1) notification and preparation of land plan schedule, if any IP is identified, the project will address the same in line with the Draft ESMS of NCRPB.
638. In line with the Draft ESMS of NCRPB, projects funded by NCRPB will require a
resettlement plan and/or an indigenous peoples plan commensurate with the significance33 of impact. Formation of bypass at Badli will come under S-2 category for involuntary resettlement and S-3 category for indigenous peoples as per NCRPB’s social categorization.
639. A short resettlement plan has been prepared in line with the Draft ESMS
requirements. The summary of resettlement impacts is given in the following table.
33
As per the Draft ESMS projects are categorized based on the significance of involuntary resettlement and impact to indigenous
peoples. Involuntary resettlement categories are (a) Category S-1 (Significant Impact): means 200 or more people will experience major impacts, which are defined as (i) being physically displaced from housing, or (ii) losing 10% or more of their productive assets (income generating). Category S-1 projects require a full resettlement plan; (b) Category S-2 (Not Significant). Category S-2 projects include involuntary resettlement impacts that are not deemed significant and require a short resettlement plan; and (c) Involuntary Resettlement Category S-3: There is no involuntary resettlement impacts and hence does not require any action. Indigenous Peoples categories are (a) S-I Significant impacts are those projects that directly or indirectly affect the dignity, human rights, livelihood systems, or culture of indigenous peoples or affect the territories or natural or cultural resources that Indigenous peoples own, use, occupy or claim as their ancestral domain. Category S-1 projects will require a indigenous peoples plan; (b) S-2 Not Significant are projects where the indigenous peoples are the sole or the overwhelming majority of project beneficiaries, and when only positive impacts are identified. Category S-2 projects will require a summary note on IP in project document; and (c) S-3 are projects where no impacts on indigenous peoples are envisaged and hence does not require any action.

TA 7114-IND National Capital Region Planning Board Project
Final Report
Sheladia Associates, Inc. USA 222
Volume 1 – Main Rep
ort
Table 5.41 Summary of Resettlement Impacts
Impact Formation of Badli
Bypass Permanent Land Acquisition (ha) 63.15 acres
Temporary Land Acquisition (ha) 0
Affected Households (AHs) – Significant Impact 31 a
Affected Persons (APs) – Significant Impact 149
Affected Households (AHs) – Not Significant Impact 96a
Affected Persons (APs) – Not Significant Impact 461
Titled APs 610
Non-titled APs (Encroachers) 0
Female-headed AH 0
IP/ST-headed AH 0
BPL AH 0
Affected Structures 0
Affected Trees/Crops 0
Affected Common Property Resources 0
Average Family Size 4.8
Average Household Income Rs.4,800/- p.m.
a Of the 127 households losing their agricultural land, 31 households losing their agricultural land will face significant
impact and the impact on the remaining 96 household sis not significant and hey will lose only a strip of their landholding.
b) Environment
640. The Badli bypass sub-project has been categorized as Category E-2, and accordingly an Initial Environmental Examination (IEE) and an Environmental Management Plan (EMP) prepared by HSRDC. The Environmental Information Format for Screening, as laid down in the ESMS is provided in the IEE. The 5.68km long bypass alignment with a RoW of 60m, passes through agricultural lands for a major length, apart from lands being used for brick kilns. Location impacts pertaining to siting of alignment within or in the vicinity of environmentally sensitive areas are not envisaged. Clearance of trees within the agricultural lands along the proposed alignment is envisaged and shall be addressed through compensatory plantation activities carried out in line with the ESMS provisions, after clearances from the Forest Department.

TA 7114-IND National Capital Region Planning Board Project
Final Report
Sheladia Associates, Inc. USA 223
Volume 1 – Main Rep
ort
641. Given the magnitude of civil works in the development of a green field bypass alignment, there would be typical construction related impacts, and could be mitigated by appropriate mitigation measures and adoption of good construction practices. These have been put forth in the EMP. In addition to the general good construction practices to be adopted during construction, the key measures to address specific impacts envisaged in the Badli bypass include – management of topsoil from the agricultural land cleared for the project and provision of cross-drainage structures to ensure that the adjoining lands along the alignment do not get flooded or waterlogged. During the operation of the bypass, the EMP recommends measures by HSRDC in coordination with the planning authorities to address potential impacts pertaining to induced development along the bypass alignment through appropriate development controls and land use regulations.
642. The effective implementation of the measures proposed will be ensured with the
technical expertise of an Environmental Specialist as part of the Supervision Consultants. Further, the environmental monitoring plans prepared as part of the EMP will provide adequate opportunities towards course correction to address any residual impacts during construction or operation stages.
H. CONSTRUCTION OF VARIOUS ROADS IN SONEPAT DISTRICT.
1. Rationale for Subproject
643. The State of Haryana envelops the NCT on three sides and acts as a major entry point to National Capital Region. The rapid growth in the region is putting pressure on the road network and especially with many single lane sections and poor condition due to neglected maintenance. The Government Haryana has selected five roads in Sonepat district having an aggregate length of 94.3km serving as important regional connection in the sub region for upgrading. The upgrading will improve the road connectivity in Sonepat district and support the development of the district and thus meets the regional development objective.
644. The traffic studies described later indicate that the present AADT is in the range of 1900 to 4000 vehicles and is expected to grow at a faster pace with cars and two wheelers at the rate of 11% per annum and that of buses and trucks at the rate of 7 and 6% respectively. The poor pavement condition, bad geometry and the heavy traffic growth combined together warrant for an immediate rehabilitation and improvement of the project roads.
2. Scope and Components;
Table 5.42 Roads proposed for rehabilitation and widening S.No. Name of the Road District Length(km)
1 Gohana-Sisana Road Sonepat 28.563
2 Sonepat-Mehlana-Farmana Road Sonepat 21.883 3 Sonepat-Kakroi-Bidhlan Road VT Sonepat 19.635

TA 7114-IND National Capital Region Planning Board Project
Final Report
Sheladia Associates, Inc. USA 224
Volume 1 – Main Rep
ort
4 Jagsi-Gangana Road VT Sonepat 6.177 5 Kharkhauda-Assaudha Road Sonepat and Jhajjar 18.045
645. The main road network of Sonepat district consist two national highway (NH1 and NH71), five state highways and two major District Roads. The five roads selected for improvements are linking various villages to the main transport network consisting of National Highways and State Highways. In addition to the requirement for widening, the conditions of the existing road are very poor and needs rehabilitation.
3. Technical Description and Analysis
646. The project corridor consists of five separate roads having carriageway width
varying from 3.5m to 5.5m and with 1m to 1.5 wide earthen shoulders on both sides. The design service volume (DSV) of single lane carriage way is 2000PCU and the current traffic in almost all the project roads exceeds the DSV. This indicates the immediate requirement of capacity augmentation in form of widening to 2 lane carriageway. The present condition of the pavement is very poor and the existing bituminous layer has no residual strength and hence scarification of existing pavement and reconstruction from the base or sub base level is required.

TA 7114-IND National Capital Region Planning Board Project
Final Report
Sheladia Associates, Inc. USA 225
Volume 1 – Main Rep
ort
647. The improvement proposal is generally restricted within the available ROW. However DPR adopted design standard of state highways for project improvement and suggest realignment and other geometric improvement. Land acquisition is required on these locations.
648. The carriageway width proposed is 7.0 m for two lane traffic with 1.0 m earthen shoulders on either side. The road pavement is designed for the projected traffic over 10 years. Flexible pavement is recommended for the project road except on stretches where concrete pavement exists where widening and strengthening with concrete pavement is proposed.
649. Six out of 18 minor bridges in the project road are proposed for replacement. 119
culverts are provided as part of the project improvement which includes 20 new culverts, reconstruction of 36 culverts and widening of 10 culverts.
650. The project is proposed to be implemented over a period of 18 months and as a
single construction package.
4. Sub-Project Selection Criteria
651. The proposed project provides relief from severe congestion due to capacity augmentation and also improves the riding quality. The project has been selected based on the benefit to the traffic and the improvement in road network connectivity it provides to support the development of the region immediately outside the NCTD thus meeting a major objective of NCR.
Table 5.43 Cost estimates and financing plan; Base Cost (Rupees Million
2010 2011 2012 Total
I. Investment Costs
A. Civil Works
1. Sonipat - Bidhalan - 19.635 kms
Site Clearance 0.1 0.4 0.3 0.8
Earthwork 1.8 10.0 6.3 18.1
Sub Base and Base Courses 7.0 38.6 24.6 70.3
Bituminous Base and Surface Courses 5.6 30.7 19.5 55.8
Concrete Pavement 1.2 6.5 4.2 11.9
Cross Drainage Works and Bridges 1.6 8.8 5.6 15.9
Drainage and Protection Works 1.5 8.5 5.4 15.4
Traffic Safety and Road Appurtenances 2.5 13.8 8.8 25.2
Miscellaneous Items 0.5 2.7 1.7 4.9
Deforestation 1.6 8.6 5.5 15.7
Utility Shifting 0.4 2.2 1.4 3.9
Land Acquisition 0.1 0.3 0.2 0.6
Subtotal Sonipat - Bidhalan - 19.635 kms 23.8 131.1 83.4 238.4
2. Jagsi - Gangana - 6.177 kms
Site Clearance 0.0 0.2 0.1 0.3
Earthwork 0.7 3.7 2.3 6.7
Sub Base and Base Courses 2.5 13.5 8.6 24.5

TA 7114-IND National Capital Region Planning Board Project
Final Report
Sheladia Associates, Inc. USA 226
Volume 1 – Main Rep
ort
Base Cost (Rupees Million
2010 2011 2012 Total
Bituminous Base and Surface Courses 1.8 10.2 6.5 18.5
Concrete Pavement - - - -
Cross Drainage Works and Bridges 0.8 4.6 2.9 8.3
Drainage and Protection Works - - - -
Traffic Safety and Road Appurtenances 0.8 4.5 2.9 8.1
Miscellaneous Items 0.2 0.9 0.6 1.7
Deforestation 0.5 2.7 1.7 4.9
Utility Shifting 0.1 0.7 0.4 1.2
Land Acquisition - - - -
Subtotal Jagsi - Gangana - 6.177 kms 7.4 40.9 26.0 74.4
3. Gohna - Sisana - 28.563 kms
Site Clearance 0.2 0.9 0.6 1.7
Earthwork 2.1 11.6 7.4 21.1
Sub Base and Base Courses 10.4 57.0 36.3 103.6
Bituminous Base and Surface Courses 14.3 78.8 50.1 143.3
Concrete Pavement 0.9 4.7 3.0 8.6
Cross Drainage Works and Bridges 2.4 13.0 8.3 23.7
Drainage and Protection Works 0.7 3.8 2.4 6.9
Traffic Safety and Road Appurtenances 3.6 19.7 12.5 35.7
Miscellaneous Items 0.9 4.8 3.1 8.8
Deforestation 2.3 12.6 8.0 22.9
Utility Shifting 0.6 3.1 2.0 5.7
Land Acquisition - - - -
Subtotal Gohna - Sisana - 28.563 kms 38.2 210.1 133.7 381.9
4. Kharkhauda - Asaudha - 18.045 kms
Site Clearance 0.1 0.4 0.2 0.7
Earthwork 1.2 6.7 4.3 12.2
Sub Base and Base Courses 4.0 22.0 14.0 40.0
Bituminous Base and Surface Courses 9.5 52.1 33.1 94.6
Concrete Pavement 1.5 8.4 5.4 15.3
Cross Drainage Works and Bridges 0.2 1.4 0.9 2.5
Drainage and Protection Works 2.0 10.8 6.9 19.7
Traffic Safety and Road Appurtenances 2.3 12.6 8.0 22.9
Miscellaneous Items 0.4 2.4 1.5 4.4
Deforestation 1.4 7.9 5.1 14.4
Utility Shifting 0.4 2.0 1.3 3.6
Land Acquisition - - - -
Subtotal Kharkhauda - Asaudha - 18.045 kms 23.0 126.7 80.6 230.4
5. Sonipat - Farmana - 21.883 kms
Site Clearance 0.1 0.5 0.3 1.0
Earthwork 2.1 11.3 7.2 20.5
Sub Base and Base Courses 6.2 34.0 21.6 61.8
Bituminous Base and Surface Courses 6.5 35.5 22.6 64.6
Concrete Pavement - - - -
Cross Drainage Works and Bridges 1.4 7.6 4.9 13.9
Drainage and Protection Works 1.5 8.3 5.3 15.0
Traffic Safety and Road Appurtenances 2.7 14.9 9.5 27.1
Miscellaneous Items 6.2 34.0 21.6 61.8
Deforestation 1.8 9.6 6.1 17.5
Utility Shifting 0.4 2.4 1.5 4.4
Land Acquisition - - - -
Subtotal Sonipat - Farmana - 21.883 kms 28.8 158.2 100.6 287.6
Total 121.3 667.0 424.4 1,212.6

TA 7114-IND National Capital Region Planning Board Project
Final Report
Sheladia Associates, Inc. USA 227
Volume 1 – Main Rep
ort
652. As indicated earlier, the financial appraisal of Sonepat roads (and also Badli
Byepass and Jhajjar roads) have not been carried as these projects do not have revenue earning potential. As the cost recovery would be done through administered taxes by the Haryana Government, an analysis of the financials of Haryana Government is provided in a subsequent section.
5. Economic Analysis
653. An economic analysis of the proposed project has been undertaken to determine its economic viability.
654. The major economic benefits comprise (i) Vehicle operating cost savings to traffic on the project roads with improved surface and capacity and (ii) travel time savings to all traffic with improved speeds. Other benefits are envisaged to accrue with better access but have not been quantified. These include reduced emissions due to better level of service, social benefits and improved road safety in the town sections.
i. Based on the above considerations, the economic cost and benefit streams over the analysis
period have been worked out using the HDM-4 model. All costs and benefits are valued in
monetary terms and expressed in economic prices to avoid distortions in the input prices of
labor, materials, equipment and foreign exchange due to market imperfections. In calculating
the road agency economic costs (construction and maintenance), a Conversion Factor (CF)
0.9 was used, as generally used for road projects in India, to derive economic costs from the
estimated financial cost.
ii. The economic cost of vehicle operating cost components and time costs (VOCs) have been
calculated separately for each individual component and input to the HDM model. The input
values used for recent road sector studies in India have been used.
iii. A 20 year analysis period has been used. A residual value of 10% is assumed, as the project
involves widening. To be acceptable for implementation, the proposed investments have to
result in an EIRR of 12% which is generally considered in economic analysis as acceptable.
NPV's are calculated using opportunity cost of capital as the discount rate. The results of
economic analysis for the project is summarized in Table 5.44.
Table 5.44 Economic Analysis Results NPV EIRR
Road (Rs. Million) NPV/Cost Ratio (%) Gohana - Sisana 1611.5 5.7 57.5 Jagsi - Gangana Road 89.3 1.3 28.1 Kharkhauda-Assaudha Road 1178.8 6.8 64.8 Sonepat-Farmana 850.4 4.0 49.2 Sonepat - Kakroi Road 350.9 1.8 31.4

TA 7114-IND National Capital Region Planning Board Project
Final Report
Sheladia Associates, Inc. USA 228
Volume 1 – Main Rep
ort
655. The economic analysis indicates a robust economic rate of return well above the acceptable rate of return of 12% for all project road sections. The proposed project will improve the level of service and augment capacity to sustain the level of service over the design period and has an acceptable economic rate of return and is therefore recommended for implementation.
656. The cost and benefit estimates involve uncertainties. Sensitivity analysis has been carried out by changing cost and benefit estimates. The results of the sensitivity analysis are given in Table 5.45. The results indicate that with adverse variation in benefits or costs, the rate of return is still above the acceptable rate of return.
Table 5.45 Sensitivity Analysis Results
Economic Internal Rate Of Return Under Different Scenarios
Road Section Base Case Increase In Cost by 15%
Decrease In Benefits by
15%
Increase in Cost and Decrease in Benefits By 15%
Delay in Construction by
One Year Gohana - Sisana 57.5% 52.1% 51.3% 46.5% 48.0%
Jagsi - Gangana 28.1% 24.9% 24.4% 21.6% 27.0%
Kharkhauda - Assaudha Road
64.8% 58.8% 57.9% 52.5% 53.5%
Sonepat - Farmana 49.2% 44.2% 43.5% 39.0% 39.0%
Sonepat-Kakroi-Bidhlan Road
31.4% 28.1% 27.5% 24.5% 26.1%
6. Land Acquisition, Involuntary Resettlement and Impact to Indigenous Peoples
657. The rehabilitation proposed for 4 of the 5 road corridors in Sonipat Division does
not involve any land acquisition as all improvement works are proposed within the existing Right-of-Way (RoW). Only in one road corridor viz. Sonipat-Bidhlana, there is minimal land acquisition for a realignment proposed to improve a sharp curve. The land to be acquired is agricultural land measuring 0.3 acres. However, the project will impact two encroachers who have encroached upon the RoW and 13 community assets that have been built encroaching upon the RoW. There are no impacts to indigenous peoples.
658. In built-up stretches no widening is proposed in order to minimise involuntary
resettlement and it has been proposed to only strengthen the existing road with proper drainage facility. Necessary traffic arrangement measures with proper signage have been proposed to ensure smooth flow of traffic in these constricted stretches.
659. The project will impact 2 households of whom 1 household would lose their place
of residence and the other household their place of business. The project will also impact 13 common property resources that include 2 bus shelters, 2 places of

TA 7114-IND National Capital Region Planning Board Project
Final Report
Sheladia Associates, Inc. USA 229
Volume 1 – Main Rep
ort
worship, 4 water tank, 2 well, 1 community building and 2 compound walls of common property resources.
660. In line with the Draft ESMS of NCRPB, projects funded by NCRPB will require a
resettlement plan and/or an indigenous peoples plan commensurate with the significance34 of impact. Rehabilitation of 5 roads in Sonipat Division will come under S-2 category for involuntary resettlement and S-3 category for indigenous peoples as per NCRPB’s social categorization.
661. A short resettlement plan has been prepared in line with the Draft ESMS
requirements. The summary of resettlement impacts is given in the following table. Table 5.46 Summary of Resettlement Impacts
Impact Rehabilitation of 5 Roads
in Sonipat Division Permanent Land Acquisition (ha) 0.3 acres
Temporary Land Acquisition (ha) 0
Affected Households (AHs) 2 a
Affected Persons (APs) 8
Titled APs 0
Non-titled APs (Encroachers) 8
Female-headed AH 0
IP/ST-headed AH 0
BPL AH 0
Affected Structures 2
Affected Trees/Crops 0
Affected Common Property Resources 13
Average Family Size 4.0
Average Household Income Rs.4,000/- p.m.
a Both the households getting impacted will face significant impact
34
As per the Draft ESMS projects are categorized based on the significance of involuntary resettlement and impact to indigenous
peoples. Involuntary resettlement categories are (a) Category S-1 (Significant Impact): means 200 or more people will experience major impacts, which are defined as (i) being physically displaced from housing, or (ii) losing 10% or more of their productive assets (income generating). Category S-1 projects require a full resettlement plan; (b) Category S-2 (Not Significant). Category S-2 projects include involuntary resettlement impacts that are not deemed significant and require a short resettlement plan; and (c) Involuntary Resettlement Category S-3: There is no involuntary resettlement impacts and hence does not require any action. Indigenous Peoples categories are (a) S-I Significant impacts are those projects that directly or indirectly affect the dignity, human rights, livelihood systems, or culture of indigenous peoples or affect the territories or natural or cultural resources that Indigenous peoples own, use, occupy or claim as their ancestral domain. Category S-1 projects will require a indigenous peoples plan; (b) S-2 Not Significant are projects where the indigenous peoples are the sole or the overwhelming majority of project beneficiaries, and when only positive impacts are identified. Category S-2 projects will require a summary note on IP in project document; and (c) S-3 are projects where no impacts on indigenous peoples are envisaged and hence does not require any action.

TA 7114-IND National Capital Region Planning Board Project
Final Report
Sheladia Associates, Inc. USA 230
Volume 1 – Main Rep
ort
7. Environment
662. The Sonepat roads sub-project, comprising the improvement of 5 existing road
stretches for a total length of 94km has been categorized as Category E-2, and accordingly an Initial Environmental Examination (IEE) and an Environmental Management Plan (EMP) prepared by HSRDC. The Environmental Information Format for Screening, as laid down in the ESMS is provided in the IEE. The alignments are proposed along the existing routes and all proposed improvements are envisaged within the available RoW. In case of stretches within settlements, resettlement impacts have been avoided through design of constricted cross-sections and provision of appropriate traffic management measures. Design of the alignment adopting this approach has enabled avoidance of impacts related to land acquisition, and impacts on agriculture lands. Location impacts pertaining to siting of alignment within or in the vicinity of environmentally sensitive areas are not envisaged. The Bhindawas Bird Sanctuary, situated about 50 km from the Kharkhauda-Assaudha Road, is the only protected area in the project districts. There are no impacts envisaged on this sanctuary due to the proposed road developments. Clearance of trees (mostly eucalyptus and acacia species) along the project roads is envisaged and shall be addressed through compensatory plantation activities carried out in line with the ESMS provisions, after clearances from the Forest Department.
663. Given the magnitude of civil works, there would be typical construction related
impacts, and could be mitigated by appropriate mitigation measures and adoption of good construction practices. These have been put forth in the EMP. The effective implementation of the measures proposed will be ensured with the technical expertise of an Environmental Specialist as part of the Supervision Consultants. Further, the environmental monitoring plans prepared as part of the EMP will provide adequate opportunities towards course correction to address any residual impacts during construction or operation stages.
I. REHABILITATION OF 13 ROADS IN JHAJJAR DISTRICT.
1. Rationale for Subproject
664. The State of Haryana envelops the NCT on three sides and acts as a major entry
point to National Capital Region. Eight districts of Haryana viz. Faridabad, Mewat, Gurgaon, Rohtak, Sonepat , Rewari, Jhajjar and Panipat. Many major development projects are taking place in NCR of Haryana which includes 20 SEZs with an investment of Rs 870 Billion. All this developments also attracts heavy good and industrial traffic to the NCR region of Haryana from surrounding states. The rapid growth in the region is putting pressure on the main road network of these districts. The Government of Haryana through is taking up upgrading of the road network in these districts and has prepared a project for taking up thirteen roads for upgrading in Jhajjar district which is located on the north north-west side

TA 7114-IND National Capital Region Planning Board Project
Final Report
Sheladia Associates, Inc. USA 231
Volume 1 – Main Rep
ort
of NCTD. HSRDC has approached NCRPB for funding of this project of upgrading 13 roads in Jhajjar district.
665. In Jhajjar, Bahadurgarh is emerging as an industrial hub of the district and is
famous for glazed Tiles, steel pipes, biscuits and sanitaryware products. The upcoming project, Kundli-Manesar-Palwal Express Highway will pass through the district of Jhajjar. Besides, there are SEZ proposals for the districts of Jhajjar and Gurgaon that will open up new avenues for industrial and economic activities in these districts. In addition to these industrial developments this district is also an agri based district adjacent to NCTD. Hence in order to meet the requirement of these industries, the government has proposed to improve the road infrastructure in the district. In addition to the requirement for widening, the condition of the existing road is poor and needs immediate rehabilitation.
666. The traffic studies described later indicate that the present AADT on these roads is in the range of 3380 to 15380 within the next 10 years. The poor pavement condition, bad geometry and the heavy traffic growth combined together warrant for an immediate rehabilitation and capacity augmentation of the project roads.

TA 7114-IND National Capital Region Planning Board Project
Final Report
Sheladia Associates, Inc. USA 232
Volume 1 – Main Rep
ort
2. Scope and Components
Table 5.47 Thirteen roads proposed for upgrading
Road No.
Name of Work Length in (km)
Existing carriageway width (m)
1. Jharli Mohanbari Approach road 3.235 3.66 2. Jhajjar, Talao, Chhuchakawas road 13.460 5.50 3. Beri, Rohtak road 8.560 5.50 4. Badli to Durina via Ladpur Munimpur 11.430 5.50 5. Badli Pela Sondhi Yakubpur road 9.800 5.50
6. Sahlawas Amboli Bithla Dhakla SH-22 including Jatwara approach road
16.220 3.66
7. Subana (SH-22) Sarola Ahri road. 6.640 3.66 8. Patauda (MDR-132 Dhani Saniyan Kahari Machroli(NH-71). 10.080 3.66
9. Jhajjar Farrukhnagar road (SH15A) Mubarakpur Ismailpur Mundakhera (MDR-136) Badli, Iqbalpur Galibpur upto Distt Border.
11.755 3.66
10. Badli Iqbalpur road Lohat Delhi Border. 3.765 3.66 11. Chhuchakwas (MDR-130) Achej Paharipur, Malikpur Safipur road. 12.475 3.66 12. Godhri Safipur Impota. 6.290 3.66
13. Gawalision (VT)Kheri Hosdarpur Karodha Raiya (SH-22) Salodha Gijrodh (NH-71)
15.020 3.66
Total 128.73
3. Technical Description and Analysis
667. The project package consists of thirteen separate roads having carriageway width varying from 3.66m to 5.5m and with 1m to 1.5 wide earthen shoulders on both sides. The design service volume (DSV) of single lane carriage way is 2000PCU and the projected traffic for all the project roads exceeds the DSV for single lane. This indicates the immediate requirement of capacity augmentation in form of widening to intermediate or 2 lane carriage way. The present condition of the pavement is very poor and the existing bituminous layer has no residual strength and hence scarification of existing pavement and reconstruction from the base or sub base level is required.
668. The improvement proposal is generally restricted within the available ROW.
669. Carriageway widths for different roads are shown in table above and 1m wide earthen shoulder is provided on either side. The road pavement is designed for the projected traffic over 10 years.
670. Project road sections crosses railway line at four locations and level crossing is retained at all those locations for the present. The project design need to consider

TA 7114-IND National Capital Region Planning Board Project
Final Report
Sheladia Associates, Inc. USA 233
Volume 1 – Main Rep
ort
grade separation in the future and HSRDC to include in its plan the grade separation in future to realize the traffic growth and maximize the project benefits.
4. Sub-Project Selection Criteria
671. The proposed project provides relief from severe congestion with capacity augmentation and also improves the riding quality. The project has been selected based on the benefit to the traffic and the improvement in road network connectivity it provides to support the development of the region immediately outside the NCTD thus meeting a major objective of NCR.
Table 5.48 Cost estimates and financing plan; Base Cost Rs in Millions 2010 2011 2012 Total I. Investment Costs A. Civil Works Site Clearance 0.5 2.9 1.8 5.2 Earthwork 10.4 57.4 36.5 104.4 Sub Base and Base Courses 43.4 238.7 151.9 434.0 Bituminous Course 56.4 310.2 197.4 563.90 Cement Concrete Pavement 26.1 143.6 91.4 261.2 Drainage and Protection Works 14.3 78.8 50.1 143.2 Traffic Safety and Road Appurtenances 13.2 72.7 46.3 132.2 Bridges, Culverts and Causeways 8.8 48.5 30.9 88.2 Utility Shifting 6.4 35.4 22.5 64.4 Retaining Wall 5.1 27.8 17.7 50.6 Removal of Trees and Compulsory Afforestation 9.0 49.6 31.5 90.1 Improvement of Railway Crossing 4.0 22.0 14.0 40.0 Total 197.6 1087.6 692.0 1977.2
5. Project Operation and Maintenance
672. The operation and maintenance of the proposed facility will be the responsibility of HSRDC. The funds needed for the maintenance need to be allocated by the state government from its budgetary resources. The resource constraints of the state government may affect the timely maintenance of the facility.
6. Economic Analysis
673. An economic analysis of the proposed project has been undertaken to determine its economic viability.
674. The major economic benefits comprise (i) Vehicle operating cost savings to traffic on the project roads with improved surface and capacity and (ii) travel time savings to all traffic with improved speeds. Other benefits are envisaged to accrue with better access but have not been quantified. These include reduced emissions

TA 7114-IND National Capital Region Planning Board Project
Final Report
Sheladia Associates, Inc. USA 234
Volume 1 – Main Rep
ort
due to better level of service, social benefits and improved road safety in the town sections.
675. Based on the above considerations, the economic cost and benefit streams over the analysis period have been worked out using the HDM-4 model. All costs and benefits are valued in monetary terms and expressed in economic prices to avoid distortions in the input prices of labor, materials, equipment and foreign exchange due to market imperfections. In calculating the road agency economic costs (construction and maintenance), a Conversion Factor (CF) 0.9 was used, as generally used for road projects in India, to derive economic costs from the estimated financial cost.
676. The economic cost of vehicle operating cost components and time costs (VOCs) have been calculated separately for each individual component and input to the HDM model. The input values used for recent road sector studies in India have been used.
677. A 20 year analysis period has been used. A residual value of 10% is assumed, as the project involves widening. To be acceptable for implementation, the proposed investments have to result in an EIRR of 12% which is generally considered in economic analysis as acceptable. NPV's are calculated using opportunity cost of capital as the discount rate. The results of economic analysis for the project is summarized below in Table 5.49
Table 5.49 Economic Analysis Results for Jhjjar District Roads NPV EIRR
Road (Rs. Million) NPV/Cost Ratio (%) Badli Iqbalpur road 9.1 0.3 14.4
Badli Pela Sondhi Yakubpur road 164.3 1.5 25.5
Badli to Durina 310.8 2.2 33.1
Beri - Rohtak road 146.1 1.5 27.9
Chhuchakwas - Malikpur Safipur(MDR-130) 123.6 1.0 21.9
Gawalision(SH-22) 55.3 0.4 15.4
Godhri - Safipur 6.9 0.3 13.3
Jhajjar - Farrukhnagar road 160.7 1.1 22.2
Jhajjar-Talao-Chhuchakawas 617.1 3.0 39.9
Jharli - Mohanbari 42.3 1.2 23.4
Patauda (MDR-132 ) 190.8 2.1 32.8
Sahlawas-Amboli-Bithla 143.2 0.8 20.8
Subana-Sarola Ahri road. 114.3 1.7 28.3
678. The economic analysis indicates a robust economic rate of return well above the acceptable rate of return of 12% for all project road sections. The proposed project will improve the level of service and augment capacity to sustain the level of service over the design period and has an acceptable economic rate of return and is therefore recommended for implementation.

TA 7114-IND National Capital Region Planning Board Project
Final Report
Sheladia Associates, Inc. USA 235
Volume 1 – Main Rep
ort
679. The cost and benefit estimates involve uncertainties. Sensitivity analysis has been carried out by changing cost and benefit estimates. The results of the sensitivity analysis are given in Table 5.50. The results indicate that with adverse variation in benefits or costs, the rate of return is still above the acceptable rate of return in mostcases except in the case of Godhri-Safipur and Gwalision Roads. The sensitivity analysis indicates that the economic justification for the project investment is robust.
Table 5.50 Sensitivity Analysis Results
Economic Internal Rate Of Return Under Different Scenarios
Road Section Base Case Increase In Cost by 15%
Decrease In Benefits by
15%
Increase in Cost and Decrease in Benefits
By 15%
Delay in Construction by
One Year
Badli Iqbalpur road 14.4% 12.4% 12.1% 10.3% 14.2%
Badli Pela Sondhi Yakubpur road
25.5% 22.9% 22.4% 20.0% 25.4%
Badli to Durina 33.1% 29.6% 29.1% 26.0% 32.5%
Beri - Rohtak 27.9% 24.8% 24.3% 21.5% 26.7%
Chucchakwas 21.8% 19.2% 18.8% 16.4% 21.2%
Gwalision 15.4% 13.3% 13.0% 11.0% 15.0%
Godhri Safipur 13.3% 11.3% 11.0% 9.1% 13.1%
Jhajjar Farrukhnagar road
22.1% 19.6% 19.3% 17.0% 21.8%
Jhajjar - Talao 39.9% 35.7% 35.1% 31.4% 37.8%
Jharli - Mohanbari 23.4% 20.8% 20.4% 18.0% 23.0%
Patauda 32.7% 29.1% 28.5% 25.3% 31.2%
Sahalwas - Bithala 20.8% 18.2% 17.8% 15.5% 20.4%
Subana Sarola Ahri road.
28.3% 25.2% 24.7% 21.9% 27.3%
7. Land Acquisition, Involuntary Resettlement and Impact to Indigenous Peoples
680. The rehabilitation proposed for 13 road corridors in Jhajjar District does not involve
any land acquisition as all improvement works are proposed within the existing Right-of-Way (RoW). However, the project will impact some encroachers who have encroached upon the RoW and some community assets that have been built encroaching upon the RoW. There are no impacts to indigenous peoples.
681. In built-up stretches no widening is proposed in order to minimise involuntary
resettlement and it has been proposed to only strengthen the existing road with proper drainage facility. Necessary traffic arrangement measures with proper signage have been proposed to ensure smooth flow of traffic in these constricted stretches.

TA 7114-IND National Capital Region Planning Board Project
Final Report
Sheladia Associates, Inc. USA 236
Volume 1 – Main Rep
ort
682. The project will impact 20 households of whom 2 households would lose their place of residence, 7 households will lose a small portion of their house, 4 households will lose their shop, 5 households will lose their compound wall and 2 households their storage/motor room. The project will also impact 15 common property resources that include 4 bus shelters, 1 water tank, 1water tap, 1 community building, 1 tomb and 7 compound walls of common property resources.
683. In line with the Draft ESMS of NCRPB, projects funded by NCRPB will require a
resettlement plan and/or an indigenous peoples plan commensurate with the significance35 of impact. Rehabilitation of 13 roads in Jhajjar District will come under S-2 category for involuntary resettlement and S-3 category for indigenous peoples as per NCRPB’s social categorization.
684. A short resettlement plan has been prepared in line with the Draft ESMS
requirements. The summary of resettlement impacts is given in the following table. Table 5.51 Summary of Resettlement Impacts
Impact Rehabilitation of 13
Roads in Jhajjar District Permanent Land Acquisition (ha) 0
Temporary Land Acquisition (ha) 0
Affected Households (AHs) 20 a
Affected Persons (APs) 70
Titled APs 0
Non-titled APs (Encroachers) 70
Female-headed AH 0
IP/ST-headed AH 0
BPL AH 4
Affected Structures 20
Affected Trees/Crops 0
Affected Common Property Resources 15
35
As per the Draft ESMS projects are categorized based on the significance of involuntary resettlement and impact to indigenous
peoples. Involuntary resettlement categories are (a) Category S-1 (Significant Impact): means 200 or more people will experience major impacts, which are defined as (i) being physically displaced from housing, or (ii) losing 10% or more of their productive assets (income generating). Category S-1 projects require a full resettlement plan; (b) Category S-2 (Not Significant). Category S-2 projects include involuntary resettlement impacts that are not deemed significant and require a short resettlement plan; and (c) Involuntary Resettlement Category S-3: There is no involuntary resettlement impacts and hence does not require any action. Indigenous Peoples categories are (a) S-I Significant impacts are those projects that directly or indirectly affect the dignity, human rights, livelihood systems, or culture of indigenous peoples or affect the territories or natural or cultural resources that Indigenous peoples own, use, occupy or claim as their ancestral domain. Category S-1 projects will require a indigenous peoples plan; (b) S-2 Not Significant are projects where the indigenous peoples are the sole or the overwhelming majority of project beneficiaries, and when only positive impacts are identified. Category S-2 projects will require a summary note on IP in project document; and (c) S-3 are projects where no impacts on indigenous peoples are envisaged and hence does not require any action.

TA 7114-IND National Capital Region Planning Board Project
Final Report
Sheladia Associates, Inc. USA 237
Volume 1 – Main Rep
ort
Impact Rehabilitation of 13
Roads in Jhajjar District Average Family Size 3.5
Average Household Income Rs.4,579/- p.m.
a Of the 20 households getting impacted, only 2 households will face significant impact and for 18 households the
impact is not significant
8. Environment
685. The Jhajjar roads sub-project, comprising the improvement of 13 existing road stretches for a total length of 128km has been categorized as Category E-2, and accordingly an Initial Environmental Examination (IEE) and an Environmental Management Plan (EMP) prepared by HSRDC. The Environmental Information Format for Screening, as laid down in the ESMS is provided in the IEE. The alignments are proposed along the existing routes and all proposed improvements are envisaged within the available RoW. In case of stretches within settlements, resettlement impacts have been avoided through design of constricted cross-sections and provision of appropriate traffic management measures. Design of the alignment adopting this approach has enabled avoidance of impacts related to land acquisition, and impacts on agriculture lands. Location impacts pertaining to siting of alignment within or in the vicinity of environmentally sensitive areas are not envisaged. The Bhindawas Bird Sanctuary, situated about 15 km from Jhajjar town and about 3.5 km from Gawalision (VT) Kheri Hosdarpur Karodha Raiya (SH-22) Salodha Gijrodh Road, is the only protected area in the project districts. There are no impacts envisaged on this sanctuary due to the proposed road developments. Clearance of trees (mostly eucalyptus and acacia species) along the project roads is envisaged and shall be addressed through compensatory plantation activities carried out in line with the ESMS provisions, after clearances from the Forest Department.
686. Given the magnitude of civil works, there would be typical construction related impacts, and could be mitigated by appropriate mitigation measures and adoption of good construction practices. These have been put forth in the EMP. The effective implementation of the measures proposed will be ensured with the technical expertise of an Environmental Specialist as part of the Supervision Consultants. Further, the environmental monitoring plans prepared as part of the EMP will provide adequate opportunities towards course correction to address any residual impacts during construction or operation stages
9. Financial Appraisal (Applicable for all 3 Road Projects)
687. The financial sustainability of the project would be determined by project revenues
in relation to debt servicing and O&M expenditure. As no tolls are proposed to be levied, the O&M expenses have to be met out of the PWD’s budget only, financial appraisal of project is not required. However borrower appraisal and economic appraisal is recommended for the project.

TA 7114-IND National Capital Region Planning Board Project
Final Report
Sheladia Associates, Inc. USA 238
Volume 1 – Main Rep
ort
688. Though the financial analysis cannot be worked out for the project, O&M cost of the project has to be arrived at and PWD has to ensure that sufficient funds are provided for O&M in the state budget to the PWD department.
Borrower Financial Appraisal
689. As state government is the borrower state government finances were reviewed.
The past financials of Haryana state is given in Table below. A snap shot of the past financial position of the state government from 2004-05 to 2008-09 reflects growth in both revenues as well as expenditure. The compounded annual growth rate (CAGR) of revenue income from 2004-05 to 2007-08 is 15.37% and revenue expenditure is 9.86%. Thus the rate of growth of revenue income is more that the growth of revenue expenditure, facilitating reduction in revenue deficits from Rs. 24925.4 Million in the year 2004-05 to Rs. 1219.0 Million in the year 2007-08. However this positive trend was reversed in 2008-09 when revenues were affected by the economic slowdown, whereas revenue expenditure went up dramatically. It is hoped that this is a temporary aberration and the state will revert to its trajectory of fiscal prudence. The CAGR of capital receipts from 2004-05 to 2006-07 is 24.20%. The capital receipt growth is compared only for three years as there is an exceptional negative trend in the year 2007-08. The CAGR for capital expenditure for same three year period is 33.22% (35.38% for four years). It may be observed that the CAGR for capital expenditure is more that the capital receipt, which shows that the state is allocating more resources for plan expenditure.
690. The financial performance of the state government has also been analysed based
on 12th Finance Commission, recommendations and compared with NCR states and the national average. The 12th Finance Commission, as part of restructuring of public finances, has recommended certain measures to improve the long term financial sustainability of Centre and state governments. The suggested indicators suggested by the 12th finance commission include the following:
• The Tax to GDP ratio should be improved to 17.6 % by 2009-10
• Debt to GDP ratio to be brought down to 75% by 2009-10
• Fiscal deficit to GDP should be less than 3%
• There should not be any revenue deficit by 2008-09
• Interest payment to revenue receipts to be brought down to 15% in case of state government
691. The analysis shows that Haryana has achieved most of the targets in 2008-09
except the revenue deficit and fiscal deficit which has slipped marginally. However due to the slowdown in the economy the deficit has increased in the year 2008-09. Even the Centre in its budget has relaxed the norms of gross fiscal deficit by 0.5% for 2008-09 and further 0.5% for 2009-10 to extend the fiscal stimulus to accelerate the growth in economy. Further all other recommendations given by 12th finance commissions have been achieved by the state. The growth rate of gross state domestic product at nominal rates is about 9.35% and 8.02% in the

TA 7114-IND National Capital Region Planning Board Project
Final Report
Sheladia Associates, Inc. USA 239
Volume 1 – Main Rep
ort
year 2007-08 and 2008-09 respectively. On the whole, Haryana has demonstrated better economic and fiscal management.
Table 5.52 Haryana State Financials
2004-05 2005-06 2006-07 2007-08 2008-09
All in Rs. Million Actual Revised Estimates
I Revenue Receipts
1 Tax Revenue 80,600 102,800 122,230 132,520 162,230
2 Non-Tax Revenue 30,900 35,740 57,290 64,990 55,480
Total Revenue Receipts(a) = (1)+(2) 111,490 138,530 179,520 197,510 217,710
II Capital Receipts
3 Recoveries of Loans 1570 2900 22,010 2140 3780
4 Misc.Capital Receipts 100 140
5 Public Debt. (Net) 14,600 22,410 8980 30 34,030
Total Capital Receipts (b) = (3)+(4)+(5)
16,170 25,310 30,990 2270 37,950
Total Receipts (c) = (a)+(b) 127,660 163,840 210,510 199,770 255,660
III Revenue Expenditure
Non-Plan Expenditure 98,070 107,220 139,990 146,260 176,460
6 On Revenue Account 99,540 106,250 139,080 143,510 172,200
7 Interest Payments 22,350 21,000 22,650 23,460 23,540
Plan Expenditure
8 On Revenue Account 14,530 20,150 24,540 31,760 44,950
Total Revenue Expenditure (d) = (6)+(7)+(8)
136,420 147,400 186,270 198,730 240,700
IV Capital Expenditure
Non-Plan Expenditure
9 On Capital Account -1470 970 910 2750 4260
Plan Expenditure
10 On Capital Account 12,520 16,920 25,210 34,370 37,300
Total Capital Expenditure (e) = (9)+(10)
11,050 17,890 26,120 37,120 41,560
Total Expenditure (f) = (d)+(e) 147,470 165,290 212,400 235,840 282,250
11 Revenue Surplus(+)/Deficit(-) (g) =
(a)-(d) -24,930 -8860 -6750 -1220 -22,990
12 Fiscal Surplus(+)/Deficit(-) (h) = (c)-(5)-(f)
-34,400 -23,860 -10,860 -36,100 -60,630
# Source: Haryana state budgets

TA 7114-IND National Capital Region Planning Board Project
Final Report
Sheladia Associates, Inc. USA 240
Volume 1 – Main Rep
ort
Table 5.53 Comparison of state fiscal indicators
Norms Haryana Delhi Rajasthan Uttar Pradesh Consolidation of
27 states (w.r.t GDP)
National (w.r.t GDP)
FY08 FY09 FY08 FY09 FY08 FY09 FY08 FY09 FY08 FY09 FY08 FY09
Revenue deficit/GSDP
Zero by FY09
0.12% 2.04% Surplus by2.65%
Surplus by3.69%
Surplus by0.20%
Surplus by0.89%
Surplus by3.54%
Surplus by4.05%
Surplus by0.9%
Surplus by0.1%
0.20% 4.40%
fiscal deficit/ GSDP
<3% 3.46% 5.39% 5.12% 4.33% Surplus by 0.15%
Surplus by 0.14%
0.83% Surplus by 0.68%
1.50% 2.70% 4.20% 8.90%
Debt/GSDP <75% by FY10
27.50% 28.61% 26.34% 23.24% 61.22% 63.43% -- -- 27.80% 27.10% 60.10% 58.90%
Interest payment/ revenue receipts
<15% 11.88% 10.81% 16.49% 14.02% 19.65% 19.52% 18.31% 17.00% 2.10% 2.00% 24.60% 24.50%
Tax Income/ GSDP
>17.6% by FY10
12.72% 14.41% 12.14% 11.47% 10.19% 10.96% 10.89% 11.93% 9.20% 9.40% 18.50% 18.10%
GSDP Growth at nominal rates
9.35% 8.02% 15.06% 12.48% 7.11% 5.48% 7.16% 6.46% -- -- 9.01% 6.70%
#Source: RBI Annual report 2008-09 and respective Government website. Data on debt outstanding for UP is not available hence not included.

TA 7114-IND National Capital Region Planning Board Project
Final Report
Sheladia Associates, Inc. USA 241
Volume 1 – Main Rep
ort
10. Institutional
Project Implementation
692. The HSRDC will be the executing agency and the employer for the civil construction works. Contactors for the execution of the projects will be selected on the basis of National Competitive Bidding. The procurement process of contract is done by the head office of the HSRDC. The contact management framework for the execution of the project is discussed briefly below.
693. Civil construction package will have an Implementation Unit (IU) headed by a Superintending Engineer/Executing Engineer/ Dy. General Manager duly supported with the sub-ordinate officers/staff. The respective IU will interact with both the Supervision Consultant and Contactor of their construction packages.
694. A consultant will be appointed by the HSRDC to undertake supervision and contact management of the proposed projects. The supervision consultant, will be The Engineer for the contract and duties of The engineer will includes the overall contract management, quality assurance, modification of design if any etc. It is understood that the engineers of Haryana PWD is working as implementation engineers in the IU.
695. The Implementation Schedule and Procurement Plan: The implementation schedule and procurement plans are presented in Appendix 21 and Appendix 28.
Risk and Uncertainties Risk Risk Level Mitigation Measure Project Completion Risk
Moderate Implementation Schedule and Procurement Plan Budgetary provision for counterpart contribution Obtain necessary clearances for utility shifting priori to release Short Resettlement Plan based management of project affected persons Support in supervision and management of project from project development facility Contractor Selection based on ICB procedures
Revenue Risk Low Sustainability Moderate Budgetary allocation for O&M
Possible TA support in structuring maintenance fund
696. Recommendation: Conditions of lending i. Submit Final IEE - Completed ii. Submit Final Short Resettlement Plan to NCRPB-Completed iii. Completion of design and updated costs- By March 2010 iv. A procurement plan and implementation schedule for the project-Completed v. Draft Bid Documents confirming to ADB document for Review by NCRPB/ADB By March
2010 vi. utility shifting plan and Certificate of clearance from agencies for shifting of utility vii. Budget Provision of counterpart contribution of 25% and O&M viii. Government Guarantee for Debt Servicing

TA 7114-IND National Capital Region Planning Board Project
Final Report
Sheladia Associates, Inc. USA 242
Volume 1 – Main Rep
ort
VI. SAFEGUARDS, RISKS AND ASSUMPTIONS ENVIRONMENTAL SAFEGUARDS
697. The environmental conditions of the project sites will benefit substantially from the project. The sub projects when implemented shall have minimal negative impacts on the environment. Any component included in the project shall go through the environmental requirements of GoI and respective state government and ADB as outlined in the ESMS of NCRPB (Draft).
698. Recognizing the environmental and social issues that can arise in infrastructure
projects, NCRPB has prepared a Draft Environmental and Social Management Systems (ESMS) in line with ADBs safeguard requirements for Financial Intermediaries (FIs). The ESMS provides an overall management system to NCRPB to identify, assess, and mitigate environmental and social issues that are likely to arise in projects financed by NCRPB and implemented by Implementing Agencies (IAs). The ESMS outlines the policies, methods of assessments and procedures that will enable NCRPB to ensure that a project that it funds is developed in accordance with ESMS and is adequately protected from associated risks. IAs will have to comply with the ESMS conditions while submitting their loan application. This IEE has been prepared in line with the ESMS of NCRPB.
699. Based on the ESMS, the need for an IEE or EIA of the sub projects selected shall
be established. (See Volume 6). IEEs for sample sub-projects have been prepared. The Environmental Information Format for Screening, as laid down in the ESMS is provided in the IEE. The projects and their categorization is as follows:
Project Category Pataudi Water Supply E2 Pataudi Sewerage E2 MMTC- Anand Vihar E2 MMTC Sarai Kale Khan E2 Badli Bypass E2 Sonepat Roads E2 Jhajjar Roads E2
700. The environmental status of the proposed sub-projects is presented in the Initial
Environmental Examinations and the Environmental Management Plans for the B-sensitive projects.
701. The Environmental Impact Assessment (EIA) Notification 1994, (and as amended
subsequently in 2006) issued under the Environmental (Protection) Act, 1986 of Government of India, lays downs the process and requirements of environmental clearance from the GoI / States for specific type of projects indicated therein. All projects and activities are categorized into Category A and Category B, based on

TA 7114-IND National Capital Region Planning Board Project
Final Report
Sheladia Associates, Inc. USA 243
Volume 1 – Main Rep
ort
the spatial extent of potential impacts and potential impacts on human health and natural and manmade resources. Category A projects shall require prior environmental clearance from the Central Government in the MoEF on the recommendations of an Expert Appraisal Committee constituted by the Central Government. Category B projects, will require prior environmental clearance from the SEIAA36. The SEIAA shall base its decision on the recommendations of the State EAC (SEAC)37. The categorization of the various potential project components to be undertaken is presented below:
List of Potential Sub-projects or activities requiring prior environmental clearances
Category with threshold limit S. No Project
Category A Category B Conditions, if any
7 Physical infrastructure including environmental services
7(f) Highways new national highways
new state highways
General conditions38 shall apply
7 (h) Common effluent treatment plants (CETPs)
All projects General conditions, shall apply
7 (i) Common municipal solid waste management facility (CMSWMF)
All projects General conditions, shall apply
8 Building/ Construction projects / area development projects and townships
8 (a) Building and construction projects
> 20000 sq.m and < 1,50,000 sq.m of built up area39
702. The Project is designed to maximize environmental and public health benefits. An
initial environmental examination conducted for the Project shows that net environmental benefits are positive and large including: improved public health through water and waste water investments, and increased social benefits from access arrangements, street lighting, and slum and area upgrading. Potential negative impacts notably during construction and operation will not be significant considering the scale of sub-projects, avoidance of impacts through the application of environmental criteria in sub-project selection, and the incorporation of mitigation measures in design. The effective implementation of the same shall be ensured through the building up of capacity towards environmental management within the IA’s supplemented with the technical expertise of an Environmental Specialist as part of the DSC. Further, the monitoring plans shall provide adequate
36
The notification mandates the creation of a state level SEIAA. The state governments are in the process of creation
of SEIAA, and the SEIAA is expected to be functional by the end of 2008. 37
In the absence of a duly constituted SEIAA or SEAC, a Category B project shall be treated as a Category A project. 38
General Condition (GC): Any project or activity specified in Category B, will be treated as Category A, if located in
whole or in part within 10km from the boundary of: (i) protected areas notified under the Wild Life (Protection) Act,
1972, (ii) Critically polluted areas as notified by the Central Pollution Control Board from time to time, (iii) Notified
Eco-sensitive areas, (iv) inter-state boundaries and international boundaries. 39
Built-up area for covered construction; in the case of facilities open to the sky, it will be the activity area.

TA 7114-IND National Capital Region Planning Board Project
Final Report
Sheladia Associates, Inc. USA 244
Volume 1 – Main Rep
ort
opportunities towards course correction to address any residual impacts during construction or operation stages (See Volume 6).
LAND ACQUISITION AND RESETTLEMENT
703. To minimize land uptake and resettlement, the sub-project selection has been done in a manner that improvement and construction works in the various infrastructure sectors will be carried out within the existing government lands. Therefore, no major impacts pertaining to land acquisition or resettlement are envisaged for most of the rehabilitation components. Significant impacts are envisaged only for select transport projects based on new alignments and water and sanitation projects.. Redevelopment of Terminals is proposed in situ and no additional land acquisition is envisaged. The issue of existing vendors and shopkeepers will be limited as the lease is annual in nature and the schedule of construction/ relocation will be timed accordingly. A total of 133 Acres hectares of private land shall be acquired for the proposed sub-projects. The overall impacts of resettlement will be minimized further at the sub project design and implementation stages. Summary of the land acquisition and resettlement impacts of the sample sub-projects is provided below
Summary of Land Acquisition / Resettlement in - sample sub-projects
Impact
Providing Water
Supply for Pataudi Town
Providing Water
Supply for Pataudi Town
Formation of Badli Bypass
Rehabilitation of 5 Roads in
Sonipat Division
Rehabilitation of 13 Roads in
Jhajjar District
Category S2 S2 S2 S2 S2
Permanent Land Acquisition (Acres)
35 35 63.15 0.3 0
Temporary Land Acquisition
0 0 0 0 0
Affected Households (AHs)
27 a 27 a 31 a 2:00 AM 20 a
Affected Persons (APs)
157 157 149 8 70
Titled APs 157 157 96a 0 0 Non-titled APs (Encroachers)
0 0 461 8 70
Female-headed AH 0 0 610 0 0
IP/ST-headed AH 0 0 0 0 0 BPL AH 0 0 0 0 4
Affected Structures 0 0 0 2 20
Affected Trees/Crops
0 0 0 0 0
Affected Common Property Resources
0 0 0 13 15

TA 7114-IND National Capital Region Planning Board Project
Final Report
Sheladia Associates, Inc. USA 245
Volume 1 – Main Rep
ort
Impact
Providing Water
Supply for Pataudi Town
Providing Water
Supply for Pataudi Town
Formation of Badli Bypass
Rehabilitation of 5 Roads in
Sonipat Division
Rehabilitation of 13 Roads in
Jhajjar District
Category S2 S2 S2 S2 S2
Average Family Size 5.8 5.8 4.8 4 3.5
Average Household Income
Rs.6,333/- p.m.
Rs.6,333/- p.m.
Rs.4,800/- p.m. Rs.4,000/- p.m.
Rs.4,579/- p.m.
a The 27 households losing their cultivable land will face significant impact.
a The 27 households losing their cultivable land will face significant impact.
a Of the 127 households losing their agricultural land, 31 households losing their agricultural land will face significant impact and the impact on the remaining 96 household sis not significant and hey will lose only a strip of their landholding.
a Both the households getting impacted will face significant impact
a Of the 20 households getting impacted, only 2 households will face significant impact and for 18 households the impact is not significant
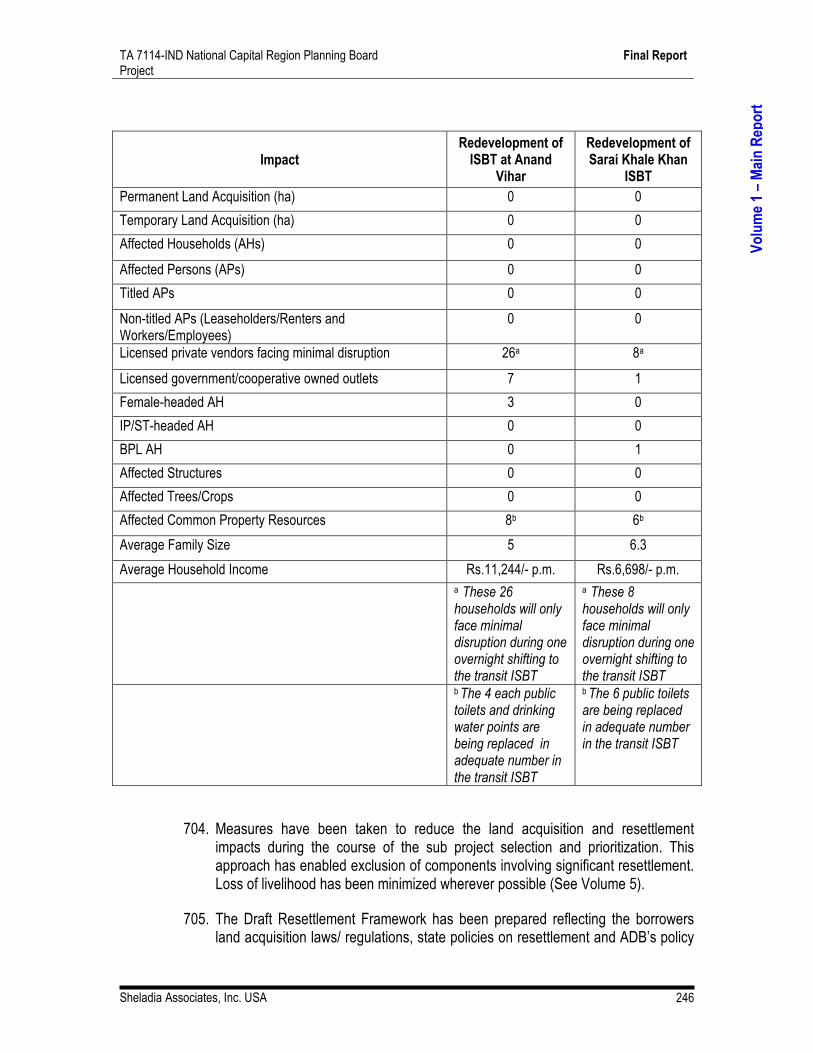
TA 7114-IND National Capital Region Planning Board Project
Final Report
Sheladia Associates, Inc. USA 246
Volume 1 – Main Rep
ort
Impact Redevelopment of ISBT at Anand
Vihar
Redevelopment of Sarai Khale Khan
ISBT
Permanent Land Acquisition (ha) 0 0
Temporary Land Acquisition (ha) 0 0
Affected Households (AHs) 0 0
Affected Persons (APs) 0 0
Titled APs 0 0
Non-titled APs (Leaseholders/Renters and Workers/Employees)
0 0
Licensed private vendors facing minimal disruption 26a 8a
Licensed government/cooperative owned outlets 7 1
Female-headed AH 3 0
IP/ST-headed AH 0 0
BPL AH 0 1
Affected Structures 0 0
Affected Trees/Crops 0 0
Affected Common Property Resources 8b 6b
Average Family Size 5 6.3
Average Household Income Rs.11,244/- p.m. Rs.6,698/- p.m.
a These 26 households will only face minimal disruption during one overnight shifting to the transit ISBT
a These 8 households will only face minimal disruption during one overnight shifting to the transit ISBT
b The 4 each public toilets and drinking water points are being replaced in adequate number in the transit ISBT
b The 6 public toilets are being replaced in adequate number in the transit ISBT
704. Measures have been taken to reduce the land acquisition and resettlement impacts during the course of the sub project selection and prioritization. This approach has enabled exclusion of components involving significant resettlement. Loss of livelihood has been minimized wherever possible (See Volume 5).
705. The Draft Resettlement Framework has been prepared reflecting the borrowers
land acquisition laws/ regulations, state policies on resettlement and ADB’s policy

TA 7114-IND National Capital Region Planning Board Project
Final Report
Sheladia Associates, Inc. USA 247
Volume 1 – Main Rep
ort
on involuntary resettlement and other social safeguard guidelines as outlined in the ESMS. The ESMS40 outlines the objectives, policy principles and procedures for land acquisition, if any, compensation and other assistance measures for Affected Persons (APs), if any. The Resettlement Framework and resettlement procedural guidelines shall apply to all sub project so as to ensure that persons affected due to the land acquisition will be eligible for appropriate compensation and rehabilitation assistance.
706. Financial Intermediation loans have risks similar to any project and in case of
NCRPB, one of the major issue is that it’s a Central Government Agency with jurisdiction over 4 states and technically with very little control over projects. Further NCRPB’s investment support being multi-city, multi-sector project involving a multitude of stakeholders and responsible authorities. However NCRPB has demonstrated that the projects can be managed if monitored effectively through State machinery. AS outlined earlier, the proposed project has requirements far more stringent than NCRPB’s normal line of. Therefore, early acknowledgement of the potential risks will help in mitigating or even eliminating the problems that they may cause during project implementation and beyond. The potential risks and assumptions come in a number of different categories and are classified below for better appreciation.
Physical Component Risks
• Land transfers and affected person (AP) compensation agreed and completed before scheduled construction;
• Completion of processes relating to utility shifting priori to award of contract
• Environmental clearances completed before award of contract for construction;
• Temporary relocation of street vendor and hawkers likely during civil works construction; adequate provision for compensation to be allocated in the Project;
• Mandatory supervision for high value contracts/ complex projects
• Contractors perform competently, to time and budget; and
40
As per the Draft ESMS projects are categorized based on the significance of involuntary resettlement and impact to indigenous
peoples. Involuntary resettlement categories are (a) Category S-1 (Significant Impact): means 200 or more people will experience major impacts, which are defined as (i) being physically displaced from housing, or (ii) losing 10% or more of their productive assets (income generating). Category S-1 projects require a full resettlement plan; (b) Category S-2 (Not Significant). Category S-2 projects include involuntary resettlement impacts that are not deemed significant and require a short resettlement plan; and (c) Involuntary Resettlement Category S-3: There is no involuntary resettlement impacts and hence does not require any action. Indigenous Peoples categories are (a) S-I Significant impacts are those projects that directly or indirectly affect the dignity, human rights, livelihood systems, or culture of indigenous peoples or affect the territories or natural or cultural resources that Indigenous peoples own, use, occupy or claim as their ancestral domain. Category S-1 projects will require a indigenous peoples plan; (b) S-2 Not Significant are projects where the indigenous peoples are the sole or the overwhelming majority of project beneficiaries, and when only positive impacts are identified. Category S-2 projects will require a summary note on IP in project document; and (c) S-3 are projects where no impacts on indigenous peoples are envisaged and hence does not require any action.

TA 7114-IND National Capital Region Planning Board Project
Final Report
Sheladia Associates, Inc. USA 248
Volume 1 – Main Rep
ort
• IA to access TA funds for support activities including post project actions such as O&M
Policy Risks
• State and local governments’ commitment to necessary decentralization reforms in urban planning and management to provide improved services or to the other sectors;- Reforms required in sync with National sector reforms and TA support available for implementation of reforms
• Political acceptance of required changes in tariffs, taxes, and rates- will be covenants with support to enable progress by entities.
Institutional Risks
• The State and the ULB’s to assure executing units are adequately staffed and capable of undertaking duties prior to and during project implementation;
• To maintain effective management during project implementation the project management should remain constant, for at least the first 3 years;
• Resources available for design work and mandatory supervision for high value projects.
• Public awareness and community participation programs must be effective for getting the support of the public for charging for improved services;
• Adequate training opportunities for elected officials and municipal staff must be available and provided for ;
Social Risks
• Adequate technical support to help the IA’s in implementing resettlement and rehabilitation activities;
• Improved inclusiveness in project preparation
• Investment integrated with other programs (e.g. JNNURM, UIDSSMT and Other Central Programs/ PFC/REC) to target the poor more effectively and for maximum benefit;
Financial Risks
• Financial Improvement Action Plan to be in place, especially revisions to tax or tariff setting not implemented to scale or schedule necessary for sustained operation and maintenance;

TA 7114-IND National Capital Region Planning Board Project
Final Report
Sheladia Associates, Inc. USA 249
Volume 1 – Main Rep
ort
• Willingness of beneficiaries to pay for proper management, maintenance and operation of infrastructure facilities;
• Set Tariffs for services to meet O&M obligations as mandated under various national reform programs ; and
• Timely provision of counterpart funds to prevent delay in implementation.
Economic Risks
• Limit Overrun of project construction costs due to delays through advance actions on preparedness;
• Ensure Operation and maintenance of the infrastructure and equipment provided by the Project through tariffs and budgetary funds sufficient to sustain project benefits.
707. The project risks will be mitigated through various measures through the TA facility (See Chapter 4).