Sheffield Performer and Audience Research Centre. - White ...
Upload
khangminh22Category
view
2download
0
Fixated on Megawatts
Daljit Singh
Ashwini K Swain
July 2018
Centre for Energy, Environment & Resources
Urgent Need to Improve Power Procurement and Resource Planning by Distribution Companies in India
AN INITIATIVE SUPPORTED BY:
Swiss Agency for Developmentand Cooperation SDC

Fixated on Megawatts
Daljit Singh
Ashwini K Swain
July 2018
Centre for Energy, Environment & Resources
Urgent Need to Improve Power Procurement and Resource Planning by Distribution Companies in India

The study is supported by:
Published by:
Designed & Printed by:
Suggested Citation:
Copyrights:
The views and analysis expressed in this report do not necessarily reflect the views of the Shakti
Sustainable Energy Foundation or the Swiss Agency for Development and Cooperation (SDC). The
Foundation and SDC also do not guarantee the accuracy of any data included in this publication
nor do they accept any responsibility for the consequences of its use.
Centre for Energy, Environment & Resources Pvt. Ltd.
FPAI Bhawan, First Floor, #10, Institutional Area
RK Puram, Sector 4, New Delhi 110022, INDIA
Shivshakti Enterprises, New Delhi
Singh, Daljit & Swain, Ashwini K. 2018. Fixated on Megawatts: Urgent Need to Improve Power
Procurement and Resource Planning by Distribution Companies in India. New Delhi: Centre for
Energy, Environment & Resources.
Any part of this report can be reproduced for non-commercial use without prior permission,
provided that the authors and CEER are clearly acknowledged.
ISBN 978-81-938607-0-0
July 2018, New Delhi.
For Private Circulation
Cover Photo Credits: www.livemint.com, www.bestwebsiteinindia.com, www.mercomindia.com, www.saurenergy.com
Swiss Agency for Developmentand Cooperation SDC

Table of Contents
Acknowledgments i
List of Boxes, Figures and Tables ii
List of Abbreviations iii
Executive Summary iv
1. Introduction 1
2. Basics of Resource Planning 5
3. India's Approach to Planning in the Electricity Sector 8
4. State Experience: Punjab 15
5. State Experience: Delhi 22
6. State Experience: Uttar Pradesh 28
7. Improving Resource Planning: Priority Areas and
International Experience 36
8. Conclusions 59
9. Recommendations for Introducing and Promoting
Resource Planning in India 65
References 68
About the Authors 71
About CEER 72

AcknowledgementsThe authors would like to thank the various experts and practitioners who shared their insights
and feedback during the course of this study. The study benefited from feedback received during
presentations made at the CSTEP-SSEF workshop on the UDAY scheme (11th April 2018, New
Delhi), at meetings with UPERC (19th June 2018, Lucknow) and PSERC (21st June 2018,
Chandigarh), and during a webinar on 3rd July 2018. The authors also benefited from discussions
early in this study with Ashwini Chitnis of Prayas Energy Group. Sarada Prasanna Das and Ira
Sharma, at CEER, provided invaluable research support.
The authors are grateful to Shakti Sustainable Energy Foundation and Swiss Agency for
Development and Cooperation for their support for this study. Deepak Gupta, Saloni Sachdeva
and Radhika Sharma, at the Foundation, provided timely inputs and able stewardship through the
course of this project.
The authors would like to thank all these individuals and organisations for their inputs and
support. However, the views and opinions expressed in the report are the authors', and they
remain responsible for all errors of fact or interpretation.
Fixated on Megawatts | i
List of Boxes, Figures and Tables
Box 7.1: RE Integration Study by Pacficorp (USA) 43
Box 7.2: RE Integration Studies in India 44
Box 7.3: Example of Resource Planning from USA – 2017 50
Integrated Resource Plan of PacifiCorp
Fig. ES.1: Steps in Resource Planning vi
Fig. 1.1: Growth in Installed Generation Capacity, Peak 2
Demand, and Energy Requirement (2005-18)
Fig. 1.2: Sector-wise Installed Capacity and Energy Generation 2
Fig. 2.1: Steps in Resource Planning 7
Fig. 4.1: Ownership and Fuel Type of Installed Generation 15
Capacity in Punjab
Fig. 4.2: Growth in Installed Capacity, Peak Demand, Energy 16
Requirement and Deficit (2007-2018)
Fig. 4.3: Month-wise Peak Demand and Energy Requirement 16
(2016-17)
Fig. 5.1: Ownership and Fuel Type of Installed Generation 22
Capacity in Delhi
Fig. 5.2: Growth in Installed Capacity, Peak Demand and Energy 22
Requirement (2007-2018)
Fig. 5.3: Month-wise Peak Demand and Energy Requirement 23
(2016-17)
Fig. 6.1: Ownership and Fuel Type of Installed Generation 28
Capacity in Uttar Pradesh
Fig. 6.2: Growth in Installed Capacity, Peak Demand, Energy 28
Requirement and Deficit (2007-2018)
Fig. 6.3: Month-wise Peak Demand and Energy Requirement 29
(2016-17)
Fig. 7.1: Expected All India Net Load Curve With 20 GW of Solar 40
Generation
Fig. 7.2: Typical Lead Times and Life Times for Electricity Resources 47
Fig. 7.3: Best Practice for Risk Management 49
Fig. 7.4: Hierarchy of Plans in China 55
Fig. B7.3.1: Key Elements of PacifiCorp's Planning Process 50
Fig. B7.3.2: Stages in the Evaluation of Resource Portfolios 52
Fig. B7.3.3: Steps within Each Stage of Evolution of Portfolios 52
Table 3.1: Comparison of CEA Demand Growth Projections with 11
Actual Demand Growth
Table B7.1.1: Portfolio Regulation Reserve Requirements by Scenario 43
Fixated on Megawatts | ii

List of AbbreviationsAT&C Aggregate Technical and Commercial
CAGR Cumulative Average Growth Rate
CEA Central Electricity Authority
DERC Delhi Electricity Regulatory Commission
Discom Distribution Company
DPPG Delhi Power Procurement Group
DR Demand Response
DSM Demand Side Management
EAct Electricity Act
EE Energy Efficiency
EPS Electric Power Survey
EV Electric Vehicle
GW Gigawatt
GWh Gigawatt Hour
ICT Information and Communication Technology
IRP Integrated Resource Planning
kWh Kilowatt Hour
LGBR Load Generation Balance Report
MoU Memorandum of Understanding
MW Megawatt
MYT Multi-Year Tariff
NEP National Electricity Plan
PFA Power for All
PLF Plant Load Factor
PPA Power Purchase Agreement
PSEB Punjab State Electricity Board
PSERC Punjab State Electricity Regulatory Commission
PSPCL Punjab State Power Corporation Ltd
RE Renewable Energy
RLDC Regional Load Dispatch Centre
RT Roof Top
RTC Round the Clock
SLDC State Load Dispatch Centre
T&D Transmission and Distribution
ToU Time of Use
TPDDL Tata Power Delhi Distribution Ltd
TWh Terawatt Hour
UDAY Ujwal Discom Assurance Yojana
UK United Kingdom
UP Uttar Pradesh
UPERC Uttar Pradesh Electricity Regulatory Commission
UPPCL Uttar Pradesh Power Corporation Ltd
Fixated on Megawatts | iii

Executive Summary
Basics of Resource Planning
Recently, there have been several news stories about the declining plant load factor (PLF) of
thermal power plants in the country. One of the reasons for the decline is excess generating
capacity in several states. This excess capacity imposes significant costs on consumers. It is a cruel
irony that while there is this “excess” capacity in some states, 20% of Indians do not have access to
electricity.
The swings between shortages and surpluses of generating capacity point to serious shortcomings
in the power procurement practices of distribution companies (discoms). The challenge of
effective power procurement will be even greater in the future. Discoms will need to deal with
increasing amounts of renewable energy (RE) in the resource mix. Not only will there be
uncertainty in the amount of RE in the resource mix, discoms will also have to address RE's impacts
on the operation of the grid and the need for much higher level of ancillary services. The impacts
of improvements in information and communication technologies (ICT), the establishment of
smart grids and smart homes, and the presence of electric vehicles will also have to be considered
in the development of plans. Because of all these developments, power procurement plans will
have to be developed for a future that will have a much higher level of uncertainty.
Effective power procurement practices can result in improved energy access. Development of
more accurate load forecasts pushes utility analysts to incorporate latent demand for service to
consumers such as rural households that are often forgotten in utilities' plans. In addition,
improvement in power procurement can lead to a decrease in the cost per kWh of providing
electricity, which will allow access to electricity to a greater number of people for the same
amount of money.
Clearly there is an urgent need to improve the power procurement practices in the country.
Therefore, CEER recently conducted a study to analyse the current practice of resource planning
and power procurement at the discom level, by looking into the experience of selected discoms.
Given limitations of time and resources the study focused on on one discom in each of three
states: Delhi, Punjab and Uttar Pradesh. Building on the analysis and drawing from a review of
international experience, the study aimed to develop a strategy for improving power
procurement practices at the discom level.
Rather than discussing power procurement only, the discourse needs to move to resource
planning which includes power procurement but also covers a broader range of activities.
Resource Planning is the process used by discoms to meet the forecasted peak demand and total
energy requirements of all their customers. Resource plans usually have a long-term horizon,
typically 10-20 years. The output of a resource planning exercise is an Action Plan that lists all the
actions that need to be taken over the plan period such as: capacity additions that need to be
made; power purchases that need to be made; and other actions such as programs to be initiated
to improve energy efficiency of consumers.
Effective resource planning requires more than simply ensuring that there are sufficient resources
to meet load at all times. A good resource plan should also be cost-effective, minimize risks, and
comply with environmental and policy goals. These attributes can make resource planning more
involved than would seem at first glance. Minimizing costs that are likely to be incurred over the
entire period can be quite involved. Furthermore, because the planning horizon for a resource
Fixated on Megawatts | iv

plan is long, it is difficult to predict future load, fuel prices and capital costs with great accuracy. All these variables create uncertainty, and resource planning under uncertainty can be challenging.
The most important reason to do resource planning is economic. Generation costs make up 70-
80% of the tariff and so unnecessary increases in these costs have a great impact on consumers'
tariffs. Having too much generation capacity or too little to meet the energy requirements of the
discom would result in higher costs. Excess capacity is expensive because fixed costs of the excess
capacity have to be paid even though the plants are not generating any electricity. We see this
problem in many states in India. Having insufficient capacity is also uneconomic, because it leads
to load shedding which is not only inconvenient for customers, but also leads to reduction in
economic activity creating losses for customers and society at large. Because a good resource plan
considers uncertainties and minimizes the risk, it reduces the additional costs that the discom and
its consumers will have to pay for a surplus or deficit of capacity.
Not only is it important to have the right amount of capacity to meet load, it is also important to
have the right mix of capacity. Too much baseload and insufficient peaking capacity can also add
to the cost of generation. With increasing amount of RE in the mix, the issue of capacity mix
assumes much greater importance. Furthermore, because of the greater variability and
intermittence of RE sources, there needs to be an adequate amount of flexible resources that can
ramp up and down their generation rapidly. A good resource plan would ensure that there is
sufficient amount of such flexible capacity in the generation mix. Resource planning also helps in
minimizing environmental impacts and ensuring that environmental and policy goals are met at
the least cost. A good resource plan considers not only supply-side options but also demand-side
and transmission and distribution (T&D) options, which often have both lower costs and lower
environmental costs.
Figure ES.1 shows the steps in developing a resource plan. Resource planning starts with a load
forecast. Because the forecast will be used later in models to determine the different types of
capacity required, the load forecast must include not only the peak load and total energy required
for every year of the plan period, it must also include information about the load shape, in the
form of hourly loads. Next, a list of all the existing supply resources should be generated, along
with the availability of those resources over the year for all the years of the plan period. The
existing resources would include not only the company's own capacity but also all the PPAs from
which the discom is entitled to get power. Using information mostly about peak load from the
forecast, an estimate is developed of the need for new resources. Essentially, this means checking
when the required peak load plus a reserve margin is more than the total capacity of existing
resources.
Once the size of the generation capacity deficit is known, various alternative portfolios of
resources are created that satisfy the need for additional capacity. In developing these alternative
resource portfolios of resources, one must ensure that the policy goals and any regulatory
requirements are considered. The alternative portfolios would have different combinations of
additions of supply options, demand-side options and T&D options. These alternative portfolios
are then subjected to an uncertainty and risk analysis which helps in selecting a preferred plan that
has the lowest overall cost with the least risk. The preferred plan is used to create an action plan
which contains information about what supply additions have to be made and when, what
demand-side programs need to developed and what T&D augmentations are required to be done.
Interactions with personnel from discoms revealed that resource planning is not part of the
lexicon of the power sector. Resource planning is poorly understood by utilities and regulators, if
at all. Its value is not appreciated at all, even though with the cost of generation contributing to 70
Current State of Long-Term Planning by Distribution Companies
Fixated on Megawatts | v

to 80 per cent of the average cost of supply, bad decisions regarding capacity additions can be
costly for the discom, and ultimately for consumers. At best, resource planning has been reduced
to ensuring adequacy of capacity (MW). Even there, load shedding is seen as a viable option for
handling shortages.
Source: Adapted from Hirst (1992), Wilson & Biewald (2013), and Kahrl et. al. (2016)
Power procurement planning is usually bundled with the tariff filing, where the planning horizon is
1-3 years with little thought to long-term issues. Some regulatory scrutiny is exercised when
approvals for supply additions (capacity additions or new PPAs) is sought. However, it is carried out
on a case-by-case basis restricted to the specific supply addition for which approval is sought.
There is no holistic long-term view taken of the electricity requirements nor of the supply
additions that are already in the pipeline. This becomes troublesome because many plants get
delayed for a long-time and it is unclear whether they should be included in the resource mix
expected in the future.
In the organizational structure of discoms, there are often multiple cells for interlinked activities
Figure ES.1: Steps in Resource Planning
Fixated on Megawatts | vi

leading to diffused responsibility for long term resource planning. For example, in Punjab, PSPCL
has divisions for: Power Procurement and Regulation (PP&R); Planning; and ARR & TR that also
prepares forecasts for tariff filings. In addition, there is a Long-Term Power Purchase Committee.
It is not clear which division is responsible for long-term resource planning.
The approach to planning being followed by discoms also has several methodological
shortcomings:
Poor Quality of Load Forecast. Most utilities do not carry out their own load forecast,
relying on the CEA's forecast in the Electric Power Survey (EPS). Even where utilities carry
out a forecast, trend analysis s used instead of econometric and/or end-use models.
Inadequate Analytical Backup for Some Capacity Additions. In many cases, State
Governments seem to play a major role in capacity additions often through directives to
the discoms.
?Lack of Integrated Consideration of All Options to Meet Load. The focus is on supply
options, mostly coal plants. There is not much appreciation that transmission additions
can substitute for generation additions. Energy Efficiency and Demand-Side Management
(EE & DSM) are not usually considered as resources although their potential is recognized
by most people.
Insufficient Attention to Resource Mix. The resource mix is dominated by round-the-
clock (RTC) power purchases from coal plants. Long-term seasonal and peak power
contracts are not considered. Flexibility of hydro plants is limited because of other uses
of the water.
Uncertainty and Risk Management Ignored. There is little attention to uncertainty and
risk management in spite of the huge amount of uncertainty in the sector and the
potential costs of mistakes due to long lead and life times of resources. Power
procurement decisions are based on a deterministic vision of the future with a single load
forecast. There is almost no discussion of what would happen if the load forecast and fuel
prices are different from those assumed.
Environmental Impacts Not Considered. In spite of very significant environmental and
water impacts of power generation, these impacts are not even mentioned in power
procurement decisions.
While the overall process of resource planning is relatively straight forward, implementing it may
not be easy. As states and discoms move to adopt resource planning, there will be some activities
that will require special attention. These are also the activities that will be important to meet
future challenges.
As discussed earlier, there is considerable reliance on CEA's forecasts in the EPS which have shown
consistent overestimation. CEA's projected growth rates have been usually 30-40% higher than
the actual rate, sometimes much higher. Discoms need to carry out their own forecasts using a
combination of econometric and end-use models. End-use models will require electricity usage
data which should come from load research carried out by the discoms.
Demand-Side resources will have increased relevance in the future. The power sector is going
through a period of great change and uncertainty. EE & DSM will have great value during this
transition, because by slowing down load growth they help in deferring decisions until there is greater certainty about costs and technologies.
Distributed generation, information technologies, and energy storage will open up new
?
?
?
?
?
Key Priorities for Improving Resource Planning
Load Forecasting
Demand-Side Resources
Fixated on Megawatts | vii

opportunities for demand-side resources. Price responsive demand-reduction will be able to
substitute for supply resources. However, as with most parts of the world, in India there is not
sufficient understanding of price-responsive behaviour of demand, and more work is required in
this area.
With a target of 227 GW of RE by 2022, integration of RE in the grid will be an important issue. For
grid-connected RE, resource planning will need to make two key assessments. First, whether there
are sufficient flexible resources in the resource mix of the discom to balance the variability of RE.
Second, to assess the additional costs of having the required reserves ready. Both these
assessments will require RE integration studies. Because these assessments change as the
amount of RE in the discom's resource mix changes, RE integration studies will have to be carried
out every time a resource planning exercise is carried out. Regional coordination can help lower
operating reserve requirements and the cost of balancing. Therefore, the regulatory framework
should encourage such regional coordination.
Distributed generation is different from other resources because it is beyond the discom's control.
Therefore, it is a challenge to forecast, yet an accurate forecast of it is essential for effective
resource planning, if it is a significant part of the resource mix of a discom. One significant but
unexplored benefit of distributed generation is targeting it to defer distribution system
augmentation.
With a significant amount of distributed generation, the distinction between resource planning
and distribution planning will be blurred and may even disappear. Earlier, resource planning was
carried out at the bulk level, and distribution planning was mostly about having sufficient
infrastructure (wires, poles, transformers, etc.) to carry the load. However, with generation
sources on the distribution side that is likely to change. In the future, we may need two levels of
resource planning; one at the local level which would deal with loads and generators at the local
level, and another at the bulk power level. The aggregate net load requirements from the various
local resource plans would feed into the bulk level resource planning.
Recognition of uncertainty and management of the associated risk is one of the most neglected
part of long-term planning in the power sector. The sector is beset by uncertainty from many
sources: load growth; fuel prices; technological changes; capital costs; and environmental and
other laws. On the other hand, most of the resources available to meet load have long lead and life
times. Therefore, there is a risk that resources, when completed, may not be needed. Or existing
resources may not be needed in later years of their useful life. Coal plants in India may face such
risks. In spite of this challenging situation, planning in the Indian power sector very rarely
addresses uncertainty and risk management. Even when it is done, it is in a perfunctory manner.
Software and modeling tools are available to help in risk management. Scenario planning,
sensitivity analysis and probabilistic analysis are some of the techniques that are often used in
resource planning. One newer technique is option analysis, which recognizes that decisions need
not be treated as one-time events, all or none, based on what is known now. Instead decisions can
be broken into stages. For example, acquiring land for a power plant is an option that allows one
to build a power plant but does not require it to be constructed until needed.
Each of the analytical techniques has its advantages and disadvantages. Fortunately, best practice
does not require selecting one or the other technique. Instead these can be woven into a logical
progression. Scenario analysis can be used to generate alternatives and identify uncertainties.
Integration of Grid-Connected RE
Distributed Generation
Uncertainty and Risk Management
Fixated on Megawatts | viii

Then sensitivity analysis can be used to identify the most important drivers and the better
performing alternatives. This would be followed by probabilistic analysis to determine better
performing alternatives that best balance value and risk. Option analysis can then be used to
determine the best adaptive management plan for the preferred alternative.
Surplus capacity and the associated additional costs are consequences of inadequate resource
planning that are already being experienced by most states. The challenges for discoms are going
to become much greater in the future and it will not be possible for discoms to meet these
challenges without effective resource planning. Therefore, we recommend the following steps to
introduce and promote resource planning in India.
Increase awareness of the need for effective long-term resource planning. Knowledge of
resource planning is absent from most sections of the sector. Information needs to be
provided about the benefits of resource planning and its critical need for facing challenges
of the future.
Introduce regulations mandating resource planning by discoms. Resource planning
must be seen as an important function of regulatory commissions and regulators must be
mandated to require discoms to carry out a resource planning exercise at regular
intervals.
Develop regulatory framework for resource planning. The proceedings for resource
planning should be separated from tariff proceedings. The regulations should specify the
following items for the resource planning exercise:
? Process. The process for discoms to follow for resource planning, similar to the
process shown in Figure ES.1.
? Planning Horizon. We suggest 20 years.
? Frequency of Updates. Every two years seems reasonable.
? RE Integration Study.
? Public Participation. Involvement of all stakeholders in the development of a
resource plan facilitates valuable inputs, and increases the buy-in by
stakeholders.
Enhance capabilities of Discom and SERC Staff. Within the discom, a unit should be
created that would be responsible for resource planning. Nation-wide training programs
will likely be required to train staff in resource planning including the use of models.
Develop a road map for gradually adopting international best practices in resource
planning.
Recommendations
?
?
?
?
?
Fixated on Megawatts | ix
1. IntroductionIn India there is great concern about the retail tariffs being charged for electricity, but ironically
little attention is paid to the components of electricity costs. Generation costs make up 70-80% of
the cost of supplying electricity, and power procurement practices have a significant effect on that
cost. Yet almost no attention has been paid to how distribution companies (discoms) procure
power.
Recently, there have been several news stories about the declining plant load factor (PLF) of
thermal power plants in the country. One of the reasons for the decline is excess generating
capacity in states such as Gujarat, Madhya Pradesh, Maharashtra, Punjab and Rajasthan. A recent
report estimated the excess capacity to be between 14 percent and 30 percent in these states and
noted that the excess had been sustained for 4-5 years (PEG, 2017). This excess capacity imposes
significant costs on consumers. The report estimated that the excess capacity added 16-36
percent to the fixed costs for contracted capacity. While some may argue that excess capacity is
preferable to persistent shortages, the swings between shortages and surpluses of generating
capacity do point to serious shortcomings in the power procurement practices of distribution
companies (discoms). Previously, other shortcomings of power procurement practices have come
to light; for example, that there is often too much baseload capacity and not enough peaking
capacity, and that hydro resources are not being used appropriately.
The challenge of effective power procurement will be even greater in the future. Discoms will
need to deal with increasing amounts of renewable energy (RE) in the resource mix. Not only will
there be uncertainty in the amount of RE in the resource mix, discoms will also have to address
RE's impact on the operation of the grid and the need for much higher level of ancillary services.
With some of the RE being in the form of distributed generation (like roof-top solar), the challenge
for integration will be even greater. Discoms will also need to integrate in their resource plans the
impact of demand-side resources such as energy efficiency, demand-response and energy
storage. The impacts of improvements in information and communication technologies (ICT) and
the establishment of smart grids and smart homes will also have to be factored in the
development of resource plans. To top it all, resource plans will have to be developed for a future
that will have a much higher level of uncertainty, stemming from not only the variability of RE, but
also from the lack of control over the level of distributed generation due to the uncertainties such
as the number of electric vehicles which could provide storage of energy.
There are other important additional benefits to improved power procurement practices that will
result in improved energy access and enhancement in the efficiency of energy use. The most
direct benefit of improved power procurement will be a decrease in the cost per kWh of providing
electricity, which would allow greater access to electricity for the same amount of money. The first
step in effective power procurement is the development of a good forecast of electricity that will
be required over the plan period. Development of the forecast, in turn, will push the analyst to
incorporate latent demand for service to consumers such as rural households that are often
forgotten in utilities' plans. Further, it will encourage the inclusion of measures to reduce
electricity demand through enhanced energy efficiency and demand response.
Clearly, there is an urgent need to improve resource planning and power procurement practices in
the country. Against this backdrop, this study aims to first understand the current power
procurement practices of discoms and then develop recommendations for improving these
practices.
Fixated on Megawatts | 1
1.1 A Snapshot of the Supply SideAfter two and half decades of reforms, India's electricity supply industry continues to struggle
with the same set of challenges, albeit some reduced in intensity and some strengthened. A major
outcome of the reform process has been an increase in private sector participation in electricity
generation. When the Government of India opened up the electricity generation business for
private sector investment in 1991, the country had less than 70 GW of generation capacity. Many
of the states were facing acute power shortages ranging up to a quarter of the energy
requirement. Despite several incentives, India did not achieve much success in the first decade.
The generation capacity increased by less than 50 percent, driven largely by state utilities and
central public agencies.
However, the recent decade saw a significant increase in private sector investment. Starting with a
mere 10 percent share of capacity in 2001-02, the private sector now accounts for about 45
percent of the total generation capacity and 36 percent of the energy generated. As the private
sector's share in capacity and generation is increasing, the share of state and central sectors is in
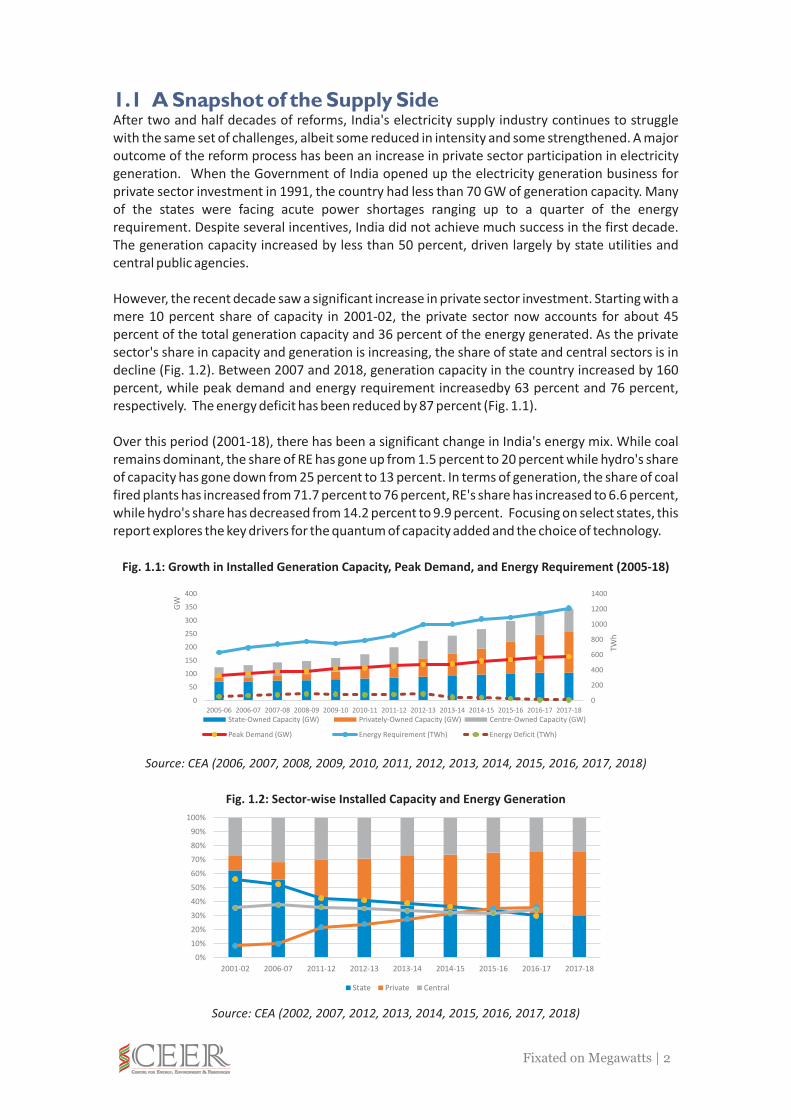
decline (Fig. 1.2). Between 2007 and 2018, generation capacity in the country increased by 160
percent, while peak demand and energy requirement increasedby 63 percent and 76 percent,
respectively. The energy deficit has been reduced by 87 percent (Fig. 1.1).
Over this period (2001-18), there has been a significant change in India's energy mix. While coal
remains dominant, the share of RE has gone up from 1.5 percent to 20 percent while hydro's share
of capacity has gone down from 25 percent to 13 percent. In terms of generation, the share of coal
fired plants has increased from 71.7 percent to 76 percent, RE's share has increased to 6.6 percent,
while hydro's share has decreased from 14.2 percent to 9.9 percent. Focusing on select states, this
report explores the key drivers for the quantum of capacity added and the choice of technology.
Fig. 1.1: Growth in Installed Generation Capacity, Peak Demand, and Energy Requirement (2005-18)
Source: CEA (2006, 2007, 2008, 2009, 2010, 2011, 2012, 2013, 2014, 2015, 2016, 2017, 2018)
Fig. 1.2: Sector-wise Installed Capacity and Energy Generation
Source: CEA (2002, 2007, 2012, 2013, 2014, 2015, 2016, 2017, 2018)
Fixated on Megawatts | 2
0
200
400
600
800
1000
1200
1400
0
50
100
150
200
250
300
350
400
2005-06 2006-07 2007-08 2008-09 2009-10 2010-11 2011-12 2012-13 2013-14 2014-15 2015-16 2016-17 2017-18
TW
h
GW
State-Owned Capacity (GW) Privately-Owned Capacity (GW) Centre-Owned Capacity (GW)
Peak Demand (GW) Energy Requirement (TWh) Energy Deficit (TWh)
0%
10%
20%
30%
40%
50%
60%
70%
80%
90%
100%
2001-02 2006-07 2011-12 2012-13 2013-14 2014-15 2015-16 2016-17 2017-18
State Private Central

1.2 Research Focus and ApproachCurrent power procurement practices focus on the short term, and at best, on ensuring resource
adequacy, that is having sufficient generating capacity to meet peak demand. But how resource
adequacy is achieved is also important; the discom must strive to have the right mix of resources
to ensure that demand is met in the least cost manner. Therefore, the discourse needs to move to
resource planning which focuses on more than just resource adequacy. As discussed in more detail
in Chapter 2, resource planning has a longer-term focus and while it too aims to meet the
forecasted peak demand and total energy requirements of all the customers, it focuses on doing
so cost-effectively and with minimum risk in a systematic way.
The objective of this study was to develop recommendations for improving long term resource
planning and power procurement by discoms. There were three main tasks in pursuing this
objective. First, to understand and analyse the current processes and practices followed by
discoms to procure power. The second task was to identify best practices, mostly international, for
power procurement. Based on the first two tasks, the third task was to develop recommendations
for improving long term power procurement and resource planning in India.
Review of Current Power Procurement Practices in Selected States
Given limitations of time and resources, the study focused on three states: Delhi, Punjab and Uttar
Pradesh. These states were chosen because they differ in the effectiveness of their power
procurement practices and, to some extent, in the organizational structure of the power sector,
and therefore we expected this combination would capture much of the diversity among Indian
states on this issue. Delhi discoms are privately owned and are said to follow good power
procurement practices, and we expected that there will be much that can help other states.
Punjab is one of the states that has been experiencing serious problems with excess capacity and
we felt it would give us good information about how and why power procurement practices can go
awry. Because one of the larger benefits of good power procurement practices is greater access to
electricity for consumers, we wanted to include a state where electricity access has been limited
and is therefore likely to benefit greatly from improved power procurement practices. The
inclusion of UP as the third state fulfilled these requirements.
We selected one discom from each of the selected states to understand the underlying process
used to procure power and the reasons for any dysfunction. In Delhi, we chose TPDDL for this
study. Punjab has a single discom, i.e. PSPCL, which was covered in the study. Though Uttar
Pradesh has five discoms, power procurement is managed by the holding company UPPCL. For our
study, we looked into the power procurement practices of UPPCL. In each state, we met with key
people in the discoms, SERCs and members of civil society to gain greater insight into the power
procurement practices. We also met with key people in CEA to gain a better understanding of
overall issues in power procurement in India.
Identification of International Best Practices in Resource Planning
We reviewed resource planning and power procurement practices in more advanced countries,
with particular attention to measures used to handle newer challenges and increased uncertainty
in the resource planning environment due to a greater role of renewable energy. The US has a long
history of states requiring resource planning by electric utilities, and there is a rich literature on
that experience. Thus much of the discussion on best practices is based on the US experience. We
also looked at the experience in Australia, China, Germany and UK and drew important lessons for
India.
Development of Recommendations for Improvement of Power Procurement in India
Drawing on the analysis of the states' experience, the study draws conclusions about the state of
power procurement and resource planning in India. Then it develops guidelines for Indian
Fixated on Megawatts | 3

discoms to move from the current dysfunctional state of power procurement to effective
operation in the challenging future ahead. Recognizing that international best practices cannot be
applied directly to the current situation, the study also provides guidelines on gradually adopting
these best practices.
The next chapter (Chapter 2) outlines the basics of resource planning in electricity and why it is
important. Chapter 3 analyses the Indian approach to resource planning in the electricity sector,
with a specific focus on legislative and policy issues in order to provide an understanding of the
broader policy background provided by the Central Government and its institutions. The
subsequent three chapters, Chapters 4,5 and 6, describe the resource planning and power
procurement practises in each of the three states: Punjab, Delhi and UP. Each chapter focuses on
four aspects of the experience in the respective state: a quick overview of the state electricity
supply system; analysis of the state policy priorities and regulatory provisions; the process of
resource planning and power procurement in the state; and key insights from the state. Chapter 7
focuses on how to improve resource planning in India. Informed by international experience, it
identifies priority areas that will require special attention in resource planning by Indian discoms
so that the Indian power sector can meet the challenging future that lies ahead. Chapter 8 draws
conclusions about the state of power procurement and resource planning in India and identifies
shortcomings in current practices and processes employed by discoms. The final chapter, Chapter
9, gives recommendations for improving discom level resource planning and power procurement
in India.
1.3 Outline of the Report
Fixated on Megawatts | 4

2. Basics of Resource Planning
2.1 Overview of Resource Planning
Resource Planning is the process used by distribution companies to identify long-term
investments, contracts, and other measures to meet the electricity requirements of their
customers. It includes power procurement but covers a broader range of activities. Resource
planning was developed in the US around the 1980s during a difficult time for the electric utility
industry when slackening electricity demand and rising interest rates and fuel costs led to cost
overruns at generating stations and surplus capacity for utilities. State regulators found
themselves confronting opposing interests: electricity customers who opposed rate increases;
environmentalists who advocated for a reduction in the environmental footprint of the sector;
and utility owners who argued for higher rates to cover rising costs (Kahrl et.al., 2016). Resource
planning provided an open and transparent process to address these conflicting requirements.
The term often used was Integrated Resource Planning (IRP) because one of the features that
emerged was to treat all resources, both supply and demand, equally and in an integrated manner.
While demand-side resources remain an important component of any long-term plan, integration
of RE and distributed generation, and risk management have also become important in the
planning process.
Current power procurement practices in India focus on the short term, and at best, on ensuring
resource adequacy, that is having sufficient generating capacity to meet peak demand. But how
resource adequacy is achieved is also important; the distribution company (discom) must strive to
have the right mix of resources to ensure that demand is met in the least cost manner. This is
where resource planning can help. The next section provides a very broad overview of resource
planning and answers the question: “What is resource planning?” Then we discuss the reasons for
carrying out resource planning, followed by a description of the steps involved in resource
planning.
Resource Planning is the process used by distribution companies to meet the energy
requirements of all the customers in their service territories. Resource plans usually have a long-
term horizon, usually 10-20 years. The output of a resource planning exercise is an Action Plan that
lists all the actions that need to be taken over the plan period such as: capacity additions that need
to be made; power purchases that need to be made; and other actions such as programs to be
initiated to improve energy efficiency of consumers.
While it may seem relatively easy to add resources to ensure that load is met at all times, effective
or good resource planning takes effort because it should ideally satisfy some other conditions:
? Cost-Effectiveness. A good resource plan should meet the energy requirements of the
discom at minimum cost. Minimizing total costs that are likely to be incurred over the
entire plan period can be quite involved.
? Minimization of Risk. Because the planning horizon for a resource plan is long, it is difficult
to predict future load, fuel prices and capital costs with great accuracy. All these variables
create uncertainty. Resource planning under uncertainty can be challenging.
? Compliance with Environmental and Policy Goals. Electricity generation has considerable
harmful environmental impacts in the form of air and water pollution and contribution to
climate change. In addition, large quantities of water are often required for cooling of
thermal power plants. Excessive water use can be a serious undesirable impact in a
country like India where water is scarce in many parts of the country. Furthermore,
electricity generation produces environmental impacts upstream, for example in coal
mining and transport. For all these reasons, a good resource plan must, at a minimum,
Fixated on Megawatts | 5

comply with all the environmental laws. It would be better if the resource plan goes
further and minimizes environmental impacts to the maximum extent possible.
Consideration of All Resources. For all the reasons given above, a good resource plan
should consider not just supply options but should also look at demand-side and
transmission and distribution (T&D) options. Often using these other options can lead to
lower cost, lower risk and lower environmental impacts.
The most important reason to do resource planning is economic. Generation costs make up 70-80
per cent of the tariff and so unnecessary increases in these costs have a great impact on
consumers' tariffs. Having too much generation capacity or too little to meet the energy
requirements of the discom would result in higher costs. Excess capacity is expensive because
fixed costs of the excess capacity have to be paid even though the plants are not generating any
electricity. Currently, we see this problem in many states in India. Having insufficient capacity is
also uneconomic, because it leads to load shedding which is not only inconvenient for customers,
but also leads to reduction in economic activity creating losses for customers and society at large.
Because a good resource plan considers uncertainties and minimizes the risk, it reduces the
additional costs that the discom and its consumers will have to pay for a surplus or deficit of
capacity.
Not only is it important to have the right amount of capacity to meet load, it is also important to
have the right mix of capacity. Too much baseload and insufficient peaking capacity can also add to
the cost of generation. With increasing amount of RE in the mix, the issue of capacity mix assumes
much greater importance. Because of the greater variability and intermittence of RE sources,
there needs to be an adequate amount of flexible resources that can ramp up and down their
generation rapidly. A good resource plan would ensure that there is sufficient amount of such
flexible capacity in the generation mix.
Resource planning also helps in minimizing environmental impacts and ensuring that
environmental and policy goals are met at the least cost. A good resource plan considers not only
supply-side options but also demand-side and T&D options, which often have both lower costs
and lower environmental costs.
Figure 2.1 shows the steps in developing a resource plan. Resource planning starts with a load
forecast. Because the forecast will be used later in models to determine the different types of
capacity required, the load forecast must include not only the peak load and total energy required
for every year of the plan period, it must also include information about the load shape in the form
of hourly load for each year. Next, a list of all the existing supply resources should be generated,
along with the availability of those resources over the year for all the years of the plan period. The
existing resources would include not only the state generation company's capacity but also all the
PPAs from which the discom is entitled to get power. Using information mostly about peak load
from the forecast, an estimate is developed of the need for new resources. Essentially, this means
checking when the required peak load plus a reserve margin exceeds the total capacity of existing
resources.
Once the size of the generation capacity deficit is known, various alternative portfolios of
resources are created that satisfy the need for additional capacity. In developing these alternative
resource portfolios, one must ensure that the policy goals and any regulatory requirements are
considered. The alternative portfolios could have different combinations of supply options,
demand-side options and T&D options. These alternative portfolios are then subjected to an
?
2.2 Importance of Effective Resource Planning
2.3 Steps in Resource Planning
Fixated on Megawatts | 6

uncertainty and risk analysis which helps in selecting a preferred plan that has the lowest overall
cost with the least risk. The preferred plan is used to create an action plan which contains
information about what supply additions have to be made and when, what demand-side
programs need to developed and what T&D augmentations are required to be done.
Chapter 7 provides more detail on load forecasting, inclusion of demand-side resources,
integration of RE, and uncertainty and risk analysis. It discusses the practices of Indian discoms
around these activities. It also describes how these steps are generally implemented
internationally and emerging best practices for these activities.
Fig. 2.1: Steps in Resource Planning
Source: Adapted from Hirst (1992); Wilson & Biewald (2013); Kahrl et.al. (2016)
Fixated on Megawatts | 7

3. India's Approach to Planning in
the Electricity Sector
3.1 Gradual Decline of Planning in the Power Sector
In keeping with India's thrust on planned economic development, the electricity sector has also
followed, until recently, a five-year plan-based development trajectory and public spending
schedule. But there has been a gradual decline in the quality of planning starting around the early
1970s with economic rationality being gradually displaced by electoral considerations. With the
passage of the EAct and its requirement for unbundling of electric utilities and opening up of the
generation sector to private investment, it was expected that the locus of planning would shift and
centralized planning would be replaced by planning at the discom-level. In reality however, now
both centralized and discom-level planning coexist. Unfortunately, both have serious
shortcomings resulting in the poor quality of planning in the power sector we see today. Section
3.1 provides a brief history of the decline of planning in the electricity sector driven by the rise of
political considerations over economic rationality. Section 3.2 looks at two of the centralized
planning exercises carried out by the Central Electricity Authority (CEA). Section 3.3 discusses a
partial attempt at decentralising the planning process to the discom level, through the model
regulation for planning issued by the Forum of Regulators (FoR).
By the middle of the twentieth century, there was a global consensus that availability of electricity
will be a critical driver for the economic growth of countries. While the major economies of the
world were completing electrification, India's electricity supply system was still in its nascence, 1
fragmented across the country and confined to few urban pockets. Existing energy poverty was
exacerbated by scarcity of technology, skilled human resource, capital, and consumers inability to
pay (Chatterjee, 2018). Given the huge capital investment required for building the electricity grid, 2 3
limits of private sector interest, and simultaneously driven by the prevailing global trend, India
chose to pursue electrical development under state ownership. Large scale electricity generation
capacity development became the priority for obvious reasons. India's icon of electrical
development was large hydroelectric dams, which Nehru called 'temples of modern India'.
1 At the time of independence, India had mere 1,362 MW generation capacity producing 4,073 GWh
electricity. With just 1,500 electrified villages, household consumption accounted for 10% of the electricity
produced, while the bulk of the rest was consumed by industries. Per capita consumption was recorded to
be 16kWh (CEA, 2017a).2 In 1944, a group of influential and leading Indian industrialists put together A Plan of Economic
Development in India and emphasised the importance of electrical development for facilitating
development of industries, both large and small scale, as well as agriculture and development. The plan
sought to prioritise industries for production of power and capital goods, under public sector ownership
(Thakurdas et. al., 1944). In the subsequent years, the industrialist class endorsed government's policy of
running a large public sector providing capital goods, immediate products and infrastructure facilities for
private owned industries, often at a low price (Bardhan, 2005).3 The model of electrical development in independent India was set by its first legislation on electricity, i.e.
the Electricity (Supply) Act 1948, and was explicitly drawn on centralised investment allocation and five-
year plans of the Soviet Union, nationalised electricity system in the United Kingdom, and the massive
public works by Tennessee Valley Authority in the United States. Public sector dominance of electricity was
confirmed later in the Industrial Policy Resolution of 1956 (Swain, 2006).
Fixated on Megawatts | 8

During the initial years, electrical development in the country followed a planned approach,
balancing generation capacity augmentation with grid expansion, powering industrialisation and
irrigating farm lands through large hydro projects. Newly established State Electricity Boards
(SEBs) performed well during the initial two decades, putting up generation plants, expanding the
grid to rural areas, and making a return on the investments. By the 1970s, the scenario had
changed, as electrification emerged as an electoral tool and mobilised rural elites started
demanding subsidised electricity both at home and in the fields.
With additional developmental benefits like employment and local area development, large-scale
power plants became a politically attractive proposition. In the energy scarcity context, power
plants as visible signs of electrical development were politically rewarding. Both the Centre and
states prioritised generation capacity addition to provide electricity to their political constituents
and reap the political rewards.
Political interference over the planning and management of the sector was facilitated by an
amendment made to the Electricity (Supply) Act in 1956 that added a provision that the SEBs
would take 'policy directives' from the state governments. Another provision inserted through
the same amendment stated that the State Government could replace the Chairman and
members of the Board if it failed to carry out its functions or refused or failed to follow the 4
directions from the State Government. These two provisions in the amendment greatly
diminished the SEBs' ability to take decisions independently and opened the door to electoral
considerations in tariff-setting, grid expansion, plant location, and appointments (Swain, 2006).
The legacy seems to have continued and has been strengthened since then. The following three
chapters highlight the effects of state governments' interference on techno-economic issues for
the sector, especially generation capacity addition.
In 1975, the Central government set up public sector entities like National Thermal Power
Corporation and National Hydro Power Corporation to complement states' effort at generation
capacity addition. Grid expansion in the following 15 years bypassed the planning approach, 5
following political dictates and priorities and happened at an aggressive rate. Consequently, grid
expansion outpaced generation capacity expansion. By late 1980s, India was facing a major power
shortage crisis. The demand for power was much higher than the generation capacity. SEBs were
running out of cash as their unremunerative and less remunerative load ballooned, which in turn
limited their capability to invest in generation capacity. Lack of adequate generation capacity
impaired the quality of supply, which in turn motivated the consumers to default on paying their
electricity bills.
Faced with the crisis of electricity shortages, the Government of India concluded that
4 Section 78A, which was inserted by Act 101 of 1956 (w.e.f. 30.12.1956), states that “in the discharge of its
functions, the Board shall be guided by such directions on questions of policy as may be given to it by the
State Government.” Section 10.5, which was inserted by the same amendment, says that “if the Board fails
to carry out its functions, or refuses or fails to follow the directions issued by the State Government under
this Act, the State Government may remove the Chairman and the members of the Board and appoint a
Chairman and members in their place” (GoI, 1948).5 Political oversight in the sector followed two routes, viz. policy directives as prescribed by the law and
executive instructions through informal command and control. The executive instructions were more
problematic and often went against the policy directives requiring politically patronising implementation
(Ruet, 2005).
Fixated on Megawatts | 9

augmentation of generation capacity would solve all problems in the Indian power sector, and
therefore, opened up electricity generation for private sector investment. While deregulation and
incentives were important to attract private investment, the pursuit of private sector participation
seems to have ignored some critical planning requirements. In any case, India did not achieve
much success in the first one and half decades after opening up the generation sector.
Deteriorating finances of SEBs, the only customers of electricity from the generation plants, seem
to have negated the incentives offered by the government.
In response, a series of attempts were made at institutional restructuring culminating in
mandatory unbundling of the monolithic SEBs and making provisions for independent sector
regulation through a sweeping legislative change in 2003, the Electricity Act. By that time, the
states and newly created distribution companies were facing severe power shortages. Financially
better off discoms were spending around a quarter of their expenditure on short-term power
purchases and the worse off discoms preferred to sell their power at the exchange instead of
supplying it to their consumers. The price of power at the exchange soared up to three-times the
long-term power purchase cost. Deteriorating quality of supply and frequent outages featured in
many state elections. Faced with this crisis, the state governments put additional effort in
attracting private investment in generation, by drafting state level power policies with incentives
for private investors. This was partly facilitated by the rise of state politics and the weakening of
the Centre in the liberalisation era, enabling the state governments to make large scale
infrastructure investment choices. Simultaneously, there was a strong push from the regulators to
increase the quantum of long term power purchase, at least up to 90 percent of the demand, and
thereby reduce the power purchase cost (Swain, 2018). Given the high price of power, some
regulators and state governments saw an opportunity in building up generation capacity and
selling any surplus power at the exchange at a higher price. (The following three chapters discuss
the trajectory and drivers for capacity addition in the three states that were the focus of this
study). Consequently, the following decade saw a huge increase in generation capacity, pushing
many of the states into an unexpected surplus situation.
The Indian electricity supply industry has been experiencing scarcity for the last seven decades.
Therefore, the supply side has received primacy in India's policy agenda, but unfortunately this
has been accompanied by a steady decline in planning of supplies with almost no attention to
assessment and management of risk. In the mindless pursuit of megawatts, the states seem to
have missed the importance of resource planning and have therefore landed in the current
situation of surplus capacity.
The Electricity (Supply) Act 1948 made provisions for the establishment of CEA with the key
function to prepare short-term and prospective plans for electrical development in the country.
The sweeping legislation of 2003, the Electricity Act, retained the mandate and primacy given to
CEA, while making provisions for institutional restructuring in the sector. From the very beginning,
CEA has been the nodal agency for national planning for the electricity sector. There are two major
activities related to resource planning undertaken by CEA. First, is the Electric Power Survey (EPS)
of India which provides a long-term forecast for each state and the country as a whole. The second
activity is the National Electricity Plan which is essentially a resource plan for the whole country.
The next two sub-sections discuss these two activities.
The EPS is carried out every five years. It provides a forecast of the electricity requirements of the
3.2 Continuation of Centralised Planning: The Central Electricity Authority
3.2.1 Electric Power Survey (EPS) of India
Fixated on Megawatts | 10

country for the following ten years on a year-by-year basis. It also provides a forecast for the 15th
and 20th year from the year in which it is released.
The EPS uses a Partial End-Use Method to develop the forecast. It is a combination of trend
analysis and end-use based analysis. The forecast of energy requirements (MU) and peak demand
(MW) is done category-wise. The forecast for most of the categories is done by multiplying the
specific consumption (consumption per consumer) by the number of consumers. Electricity use
per consumer is obtained from the state's distribution company; this forms the end-use part of the
approach. The projection of the electricity use per consumer for future years is done through
trend analysis, with greater weight given to more recent period. The impact of the following
schemes and programs is taken into account in developing the forecast:
T&D Loss Reduction
Energy Efficiency and Demand-Side Management Programs
Power for All
Make in India
Roof top solar
Electric vehicles.
Because much of the data for the EPS comes from the states, the development of the EPS requires
consultations with the states and discoms.
EPS forecasts form the basis of many decisions in the power sector. Many discoms use them for
planning their power procurements, and many SERCs encourage their use. For example, in its
Power Purchase and Procurement Process of Licensee Regulations, Punjab State Electricity
Regulatory Commission (PSERC) says that in the development of both short-term and long-term
forecasts, “The Distribution Licensee (s) shall also be guided by the methodology adopted in the
latest Electric Power Survey of Central Electricity Authority (CEA) for the State.”
Given the importance accorded to the EPS, it is worthwhile to examine the process used to
develop the EPS and the results of the EPS, the actual forecasts. While the CEA projections do use
the current energy use per consumer, there is no measured data on the consumption per
customer by end-use. Most likely, the growth in energy use per customer is based on heuristics.
Good load research that yields measured data would facilitate more accurate projections.
Table 3.1: Comparison of CEA Demand Growth Projections with Actual Demand Growth
Source: PEG, 2017; CEA, 2017b
We also looked at how the projected growth in the EPS compares with the actual growth. Table 3.1
compares CEA's forecasts for demand growth with actual demand growth over several rounds of
EPS. As can be seen from the table, CEA forecasts have consistently overestimated demand. While
?
?
?
?
?
?
Fixated on Megawatts | 11
EPS Round Period CEA Projected
Annual Average
Demand Growth
Actual Annual
Average Demand
Growth
14th 1988-95 12.45% 8.75%
15th 1998-02 6.85% 4.64%
16th 1999-05 7.04% 4.40%
17th 2006-12 7.81% 5.75%
18th 2012-17 9.46% 4.91%
19th 2017-22 6.88% --

generally the forecast was 30-40% higher than actual, in some periods, it has been much higher.
This very large overestimation has serious implications for capacity additions and power
procurement by discoms in the various states. CEA has recognized this tendency for
overestimation, and is making attempts to remedy the situation in future forecasts.
EAct (2003) requires that CEA prepare a National Electricity Plan (NEP) once every five years. In
December 2016, CEA issued a draft NEP, and in January 2018 it issued the Final NEP.
For developing the NEP, CEA relied on a capacity expansion model, Electric Generation Expansion
Analysis System (EGEAS). The user inputs the expected load both in terms of magnitude and
shape, essentially load data for every hour of the year. Information about existing resources,
assumptions about fuel prices, etc. are input into the model. The model simulates the operation of
the power system probabilistically. The model adds new resources to meet the load by minimizing
the total costs over the planning period. These costs are the operating costs of the plant,
annualized capital cost new plants and the cost of energy not served.
For the NEP, CEA estimated the net load for the country and used that as input for the country. Net
load is obtained by subtracting the contribution of RE from the load.
In addition to a base case, for the Draft NEP, CEA also ran some sensitivity cases to account for
uncertainties and to see how the requirements for new resources would change if there was some
change in load, RE capacity or hydro availability. For the base case, CEA found that no new coal
plant would be required until 2021-22. Over 2022-27, 44 GW of new coal would be required.
However, CEA reasoned that because 50 GW is already under construction and can be used 2022-
27, therefore, under base case conditions in the Draft NEP no additional capacity would be
required until 2027. It also found that changing RE and hydro did not affect the amount of new coal
capacity that would be required in the base case. Reduced RE and hydro, would lead to higher PLFs
for coal plants. Changing the load growth assumptions led to an increased requirement for new
coal plants. The amount of new coal capacity required depended on the level of RE and hydro.
For the Final NEP, CEA considered retirements of 22,716 MW between 2017-22 and another
25,572 MW between 2022-27. Quite naturally, it found that relative to the Draft NEP, further
capacity additions would be required: 6,445 MW over 2017-22; and 46,420 MW over 2022-27.
For the Final NEP, CEA ran only one alternate scenario where the load growth rate was increased to
7.18% from 6.18% in the base case. Consequently, more capacity additions were required, 19,700
MW over the period 2017-22, while the additions over 2022-27 remained at 46,420 MW. One
would have expected the capacity additions during 2022-27 to also increase; CEA does not discuss
this issue.
The handling of uncertainty in both the Draft and Final NEP is quite inadequate. There was no
consideration of wide-ranging scenarios. Consequently, the uncertainty analysis was restricted
to a very narrow range of futures. For example, there was no consideration of what would
happen if RE with storage becomes less expensive than electricity from coal. In that case, much of
the remunerative load would have a strong economic incentive to move off the grid, resulting in a
large reduction in load.
In addition, there was no analysis provided for the estimates of retirements. The rationale given
for retirement of 25,572 MW over 2022-27 is that these plants would be more than 25 years old
3.2.2 National Electricity Plan
Fixated on Megawatts | 12

and would have outlived their usefulness. Currently, we have many plants running well beyond 25
years of life, and generally the useful life of a coal plant is estimated to be around 40 years. No
analysis is given to back up CEA's assumption.
Until the EAct was passed in 2003, the Centre, through CEA, played a major role in supply planning
for the power sector. After the passage of the EAct and subsequent unbundling of SEBs, the
responsibility for planning has shifted more to the discoms. But as we will see in this section and
the next three chapters, this discom-level supply planning has some serious shortcomings.
Few regulatory commissions have regulations that deal with long term resource planning and
power procurement exclusively. As part of its Model Regulations for Multi-Year Distribution Tariff,
FoR has provided some guidance and direction on resource planning (FoR, 2011). There are three
sections, 5, 16 and 19 that deal with load forecast, resource planning and power procurement.
Section 5 requires the distribution licensee to develop a business plan that should include detailed
category-wise sales and demand projection, a power procurement plan and a capital investment
plan. There is also a single sentence that exhorts the licensee to include the effects of energy
efficiency improvement and demand-side management (DSM) programs.
According to Section 16, short-term metered sales are to be forecast based on the trend for the
last 2 or 3 years. It also recommends that the licensee make adjustments for unusual
circumstances due to economic conditions, changes in incentives to industry, changes in weather
patterns. For unmetered sales, the licensee is to conduct a study by measuring the consumption
of a representative sample of consumers.
Long-term forecasting is to be carried out through the use of a log-linear regression model that
includes GDP, average tariff for electricity and the population as variables. It also requires that
similar log-linear model be used to estimate category-wise forecast of electricity requirements.
Section 19 also has short paragraphs, of 3-5 lines each, on the following issues:
Assessing contribution from existing resources and contracts to develop a month-wise
estimate of deficit or surplus of power for both peak and off-peak period.
To diversify the generation mix, the licensee is to explore joint ventures with other states.
The long-term power procurement plan should also include proposals for acquisition of
demand-side resources and renewable energy (RE).
Specification in the procurement plan of the firm power for backup or balancing of RE.
Competitive bidding for any additional requirements. (Not clear if this is additional
requirements beyond what the licensee has or beyond what is in the power procurement
plan.)
The fact that FoR does not have a separate regulation for long term resource planning is an
indicator of how little is the recognition of the importance of effective resource planning. It is
ironic that the regulations for resource planning are embedded in the MYT regulations.
Generation costs contribute more than 70% of the tariff that consumers must pay for electricity
service. Incorrect capacity additions, in terms of the type, size or timing, can add huge amounts to
the revenue requirements of distribution companies. Thus, neglecting long term resource
planning and focussing only on tariff setting which has a horizon of about 3 years only, is short-
sighted.
3.3 Moving to Discom-Level Planning: FoR Model Regulation
?
?
?
?
?
Fixated on Megawatts | 13

Because long-term resource planning and tariff setting are important functions for regulators and
distribution companies, and because tariff setting can involve many issues, it may be best to
separate resource planning from tariff setting. It would also be useful to have these resource
planning proceedings at different times of the year, so that both these functions receive the level
of attention they deserve.
The regulations on resource planning that are in FoR's model regulations do not give clear
guidelines on how to do resource planning. For example, the suggested process for load
forecasting is muddled. It is not clear why there is a different approach for short and medium-term
forecasts based on trend analysis from the suggested process for long term forecasts which is to be
based on an econometric model. Furthermore, for long term forecasting, the actual model
including the variables to use are given. It may have been better for the distribution company to
decide on a model and which variable to use, because the conditions may be different in each state
and correspondingly the variables that determine electricity consumption may be different.
Several other issues, such as EE and RE, are mentioned but very little guidance is given on how to
include them in resource planning. One of the most important issues in resource planning is the
selection of resources. There is minimal guidance on how to do this during resource planning.
Further, the model regulations contain nothing on uncertainty and risk management, modelling
and evaluation of alternate plans.
For the first two decades or so after Independence, the Centre through CEA played a major role in
electric supply planning. However, economic rationality in planning gave way to electoral
considerations. Low tariffs that did not provide full cost recovery for the SEBs, led to financial
difficulties for SEBs who were then no longer able to fund sufficient investments in new generation
capacity. This then led to shortages of power. The establishment of NTPC and NHPC helped
ameliorate the shortages but not eliminate them.
The struggle with shortages led to the opening up of the generation sector to private investment.
With the passage of the EAct in 2003, private investment in the power sector increased rapidly.
The locus of planning is also shifting towards the discom. However, the legacy of centralized
planning also continues. Most discoms continue to rely on the CEA's forecast done every five years
through the EPS. Consistent overestimation of load growth in these forecasts is one reason for
surplus capacity in some states. The other manifestation of centralized planning is the National
Electricity Plan also carried out by CEA every five years. The process used to develop the NEP also
has some serious shortcomings. The treatment of uncertainty and management of risk is grossly
inadequate.
While there has been a partial shift away from centralized planning to discom-level planning, it too
has produced a planning regime that is woefully inadequate, as exemplified by the shortcomings
in the Model Regulation issued by FoR, and discussed in this chapter.
3.4 Summary of Findings
Fixated on Megawatts | 14
4. State Experience: Punjab
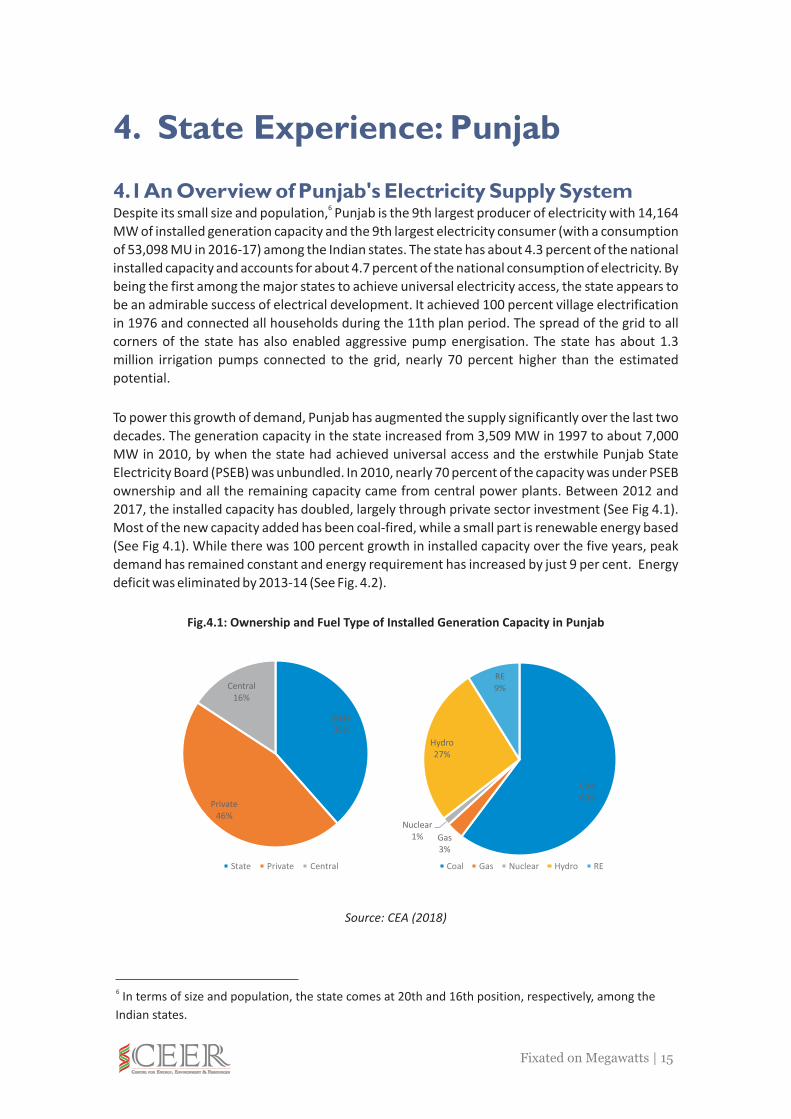
4.1 An Overview of Punjab's Electricity Supply System6
Despite its small size and population, Punjab is the 9th largest producer of electricity with 14,164
MW of installed generation capacity and the 9th largest electricity consumer (with a consumption
of 53,098 MU in 2016-17) among the Indian states. The state has about 4.3 percent of the national
installed capacity and accounts for about 4.7 percent of the national consumption of electricity. By
being the first among the major states to achieve universal electricity access, the state appears to
be an admirable success of electrical development. It achieved 100 percent village electrification
in 1976 and connected all households during the 11th plan period. The spread of the grid to all
corners of the state has also enabled aggressive pump energisation. The state has about 1.3
million irrigation pumps connected to the grid, nearly 70 percent higher than the estimated
potential.
To power this growth of demand, Punjab has augmented the supply significantly over the last two
decades. The generation capacity in the state increased from 3,509 MW in 1997 to about 7,000
MW in 2010, by when the state had achieved universal access and the erstwhile Punjab State
Electricity Board (PSEB) was unbundled. In 2010, nearly 70 percent of the capacity was under PSEB
ownership and all the remaining capacity came from central power plants. Between 2012 and
2017, the installed capacity has doubled, largely through private sector investment (See Fig 4.1).
Most of the new capacity added has been coal-fired, while a small part is renewable energy based
(See Fig 4.1). While there was 100 percent growth in installed capacity over the five years, peak
demand has remained constant and energy requirement has increased by just 9 per cent. Energy
deficit was eliminated by 2013-14 (See Fig. 4.2).
Fig.4.1: Ownership and Fuel Type of Installed Generation Capacity in Punjab
Source: CEA (2018)
6 In terms of size and population, the state comes at 20th and 16th position, respectively, among the
Indian states.
Fixated on Megawatts | 15
State
38%
Private
46%
Central
16%
State Private Central
Coal
60%
Gas
3%
Nuclear
1%
Hydro
27%
RE
9%
Coal Gas Nuclear Hydro RE

Fig. 4.2: Growth in Installed Capacity, Peak Demand, Energy Requirement and Deficit (2007-2018)
Source: CEA (2008, 2009, 2010, 2011, 2012, 2013, 2014, 2015, 2016, 2017, 2018)
The load profile of the state is dominated by small consumers. In 2014-15, domestic and
agricultural consumers accounted for 28 percent and 26 percent of consumption, respectively,
while industries consumed 34 percent of available power. Given the high share of agricultural
demand with a seasonal concentration, Punjab has a peaky load curve. The peak load and energy
requirement during the four months of paddy season (June-September) is about double the peak
load and energy requirement during the other months (See Fig. 4.3), while off-peak demand in
winter months remain as low as a quarter of the peak demand.
Fig. 4.3: Month-wise Peak Demand and Energy Requirement (2016-17)
Source: CEA (2017c)
Despite reasonable operational efficiency, Punjab State Power Corporation Limited (PSPCL) has
been incurring commercial losses. After two years of a small commercial profit, following the
unbundling, the discom has again plunged into losses, which can be attributed to the gap in
subsidy booked and disbursed by the state government. Consequently, the discom received a 'B+'
grade in the Fifth Annual Integrated Rating of Distribution Utilities, which implies 'moderate
Fixated on Megawatts | 16
0
10
20
30
40
50
60
0
2
4
6
8
10
12
14
16
2007-08 2008-09 2009-10 2010-11 2011-12 2012-13 2013-14 2014-15 2015-16 2016-17 2017-18
TW
h
GW
Installed Capacity (GW) Peak Demand (GW)
Energy Requirement (TWh) Energy Deficit (TWh)
0
1
2
3
4
5
6
7
0
2
4
6
8
10
12
Apr May Jun Jul Aug Sep Oct Nov Dec Jan Feb Mar
TW
h
GW
Peak Demand (GW) Energy Requirement (TWh)

operational and financial performance capability'. On the other hand, average cost of supply has
increased by two-fold over the past decade, from Rs 3.05 per kWh in 2007-08 to Rs 6.42 per kWh
approved for 2017-18, largely driven by increases in power purchase, employee and interest costs.
With the objective to meet the peak demand, the state has accumulated huge amount of
generation capacity that remains stranded during the off-peak months. While the state
government takes the position that generation capacity addition matching the peak demand is
necessary to ensure reliability of supply, such reliability has come at a high cost. The fixed charge
for the unutilised capacity accounted for 12 percent of the revenue requirement of PSPCL in 2015-
16. Among the power surplus states, Punjab has backed down the second highest share of
contracted capacity (27 percent), after Gujarat (Josey et. al., 2017). The newest operational plant
in Goindwal Sahib remained completely idle in 2016-17, the first year of its operation. On the
other hand, the state government has decided to shut down the thermal plant in Bhatinda and
two units of the plant in Ropar, both owned by PSPCL, from the beginning of 2018. In 2016, Punjab
offered to surrender 336 MW capacity from its share in NTPC plants, which is 15 percent of its total
allocation from central power plants. Besides additional costs for the strapped discom and tariff
burden on consumers, surplus generation capacity has stifled the prospects for open access,
demand-side management and renewable energy deployment. Given the peculiar seasonal peak
load, the state could have used resource planning to explore alternative ways to meet the peak
demand, rather than going for long-term round-the-clock (RTC) power purchase contracts.
The primacy of agriculture in Punjab's economy has driven its policy priorities for many years.
Despite following the Central Government's guidelines, the state failed to gain from economic
liberalisation and attract private sector investment during the first two decades of economic
reforms. Moreover, the legacy of agricultural economic success in the early years seems to have
limited the political will to diversify to secondary sectors. Rather, the state experienced the flight 7
of some industries during the 1990s and 2000s. While there were several reasons, increasing
industrial electricity tariff (to cross-subsidise agricultural consumers) and unreliability of supply
are claimed to have contributed to the sluggish industrial growth in Punjab. During the scarcity
years, supply of electricity to agriculture was prioritised over industrial supply. Not only was
industrial supply disrupted to cater to the agricultural demand, the industries were made to pay a
peak load exemption charge (PLEC) for consumption beyond their contracted load during the
evening peak hours.
With the induction of Sukhbir Singh Badal into state politics in 2009, the developmental approach
of the state opened up beyond the agricultural focus. Badal was instrumental in developing a
vision and strategy for industrial promotion and agricultural diversification developing a vision
and strategy for industrial promotion and agricultural diversification in the state, which were long
overdue. The new leadership recognized that availability and reliability of power supply are
necessary to attract industrial investment to the state, and capacity addition as a way out of the
power availability crisis received support from both the older and younger generations of leaders
in the SAD government. While the former supported it for catering to the peak agricultural
demand, the latter saw capacity addition as a prerequisite for industrial promotion (Swain,
2018a).
7
land-locked geography, lack of access to raw material, and elimination of freight equalisation increased the
cost of raw material transportation.
4.2 Policy Priorities and Regulatory Provisions
Overutilization of land for agriculture limited land availability for industries, lack of local industrial labour,
Fixated on Megawatts | 17
The Industrial Policy of Punjab, 2009 recognised that “adequate, assured and reliable power is key
to the growth of Industry” and proposed four new power plants with a combined capacity of 6,520
MW and expansion of two existing plants by 1,000 MW, with the objective to achieve total 8
installed capacity of 16,275 MW by 2016-17 (GoP, 2009). The Power Generation Policy issued in
the following year, just after the unbundling of PSEB, reiterated that “reliable, quality, and
affordable power supply is one of the key drivers for the State's industrial and commercial
growth.” The policy, recognising the acute power shortage, presented the government's decision
to set up three of the proposed four power plants by private sector through tariff-based
competitive bidding as per case-II guidelines of the Government of India (GoP, 2010).
However, the three privately-owned power plants currently operational within Punjab were
pending projects. The newest plant to be commissioned in Gowindwal Sahib was conceptualised
in 1998, and PSEB had signed the MoU in 2000. Similarly, the plants in Talwandi Sabo and Rajpura
were approved in 2007 by the PSERC, against a requisition from PSEB for additional capacity.
However, the PPAs for Talwandi Sabo and Rajpura Plants were signed in 2008 and 2010
respectively. Sukhbir Singh Badal, who kept the power portfolio with himself, was instrumental in
accelerating these projects. Between 2012 and 2016, PSPCL also signed another six PPAs with IPPs
outside the state amounting to 1819 MW capacity, viz. Durgapur DVC TPS (200 MW),
Raghunathpura RTPS (300 MW), Pragati III Bawana (137.1 MW), Malana-2 (88 MW), Sasan UMPP
(594 MW), and Mundra UMPP (500 MW).
One reason for the surplus capacity in the state is that there was a push by the regulatory
commission to estimate the power requirements based on the method used by CEA in developing
the EPS, which itself resulted in an over-estimation of power requirements. The impact of this
approach was exacerbated by the decision to make long-term capacity additions to meet 100
percent of the demand rather than rely on short-term purchases to provide at least a fraction of
the requirements at peak. However, there have been allegations of corruption in the award of
contracts to IPPs.
The capacity addition has certainly ensured improvements in service quality. Since 2014, PSPCL
has ensured round-the-clock supply for all its consumers except agricultural consumers, who
receive eight hours of continuous supply every day. Keeping with the aspiration to grow the
industrial base, the archaic PLEC burden on the industries was eliminated. Moreover, the state has
offered to serve the new industrial power demand (whether from upcoming industries or
additional load from existing industries) at Rs. 4.99 per kWh, lower than the average cost of supply.
While the lower industrial tariff is in line with the state's industrial aspirations, it is also alleged to
be a desperate move to mitigate the burden of surplus power.
Unfortunately, the decision for capacity addition and acceleration of deployment was made by the
state government, without proper resource planning at the utility level. Interestingly, after the
three power plants were contracted out, the Punjab State Electricity Regulatory Commission
(PSERC) issued the Power Purchase and Procurement Process of Licensee Regulations in 2012.
Unlike most other commissions, PSERC has a separate and detailed regulation for power
procurement by the discom, but without any provisions for crucial steps of resource planning.
8 The proposed new plants included Talwandi Sabo (1,980 MW), Rajpura (1,320 MW), Goindwal Sahib (540
MW), and Gidderbaha (2,680 MW). Capacity extension was proposed for Bhatinda TPS (500 MW) and
LehraMohabat TPS (500 MW).
Fixated on Megawatts | 18
The regulation emphasises the need for long-term and short-term forecasting of demand and
energy. As part of the long-term forecast, the licensee is required to submit a 10-year rolling
forecast every year, with month wise variations. In preparing the forecast, the licensee is required
to assess the historical data, load requirement projections in accordance with the business plan,
efficiency gains from T&D loss reduction and DSM, economic growth implications, effects of
captive power and open access sales migration, and variation in agricultural demand over months.
The licensee is also required to follow the methodology used in latest Electricity Power Survey of
CEA to prepare the forecast. The licensee is also required to submit a short-term forecasting for
the next year, with month-wise information. In preparing the short-term forecast, the licensee is
required to follow all above criteria as well as factor in the weather forecast and maintenance
schedule of its own generation plants.
The discom is also required to submit a long-term, 10-year, rolling assessment of availability. The
assessment of availability must consider all sources of power available and in the pipeline as well
as from banking arrangements. Building on the demand forecast and assessment of availability,
the discom is required to submit a long-term (10-year) and short-term (one-year) power
procurement plan. Both the plans need to be duly reviewed and approved by the Commission. The
discom is allowed to procure up to an additional 10% of the approved long-term power, to meet
any unforeseen circumstances, including fuel unavailability. The discom must follow the approved
plan for short-term power procurement. As long as the approved plans and procedures are
followed by the licensee, the regulation states, the Commission shall not intervene in the power
procurement process.
However, the 15-page regulation, drawn from the FoR Model MYT Regulation, does not require
the licensee to consider environmental or social impacts. It also did not draw attention to the need
for an optimal mix of baseload, intermediate and peaking supply sources. Nor was there any
mention in the regulation of assessment of alternate plans, modelling or risk assessment.
There are three groups whose work could possibly be related to long term resource planning and
power procurement:
? . This cell is headed by a Chief Engineer and has
more than 15 engineers. While it has several sub-cells such as historical data, open
access, scheduling etc., there is no mention of long term resource planning and power
procurement.
Planning Cell. The planning cell is focused on material planning. It focuses on materials
required for its projects.
CE (ARR & Tariff Regulation). The Chief Engineer for ARR & TR is responsible for filing
capital investment and business plans.
While none of these groups seemed to deal with long term resource planning and power
procurement, there is a Long-Term Power Purchase Committee that deals with some of these issues. It makes, or at least reviews, decisions to add a supply resource either in the form of
capacity addition by PSPCL or a new PPA. The Committee meets whenever a new proposal comes
up. The Committee consists of Chief Engineers from the following divisions:
Planning
PP&R
4.3 The Practice of Resource Planning & Power Procurement
4.3.1 Discom Process
Power Purchase & Regulation (PP&R) Cell
?
?
?
?
Fixated on Megawatts | 19

?
?
?
?
?
?
?
?
Thermal Projects
Hydel Projects
Cost Controller
Finance Administrator
In PSPCL, long term resource planning seems to be a neglected area. There is no clarity as to who is
responsible for long term resource planning. The responsibility seems to be divided between
various groups and the Long Term Power Purchase Committee.
The Power Purchase and Procurement Process of Licensee Regulations were issued by PSERC in
October 2012. By then most of the long term supply additions (Talwandi Sabo, Rajpura and
Goindwal plants) were already under construction, and there has not been a need after that for
long term supply additions. So, these regulations have been used for dealing with short term
power procurement. While petitions from PSPCL on these issues were not available, a review of
an order allowed us to come to some conclusions. Generally, PSPCL followed the requirements of
the regulations and filed: month-wise restricted and unrestricted demand projections; power
availability; demand-supply gap; and requirements for additional power to fill the gap.
In addition to these filings, PSPCL also files information in its tariff petition the following
information, as required by the tariff regulations of PSERC:
Energy sales projections for the control period (3 years) by category based on the
historical trend (CAGR) of the last three years;
Energy availability over the control period;
Energy balance for each year of the control period;
Power Procurement plan to satisfy the energy requirements.
While this information is adequate for tariff setting purposes, longer term resource planning is
neglected. Even though PSPCL does not need any additional supply resource now, it may need
them in the near future. A plan for a longer time horizon of say, 20 years would alert PSPCL to
changes that may be looming on the horizon and for which it should start preparing now.
There is very little, if any, thought being given to long term resource planning in Punjab. While
there may not be any immediate need for new supply sources, the state does not have the
organization and processes in place to carry out effective resource planning, when that need
arises. Furthermore, the inadequacies in the state regarding resource planning may explain why
the state has so much surplus capacity, putting a huge cost burden on the state and its electricity
consumers.
The responsibility for long term resource planning in PSPCL is not at all clear. While there are cells
in the discom that cover issues related to long term resource planning, it is not seen as one of the
functions by any of these cells. The Long Term Power Purchase Committee may be handling these
issues but there is no clear organization or process that is in place to do so systematically. Moreover, the Committee may be an ad-hoc entity whose existence is not necessarily assured in
the discom.
Regarding the recent capacity additions, there does not seem to have been any detailed analysis
to estimate the need for new generation or to ascertain that these were the right type of capacity
4.3.2 Regulatory Process
4.4 Key Findings
Fixated on Megawatts | 20

to add. Mostly there was a desire to increase supply to attract industry to the state. The need to
add generation capacity may be have been reasonable, but no thought was given to what would
happen if the industrial growth did not take place at the rate expected. Good resource planning
would have ensured some synchronization of capacity addition with industrial growth. Instead,
there was no thought given to handling of risks due to changes in load growth.
It also seems that the State Government pushed capacity additions without any resource planning
process. PSPCL and PSERC seemed to have followed the Government's directives without raising
any questions about its appropriateness or the insertion of safeguards in the policy.
Fixated on Megawatts | 21

5. State Experience: Delhi
5.1 An Overview of Delhi's Electricity Supply SystemAs a small city state and being the national capital, Delhi's electricity supply system developed
early. Not only has the state ensured universal electricity access, but it has also ensured 24×7
supply for all consumers. To come out of the crisis of electricity shortages experienced in the
1990s, the state increased the installed generation capacity by three-fold since the erstwhile Delhi
Vidyut Board was unbundled. During the period 2007-17, the installed generation capacity in the
state increased by 112 percent (Fig. 5.2). Delhi's space constraint has limited the addition of
generation capacities located within the state territory. Consequently, a major share of the total
generation capacity comes from central power plants, largely coal-fired. Much of the state's own
generation capacity is gas fired (Fig. 5.1), possibly because of the concern about putting large
polluting plants within the territory. Over the past decade, despite a rapid growth in generation
capacity, energy requirement of the state has increased by only 37 percent. Peak demand has
increased by 56 percent (Fig. 5.2). The state has more than overcome the power deficit that was
experienced in the 1990s.
Fig. 5.1: Ownership and Fuel Type of Installed Generation Capacity in Delhi
Source: CEA (2018)
Fig. 5.2: Growth in Installed Capacity, Peak Demand and Energy Requirement (2007-2018)
Source: CEA (2008, 2009, 2010, 2011, 2012, 2013, 2014, 2015, 2016, 2017, 2018)
State25%
Private14%
Central61%
State Private Central
Coal61%
Gas27%
Nuclear1%
Hydro9%
RE2%
Coal Gas Nuclear Hydro RE
0
5
10
15
20
25
30
35
0
1
2
3
4
5
6
7
8
9
2007-08 2008-09 2009-10 2010-11 2011-12 2012-13 2013-14 2014-15 2015-16 2016-17 2017-18
TW
h
GW
Installed Capacity (GW) Peak Demand (GW)
Energy Requirement (TWh) Energy Deficit (TWh)
Fixated on Megawatts | 22
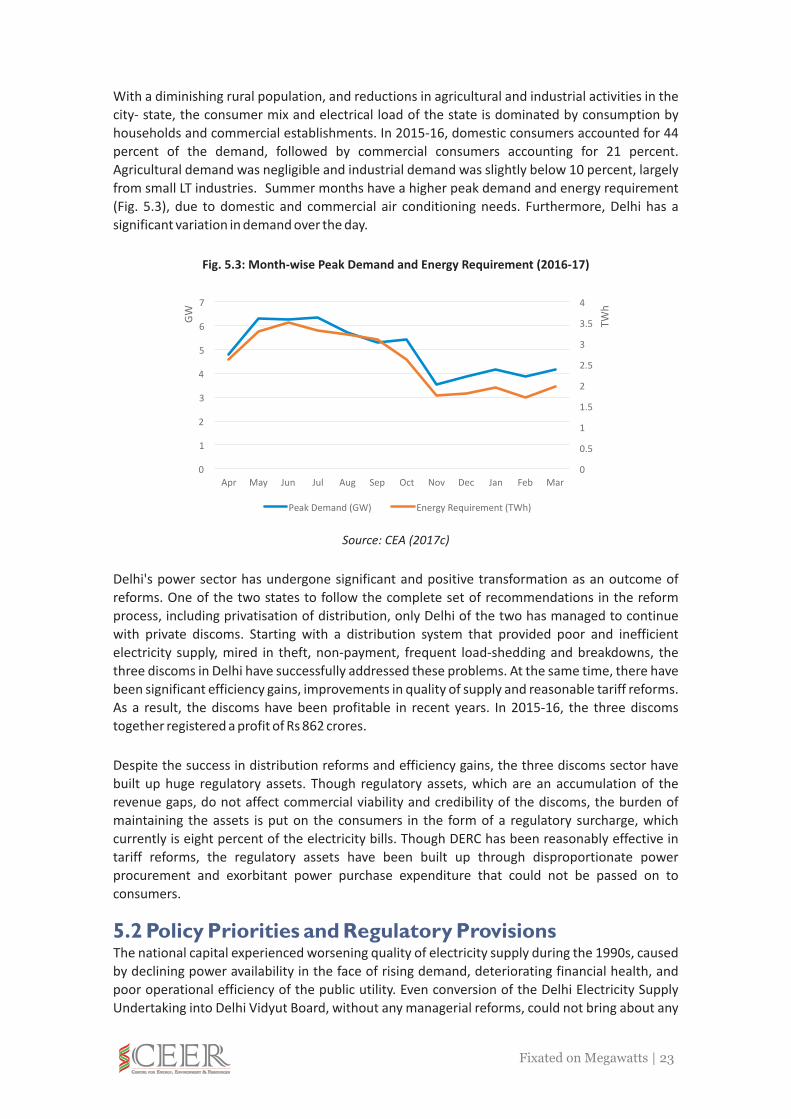
With a diminishing rural population, and reductions in agricultural and industrial activities in the
city- state, the consumer mix and electrical load of the state is dominated by consumption by
households and commercial establishments. In 2015-16, domestic consumers accounted for 44
percent of the demand, followed by commercial consumers accounting for 21 percent.
Agricultural demand was negligible and industrial demand was slightly below 10 percent, largely
from small LT industries. Summer months have a higher peak demand and energy requirement
(Fig. 5.3), due to domestic and commercial air conditioning needs. Furthermore, Delhi has a
significant variation in demand over the day.
Fig. 5.3: Month-wise Peak Demand and Energy Requirement (2016-17)
Source: CEA (2017c)
Delhi's power sector has undergone significant and positive transformation as an outcome of
reforms. One of the two states to follow the complete set of recommendations in the reform
process, including privatisation of distribution, only Delhi of the two has managed to continue
with private discoms. Starting with a distribution system that provided poor and inefficient
electricity supply, mired in theft, non-payment, frequent load-shedding and breakdowns, the
three discoms in Delhi have successfully addressed these problems. At the same time, there have
been significant efficiency gains, improvements in quality of supply and reasonable tariff reforms.
As a result, the discoms have been profitable in recent years. In 2015-16, the three discoms
together registered a profit of Rs 862 crores.
Despite the success in distribution reforms and efficiency gains, the three discoms sector have
built up huge regulatory assets. Though regulatory assets, which are an accumulation of the
revenue gaps, do not affect commercial viability and credibility of the discoms, the burden of
maintaining the assets is put on the consumers in the form of a regulatory surcharge, which
currently is eight percent of the electricity bills. Though DERC has been reasonably effective in
tariff reforms, the regulatory assets have been built up through disproportionate power
procurement and exorbitant power purchase expenditure that could not be passed on to
consumers.
The national capital experienced worsening quality of electricity supply during the 1990s, caused
by declining power availability in the face of rising demand, deteriorating financial health, and
poor operational efficiency of the public utility. Even conversion of the Delhi Electricity Supply
Undertaking into Delhi Vidyut Board, without any managerial reforms, could not bring about any
5.2 Policy Priorities and Regulatory Provisions
0
0.5
1
1.5
2
2.5
3
3.5
4
0
1
2
3
4
5
6
7
Apr May Jun Jul Aug Sep Oct Nov Dec Jan Feb Mar
TW
h
GW
Peak Demand (GW) Energy Requirement (TWh)
Fixated on Megawatts | 23

change. Prior to the 1998 state assembly election, quality of electricity supply emerged as a major
electoral issue and resulted in a change in power in the state. Then, it became imperative for the
state government to explore distribution reforms in the state. Despite Odisha's experience with
distribution reforms and privatisation, and even though many states had halted the reforms, Delhi
went ahead with privatising the three discoms in 2002.
Along with distribution reforms, there was an equal push for augmenting the generation capacity
in order to eliminate shortages. During the initial five years (2002-07), when bulk purchase and
power procurement remained with Delhi Transmission Corporation (Transco), contracted
generation capacity was increased by about 50 percent, from 2,500 MW to 3,689 MW. In this
period, the major thrust was on meeting the growing demand within the state. In 2007, the
existing PPAs were split among the discoms, according to their load, and the responsibility of
additional power procurement was transferred to the discoms. At that time, the state total
capacity of 3,689 MW was lower than the peak demand of 4,075 MW. But, with the energy
requirement of 22,439 GWh, the energy deficit was a mere 138 GWh.
Over the period 2007-2017, generation capacity increased by 112 percent (Fig. 5.2). Three factors
seem to have driven this increase. First, for the Commonwealth Games held in 2010, there was a
great push from both the Central and state governments to ensure adequacy of power availability.
NTPC, as an official partner for the games, expedited its projects to ensure an additional 1,500 MW
capacity for Delhi. Second, high growth was projected in the power demand from households,
commercial consumers, as well as new industries. However, promotion of industrial hubs failed
and the energy demand was much lower than expected. Third, even though DERC was aware of
the potential for surplus capacity, it encouraged those additions with the expectation that the
discoms would be able to sell the surplus power through the power exchange and gain from a
higher price for short-term sales. The discoms did receive good revenue from short-term sales in
2007-08 and 2008-09, a higher return than DERC's estimation. However, gradually the returns
decreased not only below the Commission's estimation, but also below the cost of long-term bulk
purchase price that the discoms paid to generators.
The revenue loss has been accumulated as regulatory assets. The regulatory surcharge collected
from consumers is not enough to amortise the assets. Consequently, there is a consensus about
the urgency to address the surplus power situation. Recently, the state has decided to shutdown
two of its aging and inefficient power plants, while it has offered to surrender 1,920 MW of its
allocation from NTPC plants, which is about a quarter of the total contracted capacity in the state.
Overzealous power procurement in Delhi is a result of lack of resource planning, over projection of
demand growth, and misguided incentives. Yet DERC follows a minimalist approach to regulate
the long-term resource planning of discoms. It does not have any specific regulation on resource
planning or power procurement. As part of its regulations on terms and conditions for tariff
determination issued in 2011 and 2017, it makes some provisions in line with the Model MYT
Regulation issued by FoR. But both versions of the tariff regulation have minimal requirements
from the discoms. The discoms are required to submit a load forecast, with consumer category
wise details, and a business plan on a yearly basis, as part of their ARR filing. However, each
capacity addition proposal is reviewed and approved by the commission on a case by case basis.
The minimalist approach followed by DERC for long-term resource planning may partly be
explained by the expectation that effective and efficient resource planning is in the self-interest of
the private discoms.
DERC, however, has issued directions for short term power procurement. The discoms are
Fixated on Megawatts | 24

required to prepare an annual power procurement plan indicating month-wise power
requirements and sources, on the basis of LGBR issued by the Northern Regional Power
Committee. The plan needs to be discussed in the DPPG and adopted by the 15th day of issue of
LGBR. The projections in the plan may be revised at any time with the approval of the DPPG. The
discoms are also required to upload the requirement of power and availability of surplus power
for the year on their respective websites, and update it every month. The guidelines emphasize
transparency in the procurement process and empower the DPPG to examine any power
procurement case following completion of the procurement process.
Tata Power Delhi Distribution Ltd (TPDDL) was selected for a more detailed look at the discom
experience with resource planning. TPDDL is a public-private joint venture between Tata Power
and the Government of Delhi, with Tata Power holding 51% share. There are two groups within
TPDDL that handle planning. The Power System Control Group has all the SCADA data and does
the demand forecasting. The Power Monitoring Group (PMG) does resource planning, manages
existing resources, selects new resources, and oversees RE resources.
Like the whole of Delhi, TPDDL has a very peaky load. Its peak during the summer was about 1800-
1900 MW, while during the winter months its peak is about 1200 MW only. The load shape within
a day is also very peaky. During the summer season, there are two daily peaks: one at 1300-1700
hours and the other between 2300-0200 hours due to night time use of air conditioners. During
winter nights, TPDDL's load is negligible but spikes around 7am due to people turning on their
water heaters.
For managing the peak load, TPDDL uses a combination of the following strategies:
Backing down coal plants to 55% of capacity
Banking with HP, J&K, and MP. These are on a year-by-year basis. There are no long-term agreements.
During periods of low demand, sell excess power while keeping some surplus power for contingencies.
Hydro plants are not under TPDDL control. Hydro and nuclear units are treated as must-run units. Except for Tehri, all the hydro is run-of-river. Tehri runs continuously during the monsoon season. From November-March it runs about 8 hours per day; 4 hours in the morning and 4 hours in the evening. For the other months, the generation is lower. The Indian Meteorological department gives a forecast of the water flow.
TPDDL relies on about long-term agreements for about 80% of its requirements and on short-term
purchases or agreements for the remaining 20% of its requirements. TPDDL does not anticipate
any requirements for new long-term agreements until 2025, so not much long-term resource
planning is being done. It expects to carry out competitive bidding to acquire new long-term
resources, when the need arises.
While earlier TPDDL relied on CEA forecasts, it now carries out its own forecast. TPDDL is working
with IBM for planning. IBM has developed a Power Portfolio Management system for them. It can be used for short-term (day ahead) forecast, medium term (6 months) and long term (10-15
years) forecast. Until recently this system was used for short-term forecasts only. But now they are
5.3 The Practice of Resource Planning and Power Procurement
5.3.1 Discom Process
?
?
?
?
Fixated on Megawatts | 25

also doing medium and long-term forecasts. The system uses historical data for the last 7 years to
prepare a forecast.
Looking ahead, as greater amounts of RE are added, the need for flexible resources will increase.
TPDDL may need to use large DG sets for flexibility. TPDDL is looking seriously at EE & DSM
resources. One strategy could be to use DSM to clip the peak load, and sell any excess energy at
peak when prices are likely to be high. This could help in reducing the regulatory asset that has
been built up. However, as of now, the DSM contribution is small. Mostly these are pilot programs
reducing peak by only about 10-15 MW.
As discussed above, there is some requirement for providing category-wise demand forecasts in
the MYT regulations of DERC. However, there is very little on long term resource planning. DERC
seems to rely on a case by case review of a proposal for any supply addition in the form of capacity
addition or a new PPA.
There is however, another DERC order that encourages discoms to have sufficient generating
capacity at hand. In June 2009, there was “unprecedented load shedding” that occurred in the
service territory of BRPL. Criticism and concern were expressed by citizens, consumer
representatives and the State Government. Taking suo moto cognizance of the issue, the
Commission ordered that there could be no load shedding more than 1% of the total energy
supplied by a discom in any month. Force-majeure events were exempted. If a discom exceeded
the 1% limit, it would have to pay a penalty of Rs 5 lakh for every 2 lakh kWh that was unserved.
This order has provided an incentive to discoms to maintain sufficient generating capacity for
serving their consumers.
At least part of the reason for the surplus capacity in Delhi is due to the push from the Central and
State Governments and possibly DERC to have sufficient generating capacity. In a way, the Indian
experience with power shortages may be creating a mind-set that no amount of capacity would be
enough. It is unclear if the discoms pushed back for more realistic estimates of the energy
requirements during CWG.
Another reason for the surplus capacity is an over-estimation of the expected growth in load.
Some of this can be attributed to CEA forecasts which were relied upon and which in the past have
tended to be rather optimistic about the level of growth expected. In addition, in the planning for
new supply additions, there was no consideration of the additional load not materializing and
consequently there were no safeguards that would be required if the load forecast was too high.
Essentially, no thought seems to have been given to uncertainty in the load forecast.
The third reason for surplus capacity is the expectation that sales of surplus capacity would
continue at high prices. There seemed to be no recognition of the fact that both very high and very
low prices in the market are short term phenomenon. They are a response to shortages or
surpluses in the market and are often self-correcting.
The imposition of a limit on load shedding of 1% of the energy sales in a month may result in better
service for consumers. However, by itself, such a rule can result in over-capacity. A better approach
would be to have effective long-term resource planning where DERC ensures that uncertainties
have been taken into account. Such an approach balances cost and risk.
5.3.2 Regulatory Process
5.4 Key Findings
Fixated on Megawatts | 26

Demand-side measures are important, particularly in service territories like Delhi that have a very
peaky load. It is heartening to see that the discoms in Delhi are pursuing this path. Given that most
of the peak is coming from ACs in the summer and water heaters in the winters, DSM measures
targeted at these two appliances may be the most fruitful. Incentives for 5-Star or even super-
efficient ACs may be worthwhile. Time-of-Use rates and direct control of these two appliances
should also be considered. Direct control allows cycling of appliances so that the distribution grid
does not “see” all the appliances on at one time; instead it would see only a fraction, say 33% on at
any time. Such cycling of appliances may not even be noticed by the owners of the appliances.
Fixated on Megawatts | 27
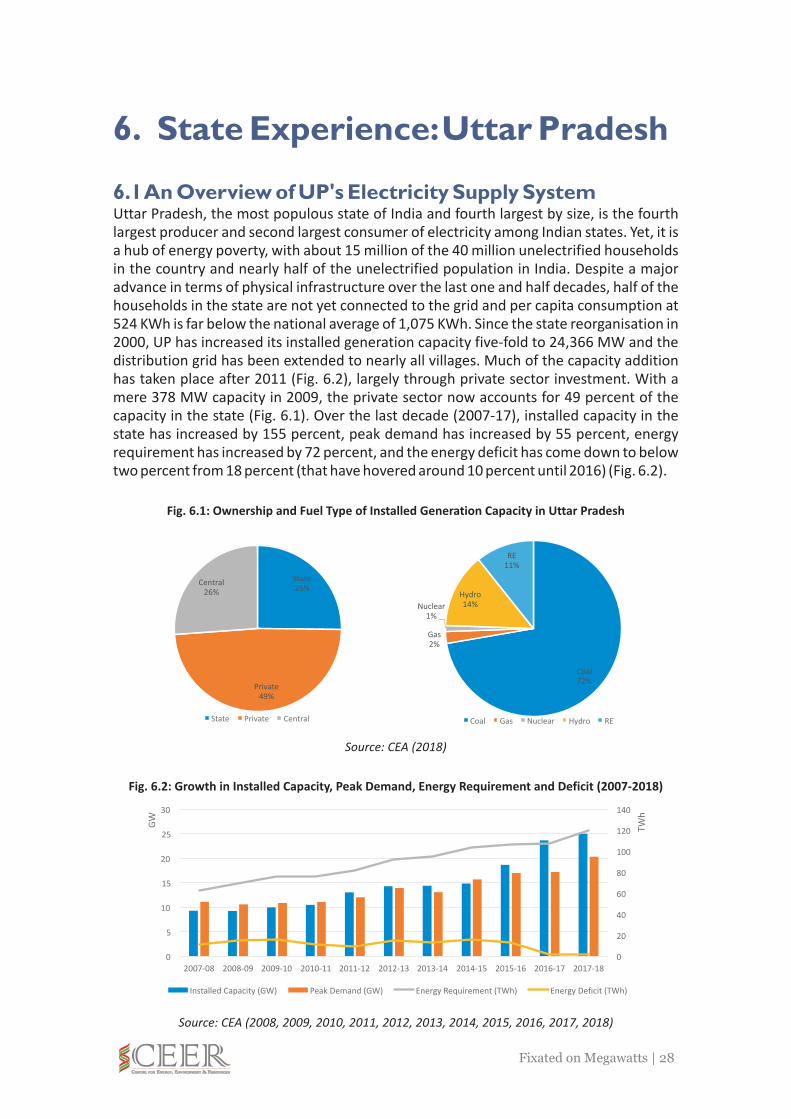
6. State Experience: Uttar Pradesh
6.1 An Overview of UP's Electricity Supply SystemUttar Pradesh, the most populous state of India and fourth largest by size, is the fourth largest producer and second largest consumer of electricity among Indian states. Yet, it is a hub of energy poverty, with about 15 million of the 40 million unelectrified households in the country and nearly half of the unelectrified population in India. Despite a major advance in terms of physical infrastructure over the last one and half decades, half of the households in the state are not yet connected to the grid and per capita consumption at 524 KWh is far below the national average of 1,075 KWh. Since the state reorganisation in 2000, UP has increased its installed generation capacity five-fold to 24,366 MW and the distribution grid has been extended to nearly all villages. Much of the capacity addition has taken place after 2011 (Fig. 6.2), largely through private sector investment. With a mere 378 MW capacity in 2009, the private sector now accounts for 49 percent of the capacity in the state (Fig. 6.1). Over the last decade (2007-17), installed capacity in the state has increased by 155 percent, peak demand has increased by 55 percent, energy requirement has increased by 72 percent, and the energy deficit has come down to below two percent from 18 percent (that have hovered around 10 percent until 2016) (Fig. 6.2).
Fig. 6.1: Ownership and Fuel Type of Installed Generation Capacity in Uttar Pradesh
Source: CEA (2018)
Fig. 6.2: Growth in Installed Capacity, Peak Demand, Energy Requirement and Deficit (2007-2018)
Source: CEA (2008, 2009, 2010, 2011, 2012, 2013, 2014, 2015, 2016, 2017, 2018)
State25%
Private49%
Central26%
State Private Central
Coal72%
Gas2%
Nuclear1%
Hydro14%
RE11%
Coal Gas Nuclear Hydro RE
0
20
40
60
80
100
120
140
0
5
10
15
20
25
30
2007-08 2008-09 2009-10 2010-11 2011-12 2012-13 2013-14 2014-15 2015-16 2016-17 2017-18
TW
h
GW
Installed Capacity (GW) Peak Demand (GW) Energy Requirement (TWh) Energy Deficit (TWh)
Fixated on Megawatts | 28

While one-third of the electricity is unaccounted for and booked under AT&C loss, a major part of
remaining energy goes to less remunerative smaller consumers. In 2015-16, domestic consumers
accounted for 41 percent of consumption, followed by industries (20 percent) and agricultural
consumers (14 percent). With high share of domestic demand and low level of household
consumption, the state does not have drastic variation in peak demand and energy requirement
(Fig. 6.3), as in Punjab or Delhi. High level of AT&C loss and large share of underpaid load has
resulted in a high level of revenue loss for the discoms. In 2015-16, while KESCO made a marginal
profit of Rs 4 crore, the other four discoms incurred a cumulative revenue loss of Rs 8,681 crore.
The discoms in the state have an accumulated debt of Rs 40,762 crore, the third highest after Tamil
Nadu and Rajasthan, even after some adjustments under the UDAY scheme.
Fig. 6.3: Month-wise Peak Demand and Energy Requirement (2016-17)
Source: CEA (2017c)
UP was one of the first movers on distribution reforms. In the face of a major financial crisis in the
state and rising financial dependency of UPSEB, the state government initiated a reform
programme for the power sector, aided by the World Bank. The Board was split up, and action was
taken to invest in transmission infrastructure, facilitate private investment in generation, and
institute independent tariff-setting. Plans were also initiated to privatize the state's distribution
companies. But, the reform stalled after the BJP lost power in the 2002 state elections, and a
period of President's Rule was followed by two weak coalition governments. Five public discoms
were created during this period, but plans for privatization failed twice. Furthermore, these
discoms were not made independent companies with separate asset bases and, even until now,
continue to operate under the holding company UPPCL. While the discoms perform the
operational duties in their respective territories, UPPCL holds the responsibility for resource
planning, bulk purchase and cash flow management. To make matters worse, bifurcation of the
state with the creation of Uttarakhand led to UP losing access to a significant amount (two-thirds)
of inexpensive hydro power thereby raising its overall cost of power procurement over the
following years. Unlike Punjab and Delhi, UP needs to procure more power to meet the national
objective of round-the-clock power supply for all, an objective also shared by the state
government. Under these challenging circumstances, it is critical for the state to get its resource
planning right as it adds new supply sources while containing the expenditure on bulk power
purchases.
Fixated on Megawatts | 29
5
6
7
8
9
10
10
11
12
13
14
15
16
17
18
19
20
Apr May Jun Jul Aug Sep Oct Nov Dec Jan Feb Mar
TW
h
GW
Peak Demand Energy Requirement

6.2 Policy Priorities and Regulatory ProvisionsUP's power sector has long been characterised by scarcity, high level of loss, low efficiency and
chronic financial shortages. As described earlier, just as the state was preparing for reforms of the
sector, problems were exacerbated by the state reorganisation of 2000. With an ailing power
sector and high level of energy poverty, the state's primary objective was to connect more people
to the grid and ensure a modest supply.
In 2003, the state government published the first energy policy. The key goal, as set in the policy,
was to ensure power to all by 2012. The policy emphasised that, over the next decade, energy and
peaking shortages needed to be overcome and adequate spinning reserve should be made
available. It also recognised the need to upgrade and augment the transmission and distribution
network. It estimated that the state needed an additional 1,300 MW of generation capacity to
meet the then demand of 11,250 MW to ensure power for all and 14,200 MW to match the
national average per capita electricity consumption. In order to accomplish these goals, the policy
underlined the need for new capacity and optimisation of the operation of the existing power
plants and recognised the importance of private sector investment. However, the actions did not
match the vision in the following years. In a highly competitive political environment, these goals
for the power sector were lost in intense jockeying for power among the three major parties – SP,
BSP, and BJP.
In 2009, the state government published a new energy policy that reiterated the old goals. The
deadline for ensuring power supply to all was extended to 2014, with the additional objective to
increase power availability to 1,000 kWh per capita by 2017. However, round-the-clock supply was
not yet a policy goal; the objective was to ensure reasonable hours of supply depending on the
location. The policy estimated that UP would need an additional 32,000 MW to be at par with the
national average per capita consumption. While this goal has not been met, there have been
significant capacity additions following the new energy policy- the state has added about 15,000
MW capacity since 2009, with 12,000 MW coming from the private sector.
Clearly, UP had a major thrust on capacity addition and increase in the availability of power, and
rightly so. The state has added nearly 20,000 MW capacity since 2003. Yet, half of the households
are still to be connected to the grid. What went wrong? Did the state add the right resources?
Current sector goals are at cross-purposes; while PFA and Saubhagya schemes require the discom
to significantly increase its less remunerative load, the UDAY scheme requires the discom to bring
down its expenditure and reduce the revenue gap. As the state adds more capacity to meet the
national objective of 24×7 power for all, UP must learn from past mistakes and plan its resource
additions optimally.
In 2013, UPERC issued a regulation on multiyear distribution tariff, which also contained some
guidelines on resource planning and power procurement for the discoms. A detailed section on
power procurement seems to have been drawn verbatim from the Model Regulation issued by
FoR. According to the guidelines, along with the ARR filing, the discoms are required to submit a
demand forecast. The regulation provides the methodology for forecasting and suggests a specific
economic regression model for the purpose. The forecast is required to be based on past trends
and must consider abnormal variations in consumer mix, inflection point in economic cycle and
variations in weather condition. Considering UP's unique context, the commission requires
separate forecasts for metered and unmetered connections.
The regulation also requires the licensee to submit a comprehensive power procurement plan, as
part of the MYT petition, covering short-term (one year) and medium-term (five year) scenarios. It
Fixated on Megawatts | 30

must contain information about peak and off-peak period, and unrestricted demand of electricity
for each consumer category in its area of operation. The regulation tries to guide the utilities by
suggesting a specific model to be used by the discoms. However, for short-term power
procurement, the regulation does not have much information. It suggests that the licensee must
follow the guidelines issued by the central government (UPERC, 2013).
The goals of providing power for all have been reiterated in the new “Power for All” (PFA) scheme
released in April 2017. However, there is a major difference between the earlier scenario and the
current scenario. Earlier, UPPCL was experiencing shortages of power and was on a significant
drive to add capacity. Now UPPCL has to deal with having too much capacity. There is another
challenge: given the small industrial base in the state and the addition under PFA of large number
of consumers with low paying ability, the revenue gap will likely increase. UDAY on the other hand
requires UPPCL to narrow the revenue gap. Recognizing that meeting PFA goals would be a
challenge because of the conflicting requirements of the UDAY scheme, UPPCL hired a consulting
company, Crisil, to help them chart a path through this difficult situation. In its list of key
challenges, Crisil, pointed out that the cost of power procurement for UPPCL was much higher
than other states. Therefore, there is a need to reduce the cost of procuring power.
Consequently, UPPCL identified the supply sources (own capacity and PPAs) with very high power
costs. One of those contracts is with Bajaj. For that contract the variable cost was very high and
hence it was not dispatched much. But the fixed costs had to be paid anyway resulting in a high
overall cost. UPPCL decided to discontinue the PPA, but later UPERC restored the PPAs. We discuss
this case in more detail in the discussion on the Regulatory Process. In addition, UPPCL found that
there were seven contracts with a total capacity of 7040 MW that were to start supplying around
2021-22 and that were signed under the Mayawati regime that were also high cost and also
unlikely to be needed. These contracts were also cancelled.
In addition, UPPCL found that some RE contracts that resulted in high costs for UPPCL. Almost all
of them have been retained but some have been curtailed. UPPCL found that power form the
Cogent Plant based on bagasse was too expensive at Rs 6.38 per kWh. Instead of cancelling the
PPA, UPPCL negotiated a lower rate of Rs 5.56 per kWh. The reasoning behind Rs 5.56 is that the
average cost of power for UPPCL is Rs 4.06 per kWh, and the cost of a REC is Rs 1.50 per kWh.
Therefore, the rate has been negotiated at Rs 4.06 + Rs 1.50 = Rs 5.56 per kWh.
In addition to these efforts to trim its power portfolio and remove high cost PPAs, UPPCL is putting
in more effort in its planning exercise. Earlier it followed the EPS forecast but now it is carrying out
its own forecast, which has also been used for PFA. In addition, IIT Kanpur is doing a study for them
to optimally use its supply resources. IIT Kanpur is developing a ten year forecast for UPPCL and
using a Unit Commitment Model to see how to utilize its PPAs optimally. In the study, IIT is
addressing uncertainties particularly regarding expected load growth and looking at many
alternative scenarios. CEA is also doing a similar study for the country which may provide some
additional insights for UP.
In addition, UPPCL is developing EE & DSM programs and looking at the impacts of these measures
on the load forecast. There is a special unit at the company that is doing that. It is looking at the
impacts of solar power, energy efficient fans, building codes and demand response programs.
6.3 The Practice of Resource Planning and Power Procurement
6.3.1 Discom Process
Fixated on Megawatts | 31

6.3.2 Regulatory Process
6.3.2.1 No Attention to Estimate Need for New Resources
6.3.2.2 UPPCL's Lax Attitude towards Capital Cost of Project
In order to understand how the regulatory process for resource additions works in UP, it may be
best to review the path followed for one particular capacity addition. For this, we look at the 9
approval process for the plants put up by Bajaj Energy Limited (BEL), that were the subject of
controversy and were discussed earlier in this chapter.
As discussed earlier, in 2009 GoUP issued an Energy Policy that highlighted the need for rapid
addition of new generating capacity. It asserted that to achieve the average per capita
consumption in India, UP would need to add 32,000 MW by 2017. The Policy also stated that in
addition to competitive bidding for capacity additions, UP would also allow capacity addition and
power procurement through the MoU route (GoUP, 2009).
Pursuant to this policy, BEL signed a MoU with GoUP and set up 2x45 MW coal fired power plants
at five locations, providing a total capacity of 450 MW. On 08-07-2017, soon after the Government
of Yogi Adityanath took office, UPPCL issued a notice to BEL exiting from the PPA. It said that it had
signed the “Power for All” agreement to provide affordable power to all consumers. Therefore, it
needed to reduce the power purchase cost. It said that the tariff being paid to BEL of Rs. 7.63 per
kWh was twice the average power purchase cost of Rs. 3.80 per kWh, and therefore was
discontinuing the PPA. BEL approached the Allahabad High Court which directed it to petition
UPERC. UPERC restored the PPAs with a reduction in tariff of about 50 Paisa per kWh (UPERC ,
2018).
The process for approving the PPAs for these plants illustrate several shortcomings of the planning
process in UP.
UPERC's order approving the draft PPAs considers several procedural issues such as: the status of
UPPCL as a purchaser of power for the state; allocation of the power between the discoms;
deviations in the draft PPA from the standard PPA (UPEC, 2010). However, there was no discussion
about any estimate of the need for new resources. Given the huge estimate of new capacity
needed of upto 32,000 MW in the Energy Policy, 2009, there seemed to be a sense that almost any
and all capacity that was offered should be taken up. It should also be noted that the amount of
capacity needed was determined by GoUP and not by UPPCL or UPERC. Furthermore, the MoU
was signed between GoUP and BEL. UPPCL may have provided some advice on the capacity
additions, but the extent of its role in not known.
In proceedings in December 2011, when the issue of tariffs for the BEL plants came up for
discussion, UPPCL stated that it did not have the different components of capital costs and so it
could not verify them, and therefore requested UPERC to set provisional tariffs. While setting
provisional tariffs, UPERC had directed BEL to submit actual project completion cost to UPPCL for
verification, and UPPCL was to, in turn, submit them to UPERC for setting the final tariff (UPERC,
2011; UPERC, 2012).
Around October of 2012, in spite of UPERC's directive, when BEL filed the for approval of tariff, it
included the capital cost but again without verification by, and agreement with, UPPCL. Having
9 Bajaj Energy Limited (BEL) was earlier known as Bajaj Energy Private Limited (BEPL). In order to minimize
confusion, we will refer to the company as Bajaj Energy Limited (BEL).
Fixated on Megawatts | 32

previously allowed a provisional tariff on the basis of 95% of the submitted capital cost, UPERC
declined to revise the tariff. UPERC again directed BEL to submit capital costs for verification to
UPPCL, who would then submit it to UPERC for a prudence check (UPERC, 2012).
In January 2013, UPERC again held a hearing regarding a petition by BEL. BEL claimed that it had
submitted the required data to UPPCL. However, UPPCL did not submit any data on capital cost as
had been directed by UPERC. Emphasizing the responsibility of UPPCL regarding cost of the
project, UPERC stated:
Here it is further necessary to stress upon that as a Procurer, UPPCL must ascertain that
at what price they are going to purchase power from the certain project, taking into
consideration the escalation factors. If the estimated capital is not ascertained at the
initial stage, the future cost of procurement of power cannot be arrived at. Such exercise
is also necessary to establish that the MoU route projects are in no way inferior to the
bidding route projects in bringing the power for the people of the State at competitive
rates. UPPCL, being the authorized representative for purchase of power all the State
Discoms, has a major responsibility to procure the power for them at the most
reasonable rates. Therefore, the Commission considered it appropriate to direct UPPCL
to examine, verify and then submit the agreed cost for the prudence check and approval
of the Commission. It is also pertinent with the fact that UPPCL is an organization having
all requisite expertise for this purpose and has been authorized by the GoUP and State
Discoms to procure power for the people of the State (UPERC, 2013a).
UPERC allowed UPPCL an additional 15 days to file the verified cost in compliance with its earlier
orders. In its response, UPPCL claimed that it did not have the required expertise to verify the
proposed cost and requested UPERC to appoint an expert committee to determine the actual
completed cost of the project and submit for UPERC's approval. UPERC said that it was “quite
unacceptable” that UPPCL did not follow its directions and instead claimed not having the
required expertise. Giving UPPCL a last chance, UPERC allowed another three months for UPPCL to
complete the job, otherwise it would be treated as non-compliance of its orders (UPERC, 2013b).
Frustrated with the reluctance on this issue by UPPCL, UPERC stated that for all future MoU route
projects, the agreed ceiling capital cost shall be part of the PPA. If the actual capital cost is lower
than the ceiling, it will be used for tariff setting. If the actual cost is higher, it will first be verified by
UPPCL and then taken up by UPERC for approval. But because the BEL projects were already
operational, these requirements were not applicable. In the meantime, UPERC allowed 95% of
the claimed cost subject to later adjustment (UPERC, 2013b).
It was only in 2014 that BEL submitted a capital cost of Rs. 2569.80 Cr that it said had been
scrutinized and agreed by UPPCL. Subsequently an Expert Committee carried out verification and
prudence check and arrived at Rs. 2497.97 Cr for the capital cost to be used for setting the tarif
(UPERC, 2016).
From this description of events surrounding the verification of capital cost, it can be seen that
despite repeated directives from UPERC, UPPCL was extremely tardy and reluctant to verify the
costs. Generally, a utility is most concerned about costs because it has a direct bearing on tariffs.
But here UPERC was more concerned than UPPCL. These events highlight the lax attitude of UPPCL
towards capital cost of the project.
Fixated on Megawatts | 33
6.3.2.3 No Attention to Appropriateness of Resource
6.3.2.4 No Attention to Variable Cost of the Plants
6.4 Key Findings
In its order approving the draft PPAs, UPERC did not discuss whether these five plants were the
appropriate choice for UPPCL. There was no discussion about what type of capacity addition was
required for UPPCL. UPERC did not seek, and UPPCL did not provide, any evidence that these
plants were the least cost choice for the utility. There was also no discussion of whether a larger
plant would be more efficient and less expensive on a per kWh basis. Generally, there are
economies of scale for power plants and it is quite likely that a single large generating unit would
have been less expensive than 5x2x45 MW units.
While approving the tariffs for these power plants of BEL, UPERC sets the variable charge based on
actual costs (UPERC Order of 5.11.2012). There was no assessment by UPERC of an estimate of
these charges. Therefore, selection of these plants based on an MoU did not take into account
their variable costs. As it turns out, these costs have been very high. For example, for 2016-17 the
variable costs were estimated to be Rs. 4.57 per kWh (Table 5-39 of PVVNL Tariff Order FY 2016-
17, dated August 1, 2016). This is probably the reason that UPPCL found that in 2016-17 the total
cost of power from these plants was Rs. 7.63 per kWh, twice its average power purchase cost. The
selection of these power plants for signing of PPAs and UPERC's approval of those PPAs clearly did
not consider the cost of power from these plants. If cost of power is ignored in selection of
resources, overall tariffs for consumers could be much higher than necessary. Clearly such
planning by UPPCL does nothing to ensure cost-effectiveness of power procurement plans.
From the late 1990s and up to the middle of this decade, the focus in UP was on adding capacity.
While the desire to provide power for all is a laudable goal, it seems that some political
considerations also tinged the forecast and edged it higher than was reasonable.
The process for adding supply resources in UP is woefully inadequate. First, the State Government
plays a much larger role in supply additions than would normally be appropriate. In the recent
past, GoUP has decided how much additional capacity would be needed and has decided with
whom to sign MoUs. It would have been more appropriate for GoUP to set the broad policy goals
of providing power for all by a certain target date, and left the details about how much capacity to
add and at what pace to UPPCL. In addition, reliance on the MoU route instead of competitive
bidding seems to have led to higher costs, as exemplified by the case of BEL plants.
Once the State Government stated how much capacity was required (32,000 MW by 2017), there
was no questioning of the appropriateness of this figure by either UPPCL or UPERC. Moreover, the
entire capacity addition was treated as a single decision. It would have been better if this decision
could have been broken up into multiple decisions with several points where course correction
could have been done, if required. For example, if load was not growing at the same pace as
capacity additions, the capacity additions could have been slowed down. Such consideration of
uncertainty, risk management and options thinking did not occur.
UPPCL displayed a rather lax attitude towards the capital cost and variable costs of supply
additions, as exemplified by the case of the BEL power plants. This lax attitude during the initial
period when the PPA was being signed resulted in very high-power procurement costs for some
supply additions; for example, the BEL plants had a cost of Rs 7.63 per kWh in 2016-17, twice the
average power procurement costs.
As new supply resources were being added, there seems to have been no attention given to the
Fixated on Megawatts | 34

appropriateness of the type of resource. For example, in the case of the BEL plants, during the
PPA approval process, no questions were asked about how the BEL plants fit in with the resource
mix of UPPCL.
There are some signs of improvement. It is heartening to see that UP is taking a more realistic and
diligent approach to reforming the power sector. First, UPPCL recognizes the challenge of
implementing PFA and is taking steps to address the challenge, albeit partially, by trimming its
resource portfolio of high cost power contracts. It is also laudable that UPPCL enlisted the aid of
IIT Kanpur to carry out studies that address uncertainties and thus are likely to lead to more robust
decisions.
During the earlier period of rapid build-up of generation capacity, very little attention was paid to
augment the T&D network. Without an adequate T&D network, capacity additions lose their
value because the power will not be delivered to consumers. Now UPPCL is paying attention to
augmenting the T&D network also as part of its efforts on the PFA scheme.
It is also encouraging to see that UPPCL recognizes the role that EE & DSM could play in resource
planning.
Fixated on Megawatts | 35

7. Improving Resource Planning: Priority Areas and International Experience
7.1 Load Forecasting
7.1.1 Simple Approaches
Chapter 2 provided the basics of resource planning and outlined the steps involved. While the
overall process of resource planning is relatively straight forward, implementing it can become
quite involved. In this chapter, we look in more detail at the activities in resource planning that
will require special attention in India. Load forecasting is the starting point of resource planning
and is one of the most important steps. Chapters 3-6 have shown that there has been consistent
overestimation of the forecasted load, so there is a need to see how it can be done more
accurately. Another area that requires special attention is the inclusion of demand-side resources.
While there is an appreciation of the benefits of energy efficiency and demand-side management
(EE & DSM), it is not included in power procurement and resource planning done by Indian
discoms. One of the major challenges in the near future is going to be integration of RE, both in its
grid-connected form and as distributed generation. Therefore, this is also an area that is discussed
in this chapter. It is important that any long-term planning process recognize the uncertainty the
power sector will face from technological changes and changes in costs. Unfortunately, this is
covered only in a limited way by Indian discoms, if at all, and therefore, this chapter also includes a
detailed discussion of uncertainty analysis and risk management.
The discussion in this chapter on how these activities are done, and how they can be improved, is
based mostly on the experience in the US because almost all states in the US have required some
form of resource planning for a long time, and there is a rich literature on that experience. The
experience in Australia, China, Germany and UK is also discussed with a focus on the challenges
being faced in those countries with resource planning. Many of those challenges will also be faced
in India, making these countries' experience highly relevant.
In order to pull all the information together and to present an example of an actual resource
planning exercise, in Box 7.3 we provide a brief summary of a recent resource plan carried out by
one the leading electric utilities in the US.
Load forecasting is one of the most important steps in resource planning because it is the starting
point for all the other steps. Forecasters use simple methods which are easy to use but not very
reliable, or more sophisticated methods using econometric models or end-use models.
Sometimes, utilities use simple approaches based on estimates of growth rates or elasticities in
the future (Bhattacharya, 2011:108). For example, the Integrated Energy Policy (GoI, 2006)
assumed a trajectory for elasticity of electricity use to GDP and estimated electricity requirements
in the future. Another simple approach is the use of a trend line. For some Indian discoms too,
sometimes a growth rate is derived from historical data and the cumulative average growth rate
(CAGR) is used to forecast future electricity consumption.
These methods are simple to use but they are not very reliable. They assume that the historical trend will continue but in reality, the future electricity requirements may deviate significantly
Fixated on Megawatts | 36

from the past. These methods do not account for structural changes in the economy or in
electricity use. Furthermore, these methods do not explain what factors affect demand and do
not explicitly include the effects of changes in prices, incomes, etc. (Bhattacharya, 2011:110).
Econometric models relate energy use to several economic variables. For example, an
econometric model for estimating energy use by commercial consumers would use the price of
electricity, GDP growth, or other indicators of level of economic activity (Hirst, 1992). One major
advantage of econometric models is that the required data is easily available.
While econometric models are generally thought of as top-down models and use aggregate
variables, end-use models follow a bottom-up approach based on disaggregated data. End-use
models follow an engineering approach and estimate energy use by consumer category using
consumption data for each end-use. For example, an end-use model for consumption by
commercial consumers would include engineering estimates of energy use for various end-uses
such as lighting and air-conditioning in different types of buildings such as hospitals, schools, retail
stores etc. (Hirst, 1992). A major advantage of end-use models is that they allow an understanding
of the factors that affect energy use and hence allow incorporation of factors such as
improvements in appliance efficiency or increase in penetration of a particular appliance. On the
other hand, data requirements for end-use models are a major hurdle. Often load research is
required to obtain data to use end-use models.
Even as far back as the early 1990s, in the US, organizations like the Electric Power Research
Institute (EPRI) developed models that combined the best features of both econometric and end-
use models (Hirst, 1992). For example, these models combined behavioural features like the
relationship of electricity consumption and price of electricity with engineering data on electricity
consumption disaggregated by end-use and type of building.
As mentioned above, end-use models require data and load research can help collect that data.
Load research allows utilities to examine and understand how their consumers use electricity,
both for individual end-uses and on an aggregate basis (AEIC, 2017). However, it requires people
with a wide variety of expertise such as engineering and statistics.
In the context of resource planning, load research is very valuable for load forecasting and system
planning. Data from load research is used to estimate future load. Information on peak demand
and load profiles is used for planning additions to generation facilities, transmission and
distribution networks. With the rise in distributed generation including on-site generation using
solar PV and wind, and of electric vehicles and storage, load research can greatly help assess the
impacts of these resources and ensure stable grid operation (AEIC, 2017).
While our interest here is mainly in the use of load research for load forecasting, there are many
other uses of load research in the planning and operation of power systems. Some of these are:
Design of energy efficiency and load management programs.
Design of time-of-use (TOU) tariffs.
Cost allocation between consumer categories for design of tariffs.
Where retail competition has been introduced, load research can be used for
settlements involving small consumers where 100% real-time metering is not available
or is too expensive. Competitive retailers can also use load research for developing price
7.1.2 Econometric Models
7.1.3 End-Use Models
7.1.4 Load Research
?
?
?
?
Fixated on Megawatts | 37

offerings for different consumer groups. Load research consists of three major steps:
o Design of the sample for measurements
?o Metering of the households in the sample
?o Analysis of the data obtained from metering
Until recently, there had been very little load research carried out in India. However, around 2015,
EESL commissioned load research studies in many states, to enhance the design of energy
efficiency programs. See for example, PwC (2015) for a study done for BESCOM.
These studies used the following approach:
·Development of Category-Wise Load Profile. First a set of representative feeders were
selected for each consumer category (residential, commercial, industrial). A feeder was
considered representative if a large fraction, usually about 90%, of the connected load on
it belonged to the that particular consumer category. Using hourly load data for the
feeder, a representative hourly load profile for an entire day per kW or kVA of connected
load was developed. Then this was multiplied by the total connected load for the category
to get the load profile of the consumer category.
·Consumer Survey of Appliance Ownership and Pattern of Use. Survey of a sample of
consumers in each category was carried out to determine the appliances used in the
household, and when during the day they were used.
·Development of End-Use Load Profile for Each Category. Information from the survey
about the pattern of use for each appliance was used to divide the category's overall
profile and estimate the contribution by an individual appliance or end-use.
There are three limitations of the approach to load research described above. First, end-use
consumption at the household level was not measured. The pattern of use for an end-use or
appliance was based on survey responses, which in turn relied on memory which is often not very
accurate. Accuracy of the end-use consumption at the household level is important, particularly
for load forecasting. There are many types of smart meters and data loggers available that allow
periodic measurements at the individual appliance level. More information on such equipment is
given in Heffner (2008).
The second limitation of this approach is that it is not clear how the bottom-up load profile
developed from survey data is reconciled with the top-down information available from the
hourly feeder data. The third limitation is that it is not clear if the sample for the survey was
representative and covered all types of consumers within one consumer category. For example, it
is not clear if the differences between rural and urban consumers were taken into account.
Similarly, it is not clear if important variations between consumers based on income, education
and others socio-economic variables were taken into account.
There is considerable awareness in India about the benefits of energy efficiency and demand-side
management (EE&DSM) measures. Many discoms have developed EE & DSM programs, though
mostly on small scales. However, there has been very little integration of these programs in power
procurement or resource planning by discoms.
In contrast, in the US most discoms have 20-30 years of experience in the inclusion of utility
funded EE & DSM programs in resource planning. Utilities have used three approaches to deciding
how much EE & DSM to include in resource plans (Kahrl et. al., 2016):
7.1.4.1 Experience in India with Load Research
7.1.4.2 Limitations of Approach
7.2 Demand-Side Resources
7.2.1 Current Practice
Fixated on Megawatts | 38

·Using a pre-set standard or target usually set by the respective state regulatory
commission. For example, a target may be set as a certain percentage reduction in
forecasted load.
·The target is based on cost-effectiveness calculations. These cost-effectiveness targets
are usually based on calculation of the cost that would be avoided by the utility due to the
EE & DSM programs and a comparison of that cost with the cost of the EE & DSM
measures.
·Including EE & DSM cost curves in capacity expansion models, and treating EE & DSM
resources just like supply resources. This approach optimizes the amount of EE & DSM
resources to include in the resource plan.
Both the pre-set targets and the cost-effectiveness approaches rely on a static vision of fuel prices
and expected supply capacity additions. The optimization approach in contrast is dynamic, and
the amount of EE & DSM resources depends on the fuel prices and capacity additions included in
the portfolio under consideration. Therefore, the optimization approach is more rigorous and
includes the optimal level of EE & DSM resources. However, the use of the optimization approach
is rare. In a recent study of ten utilities in the US, only two used the optimization approach for
determining the level of EE & DSM resources to include in their resource plans (Kahrl et.al., 2016).
EE & DSM can also be used in a targeted way to defer T&D investments. In the US, utilities have
considered such Targeted EE & DSM. But usually they have been isolated efforts and not part of a
resource planning exercise (Kahrl et.al., 2016).
The power sector is going through a period of great change due to rapid developments in
technology and associated dramatic changes in the prices of generation technologies. These
changes have created uncertainties not only about the resource mix but also about the very
structure of the industry. EE & DSM resources will have great value during this transition (Kahrl
et.al., 2016), because they will help in deferring decisions until there is greater certainty allowing
more informed decision-making.
Developments such as distributed generation, information technology (IT), energy storage, EVs
will open up new opportunities for demand-side resources. As India moves to a market-based
structure for the power sector, third-party aggregation of demand-side resources may result in
more integrated control of distribution level energy storage and EV charging. More broadly, price-
responsive demand will be able to participate in wholesale markets as a dispatchable resource
(Kahrl et.al., 2016).
Success of many of these developments will require new retail tariff structures that permit price-
responsive behaviour. In India as with many other parts of the world, there is not enough
understanding of price-responsive behaviour of electricity consumers. Some states have started
experimenting with ToU rates. However, much more work is required in this area.
In keeping with the target of 227 MW of RE by 2022, RE resources are being rapidly added by most
discoms. These additions are of two types: grid connected RE; and distributed generation such as
roof-top solar. We cover the grid-connected RE here, and distributed generation later.
There are three issues that are important when dealing with integration of grid-connected RE in
resource planning. First, how to decide the level and composition of grid-connected RE in developing a resource plan. Second, to understand how the variability and intermittency of RE
affects the operation of the power system. And third, how these characteristics of RE affect the
process of resource planning. We discuss each of these issues in the following sub-section.
7.2.2 Increased Relevance of Demand-Side Resources in the Future
7.3 Integration of Grid-Connected RE
Fixated on Megawatts | 39

7.3.1 Level and Composition of Grid-Connected RE
7.3.2 Operational Impacts of RE
Some utilities in the US use pre-determined levels dictated by government or regulatory policy, as
is done by Indian discoms currently. However, other utilities treat RE resources as selectable
resources in the capacity expansion model. This could make a significant difference in the
resource mix when prices for solar and wind drop further, because then solar and wind will
become competitive with conventional resources. Adders to reflect environmental costs of CO2
will accelerate this process. For utilities that treat RE as selectable resources, as the price of RE
drops, RE will have a larger share of the resource portfolio of a utility (Kahrl et. al., 2016).
In India, ambitious targets for RE will drive the addition of RE. However, if operational impacts or
costs become significant, then these issues may determine how much RE can be added.
Because of intermittency and variability, solar and wind place additional requirements on the
power system compared to conventional generation resources. Therefore, resource planning for
RE can be somewhat more involved, and can impose additional costs on the power system.
The main function of any power system is to service load that is continuously varying. Thus load is
the primary independent variable and the power system has to respond to it. Solar PV and wind
generation are intermittent resources that differ from conventional baseload, cycling and peaking
units in that their output fluctuates, often rapidly, in response to climatic conditions that are
beyond the power system operator's control and are difficult for the operator to forecast. In this
way, solar PV and wind have more in common with load than conventional generation. Therefore,
the impact of solar and wind on system operations is evaluated by studying the net load, which is
defined as the total customers' load minus solar PV and wind generation. Other resources on the
system (fossil-fuelled generation units, hydro units, and energy storage) must be able to respond
to the fluctuations in net load (NYISO, 2016).
Fig. 7.1: Expected All India Net Load Curve With 20 GW of Solar Generation
Source: MoP. 2016. Report of the Technical Committee on Large Scale Integration
of Renewable Energy, Need for Balancing, Deviation Settlement Mechanism
(DSM) and Associated Issues. New Delhi: Ministry of Power, Government of
India.
Because solar PV generates during the day only, with large amounts of solar PV added to the
system, the net load curve can display some unusual characteristics. Figure 7.1 shows a projected
load curve and net-load curve for India assuming there is 20 GW of solar PV. The net load curve
Fixated on Megawatts | 40

resembles the silhouette of a duck; starting around 8 am when sunshine starts increasing to
around 5 pm when sunshine starts declining, the net load curve resembles the belly of a duck.
From 5 pm onwards as sunshine declines and as load picks up, there is a steep ramping of the net
load which resembles the neck of a duck. For this reason, the net load curve with large amounts of
RE is often known as the “duck curve.” In the projected net load curve shown in Figure 7.1, the
ramp rate of demand during the neck portion of the duck curve is about 20 GW per hour.
From the shape of the net load curve, we can see that to ensure the reliability of the grid with large
amounts of RE, resources will be required that have the flexibility to change power output levels
rapidly and be able to start and stop depending on grid conditions. Essentially such flexible
resources must have high ramping up and down capabilities and be able to start and stop multiple
times within a day (CAISO, 2016).
Because of the variability and intermittency of RE, the inclusion of large amounts of RE in a
discom's resource mix requires attention to two issues in resource planning that are not of much
concern when mostly conventional generation resources are being considered. First, what if any,
can be considered the contributions to generation capacity by RE sources. Second, how to assess
the operational impacts of RE: (1) the requirement for additional flexibility in generation; and (2)
additional costs.
Assessing the capacity contribution of RE for purposes of ensuring resource adequacy can be quite
different from that done for conventional sources. For conventional resources, the capacity
contribution is based on the name plate capacity. For solar PV and wind, it is often much less than
the name plate capacity because the seasonal and daily patterns of solar and wind generation are
not synchronized with the discom's load. There are two main approaches for calculating the
capacity credit for solar PV and wind generation (Madaeni et. al., 2012). One approach uses
reliability-based methods and the other relies on approximations.
Reliability based methods estimate the improvement (reduction) in loss-of-load probability due
to the solar PV or wind capacity. It requires modelling and hence can be quite data-intensive. One
of the most commonly used method calculates the effective load carrying capability (ELCC) (Kahrl
et. al., 2016). The ELCC for a generator is an estimate of how much the load can be increased when
the generator is added to the system while maintaining the same level of system reliability as
without the generator (Madaeni et. al., 2012).
Because of the intensive computations required for reliability based approaches such as ELCC,
approximations are used in some cases. Sometimes the capacity credit from a study done for
another utility is used as a rule of thumb. Other approximation approaches focus on the capacity
factor of solar PV and wind generation during the peak hours or high risk hours where LOLP is the
highest. Often these approximate approaches based on the selective capacity factor provide
estimates that are reasonably close to the reliability based estimates (Madaeni et. al., 2012).
As discussed earlier, because of the intermittency and variability of RE, flexible resources are
required to provide operating reserves to ensure that the power system is able to meet the
demand at all times. Assessing the operational impacts of RE consists of two parts. First an
assessment of the required amount of flexible resources and a determination of whether the
existing resources of the discom will be sufficient. Second, an estimate of the additional cost for
having the required reserves ready. This could include the cost of having generating units running
at partial load. These costs are required in resource planning for the economic assessment of
resources, and are usually estimated on a per kWh of solar PV or wind. The per kWh cost then
becomes an adder to the cost of RE.
7.3.3 Resource Planning with Large Amounts of RE
7.3.3.1 Capacity Credit for RE
7.3.4 Assessing Operating Impacts of RE
Fixated on Megawatts | 41

In the US, many utilities carry out integration studies for wind and solar PV to assess these two
components of the operational impacts of RE (Kahrl et.al., 2016). As an example of such an
integration study, See Box 7.1 for a description of the integration study done by PacifiCorp for its
2017 IRP. Also see Box 7.2 for a discussion about an RE integration study carried out for India by
CEA.
Different resources place a different operating reserve burden on the power system. The
integration study by PacifiCorp shows that the operating reserve burden in that case due to wind
deviations was twice the amount due to solar, three times that due to variations in load and four
times that associated with non-variable resources (mostly conventional generation). These ratios
will be different for other service territories because wind and solar patterns will be different and
the amount of these resources in the mix will also be different. However, it is likely that most of
the time, the operating reserve burden for wind would be higher than that for solar. Solar is
somewhat more predictable than wind, and hence day-ahead forecasts and unit commitment can
be used to offset to a greater extent, the need for operating reserves.
Comparing the results discussed in Box 7.1 and 7.2, it can be seen that the additional integration
costs for RE in the PacifiCorp case is much lower than that in the CEA study for India. In the
PacifiCorp case the cost is $0.60 per MWh (~Rs. 0.04 per kWh), while the costs for Gujarat and
Tamil Nadu in the study by CEA are Rs. 1.45 and 1.57 per kWh respectively. The Gujarat and Tamil
Nadu costs are high even compared to the costs calculated for PacifiCorp in its earlier study of
2014 which were $3.06 per MWh (~Rs. 0.20 per kWh). The costs in India are likely to be higher
than the Western part of the US because in India, the operating reserve would likely be provided,
at least partly, by coal plants while the in Western US, it would likely be provided by gas plants.
Because gas plants are inherently more flexible, their cost for providing operating reserve are
likely to be lower. However, it is not clear if that alone can explain the very large difference
between the results in the PacifiCorp and CEA studies.
These estimates of integration costs should be used with some caution. First, these estimates are
specific to a particular utility at a particular time, because these estimates depend on the
composition of a power system – generation mix and the characteristics of the non-solar and non-
wind generators on the system. Second these estimates depend on the level of penetration of
solar and wind. For example, when the amount of solar PV and wind is small relative to the overall
capacity of the system, there is often no need for additional flexible resources. But if the amount
of solar PV and wind becomes a significant fraction of the overall generation mix, then the need for
additional flexible resources is likely to increase.
Who should be responsible for these additional integration costs for RE? The CEA study says that
the costs for balancing RE should be applied uniformly across states because the RPO is applied
uniformly across states on a per kWh of load basis (CEA, 2017d and Box 7.2). In the US, states differ
in which entity absorbs the additional integration costs of RE. In some states, (for example New
York and Pennsylvania), the RE generator (seller) absorbs these costs, while in other states (for
example California), the utility (purchaser) absorbs the costs (Kahrl et.al., 2016). These differences
are reflected in the process for contracting for RE.
Research in the US has underscored the benefits of regionally coordinated development and
operation of RE (Kahrl et.al., 2016). Regionally coordinated development has been shown to lower
transmission costs, realize economies of scale and allow the most economic resources to be
developed first. Regionally coordinated operations results in smoothing the variability of the net
load curve, allowing a reduction in operating reserve requirements and cost of balancing. Regionally coordinated operations also result in lower curtailment due to overgeneration during
some periods. Regionally coordinated development of RE may be difficult in India, given the state-
wise responsibility for RE. But regionally coordinated operations should certainly be pursued.
The CEA study recognizes this and has recommended that ancillary services should be under the
Fixated on Megawatts | 42

control of the Regional Load Dispatch Centres (RLDCs) (CEA, 2017d and Box 7.2).
Box 7.1: RE Integration Study by Pacficorp (USA)
For the development of its IRP for 2017, PacifiCorp carried out a Flexible Reserve Study (FRS) to
assess the operational impact of RE. The FRS had three steps. First, it estimated the generation
capacity required to respond to changes in generation and load (also known as regulation reserve) for
a specified portfolio of wind and solar resources. This regulation reserve is required to manage the
variations in load, variable energy resources (VERs), and resources that are not VERs (non-VERs).
Second, the FRS calculated the cost of holding the level of regulation reserve and the cost of using
day-ahead load, wind, and solar forecasts to commit gas units. Third, the FRS compared PacifiCorp's 10
overall operating reserve requirements (including both regulation reserve and contingency reserve )
to the amount of flexible resources in its portfolio.
The FRS used operational data from 2015, most recent at that time, for wind, solar, non-VERs and load
variations. Regulation reserve requirements were estimated for each of these categories on a
standalone basis, and on a joint basis to arrive at diversity benefits. The regulation reserve
requirement for the combined portfolio is the sum of the individual reserve requirements for load,
wind, solar and non-VERS, less the savings due to diversity. These estimates were carried out for the
base case portfolio and various alternative portfolios considered in the IRP process. The results are
shown in Table B7.1.1
Table B7.1.1: Portfolio Regulation Reserve Requirements by Scenario
As Table B7.1.1 shows, the diversity benefits are between 35%-40%. The stand-alone requirements
for each category, not shown here, also provided some interesting insights. PacifiCorp found that the
regulating reserve burden due to wind deviations is twice the amount due to solar, three times that
due to variations in load and four times that associated with non-variable resources (mostly
conventional generation).Comparing the four different scenarios (rows) in Table B7.1.1, we can see
the difference between the regulating reserve requirements between solar and wind. Increasing the
amount of wind in the portfolio (Incremental Wind vs. Base Case) increased the reserve requirements
more than increasing the amount of solar in the portfolio (Incremental Solar 1 vs. Base Case).
The FRS estimated the cost of holding reserve to be $0.57 per MWh for wind, and $0.60 per MWh for
solar.
An earlier estimation of the costs done by PacifiCorp in 2014 found the costs to be $3.06 per MWh for
wind. PacifiCorp used the costs for 2017 in the development of its 2017 IRP. Specifically, the costs $0.57
and $0.60 per MWh for wind and solar respectively, are added to the cost of wind and solar resources
in the development of alternative portfolios. Once alternative portfolios have been created using SO
model (PacifiCorp's capacity expansion model), a risk analysis is carried out using the Planning and Risk
(PaR) model.
10 Contingency reserves are deployed when there is an unexpected outage of a generator or
transmission line.
Scenario Wind
Capacity
(MW)
Solar
Capacity
(MW)
Stand-Alone Regulation
Reserve Requirement
(MW)
Diversity
Credit
(%)
Regulation Reserve
Requirement with
Diversity (MW)
Base Case 2,757 1,050 998 38.2% 617
Incremental Wind 3,007 1,050 1023 38.3% 631
Incremental Solar 1 2,757 1,550 1033 38.6% 635
Incremental Solar 2 2,757 2,050 1074 39.2% 653
Fixated on Megawatts | 43

The regulation reserve requirement for a particular portfolio is input into the PaR model when it is
evaluating that portfolio. In this way, the operational impacts of RE, both in terms of reserve
requirement and cost adders, are included in the resource planning process of PacifiCorp.
Source: PacifiCorp. 2017. Integrated Resource Planning. Appendix F: Flexible Resource Study.
Box 7.2: RE Integration Studies in India
Recognizing the importance of RE integration, CEA set up a technical committee to look at ways to
facilitate the integration of RE in the grid. The study had two aims. First, to carry out a detailed analysis
of the costs for integrating RE. Second, to provide recommendations for ways in which such
integration can be facilitated.
The Committee estimated the costs for two states: Tamil Nadu and Gujarat. For Tamil Nadu the costs
were estimated to be Rs. 1.57 per kWh and for Gujarat Rs. 1.45 per kWh (CEA, 2017). These costs are
much higher than the costs in the US.
The Committee also made several recommendations regarding integration of RE (CEA, 2017):·Because generating capacity for balancing will be required on a permanent basis, the
Committee recommended that ancillary services be treated as separate service, and that
resources to provide ancillary services be procured just as resources are procured to provide
energy to service load.
·Because the renewable purchase obligation (RPO) will be uniform across states, the costs for
balancing RE should also be shared uniformly.
·Hydro and gas plants should be preferred for providing balancing services because of their
ability to respond rapidly to an increase or decrease in demand. The Committee also
recommends that for coal plants, the more efficient plants (supercritical and ultra supercritical)
be run at higher load without much fluctuation but instead the less efficient subcritical plants be
used to respond to fluctuations.
·The requirement for balancing due to RE and that due to load variations should be separated.
·Ancillary services should be under the control of the respective RLDCs.
·Demand response should be pursued because it is an inexpensive and quick way to obtain
ancillary services.
·In order to incentivize states with large hydro capacity to provide ancillary services, firm
baseload power may be exchanged for providing ancillary services.
Source: CEA (2017d)
With increasing interest in roof-top (RT) solar PV in India and the likelihood of a significant amount
of energy storage devices, either in the form of electric vehicle (EV) batteries or batteries to back-
up solar PV, the nature of distribution systems will be changing. Instead of one-way flow of power
from generation units to consumers, distribution systems will see two way flows of power as
consumers become both producers and consumers (prosumers). These changes will alter the load
“seen” by the power system. Therefore, it is important to consider distributed generation in
resource planning.
11 This section draws on the discussion on distributed generation in Kahrl et.al. (2016).
117.4 Distributed Generation
Fixated on Megawatts | 44

Distributed generation is different from other resources that are considered in resource planning.
First, the decision to use distributed generation is beyond the control of the discom; it is a decision
taken by consumers. Second, as with grid-connected RE, the amount of energy generated is also
beyond the control of the discom because it depends on weather conditions such as whether it is a
cloudy or a sunny day. In this sense, the discom has almost no direct control on distributed
generation; yet it can have a significant effect on the net load the discom has to serve.
These characteristics of distributed generation create considerable uncertainty about distributed
generation. Adoption of distributed generation by any consumer depends on the preferences of
the consumer, evolution of RE technology and costs, design and level of tariffs, and incentives
offered for distributed generation. These uncertainties make forecasting distributed generation a
challenge, yet good forecasts are essential for effective resource planning. Further, as with grid-
connected RE, resource planners need to ensure that the power system will be able to operate
reliably with the expected level of distributed generation.
Currently in the US, forecasts of distributed generation are treated as exogenous to the resource
planning process. Rarely is distributed generation treated as a selectable resource in a capacity
expansion model where it competes head-to-head with other resources. (See for example the
process used by ten utilities in the US discussed in Kahrl et.al. (2016:34-40)). This may be because
T&D benefits of distributed generation are difficult to estimate, and/or the cost of generation for
grid-connected RE is usually lower than that for distributed generation.
Forecasts of distributed generation are made in one of three ways (Kahrl et.al., 2016):
? Based on policy mandates or program goals of the discom. In India, such a forecast could
be based on the government's target of 40 GW of RT Solar PV by 2022.
? A single forecast of expected distributed generation.
?Multiple forecasts to represent various scenarios with different levels of consumer
preferences, RE price projections, and other variables.
As part of resource planning, the discom should ensure that the power system will be able to
operate reliably with the expected level of distributed generation and its associated variability
and intermittency. A simple way that is used sometimes is to scale down the annual energy or peak
demand by the amount of distributed generation expected, essentially keeping the load shape
unchanged. A more accurate way is to modify the hourly load profile by the hourly profiles of
distributed generation, resulting in an hourly net load (Kahrl et.al., 2016). The hourly net load is
then used in the capacity expansion model to select grid connected resources to meet the need
for power in a cost-effective way.
One of the significant, but mostly unexplored benefit of distributed generation is to its potential to
reduce peak load at selected locations and thus defer distribution system augmentation. Some
utilities in the US are doing so. For example, Tennessee Valley Authority (TVA) is using a model to
identify preferred sites for installation of distributed PV (Kahrl et.al., 2016). Because distributed
generation is often treated as exogenous to the resource planning process, such use of targeted
distribution generation is not widespread. Combining targeted distributed generation with
targeted DSM and energy storage can lead to significant deferrals of augmentation of the T&D
system.
·Use of market diffusion models to improve forecasts of distributed generation. Such
models could incorporate the effect of RE costs, retail tariffs and incentives on adoption
rates for distributed generation (Kahrl et.al., 2016: 65).
7.4.1 Forecasting Distributed Generation
7.4.2 Integrating Distributed Generation in Power System
7.4.3 Targeted Distributed Generation
7.4.4 Emerging Best Practices
Fixated on Megawatts | 45

·In order to address uncertainty in the forecast of distributed generation, some utilities
develop alternate resource plans that are optimal for different levels of expected
distributed generation. The resulting information provides a signal about whether the
preferred plan needs to be changed when the actual level of distribution generation is
significantly different from the forecast (Kahrl et.al., 2016: 66).
·Estimate of hourly net load based on hourly distributed generation profiles that can then
be used in capacity expansion models to select grid-connected resources and complete
the resource planning process.
·Computational tools are now available that allow integrated assessment of distributed
generation, battery energy storage, and demand response to provide hourly net load for
each feeder in a distribution system (Dickerman, 2016). Such integrated assessment can
also be used to identify preferred sites for targeted peak reduction to defer T&D
augmentation.
·Distribution systems are changing. Instead of having only loads, now distribution systems
have both distributed generation, demand response, and storage in addition to load. So
distribution planning is beginning to look like integrated resource planning (IRP) at the
local level (Dickerman, 2016). The output of such a distributed IRP, the net load, becomes
the input to the grid level resource planning process. Computation tools discussed just
above can help with such distribution planning (Dickerman, 2016). Of course, scenarios
selected for planning at the distribution level will need to be consistent with scenarios at
the grid level plan.
The electricity sector is beset by uncertainty from many sources. First, the commonly known ones
such as load growth, fuel prices and capital costs. In addition, more recently other sources of
uncertainty have been added to the list. As local environmental impacts such air pollution and
water scarcity become important, local environmental regulations can change, affecting the
operation of power plants. Concern about global environmental impacts such as climate change
can lead to much stricter environmental regulations. Last, but not least, technology can be
disruptive, as has been seen in the rapid pace of development of renewable energy (RE)
technologies.
What makes the situation in the power sector really challenging is that most of the resources in
the sector have long lead times and/or long lifetimes. Figure 7.2 shows the typical lead times and
life times of various resources. With resources that have long lead times, there is a risk that they
will not be needed when completed creating non-performing assets (NPAs) (Kahrl et.al, 2016).
Resources with long lifetimes run the risk that they may not be needed in the future. So both long
lead times and long lifetimes result in increased costs which ultimately have to be paid by
consumers and/or taxpayers.
Not much is done in India to manage these risks. In more developed countries, considerable
attention has been paid to risk management by electric utilities, assisted by the development of
software tools to conduct sophisticated uncertainty analyses and to manage risks (Kahrl et.al.,
2016: 51). The objective in these analyses is generally to minimize the present value of required
revenues (PVRR) over the entire planning period. With the availability of software tools, the focus
has shifted from just least cost to expected cost and variance of these costs under alternative
scenarios (Kahrl et.al., 2016: 51).
Even in developed countries, there is no single approach to uncertainty and risk management.
Most of them use a combination of scenario planning, sensitivity analysis and probabilistic
analysis. We discuss each of these techniques in the following subsections. We also discuss
another emerging technique: option analysis. Then we discuss how these techniques can be
combined resulting in current best practice.
7.5 Uncertainty and Risk Management
Fixated on Megawatts | 46
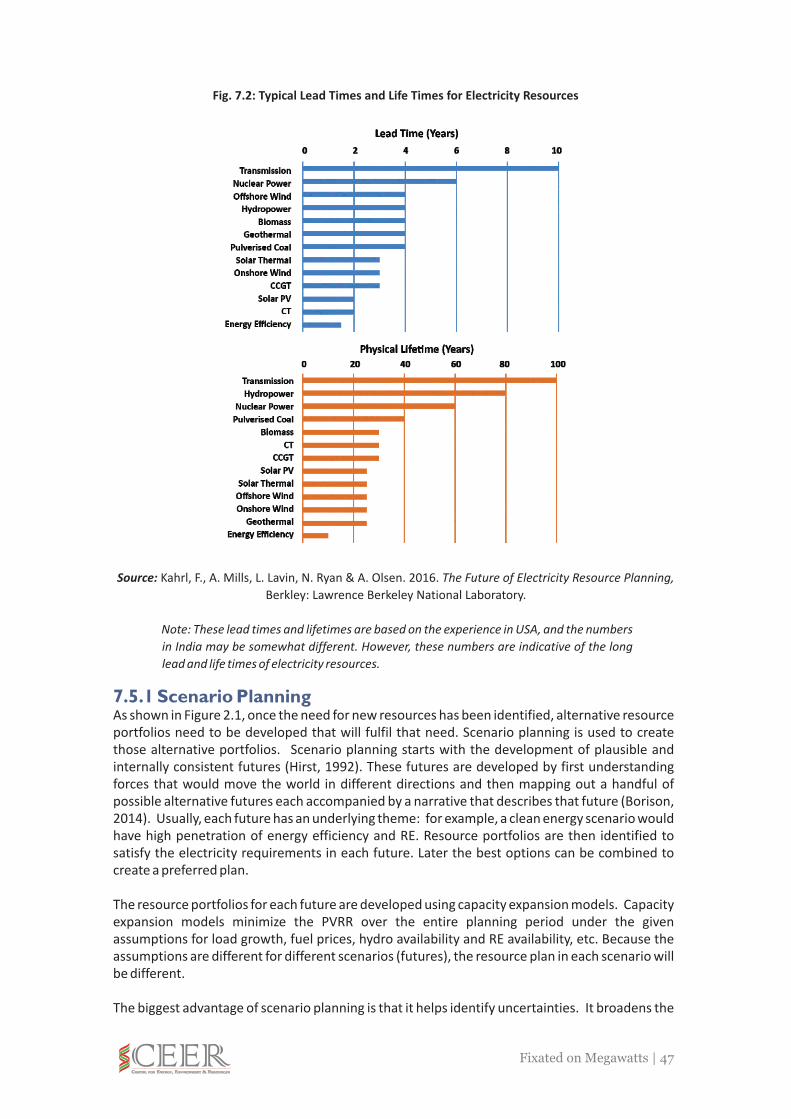
Fig. 7.2: Typical Lead Times and Life Times for Electricity Resources
Source: Kahrl, F., A. Mills, L. Lavin, N. Ryan & A. Olsen. 2016. The Future of Electricity Resource Planning,
Berkley: Lawrence Berkeley National Laboratory.
Note: These lead times and lifetimes are based on the experience in USA, and the numbers
in India may be somewhat different. However, these numbers are indicative of the long
lead and life times of electricity resources.
As shown in Figure 2.1, once the need for new resources has been identified, alternative resource
portfolios need to be developed that will fulfil that need. Scenario planning is used to create
those alternative portfolios. Scenario planning starts with the development of plausible and
internally consistent futures (Hirst, 1992). These futures are developed by first understanding
forces that would move the world in different directions and then mapping out a handful of
possible alternative futures each accompanied by a narrative that describes that future (Borison,
2014). Usually, each future has an underlying theme: for example, a clean energy scenario would
have high penetration of energy efficiency and RE. Resource portfolios are then identified to
satisfy the electricity requirements in each future. Later the best options can be combined to
create a preferred plan.
The resource portfolios for each future are developed using capacity expansion models. Capacity
expansion models minimize the PVRR over the entire planning period under the given
assumptions for load growth, fuel prices, hydro availability and RE availability, etc. Because the
assumptions are different for different scenarios (futures), the resource plan in each scenario will
be different.
The biggest advantage of scenario planning is that it helps identify uncertainties. It broadens the
7.5.1 Scenario Planning
Fixated on Megawatts | 47

planners' horizons by drawing attention to what could happen in the future, both good and bad.
It also facilitates the understanding of the impact of an alternative future on a plan developed for
another future. Further, because scenario planning involves brainstorming with many people, it
tends to be inclusive and participatory (Borison, 2014).
Sensitivity analysis is carried out to understand how changes in key assumptions are likely to
affect the PVRR. It answers “what if” questions. Typically, a single assumption (load growth or
fuel price, etc.) is varied over a plausible range, from low to high. Sometimes, a cluster of
assumptions are varied. Sensitivity analysis helps identify uncertainties with the greatest impact;
the impact of such variables can be studied in more depth later. Sensitivity analysis generally uses
production cost (dispatch) models which give more precise numbers compared to capacity
expansion models.
One of the shortcomings of sensitivity analysis is that it lacks analytical rigour. The basis for
selecting a certain “high” or “low” level for a variable is not well defined, sometimes arbitrarily
put as + 10% and -10% from the base case value. It can be made more rigorous by defining “high”
and “low” values at say, the 90th and 10th percentile respectively of the variable value (Borison,
2014). However, this could be difficult in some cases to do because data on the variability of a
parameter may not be available. Another shortcoming of sensitivity analysis is that it ignores
correlations and interactions between variables.
Probabilistic Analysis overcomes the shortcomings of sensitivity analysis, and also provides
information that can be used to rank alternative plans. Probabilities are assigned to different
values of key variables and the PVRR and any other important output calculated for each
combination of variables. The results are obtained either using decision trees or Monte-Carlo
simulation. The results for each plan give the expected value and probability distribution for key
outcomes such as PVRR and electricity prices (Hirst, 1992).
Thus, probabilistic analysis gives an idea of how a particular plan will perform under the various
uncertainties that are likely to occur. It allows much better comparison between plans. For
example, Plan A may have a slightly higher expected value of PVRR compared with Plan B.
However, the variation in the PVRR of Plan B may be much higher, meaning that under some
conditions it could perform much worse than Plan A. Under these circumstances, one may
choose Plan A even though it has slightly higher costs.
Probabilistic analysis can be more difficult to carry out because it requires data on the probability
distribution for the important variables that are to be modelled. In India such information is
unlikely to be available and may be difficult to generate.
All the analytical techniques to handle uncertainty in resource planning discussed so far, scenario
analysis, sensitivity analysis and probabilistic analysis, treat uncertainties as fixed and hence the
analysis is static over the plan period. But in real life, uncertainties evolve and there is learning as
they evolve. Therefore, the response needs to be dynamic. Decisions need not be treated as
onetime events, all or none, based on what is known now. Instead decisions can be broken up into
stages. For example, a dynamic approach could allow to start phase 1 of a project only and cancel
if things do not turn out as expected. This approach is more consistent with real world
management of risk (Borison, 2014).
12This section draws on the work on option analysis in Borison (2014).
7.5.2 Sensitivity Analysis
7.5.3 Probabilistic Analysis
127.5.4 Option Analysis
Fixated on Megawatts | 48
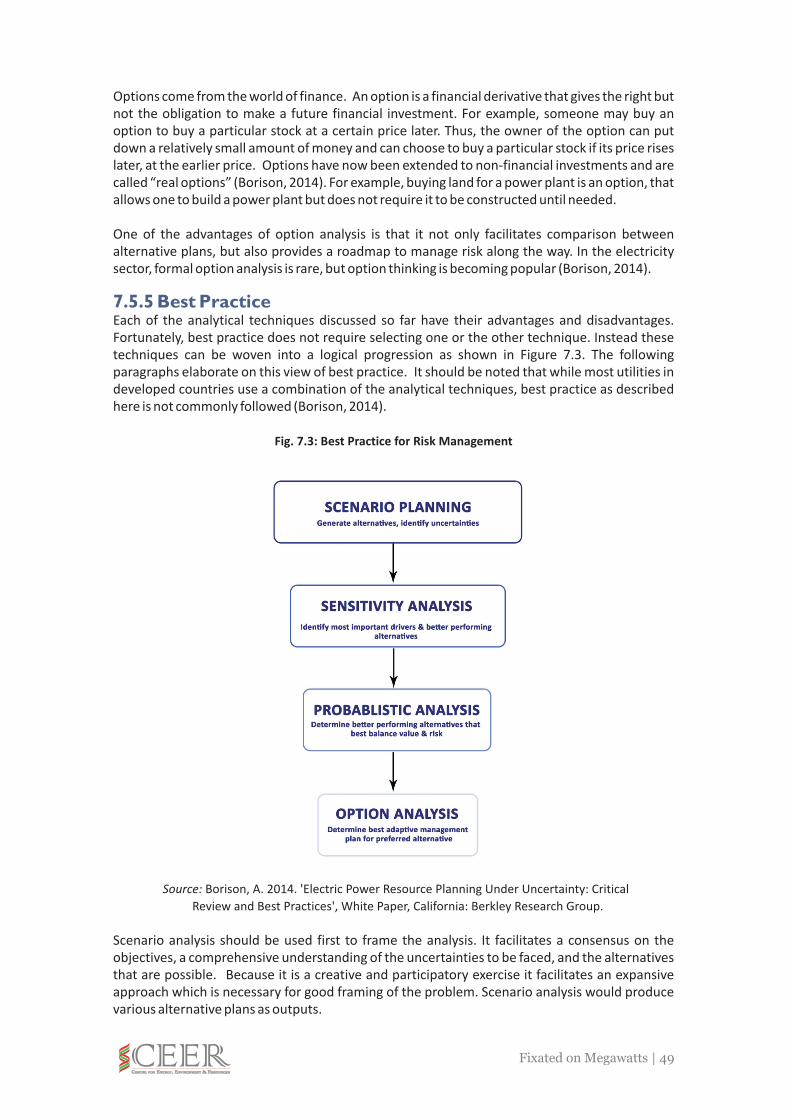
Options come from the world of finance. An option is a financial derivative that gives the right but
not the obligation to make a future financial investment. For example, someone may buy an
option to buy a particular stock at a certain price later. Thus, the owner of the option can put
down a relatively small amount of money and can choose to buy a particular stock if its price rises
later, at the earlier price. Options have now been extended to non-financial investments and are
called “real options” (Borison, 2014). For example, buying land for a power plant is an option, that
allows one to build a power plant but does not require it to be constructed until needed.
One of the advantages of option analysis is that it not only facilitates comparison between
alternative plans, but also provides a roadmap to manage risk along the way. In the electricity
sector, formal option analysis is rare, but option thinking is becoming popular (Borison, 2014).
Each of the analytical techniques discussed so far have their advantages and disadvantages.
Fortunately, best practice does not require selecting one or the other technique. Instead these
techniques can be woven into a logical progression as shown in Figure 7.3. The following
paragraphs elaborate on this view of best practice. It should be noted that while most utilities in
developed countries use a combination of the analytical techniques, best practice as described
here is not commonly followed (Borison, 2014).
Fig. 7.3: Best Practice for Risk Management
Source: Borison, A. 2014. 'Electric Power Resource Planning Under Uncertainty: Critical
Review and Best Practices', White Paper, California: Berkley Research Group.
Scenario analysis should be used first to frame the analysis. It facilitates a consensus on the
objectives, a comprehensive understanding of the uncertainties to be faced, and the alternatives
that are possible. Because it is a creative and participatory exercise it facilitates an expansive
approach which is necessary for good framing of the problem. Scenario analysis would produce
various alternative plans as outputs.
7.5.5 Best Practice
Fixated on Megawatts | 49

The next step should be sensitivity analysis. Sensitivity analysis identifies the most important
uncertainties and hence draws attention to the more important issues. It also eliminates
alternative plans that are likely to perform poorly under uncertainty. With its focus on rigorous
computational analysis, sensitivity analysis narrows the focus after the expansion in scenario
analysis.
Next, probabilistic analysis compares alternatives across a range of futures. It identifies the best
or preferred plan that best balances value and risk.
Probabilistic analysis should be followed by option analysis that would provide the roadmap for
implementing the preferred plan. It would provide the sequence of actions and decision points to
implement the plan with the minimum of regret. The roadmap would help the resource planner
to adapt the plan as some of the uncertainties become better known.
PacifiCorp is a vertically integrated utility operating in Western USA, and operates in four states –
California, Oregon, Utah and Washington. Here we look at the process followed by PacifiCorp to
develop its Integrated Resource Plan (IRP) for 2017.
PacifiCorp states that the objective of its IRP is to identify the best mix of resources to serve its
customers in the future. This best mix, defined as the “preferred portfolio” is the portfolio that
results in reasonable cost and manageable risk.
Every two years, PacifiCorp develops an IRP, and in the intervening years, it carries out a review and
update. Thus, the longer term parts of the plans can, and do, change. The plan is developed through
an open and public process where it gets inputs from a wide group of stakeholders including
consumer representatives, regulatory staff and other interested parties.
Figure B7.3.1 shows the steps PacifiCorp follows in developing its IRP:
1. Load and Resource Balance. Here a forecast of the load is compared to existing resources to
identify the expected deficits in resources.
2. Development of Resource Portfolios. A range of different resource portfolios are developed to
meet the estimated deficit. These resource portfolios differ in the type, timing and location of
new resources.
3. Resource Portfolio Analysis. These different resource portfolios are then analysed to determine
the relative cost, risk, reliability and emission levels.
4. Selection of Preferred Portfolio. Based on the portfolio analysis above, a preferred portfolio is
selected.
5. Development of an Action Plan. An action plan is developed to implement the preferred
portfolio. The action plan lists what is needed to be done and when.
Fig. B7.3.1: Key Elements of PacifiCorp's Planning Process
Source: PacifiCorp, 2017
The entire planning process is supported by many supplemental studies that provide the necessary
modelling assumptions.
In the following subsections, we discuss in some more detail, how the last three steps in Figure
Box 7.3: Example of Resource Planning from USA – 2017 Integrated Resource Plan of PacifiCorp
Fixated on Megawatts | 50

B7.3.1 are carried out.
A. Resource Portfolio Analysis and Modelling
Modelling and Portfolio Analysis is carried out in three stages (See Figure B7.3.2):
11. Regional Haze Screening. This is to ensure that regional haze rules pertaining to emissions from
power plants are adhered to at lowest cost and minimum risk. The best portfolio from the
regional haze screening is used to set the conditions regarding fossil-fuel power plants. This
screening establishes the best options – retirement or installation of pollution controls - for each
of the fossil fuelled power plants of the utility. These conditions should be met by all the
portfolios that are included in the next stage of eligible portfolio screening.
2. Eligible Portfolio Screening. From all the eligible portfolios, the portfolio that is the least-cost,
least-risk is selected as the draft preferred portfolio.
3. Final Screening. Because the IRP process is lengthy and there may have been some significant
events between the time the draft preferred portfolio was selected and the time to release the IRP,
this screening stage is used as the last opportunity to refine the analysis. This stage considers the
draft preferred portfolio, any significant new information from studies, additional sensitivities, any
significant changes due to recent events, and additional feedback from stakeholders. The result of
this screening stage is the preferred portfolio.
Each screening stage, in turn, has three steps: resource portfolio development; cost and risk analysis;
and portfolio selection (See Figure B7.3.3).
A.1 Resource Portfolio Development
PacifiCorp uses System Optimizer (SO), a capacity expansion model, to generate resource portfolios
with sufficient capacity to meet the load requirements of the utility. For new resources, SO can select
thermal generation units, power purchases, demand-side resources, RE resources and energy
storage resources.
Unlike modelling efforts by most utilities, PacifiCorp does not decrement the load by the expected
savings from energy efficient (EE) and DSM programs. Instead it treats EE & DSM as resources,
equivalent to supply that get selected on economic consideration. EE&DSM resources are
represented by a supply curve which shows the savings available at various levels of costs. The
supply curve is based on a technical potential study. For ease of computation, measures are
aggregated into cost bundles.
Capital costs of power plants are accounted for through real levelization (annualization in constant
dollars). This avoids problems due to end-effects. The discount rate used for all calculations is the
weighted average cost of capital (WACC) of the utility.
13 In order to protect visibility in specific national parks and scenic areas, the US EPA has issued the Regional
Haze Rule (1999). The rule sets a long-term path for improvement of visibility. States are required to provide a series of interim goals to ensure progress towards the goal of improving visibility. States, like California have put stringent environmental emission limits for point sources such as power plants. The regional haze screening by PacifiCorp is to ensure compliance with the emission limits on power plants, at the lowest cost with minimum risk (CARB, 2009).
3
Fixated on Megawatts | 51

Fig. B7.3.2: Stages in the Evaluation of Resource Portfolios
Source: (PacifiCorp, 2017)
Figure B7.3.3 Steps Within Each Stage of Evaluation of Portfolios
Source: (PacifiCorp, 2017)
A.2 Cost and Risk Analysis
PacifiCorp uses probabilistic analysis to compare portfolios under uncertainty. Stochastic (Monte
Carlo) modelling is used to see how each portfolio behaves under uncertain conditions. In the
stochastic modelling, variations are introduced in load, gas prices, wholesale electricity prices, hydro
generation and unplanned outages of power plants.
The result of this stochastic modelling is a probability distribution of the PVRR that is likely to occur
under real world (uncertain) conditions. Based on the results, various performance measures are
calculated for each portfolio. These include:
· Stochastic Mean PVRR. This is the average of all the 50 iterations.
Fixated on Megawatts | 52

· Risk Adjusted PVRR. This measure adjusts the mean PVRR to account for low-th
probability high cost outcomes. Five percent of the 95 percentile variable costs are
added to the stochastic mean PVRR.
· Upper-Tail Mean PVRR. The upper-tail mean PVRR is a measure of high-cost risk. The
iterations with the three highest PVRR are averaged to get this measure.th th
· 95 and 5 Percentile PVRR. These measures represent high cost and low-cost risk.
· PVRR Standard Deviation. This measure is an estimate of the expected variability of
costs for a resource portfolio.
· Average and Upper-Tail Energy Not Served
· Loss of Load Probability.
· Cumulative CO2 Emissions
PacifiCorp carries out this analysis of 50 iterations for six price-emissions scenarios. These
scenarios represent combinations of two emissions policy scenarios and three natural gas price
scenarios (low, base and high) (PacifiCorp, 2017).
Within each stage of the portfolio evaluation (Figure B7.3.3), the final step is portfolio selection.
In the first stage, Regional Haze Screening, the Regional Haze portfolio with the least cost, least
risk is selected. In the second stage, Eligible Portfolio Screening, the draft preferred portfolios
selected. In the final screening stage, the preferred portfolio is selected.
From the preferred Portfolio, PacifiCorp develops an Action Plan. Each resource addition is
broken up into tasks and target dates set for their completion. For example, in its 2017 IRP,
PacifiCorp selected an addition of 1100 MW of wind as one of its resources. The implementation
of this resource addition was broken up into the following tasks, along with proposed dates for
completion:
Notify the Regulatory Commission of intent to issue a wind RFP.
File a draft wind RFP with the Commission
Obtain approval of the wind RFP
Issue the RFP to the market
Due date for response to RFP
Complete initial short list bid evaluation
Complete bid evaluation, get approval from Commission of winning bids
Complete construction of new wind projects.
Source: PacifiCorp (2017)
The electricity sector in Australia was restructured starting in the 1990s. The National Electricity
Market (NEM) was created in 1998 and it covers five of the six states and serves 90% of the
electricity demand in the country. In all these five states, generation, transmission and distribution
have been functionally separated. NEM is overseen by a single market operator. Aggressive
environmental policies have led to a rapid increase in RE generation in NEM. In 2015, wind and
solar together accounted for about 8% of NEM generation (15% of capacity). Policies target 23.5%
of generation from large wind and solar installations by 2020 (Weimar et.al., 2016).
The rapid increase in RE generation has created challenges. The issues that Australia is facing will
A.3 Portfolio Selection
A. Action Plan
7.6 Additional International Experience
7.6.1 Australia
?
?
?
?
?
?
?
?
Fixated on Megawatts | 53
become important for India as it moves towards its target of 227 GW of RE by 2022. Therefore,
there are important lessons for resource planning in India from the Australian experience.
PV output peak occurs mid-day while the system peak demand occurs later in the day. This
mismatch results in the non-PV generators being under-utilized during the day but having to ramp
up rapidly later. In addition, as greater amounts of RE are added to the system, the need for
dispatchable reserves also increases rapidly. The Australian Electricity Market Operator (AEMO)
projects that at 100% RE penetration, reserve capacity would have to increase to about 100-130%
of peak demand (Weimar et.al., 2016).
However, high RE penetration has led to lower market prices resulting in dispatchable capacity
exiting the market. High RE penetration results in lower prices in two ways. First, RE generators
bid low because their marginal costs are low. Second, distributed RE generation lowers the
demand also leading to lower prices (Weimar et.al., 2016).
Lack of sufficient non-RE can result in difficulty in maintaining system stability. Like in India, the
Australian system operates at 50 Hz and the AEMO is responsible for maintaining the frequency in
a narrow band around 50 Hz. Frequency control requires synchronous generators, but wind and
solar are non-synchronous. Synchronous generators also provide inertia which helps to dampen
frequency variation which otherwise would lead to tripping of generators. But wind and solar
generators do not provide inertia.
The lack of sufficient reserves also leads to a greater reliance on the interconnectors (transmission
lines) between states. Therefore, as RE penetration increases these interconnectors will need to
be strengthened adding to transmission cost. Transmission costs are likely to be high also because
transmission lines are required to carry power from remotely located RE facilities.
Some solutions are being proposed to address these challenges, specifically (Weimar et.al., 2017):
·Setting requirements for a minimum amount of synchronous capacity as part of the
reserve requirements.
·Increasing the capacity value of RE by requiring some features in inverter circuits used
with PV generators, and some changes to how wind generators operate.
·Allowing AEMO to intervene in dispatch. One such intervention is to restrict addition of PV
under low frequency conditions. Another is to require minimum ramp rates for non-RE
generators.
·Use of demand response (DR) to reduce load under low frequency conditions (caused by
too much load). DR can also be used to lower the ramp rates that are required as PV
output decreases while load picks up.
In China, the responsibility for electricity planning has been primarily with the national
government (Bradford, 2005). Much of electricity planning is done through the five-year
development planning process (Kahrl& Wang, 2015; Bradford, 2005). The process is guided by the
national industry policy which sets the national priorities and long-term policy direction. The five-
year plan is a hierarchy of plans, with the Five-Year Plan for the National Economy and Social
Development at the top. At the next level below are sector or industry plans, with energy being
one of them. Then there are special plans for each sector, for example on RE and energy
conservation for the energy sector (Bradford, 2005). See Figure 7.4.
7.6.1.1 Challenges of High RE Penetration
7.6.1.2 Potential Solutions
7.6.2 China
Fixated on Megawatts | 54
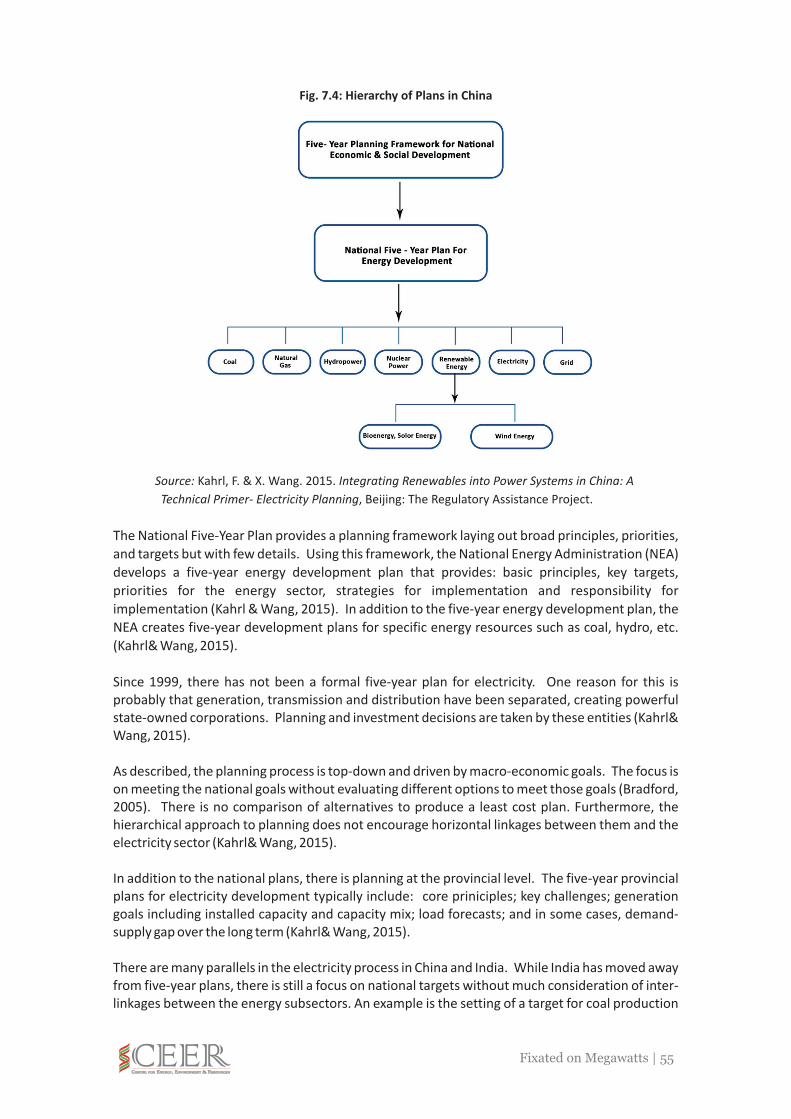
Fig. 7.4: Hierarchy of Plans in China
Source: Kahrl, F. & X. Wang. 2015. Integrating Renewables into Power Systems in China: A
Technical Primer- Electricity Planning, Beijing: The Regulatory Assistance Project.
The National Five-Year Plan provides a planning framework laying out broad principles, priorities,
and targets but with few details. Using this framework, the National Energy Administration (NEA)
develops a five-year energy development plan that provides: basic principles, key targets,
priorities for the energy sector, strategies for implementation and responsibility for
implementation (Kahrl & Wang, 2015). In addition to the five-year energy development plan, the
NEA creates five-year development plans for specific energy resources such as coal, hydro, etc.
(Kahrl& Wang, 2015).
Since 1999, there has not been a formal five-year plan for electricity. One reason for this is
probably that generation, transmission and distribution have been separated, creating powerful
state-owned corporations. Planning and investment decisions are taken by these entities (Kahrl&
Wang, 2015).
As described, the planning process is top-down and driven by macro-economic goals. The focus is
on meeting the national goals without evaluating different options to meet those goals (Bradford,
2005). There is no comparison of alternatives to produce a least cost plan. Furthermore, the
hierarchical approach to planning does not encourage horizontal linkages between them and the
electricity sector (Kahrl& Wang, 2015).
In addition to the national plans, there is planning at the provincial level. The five-year provincial
plans for electricity development typically include: core priniciples; key challenges; generation
goals including installed capacity and capacity mix; load forecasts; and in some cases, demand-
supply gap over the long term (Kahrl& Wang, 2015).
There are many parallels in the electricity process in China and India. While India has moved away
from five-year plans, there is still a focus on national targets without much consideration of inter-
linkages between the energy subsectors. An example is the setting of a target for coal production
Fixated on Megawatts | 55

which many researchers have said is considerably higher than will be required. In India, while
distribution companies should be responsible for resource planning, there is not much emphasis
placed on this responsibility.
The electricity sector in Germany was restructured in 1998, opening up the wholesale and retail
market for competition. Subsequent market consolidation led to a sector dominated by four large
vertically integrated companies. In addition, since 2000 Germany has been aggressively
promoting RE through very attractive feed-in tariffs (FiTs), and that has led to rapid increase in RE.
In 2014, RE capacity accounted for more than 40% of the capacity and supplied more than 25% of
the electrical energy (Weimar et.al., 2016: Table 3.3). The early increase in RE coincided with the
phase-out of nuclear plants also announced in 2000. The push for more RE has been hugely
successful but it has created some challenges for Germany.
While there is sufficient capacity now, there is concern about the long-term adequacy of flexible
resources to ensure stability as more RE capacity is added. Such flexible resources are required for
fast response for balancing over short-term fluctuations due to RE. RE generators do not have such
capability. Moreover, the distributed RE generators disconnect automatically when they detect
frequency fluctuations, exacerbating the situation (Weimar et.al., 2016).
Most of the country's wind generation is located in the northern part, while most of the load is
located in the southern part. Furthermore, much of the nuclear capacity that is being phased out
is also located in the southern part. Consequently, there is a North to South transmission
bottleneck, with excess power available in the North and shortages in the South (Weimar et.al.,
2016).
In order to address these challenges, the following solutions are being contemplated:
·Additional transmission infrastructure will be created to address the bottlenecks. In
addition, interconnections with other countries are being strengthened to allow greater
trade and increased support for balancing purposes.
·FiTs are being gradually phased out.
·Attention is being given to possible redesign of markets.
o Regarding the concern about adequate flexible capacity, after considerable debate
about the need for a capacity market, it has been decided not to have one and
continue with an energy-only market (Weimar et.al., 2016). This is similar to the
market in Texas, USA. Most other states in the US have added a capacity market and
so has the UK. Germany's decision will require public acceptance of high prices. It is
also expected that systems for balancing will be strengthened.
o Rather than relying on the transmission system operator (TSO) to be responsible for
all the balancing, incentives are being created for balancing groups to balance
supply and demand locally, reducing the burden on the TSO (Weimar et.al., 2016).
14 This section draws on the discussion on Germany in Weimar et.al. (2016), Section 3.
147.6.3 Germany
7.6.3.1 Challenges
7.6.3.2 Potential Solutions
Fixated on Megawatts | 56

7.6.4 United Kingdom (UK)
7.6.4 Lessons from Additional International Experience
Restructuring of the electricity sector started in 1989 with privatization of the sector. There have
been some changes in the structure of the sector over the years. Initially the electricity market
was structured as a mandatory pool, but that was replaced by NETA in 2000, which in turn was
replaced by BETTA in 2004. More recently there was concern that because of the increasing
amount of wind with almost zero marginal costs, there were not strong enough market signals for
additional flexible generation to maintain stability and serve demand in the medium and long
term (Weimar et.al., 2016: 5.1). In response, the UK Government introduced Electricity Market
Reform (EMR) through the Energy Act of 2013.
EMR had three objectives: (1) ensure a secure electricity supply; (2) ensure sufficient investment
in low-carbon technologies and decarbonise energy generation; and (3) ensure electricity is
affordable (DECC, 2012). EMR seeks to achieve these objectives through two mechanisms:
Use of contract for differences (CfDs) instead of FiTs. CfDs provide developers of RE an
assured payment stream.
A capacity market to ensure that there will be sufficient firm capacity.
There is another innovative change that is being considered in UK. With the reductions in costs for
RE and storage, self-generation using RE will become more prevalent resulting in dramatic
changes in the distribution systems. Coupled with smart technologies and demand response, a
much more flexible distribution system could be created that could reduce the cost of electricity
for consumers. Ofgem would like to enable the creation of such a smart and flexible energy
system. Through consultations with stakeholders, it is exploring what changes need to be made in
order to:
?Remove barriers to these new technologies including energy storage.
Enable creation of smart homes and businesses.
Use markets to facilitate flexibility (Ofgem, 2017).
Some examples of activities that a smart, flexible system would facilitate include (Ofgem, 2017):
·Aggregation of home systems of solar panels and batteries to charge at off-peak hours and
provide support to system operators during high demand periods.
·Facilitate greater participation by small players in providing services to the grid.
·Greater use of ToU rates
·Use of cloud-based services that aggregate the energy stored in people's and businesses'
devices, create a virtual energy store to the grid to balance supply and demand.
·Smart control of heating and cooling.
·Smart charging of electric vehicles.
·Smart demand response.
·Use of electric vehicles to become mobile energy hubs providing grid services.
·Peer-to-peer energy markets
Such systems would greatly change how resource planning is carried out. Forecasting the impact
of these systems on the requirements for grid connected resources will be a challenge.
There are several lessons that emerge from the experience in the four countries just discussed,
and several are common are across almost all four.
·Balancing requirements for RE are a concern in all four countries. Requirements for
flexible generation can be large, particularly when the share of RE in the generation mix is
large.
·The impact of large amounts of RE on the grid can be significant for fossil-fuelled plants.
?
?
?
?
Fixated on Megawatts | 57

Costs for these plants can increase, pushing some of them to close down creating
shortage of flexible capacity to back up RE. This is sometimes referred to as the death
spiral.
·As the amount of RE in the grid increases, the flows of power can change. These changes
could be due to the retirement of conventional generators or due to location of RE. The
changes in power flow can result in the need for transmission augmentation.
·Lack of synchronous generation on the grid due to displacement by RE can create
instability. Attention must be paid to the design of inverters connected to PV installations
to ensure that they can ride through frequency variations. Addition of synchronous
condensers may also be required.
·The distinction between resource planning and distribution planning is disappearing. This
would pose greater challenges for resource planning.
Fixated on Megawatts | 58

8. Conclusions
8.1 State Government Interference in Planning and Procurement of Power
Our review of the power procurement practices in three states – Punjab, Delhi and UP – reveal
serious shortcomings. Generation costs make up 70-80% of the cost of supplying electricity, and
power procurement costs have a significant effect on that cost. One of the most obvious impact of
poor procurement practices is surplus capacity. In these states and in several others around the
country, there is significant surplus generating capacity which leads to additional fixed costs that
must ultimately be paid by consumers.
Current practices focus on the short term and at best, on ensuring resource adequacy, that is
having sufficient generation capacity to meet peak demand. Discoms are fixated on having
sufficient megawatts. But how resource adequacy is achieved is also important; the discom must
strive to have the right mix of resources to ensure that demand is met in the least cost manner.
Therefore, the discourse needs to move to resource planning which focuses on more than just
resource adequacy. Resource planning still aims to meet the forecasted peak demand and total
energy requirements of all the customers, but it focuses on doing so cost-effectively, and with
minimum risk. Unfortunately, resource planning is not a part of the lexicon of the power sector in
India, and its value is not appreciated.
In this chapter, we first look at the broader policy and institutional framework that has contributed
to poor power procurement practices. Then we look more closely at the planning and
procurement practices of discoms and identify flaws in those practices.
In each of the states in this study, we found the State Government playing a major role in directing
the level of supply additions. The Punjab Power Generation Policy of 2010 determined the
quantum, technology, ownership and location of the power plants to be installed and required the
discom to sign binding PPAs. In Delhi, while granting the freedom of power procurement in 2007,
the discoms were handed over almost double the amount of PPAs that were already part of their 15
existing commissioned capacity. Similarly, UPPCL signed several PPAs in 2010 and 2011, following
the UP Energy Policy 2009 that projected the power requirement of the state and emphasised
greater participation of IPPs. The UP Energy Policy also allowed the discoms to procure power
through the MoU route in addition to competitive bidding, particularly for large projects. Chapter
6 provides an example of how the use of the MoU route has probably contributed to the higher
cost of power.
Autonomy of electric utilities has been a lingering issue of contention in India. Following detailed
consideration, the framers of the Indian Constitution chose autonomous SEBs, instead of
electricity departments attached to ministries, to keep the sector free from vagaries of ministerial
change (Swain, 2006). However, as discussed earlier, an amendment to the Electricity (Supply) Act
in 1956 allowed state governments' oversight on SEB management and operations through
binding policy directives. Later starting in the mid-1970s, with the additional benefits like
employment and local area development, large-scale power plants became a politically attractive
proposition. In the context of energy scarcity, power plants as visible signs of electrical
development were politically rewarding.
15 In 2006-07, Delhi's energy deficit was 1.7 percent (384 MU) and peak deficit was 264 MW (6.6 percent).
Fixated on Megawatts | 59

Given these politically motivated developments in the power sector, the issue of independence
gained prominence during the reforms process in the 1990s. Efforts were made through legislative
provisions to remove interference by state governments by unbundling and corporatizing utilities
and introducing independent regulation in the sector.
The Electricity Act of 2003 allows discoms to independently manage their power purchase and
procurement. However, the reality is quite different, and interference by state governments has
increased specially in the case of state-owned utilities. Furthermore, with greater private
investment in generation, state governments' jurisdiction has widened through control over
approvals, incentives and facilities offered to IPPs. Consequently, state governments in their
ambitious and aggressive pursuit of megawatts have crossed into the domain of the utility
management, as seen in the case of the three states in this study and discussed at the beginning of
this section.
While resource adequacy has been a priority in the sector from the beginning, as seen in the case
of the three states in this study, recent large additions of generation capacity and the resultant
surplus capacity have multiple drivers. One major driver, also discussed above, is the strong role
played by state governments in attracting private sector investments. State governments'
interference in adding megawatts seems to have undermined the planning processes that the
discoms should have followed. The almost obsessive pursuit of megawatts by states was further
facilitated by an ambitious forecast of power requirements by the CEA. Chapter 3 demonstrates
the consistent overestimation of load growth projected by CEA. These projections became the
basis for capacity addition at the state level.
There have also been misjudgements by discoms. For example, expectations about growth of
industrial growth in Delhi did not materialize leading to overall load being lower than projected. In
other cases, there have been allegations of rent-seeking in IPP contracts (Swain, 2018a).
Governance of the power sector in India, like in many other public-sector enterprises, is plagued
by diffused responsibility and diluted accountability. Diffusion of responsibility is a governance
challenge that may result in dilution of accountability. As Mark Bovens observed, “[when] the
responsibility of any given instance of conduct is scattered among more people, the discrete
responsibility of every individual diminishes proportionately” (Bovens, 1998: 46). The plurality of
responsibility and their interrelationships, may make it difficult, and sometimes impossible, to
determine individual causes and thus to determine who is accountable for what (May, 1992).
In the case of Punjab, there are three divisions in PSPCL who are responsible for different, but
interrelated, aspects of resource planning. The final decision on capacity addition is taken by an 16
ad- hoc committee. Similarly, in UP, UPPCL has separate divisions for power purchase and
planning. But the approvals for long-term power purchases are made by the Energy Task Force
constituted by the state government. In contrast, TPDDL in Delhi has a single cell, called Power
Management Group, that looks into planning and power purchase, indicating clearer
responsibilities. In all the three states in this study, we found that the existence of multiple cells or
entities for interrelated responsibilities has not only led to diffusion of responsibility and
coordination challenges, but also has allowed dilution of accountability.
16 Ad hoc committees are formed for a specific task, in this context to determine the quantum of generation
capacity requirement, and dissolved after completion of the task. Therefore, no individual or the committee
could be hold accountable for their decision, as it ceases to exist after the decision is taken.
8.2 Overestimation of Load Growth
8.3 Diffused Responsibility and Diluted Accountability
Fixated on Megawatts | 60

8.4 Flawed Practice of Resource Planning
8.4.1 Poor Quality of Load Forecast
8.4.2 Inadequate analytical backup for some capacity additions
8.4.3 Lack of integrated consideration of all options to meet load
Many utilities and even CEA use trend analysis to estimate future energy requirements. While
such simple approaches are easy to use, they are often wrong because they do not help the analyst
understand the components of demand. More sophisticated methods using econometric and/or
end-use models would provide better forecasts of load and should be used.
In this study, except for TPDDL, none of the discoms carried out their own load forecast.
Furthermore, almost no load research is done by the discoms. Load research would provide
information on what causes hourly variations in the discoms' load, and would thus facilitate more
effective resource planning. Information about the contributions of various end-uses to load also
helps in making better forecast of load. Some load research studies that have been done use
surveys of consumers to understand their pattern of electricity usage, but that often does not lead
to accurate estimates. Actual measurement would provide more reliable results but that is not
done
As mentioned earlier in this chapter, the forecast in the EPS is relied on by many parties – discoms,
regulators etc. But it has often been over-stated. Reliance on these forecasts is one of the reasons
for the excess capacity that is discussed in this study. Utilities need to do their own forecasts using
their own judgement and knowledge of their service territories. More accurate forecasts would
be greatly facilitated by good load research, based not on surveys but on measurement of energy
use by households, offices, and factories.
Also discussed earlier, many past additions of capacity have been made based on the diktat of the
state government. While the government's intentions may be laudable; for example, wanting to
attract industry in Punjab; or to provide power to previously unconnected household in UP, there
needs to be some analysis done to justify the type of capacity addition. For example, in Punjab
with its peaky load, the question arises whether RTC supply from IPPs was the appropriate choice.
Or whether in-state generation was appropriate given that in-state generation is likely to be
expensive because of the cost for transportation of coal. Some capacity additions also raise
questions about whether they were made for the benefit of consumers. For example, in UP with
the massive build-up of capacity, there was very little attention given to augmenting the
distribution network, without which power would not reach consumers.
One of the hallmarks of a good resource plan is that it considers not only supply options to meet
load but also looks at demand-side and T&D options. Consideration of these other options can
lead to lower cost, lower risk and lower environmental impacts. However, in this study we found
that discoms considered supply options only.
There needs to be coordination between generation planning and transmission planning.
Generation and transmission can be substitutes for each other, and therefore, it is best to look at
them jointly so that the best option in a particular case is selected. For example, in Punjab, in-state
generation is expensive because of high cost of transporting coal over long distances. So it may be
less expensive to purchase power. But transmission capacity for bringing power into Punjab is
limited. In such cases, it would help to consider transmission options when thinking about
resource additions.
Fixated on Megawatts | 61

Distribution networks must be upgraded if necessary when resource additions take place.
Otherwise power from the new addition will not be able to reach consumers. During the earlier
period of rapid build-up of generation capacity in UP, very little attention was paid to augment the
T&D network. Without an adequate T&D network, the capacity additions would not have much
value because the power would not be delivered to consumers. Now UPPCL is paying attention to
augmenting the T&D network also as part of its efforts on the PFA scheme.
Most of the people interviewed for this study recognized the value of EE & DSM and the role that
they could play in resource planning. However, beyond some pilot programs, there hasn't been
much action on this issue. Certainly, when resource additions were being considered to meet a
capacity deficit, EE & DSM were not considered as options. Even the state regulations on power
procurement mention EE & DSM, but there is little guidance on how to incorporate these activities
in long term planning. One exception is that TPDDL is considering DSM to clip its peak load so that
it can sell some of its excess capacity as RTC power.
Planning by most utilities focuses almost exclusively on having sufficient megawatts to meet the
expected load. Almost no attention is given to resource mix in the supply portfolio of a utility.
Consequently, the mix of resources is heavily dominated by round-the-clock (RTC) power
purchases from coal plants. This is, at least partially, a consequence of the absence of modelling
while developing a resource plan. Capacity expansion models prod the planner to compare
alternative resources head-to-head. In addition, because these models use an hourly load profile,
they draw attention to the impact of expected plant load factor (PLF) on the relative attractiveness
of different resource options.
Potentially hydro plants can be desirable because of their flexibility, i.e. they can increase or
decrease power output rapidly. However, in discussions with utility personnel, it was found that
there are limits to this flexibility. First, in almost all cases, hydro dispatch needs to coordinated
with requirements of irrigation downstream from the plant. There can be additional constraints.
For example, in Punjab for some plants, there is a need to maximizing the use of the water in the
river before it reaches the Pakistan border. In Delhi, TPDDL treats the hydro plants as must run
without the discom having any flexibility in its dispatch. In UP, hydro dispatch is governed mostly
by irrigation requirements and the cooling water requirements for about coal based plants
downstream the Ganges, which are higher in the summer just when power requirements peak.
It is important that utilities begin to think of other resources in their mix such as:
·Gas plants, particularly to be used for cycling (intermediate) or peaking operation
·Use of hydro to dispatch when necessary to the extent possible, keeping in mind other
uses of the water such as irrigation.
·Long term seasonal and peak power contracts.
In spite of the very significant environmental and water impacts of power generation and
concerns about global and local environmental impacts and scarcity of water, environmental
impacts are not even mentioned in the resource planning and power procurement decisions of
discoms. While discoms are adding greater amounts of RE, this is in response to RPO type
mandates from the government and not due to motivation within the discom. It is important that
environmental impacts be considered in resource planning, at least to the extent practical.
Even the SERCs do not consider environmental impacts in their scrutiny of power procurement
petitions by the discoms. This may be because there is no explicit mandate to the SERCs to protect
8.4.4 Insufficient attention to resource mix
8.4.5 Environmental impacts not considered
Fixated on Megawatts | 62

the environment.
In the three states, as in most other states, there is almost no consideration given to uncertainty
and how to manage the associated risk. Power procurement decisions are based on a
deterministic vision of the future with a single load forecast. The discoms assume the future will
unfold as per the forecast. There is almost no discussion of what would happen if the assumptions
about load forecast and fuel prices are different from those assumed.
There are some encouraging signs from CEA's Draft National Electricity Plan and from the IIT
Kanpur study for UPPCL. Both these studies at least consider alternative futures. However, even
here the treatment of uncertainty is limited. The CEA study relies on sensitivity analysis done by
increasing and decreasing a variable by a certain percentage. But there is no analysis to back up
that choice. Furthermore, a more rigorous treatment according to best practices as described in
Chapter 7 is not attempted. The IIT Kanpur study does consider various scenarios, but it is being
carried out to see how best to deal with the surplus capacity that has already been created. The
study report is not available and it is to be seen whether it will influence how resource planning
will be carried out.
Given the huge amount of uncertainty in the power sector, and the consequent high costs of
mistakes because of the long lead and long life of electricity resources, it is surprising that so little
attention has been paid to uncertainty and risk management in power procurement by discoms.
As more RE is added, both grid connected and as roof-top installations, and as the population of
EVs grows, uncertainty faced by discoms will grow manifold. Robust strategies will be needed by
discoms to deal with the much higher level of uncertainty.
Surplus capacity and the associated additional costs are consequences of inadequate resource
planning that are already being experienced by most states. The challenges for discoms are going
to become much greater in the future and it will not be possible for discoms to meet these
challenges without effective resource planning.
The biggest challenge is going to come from integrating large amounts of RE in the resource mix.
As discussed in Chapter 2, Australia, Germany and UK are facing concerns about having adequate
amount of flexible resources to provide balancing services for RE. In Australia, the problem is
exacerbated by the exit of flexible resource because as the share of RE has increased, the revenue
earned by flexible resources has reduced prompting them to leave the grid. This could lead to a
vicious cycle of more flexible resource exiting the system. The experience of the three countries
also points to the need to ensure that there is enough synchronous capacity that provides
sufficient inertia so that the system can withstand frequency fluctuations. In addition, the
inverters used with solar PV systems will need to be designed to ride through frequency
fluctuations and low voltages and not shut down.
With India targeting to have 227 GW of RE by 2022, these issues of adequacy of flexible resources
and synchronous resources will need to be addressed. 40 GW of the 227 GW is targeted to be from
roof-top solar PV. Because the 40 GW will be installed by consumers, the utility will not have
control over it and may not have knowledge about it. Moreover, it is not known at what rate the
roof-top units will be installed, leading to great uncertainty about the load the discom will have to
supply. There will also be a lot of uncertainty regarding the remaining 187 GW of grid connected
RE. The presence of EVs with unknown charging patterns will further add to the uncertainty that
8.4.6 Uncertainty and risk management ignored
8.5 Effective Resource Planning Will Be Essential in the Future
Fixated on Megawatts | 63

the discom will face about the amount of load it has to supply.
In order to handle the uncertainty and variability associated with the large amount (227 GW) of
RE, development of alternative plans and rigorous process of risk management will need to
pursued. In addition, planners will need to ensure adequate amount of flexible resources and
synchronous resources. All these will require the application of many of the best practices in
resource planning discussed in Chapter 7.
Fixated on Megawatts | 64
9. Recommendations for
Introducing and PromotingResource Planning in India
9.1 Increasing Awareness of Importance of Resource Planning
9.2 Mandate to Regulators to Require Resource Planning
9.3 Regulatory Framework for Resource Planning
9.3.1 Separate Proceeding for Resource Planning
As pointed out in the previous chapter, long-term resource planning is not part of the power sector
lexicon in India. Resource planning is poorly understood, if at all, and there is little appreciation of
its value. Therefore, the first step in promoting resource planning needs to be to be to increase
awareness about resource planning and inform key stakeholders about its benefits.
It must be recognized that effective resource planning can greatly enhance the functioning of a
discom. Resource Planning helps the discom to provide quality electricity service while minimizing
costs and environmental impacts. It also helps the discom to navigate a path through uncertainties
that are inherent to the sector and the economy, with the least possible disruption and lowest
cost. Not implementing resource planning can often lead to large surpluses or shortages of power,
inconveniencing customers and/or increasing the cost of electricity service for them. Even more
important, the challenges for discoms will grow as greater amounts of RE are added to the
generation mix, and as battery storage and EV charging are added behind the meter by
consumers. Effective resource planning will be essential to meet these new challenges.
While the EAct of 2003 authorizes the SERCs to “regulate electricity purchase and procurement
process of distribution licensees” and the associated purchase price of electricity (Section 86 of
Eact), this requirement is too narrow. Some of the current problems with power procurement
practices are the result of regulators interpreting this function in the EAct to mean case-by-case
scrutiny of supply additions with a focus on the appropriateness of the cost of power being
charged by the seller. There is almost no long-term holistic view taken by regulators of supply
additions.
Resource planning must be seen as an important function of regulatory commissions and
regulators must be mandated to require discoms to carry out a resource planning exercise at
regular intervals. Getting a legislative mandate for resource planning may be a long and involved
process because it would likely require an amendment to the EAct. Therefore, it may be more
appropriate for FoR to promote the requirement of resource planning by discoms. FoR could
develop model regulations for resource planning to facilitate the development of a regulatory
framework by the various SERCs as outlined in the following section.
SERCs must establish a regulatory framework for resource planning and develop regulations in accordance with that framework. The next few subsections list items that should be included in the regulations.
Currently in most states, at least some aspects of resource planning get reviewed during the tariff
cases. Given the importance of resource planning, its review and evaluation should be separate
from tariff proceedings. Moreover, it should happen on a regular basis, say every two years,
Fixated on Megawatts | 65

instead of only when some resource has to be added. It is important that all resource planning
issues are considered together, because resource additions are system level issues and they must
be evaluated from a system perspective. Having all resource addition issues considered together
will allow regulatory commissions to understand the interactions between two or more resource
additions. Also, it will make the regulatory commission aware of what is in the power plant
construction pipeline and how that may affect the addition of another resource. Otherwise,
delayed projects may come on line just as another resource is added resulting in excess capacity.
It is also important that proceedings on resource planning be carried out at a different time of the
year from tariff cases. Otherwise, resource planning will be overshadowed by tariff issues because
of the urgency and immediacy of tariff issues.
Process. The regulations should specify a process for resource planning similar to that
given in Figure 2.1. It should require: load forecasting; estimation of need for new
resources; consideration of all supply, demand and T&D options that can potentially meet
the need for new resource; and handling of uncertainty and mitigation of risk.
Planning Horizon. The planning horizon must be long enough to incorporate long term
concerns but not so long that it is difficult to make any reasonable assumptions about the
future. 20 years seems like a reasonable compromise.
Frequency of Updates. Resource plans need to be updated to reflect changes in load
forecast, fuel prices, capital costs, technologies, environmental legislation and regulation,
and broader changes in the economy and/or industry (Wilson and Biewald, 2014).
Requiring plans to be updated every two years is a reasonable period after which to re-
look at these issues.
RE Integration Study. RE Integration studies for the respective discom should be required
for three purposes: (1) Estimating the capacity value of RE sources; (2) Estimation of
requirements for flexible generation to balance RE; and (3) Estimation of the need for
synchronous resources that provide inertia to help ride through frequency fluctuations.
Public Participation. Involvement of the public in the development of a resource plan has
significant benefits. First, it increases the buy-in by the public in the resource plan.
Second, civil-society participants, academics and researchers can provide valuable inputs.
Chapter 7 describes new developments and emerging international best practices for resource
planning. We recognize that some of these techniques can be quite sophisticated with large data
and training requirements. Therefore, it would be unrealistic to expect that they would be applied
immediately. However, Indian discoms can get started and work their way up to the international
best practices. Some things that might be relatively easy to do are:
Initiate load research studies, not based just on surveys, but also on measurements. Data
from the load research studies can be used to improve load forecasts.
Include consideration of all resources including EE & DSM and T&D options when
considering addition of a new resource;
Start using some risk management practices. Sensitivity analysis is relatively easy to use.
However, instead of defining “high” and “low” values by adding or subtracting 10% from th th
the base case, greater rigor can be introduced by defining them at say, the 90 and 10
percentile.
While option analysis may be difficult to use, utilities can begin to use option thinking.
Instead of treating of each resource addition decision as an all or nothing decision, break
up the decision into stages and exercise judgment at every stage. For example, instead of
simply deciding to build a power plant when there is uncertainty about load growth, buy
the land for the project but start building when there is greater certainty about load
9.3.2 Suggested Specifications for Resource Planning
9.4 Road Map for Gradually Adopting International Best Practices in Resource Planning
?
?
?
?
?
?
?
?
?
Fixated on Megawatts | 66

growth. Construction of individual units of a power plant can also be built in phases,
matching the actual load growth.
Develop training programs for utility staff in modelling and other aspects of best practices
around resource planning.
Instead of focusing always on RTC arrangements for power, discoms need to consider the use of
long term seasonal power contracts or peaking power contracts. This is particularly useful for
states where the load is peaky. For example, Punjab could choose to have a long term seasonal
contract that covers the paddy season (~4 months). Or Delhi could choose peaking power
contracts for power from the peak period (a few hours) every day during the summer.
Instead of focusing only on supply side options for meeting load, discoms should consider all
options. For example, in states such as Punjab, augmentation of transmission capacity into the
state should be considered so that new in-state power plants can be avoided by buying less
expensive power from pit-head power plants.
Similarly, EE & DSM can be effective alternatives to supply side resources, particularly in peaky
service territories. Targeted EE & DSM, where the targeting is either for a particular end-use, like
air-conditioning, or for a particular geographical area, where transmission and/or distribution
may be limited, could be useful for adding or at least deferring a new supply resource.
Until now, resource planning was carried out for the bulk supply system. Demand and supply were
balanced at the bulk supply level. While demand-side measures were considered, their effect was
aggregated and considered at the bulk supply level as a reduction in load. The distribution system
was thought of consisting of load with one-way flow of power from the bulk supply to the
customers' premises. Distribution planning consisted mainly in ensuring that there was sufficient
infrastructure to handle the load.
But now we are entering a new era. Distribution networks have both generation and load.
Feeders can also have battery storage. Power flow can be two-way; from bulk supply point to
consumer or from consumer to the supply point. In addition, demand response can be considered
at the local (feeder) level.
Because feeders were built to handle one-way power flow, supply and demand needs to be
balanced on the individual feeder level to protect the wires and transformers from excessively
high power levels. Therefore, it makes sense to have resource planning at the local (feeder) level.
Based on the level of distributed generation on a feeder and the loads of the customers on that
feeder, appropriate amount of energy storage and demand response can be provided to prevent
overloading of the infrastructure.
The aggregate load of the feeders would then be forwarded as the net load of the discom to be
used in the resource planning for the bulk power system. Thus, we would have two levels of
resource planning. First would be the local level resource planning. The aggregate net load from
all the feeders would be the input to the second phase of resource planning which would be for the
bulk system. The second phase would deal with additional bulk supply resources that would be
required.
?
9.5 Long Term Seasonal Power and Peaking Power Contracts
9.6 Consideration of All Options to Meet Load
9.7 Preparation for Dual Levels of Resource Planning
Fixated on Megawatts | 67

Referencesrd
AEIC. 2017. Load Research Manual- 3 edition, Birmingham: Association of Edison Illuminating
Companies.
Bardhan, P. 2005. The Political Economy of Development in India: Expanded Edition with a
Epilogue on the Political Economy of Reform in India, New Delhi: Oxford University Press.
Bhattacharya, S.C. 2011. Energy Economics: Concepts, Issues, Markets and Governance, Springer.
Borison, A. 2014. 'Electric Power Resource Planning Under Uncertainty: Critical review and Best
Practices', White Paper, California: Berkley Research Group.
Bovens, M. 1998. The Quest for Responsibility: Accountability and Citizenship in Complex
Organisations, Cambridge: Cambridge University Press.
Bradford, P. 2005. Integrated Resource Planning in the Context of China's Electricity Situation, The
Regulatory Assistance Project.
CAISO. 2016. California Independent System Operator,
www.caiso.com/documents/flexibleresourceshelprenewables_fastfacts.pdf, accessed
June 28, 2018.
CARB. 2009. California Regional Haze Plan, California Air Resources Board.
CEA. 2006. Executive Summary: Power Sector, March, New Delhi: Central Electricity Authority.
CEA. 2007. Executive Summary: Power Sector, March, New Delhi: Central Electricity Authority.
CEA. 2008. Executive Summary: Power Sector, March, New Delhi: Central Electricity Authority.
CEA. 2009. Executive Summary: Power Sector, March, New Delhi: Central Electricity Authority.
CEA. 2010. Executive Summary: Power Sector, March, New Delhi: Central Electricity Authority.
CEA. 2011. Executive Summary: Power Sector, March, New Delhi: Central Electricity Authority.
CEA. 2012. Executive Summary: Power Sector, March, New Delhi: Central Electricity Authority.
CEA. 2013. Executive Summary: Power Sector, March, New Delhi: Central Electricity Authority.
CEA. 2014. Executive Summary: Power Sector, March, New Delhi: Central Electricity Authority.
CEA. 2015. Executive Summary: Power Sector, March, New Delhi: Central Electricity Authority.
CEA. 2016. Executive Summary: Power Sector, March, New Delhi: Central Electricity Authority.
CEA. 2017. Executive Summary: Power Sector, March, New Delhi: Central Electricity Authority.
CEA. 2017a. Growth of Electricity Sector in India, 1947-2017, New Delhi: Central Electricity
Authority.th
CEA. 2017b. 19 Electric Power Survey Report, New Delhi: Central Electricity Authority.
CEA. 2017c. Load Generation Balance Report 2017-18, New Delhi: Central Electricity Authority.
CEA. 2017d. Report of The Technical Committee on Study of Optimal Location of Various Types of
Balancing Energy Sources/ Energy Storage Devices to Facilitate Grid Integration of
Renewable Energy Sources and Associated Issues, New Delhi: Central Electricity Authority.
CEA. 2018. Executive Summary: Power Sector, March, New Delhi: Central Electricity Authority.
Chatterjee, E. 2018. “A Climate of Scarcity: Electricity in India, 1899–2016,” in John Brewer, Neil
Fromer, Fredrik Albritton Jonsson, and Frank Trentmann (eds.), Scales of Scarcity in the
Modern World, 1800–2075 Bloomsbury.
Dickerman, L. 2016. 'Distribution-Level Integrated Resource Plans: A Necessity for the Future-
How Should Utilities Evolve Resource Planning to Meet Complex Future Energy
Challenges?', White Paper, Landis+Gyr.
FoR. 2011. Model Regulations for Multi Year Distribution Tariff. New Delhi: Forum of
Regulators.
GE Energy Consulting. 2005. The Effects of Integrating Wind Power on Transmission System
Planning, Reliability, and Operations, Report on Phase 2: System Performance Evaluation,
Albany, NY: The New York State Energy Research and Development Authority.
GoI. 1948. The Electricity (Supply) Act. Delhi: Government of India.
GoI. 2006. Integrated Energy Policy, New Delhi: Government of India.
Fixated on Megawatts | 68

GoP. 2009. Industrial Policy – 2009. Chandigarh: Department of Industry & Commerce, Government of Punjab.
GoP. 2010. Power Generation Policy. Chandigarh: Department of Power, Government of
Punjab.
Heffner, G. 2008. 'Load Research Fundamentals', Maharashtra Workshop on Resource Planning,
10-15 March, Mumbai.
Hirst, E. 1992. A Good Integrated Resource Plan: Guidelines for Electric Utilities and Regulators,
Oak Ridge National Laboratory, Tennessee.
Josey, A., M. Mandal & S. Dixit. 2017. The Price of Plenty: Insights from 'surplus' power in Indian
States, Pune: Prayas Energy Group.
Kahrl, F. & X. Wang. 2015. Integrating Renewables into Power Systems in China: A Technical Primer-
Electricity Planning, Beijing: The Regulatory Assistance Project.
Kahrl, F., A. Mills, L. Lavin, N. Ryan & A. Olsen. 2016. The Future of Electricity Resource Planning,
Berkley: Lawrence Berkeley National Laboratory.
Madaeni, S.H., R. Sioshansi & P. Denholm. 2012. Comparison of Capacity Value Methods for
Photovoltaics in the Western United States, Colorado: National Renewable Energy
Laboratory.
May, L. 1992. Sharing Responsibility, Chicago: Chicago University Press.
MoP. 2016. Report f the Technical Committee on Large Scale Integration of Renewable Energy,
Need for Balancing, Deviation Settlement Mechanism (DSM) and Associated Issues.
New Delhi: Ministry of Power, Government of India.
NYISO. 2016. 'Solar Impact on Grid Operations – An Initial Assessment', New York Independent
System Operator.
Ofgem. 2017. Upgrading Our Energy System: Smart Systems and Flexibility Plan, London: Office of
Gas and Electricity Markets, United Kingdom.
PacifiCorp. 2017. Integrated Resource Plan, Portland: PacifiCorp.
PEG. 2017. Many Sparks but Little Light: The Rhetoric and Practice of Electricity Sector Reforms in
India, Pune: Prayas Energy Group.
PwC. 2015. Load Research and Analysis for BESCOM, Noida: Energy Efficiency Services Limited.
Ruet, J. 2005. Privatising Power Cuts? Ownership and Reform of State Electricity Boards in India.
New Delhi: Academic Foundation.
Swain, A.K. 2006. “Political Economy of Public Policy Making in the Indian Electricity Sector: A
Study of Orissa and Andhra Pradesh”, MPhil Dissertation, New Delhi: Jawaharlal Nehru
University.
Swain, A.K. 2018: 'Poverty in the Midst of Abundance: Repressive Populism, Bureaucratization,
and Supply-Side Bias in Madhya Pradesh's Power Sector', in NK Dubash, SS Kale & R
Bharvirkar eds. Mapping Power: The Political Economy of Electricity in Indian States, New
Delhi: Oxford University Press.
Swain, A.K. 2018a: 'Protecting Power: The Politics of Partial Reforms in Punjab', in NK Dubash, SS
Kale & R Bharvirkar eds. Mapping Power: The Political Economy of Electricity in Indian
States, New Delhi: Oxford University Press.
UPERC. 2018. Order regarding Petition No. 1258/2017, 1259/2017, 1260/2017, 1261/2017 & rd
1262/2017, 03 January 2018. Lucknow: Uttar Pradesh Electricity Regulatory
Commission. Available at:
http://uperc.org/App_File/Pt1258,12591260,1261,and1262of2017orderdt-03-01-18-th
pdf142018123800PM.pdf, last accessed on 15 July 2018.th
UPERC. 2010. Order regarding Petition Nos. 662, 663, 664, 665, 666, 689 and 701 of 2010, 18
November 2010. Lucknow: Uttar Pradesh Electricity Regulatory Commission. Available
at: http://uperc.org/App_File/MOURouteOrderdt-18-11-10-th
pdf7252011104311AM.pdf, last accessed on 15 July 2018.nd
UPERC. 2011. Order regarding Petition Nos. 763, 764, 765, 766 and 767 of 2011, 22 December
2011. Lucknow: Uttar Pradesh Electricity Regulatory Commission. Available at:
Fixated on Megawatts | 69

http://www.uperc.org/App_File/Order-ProvisionalTariff-22-12-12-Pet-No-763-767-th
2011-pdf1223201153222PM.pdf, last accessed on 15 July 2018.th
UPERC. 2012. Order regarding Petition No. 825, 826, 827, 828 & 829 of 2012, 5 November
2012. Lucknow: Uttar Pradesh Electricity Regulatory Commission. Available at:
http://www.uperc.org/App_File/OrderBajaj825to829dt-5-11-12-th
pdf116201244334PM.pdf, last accessed on 15 July 2018.th
UPERC. 2013a. Order regarding Petition No. 825, 826, 827, 828 & 829 of 2012, 28 January
2013. Lucknow: Uttar Pradesh Electricity Regulatory Commission. Available at:
http://www.uperc.org/App_File/OrderinterimBajaj825to829-dt-28-1-13-th
pdf130201334936PM.pdf, last accessed on 15 July 2018.th
UPERC. 2013b. Order regarding Petition No. 825, 826, 827, 828 & 829 of 2012, 20 May 2013.
Lucknow: Uttar Pradesh Electricity Regulatory Commission. Available at:
http://www.uperc.org/App_File/FinalOrderdt-20-5-13-Bajaj825to829-th
pdf523201333128PM.pdf, last accessed on 15 July 2018.th
UPERC. 2016. Order regarding Petition No. 1079,1080,1081,1082 and 1083 of 2016, 04
February 2016. Lucknow: Uttar Pradesh Electricity Regulatory Commission. Available
at: http://www.uperc.org/App_File/MYTBajaj450MWAdmittanceOrder_4-02-2016_-th
docx282016111702AM.docx, last accessed on 15 July 2018.
UPERC. 2013. Uttar Pradesh Electricity Regulatory Commission (Multi Year Distribution Tariff)
Regulations, 2013. Lucknow: Uttar Pradesh Electricity Regulatory Commission.
Weimar, MR, A Botterud, ME Mylrea, E O'Shaughnessy, T Levin & L Bird. 2016. Integrating
Renewable Generation into Grid Operations- Four International Experiences, Washington:
Pacific Northwest National Library.
Wilson, R. & B. Biewald. 2013. Best Practices in Electric Utility Integrated Resource Planning:
Examples of State Regulations and Recent Utility Plans, The Regulatory Assistance Project,
Synapse Energy Economics Inc.
Fixated on Megawatts | 70

About Authors
Daljit Singh
Ashwini K Swain
Daljit Singh is the Director of Research at CEER with many years of experience in the energy sector in India and USA. He has extensive experience in reforms and regulation of the Indian power sector, covering almost all aspects of the sector, and has also done work on the coal and gas sectors. In addition, he has in-depth experience of regulation of US electric utilities both as an intervenor on behalf of consumer and environmental advocates, and as staff of a regulatory commission.
Before joining CEER, Mr. Singh was a Visiting Scholar at Brookings India, working on issues related to competition in the electricity sector in India. Mr. Singh has worked as consultant for the World Bank and the National Transport Development Policy Committee (NTDPC). Mr. Singh also worked for eight years with Prayas Energy Group, a leading research-based advocacy group representing the public interest, on almost all aspects of reforms and regulation of the Indian power sector.
Earlier in the US, he worked for the Massachusetts Department of Public Utilities on regulation of electric utilities in the state where he was lead technical staff person on several cases regarding restructuring of the electric utility industry. He also worked for Tellus Institute for Resource and Environmental Strategies in Boston for several years.
Mr. Singh has a B.Tech degree in Electrical Engineering from Indian Institute of Technology, Kanpur, a Master's degree in Electrical Engineering from the University of Missouri, Columbia, and a Master's degree in Technology and Policy from Massachusetts Institute of Technology.
Ashwini K Swain is executive director at CEER and a visiting fellow at Centre for Policy Research. He is also a fellow at Energy for Growth Hub, Centre for Global Development. His research interests include political economy of electricity, interface between energy service needs and climate mitigation goals, and water-energy-food nexus, especially in Indian context. He has also worked on public participation in service delivery, and has a keen interest in political economy of India and political analysis. In addition, he has been
actively engaging with civil society organisations and public agencies at national and subnational level on these issues.
Earlier, he has worked for CUTS Institute for Regulation & Competition, Agence Françaisede Développement, University of York, University of Wisconsin-Madison, and National Institute of Public Finance and Policy. He holds a PhD in Politics from University of York and MPhil and MA degrees in Political Studies from Jawaharlal Nehru University.
Fixated on Megawatts | 71

About CEER
Centre for Energy, Environment & Resources (CEER) is a research centre focused on
energy, environment and natural resource policy and governance in India. The mission of
CEER is to carry out innovative research on major policy challenges, and develop effective,
pragmatic and sustainable solutions, bringing together diverse constituencies and
perspectives, and thus, inject new ideas into the policy arena. The Centre seeks to
investigate blems and interlinkages in these sectors and find holistic solutions. Through
high-quality research and engagement with agencies and actors, in both public & private
sectors, the Centre aims to promote public awareness, informed dialogue and common
understanding on critical policy and governance issues in energy, environment and natural
resources.
Further details on CEER can be found at www.ceer.in
Fixated on Megawatts | 72


Centre for Energy, Environment & ResourcesFPAI Bhawan, First Floor, #10, Institutional AreaRK Puram, Sector 4, New Delhi 110022, INDIA www.ceer.in @CEERIndia CEERIndia
Copyright © 2022 FDOKUMEN