
Microwave Initiated Atomic Spectra from Select Atomic Species
Upload
khangminh22Category
view
1download
0
Indira Gandhi Centre for Atomic Research
IGC
AR A
NN
UA
L REPO
RT - 2
018
Government of IndiaDepartment of Atomic Energy
Indira Gandhi Centre for Atomic ResearchKalpakkam - 603 102
Annual Report - 2018
Published by Scientific Information Resource Division, RMG, RM&PAG, IGCAR, Kalpakkam-603102
I G C a n n u a l R e p o R t - 2 0 1 8
2018
INDIRA GANDHI CENTRE FOR ATOMIC RESEARCH
Government of IndiaDepartment of Atomic EnergyIndira Gandhi Centre for Atomic ResearchKalpakkam 603 102
ANNUAL REPORT

I G C a n n u a l R e p o R t - 2 0 1 8
Indira Gandhi Centre for Atomic Research
IGC
AR A
NN
UA
L REPO
RT - 2
018
Government of IndiaDepartment of Atomic Energy
Indira Gandhi Centre for Atomic ResearchKalpakkam - 603 102
Annual Report - 2018
Published by Scientific Information Resource Division, RMG, RM&PAG, IGCAR, Kalpakkam-603102
Back Cover Front Cover
Front Cover
1. Fast Breeder test Reactor 2. Core configuration for 40 MWt operation of fast breeder test reactor 3. Retraction of pump internal assembly of PFBR secondary sodium pump - 2 4. Temperature distribution (K) in metal fuel pins of special sub-assembly during 74% flow blocked condition 5. LiCl-KCl eutectic melt and Cd loaded with Ce and La after actinide drawdown experiments 6. Internal view of the skylight of energy efficient large habitat structures 7. BCC 3x3x3 supercell with labeled atoms to define atomic defect configurations
Back Cover
Flora and Fauna at Kalpakkam
1
2 3
4
56
7
I G C a n n u a l R e p o R t - 2 0 1 8
Activities of IGCAR at a Glance
Foreword
Editorial
I. Fast Breeder test Reactor 1
II. Prototype Fast Breeder Reactor 14
III. R&D for Fast Breeder Reactors 33
IV. Fuel Cycle 81
V. Directed Basic Research and Infrastructure Facilities 109
VI. Basic Research 148
VII. Awards / Publications / News & Events / Organisation 175
Contents
Published by Scientific Information Resource Division, Resource Management Group, RM&PAG
Indira Gandhi Centre for Atomic Research, Kalpakkam - 603 102
Editorial Committee Members: Dr. T. S. Lakshmi Narasimhan, Dr. N. V. Chandra Shekar, Dr. C. K. Mukhopadhyay, Dr. Vidya Sundararajan, Shri A. Suriyanarayanan, Dr. C. V. S. Brahmananda Rao, Dr. V. Subramanian, Ms. R. Preetha, Shri J. Kodandaraman, Shri G. Venkat Kishore, Shri S. Kishore, Dr. N. Desigan, Shri M. Rajendra Kumar, Shri V. Rajendran, Ms. S. Rajeswari, Shri K. Ganesan, Shri K. Varathan and Shri G. Pentaiah
Address for CorrespondenceDr. T. S. Lakshmi NarasimhanAssociate Director, Resource Management Group, RM&PAGIndira Gandhi Centre for Atomic ResearchKalpakkam - 603 102Phone : +91-44-2748 0301; Fax : +91-44-2748 0060; Email : [email protected]; Website : www.igcar.gov.in

I G C a n n u a l R e p o R t - 2 0 1 8
Activities of IGCAR at a GlanceIndira Gandhi Centre for Atomic Research (IGCAR), a unit of the Department of Atomic Energy (DAE), was established at Kalpakkam in 1971, with a mandate to conduct a broad based multidisciplinary programme of scientific research and advanced engineering development, directed towards the establishment of technology of Sodium Cooled Fast Breeder Reactors (FBR) in the country. The mission includes the development and applications of new and improved materials, techniques, equipments and systems for FBRs, pursue basic research to achieve breakthroughs in fast reactor technology.
Fast Reactor Design & Technology
• Operation of Fast Breeder Test Reactor (FBTR), Steam Generator Test Facility (SGTF) and other sodium test loops
• Technical support to Prototype Fast Breeder Reactor (PFBR) in commissioning and operation
• Design and technology development of future FBRs and metal fuel based test reactor
• Experimental R&D in the area of Structural Mechanics, Structural Dynamics, Thermal Hydraulics and Reactor Engineering
• Development and testing of FBR components in air, water and sodium
• Development and manufacture of sodium sensors and electromagnetic devices
• Human Resource Development for design, commissioning and operation of FBRs
Nuclear Fuel Cycle
• Fast Reactor Fuel Reprocessing - Development of processes, process equipment, hot cell and remote handling systems, automation & robotics for hot cell applications.
• R&D for fast reactor fuel reprocessing, including aqueous reprocessing of metallic fuels.
• Design, construction, commissioning and Operation of Fast Reactor Fuel Reprocessing plants
• Construction, commissioning and operation of Fast Reactor Fuel Cycle Facility (FRFCF) and closing the fuel cycle for fast reactors.
• Indigenous fuel fabrication and development
• Pyro-reprocessing of metallic fuel
• Studies related to chemistry of fuels and coolant
• Development of sensors
Materials and Electronics
• Radiation damage studies of materials, hard coating & nanostructured materials
• Materials study under extreme conditions
• Development of materials for extended life of future fast reactors
• Post-irradiation studies on fast reactor fuels and structural materials
• Non-destructive evaluation and corrosion studies of materials
• Materials development for Advanced Ultra Super Critical (AUSC) power plant
• Design and development of indigenous technology in the areas of Electronic Instrumentation & Control systems for Fast Reactors and Reprocessing plants.
• Design and Development of advanced equipments and technologies, Design of Wireless Sensor Networks, Time Domain Electromagnetic (TDEM) systems for Deep Seated Atomic Minerals Exploration, Plutonium Condition Air Monitoring Systems etc.
• Designing, building and maintaining state-of-the-art high-performance supercomputing facility, computational intelligence systems, cryptography, cyber security solutions, knowledge management and development and deployment of modern security systems for access control and physical protection of nuclear complexes.
Health Safety Management and Engineering Services
• Effective and efficient radiological protection and health physics services for the radioactive facilities, industrial, fire safety, occupational health and Quality Assurance / Quality Control / Non Destructive Evaluation services for the various projects and facilities at IGCAR
• Radiological and environmental monitoring within the DAE Complex at Kalpakkam and applied R&D related to radiation, environment and atmospheric dispersion
• Planning and management of human and scientific information resources, conduct of academic programmes of BARC Training School at IGCAR, technical coordination and public awareness activities
• Centre for advanced and precision manufacturing facility towards the development of FBR & back end-technologies
• Providing reliable power supply & communication, air conditioning & ventilation system services. Civil Engineering Services such as design, analysis & construction of infrastructure for R&D requirement in line with the VISION of the Centre
I G C a n n u a l R e p o R t - 2 0 1 8
Foreword
I am happy to share with you the Annual report of 2018. The report highlights the achievements and accomplishments of the Centre on the R&D activities pertaining to fast reactor and associated fuel cycle technologies as well as in some of the frontier areas of basic research.
Fast Breeder Test Reactor, the flagship of our Centre continues as test bed for irradiation of fuel & structural materials in fast neutron flux. The reactor achieved a maximum power level of 32 MWt, a major milestone in its history, during the 27th irradiation campaign, with the Turbo Generator (TG) synchronised to the Grid delivering an output of 7 MWe. One of the four Steam Generator modules has been upgraded with better material and the TG exciter has been retrofitted with a state-of-the -art Automatic Voltage Regulator to facilitate smooth operation of TG. Gripper and Translation bellows for FBTR Control Rod Drive Mechanism were indigenously developed and qualified for their use through sodium testing. Towards reaching the targeted power of 40 MWt, an optimum core configuration, based on Mark I fuel and boron carbide poison subassemblies has been chosen and the conceptual proposal has been submitted for ‘in principle clearance’ from the regulators.
KAMINI relicensed till June 2020 continued its operation and was upgraded successfully with the state-of-the -art Safety Control Plate (SCP) Drive Mechanism (DM) and Integrated Control and Information System (ICIS) developed by BARC. The reactor has been operating at 30 kWt and serves as an excellent facility for neutron activation studies, neutron radiography of pyro devices of Indian Space Research Organisation (ISRO) and neutron detector testing.
IGCAR continued extending its technical expertise for the commissioning of PFBR. This has enabled commissioning of many support systems. Advanced thermo-mechanical analysis of the gripper assembly in the transfer arm of PFBR was carried out and its geometry was optimized to minimize the contact stress. Based on detailed computational fluid dynamic and
structural mechanics analyses, the electro-magnetic pumps used in secondary system of PFBR have been modified and installed in the site. A miniaturised Annular Linear Induction Pump was developed and a multi Diverse Safety Rod (DSR) test facility was constructed and commissioned. Dissimilar metal weld inspection device (DISHA) has been successfully developed for carrying out periodic remote visual examination and ultrasonic testing of dissimilar metal weld between the roof-slab and main vessel of PFBR. Room temperature qualification trials for the device have been successfully completed. Back up seal used in top shield of fast reactor has been indigenously developed using silicone.
For the future FBR’s, a preliminary layout and design for FBR 1 & 2 (2 x 600 MWe) is in the finalisation stage. Design optimisation of surge tank geometry for secondary system of future FBR’s and bellow sealed sodium valves have been completed. Design of Hydraulically Suspended Absorber Rods have been made which will enhance the passive safety of FBR’s. A prototype data diode has been developed for network security of safety critical systems of FBR’s.
With regard to fuel reprocessing, CORAL has been successfully relicensed for a further period of five years for reprocessing of FBTR spent fuel. Remote handling equipment’s and tools for pyro process R&D facility have been developed. The Fast Reactor Fuel Cycle Facility, being constructed with the objective of closing the fuel cycle has advanced further with civil constructions at various nuclear power plant buildings. Pouring of about 8000 cu.m of concrete, the largest mega pour in Department of Atomic Energy, was completed successfully in 130 hours. and a cumulative concreting of 3.8 lakh cubic metres has been achieved. Also the construction of training Centre was completed and inaugurated.
The future FBRs are planned with metallic fuel and hence a major thrust area of the centre has been the development of technology for metallic fuel fabrication and reprocessing. A metal fuel fabrication facility at

I G C a n n u a l R e p o R t - 2 0 1 8
Mission of IGCAR• To conduct a broad based multidisciplinary programme of scientific research and advanced
engineering development, directed towards the establishment of the technology of Sodium cooled Fast Breeder Reactors (FBR) and associated fuel cycle facilities in the country
• The development and applications of new and improved materials, techniques, equipment and systems for FBRs
• To pursue basic research to achieve breakthroughs in fast reactor technology• To utilize the expertise in core and strategic sectors like materials development for Advanced
Ultra Super Critical Technology, testing of pyro devices etc., beyond the accomplishment of mission oriented programmes
VisionTo be a Global Leader in Sodium cooled Fast Breeder Reactor and associatedFuel Cycle Technologies
MC&MFCG for demonstrating fabrication of sodium bonded metal fuel pin containing U-Pu-Zr metal alloy was inaugurated remotely from BARC and dedicated to the nation by Shri Ram Nath Kovind, Honourable president of India on May 15, 2018. This is a major milestone and a proud moment in the history of IGCAR.
A significant number of experimental facilities have been commissioned which include mobile purification loop for the flooding circuit of FBTR, irradiation capsule fabrication facility, new spark plasma sintering facility, orbital Tungsten Inert Gas Welding Facility, facility for remote impact testing of irradiated structural materials.
On the electronics and instrumentation side, virtual desktop infrastructural facility to virtualise and centralise desktop computing and storage resources has been successfully designed and implemented. A large solar powered in-house developed outdoor wireless sensor network covering 10 Km2 for radiation surveillance in DAE complex, Kalpakkam have been successfully developed and deployed.
On the materials front, development and demonstration of welding and inspection procedures for dissimilar weld between 10%Cr Steel and Alloy 617M of Rotor of Advanced Ultra Supercritical (AUSC) plant was successfully accomplished. ZrO2 dispersed 9Cr-ODS steel, candidate material for in core applications and B4C pellets for use in FBTR have been successfully produced. The annual report has also highlighted the developments in other frontier areas like synthesis of novel functional
and other structural materials, and basic studies on materials under extreme conditions of pressure and temperature.
In the field of radiological safety, a state-of-the-art calibration facility for calibration of gamma radiation survey instruments was successfully commissioned and accredited by AERB.
Towards human resource development, BARC Training School at IGCAR has successfully completed its 12th year and twenty nine young trained scientists and engineers have been placed to various units of DAE. Twenty six JRF’s joined for Ph.D. program under HBNI. IGCAR continued to support the visits of engineering graduate and science post graduate students from various institutions across the country. Also summer training and project internship programs were arranged. This has enabled many students to get exposed to the high end facilities available at IGCAR and in turn helped the academic programs of the various colleges and universities, which has been one of the main objectives of our department.
I appreciate the efforts put in by the editorial committee in bringing out the annual report. I would be happy to receive the suggestions and comments from you.
Dr. Arun Kumar Bhaduri
Director, IGCAR
I G C a n n u a l R e p o R t - 2 0 1 8
Editorial
On behalf of the Editorial Committee I am happy to put forth the Annual report of our Centre. It represents a blend of mission oriented R&D activities as well as basic research work carried out in the Centre.
Like last year, the current annual report is structured into seven chapters; FBTR, PFBR, R&D of FBRs, Fuel cycle, Directed Basic Research and infrastructure Facilities, Basic Research and compilation of events, seminars, awards etc., and the articles have been segregated accordingly. The technical articles reflect the continuing thrust in R&D in areas pertaining to the mission of our Centre and the venture into some of the newer areas as well.
Chapter I on FBTR highlights achieving a power level of 32 MWt, a major milestone and efforts towards reaching 40 MWt have been brought out. A mobile purification loop was commissioned in the flooding circuit of FBTR and also the online sodium purification system has been automated. A pot transfer facility has been fabricated for the transfer of irradiated fuel subassembly from FBTR to other laboratories.
In Chapter II on Prototype Fast Breeder Reactor (PFBR), its current status, the commissioning activities and the R&D support from our Centre have all been well highlighted. Chapter III is on R&D in FBRs and highlights our efforts in design and technology development for future reactors. Towards developing devices and evolving methodologies for in-service inspection of FBRs an advanced phased array ultrasonic based methodology for inspecting thick dissimilar weld has been successfully demonstrated. Construction of fast reactor fuel cycle facility, which houses plants for carrying out reprocessing, fuel refabrication, core assembling and waste management, is progressing at full pace and the details are described in Chapter IV. Also the design and development of various components and chemical procedures for fuel reprocessing have been included here. Chapter V focuses on Directed Basic Research and Infrastructural Facilities. It showcases some of our achievements in the
development of new materials and technologies which have supported our mission. It also contains activities that have societal relevance such as IR thermography for breast cancer detection. Interesting work related to some of the areas at the forefront of basic research are reported in chapter VI. For example the studies on magnetic nanofluids, synthesis of superhard materials by laser heating, fabrication of photonic crystals etc., have been reported. These articles showcase the open ended basic research activities, reflecting the high quality R&D capabilities of the Centre. The last chapter (i.e.) Chapter VII details the events, awards, meetings, honours, seminars etc., pertaining to our Centre. The successful functioning of BARC Training School at IGCAR and vital research contributions from HBNI scholars provide the required impetus for the academic component and also a vibrant environment.
We welcome and value suggestions and inputs from our readers which will be crucial for bringing improvements in the report. We thank the Group Directors for their support and authors from the different Groups for providing interesting articles reflecting their high quality R&D work. The committee sincerely thanks Dr. Arun Kumar Bhaduri, Director, IGCAR for his continued guidance, advice and constructive suggestions which enabled us to bring out such a comprehensive report. The committee also thanks Dr. B. Venkatraman, Director, Health, Safety, Environment and Resource Management and Public Awareness Groups for the comprehensive support and suggestions rendered from time to time. I also thank all the members of the editorial committees for their sustained and dedicated efforts in the editing and compilation of the report.
(T. S. Lakshmi Narasimhan)
(On behalf of the Editorial Committee, IGC Annual Report)

I G C a n n u a l R e p o R t - 2 0 1 8
Homage to Dr. Baldev Raj
Dr. Baldev Raj, former Director of the Centre passed away on January 6, 2018. Dr. Baldev Raj was born on April 9, 1947. He joined the then Reactor Research Centre in the year 1971 after graduating from the 14th batch of BARC Training School. He became the Director of IGCAR in the year 2004 and served till 2011. Subsequent to his retirement from IGCAR, Dr. Baldev Raj was with the P. S. G. Institutions, Coimbatore as President, Research during 2011–2014 and then with National Institute of Advanced Studies (NIAS), Bengaluru as its Director from 2015 until his demise.
He was an active researcher in the field of Materials and Metallurgy. He pioneered applications of non-destructive evaluation for basic research using acoustic and electromagnetic techniques in a variety of materials and components. He is responsible for realizing societal applications of NDE in areas relating to cultural heritage and medical diagnosis. Dr. Baldev Raj stimulated a whole community of scientists and engineers for the development and advancement of the Fast Breeder Reactor and associated closed fuel cycle technologies. Under his dynamic leadership, scientific work in many areas including non-destructive evaluation, nuclear materials development, physical and mechanical metallurgy, welding science and technology, corrosion science and engineering, separation science and technology, liquid sodium science and technology, mechanics, safety research, electronics and instrumentation, materials science, nanoscience and technology, robotics and automation prospered at IGCAR.
He has occupied several important positions in National and International bodies. He was a fellow of all the four Academies of Science and Engineering in India, German Academy of Sciences, Third World Academy of Sciences, International Medical Sciences, ASM International and The Indian Institute of Metals. He was awarded Padma Shri in 2007 in recognition of his significant contributions to science and engineering. He is also a recipient of Homi Bhabha Gold Medal; H K Firodia Award; Om Prakash Bhasin Award; Vasvik Award, National Metallurgist Award; Lifetime Achievement Award of Indian Nuclear Society, Distinguished Material Scientist Award; and Distinguished Alumni of Indian Institute of Science, to name a few.
With his passing away, we have lost a visionary leader in science and technology and more importantly a human being par excellence.

Fast Breeder test reactor
1
CHAPTERI Fast Breeder
Test Reactor

IGc aNNUaL rePort - 2018
2
crossing another Milestone: FBtr attains 32 MWt
Irradiation campaign # 26 during which reactor was operated at 30.2 MWt with turbo generator
synchronized to the grid generating 6.5 MWe power, came to an end on June 18, 2018 when one Mark I and another Mark II fuel subassembly (SA) reached their specified target burn-up limits. For commencing the 27th irradiation campaign, necessary core changes were carried out. The SAs which reached target burn-up were shifted to core periphery for in-pile cooling. Five fresh Mark I fuel sub assemblies were loaded in the core. With this, the core has 56 fuel subassemblies (47 Mark I, 1 Mark II and 8 MOX) (Figure 1). The ternary metallic fuel (23%Pu-Enriched.U-6%Zr) and specimen of tungsten carbide - a potential alternate lower axial shield material for FBTR were also loaded.
Major objectives of the campaign are as follows:
• Continuing the irradiation of sodium bonded metallic fuel pins (19%Pu-U-6%Zr, 14.8%EU-6%Zr and natural U-6%Zr)
• Irradiation of ternary metallic fuel (23%Pu-EU-6%Zr)
• Irradiation of yttria capsule
• Irradiation of tungsten carbide material
• Continuing the long term irradiation of structural materials
Tables 1 and 2 give the details of process and physics parameters during the campaign.
Reactor was started and the 27th irradiation campaign commenced on September 29, 2018. After completing
1.01
Fig. 1 Core configuration for 27th irradiation campaign
the low power physics experiments, reactor power was raised to 32 MWt for the first time on October 8, 2018 thus crossing another major milestone in the history of FBTR. The campaign was completed on November 25, 2018
Table 1: Heat transport parameters in 27th irradiation campaign
Parameter ValueReactor power / TG power 32 MWt / ~7 MWe
Reactor inlet/outlet temperature 380°C /484°C
SG inlet/outlet temperatures 479°C /309°C
Primary sodium loop flow 504.4 m3/h
Secondary sodium loop flow 295 m3/h
Feed water flow 53.35 m3/h
Feed water / steam temperature 190°C / 450°C
Steam pressure 122 kg/cm2
Table 2: Reactor physics parameters for 27th campaign
Parameters ValueTechnical specification limit
Temperature coefficient of reactivity
-4.2 pcm/°C < -3.0 pcm/°C
Power coefficient of reactivity
-8 pcm/MWt < -4.0 pcm/MWt
Shutdown margin (at 180°C)
5462 pcm > 4200 pcm
Total control rod (CR) worth
9650 pcm -
Fast Breeder test reactor
3
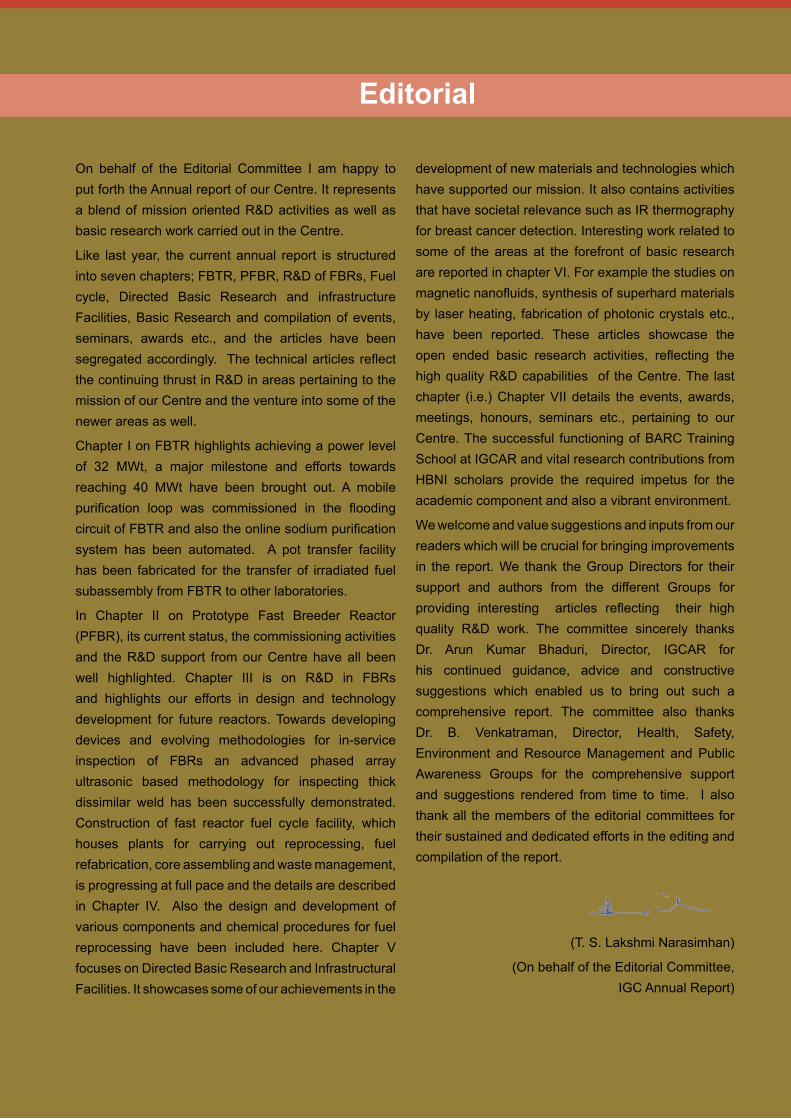
Conceptual Core Configuration for 40 MWt Operation of Fast Breeder Test Reactor
The engineering systems of FBTR are designed for 40 MWt operation. From the initial small core rated
for 10 MWt with 22 fuel subassemblies (SAs), the reactor power has been progressively increased to 32 MWt, the highest so far, by adding more fuel SAs. At present, the core has 56 fuel SAs (47 Mark I, 1 Mark II and 8 MOX). However, there is a limitation in increasing the number of Mark I fuel SAs due to reduction in shutdown margin below the Technical Specification limit (4200 pcm). In the current core configuration, the maximum power that could be achieved is 32 MWt. Hence, the feasibility of raising the reactor power using alternate ways has been explored. Though it is possible to achieve the target power of 40 MWt using Mark II core (55% PuC + 45% UC) respecting the minimum required shutdown margin (SDM), this could not be accomplished as RMD/BARC, the fuel fabricator, could not have simultaneous assembly line for Mark I (required for replacing the burnt Mark I SAs periodically) and Mark II fuel pins. Hence, a possible Mark I core configuration to realize 40 MWt power using boron carbide (B4C) poison SAs at core centre, first ring and second ring and with different B4C enrichment was studied. Based on this, an optimum core configuration has been chosen.Proposed 40 MWt configuration
The core configuration of FBTR to operate at 40 MWt is envisaged to have following features:
• All fuel SAs are of Mark I type.
• Central location is reserved for experimental fuel SA for irradiation of structural materials and two locations in the first ring for experimental SAs for irradiation of fuel material.
Four B4C poison SAs with poison column length of 375 mm (50% enriched in B-10) at 02-01, 02-04, 02-07 and 02-10 locations in the core (Figure 1) is planned. The top of the B4C column is aligned with the top of the fuel column whose length is 320 mm. The remaining 55 mm of B4C column will be below bottom elevation of the fuel column.
With this arrangement, the maximum power attainable is 41.3 MWt with the peak linear heat rate (LHR) at 400 W/cm. The configuration requires 70 numbers of Mark I fuel SAs. The core parameters are listed in Table 1.
The power level of FBTR can be raised to the design power of 40 MWt with 70 Mark I type fuel SAs, by
1.02
adding four B4C poison SAs in the second ring. The core configuration is such that all the basic physics parameters meet the Technical Specification requirements.
Fig. 1 Core configuration for 40 MWt operation of fast breeder test reactor
Table 1: The core parameters Number of fuel subassemblies 70Power (MWt) 41.3 (max.)
limited to 40Location of peak rated SA 00-00Power of peak rated SA 620 kWControl rod (CR) worth 9805 pcmShutdown margin 4928 pcmExcess reactivity 4877 pcmExpected critical height 197 mmCR height at beginning of campaign full power
242 mm
Minimum height to ensure safe overriding of (power + temperature) defect
160 mm
Campaign length (days) 92 Location of B4C (50% enriched in B-10)
02-01, 02-04
02-07, 02-10Length of B4C column 375 mmWorth change B4C replaced by MK I SA
2800 pcm
Power in one B4C SA 19.6 kW
IGc aNNUaL rePort - 2018
4
Mobile Purification Loop for FBTR
Flooding circuit of FBTR consists of two sodium tanks containing total sodium inventory of 64 m3. This
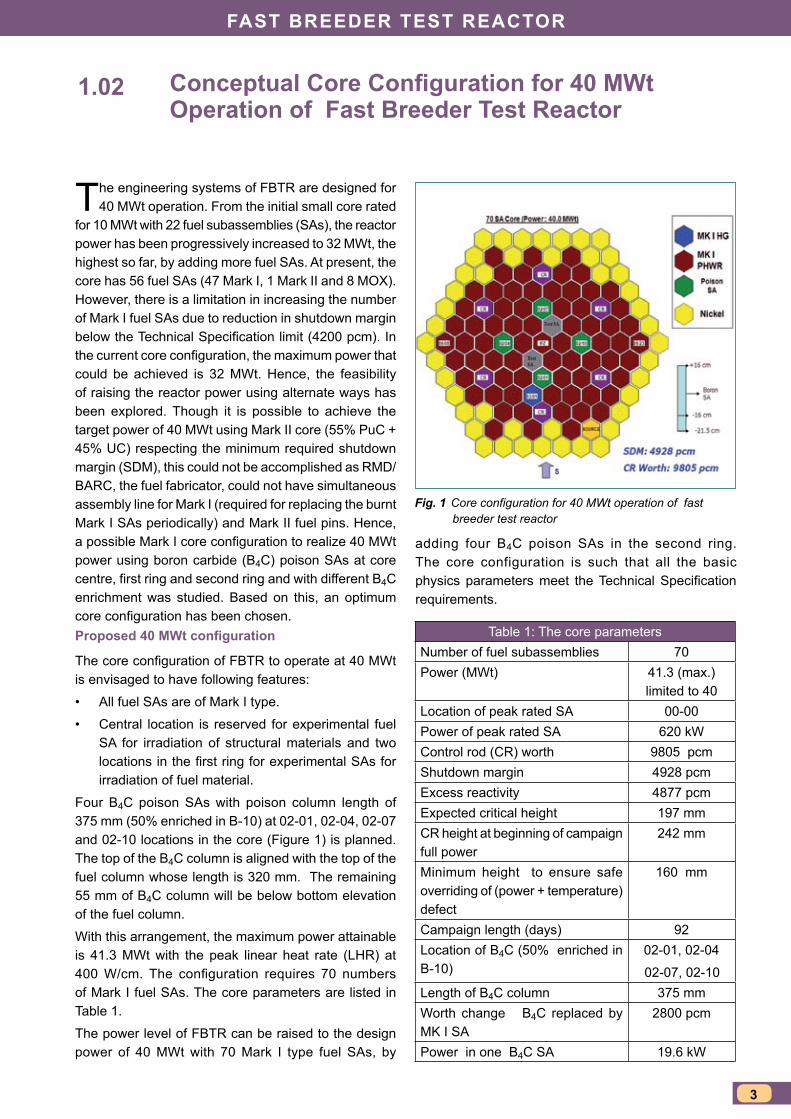
sodium in flooding circuit will be flooded in the reactor core during any sodium leak incident in reactor vessel and subsequent reduction in sodium level which may cause loss of coolant from core. The sodium flooded in the core will remove heat from the core which avoids core meltdown. This flooding circuit is called emergency core cooling system. The sodium tanks were erected and filled with sodium during the year 1985. After filling, impurity level in sodium could not be measured since no purification circuit was available in the flooding circuit. AERB insisted to install a separate sodium purification system for purifying this sodium. It was decided to utilise an existing Mobile Purification Loop (MPL). This loop was designed, constructed and operated for purification of sodium. Initially, it was used to purify the sodium inventory required for FBTR. MPL can be connected to any sodium tank/vessel for purifying sodium. This loop was used for purification of sodium required for FBTR CRDM test facility and FBTR Flowmeter Calibration test facility. Figure 1 shows the photograph of MPL during FBTR flowmeter calibration. It was proposed to bring back this loop into operation to ensure the performance before installing and operating in FBTR.
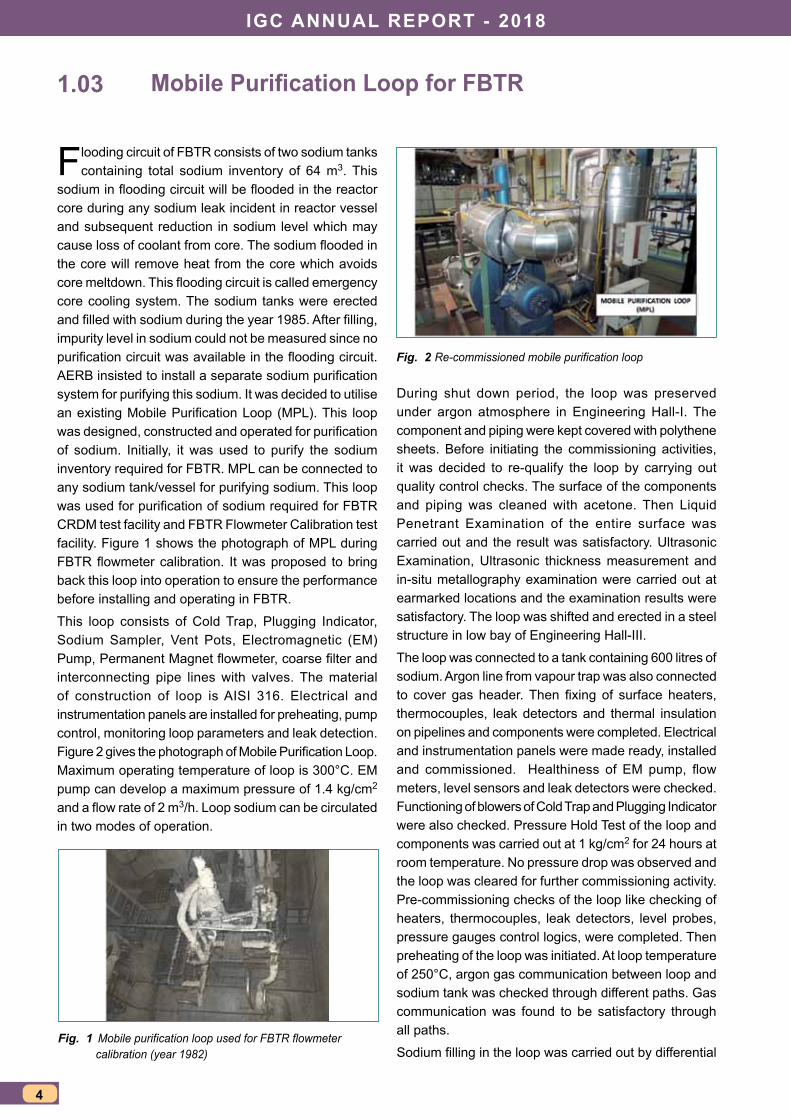
This loop consists of Cold Trap, Plugging Indicator, Sodium Sampler, Vent Pots, Electromagnetic (EM) Pump, Permanent Magnet flowmeter, coarse filter and interconnecting pipe lines with valves. The material of construction of loop is AISI 316. Electrical and instrumentation panels are installed for preheating, pump control, monitoring loop parameters and leak detection. Figure 2 gives the photograph of Mobile Purification Loop. Maximum operating temperature of loop is 300°C. EM pump can develop a maximum pressure of 1.4 kg/cm2 and a flow rate of 2 m3/h. Loop sodium can be circulated in two modes of operation.
1.03
Fig. 1 Mobile purification loop used for FBTR flowmeter calibration (year 1982)
Fig. 2 Re-commissioned mobile purification loop
During shut down period, the loop was preserved under argon atmosphere in Engineering Hall-I. The component and piping were kept covered with polythene sheets. Before initiating the commissioning activities, it was decided to re-qualify the loop by carrying out quality control checks. The surface of the components and piping was cleaned with acetone. Then Liquid Penetrant Examination of the entire surface was carried out and the result was satisfactory. Ultrasonic Examination, Ultrasonic thickness measurement and in-situ metallography examination were carried out at earmarked locations and the examination results were satisfactory. The loop was shifted and erected in a steel structure in low bay of Engineering Hall-III.
The loop was connected to a tank containing 600 litres of sodium. Argon line from vapour trap was also connected to cover gas header. Then fixing of surface heaters, thermocouples, leak detectors and thermal insulation on pipelines and components were completed. Electrical and instrumentation panels were made ready, installed and commissioned. Healthiness of EM pump, flow meters, level sensors and leak detectors were checked. Functioning of blowers of Cold Trap and Plugging Indicator were also checked. Pressure Hold Test of the loop and components was carried out at 1 kg/cm2 for 24 hours at room temperature. No pressure drop was observed and the loop was cleared for further commissioning activity. Pre-commissioning checks of the loop like checking of heaters, thermocouples, leak detectors, level probes, pressure gauges control logics, were completed. Then preheating of the loop was initiated. At loop temperature of 250°C, argon gas communication between loop and sodium tank was checked through different paths. Gas communication was found to be satisfactory through all paths.
Sodium filling in the loop was carried out by differential
Fast Breeder test reactor
5
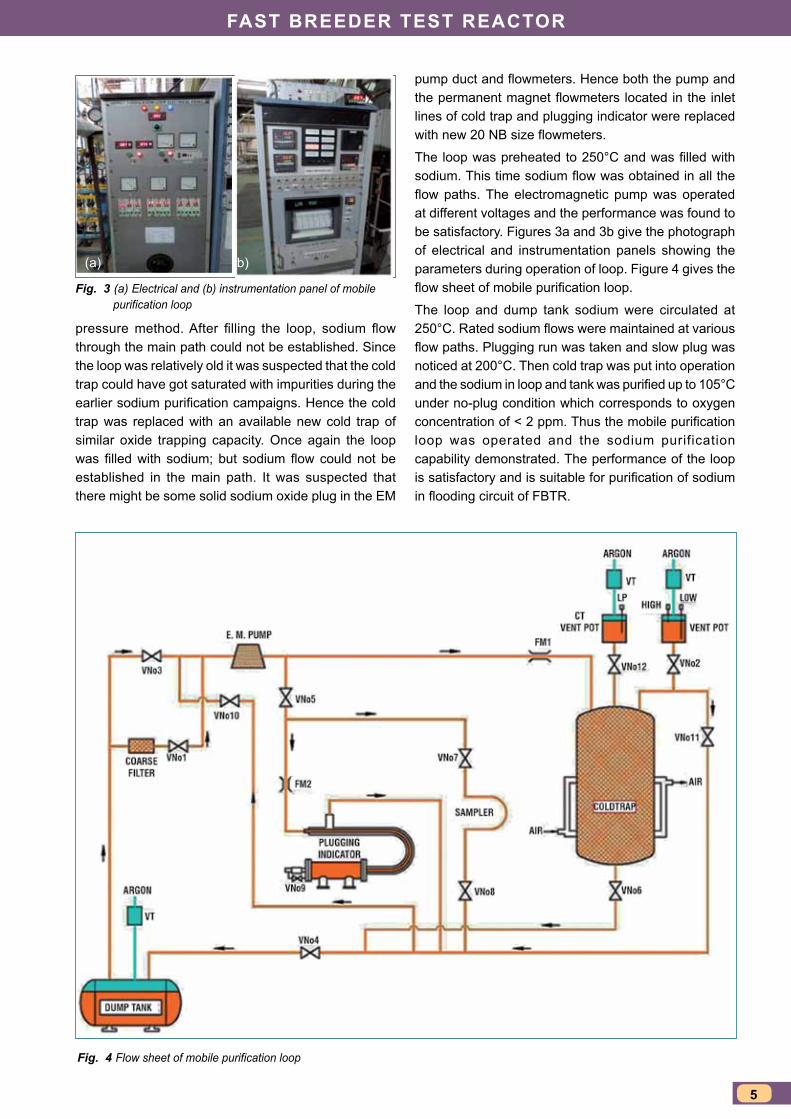
Fig. 4 Flow sheet of mobile purification loop
pressure method. After filling the loop, sodium flow through the main path could not be established. Since the loop was relatively old it was suspected that the cold trap could have got saturated with impurities during the earlier sodium purification campaigns. Hence the cold trap was replaced with an available new cold trap of similar oxide trapping capacity. Once again the loop was filled with sodium; but sodium flow could not be established in the main path. It was suspected that there might be some solid sodium oxide plug in the EM
pump duct and flowmeters. Hence both the pump and the permanent magnet flowmeters located in the inlet lines of cold trap and plugging indicator were replaced with new 20 NB size flowmeters.
The loop was preheated to 250°C and was filled with sodium. This time sodium flow was obtained in all the flow paths. The electromagnetic pump was operated at different voltages and the performance was found to be satisfactory. Figures 3a and 3b give the photograph of electrical and instrumentation panels showing the parameters during operation of loop. Figure 4 gives the flow sheet of mobile purification loop.
The loop and dump tank sodium were circulated at 250°C. Rated sodium flows were maintained at various flow paths. Plugging run was taken and slow plug was noticed at 200°C. Then cold trap was put into operation and the sodium in loop and tank was purified up to 105°C under no-plug condition which corresponds to oxygen concentration of < 2 ppm. Thus the mobile purification loop was operated and the sodium purification capability demonstrated. The performance of the loop is satisfactory and is suitable for purification of sodium in flooding circuit of FBTR.
Fig. 3 (a) Electrical and (b) instrumentation panel of mobile purification loop
(a) (b)
IGc aNNUaL rePort - 2018
6
Retrofitting a State-of-the-art Automatic Voltage Regulation System for Turbo-Generator of FBTR
FBTR has a turbo generator (TG) rated for 16.4 MWe. The TG operates at 3000 rpm and is synchronized to
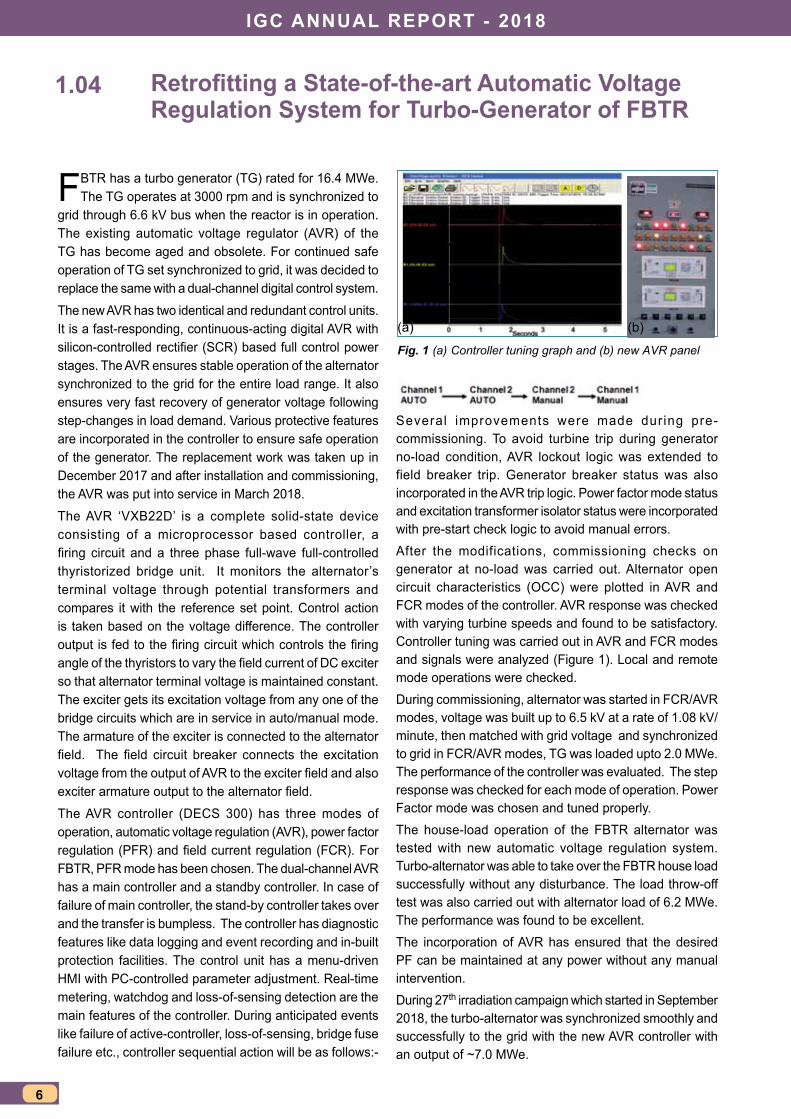
grid through 6.6 kV bus when the reactor is in operation. The existing automatic voltage regulator (AVR) of the TG has become aged and obsolete. For continued safe operation of TG set synchronized to grid, it was decided to replace the same with a dual-channel digital control system.The new AVR has two identical and redundant control units. It is a fast-responding, continuous-acting digital AVR with silicon-controlled rectifier (SCR) based full control power stages. The AVR ensures stable operation of the alternator synchronized to the grid for the entire load range. It also ensures very fast recovery of generator voltage following step-changes in load demand. Various protective features are incorporated in the controller to ensure safe operation of the generator. The replacement work was taken up in December 2017 and after installation and commissioning, the AVR was put into service in March 2018.The AVR ‘VXB22D’ is a complete solid-state device consisting of a microprocessor based controller, a firing circuit and a three phase full-wave full-controlled thyristorized bridge unit. It monitors the alternator’s terminal voltage through potential transformers and compares it with the reference set point. Control action is taken based on the voltage difference. The controller output is fed to the firing circuit which controls the firing angle of the thyristors to vary the field current of DC exciter so that alternator terminal voltage is maintained constant. The exciter gets its excitation voltage from any one of the bridge circuits which are in service in auto/manual mode. The armature of the exciter is connected to the alternator field. The field circuit breaker connects the excitation voltage from the output of AVR to the exciter field and also exciter armature output to the alternator field. The AVR controller (DECS 300) has three modes of operation, automatic voltage regulation (AVR), power factor regulation (PFR) and field current regulation (FCR). For FBTR, PFR mode has been chosen. The dual-channel AVR has a main controller and a standby controller. In case of failure of main controller, the stand-by controller takes over and the transfer is bumpless. The controller has diagnostic features like data logging and event recording and in-built protection facilities. The control unit has a menu-driven HMI with PC-controlled parameter adjustment. Real-time metering, watchdog and loss-of-sensing detection are the main features of the controller. During anticipated events like failure of active-controller, loss-of-sensing, bridge fuse failure etc., controller sequential action will be as follows:-
1.04
Fig. 1 (a) Controller tuning graph and (b) new AVR panel
Several improvements were made during pre-commissioning. To avoid turbine trip during generator no-load condition, AVR lockout logic was extended to field breaker trip. Generator breaker status was also incorporated in the AVR trip logic. Power factor mode status and excitation transformer isolator status were incorporated with pre-start check logic to avoid manual errors.After the modifications, commissioning checks on generator at no-load was carried out. Alternator open circuit characteristics (OCC) were plotted in AVR and FCR modes of the controller. AVR response was checked with varying turbine speeds and found to be satisfactory. Controller tuning was carried out in AVR and FCR modes and signals were analyzed (Figure 1). Local and remote mode operations were checked.During commissioning, alternator was started in FCR/AVR modes, voltage was built up to 6.5 kV at a rate of 1.08 kV/minute, then matched with grid voltage and synchronized to grid in FCR/AVR modes, TG was loaded upto 2.0 MWe. The performance of the controller was evaluated. The step response was checked for each mode of operation. Power Factor mode was chosen and tuned properly.The house-load operation of the FBTR alternator was tested with new automatic voltage regulation system. Turbo-alternator was able to take over the FBTR house load successfully without any disturbance. The load throw-off test was also carried out with alternator load of 6.2 MWe. The performance was found to be excellent. The incorporation of AVR has ensured that the desired PF can be maintained at any power without any manual intervention. During 27th irradiation campaign which started in September 2018, the turbo-alternator was synchronized smoothly and successfully to the grid with the new AVR controller with an output of ~7.0 MWe.
(a) (b)
Fast Breeder test reactor
7
Pot Transfer Device for the Irradiated Fuel Subassembly Shipping Cask of High End Facility
Currently, there is no route available for the direct transfer of irradiated fuel subassembly (IFSA) from
FBTR to other laboratories of IGCAR. At first, the IFSA of interest is brought to Radio Metallurgical Laboratory from FBTR and is transferred to hot cell#1 using α-tight vertical transfer system (VTS). Inside the hot cell, IFSA is cleaned and dismantled. Subsequently, fuel and structural materials are sent to various laboratories using α-tight horizontal transfer system (HTS). Each transfer operation takes about two weeks for completion.
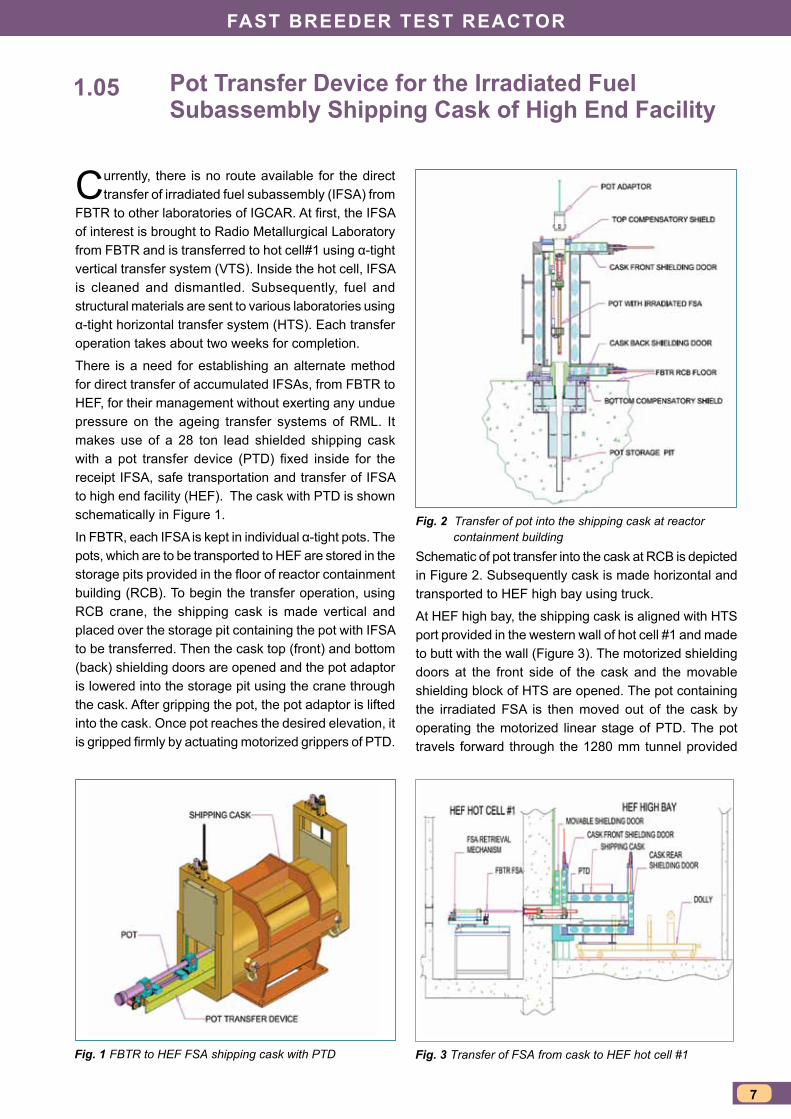
There is a need for establishing an alternate method for direct transfer of accumulated IFSAs, from FBTR to HEF, for their management without exerting any undue pressure on the ageing transfer systems of RML. It makes use of a 28 ton lead shielded shipping cask with a pot transfer device (PTD) fixed inside for the receipt IFSA, safe transportation and transfer of IFSA to high end facility (HEF). The cask with PTD is shown schematically in Figure 1.
In FBTR, each IFSA is kept in individual α-tight pots. The pots, which are to be transported to HEF are stored in the storage pits provided in the floor of reactor containment building (RCB). To begin the transfer operation, using RCB crane, the shipping cask is made vertical and placed over the storage pit containing the pot with IFSA to be transferred. Then the cask top (front) and bottom (back) shielding doors are opened and the pot adaptor is lowered into the storage pit using the crane through the cask. After gripping the pot, the pot adaptor is lifted into the cask. Once pot reaches the desired elevation, it is gripped firmly by actuating motorized grippers of PTD.
1.05
Fig. 1 FBTR to HEF FSA shipping cask with PTD
Fig. 2 Transfer of pot into the shipping cask at reactor containment building
Schematic of pot transfer into the cask at RCB is depicted in Figure 2. Subsequently cask is made horizontal and transported to HEF high bay using truck.
At HEF high bay, the shipping cask is aligned with HTS port provided in the western wall of hot cell #1 and made to butt with the wall (Figure 3). The motorized shielding doors at the front side of the cask and the movable shielding block of HTS are opened. The pot containing the irradiated FSA is then moved out of the cask by operating the motorized linear stage of PTD. The pot travels forward through the 1280 mm tunnel provided
Fig. 3 Transfer of FSA from cask to HEF hot cell #1
IGc aNNUaL rePort - 2018
8
in the hot cell wall until it reaches in front of the cell side flange of α-tight double door provided in the inner surface of the hot cell. Now by operating the stepper motor for pot rotation the lips of the pot is matched with grooves in the cell flange. There is a provision for remote/ manual operation of the linear stage. The pot is then moved inside the cell flange by manually operating the linear stage. Subsequently by operating the pneumatic cylinders, the pot is locked with the cell flange, the pot door and cell flange door are assembled together and the pot-cell flange door assembly is opened. The irradiated FSA is taken into the hot cell using FSA retrieval mechanism. There are video cameras with lighting at many points inside the cask for continuous monitoring of remote operations.
The objectives of the remotely operated PTD are as follows:
• Gripping of the pot lifted inside the cask from the storage pits
• Translation pot out of the cask to engage with cell flange of α-tight double door and
• Rotation of pot to match its lips with grooves of cell flange.
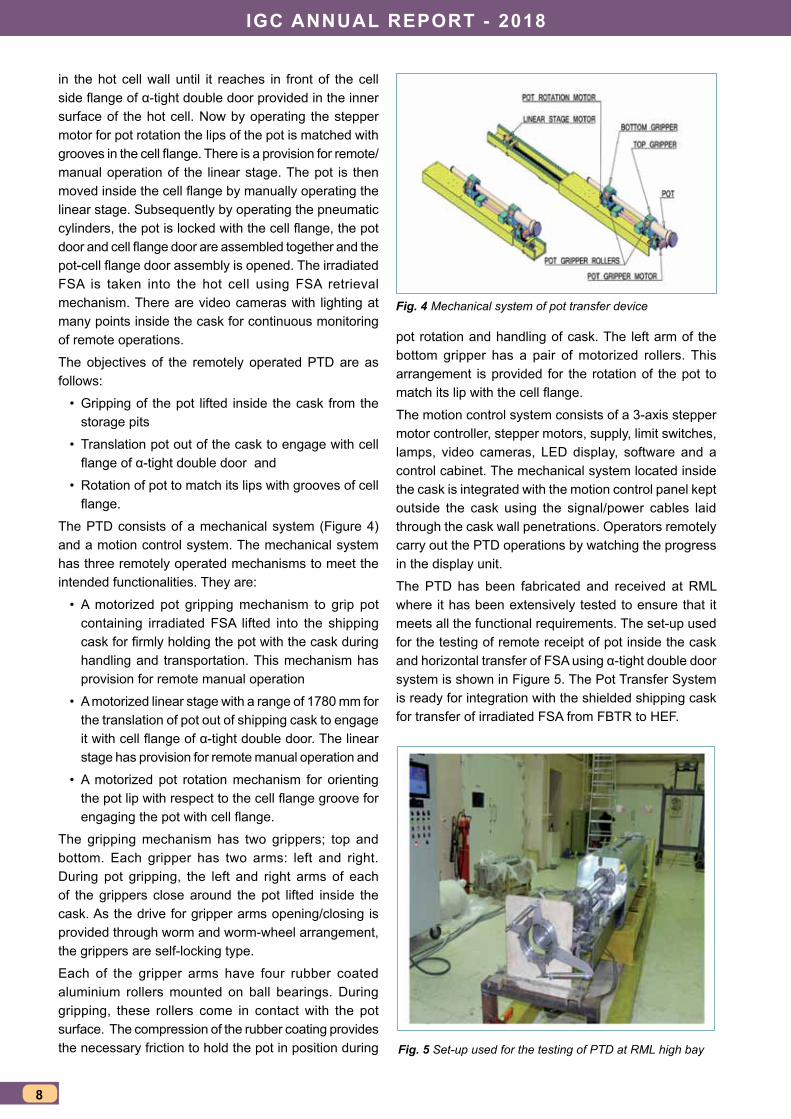
The PTD consists of a mechanical system (Figure 4) and a motion control system. The mechanical system has three remotely operated mechanisms to meet the intended functionalities. They are:
• A motorized pot gripping mechanism to grip pot containing irradiated FSA lifted into the shipping cask for firmly holding the pot with the cask during handling and transportation. This mechanism has provision for remote manual operation
• A motorized linear stage with a range of 1780 mm for the translation of pot out of shipping cask to engage it with cell flange of α-tight double door. The linear stage has provision for remote manual operation and
• A motorized pot rotation mechanism for orienting the pot lip with respect to the cell flange groove for engaging the pot with cell flange.
The gripping mechanism has two grippers; top and bottom. Each gripper has two arms: left and right. During pot gripping, the left and right arms of each of the grippers close around the pot lifted inside the cask. As the drive for gripper arms opening/closing is provided through worm and worm-wheel arrangement, the grippers are self-locking type.
Each of the gripper arms have four rubber coated aluminium rollers mounted on ball bearings. During gripping, these rollers come in contact with the pot surface. The compression of the rubber coating provides the necessary friction to hold the pot in position during
pot rotation and handling of cask. The left arm of the bottom gripper has a pair of motorized rollers. This arrangement is provided for the rotation of the pot to match its lip with the cell flange.
The motion control system consists of a 3-axis stepper motor controller, stepper motors, supply, limit switches, lamps, video cameras, LED display, software and a control cabinet. The mechanical system located inside the cask is integrated with the motion control panel kept outside the cask using the signal/power cables laid through the cask wall penetrations. Operators remotely carry out the PTD operations by watching the progress in the display unit.
The PTD has been fabricated and received at RML where it has been extensively tested to ensure that it meets all the functional requirements. The set-up used for the testing of remote receipt of pot inside the cask and horizontal transfer of FSA using α-tight double door system is shown in Figure 5. The Pot Transfer System is ready for integration with the shielded shipping cask for transfer of irradiated FSA from FBTR to HEF.
Fig. 4 Mechanical system of pot transfer device
Fig. 5 Set-up used for the testing of PTD at RML high bay
Fast Breeder test reactor
9
Production of Tungsten Carbide Pellets by Spark Plasma Sintering for FBTR Irradiation Experiments
In order to extend the life span of FBTR grid plate, attempts are being made to provide adequate axial
shielding against fast neutron irradiation by introducing tungsten carbide (chemical formula: WC) shield subassemblies. Spark plasma sintering (SPS) technique is employed to produce high density pellets of WC without making use of any additives like Co or Ni and further subject to irradiation experiments up to about 1-2 dpa in FBTR.
The SPS of WC pellets were made using WC powder feed in a 25 T SPS facility (Figures 1a and 1b). The SPS process parameters were optimized and the pellets were fabricated using a temperature and pressing force of 1750°C and 14 kN respectively. The complete process was carried out in a vacuum of 10-3 Pa. A typical stacking of 12 numbers of such pellets produced in this manner is shown in Figure 1c.
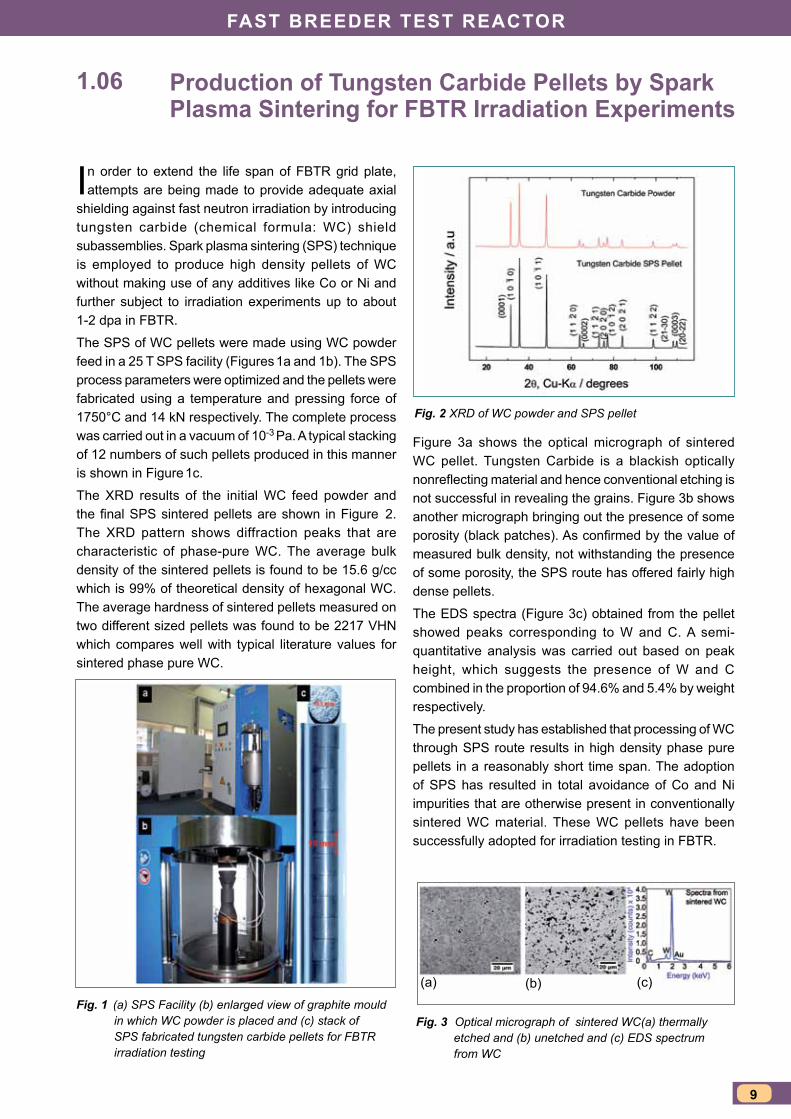
The XRD results of the initial WC feed powder and the final SPS sintered pellets are shown in Figure 2. The XRD pattern shows diffraction peaks that are characteristic of phase-pure WC. The average bulk density of the sintered pellets is found to be 15.6 g/cc which is 99% of theoretical density of hexagonal WC. The average hardness of sintered pellets measured on two different sized pellets was found to be 2217 VHN which compares well with typical literature values for sintered phase pure WC.
1.06
Fig. 1 (a) SPS Facility (b) enlarged view of graphite mould in which WC powder is placed and (c) stack of SPS fabricated tungsten carbide pellets for FBTR irradiation testing
Fig. 2 XRD of WC powder and SPS pellet
Fig. 3 Optical micrograph of sintered WC(a) thermally etched and (b) unetched and (c) EDS spectrum from WC
Figure 3a shows the optical micrograph of sintered WC pellet. Tungsten Carbide is a blackish optically nonreflecting material and hence conventional etching is not successful in revealing the grains. Figure 3b shows another micrograph bringing out the presence of some porosity (black patches). As confirmed by the value of measured bulk density, not withstanding the presence of some porosity, the SPS route has offered fairly high dense pellets.
The EDS spectra (Figure 3c) obtained from the pellet showed peaks corresponding to W and C. A semi-quantitative analysis was carried out based on peak height, which suggests the presence of W and C combined in the proportion of 94.6% and 5.4% by weight respectively.
The present study has established that processing of WC through SPS route results in high density phase pure pellets in a reasonably short time span. The adoption of SPS has resulted in total avoidance of Co and Ni impurities that are otherwise present in conventionally sintered WC material. These WC pellets have been successfully adopted for irradiation testing in FBTR.
(a) (b) (c)
IGc aNNUaL rePort - 2018
10
Upgraded Shutdown Drive System of KAMINI Reactor
Safety Control Plate (SCP) Drive Mechanisms (DM) in KAMINI Reactor have been provided for startup,
shutdown and control of reactor. The SCP-DMs have been in operation for more than 21 years. As SCP drives have seen extensive service life and also due to non-availability of spares and component obsolescence, it has been decided to replace the same with new drives. The new SCP-DM and its electronics have been supplied by BARC. The improvements are in the design of Electromagnetic (EM) clutch with improved torque rating, two vane hydraulic dashpot with mechanical shaft seal, new stepper motor and its driver in place of obsolete stepper motor and a single turn potentiometer in place of obsolete potentiometer.
BARC has manufactured and assembled four SCP drive mechanisms. One of the SCP-DMs was subjected to life cycle tests i.e. 1000 drop tests and 1000 up and down cycles on mock up facility. Remaining three SCP-DMs were subjected to 10 full drops and 10 partial drops tests.
Based on the functions performed by SCP-DM, it is classified as class IB system as per AERB-SG-D-01 guidelines. Hence the complete lifecycle for the hardware and software developments have been followed as per the guidelines stipulated by AERB-SG-D25 as the system is responsible for operating safety control plates.
Design was reviewed by various safety authorities, KAMINI Operation and Review Committee, IGCAR Safety Committee, working groups constituted by AERB and Safety Review Committee for Operating Plants (SARCOP). The SCP-Drive electronics is qualified for environmental tests as per IS-9001 and EMI-EMC tests as per IEC 61400.
After obtaining all safety clearances, replacement of SCP-DM was taken up. A procedure was prepared, a mock up test facility made and functional testing of SCP-DMs carried out before installing in the reactor. Existing
1.07
SCP-DMs and drive electronics were uninstalled and new SCP-DMs (Figure 1) installed in the reactor vault. Components like power supplies, potentiometer signal conditioner, drive electronics power cables, SS wire rope, rubber bush and rope slack indicator were also replaced with new ones to improve the reliability of the system. New drive electronics were installed in Panel-H as shown in Figure 2 and necessary wiring between drive electronics, motor and power supplies was carried out.
Status indications like SCP-Drive fail, SCP-raise and lower were newly provided for easy diagnostics in addition to the existing indications from Integrated Control and Information System (ICIS).
As a part of functional checking, drive uptime, drive downtime, drop time, response time and clutch release time were checked. All the indications and alarms pertaining to both SCP-DMs were tested as per the procedure. Ten drops were carried out on each SCP to validate the drop time. After successful completion of tests, the reactor was made critical with new SCP DMs. Reactor operations have been smooth after the aforesaid upgradation.
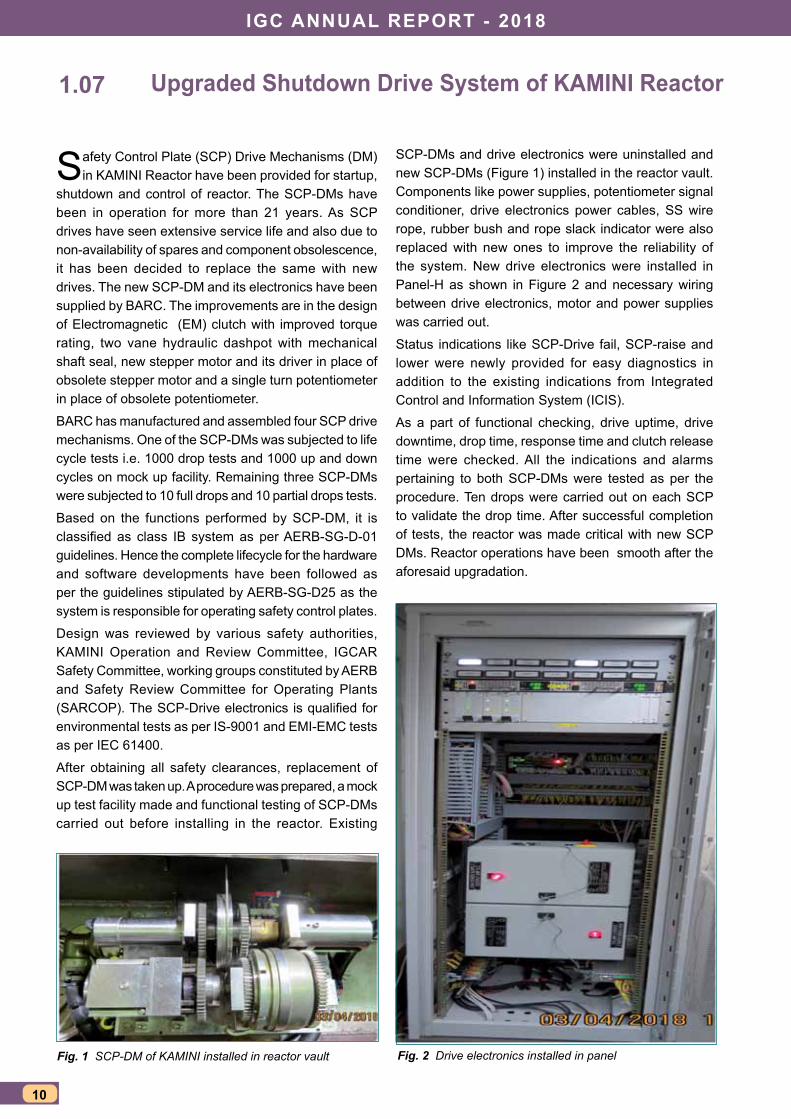
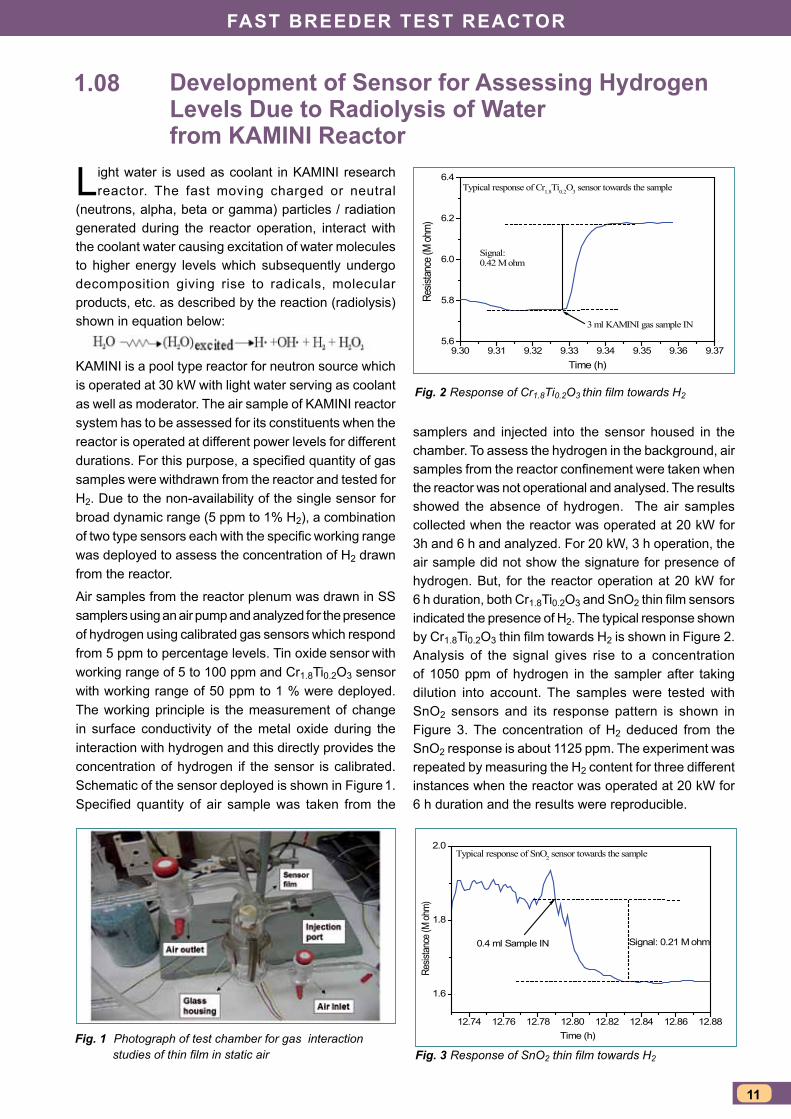
Fig. 1 SCP-DM of KAMINI installed in reactor vault Fig. 2 Drive electronics installed in panel
Fast Breeder test reactor
11
Development of Sensor for Assessing Hydrogen Levels Due to Radiolysis of Water from KAMINI Reactor
Light water is used as coolant in KAMINI research reactor. The fast moving charged or neutral
(neutrons, alpha, beta or gamma) particles / radiation generated during the reactor operation, interact with the coolant water causing excitation of water molecules to higher energy levels which subsequently undergo decomposition giving rise to radicals, molecular products, etc. as described by the reaction (radiolysis) shown in equation below:
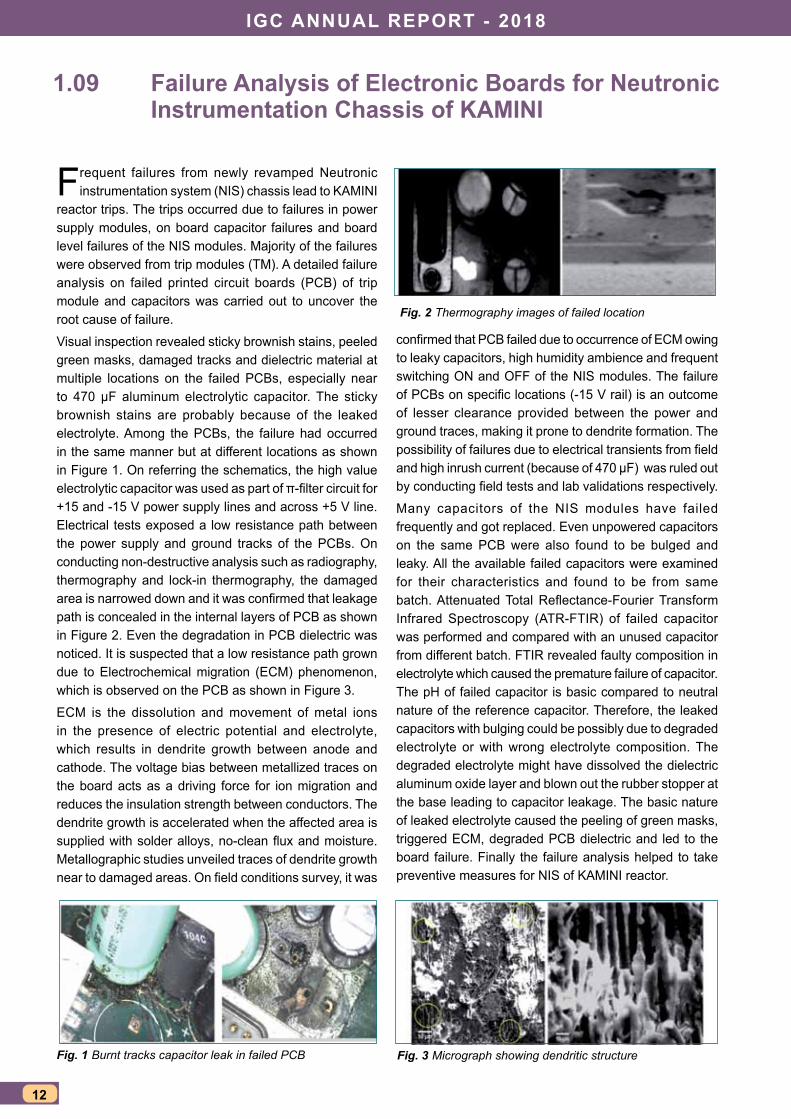
KAMINI is a pool type reactor for neutron source which is operated at 30 kW with light water serving as coolant as well as moderator. The air sample of KAMINI reactor system has to be assessed for its constituents when the reactor is operated at different power levels for different durations. For this purpose, a specified quantity of gas samples were withdrawn from the reactor and tested for H2. Due to the non-availability of the single sensor for broad dynamic range (5 ppm to 1% H2), a combination of two type sensors each with the specific working range was deployed to assess the concentration of H2 drawn from the reactor.
Air samples from the reactor plenum was drawn in SS samplers using an air pump and analyzed for the presence of hydrogen using calibrated gas sensors which respond from 5 ppm to percentage levels. Tin oxide sensor with working range of 5 to 100 ppm and Cr1.8Ti0.2O3 sensor with working range of 50 ppm to 1 % were deployed. The working principle is the measurement of change in surface conductivity of the metal oxide during the interaction with hydrogen and this directly provides the concentration of hydrogen if the sensor is calibrated. Schematic of the sensor deployed is shown in Figure 1. Specified quantity of air sample was taken from the
1.08
9.30 9.31 9.32 9.33 9.34 9.35 9.36 9.375.6
5.8
6.0
6.2
6.4
Signal:0.42 M ohm
Typical response of Cr1.8Ti0.2O3 sensor towards the sample
3 ml KAMINI gas sample IN
Resis
tance
(M oh
m)
Time (h)
12.74 12.76 12.78 12.80 12.82 12.84 12.86 12.88
1.6
1.8
2.0Typical response of SnO2 sensor towards the sample
Signal: 0.21 M ohm0.4 ml Sample IN
Resis
tance
(M oh
m)
Time (h)Fig. 1 Photograph of test chamber for gas interaction studies of thin film in static air
Fig. 2 Response of Cr1.8Ti0.2O3 thin film towards H2
Fig. 3 Response of SnO2 thin film towards H2
samplers and injected into the sensor housed in the chamber. To assess the hydrogen in the background, air samples from the reactor confinement were taken when the reactor was not operational and analysed. The results showed the absence of hydrogen. The air samples collected when the reactor was operated at 20 kW for 3h and 6 h and analyzed. For 20 kW, 3 h operation, the air sample did not show the signature for presence of hydrogen. But, for the reactor operation at 20 kW for 6 h duration, both Cr1.8Ti0.2O3 and SnO2 thin film sensors indicated the presence of H2. The typical response shown by Cr1.8Ti0.2O3 thin film towards H2 is shown in Figure 2. Analysis of the signal gives rise to a concentration of 1050 ppm of hydrogen in the sampler after taking dilution into account. The samples were tested with SnO2 sensors and its response pattern is shown in Figure 3. The concentration of H2 deduced from the SnO2 response is about 1125 ppm. The experiment was repeated by measuring the H2 content for three different instances when the reactor was operated at 20 kW for 6 h duration and the results were reproducible.
IGc aNNUaL rePort - 2018
12
Failure Analysis of Electronic Boards for Neutronic Instrumentation Chassis of KAMINI
Frequent failures from newly revamped Neutronic instrumentation system (NIS) chassis lead to KAMINI
reactor trips. The trips occurred due to failures in power supply modules, on board capacitor failures and board level failures of the NIS modules. Majority of the failures were observed from trip modules (TM). A detailed failure analysis on failed printed circuit boards (PCB) of trip module and capacitors was carried out to uncover the root cause of failure. Visual inspection revealed sticky brownish stains, peeled green masks, damaged tracks and dielectric material at multiple locations on the failed PCBs, especially near to 470 µF aluminum electrolytic capacitor. The sticky brownish stains are probably because of the leaked electrolyte. Among the PCBs, the failure had occurred in the same manner but at different locations as shown in Figure 1. On referring the schematics, the high value electrolytic capacitor was used as part of π-filter circuit for +15 and -15 V power supply lines and across +5 V line. Electrical tests exposed a low resistance path between the power supply and ground tracks of the PCBs. On conducting non-destructive analysis such as radiography, thermography and lock-in thermography, the damaged area is narrowed down and it was confirmed that leakage path is concealed in the internal layers of PCB as shown in Figure 2. Even the degradation in PCB dielectric was noticed. It is suspected that a low resistance path grown due to Electrochemical migration (ECM) phenomenon, which is observed on the PCB as shown in Figure 3.ECM is the dissolution and movement of metal ions in the presence of electric potential and electrolyte, which results in dendrite growth between anode and cathode. The voltage bias between metallized traces on the board acts as a driving force for ion migration and reduces the insulation strength between conductors. The dendrite growth is accelerated when the affected area is supplied with solder alloys, no-clean flux and moisture. Metallographic studies unveiled traces of dendrite growth near to damaged areas. On field conditions survey, it was
1.09
Fig. 1 Burnt tracks capacitor leak in failed PCB
Fig. 2 Thermography images of failed location
Fig. 3 Micrograph showing dendritic structure
confirmed that PCB failed due to occurrence of ECM owing to leaky capacitors, high humidity ambience and frequent switching ON and OFF of the NIS modules. The failure of PCBs on specific locations (-15 V rail) is an outcome of lesser clearance provided between the power and ground traces, making it prone to dendrite formation. The possibility of failures due to electrical transients from field and high inrush current (because of 470 µF) was ruled out by conducting field tests and lab validations respectively.Many capacitors of the NIS modules have failed frequently and got replaced. Even unpowered capacitors on the same PCB were also found to be bulged and leaky. All the available failed capacitors were examined for their characteristics and found to be from same batch. Attenuated Total Reflectance-Fourier Transform Infrared Spectroscopy (ATR-FTIR) of failed capacitor was performed and compared with an unused capacitor from different batch. FTIR revealed faulty composition in electrolyte which caused the premature failure of capacitor. The pH of failed capacitor is basic compared to neutral nature of the reference capacitor. Therefore, the leaked capacitors with bulging could be possibly due to degraded electrolyte or with wrong electrolyte composition. The degraded electrolyte might have dissolved the dielectric aluminum oxide layer and blown out the rubber stopper at the base leading to capacitor leakage. The basic nature of leaked electrolyte caused the peeling of green masks, triggered ECM, degraded PCB dielectric and led to the board failure. Finally the failure analysis helped to take preventive measures for NIS of KAMINI reactor.

Fast Breeder test reactor
13
Decay Heat Measurements using Whole Energy Absorption Spectrometer in KAMINI Reactor
For nuclear reactor applications, the decay power is theoretically estimated using codes such as
ORIGEN2 and CHANDY. To gain confidence on the predictions of reactor physics codes or nuclear database used for calculations, the results must be validated against experimental/theoretical benchmarks. But no such benchmarks are available for validating the decay heat predictions. An uncertainty of about 20% is usually taken over the predicted values for practical applications. This uncertainty is considered to accommodate approximations involved in the numerical methods, nuclear data and neutron flux.
With an intention to quantify and if possible reduce the uncertainty margin and to validate the decay power predictions, a first-of-its-kind, experiment was proposed in the XII plan for decay heat measurements using Whole Energy Absorption Spectrometer (WEAS). WEAS consists of a pair of large Bismuth-Germanate (Bi4Ge3O12, BGO) scintillators mounted on a movable assembly for 4π geometry and associated electronics facilitating high efficiency measurement. Figure 1a gives the WEAS set-up assembled near pneumatic fast transfer system (PFTS) of KAMINI reactor. The system gives three outputs viz. signal from individual detectors and sum from each detector. This system is housed inside acrylic, copper and lead (10 cm thick) shields to reduce background as shown in Figure 1b. WEAS has been successfully commissioned near PFTS of KAMINI reactor. After installation, the functioning of the detectors, electronics and the background radiation were verified.
The detector efficiency for photons is close to 100% below 0.5 MeV, ~90% at 1 MeV and ~ 80% at 2 MeV and for electron is ~ 100%. The energy scale of the two detectors was calibrated using 137Cs (662 keV),
1.10
Fig. 1 (a) WEAS set-up (b) shielding
Fig. 2 Comparison of measured and calculated decay powers from molybdenum
60 Co (1173 keV and 1333 keV) and 22Na (511 keV and 1275 keV) gamma sources and it was also verified by measuring the gamma rays from 133Ba and 152Eu.
As a first step, decay power from structural materials viz., Fe, Cr, Mn, Cu, Ni and Mo foils were measured. The foils were irradiated in PFTS location of KAMINI reactor. The reactor power and irradiation period were different for each foil. Hence the foils were introduced one at a time and irradiations performed. The irradiated foils were transferred to WEAS set-up for measurements. In general, it took about 6 to 8 minutes to transfer the irradiated sample from PFTS to WEAS. This delay included dose rate measurements, transferring to sample holder, placing the sample holder on the detector surface, closing the lead shielding door, power supply to detector and starting counting. Once the WEAS set-up was ready, counting was started and recorded for 300 seconds. With a gap of 30 minutes, second set of readings were noted. This was repeated until the counting reached background level.
The decay power was deduced from the measured sum pulse height spectrum (Sum-PHS) after deducting the background and applying correction factors. The total counts from 10 keV to 5 MeV were considered. By considering the respective powers and irradiation periods of the samples, the decay powers were calculated using the code ORIGEN2. Figure 2 gives the estimated and measured decay powers from molybdenum sample. The ratios of calculated to measured (C/E) decay powers for molybdenum is 1.03 and for other samples they are generally in the range of 1.0 to 0.4. The possible cause of significant observed deviation is being analysed. In near future, decay power measurements from different steels such as SS316LN and from actinides are planned.
(a) (b)
IGC ANNUAL REPORT - 2018
14
CHAPTERII Prototype Fast
Breeder Reactor
PROTOTyPE FAsT BREEdER REACTOR
15
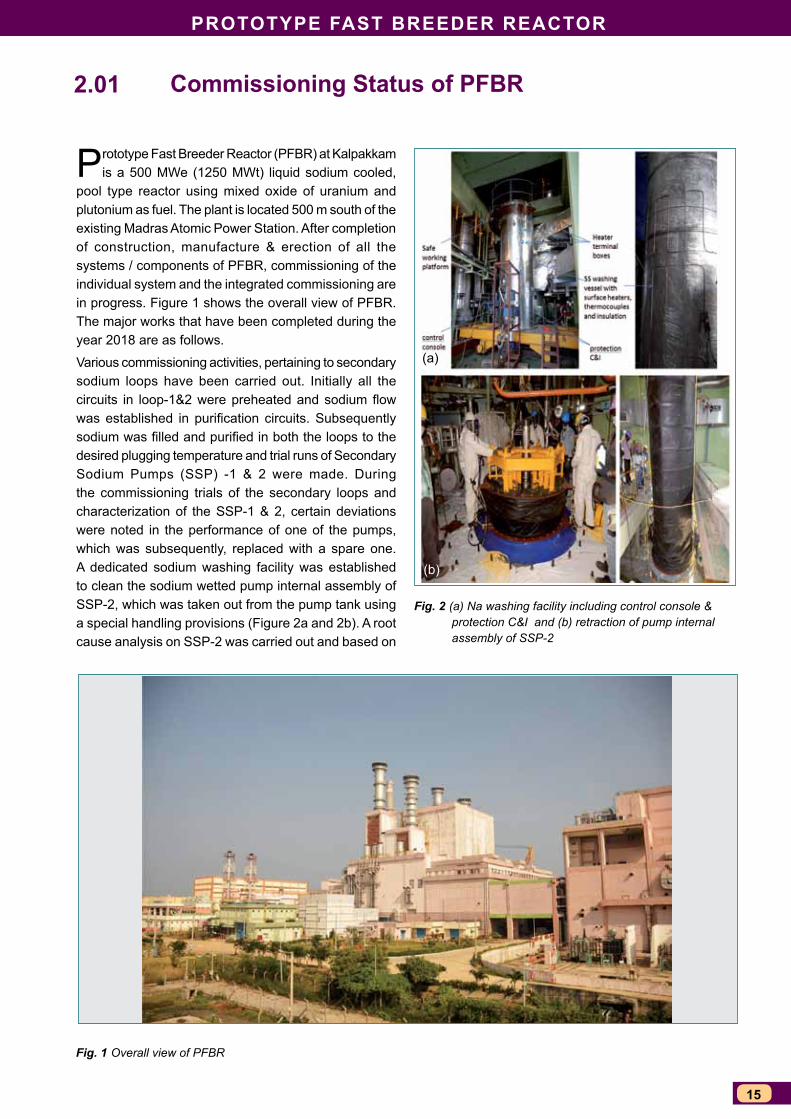
Fig. 2 (a) Na washing facility including control console & protection C&I and (b) retraction of pump internal assembly of SSP-2
Commissioning status of PFBR
Prototype Fast Breeder Reactor (PFBR) at Kalpakkam is a 500 MWe (1250 MWt) liquid sodium cooled,
pool type reactor using mixed oxide of uranium and plutonium as fuel. The plant is located 500 m south of the existing Madras Atomic Power Station. After completion of construction, manufacture & erection of all the systems / components of PFBR, commissioning of the individual system and the integrated commissioning are in progress. Figure 1 shows the overall view of PFBR. The major works that have been completed during the year 2018 are as follows.
Various commissioning activities, pertaining to secondary sodium loops have been carried out. Initially all the circuits in loop-1&2 were preheated and sodium flow was established in purification circuits. Subsequently sodium was filled and purified in both the loops to the desired plugging temperature and trial runs of Secondary Sodium Pumps (SSP) -1 & 2 were made. During the commissioning trials of the secondary loops and characterization of the SSP-1 & 2, certain deviations were noted in the performance of one of the pumps, which was subsequently, replaced with a spare one. A dedicated sodium washing facility was established to clean the sodium wetted pump internal assembly of SSP-2, which was taken out from the pump tank using a special handling provisions (Figure 2a and 2b). A root cause analysis on SSP-2 was carried out and based on
2.01
PFBR
Fig. 1 Overall view of PFBR
(a)
(b)
IGC ANNUAL REPORT - 2018
16
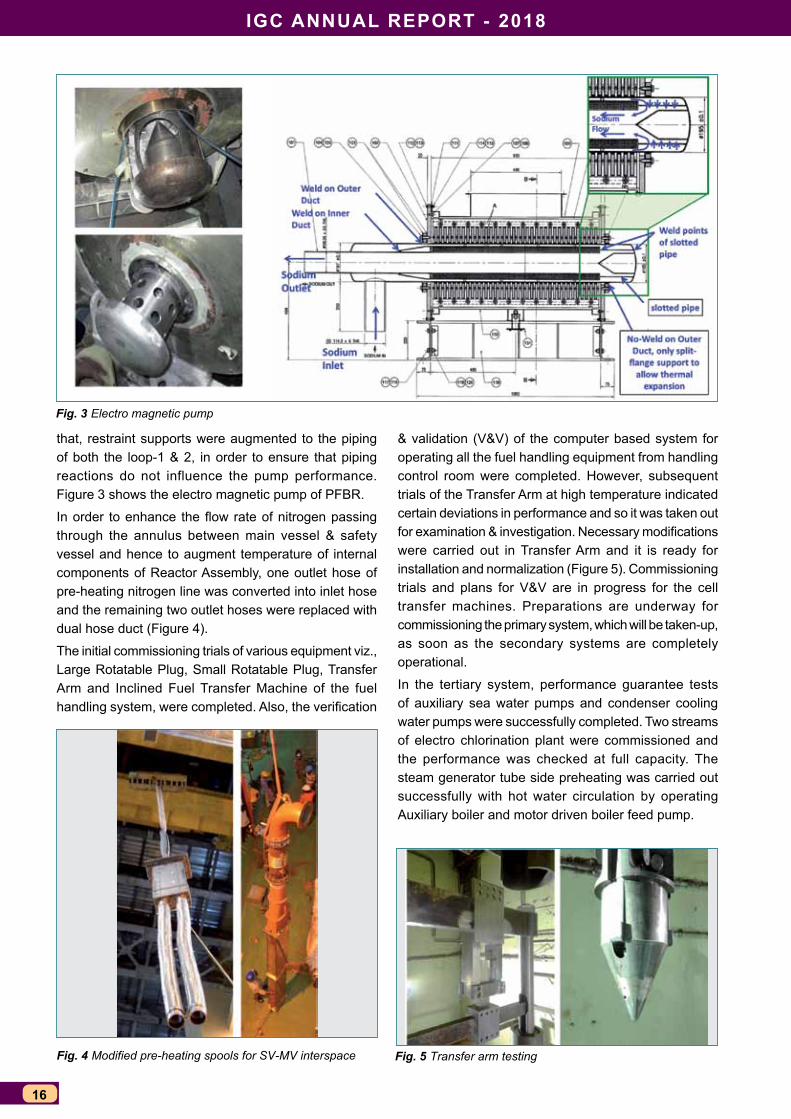
that, restraint supports were augmented to the piping of both the loop-1 & 2, in order to ensure that piping reactions do not influence the pump performance. Figure 3 shows the electro magnetic pump of PFBR.
In order to enhance the flow rate of nitrogen passing through the annulus between main vessel & safety vessel and hence to augment temperature of internal components of Reactor Assembly, one outlet hose of pre-heating nitrogen line was converted into inlet hose and the remaining two outlet hoses were replaced with dual hose duct (Figure 4).
The initial commissioning trials of various equipment viz., Large Rotatable Plug, Small Rotatable Plug, Transfer Arm and Inclined Fuel Transfer Machine of the fuel handling system, were completed. Also, the verification
Fig. 5 Transfer arm testing
& validation (V&V) of the computer based system for operating all the fuel handling equipment from handling control room were completed. However, subsequent trials of the Transfer Arm at high temperature indicated certain deviations in performance and so it was taken out for examination & investigation. Necessary modifications were carried out in Transfer Arm and it is ready for installation and normalization (Figure 5). Commissioning trials and plans for V&V are in progress for the cell transfer machines. Preparations are underway for commissioning the primary system, which will be taken-up, as soon as the secondary systems are completely operational.
In the tertiary system, performance guarantee tests of auxiliary sea water pumps and condenser cooling water pumps were successfully completed. Two streams of electro chlorination plant were commissioned and the performance was checked at full capacity. The steam generator tube side preheating was carried out successfully with hot water circulation by operating Auxiliary boiler and motor driven boiler feed pump.
Fig. 4 Modified pre-heating spools for SV-MV interspace
Fig. 3 Electro magnetic pump
PROTOTyPE FAsT BREEdER REACTOR
17
Construction and Commissioning of Multi dsR drop Time Test Facility
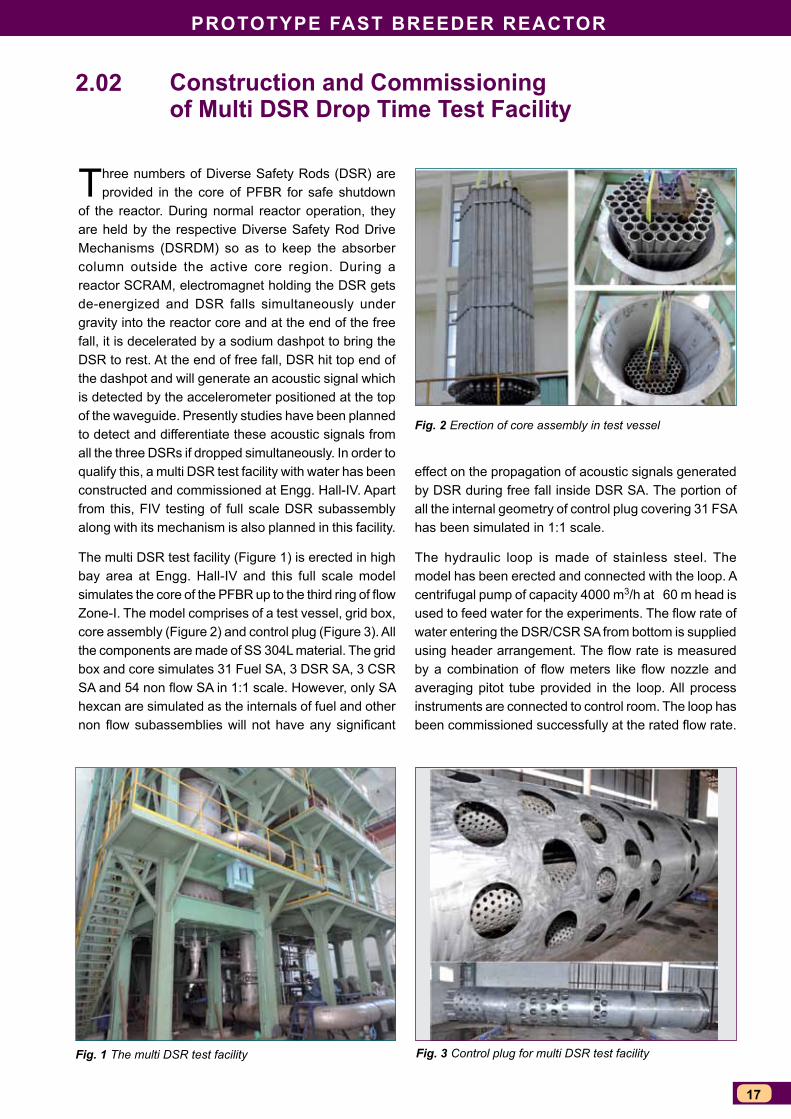
Three numbers of Diverse Safety Rods (DSR) are provided in the core of PFBR for safe shutdown
of the reactor. During normal reactor operation, they are held by the respective Diverse Safety Rod Drive Mechanisms (DSRDM) so as to keep the absorber column outside the active core region. During a reactor SCRAM, electromagnet holding the DSR gets de-energized and DSR falls simultaneously under gravity into the reactor core and at the end of the free fall, it is decelerated by a sodium dashpot to bring the DSR to rest. At the end of free fall, DSR hit top end of the dashpot and will generate an acoustic signal which is detected by the accelerometer positioned at the top of the waveguide. Presently studies have been planned to detect and differentiate these acoustic signals from all the three DSRs if dropped simultaneously. In order to qualify this, a multi DSR test facility with water has been constructed and commissioned at Engg. Hall-IV. Apart from this, FIV testing of full scale DSR subassembly along with its mechanism is also planned in this facility.
The multi DSR test facility (Figure 1) is erected in high bay area at Engg. Hall-IV and this full scale model simulates the core of the PFBR up to the third ring of flow Zone-I. The model comprises of a test vessel, grid box, core assembly (Figure 2) and control plug (Figure 3). All the components are made of SS 304L material. The grid box and core simulates 31 Fuel SA, 3 DSR SA, 3 CSR SA and 54 non flow SA in 1:1 scale. However, only SA hexcan are simulated as the internals of fuel and other non flow subassemblies will not have any significant
2.02
Fig. 1 The multi DSR test facility
Fig. 2 Erection of core assembly in test vessel
Fig. 3 Control plug for multi DSR test facility
effect on the propagation of acoustic signals generated by DSR during free fall inside DSR SA. The portion of all the internal geometry of control plug covering 31 FSA has been simulated in 1:1 scale.
The hydraulic loop is made of stainless steel. The model has been erected and connected with the loop. A centrifugal pump of capacity 4000 m3/h at 60 m head is used to feed water for the experiments. The flow rate of water entering the DSR/CSR SA from bottom is supplied using header arrangement. The flow rate is measured by a combination of flow meters like flow nozzle and averaging pitot tube provided in the loop. All process instruments are connected to control room. The loop has been commissioned successfully at the rated flow rate.
IGC ANNUAL REPORT - 2018
18
Manufacture of Improved Transfer Arm Guide and Rail with Colmonoy Hard Face Coating
Transfer Arm (TA) is the in vessel handling machine of PFBR used to transfer fresh and spent core
subassemblies (SA) within the main vessel. It is an offset arm type machine with an offset length of 572.5 mm. An additional guide & rail arrangement is provided between the offset link and the connecting piece of the gripper assembly. The rail and guide are designed to perform translation movement during operation. The relative motion between these components in the assembly at elevated temperature and sodium environment may lead to wear and self welding. To minimize such problems throughout the operating period of the reactor; these components are designed with hard facing deposit on its mating surfaces.
This is an improved design compared to the previous one. The improvements are
(i) replacement of 90 µm thick chromium plating of the mating surfaces of guide and rail with 1.9 mm thick Colmonoy coating and
(ii) 2D profile of the guide has been replaced with 3D profile for ease of operation.
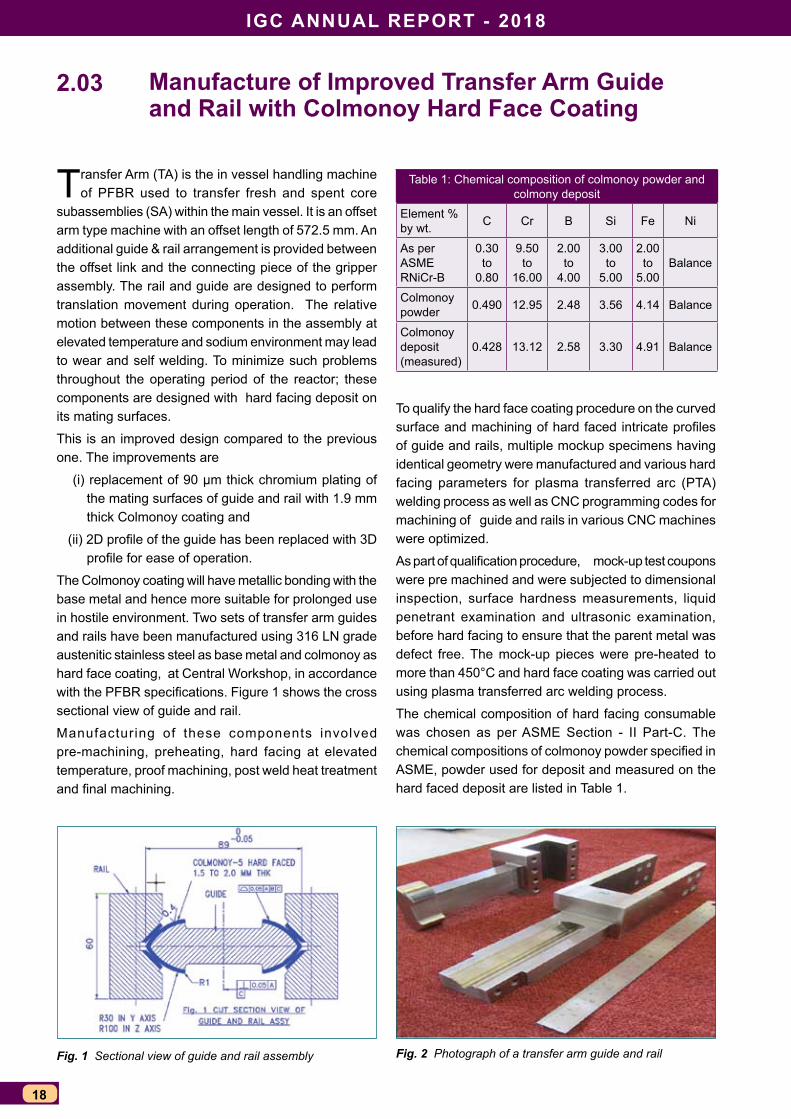
The Colmonoy coating will have metallic bonding with the base metal and hence more suitable for prolonged use in hostile environment. Two sets of transfer arm guides and rails have been manufactured using 316 LN grade austenitic stainless steel as base metal and colmonoy as hard face coating, at Central Workshop, in accordance with the PFBR specifications. Figure 1 shows the cross sectional view of guide and rail.
Manufacturing of these components involved pre-machining, preheating, hard facing at elevated temperature, proof machining, post weld heat treatment and final machining.
2.03
To qualify the hard face coating procedure on the curved surface and machining of hard faced intricate profiles of guide and rails, multiple mockup specimens having identical geometry were manufactured and various hard facing parameters for plasma transferred arc (PTA) welding process as well as CNC programming codes for machining of guide and rails in various CNC machines were optimized.
As part of qualification procedure, mock-up test coupons were pre machined and were subjected to dimensional inspection, surface hardness measurements, liquid penetrant examination and ultrasonic examination, before hard facing to ensure that the parent metal was defect free. The mock-up pieces were pre-heated to more than 450°C and hard face coating was carried out using plasma transferred arc welding process.
The chemical composition of hard facing consumable was chosen as per ASME Section - II Part-C. The chemical compositions of colmonoy powder specified in ASME, powder used for deposit and measured on the hard faced deposit are listed in Table 1.
Table 1: Chemical composition of colmonoy powder and colmony deposit
Element % by wt. C Cr B Si Fe Ni
As per ASME RNiCr-B
0.30 to
0.80
9.50 to
16.00
2.00 to
4.00
3.00 to
5.00
2.00 to
5.00Balance
Colmonoy powder 0.490 12.95 2.48 3.56 4.14 Balance
Colmonoy deposit (measured)
0.428 13.12 2.58 3.30 4.91 Balance
Fig. 1 Sectional view of guide and rail assembly Fig. 2 Photograph of a transfer arm guide and rail
PROTOTyPE FAsT BREEdER REACTOR
19
Fig. 5 Photograph of TA guide and rail assembly
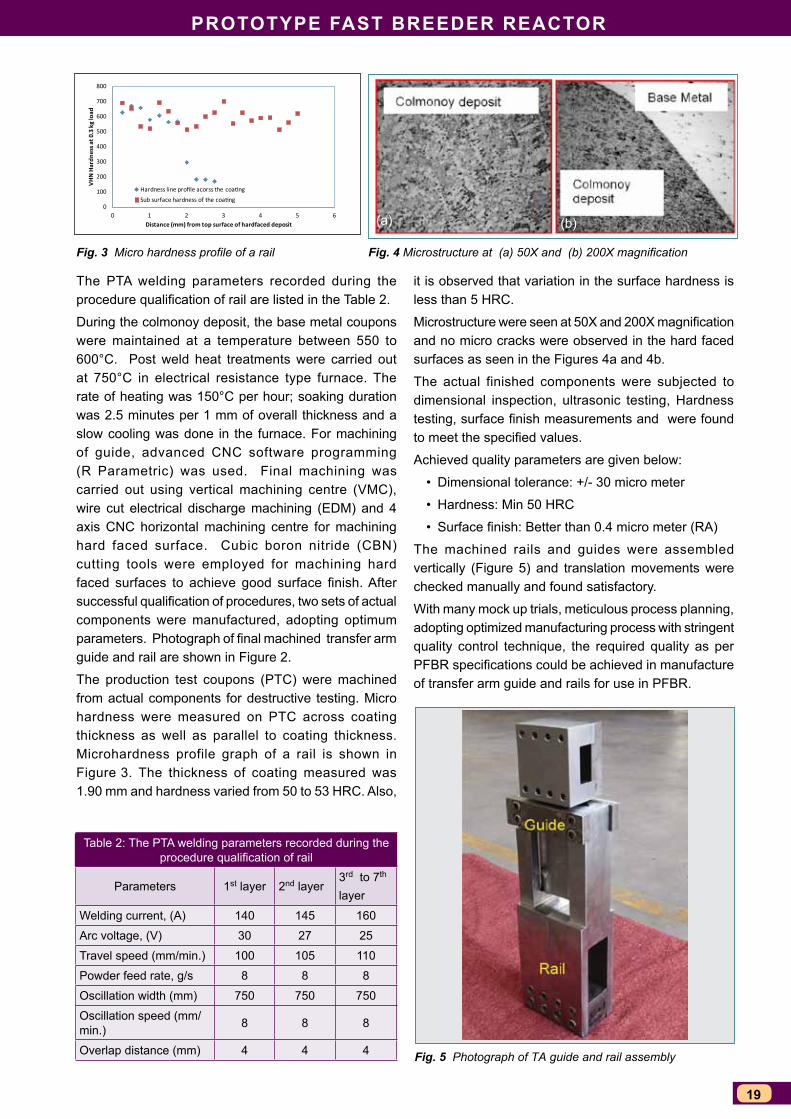
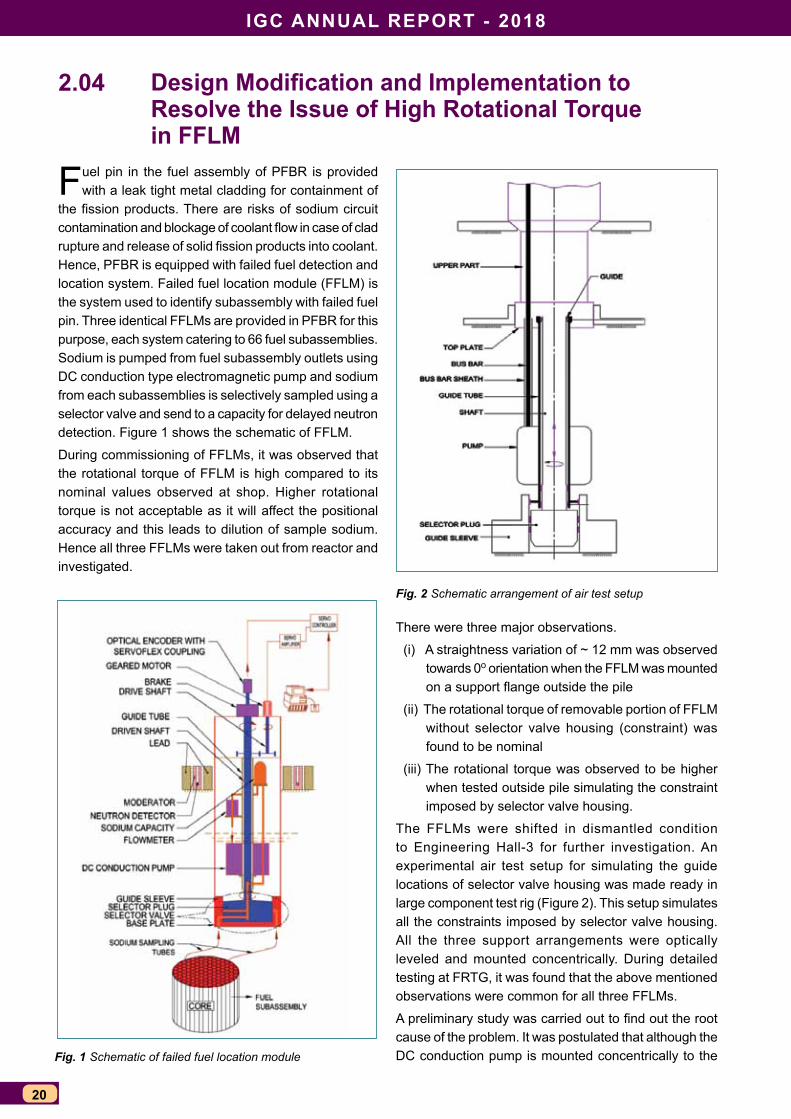
Fig. 3 Micro hardness profile of a rail Fig. 4 Microstructure at (a) 50X and (b) 200X magnification
The PTA welding parameters recorded during the procedure qualification of rail are listed in the Table 2.
During the colmonoy deposit, the base metal coupons were maintained at a temperature between 550 to 600°C. Post weld heat treatments were carried out at 750°C in electrical resistance type furnace. The rate of heating was 150°C per hour; soaking duration was 2.5 minutes per 1 mm of overall thickness and a slow cooling was done in the furnace. For machining of guide, advanced CNC software programming (R Parametric) was used. Final machining was carried out using vertical machining centre (VMC), wire cut electrical discharge machining (EDM) and 4 axis CNC horizontal machining centre for machining hard faced surface. Cubic boron nitride (CBN) cutting tools were employed for machining hard faced surfaces to achieve good surface finish. After successful qualification of procedures, two sets of actual components were manufactured, adopting optimum parameters. Photograph of final machined transfer arm guide and rail are shown in Figure 2.
The production test coupons (PTC) were machined from actual components for destructive testing. Micro hardness were measured on PTC across coating thickness as well as parallel to coating thickness. Microhardness profile graph of a rail is shown in Figure 3. The thickness of coating measured was 1.90 mm and hardness varied from 50 to 53 HRC. Also,
0
100
200
300
400
500
600
700
800
0 1 2 3 4 5 6
VHN
Har
dnes
s at 0
.3 k
g lo
ad
Distance (mm) from top surface of hardfaced deposit
Hardness line profile acorss the coatingSub surface hardness of the coating
it is observed that variation in the surface hardness is less than 5 HRC.
Microstructure were seen at 50X and 200X magnification and no micro cracks were observed in the hard faced surfaces as seen in the Figures 4a and 4b.
The actual finished components were subjected to dimensional inspection, ultrasonic testing, Hardness testing, surface finish measurements and were found to meet the specified values.
Achieved quality parameters are given below:
• Dimensional tolerance: +/- 30 micro meter
• Hardness: Min 50 HRC
• Surface finish: Better than 0.4 micro meter (RA)
The machined rails and guides were assembled vertically (Figure 5) and translation movements were checked manually and found satisfactory.
With many mock up trials, meticulous process planning, adopting optimized manufacturing process with stringent quality control technique, the required quality as per PFBR specifications could be achieved in manufacture of transfer arm guide and rails for use in PFBR.
Table 2: The PTA welding parameters recorded during the procedure qualification of rail
Parameters 1st layer 2nd layer3rd to 7th
layer
Welding current, (A) 140 145 160
Arc voltage, (V) 30 27 25
Travel speed (mm/min.) 100 105 110
Powder feed rate, g/s 8 8 8
Oscillation width (mm) 750 750 750
Oscillation speed (mm/min.) 8 8 8
Overlap distance (mm) 4 4 4
(a) (b)
IGC ANNUAL REPORT - 2018
20
Design Modification and Implementation to Resolve the Issue of High Rotational Torque in FFLM
Fuel pin in the fuel assembly of PFBR is provided with a leak tight metal cladding for containment of
the fission products. There are risks of sodium circuit contamination and blockage of coolant flow in case of clad rupture and release of solid fission products into coolant. Hence, PFBR is equipped with failed fuel detection and location system. Failed fuel location module (FFLM) is the system used to identify subassembly with failed fuel pin. Three identical FFLMs are provided in PFBR for this purpose, each system catering to 66 fuel subassemblies. Sodium is pumped from fuel subassembly outlets using DC conduction type electromagnetic pump and sodium from each subassemblies is selectively sampled using a selector valve and send to a capacity for delayed neutron detection. Figure 1 shows the schematic of FFLM.
During commissioning of FFLMs, it was observed that the rotational torque of FFLM is high compared to its nominal values observed at shop. Higher rotational torque is not acceptable as it will affect the positional accuracy and this leads to dilution of sample sodium. Hence all three FFLMs were taken out from reactor and investigated.
2.04
Fig. 1 Schematic of failed fuel location module
Fig. 2 Schematic arrangement of air test setup
There were three major observations.
(i) A straightness variation of ~ 12 mm was observed towards 0o orientation when the FFLM was mounted on a support flange outside the pile
(ii) The rotational torque of removable portion of FFLM without selector valve housing (constraint) was found to be nominal
(iii) The rotational torque was observed to be higher when tested outside pile simulating the constraint imposed by selector valve housing.
The FFLMs were shifted in dismantled condition to Engineering Hall-3 for further investigation. An experimental air test setup for simulating the guide locations of selector valve housing was made ready in large component test rig (Figure 2). This setup simulates all the constraints imposed by selector valve housing. All the three support arrangements were optically leveled and mounted concentrically. During detailed testing at FRTG, it was found that the above mentioned observations were common for all three FFLMs.
A preliminary study was carried out to find out the root cause of the problem. It was postulated that although the DC conduction pump is mounted concentrically to the
PROTOTyPE FAsT BREEdER REACTOR
21
Fig. 4 Existing arrangement at top plate Fig. 5 Modified arrangement at top plate
guide tube of FFLM, the centre of gravity of the same is not concentric to guide tube axis due to its uneven mass distribution. This causes moment load on guide tube and shaft, which is responsible for the increased rotational torque. To verify this, detailed theoretical analysis and experimental studies were carried out. The 3D modeling of DC conduction pump showed that the position of centre of gravity is 60 mm away from its geometrical
centre. This was later confirmed by measurement. The straightness variation of FFLM is due to deflection of FFLM only under eccentric loading (Figure 3). When this deflection is constrained by the guide sleeve, the reactive forces generated between contact surfaces of guide sleeve- selector plug & guide tube lead to increase in frictional force and rotational torque. The rotational torque was estimated theoretically as well as experimentally.
Various design options to rectify the FFLM were studied. The design of bush and bus bar sheath was modified at top plate region as shown in Figures 4 and 5. In this configuration, a threaded sleeve is welded to top of copper bar sheath. Load of DC conduction pump is transferred to top plate through a mating threaded member (Figure 5) thereby relieving the guide tube from eccentric loading of pump. The support location in the modified design is in line with the centre of gravity of DC conduction pump. This option was chosen as it was best feasible and permanent solution which calls for only minimal modification and partial dismantling.
The design modifications were implemented in one FFLM and tested in air at Engineering Hall-3. Air testing was carried out simulating the constraints imposed by selector valve housing. It was observed that the rotational torque has reduced from 30 Nm, to 5 Nm after implementing the design modification. The measured value is now acceptable. The modified FFLM was erected in PFBR and the rotational torque was measured at 150 °C in nitrogen environment. The measured torque was 5 Nm thus confirming the successful resolution of the problem.
Fig. 3 Bending of FFLM due to eccentric loading from DC conduction pump
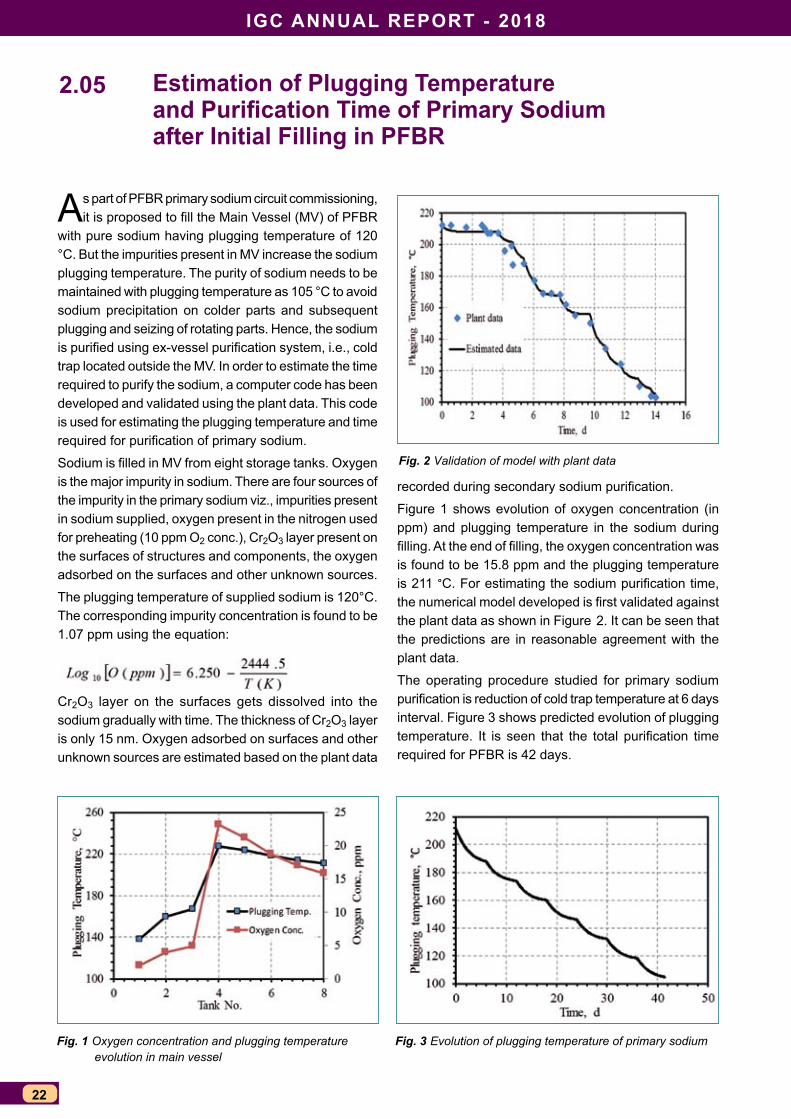
IGC ANNUAL REPORT - 2018
22
Estimation of Plugging Temperature and Purification Time of Primary Sodium after Initial Filling in PFBR
As part of PFBR primary sodium circuit commissioning, it is proposed to fill the Main Vessel (MV) of PFBR
with pure sodium having plugging temperature of 120 °C. But the impurities present in MV increase the sodium plugging temperature. The purity of sodium needs to be maintained with plugging temperature as 105 °C to avoid sodium precipitation on colder parts and subsequent plugging and seizing of rotating parts. Hence, the sodium is purified using ex-vessel purification system, i.e., cold trap located outside the MV. In order to estimate the time required to purify the sodium, a computer code has been developed and validated using the plant data. This code is used for estimating the plugging temperature and time required for purification of primary sodium.
Sodium is filled in MV from eight storage tanks. Oxygen is the major impurity in sodium. There are four sources of the impurity in the primary sodium viz., impurities present in sodium supplied, oxygen present in the nitrogen used for preheating (10 ppm O2 conc.), Cr2O3 layer present on the surfaces of structures and components, the oxygen adsorbed on the surfaces and other unknown sources.
The plugging temperature of supplied sodium is 120°C. The corresponding impurity concentration is found to be 1.07 ppm using the equation:
Cr2O3 layer on the surfaces gets dissolved into the sodium gradually with time. The thickness of Cr2O3 layer is only 15 nm. Oxygen adsorbed on surfaces and other unknown sources are estimated based on the plant data
2.05
Fig. 2 Validation of model with plant data
Fig. 3 Evolution of plugging temperature of primary sodiumFig. 1 Oxygen concentration and plugging temperature evolution in main vessel
recorded during secondary sodium purification.
Figure 1 shows evolution of oxygen concentration (in ppm) and plugging temperature in the sodium during filling. At the end of filling, the oxygen concentration was is found to be 15.8 ppm and the plugging temperature is 211 °C. For estimating the sodium purification time, the numerical model developed is first validated against the plant data as shown in Figure 2. It can be seen that the predictions are in reasonable agreement with the plant data.
The operating procedure studied for primary sodium purification is reduction of cold trap temperature at 6 days interval. Figure 3 shows predicted evolution of plugging temperature. It is seen that the total purification time required for PFBR is 42 days.

PROTOTyPE FAsT BREEdER REACTOR
23
Indigenous development of Back-up seal in silicone
In Fast Breeder Reactors, top shield acts as reactor cover in the axial direction and consists of roof slab and
rotatable plugs. To enable the rotation of the rotatable plugs to facilitate positioning of in-vessel fuel handling machine over desired fuel subassembly location, they are mounted over large diameter bearings. Since the interface between the rotating and stationary members of the top shield forms boundary for primary radioactive argon cover gas, the interspace is sealed with an inflatable seal as a primary barrier and an elastomeric back-up seal as a secondary barrier during normal operation of reactor. Back-up seals are custom made seals of complex geometry. For PFBR, these seals made of fuorocarbon material were developed, tested and manufactured with the help of an Indian industry. However, owing to the complicated technology of fluorocarbon extrusion, the repeatability of seal production with alternate supplier could not be ensured. To overcome this shortcoming of single supplier with difficult to work the material composition, need for developing back-up seal with an alternate material as well as supplier was identified. As part of this, development activities with an alternate candidate material i.e., silicone, a versatile rubber having vast applications was initiated with an objective of developing 1 m diameter back-up seal and qualifying it in test rig before producing reactor grade seals.
The development was divided into two stages:
stage 1- Development of seal through extrusion/moulding,
testing and manufacture of 7 m continuous length of seal in Silicone, meeting the geometrical and technical requirements as per specification.
- Demonstration of end joining meeting the splice strength and other visual quality requirements.
stage 2Developing 3 numbers of 1 m diameter test back-up seal for qualification at IGCAR
Process flowFollowing process flow diagram was adopted for the seal development:
Incoming Inspection of raw material → batch mixing as per mixing ration → test slab and button preparation → test slab and button inspection → extrusion trials → first off sample inspection → bulk production / periodic inspection → final inspection → packing & despatch
MaterialTwo grades of Silicone base material, Elastosil ® R 401 / 70 S and Elastosil ®R 401 /40S in the ratio of 60:40 were
2.06
chosen for the extrusion based on acceptable material properties with respect to hardness, tensile strength and elongation. Flat dumbbell shaped samples of 2 mm thick were used for checking the tensile properties.
Further, heat ageing test on flat samples was carried out as per ASTM D573 after ageing the samples to 70 Hrs @ 225°C.
Extrusion trialsSubsequent to finalization of material composition, extrusion trails were taken-up to obtain a stable profile of back-up seal. Extrusion was carried out using a screw feed type extruder (Figure 1). Since, the extruder was not fitted with a conveyor, seal was extruded continuously with normal feather touch support and rotated in the table with talc powder to avoid sticking. The seal was cured in an Autoclave oven. To check the compliance of extruded shape to geometrical features as per specification, a gauge in Perspex material was machined and fitment trials of extruded seal samples were taken (Figure 2). The confirmation to geometry
Fig. 1 Back-up seal is being extruded
Fig. 2 Checking with fitment gauge in perspex
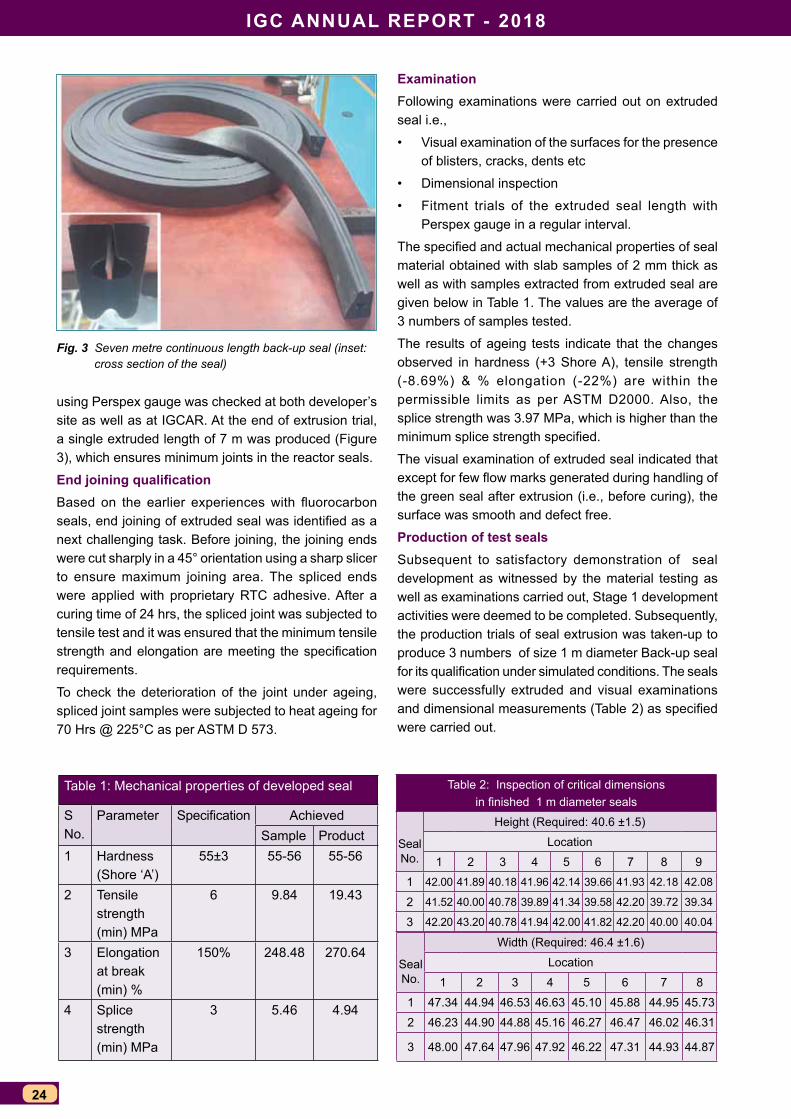
IGC ANNUAL REPORT - 2018
24
Fig. 3 Seven metre continuous length back-up seal (inset: cross section of the seal)
using Perspex gauge was checked at both developer’s site as well as at IGCAR. At the end of extrusion trial, a single extruded length of 7 m was produced (Figure 3), which ensures minimum joints in the reactor seals.
End joining qualificationBased on the earlier experiences with fluorocarbon seals, end joining of extruded seal was identified as a next challenging task. Before joining, the joining ends were cut sharply in a 45° orientation using a sharp slicer to ensure maximum joining area. The spliced ends were applied with proprietary RTC adhesive. After a curing time of 24 hrs, the spliced joint was subjected to tensile test and it was ensured that the minimum tensile strength and elongation are meeting the specification requirements.
To check the deterioration of the joint under ageing, spliced joint samples were subjected to heat ageing for 70 Hrs @ 225°C as per ASTM D 573.
ExaminationFollowing examinations were carried out on extruded seal i.e.,
• Visual examination of the surfaces for the presence of blisters, cracks, dents etc
• Dimensional inspection
• Fitment trials of the extruded seal length with Perspex gauge in a regular interval.
The specified and actual mechanical properties of seal material obtained with slab samples of 2 mm thick as well as with samples extracted from extruded seal are given below in Table 1. The values are the average of 3 numbers of samples tested.
The results of ageing tests indicate that the changes observed in hardness (+3 Shore A), tensile strength (-8.69%) & % elongation (-22%) are within the permissible limits as per ASTM D2000. Also, the splice strength was 3.97 MPa, which is higher than the minimum splice strength specified.
The visual examination of extruded seal indicated that except for few flow marks generated during handling of the green seal after extrusion (i.e., before curing), the surface was smooth and defect free.
Production of test sealsSubsequent to satisfactory demonstration of seal development as witnessed by the material testing as well as examinations carried out, Stage 1 development activities were deemed to be completed. Subsequently, the production trials of seal extrusion was taken-up to produce 3 numbers of size 1 m diameter Back-up seal for its qualification under simulated conditions. The seals were successfully extruded and visual examinations and dimensional measurements (Table 2) as specified were carried out.
Seal No.
Width (Required: 46.4 ±1.6)
Location
1 2 3 4 5 6 7 8
1 47.34 44.94 46.53 46.63 45.10 45.88 44.95 45.73
2 46.23 44.90 44.88 45.16 46.27 46.47 46.02 46.31
3 48.00 47.64 47.96 47.92 46.22 47.31 44.93 44.87
Table 2: Inspection of critical dimensions in finished 1 m diameter seals
Seal No.
Height (Required: 40.6 ±1.5)
Location
1 2 3 4 5 6 7 8 9
1 42.00 41.89 40.18 41.96 42.14 39.66 41.93 42.18 42.08
2 41.52 40.00 40.78 39.89 41.34 39.58 42.20 39.72 39.34
3 42.20 43.20 40.78 41.94 42.00 41.82 42.20 40.00 40.04
Table 1: Mechanical properties of developed seal
S No.
Parameter Specification AchievedSample Product
1 Hardness (Shore ‘A’)
55±3 55-56 55-56
2 Tensile strength (min) MPa
6 9.84 19.43
3 Elongation at break (min) %
150% 248.48 270.64
4 Splice strength (min) MPa
3 5.46 4.94

PROTOTyPE FAsT BREEdER REACTOR
25
development of Ultrasonic Guided Waves Based Methodology for Inspection of steam Generator Tubes of PFBR
Steam generator (SG) tubes in Prototype Fast Breeder Reactor (PFBR) carry water/steam inside the tubes
surrounded by hot liquid sodium serving as a coolant in PFBR. If any leakage occurs in an SG tube of PFBR, sodium and high-pressure water/steam can react exothermically leading to the evolution of hydrogen, corrosive products and intense local heat. This may cause huge damage to the surrounding tubes and disrupt the smooth operation of the reactor. Therefore, a periodic assessment of integrity of the tubes using a suitable, reliable and rapid testing method is mandatory. For in-service inspection of SG tubes of PFBR, remote field eddy current technique (RFEC) is used. It requires the insertion of the RFEC probe into the tube all along the length of 23 m of the tube and hence, is very time consuming. Besides, RFEC is influenced by misalignment of coils, probe wobble, welds, permeability variations, and residual stresses and bends. To circumvent the difficulties, ultrasonic guided wave-based inspection methodology is being developed for rapid inspection of the whole SG tube from one end without having to insert and guide a probe all along the length of the tube.
Towards the development of inspection methodology, axi-symmetric longitudinal mode L(0,2) at 250 kHz was optimized using Disperse software and finite element (FE) simulation using ABAQUS for negligible dispersion, defect detection capability and long-range propagation. To examine the long range propagation of the L(0,2) mode at 250 kHz experimentally, an ultrasonic transducer of 250 kHz frequency was coupled to the end of a 3.8 m long SG tube. Figure 1 shows the experimental time signal obtained in a 3.8 m long tube. There are six multiple reflections which amount to the propagation distance of 45.6 m against the required 46 m. Thus, L(0,2) mode at 250 kHz propagates for a distance of 45.6 m without much dispersion. In order to examine the defect detection capability, experiments were conducted on
2.07
0.0 2.0 4.0 6.0 8.0 -2
-1
0
1
2
Amplit
ude (
A.U.)
Time (ms)
Multiple End Reflections
0.0 0.3 0.6 0.9 1.2
-3
-2
-1
0
1
2
3
Ampli
tude (
A.U)
Time (ms)
10%WT Deep Circumferential defects
End Reflection
Fig. 1 Experimental time signal obtained in a 3.8 m long tube. There are six multiple reflections which amount to the propagation distance of 45.6 m
Fig. 3 Experimental signal obtained in a bent tube. A-E are full circumferential defects of 10%WT depth. F, the tube end reflection
Fig. 2 (a) FE and (b) experimental signals for the case of six circumferential defects in a 1.5 m long tube. A-F indicate defects and G, the end reflection
1.5 m long tubes with six circumferential, axial and pinhole defects. The results were validated using FE simulation as well. The FE and experimental results correlated well in terms of normalized amplitudes and times of flight. The sensitivity achieved was (a) circumferential defect: 0.23 mm (10%WT) depth, 7 mm circumferential extent and 1 mm width, (b) axial defect: 0.23 mm (10%WT) depth, 7 mm axial length and 1 mm width and (c) pinhole defect: 1.38 mm (60%WT) depth and 1 mm diameter. Figures 2a and 2b show the FE signal and the experimental signals, respectively for the case of six circumferential defects in 1.5 m long tube.
Further, the propagation of L(0,2) mode in the thermal expansion bend and its influence on the mode and the defect detection capability in the bend were studied. Towards this, an experiment was performed with a 3 m long bent tube with five full circumferential defects. Figure 3 shows the experimental signal in which all five defects were detected with the required sensitivity with the negligible influence of the bend.
Thus, L(0,2) mode at 250 kHz satisfies all the requirements in terms of less dispersion, long range propagation, the detection of axial, circumferential and pinhole defects,
0.0 100.0 200.0 300.0 400.0 500.0 600.0-1
0
1-1
0
1
GFEDA
Norm
alize
d Am
p.
Time (µs)
Experimental result
G
CB
Norm
alize
d Di
sp. FE simulation result
AB C D
E F
(a)
(b)
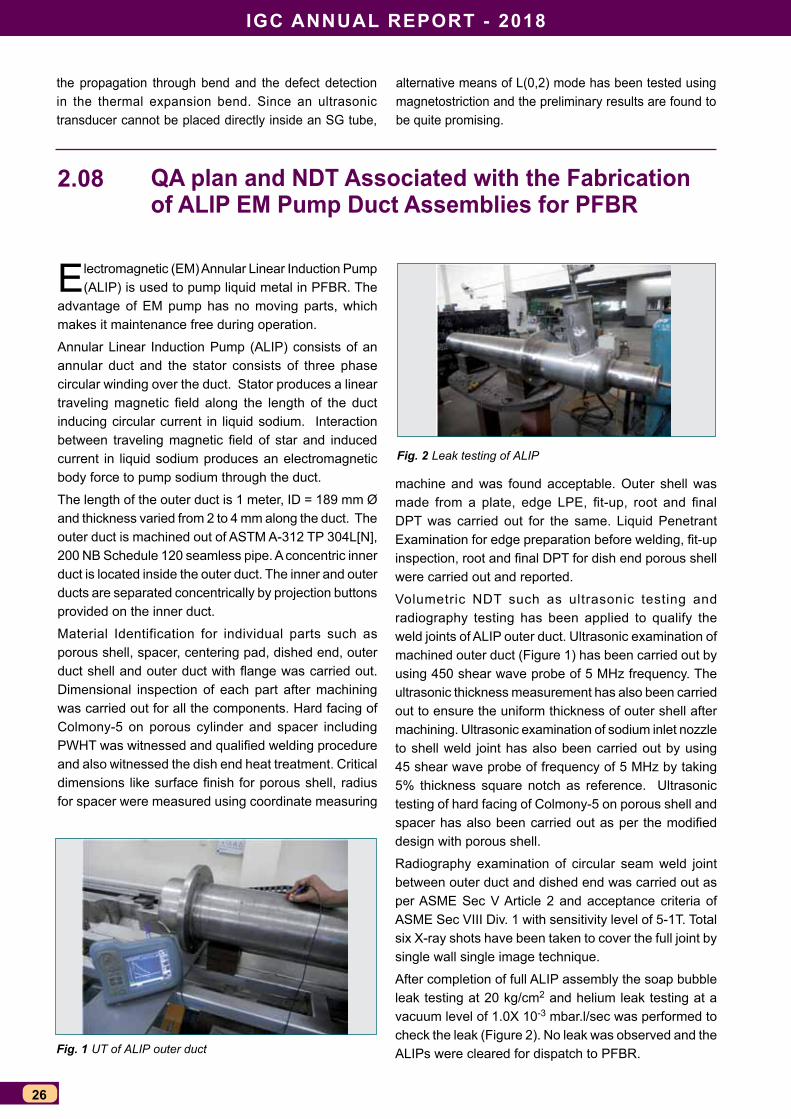
IGC ANNUAL REPORT - 2018
26
QA plan and NdT Associated with the Fabrication of ALIP EM Pump duct Assemblies for PFBR
Electromagnetic (EM) Annular Linear Induction Pump (ALIP) is used to pump liquid metal in PFBR. The
advantage of EM pump has no moving parts, which makes it maintenance free during operation.
Annular Linear Induction Pump (ALIP) consists of an annular duct and the stator consists of three phase circular winding over the duct. Stator produces a linear traveling magnetic field along the length of the duct inducing circular current in liquid sodium. Interaction between traveling magnetic field of star and induced current in liquid sodium produces an electromagnetic body force to pump sodium through the duct.
The length of the outer duct is 1 meter, ID = 189 mm Ø and thickness varied from 2 to 4 mm along the duct. The outer duct is machined out of ASTM A-312 TP 304L[N], 200 NB Schedule 120 seamless pipe. A concentric inner duct is located inside the outer duct. The inner and outer ducts are separated concentrically by projection buttons provided on the inner duct.
Material Identification for individual parts such as porous shell, spacer, centering pad, dished end, outer duct shell and outer duct with flange was carried out. Dimensional inspection of each part after machining was carried out for all the components. Hard facing of Colmony-5 on porous cylinder and spacer including PWHT was witnessed and qualified welding procedure and also witnessed the dish end heat treatment. Critical dimensions like surface finish for porous shell, radius for spacer were measured using coordinate measuring
Fig. 1 UT of ALIP outer duct
Fig. 2 Leak testing of ALIP
machine and was found acceptable. Outer shell was made from a plate, edge LPE, fit-up, root and final DPT was carried out for the same. Liquid Penetrant Examination for edge preparation before welding, fit-up inspection, root and final DPT for dish end porous shell were carried out and reported.
Volumetric NDT such as ultrasonic testing and radiography testing has been applied to qualify the weld joints of ALIP outer duct. Ultrasonic examination of machined outer duct (Figure 1) has been carried out by using 450 shear wave probe of 5 MHz frequency. The ultrasonic thickness measurement has also been carried out to ensure the uniform thickness of outer shell after machining. Ultrasonic examination of sodium inlet nozzle to shell weld joint has also been carried out by using 45 shear wave probe of frequency of 5 MHz by taking 5% thickness square notch as reference. Ultrasonic testing of hard facing of Colmony-5 on porous shell and spacer has also been carried out as per the modified design with porous shell.
Radiography examination of circular seam weld joint between outer duct and dished end was carried out as per ASME Sec V Article 2 and acceptance criteria of ASME Sec VIII Div. 1 with sensitivity level of 5-1T. Total six X-ray shots have been taken to cover the full joint by single wall single image technique.
After completion of full ALIP assembly the soap bubble leak testing at 20 kg/cm2 and helium leak testing at a vacuum level of 1.0X 10⁻³ mbar.l/sec was performed to check the leak (Figure 2). No leak was observed and the ALIPs were cleared for dispatch to PFBR.
2.08
the propagation through bend and the defect detection in the thermal expansion bend. Since an ultrasonic transducer cannot be placed directly inside an SG tube,
alternative means of L(0,2) mode has been tested using magnetostriction and the preliminary results are found to be quite promising.

PROTOTyPE FAsT BREEdER REACTOR
27
Performance Evaluation of Project dC Conduction Pump and PM Flowmeter of FFLM in LCTR
The Failed Fuel Location Module (FFLM) for PFBR is an in-service inspection mechanism for identifying
the failed fuel subassemblies in the reactor. The mode of detection is by monitoring the presence of delayed neutrons in the sampled sodium flowing out of each fuel subassembly. Sodium flowing out of each subassembly is sucked by means of a Direct Current Conduction Pump (DCCP) and sent to the detector circuit at reactor top and returns to the pool. Measurement of the sodium flow through the detector circuit is a process requirement. A Permanent Magnet Flowmeter (PMFM) is used to measure the sodium flow in the FFLM. Conventional pipeline magnetic flowmeter normally used for sodium flow measurement cannot be used here. Flowmeter should be very compact so that it can be accommodated in the available space. Small pipe size (10mm OD/8mm ID), very high operating temperature (460°C), sodium mist atmosphere, requirement of two pairs of electrodes and requirement of long electrode cable of 3 m length are the specialties of FFLM flowmeter. One such flowmeter which is planned to be used in PFBR was installed in the DCCP test facility of LCTR to evaluate its sensitivity in sodium. Photograph of FFLM PM Flowmeter is given in Figure 1.
Sensitivity evaluation of this flowmeter was carried out based on reference flowmeter. Sodium tested PM flowmeter which is installed in series with the FFLM flowmeter is used as the reference flowmeter. Average sensitivity of the reference flowmeter is 8.64 mV/m3/h. After establishing required sodium flow in the test facility, flow output of FFLM flowmeter was compared with reference flow and sensitivity was estimated. Accuracy of the sensitivity estimated by this method is within ±3%. An instrumentation system was made ready for acquiring millivolt output from both flowmeters by using a Data Acquisition System (DAS). Scan interval was set at one second so that every one second millivolt output from both flowmeters was scanned and recorded. While circulating sodium, millivolt output of both flowmeters was acquired in every second and stored in the PC. From this data the sensitivity of the flowmeter was calculated. Trial runs were repeated at different sodium temperatures and different flow rates. Graph of reference flowmeter versus FFLM flowmeter output is given in Figure 2.
Sensitivity evaluation of FFLM PM flowmeter was completed with different sodium flows and sodium temperatures in DCCP test facility of LCTR. Readings acquired during sensitivity evaluation were processed and sensitivity obtained at different sodium temperatures
2.09
and flows was tabulated. Accuracy of the sensitivity evaluation is well within ±3%. Average sensitivity based on sensitivity evaluation was found to be 8.3296 mV/m3/h. Based on estimated sensitivity, flowmeter output at a rated flow of 0.36 m3/h is 3 mV. The flowmeter output is found to be linear. Both the electrode pairs are found to be giving almost the same output. Deviation of experimentally estimated sensitivity value from the analytically estimated value at sodium temperature of 550°C was found to be -8%.
A DC conduction pump is used for circulating sodium through FFLM. This pump was indigenously designed at IGCAR and fabricated by BHAVINI. It was required to test the PFBR DCCP and establish its performance characteristics. Since measurement of differential pressure for establishing the performance curves by operating the pump immersed in sodium is not possible, it was decided to carry out the performance testing outside in a sodium loop. The pump was dismantled from the
0
0.5
1
1.5
2
2.5
3
3.5
4
4.5
0.2 0.25 0.3 0.35 0.4 0.45 0.5
FFLM
flow
met
er o
utpu
t (m
V)
Ref flow in m3/h
Ref flow vs FFLM flowmeter output at 250 °CFMP1FMP2
Fig. 1 Photograph of FFLM PM flowmeter
Fig. 2 Reference flow vs FFLM flowmeter output trace
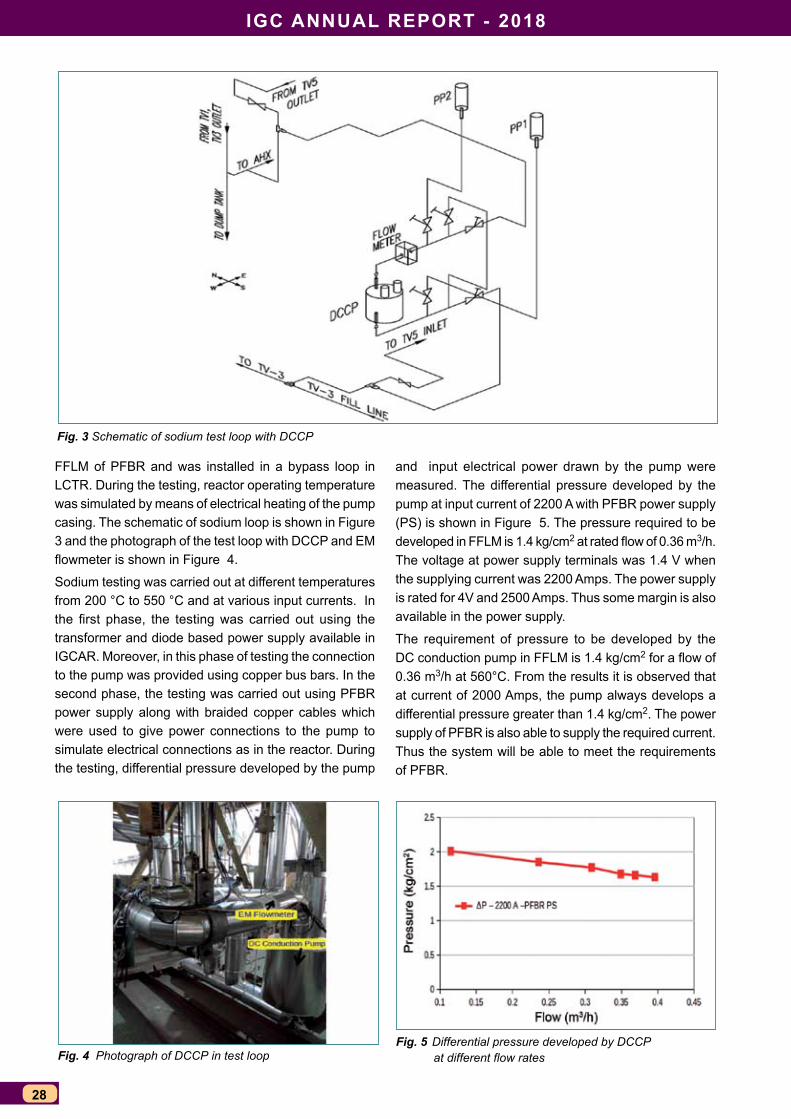
IGC ANNUAL REPORT - 2018
28
FFLM of PFBR and was installed in a bypass loop in LCTR. During the testing, reactor operating temperature was simulated by means of electrical heating of the pump casing. The schematic of sodium loop is shown in Figure 3 and the photograph of the test loop with DCCP and EM flowmeter is shown in Figure 4.
Sodium testing was carried out at different temperatures from 200 °C to 550 °C and at various input currents. In the first phase, the testing was carried out using the transformer and diode based power supply available in IGCAR. Moreover, in this phase of testing the connection to the pump was provided using copper bus bars. In the second phase, the testing was carried out using PFBR power supply along with braided copper cables which were used to give power connections to the pump to simulate electrical connections as in the reactor. During the testing, differential pressure developed by the pump
Fig. 3 Schematic of sodium test loop with DCCP
Fig. 4 Photograph of DCCP in test loopFig. 5 Differential pressure developed by DCCP
at different flow rates
and input electrical power drawn by the pump were measured. The differential pressure developed by the pump at input current of 2200 A with PFBR power supply (PS) is shown in Figure 5. The pressure required to be developed in FFLM is 1.4 kg/cm2 at rated flow of 0.36 m3/h. The voltage at power supply terminals was 1.4 V when the supplying current was 2200 Amps. The power supply is rated for 4V and 2500 Amps. Thus some margin is also available in the power supply.
The requirement of pressure to be developed by the DC conduction pump in FFLM is 1.4 kg/cm2 for a flow of 0.36 m3/h at 560°C. From the results it is observed that at current of 2000 Amps, the pump always develops a differential pressure greater than 1.4 kg/cm2. The power supply of PFBR is also able to supply the required current. Thus the system will be able to meet the requirements of PFBR.
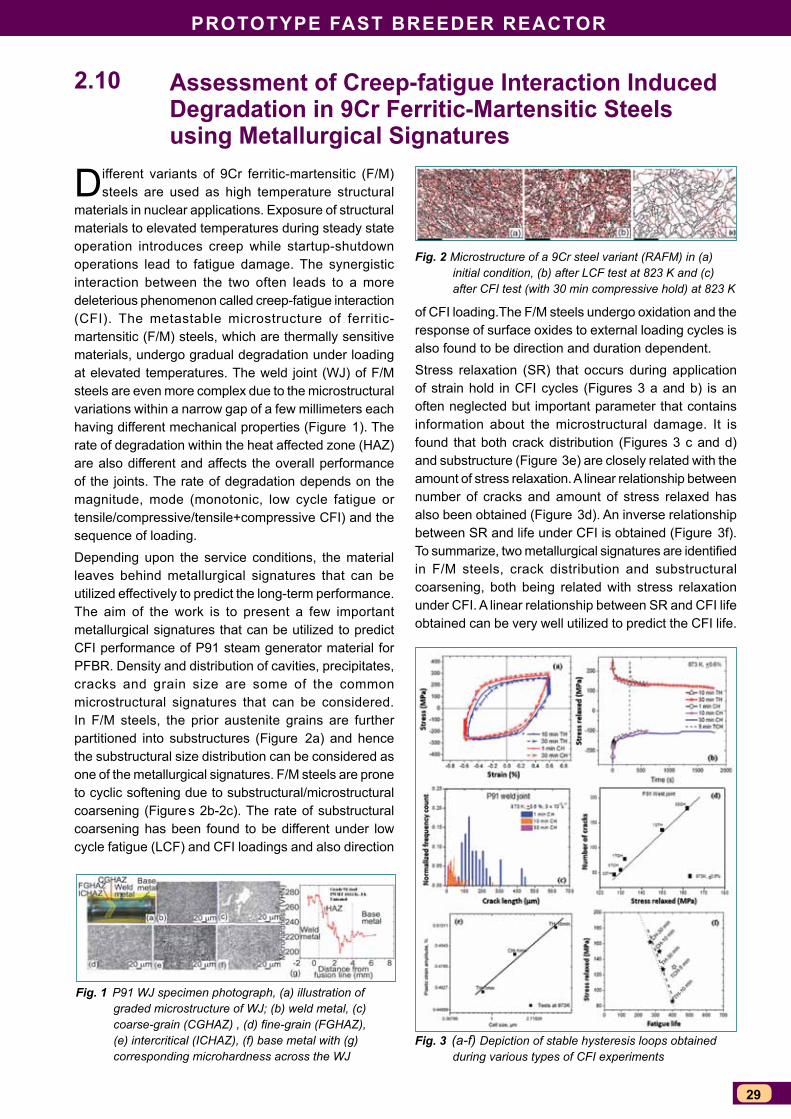
PROTOTyPE FAsT BREEdER REACTOR
29
Assessment of Creep-fatigue Interaction Induced degradation in 9Cr Ferritic-Martensitic steels using Metallurgical signatures
Different variants of 9Cr ferritic-martensitic (F/M) steels are used as high temperature structural
materials in nuclear applications. Exposure of structural materials to elevated temperatures during steady state operation introduces creep while startup-shutdown operations lead to fatigue damage. The synergistic interaction between the two often leads to a more deleterious phenomenon called creep-fatigue interaction (CFI). The metastable microstructure of ferritic-martensitic (F/M) steels, which are thermally sensitive materials, undergo gradual degradation under loading at elevated temperatures. The weld joint (WJ) of F/M steels are even more complex due to the microstructural variations within a narrow gap of a few millimeters each having different mechanical properties (Figure 1). The rate of degradation within the heat affected zone (HAZ) are also different and affects the overall performance of the joints. The rate of degradation depends on the magnitude, mode (monotonic, low cycle fatigue or tensile/compressive/tensile+compressive CFI) and the sequence of loading. Depending upon the service conditions, the material leaves behind metallurgical signatures that can be utilized effectively to predict the long-term performance. The aim of the work is to present a few important metallurgical signatures that can be utilized to predict CFI performance of P91 steam generator material for PFBR. Density and distribution of cavities, precipitates, cracks and grain size are some of the common microstructural signatures that can be considered. In F/M steels, the prior austenite grains are further partitioned into substructures (Figure 2a) and hence the substructural size distribution can be considered as one of the metallurgical signatures. F/M steels are prone to cyclic softening due to substructural/microstructural coarsening (Figure s 2b-2c). The rate of substructural coarsening has been found to be different under low cycle fatigue (LCF) and CFI loadings and also direction
2.10
Fig. 3 (a-f) Depiction of stable hysteresis loops obtained during various types of CFI experiments
Fig. 1 P91 WJ specimen photograph, (a) illustration of graded microstructure of WJ; (b) weld metal, (c) coarse-grain (CGHAZ) , (d) fine-grain (FGHAZ), (e) intercritical (ICHAZ), (f) base metal with (g)corresponding microhardness across the WJ
Fig. 2 Microstructure of a 9Cr steel variant (RAFM) in (a) initial condition, (b) after LCF test at 823 K and (c) after CFI test (with 30 min compressive hold) at 823 K
of CFI loading.The F/M steels undergo oxidation and the response of surface oxides to external loading cycles is also found to be direction and duration dependent.Stress relaxation (SR) that occurs during application of strain hold in CFI cycles (Figures 3 a and b) is an often neglected but important parameter that contains information about the microstructural damage. It is found that both crack distribution (Figures 3 c and d) and substructure (Figure 3e) are closely related with the amount of stress relaxation. A linear relationship between number of cracks and amount of stress relaxed has also been obtained (Figure 3d). An inverse relationship between SR and life under CFI is obtained (Figure 3f). To summarize, two metallurgical signatures are identified in F/M steels, crack distribution and substructural coarsening, both being related with stress relaxation under CFI. A linear relationship between SR and CFI life obtained can be very well utilized to predict the CFI life.
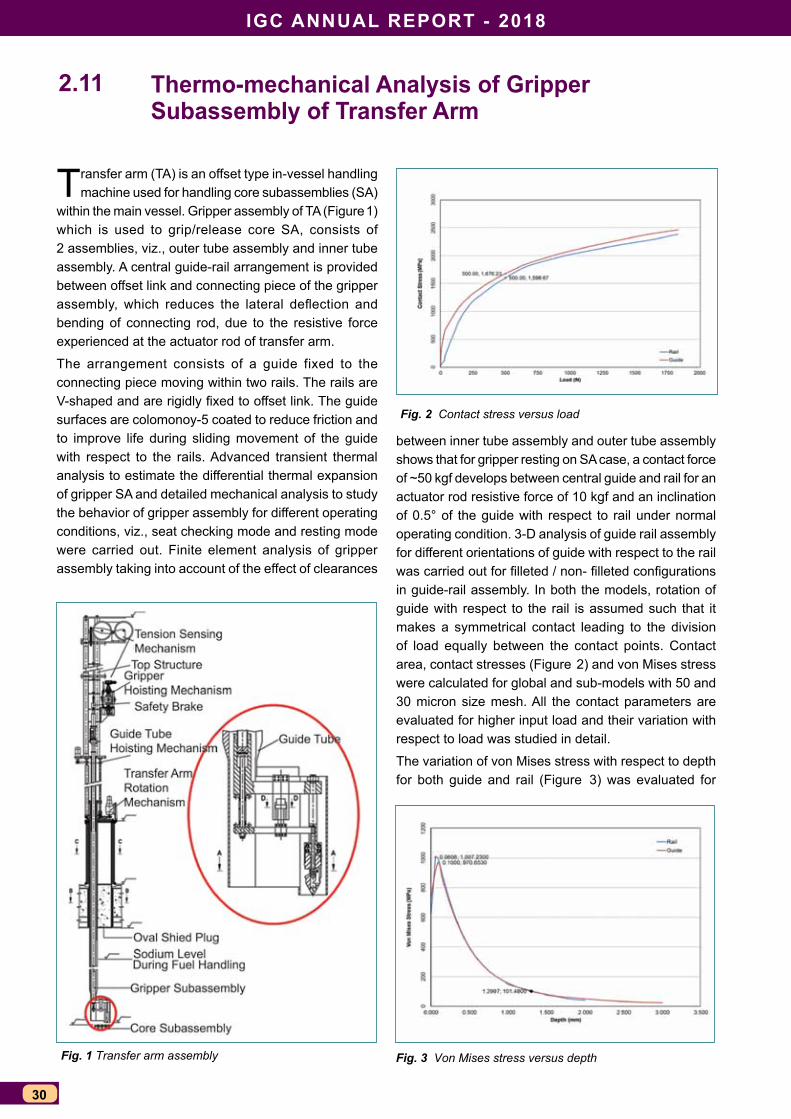
IGC ANNUAL REPORT - 2018
30
Thermo-mechanical Analysis of Gripper subassembly of Transfer Arm
Transfer arm (TA) is an offset type in-vessel handling machine used for handling core subassemblies (SA)
within the main vessel. Gripper assembly of TA (Figure 1) which is used to grip/release core SA, consists of 2 assemblies, viz., outer tube assembly and inner tube assembly. A central guide-rail arrangement is provided between offset link and connecting piece of the gripper assembly, which reduces the lateral deflection and bending of connecting rod, due to the resistive force experienced at the actuator rod of transfer arm.
The arrangement consists of a guide fixed to the connecting piece moving within two rails. The rails are V-shaped and are rigidly fixed to offset link. The guide surfaces are colomonoy-5 coated to reduce friction and to improve life during sliding movement of the guide with respect to the rails. Advanced transient thermal analysis to estimate the differential thermal expansion of gripper SA and detailed mechanical analysis to study the behavior of gripper assembly for different operating conditions, viz., seat checking mode and resting mode were carried out. Finite element analysis of gripper assembly taking into account of the effect of clearances
2.11
between inner tube assembly and outer tube assembly shows that for gripper resting on SA case, a contact force of ~50 kgf develops between central guide and rail for an actuator rod resistive force of 10 kgf and an inclination of 0.5° of the guide with respect to rail under normal operating condition. 3-D analysis of guide rail assembly for different orientations of guide with respect to the rail was carried out for filleted / non- filleted configurations in guide-rail assembly. In both the models, rotation of guide with respect to the rail is assumed such that it makes a symmetrical contact leading to the division of load equally between the contact points. Contact area, contact stresses (Figure 2) and von Mises stress were calculated for global and sub-models with 50 and 30 micron size mesh. All the contact parameters are evaluated for higher input load and their variation with respect to load was studied in detail.
The variation of von Mises stress with respect to depth for both guide and rail (Figure 3) was evaluated for
Fig. 1 Transfer arm assembly Fig. 3 Von Mises stress versus depth
Fig. 2 Contact stress versus load
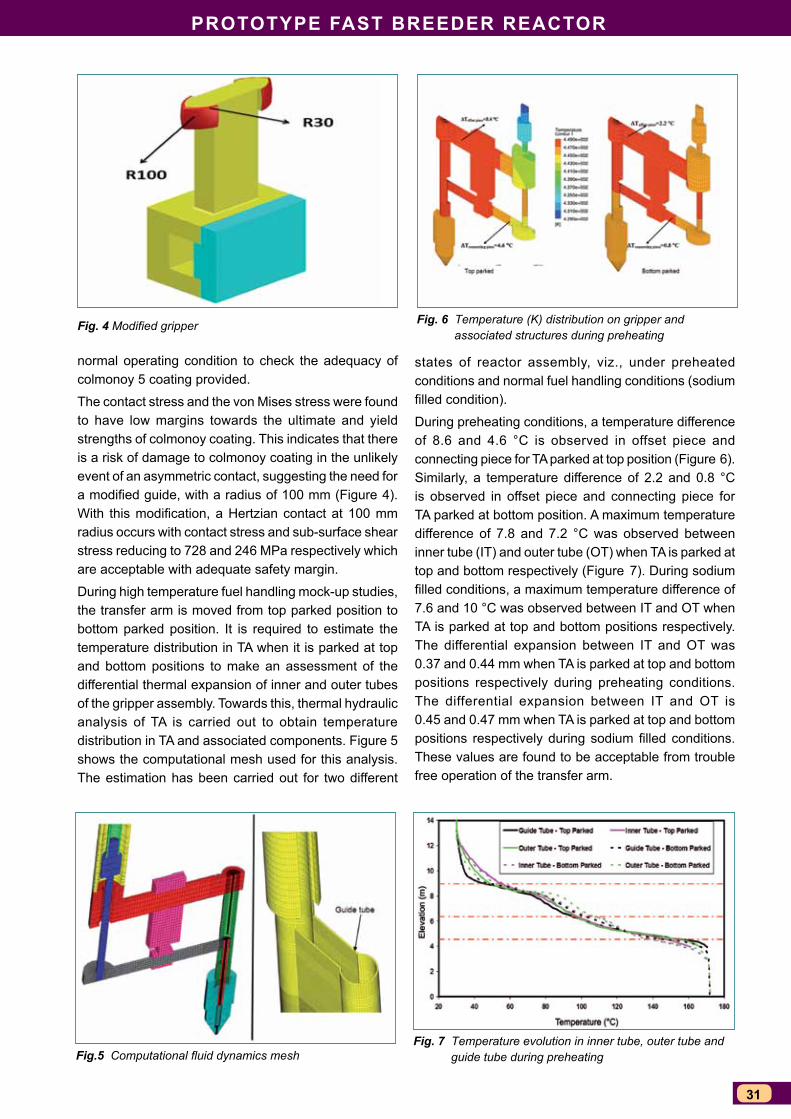
PROTOTyPE FAsT BREEdER REACTOR
31
Fig. 4 Modified gripper Fig. 6 Temperature (K) distribution on gripper and associated structures during preheating
Fig. 7 Temperature evolution in inner tube, outer tube and guide tube during preheatingFig.5 Computational fluid dynamics mesh
normal operating condition to check the adequacy of colmonoy 5 coating provided.
The contact stress and the von Mises stress were found to have low margins towards the ultimate and yield strengths of colmonoy coating. This indicates that there is a risk of damage to colmonoy coating in the unlikely event of an asymmetric contact, suggesting the need for a modified guide, with a radius of 100 mm (Figure 4). With this modification, a Hertzian contact at 100 mm radius occurs with contact stress and sub-surface shear stress reducing to 728 and 246 MPa respectively which are acceptable with adequate safety margin.
During high temperature fuel handling mock-up studies, the transfer arm is moved from top parked position to bottom parked position. It is required to estimate the temperature distribution in TA when it is parked at top and bottom positions to make an assessment of the differential thermal expansion of inner and outer tubes of the gripper assembly. Towards this, thermal hydraulic analysis of TA is carried out to obtain temperature distribution in TA and associated components. Figure 5 shows the computational mesh used for this analysis. The estimation has been carried out for two different
states of reactor assembly, viz., under preheated conditions and normal fuel handling conditions (sodium filled condition).
During preheating conditions, a temperature difference of 8.6 and 4.6 °C is observed in offset piece and connecting piece for TA parked at top position (Figure 6). Similarly, a temperature difference of 2.2 and 0.8 °C is observed in offset piece and connecting piece for TA parked at bottom position. A maximum temperature difference of 7.8 and 7.2 °C was observed between inner tube (IT) and outer tube (OT) when TA is parked at top and bottom respectively (Figure 7). During sodium filled conditions, a maximum temperature difference of 7.6 and 10 °C was observed between IT and OT when TA is parked at top and bottom positions respectively. The differential expansion between IT and OT was 0.37 and 0.44 mm when TA is parked at top and bottom positions respectively during preheating conditions. The differential expansion between IT and OT is 0.45 and 0.47 mm when TA is parked at top and bottom positions respectively during sodium filled conditions. These values are found to be acceptable from trouble free operation of the transfer arm.
IGC ANNUAL REPORT - 2018
32
simulation of Controlled shutdown Operation for PFBR Operator Training simulator
A PFBR operator training simulator was developed at computer division, IGCAR and commissioned at
BHAVINI training facility to train the PFBR plant operators. The PFBR operator training simulator (OTS) facility at BHAVINI is integrated with balance of plant (BOP) simulator. The primary simulator simulates dynamics of core and sodium circuits whereas BOP simulator simulates balance of plant fluid networks and its associated distributed control system (DCS). As an enhancement, the simulation of controlled shutdown operation of PFBR was envisaged. The controlled shutdown operation involves reducing the neutronic power gradually in accord with the restrictions imposed on the rate of decrease of sodium temperatures. The controlled shutdown procedure followed in the simulator was adopted from the PFBR safety analysis reports. The control shutdown operation was simulated for balance of equilibrium core. For the purpose of simulating controlled shutdown operation, the existing process models and plant control logic in the simulator was used with minor modifications. The core dynamics simulation code was modified to ensure the effect of decreasing neutronic power as the control rods were lowered towards bottom most position. While simulating this operation, tuning of process control loops for various intermediate power levels of the reactor was carried out to ensure stability of the simulation. The performance of boiler feed pumps was ensured to be stable as per the varying load requirements.The controlled shutdown operation in the simulator was performed with plant in full power state with Operation Grade Decay Heat Removal (OGDHR) circuit in manual
2.12
mode. All the process control loops were ensured to be available while performing this operation. As the control rods are lowered the sodium temperatures started coming down which in turn reduces the steam generator (SG) outlet temperatures. Some of the major events while performing this operation were reduction of thermal power as control rods were lowered, reduction in feed water flow due to reduced sodium temperatures, tripping of turbine, separator valving in and deployment of OGDHR. The rod lowering was continued till the neutronic power reaches zero. The plant was maintained at cold shutdown state using OGDHR circuit. The process parameters at various intermediate power levels were recorded and validated against the profiles obtained from the safety analysis reports. The entire operation took approximately 20 hours to perform prior to the deployment of OGDHR. The progression of thermal and electrical power and SG water parameters during controlled shutdown operation are provided in Figures 1a and 1b respectively. The overview of the plant at an intermediate power level of 649 MWt reached while performing controlled shutdown operation is shown in Figure 2. The entire operation was simulated and demonstrated to BHAVINI Engineers at PFBR operator training facility.
Fig. 1 Profiles of (a) thermal and electrical power and (b) SG parameters
Fig. 2 Controlled shutdown at 649 MWt
(a) (b)
ReseaRch & Development foR fBRs
33
CHAPTERIII
Research & Development for
FBRs
IGc annUal RepoRt - 2018
34
Development of out-of-pile version of fuel Instrumented capsule to measure the centre-line and clad surface temperature of fuel pin containing Dummy metal slug
It is planned to develop “fuel instrumented irradiation capsule” to measure the centreline temperature
of fuel and outside surface temperature of clad of sodium bonded test metallic fuel pin in FBTR. Prior to development of fuel instrumented irradiation capsule an “out-of-pile version of fuel instrumented capsule” containing “sodium bonded dummy fuel pin” has been developed. The out-of pile test has been designed to simulate the main features of fuel instrumented irradiation capsule and to demonstrate the technology development. The scope of development, fabrication and thereafter test in the furnace includes check the feasibility of (i) sealing the hole/s of the end plug and intermediate plug through which thermocouple(s) of diameter: 1 mm passes, (ii) filling the required amount of sodium in the dummy fuel pin by ensuring layer of sodium in between the gap of clad tube and the slug, (iii) fixing the thermocouple on the outer surface of the clad tube and (iv) successful recording of the centerline and outer surface temperature of fuel pin during temperature rise under the experimental condition. Fuel Instrumented irradiation capsule will have thermocouple of diameter 1.0 mm passing through the end plug of the fuel pin in a leak tight manner to prevent the release of fission gases generated in the fuel pin.
For the development of “out-of-pile version of fuel instrumented capsule”, slug made of SS-316 was used as a “sodium bonded dummy fuel pin”. Hot junction of K-type thermocouple of diameter 1 mm and length of 10 meter was fixed in the centre of the slug by drilling a hole of depth 20 mm from the top of it. Thereafter, hole of the end plug of dummy fuel pin through which
3.01
Fig. 1 (a) Sketch and (b) assembly
Fig. 2 Assembly loaded in the vertical furnace
thermocouple passes through, was sealed using laser welding. Liquid sodium of around 4 grams was filled through the bottom plug of the dummy fuel pin inside the glovebox using suitable technique. Heating and vibration were applied at the same time for settling of sodium in between the gap of slug outer surface & inner surface of clad tube and it was ensured by X-radiography. Hot junction of another K-type thermocouple of diameter 1 mm and length of 10 meter was fixed on the outer surface of the clad tube using a ring and it was ensured by spot weld that thermocouple is in good contact with the surface of the clad tube. Both the thermocouples were passed through spring, spring seat and intermediate plug. Laser welding was carried out for sealing the holes of intermediate plug and the assembly (Figure 1) called “out-of-pile version of fuel instrumented capsule” was fabricated. Thereafter, assembly was loaded in the vertical furnace (Figure 2)and tested at the temperature of 400, 500, 600 and 700°C. Clad outer surface temperature and centreline temperature recorded by using the data acquisition system at the setting of 600°C in furnace controller is shown in Table 1.
Table 1: Clad outer surface temperature and centreline temperature with time
Time (in h)
Clad outer surface temperature (°C)
Centreline temperature (°C)
0 29.1 29.1
1 106.0 105.92 245.8 245.83 353.8 353.74 436.0 435.95 501.7 501.76 552.8 552.87 593.6 593.68 600.0 600.0
(a) (b)
ReseaRch & Development foR fBRs
35
advanced cfD analysis to finalize thermal management scheme for main vessel – Roof slab Junction in fBR 1&2
In the Indian pool type SFR Main Vessel (MV) a stainless steel (SS 316 LN) structure, is integrated
with the roof slab, a MS structure through two Dissimilar Metallic Welds (DMW # 1 and DMW # 2) and the integrated system is provided with dual support as shown in Figure 1. Knowledge of temperature distribution near the DMW and MS support structure under various operating conditions of the reactor is essential to assess its structural integrity by thermo – mechanical analysis. In the present study, the temperature distribution in upper region of reactor assembly is estimated through CFD analysis for various operating conditions of the reactor by considering natural convection of argon cover gas, natural convection of nitrogen, conduction through MV, insulation, concrete liner and thermal radiation interaction among all the structures in transparent media, viz., argon and nitrogen. Two different cases of insulation lagging are considered, viz., (a) insulation panels lagged over reactor vault liner and (b) insulation panels lagged over safety vessel. Figures 2a and 2b show the temperature distributions in the main vessel when the insulation is laid over vault surface and safety vessel respectively, for different operating conditions. Above DMW, temperature of MV is lower due to the forced cooling provided for roof slab. Below DMW, MV upper portion temperature increases steeply. Non–uniform temperature gradient at 1.3 m location is observed in MV during normal operation and Safety Grade Decay Heat Removal (SGDHR) condition when insulation is laid over the vault surface. This temperature non–uniformity is due to the heat transferred to the upper region of MV through the hanging shell which is provided to support the insulation. This higher temperature is attributed to the convective
3.02
loop of hot nitrogen gas moving upward and impacting hanging vessel which in turn influences main vessel. The conclusions of this study are (i) Maximum temperature of DMW predicted during normal and SBO condition of reactor is 145 and 190oC respectively, when insulation is lagged over reactor vault, while it is 118 and 130oC respectively when insulation is lagged over safety vessel (Figure 2). Figure 3 shows the temperature distribution in the physical domain of interest during normal operation when insulation is lagged over the safety vessel. In view of this reduction in the temperature near DMW location in MV, it is recommended to lag the insulation panel over the safety vessel instead of over the reactor vault liner. Predicted temperature distributions form critical input for thermo–mechanical analysis of various structures in this location.
Fig. 1 2 – D physical domain representing different zone as specified (insulation over vault liner)
Fig. 2 Temperature distribution along MV when insulation lagged over safety vessel (normal operation: SGDHR; SBO; fuel handling)
Fig. 3 Temperature contour plot in the physical domain (with insulation over SV) during normal operation
IGc annUal RepoRt - 2018
36
characterization of free level fluctuation in Reactor hot pool by experiments using 5/8 scale Water model
Free level fluctuation occurs in reactor hot pool due to interaction of sodium stream exiting from
the core with the free surface. Due to its high thermal conductivity, sodium transfers heat to metal surfaces of immersed components in a faster rate than that from Argon. The large difference in the heat transfer rates from sodium and argon to the metal surface creates high temperature gradient on the metal surface. When the sodium to argon interface fluctuates the metal surface temperature also fluctuates, which can cause high cycle thermal fatigue. Therefore, characterization of free level fluctuations is important to assess the structural integrity of the partially immersed components as well as the inner vessel. Accordingly experiments were carried out in a 5/8 scale 90° sector model of reactor primary circuit using water as simulant to characterize the free level fluctuation in hot pool. This model consists of a vessel simulating the main vessel, core assembly, Intermediate Heat Exchanger (IHX), Control Plug (CP) and Decay Heat Exchanger (DHX). The Photograph of this model is shown in Figure 1. In the present work, free level fluctuation in hot pool has been characterized for three cases: (i) with reference design, (ii) with deployment of horizontal baffle plate and (iii) with horizontal baffle plate combined with 25% porous skirt having graded porosity. The free level fluctuation was measured by Conductance Wave Gauge (CWG) type of probes with response time of 20 ms. These probes are dipped into the hot pool. Due to the oscillation in free level, the conductance of the probe varies. The variation in conductance was measured with respect to time and
3.03
transformed to level fluctuation using in-situ calibration data of the probe. Various measurement locations are selected at the hot pool free surface where high free level fluctuations are observed. The time history of the fluctuation in a location near IHX for these three cases is shown in Figure 2. Standard deviation for level fluctuation is calculated for all the measurement locations. It is found that the maximum amplitude of fluctuation is 65 mm in model near the IHX boundary facing CP side. Dominant frequency range of free level fluctuation is found to be 2 Hz. Further the experimental data is extrapolated to reactor condition using appropriate similarity laws. The maximum amplitudes of free level fluctuation with 95% confidence level for different cases are shown in Table 1. It can be seen that, with the deployment of gas entrainment mitigation devices i.e. baffle plates and porous skirt, the free level fluctuation amplitude has been reduced by 38%.
0 10 20-40
-20
0
20
40
60
Fluc
tuat
ion
(mm
)Time (s)
Without any device With horizontal baffle plate With baffle plate and 25% graded porosity skirt
Fig. 1 Top view of 5/8 scale model
Fig. 2 Typical free level fluctuations
Table 1: The maximum free level fluctuations of amplitude
at various casesS l . No.
Description Fluctuations in model
Fluctuations in reactor
1 Reference design 65 mm 104 mm2 With r ing type
baffle plate 43 mm 69 mm
3 With r ing type baff le p la te + graded porous skirt
40 mm 64 mm
ReseaRch & Development foR fBRs
37
Design of hydraulically suspended absorber to enhance the passive safety of fBRs
The Hydraulically Suspended Absorber Rod (HSAR) is a passive shutdown device envisaged for future
FBRs. In the event of failure of Reactor Protection System to scram the reactor following a loss of flow event, the HSAR automatically falls under gravity into the reactor core and shuts down the reactor.
The HSAR is suspended in its normal operating position with hydraulic force developed by flowing sodium. In the case of a loss of flow event, the hydraulic force reduces significantly, resulting in automatic drop of the absorber rod. The HSAR is raised to the operating position with the help of its drive mechanism. This mechanism also forces HSAR into active core during normal SCRAM. Thus, HSAR also contributes to negative reactivity insertion for every scram. The HSAR consists of B4C pellets enriched with 10B. The HSAR is housed within its hexagonal sheath like any other core assembly.
HSAR is designed to shutdown the reactor in case of unprotected pump trip event. Bulk sodium boiling for unprotected pump trip event starts at 24s. HSAR will start descending after flow reduces to less than 50%, i.e., after 8s. Estimated drop time of HSAR is ~2s.
The time range in which HSAR will operate is 8-12 s, which is well within the limit for sodium boiling. Figure 1 depicts the scenario and the schematic of HSAR is shown in Figure 2. The criteria for design of HSAR are,
• (i) at sodium flow through core greater than 50% of nominal value, the hydraulic force developed shall be sufficient to suspend the HSAR in its normal operating position,
• (ii) the HSAR shall not lift from its bottom position even at 110% nominal flow and
Fig. 1 Flow coast down with HSAR drop zone
Fig. 2 Schematic of HSAR sub-assembly
• (iii) Minimum flow through HSAR subassembly (HSAR SA) shall be greater than 3 kg/s in order to effectively remove the heat generated in the HSAR in case of accidental fall of one HSAR during full power operation.
The HSAR is suspended in its normal operating position mainly by form drag and the contribution from friction drag is intentionally kept minimum. This is achieved by the pressure drop at the top region of HSAR subassembly when the head of HSAR is butted against the seat in HSAR SA. This is to make hydraulic suspending force less dependent on flow and in-turn to reduce the drop time.
The following are some of the important design parameters arrived at by iterative detailed design. The weight of HSAR and flow are fixed at 38 kg and 3.9 kg/s. When HSAR is at normal operating position and sodium flow is 50% of nominal value, a net downward force of 7.7 kg is available to drive down the HSAR to shutdown the reactor. When HSAR is deposited and sodium flow is 110% of nominal value, the net downward force is 14 kg and hence the HSAR will not eject from its bottom position.
Extensive testing under simulated operating conditions are planned to qualify the design by full scale testing.
3.04
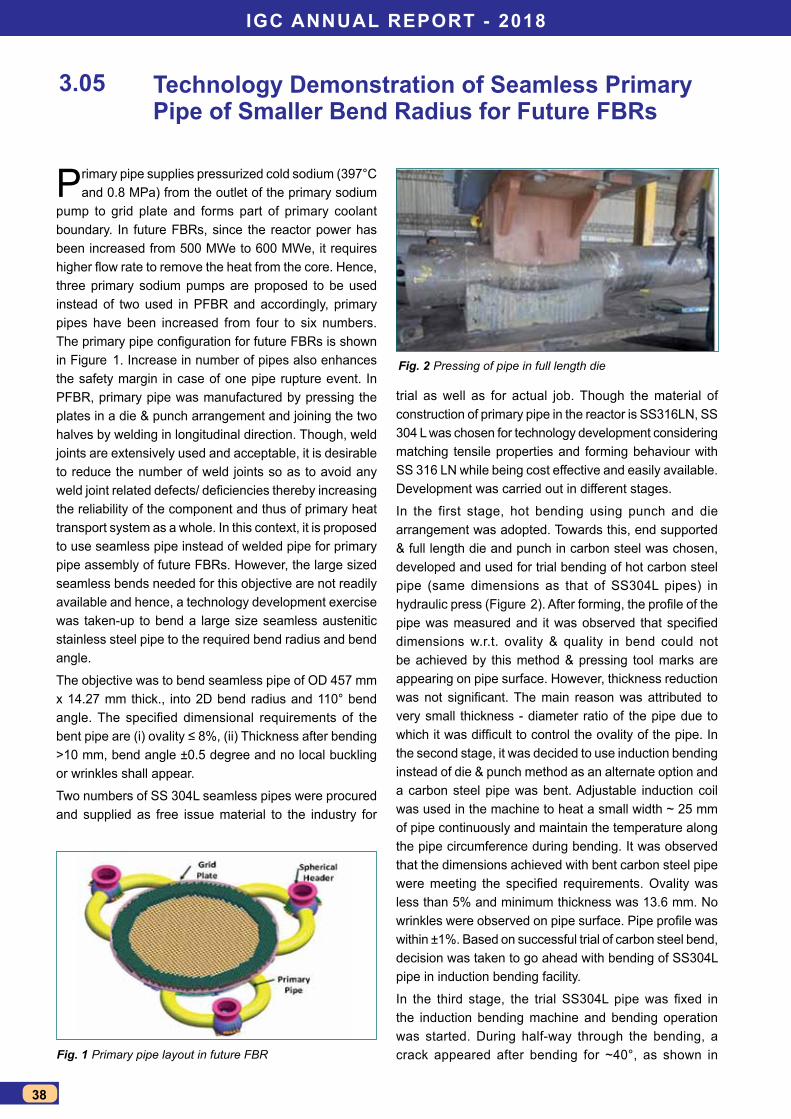
IGc annUal RepoRt - 2018
38
technology Demonstration of seamless primary pipe of smaller Bend Radius for future fBRs
Primary pipe supplies pressurized cold sodium (397°C and 0.8 MPa) from the outlet of the primary sodium
pump to grid plate and forms part of primary coolant boundary. In future FBRs, since the reactor power has been increased from 500 MWe to 600 MWe, it requires higher flow rate to remove the heat from the core. Hence, three primary sodium pumps are proposed to be used instead of two used in PFBR and accordingly, primary pipes have been increased from four to six numbers. The primary pipe configuration for future FBRs is shown in Figure 1. Increase in number of pipes also enhances the safety margin in case of one pipe rupture event. In PFBR, primary pipe was manufactured by pressing the plates in a die & punch arrangement and joining the two halves by welding in longitudinal direction. Though, weld joints are extensively used and acceptable, it is desirable to reduce the number of weld joints so as to avoid any weld joint related defects/ deficiencies thereby increasing the reliability of the component and thus of primary heat transport system as a whole. In this context, it is proposed to use seamless pipe instead of welded pipe for primary pipe assembly of future FBRs. However, the large sized seamless bends needed for this objective are not readily available and hence, a technology development exercise was taken-up to bend a large size seamless austenitic stainless steel pipe to the required bend radius and bend angle.
The objective was to bend seamless pipe of OD 457 mm x 14.27 mm thick., into 2D bend radius and 110° bend angle. The specified dimensional requirements of the bent pipe are (i) ovality ≤ 8%, (ii) Thickness after bending >10 mm, bend angle ±0.5 degree and no local buckling or wrinkles shall appear.
Two numbers of SS 304L seamless pipes were procured and supplied as free issue material to the industry for
3.05
Fig. 1 Primary pipe layout in future FBR
Fig. 2 Pressing of pipe in full length die
trial as well as for actual job. Though the material of construction of primary pipe in the reactor is SS316LN, SS 304 L was chosen for technology development considering matching tensile properties and forming behaviour with SS 316 LN while being cost effective and easily available. Development was carried out in different stages.
In the first stage, hot bending using punch and die arrangement was adopted. Towards this, end supported & full length die and punch in carbon steel was chosen, developed and used for trial bending of hot carbon steel pipe (same dimensions as that of SS304L pipes) in hydraulic press (Figure 2). After forming, the profile of the pipe was measured and it was observed that specified dimensions w.r.t. ovality & quality in bend could not be achieved by this method & pressing tool marks are appearing on pipe surface. However, thickness reduction was not significant. The main reason was attributed to very small thickness - diameter ratio of the pipe due to which it was difficult to control the ovality of the pipe. In the second stage, it was decided to use induction bending instead of die & punch method as an alternate option and a carbon steel pipe was bent. Adjustable induction coil was used in the machine to heat a small width ~ 25 mm of pipe continuously and maintain the temperature along the pipe circumference during bending. It was observed that the dimensions achieved with bent carbon steel pipe were meeting the specified requirements. Ovality was less than 5% and minimum thickness was 13.6 mm. No wrinkles were observed on pipe surface. Pipe profile was within ±1%. Based on successful trial of carbon steel bend, decision was taken to go ahead with bending of SS304L pipe in induction bending facility.
In the third stage, the trial SS304L pipe was fixed in the induction bending machine and bending operation was started. During half-way through the bending, a crack appeared after bending for ~40°, as shown in

ReseaRch & Development foR fBRs
39
Figure 3. Root cause study concluded that the crack was due to higher vanadium percentage in the material which increases the hot hardness of the material and this information was not available apriori to set the bending parameters in the machine. The initial variation in thickness of the pipe along the circumference, though the same was within the limit as per ASTM standard, due to which heating was not uniform.
Based on the above observations, bending parameters were identified (viz., heating rate, water flow rate, coil to pipe gap, air flow rate etc.), which needed to be fine tuned / varied as the bending progresses to account for the thickness variation as well as presence of vanadium. Subsequently, the trial bending was taken-up again with the balance material sufficient for ~70° bend. Based on the detailed inspection carried out, it was observed that the trial pipe bend met all the dimensional requirements. In the fourth stage, actual pipe bend of 110° was taken-up based on the finalised machine parameters and completed successfully (Figure 4). The temperature of extrodus and introdus surfaces of pipe was maintained in the range of 900 - 1100°C and was monitored by laser sensors. It is required to maintain the lower temperature at extrodus and higher temperature at introdus because introdus is under compression during bending and needs to be softer. The feed rate of the pipe was automatically controlled to ~20 mm/min. As the bent pipe segment moves out of the induction coil region, water was continuously sprayed in a controlled rate along the circumference of heated pipe for quenching the surface to reduce oxidation. The water, after quenching is blown away from the induction coil using directed and controlled air flow. Bending load was applied
Fig. 3 Crack at 40° bend angle
Fig. 4 Final primary pipe 110° bend Fig. 5 Dimensional measurement of actual bend
continuously at one fixed end of the pipe by rotating the gripper assembly in the required bend radius.
After induction bending, stress relieving heat treatment of bent pipes were carried out at 1050±15°C in electrical furnace. Heating & cooling rate, ΔT between two thermocouples were controlled. After heat treatment, the bent pipe was thoroughly cleaned and a setup was made for hydrostatic test. Both the ends of the pipe were closed via welding of circular plates and filled with de-mineralized (DM) water. DM water was pressurized via reciprocating pump upto 1 MPa and pressure was held for ten minutes. There were no leakages of water and no drop in pressure.
Visual examination of the actual and trial pipe was carried out and it was free from cracks, dents and any other injurious defects. Liquid penetration examination was carried out on entire outer surface as well as accessible portion of inner surface and no defects were observed in the bend. Ultrasonic testing was carried out for thickness measurement and volumetric defect checking. No defects were observed during UT of the pipe. The average ASTM grain size observed was No. 5 and is within the specified limits.
Bend and dimensional inspections were carried out at two stages, first after hot induction bending and second, after heat treatment & hydrostatic test to check for any variation in dimensions subsequent to hydro test. The ovality and thinning were checked at seven circumferential locations along the length as shown in Figure 5. Pipe profile was checked on layout and found to be within 10 mm (2% of OD of pipe).
Technology development of primary pipe was carried out successfully, meeting all the specified requirements. The ovality was minimum at the end (1.09 %) and maximum at the center (6.78%). Minimum thickness of bent pipe at introdus, extrodus, and other locations were 15.3 mm, 13.9 mm and 12.5 mm respectively. Bend angle was ±0.32° and no wrinkles were observed. The successful completion of hot bending of large diameter seamless pipe has demonstrated the indigenous manufacturing capability for such bends and has given confidence for its incorporation in the primary pipe of reactor assembly of future FBR.
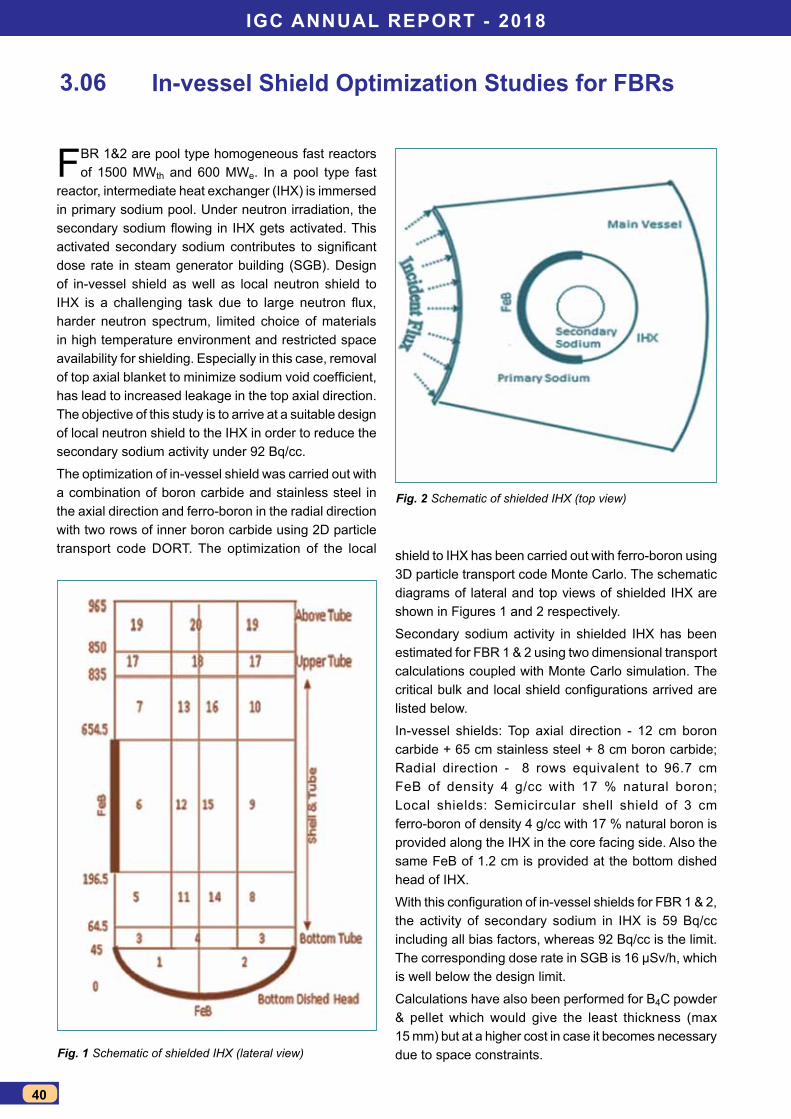
IGc annUal RepoRt - 2018
40
In-vessel shield optimization studies for fBRs
FBR 1&2 are pool type homogeneous fast reactors of 1500 MWth and 600 MWe. In a pool type fast
reactor, intermediate heat exchanger (IHX) is immersed in primary sodium pool. Under neutron irradiation, the secondary sodium flowing in IHX gets activated. This activated secondary sodium contributes to significant dose rate in steam generator building (SGB). Design of in-vessel shield as well as local neutron shield to IHX is a challenging task due to large neutron flux, harder neutron spectrum, limited choice of materials in high temperature environment and restricted space availability for shielding. Especially in this case, removal of top axial blanket to minimize sodium void coefficient, has lead to increased leakage in the top axial direction. The objective of this study is to arrive at a suitable design of local neutron shield to the IHX in order to reduce the secondary sodium activity under 92 Bq/cc.
The optimization of in-vessel shield was carried out with a combination of boron carbide and stainless steel in the axial direction and ferro-boron in the radial direction with two rows of inner boron carbide using 2D particle transport code DORT. The optimization of the local
3.06
Fig. 1 Schematic of shielded IHX (lateral view)
Fig. 2 Schematic of shielded IHX (top view)
shield to IHX has been carried out with ferro-boron using 3D particle transport code Monte Carlo. The schematic diagrams of lateral and top views of shielded IHX are shown in Figures 1 and 2 respectively.
Secondary sodium activity in shielded IHX has been estimated for FBR 1 & 2 using two dimensional transport calculations coupled with Monte Carlo simulation. The critical bulk and local shield configurations arrived are listed below.
In-vessel shields: Top axial direction - 12 cm boron carbide + 65 cm stainless steel + 8 cm boron carbide; Radial direction - 8 rows equivalent to 96.7 cm FeB of density 4 g/cc with 17 % natural boron; Local shields: Semicircular shell shield of 3 cm ferro-boron of density 4 g/cc with 17 % natural boron is provided along the IHX in the core facing side. Also the same FeB of 1.2 cm is provided at the bottom dished head of IHX.
With this configuration of in-vessel shields for FBR 1 & 2, the activity of secondary sodium in IHX is 59 Bq/cc including all bias factors, whereas 92 Bq/cc is the limit. The corresponding dose rate in SGB is 16 µSv/h, which is well below the design limit.
Calculations have also been performed for B4C powder & pellet which would give the least thickness (max 15 mm) but at a higher cost in case it becomes necessary due to space constraints.

ReseaRch & Development foR fBRs
41
optimization of surge tank Geometry for secondary system of future fBRs
Surge tank in secondary system of Sodium cooled Fast Reactor (SFR) mitigates the pressure surges
due to sodium water reaction inside the steam generator (SG) in case of accidental failure of steam tubes or the inadvertent closure of isolation valves of SG. Argon filled above free surface of sodium inside the surge tank provides a cushion for pressure surges in the secondary sodium circuit. During reactor operation, there exist a probability for entrainment of these argon cover gas into liquid sodium inside surge tank due to various reasons such as high perturbation of free surface, vortex formation etc. This entrainment of cover gas can lead to operational difficulties in the reactor. Hence it is required to avoid gas entrainment in surge tank and this is achieved by deployment of passive structures inside surge tank which essentially alters the flow pattern such a way that the free surface become quiscent and free from gas entrainment. These passive structures are termed as gas entrainment mitigation devices. However, inclusion of these devices may result in additional pressure drop in the secondary sodium circuit which in turn increases the pump head requirement. The devices (20% porous plate and a 60° stiffener ring ) developed for PFBR surge tank was found
3.07
to be very effective for mitigation of gas entrainment but offered additional pressure drop which is 14.2 % of the pressure developed by the Secondary Sodium Pump (SSP). Hence studies are continued for future fast reactors to develop better surge tank geometry and gas entrainment mitigation devices with the aim of reduction in pressure drop inside surge tank during normal operation, without increasing the surge tank dimension. Initially changing the inlet and outlet nozzle configuration along with suitable gas entrainment mitigation devices were conceptualised. Further these gas entrainment mitigation devices have been developed though numerical analysis. The effect of various gas entrainment mitigation devices such as porous cylindrical shell and porous conical shell, with different porosity and geometry were analysed using CFD tools. Among these device configurations, few promising geometries were chosen for testing in small scale water model experiments. It was found from these experiments, that combination of conical porous shell and sheet matrix is very effective towards mitigation of gas entrainment as well as offering low additional pressure drop. The final performance of these selected devices have been tested in a large 5/8 scale model of surge tank (Figure 1) using water as simulant. This geometrical scale size was arrived to respect both Froude number (Fr) and Weber number (We) similitude simultaneously which are very important to represent the physics of gas entrainment phenomena. The experiments have been carried out at Fluid Control Research Institute (FCRI).
Experiments were carried out in surge tank where water was pumped from a very large sump to the surge tank through the two side inlets and back to the sump through four bottom outlets. The flow rate of water through the inlet and outlet lines was measured using calibrated averaging pitot tubes with an accuracy of ± 1% and the pressure drop across the surge tank was measured using differential pressure transmitters of accuracy ± 0.04%. Level of water in the tank was monitored using a graduated scale attached to the surge tank.Fig. 1 5/8 scale surge tank model
Fig. 2 Conical porous device and sheet matrix
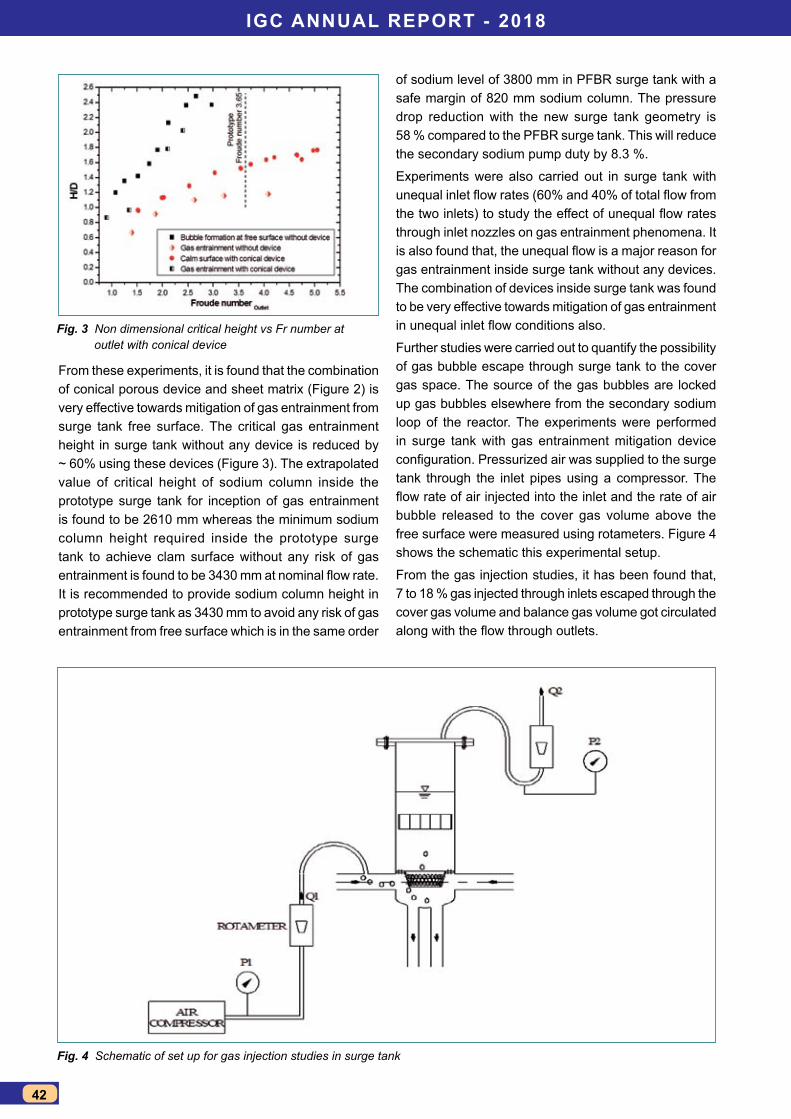
IGc annUal RepoRt - 2018
42
From these experiments, it is found that the combination of conical porous device and sheet matrix (Figure 2) is very effective towards mitigation of gas entrainment from surge tank free surface. The critical gas entrainment height in surge tank without any device is reduced by ~ 60% using these devices (Figure 3). The extrapolated value of critical height of sodium column inside the prototype surge tank for inception of gas entrainment is found to be 2610 mm whereas the minimum sodium column height required inside the prototype surge tank to achieve clam surface without any risk of gas entrainment is found to be 3430 mm at nominal flow rate. It is recommended to provide sodium column height in prototype surge tank as 3430 mm to avoid any risk of gas entrainment from free surface which is in the same order
of sodium level of 3800 mm in PFBR surge tank with a safe margin of 820 mm sodium column. The pressure drop reduction with the new surge tank geometry is 58 % compared to the PFBR surge tank. This will reduce the secondary sodium pump duty by 8.3 %.
Experiments were also carried out in surge tank with unequal inlet flow rates (60% and 40% of total flow from the two inlets) to study the effect of unequal flow rates through inlet nozzles on gas entrainment phenomena. It is also found that, the unequal flow is a major reason for gas entrainment inside surge tank without any devices. The combination of devices inside surge tank was found to be very effective towards mitigation of gas entrainment in unequal inlet flow conditions also.
Further studies were carried out to quantify the possibility of gas bubble escape through surge tank to the cover gas space. The source of the gas bubbles are locked up gas bubbles elsewhere from the secondary sodium loop of the reactor. The experiments were performed in surge tank with gas entrainment mitigation device configuration. Pressurized air was supplied to the surge tank through the inlet pipes using a compressor. The flow rate of air injected into the inlet and the rate of air bubble released to the cover gas volume above the free surface were measured using rotameters. Figure 4 shows the schematic this experimental setup.
From the gas injection studies, it has been found that, 7 to 18 % gas injected through inlets escaped through the cover gas volume and balance gas volume got circulated along with the flow through outlets.
Fig. 4 Schematic of set up for gas injection studies in surge tank
Fig. 3 Non dimensional critical height vs Fr number at outlet with conical device
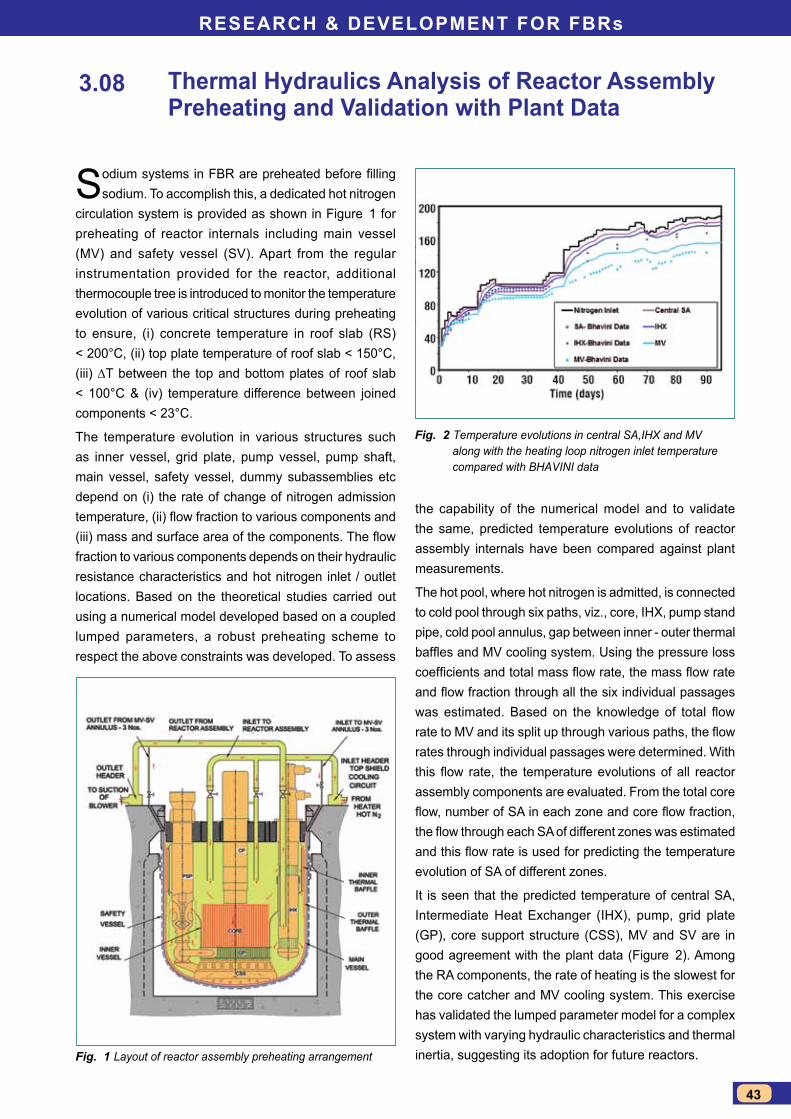
ReseaRch & Development foR fBRs
43
thermal hydraulics analysis of Reactor assembly preheating and validation with plant Data
Sodium systems in FBR are preheated before filling sodium. To accomplish this, a dedicated hot nitrogen
circulation system is provided as shown in Figure 1 for preheating of reactor internals including main vessel (MV) and safety vessel (SV). Apart from the regular instrumentation provided for the reactor, additional thermocouple tree is introduced to monitor the temperature evolution of various critical structures during preheating to ensure, (i) concrete temperature in roof slab (RS) < 200°C, (ii) top plate temperature of roof slab < 150°C, (iii) ∆T between the top and bottom plates of roof slab < 100°C & (iv) temperature difference between joined components < 23°C.
The temperature evolution in various structures such as inner vessel, grid plate, pump vessel, pump shaft, main vessel, safety vessel, dummy subassemblies etc depend on (i) the rate of change of nitrogen admission temperature, (ii) flow fraction to various components and (iii) mass and surface area of the components. The flow fraction to various components depends on their hydraulic resistance characteristics and hot nitrogen inlet / outlet locations. Based on the theoretical studies carried out using a numerical model developed based on a coupled lumped parameters, a robust preheating scheme to respect the above constraints was developed. To assess
3.08
Fig. 1 Layout of reactor assembly preheating arrangement
Fig. 2 Temperature evolutions in central SA,IHX and MV along with the heating loop nitrogen inlet temperature compared with BHAVINI data
the capability of the numerical model and to validate the same, predicted temperature evolutions of reactor assembly internals have been compared against plant measurements.
The hot pool, where hot nitrogen is admitted, is connected to cold pool through six paths, viz., core, IHX, pump stand pipe, cold pool annulus, gap between inner - outer thermal baffles and MV cooling system. Using the pressure loss coefficients and total mass flow rate, the mass flow rate and flow fraction through all the six individual passages was estimated. Based on the knowledge of total flow rate to MV and its split up through various paths, the flow rates through individual passages were determined. With this flow rate, the temperature evolutions of all reactor assembly components are evaluated. From the total core flow, number of SA in each zone and core flow fraction, the flow through each SA of different zones was estimated and this flow rate is used for predicting the temperature evolution of SA of different zones.
It is seen that the predicted temperature of central SA, Intermediate Heat Exchanger (IHX), pump, grid plate (GP), core support structure (CSS), MV and SV are in good agreement with the plant data (Figure 2). Among the RA components, the rate of heating is the slowest for the core catcher and MV cooling system. This exercise has validated the lumped parameter model for a complex system with varying hydraulic characteristics and thermal inertia, suggesting its adoption for future reactors.
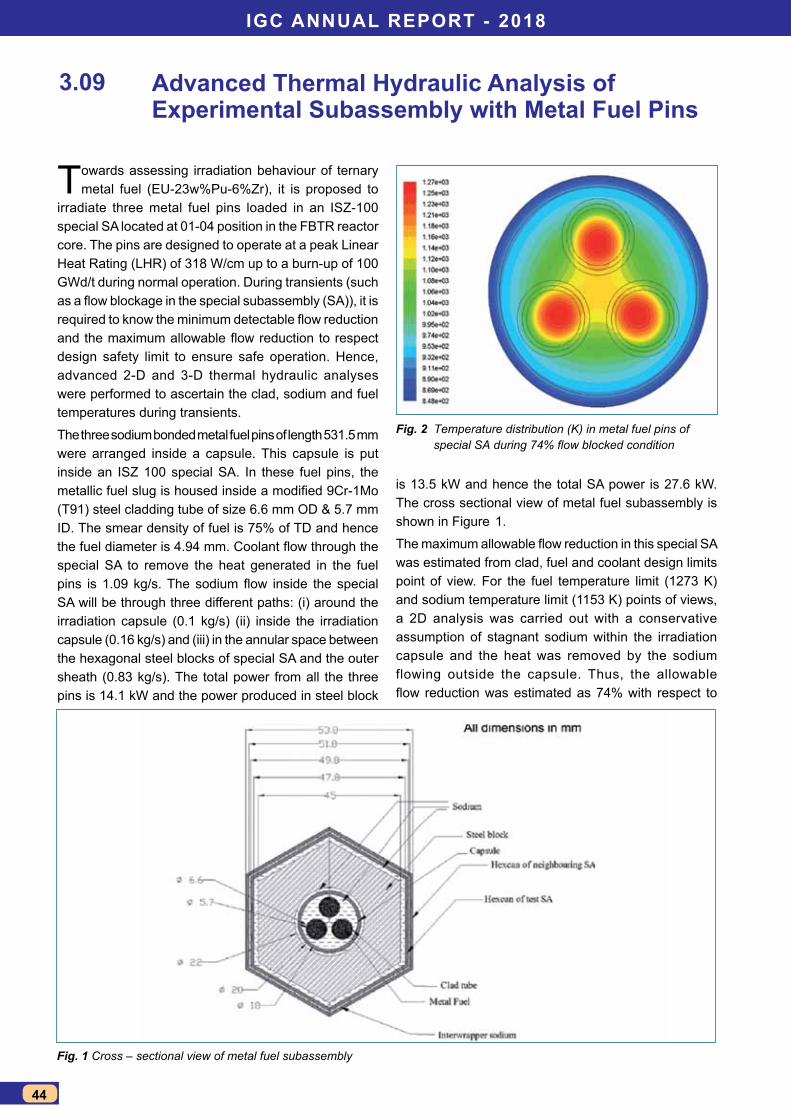
IGc annUal RepoRt - 2018
44
advanced thermal hydraulic analysis of experimental subassembly with metal fuel pins
Towards assessing irradiation behaviour of ternary metal fuel (EU-23w%Pu-6%Zr), it is proposed to
irradiate three metal fuel pins loaded in an ISZ-100 special SA located at 01-04 position in the FBTR reactor core. The pins are designed to operate at a peak Linear Heat Rating (LHR) of 318 W/cm up to a burn-up of 100 GWd/t during normal operation. During transients (such as a flow blockage in the special subassembly (SA)), it is required to know the minimum detectable flow reduction and the maximum allowable flow reduction to respect design safety limit to ensure safe operation. Hence, advanced 2-D and 3-D thermal hydraulic analyses were performed to ascertain the clad, sodium and fuel temperatures during transients.
The three sodium bonded metal fuel pins of length 531.5 mm were arranged inside a capsule. This capsule is put inside an ISZ 100 special SA. In these fuel pins, the metallic fuel slug is housed inside a modified 9Cr-1Mo (T91) steel cladding tube of size 6.6 mm OD & 5.7 mm ID. The smear density of fuel is 75% of TD and hence the fuel diameter is 4.94 mm. Coolant flow through the special SA to remove the heat generated in the fuel pins is 1.09 kg/s. The sodium flow inside the special SA will be through three different paths: (i) around the irradiation capsule (0.1 kg/s) (ii) inside the irradiation capsule (0.16 kg/s) and (iii) in the annular space between the hexagonal steel blocks of special SA and the outer sheath (0.83 kg/s). The total power from all the three pins is 14.1 kW and the power produced in steel block
3.09
is 13.5 kW and hence the total SA power is 27.6 kW. The cross sectional view of metal fuel subassembly is shown in Figure 1.
The maximum allowable flow reduction in this special SA was estimated from clad, fuel and coolant design limits point of view. For the fuel temperature limit (1273 K) and sodium temperature limit (1153 K) points of views, a 2D analysis was carried out with a conservative assumption of stagnant sodium within the irradiation capsule and the heat was removed by the sodium flowing outside the capsule. Thus, the allowable flow reduction was estimated as 74% with respect to
Fig. 1 Cross – sectional view of metal fuel subassembly
Fig. 2 Temperature distribution (K) in metal fuel pins of special SA during 74% flow blocked condition
ReseaRch & Development foR fBRs
45
Fig. 4 (a) Temperature colour plot at outlet plane at L = 160 mm and (b) temperature evolution on the outlet plane at L = 160 mm along inner diameter and outer diameter of clad
fuel and sodium temperature limits. Figure 2 shows the temperature distribution (K) in metal fuel pins of special SA for 74% flow blocked condition. From clad temperature (993 K) limit point of view, the allowable flow reduction was analytically estimated as 60.3%. However, this estimation had to be verified through a 3-D Computational Fluid Dynamics (CFD) based thermal hydraulic analysis, since (i) three sodium flow paths with differing hydraulic resistance co-exist and (ii) heat is produced in the three fuel pins as well as in the surrounding steel blocks. Such an analysis was carried out using a commercial CFD code to estimate the temperature distribution in the subassembly during
normal operating conditions and at 60% reduced flow conditions. Figure 3 shows the cross–sectional view of the physical domain with bounding surfaces. Figure 4a shows temperature distribution in the outlet plane.
The maximum temperature is found to be 794°C inside the fuel pin which is due to heat generation. It is observed that the heat is predominantly removed in radial direction from fuel pin to sodium. Figure 4b shows temperature evolution along inner and outer surfaces of the clad in azimuthal direction at the top of fuel pin. Peak clad temperature is determined to be 630°C and with hotspot factors, it was estimated to be 710°C which is less than the limiting value of 720°C. Fuel and sodium temperatures were also found to be within the design safety limits for the 60% reduced flow conditions. Thus, the 3-D analysis results concur with the conservative 2-D analysis.
From the plugging detection point of view, the minimum detectable flow reduction was estimated by considering the temperature dilution in the thermocouple reading in the FBTR core and also the inter SA heat transfer. It is seen that there is a large dilution of about 36°C in the thermocouple reading of the SA during normal operation of the reactor. However, during a partial flow blockage scenario in the SA, a rise of 14°C (trip threshold being 10°C) in its thermocouple reading is seen when the flow reduction in the SA is 30%. Hence, a safe plugging detection of ternary metal fuel SA is ensured within 30% of flow reduction in the SA whereas the allowable flow reduction is 60%.
(a) (b)
Fig. 3 Cross – sectional view of physical domain and different boundary conditions imposed on the model
IGc annUal RepoRt - 2018
46
Integrated structural analysis of em pump, piping and secondary sodium main pump
Electromagnetic (EM) pumps used in sodium cooled Fast Reactors are generally delicate with thin shell
structures (thickness varying from 2–3 mm). They are connected to sodium piping systems which are relatively stiff. A decoupled analysis of piping and EM pump over-predicts the stress at the EM pump-piping junction. For a realistic assessment of this stress, an integrated EM pump and piping system analysis is essential. Such an integrated 3-D finite element analysis of the coupled system (Figure 1) was carried out and the resulting deformations of the piping (Figure 2) and stress levels in the EM pump at critical locations were determined, at various temperature conditions possible in the plant. Based on detailed parametric studies, the support locations in the pipes were optimized to minimize the stress values in the EM pump.
stress analysis of ssp outer shell under various nozzle reactionsSecondary sodium pump (SSP) operates at various temperatures ranging from 200-510°C. Due to thermal expansion of attached piping layout, nozzle reaction from piping layout is imposed on SSP outer shell. Due to this, the outer shell of SSP can deform and clearance between outer shell and internal assembly of SSP, which is critical to functioning of the SSP may change. Knowledge on deformation of the outer shell of SSP under various temperature conditions is essential to ensure a smooth operation of the pump. Towards this, detailed stress analysis of SSP with internal assembly was carried out (Figures 3a and 3b). It is seen that the maximum displacement of outer shell due to allowable nozzle reaction is only ~0.5 mm, which is acceptable.
Buckling analysis of ssp outer shellOuter shell of SSP consists of a cylindrical shell and a spherical header, connected to various piping systems. This shell is subjected to nozzle reactions due to thermal
3.10
expansion of piping layout. These reaction forces and moments induce compressive stress in SSP outer shell. Hence, there is a need to understand the risk of buckling under axial compressive load. Buckling analysis of the shell under nozzle reactions corresponding to 530oC carried out. The critical buckling load factor from linear buckling analysis is found to be 178. Computed rigidity parameters are found to be very high suggesting that there is no risk of buckling failure of SSP outer shell.
Fig. 1 Integrated model of EM pump and piping layout
Fig. 2 Deformation in piping due to thermal expansion
Fig. 3 (a) Geometric model of outer shell of SSP with key location and (b) displacement (m) contours of SSP under a combination of allowable nozzle reactions
(a)
(b)
ReseaRch & Development foR fBRs
47
effect of slotting on the Response time of csRDm electromagnet
Control & Safety Rod Drive Mechanisms (CSRDM) form part of first shut down system in Indian FBRs.
It consists of an Electromagnet (EM), which, upon de-energisation, releases the Control and safety rod to scram the reactor under abnormal conditions. The response time of EM has a safety implication and thus is an important safety parameter.
In order to enhance the margin in EM response time, few experimental studies were carried out. Changing the material of EM, increasing the number of slots on EM, improving the EM driving circuit, introducing auxiliary winding are some of the means to reduce the EM response time. The experiments done to study the effect of increasing the number of slots on EM on response time is the main focus of the present article.
It is well known that the eddy currents are generated during the EM current decay and they effect the EM response time. The significant role of eddy currents on current decay in case of CSRDM EM can be appreciated by referring Figure 1, which shows the typical decay characteristic of EM.
These characteristics were obtained by measuring the voltage across a resister placed parallel to EM. The characteristics can be divided into three regions; fast decay region which covers until the current decays to approximately 0.1 A from the moment of initiation of decay, the slow decay region which covers between 0.1 A and the valley point and built-up region which covers between valley point to second peak.
Increasing the number of slots in EM is one of the methods to reduce the eddy current generation during current decay, which in turn reduces the total EM response time. Hence design change to increase the number of slots in EM was taken up. As per existing design the number of slots in cover (outer core) is less
3.11
-0.05
0
0.05
0.1
0.15
0.2
0.25
0.3
0.35
0.4
0.45
0.5
0.55
1300 1400 1500 1600 1700 1800
1
2
1 - Fast Decay2 - Slow Decay3 - Build-up
Time (ms)
Volta
ge (V
olts
)
3
-0.1
0
0.1
0.2
0.3
0.4
0.5
0.6
0.7
0.8
1200 1300 1400 1500 1600 1700 1800 1900 2000
Volta
ge (
volts
)
Time (ms)
a - Before slotting with base cktb - After slotting with base cktc - After slotting with improved ckt
ab
c
Fig. 1 Decay characteristics of EM
Fig. 2 Decay characteristics of EM during experiments in eccentric condition
than that in inner core. The inner core has 16 slots & the cover (outer core) has 8 slots. The number of slots on the outer cover was increased to 16 and at the bottom of cover, a ring of 10 mm that was earlier left without slot was also cut. A slot of 10 mm depth is also introduced in the guide tube, which is the armature.
Experiments were carried out with two different configurations of EM driving circuit. One is base circuit which does not consist of any capacitor, whereas the other circuit, called improved circuit, consists of a single capacitor with a capacitance of 10 µF. Addition of capacitor in the driving circuit enhances the current decay rate in the EM coil.
After incorporating extra slots in CSRDM EM as well as in guide tube, experiments were carried out in Engg. Hall-III. Each experiment involves lifting the mobile assembly along with EM to 300 mm position, de-energizing the EM and recording the decay current. Full scale CSRDM is used for these experiments. Experiments were done in concentric as well as in eccentric condition by pushing the EM manually. Throughout these experiments, EM was energized with a set current of 0.6 A.
The decay characteristics obtained after slotting in eccentric condition for base as well as improved EM driving circuits are shown in Figure 2.
After slotting, there was an improvement of approximately 35% and 48% in EM response time in base circuit and improved circuit respectively with respect to the unslotted EM.
Thus, it can be concluded that slotting on EM & guide tube reduces the total response time of EM, enhancing the margin in EM response time. Further studies for implementing the proposed design changes in EM and EM driving circuit in CSRDMs are in progress.
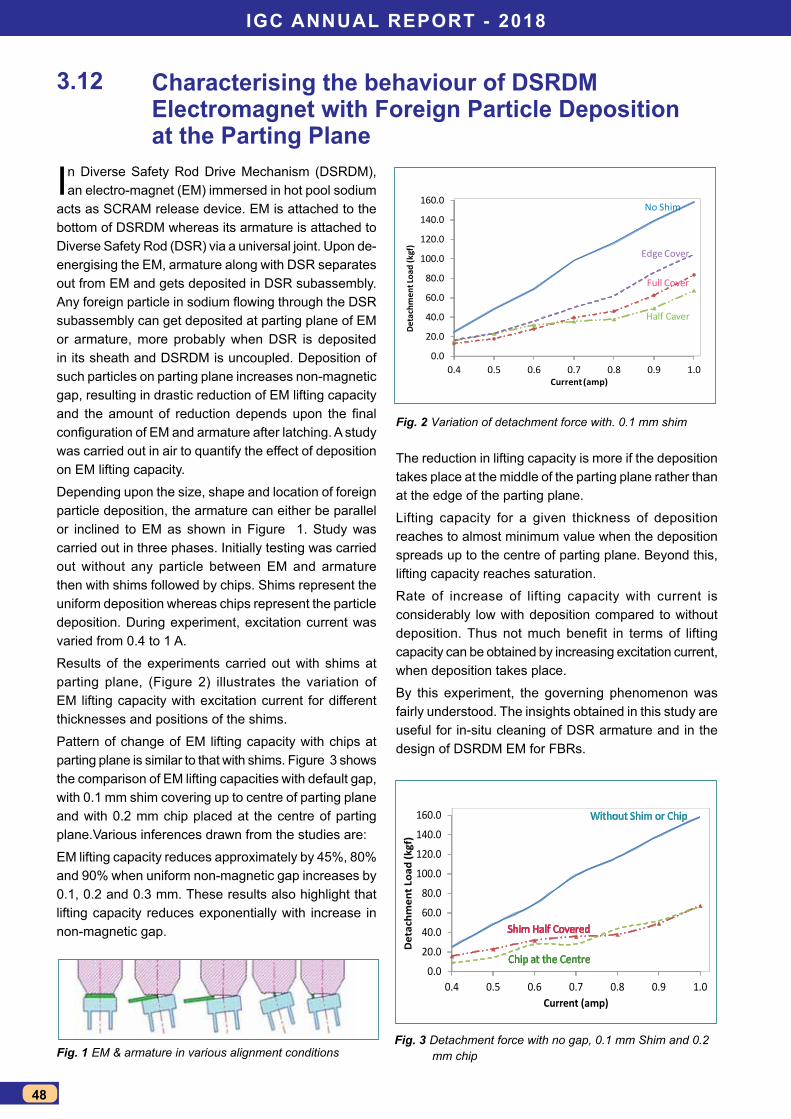
IGc annUal RepoRt - 2018
48
characterising the behaviour of DsRDm electromagnet with foreign particle Deposition at the parting plane
In Diverse Safety Rod Drive Mechanism (DSRDM), an electro-magnet (EM) immersed in hot pool sodium
acts as SCRAM release device. EM is attached to the bottom of DSRDM whereas its armature is attached to Diverse Safety Rod (DSR) via a universal joint. Upon de-energising the EM, armature along with DSR separates out from EM and gets deposited in DSR subassembly. Any foreign particle in sodium flowing through the DSR subassembly can get deposited at parting plane of EM or armature, more probably when DSR is deposited in its sheath and DSRDM is uncoupled. Deposition of such particles on parting plane increases non-magnetic gap, resulting in drastic reduction of EM lifting capacity and the amount of reduction depends upon the final configuration of EM and armature after latching. A study was carried out in air to quantify the effect of deposition on EM lifting capacity.
Depending upon the size, shape and location of foreign particle deposition, the armature can either be parallel or inclined to EM as shown in Figure 1. Study was carried out in three phases. Initially testing was carried out without any particle between EM and armature then with shims followed by chips. Shims represent the uniform deposition whereas chips represent the particle deposition. During experiment, excitation current was varied from 0.4 to 1 A.
Results of the experiments carried out with shims at parting plane, (Figure 2) illustrates the variation of EM lifting capacity with excitation current for different thicknesses and positions of the shims.
Pattern of change of EM lifting capacity with chips at parting plane is similar to that with shims. Figure 3 shows the comparison of EM lifting capacities with default gap, with 0.1 mm shim covering up to centre of parting plane and with 0.2 mm chip placed at the centre of parting plane.Various inferences drawn from the studies are:
EM lifting capacity reduces approximately by 45%, 80% and 90% when uniform non-magnetic gap increases by 0.1, 0.2 and 0.3 mm. These results also highlight that lifting capacity reduces exponentially with increase in non-magnetic gap.
3.12
0.0
20.0
40.0
60.0
80.0
100.0
120.0
140.0
160.0
0.4 0.5 0.6 0.7 0.8 0.9 1.0
Deta
chm
ent L
oad
(kgf
)
Current (amp)
No Shim
Full Cover
Half Caver
Edge Cover
0.0
20.0
40.0
60.0
80.0
100.0
120.0
140.0
160.0
0.4 0.5 0.6 0.7 0.8 0.9 1.0
Det
achm
ent L
oad
(kgf
)
Current (amp)
Without Shim or Chip
Shim Half Covered
Chip at the Centre
Fig. 1 EM & armature in various alignment conditions
Fig. 2 Variation of detachment force with. 0.1 mm shim
Fig. 3 Detachment force with no gap, 0.1 mm Shim and 0.2 mm chip
The reduction in lifting capacity is more if the deposition takes place at the middle of the parting plane rather than at the edge of the parting plane.
Lifting capacity for a given thickness of deposition reaches to almost minimum value when the deposition spreads up to the centre of parting plane. Beyond this, lifting capacity reaches saturation.
Rate of increase of lifting capacity with current is considerably low with deposition compared to without deposition. Thus not much benefit in terms of lifting capacity can be obtained by increasing excitation current, when deposition takes place.
By this experiment, the governing phenomenon was fairly understood. The insights obtained in this study are useful for in-situ cleaning of DSR armature and in the design of DSRDM EM for FBRs.
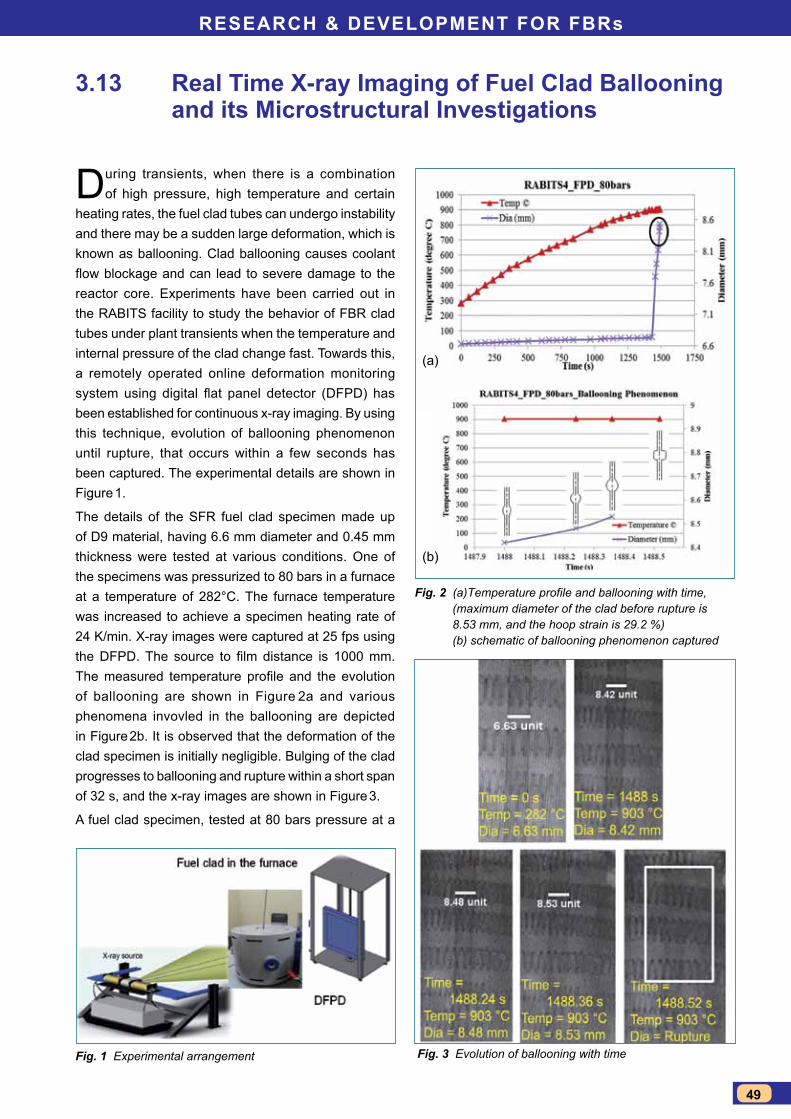
ReseaRch & Development foR fBRs
49
Real time X-ray Imaging of fuel clad Ballooning and its microstructural Investigations
During transients, when there is a combination of high pressure, high temperature and certain
heating rates, the fuel clad tubes can undergo instability and there may be a sudden large deformation, which is known as ballooning. Clad ballooning causes coolant flow blockage and can lead to severe damage to the reactor core. Experiments have been carried out in the RABITS facility to study the behavior of FBR clad tubes under plant transients when the temperature and internal pressure of the clad change fast. Towards this, a remotely operated online deformation monitoring system using digital flat panel detector (DFPD) has been established for continuous x-ray imaging. By using this technique, evolution of ballooning phenomenon until rupture, that occurs within a few seconds has been captured. The experimental details are shown in Figure 1.
The details of the SFR fuel clad specimen made up of D9 material, having 6.6 mm diameter and 0.45 mm thickness were tested at various conditions. One of the specimens was pressurized to 80 bars in a furnace at a temperature of 282°C. The furnace temperature was increased to achieve a specimen heating rate of 24 K/min. X-ray images were captured at 25 fps using the DFPD. The source to film distance is 1000 mm. The measured temperature profile and the evolution of ballooning are shown in Figure 2a and various phenomena invovled in the ballooning are depicted in Figure 2b. It is observed that the deformation of the clad specimen is initially negligible. Bulging of the clad progresses to ballooning and rupture within a short span of 32 s, and the x-ray images are shown in Figure 3.
A fuel clad specimen, tested at 80 bars pressure at a
3.13
Fig. 1 Experimental arrangement
Fig. 2 (a)Temperature profile and ballooning with time, (maximum diameter of the clad before rupture is 8.53 mm, and the hoop strain is 29.2 %) (b) schematic of ballooning phenomenon captured
Fig. 3 Evolution of ballooning with time
(a)
(b)
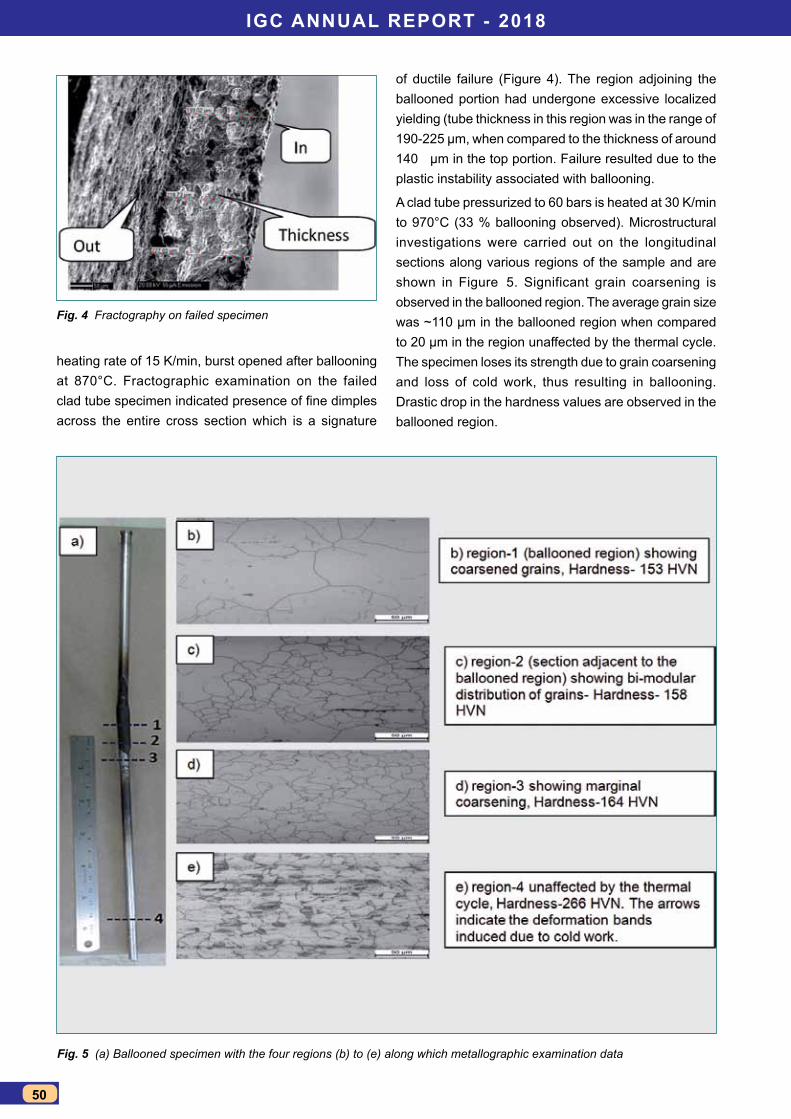
IGc annUal RepoRt - 2018
50
Fig. 4 Fractography on failed specimen
Fig. 5 (a) Ballooned specimen with the four regions (b) to (e) along which metallographic examination data
heating rate of 15 K/min, burst opened after ballooning at 870°C. Fractographic examination on the failed clad tube specimen indicated presence of fine dimples across the entire cross section which is a signature
of ductile failure (Figure 4). The region adjoining the ballooned portion had undergone excessive localized yielding (tube thickness in this region was in the range of 190-225 µm, when compared to the thickness of around 140 µm in the top portion. Failure resulted due to the plastic instability associated with ballooning.
A clad tube pressurized to 60 bars is heated at 30 K/min to 970°C (33 % ballooning observed). Microstructural investigations were carried out on the longitudinal sections along various regions of the sample and are shown in Figure 5. Significant grain coarsening is observed in the ballooned region. The average grain size was ~110 µm in the ballooned region when compared to 20 µm in the region unaffected by the thermal cycle. The specimen loses its strength due to grain coarsening and loss of cold work, thus resulting in ballooning. Drastic drop in the hardness values are observed in the ballooned region.
ReseaRch & Development foR fBRs
51
Design & Development of custom Backplane communication scheme for compact DaQs of fBRs
Data Acquisition and control systems (DAQs) were developed for PFBR for acquiring various analog
and digital plant parameters and generating control outputs for plant and communicating the digitized data to the centralized server via TCP/IP communication over Ethernet. For performance enhancements, miniaturization and improved diagnostics & fault tolerance capabilities, a field mountable Compact DAQs is designed. A custom backplane based communication scheme designed for this system for very simple, reliable and independent communication among CPU and various IO modules is briefly described in this article.
The key concept for this backplane design was to have independent communication links for each IO slot with dual CPUs. Basically a 4 wire interface similar to SPI communication protocol was chosen. This is described with the help of fig-1 and fig-2. CPU and IO modules are designed with FPGAs on board for implementing this communication scheme. The backplane interface logic is developed using VHDL. The key design features of this backplane interface is mentioned below:1. Each CPU interfaces independently with each IO
module using 4 signals – CLK, SOT, DIN, DOUT2. Presence of IO Board is sensed by a board connect
(BC) signal which is pulled high in backplane and it is pulled down with the IO board circuitry when the board is inserted properly and all internal diagnostics are passed.
3. Unique board ID is serially transmitted and checked at each scan cycle.
4. CPU module interacts independently with each IO board as per the received board ID.
3.14
Fig. 1 Dual redundant hot standby architecture
Fig. 2 Signals involved in single CPU-IO module communication
Fig. 3 (a) Fabricated backplane and (b) complete system assembled with dual redundant power supply, dual redundant CPU and various IO modules
5. IO module interacts independently with both the CPU modules.
6. Parity check is done for each data packet.7. Each CPU communicates its healthiness information
to other CPU using two diverse mechanisms8. Online CPU information for IO modules is also derived
with redundant links9. Output modules generate output as per the online
CPU information. If both the CPUs are online or if CPU-1 alone is online then it will respond to CPU-1. Control is transferred to CPU-2 in the case of failure of CPU-1.
10. Backplane expansion is not supported11. Based on pin density and power requirements,
different backplane connectors are provided for power supply module, CPUs and IO modules. CPU and IO modules can be inserted in any one of the CPU and IO slots respectively.
12. Fabricated 8 IO slot backplane is shown in Figure 3a.13. Complete System assembled with dual redundant
power supply, dual redundant CPU and various IO modules is shown in Figure 3b.
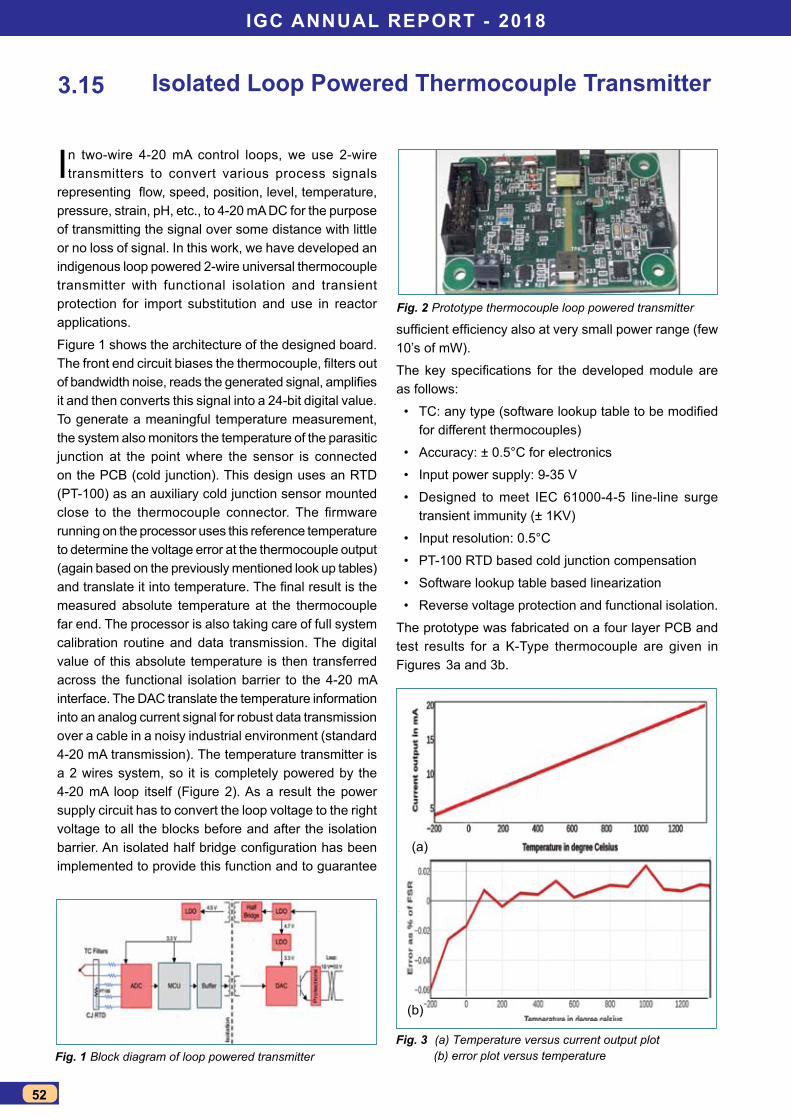
IGc annUal RepoRt - 2018
52
Isolated loop powered thermocouple transmitter
In two-wire 4-20 mA control loops, we use 2-wire transmitters to convert various process signals
representing flow, speed, position, level, temperature, pressure, strain, pH, etc., to 4-20 mA DC for the purpose of transmitting the signal over some distance with little or no loss of signal. In this work, we have developed an indigenous loop powered 2-wire universal thermocouple transmitter with functional isolation and transient protection for import substitution and use in reactor applications.
Figure 1 shows the architecture of the designed board. The front end circuit biases the thermocouple, filters out of bandwidth noise, reads the generated signal, amplifies it and then converts this signal into a 24-bit digital value. To generate a meaningful temperature measurement, the system also monitors the temperature of the parasitic junction at the point where the sensor is connected on the PCB (cold junction). This design uses an RTD (PT-100) as an auxiliary cold junction sensor mounted close to the thermocouple connector. The firmware running on the processor uses this reference temperature to determine the voltage error at the thermocouple output (again based on the previously mentioned look up tables) and translate it into temperature. The final result is the measured absolute temperature at the thermocouple far end. The processor is also taking care of full system calibration routine and data transmission. The digital value of this absolute temperature is then transferred across the functional isolation barrier to the 4-20 mA interface. The DAC translate the temperature information into an analog current signal for robust data transmission over a cable in a noisy industrial environment (standard 4-20 mA transmission). The temperature transmitter is a 2 wires system, so it is completely powered by the 4-20 mA loop itself (Figure 2). As a result the power supply circuit has to convert the loop voltage to the right voltage to all the blocks before and after the isolation barrier. An isolated half bridge configuration has been implemented to provide this function and to guarantee
3.15
Fig. 1 Block diagram of loop powered transmitterFig. 3 (a) Temperature versus current output plot
(b) error plot versus temperature
Fig. 2 Prototype thermocouple loop powered transmitter
sufficient efficiency also at very small power range (few 10’s of mW).
The key specifications for the developed module are as follows:
• TC: any type (software lookup table to be modified for different thermocouples)
• Accuracy: ± 0.5°C for electronics
• Input power supply: 9-35 V
• Designed to meet IEC 61000-4-5 line-line surge transient immunity (± 1KV)
• Input resolution: 0.5°C
• PT-100 RTD based cold junction compensation
• Software lookup table based linearization
• Reverse voltage protection and functional isolation.
The prototype was fabricated on a four layer PCB and test results for a K-Type thermocouple are given in Figures 3a and 3b.
(a)
(b)
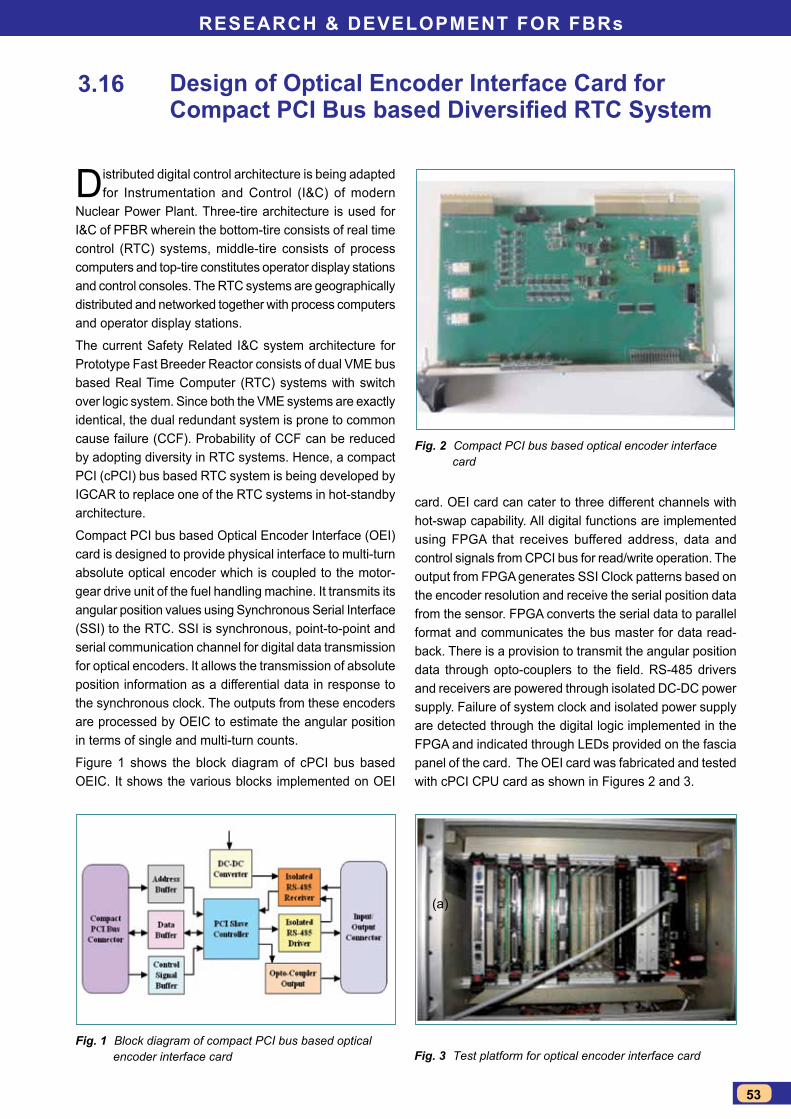
ReseaRch & Development foR fBRs
53
Design of optical encoder Interface card for Compact PCI Bus based Diversified RTC System
Distributed digital control architecture is being adapted for Instrumentation and Control (I&C) of modern
Nuclear Power Plant. Three-tire architecture is used for I&C of PFBR wherein the bottom-tire consists of real time control (RTC) systems, middle-tire consists of process computers and top-tire constitutes operator display stations and control consoles. The RTC systems are geographically distributed and networked together with process computers and operator display stations.
The current Safety Related I&C system architecture for Prototype Fast Breeder Reactor consists of dual VME bus based Real Time Computer (RTC) systems with switch over logic system. Since both the VME systems are exactly identical, the dual redundant system is prone to common cause failure (CCF). Probability of CCF can be reduced by adopting diversity in RTC systems. Hence, a compact PCI (cPCI) bus based RTC system is being developed by IGCAR to replace one of the RTC systems in hot-standby architecture.
Compact PCI bus based Optical Encoder Interface (OEI) card is designed to provide physical interface to multi-turn absolute optical encoder which is coupled to the motor-gear drive unit of the fuel handling machine. It transmits its angular position values using Synchronous Serial Interface (SSI) to the RTC. SSI is synchronous, point-to-point and serial communication channel for digital data transmission for optical encoders. It allows the transmission of absolute position information as a differential data in response to the synchronous clock. The outputs from these encoders are processed by OEIC to estimate the angular position in terms of single and multi-turn counts.
Figure 1 shows the block diagram of cPCI bus based OEIC. It shows the various blocks implemented on OEI
3.16
Fig. 1 Block diagram of compact PCI bus based optical encoder interface card
Fig. 2 Compact PCI bus based optical encoder interface card
Fig. 3 Test platform for optical encoder interface card
card. OEI card can cater to three different channels with hot-swap capability. All digital functions are implemented using FPGA that receives buffered address, data and control signals from CPCI bus for read/write operation. The output from FPGA generates SSI Clock patterns based on the encoder resolution and receive the serial position data from the sensor. FPGA converts the serial data to parallel format and communicates the bus master for data read-back. There is a provision to transmit the angular position data through opto-couplers to the field. RS-485 drivers and receivers are powered through isolated DC-DC power supply. Failure of system clock and isolated power supply are detected through the digital logic implemented in the FPGA and indicated through LEDs provided on the fascia panel of the card. The OEI card was fabricated and tested with cPCI CPU card as shown in Figures 2 and 3.
(a)
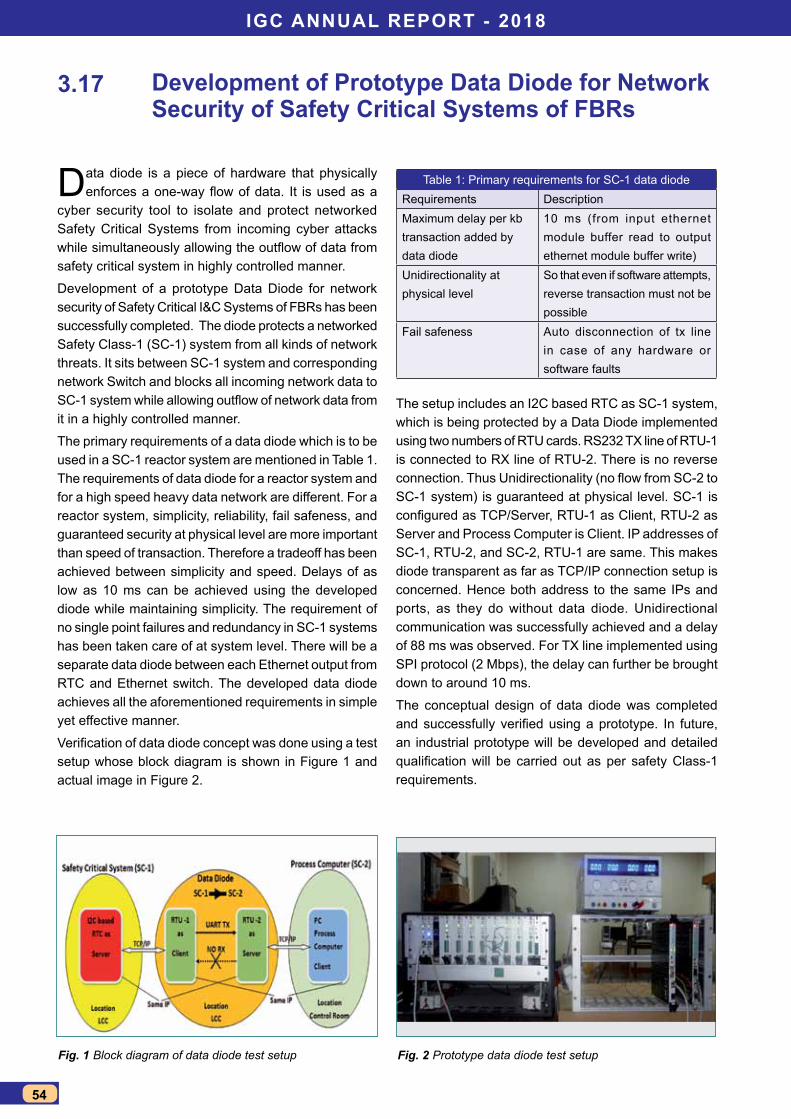
IGc annUal RepoRt - 2018
54
Development of prototype Data Diode for network security of safety critical systems of fBRs
Data diode is a piece of hardware that physically enforces a one-way flow of data. It is used as a
cyber security tool to isolate and protect networked Safety Critical Systems from incoming cyber attacks while simultaneously allowing the outflow of data from safety critical system in highly controlled manner.
Development of a prototype Data Diode for network security of Safety Critical I&C Systems of FBRs has been successfully completed. The diode protects a networked Safety Class-1 (SC-1) system from all kinds of network threats. It sits between SC-1 system and corresponding network Switch and blocks all incoming network data to SC-1 system while allowing outflow of network data from it in a highly controlled manner.
The primary requirements of a data diode which is to be used in a SC-1 reactor system are mentioned in Table 1. The requirements of data diode for a reactor system and for a high speed heavy data network are different. For a reactor system, simplicity, reliability, fail safeness, and guaranteed security at physical level are more important than speed of transaction. Therefore a tradeoff has been achieved between simplicity and speed. Delays of as low as 10 ms can be achieved using the developed diode while maintaining simplicity. The requirement of no single point failures and redundancy in SC-1 systems has been taken care of at system level. There will be a separate data diode between each Ethernet output from RTC and Ethernet switch. The developed data diode achieves all the aforementioned requirements in simple yet effective manner.
Verification of data diode concept was done using a test setup whose block diagram is shown in Figure 1 and actual image in Figure 2.
3.17
Fig. 1 Block diagram of data diode test setup Fig. 2 Prototype data diode test setup
The setup includes an I2C based RTC as SC-1 system, which is being protected by a Data Diode implemented using two numbers of RTU cards. RS232 TX line of RTU-1 is connected to RX line of RTU-2. There is no reverse connection. Thus Unidirectionality (no flow from SC-2 to SC-1 system) is guaranteed at physical level. SC-1 is configured as TCP/Server, RTU-1 as Client, RTU-2 as Server and Process Computer is Client. IP addresses of SC-1, RTU-2, and SC-2, RTU-1 are same. This makes diode transparent as far as TCP/IP connection setup is concerned. Hence both address to the same IPs and ports, as they do without data diode. Unidirectional communication was successfully achieved and a delay of 88 ms was observed. For TX line implemented using SPI protocol (2 Mbps), the delay can further be brought down to around 10 ms.
The conceptual design of data diode was completed and successfully verified using a prototype. In future, an industrial prototype will be developed and detailed qualification will be carried out as per safety Class-1 requirements.
Table 1: Primary requirements for SC-1 data diodeRequirements DescriptionMaximum delay per kb transaction added by data diode
10 ms (from input ethernet module buffer read to output ethernet module buffer write)
Unidirectionality at physical level
So that even if software attempts, reverse transaction must not be possible
Fail safeness Auto disconnection of tx line in case of any hardware or software faults
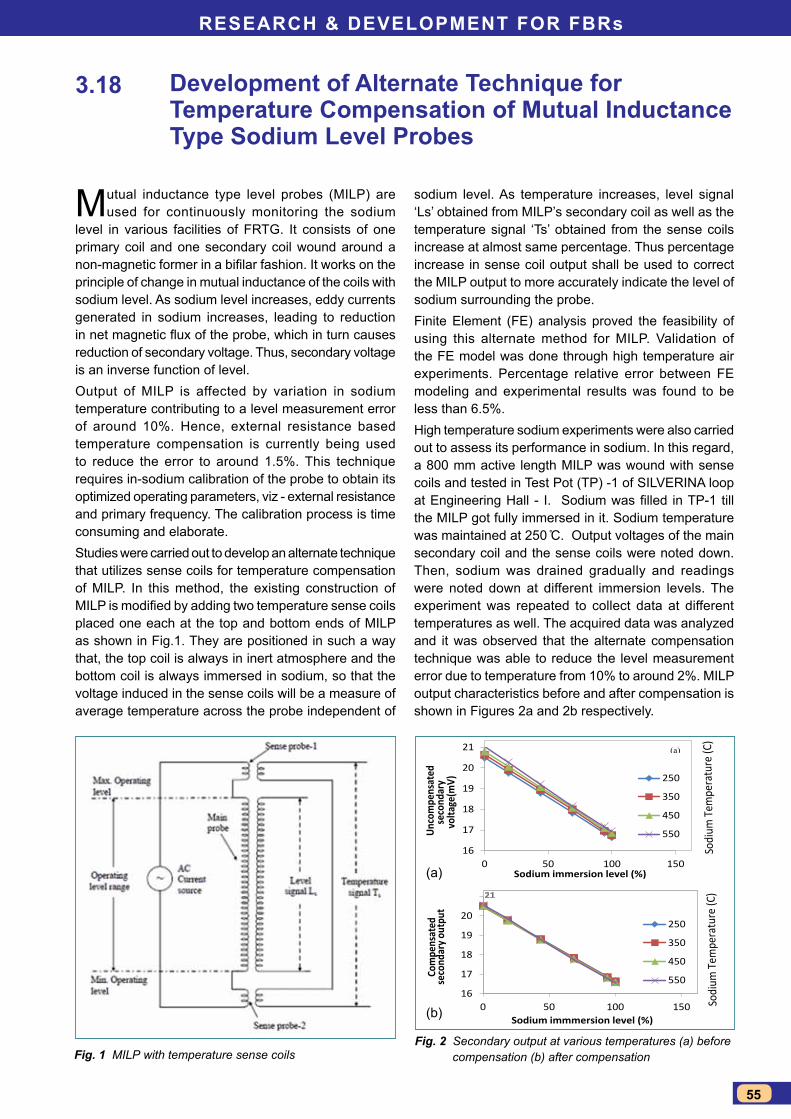
ReseaRch & Development foR fBRs
55
Development of alternate technique for temperature compensation of mutual Inductance type sodium level probes
Mutual inductance type level probes (MILP) are used for continuously monitoring the sodium
level in various facilities of FRTG. It consists of one primary coil and one secondary coil wound around a non-magnetic former in a bifilar fashion. It works on the principle of change in mutual inductance of the coils with sodium level. As sodium level increases, eddy currents generated in sodium increases, leading to reduction in net magnetic flux of the probe, which in turn causes reduction of secondary voltage. Thus, secondary voltage is an inverse function of level.Output of MILP is affected by variation in sodium temperature contributing to a level measurement error of around 10%. Hence, external resistance based temperature compensation is currently being used to reduce the error to around 1.5%. This technique requires in-sodium calibration of the probe to obtain its optimized operating parameters, viz - external resistance and primary frequency. The calibration process is time consuming and elaborate.Studies were carried out to develop an alternate technique that utilizes sense coils for temperature compensation of MILP. In this method, the existing construction of MILP is modified by adding two temperature sense coils placed one each at the top and bottom ends of MILP as shown in Fig.1. They are positioned in such a way that, the top coil is always in inert atmosphere and the bottom coil is always immersed in sodium, so that the voltage induced in the sense coils will be a measure of average temperature across the probe independent of
3.18
sodium level. As temperature increases, level signal ‘Ls’ obtained from MILP’s secondary coil as well as the temperature signal ‘Ts’ obtained from the sense coils increase at almost same percentage. Thus percentage increase in sense coil output shall be used to correct the MILP output to more accurately indicate the level of sodium surrounding the probe. Finite Element (FE) analysis proved the feasibility of using this alternate method for MILP. Validation of the FE model was done through high temperature air experiments. Percentage relative error between FE modeling and experimental results was found to be less than 6.5%. High temperature sodium experiments were also carried out to assess its performance in sodium. In this regard, a 800 mm active length MILP was wound with sense coils and tested in Test Pot (TP) -1 of SILVERINA loop at Engineering Hall - I. Sodium was filled in TP-1 till the MILP got fully immersed in it. Sodium temperature was maintained at 250 C. Output voltages of the main secondary coil and the sense coils were noted down. Then, sodium was drained gradually and readings were noted down at different immersion levels. The experiment was repeated to collect data at different temperatures as well. The acquired data was analyzed and it was observed that the alternate compensation technique was able to reduce the level measurement error due to temperature from 10% to around 2%. MILP output characteristics before and after compensation is shown in Figures 2a and 2b respectively.
Fig. 1 MILP with temperature sense coilsFig. 2 Secondary output at various temperatures (a) before
compensation (b) after compensation
16
17
18
19
20
21
0 50 100 150
Unco
mpe
nsat
ed
seco
ndar
y vo
ltage
(mV)
Sodium immersion level (%)
250
350
450
550
16
17
18
19
20
21
0 50 100 150
Com
pens
ated
se
cond
ary o
utpu
t
Sodium immmersion level (%)
250
350
450
550
Sodi
um T
empe
ratu
re (C
) So
dium
Tem
pera
ture
(C)
(a)
(a)
(b)
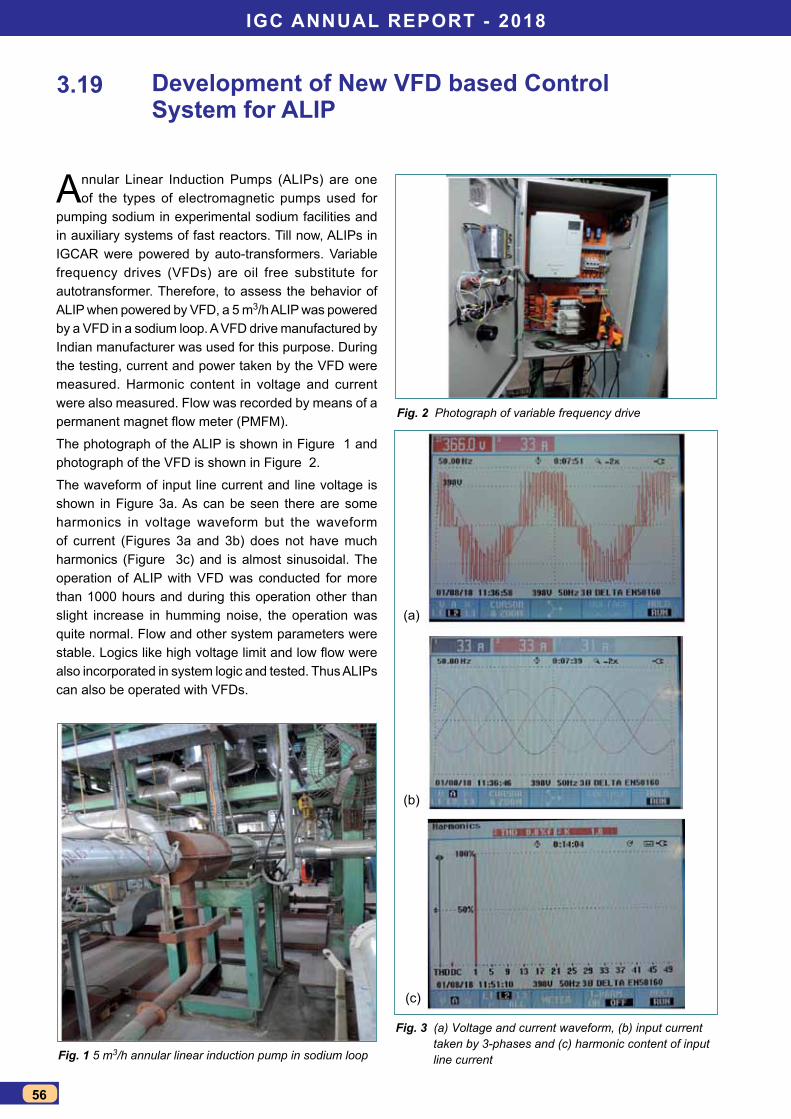
IGc annUal RepoRt - 2018
56
Development of new vfD based control system for alIp
Annular Linear Induction Pumps (ALIPs) are one of the types of electromagnetic pumps used for
pumping sodium in experimental sodium facilities and in auxiliary systems of fast reactors. Till now, ALIPs in IGCAR were powered by auto-transformers. Variable frequency drives (VFDs) are oil free substitute for autotransformer. Therefore, to assess the behavior of ALIP when powered by VFD, a 5 m3/h ALIP was powered by a VFD in a sodium loop. A VFD drive manufactured by Indian manufacturer was used for this purpose. During the testing, current and power taken by the VFD were measured. Harmonic content in voltage and current were also measured. Flow was recorded by means of a permanent magnet flow meter (PMFM).
The photograph of the ALIP is shown in Figure 1 and photograph of the VFD is shown in Figure 2.
The waveform of input line current and line voltage is shown in Figure 3a. As can be seen there are some harmonics in voltage waveform but the waveform of current (Figures 3a and 3b) does not have much harmonics (Figure 3c) and is almost sinusoidal. The operation of ALIP with VFD was conducted for more than 1000 hours and during this operation other than slight increase in humming noise, the operation was quite normal. Flow and other system parameters were stable. Logics like high voltage limit and low flow were also incorporated in system logic and tested. Thus ALIPs can also be operated with VFDs.
3.19
Fig. 3 (a) Voltage and current waveform, (b) input current taken by 3-phases and (c) harmonic content of input line currentFig. 1 5 m3/h annular linear induction pump in sodium loop
Fig. 2 Photograph of variable frequency drive
(a)
(b)
(c)
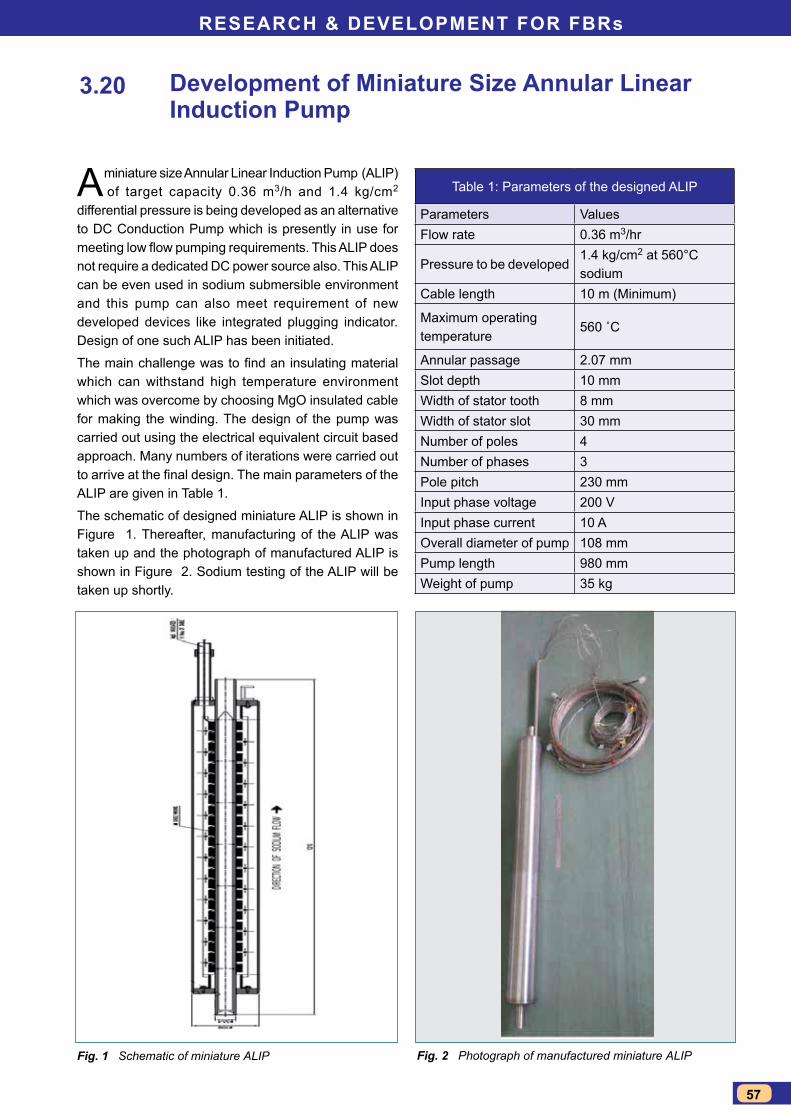
ReseaRch & Development foR fBRs
57
Development of miniature size annular linear Induction pump
A miniature size Annular Linear Induction Pump (ALIP) of target capacity 0.36 m3/h and 1.4 kg/cm2
differential pressure is being developed as an alternative to DC Conduction Pump which is presently in use for meeting low flow pumping requirements. This ALIP does not require a dedicated DC power source also. This ALIP can be even used in sodium submersible environment and this pump can also meet requirement of new developed devices like integrated plugging indicator. Design of one such ALIP has been initiated.
The main challenge was to find an insulating material which can withstand high temperature environment which was overcome by choosing MgO insulated cable for making the winding. The design of the pump was carried out using the electrical equivalent circuit based approach. Many numbers of iterations were carried out to arrive at the final design. The main parameters of the ALIP are given in Table 1.
The schematic of designed miniature ALIP is shown in Figure 1. Thereafter, manufacturing of the ALIP was taken up and the photograph of manufactured ALIP is shown in Figure 2. Sodium testing of the ALIP will be taken up shortly.
3.20
Fig. 1 Schematic of miniature ALIP Fig. 2 Photograph of manufactured miniature ALIP
Table 1: Parameters of the designed ALIP
Parameters ValuesFlow rate 0.36 m3/hr
Pressure to be developed 1.4 kg/cm2 at 560°C sodium
Cable length 10 m (Minimum)
Maximum operating temperature
560 ˚C
Annular passage 2.07 mmSlot depth 10 mmWidth of stator tooth 8 mmWidth of stator slot 30 mmNumber of poles 4Number of phases 3Pole pitch 230 mmInput phase voltage 200 VInput phase current 10 AOverall diameter of pump 108 mmPump length 980 mmWeight of pump 35 kg
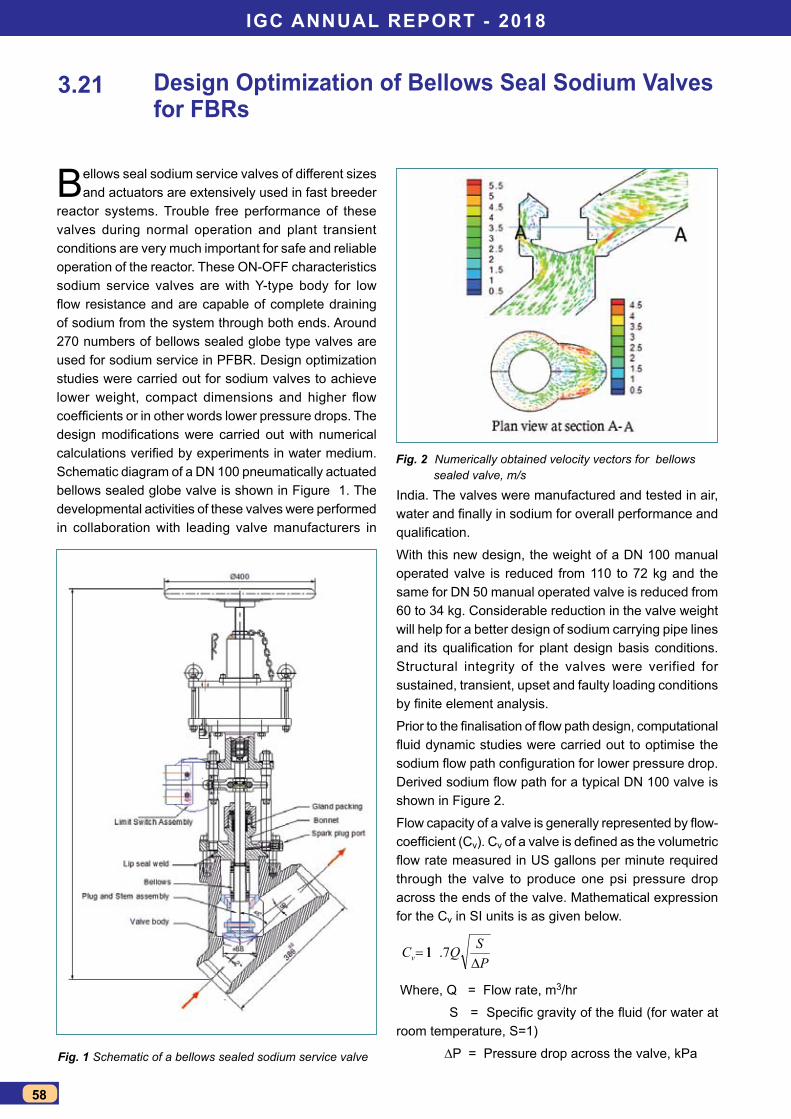
IGc annUal RepoRt - 2018
58
Design optimization of Bellows seal sodium valves for fBRs
Bellows seal sodium service valves of different sizes and actuators are extensively used in fast breeder
reactor systems. Trouble free performance of these valves during normal operation and plant transient conditions are very much important for safe and reliable operation of the reactor. These ON-OFF characteristics sodium service valves are with Y-type body for low flow resistance and are capable of complete draining of sodium from the system through both ends. Around 270 numbers of bellows sealed globe type valves are used for sodium service in PFBR. Design optimization studies were carried out for sodium valves to achieve lower weight, compact dimensions and higher flow coefficients or in other words lower pressure drops. The design modifications were carried out with numerical calculations verified by experiments in water medium. Schematic diagram of a DN 100 pneumatically actuated bellows sealed globe valve is shown in Figure 1. The developmental activities of these valves were performed in collaboration with leading valve manufacturers in
3.21
Fig. 1 Schematic of a bellows sealed sodium service valve
Fig. 2 Numerically obtained velocity vectors for bellows sealed valve, m/s
India. The valves were manufactured and tested in air, water and finally in sodium for overall performance and qualification.
With this new design, the weight of a DN 100 manual operated valve is reduced from 110 to 72 kg and the same for DN 50 manual operated valve is reduced from 60 to 34 kg. Considerable reduction in the valve weight will help for a better design of sodium carrying pipe lines and its qualification for plant design basis conditions. Structural integrity of the valves were verified for sustained, transient, upset and faulty loading conditions by finite element analysis.
Prior to the finalisation of flow path design, computational fluid dynamic studies were carried out to optimise the sodium flow path configuration for lower pressure drop. Derived sodium flow path for a typical DN 100 valve is shown in Figure 2.
Flow capacity of a valve is generally represented by flow-coefficient (Cv). Cv of a valve is defined as the volumetric flow rate measured in US gallons per minute required through the valve to produce one psi pressure drop across the ends of the valve. Mathematical expression for the Cv in SI units is as given below.
PSQCv ∆
= 7.11
Where, Q = Flow rate, m3/hr
S = Specific gravity of the fluid (for water at room temperature, S=1)
∆P = Pressure drop across the valve, kPa
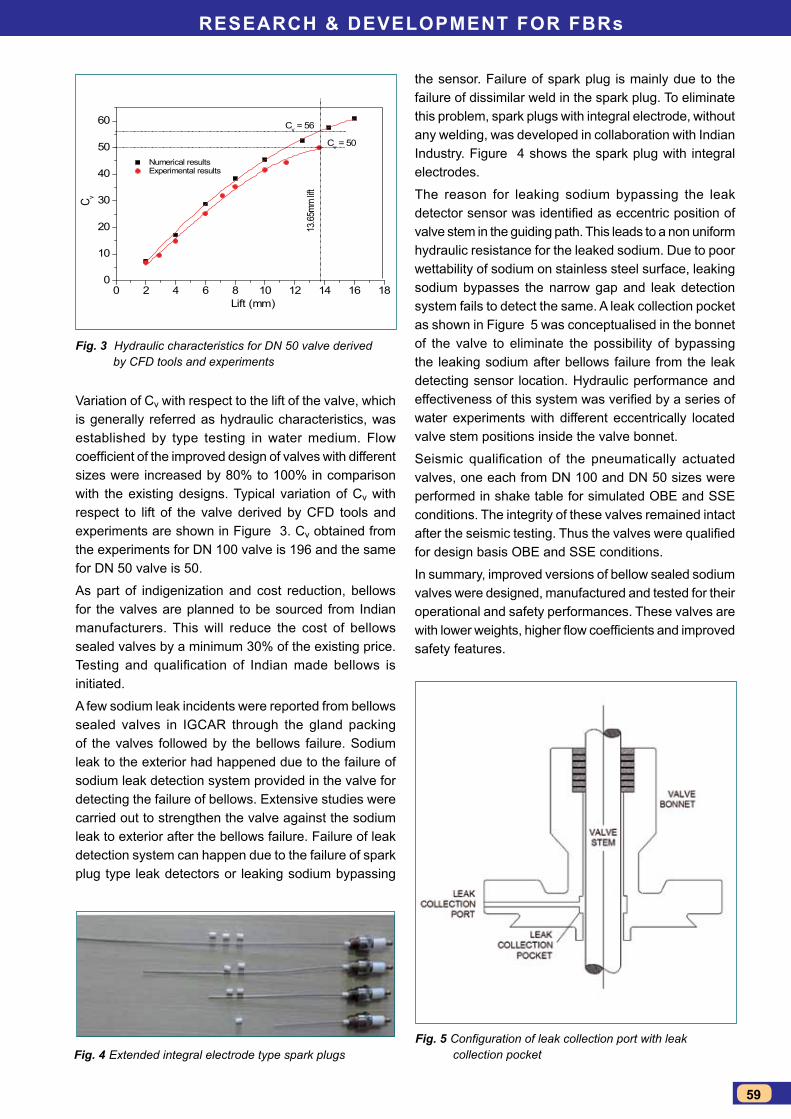
ReseaRch & Development foR fBRs
59
Fig. 4 Extended integral electrode type spark plugsFig. 5 Configuration of leak collection port with leak
collection pocket
Variation of Cv with respect to the lift of the valve, which is generally referred as hydraulic characteristics, was established by type testing in water medium. Flow coefficient of the improved design of valves with different sizes were increased by 80% to 100% in comparison with the existing designs. Typical variation of Cv with respect to lift of the valve derived by CFD tools and experiments are shown in Figure 3. Cv obtained from the experiments for DN 100 valve is 196 and the same for DN 50 valve is 50.
As part of indigenization and cost reduction, bellows for the valves are planned to be sourced from Indian manufacturers. This will reduce the cost of bellows sealed valves by a minimum 30% of the existing price. Testing and qualification of Indian made bellows is initiated.
A few sodium leak incidents were reported from bellows sealed valves in IGCAR through the gland packing of the valves followed by the bellows failure. Sodium leak to the exterior had happened due to the failure of sodium leak detection system provided in the valve for detecting the failure of bellows. Extensive studies were carried out to strengthen the valve against the sodium leak to exterior after the bellows failure. Failure of leak detection system can happen due to the failure of spark plug type leak detectors or leaking sodium bypassing
the sensor. Failure of spark plug is mainly due to the failure of dissimilar weld in the spark plug. To eliminate this problem, spark plugs with integral electrode, without any welding, was developed in collaboration with Indian Industry. Figure 4 shows the spark plug with integral electrodes.
The reason for leaking sodium bypassing the leak detector sensor was identified as eccentric position of valve stem in the guiding path. This leads to a non uniform hydraulic resistance for the leaked sodium. Due to poor wettability of sodium on stainless steel surface, leaking sodium bypasses the narrow gap and leak detection system fails to detect the same. A leak collection pocket as shown in Figure 5 was conceptualised in the bonnet of the valve to eliminate the possibility of bypassing the leaking sodium after bellows failure from the leak detecting sensor location. Hydraulic performance and effectiveness of this system was verified by a series of water experiments with different eccentrically located valve stem positions inside the valve bonnet.
Seismic qualification of the pneumatically actuated valves, one each from DN 100 and DN 50 sizes were performed in shake table for simulated OBE and SSE conditions. The integrity of these valves remained intact after the seismic testing. Thus the valves were qualified for design basis OBE and SSE conditions.
In summary, improved versions of bellow sealed sodium valves were designed, manufactured and tested for their operational and safety performances. These valves are with lower weights, higher flow coefficients and improved safety features.
0 2 4 6 8 10 12 14 16 180
10
20
30
40
50
60
13.65
mm lif
t
Cv = 50
Cv = 56
Numerical results Experimental results
C v
Lift (mm)
Fig. 3 Hydraulic characteristics for DN 50 valve derived by CFD tools and experiments
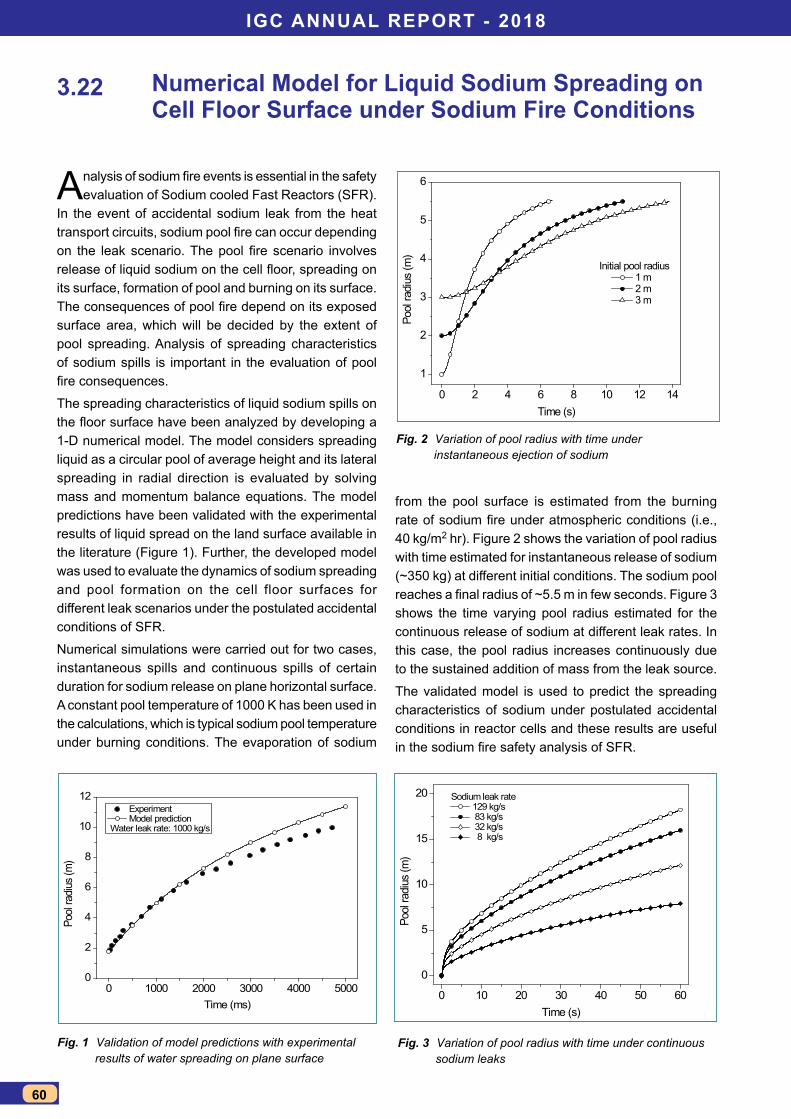
IGc annUal RepoRt - 2018
60
numerical model for liquid sodium spreading on cell floor surface under sodium fire conditions
Analysis of sodium fire events is essential in the safety evaluation of Sodium cooled Fast Reactors (SFR).
In the event of accidental sodium leak from the heat transport circuits, sodium pool fire can occur depending on the leak scenario. The pool fire scenario involves release of liquid sodium on the cell floor, spreading on its surface, formation of pool and burning on its surface. The consequences of pool fire depend on its exposed surface area, which will be decided by the extent of pool spreading. Analysis of spreading characteristics of sodium spills is important in the evaluation of pool fire consequences.
The spreading characteristics of liquid sodium spills on the floor surface have been analyzed by developing a 1-D numerical model. The model considers spreading liquid as a circular pool of average height and its lateral spreading in radial direction is evaluated by solving mass and momentum balance equations. The model predictions have been validated with the experimental results of liquid spread on the land surface available in the literature (Figure 1). Further, the developed model was used to evaluate the dynamics of sodium spreading and pool formation on the cell floor surfaces for different leak scenarios under the postulated accidental conditions of SFR.
Numerical simulations were carried out for two cases, instantaneous spills and continuous spills of certain duration for sodium release on plane horizontal surface. A constant pool temperature of 1000 K has been used in the calculations, which is typical sodium pool temperature under burning conditions. The evaporation of sodium
3.22
0 1000 2000 3000 4000 50000
2
4
6
8
10
12 Experiment Model prediction
Water leak rate: 1000 kg/s
Pool
radiu
s (m
)
Time (ms)
0 2 4 6 8 10 12 14
1
2
3
4
5
6
Pool
radi
us (m
)Time (s)
Initial pool radius 1 m 2 m 3 m
0 10 20 30 40 50 60
0
5
10
15
20
Pool
radi
us (m
)
Time (s)
Sodium leak rate 129 kg/s 83 kg/s 32 kg/s 8 kg/s
Fig. 1 Validation of model predictions with experimental results of water spreading on plane surface
Fig. 2 Variation of pool radius with time under instantaneous ejection of sodium
Fig. 3 Variation of pool radius with time under continuous sodium leaks
from the pool surface is estimated from the burning rate of sodium fire under atmospheric conditions (i.e., 40 kg/m2 hr). Figure 2 shows the variation of pool radius with time estimated for instantaneous release of sodium (~350 kg) at different initial conditions. The sodium pool reaches a final radius of ~5.5 m in few seconds. Figure 3 shows the time varying pool radius estimated for the continuous release of sodium at different leak rates. In this case, the pool radius increases continuously due to the sustained addition of mass from the leak source.
The validated model is used to predict the spreading characteristics of sodium under postulated accidental conditions in reactor cells and these results are useful in the sodium fire safety analysis of SFR.
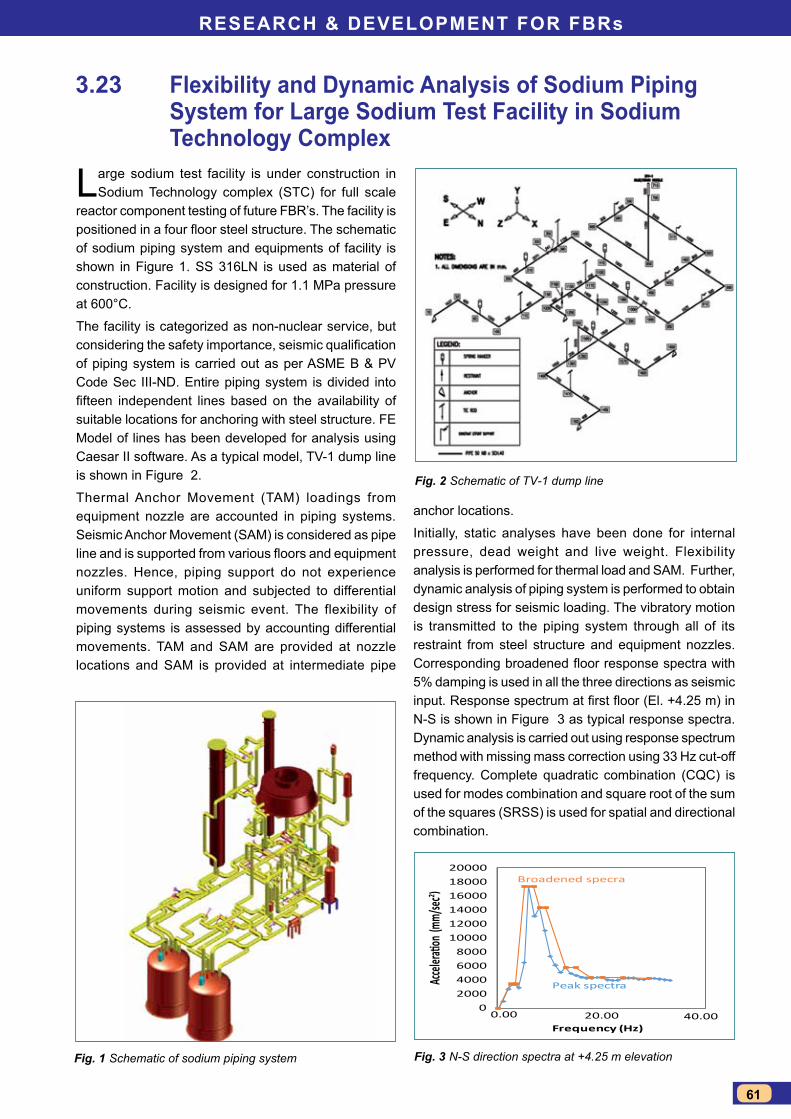
ReseaRch & Development foR fBRs
61
flexibility and Dynamic analysis of sodium piping system for large sodium test facility in sodium technology complex
Large sodium test facility is under construction in Sodium Technology complex (STC) for full scale
reactor component testing of future FBR’s. The facility is positioned in a four floor steel structure. The schematic of sodium piping system and equipments of facility is shown in Figure 1. SS 316LN is used as material of construction. Facility is designed for 1.1 MPa pressure at 600°C.
The facility is categorized as non-nuclear service, but considering the safety importance, seismic qualification of piping system is carried out as per ASME B & PV Code Sec III-ND. Entire piping system is divided into fifteen independent lines based on the availability of suitable locations for anchoring with steel structure. FE Model of lines has been developed for analysis using Caesar II software. As a typical model, TV-1 dump line is shown in Figure 2.
Thermal Anchor Movement (TAM) loadings from equipment nozzle are accounted in piping systems. Seismic Anchor Movement (SAM) is considered as pipe line and is supported from various floors and equipment nozzles. Hence, piping support do not experience uniform support motion and subjected to differential movements during seismic event. The flexibility of piping systems is assessed by accounting differential movements. TAM and SAM are provided at nozzle locations and SAM is provided at intermediate pipe
3.23
02000400060008000
100001200014000160001800020000
0.00 20.00 40.00
Accel
eratio
n (mm
/sec2 )
Frequency (Hz)
Broadened specra
Peak spectra
Fig. 1 Schematic of sodium piping system Fig. 3 N-S direction spectra at +4.25 m elevation
Fig. 2 Schematic of TV-1 dump line
anchor locations.
Initially, static analyses have been done for internal pressure, dead weight and live weight. Flexibility analysis is performed for thermal load and SAM. Further, dynamic analysis of piping system is performed to obtain design stress for seismic loading. The vibratory motion is transmitted to the piping system through all of its restraint from steel structure and equipment nozzles. Corresponding broadened floor response spectra with 5% damping is used in all the three directions as seismic input. Response spectrum at first floor (El. +4.25 m) in N-S is shown in Figure 3 as typical response spectra. Dynamic analysis is carried out using response spectrum method with missing mass correction using 33 Hz cut-off frequency. Complete quadratic combination (CQC) is used for modes combination and square root of the sum of the squares (SRSS) is used for spatial and directional combination.
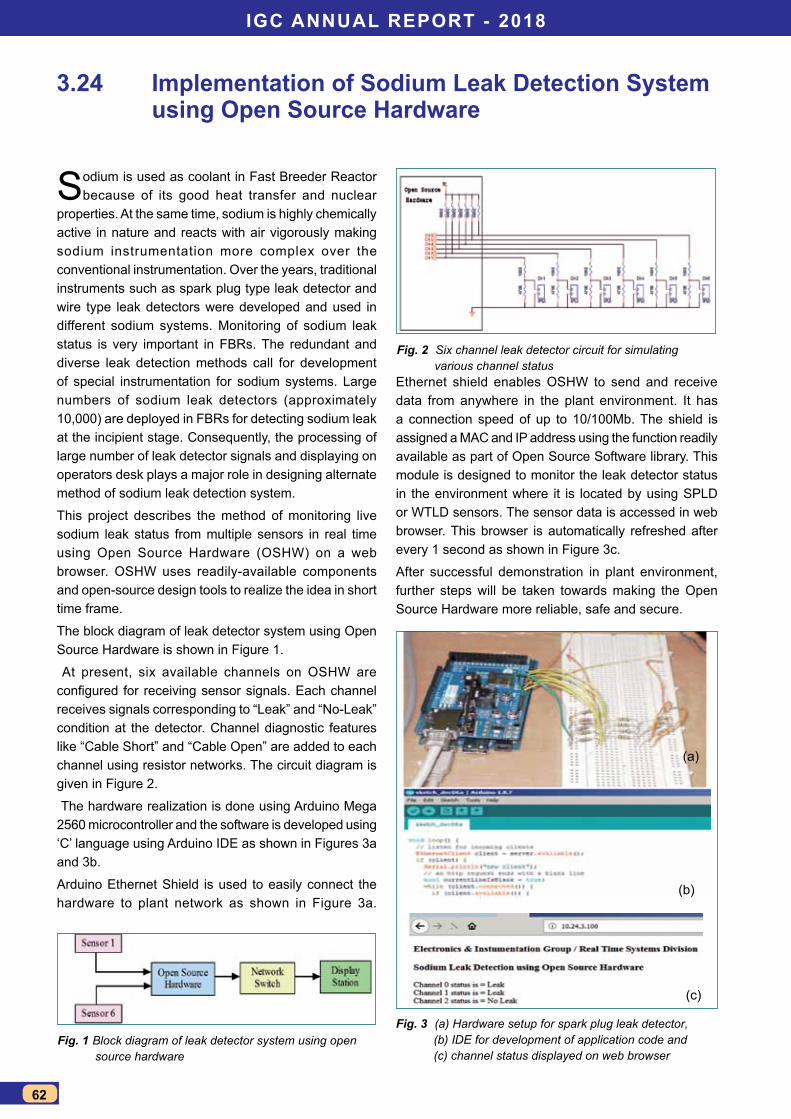
IGc annUal RepoRt - 2018
62
Implementation of sodium leak Detection system using open source hardware
Sodium is used as coolant in Fast Breeder Reactor because of its good heat transfer and nuclear
properties. At the same time, sodium is highly chemically active in nature and reacts with air vigorously making sodium instrumentation more complex over the conventional instrumentation. Over the years, traditional instruments such as spark plug type leak detector and wire type leak detectors were developed and used in different sodium systems. Monitoring of sodium leak status is very important in FBRs. The redundant and diverse leak detection methods call for development of special instrumentation for sodium systems. Large numbers of sodium leak detectors (approximately 10,000) are deployed in FBRs for detecting sodium leak at the incipient stage. Consequently, the processing of large number of leak detector signals and displaying on operators desk plays a major role in designing alternate method of sodium leak detection system.
This project describes the method of monitoring live sodium leak status from multiple sensors in real time using Open Source Hardware (OSHW) on a web browser. OSHW uses readily-available components and open-source design tools to realize the idea in short time frame.
The block diagram of leak detector system using Open Source Hardware is shown in Figure 1.
At present, six available channels on OSHW are configured for receiving sensor signals. Each channel receives signals corresponding to “Leak” and “No-Leak” condition at the detector. Channel diagnostic features like “Cable Short” and “Cable Open” are added to each channel using resistor networks. The circuit diagram is given in Figure 2.
The hardware realization is done using Arduino Mega 2560 microcontroller and the software is developed using ‘C’ language using Arduino IDE as shown in Figures 3a and 3b.
Arduino Ethernet Shield is used to easily connect the hardware to plant network as shown in Figure 3a.
3.24
Fig. 1 Block diagram of leak detector system using open source hardware
Fig. 2 Six channel leak detector circuit for simulating various channel status
Fig. 3 (a) Hardware setup for spark plug leak detector, (b) IDE for development of application code and (c) channel status displayed on web browser
Ethernet shield enables OSHW to send and receive data from anywhere in the plant environment. It has a connection speed of up to 10/100Mb. The shield is assigned a MAC and IP address using the function readily available as part of Open Source Software library. This module is designed to monitor the leak detector status in the environment where it is located by using SPLD or WTLD sensors. The sensor data is accessed in web browser. This browser is automatically refreshed after every 1 second as shown in Figure 3c.
After successful demonstration in plant environment, further steps will be taken towards making the Open Source Hardware more reliable, safe and secure.
(a)
(b)
(c)
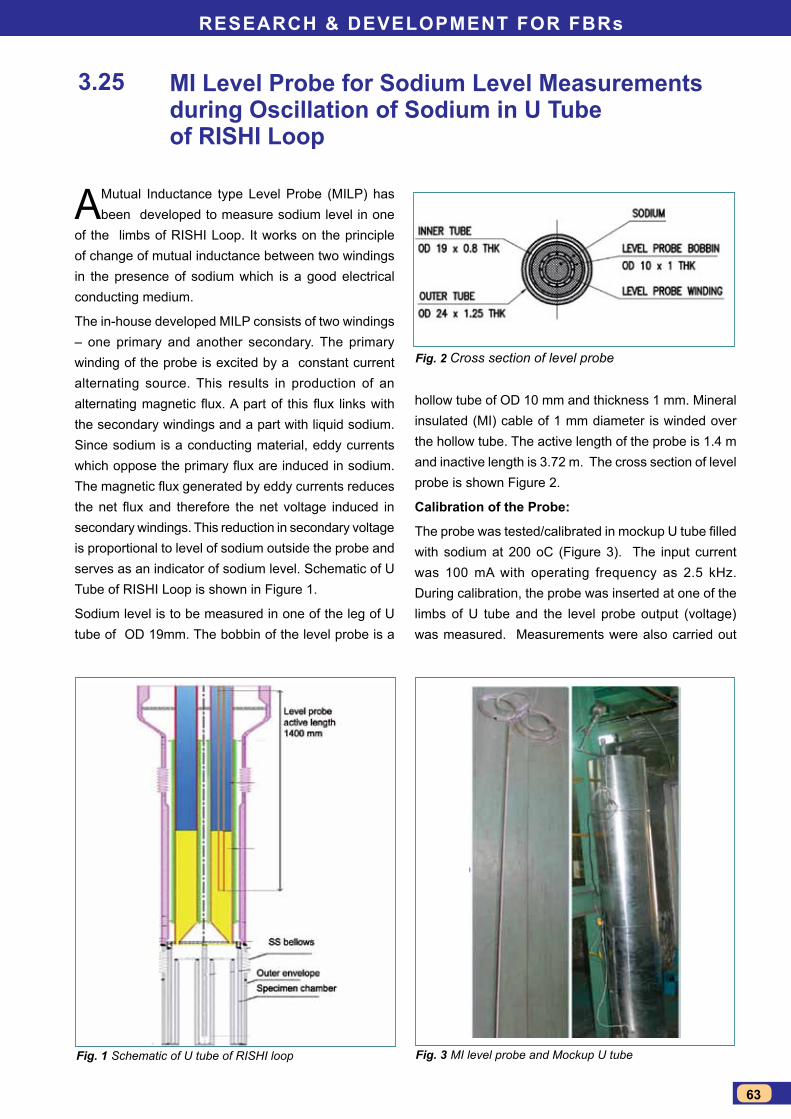
ReseaRch & Development foR fBRs
63
mI level probe for sodium level measurements during oscillation of sodium in U tube of RIshI loop
A Mutual Inductance type Level Probe (MILP) has been developed to measure sodium level in one
of the limbs of RISHI Loop. It works on the principle of change of mutual inductance between two windings in the presence of sodium which is a good electrical conducting medium.
The in-house developed MILP consists of two windings – one primary and another secondary. The primary winding of the probe is excited by a constant current alternating source. This results in production of an alternating magnetic flux. A part of this flux links with the secondary windings and a part with liquid sodium. Since sodium is a conducting material, eddy currents which oppose the primary flux are induced in sodium. The magnetic flux generated by eddy currents reduces the net flux and therefore the net voltage induced in secondary windings. This reduction in secondary voltage is proportional to level of sodium outside the probe and serves as an indicator of sodium level. Schematic of U Tube of RISHI Loop is shown in Figure 1.
Sodium level is to be measured in one of the leg of U tube of OD 19mm. The bobbin of the level probe is a
3.25
Fig. 1 Schematic of U tube of RISHI loop Fig. 3 MI level probe and Mockup U tube
Fig. 2 Cross section of level probe
hollow tube of OD 10 mm and thickness 1 mm. Mineral insulated (MI) cable of 1 mm diameter is winded over the hollow tube. The active length of the probe is 1.4 m and inactive length is 3.72 m. The cross section of level probe is shown Figure 2.
calibration of the probe:
The probe was tested/calibrated in mockup U tube filled with sodium at 200 oC (Figure 3). The input current was 100 mA with operating frequency as 2.5 kHz. During calibration, the probe was inserted at one of the limbs of U tube and the level probe output (voltage) was measured. Measurements were also carried out
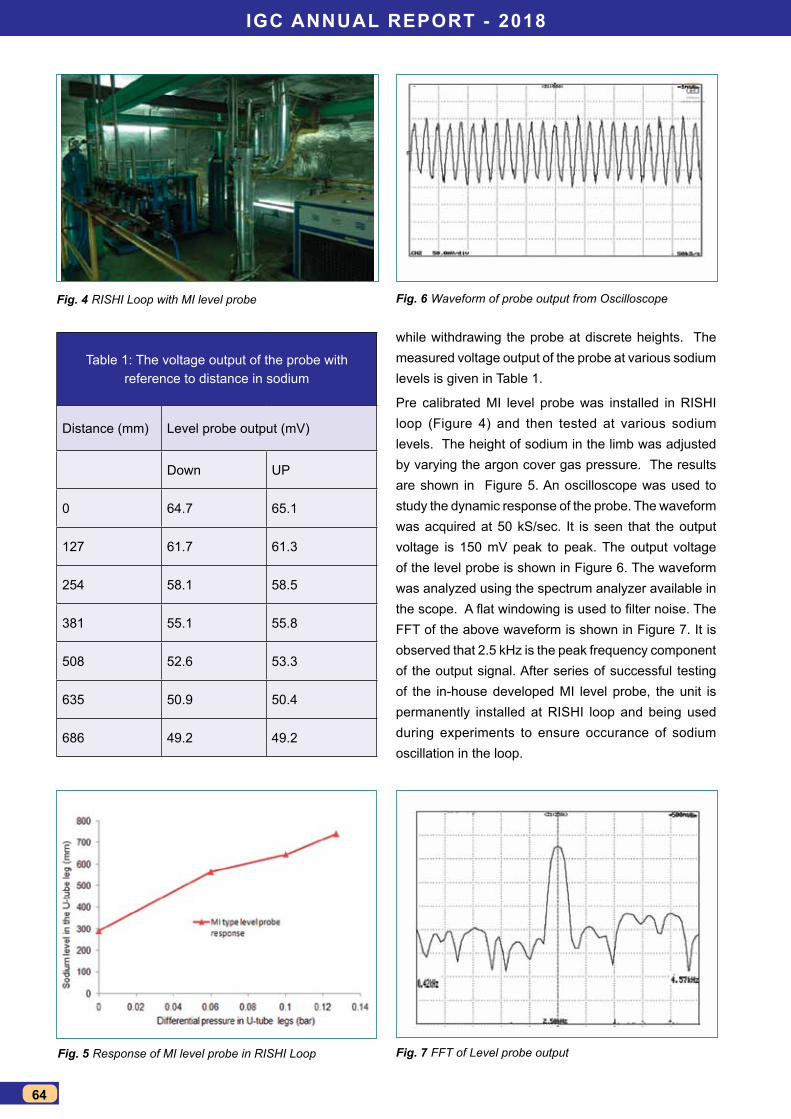
IGc annUal RepoRt - 2018
64
Fig. 4 RISHI Loop with MI level probe Fig. 6 Waveform of probe output from Oscilloscope
Fig. 7 FFT of Level probe outputFig. 5 Response of MI level probe in RISHI Loop
Table 1: The voltage output of the probe with reference to distance in sodium
Distance (mm) Level probe output (mV)
Down UP
0 64.7 65.1
127 61.7 61.3
254 58.1 58.5
381 55.1 55.8
508 52.6 53.3
635 50.9 50.4
686 49.2 49.2
while withdrawing the probe at discrete heights. The measured voltage output of the probe at various sodium levels is given in Table 1.
Pre calibrated MI level probe was installed in RISHI loop (Figure 4) and then tested at various sodium levels. The height of sodium in the limb was adjusted by varying the argon cover gas pressure. The results are shown in Figure 5. An oscilloscope was used to study the dynamic response of the probe. The waveform was acquired at 50 kS/sec. It is seen that the output voltage is 150 mV peak to peak. The output voltage of the level probe is shown in Figure 6. The waveform was analyzed using the spectrum analyzer available in the scope. A flat windowing is used to filter noise. The FFT of the above waveform is shown in Figure 7. It is observed that 2.5 kHz is the peak frequency component of the output signal. After series of successful testing of the in-house developed MI level probe, the unit is permanently installed at RISHI loop and being used during experiments to ensure occurance of sodium oscillation in the loop.
ReseaRch & Development foR fBRs
65
sodium aerosol leakage through capillaries
During Core Disruptive Accident (CDA) in Sodium cooled Fast Reactors (SFR), the reactor containment
building is bottled-up with aerosols of sodium and fuel and fission products along with gases. Since pressure of the RCB increases, aerosols along with the fission gases may leak out through the perforations of electrical penetrations, ducts, pores and developed cracks in the containment wall, contributing to the environmental source term. Penetration of aerosols through these leak paths depends on various factors including, pressure difference between atmosphere and inside the RCB, suspended aerosol concentration, aerosol size distribution, leak path dimensions and relative humidity inside the RCB etc. As the penetration paths can have diverse shapes and dimension, and cannot be predefined, it is necessary to simplify the leak path to an idealized geometry for the smooth theoretical and experimental formulation. In this context, sodium aerosol leakage studies through staright capillaries is initiated at RESD, IGCAR. Experiments are carried out in Aerosol Test Facility (ATF). The facility has sodium combustion cell (maintained at inert atmosphere), aerosol chamber of 1 m3 volume and stainless steel capillary connected to one of the diagnostic ports of aerosol chamber (Figure 1). The other end of the capillary is connected to the gas washing bottle containing 100 ml deionized water.
Sodium combustion aerosols are generated, bottled-up in the aerosol chamber and made to leak through capillary to get dissolved in deionized water. The conductivity of the solution is measured online by conductivity meter (M/s Metrohm, 856 conductivity module) and quantity of sodium compound aerosols leaked through capillary is determined using pre-established calibration graph.
Experiments were conducted by generating sodium aerosols of mass concentration ~4 g/m3, relative humidity of the chamber is maintained ~75% and capillaries of
3.26
0
1
2
3
4
5
0.0
0.3
0.6
0.9
1.2
1.5
0 10 20 30 40 50 60 70 800
2
4
6
8
10
15kPa
Aer
osol
mas
s le
aked
out
(mg) Experiment Theory
5kPa 20kPa
Time (min)0 10 20 30 40 50 60 70 80
Time (min)0 10 20 30 40 50 60 70 80
Time (min)
Fig. 1 Aerosol leakage experimental setup
Fig. 2 Measured and simulated cumulative aerosol mass leak for different pressures
various diameters 125, 254 and 508 μm having length of 10 cm and 20 cm. It is observed that as the length of the capillary increases the average leak rate decreases for fixed capillary diameter. The sodium aerosol leaked mass from outside the capillary is found to be NIL for the capillary of bore 125 and 250 μm and 10 cm length, i.e. the capillaries get plugged for all the pressure conditions.
Experiments were conducted by maintaining aerosol chamber at three differential pressure conditions 5, 15 and 20 kPa and at constant relative humidity ~75% using capillary having bore 508 μm and length 10 cm. The measured and simulated cumulative aerosol mass leaked through the capillary for different pressures is shown in Figure 2. It is observed that the average leak rate of aerosols increases with increase of aerosol chamber pressure i.e. differential pressure across the capillary.
The effect of aerosol mass concentration (initial) on aerosol leakage was studied by changing initial mass concentration of the bottled-up aerosols and keeping RH ~75% for the capillary bore size 508 μm and length 10 cm. The results show that the average leak rate increases with the increase of mass concentration for the fixed pressure. It is further observed that by changing RH% ~90 the average leak rate increases with the increase of RH% for constant capillary dimension, aerosol concentration and pressure.
The aerosol concentration as a function of space and time inside the capillary is calculated numerically by solving the following 1D transport equation:
where A is the cross-sectional area of the capillary, u is the velocity of air inside the capillary, χ is the wetted perimeter of the capillary and Vd is the deposition velocity of aerosol. The measured aerosol mass agree well with the estimated leaked aerosol mass.
Sodium aerosol leakage under various parametric combinations viz. size of the bore, concentration, pressure and RH were carried out and simulated. The work is continued for actual concrete leak paths.
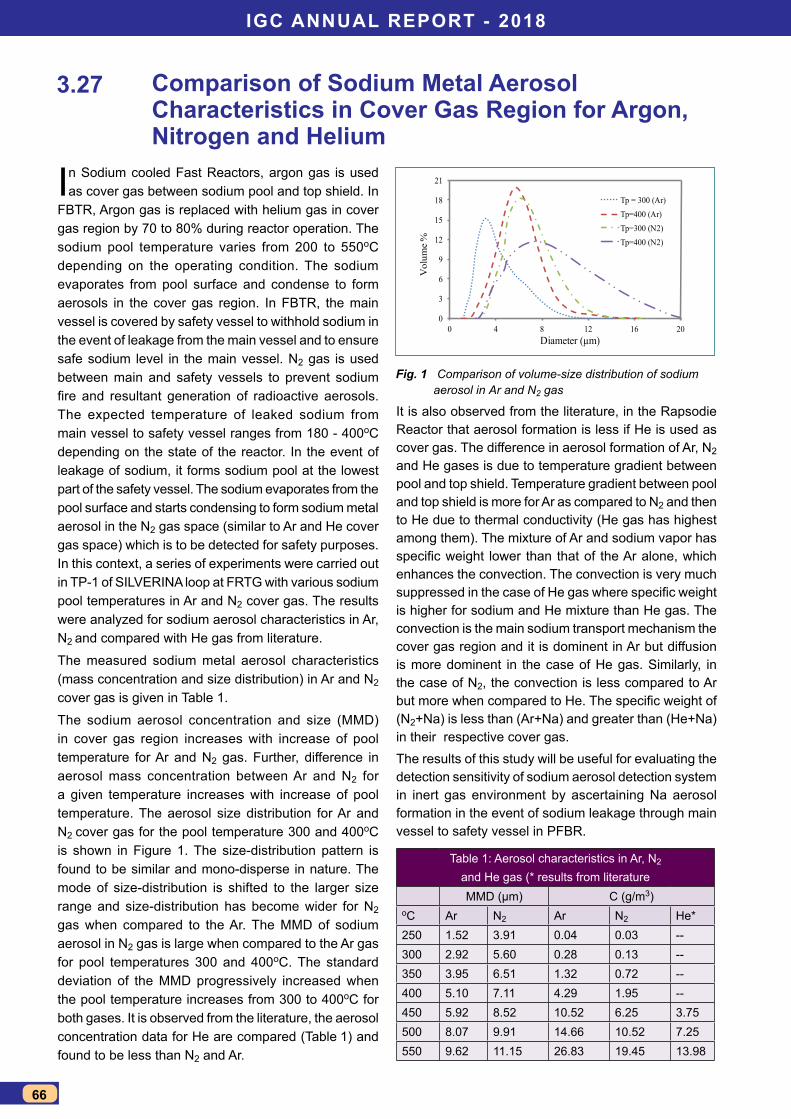
IGc annUal RepoRt - 2018
66
comparison of sodium metal aerosol characteristics in cover Gas Region for argon, nitrogen and helium
In Sodium cooled Fast Reactors, argon gas is used as cover gas between sodium pool and top shield. In
FBTR, Argon gas is replaced with helium gas in cover gas region by 70 to 80% during reactor operation. The sodium pool temperature varies from 200 to 550oC depending on the operating condition. The sodium evaporates from pool surface and condense to form aerosols in the cover gas region. In FBTR, the main vessel is covered by safety vessel to withhold sodium in the event of leakage from the main vessel and to ensure safe sodium level in the main vessel. N2 gas is used between main and safety vessels to prevent sodium fire and resultant generation of radioactive aerosols. The expected temperature of leaked sodium from main vessel to safety vessel ranges from 180 - 400oC depending on the state of the reactor. In the event of leakage of sodium, it forms sodium pool at the lowest part of the safety vessel. The sodium evaporates from the pool surface and starts condensing to form sodium metal aerosol in the N2 gas space (similar to Ar and He cover gas space) which is to be detected for safety purposes. In this context, a series of experiments were carried out in TP-1 of SILVERINA loop at FRTG with various sodium pool temperatures in Ar and N2 cover gas. The results were analyzed for sodium aerosol characteristics in Ar, N2 and compared with He gas from literature.
The measured sodium metal aerosol characteristics (mass concentration and size distribution) in Ar and N2 cover gas is given in Table 1.
The sodium aerosol concentration and size (MMD) in cover gas region increases with increase of pool temperature for Ar and N2 gas. Further, difference in aerosol mass concentration between Ar and N2 for a given temperature increases with increase of pool temperature. The aerosol size distribution for Ar and N2 cover gas for the pool temperature 300 and 400oC is shown in Figure 1. The size-distribution pattern is found to be similar and mono-disperse in nature. The mode of size-distribution is shifted to the larger size range and size-distribution has become wider for N2 gas when compared to the Ar. The MMD of sodium aerosol in N2 gas is large when compared to the Ar gas for pool temperatures 300 and 400oC. The standard deviation of the MMD progressively increased when the pool temperature increases from 300 to 400oC for both gases. It is observed from the literature, the aerosol concentration data for He are compared (Table 1) and found to be less than N2 and Ar.
3.27
It is also observed from the literature, in the Rapsodie Reactor that aerosol formation is less if He is used as cover gas. The difference in aerosol formation of Ar, N2 and He gases is due to temperature gradient between pool and top shield. Temperature gradient between pool and top shield is more for Ar as compared to N2 and then to He due to thermal conductivity (He gas has highest among them). The mixture of Ar and sodium vapor has specific weight lower than that of the Ar alone, which enhances the convection. The convection is very much suppressed in the case of He gas where specific weight is higher for sodium and He mixture than He gas. The convection is the main sodium transport mechanism the cover gas region and it is dominent in Ar but diffusion is more dominent in the case of He gas. Similarly, in the case of N2, the convection is less compared to Ar but more when compared to He. The specific weight of (N2+Na) is less than (Ar+Na) and greater than (He+Na) in their respective cover gas. The results of this study will be useful for evaluating the detection sensitivity of sodium aerosol detection system in inert gas environment by ascertaining Na aerosol formation in the event of sodium leakage through main vessel to safety vessel in PFBR.
0
3
6
9
12
15
18
21
0 4 8 12 16 20
Vol
ume
%
Diameter (µm)
Tp = 300 (Ar)Tp=400 (Ar)Tp=300 (N2)Tp=400 (N2)
Fig. 1 Comparison of volume-size distribution of sodium aerosol in Ar and N2 gas
Table 1: Aerosol characteristics in Ar, N2 and He gas (* results from literatureMMD (µm) C (g/m3)
oC Ar N2 Ar N2 He*250 1.52 3.91 0.04 0.03 --300 2.92 5.60 0.28 0.13 --350 3.95 6.51 1.32 0.72 --400 5.10 7.11 4.29 1.95 --450 5.92 8.52 10.52 6.25 3.75500 8.07 9.91 14.66 10.52 7.25550 9.62 11.15 26.83 19.45 13.98
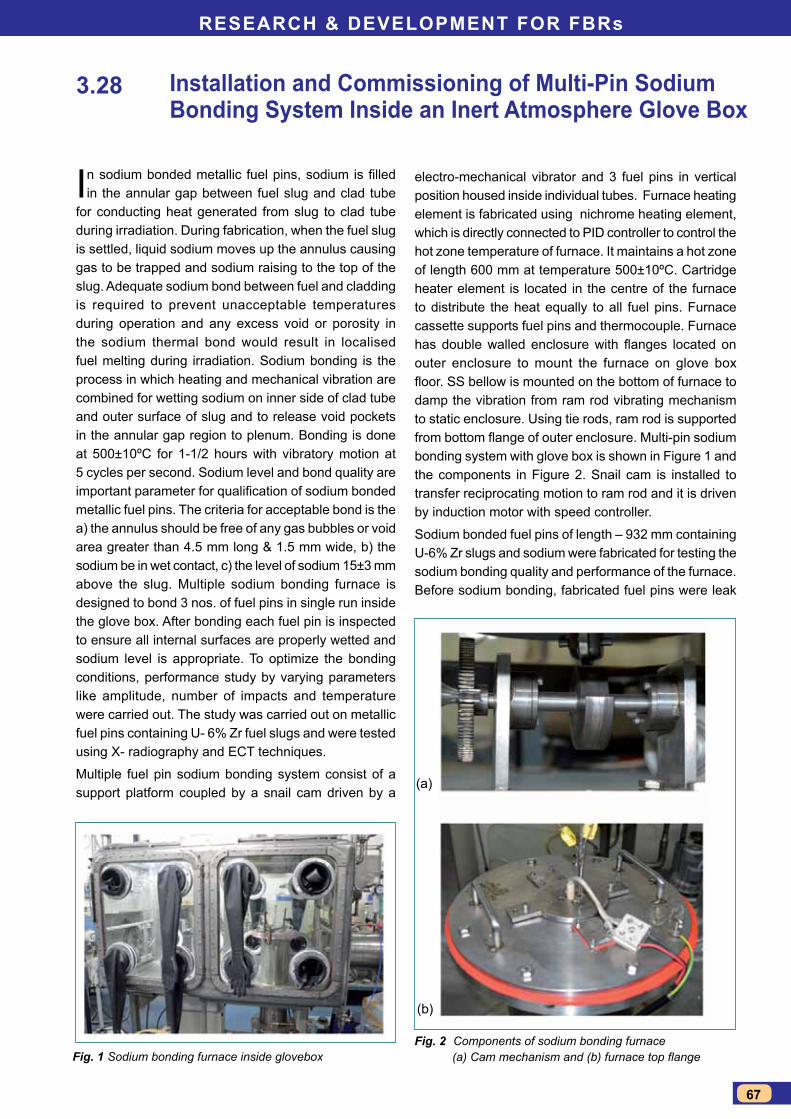
ReseaRch & Development foR fBRs
67
Installation and commissioning of multi-pin sodium Bonding system Inside an Inert atmosphere Glove Box
In sodium bonded metallic fuel pins, sodium is filled in the annular gap between fuel slug and clad tube
for conducting heat generated from slug to clad tube during irradiation. During fabrication, when the fuel slug is settled, liquid sodium moves up the annulus causing gas to be trapped and sodium raising to the top of the slug. Adequate sodium bond between fuel and cladding is required to prevent unacceptable temperatures during operation and any excess void or porosity in the sodium thermal bond would result in localised fuel melting during irradiation. Sodium bonding is the process in which heating and mechanical vibration are combined for wetting sodium on inner side of clad tube and outer surface of slug and to release void pockets in the annular gap region to plenum. Bonding is done at 500±10ºC for 1-1/2 hours with vibratory motion at 5 cycles per second. Sodium level and bond quality are important parameter for qualification of sodium bonded metallic fuel pins. The criteria for acceptable bond is the a) the annulus should be free of any gas bubbles or void area greater than 4.5 mm long & 1.5 mm wide, b) the sodium be in wet contact, c) the level of sodium 15±3 mm above the slug. Multiple sodium bonding furnace is designed to bond 3 nos. of fuel pins in single run inside the glove box. After bonding each fuel pin is inspected to ensure all internal surfaces are properly wetted and sodium level is appropriate. To optimize the bonding conditions, performance study by varying parameters like amplitude, number of impacts and temperature were carried out. The study was carried out on metallic fuel pins containing U- 6% Zr fuel slugs and were tested using X- radiography and ECT techniques.
Multiple fuel pin sodium bonding system consist of a support platform coupled by a snail cam driven by a
3.28
Fig. 1 Sodium bonding furnace inside gloveboxFig. 2 Components of sodium bonding furnace
(a) Cam mechanism and (b) furnace top flange
electro-mechanical vibrator and 3 fuel pins in vertical position housed inside individual tubes. Furnace heating element is fabricated using nichrome heating element, which is directly connected to PID controller to control the hot zone temperature of furnace. It maintains a hot zone of length 600 mm at temperature 500±10ºC. Cartridge heater element is located in the centre of the furnace to distribute the heat equally to all fuel pins. Furnace cassette supports fuel pins and thermocouple. Furnace has double walled enclosure with flanges located on outer enclosure to mount the furnace on glove box floor. SS bellow is mounted on the bottom of furnace to damp the vibration from ram rod vibrating mechanism to static enclosure. Using tie rods, ram rod is supported from bottom flange of outer enclosure. Multi-pin sodium bonding system with glove box is shown in Figure 1 and the components in Figure 2. Snail cam is installed to transfer reciprocating motion to ram rod and it is driven by induction motor with speed controller.
Sodium bonded fuel pins of length – 932 mm containing U-6% Zr slugs and sodium were fabricated for testing the sodium bonding quality and performance of the furnace. Before sodium bonding, fabricated fuel pins were leak
(a)
(b)
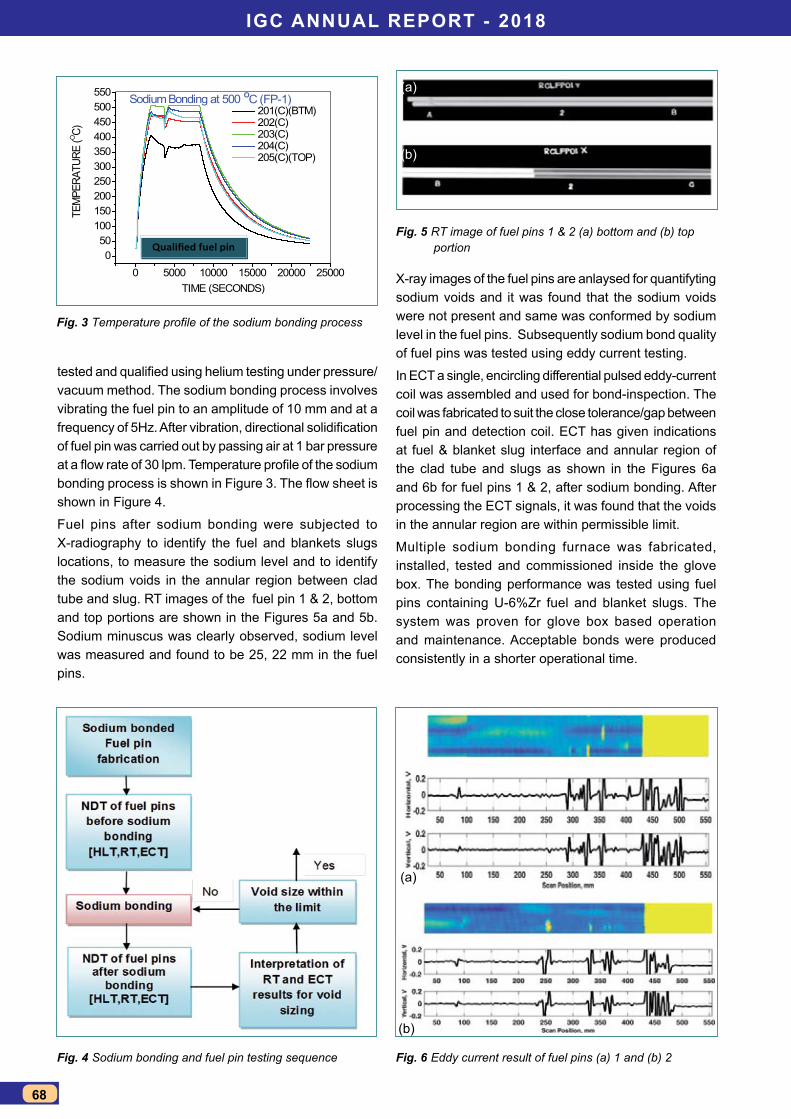
IGc annUal RepoRt - 2018
68
0 5000 10000 15000 20000 250000
50100150200250300350400450500550 Sodium Bonding at 500 OC (FP-1)
TEM
PERA
TURE
(O C)
TIME (SECONDS)
201(C)(BTM) 202(C) 203(C) 204(C) 205(C)(TOP)
Qualified fuel pin
Fig. 3 Temperature profile of the sodium bonding process
Fig. 6 Eddy current result of fuel pins (a) 1 and (b) 2
tested and qualified using helium testing under pressure/vacuum method. The sodium bonding process involves vibrating the fuel pin to an amplitude of 10 mm and at a frequency of 5Hz. After vibration, directional solidification of fuel pin was carried out by passing air at 1 bar pressure at a flow rate of 30 lpm. Temperature profile of the sodium bonding process is shown in Figure 3. The flow sheet is shown in Figure 4.
Fuel pins after sodium bonding were subjected to X-radiography to identify the fuel and blankets slugs locations, to measure the sodium level and to identify the sodium voids in the annular region between clad tube and slug. RT images of the fuel pin 1 & 2, bottom and top portions are shown in the Figures 5a and 5b. Sodium minuscus was clearly observed, sodium level was measured and found to be 25, 22 mm in the fuel pins.
X-ray images of the fuel pins are anlaysed for quantifyting sodium voids and it was found that the sodium voids were not present and same was conformed by sodium level in the fuel pins. Subsequently sodium bond quality of fuel pins was tested using eddy current testing.
In ECT a single, encircling differential pulsed eddy-current coil was assembled and used for bond-inspection. The coil was fabricated to suit the close tolerance/gap between fuel pin and detection coil. ECT has given indications at fuel & blanket slug interface and annular region of the clad tube and slugs as shown in the Figures 6a and 6b for fuel pins 1 & 2, after sodium bonding. After processing the ECT signals, it was found that the voids in the annular region are within permissible limit.
Multiple sodium bonding furnace was fabricated, installed, tested and commissioned inside the glove box. The bonding performance was tested using fuel pins containing U-6%Zr fuel and blanket slugs. The system was proven for glove box based operation and maintenance. Acceptable bonds were produced consistently in a shorter operational time.
Fig. 5 RT image of fuel pins 1 & 2 (a) bottom and (b) top portion
Fig. 4 Sodium bonding and fuel pin testing sequence
(a)
(b)
(a)
(b)
ReseaRch & Development foR fBRs
69
Immobilization of contaminated sodium: optimization with Inactive sodium
Sodium is used as heat transferring medium in sodium bonded metal fuel pin in fast reactors.
It is used for bonding fuel slug and inner surface of clad to enhance thermal conductivity. The bonded sodium removed from rejected / defective fuel pins is contaminated with radioactive elements such as uranium and plutonium. Though several methods have been used for cleaning and disposal of small amount of sodium but each has their own constraint. A novel method has been developed for the safe disposal of this sodium without evolution of hydrogen using metal oxide mitigation process. Vitrification is a suitable technique to immobilize the contaminated sodium for safe and final disposal.
Borosilicate glasses were synthesized using glass formers (oxides of Si and B), modifiers (oxides of Ca and Zn) with varying amount of inactive Na2O to optimise the composition with minimum volatilisation loss. The oxide mixture was calcined at 500oC and melted at 925oC. Since the melt was highly viscous, the molten mass was heated to 1150oC, poured and air quenched. By varying glass former to modifier ratio along with varying concentration of Na2O, nine borosilicate glasses were synthesized and checked for volatilisation loss. Maximum weight loss observed was less than 2%. No phase separation or crystallisation was observed for the quenched samples as confirmed by XRD technique. Among the various glasses prepared, the glass with the composition of 43.2 SiO2 - 8 ZnO - 6.5 CaO-12.3 B2O3 - 30 Na2O (wt. %) (BSG-7) was accepted based on higher loading of Na2O and lower volatilisation loss during the synthesis. Typical XRD pattern of the BSG – 7 is shown in Figure 1. Average density was measured by Archimedes principle using di-butyl phthalate as liquid medium and the density of BSG-7 was 2.57 ± 0.01 g/cc. Glass rods were formed by pouring inside graphite crucible as shown in Figure 2a. The faces of the cylindrical rod (Figure 2b) was sliced and polished
3.29
Fig. 1 XRD pattern of BSG -7
Fig. 2 (a) Air quenching of molten borosilicate melt (b) moulded BSG -7
Fig. 3 (a) Thermal expansion behavior of BSG - 7 and (b) micrograph showing the homogeneity of surface of BSG -7
after annealing at 400oC for 4 h to study the linear thermal expansion. Thermal expansion measurements (Figure 3a) were carried out using dilatometer up to 450oC. Thermal expansion behavior is similar to those borosilicate glasses available in literature. The glass was analyzed by SEM and the micrograph (Figure 3b) shows the homogeneity of the glass surface. The glass transition temperature of BSG -7, analyzed by DSC was 457 ± 1oC, a well-accepted glass transition temperature as per standards. Preliminary chemical durability studies of BSG -7 was carried out under static condition at 90oC for seven days with given dimension of the glass sample and volume of the leachant (demineralized water). The leachant was analyzed by ICP-AES and AAS. The analysis indicates that, all the elements are well below the detection limit except Na. On the 7th day, the concentration of Na was 7 µg / mL, which is well within the acceptable limit in waste immobilization.
(a) (b)
(a)
(b)
IGc annUal RepoRt - 2018
70
enhancement of natural convection heat transfer using cooling pipes in heat shield plate
W hole core meltdown scenario is considered as a beyond design basis accident with probability of
occurrence less than 10-6 per reactor year. To prevent and mitigate such a hypothetical severe accident in Fast Breeder Reactors, research is focused on accommodating the destroyed core debris within primary containment boundary. An in-vessel core catcher (CC) is provided to retain the fuel debris arising out of core meltdown and disperses it uniformly, thus enabling safe and adequate heat transfer by natural convection. In the present study, multiple protruded pipes are proposed on top of Heat Shield Plate (HSP), which are closed at top and liquid sodium flows inside these pipes. Three-dimensional (3-D) simulations were carried out for lower plenum of the reactor to evaluate coolabilty of CC under core disruptive accident.
The objective of present numerical study is to provide more realistic fluid flow characteristics and heat transfer phenomena in a possible conceptual design of CC. Numerical analysis (3-D) is carried out in the cylindrical enclosure whose diameter is 7.7 m and height 2.5 m filled with liquid metal (sodium, Pr=0.0045). The physical and computational models of HSP with protrusion of multiple pipes/chimney are shown in Figure 1. Two rows of pipes with six pipes in each row are proposed. Providing the pipes at regular interval on the upper plate improve the heat transfer by natural convection around the pipes.
Numerical analysis revealed that when there are no pipes protruded in the top plate, liquid sodium gets heated up and a large anti-clockwise vortex is formed above the debris bed as shown in Figure 2a. It is also revealed that, no significant fluid movement was observed at the region below the lower tray. The fluid is expected to be stagnant at this region with marginal change in temperature. In case of multiple chimneys, velocity vectors showed enhanced natural circulation at the symmetry plane with increase in velocity of liquid sodium at about 0.46 m/s
3.30
Fig. 1 Physical and computational model of HSP
Fig. 2 (a) Velocity vectors in solid tray of HSP and (b) velocity vectors in HSP with multiple pipes/chimneys
Fig. 3 Temperature variation at HSP (a) without and (b) with pipes/multiple chimneys
as depicted in Figure 2b. It is also observed that the temperature on top HSP is less toward a center chimney compared to peripheral chimney.
The variation of temperature at HSP with distance from centre of the vessel is shown in Figures 3a and 3b. From the graph, it is also seen that the area weighted average temperature on the upper plate decreases to as low as 786 K. The role of multi chimneys in CC depicting higher temperature gradient over the tray is shown in Figure 3a. This study provides the confidence in pursuing further research in optimization of CC design with suitable chimneys for the future sodium cooled fast reactors.
(a)
(a)
(b)
(b)
ReseaRch & Development foR fBRs
71
simulation of model subassembly melting usingthermite process
Simulation of subassembly melting has been taken up at Safety Engineering Division, to study the melt
progression from the fuel subassembly as a part of severe accident research. For this, a melt generation chamber and interaction chamber have been designed, fabricated and installed at ‘THEME’ facility. The melt chamber (shown in Figure 1) consists of a steel cylindrical shell with a dished bottom for melt discharge and a conical top portion for release of exhaust gases. The melt chamber is provided with door for material handling, instrument ports and feed-through, quartz glass windows for thermal and high speed video imaging. Inner walls of chamber are provided with ceramic coating for protection against melt splash during the experiments. The interaction chamber is meant for collecting the melt through the foot section, in case of axial melt progression.
Preliminary experiments were conducted on single pin melting. A clad tube of about 500 m length was filled with thermite mixture (stoichiometric mixture of Aluminum and iron oxide powders) and ignited.
Fe2O3 + Al --> Fe + Al2O3 + 4 MJ/kg
After few successful runs, subassembly melting simulation was taken up with a 37-pin model hex can with foot section. A stainless steel clad with equivalent thickness was used instead of individual fuel clad tubes for ease of igniting the thermite mixture. About 500 g of thermite mixture was filled in the SS clad and Test Sub-Assembly (TSA) was
3.31
0 30 60 90 120 150 180 210 2400
400
800
1200
1600
2000
2400
SA outer
TC1 ThermiteTC2 Thermite
Pyro Thermite
Tem
pera
ture
(o C)
Time (s)
Fig. 1 Melt generation chamber and interaction chamber
Fig. 2 Single pin and 37 pin TSA melting scenario
Fig. 3 Temperatures in the TSA
installed in the melt generation chamber. The quantity of thermite mixture was estimated based on equivalent energy release from a 37 fuel pin bundle similar to test subassembly geometry.
Two pyrometers were focused at the melt discharge nozzle to measure the melt temperature before entering the water pool. Three thermocouples were mounted in TSA, two of them in the thermite mixture and one on the sheath. Three thermocouples were provided in the interaction chamber. Thermal imaging and high speed video imaging cameras were focused in the melt chamber as well as interaction chamber.
Thermite mixture was ignited remotely by electric triggering circuit. The reaction was instantaneous and generated a mixture of molten alumina and steel.
The melt couldn’t penetrate through the side walls and foot section of TSA. However, temperature in the TSA has caused rupture of one side as shown in Figure 2. The maximum melt temperature recorded by pyrometer was about 2200 °C as shown in Figure 3 along with temperatures in TSA at two locations and on outer sheath. Further experiments are planned in higher scale with more realistic subassembly configuration.
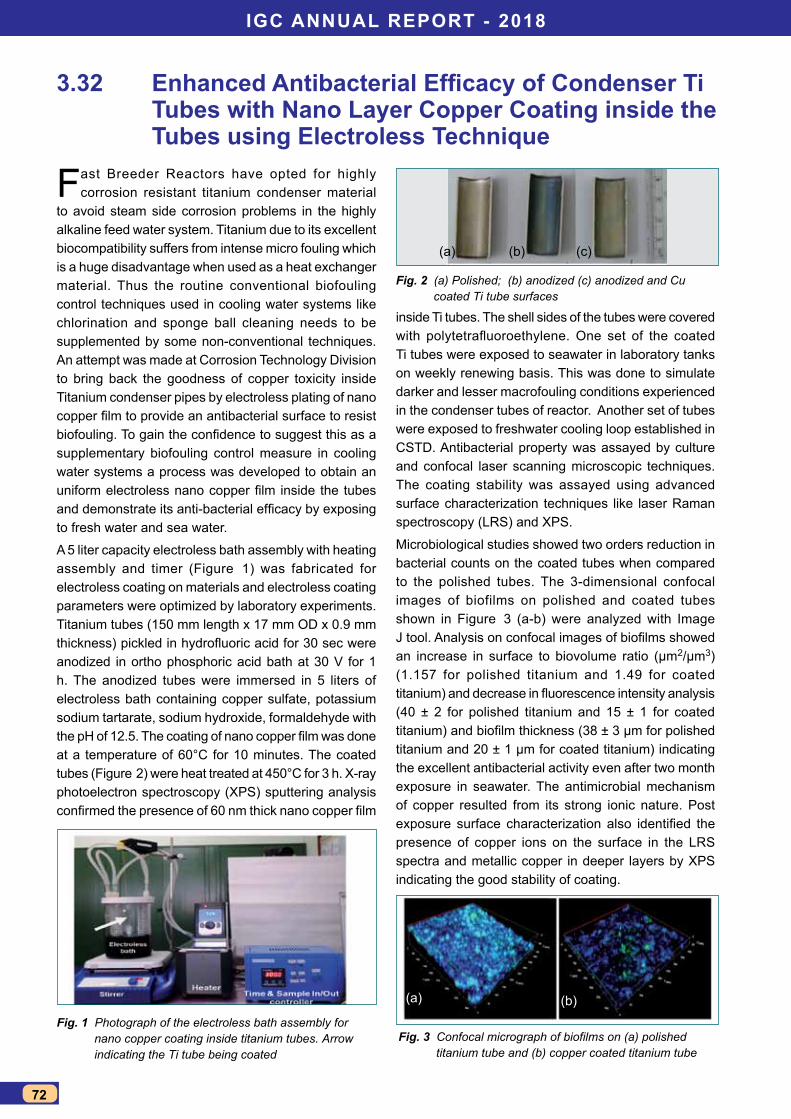
IGc annUal RepoRt - 2018
72
Enhanced Antibacterial Efficacy of Condenser Ti tubes with nano layer copper coating inside the tubes using electroless technique
Fast Breeder Reactors have opted for highly corrosion resistant titanium condenser material
to avoid steam side corrosion problems in the highly alkaline feed water system. Titanium due to its excellent biocompatibility suffers from intense micro fouling which is a huge disadvantage when used as a heat exchanger material. Thus the routine conventional biofouling control techniques used in cooling water systems like chlorination and sponge ball cleaning needs to be supplemented by some non-conventional techniques. An attempt was made at Corrosion Technology Division to bring back the goodness of copper toxicity inside Titanium condenser pipes by electroless plating of nano copper film to provide an antibacterial surface to resist biofouling. To gain the confidence to suggest this as a supplementary biofouling control measure in cooling water systems a process was developed to obtain an uniform electroless nano copper film inside the tubes and demonstrate its anti-bacterial efficacy by exposing to fresh water and sea water.
A 5 liter capacity electroless bath assembly with heating assembly and timer (Figure 1) was fabricated for electroless coating on materials and electroless coating parameters were optimized by laboratory experiments. Titanium tubes (150 mm length x 17 mm OD x 0.9 mm thickness) pickled in hydrofluoric acid for 30 sec were anodized in ortho phosphoric acid bath at 30 V for 1 h. The anodized tubes were immersed in 5 liters of electroless bath containing copper sulfate, potassium sodium tartarate, sodium hydroxide, formaldehyde with the pH of 12.5. The coating of nano copper film was done at a temperature of 60°C for 10 minutes. The coated tubes (Figure 2) were heat treated at 450°C for 3 h. X-ray photoelectron spectroscopy (XPS) sputtering analysis confirmed the presence of 60 nm thick nano copper film
3.32
inside Ti tubes. The shell sides of the tubes were covered with polytetrafluoroethylene. One set of the coated Ti tubes were exposed to seawater in laboratory tanks on weekly renewing basis. This was done to simulate darker and lesser macrofouling conditions experienced in the condenser tubes of reactor. Another set of tubes were exposed to freshwater cooling loop established in CSTD. Antibacterial property was assayed by culture and confocal laser scanning microscopic techniques. The coating stability was assayed using advanced surface characterization techniques like laser Raman spectroscopy (LRS) and XPS.
Microbiological studies showed two orders reduction in bacterial counts on the coated tubes when compared to the polished tubes. The 3-dimensional confocal images of biofilms on polished and coated tubes shown in Figure 3 (a-b) were analyzed with Image J tool. Analysis on confocal images of biofilms showed an increase in surface to biovolume ratio (µm2/µm3) (1.157 for polished titanium and 1.49 for coated titanium) and decrease in fluorescence intensity analysis (40 ± 2 for polished titanium and 15 ± 1 for coated titanium) and biofilm thickness (38 ± 3 µm for polished titanium and 20 ± 1 µm for coated titanium) indicating the excellent antibacterial activity even after two month exposure in seawater. The antimicrobial mechanism of copper resulted from its strong ionic nature. Post exposure surface characterization also identified the presence of copper ions on the surface in the LRS spectra and metallic copper in deeper layers by XPS indicating the good stability of coating.
Fig. 1 Photograph of the electroless bath assembly for nano copper coating inside titanium tubes. Arrow indicating the Ti tube being coated
Fig. 2 (a) Polished; (b) anodized (c) anodized and Cu coated Ti tube surfaces
Fig. 3 Confocal micrograph of biofilms on (a) polished titanium tube and (b) copper coated titanium tube
(a)
(a)
(b)
(b)
(c)
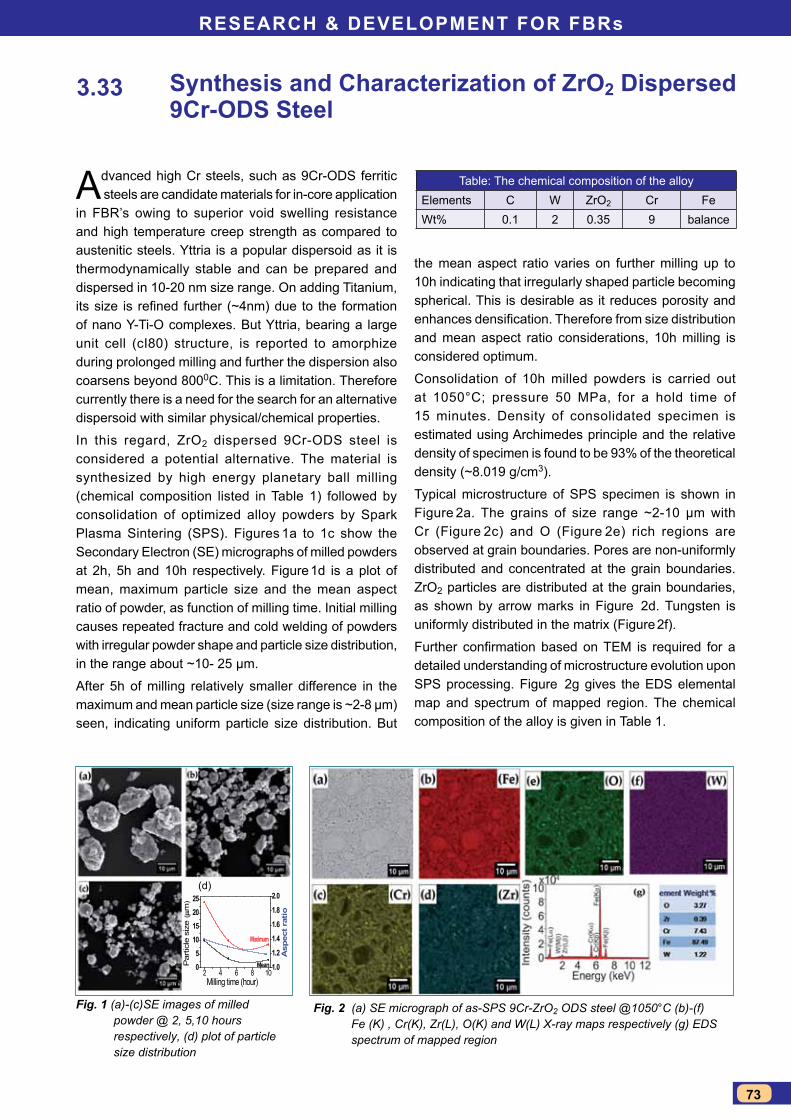
ReseaRch & Development foR fBRs
73
synthesis and characterization of Zro2 Dispersed 9cr-oDs steel
Advanced high Cr steels, such as 9Cr-ODS ferritic steels are candidate materials for in-core application
in FBR’s owing to superior void swelling resistance and high temperature creep strength as compared to austenitic steels. Yttria is a popular dispersoid as it is thermodynamically stable and can be prepared and dispersed in 10-20 nm size range. On adding Titanium, its size is refined further (~4nm) due to the formation of nano Y-Ti-O complexes. But Yttria, bearing a large unit cell (cI80) structure, is reported to amorphize during prolonged milling and further the dispersion also coarsens beyond 8000C. This is a limitation. Therefore currently there is a need for the search for an alternative dispersoid with similar physical/chemical properties.
In this regard, ZrO2 dispersed 9Cr-ODS steel is considered a potential alternative. The material is synthesized by high energy planetary ball milling (chemical composition listed in Table 1) followed by consolidation of optimized alloy powders by Spark Plasma Sintering (SPS). Figures 1a to 1c show the Secondary Electron (SE) micrographs of milled powders at 2h, 5h and 10h respectively. Figure 1d is a plot of mean, maximum particle size and the mean aspect ratio of powder, as function of milling time. Initial milling causes repeated fracture and cold welding of powders with irregular powder shape and particle size distribution, in the range about ~10- 25 μm.
After 5h of milling relatively smaller difference in the maximum and mean particle size (size range is ~2-8 μm) seen, indicating uniform particle size distribution. But
3.33
the mean aspect ratio varies on further milling up to 10h indicating that irregularly shaped particle becoming spherical. This is desirable as it reduces porosity and enhances densification. Therefore from size distribution and mean aspect ratio considerations, 10h milling is considered optimum.
Consolidation of 10h milled powders is carried out at 1050°C; pressure 50 MPa, for a hold time of 15 minutes. Density of consolidated specimen is estimated using Archimedes principle and the relative density of specimen is found to be 93% of the theoretical density (~8.019 g/cm3).
Typical microstructure of SPS specimen is shown in Figure 2a. The grains of size range ~2-10 μm with Cr (Figure 2c) and O (Figure 2e) rich regions are observed at grain boundaries. Pores are non-uniformly distributed and concentrated at the grain boundaries. ZrO2 particles are distributed at the grain boundaries, as shown by arrow marks in Figure 2d. Tungsten is uniformly distributed in the matrix (Figure 2f).
Further confirmation based on TEM is required for a detailed understanding of microstructure evolution upon SPS processing. Figure 2g gives the EDS elemental map and spectrum of mapped region. The chemical composition of the alloy is given in Table 1.
2 4 6 8 1005
10152025
Mean
Maximum
Par
ticle
siz
e ( µ
m)
Milling time (hour)1.0
1.2
1.4
1.6
1.8
2.0
Asp
ect r
atio
Fig. 1 (a)-(c)SE images of milled powder @ 2, 5,10 hours respectively, (d) plot of particle size distribution
Fig. 2 (a) SE micrograph of as-SPS 9Cr-ZrO2 ODS steel @1050°C (b)-(f) Fe (K) , Cr(K), Zr(L), O(K) and W(L) X-ray maps respectively (g) EDS spectrum of mapped region
Table: The chemical composition of the alloyElements C W ZrO2 Cr FeWt% 0.1 2 0.35 9 balance
(d)
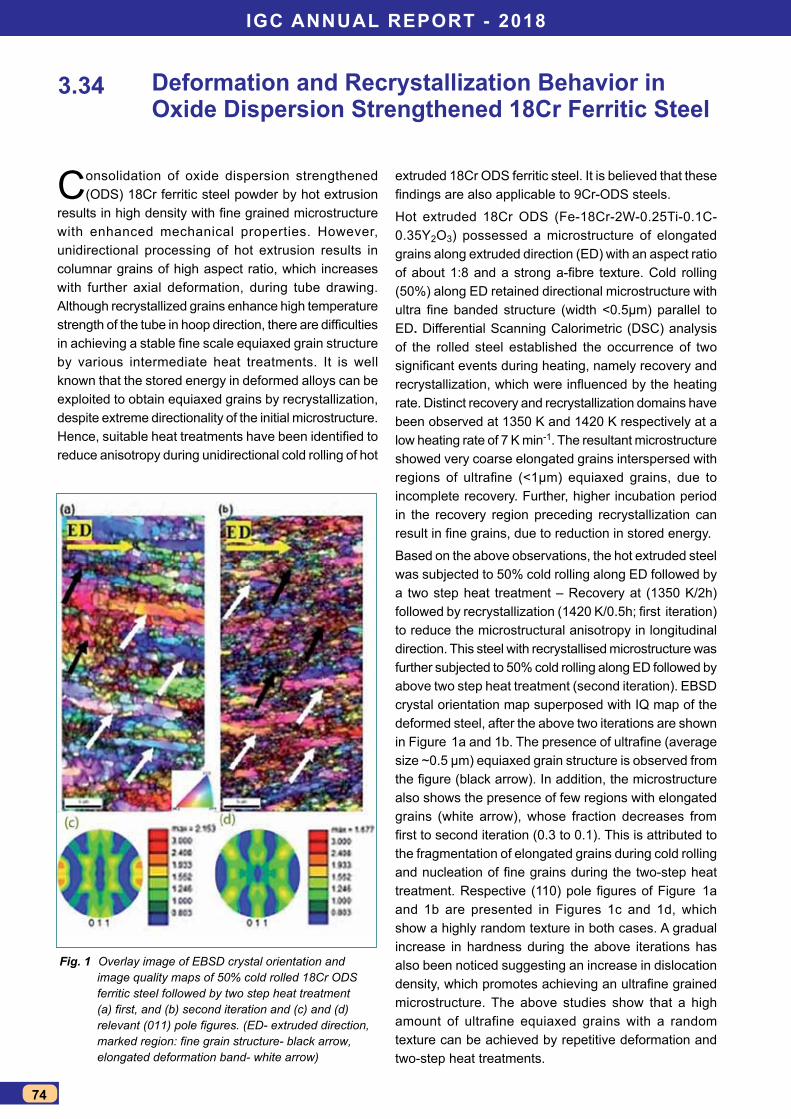
IGc annUal RepoRt - 2018
74
Deformation and Recrystallization Behavior in oxide Dispersion strengthened 18cr ferritic steel
Consolidation of oxide dispersion strengthened (ODS) 18Cr ferritic steel powder by hot extrusion
results in high density with fine grained microstructure with enhanced mechanical properties. However, unidirectional processing of hot extrusion results in columnar grains of high aspect ratio, which increases with further axial deformation, during tube drawing. Although recrystallized grains enhance high temperature strength of the tube in hoop direction, there are difficulties in achieving a stable fine scale equiaxed grain structure by various intermediate heat treatments. It is well known that the stored energy in deformed alloys can be exploited to obtain equiaxed grains by recrystallization, despite extreme directionality of the initial microstructure. Hence, suitable heat treatments have been identified to reduce anisotropy during unidirectional cold rolling of hot
3.34
Fig. 1 Overlay image of EBSD crystal orientation and image quality maps of 50% cold rolled 18Cr ODS ferritic steel followed by two step heat treatment (a) first, and (b) second iteration and (c) and (d) relevant (011) pole figures. (ED- extruded direction, marked region: fine grain structure- black arrow, elongated deformation band- white arrow)
extruded 18Cr ODS ferritic steel. It is believed that these findings are also applicable to 9Cr-ODS steels.
Hot extruded 18Cr ODS (Fe-18Cr-2W-0.25Ti-0.1C-0.35Y2O3) possessed a microstructure of elongated grains along extruded direction (ED) with an aspect ratio of about 1:8 and a strong a-fibre texture. Cold rolling (50%) along ED retained directional microstructure with ultra fine banded structure (width <0.5μm) parallel to ED. Differential Scanning Calorimetric (DSC) analysis of the rolled steel established the occurrence of two significant events during heating, namely recovery and recrystallization, which were influenced by the heating rate. Distinct recovery and recrystallization domains have been observed at 1350 K and 1420 K respectively at a low heating rate of 7 K min-1. The resultant microstructure showed very coarse elongated grains interspersed with regions of ultrafine (<1μm) equiaxed grains, due to incomplete recovery. Further, higher incubation period in the recovery region preceding recrystallization can result in fine grains, due to reduction in stored energy.
Based on the above observations, the hot extruded steel was subjected to 50% cold rolling along ED followed by a two step heat treatment – Recovery at (1350 K/2h) followed by recrystallization (1420 K/0.5h; first iteration) to reduce the microstructural anisotropy in longitudinal direction. This steel with recrystallised microstructure was further subjected to 50% cold rolling along ED followed by above two step heat treatment (second iteration). EBSD crystal orientation map superposed with IQ map of the deformed steel, after the above two iterations are shown in Figure 1a and 1b. The presence of ultrafine (average size ~0.5 μm) equiaxed grain structure is observed from the figure (black arrow). In addition, the microstructure also shows the presence of few regions with elongated grains (white arrow), whose fraction decreases from first to second iteration (0.3 to 0.1). This is attributed to the fragmentation of elongated grains during cold rolling and nucleation of fine grains during the two-step heat treatment. Respective (110) pole figures of Figure 1a and 1b are presented in Figures 1c and 1d, which show a highly random texture in both cases. A gradual increase in hardness during the above iterations has also been noticed suggesting an increase in dislocation density, which promotes achieving an ultrafine grained microstructure. The above studies show that a high amount of ultrafine equiaxed grains with a random texture can be achieved by repetitive deformation and two-step heat treatments.

ReseaRch & Development foR fBRs
75
effect of thermal aging and test temperatures on fracture toughness of ss 316 (n) Welds
Austenitic stainless steels SS 316LN is one of the major structural material used for high temperature
structural components of Indian fast breeder reactor and many of these components are exposed to temperatures between 380 and 550 °C. For fabricating these components welding is one the major manufacturing process. The fracture properties of these welds at various temperatures are essential to evaluate the structural integrity of these components. The welds of this class of stainless steel are known to contain delta ferrite in some amount to prevent hot cracking during solidification. On ageing at high temperatures this delta ferrite may act as a precursor for precipitation of brittle phases, leading to degradation of fracture resistance. In this investigation the effect of various ageing treatments on fracture resistance at different test temperatures are reported.
3.35
0 5000 10000 15000 200000
50100150200250300350400450500550600
RCC-MR
a 380 oC tested as-weld
aged at 370 oC aged at 475 oC aged at 550 oC
J 0.
2, kJ
.m-2
Ageing durations, h
0 5000 10000 15000 200000
50100150200250300350400450500550600
RCC-MR
550 oC tested as-weld aged at 370 oC aged at 475 oC aged at 550 oC
J 0.2,
kJ.m
-2
Ageing durations, h
b
0.0 0.5 1.0 1.5 2.0 2.5 3.00
100200300400500600700800900
100011001200
∆a, mm
RCC-MR
550 oC tested
aged at 550 oC as weld aged 1000 h aged 2000 h aged 10000 h aged 20000 h
J,
kJ.m-2
Fig. 1 J0.2 values of welds after ageing and tested at (a) 380 °C and (b) 550 °C
Fig. 2 J values of welds after ageing at 550 °C and tested at 550 °C
The weld pads were prepared by shielded metal arc welding process and subjected to various ageing conditions. After ageing compact tension specimens were subjected to fracture (J-R curves) testing at test temperatures of 380 and 550 °C
From the J-R curves, elastic-plastic fracture toughness (J0.2) were determined. The J0.2 values in as-weld condition at test temperatures 380 and 550 °C are ~ 324 and 199 kJ.m-2 respectively. For welds aged up to 20,000 h durations, decrease in J0.2 values are observed for all aging (Figures 1a and 1b) and test temperatures, compared to as-weld condition. The J0.2 values for all the test temperatures are higher than the minimum specified fracture toughness (~ 75 kJ.m-2) in this class of welds (RCC-MR, 2002).
The J values (after aging and tested at 550 °C) at crack extensions of 0.2, 1.0 and 3.0 mm are compared to the J values specified for this class of welds and shown in Figure 2. It is observed that all the J values after different aging conditions (including as weld condition) are higher than the specified values (RCC-MR). Similar trends in J values are observed after aging and tested at 380 °C.
The fracture toughness (J0.2) of SS 316 (N) welds decreased after 20,000 h aging durations for all aging temperatures and test temperatures. The fracture resistance for all aging conditions and test temperatures are higher than the minimum specified values in this class of stainless steel welds.
(a)
(b)
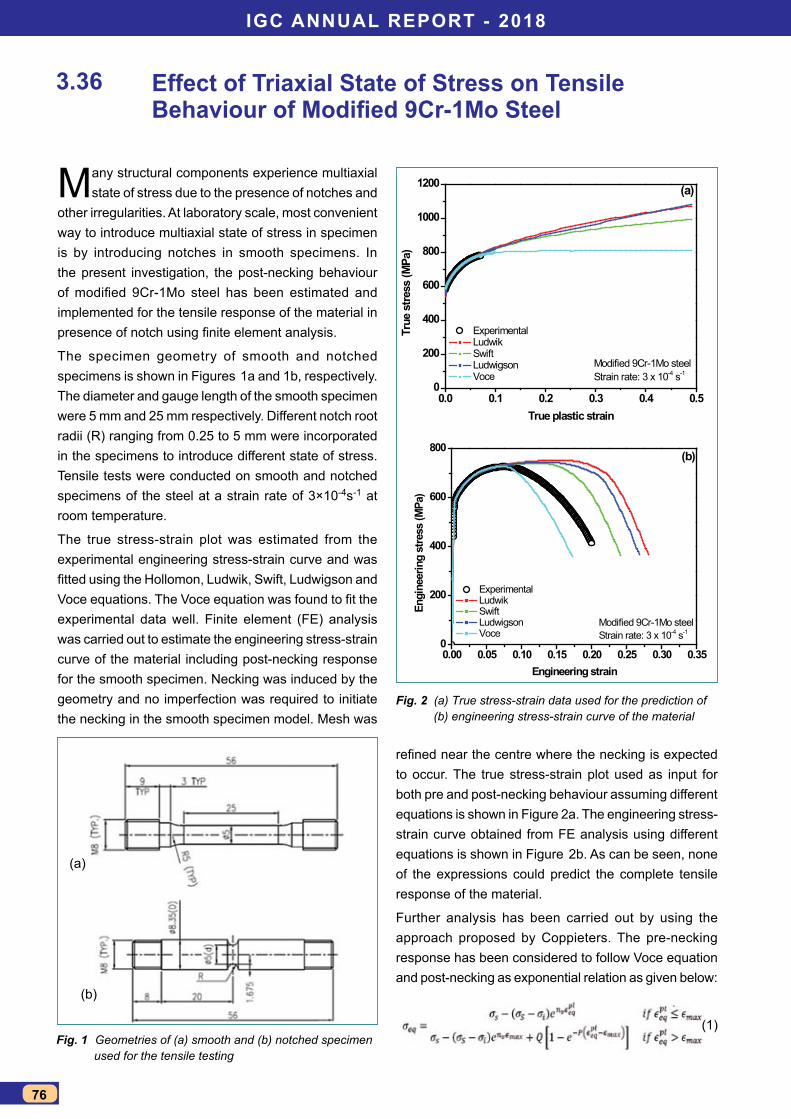
IGc annUal RepoRt - 2018
76
effect of triaxial state of stress on tensile Behaviour of Modified 9Cr-1Mo Steel
Many structural components experience multiaxial state of stress due to the presence of notches and
other irregularities. At laboratory scale, most convenient way to introduce multiaxial state of stress in specimen is by introducing notches in smooth specimens. In the present investigation, the post-necking behaviour of modified 9Cr-1Mo steel has been estimated and implemented for the tensile response of the material in presence of notch using finite element analysis.
The specimen geometry of smooth and notched specimens is shown in Figures 1a and 1b, respectively. The diameter and gauge length of the smooth specimen were 5 mm and 25 mm respectively. Different notch root radii (R) ranging from 0.25 to 5 mm were incorporated in the specimens to introduce different state of stress. Tensile tests were conducted on smooth and notched specimens of the steel at a strain rate of 3×10⁻⁴s-1 at room temperature.
The true stress-strain plot was estimated from the experimental engineering stress-strain curve and was fitted using the Hollomon, Ludwik, Swift, Ludwigson and Voce equations. The Voce equation was found to fit the experimental data well. Finite element (FE) analysis was carried out to estimate the engineering stress-strain curve of the material including post-necking response for the smooth specimen. Necking was induced by the geometry and no imperfection was required to initiate the necking in the smooth specimen model. Mesh was
3.36
0.0 0.1 0.2 0.3 0.4 0.50
200
400
600
800
1000
1200
Modified 9Cr-1Mo steelStrain rate: 3 x 10⁻⁴ s-1
(a)
True
stre
ss (M
Pa)
True plastic strain
Experimental Ludwik Swift Ludwigson Voce
0.00 0.05 0.10 0.15 0.20 0.25 0.30 0.350
200
400
600
800
Modified 9Cr-1Mo steelStrain rate: 3 x 10⁻⁴ s-1
(b)
Engi
neer
ing
stre
ss (M
Pa)
Engineering strain
Experimental Ludwik Swift Ludwigson Voce
Fig. 1 Geometries of (a) smooth and (b) notched specimen used for the tensile testing
Fig. 2 (a) True stress-strain data used for the prediction of (b) engineering stress-strain curve of the material
(a)
(b)
refined near the centre where the necking is expected to occur. The true stress-strain plot used as input for both pre and post-necking behaviour assuming different equations is shown in Figure 2a. The engineering stress-strain curve obtained from FE analysis using different equations is shown in Figure 2b. As can be seen, none of the expressions could predict the complete tensile response of the material.
Further analysis has been carried out by using the approach proposed by Coppieters. The pre-necking response has been considered to follow Voce equation and post-necking as exponential relation as given below:
(1)
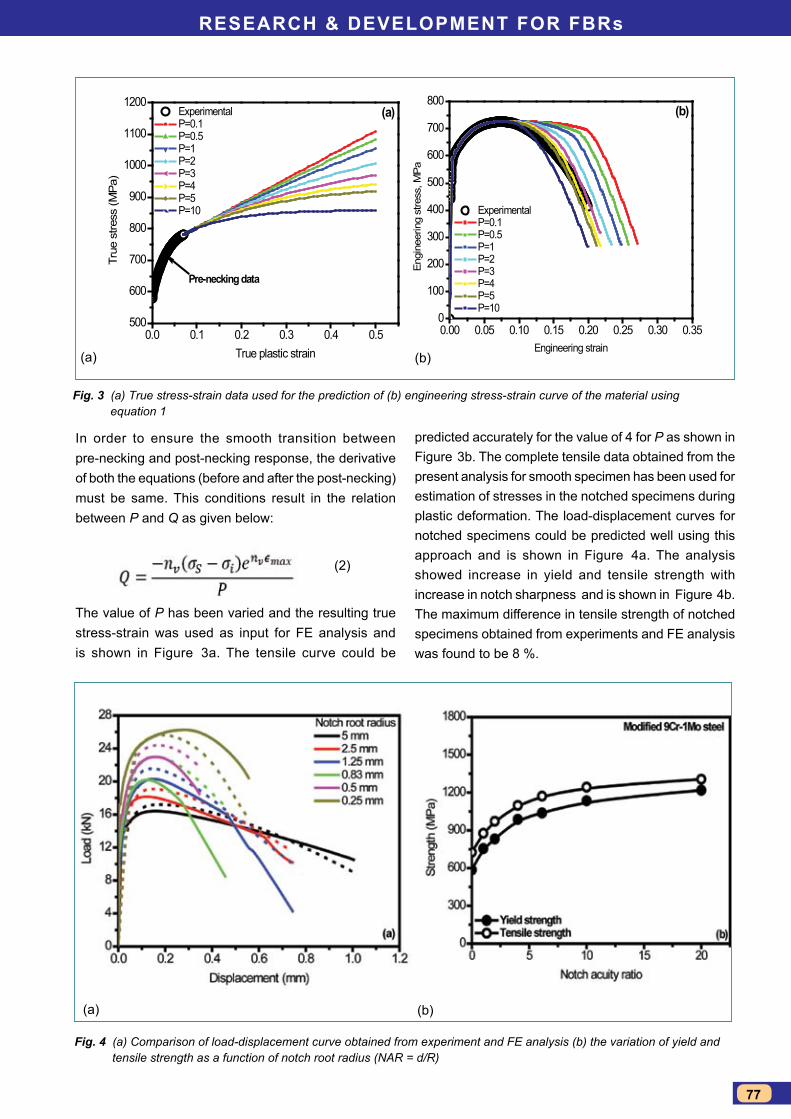
ReseaRch & Development foR fBRs
77
0.0 0.1 0.2 0.3 0.4 0.5500
600
700
800
900
1000
1100
1200(a)
Pre-necking data
True
stre
ss (M
Pa)
True plastic strain
Experimental P=0.1 P=0.5 P=1 P=2 P=3 P=4 P=5 P=10
0.00 0.05 0.10 0.15 0.20 0.25 0.30 0.350
100
200
300
400
500
600
700
800(b)
Engi
neer
ing
stre
ss, M
Pa
Engineering strain
Experimental P=0.1 P=0.5 P=1 P=2 P=3 P=4 P=5 P=10
Fig. 3 (a) True stress-strain data used for the prediction of (b) engineering stress-strain curve of the material using equation 1
Fig. 4 (a) Comparison of load-displacement curve obtained from experiment and FE analysis (b) the variation of yield and tensile strength as a function of notch root radius (NAR = d/R)
In order to ensure the smooth transition between pre-necking and post-necking response, the derivative of both the equations (before and after the post-necking) must be same. This conditions result in the relation between P and Q as given below:
(2)
The value of P has been varied and the resulting true stress-strain was used as input for FE analysis and is shown in Figure 3a. The tensile curve could be
predicted accurately for the value of 4 for P as shown in Figure 3b. The complete tensile data obtained from the present analysis for smooth specimen has been used for estimation of stresses in the notched specimens during plastic deformation. The load-displacement curves for notched specimens could be predicted well using this approach and is shown in Figure 4a. The analysis showed increase in yield and tensile strength with increase in notch sharpness and is shown in Figure 4b. The maximum difference in tensile strength of notched specimens obtained from experiments and FE analysis was found to be 8 %.
(a)
(a)
(b)
(b)
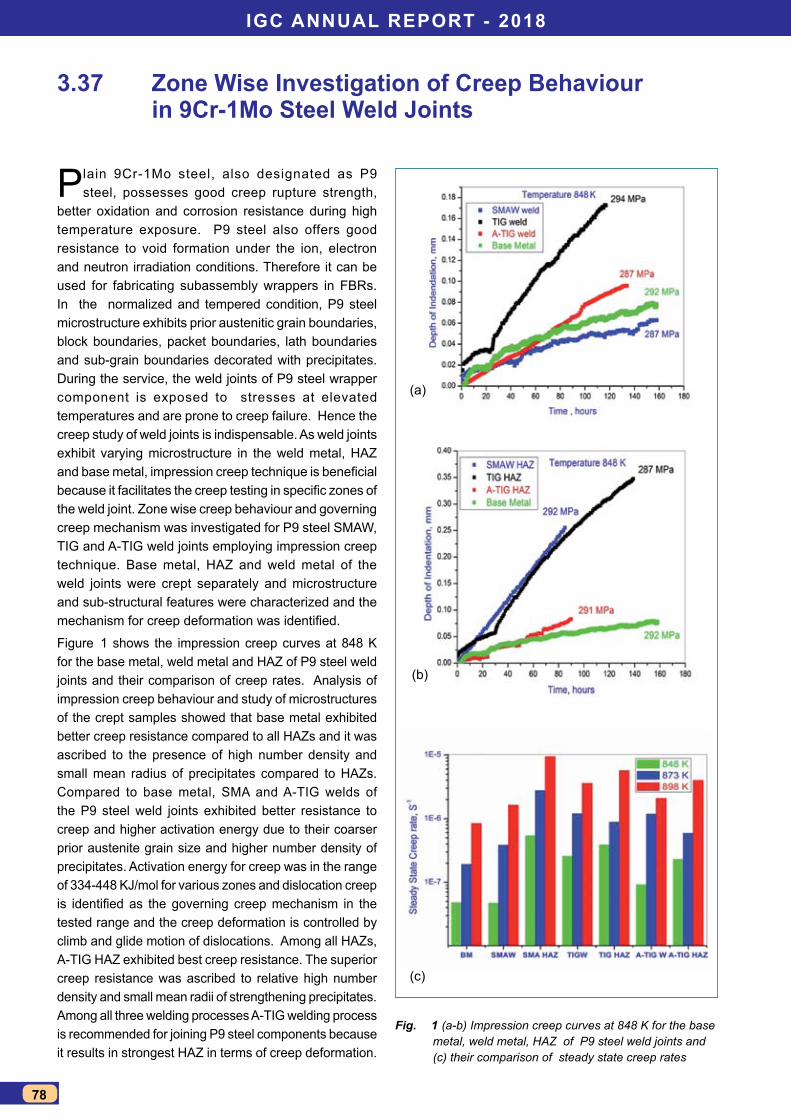
IGc annUal RepoRt - 2018
78
Zone Wise Investigation of creep Behaviourin 9cr-1mo steel Weld Joints
Plain 9Cr-1Mo steel, also designated as P9 steel, possesses good creep rupture strength,
better oxidation and corrosion resistance during high temperature exposure. P9 steel also offers good resistance to void formation under the ion, electron and neutron irradiation conditions. Therefore it can be used for fabricating subassembly wrappers in FBRs. In the normalized and tempered condition, P9 steel microstructure exhibits prior austenitic grain boundaries, block boundaries, packet boundaries, lath boundaries and sub-grain boundaries decorated with precipitates. During the service, the weld joints of P9 steel wrapper component is exposed to stresses at elevated temperatures and are prone to creep failure. Hence the creep study of weld joints is indispensable. As weld joints exhibit varying microstructure in the weld metal, HAZ and base metal, impression creep technique is beneficial because it facilitates the creep testing in specific zones of the weld joint. Zone wise creep behaviour and governing creep mechanism was investigated for P9 steel SMAW, TIG and A-TIG weld joints employing impression creep technique. Base metal, HAZ and weld metal of the weld joints were crept separately and microstructure and sub-structural features were characterized and the mechanism for creep deformation was identified.
Figure 1 shows the impression creep curves at 848 K for the base metal, weld metal and HAZ of P9 steel weld joints and their comparison of creep rates. Analysis of impression creep behaviour and study of microstructures of the crept samples showed that base metal exhibited better creep resistance compared to all HAZs and it was ascribed to the presence of high number density and small mean radius of precipitates compared to HAZs. Compared to base metal, SMA and A-TIG welds of the P9 steel weld joints exhibited better resistance to creep and higher activation energy due to their coarser prior austenite grain size and higher number density of precipitates. Activation energy for creep was in the range of 334-448 KJ/mol for various zones and dislocation creep is identified as the governing creep mechanism in the tested range and the creep deformation is controlled by climb and glide motion of dislocations. Among all HAZs, A-TIG HAZ exhibited best creep resistance. The superior creep resistance was ascribed to relative high number density and small mean radii of strengthening precipitates. Among all three welding processes A-TIG welding process is recommended for joining P9 steel components because it results in strongest HAZ in terms of creep deformation.
3.37
Fig. 1 (a-b) Impression creep curves at 848 K for the base metal, weld metal, HAZ of P9 steel weld joints and (c) their comparison of steady state creep rates
(a)
(b)
(c)
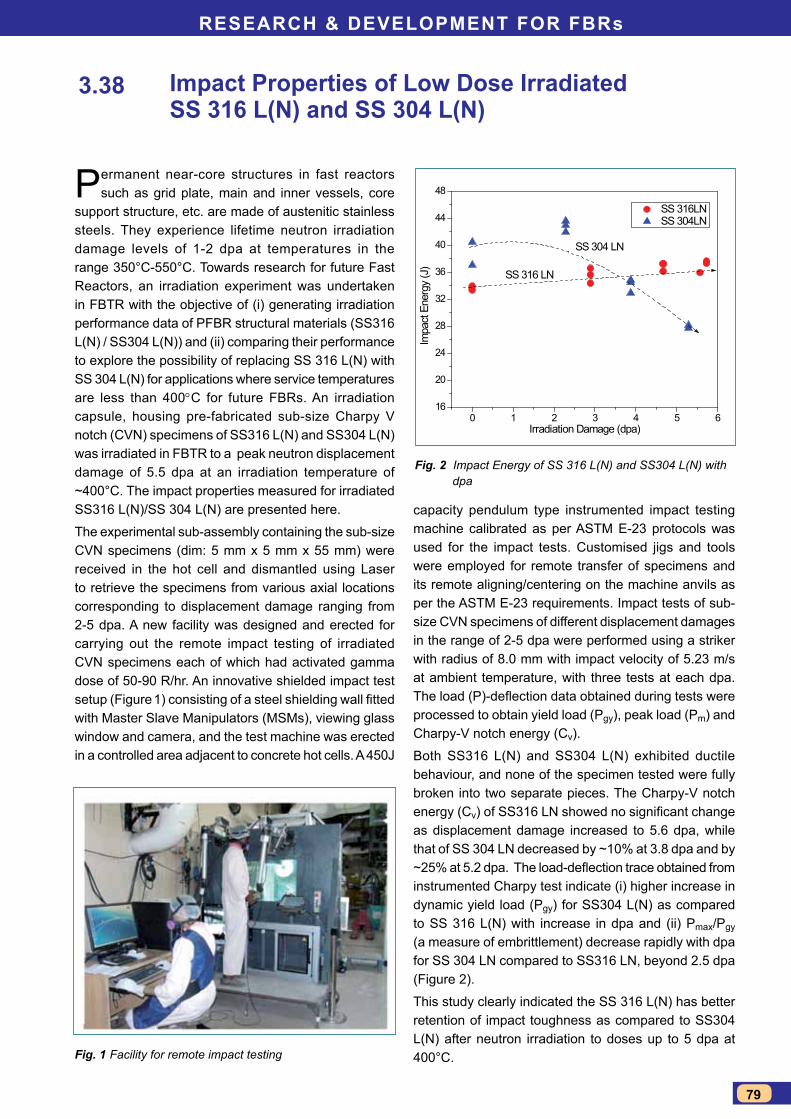
ReseaRch & Development foR fBRs
79
Impact properties of low Dose Irradiatedss 316 l(n) and ss 304 l(n)
Permanent near-core structures in fast reactors such as grid plate, main and inner vessels, core
support structure, etc. are made of austenitic stainless steels. They experience lifetime neutron irradiation damage levels of 1-2 dpa at temperatures in the range 350°C-550°C. Towards research for future Fast Reactors, an irradiation experiment was undertaken in FBTR with the objective of (i) generating irradiation performance data of PFBR structural materials (SS316 L(N) / SS304 L(N)) and (ii) comparing their performance to explore the possibility of replacing SS 316 L(N) with SS 304 L(N) for applications where service temperatures are less than 400°C for future FBRs. An irradiation capsule, housing pre-fabricated sub-size Charpy V notch (CVN) specimens of SS316 L(N) and SS304 L(N) was irradiated in FBTR to a peak neutron displacement damage of 5.5 dpa at an irradiation temperature of ~400°C. The impact properties measured for irradiated SS316 L(N)/SS 304 L(N) are presented here.
The experimental sub-assembly containing the sub-size CVN specimens (dim: 5 mm x 5 mm x 55 mm) were received in the hot cell and dismantled using Laser to retrieve the specimens from various axial locations corresponding to displacement damage ranging from 2-5 dpa. A new facility was designed and erected for carrying out the remote impact testing of irradiated CVN specimens each of which had activated gamma dose of 50-90 R/hr. An innovative shielded impact test setup (Figure 1) consisting of a steel shielding wall fitted with Master Slave Manipulators (MSMs), viewing glass window and camera, and the test machine was erected in a controlled area adjacent to concrete hot cells. A 450J
3.38
0 1 2 3 4 5 616
20
24
28
32
36
40
44
48
SS 304 LN
SS 316 LN
SS 316LN SS 304LN
Impa
ct E
nerg
y (J
)Irradiation Damage (dpa)
Fig. 1 Facility for remote impact testing
Fig. 2 Impact Energy of SS 316 L(N) and SS304 L(N) with dpa
capacity pendulum type instrumented impact testing machine calibrated as per ASTM E-23 protocols was used for the impact tests. Customised jigs and tools were employed for remote transfer of specimens and its remote aligning/centering on the machine anvils as per the ASTM E-23 requirements. Impact tests of sub-size CVN specimens of different displacement damages in the range of 2-5 dpa were performed using a striker with radius of 8.0 mm with impact velocity of 5.23 m/s at ambient temperature, with three tests at each dpa. The load (P)-deflection data obtained during tests were processed to obtain yield load (Pgy), peak load (Pm) and Charpy-V notch energy (Cv).
Both SS316 L(N) and SS304 L(N) exhibited ductile behaviour, and none of the specimen tested were fully broken into two separate pieces. The Charpy-V notch energy (Cv) of SS316 LN showed no significant change as displacement damage increased to 5.6 dpa, while that of SS 304 LN decreased by ~10% at 3.8 dpa and by ~25% at 5.2 dpa. The load-deflection trace obtained from instrumented Charpy test indicate (i) higher increase in dynamic yield load (Pgy) for SS304 L(N) as compared to SS 316 L(N) with increase in dpa and (ii) Pmax/Pgy (a measure of embrittlement) decrease rapidly with dpa for SS 304 LN compared to SS316 LN, beyond 2.5 dpa (Figure 2).
This study clearly indicated the SS 316 L(N) has better retention of impact toughness as compared to SS304 L(N) after neutron irradiation to doses up to 5 dpa at 400°C.

IGc annUal RepoRt - 2018
80
Design and Development of pulse coded logic based containment Isolation system for ahWR
P ulse Coded Logic based Containment Isolation System (PCL-CIS) for AHWR is a Class-IA system.
Containment Isolation System is having two independent PCL-CIS systems which shall be located in Channel-G & Channel-J rooms of Backup Control Room. PCL-CIS is designed to isolate the reactor building containment by closing the main & emergency airlock doors and also isolating other pipes/ducts carrying radioactive fluids or gases. This system is designed and developed in collaboration with BARC, Mumbai.PCL-CIS system receives triplicated input parameters and process them in 2/3 coincidence logic in each system and generate the containment isolation signal with latching. The outputs from each PCL-CIS are combined in one out of two (1/2) coincidence logic and this signal is used for isolation of equipments. Redundant isolation valves located inside and outside the containment is controlled from redundant 1/2 circuits in order to avoid any common cause failure during isolation.The PCL-CIS consists of Code Generation Logic, 2/3 core logic and fault diagnostics logic. This system processes 12 triplicated parameters including manual containment isolation and two reserve parameters. This system is designed using solid state devices. Majority of faults in solid state logic result in static conditions. PCL-CIS is a dynamic logic, which is having inherent fail safe design. Presence of dynamic signal throughout the logic drives the relays during normal reactor operation. Any fault in logic or CI signal leads to denergization of relays and isolation of the reactor containment.PCL hardware System consists of PCL Module and Diagnostic Module which includes 8 number PCBs assembled in 19” sub rack with backplane architecture. In most of the PCBs, CPLDs are used to implement the digital logic. PCL digital design is developed using a VLSI tool in Schematic entry. The design is verified through
3.39
Fig. 1 Code pulses Fig. 3 Functional testing of PCL bin with signal simulator
Fig. 2 Programming of CPLD in a PCB
simulation and then programmed in the CPLDs.Signal conditioning of input parameters, code pulse injection and 2/3 function of all parameters and latching of CI signal are carried out by two number of PCBs. Guard Line concept is used to serially link each and every parameter. 2/3 logic and guard line logic are implemented in CPLD.Code generation logic is implemented using CPLD in a separate PCB. Since clock failure lead to containment isolation, redundant clock is used to avoid single component failure. The redundant clock oscillator, generation of Codes A, B, C, Pulse D and set pulse is implemented in this PCB (Figure 1).Diagnostic logic for the PCL-CIS is implemented in three numbers of PCBs. Digital design is implemented using CPLD. All parameter 2/3 status, code pattern faults, latch fault, output stage fault logics are implemented in these PCBs.The schematic design of all PCBs and digital logic design for all CPLDs in each card are completed and verified. PCB design, layout and routing for all PCBs are completed. Signal Integrity analysis for the critical signals for 5 types of PCBs is performed and suitable terminations are incorporated. PCBs are fabricated and all PCBs are assembled in a 19” sub rack. All the CPLDs are programmed (Figure 2) and functional testing of the system was successfully completed by giving input through signal simulator (Figure 3) at IGCAR.

81
Fuel CyCle
CHAPTERIV Fuel Cycle
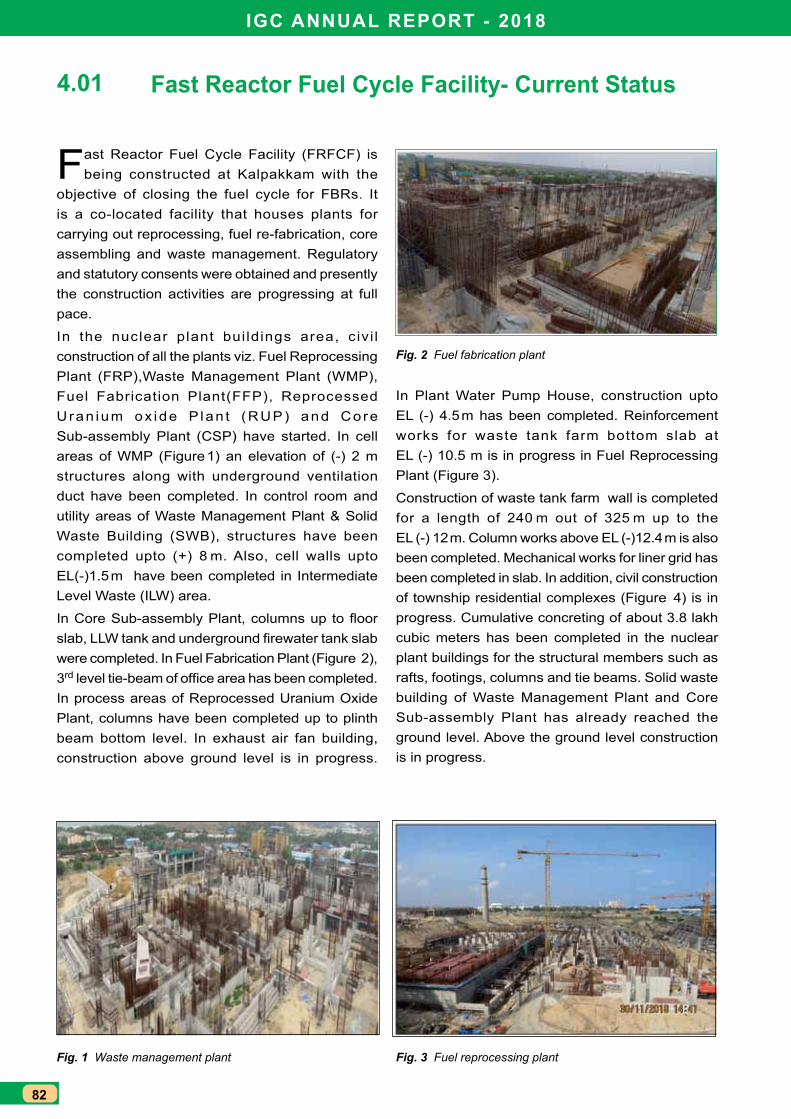
IGC ANNuAl RePORT - 2018
82
Fast Reactor Fuel Cycle Facility- Current Status
Fast Reactor Fuel Cycle Facility (FRFCF) is being constructed at Kalpakkam with the
objective of closing the fuel cycle for FBRs. It is a co-located facility that houses plants for carrying out reprocessing, fuel re-fabrication, core assembling and waste management. Regulatory and statutory consents were obtained and presently the construction activities are progressing at full pace.
In the nuclear plant bui ldings area, civi l construction of all the plants viz. Fuel Reprocessing Plant (FRP),Waste Management Plant (WMP), Fuel Fabrication Plant(FFP), Reprocessed Uran ium ox ide P lan t (RUP) and Core Sub-assembly Plant (CSP) have started. In cell areas of WMP (Figure 1) an elevation of (-) 2 m structures along with underground ventilation duct have been completed. In control room and utility areas of Waste Management Plant & Solid Waste Building (SWB), structures have been completed upto (+) 8 m. Also, cell walls upto EL(-)1.5 m have been completed in Intermediate Level Waste (ILW) area.
In Core Sub-assembly Plant, columns up to floor slab, LLW tank and underground firewater tank slab were completed. In Fuel Fabrication Plant (Figure 2), 3rd level tie-beam of office area has been completed. In process areas of Reprocessed Uranium Oxide Plant, columns have been completed up to plinth beam bottom level. In exhaust air fan building, construction above ground level is in progress.
4.01
In Plant Water Pump House, construction upto EL (-) 4.5 m has been completed. Reinforcement works for waste tank farm bottom slab at EL (-) 10.5 m is in progress in Fuel Reprocessing Plant (Figure 3).
Construction of waste tank farm wall is completed for a length of 240 m out of 325 m up to the EL (-) 12 m. Column works above EL (-)12.4 m is also been completed. Mechanical works for liner grid has been completed in slab. In addition, civil construction of township residential complexes (Figure 4) is in progress. Cumulative concreting of about 3.8 lakh cubic meters has been completed in the nuclear plant buildings for the structural members such as rafts, footings, columns and tie beams. Solid waste building of Waste Management Plant and Core Sub-assembly Plant has already reached the ground level. Above the ground level construction is in progress.
Fig. 1 Waste management plant
Fig. 2 Fuel fabrication plant
Fig. 3 Fuel reprocessing plant
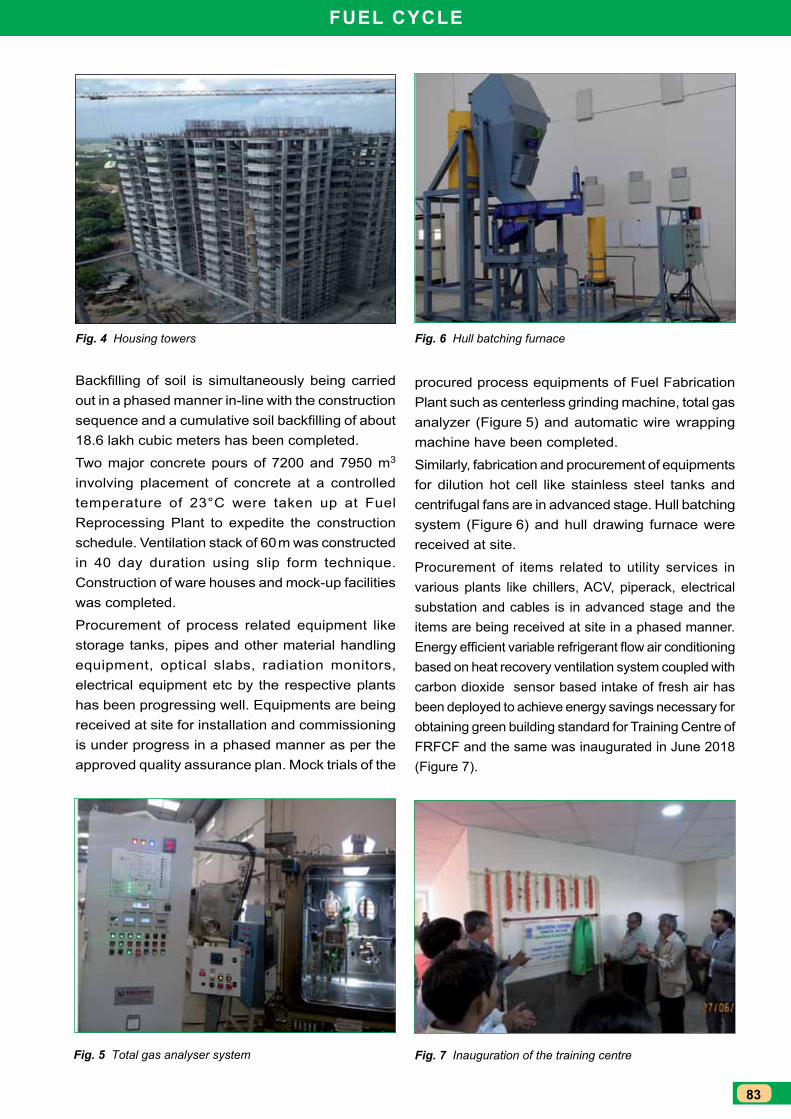
83
Fuel CyCle
Fig. 4 Housing towers
Fig. 5 Total gas analyser system
Fig. 6 Hull batching furnace
Fig. 7 Inauguration of the training centre
Backfilling of soil is simultaneously being carried out in a phased manner in-line with the construction sequence and a cumulative soil backfilling of about 18.6 lakh cubic meters has been completed.
Two major concrete pours of 7200 and 7950 m3 involving placement of concrete at a controlled temperature of 23°C were taken up at Fuel Reprocessing Plant to expedite the construction schedule. Ventilation stack of 60 m was constructed in 40 day duration using slip form technique. Construction of ware houses and mock-up facilities was completed.
Procurement of process related equipment like storage tanks, pipes and other material handling equipment, optical slabs, radiation monitors, electrical equipment etc by the respective plants has been progressing well. Equipments are being received at site for installation and commissioning is under progress in a phased manner as per the approved quality assurance plan. Mock trials of the
procured process equipments of Fuel Fabrication Plant such as centerless grinding machine, total gas analyzer (Figure 5) and automatic wire wrapping machine have been completed.
Similarly, fabrication and procurement of equipments for dilution hot cell like stainless steel tanks and centrifugal fans are in advanced stage. Hull batching system (Figure 6) and hull drawing furnace were received at site.
Procurement of items related to utility services in various plants like chillers, ACV, piperack, electrical substation and cables is in advanced stage and the items are being received at site in a phased manner. Energy efficient variable refrigerant flow air conditioning based on heat recovery ventilation system coupled with carbon dioxide sensor based intake of fresh air has been deployed to achieve energy savings necessary for obtaining green building standard for Training Centre of FRFCF and the same was inaugurated in June 2018 (Figure 7).

IGC ANNuAl RePORT - 2018
84
3D Modeling and Animation of Blocks 1&2 of Fuel Reprocessing Plant of Fast Reactor Fuel Cycle Facility
Fast Reactor Fuel Cycle Facility consists of five co-located plants catering to PFBR. Fuel reprocessing
Plant (FRP) is designated for recovering plutonium and uranium dioxide from the spent fuel (Figure 1). Waste tank farm and plutonium reconversion (PuRC) laboratory are situated in the combined Block-1 & 2 of FRP. Various waste fluids from the chemical processes in FRP are stored in huge storage tanks in this shielded facility. Tanks when filled are removed using Electrical overhead Trolley (EoT) cranes, loaded on to trucks and taken to Waste Management Plant (WMP). This section consists of stainless steel tanks for storing process waste solutions and related high dense piping. EoT cranes are used for equipment and material movement. This block also houses the PuRC laboratory and special nuclear materials (SNM) vault. Recovered plutonium is moved in Lacalhene containers from PuRC to SNM vault and from there transferred to Fuel Fabrication Plant (FFP)(Figure 2).3D modeling and workflow animation of this facility has been undertaken for design review and analysis. The civil structure and process equipment have been modeled and assembled in 3D modeling software. Process-workflow has been animated in animation software which includes material movement using EoT cranes to the truck entry area where deliverable and waste products are kept on a truck to be taken out to the WMP (Figure 3). Also removal of deep bed filter from truck at 0 m elevation and the movement of LaCalhene container from PuRC to SNM vault were animated. Additionally, functioning of ISI robot was also animated.Lights were introduced into the visualization scene to apply suitable illumination to the models. The workflow
4.02
was captured by setting up cameras at desirable locations and scripts were used to control their behavior. Transparency was introduced by modifying material properties and sectional view was achieved by modifying the clipping planes of cameras which in turn has revealed internal details of the model while executing the animation sequence. Special effects such as liquid flow and gas flow were visualized using particle systems. Rope animation was simulated using scaling operations coupled with controlled rendering.A textual description of the functions of each system and the operation sequence was compiled and converted into an audio narration using a text to speech conversion tool. The narration has been synchronized with the animation in the visualization platform. A better understanding of the system and an enhanced depth of the visualization has been achieved by this.The completed visualization has been ported to the advanced visualization center for viewing in 3D environment.
Fig. 1 Civil model of block 1&2 of fuel reprocessing plant
Fig. 2 LaCalhene container
Fig. 3 Waste tank farm
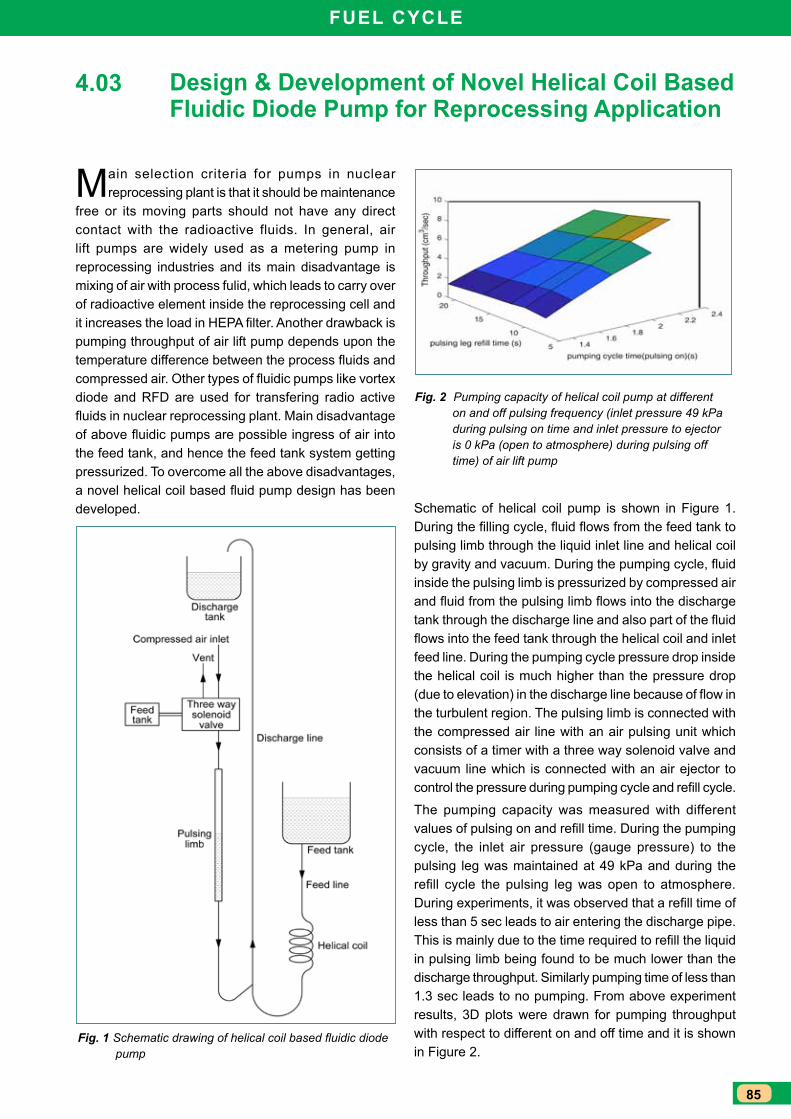
85
Fuel CyCle
Design & Development of Novel Helical Coil Based Fluidic Diode Pump for Reprocessing Application
Main selection criteria for pumps in nuclear reprocessing plant is that it should be maintenance
free or its moving parts should not have any direct contact with the radioactive fluids. In general, air lift pumps are widely used as a metering pump in reprocessing industries and its main disadvantage is mixing of air with process fulid, which leads to carry over of radioactive element inside the reprocessing cell and it increases the load in HEPA filter. Another drawback is pumping throughput of air lift pump depends upon the temperature difference between the process fluids and compressed air. Other types of fluidic pumps like vortex diode and RFD are used for transfering radio active fluids in nuclear reprocessing plant. Main disadvantage of above fluidic pumps are possible ingress of air into the feed tank, and hence the feed tank system getting pressurized. To overcome all the above disadvantages, a novel helical coil based fluid pump design has been developed.
4.03
Fig. 1 Schematic drawing of helical coil based fluidic diode pump
Fig. 2 Pumping capacity of helical coil pump at different on and off pulsing frequency (inlet pressure 49 kPa during pulsing on time and inlet pressure to ejector is 0 kPa (open to atmosphere) during pulsing off time) of air lift pump
Schematic of helical coil pump is shown in Figure 1. During the filling cycle, fluid flows from the feed tank to pulsing limb through the liquid inlet line and helical coil by gravity and vacuum. During the pumping cycle, fluid inside the pulsing limb is pressurized by compressed air and fluid from the pulsing limb flows into the discharge tank through the discharge line and also part of the fluid flows into the feed tank through the helical coil and inlet feed line. During the pumping cycle pressure drop inside the helical coil is much higher than the pressure drop (due to elevation) in the discharge line because of flow in the turbulent region. The pulsing limb is connected with the compressed air line with an air pulsing unit which consists of a timer with a three way solenoid valve and vacuum line which is connected with an air ejector to control the pressure during pumping cycle and refill cycle.
The pumping capacity was measured with different values of pulsing on and refill time. During the pumping cycle, the inlet air pressure (gauge pressure) to the pulsing leg was maintained at 49 kPa and during the refill cycle the pulsing leg was open to atmosphere. During experiments, it was observed that a refill time of less than 5 sec leads to air entering the discharge pipe. This is mainly due to the time required to refill the liquid in pulsing limb being found to be much lower than the discharge throughput. Similarly pumping time of less than 1.3 sec leads to no pumping. From above experiment results, 3D plots were drawn for pumping throughput with respect to different on and off time and it is shown in Figure 2.
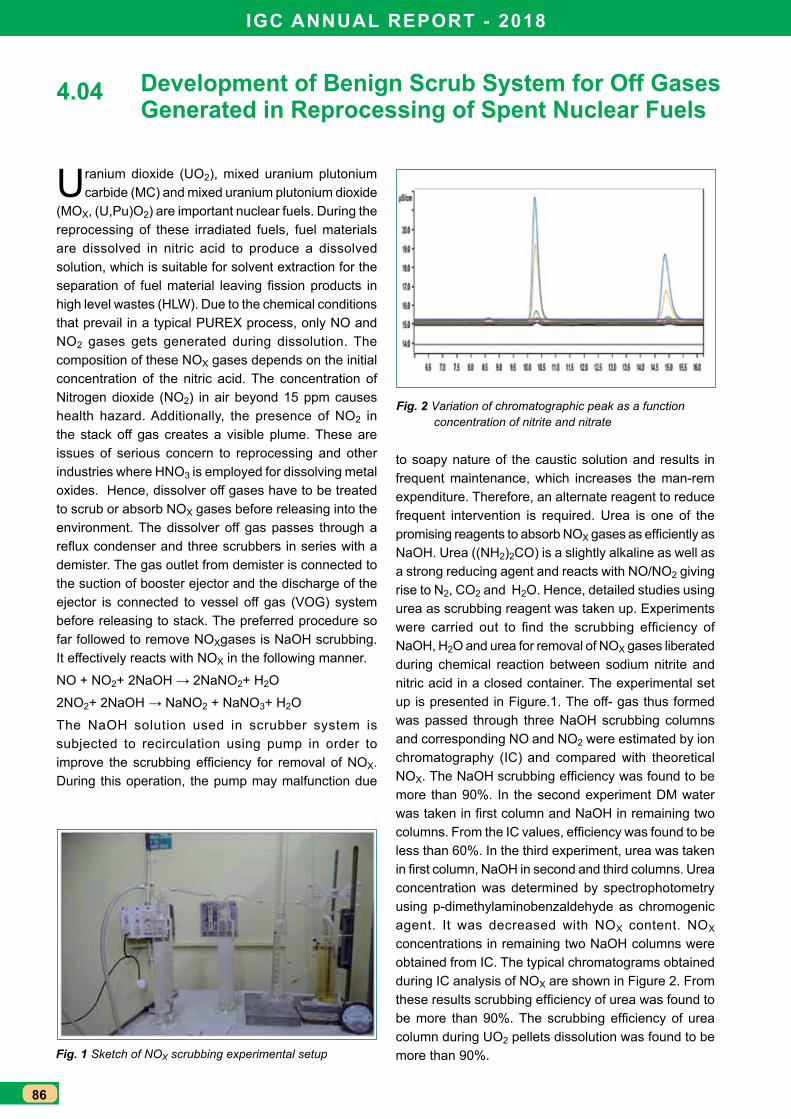
IGC ANNuAl RePORT - 2018
86
Development of Benign Scrub System for Off Gases Generated in Reprocessing of Spent Nuclear Fuels
Uranium dioxide (UO2), mixed uranium plutonium carbide (MC) and mixed uranium plutonium dioxide
(MOX, (U,Pu)O2) are important nuclear fuels. During the reprocessing of these irradiated fuels, fuel materials are dissolved in nitric acid to produce a dissolved solution, which is suitable for solvent extraction for the separation of fuel material leaving fission products in high level wastes (HLW). Due to the chemical conditions that prevail in a typical PUREX process, only NO and NO2 gases gets generated during dissolution. The composition of these NOX gases depends on the initial concentration of the nitric acid. The concentration of Nitrogen dioxide (NO2) in air beyond 15 ppm causes health hazard. Additionally, the presence of NO2 in the stack off gas creates a visible plume. These are issues of serious concern to reprocessing and other industries where HNO3 is employed for dissolving metal oxides. Hence, dissolver off gases have to be treated to scrub or absorb NOX gases before releasing into the environment. The dissolver off gas passes through a reflux condenser and three scrubbers in series with a demister. The gas outlet from demister is connected to the suction of booster ejector and the discharge of the ejector is connected to vessel off gas (VOG) system before releasing to stack. The preferred procedure so far followed to remove NOXgases is NaOH scrubbing. It effectively reacts with NOX in the following manner.
NO + NO2+ 2NaOH → 2NaNO2+ H2O
2NO2+ 2NaOH → NaNO2 + NaNO3+ H2O
The NaOH solution used in scrubber system is subjected to recirculation using pump in order to improve the scrubbing efficiency for removal of NOX. During this operation, the pump may malfunction due
4.04
Fig. 1 Sketch of NOX scrubbing experimental setup
Fig. 2 Variation of chromatographic peak as a function concentration of nitrite and nitrate
to soapy nature of the caustic solution and results in frequent maintenance, which increases the man-rem expenditure. Therefore, an alternate reagent to reduce frequent intervention is required. Urea is one of the promising reagents to absorb NOX gases as efficiently as NaOH. Urea ((NH2)2CO) is a slightly alkaline as well as a strong reducing agent and reacts with NO/NO2 giving rise to N2, CO2 and H2O. Hence, detailed studies using urea as scrubbing reagent was taken up. Experiments were carried out to find the scrubbing efficiency of NaOH, H2O and urea for removal of NOX gases liberated during chemical reaction between sodium nitrite and nitric acid in a closed container. The experimental set up is presented in Figure.1. The off- gas thus formed was passed through three NaOH scrubbing columns and corresponding NO and NO2 were estimated by ion chromatography (IC) and compared with theoretical NOX. The NaOH scrubbing efficiency was found to be more than 90%. In the second experiment DM water was taken in first column and NaOH in remaining two columns. From the IC values, efficiency was found to be less than 60%. In the third experiment, urea was taken in first column, NaOH in second and third columns. Urea concentration was determined by spectrophotometry using p-dimethylaminobenzaldehyde as chromogenic agent. It was decreased with NOX content. NOX
concentrations in remaining two NaOH columns were obtained from IC. The typical chromatograms obtained during IC analysis of NOX are shown in Figure 2. From these results scrubbing efficiency of urea was found to be more than 90%. The scrubbing efficiency of urea column during UO2 pellets dissolution was found to be more than 90%.
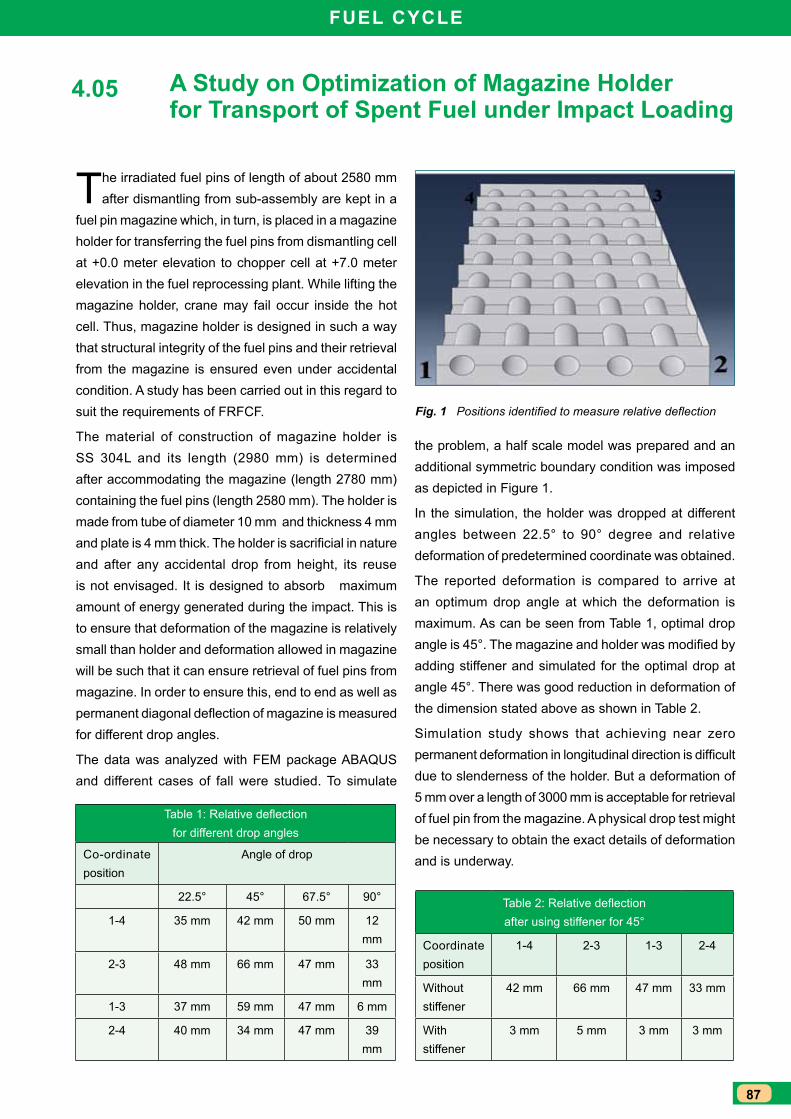
87
Fuel CyCle
A Study on Optimization of Magazine Holder for Transport of Spent Fuel under Impact loading
The irradiated fuel pins of length of about 2580 mm after dismantling from sub-assembly are kept in a
fuel pin magazine which, in turn, is placed in a magazine holder for transferring the fuel pins from dismantling cell at +0.0 meter elevation to chopper cell at +7.0 meter elevation in the fuel reprocessing plant. While lifting the magazine holder, crane may fail occur inside the hot cell. Thus, magazine holder is designed in such a way that structural integrity of the fuel pins and their retrieval from the magazine is ensured even under accidental condition. A study has been carried out in this regard to suit the requirements of FRFCF.
The material of construction of magazine holder is SS 304L and its length (2980 mm) is determined after accommodating the magazine (length 2780 mm) containing the fuel pins (length 2580 mm). The holder is made from tube of diameter 10 mm and thickness 4 mm and plate is 4 mm thick. The holder is sacrificial in nature and after any accidental drop from height, its reuse is not envisaged. It is designed to absorb maximum amount of energy generated during the impact. This is to ensure that deformation of the magazine is relatively small than holder and deformation allowed in magazine will be such that it can ensure retrieval of fuel pins from magazine. In order to ensure this, end to end as well as permanent diagonal deflection of magazine is measured for different drop angles.
The data was analyzed with FEM package ABAQUS and different cases of fall were studied. To simulate
4.05
the problem, a half scale model was prepared and an additional symmetric boundary condition was imposed as depicted in Figure 1.
In the simulation, the holder was dropped at different angles between 22.5° to 90° degree and relative deformation of predetermined coordinate was obtained.
The reported deformation is compared to arrive at an optimum drop angle at which the deformation is maximum. As can be seen from Table 1, optimal drop angle is 45°. The magazine and holder was modified by adding stiffener and simulated for the optimal drop at angle 45°. There was good reduction in deformation of the dimension stated above as shown in Table 2.
Simulation study shows that achieving near zero permanent deformation in longitudinal direction is difficult due to slenderness of the holder. But a deformation of 5 mm over a length of 3000 mm is acceptable for retrieval of fuel pin from the magazine. A physical drop test might be necessary to obtain the exact details of deformation and is underway.
Fig. 1 Positions identified to measure relative deflection
Table 1: Relative deflection for different drop angles
Co-ordinate position
Angle of drop
22.5° 45° 67.5° 90°
1-4 35 mm 42 mm 50 mm 12 mm
2-3 48 mm 66 mm 47 mm 33 mm
1-3 37 mm 59 mm 47 mm 6 mm
2-4 40 mm 34 mm 47 mm 39 mm
Table 2: Relative deflection after using stiffener for 45°
Coordinate position
1-4 2-3 1-3 2-4
Without stiffener
42 mm 66 mm 47 mm 33 mm
With stiffener
3 mm 5 mm 3 mm 3 mm
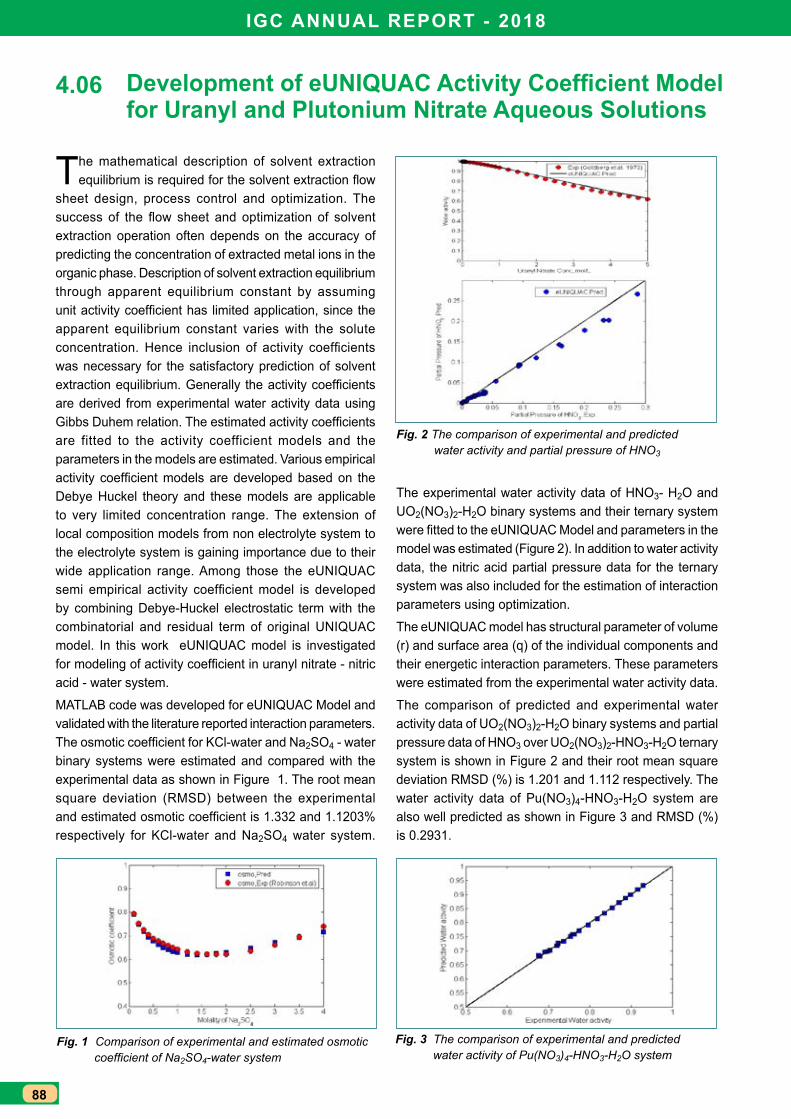
IGC ANNuAl RePORT - 2018
88
Development of eUNIQUAC Activity Coefficient Model for uranyl and Plutonium Nitrate Aqueous Solutions
The mathematical description of solvent extraction equilibrium is required for the solvent extraction flow
sheet design, process control and optimization. The success of the flow sheet and optimization of solvent extraction operation often depends on the accuracy of predicting the concentration of extracted metal ions in the organic phase. Description of solvent extraction equilibrium through apparent equilibrium constant by assuming unit activity coefficient has limited application, since the apparent equilibrium constant varies with the solute concentration. Hence inclusion of activity coefficients was necessary for the satisfactory prediction of solvent extraction equilibrium. Generally the activity coefficients are derived from experimental water activity data using Gibbs Duhem relation. The estimated activity coefficients are fitted to the activity coefficient models and the parameters in the models are estimated. Various empirical activity coefficient models are developed based on the Debye Huckel theory and these models are applicable to very limited concentration range. The extension of local composition models from non electrolyte system to the electrolyte system is gaining importance due to their wide application range. Among those the eUNIQUAC semi empirical activity coefficient model is developed by combining Debye-Huckel electrostatic term with the combinatorial and residual term of original UNIQUAC model. In this work eUNIQUAC model is investigated for modeling of activity coefficient in uranyl nitrate - nitric acid - water system.
MATLAB code was developed for eUNIQUAC Model and validated with the literature reported interaction parameters. The osmotic coefficient for KCl-water and Na2SO4 - water binary systems were estimated and compared with the experimental data as shown in Figure 1. The root mean square deviation (RMSD) between the experimental and estimated osmotic coefficient is 1.332 and 1.1203% respectively for KCl-water and Na2SO4 water system.
4.06
Fig. 1 Comparison of experimental and estimated osmotic coefficient of Na2SO4-water system
Fig. 2 The comparison of experimental and predicted water activity and partial pressure of HNO3
Fig. 3 The comparison of experimental and predicted water activity of Pu(NO3)4-HNO3-H2O system
The experimental water activity data of HNO3- H2O and UO2(NO3)2-H2O binary systems and their ternary system were fitted to the eUNIQUAC Model and parameters in the model was estimated (Figure 2). In addition to water activity data, the nitric acid partial pressure data for the ternary system was also included for the estimation of interaction parameters using optimization.
The eUNIQUAC model has structural parameter of volume (r) and surface area (q) of the individual components and their energetic interaction parameters. These parameters were estimated from the experimental water activity data.
The comparison of predicted and experimental water activity data of UO2(NO3)2-H2O binary systems and partial pressure data of HNO3 over UO2(NO3)2-HNO3-H2O ternary system is shown in Figure 2 and their root mean square deviation RMSD (%) is 1.201 and 1.112 respectively. The water activity data of Pu(NO3)4-HNO3-H2O system are also well predicted as shown in Figure 3 and RMSD (%) is 0.2931.
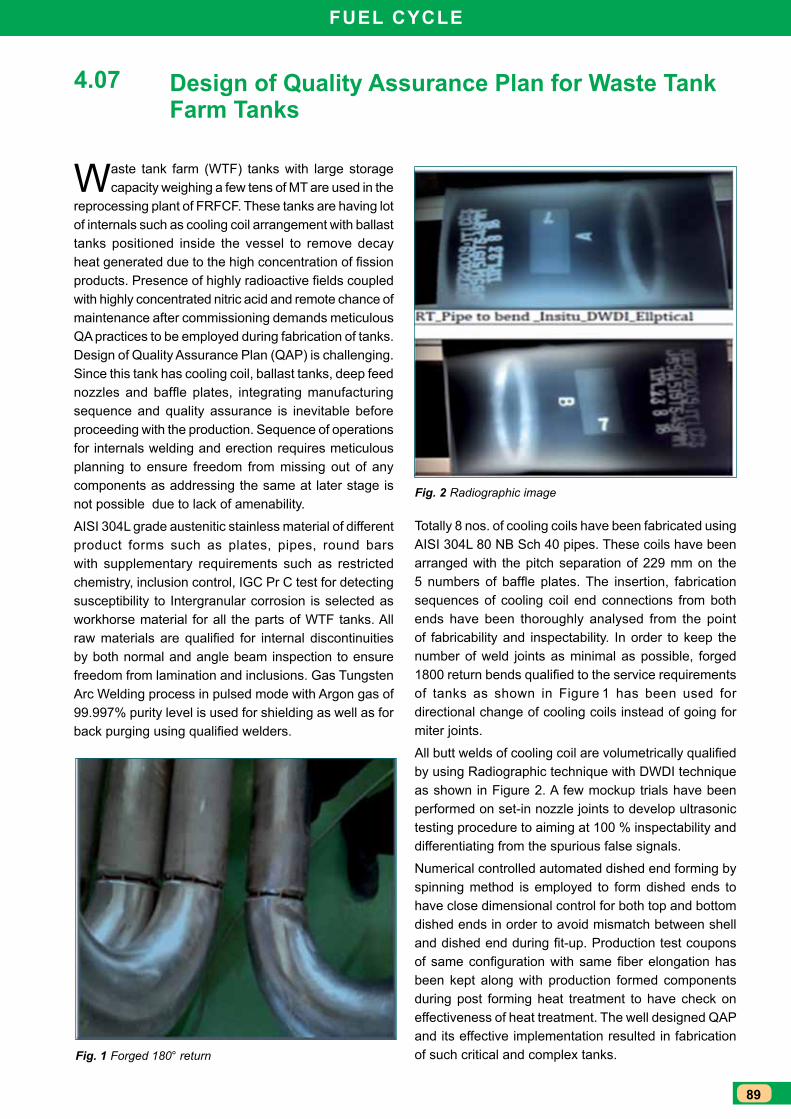
89
Fuel CyCle
Design of Quality Assurance Plan for Waste Tank Farm Tanks
Waste tank farm (WTF) tanks with large storage capacity weighing a few tens of MT are used in the
reprocessing plant of FRFCF. These tanks are having lot of internals such as cooling coil arrangement with ballast tanks positioned inside the vessel to remove decay heat generated due to the high concentration of fission products. Presence of highly radioactive fields coupled with highly concentrated nitric acid and remote chance of maintenance after commissioning demands meticulous QA practices to be employed during fabrication of tanks. Design of Quality Assurance Plan (QAP) is challenging. Since this tank has cooling coil, ballast tanks, deep feed nozzles and baffle plates, integrating manufacturing sequence and quality assurance is inevitable before proceeding with the production. Sequence of operations for internals welding and erection requires meticulous planning to ensure freedom from missing out of any components as addressing the same at later stage is not possible due to lack of amenability.
AISI 304L grade austenitic stainless material of different product forms such as plates, pipes, round bars with supplementary requirements such as restricted chemistry, inclusion control, IGC Pr C test for detecting susceptibility to Intergranular corrosion is selected as workhorse material for all the parts of WTF tanks. All raw materials are qualified for internal discontinuities by both normal and angle beam inspection to ensure freedom from lamination and inclusions. Gas Tungsten Arc Welding process in pulsed mode with Argon gas of 99.997% purity level is used for shielding as well as for back purging using qualified welders.
4.07
Fig. 1 Forged 180° return
Fig. 2 Radiographic image
Totally 8 nos. of cooling coils have been fabricated using AISI 304L 80 NB Sch 40 pipes. These coils have been arranged with the pitch separation of 229 mm on the 5 numbers of baffle plates. The insertion, fabrication sequences of cooling coil end connections from both ends have been thoroughly analysed from the point of fabricability and inspectability. In order to keep the number of weld joints as minimal as possible, forged 1800 return bends qualified to the service requirements of tanks as shown in Figure 1 has been used for directional change of cooling coils instead of going for miter joints.
All butt welds of cooling coil are volumetrically qualified by using Radiographic technique with DWDI technique as shown in Figure 2. A few mockup trials have been performed on set-in nozzle joints to develop ultrasonic testing procedure to aiming at 100 % inspectability and differentiating from the spurious false signals.
Numerical controlled automated dished end forming by spinning method is employed to form dished ends to have close dimensional control for both top and bottom dished ends in order to avoid mismatch between shell and dished end during fit-up. Production test coupons of same configuration with same fiber elongation has been kept along with production formed components during post forming heat treatment to have check on effectiveness of heat treatment. The well designed QAP and its effective implementation resulted in fabrication of such critical and complex tanks.
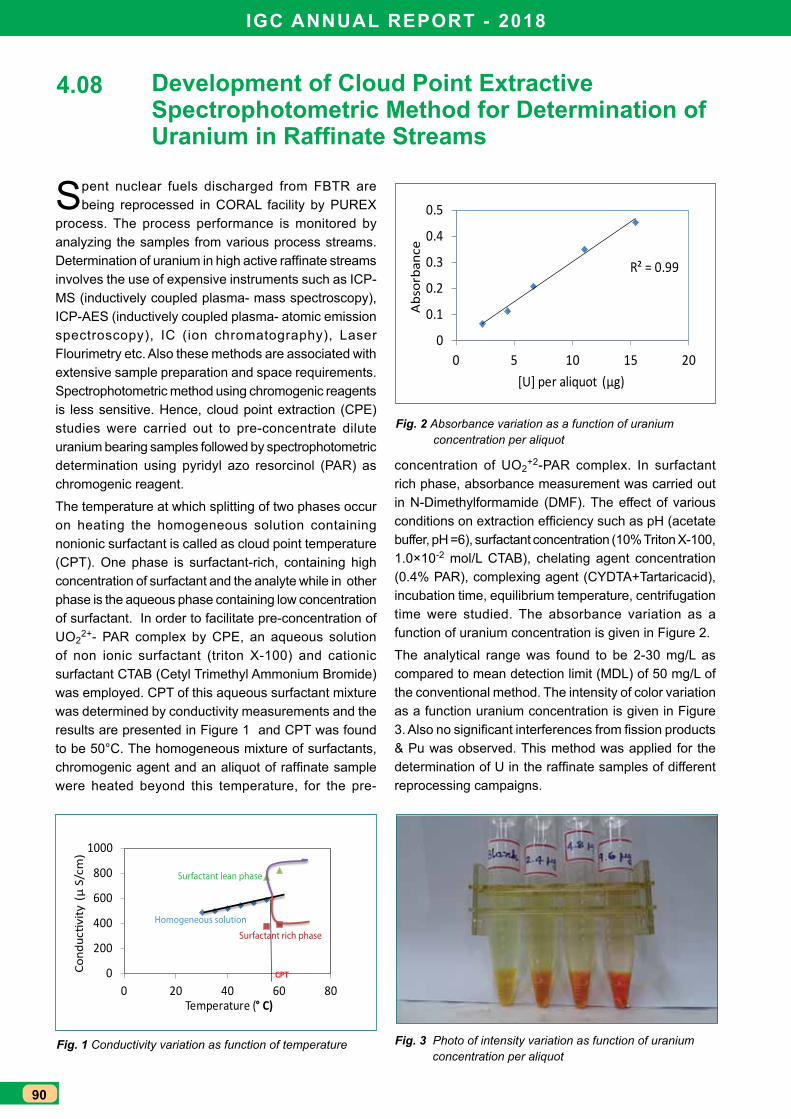
IGC ANNuAl RePORT - 2018
90
Development of Cloud Point extractive Spectrophotometric Method for Determination of Uranium in Raffinate Streams
Spent nuclear fuels discharged from FBTR are being reprocessed in CORAL facility by PUREX
process. The process performance is monitored by analyzing the samples from various process streams. Determination of uranium in high active raffinate streams involves the use of expensive instruments such as ICP-MS (inductively coupled plasma- mass spectroscopy), ICP-AES (inductively coupled plasma- atomic emission spectroscopy), IC (ion chromatography), Laser Flourimetry etc. Also these methods are associated with extensive sample preparation and space requirements. Spectrophotometric method using chromogenic reagents is less sensitive. Hence, cloud point extraction (CPE) studies were carried out to pre-concentrate dilute uranium bearing samples followed by spectrophotometric determination using pyridyl azo resorcinol (PAR) as chromogenic reagent.
The temperature at which splitting of two phases occur on heating the homogeneous solution containing nonionic surfactant is called as cloud point temperature (CPT). One phase is surfactant-rich, containing high concentration of surfactant and the analyte while in other phase is the aqueous phase containing low concentration of surfactant. In order to facilitate pre-concentration of UO2
2+- PAR complex by CPE, an aqueous solution of non ionic surfactant (triton X-100) and cationic surfactant CTAB (Cetyl Trimethyl Ammonium Bromide) was employed. CPT of this aqueous surfactant mixture was determined by conductivity measurements and the results are presented in Figure 1 and CPT was found to be 50°C. The homogeneous mixture of surfactants, chromogenic agent and an aliquot of raffinate sample were heated beyond this temperature, for the pre-
4.08
concentration of UO2+2-PAR complex. In surfactant
rich phase, absorbance measurement was carried out in N-Dimethylformamide (DMF). The effect of various conditions on extraction efficiency such as pH (acetate buffer, pH =6), surfactant concentration (10% Triton X-100, 1.0×10⁻² mol/L CTAB), chelating agent concentration (0.4% PAR), complexing agent (CYDTA+Tartaricacid), incubation time, equilibrium temperature, centrifugation time were studied. The absorbance variation as a function of uranium concentration is given in Figure 2.
The analytical range was found to be 2-30 mg/L as compared to mean detection limit (MDL) of 50 mg/L of the conventional method. The intensity of color variation as a function uranium concentration is given in Figure 3. Also no significant interferences from fission products & Pu was observed. This method was applied for the determination of U in the raffinate samples of different reprocessing campaigns.
0
200
400
600
800
1000
0 20 40 60 80
Cond
uctiv
ity (
µ S/
cm)
Temperature (° C)
CPT
Homogeneous solution
Surfactant rich phase
Surfactant lean phase
R² = 0.99
0
0.1
0.2
0.3
0.4
0.5
0 5 10 15 20
Abs
orba
nce
[U] per aliquot (µg)
Fig. 1 Conductivity variation as function of temperature Fig. 3 Photo of intensity variation as function of uranium concentration per aliquot
Fig. 2 Absorbance variation as a function of uranium concentration per aliquot
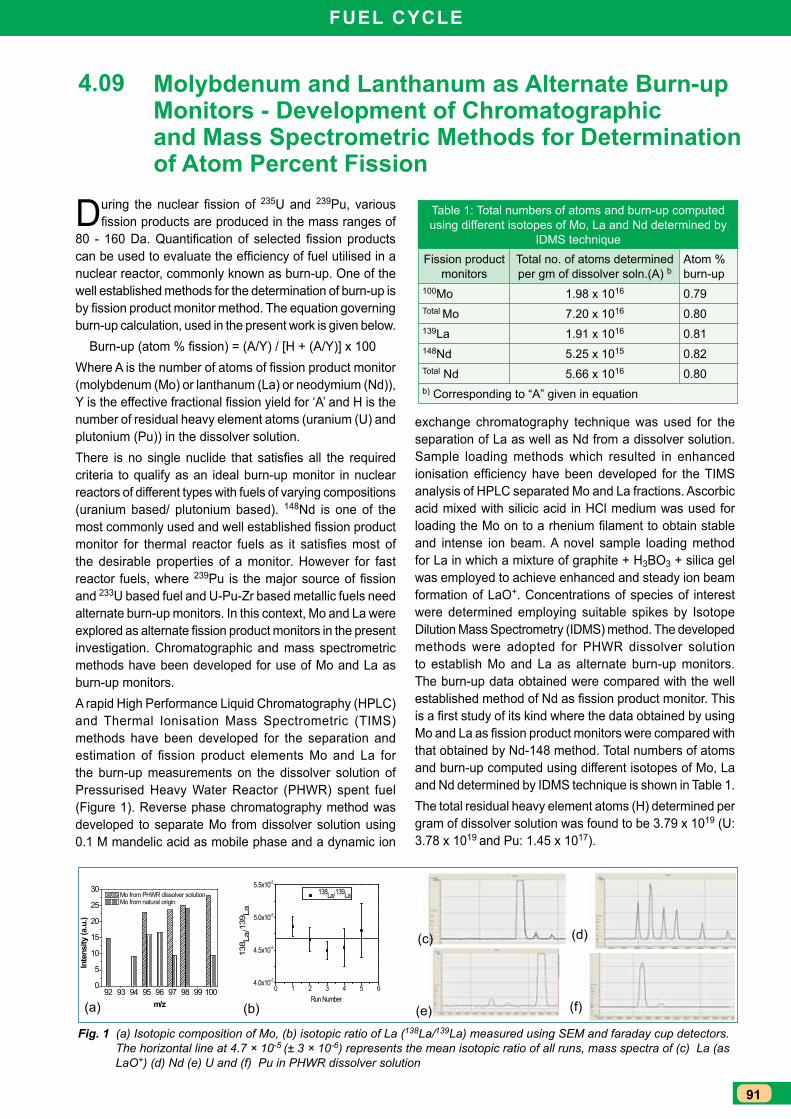
91
Fuel CyCle
Molybdenum and lanthanum as Alternate Burn-up Monitors - Development of Chromatographic and Mass Spectrometric Methods for Determination of Atom Percent Fission
During the nuclear fission of 235U and 239Pu, various fission products are produced in the mass ranges of
80 - 160 Da. Quantification of selected fission products can be used to evaluate the efficiency of fuel utilised in a nuclear reactor, commonly known as burn-up. One of the well established methods for the determination of burn-up is by fission product monitor method. The equation governing burn-up calculation, used in the present work is given below. Burn-up (atom % fission) = (A/Y) / [H + (A/Y)] x 100Where A is the number of atoms of fission product monitor (molybdenum (Mo) or lanthanum (La) or neodymium (Nd)), Y is the effective fractional fission yield for ‘A’ and H is the number of residual heavy element atoms (uranium (U) and plutonium (Pu)) in the dissolver solution. There is no single nuclide that satisfies all the required criteria to qualify as an ideal burn-up monitor in nuclear reactors of different types with fuels of varying compositions (uranium based/ plutonium based). 148Nd is one of the most commonly used and well established fission product monitor for thermal reactor fuels as it satisfies most of the desirable properties of a monitor. However for fast reactor fuels, where 239Pu is the major source of fission and 233U based fuel and U-Pu-Zr based metallic fuels need alternate burn-up monitors. In this context, Mo and La were explored as alternate fission product monitors in the present investigation. Chromatographic and mass spectrometric methods have been developed for use of Mo and La as burn-up monitors.A rapid High Performance Liquid Chromatography (HPLC) and Thermal Ionisation Mass Spectrometric (TIMS) methods have been developed for the separation and estimation of fission product elements Mo and La for the burn-up measurements on the dissolver solution of Pressurised Heavy Water Reactor (PHWR) spent fuel (Figure 1). Reverse phase chromatography method was developed to separate Mo from dissolver solution using 0.1 M mandelic acid as mobile phase and a dynamic ion
4.09
exchange chromatography technique was used for the separation of La as well as Nd from a dissolver solution. Sample loading methods which resulted in enhanced ionisation efficiency have been developed for the TIMS analysis of HPLC separated Mo and La fractions. Ascorbic acid mixed with silicic acid in HCl medium was used for loading the Mo on to a rhenium filament to obtain stable and intense ion beam. A novel sample loading method for La in which a mixture of graphite + H3BO3 + silica gel was employed to achieve enhanced and steady ion beam formation of LaO+. Concentrations of species of interest were determined employing suitable spikes by Isotope Dilution Mass Spectrometry (IDMS) method. The developed methods were adopted for PHWR dissolver solution to establish Mo and La as alternate burn-up monitors. The burn-up data obtained were compared with the well established method of Nd as fission product monitor. This is a first study of its kind where the data obtained by using Mo and La as fission product monitors were compared with that obtained by Nd-148 method. Total numbers of atoms and burn-up computed using different isotopes of Mo, La and Nd determined by IDMS technique is shown in Table 1.The total residual heavy element atoms (H) determined per gram of dissolver solution was found to be 3.79 x 10¹⁹ (U: 3.78 x 10¹⁹ and Pu: 1.45 x 10¹⁷).
Table 1: Total numbers of atoms and burn-up computed using different isotopes of Mo, La and Nd determined by
IDMS techniqueFission product
monitorsTotal no. of atoms determined per gm of dissolver soln.(A) b
Atom % burn-up
100Mo 1.98 x 10¹⁶ 0.79Total Mo 7.20 x 10¹⁶ 0.80139La 1.91 x 10¹⁶ 0.81148Nd 5.25 x 10¹⁵ 0.82Total Nd 5.66 x 10¹⁶ 0.80b) Corresponding to “A” given in equation
Fig. 1 (a) Isotopic composition of Mo, (b) isotopic ratio of La (138La/139La) measured using SEM and faraday cup detectors. The horizontal line at 4.7 × 10⁻⁵ (± 3 × 10⁻⁶) represents the mean isotopic ratio of all runs, mass spectra of (c) La (as LaO+) (d) Nd (e) U and (f) Pu in PHWR dissolver solution
92 93 94 95 96 97 98 99 1000
5
10
15
20
25
30
Inte
nsity
(a.u
.)
m/z
Mo from PHWR dissolver solution Mo from natural origin
0 1 2 3 4 5 64.0x10⁻⁵
4.5x10⁻⁵
5.0x10⁻⁵
5.5x10⁻⁵
138 L
a/13
9 La
138La/139La
Run Number(a) (b)
(c)
(e)
(d)
(f)
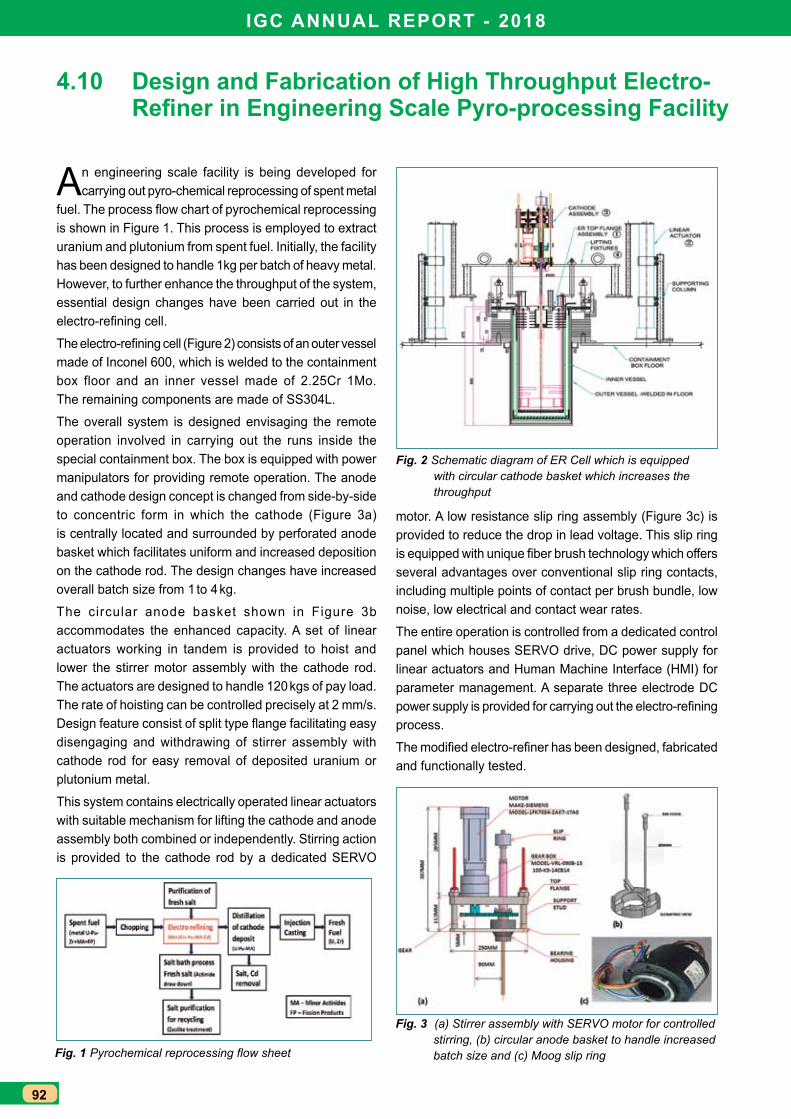
IGC ANNuAl RePORT - 2018
92
Design and Fabrication of High Throughput electro-Refiner in Engineering Scale Pyro-processing Facility
An engineering scale facility is being developed for carrying out pyro-chemical reprocessing of spent metal
fuel. The process flow chart of pyrochemical reprocessing is shown in Figure 1. This process is employed to extract uranium and plutonium from spent fuel. Initially, the facility has been designed to handle 1kg per batch of heavy metal. However, to further enhance the throughput of the system, essential design changes have been carried out in the electro-refining cell.
The electro-refining cell (Figure 2) consists of an outer vessel made of Inconel 600, which is welded to the containment box floor and an inner vessel made of 2.25Cr 1Mo. The remaining components are made of SS304L.
The overall system is designed envisaging the remote operation involved in carrying out the runs inside the special containment box. The box is equipped with power manipulators for providing remote operation. The anode and cathode design concept is changed from side-by-side to concentric form in which the cathode (Figure 3a) is centrally located and surrounded by perforated anode basket which facilitates uniform and increased deposition on the cathode rod. The design changes have increased overall batch size from 1 to 4 kg.
The circular anode basket shown in Figure 3b accommodates the enhanced capacity. A set of linear actuators working in tandem is provided to hoist and lower the stirrer motor assembly with the cathode rod. The actuators are designed to handle 120 kgs of pay load. The rate of hoisting can be controlled precisely at 2 mm/s. Design feature consist of split type flange facilitating easy disengaging and withdrawing of stirrer assembly with cathode rod for easy removal of deposited uranium or plutonium metal.
This system contains electrically operated linear actuators with suitable mechanism for lifting the cathode and anode assembly both combined or independently. Stirring action is provided to the cathode rod by a dedicated SERVO
4.10
Fig. 1 Pyrochemical reprocessing flow sheet
Fig. 2 Schematic diagram of ER Cell which is equipped with circular cathode basket which increases the throughput
Fig. 3 (a) Stirrer assembly with SERVO motor for controlled stirring, (b) circular anode basket to handle increased batch size and (c) Moog slip ring
motor. A low resistance slip ring assembly (Figure 3c) is provided to reduce the drop in lead voltage. This slip ring is equipped with unique fiber brush technology which offers several advantages over conventional slip ring contacts, including multiple points of contact per brush bundle, low noise, low electrical and contact wear rates.
The entire operation is controlled from a dedicated control panel which houses SERVO drive, DC power supply for linear actuators and Human Machine Interface (HMI) for parameter management. A separate three electrode DC power supply is provided for carrying out the electro-refining process.
The modified electro-refiner has been designed, fabricated and functionally tested.
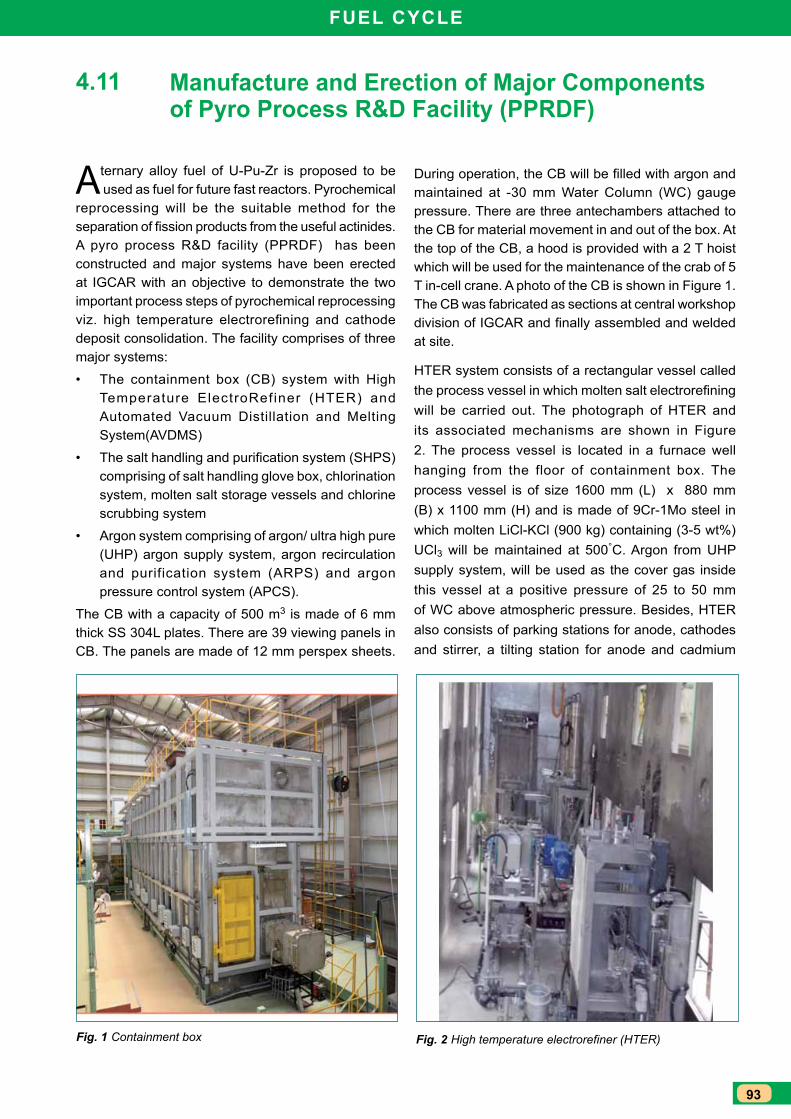
93
Fuel CyCle
Manufacture and erection of Major Components of Pyro Process R&D Facility (PPRDF)
A ternary alloy fuel of U-Pu-Zr is proposed to be used as fuel for future fast reactors. Pyrochemical
reprocessing will be the suitable method for the separation of fission products from the useful actinides. A pyro process R&D facility (PPRDF) has been constructed and major systems have been erected at IGCAR with an objective to demonstrate the two important process steps of pyrochemical reprocessing viz. high temperature electrorefining and cathode deposit consolidation. The facility comprises of three major systems:
• The containment box (CB) system with High Temperature ElectroRefiner (HTER) and Automated Vacuum Distillation and Melting System(AVDMS)
• The salt handling and purification system (SHPS) comprising of salt handling glove box, chlorination system, molten salt storage vessels and chlorine scrubbing system
• Argon system comprising of argon/ ultra high pure (UHP) argon supply system, argon recirculation and purification system (ARPS) and argon pressure control system (APCS).
The CB with a capacity of 500 m3 is made of 6 mm thick SS 304L plates. There are 39 viewing panels in CB. The panels are made of 12 mm perspex sheets.
4.11
Fig. 1 Containment box Fig. 2 High temperature electrorefiner (HTER)
During operation, the CB will be filled with argon and maintained at -30 mm Water Column (WC) gauge pressure. There are three antechambers attached to the CB for material movement in and out of the box. At the top of the CB, a hood is provided with a 2 T hoist which will be used for the maintenance of the crab of 5 T in-cell crane. A photo of the CB is shown in Figure 1. The CB was fabricated as sections at central workshop division of IGCAR and finally assembled and welded at site.
HTER system consists of a rectangular vessel called the process vessel in which molten salt electrorefining will be carried out. The photograph of HTER and its associated mechanisms are shown in Figure 2. The process vessel is located in a furnace well hanging from the floor of containment box. The process vessel is of size 1600 mm (L) x 880 mm (B) x 1100 mm (H) and is made of 9Cr-1Mo steel in which molten LiCl-KCl (900 kg) containing (3-5 wt%) UCl3 will be maintained at 500°C. Argon from UHP supply system, will be used as the cover gas inside this vessel at a positive pressure of 25 to 50 mm of WC above atmospheric pressure. Besides, HTER also consists of parking stations for anode, cathodes and stirrer, a tilting station for anode and cadmium
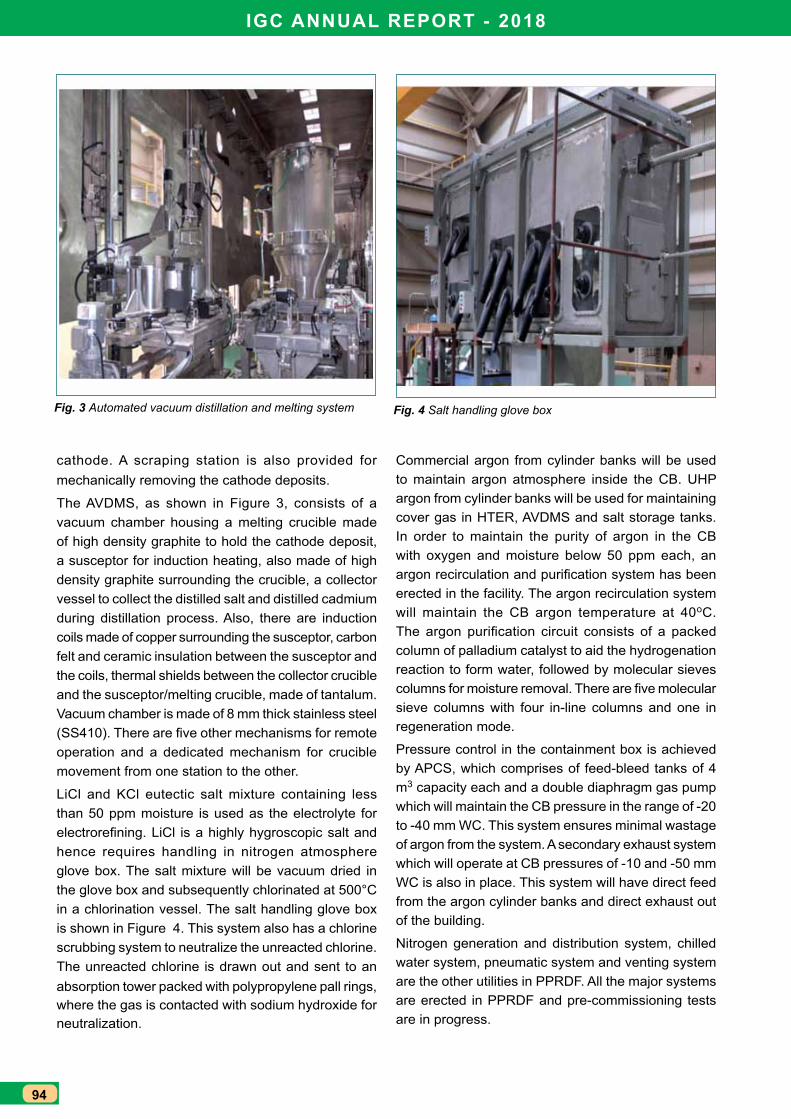
IGC ANNuAl RePORT - 2018
94
cathode. A scraping station is also provided for mechanically removing the cathode deposits.
The AVDMS, as shown in Figure 3, consists of a vacuum chamber housing a melting crucible made of high density graphite to hold the cathode deposit, a susceptor for induction heating, also made of high density graphite surrounding the crucible, a collector vessel to collect the distilled salt and distilled cadmium during distillation process. Also, there are induction coils made of copper surrounding the susceptor, carbon felt and ceramic insulation between the susceptor and the coils, thermal shields between the collector crucible and the susceptor/melting crucible, made of tantalum. Vacuum chamber is made of 8 mm thick stainless steel (SS410). There are five other mechanisms for remote operation and a dedicated mechanism for crucible movement from one station to the other.
LiCl and KCl eutectic salt mixture containing less than 50 ppm moisture is used as the electrolyte for electrorefining. LiCl is a highly hygroscopic salt and hence requires handling in nitrogen atmosphere glove box. The salt mixture will be vacuum dried in the glove box and subsequently chlorinated at 500°C in a chlorination vessel. The salt handling glove box is shown in Figure 4. This system also has a chlorine scrubbing system to neutralize the unreacted chlorine. The unreacted chlorine is drawn out and sent to an absorption tower packed with polypropylene pall rings, where the gas is contacted with sodium hydroxide for neutralization.
Fig. 3 Automated vacuum distillation and melting system Fig. 4 Salt handling glove box
Commercial argon from cylinder banks will be used to maintain argon atmosphere inside the CB. UHP argon from cylinder banks will be used for maintaining cover gas in HTER, AVDMS and salt storage tanks. In order to maintain the purity of argon in the CB with oxygen and moisture below 50 ppm each, an argon recirculation and purification system has been erected in the facility. The argon recirculation system will maintain the CB argon temperature at 40oC. The argon purification circuit consists of a packed column of palladium catalyst to aid the hydrogenation reaction to form water, followed by molecular sieves columns for moisture removal. There are five molecular sieve columns with four in-line columns and one in regeneration mode.
Pressure control in the containment box is achieved by APCS, which comprises of feed-bleed tanks of 4 m3 capacity each and a double diaphragm gas pump which will maintain the CB pressure in the range of -20 to -40 mm WC. This system ensures minimal wastage of argon from the system. A secondary exhaust system which will operate at CB pressures of -10 and -50 mm WC is also in place. This system will have direct feed from the argon cylinder banks and direct exhaust out of the building.
Nitrogen generation and distribution system, chilled water system, pneumatic system and venting system are the other utilities in PPRDF. All the major systems are erected in PPRDF and pre-commissioning tests are in progress.
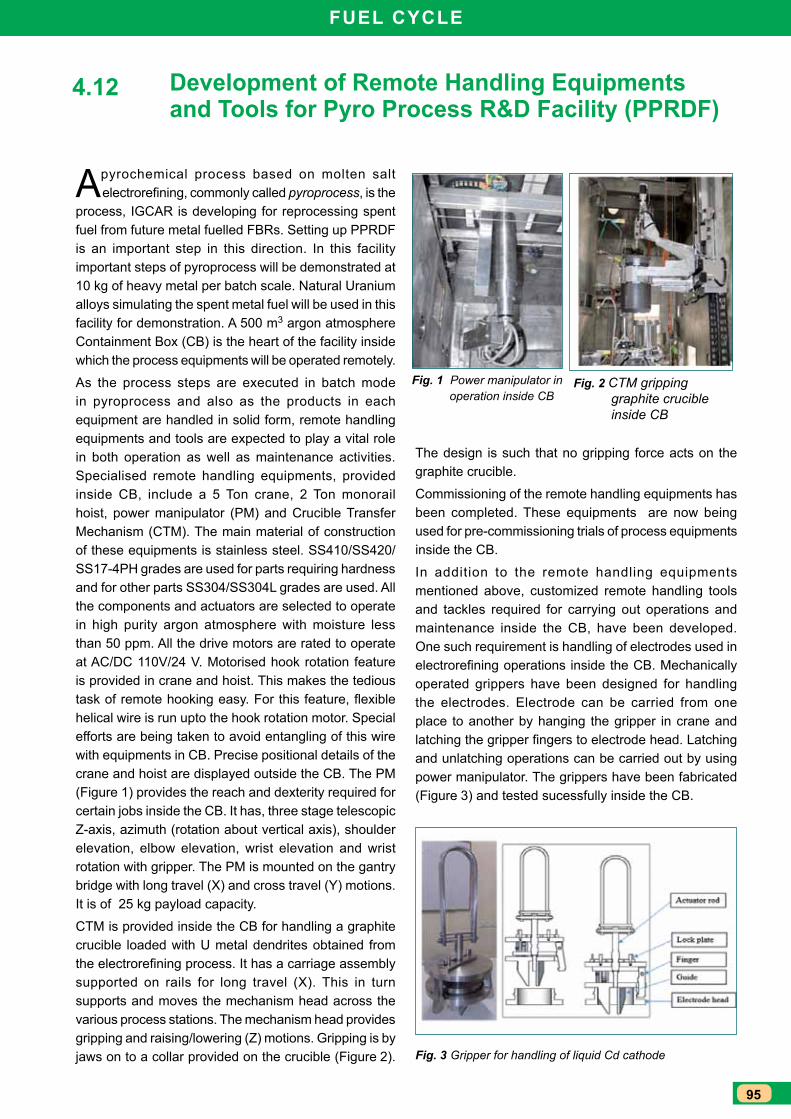
95
Fuel CyCle
Development of Remote Handling equipments and Tools for Pyro Process R&D Facility (PPRDF)
A pyrochemical process based on molten salt electrorefining, commonly called pyroprocess, is the
process, IGCAR is developing for reprocessing spent fuel from future metal fuelled FBRs. Setting up PPRDF is an important step in this direction. In this facility important steps of pyroprocess will be demonstrated at 10 kg of heavy metal per batch scale. Natural Uranium alloys simulating the spent metal fuel will be used in this facility for demonstration. A 500 m3 argon atmosphere Containment Box (CB) is the heart of the facility inside which the process equipments will be operated remotely.
As the process steps are executed in batch mode in pyroprocess and also as the products in each equipment are handled in solid form, remote handling equipments and tools are expected to play a vital role in both operation as well as maintenance activities. Specialised remote handling equipments, provided inside CB, include a 5 Ton crane, 2 Ton monorail hoist, power manipulator (PM) and Crucible Transfer Mechanism (CTM). The main material of construction of these equipments is stainless steel. SS410/SS420/SS17-4PH grades are used for parts requiring hardness and for other parts SS304/SS304L grades are used. All the components and actuators are selected to operate in high purity argon atmosphere with moisture less than 50 ppm. All the drive motors are rated to operate at AC/DC 110V/24 V. Motorised hook rotation feature is provided in crane and hoist. This makes the tedious task of remote hooking easy. For this feature, flexible helical wire is run upto the hook rotation motor. Special efforts are being taken to avoid entangling of this wire with equipments in CB. Precise positional details of the crane and hoist are displayed outside the CB. The PM (Figure 1) provides the reach and dexterity required for certain jobs inside the CB. It has, three stage telescopic Z-axis, azimuth (rotation about vertical axis), shoulder elevation, elbow elevation, wrist elevation and wrist rotation with gripper. The PM is mounted on the gantry bridge with long travel (X) and cross travel (Y) motions. It is of 25 kg payload capacity.
CTM is provided inside the CB for handling a graphite crucible loaded with U metal dendrites obtained from the electrorefining process. It has a carriage assembly supported on rails for long travel (X). This in turn supports and moves the mechanism head across the various process stations. The mechanism head provides gripping and raising/lowering (Z) motions. Gripping is by jaws on to a collar provided on the crucible (Figure 2).
4.12
Fig. 1 Power manipulator in operation inside CB
Fig. 2 CTM gripping graphite crucible inside CB
Fig. 3 Gripper for handling of liquid Cd cathode
The design is such that no gripping force acts on the graphite crucible.
Commissioning of the remote handling equipments has been completed. These equipments are now being used for pre-commissioning trials of process equipments inside the CB.
In addition to the remote handling equipments mentioned above, customized remote handling tools and tackles required for carrying out operations and maintenance inside the CB, have been developed. One such requirement is handling of electrodes used in electrorefining operations inside the CB. Mechanically operated grippers have been designed for handling the electrodes. Electrode can be carried from one place to another by hanging the gripper in crane and latching the gripper fingers to electrode head. Latching and unlatching operations can be carried out by using power manipulator. The grippers have been fabricated (Figure 3) and tested sucessfully inside the CB.
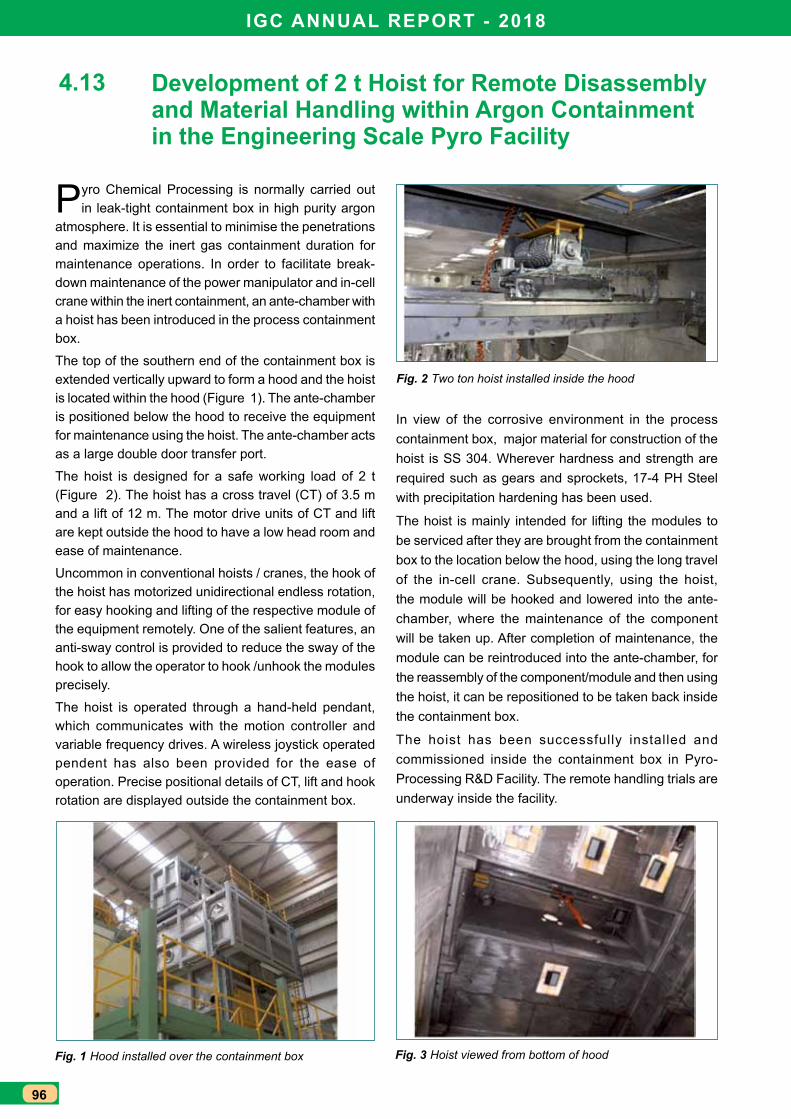
IGC ANNuAl RePORT - 2018
96
Development of 2 t Hoist for Remote Disassembly and Material Handling within Argon Containment in the engineering Scale Pyro Facility
Pyro Chemical Processing is normally carried out in leak-tight containment box in high purity argon
atmosphere. It is essential to minimise the penetrations and maximize the inert gas containment duration for maintenance operations. In order to facilitate break-down maintenance of the power manipulator and in-cell crane within the inert containment, an ante-chamber with a hoist has been introduced in the process containment box.
The top of the southern end of the containment box is extended vertically upward to form a hood and the hoist is located within the hood (Figure 1). The ante-chamber is positioned below the hood to receive the equipment for maintenance using the hoist. The ante-chamber acts as a large double door transfer port.
The hoist is designed for a safe working load of 2 t (Figure 2). The hoist has a cross travel (CT) of 3.5 m and a lift of 12 m. The motor drive units of CT and lift are kept outside the hood to have a low head room and ease of maintenance.
Uncommon in conventional hoists / cranes, the hook of the hoist has motorized unidirectional endless rotation, for easy hooking and lifting of the respective module of the equipment remotely. One of the salient features, an anti-sway control is provided to reduce the sway of the hook to allow the operator to hook /unhook the modules precisely.
The hoist is operated through a hand-held pendant, which communicates with the motion controller and variable frequency drives. A wireless joystick operated pendent has also been provided for the ease of operation. Precise positional details of CT, lift and hook rotation are displayed outside the containment box.
4.13
Fig. 1 Hood installed over the containment box
Fig. 2 Two ton hoist installed inside the hood
Fig. 3 Hoist viewed from bottom of hood
In view of the corrosive environment in the process containment box, major material for construction of the hoist is SS 304. Wherever hardness and strength are required such as gears and sprockets, 17-4 PH Steel with precipitation hardening has been used.
The hoist is mainly intended for lifting the modules to be serviced after they are brought from the containment box to the location below the hood, using the long travel of the in-cell crane. Subsequently, using the hoist, the module will be hooked and lowered into the ante-chamber, where the maintenance of the component will be taken up. After completion of maintenance, the module can be reintroduced into the ante-chamber, for the reassembly of the component/module and then using the hoist, it can be repositioned to be taken back inside the containment box.
The hoist has been successfully installed and commissioned inside the containment box in Pyro-Processing R&D Facility. The remote handling trials are underway inside the facility.
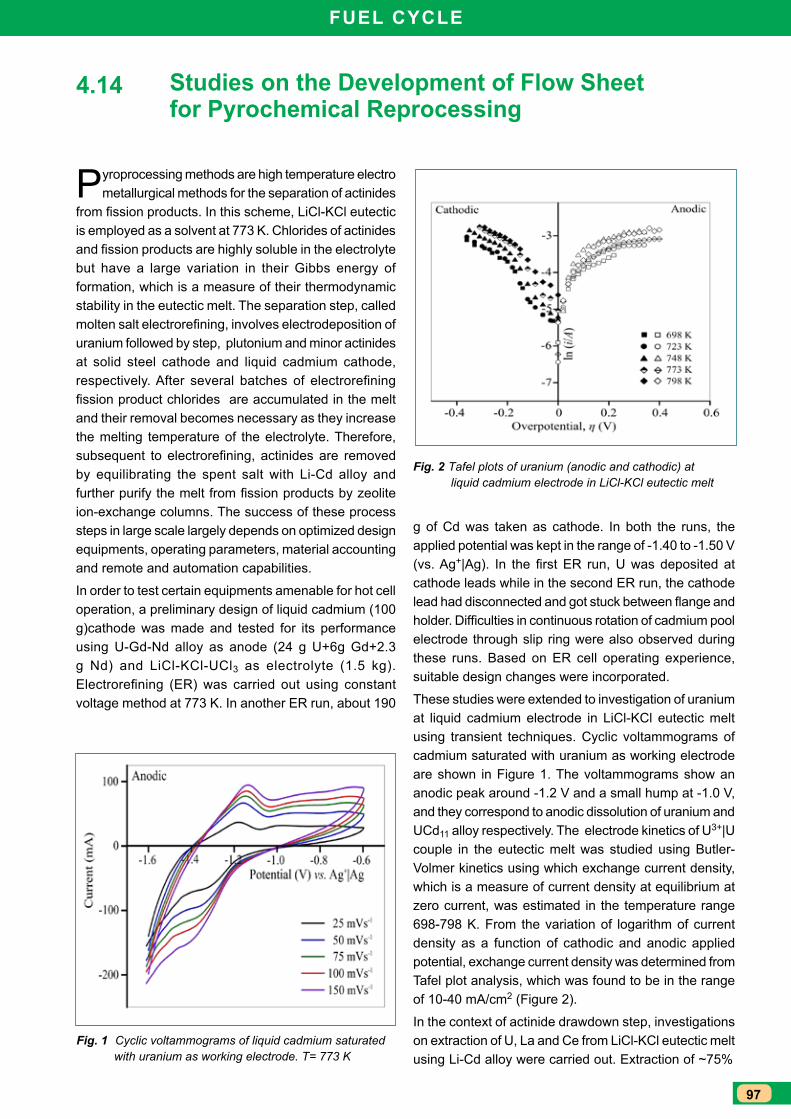
97
Fuel CyCle
Studies on the Development of Flow Sheet for Pyrochemical Reprocessing
Pyroprocessing methods are high temperature electro metallurgical methods for the separation of actinides
from fission products. In this scheme, LiCl-KCl eutectic is employed as a solvent at 773 K. Chlorides of actinides and fission products are highly soluble in the electrolyte but have a large variation in their Gibbs energy of formation, which is a measure of their thermodynamic stability in the eutectic melt. The separation step, called molten salt electrorefining, involves electrodeposition of uranium followed by step, plutonium and minor actinides at solid steel cathode and liquid cadmium cathode, respectively. After several batches of electrorefining fission product chlorides are accumulated in the melt and their removal becomes necessary as they increase the melting temperature of the electrolyte. Therefore, subsequent to electrorefining, actinides are removed by equilibrating the spent salt with Li-Cd alloy and further purify the melt from fission products by zeolite ion-exchange columns. The success of these process steps in large scale largely depends on optimized design equipments, operating parameters, material accounting and remote and automation capabilities.
In order to test certain equipments amenable for hot cell operation, a preliminary design of liquid cadmium (100 g)cathode was made and tested for its performance using U-Gd-Nd alloy as anode (24 g U+6g Gd+2.3 g Nd) and LiCl-KCl-UCl3 as electrolyte (1.5 kg). Electrorefining (ER) was carried out using constant voltage method at 773 K. In another ER run, about 190
4.14
Fig. 1 Cyclic voltammograms of liquid cadmium saturated with uranium as working electrode. T= 773 K
Fig. 2 Tafel plots of uranium (anodic and cathodic) at liquid cadmium electrode in LiCl-KCl eutectic melt
g of Cd was taken as cathode. In both the runs, the applied potential was kept in the range of -1.40 to -1.50 V (vs. Ag+|Ag). In the first ER run, U was deposited at cathode leads while in the second ER run, the cathode lead had disconnected and got stuck between flange and holder. Difficulties in continuous rotation of cadmium pool electrode through slip ring were also observed during these runs. Based on ER cell operating experience, suitable design changes were incorporated.
These studies were extended to investigation of uranium at liquid cadmium electrode in LiCl-KCl eutectic melt using transient techniques. Cyclic voltammograms of cadmium saturated with uranium as working electrode are shown in Figure 1. The voltammograms show an anodic peak around -1.2 V and a small hump at -1.0 V, and they correspond to anodic dissolution of uranium and UCd11 alloy respectively. The electrode kinetics of U3+|U couple in the eutectic melt was studied using Butler-Volmer kinetics using which exchange current density, which is a measure of current density at equilibrium at zero current, was estimated in the temperature range 698-798 K. From the variation of logarithm of current density as a function of cathodic and anodic applied potential, exchange current density was determined from Tafel plot analysis, which was found to be in the range of 10-40 mA/cm2 (Figure 2).
In the context of actinide drawdown step, investigations on extraction of U, La and Ce from LiCl-KCl eutectic melt using Li-Cd alloy were carried out. Extraction of ~75%
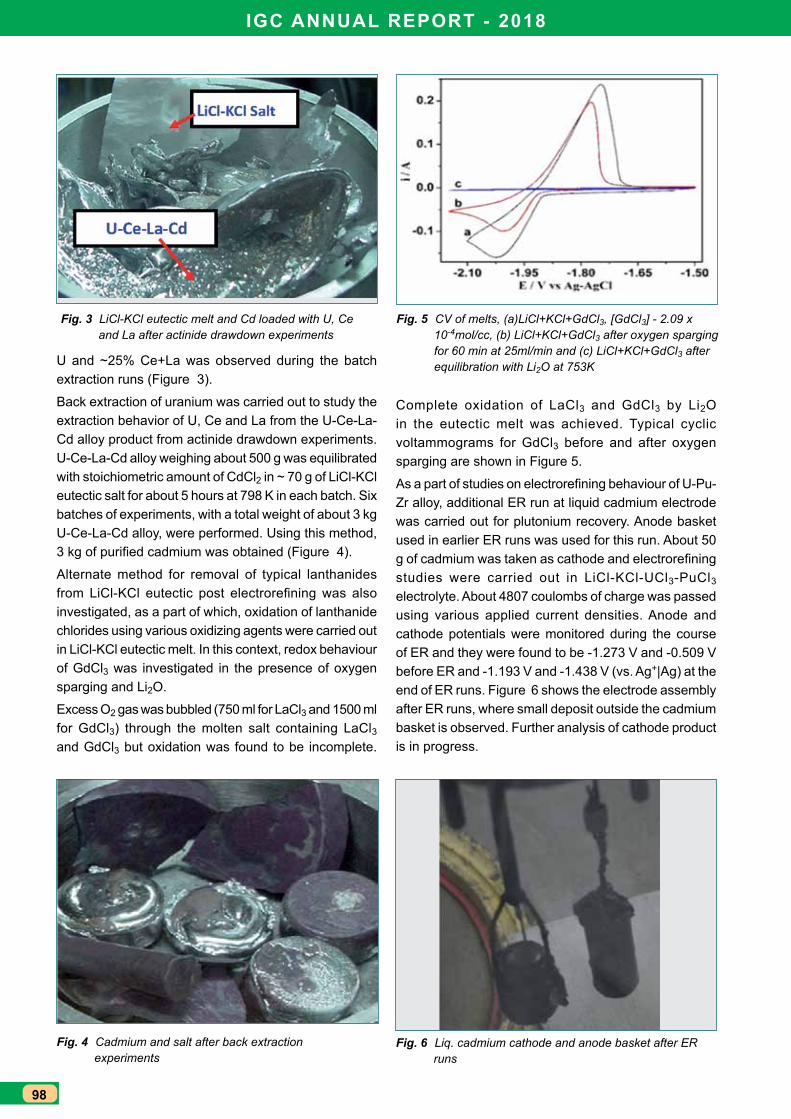
IGC ANNuAl RePORT - 2018
98
Fig. 3 LiCl-KCl eutectic melt and Cd loaded with U, Ce and La after actinide drawdown experiments
Fig. 4 Cadmium and salt after back extraction experiments
Fig. 5 CV of melts, (a)LiCl+KCl+GdCl3, [GdCl3] - 2.09 x 10⁻⁴mol/cc, (b) LiCl+KCl+GdCl3 after oxygen sparging for 60 min at 25ml/min and (c) LiCl+KCl+GdCl3 after equilibration with Li2O at 753K
Fig. 6 Liq. cadmium cathode and anode basket after ER runs
U and ~25% Ce+La was observed during the batch extraction runs (Figure 3).
Back extraction of uranium was carried out to study the extraction behavior of U, Ce and La from the U-Ce-La-Cd alloy product from actinide drawdown experiments. U-Ce-La-Cd alloy weighing about 500 g was equilibrated with stoichiometric amount of CdCl2 in ~ 70 g of LiCl-KCl eutectic salt for about 5 hours at 798 K in each batch. Six batches of experiments, with a total weight of about 3 kg U-Ce-La-Cd alloy, were performed. Using this method, 3 kg of purified cadmium was obtained (Figure 4).
Alternate method for removal of typical lanthanides from LiCl-KCl eutectic post electrorefining was also investigated, as a part of which, oxidation of lanthanide chlorides using various oxidizing agents were carried out in LiCl-KCl eutectic melt. In this context, redox behaviour of GdCl3 was investigated in the presence of oxygen sparging and Li2O.
Excess O2 gas was bubbled (750 ml for LaCl3 and 1500 ml for GdCl3) through the molten salt containing LaCl3 and GdCl3 but oxidation was found to be incomplete.
Complete oxidation of LaCl3 and GdCl3 by Li2O in the eutectic melt was achieved. Typical cyclic voltammograms for GdCl3 before and after oxygen sparging are shown in Figure 5.
As a part of studies on electrorefining behaviour of U-Pu-Zr alloy, additional ER run at liquid cadmium electrode was carried out for plutonium recovery. Anode basket used in earlier ER runs was used for this run. About 50 g of cadmium was taken as cathode and electrorefining studies were carried out in LiCl-KCl-UCl3-PuCl3 electrolyte. About 4807 coulombs of charge was passed using various applied current densities. Anode and cathode potentials were monitored during the course of ER and they were found to be -1.273 V and -0.509 V before ER and -1.193 V and -1.438 V (vs. Ag+|Ag) at the end of ER runs. Figure 6 shows the electrode assembly after ER runs, where small deposit outside the cadmium basket is observed. Further analysis of cathode product is in progress.
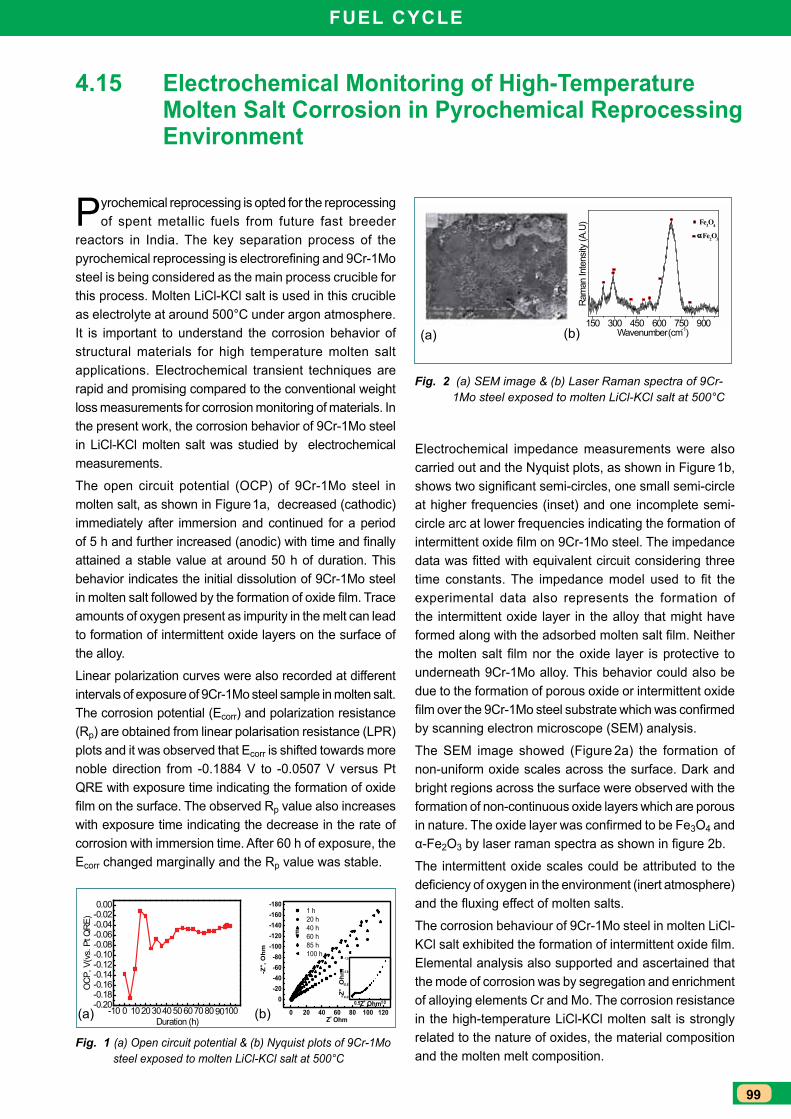
99
Fuel CyCle
electrochemical Monitoring of High-Temperature Molten Salt Corrosion in Pyrochemical Reprocessing environment
Pyrochemical reprocessing is opted for the reprocessing of spent metallic fuels from future fast breeder
reactors in India. The key separation process of the pyrochemical reprocessing is electrorefining and 9Cr-1Mo steel is being considered as the main process crucible for this process. Molten LiCl-KCl salt is used in this crucible as electrolyte at around 500°C under argon atmosphere. It is important to understand the corrosion behavior of structural materials for high temperature molten salt applications. Electrochemical transient techniques are rapid and promising compared to the conventional weight loss measurements for corrosion monitoring of materials. In the present work, the corrosion behavior of 9Cr-1Mo steel in LiCl-KCl molten salt was studied by electrochemical measurements.
The open circuit potential (OCP) of 9Cr-1Mo steel in molten salt, as shown in Figure 1a, decreased (cathodic) immediately after immersion and continued for a period of 5 h and further increased (anodic) with time and finally attained a stable value at around 50 h of duration. This behavior indicates the initial dissolution of 9Cr-1Mo steel in molten salt followed by the formation of oxide film. Trace amounts of oxygen present as impurity in the melt can lead to formation of intermittent oxide layers on the surface of the alloy. Linear polarization curves were also recorded at different intervals of exposure of 9Cr-1Mo steel sample in molten salt. The corrosion potential (Ecorr) and polarization resistance (Rp) are obtained from linear polarisation resistance (LPR) plots and it was observed that Ecorr is shifted towards more noble direction from -0.1884 V to -0.0507 V versus Pt QRE with exposure time indicating the formation of oxide film on the surface. The observed Rp value also increases with exposure time indicating the decrease in the rate of corrosion with immersion time. After 60 h of exposure, the Ecorr changed marginally and the Rp value was stable.
4.15
-10 0 102030405060708090100-0.20-0.18-0.16-0.14-0.12-0.10-0.08-0.06-0.04-0.020.00
OCP
, V(v
s. P
t QRE
)
Duration (h)
150 300 450 600 750 900
Fe2O3α
Fe3O4
Ram
an In
tens
ity (A
.U)
Wavenumber (cm-1)
Fig. 1 (a) Open circuit potential & (b) Nyquist plots of 9Cr-1Mo steel exposed to molten LiCl-KCl salt at 500°C
Fig. 2 (a) SEM image & (b) Laser Raman spectra of 9Cr- 1Mo steel exposed to molten LiCl-KCl salt at 500°C
Electrochemical impedance measurements were also carried out and the Nyquist plots, as shown in Figure 1b, shows two significant semi-circles, one small semi-circle at higher frequencies (inset) and one incomplete semi-circle arc at lower frequencies indicating the formation of intermittent oxide film on 9Cr-1Mo steel. The impedance data was fitted with equivalent circuit considering three time constants. The impedance model used to fit the experimental data also represents the formation of the intermittent oxide layer in the alloy that might have formed along with the adsorbed molten salt film. Neither the molten salt film nor the oxide layer is protective to underneath 9Cr-1Mo alloy. This behavior could also be due to the formation of porous oxide or intermittent oxide film over the 9Cr-1Mo steel substrate which was confirmed by scanning electron microscope (SEM) analysis.
The SEM image showed (Figure 2a) the formation of non-uniform oxide scales across the surface. Dark and bright regions across the surface were observed with the formation of non-continuous oxide layers which are porous in nature. The oxide layer was confirmed to be Fe3O4 and α-Fe2O3 by laser raman spectra as shown in figure 2b.
The intermittent oxide scales could be attributed to the deficiency of oxygen in the environment (inert atmosphere) and the fluxing effect of molten salts.
The corrosion behaviour of 9Cr-1Mo steel in molten LiCl-KCl salt exhibited the formation of intermittent oxide film. Elemental analysis also supported and ascertained that the mode of corrosion was by segregation and enrichment of alloying elements Cr and Mo. The corrosion resistance in the high-temperature LiCl-KCl molten salt is strongly related to the nature of oxides, the material composition and the molten melt composition.
(a) (b)
(a) (b)
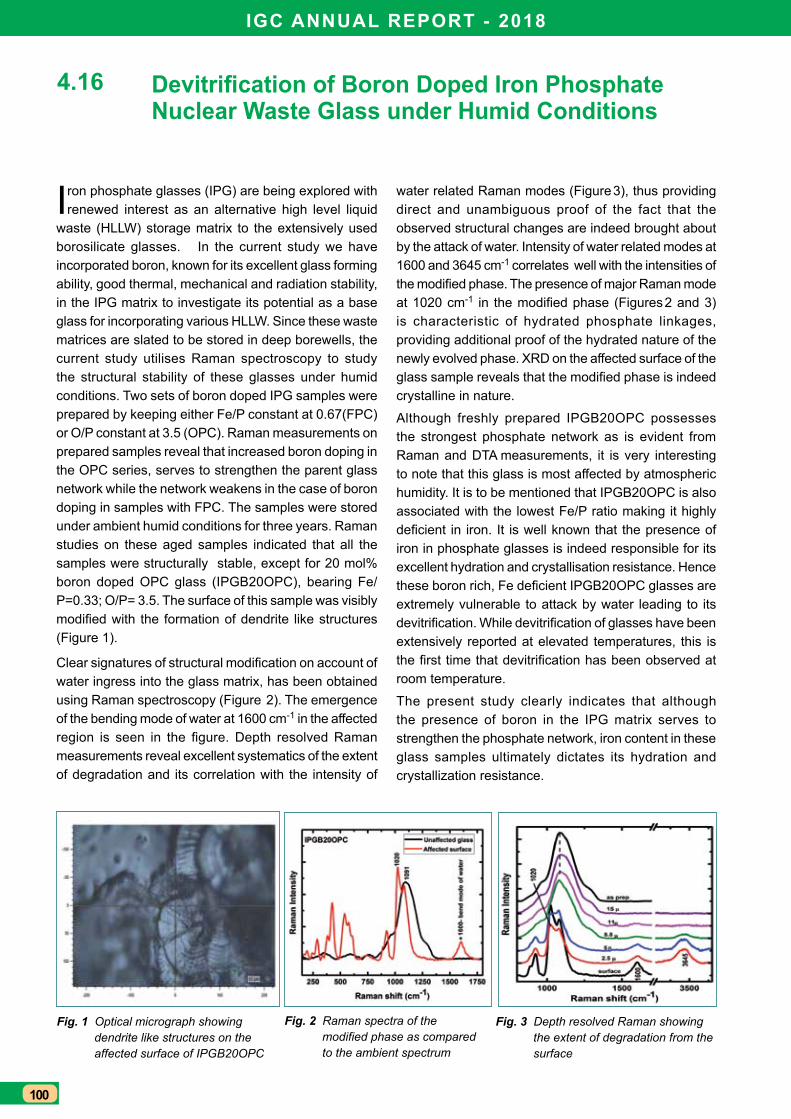
IGC ANNuAl RePORT - 2018
100
Devitrification of Boron Doped Iron Phosphate Nuclear Waste Glass under Humid Conditions
Iron phosphate glasses (IPG) are being explored with renewed interest as an alternative high level liquid
waste (HLLW) storage matrix to the extensively used borosilicate glasses. In the current study we have incorporated boron, known for its excellent glass forming ability, good thermal, mechanical and radiation stability, in the IPG matrix to investigate its potential as a base glass for incorporating various HLLW. Since these waste matrices are slated to be stored in deep borewells, the current study utilises Raman spectroscopy to study the structural stability of these glasses under humid conditions. Two sets of boron doped IPG samples were prepared by keeping either Fe/P constant at 0.67(FPC) or O/P constant at 3.5 (OPC). Raman measurements on prepared samples reveal that increased boron doping in the OPC series, serves to strengthen the parent glass network while the network weakens in the case of boron doping in samples with FPC. The samples were stored under ambient humid conditions for three years. Raman studies on these aged samples indicated that all the samples were structurally stable, except for 20 mol% boron doped OPC glass (IPGB20OPC), bearing Fe/P=0.33; O/P= 3.5. The surface of this sample was visibly modified with the formation of dendrite like structures (Figure 1).
Clear signatures of structural modification on account of water ingress into the glass matrix, has been obtained using Raman spectroscopy (Figure 2). The emergence of the bending mode of water at 1600 cm-1 in the affected region is seen in the figure. Depth resolved Raman measurements reveal excellent systematics of the extent of degradation and its correlation with the intensity of
4.16
water related Raman modes (Figure 3), thus providing direct and unambiguous proof of the fact that the observed structural changes are indeed brought about by the attack of water. Intensity of water related modes at 1600 and 3645 cm-1 correlates well with the intensities of the modified phase. The presence of major Raman mode at 1020 cm-1 in the modified phase (Figures 2 and 3) is characteristic of hydrated phosphate linkages, providing additional proof of the hydrated nature of the newly evolved phase. XRD on the affected surface of the glass sample reveals that the modified phase is indeed crystalline in nature.
Although freshly prepared IPGB20OPC possesses the strongest phosphate network as is evident from Raman and DTA measurements, it is very interesting to note that this glass is most affected by atmospheric humidity. It is to be mentioned that IPGB20OPC is also associated with the lowest Fe/P ratio making it highly deficient in iron. It is well known that the presence of iron in phosphate glasses is indeed responsible for its excellent hydration and crystallisation resistance. Hence these boron rich, Fe deficient IPGB20OPC glasses are extremely vulnerable to attack by water leading to its devitrification. While devitrification of glasses have been extensively reported at elevated temperatures, this is the first time that devitrification has been observed at room temperature.
The present study clearly indicates that although the presence of boron in the IPG matrix serves to strengthen the phosphate network, iron content in these glass samples ultimately dictates its hydration and crystallization resistance.
Fig. 1 Optical micrograph showing dendrite like structures on the affected surface of IPGB20OPC
Fig. 3 Depth resolved Raman showing the extent of degradation from the surface
Fig. 2 Raman spectra of the modified phase as compared to the ambient spectrum
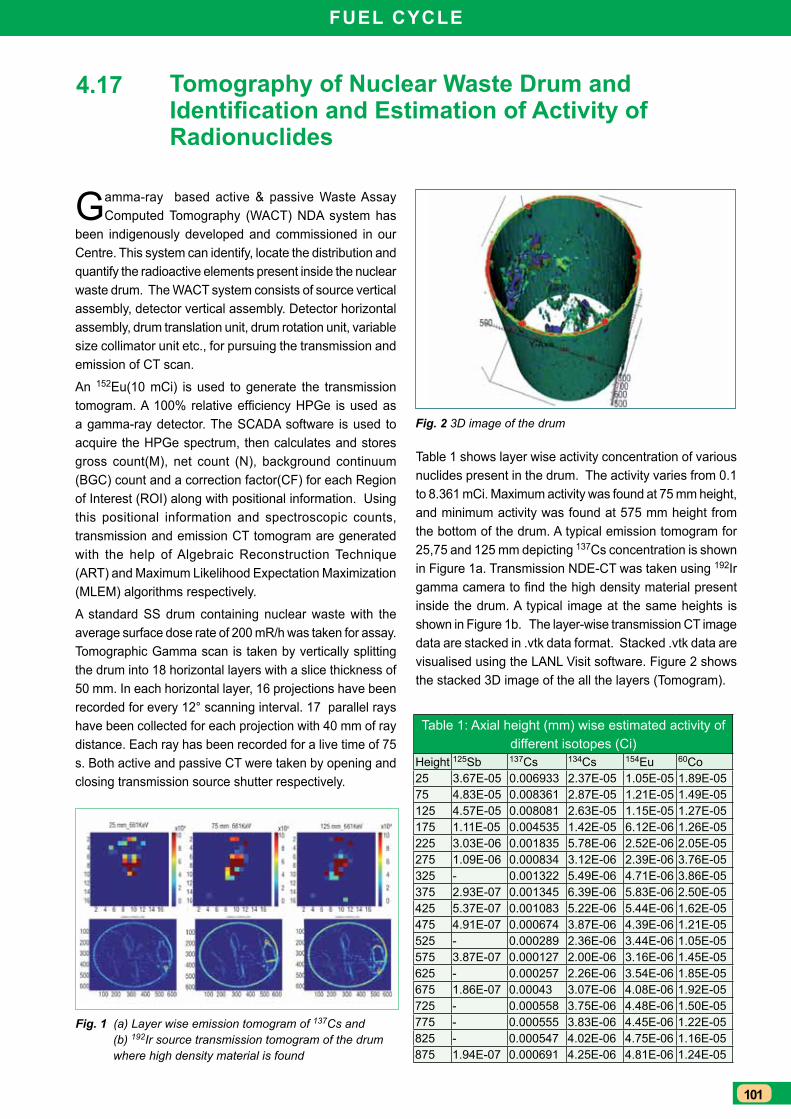
101
Fuel CyCle
Tomography of Nuclear Waste Drum and Identification and Estimation of Activity of Radionuclides
Gamma-ray based active & passive Waste Assay Computed Tomography (WACT) NDA system has
been indigenously developed and commissioned in our Centre. This system can identify, locate the distribution and quantify the radioactive elements present inside the nuclear waste drum. The WACT system consists of source vertical assembly, detector vertical assembly. Detector horizontal assembly, drum translation unit, drum rotation unit, variable size collimator unit etc., for pursuing the transmission and emission of CT scan.
An 152Eu(10 mCi) is used to generate the transmission tomogram. A 100% relative efficiency HPGe is used as a gamma-ray detector. The SCADA software is used to acquire the HPGe spectrum, then calculates and stores gross count(M), net count (N), background continuum (BGC) count and a correction factor(CF) for each Region of Interest (ROI) along with positional information. Using this positional information and spectroscopic counts, transmission and emission CT tomogram are generated with the help of Algebraic Reconstruction Technique (ART) and Maximum Likelihood Expectation Maximization (MLEM) algorithms respectively.
A standard SS drum containing nuclear waste with the average surface dose rate of 200 mR/h was taken for assay. Tomographic Gamma scan is taken by vertically splitting the drum into 18 horizontal layers with a slice thickness of 50 mm. In each horizontal layer, 16 projections have been recorded for every 12° scanning interval. 17 parallel rays have been collected for each projection with 40 mm of ray distance. Each ray has been recorded for a live time of 75 s. Both active and passive CT were taken by opening and closing transmission source shutter respectively.
4.17
Table 1 shows layer wise activity concentration of various nuclides present in the drum. The activity varies from 0.1 to 8.361 mCi. Maximum activity was found at 75 mm height, and minimum activity was found at 575 mm height from the bottom of the drum. A typical emission tomogram for 25,75 and 125 mm depicting 137Cs concentration is shown in Figure 1a. Transmission NDE-CT was taken using 192Ir gamma camera to find the high density material present inside the drum. A typical image at the same heights is shown in Figure 1b. The layer-wise transmission CT image data are stacked in .vtk data format. Stacked .vtk data are visualised using the LANL Visit software. Figure 2 shows the stacked 3D image of the all the layers (Tomogram).
Fig. 2 3D image of the drum
Fig. 1 (a) Layer wise emission tomogram of 137Cs and (b) 192Ir source transmission tomogram of the drum where high density material is found
Table 1: Axial height (mm) wise estimated activity of different isotopes (Ci)
Height 125Sb 137Cs 134Cs 154Eu 60Co 25 3.67E-05 0.006933 2.37E-05 1.05E-05 1.89E-05 75 4.83E-05 0.008361 2.87E-05 1.21E-05 1.49E-05 125 4.57E-05 0.008081 2.63E-05 1.15E-05 1.27E-05 175 1.11E-05 0.004535 1.42E-05 6.12E-06 1.26E-05 225 3.03E-06 0.001835 5.78E-06 2.52E-06 2.05E-05 275 1.09E-06 0.000834 3.12E-06 2.39E-06 3.76E-05 325 - 0.001322 5.49E-06 4.71E-06 3.86E-05 375 2.93E-07 0.001345 6.39E-06 5.83E-06 2.50E-05 425 5.37E-07 0.001083 5.22E-06 5.44E-06 1.62E-05 475 4.91E-07 0.000674 3.87E-06 4.39E-06 1.21E-05 525 - 0.000289 2.36E-06 3.44E-06 1.05E-05 575 3.87E-07 0.000127 2.00E-06 3.16E-06 1.45E-05 625 - 0.000257 2.26E-06 3.54E-06 1.85E-05 675 1.86E-07 0.00043 3.07E-06 4.08E-06 1.92E-05 725 - 0.000558 3.75E-06 4.48E-06 1.50E-05 775 - 0.000555 3.83E-06 4.45E-06 1.22E-05 825 - 0.000547 4.02E-06 4.75E-06 1.16E-05 875 1.94E-07 0.000691 4.25E-06 4.81E-06 1.24E-05
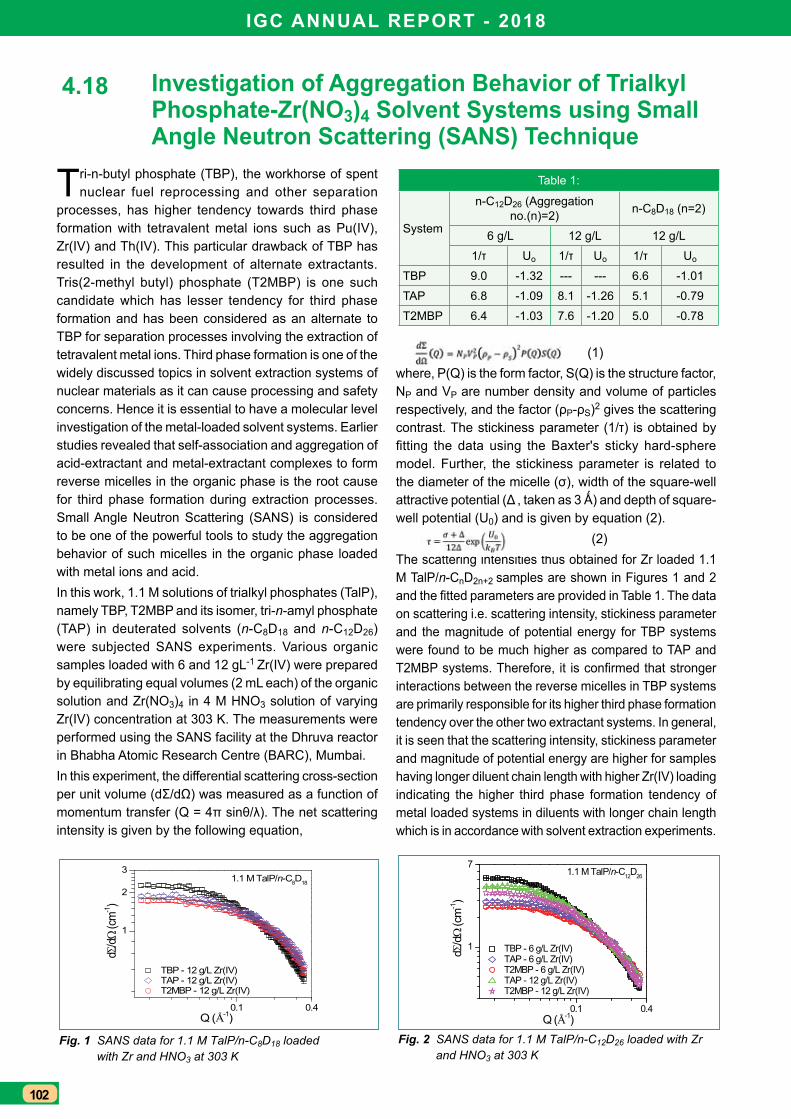
IGC ANNuAl RePORT - 2018
102
Investigation of Aggregation Behavior of Trialkyl Phosphate-Zr(NO3)4 Solvent Systems using Small Angle Neutron Scattering (SANS) Technique
Tri-n-butyl phosphate (TBP), the workhorse of spent nuclear fuel reprocessing and other separation
processes, has higher tendency towards third phase formation with tetravalent metal ions such as Pu(IV), Zr(IV) and Th(IV). This particular drawback of TBP has resulted in the development of alternate extractants. Tris(2-methyl butyl) phosphate (T2MBP) is one such candidate which has lesser tendency for third phase formation and has been considered as an alternate to TBP for separation processes involving the extraction of tetravalent metal ions. Third phase formation is one of the widely discussed topics in solvent extraction systems of nuclear materials as it can cause processing and safety concerns. Hence it is essential to have a molecular level investigation of the metal-loaded solvent systems. Earlier studies revealed that self-association and aggregation of acid-extractant and metal-extractant complexes to form reverse micelles in the organic phase is the root cause for third phase formation during extraction processes. Small Angle Neutron Scattering (SANS) is considered to be one of the powerful tools to study the aggregation behavior of such micelles in the organic phase loaded with metal ions and acid. In this work, 1.1 M solutions of trialkyl phosphates (TalP), namely TBP, T2MBP and its isomer, tri-n-amyl phosphate (TAP) in deuterated solvents (n-C8D18 and n-C12D26) were subjected SANS experiments. Various organic samples loaded with 6 and 12 gL-1 Zr(IV) were prepared by equilibrating equal volumes (2 mL each) of the organic solution and Zr(NO3)4 in 4 M HNO3 solution of varying Zr(IV) concentration at 303 K. The measurements were performed using the SANS facility at the Dhruva reactor in Bhabha Atomic Research Centre (BARC), Mumbai. In this experiment, the differential scattering cross-section per unit volume (dΣ/dΩ) was measured as a function of momentum transfer (Q = 4π sinθ/λ). The net scattering intensity is given by the following equation,
4.18
(1)where, P(Q) is the form factor, S(Q) is the structure factor, NP and VP are number density and volume of particles respectively, and the factor (ρP-ρS)2 gives the scattering contrast. The stickiness parameter (1/τ) is obtained by fitting the data using the Baxter's sticky hard-sphere model. Further, the stickiness parameter is related to the diameter of the micelle (σ), width of the square-well attractive potential (Δ , taken as 3 Ǻ) and depth of square-well potential (U0) and is given by equation (2). (2)The scattering intensities thus obtained for Zr loaded 1.1 M TalP/n-CnD2n+2 samples are shown in Figures 1 and 2 and the fitted parameters are provided in Table 1. The data on scattering i.e. scattering intensity, stickiness parameter and the magnitude of potential energy for TBP systems were found to be much higher as compared to TAP and T2MBP systems. Therefore, it is confirmed that stronger interactions between the reverse micelles in TBP systems are primarily responsible for its higher third phase formation tendency over the other two extractant systems. In general, it is seen that the scattering intensity, stickiness parameter and magnitude of potential energy are higher for samples having longer diluent chain length with higher Zr(IV) loading indicating the higher third phase formation tendency of metal loaded systems in diluents with longer chain length which is in accordance with solvent extraction experiments.
0.1 0.4
1
2
31.1 M TalP/n-C8D18
TBP - 12 g/L Zr(IV) TAP - 12 g/L Zr(IV) T2MBP - 12 g/L Zr(IV)
dΣ/dΩ
(cm
-1)
Q (Å-1)0.1 0.4
1
71.1 M TalP/n-C12D26
TBP - 6 g/L Zr(IV) TAP - 6 g/L Zr(IV) T2MBP - 6 g/L Zr(IV) TAP - 12 g/L Zr(IV) T2MBP - 12 g/L Zr(IV)
dΣ/dΩ
(cm
-1)
Q (Å-1)
Fig. 1 SANS data for 1.1 M TalP/n-C8D18 loaded with Zr and HNO3 at 303 K
Fig. 2 SANS data for 1.1 M TalP/n-C12D26 loaded with Zr and HNO3 at 303 K
Table 1:
System
n-C12D26 (Aggregation no.(n)=2) n-C8D18 (n=2)
6 g/L 12 g/L 12 g/L
1/τ Uo 1/τ Uo 1/τ Uo
TBP 9.0 -1.32 --- --- 6.6 -1.01
TAP 6.8 -1.09 8.1 -1.26 5.1 -0.79
T2MBP 6.4 -1.03 7.6 -1.20 5.0 -0.78
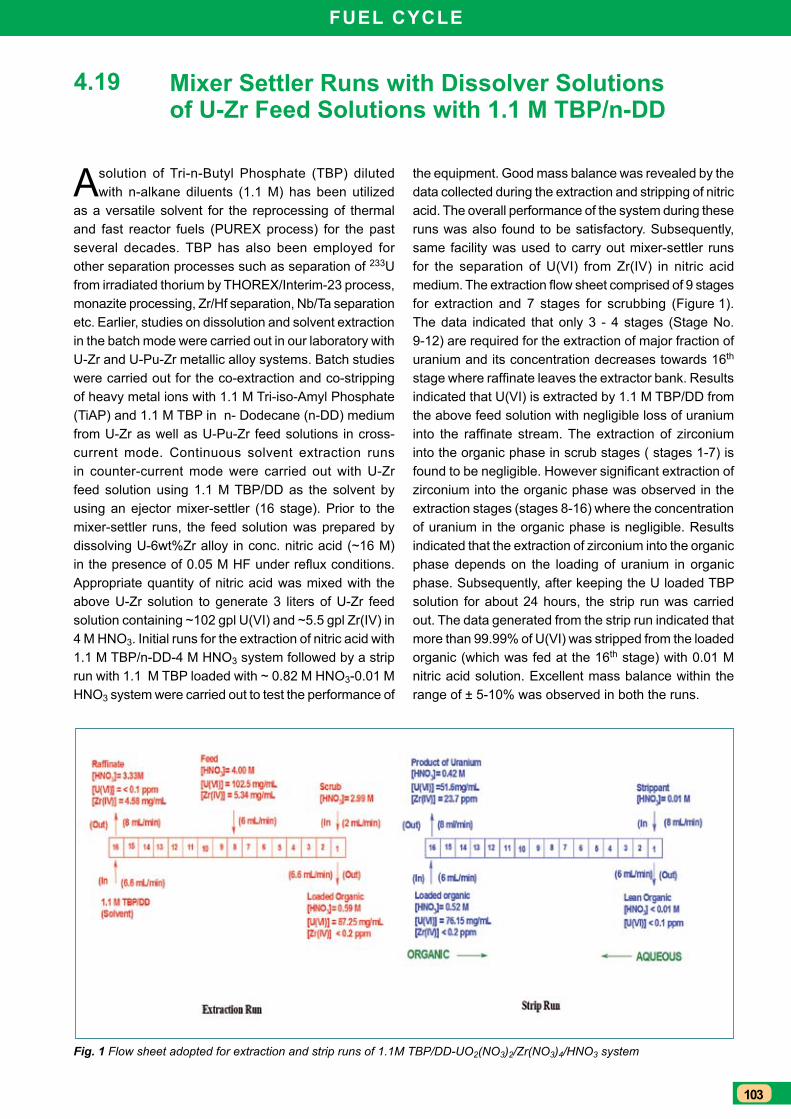
103
Fuel CyCle
Mixer Settler Runs with Dissolver Solutions of u-Zr Feed Solutions with 1.1 M TBP/n-DD
A solution of Tri-n-Butyl Phosphate (TBP) diluted with n-alkane diluents (1.1 M) has been utilized
as a versatile solvent for the reprocessing of thermal and fast reactor fuels (PUREX process) for the past several decades. TBP has also been employed for other separation processes such as separation of 233U from irradiated thorium by THOREX/Interim-23 process, monazite processing, Zr/Hf separation, Nb/Ta separation etc. Earlier, studies on dissolution and solvent extraction in the batch mode were carried out in our laboratory with U-Zr and U-Pu-Zr metallic alloy systems. Batch studies were carried out for the co-extraction and co-stripping of heavy metal ions with 1.1 M Tri-iso-Amyl Phosphate (TiAP) and 1.1 M TBP in n- Dodecane (n-DD) medium from U-Zr as well as U-Pu-Zr feed solutions in cross-current mode. Continuous solvent extraction runs in counter-current mode were carried out with U-Zr feed solution using 1.1 M TBP/DD as the solvent by using an ejector mixer-settler (16 stage). Prior to the mixer-settler runs, the feed solution was prepared by dissolving U-6wt%Zr alloy in conc. nitric acid (~16 M) in the presence of 0.05 M HF under reflux conditions. Appropriate quantity of nitric acid was mixed with the above U-Zr solution to generate 3 liters of U-Zr feed solution containing ~102 gpl U(VI) and ~5.5 gpl Zr(IV) in 4 M HNO3. Initial runs for the extraction of nitric acid with 1.1 M TBP/n-DD-4 M HNO3 system followed by a strip run with 1.1 M TBP loaded with ~ 0.82 M HNO3-0.01 M HNO3 system were carried out to test the performance of
4.19
the equipment. Good mass balance was revealed by the data collected during the extraction and stripping of nitric acid. The overall performance of the system during these runs was also found to be satisfactory. Subsequently, same facility was used to carry out mixer-settler runs for the separation of U(VI) from Zr(IV) in nitric acid medium. The extraction flow sheet comprised of 9 stages for extraction and 7 stages for scrubbing (Figure 1). The data indicated that only 3 - 4 stages (Stage No. 9-12) are required for the extraction of major fraction of uranium and its concentration decreases towards 16th stage where raffinate leaves the extractor bank. Results indicated that U(VI) is extracted by 1.1 M TBP/DD from the above feed solution with negligible loss of uranium into the raffinate stream. The extraction of zirconium into the organic phase in scrub stages ( stages 1-7) is found to be negligible. However significant extraction of zirconium into the organic phase was observed in the extraction stages (stages 8-16) where the concentration of uranium in the organic phase is negligible. Results indicated that the extraction of zirconium into the organic phase depends on the loading of uranium in organic phase. Subsequently, after keeping the U loaded TBP solution for about 24 hours, the strip run was carried out. The data generated from the strip run indicated that more than 99.99% of U(VI) was stripped from the loaded organic (which was fed at the 16th stage) with 0.01 M nitric acid solution. Excellent mass balance within the range of ± 5-10% was observed in both the runs.
Fig. 1 Flow sheet adopted for extraction and strip runs of 1.1M TBP/DD-UO2(NO3)2/Zr(NO3)4/HNO3 system
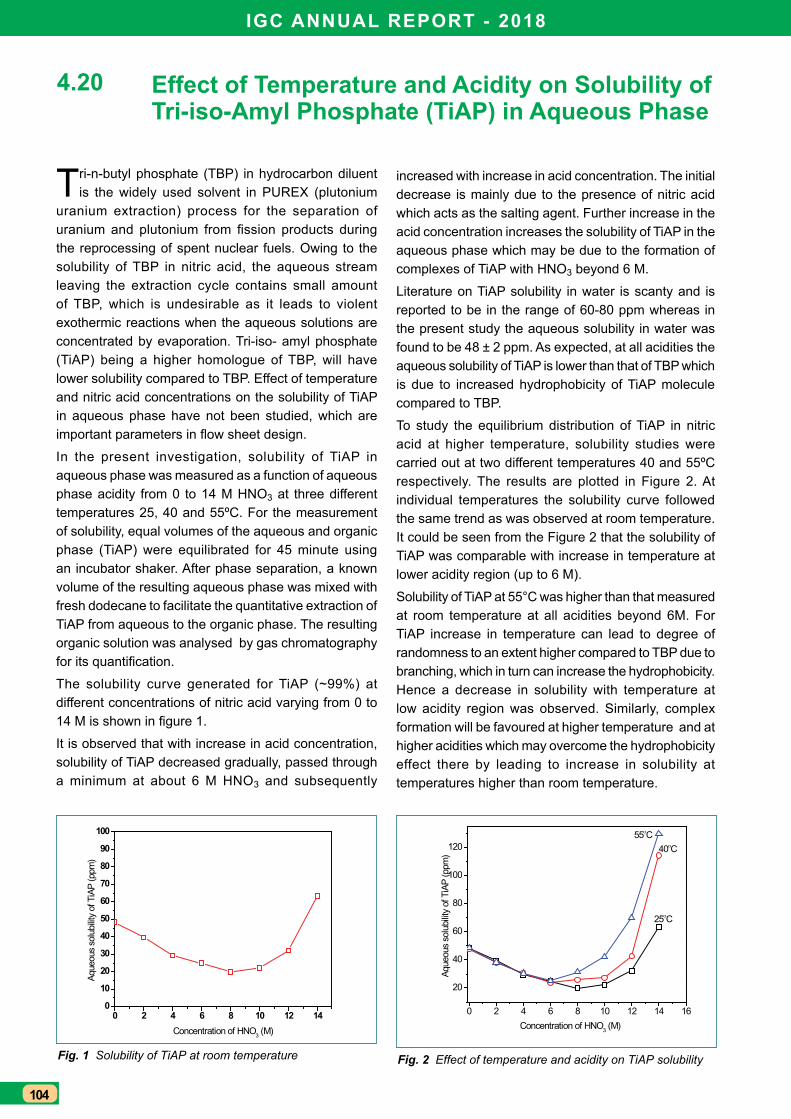
IGC ANNuAl RePORT - 2018
104
effect of Temperature and Acidity on Solubility of Tri-iso-Amyl Phosphate (TiAP) in Aqueous Phase
Tri-n-butyl phosphate (TBP) in hydrocarbon diluent is the widely used solvent in PUREX (plutonium
uranium extraction) process for the separation of uranium and plutonium from fission products during the reprocessing of spent nuclear fuels. Owing to the solubility of TBP in nitric acid, the aqueous stream leaving the extraction cycle contains small amount of TBP, which is undesirable as it leads to violent exothermic reactions when the aqueous solutions are concentrated by evaporation. Tri-iso- amyl phosphate (TiAP) being a higher homologue of TBP, will have lower solubility compared to TBP. Effect of temperature and nitric acid concentrations on the solubility of TiAP in aqueous phase have not been studied, which are important parameters in flow sheet design.
In the present investigation, solubility of TiAP in aqueous phase was measured as a function of aqueous phase acidity from 0 to 14 M HNO3 at three different temperatures 25, 40 and 55ºC. For the measurement of solubility, equal volumes of the aqueous and organic phase (TiAP) were equilibrated for 45 minute using an incubator shaker. After phase separation, a known volume of the resulting aqueous phase was mixed with fresh dodecane to facilitate the quantitative extraction of TiAP from aqueous to the organic phase. The resulting organic solution was analysed by gas chromatography for its quantification.
The solubility curve generated for TiAP (~99%) at different concentrations of nitric acid varying from 0 to 14 M is shown in figure 1.
It is observed that with increase in acid concentration, solubility of TiAP decreased gradually, passed through a minimum at about 6 M HNO3 and subsequently
4.20
increased with increase in acid concentration. The initial decrease is mainly due to the presence of nitric acid which acts as the salting agent. Further increase in the acid concentration increases the solubility of TiAP in the aqueous phase which may be due to the formation of complexes of TiAP with HNO3 beyond 6 M.
Literature on TiAP solubility in water is scanty and is reported to be in the range of 60-80 ppm whereas in the present study the aqueous solubility in water was found to be 48 ± 2 ppm. As expected, at all acidities the aqueous solubility of TiAP is lower than that of TBP which is due to increased hydrophobicity of TiAP molecule compared to TBP.
To study the equilibrium distribution of TiAP in nitric acid at higher temperature, solubility studies were carried out at two different temperatures 40 and 55ºC respectively. The results are plotted in Figure 2. At individual temperatures the solubility curve followed the same trend as was observed at room temperature. It could be seen from the Figure 2 that the solubility of TiAP was comparable with increase in temperature at lower acidity region (up to 6 M).
Solubility of TiAP at 55°C was higher than that measured at room temperature at all acidities beyond 6M. For TiAP increase in temperature can lead to degree of randomness to an extent higher compared to TBP due to branching, which in turn can increase the hydrophobicity. Hence a decrease in solubility with temperature at low acidity region was observed. Similarly, complex formation will be favoured at higher temperature and at higher acidities which may overcome the hydrophobicity effect there by leading to increase in solubility at temperatures higher than room temperature.
0 2 4 6 8 10 12 140
10
20
30
40
50
60
70
80
90
100
Concentration of HNO3 (M)
Aque
ous
solu
bility
of T
iAP
(ppm
)
0 2 4 6 8 10 12 14 16
20
40
60
80
100
120
25οC
40οC 55οC
Aque
ous
solu
bility
of T
iAP
(ppm
)
Concentration of HNO3 (M)
Fig. 1 Solubility of TiAP at room temperature Fig. 2 Effect of temperature and acidity on TiAP solubility
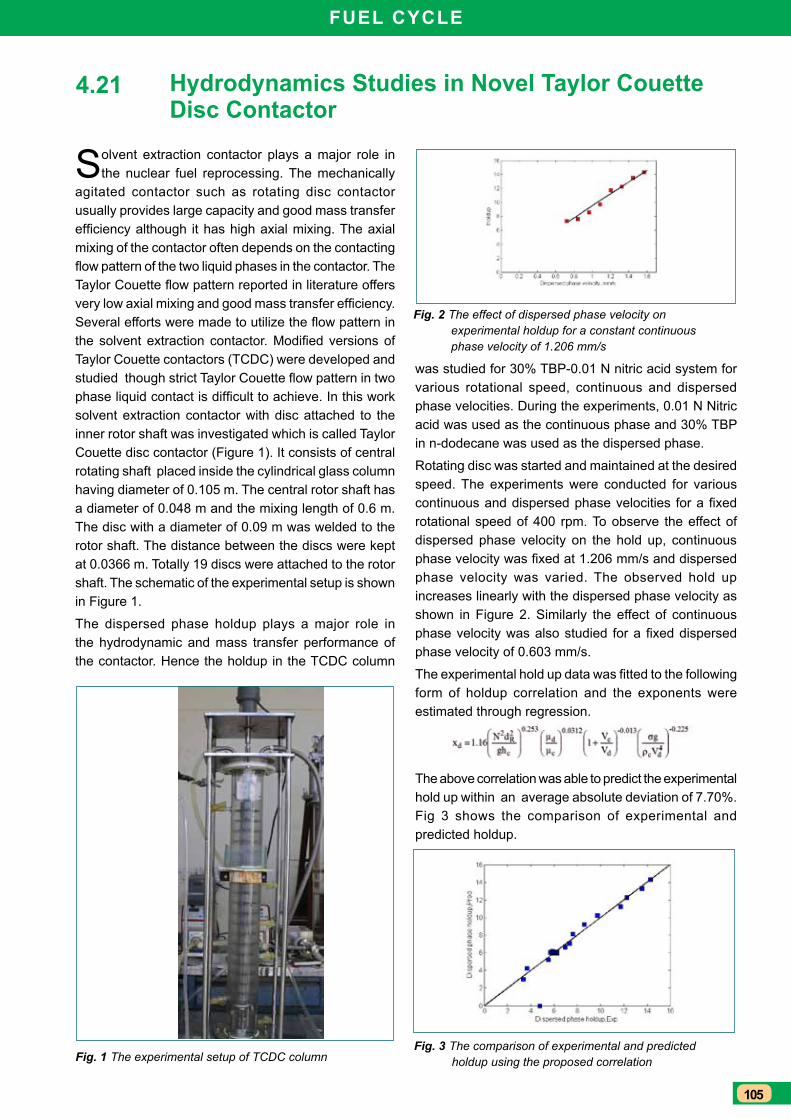
105
Fuel CyCle
Hydrodynamics Studies in Novel Taylor Couette Disc Contactor
Solvent extraction contactor plays a major role in the nuclear fuel reprocessing. The mechanically
agitated contactor such as rotating disc contactor usually provides large capacity and good mass transfer efficiency although it has high axial mixing. The axial mixing of the contactor often depends on the contacting flow pattern of the two liquid phases in the contactor. The Taylor Couette flow pattern reported in literature offers very low axial mixing and good mass transfer efficiency. Several efforts were made to utilize the flow pattern in the solvent extraction contactor. Modified versions of Taylor Couette contactors (TCDC) were developed and studied though strict Taylor Couette flow pattern in two phase liquid contact is difficult to achieve. In this work solvent extraction contactor with disc attached to the inner rotor shaft was investigated which is called Taylor Couette disc contactor (Figure 1). It consists of central rotating shaft placed inside the cylindrical glass column having diameter of 0.105 m. The central rotor shaft has a diameter of 0.048 m and the mixing length of 0.6 m. The disc with a diameter of 0.09 m was welded to the rotor shaft. The distance between the discs were kept at 0.0366 m. Totally 19 discs were attached to the rotor shaft. The schematic of the experimental setup is shown in Figure 1.
The dispersed phase holdup plays a major role in the hydrodynamic and mass transfer performance of the contactor. Hence the holdup in the TCDC column
4.21
Fig. 1 The experimental setup of TCDC columnFig. 3 The comparison of experimental and predicted
holdup using the proposed correlation
Fig. 2 The effect of dispersed phase velocity on experimental holdup for a constant continuous phase velocity of 1.206 mm/s
was studied for 30% TBP-0.01 N nitric acid system for various rotational speed, continuous and dispersed phase velocities. During the experiments, 0.01 N Nitric acid was used as the continuous phase and 30% TBP in n-dodecane was used as the dispersed phase.
Rotating disc was started and maintained at the desired speed. The experiments were conducted for various continuous and dispersed phase velocities for a fixed rotational speed of 400 rpm. To observe the effect of dispersed phase velocity on the hold up, continuous phase velocity was fixed at 1.206 mm/s and dispersed phase velocity was varied. The observed hold up increases linearly with the dispersed phase velocity as shown in Figure 2. Similarly the effect of continuous phase velocity was also studied for a fixed dispersed phase velocity of 0.603 mm/s.
The experimental hold up data was fitted to the following form of holdup correlation and the exponents were estimated through regression.
The above correlation was able to predict the experimental hold up within an average absolute deviation of 7.70%. Fig 3 shows the comparison of experimental and predicted holdup.
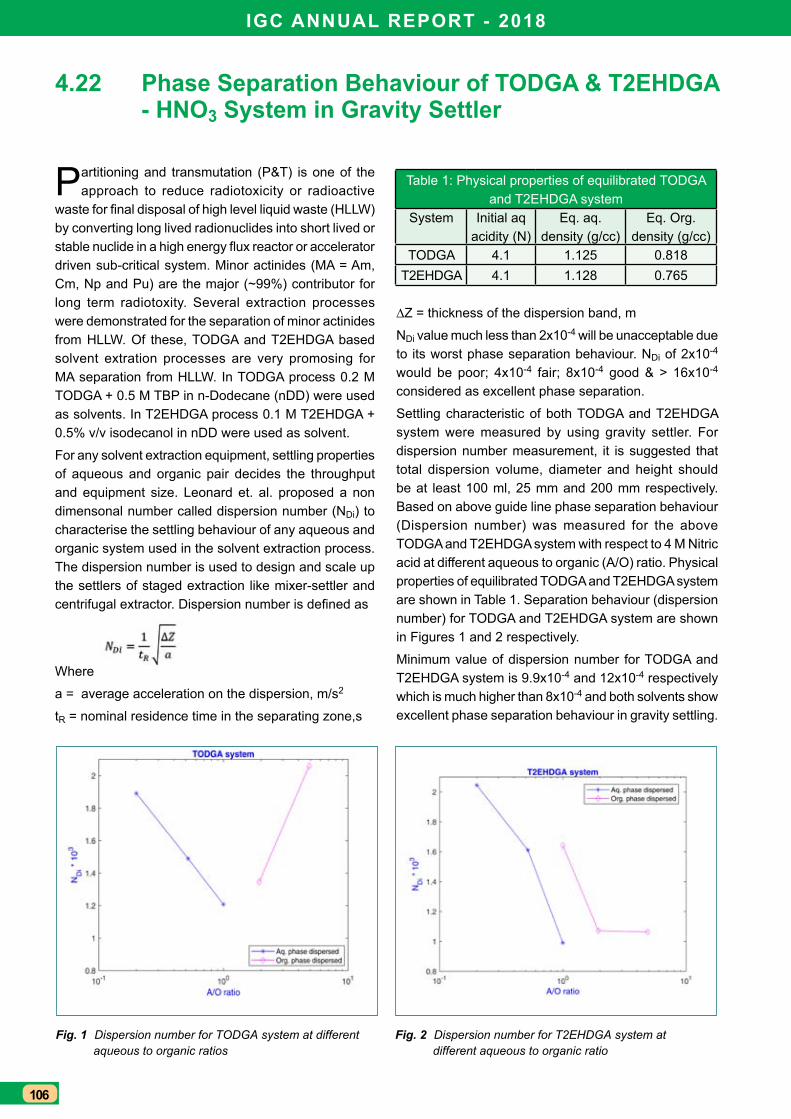
IGC ANNuAl RePORT - 2018
106
Phase Separation Behaviour of TODGA & T2eHDGA - HNO3 System in Gravity Settler
Partitioning and transmutation (P&T) is one of the approach to reduce radiotoxicity or radioactive
waste for final disposal of high level liquid waste (HLLW) by converting long lived radionuclides into short lived or stable nuclide in a high energy flux reactor or accelerator driven sub-critical system. Minor actinides (MA = Am, Cm, Np and Pu) are the major (~99%) contributor for long term radiotoxity. Several extraction processes were demonstrated for the separation of minor actinides from HLLW. Of these, TODGA and T2EHDGA based solvent extration processes are very promosing for MA separation from HLLW. In TODGA process 0.2 M TODGA + 0.5 M TBP in n-Dodecane (nDD) were used as solvents. In T2EHDGA process 0.1 M T2EHDGA + 0.5% v/v isodecanol in nDD were used as solvent.
For any solvent extraction equipment, settling properties of aqueous and organic pair decides the throughput and equipment size. Leonard et. al. proposed a non dimensonal number called dispersion number (NDi) to characterise the settling behaviour of any aqueous and organic system used in the solvent extraction process. The dispersion number is used to design and scale up the settlers of staged extraction like mixer-settler and centrifugal extractor. Dispersion number is defined as
Where
a = average acceleration on the dispersion, m/s2
tR = nominal residence time in the separating zone,s
4.22
Fig. 1 Dispersion number for TODGA system at different aqueous to organic ratios
Fig. 2 Dispersion number for T2EHDGA system at different aqueous to organic ratio
∆Z = thickness of the dispersion band, m
NDi value much less than 2x10⁻⁴ will be unacceptable due to its worst phase separation behaviour. NDi of 2x10⁻⁴ would be poor; 4x10⁻⁴ fair; 8x10⁻⁴ good & > 16x10-4 considered as excellent phase separation.
Settling characteristic of both TODGA and T2EHDGA system were measured by using gravity settler. For dispersion number measurement, it is suggested that total dispersion volume, diameter and height should be at least 100 ml, 25 mm and 200 mm respectively. Based on above guide line phase separation behaviour (Dispersion number) was measured for the above TODGA and T2EHDGA system with respect to 4 M Nitric acid at different aqueous to organic (A/O) ratio. Physical properties of equilibrated TODGA and T2EHDGA system are shown in Table 1. Separation behaviour (dispersion number) for TODGA and T2EHDGA system are shown in Figures 1 and 2 respectively.
Minimum value of dispersion number for TODGA and T2EHDGA system is 9.9x10⁻⁴ and 12x10-4 respectively which is much higher than 8x10⁻⁴ and both solvents show excellent phase separation behaviour in gravity settling.
Table 1: Physical properties of equilibrated TODGA and T2EHDGA system
System Initial aq acidity (N)
Eq. aq. density (g/cc)
Eq. Org. density (g/cc)
TODGA 4.1 1.125 0.818T2EHDGA 4.1 1.128 0.765
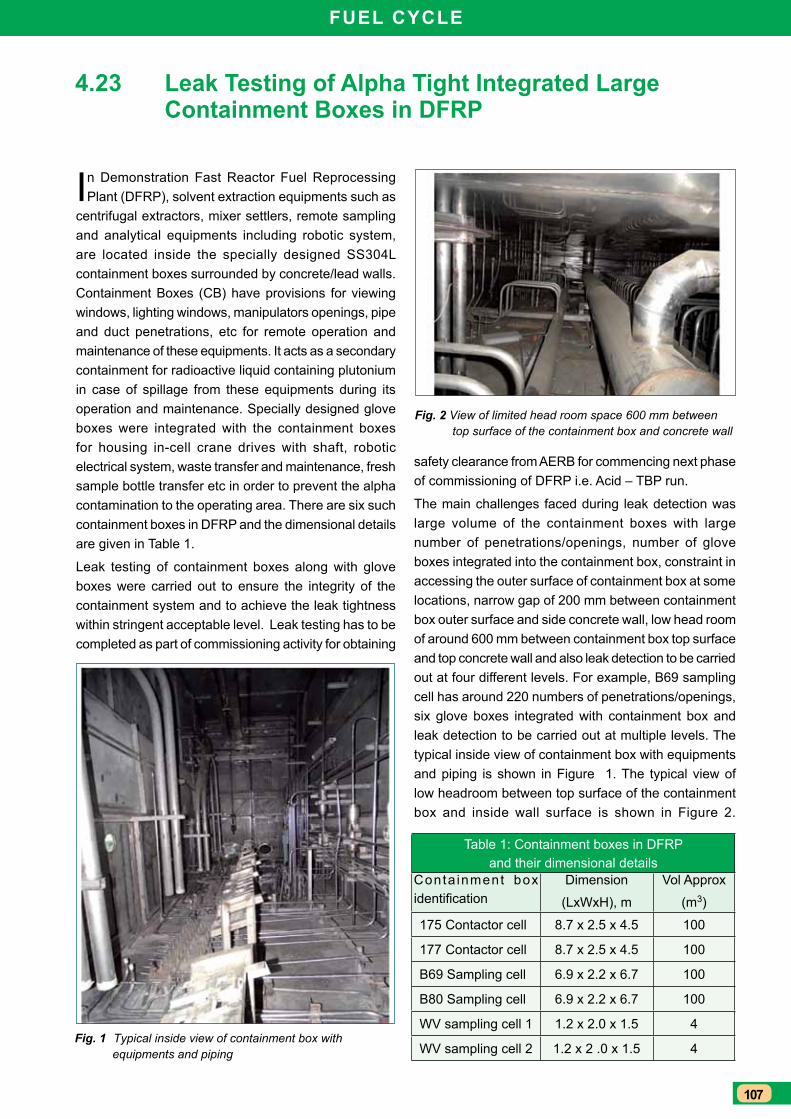
107
Fuel CyCle
leak Testing of Alpha Tight Integrated large Containment Boxes in DFRP
In Demonstration Fast Reactor Fuel Reprocessing Plant (DFRP), solvent extraction equipments such as
centrifugal extractors, mixer settlers, remote sampling and analytical equipments including robotic system, are located inside the specially designed SS304L containment boxes surrounded by concrete/lead walls. Containment Boxes (CB) have provisions for viewing windows, lighting windows, manipulators openings, pipe and duct penetrations, etc for remote operation and maintenance of these equipments. It acts as a secondary containment for radioactive liquid containing plutonium in case of spillage from these equipments during its operation and maintenance. Specially designed glove boxes were integrated with the containment boxes for housing in-cell crane drives with shaft, robotic electrical system, waste transfer and maintenance, fresh sample bottle transfer etc in order to prevent the alpha contamination to the operating area. There are six such containment boxes in DFRP and the dimensional details are given in Table 1.
Leak testing of containment boxes along with glove boxes were carried out to ensure the integrity of the containment system and to achieve the leak tightness within stringent acceptable level. Leak testing has to be completed as part of commissioning activity for obtaining
4.23
Fig. 1 Typical inside view of containment box with equipments and piping
Fig. 2 View of limited head room space 600 mm between top surface of the containment box and concrete wall
safety clearance from AERB for commencing next phase of commissioning of DFRP i.e. Acid – TBP run.
The main challenges faced during leak detection was large volume of the containment boxes with large number of penetrations/openings, number of glove boxes integrated into the containment box, constraint in accessing the outer surface of containment box at some locations, narrow gap of 200 mm between containment box outer surface and side concrete wall, low head room of around 600 mm between containment box top surface and top concrete wall and also leak detection to be carried out at four different levels. For example, B69 sampling cell has around 220 numbers of penetrations/openings, six glove boxes integrated with containment box and leak detection to be carried out at multiple levels. The typical inside view of containment box with equipments and piping is shown in Figure 1. The typical view of low headroom between top surface of the containment box and inside wall surface is shown in Figure 2.
Table 1: Containment boxes in DFRP and their dimensional details
Conta inment box identification
Dimension
(LxWxH), m
Vol Approx
(m3)
175 Contactor cell 8.7 x 2.5 x 4.5 100
177 Contactor cell 8.7 x 2.5 x 4.5 100
B69 Sampling cell 6.9 x 2.2 x 6.7 100
B80 Sampling cell 6.9 x 2.2 x 6.7 100
WV sampling cell 1 1.2 x 2.0 x 1.5 4
WV sampling cell 2 1.2 x 2 .0 x 1.5 4
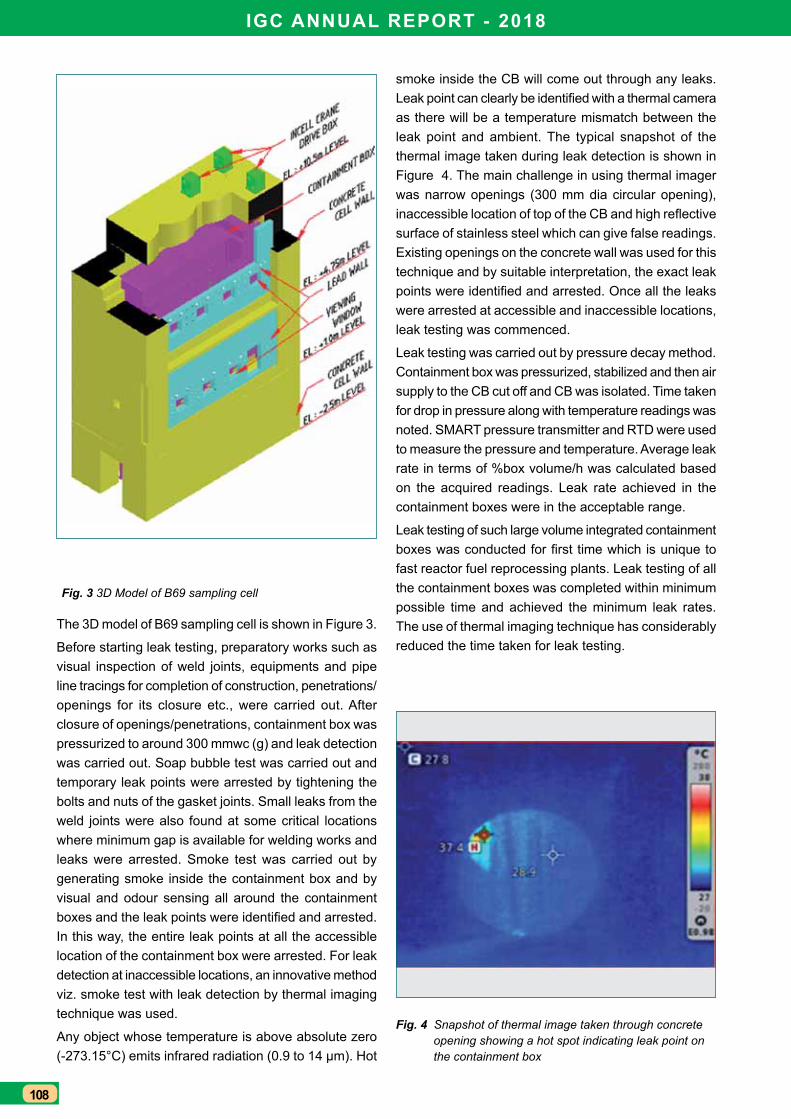
IGC ANNuAl RePORT - 2018
108
The 3D model of B69 sampling cell is shown in Figure 3.
Before starting leak testing, preparatory works such as visual inspection of weld joints, equipments and pipe line tracings for completion of construction, penetrations/openings for its closure etc., were carried out. After closure of openings/penetrations, containment box was pressurized to around 300 mmwc (g) and leak detection was carried out. Soap bubble test was carried out and temporary leak points were arrested by tightening the bolts and nuts of the gasket joints. Small leaks from the weld joints were also found at some critical locations where minimum gap is available for welding works and leaks were arrested. Smoke test was carried out by generating smoke inside the containment box and by visual and odour sensing all around the containment boxes and the leak points were identified and arrested. In this way, the entire leak points at all the accessible location of the containment box were arrested. For leak detection at inaccessible locations, an innovative method viz. smoke test with leak detection by thermal imaging technique was used.
Any object whose temperature is above absolute zero (-273.15°C) emits infrared radiation (0.9 to 14 µm). Hot
Fig. 3 3D Model of B69 sampling cell
Fig. 4 Snapshot of thermal image taken through concrete opening showing a hot spot indicating leak point on the containment box
smoke inside the CB will come out through any leaks. Leak point can clearly be identified with a thermal camera as there will be a temperature mismatch between the leak point and ambient. The typical snapshot of the thermal image taken during leak detection is shown in Figure 4. The main challenge in using thermal imager was narrow openings (300 mm dia circular opening), inaccessible location of top of the CB and high reflective surface of stainless steel which can give false readings. Existing openings on the concrete wall was used for this technique and by suitable interpretation, the exact leak points were identified and arrested. Once all the leaks were arrested at accessible and inaccessible locations, leak testing was commenced.
Leak testing was carried out by pressure decay method. Containment box was pressurized, stabilized and then air supply to the CB cut off and CB was isolated. Time taken for drop in pressure along with temperature readings was noted. SMART pressure transmitter and RTD were used to measure the pressure and temperature. Average leak rate in terms of %box volume/h was calculated based on the acquired readings. Leak rate achieved in the containment boxes were in the acceptable range.
Leak testing of such large volume integrated containment boxes was conducted for first time which is unique to fast reactor fuel reprocessing plants. Leak testing of all the containment boxes was completed within minimum possible time and achieved the minimum leak rates. The use of thermal imaging technique has considerably reduced the time taken for leak testing.

109
DirecteD Basic research anD infrastructure facilities
CHAPTERV
Directed Basic Research and Infrastructure
Facilities
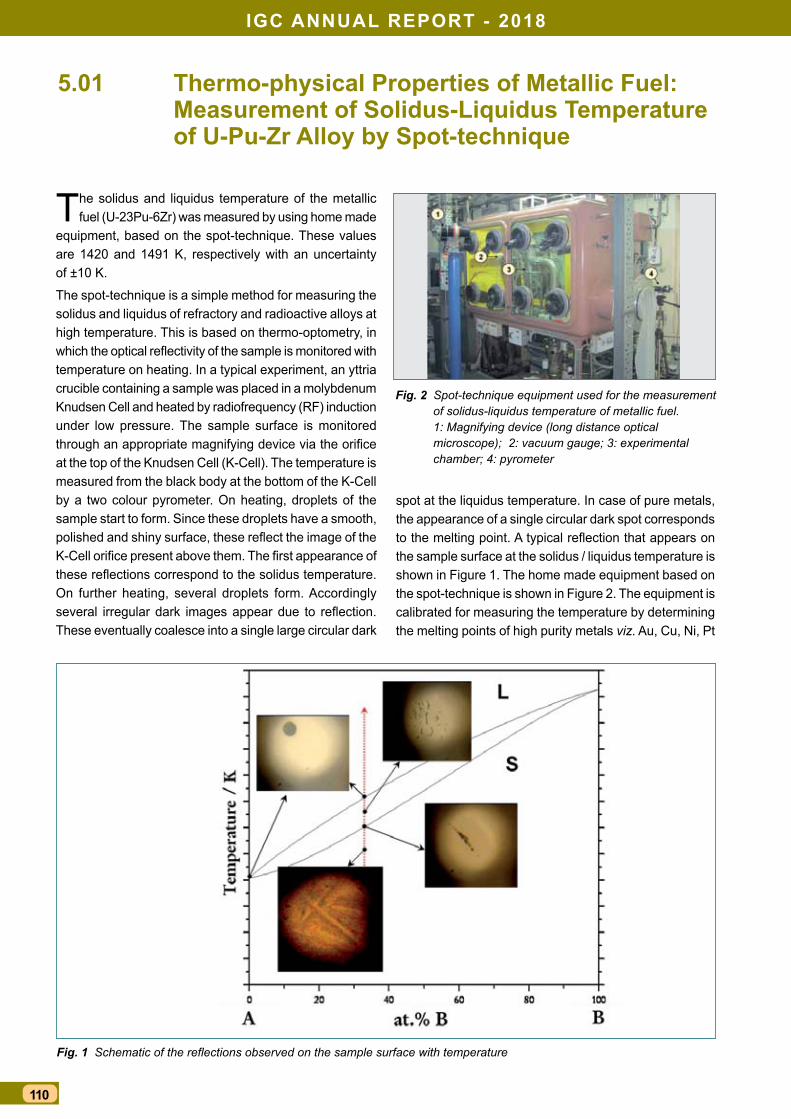
iGc annual rePOrt - 2018
110
thermo-physical Properties of Metallic fuel: Measurement of solidus-liquidus temperature of u-Pu-Zr alloy by spot-technique
The solidus and liquidus temperature of the metallic fuel (U-23Pu-6Zr) was measured by using home made
equipment, based on the spot-technique. These values are 1420 and 1491 K, respectively with an uncertainty of ±10 K.
The spot-technique is a simple method for measuring the solidus and liquidus of refractory and radioactive alloys at high temperature. This is based on thermo-optometry, in which the optical reflectivity of the sample is monitored with temperature on heating. In a typical experiment, an yttria crucible containing a sample was placed in a molybdenum Knudsen Cell and heated by radiofrequency (RF) induction under low pressure. The sample surface is monitored through an appropriate magnifying device via the orifice at the top of the Knudsen Cell (K-Cell). The temperature is measured from the black body at the bottom of the K-Cell by a two colour pyrometer. On heating, droplets of the sample start to form. Since these droplets have a smooth, polished and shiny surface, these reflect the image of the K-Cell orifice present above them. The first appearance of these reflections correspond to the solidus temperature. On further heating, several droplets form. Accordingly several irregular dark images appear due to reflection. These eventually coalesce into a single large circular dark
5.01
spot at the liquidus temperature. In case of pure metals, the appearance of a single circular dark spot corresponds to the melting point. A typical reflection that appears on the sample surface at the solidus / liquidus temperature is shown in Figure 1. The home made equipment based on the spot-technique is shown in Figure 2. The equipment is calibrated for measuring the temperature by determining the melting points of high purity metals viz. Au, Cu, Ni, Pt
Fig. 1 Schematic of the reflections observed on the sample surface with temperature
Fig. 2 Spot-technique equipment used for the measurement of solidus-liquidus temperature of metallic fuel. 1: Magnifying device (long distance optical microscope); 2: vacuum gauge; 3: experimental chamber; 4: pyrometer
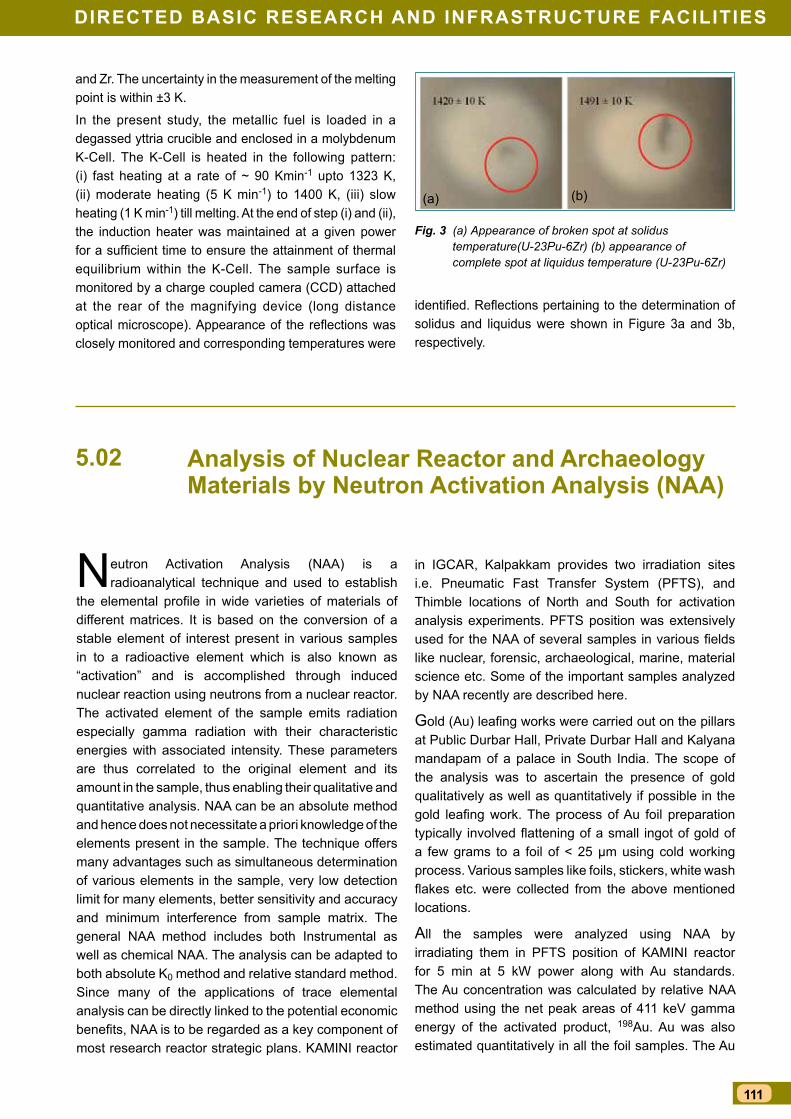
111
DirecteD Basic research anD infrastructure facilities
analysis of nuclear reactor and archaeology Materials by neutron activation analysis (naa)
Neutron Activation Analysis (NAA) is a radioanalytical technique and used to establish
the elemental profile in wide varieties of materials of different matrices. It is based on the conversion of a stable element of interest present in various samples in to a radioactive element which is also known as “activation” and is accomplished through induced nuclear reaction using neutrons from a nuclear reactor. The activated element of the sample emits radiation especially gamma radiation with their characteristic energies with associated intensity. These parameters are thus correlated to the original element and its amount in the sample, thus enabling their qualitative and quantitative analysis. NAA can be an absolute method and hence does not necessitate a priori knowledge of the elements present in the sample. The technique offers many advantages such as simultaneous determination of various elements in the sample, very low detection limit for many elements, better sensitivity and accuracy and minimum interference from sample matrix. The general NAA method includes both Instrumental as well as chemical NAA. The analysis can be adapted to both absolute K0 method and relative standard method. Since many of the applications of trace elemental analysis can be directly linked to the potential economic benefits, NAA is to be regarded as a key component of most research reactor strategic plans. KAMINI reactor
5.02
Fig. 3 (a) Appearance of broken spot at solidus temperature(U-23Pu-6Zr) (b) appearance of complete spot at liquidus temperature (U-23Pu-6Zr)
(a) (b)
in IGCAR, Kalpakkam provides two irradiation sites i.e. Pneumatic Fast Transfer System (PFTS), and Thimble locations of North and South for activation analysis experiments. PFTS position was extensively used for the NAA of several samples in various fields like nuclear, forensic, archaeological, marine, material science etc. Some of the important samples analyzed by NAA recently are described here.
Gold (Au) leafing works were carried out on the pillars at Public Durbar Hall, Private Durbar Hall and Kalyana mandapam of a palace in South India. The scope of the analysis was to ascertain the presence of gold qualitatively as well as quantitatively if possible in the gold leafing work. The process of Au foil preparation typically involved flattening of a small ingot of gold of a few grams to a foil of < 25 µm using cold working process. Various samples like foils, stickers, white wash flakes etc. were collected from the above mentioned locations.
All the samples were analyzed using NAA by irradiating them in PFTS position of KAMINI reactor for 5 min at 5 kW power along with Au standards. The Au concentration was calculated by relative NAA method using the net peak areas of 411 keV gamma energy of the activated product, 198Au. Au was also estimated quantitatively in all the foil samples. The Au
and Zr. The uncertainty in the measurement of the melting point is within ±3 K.
In the present study, the metallic fuel is loaded in a degassed yttria crucible and enclosed in a molybdenum K-Cell. The K-Cell is heated in the following pattern: (i) fast heating at a rate of ~ 90 Kmin-1 upto 1323 K, (ii) moderate heating (5 K min-1) to 1400 K, (iii) slow heating (1 K min-1) till melting. At the end of step (i) and (ii), the induction heater was maintained at a given power for a sufficient time to ensure the attainment of thermal equilibrium within the K-Cell. The sample surface is monitored by a charge coupled camera (CCD) attached at the rear of the magnifying device (long distance optical microscope). Appearance of the reflections was closely monitored and corresponding temperatures were
identified. Reflections pertaining to the determination of solidus and liquidus were shown in Figure 3a and 3b, respectively.
iGc annual rePOrt - 2018
112
concentration was varying from around 0.1 to 7% of the sample weight except in A-series samples (Table 1).
However, the quantitative analysis of gold in various samples were not considered for the evaluation of the absolute values in their matrices because of some loss of gold in the samples during their collection and hence, only the qualitative values were considered. This analysis established the genuinity of the gold leaf work.
Zirconium alloys are generally used in water reactors and not desirable as structural materials in FBRs for their unfavorable mechanical properties at high temperatures. The feedback of void swelling from FBTR clad (SS-316) with increasing burn-up necessitated the development of a Ti modified D9 alloy for PFBR. The Ti/C ratio in the alloy is very important from the point of view of tensile and creep properties which makes 0.26% Ti is desirable. A method was developed for the analysis of the Ti content in D9 sample by NAA. However, Ti analysis by INAA suffered from high Compton background due to the gamma rays of 56Mn. Hence, Ti was separated from Mn by extracting the former in TOPO / cyclohexane. But, a trace level of Mo was also co-extracted along with Ti.
The short half life of 51Ti (5.6 min) favoured Chemical Neutron Activation Analysis (CNAA) over Radiochemical Neutron Activation analysis (RNAA). A stock solution of D9 was prepared in H2SO4 by heating ~ 0.3 g of D9 sample in 20 mL of 6.5M sulphuric acid and making up to 25 mL maintaining the acidity unchanged. Separation of Ti was accomplished by solvent extraction using 0.1M TOPO in cyclohexane with the equilibration and phase separation time of 20 and 15 min respectively. The Ti content extracted into the organic phase were analysed by NAA. The extraction of Ti from the aqueous phase was carried out thrice every time using fresh organic phase. The Ti contents of the organic phases of first and second extractions were obtained by NAA and found to be 0.25(±0.02) % and 0.03(±0.01) % respectively while the organic phase of the third extraction contained Ti less than the detection limit by NAA. The analysis of the Ti fraction had no interference either from Mn which was totally absent or from Mo which was present in too low an amount to cause any gamma spectral interference. Hence, the total Ti in D9 sample was reported to be (0.28±0.02) % agreeing well with the expected value of 0.26%.
Radionuclide trap development studies to entrap Zn, Mn & Co from liquid sodium were carried out at Radiochemistry Laboratories using nickel foam. Ni foam was chosen as the trap material for it has several advantages such as high porosity, surface area and minimization of the pressure drop for the flow of sodium through the trap. The deposition behavior of Mn, Co and
Zn was evaluated by estimation of these elements in Ni foam by INAA analysis.
Ni foams of 0.5×0.5×0.18 cm were immersed in liquid Na containing a mixture of of inactive Mn, Co & Zn powder taken in an alumina crucible. The Ni foams were equilibrated at different temperatures for various time periods. The equilibrated nickel foam samples and standards were weighed and sealed in polythene covers separately. Two separate sets of irradiations were carried out i.e. short irradiations for Mn and long irradiations for Zn & Co. The samples were irradiated at 1 kW for 5 min at PFTS position of KAMINI reactor. The samples after each short irradiation were counted immediately for 56Mn. The same samples were irradiated after one month, at 20 kW for 2 h to determine Zn and Co. The samples were counted initially for 69mZn and subsequently for 65Zn and 60Co.
The adsorbed Mn, Co and Zn on Ni foam were activated to 56Mn, 60Co and 69mZn/65Zn respectively during the irradiation. Their gamma spectra were analyzed for the Mn, Co and Zn content. The analysis established the order of absorption of the elements by the nickel foam i.e. Zn>Mn>Co which was proportional to their solubilities in liquid Na.
Thus, NAA was proved to be a desirable technique towards the analyses of samples in different matrices nondestructively and established the utilization of KAMINI reactor towards the radioanalytical support for the department as well as for the various other organizations in India.
Table 1: Au in various gold foil samplesSample id Au Conc. (%)
A1-A7 < 2 ppm
B1 0.358 ± 0.004
B2 0.387 ± 0.009
D13 0.317 ± 0.008
D14 0.256 ± 0.008
D16 0.432 ± 0.012
D19 0.264 ± 0.007
D20 0.297 ± 0.007
DNo 0.370 ± 0.009
E1 7.179 ± 0.183
E2 5.352 ± 0.127
E3 0.960 ± 0.022
F1 0.116 ± 0.003
G1 2.081 ± 0.057

113
DirecteD Basic research anD infrastructure facilities
high temperature Phase stability of 10cr ferritic-Martensitic steel
Advanced Ultra Super Critical (AUSC) power plants operating at a steam temperature and pressure
combination of 973-1023 K and 25-35 MPa are envisaged to improve the thermal efficiency and thereby reduce CO2 emission. Such demanding operating conditions require the development of high strength materials for critical components. In this regard, 10Cr ferritic-martensitic (F-M) steels are appropriate candidate materials for components operating up to 923 K, due to their excellent steam oxidation resistance, improved stress rupture strength and low thermal expansion coefficient, coupled with good thermal conductivity. Though reports exist on high temperature mechanical properties of 10Cr F-M steels, efforts to establish phase stability diagrams are indeed limited, and this forms the objective of the present work.
Nominal chemical composition of 10 Cr steel used in the present study is given in Table 1. Optical micrograph (Figure 1) of normalized (1423 K, 1h) and tempered (1023 K, 1h) (N&T) steel exhibited martensite microstructure with an average hardness of 274 VHN. To establish the phase stability and phase transformation temperatures, following experiments were carried out using differential scanning calorimetry.
In the first set of experiments, the steel was heated upto 1373 K at a heating rate of 10 K min-1; then cooled to room temperature at the same rate. The Heating/cooling cycle DSC thermogram is displayed in Figure 2. The heating profile had two phase transformation events at : (a) 1001 K corresponding to the magnetic transformation (αferromagnetic ® αparamagnetic) and (b) 1090 K related to structural transition from bcc-ferrite (a) to fcc-austenite (g) phase. In the cooling DSC profile, though the reverse transformation of these two events was not observed, a single transformation event occurred at 616 K,
5.03
corresponding to the starting of γ→martensite (a’) transformation (Ms temperature).
In the second set of experiments, the steel was taken up to the melting temperature by employing the same heating and cooling rate and the result is given in Figure 3. The on-heating solidus and liquidus temperatures were measured as 1720 and 1791 K respectively. As observed in Figure 2, a transformation event occurred close to 690 K corresponding to γ→a’ transformation. This is Ms temperature, but obtained during cooling from the melting regime (not from single phase austenite). This Ms was higher due to the different composition of g austenite phase obtained by cooling from liquid. The on-cooling magnetic transformation peak recorded at 995 K (Figure 2) signifies the formation of a ferrite phase in addition to g-austenite in 10Cr steels.
Fig. 1 Optical micrograph of N&T 10Cr steel
Fig. 2 DSC thermogram obtained up to 1373 K at a heating/cooling rate of 10 K min-1
Fig. 3 DSC profile recorded up to 1823 K employing a heating/cooling rate of 10 K min-1
Table 1: Nominal chemical composition of 10 Cr steel used in the present study
Cr C Mo Mn W Ni V Nb10.4 0.09 0.4 0.5 2.5 0.33 0.18 0.06B Si S P B O N Fe.002 0.37 .003 .002 .002 .001 0.06 Bal

iGc annual rePOrt - 2018
114
formability study of aisi type 304l and its tailor Welded Blanks
Tailor welded Blanks (TWBs) are fabricated by joining of materials of different compositions, thickness,
coatings, by suitable joining method before forming operations. 1.55 mm thick SS304L steel sheet in cold rolled form is chosen for the formability study. Automatic autogenous gas tungsten arc welding facility is used for the TWB fabrication. Square butt joint design was selected without any groove preparation as thickness of material was small. The welding process parameters chosen are mentioned in Table 1.
In as received and TWB sheets, uniaxial tensile test was carried out by using tensile testing machine. Tests were performed at room temperature and at constant strain rate of 3x10⁻⁴ s-1. Formability parameters such as, strain hardening exponent (n), and strength coefficient (k) were found out by graphical method; the load-extension data received from tensile test was then converted into true stress-strain data. Strain hardening exponent (n) is a quantitative measure of work hardening characteristic of a material, it shows the relationship between true stress and true strain. From Table 2, it is observed that n value of welded samples is higher than as received samples. A higher n values cause the increase of flow stresses rapidly with straining, which is a reason for the uniform strain distribution in sheet, thereby the material is able to resist necking and eventually the material possesses better formability. The plastic strain ratio is the value which indicates the ability of material to resist thinning during plastic deformation, thus ‘r’ value is a measure of drawability of sheet metal. Table 2 also shows the average normal anisotropy and the average planar anisotropy values. For isotropic materials the normal anisotropy value is one. It is always desirable to have high normal anisotropy value, as it implies the high resistance to thinning and a good strength in transverse direction. It is always better to have normal anisotropic value r >1, as it implies higher resistance to thinning than r<1, generally, for stainless steels r value lies between 0.9 and 1.2. From Table 2, it is observed that normal
5.04
Fig. 1 Earring in formed samples, as received and TWB
Fig. 2 Depth of cup measurement
anisotropy value for as received material is higher than TIG welded specimen hence it can be expected that as received material will attribute better formability than tailor welded blanks. Since the material is not isotropic some amount of planar anisotropy (Δr) can be observed. Planar anisotropy is considered to be defect in sheet metal, it is also called as an ‘earring tendency’, Earring is nothing but the formation of ear like folds along the cup length as shown in Figure 1.
Figure 2 illustrates the comparative depth of cup measured on as received and TWBs. The depth of cup of as received blanks is higher than tailor welded blanks, confirming that the stretchability of as received blank is higher. Highest dome height has been achieved by 120x200 mm sheet in both types of blanks. In the tension-tension regions the depth of cup seemed to be almost same for as received and TWBs, making that to conclude the weld joint is not only sound but also possesses the same formability characteristics of the as received SS304L sheets.
Usually, TWBs fail at weld line and parallel to it, but in this study all the samples fracture occurred transverse to weld direction, which is a good sign of welding practice.
Table 1: Welding process parametersSl. No
Current (A)
Voltage (v)
Speed (mm/min)
Argon purging (SLPM)
1 70 10.5 170 12
Table 2: Anisotropic propertiesSl. No
Type Avg (n) Avg (K) (MPa)
Avg (rm) Avg (Δr)
1 As recd. 0.380 793 0.907 -0.05472 TIG Weld 0.448 905 0.790 0.1647
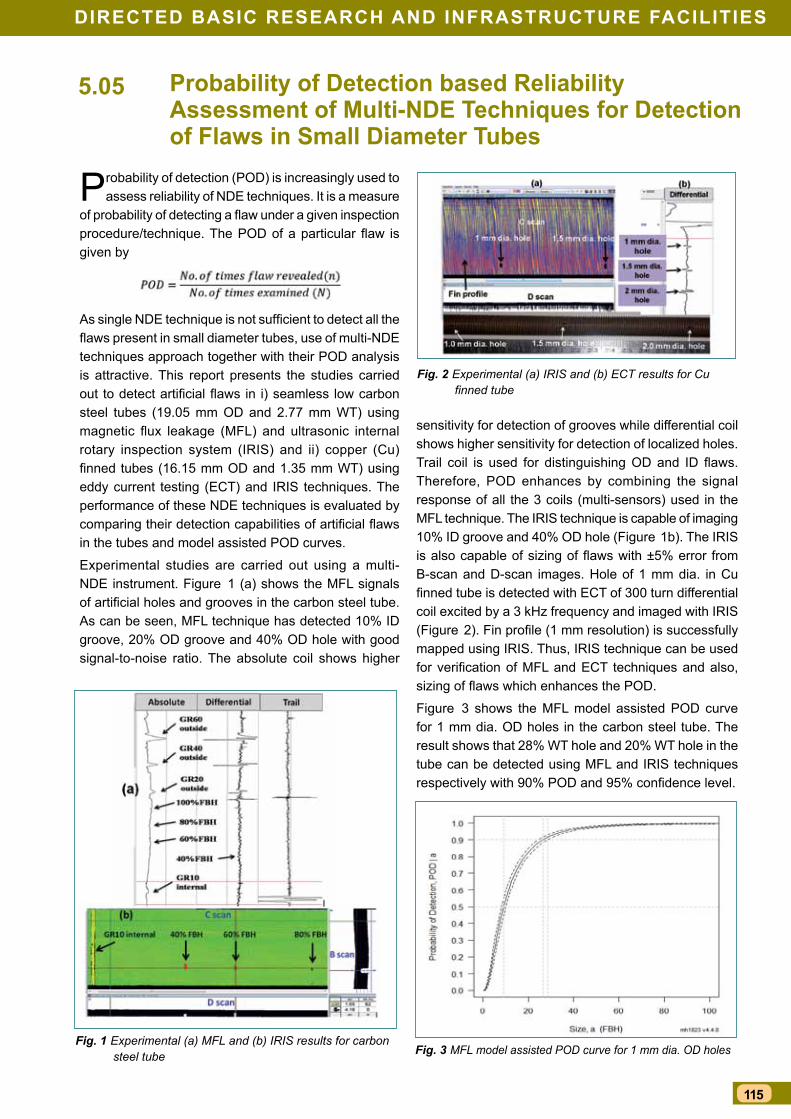
115
DirecteD Basic research anD infrastructure facilities
Probability of Detection based reliability assessment of Multi-nDe techniques for Detection of flaws in small Diameter tubes
Probability of detection (POD) is increasingly used to assess reliability of NDE techniques. It is a measure
of probability of detecting a flaw under a given inspection procedure/technique. The POD of a particular flaw is given by
As single NDE technique is not sufficient to detect all the flaws present in small diameter tubes, use of multi-NDE techniques approach together with their POD analysis is attractive. This report presents the studies carried out to detect artificial flaws in i) seamless low carbon steel tubes (19.05 mm OD and 2.77 mm WT) using magnetic flux leakage (MFL) and ultrasonic internal rotary inspection system (IRIS) and ii) copper (Cu) finned tubes (16.15 mm OD and 1.35 mm WT) using eddy current testing (ECT) and IRIS techniques. The performance of these NDE techniques is evaluated by comparing their detection capabilities of artificial flaws in the tubes and model assisted POD curves.
Experimental studies are carried out using a multi-NDE instrument. Figure 1 (a) shows the MFL signals of artificial holes and grooves in the carbon steel tube. As can be seen, MFL technique has detected 10% ID groove, 20% OD groove and 40% OD hole with good signal-to-noise ratio. The absolute coil shows higher
5.05
Fig. 1 Experimental (a) MFL and (b) IRIS results for carbon steel tube
Fig. 2 Experimental (a) IRIS and (b) ECT results for Cu finned tube
Fig. 3 MFL model assisted POD curve for 1 mm dia. OD holes
sensitivity for detection of grooves while differential coil shows higher sensitivity for detection of localized holes. Trail coil is used for distinguishing OD and ID flaws. Therefore, POD enhances by combining the signal response of all the 3 coils (multi-sensors) used in the MFL technique. The IRIS technique is capable of imaging 10% ID groove and 40% OD hole (Figure 1b). The IRIS is also capable of sizing of flaws with ±5% error from B-scan and D-scan images. Hole of 1 mm dia. in Cu finned tube is detected with ECT of 300 turn differential coil excited by a 3 kHz frequency and imaged with IRIS (Figure 2). Fin profile (1 mm resolution) is successfully mapped using IRIS. Thus, IRIS technique can be used for verification of MFL and ECT techniques and also, sizing of flaws which enhances the POD.
Figure 3 shows the MFL model assisted POD curve for 1 mm dia. OD holes in the carbon steel tube. The result shows that 28% WT hole and 20% WT hole in the tube can be detected using MFL and IRIS techniques respectively with 90% POD and 95% confidence level.
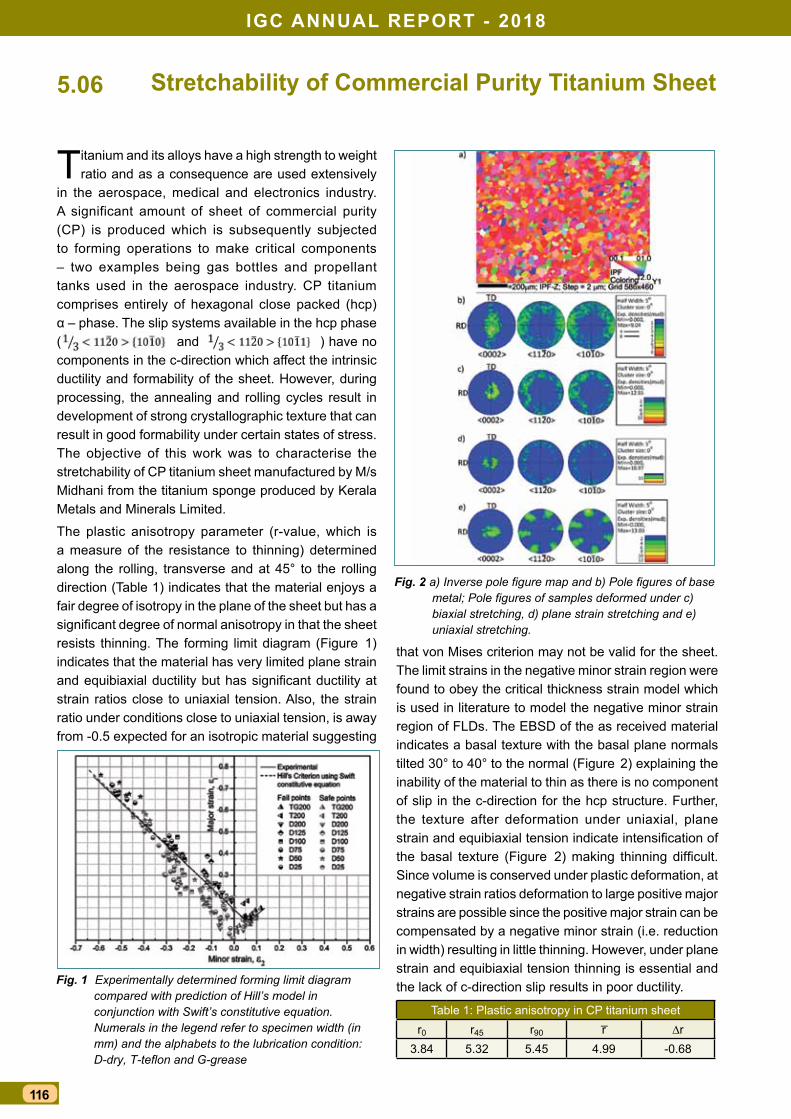
iGc annual rePOrt - 2018
116
stretchability of commercial Purity titanium sheet
Titanium and its alloys have a high strength to weight ratio and as a consequence are used extensively
in the aerospace, medical and electronics industry. A significant amount of sheet of commercial purity (CP) is produced which is subsequently subjected to forming operations to make critical components – two examples being gas bottles and propellant tanks used in the aerospace industry. CP titanium comprises entirely of hexagonal close packed (hcp) α – phase. The slip systems available in the hcp phase ( and ) have no components in the c-direction which affect the intrinsic ductility and formability of the sheet. However, during processing, the annealing and rolling cycles result in development of strong crystallographic texture that can result in good formability under certain states of stress. The objective of this work was to characterise the stretchability of CP titanium sheet manufactured by M/s Midhani from the titanium sponge produced by Kerala Metals and Minerals Limited.
The plastic anisotropy parameter (r-value, which is a measure of the resistance to thinning) determined along the rolling, transverse and at 45° to the rolling direction (Table 1) indicates that the material enjoys a fair degree of isotropy in the plane of the sheet but has a significant degree of normal anisotropy in that the sheet resists thinning. The forming limit diagram (Figure 1) indicates that the material has very limited plane strain and equibiaxial ductility but has significant ductility at strain ratios close to uniaxial tension. Also, the strain ratio under conditions close to uniaxial tension, is away from -0.5 expected for an isotropic material suggesting
5.06
Fig. 1 Experimentally determined forming limit diagram compared with prediction of Hill’s model in conjunction with Swift’s constitutive equation. Numerals in the legend refer to specimen width (in mm) and the alphabets to the lubrication condition: D-dry, T-teflon and G-grease
Fig. 2 a) Inverse pole figure map and b) Pole figures of base metal; Pole figures of samples deformed under c) biaxial stretching, d) plane strain stretching and e) uniaxial stretching.
that von Mises criterion may not be valid for the sheet. The limit strains in the negative minor strain region were found to obey the critical thickness strain model which is used in literature to model the negative minor strain region of FLDs. The EBSD of the as received material indicates a basal texture with the basal plane normals tilted 30° to 40° to the normal (Figure 2) explaining the inability of the material to thin as there is no component of slip in the c-direction for the hcp structure. Further, the texture after deformation under uniaxial, plane strain and equibiaxial tension indicate intensification of the basal texture (Figure 2) making thinning difficult. Since volume is conserved under plastic deformation, at negative strain ratios deformation to large positive major strains are possible since the positive major strain can be compensated by a negative minor strain (i.e. reduction in width) resulting in little thinning. However, under plane strain and equibiaxial tension thinning is essential and the lack of c-direction slip results in poor ductility.
Table 1: Plastic anisotropy in CP titanium sheetr0 r45 r90 r ∆r
3.84 5.32 5.45 4.99 -0.68
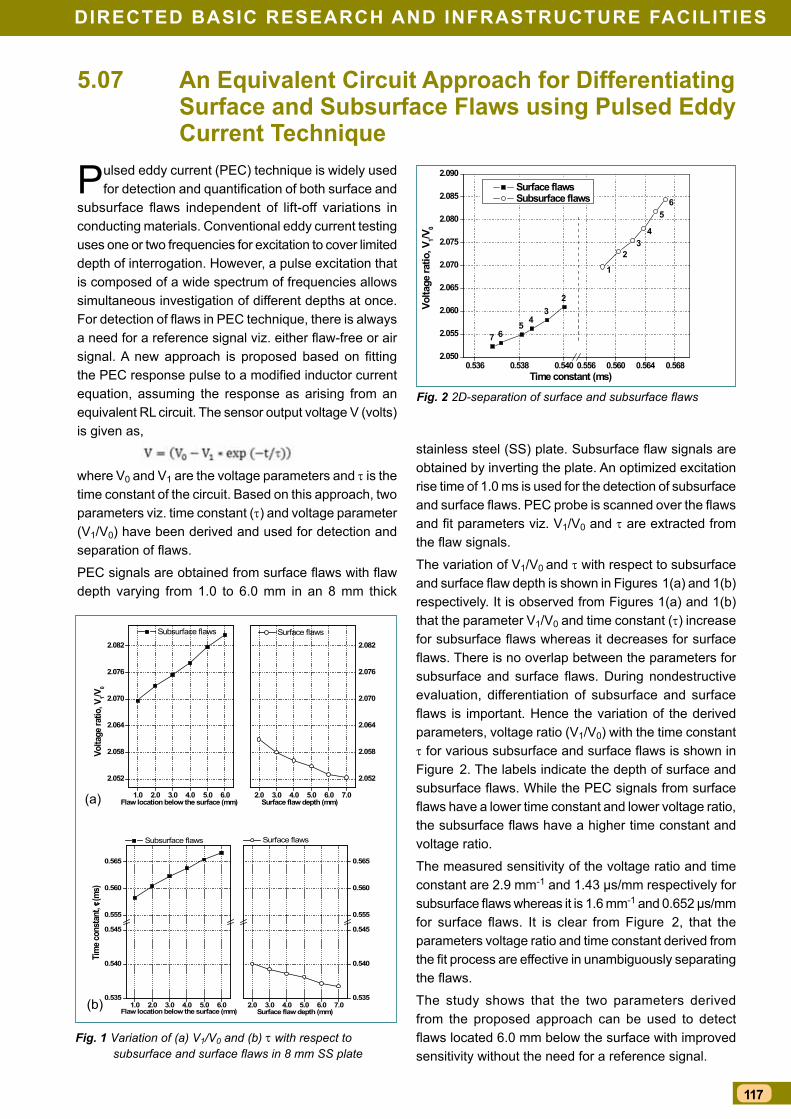
117
DirecteD Basic research anD infrastructure facilities
an equivalent circuit approach for Differentiating surface and subsurface flaws using Pulsed eddy current technique
Pulsed eddy current (PEC) technique is widely used for detection and quantification of both surface and
subsurface flaws independent of lift-off variations in conducting materials. Conventional eddy current testing uses one or two frequencies for excitation to cover limited depth of interrogation. However, a pulse excitation that is composed of a wide spectrum of frequencies allows simultaneous investigation of different depths at once. For detection of flaws in PEC technique, there is always a need for a reference signal viz. either flaw-free or air signal. A new approach is proposed based on fitting the PEC response pulse to a modified inductor current equation, assuming the response as arising from an equivalent RL circuit. The sensor output voltage V (volts) is given as,
where V0 and V1 are the voltage parameters and t is the time constant of the circuit. Based on this approach, two parameters viz. time constant (t) and voltage parameter (V1/V0) have been derived and used for detection and separation of flaws.
PEC signals are obtained from surface flaws with flaw depth varying from 1.0 to 6.0 mm in an 8 mm thick
5.07
0.536 0.538 0.540 0.556 0.560 0.564 0.5682.050
2.055
2.060
2.065
2.070
2.075
2.080
2.085
2.090
23
4567
1
23
4
56
Time constant (ms)
Volta
ge ra
tio, V
1/V0
Surface flaws Subsurface flaws
1.0 2.0 3.0 4.0 5.0 6.0
2.052
2.058
2.064
2.070
2.076
2.082
Subsurface flaws
Surface flaw depth (mm) Flaw location below the surface (mm)
Volta
ge ra
tio, V
1/V0
2.0 3.0 4.0 5.0 6.0 7.0
2.052
2.058
2.064
2.070
2.076
2.082 Surface flaws
1.0 2.0 3.0 4.0 5.0 6.00.535
0.540
0.545
0.555
0.560
0.565
Flaw location below the surface (mm)
Tim
e con
stan
t, τ (
ms)
Subsurface flaws
2.0 3.0 4.0 5.0 6.0 7.00.535
0.540
0.545
0.555
0.560
0.565
Surface flaw depth (mm)
Surface flaws
Fig. 1 Variation of (a) V1/V0 and (b) t with respect to subsurface and surface flaws in 8 mm SS plate
Fig. 2 2D-separation of surface and subsurface flaws
stainless steel (SS) plate. Subsurface flaw signals are obtained by inverting the plate. An optimized excitation rise time of 1.0 ms is used for the detection of subsurface and surface flaws. PEC probe is scanned over the flaws and fit parameters viz. V1/V0 and t are extracted from the flaw signals.
The variation of V1/V0 and t with respect to subsurface and surface flaw depth is shown in Figures 1(a) and 1(b) respectively. It is observed from Figures 1(a) and 1(b) that the parameter V1/V0 and time constant (t) increase for subsurface flaws whereas it decreases for surface flaws. There is no overlap between the parameters for subsurface and surface flaws. During nondestructive evaluation, differentiation of subsurface and surface flaws is important. Hence the variation of the derived parameters, voltage ratio (V1/V0) with the time constant t for various subsurface and surface flaws is shown in Figure 2. The labels indicate the depth of surface and subsurface flaws. While the PEC signals from surface flaws have a lower time constant and lower voltage ratio, the subsurface flaws have a higher time constant and voltage ratio.
The measured sensitivity of the voltage ratio and time constant are 2.9 mm-1 and 1.43 μs/mm respectively for subsurface flaws whereas it is 1.6 mm-1 and 0.652 μs/mm for surface flaws. It is clear from Figure 2, that the parameters voltage ratio and time constant derived from the fit process are effective in unambiguously separating the flaws.
The study shows that the two parameters derived from the proposed approach can be used to detect flaws located 6.0 mm below the surface with improved sensitivity without the need for a reference signal.
(a)
(b)
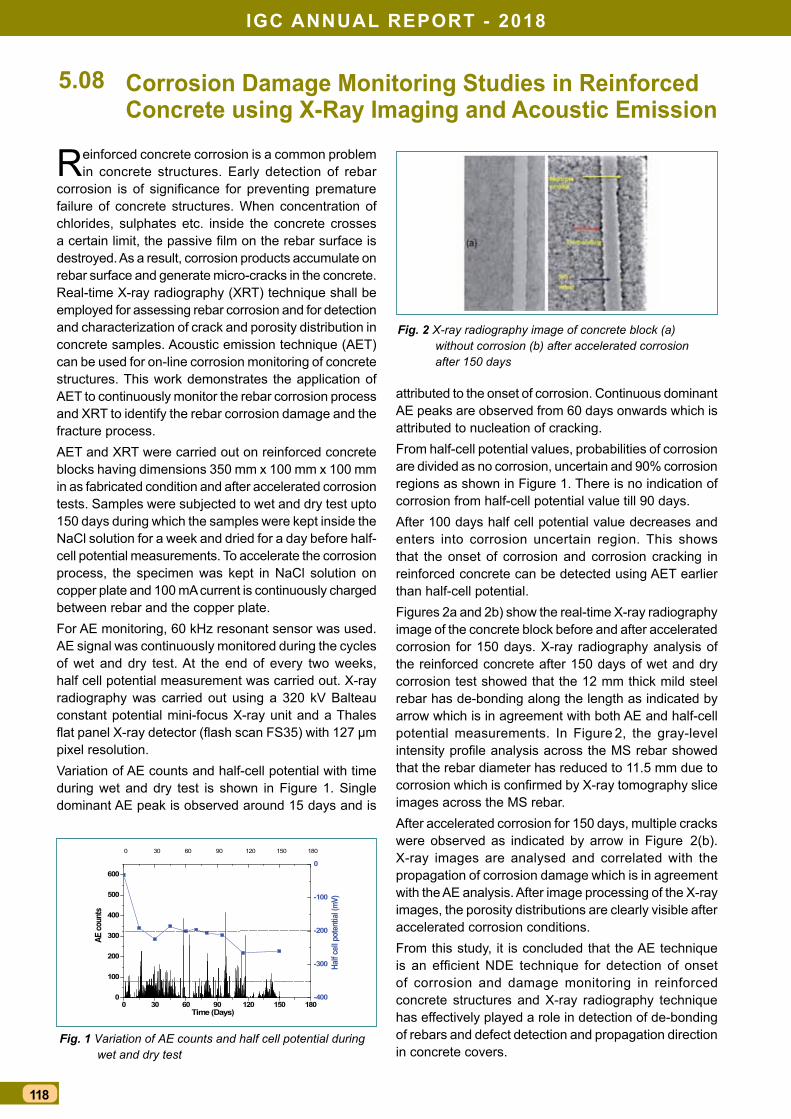
iGc annual rePOrt - 2018
118
corrosion Damage Monitoring studies in reinforced concrete using X-ray imaging and acoustic emission
Reinforced concrete corrosion is a common problem in concrete structures. Early detection of rebar
corrosion is of significance for preventing premature failure of concrete structures. When concentration of chlorides, sulphates etc. inside the concrete crosses a certain limit, the passive film on the rebar surface is destroyed. As a result, corrosion products accumulate on rebar surface and generate micro-cracks in the concrete. Real-time X-ray radiography (XRT) technique shall be employed for assessing rebar corrosion and for detection and characterization of crack and porosity distribution in concrete samples. Acoustic emission technique (AET) can be used for on-line corrosion monitoring of concrete structures. This work demonstrates the application of AET to continuously monitor the rebar corrosion process and XRT to identify the rebar corrosion damage and the fracture process. AET and XRT were carried out on reinforced concrete blocks having dimensions 350 mm x 100 mm x 100 mm in as fabricated condition and after accelerated corrosion tests. Samples were subjected to wet and dry test upto 150 days during which the samples were kept inside the NaCl solution for a week and dried for a day before half-cell potential measurements. To accelerate the corrosion process, the specimen was kept in NaCl solution on copper plate and 100 mA current is continuously charged between rebar and the copper plate. For AE monitoring, 60 kHz resonant sensor was used. AE signal was continuously monitored during the cycles of wet and dry test. At the end of every two weeks, half cell potential measurement was carried out. X-ray radiography was carried out using a 320 kV Balteau constant potential mini-focus X-ray unit and a Thales flat panel X-ray detector (flash scan FS35) with 127 μm pixel resolution. Variation of AE counts and half-cell potential with time during wet and dry test is shown in Figure 1. Single dominant AE peak is observed around 15 days and is
5.08
0 30 60 90 120 150 1800
100
200
300
400
500
600
Half
cell p
oten
tial (
mV)
AE co
unts
Time (Days)
0 30 60 90 120 150 180
-400
-300
-200
-100
0
Fig. 1 Variation of AE counts and half cell potential during wet and dry test
Fig. 2 X-ray radiography image of concrete block (a) without corrosion (b) after accelerated corrosion after 150 days
attributed to the onset of corrosion. Continuous dominant AE peaks are observed from 60 days onwards which is attributed to nucleation of cracking.From half-cell potential values, probabilities of corrosion are divided as no corrosion, uncertain and 90% corrosion regions as shown in Figure 1. There is no indication of corrosion from half-cell potential value till 90 days.After 100 days half cell potential value decreases and enters into corrosion uncertain region. This shows that the onset of corrosion and corrosion cracking in reinforced concrete can be detected using AET earlier than half-cell potential.Figures 2a and 2b) show the real-time X-ray radiography image of the concrete block before and after accelerated corrosion for 150 days. X-ray radiography analysis of the reinforced concrete after 150 days of wet and dry corrosion test showed that the 12 mm thick mild steel rebar has de-bonding along the length as indicated by arrow which is in agreement with both AE and half-cell potential measurements. In Figure 2, the gray-level intensity profile analysis across the MS rebar showed that the rebar diameter has reduced to 11.5 mm due to corrosion which is confirmed by X-ray tomography slice images across the MS rebar. After accelerated corrosion for 150 days, multiple cracks were observed as indicated by arrow in Figure 2(b). X-ray images are analysed and correlated with the propagation of corrosion damage which is in agreement with the AE analysis. After image processing of the X-ray images, the porosity distributions are clearly visible after accelerated corrosion conditions. From this study, it is concluded that the AE technique is an efficient NDE technique for detection of onset of corrosion and damage monitoring in reinforced concrete structures and X-ray radiography technique has effectively played a role in detection of de-bonding of rebars and defect detection and propagation direction in concrete covers.
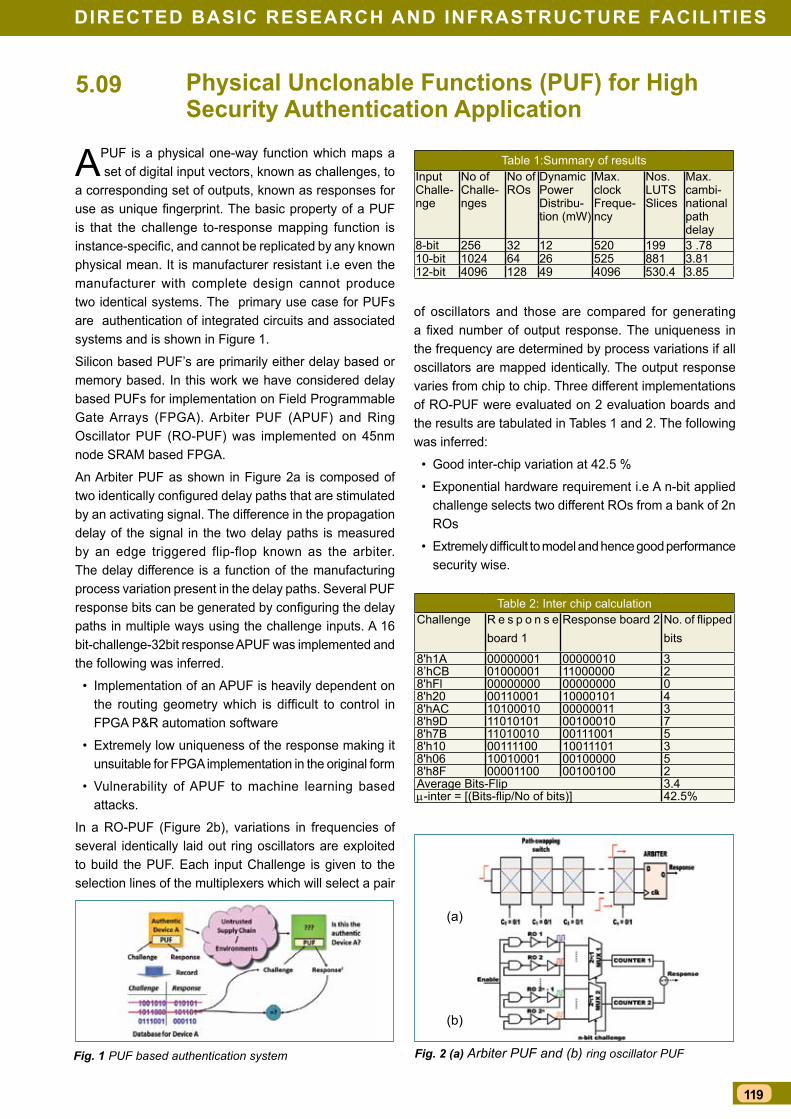
119
DirecteD Basic research anD infrastructure facilities
Physical unclonable functions (Puf) for high security authentication application
A PUF is a physical one-way function which maps a set of digital input vectors, known as challenges, to
a corresponding set of outputs, known as responses for use as unique fingerprint. The basic property of a PUF is that the challenge to-response mapping function is instance-specific, and cannot be replicated by any known physical mean. It is manufacturer resistant i.e even the manufacturer with complete design cannot produce two identical systems. The primary use case for PUFs are authentication of integrated circuits and associated systems and is shown in Figure 1.
Silicon based PUF’s are primarily either delay based or memory based. In this work we have considered delay based PUFs for implementation on Field Programmable Gate Arrays (FPGA). Arbiter PUF (APUF) and Ring Oscillator PUF (RO-PUF) was implemented on 45nm node SRAM based FPGA.
An Arbiter PUF as shown in Figure 2a is composed of two identically configured delay paths that are stimulated by an activating signal. The difference in the propagation delay of the signal in the two delay paths is measured by an edge triggered flip-flop known as the arbiter. The delay difference is a function of the manufacturing process variation present in the delay paths. Several PUF response bits can be generated by configuring the delay paths in multiple ways using the challenge inputs. A 16 bit-challenge-32bit response APUF was implemented and the following was inferred.
• Implementation of an APUF is heavily dependent on the routing geometry which is difficult to control in FPGA P&R automation software
• Extremely low uniqueness of the response making it unsuitable for FPGA implementation in the original form
• Vulnerability of APUF to machine learning based attacks.
In a RO-PUF (Figure 2b), variations in frequencies of several identically laid out ring oscillators are exploited to build the PUF. Each input Challenge is given to the selection lines of the multiplexers which will select a pair
5.09
Fig. 1 PUF based authentication system Fig. 2 (a) Arbiter PUF and (b) ring oscillator PUF
of oscillators and those are compared for generating a fixed number of output response. The uniqueness in the frequency are determined by process variations if all oscillators are mapped identically. The output response varies from chip to chip. Three different implementations of RO-PUF were evaluated on 2 evaluation boards and the results are tabulated in Tables 1 and 2. The following was inferred:
• Good inter-chip variation at 42.5 %
• Exponential hardware requirement i.e A n-bit applied challenge selects two different ROs from a bank of 2n ROs
• Extremely difficult to model and hence good performance security wise.
Table 1:Summary of resultsInput Challe-nge
No of Challe-nges
No of ROs
Dynamic Power Distribu-tion (mW)
Max. clock Freque-ncy
Nos. LUTS Slices
Max.cambi-national path delay
8-bit 256 32 12 520 199 3 .7810-bit 1024 64 26 525 881 3.8112-bit 4096 128 49 4096 530.4 3.85
Table 2: Inter chip calculationChallenge R e s p o n s e
board 1Response board 2 No. of flipped
bits
8'h1A 00000001 00000010 38’hCB 01000001 11000000 28'hFl 00000000 00000000 08'h20 00110001 10000101 48'hAC 10100010 00000011 38'h9D 11010101 00100010 78'h7B 11010010 00111001 58'h10 00111100 10011101 38'h06 10010001 00100000 58'h8F 00001100 00100100 2Average Bits-Flip 3.4m-inter = [(Bits-flip/No of bits)] 42.5%
(a)
(b)
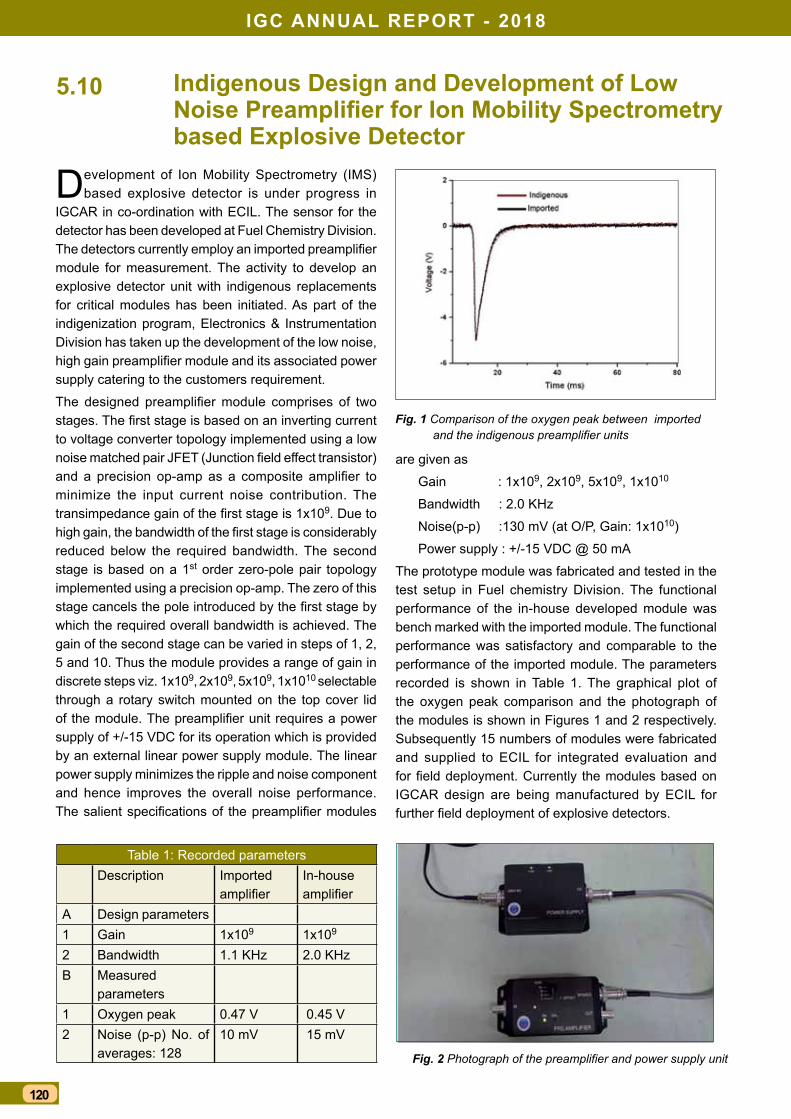
iGc annual rePOrt - 2018
120
indigenous Design and Development of low Noise Preamplifier for Ion Mobility Spectrometry based explosive Detector
Development of Ion Mobility Spectrometry (IMS) based explosive detector is under progress in
IGCAR in co-ordination with ECIL. The sensor for the detector has been developed at Fuel Chemistry Division. The detectors currently employ an imported preamplifier module for measurement. The activity to develop an explosive detector unit with indigenous replacements for critical modules has been initiated. As part of the indigenization program, Electronics & Instrumentation Division has taken up the development of the low noise, high gain preamplifier module and its associated power supply catering to the customers requirement.
The designed preamplifier module comprises of two stages. The first stage is based on an inverting current to voltage converter topology implemented using a low noise matched pair JFET (Junction field effect transistor) and a precision op-amp as a composite amplifier to minimize the input current noise contribution. The transimpedance gain of the first stage is 1x10⁹. Due to high gain, the bandwidth of the first stage is considerably reduced below the required bandwidth. The second stage is based on a 1st order zero-pole pair topology implemented using a precision op-amp. The zero of this stage cancels the pole introduced by the first stage by which the required overall bandwidth is achieved. The gain of the second stage can be varied in steps of 1, 2, 5 and 10. Thus the module provides a range of gain in discrete steps viz. 1x10⁹, 2x10⁹, 5x10⁹, 1x10¹⁰ selectable
through a rotary switch mounted on the top cover lid of the module. The preamplifier unit requires a power supply of +/-15 VDC for its operation which is provided by an external linear power supply module. The linear power supply minimizes the ripple and noise component and hence improves the overall noise performance. The salient specifications of the preamplifier modules
5.10
are given as
Gain : 1x10⁹, 2x10⁹, 5x10⁹, 1x10¹⁰
Bandwidth : 2.0 KHz
Noise(p-p) :130 mV (at O/P, Gain: 1x10¹⁰)
Power supply : +/-15 VDC @ 50 mA
The prototype module was fabricated and tested in the test setup in Fuel chemistry Division. The functional performance of the in-house developed module was bench marked with the imported module. The functional performance was satisfactory and comparable to the performance of the imported module. The parameters recorded is shown in Table 1. The graphical plot of the oxygen peak comparison and the photograph of the modules is shown in Figures 1 and 2 respectively. Subsequently 15 numbers of modules were fabricated and supplied to ECIL for integrated evaluation and for field deployment. Currently the modules based on IGCAR design are being manufactured by ECIL for further field deployment of explosive detectors.
Fig. 1 Comparison of the oxygen peak between imported and the indigenous preamplifier units
Fig. 2 Photograph of the preamplifier and power supply unit
Table 1: Recorded parametersDescription Imported
amplifierIn-house amplifier
A Design parameters1 Gain 1x10⁹ 1x10⁹
2 Bandwidth 1.1 KHz 2.0 KHzB Measured
parameters1 Oxygen peak 0.47 V 0.45 V2 Noise (p-p) No. of
averages: 12810 mV 15 mV
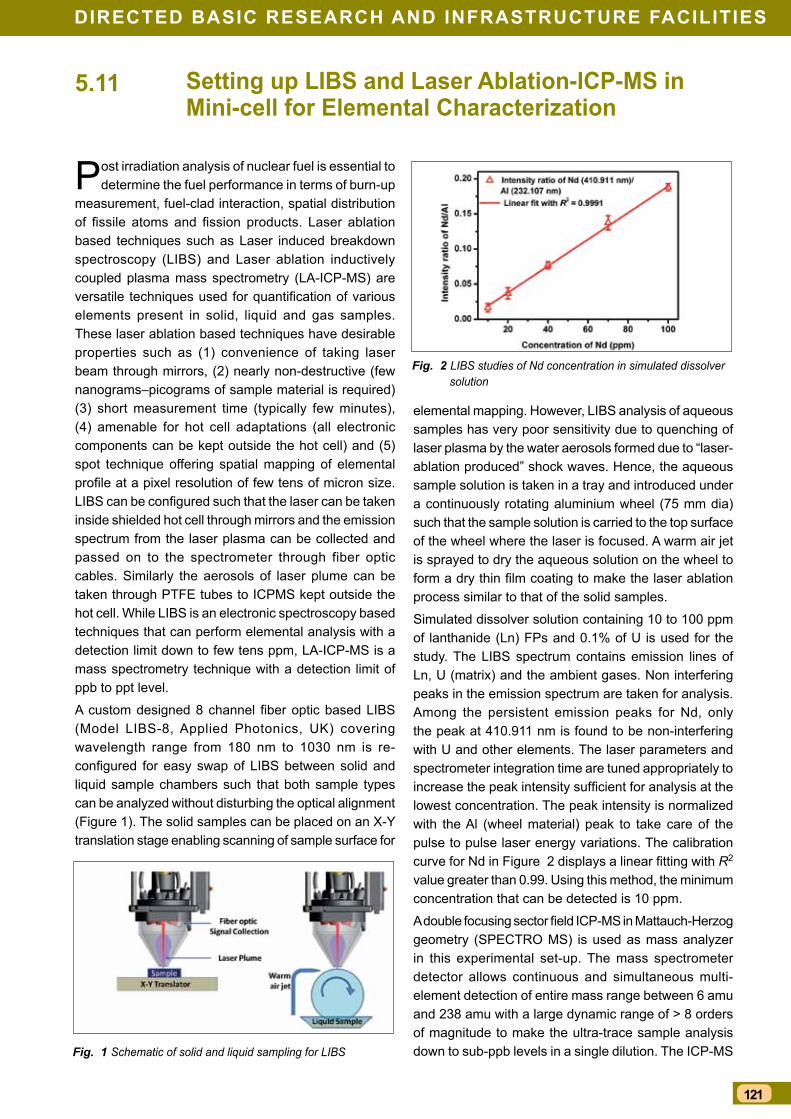
121
DirecteD Basic research anD infrastructure facilities
setting up liBs and laser ablation-icP-Ms in Mini-cell for elemental characterization
Post irradiation analysis of nuclear fuel is essential to determine the fuel performance in terms of burn-up
measurement, fuel-clad interaction, spatial distribution of fissile atoms and fission products. Laser ablation based techniques such as Laser induced breakdown spectroscopy (LIBS) and Laser ablation inductively coupled plasma mass spectrometry (LA-ICP-MS) are versatile techniques used for quantification of various elements present in solid, liquid and gas samples. These laser ablation based techniques have desirable properties such as (1) convenience of taking laser beam through mirrors, (2) nearly non-destructive (few nanograms–picograms of sample material is required) (3) short measurement time (typically few minutes), (4) amenable for hot cell adaptations (all electronic components can be kept outside the hot cell) and (5) spot technique offering spatial mapping of elemental profile at a pixel resolution of few tens of micron size. LIBS can be configured such that the laser can be taken inside shielded hot cell through mirrors and the emission spectrum from the laser plasma can be collected and passed on to the spectrometer through fiber optic cables. Similarly the aerosols of laser plume can be taken through PTFE tubes to ICPMS kept outside the hot cell. While LIBS is an electronic spectroscopy based techniques that can perform elemental analysis with a detection limit down to few tens ppm, LA-ICP-MS is a mass spectrometry technique with a detection limit of ppb to ppt level.
A custom designed 8 channel fiber optic based LIBS (Model LIBS-8, Applied Photonics, UK) covering wavelength range from 180 nm to 1030 nm is re-configured for easy swap of LIBS between solid and liquid sample chambers such that both sample types can be analyzed without disturbing the optical alignment (Figure 1). The solid samples can be placed on an X-Y translation stage enabling scanning of sample surface for
5.11
Fig. 1 Schematic of solid and liquid sampling for LIBS
Fig. 2 LIBS studies of Nd concentration in simulated dissolver solution
elemental mapping. However, LIBS analysis of aqueous samples has very poor sensitivity due to quenching of laser plasma by the water aerosols formed due to “laser-ablation produced” shock waves. Hence, the aqueous sample solution is taken in a tray and introduced under a continuously rotating aluminium wheel (75 mm dia) such that the sample solution is carried to the top surface of the wheel where the laser is focused. A warm air jet is sprayed to dry the aqueous solution on the wheel to form a dry thin film coating to make the laser ablation process similar to that of the solid samples.
Simulated dissolver solution containing 10 to 100 ppm of lanthanide (Ln) FPs and 0.1% of U is used for the study. The LIBS spectrum contains emission lines of Ln, U (matrix) and the ambient gases. Non interfering peaks in the emission spectrum are taken for analysis. Among the persistent emission peaks for Nd, only the peak at 410.911 nm is found to be non-interfering with U and other elements. The laser parameters and spectrometer integration time are tuned appropriately to increase the peak intensity sufficient for analysis at the lowest concentration. The peak intensity is normalized with the Al (wheel material) peak to take care of the pulse to pulse laser energy variations. The calibration curve for Nd in Figure 2 displays a linear fitting with R2 value greater than 0.99. Using this method, the minimum concentration that can be detected is 10 ppm.
A double focusing sector field ICP-MS in Mattauch-Herzog geometry (SPECTRO MS) is used as mass analyzer in this experimental set-up. The mass spectrometer detector allows continuous and simultaneous multi-element detection of entire mass range between 6 amu and 238 amu with a large dynamic range of > 8 orders of magnitude to make the ultra-trace sample analysis down to sub-ppb levels in a single dilution. The ICP-MS
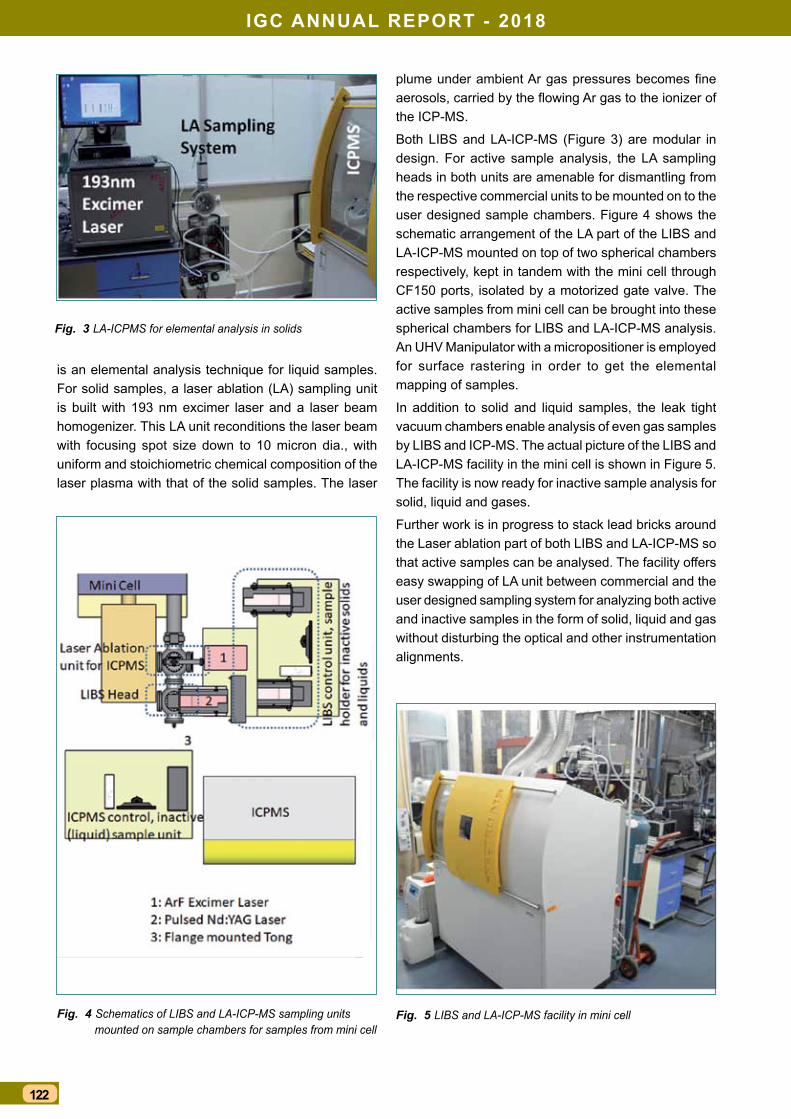
iGc annual rePOrt - 2018
122
Fig. 3 LA-ICPMS for elemental analysis in solids
Fig. 4 Schematics of LIBS and LA-ICP-MS sampling units mounted on sample chambers for samples from mini cell
Fig. 5 LIBS and LA-ICP-MS facility in mini cell
is an elemental analysis technique for liquid samples. For solid samples, a laser ablation (LA) sampling unit is built with 193 nm excimer laser and a laser beam homogenizer. This LA unit reconditions the laser beam with focusing spot size down to 10 micron dia., with uniform and stoichiometric chemical composition of the laser plasma with that of the solid samples. The laser
plume under ambient Ar gas pressures becomes fine aerosols, carried by the flowing Ar gas to the ionizer of the ICP-MS.
Both LIBS and LA-ICP-MS (Figure 3) are modular in design. For active sample analysis, the LA sampling heads in both units are amenable for dismantling from the respective commercial units to be mounted on to the user designed sample chambers. Figure 4 shows the schematic arrangement of the LA part of the LIBS and LA-ICP-MS mounted on top of two spherical chambers respectively, kept in tandem with the mini cell through CF150 ports, isolated by a motorized gate valve. The active samples from mini cell can be brought into these spherical chambers for LIBS and LA-ICP-MS analysis. An UHV Manipulator with a micropositioner is employed for surface rastering in order to get the elemental mapping of samples.
In addition to solid and liquid samples, the leak tight vacuum chambers enable analysis of even gas samples by LIBS and ICP-MS. The actual picture of the LIBS and LA-ICP-MS facility in the mini cell is shown in Figure 5. The facility is now ready for inactive sample analysis for solid, liquid and gases.
Further work is in progress to stack lead bricks around the Laser ablation part of both LIBS and LA-ICP-MS so that active samples can be analysed. The facility offers easy swapping of LA unit between commercial and the user designed sampling system for analyzing both active and inactive samples in the form of solid, liquid and gas without disturbing the optical and other instrumentation alignments.

123
DirecteD Basic research anD infrastructure facilities
clinical studies in coronary artery Disease (caD) using Magnetocardiography (McG)
A 37 channel system for magnetocardiography (MCG) using Superconducting Quantum Interference
(SQUID) devices is functional at Materials Science Group, IGCAR for measurement and investigation of cardiac electrophysiological activity. As part of an ongoing programme, a joint research project was undertaken with JIPMER, Puducherry, to measure and analyze MCG of patients who are suspected to have coronary artery disease (CAD) which is associated with reduced blood supply to the heart. For patients reporting typical clinical symptoms like angina or chest pain, current diagnostic procedures usually involve measuring a rest ECG and subsequently a treadmill ECG test (TMT) to observe the possible deviations in the ECG waveform due to the presence of possible blocks in coronary arteries; indeed, these deviations get accentuated under conditions of exertion such as during the TMT test. The present study was aimed at investigating the feasibility of using MCG as a sensitive diagnostic technique for unraveling CAD even under rest condition (without subjecting patient to exertion as in a TMT study), and more importantly, in identifying possible candidates who are likely to develop CAD.
A total of twenty eight subjects (including those exhibiting both TMT positive and TMT negative conditions) were subjected to MCG measurements. Each subject rested in a supine position with his chest close to the tail of the cryostat which housed the sensors kept at a temperature of 4.2 K. It was observed that the MCG cardiac signals of TMT positive subjects revealed significant elevation in the ST segment of the cardiac cycle as shown in Figure 1. The unusual increase in the magnitude of T wave (relative to the R wave) might
5.12
Fig. 1 MCG trace of a TMT positive subject
Fig. 2 Magnetic field maps (MFM) generated at the ST segment of the cardiac cycle for healthy control subject (a) and abnormal MFMs of TMT positive subjects (b)-(d)
be a pharmacologically induced change specific to this subject. The characteristic variations in the ST segment that is expected for CAD cases could be visualized better by plotting the spatial distribution of the cardiac magnetic field in the form of magnetic field map (MFM), generated from the MCG measured at 37 distinct sensor locations arranged in a hexagonal array shown in Figure 2. The MFMs were generated at the ST time instant for all TMT positive subjects. In stark contrast to the MFM of a healthy control subject, TMT positive subjects either showed a MFM corresponding to a significantly different orientation of the current dipole, or MFM with multiple foci which are indicative of the presence of multiple current dipoles simultaneously active as shown in the Figure 2. It is thus evident that the MFM allows one to easily and clearly differentiate between a healthy subject and a subject with CAD. These observations are indicative of the potential of MCG in quickly diagnosing CAD in a given population. Further detailed studies of measured MFM patterns are expected to aid the clinician in arriving at an improved diagnosis and possibly a more effective treatment plan.
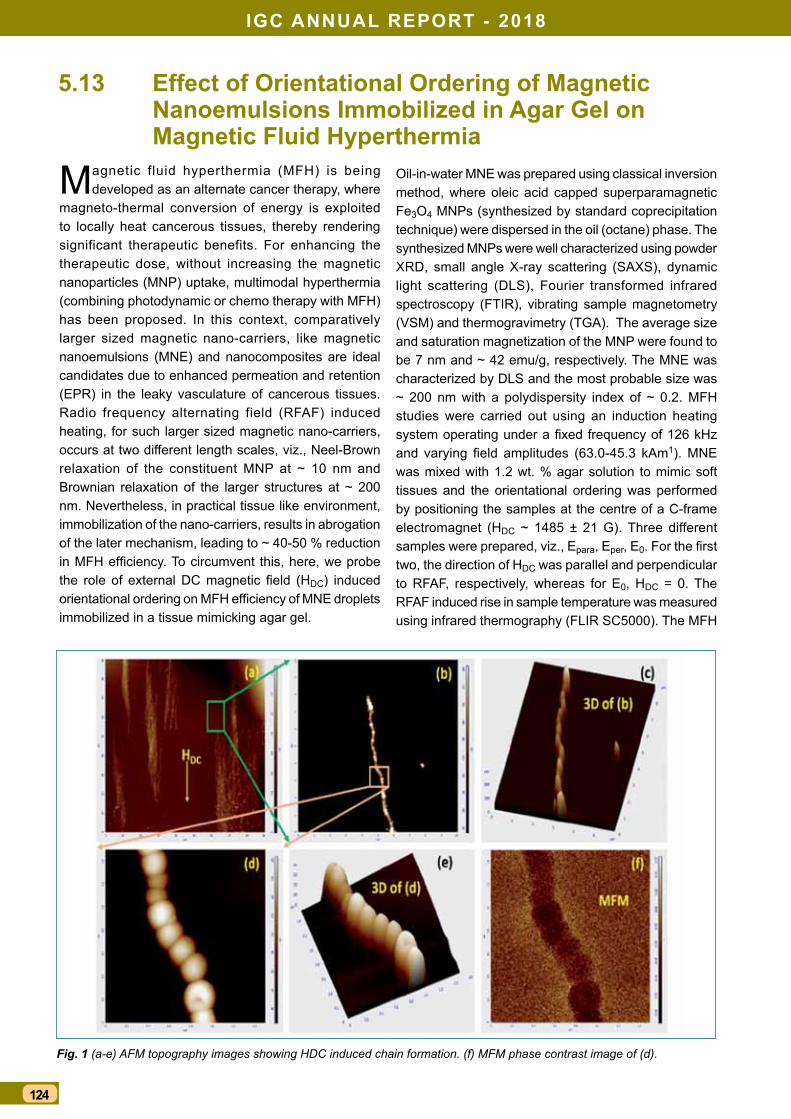
iGc annual rePOrt - 2018
124
effect of Orientational Ordering of Magnetic nanoemulsions immobilized in agar Gel on Magnetic fluid hyperthermia
Magnetic fluid hyperthermia (MFH) is being developed as an alternate cancer therapy, where
magneto-thermal conversion of energy is exploited to locally heat cancerous tissues, thereby rendering significant therapeutic benefits. For enhancing the therapeutic dose, without increasing the magnetic nanoparticles (MNP) uptake, multimodal hyperthermia (combining photodynamic or chemo therapy with MFH) has been proposed. In this context, comparatively larger sized magnetic nano-carriers, like magnetic nanoemulsions (MNE) and nanocomposites are ideal candidates due to enhanced permeation and retention (EPR) in the leaky vasculature of cancerous tissues. Radio frequency alternating field (RFAF) induced heating, for such larger sized magnetic nano-carriers, occurs at two different length scales, viz., Neel-Brown relaxation of the constituent MNP at ~ 10 nm and Brownian relaxation of the larger structures at ~ 200 nm. Nevertheless, in practical tissue like environment, immobilization of the nano-carriers, results in abrogation of the later mechanism, leading to ~ 40-50 % reduction in MFH efficiency. To circumvent this, here, we probe the role of external DC magnetic field (HDC) induced orientational ordering on MFH efficiency of MNE droplets immobilized in a tissue mimicking agar gel.
5.13
Oil-in-water MNE was prepared using classical inversion method, where oleic acid capped superparamagnetic Fe3O4 MNPs (synthesized by standard coprecipitation technique) were dispersed in the oil (octane) phase. The synthesized MNPs were well characterized using powder XRD, small angle X-ray scattering (SAXS), dynamic light scattering (DLS), Fourier transformed infrared spectroscopy (FTIR), vibrating sample magnetometry (VSM) and thermogravimetry (TGA). The average size and saturation magnetization of the MNP were found to be 7 nm and ~ 42 emu/g, respectively. The MNE was characterized by DLS and the most probable size was ~ 200 nm with a polydispersity index of ~ 0.2. MFH studies were carried out using an induction heating system operating under a fixed frequency of 126 kHz and varying field amplitudes (63.0-45.3 kAm1). MNE was mixed with 1.2 wt. % agar solution to mimic soft tissues and the orientational ordering was performed by positioning the samples at the centre of a C-frame electromagnet (HDC ~ 1485 ± 21 G). Three different samples were prepared, viz., Epara, Eper, E0. For the first two, the direction of HDC was parallel and perpendicular to RFAF, respectively, whereas for E0, HDC = 0. The RFAF induced rise in sample temperature was measured using infrared thermography (FLIR SC5000). The MFH
Fig. 1 (a-e) AFM topography images showing HDC induced chain formation. (f) MFM phase contrast image of (d).

125
DirecteD Basic research anD infrastructure facilities
Fig. 2 Bar chart comparing SAR values of Epara, Eper and E0
a study on early screening and Women Well-Being- application of ir thermography technique for Breast cancer Detection
Breast cancer is most common in women with only 30% of long term survival rate. The estimated breast
cancer projection during the year 2020 is expected to reach 1797900. Early diagnosis may increase the chance of remission and life’s expectancy. Several screening modalities are available for breast cancer such as Mammography, Magnetic Resonance Imaging (MRI), Positron Emission Tomography (PET), Computed Tomography (CT), Ultrasonography, Single Photon Emission Computed Tomography (SPECT), Clinical/Self Examination, Histopathology (Biopsy), and FNAC. Raising concerns in the present screening modalities create interest in alternative techniques for diagnosing breast cancer. One of the promising alternate noninvasive techniques is Infrared Thermography. This report discusses the application of infrared thermography for early beast detection and classification of breast thermograms based on quantitative temperature analysis.
Infrared thermal images were acquired in the LWIR wavelength range on bilateral breasts using infrared
5.14
camera containing uncooled microbolometer detector. The temperature sensitivity of the camera is 0.01°C and spatial resolution is 320 x 240 pixels. Prior to actual thermal imaging of the region of interest, a series of protocols were observed. This was necessary because, in thermal imaging, the superficial temperature distribution of the human body is imaged which can be altered by a number of conditions such as ambient temperature, air drifts etc. Images were acquired in five different positions namely straight, left lateral, left oblique, right lateral, right oblique. Radiometric corrections for distance, emissivity, humidity, atmospheric temperature were applied on the thermograms to get accurate absolute temperature values. Straight images find its application in bilateral temperature symmetry analysis, while oblique and lateral positions are used for the temperature analysis in axillary lymph node areas. Image interpretation was carried out using three regions of interests (ROIs) which include Nipple, Upper inner quadrant and Upper outer quadrant of the both breasts. Based on the analyzed
efficiency was quantified in terms of specific absorption rates (SAR), which were determined from the initial rates of temperature rise, under non-adiabatic limit.
Under, the influence of HDC, the MNE droplets undergo disorder-to-order transition and form linear chain like structures, due to head-on aggregation along the direction of HDC. Formation of such chain like structures were experimentally probed using atomic and magnetic force microscopy (AFM & MFM). Figures 1a to 1e show the formation of linear chain like structures, constituting individual MNE droplets, under the influence of HDC. MFM phase contrast imaging (Figure 1f) confirmed the superparamagnetic nature of the MNE droplets. Figure 2 shows a bar chart comparing the SAR values for Epara, Eper and E0, where it can be seen that SAR was the highest for Epara in all the cases. This was attributed to an increase in uniaxial energy density along the chain direction, for HDC parallel to RFAF, which resulted in an enhancement of effective relaxation time for Epara, leading to a higher SAR. Experimental findings indicate ~ 20-30 % enhancement in SAR for Epara, as compared
to Eper. Our systematic studies on the effect of HDC induced orientational ordering on MFH efficiency of MNE immobilized in tissue mimicking agar gel, is beneficial for fine-tuning larger sized magnetic nano-carriers for multimodal hyperthermia therapy and shows the efficacy of static DC bias on circumventing the detrimental effects of viscosity induced abrogation of Brownian relaxation on MFH efficiency.
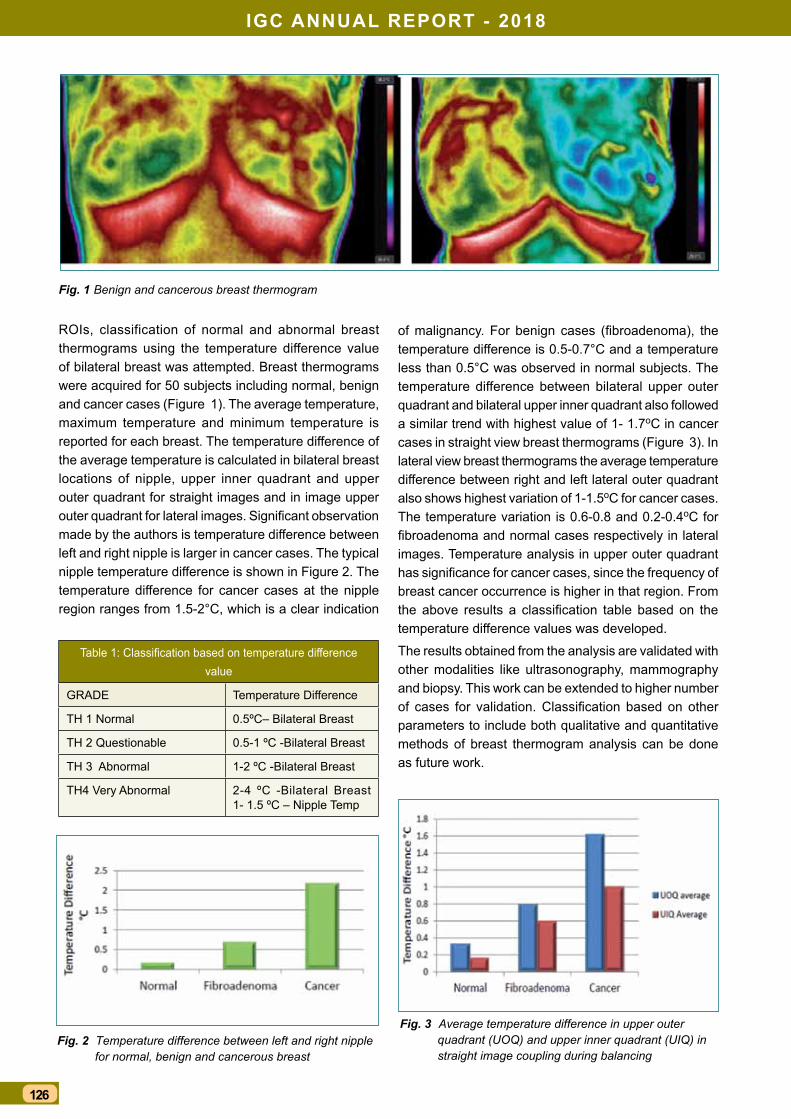
iGc annual rePOrt - 2018
126
Table 1: Classification based on temperature difference value
GRADE Temperature Difference
TH 1 Normal 0.5ºC– Bilateral Breast
TH 2 Questionable 0.5-1 ºC -Bilateral Breast
TH 3 Abnormal 1-2 ºC -Bilateral Breast
TH4 Very Abnormal 2-4 ºC -Bilateral Breast 1- 1.5 ºC – Nipple Temp
Fig. 3 Average temperature difference in upper outer quadrant (UOQ) and upper inner quadrant (UIQ) in straight image coupling during balancing
Fig. 1 Benign and cancerous breast thermogram
ROIs, classification of normal and abnormal breast thermograms using the temperature difference value of bilateral breast was attempted. Breast thermograms were acquired for 50 subjects including normal, benign and cancer cases (Figure 1). The average temperature, maximum temperature and minimum temperature is reported for each breast. The temperature difference of the average temperature is calculated in bilateral breast locations of nipple, upper inner quadrant and upper outer quadrant for straight images and in image upper outer quadrant for lateral images. Significant observation made by the authors is temperature difference between left and right nipple is larger in cancer cases. The typical nipple temperature difference is shown in Figure 2. The temperature difference for cancer cases at the nipple region ranges from 1.5-2°C, which is a clear indication
of malignancy. For benign cases (fibroadenoma), the temperature difference is 0.5-0.7°C and a temperature less than 0.5°C was observed in normal subjects. The temperature difference between bilateral upper outer quadrant and bilateral upper inner quadrant also followed a similar trend with highest value of 1- 1.7oC in cancer cases in straight view breast thermograms (Figure 3). In lateral view breast thermograms the average temperature difference between right and left lateral outer quadrant also shows highest variation of 1-1.5oC for cancer cases. The temperature variation is 0.6-0.8 and 0.2-0.4oC for fibroadenoma and normal cases respectively in lateral images. Temperature analysis in upper outer quadrant has significance for cancer cases, since the frequency of breast cancer occurrence is higher in that region. From the above results a classification table based on the temperature difference values was developed.
The results obtained from the analysis are validated with other modalities like ultrasonography, mammography and biopsy. This work can be extended to higher number of cases for validation. Classification based on other parameters to include both qualitative and quantitative methods of breast thermogram analysis can be done as future work.
Fig. 2 Temperature difference between left and right nipple for normal, benign and cancerous breast
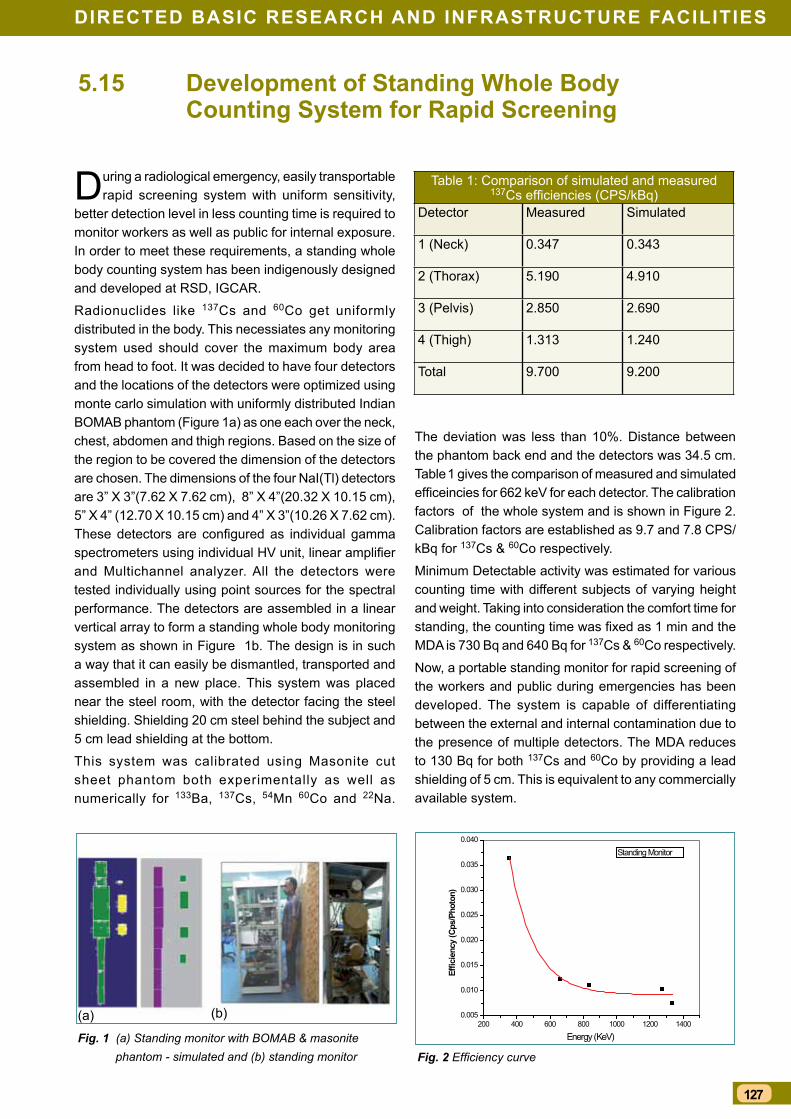
127
DirecteD Basic research anD infrastructure facilities
Development of standing Whole Body counting system for rapid screening
During a radiological emergency, easily transportable rapid screening system with uniform sensitivity,
better detection level in less counting time is required to monitor workers as well as public for internal exposure. In order to meet these requirements, a standing whole body counting system has been indigenously designed and developed at RSD, IGCAR.
Radionuclides like 137Cs and 60Co get uniformly distributed in the body. This necessiates any monitoring system used should cover the maximum body area from head to foot. It was decided to have four detectors and the locations of the detectors were optimized using monte carlo simulation with uniformly distributed Indian BOMAB phantom (Figure 1a) as one each over the neck, chest, abdomen and thigh regions. Based on the size of the region to be covered the dimension of the detectors are chosen. The dimensions of the four NaI(Tl) detectors are 3” X 3”(7.62 X 7.62 cm), 8” X 4”(20.32 X 10.15 cm), 5” X 4” (12.70 X 10.15 cm) and 4” X 3”(10.26 X 7.62 cm). These detectors are configured as individual gamma spectrometers using individual HV unit, linear amplifier and Multichannel analyzer. All the detectors were tested individually using point sources for the spectral performance. The detectors are assembled in a linear vertical array to form a standing whole body monitoring system as shown in Figure 1b. The design is in such a way that it can easily be dismantled, transported and assembled in a new place. This system was placed near the steel room, with the detector facing the steel shielding. Shielding 20 cm steel behind the subject and 5 cm lead shielding at the bottom.
This system was calibrated using Masonite cut sheet phantom both experimentally as well as numerically for 133Ba, 137Cs, 54Mn 60Co and 22Na.
5.15
The deviation was less than 10%. Distance between the phantom back end and the detectors was 34.5 cm. Table 1 gives the comparison of measured and simulated efficeincies for 662 keV for each detector. The calibration factors of the whole system and is shown in Figure 2. Calibration factors are established as 9.7 and 7.8 CPS/kBq for 137Cs & 60Co respectively.
Minimum Detectable activity was estimated for various counting time with different subjects of varying height and weight. Taking into consideration the comfort time for standing, the counting time was fixed as 1 min and the MDA is 730 Bq and 640 Bq for 137Cs & 60Co respectively.
Now, a portable standing monitor for rapid screening of the workers and public during emergencies has been developed. The system is capable of differentiating between the external and internal contamination due to the presence of multiple detectors. The MDA reduces to 130 Bq for both 137Cs and 60Co by providing a lead shielding of 5 cm. This is equivalent to any commercially available system.
200 400 600 800 1000 1200 14000.005
0.010
0.015
0.020
0.025
0.030
0.035
0.040
Effic
ienc
y (C
ps/P
hoto
n)
Energy (KeV)
Standing Monitor
Fig. 1 (a) Standing monitor with BOMAB & masonite phantom - simulated and (b) standing monitor Fig. 2 Efficiency curve
Table 1: Comparison of simulated and measured 137Cs efficiencies (CPS/kBq)
Detector Measured Simulated
1 (Neck) 0.347 0.343
2 (Thorax) 5.190 4.910
3 (Pelvis) 2.850 2.690
4 (Thigh) 1.313 1.240
Total 9.700 9.200
(a) (b)
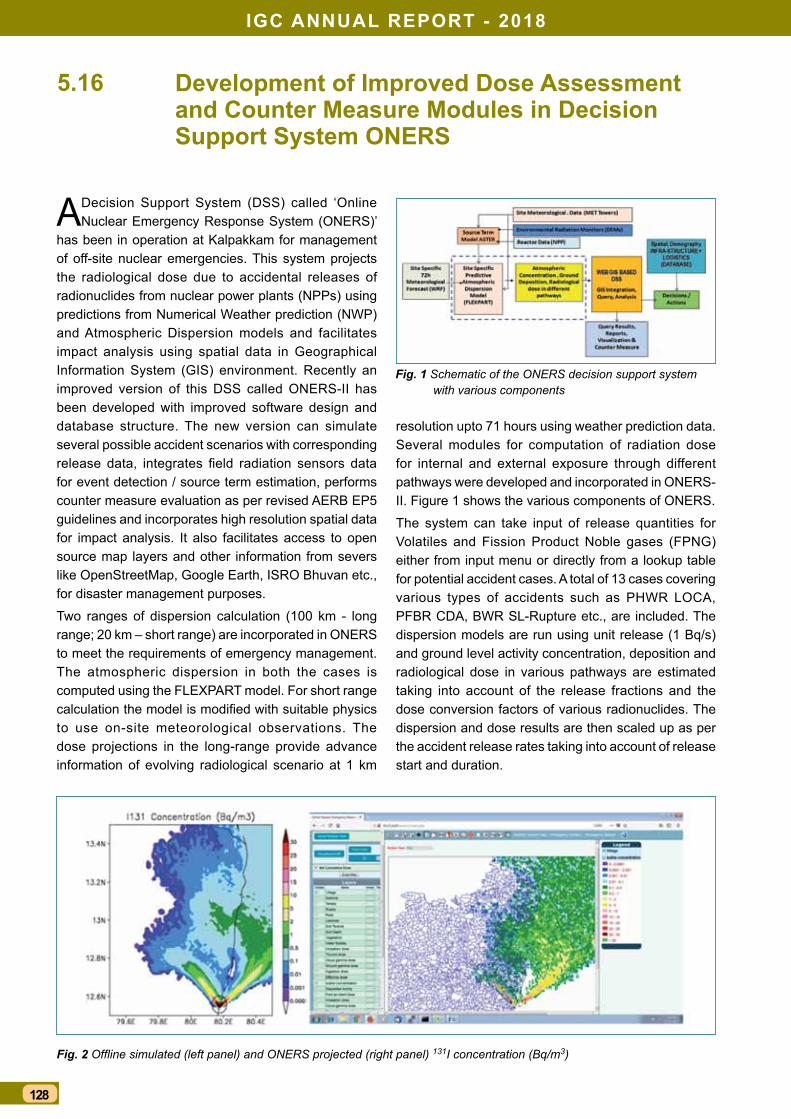
iGc annual rePOrt - 2018
128
Development of improved Dose assessment and counter Measure Modules in Decision support system Oners
A Decision Support System (DSS) called ‘Online Nuclear Emergency Response System (ONERS)’
has been in operation at Kalpakkam for management of off-site nuclear emergencies. This system projects the radiological dose due to accidental releases of radionuclides from nuclear power plants (NPPs) using predictions from Numerical Weather prediction (NWP) and Atmospheric Dispersion models and facilitates impact analysis using spatial data in Geographical Information System (GIS) environment. Recently an improved version of this DSS called ONERS-II has been developed with improved software design and database structure. The new version can simulate several possible accident scenarios with corresponding release data, integrates field radiation sensors data for event detection / source term estimation, performs counter measure evaluation as per revised AERB EP5 guidelines and incorporates high resolution spatial data for impact analysis. It also facilitates access to open source map layers and other information from severs like OpenStreetMap, Google Earth, ISRO Bhuvan etc., for disaster management purposes.
Two ranges of dispersion calculation (100 km - long range; 20 km – short range) are incorporated in ONERS to meet the requirements of emergency management. The atmospheric dispersion in both the cases is computed using the FLEXPART model. For short range calculation the model is modified with suitable physics to use on-site meteorological observations. The dose projections in the long-range provide advance information of evolving radiological scenario at 1 km
5.16
resolution upto 71 hours using weather prediction data. Several modules for computation of radiation dose for internal and external exposure through different pathways were developed and incorporated in ONERS-II. Figure 1 shows the various components of ONERS.
The system can take input of release quantities for Volatiles and Fission Product Noble gases (FPNG) either from input menu or directly from a lookup table for potential accident cases. A total of 13 cases covering various types of accidents such as PHWR LOCA, PFBR CDA, BWR SL-Rupture etc., are included. The dispersion models are run using unit release (1 Bq/s) and ground level activity concentration, deposition and radiological dose in various pathways are estimated taking into account of the release fractions and the dose conversion factors of various radionuclides. The dispersion and dose results are then scaled up as per the accident release rates taking into account of release start and duration.
Fig. 1 Schematic of the ONERS decision support system with various components
Fig. 2 Offline simulated (left panel) and ONERS projected (right panel) 131I concentration (Bq/m3)
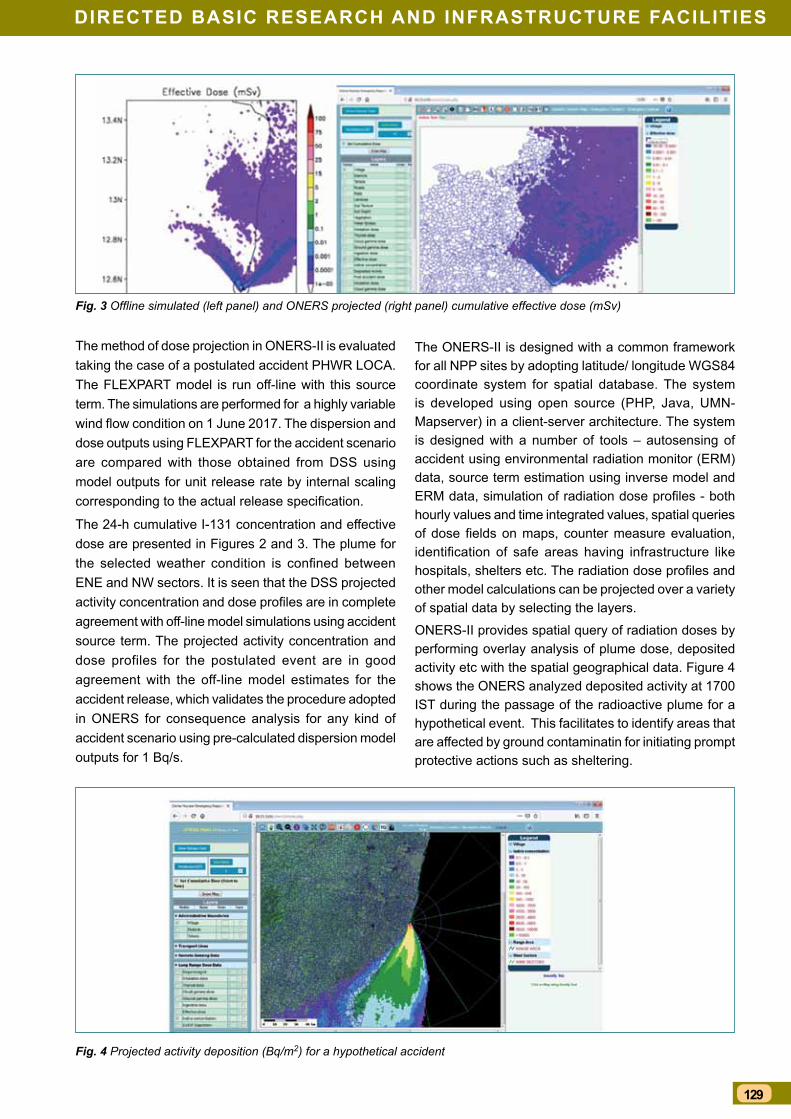
129
DirecteD Basic research anD infrastructure facilities
Fig. 3 Offline simulated (left panel) and ONERS projected (right panel) cumulative effective dose (mSv)
The method of dose projection in ONERS-II is evaluated taking the case of a postulated accident PHWR LOCA. The FLEXPART model is run off-line with this source term. The simulations are performed for a highly variable wind flow condition on 1 June 2017. The dispersion and dose outputs using FLEXPART for the accident scenario are compared with those obtained from DSS using model outputs for unit release rate by internal scaling corresponding to the actual release specification.
The 24-h cumulative I-131 concentration and effective dose are presented in Figures 2 and 3. The plume for the selected weather condition is confined between ENE and NW sectors. It is seen that the DSS projected activity concentration and dose profiles are in complete agreement with off-line model simulations using accident source term. The projected activity concentration and dose profiles for the postulated event are in good agreement with the off-line model estimates for the accident release, which validates the procedure adopted in ONERS for consequence analysis for any kind of accident scenario using pre-calculated dispersion model outputs for 1 Bq/s.
The ONERS-II is designed with a common framework for all NPP sites by adopting latitude/ longitude WGS84 coordinate system for spatial database. The system is developed using open source (PHP, Java, UMN-Mapserver) in a client-server architecture. The system is designed with a number of tools – autosensing of accident using environmental radiation monitor (ERM) data, source term estimation using inverse model and ERM data, simulation of radiation dose profiles - both hourly values and time integrated values, spatial queries of dose fields on maps, counter measure evaluation, identification of safe areas having infrastructure like hospitals, shelters etc. The radiation dose profiles and other model calculations can be projected over a variety of spatial data by selecting the layers.
ONERS-II provides spatial query of radiation doses by performing overlay analysis of plume dose, deposited activity etc with the spatial geographical data. Figure 4 shows the ONERS analyzed deposited activity at 1700 IST during the passage of the radioactive plume for a hypothetical event. This facilitates to identify areas that are affected by ground contaminatin for initiating prompt protective actions such as sheltering.
Fig. 4 Projected activity deposition (Bq/m2) for a hypothetical accident
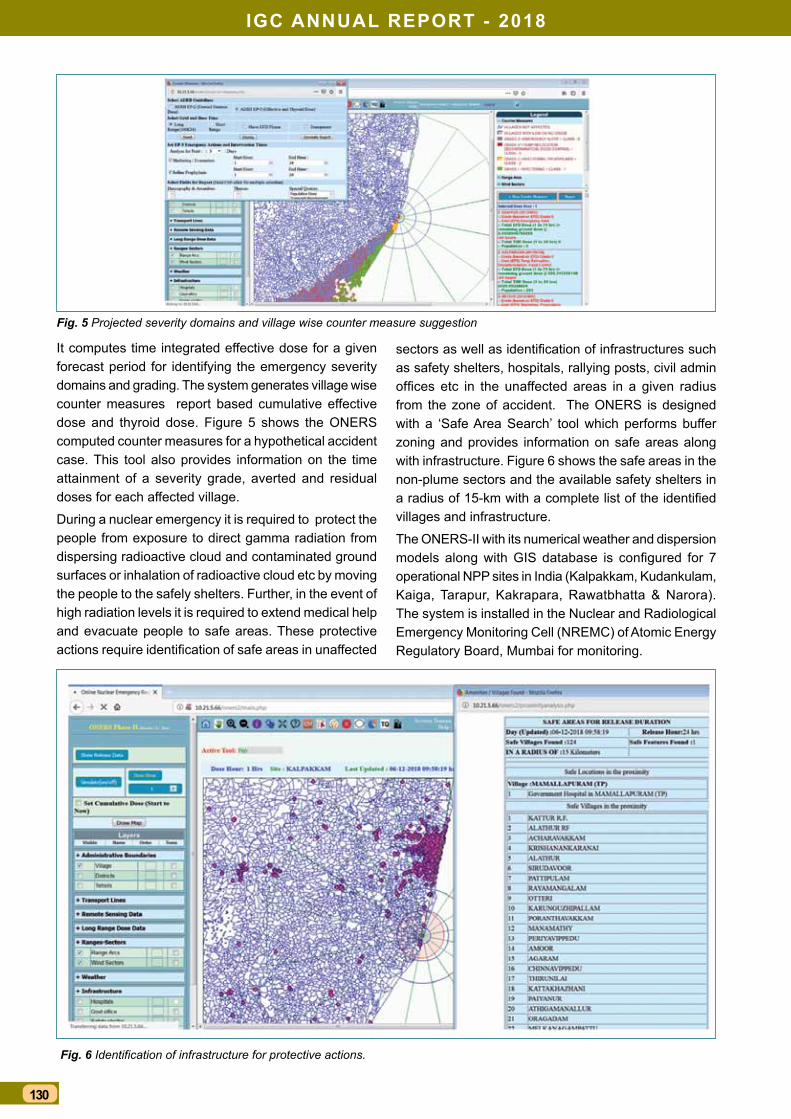
iGc annual rePOrt - 2018
130
Fig. 6 Identification of infrastructure for protective actions.
Fig. 5 Projected severity domains and village wise counter measure suggestion
It computes time integrated effective dose for a given forecast period for identifying the emergency severity domains and grading. The system generates village wise counter measures report based cumulative effective dose and thyroid dose. Figure 5 shows the ONERS computed counter measures for a hypothetical accident case. This tool also provides information on the time attainment of a severity grade, averted and residual doses for each affected village.
During a nuclear emergency it is required to protect the people from exposure to direct gamma radiation from dispersing radioactive cloud and contaminated ground surfaces or inhalation of radioactive cloud etc by moving the people to the safely shelters. Further, in the event of high radiation levels it is required to extend medical help and evacuate people to safe areas. These protective actions require identification of safe areas in unaffected
sectors as well as identification of infrastructures such as safety shelters, hospitals, rallying posts, civil admin offices etc in the unaffected areas in a given radius from the zone of accident. The ONERS is designed with a ‘Safe Area Search’ tool which performs buffer zoning and provides information on safe areas along with infrastructure. Figure 6 shows the safe areas in the non-plume sectors and the available safety shelters in a radius of 15-km with a complete list of the identified villages and infrastructure.
The ONERS-II with its numerical weather and dispersion models along with GIS database is configured for 7 operational NPP sites in India (Kalpakkam, Kudankulam, Kaiga, Tarapur, Kakrapara, Rawatbhatta & Narora). The system is installed in the Nuclear and Radiological Emergency Monitoring Cell (NREMC) of Atomic Energy Regulatory Board, Mumbai for monitoring.
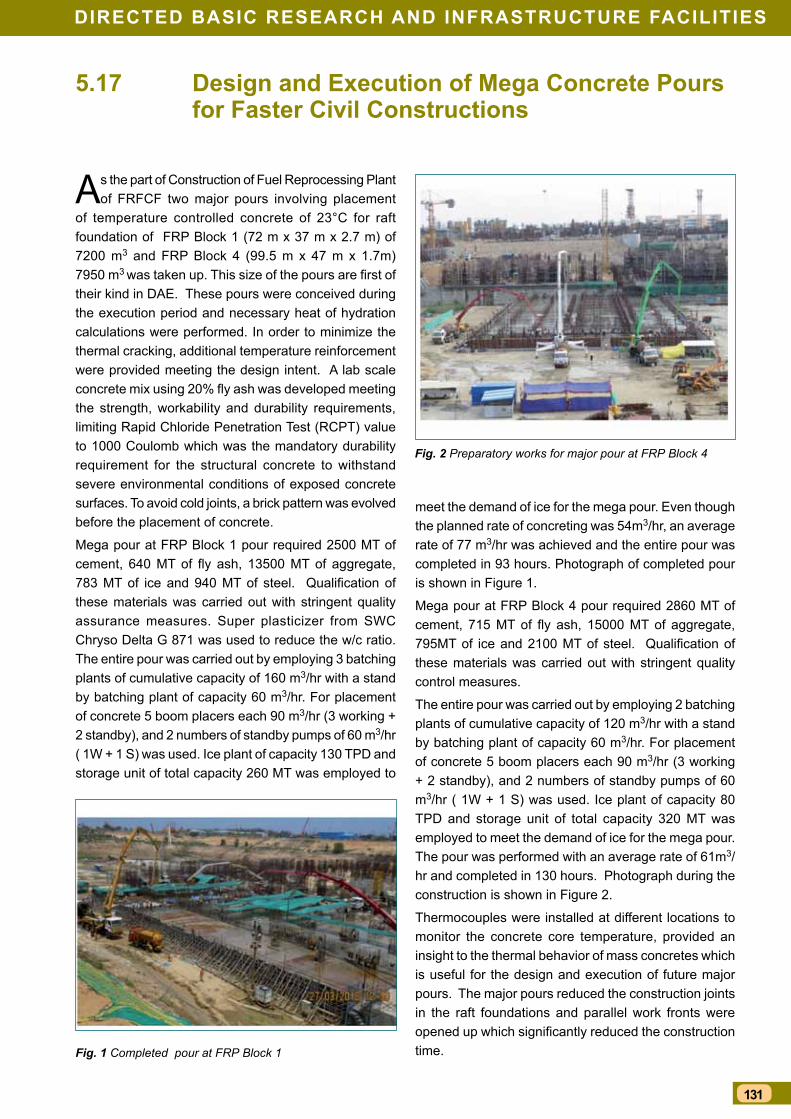
131
DirecteD Basic research anD infrastructure facilities
Design and execution of Mega concrete Pours for faster civil constructions
As the part of Construction of Fuel Reprocessing Plant of FRFCF two major pours involving placement
of temperature controlled concrete of 23°C for raft foundation of FRP Block 1 (72 m x 37 m x 2.7 m) of 7200 m3 and FRP Block 4 (99.5 m x 47 m x 1.7m) 7950 m3 was taken up. This size of the pours are first of their kind in DAE. These pours were conceived during the execution period and necessary heat of hydration calculations were performed. In order to minimize the thermal cracking, additional temperature reinforcement were provided meeting the design intent. A lab scale concrete mix using 20% fly ash was developed meeting the strength, workability and durability requirements, limiting Rapid Chloride Penetration Test (RCPT) value to 1000 Coulomb which was the mandatory durability requirement for the structural concrete to withstand severe environmental conditions of exposed concrete surfaces. To avoid cold joints, a brick pattern was evolved before the placement of concrete.
Mega pour at FRP Block 1 pour required 2500 MT of cement, 640 MT of fly ash, 13500 MT of aggregate, 783 MT of ice and 940 MT of steel. Qualification of these materials was carried out with stringent quality assurance measures. Super plasticizer from SWC Chryso Delta G 871 was used to reduce the w/c ratio. The entire pour was carried out by employing 3 batching plants of cumulative capacity of 160 m3/hr with a stand by batching plant of capacity 60 m3/hr. For placement of concrete 5 boom placers each 90 m3/hr (3 working + 2 standby), and 2 numbers of standby pumps of 60 m3/hr ( 1W + 1 S) was used. Ice plant of capacity 130 TPD and storage unit of total capacity 260 MT was employed to
5.17
meet the demand of ice for the mega pour. Even though the planned rate of concreting was 54m3/hr, an average rate of 77 m3/hr was achieved and the entire pour was completed in 93 hours. Photograph of completed pour is shown in Figure 1.
Mega pour at FRP Block 4 pour required 2860 MT of cement, 715 MT of fly ash, 15000 MT of aggregate, 795MT of ice and 2100 MT of steel. Qualification of these materials was carried out with stringent quality control measures.
The entire pour was carried out by employing 2 batching plants of cumulative capacity of 120 m3/hr with a stand by batching plant of capacity 60 m3/hr. For placement of concrete 5 boom placers each 90 m3/hr (3 working + 2 standby), and 2 numbers of standby pumps of 60 m3/hr ( 1W + 1 S) was used. Ice plant of capacity 80 TPD and storage unit of total capacity 320 MT was employed to meet the demand of ice for the mega pour. The pour was performed with an average rate of 61m3/hr and completed in 130 hours. Photograph during the construction is shown in Figure 2.
Thermocouples were installed at different locations to monitor the concrete core temperature, provided an insight to the thermal behavior of mass concretes which is useful for the design and execution of future major pours. The major pours reduced the construction joints in the raft foundations and parallel work fronts were opened up which significantly reduced the construction time.
Fig. 2 Preparatory works for major pour at FRP Block 4
Fig. 1 Completed pour at FRP Block 1
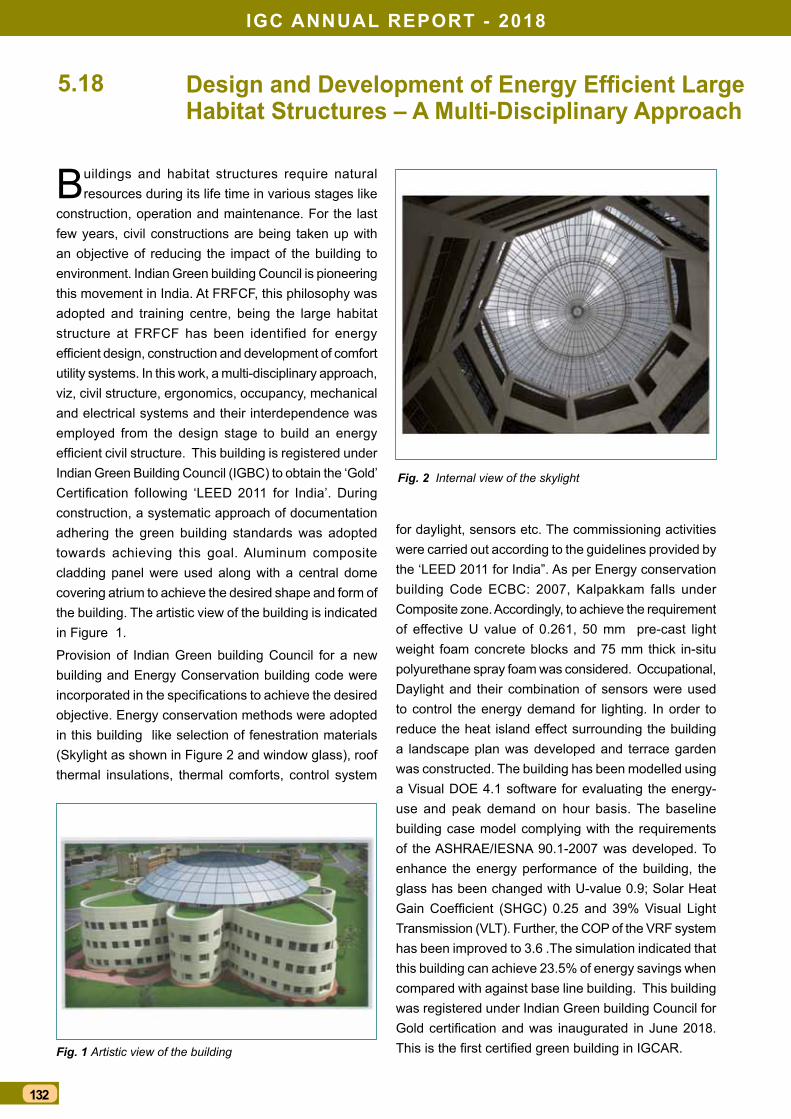
iGc annual rePOrt - 2018
132
Design and Development of Energy Efficient Large habitat structures – a Multi-Disciplinary approach
Buildings and habitat structures require natural resources during its life time in various stages like
construction, operation and maintenance. For the last few years, civil constructions are being taken up with an objective of reducing the impact of the building to environment. Indian Green building Council is pioneering this movement in India. At FRFCF, this philosophy was adopted and training centre, being the large habitat structure at FRFCF has been identified for energy efficient design, construction and development of comfort utility systems. In this work, a multi-disciplinary approach, viz, civil structure, ergonomics, occupancy, mechanical and electrical systems and their interdependence was employed from the design stage to build an energy efficient civil structure. This building is registered under Indian Green Building Council (IGBC) to obtain the ‘Gold’ Certification following ‘LEED 2011 for India’. During construction, a systematic approach of documentation adhering the green building standards was adopted towards achieving this goal. Aluminum composite cladding panel were used along with a central dome covering atrium to achieve the desired shape and form of the building. The artistic view of the building is indicated in Figure 1.
Provision of Indian Green building Council for a new building and Energy Conservation building code were incorporated in the specifications to achieve the desired objective. Energy conservation methods were adopted in this building like selection of fenestration materials (Skylight as shown in Figure 2 and window glass), roof thermal insulations, thermal comforts, control system
5.18
for daylight, sensors etc. The commissioning activities were carried out according to the guidelines provided by the ‘LEED 2011 for India”. As per Energy conservation building Code ECBC: 2007, Kalpakkam falls under Composite zone. Accordingly, to achieve the requirement of effective U value of 0.261, 50 mm pre-cast light weight foam concrete blocks and 75 mm thick in-situ polyurethane spray foam was considered. Occupational, Daylight and their combination of sensors were used to control the energy demand for lighting. In order to reduce the heat island effect surrounding the building a landscape plan was developed and terrace garden was constructed. The building has been modelled using a Visual DOE 4.1 software for evaluating the energy-use and peak demand on hour basis. The baseline building case model complying with the requirements of the ASHRAE/IESNA 90.1-2007 was developed. To enhance the energy performance of the building, the glass has been changed with U-value 0.9; Solar Heat Gain Coefficient (SHGC) 0.25 and 39% Visual Light Transmission (VLT). Further, the COP of the VRF system has been improved to 3.6 .The simulation indicated that this building can achieve 23.5% of energy savings when compared with against base line building. This building was registered under Indian Green building Council for Gold certification and was inaugurated in June 2018. This is the first certified green building in IGCAR.Fig. 1 Artistic view of the building
Fig. 2 Internal view of the skylight

133
DirecteD Basic research anD infrastructure facilities
Design and Development of Energy Efficient Large habitat structures – a Multi-Disciplinary approach
seismic Margin assessment (sMa) of a nuclear facility in frfcf using Pushover analysis
Post nuclear incidents, AERB has made Seismic Margin Assessment (SMA) mandatory for
commissioning of new nuclear facilities. Nonlinear Static Pushover Analysis (NLSPA) can be employed to find out SMA for facility structures. NLSPA offers simplicity of static analysis and its accuracy is much higher. Pushover analysis is a static, non-linear procedure in which an incremental lateral load is applied to the mathematical model of a structure in accordance with a certain predefined pattern. With such an approach, weak links and failure modes of the structure are found. The analysis is for assessing the performance levels and for assessing the margin of maximum capacity of the structure from that required for a given ground motion, which is also termed as SMA. Frequently used literature for SMA are ATC 40 and ASCE 43-05. The method of margin assessment explained in ATC 40 is called Capacity Spectrum Method (CSM). The CSM provides a graphical representation of the global force-displacement (V-D), capacity curve, of the structure and compares it to the response spectra, represents earthquake demand. The curves were further converted to Acceleration-Displacement Response Spectra (ADRS) format so as to represent both capacity and demand in same platform. Performance of a building is assessed by calculating the performance point, the global /local response of the structure and compared with specific performance goal of the building corresponding to the performance limits provided in ASCE 43-05.
SMA of Reprocessed Uranium-Oxide Plant (RUP) in FRFCF has been carried out. The structure is designed for OBE level of earthquake. Performance of structure further assessed for SSE level of earthquake. Seismic margin assessed with respect to each limit states as in ASCE 43-05. Further margin checked with impound with adjacent structure. Selection of material model is the first step. FE model is generated as shown in
5.19
Figure 1. Nonlinear hinge properties as a function of cross section of frame members developed using computation program and assigned for nonlinear simulation. Multi-layered shell elements used for simulation of shear wall nonlinear behavior. Effective stiffness for structural elements pre-yielding taken as, Beam=0.5EcI, Column=0.7EcI. Loading has been carried out first gravity push then lateral load in proportion to fundamental mode to obtain capacity curve, indicated in Figure 2. The capacity curve and response spectra merged in ADRS to obtain performance point using an in-house developed computation program.
Performance objective, inter story drift and structural member rotation from pushover analysis of RUP structure has been compared with allowable limits of ASCE 43-05. The structure being adjacent to RUP zone 2, impounding of building forms critical and hence, checked. Performance point assessed using procedure A, stated in ATC 40, results presented in Table 1 and seismic margin with different limit state in Table 2. The performance objective reached at a PGA of 0.249g. Hence, a seismic margin with respect to LS D is found to be 3.2. A seismic margin of 3.9 is found against impound in the N-S direction.
0 0.05 0.10 0.15 0.20Roof displacement (m)
1086420
Bas
e Sh
ear (
kN) x
104
Fig. 1 FE model for RUP
Fig. 2 Capacity curve V-D in E-W dir; performance point assessment in ADRS
Table 1: Pushover parameters at prescribed limitsLimit
statesY(EW) X(NS)
ASCE 43-05
PGA (/g)
roof disp (m)
Base shear (kN)
Beta eff. (%)
PGA (/g)
roof disp (m)
Base shear (kN)
Beta eff. (%)
OBE 0.078 0.014 13319 4 0.078 0.014 13423 4.00
LS D 0.249 0.043 42518 4 0.292 0.051 50252 4.00LS C 0.267 0.047 45339 4.1 0.355 0.062 59902 4.54LS B 0.482 0.074 66067 7.03 0.627 0.095 83500 7.29LS A 0.684 0.1 76446 11.1 0.828 0.122 95186 10.4
LSsep gap
- - 0.303 0.053 51764 4.11
Table 2: Seismic marginLimit states LS D LS C LS B LS A LS imp
E-W 3.2 3.4 6.2 8.8 -N-S 3.74 4.5 8.0 10.6 3.9
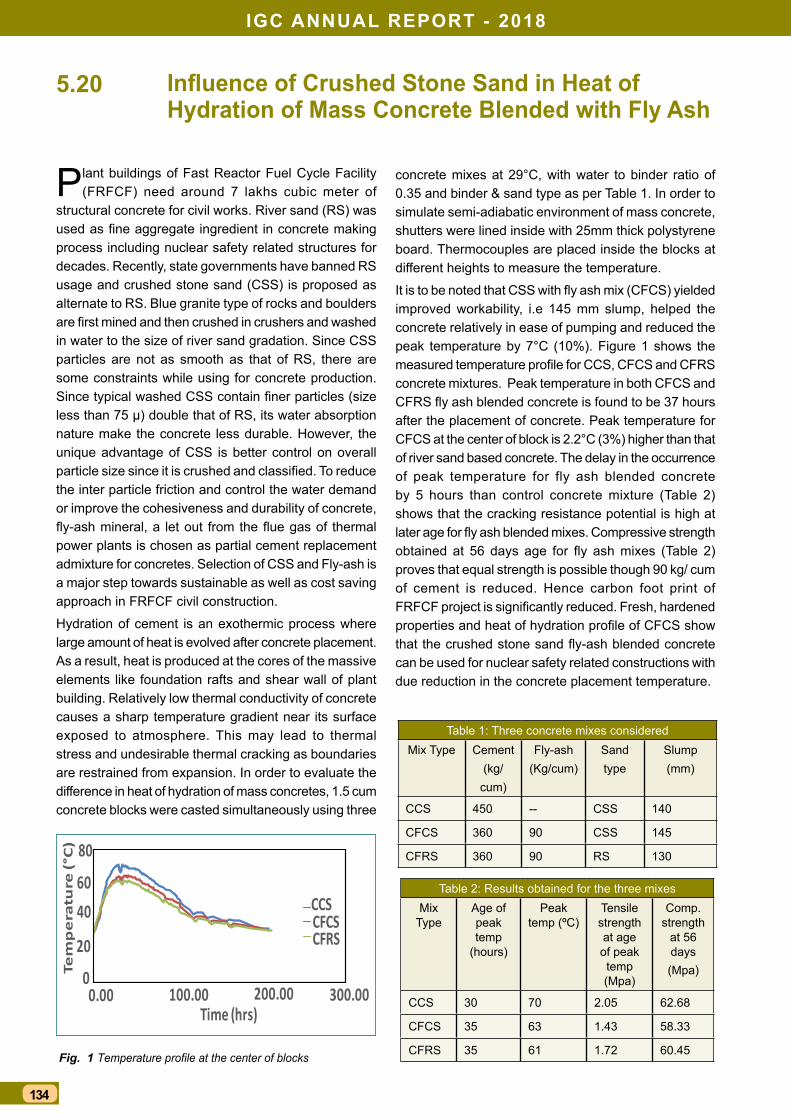
iGc annual rePOrt - 2018
134
Influence of Crushed Stone Sand in Heat of hydration of Mass concrete Blended with fly ash
Plant buildings of Fast Reactor Fuel Cycle Facility (FRFCF) need around 7 lakhs cubic meter of
structural concrete for civil works. River sand (RS) was used as fine aggregate ingredient in concrete making process including nuclear safety related structures for decades. Recently, state governments have banned RS usage and crushed stone sand (CSS) is proposed as alternate to RS. Blue granite type of rocks and boulders are first mined and then crushed in crushers and washed in water to the size of river sand gradation. Since CSS particles are not as smooth as that of RS, there are some constraints while using for concrete production. Since typical washed CSS contain finer particles (size less than 75 µ) double that of RS, its water absorption nature make the concrete less durable. However, the unique advantage of CSS is better control on overall particle size since it is crushed and classified. To reduce the inter particle friction and control the water demand or improve the cohesiveness and durability of concrete, fly-ash mineral, a let out from the flue gas of thermal power plants is chosen as partial cement replacement admixture for concretes. Selection of CSS and Fly-ash is a major step towards sustainable as well as cost saving approach in FRFCF civil construction.
Hydration of cement is an exothermic process where large amount of heat is evolved after concrete placement. As a result, heat is produced at the cores of the massive elements like foundation rafts and shear wall of plant building. Relatively low thermal conductivity of concrete causes a sharp temperature gradient near its surface exposed to atmosphere. This may lead to thermal stress and undesirable thermal cracking as boundaries are restrained from expansion. In order to evaluate the difference in heat of hydration of mass concretes, 1.5 cum concrete blocks were casted simultaneously using three
5.20
0
20
4060
80
0.00 100.00 200.00 300.00
Tem
pe
ratu
re (°
C)
Time (hrs)
CCSCFCSCFRS
Fig. 1 Temperature profile at the center of blocks
concrete mixes at 29°C, with water to binder ratio of 0.35 and binder & sand type as per Table 1. In order to simulate semi-adiabatic environment of mass concrete, shutters were lined inside with 25mm thick polystyrene board. Thermocouples are placed inside the blocks at different heights to measure the temperature.
It is to be noted that CSS with fly ash mix (CFCS) yielded improved workability, i.e 145 mm slump, helped the concrete relatively in ease of pumping and reduced the peak temperature by 7°C (10%). Figure 1 shows the measured temperature profile for CCS, CFCS and CFRS concrete mixtures. Peak temperature in both CFCS and CFRS fly ash blended concrete is found to be 37 hours after the placement of concrete. Peak temperature for CFCS at the center of block is 2.2°C (3%) higher than that of river sand based concrete. The delay in the occurrence of peak temperature for fly ash blended concrete by 5 hours than control concrete mixture (Table 2) shows that the cracking resistance potential is high at later age for fly ash blended mixes. Compressive strength obtained at 56 days age for fly ash mixes (Table 2) proves that equal strength is possible though 90 kg/ cum of cement is reduced. Hence carbon foot print of FRFCF project is significantly reduced. Fresh, hardened properties and heat of hydration profile of CFCS show that the crushed stone sand fly-ash blended concrete can be used for nuclear safety related constructions with due reduction in the concrete placement temperature.
Table 1: Three concrete mixes consideredMix Type Cement
(kg/cum)
Fly-ash (Kg/cum)
Sand type
Slump (mm)
CCS 450 -- CSS 140
CFCS 360 90 CSS 145
CFRS 360 90 RS 130
Table 2: Results obtained for the three mixesMix
TypeAge of peak temp
(hours)
Peak temp (ºC)
Tensile strength at age of peak temp (Mpa)
Comp. strength
at 56 days(Mpa)
CCS 30 70 2.05 62.68
CFCS 35 63 1.43 58.33
CFRS 35 61 1.72 60.45
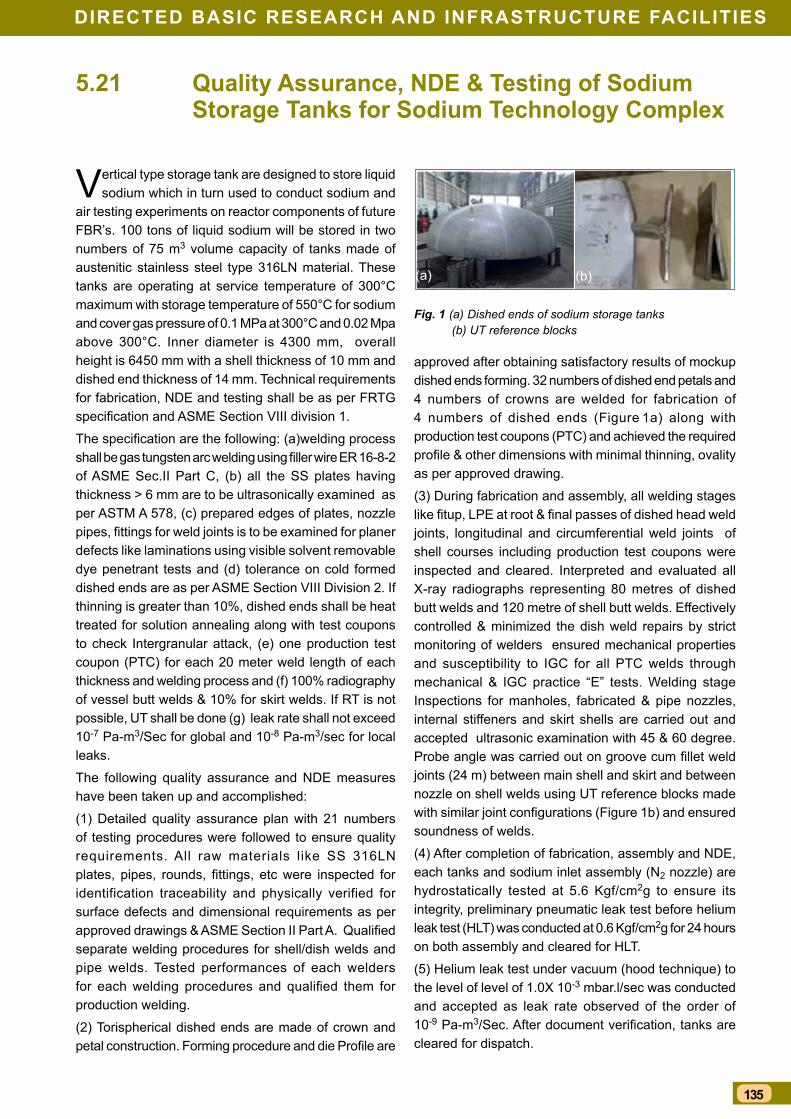
135
DirecteD Basic research anD infrastructure facilities
Quality assurance, nDe & testing of sodium storage tanks for sodium technology complex
Vertical type storage tank are designed to store liquid sodium which in turn used to conduct sodium and
air testing experiments on reactor components of future FBR’s. 100 tons of liquid sodium will be stored in two numbers of 75 m3 volume capacity of tanks made of austenitic stainless steel type 316LN material. These tanks are operating at service temperature of 300°C maximum with storage temperature of 550°C for sodium and cover gas pressure of 0.1 MPa at 300°C and 0.02 Mpa above 300°C. Inner diameter is 4300 mm, overall height is 6450 mm with a shell thickness of 10 mm and dished end thickness of 14 mm. Technical requirements for fabrication, NDE and testing shall be as per FRTG specification and ASME Section VIII division 1.
The specification are the following: (a)welding process shall be gas tungsten arc welding using filler wire ER 16-8-2 of ASME Sec.II Part C, (b) all the SS plates having thickness > 6 mm are to be ultrasonically examined as per ASTM A 578, (c) prepared edges of plates, nozzle pipes, fittings for weld joints is to be examined for planer defects like laminations using visible solvent removable dye penetrant tests and (d) tolerance on cold formed dished ends are as per ASME Section VIII Division 2. If thinning is greater than 10%, dished ends shall be heat treated for solution annealing along with test coupons to check Intergranular attack, (e) one production test coupon (PTC) for each 20 meter weld length of each thickness and welding process and (f) 100% radiography of vessel butt welds & 10% for skirt welds. If RT is not possible, UT shall be done (g) leak rate shall not exceed 10-7 Pa-m3/Sec for global and 10-8 Pa-m3/sec for local leaks.
The following quality assurance and NDE measures have been taken up and accomplished:
(1) Detailed quality assurance plan with 21 numbers of testing procedures were followed to ensure quality requirements. All raw materials like SS 316LN plates, pipes, rounds, fittings, etc were inspected for identification traceability and physically verified for surface defects and dimensional requirements as per approved drawings & ASME Section II Part A. Qualified separate welding procedures for shell/dish welds and pipe welds. Tested performances of each welders for each welding procedures and qualified them for production welding.
(2) Torispherical dished ends are made of crown and petal construction. Forming procedure and die Profile are
Fig. 1 (a) Dished ends of sodium storage tanks (b) UT reference blocks
approved after obtaining satisfactory results of mockup dished ends forming. 32 numbers of dished end petals and 4 numbers of crowns are welded for fabrication of 4 numbers of dished ends (Figure 1a) along with production test coupons (PTC) and achieved the required profile & other dimensions with minimal thinning, ovality as per approved drawing.
(3) During fabrication and assembly, all welding stages like fitup, LPE at root & final passes of dished head weld joints, longitudinal and circumferential weld joints of shell courses including production test coupons were inspected and cleared. Interpreted and evaluated all X-ray radiographs representing 80 metres of dished butt welds and 120 metre of shell butt welds. Effectively controlled & minimized the dish weld repairs by strict monitoring of welders ensured mechanical properties and susceptibility to IGC for all PTC welds through mechanical & IGC practice “E” tests. Welding stage Inspections for manholes, fabricated & pipe nozzles, internal stiffeners and skirt shells are carried out and accepted ultrasonic examination with 45 & 60 degree. Probe angle was carried out on groove cum fillet weld joints (24 m) between main shell and skirt and between nozzle on shell welds using UT reference blocks made with similar joint configurations (Figure 1b) and ensured soundness of welds.
(4) After completion of fabrication, assembly and NDE, each tanks and sodium inlet assembly (N2 nozzle) are hydrostatically tested at 5.6 Kgf/cm2g to ensure its integrity, preliminary pneumatic leak test before helium leak test (HLT) was conducted at 0.6 Kgf/cm2g for 24 hours on both assembly and cleared for HLT.
(5) Helium leak test under vacuum (hood technique) to the level of level of 1.0X 10⁻³ mbar.l/sec was conducted and accepted as leak rate observed of the order of 10-9 Pa-m3/Sec. After document verification, tanks are cleared for dispatch.
5.21
(a) (b)
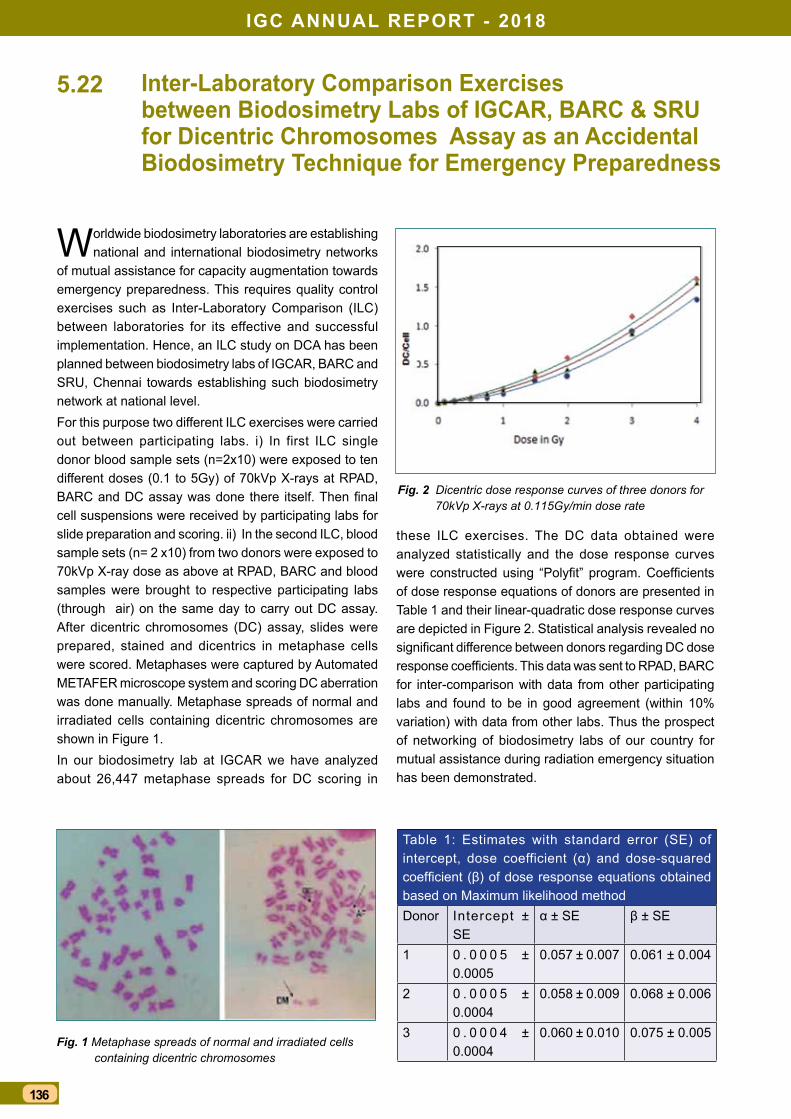
iGc annual rePOrt - 2018
136
Worldwide biodosimetry laboratories are establishing national and international biodosimetry networks
of mutual assistance for capacity augmentation towards emergency preparedness. This requires quality control exercises such as Inter-Laboratory Comparison (ILC) between laboratories for its effective and successful implementation. Hence, an ILC study on DCA has been planned between biodosimetry labs of IGCAR, BARC and SRU, Chennai towards establishing such biodosimetry network at national level.For this purpose two different ILC exercises were carried out between participating labs. i) In first ILC single donor blood sample sets (n=2x10) were exposed to ten different doses (0.1 to 5Gy) of 70kVp X-rays at RPAD, BARC and DC assay was done there itself. Then final cell suspensions were received by participating labs for slide preparation and scoring. ii) In the second ILC, blood sample sets (n= 2 x10) from two donors were exposed to 70kVp X-ray dose as above at RPAD, BARC and blood samples were brought to respective participating labs (through air) on the same day to carry out DC assay. After dicentric chromosomes (DC) assay, slides were prepared, stained and dicentrics in metaphase cells were scored. Metaphases were captured by Automated METAFER microscope system and scoring DC aberration was done manually. Metaphase spreads of normal and irradiated cells containing dicentric chromosomes are shown in Figure 1.In our biodosimetry lab at IGCAR we have analyzed about 26,447 metaphase spreads for DC scoring in
5.22
these ILC exercises. The DC data obtained were analyzed statistically and the dose response curves were constructed using “Polyfit” program. Coefficients of dose response equations of donors are presented in Table 1 and their linear-quadratic dose response curves are depicted in Figure 2. Statistical analysis revealed no significant difference between donors regarding DC dose response coefficients. This data was sent to RPAD, BARC for inter-comparison with data from other participating labs and found to be in good agreement (within 10% variation) with data from other labs. Thus the prospect of networking of biodosimetry labs of our country for mutual assistance during radiation emergency situation has been demonstrated.
Fig. 1 Metaphase spreads of normal and irradiated cells containing dicentric chromosomes
Fig. 2 Dicentric dose response curves of three donors for 70kVp X-rays at 0.115Gy/min dose rate
inter-laboratory comparison exercises between Biodosimetry labs of iGcar, Barc & sru for Dicentric chromosomes assay as an accidental Biodosimetry technique for emergency Preparedness
Table 1: Estimates with standard error (SE) of intercept, dose coefficient (α) and dose-squared coefficient (β) of dose response equations obtained based on Maximum likelihood methodDonor Intercept ±
SEα ± SE β ± SE
1 0 . 0 0 0 5 ± 0.0005
0.057 ± 0.007 0.061 ± 0.004
2 0 . 0 0 0 5 ± 0.0004
0.058 ± 0.009 0.068 ± 0.006
3 0 . 0 0 0 4 ± 0.0004
0.060 ± 0.010 0.075 ± 0.005
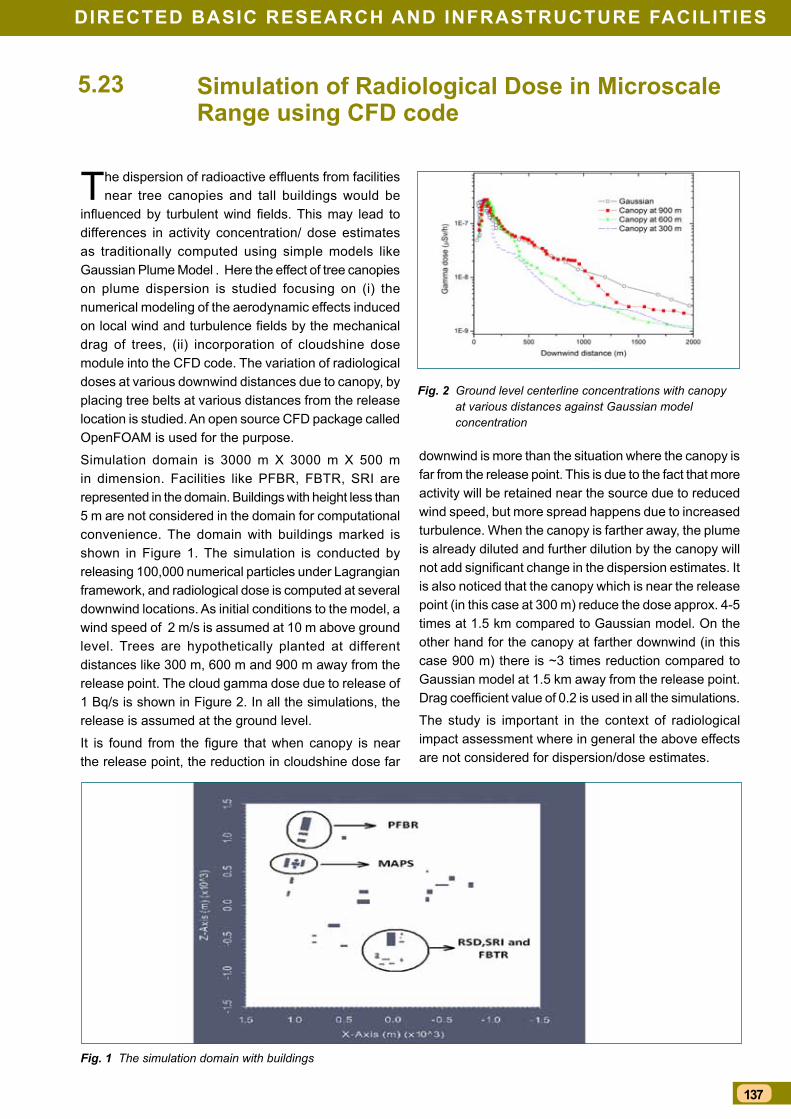
137
DirecteD Basic research anD infrastructure facilities
simulation of radiological Dose in Microscale range using cfD code
The dispersion of radioactive effluents from facilities near tree canopies and tall buildings would be
influenced by turbulent wind fields. This may lead to differences in activity concentration/ dose estimates as traditionally computed using simple models like Gaussian Plume Model . Here the effect of tree canopies on plume dispersion is studied focusing on (i) the numerical modeling of the aerodynamic effects induced on local wind and turbulence fields by the mechanical drag of trees, (ii) incorporation of cloudshine dose module into the CFD code. The variation of radiological doses at various downwind distances due to canopy, by placing tree belts at various distances from the release location is studied. An open source CFD package called OpenFOAM is used for the purpose.
Simulation domain is 3000 m X 3000 m X 500 m in dimension. Facilities like PFBR, FBTR, SRI are represented in the domain. Buildings with height less than 5 m are not considered in the domain for computational convenience. The domain with buildings marked is shown in Figure 1. The simulation is conducted by releasing 100,000 numerical particles under Lagrangian framework, and radiological dose is computed at several downwind locations. As initial conditions to the model, a wind speed of 2 m/s is assumed at 10 m above ground level. Trees are hypothetically planted at different distances like 300 m, 600 m and 900 m away from the release point. The cloud gamma dose due to release of 1 Bq/s is shown in Figure 2. In all the simulations, the release is assumed at the ground level.
It is found from the figure that when canopy is near the release point, the reduction in cloudshine dose far
5.23
downwind is more than the situation where the canopy is far from the release point. This is due to the fact that more activity will be retained near the source due to reduced wind speed, but more spread happens due to increased turbulence. When the canopy is farther away, the plume is already diluted and further dilution by the canopy will not add significant change in the dispersion estimates. It is also noticed that the canopy which is near the release point (in this case at 300 m) reduce the dose approx. 4-5 times at 1.5 km compared to Gaussian model. On the other hand for the canopy at farther downwind (in this case 900 m) there is ~3 times reduction compared to Gaussian model at 1.5 km away from the release point. Drag coefficient value of 0.2 is used in all the simulations.
The study is important in the context of radiological impact assessment where in general the above effects are not considered for dispersion/dose estimates.
Fig. 1 The simulation domain with buildings
Fig. 2 Ground level centerline concentrations with canopy at various distances against Gaussian model concentration
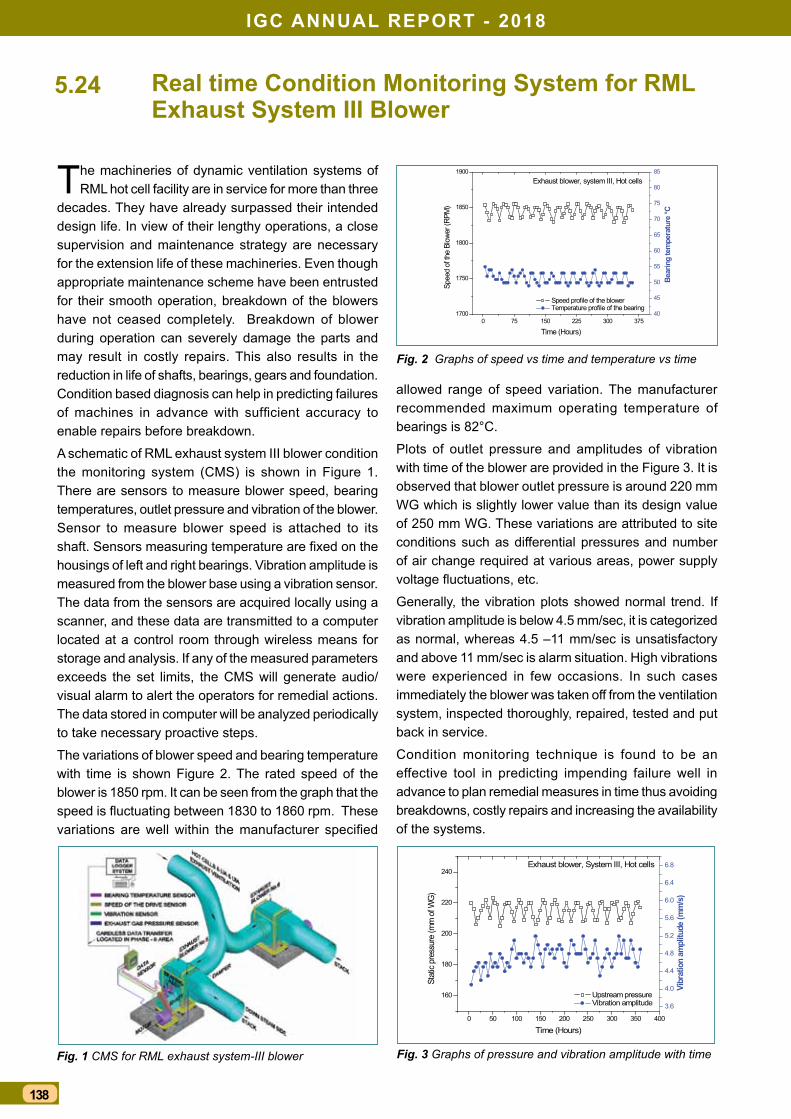
iGc annual rePOrt - 2018
138
real time condition Monitoring system for rMl exhaust system iii Blower
The machineries of dynamic ventilation systems of RML hot cell facility are in service for more than three
decades. They have already surpassed their intended design life. In view of their lengthy operations, a close supervision and maintenance strategy are necessary for the extension life of these machineries. Even though appropriate maintenance scheme have been entrusted for their smooth operation, breakdown of the blowers have not ceased completely. Breakdown of blower during operation can severely damage the parts and may result in costly repairs. This also results in the reduction in life of shafts, bearings, gears and foundation. Condition based diagnosis can help in predicting failures of machines in advance with sufficient accuracy to enable repairs before breakdown.
A schematic of RML exhaust system III blower condition the monitoring system (CMS) is shown in Figure 1. There are sensors to measure blower speed, bearing temperatures, outlet pressure and vibration of the blower. Sensor to measure blower speed is attached to its shaft. Sensors measuring temperature are fixed on the housings of left and right bearings. Vibration amplitude is measured from the blower base using a vibration sensor. The data from the sensors are acquired locally using a scanner, and these data are transmitted to a computer located at a control room through wireless means for storage and analysis. If any of the measured parameters exceeds the set limits, the CMS will generate audio/visual alarm to alert the operators for remedial actions. The data stored in computer will be analyzed periodically to take necessary proactive steps.
The variations of blower speed and bearing temperature with time is shown Figure 2. The rated speed of the blower is 1850 rpm. It can be seen from the graph that the speed is fluctuating between 1830 to 1860 rpm. These variations are well within the manufacturer specified
5.24
allowed range of speed variation. The manufacturer recommended maximum operating temperature of bearings is 82°C.
Plots of outlet pressure and amplitudes of vibration with time of the blower are provided in the Figure 3. It is observed that blower outlet pressure is around 220 mm WG which is slightly lower value than its design value of 250 mm WG. These variations are attributed to site conditions such as differential pressures and number of air change required at various areas, power supply voltage fluctuations, etc.
Generally, the vibration plots showed normal trend. If vibration amplitude is below 4.5 mm/sec, it is categorized as normal, whereas 4.5 –11 mm/sec is unsatisfactory and above 11 mm/sec is alarm situation. High vibrations were experienced in few occasions. In such cases immediately the blower was taken off from the ventilation system, inspected thoroughly, repaired, tested and put back in service.
Condition monitoring technique is found to be an effective tool in predicting impending failure well in advance to plan remedial measures in time thus avoiding breakdowns, costly repairs and increasing the availability of the systems.
0 75 150 225 300 3751700
1750
1800
1850
1900Exhaust blower, system III, Hot cells
Speed profile of the blower Temperature profile of the bearing
Time (Hours)
Spee
d of
the
Blow
er (R
PM)
40
45
50
55
60
65
70
75
80
85
Bear
ing
tem
pera
ture
°C
0 50 100 150 200 250 300 350 400
160
180
200
220
240Exhaust blower, System III, Hot cells
Upstream pressure Vibration amplitude
Time (Hours)
Stat
ic pr
essu
re (m
m o
f WG)
3.6
4.0
4.4
4.8
5.2
5.6
6.0
6.4
6.8
Vibr
atio
n am
plitu
de (m
m/s)
Fig. 2 Graphs of speed vs time and temperature vs time
Fig. 3 Graphs of pressure and vibration amplitude with timeFig. 1 CMS for RML exhaust system-III blower
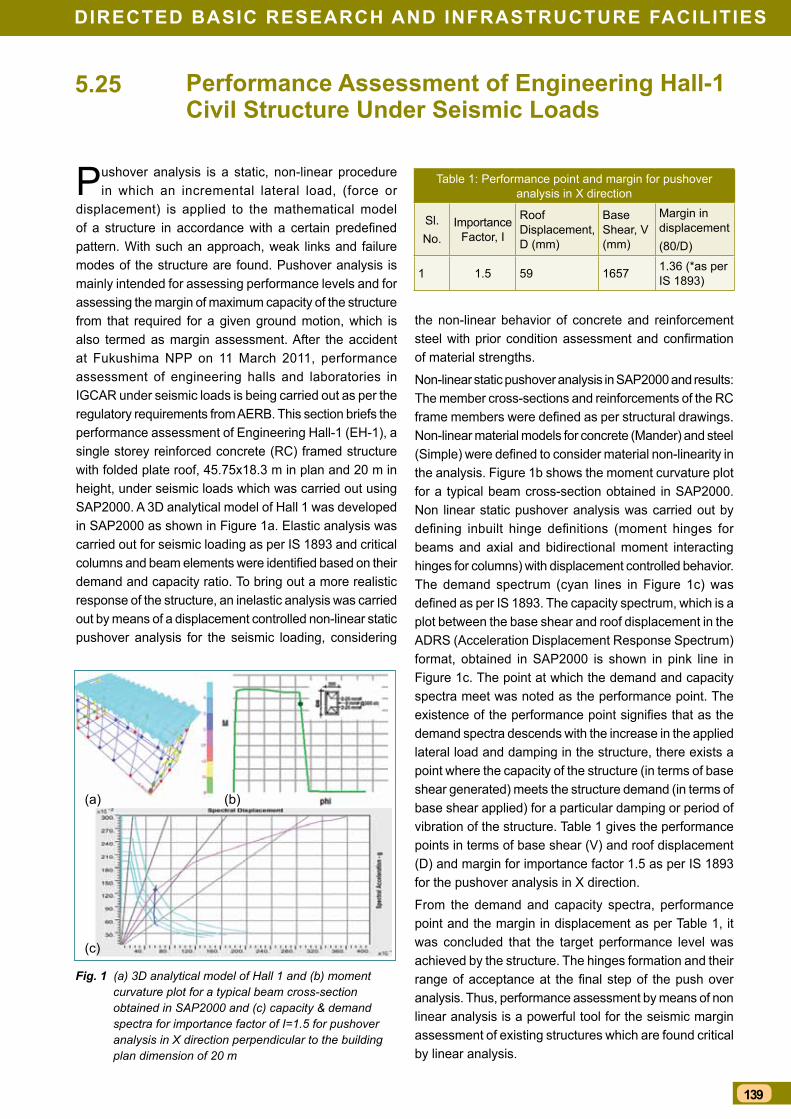
139
DirecteD Basic research anD infrastructure facilities
Performance assessment of engineering hall-1 civil structure under seismic loads
Pushover analysis is a static, non-linear procedure in which an incremental lateral load, (force or
displacement) is applied to the mathematical model of a structure in accordance with a certain predefined pattern. With such an approach, weak links and failure modes of the structure are found. Pushover analysis is mainly intended for assessing performance levels and for assessing the margin of maximum capacity of the structure from that required for a given ground motion, which is also termed as margin assessment. After the accident at Fukushima NPP on 11 March 2011, performance assessment of engineering halls and laboratories in IGCAR under seismic loads is being carried out as per the regulatory requirements from AERB. This section briefs the performance assessment of Engineering Hall-1 (EH-1), a single storey reinforced concrete (RC) framed structure with folded plate roof, 45.75x18.3 m in plan and 20 m in height, under seismic loads which was carried out using SAP2000. A 3D analytical model of Hall 1 was developed in SAP2000 as shown in Figure 1a. Elastic analysis was carried out for seismic loading as per IS 1893 and critical columns and beam elements were identified based on their demand and capacity ratio. To bring out a more realistic response of the structure, an inelastic analysis was carried out by means of a displacement controlled non-linear static pushover analysis for the seismic loading, considering
5.25
the non-linear behavior of concrete and reinforcement steel with prior condition assessment and confirmation of material strengths.
Non-linear static pushover analysis in SAP2000 and results: The member cross-sections and reinforcements of the RC frame members were defined as per structural drawings. Non-linear material models for concrete (Mander) and steel (Simple) were defined to consider material non-linearity in the analysis. Figure 1b shows the moment curvature plot for a typical beam cross-section obtained in SAP2000. Non linear static pushover analysis was carried out by defining inbuilt hinge definitions (moment hinges for beams and axial and bidirectional moment interacting hinges for columns) with displacement controlled behavior. The demand spectrum (cyan lines in Figure 1c) was defined as per IS 1893. The capacity spectrum, which is a plot between the base shear and roof displacement in the ADRS (Acceleration Displacement Response Spectrum) format, obtained in SAP2000 is shown in pink line in Figure 1c. The point at which the demand and capacity spectra meet was noted as the performance point. The existence of the performance point signifies that as the demand spectra descends with the increase in the applied lateral load and damping in the structure, there exists a point where the capacity of the structure (in terms of base shear generated) meets the structure demand (in terms of base shear applied) for a particular damping or period of vibration of the structure. Table 1 gives the performance points in terms of base shear (V) and roof displacement (D) and margin for importance factor 1.5 as per IS 1893 for the pushover analysis in X direction.
From the demand and capacity spectra, performance point and the margin in displacement as per Table 1, it was concluded that the target performance level was achieved by the structure. The hinges formation and their range of acceptance at the final step of the push over analysis. Thus, performance assessment by means of non linear analysis is a powerful tool for the seismic margin assessment of existing structures which are found critical by linear analysis.
Fig. 1 (a) 3D analytical model of Hall 1 and (b) moment curvature plot for a typical beam cross-section obtained in SAP2000 and (c) capacity & demand spectra for importance factor of I=1.5 for pushover analysis in X direction perpendicular to the building plan dimension of 20 m
Table 1: Performance point and margin for pushover analysis in X direction
Sl.No.
Importance Factor, I
Roof Displacement, D (mm)
Base Shear, V (mm)
Margin in displacement(80/D)
1 1.5 59 1657 1.36 (*as per IS 1893)
(a)
(c)
(b)

iGc annual rePOrt - 2018
140
introduction of Dc lighting for laboratory environment
The concept of LVDC (Low voltage DC) for distribution has drawn the interest of electrical community in
recent years. The indications are that use of LVDC powered load within homes, offices and labs will be realized in the near future. DC powered LED fixtures and fans show inherent advantages in comparison to their AC counterparts. There is clear cut advantage in terms of efficiency, reliability and life cycle cost. Realising the importance, it was decided to introduce LVDC powered lighting system in IGCAR. A pilot project with SELV (safety extra low voltage) distribution comprising 48V DC lighting & fans is recently commissioned at MMG II building at IGCAR north plant site.
LED operates on DC power. The generally used AC power line requires an AC-DC converter to be used in conjunction with the LED fixture. These converters called drivers when made for each fixture (as in the normal case) will be of lower rating and lot of optimization is done at component level to make it economic. But if the drivers are combined and DC is distributed the convertor will be of higher rating say 600 W or 1000 W. At this capacity it is possible to utilise rated components economically which gives superior performance and longer life. At the LED fixture end a DC driver is used. This method is adopted in the IGCAR project.
The LVDC system deployed has converter panel (Figure 1) to receive AC as input and output as DC. Converter panel contains multiple converters and are paralleled. Near equal load sharing is achieved by communication link between the converters. The DC output from converter panel is wired to lighting sub distribution boards and from there to different types of DC LED fixtures and fans through control switches (Figure 2). The DC voltage level adopted is 48V. This is a safe extra low voltage which gives lesser cable loss compared to 12V/24V DC systems. Various forums in India viz., BIS, CEA decided to adopt 48V DC. 48V DC voltage is becoming the de-facto standard for power up to 500W in each loop.
Power conversion efficiency: A well designed AC/DC driver at 18W has power conversion efficiency of 85%. On the other hand, a well-designed DC-driver for the same wattage can provide conversion efficiency of about 95%.
Luminous efficacy: LED lights are significantly more efficient compared to conventional lights because of the lower power consumption and narrow beam angle which reduces the light loss. For the same wattage, the system efficacy of LED with LVDC powering compared to other
5.26
available light sources is better due to a combination of improved lumen/W as well as driver efficiency.
Reliability: There are two main reasons for failures of AC drivers in the field.
i. Lack of or improper surge protection at the front end
ii. Use of components with lower margins on economic considerations
iii.Usage of electrolytic capacitors (instead of film capacitors) after the front end rectifier for filtering AC ripple and removal of switching noise.
DC drivers do not require surge protection circuitry & filter capacitors and have much lesser number of components leading to a more reliable product as compared to AC drivers. Entire driver circuitry including all the protection features is available as single IC package, to be used in low power applications up to about 20 W. As the IC versions require very minimal external components, the driver can be miniaturized with enhanced reliability.
DC powered LED has caught the attention of lighting industry internationally. Major attractions are improved efficiency & lower maintenance leading to lower life cycle cost and in turn lower carbon foot print. With climate change and sustainable energy being the foremost topic of current discourse, DC powered LED lighting has a role to play. A prototype is made and will be expanded to future buildings based on the O&M experience gathered from this project.
Fig. 1 Converter panel in electrical room
Fig. 2 Corridor and laboratory at MMG II illuminated by 48V LED fixtures
141
DirecteD Basic research anD infrastructure facilities
upgradation of 33 kV iGcar feeder no.2 at MaPs
Thirty three kV Central Switching Station (CSS), IGCAR receives two feeders from MAPS and
one from BHAVINI. 33 kV CSS caters to the power requirement of IGCAR and all the DAE facilities at Kalpakkam since 40 years. Planning was afoot to upgrade the system capacity to meet the expected load growth in the near future. During this time a major problem developed with the old 25 MVA 230/33 kV transformer-2 at MAPS feeding IGCAR. Coincident to that as part of Fukushima retrofit, MAPS came up with a request for a 6.6 kV power supply whose components are to be placed at a higher elevation. A committee constituting IGCAR and MAPS Engineers considered the aspects like post Fukushima requirements, projected power need for the next 20 years & the cost benefits and concluded to upgrade the old transformer with new 3 winding transformer of higher capacity and locate all the system components at elevated platforms.
Old transformer with 230 kV wall bushings was located in the indoor bay. The new transformer is rated for 47/35/12 MVA, 230/33/6.6 kV which will meet the expected future demand of IGCAR and emergency load requirement of MAPS (Figure 1). The following layout configuration is made to meet the post Fukushima requirement mandated by AERB.
The existing indoor bay of old transformer is converted to switchgear room and a platform constructed at 13.2 m Reduced level (RL). The 47 MVA new transformer is located outdoor on an elevated platform at 13.2 m RL. 230 kV wall bushing CTs extending the 230 kV supply to new transformer are placed at an elevation of 9.5 m from Finished Floor Level. Retrofitting of existing transformer bay into Fukushima complied 230 kV bay was a challenging task which involved precise layout of indoor and outdoor equipment to meet mandatory electrical clearances. This was the most difficult task
5.27
as multiple equipment of varying voltage levels were to be located in a limited area at different elevations without compromising the mandatory clearances for each equipment. After many iterations optimum layout meeting all clearances was made with 3D AUTO CAD modelling.
Special civil structures were constructed for installation of 230 kV wall bushings each weighing 1.2 T, modification of existing indoor transformer bay into elevated platform for switchgear, construction of elevated concrete structures for installation of the transformer & radiators weighing 128 Tons and construction of new oil collection pit with enhanced capacity.
Procurement, installation and testing of 6 numbers 230 kV wall bushings, 47 MVA 230 kV transformer (Figure 1), 33 kV & 6.6 kV switchboards, integrating the system with 230 kV switchyard and 33 kV & 6.6 kV under ground cables, control relay and protection panels, control cables between transformer bay to relay room at turbine building, mulsifire protection for automatic fire protection of the transformer etc.
47 MVA transformer is provided with state of the art online monitoring systems like 230 kV bushing monitoring system which monitors healthiness (tanδ) of the EHV bushings, transformer oil monitoring system, fibre optic measuring system mainly for continuous monitoring of hot spot temperatures of windings etc. 33 kV and 6.6 kV switchgears are provided with arc flash detection system for better personal & equipment safety.
Complete system is erected, tested and kept ready for commissioning. Feeder will be energized during biennial shutdown of MAPS i.e. in December, 2018. Energisation of this feeder strengthens the power source capability for all DAE units of Kalpakkam campus and will meet the offsite emergency power requirement of MAPS.
Fig. 1 47 MVA transformer
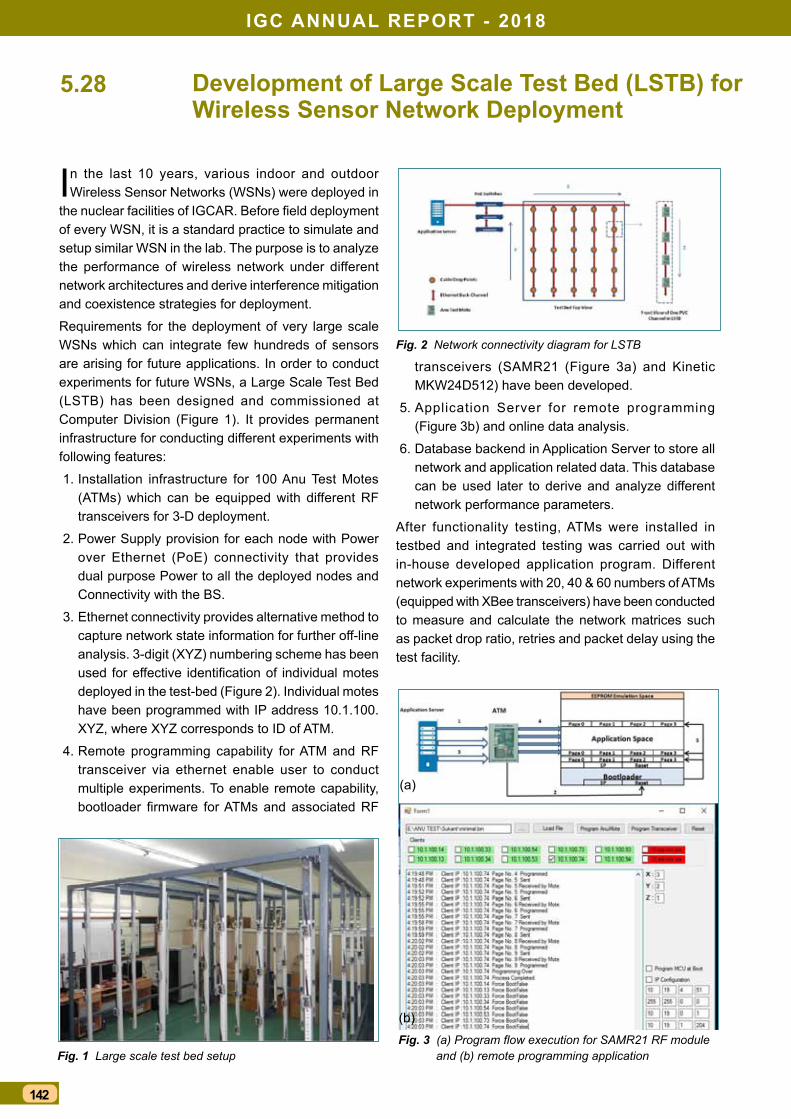
iGc annual rePOrt - 2018
142
Development of large scale test Bed (lstB) for Wireless sensor network Deployment
In the last 10 years, various indoor and outdoor Wireless Sensor Networks (WSNs) were deployed in
the nuclear facilities of IGCAR. Before field deployment of every WSN, it is a standard practice to simulate and setup similar WSN in the lab. The purpose is to analyze the performance of wireless network under different network architectures and derive interference mitigation and coexistence strategies for deployment.
Requirements for the deployment of very large scale WSNs which can integrate few hundreds of sensors are arising for future applications. In order to conduct experiments for future WSNs, a Large Scale Test Bed (LSTB) has been designed and commissioned at Computer Division (Figure 1). It provides permanent infrastructure for conducting different experiments with following features:
1. Installation infrastructure for 100 Anu Test Motes (ATMs) which can be equipped with different RF transceivers for 3-D deployment.
2. Power Supply provision for each node with Power over Ethernet (PoE) connectivity that provides dual purpose Power to all the deployed nodes and Connectivity with the BS.
3. Ethernet connectivity provides alternative method to capture network state information for further off-line analysis. 3-digit (XYZ) numbering scheme has been used for effective identification of individual motes deployed in the test-bed (Figure 2). Individual motes have been programmed with IP address 10.1.100.XYZ, where XYZ corresponds to ID of ATM.
4. Remote programming capability for ATM and RF transceiver via ethernet enable user to conduct multiple experiments. To enable remote capability, bootloader firmware for ATMs and associated RF
5.28
transceivers (SAMR21 (Figure 3a) and Kinetic MKW24D512) have been developed.
5. Application Server for remote programming (Figure 3b) and online data analysis.
6. Database backend in Application Server to store all network and application related data. This database can be used later to derive and analyze different network performance parameters.
After functionality testing, ATMs were installed in testbed and integrated testing was carried out with in-house developed application program. Different network experiments with 20, 40 & 60 numbers of ATMs (equipped with XBee transceivers) have been conducted to measure and calculate the network matrices such as packet drop ratio, retries and packet delay using the test facility.
Fig. 1 Large scale test bed setupFig. 3 (a) Program flow execution for SAMR21 RF module
and (b) remote programming application
Fig. 2 Network connectivity diagram for LSTB
(a)
(b)
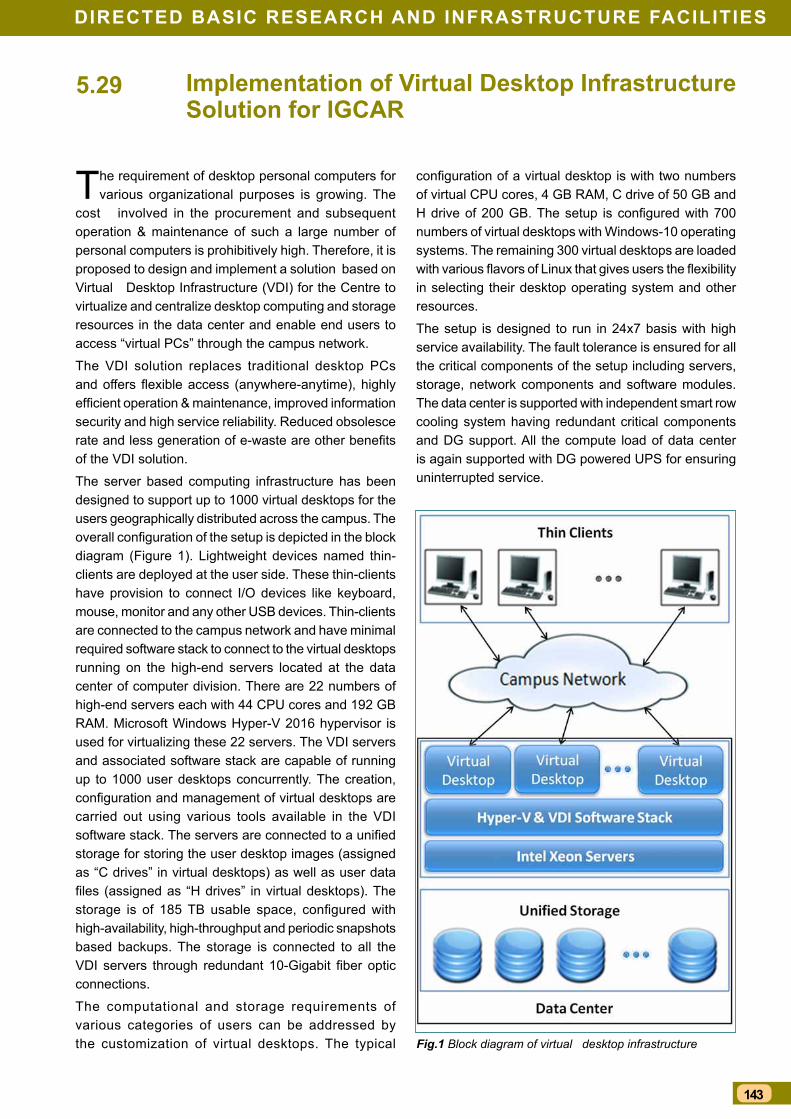
143
DirecteD Basic research anD infrastructure facilities
Development of large scale test Bed (lstB) for Wireless sensor network Deployment
implementation of Virtual Desktop infrastructure solution for iGcar
The requirement of desktop personal computers for various organizational purposes is growing. The
cost involved in the procurement and subsequent operation & maintenance of such a large number of personal computers is prohibitively high. Therefore, it is proposed to design and implement a solution based on Virtual Desktop Infrastructure (VDI) for the Centre to virtualize and centralize desktop computing and storage resources in the data center and enable end users to access “virtual PCs” through the campus network.
The VDI solution replaces traditional desktop PCs and offers flexible access (anywhere-anytime), highly efficient operation & maintenance, improved information security and high service reliability. Reduced obsolesce rate and less generation of e-waste are other benefits of the VDI solution.
The server based computing infrastructure has been designed to support up to 1000 virtual desktops for the users geographically distributed across the campus. The overall configuration of the setup is depicted in the block diagram (Figure 1). Lightweight devices named thin-clients are deployed at the user side. These thin-clients have provision to connect I/O devices like keyboard, mouse, monitor and any other USB devices. Thin-clients are connected to the campus network and have minimal required software stack to connect to the virtual desktops running on the high-end servers located at the data center of computer division. There are 22 numbers of high-end servers each with 44 CPU cores and 192 GB RAM. Microsoft Windows Hyper-V 2016 hypervisor is used for virtualizing these 22 servers. The VDI servers and associated software stack are capable of running up to 1000 user desktops concurrently. The creation, configuration and management of virtual desktops are carried out using various tools available in the VDI software stack. The servers are connected to a unified storage for storing the user desktop images (assigned as “C drives” in virtual desktops) as well as user data files (assigned as “H drives” in virtual desktops). The storage is of 185 TB usable space, configured with high-availability, high-throughput and periodic snapshots based backups. The storage is connected to all the VDI servers through redundant 10-Gigabit fiber optic connections.
The computational and storage requirements of various categories of users can be addressed by the customization of virtual desktops. The typical
5.29
configuration of a virtual desktop is with two numbers of virtual CPU cores, 4 GB RAM, C drive of 50 GB and H drive of 200 GB. The setup is configured with 700 numbers of virtual desktops with Windows-10 operating systems. The remaining 300 virtual desktops are loaded with various flavors of Linux that gives users the flexibility in selecting their desktop operating system and other resources.
The setup is designed to run in 24x7 basis with high service availability. The fault tolerance is ensured for all the critical components of the setup including servers, storage, network components and software modules. The data center is supported with independent smart row cooling system having redundant critical components and DG support. All the compute load of data center is again supported with DG powered UPS for ensuring uninterrupted service.
Fig.1 Block diagram of virtual desktop infrastructure
iGc annual rePOrt - 2018
144
Online APAR Workflow Automation with Digital signature
A Web portal has been developed to facilitate submission, assessment, review & acceptance of
Annual Performance Appraisal Report (APAR) online integrated with digital signature scheme to make the entire process up to final stage paperless. The overall workflow of APAR is shown in Figure 1.
The portal is developed in-house in computer division with open source packages and development platform. The portal consists of following sub modules:
Self Appraisal module facilitates the employee to fill the APAR with specified format as per pay level and category. The employee personal information & leave details are automatically fetched from the personal database and displayed. The work tasks & accomplishments entered by the employee are validated against the predefined character limits and types mentioned in the APAR template. After successful validation the APAR contents are encrypted and saved in database and also embedded in APAR template PDF. The final self appraisal part of APAR in PDF is signed digitally by the employee and forwarded to respective reporting officer for assessment
Assessment module facilitates the reporting officer to evaluate the work tasks & accomplishments of the employee and award the numerical grading. The grading awarded are validated, encrypted and stored in database. The evaluated APAR PDF is signed digitally and forwarded automatically to respective reviewing officer
Reviewing module facilitates the reviewing officer to review the reporting officer assessment and award the numerical grading on employee work accomplishments & personal attributes. The reviewed APAR is signed digitally and forwarded to respective accepting authority.
The final acceptance module facilitates the accepting authority to view & award the final numerical grading. The numerical grading is automatically converted to actual APAR grading as per predefined conversion logic. The accepted APAR PDF is signed digitally and preserved in database in encrypted form.
A graphical drill down analytics module has been developed for division heads/associate director/group director/unit head to view the completion status, assessment & grading of the respective division/group/unit in the capacity of accepting authority or more. This helps in monitoring the APAR completion status and get the statistics of gradings in each section/division/group.
All required security measures and access control restrictions are implemented to make sure the authorized users can only access the relevant contents.
5.30
To implement the digital signature scheme in APAR workflow, a public key infrastructure (PKI) has been deployed in-house for creation, administration, distribution and revocation of digital certificates of all APAR users. A java based digital signature signing client software has been developed to interact with APAR server and sign the APAR at the user end using digital signature certificate. The overall workflow of the digital signature scheme integrated in the APAR is depicted in Figure 2.
The required metadata like ICNO, APAR to be signed are sent to digital signature client software running in the user machine through browser. The client software downloads the relevant encrypted signature file (PFX) from PKI server. The client software then digital signs the APAR provided by APAR server with the downloaded user digital signature certificate and a valid user PIN.
Fig. 1 APAR workflow
Fig. 2 APAR digital signature scheme
145
DirecteD Basic research anD infrastructure facilities
hand Geometry based Online Visitor Gate Pass Management system for fBtr
Fast Breeder Test Reactor (FBTR) at Indira Gandhi Centre for Atomic Research (IGCAR), Kalpakkam
is a 40 MWt, 13.3 MWe, sodium cooled, loop type fast reactor. It uses a mixed carbide fuel, which is unique in the world. Considering the strategic nature of the this nuclear research reactor, the entry/exit to FBTR is highly restricted. Employees of FBTR have been granted access to FBTR. However, the employees of other groups/units, visitors, contractors will be allowed based on the requirement for the specific period. Manual paper based procedural gate pass system was followed in FBTR, wherein, the employee creates a paper based pass with the approval of competent approving authority to grant access to visitors/contractors and employees of other units to enter into FBTR complex. With this procedure, biometric features were not utilized. In order to replace the existing manual gate pass procedure and enhance the security, a new web based, Visitor Gate Pass Management System(VGPMS) is implemented.
Online web-based VGPMS has been developed in-house for the benefit of personnel visiting FBTR using PHP as Front-end and MYSQL Server[database] as Back-end. MYSQL database is created as per the requirement.
The procedure for visitor entry/exit has been automated and the employee of FBTR, can upload the data(details of visitor) in the website. After uploading visitor details, gate-pass number will be auto-generated to achieve uniqueness among the visitor passes. Moreover, auto-generated barcode facility helps to achieve easy retrieval of information. In each visitor gate-pass, a maximum of five visitors can be accommodated. HMI interface has been created to interface the camera through Ethernet to PC for capturing the photograph of the visitors and hand geometry device to capture the hand template of the visitor.
5.31
Once the visitor pass is submitted by an employee, it appears on the respective approving authority profile. He/she approves the visitor gate-pass online. After the online approval, that particular visitor gate pass record appears in CISF profile. CISF personnel will verify the details provided by the visitor against the details provided in the employee(FBTR) request displayed in his profile. If there is any mismatch then that particular visitor gate pass will be rejected.
RFID card programmer is designed and developed in-house to program the visitor RFID cards, wherein the visitor details along with his/her hand geometry are stored. PC is connected to the RFID card programmer through serial interface. Client software has been developed to read and write the visitor RFID card. In addition, details of the RFID cards issued to the visitors are recorded.
So the visitor can gain access into FBTR premises through turnstile gates installed at the entrance of the FBTR main gate complex, provided hand template of the visitor is matching the hand template stored in the RFID card.
The system has the provision for tracing the IP address of client PC from where that particular visitor gate pass is created, approved and verified by CISF. Auto-generating e-mails will be sent to appropriate approving authority and employee who created the visitor gate pass as soon as the particular visitor gate pass is checked and issued by CISF. The IN/OUT status of the RFID cards are also maintained to trace the log details of card issued to various visitors. The system has the provision for generating the summary report as demanded, based on the intelligent search options. Moreover, this system has the facility to track the log details of visitor up to date.
Fig. 1 (a)VGPMS web portal and (b) CISF personnel operating VGPMS and (c) summary report
(a) (b) (c)
iGc annual rePOrt - 2018
146
enhanced Digital infrastructural facilities and services
Scientific Information Resource Division (SIRD) is one of the modern libraries catering to the
information needs of Scientists, Engineers and Research Scholars of various DAE Units at Kalpakkam. SIRD has been constantly endeavoring to modernize and keep itself abreast with the latest technology through implementation of digital library technologies and services.
The intranet Library gateway http://vaigai is revamped and made more user-friendly (Figure 1). The subscribed e-journals, e-books, bibliographic details of the library holdings, e-reports, databases, e-journal gateways, institutional repositories are accessible through this portal. Some of the e-resources/tools subscribed during this year include:
• Ithenticate Plagiarism Checking Tool
• J-Gate Journals Gateway
• Canadian Nuclear Standards
• National Agency for Finite Element Methods & Standards.
SIRD is providing various services like auditorium, photography, videography, reprography, content creation and desktop design of in house publications. During this period,the Vikram Sarabhai auditorium was renovated (Figure 2) with latest digital audio conference system including chairperson unit, delegate system with 90 seat mikes, to support various modes like panel discussions, user interactive sessions, conference mode, discussion, music performance, etc. Display systems were enhanced with HDMI to support multiple displays. Acoustical wall paneling with glass wool backing for echo arresting and suitable flooring and seating were commissioned. Intelligent
5.32
Fig. 1 Library Gateway
Fig. 2 Vikram Sarabhai Auditorium
Fig. 3 Publication Management Portal
analogue addressable loop powered beam detectors were installed with fire alarm control system.
Publication is one of the major metrics to measure the performance of any research organization. In this context, guidelines to ensure that authorship and publication ethics were formulated. In order to ensure the guidelines are followed, the review, approval and plagiarism checking mechanism of pre-prints of journal publications, a publication management system was developed and commissioned at SIRD. The snapshot of functional modules of the publication management portal is shown in Figure 3.
Besides the journal articles, this portal is also used to check plagiarism in theses, book chapters and articles submitted to the conference.
SIRD records the Scientific & Technical videos of IGCAR. The short films made after necessary non-linear editing works and voice over are, “The birds of Kalpakkam named “Our Sojourning Avians”, “Metal Fuel Fabrication Facility, presented before the President of India, and short film on current status of FRFCF.”
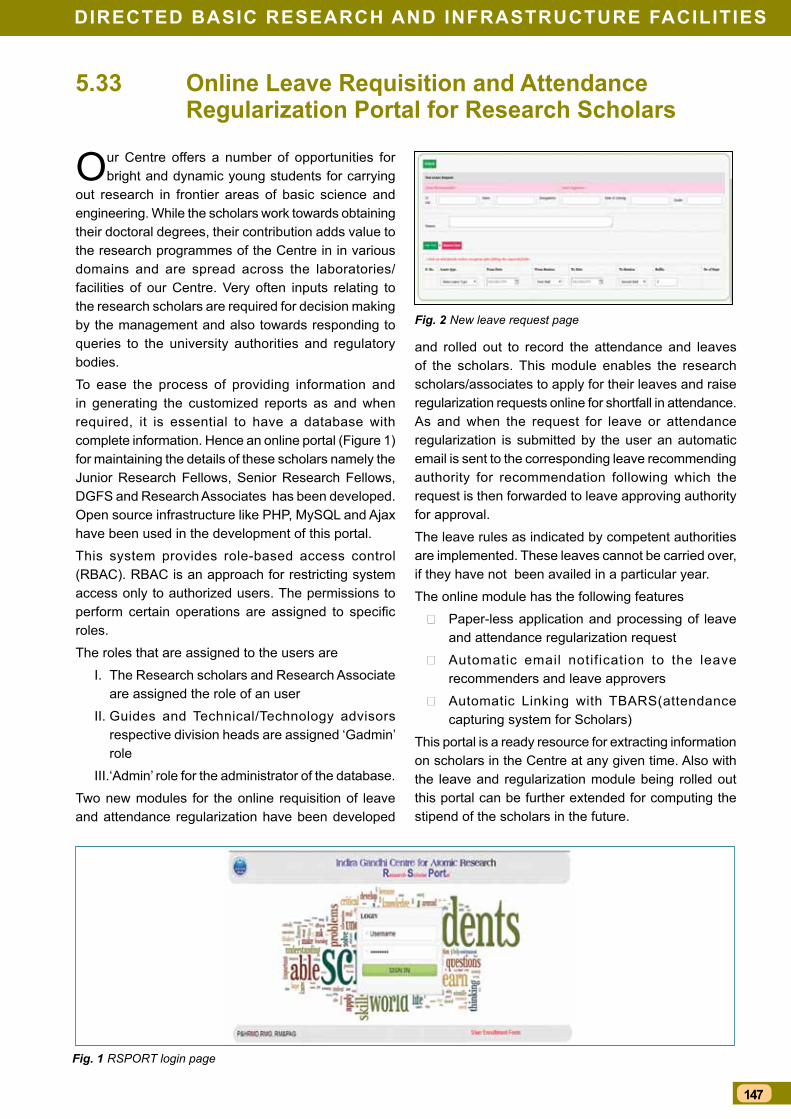
147
DirecteD Basic research anD infrastructure facilities
Online leave requisition and attendance regularization Portal for research scholars
Our Centre offers a number of opportunities for bright and dynamic young students for carrying
out research in frontier areas of basic science and engineering. While the scholars work towards obtaining their doctoral degrees, their contribution adds value to the research programmes of the Centre in in various domains and are spread across the laboratories/facilities of our Centre. Very often inputs relating to the research scholars are required for decision making by the management and also towards responding to queries to the university authorities and regulatory bodies.
To ease the process of providing information and in generating the customized reports as and when required, it is essential to have a database with complete information. Hence an online portal (Figure 1) for maintaining the details of these scholars namely the Junior Research Fellows, Senior Research Fellows, DGFS and Research Associates has been developed. Open source infrastructure like PHP, MySQL and Ajax have been used in the development of this portal.
This system provides role-based access control (RBAC). RBAC is an approach for restricting system access only to authorized users. The permissions to perform certain operations are assigned to specific roles.
The roles that are assigned to the users are
I. The Research scholars and Research Associate are assigned the role of an user
II. Guides and Technical/Technology advisors respective division heads are assigned ‘Gadmin’ role
III. ‘Admin’ role for the administrator of the database.
Two new modules for the online requisition of leave and attendance regularization have been developed
5.33
Fig. 1 RSPORT login page
Fig. 2 New leave request page
and rolled out to record the attendance and leaves of the scholars. This module enables the research scholars/associates to apply for their leaves and raise regularization requests online for shortfall in attendance. As and when the request for leave or attendance regularization is submitted by the user an automatic email is sent to the corresponding leave recommending authority for recommendation following which the request is then forwarded to leave approving authority for approval.
The leave rules as indicated by competent authorities are implemented. These leaves cannot be carried over, if they have not been availed in a particular year.
The online module has the following features
Paper-less application and processing of leave and attendance regularization request
Automatic email notification to the leave recommenders and leave approvers
Automatic Linking with TBARS(attendance capturing system for Scholars)
This portal is a ready resource for extracting information on scholars in the Centre at any given time. Also with the leave and regularization module being rolled out this portal can be further extended for computing the stipend of the scholars in the future.
IGC ANNUAL REPORT - 2018
148
CHAPTERVI
Basic Research
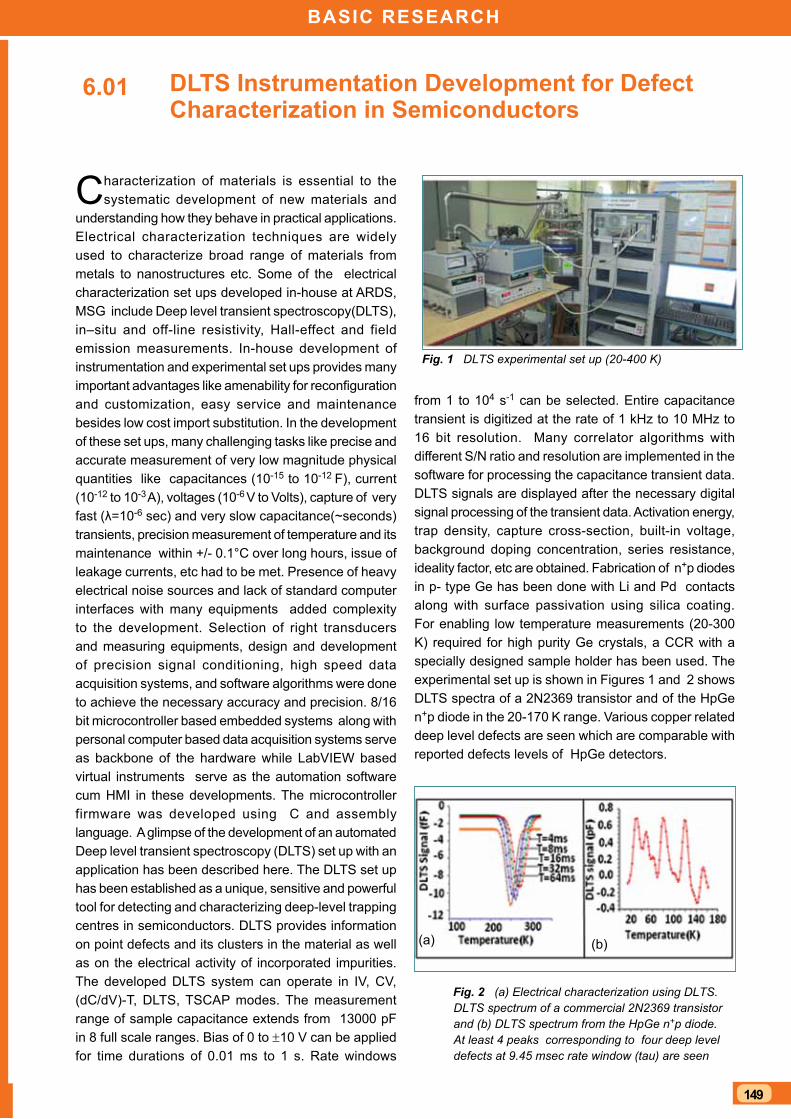
149
BAsIC REsEARCh
DLTs Instrumentation Development for Defect Characterization in semiconductors
Characterization of materials is essential to the systematic development of new materials and
understanding how they behave in practical applications. Electrical characterization techniques are widely used to characterize broad range of materials from metals to nanostructures etc. Some of the electrical characterization set ups developed in-house at ARDS, MSG include Deep level transient spectroscopy(DLTS), in–situ and off-line resistivity, Hall-effect and field emission measurements. In-house development of instrumentation and experimental set ups provides many important advantages like amenability for reconfiguration and customization, easy service and maintenance besides low cost import substitution. In the development of these set ups, many challenging tasks like precise and accurate measurement of very low magnitude physical quantities like capacitances (10-15 to 10-12 F), current (10-12 to 10-3 A), voltages (10-6 V to Volts), capture of very fast (λ=10-6 sec) and very slow capacitance(~seconds) transients, precision measurement of temperature and its maintenance within +/- 0.1°C over long hours, issue of leakage currents, etc had to be met. Presence of heavy electrical noise sources and lack of standard computer interfaces with many equipments added complexity to the development. Selection of right transducers and measuring equipments, design and development of precision signal conditioning, high speed data acquisition systems, and software algorithms were done to achieve the necessary accuracy and precision. 8/16 bit microcontroller based embedded systems along with personal computer based data acquisition systems serve as backbone of the hardware while LabVIEW based virtual instruments serve as the automation software cum HMI in these developments. The microcontroller firmware was developed using C and assembly language. A glimpse of the development of an automated Deep level transient spectroscopy (DLTS) set up with an application has been described here. The DLTS set up has been established as a unique, sensitive and powerful tool for detecting and characterizing deep-level trapping centres in semiconductors. DLTS provides information on point defects and its clusters in the material as well as on the electrical activity of incorporated impurities. The developed DLTS system can operate in IV, CV, (dC/dV)-T, DLTS, TSCAP modes. The measurement range of sample capacitance extends from 13000 pF in 8 full scale ranges. Bias of 0 to ±10 V can be applied for time durations of 0.01 ms to 1 s. Rate windows
6.01
from 1 to 104 s-1 can be selected. Entire capacitance transient is digitized at the rate of 1 kHz to 10 MHz to 16 bit resolution. Many correlator algorithms with different S/N ratio and resolution are implemented in the software for processing the capacitance transient data. DLTS signals are displayed after the necessary digital signal processing of the transient data. Activation energy, trap density, capture cross-section, built-in voltage, background doping concentration, series resistance, ideality factor, etc are obtained. Fabrication of n+p diodes in p- type Ge has been done with Li and Pd contacts along with surface passivation using silica coating. For enabling low temperature measurements (20-300 K) required for high purity Ge crystals, a CCR with a specially designed sample holder has been used. The experimental set up is shown in Figures 1 and 2 shows DLTS spectra of a 2N2369 transistor and of the HpGe n+p diode in the 20-170 K range. Various copper related deep level defects are seen which are comparable with reported defects levels of HpGe detectors.
Fig. 1 DLTS experimental set up (20-400 K)
Fig. 2 (a) Electrical characterization using DLTS. DLTS spectrum of a commercial 2N2369 transistor and (b) DLTS spectrum from the HpGe n+p diode. At least 4 peaks corresponding to four deep level defects at 9.45 msec rate window (tau) are seen
(a) (b)
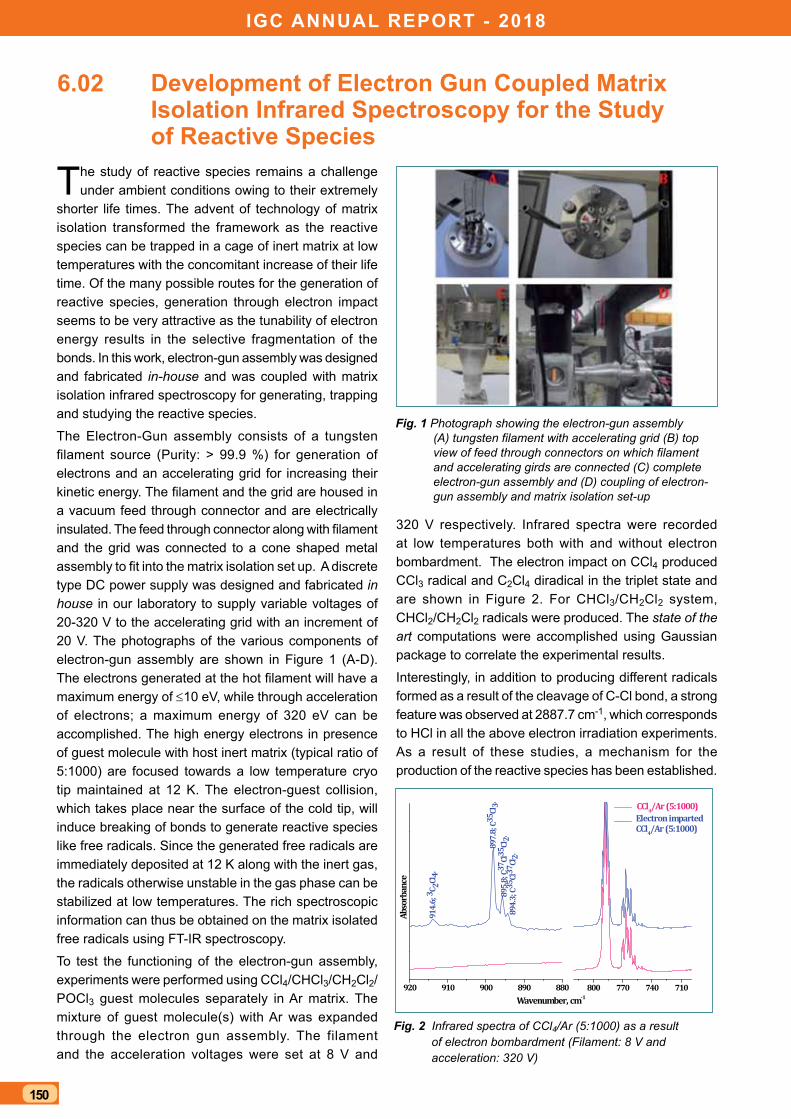
IGC ANNUAL REPORT - 2018
150
Development of Electron Gun Coupled Matrix Isolation Infrared spectroscopy for the study of Reactive species
The study of reactive species remains a challenge under ambient conditions owing to their extremely
shorter life times. The advent of technology of matrix isolation transformed the framework as the reactive species can be trapped in a cage of inert matrix at low temperatures with the concomitant increase of their life time. Of the many possible routes for the generation of reactive species, generation through electron impact seems to be very attractive as the tunability of electron energy results in the selective fragmentation of the bonds. In this work, electron-gun assembly was designed and fabricated in-house and was coupled with matrix isolation infrared spectroscopy for generating, trapping and studying the reactive species.
The Electron-Gun assembly consists of a tungsten filament source (Purity: > 99.9 %) for generation of electrons and an accelerating grid for increasing their kinetic energy. The filament and the grid are housed in a vacuum feed through connector and are electrically insulated. The feed through connector along with filament and the grid was connected to a cone shaped metal assembly to fit into the matrix isolation set up. A discrete type DC power supply was designed and fabricated in house in our laboratory to supply variable voltages of 20-320 V to the accelerating grid with an increment of 20 V. The photographs of the various components of electron-gun assembly are shown in Figure 1 (A-D). The electrons generated at the hot filament will have a maximum energy of ≤10 eV, while through acceleration of electrons; a maximum energy of 320 eV can be accomplished. The high energy electrons in presence of guest molecule with host inert matrix (typical ratio of 5:1000) are focused towards a low temperature cryo tip maintained at 12 K. The electron-guest collision, which takes place near the surface of the cold tip, will induce breaking of bonds to generate reactive species like free radicals. Since the generated free radicals are immediately deposited at 12 K along with the inert gas, the radicals otherwise unstable in the gas phase can be stabilized at low temperatures. The rich spectroscopic information can thus be obtained on the matrix isolated free radicals using FT-IR spectroscopy.
To test the functioning of the electron-gun assembly, experiments were performed using CCl4/CHCl3/CH2Cl2/POCl3 guest molecules separately in Ar matrix. The mixture of guest molecule(s) with Ar was expanded through the electron gun assembly. The filament and the acceleration voltages were set at 8 V and
6.02
320 V respectively. Infrared spectra were recorded at low temperatures both with and without electron bombardment. The electron impact on CCl4 produced CCl3 radical and C2Cl4 diradical in the triplet state and are shown in Figure 2. For CHCl3/CH2Cl2 system, CHCl2/CH2Cl2 radicals were produced. The state of the art computations were accomplished using Gaussian package to correlate the experimental results.
Interestingly, in addition to producing different radicals formed as a result of the cleavage of C-Cl bond, a strong feature was observed at 2887.7 cm-1, which corresponds to HCl in all the above electron irradiation experiments. As a result of these studies, a mechanism for the production of the reactive species has been established.
920 910 900 890 880
Wavenumber, cm-1
Electron imparted CCl4/Ar (5:1000)
CCl4/Ar (5:1000)
914.
6; 3 C 2Cl
4.
Abso
rban
ce
894.
3; C
35Cl
37Cl
2.89
5.8;
C37
Cl35
Cl2.
897.
8; C
35Cl
3.
800 770 740 710
Fig. 1 Photograph showing the electron-gun assembly (A) tungsten filament with accelerating grid (B) top view of feed through connectors on which filament and accelerating girds are connected (C) complete electron-gun assembly and (D) coupling of electron-gun assembly and matrix isolation set-up
Fig. 2 Infrared spectra of CCl4/Ar (5:1000) as a result of electron bombardment (Filament: 8 V and acceleration: 320 V)
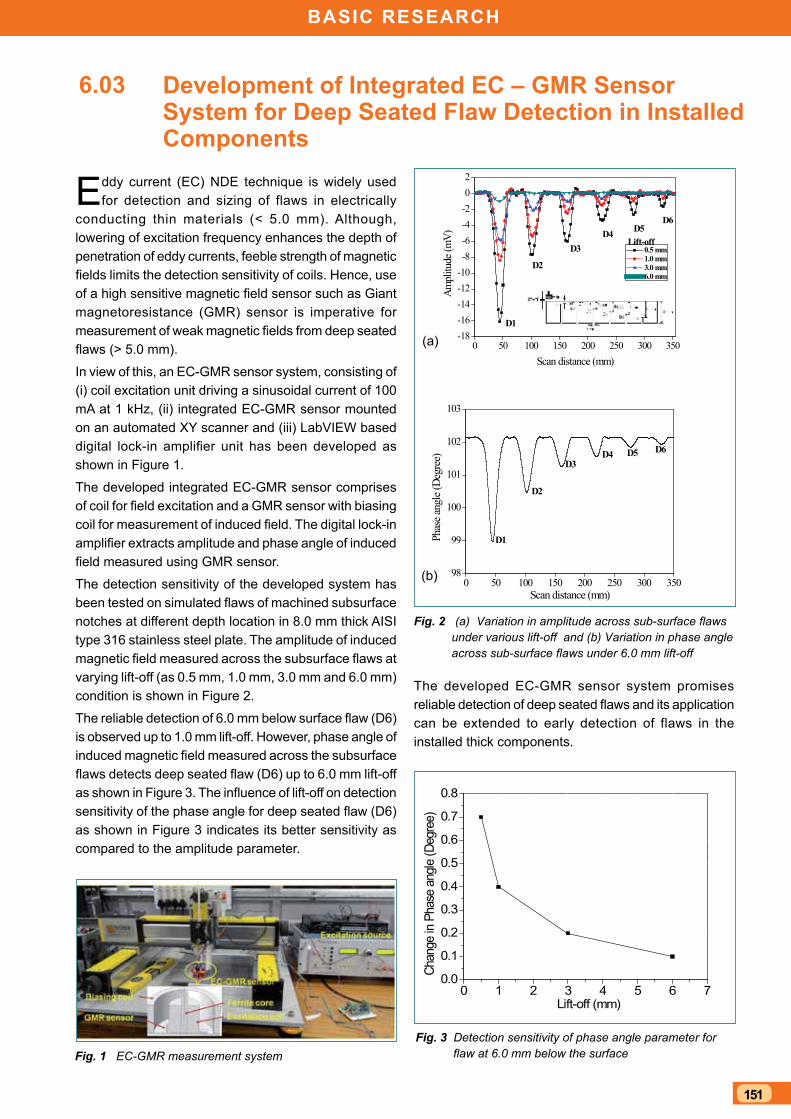
151
BAsIC REsEARCh
Development of Integrated EC – GMR sensor system for Deep seated Flaw Detection in Installed Components
Eddy current (EC) NDE technique is widely used for detection and sizing of flaws in electrically
conducting thin materials (< 5.0 mm). Although, lowering of excitation frequency enhances the depth of penetration of eddy currents, feeble strength of magnetic fields limits the detection sensitivity of coils. Hence, use of a high sensitive magnetic field sensor such as Giant magnetoresistance (GMR) sensor is imperative for measurement of weak magnetic fields from deep seated flaws (> 5.0 mm).
In view of this, an EC-GMR sensor system, consisting of (i) coil excitation unit driving a sinusoidal current of 100 mA at 1 kHz, (ii) integrated EC-GMR sensor mounted on an automated XY scanner and (iii) LabVIEW based digital lock-in amplifier unit has been developed as shown in Figure 1.
The developed integrated EC-GMR sensor comprises of coil for field excitation and a GMR sensor with biasing coil for measurement of induced field. The digital lock-in amplifier extracts amplitude and phase angle of induced field measured using GMR sensor.
The detection sensitivity of the developed system has been tested on simulated flaws of machined subsurface notches at different depth location in 8.0 mm thick AISI type 316 stainless steel plate. The amplitude of induced magnetic field measured across the subsurface flaws at varying lift-off (as 0.5 mm, 1.0 mm, 3.0 mm and 6.0 mm) condition is shown in Figure 2.
The reliable detection of 6.0 mm below surface flaw (D6) is observed up to 1.0 mm lift-off. However, phase angle of induced magnetic field measured across the subsurface flaws detects deep seated flaw (D6) up to 6.0 mm lift-off as shown in Figure 3. The influence of lift-off on detection sensitivity of the phase angle for deep seated flaw (D6) as shown in Figure 3 indicates its better sensitivity as compared to the amplitude parameter.
6.03
0 1 2 3 4 5 6 70.0
0.1
0.2
0.3
0.4
0.5
0.6
0.7
0.8
Chan
ge in
Pha
se a
ngle
(Deg
ree)
Lift-off (mm)
0 50 100 150 200 250 300 35098
99
100
101
102
103
D6D5D4D3
D2
Phas
e ang
le (D
egre
e)
Scan distance (mm)
D1
0 50 100 150 200 250 300 350-18-16-14-12-10-8-6-4-202
D6D5D4
D3
D2
Ampl
itude
(mV)
Scan distance (mm)
0.5 mm 1.0 mm 3.0 mm 6.0 mm
D1
Lift-off
Fig. 1 EC-GMR measurement system
Fig. 2 (a) Variation in amplitude across sub-surface flaws under various lift-off and (b) Variation in phase angle across sub-surface flaws under 6.0 mm lift-off
Fig. 3 Detection sensitivity of phase angle parameter for flaw at 6.0 mm below the surface
The developed EC-GMR sensor system promises reliable detection of deep seated flaws and its application can be extended to early detection of flaws in the installed thick components.
(a)
(b)
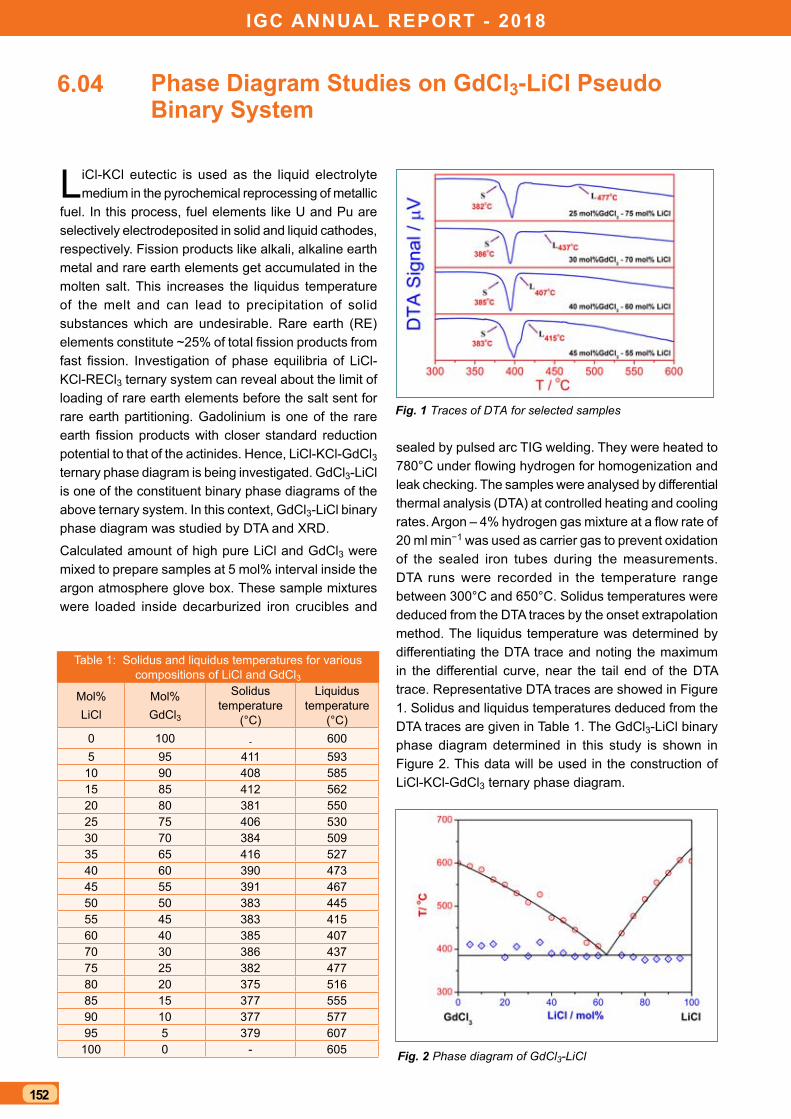
IGC ANNUAL REPORT - 2018
152
Phase Diagram studies on GdCl3-LiCl Pseudo Binary system
LiCl-KCl eutectic is used as the liquid electrolyte medium in the pyrochemical reprocessing of metallic
fuel. In this process, fuel elements like U and Pu are selectively electrodeposited in solid and liquid cathodes, respectively. Fission products like alkali, alkaline earth metal and rare earth elements get accumulated in the molten salt. This increases the liquidus temperature of the melt and can lead to precipitation of solid substances which are undesirable. Rare earth (RE) elements constitute ~25% of total fission products from fast fission. Investigation of phase equilibria of LiCl-KCl-RECl3 ternary system can reveal about the limit of loading of rare earth elements before the salt sent for rare earth partitioning. Gadolinium is one of the rare earth fission products with closer standard reduction potential to that of the actinides. Hence, LiCl-KCl-GdCl3 ternary phase diagram is being investigated. GdCl3-LiCl is one of the constituent binary phase diagrams of the above ternary system. In this context, GdCl3-LiCl binary phase diagram was studied by DTA and XRD.
Calculated amount of high pure LiCl and GdCl3 were mixed to prepare samples at 5 mol% interval inside the argon atmosphere glove box. These sample mixtures were loaded inside decarburized iron crucibles and
6.04
Fig. 1 Traces of DTA for selected samples
Fig. 2 Phase diagram of GdCl3-LiCl
sealed by pulsed arc TIG welding. They were heated to 780°C under flowing hydrogen for homogenization and leak checking. The samples were analysed by differential thermal analysis (DTA) at controlled heating and cooling rates. Argon – 4% hydrogen gas mixture at a flow rate of 20 ml min−1 was used as carrier gas to prevent oxidation of the sealed iron tubes during the measurements. DTA runs were recorded in the temperature range between 300°C and 650°C. Solidus temperatures were deduced from the DTA traces by the onset extrapolation method. The liquidus temperature was determined by differentiating the DTA trace and noting the maximum in the differential curve, near the tail end of the DTA trace. Representative DTA traces are showed in Figure 1. Solidus and liquidus temperatures deduced from the DTA traces are given in Table 1. The GdCl3-LiCl binary phase diagram determined in this study is shown in Figure 2. This data will be used in the construction of LiCl-KCl-GdCl3 ternary phase diagram.
Table 1: Solidus and liquidus temperatures for various compositions of LiCl and GdCl3
Mol% LiCl
Mol% GdCl3
Solidus temperature
(°C)
Liquidus temperature
(°C)0 100 - 6005 95 411 593
10 90 408 58515 85 412 56220 80 381 55025 75 406 53030 70 384 50935 65 416 52740 60 390 47345 55 391 46750 50 383 44555 45 383 41560 40 385 40770 30 386 43775 25 382 47780 20 375 51685 15 377 55590 10 377 57795 5 379 607100 0 - 605
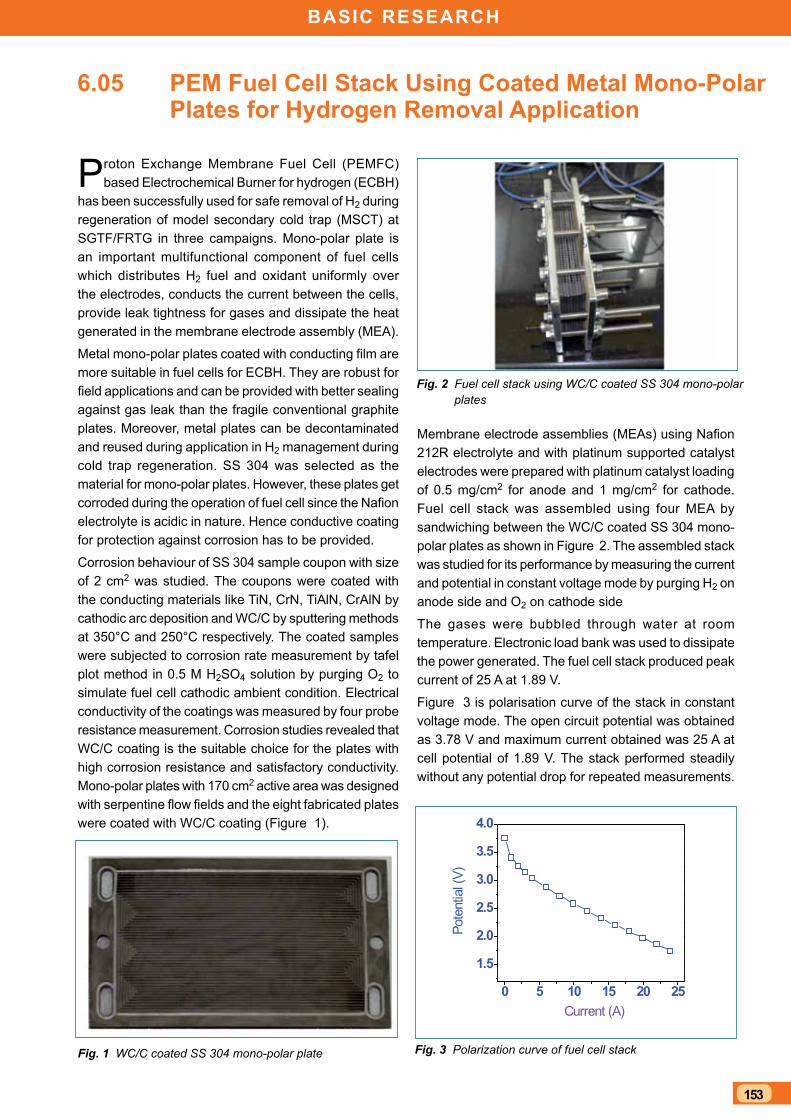
153
BAsIC REsEARCh
PEM Fuel Cell stack Using Coated Metal Mono-Polar Plates for hydrogen Removal Application
Proton Exchange Membrane Fuel Cell (PEMFC) based Electrochemical Burner for hydrogen (ECBH)
has been successfully used for safe removal of H2 during regeneration of model secondary cold trap (MSCT) at SGTF/FRTG in three campaigns. Mono-polar plate is an important multifunctional component of fuel cells which distributes H2 fuel and oxidant uniformly over the electrodes, conducts the current between the cells, provide leak tightness for gases and dissipate the heat generated in the membrane electrode assembly (MEA).
Metal mono-polar plates coated with conducting film are more suitable in fuel cells for ECBH. They are robust for field applications and can be provided with better sealing against gas leak than the fragile conventional graphite plates. Moreover, metal plates can be decontaminated and reused during application in H2 management during cold trap regeneration. SS 304 was selected as the material for mono-polar plates. However, these plates get corroded during the operation of fuel cell since the Nafion electrolyte is acidic in nature. Hence conductive coating for protection against corrosion has to be provided.
Corrosion behaviour of SS 304 sample coupon with size of 2 cm2 was studied. The coupons were coated with the conducting materials like TiN, CrN, TiAlN, CrAlN by cathodic arc deposition and WC/C by sputtering methods at 350°C and 250°C respectively. The coated samples were subjected to corrosion rate measurement by tafel plot method in 0.5 M H2SO4 solution by purging O2 to simulate fuel cell cathodic ambient condition. Electrical conductivity of the coatings was measured by four probe resistance measurement. Corrosion studies revealed that WC/C coating is the suitable choice for the plates with high corrosion resistance and satisfactory conductivity. Mono-polar plates with 170 cm2 active area was designed with serpentine flow fields and the eight fabricated plates were coated with WC/C coating (Figure 1).
6.05
Membrane electrode assemblies (MEAs) using Nafion 212R electrolyte and with platinum supported catalyst electrodes were prepared with platinum catalyst loading of 0.5 mg/cm2 for anode and 1 mg/cm2 for cathode. Fuel cell stack was assembled using four MEA by sandwiching between the WC/C coated SS 304 mono-polar plates as shown in Figure 2. The assembled stack was studied for its performance by measuring the current and potential in constant voltage mode by purging H2 on anode side and O2 on cathode side
The gases were bubbled through water at room temperature. Electronic load bank was used to dissipate the power generated. The fuel cell stack produced peak current of 25 A at 1.89 V.
Figure 3 is polarisation curve of the stack in constant voltage mode. The open circuit potential was obtained as 3.78 V and maximum current obtained was 25 A at cell potential of 1.89 V. The stack performed steadily without any potential drop for repeated measurements.
0 5 10 15 20 25
1.5
2.0
2.5
3.0
3.5
4.0
Pote
ntia
l (V)
Current (A)
Fig. 1 WC/C coated SS 304 mono-polar plate
Fig. 2 Fuel cell stack using WC/C coated SS 304 mono-polar plates
Fig. 3 Polarization curve of fuel cell stack
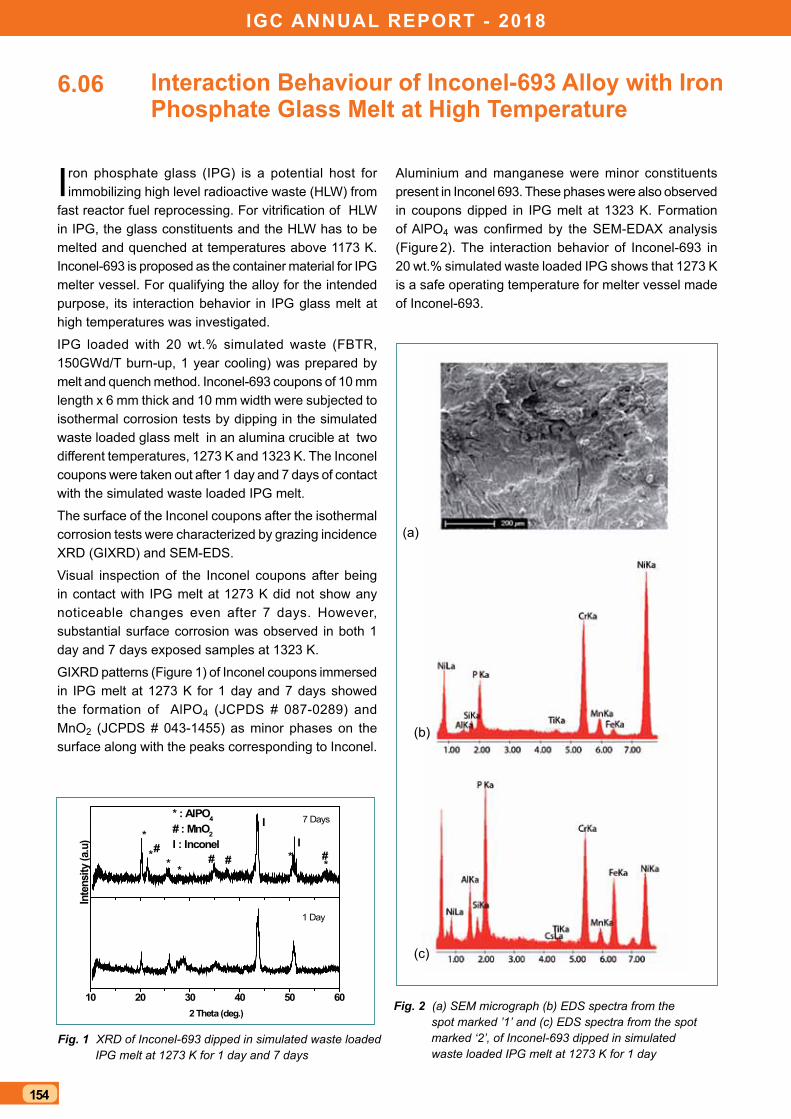
IGC ANNUAL REPORT - 2018
154
Interaction Behaviour of Inconel-693 Alloy with Iron Phosphate Glass Melt at high Temperature
Iron phosphate glass (IPG) is a potential host for immobilizing high level radioactive waste (HLW) from
fast reactor fuel reprocessing. For vitrification of HLW in IPG, the glass constituents and the HLW has to be melted and quenched at temperatures above 1173 K. Inconel-693 is proposed as the container material for IPG melter vessel. For qualifying the alloy for the intended purpose, its interaction behavior in IPG glass melt at high temperatures was investigated.
IPG loaded with 20 wt.% simulated waste (FBTR, 150GWd/T burn-up, 1 year cooling) was prepared by melt and quench method. Inconel-693 coupons of 10 mm length x 6 mm thick and 10 mm width were subjected to isothermal corrosion tests by dipping in the simulated waste loaded glass melt in an alumina crucible at two different temperatures, 1273 K and 1323 K. The Inconel coupons were taken out after 1 day and 7 days of contact with the simulated waste loaded IPG melt.
The surface of the Inconel coupons after the isothermal corrosion tests were characterized by grazing incidence XRD (GIXRD) and SEM-EDS.
Visual inspection of the Inconel coupons after being in contact with IPG melt at 1273 K did not show any noticeable changes even after 7 days. However, substantial surface corrosion was observed in both 1 day and 7 days exposed samples at 1323 K.
GIXRD patterns (Figure 1) of Inconel coupons immersed in IPG melt at 1273 K for 1 day and 7 days showed the formation of AlPO4 (JCPDS # 087-0289) and MnO2 (JCPDS # 043-1455) as minor phases on the surface along with the peaks corresponding to Inconel.
6.06
10 20 30 40 50 60
1 Day
2 Theta (deg.)
* : AlPO4
# : MnO2
I : Inconel## ##
I
I
**
***
*7 Days
Inte
nsity
(a.u
)
Fig. 1 XRD of Inconel-693 dipped in simulated waste loaded IPG melt at 1273 K for 1 day and 7 days
Fig. 2 (a) SEM micrograph (b) EDS spectra from the spot marked ’1’ and (c) EDS spectra from the spot marked ‘2’, of Inconel-693 dipped in simulated waste loaded IPG melt at 1273 K for 1 day
Aluminium and manganese were minor constituents present in Inconel 693. These phases were also observed in coupons dipped in IPG melt at 1323 K. Formation of AlPO4 was confirmed by the SEM-EDAX analysis (Figure 2). The interaction behavior of Inconel-693 in 20 wt.% simulated waste loaded IPG shows that 1273 K is a safe operating temperature for melter vessel made of Inconel-693.
(a)
(b)
(c)
155
BAsIC REsEARCh
Modelling the Composition Dependence of Elastic Properties in terms of Electron Density and Molar Volume
A comprehensive knowledge of the elastic properties of various engineering materials, encompassing their
temperature, pressure, and composition dependencies, is of great importance to the design and performance of advanced engineering machinery. In addition, such data are also of central interest to the basic understanding of bonding forces in materials. There are only few studies devoted exclusively to establishing robust thermodynamic models for the composition dependence of elastic properties.
From an engineering point of view, it is advantageous and useful to understand the composition induced changes in elastic properties, in terms of a thermodynamic framework that is related to the corresponding change in another measurable thermodynamic quantity, like molar volume and formation enthalpy, which are amenable for accurate experimental quantification.
In this regard, we have proposed recently a bridging thermodynamic framework connecting ∆oH f, the standard molar enthalpy of formation with DBT, and the change in bulk modulus due to alloying. This connection has been made by defining DBT in terms of ∆oGmix, the mixing contribution to total Gibbs energy change. Further, the composition dependence of ∆oHmix(x) is expressed in terms of regular or subregular solution formalisms, incorporating separately the contribution from configurational and vibrational entropy of mixing. This model is further developed here by proposing an explicit link between the composition induced changes to an elastic property in terms of corresponding changes in bonding charge density; since, it is well known that elastic properties are related to bonding electron density (∆ρb).
From fundamental density functional theory, it can be proven that for metallic alloy systems, the following relation holds good.
BT = C Zbm × V1-m. (1)
Zb is the bonding valence, V (V = 4/3 × πro3; ro = rs Zb
1/3 ; ρb = Zb/V = ¾πro
3; and Zb = ¾πrs3) is the atomic volume.
C is the proportionality constant and m is an exponent with a value close to 2 for metallic systems. Thus, we obtain a simple model for (∂BT/∂x)T,p.
(∂BT/∂x)T,p = (∂BT/∂V)T,p × (∂V/∂x)T,p (2)
6.07
The first term on the right hand side of Eq. (2) represents implicitly the influence of a change in bonding charge density (∆ρb) on bulk modulus upon alloying via, the corresponding change in molar volume (∆V). The second term on right hand side of Eq. (2) is the usual composition induced dilatation or contraction, which can be estimated from the experimental volume versus composition data, if available; or through a suitable model for the composition variation of atomic volume. In the present study, we model these two terms separately, to arrive at a simple approximation for (∂BT/∂x)T,p. The derivative (∂BT/∂V)T,p can now be expressed as follows.
(∂BT/∂V)T,p = C × m Zbm-1 (∂Zb/∂V) × V1-m
+ Zbm × (1-m)V-m . (3)
We model the composition induced change in molar volume ∂V(x)/∂x in the following manner.
(∂V/∂x)T,p = (VoB - Vo
A + Ω1) + 2x(Ω2 - 2Ω1)
+ 3x2 (Ω1 - Ω2 (4)
Here, VoA and Vo
B refer to the molar volume of pure A and B; Ωi (i=1, 2) are subregular solution model parameters for V(x); The coefficients ai are defined as: a1 = (Vo
B –Vo
A+Ω1); a2 = (Ω2-2Ω1) and a3 = (Ω2-Ω1). From Eq. (1) to (4), and besides making use of some simplifications, we obtain the following result for the composition variation of bulk modulus.
(BT/V) = (Bo/Vo) × exp (-m/V*[a1 x + a2 x2 + a3 x3]) (5)
It is useful to recall that ai (i= 1, 2, 3) are composition independent model parameters, which are constants for a given A-B alloy combination. Since, b=m/V* is also a material dependent constant in our model, we may further simplify Eq. (5) to obtain the following general expression for the composition dependence of bulk modulus. Thus,
(BT/V) = (Bo/Vo) × exp -(k1 x + k2 x2 + k3 x3) (6)
Here, ki = ai×m/V*; for i=1, 2, 3.
Since our model is essentially semiempirical in nature, the coefficients ki can be treated as fit parameters, for a combined modelling of the experimental bulk modulus and molar volume data as a function of composition.
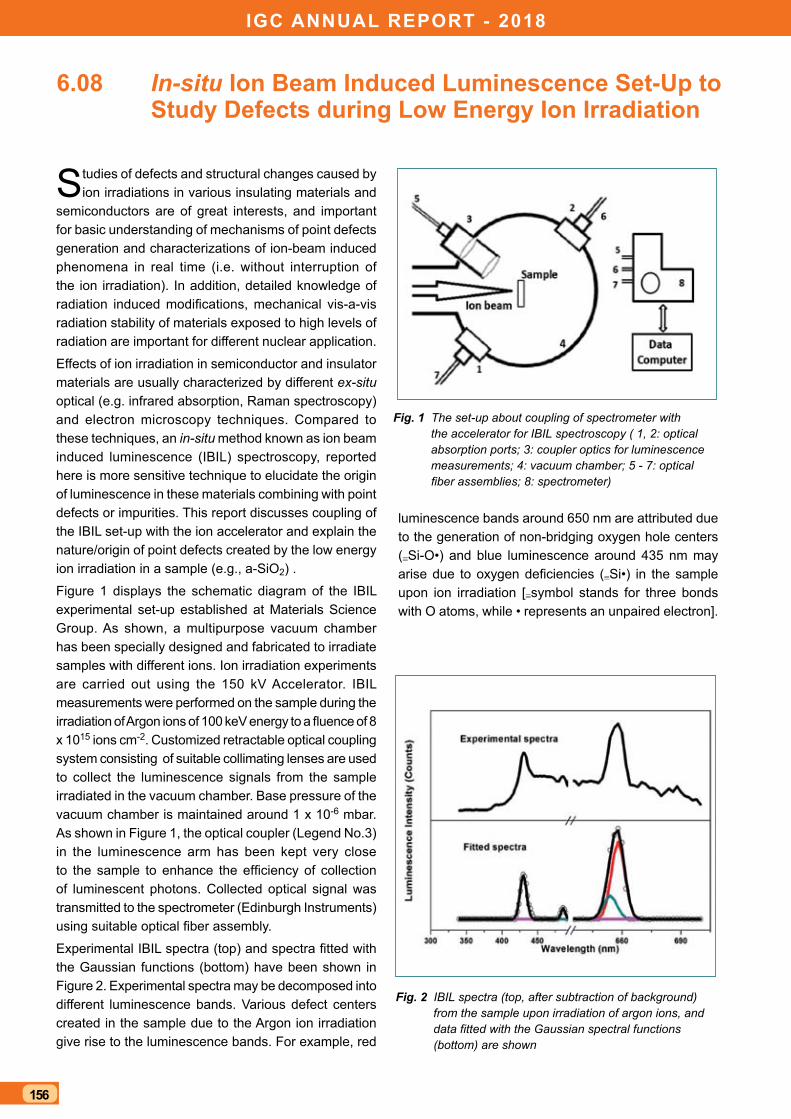
IGC ANNUAL REPORT - 2018
156
In-situ Ion Beam Induced Luminescence set-Up to study Defects during Low Energy Ion Irradiation
Studies of defects and structural changes caused by ion irradiations in various insulating materials and
semiconductors are of great interests, and important for basic understanding of mechanisms of point defects generation and characterizations of ion-beam induced phenomena in real time (i.e. without interruption of the ion irradiation). In addition, detailed knowledge of radiation induced modifications, mechanical vis-a-vis radiation stability of materials exposed to high levels of radiation are important for different nuclear application.
Effects of ion irradiation in semiconductor and insulator materials are usually characterized by different ex-situ optical (e.g. infrared absorption, Raman spectroscopy) and electron microscopy techniques. Compared to these techniques, an in-situ method known as ion beam induced luminescence (IBIL) spectroscopy, reported here is more sensitive technique to elucidate the origin of luminescence in these materials combining with point defects or impurities. This report discusses coupling of the IBIL set-up with the ion accelerator and explain the nature/origin of point defects created by the low energy ion irradiation in a sample (e.g., a-SiO2) .
Figure 1 displays the schematic diagram of the IBIL experimental set-up established at Materials Science Group. As shown, a multipurpose vacuum chamber has been specially designed and fabricated to irradiate samples with different ions. Ion irradiation experiments are carried out using the 150 kV Accelerator. IBIL measurements were performed on the sample during the irradiation of Argon ions of 100 keV energy to a fluence of 8 x 10¹⁵ ions cm-2. Customized retractable optical coupling system consisting of suitable collimating lenses are used to collect the luminescence signals from the sample irradiated in the vacuum chamber. Base pressure of the vacuum chamber is maintained around 1 x 10⁻⁶ mbar. As shown in Figure 1, the optical coupler (Legend No.3) in the luminescence arm has been kept very close to the sample to enhance the efficiency of collection of luminescent photons. Collected optical signal was transmitted to the spectrometer (Edinburgh Instruments) using suitable optical fiber assembly.
Experimental IBIL spectra (top) and spectra fitted with the Gaussian functions (bottom) have been shown in Figure 2. Experimental spectra may be decomposed into different luminescence bands. Various defect centers created in the sample due to the Argon ion irradiation give rise to the luminescence bands. For example, red
6.08
luminescence bands around 650 nm are attributed due to the generation of non-bridging oxygen hole centers (≡Si-O•) and blue luminescence around 435 nm may arise due to oxygen deficiencies (≡Si•) in the sample upon ion irradiation [≡symbol stands for three bonds with O atoms, while • represents an unpaired electron].
Fig. 2 IBIL spectra (top, after subtraction of background) from the sample upon irradiation of argon ions, and data fitted with the Gaussian spectral functions (bottom) are shown
Fig. 1 The set-up about coupling of spectrometer with the accelerator for IBIL spectroscopy ( 1, 2: optical absorption ports; 3: coupler optics for luminescence measurements; 4: vacuum chamber; 5 - 7: optical fiber assemblies; 8: spectrometer)
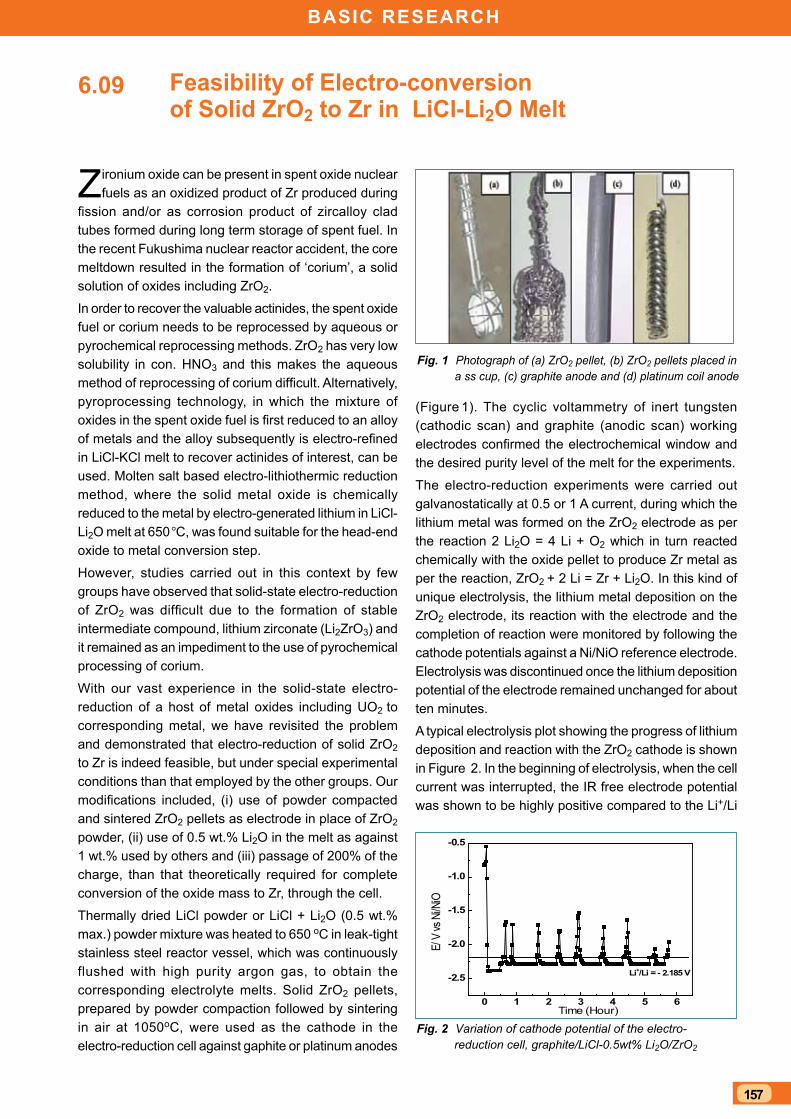
157
BAsIC REsEARCh
Feasibility of Electro-conversion of solid ZrO2 to Zr in LiCl-Li2O Melt
Zironium oxide can be present in spent oxide nuclear fuels as an oxidized product of Zr produced during
fission and/or as corrosion product of zircalloy clad tubes formed during long term storage of spent fuel. In the recent Fukushima nuclear reactor accident, the core meltdown resulted in the formation of ‘corium’, a solid solution of oxides including ZrO2.
In order to recover the valuable actinides, the spent oxide fuel or corium needs to be reprocessed by aqueous or pyrochemical reprocessing methods. ZrO2 has very low solubility in con. HNO3 and this makes the aqueous method of reprocessing of corium difficult. Alternatively, pyroprocessing technology, in which the mixture of oxides in the spent oxide fuel is first reduced to an alloy of metals and the alloy subsequently is electro-refined in LiCl-KCl melt to recover actinides of interest, can be used. Molten salt based electro-lithiothermic reduction method, where the solid metal oxide is chemically reduced to the metal by electro-generated lithium in LiCl-Li2O melt at 650 °C, was found suitable for the head-end oxide to metal conversion step.
However, studies carried out in this context by few groups have observed that solid-state electro-reduction of ZrO2 was difficult due to the formation of stable intermediate compound, lithium zirconate (Li2ZrO3) and it remained as an impediment to the use of pyrochemical processing of corium.
With our vast experience in the solid-state electro-reduction of a host of metal oxides including UO2 to corresponding metal, we have revisited the problem and demonstrated that electro-reduction of solid ZrO2 to Zr is indeed feasible, but under special experimental conditions than that employed by the other groups. Our modifications included, (i) use of powder compacted and sintered ZrO2 pellets as electrode in place of ZrO2 powder, (ii) use of 0.5 wt.% Li2O in the melt as against 1 wt.% used by others and (iii) passage of 200% of the charge, than that theoretically required for complete conversion of the oxide mass to Zr, through the cell.
Thermally dried LiCl powder or LiCl + Li2O (0.5 wt.% max.) powder mixture was heated to 650 oC in leak-tight stainless steel reactor vessel, which was continuously flushed with high purity argon gas, to obtain the corresponding electrolyte melts. Solid ZrO2 pellets, prepared by powder compaction followed by sintering in air at 1050oC, were used as the cathode in the electro-reduction cell against gaphite or platinum anodes
6.09
0 1 2 3 4 5 6
-2.5
-2.0
-1.5
-1.0
-0.5
Li+/Li = - 2.185 V
E/ V
vs N
i/NiO
Time (Hour)
Fig. 1 Photograph of (a) ZrO2 pellet, (b) ZrO2 pellets placed in a ss cup, (c) graphite anode and (d) platinum coil anode
Fig. 2 Variation of cathode potential of the electro-reduction cell, graphite/LiCl-0.5wt% Li2O/ZrO2
(Figure 1). The cyclic voltammetry of inert tungsten (cathodic scan) and graphite (anodic scan) working electrodes confirmed the electrochemical window and the desired purity level of the melt for the experiments.
The electro-reduction experiments were carried out galvanostatically at 0.5 or 1 A current, during which the lithium metal was formed on the ZrO2 electrode as per the reaction 2 Li2O = 4 Li + O2 which in turn reacted chemically with the oxide pellet to produce Zr metal as per the reaction, ZrO2 + 2 Li = Zr + Li2O. In this kind of unique electrolysis, the lithium metal deposition on the ZrO2 electrode, its reaction with the electrode and the completion of reaction were monitored by following the cathode potentials against a Ni/NiO reference electrode. Electrolysis was discontinued once the lithium deposition potential of the electrode remained unchanged for about ten minutes.
A typical electrolysis plot showing the progress of lithium deposition and reaction with the ZrO2 cathode is shown in Figure 2. In the beginning of electrolysis, when the cell current was interrupted, the IR free electrode potential was shown to be highly positive compared to the Li+/Li
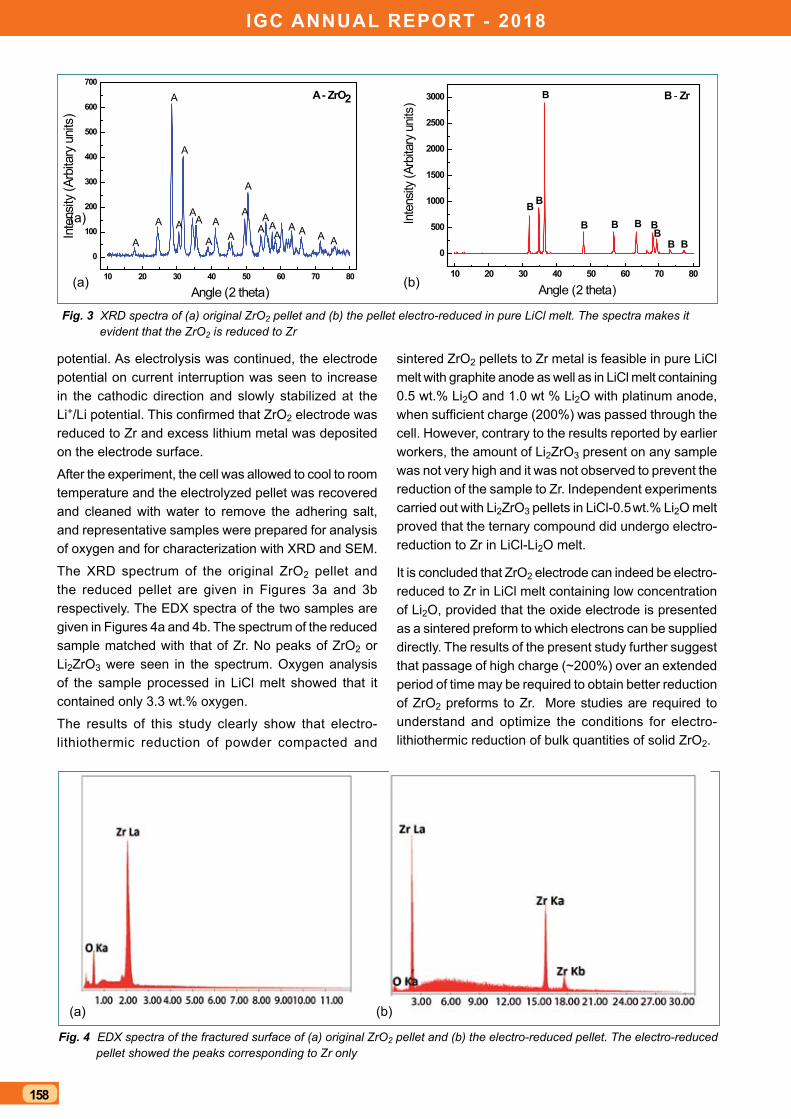
IGC ANNUAL REPORT - 2018
158
Fig. 4 EDX spectra of the fractured surface of (a) original ZrO2 pellet and (b) the electro-reduced pellet. The electro-reduced pellet showed the peaks corresponding to Zr only
potential. As electrolysis was continued, the electrode potential on current interruption was seen to increase in the cathodic direction and slowly stabilized at the Li+/Li potential. This confirmed that ZrO2 electrode was reduced to Zr and excess lithium metal was deposited on the electrode surface.
After the experiment, the cell was allowed to cool to room temperature and the electrolyzed pellet was recovered and cleaned with water to remove the adhering salt, and representative samples were prepared for analysis of oxygen and for characterization with XRD and SEM.
The XRD spectrum of the original ZrO2 pellet and the reduced pellet are given in Figures 3a and 3b respectively. The EDX spectra of the two samples are given in Figures 4a and 4b. The spectrum of the reduced sample matched with that of Zr. No peaks of ZrO2 or Li2ZrO3 were seen in the spectrum. Oxygen analysis of the sample processed in LiCl melt showed that it contained only 3.3 wt.% oxygen.
The results of this study clearly show that electro-lithiothermic reduction of powder compacted and
sintered ZrO2 pellets to Zr metal is feasible in pure LiCl melt with graphite anode as well as in LiCl melt containing 0.5 wt.% Li2O and 1.0 wt % Li2O with platinum anode, when sufficient charge (200%) was passed through the cell. However, contrary to the results reported by earlier workers, the amount of Li2ZrO3 present on any sample was not very high and it was not observed to prevent the reduction of the sample to Zr. Independent experiments carried out with Li2ZrO3 pellets in LiCl-0.5 wt.% Li2O melt proved that the ternary compound did undergo electro-reduction to Zr in LiCl-Li2O melt.
It is concluded that ZrO2 electrode can indeed be electro-reduced to Zr in LiCl melt containing low concentration of Li2O, provided that the oxide electrode is presented as a sintered preform to which electrons can be supplied directly. The results of the present study further suggest that passage of high charge (~200%) over an extended period of time may be required to obtain better reduction of ZrO2 preforms to Zr. More studies are required to understand and optimize the conditions for electro-lithiothermic reduction of bulk quantities of solid ZrO2.
10 20 30 40 50 60 70 80
0
100
200
300
400
500
600
700
AAAAAA
AA
A
A
A
A
AA
AA
A
A
A
Inte
nsity
(Arb
itary
uni
ts)
Angle (2 theta)
A - ZrO2
A
Fig. 3 XRD spectra of (a) original ZrO2 pellet and (b) the pellet electro-reduced in pure LiCl melt. The spectra makes it evident that the ZrO2 is reduced to Zr
10 20 30 40 50 60 70 80
0
500
1000
1500
2000
2500
3000
B B
BB
BB
B
B
B
B - Zr
Inte
nsity
(Arb
itary
uni
ts)
Angle (2 theta)
B(a)
(a)
(a)
(b)
(b)
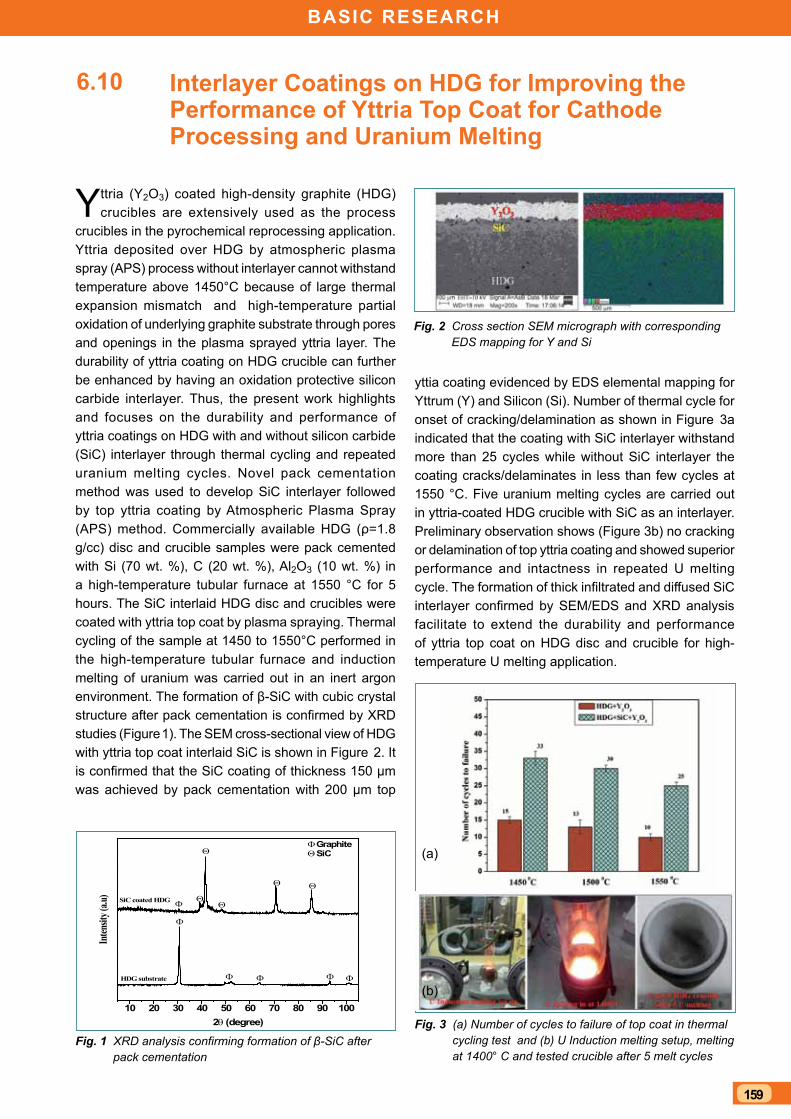
159
BAsIC REsEARCh
Interlayer Coatings on hDG for Improving the Performance of Yttria Top Coat for Cathode Processing and Uranium Melting
Yttria (Y2O3) coated high-density graphite (HDG) crucibles are extensively used as the process
crucibles in the pyrochemical reprocessing application. Yttria deposited over HDG by atmospheric plasma spray (APS) process without interlayer cannot withstand temperature above 1450°C because of large thermal expansion mismatch and high-temperature partial oxidation of underlying graphite substrate through pores and openings in the plasma sprayed yttria layer. The durability of yttria coating on HDG crucible can further be enhanced by having an oxidation protective silicon carbide interlayer. Thus, the present work highlights and focuses on the durability and performance of yttria coatings on HDG with and without silicon carbide (SiC) interlayer through thermal cycling and repeated uranium melting cycles. Novel pack cementation method was used to develop SiC interlayer followed by top yttria coating by Atmospheric Plasma Spray (APS) method. Commercially available HDG (ρ=1.8 g/cc) disc and crucible samples were pack cemented with Si (70 wt. %), C (20 wt. %), Al2O3 (10 wt. %) in a high-temperature tubular furnace at 1550 °C for 5 hours. The SiC interlaid HDG disc and crucibles were coated with yttria top coat by plasma spraying. Thermal cycling of the sample at 1450 to 1550°C performed in the high-temperature tubular furnace and induction melting of uranium was carried out in an inert argon environment. The formation of β-SiC with cubic crystal structure after pack cementation is confirmed by XRD studies (Figure 1). The SEM cross-sectional view of HDG with yttria top coat interlaid SiC is shown in Figure 2. It is confirmed that the SiC coating of thickness 150 µm was achieved by pack cementation with 200 µm top
6.10
yttia coating evidenced by EDS elemental mapping for Yttrum (Y) and Silicon (Si). Number of thermal cycle for onset of cracking/delamination as shown in Figure 3a indicated that the coating with SiC interlayer withstand more than 25 cycles while without SiC interlayer the coating cracks/delaminates in less than few cycles at 1550 °C. Five uranium melting cycles are carried out in yttria-coated HDG crucible with SiC as an interlayer. Preliminary observation shows (Figure 3b) no cracking or delamination of top yttria coating and showed superior performance and intactness in repeated U melting cycle. The formation of thick infiltrated and diffused SiC interlayer confirmed by SEM/EDS and XRD analysis facilitate to extend the durability and performance of yttria top coat on HDG disc and crucible for high-temperature U melting application.
Fig. 2 Cross section SEM micrograph with corresponding EDS mapping for Y and Si
Fig. 3 (a) Number of cycles to failure of top coat in thermal cycling test and (b) U Induction melting setup, melting at 1400° C and tested crucible after 5 melt cycles
Fig. 1 XRD analysis confirming formation of β-SiC after pack cementation
10 20 30 40 50 60 70 80 90 100
Θ
ΘΘΦ
Θ
ΦΦΦΦ
SiC coated HDG
Inten
sity (
a.u)
2θ (degree)
HDG substrate
Φ Graphite Θ SiC
Φ
Θ
(b)
(a)
IGC ANNUAL REPORT - 2018
160
Interaction of Oxygen Impurity with Dislocation Loops in bcc Fe studied by Ion Channeling and DFT Calculations
The reduced activation ferritic/martensitic steels are proposed structural materials for future nuclear
reactors due to their better void swelling resistance over austenitic steels. For these materials, bcc Fe and FeCr alloy are used as model systems in computer simulation as well as ion irradiation experiments. High energy neutron irradiation of the structural materials produce primary defects of vacancies and interstitials, which cluster to form dislocation loops and voids. These defects lead to notable changes in mechanical properties and dimension of structural materials which limit long term reactor operation. The impurities present in these materials strongly interact with radiation induced defects and produce considerable modification in the radiation induced microstructure. The lattice location of impurity atoms in a specific crystal structure will be decided by their interaction and trapping with the defects.
The lattice location of 18O impurity atom in bcc Fe crystals and the type of defects is measured by ion channeling. The most probable defect configuration responsible for this lattice position is predicted by DFT calculations using VASP code, by studying the interaction of O with various oxygen-vacancy cluster configurations. 18O impurity atoms and dislocation loops are introduced into bcc Fe single crystals by implantation of 300 keV 18O ions at a fluence of 5×10¹⁵ /cm2 and annealing. Fe+ ions are implanted into a few crystals at the ion range Rp or 2Rp
of 300 keV 18O ions to produce excess interstitials and vacancies (utilizing Rp/2 effect) respectively, to overlap with 18O depth profile.
Ion channeling tilt angular scans of Fe and 18O signals are taken along <100> and <110> axes and the scan along <100> axis with simulated data from O18 implanted Fe crystal is shown in Figure 1(a). Oxygen is found to be at tetrahedral interstitial site in
6.11
this sample by simulating the measured tilt angular scans using FLUX7 software. It is found to be displaced 0.2 Å from tetrahedral towards octahedral interstitial site upon introduction of excess interstitials. Energy dependent dechanneling measurements show the presence of dislocation loops with a density of 2.8×10¹⁰ /cm2. DFT calculations are carried out by assuming interaction of oxygen with <100> interstitial dislocation loop as in Figure 1(b). Tetrahedral interstitial site with 0.4 Å displacement towards octahedral interstitial site is predicted with positive binding energy of 0.3 eV.
Figure 2a and 2b show <110> tilt angular scans from 18O+ implanted Fe crystal with introduction of excess vacancies and upon further introduction. Oxygen is found to be displaced 1.2 Å from body center along <111> from 2a and 0.62 Å for 18O from octahedral along <100> from 2c. DFT predicted structures shown in Figures 2c and 2d trapping with displacements of 1.16Å from body center along <111> by assuming interaction with 1/2<111> vacancy dislocation loops and 0.46Å towards the vacancy cluster along <100> for <100> vacancy dislocation, which are comparable with experimental values.
These results show that lattice position of impurity depends on its interaction with type of defects as well as their concentration. There is strong evidence of attractive interaction of oxygen with vacancy dislocation loops and trapping of oxygen at dislocation loops in bcc Fe under radiation damage.
Fig. 1 (a) Tilt angular scan along <110> axis of O18 ion implanted Fe crystal with introduction of excess interstitials, (b) DFT predicted defect structure
Fig. 2 Tilt angular scans along <110> axis of O18 ion implanted Fe crystal (a) with introduction of excess vacancies and (b) upon further introduction, (c) and (d) corresponding DFT predicted defect structures
(a)
(b)
(c)
(d)
161
BAsIC REsEARCh
First-principles study of Interaction Energies of Atomic Defects in bcc Ferromagnetic Iron
The oxide dispersion strengthened steels have superior creep resistance and stability under irradiation,
attributed to the finest oxide particles densely dispersed in the ferritic Fe matrix with high dislocation density. The evolution of size and population of these nanoparticles is not well understood. Vacancy and solute formation energies and vacancy-solute and solute-solute binding energies are important parameters controlling the diffusion of solute atoms and hence nucleation, growth, and coarsening of precipitates. We have created a large database of solute formation energies, vacancy-solute, and solute-solute binding energies in iron using DFT total energy calculations. Then we analyzed the results to identify physical trends in the formation and binding energies of the solutes.
Figure 1 illustrates our model of atomic defects in iron. Labels 1, 2, and 3 represent substitution sites. Labels 4 to 12 represent octahedral interstitial sites. Solute-solute nearest neighbour pair configuration was obtained by substituting the Fe atoms at sites 1 and 2 with the given solute atoms. Vacancy-solute 1st and 2nd neighbour pairs were formed by placing the given solute atom at site 2 or 3 respectively while site 1 is made vacant. A single interstitial atom defect was formed by placing the atom at site 4. Configurations of pairs of interstitial atoms were created by placing them at pairs of sites 5-6, 5-7, 5-8, 5-9, 5-10, 5-11, and 5-12 respectively. Vacancy-interstitial pairs were formed by removing the atoms at site 1 and placing an interstitial at site 4 or 5 respectively for 1st and 2nd nn configurations.
Our calculations reveal several trends in formation and binding energies of solutes and their size factors. (1) It is found that the formation energies of solutes (Figure 2), from 4th and 5th periods vary with their atomic numbers such that they reach a maximum near the ends of the periods and minimum in between, with a local hump
6.12
near Cu/Ag. Solutes from the 2nd and 3rd periods show similar trends like the elements near the ends of the 4th and 5th periods. The common solute additions to Fe are found to possess moderate formation energies. Large endot- hermic formation energies are obtained for solutes that lack solubility in Fe. (2) Like formation energies, the size factors of the solutes also vary with their atomic numbers such that they reach maximum near the ends of the periods and minimum in between. (3) Solubility estimated from formation energies are found to be in reasonable agreement with those from the phase diagram database. (4) The solute-solute and vacancy-solute binding energies vary with the atomic number of the solutes in a manner inverse to the formation energies and size factors. (5) The size factors of isoelectronic sets of elements increase down the groups with an associated increase of the formation energies, as shown in Figure 3. (6) Comparison of predicted vacancy-solute binding energies of 3d and 4d elements with their diffusion coefficients from literature shows a significant correlation whereby solutes with strong binding energies possess higher diffusion coefficients and vice versa.
Fig. 1 BCC 3x3x3 supercell with labeled atoms to define atomic defect configurations
Fig. 2 Formation energies of solutes in bcc Fe. The curves are guides to eye
Fig. 3 Vacancy-solute binding energy versus solute size factor in bcc Fe. The dashed lines indicate trends along the groups. Similar trends can be seen along the other groups also

IGC ANNUAL REPORT - 2018
162
Experimental Evidence for the Significant Role of initial Cluster Size and Liquid Confinement on Thermo-Physical Properties of Magnetic Nanofluids
The role of initial cluster size and the liquid layer confinement between intra-chain magnetic
nanoparticles,under the influence of an external magnetic field, on thermal and rheological properties of model magnetic nanofluids (ferrofluids) is studied. Three different ferrofluids containing oleic acid capped superparamagnetic Fe3O4 nanoparticles of average crystallite sizes (and polydispersity index) 9.6 (0.22), 8.3 (0.23) and 10.5 (0.79) nm (referred as S1, S2 and S3, respectively) were used in the present study.The magnetic nanoparticles were well characterized by X-ray diffraction (XRD), small angle X-ray scattering (SAXS), dynamic light scattering (DLS), vibrating sample magnetometry (VSM) and thermogravimetry (TGA).
Thermal conductivity enhancement in samples S1 and S2 in the presence of magnetic field (parallel to the direction of heat flux) were ~ 127% (at 160 G) and 42% (at 70 G), respectively, while S3 did not show significant enhancement in thermal conductivity, as shown in Figure 1a. In a relatively monodisperse system, nucleation occurs at longer time scales and at high field strengths. On the contrary, in significantly polydisperse system, the larger particles act as nucleation centers and hence, the aggregation kinetics is much faster. Under a low magnetic field strength, the particles present in S1 interact with each other and form short nano-sized chains, which enhance thermal conductivity. However in S3, larger sized particles act as nucleation centers to initiate chain formation at low field and form thick columnar structures via zippering at higher fields,which lower the heat transport efficiency. Formation of such thick chains, in the case of S3, was clearly discernible from the optical phase contrast microscopy images (Figure 2).
For a field strength of 200 G, S3 showed ~ 800% enhancement in viscosity, while S1 and S2 showed negligible enhancement in viscosity (Figure 1b). For an applied magnetic field perpendicular to the shear field, the viscosity of ferrofluids increases due to the formation of aggregates that resist shear induced flow. Experimental findings indicated that only S3 showed a significant increase in viscosity, as it contained sizeable quantity of larger sized magnetic nanoparticles, which resulted in formation of long and thick chains in the presence of a magnetic field. These thick chains spanned the gap between the rheometer plates, there by
6.13
hindering the flow in a shear field, applied perpendicular to the magnetic field. S1 and S2, on the other hand, being highly monodisperse, contained larger fractions of smaller sized magnetic nanoparticles that may only interact very weakly in the presence of magnetic field.
Significantly higher thermal conductivity enhancement in ferrofluids with very small fraction of larger sized magnetic nanoparticles confirms the numerical simulation based results that when liquids are confined in nano-channels, long range phonons are sustained by the base fluid, which causes an enhancement in heat transport by lowering the Kapitza resistance. Experimental findings obtained in the present study provide several new insights into the mechanism of heat conduction in magnetic nanofluids, under the influence of an external magnetic field and ways to achieve efficient heat transfer without increasing the pumping power.
Fig. 1 (a)Thermal conductivity enhancement in S1, S2 and S3 in the presence of a magnetic field, parallel to the direction of heat flux. (b) Enhancement in viscosity with magnetic field (perpendicular to the direction of shear field) sweep at a shear rate of 75 s−1
Fig. 2 Phase contrast optical microscopy images showing external magnetic field induced chain formation in S1, S2 and S3 at different magnetic field strengths
163
BAsIC REsEARCh
A Novel Approach for Phase Identification in Binary Mixture of Nanopowders from Deconvoluted Valence Band spectra using X-Ray Photoelectron spectroscopy
A new method for quantifying the phases present in a binary mixture of nanopowder from deconvoluted
valence band spectra using X-ray photoelectron spectroscopy (XPS) is developed. The advantage of the XPS valence band analysis is that it can provide the phase information of the topmost surface layers irrespective of the surface roughness.
Polymorphs of iron oxide (γ-Fe2O3 and α-Fe2O3) and titania (anatase and rutile TiO2) nanopowders containing different weight percentages of the polymorphs were chosen for the present study. Pure iron oxide nanopowder (Fe3O4) prepared by co-precipitation was air annealed at 250 and 700 °C to obtain γ-Fe2O3 and α-Fe2O3 phases respectively. In addition, anatase and rutile TiO2 were also used in the present study. The deconvoluted valence bands of the iron oxide and titania polymorphs are shown in Figure 1. A linear correlation between the percentage of the phase and the valance band peak area was observed in both the cases as shown in the Figure 2.
The phase compositions of the nanopowder mixtures identified from the valence band spectra were compared with that of the X-ray Diffraction (XRD) data and the results were found to be in good agreement with each other. For nanoparticles of size greater than 30 nm, no size dependent effect was observed in determining the phase composition but for particle size below 10 nm,
6.14
size was found to have a detrimental role. These results showed that the polymorphs can be quantified from XPS valence band analysis.
The substrate used for mounting the powder samples is found to affect the quality of the data. This issue is resolved by using a metallic substrate avoiding the conventional carbon tape mounting. The surface contamination by the adventitious carbon had no observable influence in analyzing the XPS valence band data for the carbon concentrations below 25 at.%. However, the ion sputtering of the surface carbon was detrimental for the analysis. The polymorphs of iron oxide and titania systems each with similar densities had no observable effect on the XPS or XRD analysis in determining the phase composition. The number of constraints used for the deconvolution of XPS valence band spectra was found to be a major factor affecting the quantification of the phase composition.
A conventional XPS core level analysis cannot distinguish between the polymorphs of a chemical composition. The neighboring atoms’ arrangement can only affect the outermost electron energy levels of an atom, i.e. valence band. Thus, it is possible to extract the information of the crystal structure or phase of a sample surface by analysing the valence band using XPS. The main advantage of this approach is that it allows simultaneous identification of the phase and chemical compositions of a material surface using XPS and also both the compositions correspond to almost the same nano scale thickness.
-5 0 5 10 15 20
0
50
100
150
200
250
Inte
snity
(AU
)In
tesn
ity (A
U)
Binding Energy (eV) Binding Energy (eV)
-5 0 5 10 15 20-20
020406080
100120140160
-2 0 2 4 6 8 10 12 14 16-50
050
100150200250300350
-2 0 2 4 6 8 10 12 14 16-50
050
100150200250300350400
0 20 40 60 80 1001416182022242628303234
Peak
1 %
Actual γ Fe2O 3wt %0 20 40 60 80 100
1416182022242628303234
Peak
1 %
Actual Anatase wt %
Fig. 1 The deconvoluted high resolution spectra of the valence band region for the iron oxide and titania polymorphs (a) haematite, (b) maghemite, (c) rutile and (d) anatase nanopowders
Fig. 2 The actual wt.% of the (a) maghemite and (b) anatase phases of the iron oxide and titania nanopowders and their corresponding distinctive feature peak % determined from deconvoluting their XPS valence bands. The standard deviations (σ) of the linear fits are (a) 0.767 and (b) 0.367 with R2 values of (a) 0.985 and (b) 0.977
(a)
(a)
(c) (d)
(b)
(b)
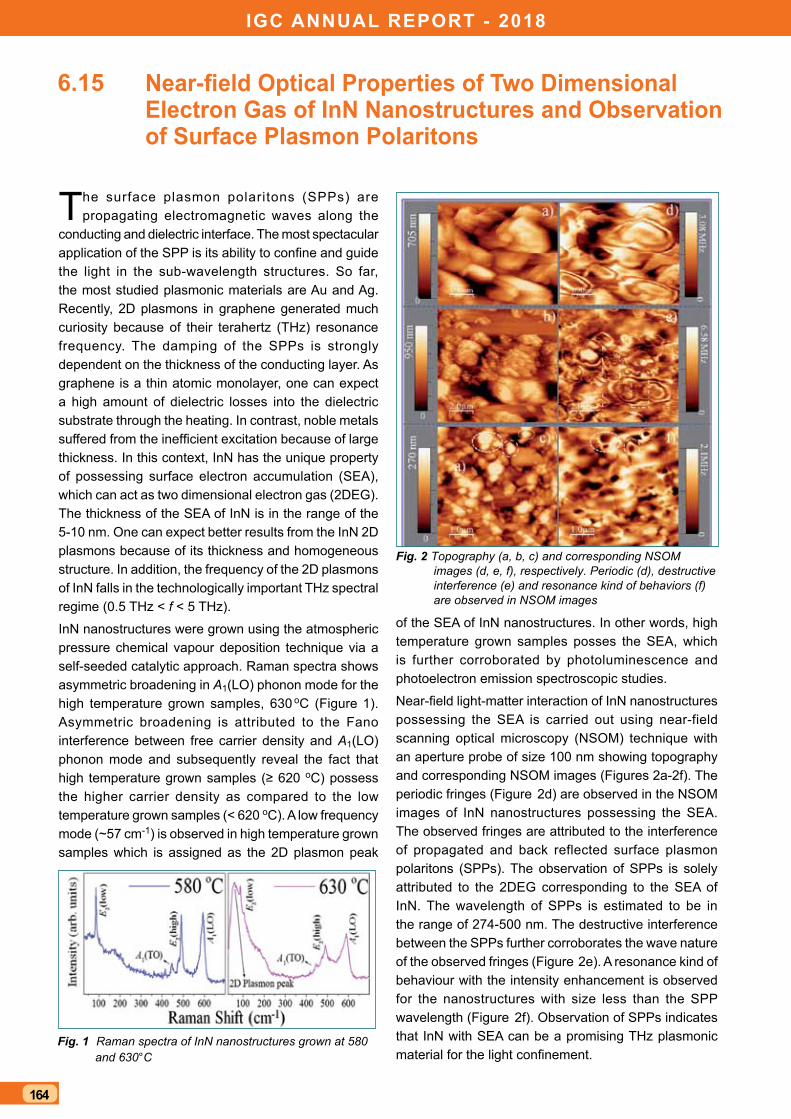
IGC ANNUAL REPORT - 2018
164
Near-field Optical Properties of Two Dimensional Electron Gas of InN Nanostructures and Observation of surface Plasmon Polaritons
The surface plasmon polaritons (SPPs) are propagating electromagnetic waves along the
conducting and dielectric interface. The most spectacular application of the SPP is its ability to confine and guide the light in the sub-wavelength structures. So far, the most studied plasmonic materials are Au and Ag. Recently, 2D plasmons in graphene generated much curiosity because of their terahertz (THz) resonance frequency. The damping of the SPPs is strongly dependent on the thickness of the conducting layer. As graphene is a thin atomic monolayer, one can expect a high amount of dielectric losses into the dielectric substrate through the heating. In contrast, noble metals suffered from the inefficient excitation because of large thickness. In this context, InN has the unique property of possessing surface electron accumulation (SEA), which can act as two dimensional electron gas (2DEG). The thickness of the SEA of InN is in the range of the 5-10 nm. One can expect better results from the InN 2D plasmons because of its thickness and homogeneous structure. In addition, the frequency of the 2D plasmons of InN falls in the technologically important THz spectral regime (0.5 THz < f < 5 THz).
InN nanostructures were grown using the atmospheric pressure chemical vapour deposition technique via a self-seeded catalytic approach. Raman spectra shows asymmetric broadening in A1(LO) phonon mode for the high temperature grown samples, 630 oC (Figure 1). Asymmetric broadening is attributed to the Fano interference between free carrier density and A1(LO) phonon mode and subsequently reveal the fact that high temperature grown samples (≥ 620 oC) possess the higher carrier density as compared to the low temperature grown samples (< 620 oC). A low frequency mode (~57 cm-1) is observed in high temperature grown samples which is assigned as the 2D plasmon peak
6.15
Fig. 1 Raman spectra of InN nanostructures grown at 580 and 630°C
Fig. 2 Topography (a, b, c) and corresponding NSOM images (d, e, f), respectively. Periodic (d), destructive interference (e) and resonance kind of behaviors (f) are observed in NSOM images
of the SEA of InN nanostructures. In other words, high temperature grown samples posses the SEA, which is further corroborated by photoluminescence and photoelectron emission spectroscopic studies.
Near-field light-matter interaction of InN nanostructures possessing the SEA is carried out using near-field scanning optical microscopy (NSOM) technique with an aperture probe of size 100 nm showing topography and corresponding NSOM images (Figures 2a-2f). The periodic fringes (Figure 2d) are observed in the NSOM images of InN nanostructures possessing the SEA. The observed fringes are attributed to the interference of propagated and back reflected surface plasmon polaritons (SPPs). The observation of SPPs is solely attributed to the 2DEG corresponding to the SEA of InN. The wavelength of SPPs is estimated to be in the range of 274-500 nm. The destructive interference between the SPPs further corroborates the wave nature of the observed fringes (Figure 2e). A resonance kind of behaviour with the intensity enhancement is observed for the nanostructures with size less than the SPP wavelength (Figure 2f). Observation of SPPs indicates that InN with SEA can be a promising THz plasmonic material for the light confinement.

165
BAsIC REsEARCh
Nanomechanical Investigations on Ti doped AlN Thin Films and Corroborative studies using XPs and synchrotron
Group III nitrides are highly attracted in semiconductor industry with great technological advantages.
Amongst, aluminum nitride (AlN) has gained much interest for high-temperature deep ultra violet optoelectronic applications due to its wide band gap (6.2 eV), giant thermal conductivity and melting temperature (3000 °C) with higher hardness. Addition of transition elements to AlN, such as Ti, Cr and Zr has yielded ternary nitrides with higher hardness, superior oxidation resistance, good wear and corrosion resistance. In these, Ti-doped AlN film has exhibited n-type ferromagnetism as dilute magnetic semiconductor (DMS) at room temperature, reported both by first principle calculation and experimental methods.
A representative fitted core level spectrum (XPS) corresponding to Al1-xTixN film with x = 4 at% after Shirley background subtraction is shown in Figure 1. The convolution of a Gaussian and a Lorentzian function is used to fit the high-resolution core level XPS spectra for Al 2p, N 1s O 1s and Ti 2p and the resultant binding energy is extracted. These results confirm the formation of Al-N, Ti-N and Al-O (impurity); however Al-Al formation was absent. This confirms that there is no Al cluster formation in the system.
XANES (X-ray absorption near-edge structure) is very sensitive to the geometrical arrangements of X-ray absorbing atom (symmetry e.g. octahedral, tetrahedral coordination) in the host material. From Figure 2 it can be seen that K-dege absorption spectra of Ti in AlTiN films, a pre-edge peak is observed at around 4967 eV. This confirms that Ti atoms occupy the cation (Al) site of hexagonal AlN structure and forms localized TiN species. In this study, the XANES analysis confirms
6.16
that Ti replaces the Al atom tetrahedrally in AlN matrix and this has led to TiN species with p-d mixing. The pre-edge peak position is constant but a small increase in the intensity with increase in Ti concentration confirms a distorted tetrahedron structure with increase in stress.
Nano-mechanical characterization on these films was performed as a function of depth at different loads by following standard, ISO-14001. Indentation hardness (H) was calculated using Oliver and Pharr model and plotted (Figure 3) against different depth of penetration, different doping concentrations, along with Si substrate. Grain refinement due to the addition of Ti in the place of Al, a subsequent increase in the stress, the hardness increased. However with the increase in depth, the hardness decreased and reached the substrate hardness, since it has gone beyond 1/10th range of the total thickness of the film.
Fig. 1 XPS of as-synthesized Al1-xTixN thin film with Ti = 4at%
Fig. 2 XANES of as- synthesized Al1-xTixN films
Fig. 3 Indentation hardness with depth (Inset: hardness & modulus increases with the addition of Ti)
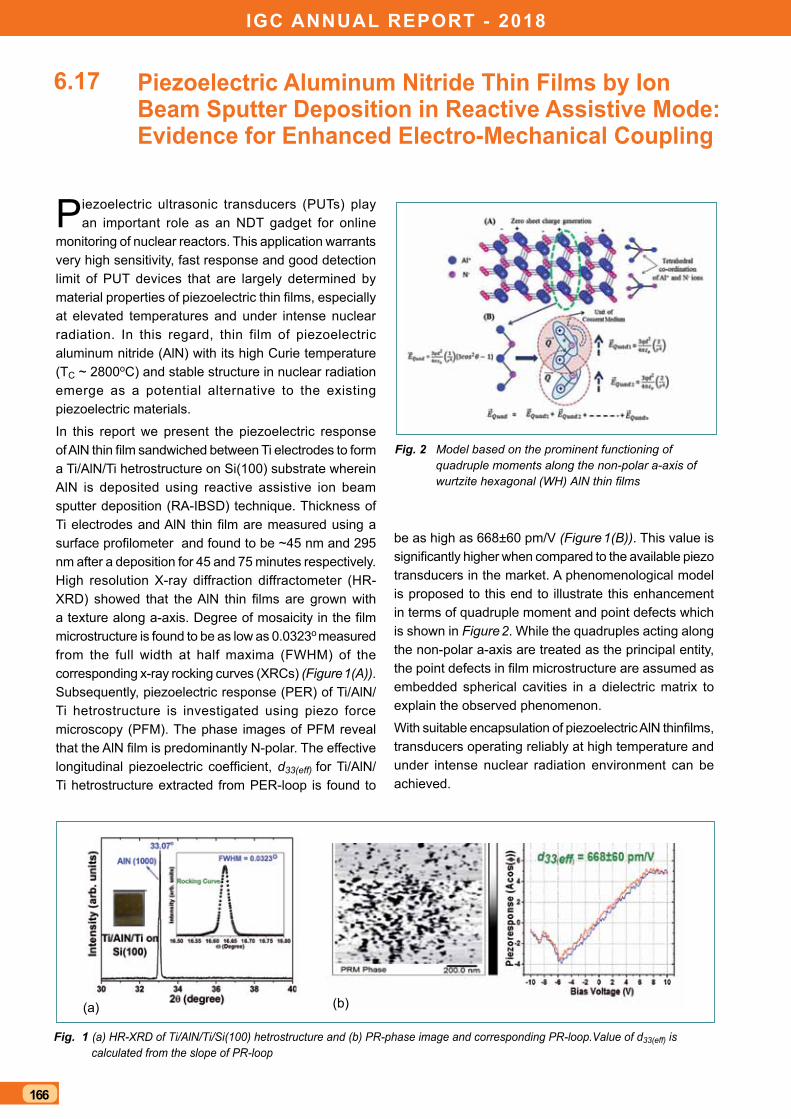
IGC ANNUAL REPORT - 2018
166
Piezoelectric Aluminum Nitride Thin Films by Ion Beam sputter Deposition in Reactive Assistive Mode: Evidence for Enhanced Electro-Mechanical Coupling
Piezoelectric ultrasonic transducers (PUTs) play an important role as an NDT gadget for online
monitoring of nuclear reactors. This application warrants very high sensitivity, fast response and good detection limit of PUT devices that are largely determined by material properties of piezoelectric thin films, especially at elevated temperatures and under intense nuclear radiation. In this regard, thin film of piezoelectric aluminum nitride (AlN) with its high Curie temperature (TC ~ 2800oC) and stable structure in nuclear radiation emerge as a potential alternative to the existing piezoelectric materials.
In this report we present the piezoelectric response of AlN thin film sandwiched between Ti electrodes to form a Ti/AlN/Ti hetrostructure on Si(100) substrate wherein AlN is deposited using reactive assistive ion beam sputter deposition (RA-IBSD) technique. Thickness of Ti electrodes and AlN thin film are measured using a surface profilometer and found to be ~45 nm and 295 nm after a deposition for 45 and 75 minutes respectively. High resolution X-ray diffraction diffractometer (HR-XRD) showed that the AlN thin films are grown with a texture along a-axis. Degree of mosaicity in the film microstructure is found to be as low as 0.0323o measured from the full width at half maxima (FWHM) of the corresponding x-ray rocking curves (XRCs) (Figure 1(A)). Subsequently, piezoelectric response (PER) of Ti/AlN/Ti hetrostructure is investigated using piezo force microscopy (PFM). The phase images of PFM reveal that the AlN film is predominantly N-polar. The effective longitudinal piezoelectric coefficient, d33(eff) for Ti/AlN/Ti hetrostructure extracted from PER-loop is found to
6.17
Fig. 1 (a) HR-XRD of Ti/AlN/Ti/Si(100) hetrostructure and (b) PR-phase image and corresponding PR-loop.Value of d33(eff) is calculated from the slope of PR-loop
Fig. 2 Model based on the prominent functioning of quadruple moments along the non-polar a-axis of wurtzite hexagonal (WH) AlN thin films
be as high as 668±60 pm/V (Figure 1(B)). This value is significantly higher when compared to the available piezo transducers in the market. A phenomenological model is proposed to this end to illustrate this enhancement in terms of quadruple moment and point defects which is shown in Figure 2. While the quadruples acting along the non-polar a-axis are treated as the principal entity, the point defects in film microstructure are assumed as embedded spherical cavities in a dielectric matrix to explain the observed phenomenon.
With suitable encapsulation of piezoelectric AlN thinfilms, transducers operating reliably at high temperature and under intense nuclear radiation environment can be achieved.
(a) (b)
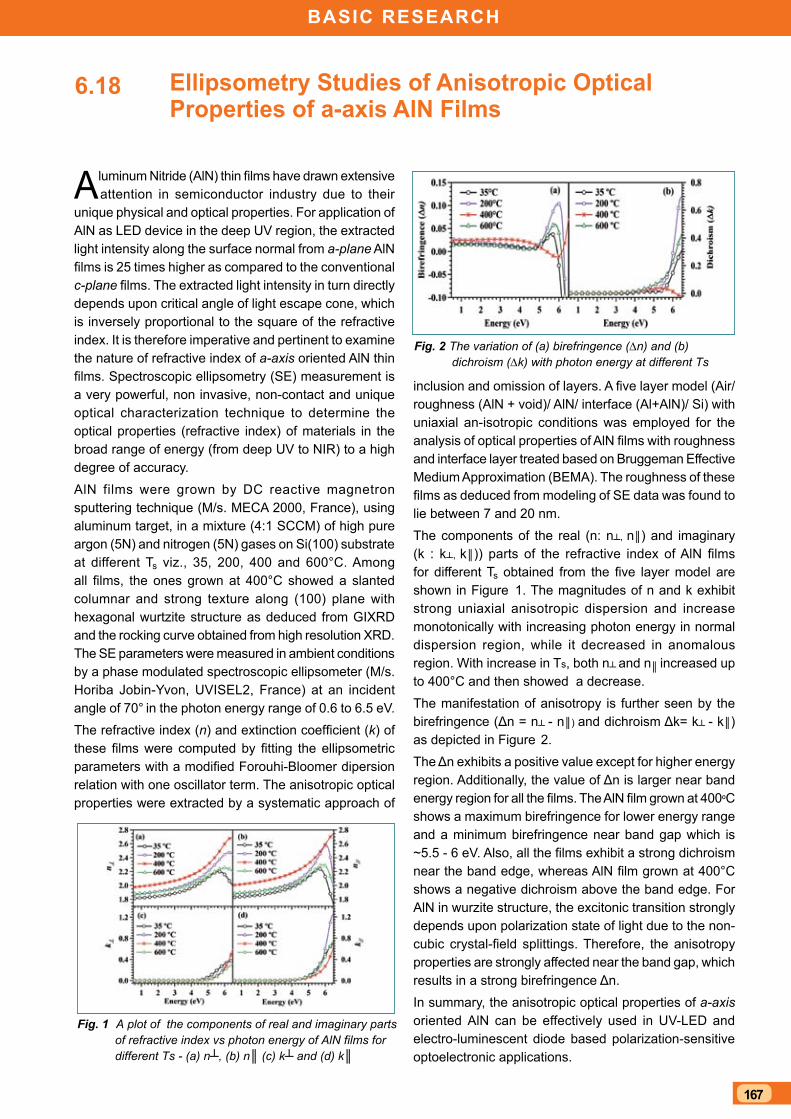
167
BAsIC REsEARCh
Ellipsometry studies of Anisotropic Optical Properties of a-axis AlN Films
Aluminum Nitride (AlN) thin films have drawn extensive attention in semiconductor industry due to their
unique physical and optical properties. For application of AlN as LED device in the deep UV region, the extracted light intensity along the surface normal from a-plane AlN films is 25 times higher as compared to the conventional c-plane films. The extracted light intensity in turn directly depends upon critical angle of light escape cone, which is inversely proportional to the square of the refractive index. It is therefore imperative and pertinent to examine the nature of refractive index of a-axis oriented AlN thin films. Spectroscopic ellipsometry (SE) measurement is a very powerful, non invasive, non-contact and unique optical characterization technique to determine the optical properties (refractive index) of materials in the broad range of energy (from deep UV to NIR) to a high degree of accuracy.AlN films were grown by DC reactive magnetron sputtering technique (M/s. MECA 2000, France), using aluminum target, in a mixture (4:1 SCCM) of high pure argon (5N) and nitrogen (5N) gases on Si(100) substrate at different Ts viz., 35, 200, 400 and 600°C. Among all films, the ones grown at 400°C showed a slanted columnar and strong texture along (100) plane with hexagonal wurtzite structure as deduced from GIXRD and the rocking curve obtained from high resolution XRD. The SE parameters were measured in ambient conditions by a phase modulated spectroscopic ellipsometer (M/s. Horiba Jobin-Yvon, UVISEL2, France) at an incident angle of 70° in the photon energy range of 0.6 to 6.5 eV.The refractive index (n) and extinction coefficient (k) of these films were computed by fitting the ellipsometric parameters with a modified Forouhi-Bloomer dipersion relation with one oscillator term. The anisotropic optical properties were extracted by a systematic approach of
6.18
Fig. 1 A plot of the components of real and imaginary parts of refractive index vs photon energy of AlN films for different Ts - (a) n, (b) n (c) k and (d) k
Fig. 2 The variation of (a) birefringence (∆n) and (b) dichroism (∆k) with photon energy at different Ts
inclusion and omission of layers. A five layer model (Air/ roughness (AlN + void)/ AlN/ interface (Al+AlN)/ Si) with uniaxial an-isotropic conditions was employed for the analysis of optical properties of AlN films with roughness and interface layer treated based on Bruggeman Effective Medium Approximation (BEMA). The roughness of these films as deduced from modeling of SE data was found to lie between 7 and 20 nm.The components of the real (n: n, n) and imaginary (k : k, k)) parts of the refractive index of AlN films for different Ts obtained from the five layer model are shown in Figure 1. The magnitudes of n and k exhibit strong uniaxial anisotropic dispersion and increase monotonically with increasing photon energy in normal dispersion region, while it decreased in anomalous region. With increase in Ts, both n and n increased up to 400°C and then showed a decrease. The manifestation of anisotropy is further seen by the birefringence (Δn = n - n) and dichroism Δk= k - k) as depicted in Figure 2. The Δn exhibits a positive value except for higher energy region. Additionally, the value of Δn is larger near band energy region for all the films. The AlN film grown at 400⁰C shows a maximum birefringence for lower energy range and a minimum birefringence near band gap which is ~5.5 - 6 eV. Also, all the films exhibit a strong dichroism near the band edge, whereas AlN film grown at 400°C shows a negative dichroism above the band edge. For AlN in wurzite structure, the excitonic transition strongly depends upon polarization state of light due to the non-cubic crystal-field splittings. Therefore, the anisotropy properties are strongly affected near the band gap, which results in a strong birefringence Δn. In summary, the anisotropic optical properties of a-axis oriented AlN can be effectively used in UV-LED and electro-luminescent diode based polarization-sensitive optoelectronic applications.
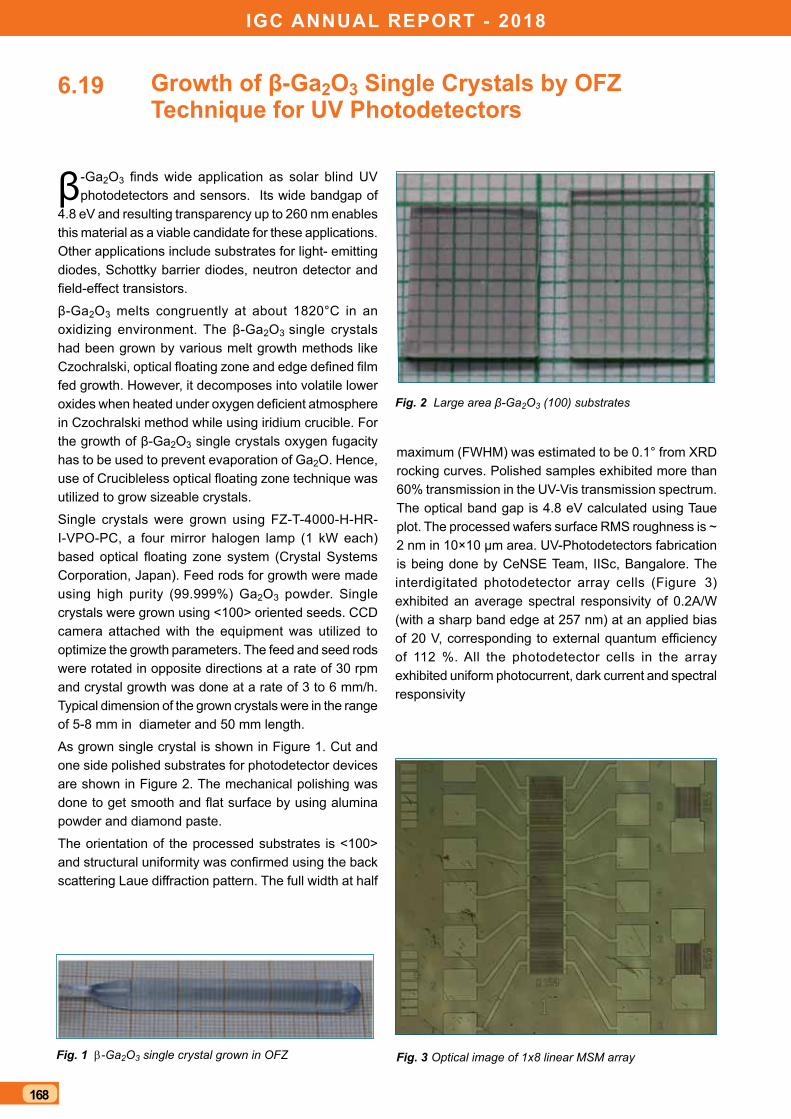
IGC ANNUAL REPORT - 2018
168
Growth of β-Ga2O3 single Crystals by OFZ Technique for UV Photodetectors
β-Ga2O3 finds wide application as solar blind UV photodetectors and sensors. Its wide bandgap of
4.8 eV and resulting transparency up to 260 nm enables this material as a viable candidate for these applications. Other applications include substrates for light- emitting diodes, Schottky barrier diodes, neutron detector and field-effect transistors.
β-Ga2O3 melts congruently at about 1820°C in an oxidizing environment. The β-Ga2O3 single crystals had been grown by various melt growth methods like Czochralski, optical floating zone and edge defined film fed growth. However, it decomposes into volatile lower oxides when heated under oxygen deficient atmosphere in Czochralski method while using iridium crucible. For the growth of β-Ga2O3 single crystals oxygen fugacity has to be used to prevent evaporation of Ga2O. Hence, use of Crucibleless optical floating zone technique was utilized to grow sizeable crystals.
Single crystals were grown using FZ-T-4000-H-HR-I-VPO-PC, a four mirror halogen lamp (1 kW each) based optical floating zone system (Crystal Systems Corporation, Japan). Feed rods for growth were made using high purity (99.999%) Ga2O3 powder. Single crystals were grown using <100> oriented seeds. CCD camera attached with the equipment was utilized to optimize the growth parameters. The feed and seed rods were rotated in opposite directions at a rate of 30 rpm and crystal growth was done at a rate of 3 to 6 mm/h. Typical dimension of the grown crystals were in the range of 5-8 mm in diameter and 50 mm length.
As grown single crystal is shown in Figure 1. Cut and one side polished substrates for photodetector devices are shown in Figure 2. The mechanical polishing was done to get smooth and flat surface by using alumina powder and diamond paste.
The orientation of the processed substrates is <100> and structural uniformity was confirmed using the back scattering Laue diffraction pattern. The full width at half
6.19
Fig. 1 b-Ga2O3 single crystal grown in OFZ Fig. 3 Optical image of 1x8 linear MSM array
Fig. 2 Large area β-Ga2O3 (100) substrates
maximum (FWHM) was estimated to be 0.1° from XRD rocking curves. Polished samples exhibited more than 60% transmission in the UV-Vis transmission spectrum. The optical band gap is 4.8 eV calculated using Taue plot. The processed wafers surface RMS roughness is ~ 2 nm in 10×10 µm area. UV-Photodetectors fabrication is being done by CeNSE Team, IISc, Bangalore. The interdigitated photodetector array cells (Figure 3) exhibited an average spectral responsivity of 0.2A/W (with a sharp band edge at 257 nm) at an applied bias of 20 V, corresponding to external quantum efficiency of 112 %. All the photodetector cells in the array exhibited uniform photocurrent, dark current and spectral responsivity
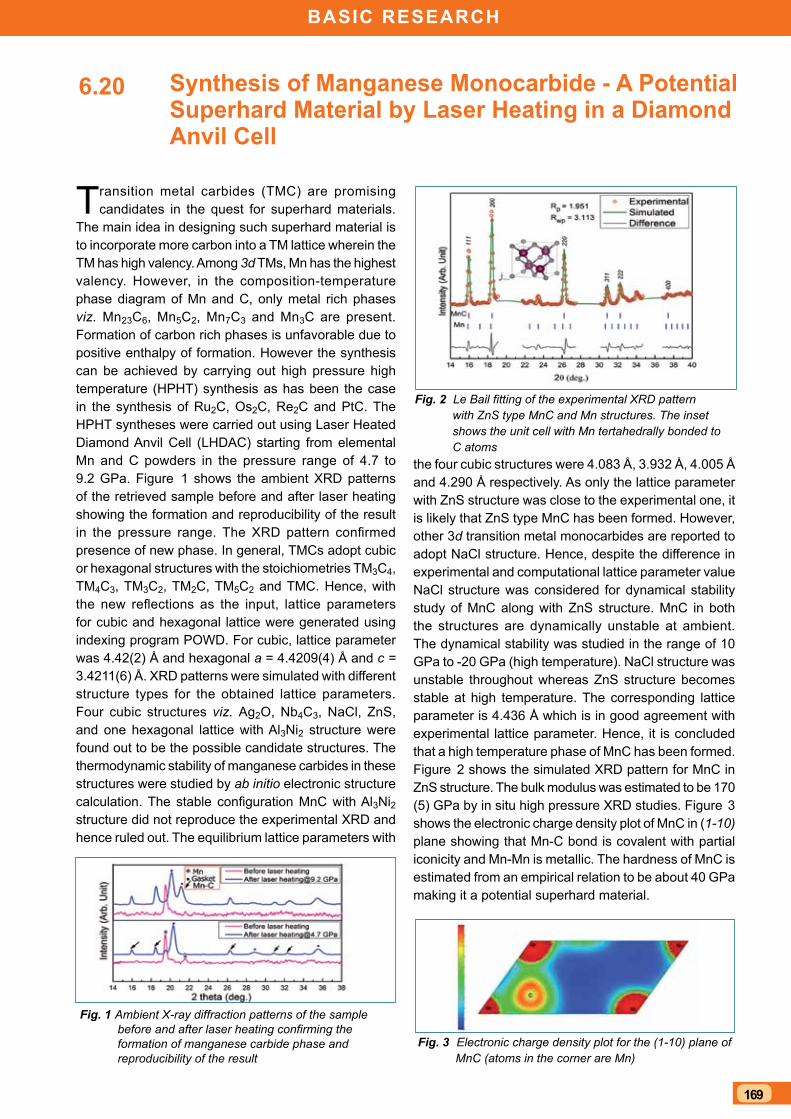
169
BAsIC REsEARCh
synthesis of Manganese Monocarbide - A Potential superhard Material by Laser heating in a Diamond Anvil Cell
Transition metal carbides (TMC) are promising candidates in the quest for superhard materials.
The main idea in designing such superhard material is to incorporate more carbon into a TM lattice wherein the TM has high valency. Among 3d TMs, Mn has the highest valency. However, in the composition-temperature phase diagram of Mn and C, only metal rich phases viz. Mn23C6, Mn5C2, Mn7C3 and Mn3C are present. Formation of carbon rich phases is unfavorable due to positive enthalpy of formation. However the synthesis can be achieved by carrying out high pressure high temperature (HPHT) synthesis as has been the case in the synthesis of Ru2C, Os2C, Re2C and PtC. The HPHT syntheses were carried out using Laser Heated Diamond Anvil Cell (LHDAC) starting from elemental Mn and C powders in the pressure range of 4.7 to 9.2 GPa. Figure 1 shows the ambient XRD patterns of the retrieved sample before and after laser heating showing the formation and reproducibility of the result in the pressure range. The XRD pattern confirmed presence of new phase. In general, TMCs adopt cubic or hexagonal structures with the stoichiometries TM3C4, TM4C3, TM3C2, TM2C, TM5C2 and TMC. Hence, with the new reflections as the input, lattice parameters for cubic and hexagonal lattice were generated using indexing program POWD. For cubic, lattice parameter was 4.42(2) Å and hexagonal a = 4.4209(4) Å and c = 3.4211(6) Å. XRD patterns were simulated with different structure types for the obtained lattice parameters. Four cubic structures viz. Ag2O, Nb4C3, NaCl, ZnS, and one hexagonal lattice with Al3Ni2 structure were found out to be the possible candidate structures. The thermodynamic stability of manganese carbides in these structures were studied by ab initio electronic structure calculation. The stable configuration MnC with Al3Ni2 structure did not reproduce the experimental XRD and hence ruled out. The equilibrium lattice parameters with
6.20
Fig. 1 Ambient X-ray diffraction patterns of the sample before and after laser heating confirming the formation of manganese carbide phase and reproducibility of the result
Fig. 2 Le Bail fitting of the experimental XRD pattern with ZnS type MnC and Mn structures. The inset shows the unit cell with Mn tertahedrally bonded to C atoms
Fig. 3 Electronic charge density plot for the (1-10) plane of MnC (atoms in the corner are Mn)
the four cubic structures were 4.083 Å, 3.932 Å, 4.005 Å and 4.290 Å respectively. As only the lattice parameter with ZnS structure was close to the experimental one, it is likely that ZnS type MnC has been formed. However, other 3d transition metal monocarbides are reported to adopt NaCl structure. Hence, despite the difference in experimental and computational lattice parameter value NaCl structure was considered for dynamical stability study of MnC along with ZnS structure. MnC in both the structures are dynamically unstable at ambient. The dynamical stability was studied in the range of 10 GPa to -20 GPa (high temperature). NaCl structure was unstable throughout whereas ZnS structure becomes stable at high temperature. The corresponding lattice parameter is 4.436 Å which is in good agreement with experimental lattice parameter. Hence, it is concluded that a high temperature phase of MnC has been formed. Figure 2 shows the simulated XRD pattern for MnC in ZnS structure. The bulk modulus was estimated to be 170 (5) GPa by in situ high pressure XRD studies. Figure 3 shows the electronic charge density plot of MnC in (1-10) plane showing that Mn-C bond is covalent with partial iconicity and Mn-Mn is metallic. The hardness of MnC is estimated from an empirical relation to be about 40 GPa making it a potential superhard material.
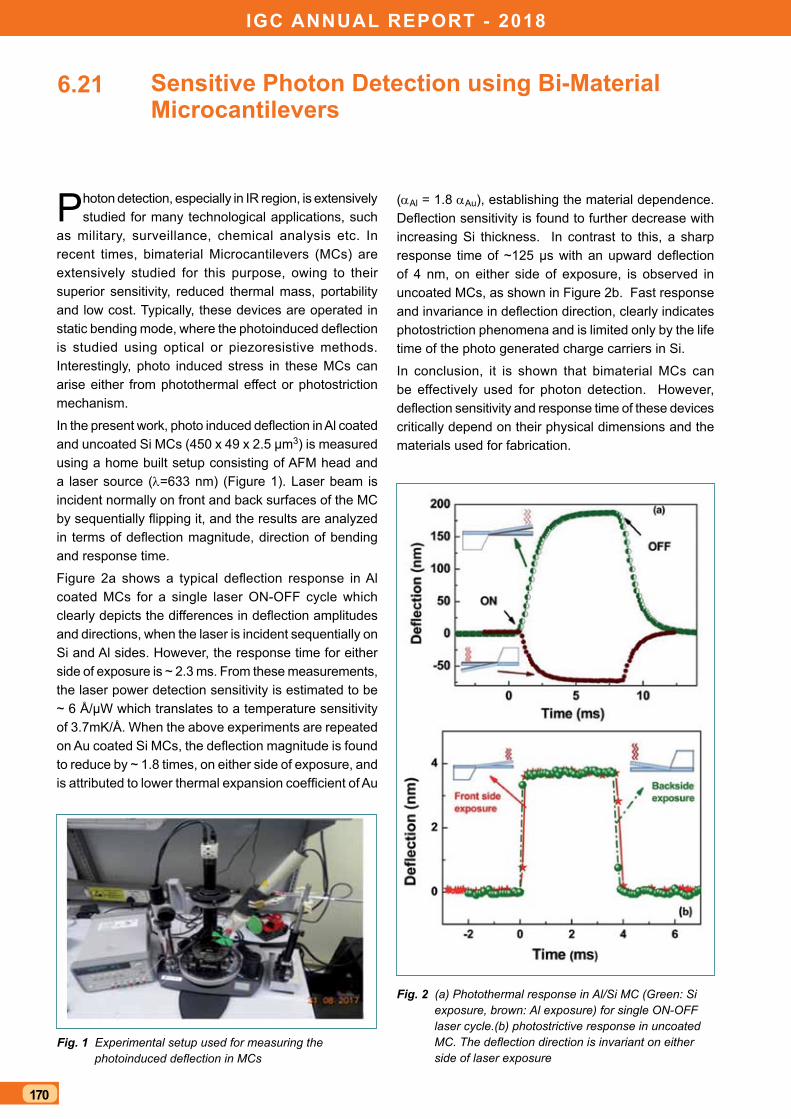
IGC ANNUAL REPORT - 2018
170
sensitive Photon Detection using Bi-Material Microcantilevers
Photon detection, especially in IR region, is extensively studied for many technological applications, such
as military, surveillance, chemical analysis etc. In recent times, bimaterial Microcantilevers (MCs) are extensively studied for this purpose, owing to their superior sensitivity, reduced thermal mass, portability and low cost. Typically, these devices are operated in static bending mode, where the photoinduced deflection is studied using optical or piezoresistive methods. Interestingly, photo induced stress in these MCs can arise either from photothermal effect or photostriction mechanism.
In the present work, photo induced deflection in Al coated and uncoated Si MCs (450 x 49 x 2.5 µm3) is measured using a home built setup consisting of AFM head and a laser source (l=633 nm) (Figure 1). Laser beam is incident normally on front and back surfaces of the MC by sequentially flipping it, and the results are analyzed in terms of deflection magnitude, direction of bending and response time.
Figure 2a shows a typical deflection response in Al coated MCs for a single laser ON-OFF cycle which clearly depicts the differences in deflection amplitudes and directions, when the laser is incident sequentially on Si and Al sides. However, the response time for either side of exposure is ~ 2.3 ms. From these measurements, the laser power detection sensitivity is estimated to be ~ 6 Å/µW which translates to a temperature sensitivity of 3.7mK/Å. When the above experiments are repeated on Au coated Si MCs, the deflection magnitude is found to reduce by ~ 1.8 times, on either side of exposure, and is attributed to lower thermal expansion coefficient of Au
6.21
(aAl = 1.8 aAu), establishing the material dependence. Deflection sensitivity is found to further decrease with increasing Si thickness. In contrast to this, a sharp response time of ~125 µs with an upward deflection of 4 nm, on either side of exposure, is observed in uncoated MCs, as shown in Figure 2b. Fast response and invariance in deflection direction, clearly indicates photostriction phenomena and is limited only by the life time of the photo generated charge carriers in Si.
In conclusion, it is shown that bimaterial MCs can be effectively used for photon detection. However, deflection sensitivity and response time of these devices critically depend on their physical dimensions and the materials used for fabrication.
Fig. 1 Experimental setup used for measuring the photoinduced deflection in MCs
Fig. 2 (a) Photothermal response in Al/Si MC (Green: Si exposure, brown: Al exposure) for single ON-OFF laser cycle.(b) photostrictive response in uncoated MC. The deflection direction is invariant on either side of laser exposure
171
BAsIC REsEARCh
Evolution of Electrical Transport behaviour of MnAs system at high Pressures
MnAs has attracted huge attention due to its exotic structural and magnetic properties and
large potential for technological applications in magnetic refrigeration. It shows ferromagnetic (FM) to paramagnetic (PM) transition at TC ~ 318 K in concomitance with a structural (Hexagonal to Orthorhombic) transition. This transition is followed by Orthorhombic (PM) to Hexagonal (PM) structural transition at Tt ~ 398 K. Previous high pressure structural and magnetic studies on MnAs indicated that the ground state stabilizes in orthorhombic phase for pressures beyond P ~ 0.3 GPa. It also shows multiple magnetic transitions (FM to antiferromagnetic (AFM) and AFM to PM) as a function of temperature within this phase. Study of high pressure transport behaviour is lacking in this system and we have studied the resistivity behaviour at high pressures using home built opposed anvil pressure locked cell in a dipper cryostat.
Figure 1a shows temperature (T) dependent resistivity of MnAs at ambient pressure in the cooling and warming cycles. The system clearly shows a first order phase transition at TC ~ 318 K with a hysteresis width ∆TC ~ 9 K. The transition is magnetic in origin and it is evidenced by FM to PM transition as observed in the magnetization measurements (inset of Figure 1a).The system exhibits positive and negative temperature coefficients of resistivity (TCR) in the FM and PM phases respectively demarcated by the transition at TC. Figure 1b shows resistance variation with temperature at different pressures (P) in the range 0.9-3.25 GPa. With decrease in T, the system exhibits negative TCR at high temperatures and shows a maximum at Tmax and exhibits positive TCR below Tmax upto Tmin. Contrary to the transition at P = 0 GPa, Tmax observed at high pressures is due to PM to AFM transition (TN) which was established in high pressure magnetization measurements. The hysteresis between the cooling and warming cycles indicates that this is a first order transition. The subsequent AFM to FM transition (TC) reported in literature is not clearly seen up to P ∼2.5 GPa, however it is observed at P ~ 3.2 GPa as a change in curvature in R(T). Tmax shows non monotonic dependence with P as shown in Figure 1c. This is in contrast to monotonic increase of TN reported in literature. The system again shows negative TCR below Tmin and the value of Tmin decreases monotonically with increase in P as shown in Fig 1d.
At high pressures, in the PM phase, between TN (TC at ambient pressure) and Tt, the system exhibits continuous
6.22
Fig. 1 (a) resistivity(ρ) versus temperature(T) for MnAs at pressure P = 0 GPa; inset: magnetic moment (m) versus T; (b) resistance (R) versus T at different P ; (c) Tmax versus pressure and (d) Tmin versus pressure P
high spin (HS) to low spin (LS) transition. This transition is responsible for the observed negative TCR above Tmax. The R(T) behaviour is qualitatively explained using Kasuya’s theoretical model for multiple moments (HS and LS) by assuming a model HS to LS fraction for HS to LS transition and Brillouin functions for spin order below TC and TN. Since HS to LS transition is extended below TN, the competing metallic and insulating contributions from AFM and PM phases may give Tmax at TN or below it depending up on the extent of this transition below TN. This may be the possible reason for non monotonic change in Tmax with P in contrast to the literature reports. The formation of quasi bound states of excited electrons from aT and eT orbitals to e orbitals in the orthorhombic phase with cationic moments is responsible for enhanced scattering and negative TCR below Tmin.
IGC ANNUAL REPORT - 2018
172
Gel Immobilized Microgel Photonic Crystals: Temperature Response and Role of Entanglements
Photonic crystals (PCs) are materials which allow control over propagation of photons of certain
energy through them by virtue of periodicity in their dielectric constant. We have fabricated PCs of microgel colloids through self-assembly route. The microgels consist of poly N-isopropyl acrylamide, which are temperature responsive, enabling the tuning of photonic properties of the fabricated microgel crystals using temperature. Microgel PCs are fragile: they lose their crystalline order under mild mechanical agitation (e.g., during transportation) due to shear forces, and also at elevated temperatures due to melting of the crystals. In order to retain the crystalline order against shear and heat, the microgel PCs have been immobilized in a hydrogel matrix. This has been achieved by preparing the crystals in a pregel solution and then gelation through photo-polymerization to fix the crystalline order.
Optical transmission spectra of gel immobilized microgel PCs at different temperatures are shown in Figure 1. At all temperatures, the spectra show a dip due Bragg diffraction, indicating presence of photonic stop band and hence crystalline order in immobilized microgel PCs. The photonic stop band is more prominent at elevated temperatures than at room temperature (RT) (Figure 2a), suggesting that microgel PCs can serve as temperature sensor. The temperature tuning of the stop band becomes possible due to change of microgel size (transition from swollen to de-swollen state) as shown in Figure 2b. Microgels are porous polymeric particles. It has been shown that in the immobilization process these porous particles form interpenetrating networks/
6.23
Fig. 1 UV-Vis transmission spectra of immobilized microgel PC at different temperatures showing stop band at ~710nm
Fig. 2 (a) Minimum of transmission for PC shown in Figure 1 as a function of temperature (b) variation of microgel size with temperature
Fig. 3 Schematic depiction of microgel PC with entanglements of polymer chains, in a swollen state at RT and a deswollen state at elevated temperature
entanglements of polymer chains with hydrogel matrix. Dynamics measurements on immobilized microgel crystals using dynamic light scattering showed a decrease in thermal vibrations of microgel particles upon heating. This confirmed the formation of entanglements of polymer chains between microgels and hydrogel. The microgel PC with entanglements of polymer chains in the swollen state at room temperature and de-swollen state at elevated temperature are depicted schematically in Figure 3. These entanglements help in retaining the crystalline order in the de-swollen state of microgels by fixing their position and in turn allow temperature tuning of photonic stop band of microgel PCs. These studies bring out the complex nature of interactions between microgels and hydrogel which will be useful in understanding and fabricating polymer composites with improved optical and mechanical properties.
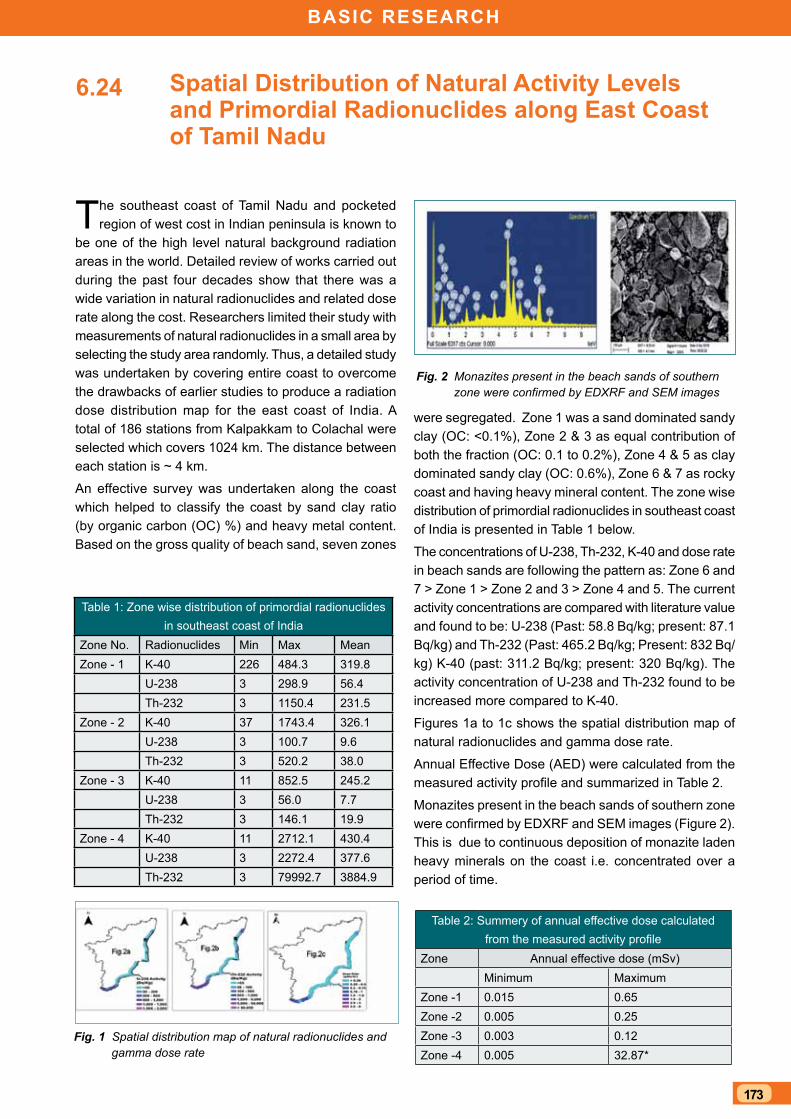
173
BAsIC REsEARCh
spatial Distribution of Natural Activity Levels and Primordial Radionuclides along East Coast of Tamil Nadu
The southeast coast of Tamil Nadu and pocketed region of west cost in Indian peninsula is known to
be one of the high level natural background radiation areas in the world. Detailed review of works carried out during the past four decades show that there was a wide variation in natural radionuclides and related dose rate along the cost. Researchers limited their study with measurements of natural radionuclides in a small area by selecting the study area randomly. Thus, a detailed study was undertaken by covering entire coast to overcome the drawbacks of earlier studies to produce a radiation dose distribution map for the east coast of India. A total of 186 stations from Kalpakkam to Colachal were selected which covers 1024 km. The distance between each station is ~ 4 km.
An effective survey was undertaken along the coast which helped to classify the coast by sand clay ratio (by organic carbon (OC) %) and heavy metal content. Based on the gross quality of beach sand, seven zones
6.24
were segregated. Zone 1 was a sand dominated sandy clay (OC: <0.1%), Zone 2 & 3 as equal contribution of both the fraction (OC: 0.1 to 0.2%), Zone 4 & 5 as clay dominated sandy clay (OC: 0.6%), Zone 6 & 7 as rocky coast and having heavy mineral content. The zone wise distribution of primordial radionuclides in southeast coast of India is presented in Table 1 below.
The concentrations of U-238, Th-232, K-40 and dose rate in beach sands are following the pattern as: Zone 6 and 7 > Zone 1 > Zone 2 and 3 > Zone 4 and 5. The current activity concentrations are compared with literature value and found to be: U-238 (Past: 58.8 Bq/kg; present: 87.1 Bq/kg) and Th-232 (Past: 465.2 Bq/kg; Present: 832 Bq/kg) K-40 (past: 311.2 Bq/kg; present: 320 Bq/kg). The activity concentration of U-238 and Th-232 found to be increased more compared to K-40.
Figures 1a to 1c shows the spatial distribution map of natural radionuclides and gamma dose rate.
Annual Effective Dose (AED) were calculated from the measured activity profile and summarized in Table 2.
Monazites present in the beach sands of southern zone were confirmed by EDXRF and SEM images (Figure 2). This is due to continuous deposition of monazite laden heavy minerals on the coast i.e. concentrated over a period of time.
Fig. 2 Monazites present in the beach sands of southern zone were confirmed by EDXRF and SEM images
Fig. 1 Spatial distribution map of natural radionuclides and gamma dose rate
Table 1: Zone wise distribution of primordial radionuclides in southeast coast of India
Zone No. Radionuclides Min Max MeanZone - 1 K-40 226 484.3 319.8
U-238 3 298.9 56.4Th-232 3 1150.4 231.5
Zone - 2 K-40 37 1743.4 326.1U-238 3 100.7 9.6Th-232 3 520.2 38.0
Zone - 3 K-40 11 852.5 245.2U-238 3 56.0 7.7Th-232 3 146.1 19.9
Zone - 4 K-40 11 2712.1 430.4U-238 3 2272.4 377.6Th-232 3 79992.7 3884.9
Table 2: Summery of annual effective dose calculated from the measured activity profile
Zone Annual effective dose (mSv)Minimum Maximum
Zone -1 0.015 0.65Zone -2 0.005 0.25Zone -3 0.003 0.12Zone -4 0.005 32.87*
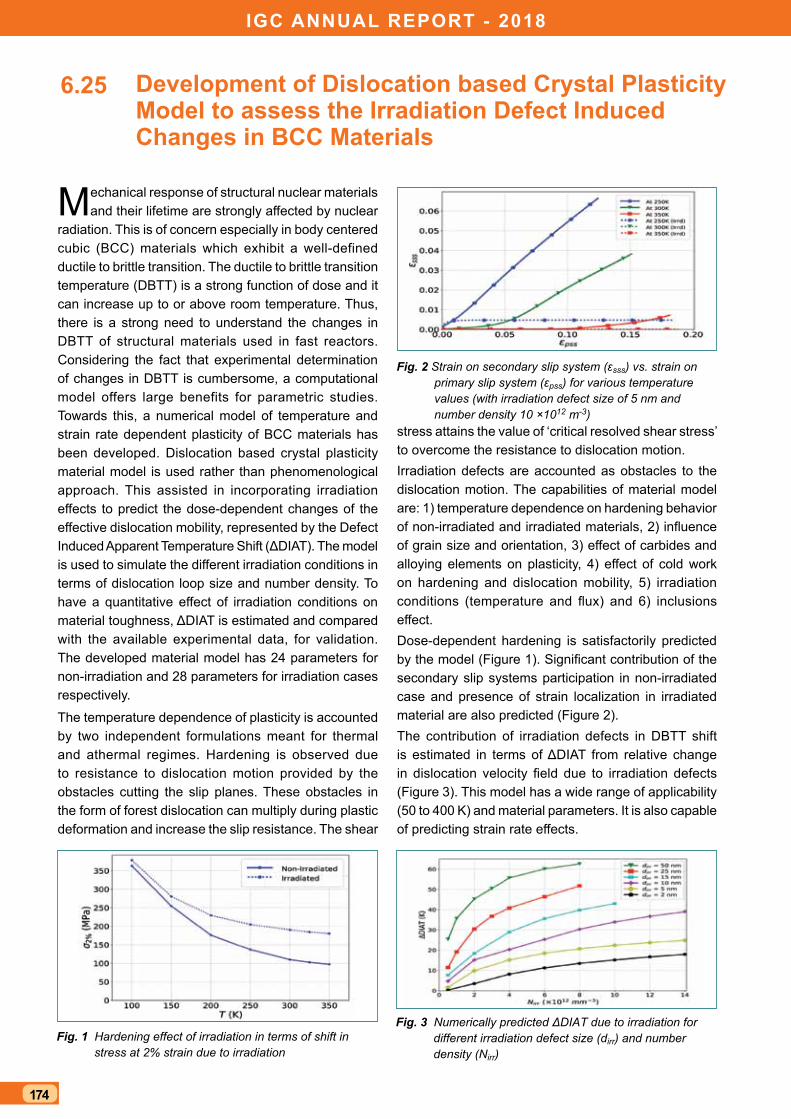
IGC ANNUAL REPORT - 2018
174
Development of Dislocation based Crystal Plasticity Model to assess the Irradiation Defect Induced Changes in BCC Materials
Mechanical response of structural nuclear materials and their lifetime are strongly affected by nuclear
radiation. This is of concern especially in body centered cubic (BCC) materials which exhibit a well-defined ductile to brittle transition. The ductile to brittle transition temperature (DBTT) is a strong function of dose and it can increase up to or above room temperature. Thus, there is a strong need to understand the changes in DBTT of structural materials used in fast reactors. Considering the fact that experimental determination of changes in DBTT is cumbersome, a computational model offers large benefits for parametric studies. Towards this, a numerical model of temperature and strain rate dependent plasticity of BCC materials has been developed. Dislocation based crystal plasticity material model is used rather than phenomenological approach. This assisted in incorporating irradiation effects to predict the dose-dependent changes of the effective dislocation mobility, represented by the Defect Induced Apparent Temperature Shift (ΔDIAT). The model is used to simulate the different irradiation conditions in terms of dislocation loop size and number density. To have a quantitative effect of irradiation conditions on material toughness, ΔDIAT is estimated and compared with the available experimental data, for validation. The developed material model has 24 parameters for non-irradiation and 28 parameters for irradiation cases respectively.
The temperature dependence of plasticity is accounted by two independent formulations meant for thermal and athermal regimes. Hardening is observed due to resistance to dislocation motion provided by the obstacles cutting the slip planes. These obstacles in the form of forest dislocation can multiply during plastic deformation and increase the slip resistance. The shear
6.25
stress attains the value of ‘critical resolved shear stress’ to overcome the resistance to dislocation motion. Irradiation defects are accounted as obstacles to the dislocation motion. The capabilities of material model are: 1) temperature dependence on hardening behavior of non-irradiated and irradiated materials, 2) influence of grain size and orientation, 3) effect of carbides and alloying elements on plasticity, 4) effect of cold work on hardening and dislocation mobility, 5) irradiation conditions (temperature and flux) and 6) inclusions effect. Dose-dependent hardening is satisfactorily predicted by the model (Figure 1). Significant contribution of the secondary slip systems participation in non-irradiated case and presence of strain localization in irradiated material are also predicted (Figure 2). The contribution of irradiation defects in DBTT shift is estimated in terms of ΔDIAT from relative change in dislocation velocity field due to irradiation defects (Figure 3). This model has a wide range of applicability (50 to 400 K) and material parameters. It is also capable of predicting strain rate effects.
Fig. 2 Strain on secondary slip system (εsss) vs. strain on primary slip system (εpss) for various temperature values (with irradiation defect size of 5 nm and number density 10 ×1012 m-3)
Fig. 3 Numerically predicted ΔDIAT due to irradiation for different irradiation defect size (dirr) and number density (Nirr)
Fig. 1 Hardening effect of irradiation in terms of shift in stress at 2% strain due to irradiation

AwArds / PublicAtions / news & events / orgAnisAtion
175
CHAPTER VII Awards/Publications/News & Events/
Organisation
igc AnnuAl rePort - 2018
176
Dr. Shaju K. Albert, MEG, MMG has been inducted as Associate Editor of the Welding in the World, an Official Journal of International Institute of Welding Dr. C.K. Mukhopadhyay, NDED, MMG received ISNT National NDT Award for R&D during National Seminar on NDE (NDE-2018) at Mumbai, December 19-21, 2018
Dr.John Philip has been selected as aMember of Editorial Board of Infrared Physics and Technology, Elsevier, NetherlandMember of Research Council of CSIR-Central Glass & Ceramic Research Institute (CSIR-CGCRI), Kolkata Member of Research Council of CSIR-Advanced Materials and Processes Research Institute (CSIR-AMPRI), Bhopal
Dr. R. Divakar, PIED, MMG has been conferred with the Metallurgist of the year Award in Metal Science category for the year 2018 from the Ministry of Steel, Government of India
Dr. B. K. Sreedhar, Dr. Shaju K. Albert and Dr. A. B. Pandit have been awarded Dr. S. Parthasarthy Memorial Award for the year 2017 by Ultrasonics Society of India for the paper titled “Computation of Erosion Potential of Cavitation Bubbles in Ultrasonic Pressure Field” published in Journal of Pure and Applied Ultrasonics. 39 (2017) 60-69. The award was presented on November 12, 2018 by Ultrasonics Society of India Ms. Alphy George, PMD, MMG received the “FSM-YSA (International Federation of Societies for Microscopy –Young Scientist) Award” in IMC-19 (19th International Microscopy Congress) held during September 9-14, 2018, at International Convention Centre (ICC), Sydney, Australia
She also received the “Micrography Contest Award” in International Conference on Microscope and XXXIX Annual Meeting of Electron Microscope Society of India held during July 18 - 20, 2018 at Mayfair Convention Center, Bhubaneswar, Odisha (EMSI-2018)
Dr. Gopa Chakraborty, Shri O. Venkata Ramana, Shri T. K. Haneef, Dr. Shaju K. Albert, Dr. Babu Rao Jinugu, Dr. C. K. Mukhopadhyay and Dr. B. P. C. Rao, presented the paper titled “Detection of Hydrogen Assisted Cracking Susceptibility in Modified 9Cr-1Mo Steel Welds by Acoustic Emission Technique” at the International Congress 2017 (IC-2017) held at the Chennai Trade Centre, Chennai during December 7-9, 2017, has been adjudged the winner of Sharp Tools Award - 2018 by the Indian Institute of Welding. The award was presented on December 13, 2018
Ms. Jemimah Ebenezer of Computer Division was conferred “Distinguished Women in Engineering” for her contribution and achievements in the field of Electronics Engineering at the 3rd Annual Women’s Meet-AWM 2018 conducted by Venus International Foundation, Chennai on March 3, 2018Ms. S. Rajeswari Head, SIRD, RMPAG has been awarded the Best Organiser Award-2018 by the Madras Library Association (MALA), ChennaiDr. Rani P. George, Head, SM&CS, CSTD, MMG received “NACE Fellow Honor 2018” for sustained contributions to corrosion control from NACE International USADr. Anita Toppo, Corrosion Science & Technology Division (CSTD), MMG received “Corrosion Awareness Award – 2018” for Distinction in Corrosion Science & Technology in Research & Education from NACE International Gateway India on October 02, 2018 Shri S. Thiyagu, has participated in 2018 Arc Cup International Welding Competition held at Zhuzhou City, Hunan Province, China during 4 –10 June, 2018 and won 3rd Prize in Gas Tungsten Arc Welding Competition and Excellent Award in Finished Product Welding National QC Meet (NCQC -2018) at IIIT, Gwalior, December 19-24, 2018
Shri A. Mainvannan, Ms. Dinu Shaji, Shri G. Saravanan, Shri S. Maharajan, Ms. R. Jayashree and Shri M. Santosh FERMI team of MFFD, MC&MFCG received “Par Excellance” award for the case study presentation on “Minimizing the Downtime in Sodium Bonding Furnace” Shri R. R. Shridharan, Shri D. Alagar, Shri E. Radha, Shri D. Seenivasan, Shri M. S. Murugappa and Shri V. Nandakumar EXCEL team of PPED, MC&MFCG received “Excellance” award for the case study presentation on “Reduction of Interruption Time in Nitrogen Generation System (NGS) Furnace” Shri K. Murugan, Shri P. Azhagesan, Shri S.P. Manivannan, Shri D. Suresh, Shri P. Ettiyappan and Shri P. Chentil Kumar, QAD, HSEG, 5S Team, received “Par Excellence Award” for the Case Study Presentation titled “Guide for Ultrasonic Examination of Nozzle Welds”
Awards & Honours
AwArds / PublicAtions / news & events / orgAnisAtion
177
Department of Atomic Energy has instituted annual awards for excellence in Science, Engineering and Technology in order to identify best performers in the area of Research, Technology Development and Engineering in the constituent units (other than Public Sector Undertakings and Aided Institutions). The Young Applied Scientist, Young Engineer, Young Technologist, Homi Bhabha Science and Technology Award and Scientific and Technical Excellence Award fall under this category. Group Achievement awards for recognition of major achievements by groups have also been instituted. Life-time Achievement Award is awarded to one who has made significant impact on the DAE’s programmes. They are the icons for young scientists and engineers to emulate. The awards consist of a memento, citation and cash prize.
the recipients of the Awards from igcAr for the year 2017 were:
Young scientist Award : Dr. Amit Kumar, HSEG
Young Applied scientist/technologist Award : Shri J Christopher, MMG Shri Joel Jose, FRTG
Scientific and Technical Excellence Award : Dr. A. Nagesha, MMG Dr. Rajesh Ganesan, MC&MFCG Shri V. Vinod, FRTGYoung engineer Award : Shri Kulbir Singh, RDG
Shri S. Sathiskumar, FRTG Shri Muhammad Sabih, FRTG
Meritorious service Award : Ms. Hema Ravichandran, RFG Shri P. Jayabalan, CCMeritorious technical support Award : Shri M. Muthukumaraswamy, RFG Shri R. Viswanathan, RFG Ms. K. Shyamala Devi, HSEG
group Achievement Awards: Design, Development, Integration and Testing of a Indigenous Plutonium Continuous Air Monitor (PuCAM)Ms. L. Srivani, EIG, Group LeaderShri N. Anil, Shri Alok Kumar Gupta, Shri K. Elangovan, Shri K. Praveen and Shri M. Thangadurai from EIG; Shri J. Abilash, Shri P. Balakrishnan, Shri N. Chockalingam, Shri D. Dileep, Shri M. Krishnamoorthy, Shri C. Muthusamy, Shri A. Padmanabhan, Shri B. Ramalingam, Shri S. Ramesh, Shri P. Shanmugam, Shri C. Siva and Shri E. Venkatesan from ESG; Shri K. C. Ajoy, and Shri A. Dhanasekaran from HSEG; Dr. G. Raghavan from MSG; Shri Amit Kumar Dash, Shri D. Anandaraj, Shri Avik Kumar Saha, Shri R. Raghunath, Shri P. Vijayasekaran, Shri Geo Mathews, Shri P. Varadharajan, Shri S. Somasundaram and Shri Saju George from RpG; Shri C. R. Venkatasubramani, RRF (Retired); Dr. V. Anita Topkar, Ms. Aggarwal Bharti, Shri H. H. Vaity, Shri C. P. Kulkarni, Shri S. Chakraborty, Shri M. M. Kuswarkar, Shri Mahesh Punna, Shri M. U. Pawar, Shri L. V. Murali Krishna, Ms. S. Padmini and Shri S. K. Patil from E&IG, BARC
Identification and Replacement of Failed Steam Generator for the First Time in FBTRShri K. G. Subramanian, RFG, Group LeaderShri K. V. Suresh Kumar, Shri A. Babu, Shri S. Sridhar, Shri P. V. Anilkumar, Shri D. Chandrasekaran,
DAE Awards
igc AnnuAl rePort - 2018
178
Shri M. Babu, Shri E. Ramesh, Shri M. Elango, Shri K. Ramachandran, Ms. Liji Jacob, Shri P. Ragothkumar, Shri G. Shanmugam, Shri N. Manimaran, Shri V. Alagudurai, Shri A. Suriyanarayanan, Shri D. Vignesh Babu, Shri R. Sekar, Shri N. Sampathkumar, Shri S. Kanagaraju, Shri P. Balamurali, Shri A. Ramamoorthy, Shri N. Ranjithkumar, Shri G. Kannan, Shri N. Kathiresan, Shri R. Desingu, Shri M. Karthikeyan, Shri J. Manikandan, Shri R. Vedhamanickam, Shri K. Kamaludeen, Shri R. Gopal, Shri M. Muthukumarasamy, Shri A. Nagalingam, Shri Syed Saleem, Shri C. Kannan, Shri M.Chitrarasu, Shri V. Velu, Shri V. Govindaraj, Shri M. Jayasankar, Shri N. Manivel, Shri G. Narayanassamy, Shri M. Sounder, Shri D.Jaisrinivasan, Shri A. Udaya Sankar, Shri N. Basavaiah, Ms. N. K Lakshmi, Ms. P.Thyyal Nayaghi, Ms. R.Vasanthi, Ms. S. Manjula, Shri Raghav Sharma, Shri A. Lakshmanan, Shri S. Sathis Kumar, Shri K. Perumal, Shri D. Gautham, Shri Sachin Kale, Shri Ashok D Hanimana, Shri M. S Koteeswaran, Shri K. Prakash, Shri R. Vijayanand, Shri Vijayavarman, Shri S. Sathish, Shri D. Samayaraj, Shri S. Haridas, Shri Challa Ravikumar, Shri Shyam Ravikumar, Shri Manoj Kumar Agarwal, Shri Balamurugan, Shri P. Munuswamy, Shri Jayamoorthi, Shri M. Uthaman, Shri A. Thandavamurthy, Shri R. Balasubramaniyam, Shri K. Ganapathy Subramanian, Shri S. Sathish kumar, Shri A. M. Kannan, Shri B. Mohanarangan, Ashish D Jain Shri J. Sasikumar, Shri M. Thangamani, Shri D. Vinoth, Shri S. Joy, Shri K. Gopal, Ms. S. Anthoniammal, Shri D. Ezhilan, Shri V. Sreenivasan from RFG; Shri B. Anandapadmanaban, Shri N. Raghu, Shri G. Ramesh, Shri Saju T. Abraham, Ms. Alka Kumari, Shri P. Azhagesan, Ms. D. Chitra, Shri P. Narayana Rao, Shri Henson Raj, Shri D. Kuppusamy, Shri R. Rajesh and Shri G. Vijaya Raghavan from HSEG; Dr. B. P. C. Rao, Dr. A. Joseph, Dr. G. K. Sharma, Ms. T. Nivedha from MMG; Shri E. Premkumar from RM&PAG
Design, Manufacturing, Erection Commissioning and Operation of Sodium Facility for Component Testing (SFCT)Dr. C. Meikandamurthy FRTG, Group LeaderShri S. Chandramouli, Shri R. Punniyamoorthy, Shri A. Ashokkumar, Shri S. Ravishankar, Shri D. Muralidhar, Shri Parmanand Kumar, Shri A. Thirunavukkarasu, Shri C. Rajappan, Shri N. Sreenivas, Shri K. Arumugam, Shri P. R. Ashokkumar, Shri L. Eagambaram, Shri J. Prabhakaran, Shri M. Karthikeyan, Shri Shaik Rafee, Shri K. Ganesh, Shri Ashish Tiwari, Shri L. Mohanasundaram, Shri L. Muthu, Shri Vijay Tirkey, Shri G. Vijayakumar, Shri R. Rajendraprasad, Shri Gautam Anand, Shri R. Iyappan, Shri R. Parandaman, Shri S. Kannan, Shri P. Lakshmayya, Shri P. Pothi. Ms. M.Chandra, Shri P. Rajasundaram, Ms. P. Anitha, Shri M. V. Subramanya Deepak, Shri T. V. Maran, Shri K. Mohanraj, Shri A. Anthuvan Clement, Shri K. Ramesh, Shri V. Ramakrishnan, Shri M. Anandaraj, Shri D.Laxman, Shri R. Rajendran, Shri S. Shanmugam, Shri H. Rafiq Basha, Shri M. Kathiravan, Shri K.A. Bijoy, Shri A. Selvakumaran, Dr. B. Babu, Shri T. Chandran, Ms. Shanthi Rajendran, Shri Rakesh Kumar Mourya, Shri S. Ignatius Sundar Raj, Shri S. C. S. P. Kumar Krovvidi, Shri A. Kolanjiappan, Shri R. Ramalingam, Shri J. Saravanan, Shri Anant Kumar, Shri V. Vinod, Shri M.G. Hemanath, Shri S. Sathishkumar, Shri Muhammad Sabih, Shri S. Balakrishnan, Shri S. Alexander Xavier, Shri N. Venkatesan, Shri P. Chenthilvelmurugan, Shri N. Mohan, Shri J. Prem, Shri V. Gunasekaran, Shri B.K. Nashine, Ms. S. Saravana Priya, Ms. Kamalambigai from FRTG; Shri N. Raghu, Shri G. Ramesh, Shri M. V. Kuppusamy, Shri C.B. Rajeev, Ms. D. Chitra, Shri Shri Krishna Tripathi, Shri Navtesh Bajpai, Shri D. Hensonraj, Shri P. Narayana Rao, Shri K. Murugan from HSEG; Shri N. Suresh, Shri H. I. Abdul Gani, Ms. R. Thilakavathy, Ms. K. Subhashini from ESG.
swachhta Pakhwada Award:Department of Atomic Energy had instituted “Swachhta Pakhwada Awards” to the constituent units of DAE for the exemplary performance during the Pakhwada. Indira Gandhi Centre for Atomic Research was awarded the Certificate of Excellence (second position among the DAE units) for its Swachhta activities ( February 16-28, 2018)

AwArds / PublicAtions / news & events / orgAnisAtion
179
International Seminar on Advanced Nanomaterials- 2018 (ISAN-2018), held during February 27-28, 2018, National Centre for Nanoscience and Nanotechnology, University of Madras, Chennai
Role of Field-Induced Nanostructures and Polydispersity on Effective Thermal Transport in Magnetic FluidsMs Sithara Vinod and Dr. John PhilipOxidation and Corrosion Behavior of Ni-based Amorphous Alloy in the Nitric Acid EnvironmentShri Chiranjit Poddar, Shri J. Jayaraj and Dr. S. Ningshen
International Corrosion Prevention Symposium for Research Scholars, CORSYM-2018, March 23-24, 2018, IIT Madras, ChennaiOptimization of CVD Silicon Carbide Interlayer for Plasma Sprayed Yttria on High Density Graphite for Pyrochemical ReprocessingShri B. Madhura, Shri E. Vetrivendan, Dr. Ch. Jagadeeswara Rao, Shri A. Udayakumar and Dr. S. Ningshen
International Conference on Recent Trends in Analytical Chemistry (ICORTAC-2018), March 15-17, 2018, University of Madras, Chennai Fiber Optic aided Spectrophotometric Determination of Trace Amount of Samarium in Aqueous Streams of Nuclear WasteShri S. Ganesh and Shri N. K. Pandey
Second International Conference on Structural Integrity Conference & Exhibition 2018 organised by DMRL, Hyderabad and Indian Structural Integrity Society held at Hyderabad during July 25 - 27, 2018Effect of Cold Working on Corrosion Fatigue behaviour of Austenitic Stainless Steel in Acidified Chloride MediumMs. A. Poonguzhali, Dr. S. Ningshen and Dr. G. Amarendra
11th National Conference on Recent Advances in Information Technology (READIT 2018), Indira Gandhi Centre for Atomic Research, Kalpakkam, August 8-9, 2018
Causal Factor Mining of Publication Data: A Case StudyMs. K. Bharathi Manjula, Dr. N. Madurai Meenachi, Dr. G. Sivakumar, Dr. B. Venkatraman and Dr. M. Sai BabaSmart RFID Access Control for IGCAR LibraryShri S. Lakshmi Prasad, Shri T. Sathishkumar, Shri J. Immanuel, Shri P. Balaji, Shri P. Arumugam and Shri G. Prabhakara Rao
IETE CDIL Award for Industry (published in IETE Technical Review September-October 2017 issue) presented during Annual IETE Convention held in September 29-30, 2018 at Amravati Development of Pulsed Eddy Current Instrument and Probe for Detection of Sub-Surface Flaws in Thick MaterialsShri K. Samba Siva Rao, Dr. B. Purna Chandra Rao and Dr. S. Thirunavukkarasu
CORCON 2018, held during September 30 - October 03, 2018 in Jaipur Self - healing Plasma Spray Coatings on Graphite for High Temperature Applications Ms. B. Madhura, Shri E. Vetrivendan, Dr. Ch. Jagadeeshwara Rao and Dr. S. Ningshen
Best Paper Awards
igc AnnuAl rePort - 2018
180
International Seminar on Advanced Nanomaterials- 2018 (ISAN-2018), held during February 27-28, 2018, National Centre for Nanoscience and Nanotechnology, University of Madras, Chennai (C. V. Raman Best Poster Award)
A Comparative Study of the Diagnostic X-ray Attenuation Property of β-Bi2O3 and Bi Nanoparticles Based NanocompositesMs J. Sangeetha, Shri T. Saravanan and Dr. John PhilipEvaluating the Efficacy of PDMS Nanocomposites to Inhibit Barnacle Settlement: A Comparison of Laboratory and Field AssaysShri S. Venkatnarayanan, Shri P. Sriyutha Murthy, Dr. Arindam Das, Shri V. Pandiyan, Shri V. S. Sathyaseelan, Shri B. Anandkumar, Shri R. Kirubagaran and Shri V. P. Venugopalan
DAE-BRNS Symposium on Emerging Trends in Separation Science and Technology (SESTEC-2018) held during May 23-26, 2018 at BITS Pilani, K. K. Birla Goa campus, Goa, India Synthesis and Evaluation of Hexahexylphosphoramide for Extraction of ActinidesShri G. Jegan, Ms. K. Barani Priya, Shri Karanam Kaushik, Dr. C. V. S. Brahmananda Rao, Dr. A. Suresh and Dr. N. Sivaraman
International Conference on Microscope and XXXIX Annual Meeting of Electron Microscope Society of India, July 18 - 20, 2018 at Mayfair Convention Center, Bhubaneswar, Odisha (EMSI-2018)
Theoretical and Experimental Study of Structural Characteristics in Equiatomic CrFeMoV AlloyShri A. Saikumaran, Dr. R. Mythili, Dr. S. Saroja, Dr. Rajesh GanesanEffect of Nitrogen on Precipitation in SS 316LN during Long Term Thermal AgeingMs. Alphy George, Dr. R. Mythili, Dr. Arup Dasgupta, Dr. J. Ganesh Kumar and Dr. G. V. Prasad Reddy
11th National Conference on Recent Advances in Information Technology (READIT 2018), Indira Gandhi Centre for Atomic Research, Kalpakkam, August 8-9, 2018
Challenges in Documenting Biodiversity of DAE Kalpakkam Campus, KalpakkamShri E. Premkumar, Shri E.Soundararajan and Ms. S. RajeswariEvaluating Research Output in the Field of “Nuclear Fuel Reprocessing” with Scifinder Database – A Case StudyShri G. Pentaiah
Interdisciplinary Symposium on Material Science 2018 (ISMC 2018) held in BARC, Mumbai, December 4-8, 2018
Development of Yttria Coating on the Inner Surface of Quartz Tube for Metal Alloy Casting Shri M. Rahman Mollah, Shri A. V. Vinod and Dr. Soumen Das Laser Ablated Thin Films of PbS for Ammonia Sensing under Inert Ambient Ms. T. V. Beatrice Veena, Dr. E. Prabhu and Dr. K. I. Gnanasekar Preliminary Studies on the Oxidation of Rare Earth (La, Gd) Chlorides in LiCl-KCl Shri Pabitra Ghosh, Dr. Manish Chandra, Shri P. Venkatesh, Dr. K. S. Mohandas and Dr. B. Prabhakara Reddy
CORCON 2018, held during September 30 - October 03, 2018 in Jaipur A Novel Chitosan/Ag/Go Composite Coating with Enhanced Antibacterial Activity and Improved Corrosion Resistance Ms. Geetisubhra Jena, Dr. B. Anandkumar, Dr. S. C Vanithakumari, Dr. Rani P. George, Dr. John Philip and Dr. G. Amarendra High Performance Green Concrete with Improved Biodeterioration Resistance against Fungus Fusarium Shri Manu Harilal, Ms. Sudha Uthaman, Dr. B. Anandkumar, Dr. Rani P. George, Dr. John Philip and Dr. G. Amarendra
Best Poster Awards
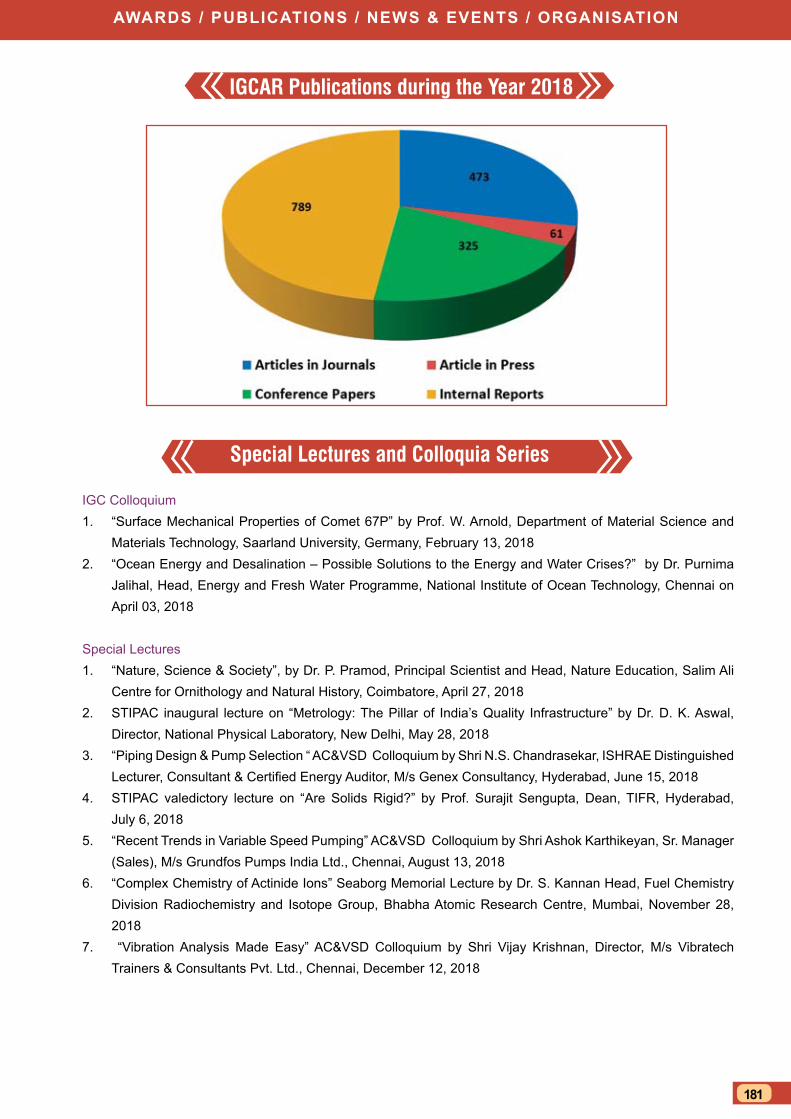
AwArds / PublicAtions / news & events / orgAnisAtion
181
IGC Colloquium1. “Surface Mechanical Properties of Comet 67P” by Prof. W. Arnold, Department of Material Science and
Materials Technology, Saarland University, Germany, February 13, 20182. “Ocean Energy and Desalination – Possible Solutions to the Energy and Water Crises?” by Dr. Purnima
Jalihal, Head, Energy and Fresh Water Programme, National Institute of Ocean Technology, Chennai on April 03, 2018
Special Lectures1. “Nature, Science & Society”, by Dr. P. Pramod, Principal Scientist and Head, Nature Education, Salim Ali
Centre for Ornithology and Natural History, Coimbatore, April 27, 20182. STIPAC inaugural lecture on “Metrology: The Pillar of India’s Quality Infrastructure” by Dr. D. K. Aswal,
Director, National Physical Laboratory, New Delhi, May 28, 2018 3. “Piping Design & Pump Selection “ AC&VSD Colloquium by Shri N.S. Chandrasekar, ISHRAE Distinguished
Lecturer, Consultant & Certified Energy Auditor, M/s Genex Consultancy, Hyderabad, June 15, 20184. STIPAC valedictory lecture on “Are Solids Rigid?” by Prof. Surajit Sengupta, Dean, TIFR, Hyderabad,
July 6, 20185. “Recent Trends in Variable Speed Pumping” AC&VSD Colloquium by Shri Ashok Karthikeyan, Sr. Manager
(Sales), M/s Grundfos Pumps India Ltd., Chennai, August 13, 20186. “Complex Chemistry of Actinide Ions” Seaborg Memorial Lecture by Dr. S. Kannan Head, Fuel Chemistry
Division Radiochemistry and Isotope Group, Bhabha Atomic Research Centre, Mumbai, November 28, 2018
7. “Vibration Analysis Made Easy” AC&VSD Colloquium by Shri Vijay Krishnan, Director, M/s Vibratech Trainers & Consultants Pvt. Ltd., Chennai, December 12, 2018
IGCAR Publications during the Year 2018
Special Lectures and Colloquia Series

igc AnnuAl rePort - 2018
182
Seminars, Workshops and Meetings1. “Research Scholars Meet “ on Materials Science and Engineering of Nuclear Materials (RSM- MSENM-2018),
May 7-9, 20182. “National Technology Day Meet 2018”, May 31, 2018.3. “Graduation Function of the 12th Batch of Trainee Scientific Officers of BARC Training School at IGCAR”,
July 26, 20184. 11th Bieninal National Conference on “REcent Advances in Information Technology (READIT-2018)”, with
the theme ‘Reinventing Libraries: Digital Innovations & Technologies, August 8-9, 20185. Workshop on “Stainless Steels for Nuclear Projects (WOSSP)”, September 27, 20186. Theme meeting on “Fatigue deformation & damage” , October 29, 20187. National Conference URJAVARAN-2018 with the theme Climate Change-Emerging Solutions, November 15-16, 20188. Theme meeting on “Materials development to performance - Key issues faced & lessons learnt”, October 29, 2018
Nurturing Activities1. Swachhta Pakhwada, February 16-28, 2018 2. “International Women’s Day Celebration”, organized by IWSA, March 23, 20183. Dr. Baldev Raj Memorial Bridge Course on Non-Destructive Evaluation (NDE) and Quality Assurance
(BRM-BCNQ) organised jointly by IGCAR, ISNT Kalpakkam Chapter and Society for Failure Analysis (SFA) Chennai Chapter, May 21-25, 2018
4. “Summer Practice School of BITS (PS-1)”, May 22 - July 14, 20185. “Summer Training in Physics and Chemistry (STIPAC-2018)”, May 28 - July 6, 20186. “4th International Day of Yoga: Healthy Living”, June 21, 20187. “Quality Circle Annual Meet-2018 (QCAM-2018)”, September 11, 20188. “Prof. Brahm Prakash Memorial Materials Quiz-2018” organized by IIM, Kalpakkam Chapter,
October 5-6, 20189. Health Awareness Programme: “Cardio Health and Fitness” by Dr.M.Susruthan, Associate Proffessor of
Pathology & Associate Asst. Director,Central Lab., Sri.Ramachandra Institute of Higher education and Research, Chennai ; “Diabetics and Eye care” by Dr.U. Manoharan, Ophthalmologist, DAE Hospital, Kalpakkam
Administrative Seminars / Meetings1. “World Hindi Day Celebration” January 10, 20182. ATI Training Programme on “7th Pay Commission Implementation”, March 20, 20183. Rajabhasha Sammelan”, March 22, 20184. “Cadre Officers Colloquium”, April 19 & 24, 20185. “Outreach Programme on Income Tax”, July 18, 20186. ATI/DAE Training Programme on “Crisis Management”, August 2-3, 20187. ATI/DAE Workshop on “Pension and Retirement Benefits”, August 20-21, 20188. “Hindi Fortnight””, August 31 - September 14, 2018 9. “Hindi Day Celebration”, September 14, 201810. “Vigilance Awareness Week”, October 27 - November 02, 201811. ATI/DAE Workshop on “Intensive Noting and Drafting”, October 29-31, 201812. Workshop on “TDS on GST”, October 31, 2018
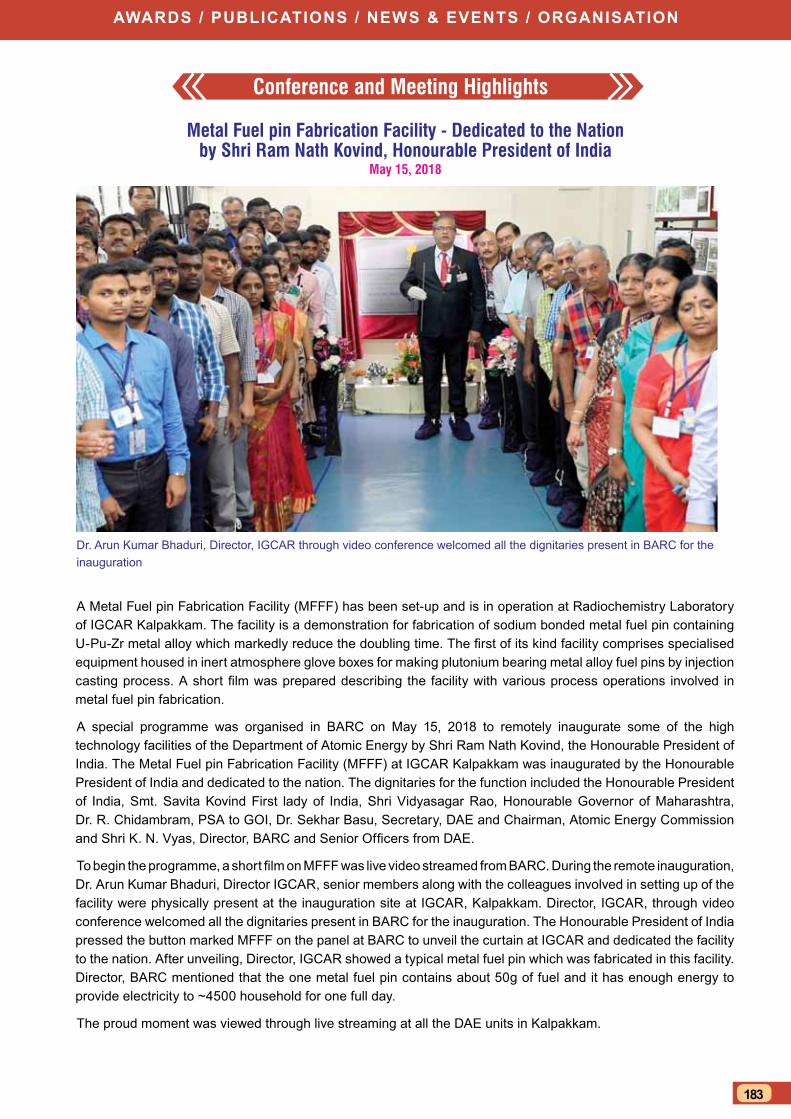
AwArds / PublicAtions / news & events / orgAnisAtion
183
Conference and Meeting Highlights
A Metal Fuel pin Fabrication Facility (MFFF) has been set-up and is in operation at Radiochemistry Laboratory of IGCAR Kalpakkam. The facility is a demonstration for fabrication of sodium bonded metal fuel pin containing U-Pu-Zr metal alloy which markedly reduce the doubling time. The first of its kind facility comprises specialised equipment housed in inert atmosphere glove boxes for making plutonium bearing metal alloy fuel pins by injection casting process. A short film was prepared describing the facility with various process operations involved in metal fuel pin fabrication.
A special programme was organised in BARC on May 15, 2018 to remotely inaugurate some of the high technology facilities of the Department of Atomic Energy by Shri Ram Nath Kovind, the Honourable President of India. The Metal Fuel pin Fabrication Facility (MFFF) at IGCAR Kalpakkam was inaugurated by the Honourable President of India and dedicated to the nation. The dignitaries for the function included the Honourable President of India, Smt. Savita Kovind First lady of India, Shri Vidyasagar Rao, Honourable Governor of Maharashtra, Dr. R. Chidambram, PSA to GOI, Dr. Sekhar Basu, Secretary, DAE and Chairman, Atomic Energy Commission and Shri K. N. Vyas, Director, BARC and Senior Officers from DAE.
To begin the programme, a short film on MFFF was live video streamed from BARC. During the remote inauguration, Dr. Arun Kumar Bhaduri, Director IGCAR, senior members along with the colleagues involved in setting up of the facility were physically present at the inauguration site at IGCAR, Kalpakkam. Director, IGCAR, through video conference welcomed all the dignitaries present in BARC for the inauguration. The Honourable President of India pressed the button marked MFFF on the panel at BARC to unveil the curtain at IGCAR and dedicated the facility to the nation. After unveiling, Director, IGCAR showed a typical metal fuel pin which was fabricated in this facility. Director, BARC mentioned that the one metal fuel pin contains about 50g of fuel and it has enough energy to provide electricity to ~4500 household for one full day.
The proud moment was viewed through live streaming at all the DAE units in Kalpakkam.
Metal Fuel pin Fabrication Facility - Dedicated to the Nation by Shri Ram Nath Kovind, Honourable President of India
May 15, 2018
Dr. Arun Kumar Bhaduri, Director, IGCAR through video conference welcomed all the dignitaries present in BARC for the inauguration
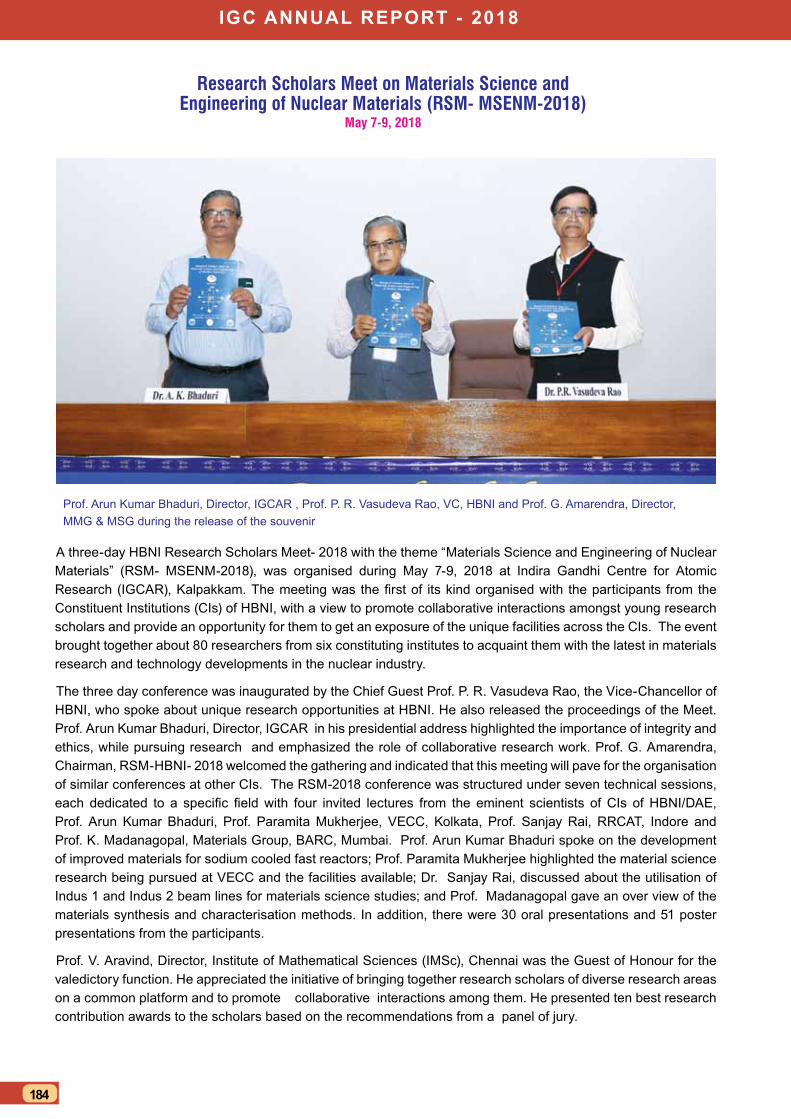
igc AnnuAl rePort - 2018
184
Research Scholars Meet on Materials Science and Engineering of Nuclear Materials (RSM- MSENM-2018)
May 7-9, 2018
A three-day HBNI Research Scholars Meet- 2018 with the theme “Materials Science and Engineering of Nuclear Materials” (RSM- MSENM-2018), was organised during May 7-9, 2018 at Indira Gandhi Centre for Atomic Research (IGCAR), Kalpakkam. The meeting was the first of its kind organised with the participants from the Constituent Institutions (CIs) of HBNI, with a view to promote collaborative interactions amongst young research scholars and provide an opportunity for them to get an exposure of the unique facilities across the CIs. The event brought together about 80 researchers from six constituting institutes to acquaint them with the latest in materials research and technology developments in the nuclear industry.
The three day conference was inaugurated by the Chief Guest Prof. P. R. Vasudeva Rao, the Vice-Chancellor of HBNI, who spoke about unique research opportunities at HBNI. He also released the proceedings of the Meet. Prof. Arun Kumar Bhaduri, Director, IGCAR in his presidential address highlighted the importance of integrity and ethics, while pursuing research and emphasized the role of collaborative research work. Prof. G. Amarendra, Chairman, RSM-HBNI- 2018 welcomed the gathering and indicated that this meeting will pave for the organisation of similar conferences at other CIs. The RSM-2018 conference was structured under seven technical sessions, each dedicated to a specific field with four invited lectures from the eminent scientists of CIs of HBNI/DAE, Prof. Arun Kumar Bhaduri, Prof. Paramita Mukherjee, VECC, Kolkata, Prof. Sanjay Rai, RRCAT, Indore and Prof. K. Madanagopal, Materials Group, BARC, Mumbai. Prof. Arun Kumar Bhaduri spoke on the development of improved materials for sodium cooled fast reactors; Prof. Paramita Mukherjee highlighted the material science research being pursued at VECC and the facilities available; Dr. Sanjay Rai, discussed about the utilisation of Indus 1 and Indus 2 beam lines for materials science studies; and Prof. Madanagopal gave an over view of the materials synthesis and characterisation methods. In addition, there were 30 oral presentations and 51 poster presentations from the participants.
Prof. V. Aravind, Director, Institute of Mathematical Sciences (IMSc), Chennai was the Guest of Honour for the valedictory function. He appreciated the initiative of bringing together research scholars of diverse research areas on a common platform and to promote collaborative interactions among them. He presented ten best research contribution awards to the scholars based on the recommendations from a panel of jury.
Prof. Arun Kumar Bhaduri, Director, IGCAR , Prof. P. R. Vasudeva Rao, VC, HBNI and Prof. G. Amarendra, Director, MMG & MSG during the release of the souvenir
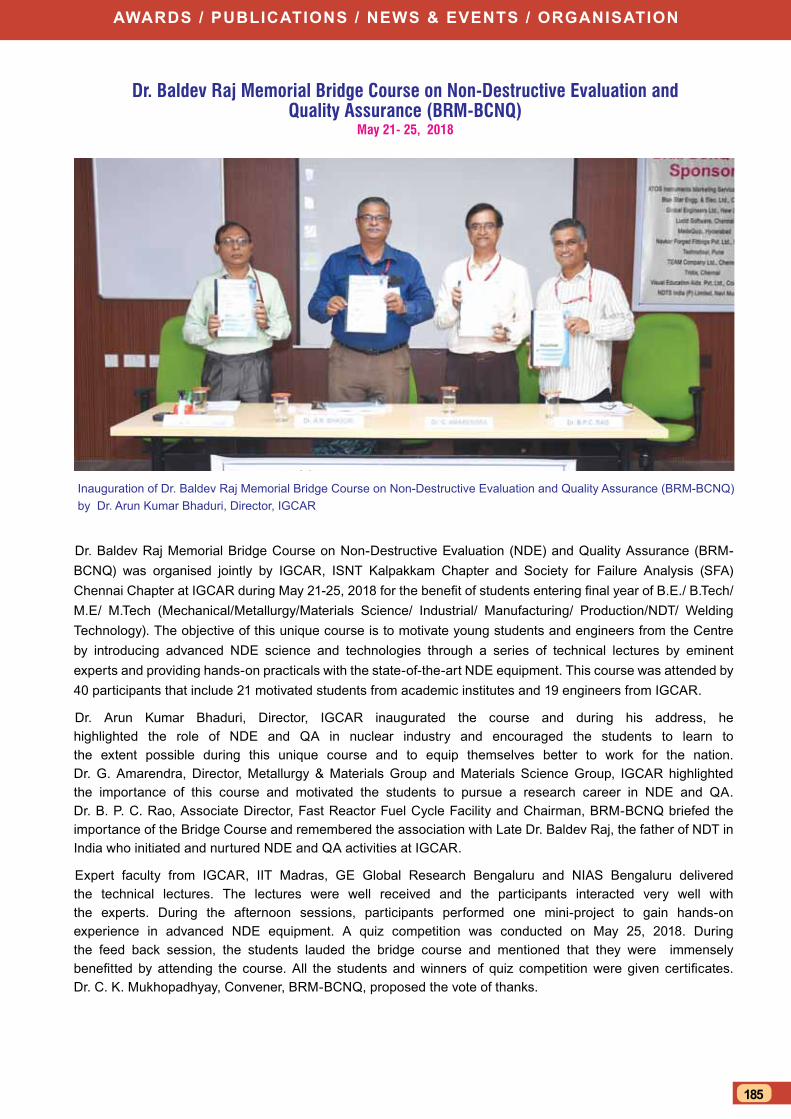
AwArds / PublicAtions / news & events / orgAnisAtion
185
Dr. Baldev Raj Memorial Bridge Course on Non-Destructive Evaluation (NDE) and Quality Assurance (BRM-BCNQ) was organised jointly by IGCAR, ISNT Kalpakkam Chapter and Society for Failure Analysis (SFA) Chennai Chapter at IGCAR during May 21-25, 2018 for the benefit of students entering final year of B.E./ B.Tech/ M.E/ M.Tech (Mechanical/Metallurgy/Materials Science/ Industrial/ Manufacturing/ Production/NDT/ Welding Technology). The objective of this unique course is to motivate young students and engineers from the Centre by introducing advanced NDE science and technologies through a series of technical lectures by eminent experts and providing hands-on practicals with the state-of-the-art NDE equipment. This course was attended by 40 participants that include 21 motivated students from academic institutes and 19 engineers from IGCAR.
Dr. Arun Kumar Bhaduri, Director, IGCAR inaugurated the course and during his address, he highlighted the role of NDE and QA in nuclear industry and encouraged the students to learn to the extent possible during this unique course and to equip themselves better to work for the nation. Dr. G. Amarendra, Director, Metallurgy & Materials Group and Materials Science Group, IGCAR highlighted the importance of this course and motivated the students to pursue a research career in NDE and QA. Dr. B. P. C. Rao, Associate Director, Fast Reactor Fuel Cycle Facility and Chairman, BRM-BCNQ briefed the importance of the Bridge Course and remembered the association with Late Dr. Baldev Raj, the father of NDT in India who initiated and nurtured NDE and QA activities at IGCAR.
Expert faculty from IGCAR, IIT Madras, GE Global Research Bengaluru and NIAS Bengaluru delivered the technical lectures. The lectures were well received and the participants interacted very well with the experts. During the afternoon sessions, participants performed one mini-project to gain hands-on experience in advanced NDE equipment. A quiz competition was conducted on May 25, 2018. During the feed back session, the students lauded the bridge course and mentioned that they were immensely benefitted by attending the course. All the students and winners of quiz competition were given certificates. Dr. C. K. Mukhopadhyay, Convener, BRM-BCNQ, proposed the vote of thanks.
Dr. Baldev Raj Memorial Bridge Course on Non-Destructive Evaluation and Quality Assurance (BRM-BCNQ)
May 21- 25, 2018
Inauguration of Dr. Baldev Raj Memorial Bridge Course on Non-Destructive Evaluation and Quality Assurance (BRM-BCNQ) by Dr. Arun Kumar Bhaduri, Director, IGCAR
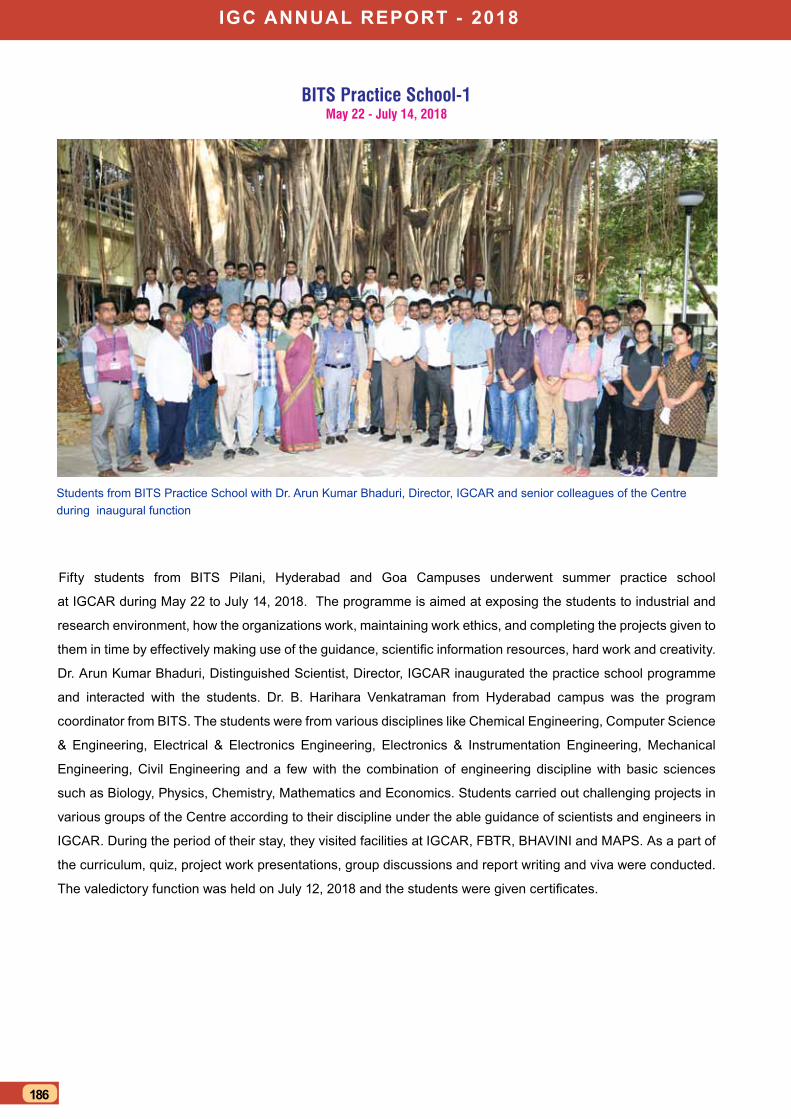
igc AnnuAl rePort - 2018
186
BITS Practice School-1May 22 - July 14, 2018
Fifty students from BITS Pilani, Hyderabad and Goa Campuses underwent summer practice school
at IGCAR during May 22 to July 14, 2018. The programme is aimed at exposing the students to industrial and
research environment, how the organizations work, maintaining work ethics, and completing the projects given to
them in time by effectively making use of the guidance, scientific information resources, hard work and creativity.
Dr. Arun Kumar Bhaduri, Distinguished Scientist, Director, IGCAR inaugurated the practice school programme
and interacted with the students. Dr. B. Harihara Venkatraman from Hyderabad campus was the program
coordinator from BITS. The students were from various disciplines like Chemical Engineering, Computer Science
& Engineering, Electrical & Electronics Engineering, Electronics & Instrumentation Engineering, Mechanical
Engineering, Civil Engineering and a few with the combination of engineering discipline with basic sciences
such as Biology, Physics, Chemistry, Mathematics and Economics. Students carried out challenging projects in
various groups of the Centre according to their discipline under the able guidance of scientists and engineers in
IGCAR. During the period of their stay, they visited facilities at IGCAR, FBTR, BHAVINI and MAPS. As a part of
the curriculum, quiz, project work presentations, group discussions and report writing and viva were conducted.
The valedictory function was held on July 12, 2018 and the students were given certificates.
Students from BITS Practice School with Dr. Arun Kumar Bhaduri, Director, IGCAR and senior colleagues of the Centre during inaugural function
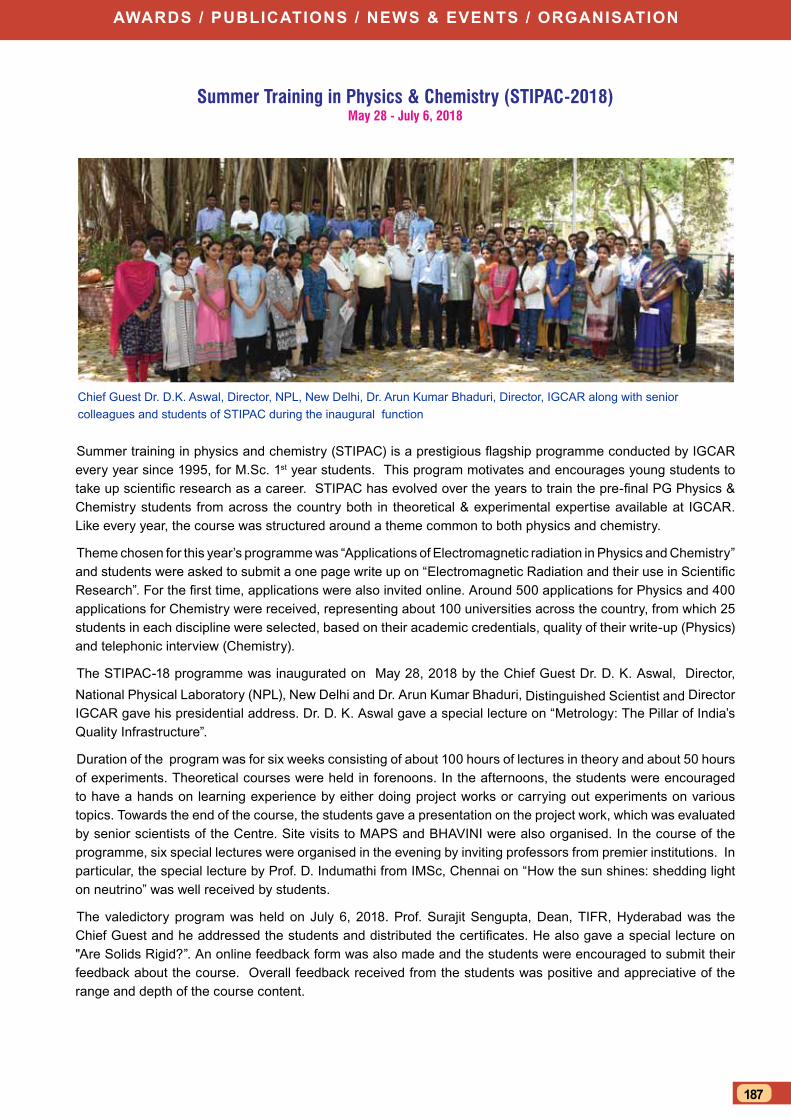
AwArds / PublicAtions / news & events / orgAnisAtion
187
Summer training in physics and chemistry (STIPAC) is a prestigious flagship programme conducted by IGCAR every year since 1995, for M.Sc. 1st year students. This program motivates and encourages young students to take up scientific research as a career. STIPAC has evolved over the years to train the pre-final PG Physics & Chemistry students from across the country both in theoretical & experimental expertise available at IGCAR. Like every year, the course was structured around a theme common to both physics and chemistry.
Theme chosen for this year’s programme was “Applications of Electromagnetic radiation in Physics and Chemistry” and students were asked to submit a one page write up on “Electromagnetic Radiation and their use in Scientific Research”. For the first time, applications were also invited online. Around 500 applications for Physics and 400 applications for Chemistry were received, representing about 100 universities across the country, from which 25 students in each discipline were selected, based on their academic credentials, quality of their write-up (Physics) and telephonic interview (Chemistry).
The STIPAC-18 programme was inaugurated on May 28, 2018 by the Chief Guest Dr. D. K. Aswal, Director, National Physical Laboratory (NPL), New Delhi and Dr. Arun Kumar Bhaduri, Distinguished Scientist and Director IGCAR gave his presidential address. Dr. D. K. Aswal gave a special lecture on “Metrology: The Pillar of India’s Quality Infrastructure”.
Duration of the program was for six weeks consisting of about 100 hours of lectures in theory and about 50 hours of experiments. Theoretical courses were held in forenoons. In the afternoons, the students were encouraged to have a hands on learning experience by either doing project works or carrying out experiments on various topics. Towards the end of the course, the students gave a presentation on the project work, which was evaluated by senior scientists of the Centre. Site visits to MAPS and BHAVINI were also organised. In the course of the programme, six special lectures were organised in the evening by inviting professors from premier institutions. In particular, the special lecture by Prof. D. Indumathi from IMSc, Chennai on “How the sun shines: shedding light on neutrino” was well received by students.
The valedictory program was held on July 6, 2018. Prof. Surajit Sengupta, Dean, TIFR, Hyderabad was the Chief Guest and he addressed the students and distributed the certificates. He also gave a special lecture on "Are Solids Rigid?”. An online feedback form was also made and the students were encouraged to submit their feedback about the course. Overall feedback received from the students was positive and appreciative of the range and depth of the course content.
Summer Training in Physics & Chemistry (STIPAC-2018)May 28 - July 6, 2018
Chief Guest Dr. D.K. Aswal, Director, NPL, New Delhi, Dr. Arun Kumar Bhaduri, Director, IGCAR along with senior colleagues and students of STIPAC during the inaugural function
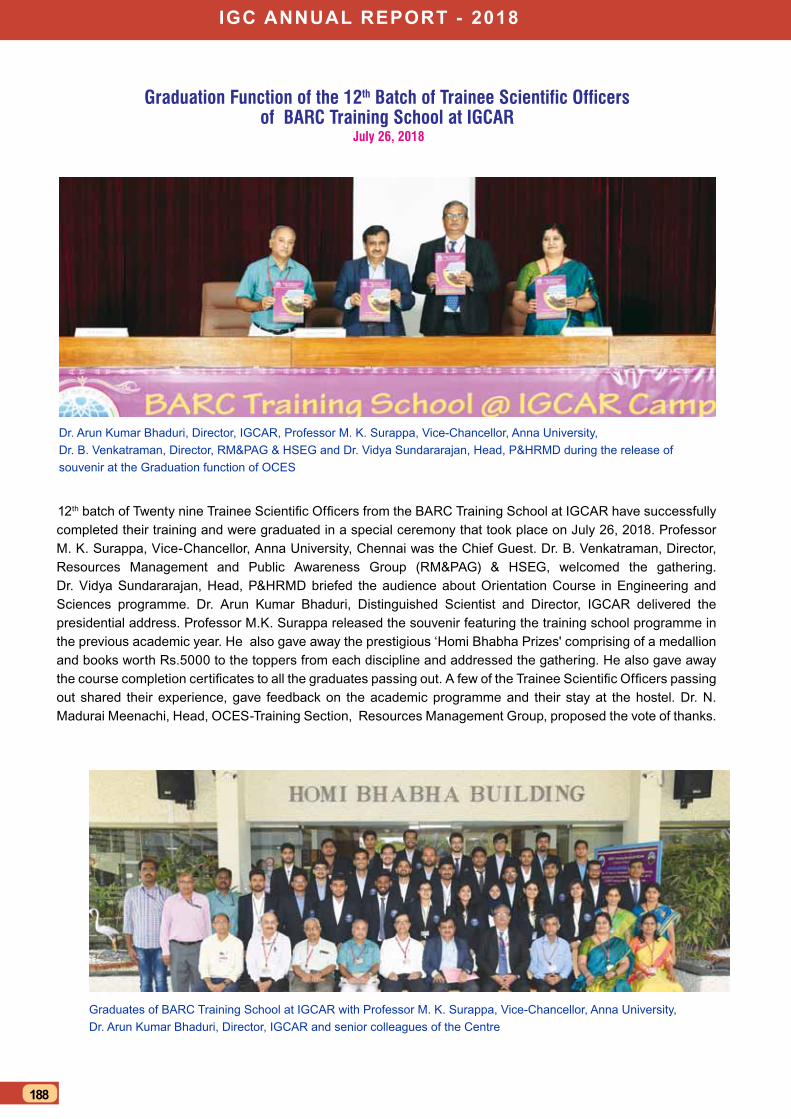
igc AnnuAl rePort - 2018
188
12th batch of Twenty nine Trainee Scientific Officers from the BARC Training School at IGCAR have successfully completed their training and were graduated in a special ceremony that took place on July 26, 2018. Professor M. K. Surappa, Vice-Chancellor, Anna University, Chennai was the Chief Guest. Dr. B. Venkatraman, Director, Resources Management and Public Awareness Group (RM&PAG) & HSEG, welcomed the gathering. Dr. Vidya Sundararajan, Head, P&HRMD briefed the audience about Orientation Course in Engineering and Sciences programme. Dr. Arun Kumar Bhaduri, Distinguished Scientist and Director, IGCAR delivered the presidential address. Professor M.K. Surappa released the souvenir featuring the training school programme in the previous academic year. He also gave away the prestigious ‘Homi Bhabha Prizes' comprising of a medallion and books worth Rs.5000 to the toppers from each discipline and addressed the gathering. He also gave away the course completion certificates to all the graduates passing out. A few of the Trainee Scientific Officers passing out shared their experience, gave feedback on the academic programme and their stay at the hostel. Dr. N. Madurai Meenachi, Head, OCES-Training Section, Resources Management Group, proposed the vote of thanks.
Graduation Function of the 12th Batch of Trainee Scientific Officers of BARC Training School at IGCAR
July 26, 2018
Dr. Arun Kumar Bhaduri, Director, IGCAR, Professor M. K. Surappa, Vice-Chancellor, Anna University, Dr. B. Venkatraman, Director, RM&PAG & HSEG and Dr. Vidya Sundararajan, Head, P&HRMD during the release of souvenir at the Graduation function of OCES
Graduates of BARC Training School at IGCAR with Professor M. K. Surappa, Vice-Chancellor, Anna University, Dr. Arun Kumar Bhaduri, Director, IGCAR and senior colleagues of the Centre
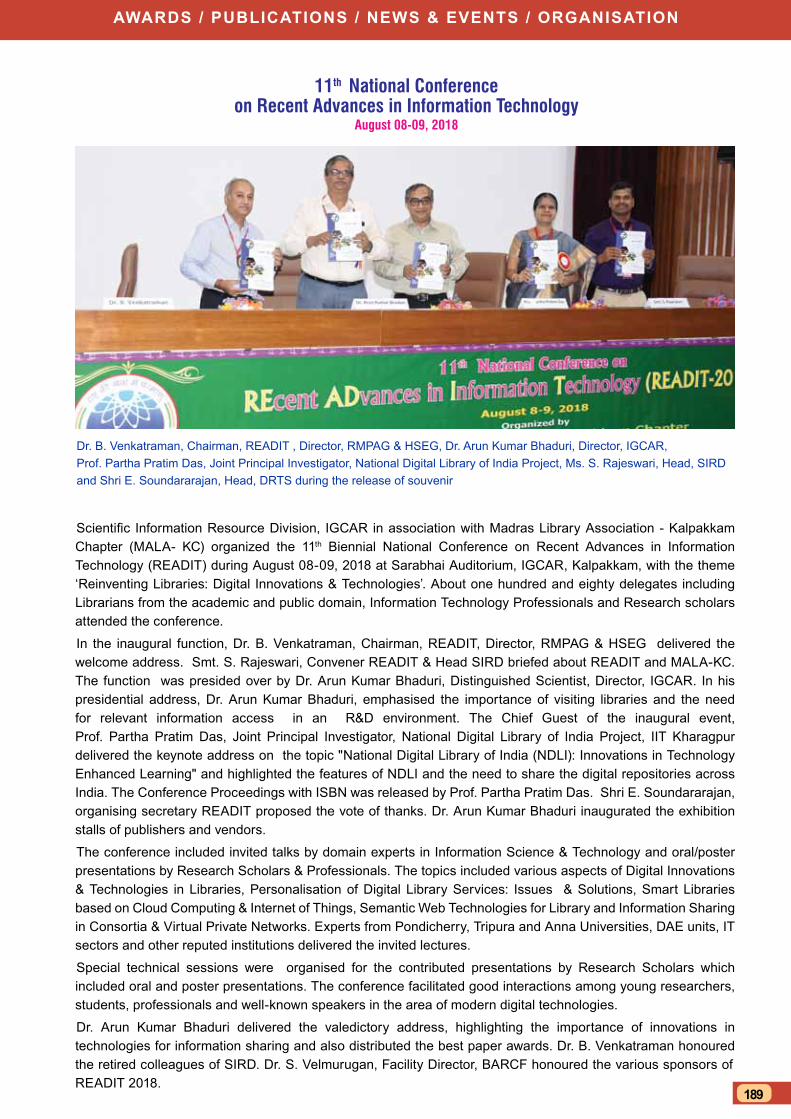
AwArds / PublicAtions / news & events / orgAnisAtion
189
11th National Conference on Recent Advances in Information Technology
August 08-09, 2018
Scientific Information Resource Division, IGCAR in association with Madras Library Association - Kalpakkam Chapter (MALA- KC) organized the 11th Biennial National Conference on Recent Advances in Information Technology (READIT) during August 08-09, 2018 at Sarabhai Auditorium, IGCAR, Kalpakkam, with the theme ‘Reinventing Libraries: Digital Innovations & Technologies’. About one hundred and eighty delegates including Librarians from the academic and public domain, Information Technology Professionals and Research scholars attended the conference.
In the inaugural function, Dr. B. Venkatraman, Chairman, READIT, Director, RMPAG & HSEG delivered the welcome address. Smt. S. Rajeswari, Convener READIT & Head SIRD briefed about READIT and MALA-KC. The function was presided over by Dr. Arun Kumar Bhaduri, Distinguished Scientist, Director, IGCAR. In his presidential address, Dr. Arun Kumar Bhaduri, emphasised the importance of visiting libraries and the need for relevant information access in an R&D environment. The Chief Guest of the inaugural event, Prof. Partha Pratim Das, Joint Principal Investigator, National Digital Library of India Project, IIT Kharagpur delivered the keynote address on the topic "National Digital Library of India (NDLI): Innovations in Technology Enhanced Learning" and highlighted the features of NDLI and the need to share the digital repositories across India. The Conference Proceedings with ISBN was released by Prof. Partha Pratim Das. Shri E. Soundararajan, organising secretary READIT proposed the vote of thanks. Dr. Arun Kumar Bhaduri inaugurated the exhibition stalls of publishers and vendors.
The conference included invited talks by domain experts in Information Science & Technology and oral/poster presentations by Research Scholars & Professionals. The topics included various aspects of Digital Innovations & Technologies in Libraries, Personalisation of Digital Library Services: Issues & Solutions, Smart Libraries based on Cloud Computing & Internet of Things, Semantic Web Technologies for Library and Information Sharing in Consortia & Virtual Private Networks. Experts from Pondicherry, Tripura and Anna Universities, DAE units, IT sectors and other reputed institutions delivered the invited lectures.
Special technical sessions were organised for the contributed presentations by Research Scholars which included oral and poster presentations. The conference facilitated good interactions among young researchers, students, professionals and well-known speakers in the area of modern digital technologies.
Dr. Arun Kumar Bhaduri delivered the valedictory address, highlighting the importance of innovations in technologies for information sharing and also distributed the best paper awards. Dr. B. Venkatraman honoured the retired colleagues of SIRD. Dr. S. Velmurugan, Facility Director, BARCF honoured the various sponsors of READIT 2018.
Dr. B. Venkatraman, Chairman, READIT , Director, RMPAG & HSEG, Dr. Arun Kumar Bhaduri, Director, IGCAR, Prof. Partha Pratim Das, Joint Principal Investigator, National Digital Library of India Project, Ms. S. Rajeswari, Head, SIRD and Shri E. Soundararajan, Head, DRTS during the release of souvenir
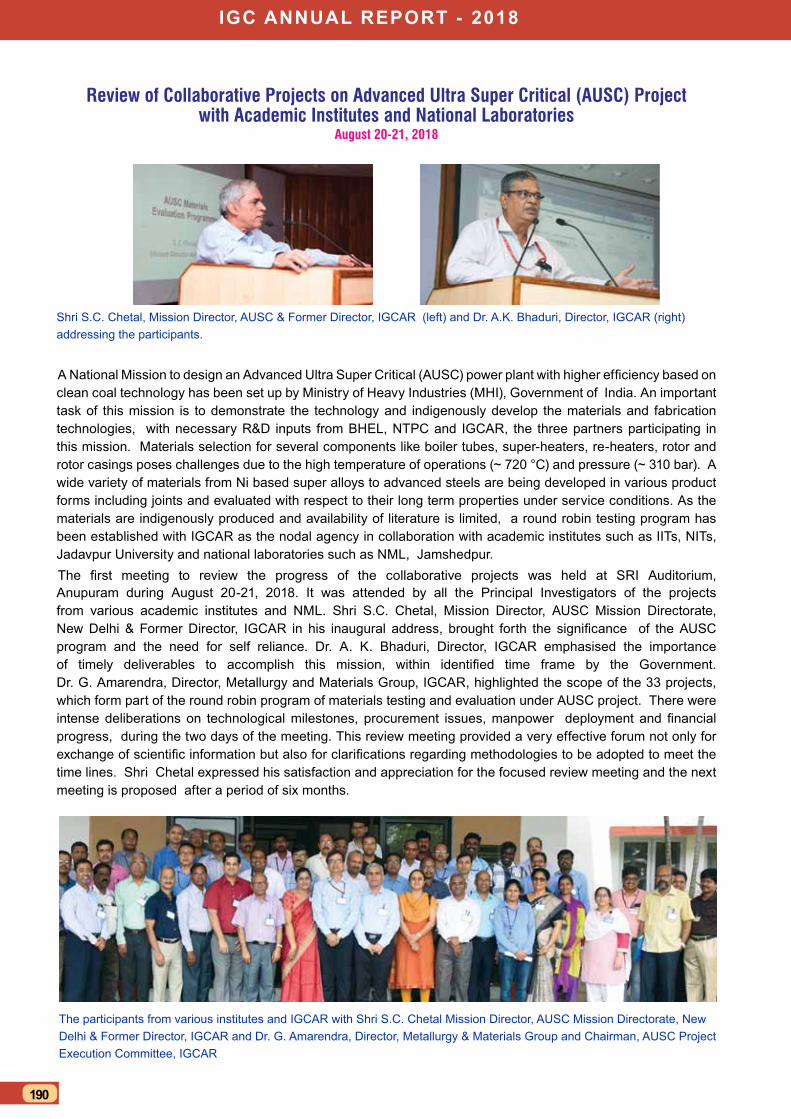
igc AnnuAl rePort - 2018
190
A National Mission to design an Advanced Ultra Super Critical (AUSC) power plant with higher efficiency based on clean coal technology has been set up by Ministry of Heavy Industries (MHI), Government of India. An important task of this mission is to demonstrate the technology and indigenously develop the materials and fabrication technologies, with necessary R&D inputs from BHEL, NTPC and IGCAR, the three partners participating in this mission. Materials selection for several components like boiler tubes, super-heaters, re-heaters, rotor and rotor casings poses challenges due to the high temperature of operations (~ 720 °C) and pressure (~ 310 bar). A wide variety of materials from Ni based super alloys to advanced steels are being developed in various product forms including joints and evaluated with respect to their long term properties under service conditions. As the materials are indigenously produced and availability of literature is limited, a round robin testing program has been established with IGCAR as the nodal agency in collaboration with academic institutes such as IITs, NITs, Jadavpur University and national laboratories such as NML, Jamshedpur. The first meeting to review the progress of the collaborative projects was held at SRI Auditorium, Anupuram during August 20-21, 2018. It was attended by all the Principal Investigators of the projects from various academic institutes and NML. Shri S.C. Chetal, Mission Director, AUSC Mission Directorate, New Delhi & Former Director, IGCAR in his inaugural address, brought forth the significance of the AUSC program and the need for self reliance. Dr. A. K. Bhaduri, Director, IGCAR emphasised the importance of timely deliverables to accomplish this mission, within identified time frame by the Government. Dr. G. Amarendra, Director, Metallurgy and Materials Group, IGCAR, highlighted the scope of the 33 projects, which form part of the round robin program of materials testing and evaluation under AUSC project. There were intense deliberations on technological milestones, procurement issues, manpower deployment and financial progress, during the two days of the meeting. This review meeting provided a very effective forum not only for exchange of scientific information but also for clarifications regarding methodologies to be adopted to meet the time lines. Shri Chetal expressed his satisfaction and appreciation for the focused review meeting and the next meeting is proposed after a period of six months.
Review of Collaborative Projects on Advanced Ultra Super Critical (AUSC) Project with Academic Institutes and National Laboratories
August 20-21, 2018
Shri S.C. Chetal, Mission Director, AUSC & Former Director, IGCAR (left) and Dr. A.K. Bhaduri, Director, IGCAR (right) addressing the participants.
The participants from various institutes and IGCAR with Shri S.C. Chetal Mission Director, AUSC Mission Directorate, New Delhi & Former Director, IGCAR and Dr. G. Amarendra, Director, Metallurgy & Materials Group and Chairman, AUSC Project Execution Committee, IGCAR
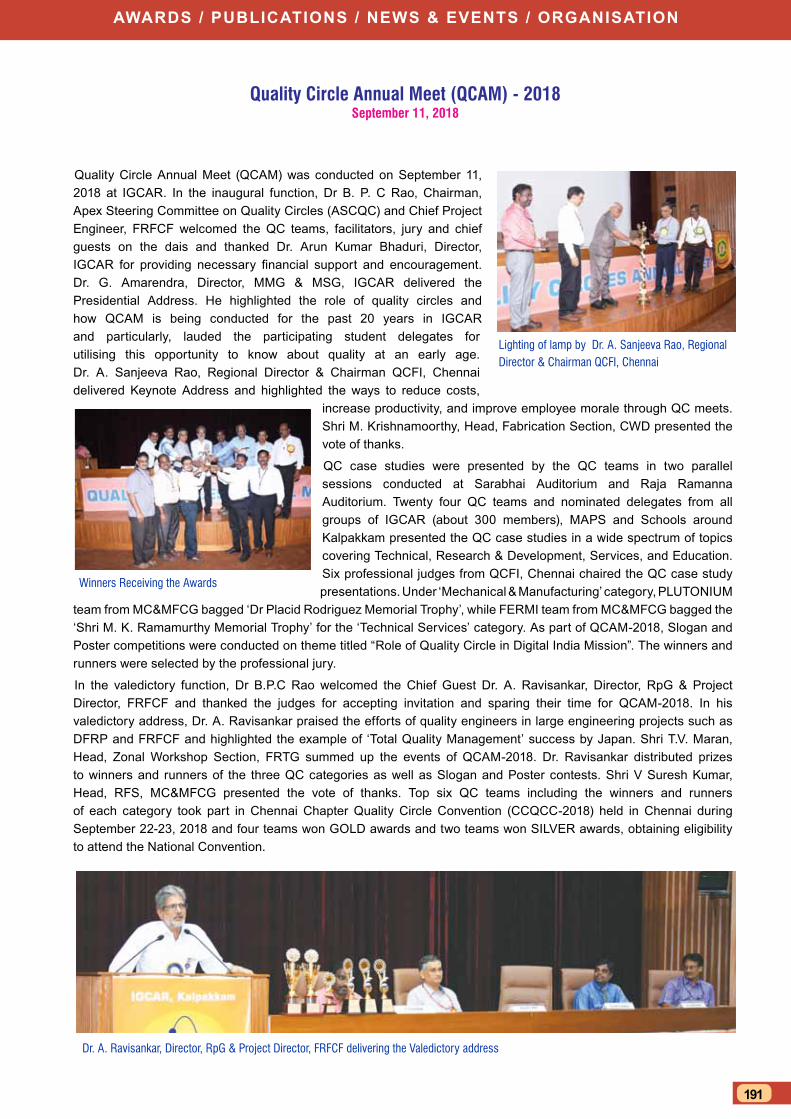
AwArds / PublicAtions / news & events / orgAnisAtion
191
Quality Circle Annual Meet (QCAM) was conducted on September 11, 2018 at IGCAR. In the inaugural function, Dr B. P. C Rao, Chairman, Apex Steering Committee on Quality Circles (ASCQC) and Chief Project Engineer, FRFCF welcomed the QC teams, facilitators, jury and chief guests on the dais and thanked Dr. Arun Kumar Bhaduri, Director, IGCAR for providing necessary financial support and encouragement. Dr. G. Amarendra, Director, MMG & MSG, IGCAR delivered the Presidential Address. He highlighted the role of quality circles and how QCAM is being conducted for the past 20 years in IGCAR and particularly, lauded the participating student delegates for utilising this opportunity to know about quality at an early age. Dr. A. Sanjeeva Rao, Regional Director & Chairman QCFI, Chennai delivered Keynote Address and highlighted the ways to reduce costs,
increase productivity, and improve employee morale through QC meets. Shri M. Krishnamoorthy, Head, Fabrication Section, CWD presented the vote of thanks.
QC case studies were presented by the QC teams in two parallel sessions conducted at Sarabhai Auditorium and Raja Ramanna Auditorium. Twenty four QC teams and nominated delegates from all groups of IGCAR (about 300 members), MAPS and Schools around Kalpakkam presented the QC case studies in a wide spectrum of topics covering Technical, Research & Development, Services, and Education. Six professional judges from QCFI, Chennai chaired the QC case study presentations. Under ‘Mechanical & Manufacturing’ category, PLUTONIUM
team from MC&MFCG bagged ‘Dr Placid Rodriguez Memorial Trophy’, while FERMI team from MC&MFCG bagged the ‘Shri M. K. Ramamurthy Memorial Trophy’ for the ‘Technical Services’ category. As part of QCAM-2018, Slogan and Poster competitions were conducted on theme titled “Role of Quality Circle in Digital India Mission”. The winners and runners were selected by the professional jury.
In the valedictory function, Dr B.P.C Rao welcomed the Chief Guest Dr. A. Ravisankar, Director, RpG & Project Director, FRFCF and thanked the judges for accepting invitation and sparing their time for QCAM-2018. In his valedictory address, Dr. A. Ravisankar praised the efforts of quality engineers in large engineering projects such as DFRP and FRFCF and highlighted the example of ‘Total Quality Management’ success by Japan. Shri T.V. Maran, Head, Zonal Workshop Section, FRTG summed up the events of QCAM-2018. Dr. Ravisankar distributed prizes to winners and runners of the three QC categories as well as Slogan and Poster contests. Shri V Suresh Kumar, Head, RFS, MC&MFCG presented the vote of thanks. Top six QC teams including the winners and runners of each category took part in Chennai Chapter Quality Circle Convention (CCQCC-2018) held in Chennai during September 22-23, 2018 and four teams won GOLD awards and two teams won SILVER awards, obtaining eligibility to attend the National Convention.
Dr. A. Ravisankar, Director, RpG & Project Director, FRFCF delivering the Valedictory address
Lighting of lamp by Dr. A. Sanjeeva Rao, Regional Director & Chairman QCFI, Chennai
Winners Receiving the Awards
Quality Circle Annual Meet (QCAM) - 2018September 11, 2018
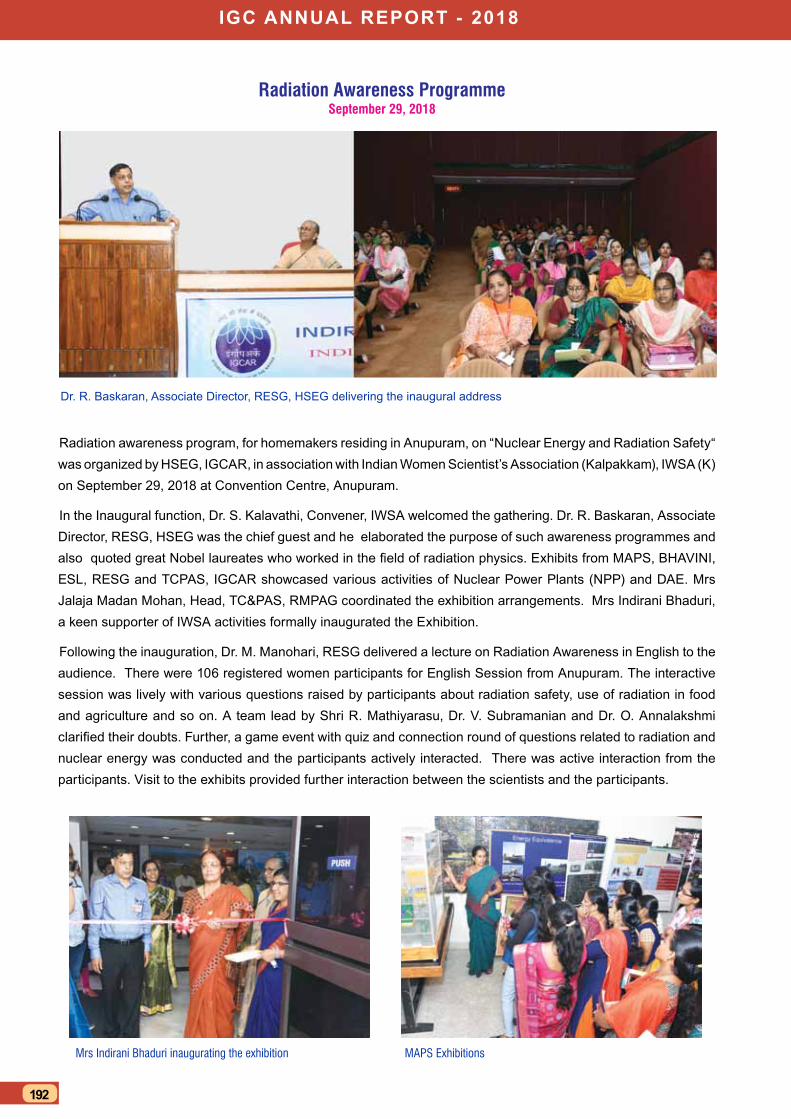
igc AnnuAl rePort - 2018
192
Radiation awareness program, for homemakers residing in Anupuram, on “Nuclear Energy and Radiation Safety“ was organized by HSEG, IGCAR, in association with Indian Women Scientist’s Association (Kalpakkam), IWSA (K) on September 29, 2018 at Convention Centre, Anupuram.
In the Inaugural function, Dr. S. Kalavathi, Convener, IWSA welcomed the gathering. Dr. R. Baskaran, Associate Director, RESG, HSEG was the chief guest and he elaborated the purpose of such awareness programmes and also quoted great Nobel laureates who worked in the field of radiation physics. Exhibits from MAPS, BHAVINI, ESL, RESG and TCPAS, IGCAR showcased various activities of Nuclear Power Plants (NPP) and DAE. Mrs Jalaja Madan Mohan, Head, TC&PAS, RMPAG coordinated the exhibition arrangements. Mrs Indirani Bhaduri, a keen supporter of IWSA activities formally inaugurated the Exhibition.
Following the inauguration, Dr. M. Manohari, RESG delivered a lecture on Radiation Awareness in English to the audience. There were 106 registered women participants for English Session from Anupuram. The interactive session was lively with various questions raised by participants about radiation safety, use of radiation in food and agriculture and so on. A team lead by Shri R. Mathiyarasu, Dr. V. Subramanian and Dr. O. Annalakshmi clarified their doubts. Further, a game event with quiz and connection round of questions related to radiation and nuclear energy was conducted and the participants actively interacted. There was active interaction from the participants. Visit to the exhibits provided further interaction between the scientists and the participants.
Radiation Awareness Programme September 29, 2018
Dr. R. Baskaran, Associate Director, RESG, HSEG delivering the inaugural address
Mrs Indirani Bhaduri inaugurating the exhibition MAPS Exhibitions
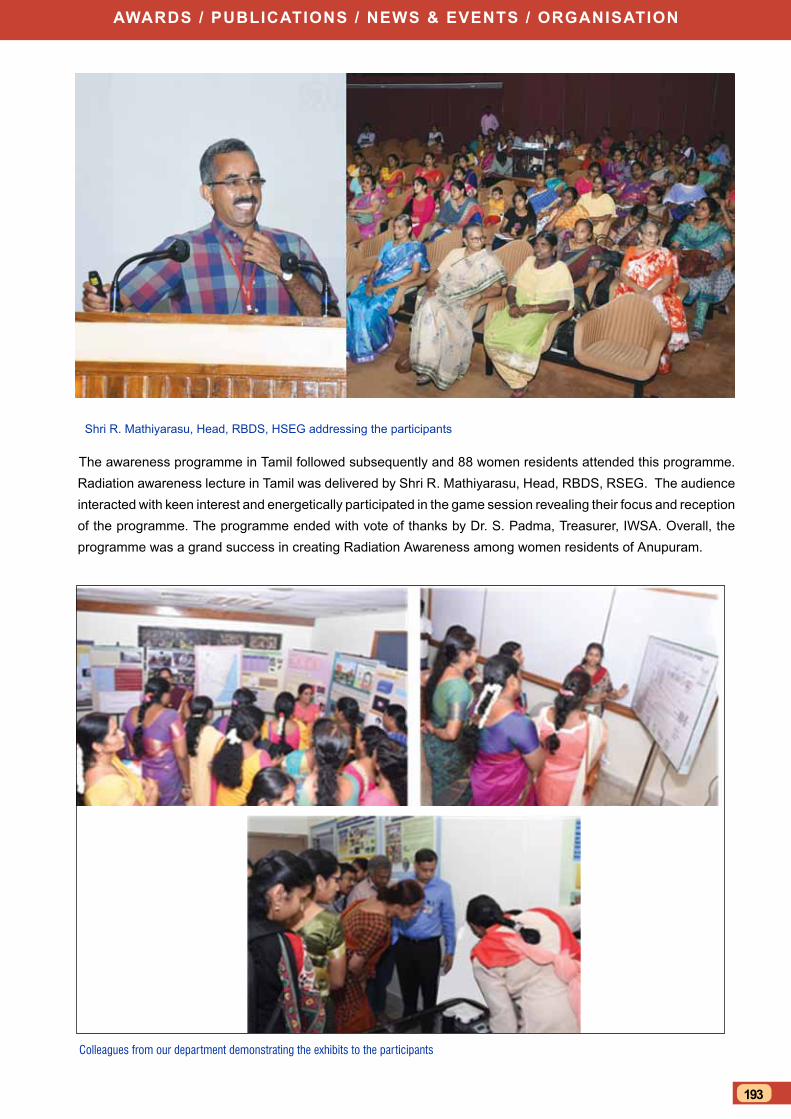
AwArds / PublicAtions / news & events / orgAnisAtion
193
Shri R. Mathiyarasu, Head, RBDS, HSEG addressing the participants
Colleagues from our department demonstrating the exhibits to the participants
The awareness programme in Tamil followed subsequently and 88 women residents attended this programme. Radiation awareness lecture in Tamil was delivered by Shri R. Mathiyarasu, Head, RBDS, RSEG. The audience interacted with keen interest and energetically participated in the game session revealing their focus and reception of the programme. The programme ended with vote of thanks by Dr. S. Padma, Treasurer, IWSA. Overall, the programme was a grand success in creating Radiation Awareness among women residents of Anupuram.
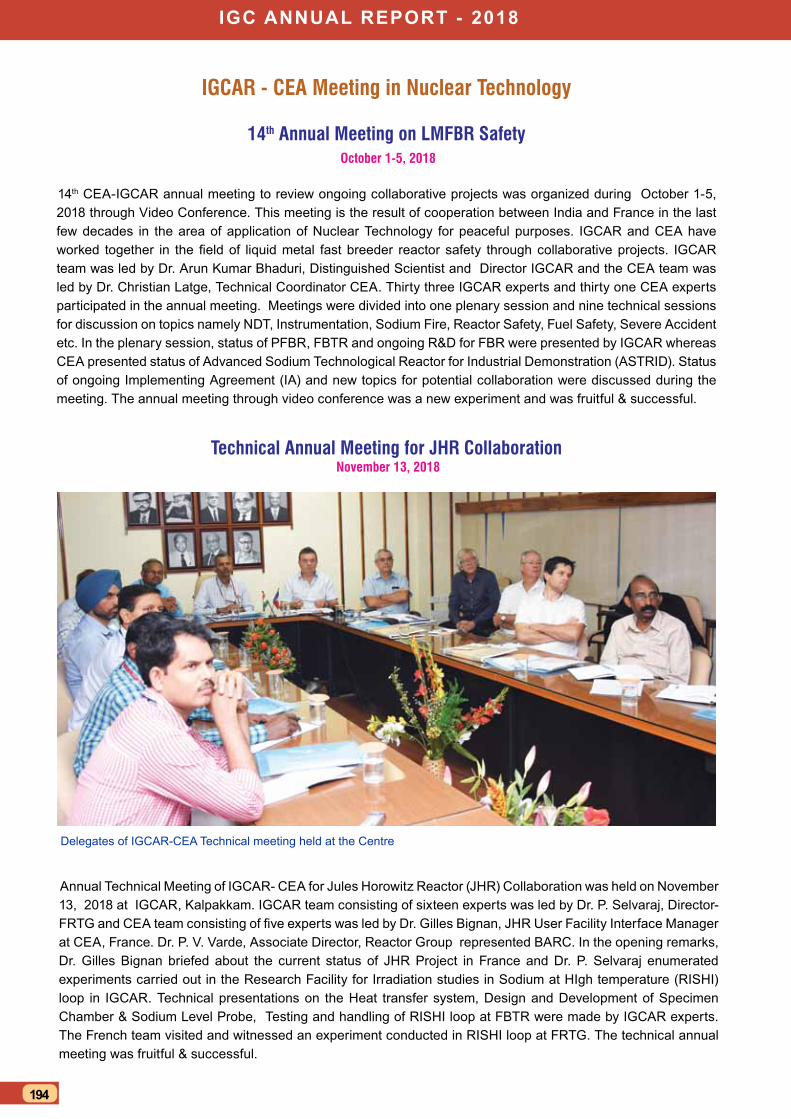
igc AnnuAl rePort - 2018
194
IGCAR - CEA Meeting in Nuclear Technology
14th Annual Meeting on LMFBR Safety October 1-5, 2018
14th CEA-IGCAR annual meeting to review ongoing collaborative projects was organized during October 1-5, 2018 through Video Conference. This meeting is the result of cooperation between India and France in the last few decades in the area of application of Nuclear Technology for peaceful purposes. IGCAR and CEA have worked together in the field of liquid metal fast breeder reactor safety through collaborative projects. IGCAR team was led by Dr. Arun Kumar Bhaduri, Distinguished Scientist and Director IGCAR and the CEA team was led by Dr. Christian Latge, Technical Coordinator CEA. Thirty three IGCAR experts and thirty one CEA experts participated in the annual meeting. Meetings were divided into one plenary session and nine technical sessions for discussion on topics namely NDT, Instrumentation, Sodium Fire, Reactor Safety, Fuel Safety, Severe Accident etc. In the plenary session, status of PFBR, FBTR and ongoing R&D for FBR were presented by IGCAR whereas CEA presented status of Advanced Sodium Technological Reactor for Industrial Demonstration (ASTRID). Status of ongoing Implementing Agreement (IA) and new topics for potential collaboration were discussed during the meeting. The annual meeting through video conference was a new experiment and was fruitful & successful.
Delegates of IGCAR-CEA Technical meeting held at the Centre
Technical Annual Meeting for JHR Collaboration November 13, 2018
Annual Technical Meeting of IGCAR- CEA for Jules Horowitz Reactor (JHR) Collaboration was held on November 13, 2018 at IGCAR, Kalpakkam. IGCAR team consisting of sixteen experts was led by Dr. P. Selvaraj, Director-FRTG and CEA team consisting of five experts was led by Dr. Gilles Bignan, JHR User Facility Interface Manager at CEA, France. Dr. P. V. Varde, Associate Director, Reactor Group represented BARC. In the opening remarks, Dr. Gilles Bignan briefed about the current status of JHR Project in France and Dr. P. Selvaraj enumerated experiments carried out in the Research Facility for Irradiation studies in Sodium at HIgh temperature (RISHI) loop in IGCAR. Technical presentations on the Heat transfer system, Design and Development of Specimen Chamber & Sodium Level Probe, Testing and handling of RISHI loop at FBTR were made by IGCAR experts. The French team visited and witnessed an experiment conducted in RISHI loop at FRTG. The technical annual meeting was fruitful & successful.

AwArds / PublicAtions / news & events / orgAnisAtion
195
The 26th Prof. Brahm Prakash Memorial Materials Quiz Grand Finale was conducted in a grand manner at Indira Gandhi Centre for Atomic Research during October 5-6, 2018. This year saw the participation from 37 teams representing 22 chapters of Indian Institute of Metals (IIM) across the country. The students were from classes XI and XII and were accompanied by teachers for this event.
On October 05, 2018, a visit to nuclear facilities in Kalpakkam, popularly known as the ‘Metal Camp’ programme was arranged. The student participants and teachers assembled in Sarabhai Auditorium at IGCAR Campus and Dr. R. Divakar, Chairman, IIM Kalpakkam Chapter welcomed them. Following this, Dr. G. Amarendra, Director, MSG & MMG and Chairman, BPMMQ Organising Committee, addressed the students and briefed them about the visits to the various facilities during the day. Dr. Shaju K. Albert, Associate Director, MEG, MMG recollected his association with the quiz in earlier years and described its rapid growth of popularity over the years. After watching a video on the science of nuclear energy, the students and teachers visited FBTR, MAPS and BHAVINI.
On October 06, 2018 the students assembled at the Training School seminar hall for the Prof. Brahm Prakash Memorial Materials Quiz event. Dr. V. S. Srinivasan welcomed the participants and briefed them the details of technical programme. This was followed by computerised draw of lots by Dr. G. Amarendra, Director, MSG & MMG. The preliminary rounds were held in six parallel sessions and the winner and runner of each session were chosen for semi finals. The semi finalists were Kolkata A & B, Chennai B, Coimbatore B, Trichy A, Kalpakkam A, Raigarh A & B, Ranchi A, Kanpur A, Mumbai and Bhopal. Six teams from the semi finals, namely, Trichy A, Chennai B, Raigarh A, Ranchi A, Mumbai and Bhopal qualified for the finals.
The Prof. Brahm Prakash Memorial Lecture 2018 was delivered by Dr. A. K. Bhaduri, Distinguished Scientist and Director, IGCAR on the topic “Improved Materials & Fabrication Technologies for the Indian Fast Breeder Reactor Programme”. He emphasized the need to engineer structural materials to withstand the fast reactor environment. He also described various innovative techniques for fabricating various components of the fast breeder reactor and disclosed how intricate fast reactor components fabricated in India have drawn appreciation in the international arena.
The BPMMQ Grand Finale was conducted by Dr. Sumanth C. Raman, a renowned doctor with TCS, Chennai and a popular quiz master. In a closely contested final, IIM Trichy Team comprising of Shri Jeya Amirthan and Shri S. Natarajan from Sri Jayendra Saraswathi Swamigal Silver Jubilee MHSS won the first prize and IIM Chennai Team comprising of Shri G. Karthik Balaji and Shri Manav Tathacharva from Padma Seshadri Bala Bhavan Senior Secondary School, K. K. Nagar, Chennai won the second place.
Dr. Arun Kumar Bhaduri, Distinguished Scientist and Director, IGCAR addressing the participants
26th Prof. Brahm Prakash Memorial Materials Quiz Grand Finale (BPMMQ 2018) October 5 -6, 2018
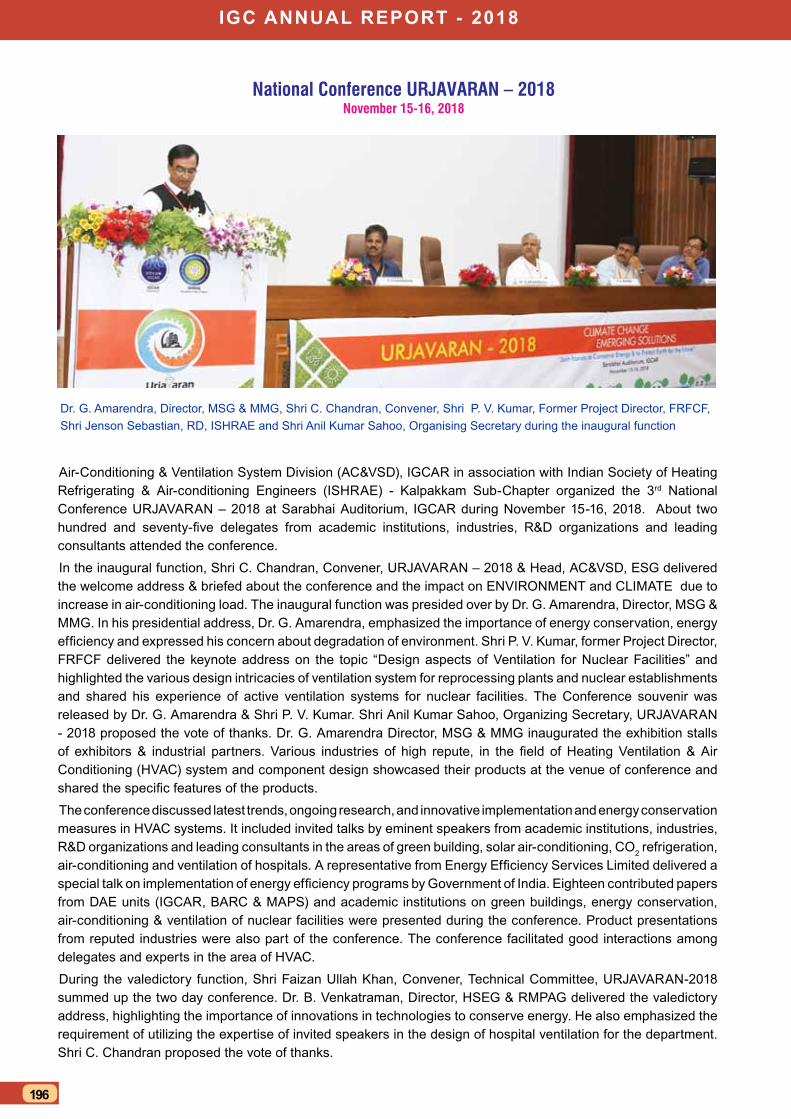
igc AnnuAl rePort - 2018
196
Air-Conditioning & Ventilation System Division (AC&VSD), IGCAR in association with Indian Society of Heating Refrigerating & Air-conditioning Engineers (ISHRAE) - Kalpakkam Sub-Chapter organized the 3rd National Conference URJAVARAN – 2018 at Sarabhai Auditorium, IGCAR during November 15-16, 2018. About two hundred and seventy-five delegates from academic institutions, industries, R&D organizations and leading consultants attended the conference.In the inaugural function, Shri C. Chandran, Convener, URJAVARAN – 2018 & Head, AC&VSD, ESG delivered the welcome address & briefed about the conference and the impact on ENVIRONMENT and CLIMATE due to increase in air-conditioning load. The inaugural function was presided over by Dr. G. Amarendra, Director, MSG & MMG. In his presidential address, Dr. G. Amarendra, emphasized the importance of energy conservation, energy efficiency and expressed his concern about degradation of environment. Shri P. V. Kumar, former Project Director, FRFCF delivered the keynote address on the topic “Design aspects of Ventilation for Nuclear Facilities” and highlighted the various design intricacies of ventilation system for reprocessing plants and nuclear establishments and shared his experience of active ventilation systems for nuclear facilities. The Conference souvenir was released by Dr. G. Amarendra & Shri P. V. Kumar. Shri Anil Kumar Sahoo, Organizing Secretary, URJAVARAN - 2018 proposed the vote of thanks. Dr. G. Amarendra Director, MSG & MMG inaugurated the exhibition stalls of exhibitors & industrial partners. Various industries of high repute, in the field of Heating Ventilation & Air Conditioning (HVAC) system and component design showcased their products at the venue of conference and shared the specific features of the products.The conference discussed latest trends, ongoing research, and innovative implementation and energy conservation measures in HVAC systems. It included invited talks by eminent speakers from academic institutions, industries, R&D organizations and leading consultants in the areas of green building, solar air-conditioning, CO2 refrigeration, air-conditioning and ventilation of hospitals. A representative from Energy Efficiency Services Limited delivered a special talk on implementation of energy efficiency programs by Government of India. Eighteen contributed papers from DAE units (IGCAR, BARC & MAPS) and academic institutions on green buildings, energy conservation, air-conditioning & ventilation of nuclear facilities were presented during the conference. Product presentations from reputed industries were also part of the conference. The conference facilitated good interactions among delegates and experts in the area of HVAC. During the valedictory function, Shri Faizan Ullah Khan, Convener, Technical Committee, URJAVARAN-2018 summed up the two day conference. Dr. B. Venkatraman, Director, HSEG & RMPAG delivered the valedictory address, highlighting the importance of innovations in technologies to conserve energy. He also emphasized the requirement of utilizing the expertise of invited speakers in the design of hospital ventilation for the department. Shri C. Chandran proposed the vote of thanks.
Dr. G. Amarendra, Director, MSG & MMG, Shri C. Chandran, Convener, Shri P. V. Kumar, Former Project Director, FRFCF, Shri Jenson Sebastian, RD, ISHRAE and Shri Anil Kumar Sahoo, Organising Secretary during the inaugural function
National Conference URJAVARAN – 2018 November 15-16, 2018
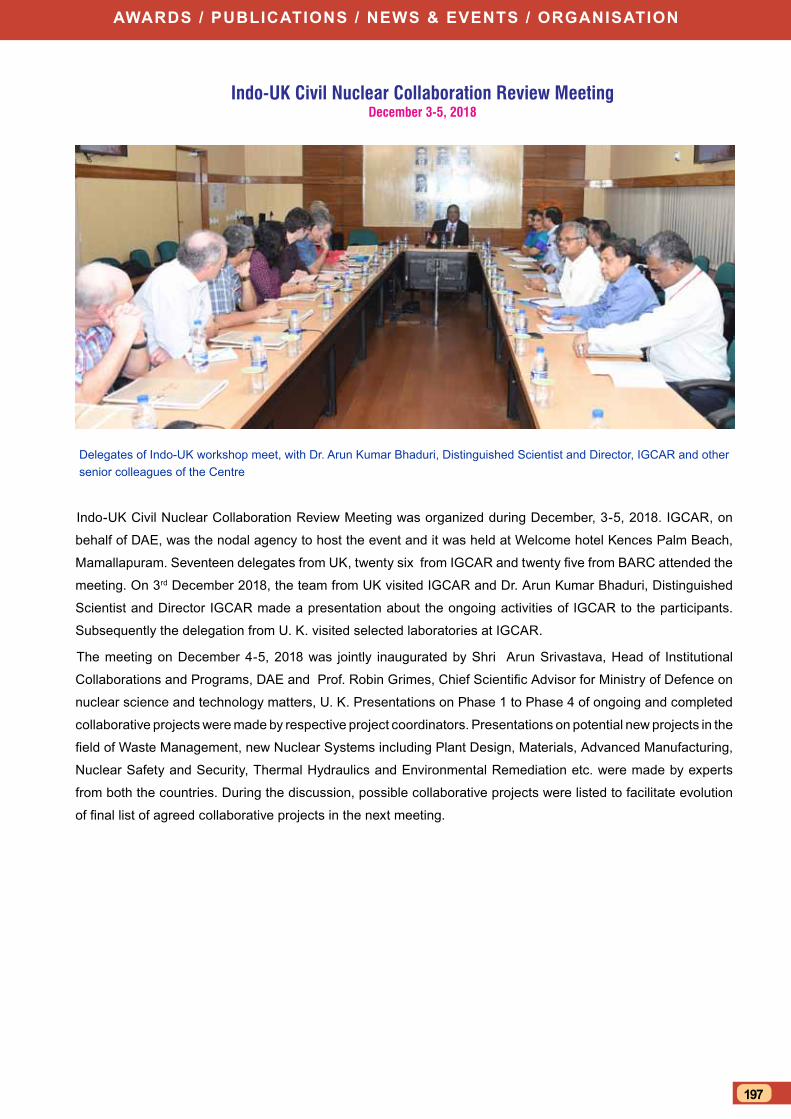
AwArds / PublicAtions / news & events / orgAnisAtion
197
Delegates of Indo-UK workshop meet, with Dr. Arun Kumar Bhaduri, Distinguished Scientist and Director, IGCAR and other senior colleagues of the Centre
Indo-UK Civil Nuclear Collaboration Review MeetingDecember 3-5, 2018
Indo-UK Civil Nuclear Collaboration Review Meeting was organized during December, 3-5, 2018. IGCAR, on
behalf of DAE, was the nodal agency to host the event and it was held at Welcome hotel Kences Palm Beach,
Mamallapuram. Seventeen delegates from UK, twenty six from IGCAR and twenty five from BARC attended the
meeting. On 3rd December 2018, the team from UK visited IGCAR and Dr. Arun Kumar Bhaduri, Distinguished
Scientist and Director IGCAR made a presentation about the ongoing activities of IGCAR to the participants.
Subsequently the delegation from U. K. visited selected laboratories at IGCAR.
The meeting on December 4-5, 2018 was jointly inaugurated by Shri Arun Srivastava, Head of Institutional
Collaborations and Programs, DAE and Prof. Robin Grimes, Chief Scientific Advisor for Ministry of Defence on
nuclear science and technology matters, U. K. Presentations on Phase 1 to Phase 4 of ongoing and completed
collaborative projects were made by respective project coordinators. Presentations on potential new projects in the
field of Waste Management, new Nuclear Systems including Plant Design, Materials, Advanced Manufacturing,
Nuclear Safety and Security, Thermal Hydraulics and Environmental Remediation etc. were made by experts
from both the countries. During the discussion, possible collaborative projects were listed to facilitate evolution
of final list of agreed collaborative projects in the next meeting.
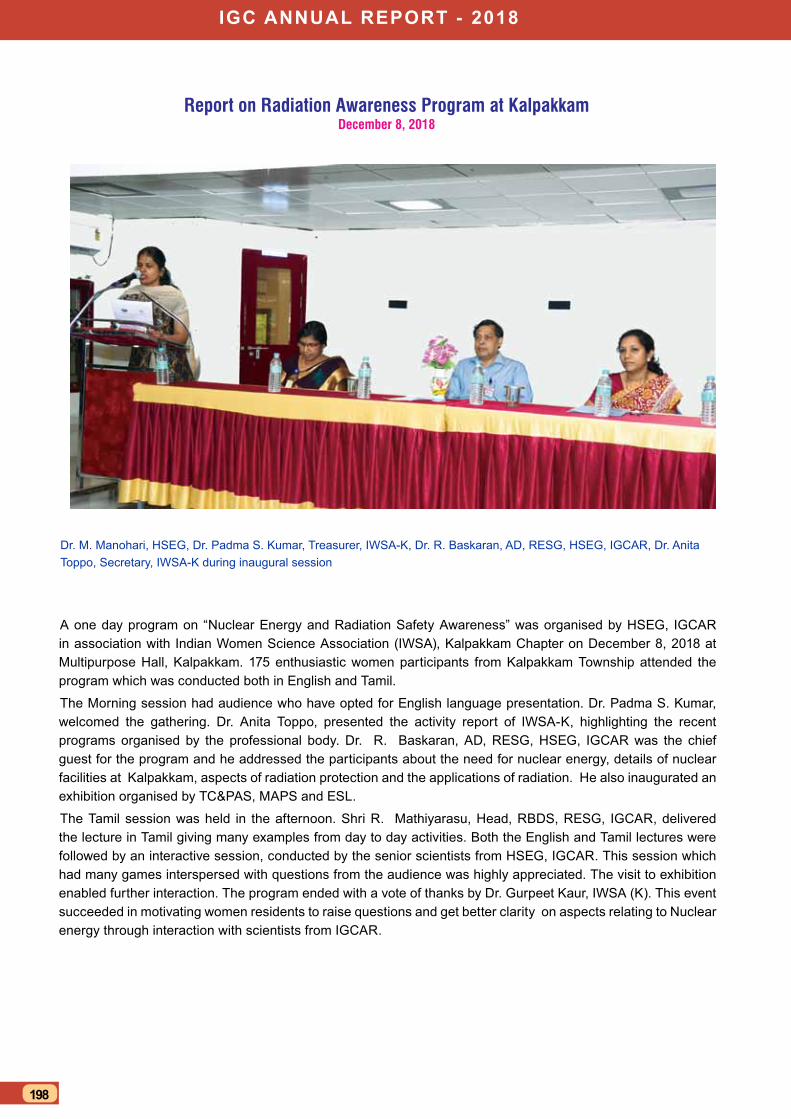
igc AnnuAl rePort - 2018
198
A one day program on “Nuclear Energy and Radiation Safety Awareness” was organised by HSEG, IGCAR in association with Indian Women Science Association (IWSA), Kalpakkam Chapter on December 8, 2018 at Multipurpose Hall, Kalpakkam. 175 enthusiastic women participants from Kalpakkam Township attended the program which was conducted both in English and Tamil.
The Morning session had audience who have opted for English language presentation. Dr. Padma S. Kumar, welcomed the gathering. Dr. Anita Toppo, presented the activity report of IWSA-K, highlighting the recent programs organised by the professional body. Dr. R. Baskaran, AD, RESG, HSEG, IGCAR was the chief guest for the program and he addressed the participants about the need for nuclear energy, details of nuclear facilities at Kalpakkam, aspects of radiation protection and the applications of radiation. He also inaugurated an exhibition organised by TC&PAS, MAPS and ESL.
The Tamil session was held in the afternoon. Shri R. Mathiyarasu, Head, RBDS, RESG, IGCAR, delivered the lecture in Tamil giving many examples from day to day activities. Both the English and Tamil lectures were followed by an interactive session, conducted by the senior scientists from HSEG, IGCAR. This session which had many games interspersed with questions from the audience was highly appreciated. The visit to exhibition enabled further interaction. The program ended with a vote of thanks by Dr. Gurpeet Kaur, IWSA (K). This event succeeded in motivating women residents to raise questions and get better clarity on aspects relating to Nuclear energy through interaction with scientists from IGCAR.
Report on Radiation Awareness Program at KalpakkamDecember 8, 2018
Dr. M. Manohari, HSEG, Dr. Padma S. Kumar, Treasurer, IWSA-K, Dr. R. Baskaran, AD, RESG, HSEG, IGCAR, Dr. Anita Toppo, Secretary, IWSA-K during inaugural session
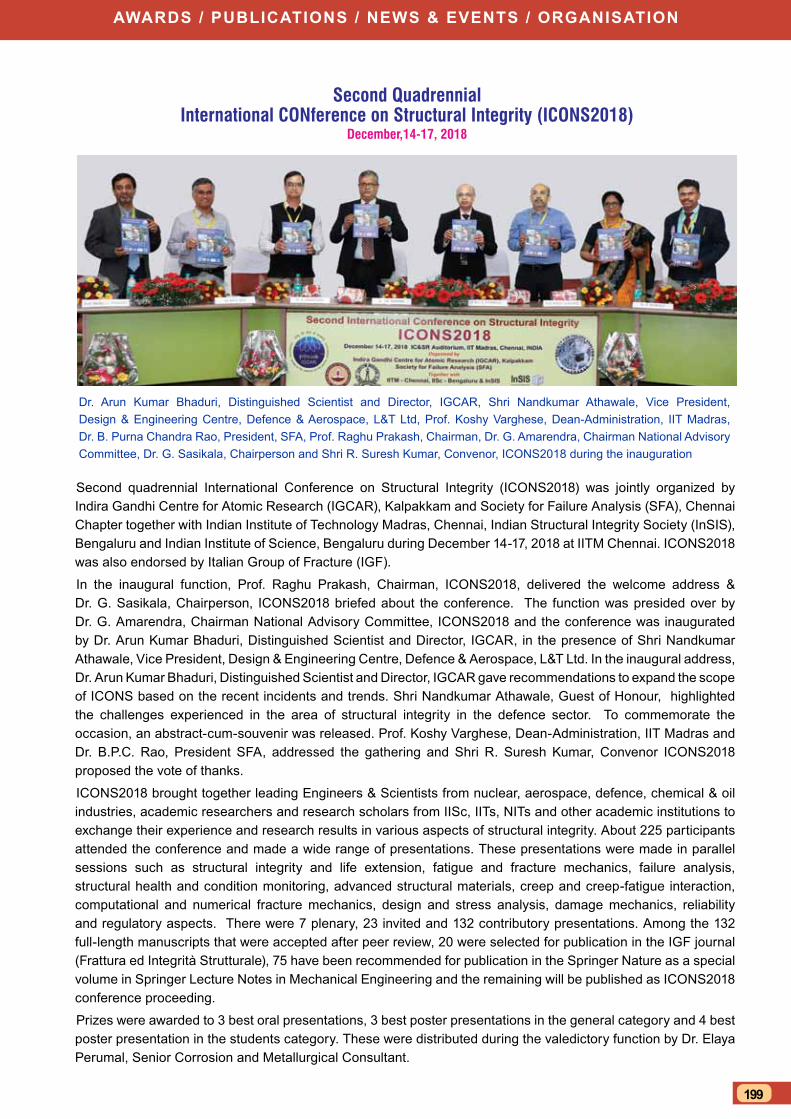
AwArds / PublicAtions / news & events / orgAnisAtion
199
Second quadrennial International Conference on Structural Integrity (ICONS2018) was jointly organized by Indira Gandhi Centre for Atomic Research (IGCAR), Kalpakkam and Society for Failure Analysis (SFA), Chennai Chapter together with Indian Institute of Technology Madras, Chennai, Indian Structural Integrity Society (InSIS), Bengaluru and Indian Institute of Science, Bengaluru during December 14-17, 2018 at IITM Chennai. ICONS2018 was also endorsed by Italian Group of Fracture (IGF).
In the inaugural function, Prof. Raghu Prakash, Chairman, ICONS2018, delivered the welcome address & Dr. G. Sasikala, Chairperson, ICONS2018 briefed about the conference. The function was presided over by Dr. G. Amarendra, Chairman National Advisory Committee, ICONS2018 and the conference was inaugurated by Dr. Arun Kumar Bhaduri, Distinguished Scientist and Director, IGCAR, in the presence of Shri Nandkumar Athawale, Vice President, Design & Engineering Centre, Defence & Aerospace, L&T Ltd. In the inaugural address, Dr. Arun Kumar Bhaduri, Distinguished Scientist and Director, IGCAR gave recommendations to expand the scope of ICONS based on the recent incidents and trends. Shri Nandkumar Athawale, Guest of Honour, highlighted the challenges experienced in the area of structural integrity in the defence sector. To commemorate the occasion, an abstract-cum-souvenir was released. Prof. Koshy Varghese, Dean-Administration, IIT Madras and Dr. B.P.C. Rao, President SFA, addressed the gathering and Shri R. Suresh Kumar, Convenor ICONS2018 proposed the vote of thanks.
ICONS2018 brought together leading Engineers & Scientists from nuclear, aerospace, defence, chemical & oil industries, academic researchers and research scholars from IISc, IITs, NITs and other academic institutions to exchange their experience and research results in various aspects of structural integrity. About 225 participants attended the conference and made a wide range of presentations. These presentations were made in parallel sessions such as structural integrity and life extension, fatigue and fracture mechanics, failure analysis, structural health and condition monitoring, advanced structural materials, creep and creep-fatigue interaction, computational and numerical fracture mechanics, design and stress analysis, damage mechanics, reliability and regulatory aspects. There were 7 plenary, 23 invited and 132 contributory presentations. Among the 132 full-length manuscripts that were accepted after peer review, 20 were selected for publication in the IGF journal (Frattura ed Integrità Strutturale), 75 have been recommended for publication in the Springer Nature as a special volume in Springer Lecture Notes in Mechanical Engineering and the remaining will be published as ICONS2018 conference proceeding.
Prizes were awarded to 3 best oral presentations, 3 best poster presentations in the general category and 4 best poster presentation in the students category. These were distributed during the valedictory function by Dr. Elaya Perumal, Senior Corrosion and Metallurgical Consultant.
Second Quadrennial International CONference on Structural Integrity (ICONS2018)
December,14-17, 2018
Dr. Arun Kumar Bhaduri, Distinguished Scientist and Director, IGCAR, Shri Nandkumar Athawale, Vice President, Design & Engineering Centre, Defence & Aerospace, L&T Ltd, Prof. Koshy Varghese, Dean-Administration, IIT Madras, Dr. B. Purna Chandra Rao, President, SFA, Prof. Raghu Prakash, Chairman, Dr. G. Amarendra, Chairman National Advisory Committee, Dr. G. Sasikala, Chairperson and Shri R. Suresh Kumar, Convenor, ICONS2018 during the inauguration
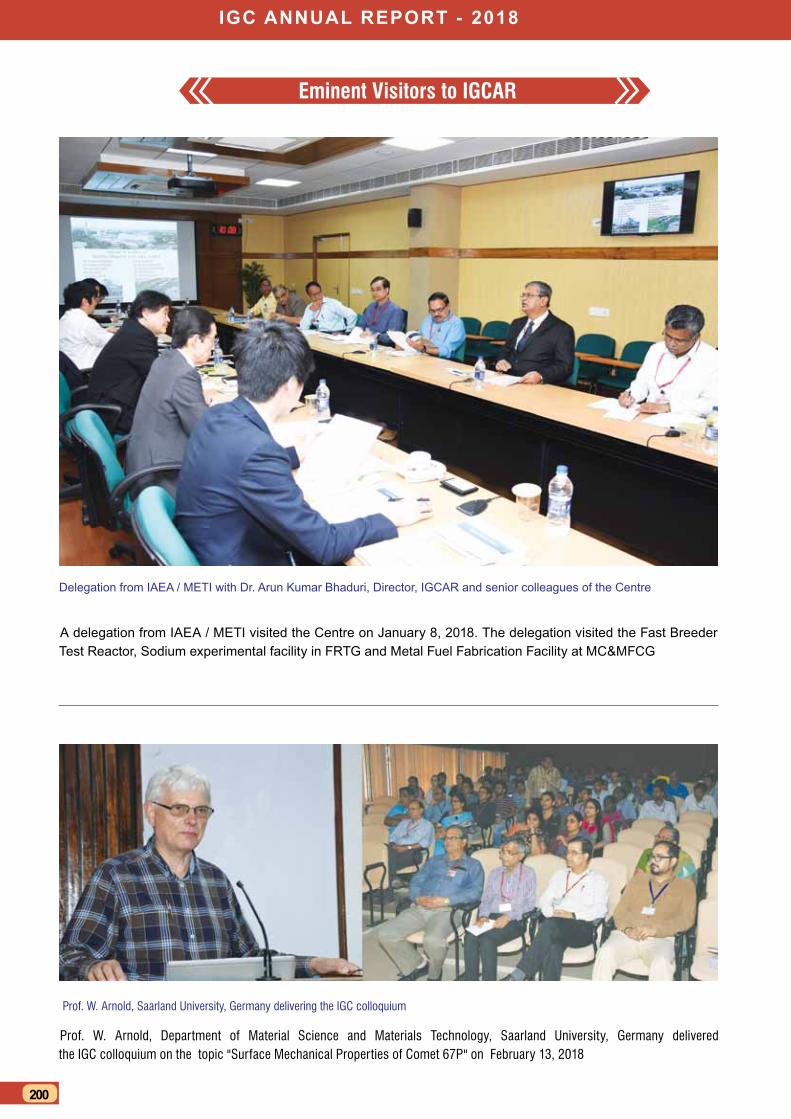
igc AnnuAl rePort - 2018
200
Eminent Visitors to IGCAR
A delegation from IAEA / METI visited the Centre on January 8, 2018. The delegation visited the Fast Breeder Test Reactor, Sodium experimental facility in FRTG and Metal Fuel Fabrication Facility at MC&MFCG
Delegation from IAEA / METI with Dr. Arun Kumar Bhaduri, Director, IGCAR and senior colleagues of the Centre
Prof. W. Arnold, Department of Material Science and Materials Technology, Saarland University, Germany delivered the IGC colloquium on the topic "Surface Mechanical Properties of Comet 67P" on February 13, 2018
Prof. W. Arnold, Saarland University, Germany delivering the IGC colloquium
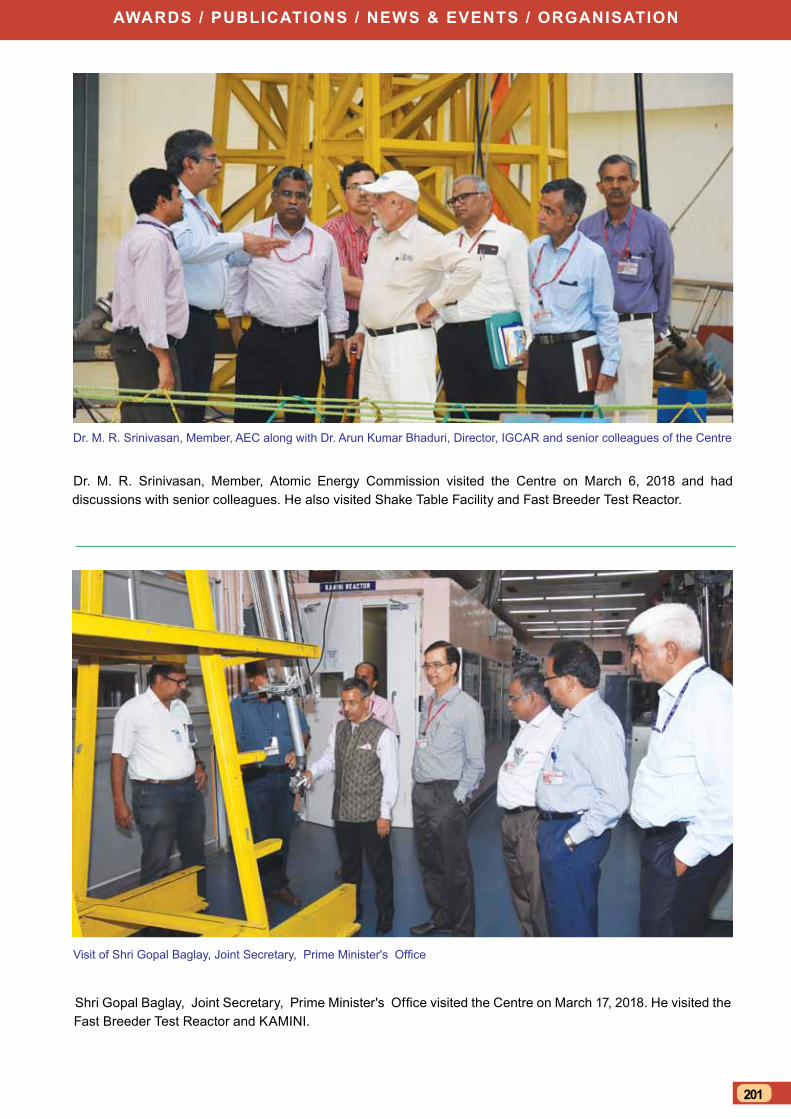
AwArds / PublicAtions / news & events / orgAnisAtion
201
Dr. M. R. Srinivasan, Member, Atomic Energy Commission visited the Centre on March 6, 2018 and had discussions with senior colleagues. He also visited Shake Table Facility and Fast Breeder Test Reactor.
Shri Gopal Baglay, Joint Secretary, Prime Minister's Office visited the Centre on March 17, 2018. He visited the Fast Breeder Test Reactor and KAMINI.
Dr. M. R. Srinivasan, Member, AEC along with Dr. Arun Kumar Bhaduri, Director, IGCAR and senior colleagues of the Centre
Visit of Shri Gopal Baglay, Joint Secretary, Prime Minister's Office
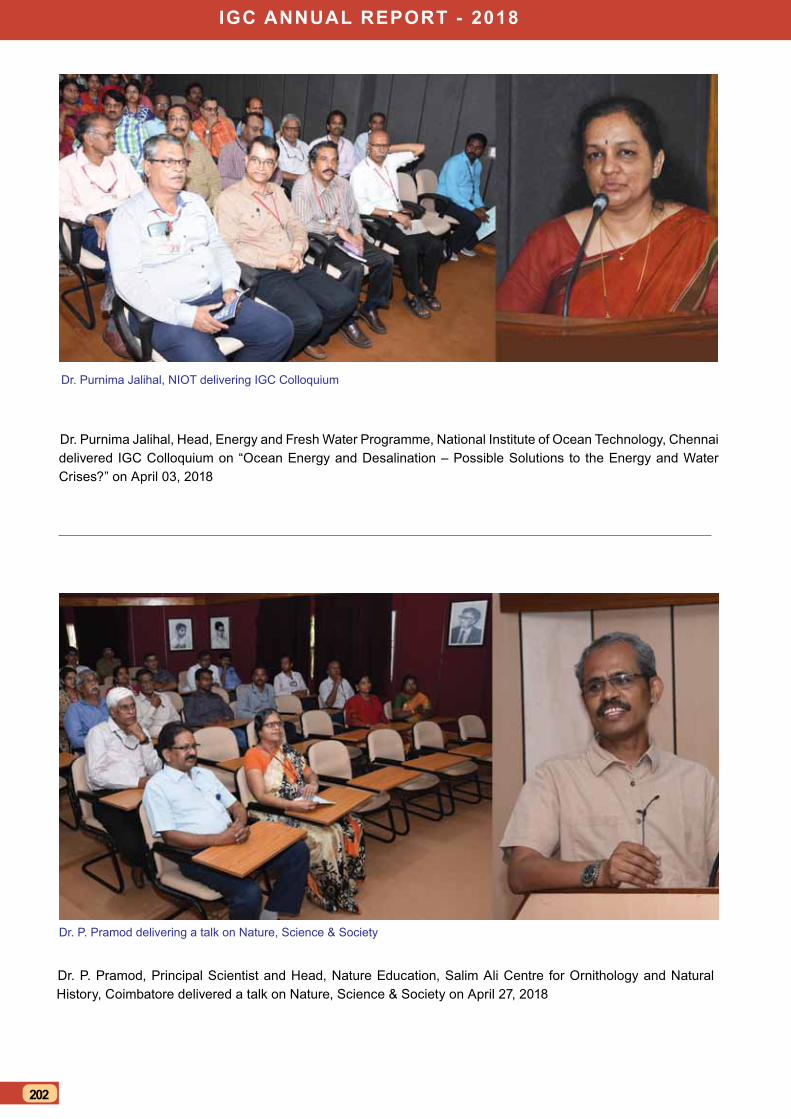
igc AnnuAl rePort - 2018
202
Dr. Purnima Jalihal, Head, Energy and Fresh Water Programme, National Institute of Ocean Technology, Chennai delivered IGC Colloquium on “Ocean Energy and Desalination – Possible Solutions to the Energy and Water Crises?” on April 03, 2018
Dr. P. Pramod, Principal Scientist and Head, Nature Education, Salim Ali Centre for Ornithology and Natural History, Coimbatore delivered a talk on Nature, Science & Society on April 27, 2018
Dr. Purnima Jalihal, NIOT delivering IGC Colloquium
Dr. P. Pramod delivering a talk on Nature, Science & Society
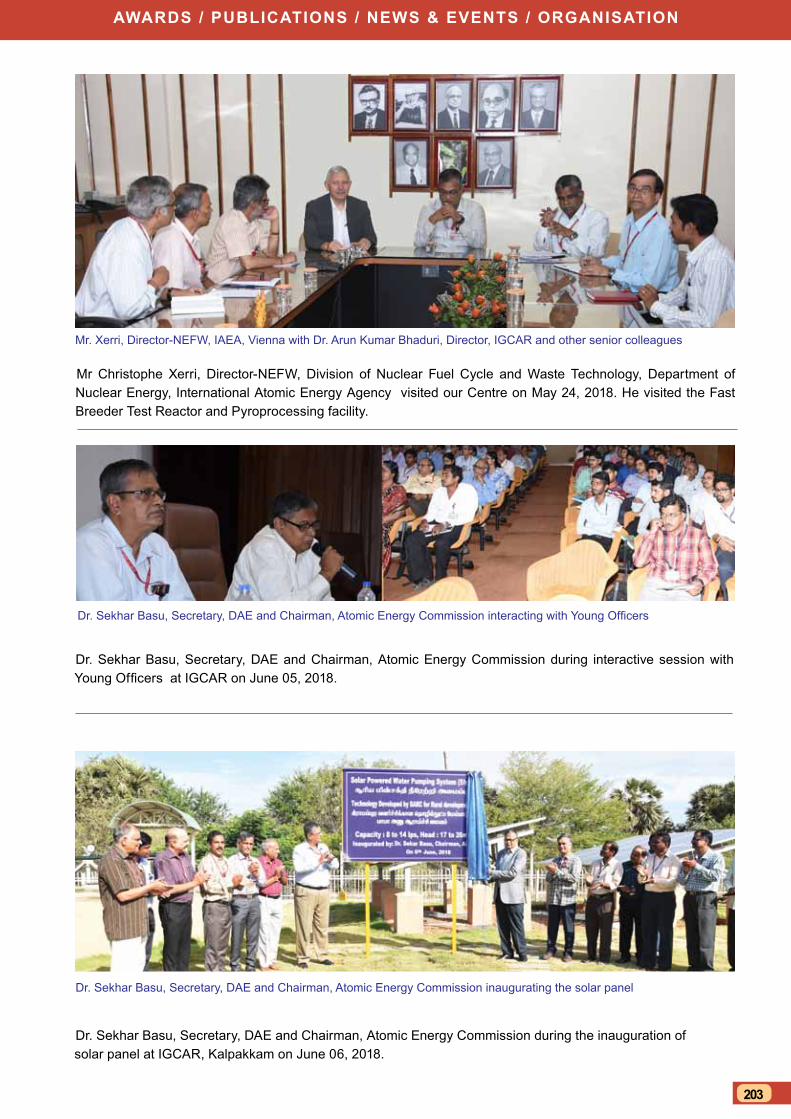
AwArds / PublicAtions / news & events / orgAnisAtion
203
Mr Christophe Xerri, Director-NEFW, Division of Nuclear Fuel Cycle and Waste Technology, Department of Nuclear Energy, International Atomic Energy Agency visited our Centre on May 24, 2018. He visited the Fast Breeder Test Reactor and Pyroprocessing facility.
Dr. Sekhar Basu, Secretary, DAE and Chairman, Atomic Energy Commission during the inauguration of solar panel at IGCAR, Kalpakkam on June 06, 2018.
Dr. Sekhar Basu, Secretary, DAE and Chairman, Atomic Energy Commission during interactive session with Young Officers at IGCAR on June 05, 2018.
Mr. Xerri, Director-NEFW, IAEA, Vienna with Dr. Arun Kumar Bhaduri, Director, IGCAR and other senior colleagues
Dr. Sekhar Basu, Secretary, DAE and Chairman, Atomic Energy Commission interacting with Young Officers
Dr. Sekhar Basu, Secretary, DAE and Chairman, Atomic Energy Commission inaugurating the solar panel
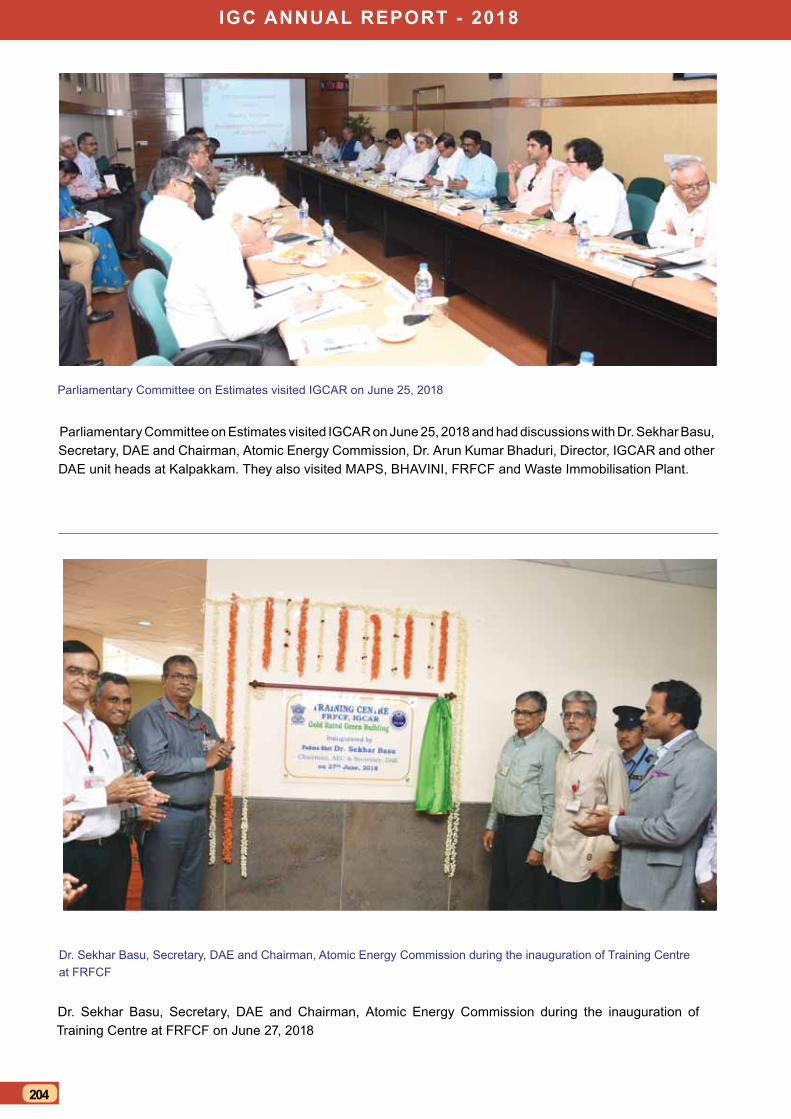
igc AnnuAl rePort - 2018
204
Dr. Sekhar Basu, Secretary, DAE and Chairman, Atomic Energy Commission during the inauguration of Training Centre at FRFCF on June 27, 2018
Parliamentary Committee on Estimates visited IGCAR on June 25, 2018 and had discussions with Dr. Sekhar Basu, Secretary, DAE and Chairman, Atomic Energy Commission, Dr. Arun Kumar Bhaduri, Director, IGCAR and other DAE unit heads at Kalpakkam. They also visited MAPS, BHAVINI, FRFCF and Waste Immobilisation Plant.
Parliamentary Committee on Estimates visited IGCAR on June 25, 2018
Dr. Sekhar Basu, Secretary, DAE and Chairman, Atomic Energy Commission during the inauguration of Training Centre at FRFCF

AwArds / PublicAtions / news & events / orgAnisAtion
205
HSEG, IGCAR had embarked on a State Level Inter Collegiate Quiz Competition as part of its outreach efforts to create sustained and enhanced awareness about the peaceful uses of nuclear energy, beneficial applications of ionization radiation and the role of Department of Atomic Energy.
Continuing efforts on creating awareness among students, the programme was organized by including small towns across various districts in Tamil Nadu. In order to cover all districts, the state is divided into eight zones and one college was made as a nodal institution for co-ordination in each zone (Table 1).
Students of nearly 30 colleges participated in the competitions in each zone. Overall, about 3000 students from 185 colleges actively participated in the programme. The program consisted of State level inter-collegiate quiz competition with a focal theme of “Atoms for Peace and Radiation technology for Societal Development”. Apart from competition, an exhibition of posters and models showcasing the various activities of DAE were also arranged.
One day science awareness programme which included lecture, quiz, drawing and elocution competitions organized for students from schools located in and around Kalpakkam was conducted on January 6, 2018 at Anupuram. A total of 250 students from 19 schools and about 20 teachers took part in the
Awareness Programme on Nuclear Energy and Societal Benefits of nuclear technology to students
programme. The entire programme was conducted in Tamil and presided by Shri Jayaseelan, Sub–Collector, Kanchipuram district. Students participated with keen interest and enthusiasm in the programme.
Radiation awareness program on nuclear energy and radiation safety for home makers residing in Anupuram was organized by HSEG, IGCAR, in association with Indian Women Scientist’s Association (Kalpakkam), IWSA on September 29, 2018 at Convention Centre, Anupuram.
The program was arranged in two sessions, one in Tamil and the other in English. Dr. S. Kalavathi, Convener, IWSA and other committee members were present during the event. Exhibition by MAPS, BHAVINI, ESL, RESG and TCPAS, IGCAR showcasing the various activities of NPP and DAE was arranged. The program included lecture on radiation safety and use of radiation in societal benefits (agriculture, medical, industrial etc.), interactive sessions and quiz in a lively format- connection round.
Overall, the programme was a grand success to create radiation awareness among women residents from Anupram and about 200 participants got benefited by the programme.
Table 1: Zonal colleges and districts covered
Zone Zonal college Districts covered
1 Ayya Nadar Janaki Ammal College, Sivakasi
Virudunagar, Madurai
2 Sri Sarada College for Women, Salem
Salem, Erode, Karur
3 MDT Hindu College, Tirunelveli
Tirunelveli, Kanyakumari and Nagercoil
4 MDT AVC College, Mayiladuthurai
Kumbakonam, Tanjore
5 Jamal Mohamed College, Tiruchi
Tiruchi, Perambalur
6 Madras Christian College, Tambaram
Chennai, Kanchipuram and Tiruvallur
7 Sacred Heart College, Tirupattur
Vellore, Tiruvannamalai
8 PSG Arts and Science College, Coimbatore
CoimbatoreAwareness Programme

igc AnnuAl rePort - 2018
206
Chairman dr. Arun Kumar bhaduri
distinguished scientist & director, igcAr
dr. Arun Kumar bhaduri, a graduate and Ph.D. in Metallurgical Engineering from Indian Institute of Technology, Kharagpur, joined Department of Atomic Energy in 1983. He is with the Indira Gandhi Centre for Atomic Research, Kalpakkam since 1984, where he is presently Distinguished Scientist and Director and also a Senior Professor, Homi Bhabha National Institute. He received Research Fellowship from Alexander von Humboldt Foundation, Germany in 1994 for a 2-year post-doctoral research at University of Stuttgart, Germany. He pilots the design and technology development of sodium-cooled fast reactors and its associated fuel cycle for the second stage of India’s nuclear power programme, and anchors the development of materials and their fabrication technologies for Indian programmes on sodium-cooled fast reactors, fusion reactors and advanced ultra supercritical thermal power. He specialises in the field of materials joining, and has to his credit more than 250 journal publications, 400 conference presentations and 2 international patents. He is a fellow of Indian National Academy of Engineering, Indian Institute of Metals and Fellow, Indian Institute of Welding. Some of his notable recognitions include: Doctor of Science (2017), Jadavpur University, Kolkata; Distinguished Alumnus Award (2017), IIT Kharagpur; Jaeger Lecture Award (2017), International Institute of Welding; GD Birla Gold Medal (2017), Indian Institute of Metals; Carl von Bach Commemorative Medal (2016), MPA University of Stuttgart, Germany; VASVIK Award (2005), Vividhlaxi Audyogik Samshodhan Vikas Kendra, Mumbai; DAE Group Achievement Awards (2006–2016) 11 times, including 4 times as Group Leader; National Metallurgists’ Day Metallurgist of the Year Award (2003), Ministry of Steel; DAE Homi Bhabha Science & Technology Award (2002).
Members
shri K. n. vyas is a Mechanical Engineering graduate from MS University, Vadodara. After completion of the training in the 22nd Batch of the BARC Training School in 1979, he joined Fuel Design & Development Section of Reactor Engineering Division of BARC. Shri Vyas has worked for design & analysis of nuclear reactor fuels. He was also responsible for design & development of a novel fuel for strategic applications. He has worked extensively in thermal hydraulics and stress analysis of critical reactor core components. Shri Vyas, as an engineer, has played a key role for completion of strategic projects. Shri Vyas has also participated
in design & analysis of the Test Blanket Module planned to be installed in ITER, France. Shri Vyas has been conferred several awards, which include Indian Nuclear Society Outstanding Service Award 2011, Homi Bhabha Science and Technology Award 2006, DAE Awards in the years 2007, 2008, 2012 and 2013. He is also a Fellow of the Indian National Academy of Engineers. Shri Vyas, as Director, BARC, Secretary, DAE and Chairman, AEC is committed to focus on work related to societal applications. Shri Vyas will also continue to further the research activities being carried out in the basic and applied areas.
IGC COUNCIL
AwArds / PublicAtions / news & events / orgAnisAtion
207
dr. g. Amarendra is the Director, Materials Science Group (MSG) and Metallurgy & Materials Group (MMG), IGCAR. He obtained his M.Sc (Physics) degree from Sardar Patel University, Gujarat in 1980, and passed out from the 24th batch of BARC Training School, Mumbai. He then joined the Materials Science Programme at IGCAR, Kalpakkam in 1981. He carried out experimental studies on helium clustering and radiation damage in metals and alloys and obtained his Ph.D degree from University of Madras in 1991. Dr. Amarendra was a post-doctoral fellow at Brandeis University, Boston, USA during 1993-94. He was instrumental in indigenous design and development of an unique variable low energy positron beam in 1995,
which enabled non-destructive depth-profiling of defects at surfaces and interfaces of materials, at IGCAR. His broad areas of research are defect studies in materials, radiation damage studies of structural materials, nuclear spectroscopy, thin films and nanomaterials. Dr. Amarendra is a Senior Professor of Homi Bhabha National Institute, Mumbai, the Convener of Board of Studies (Physical Sciences) and the Chairman of Apex Committee of HBNI-IGCAR. He is a member of Scientific Advisory Council of RRCAT and UGC-DAE CSR. He is a recipient of INSA Young Scientist Award (1991), IPA S.N.Seshadri Memorial Award (1996), Kalpakkam Science & Technology Award (1996), DAE Homi Bhabha Science & Technology Award (2006), MRSI Medal Award (2013) and DAE Group Achievement Award (2016). He had guided eight Ph.D students and has over 300 journal and conference publications and two edited books.
dr. Kallol roy, an Outstanding Scientist, is B.Tech in Electrical Engineering from NIT-Calicut; M.Tech in Electronics Design from CEDT-Indian Institute of Science; Ph.D. in Fault Diagnostics – Systems & Controls from IIT, Bombay and Post Doctorate in Computer Process Control from University of Alberta, Canada. He is from the 28th Batch of BARC Training School. Dr. Kallol Roy’s field of specialisation includes Total Maintenance Management of Reactors, Upgrading and Retrofit of C&I and Computer Based Systems, EMI / EMC Studies and Modelling in Plants, Fault Diagnostics of Systems and
Equipment Reactor Safety, Surveillance & Tech-Specs, Analysis (CRP with IAEA) using Bayesian Estimation techniques and Safety and Security aspects of Computer based Systems. He was also a Professor of HBNI. Dr. Kallol Roy took charge as Chairman & Managing Director, BHAVINI on 31st March 2016.
shri o.t. g. nair joined IGCAR as Director (P & A) on June 21, 2018. He joined the Department of Atomic Energy in 1984. During the 35 years of his service in the Department, Shri Nair has worked in different capacities like Assistant Personnel Officer, Section Officer, Administrative Officer, Under Secretary, Deputy Secretary, Chief Administrative Officer and Director (P&A) and handled many portfolios in DAE Secretariat, BARC and IGCAR. He has received DAE Special Contributions Award - 2010

igc AnnuAl rePort - 2018
208
dr. A. ravisankar, Distinguished Scientist, is from the 25th batch of BARC Training School, and joined the Department in 1981. As Director, Reprocessing Group and Project Director, Fast Reactor Fuel Cycle Facility (FRFCF) he is spearheading the fast reactor fuel reprocessing program as well as the construction and commissioning of FRFCF. Under his leadership, many Hot cell systems, novel equipment and Remote handling systems required for COmpact facility for Reprocessing of Advanced fuels in Lead cells (CORAL) and Demonstration Fast Reactor fuel Reprocessing Plant (DFRP), have been successfully developed. Some of his important
achievements include development of special purpose machines like multi fuel pin chopper, electrolytic dissolver, centrifugal extractor, high speed centrifuge, Laser based fuel sub-assembly dismantling system, various versions of Master slave manipulators, robotic sampling system etc. Some of these developments are import substitutes. He has made outstanding contribution to the design, construction and commissioning of CORAL for reprocessing of irradiated FBTR fuel, and successfully processed many campaigns including fuel irradiated up to burnup as high as 155 GWD/t with very short cooling periods. He was also involved in the Thorium fuel reprocessing campaigns and successfully recovered U-233. He has over 150 classified reports, 70 technical presentations and publications to his credit. He has been conferred INS – Gold medal by Indian Nuclear Society in 2001, NOCIL award for Excellence in Design/Development of process Plant and Equipment for the year 2005, DAE Group Award in the year 2006, 2011, 2012, 2016 & 2017, DAE-Homi Bhabha Science and Technology award in 2010 and INS Outstanding Service Award in 2014. He is a Fellow of the Indian National Academy of Engineering.
dr. b. venkatraman, post graduate in physics and doctorate from University of Madras is from the 27th batch of BARC Training School and joined IGCAR in 1984. He has specialized in the areas of Non-Destructive Evaluation, Radiation sciences, its applications and quality assurance. He has been primarily responsible for establishing the conventional, digital X-ray, neutron radiography and thermal imaging facilities at IGCAR. He has developed many NDE procedures and techniques such as microfocal radiography for steam generator of Fast reactor,
X-ray and neutron radiography for highly irradiated fuel pins, neutron radiography of pyro-devices, NDE of tail rotor blades of defence helicopters, to name a few. All these have been successfully implemented in the Centre and in other industries. He is certified by American Society for NDT Level-III in X-ray and gamma radiography, penetrant testing, Visual testing and neutron radiography. He is a Senior Professor of Homi Bhabha National Institute. He has over 300 publications in Journals and Conferences including two articles in Encyclopedia of Material Science, two monographs, three books and is the series editor for the NDT handbooks published by National Certification Board, ISNT. He is the recipient of Homi Bhabha Science and Technology Award 2007 for Individual Excellence (highest award of the Department of Atomic Energy for individual scientific excellence). DAE Group Achievement Awards in 2008, 2010, 2011, 2012, 2015, D&H Schereon Award, 1993, ISNT-NDT Man of the Year Award (R&D) 2001, INS Gold Medal 2005, IIW-Sharp Tools Award 2011, International Recognition Award 2013, and has won more than 10 best paper awards. He is a Honorary Fellow of ISNT, Board Member, Asian Pacific Federation of NDT, President Elect, Indian Society for NDT, Vice President, Indian Association for Radiation Protection. He is presently the Director, Health, Safety and Environment Group and Director, Resource Management & Public Awareness Group, IGCAR and is also serving as Director, Medical Group, GSO.
AwArds / PublicAtions / news & events / orgAnisAtion
209
organisation and Activities of various groups
Electronics and Instrumentation Group is focused on design and development of indigenous technology in the areas of Electronic Instrumentation & Control systems for fast breeder reactors and reprocessing plants that include Development of Distributed Digital Control System, Safety Critical and Safety Related Systems, Safe & Secure PLC, Virtual Control Panel based Control Room, Full-scope Operator Training Simulator, 3D modeling, animation & visualization of FBR subsystems and VR walkthrough of structures, Cyber Security Management for IT and I&C systems. Design and Development of advanced equipment and technology such as, indigenous Wireless Sensor Networks for nuclear facilities, strategic and societal applications, Time Domain Electromagnetic for Deep Seated Atomic Minerals Exploration, Plutonium Condition Air Monitoring System for reprocessing plants, Test Instrument for Steam Generator Tube Inspection, Radar Level Probe for Liquid Sodium Level Measurement, radiation resistance MEMS based sensor for nuclear applications and innovative sensors and instruments for nuclear facilities have been completed. Considerable expertise exists in designing, building and maintaining state-of the-art high-performance supercomputing facility that continues to meet large scale compute- and data-intensive requirements in multi-disciplinary domains. Implementation of IT-enabled Nuclear Knowledge Management system for Fast Reactors and associated domains, computational intelligence systems, cryptography, cyber security solutions, knowledge management and development and deployment of modern security systems for access control and physical protection of nuclear complexes are initiated.
dr. d. thirugnanamurthyHead, EID
shri r. JehadeesanHead, CD
Ms. t. JayanthiAD, RCCG
shri M. sakthivel Head, RTSD
shri A. venkatesan Head, ICD
shri g. Prabhakara rao Head, SISD
electronics and instrumentation group
dr. b. K. Panigrahi Director, EIG
dr. Arun Kumar bhaduri director, igcAr
igc AnnuAl rePort - 2018
210
engineering services group
shri P. Puthiyavinayagam Director, ESG
shri t. Johny Ad, tsg & Head, CWD
shri b. Harikrishnan AD, CEG & Head,C&MWD
shri c. chandranHead, AC&VSD
shri K. P. Kesavan nairHead, ESD
shri n. sureshHead, CED
shri H. r. sridhara Head, ASED
The Engineering Services Group is responsible for the development of infrastructure in line with the mandate
& the vision program of the centre. It provides quality services and activities pertaining to Civil, Electrical,
Mechanical engineering including Voice Communication Systems, Air-conditioning and Ventilation Systems.
In the mechanical engineering domain, one key element is the manufacturing of critical components towards
the development of fast reactor & reprocessing technologies. The group also coordinates with BSNL for
providing data communication and for mobile communication. The group has a mandate to establish
additional infrastructure requirements so as to meet Design, R&D and operational objectives of IGCAR which
includes the backend fuel cycle. The group consists of expert teams with capability to design, engineer and
execute systems under their jurisdiction. Aesthetically designed buildings & structures, providing reliable
power supply, potable water, quality-air and other services including services from Central Workshop are
being extended to other units of DAE located at Kalpakkam. The group is also involved in the horticulture
development, which enhances the green cover and maintenance of roads and drainage system. The
nature of work involves interaction with several State and Central Government Organisations. The group
is responsible for providing reliable air-conditioning and ventilation services to various R&D facilities of the
Centre. The group ensures that all infrastructural developments are carried out in harmony with environment.
AwArds / PublicAtions / news & events / orgAnisAtion
211
shri b.M. Ananda raoAD, DFE
dr. A. ravisankar Project Director
Fast reactor Fuel cycle Facility
Fast Reactor Fuel Cycle Facility is entrusted with the work of planning, designing, constructing and commissioning the Fast Reactor Fuel Cycle Facility to close the fuel cycle of PFBR. FRFCF is a multi unit project piloted by IGCAR involving BARC, NRB and NFC and the construction is being executed by IGCAR. Detailed engineering design of the facility has been completed and regulatory clearance and financial sanction have been obtained. The group is currently engaged in the construction and commissioning of FRFCF. Civil construction activity is under progress for all the five radiological plants in the nuclear island namely the Fuel Reprocessing Plant, Fuel Fabrication Plant, Reprocessed Uranium oxide Plant, Core Subassembly Plant and Waste Management Plant. Construction of all the infrastructure buildings such as administrative building, training centre, centralized surveillance, safety and Health physics building and Utility & Service buildings such as DG building, Central chilling plant, Air compressor building etc have been completed. Concurrently the design and development of process equipment to meet the required capacities of FRFCF is also being carried out and many equipments are manufactured, delivered to site and validation is under progress. Successful commissioning of FRFCF is an essential step for embarking on construction of second stage nuclear power plants based on plutonium fuel that would pave the way for achieving energy security for the nation.
dr. b. Purna chandra Rao Chief PE, Const.
shri P. selvaraj Director, FRTG
shri b.K. sreedhar Head, SEHD
shri i.b. noushad Head, SGTFD
dr. s. Murugan AD, CDHG &
Head, RIEMMD
dr. b. K. nashine AD, SFG
shri b. babu Head, DDRSD
dr. d. Ponraju Head, SED
Fast reactor technology group
The Fast Reactor Technology Group (FRTG) is responsible for the engineering development and testing in air, water and sodium components of FBR. Design validation of critical components of FBRs are achieved through
shri v. vinod Head, ETHD
igc AnnuAl rePort - 2018
212
experiments in sodium and in water using full scale/scaled down models. FRTG has acquired expertise in the development of sensors and devices for sodium applications, such as electromagnetic flow meters, level probes, leak detectors, cold traps and electromagnetic pumps. Expertise has been developed in sodium handling and in the design, construction, commissioning and operation of high temperature sodium systems. The major sodium test facilities of FRTG include 5.5 MWt Steam Generator Test Facility (SGTF) for testing model steam generators of FBRs, SADHANA loop for experimentally demonstrating natural convection based safety grade decay heat removal system, Large Component Test Rig (LCTR) for testing critical full scale components, In Sodium Test facility (INSOT) for creep and fatigue testing of advanced materials, Sodium Water Reaction Test (SOWART) facility to study self wastage and impingement wastage of Steam Generator tubes and a state-of-art sodium facility (SFCT- Sodium Facility for Component Testing) for testing small and medium sized components and sensors. To take care of components testing of future FBRs a new facility called Sodium Technology Complex is under construction. Severe accident and sodium fire studies are also being carried out in FRTG. The major experimental facilities for this purpose are THEME facility for simulation of molten fuel coolant interaction; PATH facility for post accident heat removal studies; MINA- Mini sodium fire test facility, SOCA- Sodium cable interaction facility, SFEF- Large scale sodium fire experimental facility. In addition to the above the responsibility of FRTG includes: Development of In service inspection devices for PFBR Main Vessel & Safety Vessel, FBR fuel reprocessing plants, Steam Generation tubes and remote handling equipments; Planning of irradiation experiments for testing of various fuel, structural and shielding materials in FBTR; Design, development and fabrication of various types of irradiation devices for irradiation experiments in FBTR; Out-of-pile testing, precision machining and welding of miniature components and design, fabrication and machining services. Recent achievements of FRTG: Correction of high rotational torque of Failed Fuel Location module; Sodium testing of 0.36 m3/h, Failed Fuel Localisation Module DC conduction pump along with permanent magnet flow meter; Development of new miniature size Annular Linear Induction Pump (ALIP) of flow rate 0.36 m3/h; Design and fabrication of jacketed bellows for secondary sodium piping; Increased pre-service inspection speed of PFBR Steam generator tubes; Fabrication of capsule containing tungsten and tungsten carbide specimens for irradiation in FBTR; Development of out-of-pile version of fuel instrumented capsule; FBTR gripper bellows for Control Rod Drive Mechanism; commissioning and operation of Mobile Purification Loop for FBTR flooding tanks; Inspection device for the active dissolver vessel in CORAL reprocessing facility and the completion of second mandatory inspection; Development of 2t Precision Hoist for engineering scale pyro-processing facility; Seismic qualification of optimized bellow sealed globe type sodium service valve; Completion of 50000 h (~6 years) carbon transfer behavior experiment in bi-metallic sodium loop; Civil construction of Sodium Technology Complex; Development of semi-automated system for inspection of dissimilar weld between main vessel and safety vessel of PFBR.
AwArds / PublicAtions / news & events / orgAnisAtion
213
The Health, Safety & Environment Group comprises of Radiological & Environmental Safety Division, Health & Industrial Safety Division and Quality Assurance Division. The Group is actively involved in health physics, radiation safety services, radiological and environmental impact assessment studies, quality control and quality assurance services, biodiversity studies, coastal water, air quality, industrial and fire safety related services for fast reactor and fuel cycle technologies and related projects of DAE. The Group organizes public awareness programmes on radiation safety and nuclear energy in addition to training and awareness programmes on industrial, radiation and fire safety to occupational workers. The Radiological & Environmental Safety Division (RESD) of the Group is responsible for providing radiation safety services such TLD personal monitoring, Bio assay, Bio dosimeter and Whole body counting services to all the occupational workers of the Centre. It also focuses on R&D activities in the areas of atmospheric dispersion and modelling, sodium aerosol science and technology, luminescence dosimetry, radiation safety through modelling & simulation and societal applications of ionising and non ionising radiations. Health & Industrial Safety Division (HISD), provides radiological protection and surveillance of all active plants and apart from its services to meet the mandatory requirements AERB (such as industrial, and occupational health safety). Quality Assurance Division (QAD) is primarily responsible for catering to the quality assurance, inspection, Non-Destructive Testing (NDT) and quality audit activities of all the Groups of our Centre. QAD establishes and implements an effective quality management system for fabrication, construction & erection (mechanical), NDT and inspection requirements of various R&D projects and Divisions of our Centre including Demonstration Fuel Reprocessing Plant (DFRP), Sodium Technology Complex (STC) and Fast Reactor Fuel Cycle Facility (FRFCF) and ensures conformance to in-house/national/international codes, standards and specifications. QAD also provides its expertise to other DAE units at Kalpakkam and also for strategic sectors.
dr. M. t. Jose Head, HISD
dr. r. baskaran AD, RESG
dr. b. venkatraman Director, HSEG
dr. r. venkatesanHead, RESD
Health, safety & environment group
dr. b. Purna chandra Rao Head, QAD
igc AnnuAl rePort - 2018
214
Materials chemistry & Metal Fuel cycle group
shri r.r. ramanarayanan Head, CFD
shri b. Muralidharan Head, PPED
dr. K.s. Mohandas Head, PMPD
dr. K. Ananthasivan AD, MFCG
dr. n. sivaraman Head, FChD
shri P. Muralidharan Head, MFFD
dr. b. Prabhakara reddy AD, MFRG
dr. v. Jayaraman Head, MCD
Dr. B. K. Panigrahi Director, MC&MFCG
The mandate of Materials Chemistry and Metal Fuel Cycle Group (MC&MFCG) is to carry out broad based research and development on advanced fuel fabrication methods; advanced methods of fuel reprocessing technology & development of back-end fuel cycle technology; and sodium chemistry and novel chemical sensors; that includes chemistry of un-irradiated as well as irradiated fuels, development of alternate solvents and extractants for the separation of actinides and lanthanides and development of processes for minor actinide partitioning. Some of the current activities include fabrication of sodium bonded metal fuel pins & sub-assembly for test irradiation in FBTR, Development of process for pyro-chemical reprocessing of U-Pu-Zr alloy in 500 g batch scale, Development of radioanalytical, electron microscopy and optical methods (ICP-OES, AAS) for fresh fuel characterization, prototype development of electrochemical hydrogen burner for cold trap regeneration, Development of flow sheet for minor actinide partitioning and establishing a sol-gel laboratory for incorporation of minor actinide in MOX matrices. The materials chemistry related activities include sodium chemistry, high temperature chemistry, R&D on suitable electrolyte and electrode materials for ECHM, development of novel thin film based chemical sensors, development of molten salt electrolytic process. The group is also carrying out post irradiation studies such as dissolution of fuel, measurement of burn up, recovery of minor actinides; to provide expert analytical services to various programmes in the Centre and other DAE units and to develop new analytical techniques; to carry out basic chemical studies to fine tune the R&D capabilities and be in a state of readiness to undertake challenging investigations for furthering the Department’s goal.
AwArds / PublicAtions / news & events / orgAnisAtion
215
Materials science group
dr. g. AmarendraDirector, MSG
dr. n. v. chandra shekar Head, CMPD
dr. sandip Kumar dhara Head, SND
dr. r. govindaraj Head, MPD
dr. M. Kamruddin AD, A&NG
The Materials Science Group (MSG) has the mandate of pursuing basic research on topical problems in Materials Science relevant to fast reactors. The Accelerator and Nanoscience Group (A&NG) consists of Materials Physics Division (MPD), and Surface and Nanoscience Division (SND). The MPD focuses on studies on ion beam simulation of radiation damage using a 1.7 MV tandem accelerator,specializes on dual-Irradiation Platform for Studies of Radiation Response in Fission and Fusion Reactor Materials, materials synthesis and modification and manipulation of materials using ion beams, studies on defects using positron annihilation spectroscopy and computer simulation of material properties. Several nuclear techniques such as Time Differential Perturbed Angular Correlation (TDPAC), Auger Electron Spectroscopy, Mossbauer Spectroscopy etc. have been used for the study of condensed matter, while positron beam set-up is used for depth resolved studies of defects. There is also an active group working on computational studies of materials using a variety of simulation and ab-initio codes. The non-equilibrium Green’s function techniques are powerful tools and are adopted for modeling and evaluation of magnetic nanostructures. There is also an intense effort towards nucleating quantum metrology based research studies. The SND focuses on the study of monolithic and multilayered thin films and nanostructures using a variety of techniques such as secondary ion mass spectrometry, nanomechanical testing and Scanning Probe Microscopy specializing ininnovative methodology of imaging at sub-diffraction limit using confinement of polarized light. Also, development of novel nanomaterials for advanced sensor applications is being carried out. Research activities relating to sensors based micromachined cantilevers and MEMS are also being pursued. Condensed Matter Physics Division (CMPD) pursues several theme based research programs, such as investigation of structure and physical properties of materials under extreme conditions such as high pressures, low temperatures, high temperatures and high magnetic fields. Further, over the years various facilities for the synthesis of novel, superhard materials have been established including Laser Heated Diamond Anvil Cell (LHDAC) facility. The systems under investigations encompass nuclear materials, superconductors, strongly correlated systems, multiferroics, frustrated systems, f-electron based intermetallics and oxides, glasses and super hard transition metal borides.The Division also concentrates on the development of technologically important single crystals for detector applications. Dynamic light scattering and confocal microscopy are utilized for studies on soft condensed matter. SQUID based systems for Magneto-Cardiography (MCG) and Magneto-Encephalography (MEG) have been successfully designed, assembled, standardized and used for clinical studies. Further, SQUID based measuring systems such as high field SQUID magnetometer, SQUID VSM, SQUID based set-up for Non-Destructive Evaluation (NDE) have been developed.
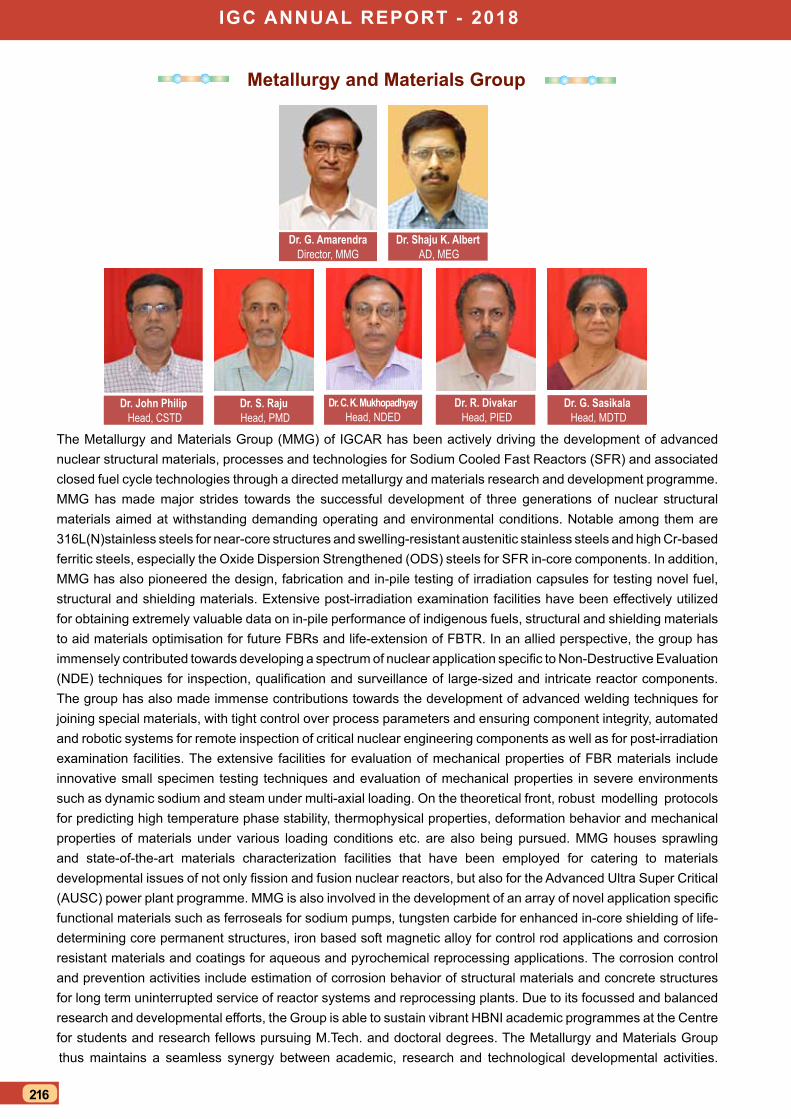
igc AnnuAl rePort - 2018
216
Metallurgy and Materials group
dr. g. Amarendra Director, MMG
dr. c. K. Mukhopadhyay Head, NDED
dr. shaju K. Albert AD, MEG
dr. s. raju Head, PMD
dr. r. divakar Head, PIED
dr. g. sasikala Head, MDTD
dr. John Philip Head, CSTD
The Metallurgy and Materials Group (MMG) of IGCAR has been actively driving the development of advanced nuclear structural materials, processes and technologies for Sodium Cooled Fast Reactors (SFR) and associated closed fuel cycle technologies through a directed metallurgy and materials research and development programme. MMG has made major strides towards the successful development of three generations of nuclear structural materials aimed at withstanding demanding operating and environmental conditions. Notable among them are 316L(N)stainless steels for near-core structures and swelling-resistant austenitic stainless steels and high Cr-based ferritic steels, especially the Oxide Dispersion Strengthened (ODS) steels for SFR in-core components. In addition, MMG has also pioneered the design, fabrication and in-pile testing of irradiation capsules for testing novel fuel, structural and shielding materials. Extensive post-irradiation examination facilities have been effectively utilized for obtaining extremely valuable data on in-pile performance of indigenous fuels, structural and shielding materials to aid materials optimisation for future FBRs and life-extension of FBTR. In an allied perspective, the group has immensely contributed towards developing a spectrum of nuclear application specific to Non-Destructive Evaluation (NDE) techniques for inspection, qualification and surveillance of large-sized and intricate reactor components. The group has also made immense contributions towards the development of advanced welding techniques for joining special materials, with tight control over process parameters and ensuring component integrity, automated and robotic systems for remote inspection of critical nuclear engineering components as well as for post-irradiation examination facilities. The extensive facilities for evaluation of mechanical properties of FBR materials include innovative small specimen testing techniques and evaluation of mechanical properties in severe environments such as dynamic sodium and steam under multi-axial loading. On the theoretical front, robust modelling protocols for predicting high temperature phase stability, thermophysical properties, deformation behavior and mechanical properties of materials under various loading conditions etc. are also being pursued. MMG houses sprawling and state-of-the-art materials characterization facilities that have been employed for catering to materials developmental issues of not only fission and fusion nuclear reactors, but also for the Advanced Ultra Super Critical (AUSC) power plant programme. MMG is also involved in the development of an array of novel application specific functional materials such as ferroseals for sodium pumps, tungsten carbide for enhanced in-core shielding of life-determining core permanent structures, iron based soft magnetic alloy for control rod applications and corrosion resistant materials and coatings for aqueous and pyrochemical reprocessing applications. The corrosion control and prevention activities include estimation of corrosion behavior of structural materials and concrete structures for long term uninterrupted service of reactor systems and reprocessing plants. Due to its focussed and balanced research and developmental efforts, the Group is able to sustain vibrant HBNI academic programmes at the Centre for students and research fellows pursuing M.Tech. and doctoral degrees. The Metallurgy and Materials Group thus maintains a seamless synergy between academic, research and technological developmental activities.
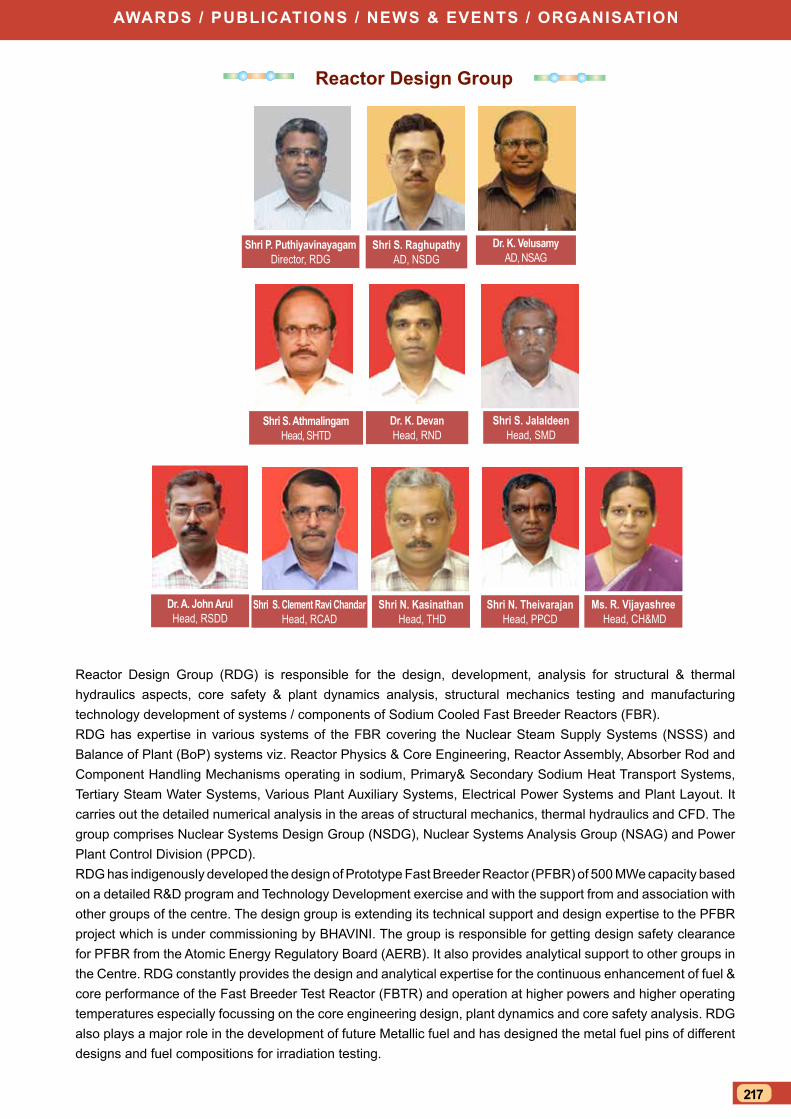
AwArds / PublicAtions / news & events / orgAnisAtion
217
reactor design group
shri P. Puthiyavinayagam Director, RDG
dr. K. velusamyAD, NSAG
shri s. AthmalingamHead, SHTD
dr. K. devan Head, RND
dr. A. John ArulHead, RSDD
shri s. clement ravi chandar Head, RCAD
shri s. JalaldeenHead, SMD
Ms. r. vijayashree Head, CH&MD
shri n. Kasinathan Head, THD
shri n. theivarajan Head, PPCD
shri s. raghupathy AD, NSDG
Reactor Design Group (RDG) is responsible for the design, development, analysis for structural & thermal hydraulics aspects, core safety & plant dynamics analysis, structural mechanics testing and manufacturing technology development of systems / components of Sodium Cooled Fast Breeder Reactors (FBR).RDG has expertise in various systems of the FBR covering the Nuclear Steam Supply Systems (NSSS) and Balance of Plant (BoP) systems viz. Reactor Physics & Core Engineering, Reactor Assembly, Absorber Rod and Component Handling Mechanisms operating in sodium, Primary& Secondary Sodium Heat Transport Systems, Tertiary Steam Water Systems, Various Plant Auxiliary Systems, Electrical Power Systems and Plant Layout. It carries out the detailed numerical analysis in the areas of structural mechanics, thermal hydraulics and CFD. The group comprises Nuclear Systems Design Group (NSDG), Nuclear Systems Analysis Group (NSAG) and Power Plant Control Division (PPCD). RDG has indigenously developed the design of Prototype Fast Breeder Reactor (PFBR) of 500 MWe capacity based on a detailed R&D program and Technology Development exercise and with the support from and association with other groups of the centre. The design group is extending its technical support and design expertise to the PFBR project which is under commissioning by BHAVINI. The group is responsible for getting design safety clearance for PFBR from the Atomic Energy Regulatory Board (AERB). It also provides analytical support to other groups in the Centre. RDG constantly provides the design and analytical expertise for the continuous enhancement of fuel & core performance of the Fast Breeder Test Reactor (FBTR) and operation at higher powers and higher operating temperatures especially focussing on the core engineering design, plant dynamics and core safety analysis. RDG also plays a major role in the development of future Metallic fuel and has designed the metal fuel pins of different designs and fuel compositions for irradiation testing.
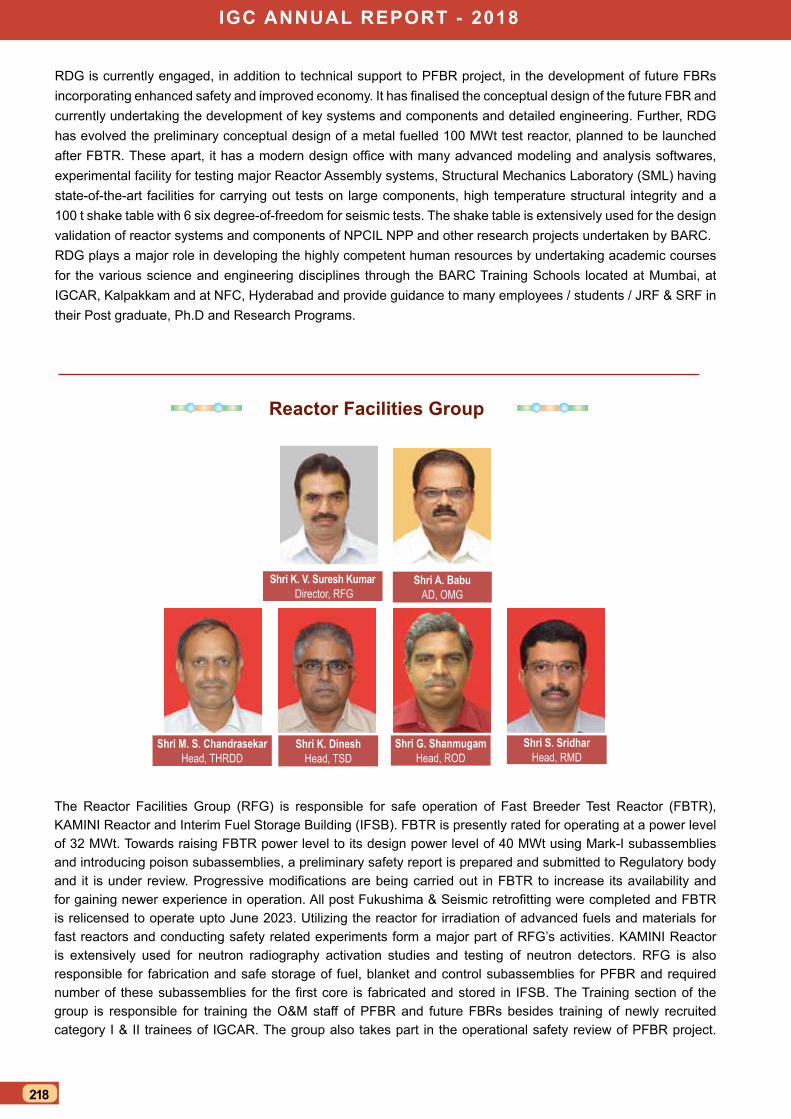
igc AnnuAl rePort - 2018
218
RDG is currently engaged, in addition to technical support to PFBR project, in the development of future FBRs incorporating enhanced safety and improved economy. It has finalised the conceptual design of the future FBR and currently undertaking the development of key systems and components and detailed engineering. Further, RDG has evolved the preliminary conceptual design of a metal fuelled 100 MWt test reactor, planned to be launched after FBTR. These apart, it has a modern design office with many advanced modeling and analysis softwares, experimental facility for testing major Reactor Assembly systems, Structural Mechanics Laboratory (SML) having state-of-the-art facilities for carrying out tests on large components, high temperature structural integrity and a 100 t shake table with 6 six degree-of-freedom for seismic tests. The shake table is extensively used for the design validation of reactor systems and components of NPCIL NPP and other research projects undertaken by BARC. RDG plays a major role in developing the highly competent human resources by undertaking academic courses for the various science and engineering disciplines through the BARC Training Schools located at Mumbai, at IGCAR, Kalpakkam and at NFC, Hyderabad and provide guidance to many employees / students / JRF & SRF in their Post graduate, Ph.D and Research Programs.
reactor Facilities group
shri g. shanmugamHead, ROD
shri s. sridharHead, RMD
shri K. dineshHead, TSD
shri M. s. chandrasekarHead, THRDD
shri A. babu AD, OMG
shri K. v. suresh Kumar Director, RFG
The Reactor Facilities Group (RFG) is responsible for safe operation of Fast Breeder Test Reactor (FBTR), KAMINI Reactor and Interim Fuel Storage Building (IFSB). FBTR is presently rated for operating at a power level of 32 MWt. Towards raising FBTR power level to its design power level of 40 MWt using Mark-I subassemblies and introducing poison subassemblies, a preliminary safety report is prepared and submitted to Regulatory body and it is under review. Progressive modifications are being carried out in FBTR to increase its availability and for gaining newer experience in operation. All post Fukushima & Seismic retrofitting were completed and FBTR is relicensed to operate upto June 2023. Utilizing the reactor for irradiation of advanced fuels and materials for fast reactors and conducting safety related experiments form a major part of RFG’s activities. KAMINI Reactor is extensively used for neutron radiography activation studies and testing of neutron detectors. RFG is also responsible for fabrication and safe storage of fuel, blanket and control subassemblies for PFBR and required number of these subassemblies for the first core is fabricated and stored in IFSB. The Training section of the group is responsible for training the O&M staff of PFBR and future FBRs besides training of newly recruited category I & II trainees of IGCAR. The group also takes part in the operational safety review of PFBR project.
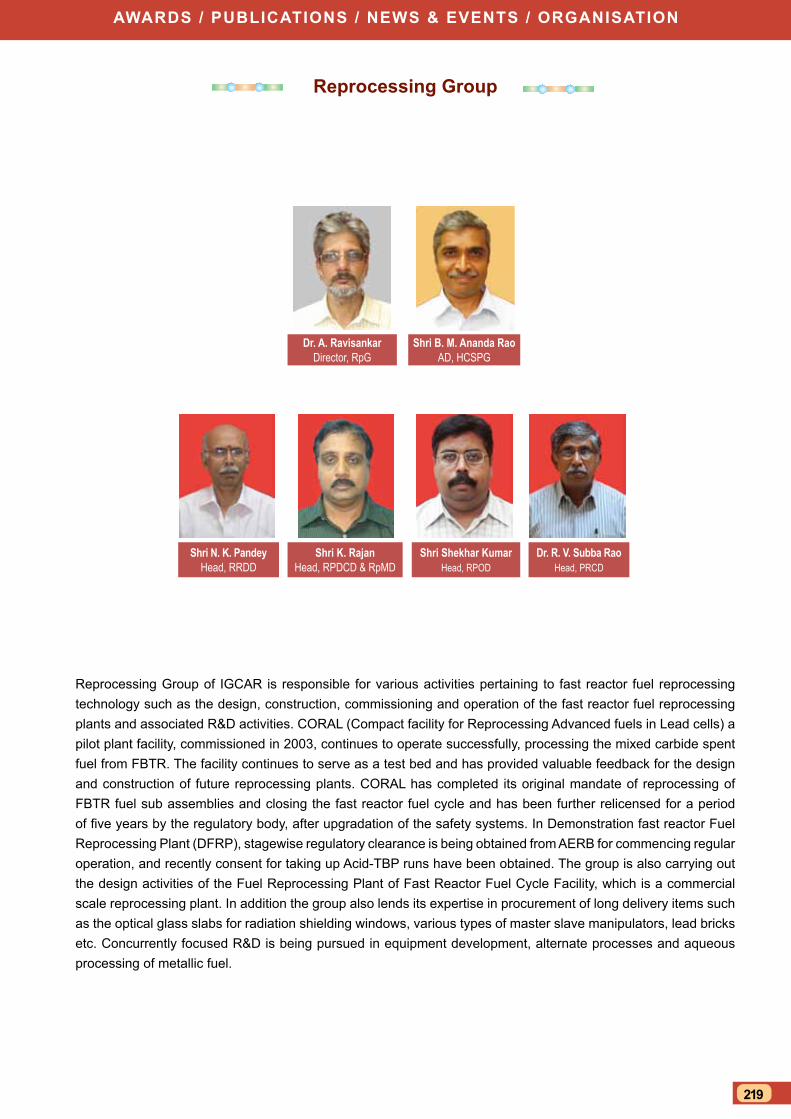
AwArds / PublicAtions / news & events / orgAnisAtion
219
reprocessing group
dr. A. ravisankar Director, RpG
shri K. rajan Head, RPDCD & RpMD
shri n. K. PandeyHead, RRDD
dr. r. v. subba raoHead, PRCD
shri shekhar KumarHead, RPOD
shri b. M. Ananda raoAD, HCSPG
Reprocessing Group of IGCAR is responsible for various activities pertaining to fast reactor fuel reprocessing technology such as the design, construction, commissioning and operation of the fast reactor fuel reprocessing plants and associated R&D activities. CORAL (Compact facility for Reprocessing Advanced fuels in Lead cells) a pilot plant facility, commissioned in 2003, continues to operate successfully, processing the mixed carbide spent fuel from FBTR. The facility continues to serve as a test bed and has provided valuable feedback for the design and construction of future reprocessing plants. CORAL has completed its original mandate of reprocessing of FBTR fuel sub assemblies and closing the fast reactor fuel cycle and has been further relicensed for a period of five years by the regulatory body, after upgradation of the safety systems. In Demonstration fast reactor Fuel Reprocessing Plant (DFRP), stagewise regulatory clearance is being obtained from AERB for commencing regular operation, and recently consent for taking up Acid-TBP runs have been obtained. The group is also carrying out the design activities of the Fuel Reprocessing Plant of Fast Reactor Fuel Cycle Facility, which is a commercial scale reprocessing plant. In addition the group also lends its expertise in procurement of long delivery items such as the optical glass slabs for radiation shielding windows, various types of master slave manipulators, lead bricks etc. Concurrently focused R&D is being pursued in equipment development, alternate processes and aqueous processing of metallic fuel.
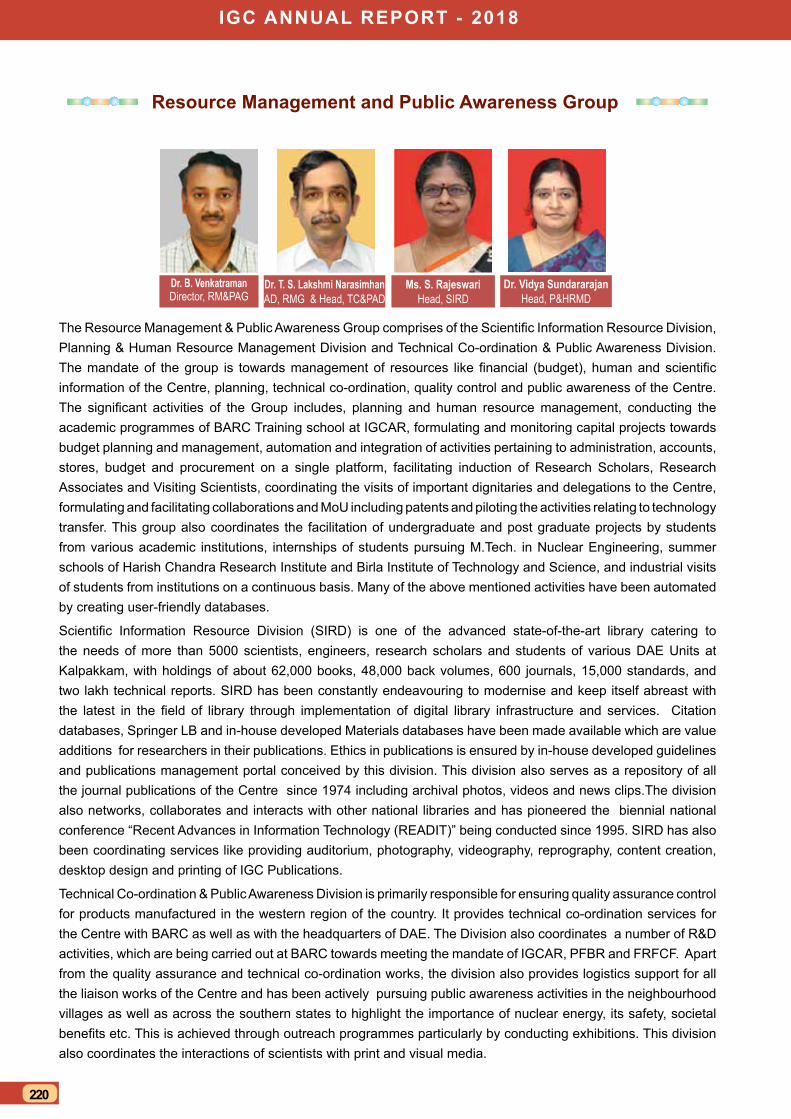
igc AnnuAl rePort - 2018
220
The Resource Management & Public Awareness Group comprises of the Scientific Information Resource Division, Planning & Human Resource Management Division and Technical Co-ordination & Public Awareness Division. The mandate of the group is towards management of resources like financial (budget), human and scientific information of the Centre, planning, technical co-ordination, quality control and public awareness of the Centre. The significant activities of the Group includes, planning and human resource management, conducting the academic programmes of BARC Training school at IGCAR, formulating and monitoring capital projects towards budget planning and management, automation and integration of activities pertaining to administration, accounts, stores, budget and procurement on a single platform, facilitating induction of Research Scholars, Research Associates and Visiting Scientists, coordinating the visits of important dignitaries and delegations to the Centre, formulating and facilitating collaborations and MoU including patents and piloting the activities relating to technology transfer. This group also coordinates the facilitation of undergraduate and post graduate projects by students from various academic institutions, internships of students pursuing M.Tech. in Nuclear Engineering, summer schools of Harish Chandra Research Institute and Birla Institute of Technology and Science, and industrial visits of students from institutions on a continuous basis. Many of the above mentioned activities have been automated by creating user-friendly databases.
Scientific Information Resource Division (SIRD) is one of the advanced state-of-the-art library catering to the needs of more than 5000 scientists, engineers, research scholars and students of various DAE Units at Kalpakkam, with holdings of about 62,000 books, 48,000 back volumes, 600 journals, 15,000 standards, and two lakh technical reports. SIRD has been constantly endeavouring to modernise and keep itself abreast with the latest in the field of library through implementation of digital library infrastructure and services. Citation databases, Springer LB and in-house developed Materials databases have been made available which are value additions for researchers in their publications. Ethics in publications is ensured by in-house developed guidelines and publications management portal conceived by this division. This division also serves as a repository of all the journal publications of the Centre since 1974 including archival photos, videos and news clips.The division also networks, collaborates and interacts with other national libraries and has pioneered the biennial national conference “Recent Advances in Information Technology (READIT)” being conducted since 1995. SIRD has also been coordinating services like providing auditorium, photography, videography, reprography, content creation, desktop design and printing of IGC Publications.
Technical Co-ordination & Public Awareness Division is primarily responsible for ensuring quality assurance control for products manufactured in the western region of the country. It provides technical co-ordination services for the Centre with BARC as well as with the headquarters of DAE. The Division also coordinates a number of R&D activities, which are being carried out at BARC towards meeting the mandate of IGCAR, PFBR and FRFCF. Apart from the quality assurance and technical co-ordination works, the division also provides logistics support for all the liaison works of the Centre and has been actively pursuing public awareness activities in the neighbourhood villages as well as across the southern states to highlight the importance of nuclear energy, its safety, societal benefits etc. This is achieved through outreach programmes particularly by conducting exhibitions. This division also coordinates the interactions of scientists with print and visual media.
resource Management and Public Awareness group
Ms. s. rajeswari Head, SIRD
dr. vidya sundararajan Head, P&HRMD
dr. t. s. lakshmi narasimhan AD, RMG & Head, TC&PAD
dr. b. venkatraman Director, RM&PAG
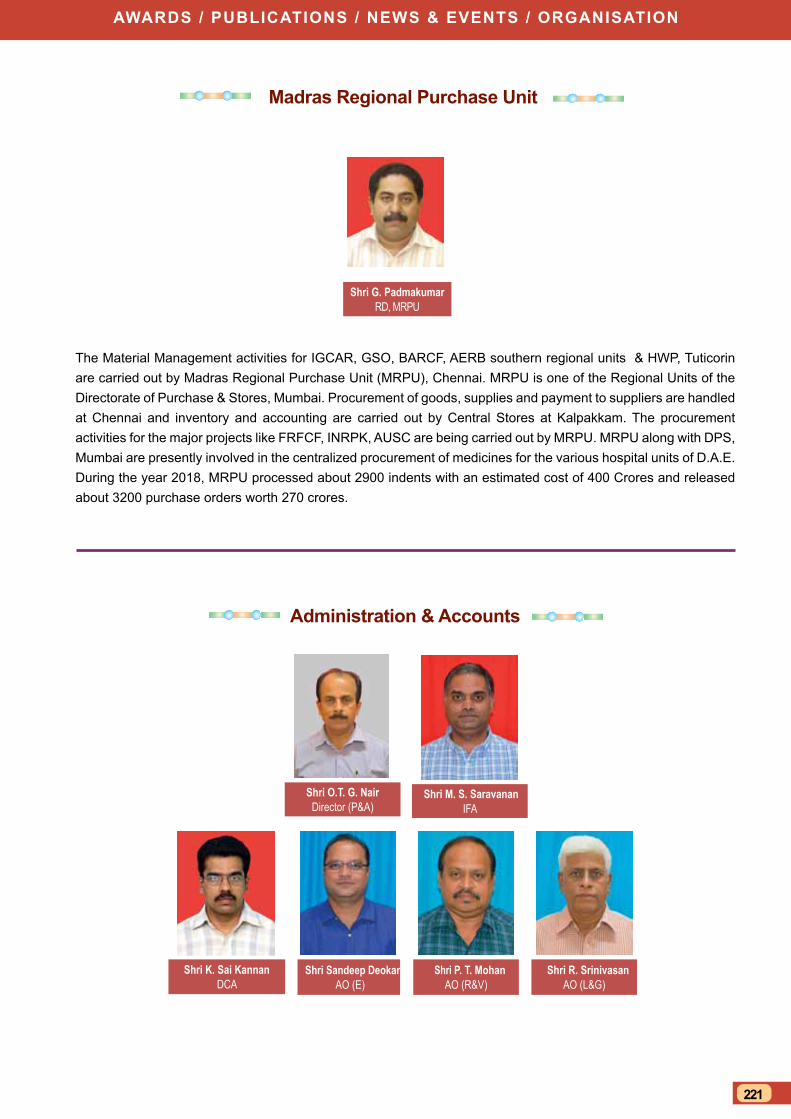
AwArds / PublicAtions / news & events / orgAnisAtion
221
The Material Management activities for IGCAR, GSO, BARCF, AERB southern regional units & HWP, Tuticorin are carried out by Madras Regional Purchase Unit (MRPU), Chennai. MRPU is one of the Regional Units of the Directorate of Purchase & Stores, Mumbai. Procurement of goods, supplies and payment to suppliers are handled at Chennai and inventory and accounting are carried out by Central Stores at Kalpakkam. The procurement activities for the major projects like FRFCF, INRPK, AUSC are being carried out by MRPU. MRPU along with DPS, Mumbai are presently involved in the centralized procurement of medicines for the various hospital units of D.A.E. During the year 2018, MRPU processed about 2900 indents with an estimated cost of 400 Crores and released about 3200 purchase orders worth 270 crores.
shri g. Padmakumar RD, MRPU
Administration & Accounts
Madras regional Purchase unit
shri M. s. saravanan IFA
shri o.t. g. nairDirector (P&A)
shri sandeep deokar AO (E)
shri P. t. Mohan AO (R&V)
shri r. srinivasan AO (L&G)
shri K. sai Kannan DCA
igc AnnuAl rePort - 2018
222
MSG Materials Science GroupNDED Non-Destructive Evaluation DivisionNFC Nuclear Fuel ComplexNICB Nuclear Island Connected BuildingNPCIL Nuclear Power Corporation of India Ltd.NSAG Nuclear Systems Analysis GroupNSDG Nuclear Systems Design GroupOMG Operation & Maintenance GroupPFBR Prototype Fast Breeder ReactorP&HRMD Planning & Human Resource Management DivisionPHWR Pressurized Heavy Water ReactorPIED Post Irradiation Examination DivisionPMPD Pyro-chemical & Materials Processing DivisionPMD Physical Metallurgy DivisionPPCD Power Plant Control DivisionPPED Pyro Process Engineering DivisionPRCD Process & Radio Chemistry DivisionQAD Quality Assurance DivisionRCAD Reactor Core & Assembly DivisionRDG Reactor Design GroupR&ESD Radiological & Environmental Safety DivisionRESG Radiological & Environmental Safety GroupRIEMMD Robotics, Irradiation experiments and Mechanical
Maintenance DivisionRMD Reactor Maintenance DivisionRMG Resource Management GroupRMPAG Resource Management and Public Awareness GroupRND Reactor Neutronics DivisionROD Reactor Operation DivisionRFG Reactor Facilities GroupRpMD Reprocessing Maintenance DivisionRpG Reprocessing GroupRPDCD Reprocessing Plant Design & Commissioning DivisionRpOD Reprocessing Operation DivisionRRDD Reprocessing Research and Development DivisionRSDD Reactor Shielding and Data DivisionRTSD Real Time Systems DivisionRTCCG Real-time Controls & Computer GroupSED Safety Engineering DivisionSE&HD Sodium Experiments & Hydraulics DivisionSFG Sodium Facility GroupSFR Sodium cooled Fast ReactorsSGTFD Steam Generator Test Facility DivisionSHTD Sodium Heat Transport DivisionSIRD Scientific Information Resource DivisionSISD Security and Innovative Sensors Division SMD Structural Mechanics DivisionSND Surface and Nanoscience DivisionTCPAD Technical Coordination & Public Awareness DivisionTHD Thermal Hydraulics DivisionTHRDD Training & Human Resource Development DivisionTSD Technical Services DivisionTSG Technical Services Group
AC&VSD Air Conditioning and Ventilation System DivisionAERB Atomic Energy Regulatory BoardA&SED Architecture & Structural Engineering DivisionANG Accelerator & Nanoscience GroupBARC Bhabha Atomic Research CentreBARCF Bhabha Atomic Research Centre FacilitiesBHAVINI Bharatiya Nabhikiya Vidyut Nigam LimitedBPD Budget & Procurement DivisionCD Computer DivisionCED Civil Engineering DivisionCEG Civil Engineering GroupCFD Chemical Facilities DivisionCH&MD Components Handling & Mechanism DivisionCMPD Condensed Matter Physics Division C&MWD Contracts & Major Works DivisionCD&HG Components Development & Hydraulics GroupCORAL Compact facility for Reprocessing Advanced fuels
in Lead cellCSTD Corrosion Science & Technology Division CWD Central Workshop DivisionDDRSD Device Development and Rig Services DivisionDFE Design & Field EngineeringDFMFF Demonstration Facility for Metallic Fuel FabricationDFRP Demonstration Fuel Reprocessing PlantEID Electronics and Instrumentation DivisionEIG Electronics and Instrumentation GroupESD Electrical Services DivisionESG Engineering Services GroupETHD Experimental Thermal Hydraulics DivisionFBR Fast Breeder Reactor FBTR Fast Breeder Test ReactorFChD Fuel Chemistry DivisionFRFCF Fast Reactor Fuel Cycle FacilityFRTG Fast Reactor Technology GroupHCSPG Hot Cell Systems and Project Group HISD Health & Industrial Safety DivisionHSEG Health, Safety & Environment GroupGSO General Services OrganisationIAEA International Atomic Energy Agency IIT Indian Institute of TechnologyIMSc Institute of Mathematical SciencesI&CD Instrumentation & Control DivisionMAPS Madras Atomic Power StationMCG Materials Characterization GroupMC&MFCG Materials Chemistry & Metal Fuel Cycle GroupMCD Materials Chemistry DivisionMDTD Materials Development & Technology DivisionMEG Materials Engineering GroupMFCG Materials & Fuel Chemistry GroupMFFD Metal Fuel Fabrication DivisionMFRG Metal Fuel Recycle GroupMMG Metallurgy and Materials GroupMPD Materials Physics DivisionMRPU Madras Regional Purchase Unit
list oF iMPortAnt AbbreviAtions
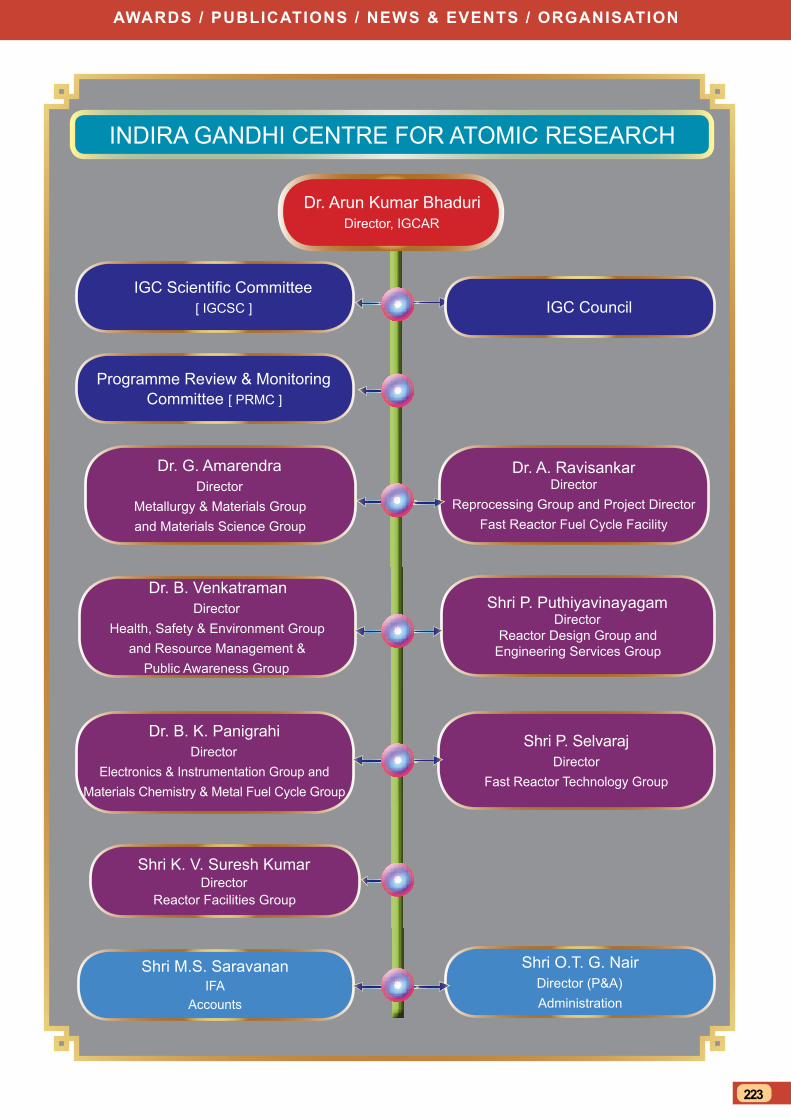
AwArds / PublicAtions / news & events / orgAnisAtion
223
Dr. B. K. PanigrahiDirector
Electronics & Instrumentation Group and Materials Chemistry & Metal Fuel Cycle Group
Dr. Arun Kumar Bhaduri Director, IGCAR
IGC Scientific Committee [ IGCSC ]
Shri P. SelvarajDirector
Fast Reactor Technology Group
Dr. B. VenkatramanDirector
Health, Safety & Environment Groupand Resource Management &
Public Awareness Group
Dr. G. AmarendraDirector
Metallurgy & Materials Group and Materials Science Group
Shri M.S. Saravanan IFA
Accounts
Shri O.T. G. NairDirector (P&A)Administration
INDIRA GANDHI CENTRE FOR ATOMIC RESEARCH
IGC Council
Programme Review & Monitoring Committee [ PRMC ]
Shri P. PuthiyavinayagamDirector
Reactor Design Group and Engineering Services Group
Shri K. V. Suresh KumarDirector
Reactor Facilities Group
Dr. A. RavisankarDirector
Reprocessing Group and Project DirectorFast Reactor Fuel Cycle Facility
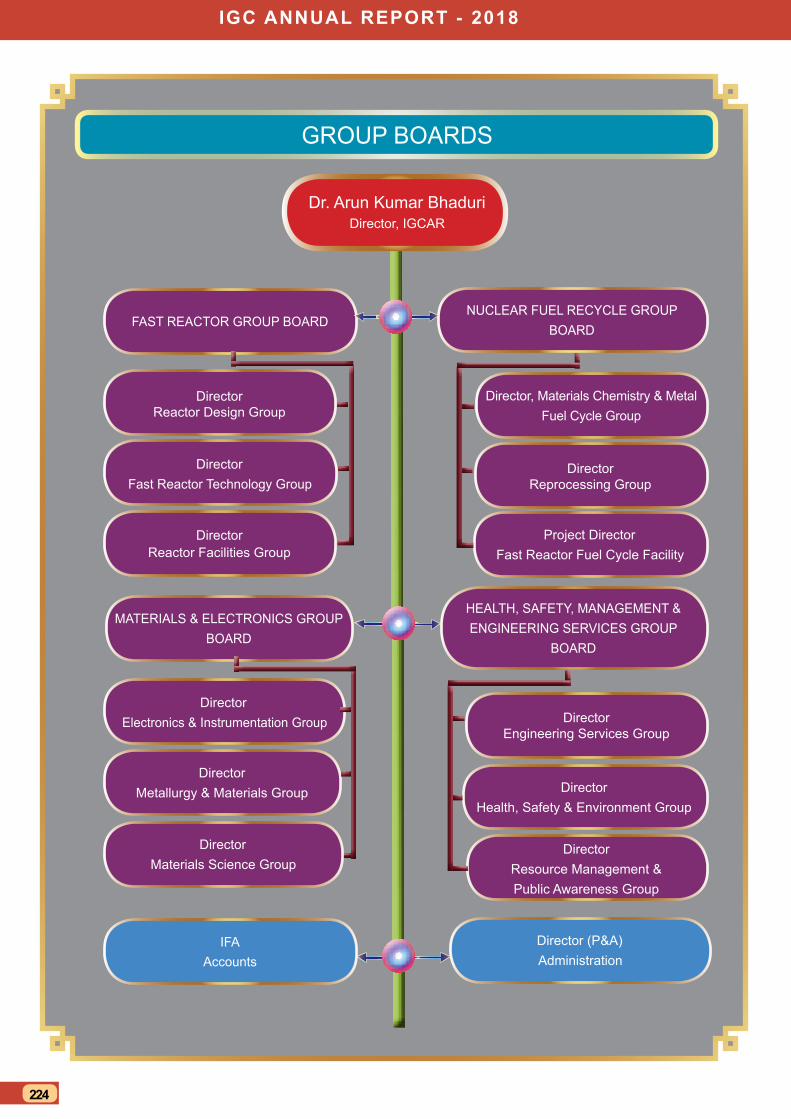
igc AnnuAl rePort - 2018
224
DirectorElectronics & Instrumentation Group
FAST REACTOR GROUP BOARDNUCLEAR FUEL RECYCLE GROUP
BOARD
MATERIALS & ELECTRONICS GROUP BOARD
HEALTH, SAFETY, MANAGEMENT & ENGINEERING SERVICES GROUP
BOARD
Dr. Arun Kumar Bhaduri Director, IGCAR
DirectorEngineering Services Group
DirectorFast Reactor Technology Group
DirectorHealth, Safety & Environment Group
DirectorMetallurgy & Materials Group
IFAAccounts
DirectorResource Management & Public Awareness Group
Director (P&A)Administration
GROUP BOARDS
DirectorReactor Design Group
DirectorReactor Facilities Group
Director Reprocessing Group
Project DirectorFast Reactor Fuel Cycle Facility
Director, Materials Chemistry & Metal Fuel Cycle Group
DirectorMaterials Science Group
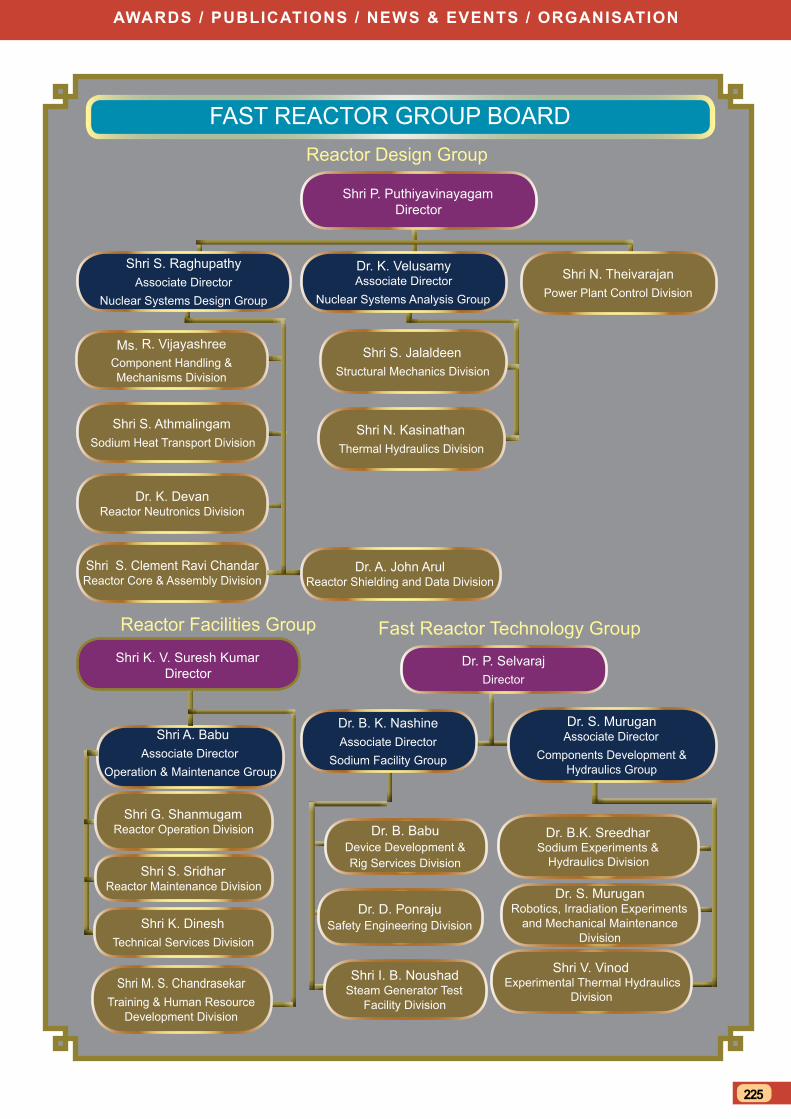
AwArds / PublicAtions / news & events / orgAnisAtion
225
Dr. P. SelvarajDirector
Fast Reactor Technology Group
Dr. B. Babu Device Development & Rig Services Division
Dr. D. Ponraju Safety Engineering Division
Dr. B.K. Sreedhar Sodium Experiments &
Hydraulics Division
Shri V. Vinod Experimental Thermal Hydraulics
Division
Shri I. B. Noushad Steam Generator Test
Facility Division
Dr. S. Murugan Robotics, Irradiation Experiments
and Mechanical Maintenance Division
Dr. S. Murugan Associate Director
Components Development & Hydraulics Group
FAST REACTOR GROUP BOARD
Shri A. BabuAssociate Director
Operation & Maintenance Group
Dr. B. K. Nashine Associate Director
Sodium Facility Group
Reactor Facilities Group
Shri K. V. Suresh KumarDirector
Shri G. Shanmugam Reactor Operation Division
Shri M. S. ChandrasekarTraining & Human Resource
Development Division
Shri K. DineshTechnical Services Division
Shri S. Sridhar Reactor Maintenance Division
Reactor Design Group
Shri P. PuthiyavinayagamDirector
Shri S. Clement Ravi Chandar Reactor Core & Assembly Division
Dr. K. Velusamy Associate Director
Nuclear Systems Analysis Group
Shri N. KasinathanThermal Hydraulics Division
Shri S. JalaldeenStructural Mechanics Division
Dr. K. Devan Reactor Neutronics Division
Shri S. AthmalingamSodium Heat Transport Division
Shri S. RaghupathyAssociate Director
Nuclear Systems Design Group
Shri N. TheivarajanPower Plant Control Division
Dr. A. John Arul Reactor Shielding and Data Division
Ms. R. VijayashreeComponent Handling & Mechanisms Division

igc AnnuAl rePort - 2018
226
NUCLEAR FUEL RECYCLE GROUP BOARD
Dr. B. K. PanigrahiDirector
Dr. V. JayaramanMaterials Chemistry Division
Shri B. MuralidharanPyro Process Engineering Division
Dr. N. Sivaraman Fuel Chemistry Division
Dr. K.S. Mohandas Pyro-chemical & Materials Processing
Division
Dr. B. Prabhakara Reddy Associate Director
Metal Fuel Recycle Group
Dr. K. Ananthasivan Associate Director
Materials & Fuel Chemistry Group
Shri P. MuralidharanMetal Fuel Fabrication Division
Materials Chemistry & Metal Fuel Cycle Group
Shri R. R. Ramanarayanan Chemical Facilities Division
Reprocessing Group
Shri B. M. Ananda Rao Associate Director
Hot Cell Systems and Project Group
Shri K. RajanReprocessing Plant Design &
Commissioning Division
Shri K. Rajan Reprocessing Maintenance Division
Dr. R.V. Subba RaoProcess & Radio Chemistry Division
Shri Shekhar KumarReprocessing Operations Division
Dr. A. RavisankarDirector
Shri N. K. Pandey Reprocessing Research &
Development Division
Fast Reactor Fuel Cycle Facility
Shri B. M. Ananda Rao Associate Director
Design & Field Engineering
Dr. B. Purna Chandra Rao Chief PE
Construction
Dr. A. RavisankarProject Director
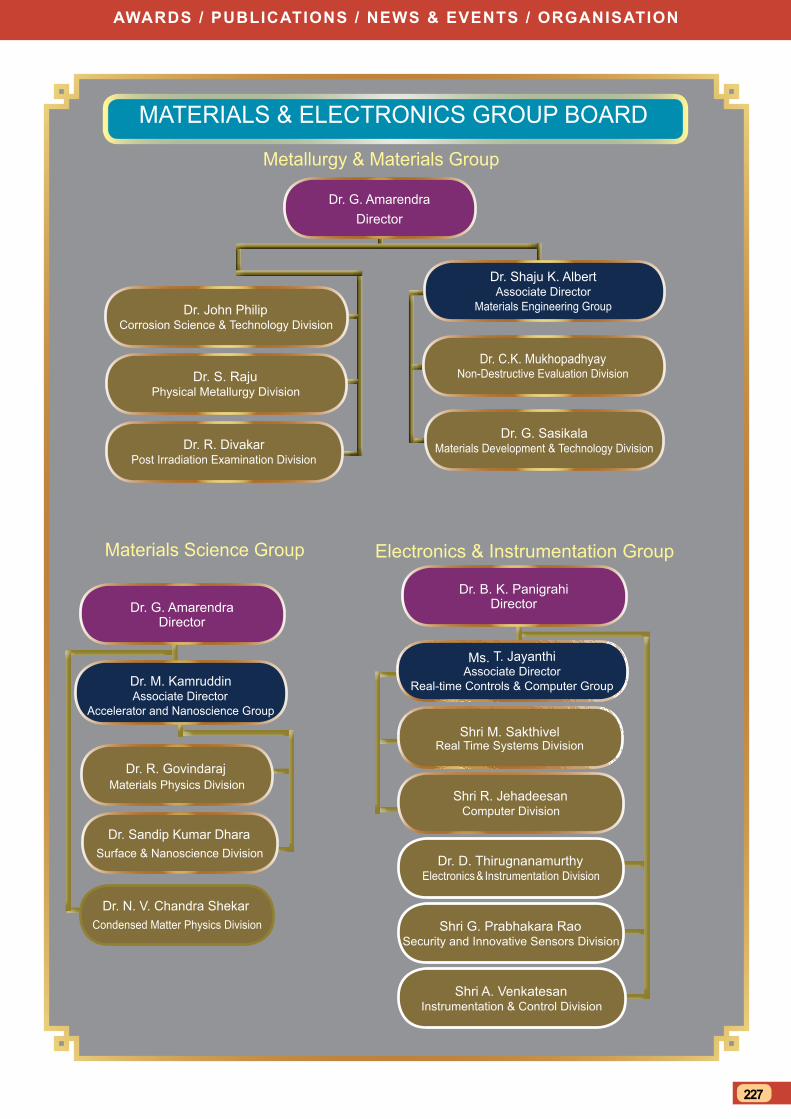
AwArds / PublicAtions / news & events / orgAnisAtion
227
MATERIALS & ELECTRONICS GROUP BOARD
Dr. G. AmarendraDirector
Dr. G. Sasikala Materials Development & Technology DivisionDr. R. Divakar
Post Irradiation Examination Division
Metallurgy & Materials Group
Dr. C.K. Mukhopadhyay Non-Destructive Evaluation Division
Dr. John PhilipCorrosion Science & Technology Division
Dr. S. Raju Physical Metallurgy Division
Dr. Shaju K. AlbertAssociate Director
Materials Engineering Group
Materials Science Group
Dr. M. Kamruddin Associate Director
Accelerator and Nanoscience Group
Dr. N. V. Chandra ShekarCondensed Matter Physics Division
Dr. R. Govindaraj Materials Physics Division
Dr. Sandip Kumar DharaSurface & Nanoscience Division
Dr. G. Amarendra Director
Electronics & Instrumentation Group
Shri R. Jehadeesan Computer Division
Shri G. Prabhakara Rao Security and Innovative Sensors Division
Shri A. Venkatesan Instrumentation & Control Division
Dr. B. K. Panigrahi Director
Shri M. Sakthivel Real Time Systems Division
Ms. T. Jayanthi Associate Director
Real-time Controls & Computer Group
Dr. D. Thirugnanamurthy Electronics & Instrumentation Division
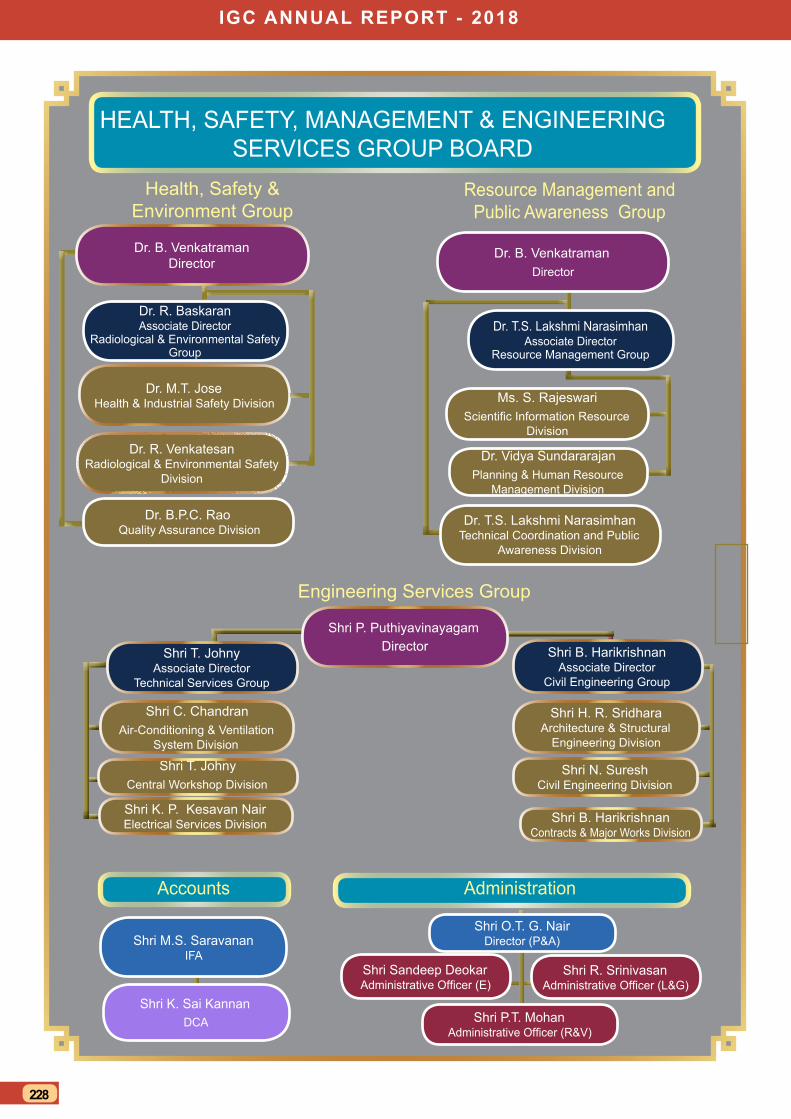
igc AnnuAl rePort - 2018
228
HEALTH, SAFETY, MANAGEMENT & ENGINEERING SERVICES GROUP BOARD
Health, Safety & Environment Group
Dr. M.T. Jose Health & Industrial Safety Division
Dr. B.P.C. Rao Quality Assurance Division
Dr. R. Venkatesan Radiological & Environmental Safety
Division
Dr. B. VenkatramanDirector
Shri K. P. Kesavan Nair Electrical Services Division
Shri T. JohnyCentral Workshop Division
Shri C. ChandranAir-Conditioning & Ventilation
System Division
Shri B. Harikrishnan Contracts & Major Works Division
Shri H. R. Sridhara Architecture & Structural
Engineering Division
Shri N. Suresh Civil Engineering Division
Engineering Services Group
Dr. B. VenkatramanDirector
Resource Management and Public Awareness Group
Ms. S. RajeswariScientific Information Resource
Division
Dr. T.S. Lakshmi Narasimhan Technical Coordination and Public
Awareness Division
Dr. Vidya SundararajanPlanning & Human Resource
Management Division
Dr. T.S. Lakshmi Narasimhan Associate Director
Resource Management Group
Dr. R. Baskaran Associate Director
Radiological & Environmental Safety Group
Shri M.S. Saravanan IFA
Shri K. Sai KannanDCA
AdministrationAccounts
Shri R. Srinivasan Administrative Officer (L&G)
Shri Sandeep Deokar Administrative Officer (E)
Shri O.T. G. Nair Director (P&A)
Shri P.T. Mohan Administrative Officer (R&V)
Shri B. Harikrishnan Associate Director
Civil Engineering Group
Shri T. Johny Associate Director
Technical Services Group
Shri P. PuthiyavinayagamDirector

Indira Gandhi Centre for Atomic Research
IGC
AR A
NN
UA
L REPO
RT - 2
018
Government of IndiaDepartment of Atomic Energy
Indira Gandhi Centre for Atomic ResearchKalpakkam - 603 102
Annual Report - 2018
Published by Scientific Information Resource Division, RMG, RM&PAG, IGCAR, Kalpakkam-603102
Copyright © 2022 FDOKUMEN