Finite element modeling of dynamic impact and cornering ...
307
University of Windsor University of Windsor Scholarship at UWindsor Scholarship at UWindsor Electronic Theses and Dissertations Theses, Dissertations, and Major Papers 2006 Finite element modeling of dynamic impact and cornering fatigue Finite element modeling of dynamic impact and cornering fatigue of cast aluminum and forged magnesium road wheels. of cast aluminum and forged magnesium road wheels. Shixian (Robert) Shang University of Windsor Follow this and additional works at: https://scholar.uwindsor.ca/etd Recommended Citation Recommended Citation Shang, Shixian (Robert), "Finite element modeling of dynamic impact and cornering fatigue of cast aluminum and forged magnesium road wheels." (2006). Electronic Theses and Dissertations. 2110. https://scholar.uwindsor.ca/etd/2110 This online database contains the full-text of PhD dissertations and Masters’ theses of University of Windsor students from 1954 forward. These documents are made available for personal study and research purposes only, in accordance with the Canadian Copyright Act and the Creative Commons license—CC BY-NC-ND (Attribution, Non-Commercial, No Derivative Works). Under this license, works must always be attributed to the copyright holder (original author), cannot be used for any commercial purposes, and may not be altered. Any other use would require the permission of the copyright holder. Students may inquire about withdrawing their dissertation and/or thesis from this database. For additional inquiries, please contact the repository administrator via email ([email protected]) or by telephone at 519-253-3000ext. 3208.
-
Upload
khangminh22 -
Category
Documents
-
view
6 -
download
0
Transcript of Finite element modeling of dynamic impact and cornering ...
University of Windsor University of Windsor
Scholarship at UWindsor Scholarship at UWindsor
Electronic Theses and Dissertations Theses, Dissertations, and Major Papers
2006
Finite element modeling of dynamic impact and cornering fatigue Finite element modeling of dynamic impact and cornering fatigue
of cast aluminum and forged magnesium road wheels. of cast aluminum and forged magnesium road wheels.
Shixian (Robert) Shang University of Windsor
Follow this and additional works at: https://scholar.uwindsor.ca/etd
Recommended Citation Recommended Citation Shang, Shixian (Robert), "Finite element modeling of dynamic impact and cornering fatigue of cast aluminum and forged magnesium road wheels." (2006). Electronic Theses and Dissertations. 2110. https://scholar.uwindsor.ca/etd/2110
This online database contains the full-text of PhD dissertations and Masters’ theses of University of Windsor students from 1954 forward. These documents are made available for personal study and research purposes only, in accordance with the Canadian Copyright Act and the Creative Commons license—CC BY-NC-ND (Attribution, Non-Commercial, No Derivative Works). Under this license, works must always be attributed to the copyright holder (original author), cannot be used for any commercial purposes, and may not be altered. Any other use would require the permission of the copyright holder. Students may inquire about withdrawing their dissertation and/or thesis from this database. For additional inquiries, please contact the repository administrator via email ([email protected]) or by telephone at 519-253-3000ext. 3208.
FINITE ELEMENT MODELING OF DYNAMIC IMPACT AND CORNERING FATIGUE OF CAST ALUMINUM AND FORGED
MAGNESIUM ROAD WHEELS
by
Shixian (Robert) Shang
A DissertationSubmitted to the Faculty of Graduate Studies and Research through Mechanical, Automotive and Materials Engineering
in Partial Fulfillment for the Requirements for the Degree of Doctor of Philosophy at the
University of Windsor
Windsor, Ontario, Canada
2006
© 2006 Shixian (Robert) Shang
Reproduced with permission of the copyright owner. Further reproduction prohibited without permission.

Library and Archives Canada
Bibliotheque et Archives Canada
Published Heritage Branch
395 Wellington Street Ottawa ON K1A 0N4 Canada
Your file Votre reference ISBN: 978-0-494-17130-1 Our file Notre reference ISBN: 978-0-494-17130-1
Direction du Patrimoine de I'edition
395, rue Wellington Ottawa ON K1A 0N4 Canada
NOTICE:The author has granted a nonexclusive license allowing Library and Archives Canada to reproduce, publish, archive, preserve, conserve, communicate to the public by telecommunication or on the Internet, loan, distribute and sell theses worldwide, for commercial or noncommercial purposes, in microform, paper, electronic and/or any other formats.
AVIS:L'auteur a accorde une licence non exclusive permettant a la Bibliotheque et Archives Canada de reproduire, publier, archiver, sauvegarder, conserver, transmettre au public par telecommunication ou par I'lnternet, preter, distribuer et vendre des theses partout dans le monde, a des fins commerciales ou autres, sur support microforme, papier, electronique et/ou autres formats.
The author retains copyright ownership and moral rights in this thesis. Neither the thesis nor substantial extracts from it may be printed or otherwise reproduced without the author's permission.
L'auteur conserve la propriete du droit d'auteur et des droits moraux qui protege cette these.Ni la these ni des extraits substantiels de celle-ci ne doivent etre imprimes ou autrement reproduits sans son autorisation.
In compliance with the Canadian Privacy Act some supporting forms may have been removed from this thesis.
While these forms may be included in the document page count, their removal does not represent any loss of content from the thesis.
Conformement a la loi canadienne sur la protection de la vie privee, quelques formulaires secondaires ont ete enleves de cette these.
Bien que ces formulaires aient inclus dans la pagination, il n'y aura aucun contenu manquant.
i * i
CanadaReproduced with permission of the copyright owner. Further reproduction prohibited without permission.
ABSTRACT
Numerical investigation o f wheel dynamic impact and cornering fatigue
performance is essential to shorten design time, enhance mechanical performance, and
lower development cost. This dissertation focused on two objectives. First, finite element
models o f the dynamic impact test on a wheel and tire assembly were developed, which
considered the material inhomogeneity o f the wheel. The model complexity and resultant
additional analysis time led to the development o f a simplified approach for wheel impact
testing without the tired. Comparison o f the numerical predictions with the experimental
measurements of wheel impact indicated that an approximate 20% reduction o f the initial
striker kinetic energy provides an effective method for simplifying the numerical
modeling. Second, numerical prediction o f wheel cornering fatigue testing was
considered. Two numerical prediction methods were applied to simulate wheel cornering
fatigue testing. The first method utilizes a static stress analysis with different bending
directions applied to the hub. The second approach uses a dynamic stress analysis with
the application o f a rotating bending moment applied to the hub. The fatigue performance
of the wheel was evaluated based upon the results from both the static and dynamic stress
analyses. Using a Goodman linear fatigue failure criterion for multiaxial stresses, both the
equivalent alternating and mean components o f the combined stresses as well as the
safety factors o f wheel fatigue design were determined. The elements with low factors of
fatigue safety were identified either by boundary constraints or by geometric stress
concentration. Experimental testing results verified the numerical predictions. A design
modification was applied to the forged magnesium wheel to improve its fatigue
performance.
iii
Reproduced with permission of the copyright owner. Further reproduction prohibited without permission.

ACKNOWLEDGEMENTS
I would like to express my gratitude to Dr. Henry Hu and Dr. William Altenhof,
whose expertise, understanding, and patience, added considerably to my graduate
experience. They provided me with direction, encouragement, and recommendations. A
special thank goes out to Dr. Naiyi Li, without whose motivation and support, I would
not have continued a graduate career in light metal research. The help with experimental
testing at Superior Industries International Inc. is gratefully acknowledged. In conclusion,
I recognize that this research would not have been possible without the financial
assistance o f Ford Motor Company, Materials and Manufacturing Ontario (MMO), and
the University o f Windsor.
IV
Reproduced with permission of the copyright owner. Further reproduction prohibited without permission.
TABLE OF CONTENTS
ABSTRACT........................................................................................................................ iii
ACKNOW LEDGEM ENTS............................................................................................. iv
LIST OF TABLES............................................................................................................. xi
LIST OF FIG U RES.......................................................................................................... xiii
NOM ENCLATURE.......................................................................................................... xix
1. INTRODUCTION ................................................................................................... 1
1.1. Lightweight Vehicles and Lightweight Materials.......................................... 2
1.2. Road Wheel Evolution....................................................................................... 4
1.3. Modeling of Lightweight Road Wheels.......................................................... 6
1.4. Research Objectives........................................................................................... 7
1.5. Dissertation Layout............................................................................................ 9
2. LITERATURE REV IEW ....................................................................................... 11
2.1. Wheel and Tire Terminology............................................................................ 12
2.2. Performance Benefits of Lightweight Wheels............................................... 16
2.3. Cast Aluminum and Forged Magnesium Wheels.......................................... 17
2.3.1. Casting versus Forging........................................................................... 18
2.3.2. Cast Aluminum Wheels........................................................................ 19
2.3.3. Forged Magnesium Wheels................................................................... 20
2.4. Microstructure Inhomogeneity and Mechanical Property............................ 21
2.4.1. Aluminum Castings................................................................................ 21
2.4.2. Magnesium Forgings.............................................................................. 24
2.5. Wheel Dynamic Impact and Cornering Fatigue Tests.................................. 25
v
Reproduced with permission of the copyright owner. Further reproduction prohibited without permission.
2.5.1. Wheel Dynamic Impact Test............................................................... 25
2.5.2. Wheel Cornering Fatigue Test............................................................ 27
2.6. Material Yield and Fatigue Failure Criteria.................................................... 28
2.6.1. Maximum Shear Stress Failure Criterion............................................ 28
2.6.2. von Mises Stress Failure Criterion...................................................... 29
2.6.3. Fatigue Failure Criteria under Multi-stresses.................................... 31
2.7. Finite Element Analysis..................................................................................... 34
2.8. Wheel Impact and Fatigue Numerical Modeling........................................... 36
2.9. Summary.............................................................................................................. 38
3. EXPERIMENTAL PROCEDURE...................................................................... 40
3.1. Chemical Composition..................................................................................... 41
3.1.1. Cast Aluminum Wheel.......................................................................... 41
3.1.2. Forged Magnesium Wheel................................................................... 42
3.2. Material Analysis............................................................................................. 43
3.2.1. Preparation for Metallographic Specimens......................................... 43
3.2.2. Microstructural Analysis...................................................................... 44
3.2.3. Density Measurement............................................................................ 46
3.2.4. Tensile and Fatigue Testing................................................................ 46
3.3. Wheel Impact Test........................................................................................... 50
3.3.1. Test Setup............................................................................................... 50
3.3.2. Testing Procedures................................................................................ 51
3.3.3. Impact Locations................................................................................... 52
3.4. Wheel Cornering Fatigue Test....................................................................... 54
3.4.1. Test Setup............................................................................................... 54
vi
Reproduced with permission of the copyright owner. Further reproduction prohibited without permission.
3.4.2. Test Procedures 55
4. WHEEL MATERIAL INHOMOGENEITY.................................................... 57
4.1. Cast Aluminum Wheel...................................................................................... 58
4.1.1. Isotropic Microstructure....................................................................... 58
4.1.2. DAS Inhomogeneity.............................................................................. 58
4.1.3. Phase Identification............................................................................... 65
4.1.4. Tensile and Fatigue Properties............................................................ 68
4.2. Forged Magnesium Wheel................................................................................ 73
4.2.1. Microstructure Anisotropy................................................................... 73
4.2.2. Tensile and Fatigue Properties............................................................ 83
5. MODELING OF WHEEL IMPACT TEST ..................................................... 85
5.1. FEA Software Selection.................................................................................... 86
5.2. Numerical Modeling.......................................................................................... 87
5.2.1. Wheel...................................................................................................... 88
5.2.2. Striker...................................................................................................... 93
5.2.3. Tire.......................................................................................................... 93
5.3. FE Model o f Wheel Impact Test...................................................................... 96
5.3.1. Model with the Tire Portion................................................................ 96
5.3.2. Initial Velocity o f the Striker Prior to Impact................................... 97
5.4. Simplified Approach without the Tire Portion.............................................. 98
5.4.1. Wheel and Striker Modeling............................................................... 98
5.4.2. Initial Velocity o f the Striker in the Simplified Approach.............. 99
5.5. Material Models o f the Wheels......................................................................... 101
vii
Reproduced with permission of the copyright owner. Further reproduction prohibited without permission.

5.6. Boundary Constraints......................................................................................... 102
5.7. Gravity................................................................................................................. 102
6 . M ODELING OF THE W H EEL CORNERING FATIGUE T E ST 103
6.1. FE Software Selection........................................................................................ 104
6.2. Implicit Simulation Considering Different Bending Directions.................. 104
6.2.1. Cast Aluminum Wheel.......................................................................... 104
6.2.2. Forged Magnesium Wheel................................................................... 107
6.3. Explicit Simulation Considering a Rotating Bending Moment................... 110
6.3.1. Cast Aluminum Wheel.......................................................................... 110
6.3.2. Forged Magnesium W heel.................................................................... 113
6.4. System Damping................................................................................................ 114
6.5. Boundary Conditions......................................................................................... 115
7. RESULTS AND DISCUSSION OF W HEEL IM PACT T E ST .................... 116
7.1. Cast Aluminum Wheel...................................................................................... 117
7.1.1. Impact Velocity Variation o f the Striker............................................. 117
7.1.2. von Mises Stress and Effective Plastic Strain Distributions 121
7.1.3. Wheel Geometry Change during Impact............................................ 125
7.1.4. Comparison of the Experimental and Numerical Results................ 130
7.1.5. Effect o f Impact Locations................................................................... 130
7.2. Forged Magnesium Wheel................................................................................ 135
7.2.1. Impact Deformation and Plastic Deformation................................... 135
7.2.2. Wheel Geometry Change during Impact........................................... 138
7.2.3. Experimental Validation o f Kinetic Energy Compensation 142
viii
Reproduced with permission of the copyright owner. Further reproduction prohibited without permission.
8. RESULTS AND DISCUSSION OF WHEEL CORNERING FATIGUE... 144
8.1. Cast Aluminum Wheels.................................................................................... 145
8.1.1. Wheel Deformation Comparison......................................................... 145
8 .1.2. Fatigue Analysis through the Self-developed Post-processor 150
8 .1.2.1. Stress Data Output..................................................................... 150
8.1.2.2. Calculation of the Equivalent Alternating & Mean Stresses 152
8.1.3. Safety Analysis of Fatigue Failure....................................................... 155
8.2. Forged Magnesium Wheels.............................................................................. 164
8.2.1. Influence o f System Damping............................................................... 164
8.2.2. Wheel Deformations o f Implicit and Explicit Simulations.............. 166
8.2.3. Fatigue Analysis through the Self-developed Post-processor 174
8 .2.3.1. Stress Data Output..................................................................... 174
8 .2.3.2. Calculation o f the Equivalent Alternating & Mean Stresses 176
8.2.4. Safety Analysis of Fatigue Failure....................................................... 176
8.3. Wheel Design Modification for Improving Fatigue Resistance.................. 187
8.3.1. Experimental Validation....................................................................... 187
8.3.2. Re-design and Re-modeling.................................................................. 191
8.3.3. Safety Analysis o f the Re-designed Wheel......................................... 194
9. CONCLUSIONS AND RECOMMENDATIONS............................................ 200
9.1. Wheel Impact Testing........................................................................................ 201
9.2. Wheel Cornering Fatigue Testing.................................................................... 202
9.3. Recommendations for Future W ork................................................................. 204
10. CLAIMS TO ORIGINALITY.............................................................................. 205
ix
Reproduced with permission of the copyright owner. Further reproduction prohibited without permission.
REFERENCES................................................................................................................
APPENDICES
Appendix A - List o f publications and technical reports
Appendix B - An example of original data o f aluminum wheel tensile testing
Appendix C - Original data o f fatigue testing o f magnesium wheels
Appendix D - Ford engineering specification
WHEEL ASSEMBLY (FORMED ALUMINUM) ES-F3LC-1007-AA
Appendix E - Ford engineering specification
WHEEL ASSEMBLY (CAST ALUMINUM) ES-F3LC-1007-BA
Appendix F - Abbreviated input keywords o f impact testing model (LS-DYNA)
Appendix G - Abbreviated input keywords o f cornering fatigue testing model with implicit simulation method (NASTRAN)
Appendix H - Abbreviated input keywords o f cornering fatigue testing model with dynamic simulation method (LS-DYNA)
Appendix I - Software code o f stress-based fatigue analysis (java language)
Appendix J - Description o f the accompanying DVD disc
x
Reproduced with permission of the copyright owner. Further reproduction prohibited without permission.
206
219
220
221
227
228
242
264
268
271
277
283
Table 2-1.
LIST OF TABLES
Longitudinal & transverse elongations vs. grain size in AZ80
forgings [46] 24
Table 3-1. Chemical composition of aluminum cast wheels 41
Table 3-2. Chemical composition o f magnesium forged wheels 43
Table 3-3. Testing conditions o f the 16” wheel impact test 52
Table 4-1. The measurement data of the DAS in the bottom flange, rim, spoke
and hub 64
Table 4-2. Material properties o f the cast aluminum wheel 70
Table 4-3. Material properties of the magnesium forged wheel 83
Table 5-1. FEM statistics of cast aluminum wheel 91
Table 5-2. FEM statistics o f forged magnesium wheel 91
Table 5-3. Element quality checking results o f cast aluminum wheel 92
Table 5-4. Element quality checking results o f forged magnesium wheel 92
Table 5-5. Material parameters o f the three portions o f the carcass 94
Table 5-6. Material parameters o f the three portions o f the tread 94
Table 5-7. Statistic o f the FE model with the wheel and tire assembly 97
Table 5-8. Percentage o f the kinetic energy reduction rj vs. initial velocity V in i t ia i 101
Table 6-1. Statistic o f the FE model of aluminum cast wheel 107
Table 6-2. Statistic o f the FE model o f forged magnesium wheel 108
Table 7-1. Average final lengths of Line A from numerical simulations 128
Table 7-2. Maximum predicted plastic strain o f the spoke and rim 134
Table 7-3. The average final lengths o f Line A from numerical simulations 140
xi
Reproduced with permission of the copyright owner. Further reproduction prohibited without permission.

Table 8-1. Maximum magnitudes of nodal displacements and their x, y, and z
components 148
Table 8-2. Dynamic cycle times corresponding with specified bending
directions 148
Table 8-3. An example o f the first 26 calculated results arranged sequentially 153
Table 8-4. Results o f finite elements with factors o f safety less than 1.4 158
Table 8-5. Results o f finite elements with factors o f safety between 1.4 and 1.6 159
Table 8-6 . Results of finite elements with factors o f safety between 1.6 and 1.8 160
Table 8-7. The maximum and minimum displacements with the x, y and z
axes 168
Table 8-8 . Results o f finite elements with factors o f safety less than 0.8 178
Table 8-9. Results o f finite elements with factors o f safety between 0.8 and 0.9 182
Table 8-10. Results o f finite elements with factors o f safety between 0.9 and 1.0 185
Table 8-11. Results o f finite elements with factors o f safety less than 1.5 196
Table 8-12. Results of finite elements with factors o f safety between 1.4 and 1.8 198
xii
Reproduced with permission of the copyright owner. Further reproduction prohibited without permission.
LIST OF FIGURES
Figure 2-1. Lightweight wheels used for passenger cars and light trucks. 13
Figure 2-2. A cross section view o f a wheel and the associated terminologies [22], 14
Figure 2-3. Tire terminologies on its sidewall [26]. 16
Figure 2-4. Schematic illustration of the formation of dendrites to make grains [44]. 23
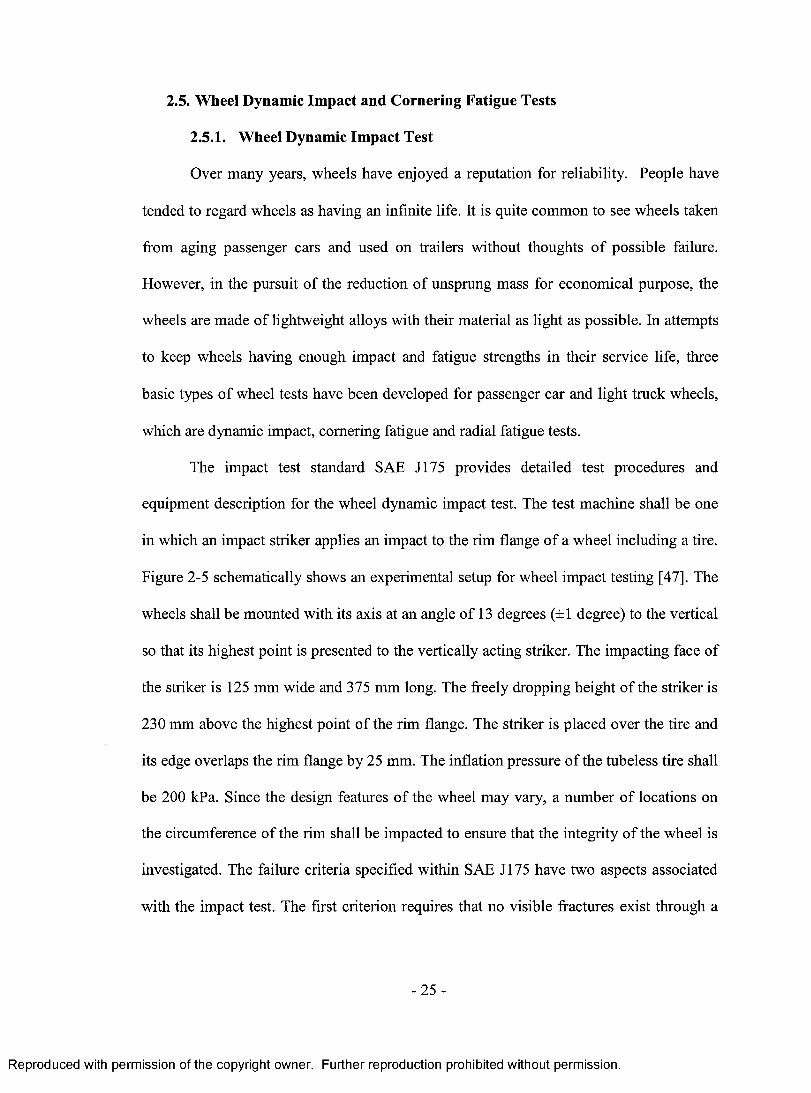
Figure 2-5. Schematic diagram of wheel impact test machine [47]. 26
Figure 2-6. Schematic diagram of wheel cornering fatigue test [48]. 27
Figure 2-7. von Mises stress failure criteria [53]. 30
Figure 2-8. The Goodman, Gerber parabola and Soderberg lines plotted on crm -
o a axes for fluctuating stress fatigue failure criteria [55]. 32
Figure 3-1. 14-spoke cast aluminum wheel. 41
Figure 3-2. 10-spoke forged magnesium wheel. 42
Figure 3-3. Axiovert 25 optical microscope 45
Figure 3-4. JSM-5800LV electronic scanning microscope. 45
Figure 3-5. Locations and directions o f subsize tensile specimens. 47
Figure 3-6. INSTRON 8562 tensile testing machine. 48
Figure 3-7. Subsize tensile specimens. 48
Figure 3-8. Dimensions o f fatigue specimens in millimater. 50
Figure 3-9. Wheel impact test machine. 52
Figure 3-10. a) cast aluminum wheels, and b) a CAD model indicating the
naming convention and impact locations. 53
Figure 3-11. Wheel shape change and the definition o f Line A. 54
Figure 3-12. Experimental wheel cornering fatigue test machine. 56
xiii
Reproduced with permission of the copyright owner. Further reproduction prohibited without permission.
Figure 4-1. Three geometrical view directions based upon the cylindrical
coordinates. 60
Figure 4-2. Isotropic microstructures o f the rim, spoke and hub regions in the
casting aluminum wheel. 61
Figure 4-3. Microstructure images o f four locations with five DAS measurement
marks. 63
Figure 4-4. SEM micrographs of the spoke showing the phases that exist in the
wheel. 66
Figure 4-5. EDS curves showing a) the iron-rich (3 and b) 7T intermetallics. 67
Figure 4-6. Engineering stress versus engineering strain o f the hub, spoke, and
rim in the aluminum wheel. 70
Figure 4-7. The effect of the DAS on the tensile properties and elongation o f the
test specimens. 71
Figure 4-8. S-N curve o f fatigue tests on aluminum alloy A356-T6 [95], 72
Figure 4-9. View directions along the axis directions o f tensile specimens. 73
Figure 4-10. Microstructures o f the rim in three different view directions. 77
Figure 4-11. View A, B & C in the rim region at high magnifications. 80
Figure 4-12. Microstructures o f the spoke in three different view directions. 81
Figure 4-13. View D, E & F in the spoke region at high magnifications. 82
Figure 4-14. Engineering stress versus strain curves o f the spoke and rim in
magnesium forged wheel. 84
Figure 4-15. The S-N curve of uniaxial fatigue experiments on magnesium alloy. 84
Figure 5-1. CAD model o f cast aluminum wheel. 89
xiv
Reproduced with permission of the copyright owner. Further reproduction prohibited without permission.
Figure 5-2. CAD model o f forged magnesium wheel. 89
Figure 5-3. FE model o f cast aluminum wheel. 90
Figure 5-4. FE model o f forged magnesium wheel. 90
Figure 5-5. The FE model o f the striker. 93
Figure 5-6. a) real tire structure, and b) its simplified numerical model. 95
Figure 5-7. a) a FE model with tire portion of wheel impact testing, b) sectioned
wheel, and c) sectioned tire. 96
Figure 5-8. Simplified FE models o f wheel impact testing with a) cast aluminum
wheel, and b) forged magnesium wheel. 99
Figure 6-1. Numerical model o f cornering fatigue testing for cast aluminum
wheel using an implicit static approach. 106
Figure 6-2. Typical bending directions o f cast aluminum wheel model using an
implicit static approach. 106
Figure 6-3. Numerical model o f cornering fatigue testing for forged magnesium
wheel using an implicit static approach. 109
Figure 6-4. Typical bending directions of forged magnesium wheel model using
an implicit static approach. 109
Figure 6-5. Numerical model of cornering fatigue testing for cast aluminum
wheel using an explicit dynamic approach. I l l
Figure 6-6 . Rotating load P combined by two perpendicular forces Px and Py. 112
Figure 6-7. Loads Px and Py versus cycle time for cast aluminum wheels. 112
Figure 6-8 . Numerical model of cornering fatigue testing for forged magnesium
wheel using an explicit dynamic approach. 113
xv
Reproduced with permission of the copyright owner. Further reproduction prohibited without permission.
Figure 7-1. Relationship between the striker velocity and impact time. 117
Figure 7-2. Wheel deformation with different impact time (factor equal to 2). 120
Figure 7-3. Maximum deformation o f cast aluminum wheel impact testing vs. its
undeformable shape. 122
Figure 7-4. von Mises stress contours on the spoke when the striker velocity is zero. 123
Figure 7-5. Effective plastic strain contours on the spoke with contour lines. 124
Figure 7-6. a) wheel shape change and the definition o f Line A, and b) deformed
and undeformed shape o f the bottom flange (Scale factor: 3.0). 126
Figure 7-7. Length of Line A versus time. 128
Figure 7-8. Length of Line A versus kinetic energy reduction for cast aluminum
wheels. 129
Figure 7-9. Effective plastic strain contours on the spoke for impact location 1. 132
Figure 7-10. Effective plastic strain contours on the spoke for impact location 2. 133
Figure 7-11. Maximum total deformation o f forged magnesium wheel, deformed
vs. undeformed shapes. 136
Figure 7-12. Plastic strain iso-contour upon the completion o f impact testing. 136
Figure 7-13. Contour o f plastic strain o f the spoke with different impact
velocities. 138
Figure 7-14. The wheel bottom flange shape varying from a circle to an ellipse. 140
Figure 7-15. Length variation o f Line A vs. impact time with different initial
impact velocities. 141
Figure 7-16. Length of Line A vs. kinetic energy reduction for forged magnesium
wheels. 141
xvi
Reproduced with permission of the copyright owner. Further reproduction prohibited without permission.
Figure 7-17. Bottom flange shape of forged magnesium wheel with a) before and
b) after impact testing. 143
Figure 8-1. Elastic displacements o f the wheel in a) direction A, b) direction B,
and c) direction C (scale factor o f 50 prescribed). 147
Figure 8-2. Displacements in the z axis direction o f three nodes. 149
Figure 8-3. A 1/7 portion of the wheel with 10551 elements. 151
Figure 8-4. A flow-chart showing the design of the self-developed post-processor. 154
Figure 8-5. a) locations of the 28 elements on the hub with nvm less than 1.4,
and b) the magnified area o f a number o f elements among the 28. 161
Figure 8-6 . a) locations o f 15 elements on the spoke with nvm between 1.4 and
1.6 , and b) the exact positions o f the 15 elements. 162
Figure 8-7. a) locations o f the 31 finite elements on the spoke with nvm between
1.4 and 1.8, and b) the exact positions o f them. 163
Figure 8-8 . Dynamic oscillations o f the free mandrel end along the x & y axes
for forged magnesium wheel cornering fatigue simulation. 165
Figure 8-9. Displacements of the free mandrel end along the x & y axis
directions. 168
Figure 8-10. Displacements in the z axis direction with bending direction A, a)
Top view, and b) Iso view (scale factor o f 25X prescribed). 169
Figure 8-11. Displacements in the z axis direction with bending direction B, a)
Top view, and b) Iso view (scale factor o f 25X prescribed). 170
Figure 8-12. Displacements in the z axis direction with bending direction C, a)
Top view, and b) Iso view (scale factor o f 25X prescribed). 171
xvii
Reproduced with permission of the copyright owner. Further reproduction prohibited without permission.
Figure 8-13. z axis displacement/time curves o f node 65776 and 32392. 172
Figure 8-14. z axis displacement/time curves o f node 73920 and 32557. 172
Figure 8-15. z axis displacement/time curves o f node 73995 and 32392. 173
Figure 8-16. 1/10 portion o f the magnesium wheel model, (a) Top view, and (b)
Iso view. 175
Figure 8-17. Locations o f the elements on the wheel with nvm less than 0.8, a)
bottom view, and b) Iso view. 179
Figure 8-18. Enlarged views of the elements with nvm less than 0.8, a) all 16
elements located on the spoke, and b) locations o f 14 o f elements
among the 16 elements. 180
Figure 8-19. a) locations o f 47 elements with nvm values less than 0.9 on the
spoke, b) and c) enlarged views showing 37 elements located in the
area adjacent to the hub and 10 elements located close to the rim. 184
Figure 8-20. Fatigue cracks on the magnesium wheel, a) crack location, b) crack
width. 189
Figure 8-21. The location of the element 52109 with the lowest value o f the
factor o f fatigue safety. 190
Figure 8-22. Geometry model o f the re-designed magnesium wheel, a) overview,
b) enlarged spoke, and c) enlarged rim. 193
Figure 8-23. FE model o f the re-designed magnesium wheel. 193
Figure 8-24. The locations o f the 5 elements with nvm less than 1.5. 197
xviii
Reproduced with permission of the copyright owner. Further reproduction prohibited without permission.

NOMENCLATURE
crx first principle stress
(72 second principle stress
cr3 third principle stress
S yield strength
cra alternating stress
<7m mean stress
Sf fatigue strength
Sut ultimate tensile strength
n factor o f safety
crxx normal stress on x direction
<7 normal stress on y direction
crzz normal stress on z direction
a xy shear stress in y direction on
<jyz shear stress in z direction on
o zx shear stress in x direction on
<rxx a alternating normal stress on x direction
a alternating normal stress on y direction
a zz a alternating normal stress on z direction
z a alternating shear stress in y direction on x face
ryz a alternating shear stress in z direction on y face
xix
x face
y face
z face
Reproduced with permission of the copyright owner. Further reproduction prohibited without permission.

r alternating shear stress in x direction on z face
<7XX m mean normal stress on x direction
a yy m mean normal stress on y direction
a 2 2 ,.m mean normal stress on z direction
t m mean shear stress in y direction on x face
t mean shear stress in z direction on y face
r mean shear stress in x direction on z facezx,m
cr mav maximum value of stress-time waveform on normal stress on x direction
(7xx mn minimum value of stress-time waveform on normal stress on x direction
<jvm a alternating component calculated by von Mises method
a vm m mean component calculated by von Mises method
nvm factor of safety calculated by von Mises method
<7a alternating component calculated by Sines Method
a m mean component calculated by Sines Method
n factor o f safety calculated by Sines Method
D a material density
Wa weight in air
D w density o f water
Ww weight in water
D mass o f striker
xx
Reproduced with permission of the copyright owner. Further reproduction prohibited without permission.
w
M
W
R
V
d
S
V impact
g
Ho
H
V,total
m
total
absorbed
impact
V. • • ,initial
maximum static wheel loading
bending moment
Vz o f the maximum vertical static load on the axle
radius of the largest tire
coefficient o f friction between the tire and the road, 0.7
inset or outset o f the wheel
load factor defined by the wheel types and positions on the vehicle
initial impact velocity o f the striker for the FE model with tire portion
local acceleration due to gravity
initial height o f the striker
modified height o f the striker
potential energy of the striker prior to impact
mass of the striker
kinetic energy o f the striker prior to impact
percentage reduction of the kinetic energy to compensate for tire absence
kinetic energy o f the striker absorbed by the tire
kinetic energy o f the striker impacting on wheel
initial velocity o f the striker in the simplified approach
true strain
engineering strain
true stress
engineering stress
xxi
Reproduced with permission of the copyright owner. Further reproduction prohibited without permission.
F tensile force
Ao original cross sectional area
£ ptrue plastic strain
yield strength
E elastic modulus
P material density
V Poisson’s ratio
P rotating load
Px rotating load on x axis
Py rotating load on y axis
t simulation time
CO angular velocity of the mandrel
L length o f Line A
N finite element number
XXII
Reproduced with permission of the copyright owner. Further reproduction prohibited without permission.
Chapter 1
INTRODUCTION
1.1. Lightweight Vehicles and Lightweight Materials 2
1.2. Road Wheel Evolution 4
1.3. Modeling o f Lightweight Road Wheels 6
1.4. Research Objectives 7
1.5. Dissertation Layout 9
- 1 -
Reproduced with permission of the copyright owner. Further reproduction prohibited without permission.
1. INTRODUCTION
1.1. Lightweight Vehicles and Lightweight Materials
The world’s transportation systems are 96% dependent on petroleum products.
The number o f transportation vehicles worldwide is forecast to increase by a factor o f 3-5
over the next 50 years and reach 2.5 billion by 2050 [1]. Global vehicle growth will result
in significant increases in global fuel demand, material requirements, and emissions.
When assessing the life cycle environmental impact o f the automobile, energy usage is an
excellent indicator o f environmental burden, because o f the high reliance of vehicles on
energy consumption in order to deliver their value to society. Further, other key
environmental impacts such as air emissions occur predominantly in the vehicle use
phase. Significant reductions in life cycle energy consumption and environmental
emissions will be critical to the long-term sustainability of automobiles during the 21st
century [2],
There are many vehicle design considerations that can impact air emissions and
energy consumption, including alternative fuel and engine technologies, rolling resistance,
aerodynamics, drive train design, friction, and vehicle weight. O f these considerations,
vehicle weight is a key factor in achieving significant reductions in the life cycle energy
consumption and primary air emission burdens o f the automobile. This is because rolling
resistance and acceleration forces, the essential elements o f transportation energy
efficiency, are directly proportional to mass or weight [3]. As a result, vehicle weight
reduction will translate into reduced energy demand across all energy distribution
elements o f the vehicle. Typically a 10% weight reduction alone can lead to a 6-8%
improvement in overall fuel economy [4], This is equivalent to a reduction of about 17 to
- 2 -
Reproduced with permission of the copyright owner. Further reproduction prohibited without permission.
20 kg o f carbon dioxide (CO2), the main greenhouse gas, per kilogram of weight
reduction over the lifetime of the vehicle [5]. In addition, weight reduction has many
significant secondary vehicle benefits including improved braking, acceleration, and
better performance handling dynamics. Unless vehicle weights are reduced significantly,
it will not be possible to achieve the transportation sector's proportionate reduction of
greenhouse gases called for in the Kyoto Protocol on Climate Change [6].
Lightweight materials enable vehicles weight reduction without a decrease in size,
load-carrying capacity, and safety. For example, using currently materials available, a
fuel cell Ford Focus weighs approximately 1,750 kg, which is more than 50 percent
heavier than the same vehicle with an internal combustion engine [7]. Unless the weight
of fuel cell vehicles can be reduced significantly, much of the potential improvement in
fuel efficiency for these vehicles will be lost. In short, commercialization of fuel cell
vehicles will not be feasible without the extensive use o f lightweight materials. The
innovation challenge is to reduce costs throughout the supply chain o f materials
production and component manufacturing, coupled with advanced vehicle design features.
In the present automotive industry, there is a growing trend to substitute aluminum and
magnesium for conventional steel and cast iron in vehicles [8]. By the estimation o f the
Alcan Aluminum Company, the largest aluminum producer in Canada, total western
world aluminum shipments to the automotive market topped 8.4 million metric tons in
2005. Automotive aluminum accounts for the major share o f the growth, climbing from
typically less than 45 kg per vehicle in the late 1970s to an estimated 116 kg in 2001. In
North America, Alcan expects that this figure will surpass 156 kg per vehicle by 2010.
Meanwhile, the European Aluminum Association estimates that the amount o f aluminum
-3 -
Reproduced with permission of the copyright owner. Further reproduction prohibited without permission.

used in each European car will increase from the present value o f 90 kg to 130 kg by the
year o f 2005 [9]. Meanwhile, magnesium is 33% lighter than aluminum and 75% lighter
than steel/cast-iron components. It has a long tradition o f use as a lightweight material in
the field o f commercial and special automotive construction. Racing cars started using
magnesium parts as early as the 1920's. However, magnesium castings were not
extensively used in commercial vehicles until 1936 when the Volkswagen (VW) Beetle
was introduced. This car contained approximately 20 kg of magnesium in the powertrain;
and during its peak production in 1971, consumption of magnesium reached 42,000
metric tons per year [10, 11]. Consumption then declined, but over the past ten years,
there has been a significant growth o f magnesium in the high-pressure die-casting sector,
averaging almost 20% per annum worldwide. The use o f magnesium as a strategic
lightweight material in the automotive industry is the driving force behind this growth.
Further growth forecast over the next 10 years. Based on 2002 report, approximately 14
kg of magnesium are used in the VW Passat, Audi A2, A4 and A6 [11]. All vehicles use
manual or automatic magnesium transmission casings, which offer a 20-25% weight
saving over aluminum. Other applications include intake manifolds, cylinder head covers,
inner trunk lid sections, and steering wheel armature and column components. In North
America, the use o f magnesium for automotive applications is more advanced. The GM
full-sized Savana & Express vans use up to 26 kg of magnesium alloy [12].
1.2. Road Wheel Evolution
The invention o f road wheels is one o f mankind’s earliest and most important
discoveries. The wheel traditionally used the material in common usage for a particular
era: stone, wood, copper, and steel. The wheel design basis varies from pure compression
- 4 -
Reproduced with permission of the copyright owner. Further reproduction prohibited without permission.
strength load supporting members, such as wooden wheels, to pure tension strength load
supporting members, such as a bicycle spoke wheel. As the tire changed to provide
longer and faster travel, the wheel and rim changed to provide an air chamber, tire
support, tire mountability, and improved fatigue resistance. Wheel types and sizes have
increased as vehicle systems, vehicle types, and tire innovations have been introduced.
The wheel is firmly entrenched as part o f the transportation system. The wheel industry
today covers wheels on smaller motorized carts with 100 mm diameter to huge 1500 mm
diameter rims for large earthmoving equipment. Load capacities range from a few
hundred kilograms to over one hundred thousand kilograms. Tire inflation capacities
range from zero for a solid tire to over 500 kPa. Materials range from plastic and
composites to metals, such as steel, aluminum and magnesium [13].
Over the last decades, passenger vehicle wheels have progressively evolved from
stamped flat steel discs to aluminum cast road wheels. The low pressure die-casting
process has been preferred as the main manufacturing method o f aluminum wheels
because o f its ability to produce a high quality and performance product with a smooth
surface appearance [14]. Where the loading conditions are more extreme and where
higher mechanical properties are required, as in the light duty and medium duty truck
market, forged aluminum wheels are beginning to appear [15]. Since magnesium is about
one-third lighter than aluminum, the use o f magnesium wheels by the original equipment
manufacturers (OEM) and after market (AM) suppliers is projected to increase gradually
and steadily. Due to their low strength and their internal defects, magnesium die-cast road
wheels are not able to offer suitable properties required for wheels, without an increase in
their wall thickness. This increased wall thickness offsets the 30% weight saving of
- 5 -
Reproduced with permission of the copyright owner. Further reproduction prohibited without permission.
magnesium alloys over aluminum alloys. As such, more interest has been expressed by
the automotive industry in development o f forged magnesium wheels [16].
1.3. Modeling of Lightweight Road Wheels
Today, computer based finite element (FE) modeling and simulation o f vehicle
road wheels prior to the production process plays an essential role in the design. It allows
the ability to accommodate the market demand for fast changing styling trends and the
cost o f production. Process control employing simulation tools and techniques has a
strong positive impact on the manufacturing conditions with respect to cost saving, time-
to-market improvement, quality assurance, and hence competitiveness [17]. High
performance computer technology and applications have been used through the whole
cycle o f the wheel design to help the engineer both to optimize the aesthetics, as well as
to improve the structural and mechanical behaviour. The mechanical behaviour o f road
wheels during the lifetime o f a vehicle is o f the utmost importance due to safety reasons.
Wheels transmit all the loads from the road and tire on one side o f an axle and chassis to
the other side is a basic function o f the wheel. A wheel is a safety component, which has
to meet strong requirements regarding strength, weight and quality. The numerical
simulation should cover all standardized tests that are required to achieve the approval: a
wheel impact test, a cornering fatigue test, and a radial fatigue test [18]. The use of finite
element analysis (FEA) technology has significant advantages, including development
benefits through cost and time reduction in tooling, manufacture, testing and design. The
use of simulation helps to produce lighter wheels that meet the similar requirements. A
decrease in material use reduces the costs and the reduced weight o f the wheel leads to
lower fuel consumption. The design o f new wheels has become a more linear sequence of
- 6 -
Reproduced with permission of the copyright owner. Further reproduction prohibited without permission.
predictable events, rather than a rushed, convoluted set of redesign and test loops, thus
making management o f new products much easier [19]. Furthermore, design
modifications could be conducted on a component to examine how the change would
influence its performance without making costly alterations to tooling and equipment in
real production [20]. Numerical modeling takes an important role in automotive wheel
design and optimization. All the wheel makers have their own wheel design and
development teams, which perform numerical modeling and simulation to study wheel
performance. However, there are very few publications on the FE modeling o f aluminum
and magnesium road wheels in the public domain. This fact is possibly because of
commercial issues, which limits further expansion o f the use o f aluminum, and more
importantly magnesium, in lightweight road wheels.
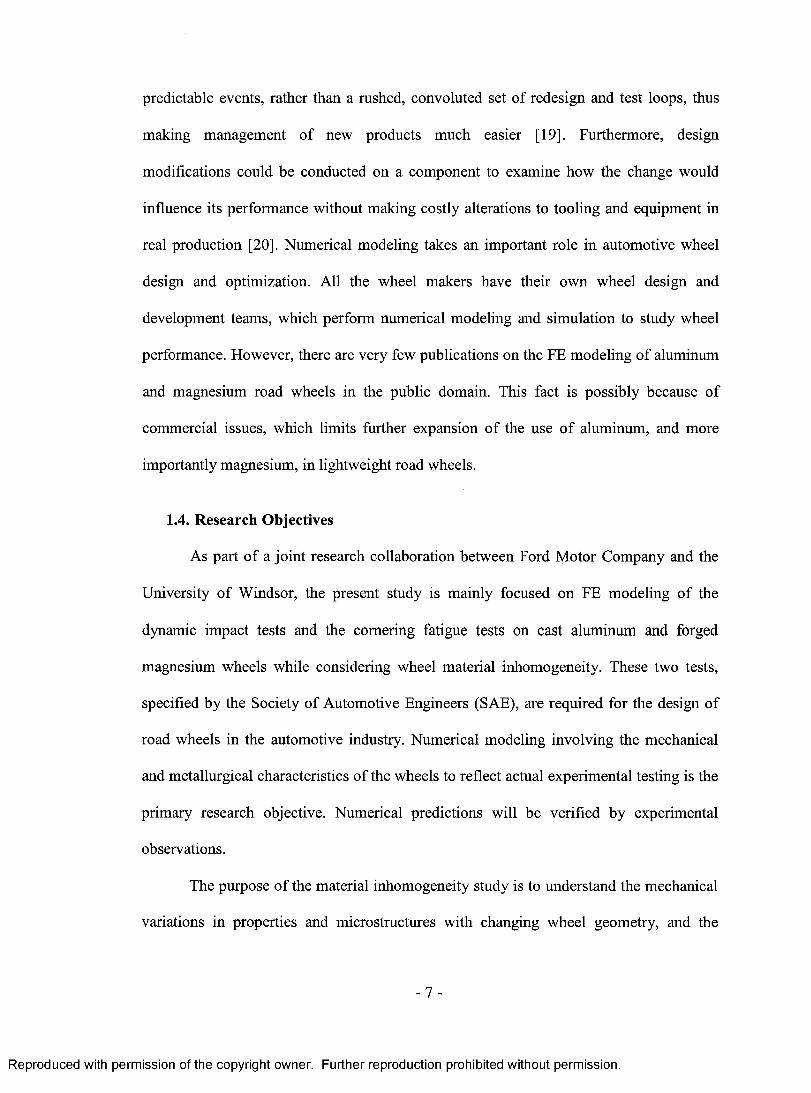
1.4. Research Objectives
As part o f a joint research collaboration between Ford Motor Company and the
University o f Windsor, the present study is mainly focused on FE modeling o f the
dynamic impact tests and the cornering fatigue tests on cast aluminum and forged
magnesium wheels while considering wheel material inhomogeneity. These two tests,
specified by the Society o f Automotive Engineers (SAE), are required for the design of
road wheels in the automotive industry. Numerical modeling involving the mechanical
and metallurgical characteristics o f the wheels to reflect actual experimental testing is the
primary research objective. Numerical predictions will be verified by experimental
observations.
The purpose o f the material inhomogeneity study is to understand the mechanical
variations in properties and microstructures with changing wheel geometry, and the
- 7 -
Reproduced with permission of the copyright owner. Further reproduction prohibited without permission.
relationship with their manufacturing processes. Meanwhile, more accurate material data
is required for numerical modeling o f wheel impact and cornering fatigue tests. The
material study will include: chemical composition analysis; metallographic analysis for
different regions o f the cast aluminum and forged magnesium wheels through using
optical metallography and scanning electron microscopy (SEM); phases identification
using energy dispersive X-ray spectrometry (EDS); and tensile and fatigue testing for
specimens extracted from the hub, spoke and rim o f the wheels.
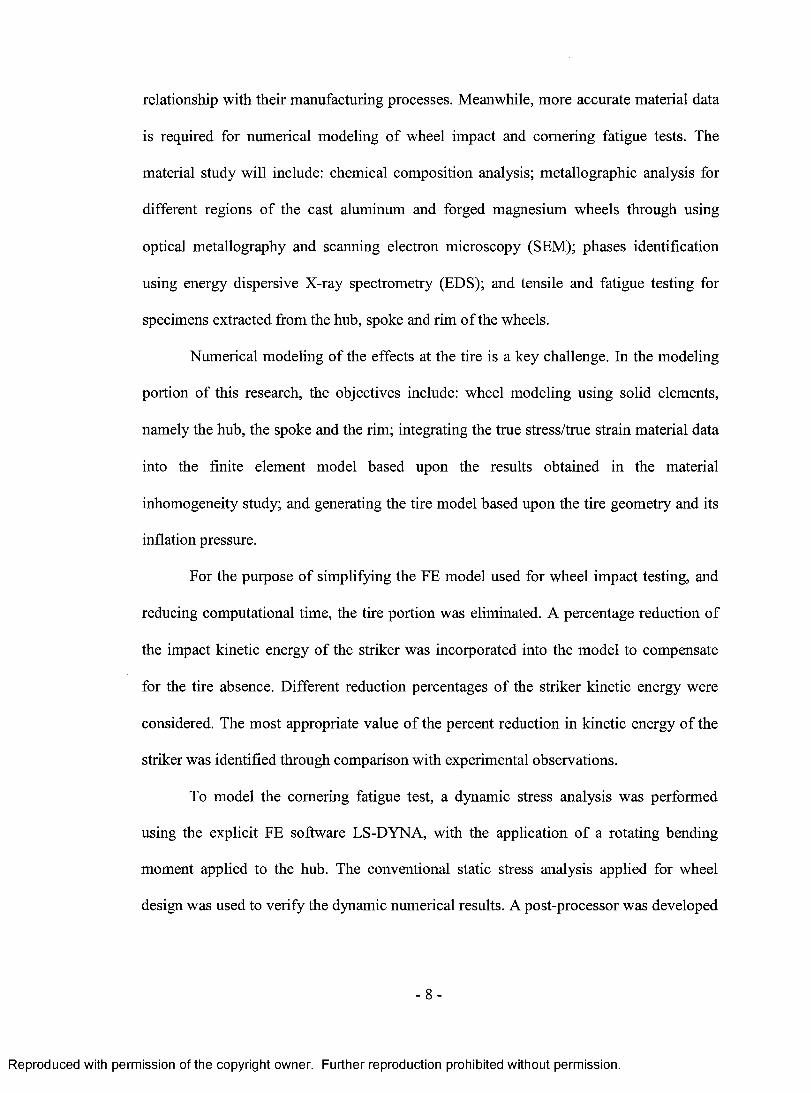
Numerical modeling o f the effects at the tire is a key challenge. In the modeling
portion of this research, the objectives include: wheel modeling using solid elements,
namely the hub, the spoke and the rim; integrating the true stress/true strain material data
into the finite element model based upon the results obtained in the material
inhomogeneity study; and generating the tire model based upon the tire geometry and its
inflation pressure.
For the purpose o f simplifying the FE model used for wheel impact testing, and
reducing computational time, the tire portion was eliminated. A percentage reduction of
the impact kinetic energy of the striker was incorporated into the model to compensate
for the tire absence. Different reduction percentages o f the striker kinetic energy were
considered. The most appropriate value o f the percent reduction in kinetic energy of the
striker was identified through comparison with experimental observations.
To model the cornering fatigue test, a dynamic stress analysis was performed
using the explicit FE software LS-DYNA, with the application of a rotating bending
moment applied to the hub. The conventional static stress analysis applied for wheel
design was used to verify the dynamic numerical results. A post-processor was developed
- 8 -
Reproduced with permission of the copyright owner. Further reproduction prohibited without permission.

to calculate the equivalent alternating and mean von Mises stresses and the safety factors
in fatigue design o f each selected finite element. Wheel design modification was be
considered based upon the numerical simulation results o f the rotary fatigue testing.
1.5. Dissertation Layout
This dissertation contains 10 chapters. Chapter 1 provides a general introduction
to both lightweight alloys used in the automobile industry and to the numerical modeling
of lightweight road wheels; it also highlights the research objectives. Chapter 2 is a
literature review that addresses: road wheel terminology, the performance benefits of
lightweight wheels; wheel material and property inhomogeneity; wheel dynamic impact
and cornering fatigue tests; material yield and fatigue criteria; and finite element analysis.
The current research status, and further development directions in the numerical
modeling o f wheel impact and fatigue performance is summarized. Chapter 3 presents the
experimental procedures for wheel impact and fatigue tests, as well as material,
metallographic analysis, and mechanical property testing. Chapter 4 introduces the wheel
structure inhomogeneity characteristics and their tensile and fatigue property data.
Numerical modeling o f wheel impact performance and a simplified approach are
introduced in Chapter 5. Static and dynamic finite element simulations o f wheel
cornering fatigue performance are described in Chapter 6. Numerical observations of
wheel dynamic impact and cornering fatigue tests are illustrated in Chapters 7 and 8,
respectively. These observations include internal stress and plastic strain analyses in
impact testing; experimental validations, numerical result comparison o f wheel; cornering
fatigue testing between static implicit and dynamic explicit approaches; as well as fatigue
- 9 -
Reproduced with permission of the copyright owner. Further reproduction prohibited without permission.
safety analyses through a self-developed post-processor. Lastly, Chapter 9 concludes the
contributions to technical knowledge from this research project, and recommendations
for future study. The dissertation concludes with the claims o f originality in Chapter 10.
- 1 0 -
Reproduced with permission of the copyright owner. Further reproduction prohibited without permission.
Chapter 2
LITERATURE REVIEW
2.1. Wheel and Tire Terminology 12
2.2. Performance Benefits o f Lightweight Wheels 16
2.3. Cast Aluminum and Forged Magnesium Wheels 17
2.3.1. Casting versus Forging 18
2.3.2. Cast Aluminum Wheels 19
2.3.3. Forged Magnesium Wheels 20
2.4. Microstructure Inhomogeneity and Mechanical Properties 21
2.4.1. Aluminum Castings 21
2.4.2. Magnesium Forgings 24
2.5. Wheel Dynamic Impact and Cornering Fatigue Tests 25
2.5.1. Wheel Dynamic Impact Test 25
2.5.2. Wheel Cornering Fatigue Test 27
2.6. Material Yield and Fatigue Failure Criteria 28
2.6.1. Maximum Shear Stress Failure Criterion 28
2.6.2. von Mises Stress Failure Criterion 29
2.6.3. Fatigue Failure Criteria under Multi-stresses 31
2.7. Finite Element Analysis 34
2.8. Wheel Impact and Fatigue Numerical Modeling 36
2.9. Summary 38
- 11 -
Reproduced with permission of the copyright owner. Further reproduction prohibited without permission.
2. LITERATURE REVIEW
2.1. Wheel and Tire Terminology
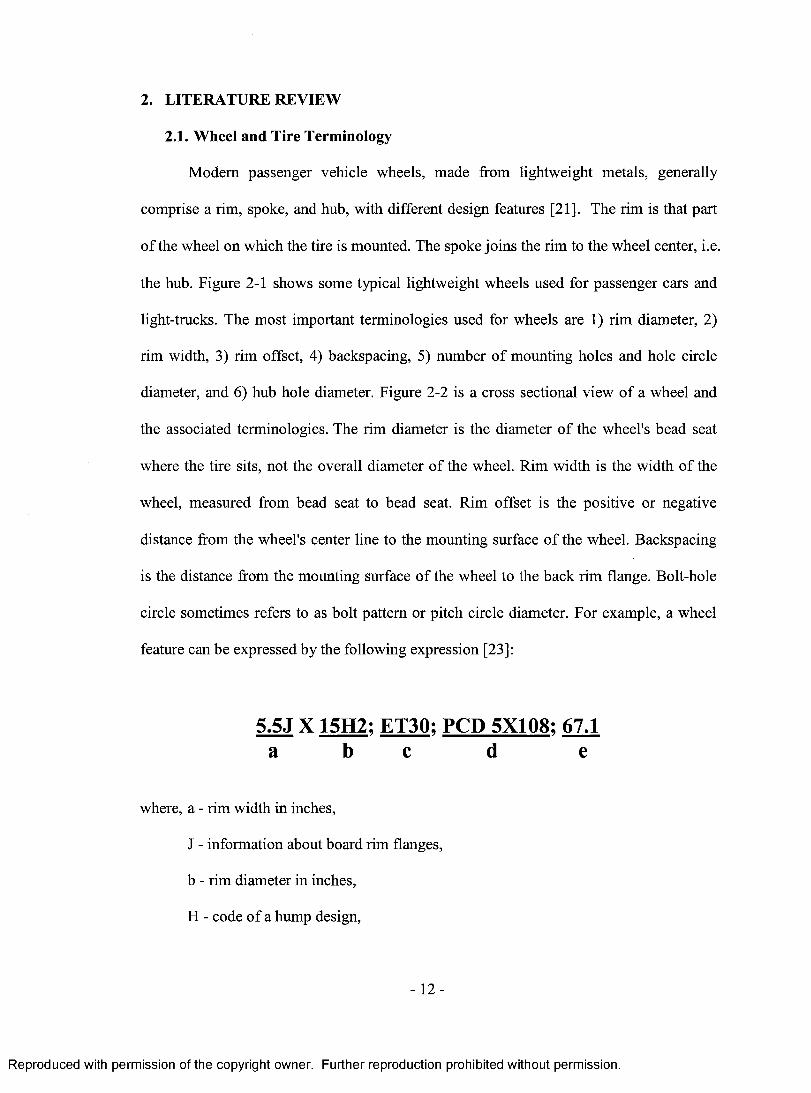
Modem passenger vehicle wheels, made from lightweight metals, generally
comprise a rim, spoke, and hub, with different design features [21]. The rim is that part
o f the wheel on which the tire is mounted. The spoke joins the rim to the wheel center, i.e.
the hub. Figure 2-1 shows some typical lightweight wheels used for passenger cars and
light-trucks. The most important terminologies used for wheels are 1) rim diameter, 2)
rim width, 3) rim offset, 4) backspacing, 5) number o f mounting holes and hole circle
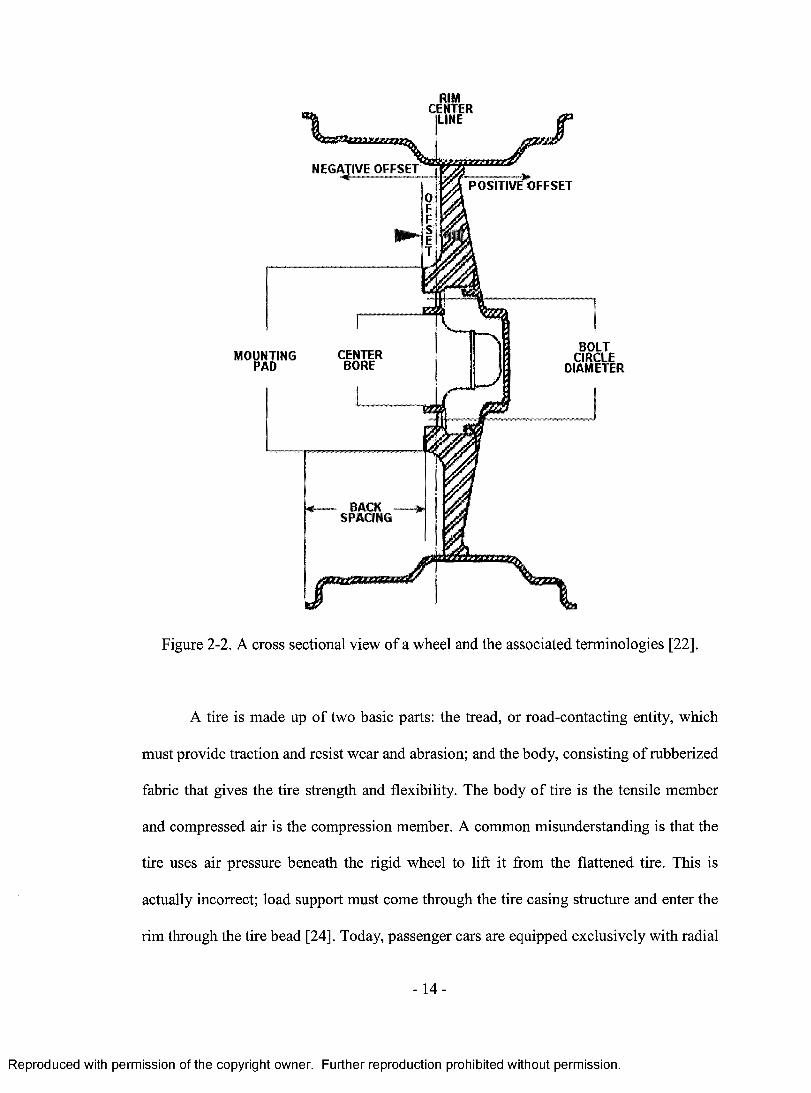
diameter, and 6) hub hole diameter. Figure 2-2 is a cross sectional view of a wheel and
the associated terminologies. The rim diameter is the diameter o f the wheel's bead seat
where the tire sits, not the overall diameter of the wheel. Rim width is the width o f the
wheel, measured from bead seat to bead seat. Rim offset is the positive or negative
distance from the wheel's center line to the mounting surface o f the wheel. Backspacing
is the distance from the mounting surface o f the wheel to the back rim flange. Bolt-hole
circle sometimes refers to as bolt pattern or pitch circle diameter. For example, a wheel
feature can be expressed by the following expression [23]:
5.5J X 15H2: ET30: PCD 5X10⁸: 67.1 a b c d e
where, a - rim width in inches,
J - information about board rim flanges,
b - rim diameter in inches,
H - code o f a hump design,
- 1 2 -
Reproduced with permission of the copyright owner. Further reproduction prohibited without permission.

c - rim offset in mm,
ET - offset o f a wheel in mm,
d - number o f mounting holes and hole circle diameter,
PCD - Pitch Circle Diameter, diameter of a circle on which mounting holes are
located (the first figure is the number o f holes and the second is strictly PCD),
e - hub hole diameter in mm.
Cast Aluminum Wheel
Forged Magnesium ^ Wheel
Figure 2-1. Lightweight wheels used for passenger cars and light trucks.
- 13 -
Reproduced with permission of the copyright owner. Further reproduction prohibited without permission.
R I MCENTER
(LINE
0O£f
4 POSITIVE OFFSET
BOLTCIRCLE
DIAMETERCENTERBORE
MOUNTINGPAD
mm — »SPACING
Figure 2-2. A cross sectional view of a wheel and the associated terminologies [22].
A tire is made up o f two basic parts: the tread, or road-contacting entity, which
must provide traction and resist wear and abrasion; and the body, consisting o f rubberized
fabric that gives the tire strength and flexibility. The body o f tire is the tensile member
and compressed air is the compression member. A common misunderstanding is that the
tire uses air pressure beneath the rigid wheel to lift it from the flattened tire. This is
actually incorrect; load support must come through the tire casing structure and enter the
rim through the tire bead [24]. Today, passenger cars are equipped exclusively with radial
- 14-
Reproduced with permission of the copyright owner. Further reproduction prohibited without permission.
type tires. Radial tires offer the longest tread life, the best traction, the cool running
condition, the highest gasoline mileage, and the greatest resistance to road hazards,
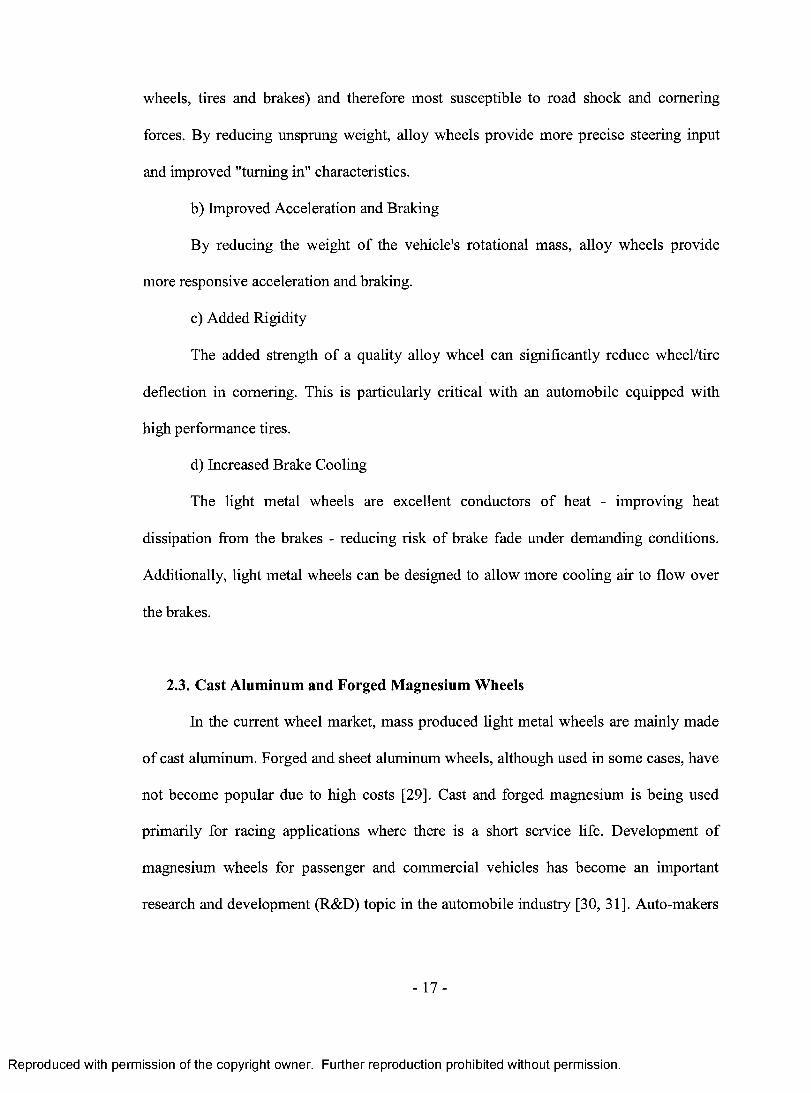
compared with other types, such as, bias-ply and bias-belted [25]. The side o f the tire,
known as the sidewall, contains all the specifications o f the tire. Figure 2-3 is a schematic
diagram of tire terminologies on a sample tire [26]. ‘Tire Type’ defines the proper use of
the tire, such as ‘P ’ means this is a passenger car tire. If the tire had an ‘LT’, then the tire
would be for a light truck. ‘Tire Width’ is the width o f the tire measured in millimeters
from sidewall to sidewall. This sample tire is 215 millimeters wide. ‘Aspect Ratio’ is the
ratio o f the height o f the tire's cross-section to its width. ‘65’ means that the height is
equal to 65% of the tire's width. The ‘R ’ stands for radial, which means that the body ply
cords, which are layers o f fabric that make up the body of the tire, run radially across the
tire from bead to bead. ‘Wheel Diameter’ is the width o f the wheel from one side to the
other in inches. The diameter o f this wheel is 15 inches. ‘Load Index’ is a number that
corresponds to the maximum load in pounds that a tire can support when properly
inflated. The maximum load in pounds or in kilograms is molded elsewhere on the tire
sidewall. ‘Speed Rating’ is a number that corresponds to the maximum service speed for
a tire, for example, ‘H ’ means that the tire has a maximum service speed of 130 mph.
‘DOT’ means the tire is compliant with all applicable safety standards established by the
U.S. Department o f Transportation (DOT). Adjacent to this is a tire identification or
serial number; a combination o f numbers and letters.
- 1 5 -
Reproduced with permission of the copyright owner. Further reproduction prohibited without permission.

Ratio of height to width (aspect
Radial Diameter of wheel in inches
Width of tire in millimeters
Load index / speed symbol
Passenger car tire
Max.coid inflation load limit
U.S. DOT safety standards code
Treadwear. traction and temperature grades
Tire ply composition and materials used
Figure 2-3. Tire terminologies on its sidewall [26].
2.2. Performance Benefits of Lightweight Wheels
While many people choose lightweight wheels for aesthetic reasons, there are
other equally important performance benefits to be derived, including [27, 28]:
a) Reduced Unsprung Weight Compared to Steel Wheels
This is one of the most critical factors affecting a vehicle's road handling ability.
Unsprung weight is that portion o f a vehicle that is not supported by the suspension (i.e.
- 16-
Reproduced with permission of the copyright owner. Further reproduction prohibited without permission.
wheels, tires and brakes) and therefore most susceptible to road shock and cornering
forces. By reducing unsprung weight, alloy wheels provide more precise steering input
and improved "turning in" characteristics.
b) Improved Acceleration and Braking
By reducing the weight o f the vehicle's rotational mass, alloy wheels provide
more responsive acceleration and braking.
c) Added Rigidity
The added strength o f a quality alloy wheel can significantly reduce wheel/tire
deflection in cornering. This is particularly critical with an automobile equipped with
high performance tires.
d) Increased Brake Cooling
The light metal wheels are excellent conductors o f heat - improving heat
dissipation from the brakes - reducing risk o f brake fade under demanding conditions.
Additionally, light metal wheels can be designed to allow more cooling air to flow over
the brakes.
2.3. Cast Aluminum and Forged Magnesium Wheels
In the current wheel market, mass produced light metal wheels are mainly made
of cast aluminum. Forged and sheet aluminum wheels, although used in some cases, have
not become popular due to high costs [29]. Cast and forged magnesium is being used
primarily for racing applications where there is a short service life. Development of
magnesium wheels for passenger and commercial vehicles has become an important
research and development (R&D) topic in the automobile industry [30, 31]. Auto-makers
- 17-
Reproduced with permission of the copyright owner. Further reproduction prohibited without permission.

in the US, and some European and Japanese auto companies are attracted by the potential
benefits o f using magnesium road wheels [32],
2.3.1. Casting versus Forging
The casting process consists o f pouring, or injecting, molten metal into a mold
containing a cavity with the desired shape o f the casting. Metal casting processes can be
classified either by the type o f mold or by the pressure used to fill the mold with liquid
metal. Casting is a solidification process. Therefore, the micro structure can be finely
tuned with respect to such metallurgical properties as grain structure, phase
transformation and precipitation. However, defects such as shrinkage porosity, cracks and
segregation are also intimately linked to solidification. These defects can lead to poor
mechanical properties. A subsequent heat treatment is often required to reduce residual
stresses and to optimize the mechanical properties [33].
Forging is a manufacturing process where metal is shaped by plastic deformation
under large applied pressures into high strength parts. Forging or cold forming are those
metal forming processes, which do not have melting and solidification processes involved.
Plastic deformation produces an increase in the number o f dislocations, resulting in a
high state o f internal stress. Indeed, strain hardening is attributed to the interaction o f
dislocations with other dislocations and other barriers (such as grain boundaries).
Simultaneously, the shape o f primary crystals (dendrites) changes after plastic working of
the metal. Dendrites are stretched in the direction o f metal flow and thus form fibers of
increased strength along the direction o f flow. During forging, hot working is involved,
which is different from cold working. Hot working is performed above the
- 18 -
Reproduced with permission of the copyright owner. Further reproduction prohibited without permission.
recrystallization temperature, and cold working is performed below it. In hot working,
strain hardening and distorted grain structure are very rapidly eliminated by the formation
o f new strain-free grains as the result o f recrystallization. Initial porosity can also be
significantly reduced, and even completely healed. Metallurgical phenomena such as
strain hardening and recrystallization are important because these changes in structure
result in an increase in ductility and toughness over the cast state [34, 35],
2.3.2. Cast Aluminum Wheels
Cast aluminum wheels are the most common type o f aluminum wheel. The
casting o f wheels is the process o f getting molten aluminum inside a mold to form a
wheel. There are different ways this can be accomplished, and although it sounds simple,
this is truly an art when done properly. Gravity casting is the most basic process of
pouring molten aluminum, utilizing the earth’s gravity to fill the mold. Gravity casting
offers a very reasonable production cost and has a simple flowing sequence. Since the
process relies on gravity to fill the mold, the aluminum is not as densely packed in the
mold as those prepared by forging or other casting processes. Often gravity cast wheels
have a higher weight than those produced by low pressure die casting process to achieve
the same required strength [36]. This is because a positive pressure is used in low
pressure die casting process to move the molten aluminum into the mold relatively fast
and achieve a finished product that has improved mechanical properties (more dense)
over gravity cast wheels. Despite its slightly higher production cost over gravity casting,
low pressure die casting is the most common process approved for aluminum wheels sold
to the OEM market and offers a good value for the aftermarket as well [37], Some
- 19-
Reproduced with permission of the copyright owner. Further reproduction prohibited without permission.
companies offer wheels that are produced under a higher pressure in special casting
equipment to create a wheel that is lighter and stronger than a wheel produced in low
pressure [38]. Evidently, using high pressure casting method to reduce the weight, there
is a higher cost associated with this process.
2.3.3. Forged Magnesium Wheels
Most o f the cast magnesium wheels are currently produced by gravity casting or
low pressure die-casting [39]. Vehicle wheels are usually designed with a certain section
thickness to meet regular driving-load requirements. In particular, the strength o f cast
magnesium alloys is generally lower than that o f cast aluminum alloys and defects in cast
wheels such as shrinkage pores are inevitable. The increased section thickness for cast
magnesium wheels required for strengthening results in added weight that negates the
30% weight advantage o f magnesium alloys over aluminum alloys. As a result, forging
processes become an important alternative for manufacturing high quality magnesium
wheels.
Forging is the process o f forcing a solid billet o f magnesium between the forge
dies under an extreme amount of pressure. This creates a finished product that is very
dense, very strong and therefore can be very light. The costs o f tooling, development,
equipment, etc., make this type o f wheel exclusive and usually need a high price in the
aftermarket [40]. The forging process, using high pressure and temperature, changes the
non-directional grain structure o f the cast magnesium starting material to the high
integrity multi-directional grain structure o f forgings. The magnesium remains solid
throughout the process as the forging dies come together and changes the shape o f the
- 2 0 -
Reproduced with permission of the copyright owner. Further reproduction prohibited without permission.
round bar to the cylindrical shape o f the wheel. This forging preform is then placed in a
custom built spin forging machine to forge the rim section. Sequentially, a round shaped
bar used as feedstock is first heated to a fixed temperature, then forged in a closed die
press to form a cylindrical shape, as a wheel preform. This forging preform finally is
forged in a power spinning forge machine to form the rim section. Before machining and
painting o f this type o f wheels, a post heat treatment for residual stress relief is required
[41].
2.4. Microstructure Inhomogeneity and Mechanical Properties
Lightweight alloys provide superior strength and dramatic weight reductions over
ferrous metals such as steel, and as such they represent the ideal material from which to
create high performance wheels. In fact, today it is hard to imagine a world class racing
car or high performance vehicle that doesn't utilize the benefits o f lightweight wheels.
The alloy used in the passenger vehicle wheels today is mainly aluminum. The material
inhomogeneity o f either aluminum or magnesium wheels due to their manufacturing
processes would lead to mechanical property variations in wheel geometry [42], which is
a important concern for wheel design and application.
2.4.1. Cast Aluminum Parts
As a traditional casting technique, low pressure die casting is the most common
process for aluminum wheel production. In castings, however, grain size is sometimes
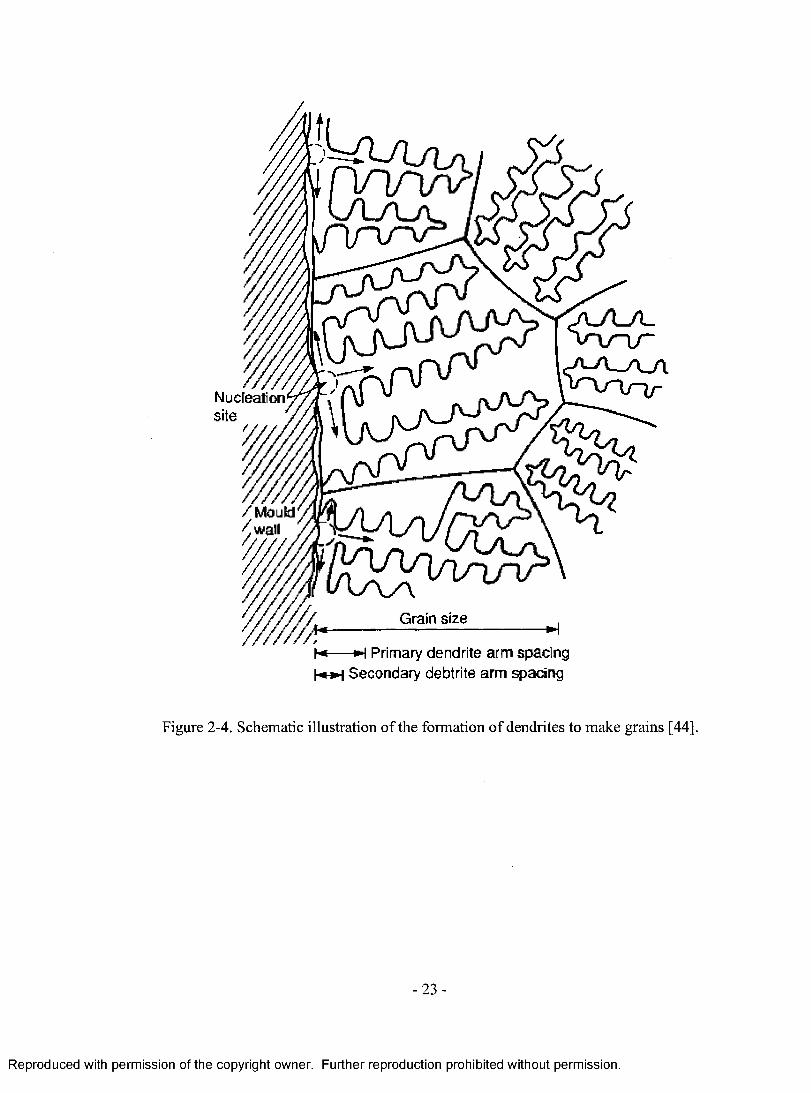
important, but more often it is the secondary dendrite arm spacing, sometimes shortened
to DAS, which is the most important structural length measurement [43]. Figure 2-4
-21 -
Reproduced with permission of the copyright owner. Further reproduction prohibited without permission.

gives gives the schematic illustration of the formation of dendrites to make grains, and
the dendrites within any grain are all crystallographically related to a common nucleus
[44], The mechanical properties o f most cast alloys are strongly dependent on secondary
arm spacing. As DAS decreases, ultimate strength, ductility and elongation increase.
Based upon the different filling and solidification procedures in wheel casting, the grain
size or dendrite arm spacing of the wheel are variable among wheel geometry. With the
reduced DAS, the mechanical properties o f cast alloys are invariably improved. The
strength and toughness o f A356 aluminum alloy increases with a decrease in DAS [45].
As the cooling rate is decreased and consequently DAS grows, the ultimate strength
decreases somewhat also [45].
- 2 2 -
Reproduced with permission of the copyright owner. Further reproduction prohibited without permission.
J W l J l -V \ r V
M j u
/Mould /w a ll
Gram size
Nucfeation site
\ Primary dendrite arm spacing Secondary debtrite arm spacing
Figure 2-4. Schematic illustration o f the formation o f dendrites to make grains [44].
- 2 3 -
Reproduced with permission of the copyright owner. Further reproduction prohibited without permission.
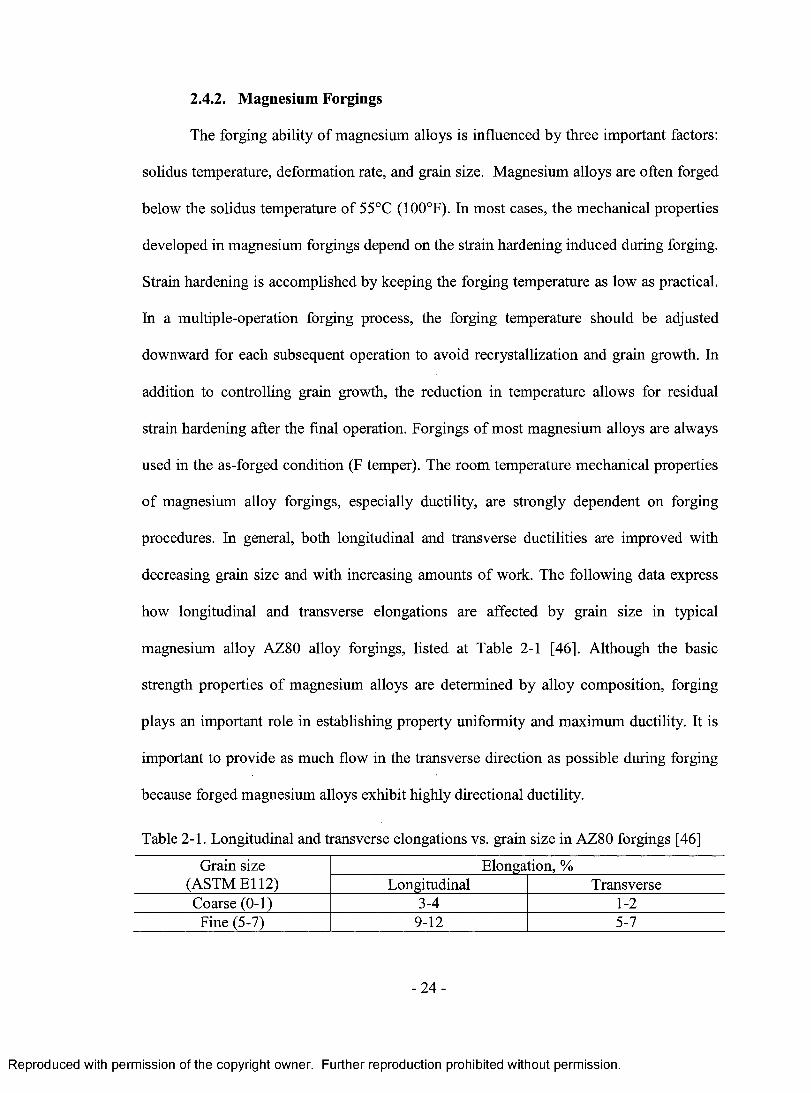
2.4.2. Magnesium Forgings
The forging ability of magnesium alloys is influenced by three important factors:
solidus temperature, deformation rate, and grain size. Magnesium alloys are often forged
below the solidus temperature o f 55°C (100°F). In most cases, the mechanical properties
developed in magnesium forgings depend on the strain hardening induced during forging.
Strain hardening is accomplished by keeping the forging temperature as low as practical.
In a multiple-operation forging process, the forging temperature should be adjusted
downward for each subsequent operation to avoid recrystallization and grain growth. In
addition to controlling grain growth, the reduction in temperature allows for residual
strain hardening after the final operation. Forgings o f most magnesium alloys are always
used in the as-forged condition (F temper). The room temperature mechanical properties
of magnesium alloy forgings, especially ductility, are strongly dependent on forging
procedures. In general, both longitudinal and transverse ductilities are improved with
decreasing grain size and with increasing amounts o f work. The following data express
how longitudinal and transverse elongations are affected by grain size in typical
magnesium alloy AZ80 alloy forgings, listed at Table 2-1 [46]. Although the basic
strength properties o f magnesium alloys are determined by alloy composition, forging
plays an important role in establishing property uniformity and maximum ductility. It is
important to provide as much flow in the transverse direction as possible during forging
because forged magnesium alloys exhibit highly directional ductility.
Table 2-1. Longitudinal and transverse elongations vs. grain size in AZ80 forgings [46]
Grain size Elongation, %(ASTME112) Longitudinal TransverseCoarse (0-1) 3-4 1-2Fine (5-7) 9-12 5-7
- 2 4 -
Reproduced with permission of the copyright owner. Further reproduction prohibited without permission.
2.5. Wheel Dynamic Impact and Cornering Fatigue Tests
2.5.1. Wheel Dynamic Impact Test
Over many years, wheels have enjoyed a reputation for reliability. People have
tended to regard wheels as having an infinite life. It is quite common to see wheels taken
from aging passenger cars and used on trailers without thoughts o f possible failure.
However, in the pursuit o f the reduction o f unsprung mass for economical purpose, the
wheels are made of lightweight alloys with their material as light as possible. In attempts
to keep wheels having enough impact and fatigue strengths in their service life, three
basic types o f wheel tests have been developed for passenger car and light truck wheels,
which are dynamic impact, cornering fatigue and radial fatigue tests.
The impact test standard SAE J175 provides detailed test procedures and
equipment description for the wheel dynamic impact test. The test machine shall be one
in which an impact striker applies an impact to the rim flange o f a wheel including a tire.
Figure 2-5 schematically shows an experimental setup for wheel impact testing [47]. The
wheels shall be mounted with its axis at an angle o f 13 degrees (±1 degree) to the vertical
so that its highest point is presented to the vertically acting striker. The impacting face of
the striker is 125 mm wide and 375 mm long. The freely dropping height o f the striker is
230 mm above the highest point o f the rim flange. The striker is placed over the tire and
its edge overlaps the rim flange by 25 mm. The inflation pressure o f the tubeless tire shall
be 200 kPa. Since the design features o f the wheel may vary, a number o f locations on
the circumference o f the rim shall be impacted to ensure that the integrity o f the wheel is
investigated. The failure criteria specified within SAE J175 have two aspects associated
with the impact test. The first criterion requires that no visible fractures exist through a
-25 -
Reproduced with permission of the copyright owner. Further reproduction prohibited without permission.
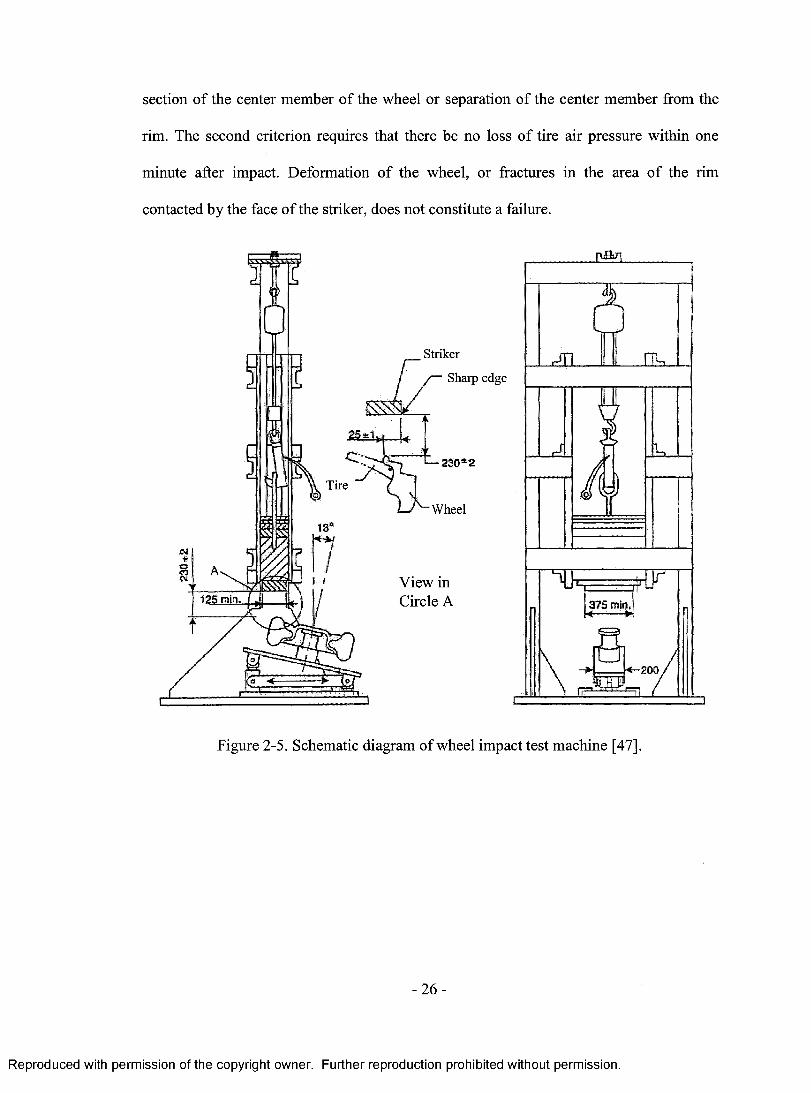
section o f the center member o f the wheel or separation of the center member from the
rim. The second criterion requires that there be no loss o f tire air pressure within one
minute after impact. Deformation o f the wheel, or fractures in the area o f the rim
contacted by the face o f the striker, does not constitute a failure.
Striker f l kSharp edge
25 3=1
230*2
\ Tire
Wheel
OView in Circle A12S ran i
200
Figure 2-5. Schematic diagram of wheel impact test machine [47].
- 2 6 -
Reproduced with permission of the copyright owner. Further reproduction prohibited without permission.
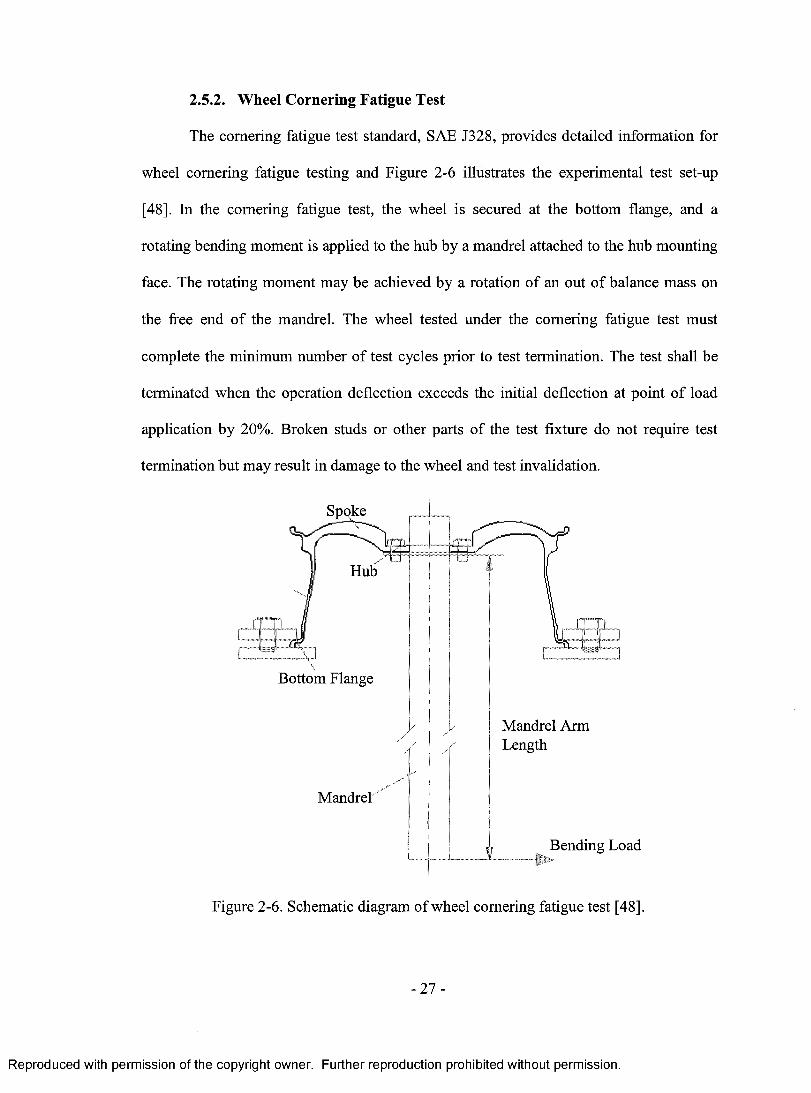
2.5.2. Wheel Cornering Fatigue Test
The cornering fatigue test standard, SAE J328, provides detailed information for
wheel cornering fatigue testing and Figure 2-6 illustrates the experimental test set-up
[48]. In the cornering fatigue test, the wheel is secured at the bottom flange, and a
rotating bending moment is applied to the hub by a mandrel attached to the hub mounting
face. The rotating moment may be achieved by a rotation o f an out o f balance mass on
the free end o f the mandrel. The wheel tested under the cornering fatigue test must
complete the minimum number of test cycles prior to test termination. The test shall be
terminated when the operation deflection exceeds the initial deflection at point of load
application by 20%. Broken studs or other parts o f the test fixture do not require test
termination but may result in damage to the wheel and test invalidation.
Spoke
Hub
Bottom Flange
Mandrel Arm Length
Mandrel
Bending Load
Figure 2-6. Schematic diagram of wheel cornering fatigue test [48].
- 2 7 -
Reproduced with permission of the copyright owner. Further reproduction prohibited without permission.
2.6. Material Yield and Fatigue Failure Criteria
Under certain circumstances o f loading a wheel is often subjected to a
combination o f tensile, compressive, and/or shear stresses. For the purposes o f analysis, it
is convenient to reduce such systems o f combined stresses to a basic system of stress
coordinates known as principal stresses [49]. The normal stresses ( a x and crv) and the
shear stress ( t ) vary smoothly with respect to the rotation angle 0 , in accordance with
the coordinate transformation equations [50].
2.6.1. Maximum Shear Stress Failure Criterion
The failure criteria are to predict or estimate the failure/yield o f machine parts and
structural members. A considerable number o f theories have been proposed. Materials
with a larger elongation can be considered ductile and those with a lower value are brittle.
All popular failure criteria rely on only a handful o f basic tests (such as uniaxial tensile
and/or compression strength), even though most machine parts and structural members
are typically subjected to multi-axial loading [51].
The maximum shear stress criterion, also known as Tresca's criterion [52], is often
used to predict the yielding of ductile materials. Yield in ductile materials is usually
caused by the slippage of crystal planes along the maximum shear stress surface.
Therefore, a given point in the body is considered safe as long as the maximum shear
stress at that point is under the shear stress (one half o f the yield strength S obtained
from a uniaxial tensile test) at material yield. With respect to two dimensional (2D)
stress, the maximum shear stress is related to the difference in the two principal stresses.
Therefore, the criterion requires the principal stress difference and the principals stress
- 2 8 -
Reproduced with permission of the copyright owner. Further reproduction prohibited without permission.
themselves to be less than the material yield strength, which is expressed in Equation 2-1.
Graphically, the maximum shear stress criterion requires that the two principal stresses
should be within the gray zone and inside the dashed line.
2.6.2. von Mises Stress Failure Criterion
The von Mises stress failure criterion, also known as the maximum distortion
energy criterion, octahedral shear stress theory, or Maxwell-Huber-Hencky von Mises
stress theory [53], is often used to estimate the yield performance o f ductile materials.
The three dimensional distortion energy theories can be described by a circular cylinder
inclined to the principle stress axes as shown in Figure 2-7. The interior o f this cylinder
defines the region safe against yielding for combined the principle stresses. The axis of
the cylinder is the locus of all hydrostatic stress and extends to positive and negative
infinity. The intersections o f this cylinder with each o f the three principle planes are
ellipses as shown in Figure 2-7. The von Mises stress criterion states that failure occurs
when the energy o f distortion reaches the same energy for yield failure in uniaxial
tension. Mathematically, this is expressed in equation 2-2.
| o - j j < ^ , I <r2\ < S y, and \ox-<T2\<,Sy (2-1)
(2-2)
- 2 9 -
Reproduced with permission of the copyright owner. Further reproduction prohibited without permission.
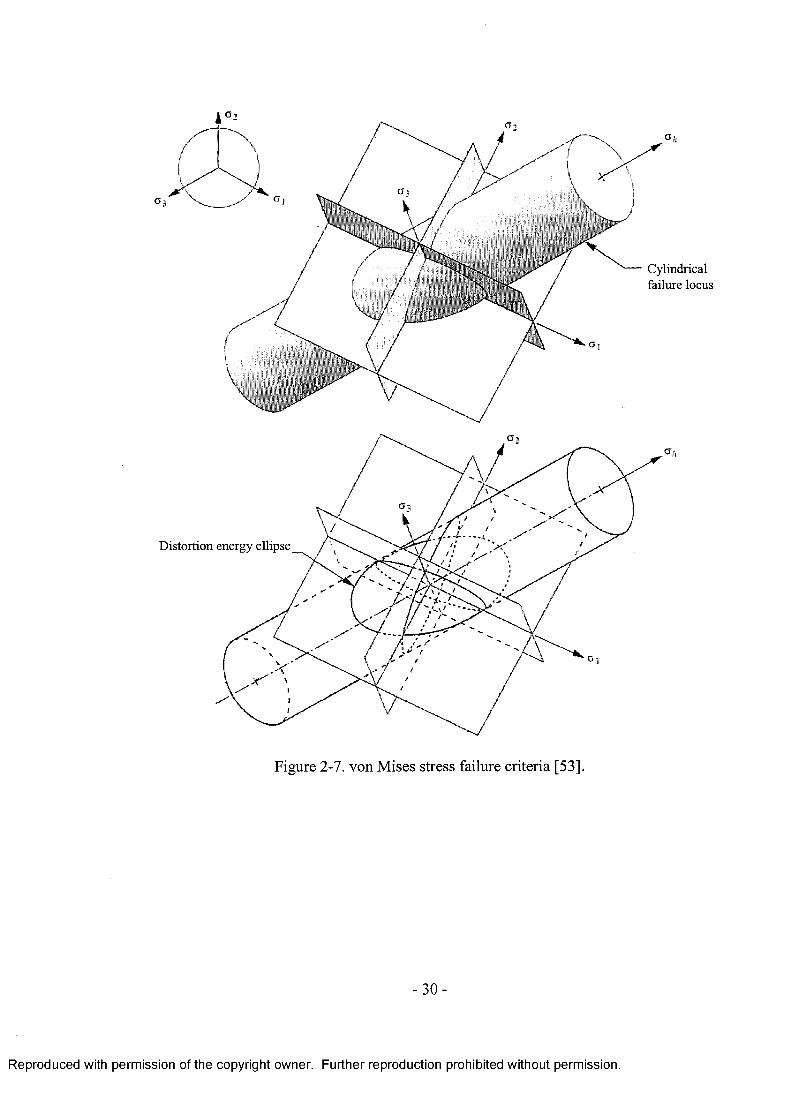
Figure 2-7. von Mises stress failure criteria [53].
- 3 0 -
Reproduced with permission of the copyright owner. Further reproduction prohibited without permission.
2.6.3. Fatigue Failure Criteria under Multi-stresses
Among the current fatigue failure criteria, the stress-based models are the most
often used for high cycle fatigue (HCF) applications where the part is expected to last for
more than about 103 cycles [54], Most applications involve nonzero mean cyclic stresses
and fatigue failure is very sensitive to the magnitude o f the mean stress in the tensile
mean stress region. Historically, alternating stress amplitude cra versus mean stress a m
has been the object o f numerous empirical curve fitting attempts [55]. Figure 2-8
illustrates the Goodman line, Gerber parabola and Soderberg line plotted on crm - a a axes
for fluctuating stress fatigue failure criteria. When designing parts subjected to mean and
alternating stresses, the Goodman linear relationship is the most commonly used failure
criterion. The Goodman line intersects the fatigue strength S f on the a a axis and the
ultimate tensile strength Sut on the a m axis. The safety factor n for any fluctuating stress
state depends on the manner in which the mean and alternating components can vary with
respect to one another in service, and the material properties, which is defined by
equation (2-3).
Stress is generally distributed as a continuously varying function with the
continuum of material. Every infinitesimal element o f the material can conceivably
experience different stresses at the same time. It is quite usual in mechanical design to
have combined loads that create simultaneous time varying biaxial or triaxial stresses at
an infinitesimal element. These normal and shear components o f stresses can be
-31 -
Reproduced with permission of the copyright owner. Further reproduction prohibited without permission.
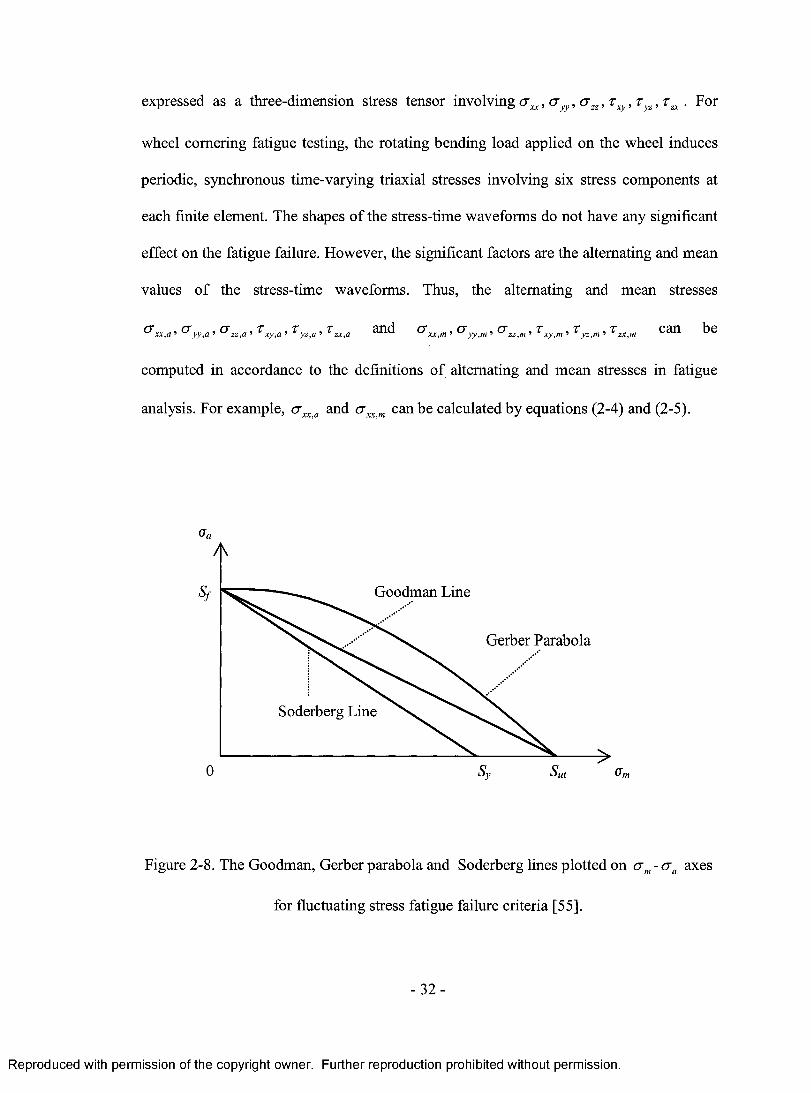
expressed as a three-dimension stress tensor involving a xx, a , crzz, v , r yz, r zx. For
wheel cornering fatigue testing, the rotating bending load applied on the wheel induces
periodic, synchronous time-varying triaxial stresses involving six stress components at
each finite element. The shapes o f the stress-time waveforms do not have any significant
effect on the fatigue failure. However, the significant factors are the alternating and mean
values o f the stress-time waveforms. Thus, the alternating and mean stresses
® xx,a ’ ® yy ,a ’ ® ’ zz,a ’ ^xy ,a ’ ^ y z ,a > ^ zx ,a 3n d G xx,m ’ ® yy,m ’ ^ z z ,m ’ ^xy,m ’ ^yz ,m ’ ^zx,m Can b e
computed in accordance to the definitions o f alternating and mean stresses in fatigue
analysis. For example, o xx a and Gxx m can be calculated by equations (2-4) and (2-5).
oa
Goodman Line
Gerber Parabola
Soderberg Line
S u t0
Figure 2-8. The Goodman, Gerber parabola and Soderberg lines plotted on o m - o a axes
for fluctuating stress fatigue failure criteria [55].
- 3 2 -
Reproduced with permission of the copyright owner. Further reproduction prohibited without permission.
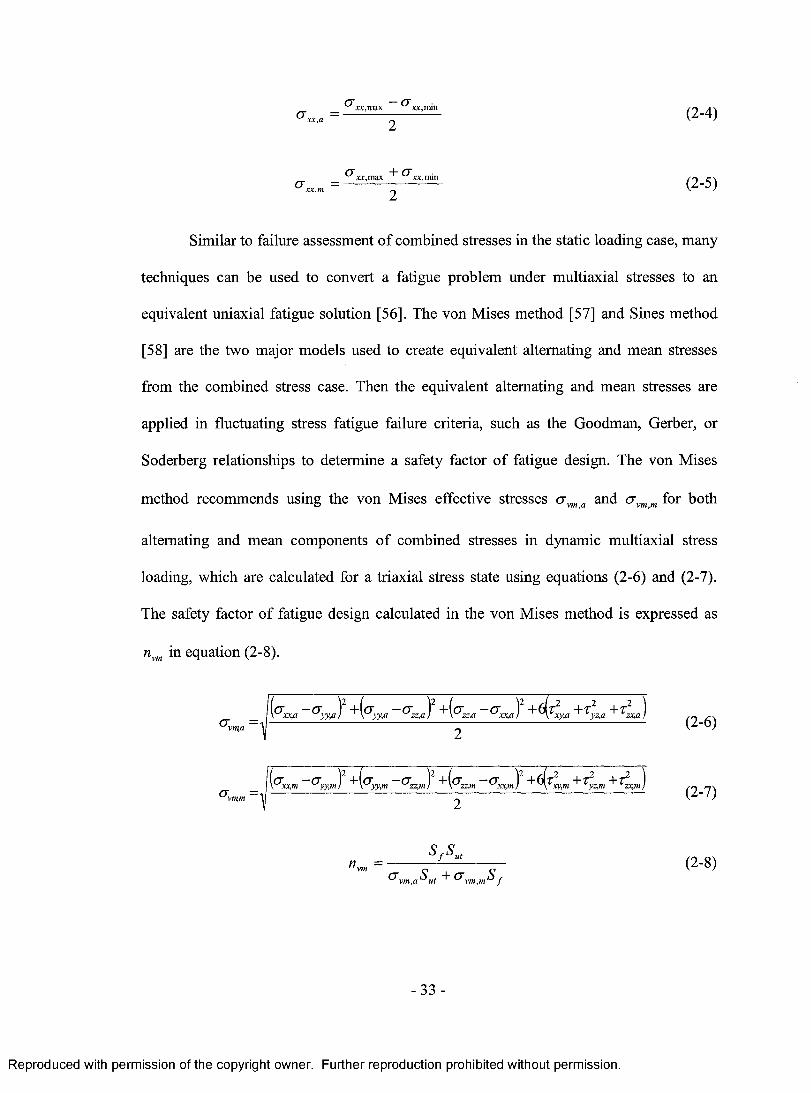
Similar to failure assessment o f combined stresses in the static loading case, many
techniques can be used to convert a fatigue problem under multiaxial stresses to an
equivalent uniaxial fatigue solution [56]. The von Mises method [57] and Sines method
[58] are the two major models used to create equivalent alternating and mean stresses
from the combined stress case. Then the equivalent alternating and mean stresses are
applied in fluctuating stress fatigue failure criteria, such as the Goodman, Gerber, or
Soderberg relationships to determine a safety factor o f fatigue design. The von Mises
method recommends using the von Mises effective stresses crvm a and crvm m for both
alternating and mean components o f combined stresses in dynamic multiaxial stress
loading, which are calculated for a triaxial stress state using equations (2-6) and (2-7).
The safety factor o f fatigue design calculated in the von Mises method is expressed as
nvm in equation (2-8).
(2-6)
CT (2-7)
n.vm (2-8)
-33 -
Reproduced with permission of the copyright owner. Further reproduction prohibited without permission.
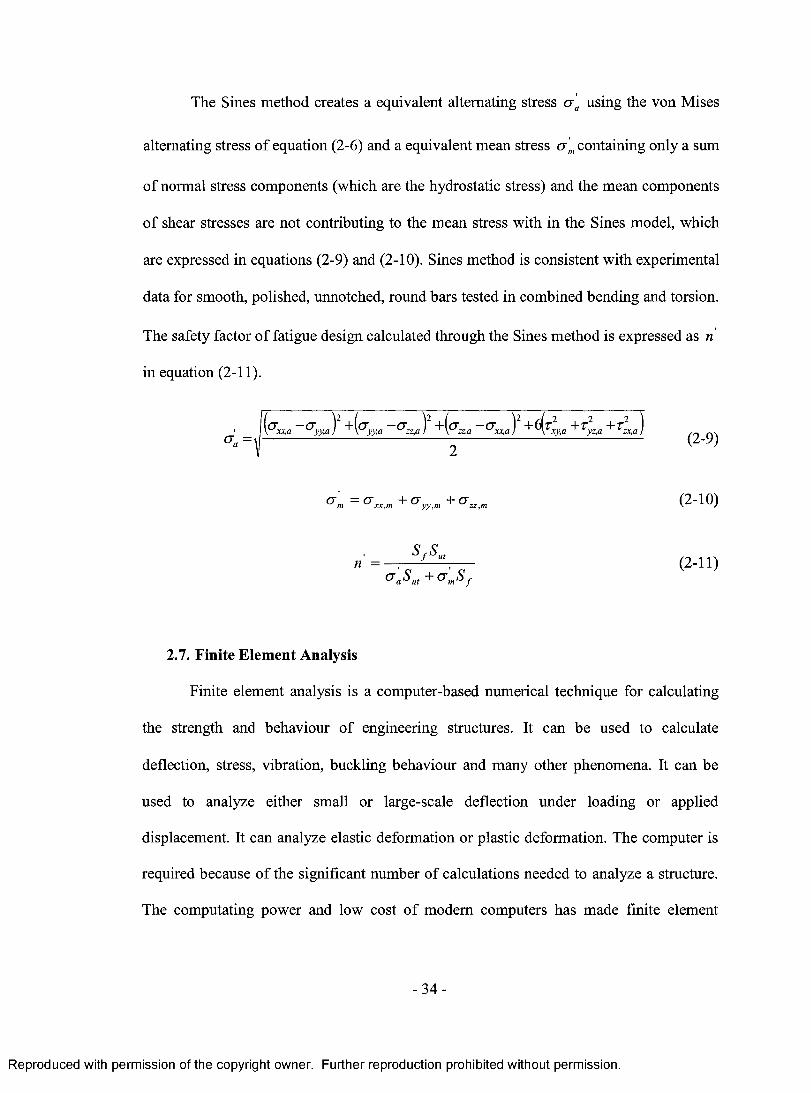
The Sines method creates a equivalent alternating stress o a using the von Mises
alternating stress o f equation (2-6) and a equivalent mean stress a m containing only a sum
of normal stress components (which are the hydrostatic stress) and the mean components
o f shear stresses are not contributing to the mean stress with in the Sines model, which
are expressed in equations (2-9) and (2-10). Sines method is consistent with experimental
data for smooth, polished, unnotched, round bars tested in combined bending and torsion.
The safety factor o f fatigue design calculated through the Sines method is expressed as n
in equation (2-11).
' - ' Ii^ x x a ^yy,a ) ~^~ip'yy,a ^ zz,a ) "^ (^ z z a - 0 2 + 6 f e a + < « + < J
\l 2(2-9)
G m ~ a xx,m + V y y .m + ° z z ,m C2' 10)
n = , SfSut~----- (2-11)v aS ut+crmS f
2.7. Finite Element Analysis
Finite element analysis is a computer-based numerical technique for calculating
the strength and behaviour of engineering structures. It can be used to calculate
deflection, stress, vibration, buckling behaviour and many other phenomena. It can be
used to analyze either small or large-scale deflection under loading or applied
displacement. It can analyze elastic deformation or plastic deformation. The computer is
required because o f the significant number o f calculations needed to analyze a structure.
The computating power and low cost o f modem computers has made finite element
- 3 4 -
Reproduced with permission of the copyright owner. Further reproduction prohibited without permission.
analysis available to many disciplines and various industries [59]. In finite element
modeling, a structure is broken down into many small elements. The behaviour o f an
individual element can be described with a relatively simple set o f equations. Just as the
set of elements would be joined together to build the whole structure, the equations
describing the behaviours o f the individual elements are joined into an extremely large
set of equations that describe the behaviour o f the whole structure. The computer can
solve this large set o f simultaneous equations. From this, the stress and deflection o f all
the parts o f the structure can be predicted. The stresses are compared to allowed values o f
stress for the materials to be used, to see if the structure is strong enough.
Finite element modeling analysis is done principally with commercially
purchased software [60]. Finite element packages may include pre-processors that can be
used to create the geometry o f the structure, or to import it from CAD files generated by
other software. The FEA software includes modules to create the element mesh, to
analyze the defined problem, and to review the results o f the analysis. Output can be in
printed form, and plotted results, such as contour maps o f stress, deflection plots, and
graphs o f output parameters. An analysis can take minutes, hours, or days. Extremely
complex models could be run on supercomputers. Depending on the complexity o f the
structures to be studied and the volume o f manufacturing, the expense for FEA hardware
can be trivial in comparison with the savings in manufacturing cost and design revisions
that can result from design improvements, and speed o f analysis. Moreover, the expense
can be very small in comparison to the cost o f a failure. However, the development o f a
FE modal needs an in-depth understanding o f engineering mechanics and material
science and engineering, as well as the fundamentals o f the theory underlying the finite
-35 -
Reproduced with permission of the copyright owner. Further reproduction prohibited without permission.
element method. The basics o f numerical methods have to be appreciated. Use o f a
particular finite element program requires familiarity with the interface o f the program in
order to create and load the models, and to review the results. To do the work well
requires experience, comprehension of structures and their classical (manual analytical)
analysis, an understanding o f a variety of FEA modeling issues, and an appreciation of
the specialized field in which the design work is taking place [61]. Moreover, it is critical
to have accurate material properties as input for reliable prediction o f stress and strain
distribution resulting from complex loading conditions o f automotive components.
2.8. Wheel Impact and Fatigue Numerical Modeling
Russo [62] has identified two main aspects to be considered in wheel design
evaluation for impact resistance, wheel solid geometry and its material properties. The
geometrical aspect of the design must be assessed for its influence on structural
performance. The mechanical properties o f the wheel material must be evaluated and
compared with published data or calculated strains. For example, a typical development
cycle might start by creating or modifying an initial wheel design based upon sound
engineering judgment and design criteria within the customer’s styling requirements.
Then, a finite element analysis could be performed on the initial design is to model the
plastic strains produced during impact loading. The FE calculated plastic strains can then
be compared to known material properties o f strength and ductility. If the FEA modeled
strains exceed the material’s ability to accommodate plastic strain, the problem may be
resolved in two ways. Geometrical design changes may be considered to reduce the
plastic strain. A modification in the manufacturing process o f the wheel could be another
- 3 6 -
Reproduced with permission of the copyright owner. Further reproduction prohibited without permission.
alternative for producing the required material properties. However, no detailed material
properties obtained from experimental testing were integrated in Russo’s model.
Linear elastic stress FEA was employed by Kao et al [63] to model an impact
loading on a wheel and tire assembly. However, this approach provides only a qualitative
picture o f general stress patterns. Linear FEA cannot provide any meaningful quantitative
stress or strain calculations that are useful in design. It can be reasonably successful in
identifying regions o f high stresses, but cannot determine the actual stress or strain levels
because impact is an inherently nonlinear event. The strains produced by impact testing
nearly always exceed the elastic limit, at least in the regions o f interest. By modeling the
nonlinear portion o f the stress-strain response, and not just the linear-elastic portion, it is
possible to accurately simulate the effects o f impact loading. Every aspect o f the wheel’s
impact behaviour is accurately predicted by the dynamic nonlinear FEA. However, the
tire as a rubber material with air pressure inside is not easy to model and always
eliminated. The influence o f the tire in absorbing some of the energy o f the impact event
was approximately by subtracting a specified percentage from the kinetic energy o f the
striker mass. The percentage used in the simulations was estimated from observations of
the rebound behaviour of the striker mass. But, a well accepted value does not exist.
Since the wheel is subjected to repeated cyclic loads, the most important concern
during wheel development and testing is fatigue performance [64]. One o f the most
common tests employed to assess wheel fatigue life is the cornering fatigue test where a
rotating bending moment on the hub is applied. Metal fatigue has been traditionally
linked to stress. Several fatigue assessment approaches are based upon the stress concept
and material S-N curves. Karandikar and Fuchs [65] used implicit static approaches to
- 3 7 -
Reproduced with permission of the copyright owner. Further reproduction prohibited without permission.
simulate the stress distribution when a bending moment was applied in a specified
direction and at a specified location. Then, the maximum values o f the first principle
stress or von Mises stress among the critical regions o f the wheel are compared with the
material fatigue strength to assess the fatigue performance of the wheel design. However,
this method can not reflect the effect o f mean stress component on the multiaxial stress
cases. With the development o f dynamic FE software, more effective approaches of
wheel fatigue numerical modeling have become to be a new developing direction for
wheel design.
2.9. Summary
Based upon the literature reviewed, several observations can be made concerning
wheel impact and cornering fatigue testing:
Lightweight wheels are mainly made of cast aluminum in the current wheel
market because forged and sheet aluminum wheels have not become popular for
commercial reasons. Magnesium forged wheels are used primarily for special race
application with obvious advantages compared with magnesium cast wheels. However,
the detailed information on design optimization and engineering performance of
lightweight wheels, which should be investigated using a systematic and cost-effective
approach, is scarce in the public domain.
It is well accepted that wheel impact testing, with other rotary fatigue tests, is the
essential method o f wheel design and development to ensure that the developed wheel
meets the necessary performance and durability requirements. But those wheel test
methods are very time consuming and expensive since prolonged lead time is required to
- 3 8 -
Reproduced with permission of the copyright owner. Further reproduction prohibited without permission.
make costly prototype wheels for testing. Although numerical simulation of wheel impact
tests can significantly reduce the time and cost required finalizing a wheel design, there is
little documentation regarding the wheel impact and fatigue testing simulations in the
open literature.
Furthermore, no publications document the impact collision between a steel
striker and a deformable elastic-plastic lightweight wheel incorporating a rubber tire
within air pressure, analyzed through dynamic nonlinear FE methods. No work has been
performed on numerical simulations o f wheel impact test incorporating material
variations using dynamic nonlinear FE methods. Further, minor experimental verification
o f numerical predictions has been conducted. No publications described the dynamic
numerical modeling o f wheel cornering fatigue test and performed the finite element
stress-based fatigue analysis.
- 3 9 -
Reproduced with permission of the copyright owner. Further reproduction prohibited without permission.
Chapter 3
EXPERIMENTAL PROCEDURE
3.1. Chemical Composition 41
3.1.1. Cast Aluminum Wheel 41
3.1.2. Forged Magnesium Wheel 42
3.2. Material Analysis 43
3.2.1. Preparation for Metallographic Specimens 43
3.2.2. Microstructural Analysis 44
3.2.3. Density Measurement 46
3.2.4. Tensile and Fatigue Testing 46
3.3. Wheel Impact Test 50
3.3.1. Test Setup 50
3.3.2. Testing Procedures 51
3.3.3. Impact Locations 52
3.4. Wheel Cornering Fatigue Test 54
3.4.1. Test Setup 54
3.4.2. Test Procedures 55
- 4 0 -
Reproduced with permission of the copyright owner. Further reproduction prohibited without permission.

3. EXPERIMENTAL PROCEDURE
3.1. Chemical Composition
3.1.1. Cast Aluminum Wheel
A 14-spoke cast aluminum wheel (16 inch) manufactured with aluminum alloy
A356 by Superior Industries International Inc., in Van Nuys, CA, USA, that appears in
Figure 3-1, was investigated,. Table 3-1 lists the alloy designation [66] of aluminum alloy
A3 56 and the average chemical composition of the tested aluminum wheels.
Table 3-1. Chemical composition of aluminum cast wheels
Alloy Si Mg Cu Mn Fe Zn Others
ASTM A356 6.5-7.5 0.25-0.45 <0.2 <0.1 <0.2 <0.1 <0.1
Sample 6.9 0.33 0.1 0.01 0.16 0.01 -
Figure 3 -1 .14-spoke cast aluminum wheel.
-41 -
Reproduced with permission of the copyright owner. Further reproduction prohibited without permission.
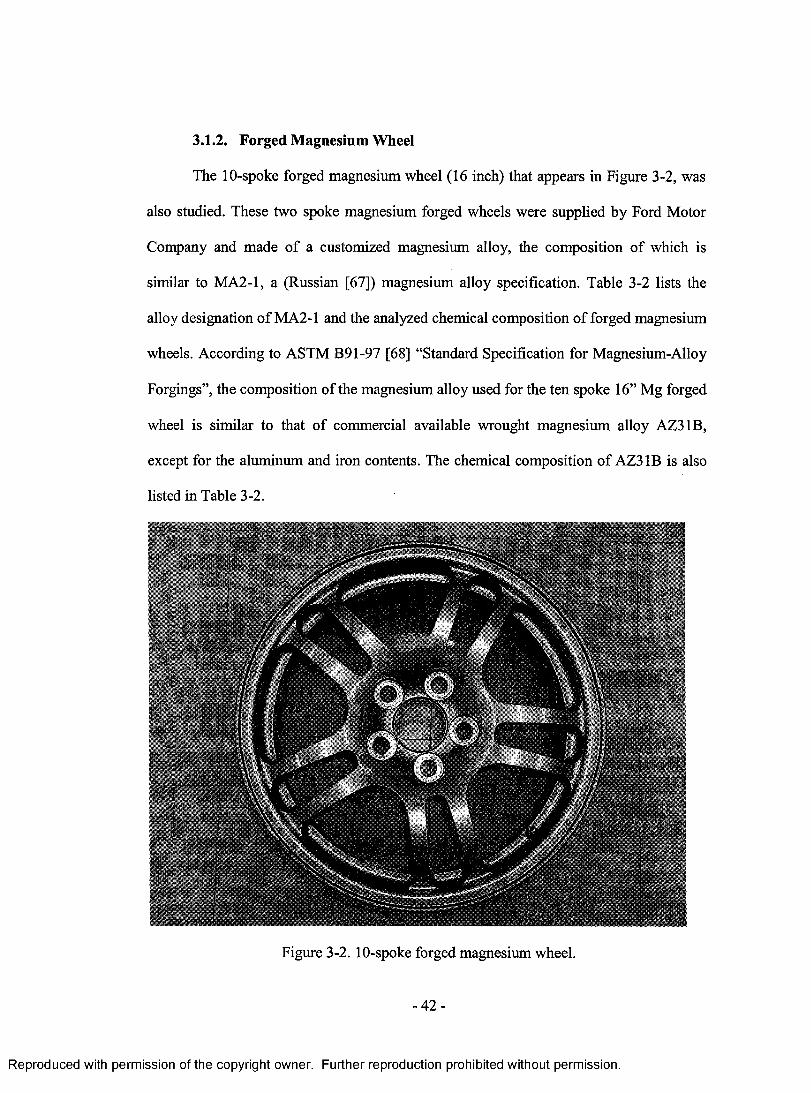
3.1.2. Forged Magnesium Wheel
The 10-spoke forged magnesium wheel (16 inch) that appears in Figure 3-2, was
also studied. These two spoke magnesium forged wheels were supplied by Ford Motor
Company and made of a customized magnesium alloy, the composition of which is
similar to MA2-1, a (Russian [67]) magnesium alloy specification. Table 3-2 lists the
alloy designation of MA2-1 and the analyzed chemical composition of forged magnesium
wheels. According to ASTM B91-97 [68] “Standard Specification for Magnesium-Alloy
Forgings”, the composition of the magnesium alloy used for the ten spoke 16” Mg forged
wheel is similar to that of commercial available wrought magnesium alloy AZ31B,
except for the aluminum and iron contents. The chemical composition of AZ31B is also
listed in Table 3-2.
Figure 3-2. 10-spoke forged magnesium wheel.
- 4 2 -
Reproduced with permission of the copyright owner. Further reproduction prohibited without permission.

Table 3-2. Chemical composition of magnesium forged wheels
AlloyA1
(wt%)
Zn
(wt%)
Mn
(wt%)
Cu
(wt%)
Ni
(wt%)
Si
(wt%)
Be
(wt%)
Fe
(wt%)
Others
(wt%)
MA2-1
(Russia)3.8-5 0.8-1.5 0.3-0.7 <0.05 <0.004 <0.1 <0.002 <0.04 <0.3
AZ31B
(ASTM B9)2.5-3.5 0.6-1.4 0.2-1.0 <0.05 <0.005 <0.1 - <0.005 <0.3
Wheel
Sample4.2 0.87 0.36 0.01 0.001 0.01 - 0.015 -
3.2. Material Analysis
3.2.1. Preparation for Metallographic Specimens
Specimens chosen for metalllographic examination should be extracted from
representative regions. With such consideration, specimens out o f longitudinal and
transverse directions of forged magnesium wheels, and thin/thick regions of cast
aluminum wheels were selected and prepared. The procedures o f specimen preparation
mainly include sectioning, mounting, grinding, polishing and etching [69],
a) Sectioning
Specimens were removed from the wheels through the use of a belt saw. Care was
exercised to prevent cold working of the metal, which may alter the
microstructure.
b) Mounting
Specimens were mounted in one of the common plastic mounting materials, such
as a cold mounting material, epoxy to be held for grinding and polishing.
- 4 3 -
Reproduced with permission of the copyright owner. Further reproduction prohibited without permission.

c) Grinding
Dry and wet grinding was performed with abrasive rotating disks and sand papers
with grit size from 260 to 2400. Abrasives used for grinding were alumina (AI2O3)
and silicon carbide.
d) Polishing
Mechanical polishing was performed in two stages. Rough polishing removed the
major part of the disturbed metal remaining after the final grinding step. Finish
polishing removed the superficial scratches that remain after rough polishing.
e) Etching
The etching at the aluminum casting and magnesium forging specimens was
different in terms of the etchants and etching times. For etching the aluminum
casting, the etchant was Nital (5 ml HNO3 and 100 ml ethanol, 95%) and etching
time was 10 seconds. Acetic glycol (20 ml acetic acid, 1 ml HNO3, 60 ml ethylene
glycol and 20 ml water) was used for etching the forged magnesium and an
etching time of 8 seconds was used.
3.2.2. Microstructural Analysis
Etched specimens were observed using an optical microscope Axiovert 25, and
analyzed using a Buehler Omnimet digital image analysis system. Metallographic
specimens were also investigated by a JSM-5800LV electronic scanning microscope
(SEM) equipped with an energy dispersive spectrometer (EDS) with element detectors to
identify the existing phases. Figures 3-3 and 3-4 show the Axiovert 25 optical microscope
and JSM-5800LV electronic scanning microscope.
- 4 4 -
Reproduced with permission of the copyright owner. Further reproduction prohibited without permission.
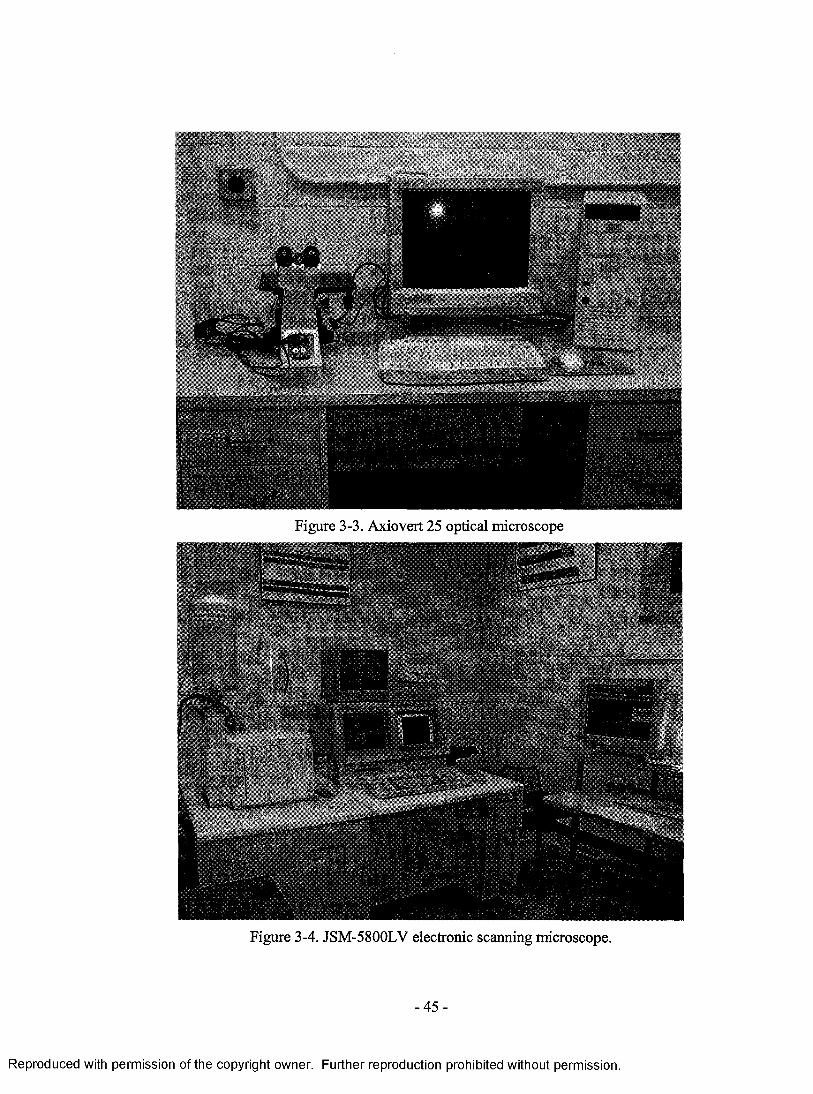
Figure 3-3. Axiovert 25 optical microscope
Figure 3-4. JSM-5800LV electronic scanning microscope.
- 4 5 -
Reproduced with permission of the copyright owner. Further reproduction prohibited without permission.
3.2.3. Density Measurement
Metal density measurements were completed in accordance to ASTM standard
D3 800-99 (2004) [70]. Metal samples were weighed in the air and distilled water. The
actual density Da of the metal sample was determined by equation 3-1.
D . = W ' D j t y . - W . ) (3-1)
where Wa and Ww were the weight of the sample in the air and distill water, respectively,
and Dw was the density o f the distilled water.
3.2.4. Tensile and Fatigue Testing
Tensile testing is widely used to provide basic design information on the strength
of materials and as an acceptance test for the specification of materials. During testing, a
specimen is subjected to a continually increasing uniaxial load (force), while
simultaneous observations are made of the elongation at the specimen. In this study,
tensile test specimens were extracted from the different regions o f the wheels, such as
spoke and rim, and machined to fit the subsize specimen dimensions in compliance with
ASTM standard B 557M-94 [71]. Subsize tensile specimens were extracted in the major
stress axis direction, which was parallel to the main geometry direction of each kind of
specimen. Figure 3-5 illustrates the locations of tensile specimens extracted from the
wheel in both rim and spoke regions. Tensile testing was carried out with a gauge length
of 25.4 mm at ambient temperature on a computer controlled INSTRON 8562 tensile
testing machine equipped with a data acquisition system, as shown in Figure 3-6. Each
specimen was loaded in tension at a controlled strain rate of 1.6 x 10'3 (1/s) [72], Due to
the sensitivity o f magnesium tensile specimens to premature fracture at punch marks, the
- 4 6 -
Reproduced with permission of the copyright owner. Further reproduction prohibited without permission.

total elongation was determined by using an extensometer, which are effective for
measuring the elongation during the entire tensile test with sufficient precision. An
extensometer was positioned in the gauge region of the specimen. The automated data
acquisition system generated the load versus engineering strain curve and provided the
values for yielding load, peak load, fracture load, yield stress, maximum stress, fracture
stress, and percent elongation. Figure 3-7 illustrates representative tensile specimens.
Tensile specimens from spokes
Tensile specimens from rim
Figure 3-5. Locations and directions of subsize tensile specimens.
- 4 7 -
Reproduced with permission of the copyright owner. Further reproduction prohibited without permission.
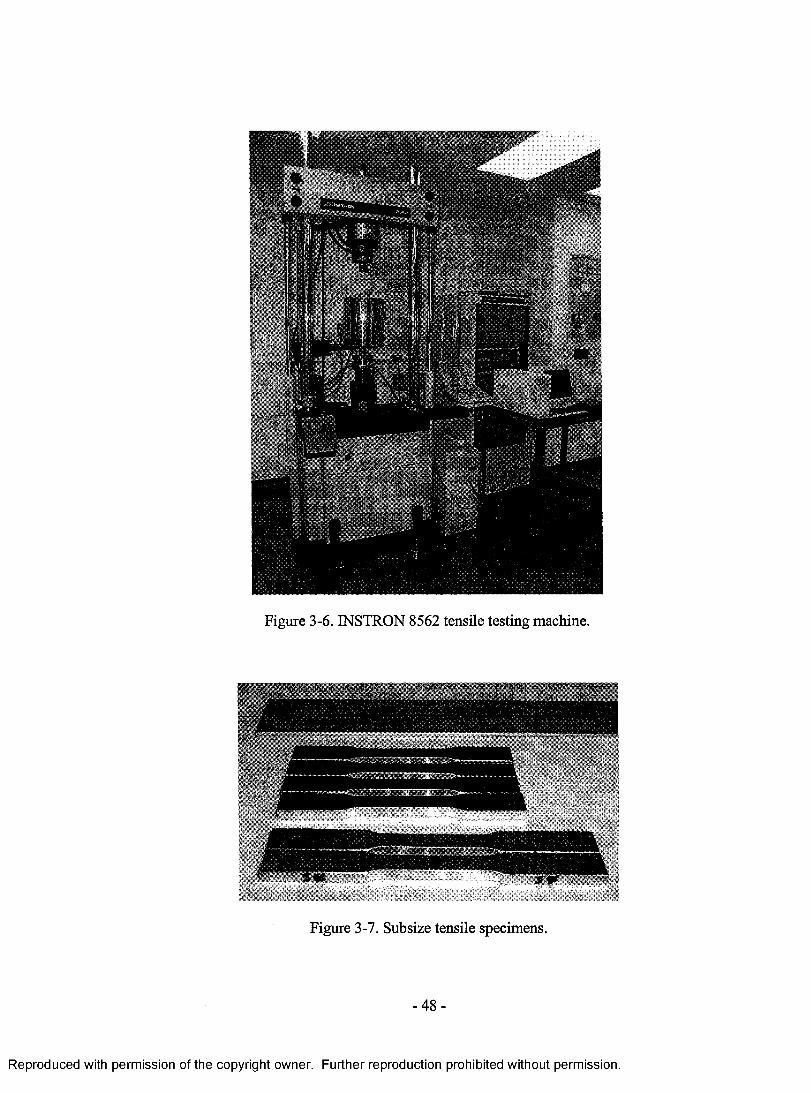
Figure 3-6. INSTRON 8562 tensile testing machine.
Figure 3-7. Subsize tensile specimens.
- 4 8 -
Reproduced with permission of the copyright owner. Further reproduction prohibited without permission.

Fatigue testing is usually conducted by employing the R. R. Moore [73] rotating
beam test in which a slightly smaller tensile test specimen is loaded as a beam in bending
while undergoing rotation. The rotation of the beam causes any one point on the surface
to undergo compression/tension loading. The test is continued at a particular stress level
until the part fractures, and the number of cycles is then noted. Many samples of the same
material are tested at various stress levels until a S-N curve is generated. It depicts the
breaking strength of a particular material at various numbers of repeated cycles of fully
reversed stress. Fatigue experiments were performed with the specimens extracted from
the spoke of the magnesium forged wheel. Figure 3-8 illustrates the dimensions of fatigue
specimens used in the present fatigue testing, which was determined based upon ASTM
standard E466-96 [74] and the geometry of the wheels. The surfaces of the specimens
were polished parallel to the specimen axis prior to the fatigue investigations with
abrasive paper of grade 1000 in order to eliminate notches and to obtain a smooth
surface. The high-frequency resonance testing method was used in order to perform
lifetime investigations in the very high-cycle regime up to 109 cycles. Using this method,
specimens were excited to longitudinal resonance vibrations at frequencies (30 Hz). This
led to sinusoidal cyclic loading with maximum load amplitude in the centre of the
specimen. Strain amplitudes were measured using strain gauges, and stresses were
calculated using the measured cyclic strain and Young’s modulus according to the
Hooke’s law. The fatigue experiments were performed with constant cyclic loads, and no
static preload was superimposed (fully reversed loading conditions, load ratio i?=-T).
- 4 9 -
Reproduced with permission of the copyright owner. Further reproduction prohibited without permission.
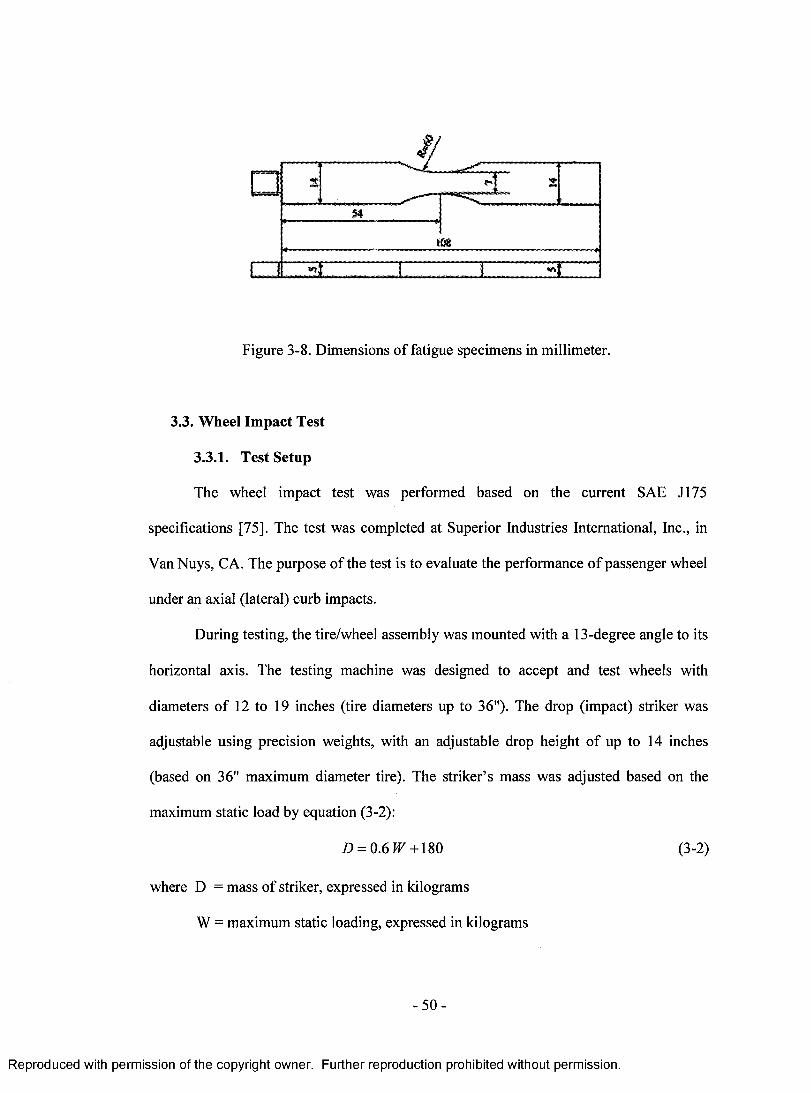
•>
Figure 3-8. Dimensions of fatigue specimens in millimeter.
3.3. Wheel Impact Test
3.3.1. Test Setup
The wheel impact test was performed based on the current SAE J175
specifications [75]. The test was completed at Superior Industries International, Inc., in
Van Nuys, CA. The purpose of the test is to evaluate the performance of passenger wheel
under an axial (lateral) curb impacts.
During testing, the tire/wheel assembly was mounted with a 13-degree angle to its
horizontal axis. The testing machine was designed to accept and test wheels with
diameters of 12 to 19 inches (tire diameters up to 36"). The drop (impact) striker was
adjustable using precision weights, with an adjustable drop height of up to 14 inches
(based on 36" maximum diameter tire). The striker’s mass was adjusted based on the
maximum static load by equation (3-2):
D = 0.6 W + 180 (3-2)
where D = mass of striker, expressed in kilograms
W = maximum static loading, expressed in kilograms
- 5 0 -
Reproduced with permission of the copyright owner. Further reproduction prohibited without permission.
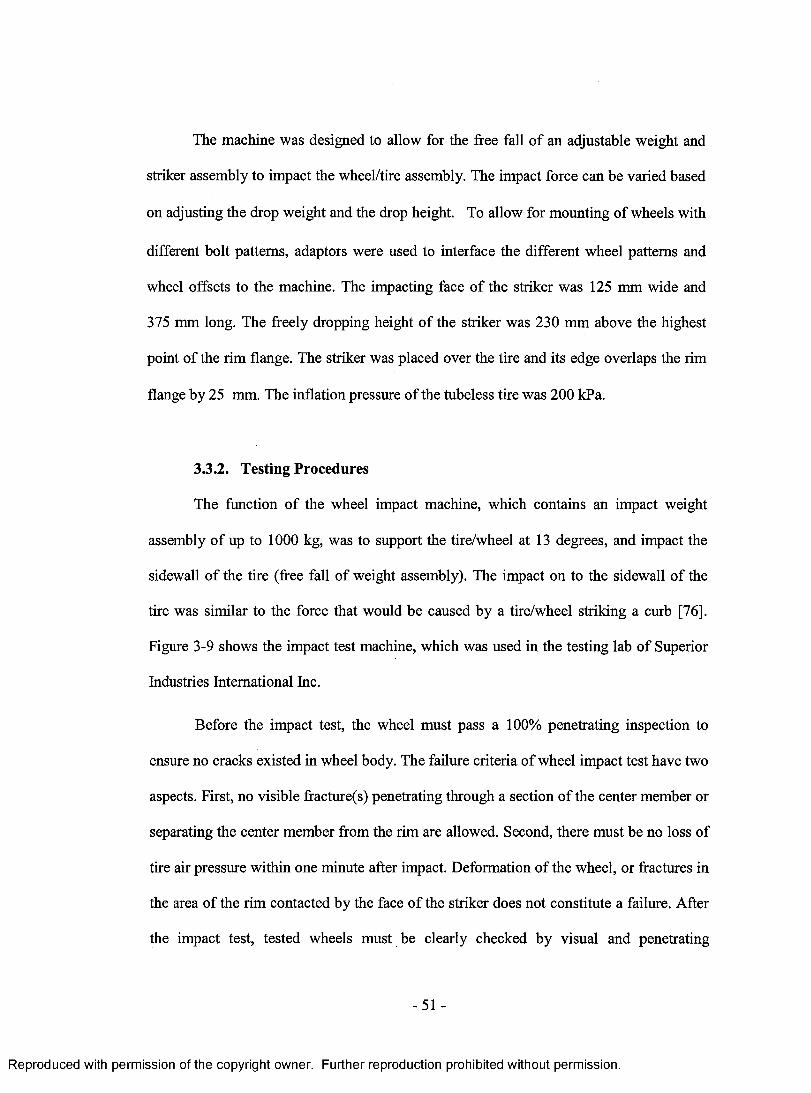
The machine was designed to allow for the free fall of an adjustable weight and
striker assembly to impact the wheel/tire assembly. The impact force can be varied based
on adjusting the drop weight and the drop height. To allow for mounting of wheels with
different bolt patterns, adaptors were used to interface the different wheel patterns and
wheel offsets to the machine. The impacting face of the striker was 125 mm wide and
375 mm long. The freely dropping height of the striker was 230 mm above the highest
point of the rim flange. The striker was placed over the tire and its edge overlaps the rim
flange by 25 mm. The inflation pressure of the tubeless tire was 200 kPa.
3.3.2. Testing Procedures
The function of the wheel impact machine, which contains an impact weight
assembly of up to 1000 kg, was to support the tire/wheel at 13 degrees, and impact the
sidewall of the tire (free fall of weight assembly). The impact on to the sidewall of the
tire was similar to the force that would be caused by a tire/wheel striking a curb [76].
Figure 3-9 shows the impact test machine, which was used in the testing lab of Superior
Industries International Inc.
Before the impact test, the wheel must pass a 100% penetrating inspection to
ensure no cracks existed in wheel body. The failure criteria of wheel impact test have two
aspects. First, no visible fracture(s) penetrating through a section of the center member or
separating the center member from the rim are allowed. Second, there must be no loss of
tire air pressure within one minute after impact. Deformation of the wheel, or fractures in
the area of the rim contacted by the face of the striker does not constitute a failure. After
the impact test, tested wheels must be clearly checked by visual and penetrating
-51 -
Reproduced with permission of the copyright owner. Further reproduction prohibited without permission.
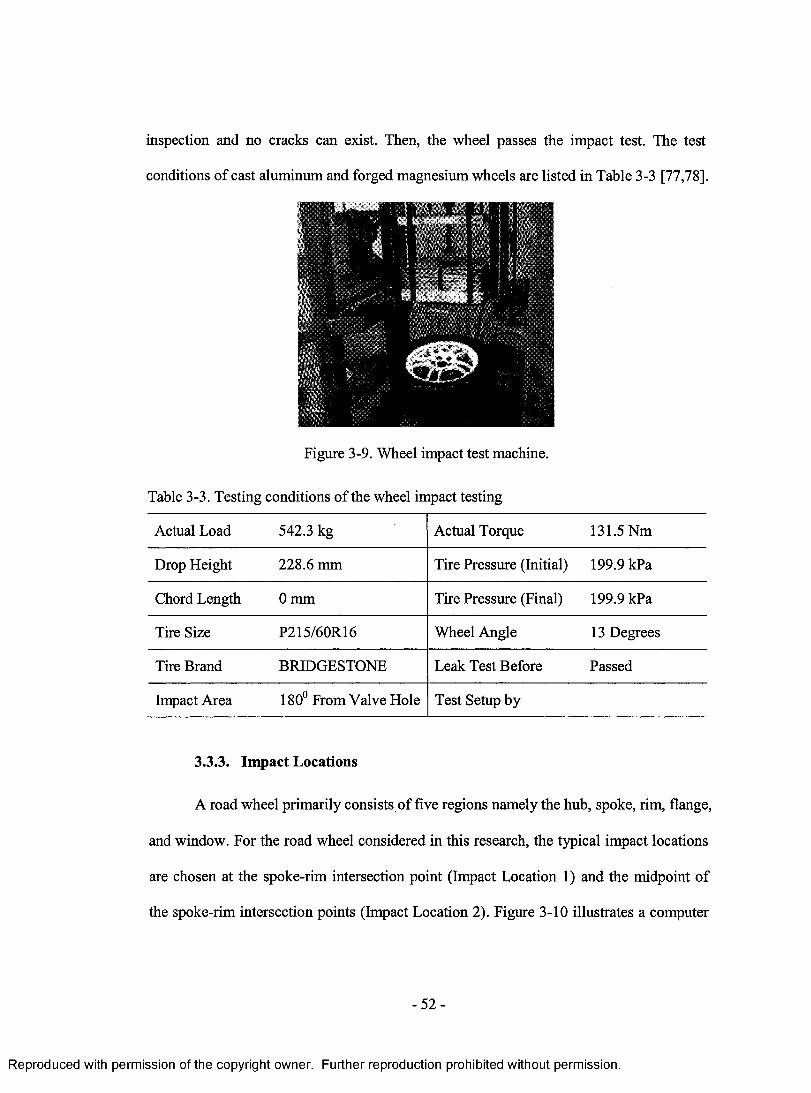
inspection and no cracks can exist. Then, the wheel passes the impact test. The test
conditions of cast aluminum and forged magnesium wheels are listed in Table 3-3 [77,78].
Figure 3-9. Wheel impact test machine.
Table 3-3. Testing conditions of the wheel impact testing
Actual Load 542.3 kg Actual Torque 131.5 Nm
Drop Height 228.6 mm Tire Pressure (Initial) 199.9 kPa
Chord Length 0 mm Tire Pressure (Final) 199.9 kPa
Tire Size P215/60R16 Wheel Angle 13 Degrees
Tire Brand BRIDGESTONE Leak Test Before Passed
Impact Area 180° From Valve Hole Test Setup by
3.3.3. Impact Locations
A road wheel primarily consists of five regions namely the hub, spoke, rim, flange,
and window. For the road wheel considered in this research, the typical impact locations
are chosen at the spoke-rim intersection point (Impact Location 1) and the midpoint of
the spoke-rim intersection points (Impact Location 2). Figure 3-10 illustrates a computer
- 5 2 -
Reproduced with permission of the copyright owner. Further reproduction prohibited without permission.
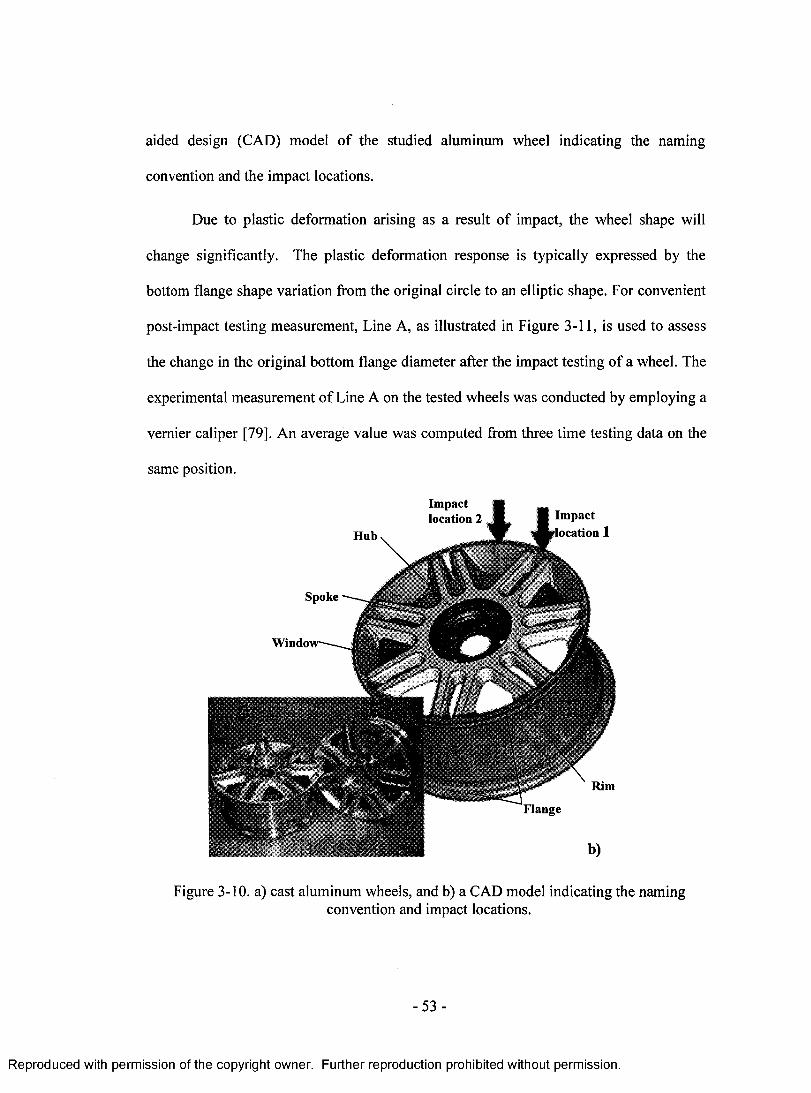
aided design (CAD) model of the studied aluminum wheel indicating the naming
convention and the impact locations.
Due to plastic deformation arising as a result of impact, the wheel shape will
change significantly. The plastic deformation response is typically expressed by the
bottom flange shape variation from the original circle to an elliptic shape. For convenient
post-impact testing measurement, Line A, as illustrated in Figure 3-11, is used to assess
the change in the original bottom flange diameter after the impact testing of a wheel. The
experimental measurement of Line A on the tested wheels was conducted by employing a
vernier caliper [79]. An average value was computed from three time testing data on the
same position.
Im pac tlocation Im p ac t
location 1
Spoke
W indow
- r . ' ■
k •*F lange
R im
b)
Figure 3-10. a) cast aluminum wheels, and b) a CAD model indicating the namingconvention and impact locations.
53 -
Reproduced with permission of the copyright owner. Further reproduction prohibited without permission.
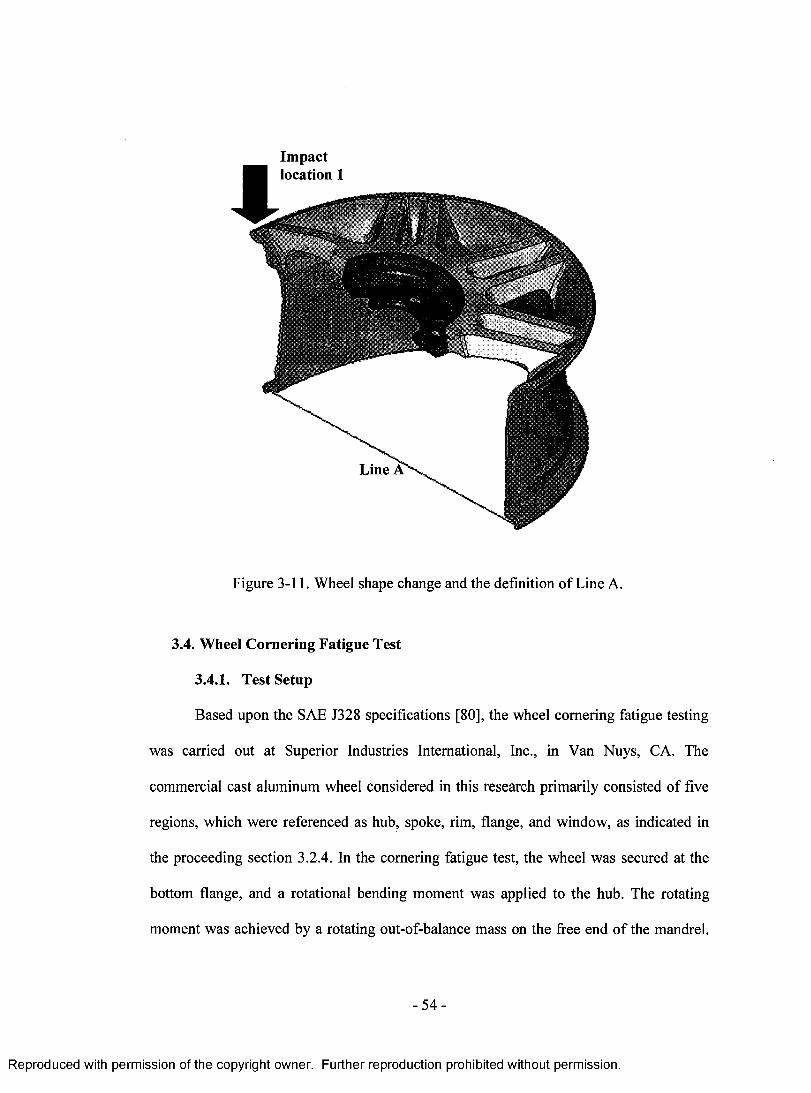
Impact location 1
Figure 3-11. Wheel shape change and the definition of Line A.
3.4. Wheel Cornering Fatigue Test
3.4.1. Test Setup
Based upon the SAE J328 specifications [80], the wheel cornering fatigue testing
was carried out at Superior Industries International, Inc., in Van Nuys, CA. The
commercial cast aluminum wheel considered in this research primarily consisted of five
regions, which were referenced as hub, spoke, rim, flange, and window, as indicated in
the proceeding section 3.2.4. In the cornering fatigue test, the wheel was secured at the
bottom flange, and a rotational bending moment was applied to the hub. The rotating
moment was achieved by a rotating out-of-balance mass on the free end of the mandrel.
- 5 4 -
Reproduced with permission of the copyright owner. Further reproduction prohibited without permission.
The bending moment M (Force x Load Arm Length) applied to the test wheel was
determined by equation (3-3).
M = W(Rfj. + d)S (3-3)
where W is the maximum vertical static load on the axle as specified by the vehicle
manufacturer or the load rating of the wheel as specified by the wheel manufacturer, R is
the static loaded radius of the largest tire specified by the vehicle and/or wheel
manufacturers, ju is the coefficient of friction developed between the tire and the road, d
is the inset or outset of the wheel, and S is the load factor defined by the wheel types and
positions on the vehicle, respectively.
3.4.2. Testing Procedures
Figure 3-12 shows the wheel cornering fatigue test machine made by Goal
Company with model MKI-6 [81], which was employed in this study. The rotational
moment of the machine varies from 500 N-m to 9000 N-m with a frequency of 10 Hz to
40 Hz. Before the cornering fatigue test, a penetrating dye inspection of the entire wheel
was conducted to check for surface flaws. The wheel nuts were tightened to 115±7 N -m,
and were retightened as necessary during the first 5000 cycles to ensure adequate torque
stabilization. The wheel was then subjected to the test-bending load as specified in SAE
J328. The wheel under test must complete the minimum number of the test cycles prior
to test termination. The test was terminated when the operating deflection exceeded the
initial deflection at point of load application by 20%. After the test, the wheel nut torque
magnitudes were examined and the wheel was inspected for cracks.
- 5 5 -
Reproduced with permission of the copyright owner. Further reproduction prohibited without permission.
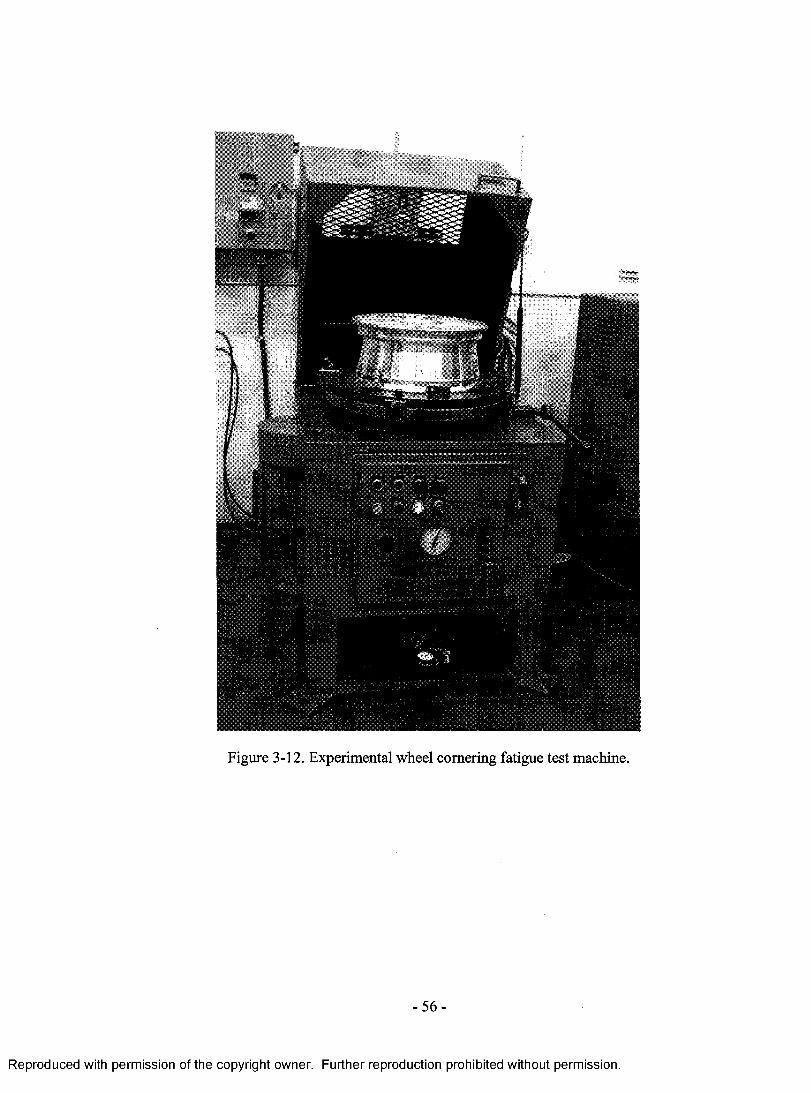
Figure 3-12. Experimental wheel cornering fatigue test machine.
- 5 6 -
Reproduced with permission of the copyright owner. Further reproduction prohibited without permission.
Chapter 4
WHEEL MATERIAL INHOMOGENEITY
4.1. Cast Aluminum Wheel 58
4.1.1. Isotropic Microstructure 5 8
4.1.2. DAS Inhomogeneity 58
4.1.3. Phase Identification 65
4.1.4. Tensile and Fatigue Properties 68
4.2. Forged Magnesium Wheel 73
4.2.1. Microstructure Anisotropy 73
4.2.2. Tensile and Fatigue Properties 83
- 5 7 -
Reproduced with permission of the copyright owner. Further reproduction prohibited without permission.
4. WHEEL MATERIAL INHOMOGENEITY
4.1. Cast Aluminum Wheels
4.1.1. Isotropic Microstructure
To facilitate microstructural analysis of different regions o f an aluminum wheel, Z,
r and 0, representing the cylindrical coordinates of the wheel geometry, shown in Figure
4-1, defined three geometrical view directions. Figure 4-2 illustrates the columnar-
dendrite microstructures of the hub, spoke, and rim in the wheel, viewed from three
cylindrical axis directions. Obviously, at one specific region, the microstructures are
isotropic in three view directions. An isotropic microstructure is a characteristic of cast
aluminum wheels, compared to forged wheels and wrought disc wheels [70, 82].
However, microstructure variation from one region to another is definitely evident, which
reveals the different sizes of the columnar-dendrite structures.
4.1.2. DAS Inhomogeneity
In castings, the secondary dendrite arm spacing (sometimes shortened merely to
dendrite arm spacing, DAS) is one of the most important microstructural length
measurements. Comparing the dendrite sizes of three locations shown in Figure 4-2,
obviously, a fine DAS was defined in the rim, and a coarse DAS observed in the spoke
and hub. Measurements of the DAS in the rim, spoke, hub and bottom flange were
carried out using a line intercept method through a digital image analysis instrument. The
dendrite arm spacing is best represented by the dendrite cell intervals (center-to-center
distance between two cells). Figure 4-3 presents four images representing typical
microstructure at four locations. Five length measurements of the DAS were performed at
- 5 8 -
Reproduced with permission of the copyright owner. Further reproduction prohibited without permission.
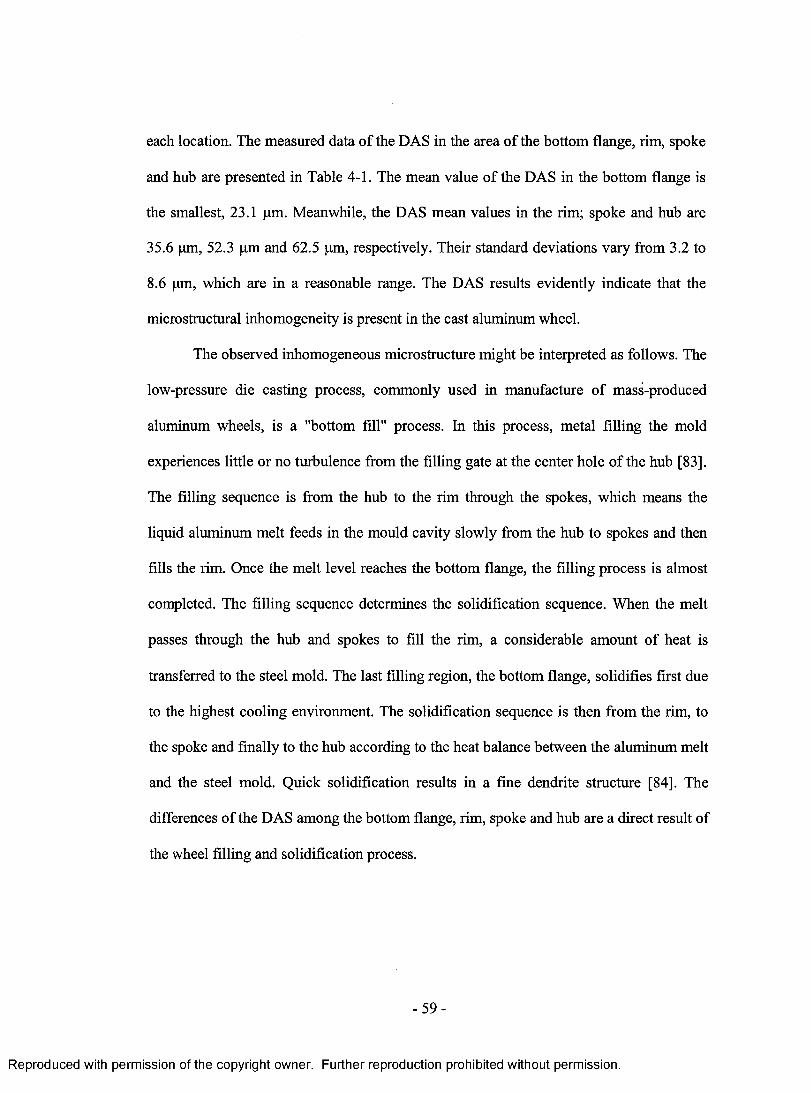
each location. The measured data of the DAS in the area of the bottom flange, rim, spoke
and hub are presented in Table 4-1. The mean value of the DAS in the bottom flange is
the smallest, 23.1 pm. Meanwhile, the DAS mean values in the rim; spoke and hub are
35.6 pm, 52.3 pm and 62.5 pm, respectively. Their standard deviations vary from 3.2 to
8.6 pm, which are in a reasonable range. The DAS results evidently indicate that the
microstructural inhomogeneity is present in the cast aluminum wheel.
The observed inhomogeneous microstructure might be interpreted as follows. The
low-pressure die casting process, commonly used in manufacture of mass-produced
aluminum wheels, is a "bottom fill" process. In this process, metal filling the mold
experiences little or no turbulence from the filling gate at the center hole of the hub [83].
The filling sequence is from the hub to the rim through the spokes, which means the
liquid aluminum melt feeds in the mould cavity slowly from the hub to spokes and then
fills the rim. Once the melt level reaches the bottom flange, the filling process is almost
completed. The filling sequence determines the solidification sequence. When the melt
passes through the hub and spokes to fill the rim, a considerable amount of heat is
transferred to the steel mold. The last filling region, the bottom flange, solidifies first due
to the highest cooling environment. The solidification sequence is then from the rim, to
the spoke and finally to the hub according to the heat balance between the aluminum melt
and the steel mold. Quick solidification results in a fine dendrite structure [84]. The
differences of the DAS among the bottom flange, rim, spoke and hub are a direct result of
the wheel filling and solidification process.
- 5 9 -
Reproduced with permission of the copyright owner. Further reproduction prohibited without permission.
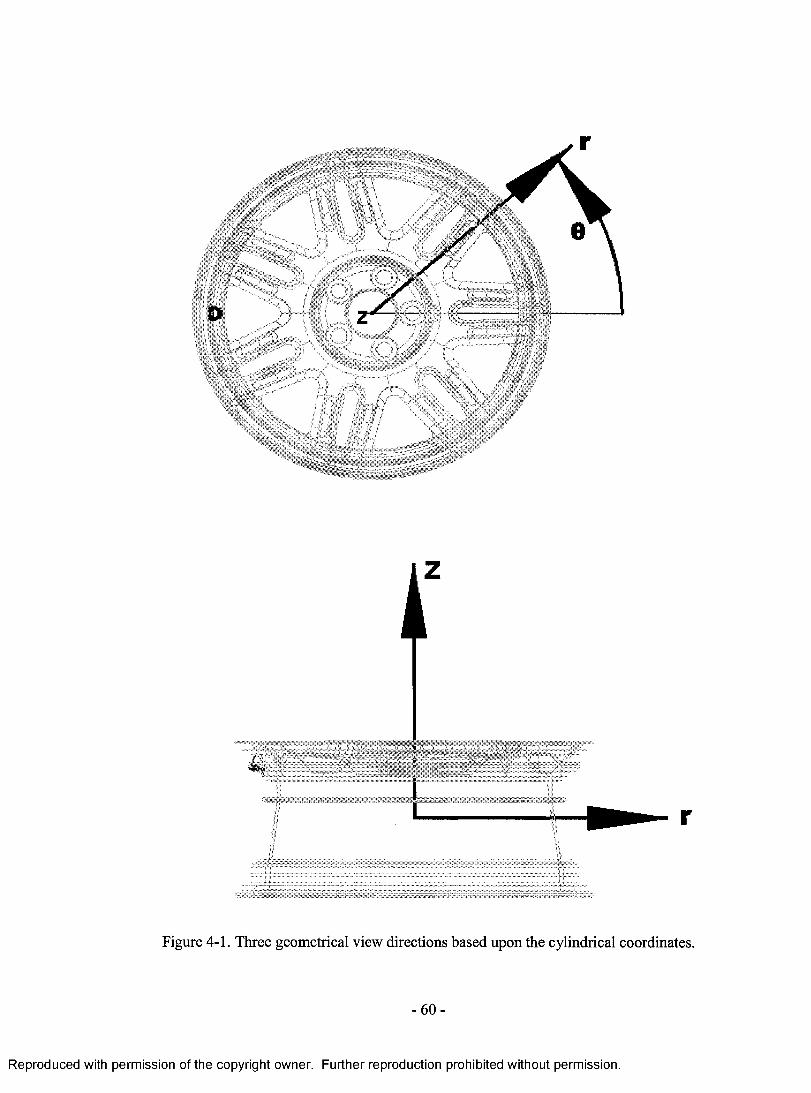
Figure 4-1. Three geometrical view directions based upon the cylindrical coordinates.
- 6 0 -
Reproduced with permission of the copyright owner. Further reproduction prohibited without permission.
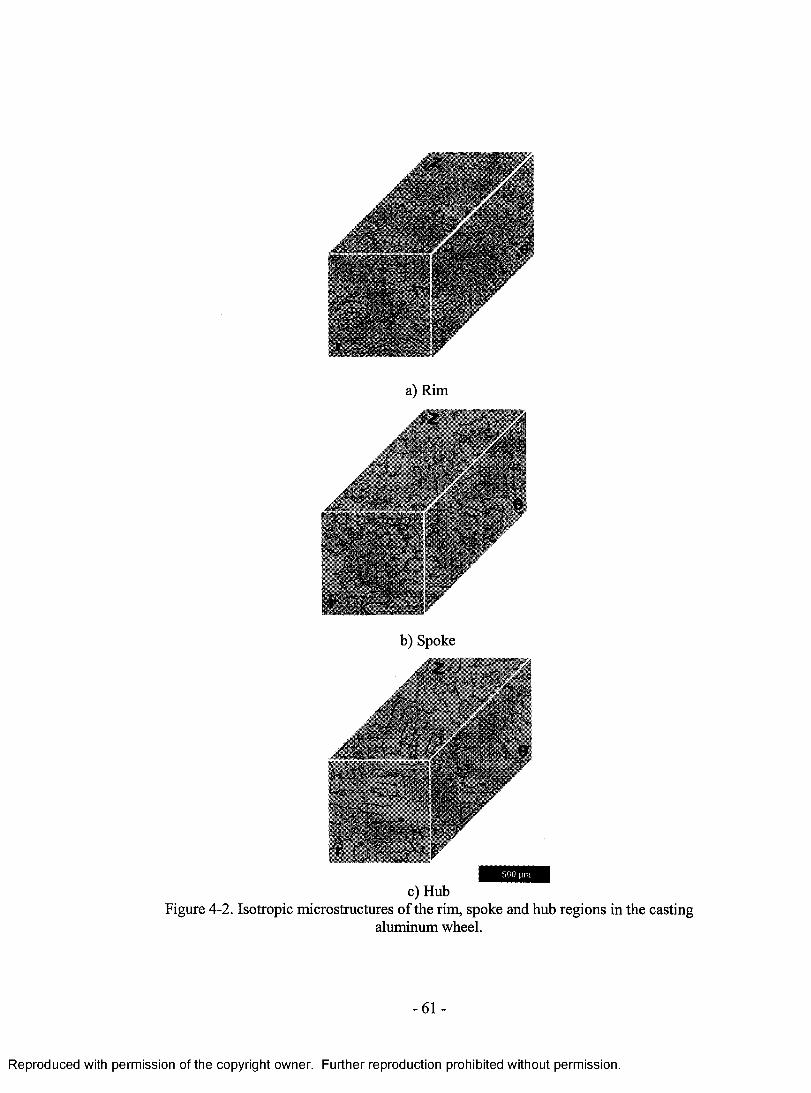
a) Rim
b) Spoke
c) HubFigure 4-2. Isotropic microstructures of the rim, spoke and hub regions in the casting
aluminum wheel.
-61 -
Reproduced with permission of the copyright owner. Further reproduction prohibited without permission.
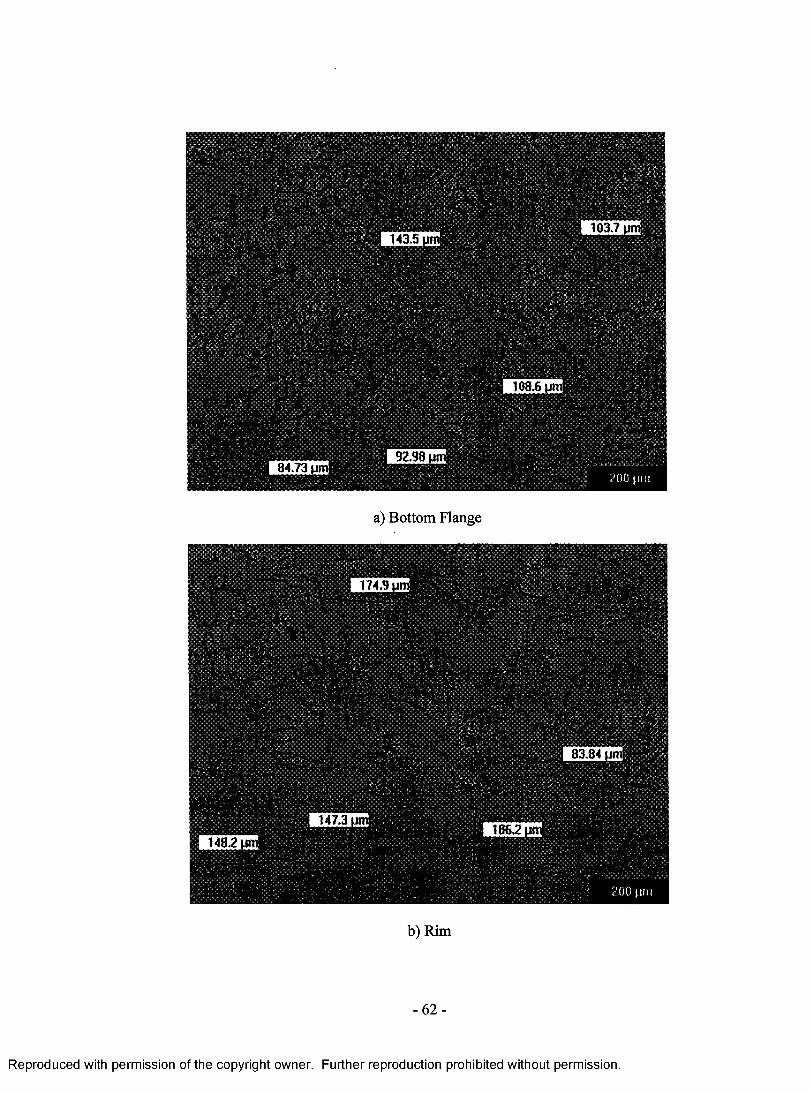
a) Bottom Flange
iR'i
b) Rim
- 6 2 -
Reproduced with permission of the copyright owner. Further reproduction prohibited without permission.

d) Hub
Figure 4-3. Microstructure images of four locations with five DAS measurement marks.
- 6 3 -
Reproduced with permission of the copyright owner. Further reproduction prohibited without permission.
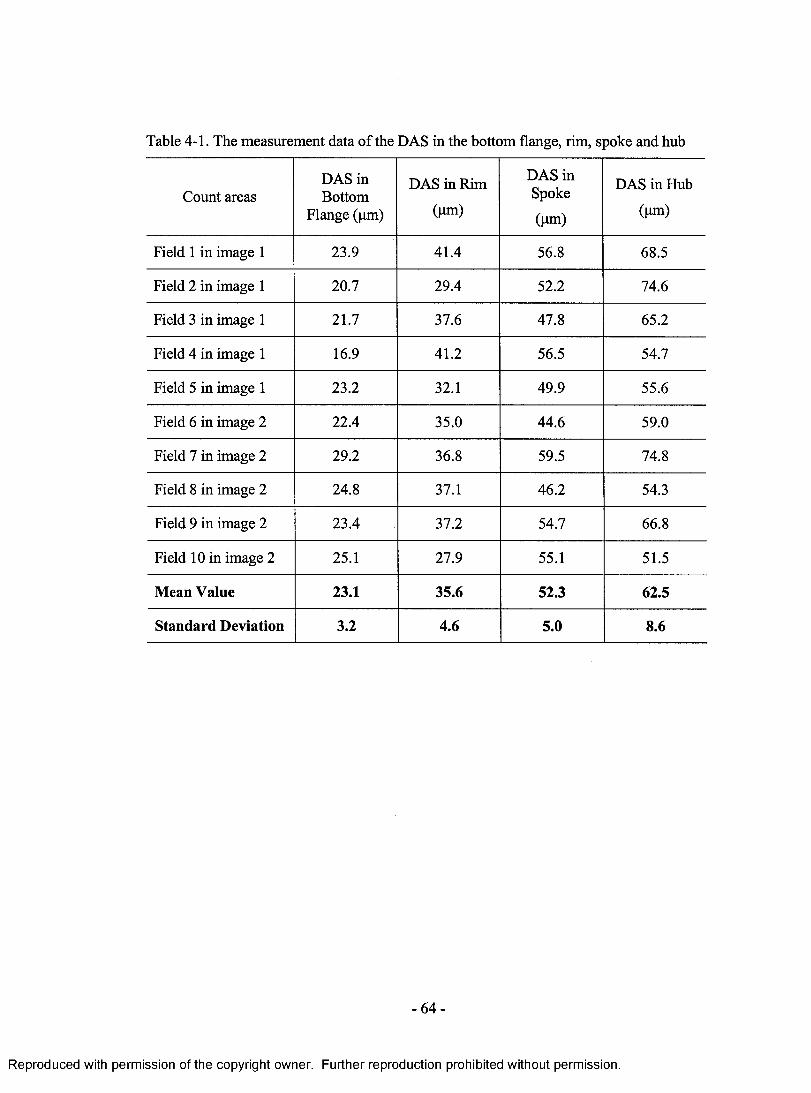
Table 4-1. The measurement data o f the DAS in the bottom flange, rim, spoke and hub
Count areasDAS in Bottom
Flange (pm)
DAS in Rim
(pm)
DAS in Spoke
(pm)
DAS in Hub
(pm)
Field 1 in image 1 23.9 41.4 56.8 68.5
Field 2 in image 1 20.7 29.4 52.2 74.6
Field 3 in image 1 21.7 37.6 47.8 65.2
Field 4 in image 1 16.9 41.2 56.5 54.7
Field 5 in image 1 23.2 32.1 49.9 55.6
Field 6 in image 2 22.4 35.0 44.6 59.0
Field 7 in image 2 29.2 36.8 59.5 74.8
Field 8 in image 2 24.8 37.1 46.2 54.3
Field 9 in image 2 23.4 37.2 54.7 66.8
Field 10 in image 2 25.1 27.9 55.1 51.5
Mean Value 23.1 35.6 52.3 62.5
Standard Deviation 3.2 4.6 5.0 8.6
- 6 4 -
Reproduced with permission of the copyright owner. Further reproduction prohibited without permission.
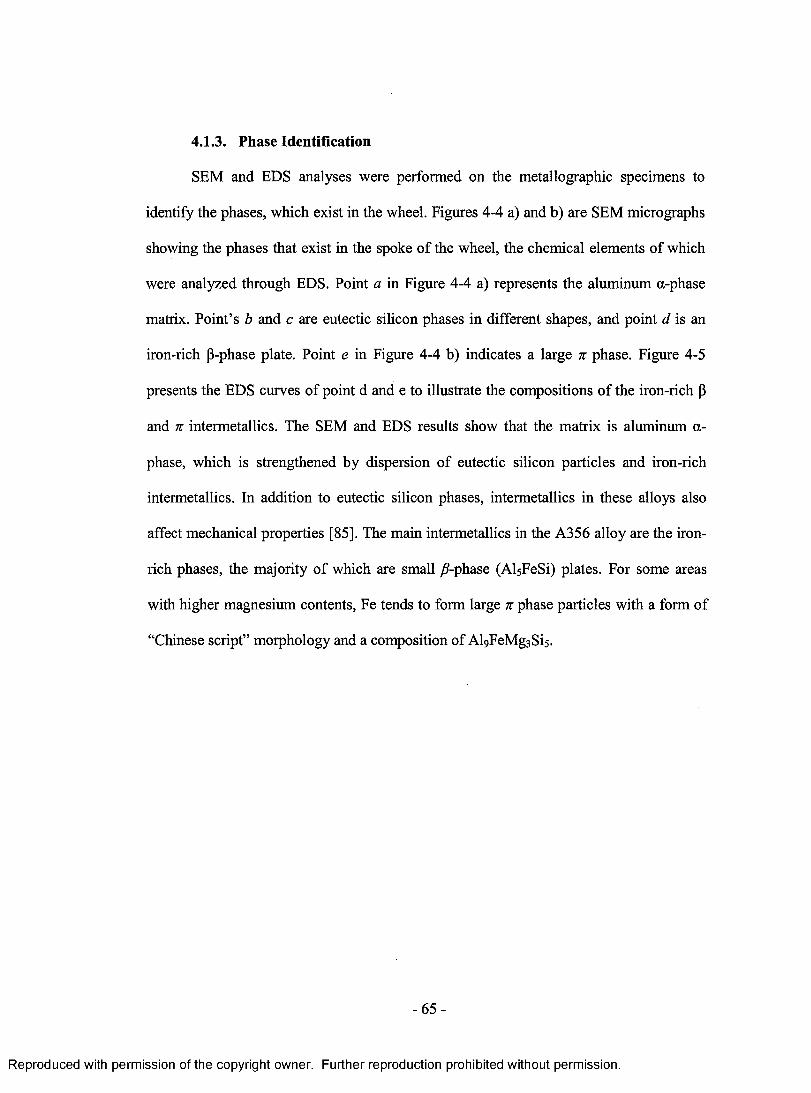
4.1.3. Phase Identification
SEM and EDS analyses were performed on the metallographic specimens to
identify the phases, which exist in the wheel. Figures 4-4 a) and b) are SEM micrographs
showing the phases that exist in the spoke of the wheel, the chemical elements of which
were analyzed through EDS. Point a in Figure 4-4 a) represents the aluminum a-phase
matrix. Point’s b and c are eutectic silicon phases in different shapes, and point d is an
iron-rich P-phase plate. Point e in Figure 4-4 b) indicates a large n phase. Figure 4-5
presents the EDS curves of point d and e to illustrate the compositions of the iron-rich p
and n intermetallics. The SEM and EDS results show that the matrix is aluminum a-
phase, which is strengthened by dispersion of eutectic silicon particles and iron-rich
intermetallics. In addition to eutectic silicon phases, intermetallics in these alloys also
affect mechanical properties [85]. The main intermetallics in the A356 alloy are the iron-
rich phases, the majority of which are small /Tphase (AlsFeSi) plates. For some areas
with higher magnesium contents, Fe tends to form large n phase particles with a form of
“Chinese script” morphology and a composition of AlgFeMgaSis.
- 6 5 -
Reproduced with permission of the copyright owner. Further reproduction prohibited without permission.
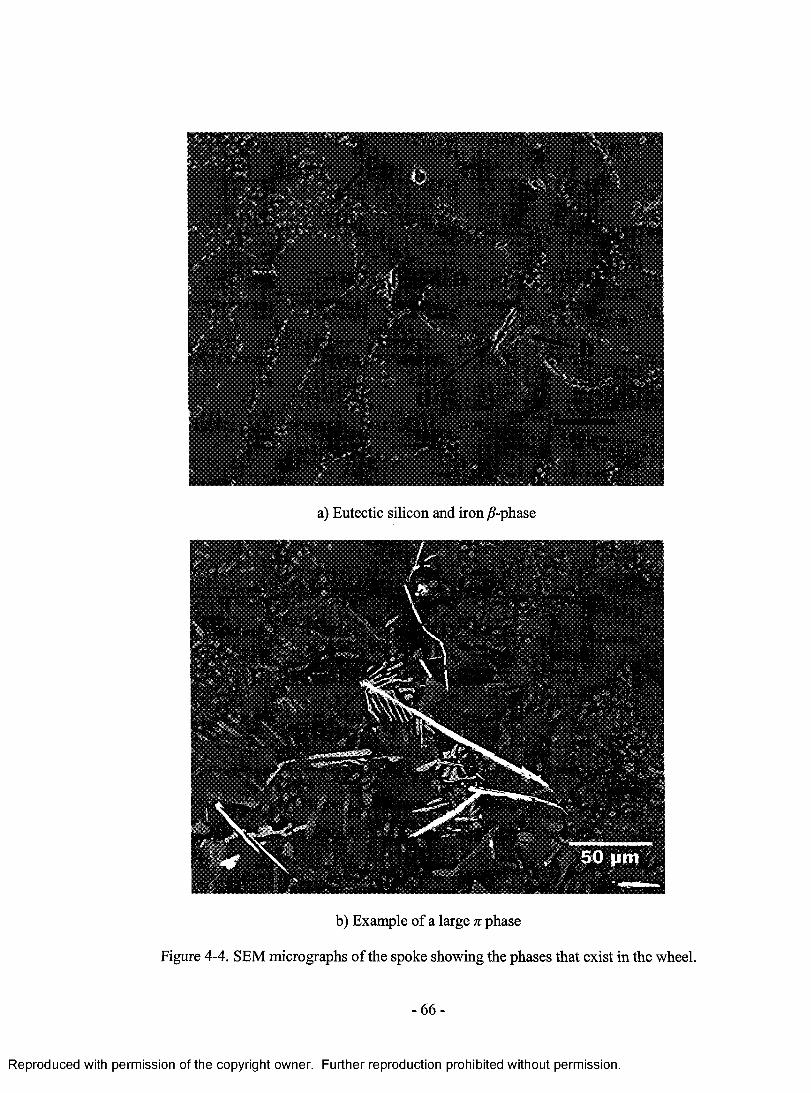
a) Eutectic silicon and iron /?-phase
b) Example of a large n phase
Figure 4-4. SEM micrographs of the spoke showing the phases that exist in the wheel.
- 6 6 -
Reproduced with permission of the copyright owner. Further reproduction prohibited without permission.
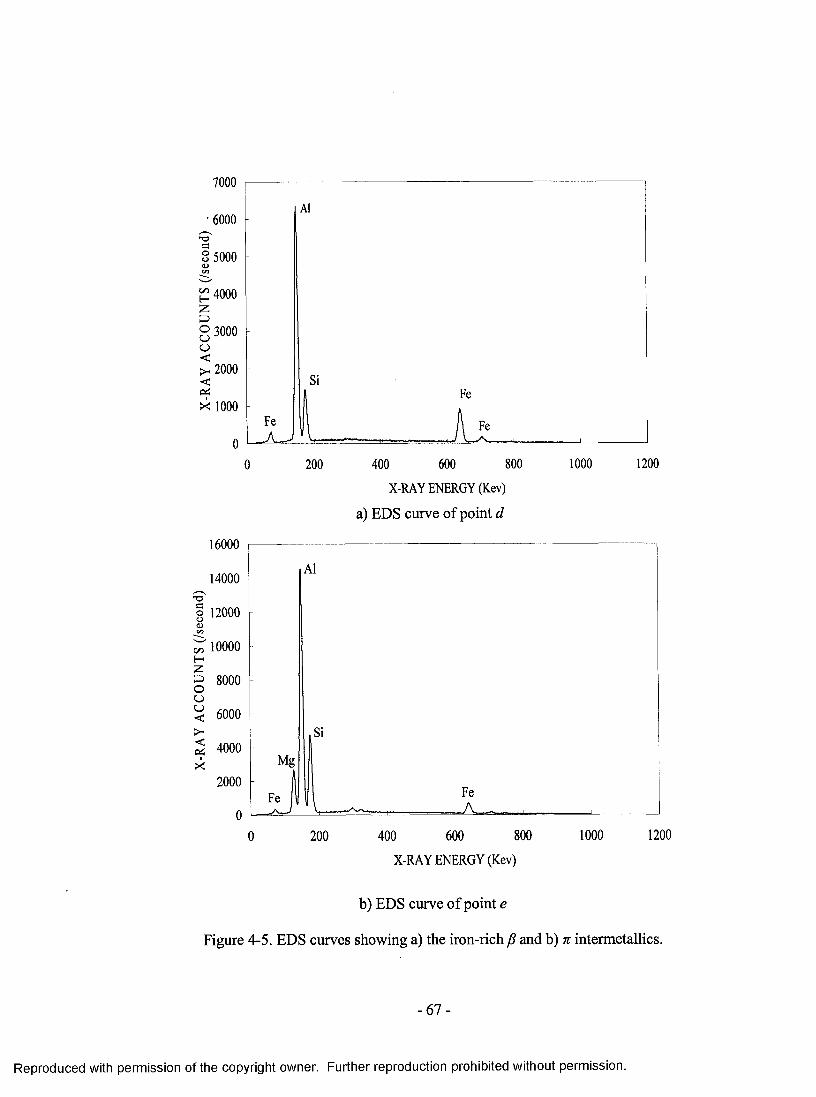
7000
•6000
5000
3000
2000
1000
200 400 600 800X-RAY ENERGY (Kev)
a) EDS curve of point d
1000 1200
o 12000
10000 E-h
» 8000
200 400 600 800X-RAY ENERGY (Kev)
1000 1200
b) EDS curve o f point e
Figure 4-5. EDS curves showing a) the iron-rich /? and b) n intermetallics.
67
Reproduced with permission of the copyright owner. Further reproduction prohibited without permission.
4.1.4. Tensile and Fatigue Properties
The difference in the microstructure throughout the wheel geometry results in
mechanical performance inhomogeneity. Figure 4-6 illustrates the representative tensile
curves of engineering stress vs. engineering strain for the rim, spoke and hub. Table 4-2
summarizes the material properties, such as Young’s modulus, Poisson’s ratio, density,
0.2% offset yield strength, ultimate strength and plastic strain, of the hub, spoke and rim
of the cast aluminum wheel. The rim illustrates the highest tensile strength and ductility
with the finest DAS among the three regions. The spoke with relatively high tensile
strength and elongation compared to the hub had a large DAS very close to the coarsest
in the hub. With the DAS increasing, the ultimate tensile strength, yield strength and
elongation to failure all decreased. Figure 4-7 presents the effect o f the secondary
dendrite arm spacing (DAS) on the tensile properties and ductility of the wheel.
The results of the tensile testing indicate that the mechanical properties of the
wheels are strongly dependent on the DAS. As the DAS decreases, the ultimate strength,
ductility and elongation increase. The improvement o f strength and toughness by a
reduction in DAS is a similar response to that given by grain refinement. However, the
effects cannot be the result of the same mechanisms because no grain boundary exists
between the arms of a single dendrite to stop the movement of a slip plane. Separate
effects combine to contribute the strength and toughness improvement with the DAS
reduction. Although the Hall-Petch hardening mechanism is likely to be a real contributor
to increased strength, resulting from the disorientation growth of the dendrite arms, in
most castings it is small compared to the other three effects. As the DAS becomes smaller,
the residual liquid is split up into progressively smaller isolated regions, which restrict the
- 6 8 -
Reproduced with permission of the copyright owner. Further reproduction prohibited without permission.
nucleation of interdendritic phase and gas pore forming. Then, the cast structure becomes
cleaner to improve the material strength. The highly deleterious effect of iron impurities
in the A3 56 alloy is attributed to the extensive plate-like morphology of the iron-rich
phases. When the DAS reduces, the iron-rich plates become smaller due to restricting
growth of interdendritic phases, which improves the strength and toughness [85].
Wheels are typically subjected to 3TO8 cycles or more during a life time, and the
high-cycle fatigue properties of wheel materials are therefore o f great concerns. Results
of high-cycle uniaxial fatigue experiments with aluminum alloy A356-T6 are shown in
Figure 4-8, in which the fatigue data can be well approximated using a straight line on a
logarithmic plot. Although no endurance limit in an ambient environment was found in
the investigated load range, the nominal fatigue strength of 80 MPa was determined at
3T08 cycles for aluminum A356-T6 wheels. This is because the normal service life of
road wheels is approximately 3* 108 cycles [11].
- 6 9 -
Reproduced with permission of the copyright owner. Further reproduction prohibited without permission.
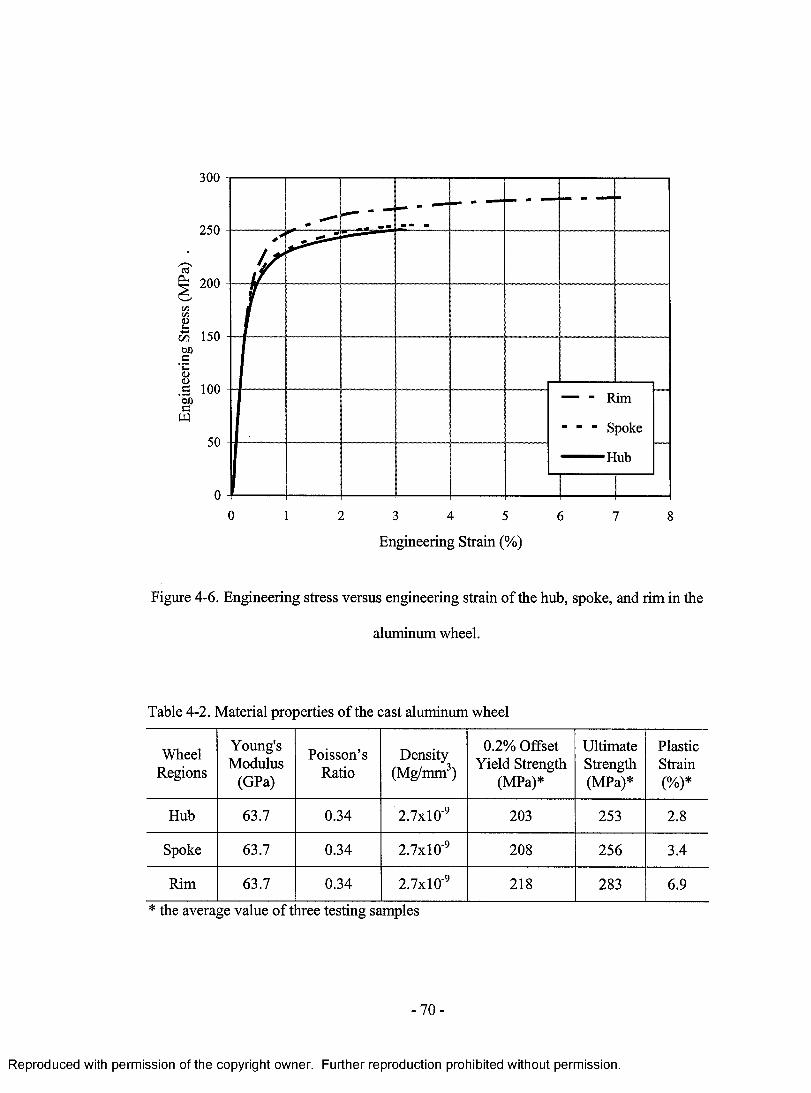
300
250
'S'
m 150bO.s’C<uu
.S 100£>0£3W
Rim
- - Spoke
Hub
0 1 2 3 4 5 6 87
Engineering Strain (%)
Figure 4-6. Engineering stress versus engineering strain of the hub, spoke, and rim in the
aluminum wheel.
Table 4-2. Material properties of the cast aluminum wheel
WheelRegions
Young'sModulus
(GPa)
Poisson’sRatio
Density(Mg/mm3)
0.2% Offset Yield Strength
(MPa)*
UltimateStrength(MPa)*
PlasticStrain(%)*
Hub 63.7 0.34 2.7xl0'9 203 253 2.8
Spoke 63.7 0.34 2.7x1 O'9 208 256 3.4
Rim 63.7 0.34 2.7xl0'9 218 283 6.9
* the average value of t xree testing samples
- 7 0 -
Reproduced with permission of the copyright owner. Further reproduction prohibited without permission.
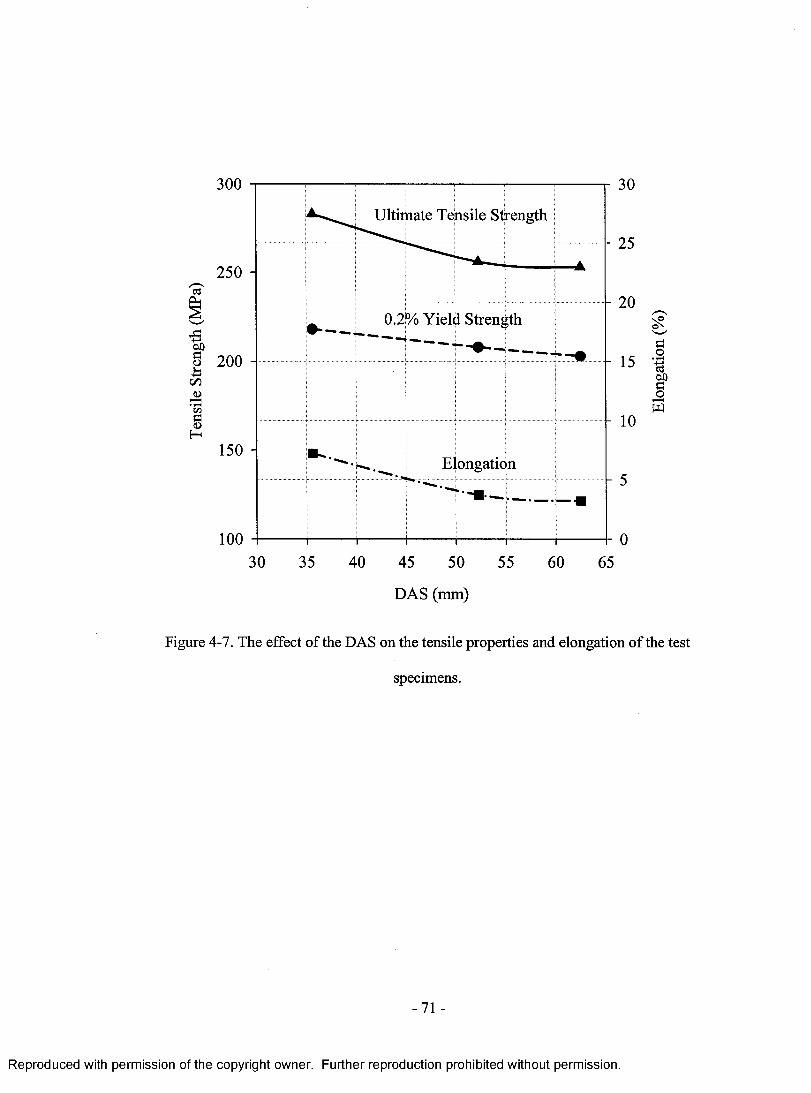
300
Ultimate Tensile Strength
- 25
250 -cd
- 200.2% Yield Strength
%§ 200 - aC/5CD03<DH
150 -igaticjnon:
10030 35 40 45 50 55 60 65
DAS (mm)
Figure 4-7. The effect of the DAS on the tensile properties and elongation of the test
specimens.
-71 -
Reproduced with permission of the copyright owner. Further reproduction prohibited without permission.
Elon
gatio
n (%
)
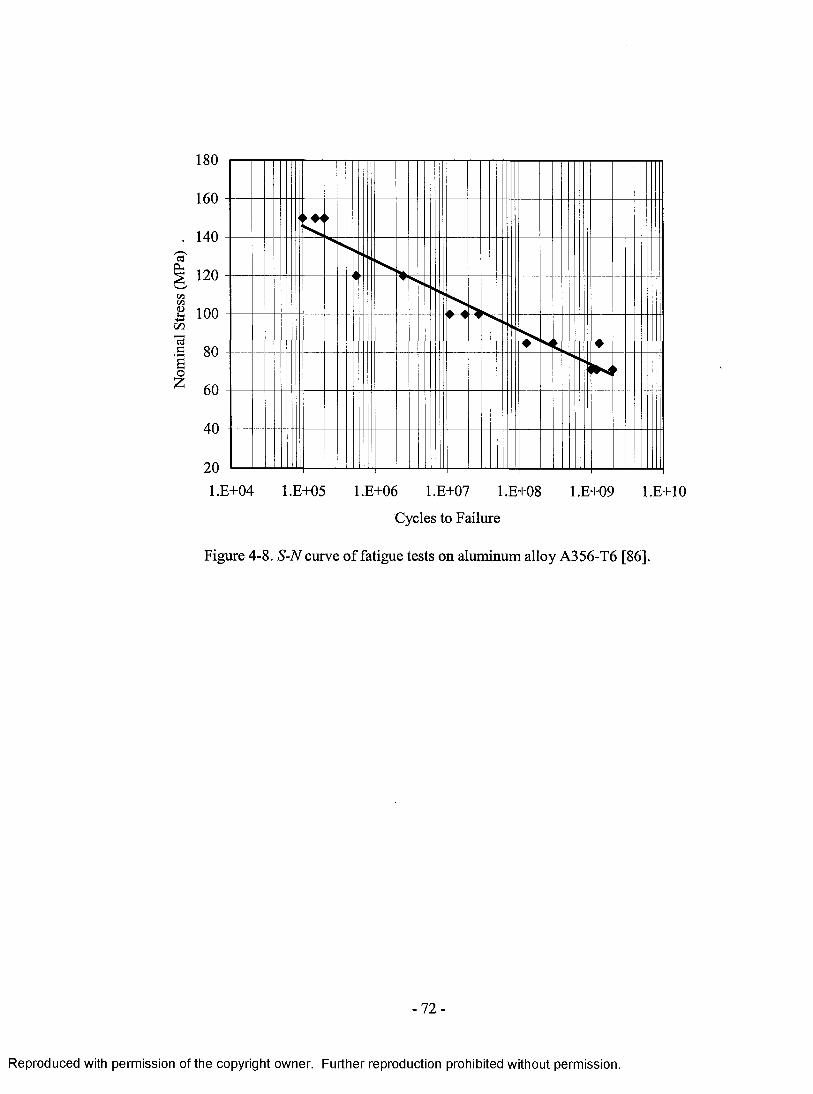
180
160
. 140
120
100CO
l.E+04 l.E+05 l.E+06 l.E+07 l.E+08 l.E+09 l.E+10
Cycles to Failure
Figure 4-8. S-N curve of fatigue tests on aluminum alloy A356-T6 [86].
- 7 2 -
Reproduced with permission of the copyright owner. Further reproduction prohibited without permission.

4.2. Forged Magnesium Wheel
4.2.1. Microstructure Anisotropy
To identify the microstructure anisotropy of the forged magnesium wheels,
different view directions for microstructure analysis on the rim and spoke sections of
magnesium wheels were defined. The three view directions on the rim, named views A,
B and C, and the three view directions on the spoke, called view D, E and F, shown in
Figure 4-9. All are defined along the axis directions of the extracted tensile test
specimens.
View C
Figure 4-9. View directions along the axis directions of tensile specimens.
Figure 4-10 shows the microstructures of the rim section of the magnesium wheel
in three different view directions, views A, B and C. Examination of the rim
microstructure shows that the relatively large equiaxed grain structure, with some smaller
recrystallized grains is dominant in view A. In views B and C, however, a predominance
of the elongated grain structure is observed, and some small-recrystallized grains located
- 7 3 -
Reproduced with permission of the copyright owner. Further reproduction prohibited without permission.

inside the metal flow lines. It is evident that the outstretched extent of grain structure in
view B is the same as that in view C.
Figure 4-11 shows the differences of microstructures along three view directions
in the rim region. It can be seen from Figure 4-11 a) & b) that the average of original
equiaxed grain sizes is about 200 pm, and some small recrystallized grains are formed
during forging process with a large grain size variation from 10 to 100 pm. At two other
views B & C (Figure 4-11 c), d), e) and f)), the microstructures have almost the same
large elongated original grains with small recrystallized equiaxed grains.
Figure 4-12 shows the microstructures of the spoke section of the magnesium
wheel in three different view directions, views D, E and F. It appears that views D, E & F
are primarily featured with various elongated grain structures, which reveals obviously
different deformation intensities. The largest deformation is observed in view D, and
view E is in the middle, and view F has the lightest intensity of deformation. The
different elongated grain structures in three dimensions of the spoke indicate that the
extent of plastic deformation varies along the three directions.
Figure 4-13 shows the detailed differences of microstructures along three view
directions in the spoke region at high magnifications. In Figures 4-13 a), b) & c), the
original equiaxed grains were severely deformed to elongate considerably. Moreover,
recrystallization occurred to form new small equiaxed grains in a few locations. Despite
the presence of the similar pattern, less deformation is observed in views E & F as
illustrated in Figures 4-13 d), e), f), g), h) and i). Especially view F reveals the lightest
deformation among these three directions.
- 7 4 -
Reproduced with permission of the copyright owner. Further reproduction prohibited without permission.
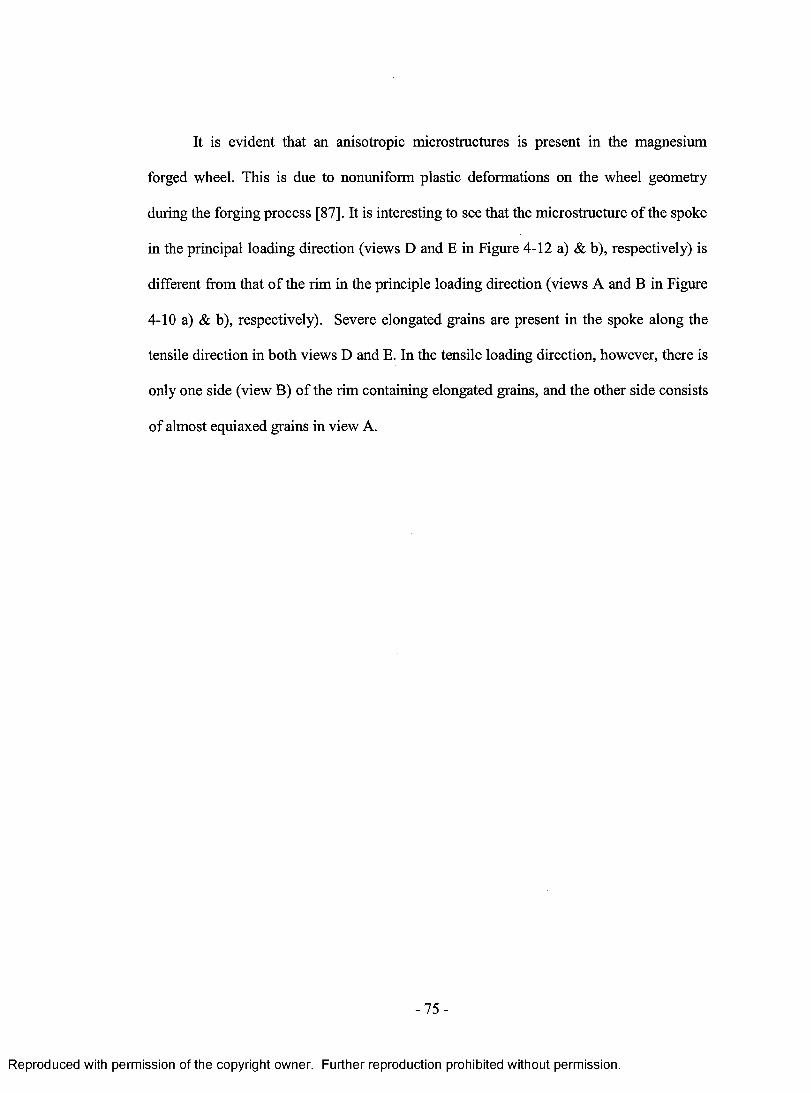
It is evident that an anisotropic microstructures is present in the magnesium
forged wheel. This is due to nonuniform plastic deformations on the wheel geometry
during the forging process [87]. It is interesting to see that the microstructure of the spoke
in the principal loading direction (views D and E in Figure 4-12 a) & b), respectively) is
different from that of the rim in the principle loading direction (views A and B in Figure
4-10 a) & b), respectively). Severe elongated grains are present in the spoke along the
tensile direction in both views D and E. In the tensile loading direction, however, there is
only one side (view B) of the rim containing elongated grains, and the other side consists
of almost equiaxed grains in view A.
- 7 5 -
Reproduced with permission of the copyright owner. Further reproduction prohibited without permission.

a) View A
b) View B
- 7 6 -
Reproduced with permission of the copyright owner. Further reproduction prohibited without permission.
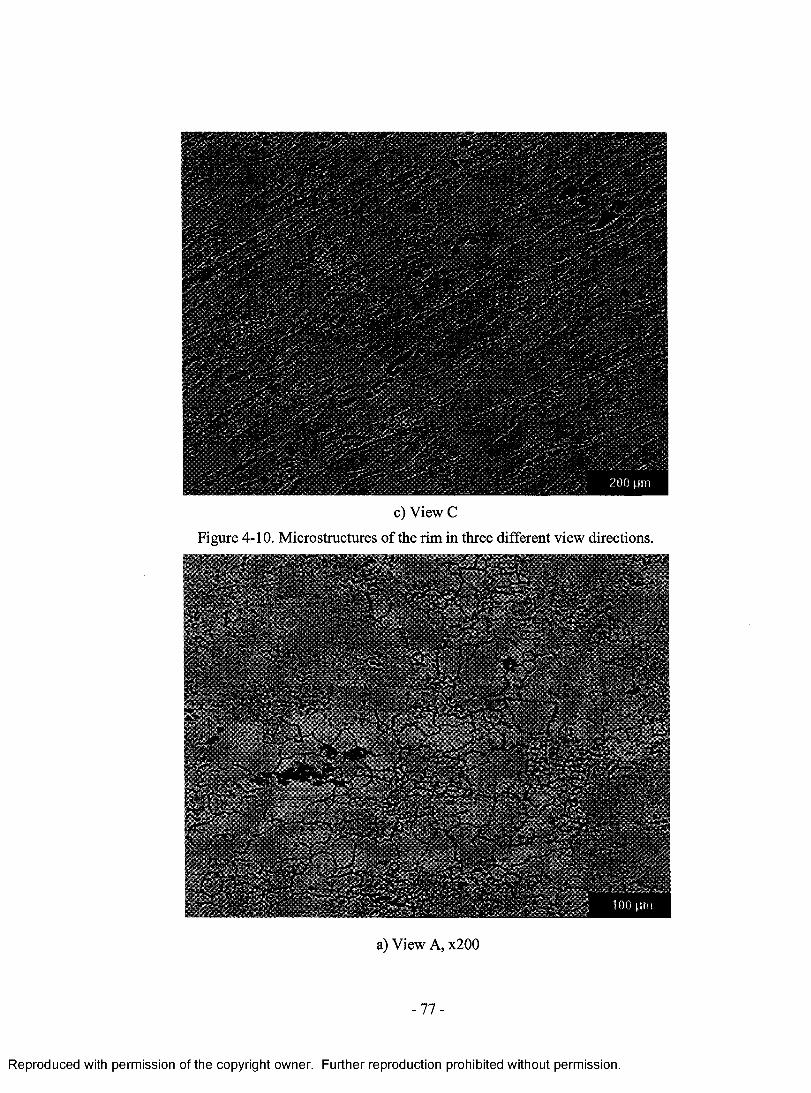
c) View C
Figure 4-10. Microstructures of the rim in three different view directions.
I On pm
a) View A, x200
- 7 7 -
Reproduced with permission of the copyright owner. Further reproduction prohibited without permission.
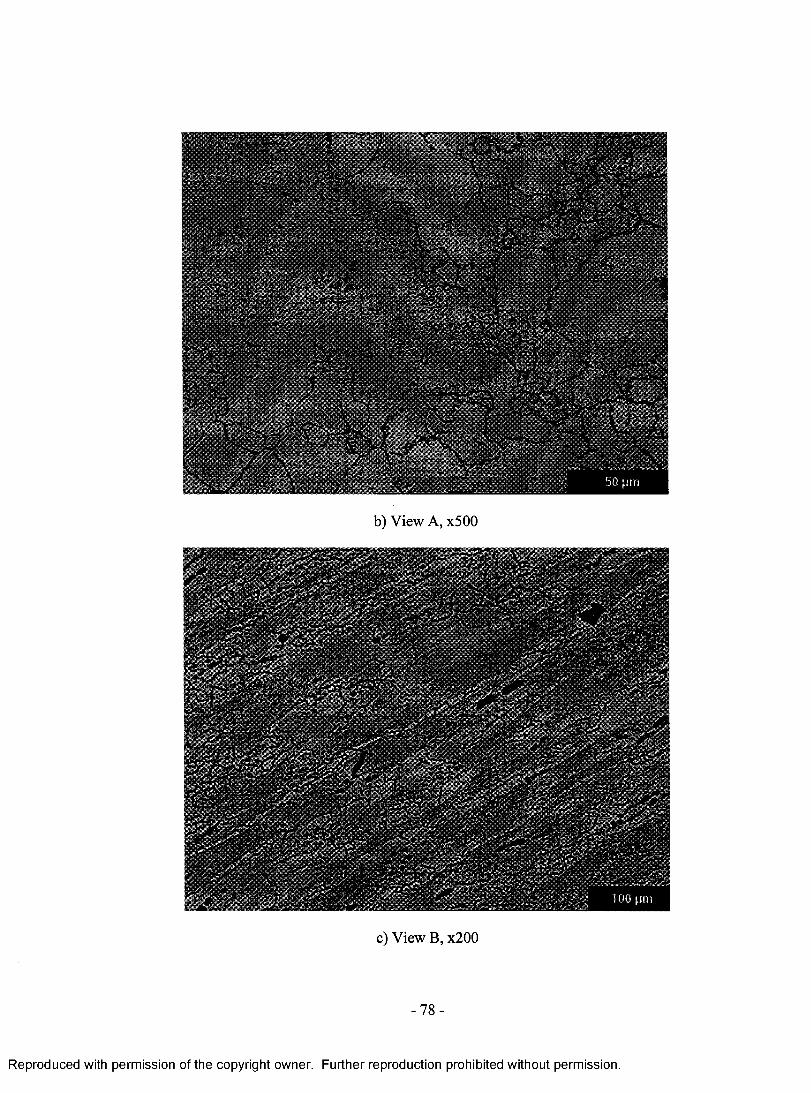
b) View A, x500
1 0 0 p m
c) View B, x200
- 7 8 -
Reproduced with permission of the copyright owner. Further reproduction prohibited without permission.
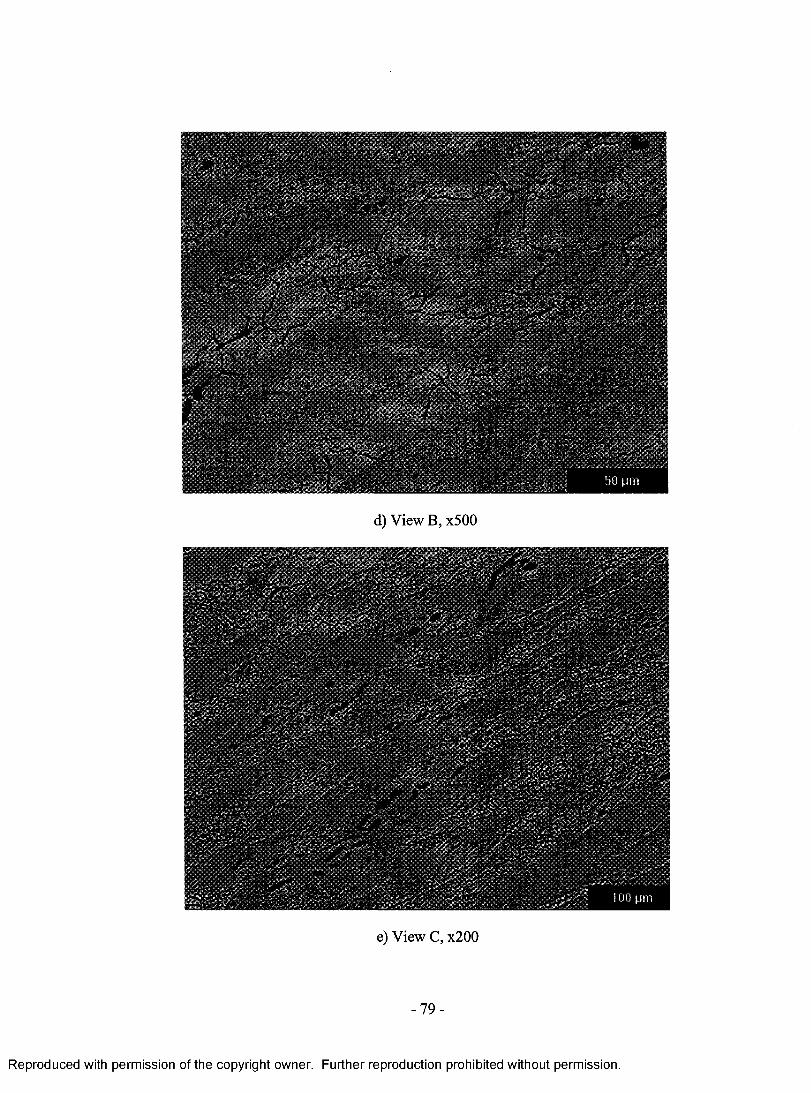
d) View B, x500
e) View C, x200
- 7 9 -
Reproduced with permission of the copyright owner. Further reproduction prohibited without permission.

• ? ■:* H ' i !)0 Mm
f) View C, x500
Figure 4-11. View A, B & C in the rim region at high magnifications.
a) View D
- 8 0 -
Reproduced with permission of the copyright owner. Further reproduction prohibited without permission.
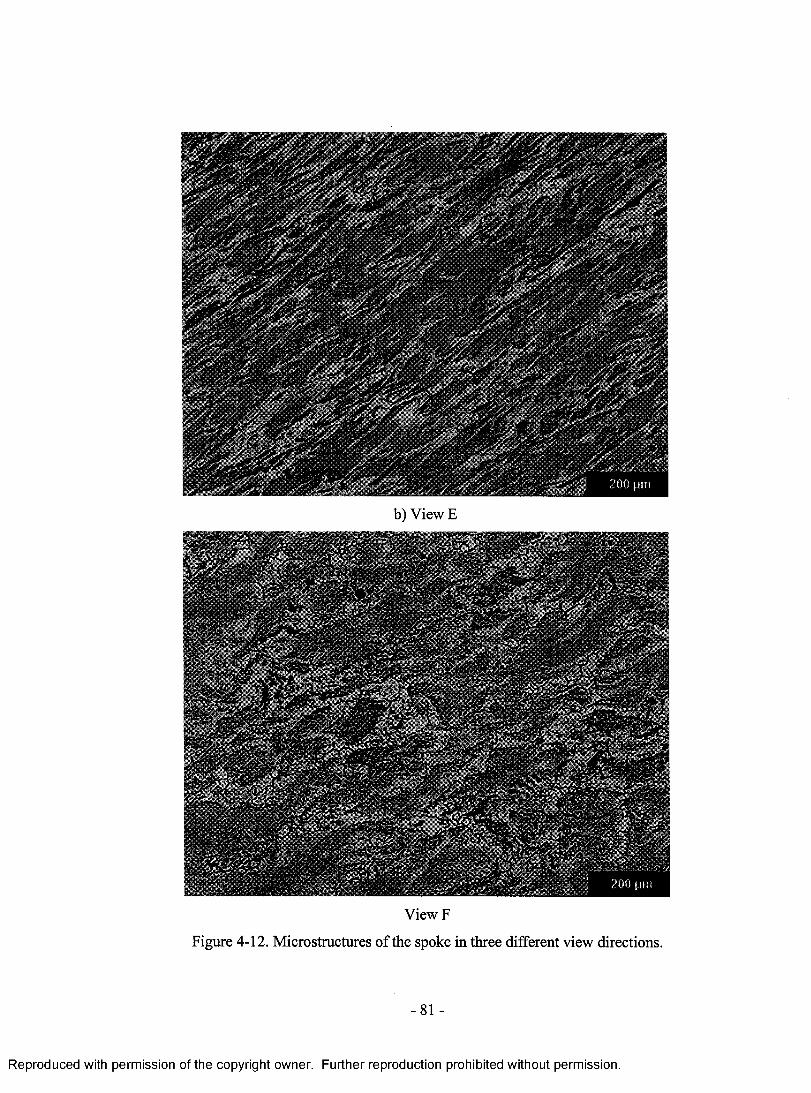
ViewF
Figure 4-12. Microstructures of the spoke in three different view directions.
-81 -
Reproduced with permission of the copyright owner. Further reproduction prohibited without permission.
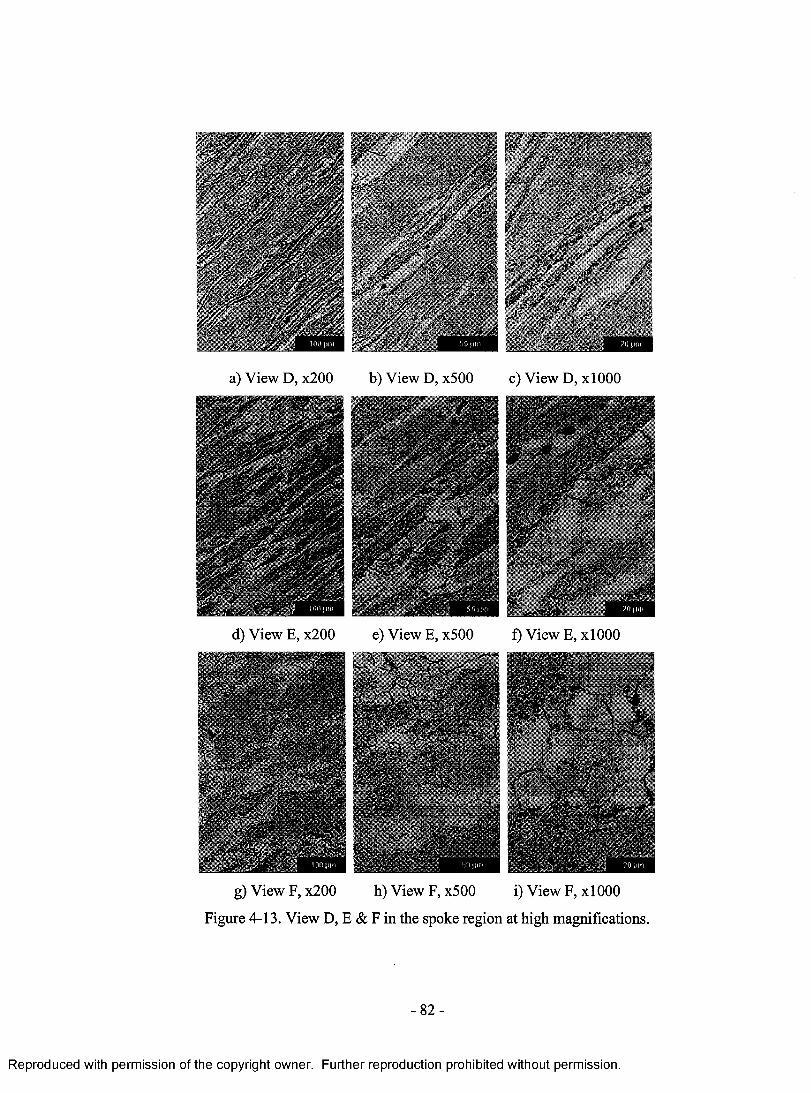
a) View D, x200 b)V iew D , x500 c) View D, xlOOO
d)ViewE, x200 e)V iew E, x500 f) View E, xlOOO
g) V iew F,x200 h) ViewF, x500 i) ViewF, xlOOO
Figure 4-13. View D, E & F in the spoke region at high magnifications.
- 8 2 -
Reproduced with permission of the copyright owner. Further reproduction prohibited without permission.
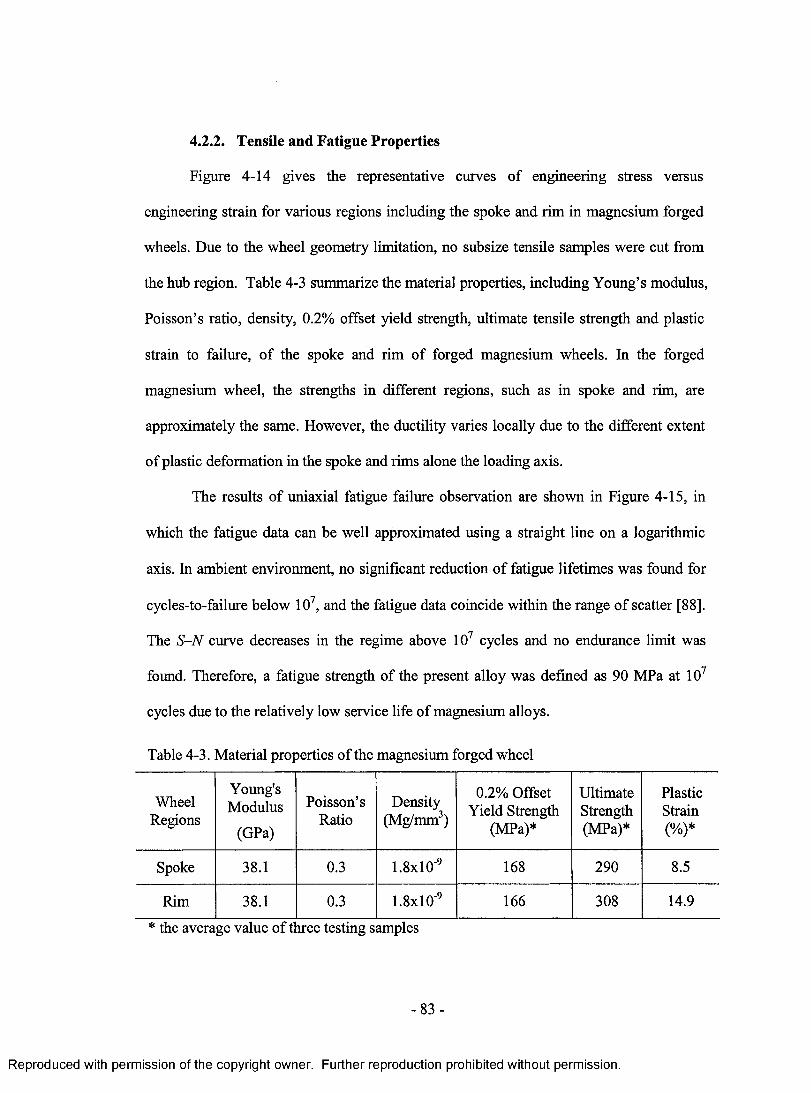
4.2.2. Tensile and Fatigue Properties
Figure 4-14 gives the representative curves of engineering stress versus
engineering strain for various regions including the spoke and rim in magnesium forged
wheels. Due to the wheel geometry limitation, no subsize tensile samples were cut from
the hub region. Table 4-3 summarize the material properties, including Young’s modulus,
Poisson’s ratio, density, 0.2% offset yield strength, ultimate tensile strength and plastic
strain to failure, o f the spoke and rim of forged magnesium wheels. In the forged
magnesium wheel, the strengths in different regions, such as in spoke and rim, are
approximately the same. However, the ductility varies locally due to the different extent
of plastic deformation in the spoke and rims alone the loading axis.
The results of uniaxial fatigue failure observation are shown in Figure 4-15, in
which the fatigue data can be well approximated using a straight line on a logarithmic
axis. In ambient environment, no significant reduction of fatigue lifetimes was found for
cycles-to-failure below 107, and the fatigue data coincide within the range of scatter [88].
The S-N curve decreases in the regime above 107 cycles and no endurance limit was
found. Therefore, a fatigue strength of the present alloy was defined as 90 MPa at 107
cycles due to the relatively low service life of magnesium alloys.
Table 4-3. Material properties of the magnesium forged wheel
WheelRegions
Young'sModulus
(GPa)
Poisson’sRatio
Density(Mg/mm3)
0.2% Offset Yield Strength
(MPa)*
UltimateStrength(MPa)*
PlasticStrain(%)*
Spoke 38.1 0.3 1.8xl0'9 168 290 8.5
Rim 38.1 0.3 1.8xl0'9 166 308 14.9
* the average value of t nee testing samples
- 8 3 -
Reproduced with permission of the copyright owner. Further reproduction prohibited without permission.
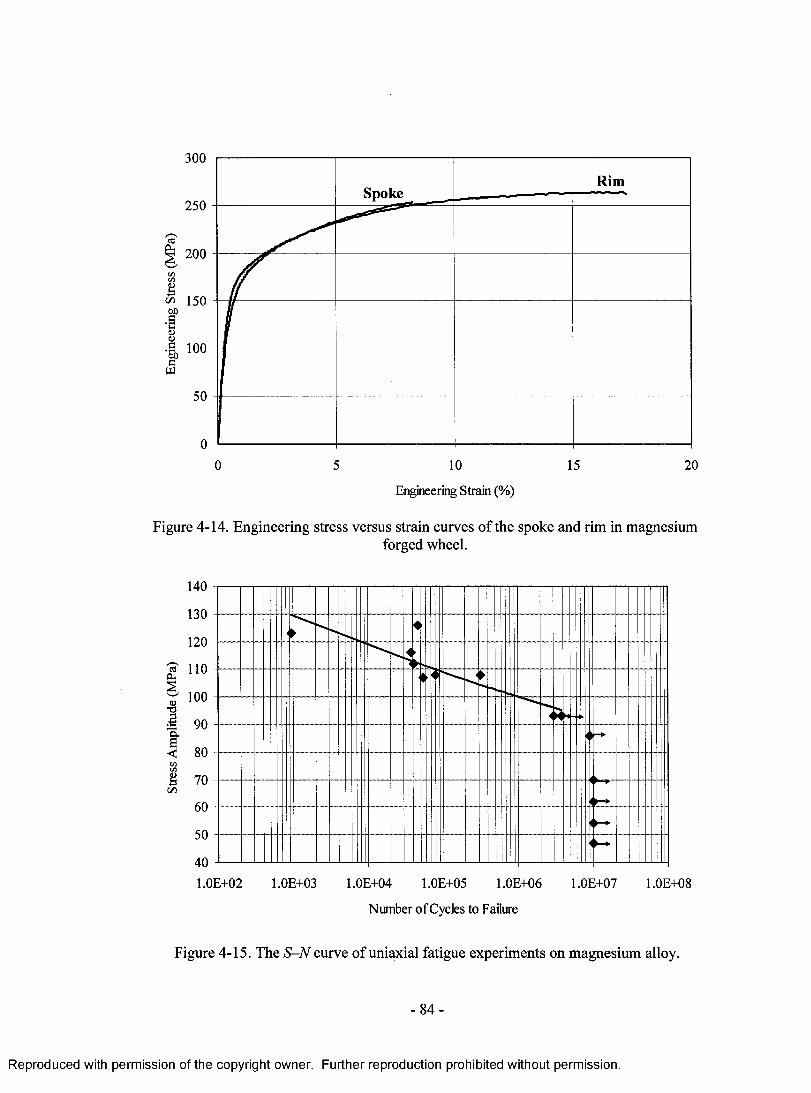
S3Pl,
$GO
toOtoto
s?W
300
RimSpoke
250
200
150
100
50
00 10 15 205
Engineering Strain (%)
Figure 4-14. Engineering stress versus strain curves of the spoke and rim in magnesiumforged wheel.
140
130
120
9 no100 -
T3II<coco$C/3
1.0E+02 1.0E+03 1.0E+04 1.0E+05 1.0E+06 1.0E+07 1.0E+08
Number of Cycles to Failure
Figure 4-15. The S -N curve of uniaxial fatigue experiments on magnesium alloy.
- 8 4 -
Reproduced with permission of the copyright owner. Further reproduction prohibited without permission.
Chapter 5
MODELING OF WHEEL IMPACT TEST
5.1. FEA Software Selection 86
5.2. Numerical Modeling 87
5.2.1. Wheel 88
5.2.2. Striker 93
5.2.3. Tire 93
5.3. FE Model of Wheel Impact Test 96
5.3.1. Model with the Tire Portion 96
5.3.2. Initial Velocity of the Striker Prior to Impact 97
5.4. Simplified Approach without the Tire Portion 98
5.4.1. Wheel and Striker Modeling 98
5.4.2. Initial Velocity of the Striker in the Simplified Approach 99
5.5. Material Models of the Wheels 101
5.6. Boundary Constraints 102
5.7. Gravity 102
- 8 5 -
Reproduced with permission of the copyright owner. Further reproduction prohibited without permission.
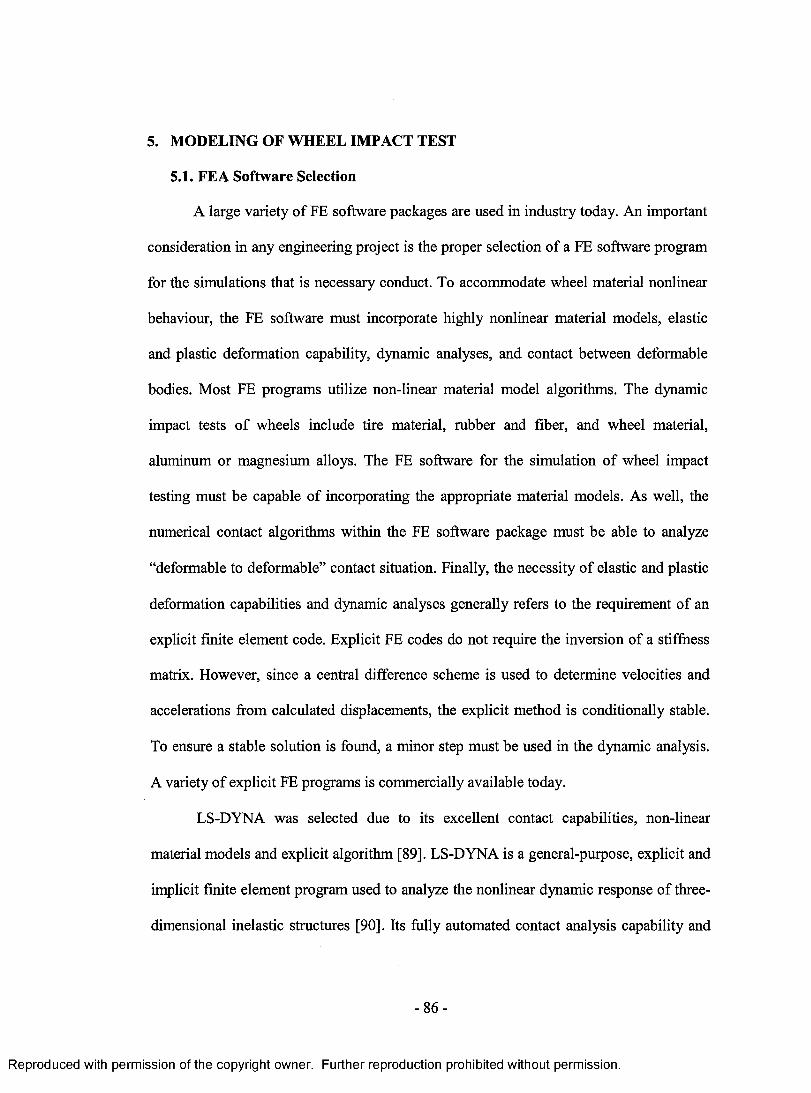
5. MODELING OF WHEEL IMPACT TEST
5.1. FEA Software Selection
A large variety o f FE software packages are used in industry today. An important
consideration in any engineering project is the proper selection of a FE software program
for the simulations that is necessary conduct. To accommodate wheel material nonlinear
behaviour, the FE software must incorporate highly nonlinear material models, elastic
and plastic deformation capability, dynamic analyses, and contact between deformable
bodies. Most FE programs utilize non-linear material model algorithms. The dynamic
impact tests of wheels include tire material, rubber and fiber, and wheel material,
aluminum or magnesium alloys. The FE software for the simulation o f wheel impact
testing must be capable of incorporating the appropriate material models. As well, the
numerical contact algorithms within the FE software package must be able to analyze
“deformable to deformable” contact situation. Finally, the necessity of elastic and plastic
deformation capabilities and dynamic analyses generally refers to the requirement of an
explicit finite element code. Explicit FE codes do not require the inversion of a stiffness
matrix. However, since a central difference scheme is used to determine velocities and
accelerations from calculated displacements, the explicit method is conditionally stable.
To ensure a stable solution is found, a minor step must be used in the dynamic analysis.
A variety of explicit FE programs is commercially available today.
LS-DYNA was selected due to its excellent contact capabilities, non-linear
material models and explicit algorithm [89]. LS-DYNA is a general-purpose, explicit and
implicit finite element program used to analyze the nonlinear dynamic response of three-
dimensional inelastic structures [90]. Its fully automated contact analysis capability and
- 8 6 -
Reproduced with permission of the copyright owner. Further reproduction prohibited without permission.
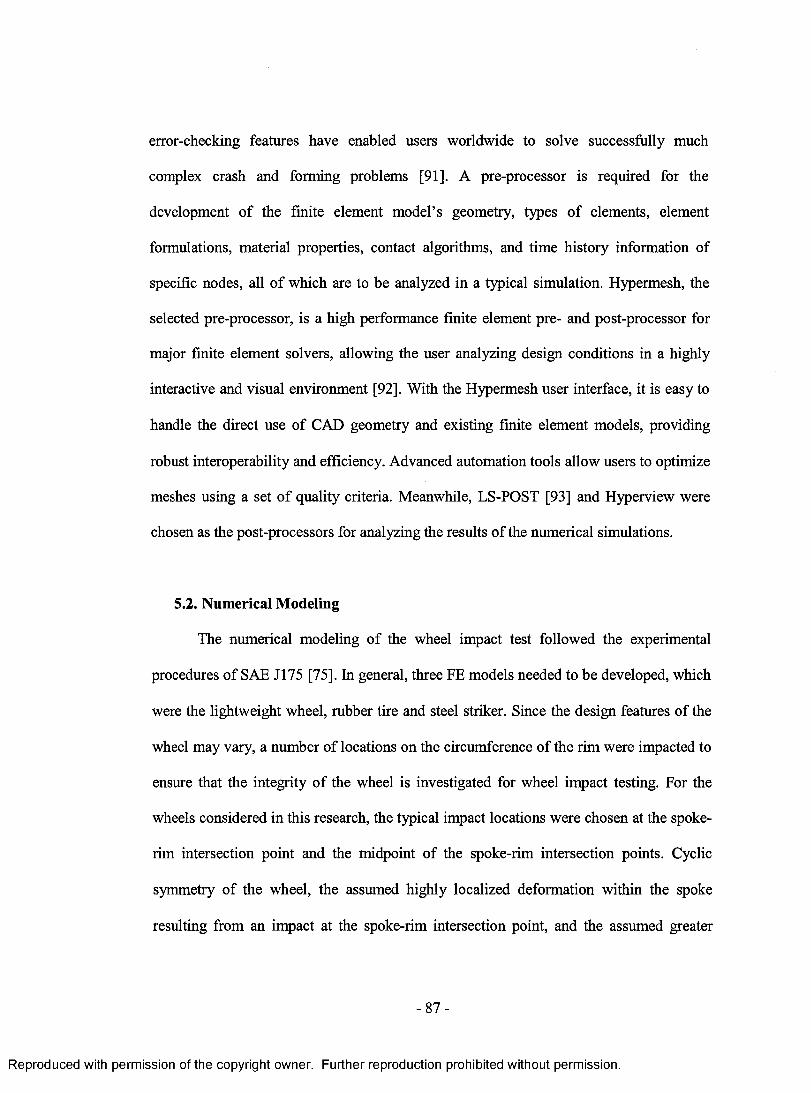
error-checking features have enabled users worldwide to solve successfully much
complex crash and forming problems [91]. A pre-processor is required for the
development of the finite element model’s geometry, types o f elements, element
formulations, material properties, contact algorithms, and time history information of
specific nodes, all of which are to be analyzed in a typical simulation. Hypermesh, the
selected pre-processor, is a high performance finite element pre- and post-processor for
major finite element solvers, allowing the user analyzing design conditions in a highly
interactive and visual environment [92]. With the Hypermesh user interface, it is easy to
handle the direct use of CAD geometry and existing finite element models, providing
robust interoperability and efficiency. Advanced automation tools allow users to optimize
meshes using a set of quality criteria. Meanwhile, LS-POST [93] and Hyperview were
chosen as the post-processors for analyzing the results of the numerical simulations.
5.2. Numerical Modeling
The numerical modeling of the wheel impact test followed the experimental
procedures of SAE J175 [75]. In general, three FE models needed to be developed, which
were the lightweight wheel, rubber tire and steel striker. Since the design features of the
wheel may vary, a number of locations on the circumference of the rim were impacted to
ensure that the integrity of the wheel is investigated for wheel impact testing. For the
wheels considered in this research, the typical impact locations were chosen at the spoke-
rim intersection point and the midpoint of the spoke-rim intersection points. Cyclic
symmetry of the wheel, the assumed highly localized deformation within the spoke
resulting from an impact at the spoke-rim intersection point, and the assumed greater
- 8 7 -
Reproduced with permission of the copyright owner. Further reproduction prohibited without permission.
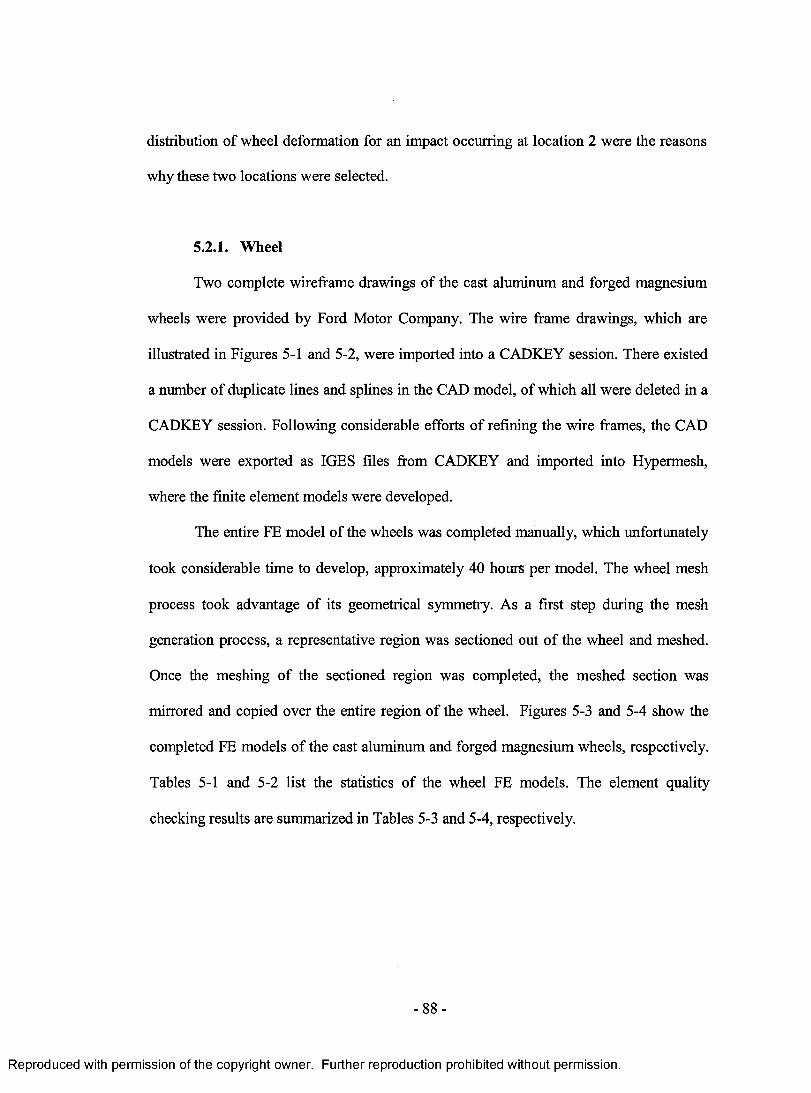
distribution of wheel deformation for an impact occurring at location 2 were the reasons
why these two locations were selected.
5.2.1. Wheel
Two complete wireframe drawings of the cast aluminum and forged magnesium
wheels were provided by Ford Motor Company. The wire frame drawings, which are
illustrated in Figures 5-1 and 5-2, were imported into a CADKEY session. There existed
a number of duplicate lines and splines in the CAD model, of which all were deleted in a
CADKEY session. Following considerable efforts of refining the wire frames, the CAD
models were exported as IGES files from CADKEY and imported into Hypermesh,
where the finite element models were developed.
The entire FE model of the wheels was completed manually, which unfortunately
took considerable time to develop, approximately 40 hours per model. The wheel mesh
process took advantage of its geometrical symmetry. As a first step during the mesh
generation process, a representative region was sectioned out o f the wheel and meshed.
Once the meshing of the sectioned region was completed, the meshed section was
mirrored and copied over the entire region of the wheel. Figures 5-3 and 5-4 show the
completed FE models of the cast aluminum and forged magnesium wheels, respectively.
Tables 5-1 and 5-2 list the statistics of the wheel FE models. The element quality
checking results are summarized in Tables 5-3 and 5-4, respectively.
- 8 8 -
Reproduced with permission of the copyright owner. Further reproduction prohibited without permission.
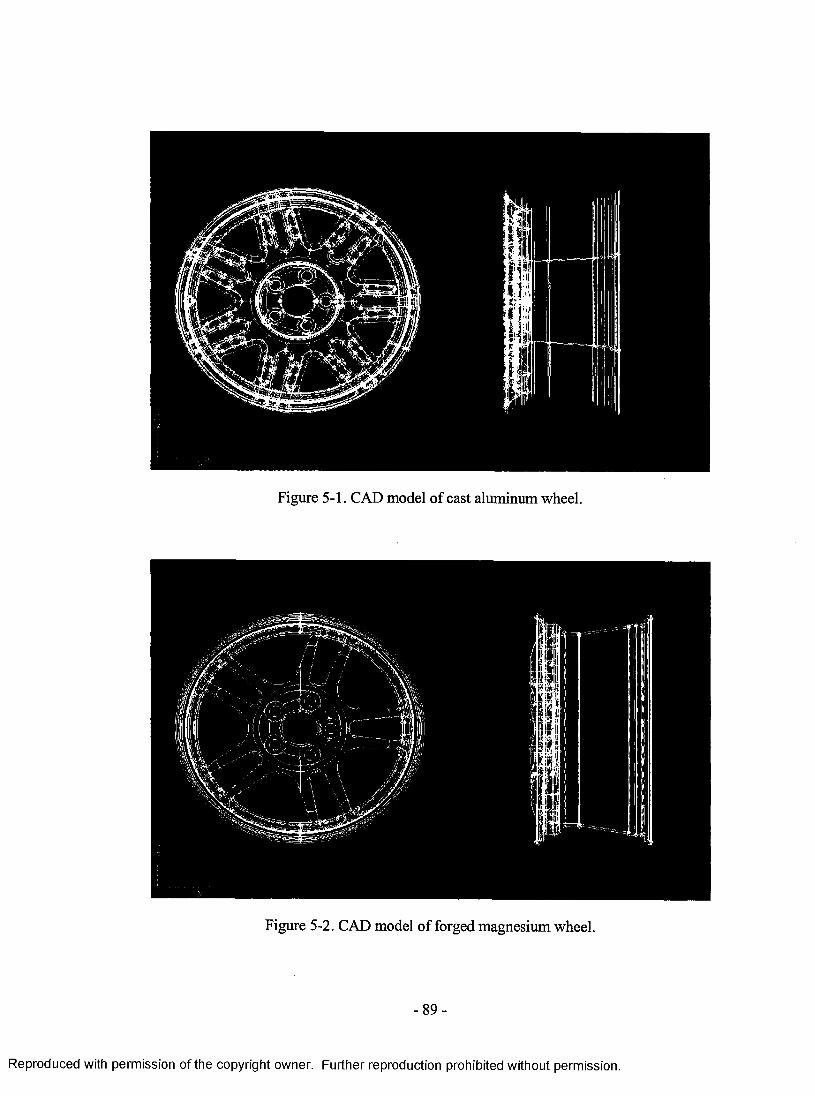
Figure 5-1. CAD model of cast aluminum wheel.
Reproduced with permission of the copyright owner. Further reproduction prohibited without permission.
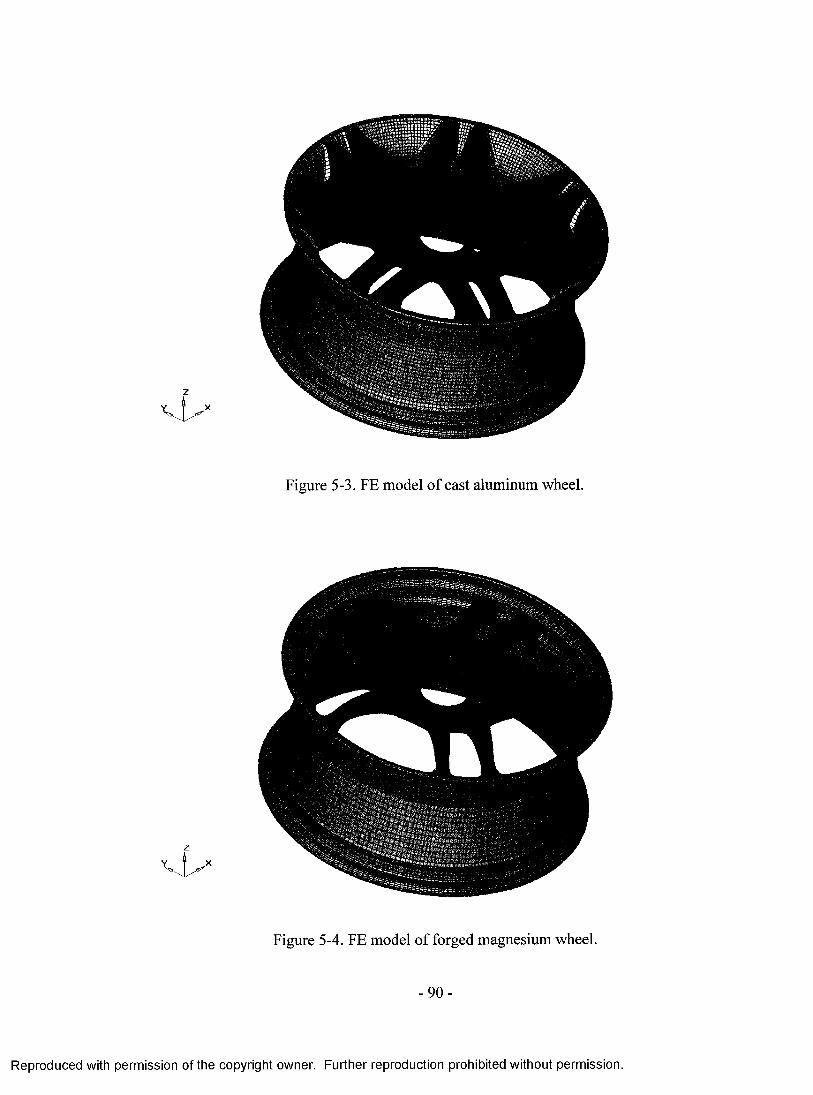
Figure 5-3. FE model o f cast aluminum wheel.
Figure 5-4. FE model of forged magnesium wheel.
Reproduced with permission of the copyright owner. Further reproduction prohibited without permission.
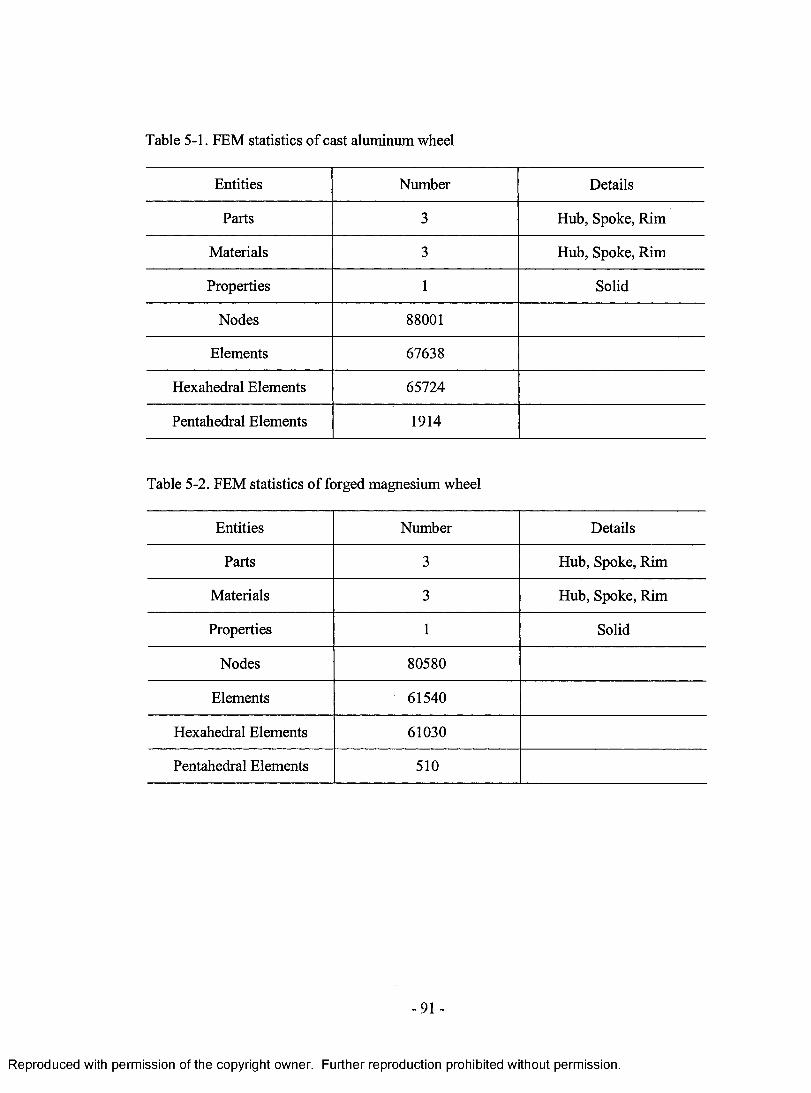
Table 5-1. FEM statistics of cast aluminum wheel
Entities Number Details
Parts 3 Hub, Spoke, Rim
Materials 3 Hub, Spoke, Rim
Properties 1 Solid
Nodes 88001
Elements 67638
Hexahedral Elements 65724
Pentahedral Elements 1914
Table 5-2. FEM statistics of forged magnesium wheel
Entities Number Details
Parts 3 Hub, Spoke, Rim
Materials 3 Hub, Spoke, Rim
Properties 1 Solid
Nodes 80580
Elements 61540
Hexahedral Elements 61030
Pentahedral Elements 510
-91 -
Reproduced with permission of the copyright owner. Further reproduction prohibited without permission.
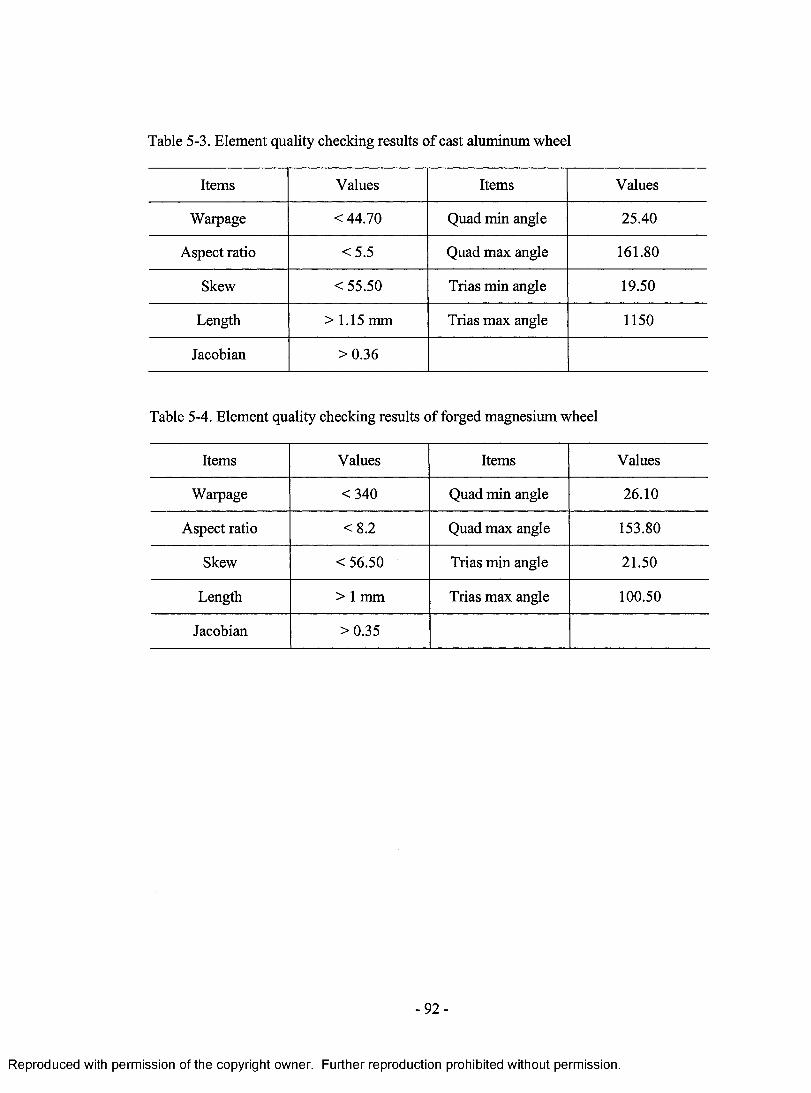
Table 5-3. Element quality checking results of cast aluminum wheel
Items Values Items Values
Warpage < 44.70 Quad min angle 25.40
Aspect ratio <5.5 Quad max angle 161.80
Skew < 55.50 Trias min angle 19.50
Length > 1.15 mm Trias max angle 1150
Jacobian >0.36
Table 5-4. Element quality checking results of forged magnesium wheel
Items Values Items Values
Warpage <340 Quad min angle 26.10
Aspect ratio < 8.2 Quad max angle 153.80
Skew <56.50 Trias min angle 21.50
Length > 1 mm Trias max angle 100.50
Jacobian >0.35
-9 2 -
Reproduced with permission of the copyright owner. Further reproduction prohibited without permission.
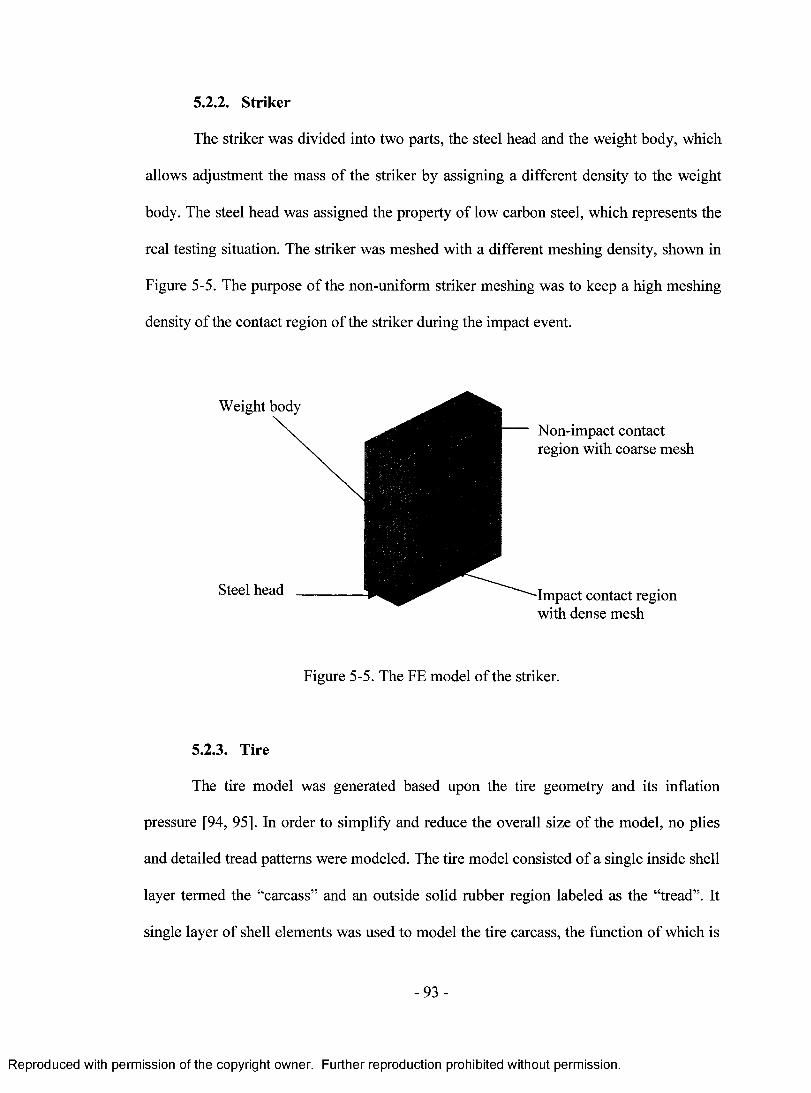
5.2.2. Striker
The striker was divided into two parts, the steel head and the weight body, which
allows adjustment the mass of the striker by assigning a different density to the weight
body. The steel head was assigned the property o f low carbon steel, which represents the
real testing situation. The striker was meshed with a different meshing density, shown in
Figure 5-5. The purpose o f the non-uniform striker meshing was to keep a high meshing
density of the contact region of the striker during the impact event.
Weight body
Steel head
Non-impact contact region with coarse mesh
Impact contact region with dense mesh
Figure 5-5. The FE model o f the striker.
5.2.3. Tire
The tire model was generated based upon the tire geometry and its inflation
pressure [94, 95]. In order to simplify and reduce the overall size of the model, no plies
and detailed tread patterns were modeled. The tire model consisted o f a single inside shell
layer termed the “carcass” and an outside solid rubber region labeled as the “tread”. It
single layer o f shell elements was used to model the tire carcass, the function o f which is
- 9 3 -
Reproduced with permission of the copyright owner. Further reproduction prohibited without permission.
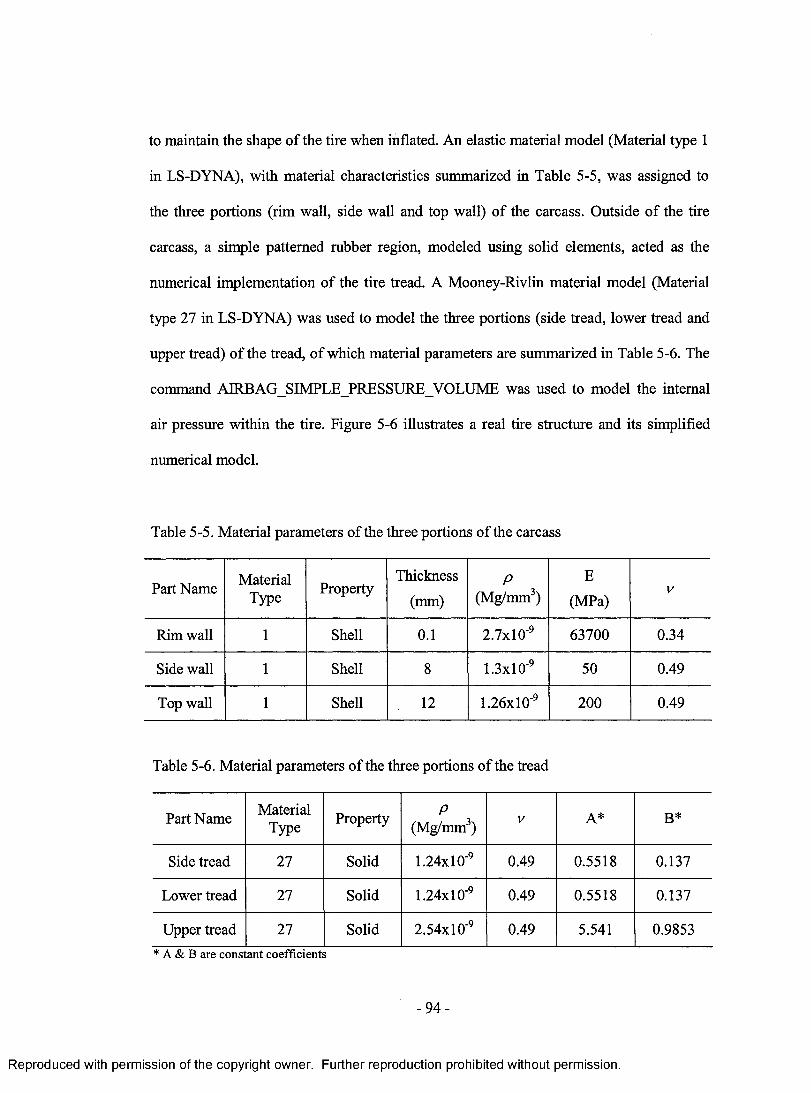
to maintain the shape of the tire when inflated. An elastic material model (Material type 1
in LS-DYNA), with material characteristics summarized in Table 5-5, was assigned to
the three portions (rim wall, side wall and top wall) of the carcass. Outside of the tire
carcass, a simple patterned rubber region, modeled using solid elements, acted as the
numerical implementation of the tire tread. A Mooney-Rivlin material model (Material
type 27 in LS-DYNA) was used to model the three portions (side tread, lower tread and
upper tread) of the tread, of which material parameters are summarized in Table 5-6. The
command AIRBAG_SIMPLE_PRESSURE_VOLUME was used to model the internal
air pressure within the tire. Figure 5-6 illustrates a real tire structure and its simplified
numerical model.
Table 5-5. Material parameters of the three portions of the carcass
Part Name MaterialType Property
Thickness
(mm)P
(Mg/mm3)E
(MPa)V
Rim wall 1 Shell 0.1 2.7x1 O'9 63700 0.34
Side wall 1 Shell 8 1.3x1 O’9 50 0.49
Top wall 1 Shell 12 1.26x1 O'9 200 0.49
Table 5-6. Material parameters of the three portions of the tread
Part Name MaterialType Property P
(Mg/mm3) V A* B*
Side tread 27 Solid 1.24x1 O'9 0.49 0.5518 0.137
Lower tread 27 Solid 1.24x1 O'9 0.49 0.5518 0.137
Upper tread 27 Solid 2.54xl0 '9 0.49 5.541 0.9853* A & B are constant coefficients
-9 4 -
Reproduced with permission of the copyright owner. Further reproduction prohibited without permission.
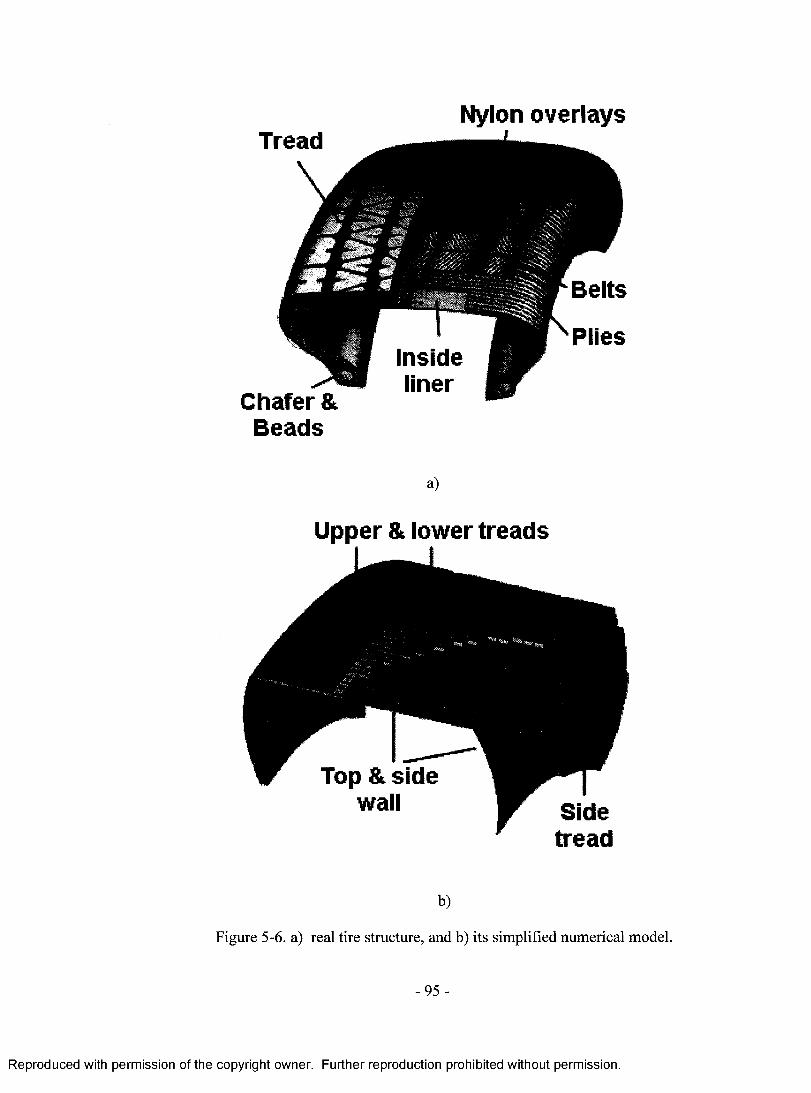
Nylon overlaysTread
Belts
Insideliner
Chafer &Beads
a)
Upper & lower treads
Side tread
b)
Figure 5-6. a) real tire structure, and b) its simplified numerical model.
-95 -
Reproduced with permission of the copyright owner. Further reproduction prohibited without permission.
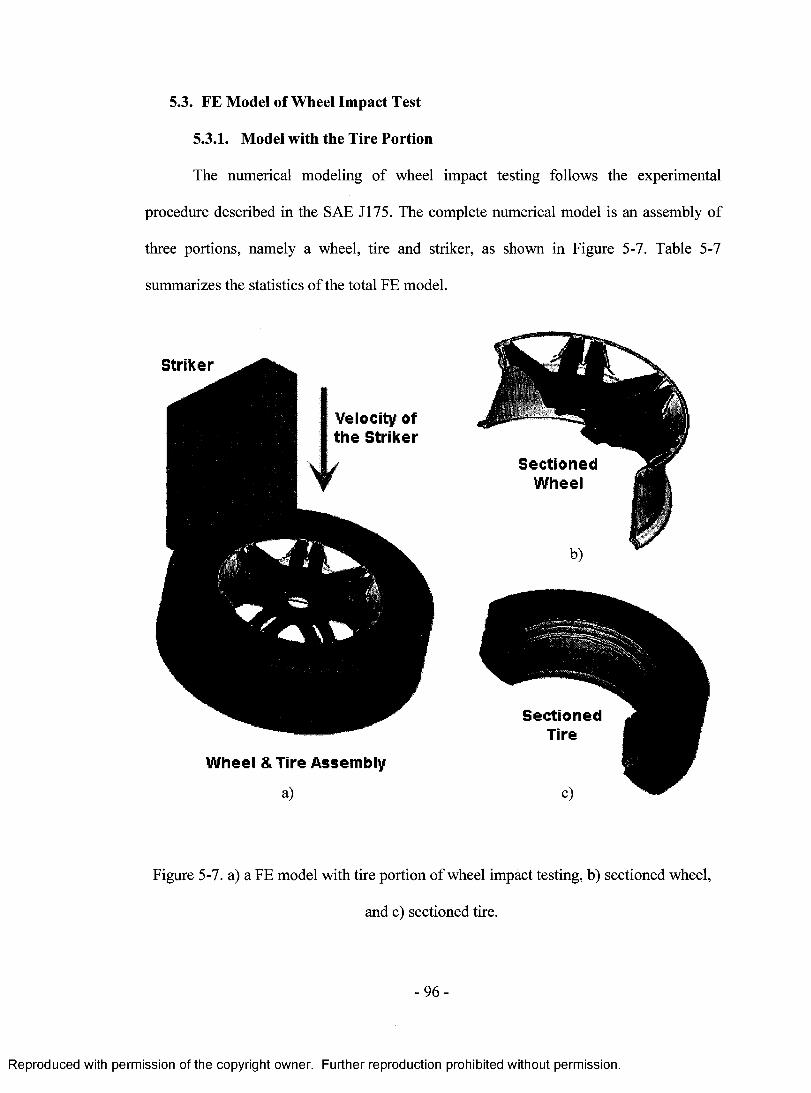
5.3. FE Model of Wheel Impact Test
5.3.1. Model with the Tire Portion
The numerical modeling of wheel impact testing follows the experimental
procedure described in the SAE J175. The complete numerical model is an assembly of
three portions, namely a wheel, tire and striker, as shown in Figure 5-7. Table 5-7
summarizes the statistics o f the total FE model.
C ^ k > i l / A W
V elocity of t h e S t r ik e r
4 N 1
S e c t io n e d W h e e l
W h e e l & T ire A sse m b ly
a)
S e c t io n e dTire
Figure 5-7. a) a FE model with tire portion of wheel impact testing, b) sectioned wheel,
and c) sectioned tire.
- 9 6 -
Reproduced with permission of the copyright owner. Further reproduction prohibited without permission.
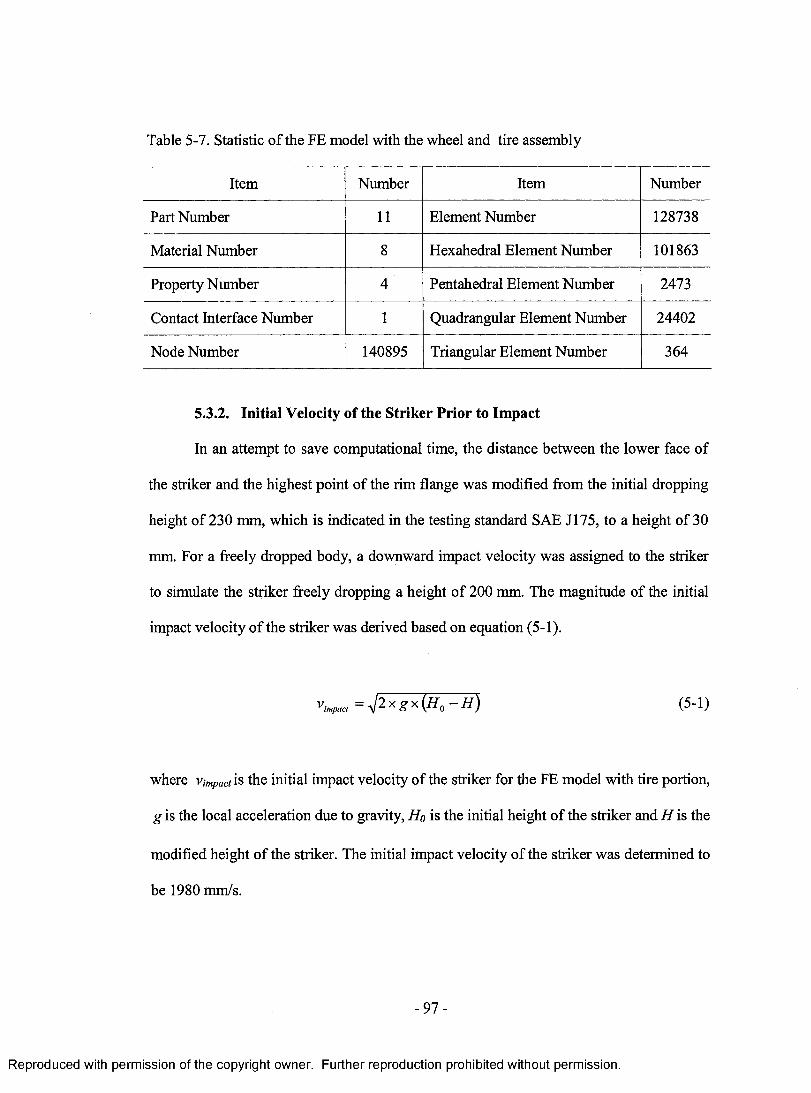
Table 5-7. Statistic of the FE model with the wheel and tire assembly
Item Number Item Number
Part Number 11 Element Number 128738
Material Number 8 Hexahedral Element Number 101863
Property Number 4 Pentahedral Element Number 2473
Contact Interface Number 1 Quadrangular Element Number 24402
Node Number 140895 Triangular Element Number 364
5.3.2. Initial Velocity of the Striker Prior to Impact
In an attempt to save computational time, the distance between the lower face of
the striker and the highest point of the rim flange was modified from the initial dropping
height of 230 mm, which is indicated in the testing standard SAE J175, to a height of 30
mm. For a freely dropped body, a downward impact velocity was assigned to the striker
to simulate the striker freely dropping a height of 200 mm. The magnitude of the initial
impact velocity of the striker was derived based on equation (5-1).
(5-!>
where vimpact is the initial impact velocity of the striker for the FE model with tire portion,
g is the local acceleration due to gravity, Ho is the initial height o f the striker and H is the
modified height o f the striker. The initial impact velocity of the striker was determined to
be 1980 mm/s.
-9 7 -
Reproduced with permission of the copyright owner. Further reproduction prohibited without permission.
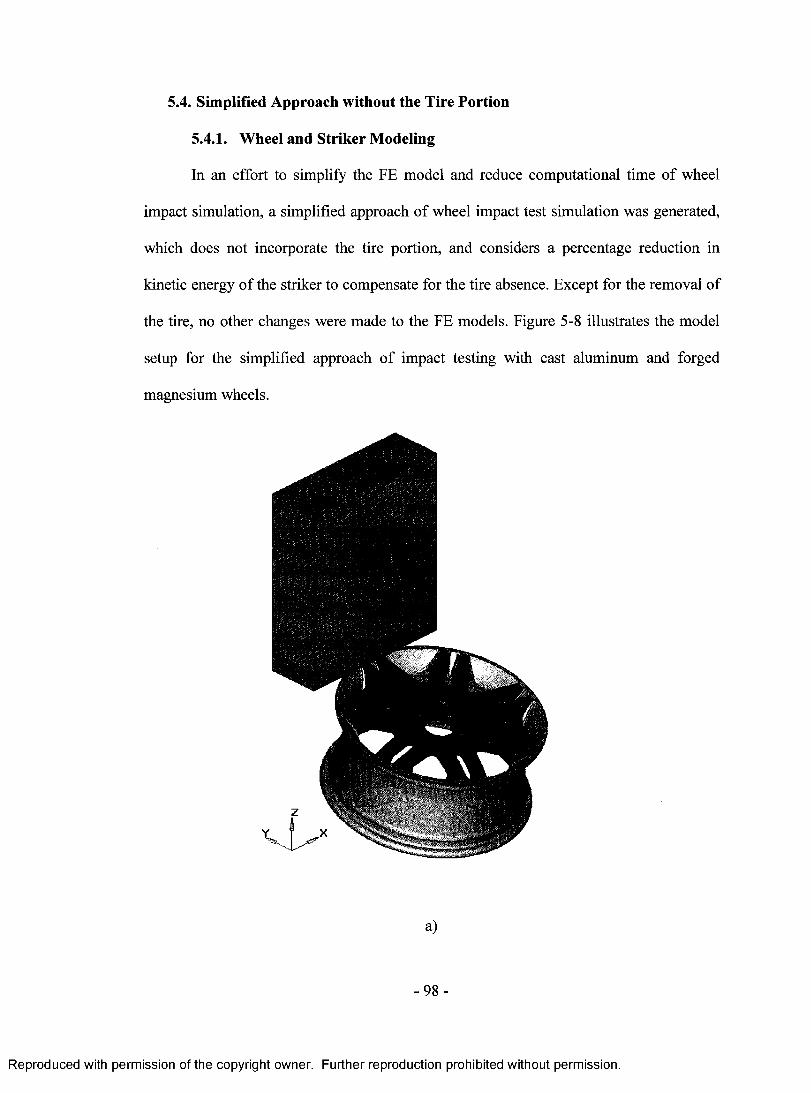
5.4. Simplified Approach without the Tire Portion
5.4.1. Wheel and Striker Modeling
In an effort to simplify the FE model and reduce computational time o f wheel
impact simulation, a simplified approach o f wheel impact test simulation was generated,
which does not incorporate the tire portion, and considers a percentage reduction in
kinetic energy o f the striker to compensate for the tire absence. Except for the removal of
the tire, no other changes were made to the FE models. Figure 5-8 illustrates the model
setup for the simplified approach of impact testing with cast aluminum and forged
magnesium wheels.
a)
- 9 8 -
Reproduced with permission of the copyright owner. Further reproduction prohibited without permission.
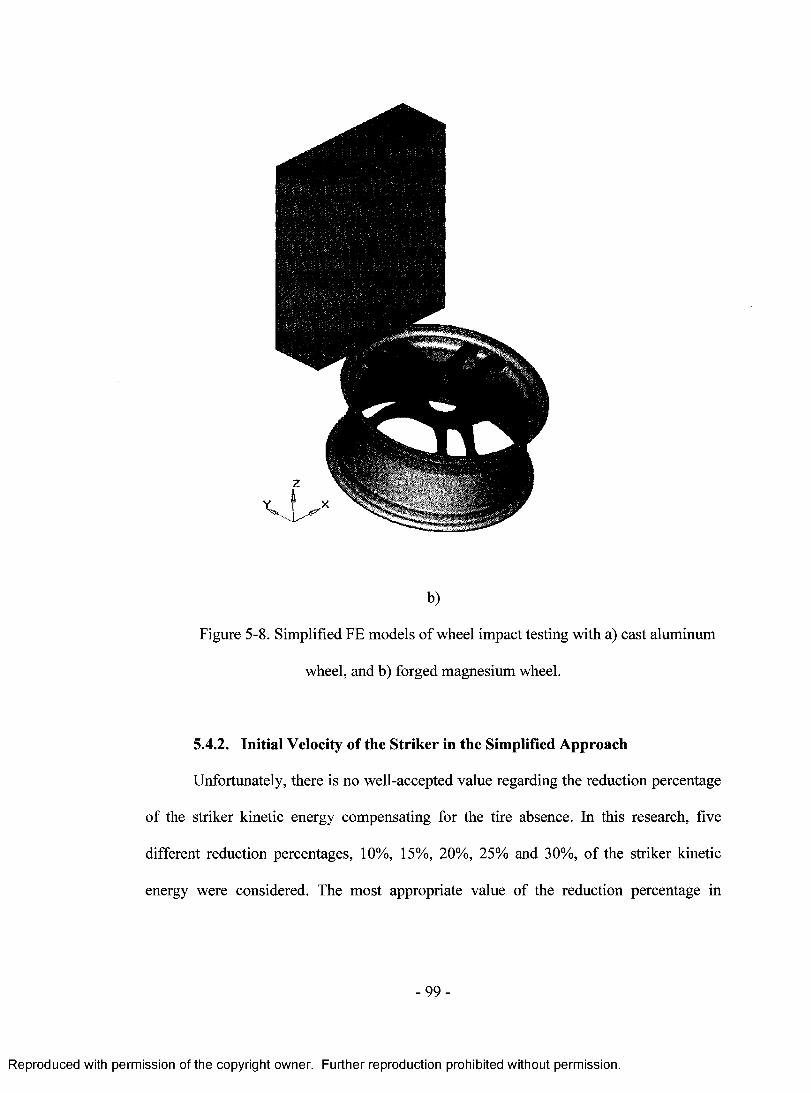
Figure 5-8. Simplified FE models o f wheel impact testing with a) cast aluminum
wheel, and b) forged magnesium wheel.
5.4.2. Initial Velocity of the Striker in the Simplified Approach
Unfortunately, there is no well-accepted value regarding the reduction percentage
o f the striker kinetic energy compensating for the tire absence. In this research, five
different reduction percentages, 10%, 15%, 20%, 25% and 30%, o f the striker kinetic
energy were considered. The most appropriate value of the reduction percentage in
- 9 9 -
Reproduced with permission of the copyright owner. Further reproduction prohibited without permission.
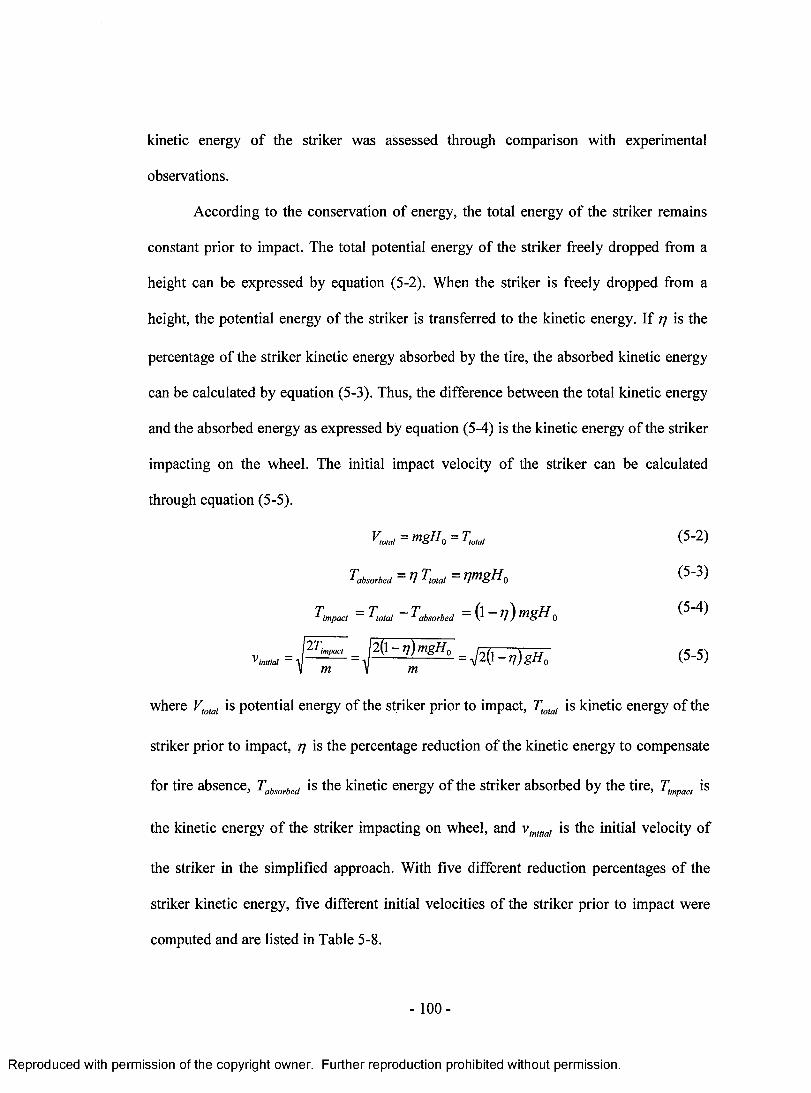
kinetic energy of the striker was assessed through comparison with experimental
observations.
According to the conservation of energy, the total energy of the striker remains
constant prior to impact. The total potential energy of the striker freely dropped from a
height can be expressed by equation (5-2). When the striker is freely dropped from a
height, the potential energy of the striker is transferred to the kinetic energy. If 77 is the
percentage of the striker kinetic energy absorbed by the tire, the absorbed kinetic energy
can be calculated by equation (5-3). Thus, the difference between the total kinetic energy
and the absorbed energy as expressed by equation (5-4) is the kinetic energy of the striker
impacting on the wheel. The initial impact velocity of the striker can be calculated
through equation (5-5).
where Vtotal is potential energy of the striker prior to impact, Ttotal is kinetic energy of the
striker prior to impact, 77 is the percentage reduction of the kinetic energy to compensate
for tire absence, Tabsorbed is the kinetic energy of the striker absorbed by the tire, Timpact is
the kinetic energy of the striker impacting on wheel, and vmial is the initial velocity of
the striker in the simplified approach. With five different reduction percentages of the
striker kinetic energy, five different initial velocities of the striker prior to impact were
computed and are listed in Table 5-8.
K m t = m S H 0 = T ,o,a, (5-2)
absorbed
absorbedimpact
impactinitial
(5-3)
(5-4)
(5-5)
- 100 -
Reproduced with permission of the copyright owner. Further reproduction prohibited without permission.

Table 5-8. Percentage of the kinetic energy reduction tj vs. initial velocity Vmua
*(% ) 10 15 20 25 30
Vinitial (mm/s) 2015 1960 1900 1840 1775
5.5. Material Models of the Wheels
As described above, the material inhomogeneity of the magnesium forged and
aluminum cast wheels were investigated through tensile testing at different regions, i.e.,
hub, spoke and rim of the wheels. Perhaps the most important consideration in numerical
modeling is the establishment of a material model incorporating with property variation
among geometry. The experimental results of tensile testing indicate that both the cast
aluminum and forged magnesium exhibits elastic-plastic behaviour under deformation.
Therefore, material model 24, capable of simulating the elastic and plastic performance
of cast aluminum and forged magnesium wheels, was selected. A piecewise linear
plasticity material model (model 24) was used for the hub, spoke and rim regions. True
stress and true strain were calculated equations (5-6) and (5-7), from the obtained
engineering stress versus strain curves, respectively [96]. Although these equations were
only valid prior to necking within the sample, a minimal amount o f necking was observed
on all the tested specimens prior to fracture, so both equations were used throughout the
entire range of stress and strain. Often in FE material models, the true effective plastic
strain is required for input. Equation (5-8) was utilized to determine the effective plastic
strain based upon experimental data.
-101 -
Reproduced with permission of the copyright owner. Further reproduction prohibited without permission.
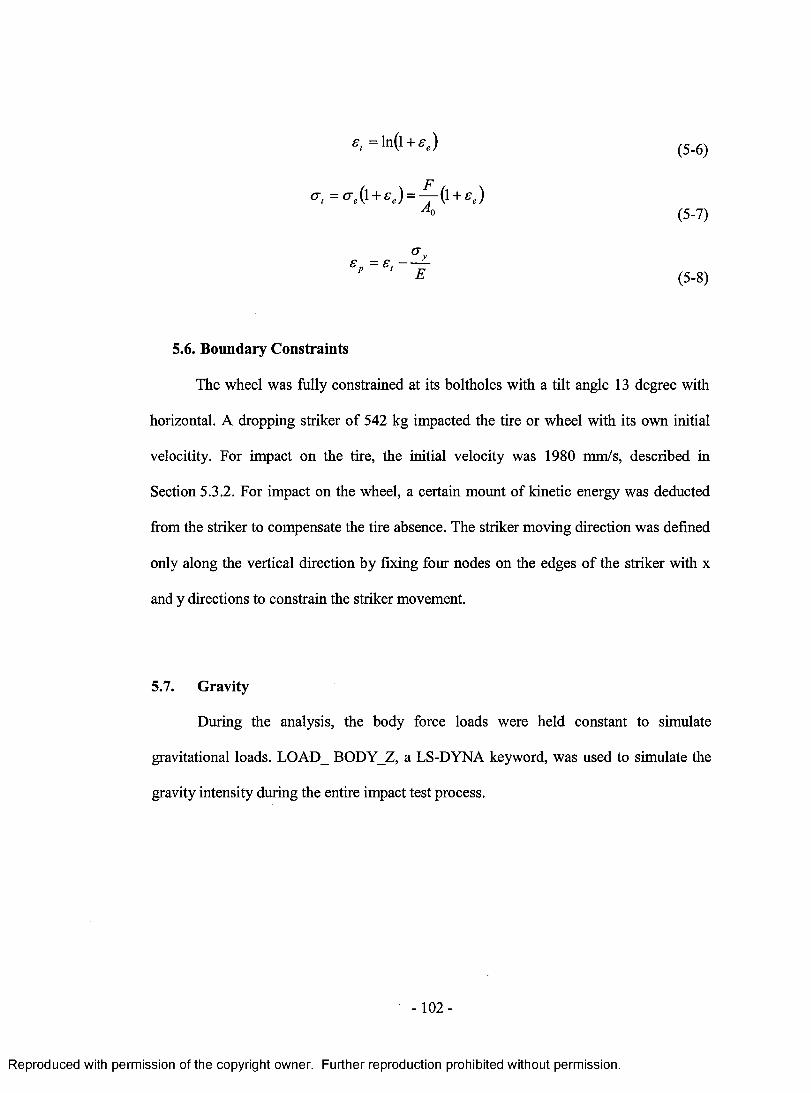
£, - ln(i + s e)
<rt =0-e(1 + 0 = - 7'(1 + 0A
(5-6)
(5-7)
£P =£t ~ —p t E(5-8)
5.6. Boundary Constraints
The wheel was fully constrained at its boltholes with a tilt angle 13 degree with
horizontal. A dropping striker of 542 kg impacted the tire or wheel with its own initial
velocitity. For impact on the tire, the initial velocity was 1980 mm/s, described in
Section 5.3.2. For impact on the wheel, a certain mount of kinetic energy was deducted
from the striker to compensate the tire absence. The striker moving direction was defined
only along the vertical direction by fixing four nodes on the edges of the striker with x
and y directions to constrain the striker movement.
5.7. Gravity
During the analysis, the body force loads were held constant to simulate
gravitational loads. LOAD_ BODY Z, a LS-DYNA keyword, was used to simulate the
gravity intensity during the entire impact test process.
-102 -
Reproduced with permission of the copyright owner. Further reproduction prohibited without permission.
Chapter 6
MODELING OF THE WHEEL CORNERING FATIGUE TEST
6.1. FE Software Selection 104
6.2. Implicit Simulation Considering Different Bending Directions 104
6.2.1. Cast Aluminum Wheel 104
6.2.2. Forged Magnesium Wheel 107
6.3. Explicit Simulation Considering a Rotating Bending Moment 110
6.3.1. Cast Aluminum Wheel 110
6.3.2. Forged Magnesium Wheel 113
6.4. System Damping 114
6.5. Boundary Conditions 115
-103 -
Reproduced with permission of the copyright owner. Further reproduction prohibited without permission.

6. MODELING OF THE WHEEL CORNERING FATIGUE TEST
6.1. FE Software Selection
Numerical simulations of wheel cornering fatigue test are highly desirable for
wheel design, which shortens design time, reduces wheel mass, and enhances engineering
performance [97]. The main concern in the wheel industry today is lightweight material
substitution in order to achieve better performance and quality with reduced weight. Two
commercial 16” cast aluminum and forged magnesium wheels were chosen to conduct
numerical and experimental analyses. Two numerical prediction methods were applied to
simulate wheel cornering fatigue testing. The first method utilized static stress analysis,
using the implicit FE software NASTRAN [98], with different bending directions applied
at the hub. The fatigue performance of the wheel was evaluated based upon results from
the static stress analysis. The second approach conducted a dynamic stress analysis, using
the explicit FE software LS-DYNA [90] with application of a time-varying rotating
bending moment applied to the hub. The fatigue performance of the wheel was evaluated
based upon the results from the dynamic stress analysis.
6.2. Implicit Approach Considering Different Bending Directions
6.2.1. Cast Aluminum Wheel
Numerical modeling with implicit static analysis of the cast aluminum wheel
cornering fatigue test followed the experimental procedures described in the SAE J328
[80]. The complete model was an assembly of three portions, namely a wheel, a rigid
mounting plate and five rigid bending beams, shown in Figure 6-1. Table 6-1 summarizes
the statistics of the total FE model. The cast aluminum wheel model was divided into
-1 0 4 -
Reproduced with permission of the copyright owner. Further reproduction prohibited without permission.
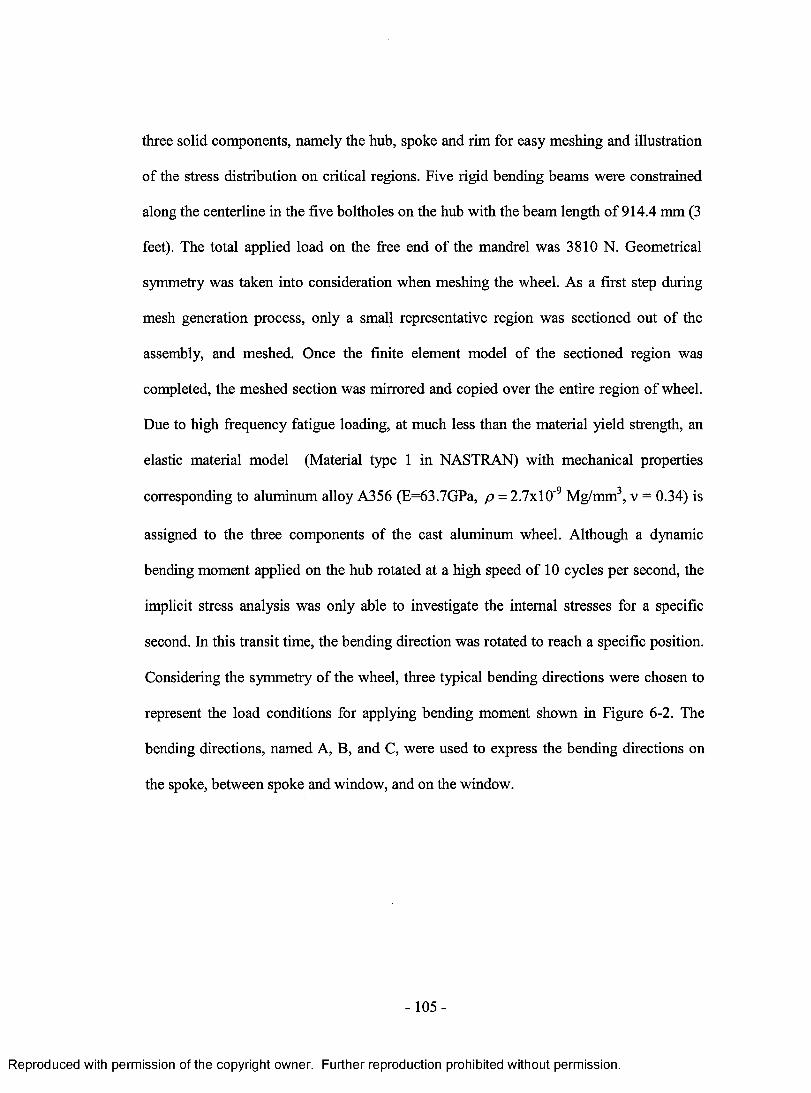
three solid components, namely the hub, spoke and rim for easy meshing and illustration
of the stress distribution on critical regions. Five rigid bending beams were constrained
along the centerline in the five boltholes on the hub with the beam length of 914.4 mm (3
feet). The total applied load on the free end of the mandrel was 3810 N. Geometrical
symmetry was taken into consideration when meshing the wheel. As a first step during
mesh generation process, only a small representative region was sectioned out of the
assembly, and meshed. Once the finite element model of the sectioned region was
completed, the meshed section was mirrored and copied over the entire region of wheel.
Due to high frequency fatigue loading, at much less than the material yield strength, an
elastic material model (Material type 1 in NASTRAN) with mechanical properties
corresponding to aluminum alloy A356 (E=63.7GPa, p - 2.7xl0 '9 Mg/mm3, v = 0.34) is
assigned to the three components of the cast aluminum wheel. Although a dynamic
bending moment applied on the hub rotated at a high speed of 10 cycles per second, the
implicit stress analysis was only able to investigate the internal stresses for a specific
second. In this transit time, the bending direction was rotated to reach a specific position.
Considering the symmetry of the wheel, three typical bending directions were chosen to
represent the load conditions for applying bending moment shown in Figure 6-2. The
bending directions, named A, B, and C, were used to express the bending directions on
the spoke, between spoke and window, and on the window.
-105 -
Reproduced with permission of the copyright owner. Further reproduction prohibited without permission.

<11.
Bending Loads 5X762 N
t S "11 >--'Ki@id Beams
Fully Constrained at Eight LocationsMounting Plate
Figure 6-1. Numerical model of cornering fatigue testing for cast aluminum wheel using
an implicit static approach.
Window
A
Figure 6-2. Typical bending directions of cast aluminum wheel model using an implicit
static approach.
- 106 -
Reproduced with permission of the copyright owner. Further reproduction prohibited without permission.

Table 6-1. Statistic of the FE model of aluminum cast wheel
Item Number Item Number
Number of part 8 Number of node 88011
Number of material 2 Number o f element 67638
Number of property 2 Number of hexahedral element 65724
Number of load 5 Number of pentahedral element 1914
6.2.2. Forged Magnesium Wheel
With the aluminum wheel modeling, the numerical modeling of the forged
magnesium wheel cornering fatigue test with implicit static analysis also followed the
experimental procedures described in the SAE J328. The entire model consisted of an
assembly of three portions, namely a wheel, a rigid mounting plate and five rigid bending
beams, shown in Figure 6-3. Table 6-2 summarizes the statistics o f the total FE model.
Since high frequency fatigue loading was much less than the yield strength of forged
magnesium alloy, an elastic material model (Material type 1 in NASTRAN) with
mechanical properties corresponding to magnesium wrought alloy “MA2-1” (E=38.1GPa,
p = 1.8x1 O'9 Mg/mm3, v = 0.30) was assigned to the three components of the forged
magnesium wheel. Considering the symmetry of the wheel, three typical bending
directions were chosen to represent the load conditions for applying bending moment
shown in Figure 6-4. The bending directions, named A, B, and C, were used to express
the bending directions on the spoke, between spoke and window, and on the window.
-107 -
Reproduced with permission of the copyright owner. Further reproduction prohibited without permission.
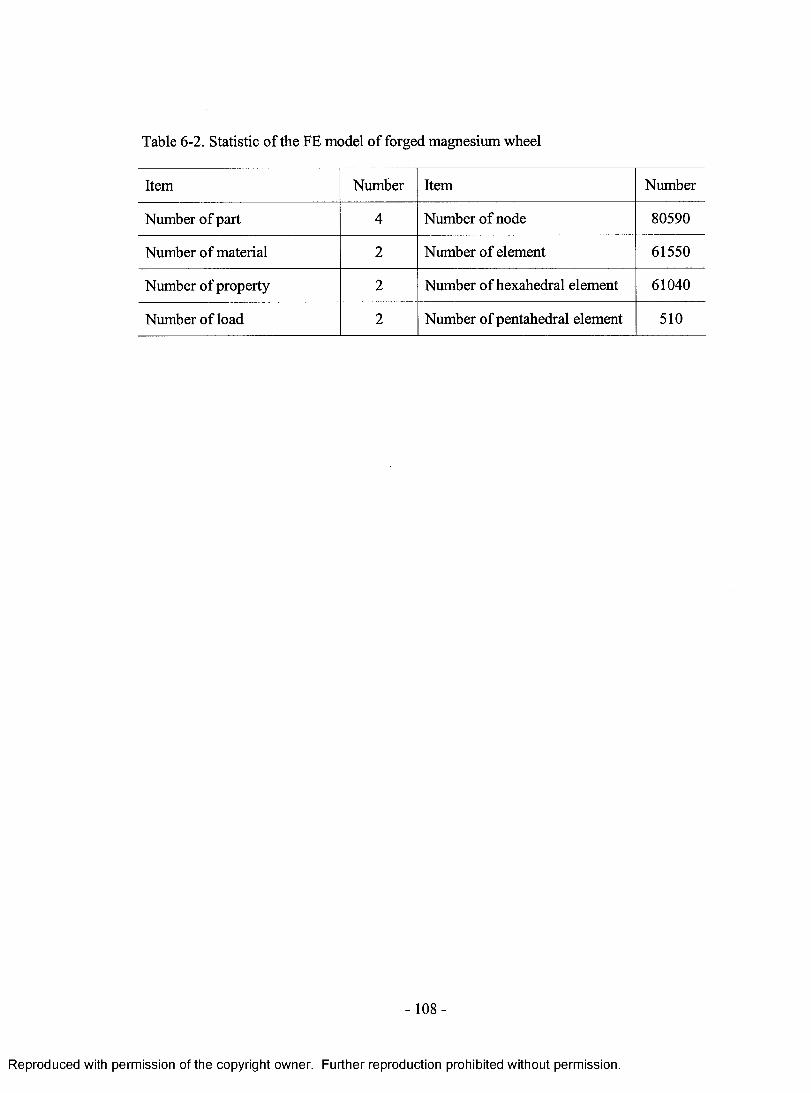
Table 6-2. Statistic of the FE model of forged magnesium wheel
Item Number Item Number
Number of part 4 Number of node 80590
Number of material 2 Number of element 61550
Number of property 2 Number o f hexahedral element 61040
Number of load 2 Number of pentahedral element 510
-108 -
Reproduced with permission of the copyright owner. Further reproduction prohibited without permission.
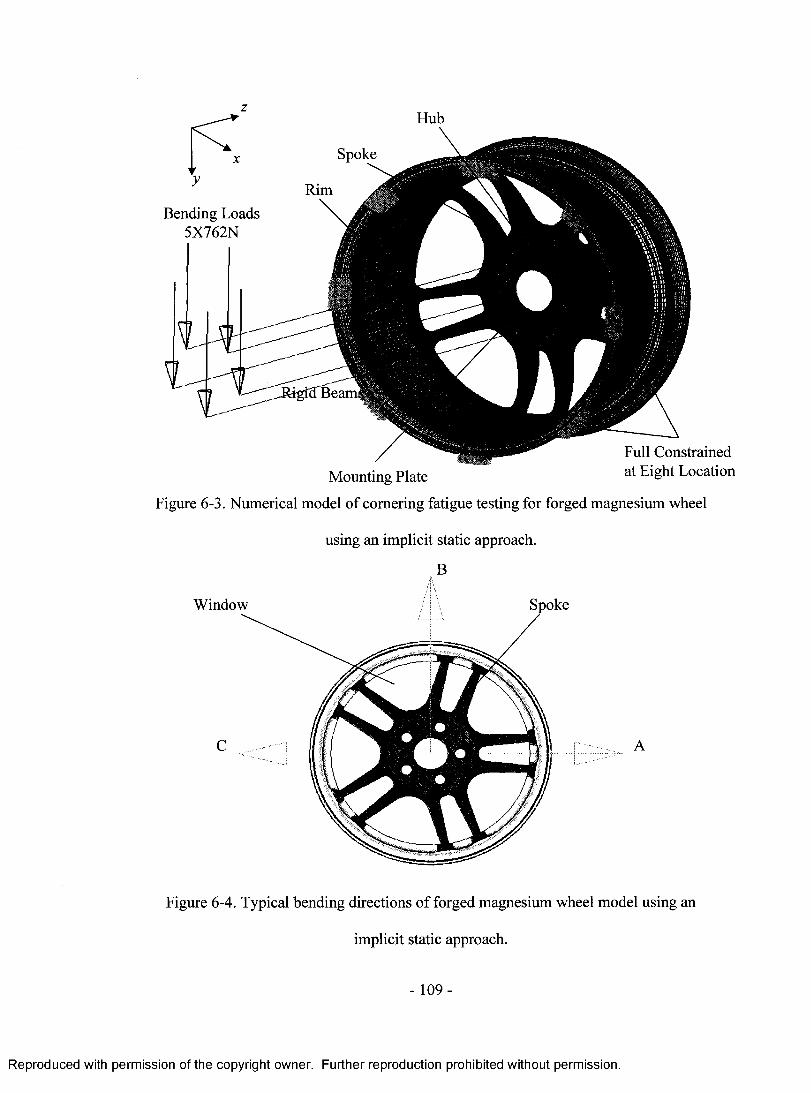
Full ConstrainedMounting Plate at Eight Location
Figure 6-3. Numerical model o f cornering fatigue testing for forged magnesium wheel
using an implicit static approach.
B
SpokeWindow
A
Figure 6-4. Typical bending directions o f forged magnesium wheel model using an
implicit static approach.
109-
Reproduced with permission of the copyright owner. Further reproduction prohibited without permission.

6.3. Explicit Approach Considering a Rotating Bending Moment
6.3.1. Cast Aluminum Wheel
The explicit simulation approach is especially well suited to solving high-speed
dynamic events that require many small increments to obtain a high-resolution solution.
The wheel cornering fatigue test has a dynamic rotating moment on the hub and for the
ideal elastic wheel material, the first cycle of the rotating moment has the same effect on
the wheel as the final cycle. Simulating one complete cycle of the rotating moment can
represent the internal stress variation and distribution for each cycle. The explicit
simulation approach is easily developed by modifying the implicit approach model.
Defining a time-dependent rotating bending moment on the hub, instead of using the
static loads, is the key step of transferring the implicit problem to explicit. This rotating
bending moment was presented by applying two perpendicular loads on the end of
mandrel varied with time using sine or cosine waves, as shown in Figure 6-5. A rigid
mounting plate and a rigid bending mandrel were constrained along the centerline of the
hub with the mandrel length of 914.4 mm. Two perpendicular forces were applied on the
free end of the mandrel with variation of sine and cosine functions to simulate a constant
rotating load. Assume that the rotating load is P acting on XY plane and consisted by Px
along the X axis and Py along the Y axis. As discussed in Chapter 3 section 3.4, the
angular velocity a was 62.8 rad/second. At the beginning, the Px increased from zero to
the absolute value of P in the first 0.005 seconds and was held on for another 0.005
seconds to balance the elastic deformation. Meanwhile, the Py was kept zero with a
bending moment in X direction only. After 0.010 seconds, the bending load P began to
rotate around the Z-axis with a constant angular velocity, which was achieved by the
-110 -
Reproduced with permission of the copyright owner. Further reproduction prohibited without permission.
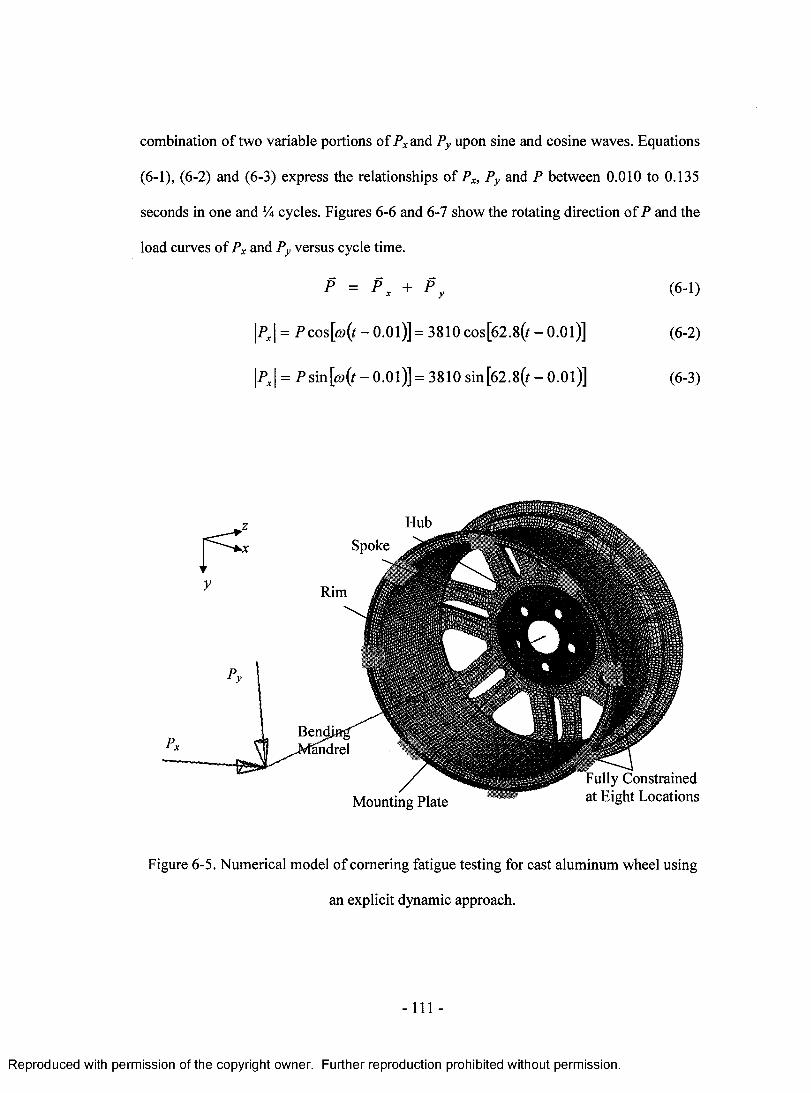
combination of two variable portions of Px and Py upon sine and cosine waves. Equations
(6-1), (6-2) and (6-3) express the relationships of Px, Py and P between 0.010 to 0.135
seconds in one and % cycles. Figures 6-6 and 6-7 show the rotating direction of P and the
load curves of Px and Py versus cycle time.
P = P x + P y (6-1)
\PX\ = Pcos[ry(f - 0 .0 l)]= 3810 cos[62.8(f - 0 .0l)] (6-2)
\PX\ = Psin[ry(f - 0 .0 l)]= 3810 sin[62.8(t - 0 .0 l)] (6-3)
andrel
Fully Constrained at Eight LocationsMounting Plate
Figure 6-5. Numerical model of cornering fatigue testing for cast aluminum wheel using
an explicit dynamic approach.
- I l l -
Reproduced with permission of the copyright owner. Further reproduction prohibited without permission.

Px and
Py
(N)
Mandrelsection Px
Rotatingangle
Figure 6-6. Rotating load P combined by two perpendicular forces Px and Py.
6000
(t-0. O il '=3810c os[62.8{ t-0.01)]4000
2000
-2000
-4000
P=Esin[(o (t-0.01)]= 381 Osin [62.8(t-i 101)]
-60000.00 0.02 0.04 0.06 0.08 0.10 0.12 0.14 0.16
Cycle time (second)Figure 6-7. Loads Px and Py versus cycle time for cast aluminum wheels.
- 1 1 2 -
Reproduced with permission of the copyright owner. Further reproduction prohibited without permission.
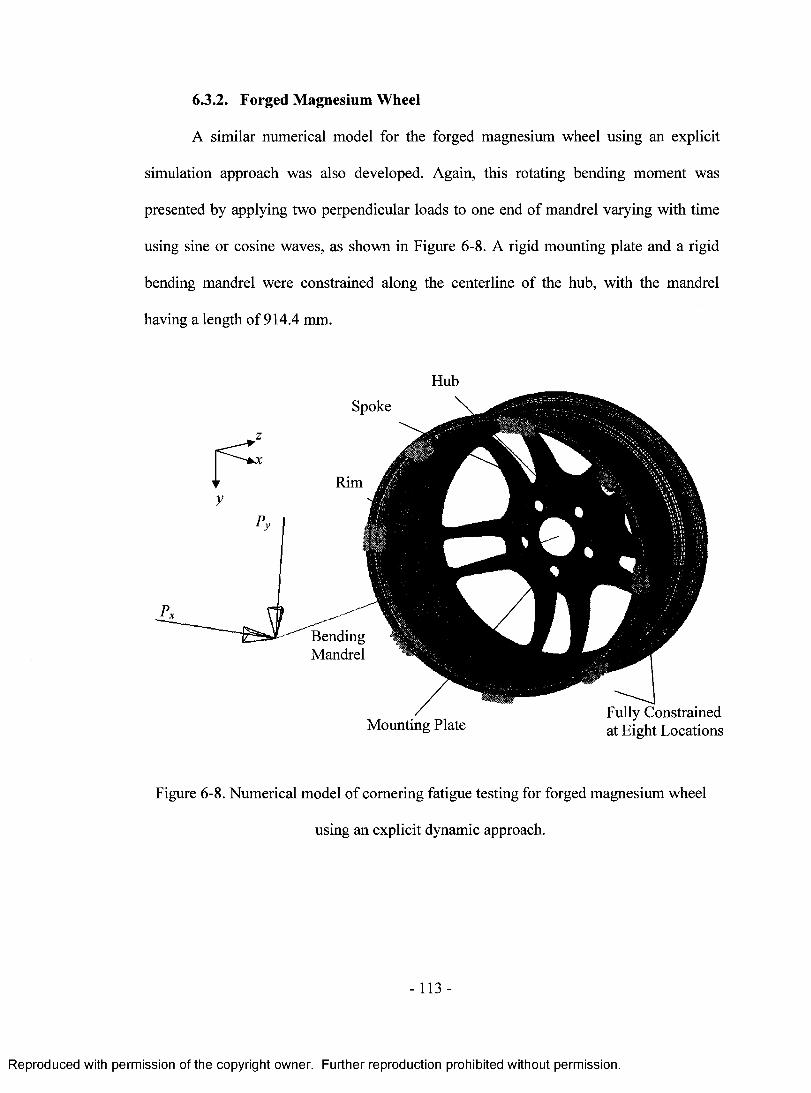
6.3.2. Forged Magnesium Wheel
A similar numerical model for the forged magnesium wheel using an explicit
simulation approach was also developed. Again, this rotating bending moment was
presented by applying two perpendicular loads to one end o f mandrel varying with time
using sine or cosine waves, as shown in Figure 6-8. A rigid mounting plate and a rigid
bending mandrel were constrained along the centerline of the hub, with the mandrel
having a length of 914.4 mm.
Figure 6-8. Numerical model o f cornering fatigue testing for forged magnesium wheel
using an explicit dynamic approach.
Hub
BendingMandrel
Mounting PlateFully Constrained at Eight Locations
- 113 -
Reproduced with permission of the copyright owner. Further reproduction prohibited without permission.
6.4. System Damping
Dynamic relaxation allows LS-DYNA to approximate solutions to linear and
nonlinear static or quasi-static processes. The wheel cornering fatigue testing models
incorporating a rotating bending moment on the hub were obviously nonlinear quasi
static problems. The solutions to most nonlinear problems are path dependent. Thus the
results obtained in the presence of dynamic oscillations may not be the same as those
from a nonlinear implicit code, and they may diverge from reality. In LS-DYNA, two
methods of damping the solution exist. The first named “dynamic relaxation” was used in
the beginning of the solution phase to obtain the initial stress and displacement field prior
to the analysis. The second is the system damping which can be applied anytime during
the solution phase either globally or to one specific material base. The best damping
constant D for the system is usually based on the critical damping factor for the lowest
frequency mode of interest. Equation (6-4) is recommended where the natural frequency
cof (given in radians per unit time) is generally taken as the fundamental frequency of the
structure. Note that this damping applies to both translational and rotation degrees of
freedom.
D = 2co f (6-4)
Due to large difference in Young’s modulus between the aluminum and
magnesium alloys, relatively severe elastic oscillations were observed in the explicit
fatigue testing model of forged magnesium wheel. The relatively large oscillation
generated unrealistic results during numerical simulation. To minimize the oscillation
effect, a system damping method was applied to the explicit fatigue testing model for the
magnesium wheel according to the following procedures. Firstly, counting the average
-114 -
Reproduced with permission of the copyright owner. Further reproduction prohibited without permission.
number N of oscillation cycles during a period of simulation time A t, and then calculating
the oscillation frequency cof based upon the following Equation (6-5).
Na>f = 2 n - — (6-5)f At
Then, the LS-DYNA keyword *DAMPING_GLOBAL was added to the model with the
damping constant as defined by Equation (6-4). By rerunning the model with the
damping constant, the elastic oscillation performance was damped out.
6.5. Boundary Conditions
During the experimental testing, a torque of 132 N-m was applied on each nut.
For simulating the nut torques, a downward load of 2224 N on each of the bolthole area
was applied to represent the bolt load from the bolt heads. A concentrated force of
2224 N was also applied to the mounting plate at the centerline of each bolthole to
represent the upward bolt load from the mounting plate. Eight positions with an arc
length of 50 mm on the bottom flange were fully constrained to simulate the wheel being
mounted on the stationary test table.
-115 -
Reproduced with permission of the copyright owner. Further reproduction prohibited without permission.
Chapter 7
RESULTS AND DISCUSSION OF WHEEL IMPACT TEST
7.1. Cast Aluminum Wheel 117
7.1.1. Impact Velocity Variation of the Striker 117
7.1.2. von Mises Stress and Effective Plastic Strain Distributions 121
7.1.3. Wheel Geometry Change during Impact 125
7.1.4. Comparison of the Experimental and Numerical Results 130
7.1.5. Effect of Impact Locations 130
7.2. Forged Magnesium Wheel 135
7.2.1. Impact Deformation and Plastic Deformation 135
7.2.2. Wheel Geometry Change during Impact 138
7.2.3. Experimental Validation of Kinetic Energy Compensation 142
-1 1 6 -
Reproduced with permission of the copyright owner. Further reproduction prohibited without permission.
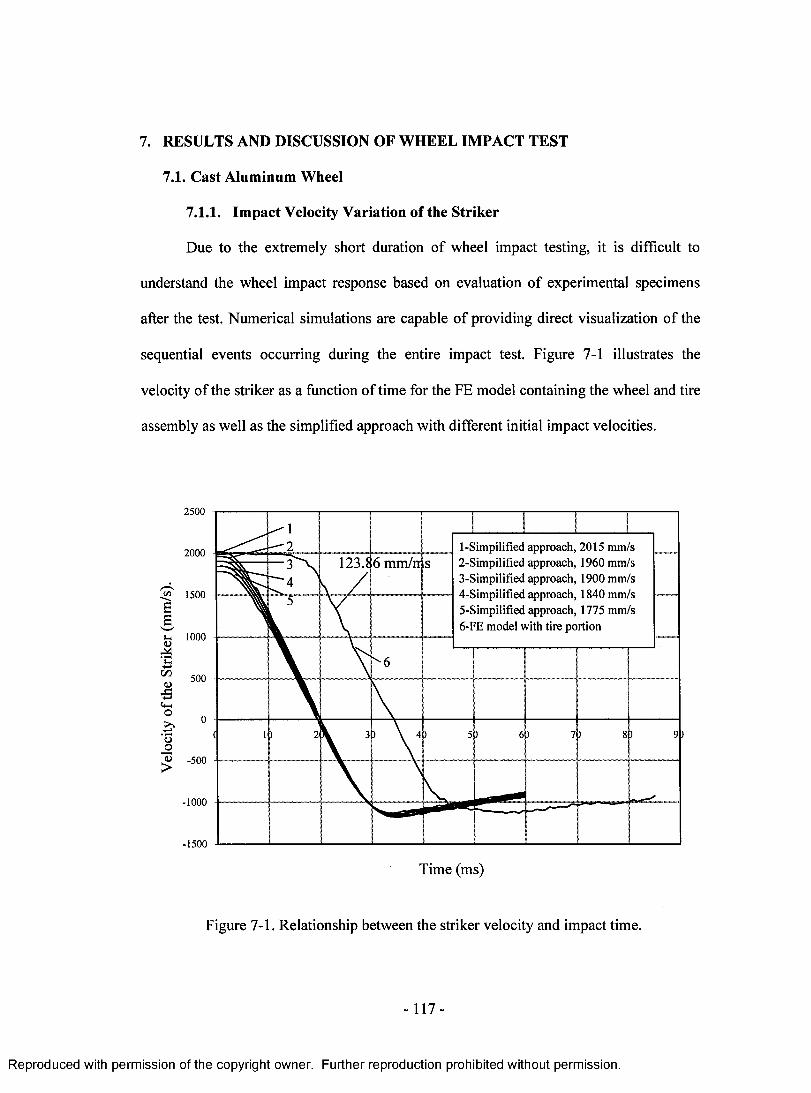
7. RESULTS AND DISCUSSION OF WHEEL IMPACT TEST
7.1. Cast Aluminum Wheel
7.1.1. Impact Velocity Variation of the Striker
Due to the extremely short duration of wheel impact testing, it is difficult to
understand the wheel impact response based on evaluation of experimental specimens
after the test. Numerical simulations are capable of providing direct visualization of the
sequential events occurring during the entire impact test. Figure 7-1 illustrates the
velocity of the striker as a function of time for the FE model containing the wheel and tire
assembly as well as the simplified approach with different initial impact velocities.
2 5 0 0
1-Simpilified approach, 2015 mm/s2-Simpilified approach, 1960 mm/s3-Simpilified approach, 1900 mm/s4-Simpilified approach, 1840 mm/s5-Simpilified approach, 1775 mm/s6-FE model with tire portion
2000123.f 6 mm/ns
w 1 5 0 0
E E.
1000l-l
B
- 5 0 0
-1000
- 1 5 0 0
Time (ms)
Figure 7-1. Relationship between the striker velocity and impact time.
-117 -
Reproduced with permission of the copyright owner. Further reproduction prohibited without permission.
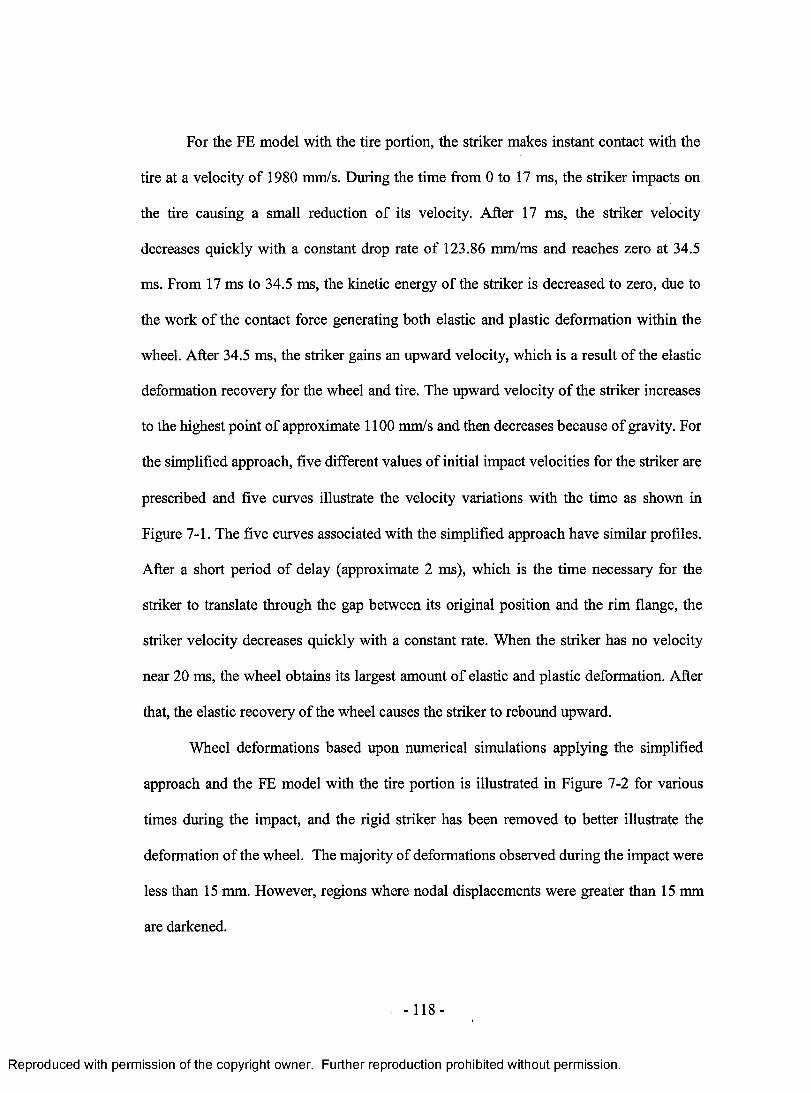
For the FE model with the tire portion, the striker makes instant contact with the
tire at a velocity of 1980 mm/s. During the time from 0 to 17 ms, the striker impacts on
the tire causing a small reduction of its velocity. After 17 ms, the striker velocity
decreases quickly with a constant drop rate of 123.86 mm/ms and reaches zero at 34.5
ms. From 17 ms to 34.5 ms, the kinetic energy of the striker is decreased to zero, due to
the work o f the contact force generating both elastic and plastic deformation within the
wheel. After 34.5 ms, the striker gains an upward velocity, which is a result of the elastic
deformation recovery for the wheel and tire. The upward velocity o f the striker increases
to the highest point of approximate 1100 mm/s and then decreases because of gravity. For
the simplified approach, five different values of initial impact velocities for the striker are
prescribed and five curves illustrate the velocity variations with the time as shown in
Figure 7-1. The five curves associated with the simplified approach have similar profiles.
After a short period of delay (approximate 2 ms), which is the time necessary for the
striker to translate through the gap between its original position and the rim flange, the
striker velocity decreases quickly with a constant rate. When the striker has no velocity
near 20 ms, the wheel obtains its largest amount of elastic and plastic deformation. After
that, the elastic recovery of the wheel causes the striker to rebound upward.
Wheel deformations based upon numerical simulations applying the simplified
approach and the FE model with the tire portion is illustrated in Figure 7-2 for various
times during the impact, and the rigid striker has been removed to better illustrate the
deformation of the wheel. The majority of deformations observed during the impact were
less than 15 mm. However, regions where nodal displacements were greater than 15 mm
are darkened.
-1 1 8 -
Reproduced with permission of the copyright owner. Further reproduction prohibited without permission.

t= 0 ms
t= 25 ms
t= 35 ms
t= 60 ms
a) FE model with tire portion
-119
Reproduced with permission of the copyright owner. Further reproduction prohibited without permission.
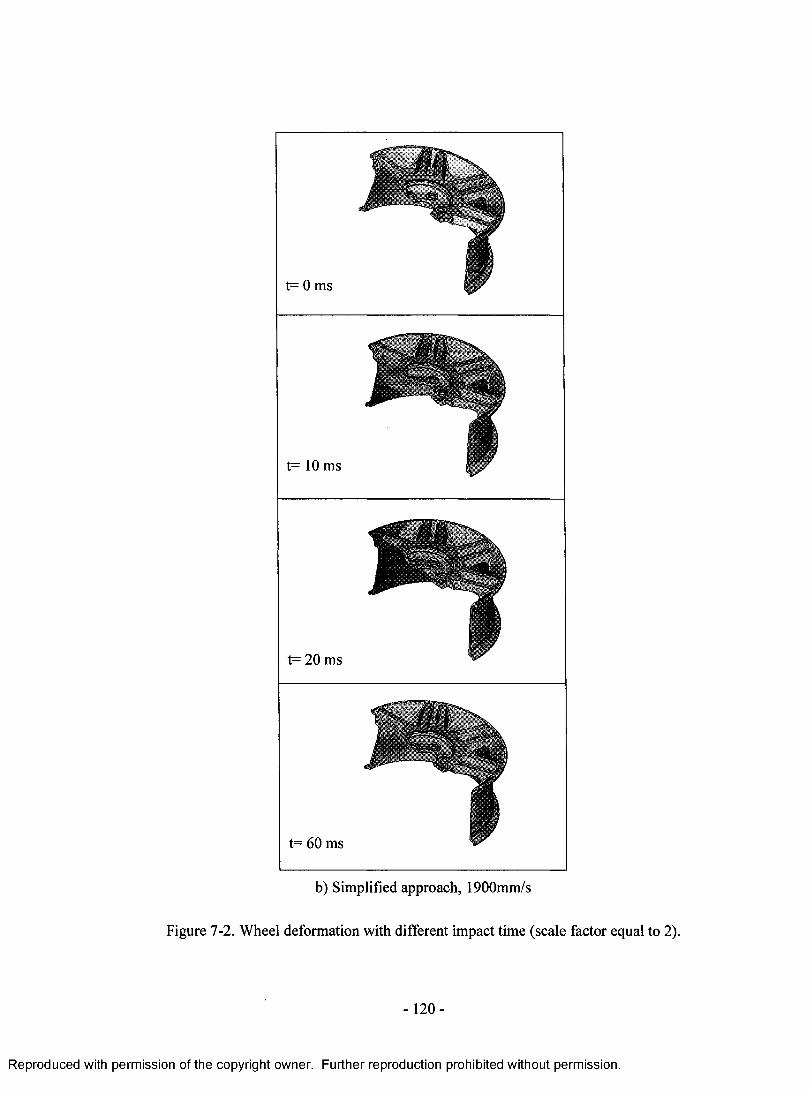
t= 0 ms
t= 10 ms
t= 20 ms
t= 60 ms
b) Simplified approach, 1900mm/s
Figure 7-2. Wheel deformation with different impact time (scale factor equal to 2).
- 120 -
Reproduced with permission of the copyright owner. Further reproduction prohibited without permission.
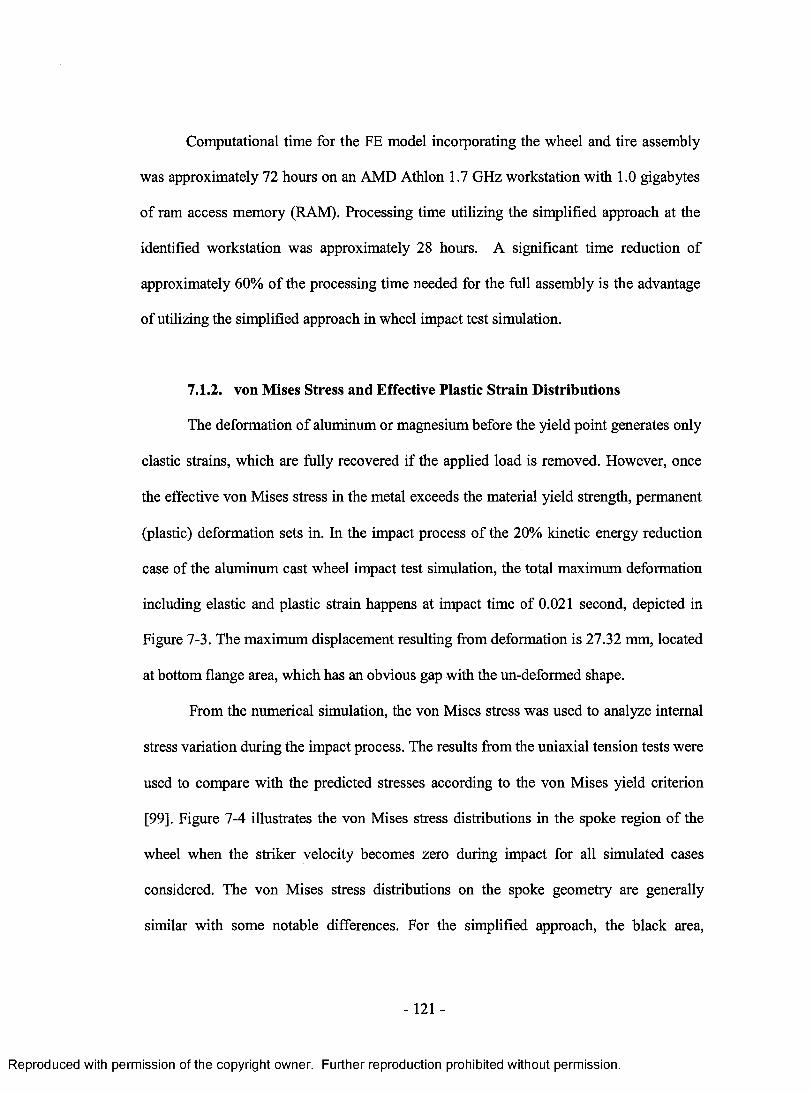
Computational time for the FE model incorporating the wheel and tire assembly
was approximately 72 hours on an AMD Athlon 1.7 GHz workstation with 1.0 gigabytes
of ram access memory (RAM). Processing time utilizing the simplified approach at the
identified workstation was approximately 28 hours. A significant time reduction of
approximately 60% of the processing time needed for the full assembly is the advantage
of utilizing the simplified approach in wheel impact test simulation.
7.1.2. von Mises Stress and Effective Plastic Strain Distributions
The deformation of aluminum or magnesium before the yield point generates only
elastic strains, which are fully recovered if the applied load is removed. However, once
the effective von Mises stress in the metal exceeds the material yield strength, permanent
(plastic) deformation sets in. In the impact process of the 20% kinetic energy reduction
case of the aluminum cast wheel impact test simulation, the total maximum deformation
including elastic and plastic strain happens at impact time of 0.021 second, depicted in
Figure 7-3. The maximum displacement resulting from deformation is 27.32 mm, located
at bottom flange area, which has an obvious gap with the un-deformed shape.
From the numerical simulation, the von Mises stress was used to analyze internal
stress variation during the impact process. The results from the uniaxial tension tests were
used to compare with the predicted stresses according to the von Mises yield criterion
[99]. Figure 7-4 illustrates the von Mises stress distributions in the spoke region of the
wheel when the striker velocity becomes zero during impact for all simulated cases
considered. The von Mises stress distributions on the spoke geometry are generally
similar with some notable differences. For the simplified approach, the black area,
-121 -
Reproduced with permission of the copyright owner. Further reproduction prohibited without permission.

representing where the von Mises stress was higher than 208 MPa, the material yield
strength, has a positive proportional relationship with the initial velocity o f the striker.
The von Mises stress distribution o f the FE model with the wheel and tire assembly is
almost the same as that o f the simplified approach with the initial striker velocity o f 1900
mm/s.
Deformation Contour (mm) for 20% kinetic energy reduction at 0.021 s
-27.32
24.23
21.25
1 5 . 1 8
1 2 . 1 4
- 0.00 No result
Max= 27.32 Min= 0.00
Figure 7-3. Maximum deformation o f cast aluminum wheel impact testing vs. its
undeformable shape.
- 122 -
Reproduced with permission of the copyright owner. Further reproduction prohibited without permission.
a) Simplified approach, 2015 mm/s
b) Simplified approach, 1960 mm/s
c) Simplified approach, 1900 mm/s
Figure 7-4. von Mises stress contours
d) Simplified approach, 1840 mm/s
e) Simplified approach, 1775 mm/s
f) FE model with tire portion
spoke when the striker velocity is zero.on the
-1 2 3 -
Reproduced with permission of the copyright owner. Further reproduction prohibited without permission.

Figure 7-5 illustrates the effective plastic strain contours in the spoke region of
the wheel after simulation has ceased for the FE model with the wheel and tire assembly
as well as the simplified approach with the initial striker velocity of 1900 mm/s. The
shaded regions indicate the effective plastic strains higher than 2%. Surrounding areas
with contour legends represent the plastic strain distributions with gradually varying
slopes. The effective plastic strain distributions for both wheels are very similar in pattern
and intensity. The maximum effective plastic strains are predicted to be 2.50% and 2.47%
for the FE model containing the wheel and tire assembly and the simplified approach
with the initial striker velocity of 1900 mm/s, respectively. Obviously, the maximum
effective plastic strains (2.50% and 2.47%) from numerical simulations are lower than the
ultimate effective plastic strain of the spoke region obtained from the uniaxial tension
tests (3.4%).
Areas of plastic strain > 2%
a) FE model with tire portion b) Simplified approach, 1900mm/s
Figure 7-5. Effective plastic strain contours on the spoke with contour lines.
- 124-
Reproduced with permission of the copyright owner. Further reproduction prohibited without permission.
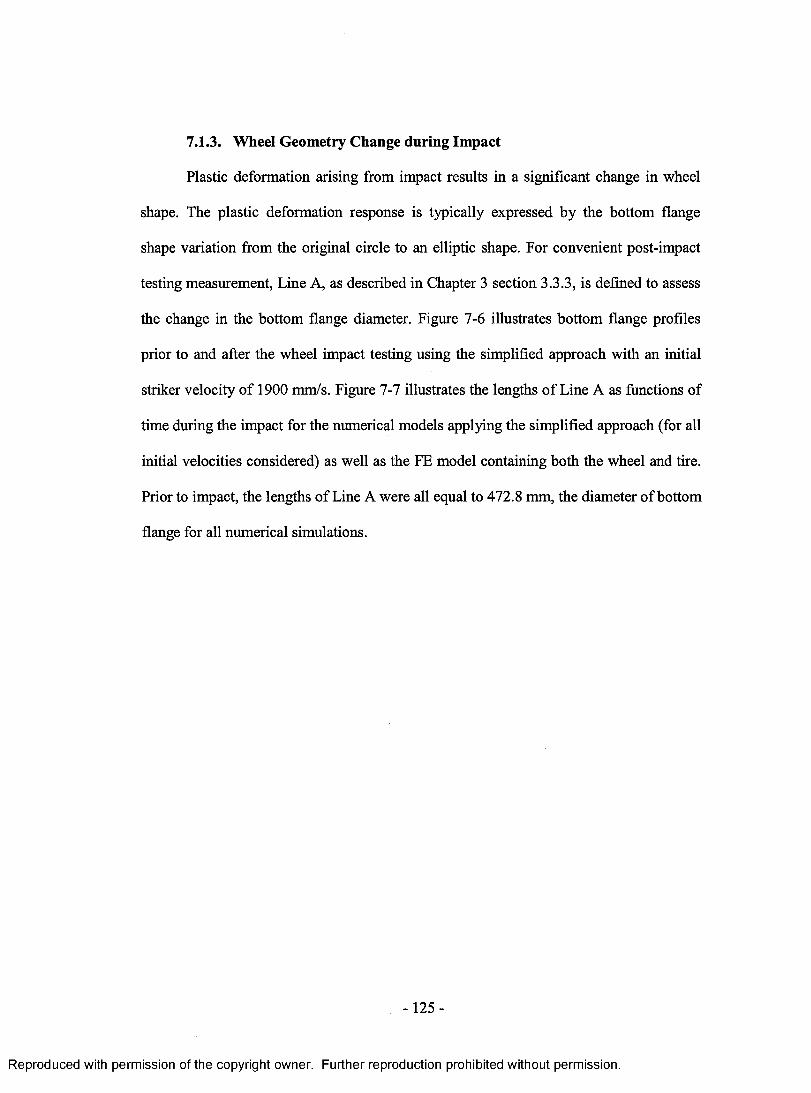
7.1.3. Wheel Geometry Change during Impact
Plastic deformation arising from impact results in a significant change in wheel
shape. The plastic deformation response is typically expressed by the bottom flange
shape variation from the original circle to an elliptic shape. For convenient post-impact
testing measurement, Line A, as described in Chapter 3 section 3.3.3, is defined to assess
the change in the bottom flange diameter. Figure 7-6 illustrates bottom flange profiles
prior to and after the wheel impact testing using the simplified approach with an initial
striker velocity of 1900 mm/s. Figure 7-7 illustrates the lengths o f Line A as functions of
time during the impact for the numerical models applying the simplified approach (for all
initial velocities considered) as well as the FE model containing both the wheel and tire.
Prior to impact, the lengths of Line A were all equal to 472.8 mm, the diameter of bottom
flange for all numerical simulations.
-1 2 5 -
Reproduced with permission of the copyright owner. Further reproduction prohibited without permission.
Impact location 1
a)
Undeformed shape
Deformed shape
b)Figure 7-6. a) wheel shape change and the definition of Line A, and b) deformed and
undeformed shape of the bottom flange (Scale factor: 3.0).
-126 -
Reproduced with permission of the copyright owner. Further reproduction prohibited without permission.
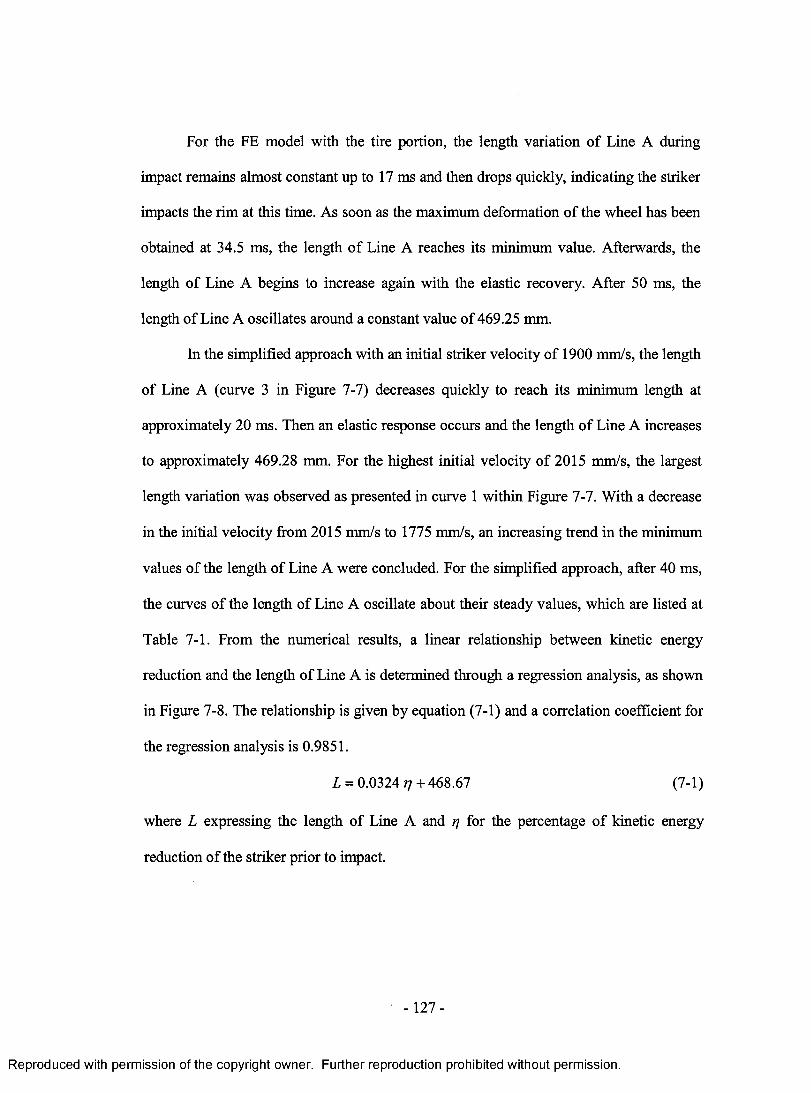
For the FE model with the tire portion, the length variation of Line A during
impact remains almost constant up to 17 ms and then drops quickly, indicating the striker
impacts the rim at this time. As soon as the maximum deformation of the wheel has been
obtained at 34.5 ms, the length of Line A reaches its minimum value. Afterwards, the
length of Line A begins to increase again with the elastic recovery. After 50 ms, the
length of Line A oscillates around a constant value of 469.25 mm.
In the simplified approach with an initial striker velocity of 1900 mm/s, the length
of Line A (curve 3 in Figure 7-7) decreases quickly to reach its minimum length at
approximately 20 ms. Then an elastic response occurs and the length of Line A increases
to approximately 469.28 mm. For the highest initial velocity of 2015 mm/s, the largest
length variation was observed as presented in curve 1 within Figure 7-7. With a decrease
in the initial velocity from 2015 mm/s to 1775 mm/s, an increasing trend in the minimum
values of the length of Line A were concluded. For the simplified approach, after 40 ms,
the curves of the length of Line A oscillate about their steady values, which are listed at
Table 7-1. From the numerical results, a linear relationship between kinetic energy
reduction and the length of Line A is determined through a regression analysis, as shown
in Figure 7-8. The relationship is given by equation (7-1) and a correlation coefficient for
the regression analysis is 0.9851.
L = 0.0324 77+468.67 (7-1)
where L expressing the length of Line A and rj for the percentage o f kinetic energy
reduction of the striker prior to impact.
-1 2 7 -
Reproduced with permission of the copyright owner. Further reproduction prohibited without permission.
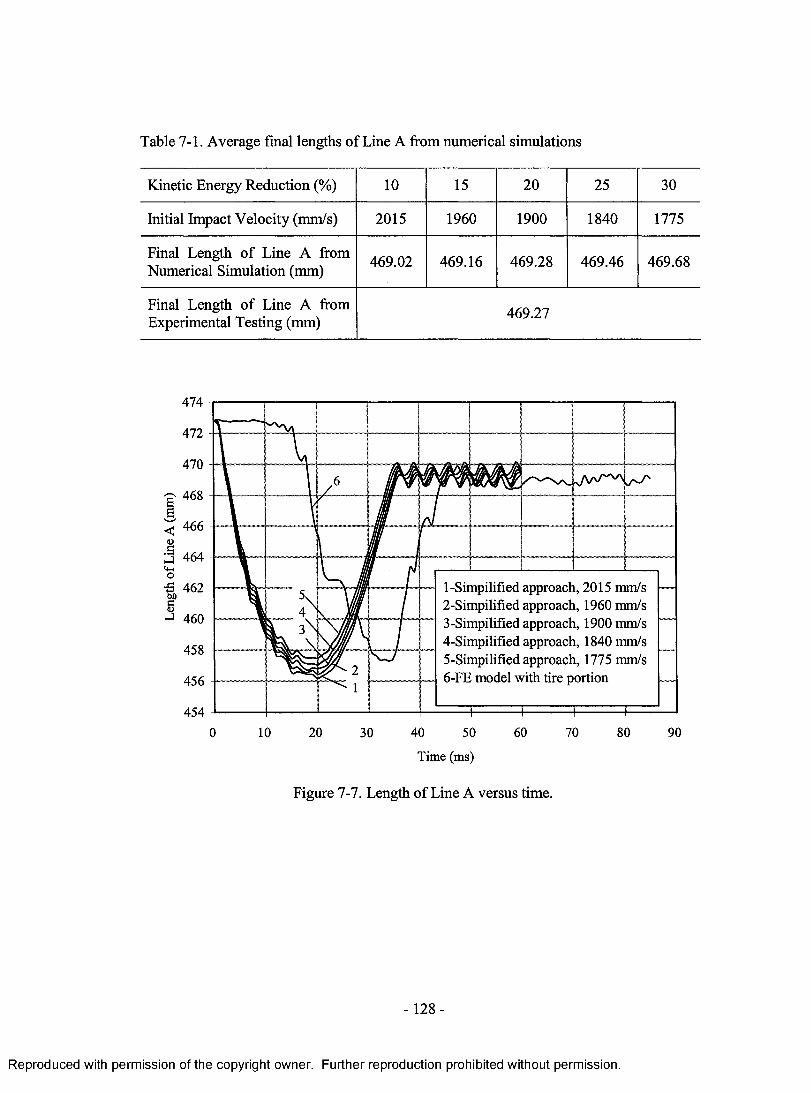
Table 7-1. Average final lengths of Line A from numerical simulations
Kinetic Energy Reduction (%) 10 15 20 25 30
Initial Impact Velocity (mm/s) 2015 1960 1900 1840 1775
Final Length of Line A from Numerical Simulation (mm) 469.02 469.16 469.28 469.46 469.68
Final Length of Line A from Experimental Testing (mm) 469.27
474
472
470
^ 468
< 466
3 464<4o3 462£o►J 460
458
456
454
0 10 20 30 40 50 60 70 80 90
Time (ms)
Figure 7-7. Length of Line A versus time.
—... H .
/T
1-Simpilified approach, 2015 mm/s2-Simpilified approach, 1960 mm/s3-Simpilified approach, 1900 mm/s4-Simpilified approach, 1840 mm/s5-Simpilified approach, 1775 mm/s6-FE model with tire portion
— ^ ----- 1--------
----------1 3\ —
2 ,—^ 1
----------
- 128 -
Reproduced with permission of the copyright owner. Further reproduction prohibited without permission.
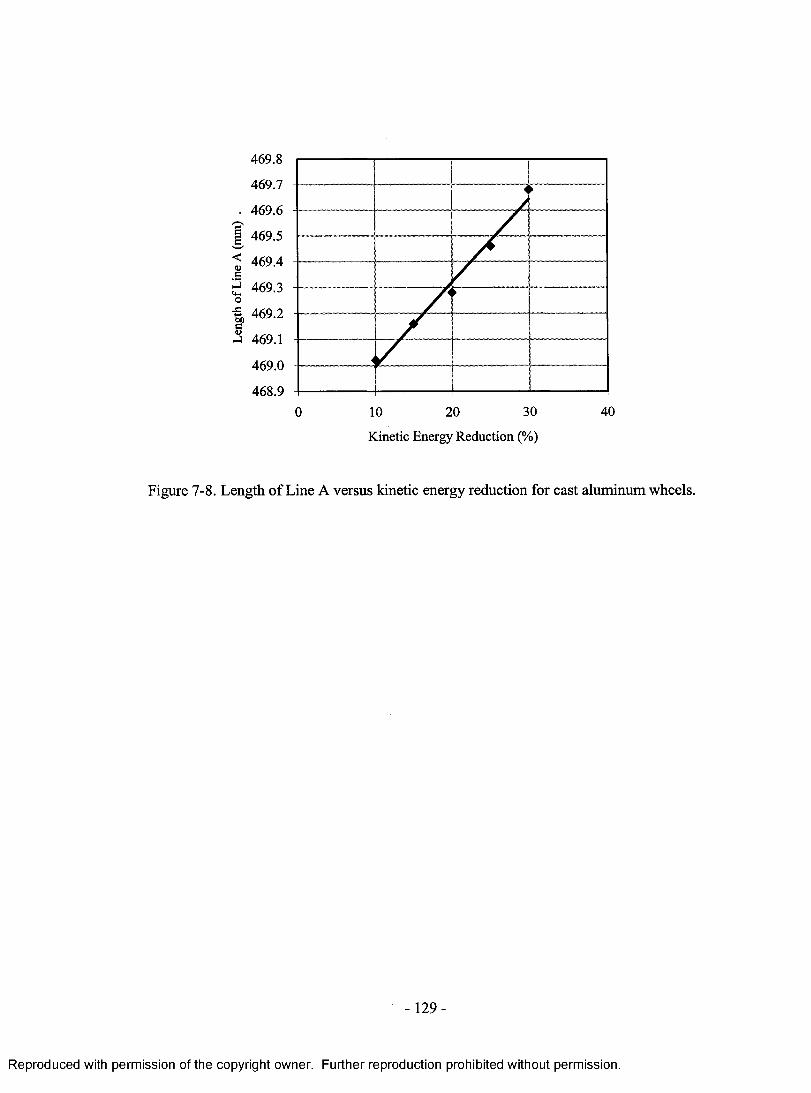
469.8
469.7
469.6S'g 469.5
469.4
J 469.3
469.2
469.1
469.0
468.930 40200 10
Kinetic Energy Reduction (%)
Figure 7-8. Length of Line A versus kinetic energy reduction for cast aluminum wheels.
-1 2 9 -
Reproduced with permission of the copyright owner. Further reproduction prohibited without permission.

7.1.4. Comparison of the Experimental and Numerical Results
The average length of Line A measured from wheels tested was found to be
469.27 mm, which provides an experimental measurement o f the wheel plastic
deformation arising due to the experimental impact test. This value is in very good
agreement to the length of Line A simulated in the FE simulation for the model
containing the tire (469.25 mm). A reasonable reduction percent of the striker kinetic
energy is assessed through comparison with experimental test measurement for the model
employing the simplified approach. Using the experimentally determined length of
Line A, 469.27 mm, the percentage in kinetic energy reduction based upon equation (7-1),
which was obtained from the least squares regressive analysis o f numerical results for the
simplified approach, indicated that an 18.5% kinetic energy reduction resulted in similar
deformation characteristics of the wheel. Thus it is apparent that the tire is responsible for
18.5% absorption of the initial kinetic energy of the striker for the testing configuration
considered.
7.1.5. Effect of Impact Locations
Using the simplified approach, a 20% kinetic energy reduction appears to be a
simple methodology to compensate for the tire absence. Numerical analyses with two
impact locations were carried out to investigate the effect of impact locations on the
wheel impact performance. Both the testing conditions remained constant except the
impact locations.
After initial contact, the development of plastic strains was observed for both the
test considerations. Figure 7-9 illustrates the effective plastic strain contours of the spoke
-130 -
Reproduced with permission of the copyright owner. Further reproduction prohibited without permission.
region predicted with impact location 1 at 5 ms and 60 ms. The effective plastic strains
between 0.01% and 1% are represented by the gray regions, and the black regions
indicates the effective plastic strain higher than 1% and less than 2.47%, the maximum
value. Figure 7-10 shows the effective plastic strain contours of the spoke region
predicted with impact location 2 at 5 ms and 60 ms. The gray regions represent the
effective plastic strains between 0.1% and 1%. The black regions indicate the effective
plastic strain higher than 1% and less than 1.83%, the maximum value. Areas of effective
plastic strains developed at 5 ms continue to increase during the impact event. At 60 ms,
the plastic strains reach maximum values. Comparison o f Figure 7-9 to 7-10 indicates
that the impact location has a considerable influence on the distribution of plastic strains
developed in the spoke. For the first impact location, the corresponding effective plastic
strains are concentrated on the spokes adjacent to the impact point. For impact location 2,
the effective plastic strains are distributed almost equally on the four spokes near the
impact location. Obviously, the two impacted spokes for impact location 1 suffer more
severe impact loads and experience higher plastic strains due to differences in wheel
geometry near the contact point for both impact conditions. Table 7-2 lists the maximum
effective plastic strains of the spoke and rim regions for both impact considerations. The
maximum effective plastic strains vary from 0.9% to 2.5% with the variation o f the wheel
geometry and impact locations. However, none of the effective plastic strains exceed the
ultimate plastic strain which was observed for the material.
-1 3 1 -
Reproduced with permission of the copyright owner. Further reproduction prohibited without permission.
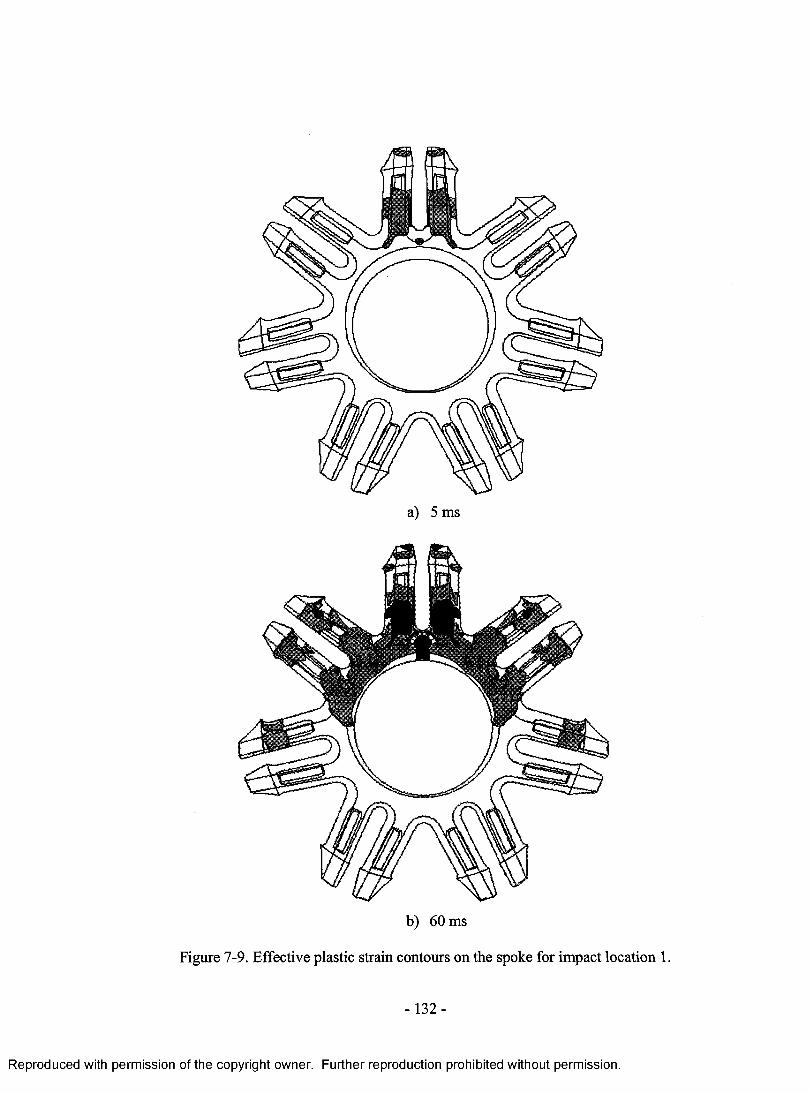
a) 5 ms
b) 60 ms
Figure 7-9. Effective plastic strain contours on the spoke for impact location 1.
-132 -
Reproduced with permission of the copyright owner. Further reproduction prohibited without permission.
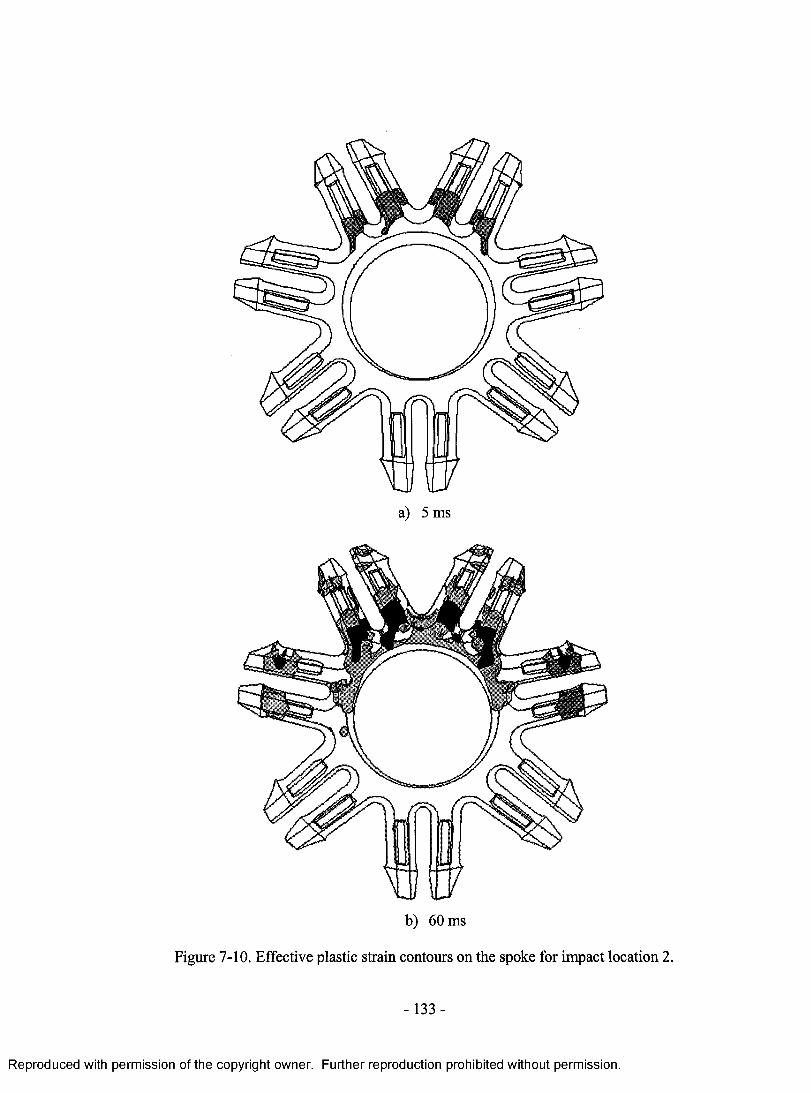
5 ms
b) 60 ms
Figure 7-10. Effective plastic strain contours on the spoke for impact location 2.
-133 -
Reproduced with permission of the copyright owner. Further reproduction prohibited without permission.

Table 7-2. Maximum predicted plastic strain of the spoke and rim
ImpactLocation Part Maximum Predicted
Plastic Strain (%)Ultimate Effective Plastic Strain (%)
1 Spoke 2.473.4
2 Spoke 1.83
1 Rim 0.936.9
2 Rim 1.94
-134 -
Reproduced with permission of the copyright owner. Further reproduction prohibited without permission.
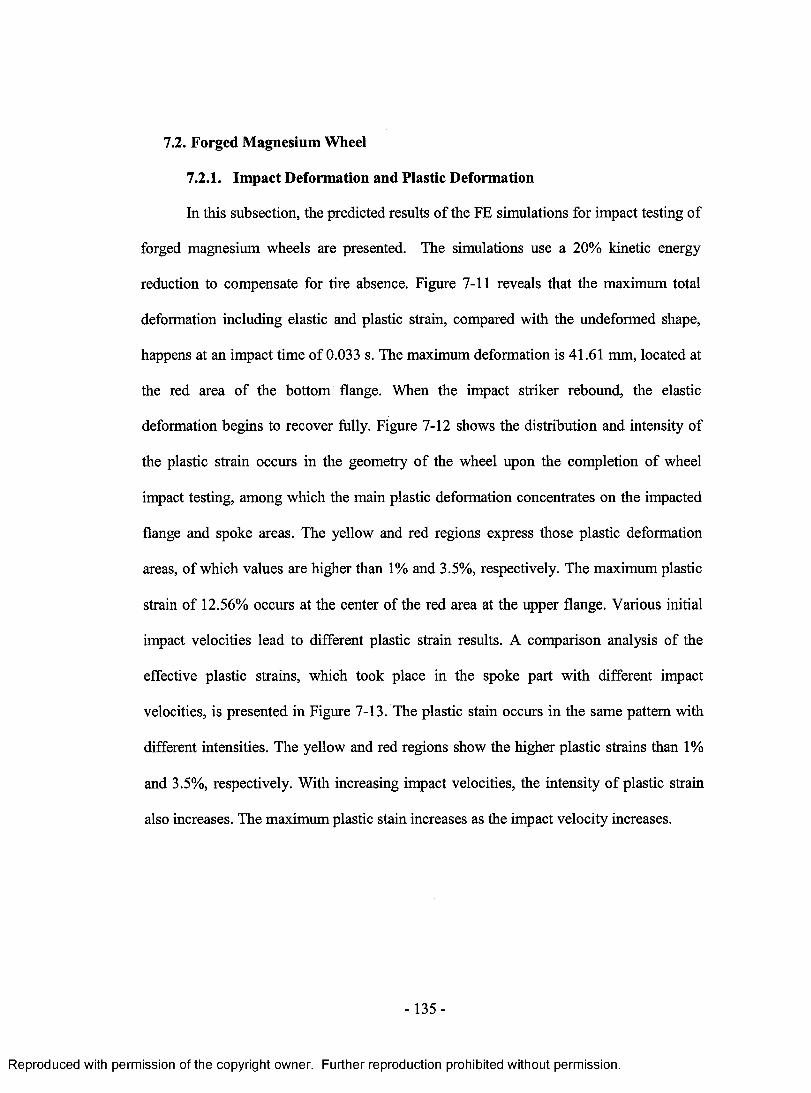
7.2. Forged Magnesium Wheel
7.2.1. Impact Deformation and Plastic Deformation
In this subsection, the predicted results of the FE simulations for impact testing of
forged magnesium wheels are presented. The simulations use a 20% kinetic energy
reduction to compensate for tire absence. Figure 7-11 reveals that the maximum total
deformation including elastic and plastic strain, compared with the undeformed shape,
happens at an impact time of 0.033 s. The maximum deformation is 41.61 mm, located at
the red area of the bottom flange. When the impact striker rebound, the elastic
deformation begins to recover fully. Figure 7-12 shows the distribution and intensity of
the plastic strain occurs in the geometry of the wheel upon the completion of wheel
impact testing, among which the main plastic deformation concentrates on the impacted
flange and spoke areas. The yellow and red regions express those plastic deformation
areas, of which values are higher than 1% and 3.5%, respectively. The maximum plastic
strain of 12.56% occurs at the center of the red area at the upper flange. Various initial
impact velocities lead to different plastic strain results. A comparison analysis of the
effective plastic strains, which took place in the spoke part with different impact
velocities, is presented in Figure 7-13. The plastic stain occurs in the same pattern with
different intensities. The yellow and red regions show the higher plastic strains than 1%
and 3.5%, respectively. With increasing impact velocities, the intensity of plastic strain
also increases. The maximum plastic stain increases as the impact velocity increases.
-135 -
Reproduced with permission of the copyright owner. Further reproduction prohibited without permission.
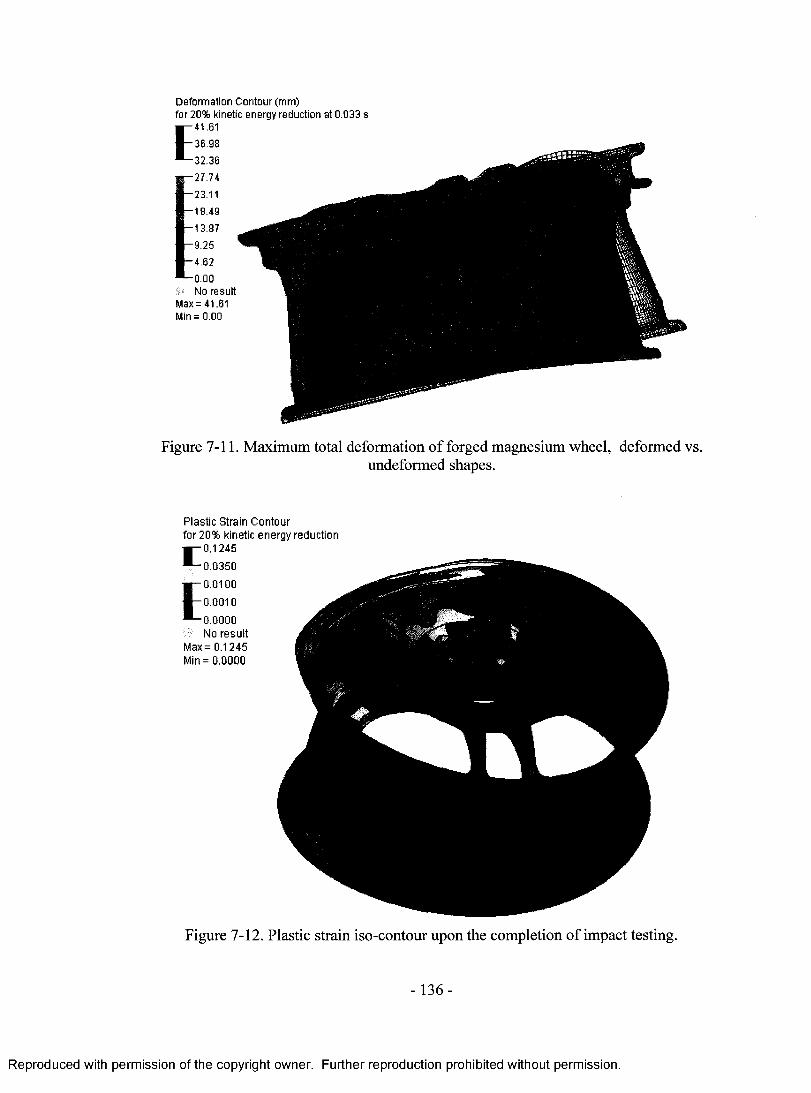
Deformation Contour (mm) for 20% kinetic energy reduction at 0.033 s
-41.61E
0.00 "M No result Max = 41.61 Min = 0.00
Figure 7-11. Maximum total deformation o f forged magnesium wheel, deformed vs.undeformed shapes.
Plastic Strain Contourfor 20% kinetic energy reductionE 0.1245
0.0350E 0.0100
0.0010
0.0000 No result
Max = 0.1245 Min = 0.0000
Figure 7-12. Plastic strain iso-contour upon the completion of impact testing.
136 -
Reproduced with permission of the copyright owner. Further reproduction prohibited without permission.
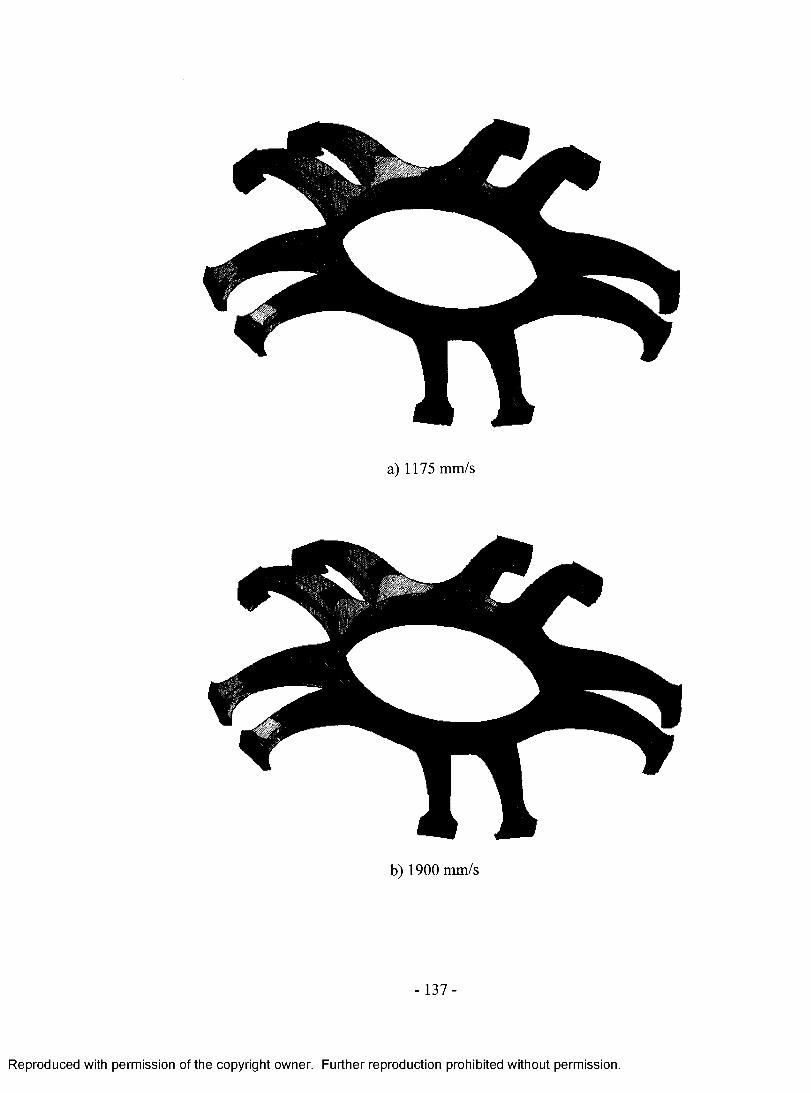
L
b) 1900 mm/s
- 137-
Reproduced with permission of the copyright owner. Further reproduction prohibited without permission.
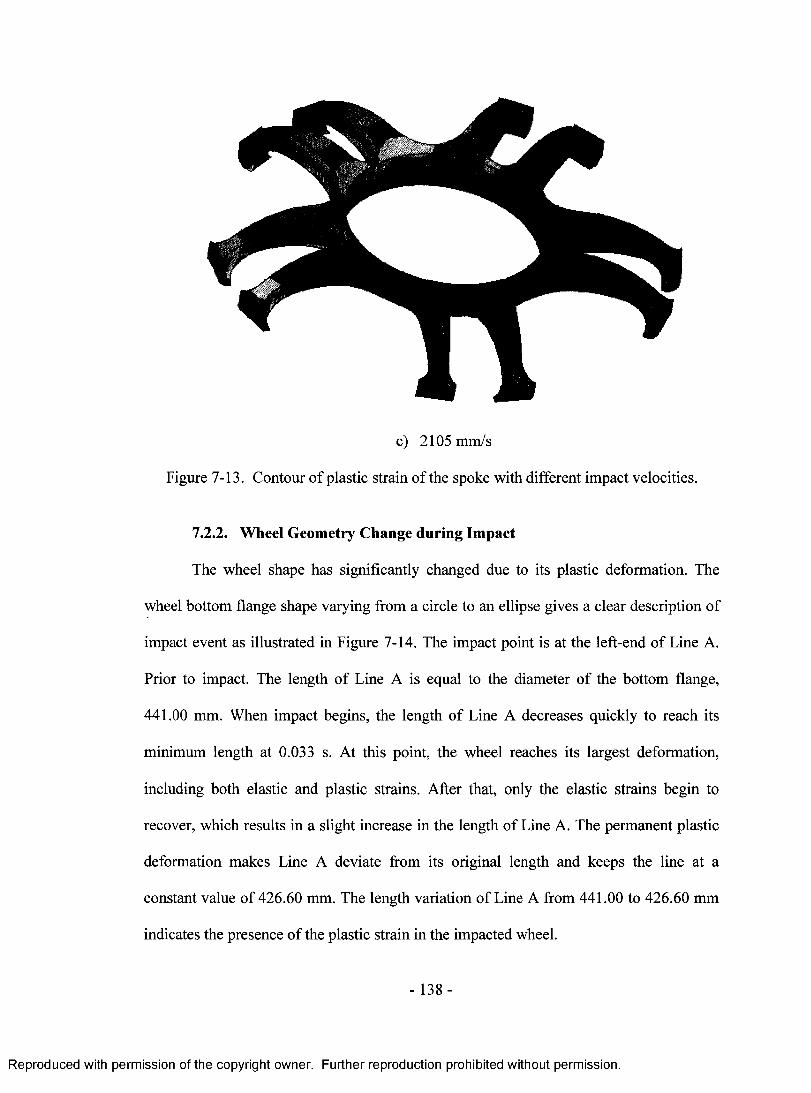
c) 2105 mm/s
Figure 7-13. Contour o f plastic strain of the spoke with different impact velocities.
7.2.2. Wheel Geometry Change during Impact
The wheel shape has significantly changed due to its plastic deformation. The
wheel bottom flange shape varying from a circle to an ellipse gives a clear description of
impact event as illustrated in Figure 7-14. The impact point is at the left-end o f Line A.
Prior to impact. The length o f Line A is equal to the diameter o f the bottom flange,
441.00 mm. When impact begins, the length of Line A decreases quickly to reach its
minimum length at 0.033 s. At this point, the wheel reaches its largest deformation,
including both elastic and plastic strains. After that, only the elastic strains begin to
recover, which results in a slight increase in the length of Line A. The permanent plastic
deformation makes Line A deviate from its original length and keeps the line at a
constant value o f 426.60 mm. The length variation of Line A from 441.00 to 426.60 mm
indicates the presence o f the plastic strain in the impacted wheel.
- 138-
Reproduced with permission of the copyright owner. Further reproduction prohibited without permission.
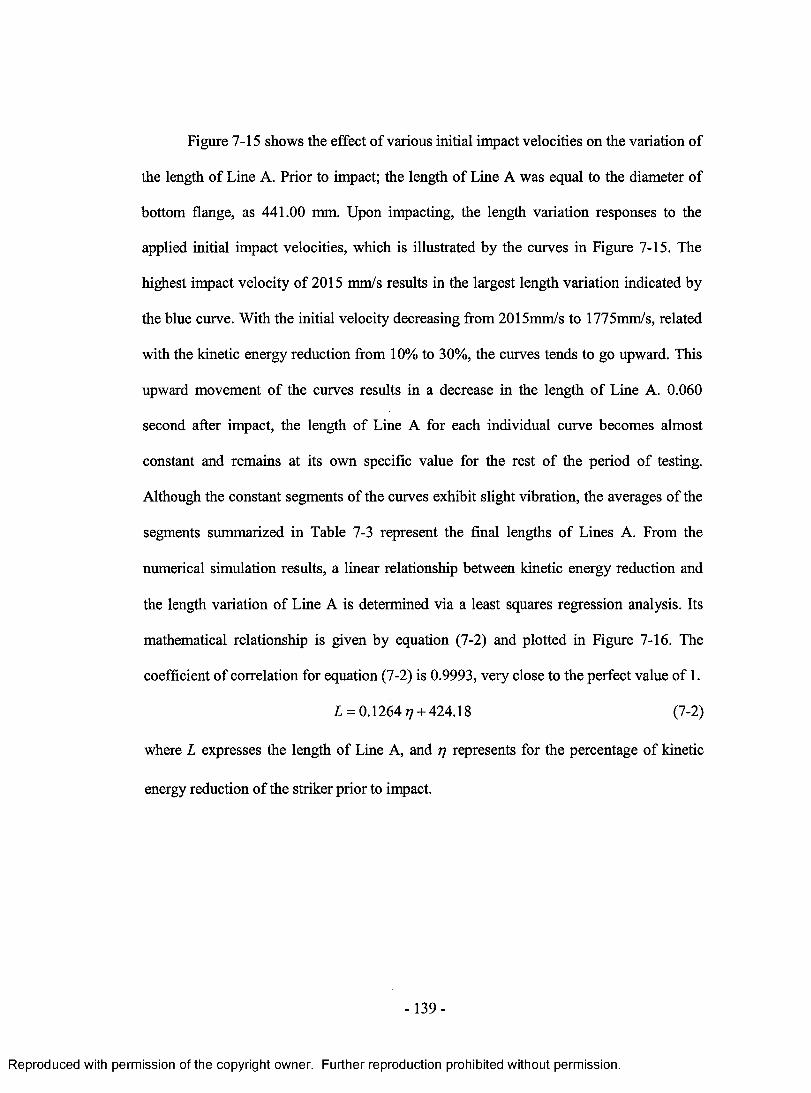
Figure 7-15 shows the effect of various initial impact velocities on the variation of
the length of Line A. Prior to impact; the length of Line A was equal to the diameter of
bottom flange, as 441.00 mm. Upon impacting, the length variation responses to the
applied initial impact velocities, which is illustrated by the curves in Figure 7-15. The
highest impact velocity of 2015 mm/s results in the largest length variation indicated by
the blue curve. With the initial velocity decreasing from 2015mm/s to 1775mm/s, related
with the kinetic energy reduction from 10% to 30%, the curves tends to go upward. This
upward movement o f the curves results in a decrease in the length o f Line A. 0.060
second after impact, the length of Line A for each individual curve becomes almost
constant and remains at its own specific value for the rest of the period of testing.
Although the constant segments of the curves exhibit slight vibration, the averages of the
segments summarized in Table 7-3 represent the final lengths of Lines A. From the
numerical simulation results, a linear relationship between kinetic energy reduction and
the length variation of Line A is determined via a least squares regression analysis. Its
mathematical relationship is given by equation (7-2) and plotted in Figure 7-16. The
coefficient of correlation for equation (7-2) is 0.9993, very close to the perfect value of 1.
L = 0.1264 77 + 424.18 (7-2)
where L expresses the length of Line A, and rj represents for the percentage of kinetic
energy reduction of the striker prior to impact.
-139 -
Reproduced with permission of the copyright owner. Further reproduction prohibited without permission.

Shape Variation of Bottom Flange o f 20% Kinetic Energy Absorbed Case ContourEffective plastic strain (Scalar value)
Max= 0.004834 Min = 0.000000
Figure 7-14. The wheel bottom flange shape varying from a circle to an ellipse.
Table 7-3. The average final lengths o f Line A from numerical simulations
Kinetic Energy Reduction (%) 10 15 20 25 30
Initial Impact Velocity (mm/s) 2015 1960 1900 1840 1775
Final Length o f Line A from Numerical Simulation (mm) 425.44 426.05 426.72 427.37 427.94
Experimental Result 426.60
- 1 4 0 -
Reproduced with permission of the copyright owner. Further reproduction prohibited without permission.
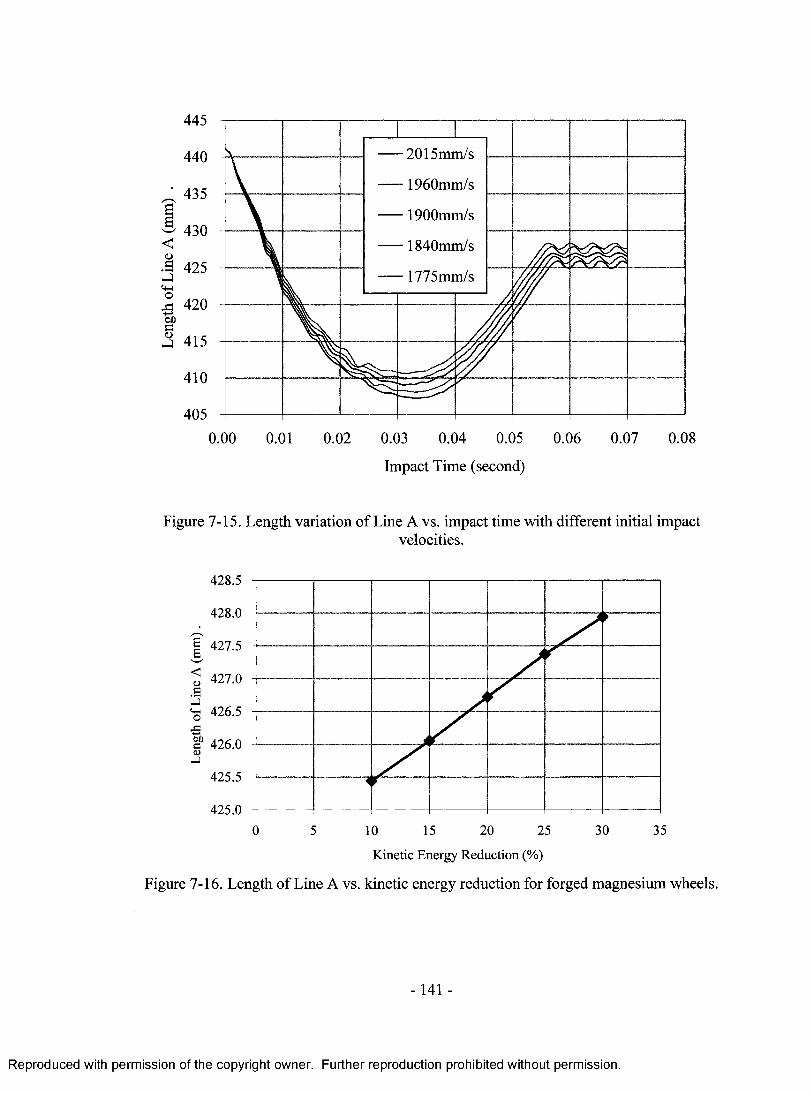
445
2015mm/s440
1960mm/s; 435 1900mm/s
& 430 <<D
.S 425
| 420
X 415
1840mm/s
1775mm/s
410
4050.04 0.05 0.06 0.07 0.080.00 0.01 0.02 0.03
Impact Time (second)
Figure 7-15. Length variation of Line A vs. impact time with different initial impactvelocities.
428.5
428.0
as'N—✓427.5
i 427.0 .5Sg 426.5
1? 426.0
425.5
425.020 30 350 5 10 15 25
Kinetic Energy Reduction (%)
Figure 7-16. Length o f Line A vs. kinetic energy reduction for forged magnesium wheels.
- 141 -
Reproduced with permission of the copyright owner. Further reproduction prohibited without permission.
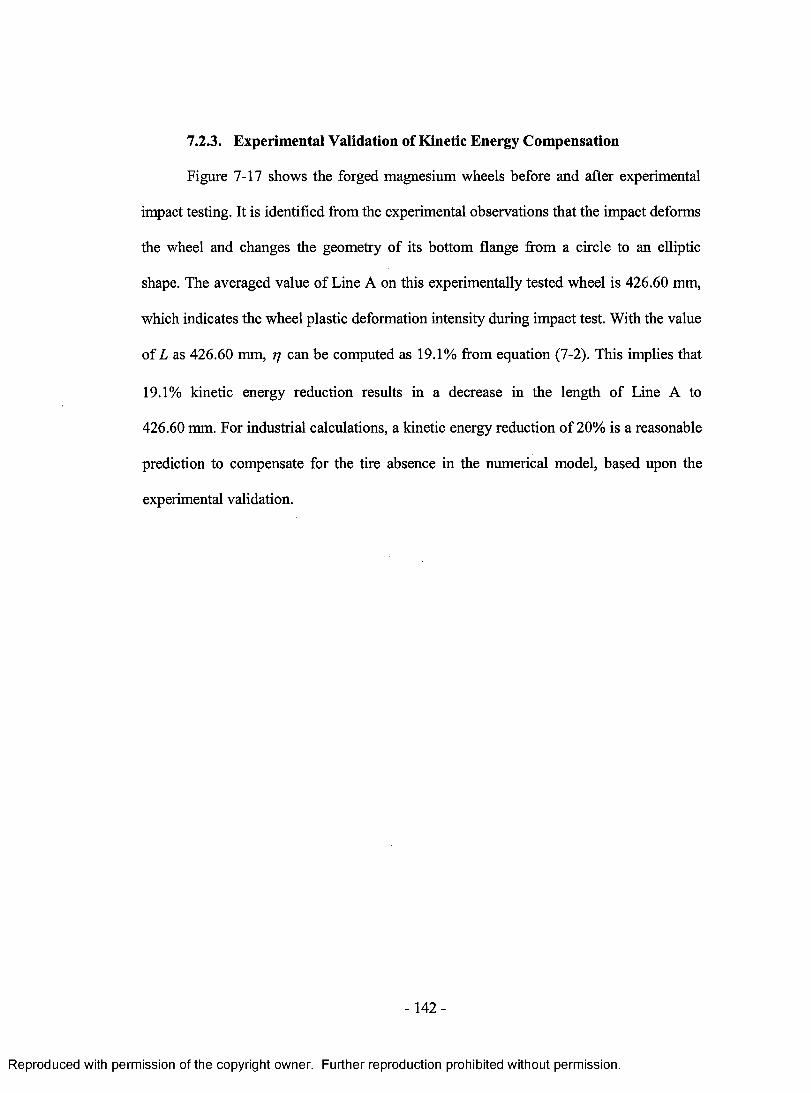
7.2.3. Experimental Validation of Kinetic Energy Compensation
Figure 7-17 shows the forged magnesium wheels before and after experimental
impact testing. It is identified from the experimental observations that the impact deforms
the wheel and changes the geometry of its bottom flange from a circle to an elliptic
shape. The averaged value of Line A on this experimentally tested wheel is 426.60 mm,
which indicates the wheel plastic deformation intensity during impact test. With the value
of L as 426.60 mm, rj can be computed as 19.1% from equation (7-2). This implies that
19.1% kinetic energy reduction results in a decrease in the length of Line A to
426.60 mm. For industrial calculations, a kinetic energy reduction of 20% is a reasonable
prediction to compensate for the tire absence in the numerical model, based upon the
experimental validation.
-1 4 2 -
Reproduced with permission of the copyright owner. Further reproduction prohibited without permission.
b)Figure 7-17. Bottom flange shape o f forged magnesium wheel with a) before and b) after
impact testing.
- 143
Reproduced with permission of the copyright owner. Further reproduction prohibited without permission.
Chapter 8
RESULTS AND DISCUSSION OF WHEEL CORNERINGFATIGUE
8.1. Cast Aluminum Wheels 145
8.1.1. Wheel Deformation Comparison 145
8.1.2. Fatigue Analysis through the Self-developed Post-processor 150
8.1.2.1. Stress Data Output 150
8.1.2.2. Calculation of the Equivalent Alternating & Mean Stresses 152
8.1.3. Safety Analysis of Fatigue Failure 155
8.2. Forged Magnesium Wheels 164
8.2.1. Influence of System Damping 164
8.2.2. Wheel Deformations of Implicit and Explicit Simulations 166
8.2.3. Fatigue Analysis through the Self-developed Post-processor 174
8.2.3.1. Stress Data Output 174
8.2.3.2. Calculation of the Equivalent Alternating & Mean Stresses 176
8.2.4. Safety Analysis of Fatigue Failure 176
8.3. Wheel Design Modification for Improving Fatigue Resistance 187
8.3.1. Experimental Validation 187
8.3.2. Re-design and Re-modeling 191
8.3.3. Safety Analysis of the Re-designed Wheel 194
-1 4 4 -
Reproduced with permission of the copyright owner. Further reproduction prohibited without permission.
8. RESULTS AND DISCUSSION OF WHEEL CORNERING FATIGUE
8.1. Cast Aluminum Wheels
8.1.1. Wheel Deformation Comparison
Although the bending moment was rotating at a high rate of 62.8 rad/s during the
experimental wheel fatigue testing, the implicit simulation approach considered only a
static response of the wheel in three loading directions. Figure 8-1 illustrates various
elastic deformations taking place in the wheel for each prescribed bending direction.
Regions with the most significant deformations occur at the opposing sides of hub and
spoke interfaces in the direction of the applied bending load. For static simulations, a
constant load with the fixed direction is applied to the mandrel end and the obtained
analysis data are only related to that individual load direction. Table 8-1 summarizes the
maximum nodal displacements in the x, y, and z direction for each prescribed bending
directions calculated by the implicit static approach. It should be noted that nodal
displacements in the x and y axis directions were insignificant compared to the nodal
displacements in the z axis direction for all loading conditions.
For the dynamic simulations, a constant rotating load was prescribed about the
mandrel axis, which includes all the bending direction in a typical fatigue cycles. It is
important to identify the corresponding times of dynamic simulation with the specified
bending directions of static approaches, which is listed in Table 8-2. The specified
bending directions of A, B and C utilized in the static analysis corresponded to times of
10 ms, 35 ms and 60 ms in the dynamic analysis completed using the explicit simulation
solution scheme. The displacements of the three previously described nodes in the z axis
direction are presented as functions of time in Figure 8-2. The z axis displacement/time
-1 4 5 -
Reproduced with permission of the copyright owner. Further reproduction prohibited without permission.
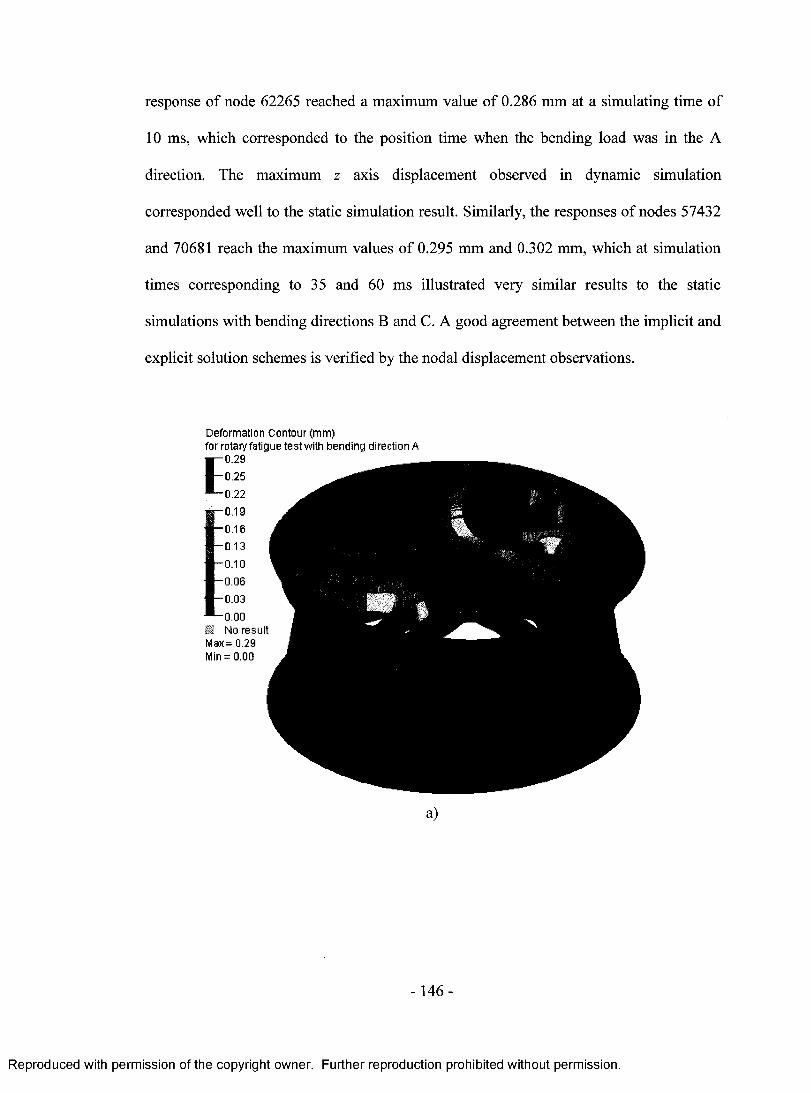
response o f node 62265 reached a maximum value of 0.286 mm at a simulating time o f
10 ms, which corresponded to the position time when the bending load was in the A
direction. The maximum z axis displacement observed in dynamic simulation
corresponded well to the static simulation result. Similarly, the responses o f nodes 57432
and 70681 reach the maximum values o f 0.295 mm and 0.302 mm, which at simulation
times corresponding to 35 and 60 ms illustrated very similar results to the static
simulations with bending directions B and C. A good agreement between the implicit and
explicit solution schemes is verified by the nodal displacement observations.
Deformation Contour (m m )for rotary fatigue test with bending direction A
0.29
0.25
0.22
0.19 A
0.06 *
0.03 *
0.00No result |
M ax= 0.29 M in= 0.00
a)
- 1 4 6 -
Reproduced with permission of the copyright owner. Further reproduction prohibited without permission.
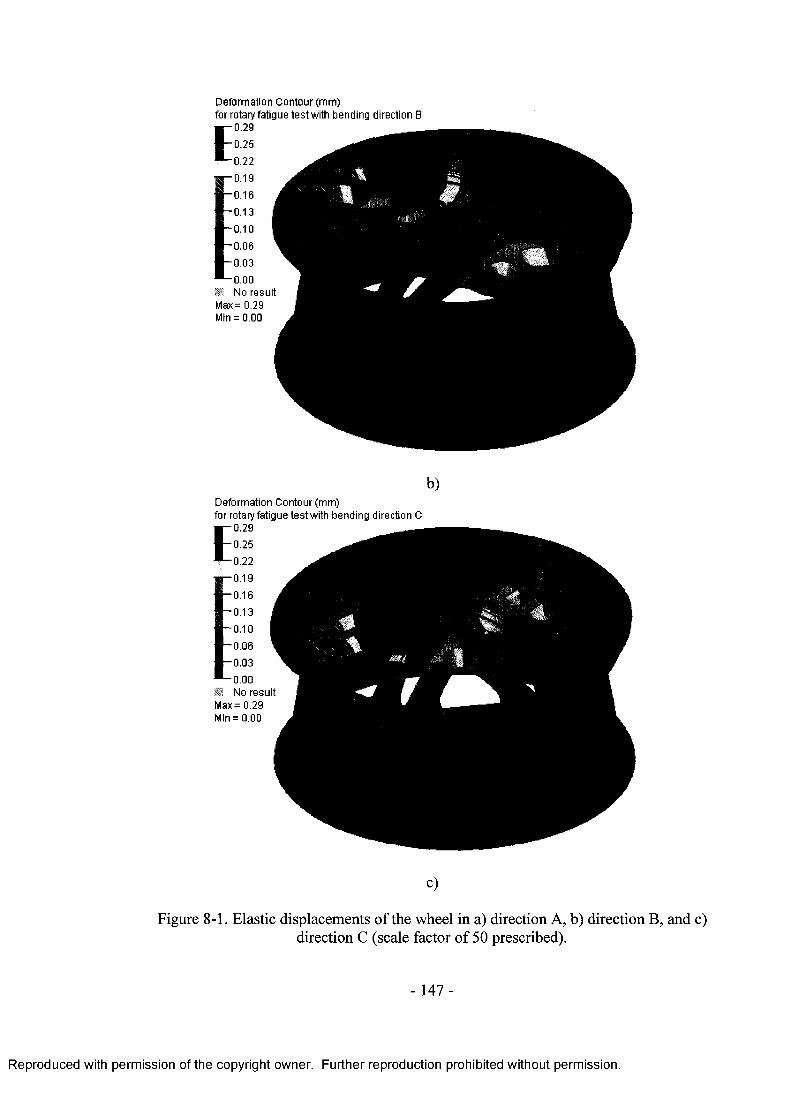
Deformation Contour (mm) for rotary fatigue test with bending direction B
-0 .29E
0.00 No result
Max= 0.29 Min = 0.00 J
b)Deformation Contour (mm) for rotary fatigue test with bending direction C
-0 .29E
No resu tMax= 0.29 - r
C)
Figure 8-1. Elastic displacements of the wheel in a) direction A, b) direction B, and c) direction C (scale factor of 50 prescribed).
- 147 -
Reproduced with permission of the copyright owner. Further reproduction prohibited without permission.

Table 8-1. Maximum magnitudes of nodal displacements and their jc, y, and z components
Simulation Type BendingMaximum Displacement (mm)
DirectionX y z
A 0.055 0.052 0.294
Static, Nastran B 0.054 0.047 0.292
C 0.055 0.048 0.283
Table 8-2. Dynamic cycle times corresponding with specified bending directions
Bending Directions of Static Approach Corresponding Cycle Time of Dynamic Simulation (ms)
A 10
B 35
C 60
-148 -
Reproduced with permission of the copyright owner. Further reproduction prohibited without permission.
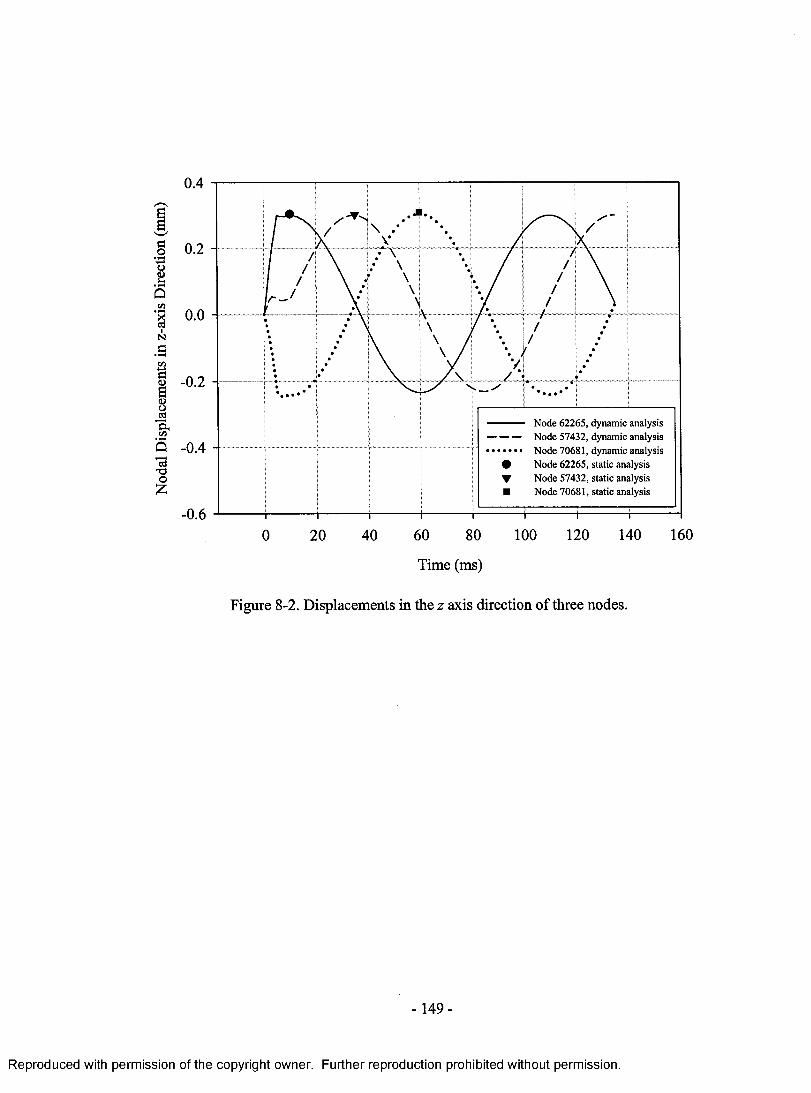
Nod
al D
ispla
cem
ents
in
z-ax
is D
irect
ion
(mm
)0.4 -r
0.2 -
0.0 -
- 0.2 -
-0.4 -
- 0.6 -
Node 62265, dynamic analysis Node 57432, dynamic analysis Node 70681, dynamic analysis Node 62265, static analysis Node 57432, static analysis Node 70681, static analysis
0 20 40 60 80 100 120 140 160
Time (ms)
Figure 8-2. Displacements in the z axis direction of three nodes.
-149 -
Reproduced with permission of the copyright owner. Further reproduction prohibited without permission.
8.1.2. Fatigue Analysis through the Self-developed Post-processor
8.1.2.1.Stress Data Output
When a wheel is subjected to a time-varying loading, stress within the wheel is
generally distributed as a continuously varying function with the continuum of material.
Every finite element of the material can conceivably experience different stresses at each
time step. Conventionally, a set of output files are automatically generated, which contain
simulation observation data for post-process analysis using commercially-available
postprocessors, such as Hyperview and LS-POST. Although these postprocessors have
very powerful functions to calculate the finite element multiaxial stress tensor and
corresponding effective von Mises and principle stresses, they do not have the ability to
conduct the stress-based fatigue analysis, even with the available repeated stress tensors
resulting from dynamic simulation. Output of the finite element 3-D stress tensors in an
ASCII format other than d3plot format is essential to carry out stress-based fatigue
analysis. With help of output options available in the LS-DYNA software database,
keywords o f DATABASEELOUT and DATABASE HISTORY SOLID SET were
defined to obtain output ASCII files containing time-varying stress simulation results.
Because of the symmetric characteristic of the wheel geometry, 1/7 portion of the wheel,
with 10551 elements, was chosen to output the 3-D stress tensor data at 540 time steps
from a typical load cycle of 0.135 s. Figure 8-3 shows the selected portion of the wheel
model, i.e., the typical 1/7 volume of the wheel according to the axial symmetry. During
the simulation, an ASCII file was generated to output stress data including
a xx»<Jyy»Gzz > Gxy >a yz ’a a at each time steP> which was defined to be 2.5 x 10"4 s. The first
row indicates the simulation time of 0.06 second. The first column represents the element
-150 -
Reproduced with permission of the copyright owner. Further reproduction prohibited without permission.

number and the second column defines its material property. The other columns list the
stress tensor o fer^ , <ryy, erzz, a xy,<jyz, a zx, von Mises effective stress and yield strain at
this specified simulation time.
Computational time for the FE model of wheel cornering fatigue test,
incorporating one and V4 cycle rotating bending moment on the hub was approximately
56 hours on an AMD Athlon 1.7 GHz workstation with 1.0 gigabytes o f RAM. The
output data of the simulation results (1.66 gigabytes) mainly consists of one Elout ASCII
file and 135 d3plot files. The Elout file has the largest size o f 763,883 megabyte, and
contains more than 11-million lines and 45-million data points.
Figure 8-3. A 1/7 portion of the wheel with 10551 elements.
-151 -
Reproduced with permission of the copyright owner. Further reproduction prohibited without permission.
8.I.2.2. Calculation of the Equivalent Alternating & Mean Stresses
A post-processor, that has the functionality to first identify the element number N
and then calculate crvma, <rvm m and nvm utilizing equations (2-12), (2-13) and (2-14) and
cr'a,cr'm and n utilizing equations (2-15), (2-16) and (2-17), as previously discussed in
Section 2.6.3 o f Chapter 2, was developed using the java programming language. Figure
8-4 illustrates a flowchart detailing the processes of the post-processor. For saving
computational time, multiaxial stress data were read by the post-processor starting at a
simulation time of 10 ms and ending at 110 ms. In this simulation time range, a typical
loading cycle was considered. The same cyclic loading condition was applied for
additional simulations. The calculation was conducted on a 2.8 GHz personal computer
with 1.6 gigabytes of RAM in an approximately time of 3 hours.
Eight result files in ASCII format were generated after post-processing. Two of
these files contained a summary of the fatigue analysis for all elements considered. An
example of the first 26 calculated results arranged sequentially with the nodal number in
“n_all_by_von_Mises” and “n_all_by_Sinese” is illustrated in Table 8-3. The remaining
six files contained a distribution of the results of the fatigue analysis based upon a range
of the factors o f safety. Obviously, for the same finite element, <r calculated using the
von Mises method is identical to o a calculated using the Sines method, but
calculated through the von Mises method is different from <r'm calculated using the Sines
method. In the Sines method, the mean components of shear stress do not contribute to
the equivalent mean stress. This is consistent with experimental data of smooth, polished,
unnotched, round bars tested in combined bending and torsion [100]. However, notched
specimens under the same loading do show dependence on the value of mean torsional
-152 -
Reproduced with permission of the copyright owner. Further reproduction prohibited without permission.
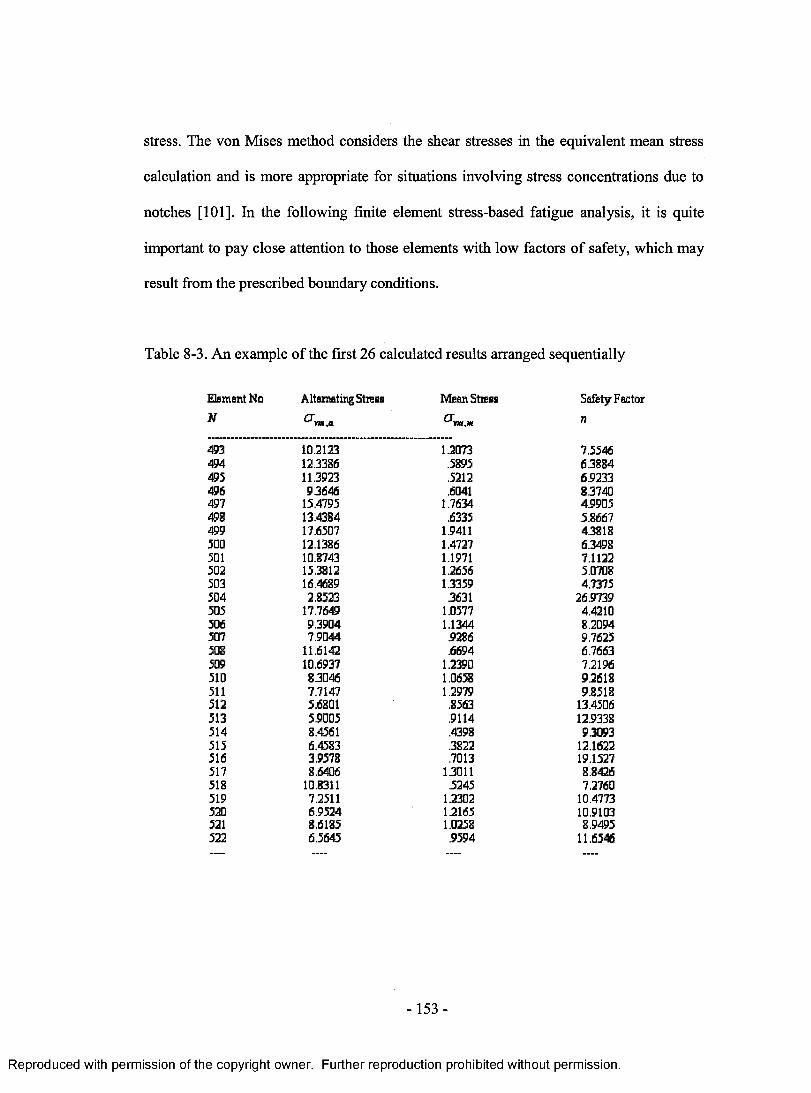
stress. The von Mises method considers the shear stresses in the equivalent mean stress
calculation and is more appropriate for situations involving stress concentrations due to
notches [101]. In the following finite element stress-based fatigue analysis, it is quite
important to pay close attention to those elements with low factors of safety, which may
result from the prescribed boundary conditions.
Table 8-3. An example o f the first 26 calculated results arranged sequentially
Element No Alternating Stress Mean Stress Safety FactorN ^K»,a n
m 10.2123 1.2073 7.5543494 12.3383 .5895 5.3884495 11.3923 .5212 6.9233493 9.3343 .6041 8.3740497 15.4795 1.7334 4.9905m 13.4384 .6335 5.8367499 17.3507 1.9411 4.381850D 12.1383 1.4727 6.34985D1 10.8743 1.1971 7.1122502 15.3812 1.2655 5.0708503 13.4389 1.3359 4.7375504 2.8523 .3331 26.9739505 17.7349 1.0577 4.4210503 9.3904 1.1344 8.2094507 7.9044 .9285 9.7625508 11.3142 .3694 6.7363509 10.3937 1.2390 7.2195510 8.3043 1.0558 9.2618511 7.7147 1.2979 9.8518512 5.3801 .8553 13.4505513 5.9005 .9114 12.9338514 8.4531 .4398 9.3093515 3.4583 .3822 12.1522513 3.9578 .7013 19.1527517 8.3403 1.3011 8.8426518 10.8311 .5245 7.2760519 7.2511 1.2302 10.4773520 5.9524 1.2165 10.9103521 8.3185 1.0258 8.9495522 5.5645 .9594 11.6546
-1 5 3 -
Reproduced with permission of the copyright owner. Further reproduction prohibited without permission.
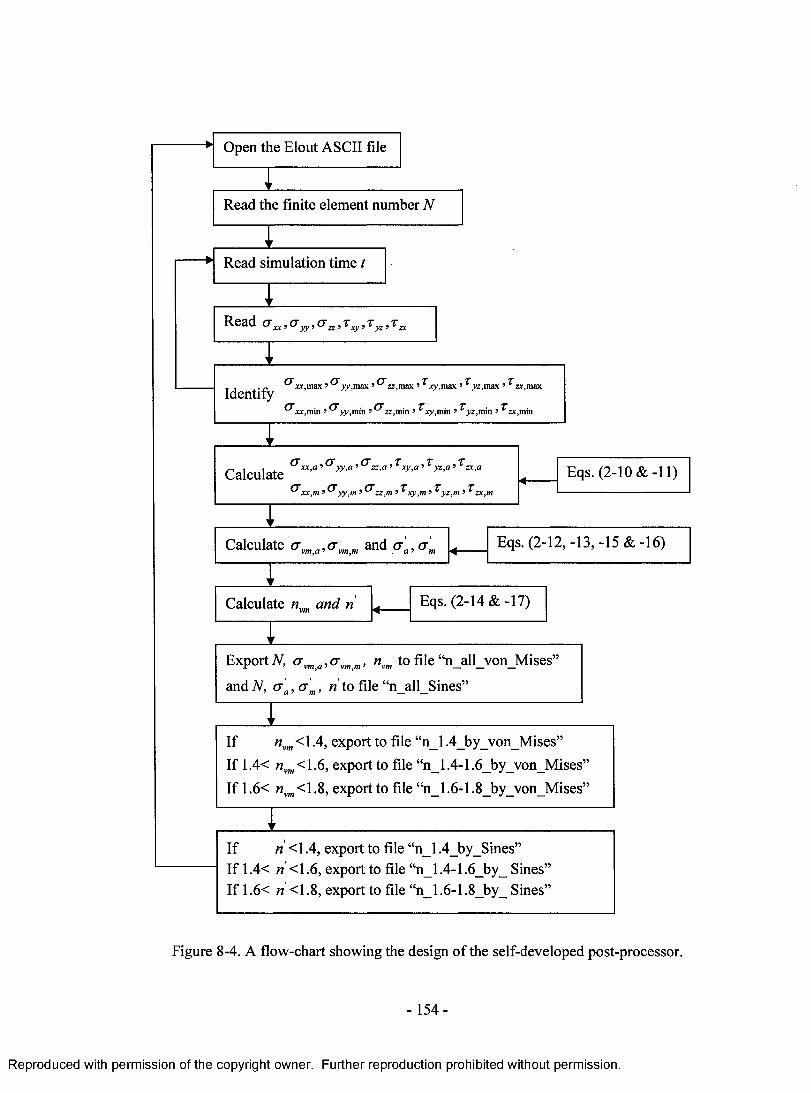
Eqs. (2-10 &-11)
Eqs. (2-14 &-17)Calculate nvm and n
Read simulation time t
Open the Elout ASCII file
Eqs. (2-12,-13,-15 &-16)
Read a ja , a >y, c r Z2 , T xy, T yz , T :
Calculate <r, and a ' , a '
Read the finite element number N
Calculate
Identifyxx,max 9 yytmax? zz,max ? xy,max ? yz,max ? zx,max
xx,min ? >%niin * zz,min * * .xy,min > * ,yz,inin ’ sc,min
ExportN, crvma,(jvm m, nvm to file “n_all_von_Mises'
and A, a'a,a 'm, n to file “n_all_Sines”
If nvm K1 -4, export to file “n_l .4_by_von_Mises”If 1.4< nvm< 1.6, export to file “n_1.4-1.6_by_von_Mises' If 1.6< wvm<1.8, export to file “n_1.6-1.8_by_von_Mises'
If ri < 1.4, export to file “n_l .4_by_Sines”If 1.4< « <1.6, export to file “n_1.4-1.6_by_ Sines' If 1.6< « <1.8, export to file “n_1.6-1.8_by_ Sines'
Figure 8-4. A flow-chart showing the design of the self-developed post-processor.
-154 -
Reproduced with permission of the copyright owner. Further reproduction prohibited without permission.
8.1.3. Safety Analysis of Fatigue Failure
Tables 8-4, 8-5 and 8-6 present the calculation results of those finite elements
with factors o f safety less than 1.4, between 1.4 and 1.6, and between 1.6 and 1.8,
respectively. For assessing the fatigue safety design, the locations of those finite elements
in Tables 8-4, 8-5 and 8-6 were identified on the wheel using a commercial post
processor (Hyperview). Finite elements with the numbers between 40000 and 51000 were
positioned in the hub region of the selected portion of the wheel. Finite elements
numbered between 59000 and 60000 were located on one spoke of the selected portion of
the wheel, and finally, finite elements between 62000 and 63000 were located on the
other spoke of the selected portion of the wheel.
As presented in Table 8-4, 28 elements were identified with nvm less than 1.4
calculated by the von Mises method. Figure 8-5 (a) illustrates the locations of these
elements on the hub and Figure 8-5 (b) magnifies the area of the hub to identify and
illustrate a number of elements among the 28 elements. Twenty elements with n less
than 1.4, calculated using the Sine method, were identified and also presented in Table 8-
4. All elements presented in Table 8-4 were located next to the elements of the low
mounting plate face where full nodal constraint boundary conditions had been prescribed.
Due to close proximity to the prescribed nodal constraints, the simulated stress
observations o f these finite elements were significantly influenced by the prescribed
boundary conditions. Although the full nodal constraints applied near the elements do
permit simulations of the rotating bending fatigue, they also impose a gradient of stress
variation which may not be observed experimentally. For example, relative sliding (
although it may be very minor) between the mounting plate and the bolt holes of the hub
-155 -
Reproduced with permission of the copyright owner. Further reproduction prohibited without permission.
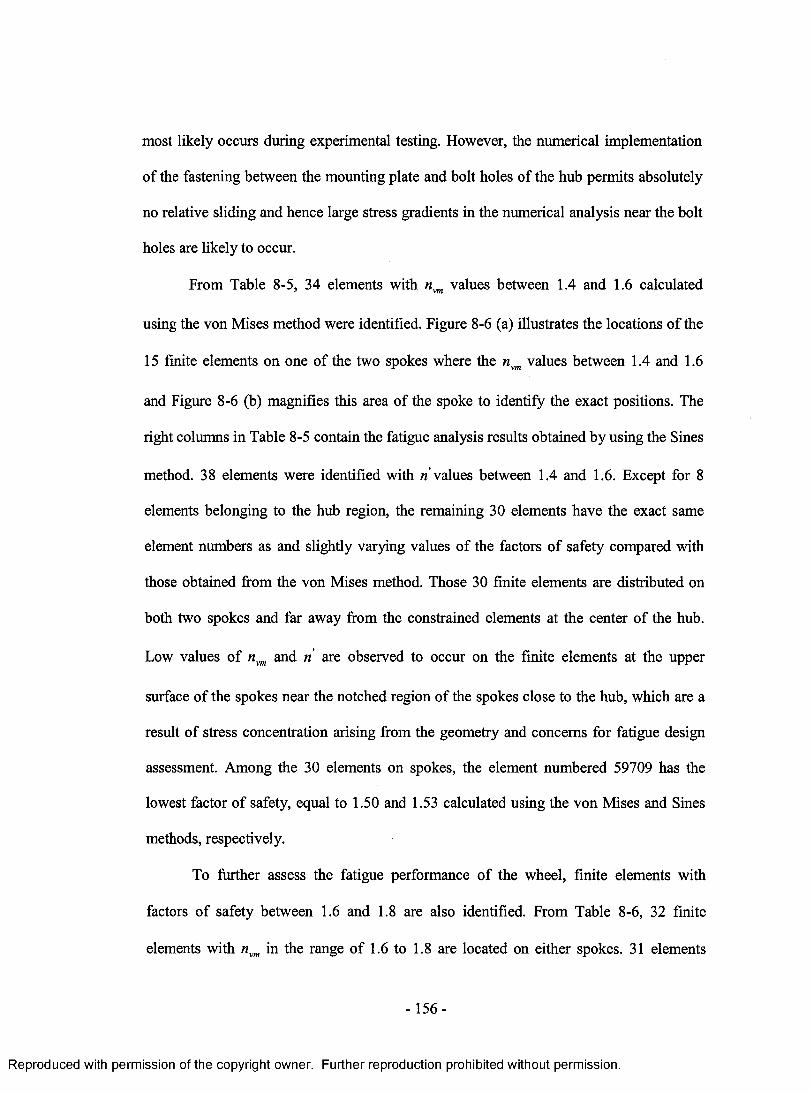
most likely occurs during experimental testing. However, the numerical implementation
of the fastening between the mounting plate and bolt holes of the hub permits absolutely
no relative sliding and hence large stress gradients in the numerical analysis near the bolt
holes are likely to occur.
From Table 8-5, 34 elements with nvm values between 1.4 and 1.6 calculated
using the von Mises method were identified. Figure 8-6 (a) illustrates the locations of the
15 finite elements on one of the two spokes where the nvm values between 1.4 and 1.6
and Figure 8-6 (b) magnifies this area of the spoke to identify the exact positions. The
right columns in Table 8-5 contain the fatigue analysis results obtained by using the Sines
method. 38 elements were identified with n values between 1.4 and 1.6. Except for 8
elements belonging to the hub region, the remaining 30 elements have the exact same
element numbers as and slightly varying values of the factors o f safety compared with
those obtained from the von Mises method. Those 30 finite elements are distributed on
both two spokes and far away from the constrained elements at the center of the hub.
Low values of nvm and n are observed to occur on the finite elements at the upper
surface of the spokes near the notched region of the spokes close to the hub, which are a
result of stress concentration arising from the geometry and concerns for fatigue design
assessment. Among the 30 elements on spokes, the element numbered 59709 has the
lowest factor of safety, equal to 1.50 and 1.53 calculated using the von Mises and Sines
methods, respectively.
To further assess the fatigue performance of the wheel, finite elements with
factors of safety between 1.6 and 1.8 are also identified. From Table 8-6, 32 finite
elements with nvm in the range of 1.6 to 1.8 are located on either spokes. 31 elements
-156 -
Reproduced with permission of the copyright owner. Further reproduction prohibited without permission.

with nvm between 1.4 and 1.8 on one of the 2 spokes were determined. Figure 8-7 (a)
illustrates the locations of the 31 finite elements numbered with nvm values in this range.
Figure 8-7 (b) magnifies Figure 8-7 (a) to clearly identify the locations of these elements.
It is evident from Figure 8-7 b) that the 30 finite elements with n between 1.4 and 1.8 are
present in one of the two spokes.
-157 -
Reproduced with permission of the copyright owner. Further reproduction prohibited without permission.
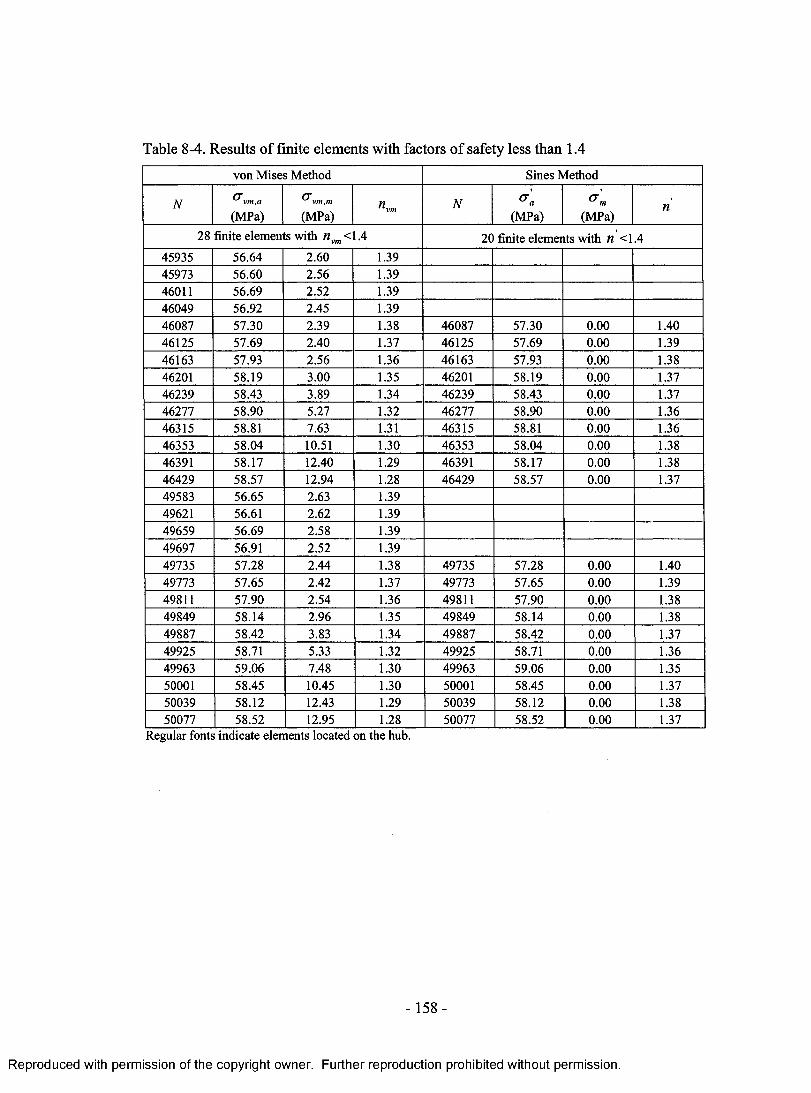
Table 8-4. Results of finite elements with factors of safety less than 1.4
von Mises Method Sines Method
N<7vm,a
(MPa)^vm ,m
(MPa)nvm N O'!
(MPa) (MPa)n
28 finite elements with nvm <1.4 20 finite elements with n <1.445935 56.64 2.60 1.3945973 56.60 2.56 1.3946011 56.69 2.52 1.3946049 56.92 2.45 1.3946087 57.30 2.39 1.38 46087 57.30 0.00 1.4046125 57.69 2.40 1.37 46125 57.69 0.00 1.3946163 57.93 2.56 1.36 46163 57.93 0.00 1.3846201 58.19 3.00 1.35 46201 58.19 0.00 1.3746239 58.43 3.89 1.34 46239 58.43 0.00 1.3746277 58.90 5.27 1.32 46277 58.90 0.00 1.3646315 58.81 7.63 1.31 46315 58.81 0.00 1.3646353 58.04 10.51 1.30 46353 58.04 0.00 1.3846391 58.17 12.40 1.29 46391 58.17 0.00 1.3846429 58.57 12.94 1.28 46429 58.57 0.00 1.3749583 56.65 2.63 1.3949621 56.61 2.62 1.3949659 56.69 2.58 1.3949697 56.91 2.52 1.3949735 57.28 2.44 1.38 49735 57.28 0.00 1.4049773 57.65 2.42 1.37 49773 57.65 0.00 1.3949811 57.90 2.54 1.36 49811 57.90 0.00 1.3849849 58.14 2.96 1.35 49849 58.14 0.00 1.3849887 58.42 3.83 1.34 49887 58.42 0.00 1.3749925 58.71 5.33 1.32 49925 58.71 0.00 1.3649963 59.06 7.48 1.30 49963 59.06 0.00 1.3550001 58.45 10.45 1.30 50001 58.45 0.00 1.3750039 58.12 12.43 1.29 50039 58.12 0.00 1.3850077 58.52 12.95 1.28 50077 58.52 0.00 1.37
Regular fonts indicate elements located on the hub.
- 158-
Reproduced with permission of the copyright owner. Further reproduction prohibited without permission.
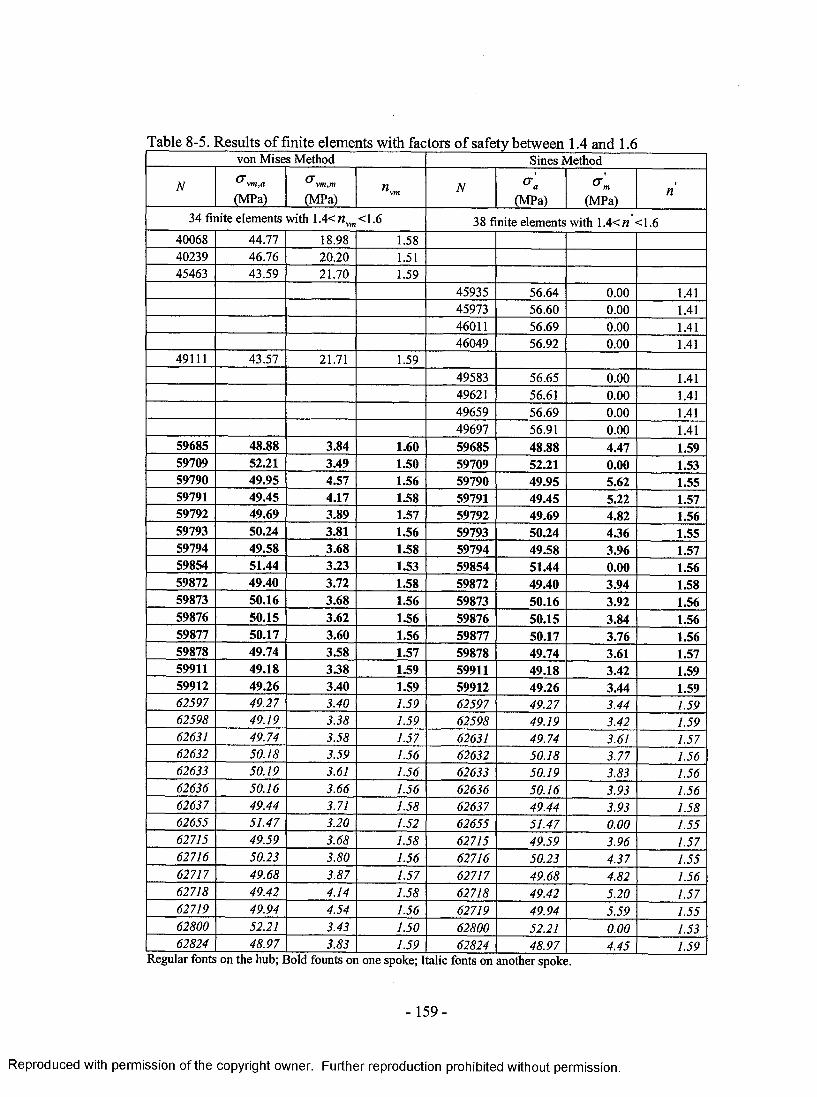
Table 8-5. Results of finite elements with factors of safety between 1.4 and 1.6von Mises Method Sines Method
Ncrvm ,a
(MPa)
crvm,m
(MPa)n vm N <*'«
(MPa) (MPa)n
34 finite elements with 1.4<«vm<1.6 38 finite elements with 1.4<« <1.640068 44.77 18.98 1.5840239 46.76 20.20 1.5145463 43.59 21.70 1.59
45935 56.64 0.00 1.4145973 56.60 0.00 1.4146011 56.69 0.00 1.4146049 56.92 0.00 1.41
49111 43.57 21.71 1.5949583 56.65 0.00 1.4149621 56.61 0.00 1.4149659 56.69 0.00 1.4149697 56.91 0.00 1.41
59685 48.88 3.84 1.60 59685 48.88 4.47 1.5959709 52.21 3.49 1.50 59709 52.21 0.00 1.5359790 49.95 4.57 1.56 59790 49.95 5.62 1.5559791 49.45 4.17 1.58 59791 49.45 5.22 1.5759792 49.69 3.89 1.57 59792 49.69 4.82 1.5659793 50.24 3.81 1.56 59793 50.24 4.36 1.5559794 49.58 3.68 1.58 59794 49.58 3.96 1.5759854 51.44 3.23 1.53 59854 51.44 0.00 1.5659872 49.40 3.72 1.58 59872 49.40 3.94 1.5859873 50.16 3.68 1.56 59873 50.16 3.92 1.5659876 50.15 3.62 1.56 59876 50.15 3.84 1.5659877 50.17 3.60 1.56 59877 50.17 3.76 1.5659878 49.74 3.58 1.57 59878 49.74 3.61 1.5759911 49.18 3.38 1.59 59911 49.18 3.42 1.5959912 49.26 3.40 1.59 59912 49.26 3.44 1.5962597 49.27 3.40 1.59 62597 49.27 3.44 1.5962598 49.19 3.38 1.59 62598 49.19 3.42 1.5962631 49.74 3.58 1.57 62631 49.74 3.61 1.5762632 50.18 3.59 1.56 62632 50.18 3.77 1.5662633 50.19 3.61 1.56 62633 50.19 3.83 1.5662636 50.16 3.66 1.56 62636 50.16 3.93 1.5662637 49.44 3.71 1.58 62637 49.44 3.93 1.5862655 51.47 3.20 1.52 62655 51.47 0.00 1.5562715 49.59 3.68 1.58 62715 49.59 3.96 1.5762716 50.23 3.80 1.56 62716 50.23 4.37 1.5562717 49.68 3.87 1.57 62717 49.68 4.82 1.5662718 49.42 4.14 1.58 62718 49.42 5.20 1.5762719 49.94 4.54 1.56 62719 49.94 5.59 1.5562800 52.21 3.43 1.50 62800 52.21 0.00 1.5362824 48.97 3.83 1.59 62824 48.97 4.45 1.59
Regular fonts on the hub; Bold founts on one spoke; Italic fonts on another spoke.
- 159-
Reproduced with permission of the copyright owner. Further reproduction prohibited without permission.
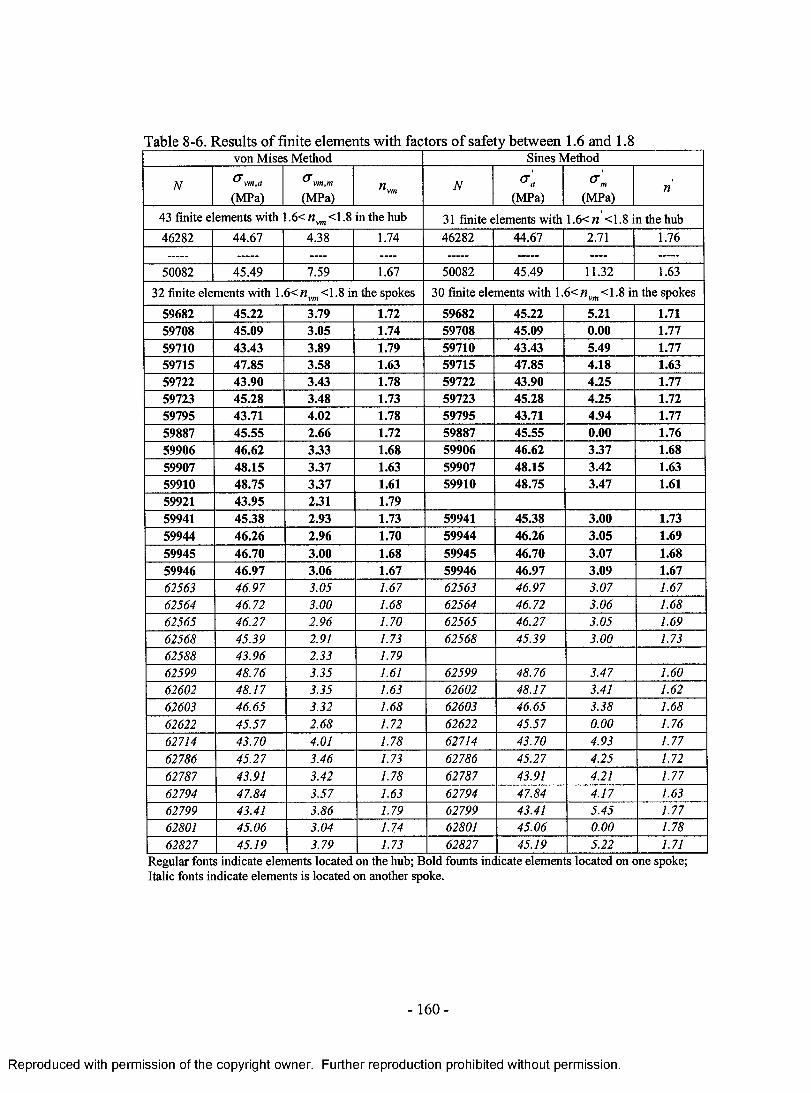
Table 8-6. Results of finite elements with factors of safety between 1.6 and 1.8von Mises Method Sines Method
Na vm ,a
(MPa)
crvm,m
(MPa)nvm N ° ' a
(MPa) (MPa)n
43 finite elements with 1,6< nvm <1.8 in the hub 31 finite elements with 1.6< n <1.8 in the hub46282 44.67 4.38 1.74 46282 44.67 2.71 1.76
— — — ----50082 45.49 7.59 1.67 50082 45.49 11.32 1.63
32 finite elements with 1.6< nvm <1.8 in the spokes 30 finite elements with 1,6< n vm <1.8 in the spokes
59682 45.22 3.79 1.72 59682 45.22 5.21 1.7159708 45.09 3.05 1.74 59708 45.09 0.00 1.1159710 43.43 3.89 1.79 59710 43.43 5.49 1.7759715 47.85 3.58 1.63 59715 47.85 4.18 1.6359722 43.90 3.43 1.78 59722 43.90 4.25 1.7759723 45.28 3.48 1.73 59723 45.28 4.25 1.7259795 43.71 4.02 1.78 59795 43.71 4.94 1.7759887 45.55 2.66 1.72 59887 45.55 0.00 1.7659906 46.62 3.33 1.68 59906 46.62 3.37 1.6859907 48.15 3.37 1.63 59907 48.15 3.42 1.6359910 48.75 3.37 1.61 59910 48.75 3.47 1.6159921 43.95 2.31 1.7959941 45.38 2.93 1.73 59941 45.38 3.00 1.7359944 46.26 2.96 1.70 59944 46.26 3.05 1.6959945 46.70 3.00 1.68 59945 46.70 3.07 1.6859946 46.97 3.06 1.67 59946 46.97 3.09 1.6762563 46.97 3.05 1.67 62563 46.97 3.07 1.6762564 46.72 3.00 1.68 62564 46.72 3.06 1.6862565 46.27 2.96 1.70 62565 46.27 3.05 1.6962568 45.39 2.91 1.73 62568 45.39 3.00 1.7362588 43.96 2.33 1.7962599 48.76 3.35 1.61 62599 48.76 3.47 1.6062602 48.17 3.35 1.63 62602 48.17 3.41 1.6262603 46.65 3.32 1.68 62603 46.65 3.38 1.6862622 45.57 2.68 1.72 62622 45.57 0.00 1.7662714 43.70 4.01 1.78 62714 43.70 4.93 1.7762786 45.27 3.46 1.73 62786 45.27 4.25 1.7262787 43.91 3.42 1.78 62787 43.91 4.21 1.7762794 47.84 3.57 1.63 62794 47.84 4.17 1.6362799 43.41 3.86 1.79 62799 43.41 5.45 1.7762801 45.06 3.04 1.74 62801 45.06 0.00 1.7862827 45.19 3.79 1.73 62827 45.19 5.22 1.71
Regular fonts indicate elements located on the hub; Bold founts indicate elements located on one spoke; Italic fonts indicate elements is located on another spoke.
- 160 -
Reproduced with permission of the copyright owner. Further reproduction prohibited without permission.
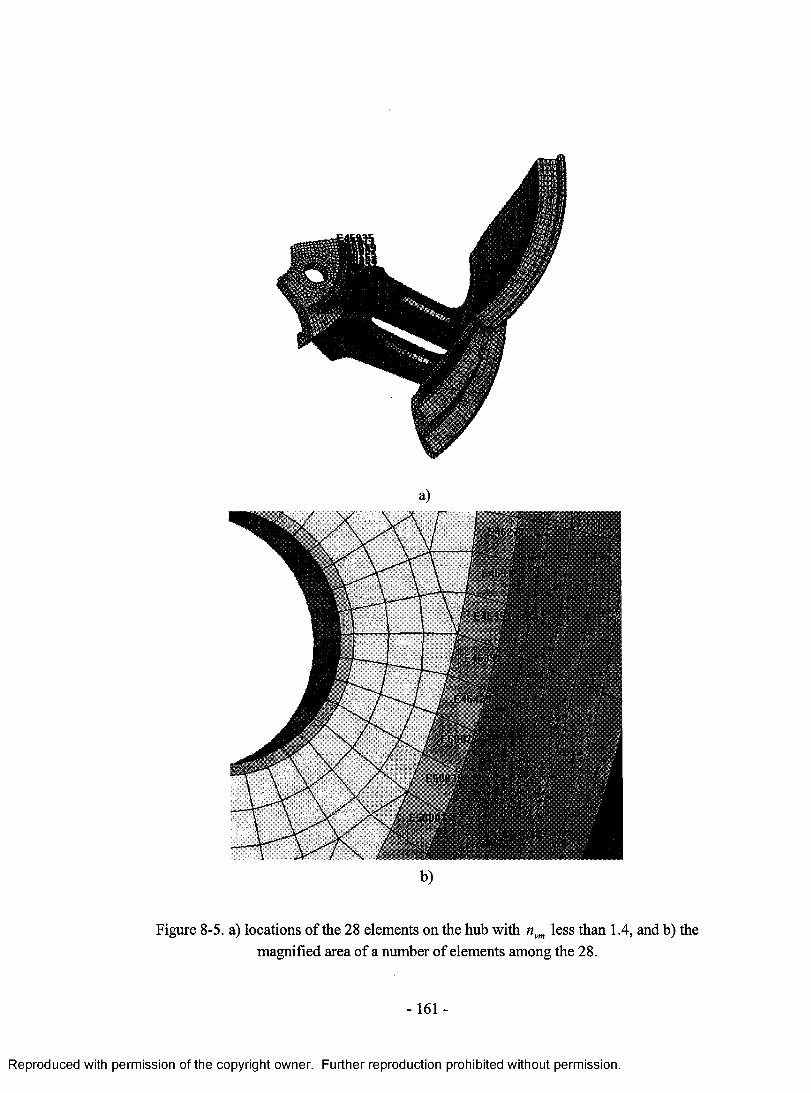
b)
Figure 8-5. a) locations of the 28 elements on the hub with nvm less than 1.4, and b) the magnified area of a number of elements among the 28.
-161 -
Reproduced with permission of the copyright owner. Further reproduction prohibited without permission.

a)
b)
Figure 8-6. a) locations of 15 elements on the spoke with nvm between 1.4 and 1.6, and b)the exact positions of the 15 elements.
-1 6 2 -
Reproduced with permission of the copyright owner. Further reproduction prohibited without permission.
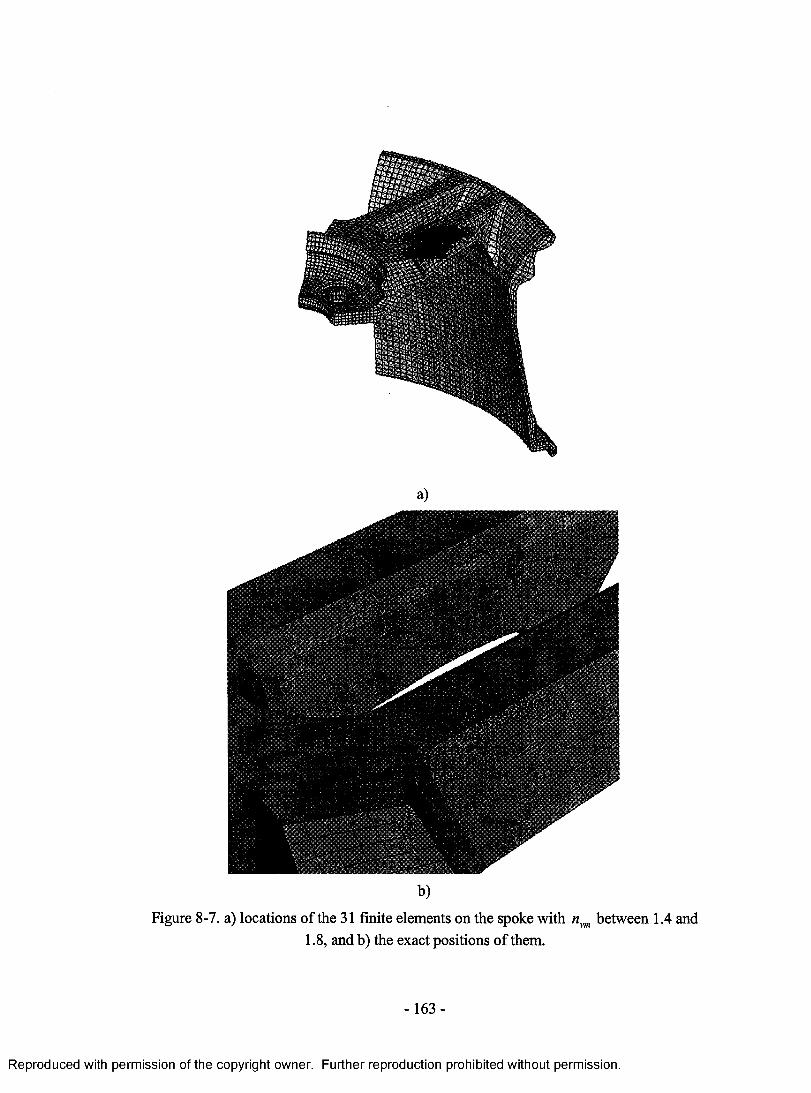
b)
Figure 8-7. a) locations of the 31 finite elements on the spoke with nvm between 1.4 and1.8, and b) the exact positions o f them.
-163 -
Reproduced with permission of the copyright owner. Further reproduction prohibited without permission.
8.2. Forged Magnesium Wheels
8.2.1. Influence of System Damping
In the numerical simulation results of aluminum wheel cornering fatigue testing
illustrated above, there were no obvious elastic oscillations during the entire loading
cycle. However, severe elastic oscillations occurred during the numerical simulation of
magnesium wheel cornering fatigue testing. The large difference in the Young’s modulus
between magnesium alloy and aluminum alloy may be responsible for this observation.
Under the same loading conditions, considerable large elastic deformations take place in
magnesium alloy due to its low Young’s modulus (38 GPa) compared with that of
aluminum alloy (64 GPa). It has been suggested [102] that the material absorbs some of
the external energy and transfers it to heat or friction energy as a kind of damping effect
in the reality of experimental testing. If the simulation results did not fit the common
sense due to the dynamic oscillation, a system damping method could be applied to
simulate the damping performance of the real material characteristics.
Figure 8-8 illustrates the dynamic oscillation of the free mandrel end along the x
and y axes during the rotating load cycle. At the beginning of the numerical simulation,
the Py increased from zero to the absolute value o f P in the first 0.005 s and was held on
for another 0.005 s to balance the elastic deformation. Then, the Py was kept zero with a
bending moment in x direction only. For the aluminum wheel, the elastic deformation
was balanced after a 0.005 s holding as shown in Figure 8-2 in the previous discussion.
However, for the magnesium wheel, severe elastic oscillation phenomena appeared in the
y direction during the whole bending loading cycle. Meanwhile, minor elastic oscillations
-1 6 4 -
Reproduced with permission of the copyright owner. Further reproduction prohibited without permission.
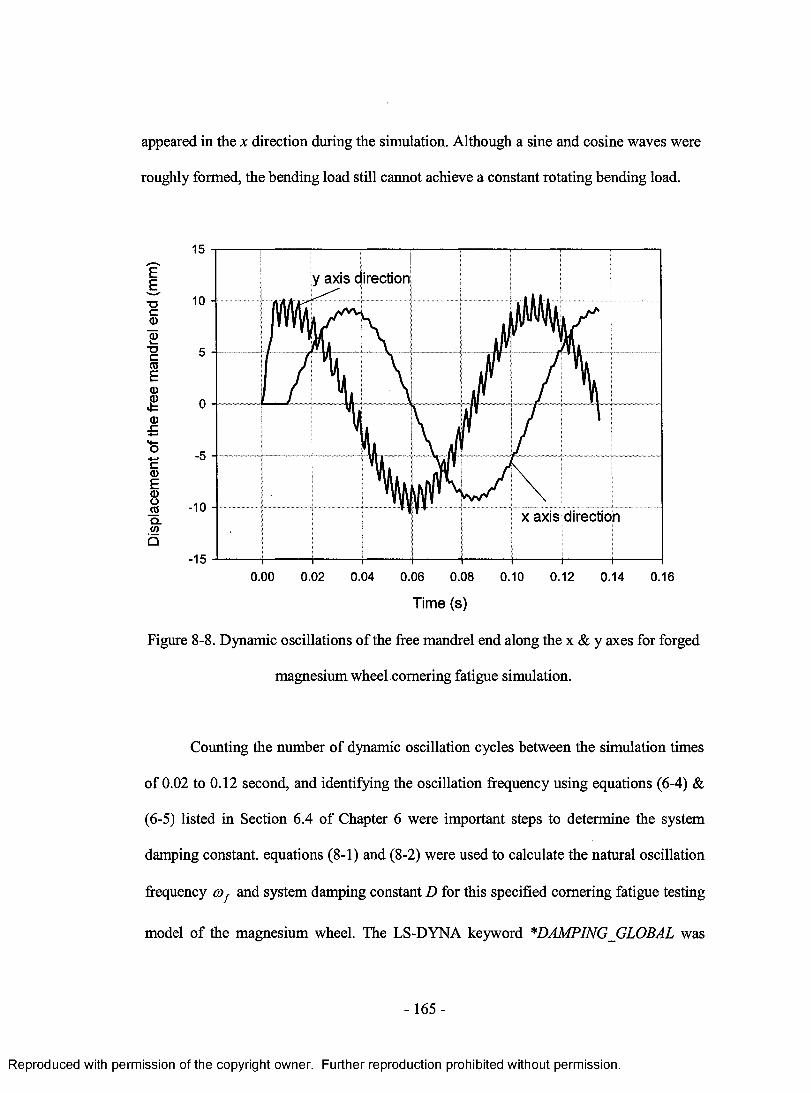
appeared in the x direction during the simulation. Although a sine and cosine waves were
roughly formed, the bending load still cannot achieve a constant rotating bending load.
y axis direction10 -
TJ 5 —
x axis directionQ.<n
-150.00 0.04 0.080.02 0.06 0.10 0.12 0.14 0.16
Time (s)
Figure 8-8. Dynamic oscillations of the free mandrel end along the x & y axes for forged
magnesium wheel cornering fatigue simulation.
Counting the number of dynamic oscillation cycles between the simulation times
of 0.02 to 0.12 second, and identifying the oscillation frequency using equations (6-4) &
(6-5) listed in Section 6.4 of Chapter 6 were important steps to determine the system
damping constant, equations (8-1) and (8-2) were used to calculate the natural oscillation
frequency cof and system damping constant D for this specified cornering fatigue testing
model of the magnesium wheel. The LS-DYNA keyword *DAMPING_GLOBAL was
-165 -
Reproduced with permission of the copyright owner. Further reproduction prohibited without permission.
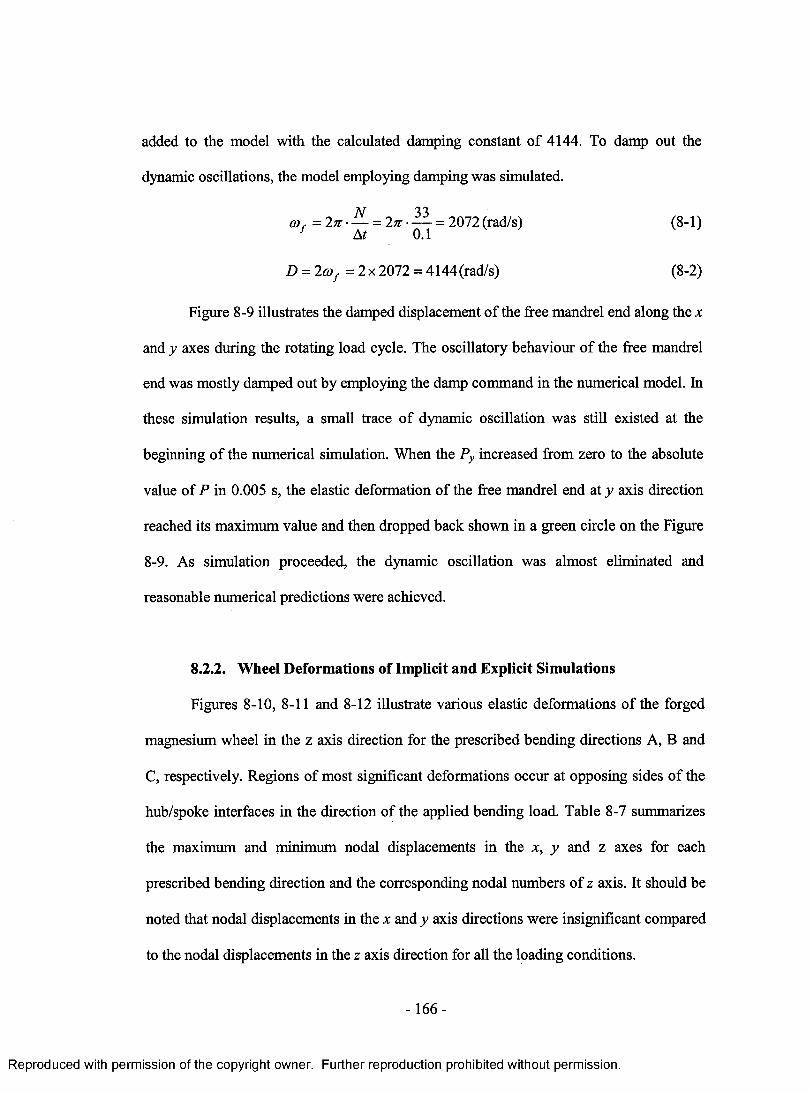
added to the model with the calculated damping constant of 4144. To damp out the
dynamic oscillations, the model employing damping was simulated.
G){ =2n- — = 2n — = 2072 (rad/s) (8-1)f At 0.1
D = 2a>f = 2 x 2072 = 4144(rad/s) (8-2)
Figure 8-9 illustrates the damped displacement of the free mandrel end along the x
and y axes during the rotating load cycle. The oscillatory behaviour of the free mandrel
end was mostly damped out by employing the damp command in the numerical model. In
these simulation results, a small trace o f dynamic oscillation was still existed at the
beginning o f the numerical simulation. When the Py increased from zero to the absolute
value of P in 0.005 s, the elastic deformation of the free mandrel end at y axis direction
reached its maximum value and then dropped back shown in a green circle on the Figure
8-9. As simulation proceeded, the dynamic oscillation was almost eliminated and
reasonable numerical predictions were achieved.
8.2.2. Wheel Deformations of Implicit and Explicit Simulations
Figures 8-10, 8-11 and 8-12 illustrate various elastic deformations of the forged
magnesium wheel in the z axis direction for the prescribed bending directions A, B and
C, respectively. Regions of most significant deformations occur at opposing sides of the
hub/spoke interfaces in the direction of the applied bending load. Table 8-7 summarizes
the maximum and minimum nodal displacements in the x, y and z axes for each
prescribed bending direction and the corresponding nodal numbers o f z axis. It should be
noted that nodal displacements in the x and y axis directions were insignificant compared
to the nodal displacements in the z axis direction for all the loading conditions.
-166 -
Reproduced with permission of the copyright owner. Further reproduction prohibited without permission.

The specified bending directions of A, B and C utilized in the static analysis
corresponded to times of 10, 15 and 60 ms in the dynamic analysis completed using the
explicit FE solution scheme. The maximum and minimum displacements in the z axis of
the six previously described nodes are presented as a function of time in respect with the
three bending directions A, B and C, shown in Figures 8-13, 8-14, and 8-15 respectively.
The z axis displacement/time response of node 65776 and 32392 reached the maximum
value of 0.82 mm and minimum value of -0.84 mm at a simulating time of 10 ms, which
corresponded to the bending load in the direction A. The maximum and minimum z axis
displacements observed in dynamic simulations corresponded well to the static
simulation result. Similarly, the responses of nodes 73920 and 32557 reached the
maximum values of 0.85 mm and minimum value of -0.85 mm at the simulating time of
15 ms. This prediction is very similar to the results of the static simulations in the
bending direction B. The z axis displacements of nodes 32392 and 73955 became
maximum at 0.84 mm and minimum at -0.82 mm when the simulating time reached 60
ms, which is in consistent with the results predicted by the static model in the bending
direction C. Thus, good agreements between the implicit and explicit solution schemes
are verified by the nodal displacement observations.
- 167 -
Reproduced with permission of the copyright owner. Further reproduction prohibited without permission.
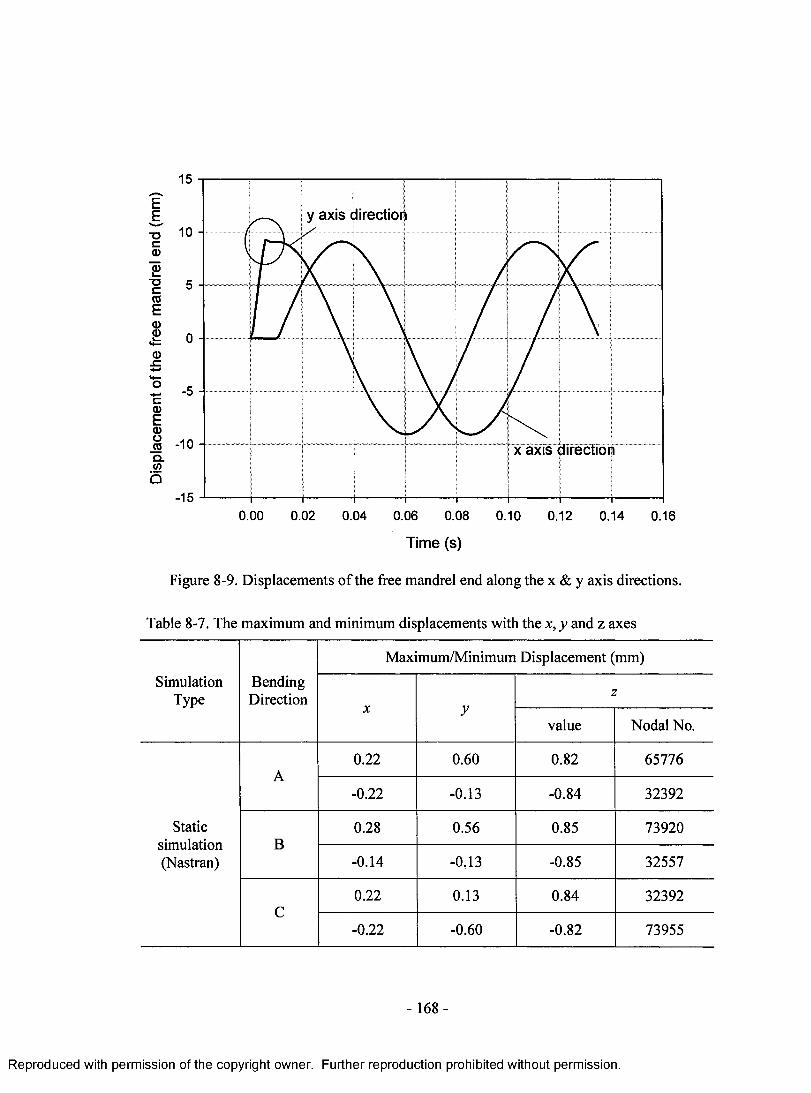
15
EE
-o 10 -cCD
y axis directior|
T3C(0Ea><DCD.c
«+—o
-5 -•HC 0)ECl)« -10Q.Wb
-15
x axis direction
o.oo 0.02 0.06 0.08 0.100.04 0.12 0.14 0.16
Time (s)
Figure 8-9. Displacements of the free mandrel end along the x & y axis directions.
Table 8-7. The maximum and minimum displacements with the x , y and z axes
Maximum/Minimum Displacement (mm)
SimulationType
BendingDirection
X yz
value Nodal No.
A0.22 0.60 0.82 65776
-0.22 -0.13 -0.84 32392
Staticsimulation(Nastran)
B0.28 0.56 0.85 73920
-0.14 -0.13 -0.85 32557
C0.22 0.13 0.84 32392
-0.22 -0.60 -0.82 73955
- 168 -
Reproduced with permission of the copyright owner. Further reproduction prohibited without permission.
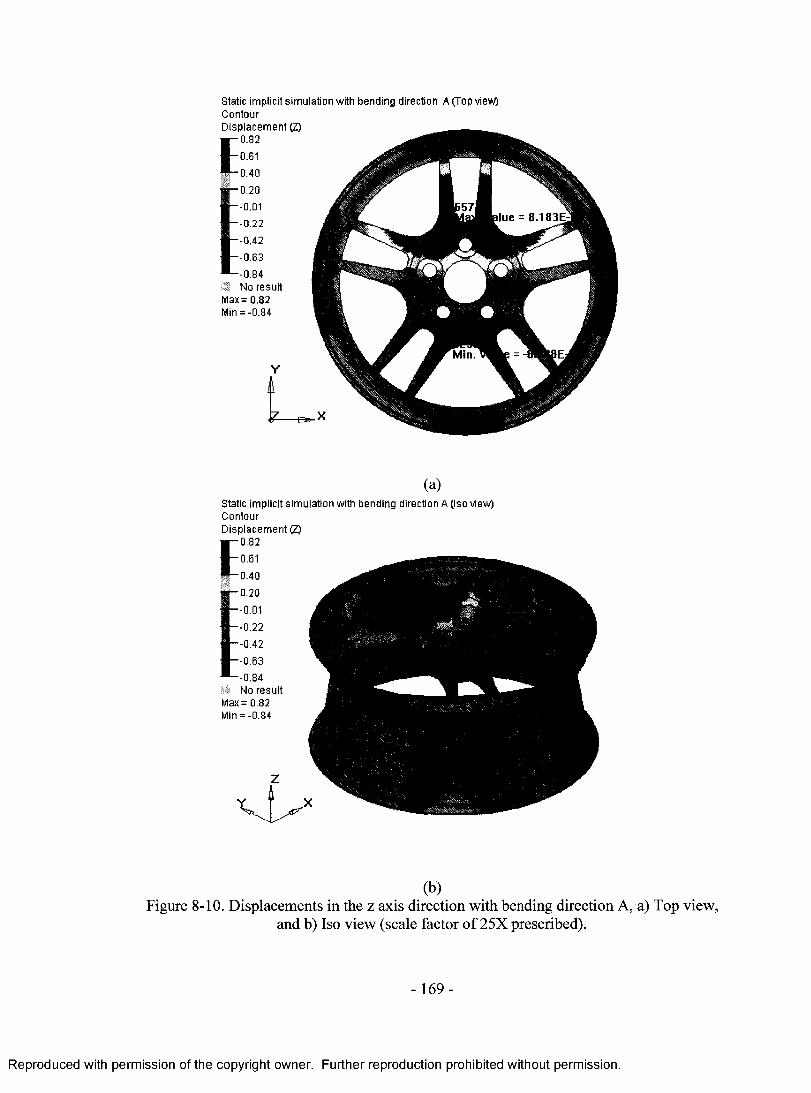
Static implicit simulation with bending direction A (Top view) ContourDisplacement (Z)
-0 .82E
No resu tMax = 0.82Min = -0.84
lue = 8.1 BSE-
Static implicit simulation with bending direction A (Iso view) ContourDisplacement (Z)
■ - - 0.22
* —-0.42
1 — 0.63■ — 0.84
No result Max = 0.82 Min = -0.84
(b)Figure 8-10. Displacements in the z axis direction with bending direction A, a) Top view,
and b) Iso view (scale factor o f 25X prescribed).
-1 6 9 -
Reproduced with permission of the copyright owner. Further reproduction prohibited without permission.
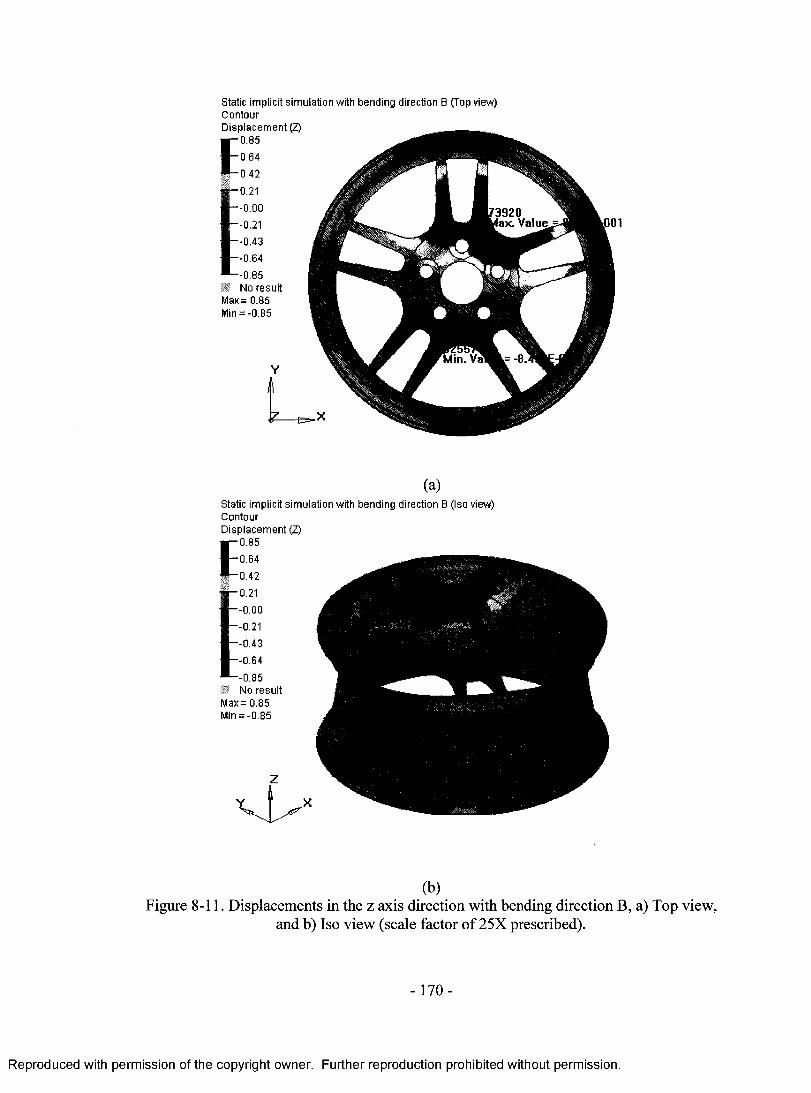
Static implicit simulation with bending direction 0 (Top view) ContourDisplacement (Z)
-0 .85E
-0.85 No result
Max= 0.85 Min = -0.85
3920 la x . V alue l001
(a)Static implicit simulation with bending direction B (Iso view) ContourDisplacement (Z)
-0 .85E
-0 .85 No result
Max = 0.85 Min = -0 .85
(b)Figure 8-11. Displacements in the z axis direction with bending direction B, a) Top view,
and b) Iso view (scale factor o f 25X prescribed).
- 170-
Reproduced with permission of the copyright owner. Further reproduction prohibited without permission.

Static implicit simulaiton with bending direction C (Top view) ContourDisplacement (2)
-0 .84E55
Value
No resultMax = 0.84Min = -0.82
(a)Static implicit simulation with bending direction C (Iso view) ContourDisplacement (Z)
-0 .84E
-0.82 No result
Max= 0.84 Min = -0 .82
(b)Figure 8-12. Displacements in the z axis direction with bending direction C, a) Top view,
and b) Iso view (scale factor o f 25X prescribed).
- 171 -
Reproduced with permission of the copyright owner. Further reproduction prohibited without permission.
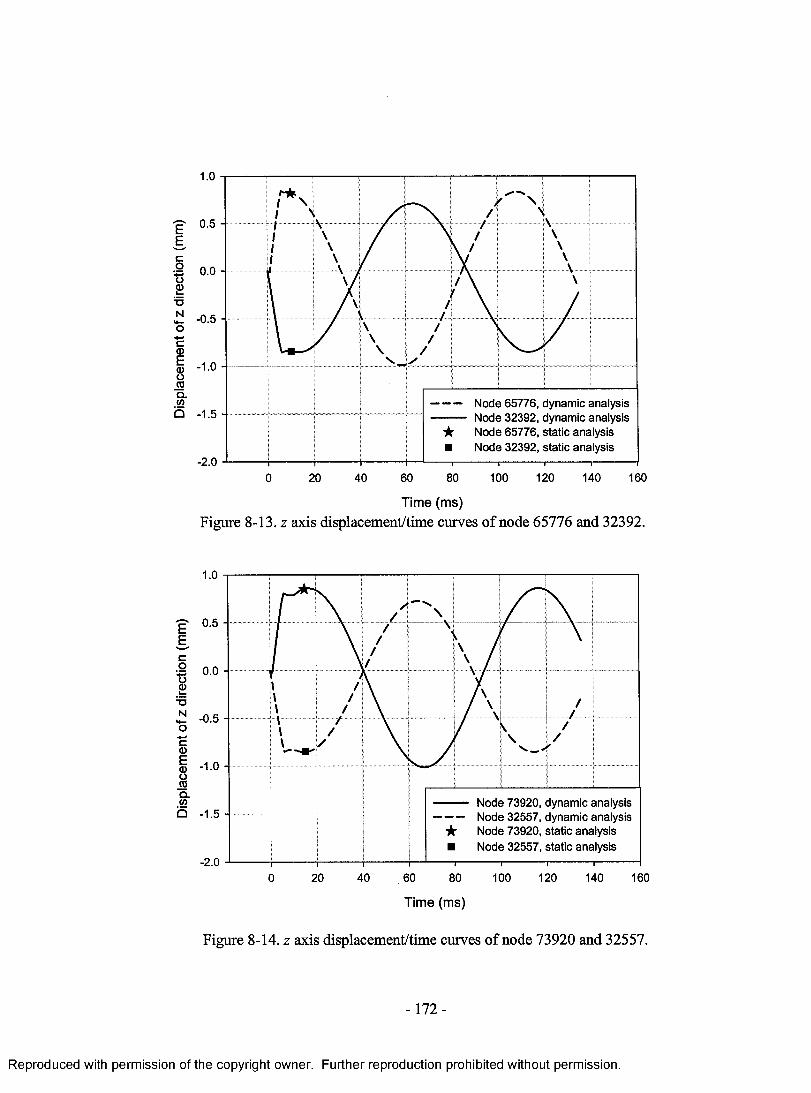
1.0
g U.O ”
§
■Q 0 . 0 -
T3£ -0.5 - ocd)§ -1.0oroo.wb -1.5
Node 65776, dynamic analysis Node 32392, dynamic analysis★ Node 65776, static analysis■ Node 32392, static analysis
- 2.0100 120 140 1600 20 40 60 80
Time (ms)Figure 8-13. z axis displacement/time curves of node 65776 and 32392.
EEcoo
14—o•4-Jc<1)Ea>oroClv>b
Node 73920, dynamic analysis Node 32557, dynamic analysis★ Node 73920, static analysis■ Node 32557, static analysis
- 2.0140 16020 40 60 80 100 1200
Time (ms)
Figure 8-14. z axis displacement/time curves of node 73920 and 32557.
-172 -
Reproduced with permission of the copyright owner. Further reproduction prohibited without permission.
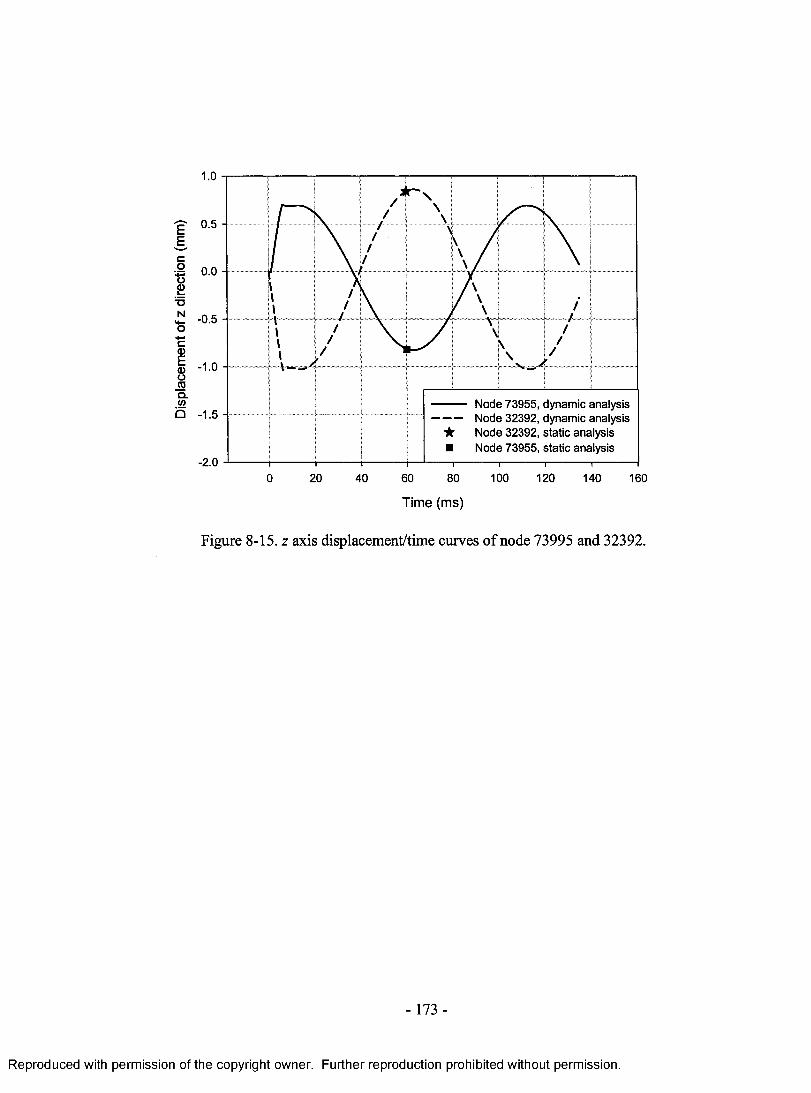
Dis
plac
emen
t of
z di
rect
ion
(mm
) 0.5 -
0.0
-0.5 -
- 1.0 -
Node 73955, dynamic analysis Node 32392, dynamic analysis★ Node 32392, static analysis■ Node 73955, static analysis
--I.5 -----
- 2.0100 120 1400 20 40 60 80 160
Time (ms)
Figure 8-15. z axis displacement/time curves of node 73995 and 32392.
-173 -
Reproduced with permission of the copyright owner. Further reproduction prohibited without permission.
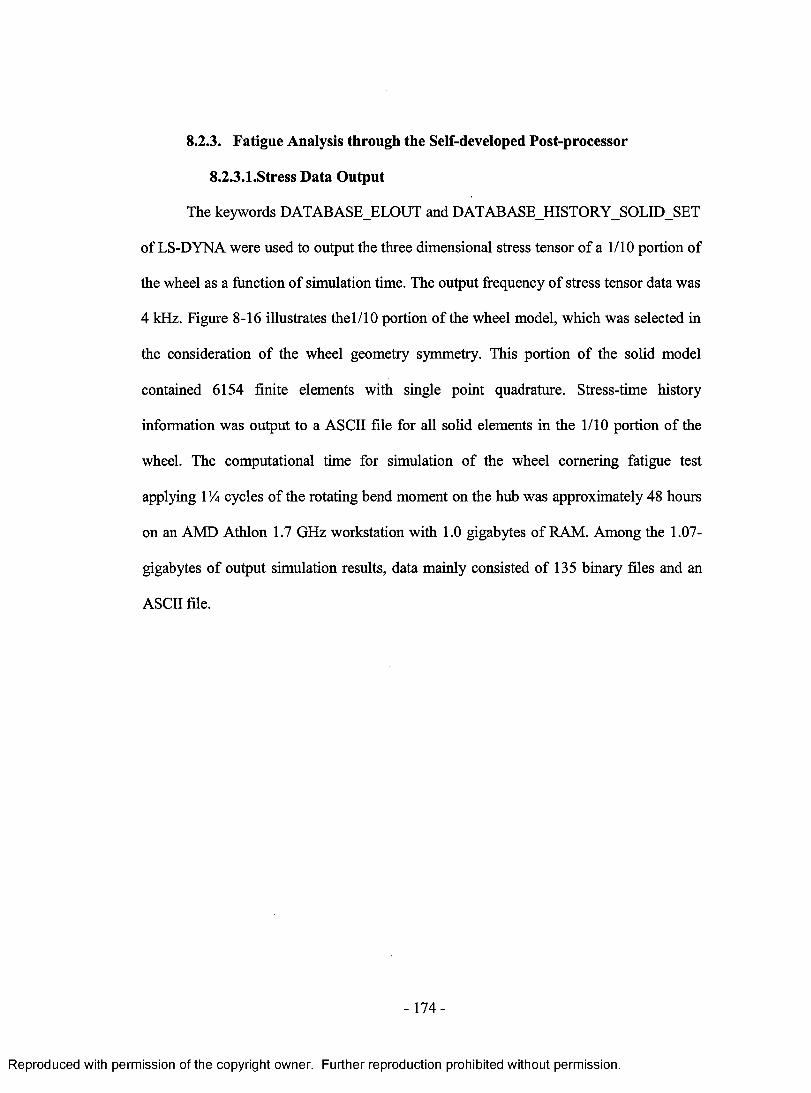
8.2.3. Fatigue Analysis through the Self-developed Post-processor
8.2.3.I.Stress Data Output
The keywords DATABASE_ELOUT and DATABASE_HISTORY_SOLID_SET
of LS-DYNA were used to output the three dimensional stress tensor of a 1/10 portion of
the wheel as a function of simulation time. The output frequency of stress tensor data was
4 kHz. Figure 8-16 illustrates thel/10 portion of the wheel model, which was selected in
the consideration of the wheel geometry symmetry. This portion of the solid model
contained 6154 finite elements with single point quadrature. Stress-time history
information was output to a ASCII file for all solid elements in the 1/10 portion of the
wheel. The computational time for simulation of the wheel cornering fatigue test
applying 1 lA cycles of the rotating bend moment on the hub was approximately 48 hours
on an AMD Athlon 1.7 GHz workstation with 1.0 gigabytes of RAM. Among the 1.07-
gigabytes of output simulation results, data mainly consisted of 135 binary files and an
ASCII file.
-174 -
Reproduced with permission of the copyright owner. Further reproduction prohibited without permission.
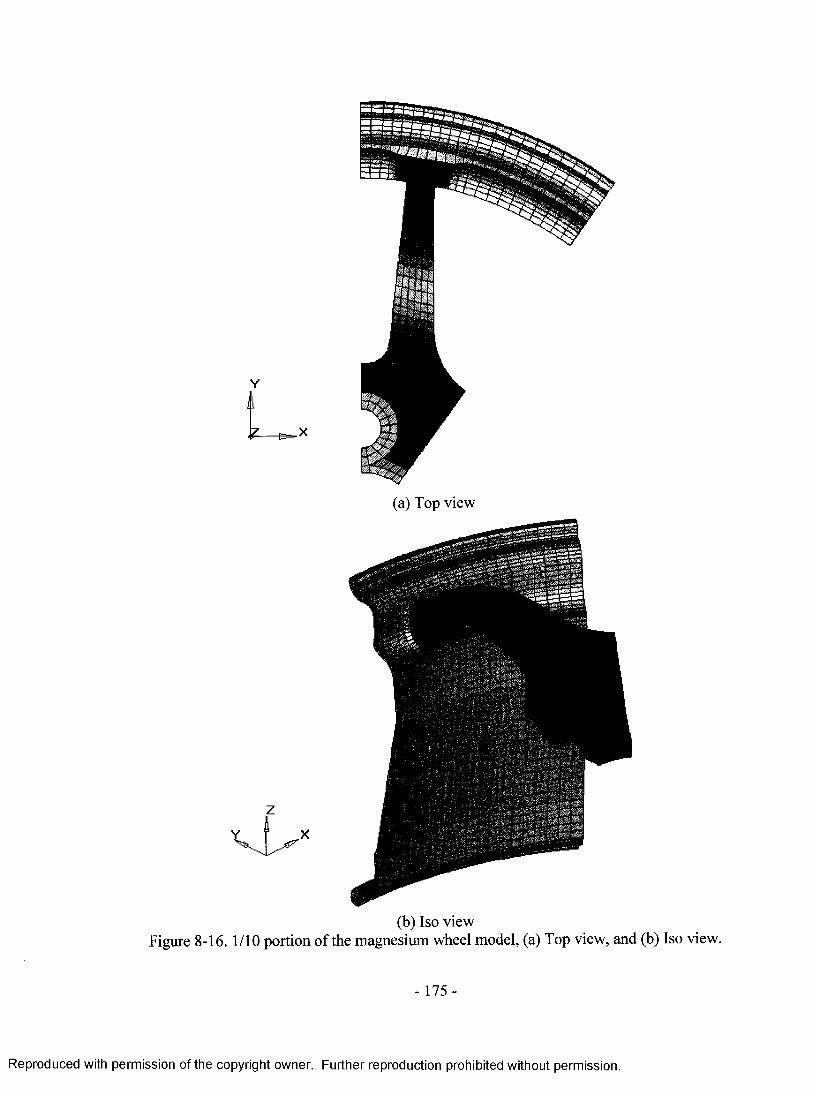
(a) Top view
(b) Iso viewFigure 8-16. 1/10 portion of the magnesium wheel model, (a) Top view, and (b) Iso view.
- 175 -
Reproduced with permission of the copyright owner. Further reproduction prohibited without permission.

8.2.3.2.Calculation of the Equivalent Alternating & Mean Stresses
As similar with the post-processing of cast aluminum wheel simulations, eight
result files in ASCII format of forged magnesium wheel cornering fatigue numerical
analysis were generated. Two of these files contained a summary of the fatigue analysis
for all elements considered. The minimum factor of safety in this case was founded less
than 1 by programming calculation. The remaining six files contained a distribution of
the results of the fatigue analysis in a range of the factors o f safety less than 1. In the
finite element stress-based fatigue analysis, those elements with the factors of safety less
than 1 are often concerns due to potential fatigue failure. It has been suggested [103] that
the factor of safety in all fatigue design calculations is a compensation of possible
material flaws, sharp comers occurred during part machining, and the worst-case
happened below the averaging of data to create an S-N curve. Normally, the factor of
safety should be larger than 1.2, which means 20% over-designing assumed [103]. If the
factor of safety are equal to or less than 1, fatigue failure would be definitely occurred
due to not only no safety margins applied to fatigue design, also the external loading
higher than material fatigue strengths.
8.2.4. Safety Analysis of Fatigue Failure
Tables 8-8, 8-9 and 8-10 present the calculation results of those finite elements
with factors o f safety less than 0.8, between 0.8 and 0.9, and between 0.9 and 1.0,
respectively. For assessing the fatigue safety design, the locations o f those finite elements
listed in Tables 8-8, 8-9 and 8-10 were identified on the forged magnesium wheel using a
commercial post-processor Hyperview. As presented in Table 8-8, 16 elements were
-1 7 6 -
Reproduced with permission of the copyright owner. Further reproduction prohibited without permission.
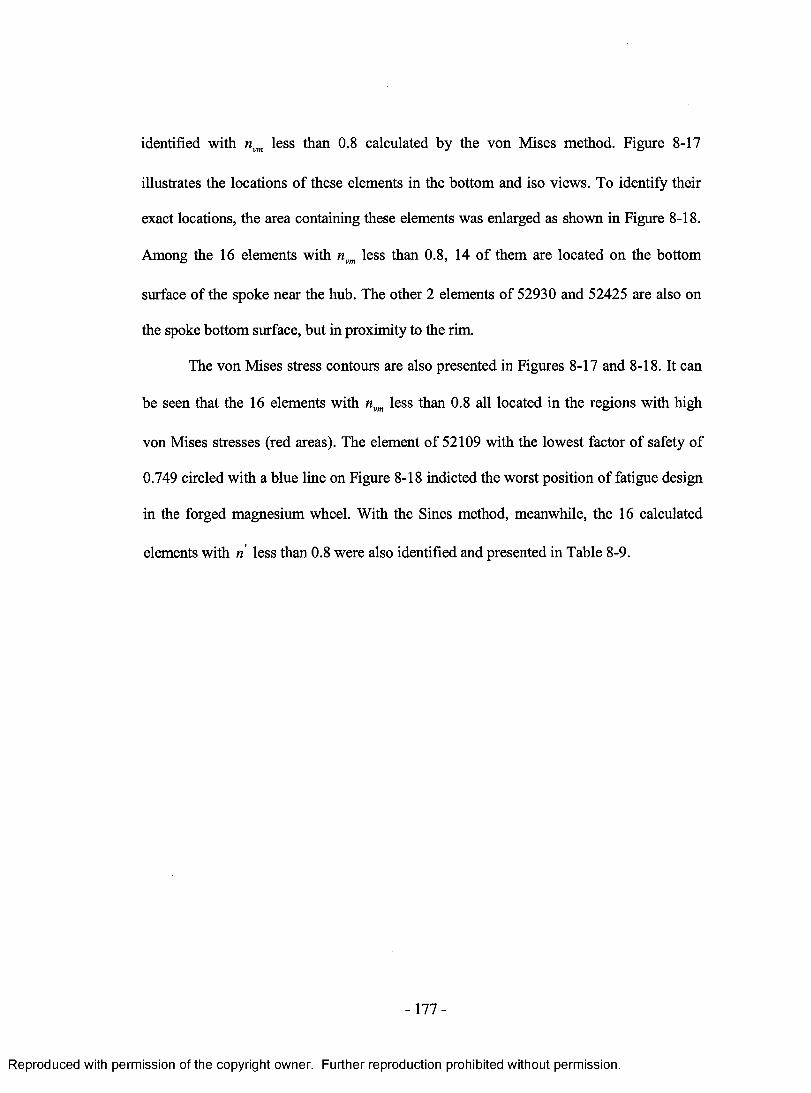
identified with nvm less than 0.8 calculated by the von Mises method. Figure 8-17
illustrates the locations of these elements in the bottom and iso views. To identify their
exact locations, the area containing these elements was enlarged as shown in Figure 8-18.
Among the 16 elements with nvm less than 0.8, 14 of them are located on the bottom
surface of the spoke near the hub. The other 2 elements of 52930 and 52425 are also on
the spoke bottom surface, but in proximity to the rim.
The von Mises stress contours are also presented in Figures 8-17 and 8-18. It can
be seen that the 16 elements with nvm less than 0.8 all located in the regions with high
von Mises stresses (red areas). The element of 52109 with the lowest factor of safety of
0.749 circled with a blue line on Figure 8-18 indicted the worst position of fatigue design
in the forged magnesium wheel. With the Sines method, meanwhile, the 16 calculated
elements with n less than 0.8 were also identified and presented in Table 8-9.
-177 -
Reproduced with permission of the copyright owner. Further reproduction prohibited without permission.
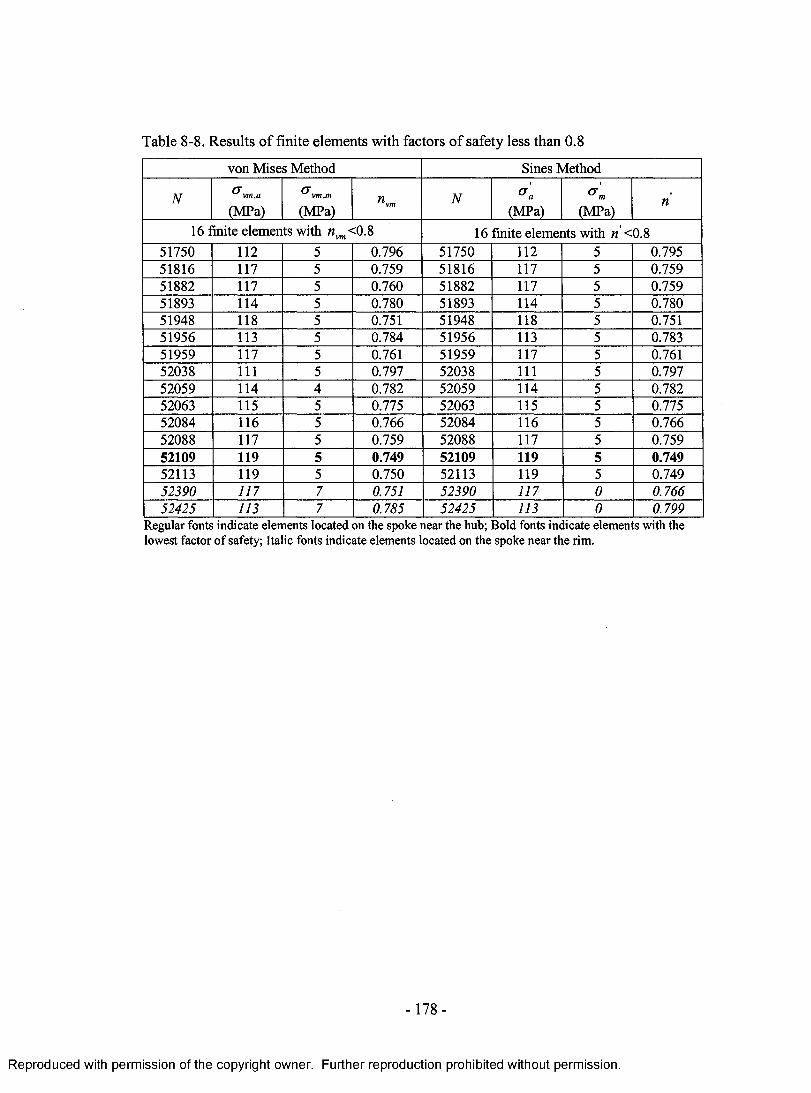
Table 8-8. Results of finite elements with factors of safety less than 0.8
von Mises Method Sines Method
N a vm ,a
(MPa)a vm,m
(MPa) »vm N ° ' a
(MPa) (MPa)n
16 finite elements with n, <0.8vm 16 finite elements with n <0.851750 112 5 0.796 51750 112 5 0.79551816 117 5 0.759 51816 117 5 0.75951882 117 5 0.760 51882 117 5 0.75951893 114 5 0.780 51893 114 5 0.78051948 118 5 0.751 51948 118 5 0.75151956 113 5 0.784 51956 113 5 0.78351959 117 5 0.761 51959 117 5 0.76152038 111 5 0.797 52038 111 5 0.79752059 114 4 0.782 52059 114 5 0.78252063 115 5 0.775 52063 115 5 0.77552084 116 5 0.766 52084 116 5 0.76652088 117 5 0.759 52088 117 5 0.75952109 119 5 0.749 52109 119 5 0.74952113 119 5 0.750 52113 119 5 0.74952390 117 7 0.751 52390 117 0 0.76652425 113 7 0.785 52425 113 0 0.799
Regular fonts indicate elements located on the spoke near the hub; Bold fonts indicate elements with the lowest factor of safety; Italic fonts indicate elements located on the spoke near the rim.
- 178 -
Reproduced with permission of the copyright owner. Further reproduction prohibited without permission.

von Mises Contour (MPa)
No result Max = 124 Min= 0
von Mises Contour (MPa)
No result Max = 124 Min = 0
b)Figure 8-17. Locations o f the elements on the wheel with nvm less than 0.8, a) bottom
view, and b) iso view.
- 179 -
Reproduced with permission of the copyright owner. Further reproduction prohibited without permission.
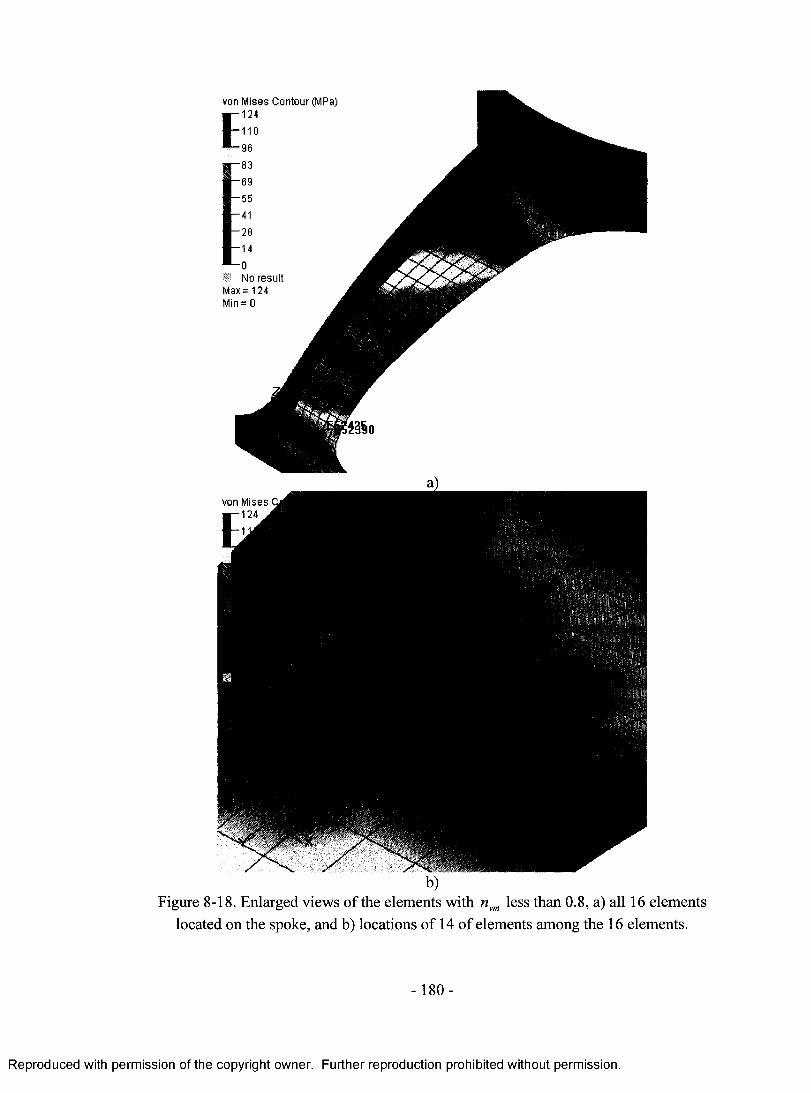
von Mises Contour (MPa) * —124
No result M ax= 124 M in= 0
von Mises Qm - m A
Figure 8-18. Enlarged views of the elements with nvm less than 0.8, a) all 16 elements located on the spoke, and b) locations o f 14 o f elements among the 16 elements.
- 180 -
Reproduced with permission of the copyright owner. Further reproduction prohibited without permission.
From Table 8-9, 31 elements with nvm values between 0.8 and 0.9 and 28
elements with n values between 0.8 and 0.9 calculated using the von Mises and Sines
methods were identified, respectively. Figure 8-19 a) illustrates the locations of all 47
elements with the nvm less than 0.9 (16 elements with nvm less than 0.8 and 31 elements
with nvm between 0.8 and 0.9) on the spoke, which were calculated by the von Mises
method. Among the 47 elements, 37 of them are located on the bottom surface of the
spoke near the hub, as shown in Figure 8-19 b), and 10 of them present in the area
adjacent to the rim on the bottom surface of the spoke as illustrated in Figure 8-19 c). It is
worthwhile mentioning that all the 47 elements with the nvm less than 0.9 are located in
the red colored region where the level of the von Mises stresses is relatively high. The
right column in Table 8-9 contains the fatigue analysis results obtained by using the Sines
method. 28 elements were identified with n values between 0.8 and 0.9, which have the
exact same element numbers and slightly varying values of the factors of safety
compared with the fatigue results obtained from the von Mises method.
To further assess the fatigue performance o f the wheel, finite elements with
factors of safety between 0.9 and 1.0 are also identified with both the von Mises and
Sines methods, and listed in Table 8-10. 69 finite elements with nvm in the range of 0.9 to
1.0 identified by the von Mises method were located in the spoke. Meanwhile, the Sines
method determines that there are 66 finite elements with n between 0.9 and 1.0 in the
spoke. The locations of all the identified elements are concentrated on the bottom spoke
surface near either the hub or the rim based upon the element number sequences. In total,
116 and 110 elements, occupied 1.9% and 1.8% of all selected elements calculated by the
-181 -
Reproduced with permission of the copyright owner. Further reproduction prohibited without permission.
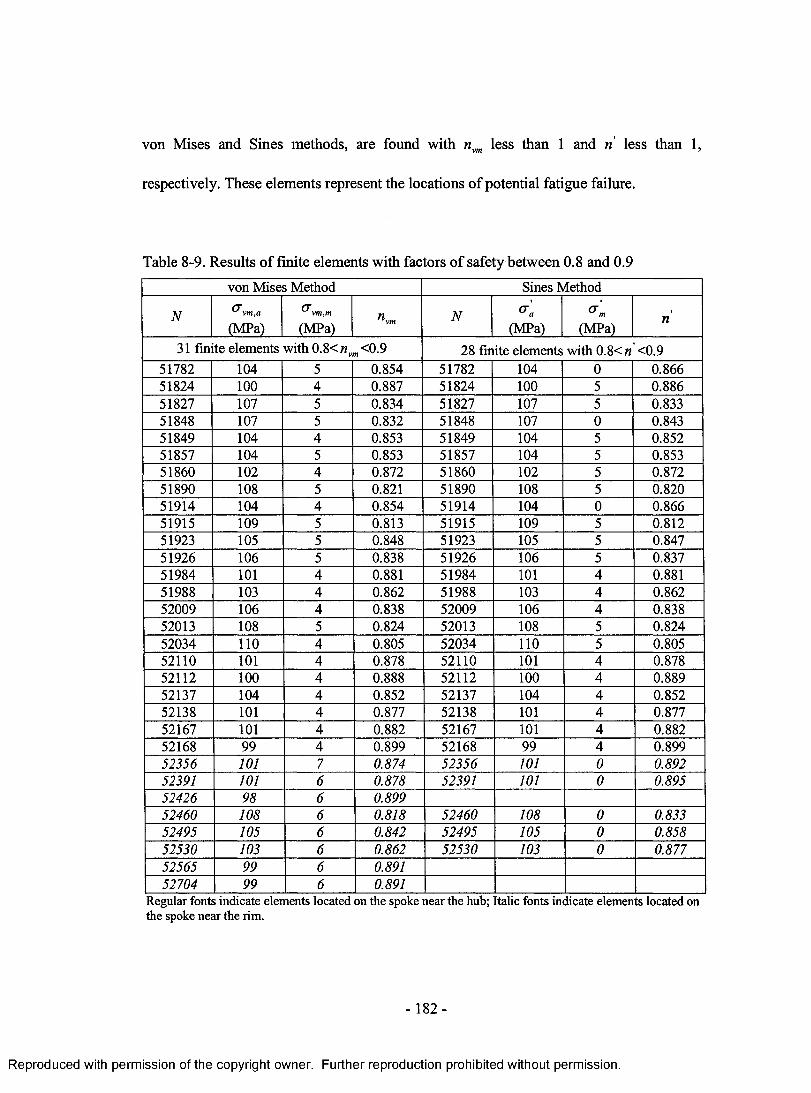
von Mises and Sines methods, are found with nvm less than 1 and n less than 1,
respectively. These elements represent the locations of potential fatigue failure.
Table 8-9. Results of finite elements with factors of safety between 0.8 and 0.9
von Mises Method Sines Method
N ®vm,a
(MPa)<jvm,m
(MPa) «vm N ° 'a
(MPa) (MPa)n
31 finite elements with 0.8<«vm<0.9 28 finite elements with 0.8<n <0.951782 104 5 0.854 51782 104 0 0.86651824 100 4 0.887 51824 100 5 0.88651827 107 5 0.834 51827 107 5 0.83351848 107 5 0.832 51848 107 0 0.84351849 104 4 0.853 51849 104 5 0.85251857 104 5 0.853 51857 104 5 0.85351860 102 4 0.872 51860 102 5 0.87251890 108 5 0.821 51890 108 5 0.82051914 104 4 0.854 51914 104 0 0.86651915 109 5 0.813 51915 109 5 0.81251923 105 5 0.848 51923 105 5 0.84751926 106 5 0.838 51926 106 5 0.83751984 101 4 0.881 51984 101 4 0.88151988 103 4 0.862 51988 103 4 0.86252009 106 4 0.838 52009 106 4 0.83852013 108 5 0.824 52013 108 5 0.82452034 110 4 0.805 52034 110 5 0.80552110 101 4 0.878 52110 101 4 0.87852112 100 4 0.888 52112 100 4 0.88952137 104 4 0.852 52137 104 4 0.85252138 101 4 0.877 52138 101 4 0.87752167 101 4 0.882 52167 101 4 0.88252168 99 4 0.899 52168 99 4 0.89952356 101 7 0.874 52356 101 0 0.89252391 101 6 0.878 52391 101 0 0.89552426 98 6 0.89952460 108 6 0.818 52460 108 0 0.83352495 105 6 0.842 52495 105 0 0.85852530 103 6 0.862 52530 103 0 0.87752565 99 6 0.89152704 99 6 0.891
Regular fonts indicate elements located on the spoke near the hub; Italic fonts indicate elements located onthe spoke near the rim.
- 182-
Reproduced with permission of the copyright owner. Further reproduction prohibited without permission.
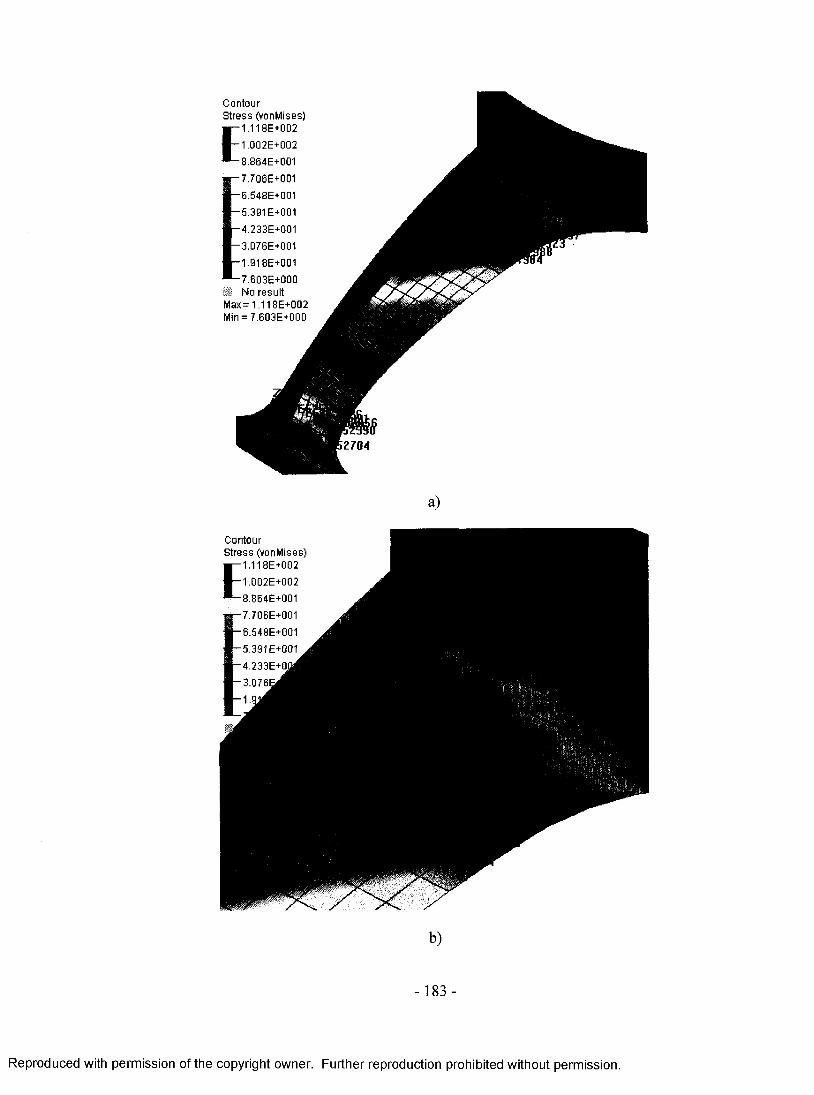
ContourStress (vonMises)
E1.118E+002
1.002E+002
8.864E+001
-7.706E+001
-6.548E+001
-5.391 E+001
-4.233E+001
-3.076E+001
-1 .9 1 8E+001
-7 .603E+000No result
Max = 1.118E+002 Min = 7.603E+000
a)
ContourStress (vonMises)
E1 .118E+002
1.002E+002
8.864E+001
* — 7.706E+001
■ — 6.548E+001
* - 5 . 3 9 1 E+001 * V - 4 .2 3 3 E + 0 M | - 3 . 0 7 6 ^ H
b)
- 183 -
Reproduced with permission of the copyright owner. Further reproduction prohibited without permission.

ContourStress (vonMises) « - 1 . 1 1 8 E + n n ^
c)
Figure 8-19. a) locations of 47 elements with nvm values less than 0.9 on the spoke, b)
and c) enlarged views showing 37 elements located in the area adjacent to the hub and 10
elements located close to the rim, respectively.
- 184 -
Reproduced with permission of the copyright owner. Further reproduction prohibited without permission.

Table 8-10. Results of finite elements with factors of safety between 0.9 and 1.0von Mises Method Sines Method
N a vm,a
(MPa)<7vm,m
(MPa) «vm N <*'a
(MPa)V m
(MPa)n
69 finite elements with 0.9< «, <1.0vtn 66 finite elements with 0.9<n <1.050746 92 6 0.954 50746 92 2 0.96750747 89 9 0.97850753 91 5 0.976 50753 91 3 0.98151415 92 8 0.949 51415 92 0 0.97351650 93 4 0.954 51650 93 0 0.96851684 91 4 0.978 51684 91 4 0.97751716 99 5 0.900 51716 99 0 0.91351717 89 4 0.994 51717 89 4 0.99251739 93 4 0.950 51739 93 0 0.96451751 93 4 0.956 51751 93 4 0.95551758 92 4 0.963 51758 92 5 0.96151761 94 4 0.940 51761 94 5 0.93851777 91 4 0.972 51777 91 0 0.98551783 97 4 0.912 51783 97 5 0.91051791 95 4 0.933 51791 95 4 0.93251794 95 4 0.933 51794 95 5 0.93351805 90 4 0.982 51805 90 0 0.99651817 95 4 0.936 51817 95 4 0.93651838 90 4 0.986 51838 90 0 1.00051843 95 4 0.939 51843 95 0 0.95251847 89 4 0.99551883 93 4 0.954 51883 93 4 0.95351892 90 4 0.984 51892 90 4 0.98351904 93 4 0.960 51904 93 0 0.97351909 97 4 0.919 51909 97 0 0.93151942 90 4 0.98751949 92 4 0.963 51949 92 4 0.96351958 90 4 0.983 51958 90 4 0.98251967 94 4 0.949 51967 94 0 0.96151969 98 4 0.908 51969 98 0 0.91951992 90 4 0.985 51992 90 0 0.99851994 95 4 0.939 51994 95 0 0.95252019 91 4 0.976 52019 91 0 0.98952035 92 4 0.964 52035 92 4 0.96452037 92 4 0.967 52037 92 4 0.96652060 95 4 0.932 52060 95 4 0.93252062 95 4 0.936 52062 95 4 0.93652064 91 4 0.975 52064 91 4 0.97552085 98 4 0.909 52085 98 4 0.90952087 97 4 0.912 52087 97 4 0.91252089 94 4 0.949 52089 94 4 0.94952114 96 4 0.926 52114 96 4 0.926
-185 -
Reproduced with permission of the copyright owner. Further reproduction prohibited without permission.
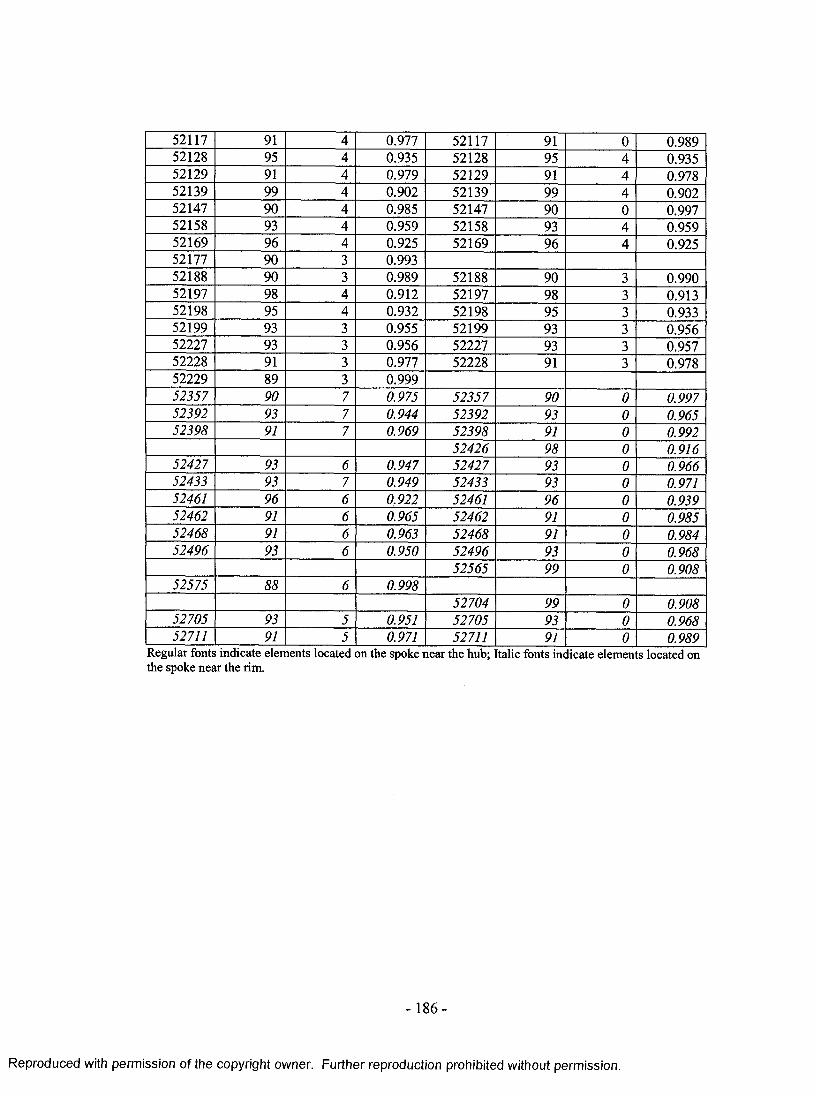
52117 91 4 0.977 52117 91 0 0.98952128 95 4 0.935 52128 95 4 0.93552129 91 4 0.979 52129 91 4 0.97852139 99 4 0.902 52139 99 4 0.90252147 90 4 0.985 52147 90 0 0.99752158 93 4 0.959 52158 93 4 0.95952169 96 4 0.925 52169 96 4 0.92552177 90 3 0.99352188 90 3 0.989 52188 90 3 0.99052197 98 4 0.912 52197 98 3 0.91352198 95 4 0.932 52198 95 3 0.93352199 93 3 0.955 52199 93 3 0.95652227 93 3 0.956 52227 93 3 0.95752228 91 3 0.977 52228 91 3 0.97852229 89 3 0.99952357 90 7 0.975 52357 90 0 0.99752392 93 7 0.944 52392 93 0 0.96552398 91 7 0.969 52398 91 0 0.992
52426 98 0 0.91652427 93 6 0.947 52427 93 0 0.96652433 93 7 0.949 52433 93 0 0.97152461 96 6 0.922 52461 96 0 0.93952462 91 6 0.965 52462 91 0 0.98552468 91 6 0.963 52468 91 0 0.98452496 93 6 0.950 52496 93 0 0.968
52565 99 0 0.90852575 88 6 0.998
52704 99 0 0.90852705 93 5 0.951 52705 93 0 0.96852711 91 5 0.971 52711 91 0 0.989
Regular fonts indicate elements located on the spoke near the hub; Italic fonts indicate elements located onthe spoke near the rim.
- 186 -
Reproduced with permission of the copyright owner. Further reproduction prohibited without permission.
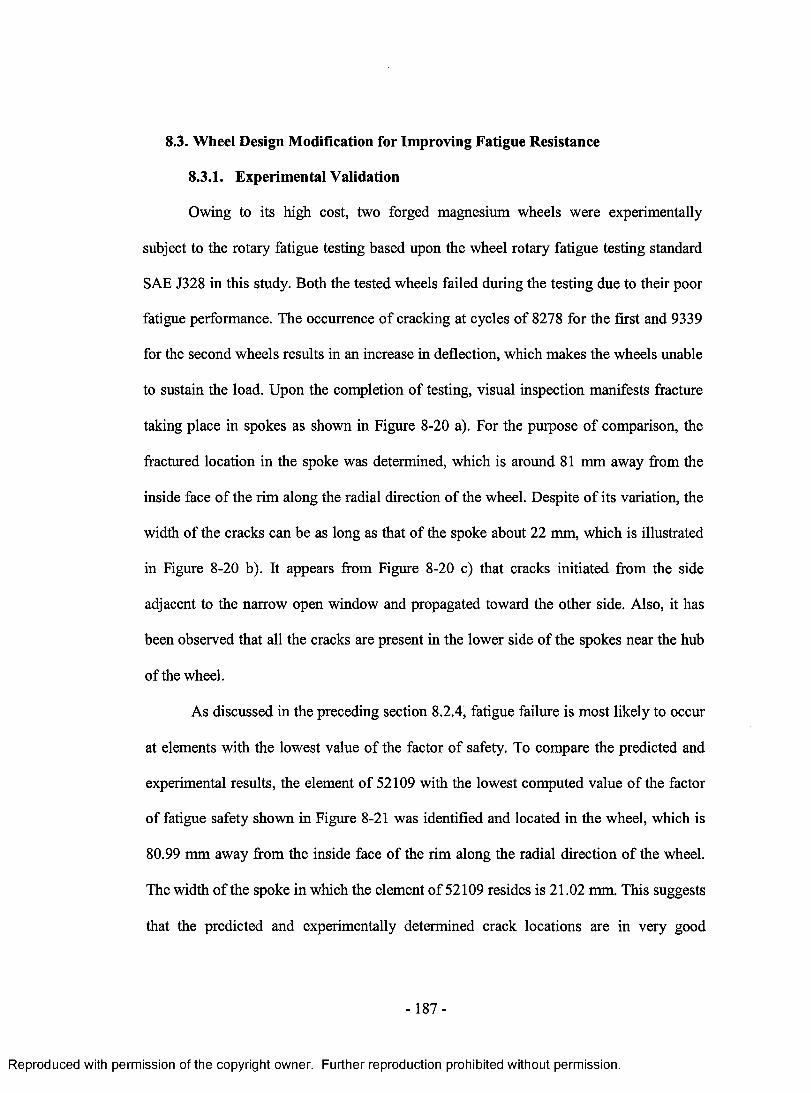
8.3. Wheel Design Modification for Improving Fatigue Resistance
8.3.1. Experimental Validation
Owing to its high cost, two forged magnesium wheels were experimentally
subject to the rotary fatigue testing based upon the wheel rotary fatigue testing standard
SAE J328 in this study. Both the tested wheels failed during the testing due to their poor
fatigue performance. The occurrence of cracking at cycles of 8278 for the first and 9339
for the second wheels results in an increase in deflection, which makes the wheels unable
to sustain the load. Upon the completion of testing, visual inspection manifests fracture
taking place in spokes as shown in Figure 8-20 a). For the purpose of comparison, the
fractured location in the spoke was determined, which is around 81 mm away from the
inside face of the rim along the radial direction of the wheel. Despite of its variation, the
width of the cracks can be as long as that of the spoke about 22 mm, which is illustrated
in Figure 8-20 b). It appears from Figure 8-20 c) that cracks initiated from the side
adjacent to the narrow open window and propagated toward the other side. Also, it has
been observed that all the cracks are present in the lower side o f the spokes near the hub
of the wheel.
As discussed in the preceding section 8.2.4, fatigue failure is most likely to occur
at elements with the lowest value of the factor of safety. To compare the predicted and
experimental results, the element of 52109 with the lowest computed value of the factor
of fatigue safety shown in Figure 8-21 was identified and located in the wheel, which is
80.99 mm away from the inside face of the rim along the radial direction of the wheel.
The width of the spoke in which the element of 52109 resides is 21.02 mm. This suggests
that the predicted and experimentally determined crack locations are in very good
-1 8 7 -
Reproduced with permission of the copyright owner. Further reproduction prohibited without permission.
agreement. However, the simulation and experimental results indicate that the current
version of the forged magnesium wheel must be re-designed in order to obtain its
significantly improved fatigue resistance.
- 188 -
Reproduced with permission of the copyright owner. Further reproduction prohibited without permission.
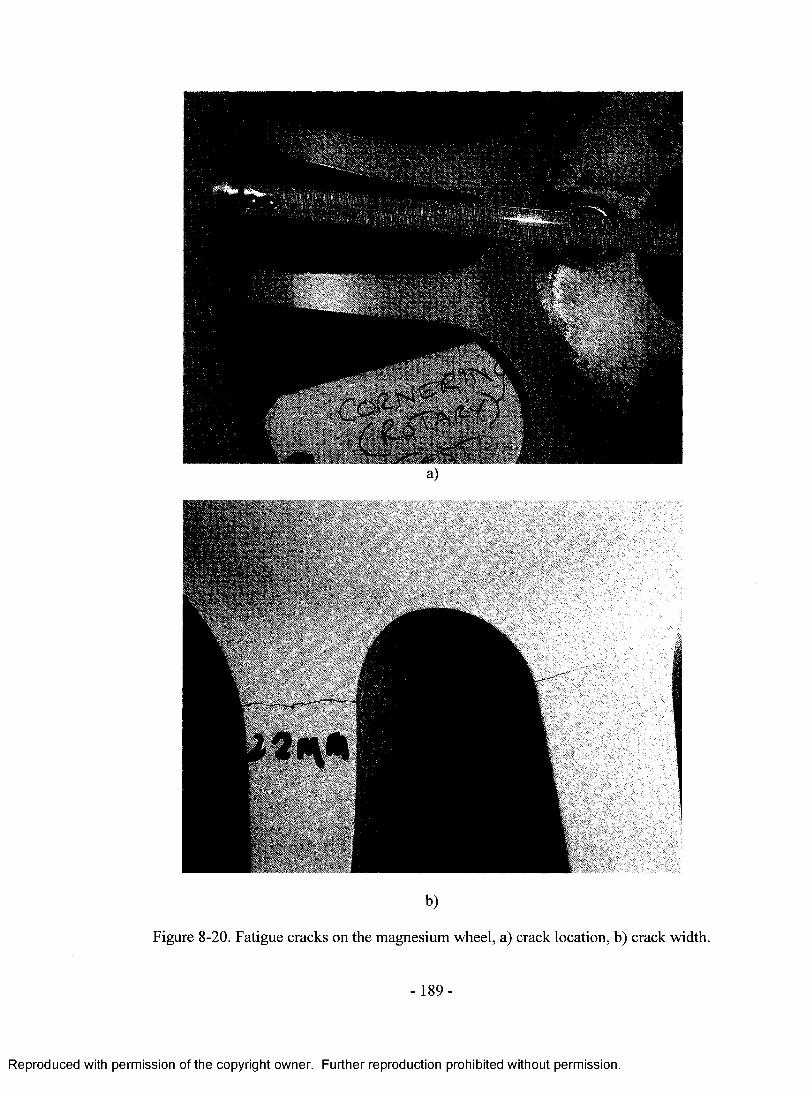
b)
Figure 8-20. Fatigue cracks on the magnesium wheel, a) crack location, b) crack width.
- 189 -
Reproduced with permission of the copyright owner. Further reproduction prohibited without permission.
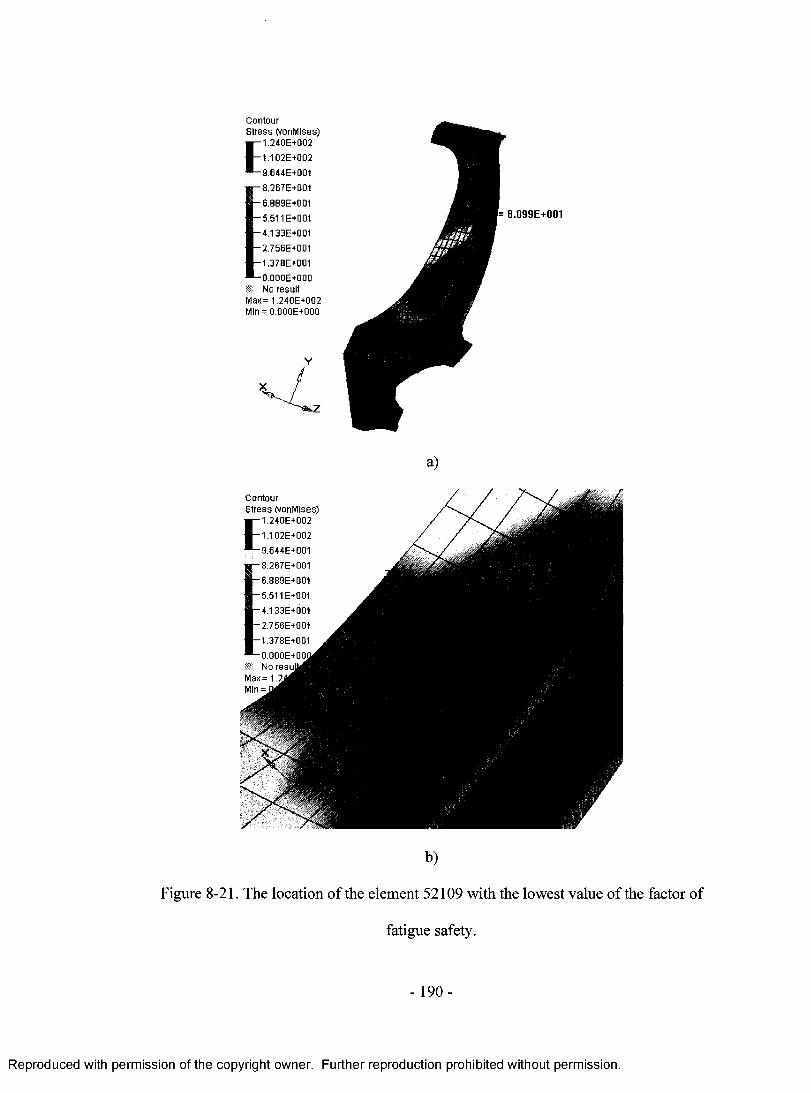
ContourStress (vonMises)
E1.240E+002
1.102E+002
9.644E+001
- 8.267E+Q01
- 6.889E+001
-5.511 E+001
-4.133E+001
-2.756E+001
-1.378E+001
-0.000E+000No result
Max = 1.240E+002 Min = O.OOOE+OOO
l= B.099E+001
a)
ContourStress (vonMises)
E1.240E+002
1.102E+002
9.644E+001
i8.267E+001
6.889E+001
5.511 E+001
4.133E+001
2.756E+001
1.378E+001
0 .0 0 0 E + 0 0 ^ SI No r e s u ^ ^ H Max= 1 .2 J ^ ^ ^ | Min =
b)
Figure 8-21. The location o f the element 52109 with the lowest value o f the factor of
fatigue safety.
- 190-
Reproduced with permission of the copyright owner. Further reproduction prohibited without permission.

8.3.2. Re-design and Re-modeling
Due to the high cost associated with retrofitting currently available tooling, it was
considered that the design modification of the magnesium wheel should be focused on
increasing its stiffness without a significant change in its style. Based on such a
consideration, it was decided that a cost effective redesign approach for improving
fatigue resistance was to increase the cross section thickness of the wheel without
changing the wheel geometry. Figure 8-22 illustrates the geometry model of the re
designed wheel. As shown in Figure 8-22 a), that the cross section thickness of the wheel
was increased by adding an extra layer of the same alloy in red color to the original
shape. Figures 8-22 b) and c) show that the cross section thicknesses of two specified
locations on the spoke and rim are increased to 35.93 and 5.72 mm from 24.82 and 3.73
mm, respectively. These are the maximum values of section thickness based upon the
original forging mould with minimum machining. Theoretically, the rotating inertia of
the wheel has improved by increasing the spoke thickness more significant than by
increasing the width of the spoke.
To demonstrate the effectiveness of the re-design on improving fatigue resistance,
a FE model of the re-designed magnesium wheel was also established and shown in
Figure 8-23 to simulate the rotary fatigue testing. The simulation was carried out with the
same boundary conditions and rotating bending moment as those employed in the
simulation of the original model.
-191 -
Reproduced with permission of the copyright owner. Further reproduction prohibited without permission.

Blue area is the wheel original shape
Red layer is the newly added material
The spoke thickness increases from 24.8 to 35.9 mm at the showing point
- 192-
Reproduced with permission of the copyright owner. Further reproduction prohibited without permission.

c)Figure 8-22. Geometry model of the re-designed magnesium wheel, a) overview,
enlarged spoke, and c) enlarged rim.
Figure 8-23. FE model o f the re-designed magnesium wheel.
-193 -
Reproduced with permission of the copyright owner. Further reproduction prohibited without permission.
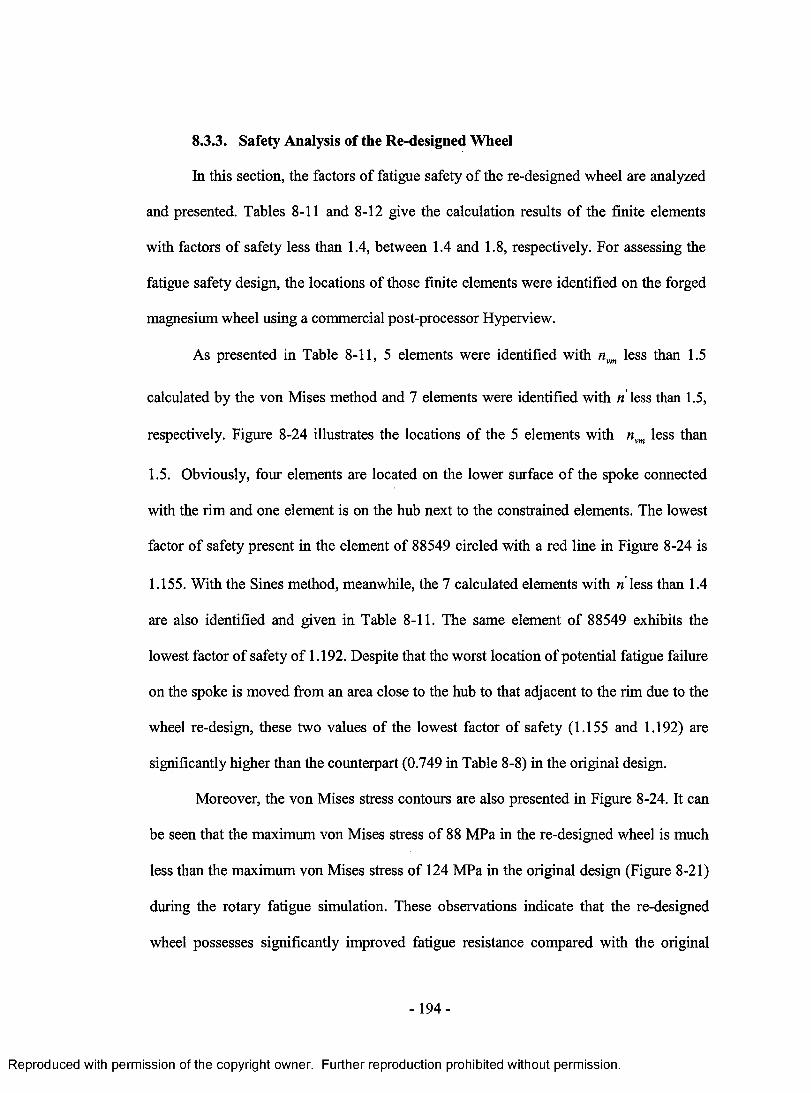
8.3.3. Safety Analysis of the Re-designed Wheel
In this section, the factors of fatigue safety of the re-designed wheel are analyzed
and presented. Tables 8-11 and 8-12 give the calculation results o f the finite elements
with factors of safety less than 1.4, between 1.4 and 1.8, respectively. For assessing the
fatigue safety design, the locations of those finite elements were identified on the forged
magnesium wheel using a commercial post-processor Hyperview.
As presented in Table 8-11, 5 elements were identified with nvm less than 1.5
calculated by the von Mises method and 7 elements were identified with n'less than 1.5,
respectively. Figure 8-24 illustrates the locations of the 5 elements with nvm less than
1.5. Obviously, four elements are located on the lower surface o f the spoke connected
with the rim and one element is on the hub next to the constrained elements. The lowest
factor of safety present in the element of 88549 circled with a red line in Figure 8-24 is
1.155. With the Sines method, meanwhile, the 7 calculated elements with w'less than 1.4
are also identified and given in Table 8-11. The same element of 88549 exhibits the
lowest factor of safety of 1.192. Despite that the worst location of potential fatigue failure
on the spoke is moved from an area close to the hub to that adjacent to the rim due to the
wheel re-design, these two values of the lowest factor of safety (1.155 and 1.192) are
significantly higher than the counterpart (0.749 in Table 8-8) in the original design.
Moreover, the von Mises stress contours are also presented in Figure 8-24. It can
be seen that the maximum von Mises stress of 88 MPa in the re-designed wheel is much
less than the maximum von Mises stress of 124 MPa in the original design (Figure 8-21)
during the rotary fatigue simulation. These observations indicate that the re-designed
wheel possesses significantly improved fatigue resistance compared with the original
-194 -
Reproduced with permission of the copyright owner. Further reproduction prohibited without permission.
version of the design. However, it is certain that detailed experimental testing on the re
designed wheel must be conducted for the purpose of engineering verification prior t the
massive implementation of this specific automotive application.
From Table 8-12, elements with nvm and n values from 1.4 to 1.5,1.5 to 1.6, and
1.6 tol.8, were presented using either the von Mises or Sines methods, respectively. It is
defined that the 10 elements with the factor of safety from 1.4 to 1.5 are all located on the
low surface of the spoke and hub. Two of them with the number beginning of “930” are
on the hub beside to the constrained elements. Seven o f them with the number beginning
of “932” are located on the spoke near the hub. The last one definitely is close to the rim
side. Obviously, 3 elements with the factor of safety from 1.5 to 1.6 identified on the
spoke close to the rim have the same element numbers beginning o f “885” either
calculated by von Mises or Sines methods. Others are located on the low surface o f the
spoke near hub or on the hub near the constrained elements. To further assess the fatigue
performance of the modified wheel, finite elements with factors of safety between 1.6
and 1.8 were also identified with both the von Mises and Sines methods. The locations of
all the identified elements are concentrated on the low spoke surface near either the hub
or the rim based upon the element number sequences. In total, 79 and 80 elements,
occupied 0.92% and 0.93% of all selected elements calculated by the von Mises and
Sines methods, are found with nvm or n less than 1.8, respectively. These elements
represent the locations of potential fatigue damage.
-195 -
Reproduced with permission of the copyright owner. Further reproduction prohibited without permission.
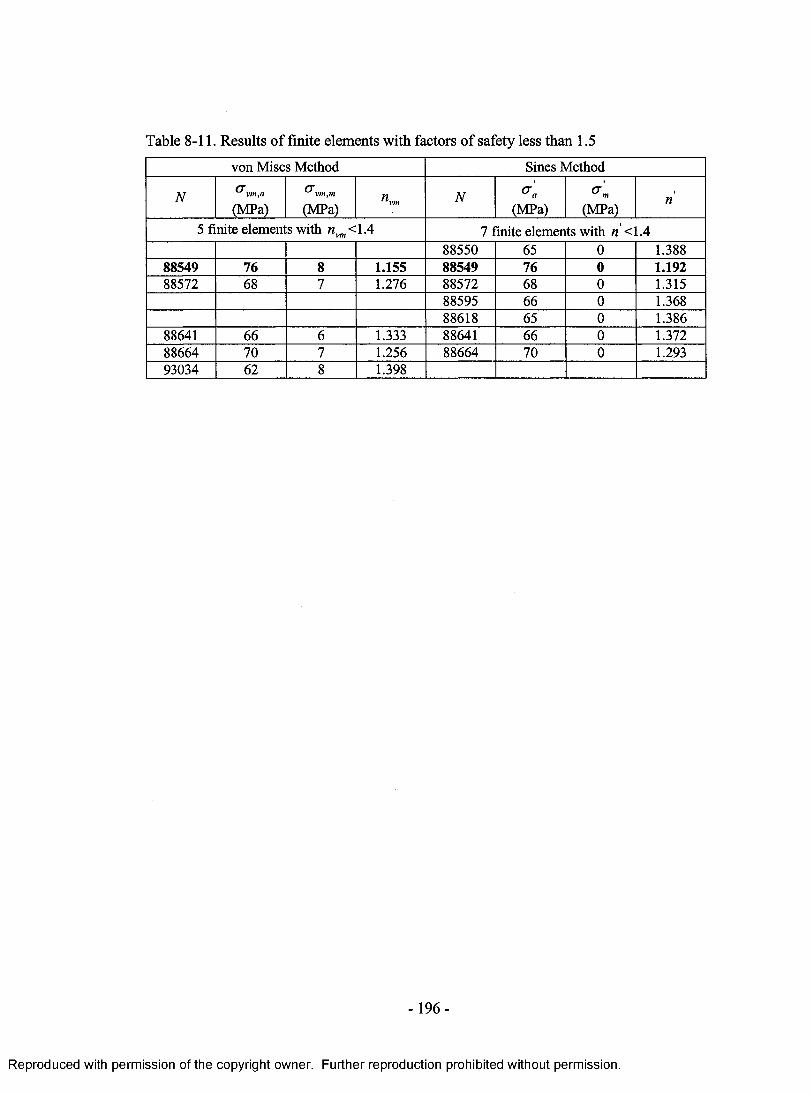
Table 8-11. Results of finite elements with factors of safety less than 1.5
von Mises Method Sines Method
N(MPa)
Ovm,m
(MPa) «vm N(MPa)
o'm(MPa)
n
5 finite elements with nvm<l.4 7 finite elements with n <1.488550 65 0 1.388
88549 76 8 1.155 88549 76 0 1.19288572 68 7 1.276 88572 68 0 1.315
88595 66 0 1.36888618 65 0 1.386
88641 66 6 1.333 88641 66 0 1.37288664 70 7 1.256 88664 70 0 1.29393034 62 8 1.398
-196 -
Reproduced with permission of the copyright owner. Further reproduction prohibited without permission.
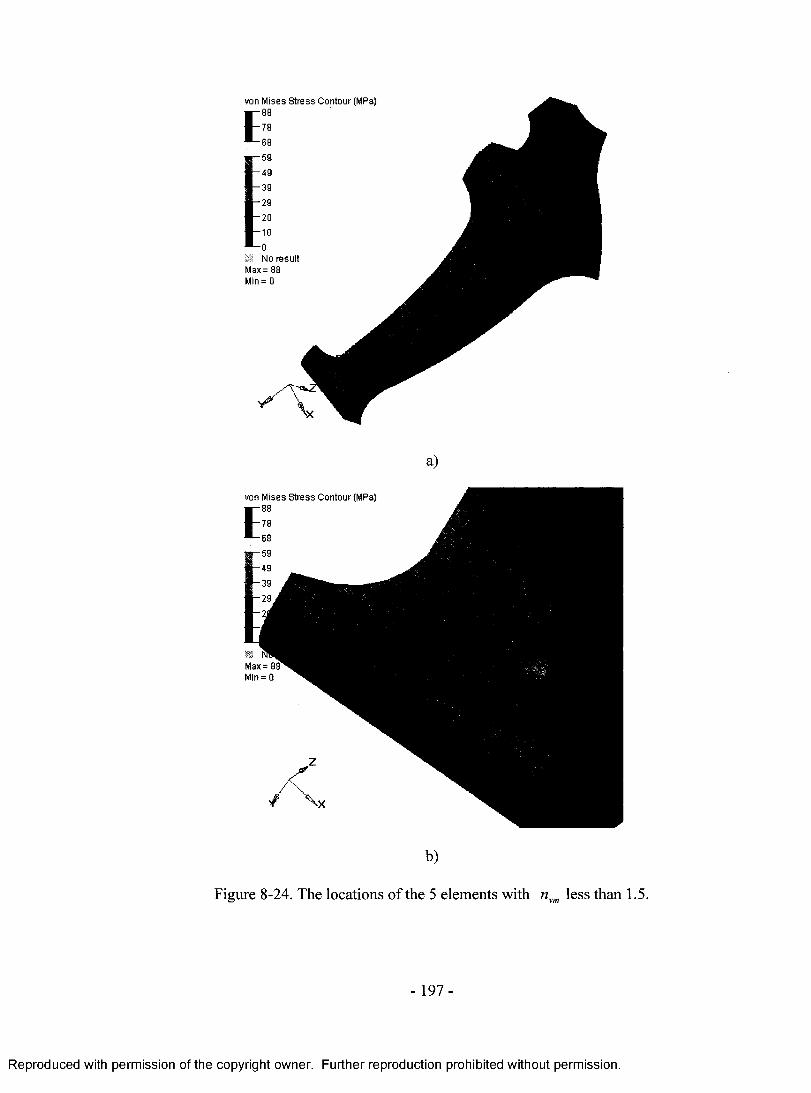
von Mises Stress Contour (MPa)
No result Max= 88 M n = 0
von Mises Stress Contour (MPa)
Figure 8-24. The locations o f the 5 elements with nvm less than 1.5.
- 197 -
Reproduced with permission of the copyright owner. Further reproduction prohibited without permission.
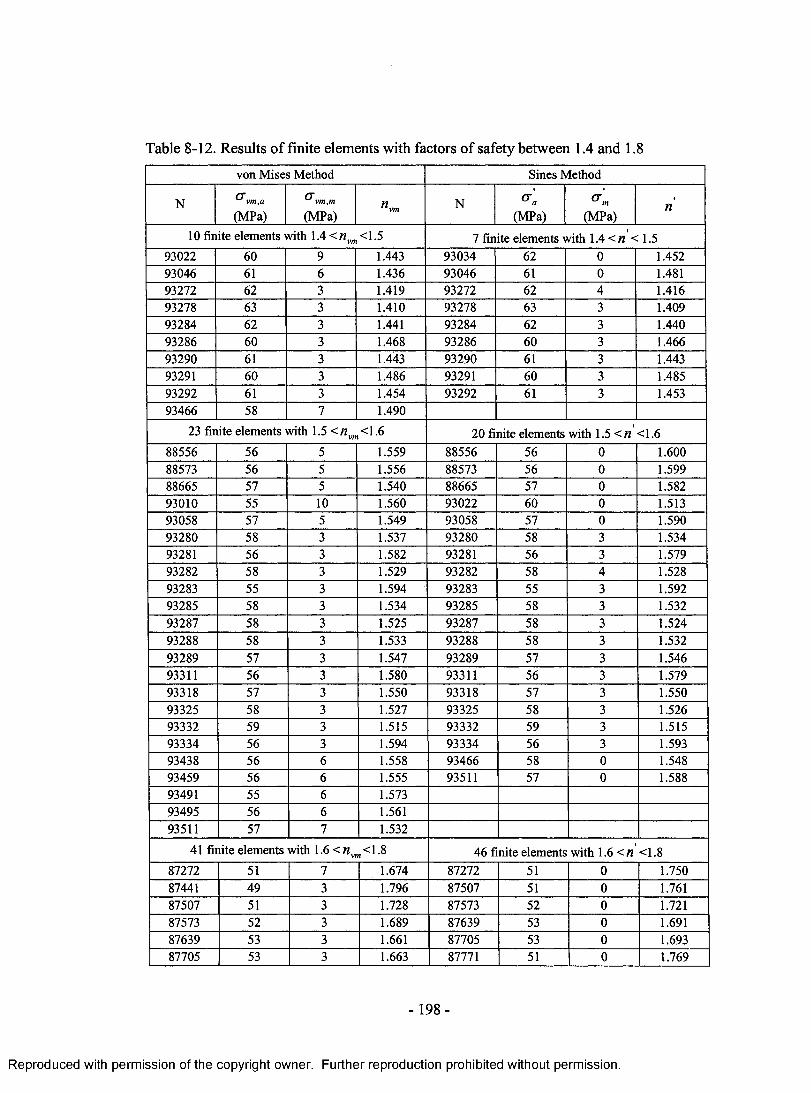
Table 8-12. Results of finite elements with factors of safety between 1.4 and 1.8
von Mises Method Sines Method
N<xvm ,a
(MPa)a vm,m
(MPa)N
(MPa) (MPa)n
10 finite elements with 1.4 < nvm <1.5 7 finite elements with 1.4 < n < 1.593022 60 9 1.443 93034 62 0 1.45293046 61 6 1.436 93046 61 0 1.48193272 62 3 1.419 93272 62 4 1.41693278 63 3 1.410 93278 63 3 1.40993284 62 3 1.441 93284 62 3 1.44093286 60 3 1.468 93286 60 3 1.46693290 61 3 1.443 93290 61 3 1.44393291 60 3 1.486 93291 60 3 1.48593292 61 3 1.454 93292 61 3 1.45393466 58 7 1.490
23 finite elements with 1.5 < « vm<1.6 20 finite elements with 1.5 < n <1.688556 56 5 1.559 88556 56 0 1.60088573 56 5 1.556 88573 56 0 1.59988665 57 5 1.540 88665 57 0 1.58293010 55 10 1.560 93022 60 0 1.51393058 57 5 1.549 93058 57 0 1.59093280 58 3 1.537 93280 58 3 1.53493281 56 3 1.582 93281 56 3 1.57993282 58 3 1.529 93282 58 4 1.52893283 55 3 1.594 93283 55 3 1.59293285 58 3 1.534 93285 58 3 1.53293287 58 3 1.525 93287 58 3 1.52493288 58 3 1.533 93288 58 3 1.53293289 57 3 1.547 93289 57 3 1.54693311 56 3 1.580 93311 56 3 1.57993318 57 3 1.550 93318 57 3 1.55093325 58 3 1.527 93325 58 3 1.52693332 59 3 1.515 93332 59 3 1.51593334 56 3 1.594 93334 56 3 1.59393438 56 6 1.558 93466 58 0 1.54893459 56 6 1.555 93511 57 0 1.58893491 55 6 1.57393495 56 6 1.56193511 57 7 1.532
41 finite elements with 1.6 < <1.8 46 finite elements with 1.6 <n <1.887272 51 7 1.674 87272 51 0 1.75087441 49 3 1.796 87507 51 0 1.76187507 51 3 1.728 87573 52 0 1.72187573 52 3 1.689 87639 53 0 1.69187639 53 3 1.661 87705 53 0 1.69387705 53 3 1.663 87771 51 0 1.769
-1 98 -
Reproduced with permission of the copyright owner. Further reproduction prohibited without permission.
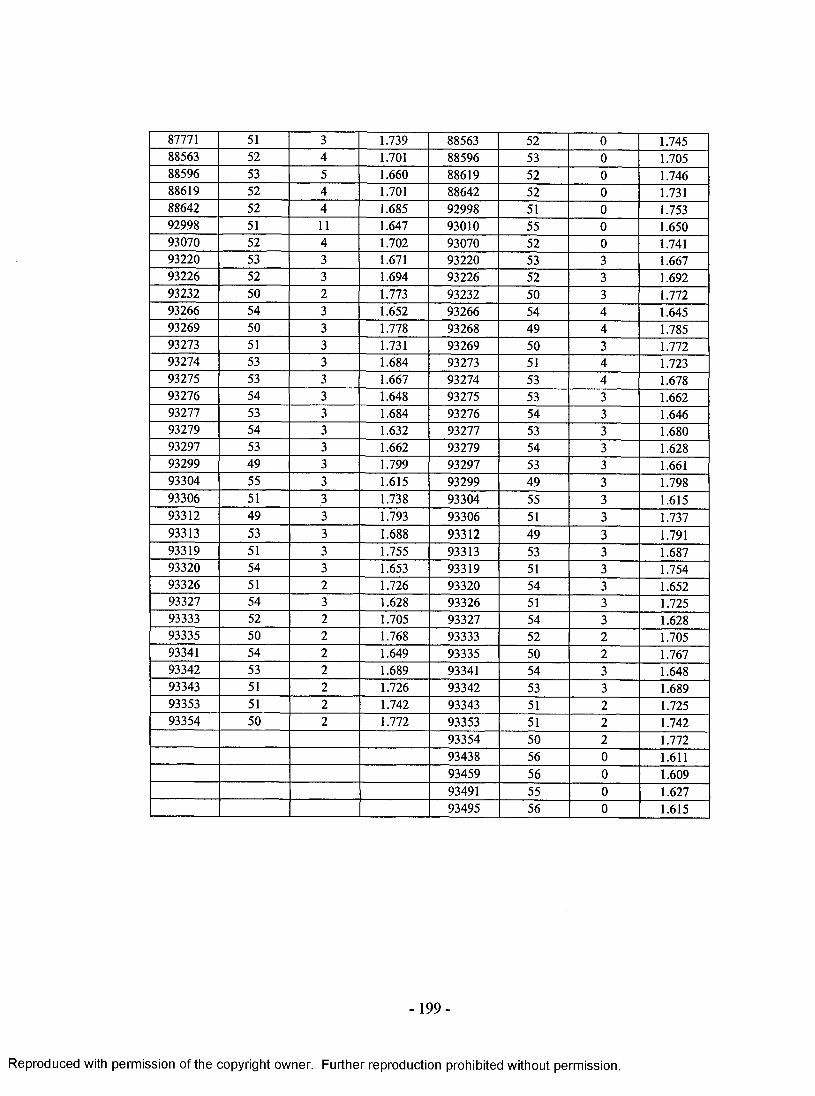
87771 51 3 1.739 88563 52 0 1.74588563 52 4 1.701 88596 53 0 1.70588596 53 5 1.660 88619 52 0 1.74688619 52 4 1.701 88642 52 0 1.73188642 52 4 1.685 92998 51 0 1.75392998 51 11 1.647 93010 55 0 1.65093070 52 4 1.702 93070 52 0 1.74193220 53 3 1.671 93220 53 3 1.66793226 52 3 1.694 93226 52 3 1.69293232 50 2 1.773 93232 50 3 1.77293266 54 3 1.652 93266 54 4 1.64593269 50 3 1.778 93268 49 4 1.78593273 51 3 1.731 93269 50 3 1.77293274 53 3 1.684 93273 51 4 1.72393275 53 3 1.667 93274 53 4 1.67893276 54 3 1.648 93275 53 3 1.66293277 53 3 1.684 93276 54 3 1.64693279 54 3 1.632 93277 53 3 1.68093297 53 3 1.662 93279 54 3 1.62893299 49 3 1.799 93297 53 3 1.66193304 55 3 1.615 93299 49 3 1.79893306 51 3 1.738 93304 55 3 1.61593312 49 3 1.793 93306 51 3 1.73793313 53 3 1.688 93312 49 3 1.79193319 51 3 1.755 93313 53 3 1.68793320 54 3 1.653 93319 51 3 1.75493326 51 2 1.726 93320 54 3 1.65293327 54 3 1.628 93326 51 3 1.72593333 52 2 1.705 93327 54 3 1.62893335 50 2 1.768 93333 52 2 1.70593341 54 2 1.649 93335 50 2 1.76793342 53 2 1.689 93341 54 3 1.64893343 51 2 1.726 93342 53 3 1.68993353 51 2 1.742 93343 51 2 1.72593354 50 2 1.772 93353 51 2 1.742
93354 50 2 1.77293438 56 0 1.61193459 56 0 1.60993491 55 0 1.62793495 56 0 1.615
-199 -
Reproduced with permission of the copyright owner. Further reproduction prohibited without permission.
Chapter 9
CONCLUSIONS AND RECOMMENDATIONS
9.1. Wheel Impact Testing 201
9.2. Wheel Cornering Fatigue Testing 202
9.3. Recommendations for Future Work 204
- 200 -
Reproduced with permission of the copyright owner. Further reproduction prohibited without permission.
9. Conclusions and Recommendations
9.1. Wheel Impact Testing
The material inhomogeneity and impact performance o f the cast aluminum and
forged magnesium wheels, studied experimentally, have provided specific material
properties corresponding to various regions of the wheel. These properties have been
used for numerical modeling and an assessment of plastic deformation verifying the
numerical results. Incorporating material inhomogeneity within the numerical model of
the wheel, couple with a simplified numerical approach for investigating wheel, impact
has enhanced and shortened the analysis o f wheels subjected to impact loading.
Conclusions arising from the experimental and numerical research include the following:
1) The microstructures of various regions of the cast aluminum wheel exhibit columnar
dendrites with differences in the DAS. The eutectic silicon phases are finely
distributed in the rim region while those in the hub and spoke regions are coarsely
distributed. The differences in tensile properties of various regions of the wheel are a
result of the microstructure inhomogeneity. The anisotropic microstructure of forged
magnesium wheels appears to be due to non-uniform plastic deformation in the wheel
geometry during the forging process. The yield and ultimate tensile strengths of
forged magnesium wheels are almost the same in different regions. However, the
material ductility varies between different regions associated with non-uniform
plastic forging processes.
2) The von Mises stress and effective plastic strain distributions in the FE model of the
wheel and tire assembly was almost identical to the simplified approach with an
-201 -
Reproduced with permission of the copyright owner. Further reproduction prohibited without permission.
initial striker velocity o f 1900 mm/s for cast aluminum and forged magnesium
wheels.
3) Plastic deformation simulated in the FE model for the wheel and tire assembly was in
very good agreement with experimental results. When employing the simplified
approach, 18.5% and 19.1% reductions in the initial kinetic energy of the striker
resulted in excellent agreement with the numerical and experimental results for cast
aluminum and forged magnesium wheels, respectively. As a result, a 20% percent
reduction of the initial kinetic energy of the striker is recommended to be used for FE
modeling o f road wheel impact testing when the tire model is absent.
4) For both the cast aluminum and forged magnesium wheels, the selection of impact
location on the wheel greatly influences the plastic strain distributions. Effective
plastic strains are concentrated largely in the spoke region when impact occurs on the
intersection of spoke and rim. Plastic strain distributions are more dispersed for
impact occurring at locations between the intersection of the spoke and rim.
9.2. Wheel Cornering Fatigue Testing
For the cast aluminum and forged magnesium wheels, the safety assessment for
fatigue failure have been completed on each finite element by the self-developed post
processor, based upon the Goodman fatigue criterion and employing the von Mises and
Sines methods for stress analysis. The following conclusions can be made based upon the
completed research:
- 202 -
Reproduced with permission of the copyright owner. Further reproduction prohibited without permission.
1) From stress-based finite element fatigue assessment of wheel cornering fatigue
testing, one element in the 1/7 portion of the cast aluminum wheel model has the
lowest factor of safety, equal to 1.50 and 1.53 calculated using the von Mises and
Sines methods, respectively. Meanwhile, one element in the 1/10 portion of the
forged magnesium wheel model exhibits the lowest factor o f safety, equal to 0.75
calculated either using the von Mises or Sines methods.
2) 62 finite elements with nvm less than 1.8 occupying 0.6% of the 1/7 portion of the
cast aluminum wheel model have been identified on the upper surface of the spokes
near the notched region and close to the hub. The low factors of safety of the
elements far away from the constrained elements at the center of the hub are induced
by geometry stress concentration. Meanwhile, 116 and 110 finite elements, occupied
1.9% and 1.8% of the 1/10 portion of the forged magnesium wheel model calculated
by the von Mises and Sines methods, are found with nvm less than 1 and n less than
1, respectively. These elements represent the locations of potential fatigue failure.
3) Comparison between the von Mises and Sines methods indicates that a good
agreement is reached for identifying the locations of the finite elements with low
factors of fatigue safety. For both the cast aluminum and forged magnesium wheel
models, however, the actual values of the safety factor determined by the von Mises
method are slightly different from those predicted by the Sines method.
4) Numerical simulation indicates that a design modification, consisting of an increase
in sectional thickness while maintaining the wheel style, significantly improve the
wheel fatigue resistance. The lowest factor of fatigue safety increases from 0.75 in the
original design to 1.155 in the re-designed model.
-203 -
Reproduced with permission of the copyright owner. Further reproduction prohibited without permission.

9.3. Recommendations for Future Work
Based upon the results and discussion of wheel impact and cornering fatigue
testing, further experimental and numerical research work should focus on the following:
1) Experimental study of wheel impact and cornering fatigue testing using a high-speed
camera recorder and stress-strain computer data acquisition to analyze the transient
performance during testing.
2) Geometry optimization o f the forged magnesium wheels to improve fatigue resistance
using numerical analysis method with experimental validation, and maximize weight
reduction.
3) Development of an elastic-plastic material model with fracture mechanism criterion
to directly predict crack initiation, growth and fracture during wheel impact testing,
also the development of the post-processor for fatigue analysis with graphic functions,
which can directly find and show the locations with selected factors of fatigue safety.
-2 04 -
Reproduced with permission of the copyright owner. Further reproduction prohibited without permission.
Chapter 10
CLAIMS TO ORIGINALITY
Aspects of this work constitute, in the author’s opinion, new and distinct
contributions to the technical knowledge in the public domain. These include:
1. Establishment a finite element model of vehicle rubber tire and assembly for
lightweight road wheels, which is capable of simulating the real experimental
conditions o f wheel impact testing.
2. Identification at the relationship between the percentage o f kinetic energy reduction
prior to the striker impacting on the wheel and the wheel geometry deformation, and
determined that a 20 % kinetic energy reduction is appropriate to compensate for the
tire absence in a simplified numerical approach for wheel impact testing.
3. Completion a dynamic model of wheel cornering fatigue testing by applying a
rotating bending moment on the hub of the wheel and employing the explicit finite
element analysis, which has been verified by the comparison with the conventional
implicit finite element approach.
4. Development of a post-processor of stress-based fatigue analysis based upon the
multiaxial Goodman fatigue failure criterion using a Java language program. It has
the capability to compute the factors of fatigue safety for every finite element in the
wheel cornering fatigue model using both von Mises and Sines methods. Additionally,
it assesses the wheel fatigue performance.
5. Suggestion of a redesign for a forged magnesium wheel to improve the rotary fatigue
performance.
205-
Reproduced with permission of the copyright owner. Further reproduction prohibited without permission.
REFERENCES
1. J. W. Mcauley, Global Sustainability and Key Needs in Future Automotive
Design, Environmental Science & Technology, Vol. 37, No. 23, 2003, p 169-172.
2. T. S. Saitoh, A. Hoshi, D. Ando, K., Kurata, and N. Yamada, Energy-efficient
Vehicle to Reduce Urban Warming, Air Pollution and CO2 Emissions in Urban
Areas, Proceedings o f the International Conference on Urban Transport and the
Environment for the 21st Century, 1998, p 521-530.
3. G. J. Huebner and D. J. Gasser, Energy and the Automobile - General Factors
Affecting Vehicle Fuel Consumption, SAE Special Publications, SP-383 730518,
Jul 1993, p 25-29.
4. P. N. Leiby and J. Rubin, Transitions in Light-duty Vehicle Transportation:
Alternative-fuel and Hybrid Vehicles and Learning, Transportation Research
Record, No.1842 03-3901, 2003, pl27-134.
5. C. Difiglio and L. Fulton, How to Reduce US Automobile Greenhouse Gas
Emissions, Energy (Oxford), Vol. 25, No. 7, 2000, p 657-673.
6. R. M. Shrestha and G. R. Timilsina, The Additionality Criterion for Identifying
Clean Development Mechanism Projects under the Kyoto Protocol, Energy Policy,
Vol. 30, No. 1,2002, p 73-79.
7. M. Glover, Hybrids and Fuel Cells High on Ford's Agenda, Automotive Engineer,
Vol. 29, No. 5, 2004, p 8-9.
-206
Reproduced with permission of the copyright owner. Further reproduction prohibited without permission.
8. G. S. Cole and A. M. Sherman, Lightweight Materials for Automobile
Applications, Microstractural Characterization o f Lightweight Structural
Materials for Transportation, Vol. 35, No. 1, 1995, p 3-9.
9. Alcan automotive website news, New Alcan Automotive Strategy Focuses on
Global, http://www.alcanautomotive.com/press7_17_01.html, accessed date, July
17, 2001.
10. E. J. DeRidder, Commercial Uses o f Magnesium in Germany, Modem Metals,
Vol. 6, NO. 5, 1980, p 21-23.
11. H. Friedrich and S. Schumann, Strategies for Overcoming Technological Barriers
to the Increased Use o f Magnesium in Cars, Transactions o f the Institution of
Mining and Metallurgy, Section C: Mineral Processing and Extractive Metallurgy,
Vol. I l l , August 2002, p 65-71.
12. B. P. Powell, Magnesium Alloys Cast into Auto Powertrain Components,
Advanced Materials and Processes, Vol. 162, No. 8, August 2004, p 60-61.
13. E. E. Tuttle, Evolution o f the Passenger Car Wheel, SAE Preprints, September
1980, pl0-13.
14. B. Fedelich, F. U. Mathiak and W. Deisenroth, Low Pressure Die Casting
Simulation o f a Wheel - Comparison with Experiment, Proceedings o f the
International Conference on Numerical Methods in Industrial Forming
Processes, June 1992, p 799-782.
-2 0 7 -
Reproduced with permission of the copyright owner. Further reproduction prohibited without permission.
15. K. Tsumura, N. Ueki and N. Nemoto, Development o f One Piece Forged
Aluminum Wheels for Passenger Cars, Sumitomo Metals (Japanese), Vol. 43, No.
5, August 1991, p 72-81.
16. M. Fujita, N. Sakate, S. Hirahara and Y. Yamamoto, Development o f Magnesium
Forged Road Wheel, JSAE Review, Vol. 16, No.3, 1995, p 299-301.
17. K. Arai and R. Iijima, Shortening Design and Trial Term for Aluminum Road
Wheel by CAE, Casting Technology (Japanese), No. 74, 2002, p 533-538.
18. X. Jiang, F. Sun and M. Zheng, Nonlinear Finite Element Mechanical Analysis of
Road Wheel and Its Modeling, Binggong Xuebao (Chinese), Vol. 21, No. 3, 2000,
p 241-244.
19. M. Riesner and R. DeVries, Finite Element Analysis and Structural Optimization
o f Vehicle Wheels, SAE Technical Paper Series 830133, 1983.
20. R. Wimmer and J. Petersen, Road Stress Resistance and Lightweight Construction
of Automobile Road Wheels, SAE Preprints, No. 790713, 11, 1979.
21. P. Reipert, Optimization of an Extremely Light Cast Aluminum Wheel Rim,
International Journal of Vehicle Design, Vol. 6, No. 4-5, 1985, p 509-513.
22. R & S Racing Inc, Wheel Technical Information, http://www.rsracing.com/tech-
wheel.html, accessed date Mar 20, 2003.
23. Robert Bosch GmbH, Automotive Handbook, Warrendale, PA., Society of
Automotive Engineers, 2000.
-2 0 8 -
Reproduced with permission of the copyright owner. Further reproduction prohibited without permission.
24. C. Schroeder and S. Chung, Influence of Tire Characteristic Properties on the
Vehicle Lateral Transient Response, Tire Science & Technology, Vol.. 23, No. 2,
1995, p 72-95.
25. Y. Zhang and C. Hazard, Effects o f Tire Properties and Their Interaction with the
Ground and Suspension on Vehicle Dynamic Behaviour - a Finite Element
Approach, Tire Science and Technology, Vol. 27, No. 4, 1999, p 227-249.
26. L. Segel, Tire as a Vehicle Component, American Society o f Mechanical
Engineers, Applied Mechanics Division, AMD, Vol.15, 1975, p 41-6.
27. M. Wutz, Tendencies towards a More Lightweight Approach to Vehicle
Construction, Schweissen und Schneiden, Vol. 37, No. 11, 1985, p 195-196.
28. C. D. Rudd, Current Trends in North American Lightweight Vehicle
Manufactures, Materials Technology, Vol. 15, No. 4, 2000, p 255-265.
29. D. L. Kerr, Chronology o f Forged Aluminum Wheel Development at Alcoa, SAE
Technical Paper Series, 830018, 1983.
30. F. Kaeumle, C. N. Toemmeraas and J. A. Bolstad, Second Generation Magnesium
Road Wheel, SAE Technical Paper Series, 850420, 1985.
31. Y. R. Sheng and D. Argo, Filling and Solidification Modeling o f Noranda's
Magnesium Wheel Casting Process, TMS Annual Meeting, 2000, p 123-131.
32. S. R. Agnew, Wrought Magnesium: A 21st Century Outlook, JOM, Vol. 56, No.
5, 2004, p 20-21.
-209
Reproduced with permission of the copyright owner. Further reproduction prohibited without permission.

33. D. J. Allen and J. D. Hunt, Solidification and Casting o f Metals, Sheffield
Conference, Metals Society, 1977, p 39-43.
34. A. M. Sabroff, F. W. Boulger, H. J. Henning and J. W. Spretnak, Fundamentals of
Forging Practice, Supplement to Technical Documentary Report, No ML-TDR-
64-95, Battelle Memorial Institure, Columbus, OH, March 1965.
35. T. Altan, F. W. Boulger, J. W. Becker, N. Akgerman and H. J. Henning, Forging
Equipment, Materials, and Practices, MCIC-HB-03, Metals and Ceramics
Information Center, Columbus, OH, 1973.
36. D. M. Smith, Development in Cast Aluminum Alloys for Wheels, Metals
Australasia, Vol. 16, No. 2, 1984, p 4-6.
37. G. Vruk, Casting under Low Pressure as an Optimum Technology not only for
Wheel Disks (Language: Russian), Litejnoe Proizvodstvo, No. 9, March 2003,
p 33.
38. T. Ito, T. Takikita and I. Miki, Wheels and Other Automotive Parts through the
Pore-free Die Casting Process, SAE Technical Paper Series 910552, 1991, p 10.
39. G. Betz, H. Fuchs and N. Zeumer, New Technologies in the Casting of
Magnesium, Metall., Vol. 42, No. 7, 1988, p 677-681.
40. R. E. Brown, Magnesium Wrought and Fabricated Products Yesterday, Today,
and Tomorrow, TMS Annual Meeting, 2002, p i 55-163.
- 2 1 0 -
Reproduced with permission of the copyright owner. Further reproduction prohibited without permission.
41. A. Asari, S. Matsumoto and T. Dosai, Production Line for One-piece Aluminum
Forged Wheel with Spinning Process, Inst o f Metals, 1986, p 565-577.
42. S. Dhar, Fracture Analysis o f Wheel Hub Fabricated from Pressure Die Cast
Aluminum Alloy, Theor Appl Fract Mech, Vol. 9, No. 1, 1988, p 45-53.
43. D. C. Wei, Mechanical Properties o f Various Cast Aluminum Wheels,
Transactions - SDCE International Die Casting Exposition & Congress Society of
Die Casting Engineer, G-T83-075, 1983, p 8-15.
44. N. L. Cupini, J. A. Galiza, M. H. Robert and P. S. Pontes, Solidification
Technology in the Foundry and Cast House, Metals Soc. Conf., 1998, p 65-69.
45. E. W. Miguelucci, The Aluminum Association Cast Alloy Test Program: Internal
Report, Transactions o f the American Foundry M en’s Society, Pittsburgh,
Pennsylvania, USA, Vol. 93, 1985, p 913-916.
46. C. F. Chan, M. S. Yong, C. J. Tay and H. M. Shang, The Influence o f Process
Parameters on Forged Magnesium Alloys, Materials Science Forum, Vol. 437-
438, 2003, p 427-430.
47. M. Riesner, M. P. Zebrowski and R. J. Gavalier, Computer Simulation o f Wheel
Impact Test, Proceedings - Society o f Automotive Engineers, 1986, p 269-275.
48. U. Kocabicak and M. Firat, Numerical Analysis o f Wheel Cornering Fatigue
Tests, Engineering Failure Analysis, Vol. 8, No. 4, 2001, p 339-354.
-211 -
Reproduced with permission of the copyright owner. Further reproduction prohibited without permission.
49. N. Dowling, Mechanical Behaviour o f Materials, Prentice-Hall, Englewood Cliffs,
New Jersey, 1993, p 347-352.
50. R. J. Roark and W. C. Young, Formulas for Stress and Strain, 6th Edition,
McGraw-Hill, New York, 1989, p i 50-156.
51. F.P. Beer and E.R. Johnston, Mechanics o f Materials, McGraw-Hill, Inc., New
York, 1981, p 322-330.
52. J. Collins, Failure o f Materials in Mechanical Design, 2nd Edition, J. Wiley &
Sons, New York, 1993, p 238-254.
53. J. Shigley and L. Mitchell, Mechanical Engineering Design, 4th Edition,
McGraw-Hill, New York, 1983, p 333-339.
54. F. S. Kelly, A General Fatigue Evaluation Method, Paper 79-PVP-77, ASME,
New York, 1979.
55. J. Smith, The Effect o f Range o f Stress on the Fatigue Strength o f Metals, Univ.
o f 111., Eng. Sta. Bull., 1942, p 334-338.
56. F. Ellyin and K. Golos, Multi-axial Fatigue Damage Criterion, Journal of
Engineering Materials and Technology, Vol. 110, 1988, p 63-68.
57. W. N. Findley, Modified Theories o f Fatigue Failure Under Combined Stress,
Proceeding o f the Society o f Experimental Analysis, Vol. 14, 1956, p 35- 46.
58. G. Sines, Failure o f Materials under Combined Repeated Stresses Superimposed
with Static Stresses, Technical Note 3495, NACA, 1955.
- 2 1 2 -
Reproduced with permission of the copyright owner. Further reproduction prohibited without permission.
59. O. Ural, Finite Element Method: Basic Concepts and Applications, New York,
Intext Educational Publishers, 1973.
60. C. S. Desai, Elementary Finite Element Method, Prentice Hall, 1979, p 89-96.
61. E. A. Liu, S. Ho, M. Winship, M. K. Wehrly and W. F. Resh, Computer Aided
Simulations in Manufacturing Applications, SAE Technical Paper Number; 2005-
01-0518, SAE 2005 World Congress & Exhibition, April 2005, Detroit, MI, USA.
62. C. J. Russo, The Design and Processing o f Cast Aluminum Wheels for Impact
Performance, SAE Technical Paper 2001-01-0749, Detroit, Michigan, Mar 2001.
63. B. Kao, M. Riesner and P. Surulinarayananami, Model Analysis o f a Tire and
Wheel and Its Application for Vehicle Ride Evaluation, SAE Technical Paper
Series, 860826, 1986.
64. G. E. Leese and R. L. Mullin, Role o f Fatigue Analysis in the Vehicle Test
Simulation Laboratory, SAE Technical Paper Series, 910166, 1991, p 12-19.
65. H. M. Karandikar and W. Fuchs, Fatigue Life Prediction for Wheels by
Simulation o f the Rotating Bending Test, SAE Technical Paper Series, 900147,
1990, p 11-23.
66. American Society o f Testing Material, Standard Specification for Aluminum-
Alloy Die Castings, Designation: B85-03, Annual Book o f ASTM Standards,
Philadelphia, PA, USA, 1994.
-213 -
Reproduced with permission of the copyright owner. Further reproduction prohibited without permission.
67. W. Zheng, X. Sun, P. Li, D. Zeng and L. B. Ber, Effect o f Heat Treatment on
Microstructure and Mechanical Properties o f MA2-1 Alloy Sheet, Material
Science Forum, Vol. 488-489, March 2005, p 151-154.
68. American Society o f Testing Materials, Standard Specification for Magnesium
Alloy Forgings, Designation: B91-97, Annual Book o f ASTM Standards,
Philadelphia, PA, USA, 2001.
69. American Society o f Testing Materials, Standard Practice for Preparation of
Metallographic Specimens, Designation: E3-01, Annual Book o f ASTM
Standards, Philadelphia, PA, USA, 1994.
70. American Society o f Testing Materials, Standard Test Method for Density of
High-Modulus Fibers, Designation: D3 800-99, Annual Book o f ASTM Standards,
Philadelphia, PA, USA, 2004.
71. American Society o f Testing Materials, Standard Test Methods of Tension
Testing Wrought and Cast Aluminum and Magnesium Alloy Products [Metric],
Designation: B557M-94, Annual Book o f ASTM Standards, Philadelphia, PA,
USA, 1994.
72. G. E. Dieter, Mechanical Behaviour o f Materials under Tension, Mechanical
Metallurgy, 2nd Edition, McGraw-Hill, New York, 1976, p 329-348.
73. R. R. Moore, Some Fatigue Tests on Non-ferrous Metals, American Society for
Testing Materials — Preprints, No. 22, 1925, p 18-25.
-2 1 4 -
Reproduced with permission of the copyright owner. Further reproduction prohibited without permission.
74. American Society of Testing Material, Standard Practice for Conducting Force
Controlled Constant Amplitude Axial Fatigue Tests o f Metallic Materials,
Designation: E466-96el, Annual Book o f ASTM Standards, Philadelphia, PA,
USA, 2002.
75. Society o f Automotive Engineers, Wheels-Impact Test Procedures-Road
Vehicles-SAE J175 JUL96, SAE Handbook, Volume 4, 400 Commonwealth
Drive, Warrendale, PA.
76. D. H. Wright, Test Methods for Automotive Wheels, International Mechanical
Engineering Conference Publications, Institution of Mechanical Engineers, 1983,
p 1 1 - 1 8 .
77. Ford Motor Company, Specification - Wheel Assembly (Cast Aluminum),
Internal Engineering Specification, ES-F3LC-1007-BA.
78. Superior Industries International Inc, Impact Test Certificate, Internal Engineering
Report, 16X7 SMW Forged Mg LS.
79. V. Lindberg, The Vernier Caliper: Part III o f a manual on Uncertainties, Graphing,
and Vernier Caliper, http://www.rit.edu/~uphysicsWemierCaliper/caliper.html,
Accessed Date, July 23, 2005.
80. Society o f Automotive Engineers, Wheels-Passenger Car and Light Tmck
Performance Requirements and Test Procedures - SAE J328 JUN94, SAE
Handbook, Volume 4, 400 Commonwealth Drive, Warrendale, PA.
-215 -
Reproduced with permission of the copyright owner. Further reproduction prohibited without permission.
81. RMS Cornering Fatigue Test System IP 40, http://www.rms-testsystems.de/en/e-
produkte/e-vehicle/e-ip40/e-ip40.html, Accessed Date, Sep. 17, 2005.
82. D. M. Smith, Developments in Cast Aluminum Alloys for Wheels, Metals
Australasia, Vol. 16, No. 2, 1984, p 4-6.
83. L. Anon, Low Pressure Machine Suits Wheel Production, Foundry Trade Journal,
Vol. 163, No. 3386, 1989, p 130-132.
84. V. Hansen, B. Andersson and J. Gjonnes, Quasicrystals as Part o f the
Precipitation Sequence in an Industrially Cast Aluminum Alloy, Journal of
Materials Science Letters, Vol. 8, No. 7, 1989, p 823-826.
85. D. J. Allen and J. D. Hunt, Solidification and Casting o f Metals, Sheffield
Conference, Metals. Soc., 1977, p 39-43.
86. J. K. Pedersen, Fatigue Properties o f An A356 (AlSi7Mg) Aluminum Alloy for
Automotive Applications-Fatigue Life Prediction, SAE paper No. 940811, 400
Commonwealth Drive, Warrendale, PA, 1994.
87. J. Xing, H. Soda, X. Yang, H. Miura and T. Sakai, Formation o f Fine Grained
Structure in a Magnesium Alloy AZ31 during Multi-directional Forging with
Decreasing Deformation Temperature, Journal o f Japan Institute o f Light Metals,
Vol. 54, No. 11, 2004, p 527-531.
88. C. L. Shen, P. H. Wirsching and G. T. Cashman, Statistical Analysis o f S-N
Fatigue Data, Design Curve Based on Tolerance, Probabilistic Mechanics and
-2 1 6 -
Reproduced with permission of the copyright owner. Further reproduction prohibited without permission.
Structural and Geotechnical Reliability, Proceedings o f the Specialty Conference,
1996, p 470-473.
89. N. Noor and H. Carden, Computational Methods for Crashworthiness, NASA
Conference Publication 3223, October 1993, p 243-249.
90. Livermore Software Technology Corporation, LS-DYNA Theoretical Manual,
Livermore, California, USA, May 1998, p 1.2-1.10.
91. Livermore Software Technology Corporation, LS-DYNA Keyword User’s
Manual v. 970, Livermore, California, USA, April 2003, p 1.29-30.
92. S. Loucif, M. Ould-Khaoua and A. Al-Ayyoub, Hypermeshes: Implementation
and Performance, Journal of Systems Architecture, Vol. 48, No. 1, 2002, p 37-47.
93. Livermore Software Technology Corporation, LS-POST: A New Post-processor
for LS-DYNA, Livermore, California, USA, May 199 p 1-58.
94. M. Shiraishi, H. Yoshinaga, N. Iwasaki and K. Hayashi, Making FEM Tire Model
and Applying It for Durability Simulation, The 6th International LS-DYNA Users
Conference, 2000, Detroit, MI, USA.
95. M. Shiraishi, N. Iwasaki, T. Saruwatari and K. Hayashi, Developing FE-Tire
Model Library for Duribility and Crash Simulation, The 7th International LS-
DYNA Users Conference, 2002, Detroit, MI, USA.
96. R. C. Hibbeler, Engineering Mechanics - Dynamics, Ninth Edition, Prentice Hall,
Upper Saddle, New Jersey, 2001, p 190-195.
-217
Reproduced with permission of the copyright owner. Further reproduction prohibited without permission.
97. C. H. Voorwald and C. Lopes, Automotive Wheels - an Approach for Structural
Analysis and Fatigue Life Prediction, SAE paper No. 2001-01-4053, SAE 2001
World Congress, Detroit, MI, 2001.
98. MSC. Software Corporation, MSC. Nastran User’s Guides, Santa Ana, CA 92707,
USA, 2005.
99. E. P. Popov, Mechanics of Materials, Second Edition, Prentice-Hall, Inc.,
Englewood Cliffs, New Jersey, 1975.
100. J. Smith, The Effect o f Range o f Stress on the Fatigue Strength o f Metals,
Engineering Statement Bulletin, 1942, p 334-338.
101. J. A. Collins, Failure o f Materials in Mechanical Design, 2nd ed. J. Wiley & Sons,
Now York, 1993, p 238-254.
102. M. Kuanmin, M. Yu, Z. Xu and T. Chen, Simulation and Characterization of
Particle Damping in Transient Vibrations, Journal o f Vibration and Acoustics,
Transactions o f the ASME, Vol. 126, No. 2, 2004, p 202-211.
103. V. A. Avakov, Safety Factor in Fatigue under Fluctuating Stresses, Journal of
Vibration, Acoustics, Stress, and Reliability in Design, Vol. 109, No. 4, 1987,
p 397-401.
-2 1 8 -
Reproduced with permission of the copyright owner. Further reproduction prohibited without permission.
APPENDICES
Appendix A - List o f publications and technical reports 220
Appendix B - An example of original data o f aluminum wheel tensile testing 221
Appendix C - Original data o f fatigue testing o f magnesium wheels 227
Appendix D - Ford engineering specification 228
WHEEL ASSEMBLY (FORMED ALUMINUM) ES-F3LC-1007-AA
Appendix E - Ford engineering specification 242
WHEEL ASSEMBLY (CAST ALUMINUM) ES-F3LC-1007-BA
Appendix F - Abbreviated input keywords o f impact testing model (LS-DYNA) 264
Appendix G - Abbreviated input keywords o f cornering fatigue testing model 268
with implicit simulation method (NASTRAN)
Appendix H - Abbreviated input keywords of cornering fatigue testing model 271
with dynamic simulation method (LS-DYNA)
Appendix I - Software code of stress-based fatigue analysis (java language) 277
Appendix J - Description of the accompanying DVD disc 283
- 219 -
Reproduced with permission of the copyright owner. Further reproduction prohibited without permission.
Appendix A - List of publications and technical reports
PUBLICATIONS:
1. Robert Shang, William Altenhof, Naiyi Li, Henry Hu and Zheng Chao, Simulation of Wheel Cornering Fatigue Performance through a Bending Moment Rotating on the Hub, International Journal o f Vehicle Design, submitted at November 4, 2005.
2. Robert Shang, William Altenhof, Naiyi Li, Henry Hu and Zheng Chao, A Postprocessor for Finite Element Stress-based Fatigue Analysis, SAE technical paper 2006-01-0537, SAE 2006 World Congress, Detroit, Michigan, April, 2006.
3. Robert Shang, William Altenhof, Naiyi Li and Henry Hu, Wheel Impact Performance with Consideration of Material Inhomogeneity and a Simplified Approach for Modeling, International Journal o f Crashworthiness, March 2005, Vol. 10, No. 2,p 137-150.
4. Robert Shang, William Altenhof, Naiyi Li and Henry Hu, Kinetic Energy Compensation o f Tire Absence in Numerical Modeling o f Wheel Impact Testing,SAE technical paper 2005-01-1825, SAE 2005 World Congress, Detroit, Michigan, April, 2005.
5. Robert Shang, Naiyi Li, William Altenhof and Henry Hu, Microstructure and property inhomogeneity o f cast aluminum wheels, JOM, Vol. 56, No. 11, 2004, p 234.
6. Robert Shang, Naiyi Li, William Altenhof and Henry Hu, Dynamic Side Impact Simulation o f Aluminum Road Wheels Incorporating Material Property Variation, Minerals, Metals and Materials Society/AIME, Automotive Alloy 2004, p 73-81.
INTERNAL TECHNICAL REPORTS:
1. Robert Shang, Naiyi Li, William Altenhof, Henry Hu, Numerical Simulation o f Dynamic Impact Test on Magnesium Forged and Aluminum Cast Wheels Incorporating Material Variation, reported to manufacturing system department, scientific research laboratory, Ford Motor Company, July, 2004.
2. Robert Shang, Henry Hu, Naiyi Li, Development o f Forged Magnesium Road Wheels, reported to manufacturing system department, scientific research laboratory, Ford Motor Company August, 2002.
- 220 -
Reproduced with permission of the copyright owner. Further reproduction prohibited without permission.
Appendix B - An example of original data of aluminum wheel tensile testing
Series IX version 8.13.00 Version date: 04 Dec 2000
Sample ID: rl
Test Type: Tensile
Operator Name: ss
Units: SI
Number o f specimens: 1
Machine type: 8500/8800
Data Rate: 5.000000 pts/sec
Ramp Rate: 0.25400 mm/min
Ramp Rate 2 : -------
Temperature: 23 Deg C
Auto-start: Disabled
User Defined Fields:
Test Date: 09 Oct 2003
Method: 4
Edit da te:-------
Geometry: Rectangular
Number o f channels: 2
Machine Control: STANDARD
Extensometer: STANDARD
Humidity: 10 %
Separate dimension entry: Enabled
[
[
Auxiliary Sample Inputs: 1: 0.000000 2 : 0.000000 3: 0.000000 4: 0.000000 5: 0.000000 6 : 0.000000 7: 0.000000 8: 0.000000 9: 0.000000
Sample comments:[
-221 -
Reproduced with permission of the copyright owner. Further reproduction prohibited without permission.
[ ]
Specimen: 1
Test end reason: Break detected
Width: 6.3400002 mmThickness: 3.9899998 mmExt. gauge len: 25.3999996 mm Spec gauge len: 25.3999996 mm
Specimen label: [ ]
Number o f data points: 142
Maximum Load point: 139 Maximum Load: 6.81870 kN
Maximum Extension point: 141 Maximum Extension: 0.76707 mm
Second Speed po in t:------- Second Speed Extension:--------
Relaxation Start po in t:-------
Range Change po in t:-------
Extensometer Removal po in t:-------
Auxiliary Specimen Inputs:1: 0.000000 2 : 0.000000 3: 0.000000 4: 0.000000 5: 0.000000 6 : 0.000000 7: 0.000000 8: 0.000000 9: 0.000000
Calculations from the machine:
Maximum LoadLoad:--------kNDisplacement:--------mmStrain:-------
- 222 -
Reproduced with permission of the copyright owner. Further reproduction prohibited without permission.

BreakLoad:--------kNDisplacement:--------mmStrain:-------
1, 0.000538, 0.0394332, 0.001674, 0.0550673, 0.002203, 0.0581944, 0.002493, 0.0613205, 0.003127, 0.0644476, 0.003180, 0.0675747, 0.003418, 0.0696588, 0.003920, 0.0712229, 0.003761, 0.07070110, 0.004105, 0.07122211, 0.004131, 0.07122212, 0.004158, 0.07903813, 0.004184, 0.07747514, 0.004290, 0.07956015, 0.004765, 0.07695416, 0.004765, 0.07903817, 0.004660, 0.08372918, 0.004871, 0.08998219, 0.005399, 0.09050320, 0.005769, 0.08789821, 0.005954, 0.09363022, 0.006086, 0.09415123, 0.006113, 0.10248924, 0.006879, 0.11708025, 0.006483, 0.11291126, 0.006985, 0.11343227, 0.007196, 0.11551728, 0.007196, 0.12698229, 0.007619, 0.12802430, 0.007222, 0.13115131, 0.007513, 0.12906632, 0.007434, 0.13532033, 0.007381, 0.14001034, 0.007830, 0.13584135, 0.008411, 0.16033336, 0.008041, 0.15668637, 0.008041, 0.16033338, 0.008358, 0.16085539, 0.008464, 0.166587
-223 -
Reproduced with permission of the copyright owner. Further reproduction prohibited without permission.
40, 0.008675, 0.17492541, 0.008940, 0.18169942, 0.008834, 0.19629143, 0.009415, 0.21036144, 0.009732, 0.22703745, 0.010208, 0.24631946, 0.010631, 0.26560047, 0.010842, 0.28696648, 0.011529, 0.31562849, 0.011529, 0.32396650, 0.011846, 0.34533251, 0.012057, 0.36252952, 0.012216, 0.38910653, 0.012691, 0.41881054, 0.013272, 0.45111955, 0.013722, 0.49697856, 0.014461, 0.54856957, 0.014911, 0.60693558, 0.016231, 0.67259659, 0.016839, 0.75441260, 0.017896, 0.84091861, 0.019270, 0.93888962, 0.020749, 1.02956463, 0.022414, 1.13900064, 0.023946, 1.23175965, 0.025109, 1.32191366, 0.026139, 1.41571567, 0.027618, 1.53870068, 0.029045, 1.63719269, 0.030577, 1.74975470, 0.032268, 1.85189471, 0.034012, 1.96706272, 0.035703, 2.07180773, 0.037949, 2.18958174, 0.038820, 2.28963675, 0.040273, 2.40271976, 0.041779, 2.50538077, 0.043708, 2.61168978, 0.045557, 2.70809779, 0.047407, 2.82378680, 0.048833, 2.92592581, 0.050630, 3.02858682, 0.052110, 3.11821983, 0.053827, 3.23599384, 0.055571, 3.33917585, 0.057631, 3.439751
-2 2 4 -
Reproduced with permission of the copyright owner. Further reproduction prohibited without permission.
86, 0.059349, 3.53720187, 0.061568, 3.64403188, 0.063232, 3.73939689, 0.064950, 3.82694590, 0.066640, 3.92387391, 0.068675, 4.01923892, 0.070762, 4.10991493, 0.072717, 4.19850494, 0.075042, 4.28240595, 0.077182, 4.37360196, 0.079348, 4.45958697, 0.081752, 4.53827698, 0.084130, 4.61852899, 0.086772, 4.698260100, 0.089546, 4.775907101, 0.092188, 4.847822102, 0.095042, 4.915046103, 0.098053, 4.989046104, 0.101012, 5.053144105, 0.104209, 5.114636106, 0.107459, 5.176128107, 0.110867, 5.238142108, 0.114381, 5.293902109, 0.117683, 5.342887110, 0.121171, 5.393957111, 0.124843, 5.447633112, 0.128674, 5.491407113, 0.132426, 5.542477114, 0.136283, 5.582603115, 0.140219, 5.634194116, 0.144843, 5.669631117, 0.148859, 5.711320118, 0.152980, 5.751447119, 0.157392, 5.789488120, 0.179585, 5.941135121, 0.203310, 6.069852122, 0.228329, 6.177203123, 0.254379, 6.262667124, 0.281142, 6.338750125, 0.308804, 6.392947126, 0.336703, 6.451834127, 0.364919, 6.496650128, 0.394245, 6.551889129, 0.423518, 6.587326130, 0.452739, 6.620678131, 0.481959, 6.656635
-2 2 5 -
Reproduced with permission of the copyright owner. Further reproduction prohibited without permission.
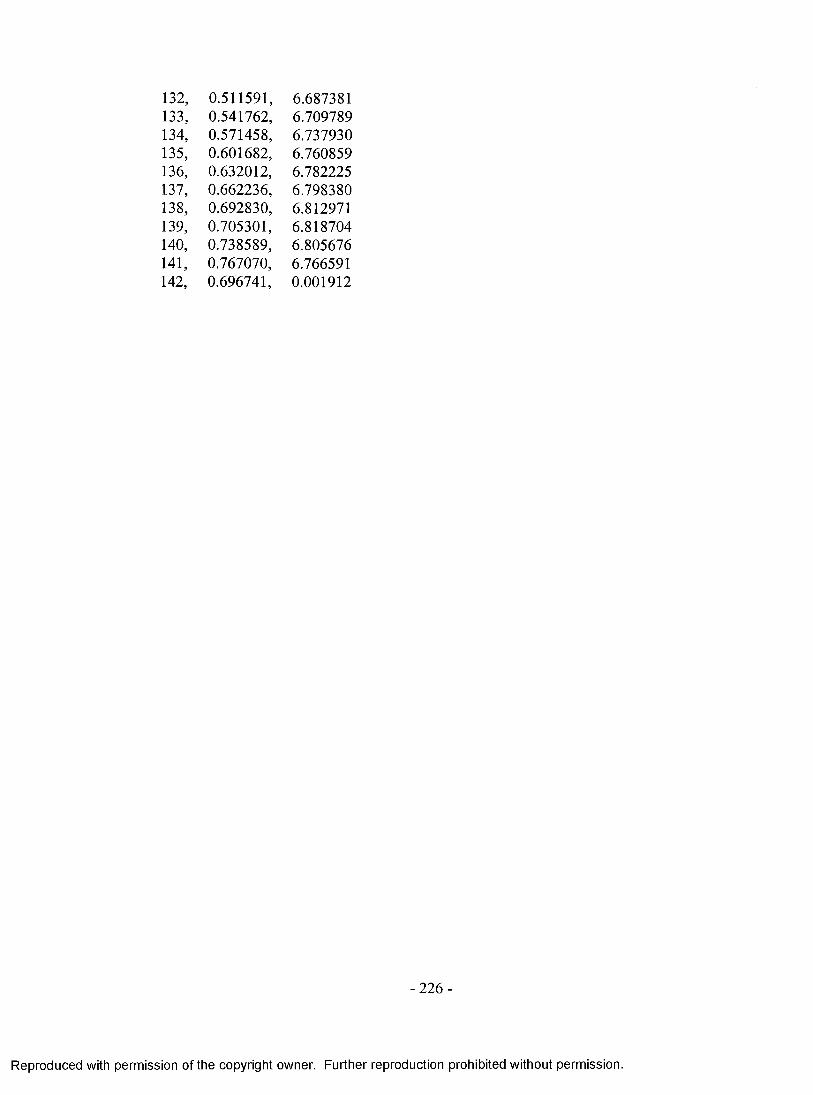
132, 0.511591, 6.687381133, 0.541762, 6.709789134, 0.571458, 6.737930135, 0.601682, 6.760859136, 0.632012, 6.782225137, 0.662236, 6.798380138, 0.692830, 6.812971139, 0.705301, 6.818704140, 0.738589, 6.805676141, 0.767070, 6.766591142, 0.696741, 0.001912
-2 2 6 -
Reproduced with permission of the copyright owner. Further reproduction prohibited without permission.
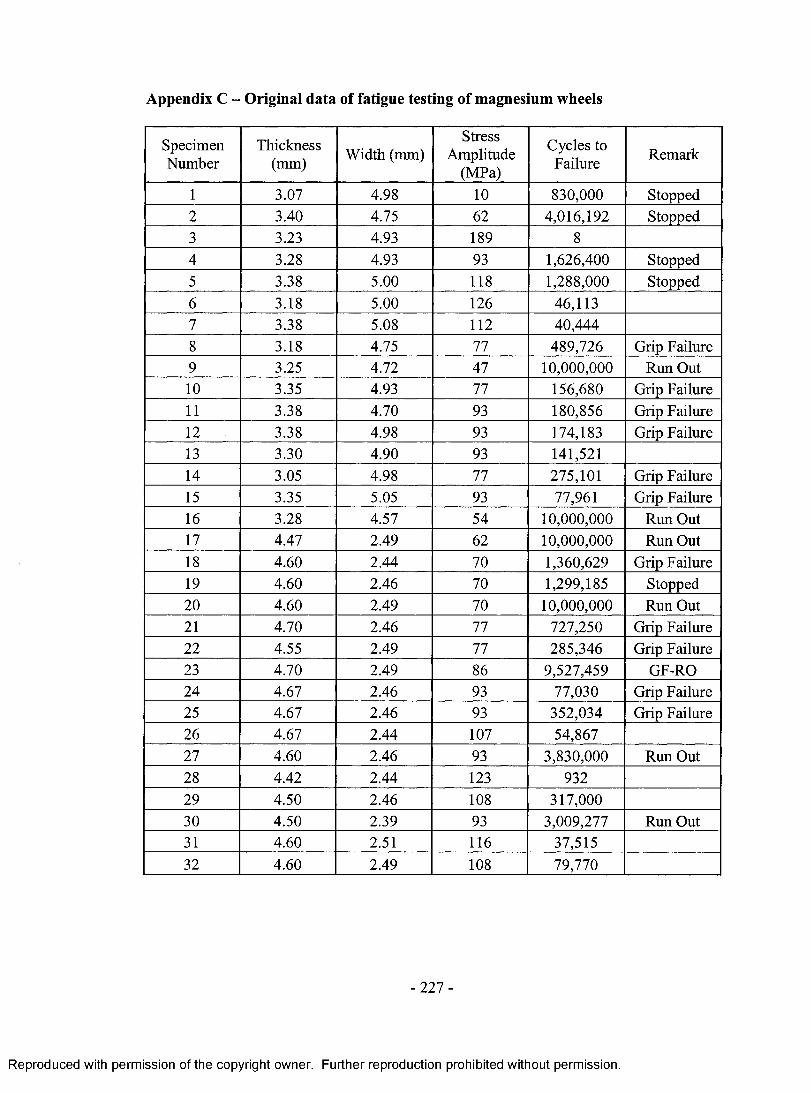
Appendix C - Original data of fatigue testing of magnesium wheels
SpecimenNumber
Thickness(mm) Width (mm)
StressAmplitude
(MPa)
Cycles to Failure Remark
1 3.07 4.98 10 830,000 Stopped2 3.40 4.75 62 4,016,192 Stopped3 3.23 4.93 189 84 3.28 4.93 93 1,626,400 Stopped5 3.38 5.00 118 1,288,000 Stopped6 3.18 5.00 126 46,1137 3.38 5.08 112 40,4448 3.18 4.75 77 489,726 Grip Failure9 3.25 4.72 47 10,000,000 Rim Out10 3.35 4.93 77 156,680 Grip Failure11 3.38 4.70 93 180,856 Grip Failure12 3.38 4.98 93 174,183 Grip Failure13 3.30 4.90 93 141,52114 3.05 4.98 77 275,101 Grip Failure15 3.35 5.05 93 77,961 Grip Failure16 3.28 4.57 54 10,000,000 Run Out17 4.47 2.49 62 10,000,000 Run Out18 4.60 2.44 70 1,360,629 Grip Failure19 4.60 2.46 70 1,299,185 Stopped20 4.60 2.49 70 10,000,000 RunOut21 4.70 2.46 77 727,250 Grip Failure22 4.55 2.49 77 285,346 Grip Failure23 4.70 2.49 86 9,527,459 GF-RO24 4.67 2.46 93 77,030 Grip Failure25 4.67 2.46 93 352,034 Grip Failure26 4.67 2.44 107 54,86727 4.60 2.46 93 3,830,000 Run Out28 4.42 2.44 123 93229 4.50 2.46 108 317,00030 4.50 2.39 93 3,009,277 Rim Out31 4.60 2.51 116 37,51532 4.60 2.49 108 79,770
-2 2 7 -
Reproduced with permission of the copyright owner. Further reproduction prohibited without permission.
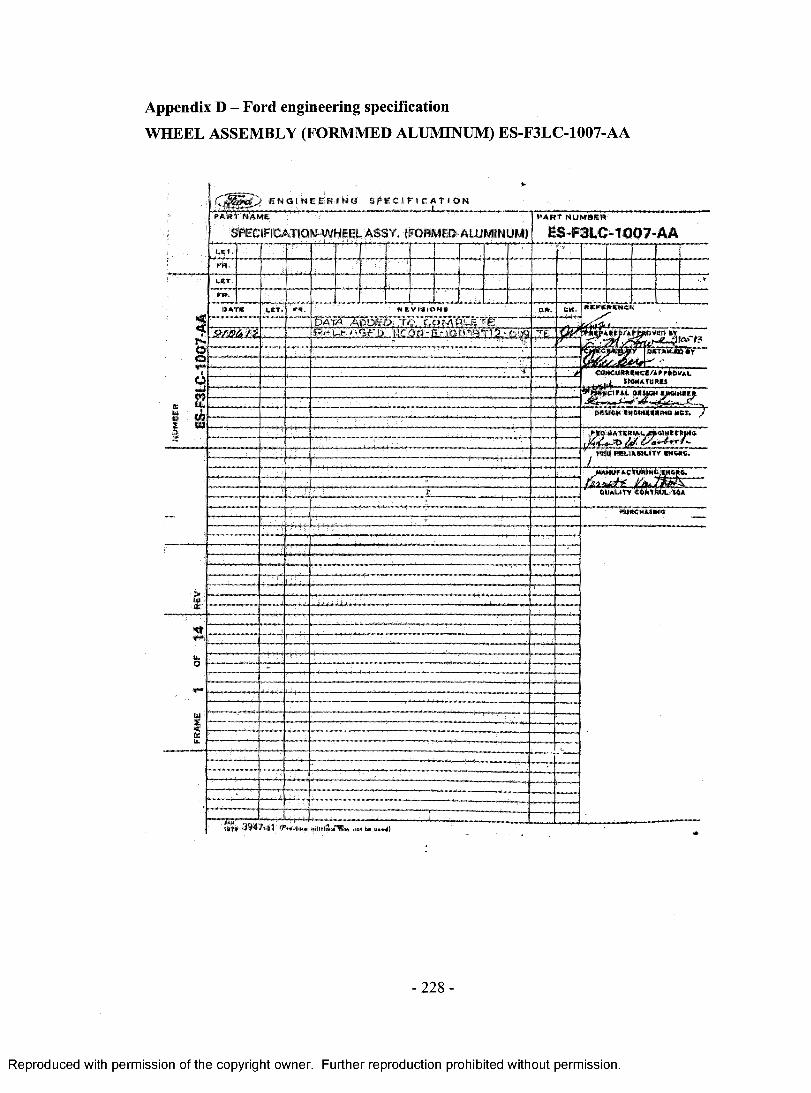
Appendix D - Ford engineering specification
WHEEL ASSEMBLY (FORMMED ALUMINUM) ES-F3LC-1007-AA
P A R T N A M E NUMBERES-P3LC-1007-AASPECIFICATION-WHEEL ASSY. (FORMED ALUMINUM}
B A T E
DATA A D D E D l a C a ^ P L E T EBEkEZi^JO^
EM CINCfRmC MCT.
P R O « U A 1 H . I T T IM M tC ,
#Ai#ypAC‘ru*«<5 6i&,fMs&d£.
c m m u t y c o h t r g l / s s *
-228 -
Reproduced with permission of the copyright owner. Further reproduction prohibited without permission.
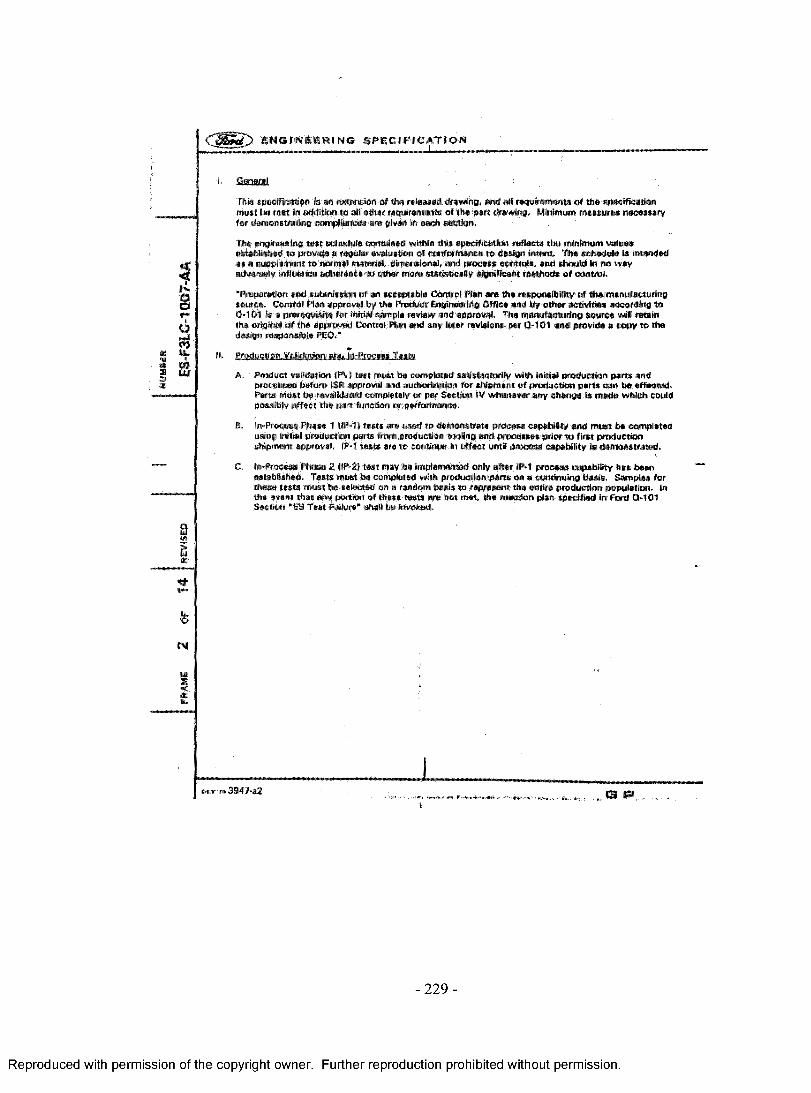
fram
e 2
OF
14 re
vis
ed
ES
-F3L
G 10
07-A
A
E N G I N E E R I N G S P E C I F I C A T I O N _
I- fienaral . .
T h i * s p e d f i e a t l i m Is m mmmmaa e l A * released strewing, and aM r e q u i r e m e n t * of t h * speeifieiMton m u s t b e m e t in addition to aM « h « r «q«lf»rM#M* el t h * part d r a w i n g , M M m u m m e a s u r e s n e c e s s a r y
for d e m o n s t r a t i n g c o m p l i a n c e s a r e g i v e n in e a c h s e c t i o n .
Tfc* «Bf»«»rio8 te s t *ch#dwl« contained within t M a s p e c f f l e a t t a n r e f l e c t s t i t s m i n i m u m values e s t a b l i s h e d t o p r o v i d e a r a g ui»r e v a l u a t i o n of c o n f o r m a n c e t o d e s i g n I n t e n t . Th# s c h e d u l e la I n t e n d e d
m ■ s u p p l e m e n t t o n o r m a l material, d i r r » n * l o n * J , and p r o c e s s control*, and should in no w ay a d v e r s e l y i n f l u e n c e a d h e r e n c e t o ether mss* a t a t i j t i c s # y a t g n t f f c a n t m e t h o d s of c o n t r a ) .
" P r e p a r a t i o n and submission of an accsptahl# Control Plan a r a t h * r e s p o n s i b i l i t y of t h e / m a n u f a c t u r i n g
s o u r c e , Control Plan approval by t h a Product Engineering Office and b y o t h e r activities a c c o r d i n g t o
Q - 1 0 1 is a p r e r e q u i s i t e for initial sample r e v i e w and approval, T h a m a n u f a c t u r i n g s o u r c e wB r e t a i n
the o r i g i n a l o f the a p p r o v e d Control Man and any l a t e r revision* per 0-101 and provide a copy t o t h e
d e s i g n r e s p o n s i b l e PE0,"
A , Product validation IP \> i t e s t m utt to * c o m p l M a d satisfactorily with I n i t i a l production part* and p r o c e s s e s b a te * (SB a p p r o v a l and a u t h o d x a d o n te r s h i p m e n t of p r o d u c t i o n pert* can tie a f f e c t e d .
Pert® m ust be r e v a l i d a t e d c o m p l e t e l y o r par Section IV whenever any c h a n g e is m a d e w h i c h could possibly affect the p a r t f u n c t i o n or p e r f o r m a n c e ,
B, I n - P r o c a s a P h a s e 1 O M i t e s t * a r e used t o d e m o n s t r a t e p r o c e s s capability a n d m u s t be c o m p l e t e d
t a m o i n f f l s l p r o d u c t i o n p a r t s f r o m p r o d u c t i o n t o o l i n g a n d p r o c e s s e s prior to first p r o d u c t i o n
s h i p m e n t a p p r o v a l . I P - 1 t e s t s e r e t o contlnu# in e f f e c t u n t l f p r o c e s s capability l a d e m o n s t r a t e d .
C, I n - P r o c e s s P h a s e 2 (IP-21 tes t may b e implemented only after I P - l p r o c e s s capability ha* been e s t a b l i s h e d . Test# m ust be completed with p r o d u c t i o n parts on s eoritlnutng b a s i s . Samples for the** tests m ust b e selected o n a random bssis to represent the e n t i r e production population. In th* e v e n t that any p o r t i o n of t h e s s rests are not met. Die r e a c t i o n p l a n s p e c i f i e d in F o r d 0-101 Section "£S T est F a i l u r e * sta ll be invoked.
3947*2- »»> •> ■ , V*H P Aft J%
-2 2 9 -
Reproduced with permission of the copyright owner. Further reproduction prohibited without permission.

ES-
F3U
M00
7-A
A
E N G I N E E R I N G S P E C I F I C A T I O N
«
memeemiQ nswscmomsraw * m a n o r ia l 12*1 CHECK 1A*i CHECK
ES ttfttiMuo Taut Aesapt*s t * t .fa s t NinfwuM
l t » t . T**tAceap.
TeatTaftilustoef*
aaapl#sta a
u s* e r lt o r la H lfiipai fm p l* * f**
Accept.C r f t tH s
S m p iea l t #
CN terS*
m • > » A
4 m m r ? 111*4 8 AU Pm* i m m s e t-u p A ll
S Him IM tin g r a t i fy # t t ! . t 8 A ll P»m 1/18CHC Maya*i
A ll ?*#•
S' lapse? M i.c 1 IM S
6 ^ I t e F i l s s s Att« Proof T**r 111.0 & A ll 8a*»
4 *spl<S«r/iMi» A t t . 8u»h o u t t m t t l l .E & A ll fa s*
4 «Spi«ter/fM* A lt , lletat A M lytt* a t . ? 2 M i p**« 1 /a ii i f t A il PMC
lu g Nut F u ll Through 111.8 8 a h r#«*
T ftrali* c iM ran e* IttaH 10 A il P m * 100 A ll P*** V 80 MT A ll P m »
? fre # §ead Sea? Mmey? i i i . j 30 M l Pm * 100 ■ A ll **** t/h a y rS w * ”im p
8 S t a t ie Saianea ** 1« A lt *****' r * ^ + ■■♦ r ^ — ■
t
8 Her -mtA* wai *1820- dmatrw m . t » 8 M t A ll IN®* 1 . i m i t A it Pm *
r#*|yff*a8®nt fa r cheariatry. *
amd tk it& m sm
8 p » im C m m m m m .K■
8 S a lt Spray ft«»U?ane« a t . a 8 A ll A*M 2/«eefe** A il pm #
* Arc aalsSssi « h e* it mj*t t» K«l#^y »*y«* At* 129278 a m Metal sp ec . --
- jft“pr®e«a» eltee i# far s* in ? E n t i t y era to fat perfanaed uotn* a m ty p ic a l m m i f r m **d» p a in t p ro cess um<!»
no? stm seapi# par smai line.
t », 3047*2
-2 3 0 -
Reproduced with permission of the copyright owner. Further reproduction prohibited without permission.
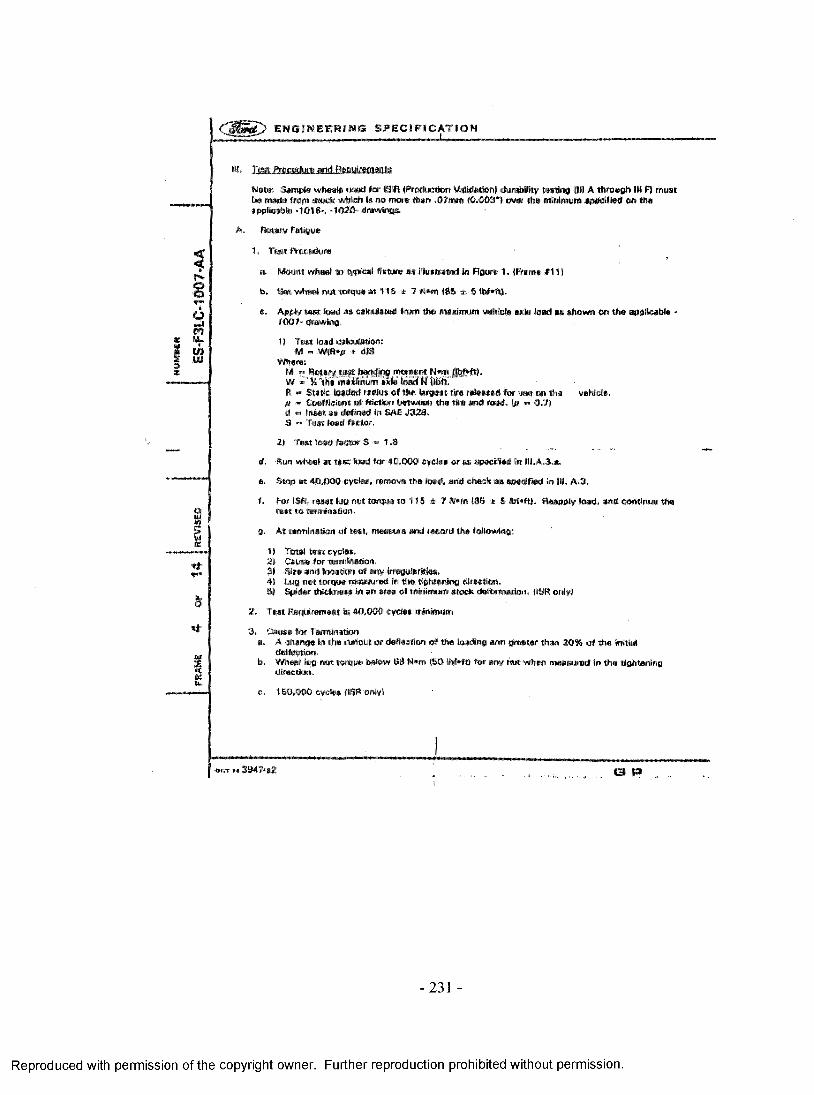
HU
MM
ER
E N G I N E E R I N G S P E C I F I C A T I O N
?P*
ill.
N o t e : S a m p l e w h e e l * used f o r (SIR ( P r o d u c t i o n V a l i d a t i o n ) d u r a b i l i t y t i n t i n g (III A t h r o u g h III R must b« made tmm s t o c k w h i c h I* n o more than , 0 7 m m ( 0 . 0 0 3 * 1 m m t h a minimum specified o n tha
• 1 0 1 6 * . - 1 0 2 0 * d r a w i n g * .
A . R o t a r y F a t i g u e
1 . T e a t P r o c e d u r e
a . M o u n t w h e e l t o typical f i x t u r e « » M u s t n t e d i n F i g u r e 1 . ( F r a m e # 1 ! }
b. S a t w h e e l n u t t o r q u e a t 1 1 5 ± 7 K « m (85 * S IhMtJ,
c . A p p l y w e t l o a d a t o d c u l a t a d f r o m t h e m a x i m u m vehicle a i d e load a t e h o w n o n the a p p l i c a b l e *
1 0 0 7 - d r a w i n g .
1 1 T© *fc i o a d c a l c u l a t i o n :
M - W ( R » p + CO S
Where;M - R « * r y b a s i n g m o m e n t N e m j f e f c f t ) .W ~ T I T f i i m iBHuni H ilS B W IIfilE "R « S t a t i c tesdad radtai of t h e torgwH tire rahNUMKl few t« * on tha vehicle.M *> Coefficient of f r i c t i o n b e t w e e n t h e t i r e a n d r o a d . U> m 0 . 7 )
d « • Inaet« « defined in ®UE J 3 2 8 .
S • Taet t a d factor.
2) Teat load f a c t o r S « 1.8
d . Run w h e a t a t t e a t load for 4 0 , 0 0 0 c y c l e s o r a s s p e c i f i e d to III, A.3.«,
e . Stop a t 40 ,000 c y c l e s , r e m o v e t h e l o a d , a n d c h e c k a s s p e c i f i e d i n 111. A.3.
f. F o r I SR., reset too nut t o r q u e l o 1 1 5 ± 1 M*m C 8 S * § lbf»ft). Ruepply load, and continue tha t a t to t e r m i n a t i o n .
0 , A t t e r m i n a t i o n of test, m e a s u r e and r e c o r d the f o l l o w i n g ;
t ) Total tes t c y c l e s .
2) Cause for termination.31 S i z e a n d l o c a t i o n of a n y (Regularities.41 Luo * « « t o r q u e m e a s u r e d in the t%bt«*isi«o d i r e c t i o n ,6) Spider thickness in a n a r e a o f m i n i m u m s t o c k d e f o r m a t i o n , ( I S R only)
2. Test R e q u i r e m e n t i s 40,000 c y c l e s minimum
3. Cause for Terminationa . A change in th# runout m d e f l e c t i o n of the l o a d i n g arm g r e a t e r than 20% of the initial
d e f l e c t i o n .
b. W h e a t lug n u t t o r q u e W o w 8 8 N » m ( S O i b M t ) f o r a n y n u t w h e n m e a s u r e d in t h e tightening d i r e c t i o n .
c. 1 5 0 , 0 0 0 c y c l e * ftSR «*lyS
« « w 3347-a2 _ t S P*
-231 -
Reproduced with permission of the copyright owner. Further reproduction prohibited without permission.
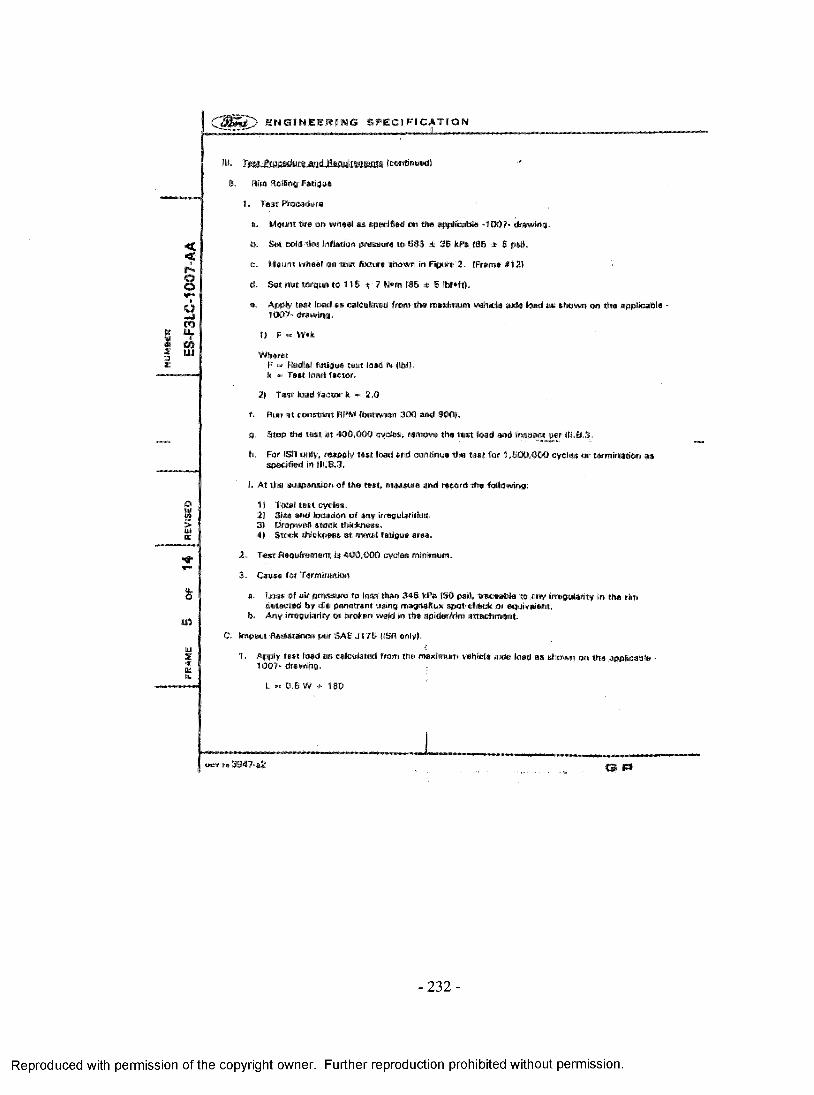
NUMB
ER
ES-
F3L
C-!
007-
AA
E N G I N E E R I N G S P E C I F I C A T I O N
B , H i m R o l l i n g F a t i g u e
1 , T e s t P r o c e d u r e
» . M o u n t tire m w h e a l a s s p e c i f i e d on t h e applicable - 1 0 6 ? * d r a w i n g .
b, Sot cold tit# inflation p r e s s u r e t o S 8 S ± 35 k l» * ( 8 5 ± S p s f l .
e . M o u n t w h e e l o n t e s t f i x t u r e s h o w n i n F i g u r e 2 . ( F r a m e # 1 2 )
d . S e t n u t t o r q u e t o 1 1 5 * 7 N » m ( 8 5 * 5 ) W * # tJ .
# . Apply t o s t load as c a l c u l a t e d Iron* d i e m a x i m u m v e h i c l e a x l e l o a d a s s h o w n o n t h a a p p l i c a b l e - 1 0 0 7 - d r a w i n g .
I» F - W»k
W h e r e :
F - R a d i a l f a t i g u e te s t t o a d N ilhfl. k - T a s t l o a d f a c t o r ,
2 ) T a a t l o a d f a c t o r i t - 2 , 0
f . R u n a t c o n s t a n t R P M ( b e t w e e n 3 0 0 a n d 900).
g . S t o p t h e t e s t at 4 0 0 , 0 0 0 c y c l e s , r e m o v e t h a t e s t toad a n d i n s p e c t p e r 1 1 1 ,0 .3 .
h. F o r I S f i o n l y , r e a p p l y t a a t l o a d a n d c o n t i n u e t h a t a s t for 1 , 5 0 0 , 0 0 0 c y c l e s o r t e r m i n a t i o n a sspecified in 111.8.3,
i . A t t h e s u s p e n s i o n o f th# t e s t , m e a s u r e a n d r e c o r d t h e f o R o v w i g :
I S T o t a l 1 2) S i z e a n d l o c a t i o n o f a n y i r r e g u l a r i t i e s .31 Dnapwail stock thickness.4 ) S t o c k t h i c k n e s s a t m e t a l f a t i g u e a r e a .
2 . T e s t R e q u i r e m e n t is 4 0 0 , 0 0 0 c y c l e s minimum.
3 . C a u s a f o r T e r m i n a t i o n
a . L o s s o f a i r p r e s s u r e t o l a s s t h a n 345 k P a ( S O psi), t r a c e a b l e t o a n y i r r e g u l a r i t y in t h e r i m
d e t e c t e d b y d i e penetrant using m a g r M f l u x s p o t - c h e c k o r e q u i v a l e n t .
b . A n y i r r e g u l a r i t y o r b r o k e n w e l d in t h e s p i d e r / r i m a t t a c h m e n t .
C . I m p a c t Resistance p e r S A E J 1 7 5 HSR o n l y ) .
1 - A p p l y t a a t l o a d a s c a l c u l a t e d f r o m t h e m a x i m u m v e h i c l e a x l e l o a d a s s h o w n o n t h e applicable - 1 0 0 7 - d r a w i n g .
L - 0 . 8 W + 1 8 0
»3S4?-a2 q p»
-2 3 2 -
Reproduced with permission of the copyright owner. Further reproduction prohibited without permission.
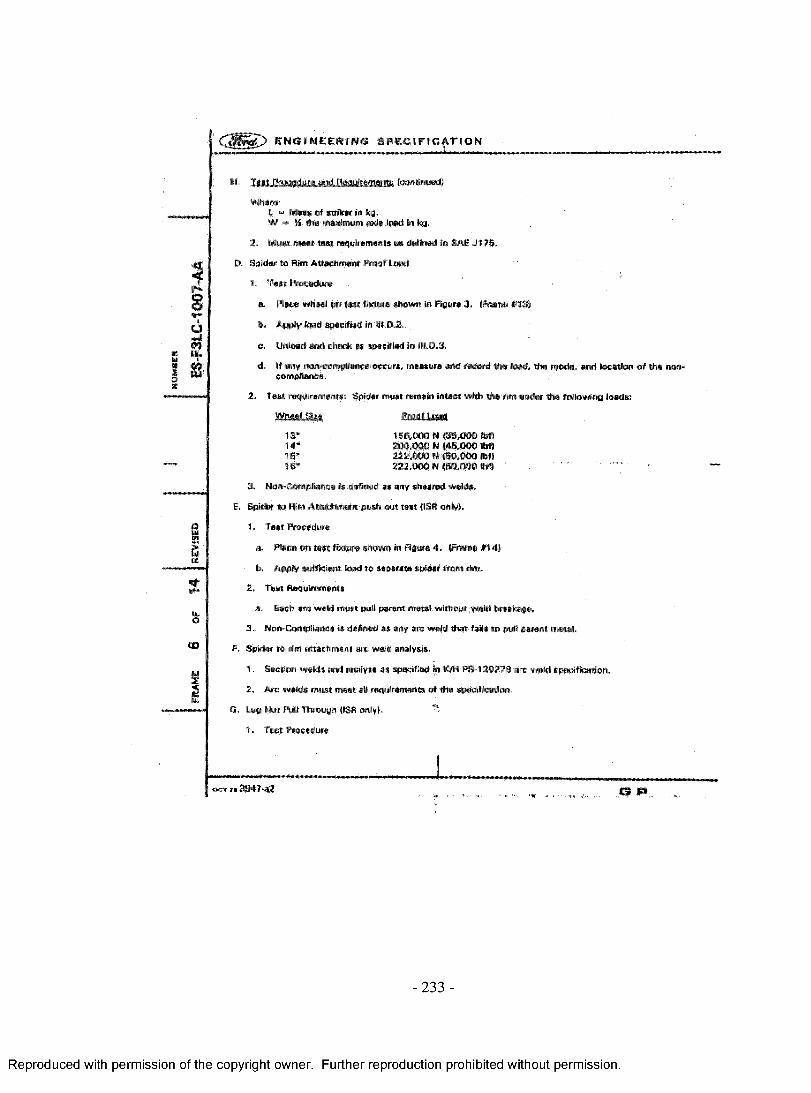
NU
MB
ER
E N G I N E E R I N G S P E C I F I C A T I O N 8_________
?r*ooo«mH I
ft
(0
I l e * t t » K ) l
t - M h i o f striker in k g .
W * K t h a m a x i m u m a x i s l o a d I n k g . .
2. M u a t m e a t t a s t r e q u i r e m e n t s « * d e f i n e d i n S A E J 1 7 8 .
D . S p i d e r t o f t n A t t a c h m e n t f i w w f L o a d
1. T#*t ftmsdura*
a . P t a c e w h e e l on t a a t f i x t u r e s h o w n In Figure 3 . ( F r a m e # t 3 }
b, Apply t a d speeWed In fll,D,2,
e . Unload and check <** s p e c i f i e d In l t l . 0 . 3 .
d . I f a n y non-cwnpfane* o c c u n , m e a s u r e a n d record t h e l o a d , t h a mod*. and taeatfcm of t h a mm- compliance.
2. Tost r e q u i r e m e n t s : S p i d e r m ust remain Intact w i t h t h e r i m u n d e r t h a t o i l o w i n g l o a d s :
SMasaLSa £BM£AB«t13* 168,000 N [38,000 tofS14* 200,000 N [48,000 am18* 222,000 H <80,000 tofti 6 - a a . o w w « 0 , o o s i b f i
3 . Non-Compliance i s defined a* a n y s h e w e d w e l d s .
6 . S p i d e r » H i m A t t a c h m e n t p u s h mm t e s t P S R o i d y } .
1. Taat Procedure
a. P l a c e o n t e s t f i x t u r e s h o w n i n R g u r e 4 . ( F r a m e # 1 4 1
b, Apply iRifficwiiif to s ^ a f s to specific ffofti elm,
2. Teat Requirements
a. Each are weld m u s t puli parent metal w i t h o u t weld b r e a k a g e .
3 . N o n - C o m p l i a n c e i s defined a s any arc weld tha t f e d s t o p u d parent m e t a l ,
P . S p i d e r t o r i m a t t a c h m e n t a r e w e l d a n a l y s t * .
1. Section wolds and a n a l y s e » * s p e c i f i e d in (CM P S - 1 20278 a r c w e l d s p e c i f i c a t i o n .
2. Arc w e l d s m ust m eet •# r e q u i r e m e n t of t h a specification,
G . L u g N u t P u B T h r o u g h O S H o n t y h **
t . T e s t P r o c e d u r e
osirT«<®47-a2
-233 -
Reproduced with permission of the copyright owner. Further reproduction prohibited without permission.
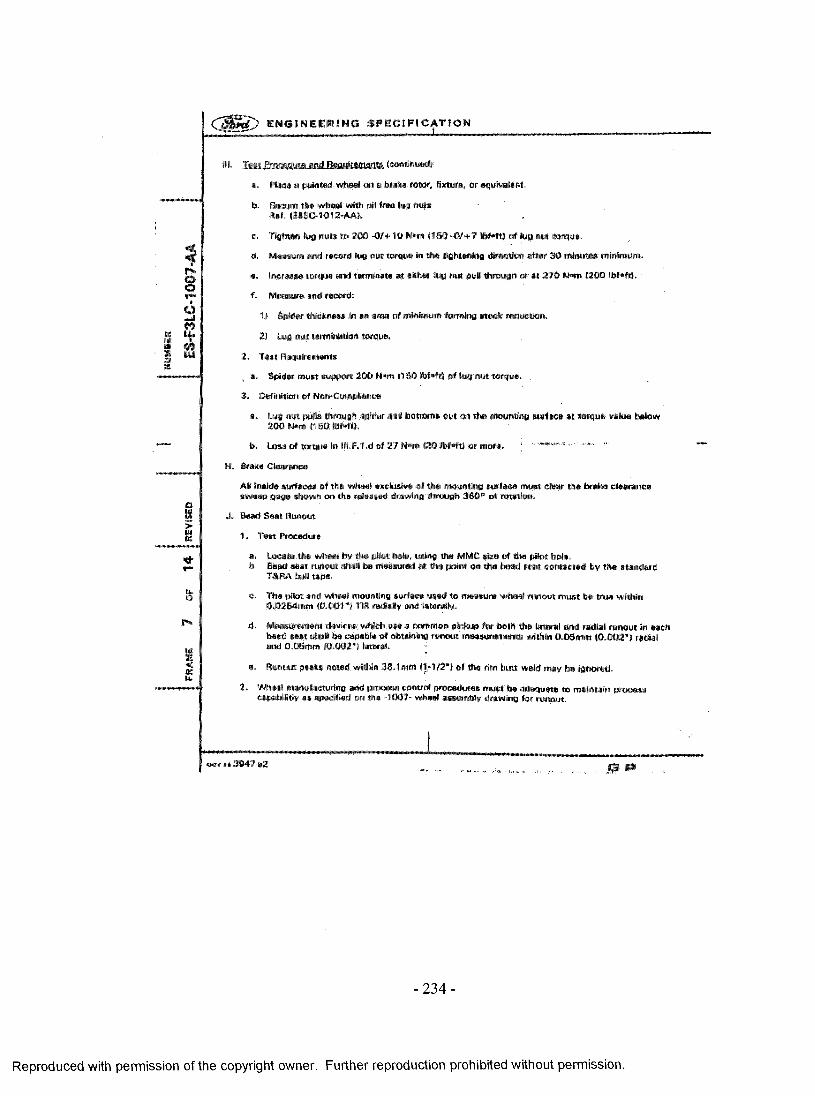
¥¥-£§§ i-m
m-m
.maamm
E N G IN E C W t M S S P E C I F I C A T I O N
I
ft* Pfiu# ft paliiiMict wfi#8§ oft ft fafslsft i&ts&f* f i x t u r e . o r e q u i v a l e n t .
b . S«cur* t h a w h e a l with o i l tim h»# m mR e f , ( E 8 3 C - 1 0 1 2 - A A ) .
e. Tlgfhtto tup « rt* to 200 - 0 /+ 10 U*m 1160 -0 /+ 7 of fcia nut torque,
4. Mmmtm w d r e c o r d l u g o u t t o r q u e In t h a tightening d i r e c t i o n a f t e r 3 0 m i n u t a a m i n i m u m .
« . I n c r e a s e torque a n d t e r m i n a t e m e i t h e r lug n u t pull through or a t 270 N*nt 1200 I W * f t ) .
f. M e a s u r e and r e c o r d :
1) S p i d e r tbtctotas* In a n a r e a of m W m u m f o r m i n g n o d e r e d u c t i o n .
2) tu g « « ttWBh»tton torque.
2. T e x t Requirement*
, a. S p i d e r m u s t support 200 N»m 1150 i b t * t t ) o f lug nut t o r q u e .
3« Definition of Nsn-Coitipfisficc
a. Luo n u t p u t t s t h r o u g h s p i d e r a n d b o t t o m s out on t h e mauntiao surface a t t o r q u e v a l u e W m2 0 0 N » m (160 m m ,
b . L o s s o f t o r q u e I n N I . F . t . d 0 f 2 7 N * n i ( 3 0 M s f t ) o r m o w . ......................................... ..................
H .
Alt I n s i d e surfaces of the w h e a t e x c l u s i v e of the m o u n t i n g s u r f a c e m u s t clear th a b r a k e c l e a r a n c e
s w o o p gage shown on t h e released d r a w i n g t h r o u g h 368® of rotation.
J , B e a d Seat Runout
1. Tfttt
a. L o c a t e the w h e a l by th* pilot h o t * , using the MMC s h t a of the pilot h o l e .
b. Bead s e a t r u n o u t »h»*l b« mowsuma m th* point on th* fei#d s*«t eoM aewd b y t h e standard TJtRA ball tape.
c . The pilot and wheal mounting surface u s e d to m e a s u r e wheal runout m ust b e h u e w i t h i n
0,0264m m ( 0 . 0 0 1 * 1 TIB r s d t t t f y end laterally,
s a l r u n o u t i n e a c h
( 0 . 0 0 2 * ) r a d i a l
e m e m d e v i c e s which u s e » c o m m o n p i c k u p f o r both t h
I seat shall be c a p a b l e of obtnMno r u n o u t m e a s u r e m e n t s i a n d O . O S m m 1 0 , 0 0 2 * 1 l a t e r a l . =
e . Runout p e a k s noted within 3 8 . 1 m m of t h e tint butt w a f d may b e i g n o r e d ,
2, Wheel m a n u f a c t u r i n g and p r o c e s s c o n t r o l procedures m u tt b e a d e q u a t e to maintain p r o c e s seapabilitiy a s s p e c i f i e d on the *1007- w h e e l a s s e m b l y drawing f o r r u n o u t .
r » • 3 9 4 7 a 2 © m
-2 3 4 -
Reproduced with permission of the copyright owner. Further reproduction prohibited without permission.
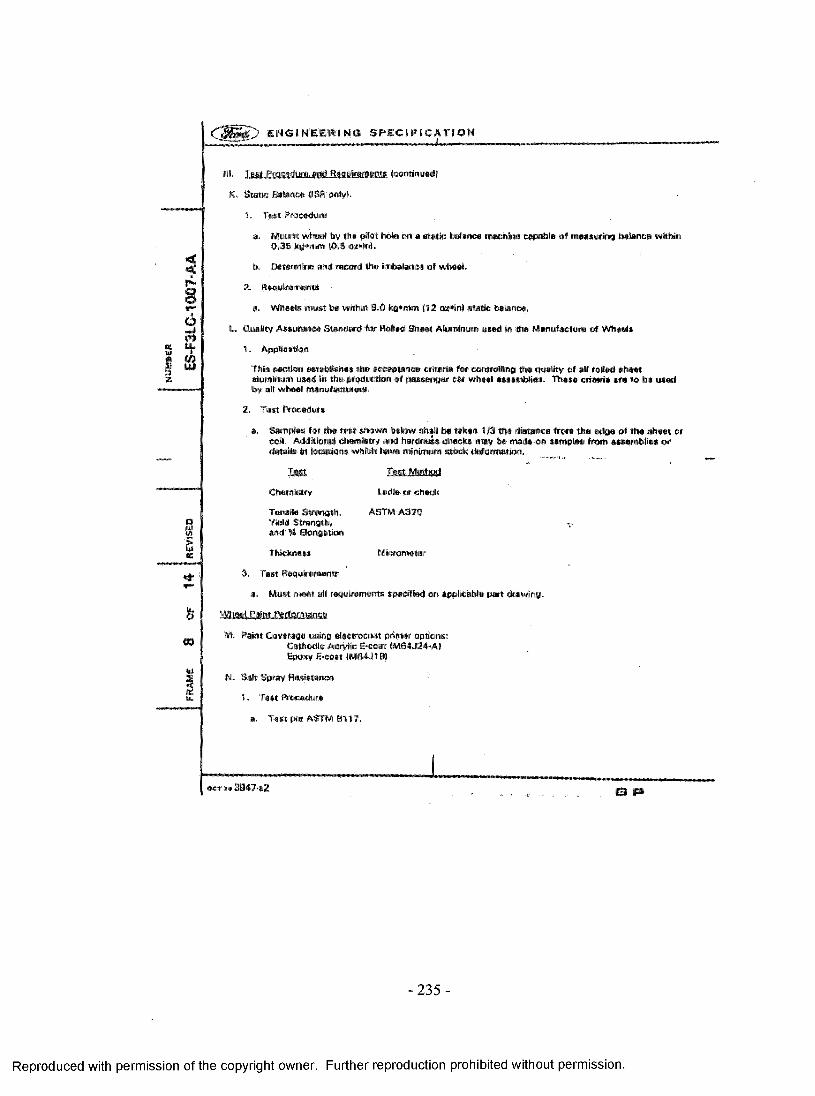
E N G I N E E R I N G S P E C I F I C A T I O N
: (oomimMKJI
f t S»«*e Balance {(SB only}.
1 , T e s t P r o c e d u r e
a. Mount w h e e l to y t h e p a o t hole o n a s t a t i c b a l a n c e m a c h i n e c a p a b l e of m e a s u r i n g b a l a n c e w t e h i n
0 , 3 5 k g * m m {0,8 < H * in ) .
b . D e t e r m i n e e n d r e c o r d t h e I m b a l a n c e o f w h e e l .
2 . R e q u i r e m e n t s
a . Wheels m u s t b e w i t h i n 9 . 0 k g * m m ( 1 2 o**in) s t a t i c b a l a n c e .
t . Quality Assuwwe* S t a n d a r d f o r Rolled S h e e t A l u m i n u m used In the M a n u f a c t u r e of Wheel*
1. Application
T h i s section e m a b R s h e * th* a c c e p t a n c e criteria for c o n t r o l l i n g tha q u a l i t y of *11 tolled s h e e t
aluminum u s e d In the p r o d u c t i o n of p a s s e n g e r ear wheel a s e s m b l j a s . Those c r i t e r i a are t o b e used b y all w h e a l m a n u f a c t u r e r * .
2. T e a t P r o c e d u r e
a, S a m p i e a te r th* t e s t *hown balow s h a l l b e t s k e n I S the d i s t a n c e from t h e e d g e of th e e h e e t or c o # . Additional c h e m i s t r y and hardness c h e c k * m m b e mad# o n s a m p l e s from a s t e m b t t e a o r
d e t a i l s i n l o c a t i e n s w h i c h h a v e m i n i m u m s t o c k d e f o r m a t i o n .
JM t
Chemistry
T e n s i l e S t r e n g t h ,
Y i e l d S t r e n g t h ,
a n d % E l o n g a t i o n
T h i c k n e s * M i c r o m e t e r
3 . T e a t Requirement*
a . M u s t m e e t a l l r e q u i r e m e n t s s p e c i f i e d o r t a p p l i c a b l e p a r t drawing.
I
m
L a d l e o r c h e c k
A S T M A 3 7 Q
M . P a i n t C o v e r a g e u s i n g e t e c t r o c c a t p r i m e r o p t i o n s ;
C a t h o d i c Acrylic E - c o a t ( M 6 4 J 2 4 - A )
E p o x y E - c o a t I M 8 4 J I 9 I
N. S a l t S p r a y R e s i s t a n c e
I . T e s t P r o c e d u r e
a. T e s t p e r A S T M 8 1 1 7 .
<*rr«3947a2
-235 -
Reproduced with permission of the copyright owner. Further reproduction prohibited without permission.

MUM
MR
ES-
F3L
C-1
007-
AA
< g ||D E N G I N E E R I N G S P E C I F I C A T I O N *
b. m m p r o d u c t i o n wheal t o a a t t s p r a y c a b i n e t a t I B 0 m i n i m u m o f f t h * v tr tc a l a s * .
c . Only t h * o u t b o a r d a u r f a c * ( o u m m t s M W w M tm e v a l u a t e d .
d . After e x p o s u r e f o r th* r e q u l r a d l a n a t h o f t b m th* parts m a y t o e i w w a d far t h * p u r p o s e o f
rssmovin# s a l t buid-up only. Wnsina w i t h tap w a t a r , IlghUy s p o n o i n f l and Mowltto. or b t o v w i n o
t h y mm «e#pt»bl* .
a, Tested parts mu&l b* evaluated within 5 minutes of removal i w t th# salt spray cabinet.
2 . Test Raflutfsownw
a . W h e e l s m u s t w i t h s t a n d 2 4 0 h o u r s of exposure without non-ootnplianc*.
3 , Definition of mm-campHmncB
N o n - c o m p l i a r v a I s em otion, e m e p a e a , or Joss of a d h e s i o n m o r e than t h a fefcwlma;
a, 3 .2 m m 1.125 Ini from p ilo t s c r a t c h * * o r th i fp © t i s e i of s i t stjrrrtpsd oiw nbtgi, i . * . ,
bolt d o te , pilot hole, M h r * hole, butMWid bln* a r e a . )
b . 8 .4 m m ( . 2 5 i n i f r o m t h * r i m t o a p i d o r j o i n t ( e r e v i c e l ,
e . Any b R s t a r i n o o r corrosion i n any otbpr l o c a t i o n b a y o i t d 3 * of « h * t o t a l imm a r a * .
iv . HmaMstmBsaMwema 7
1 . A n a w auppltor for a n y p a r t n u m b e r r a q u i r a a O M tA tt v a l i d a t i o n .
2 . t h a ftlfcwrinB l» r e q u i r e d for any c h a n a * in p r o c e s s , m a t e r i a l , oc t v i 8 | 0 f tiftilgn c h a r m * . Entries r e f e r to 68 t a c t number show n In S e c t i o n HI.
fe
m
R E V A U D A T I O N R E Q U I R E M E N T :
Section Requirement D i s c f i e v i s i a n o r
d e v i a t i o nRim revision ord e v i a t i o n
A n y R e v i s i o n o rd e v i a t i o n .
I I I . A Rotary F u r i o u s X X
I U .B M m R o l i i n g f a t i g i n s X XI H .O S p i d e r to rim attachment proof
(MdX X X
IN .E Spider to r i m attoeiwrtent p u s h
o u t t a a t
X
IH.6 (j»# nu t pull thRMgh X XH I .H B r a k e c l e a r a n c e X X Xil.K S t a t i c M in e * X X X
e«T ?* 3947-«2 . . . O P
-2 3 6 -
Reproduced with permission of the copyright owner. Further reproduction prohibited without permission.
g N t t l t t M C f t l N G S P E C I F I C A T I O H
O-I«*?u-
V. l o t Sgflnirion
a. m«mA s p i d e r im t * i* fm m m a p r o d u c t i o n a m o r e a c h 4 0 , 0 0 0 p a r t s |* M M o h * « * r f » I M * I .
a. aim*A rim lot w defined « • production iud or « * W (9 W |»«* (ttNMt «w#r In tonal.
' C, AmmmnMif
A n a o a o m b i v t o i s d W t a t o k i o q ^ Q Q O p e r t * .
V i , R o a o r t a B o t a i i a n
f t o e o r d i n a a n d m r o o n l r w a n t k w i snail c o n f o r m t o F o r t C H O I « H w » r e W , F o r w a r d s f l PV » « :
r a o u l t e to the S u r f * duality A M W W O f l I B * MH$ * 0 t h a Q uasi* EnBlmiwwing Office r a e p o n o i b M
fer whmml a p p r o v a l .
A , M a n u f a c t u r e r s l w t t s u b m i t p m c n c s t M M I t o I B * C M M i a E o o i m e e n r a n O f f i c e ,
0 . M a n u f a c t u r e r a h e l s u b m i t M a n u f a c w r l n g F a i l u r e M o d e a n d E K M t A n a b r e i * o f t h a c o m p h r t a
m a n u f a c t u r i r r o p r o c e s s I n d u d t o a * Control P l a n P r i o r to ISR Oat#,
C . Lot t m c e a W l l t y p l a n « » b e m u t u a l l y a g r e e d u p o n b y t h e m a n u f a c t u r e r a n d F o r d .
#er » 3 9 4 7 a 2
237-
Reproduced with permission of the copyright owner. Further reproduction prohibited without permission.
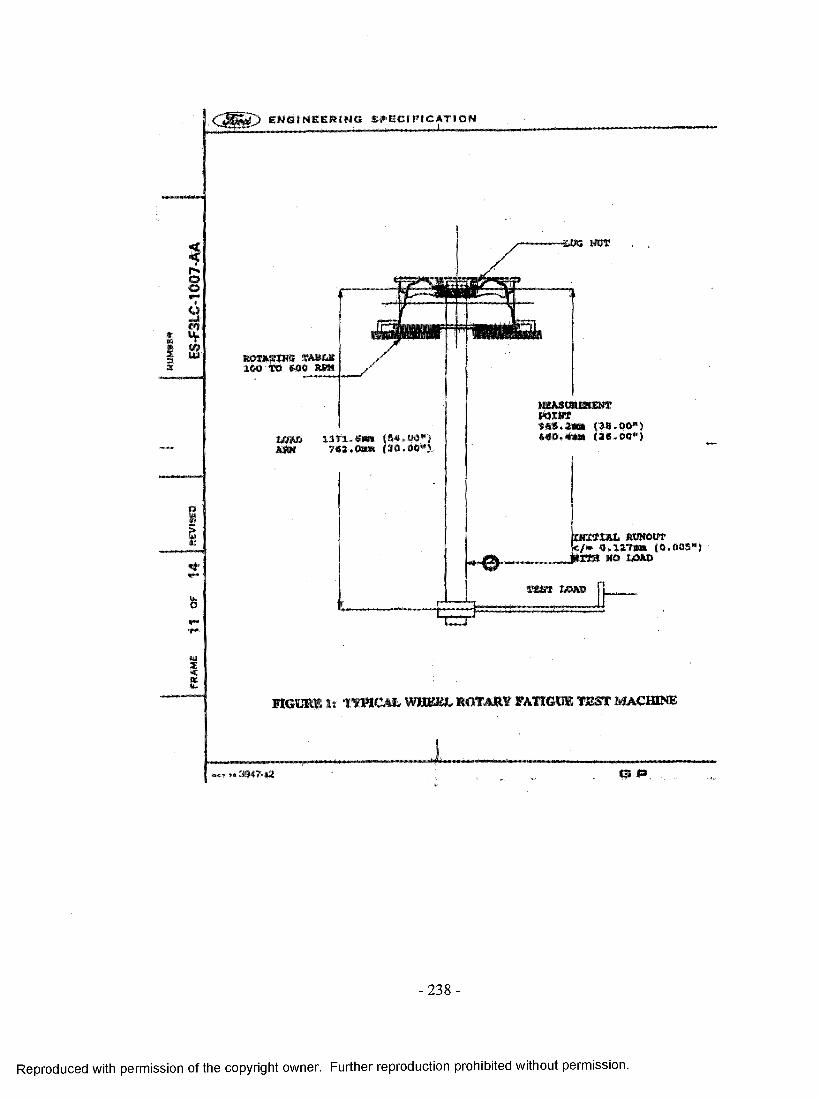
ENGINEERINGS S P E C I F I C A T I O N
I
W•Vmuu
m m t a i l7 * 2 .
m m itxm nm m 100 t o Cl
<84.00")(30.00")
» w » n fN t l tM S . 2 m (38 .00 ")««o ,4m (ae .oo ")
officiu bumqut « /« 0 .1 3 7 m (0.005")
' N O W M O M A D
t u t MAD
IT—T
mmsm ii t y p ic a l wmm.. r o t a r y f a t ig u e im p m a ch in e
m **.
-238 -
Reproduced with permission of the copyright owner. Further reproduction prohibited without permission.
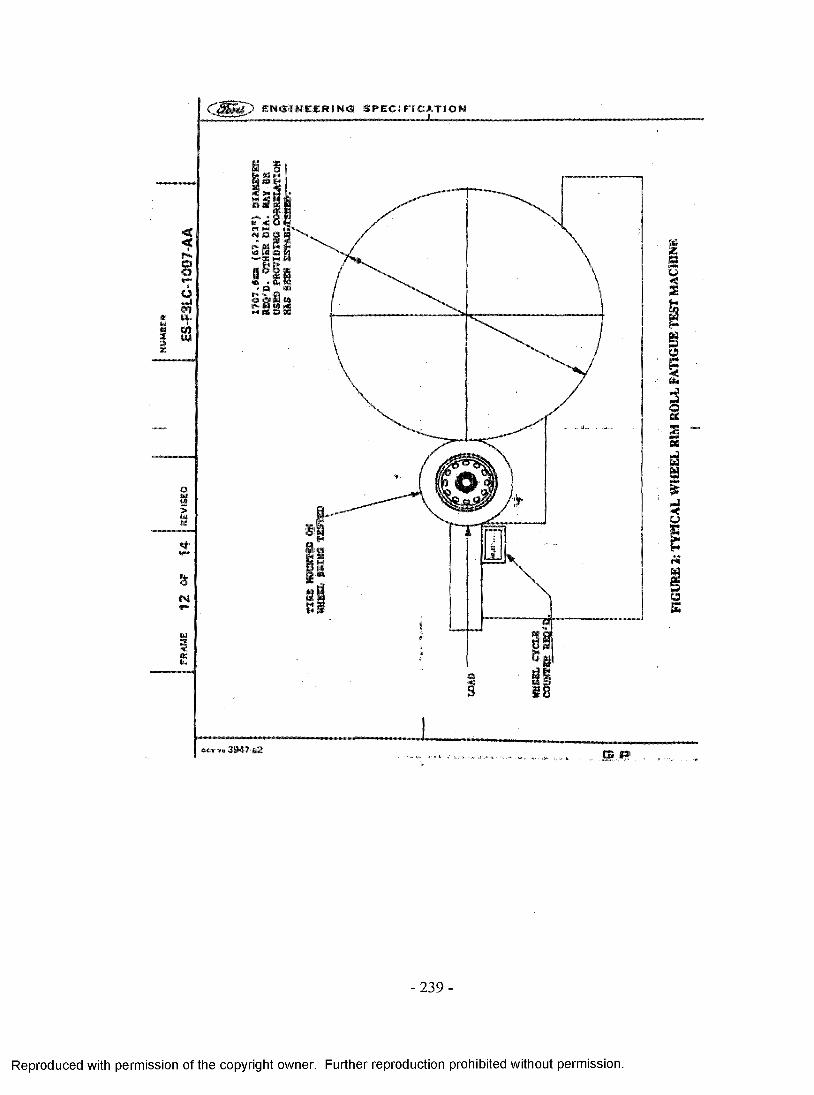
ES-
F3L
C-1
007-
AA
E N G I N E E R I N G S P E C ) F t C A T ! O N
-2 3 9 -
Reproduced with permission of the copyright owner. Further reproduction prohibited without permission.
ROLL
FA
TIGU
E TE
ST
MA
CH
INE
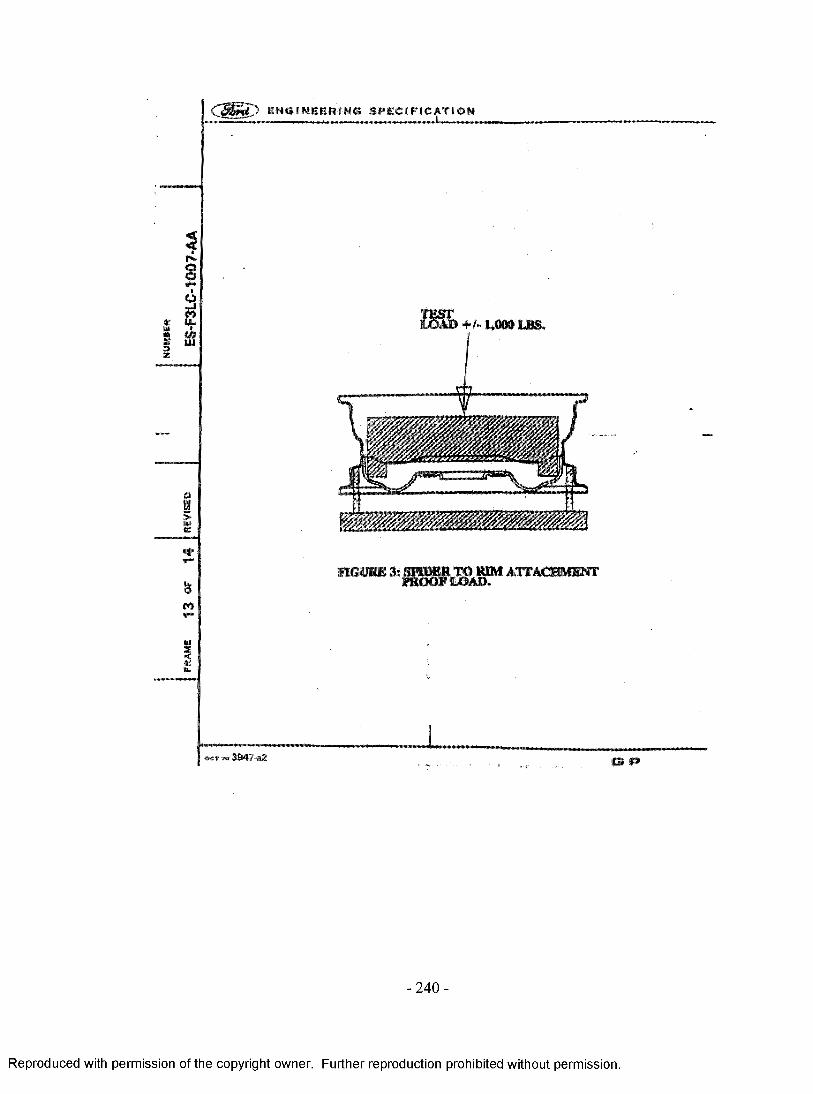
I N
UW
ER
FRA“
13 or
14 mm
sm
ES-
F3L
C-1
007-
AA
E N e i N E B H I N ® S P E C I F I C A T I O N
TESTLOAD+f-MM LBS.
F1GUHE 3s m W ^ T ^ W A MTAOTIffiMT
• e * » 3 9 4 7 - « 2
-2 4 0 -
s P»
Reproduced with permission of the copyright owner. Further reproduction prohibited without permission.

ES-F
3LC
-100
7-A
A
E N G I N E E R I N G S P E C I F I C A T I O N
3z
fe
MGIIR1 * TfHCAL'M M TO SWD1 R ATTACHMENTh i l l PA R H tr Me t a l carc w il d )
© e r m 3 9 4 7 - a 2
-241 -
8 P«
Reproduced with permission of the copyright owner. Further reproduction prohibited without permission.
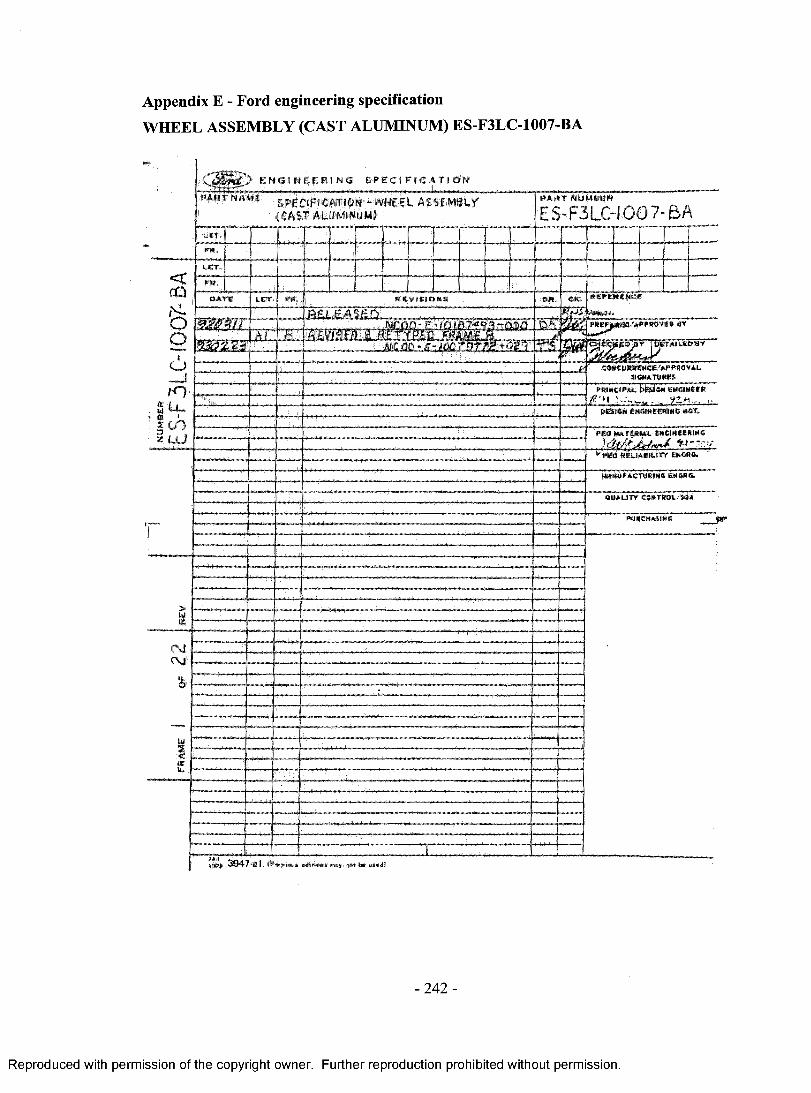
Appendix E - Ford engineering specification
W HEEL ASSEMBLY (CAST ALUMINUM) ES-F3LC-1007-BA
PA R T NAME . P A * T NUM BER
ES-F3LOI GO 7 -BAS P E C IF IC A T IO N - w h e e l a s s e m b ly(CAST ALUMINUM)
L E T .
cQ OR. CK. "EPEBENe*
*~ mmi.
r t m :
m cyisiott*LET -
n e t At c 5 T * 7 -TSq f
O COMCURRCMCe 'A PPKOVALMOM* TUBES
TO
' « LIz U J
PRINCIPA L DCSISN B K C IM SM
r ' . . f .OESI«N ENBIHEEBINS NOT,
P *0 NATWHAL ENCINE*(UNO
FEO RELIABILITY EH&RS-KANUPACTUWNS EKSRtL
QUALITY COWTROL/SQ*
PURCHASING
C\iCVJ
u .
3 3 4 7 - a l «*«* n * t to* w»v<U
-2 4 2 -
Reproduced with permission of the copyright owner. Further reproduction prohibited without permission.
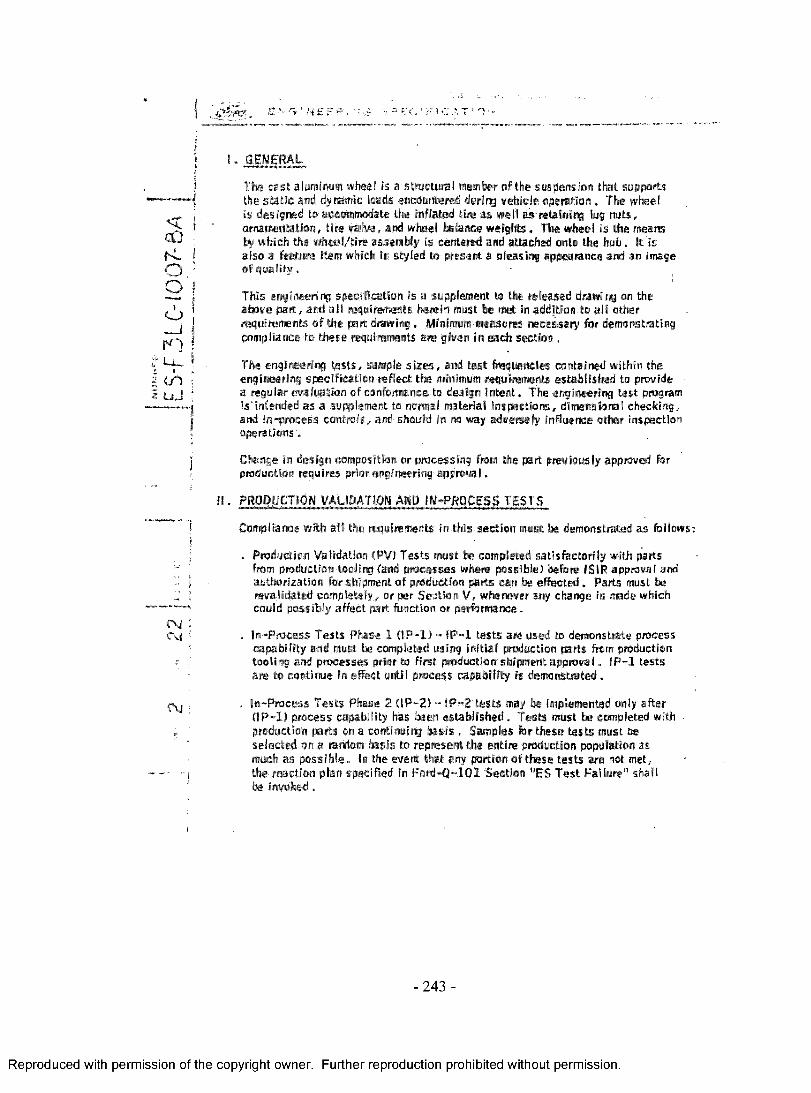
Z' ~ri ' H S E ’r , V “ KC • •
J The cast aluminum wheel Is a structural member of the suspension that supports— | the sta tic and dynamic loads encountered during vehicle operation, The wheel
j is designed to accommodate the Inflated tire as well as-retaining lug nuts,"3 : ! ' ornamentation, tire waive, and wheel balance weights, The wheel is the means^ ; by which the wheel/tire assembly is centered and attached onto the hub, It isK . j also a feature item which is styled to present a pleasing appearance and an Imageo ' o f qua lity ,
■C3 ^— [ This engineering specification is a supplement to the released dravd ng on theI above part, and a ll requirements herein must be met in addition to a ll other
j | requirements of the part drawing. Minimum measures necessary for demonstrating{ compliance to these requirements are given in each section,
The engineering te s ts , sample sizes, and test frequencies contained within the 2 ■ engineering specification reflect the minimum requirements established to provide ■i l j J * a regular evaluation of conformance to design in tent, The engineering test program
-— - —-j is intended as a supplement to normal material inspections, dimensional checking,i and in-process controls, and should in no way adversely Influence other inspection! operations,
j Change in design composition or processing from the part previously approved fori production requires prior engineering approval,
II, PRODUCTION VALIDATION ANP IW-PROCESS TESTS
f Compliance with all the requirements in this section must be demonstrated as fellows:i
, Production Validation (PV) Tests must be completed satisfactorily with parts* ' from production tooling (and processes where possible) before ISIft approval andT j authorization for shipment o f production parts can be effected. Parts must beJ • reva delated completely, or per Section V , whenever any change is made which
could possibly affect part function or performance.C\J :C\l : . In-Process Tests Phase 1 (IP -1 ) - IP -1 tests are used to demonstrate process
capability and must be completed using initial production parts from production ' tooling and processes prior to f i s t production shipment approval, IP -1 tests; are to continue in effect until process capability is demonstrated,
. , In-Process Tests Phase 2 (IP -2 ) - IP -2 tests may be implemented only after(IP -1 ) process capability has been established. Tests must be completed with ■ production parts on a continuing basis , Samples for these teste must fce selected on a random basis to represent the entire production population as much as possible. In the evert that arty portion of these tests are not met,
- - - - j the reaction plan specified in F o rd -Q -IG I Section "ES Test Failure1’ shallbe invoked.
-243 -
Reproduced with permission of the copyright owner. Further reproduction prohibited without permission.
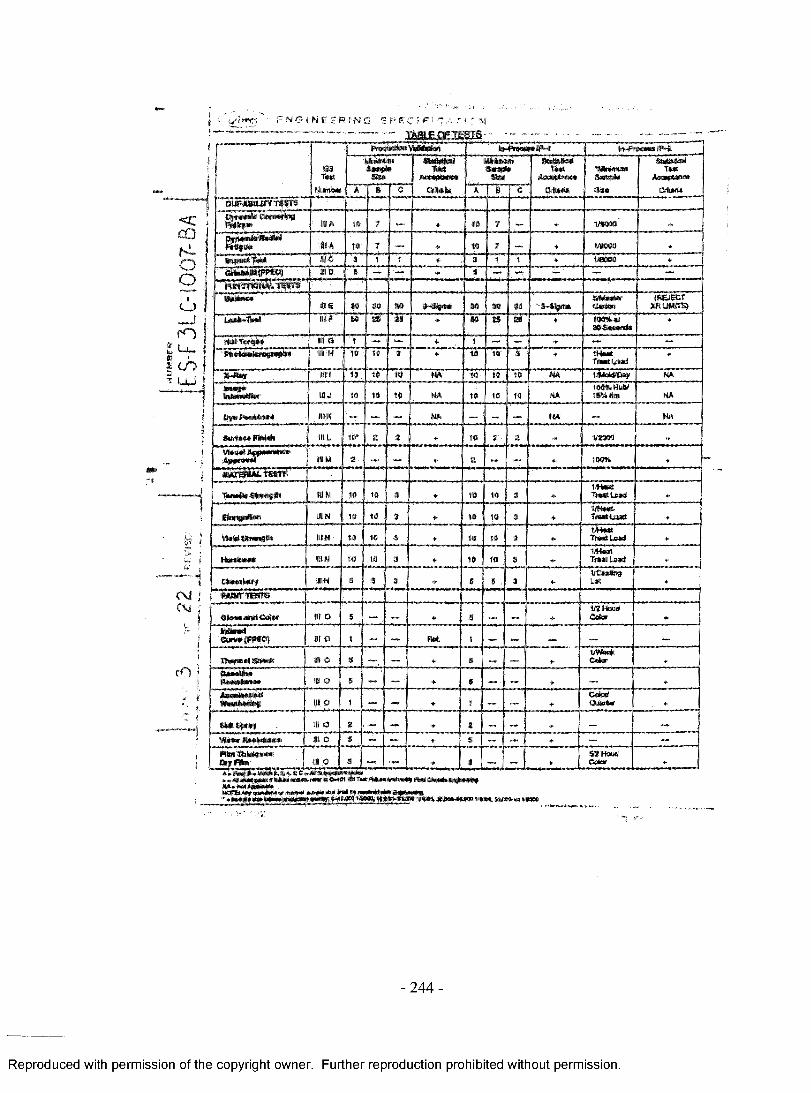
ssM W* £ ?
Wefcmmmm
ststttseiiiuw*
msrnp&mmT##l
AesgM^19Hismbsr A B 0 1 CrfM A , c zm m Sfan cm m
owMHurvTEsniOwwumte CtswxwteB PtttyH* I ill A to 7 4* 10 7 — * *DjfrnaMtaiMM(SMS#** | HI A to 7 — 4* to 7 — 4> f « 8 *-MQNMI1M t l i e 3 1 t ♦ i 1 1 * MenMiaHrPeo) j mo S — — ♦ 3 ~* — -* ™ j
( w S S nE T ^ t o "tW—
HI 6 30 30 30 '3$ St ass NtieBHfC*tm
(HEJSCtffiUMfrsj
in* m 39 as ♦ m as as ♦ 190%*iassaasM
♦
lit £ t — * — «~ * — —iU H 10 10 3 *> to 10 a * 1H<m*
TfSSiiM*•
%4Uv 181 19 to W m to to to HA l&gMOay MA
^ ^ S lle r UJ 10 to to m 10 w 10 NA 15% am HA
QfmFmwtjmn I8K m — —. HA HA
tia 10* a t * to a - a ♦ tm m ♦yie^j^eemmase
mu a — — 4» a «» 4* tocm, ♦IW W tttB T S
mm to 10 3 ♦ to 10 a •*►t^teiT«sais*d *
Urn mn 19 10 $ 4* to to a * TriNitLaad *
mn 10 to 3 ♦ to 10 a 4*t^WTMUiaeS
mm to 10 a * to to 3 ♦tMml trmti’um} +■
ChMKWry mu 5 $ 3 4“ 8 # a *iJCm&igUK *
m b * t e n s
GJ®«*4B»fC®ter Hi 0 $ — — * I —.mHautfColor ♦
WkvwtCwwffWSQJ ill 0 1 — M t — —
rstxtmmmntc.il m o $ ♦ s — <►WteakCetee *
&mt&OgmHi 0 s — * 0 _ «» •* — *
Hi 0 t 1 : — — +C MC autas- 4*
til o a * ■+■ a — — -r — —
Ml 0 s ■*> s — — ** —
Hi 0 5 « — ♦StzmmiCM 4.
1<c ;OQ |s lo oo i
mLjuih
- j
i -> -
(NJ | CM <
«o
SSBTllOMSn
-2 4 4 -
Reproduced with permission of the copyright owner. Further reproduction prohibited without permission.
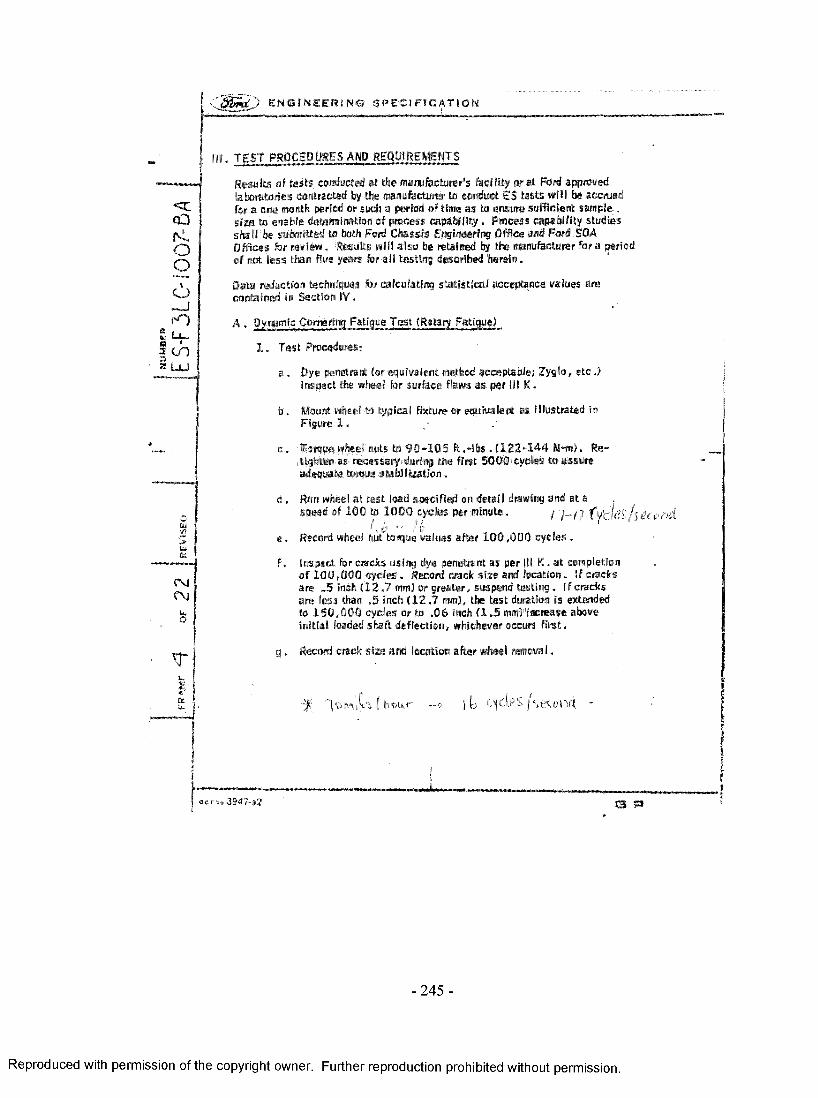
.jSSSwL E N G I N E E R I N G S P E C I F I C A T I O N
<ccO
ao
- j<*0
£ u _§ to« L U
o“S'«
CMCM-
T
I I I , TEST PROCEDURES AMD REQUIREMENTS
Results of tests conducted at the manufacturer's facility or i t Ford approved laboratories contracted by the manufacturer to conduct ES tests will l» accrued for a one month period or such a period of time as to ensure sufficient sample . size to enable determination of process capability, Process capability studies stall be submitted to both Ford Chassis Engineering Office and Ford SO A Offices for review. Results will also be retained by the manufacturer fora period of not less than five years for all testing described herein»
Data reduction techniques for calculating statistical acceptance values are contained In Section IV,
A , O/nanric Cornering Fatigue Test (Rotary Fatigue)
1 , Test Procedures:
a , Dye penetrant Cor equivalent method acceptable, Zyglo, e tc .) inspect the wheel far surface flaws as per til K.
b , Mount wheel to typical fixture or equivalent as illustrated in F igu re!,
c , Torque wheel nuts to 90*105 ft,-lbs . (122-144 M-m), Re- Ughten as necessary during the first 5000 cycles to assure adequate torque stabilization.
d , Run wheel at test load specified on detail drawing and at aspeed of 100 to 1000 cycles per minute,
e , Record wheel nut torque values after 100,000 cycles .
f , Inspect for cracks using dye penetrant as per III K . at completion of 100,000 cycles. Record crack size and location. If cracks are .5 Inch (12 .7 mm) or greater, suspend testing. I f cracks are less than ,5 inch C 1 2 .7 mm), the test duration is extended to 150,000 cycles or to .06 inch (1 .5 mm) increase above initial loaded shaft deflection, whichever occurs first.
g , Record crack size and location after wheel reamva I .
u,tL -f; I huhr
»394 7-»21
-245 -
Reproduced with permission of the copyright owner. Further reproduction prohibited without permission.
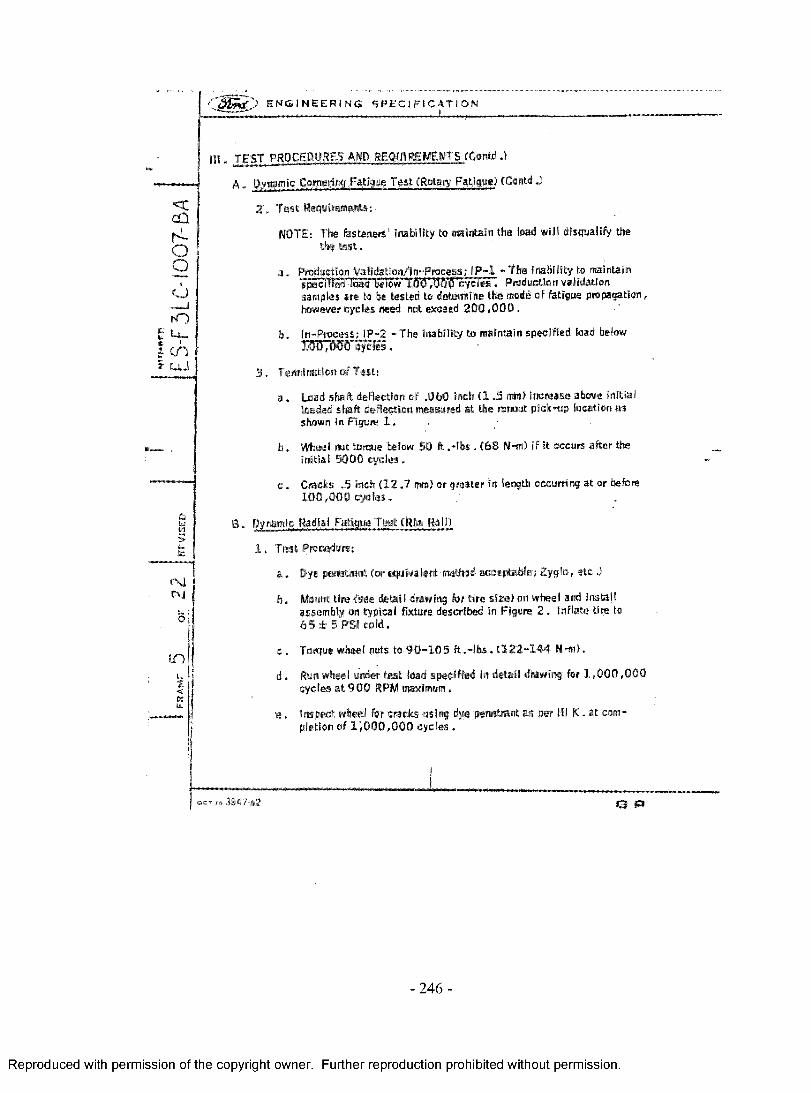
*rn
> E N G I N E E R I N G S P E C I F I C A T I O N
cQ
OO
c j
mu~th
CMcy
o i
in%,2<(e
ill,
Dynamic Cowering Fatigue Test (Rotary Fatigue} fContd J
2 . Test Requirements:
NOTE: The fasteners* Inability to maintain the load will disqualify thethe test.
a . Production Validatian/ln-Process; IP-1 - The inability to maintain I q S c lH e n o ia ^ Production validationsamples are to be tested to determine the mode: of fatigue propagation,however cycle* neesd not exceed 200 #000.
b, In-Process; IP-2 - The inability to maintain specified toad below
3 . Termination«fTest:
a . Load shaft deflection of .060 inch Cl .5 mm) Increase above initial loaded shaft deflection measured at the runout pick-up location as shown in Figure 1 .
b . Wheel nut torque below 50 ft .-lbs. <68 N-nO if it occurs after the initial 5000 cycles,
c . Cracks .5 inch (1 2 .7 mm) or greater In length occurring at or before1 0 0 ,000 cycles.
Dynamic Radial Fatigue Test (Rim Roll)
1 . Test Procedure:
a . Dye penetrant Cor equivalent method acceptable; Zygio, etc ,)
b. Mount tire (see detail drawing for tire size) on wheel and install assembly on typical fixture described In figure 2 . Inflate tire to 6 5 + 5 PS! cold,
c . Torque wheel nuts to 9 0 -1 0 5 ft .- lb s . <122-144 W .
d . Run wheel under test load specified in detail drawing for 1 ,0 0 0 ,0 0 0 cycles at 900 RPM maximum.
■e» Inspect wheel for cracks using dye penetrant as per HI K. at completion of 1”,0 0 0 ,0 0 0 cycles .
m , ,* 3 9 4 7 *2 ( 3 £3
-2 4 6 -
Reproduced with permission of the copyright owner. Further reproduction prohibited without permission.

< & £ > E N G I N E E R I N G S P E C I F I C A T I O N
<cOQK.OgOm
i u .-32 I
* < n
cvff\J
l i t . TEST PROCEDURES AW REQUIREMENTS (Cortd J
B. Dynamic Radiat Fatigue Teal {Rim RellXCo.itd J
2 , Test Requirements:
a , Production Validation/ln-Process; IP-1 - Test wheels must complete 1 ,ljd d ,d ti6 cycles wH le maintaining the specified toad as described in III S3, Preduction validation samples are te be tested to determinethe mode of fatigue propagation, however last cycles mead not exceed 2 ,0 0 0 ,0 0 0 .
b . In-Process; IP-2 - Wheel must complete 1 ,0 0 0 ,0 0 0 cycles while maintaining 'die sped fifed load as described In III B3,
3 . Termination of Test:
a . Wheel air leak during rim tali test.
b . Cracks greater than .25 inch ( 6 .35 ran) in length of rim as revealed by dye penetrant inspection as per III K.
c . Cracks extending through a metal section or onto three adjacent sunacesof a metal section in the spider area.
C . Impact Test
1 . Test Procedure-
a . Test procedure shall.be per SAE J175 fseedetail drawing for the tire size). See Figure 3 .
2 , Test Requirements:
a . No visible fractures of the center member of the wheel.
b . No separations of the center member from the rim.
e . No total sudden loss of tire air pressure.
n NOTE: Deformation of the wheel or fractures in the area of the rim section^ ! contacted by die’ face plate of the weight system decs not disqualify
u f the wheel.| |&-1 3 . Termination of Test:
a . Non-compliance with test requirements as expressed In the ES specification and/or test procedure as outlined in SAE J 175 .
O C T t : 3 9 4 7 - ^ 2 g ~ p j
-2 4 7 -
Reproduced with permission of the copyright owner. Further reproduction prohibited without permission.
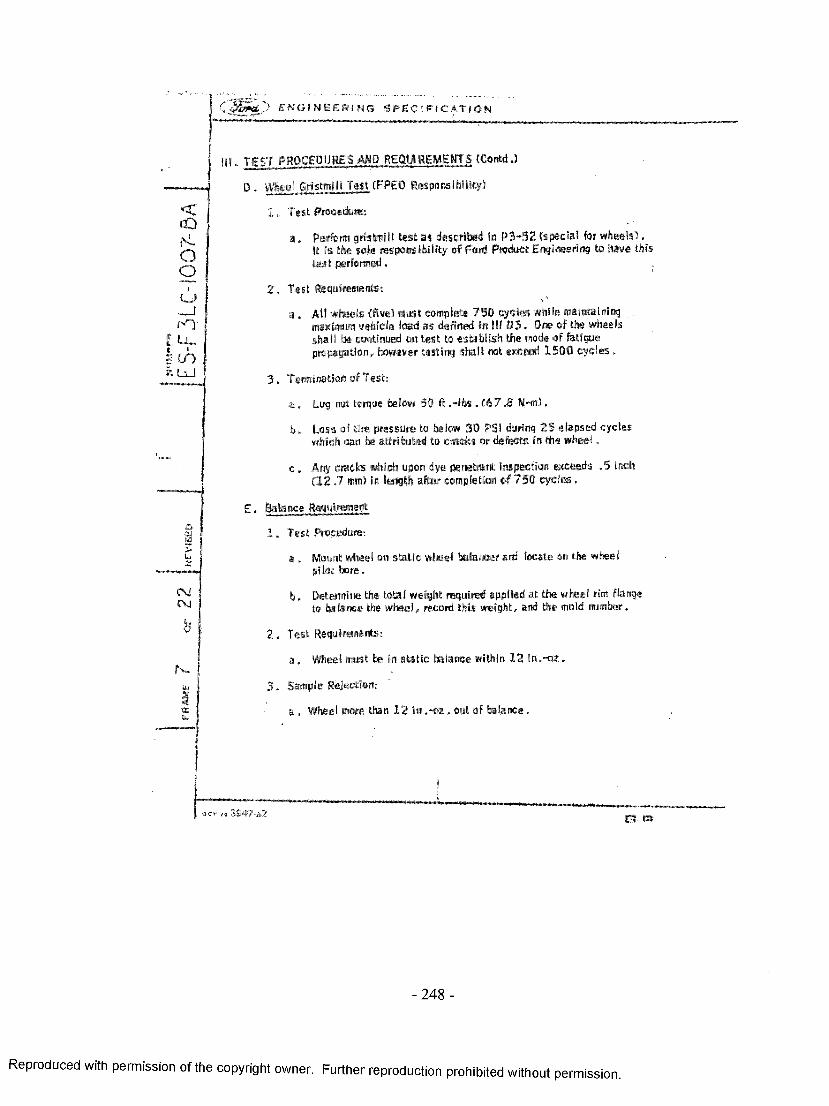
<cDf-LQO
fCJ
m£; U_t >s toz L lJ
CMCM
0
n .it,1QC
TEST PROCEDURES AND REQHREMEWTS (Contd.)
D . Wheel Gristmill Test (FF€0 Responsibility)
1 . Test Procedure;
a » Perform gristetil! test is described In P3-52 {special for wheels),It Is the sole responsibility of Ford Product Engineering to have this lest performed,
2 . Test Requirements;
a , Ail wheels (five) must complete 750 cycles while maintaining , maximum vehicle load as defined in 111 0 3 , One o f the wheels shall be continued on test to establish the mode of fetigue propagation, however testing shall not exceed 1500 cycles.
3 . Termination of Test;
a . Lug nut torque below 50 ft .-lbs . (67 £ N-m).
b . Loss of tire pressure to below 30 PSI during 25 elapsed cycles which can be attributed to cracks or defects in the wheel.
c . Any cracks which upon dye penetrant inspection exceeds .5 inch (12 ,7 wm) in length after completion of 750 cycles.
E . Balance Requirement
Test Procedure:
a Mount wheel on static wheel balancer ani locate on the wheel pilot bote.
b , Determine the total weight required applied at the wheel rim flangeto balance the wheel, record this weight, and the mold number.
Test Requirements:
a . Wheel most be in static balance within 12 in .-ox.
Sample Rejection;
a . Wheel more than 12 in .-ox . out of balance.
oct „ 3947-a2 C5 »
-248 -
with permission of the copyright owner. Further reproduction prohibited without permission.
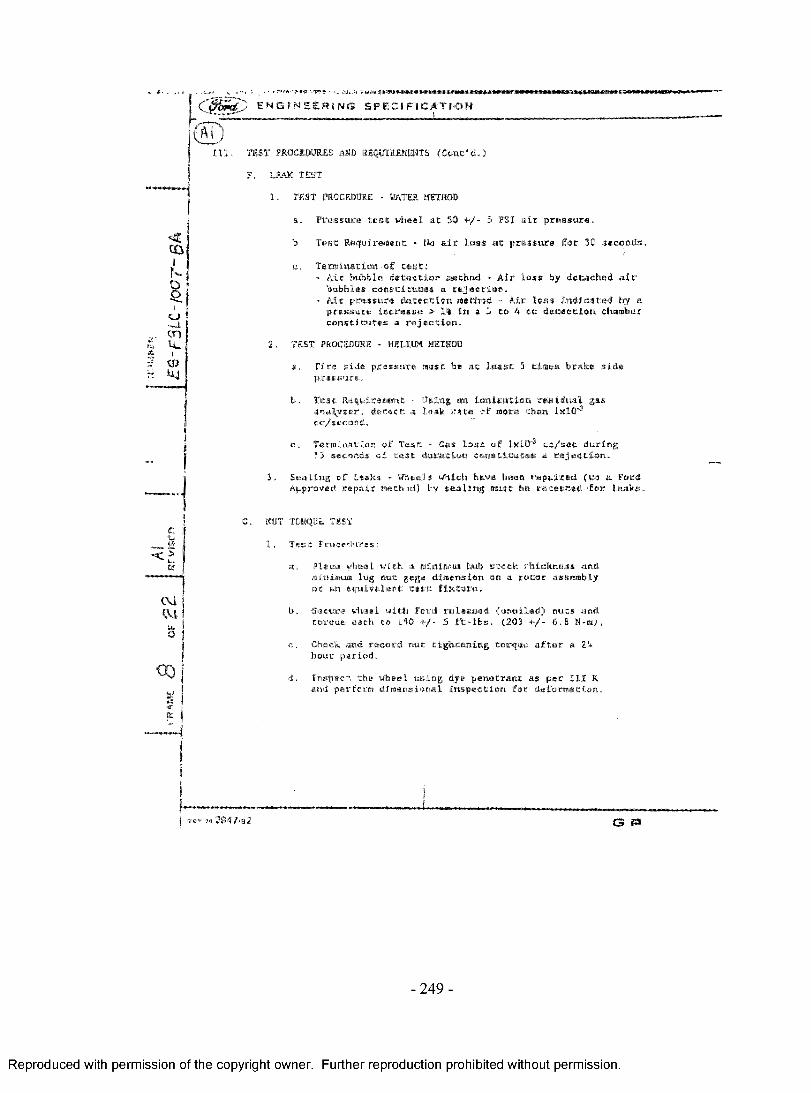
C ® ) e n g i n e e r i n g s p e c i f i c a t i o n
©
<DO
mu.
(
U)UJ
I I I . TEST PROCEOyRES AMD REQUIREMENTS { Ca n t ' d , )
F. LEAK TEST
1, TEST PROCEDURE - WATER METHOD
a. P re s s u re t e s t w heel a t 30 +•/* 3 PS I s i t p r e s s u r e .
b . T e s t R equirem ent * No a i r lo s s a t p re s s u re f o r 30 se c o n d s ,
c . T erm in a tio n o f t e s t ;• A i t bubble d e te c t i o r aech n d - A ir l o s s by d e ta c h e d a i r
b u b b les c o n s t i t u t e s a r e j e c t i o n .- A ir p re s su re d e te c t io n n e th o d - A it l a s s in d ic a te d by a
p re s s u re in c re a s e > I I in a 3 to 4 cc d e te c t io n cham ber c o n s t i t u t e s a r e j e c t i o n .
2 , TEST PROCEDURE - HELIUM METHOD
a. T ire s id e p re s s u re m ust he a t l e a s t 3 tim es b rak e s id ep r e s s u r e ,
b . T e s t R equirem ent • U sing an Io n is a tio n , r e s i d u a l gasa n a ly z e r , d e te c t a le a k r a t e more th a n 1x10*® c c /se co n d .
c . T enm »»; ion o f T e s t - Gas l a s s u£ SxlO-3 t c / s a c d u r in g 13 seconds c £ t e a t d u ra t io n eftn*elcuc«s a r e j e c t i o n ,
3 , S e a lin g o f beaks - W heels w hich have bean r e p a i r e d (co > Ford Approved r e p a i r me ch id ) ty s e a l in g m ust be r e t e s t e d Cor le a k s .
G. NUT TORQUE TEST
t , T e s t P ro c e d u re s :
0 0
3
P lace wheal w ith a minimum hub stcck , th ic k n e s s and «ini»»u*t lu g n u t g a g e d im ension on a r o to r assem blyo r an e q u iv a le n t t e s t f i x tu r e .
S ecure wheel w ith Ford re le a s e d , (u n o ile d ) n u ts and toroue, each to ISO + /- 5 f t - l b s . (203 + /- 6 .8 N-ts) .
Check and re c o rd n u t t ig h te n in g to rq u e a f t e r a 2 ‘* h o u r p e r io d .
I n s p e c t th e w heel u s in g dye p e n e t r a n t m pee I I I K and perform d im e n s io n a l in s p e c t io n fo r d s fo rw iC ia n ,
i 394 ?-a2
-2 4 9 -
Reproduced with permission of the copyright owner. Further reproduction prohibited without permission.
E N G I N E E R I N G S P E C I M C A T i O N
>%.
t .
in,Nut Toque Test (Contd J
< £ 2 , Test Requirements:cQ, , a , Muts must not pull thru spider»(<-O b. No cracks in the wheel.0
1yr n
c . No significant lass of lug nut torque.
3 , Termination of Test;
a . Cracks in the wheel, deformation of the wheel or p H thru of the ^ spider,
. m* U J b . Loss of lug nut torque to a value below 130 ft,-lb s, £176 N-m),
H , Photomicrographs
1 , Test Procedure:
a , Wheel shall be prepared to make visible the aluminum structure of the hub section, Photomicrographs are to be taken at 250X power of the prepared sample.
b . Prepared photomicrographs shall be compared to Ford approved master samples.
2 . Test Requirements:
a a , Photomicrographs should display typical grain patterns of modifiedand aged aluminum casting alloy.
<MCM 3 , Sample Rejection:
a , Material structure not consistent with the master samples,
cn 1 , Test Procedure:
22 a . Inspect wheel per ASTM E155, Volume I Standards.
b , Radiographic plates must be used In conjunction with a penetrometer. The penetrometer used shall be of consistent thickness with the wheel section being examined.
|j
r ?« 3S47-&2 XB P
-2 5 0 -
Reproduced with permission of the copyright owner. Further reproduction prohibited without permission.
E N G I N E E R I N G S P E C I Ft C AT I ON
<CeQr iOO
O_ jrO
fc <-A-K 1I (J1 Z U j
CiSr>
HI. TEST PROCEDURES A HD REQUIREMENTS (Cotrtri J
I . Radiographic Inspection (film ) X - ia y fContd.)
2 . Test Requirements:
a , Wheel must not display structural defects, such as cracks, internal voids, porosity, or inclusion, etc,
3 , Sample Rejection:
a , Wheels which display structural flaws which exceed acceptable levels as detereiined by minimum acceptance standards which are approved by Fori and the supplier. Duplicate films tor master samples) are retained by each party,
J , Image Intensifier
1 . Test Procedure:
a . Wheel shall be examined using an Image tntewiRer to examine ali wheels for defects In the hub, A minimum of ISy« of all wheels will also be examined in the Inboard rim for defects.
2 . Test Requirements:
a . Image Intensifier shall have a capability of at least 4% sensitivity.
b . Image intensifier shall have the capacity to allow the Inspector to Interrupt the automated cycle to selectively screen suspectareas
04
Q
ctu.
Sample Rejection:
a . Wheels which display structural flaws exceeding acceptablelevels as determined by established minimum acceptance standards. The acceptance standards are in the form of master samples which have been approved by Fori and the supplier.
OCT -'0 3 0 < )
-251 -
Reproduced with permission of the copyright owner. Further reproduction prohibited without permission.
e n g i n e e r i n g S P E C I F I C A T I O N
<ccQpLOOCj_ JtO
5 < ^2 U J
r\s<M
III» TEST PROCEDURES AMD REQUIREMENTS (Contd J
K . Ove Penetrant
1 . Test Procedure;
a , Coat th* sample (both the face and back s i t e ) with a dye penetrant solution, Remove excess penetrant solution and use dye penetrantdeveloper to examine for cracks»
MOTE: Several acceptable dye penetrant, methods exist which differ fan the above, Techniques such as Zyglo,Magna flux, e tc , which utilize a special light source toexamine for flaws can be used In tfeu of the above only If:
1 , Operators have a special training in Interpreting the patterns ,
2 . Supplier developed acceptance standards ate approved by Ford. These standards must be displayed a t each inspection location for operator reference»
2 . Test Requirements;
a . No structural flaws, such as cracks, hot tears, double shot, e tc ., which are attributed to casting or processing 0 ,em a c h in in g , wheel straightening, e tc .) .
3 . Sample Rejection:
MOTE: This definition applies to wheels examined prior to fatigue cycling as specified In Dynamic Cornering Fatigue Test Procedure and Dynamic Radial fatigue Test Procedure.Once fatigue cycling has been initiated, the termination of test as specified in Cornering Fatigue Test Procedure ill A . and Radial Test Procedure 111 B. applies .
a , Any cracks visible on the wheel, surface defects such as casting voids, exposed pores, e tc , as defined by acceptance standards jointly approved by Ford and the supplier.
L . Surface Finish
I . Test Procedure;
a . Using comparative plates, the surface finish of the wheel is bo be sampled both before and after painting. Surface finish shall be evaluated for as-cast, machined, polished, and painted surfaces .
t oct 13
-2 5 2 -
Reproduced with permission of the copyright owner. Further reproduction prohibited without permission.
FRA
Mf
12 or
22
REV
ISED
'
E S’F
3 L C’
I 007
- B A
cm:> E N G I N E E R I N G s p e c i f i c a t i o n
m , TEST PROCEDURES AMD REQUIREMENTS (Cortd J
L , Surface Finish (ContdJ
2 , Tast Requirements:
a , As-cast surfaces stall be no rougher than 450 micro-inches .
b . Machined surfaces stall be no rougher than 125 micro-inches,
c . Polished surfaces shall be no rougher than 35 micro-inches,
i . Painted surfaces stall ta u t a surface finish no rougher than 125 micro-inches when applied to machined or polished surfaces and 450 micro-inches when aver an as-cast surface.
3 , Sample Rejection:
a „ As-cast surfaces rougher than 4 5 0 micro-inches.
b . Machined surfaces rougher t e n 125 micro-inches ,
c J Polished surfaces rougher t e n 35 micro-inches ,
d , Painted surfaces rougher t e n 125 micro-inches applied over a machined or polished surface,
a „ Painted surfaces rougher t e n 450 micro-inches when applied .mar as-cast surface,
M. Visual Appearance Approval
1 , Test Procedure;
Production Validation
a . Wheels which display anticipated production appearance variances must be submitted (two wheels minimum) to Ford Styling far approval. Upon approval, these wheels stall be used as master samples, one to be retained by Styling SQA and one by the supplier, These wheels represent the minimum appearance levels anticipted,
lit-Process
■ a , Compare production wheels with master samples far visual appearance and reject those wheels which do not confertn,
ocr ?* 394?-»2 £“> pa
-253 -
Reproduced with permission of the copyright owner. Further reproduction prohibited without permission.
e n g i n e e r i n g s p e c i f i c a t i o n
<ccQK-o0
1CJ
rO
| <jD« U J
X I
■“nCMfM J
I<s.u.
I I I . TEST PROCEDURES AMP REQUIREMENTS fContsfJ
M , Visual Appearance Approval (Cento 3
2» Test Requirements:
a » Wheels must conform to styling theme and appearance objectives as approved by Fed Styling,
b . Wheels must be of equal or better appearance to master samples approved by Ford,
3 . Sample Rejection;
a . Wheels which do net meet the appearance intent or which do not meat the minimum appearance acceptance levels as represented % master sample wheels.
N . material Tests-.
I » Test Procedures
■ i" \ a . Test bars shall be taken from a wheel section as shown in Figure 4and meet the dimensional requirements per A5TM*€8 or SAE J416B ,
Substandard Tensile Bara, am approved by Chassis Engineering,
2 , Test Requirements:
a , Test requirements shall be consistent with ESA-M2A123-A .
3 , Sample Rejection;
a , Material properties below minimum levels specified in E5A-M2A123-A.
4 , Retest Procedure:
Retests are allowed an samples from heat treat lets which do not meet"minimum mechanical property requirements per the following procedure;
a . If the initial sample Is urebte to meet the minimum requirement for any reason (flawed or not}, test two additional samples from the same wheel, If both pass, accept the heat treat lot. if either does not meet the minimum requirements, follow 4 b .
b. Obtain three additional samples from the heat treat lead to be composed of two samples from the same casting date and lot as the originalsample and one random sample. If all pass, accept the heat beat load, IF the minimum requirements are not mat due to a flaw, fellow Section 4 c . If the minimum requirements are net met and no flaw is present, follow Section 4 d .
r St* 394 7 :>Z C ? p i
-2 5 4 -
Reproduced with permission of the copyright owner. Further reproduction prohibited without permission.
C J S E N G I N E E R I N G S P E C I F I C A T I O N
C lNLO0
1o
H I£ u _
!«/>Z 1....I I
o
CM<M
III,
N. Material Tests (Contti J ;t
4 . Retest Procedure (Contd.} • |I
c . Retest Samples Due to a Flaw; Refect entire beat treat load.Refluomseope load 100T» Chub anti rim) and sample two wheels from every casting lo t. Test samples and certify these casting lots where both samples passed. If the minimum requirements am not met for either sample, scrap that casting lot.
d . Retest Samples Met Oue ts a Flaw Should any of the retested samples not meet minimum property requirements a r t no flaws were present, the entire lead must be reheat treated or scrapped,If reheat treated, sample per Section 4 e .
e . Reheat Treatment; Reheat treated loads w ill receive the standard heat treat cycle and be issued a new heat treat number that is consistent with the heat treat sequence. Pull (fair samples minimum for certification as follows:
Randomly select two samples from the Initial casting date which did not meet the minimum property requirements and two samples from each casting lot in load. Certify the load If all pass or certify those casting lots which pass. Any casting lots which do not meet the minimum property requirements must be scrapped,
F. Definition of Flaw; A flaw is any Internal defect (porosity, inclusion, etc.) easily visible with the naked eye a r t whose total surface area is at least 2% o f the fracture surface area .Surface imperfection on tensile samples which are extremely small and do not show gross segregation are considered typical casting imperfection and cannot be considered as flaws .
0 ‘, paint Quality, Clear Coating a rt Decorative FI nish of Exterior Parts
' 1 . Test Procedure:
u * a . Tests shall be conducted as per EBA-M2P10S-AZ
2 , Test Requirements:
a . Test requirements shall be consistent with ESA-M2P1Q9-A2.
I x 394 M l & P
-2 5 5 -
permission of the copyright owner. Further reproduction prohibited without permission.

<cCOpLOoO
NOu .cn
01 >•J
r\jCM
5
lO
E N G I N E E R I N G S P E C I F I C A T ! O N
H I. TEST PROCEOORES AND REQUIREMENTS CContd,3
0 , Paint Quality, Clear Coating and Decorative Finish of Exterior Parts CContd .3
3 . Termination of Test;
a . Therainimuffl«ase^aW«i»?utrwrietits ate specified in iS M #2P 1tS -A 2.
]n the event that a Judgement dr interpretation twist be made tn determiningcompliance to these test requirements, Ford Chassis Engineering shall make that determination,
IV, STATISTICAL ANALYSIS METHODS
A . The following are methods for data reduction to be used to compute the reiiabi lity values. Alternate methods as specified in E5-D4AA-1287-AA are acceptable,
1 , Test the number of samples specified In Section H, Table oF Tests,(minimum sample size} per the requirements of Section 111.
. 2 . I f the sample is unable to meet the minim* requirements, stop the te s t. The sample does net meet the statistical acceptance criterion,The supplier shall inform For! 5GA, Purchasing, Production Control and Chassis Engineering and shall Invoke "ES Test Failure" as per Q-1G1 or the Supplier's Control Plan, The Supplier Control Plan must be reviewed and approved by ford SQA and Chassis Engineering before It can be Instituted .
3 . I? the sample satisfactorily meets the test requirements, the statistical acceptance criterion is met,
8 . 3-Sigma
The 3-sigma statistical analysis Is used to demonstrate the process capability . The analysis Is used to ensure the minimum and/or maximum acceptance levels are maintained.
1 . Test the number of samples specified in Section It, Table ofTests,(minimum sample size! and enter the measured values in column 2 of the table below,
e c r te, 394? ■>}. CS G*
-2 5 6 -
Reproduced with permission of the copyright owner. Further reproduction prohibited without permission.

<^3 I S a D E N G ! N E E « f N (5 S P E C I F I C A T I O N
<cCQf-L.o01c j
§ c n* LU
IV . STATISTICAL ANALYSIS METHODS tCotttf.)
8 . 3-Sigma (Contd.)
. 2 . Make the eafeuiitfons noted Wow:
а . Calculate:
cr = and^ =
б . MultiplyC by 3 = 1 * 3 CT
c . Determine 3-sigma levels; + 3 Sign® * 1 + 3 CF- 3 Sigma = f « 3 Cf
3 . Compare the resultant sigma values with the requirements of the appropriate test procedure given In Section f l l .
T est Sample
123
Test DataDeviation From
Mean X - I tDeviation 2
Square IX
Total : C"XL.A Total S x -X i"
C9
<• I'i. I
I
C . X Bar and ft Chart
An X Bar (5?) chart is a plot of the averages of the process measurements of several sample Sets. The chart o f f Indicates when a change has occurred inthe cental tendency. The R chart: Is a plot of the mages of the mipurwsents af several sample s e ts , The chart R values Indicate when a slgnificart gainor less In uniformity has taken place.
i3!W7 *3 V*
-257 -
Reproduced with permission of the copyright owner. Further reproduction prohibited without permission.
I E N G I N E E R I N G 5 “ E C I F I C A T I O N
V . REVAUDAT10N REQUIREMENTS
The following revaluation is required b r a change in process of Material or new supplier qualification (new materia! source). The "Test Numbers" to be enteredin the "ES Tests Required" column? refer to the ES test number In the table in Section I I .
Running Change Revalidation
Specific Process
Modifloat ton of Casting Machine (Including Relocation)
Mold Modification
Machining Process (Including Relocation)
ES Tests Required
Sample Size Per Mold
III A 3III B 3III E 30III 1 . 10
III A 3III B 311! E 30III 1 10
111 A 3‘III B 3hi e 30HI F 25III L 2
MaterialChange
NewSupplier
See Q-101 See Q-101
V i. LOT DEFINITION
. A casting tot is defined as all wheels cast fain one mold fora period of 24 hours.
. A heat te a t lot Is defined as all wheels from one heat treat furnace load.
Recording and record retortion shall conform to Ford Q -101, Section 2 .11 and 2 ,11 .1 as applicable for all product validation, in-process tost requirements.
j G
-258 -
Reproduced with permission of the copyright owner. Further reproduction prohibited without permission.
a ■«tw.E N G IN E E R IN G S P E C IF IC A T IO N
VIII. INSTRUCTIONS AND NOTES
A » Manufacturer stall submit process sheets to the Chassis Engineering Office,
<GcQ
i . Manufacturer shall submit Manufacturing Failure Mode and Effects Analysis of the complete manufacturing process including a Control Plan to Ford • • Chassis Engineering and Ford Quality Control Office prior to ISIR date.
og
C . Process capability to be established and maintained an specific dimensions .The dimensions are to be identified and mutually agreed upon by the manufacturer and Engineering.
O '- jf O '
5
0 . Lot tisceabllity plan to be mutually agreed upon by the manufacturer and Ford.
IX . COMPILATION OF REFERENCE DOCUMENTS§ cT>z LlJ E5-D4AA-1287-AA Specification - Reliability Analysis Methods
5A £J175 Wheels - Passenger Cars - Impact Performance Requirements and Test Procedures
SAEJ416B Tensile Test Specimens
* „ , ASTM-E8
ESA-M2A123-A
inspection of Aluminum and Magnesium Casting
Aluminum Alloy CM 356-T6) Modified - CastWheel
o ESA-M2P109-A Paint Quality Clear Coating and Decorative fin ish- Exterior Parts
1X Q.-101 Quality Control Specification
CMrvj
2<f c ,u
OCT M 334 7.;,2 Q P
- 2 5 9 -
Reproduced with permission of the copyright owner. Further reproduction prohibited without permission.
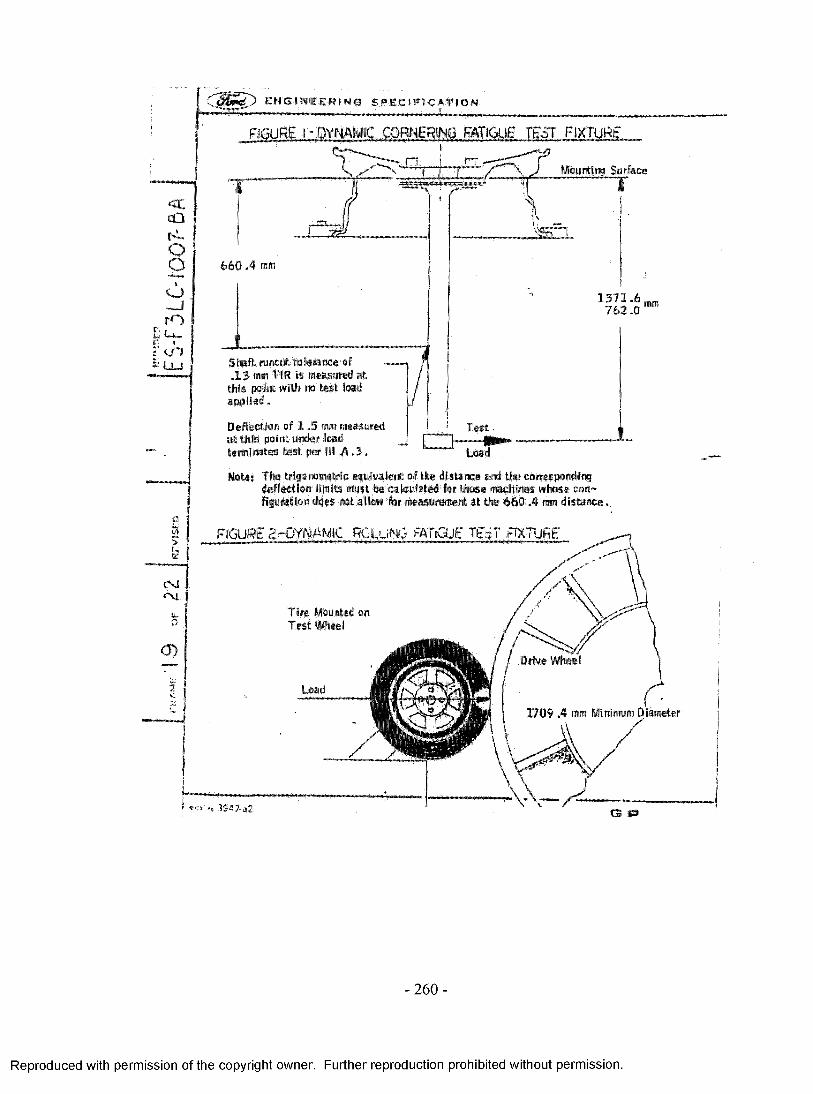
« ccQf i .oo
>
- Jr O
I" u">s’- U J
C |1 § P E N G t N E E R l N G S P E C I F I C A T I O N
FIGURE 1 -DYNAMIC CORNERING FATIGUE TEST FIXTURE
Mounting Surface
6 60 .4 mm
1 3 7 1 .6762 .0
mm
Shift runout tolerance of .13 turn T1R is measured at this point with no test load applied,
Deflection of 1 .5 mm measured at tMs point under toad terminates test per ill A .3 ,
totes The trigonometric equivalent of the distance and the corresponding deflection limits must be calculated for those machines whose cart- figuration does not allow for fBsasiiwswi at the 6 6 0 .4 mm distance,
FIGURE 2 "DYNAMIC SCLUNG FATiGUt TEcT fix tu r e
Tire Mounted on Test Wheel
Minimum Diameter1709.4
! <s« „ 194?.j2 <3 t»
- 2 6 0
Reproduced with permission of the copyright owner. Further reproduction prohibited without permission.

E N G I N E E R I N G S P E C I F I C A T I O N
-2 6 1 -
Reproduced with permission of the copyright owner. Further reproduction prohibited without permission.

E N G I N E E R I N G S P E C ' F f C A T I O N
<CcOf*LOo
tC J
, U - : t / lL U
CMCM
CMu
FIGURE 4 -MATERIAL TEST SAMPLING LOCATIONS
Tensile Sample Location
Wheel Hub ArealISTSTsciTr”™
ocr -»s 3947*a2
- 2 6 2 -
Reproduced with permission of the copyright owner. Further reproduction prohibited without permission.
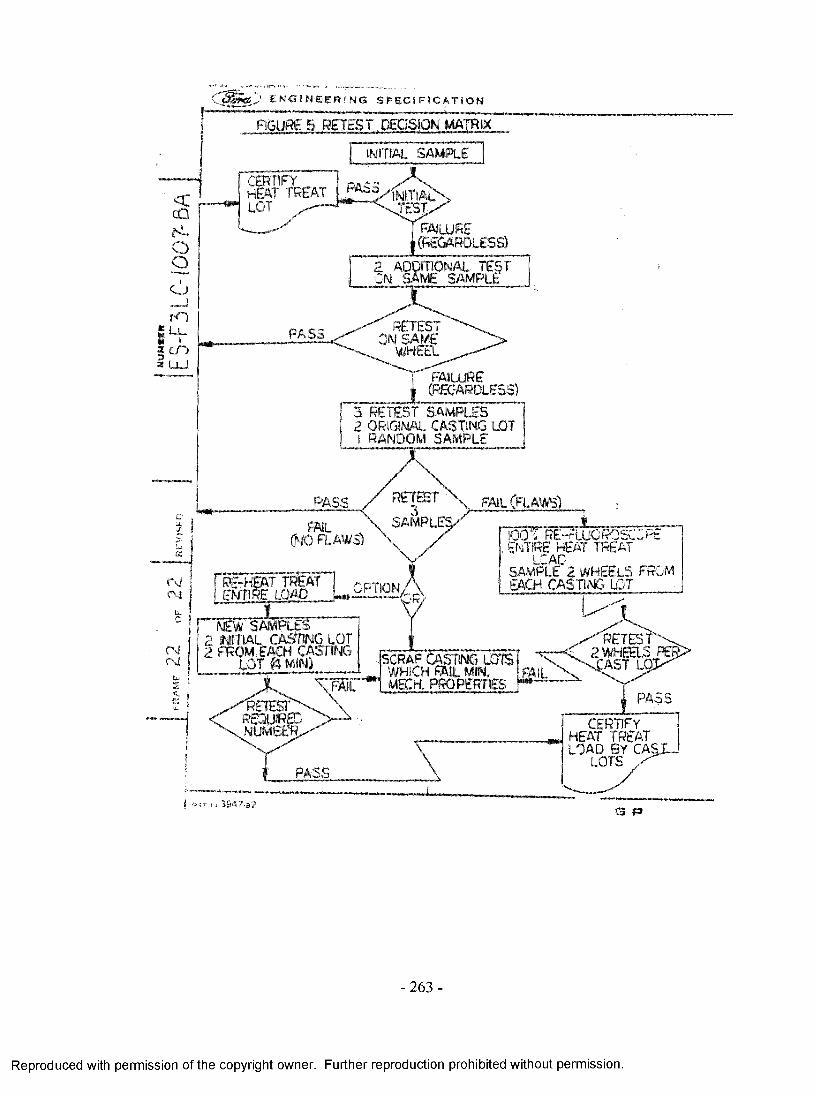
c\ jCM
<COQt LOO
iC J
rO: l l .
iCO
> E N G 1 M E E R ! N C S P E C I F I C A T I O N
FIGURE 5 RETEST DK1S10N MATRIX
INITIAL SAMPLE
CERTIFY HEM TREAT LOT
INITIALTEST
FAILURE(REGARDLESS)
2 ADDITIONAL TEST ON SAME SAMPLE
PASS
3 RETEST SAMPLES 2 ORIGINAL CASTING LOT I RANDOM SAMPLE
PASS
FAIL x (NO FLAWS)
RE-HEAT TREAT ENTIRE LOAD
I LNEW SAMPLES
2 INITIAL CASTING LOT Z FROM EACH CASTING
LOT & m m
FAIL (FLAWS)
O P TIO N /\ R>
±\QQl RE-FLUCRose0Ft ENTIRE HEAT TREAT
LOADSAMPLE 2 WHEELS FirQM EACH CASTOR LOT
SCRAP CASTING LOTS WHICH FAIL MIN. WECH. PROPERTIES
RETESTrequiredNUMBER CERTIFY
HEAT TREAT LOAD BY CAS)
LOTS
cr ■: 33*1?.a2 13 13
-263 -
Reproduced with permission of the copyright owner. Further reproduction prohibited without permission.

Appendix F - Abbreviated input keywords of impact testing model (LS-DYNA)
* KEYWORD * T I T L Ea l _ t i r e _ s p o k e$$ HM_OUTPUT_DECK c r e a t e d 1 2 : 1 8 : 2 8 0 5 - 1 7 - 2 0 0 4 b y H y p e r M e s h V e r s i o n 6 . 0$ $ L s - d y n a I n p u t D e c k G e n e r a t e d b y H y p e r M e s h V e r s i o n $ $ G e n e r a t e d u s i n g H y p e r M e s h - L s - d y n a T e m p l a t e V e r s i o n * CONTROL TERMINATION
DTMIN ENDENG ENDMAS0.0 0.0 0.0
$ $ ENDTIM ENDCYC8 . 5 E - 0 2 0
*CONTROL_TIMESTEP $ $ D T I N I T TSSFAC ISDO TS LIM T DT2MS
6 . 0 6.0
LCTM ERODE
* CONTROL_SHELL$ $ WRPANG ESORT
20.0 2* CONTROL_HOURGLAS S $ $ I HQ QH
4 0 . 1*CONTROL_SOLID $ $ ESORT
IRNXX-1
IS T U P D THEORY BWC M ITER
* CONTROL_BULK_VIS CO SIT Y $$ Q2 Q1
*CONTROL_DYNAMIC_RELAXATION $ $ NRCYCK DRTOL DRFCTR
2 1 . 0 0 0 0 E - 0 3 * CONTROL_CONTACT $ $ SLSFAC RWPNAL
$ $ USRSTR USRFRC
0 . 9 9 5
ISLCHK
NSBCS
DRTERM
SHLTHK
INTERM
TSSFD R
PENOPT4
XPENE
IRELAL
THKCHG
SSTHK
EDTTL
O R IE N
ECDT
* CONTROLJOUTPUT $ $ NPOPT NEECHO NREFUP IACCOP O P I F S I P N I N T I K E D I T
* CONTROL_ENERGY$ $ HGEN RWEN SLNTEN RYLEN
2$$DATABASE_OPTION - - C o n t r o l C a r d s f o r A S C I I o u t p u t *DATABASE_GLSTAT
8 . 5 E - 05 *DATABASE_MATSUM
8 . 5 E - 0 5* DATABAS E_RCFORC
8 . 5 E - 05* DAT ABAS E _ S LEOUT
8 . 5 E - 05 *DATABASE_BINARY_D3 PLOT$ $ D T/C Y CL LCDT BEAM NPLTC
8 . 5 E - 0 4* DATAB AS E_B INARY_D3 THDT $ $ D T/C Y CL L C ID
* DATAB AS E_EXTENT_B I NARY $ $ N E I P H N E I P S
$ $ CMPFLG
‘ NODE
IE V E R P
MAXINT3
BEAMIP
2 1 . 7 3 0 3 4
STRFLG
DCOMP
- 2 0 3 . 8 5 7 3
S IG F L G
SHGE
EPSFLG
ST S S Z
RLTFLG
N3THDT
2 5 . 6 5 8 2
1 8 6 7 6 3 1 6 4 . 1 3 6 0 7 2 9 7 4 7 9 9 3 2 6 . 9 2 7 2 6 5 1 4 5 8 0 2 1 9 . 8 2 7 7 7 9 6 7 9 9 8 2 4 *M AT_ELASTIC$HMNAME MATS l s t r i k e r
1 7 . 8 0 0 0 E - 0 9 2 0 6 7 0 0 . 0 0 . 2 9 2*M AT_ELASTIC$HMNAME MATS 2 w e i g h t
2 2 . 7 8 8 0 E - 0 8 2 0 6 7 0 0 . 0 0 . 2 9 2
- 2 6 4 -
M S IS T
PR O J
IDRFLG
ENMASS
T I E D P R J
ENGFLG
Reproduced with permission of the copyright owner. Further reproduction prohibited without permission.

*M AT_ELASTIC$HMNAME MATS S s i d e w a l l
6 1 . 3 0 0 0 E - 0 9 2 0 0 . 0 0 . 4 9*M AT_ELASTIC$HMNAME MATS 7 t o p w a l l
7 1 . 2 6 0 0 E - 0 9 2 0 0 . 0 0 . 4 9* M A T _ P IE C E W IS E _ L IN E A R _ P L A S T IC IT Y $HMNAME MATS 3 h u b
3 2 . 8 0 0 0 E - 0 9 6 3 7 0 0 . 0 0 . 3 41
$ $ HM E n t r i e s i n S t r e s s - S t r a i n C u r v e =
* MAT_P IE C E W IS E _ L IN E AR _PL A S T I C I T Y $HMNAME MATS 4 s p o k e
4 2 . 8 0 0 0 E - 0 9 6 3 7 0 0 . 0 0 . 3 42
$ $ HM E n t r i e s i n S t r e s s - S t r a i n C u r v e =
* M A T _ P IE C E W IS E _ L IN E A R _ P L A S T IC IT Y $HMNAME MATS 5 r i m
5 2 . 8 0 0 0 E - 0 9 6 3 7 0 0 . 0 0 . 3 43
$ $ HM E n t r i e s i n S t r e s s - S t r a i n C u r v e =
*M AT_MOONEY-RIVLIN_RUBBER $HMNAME MATS 8 1 o w e r t r e a d
8 1 . 2 4 0 0 E - 0 9 0 . 4 9 9 0 . 5 5 1 8
*MAT_MOONEY-RIVLIN_RUBBER $HMNAME MATS 9 u p p e r t r e a d
9 2 . 5 4 0 0 E - 0 9 0 . 4 9 9 5 . 5 4 1
‘ PART$HMNAME COMPS $HMCOLOR COMPS
$HMNAME COMPS $HMCOLOR COMPS
$HMNAME COMPS $HMCOLOR COMPS
$HMNAME COMPS $HMCOLOR COMPS
l n m1 7
L 5
12
4
3
1 34 s t r i k e r
4 9
2 s p o k e 2
3 h u b 3
$HMNAME COMPS $HMCOLOR COMPS
1 1 5 w e i g h t
5 10
$HMNAME COMPS $HMCOLOR COMPS
1 2 6 r i m _ i n n e r 6 11
$HMNAME COMPS $HMCOLOR COMPS
4 57 s i d e w a l l
7 8
$HMNAME COMPS $HMCOLOR COMPS
2 6 8 t o p w a l l
8 13
$HMNAME COMPS $HMCOLOR COMPS
3 79 s i d e t r e a d
9 6
2 0 3 . 0
2 0 8 . 0
2 1 8 . 0
0 . 1 3 7
0 . 9 8 5 3
-265 -
Reproduced with permission of the copyright owner. Further reproduction prohibited without permission.
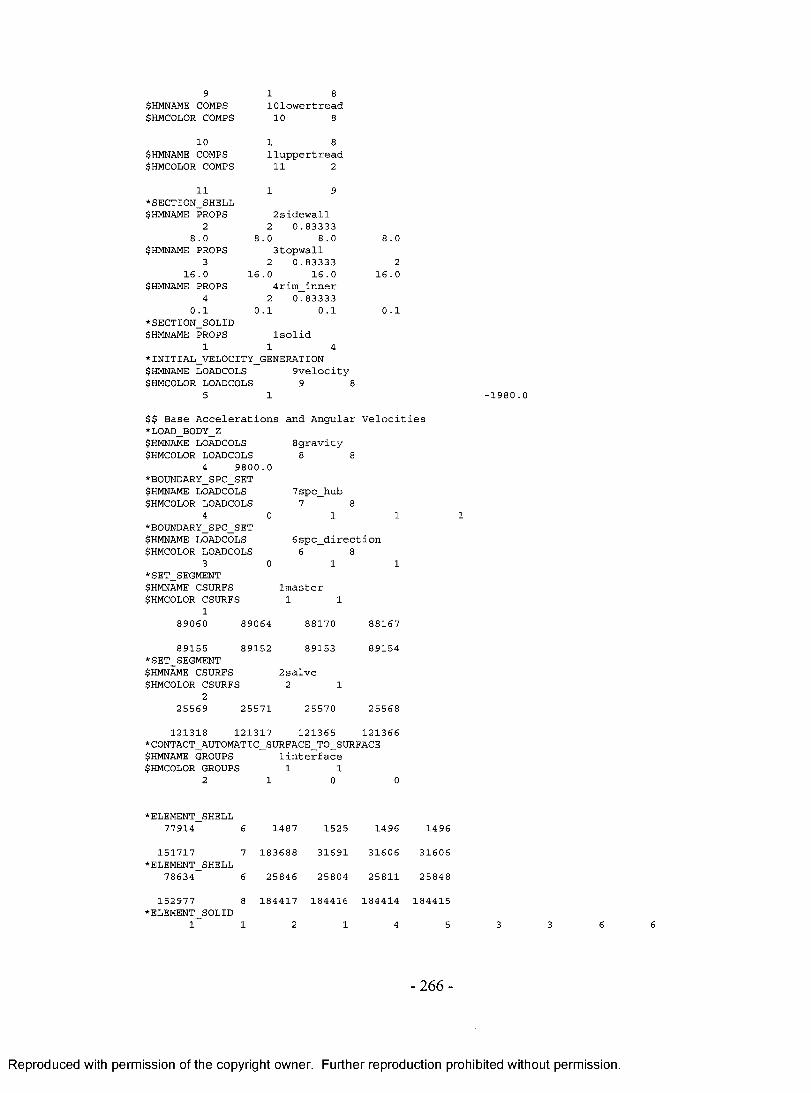
9$HMNAME COMPS $HMCOLOR COMPS
1 8 l O l o w e r t r e a d
10 8
10$HMNAME COMPS $HMCOLOR COMPS
l l u p p e r t r e a d 11 2
11*S E C T IO N _S H E L L $HMNAME PROPS
28 . 0 8
$HMNAME PROPS3
1 6 . 0 16$HMNAME PROPS
40 . 1 0
* S E C T IO N _ S O L ID $HMNAME PROPS
1* I N I T I A L _ V E L O C I T Y $HMNAME LOADCOLS $HMCOLOR LOADCOLS
5
2 s i d e w a l l 2 0 . 8 3 3 3 3
. 0 8 . 03 t o p w a l l
2 0 . 8 3 3 3 3. 0 1 6 . 0
4 r i m _ i n n e r 2 0 . 8 3 3 3 3
l . l 0.1
I s o l i d 1 4
GENERATION9 v e l o c i t y
9 81
8 . 0
21 6 . 0
0 . 1
- 1 9 8 0 . 0
$ $ B a s e A c c e l e r a t i o n s a n d A n g u l a r V e l o c i t i e s *LOAD BODY Z$HMNAME LOADCOLS $HMCOLOR LOADCOLS
4 9 8 0 0*BOUNDARY_SPC_SET $HMNAME LOADCOLS $HMCOLOR LOADCOLS
4* BOUNDARY_S P C _ S E T $HMNAME LOADCOLS $HMCOLOR LOADCOLS
3*SET_SEGMENT $HMNAME CSURFS $HMCOLOR CSURFS
18 9 0 6 0
8 g r a v i t y8
7 s p c _ h u b 7 8
1
6 s p c _ d i r e c t i o n 6 8
1
l m a s t e r 1 1
8 9 0 6 4
8 9 1 5 5 8 9 1 5 2*SET_SEGMENT $HMNAME CSURFS $HMCOLOR CSURFS
22 5 5 6 9 2 5 5 7 1
8 8 1 7 0
8 9 1 5 3
2 s a l v e 2 1
2 5 5 7 0
8 8 1 6 7
8 9 1 5 4
2 5 5 6 8
1 2 1 3 1 8 1 2 1 3 1 7 1 2 1 3 6 5 1 2 1 3 6 6* CONTACT AUTOMATIC SURFACE TO SURFACE$HMNAME GROUPS l i n t e r f a c e$HMCOLOR GROUPS 1 1
2 1 0 0
* ELEMENT SHELL7 7 9 1 4 6 1 4 8 7 1 5 2 5 1 4 9 6 1 4 9 6
1 5 1 7 1 7 7 1 8 3 6 8 8 3 1 6 9 1 3 1 6 0 6 3 1 6 0 6* ELEMENT SHELL
7 8 6 3 4 6 2 5 8 4 6 2 5 8 0 4 2 5 8 1 1 2 5 8 4 8
1 5 2 9 7 7 8 1 8 4 4 1 7 1 8 4 4 1 6 1 8 4 4 1 4 1 8 4 4 1 5♦ELEMENT SO L ID
1 1 2 1 4 5
- 2 6 6 -
Reproduced with permission of the copyright owner. Further reproduction prohibited without permission.
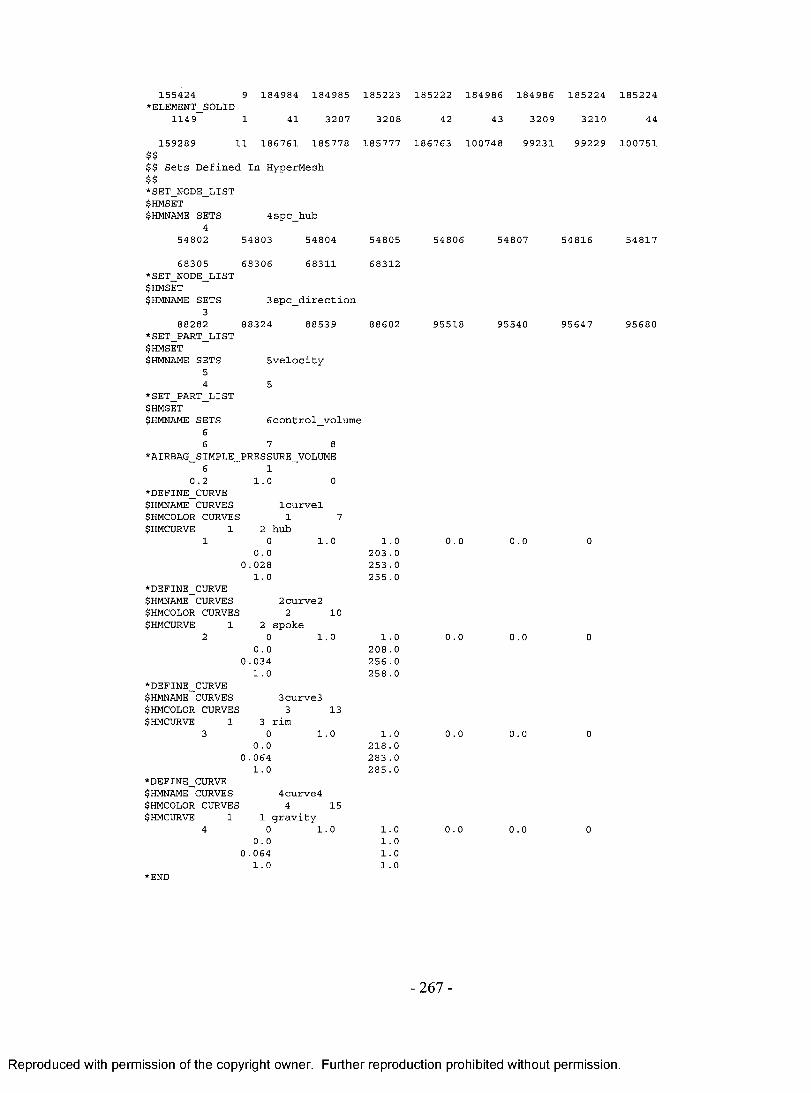
1 5 5 4 2 4 9 1 8 4 9 8 4 1 8 4 9 8 5 1 8 5 2 2 3 1 8 5 2 2 2 1 8 4 9 8 6 1 8 4 9 8 6 1 8 5 2 2 4 1 8 5 2 2 4*ELEM ENT_SOLID
1 1 4 9 1 4 1 3 2 0 7 3 2 0 8 4 2 4 3 3 2 0 9 3 2 1 0 44
1 5 9 2 8 9 1 1 1 8 6 7 6 1 1 8 5 7 7 8 1 8 5 7 7 7 1 8 6 7 6 3 1 0 0 7 4 E 9 9 2 3 1 9 9 2 2 9
5 v e l o c i t y
5
6 c o n t r o l v o l u m e
$$$ $ S e t s D e f i n e d I n H y p e r M e s h $$* S E T _ N O D E _ L IS T$HMSET$HMNAME SE TS 4 s p c _ h u b
45 4 8 0 2 5 4 8 0 3 5 4 8 0 4
6 8 3 0 5 6 8 3 0 6 6 8 3 1 1* S E T _ N O D E _ L IS T $HMSET$HMNAME SE T S 3 s p c _ d i r e c t i o n
38 8 2 8 2 8 8 3 2 4 8 8 5 3 9
* S E T _ P A R T _ L I S T $HMSET$HMNAME SE TS
54
* S E T _ P A R T _ L I S T $HMSET$HMNAME SE TS
66 7 8
*AIRBAG_SIM PLE_PRESSURE_VOLUME 6 1
0 . 2 1 . 0 0*DEFINE_CURVE$HMNAME CURVES l c u r v e l$HMCOLOR CURVES 1 7$HMCURVE 1 2 h u b
1 0 1 . 00 . 0
0 . 0 2 8 1 . 0
*DEFINE_CURVE$HMNAME CURVES 2 c u r v e 2$HMCOLOR CURVES 2 10$HMCURVE 1 2 s p o k e
2 0 1 . 00 . 0
0 . 0 3 4 1 . 0
*DEFINE_CURVE$HMNAME CURVES 3 c u r v e 3$HMCOLOR CURVES 3 13$HMCURVE 1 3 r i m
3 0 1 . 00 . 0
0 . 0 6 4 1 . 0
*DEFINE_CURVE5HMNAME CURVES 4 c u r v e 4$HMCOLOR CURVES 4 15
5 4 8 0 5
6 8 3 1 2
8 8 6 0 2
$HMCURVE
*END
1 g r a v i t y 0 1 . 0
0 . 0 0 . 0 6 4
1. 0
1 . 0 2 0 3 . 0 2 5 3 . 0 2 5 5 . 0
1. 0 2 0 8 . 0 2 5 6 . 0 2 5 8 . 0
1 . 0 2 1 8 . 0 2 8 3 . 0 2 8 5 . 0
1.0 1. 0 1.0 1 . 0
5 4 8 0 6 5 4 8 0 7 5 4 8 1 6
9 5 5 1 8 9 5 5 4 0 9 5 6 4 7
0 . 0 0 . 0
0 . 0 0 . 0
0 . 0 0 . 0
0 . 0 0 . 0
- 2 6 7 -
1 0 0 7 5 1
5 4 8 1 7
9 5 6 8 0
Reproduced with permission of the copyright owner. Further reproduction prohibited without permission.
Appendix G - Abbreviated input keywords of cornering fatigue testing model with implicit simulation method (NASTRAN)
$$--------------------------------------------------------------------------------------------------------------------------------------$$$ $$ $ NASTRAN I n p u t D e c k G e n e r a t e d b y H y p e r M e s h V e r s i o n : 6 . 0 $$ $ G e n e r a t e d u s i n g H y p e r M e s h - N a s t r a n T e m p l a t e V e r s i o n : 6 . 0 $ $ $$$ T e m p l a t e : g e n e r a l $$ $ $$$----------------------------------------------------------------------------------------------------------------- $$$--------------------------------------------------------------------------------------------------------------------------------------$$$ E x e c u t i v e C o n t r o l C a r d s $$$--------------------------------------------------------------------------------------------------------------------------------------$SOL 1 0 1 CEND
$$$ C a s e C o n t r o l C a r d s $$$----------------------------------------------------------------------------------------------------------------- $T I T L E ALWHEEL_ROTARY_SPOKE $$HMNAME LOADSTEP 2 " S E T P "SUBCASE 2
SPC = 7LOAD = 8DIS PLA C EM EN T(PU N CH)=A LL S T R E S S (P U N C H )= A L L
$-------------------------------------------------------------------------------------------------------------------$$ $ B u l k D a t a C a r d s $$$----------------------------------------------------------------------------------------------------------------- $BEG IN BULKPARAM, A U TO SPC , YES$$$ $ GR ID D a t a $$GR ID 1 2 1 . 7 3 0 3 4 - 1 9 2 . 8 6 1 7 0 . 8 5 8 5
GR ID 9 6 2 7 5 - 6 . 3 E - 1 3 5 3 . 1 2 5 - 8 4 5 . 5 0 2$$$$ S P O IN T D a t a$$ $$$$----------------------------------------------------------------------------------------------------------------- $$ $ G r o u p D e f i n i t i o n s $$$----------------------------------------------------------------------------------------------------------------- $$$$$----------------------------------------------------------------------------------------------------------------- $$ $ E l e m e n t D e f i n i t i o n s $$$--------------------------------------------------------------------------------------------------------------------------------------$$$ RBE2 E l e m e n t s - S i n g l e d e p e n d e n t n o d e $RBE2 7 4 8 8 8 9 6 2 7 5 1 2 3 4 5 6 9 6 2 6 4
RBE2 7 4 8 9 2 9 6 2 7 3 1 2 3 4 5 6 9 6 2 6 8$$HMM0VE 9$ 7 4 8 8 8 7 4 8 8 9 7 4 8 9 0 7 4 8 9 1 7 4 8 9 2$$ RBE2 E l e m e n t s - M u l t i p l e d e p e n d e n t n o d e s $RBE2 7 4 8 8 1 9 6 2 6 8 1 2 3 4 5 6 5 4 8 0 2 5 4 8 0 3 5 4 8 0 4 5 4 8 0 5 5 4 8 0 6 +
+ 6 5 4 6 5 6 5 4 6 6 6 5 4 7 3 6 5 4 7 4 6 5 4 7 5 6 5 4 8 0 6 5 4 8 1$$HMMOVE 9$ 7 4 8 8 1 7 4 8 8 3 7 4 8 8 4 7 4 8 8 5 7 4 8 8 6$$ CPENTA E l e m e n t s 6 - n o d e d
-268 -
Reproduced with permission of the copyright owner. Further reproduction prohibited without permission.
CPENTA 3 9 8 1 7 6 5 3 0 0 6 5 3 0 0 7 5 3 0 0 5 5 3 0 0 9 5 3 0 1 0 5 3 0 0 8
CPENTA$$ CHEXA $CHEXA+
1 1 4 8 8 3 1 9 3 3 2 0 6 3 0 9 8 3 1 7 8 3 1 9 1 3 1 0 1
E l e m e n t s : F i r s t O r d e r
4 0 3 8 75 4 7 9 6
65 4 7 9 7
5 4 7 9 0 5 4 7 9 1 5 4 7 9 2 5 4 7 9 3 5 4 7 9 4 5 4 7 9 5 +
CHEXA+
3 9 8 1 65 2 4 8 3
85 2 4 3 8
3 0 8 3 3 1 9 2 5 2 4 8 1 5 2 4 3 4 3 0 8 5 3 1 7 7 +
6 "HUB" 6
7 "SPOKE "7 1 0
i " R IM "13
$$$$------------------------------------------------------------------------------------------------------------$ $ H y p e r M e s h n a m e a n d c o l o r i n f o r m a t i o n f o r g e n e r i c c o m p o n e n t s$$------------------------------------------------------------------------------------------------------------$HMNAME COMP 9 " R I G I D "$HMCOLOR COMP 9 15$$$$$--------------------------------------------------------------------------------------------$ $ P r o p e r t y D e f i n i t i o n f o r S u r f a c e a n d V o l u m e E l e m e n t s$$--------------------------------------------------------------------------------------------$$$ $ P S O L ID D a t a $$HMNAME COMP $HMCOLOR COMP P S OL ID $$HMNAME COMP $HMCOLOR COMP P S OL ID $$HMNAME COMP $HMCOLOR COMP P S O L ID 8 9$$$$------------------------------------------------------------------------------------------$ $ H y p e r M e s h n a m e i n f o r m a t i o n f o r g e n e r i c p r o p e r t y c o l l e c t o r s$$------------------------------------------------------------------------------------------$HMNAME PROP 1 " s o l i d "$$$$------------------------------------------------------------------------------------------$$$ $ - $$$ $ - $$$$-----------------------------------------------------------------------------$$-----------------------------------------------------------------------------$ $ HYPERMESH TAGS$$-----------------------------------------------------------------------------$ $ B E G IN TAGS $$END TAGS $$$ $ MAT1 D a t a $$HMNAME MAT 9 11 r i m "MAT1 9 6 3 7 0 0 . 0 0 . 3 4 2 . 7 0 E - 0 9$$HMNAME MAT 8 " s p o k e "MAT1 8 6 3 7 0 0 . 0 0 . 3 4 2 . 7 0 E - 0 9$$HMNAME MAT 7 " h u b "MAT1 7 6 3 7 0 0 . 0 0 . 3 4 2 . 7 0 E - 0 9$$ $$$$-----------------------------------------------------------------------------$ $ H y p e r M e s h n a m e i n f o r m a t i o n f o r g e n e r i c m a t e r i a l s$$-----------------------------------------------------------------------------
P r o p e r t y D e f i n i t i o n f o r 1 - D E l e m e n t s
M a t e r i a l D e f i n i t i o n C a r d s
- 2 6 9 -
Reproduced with permission of the copyright owner. Further reproduction prohibited without permission.
$$$$----------------------------------------------------------------------------------------------------------------- $$ $ M a t e r i a l D e f i n i t i o n C a r d s $$$------------------------------------------------------------------------------------------------------------------------------------- $$$$$----------------------------------------------------------------------------------------------------------------- $$ $ L o a d s a n d B o u n d a r y C o n d i t i o n s $
$$$$ $ H y p e r M e s h n a m e a n d c o l o r i n f o r m a t i o n f o r g e n e r i c l o a d c o l l e c t o r s $$
7 " S P C "7 1
$HMNAME LOADCOL $HMCOLOR LOADCOL $$HMNAME LOADCOL $HMCOLOR LOADCOL $$$$$$$$$$$$$$$$$$$$$$$$$$$$$$$$$$$$$$$$$$$$$$$$$$$$$$$$$$$$$$$$$$$$$$$$$$$$$$$FORCE FORCE FORCE FORCE FORCE $$$ $ SPC D a t a $$SPC
SPCADD c a r d s
FREQ c a r d s
FREQ1 c a r d s
MPCADD c a r d s
LOAD c a r d s
GRAV c a r d s
RFORCE c a r d s
E IG R L c a r d s
EIGRB c a r d s
E IG C c a r d s
E I G P c a r d s
E IG R c a r d s
FORCE D a t a
i " f o r c e "
9 6 2 7 19 6 2 7 29 6 2 7 39 6 2 7 49 6 2 7 5
1 1 6 4 1 2 3
0 1 . 0 0 0 0 0 0 0 . 0 0 0 0 0 0 7 6 2 . 0 0 0 0 0 . 0 0 0 0 0 001.0000000.000000762.00000.0000000 1 . 0 0 0 0 0 0 0 . 0 0 0 0 0 0 7 6 2 . 0 0 0 0 0 . 0 0 0 0 0 00 1 . 0 0 0 0 0 0 0 . 0 0 0 0 0 0 7 6 2 . 0 0 0 0 0 .0 1 . 0 0 0 0 0 0 0 . 0 0 0 0 0 0 7 6 2 . 0 0 0 0 0 .
0.000000
. 000000
.000000
SPC 7 1 5 4 3 1 1 2 3 0 . 0 0 0 0 0 0$$$ $ SPCD D a t a $$ENDDATA
- 2 7 0 -
Reproduced with permission of the copyright owner. Further reproduction prohibited without permission.

Appendix H - Abbreviated input keywords of cornering fatigue testing model with dynamic simulation method (LS-DYNA)
* KEYWORD * T I T L Em g - w h e e l r o t a r y f a t i g u e t e s t i n g s i m u l a t i o n$ $ HM_OUTPUT_DECK c r e a t e d 1 0 : 5 3 : 0 0 1 1 - 1 1 - 2 0 0 5 b y H y p e r M e s h V e r s i o n 6 . 0$ $ L s - d y n a I n p u t D e c k G e n e r a t e d b y H y p e r M e s h V e r s i o n $ $ G e n e r a t e d u s i n g H y p e r M e s h - L s - d y n a T e m p l a t e V e r s i o n ‘ CONTROL TERMINATION
DTMIN$$ ENDCYCENDTIM 0 . 1 3 5
*CONTROL_TIMESTEP $ $ D T I N I T TSSFA C
0 . 0 0 . 9* CONTROL_HOURGLAS S $ $ I HQ QH
4 0 . 1* CONTROL_CONTACT $ $ SLSFAC RWPNAL
0 . 1 0 . 0$ $ USRSTR USRFRC
0* CONTROL_PARALLEL $ $ NCPU NUMRHS
1 0*CONTROL_OUTPUT $$ NPOPT NEECHO
0 0* CONTROL_ENERGY $ $ HGEN RWEN
2 2*DAMPING_GLOBAL $ $ L C ID VALDMP
2 1 9 8 . 0$ $DATABASE_OPTION - -* DAT ABAS E_NODOUT
0 . 0*DATABASE_ELOUT 2 . 5 0 0 0 E - 0 4* DAT ABAS E_GLS TAT 2 . 5 0 0 0 E - 0 4 *DATABASE_MATSUM 2 . 5 0 0 0 E - 0 4 *DATABASE_SPCFORC
0 . 0* DATABAS E_NOD FOR
0 . 0* DATABAS E_B IN A R Y _D 3PLO T $ $ D T/C Y C L LCDT 1 . 0 0 0 0 E - 0 3‘ NODE
1 4 3 8 . 0 6 1 3 8 5 5 4 5 3 1 4 6 - 6 1
ISDO0
ISLCHK2
NSBCS10
ACCU1
NREFUP1
SLNTEN1
STX
ENDENG
T S LIM T
SHLTHK0
INTERM0
IACCOP0
RYLEN1
STR
ENDMAS
DT2MS . 0 0 0 E - 0 7
PENOPT4
XPENE 4 . 0
O P I F S 0 . 0
STZ
6 . 0 6 . 0
LCTM
THKCHG1
SSTHK0
I P N I N T 0
SRX
ERODE
O R IE N1
ECDT0
I K E D I T1 0 0
SRY
C o n t r o l C a r d s f o r A S C I I o u t p u t
BEAM NPLTC
5 8 8 1 0 6 6 9 8 5 4 8 - 1 . 8 1 1 8 8 3 9 7 6 E - 1 3
1 1 3 9 3 1 1 . 5 1 2 0 4 9 7 6 2 8 E - 1 3 5 . 0 0 0 0 1 0 5 9 4 8 4 2 85 *M AT_ELASTIC$HMNAME MATS 1 0 E L A S T I C
1 0 1 . 8 0 0 0 E - 0 9 3 8 1 0 0 . 0 0 . 3*M AT _R IG ID$HMNAME MATS 9 r i g i d
9 7 . 8 0 0 0 E - 0 9 2 1 0 0 0 0 . 0 0 . 3 41. 0
- 9 0 3 . 4
‘ PART$HMNAME COMPS $HMCOLOR COMPS
90$HMNAME COMPS
9 0 h u b 90
9 1 s o p k e
7
10
-271 -
MS I ST
ENMASS0
T I E D P R J0
0
SRZ
Reproduced with permission of the copyright owner. Further reproduction prohibited without permission.

$HMCOLOR COMPS 91 10
9 1 1 1 0$HMNAME COMPS 9 2 r i m$HMCOLOR COMPS 92 1 3
9 2 1 1 0$HMNAME COMPS 9 7 b a r$HMCOLOR COMPS 9 7 1 4
9 7 2 9*SECTION_BEAM $HMNAME PROPS 2 b e a m
2 15 . 0 5 . 0 5 . 0
* S E C T IO N _ S O L ID $HMNAME PROPS l s o l i d
1 1 4 *CONSTRAIN ED_EXTRA_NODES_SET $HMNAME GROUPS l c o n s t r a i n t$HMCOLOR GROUPS 1 6$HMFLAG GROUPS SLAVE
9 7 7* S E T _ N O D E _ L IS T
71 4 15
9 7 5 4 9 9 7 5 6 9
* ELEMENT BEAM
9 7 5 5 09 9 3 4 6
1 6
9 7 5 5 5
0 . 0 5 . 0
1 7
9 7 5 5 6
18
9 7 5 5 7
19
9 7 5 6 0
20
9 7 5 6 2
8 3 8 6 2 97 1 1 3 9 2 9 1 1 3 9 3 0 1 1 3 9 3 1*ELEMENT__SOLID
1 007~ 90 14 2 8 5 8 7 2 1 8 1 1 8 5 5 1 6 7 3 1 6 7 3 1 8 5 4
7 3 2 1 4 92 1 0 1 9 6 4 1 0 1 9 7 4 2 6 7 9 2 2 6 7 8 2 1 0 1 9 6 5 1 0 1 9 6 5 2 6 7 8 3* ELEMENT_ SO L ID
8 2 1 90 15 16 1 7 2 0 1 8 2 9 1 8 3 0 1 8 3 1
7 4 7 4 9 9 2 1 0 5 3 6 2 1 0 5 3 5 4 1 0 5 3 5 5 1 0 5 3 6 9 9 9 6 8 7 9 9 6 8 6 9 9 6 5 7$$$$ S e t s D e f i n e d I n H y p e r M e s h $$* S E T _ N O D E _ L IS T$HMSET$HMNAME S E T S 5 s p c - s e t
52 5 6 3 7
1 0 5 2 3 4 * S E T _ S O L ID $HMSET$HMNAME SE TS
65 0 1 3 4
2 5 6 3 8
1 0 5 2 3 5
2 5 6 3 9
1 0 5 2 3 6
6 o u t p u t
5 0 1 3 5 5 0 1 3 6
5 8 3 6 2 5 8 3 6 35 8 3 7 0 5 8 3 7 1
*LOAD_NODE_POINT $HMNAME LOADCOLS $HMCOLOR LOADCOLS
1 1 3 9 3 0 21 1 3 9 3 0 1
*BOUNDARY_SPC_NODE $HMNAME LOADCOLS $HMCOLOR LOADCOLS
2 5 6 3 7 0
1 0 5 2 3 9 0*LOAD_SEGMENT $ $ HMNAME LOADCOLS
5 8 3 6 4
l f o r c e1
7
2 a u t o l2
1
1
2 5 6 4 0
1 0 5 2 3 7
5 0 1 3 7
5 8 3 6 5
3 8 1 0 . 0 3 8 1 0 . 0
2 5 6 4 1
1 0 5 2 3 8
5 0 1 3 8
5 8 3 6 6
2 5 6 4 2
1 0 5 2 3 9
5 0 1 3 9
5 8 3 6 7
2 5 6 4 3
5 0 1 4 0
5 8 3 6 8
3 L o a d S e g m e n t _ 3
- 2 7 2 -
Reproduced with permission of the copyright owner. Further reproduction prohibited without permission.
22
9 7 5 6 7
1 8 5 4
2 6 7 8 3
1 8 3 2
9 9 6 5 8
2 5 6 4 4
5 0 1 4 1
5 8 3 6 9

$$ HMCOLOR LOADCOLS 9 - 5 0 . 0 3 1 3 1 7 3 1 3 2 1 3 1 3 2 9
9 - 5 0 . 0*D A T A B A S E_H ISTO R Y _SO LID_S ET $HMNAME OUTPUTBLOCKS
4 7 5 0 6 4 6 3 2 9 4 5 0 7 3
1 DATABASE H IST ORY S O L ID SET
*DEFINE_CURVE $HMNAME CURVES $ HMCOLOR CURVES $HMCURVE 1
*DEFINE_CURVE $HMNAME CURVES $ HMCOLOR CURVES $HMCURVE 1
9 c u r v e 39
p r e s s u r e10
0 1 . 0 1 . 00 . 0 1 . 0
0 . 1 4 1 . 0
8 c u r v e 2 8 13
3 s i n0 1 . 0 1 . 0
0 . 0 0 . 00 . 0 1 0 . 0
0 . 0 1 1 0 . 0 6 2 7 5 8 7 2 9 2 8 0 4 30 . 0 1 2 0 . 1 2 5 2 7 0 0 2 9 5 0 8 3 9 50 . 0 1 3 0 . 1 8 7 2 8 7 4 4 7 1 3 1 3 60 . 0 1 4 0 . 2 4 8 5 6 6 4 7 5 7 5 0 70 . 0 1 5 0 . 3 0 8 8 6 5 5 2 0 0 9 8 9 3 20 . 0 1 6 0 . 3 6 7 9 4 6 8 4 8 5 3 9 70 . 0 1 7 0 . 4 2 5 5 7 7 5 3 0 3 3 5 2 0 60 . 0 1 8 0 . 4 8 1 5 3 0 3 5 3 9 8 5 9 0 20 . 0 1 9 0 . 5 3 5 5 8 4 7 2 3 0 2 1 8 2 6
0 . 02 0 . 5 8 7 5 2 7 5 2 5 7 1 3 8 9 20 . 0 2 1 0 . 6 3 7 1 5 3 9 7 5 2 7 6 2 6 50 . 0 2 2 0 . 6 8 4 2 6 8 4 1 7 2 4 7 2 7 60 . 0 2 3 0 . 7 2 8 6 8 5 1 0 0 8 6 5 7 4 90 . 0 2 4 0 . 7 7 0 2 2 8 9 1 1 4 0 1 5 5 30 . 0 2 5 0 . 8 0 8 7 3 6 0 6 0 5 5 3 1 30 . 0 2 6 0 . 8 4 4 0 5 4 7 3 2 1 9 0 0 90 . 0 2 7 0 . 8 7 6 0 4 5 6 8 0 8 9 4 9 7 90 . 0 2 8 0 . 9 0 4 5 8 2 7 8 0 9 4 4 4 7 30 . 0 2 9 0 . 9 2 9 5 5 3 5 2 3 5 6 5 5 8 7
0 . 03 0 . 9 5 0 8 5 9 4 6 0 5 0 6 4 70 . 0 3 1 0 . 9 6 8 4 1 6 5 9 2 1 7 2 9 6 80 . 0 3 2 0 . 9 8 2 1 5 5 6 9 8 8 0 0 7 2 40 . 0 3 3 0 . 9 9 2 0 2 2 6 1 3 3 5 7 1 40 . 0 3 4 0 . 9 9 7 9 7 8 4 3 5 0 9 7 2 9 40 . 0 3 5 0 . 9 9 9 9 9 9 6 8 2 9 3 1 8 3 50 . 0 3 6 0 . 9 9 8 0 7 8 3 8 8 0 0 2 2 10 . 0 3 7 0 . 9 9 2 2 2 2 1 2 5 0 9 8 2 4 40 . 0 3 8 0 . 9 8 2 4 5 3 9 8 2 7 9 4 1 9 60 . 0 3 9 0 . 9 6 8 8 1 2 4 7 2 4 2 1 0 3 5
0 . 04 0 . 9 5 1 3 5 1 3 7 6 2 3 3 8 2 90 . 0 4 1 0 . 9 3 0 1 3 9 5 3 5 3 7 2 8 3 10 . 0 4 2 0 . 9 0 5 2 6 0 5 7 8 4 5 4 2 6 10 . 0 4 3 0 . 8 7 6 8 1 2 5 9 1 8 6 0 7 9 50 . 0 4 4 0 . 8 4 4 9 0 7 7 3 3 0 3 1 6 9 60 . 0 4 5 0 . 8 0 9 6 7 1 7 8 8 2 7 7 1 6 40 . 0 4 6 0 . 7 7 1 2 4 3 6 7 6 8 6 0 2 7 70 . 0 4 7 0 . 7 2 9 7 7 4 9 0 3 3 0 1 6 80 . 0 4 8 0 . 6 8 5 4 2 8 9 6 0 0 6 6 3 4 20 . 0 4 9 0 . 6 3 8 3 8 0 6 8 2 9 8 7 3 2 2
0 . 05 0 . 5 8 8 8 1 5 5 6 1 9 6 7 7 9 50 . 0 5 1 0 . 5 3 6 9 2 9 0 0 9 6 7 8 9 5 30 . 0 5 2 0 . 4 8 2 9 2 5 5 9 1 1 3 6 9 40 . 0 5 3 0 . 4 2 7 0 1 8 2 1 7 1 9 6 2 7 60 . 0 5 4 0 . 3 6 9 4 2 7 3 0 5 1 3 9 4 4 30 . 0 5 5 0 . 3 1 0 3 7 9 9 0 9 6 7 2 0 4 20 . 0 5 6 0 . 2 5 0 1 0 8 8 2 7 7 4 9 6 2 90 . 0 5 7 0 . 1 8 8 8 5 1 6 8 0 7 6 5 4 6 80 . 0 5 8 0 . 1 2 6 8 4 9 9 7 7 7 1 7 7 3 10 . 0 5 9 0 . 0 6 4 3 4 8 1 6 3 0 4 9 6 3 7
0 . 0 6 0 . 0 0 1 5 9 2 6 5 2 9 1 6 4 8 7
0.0 0 . 0
0 . 0 0 . 0
-273 -
3 1 3 2 8
4 7 3 7 0
0
Reproduced with permission of the copyright owner. Further reproduction prohibited without permission.
0 . 0 6 1 - 0 . 0 6 1 1 6 9 1 3 6 3 2 0 8 8 60 . 0 6 2 - 0 . 1 2 3 6 8 9 7 6 3 5 4 6 0 0 20 . 0 6 3 - 0 . 1 8 5 7 2 2 7 3 8 4 3 4 2 30 . 0 6 4 - 0 . 2 4 7 0 2 3 4 9 3 2 5 1 7 3 90 . 0 6 5 - 0 . 3 0 7 3 5 0 3 4 7 0 7 4 5 5 60 . 0 6 6 - 0 . 3 6 6 4 6 5 4 5 8 6 2 6 2 4 70 . 0 6 7 - 0 . 4 2 4 1 3 5 7 6 3 9 7 7 6 1 20 . 0 6 8 - 0 . 4 8 0 1 3 3 8 9 5 4 1 1 4 90 . 0 6 9 - 0 . 5 3 4 2 3 9 0 7 7 8 2 9 9 8 9
0 . 0 7 - 0 . 5 8 6 2 3 7 9 9 9 1 7 0 0 2 70 . 0 7 1 - 0 . 6 3 5 9 2 5 6 5 1 3 9 5 5 2 80 . 0 7 2 - 0 . 6 8 3 1 0 6 1 3 8 7 5 0 6 3 20 . 0 7 3 - 0 . 7 2 7 5 9 3 4 5 0 0 8 7 3 2 70 . 0 7 4 - 0 . 7 6 9 2 1 2 1 9 2 2 2 2 5 9 40 . 0 7 5 - 0 . 8 0 7 7 9 8 2 8 1 4 3 3 7 4 90 . 0 7 6 - 0 . 8 4 3 1 9 9 5 9 0 3 6 5 7 40 . 0 7 7 - 0 . 8 7 5 2 7 6 5 4 7 7 9 9 9 4 10 . 0 7 8 - 0 . 9 0 3 9 0 2 6 8 8 9 1 9 8 2 70 . 0 7 9 - 0 . 9 2 8 9 6 5 1 5 3 9 0 4 0 7 3
0 . 0 8 - 0 . 9 5 0 3 6 5 1 3 2 8 8 1 3 7 60 . 0 8 1 - 0 . 9 6 8 0 1 8 2 5 5 4 9 2 7 1 40 . 0 8 2 - 0 . 9 8 1 8 5 4 9 2 3 5 2 5 2 0 30 . 0 8 3 - 0 . 9 9 1 8 2 0 5 8 5 3 0 6 1 1 50 . 0 8 4 - 0 . 9 9 7 8 7 5 9 5 0 7 7 5 2 4 80 . 0 8 5 - 0 . 9 9 9 9 9 7 1 4 6 3 8 7 7 1 80 . 0 8 6 - 0 . 9 9 8 1 7 5 8 0 9 2 3 6 4 5 90 . 0 8 7 - 0 . 9 9 2 4 1 9 1 2 0 0 2 3 3 5 60 . 0 8 8 - 0 . 9 8 2 7 4 9 7 7 4 7 4 9 0 0 70 . 0 8 9 - 0 . 9 6 9 2 0 5 8 9 5 2 3 2 7 4 5
0 . 0 9 - 0 . 9 5 1 8 4 0 8 7 8 8 1 5 6 8 60 . 0 9 1 - 0 . 9 3 0 7 2 3 1 8 7 8 3 9 3 6 20 . 0 9 2 - 0 . 9 0 5 9 3 6 0 7 9 7 2 9 9 2 60 . 0 9 3 - 0 . 8 7 7 5 7 7 2 7 8 7 5 2 0 8 40 . 0 9 4 - 0 . 8 4 5 7 5 8 5 9 0 7 2 6 8 8 30 . 0 9 5 - 0 . 8 1 0 6 0 5 4 6 2 2 3 2 3 3 60 . 0 9 6 - 0 . 7 7 2 2 5 6 4 8 6 0 2 4 7 7 10 . 0 9 7 - 0 . 7 3 0 8 6 2 8 5 4 6 3 0 7 8 60 . 0 9 8 - 0 . 6 8 6 5 8 7 7 6 4 2 6 4 0 60 . 0 9 9 - 0 . 6 3 9 6 0 5 7 7 1 4 1 7 0 9 9
0 . 1 - 0 . 5 9 0 1 0 2 1 0 4 6 6 4 5 7 60 . 1 0 1 - 0 . 5 3 8 2 7 1 9 3 4 3 9 1 5 2 90 . 1 0 2 - 0 . 4 8 4 3 1 9 6 0 3 3 2 5 5 2 40 . 1 0 3 - 0 . 4 2 8 4 5 7 8 2 0 9 0 6 4 5 80 . 1 0 4 - 0 . 3 7 0 9 0 6 8 2 4 6 7 0 2 3 10 . 1 0 5 - 0 . 3 1 1 8 9 3 5 1 1 9 5 2 5 6 80 . 1 0 6 - 0 . 2 5 1 6 5 0 5 4 5 3 3 6 2 8 20 . 1 0 7 - 0 . 1 9 0 4 1 5 4 3 5 3 6 8 8 0 50 . 1 0 8 - 0 . 1 2 8 4 2 9 6 0 4 1 6 6 3 9 90 . 1 0 9 - 0 . 0 6 5 9 3 7 4 3 3 5 9 6 8 3 9
0 . 1 1 - 0 . 0 0 3 1 8 5 3 0 1 7 9 3 1 3 80 . 1 1 1 0 . 0 5 9 5 7 9 3 8 8 2 0 3 0 8 10 . 1 1 2 0 . 1 2 2 1 0 9 1 8 3 8 3 8 9 6 80 . 1 1 3 0 . 1 8 4 1 5 7 5 5 8 6 4 3 0 30 . 1 1 4 0 . 2 4 5 4 7 9 8 8 4 1 6 6 5 9 10 . 1 1 5 0 . 3 0 5 8 3 4 3 9 4 4 4 2 2 1 80 . 1 1 6 0 . 3 6 4 9 8 3 1 3 9 1 5 6 6 9 60 . 1 1 7 0 . 4 2 2 6 9 2 9 2 1 7 8 0 5 9 90 . 1 1 8 0 . 4 7 8 7 3 6 2 1 8 9 5 5 8 8 40 . 1 1 9 0 . 5 3 2 8 9 2 0 7 7 5 1 6 7 3 3
0 . 1 2 0 . 5 8 4 9 4 6 9 8 5 6 0 7 1 4 30 . 1 2 1 0 . 6 3 4 6 9 5 7 1 4 4 6 0 8 1 20 . 1 2 2 0 . 6 8 1 9 4 2 1 2 7 5 2 4 5 8 20 . 1 2 3 0 . 7 2 6 4 9 9 9 5 3 7 3 5 4 3 50 . 1 2 4 0 . 7 6 8 1 9 3 5 2 1 9 0 2 3 5 70 . 1 2 5 0 . 8 0 6 8 5 8 4 5 3 2 9 7 7 4 10 . 1 2 6 0 . 8 4 2 3 4 2 3 0 9 7 2 7 7 5 20 . 1 2 7 0 . 8 7 4 5 0 5 1 9 4 5 2 6 6 2 10 . 1 2 8 0 . 9 0 3 2 2 0 3 0 4 1 0 5 4 0 60 . 1 2 9 0 . 9 2 8 3 7 4 4 2 7 8 8 0 7 1 7
0 . 1 3 0 . 9 4 9 8 6 8 3 9 4 6 1 2 4 3 20 . 1 3 1 0 . 9 6 7 6 1 7 4 6 3 3 9 0 6 7
- 2 7 4 -
Reproduced with permission of the copyright owner. Further reproduction prohibited without permission.
0 . 1 3 2 0 . 9 8 1 5 5 1 6 5 7 7 3 0 5 6 30 . 1 3 3 0 . 9 9 1 6 1 6 0 4 1 4 5 7 6 2 20 . 1 3 4 0 . 9 9 7 7 7 0 9 3 5 2 9 6 0 2 80 . 1 3 5 0 . 9 9 9 9 9 2 0 7 3 3 0 5 9 1 9
*DEFINE_CURVE$HMNAME CURVES 7 c u r v e l$ HMCOLOR CURVES 7 7$HMCURVE 1 2 COS
0 1 . 0 1 . 00 . 0 0 . 0
0 . 0 0 5 1 . 00 . 0 1 1 . 0
0 . O i l 0 . 9 9 8 0 2 8 7 2 7 9 9 2 8 90 . 0 1 2 0 . 9 9 2 1 2 2 6 8 3 7 9 8 2 1 10 . 0 1 3 0 . 9 8 2 3 0 5 1 5 2 2 5 5 1 5 20 . 0 1 4 0 . 9 6 8 6 1 4 8 3 9 4 1 3 9 3 20 . 0 1 5 0 . 9 5 1 1 0 5 7 1 9 9 3 5 4 9 50 . 0 1 6 0 . 9 2 9 8 4 6 8 2 4 2 9 4 0 3 60 . 0 1 7 0 . 9 0 4 9 2 1 9 6 6 6 2 1 3 1 40 . 0 1 8 0 . 8 7 6 4 2 9 4 1 4 2 6 5 7 5 40 . 0 1 9 0 . 8 4 4 4 8 1 5 0 0 3 6 9 0 9 3
0 . 0 2 0 . 8 0 9 2 0 4 1 8 0 9 8 8 0 3 20 . 0 2 1 0 . 7 7 0 7 3 6 5 3 8 5 0 6 9 3 50 . 0 2 2 0 . 7 2 9 2 3 0 2 3 3 2 9 9 4 0 70 . 0 2 3 0 . 6 8 4 8 4 8 9 0 5 8 0 0 5 9 50 . 0 2 4 0 . 6 3 7 7 6 7 5 3 1 3 4 7 5 7 40 . 0 2 5 0 . 5 8 8 1 7 1 7 3 0 3 3 1 3 7 50 . 0 2 6 0 . 5 3 6 2 5 7 0 3 6 3 8 0 4 2 40 . 0 2 7 0 . 4 8 2 2 2 8 1 2 5 4 6 0 6 0 80 . 0 2 8 0 . 4 2 6 2 9 8 0 0 8 9 3 1 2 6 90 . 0 2 9 0 . 3 6 8 6 8 7 1 9 3 7 3 8 5 4 4
0 . 0 3 0 . 3 0 9 6 2 2 8 1 3 0 5 7 0 2 40 . 0 3 1 0 . 2 4 9 3 3 7 7 3 0 8 0 7 2 2 10 . 0 3 2 0 . 1 8 8 0 6 9 6 2 3 5 7 9 3 0 50 . 0 3 3 0 . 1 2 6 0 6 0 0 4 3 5 8 2 6 8 90 . 0 3 4 0 . 0 6 3 5 5 3 4 6 6 3 1 5 8 1 50 . 0 3 5 7 . 9 6 3 2 6 7 1 0 7 3 3 2 6 E - 040 . 0 3 6 - 0 . 0 6 1 9 6 3 9 5 2 4 4 7 4 5 50 . 0 3 7 - 0 . 1 2 4 4 7 9 9 3 5 9 9 5 8 2 30 . 0 3 8 - 0 . 1 8 6 5 0 5 1 5 1 9 1 7 6 4 10 . 0 3 9 - 0 . 2 4 7 7 9 5 0 6 3 0 6 9 1 4 5
0 . 04 - 0 . 3 0 8 1 0 8 0 3 1 2 7 7 9 9 20 . 0 4 1 - 0 . 3 6 7 2 0 6 2 7 0 0 1 2 3 9 10 . 0 4 2 - 0 . 4 2 4 8 5 6 7 8 1 8 6 4 9 6 90 . 0 4 3 - 0 . 4 8 0 8 3 2 2 7 7 1 5 5 3 0 40 . 0 4 4 - 0 . 5 3 4 9 1 2 0 7 0 0 2 9 4 9 60 . 0 4 5 - 0 . 5 8 6 8 8 2 9 4 8 5 2 3 8 5 90 . 0 4 6 - 0 . 6 3 6 5 4 0 0 1 5 1 6 2 4 7 20 . 0 4 7 - 0 . 6 8 3 6 8 7 4 9 4 7 7 4 4 9 40 . 0 4 8 - 0 . 7 2 8 1 3 9 5 0 6 3 4 6 3 9 60 . 0 4 9 - 0 . 7 6 9 7 2 0 7 9 5 8 6 6 0 3 4
0 . 0 5 - 0 . 8 0 8 2 6 7 4 2 7 2 6 9 3 10 . 0 5 1 - 0 . 8 4 3 6 2 7 4 2 8 7 6 5 3 1 60 . 0 5 2 - 0 . 8 7 5 6 6 1 3 9 1 9 9 1 8 1 10 . 0 5 3 - 0 . 9 0 4 2 4 3 0 2 1 6 3 8 8 2 60 . 0 5 4 - 0 . 9 2 9 2 5 9 6 3 3 3 7 3 4 7 70 . 0 5 5 - 0 . 9 5 0 6 1 2 5 9 8 1 0 2 9 1 50 . 0 5 6 - 0 . 9 6 8 2 1 7 7 3 0 8 2 3 8 6 10 . 0 5 7 - 0 . 9 8 2 0 0 5 6 2 2 5 2 5 6 8 50 . 0 5 8 - 0 . 9 9 1 9 2 1 9 1 3 8 3 8 4 8 90 . 0 5 9 - 0 . 9 9 7 9 2 7 5 0 9 3 4 7 3 1 6
0 . 06 - 0 . 9 9 9 9 9 8 7 3 1 7 2 7 5 40 . 0 6 1 - 0 . 9 9 8 1 2 7 4 1 5 0 9 3 7 6 30 . 0 6 2 - 0 . 9 9 2 3 2 0 9 3 7 1 9 4 1 7 90 . 0 6 3 - 0 . 9 8 2 6 0 2 1 9 0 3 2 3 4 7 50 . 0 6 4 - 0 . 9 6 9 0 0 9 4 9 1 0 6 8 9 5 10 . 0 6 5 - 0 . 9 5 1 5 9 6 4 2 9 2 4 5 6 9 10 . 0 6 6 - 0 . 9 3 0 4 3 1 6 5 6 6 1 6 3 5 50 . 0 6 7 - 0 . 9 0 5 5 9 8 6 1 6 2 2 8 5 8 50 . 0 6 8 - 0 . 8 7 7 1 9 5 2 1 3 4 3 7 1 1 70 . 0 6 9 - 0 . 8 4 5 3 3 3 4 2 9 9 0 7 6 0 9
-275 -
Reproduced with permission of the copyright owner. Further reproduction prohibited without permission.
0 . 0 7 - 0 . 8 1 0 1 3 8 8 8 2 1 2 40 . 0 7 1 - 0 . 7 7 1 7 5 0 3 2 6 1 3 9 9 8 50 . 0 7 2 - 0 . 7 3 0 3 1 9 1 1 0 5 2 7 1 7 40 . 0 7 3 - 0 . 6 8 6 0 0 8 5 7 9 6 7 6 6 8 30 . 0 7 4 - 0 . 6 3 8 9 9 3 4 2 9 8 0 6 6 8 50 . 0 7 5 - 0 . 5 8 9 4 5 9 0 2 0 2 1 4 8 7 60 . 0 7 6 - 0 . 5 3 7 6 0 0 6 4 2 4 9 1 2 90 . 0 7 7 - 0 . 4 8 3 6 2 2 7 5 0 5 7 2 6 10 . 0 7 8 - 0 . 4 2 7 7 3 8 1 5 4 6 7 3 5 1 90 . 0 7 9 - 0 . 3 7 0 1 6 7 1 8 2 2 7 3 0 6 6
0 . 0 8 - 0 . 3 1 1 1 3 6 8 0 9 4 6 3 8 8 20 . 0 8 1 - 0 . 2 5 0 8 7 9 7 6 6 0 8 8 9 4 20 . 0 8 2 - 0 . 1 8 9 6 3 3 6 1 8 1 9 3 9 20 . 0 8 3 - 0 . 1 2 7 6 3 9 8 3 1 4 1 2 5 9 20 . 0 8 4 - 0 . 0 6 5 1 4 2 8 1 8 9 7 7 9 5 20 . 0 8 5 - 0 . 0 0 2 3 8 8 9 7 8 1 1 2 2 8 20 . 0 8 6 0 . 0 6 0 3 7 4 2 8 1 4 0 4 7 4 50 . 0 8 7 0 . 1 2 2 8 9 9 5 1 2 6 6 0 0 0 80 . 0 8 8 0 . 1 8 4 9 4 0 2 0 7 1 7 7 2 8 20 . 0 8 9 0 . 2 4 6 2 5 1 7 6 6 7 8 7 7 6
0 . 0 9 0 . 3 0 6 5 9 2 4 6 7 9 6 9 0 9 90 . 0 9 1 0 . 3 6 5 7 2 4 4 1 4 8 5 1 0 4 10 . 0 9 2 0 . 4 2 3 4 1 4 4 7 7 1 3 0 3 5 70 . 0 9 3 0 . 4 7 9 4 3 5 2 0 9 1 9 7 3 2 90 . 0 9 4 0 . 5 3 3 5 6 5 7 4 6 8 5 0 0 7 30 . 0 9 5 0 . 5 8 5 5 9 2 6 7 8 0 6 1 3 8 10 . 0 9 6 0 . 6 3 5 3 1 0 8 8 4 3 6 5 0 2 70 . 0 9 7 0 . 6 8 2 5 2 4 3 4 9 5 4 4 3 5 10 . 0 9 8 0 . 7 2 7 0 4 6 9 3 2 4 3 4 8 1 80 . 0 9 9 0 . 7 6 8 7 0 3 1 0 0 7 9 3 7 5 7
0 . 1 0 . 8 0 7 3 2 8 6 2 3 3 4 3 9 50 . 1 0 1 0 . 8 4 2 7 7 1 2 1 7 2 6 2 6 6 90 . 1 0 2 0 . 8 7 4 8 9 1 1 4 8 5 6 3 4 1 30 . 1 0 3 0 . 9 0 3 5 6 1 7 8 3 0 0 3 2 9 30 . 1 0 4 0 . 9 2 8 6 7 0 0 8 5 3 4 4 1 1 50 . 1 0 5 0 . 9 5 0 1 1 7 0 6 4 9 9 8 7 7 90 . 1 0 6 0 . 9 6 7 8 1 8 1 6 6 3 0 6 0 2 20 . 1 0 7 0 . 9 8 1 7 0 3 6 0 1 8 9 4 8 4 30 . 1 0 8 0 . 9 9 1 7 1 8 6 2 7 8 2 4 2 7 50 . 1 0 9 0 . 9 9 7 8 2 3 7 5 9 4 1 3 7 8 7
0 . 1 1 0 . 9 9 9 9 9 4 9 2 6 9 1 3 3 7 50 . 1 1 1 0 . 9 9 8 2 2 3 5 7 0 3 9 9 6 1 10 . 1 1 2 0 . 9 9 2 5 1 6 6 7 3 5 2 3 5 1 40 . 1 1 3 0 . 9 8 2 8 9 6 7 3 5 9 7 7 2 0 30 . 1 1 4 0 . 9 6 9 4 0 1 6 8 4 7 8 7 8 6 80 . 1 1 5 0 . 9 5 2 0 8 4 7 2 4 7 8 8 7 9 80 . 1 1 6 0 . 9 3 1 0 1 4 1 2 8 8 5 6 9 8 20 . 1 1 7 0 . 9 0 6 2 7 2 9 6 8 7 4 4 2 8 50 . 1 1 8 0 . 8 7 7 9 5 8 7 8 7 5 6 3 4 1 60 . 1 1 9 0 . 8 4 6 1 8 3 2 1 5 2 1 9 9 0 8
0 . 1 2 0 . 8 1 1 0 7 1 5 2 8 3 0 6 30 . 1 2 1 0 . 7 7 2 7 6 2 1 5 6 1 9 3 6 6 30 . 1 2 2 0 . 7 3 1 4 0 6 1 3 5 2 6 7 7 10 . 1 2 3 0 . 6 8 7 1 6 6 5 1 3 4 6 1 1 9 20 . 1 2 4 0 . 6 4 0 2 1 7 7 0 7 4 3 0 2 5 60 . 1 2 5 0 . 5 9 0 7 4 4 8 1 4 9 0 9 0 9 20 . 1 2 6 0 . 5 3 8 9 4 2 8 8 4 9 5 3 9 7 80 . 1 2 7 0 . 4 8 5 0 1 6 1 4 8 9 5 3 7 8 10 . 1 2 8 0 . 4 2 9 1 7 7 2 1 5 4 3 8 7 2 60 . 1 2 9 0 . 3 7 1 6 4 6 2 3 1 8 6 1 9 0 3
0 . 1 3 0 . 3 1 2 6 5 0 0 1 6 6 5 8 2 4 60 . 1 3 1 0 . 2 5 2 4 2 1 1 6 5 0 0 2 8 6 70 . 1 3 2 0 . 1 9 1 1 9 7 1 3 1 7 9 4 3 4 40 . 1 3 3 0 . 1 2 9 2 1 9 2 9 5 4 7 8 3 2 80 . 1 3 4 0 . 0 6 6 7 3 2 0 0 6 4 0 2 4 0 30 . 1 3 5 0 . 0 0 3 9 8 1 6 2 3 4 5 4 0 8
*END
- 2 7 6 -
Reproduced with permission of the copyright owner. Further reproduction prohibited without permission.
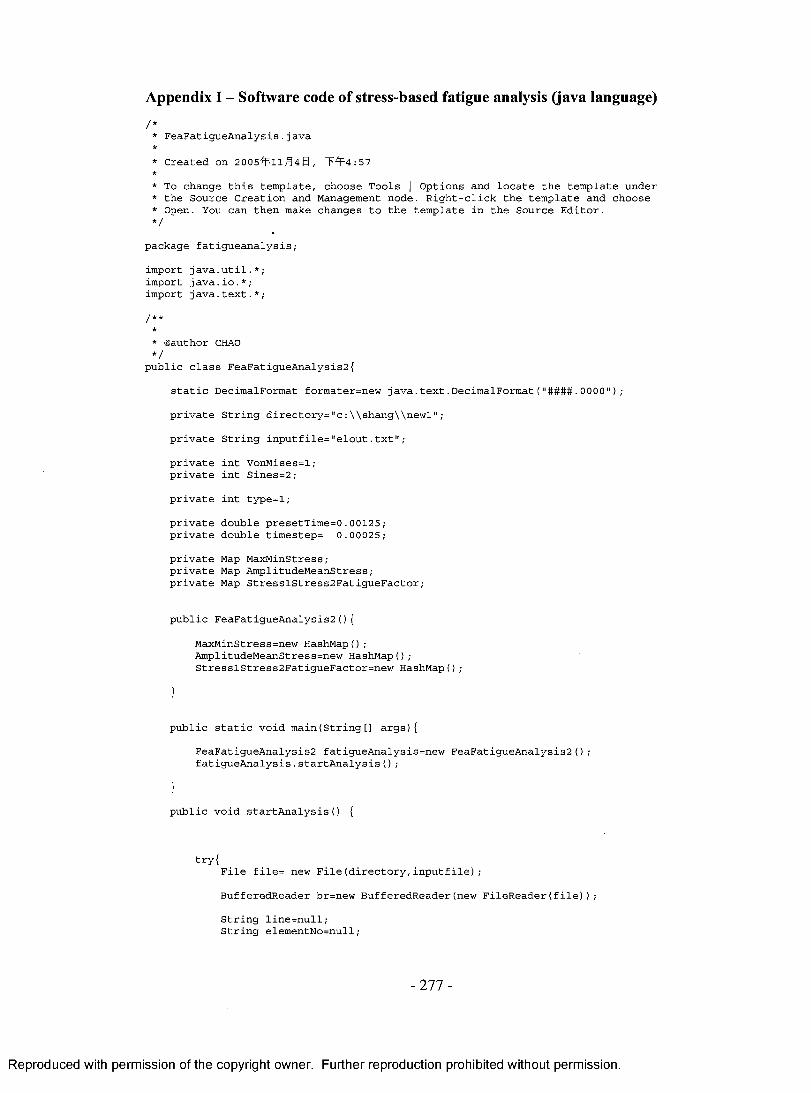
Appendix I - Software code of stress-based fatigue analysis (java language)
/ ** F e a F a t i g u e A n a l y s i s . j a v a** C r e a t e d o n 2 0 0 5 ^ 1 l j ! 4 S , T ^ 4 : 5 7*
* T o c h a n g e t h i s t e m p l a t e , c h o o s e T o o l s | O p t i o n s a n d l o c a t e t h e t e m p l a t e u n d e r* t h e S o u r c e C r e a t i o n a n d M a n a g e m e n t n o d e . R i g h t - c l i c k t h e t e m p l a t e a n d c h o o s e* O p e n . Y o u c a n t h e n m a k e c h a n g e s t o t h e t e m p l a t e i n t h e S o u r c e E d i t o r .* /
p a c k a g e f a t i g u e a n a l y s i s ;
i m p o r t j a v a . u t i 1 . * ; i m p o r t j a v a . i o . * ; i m p o r t j a v a . t e x t . * ;
j k it k* @ a u t h o r CHAO * /
p u b l i c c l a s s F e a F a t i g u e A n a l y s i s 2 {
s t a t i c D e c i m a l F o r m a t f o r m a t e r = n e w j a v a . t e x t . D e c i m a l F o r m a t ( " # # # # . 0 0 0 0 " ) ;
p r i v a t e S t r i n g d i r e c t o r y = " c : \ \ s h a n g \ \ n e w l " ;
p r i v a t e S t r i n g i n p u t f i l e = " e l o u t . t x t " ;
p r i v a t e i n t V o n M i s e s = l ; p r i v a t e i n t S i n e s = 2 ;
p r i v a t e i n t t y p e = l ;
p r i v a t e d o u b l e p r e s e t T i m e = 0 . 0 0 1 2 5 ; p r i v a t e d o u b l e t i m e s t e p = 0 . 0 0 0 2 5 ;
p r i v a t e M ap M a x M i n S t r e s s ; p r i v a t e M ap A m p l i t u d e M e a n S t r e s s ; p r i v a t e M ap S t r e s s l S t r e s s 2 F a t i g u e F a c t o r ;
p u b l i c F e a F a t i g u e A n a l y s i s 2 ( ) {
M a x M i n S t r e s s = n e w H a s h M a p O ;A m p l i t u d e M e a n S t r e s s = n e w H a s h M a p O ;S t r e s s l S t r e s s 2 F a t i g u e F a c t o r = n e w H a s h M a p O ;
p u b l i c s t a t i c v o i d m a i n ( S t r i n g [] a r g s ) {
F e a F a t i g u e A n a l y s i s 2 f a t i g u e A n a l y s i s = n e w F e a F a t i g u e A n a l y s i s 2 ( ) ; f a t i g u e A n a l y s i s . s t a r t A n a l y s i s ( ) ;
p u b l i c v o i d s t a r t A n a l y s i s 0
t r y {F i l e f i l e = new F i l e ( d i r e c t o r y , i n p u t f i l e ) ;
B u f f e r e d R e a d e r b r = n e w B u f f e r e d R e a d e r ( n e w F i l e R e a d e r ( f i l e ) ) ;
S t r i n g l i n e = n u l l ;S t r i n g e l e m e n t N o = n u l l ;
- 2 7 7 -
Reproduced with permission of the copyright owner. Further reproduction prohibited without permission.
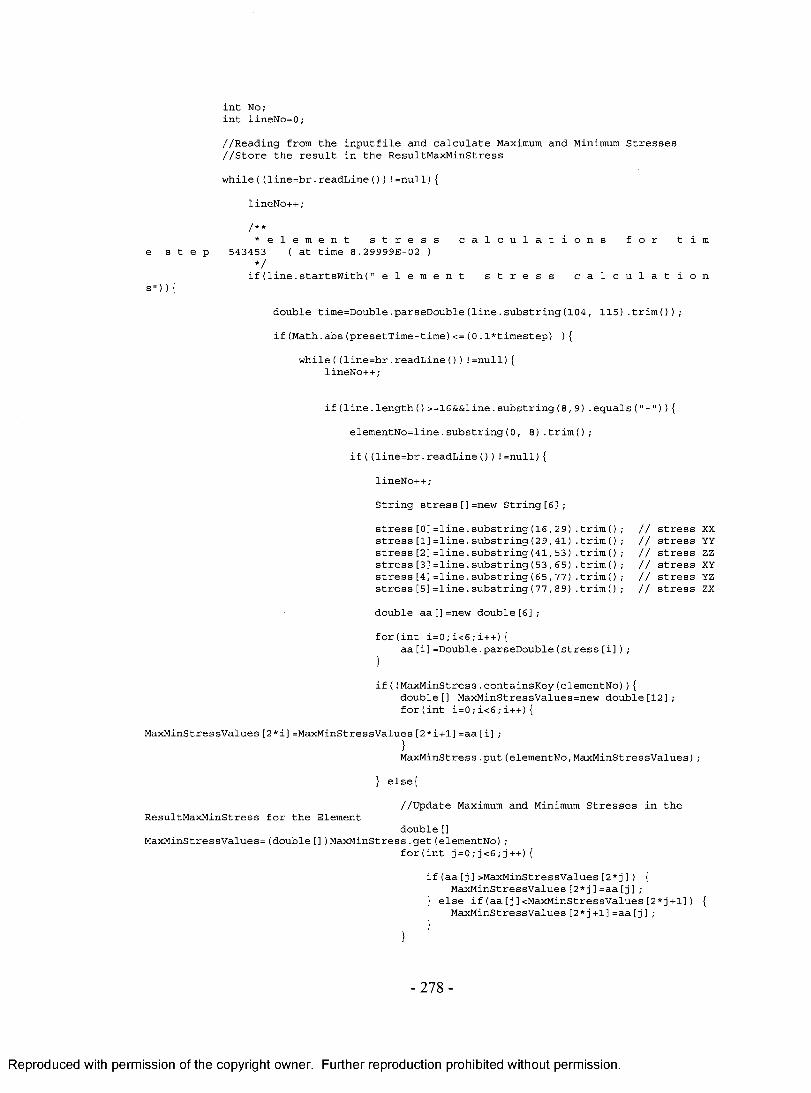
i n t N o ;i n t l i n e N o = 0 ;
/ / R e a d i n g f r o m t h e i n p u t f i l e a n d c a l c u l a t e M a x im u m a n d M i n i m u m S t r e s s e s / / S t o r e t h e r e s u l t i n t h e R e s u l t M a x M i n S t r e s s
w h i l e ( ( l i n e = b r . r e a d L i n e ( ) ) ! = n u l l ) {
l i n e N o + + ;
J * *
‘ e l e m e n t s t r e s s c a l c u l a t i o n s f o r t i m e s t e p 5 4 3 4 5 3 ( a t t i m e 8 . 2 9 9 9 9 E - 0 2 )
* /i f ( l i n e . s t a r t s W i t h ( " e l e m e n t s t r e s s c a l c u l a t i o n
s " )
d o u b l e t i m e = D o u b l e . p a r s e D o u b l e ( l i n e . s u b s t r i n g ( 1 0 4 , 1 1 5 ) . t r i m ( ) ) ;
i f ( M a t h . a b s ( p r e s e t T i m e - t i m e ) <= ( 0 . l * t i m e s t e p ) ) {
w h i l e ( ( l i n e = b r . r e a d L i n e ( ) ) ! = n u l l ) { l i n e N o + + ;
i f ( l i n e . l e n g t h ( ) > = 1 6 & & l i n e . s u b s t r i n g ( 8 , 9 ) . e q u a l s ( " - " ) ) {
e l e m e n t N o = l i n e . s u b s t r i n g ( 0 , 8 ) . t r i m ( ) ;
i f ( ( l i n e = b r . r e a d L i n e ( ) ) ! = n u l l ) {
l i n e N o + + ;
S t r i n g s t r e s s [ ] = n e w S t r i n g [ 6 ] ;
s t r e s s [0 ] = l i n e . s u b s t r i n g ( 1 6 , 2 9 ) . t r i m () ,- / / s t r e s s XXs t r e s s [1 ] = l i n e . s u b s t r i n g ( 2 9 , 4 1 ) . t r i m () ; / / s t r e s s YYs t r e s s [ 2 ] = l i n e . s u b s t r i n g ( 4 1 , 5 3 ) . t r i m ( ) ; / / s t r e s s ZZs t r e s s [3 ] = l i n e . s u b s t r i n g ( 5 3 , 6 5 ) . t r i m () ; / / s t r e s s XYs t r e s s [4 ] = l i n e . s u b s t r i n g ( 6 5 , 7 7 ) . t r i m () ; / / s t r e s s YZs t r e s s [ 5 ] = l i n e . s u b s t r i n g ( 7 7 , 8 9 ) . t r i m ( ) ; / / s t r e s s ZX
d o u b l e a a [ ] = n e w d o u b l e [6 ] ;
f o r ( i n t i = 0 ; i < 6 ; i + + ) {a a [ i ] = D o u b l e . p a r s e D o u b l e ( s t r e s s [ i ] ) ;
}
i f ( I M a x M i n S t r e s s . c o n t a i n s K e y ( e l e m e n t N o ) ) {d o u b l e t ] M a x M i n S t r e s s V a l u e s = n e w d o u b l e [ 1 2 ] ; f o r ( i n t i = 0 ; i < 6 ; i + + ) {
M a x M i n S t r e s s V a l u e s [2 * i ] = M a x M i n S t r e s s V a l u e s [ 2 * i + l ] = a a [ i ] ;
}M a x M i n S t r e s s . p u t ( e l e m e n t N o , M a x M i n S t r e s s V a l u e s ) ;
} e l s e {
/ / U p d a t e M a x im u m a n d M i n i m u m S t r e s s e s i n t h eR e s u l t M a x M i n S t r e s s f o r t h e E l e m e n t
d o u b l e []M a x M i n S t r e s s V a l u e s = ( d o u b l e [ ] ) M a x M i n S t r e s s . g e t ( e l e m e n t N o ) ;
f o r ( i n t j = 0 ; j < 6 ; j + + ) {
i f ( a a [ j ] > M a x M i n S t r e s s V a l u e s [ 2 * j ] ) { M a x M i n S t r e s s V a l u e s [ 2 * j ] = a a [ j ] ;
} e l s e i f ( a a [ j ] < M a x M i n S t r e s s V a l u e s [ 2 * j + 1 ] ) { M a x M i n S t r e s s V a l u e s [ 2 * j + 1 ] = a a [ j ] ;
- 2 7 8 -
Reproduced with permission of the copyright owner. Further reproduction prohibited without permission.
}}
}c a t c h ( E x c e p t i o n e ) {e . p r i n t S t a c k T r a c e () .
/ / C a l c u l a t e t h e M e a n S t r e s s a n d S t r e s s A m p l i t u d e a n d S t o r e T h e m i n M e a n A m p l i t u d e S t r e s s
S e t k e y s = M a x M i n S t r e s s . e n t r y S e t ( ) ;I t e r a t o r i t e r a t o r = k e y s . i t e r a t o r ( ) ;
w h i l e ( i t e r a t o r . h a s N e x t ( ) ) {M a p . E n t r y e n t r y = ( M a p . E n t r y ) i t e r a t o r . n e x t ( ) ;O b j e c t k e y = e n t r y . g e t K e y ( ) ;d o u b l e [] M a x M i n S t r e s s V a l u e s = ( d o u b l e [] ) e n t r y . g e t V a l u e () ; d o u b l e [] A m p l i t u d e M e a n S t r e s s V a l u e s = n e w d o u b l e [ 1 2 ] ; f o r ( i n t w = 0 ; w < 6 ; w + + ) {
A m p l i t u d e M e a n S t r e s s V a l u e s [ 2 * w ] = ( M a x M i n S t r e s s V a l u e s [ 2 * w ] - M a x M i n S t r e s s V a l u e s [ 2 * w + l ] ) / 2 ;
A m p l i t u d e M e a n S t r e s s V a l u e s [ 2 * w + l ] = ( M a x M i n S t r e s s V a l u e s [ 2 * w ] + M a x M i n S t r e s s V a l u e s [ 2 * w + l ] ) / 2 ;
}
A m p l i t u d e M e a n S t r e s s . p u t ( k e y , A m p l i t u d e M e a n S t r e s s V a l u e s ) ;
}
/ / U s i n g A m p l i t u d e a n d M e a n S t r e s s t o C a l c u l a t e t h e F a t i g u e F a c t o r f o r E a c hE l e m e n t
S e t k e y s 2 = A m p l i t u d e M e a n S t r e s s . e n t r y S e t ( ) ;I t e r a t o r i t e r a t o r 2 = k e y s 2 . i t e r a t o r ( ) ;
w h i l e ( i t e r a t o r 2 . h a s N e x t ( ) ) {M a p . E n t r y e n t r y 2 = ( M a p . E n t r y ) i t e r a t o r 2 . n e x t ( ) ;O b j e c t k e y 2 = e n t r y 2 . g e t K e y ( ) ;
d o u b l e [] A M S t r e s s = ( d o u b l e [] ) e n t r y 2 . g e t V a l u e () ;d o u b l e t ] S t r e s s l S t r e s s 2 F a t i g u e F a c t o r V a l u e s = n e w d o u b l e [3 ] ;
/ / C a l c u l a t e S t r e s s lS t r e s s l S t r e s s 2 F a t i g u e F a c t o r V a l u e s [ 0 ] = M a t h . s q r t ( ( M a t h . p o w ( A M S t r e s s [0 ] -
A M S t r e s s [ 2 ] , 2 ) + M a t h . p o w ( A M S t r e s s [ 2 ] - A M S t r e s s [ 4 ] , 2 ) + M a t h . p o w ( A M S t r e s s [ 4 ] - A M S t r e s s [ 0 ] , 2 )
+ 6 * ( M a t h . p o w ( A M S t r e s s [ 6 ] , 2 ) + M a t h . p o w ( A M S t r e s s [ 8 ] , 2 ) + M a t h . p o w ( A M S t r e s s [ 1 0 ] , 2 ) ) ) / 2 ) ;
/ / C a l c u l a t e S t r e s s 2 i f ( t y p e = = t h i s . V o n M i s e s ) {
S t r e s s l S t r e s s 2 F a t i g u e F a c t o r V a l u e s [ 1 ] = M a t h . s q r t ( ( M a t h . p o w ( A M S t r e s s [ 1 ] - A M S t r e s s [ 3 ] , 2 ) + M a t h . p o w ( A M S t r e s s [ 3 ] - A M S t r e s s [ 5 ] , 2 ) + M a t h . p o w ( A M S t r e s s [ 5 ] - A M S t r e s s [ 1 ] , 2 )
+ 6 * ( M a t h . p o w ( A M S t r e s s [ 7 ] , 2 ) + M a t h . p o w ( A M S t r e s s [ 9 ] , 2 ) + M a t h . p o w ( A M S t r e s s [ 1 1 ] , 2 ) ) ) / 2 ) ;} e l s e i f ( t y p e = = t h i s . S i n e s ) {
S t r e s s l S t r e s s 2 F a t i g u e F a c t o r V a l u e s [ 1 ] = A M S t r e s s [ 1 ] + A M S t r e s s [ 3 ] + A M S t r e s s [5 ]}
/ / C a l c u l a t e F a t i g u e F a c t o ri f ( S t r e s s l S t r e s s 2 F a t i g u e F a c t o r V a l u e s [ 1 ] > = 0 ) {
- 2 7 9 -
Reproduced with permission of the copyright owner. Further reproduction prohibited without permission.
S t r e s s l S t r e s s 2 F a t i g u e F a c t o r V a l u e s [ 2 ] = 1 . 0 / ( S t r e s s l S t r e s s 2 F a t i g u e F a c t o r V a l u e s [ 0 ] / 8 0 . 0 + S t r e s s l S t r e s s 2 F a t i g u e F a c t o r V a l u e s [ 1 ] / 2 5 6 . 0 ) ;
} e l s e {
S t r e s s l S t r e s s 2 F a t i g u e F a c t o r V a l u e s [ 2 ] = 8 0 . 0 / S t r e s s l S t r e s s 2 F a t i g u e F a c t o r V a l u e s [ 0 ] ;
}
S t r e s s l S t r e s s 2 F a t i g u e F a c t o r . p u t ( k e y 2 , S t r e s s l S t r e s s 2 F a t i g u e F a c t o r V a l u e s ) ;
}
/ / W r i t e t o F i l e M a x im u m a n d M i n i m u m S t r e s s e s f o r E a c h E l e m e n t t o F i l e ( M a x M i n S t r e s s , d i r e c t o r y , " M a x M i n S t r e s s . t x t " ) ;/ / W r i t e t o F i l e M e a n S t r e s s a n d S t r e s s A m p l i t u d e f o r E a c h E l e m e n t t o F i l e ( A m p l i t u d e M e a n S t r e s s , d i r e c t o r y , " A m p l i t u d e M e a n S t r e s s . t x t " ) ;/ / W r i t e t o F i l e S t r e s s l , S t r e s s 2 a n d F a t i g u e F a c t o r f o r E a c h E l e m e n t t o F i l e ( S t r e s s l S t r e s s 2 F a t i g u e F a c t o r , d i r e c t o r y , " A l l . t x t " ) ;
t o F i l e ( S t r e s s l S t r e s s 2 F a t i g u e F a c t o r , d i r e c t o r y , 0 . 0 , 1 . 2 ) ; t o F i l e ( S t r e s s l S t r e s s 2 F a t i g u e F a c t o r , d i r e c t o r y , 1 . 2 , 1 . 4 ) ; t o F i l e ( S t r e s s l S t r e s s 2 F a t i g u e F a c t o r , d i r e c t o r y , 1 . 4 , 1 . 6 ) ; t o F i l e ( S t r e s s l S t r e s s 2 F a t i g u e F a c t o r , d i r e c t o r y , 1 . 6 , 1 . 8 ) ; t o F i l e ( S t r e s s l S t r e s s 2 F a t i g u e F a c t o r , d i r e c t o r y , 1 . 8 , 2 . 0 ) ; t o F i l e ( S t r e s s l S t r e s s 2 F a t i g u e F a c t o r , d i r e c t o r y , 2 . 0 , l e 2 0 ) ;M i n i n u m N 2 F i l e ( S t r e s s l S t r e s s 2 F a t i g u e F a c t o r , d i r e c t o r y ) ;
}
p r i v a t e s t a t i c v o i d t o F i l e ( M a p m a p , S t r i n g d i r e c t o r y , S t r i n g f i l e n a m e ) } S e t k e y s = m a p . k e y s e t ( ) ;L i s t l i s t = n e w A r r a y L i s t ( k e y s ) ;C o l l e c t i o n s . s o r t ( l i s t , new E l e m e n t N o c o m p a r a t o r ( ) ) ;I t e r a t o r i t e r a t o r = l i s t . i t e r a t o r ( ) ;F i l e f ;B u f f e r e d W r i t e r bw;
t r y {f =new F i l e ( d i r e c t o r y , f i l e n a m e ) ; bw=new B u f f e r e d W r i t e r ( n e w F i l e W r i t e r ( f ) ) ; w h i l e ( i t e r a t o r . h a s N e x t ( ) ) {
O b j e c t k e y = i t e r a t o r . n e x t ( ) ;d o u b l e t ] V a l u e s = ( d o u b l e [] ) m a p . g e t (key) ;
b w . w r i t e ( k e y . t o S t r i n g ( ) ) ; b w . w r i t e ( " , " ) ;
f o r ( i n t i = 0 ; i < V a l u e s . l e n g t h ; i ++) {b w . w r i t e ( f o r m a t e r . f o r m a t ( V a l u e s [ i ] ) ) ; i f ( i != V a l u e s . l e n g t h - 1) b w . w r i t e ( " , " ) ;
}
b w . n e w L i n e ( ) ;
}b w . f l u s h ( ) ; b w . c l o s e ( ) ;
} c a t c h ( I O E x c e p t i o n e ) {
}
}
p r i v a t e s t a t i c v o i d t o F i l e ( M a p m a p , S t r i n g d i r e c t o r y , d o u b l e N m i n , d o u b l e N m a x) {
S e t k e y s = m a p . k e y s e t ( ) ;L i s t l i s t = n e w A r r a y L i s t ( k e y s ) ;
- 2 8 0 -
Reproduced with permission of the copyright owner. Further reproduction prohibited without permission.
C o l l e c t i o n s . s o r t ( l i s t , n e w E l e m e n t N o c o m p a r a t o r ( ) ) ;I t e r a t o r i t e r a t o r = l i s t . i t e r a t o r ( ) ;S t r i n g f i l e n a m e = D o u b l e . t o S t r i n g ( N m i n ) + D o u b l e . t o S t r i n g ( N m a x ) + " . t x t " F i l e f ;B u f f e r e d W r i t e r b w ;
t r y {f = n e w F i l e ( d i r e c t o r y , f i l e n a m e ) ;b w = n e w B u f f e r e d W r i t e r ( n e w F i l e W r i t e r ( f ) ) ;w h i l e ( i t e r a t o r . h a s N e x t ( ) ) {
O b j e c t k e y = i t e r a t o r . n e x t ( ) ;d o u b l e t ] V a l u e s = ( d o u b l e [ ] ) m a p . g e t ( k e y ) ;
i f ( V a l u e s [ 2 ] < N m a x & & V a l u e s [ 2 ] > = N m i n ) { b w . w r i t e ( k e y . t o S t r i n g ( ) ) ; b w . w r i t e ( " , " ) ;
f o r ( i n t i = 0 ; i < V a l u e s . l e n g t h ; i + + ) {b w . w r i t e ( f o r m a t e r . f o r m a t ( V a l u e s [ i ] ) ) ; i f ( i ! = V a l u e s . l e n g t h - 1 ) b w . w r i t e ( " , " ) ;
}
b w . n e w L i n e 0 ;}
}b w . f l u s h ( ) ; b w . c l o s e ( ) ;
} c a t c h ( I O E x c e p t i o n e ) {
}
}
p r i v a t e s t a t i c v o i d M i n i n u m N 2 F i l e ( M a p m a p , S t r i n g d i r e c t o r y ) {
S e t k e y s = m a p . k e y S e t ( ) ;I t e r a t o r i t e r a t o r = k e y s . i t e r a t o r ( ) ;
S t r i n g f i l e n a m e = " M i n i m u n F a t i g u e F a c t o r . t x t " ;F i l e f ;B u f f e r e d W r i t e r b w ;
d o u b l e [] m i n i m u m N = { 0 . 0 , 0 . 0 , 9 9 9 9 9 9 9 . 9 9 9 } ;
O b j e c t m i n i m u m N K e y = n u l l ;
t r y {f = n e w F i l e ( d i r e c t o r y , f i l e n a m e ) ;b w = n e w B u f f e r e d W r i t e r ( n e w F i l e W r i t e r ( f ) ) ;w h i l e ( i t e r a t o r . h a s N e x t ( ) ) {
O b j e c t k e y = i t e r a t o r . n e x t ( ) ;d o u b l e ! ] V a l u e s = ( d o u b l e [ ] ) m a p . g e t ( k e y ) ;
i f ( V a l u e s [ 2 ] c m i n i m u m N [ 2 ] ) { m i n i m u m N = V a l u e s ; m i n i m u m N K e y = k e y ;
}
}b w . w r i t e ( m i n i m u m N K e y . t o S t r i n g ( ) ) ; b w . w r i t e ( " , " ) ;
f o r ( i n t i = 0 ; i < m i n i m u m N . l e n g t h ; i + + ) {b w . w r i t e ( f o r m a t e r . f o r m a t ( m i n i m u m N [ i ] ) ) ; i f ( i ! = m i n i m u m N . l e n g t h - 1 ) b w . w r i t e ( " , " ) ;
}b w . f l u s h ( ) ; b w . c l o s e ( ) ;
-281 -
Reproduced with permission of the copyright owner. Further reproduction prohibited without permission.
} c a t c h ( I O E x c e p t i o n e ) {
s t a t i c c l a s s E l e m e n t N o c o m p a r a t o r i m p l e m e n t s C o m p a r a t o r ! p u b l i c i n t c o m p a r e ( O b j e c t a , O b j e c t b ) {
i n t d i f f = I n t e g e r . p a r s e l n t ( ( S t r i n g ) a ) - I n t e g e r . p a r s e l n t ( ( S t r i n g ) b ) i f ( d i f f c O ) r e t u r n - 1 ; i f ( d i f f > 0 ) r e t u r n 1 ; r e t u r n 0 ;
}
}
}
- 2 8 2 -
Reproduced with permission of the copyright owner. Further reproduction prohibited without permission.
Appendix J - Description of the accompanying DVD disc
Accompanying this dissertation is a DVD disc including the modeling input files
and simulation results files of impact and cornering fatigue testing of cast aluminum and
forged magnesium wheels, which are packaged in four folders and described as follows:
1. Folder one:
a. Name: AluminumWheelTirelmpactl 900
b. Content: Input and result files of impact testing model of cast aluminum wheel
and tire assembly with a striker velocity of 1900 mm/s
2. Folder two:
a. Name: MagnesiumWheelImpactl900
b. Content: Input and result files of impact testing model of forged magesium
wheel (no tire) with a striker velocity of 1900 mm/s
3. Folder three:
a. Name: WheelComeringFatigue_Nastran
b. Content: Input and result files of cornering fatigue testing models of cast
aluminum and forged magnesium wheels with four bending directions.
4. Folder four:
a. Name: WheelComeringFatigue_LS-DYNA
b. Content: Input and result files of cornering fatigue testing models of cast
aluminum and forged magnesium wheels with a rotating bend moment.
-283 -
Reproduced with permission of the copyright owner. Further reproduction prohibited without permission.

VITA AUCTORIS
NAME
PLACE OF BIRTH
DATE OF BIRTH
EDUCATION
Shixian (Robert) Shang
Jinan, Shangdong, China
September 20, 1963
University of Windsor, Windsor, ON, Canada
2001-2006 PhD
Beijing Institute of Aeronautical Materials, Beijing, China
1985-1988 M.Sc.
Zhejiang University, Hangzhou, Zhejiang, China
1981-1985 B.Sc.
Reproduced with permission of the copyright owner. Further reproduction prohibited without permission.