Finite Element Analysis in Offshore Geotechnics - SIMULIA ...
Upload
khangminh22Category
view
1download
0
Materials 2022, 15, 4313. https://doi.org/10.3390/ma15124313 www.mdpi.com/journal/materials
Article
Finite Element Analysis of the Mechanical Properties of Axially Compressed Square High-Strength Concrete-Filled Steel Tube Stub Columns Based on a Constitutive Model for High-Strength Materials Biao Li 1,2, Faxing Ding 3, Deren Lu 3,*, Fei Lyu 3, Shijian Huang 3, Zheya Cao 3 and Haibo Wang 1,3
1 Hunan Tieyuan Civil Engineering Testing Co., Ltd., Changsha 410075, China; [email protected] (B.L.); [email protected] (H.W.)
2 China Railway No. 3 Engineering Group Co., Ltd., Taiyuan 030001, China 3 School of Civil Engineering, Central South University, Changsha 410075, China; [email protected] (F.D.);
[email protected] (F.L.); [email protected] (S.H.); [email protected] (Z.C.) * Correspondence: [email protected]
Abstract: With the development of new concrete technology, high-strength concrete has been used worldwide. In particular, more economic benefits can be achieved by applying high-strength con-crete-filled steel tube (HSCFST) columns in the concrete core walls of super high-rise buildings. A constitutive relation with high applicability for high-strength materials with different strength grades is proposed. Based on this constitutive model, a brick element model of 181 sets of axially compressed square HSCFST members is established and experimentally verified. The effects of the concrete strength, diameter-to-thickness ratio, and steel yield strength on the axial compressive ca-pacities of these members were investigated based on finite element calculation results. The results showed that with an increase in the concrete strength, the ultimate bearing capacities of CS-CC, HS-HC, HS-CC, and CS-HC stub column members increased by 60%, 24%, 44%, and 21% at most, re-spectively. Additionally, as the steel yield strength increased, the ultimate bearing capacities of CS-CC, HS-HC, HS-CC, and CS-HC stub column members increased by 8.8%, 5.1%, 8.5%, and 5.2%, respectively, Hence, material strength has the greatest impact on CS-CC and HS-CC. The confine-ment effect of the square steel tube on the concrete weakens as the strength grade of steel or concrete increases. Notably, the confinement effect of steel tube on the concrete is strongest in CS-CC and weakest in the CS-HC. In addition, the confinement coefficients of square HSCFST stub columns with different combinations of concrete and steel strengths were analyzed. Based on the superposi-tion principle in the ultimate state, a practical axial compressive capacity calculation formula for three types of square HSCFSTs is established. Compared with existing major design code formulas, the proposed formula is more accurate and concise and has a clear physical meaning.
Keywords: high-strength concrete-filled square steel tube; finite element analysis; constitutive rela-tion; confinement effect; bearing capacity calculation formula
1. Introduction Due to their excellent structural properties, concrete-filled steel tube (CFST) columns
have been widely applied in super high-rise buildings, urban bridges, long-span bridges, and engineering structures [1–3]. Compared with reinforced concrete columns, CFST col-umns have superior mechanical properties due to the interactions between the steel tube and the concrete. Specifically, in CFST columns, the three-dimensional compression of the concrete due to the confinement by the outer steel tube improves the compressive strength and deformation capacity of the concrete, and the lateral confinement of the concrete by
Citation: Li, B.; Ding, F.; Lu, D.; Lyu,
F.; Huang, S.; Cao, Z.; Wang, H. Finite
Element Analysis of the Mechanical
Properties of Axially Compressed
Square High-Strength Concrete-Filled
Steel Tube Stub Columns Based on a
Constitutive Model for High-
Strength Materials. Materials 2022,
15, 4313. https://doi.org/10.3390/
ma15124313
Academic Editor: Alessandro P.
Fantilli
Received: 28 May 2022
Accepted: 15 June 2022
Published: 18 June 2022
Publisher’s Note: MDPI stays neu-
tral with regard to jurisdictional
claims in published maps and institu-
tional affiliations.
Copyright: © 2022 by the authors. Li-
censee MDPI, Basel, Switzerland.
This article is an open access article
distributed under the terms and con-
ditions of the Creative Commons At-
tribution (CC BY) license (https://cre-
ativecommons.org/licenses/by/4.0/).
Materials 2022, 15, 4313 2 of 23
the steel tube reduces the longitudinal stress of the steel tube in the ultimate state. There-fore, CFST columns have better flexural rigidity [4,5], bearing capacity [6], and seismic performance [7]. In addition, CFST columns have better fire [8] and corrosion resistance [9] due to the mutual protective effects of the steel tube and concrete. In practical engi-neering applications, the use of a CFST structure can significantly reduce the cross-sec-tional dimension of the columns, thereby reducing the material consumption by more than 50% [10]. CFST structures are easy to manufacture and weld on site and are conven-ient for concrete pouring with no need for formwork support [11].
In recent years, with the continuous development of materials technology, high-strength materials, such as high-strength steel (HSS), high-strength concrete (HSC), and ultrahigh-strength concrete (UHSC), have been gradually applied to engineering struc-tures. HSS usually refers to steel with a nominal yield stress equal to or greater than 460 MPa [12]. Compared with normal-strength steel, HSS has the advantages of lower con-struction cost and greater environmental friendliness [13]. In addition, HSS is more suita-ble for lightweight, high-performance high-rise buildings and long-span structures due to its excellent strength-to-weight ratio, corrosion resistance, and welding performance. However, the application of HSS in practical engineering applications is limited due to the strict restrictions on steel strength grades and imperfect bearing capacity calculation formulas. Range and classification of HSC and UHSC have already been given by Sojobi et al. [14]. HSC has a compressive strength between 50 MPa and 90 MPa, and UHSC has a compressive strength of greater than 90 MPa. Although HSC and UHSC have far greater compressive strengths than normal-strength concrete, their higher brittleness and weaker ductility are not conducive to earthquake resistance and limit their applications in con-ventional concrete structures [15]. Despite the various restrictions in the application of high-strength materials, UHSC CFST column structures have been applied in the Abeno Harukas building in Osaka, the Star City complex in Sydney, and the Obayashi Technical Research Institute in Tokyo. These UHSC CFST column structures occupied less floor area due to their small cross-sectional areas, which resulted in an increased usable area and more economic benefits. Hence, HSCFST column structures have high research value and promising application prospects.
The steel tube has a lower confinement effect on the concrete, bearing capacity, and ductility in a square CFST column than in a circular CFST column, but square CFST col-umns are easy to connect and have large cross-sectional moments of inertia, high stability, and good adaptability in terms of earthquake and fire protection measures [16,17]. Re-searchers have carried out experimental, numerical, and finite element analysis studies on the mechanical properties and practical applications of square HSCFST columns. Yan et al. [18] conducted axial load tests on 32 square UHSC CFST stub columns. Their results showed that the confinement coefficient had a significant effect on the axial load–defor-mation curves of the specimens and that when the confinement coefficient was between 1.41 and 5.27, the specimens had good ductility. Lai [19] collected 124 sets of axial com-pression test data of HSCFSTs and compared them with the design method provided by the American Institute of Steel Construction (AISC) specification. Cai and Young [20] ex-perimentally analyzed 26 square CFST stub columns (concrete strength: 34.9 MPa ≤ fc ≤ 112.7 MPa, steel strength: 629 MPa ≤ fs ≤ 1022 MPa) and conducted extensive numerical analyses on the confinement effect, material, geometry, and contact method. They also evaluated the applicability of the design codes for the compressive strengths of square and rectangular stub columns based on the test results and numerical calculation results. Existing studies have found that the interactions between the steel tube and concrete are related to the strength of the two materials. Therefore, it is necessary to propose formulas for calculating the confinement coefficient and the corresponding bearing capacity that take into account the effect of different material combinations based on the study of the HSCFST stub columns.
In this paper, three types of square HSCFSTs, namely, HSS tubes filled with normal-strength concrete (denoted as HS-CC hereinafter), HSS tubes filled with HSC (denoted as
Materials 2022, 15, 4313 3 of 23
HS-HC hereinafter), and normal-strength steel tubes filled with HSC (denoted as CS-HC hereinafter) are used as the study object. The confinement coefficient of square HSCFST stub columns and a calculation formula for their axial compressive capacity are proposed based on the uniaxial constitutive relation of HSS and concrete proposed by Ding et al. [21] as well as theoretical derivation, numerical simulation, and statistical analysis. The main steps are as follows: A test database (yield strength: 235 MPa–960 MPa, compressive strength of concrete: 30 MPa–185 MPa) was constructed by collecting the published axial compression test data of square HSCFST stub columns to verify the unified constitutive relation of steel and concrete with different strength grades. The three types of square HSCFSTs with different strength grades were analyzed to find the variation patterns of their confinement effects and the differences in their confinement efficiencies, such as the steel tube yield strength, the concrete strength grade, and the width-to-thickness ratio (steel content). Based on the results of the finite element analysis and static equilibrium theory, the confinement coefficients of the three types of square HSCFSTs were estab-lished and the practical bearing capacity calculation formula for the axially compressed square HSCFST stub columns is proposed.
2. Introduction to the Constitutive Relation of the Materials 2.1. Stress–Strain Relation for Steel
The uniaxial tensile stress–strain relation for steel proposed by Ding et al. [22] can be expressed as follows:
s y
s y st
s st st st u
u u
( )
Eff Ef
ε ε εε ε ε
σε ε ε ε ε
ε ε
≤ < ≤=
+ − < ≤ >
(1)
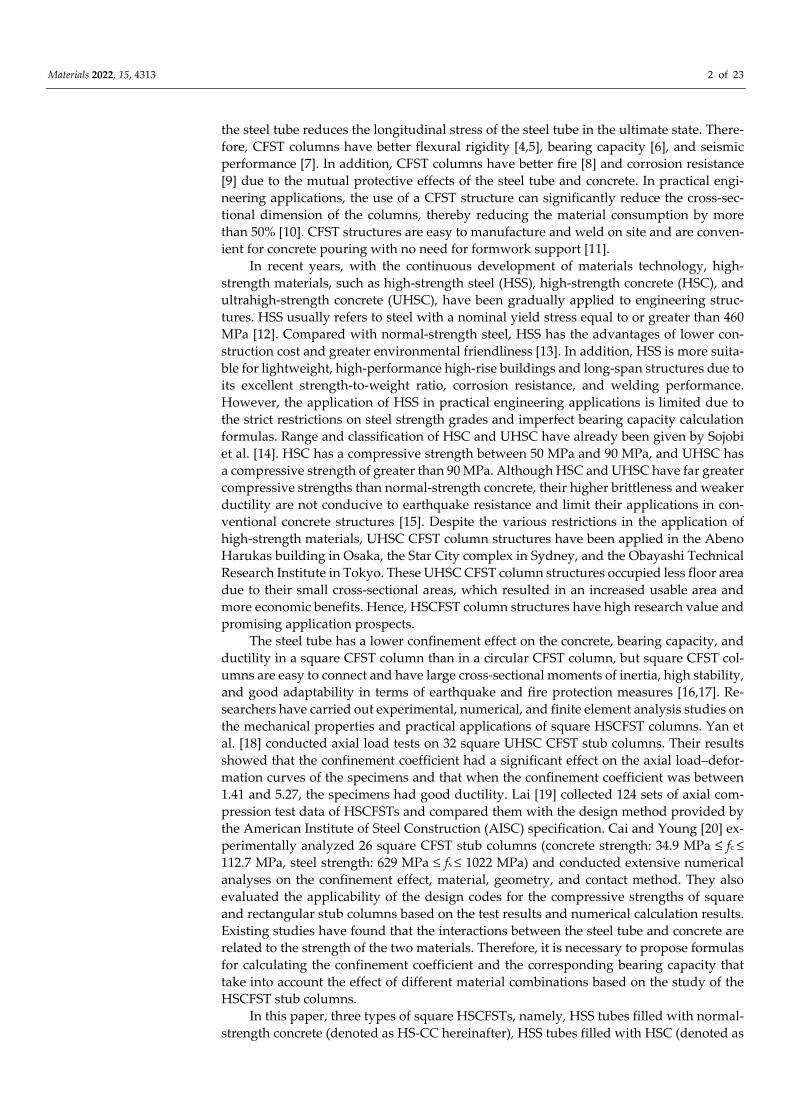
where σ is the stress, Es is the elastic modulus (Es = 200 GPa), fs is the yield strength, fu is the ultimate strength, εy is the yield strain, εst is the strain corresponding to the end of the yield plateau, εu is the ultimate strength, and Est is the hardening modulus. Then, assum-ing that the stress of the steel remains constant as the strain increases, the stress–strain relation of the steel is shown in Figure 1. For HSS with no evident yield plateau, εst = εy, as shown in Figure 1b.
fy
εuεst0 εy
Es
fu
Strain ε
Stre
ss σ
fy
εu0 εy
Es
fu
Strain ε
Stre
ss σ
(a) Normal strength steel ( sf ≤ 500 MPa) (b) High strength steel ( sf > 500 MPa)
Figure 1. Uniaxial stress–strain curve of steel with or without yield plateau.
Materials 2022, 15, 4313 4 of 23
The literature suggests that the εst of hot-rolled steel with a clear yield plateau should be 0.02 and that the fu and εu of hot-rolled steel with different strength grades are ex-pressed as follows:
yu 0.86 0.72235 235
ff = + (2)
u1.85
u,235 y
11 0.15( / 235 1)f
εε
=+ −
(3)
where εu,235 is the ultimate strength of Q235 carbon steel, where Q represents the yield limit of this material, and 235 refers to the yield stress being approximately 235 MPa.
Under axial compression, a CFST column is in a three-dimensional stress state due to the interactions between the steel tube and the core concrete. The equivalent stress σi and the equivalent strain εi are expressed as follows:
2 2 21 2 1 3 2 3
1 [( ) ( ) ( ) ]2iσ σ σ σ σ σ σ= − + − + − (4)
2 2 21 2 1 3 2 32
s
1 [( ) ( ) ( ) ]2(1 )i v
ε ε ε ε ε ε ε= − + − + −+
(5)
where σ1, σ2, and σ3 and ε1, ε2, and ε3 are the principal stresses and strains, respectively, of the outer steel tube and vs. is the Poisson’s ratio of the steel tube, which is defined as follows:
y
s y y y
y
0.285 0.81.075( / 0.8 0.285 0.80.5
i
i i
i
v f
ε εσ ε ε ε
ε ε
≤
= < ≤ >
- )+
(6)
2.2. Uniaxial Stress–Strain Curve of the Core Concrete A unified constitutive relation applicable to concrete with different strength grades
has been previously proposed [22]. The stress–strain relation of the core concrete in a CFST column can be expressed as follows:
2
2
2
( 1) 11 ( 2)
11
i i
i i
i
A x B x xA x B x
yx x
x xα
+ − ≤ + − += > − + ( )
(7)
In the formula, the physical meaning of parameter Ai is the ratio of the elastic modu-lus to the peak secant modulus of the concrete, and Bi is a parameter that controls the degree of attenuation of the elastic modulus of the ascending segment of the stress–strain curve.
When concrete is subjected to uniaxial compression, y = σ/fc and x = ε/εc in Equation (7), where σ is the stress in MPa, fc is the axial compressive strength, fc = 0.4 fcu7/6, ε is the strain, εc is the peak compressive strain, and εc = 420 fcu7/18 × 10−6. At this time, i = 1, and A1 and B1 are the parameters of the ascending segment (A1 = 6.9 fcu−11/30, B1 = 1.67(A1 − 1)2), and α1 is a parameter of the descending segment (α1 = 4 × 10⁻³ fcu1.5 considering that the param-eter of the descending segment is relatively low due to the high brittleness of concrete with a cube compressive strength exceeding 60 MPa).
To achieve the proposed stress–strain relation in the finite element model analysis, the Poisson’s ratio of the core concrete was defined as 0.2. The elastic modulus of concrete with different strengths is expressed as follows:
1/3c cu9500E f= (8)
Materials 2022, 15, 4313 5 of 23
3. Finite Element Theoretical Analysis Due to the limitations of experimental conditions and material properties, the large
amount of collected HSCFST test data still cannot cover the parameter matching required for the study. Therefore, it is necessary to use the ABAQUS finite element calculation soft-ware for calculation and analysis. The interactions between the steel tube and core con-crete can be rationally analyzed by adopting suitable element types and meshing, material properties (constitutive model), steel tube–concrete interface simulation, loading method, and boundary conditions.
3.1. Element Type and Meshing Both the outer steel tube and the core concrete are analyzed using refined modeling
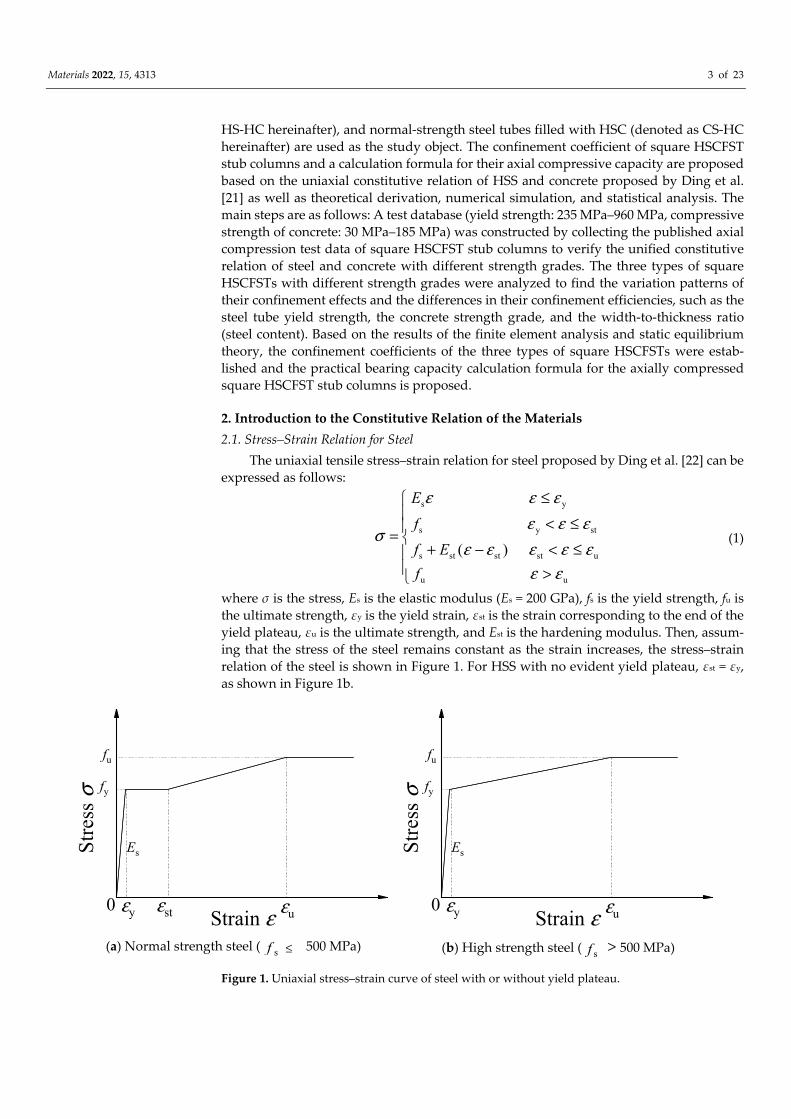
with three-dimensional eight-node brick elements (C3D8R), and each node has three translational degrees of freedom. In the study of mesh convergence, the optimal finite element mesh is determined to provide a relatively accurate solution at a relatively low computation cost. Hassanein [23] noted that mesh refinement has little effect on the nu-merical results and confirmed that its effect on the N–ε curve was negligible by testing the mesh convergence of the model with a coarse mesh. Therefore, the axial element size is selected to be 2.5 times the lateral element size. Based on the study of mesh convergence, the cross-sectional element size of the square column is set at B/10, where B is the width of the square steel tube, as shown in Figure 2.
Figure 2. Schematic diagram of model unit.
3.2. Material Constitutive Model The material constitutive model for compressed steel and concrete with different
strength grades is proposed based on Section 2. The Poisson’s ratio of the elastic part of concrete under uniaxial compressive stress ranges from 0.15 to 0.22, and the representa-tive values of Poisson’s ratio of concrete are 0.19 to 0.2 in the American Society of Civil Engineers (ASCE) Standards and 0.2 in the National Standards of China. Hence, the Pois-son’s ratio (νc) of concrete is set to 0.2 in the numerical simulation. The flow potential eccentricity e, the viscosity coefficient α, K, and fcc/fc are set at 0.1, 0.0005, 2/3, and 2/3, respectively. When the concrete strength is less than 100 MPa, the dilation angle is set to 40°, and when the concrete strength is greater than 100 MPa, the dilation angle is set to 30°. These parameter settings have been widely applied in finite element numerical sim-ulations [24–26].
3.3. Interface Simulation The interactions between the steel tube and concrete are usually simulated by the
surface-to-surface contact technique. A contact surface pair composed of the inner surface
Materials 2022, 15, 4313 6 of 23
of the steel tube and the outer surface of the core concrete is defined. A hard contact mode is set at the interface in the normal direction. This mode allows the interface to separate after stretching and disallows penetration after compression. The tangential contact can be simulated using the Coulomb friction model, with a friction coefficient of 0.5. There is almost no relative slip between the steel tube and the concrete of a stub column since they bear the load together. A rigid body loading plate with an elastic modulus of 1e12 MPa and a Poisson’s ratio of 1 × 10⁻⁷ is set at the top of the column. The contact between the loading plate and the column is taken as a tie connection, with high stiffness and good convergence. Therefore, the loading surface is taken as the master surface, and the column surface contacting the loading surface is the slave surface.
3.4. Boundary Conditions and Loading Methods The bottom surface of the CFST column member has a fixed boundary condition, the
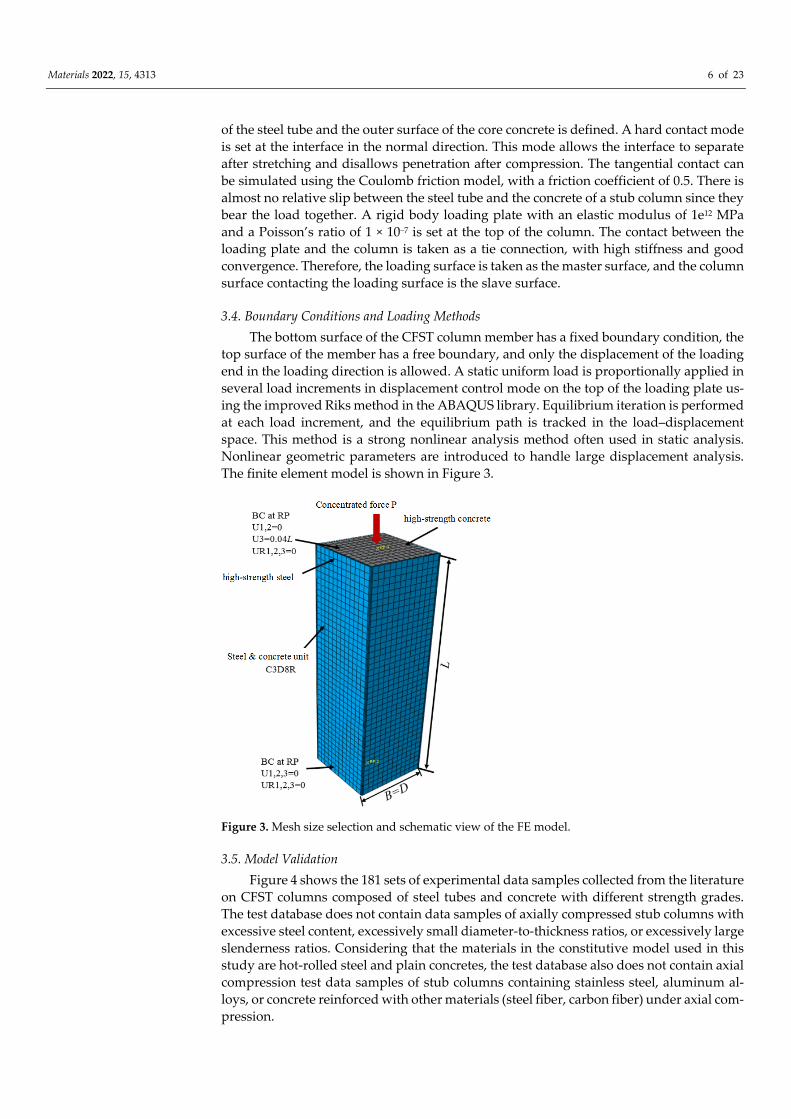
top surface of the member has a free boundary, and only the displacement of the loading end in the loading direction is allowed. A static uniform load is proportionally applied in several load increments in displacement control mode on the top of the loading plate us-ing the improved Riks method in the ABAQUS library. Equilibrium iteration is performed at each load increment, and the equilibrium path is tracked in the load–displacement space. This method is a strong nonlinear analysis method often used in static analysis. Nonlinear geometric parameters are introduced to handle large displacement analysis. The finite element model is shown in Figure 3.
Figure 3. Mesh size selection and schematic view of the FE model.
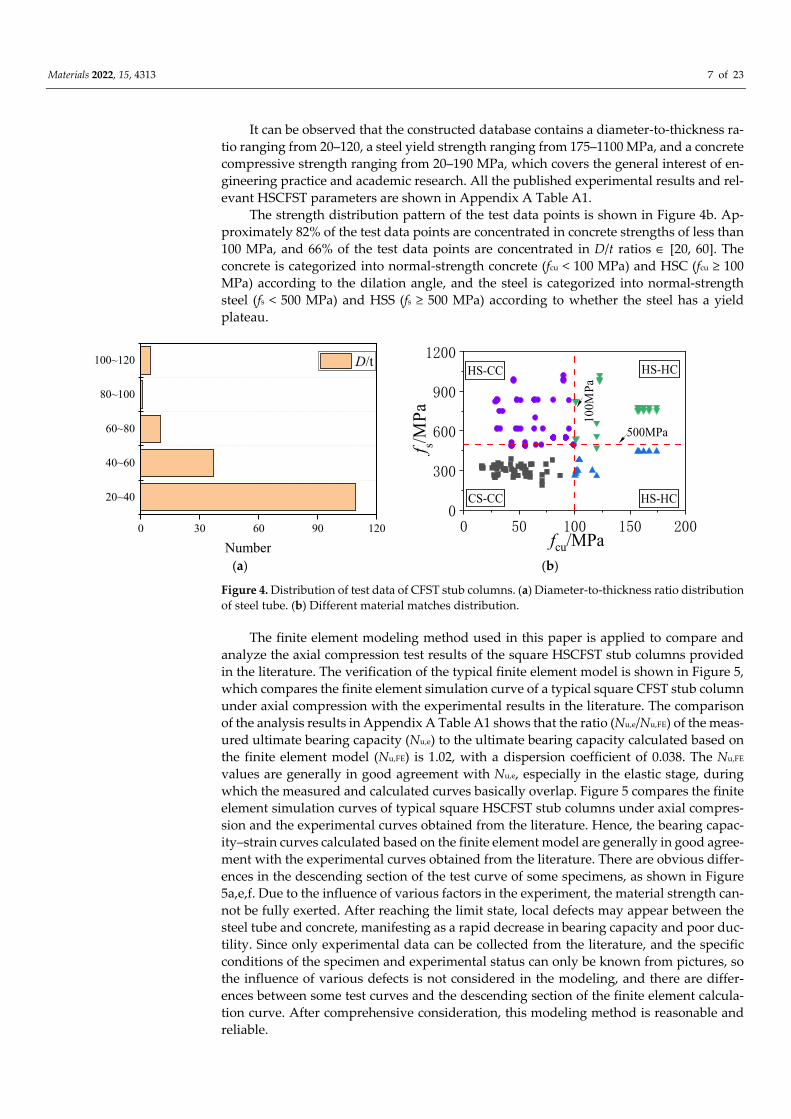
3.5. Model Validation Figure 4 shows the 181 sets of experimental data samples collected from the literature
on CFST columns composed of steel tubes and concrete with different strength grades. The test database does not contain data samples of axially compressed stub columns with excessive steel content, excessively small diameter-to-thickness ratios, or excessively large slenderness ratios. Considering that the materials in the constitutive model used in this study are hot-rolled steel and plain concretes, the test database also does not contain axial compression test data samples of stub columns containing stainless steel, aluminum al-loys, or concrete reinforced with other materials (steel fiber, carbon fiber) under axial com-pression.
Materials 2022, 15, 4313 7 of 23
It can be observed that the constructed database contains a diameter-to-thickness ra-tio ranging from 20–120, a steel yield strength ranging from 175–1100 MPa, and a concrete compressive strength ranging from 20–190 MPa, which covers the general interest of en-gineering practice and academic research. All the published experimental results and rel-evant HSCFST parameters are shown in Appendix A Table A1.
The strength distribution pattern of the test data points is shown in Figure 4b. Ap-proximately 82% of the test data points are concentrated in concrete strengths of less than 100 MPa, and 66% of the test data points are concentrated in D/t ratios ∈ [20, 60]. The concrete is categorized into normal-strength concrete (fcu < 100 MPa) and HSC (fcu ≥ 100 MPa) according to the dilation angle, and the steel is categorized into normal-strength steel (fs < 500 MPa) and HSS (fs ≥ 500 MPa) according to whether the steel has a yield plateau.
20~40
40~60
60~80
80~100
100~120
0 30 60 90 120
D/t
Number
0 50 100 150 2000
300
600
900
1200
HS-HC
HS-HCHS-CC
fcu/MPa
f s/MPa
CS-CC
500MPa
100M
Pa
(a) (b)
Figure 4. Distribution of test data of CFST stub columns. (a) Diameter-to-thickness ratio distribution of steel tube. (b) Different material matches distribution.
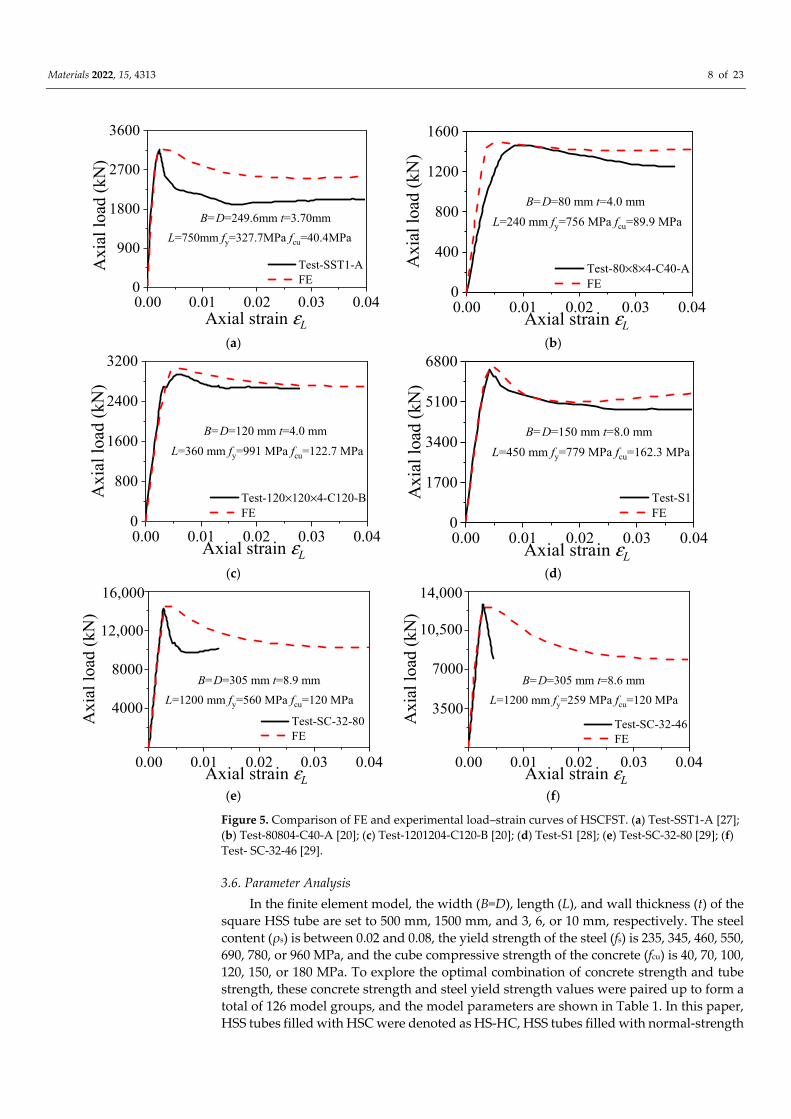
The finite element modeling method used in this paper is applied to compare and analyze the axial compression test results of the square HSCFST stub columns provided in the literature. The verification of the typical finite element model is shown in Figure 5, which compares the finite element simulation curve of a typical square CFST stub column under axial compression with the experimental results in the literature. The comparison of the analysis results in Appendix A Table A1 shows that the ratio (Nu,e/Nu,FE) of the meas-ured ultimate bearing capacity (Nu,e) to the ultimate bearing capacity calculated based on the finite element model (Nu,FE) is 1.02, with a dispersion coefficient of 0.038. The Nu,FE values are generally in good agreement with Nu,e, especially in the elastic stage, during which the measured and calculated curves basically overlap. Figure 5 compares the finite element simulation curves of typical square HSCFST stub columns under axial compres-sion and the experimental curves obtained from the literature. Hence, the bearing capac-ity–strain curves calculated based on the finite element model are generally in good agree-ment with the experimental curves obtained from the literature. There are obvious differ-ences in the descending section of the test curve of some specimens, as shown in Figure 5a,e,f. Due to the influence of various factors in the experiment, the material strength can-not be fully exerted. After reaching the limit state, local defects may appear between the steel tube and concrete, manifesting as a rapid decrease in bearing capacity and poor duc-tility. Since only experimental data can be collected from the literature, and the specific conditions of the specimen and experimental status can only be known from pictures, so the influence of various defects is not considered in the modeling, and there are differ-ences between some test curves and the descending section of the finite element calcula-tion curve. After comprehensive consideration, this modeling method is reasonable and reliable.
Materials 2022, 15, 4313 8 of 23
0.00 0.01 0.02 0.03 0.040
900
1800
2700
3600
B=D=249.6mm t=3.70mm L=750mm fy=327.7MPa fcu=40.4MPa
Axi
al lo
ad (k
N)
Axial strain εL
Test-SST1-A FE
0.00 0.01 0.02 0.03 0.040
400
800
1200
1600
B=D=80 mm t=4.0 mm L=240 mm fy=756 MPa fcu=89.9 MPa
Axial strain εL
Axi
al lo
ad (k
N)
Test-80×8×4-C40-A FE
(a) (b)
0.00 0.01 0.02 0.03 0.040
800
1600
2400
3200
B=D=120 mm t=4.0 mm L=360 mm fy=991 MPa fcu=122.7 MPa
Axial strain εL
Axi
al lo
ad (k
N)
Test-120×120×4-C120-B FE
0.00 0.01 0.02 0.03 0.040
1700
3400
5100
6800
B=D=150 mm t=8.0 mm L=450 mm fy=779 MPa fcu=162.3 MPa
Axial strain εL
Axi
al lo
ad (k
N)
Test-S1 FE
(c) (d)
0.00 0.01 0.02 0.03 0.04
4000
8000
12,000
B=D=305 mm t=8.9 mm L=1200 mm fy=560 MPa fcu=120 MPa
Axial strain εL
Axi
al lo
ad (k
N)
Test-SC-32-80 FE
16,000
0.00 0.01 0.02 0.03 0.04
3500
7000
10,500
B=D=305 mm t=8.6 mm L=1200 mm fy=259 MPa fcu=120 MPa
Axial strain εL
Axi
al lo
ad (k
N)
Test-SC-32-46 FE
14,000
(e) (f)
Figure 5. Comparison of FE and experimental load–strain curves of HSCFST. (a) Test-SST1-A [27]; (b) Test-80804-C40-A [20]; (c) Test-1201204-C120-B [20]; (d) Test-S1 [28]; (e) Test-SC-32-80 [29]; (f) Test- SC-32-46 [29].
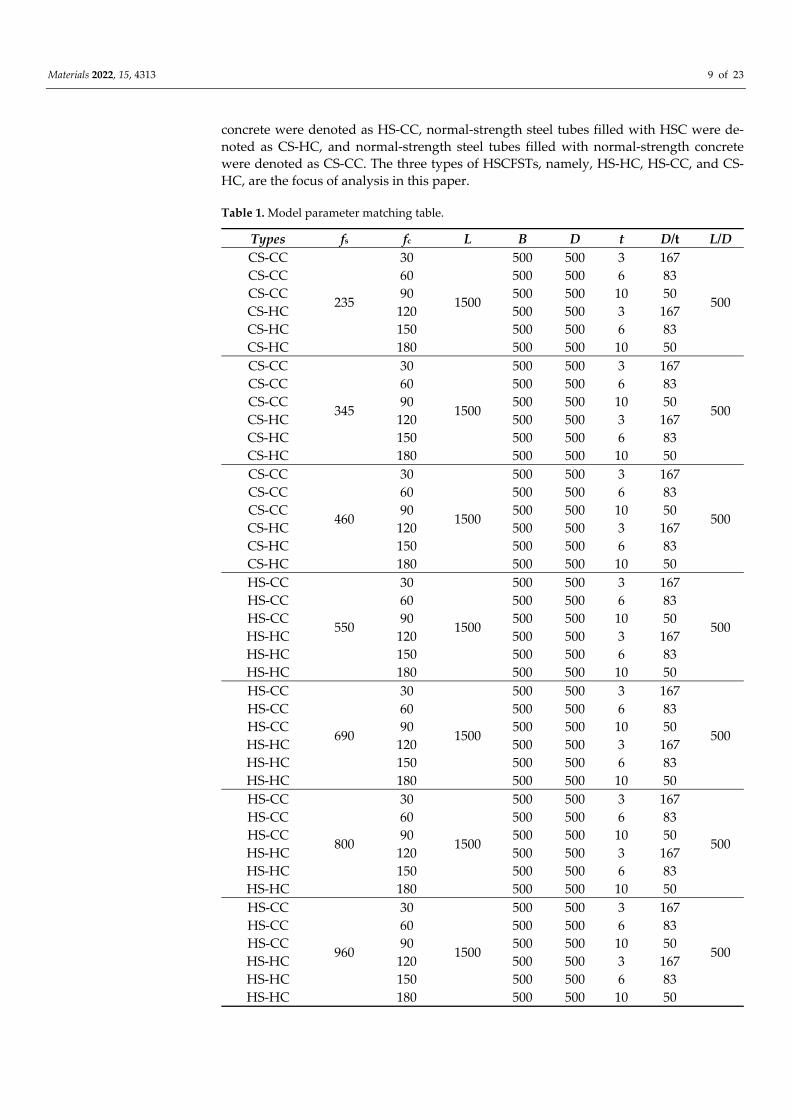
3.6. Parameter Analysis In the finite element model, the width (B=D), length (L), and wall thickness (t) of the
square HSS tube are set to 500 mm, 1500 mm, and 3, 6, or 10 mm, respectively. The steel content (ρs) is between 0.02 and 0.08, the yield strength of the steel (fs) is 235, 345, 460, 550, 690, 780, or 960 MPa, and the cube compressive strength of the concrete (fcu) is 40, 70, 100, 120, 150, or 180 MPa. To explore the optimal combination of concrete strength and tube strength, these concrete strength and steel yield strength values were paired up to form a total of 126 model groups, and the model parameters are shown in Table 1. In this paper, HSS tubes filled with HSC were denoted as HS-HC, HSS tubes filled with normal-strength
Materials 2022, 15, 4313 9 of 23
concrete were denoted as HS-CC, normal-strength steel tubes filled with HSC were de-noted as CS-HC, and normal-strength steel tubes filled with normal-strength concrete were denoted as CS-CC. The three types of HSCFSTs, namely, HS-HC, HS-CC, and CS-HC, are the focus of analysis in this paper.
Table 1. Model parameter matching table.
Types fs fc L B D t D/t L/D CS-CC
235
30
1500
500 500 3 167
500
CS-CC 60 500 500 6 83 CS-CC 90 500 500 10 50 CS-HC 120 500 500 3 167 CS-HC 150 500 500 6 83 CS-HC 180 500 500 10 50 CS-CC
345
30
1500
500 500 3 167
500
CS-CC 60 500 500 6 83 CS-CC 90 500 500 10 50 CS-HC 120 500 500 3 167 CS-HC 150 500 500 6 83 CS-HC 180 500 500 10 50 CS-CC
460
30
1500
500 500 3 167
500
CS-CC 60 500 500 6 83 CS-CC 90 500 500 10 50 CS-HC 120 500 500 3 167 CS-HC 150 500 500 6 83 CS-HC 180 500 500 10 50 HS-CC
550
30
1500
500 500 3 167
500
HS-CC 60 500 500 6 83 HS-CC 90 500 500 10 50 HS-HC 120 500 500 3 167 HS-HC 150 500 500 6 83 HS-HC 180 500 500 10 50 HS-CC
690
30
1500
500 500 3 167
500
HS-CC 60 500 500 6 83 HS-CC 90 500 500 10 50 HS-HC 120 500 500 3 167 HS-HC 150 500 500 6 83 HS-HC 180 500 500 10 50 HS-CC
800
30
1500
500 500 3 167
500
HS-CC 60 500 500 6 83 HS-CC 90 500 500 10 50 HS-HC 120 500 500 3 167 HS-HC 150 500 500 6 83 HS-HC 180 500 500 10 50 HS-CC
960
30
1500
500 500 3 167
500
HS-CC 60 500 500 6 83 HS-CC 90 500 500 10 50 HS-HC 120 500 500 3 167 HS-HC 150 500 500 6 83 HS-HC 180 500 500 10 50
Materials 2022, 15, 4313 10 of 23
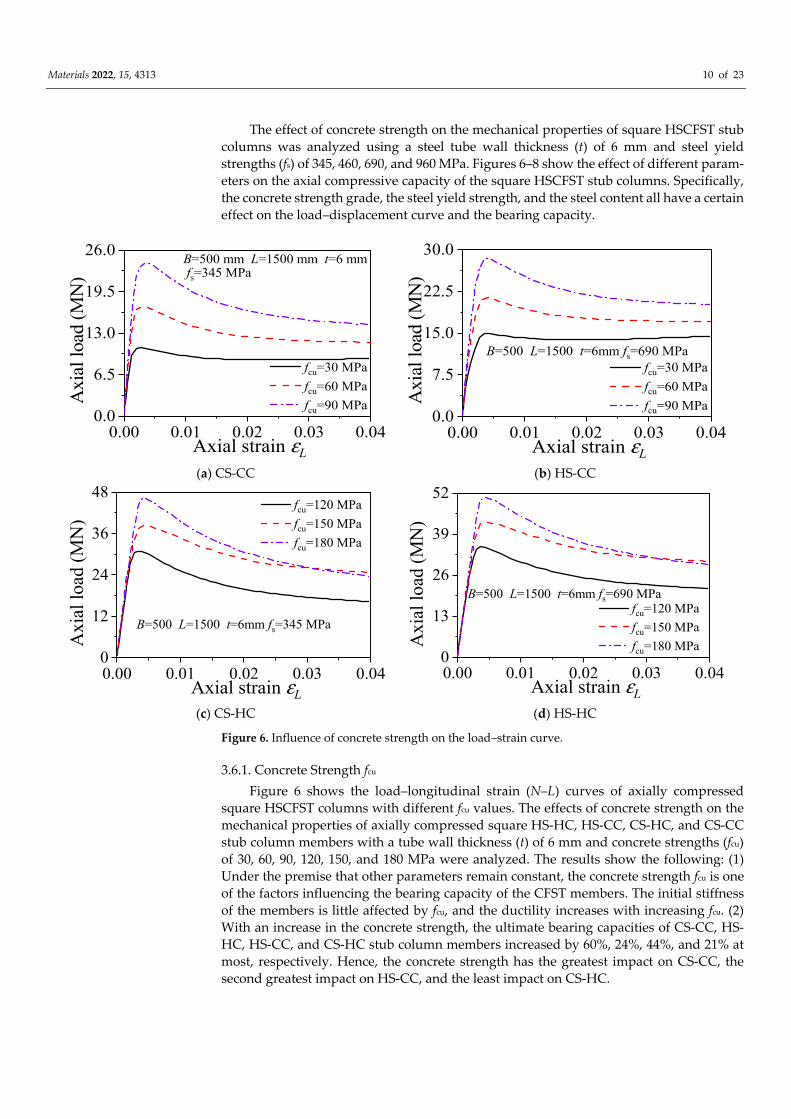
The effect of concrete strength on the mechanical properties of square HSCFST stub columns was analyzed using a steel tube wall thickness (t) of 6 mm and steel yield strengths (fs) of 345, 460, 690, and 960 MPa. Figures 6–8 show the effect of different param-eters on the axial compressive capacity of the square HSCFST stub columns. Specifically, the concrete strength grade, the steel yield strength, and the steel content all have a certain effect on the load–displacement curve and the bearing capacity.
0.00 0.01 0.02 0.03 0.040.0
6.5
13.0
19.5
26.0fs=345 MPa
fcu=30 MPa fcu=60 MPa fcu=90 MPa
Axial strain εL
Axi
al lo
ad (M
N)
B=500 mm L=1500 mm t=6 mm
0.00 0.01 0.02 0.03 0.040.0
7.5
15.0
22.5
30.0
fcu=30 MPa fcu=60 MPa fcu=90 MPa
Axial strain εL
Axi
al lo
ad (M
N)
B=500 L=1500 t=6mm fs=690 MPa
(a) CS-CC (b) HS-CC
0.00 0.01 0.02 0.03 0.040
12
24
36
48 fcu=120 MPa fcu=150 MPa fcu=180 MPa
Axial strain εL
Axi
al lo
ad (M
N)
B=500 L=1500 t=6mm fs=345 MPa
0.00 0.01 0.02 0.03 0.040
13
26
39
52
fcu=120 MPa fcu=150 MPa fcu=180 MPa
Axial strain εL
Axi
al lo
ad (M
N)
B=500 L=1500 t=6mm fs=690 MPa
(c) CS-HC (d) HS-HC
Figure 6. Influence of concrete strength on the load–strain curve.
3.6.1. Concrete Strength fcu Figure 6 shows the load–longitudinal strain (N–L) curves of axially compressed
square HSCFST columns with different fcu values. The effects of concrete strength on the mechanical properties of axially compressed square HS-HC, HS-CC, CS-HC, and CS-CC stub column members with a tube wall thickness (t) of 6 mm and concrete strengths (fcu) of 30, 60, 90, 120, 150, and 180 MPa were analyzed. The results show the following: (1) Under the premise that other parameters remain constant, the concrete strength fcu is one of the factors influencing the bearing capacity of the CFST members. The initial stiffness of the members is little affected by fcu, and the ductility increases with increasing fcu. (2) With an increase in the concrete strength, the ultimate bearing capacities of CS-CC, HS-HC, HS-CC, and CS-HC stub column members increased by 60%, 24%, 44%, and 21% at most, respectively. Hence, the concrete strength has the greatest impact on CS-CC, the second greatest impact on HS-CC, and the least impact on CS-HC.
Materials 2022, 15, 4313 11 of 23
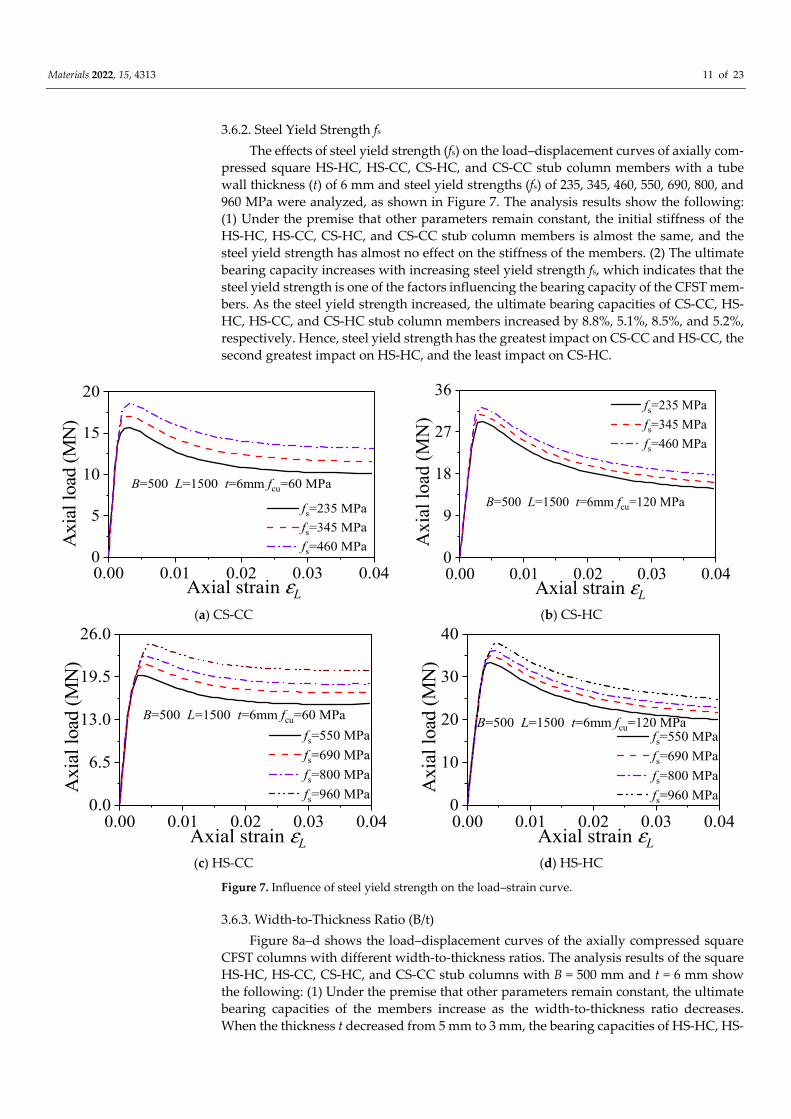
3.6.2. Steel Yield Strength fs The effects of steel yield strength (fs) on the load–displacement curves of axially com-
pressed square HS-HC, HS-CC, CS-HC, and CS-CC stub column members with a tube wall thickness (t) of 6 mm and steel yield strengths (fs) of 235, 345, 460, 550, 690, 800, and 960 MPa were analyzed, as shown in Figure 7. The analysis results show the following: (1) Under the premise that other parameters remain constant, the initial stiffness of the HS-HC, HS-CC, CS-HC, and CS-CC stub column members is almost the same, and the steel yield strength has almost no effect on the stiffness of the members. (2) The ultimate bearing capacity increases with increasing steel yield strength fs, which indicates that the steel yield strength is one of the factors influencing the bearing capacity of the CFST mem-bers. As the steel yield strength increased, the ultimate bearing capacities of CS-CC, HS-HC, HS-CC, and CS-HC stub column members increased by 8.8%, 5.1%, 8.5%, and 5.2%, respectively. Hence, steel yield strength has the greatest impact on CS-CC and HS-CC, the second greatest impact on HS-HC, and the least impact on CS-HC.
0.00 0.01 0.02 0.03 0.040
5
10
15
20
fs=235 MPa fs=345 MPa fs=460 MPa
Axial strain εL
Axi
al lo
ad (M
N)
B=500 L=1500 t=6mm fcu=60 MPa
0.00 0.01 0.02 0.03 0.040
9
18
27
36 fs=235 MPa fs=345 MPa fs=460 MPa
Axial strain εL
Axi
al lo
ad (M
N)
B=500 L=1500 t=6mm fcu=120 MPa
(a) CS-CC (b) CS-HC
0.00 0.01 0.02 0.03 0.040.0
6.5
13.0
19.5
26.0
fs=550 MPa fs=690 MPa fs=800 MPa fs=960 MPa
Axial strain εL
Axi
al lo
ad (M
N)
B=500 L=1500 t=6mm fcu=60 MPa
0.00 0.01 0.02 0.03 0.040
10
20
30
40
fs=550 MPa fs=690 MPa fs=800 MPa fs=960 MPa
Axial strain εL
Axi
al lo
ad (M
N)
B=500 L=1500 t=6mm fcu=120 MPa
(c) HS-CC (d) HS-HC
Figure 7. Influence of steel yield strength on the load–strain curve.
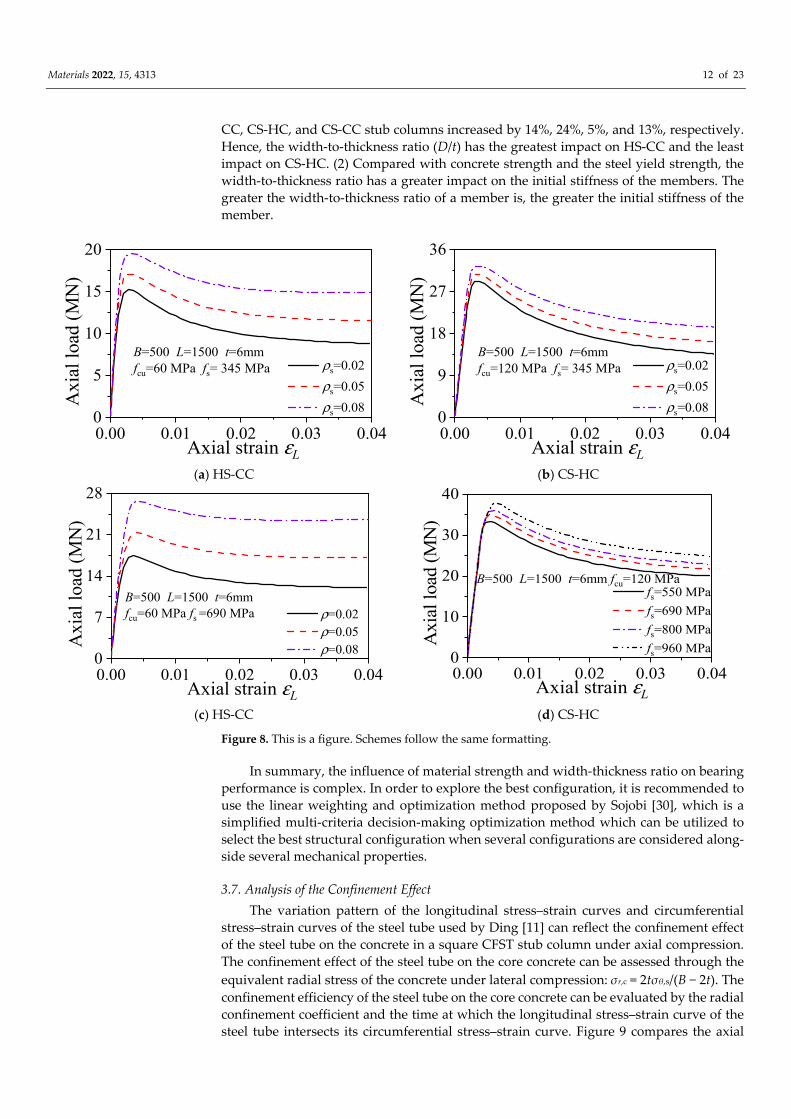
3.6.3. Width-to-Thickness Ratio (B/t) Figure 8a–d shows the load–displacement curves of the axially compressed square
CFST columns with different width-to-thickness ratios. The analysis results of the square HS-HC, HS-CC, CS-HC, and CS-CC stub columns with B = 500 mm and t = 6 mm show the following: (1) Under the premise that other parameters remain constant, the ultimate bearing capacities of the members increase as the width-to-thickness ratio decreases. When the thickness t decreased from 5 mm to 3 mm, the bearing capacities of HS-HC, HS-
Materials 2022, 15, 4313 12 of 23
CC, CS-HC, and CS-CC stub columns increased by 14%, 24%, 5%, and 13%, respectively. Hence, the width-to-thickness ratio (D/t) has the greatest impact on HS-CC and the least impact on CS-HC. (2) Compared with concrete strength and the steel yield strength, the width-to-thickness ratio has a greater impact on the initial stiffness of the members. The greater the width-to-thickness ratio of a member is, the greater the initial stiffness of the member.
0.00 0.01 0.02 0.03 0.040
5
10
15
20
ρs=0.02 ρs=0.05 ρs=0.08
Axial strain εL
Axi
al lo
ad (M
N)
B=500 L=1500 t=6mm fcu=60 MPa fs= 345 MPa
0.00 0.01 0.02 0.03 0.040
9
18
27
36
ρs=0.02 ρs=0.05 ρs=0.08
Axial strain εL
Axi
al lo
ad (M
N)
B=500 L=1500 t=6mm fcu=120 MPa fs= 345 MPa
(a) HS-CC (b) CS-HC
0.00 0.01 0.02 0.03 0.040
7
14
21
28
ρ=0.02 ρ=0.05 ρ=0.08
Axial strain εL
Axi
al lo
ad (M
N)
B=500 L=1500 t=6mm fcu=60 MPa fs =690 MPa
0.00 0.01 0.02 0.03 0.040
10
20
30
40
fs=550 MPa fs=690 MPa fs=800 MPa fs=960 MPa
Axial strain εL
Axi
al lo
ad (M
N)
B=500 L=1500 t=6mm fcu=120 MPa
(c) HS-CC (d) CS-HC
Figure 8. This is a figure. Schemes follow the same formatting.
In summary, the influence of material strength and width-thickness ratio on bearing performance is complex. In order to explore the best configuration, it is recommended to use the linear weighting and optimization method proposed by Sojobi [30], which is a simplified multi-criteria decision-making optimization method which can be utilized to select the best structural configuration when several configurations are considered along-side several mechanical properties.
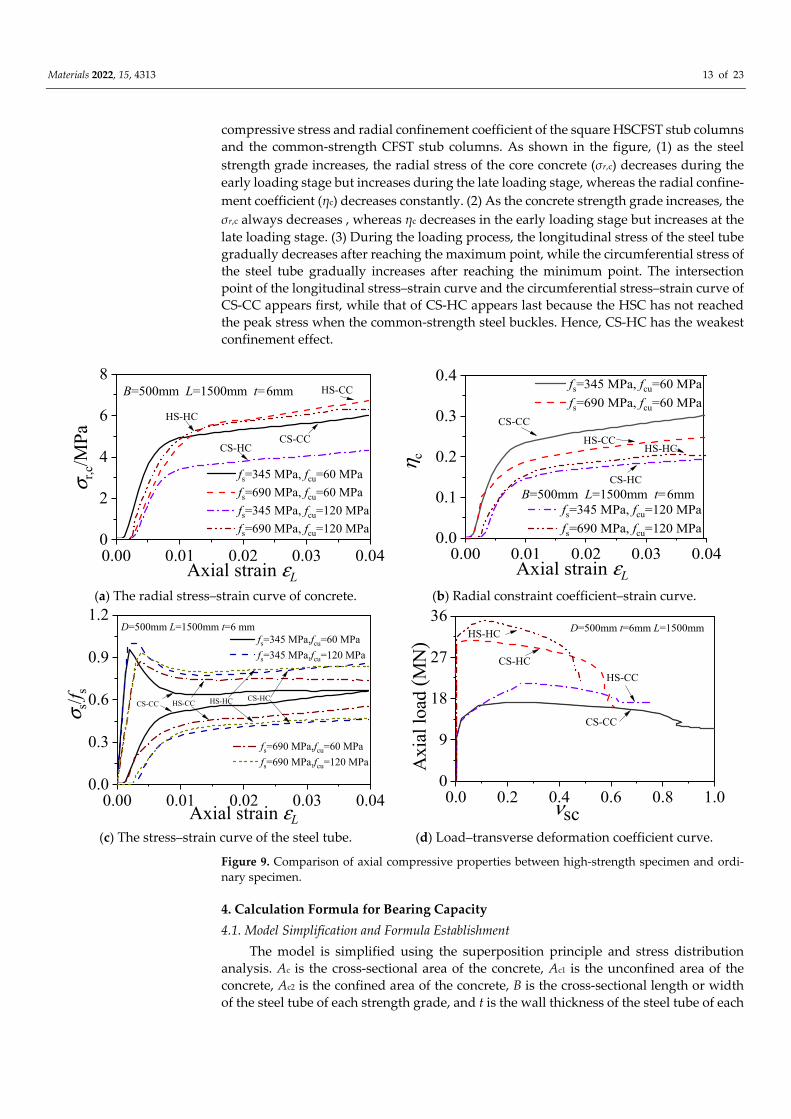
3.7. Analysis of the Confinement Effect The variation pattern of the longitudinal stress–strain curves and circumferential
stress–strain curves of the steel tube used by Ding [11] can reflect the confinement effect of the steel tube on the concrete in a square CFST stub column under axial compression. The confinement effect of the steel tube on the core concrete can be assessed through the equivalent radial stress of the concrete under lateral compression: σr,c = 2tσθ,s/(B − 2t). The confinement efficiency of the steel tube on the core concrete can be evaluated by the radial confinement coefficient and the time at which the longitudinal stress–strain curve of the steel tube intersects its circumferential stress–strain curve. Figure 9 compares the axial
Materials 2022, 15, 4313 13 of 23
compressive stress and radial confinement coefficient of the square HSCFST stub columns and the common-strength CFST stub columns. As shown in the figure, (1) as the steel strength grade increases, the radial stress of the core concrete (σr,c) decreases during the early loading stage but increases during the late loading stage, whereas the radial confine-ment coefficient (ηc) decreases constantly. (2) As the concrete strength grade increases, the σr,c always decreases , whereas ηc decreases in the early loading stage but increases at the late loading stage. (3) During the loading process, the longitudinal stress of the steel tube gradually decreases after reaching the maximum point, while the circumferential stress of the steel tube gradually increases after reaching the minimum point. The intersection point of the longitudinal stress–strain curve and the circumferential stress–strain curve of CS-CC appears first, while that of CS-HC appears last because the HSC has not reached the peak stress when the common-strength steel buckles. Hence, CS-HC has the weakest confinement effect.
0.00 0.01 0.02 0.03 0.040
2
4
6
8
CS-HC
HS-CC
CS-CC
B=500mm L=1500mm t=6mm
σ r,c/M
Pa
Axial strain εL
fs=345 MPa, fcu=60 MPa fs=690 MPa, fcu=60 MPa fs=345 MPa, fcu=120 MPa fs=690 MPa, fcu=120 MPa
HS-HC
0.00 0.01 0.02 0.03 0.040.0
0.1
0.2
0.3
0.4
fs=345 MPa, fcu=120 MPa fs=690 MPa, fcu=120 MPa
fs=345 MPa, fcu=60 MPa fs=690 MPa, fcu=60 MPa
CS-HC
HS-CC
CS-CC
B=500mm L=1500mm t=6mm
η c
Axial strain εL
HS-HC
(a) The radial stress–strain curve of concrete. (b) Radial constraint coefficient–strain curve.
0.00 0.01 0.02 0.03 0.040.0
0.3
0.6
0.9
1.2
CS-HCHS-CC HS-HC
fs=690 MPa,fcu=60 MPa fs=690 MPa,fcu=120 MPa
fs=345 MPa,fcu=60 MPa fs=345 MPa,fcu=120 MPa
D=500mm L=1500mm t=6 mm
σ s/f s
Axial strain εL
CS-CC
0.0 0.2 0.4 0.6 0.8 1.00
9
18
27
36D=500mm t=6mm L=1500mm
Axi
al lo
ad (M
N)
νsc
HS-CC
CS-CC
CS-HC
HS-HC
(c) The stress–strain curve of the steel tube. (d) Load–transverse deformation coefficient curve.
Figure 9. Comparison of axial compressive properties between high-strength specimen and ordi-nary specimen.
4. Calculation Formula for Bearing Capacity 4.1. Model Simplification and Formula Establishment
The model is simplified using the superposition principle and stress distribution analysis. Ac is the cross-sectional area of the concrete, Ac1 is the unconfined area of the concrete, Ac2 is the confined area of the concrete, B is the cross-sectional length or width of the steel tube of each strength grade, and t is the wall thickness of the steel tube of each
Materials 2022, 15, 4313 14 of 23
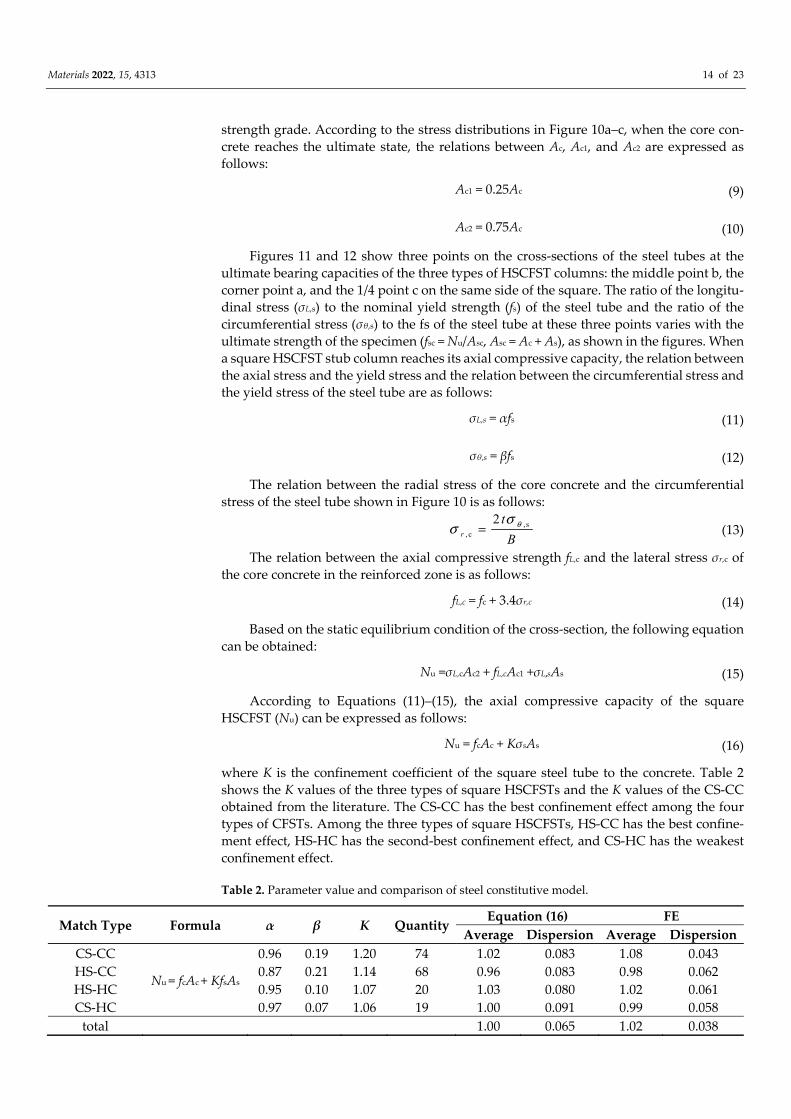
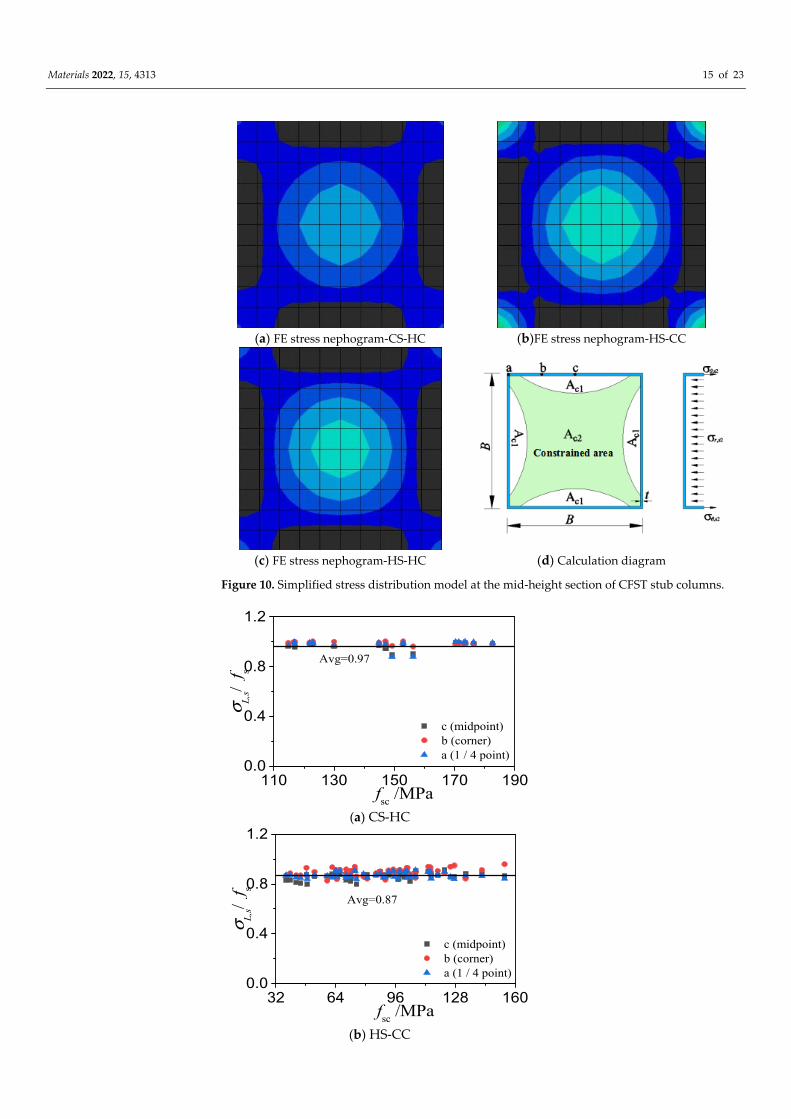
strength grade. According to the stress distributions in Figure 10a–c, when the core con-crete reaches the ultimate state, the relations between Ac, Ac1, and Ac2 are expressed as follows:
Ac1 = 0.25Ac (9)
Ac2 = 0.75Ac (10)
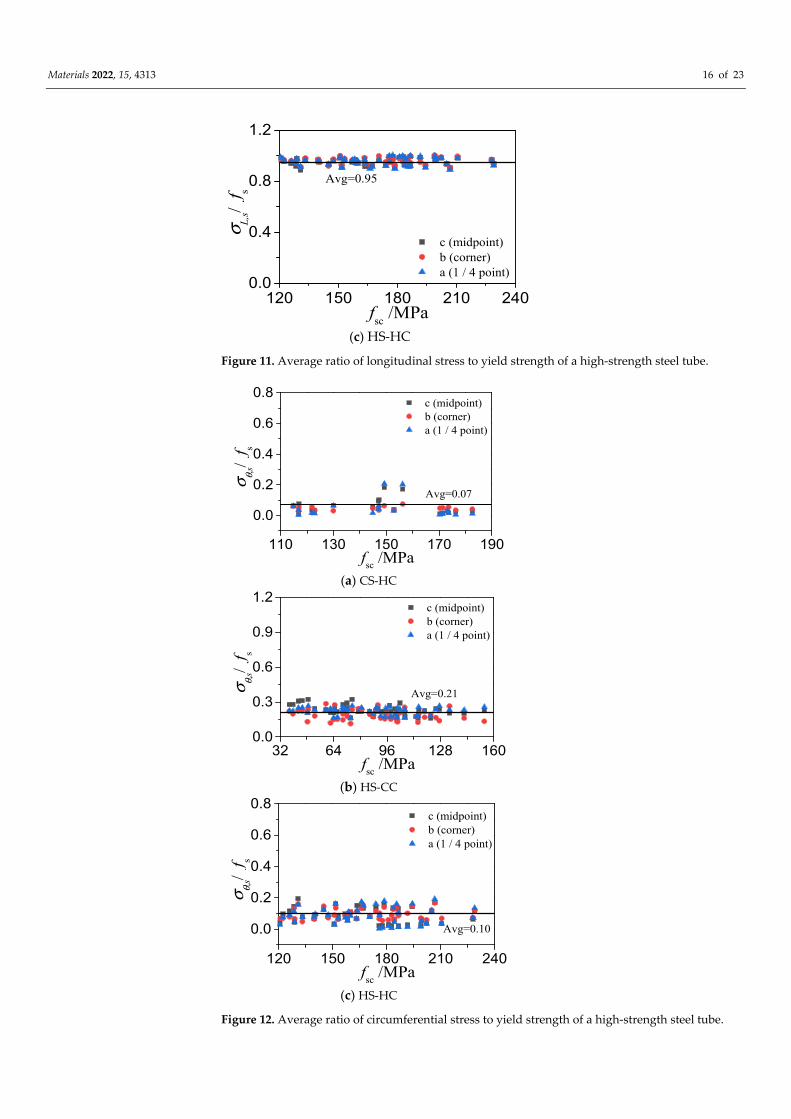
Figures 11 and 12 show three points on the cross-sections of the steel tubes at the ultimate bearing capacities of the three types of HSCFST columns: the middle point b, the corner point a, and the 1/4 point c on the same side of the square. The ratio of the longitu-dinal stress (σL,s) to the nominal yield strength (fs) of the steel tube and the ratio of the circumferential stress (σθ,s) to the fs of the steel tube at these three points varies with the ultimate strength of the specimen (fsc = Nu/Asc, Asc = Ac + As), as shown in the figures. When a square HSCFST stub column reaches its axial compressive capacity, the relation between the axial stress and the yield stress and the relation between the circumferential stress and the yield stress of the steel tube are as follows:
σL,s = αfs (11)
σθ,s = βfs (12)
The relation between the radial stress of the core concrete and the circumferential stress of the steel tube shown in Figure 10 is as follows:
,s, c
2r
tB
θσσ = (13)
The relation between the axial compressive strength fL,c and the lateral stress σr,c of the core concrete in the reinforced zone is as follows:
fL,c = fc + 3.4σr,c (14)
Based on the static equilibrium condition of the cross-section, the following equation can be obtained:
Nu =σL,cAc2 + fL,cAc1 +σL,sAs (15)
According to Equations (11)–(15), the axial compressive capacity of the square HSCFST (Nu) can be expressed as follows:
Nu = fcAc + KσsAs (16)
where K is the confinement coefficient of the square steel tube to the concrete. Table 2 shows the K values of the three types of square HSCFSTs and the K values of the CS-CC obtained from the literature. The CS-CC has the best confinement effect among the four types of CFSTs. Among the three types of square HSCFSTs, HS-CC has the best confine-ment effect, HS-HC has the second-best confinement effect, and CS-HC has the weakest confinement effect.
Table 2. Parameter value and comparison of steel constitutive model.
Match Type Formula α β K Quantity Equation (16) FE
Average Dispersion Average Dispersion CS-CC
Nu = fcAc + KfsAs
0.96 0.19 1.20 74 1.02 0.083 1.08 0.043 HS-CC 0.87 0.21 1.14 68 0.96 0.083 0.98 0.062 HS-HC 0.95 0.10 1.07 20 1.03 0.080 1.02 0.061 CS-HC 0.97 0.07 1.06 19 1.00 0.091 0.99 0.058
total 1.00 0.065 1.02 0.038
Materials 2022, 15, 4313 15 of 23
(a) FE stress nephogram-CS-HC (b)FE stress nephogram-HS-CC
(c) FE stress nephogram-HS-HC (d) Calculation diagram
Figure 10. Simplified stress distribution model at the mid-height section of CFST stub columns.
110 130 150 170 1900.0
0.4
0.8
1.2
c (midpoint) b (corner) a (1 / 4 point)
σ L,s/
f s
fsc /MPa
Avg=0.97
(a) CS-HC
32 64 96 128 1600.0
0.4
0.8
1.2
c (midpoint) b (corner) a (1 / 4 point)
σ L,s/
f s
fsc /MPa
Avg=0.87
(b) HS-CC
Materials 2022, 15, 4313 16 of 23
120 150 180 210 2400.0
0.4
0.8
1.2
c (midpoint) b (corner) a (1 / 4 point)
fsc /MPa
σ L,s/
f s
Avg=0.95
(c) HS-HC
Figure 11. Average ratio of longitudinal stress to yield strength of a high-strength steel tube.
110 130 150 170 190
0.0
0.2
0.4
0.6
0.8 c (midpoint) b (corner) a (1 / 4 point)
fsc /MPa
σ θ,s/
f s
Avg=0.07
(a) CS-HC
32 64 96 128 1600.0
0.3
0.6
0.9
1.2 c (midpoint) b (corner) a (1 / 4 point)
fsc /MPa
σ θ,s/
f s
Avg=0.21
(b) HS-CC
120 150 180 210 240
0.0
0.2
0.4
0.6
0.8
fsc /MPa
σ θ,s/
f s
c (midpoint) b (corner) a (1 / 4 point)
Avg=0.10
(c) HS-HC
Figure 12. Average ratio of circumferential stress to yield strength of a high-strength steel tube.
Materials 2022, 15, 4313 17 of 23
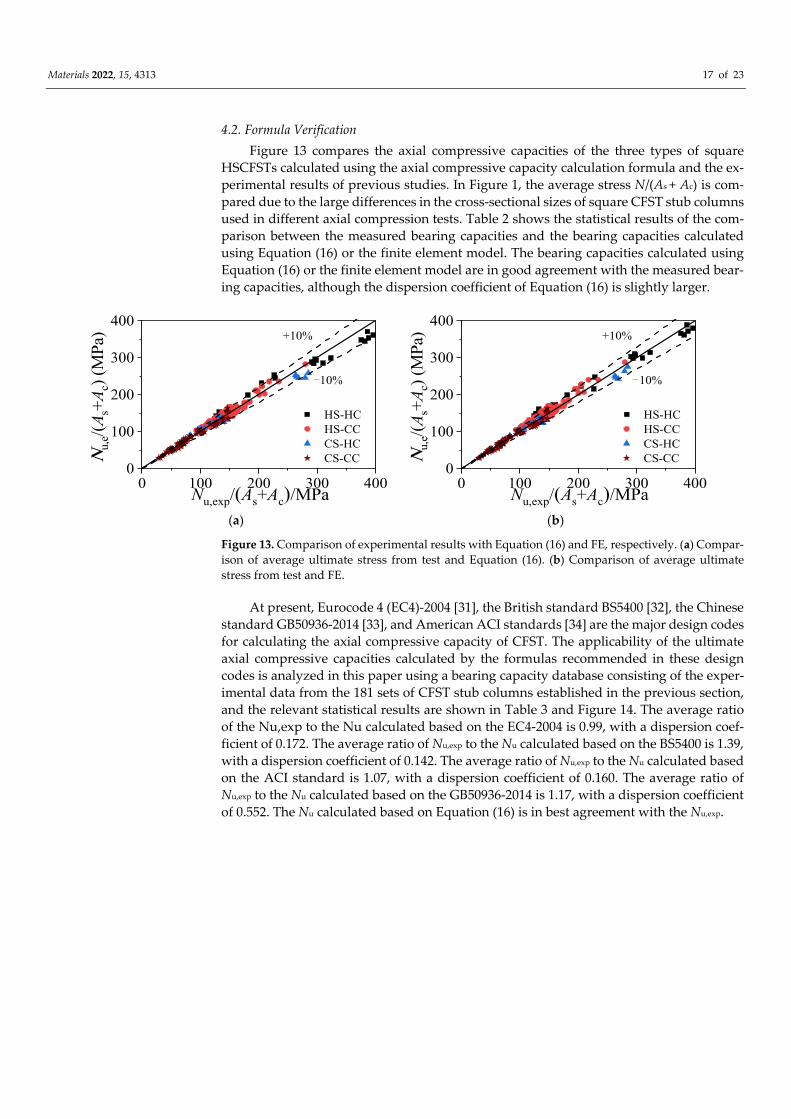
4.2. Formula Verification Figure 13 compares the axial compressive capacities of the three types of square
HSCFSTs calculated using the axial compressive capacity calculation formula and the ex-perimental results of previous studies. In Figure 1, the average stress N/(As + Ac) is com-pared due to the large differences in the cross-sectional sizes of square CFST stub columns used in different axial compression tests. Table 2 shows the statistical results of the com-parison between the measured bearing capacities and the bearing capacities calculated using Equation (16) or the finite element model. The bearing capacities calculated using Equation (16) or the finite element model are in good agreement with the measured bear-ing capacities, although the dispersion coefficient of Equation (16) is slightly larger.
0 100 200 300 4000
100
200
300
400
10%
+10%
Νu,
e/(A s
+Ac)
(MPa
)
Nu,exp/(As+Ac)/MPa
HS-HC HS-CC CS-HC CS-CC
0 100 200 300 4000
100
200
300
400
10%
+10%
Νu,
e/(A s
+Ac)
(MPa
)
Nu,exp/(As+Ac)/MPa
HS-HC HS-CC CS-HC CS-CC
(a) (b)
Figure 13. Comparison of experimental results with Equation (16) and FE, respectively. (a) Compar-ison of average ultimate stress from test and Equation (16). (b) Comparison of average ultimate stress from test and FE.
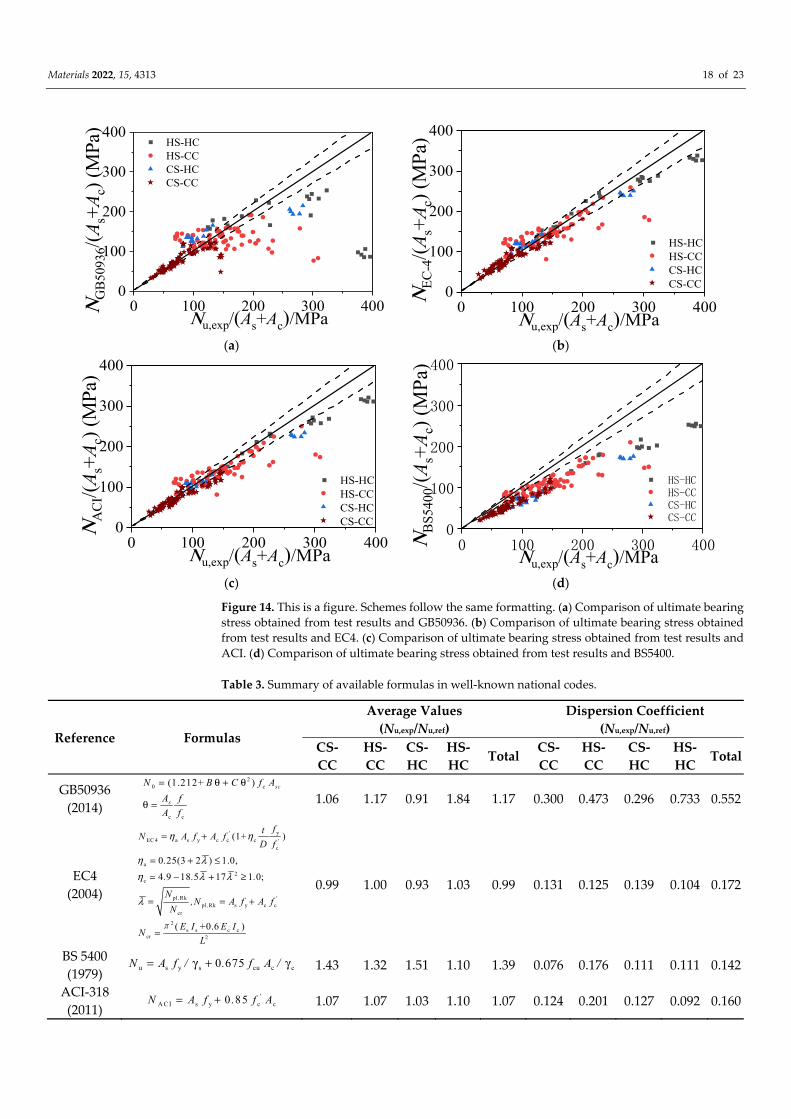
At present, Eurocode 4 (EC4)-2004 [31], the British standard BS5400 [32], the Chinese standard GB50936-2014 [33], and American ACI standards [34] are the major design codes for calculating the axial compressive capacity of CFST. The applicability of the ultimate axial compressive capacities calculated by the formulas recommended in these design codes is analyzed in this paper using a bearing capacity database consisting of the exper-imental data from the 181 sets of CFST stub columns established in the previous section, and the relevant statistical results are shown in Table 3 and Figure 14. The average ratio of the Nu,exp to the Nu calculated based on the EC4-2004 is 0.99, with a dispersion coef-ficient of 0.172. The average ratio of Nu,exp to the Nu calculated based on the BS5400 is 1.39, with a dispersion coefficient of 0.142. The average ratio of Nu,exp to the Nu calculated based on the ACI standard is 1.07, with a dispersion coefficient of 0.160. The average ratio of Nu,exp to the Nu calculated based on the GB50936-2014 is 1.17, with a dispersion coefficient of 0.552. The Nu calculated based on Equation (16) is in best agreement with the Nu,exp.
Materials 2022, 15, 4313 18 of 23
0 100 200 300 4000
100
200
300
400
ΝG
B509
36/(A
s+A c
) (M
Pa)
Νu,exp/(As+Ac)/MPa
HS-HC HS-CC CS-HC CS-CC
0 100 200 300 400
0
100
200
300
400
ΝEC
-4/(A
s+A c
) (M
Pa)
Νu,exp/(As+Ac)/MPa
HS-HC HS-CC CS-HC CS-CC
(a) (b)
0 100 200 300 4000
100
200
300
400
ΝA
CI/(A
s+A c
) (M
Pa)
Νu,exp/(As+Ac)/MPa
HS-HC HS-CC CS-HC CS-CC
0 100 200 300 400
0
100
200
300
400
ΝBS
5400
/(As+
A c) (
MPa
)
Νu,exp/(As+Ac)/MPa
HS-HC HS-CC CS-HC CS-CC
(c) (d)
Figure 14. This is a figure. Schemes follow the same formatting. (a) Comparison of ultimate bearing stress obtained from test results and GB50936. (b) Comparison of ultimate bearing stress obtained from test results and EC4. (c) Comparison of ultimate bearing stress obtained from test results and ACI. (d) Comparison of ultimate bearing stress obtained from test results and BS5400.
Table 3. Summary of available formulas in well-known national codes.
Reference Formulas
Average Values (Nu,exp/Nu,ref)
Dispersion Coefficient (Nu,exp/Nu,ref)
CS- CC
HS- CC
CS- HC
HS- HC
Total CS- CC
HS- CC
CS- HC
HS- HC
Total
GB50936 (2014)
2
c c
0 c(1.212+ ) s
s
cN B C f AA fA f
θ =
= θ + θ 1.06 1.17 0.91 1.84 1.17 0.300 0.473 0.296 0.733 0.552
EC4 (2004)
a c
a2
c
pl Rkpl Rk
c
yEC 4 s y c c
c
sr
2
cr 2
y c c
s s c c
0 254 9 1
(1+ )
(3 2 ) 1.0,
( +0.6
8 5 17
)
1 0;
''
',,
tD
.
. . .
N,N
N
fN A f A f
f
A f A f
NL
E I E I
η η
η λη λ λ
λ
=
= − + ≥
=
+= =
=
+
+ ≤
π
0.99 1.00 0.93 1.03 0.99 0.131 0.125 0.139 0.104 0.172
BS 5400 (1979) u s y s cu c c0 675N A f / . f A /= γ + γ 1.43 1.32 1.51 1.10 1.39 0.076 0.176 0.111 0.111 0.142
ACI-318 (2011) A C I s y c c0 85 'N A f . f A= + 1.07 1.07 1.03 1.10 1.07 0.124 0.201 0.127 0.092 0.160
Materials 2022, 15, 4313 19 of 23
5. Conclusions (1) A refined 3D finite element model consisting of 181 sets of axially compressed square
HSCFST members is established using the unified constitutive relation of steel and concrete.
(2) A total of 126 groups of examples were constructed to analyze the effects of the di-ameter-to-thickness ratio, concrete strength fcu, and steel strength fs on the bearing capacity and confinement effect of the members. Increasing the steel yield strength and reducing the concrete strength will weaken the confinement efficiency of the steel tube to the concrete. Among the four types of CFSTs, CS-CC has the strongest confinement effect, while CS-HC has the weakest confinement effect. Compared with concrete strength and the steel yield strength, the width-to-thickness ratio has a greater impact on the initial stiffness of the members. The greater the width-to-thick-ness ratio of a member is, the greater the initial stiffness of the member.
(3) Based on the equilibrium condition, a practical formula considering the confinement coefficient for the ultimate bearing capacity of square CFST stub columns under axial loading with different material matches was proposed. The proposed formula shows a better calculation accuracy and clearer physical meaning of HSCFST compared with major code formulae.
Author Contributions: Conceptualization, B.L. and F.D.; methodology, B.L.; software, D.L. and S.H.; validation, H.W., D.L. and F.D.; formal analysis, B.L.; resources, Z.C.; data curation, S.H.; writ-ing—original draft preparation, F.L.; writing—review and editing, D.L. All authors have read and agreed to the published version of the manuscript.
Funding: The research work was financially supported by the National Natural Science Foundation of China (Grant No. 52008400) and the Science Fund for Distinguished Young Scholars of Hunan (Grant No. 2019JJ20029).
Institutional Review Board Statement: Not applicable.
Informed Consent Statement: Not applicable.
Data Availability Statement: Not applicable.
Acknowledgments: Thanks for Testing Research Fund from Hunan Tieyuan Civil Engineering Te-sting Co., Ltd.
Conflicts of Interest: The authors declare no conflict of interest.
Appendix A
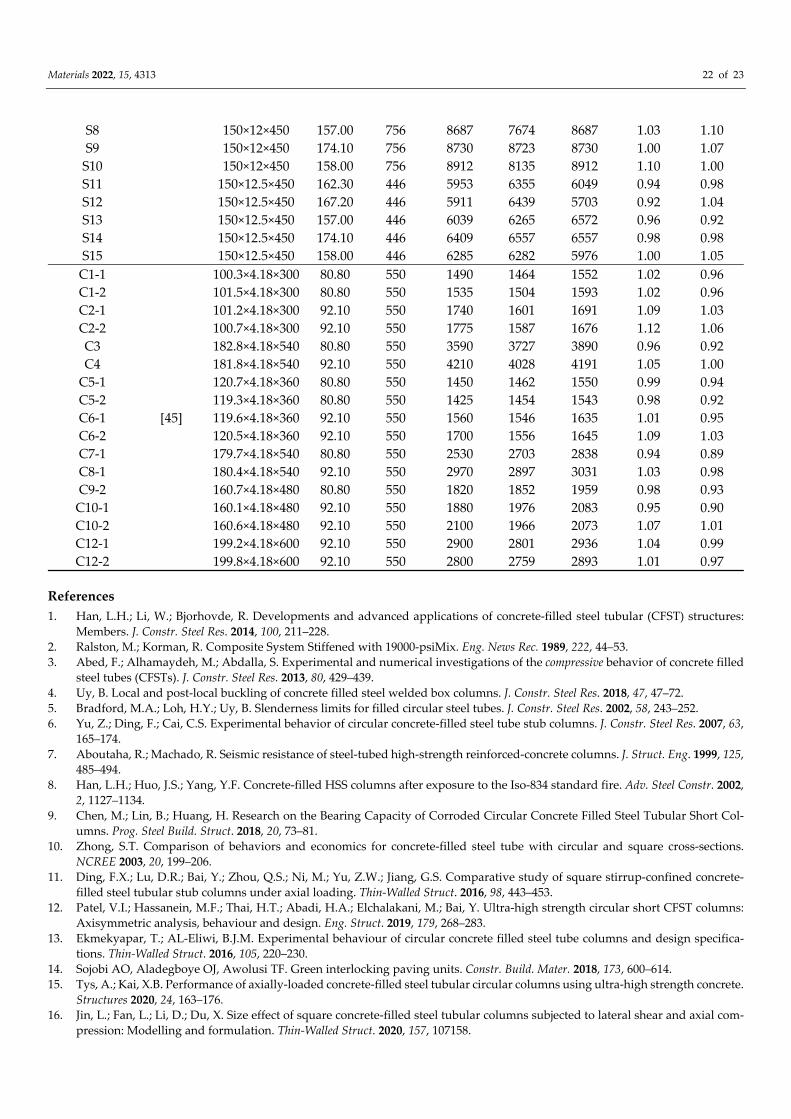
Table A1. Comparison between finite element calculation results and literature experimental results of high-strength concrete-filled square steel tube stub columns.
Specimen Number Literature D×t×L/mm fcu/MPa fy/MPa Nu,e/kN Nu,FE/kN Nu,Eq/kN Nu,e/Nu,FE Nu,e/Nu,Eq
NS1
[35]
186×3×558 40 300 1555 1628 1694 0.96 0.92 NS7 246×3×738 47.5 300 3095 2918 3005 1.06 1.03
NS13 306×3×918 47.5 281 4003 4179 4281 0.96 0.93 NS16 306×3×918 58.75 281 4658 4985 5087 0.93 0.92
S2 [36]
127×4.34×609.6 32.5 357 1095 1144 1220 0.96 0.90 S3 127×4.55×609.6 29.75 322 1113 1189 1152 0.94 0.97 S4 127×5.67×609.6 29.75 312 1202 1225 1310 0.98 0.92
C10K6-1-6-1
[37]
150×4.5×1855 80.00 379.8 1895 1758 1841 1.08 1.03 C10K6-1-6-2 150×4.5×1855 80.00 379.8 1889 1758 1841 1.07 1.03 C10K6-1-6-3 150×4.5×1855 80.00 379.8 1886 1758 1841 1.07 1.02 C10K6-1-6-4 150×4.5×1855 80.00 379.8 1892 1758 1841 1.08 1.03 C10K6-1-6-5 150×4.5×1855 80.00 379.8 1862 1758 1841 1.06 1.01
Materials 2022, 15, 4313 20 of 23
C10K6-1-6-6 150×4.5×1855 80.00 379.8 1890 1758 1841 1.07 1.03 C12K6-1-6-1 150×4.5×1855 94.00 379.8 2066.1 1935 1984 1.07 1.04 C12K6-1-6-2 150×4.5×1855 94.00 379.8 2196.4 2017 2017 1.09 1.09 C12K6-1-6-3 150×4.5×1855 94.00 379.8 2096.1 1935 2182 1.08 0.96 C12K6-1-6-4 150×4.5×1855 94.00 379.8 2090.1 1935 2100 1.08 1.00 C12K6-1-6-5 150×4.5×1855 94.00 379.8 2006.7 1935 1853 1.04 1.08 C12K6-1-6-6 150×4.5×1855 94.00 379.8 2083.5 1935 1935 1.08 1.08
HSS1
[38]
110×5×330 35 750 1836 1819 2024 1.01 0.91 HSS2 110×5×330 35 750 1832 1866 2024 0.98 0.91 HSS8 160×5×480 37.5 750 2868 2918 3127 0.98 0.92 HSS9 160×5×480 37.5 750 2922 2964 3220 0.99 0.91
CSC40SD8 [39]
150×8.275×453 43.2 488.38 3500 3326 3188 1.05 1.10 CSC50SD9 150×8.275×451 55.3 488.38 3575 3518 3381 1.02 1.06 CR4-A-8
[40]
148×4.38×444 87 262 2108 2145 2211 0.98 0.95 CR4-A-2 148×4.38×444 35.4 262 1153 1135 1201 1.02 0.96
CR4-A-4-1 148×4.38×444 50.5 262 1414 1435 1501 0.99 0.94 CR4-A-4-2 148×4.38×444 50.5 262 1402 1435 1501 0.98 0.93 CR4-A-4-3 210×5.48×630 46 294 3183 2830 2961 1.10 1.07 CR4-C-4-3 210×4.5×630 46 277 2713 2534 2637 1.07 1.03 CR4-C-8 215×4.38×645 90.3 262 3837 4028 4221 0.92 0.91
CR4-D-4-1 323×4.38×645 51.375 262 4950 5311 5457 0.93 0.91 CR6-A-2 144×6.36×432 31.75 618 2572 2615 2831 0.98 0.91
CR6-A-4-1 144×6.36×432 50.625 618 2808 2866 3082 0.98 0.91 CR6-A-4-2 144×6.36×432 50.625 618 2765 2655 2871 1.04 0.96 CR6-A-8 144×6.36×432 87 618 3399 3125 3342 1.09 1.02 CR6-C-2 211×6.36×633 31.75 618 3920 5342 5663 1.08 1.02
CR6-D-4-1 319×6.36×957 51.375 618 7780 7138 7630 1.09 1.02 CR6-D-4-2 318×6.36×954 51.375 618 7473 7108 7598 1.05 0.98 CR6-D-8 319×6.36×957 95.1 618 10,357 10,568 11,060 0.98 0.94 CR8-A-2 120×6.47×360 31.75 835 2819 2794 3039 1.01 0.93
CR8-A-4-1 120×6.47×360 50.625 835 2957 2971 3216 1.00 0.92 CR8-A-4-2 120×6.47×360 50.625 835 2961 2971 3216 1.00 0.92 CR8-A-8 119×6.47×357 87 835 3318 3100 3343 1.07 0.99 CR8-C-2 175×6.47×525 31.75 835 4210 4343 4707 0.97 0.89
CR8-C-4-2 175×6.47×525 50.625 835 4542 4733 5097 0.96 0.89 CR8-C-8 175×6.47×525 87 835 5366 5121 5485 1.05 0.98 CR8-D-2 265×6.47×795 31.75 835 6546 6691 7249 0.98 0.90
CR8-D-4-1 264×6.47×792 51.375 835 7117 7286 7841 0.98 0.91 CR8-D-4-2 265×6.47×795 51.375 835 7172 7303 7860 0.98 0.91 CR8-D-8 265×6.47×795 90.3 835 8990 8613 9171 1.04 0.98 CR4-A-9 211×5.48×633 101.1 294 4773 4552 4950 0.99 0.96 CR4-C-9 211×4.5×633 101.1 277 4371 4282 4694 1.02 0.93 CR6-A-9 211×8.83×633 113.875 536 7008 7079 7008 0.99 0.95 CR6-C-9 204×5.95×612 101.1 540 5303 5766 5403 0.92 0.90
CR8-A-4-3 180×9.45×540 48.875 825 6803 6640 6587 1.02 1.03 CR8-A-9 180×9.45×540 101.1 825 7402 6786 7402 1.09 0.93 CR8-C-9 180×6.6×540 101.1 824 5873 5446 5873 1.08 0.91
R7-1
[41]
106×4×320 99 495 1749 1658 1739 1.05 1.01 R7-2 106×4×320 99 495 1824 1658 1739 1.10 1.05
R10-1 140×4×420 99 495 2752 2604 2712 1.06 1.01 R10-2 140×4×420 99 495 2828 2604 2712 1.09 1.04
Materials 2022, 15, 4313 21 of 23
R1-1 120×4×360 70 495 1701 1669 1760 1.02 0.97 R1-2 120×4×360 70 495 1657 1669 1760 0.99 0.94 R4-1 130×4×390 70 495 2020 1884 1984 1.07 1.02 R4-2 130×4×390 70 495 2018 1884 1984 1.07 1.02 R7-1 106×4×318 99 495 1749 1658 1739 1.05 1.01 R7-2 106×4×318 99 495 1824 1658 1739 1.10 1.05
R10-1 140×4×420 99 495 2752 2604 2712 1.06 1.01 R10-2 140×4×420 99 495 2828 2604 2712 1.09 1.04
A1
[42]
120×5.8×360 93 300 1697 1566 1773 1.08 0.96 A2 120×5.8×360 116 300 1919 1840 2078 1.04 0.92
A3-1 200×5.8×600 93 300 3996 3892 4243 1.03 0.94 A3-2 200×5.8×600 93 300 3862 3892 4162 0.99 0.93 A9-1 120×4×360 65 495 1739 1609 1701 1.08 1.02 A9-2 120×4×360 65 495 1718 1609 1701 1.07 1.01 A12-1 130×4×390 65 495 1963 1814 1914 1.08 1.03 A12-2 130×4×390 65 495 1988 1814 1914 1.10 1.04 HSSC1
[43]
110×5×330 64.50 701 2203.00 2048 2195 1.08 1.00 HSSC2 110×5×330 64.50 701 2234.00 2048 2195 1.09 1.02 HSSC3 140×5×420 64.50 701 2942.00 2842 3031 1.04 0.97 HSSC4 140×5×420 64.50 701 2840.00 2842 3031 1.00 0.94
80 × 80 × 4- C120-A 80×4×240 122.70 756 1504.00 1896 1898 1.00 1.00
80 × 80 × 4- C80-B
80×4×240 89.90 1022 1791 1687 1811 1.06 0.99
80 × 80 × 4-C120-B 80×4×240 122.70 1022 1898 1896 1898 1.00 1.00
100 × 100 × 4-C40-B 100×4×299.5 44.90 980 2009 1852 2003 1.08 1.00
100 × 100 × 4-C80-B
100×4×299.5 89.90 980 2177 2210 2360 0.99 0.92
100 × 100 × 4-C120-B
100×4×299.5 122.70 980 2266 2431 2266 0.93 0.89
120 × 120 × 4-C40-B 120×4×360 44.90 991 2557 2338 2522 1.09 1.01
120 × 120 × 4-C80-B 120×4×359 89.90 991 2853 2868 3052 0.99 0.93
120 × 120 × 4-C80-B-r
120×4×359 89.90 991 2798 2868 3052 0.98 0.92
120 × 120 × 4-C120-B 120×4×360 122.70 991 2950 3089 2950 0.95 0.88
SC-32-80
[30]
305×8.9×1200 120.00 560 14,116 14,401 14,116 0.98 0.93 SC-48-80 305×6.1×1200 120.00 660 12,307 12,749 12,307 0.97 0.86 SC-32-46 305×8.6×1200 120.00 259 11,390 10,942 11,999 1.04 0.95 SC-48-46 305×5.8×1200 120.00 471 11,568 11,138 11,568 1.04 0.91
S1
[44]
150×8×450 162.30 779 6536 6510 6536 1.00 0.99 S2 150×8×450 167.20 779 6715 6358 6715 1.06 1.00 S3 150×8×450 157.00 779 6616 6867 6616 0.96 1.02 S4 150×8×450 174.10 779 7276 7557 7276 0.96 1.06 S5 150×8×450 158.00 779 6974 6532 6974 1.07 1.07 S6 150×12×450 162.30 756 8585 7765 8585 1.10 1.08 S7 150×12×450 167.20 756 8452 7850 8452 1.08 1.06
Materials 2022, 15, 4313 22 of 23
S8 150×12×450 157.00 756 8687 7674 8687 1.03 1.10 S9 150×12×450 174.10 756 8730 8723 8730 1.00 1.07
S10 150×12×450 158.00 756 8912 8135 8912 1.10 1.00 S11 150×12.5×450 162.30 446 5953 6355 6049 0.94 0.98 S12 150×12.5×450 167.20 446 5911 6439 5703 0.92 1.04 S13 150×12.5×450 157.00 446 6039 6265 6572 0.96 0.92 S14 150×12.5×450 174.10 446 6409 6557 6557 0.98 0.98 S15 150×12.5×450 158.00 446 6285 6282 5976 1.00 1.05
C1-1
[45]
100.3×4.18×300 80.80 550 1490 1464 1552 1.02 0.96 C1-2 101.5×4.18×300 80.80 550 1535 1504 1593 1.02 0.96 C2-1 101.2×4.18×300 92.10 550 1740 1601 1691 1.09 1.03 C2-2 100.7×4.18×300 92.10 550 1775 1587 1676 1.12 1.06 C3 182.8×4.18×540 80.80 550 3590 3727 3890 0.96 0.92 C4 181.8×4.18×540 92.10 550 4210 4028 4191 1.05 1.00
C5-1 120.7×4.18×360 80.80 550 1450 1462 1550 0.99 0.94 C5-2 119.3×4.18×360 80.80 550 1425 1454 1543 0.98 0.92 C6-1 119.6×4.18×360 92.10 550 1560 1546 1635 1.01 0.95 C6-2 120.5×4.18×360 92.10 550 1700 1556 1645 1.09 1.03 C7-1 179.7×4.18×540 80.80 550 2530 2703 2838 0.94 0.89 C8-1 180.4×4.18×540 92.10 550 2970 2897 3031 1.03 0.98 C9-2 160.7×4.18×480 80.80 550 1820 1852 1959 0.98 0.93
C10-1 160.1×4.18×480 92.10 550 1880 1976 2083 0.95 0.90 C10-2 160.6×4.18×480 92.10 550 2100 1966 2073 1.07 1.01 C12-1 199.2×4.18×600 92.10 550 2900 2801 2936 1.04 0.99 C12-2 199.8×4.18×600 92.10 550 2800 2759 2893 1.01 0.97
References 1. Han, L.H.; Li, W.; Bjorhovde, R. Developments and advanced applications of concrete-filled steel tubular (CFST) structures:
Members. J. Constr. Steel Res. 2014, 100, 211–228. 2. Ralston, M.; Korman, R. Composite System Stiffened with 19000-psiMix. Eng. News Rec. 1989, 222, 44–53. 3. Abed, F.; Alhamaydeh, M.; Abdalla, S. Experimental and numerical investigations of the compressive behavior of concrete filled
steel tubes (CFSTs). J. Constr. Steel Res. 2013, 80, 429–439. 4. Uy, B. Local and post-local buckling of concrete filled steel welded box columns. J. Constr. Steel Res. 2018, 47, 47–72. 5. Bradford, M.A.; Loh, H.Y.; Uy, B. Slenderness limits for filled circular steel tubes. J. Constr. Steel Res. 2002, 58, 243–252. 6. Yu, Z.; Ding, F.; Cai, C.S. Experimental behavior of circular concrete-filled steel tube stub columns. J. Constr. Steel Res. 2007, 63,
165–174. 7. Aboutaha, R.; Machado, R. Seismic resistance of steel-tubed high-strength reinforced-concrete columns. J. Struct. Eng. 1999, 125,
485–494. 8. Han, L.H.; Huo, J.S.; Yang, Y.F. Concrete-filled HSS columns after exposure to the Iso-834 standard fire. Adv. Steel Constr. 2002,
2, 1127–1134. 9. Chen, M.; Lin, B.; Huang, H. Research on the Bearing Capacity of Corroded Circular Concrete Filled Steel Tubular Short Col-
umns. Prog. Steel Build. Struct. 2018, 20, 73–81. 10. Zhong, S.T. Comparison of behaviors and economics for concrete-filled steel tube with circular and square cross-sections.
NCREE 2003, 20, 199–206. 11. Ding, F.X.; Lu, D.R.; Bai, Y.; Zhou, Q.S.; Ni, M.; Yu, Z.W.; Jiang, G.S. Comparative study of square stirrup-confined concrete-
filled steel tubular stub columns under axial loading. Thin-Walled Struct. 2016, 98, 443–453. 12. Patel, V.I.; Hassanein, M.F.; Thai, H.T.; Abadi, H.A.; Elchalakani, M.; Bai, Y. Ultra-high strength circular short CFST columns:
Axisymmetric analysis, behaviour and design. Eng. Struct. 2019, 179, 268–283. 13. Ekmekyapar, T.; AL-Eliwi, B.J.M. Experimental behaviour of circular concrete filled steel tube columns and design specifica-
tions. Thin-Walled Struct. 2016, 105, 220–230. 14. Sojobi AO, Aladegboye OJ, Awolusi TF. Green interlocking paving units. Constr. Build. Mater. 2018, 173, 600–614. 15. Tys, A.; Kai, X.B. Performance of axially-loaded concrete-filled steel tubular circular columns using ultra-high strength concrete.
Structures 2020, 24, 163–176. 16. Jin, L.; Fan, L.; Li, D.; Du, X. Size effect of square concrete-filled steel tubular columns subjected to lateral shear and axial com-
pression: Modelling and formulation. Thin-Walled Struct. 2020, 157, 107158.
Materials 2022, 15, 4313 23 of 23
17. Yin, F.; Zhang, J.; Xu, P. Summary of Research on Concrete Filled Steel Tubular (CFST) Columns. Adv. Mater. Res. 2012, 594–597, 891–895.
18. Yan, Y.; Xu, L.; Li, B.; Chi, Y.; Yu, M.; Zhou, K.; Song, Y. Axial behavior of ultra-high performance concrete (UHPC) filled stocky steel tubes with square sections. J. Constr. Steel Res. 2019, 158, 417–428.
19. Lai, Z.; Varma, A.H. High-strength rectangular CFT members: Database, modeling, and design of short columns. J. Struct. Eng. 2018, 144, 04018036.
20. Cai, Y.; Su, M.; Chen, X.; Young, B. High strength steel square and rectangular tubular stub columns infilled with concrete. J. Constr. Steel Res. 2021, 179, 106536.
21. Ding, F.; Cao, Z.; Lyu, F.; Huang, S.; Hu, M.; Lin, Q. Practical design equations of the axial compressive capacity of circular CFST stub columns based on finite element model analysis incorporating constitutive models for high-strength materials. Case Stud. Constr. Mater. 2022, 16, e01115.
22. Ding, F.; Wu, X.; Xiang, P.; Yu, Z. New Damage Ratio Strength Criterion for Concrete and Lightweight Aggregate Concrete. ACI Struct. J. 2021, 118, 165–178.
23. Hassanein, M.F. Numerical modelling of concrete-filled lean duplex slender stainless steel tubular stub columns. J. Constr. Steel Res. 2010, 66, 1057–1068.
24. Lu, D.R.; Wang, W.J.; Ding, F.; Liu, X.M.; Fang, C.J. The impact of stirrups on the composite action of concrete-filled steel tubular stub columns under axial loading. Structures 2021, 30, 786–802.
25. Ding, F.; Wang, W.; Lu, D.; Liu, X. Study on the behavior of concrete-filled square double-skin steel tubular stub columns under axial loading. Structures 2020, 23, 665–676.
26. Xu, Y. Confinement effect and efficiency of concentrically loaded RACFCST stub columns. Materials 2021, 15, 154. 27. Ding, F.; Zhu, J.; Cheng, S.; Liu, X. Comparative study of stirrup-confined circular concrete-filled steel tubular stub columns
under axial loading. Thin-Walled Struct. 2018, 123, 294–304. 28. Xiong, M.X.; Xiong, D.X.; Liew, J. Axial performance of short concrete filled steel tubes with high- and ultra-high- strength
materials. Eng. Struct. 2017, 136, 494–510. 29. Varma, A.H.; Sause, R.; Ricles, J.M.; Li, Q. Development and validation of fiber model for high-strength square concrete-filled
steel tube beam-columns. ACI Struct. J. 2005, 102, 73–84. 30. A. O. Sojobi, K.M. Liew. Flexural behaviour and efficiency of CFRP-laminate reinforced recycled concrete beams: Optimization
using linear weighted sum method. Compos. Struct. 2021, 260, 113259. 31. BS EN 1994-1-1:2004 Eurocode 4; Design of Composite Steel and Concrete Structures General Rules and Rules for Buildings.
British Standards Institution: London, UK, 2004; pp. 1–121. 32. BS 5400-5:2005; Steel, Concrete and Composite Bridges. Part 5: Code of Practice for Design of Composite Bridges. British Stand-
ards Institution: London, UK, 2005; pp. 1–48. 33. GB 50936-2014; Technical Code for Concrete Filled Steel Tubular Structures; China Architecture & Building Press: Beijng, China,
2014; pp. 1–184. 34. American Concrete Institute. Commentary on Building Code Requirements for Structural Concrete (ACI 318R-14); ACI: Detroit, US,
2011; pp. 1–524. 35. Uy, B. Axial compressive strenth of short steel and composite columns fabricated with high strength steel plate. Steel Compos.
Struct. 2001, 1, 171–185. 36. Schneider, S.P. Axially loaded concrete-filled steel tubes. J. Struct. Eng. 1999, 124, 1125–1138. 37. Lue, D.M.; Liu, J.; Yen, T. Experimental study on rectangular CFT columns with high-strength concrete. J. Constr. Steel Res. 2007,
63, 37–44. 38. Uy, B. Strength of short concrete filled high strength steel box columns. J. Constr. Steel Res. 2001, 57, 113–134. 39. Du, Y.; Chen, Z.; Liewc, J.Y.R.; Xiong, M. Rectangular concrete-filled steel tubular beam-columns using high-strength steel:
Experiments and design. J. Constr. Steel Res. 2017, 131, 1–18. 40. Sakino, K.; Nakahara, H.; Morino, S. Behavior of Centrally Loaded Concrete-Filled Steel-Tube Short Columns. J. Struct. Eng.
2004, 130, 180–188. 41. Liu, D. Tests on high-strength rectangular concrete-filled steel hollow section stub columns. J. Constr. Steel Res. 2005, 61, 902–
911. 42. Liu, D.; Gho, W.M. Axial load behaviour of high-strength rectangular concrete-filled steel tubular stub columns. Thin-Walled
Struct. 2005, 43, 1131–1142. 43. Aslani, F.; Uy, B.; Tao, Z.; Mashiri, F. Behaviour and design of composite columns incorporating compact high-strength steel
plates. J. Constr. Steel Res. 2015, 107, 94–110. 44. Xiong, M.; Xiong, D.; RichardLiew, J.Y. Behaviour of steel tubular members infilled with ultra high strength concrete. J. Constr.
Steel Res. 2017, 138, 168–183. 45. Liu, D.; Gho, W.M.; Yuan, J. Ultimate capacity of high-strength rectangular concrete-filled steel hollow section stub columns. J.
Constr. Steel Res. 2003, 59, 1499–1515.
Copyright © 2022 FDOKUMEN