Fabrication, Mechanical Characterization, and Modeling of 3D ...
175
F abrication,Mechanical Characterization, and Modeling of 3D Architected Materials upon Static and D ynamic Loading Thesis by Carlos M. Portela In Partial Fulfillment of the Requirements for the Degree of Doctor of Philosophy CALIFORNIA INSTITUTE OF TECHNOLOGY Pasadena, California 2019 Defended May 16, 2019
-
Upload
khangminh22 -
Category
Documents
-
view
1 -
download
0
Transcript of Fabrication, Mechanical Characterization, and Modeling of 3D ...
Fabrication, Mechanical Characterization,andModeling of 3D ArchitectedMaterials
upon Static and Dynamic Loading
Thesis byCarlos M. Portela
In Partial Fulfillment of the Requirements for theDegree of
Doctor of Philosophy
CALIFORNIA INSTITUTE OF TECHNOLOGYPasadena, California
2019Defended May 16, 2019

ii
c© 2019
Carlos M. PortelaORCID: 0000-0002-2649-4235
All rights reserved.

iii
ACKNOWLEDGEMENTS
I am honored to have been part of this remarkable institution. Besides providing mewith unique opportunities and resources, it allowed me to learn from and interactwith leading researchers in a variety of fields. My time at Caltech was pivotal informing the person I am today, and I am forever grateful for that.
My deepest gratitude goes to my advisors Professors Julia R. Greer and DennisM. Kochmann for their unparalleled support, guidance, and patience throughoutthese five years at Caltech. I am grateful for the freedom they entrusted me with,which enabled me to explore a wide range of interesting topics, and for constantlyencouraging me to become a better colleague, leader, and researcher. Julia’s infinitepassion for science and open-mindedness will continue to inspire me for decadesto come. I am lucky to have been able to learn from Dennis’ deep knowledge ofmechanics and his meticulous approaches, and I am thankful for my time workingwith him at ETH Zürich.
I would like to also thank my thesis committee members Professors Chiara Daraioand Guruswami Ravichandran for their kind advice and generous time throughoutthe last years of my graduate studies. Their ideas and feedback encouraged meto venture into fields that were previously unknown to me and helped me grow asa researcher. Additionally, I would like to thank Professor Sergio Pellegrino forhis guidance and mentorship throughout my graduate studies; I truly enjoyed hislectures and appreciated his perspective on the topics I was studying.
I am also thankful to Professor Andrea M. Hodge, who believed in me when I was ayoung undergraduate engineering student and encouraged me to apply to graduateschool. My Caltech experience would not have been the same without the friend-ship and advice from Gregory P. Phlipot and William J. Schill; two remarkableresearchers I had the pleasure of working with and learning from during my timehere. None of this work would have been possible without my outstanding GreerGroup colleagues. To name a few, I would like to thank Professor Lucas R. Mezaand Dr. Ottman Tertuliano for serving as my mentors during my first few years,Daryl W. Yee and Bryce W. Edwards for being great friends and office mates, andAndrey Vyatskikh, Xiaoxing Xia, and Widianto P. Moestopo for being great col-laborators. I would also like to acknowledge the financial support from the Officeof Naval Research (ONR) throughout most of my graduate studies.

iv
Lastly, I would like to thank my girlfriend Jenny, my sisters (María del Mar, MaríaAlexandra, and María Camila), and especially my parents Carlos A. and Gloria E.for always being there for me throughout my graduate studies. They encouragedme to pursue my dreams and continuously motivated me to put in the work thatmade all of this possible. For their unconditional love and unwavering support, Iam forever indebted to them.
CarlosM. PortelaJune 4, 2019Pasadena, CA

v
ABSTRACT
Architected materials have been ubiquitous in nature, enabling unique propertiesthat are unachievable by monolithic, homogeneous materials. Inspired by natu-ral processes, man-made three-dimensional (3D) architected materials have beenreported to enable novel mechanical properties such as high stiffness- and strength-to-density ratios, extreme resilience, or high energy absorption. Furthermore, ad-vanced fabrication techniques have enabled architected materials with feature sizesat the nanometer-scale, which exploit material size effects to approach theoreticalbounds. However, most architected materials have relied on symmetry, periodicity,and lack of defects to achieve the desired mechanical response, resulting in sub-optimal mechanical response under the presence of inevitable defects. Additionally,most of these nano- and micro-architected materials have only been studied in thestatic regime, leaving the dynamic parameter space unexplored.
In this work, we address these issues by: (i) proposing numerical and theoreticaltools that predict the behavior of architected materials with non-ideal geometries,(ii) presenting a pathway for scalable fabrication of tunable nano-architected mate-rials, and (iii) exploring the response of nano- and micro-architected materials underthree types of dynamic loading. We first explore lattice architectures with featuresat the micro- and millimeter scales and provide an extension to the classical stiff-ness scaling laws, enabled by reduced-order numerical models and experiments atboth scales. After discussing the effect of nodes (i.e., junctions) on the mechanicalresponse of lattice architectures, we propose alternative node-less geometries thateliminate the stress concentrations associated with nodes to provide extreme re-silience. Using natural processes such as spinodal decomposition, we present path-ways to fabricate a version of these materials with samples sizes on the order ofcubic centimeters while achieving feature sizes on the order of tens of nanometers.In the dynamic regime, we design, fabricate, and test micro-architected materialswith tunable vibrational band gaps through the use of architectural reconfigurationand local resonance. Lastly, we present methods to fabricate carbon-based materi-als at the nano- and centimeter scales and test them under supersonic impact andblast conditions, respectively. Our work provides explorations into pathways thatcould enable the use of nano- and micro-architected materials for applications thatgo beyond small-volume, quasi-static mechanical regimes.
vi
PUBLISHED CONTENT AND CONTRIBUTIONS
Chapter 2 has been adapted from:
1) L.R. Meza, G.P. Phlipot, C.M. Portela, A. Maggi, L.C. Montemayor, A. Comella,D.M. Kochmann & J.R. Greer. “Reexamining the mechanical property spaceof three-dimensional lattice architectures”. Acta Materialia (2017) 140, pp. 424–432. doi: 10.1016/j.actamat.2017.08.052.Contributions: fabricated a portion of the samples, conducted a portion of theexperiments and analyzed the data, performed a portion of the computationalanalysis, and participated in the writing of the manuscript.
Chapter 3 has been adapted from:
2) C.M. Portela, J.R. Greer & D.M. Kochmann. “Impact of node geometry on theeffective stiffness of non-slender three-dimensional truss lattice architectures”.Extreme Mechanics Letters (2018) 22, pp. 110–138. doi: 10.1016/j.eml.2018.06.004.Contributions: designed and fabricated samples, performed and analyzed theexperiments, performed the computational analysis, and wrote the manuscript.
Chapter 4 has been adapted, in part, from:
3) N.G. Dou, R.A. Jagt, C.M. Portela, J.R. Greer & A.J. Minnich. “Ultralow Ther-mal Conductivity and Mechanical Resilience of Architected Nanolattices”.Nano Letters (2018) 18, 8 pp. 4755–4761. doi: 10.1021/acs.nanolett.8b01191.Contributions: performed mechanical experiments and analyzed the data,performed the computational analysis, and participated in the writing of themanuscript.
and from:
4) C.M. Portela, A. Vidyasagar†, S. Krödel†, T. Weissenbach, D.Y. Yee, J.R. Greer& D.M Kochmann. “Extreme mechanical resilience of self-assembled nano-labyrithine materials”. Under Review (2020)Contributions: fabricated samples, performed mechanical experiments andanalyzed the data, performed the computational analysis, and wrote the manuscript.

vii
Chapter 5 has been adapted, in part, from:
5) X. Xia, A. Afshar, H. Yang, C.M. Portela, D.M. Kochmann, C.V. Di Leo &J.R. Greer. “Electrochemically Reconfigurable Architected Materials”. Nature(2019) 573, 7773 pp. 205–213. doi: 10.1038/s41586-019-1538-z.Contributions: computed the numerical dispersion relations and participatedin the writing of the manuscript.
Chapter 6 has been adapted from:
6) C.M. Portela, A. Vyatskikh & J.R. Greer. “Fabrication and Design of Compos-ites with Architected Layers”. U.S. Patent Application No. 16/206,163 andPCT International Patent Application No. PCT/US18/63306 (November 30,2018)Contributions: participated in the conception and design of the project, fabri-cated samples, performed mechanical tests and analyzed the data, and partici-pated in the writing of the application.
7) C.M. Portela, B.W. Edwards, D. Veysset, Y. Sun, K. Nelson, D.M. Kochmann& J.R. Greer. “Supersonic Impact on Nano-architected Carbon Materials”. InPreparation (2020)Contributions: participated in the conception and design of the project, de-signed and fabricated samples, participated in the mechanical testing and ana-lyzed the data, and wrote the manuscript.
Not directly adapted in this thesis:
8) A. Vyatskikh, S. Delalande, A. Kudo, X. Zhang, C.M. Portela & J.R. Greer.“Additive manufacturing of 3D nano-architected metals”. Nature Communi-cations (2018) 9, 1 pp. 593. doi: 10.1038/s41467-018-03071-9.Contributions: partially performed nanomechanical tests and analyzed thedata.
9) L.A. Shaw, F. Sun, C.M. Portela, R.I. Barranco, J.R. Greer & J.B. Hopkins.“Computationally efficient design of directionally compliant metamaterials”.Nature Communications (2019) 10, 1 pp. 291. doi: 10.1038/s41467-018-08049-1.Contributions: fabricated micro-scale samples, performed nanomechanicaltests and analyzed the data, performed the mechanical numerical analysis, andparticipated in the writing of the manuscript.
10) C.M. Portela, G.P. Phlipot, J.R. Greer & D.M. Kochmann. “ Approaches forEfficient Modeling of the Mechanical Response of Complex Periodic Truss Ar-chitectures”. SAMPE Technical Paper (2019). doi: 10.33599/nasampe/s.19.1428.

viii
Contributions: performed experiments and analyzed the data, performed partof the numerical analysis, wrote the manuscript.

ix
TABLE OF CONTENTS
Acknowledgements . . . . . . . . . . . . . . . . . . . . . . . . . . . . . . . iiiAbstract . . . . . . . . . . . . . . . . . . . . . . . . . . . . . . . . . . . . . vPublished Content and Contributions . . . . . . . . . . . . . . . . . . . . . . viTable of Contents . . . . . . . . . . . . . . . . . . . . . . . . . . . . . . . . ixList of Illustrations . . . . . . . . . . . . . . . . . . . . . . . . . . . . . . . xiiList of Tables . . . . . . . . . . . . . . . . . . . . . . . . . . . . . . . . . . xvNomenclature . . . . . . . . . . . . . . . . . . . . . . . . . . . . . . . . . . xviChapter I: Introduction to Architected Materials . . . . . . . . . . . . . . . . 1
1.1 The Concept of Architected Materials . . . . . . . . . . . . . . . . . 11.2 Natural Architected Materials . . . . . . . . . . . . . . . . . . . . . 21.3 Cellular Solids . . . . . . . . . . . . . . . . . . . . . . . . . . . . . 3
1.3.1 Fabrication Techniques . . . . . . . . . . . . . . . . . . . . 41.3.2 Mechanical Properties: Classical Scaling Laws . . . . . . . 5
1.4 Periodic Architected Materials . . . . . . . . . . . . . . . . . . . . . 61.4.1 Beam-based designs . . . . . . . . . . . . . . . . . . . . . 7
Defining Structural Rigidity . . . . . . . . . . . . . . . . . 71.4.2 Plate- and Shell-based designs . . . . . . . . . . . . . . . . 81.4.3 Fabrication Methods . . . . . . . . . . . . . . . . . . . . . 9
Nano- and Micro-Fabrication Techniques . . . . . . . . . . 9Macro-Fabrication Techniques . . . . . . . . . . . . . . . . 10
1.4.4 Static Mechanical Properties . . . . . . . . . . . . . . . . . 101.4.5 Dynamic Mechanical Properties . . . . . . . . . . . . . . . 13
1.5 Numerical Modeling of Architected Materials . . . . . . . . . . . . 141.5.1 Finite Periodic Tessellations . . . . . . . . . . . . . . . . . 151.5.2 Homogenization . . . . . . . . . . . . . . . . . . . . . . . 15
Static Response . . . . . . . . . . . . . . . . . . . . . . . . 15Wave Propagation Response . . . . . . . . . . . . . . . . . 16
1.6 Significance of Architected Materials . . . . . . . . . . . . . . . . . 171.7 Outline . . . . . . . . . . . . . . . . . . . . . . . . . . . . . . . . . 18
Chapter II: Identifying the Effect of Nodes on Lattice Architectures . . . . . . 202.1 Chapter Summary . . . . . . . . . . . . . . . . . . . . . . . . . . . 202.2 Experimental Framework . . . . . . . . . . . . . . . . . . . . . . . 21
2.2.1 Fabrication . . . . . . . . . . . . . . . . . . . . . . . . . . 212.2.2 Nanomechanical Experiments . . . . . . . . . . . . . . . . 222.2.3 Results . . . . . . . . . . . . . . . . . . . . . . . . . . . . 22
2.3 Analytical Framework: accounting for stretching and bending . . . . 252.4 Finite-element Models . . . . . . . . . . . . . . . . . . . . . . . . . 29
2.4.1 Beam-element Models . . . . . . . . . . . . . . . . . . . . 292.4.2 Full-resolution 3D-element Models . . . . . . . . . . . . . 30

x
2.4.3 Results . . . . . . . . . . . . . . . . . . . . . . . . . . . . 312.5 Discussion . . . . . . . . . . . . . . . . . . . . . . . . . . . . . . . 36
2.5.1 Solid beam nanolattices . . . . . . . . . . . . . . . . . . . . 362.5.2 Hollow-beam nanolattices . . . . . . . . . . . . . . . . . . 38
2.6 Generalization to Macroscopic Experiments and Larger Tessellations 392.7 Conclusion . . . . . . . . . . . . . . . . . . . . . . . . . . . . . . . 41
Chapter III: Impact of Node Geometry on Non-slender Lattice Architectures . 423.1 Chapter Summary . . . . . . . . . . . . . . . . . . . . . . . . . . . 423.2 Theory . . . . . . . . . . . . . . . . . . . . . . . . . . . . . . . . . 433.3 Design of Variable Node Geometry . . . . . . . . . . . . . . . . . . 443.4 Hybrid-Element Numerical Models . . . . . . . . . . . . . . . . . . 46
3.4.1 Substructuring Implementation and Theory . . . . . . . . . 483.4.2 Reduced-order Model Validation . . . . . . . . . . . . . . . 49
3.5 Experimental Framework . . . . . . . . . . . . . . . . . . . . . . . 493.5.1 Sample Fabrication and Experiments . . . . . . . . . . . . . 493.5.2 Constituent Material Properties . . . . . . . . . . . . . . . . 51
3.6 Results . . . . . . . . . . . . . . . . . . . . . . . . . . . . . . . . . 523.7 Extension of Classical Scaling Laws . . . . . . . . . . . . . . . . . 553.8 Conclusions . . . . . . . . . . . . . . . . . . . . . . . . . . . . . . 60
Chapter IV: Nodeless Architectures via Self-Assembled Geometries . . . . . 614.1 Chapter Summary . . . . . . . . . . . . . . . . . . . . . . . . . . . 614.2 Detrimental Effect of Nodes to Resilience . . . . . . . . . . . . . . . 624.3 Eliminating Nodes in Architected Materials . . . . . . . . . . . . . . 634.4 Sample Fabrication . . . . . . . . . . . . . . . . . . . . . . . . . . . 654.5 Elastic Surface Calculation . . . . . . . . . . . . . . . . . . . . . . 684.6 Nanomechanical Experiments . . . . . . . . . . . . . . . . . . . . . 694.7 Quasi-Linear Stiffness Scaling . . . . . . . . . . . . . . . . . . . . . 764.8 Conclusion . . . . . . . . . . . . . . . . . . . . . . . . . . . . . . . 794.9 Detailed Methods Description . . . . . . . . . . . . . . . . . . . . . 80
4.9.1 Sample Fabrication . . . . . . . . . . . . . . . . . . . . . . 804.9.2 Computational Framework . . . . . . . . . . . . . . . . . . 814.9.3 Nanomechanical Experiments . . . . . . . . . . . . . . . . 82
Chapter V: Vibration Mitigation via Lattice Architectures . . . . . . . . . . . 845.1 Chapter Summary . . . . . . . . . . . . . . . . . . . . . . . . . . . 845.2 Vibration Band Gaps via Reconfigurable Architectures . . . . . . . . 85
5.2.1 Fabrication and Experimental Lithiation of Si Microlattices . 855.2.2 In situ Observation and Reversibility of Lithiation-induced
Buckling . . . . . . . . . . . . . . . . . . . . . . . . . . . 875.2.3 Numerical Dynamic Analysis . . . . . . . . . . . . . . . . . 89
Elastic Dispersion Relations . . . . . . . . . . . . . . . . . 90Elastoacoustic Dispersion Relation . . . . . . . . . . . . . . 95Outlook . . . . . . . . . . . . . . . . . . . . . . . . . . . . 97
5.3 Vibration Band Gaps Enabled by Added Micro-inertia . . . . . . . . 975.3.1 Micro-scale Ultrasonic Transmission Method . . . . . . . . 98
Method Validation . . . . . . . . . . . . . . . . . . . . . . 100

xi
5.3.2 Auxetic Material with Resonators . . . . . . . . . . . . . . 101Elastic Dispersion Relations . . . . . . . . . . . . . . . . . 102µUTM Testing . . . . . . . . . . . . . . . . . . . . . . . . 103
5.3.3 Outlook . . . . . . . . . . . . . . . . . . . . . . . . . . . . 104Chapter VI: Dynamic Loading on Carbon-based Lattice Architectures . . . . 107
6.1 Chapter Summary . . . . . . . . . . . . . . . . . . . . . . . . . . . 1076.2 Fabrication Processes . . . . . . . . . . . . . . . . . . . . . . . . . 108
6.2.1 Nano-Scale Carbon Materials . . . . . . . . . . . . . . . . . 1086.2.2 Macro-Scale Carbon Materials . . . . . . . . . . . . . . . . 110
Carbon-Epoxy 3D Composites . . . . . . . . . . . . . . . . 1116.3 Baseline Quasi-static Characterization . . . . . . . . . . . . . . . . 112
6.3.1 Nanomechanical Testing . . . . . . . . . . . . . . . . . . . 1156.3.2 Macro-scale Testing . . . . . . . . . . . . . . . . . . . . . . 115
Uniaxial Compression of Octet Phases and Composites . . . 115Four-point Bending of Octet Phases and Composites . . . . 118
6.4 Supersonic Impact on Nano-scale Carbon Lattice Architectures . . . 1206.4.1 Laser Induced Particle Impact Test . . . . . . . . . . . . . . 1226.4.2 Particle-Substrate Impact . . . . . . . . . . . . . . . . . . . 1236.4.3 Nanolattice Impact Response . . . . . . . . . . . . . . . . . 1266.4.4 Dimensional Analysis of Impact Processes: from planetary
impact to nano-impact . . . . . . . . . . . . . . . . . . . . 128Impact Scaling Relations . . . . . . . . . . . . . . . . . . . 130
6.4.5 Outlook . . . . . . . . . . . . . . . . . . . . . . . . . . . . 1316.5 Blast-loading on Macro-scale Carbon and Composite Lattice Archi-
tectures . . . . . . . . . . . . . . . . . . . . . . . . . . . . . . . . . 1326.5.1 Experiments . . . . . . . . . . . . . . . . . . . . . . . . . . 1326.5.2 Outlook . . . . . . . . . . . . . . . . . . . . . . . . . . . . 135
Chapter VII: Summary & Outlook . . . . . . . . . . . . . . . . . . . . . . . 1367.1 Summary . . . . . . . . . . . . . . . . . . . . . . . . . . . . . . . . 1367.2 Outlook . . . . . . . . . . . . . . . . . . . . . . . . . . . . . . . . . 137
7.2.1 Self-Assembly . . . . . . . . . . . . . . . . . . . . . . . . 1377.2.2 Compliant, Tunable, Resilient Materials . . . . . . . . . . . 1377.2.3 MHz and Beyond . . . . . . . . . . . . . . . . . . . . . . . 1377.2.4 Carbon . . . . . . . . . . . . . . . . . . . . . . . . . . . . 138
Bibliography . . . . . . . . . . . . . . . . . . . . . . . . . . . . . . . . . . 139Appendix A: Supplementary Videos . . . . . . . . . . . . . . . . . . . . . . 157

xii
LIST OF ILLUSTRATIONS
Number Page
1.1 Stiffness vs. Density in Materials . . . . . . . . . . . . . . . . . . . 21.2 Architecture in Bone and Nacre . . . . . . . . . . . . . . . . . . . . 31.3 Open vs. Closed Cell Foam . . . . . . . . . . . . . . . . . . . . . . 51.4 Stiffness Scalings of Selected Beam-Based Periodic Architected Ma-
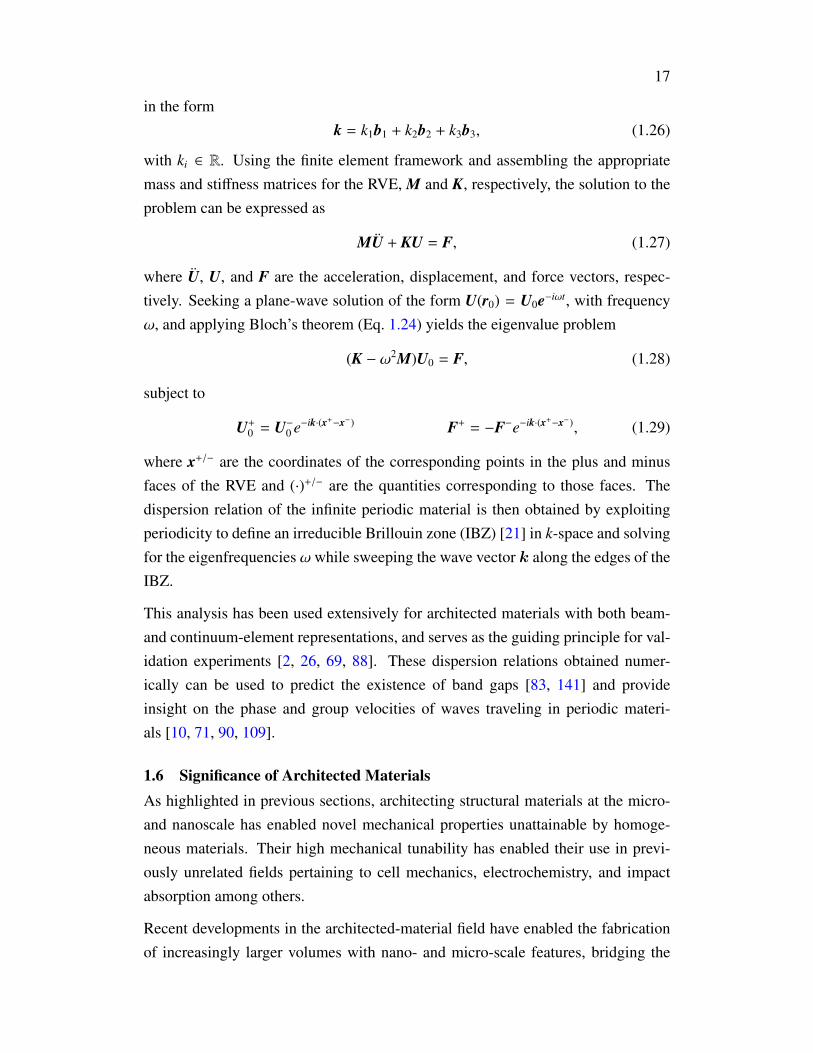
terials . . . . . . . . . . . . . . . . . . . . . . . . . . . . . . . . . . 122.1 Rigid and Non-Rigid Nanolattice Topologies . . . . . . . . . . . . . 242.2 Strength and Stiffness vs. Density of Different Nanolattice Topologies 252.3 Non-Rigid and Rigid Simplified Model Systems . . . . . . . . . . . 272.4 Solid Euler-Bernoulli and Timoshenko Beam Simulations vs. Full-
Resolution 3D-Element Models . . . . . . . . . . . . . . . . . . . . 322.5 Hollow Euler-Bernoulli and Timoshenko Beam Simulations vs. Full-
Resolution Shell-Element Models . . . . . . . . . . . . . . . . . . . 332.6 Solid-Beam Nanolattices FE and Experimental Young’s Modulus vs.
Relative Density . . . . . . . . . . . . . . . . . . . . . . . . . . . . 342.7 Hollow-Beam Nanolattices FE and Experimental Young’s Modulus
vs. Relative Density . . . . . . . . . . . . . . . . . . . . . . . . . . 352.8 Extended Hollow-Beam Octet-Truss and Tetrakaidecahedron Nanolat-
tice Simulation Results . . . . . . . . . . . . . . . . . . . . . . . . . 362.9 Polymeric Nano- and Macro-Scale Octet Trusses of Variable Tessel-
lations . . . . . . . . . . . . . . . . . . . . . . . . . . . . . . . . . . 402.10 Properties of Nano- and Macro-Scale Octet Trusses of Variable Tes-
sellations . . . . . . . . . . . . . . . . . . . . . . . . . . . . . . . . 403.1 Beam-Spring Model System for Rigid and Non-Rigid Architectures . 443.2 Node Modification and Implementation of Reduced-Order Models . . 473.3 Reduced-Order Model Validation and Error . . . . . . . . . . . . . . 493.4 Detailed View of TPL-Lattice Modified Nodes . . . . . . . . . . . . 503.5 TPL and DLP Lattice Samples and Comparison to Models . . . . . . 533.6 Strain Energy Distribution in Unit Cells . . . . . . . . . . . . . . . . 543.7 Extension of Classical Stiffness Scalings . . . . . . . . . . . . . . . 564.1 Cyclic Response of Al2O3 24-nm-Wall-Thickness Octet Nanolattices 634.2 Self-Assembled Nano-Labyrinthine Shell-Based Material . . . . . . 66

xiii
4.3 Anisotropic Al2O3 Shell-Based Bi-Continuous Geometries . . . . . . 674.4 Nano-Labyrinthine Sample Fabrication Details . . . . . . . . . . . . 684.5 Compressions of Columnar Samples at Different Thicknesses . . . . 704.6 Cyclic Loading and Recovery of Columnar Sample . . . . . . . . . . 724.7 Cyclic Resilience of Various 11-nm Nano-Labyrinthine Architectures 734.8 Curvature Distribution and Cyclic Mechanical Performance . . . . . 744.9 Cyclic Response of Octet and Columnar Al2O3 Architectures . . . . 75
4.10 Effect of Shell Waviness . . . . . . . . . . . . . . . . . . . . . . . . 764.11 Stiffness Scaling and Elastic Surface Variations in Nano-Labyrinthine
Architectures . . . . . . . . . . . . . . . . . . . . . . . . . . . . . . 774.12 Effect of Double Curvature on Load Distribution . . . . . . . . . . . 79
5.1 Fabrication Process and SEM Characterization of Si MicrolatticesBefore and After Lithiation . . . . . . . . . . . . . . . . . . . . . . 86
5.2 In Situ Optical and Electrochemical Characterization of Lithiation-Induced Cooperative Buckling in Si Microlattices . . . . . . . . . . . 88
5.3 Real- and Reciprocal-Space Unit Cells for Dispersion Relations . . . 915.4 Si Microlattice Elastic Dispersion Relations . . . . . . . . . . . . . . 935.5 Extended Si Microlattice Elastic Dispersion Relations . . . . . . . . 945.6 Si Microlattice Elastoacoustic Dispersion Relation . . . . . . . . . . 965.7 Micro-scale Ultrasonic Transmission Method (µUTM) Setup . . . . . 995.8 µUTM Setup Schematic . . . . . . . . . . . . . . . . . . . . . . . . 995.9 µUTM Validation with Single-Frequency Signal . . . . . . . . . . . 100
5.10 µUTM Validation with Chirp Signal . . . . . . . . . . . . . . . . . . 1015.11 Auxetic Unit Cell Design with Resonators . . . . . . . . . . . . . . . 1025.12 Dispersion Relation of Auxetic Unit Cells . . . . . . . . . . . . . . . 1035.13 Frequency Sweep of Auxetic Microlattices . . . . . . . . . . . . . . 1055.14 Frequency Chirp through Auxetic Microlattices . . . . . . . . . . . . 1056.1 Pre-Pyrolysis Sample Configuration . . . . . . . . . . . . . . . . . . 1096.2 Carbon-Based Nanolattice Material Obtained via Pyrolysis . . . . . . 1106.3 TG/DT-Analysis on PR-48 . . . . . . . . . . . . . . . . . . . . . . . 1116.4 Carbon-Based Lattice Materials Obtained via Pyrolysis . . . . . . . . 1126.5 Bi-Continuous Shell-Based Carbon Material . . . . . . . . . . . . . 1136.6 Carbon Tubular Part with Tetrakaidecahedron Architecture . . . . . . 1136.7 Fabrication Process of Continuous-Phase 3D Carbon Composites . . 1146.8 Carbon-Epoxy Composites . . . . . . . . . . . . . . . . . . . . . . . 1146.9 Quasi-Static Compression of Carbon Nanolattices . . . . . . . . . . 116

xiv
6.10 Quasi-Static Compression of Carbon Macro-Lattices . . . . . . . . . 1176.11 Quasi-Static Compression of Carbon-Epoxy Composite . . . . . . . 1186.12 Four-Point Bending of Carbon Phase . . . . . . . . . . . . . . . . . 1196.13 Four-Point Bending of Composite Material . . . . . . . . . . . . . . 1206.14 Nano-Architected Carbon Samples for Supersonic Impact . . . . . . 1226.15 SiO2-Si Impact Experiments . . . . . . . . . . . . . . . . . . . . . . 1246.16 SiO2-Si Impact Energetics . . . . . . . . . . . . . . . . . . . . . . . 1256.17 Inelastic Energy as a Function of Rebound Energy . . . . . . . . . . 1256.18 Impact Response Regimes . . . . . . . . . . . . . . . . . . . . . . . 1276.19 SiO2-Nanolattice Impact Energetics . . . . . . . . . . . . . . . . . . 1286.20 Effect of Relative Density and Impact Velocity on Cratering . . . . . 1296.21 Close-Up of Crater Base . . . . . . . . . . . . . . . . . . . . . . . . 1296.22 Cratering Scaling Law for ρ ≈ 17% Nanolattices . . . . . . . . . . . 1316.23 Carbon Samples for Blast Loading . . . . . . . . . . . . . . . . . . . 1336.24 Buried Blast Experimental Setup . . . . . . . . . . . . . . . . . . . 1336.25 Deflection of Sandwich Plates Upon Blast Impulse . . . . . . . . . . 134

xv
LIST OF TABLES
Number Page
2.1 Experimental Scaling Parameters for Solid- and Hollow-Beam Nanolat-tices . . . . . . . . . . . . . . . . . . . . . . . . . . . . . . . . . . . 24
3.1 Extended Stiffness Scaling Fit Parameters for Rigid and Non-RigidArchitectures . . . . . . . . . . . . . . . . . . . . . . . . . . . . . . 57
5.1 Material Properties for Reconfigurable Material’s Phases . . . . . . . 915.2 Homogenized Material Properties for Reconfigurable Material’s Dis-
persion Relations . . . . . . . . . . . . . . . . . . . . . . . . . . . . 926.1 Mechanical parameters of tested carbon octet materials including
comparison to some metals, where E corresponds to the Young’smodulus, and σy and σ f represent the yield strength and flow stress,respectively. . . . . . . . . . . . . . . . . . . . . . . . . . . . . . . 119

xvi
NOMENCLATURE
Es. Constituent material’s Young’s modulus — Young’s modulus of the materialthat makes up the architected material.
σys. Constituent material’s strength — Strength of the material that makes up thearchitected material.
ρ. Relative density — A dimensionless parameter representing the fill fractionin a unit cell, or more generally, the ratio between the density of an archi-tected material ρ and that of the constituent material ρs.
E∗. Effective Young’s modulus — serves as an estimate of a material’s actualYoung’s modulus E, i.e., a measure of stiffness for a finite volume of a ma-terial.
σ∗y. Effective strength — serves as an estimate of a material’s actual yield/failurestrength σy, i.e., a measure of strength for a finite volume of a material.

1
C h a p t e r 1
INTRODUCTION TO ARCHITECTED MATERIALS
1.1 The Concept of Architected MaterialsAlmost all engineering applications, ranging from the aerospace to the biomedicalfield, require precise control of material properties to enable a particular perfor-mance for any given machine, structure, or device. Prior to the last two centuries,humankind was limited to using readily available or engineered monolithic mate-rials such as stone, wood1, and metal alloys to fabricate tools or structures. Whilethis proved to be satisfactory for a few millennia, it resulted in overly heavy andinefficient structures such as the pyramids of Giza.
Throughout the last ∼100+ years, the concept of structural architecture enabled theconstruction of significantly more efficient designs, epitomized by the Eiffel tower.Although a significant advancement for mankind, the material choices then werestill limited to readily available materials including stiff but heavy metals such asiron or steel. Plotting the properties of all known monolithic materials, such asYoung’s modulus (i.e., the stiffness) versus the density brings to light a signifi-cant void in this parameter space corresponding to lightweight-but-stiff materials(Fig. 1.2). The efficient design of the Eiffel tower does not qualify to reach into thatvoid, since the discrete nature of its struts and arches is evident to the naked eye,exemplifying an architected structure instead of an architected material.
To understand this important distinction between an architected structure and anarchitected material, we need to consider not only the length scale l of the effective“building blocks”, but also that of the overall structure or fields of interest (i.e.,stresses, strains, and deformation), L. To be able to call a given structure a material,we require the scale of structural features to be orders of magnitude smaller thanthe characteristic length over which the fields of interest vary, i.e.,
ε =lL 1, (1.1)
such that we can assume a proper separation of scales. This implies that makingman-made architected materials requires the miniaturization of this concept of ar-chitected structures, to the point that the discrete features of a given material cannot
1Although wood is inherently not monolithic if analyzed at the microscale, most of its applica-tions do not benefit from this architected nature.

2
Figure 1.1∣∣∣ Stiffness vs. Density in GeneralMaterial Classes
be discerned or are sufficiently small compared to the applied boundary conditions(i.e., loads or displacements).
1.2 Natural Architected MaterialsArchitected materials have been ubiquitous in nature, enabling unique propertiesthat are unachievable by monolithic, homogeneous materials. An example of theseare the spicules in Euplectella aspergillum sea sponges [96] or nacre [6], whichutilize structural hierarchy to attain strength and toughness values superior to thoseof their constituent ceramics. Another example of hierarchy that spans several orderof magnitude in scale is that of human bone [98, 131, 142], which uses mechanismsat scales ranging from the mm-diameter of trabeculae to the nm-diameter of fibrilsthat make up the lamellae within a single trabecula. All of these natural materialsportray orders-of-magnitude separation of scales, which is key to enabling theirunique properties.
Although not strictly classifiable as architected materials, the atomic lattices thatmake up the crystalline structure of most metals are directly relatable to their me-chanical properties such as their anisotropy (i.e., direction-dependent properties) orplasticity (i.e., inelastic flow). These lattices, along with the microstructures foundin nacre and bone, have served as inspiration for a new age of nature-inspired andbiomimetic man-made architected materials [38, 40, 111]. Atomic-lattice inspiredmaterials, in particular, present a lightweight design approach which will be dis-cussed in this thesis.
3
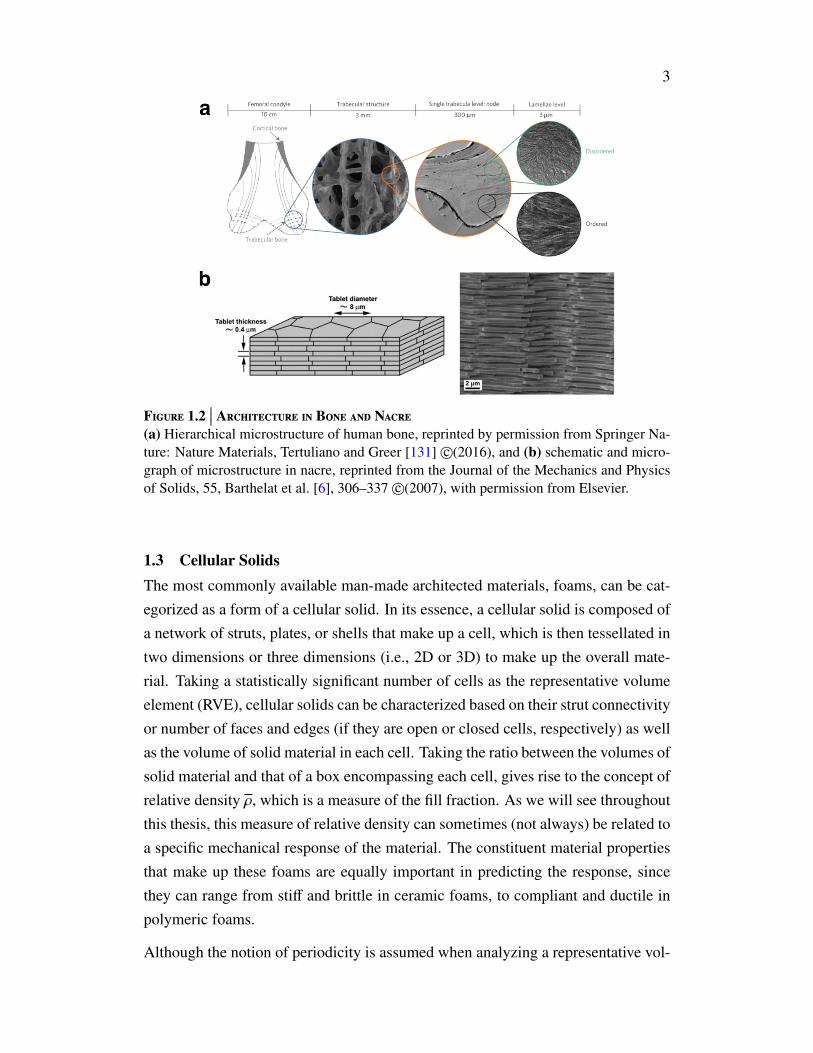
Figure 1.2∣∣∣ Architecture in Bone and Nacre
(a) Hierarchical microstructure of human bone, reprinted by permission from Springer Na-ture: Nature Materials, Tertuliano and Greer [131] c©(2016), and (b) schematic and micro-graph of microstructure in nacre, reprinted from the Journal of the Mechanics and Physicsof Solids, 55, Barthelat et al. [6], 306–337 c©(2007), with permission from Elsevier.
1.3 Cellular SolidsThe most commonly available man-made architected materials, foams, can be cat-egorized as a form of a cellular solid. In its essence, a cellular solid is composed ofa network of struts, plates, or shells that make up a cell, which is then tessellated intwo dimensions or three dimensions (i.e., 2D or 3D) to make up the overall mate-rial. Taking a statistically significant number of cells as the representative volumeelement (RVE), cellular solids can be characterized based on their strut connectivityor number of faces and edges (if they are open or closed cells, respectively) as wellas the volume of solid material in each cell. Taking the ratio between the volumes ofsolid material and that of a box encompassing each cell, gives rise to the concept ofrelative density ρ, which is a measure of the fill fraction. As we will see throughoutthis thesis, this measure of relative density can sometimes (not always) be related toa specific mechanical response of the material. The constituent material propertiesthat make up these foams are equally important in predicting the response, sincethey can range from stiff and brittle in ceramic foams, to compliant and ductile inpolymeric foams.
Although the notion of periodicity is assumed when analyzing a representative vol-

4
ume element, most scalable man-made architected materials have irregular architec-ture, owing to their fabrication techniques. In these cases, a statistically significantRVE consists of a large number of cells to obtain an on-average, homogenized re-sponse. A type of foams that exhibit unique properties albeit with a semi-irregulararchitecture are nanoporous metallic foams (np-foams) [53, 107], which benefitfrom the nanoscale size effects of its ligaments [18] and provide strength valuesthat approach theoretical bounds. Similar geometries to those of np-foams can beachieved via segregated polymeric microemulsions [7, 155], albeit with slightlylarger features, which provide further geometric tunability of the microstructurebased on mixture ratios and processing parameters.
1.3.1 Fabrication TechniquesAt the macroscale, i.e., with mm- or µm-scale feature sizes, cellular solids canbe fabricated in a variety of forms. Polymeric foams are often formed by intro-ducing some form of gas to a monomer or a hot polymer, which causes bubbling.Upon stabilization of the formed bubbles, the mixture can be polymerized to be-come solid [46]. Some metal foams are formed via liquid processing of the moltenmetal, either by mechanical agitation or by introducing particles which cause foam-ing [46].
Metallic np-foams can be synthesized by methods such as free corrosion or elec-trochemically driven dealloying [53]. The latter method can lead to extremely fineligaments, on the order of a few tens-of-nm, which has resulted in optimal mate-rial properties [18]. A commonly studied system for np-foam production is that ofAgxAux alloys, which forms almost-pure Au foams upon dealloying.
Polymeric nanoporous or microporous foams can be fabricated by mixing severaltypes of block co-polymers which segregate into ordered or disordered phases [78,136, 155]. Following equilibrated segregation, the system can be cross-linked toretain its configuration, and one or more of the phases can be selectively etchedout to produce pores [136]. Minimal changes in any of several variables such asphase concentrations, molecular weights, temperature, and pressure can give riseto drastically different configurations, some of which are highly ordered and be-come truss-like rather than foam-resembling [7]. We classify the disordered phasesin these systems as foams, while particular highly ordered configurations will bediscussed in the truss-based architected materials category in this chapter.

5
1.3.2 Mechanical Properties: Classical Scaling LawsThe configuration of foam cells typically leads to geometric arrangements whichpreferentially deform through bending of its members. Assuming a simplistic open-celled foam configuration [46] with slender struts of circular cross-section and ra-dius r and length l such as in Fig. 1.3a, the relative density can be approximated as
ρ ∝(r
l
)2, (1.2)
obtained by the ratio of the volume of the struts Vs ∝ r2l and that of the box encom-passing the unit cell VUC ∝ l3.
Figure 1.3∣∣∣ Open vs. Closed Cell Foam
Using simple Euler-Bernoulli beam theory [132], the effective Young’s modulus ofthe foam can be approximated by studying the deflection of a beam with a load P
at its center. The deflection δ can then be approximated as
δ ∝Pl3
EsI, (1.3)
where Es is the constituent material’s Young’s modulus and I ∝ r4 is the secondarea moment of the beam. Assuming proper separation of scales, this deformationcan be assumed to be characteristic of all cells in the foam, and the whole foamcan be assumed to deflect by a magnitude proportional to δ. It also follows that theuniaxial stress σ (i.e., area-normalized load) can be assumed to be
σ ∝Pl2 . (1.4)
6
Defining the uniaxial strain on the foam to be ε ∝ δ/l, the effective Young’s modulusof this foam is estimated as
E∗ ∝σ
ε∝ Esρ
2. (1.5)
In practice, the normalized effective modulus is presented as
E∗
Es= C1ρ
2, (1.6)
where Ci is a proportionality constant that accounts for geometric parameters.
If the cell is closed (Fig. 1.3b), the cell walls of thickness t can add to the effectivestiffness, assuming its contribution can be superimposed to that of Eq. 1.17. Froman energetic perspective, the work done by the external load P to deform the closedcell is proportional to 1
2 Pδ, and it is distributed between the strain energy of thebeams 1
2EsIl3 δ
2, and that of the stretching in the cell walls 12 Esε
2Vw, where Vw isthe volume of the walls. Solving for P in the energy balance described above, andassuming again E∗ ∝ (P/l2)/(δ/l) (also relating t/l to the overall relative density, seeGibson and Ashby [46]), the normalized effective modulus for a closed-cell foamis expressed as [122]
E∗
Es= C2φ
2ρ2+ C3(1 − φ)ρ, (1.7)
where φ ∈ [0, 1] is the relative distribution of solid in the beams.
Performing the same type of dimensional analysis, expressions for the collapse ofthe cells (i.e., the strength) have been obtained of the form [46]
σ∗y
σys= D1ρ
3/2, (1.8)
for open-cell foams, and
σ∗y
σys= D2(φρ)3/2 + D3(1 − φ)ρ, (1.9)
for closed-cell foams, where σys corresponds to the yield strength of the constituentmaterial and Di is again a proportionality constant.
1.4 Periodic Architected MaterialsThus far, quasi-ordered foams have been discussed in a general sense due to theirlarge variety of geometries (and vast number of variables that lead to them). Recentdevelopments in advanced manufacturing techniques have enabled types of cellu-lar solids with deterministic, repeatable, and (approximately) periodic cells. Verybroadly, we will categorize them into beam-based designs and plate- or shell-baseddesigns.

7
1.4.1 Beam-based designsEnabled mainly by 3D-printing processes, materials consisting of a network ofstruts connected at joints constitute the most common type of periodic architectedmaterial [8, 92, 118, 153]. Due to the highly controlled geometries within thesematerials, a single unit cell is usually sufficient to be taken as the RVE and can beused to fully characterize each material.
Unit cells can be described by their number of struts, vertices, and faces but thisbecomes ambiguous, for instance, when drastically different geometries with thesame number of struts exist. To categorize these structures more generally, they canbe defined based on their structural rigidity as explained in the following section.As we will see in later sections, this categorization will provide insight not only onthe topology of the architectures, but also on their mechanical behavior.
Defining Structural Rigidity
Assuming a given structure is composed of pin joints (i.e., no resistance for thestruts to rotate), it can be categorized as statically and kinematically determinateor indeterminate. Static determinacy requires the forces in each bar to be knownfrom the equilibrium equations while kinematic determinacy implies that the uniqueposition of each joint can be determined based on the lengths of the struts. Wedefine a rigid architecture as one that requires stretching of one or more struts forany of the joints to change position, implying that a rigid structure may be staticallydeterminate or indeterminate, but it necessarily has to be kinematically determinate.Static indeterminacy in these structures can occur when redundant struts exist whichallow a state of self-stress without the influence of any external forces. On the otherhand, a non-rigid architecture is kinematically indeterminate since the joints canfreely move in space without the need of stretching in any of the struts, defined asa zero-energy mechanism.
To formally understand this categorization, we will briefly describe the mathemati-cal foundation presented by Pellegrino and Calladine [110], which uses the geome-try of a given structure to form a linear-algebra framework that provides answers oneach level of determinacy. For a structure that is attached to a rigid foundation viaany k number of constraints (to prevent rigid-body motions), Maxwell’s rule statesthat a necessary condition for static and kinematic determinacy is
b = 3 j, (1.10)

8
where b is the number of struts and J is the number of joints that are not attached tothe foundation. Since this is a necessary but not sufficient condition, some structuresthat satisfy this rule can be kinematically indeterminate, which leaves room for amore in-depth analysis.
To this end, the vector of forces f∈ Rd j−k at each joint in d-dimensions can berelated to the tension t∈ Rb in each strut in the form
f = At, (1.11)
where A∈ R(d j−k)×b is the equilibrium matrix. Similarly, the extension of each strute∈ Rb can be related to the displacements of each joint d∈ Rd j−k in the form
e = Bd, (1.12)
where B∈ Rb×(d j−k) is the kinematic matrix, which can also be expressed as
B = AT. (1.13)
The fundamental subspaces of these rank-r matrices A and B can then provideinformation on the existence of zero-energy mechanisms or states of self-stress.Specifically, the number of states of self-stress s corresponds to the dimension ofthe nullspace of A, while the number of mechanisms m corresponds to that of B.Therefore, Maxwell’s law can be replaced by
s = b − r, (1.14)
m = 3 j − k − r, (1.15)
expressed together ass − m = b − 3 j + k. (1.16)
Assembling the equilibrium matrix for a given unit cell geometry then allows cate-gorization of a material’s architecture as rigid or non-rigid, based on the number ofmechanisms.
1.4.2 Plate- and Shell-based designsSeveral plate-based designs (i.e., no curvature) have emerged using the verticesof a beam-based lattice as a template, but with solid plates corresponding to eachface [15, 128]. Large variations of these structures can be made by superimposing

9
different basis lattices and also varying the plate thickness in each lattice. By defini-tion, most of these materials have closed cells (unless specifically designed to haveholes) and their density is highly dependent on the fluid encompassed within eachcell.
Alternatively, periodic materials made out of curved shells have also been designedusing a beam-based lattice architectures as templates [19, 20]. These materials haveutilized the surfaces corresponding to each beam as a shell, along with curved fea-tures such as fillets or spheres at junctions. More mathematically elaborate designs,termed triply periodic minimal surfaces (TPMS) [1, 49, 50, 101], have been fabri-cated in a variety of topologies belonging to that family. TPMS materials are uniquein the sense that their mean curvature is zero or constant and the domains on eachside of the shells are continuous, by definition. Further variations of TPMS materi-als (although not shell-based) arise when one of the two domains is filled [65, 86].
1.4.3 Fabrication MethodsNano- and Micro-Fabrication Techniques
At the micro- to nano-scale, polymer-containing materials have been most prevalentdue to advanced lithography techniques. Two-photon lithography processes haveenabled the fabrication of polymeric features with sub-micron resolution and sam-ple volumes on the order a cubic millimeter [8, 92–94, 128]. Subsequent pyrolysisor sintering of specific resins has also enabled the fabrication of carbon and metalarchitectures with features sizes below to ∼200 nm [9, 139, 152]. Additionally, con-formally coating these templates with nanometer-thick ceramic [8, 93, 120] or metalcoatings has enabled the fabrication of ceramic/metal-polymer composites. Remov-ing the polymeric template from these composites has produced hollow, shell-basedceramic [92] and metal [97] materials.
Larger sample volumes, with features on the order of tens to hundreds of microm-eters, have been achieved via large area projection microstereolithography meth-ods [153, 154]. Overall sample sizes produced through this method can reach vol-umes on the order of ∼10 cm3, and have enabled multiscale materials with dimen-sions spanning from tens of nanometers to tens of centimeters [154]. A wide rangeof material arrangements, ranging from ceramic or metallic shells to monolithicceramics have been reported using this method [153].
Nano- and micro-architected materials have also been fabricated via self-assemblyprocesses. The use of block copolymers to assemble a truss-like periodic patterns

10
has been reported to fabricate metallic (Ni) truss-like thin films [65]. At the mi-croscale, particle-stabilized emulsion gels (bijels) have produced macroporous ar-chitected materials with features on the order of ∼10 µm [79].
Macro-Fabrication Techniques
We define macro-scale fabrication techniques in this work as those capable of fab-ricating volumes larger than ∼10 cm3, with feature sizes greater than a few tens ofmicrometers. Most of the well-established additive manufacturing techniques fallin this regime, along with some lithography techniques. One such lithography tech-nique is that of self-propagating polymer waveguides, which can achieve truss-likepolymeric scaffolds [60] that can be coated and etched to produce ultralight metallicmaterials [118] or pyrolyzed to form vitreous carbon structures [61]. Similar mate-rial systems, with a larger range of printable geometries, have been made availableby 3D-printing techniques such as stereolithography [75] or laser sintering [12].
Looking beyond metallic coatings at the macro-scale, monolithic metal architectedmaterials have been fabricated through techniques such as selective electron beammelting (SEBM) or selective laser melting (SLM). Several periodic architectedmaterials have been fabricated through these processes with constituent materialssuch as stainless steel 316L [19, 20, 51, 127] and Ti-6Al-4V [141]. Lattice-coresandwich plates have been fabricated as well via sheet perforation and followedby folding or snap-fitting components, requiring no additive manufacturing tech-niques [129, 147, 149].
1.4.4 Static Mechanical PropertiesThe structural rigidity of an architecture, as defined in section 1.4.1, provides simplepredictive tools on the mechanical response of a material containing that architec-ture. For instance, the classical scaling law for the stiffness of foams (Eq. 1.17)applies to non-rigid structures (
E∗
Es
)non-rigid
= C1ρ2, (1.17)
since their deformation is inherently bending-dominated. Due to periodicity (lack-ing in foams), beam-based periodic materials will achieve a higher scaling constantC1 than foams.
An equally simple approximation for a rigid-architecture-containing material con-sists of an arrangement of bars and pin-joints in three dimensions [35], which ne-
11
glect bending deformation and provide a scaling law of the form(E∗
Es
)rigid
= C1ρ, (1.18)
where the value of C1 should be higher than that of a non-rigid architecture materialof the same constituent material and relative density.
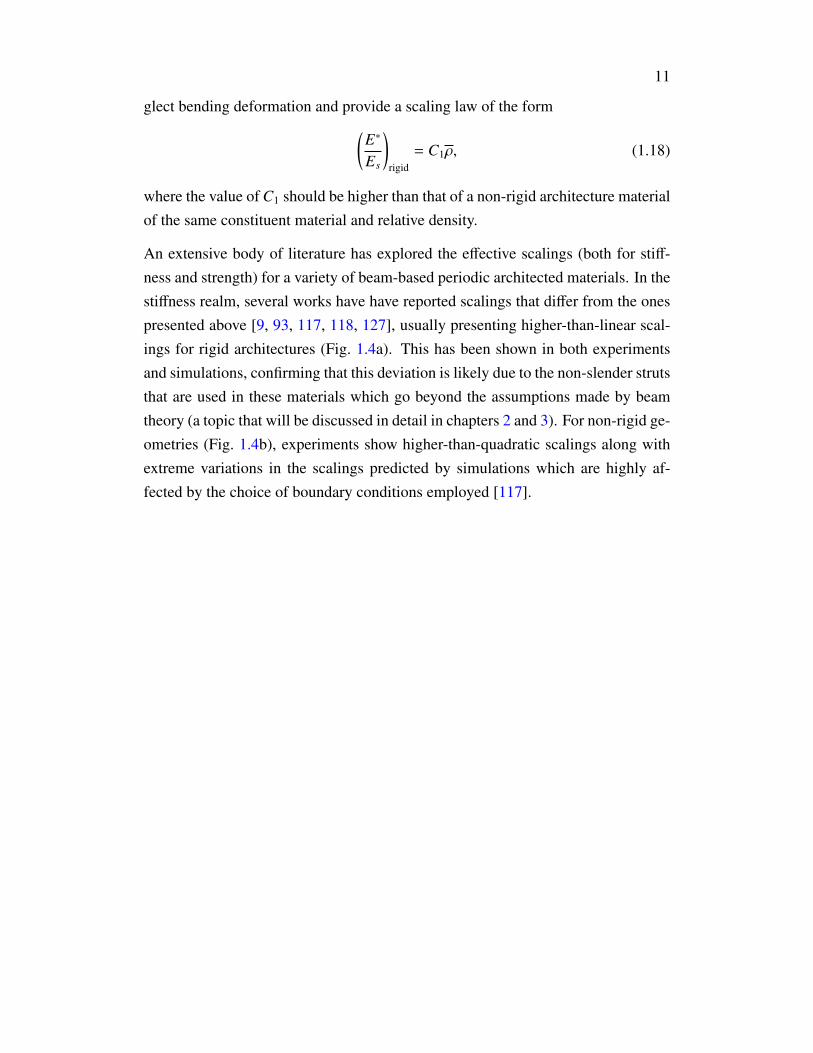
An extensive body of literature has explored the effective scalings (both for stiff-ness and strength) for a variety of beam-based periodic architected materials. In thestiffness realm, several works have have reported scalings that differ from the onespresented above [9, 93, 117, 118, 127], usually presenting higher-than-linear scal-ings for rigid architectures (Fig. 1.4a). This has been shown in both experimentsand simulations, confirming that this deviation is likely due to the non-slender strutsthat are used in these materials which go beyond the assumptions made by beamtheory (a topic that will be discussed in detail in chapters 2 and 3). For non-rigid ge-ometries (Fig. 1.4b), experiments show higher-than-quadratic scalings along withextreme variations in the scalings predicted by simulations which are highly af-fected by the choice of boundary conditions employed [117].

12
Figure 1.4∣∣∣ Stiffness Scalings of Selected Beam-Based Periodic ArchitectedMaterials
Experiments and simulations on (a) rigid and (b) non-rigid architectures.
The strength scalings and failure mechanisms of these types of materials at thenano- and micro-scales have been shown to be diverse, mainly due to the dominanteffect of inevitable defects (both structural- and material-related) on these proper-ties. Depending on the geometry of structural features and the constituent mate-rial, both ductile-like and brittle failure have been observed, relating to beam/shellbuckling or material fracture, respectively. Ductile-like failure followed by struc-

13
tural recovery has been reported in nano-architected materials enabled by elasticshell-buckling of thin ceramic beam walls [92, 93]. Although structural recovery isobserved, the material is substantially weaker due to fracture at nodes where stressconcentrations arise. Brittle failure has been observed when beam-wall thicknessesincrease [92, 93] or when the struts are monolithic or composite [8, 153]. Addi-tionally, some monolithic-beam materials with sub-micron beam dimensions madeout of carbon have approached the theoretical bounds for strength [9, 152] by har-nessing material size effects. Analogous to their nano-architected counterparts, hol-low metallic lattices with larger dimensions have also reported buckling and yield-ing failure regimes depending on the struts’ geometric parameters [134], and arestrongly affected by the compliance of hollow nodes. This important effect of stressconcentrations at nodes has been shown to be slightly mitigated if fillets are addedto strut junctions [75]. Recently, some works have explored the fracture behaviorof beam-based architected materials at both the nano- and macro-scales [87, 103]and have also highlighted the importance of nodal effects in this regime.
Looking beyond beam-based architectures, plate- and shell-based materials thathave been fabricated at the micro-scale have exhibited stiffnesses that are closeto the theoretical bounds [128]. Doubly curved geometries based on triply periodicminimal surfaces (and doubly curved derivations of truss geometries) [1, 20, 49, 50]showed mechanical performance equal or superior to beam-based architectures atthe same relative density, including close-to-linear stiffness scalings. A benefit fromthe mechanical response of these doubly curved architectures is the lack of nodes atwhich stress concentrations could occur and smoother collapse responses comparedto truss architectures [20].
1.4.5 Dynamic Mechanical PropertiesThe propagation of mechanical waves in periodic 3D architected materials has beenexplored extensively numerically and analytically, while experimental studies haveonly recently been made possible. In particular, the use of lumped masses [88]and buckling of beam-like components [140, 141] have shown to be mechanismsto achieve vibrational band gaps in these materials at centimeter scales. At themicro- and nano-scale, lattice architectures submerged in water have exhibited theformation of ultrasonic acoustic band gaps with modifications at the nodes [69] aswell as frequency-dependent group velocities [71].
Dynamic non-elastic deformation such as compaction has also been studied exper-

14
imentally. The dynamic compression of stainless steel lattices with feature sizes onthe order of hundreds of micrometers to a few millimeters and strain rates of 103 s−1
have reported that effective dynamic strength increases [127] and high energy ab-sorption [51] are achievable with the use of architecture. Similar experiments onaluminum-alloy truss-core sandwich plates explored the effect of temperature onenergy absorption during compaction and showed improved performance at tem-peratures as low as −170 C [129]. Comparable experiments on polymeric latticearchitectures with beam diameters of ∼30 µm and compaction velocities of ∼300m/s showed evidence of constant-velocity compaction waves regardless of architec-ture, hinting to an inertia-dependent process [52]. Auxetic polymeric micro-latticesstudied at strain rates of ∼1000 s−1 show beam buckling as a mechanism to enhanceenergy absorption in these materials under compaction [73].
The impact and blast response of 3D periodic architected materials has been mostlyexplored in truss-core sandwich plate configurations which usually consist of asmall tessellation of unit cells in the thickness direction (just one unit cell in somecases). Low-velocity drop-weight impact experiments on additively manufacturedmetallic and polymeric truss cores, with impact velocities of up to ∼5 m/s, reportedenergy absorption values comparable to aluminum honeycombs of the same den-sity [95, 149] as well as an important effect of architecture [12] in this regime. Athigher strain rates, the dependence on geometric parameters in the truss core hasbeen explored analytically and numerically for millimeter-scale monolithic [145]and micro-scale hollow metallic struts [41], both showing the potential of these ma-terials to sustain higher blast impulses than a monolithic plate of the same weight.The ballistic impact response of metallic truss-core sandwich plates to maximumvelocities of 1,300 m/s showed comparable energy absorption response to mono-lithic plates, and showed a diminishing effect of architecture beyond a critical ve-locity at which full sample penetration occurred [147].
1.5 Numerical Modeling of Architected MaterialsDue to the immense parameter space associated with 3D periodic architected mate-rials, numerical models have become necessary to predict and optimize the responseof lattice architectures. Depending on the problem on interest (i.e., linear response,non-linear response) and the size of tessellation to be modeled, several numericalapproaches have been proposed.
15
1.5.1 Finite Periodic TessellationsDiscrete beam-element models [37, 130] and beam homogenization models [11,106, 112, 138] have provided efficient approaches to model large tessellations ofunit cells, although they are applicable only to slender geometries where beam the-ory applies. Furthermore, these models fall short in predicting the response of com-plex architectures such as the hollow-beam geometries used in Meza et al. [93] orSchaedler et al. [118]. With these limitations in mind, these types of models havebeen used both in the static and dynamic regimes and have provided estimates onphenomena ranging from tensile viscoelastic response [130] to elastic wave direc-tionality [10, 90, 148] in lattice architectures.
More computationally demanding representations that use 3D finite elements havebeen reported to provide more accurate results when beam theory becomes insuffi-cient, but pose additional challenges due to the added computational cost [19, 127].
1.5.2 HomogenizationThe periodicity inherent in these materials allows for numerical homogenizationusing periodic boundary conditions (PBCs), which effectively predicts the responseof an infinite tessellation of unit cells. Since the work presented in this thesis utilizesnumerical homogenization methods in both the static and dynamic regimes, theseconcepts will be explained in more detail below.
Static Response
We begin by assuming a heterogenous RVE under strain field ε, whose linearizedstress field σ=σ(x, ε) and density ρ = ρ(x) undergo variations from point to point.Assuming separation of scales is achieved, we aim to express the problem in ahomogenized form such that these properties of the effective material are σ(x)=σ∗
and ρ(x)=ρ∗. Using conservation of mass we can define the effective density of amaterial volume V as
ρ∗V =
∫Ω
ρ(x)dV ⇒ ρ∗ = 〈ρ〉 , (1.19)
where Ω represents the domain of the whole RVE. In the same manner, the effectivestress and strain fields are defined as
σ∗ = 〈σ〉 and ε∗ = 〈ε〉 . (1.20)

16
Thus, conservation of energy in the small strain regime requires the strain energydensity of the macroscale to be equal to that of the microscale
σ∗ · ε∗ = 〈σ(x) · ε(x)〉. (1.21)
This energetic equivalence is attained by exploiting periodicity in the heterogeneousmaterial and applying periodic boundary conditions enforcing
u+ − u− = ε(x+ − x−) and t+ = t− on ∂Ω, (1.22)
where u+/− and t+/− are the displacements and tractions on the plus and minusboundaries (∂Ω) of the RVE (with coordinates x+ and x−), respectively.
This approach has been used to predict the effective response of periodic materialsby just modeling one unit cell [20, 94, 117, 126, 128, 134], which then implies aninfinite tessellation in all directions. If separation of scales is indeed achieved inexperimental samples, this computational technique provides an efficient approachto approximate their response.
Wave Propagation Response
Periodicity can also be employed to predict the propagation of elastic waves inperiodic materials using Bloch wave analysis [59]. This analysis begins by charac-terizing an infinite periodic material using three basis vectors, namely a1, a2, anda3 which fully define the tessellation of an elementary unit cell that composes theinfinite material. Thus, the position of a specific point α can be expressed in theunit cell’s local coordinate system as r0, and in global coordinates as
rα = r0 + n1a1 + n2a2 + n3a3, (1.23)
where ni ∈ Z correspond to the tessellation integers of the unit cell of interest.Bloch’s theorem then relates the displacement u of a point in global coordinates tothe point in the unit-cell coordinate system by the expression
u(rα) = u(r0)e−ik·(rα−r0), (1.24)
where k is the wave vector. We note that periodicity is enforced by ensuring thatthe wave vector is defined by reciprocal lattice vectors [67] given by
b1 = 2πa2 × a3
a1 · (a2 × a3), b2 = 2π
a3 × a1
a2 · (a3 × a1), b3 = 2π
a1 × a2
a3 · (a1 × a2), (1.25)
17
in the formk = k1b1 + k2b2 + k3b3, (1.26)
with ki ∈ R. Using the finite element framework and assembling the appropriatemass and stiffness matrices for the RVE, M and K, respectively, the solution to theproblem can be expressed as
MU + KU = F, (1.27)
where U, U, and F are the acceleration, displacement, and force vectors, respec-tively. Seeking a plane-wave solution of the form U(r0) = U0e−iωt, with frequencyω, and applying Bloch’s theorem (Eq. 1.24) yields the eigenvalue problem
(K − ω2M)U0 = F, (1.28)
subject to
U+0 = U−0 e−ik·(x+−x−) F+ = −F−e−ik·(x+−x−), (1.29)
where x+/− are the coordinates of the corresponding points in the plus and minusfaces of the RVE and (·)+/− are the quantities corresponding to those faces. Thedispersion relation of the infinite periodic material is then obtained by exploitingperiodicity to define an irreducible Brillouin zone (IBZ) [21] in k-space and solvingfor the eigenfrequencies ω while sweeping the wave vector k along the edges of theIBZ.
This analysis has been used extensively for architected materials with both beam-and continuum-element representations, and serves as the guiding principle for val-idation experiments [2, 26, 69, 88]. These dispersion relations obtained numer-ically can be used to predict the existence of band gaps [83, 141] and provideinsight on the phase and group velocities of waves traveling in periodic materi-als [10, 71, 90, 109].
1.6 Significance of Architected MaterialsAs highlighted in previous sections, architecting structural materials at the micro-and nanoscale has enabled novel mechanical properties unattainable by homoge-neous materials. Their high mechanical tunability has enabled their use in previ-ously unrelated fields pertaining to cell mechanics, electrochemistry, and impactabsorption among others.
Recent developments in the architected-material field have enabled the fabricationof increasingly larger volumes with nano- and micro-scale features, bridging the

18
gap between interesting material size effects and everyday applications. Futureprogress in this field has the potential to completely close this gap and thus drasti-cally change the materials parameter space presented in Fig. 1.2.
1.7 OutlineThis thesis presents an exploration on the mechanical response of architected mate-rials with dimensions ranging from the nanometers to centimeters, presenting novelfabrication and testing methods along the way. Furthermore, the first part of thethesis pertains to the response of these materials under quasi-static loading, whilethe second part explores their response in the dynamic regime. In doing so, it en-compassing mechanical loading ranging from uniaxial compression, to mechanicalvibrations in the MHz regime, and ultimately to blast loading and supersonic impactwith velocities of up to ∼1 km/s.
Chapter 2 begins by analytically, experimentally, and numerically studying the me-chanical property space of nano-architected beam-based periodic materials, specifi-cally relating geometric parameters such as unit cell topology and beam slendernessto the effective mechanical response. This chapter concludes by showing that archi-tectures that are manufacturable by current methods deviate from the mechanicalresponse predicted by classical scaling laws and qualitatively associates this devia-tion to emerge from non-slender nodes (i.e., junctions).
Chapter 3 expands on the exploration from the previous chapter and describes asystematic, quantitative experimental and numerical study of the effect of nodeson non-slender beam architectures, additionally showing that this effect is scale-independent. In this chapter, we propose an efficient reduced-order numerical modelthat accurately captures the effect of nodes on the linear mechanical response of lat-tice architectures and provides an extension to the classical stiffness scaling laws toaccount for the deviation observed in non-slender geometries.
We enhance our exploration in chapter 4 by moving beyond beam-based architec-tures and instead study node-less, shell-based geometries that do not suffer from theissues presented in the previous chapters. As part of this exploration, we present aself-assembly method for scalable fabrication of nano-architected materials withsample volumes of up to a few cubic centimeters consisting of smooth doublycurved ceramic shells. Harnessing the tunable nature of self-assembly processes,we numerically and experimentally showcase the extreme resilience and overall su-perior performance of these materials compared to other architected materials.

19
The next portion of the thesis consists of the exploration of these materials in thedynamic mechanical regime, with chapter 5 describing the propagation of mechani-cal waves in micro-architected beam-based architectures. In this chapter we explorethe use of reconfigurable geometries and added micro-inertia to elicit the emergenceof vibrational band gaps, also presenting a novel experimental method that enablesdynamic testing of small-volume micro-architected materials.
Chapter 6 further enters the dynamic regime by studying the response of carbon-based lattice architectures, both at the nano- and centimeter scales, under supersonicimpact and blast loading conditions. We also present methods to fabricate thesecarbon-based materials at both scales (including a type of 3D architected carboncomposite at the larger scale), and experimentally show their potential to dissipateenergy in these conditions.
Lastly, we summarize and provide an outlook based on the lessons learned from theabove explorations.

20
C h a p t e r 2
IDENTIFYING THE EFFECT OF NODES ON LATTICEARCHITECTURES
This chapter has been adapted from
L.R. Meza, G.P. Phlipot, C.M. Portela, A. Maggi, L.C. Montemayor, A. Comella, D.M. Kochmann& J.R. Greer. “Reexamining the mechanical property space of three-dimensional lattice ar-chitectures”. Acta Materialia (2017) 140, pp. 424–432. doi: 10.1016/j.actamat.2017.08.052.Contributions: fabricated a portion of the samples, conducted a portion of the experimentsand analyzed the data, performed a portion of the computational analysis, and participated inthe writing of the manuscript.
2.1 Chapter SummaryIn the process of studying the mechanical parameter space of lattice architectureswe conducted systematic nanomechanical experiments and finite element analysison nanolattices made from two different material systems (i.e., solid and hollowbeams), with four different topologies each. We found that the mechanical proper-ties of nanolattices in a currently experimentally realizable property space are nearlyindependent of architecture, and that the strength and stiffness of rigid and non-rigidtopologies (as defined in Section 1.4.1) at these relative densities are nearly iden-tical. This result represents a significant point of departure from theories relatingmechanical properties to the rigidity of the lattice topology [34, 35, 43, 46, 48, 154].Uniaxial compression experiments reveal a non-linear scaling of strength and stiff-ness with relative density, with exponents between m = 1.41−1.83 for stiffness andn = 1.45 − 1.92 for strength for all nanolattice topologies and material systems. Fi-nite element simulations reproduce the observed nonlinear scaling within the rangeof relative densities tested experimentally for both solid and hollow-beam nanolat-tices. They further reveal that for solid lattices with relative densities of ρ < 5%, thestiffnesses of rigid and non-rigid topologies deviate from one another to show goodagreement with existing bending- and stretching-dominated scaling laws [46]. Forhollow lattices, finite element simulations reveal a highly complex parameter spacewith orders-of-magnitude deviations in stiffness arising from small variations in pa-

21
rameters. We propose a simple analytical framework that provides insight into thestiffness scaling of solid-beam lattices, and we investigate some of the mechanismsfor the large variances in hollow-beam lattice properties. We postulate that theconvergence of strength and stiffness in solid lattices at higher densities is causedby the increased influence of beam intersections at the nodes. These results sug-gest that the existing classification of nanolattice topologies as solely stretching-or bending-dominated is insufficient, and new theories must be developed to ac-curately capture the effect of both nodal interferences in solid-beam lattices andempty nodes in hollow-beam lattices on the mechanical properties. This chaptersets the groundwork for more advanced analysis on the effect of nodes presented inchapter 3.
2.2 Experimental Framework2.2.1 FabricationPolymer nanolattices were fabricated using a two-photon lithography direct laserwriting process in IP-Dip photoresist using the Photonic Professional lithographysystem (Nanoscribe GmbH). Structures were written using laser powers of 6-14mW and writing speeds of ∼50 µm s−1. Laser power is used to control the beamdiameters. As a byproduct of the fabrication process, all beams were elliptical, withan aspect ratio of ∼3:1. Beams can be made to be circular by writing structuresusing a layer-by-layer process, but this writing method results in structures withlarger dimensions. The smallest beam dimensions that can be written using thisprocess are on the order of ∼200 nm, and in this work the beam dimensions rangefrom ∼400 nm to ∼2 µm. Unit cell sizes of fabricated nanolattices ranged from 3 to15 µm, and overall sample dimensions were between 25 and 85 µm.
Hollow structures were written using the polymer nanolattices as a base scaffold;polymer surfaces were conformally coated in alumina (Al2O3) using atomic layerdeposition (ALD). Deposition was done at 150 C in a Cambridge Nanotech S200ALD system using the following steps: H2O is pulsed for 15 ms, the system ispurged for 20 s, trimethyl aluminum (TMA) is pulsed for 15 ms, the system ispurged for 20 s, and the process is repeated. The carrier gas is nitrogen, flownat a rate of 20 sccm (standard cubic centimeters per minute). The process was cy-cled for between 50 and 1200 cycles to obtain the desired thickness coatings on thenanolattices, which ranged from 5 to 120 nm. The thickness of the coatings wasverified using spectroscopic ellipsometry with an alpha-SE Ellipsometer (J.A. Wol-lam Co., Inc.). After deposition, two outer edges of the coated nanolattices were

22
removed using focused ion beam (FIB) milling in an FEI Nova 200 Nanolab systemto expose the polymer to air. After this exposure, the samples were placed into anO2 plasma barrel asher for a time period between 50 and 75 hours with a 300 sccmflow rate of O2 under 100 W of power to fully remove the polymer. This process isnearly identical to that reported by Meza et al. [92].
2.2.2 Nanomechanical ExperimentsMonotonic and cyclic uniaxial compression experiments were performed on nanolat-tices in a G200 XP Nanoindenter (Agilent Technologies). Structures were com-pressed uniaxially to ∼50% strain at a rate of 10−3 s−1 to determine their yield stressσy, Young’s modulus E and overall deformation characteristics. The data obtainedfrom nanolattice compression experiments performed in this work had a wide rangeof stress-strain responses, which required the formulation of a consistent method tomeasure meaningful effective Young’s moduli and yield strengths. In every sampletested, the stress-strain data was comprised of a toe region, a linear region, and afailure region. The toe region is a non-linear segment of data at the beginning ofloading, and generally corresponds to slight misalignments and imperfections be-tween the sample and the indenter tip. For each sample, a subset of stress-straindata was taken starting at the beginning of loading and going to the onset of fail-ure. The maximum slope of this data subset was defined as the effective Young’smodulus, E. This is done to mitigate the effect of the toe region on the stiffnessmeasurement. In polymer samples, or any sample with ductile yielding, a line withslope E is determined using a 0.2% strain offset from the obtained Young’s modu-lus fit, and the intersection of this line and the stress-strain data is taken to be theeffective yield strength σy. In hollow Al2O3 samples, or any sample with a brittleyielding, the yield strength is taken to be the peak stress before failure. It should benoted that edge effects that arise due to the finite sample size can affect the strengthand stiffness, particularly for non-rigid topologies, so the strength and stiffness oflattices here is an effective structural response that approximates the properties ofan infinite lattice.
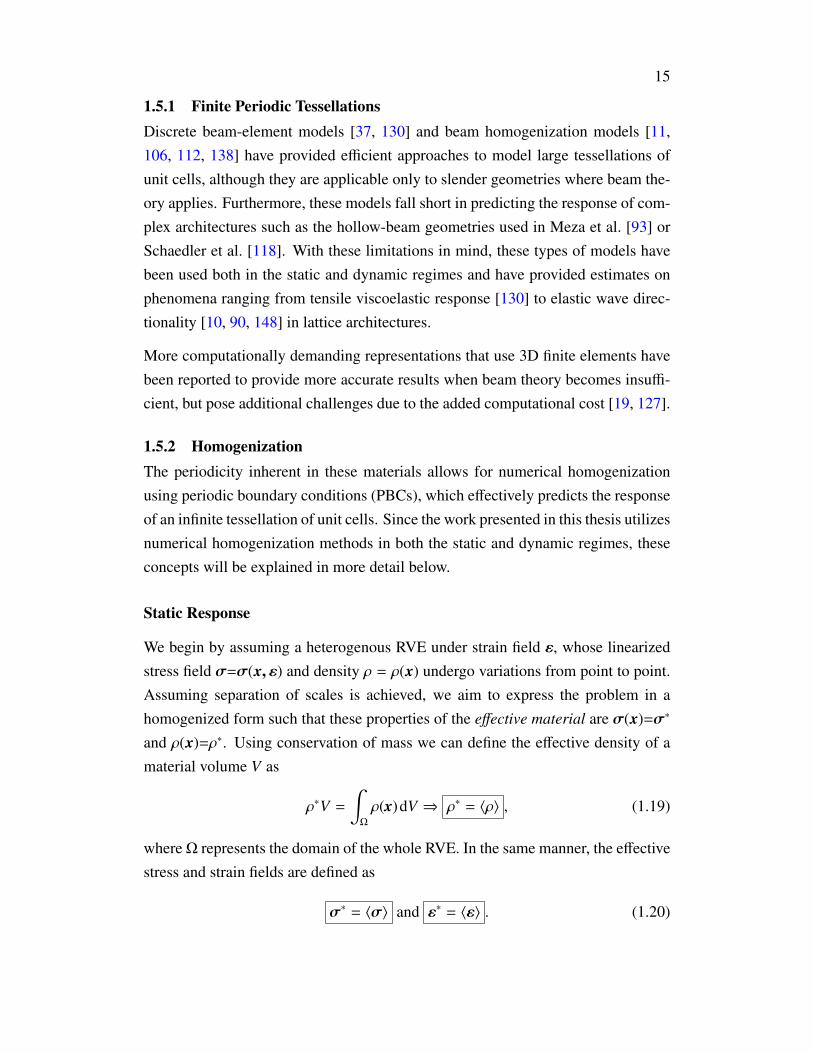
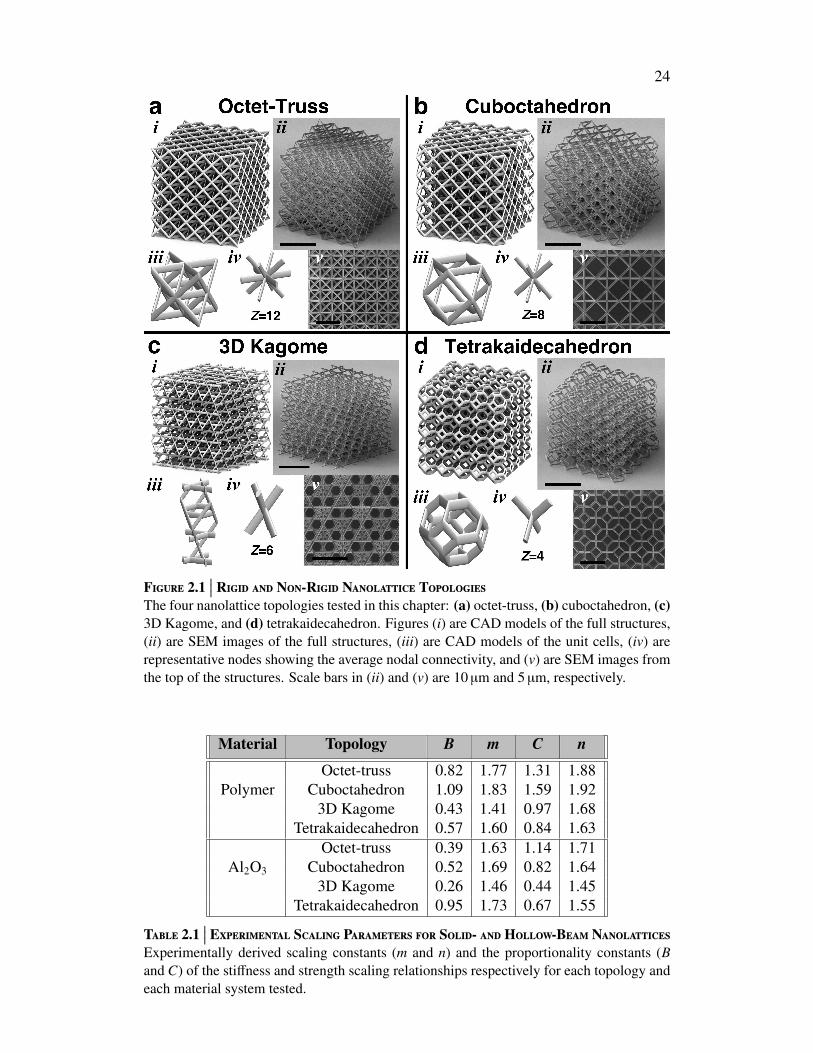
2.2.3 ResultsWe fabricated four nanolattice topologies with varying degrees of rigidity and av-erage nodal connectivity (Z): (i) an octet-truss (rigid, Z = 12), (ii) a cuboctahedron(periodically rigid, Z = 8), (iii) a 3D Kagome (periodically rigid, Z = 6), and (iv) atetrakaidecahedron (non-rigid, Z = 4) (Fig. 2.1). Each nanolattice was constructed

23
out of solid polymer and hollow Al2O3 beams with elliptical cross sections, whicharise as a result of the fabrication method [92, 93]. Octet-truss, cuboctahedron andtetrakaidecahedron samples were made with 5 × 5 × 5 unit cells, and 3D Kagomesamples were made with 6 × 6 × 3 unit cells. The relative densities of fabricatedsamples ranged from ρ = 1.1% to 62.6% for solid polymer and ρ = 0.14% to 9.1%for hollow Al2O3 and spanned at least one order of magnitude within each topology.The slenderness of the beams ranged from λ = 13.8 to 62.8 for polymer samplesand λ = 12.0 to 59.8 for Al2O3 samples, defined as λ =
√(AL2/I), with A being the
cross-sectional area and I being the area moment of inertia of the beam. Despite thehigh relative density of some of the samples, each individual architecture remainedtopologically identical throughout its relative density range, and most samples hadρ ≤ 30%.
We experimentally investigated strength and stiffness scaling relations of the form
E = BEsρm, (2.1)
σy = Cσysρn, (2.2)
where B and C are proportionality constants, Es andσy are the constituent material’sproperties, and m and n are the scaling coefficients, across all nanolattice topolo-gies, dimensions, and material systems. We found that in the monolithic polymersamples the scaling exponents for stiffness range from m = 1.41 to 1.83 and thosefor strength range from n = 1.63 to 1.92, and in the hollow Al2O3 samples, the stiff-ness exponents range from m = 1.46 to 1.73 and the strength exponents range fromn = 1.45 to 1.77. Table 2.1 provides the scaling and proportionality constants forall topologies and material systems explored in this work. The plots of strength andstiffness vs. density in Fig. 2.2 show that the mechanical properties of all topolo-gies at the same density effectively collapse onto each other for each material sys-tem. Little variation exists in the proportionality constants or scaling exponentsfor Young’s modulus between the two material systems, and the strength propor-tionality constants and scaling exponents of the polymer nanolattices are slightlyhigher than those of the Al2O3 nanolattices. These results demonstrate that in therange of relative densities tested for both materials systems, virtually no correlationexists between the rigidity of the samples and their strength and stiffness scaling.This finding is surprising because it indicates that topology has a less significantrole in controlling the strength and stiffness of lattices than commonly theorized[35, 43, 46].
24
Figure 2.1∣∣∣ Rigid and Non-Rigid Nanolattice Topologies
The four nanolattice topologies tested in this chapter: (a) octet-truss, (b) cuboctahedron, (c)3D Kagome, and (d) tetrakaidecahedron. Figures (i) are CAD models of the full structures,(ii) are SEM images of the full structures, (iii) are CAD models of the unit cells, (iv) arerepresentative nodes showing the average nodal connectivity, and (v) are SEM images fromthe top of the structures. Scale bars in (ii) and (v) are 10 µm and 5 µm, respectively.
Material Topology B m C n
Octet-truss 0.82 1.77 1.31 1.88Polymer Cuboctahedron 1.09 1.83 1.59 1.92
3D Kagome 0.43 1.41 0.97 1.68Tetrakaidecahedron 0.57 1.60 0.84 1.63
Octet-truss 0.39 1.63 1.14 1.71Al2O3 Cuboctahedron 0.52 1.69 0.82 1.64
3D Kagome 0.26 1.46 0.44 1.45Tetrakaidecahedron 0.95 1.73 0.67 1.55
Table 2.1∣∣∣ Experimental Scaling Parameters for Solid- and Hollow-Beam Nanolattices
Experimentally derived scaling constants (m and n) and the proportionality constants (Band C) of the stiffness and strength scaling relationships respectively for each topology andeach material system tested.

25
Figure 2.2∣∣∣ Strength and Stiffness vs. Density of Different Nanolattice Topologies
Logarithmic plots of (a) Young’s modulus vs. relative density and (b) yield strength vs.relative density of every sample tested from all four regular topologies and both materialsystems. The values of the fully dense constituent materials are also plotted. Trend linesfor each set of samples are meant to graphically illustrate the scaling relations.
2.3 Analytical Framework: accounting for stretching and bendingThe mechanical properties of periodic lattices are commonly modeled using thebending or stretching behavior of the constituent beams [8, 35, 43, 45, 70, 153]. Inclassical formulations, beams in a lattice are assumed to be slender and are approx-imated as Euler-Bernoulli or Timoshenko beams [46, 63]. Deformation modes likeshearing and torsion in the beams and compression and bending of the nodes areoften neglected in these simplified analyses because of the complexity associatedwith incorporating them into models and their negligible influence in slender beamlattices. In a non-rigid lattice comprised of solid Euler-Bernoulli beams with a char-acteristic cross-sectional dimension R and length L, the stiffness is assumed to bedominated by bending of the beams, giving rise to a scaling of E ∝ (R/L)4 [3, 46].In a rigid lattice, this scaling is E ∝ (R/L)2 and arises from the assumption that

26
stiffness is governed by stretching and compression of the beams [3, 35]. In latticeswith very slender beams (i.e., λ & 20), the relative density can be approximated toscale as ρ ∝ (R/L)2, where the slenderness is again defined as λ =
√(AL2/I), with
A being the cross-sectional area and I being the area moment of inertia of the beam.These three relationships give rise to the classical stiffness scaling of E ∝ ρ2 for“bending-dominated” and E ∝ ρ for “stretching-dominated” cellular solids.
These simplified relations begin to break down when the beams in a lattice cannotbe approximated as slender. Simplified relative density relations are obtained byignoring the relative contribution of beams intersecting at the nodes. Accountingfor the effects of nodal intersections, we derived the relative densities of lattices withsolid and hollow circular beams as a function of R/L and t/R to have the functionalforms
ρsolid = C1
(RL
)2
+ C2
(RL
)3
, (2.3)
ρhollow = C1
(RL
)2
f( tR
)+ C2
(RL
)3
g( tR
), (2.4)
where C1 and C2 are geometry-dependent constants and are equal in solid and hol-low lattices with the same geometry. The function f
(tR
)= 2
(tR
)−
(tR
)2is the
hollow-cylinder correction, and g(
tR
)= 3
(tR
)− 3
(tR
)2−
(tR
)3is the hollow-sphere
correction. This model accurately predicts relative density scaling over a wide rangeof beam slendernesses, and notably diverges from models that do not account fornodal corrections in solid and hollow lattices when beam slenderness is λ < 20.
Classical stiffness models ignore the combined influence of stretching and bendingin beams by assuming that one has a dominant effect over the other. In real lattices,this assumption no longer holds, and beams in a non-slender lattice are subject toboth bending and stretching, in addition to other effects such as shearing, torsionand nodal interactions. To account for some of these effects, we developed a simpleanalytical model that accurately captures the stiffness of rigid and non-rigid latticesby representing them as 3D networks of solid Euler-Bernoulli beams subject tobending and axial compression and tension.
As shown in Fig. 2.3, 3D non-rigid and rigid lattice topologies are reduced to their2D analogs and then further reduced using symmetry to representative one- andtwo-beam models, respectively. The stiffness of these simplified one- and two-beam models is then generalized to non-rigid and rigid lattice topologies. Thisanalysis considers lattices comprised of beams with uniform solid circular cross-

27
sections, radius R, length L, and a constituent Young’s modulus Es. All beams aresubject to a combination of stretching and bending, and beams are modeled usingEuler-Bernoulli theory [132] for slender elastic beams. Nodes are all taken to bewelded joints. Additional effects such as nodal compliance, torsion or shearing ofbeams, and imperfections like misalignment or waviness are ignored, as in classicaltheories for slender beams.
Figure 2.3∣∣∣ Non-Rigid and Rigid SimplifiedModel Systems
(a) Model non-rigid nanolattice topology, (b) 2D analog of the non-rigid 3D lattice in (a).(c) Simple one-beam model constructed using symmetry of the 2D lattice in B and assumingrigid nodes. (d) Model rigid lattice topology (octet-truss). (e) 2D analog of the rigid 3Dlattice in (d). (f) Simple two-beam model constructed using symmetry of the 2D lattice in(e) and assuming rigid nodes.
The stiffness S of any material is defined as the amount of deflection δ subject to agiven load F, expressed as S = F/δ. The effective stiffness of the simplified non-rigid and rigid beam models shown in Figs. 2.3c,f, respectively, are taken to be thedeflection in the vertical direction under an applied load. The diagonal beams aretaken to have length L, cross-sectional area A, area moment of inertia I, constituentmaterial stiffness Es, and are oriented at an angle θ with respect to horizontal. Theaxial stiffness of the horizontal beam in the rigid-beam model is taken to be a factorα different than the diagonal beam; this factor is intended to account for differencesin length and/or cross-sectional area. The stiffness of these one- and two-beammodel systems is found to be, respectively,
S non-rigid =Es
L3
12I cos2 θ + LA sin2 θ
, (2.5)

28
S rigid =Es
[1 + α
(cos2 θ + AL2
12I sin2 θ)]
L3
12I
(cos2 θ + α
)+ L
A sin2 θ. (2.6)
In the simple case where θ = π/4 and α = 1, these equations reduce to
S non-rigid =2E
L3
12I + LA
, (2.7)
S rigid =E
(3 + AL2
12I
)L3
4I + LA
. (2.8)
The stiffness of the non-rigid beam model can be identified as a Reuss model con-struction of a bending and stretching beam in series, where the axial stiffness of abeam is S axial = EsA/L and the stiffness of an Euler-Bernoulli beam in bending isS bend = CEsI/L3 and C is a constant depending on the boundary conditions. Thestiffness of the rigid beam model is similar to the non-rigid model but has an ad-ditional term in the numerator. This additional term arises because the horizontalbeam provides a reaction force proportional to the ratio between the stiffnesses ofthe two beams, which can be expressed as Freact ∝ Fapplied(S horz/S bend +S horz/S axial).In the extreme case where α → ∞, which represents a diagonal beam fixed on arigid surface, this equation reduces to the Voigt model construction of a bendingand stretching beam as
S rigid
∣∣∣α→∞
= Es
(12IL3 cos2 θ +
AL
sin2 θ
). (2.9)
In regular lattices, such as those shown in Figs. 2.3a,d, the structure can be approxi-mated as a repeating periodic arrangement of the simple reduced non-rigid and rigidbeam models. The stiffness of the lattice can then be approximated to be propor-tional to the stiffness of the reduced model systems, and the stiffness of non-rigidand rigid lattices can be expressed as
S non-rigid =Es
A1L3
I + A2LA
, (2.10)
S rigid =Es
(1 + B1
AL2
I
)B2
L3
I + B3LA
. (2.11)
Here, A1, A2, B1, B2, and B3 are constants that depend on the number of diagonaland horizontal beams in a structure, the angle θ, and the horizontal beam stiffness α.The effective (structural) Young’s modulus E of a lattice can then be identified as the

29
ratio of stress (force normalized by the effective area Aeff) and strain (displacementnormalized by the effective height Heff), so that E = S Heff
Aeff. The height and area
of a unit cell with beams of length L are approximately Heff ∼ L and Aeff ∼ L2,giving E ≈ S/L. Taking a lattice constructed from circular beams, the area andarea moment of inertia are As = πR2 and Is = π
4 R4, respectively. From this, theexpression for Young’s modulus of a rigid and non-rigid lattice are, respectively,
Enon-rigid =Es
A1
(RL
)−4+ A2
(RL
)−2 , (2.12)
Erigid =Es
[1 + B1
(RL−2)]
B2
(RL
)−4+ B3
(RL
)−2 . (2.13)
In the extreme case of very slender beams (i.e., R/L 1), these equations approachEnon-rigid ≈ A1Es
(RL
)4and Erigid ≈ B1Es
(RL
)2, which are the previously derived an-
alytical models for a bending- and stretching-dominated solid, respectively [46].Neither the proposed models nor the previous analytical models account for shearin the beams or stiffness of the nodes, both of which are likely to be dominantfactors affecting the stiffness of the lattices. Despite this, the proposed rigid andnon-rigid stiffness models serve to explain deviations from power-law scaling athigh R/L-ratios by accounting for both bending and stretching in the beams.
2.4 Finite-element Models2.4.1 Beam-element ModelsIn order to account for stretching and bending of struts in rigid and non-rigidtopologies, initial finite element analyses were performed with three-dimensionaltwo-node Euler-Bernoulli and Timoshenko beam elements in an in-house finite ele-ment code. The beam elements are equipped with six degrees of freedom per nodeand include a small-strain assumption. A linear elastic material model was used,and each strut was refined into an appropriate number of elements to ensure mesh-independent results. For the octahedron, cuboctahedron, and tetrakaidecahedrontopologies, the full 5× 5× 5 unit cell lattice was modeled. For the 3D Kagome, thefull 6 × 6 × 3 unit cell was modeled. All nodes in the bottom face of the unit cellwere fixed (translations and rotations), and the top nodes were only constrained inthe z-direction; a 1% compressive strain was applied to extract the effective verticalstiffness.

30
2.4.2 Full-resolution 3D-element ModelsFinite element simulations of the solid and hollow unit cells were also performedusing the commercial finite element code Abaqus. All simulations were performedstatically with linear perturbations to obtain the linear stiffness of each topology.The solid unit cell simulations were performed using C3D10 10-node quadratictetrahedral elements, and the hollow simulations used S3R 3-node shell elements torepresent the discretized unit cells. An isotropic linear elastic material model wasused for both solid and hollow structure simulations, and stiffnesses for the con-stituent polymer and Al2O3 were obtained from literature [14, 93]. Solid unit cellsimulations had between 25,000 and 250,000 elements and hollow unit cell simu-lations had between 25,000 and 100,000 elements; the exact number of elementsvaried depending on the unit cell and structural parameters used.
Simulations of the full-scale lattices tested in the experiments required prohibitivelyexpensive computational resources, so single unit cells subject to periodic boundaryconditions (PBCs) were simulated to obtain the effective stiffness of the periodic lat-tices. PBCs were manually implemented in a similar fashion to [143]. To simulateuniaxial stressing of the periodic structure, the z-component of the volume-averagedstrain was imposed, while the transverse components remained unconstrained andperiodicity of the unit cell was enforced by solving for the unknown relative dis-placements U∆
i on the X- and Y-faces below. The procedure of implementing thePBCs is summarized below.
loa 1∣∣∣ Periodic Boundary Conditions
Require: periodic mesh within tol.for node i on X+ face do
find matching X− face nodeEnsure: U+
1 − U−1 = U∆1 (constrain transverse displacements)
Ensure: U+2 = U−2 , U+
3 = U−3 (constrain in-plane displacements)Ensure: θ+
j = θ−j for j = 1, 2, 3 (constrain rotations)end forRepeat for Y- and Z-faces
Ensure: U∆3 = ∆z (constrain volume-averaged strain in z-direction)
Note that the rotation constraint was only needed for the hollow simulations sincethe tetrahedron elements used in the solid unit cell simulations do not have rota-tional degrees of freedom. The effective stiffness of the periodic lattice was calcu-lated as the ratio between the average strain and the average stress of the unit cell

31
in the z-direction. Taking F to be the reaction force across the top surface and L tobe the unit cell side length, the modulus was calculated as
E =σavg
εavg=
FL∆z
. (2.14)
2.4.3 ResultsThe beam-element models, in general, failed to match the response of the experi-ments and the 3D-element models but provide insight on the sources of deviationfrom classical scalings. The beam models for the cuboctahedron and octet-trusslattices matched the theoretical scaling of the form E ∝ (R/L)b at low (R/L) ratios,with b = 2.003. Both of these models showed a deviation from this theoreticalscaling at higher (R/L) ratios, although the deviation was not as significant as thatobserved in the full resolution, 3D-element models. The beam model for the 3DKagome lattice failed to match the theoretical scaling at low density and under-predicted the 3D-element model’s results. Larger tessellations of the 3D Kagomelattices (18 × 18 × 9 unit cells) were necessary to approach the stiffness from thefull-resolution models at low densities. This response is attributed to the finite sizeof the tessellated lattice, since the free boundaries activate intrinsic zero-energymechanisms and make beam-element models fundamentally unable to match thestiffness of the periodic (infinite) lattice for this geometry (i.e., such as with peri-odic boundary conditions). The non-rigid tetrakaidecahedron models, on the otherhand, initially matched the theory with a scaling of b ≈ 4, but showed a similardeviation from the power-law fit at higher (R/L) ratios. Since the beam models in-herently ignore the effect of the intersection volume at nodes, the models in Fig. 2.4diverge from the full-resolution simulations at higher (r/l) ratios for all topologiesexcept the 3D Kagome, which are observed to converge at higher (R/L) ratios. Thisunexpected convergence is likely an artifact caused by the relatively high sensitivityof the 3D Kagome lattice to the boundary conditions. Fitting the Euler-Bernoullibeam simulations with their respective rigid and non-rigid models (Eqs. 2.12, 2.13)yielded a correlation coefficient of R2 = 1.000 for all cases (Fig. 2.4).
The same beam-model simulations were performed for the hollow geometries, alsofailing to agree with the full-resolution simulations (Fig. 2.5). Both the Timo-shenko and Euler-Bernoulli beams significantly over-predicted the stiffness of allfour topologies across all relative densities. This is attributed to the compliant hol-low nodes that are not correctly modeled in the simple slender-beam simulations.
Full-resolution finite element (FE) simulations of monolithic polymer lattices help
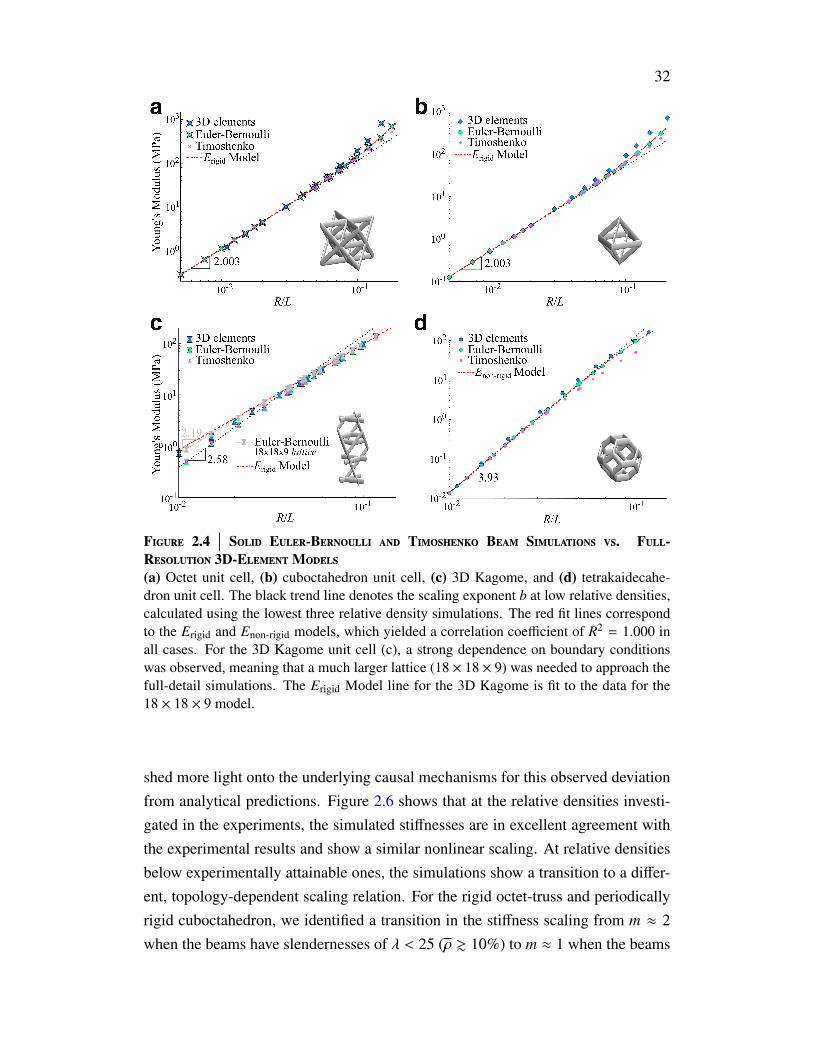
32
Figure 2.4∣∣∣ Solid Euler-Bernoulli and Timoshenko Beam Simulations vs. Full-
Resolution 3D-ElementModels(a) Octet unit cell, (b) cuboctahedron unit cell, (c) 3D Kagome, and (d) tetrakaidecahe-dron unit cell. The black trend line denotes the scaling exponent b at low relative densities,calculated using the lowest three relative density simulations. The red fit lines correspondto the Erigid and Enon-rigid models, which yielded a correlation coefficient of R2 = 1.000 inall cases. For the 3D Kagome unit cell (c), a strong dependence on boundary conditionswas observed, meaning that a much larger lattice (18 × 18 × 9) was needed to approach thefull-detail simulations. The Erigid Model line for the 3D Kagome is fit to the data for the18 × 18 × 9 model.
shed more light onto the underlying causal mechanisms for this observed deviationfrom analytical predictions. Figure 2.6 shows that at the relative densities investi-gated in the experiments, the simulated stiffnesses are in excellent agreement withthe experimental results and show a similar nonlinear scaling. At relative densitiesbelow experimentally attainable ones, the simulations show a transition to a differ-ent, topology-dependent scaling relation. For the rigid octet-truss and periodicallyrigid cuboctahedron, we identified a transition in the stiffness scaling from m ≈ 2when the beams have slendernesses of λ < 25 (ρ & 10%) to m ≈ 1 when the beams

33
Figure 2.5∣∣∣ Hollow Euler-Bernoulli and Timoshenko Beam Simulations vs. Full-
Resolution Shell-ElementModels(a) Hollow octet unit cell, (b) hollow cuboctahedron unit cell, (c) hollow 3D Kagome, and(d) hollow tetrakaidecahedron unit cell.
have slendernesses of λ > 25 (ρ . 10%). Similarly, a transition from m ≈ 1.4when beams have slendernesses of λ < 27 (ρ & 9%) to m ≈ 1 when beams haveslendernesses of λ > 27 (ρ . 9%) exists for the periodically rigid 3D Kagome.For the non-rigid tetrakaidecahedron, a similar transition occurs from a scaling ofm ≈ 1.5 when the beams have slendernesses of λ < 7 (ρ & 7%) to m ≈ 2 when thebeams have slendernesses of λ > 7 (ρ . 7%), which matches the analytic predic-tion for a non-rigid topology of E ∝ ρ2. The FE scaling fits shown in Figure 2.6 aretaken using the 4 densest and 4 least dense points, which is the reason for the slightdiscrepancy from the experimentally obtained scaling coefficients.
Finite element simulations of hollow Al2O3 nanolattices with the same structuralparameters as used in experiments corroborated most of the experimental findings.Simulations for octet, cuboctahedron, and 3D Kagome lattices match experimen-

34
Figure 2.6∣∣∣ Solid-Beam Nanolattices FE and Experimental Young’sModulus vs. Rela-
tive DensityIllustration of the comparison between FE and experimental results for (a) octet-truss, (b)octahedron, (c) 3D Kagome, and (d) tetrakaidecahedron lattices. The plots demonstratethe transition to the theoretical scaling relations at low density, as well as the agreementbetween experimental and FE results at low density. Insets show the stress distribution inthe compressed lattices.
tal results at high relative densities (ρ & 1%) and are at most a factor of 2–3 higherthan experimental results at the lowest relative densities (ρ . 1%) (Fig. 2.7a,b). Thesimulated tetrakaidecahedron stiffness matches experimental results across the en-tire range of relative densities (Fig. 2.7c). Simulations of hollow nanolattices withstructural parameters that span beyond those that were tested experimentally reveala more complex landscape. A highly non-linear relationship between Young’s mod-
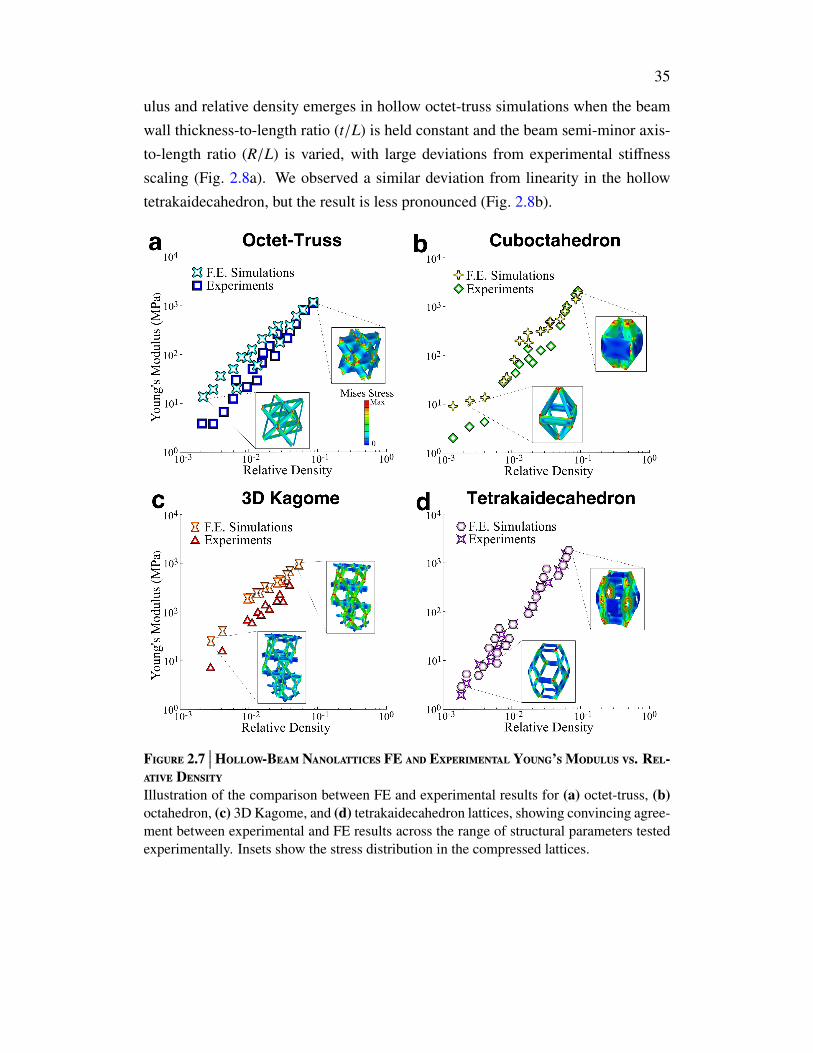
35
ulus and relative density emerges in hollow octet-truss simulations when the beamwall thickness-to-length ratio (t/L) is held constant and the beam semi-minor axis-to-length ratio (R/L) is varied, with large deviations from experimental stiffnessscaling (Fig. 2.8a). We observed a similar deviation from linearity in the hollowtetrakaidecahedron, but the result is less pronounced (Fig. 2.8b).
Figure 2.7∣∣∣ Hollow-Beam Nanolattices FE and Experimental Young’sModulus vs. Rel-
ative DensityIllustration of the comparison between FE and experimental results for (a) octet-truss, (b)octahedron, (c) 3D Kagome, and (d) tetrakaidecahedron lattices, showing convincing agree-ment between experimental and FE results across the range of structural parameters testedexperimentally. Insets show the stress distribution in the compressed lattices.

36
Figure 2.8∣∣∣ Extended Hollow-Beam Octet-Truss and Tetrakaidecahedron Nanolattice
Simulation ResultsComparison of the stiffness data of (a) octet-truss and (b) tetrakaidecahedron lattices ob-tained from experiments and from finite element simulations. Two t/L values were studiedfor each geometry over a wide range of R/L values. Simulation and experimental datapoints with matching R/L and t/L values are filled with orange.
2.5 Discussion2.5.1 Solid beam nanolatticesThe strong agreement between FE and experimental results for solid nanolatticesacross all relative densities and topologies suggests that the FE models accuratelycapture the dominant features that govern the elastic behavior (Fig. 2.6). The smallvariance between the two results can be attributed to factors like waviness in thebeams [94], non-uniformity of the cross sections [121], surface roughness [94],misalignment of the nodes, and edge effects from the finite size of the samples inexperiments. Solid-beam nanolattices in low-density regimes are difficult to realizeexperimentally because of their high sensitivity to defects and external processingparameters. All nanolattices with beams that had slendernesses of λ > 70 wereprone to spontaneous collapse because small stresses that arise during writing anddeveloping of the photopolymer can cause premature buckling of the highly slenderbeams. This is what set the relative density limit of the solid polymer samples inthis work.
The close agreement between the FE, Euler-Bernoulli and Timoshenko beam resultsat low densities (ρ < 1%) suggests that beam theories are adequate to predict latticestiffnesses in these regimes (Fig. 2.4). At higher relative densities, Euler-Bernoulli

37
beam lattice simulations show a divergence from power law scaling that is similarto experimental data and FE results and generally underpredict the magnitude ofthe stiffness (ig. 2.4). Simulations using Timoshenko beam models, which accountfor shear deformation and are used to model less slender beams, have a lower stiff-ness than Euler-Bernoulli beam models and further underpredict the stiffness. Thesimplified stiffness model in Eq. 2.13 provides insights into the mechanisms for thescaling of rigid and non-rigid solid beam lattices, viz. that there are contributionsfrom both bending and stretching of beams at high relative densities, which leadsto a stiffening behavior, but it does not fully capture the mechanisms behind theobserved deviation. The incorrect stiffness prediction of beam-based models oc-curs primarily because they fail to account for the contribution of the nodes to theoverall mechanical properties. In solid-beam lattices, the nodes form solid jointsthat hinder beam rotation, shortening the effective length of the constituent beamsand generally leading to higher stiffnesses. While beam models that capture shear-ing behavior, such as Timoshenko models, can be used to more accurately capturethe behavior of short beams [76, 91], they lead to a drop in the effective stiffness,which is opposite from the trend observed here. Accurately replicating the mechan-ics of solid lattices with computationally efficient models, similar to what is doneusing beam elements, requires in-depth investigations into the role of nodes on themechanical properties, which is outside the scope of this work.
At the lowest simulated relative densities (ρ < 1%), the FE results show thatYoung’s modulus of monolithic polymer cuboctahedron and octet-truss lattices scalesas E = Esρ/8.7 and E = Esρ/9.0, respectively (Fig. 2.6a,b). These moduli agreewell with the existing analytic prediction for the modulus of E = ρEs/9 usingpin-jointed bars [35], and are well matched by Euler-Bernoulli and Timoshenkobeam models. For the 3D Kagome lattices, FE results predict a stiffness scaling ofE = Esρ/6 at low relative densities (Fig. 2.6c). This result is different than boththe Euler-Bernoulli and Timoshenko beam simulations (Fig. 2.4). This differenceoccurs because the 3D Kagome lattice is periodically rigid and has a low connec-tivity, making it highly sensitive to imperfections and boundary conditions. The FEsimulations were performed using periodic boundary conditions, making the lat-tice effectively infinite; the Euler-Bernoulli simulations were performed on a finitelattice, rendering them sensitive to boundary conditions and preventing them fromattaining a linear scaling at low relative densities. This suggests that it is impossiblein a practical sense to fabricate a 3D Kagome lattice with a perfectly linear stiffnessscaling at any relative density.

38
2.5.2 Hollow-beam nanolatticesThe mechanical behavior of hollow-beam nanolattices is notably different from thatof solid-beam nanolattices. Two main factors affect the stiffness of hollow lattices:(i) the hollow nodes in thin-walled beams become highly compliant in bending andlead to a reduced overall stiffness, and (ii) the surface roughness that arises frombeam waviness inherent in the manufacturing process can cause a significant dropin both axial and bending stiffness at low wall thicknesses. Euler-Bernoulli andTimoshenko beam simulations for hollow lattices fail to capture the effect of thehollow nodes and, as a result, consistently over-predict the stiffness (Fig. 2.5).
Fully resolved finite element simulations of the hollow lattices capture the effectof the nodes, and, because they are performed on ideal structures, the observeddiscrepancy from experiments can primarily be attributed to the imperfections.Octet-truss, cuboctahedron and 3D Kagome lattices transmit load relatively uni-formly throughout their beams (Fig. 2.7a-c), rendering their thinner-walled vari-ations highly sensitive to roughness. This thin-walled sensitivity correlates wellwith the observed overprediction of the stiffness in the FE simulations at low rel-ative densities (Fig. 2.7). The non-rigid tetrakaidecahedron lattices accommodatemacroscopic deformation through local deformation at the nodes (Fig. 2.7d), whichcauses them to be sensitive to nodal compliance and less sensitive to the beam wavi-ness. The primary imperfections at the nodes exist in the form of misalignment [62],which have a minimal effect on the stiffness [91] and lead to an agreement betweenFE and experimental results across the tested range of relative densities.
The complex parameter space revealed by FE simulations of hollow nanolattices(Fig. 2.8) arises because the relative density and stiffness depend on two dimen-sionless parameters: R/L and t/L, where R is the minor axis of the elliptical beam,t is the wall thickness, and L is the length of the beam. The highly non-linear rela-tionship between relative density and these dimensionless parameters (Eq. 2.4) cangive rise to hollow nanolattices with different R/L and t/L that have identical rel-ative density. This leads to situations where samples can have the same geometry,wall thickness, and relative density but can have over an order-of-magnitude differ-ence in stiffness. For example, simulations of two different hollow octet unit cellswith the same wall-thickness-to-length ratio, t/L = 10−3, and with two differentcross-sectional dimensions of R/L = 0.1 (ρ = 0.78%) and R/L = 0.15 (ρ = 0.81%),have stiffnesses of 11 MPa and 205 MPa, respectively. These samples are visuallydistinct (Fig. 2.8a), with one appearing more similar to a solid beam lattice and
39
the other more closely resembling a membrane structure, but they are topologicallyidentical. This complex parameter space reveals that classical scaling laws that de-pend only on architecture and relative density are incapable of fully capturing themechanical properties of hollow lattices, and new theories that incorporate the ef-fect of hollow nodes are needed to accurately predict their stiffness. It should benoted that the ellipticity of the beams will have an effect on the stiffness of the lat-tices, particularly for low-slenderness beams, but quantifying this effect is beyondthe scope of this work.
2.6 Generalization to Macroscopic Experiments and Larger TessellationsTo support the generality of the results presented in this work, we fabricated andtested octet-truss lattices at the macro- and microscopic scale with tessellations of5 × 5 × 5 and 7 × 7 × 7 unit cells. We fabricated the macroscopic lattices out ofPR-48 resin using an Ember 3D Printer (Autodesk) and compressed them using anInstron mechanical testing machine, while the microscopic samples were fabricatedand tested in the same manner as the other samples in this study. These polymer"macro"-lattices had ∼2.65 mm-long beams with 450 µm to 850 µm-diameter circu-lar cross-sections, 3.75 mm unit cells, and overall sample dimensions of 19×19×19mm and 27 × 27 × 27 mm (Fig. 2.9).
Figure 2.10 shows the Young’s modulus and yield strength as a function of rel-ative density for polymer octet-truss nanolattices and polymer octet-truss macro-lattices. This plot reveals that the nano- and macro-lattices have nearly identicalscaling coefficients of m = 1.77 and m = 1.91 for stiffness and of n = 1.88 andn = 1.86 for strength, respectively. The tessellation seems to not play a significantrole in the stiffness or strength scalings, indicating that the 5 × 5 × 5 tessellationis a satisfactory approximation of larger, continuum-like representative volumes ofan octet-truss material. The slight offset in the strength and stiffness between thetwo lattice systems is a result of the slightly weaker properties of the PR-48 poly-mer (macro-lattices) compared to the IP-Dip polymer (nanolattices) and the circu-lar beams in the macro-lattices compared to the elliptical ones in the nanolattices.The properties of the PR-48 polymer were determined through uniaxial compres-sion experiments in an Intron testing machine, using a cylindrical specimen witha 15 mm-diameter and a height-to-diameter ratio of 2, revealing a constituent stiff-ness of E = 1.30 ± 0.03 GPa and strength of σy = 33.0 ± 1.0 MPa. These resultsdirectly support the applicability of the conclusions drawn in this chapter to solid-beam lattices of any material and absolute dimensions within the relevant ranges of

40
Figure 2.9∣∣∣ Polymeric Nano- andMacro-ScaleOctet Trusses of Variable Tessellations
Polymeric 5 × 5 × 5 (a) nanolattices and (b) macro-lattices, and self-similar 7 × 7 × 7 (c)nanolattices and (d) macro-lattices. Scale bars in (a),(c), 20 µm, and (b),(d), 1 cm.
R/L.
Figure 2.10∣∣∣ Properties of Nano- and Macro-Scale Octet Trusses of Variable Tessel-
lations
(a) Stiffness scaling and (b) strength scaling for samples at both scales and both 5 × 5 × 5and 7 × 7 × 7 tessellations.

41
2.7 ConclusionIn this chapter we provided an in-depth exploration of the parameter space of solid-and hollow-beam nanolattices using experiments, finite element analysis, and beam-based numerical simulations and models. Our work establishes that the strength andstiffness of solid- and hollow-beam nanolattices does not correlate with topologyalone, but is instead governed by an intricate combination of geometry and struc-tural parameters. Nanolattices with widely different topologies can have nearlyidentical strength and stiffness at the same relative density, and hollow nanolatticeswith the same topology and relative density can have widely different stiffness. Wepostulate that the convergence of strength and stiffness in solid lattices at higherdensities is caused by the increased influence of beam intersections at the nodes.The strength and stiffness parameter space of hollow lattices is highly complex anddependent upon changes in beam length, radius and wall thickness, and a detailedstudy of these parameters must be conducted before their relative influence canbe quantified. These results suggest that the existing classification of nanolatticetopologies as solely stretching- or bending-dominated is insufficient, and new the-ories must be developed to accurately capture the effect of both nodal interferencesin solid-beam lattices and empty nodes in hollow-beam lattices on the mechanicalproperties.

42
C h a p t e r 3
IMPACT OF NODE GEOMETRY ON NON-SLENDER LATTICEARCHITECTURES
This chapter has been adapted from
C.M. Portela, J.R. Greer & D.M. Kochmann. “Impact of node geometry on the effective stiffness ofnon-slender three-dimensional truss lattice architectures”. Extreme Mechanics Letters (2018)22, pp. 110–138. doi: 10.1016/j.eml.2018.06.004.Contributions: designed and fabricated samples, performed and analyzed the experiments,performed the computational analysis, and wrote the manuscript.
3.1 Chapter SummaryAs discussed in in previous chapters, three-dimensional (3D), lattice-based micro-and nano-architected materials can possess desirable mechanical properties that areunattainable by homogeneous materials. Manufacturing these so-called structuralmetamaterials at the nano- and microscales typically results in non-slender architec-tures (e.g., struts with a high radius-to-length ratio r/l), for which simple analyticaland computational tools are inapplicable since they fail to capture the effects ofnodes at strut junctions, which was the source of the deviation observed in chap-ter 2. Building upon the results in that chapter, we report a detailed analysis thatquantifies the effect of nodes on the effective Young’s modulus (E∗) of lattice archi-tectures with different unit cell geometries through (i) simple analytical construc-tions, (ii) reduced-order computational models, and (iii) experiments at the milli-and micrometer scales. The computational models of variable-node lattice archi-tectures match the effective stiffness obtained from experiments and incur compu-tational cost that are three orders-of-magnitude lower than alternative, conventionalmethods. We highlight a difference in the contribution of nodes to rigid versus non-rigid architectures and propose an extension to the classical stiffness scaling laws ofthe form E∗ ∝ C1(r/l)α + C2(r/l)β, which holds for slender and non-slender beam-based architectures, where constants C1 and C2 change with lattice geometry. Wefind the optimal scaling exponents for rigid architectures to be α = 2 and β = 4,and α = 4 and β = 6 for non-rigid architectures. These analytical, computational,
43
and experimental results confirm and quantify the specific contribution of nodesto the effective stiffness of beam-based architectures and highlight the necessity ofincorporating their effects into calculations of the structural stiffness. This workprovides new, efficient tools that accurately capture the mechanics and physics ofstrut junctions in 3D beam-based architected materials and brings to light the in-sufficiency of classifying cellular solids as either stretching- or bending-dominatedover the manufacturable parameter space.
3.2 TheoryWe begin with simple, representative 2D beam-element networks of rigid and non-rigid geometries to provide intuition on their stiffness scaling as a function of beamslenderness. Using linear two-node Euler-Bernoulli beam elements with circularcross-sections (radius r, modulus E, and length l), we define the beam slender-ness as the radius-to-length (r/l) ratio. To account for the effect of the nodes, i.e.,the beam junctions, we utilize variable-stiffness rotational springs at junctions inaddition to beam elements. With at most two beam elements connected at a givenjunction in the model, each junction has two translational and two rotational degreesof freedom, the latter of which are coupled by a rotational spring with stiffness kθ(Fig. 3.1a). The total strain energy density of a structure with nb beams and nθrotational springs assembled in this manner takes the form
Wtot =
nb∑i=1
W ib +
nθ∑j=1
W jθ , (3.1)
where W ib and W j
θ are the energy densities of the ith linear Euler-Bernoulli beamand the jth rotational spring, respectively. The rotational spring energy is assumedof the form
W jθ =
12
kθ(θj1 − θ
j2)2, (3.2)
where θ j1 and θ j
2 are the rotational degrees of freedom of the two beams connected atjoint j, while the beam energy consists of the classical axial stretching and bendingcontributions [29].
Upon solving the system of equations, we calculate an effective stiffness for eachstructure as k∗ = F/utop, where F is an applied vertical load at the top node andutop is the resulting vertical displacement of that node. In the limit kθ → 0, thedeformation transforms into the stretching-only behavior of a rigid structure, whileletting kθ → ∞ recovers the classical Euler-Bernoulli solution based on fixed nodalconnections. The non-rigid structure has zero stiffness in the limit kθ → 0, since this

44
activates a zero-energy mode, i.e., a mechanism. The behavior of the rigid-structuremodel in the limits resembles the stretching-to-bending transition observed in otherworks [36, 94], where kθ can be interpreted as the degree of nodal influence withdecreasing beam slenderness.
Figure 3.1∣∣∣ Beam-SpringModel System for Rigid and Non-Rigid Architectures
Effective structural stiffness k = k∗/(El) of beam-theory models applied to (a) rigid and (b)non-rigid geometries that contain rotational springs (variable stiffness kθ) at all junctions.A significantly more pronounced effect of the nodal stiffness kθ is observed in the non-rigidstructure than in the rigid one.
From the effective stiffness we calculate a dimensionless reduced stiffness k =
k∗/(El) for the two representative rigid and non-rigid structures shown in Fig. 3.1and explore their behavior as a function of (r/l) and kθ. Fig. 3.1a shows negligiblechanges in the rigid structure’s stiffness as kθ is varied, indicating that nodal geome-try is expected to have a small effect on the stiffness behavior of rigid architectures.For the range of spring stiffnesses studied, the effective structural stiffness takes theform k∗ ∝ (r/l)c with c = 2, which agrees with the classical stiffness scaling lawsfor highly slender structures since ρ ∝ (r/l)2 when (r/l) 1. In comparison, thenon-rigid structure in Fig. 3.1b shows significant changes in stiffness as kθ varies.Varying the spring stiffness from kθ = 10−4 to 10−1 changes the scaling exponentc from 2.57 to 3.98, which implies that a more pronounced effect of nodal geome-try exists for non-rigid architectures compared to rigid ones. In the following, weaim to properly quantify these effects for specific lattice architectures in order tounderstand the influence of node geometry and the associated nodal stiffness on theeffective stiffness of non-slender lattice architectures with refined analysis tools.
3.3 Design of Variable Node GeometryWe designed lattice architectures with tailorable node geometries, isolating nodesas the variable of interest in this work. We systematically explored different nodegeometries by spatially varying the cross-section of individual struts near their junc-

45
tions. Starting with a constant-cross-section cylindrical strut of a given radius-to-length ratio (r/l), the node-contributing regions of the strut were defined as thosethat extend inwards a distance of (a + b)r from the ends1 (Fig. 3.2b).For the (r/l)range studied in this work, we chose a = 1.5 and b = 1 to ensure that the nodesdid not comprise more than 75% of the strut in the least slender case. The node-contributing region at each end of the strut was segmented into a modified section,with a constant designed cross-section, and a transition section, with a cross-sectionthat approached the original circular geometry from the modified one (Fig. 3.2c)via a G0 continuous surface with a constant (linear) tangent vector. The modified
sections were designed to extend inwards from the strut ends a distance ar, whilethe transition sections extended a distance br further from the ends of the modified
sections. The remaining central gauge section of the strut was unmodified, retain-ing the original circular cross-section. This setup allowed us to arbitrarily modifythe nodal geometry independent of the strut cross-section.
When arranging the struts into a desired architecture, the node-contributing regionsof connecting struts combine into what we define as a node in this work. A node foran architecture with Z struts meeting at a junction corresponds to the combinationof Z node-contributing regions belonging to those struts. Three different node ge-ometries were constructed by selecting the modified cross-sections of the struts tobe (i) a circle (i.e., an unmodified strut for reference), (ii) a square, and (iii) an iso-toxal four-point star. The second area moment of the modified cross-section rangedfrom I0 = π
4 r4 for the circular strut to 1.05I0 for the square strut, and 1.3I0 for thestar strut. The struts were designed under the constraint that the cross-sectional arearemained constant throughout, resulting in equal strut volumes, identical gauge sec-
tion radii r, and unchanged lengths l. Building any desired architecture with eachof the three types of struts resulted in unit cells with effectively constant relativedensities ρ (at most ±0.7% variation) — and equal slenderness ratios (r/l) — thatdiffered only by the node geometry.
To study the effect of different-geometry nodes on lattice stiffness for rigid ver-sus non-rigid architectures, we designed variable-node octahedron (periodicallyrigid), octet (rigid), tetrakaidecahedron (non-rigid), and pyramidal (non-rigid) lat-tices. From these four geometries, we selected the octahedron as a representativerigid and tetrakaidecahedron as a representative non-rigid architecture to conduct
1This choice is not unique; it was deemed practicable and reasonable in numerical experimentsand is expected to not significantly alter the drawn conclusions.

46
an in-depth analysis via newly developed reduced-order models and experiments atmultiple scales.
3.4 Hybrid-Element Numerical ModelsWe developed reduced-order finite element models for the octahedron and tetrakaidec-ahedron architectures to capture the non-classical, i.e., non-slender-beam, stiffnessof typical experimental sample sizes, such as 5 × 5 × 5 unit cell tessellations. Mod-eling the actual tessellation of the samples avoided using periodic boundary con-ditions, which assume an infinite tessellation and neglect any potential boundaryeffects, see e.g. Latture et al. [74, 75]. Our models were composed of quadratictetrahedral element substructures for the lattice nodes, and the gauge sections wererepresented by Timoshenko beam elements2 (Fig. 3.2d,f). This hybrid-elementformulation significantly reduced the computational costs compared to a fully 3Dsolid-element representation.
We created node substructures with circle, square, and star modified cross-sectionsfor each architecture type. Each substructure included the node-contributing re-gions of all struts connecting at a lattice junction and terminated at the circular endsof the transition sections of the connecting struts. The octahedron node substruc-tures had eight terminal circular cross-sections (Z = 8, Fig. 3.2e); the tetrakaideca-hedron node substructures had four (Z = 4, Fig. 3.2g). After meshing the substruc-tures with quadratic tetrahedral elements, we performed a static condensation ofdegrees of freedom (DOFs) (see section 3.4.1) which reduced the substructures tosix DOFs per terminal circular cross-section (three translations and three rotationsassociated with the centroid of each face). This condensation step significantlyreduced the computation time, since it is performed only once for each uniquenode, regardless of the total number of nodes in the periodic lattice. For octahedronnode substructures, the problem size was condensed from 15, 000 – 27, 000 DOFs(3, 000 – 6, 000 elements) to 48 DOFs (six per terminal circular cross-section). Fortetrakaidecahedron node substructures, the problem size was reduced from 8, 000 –12, 000 DOFs (1, 600 – 2, 300 elements) to 24 DOFs (six per terminal circular cross-section). This condensation procedure assumes linear elastic material behavior forall effective stiffness calculations and will need refined strategies when handlingnonlinear or inelastic strut behavior. The resulting condensed-node substructureswere tessellated to form a 5×5×5 lattice, and were connected to each other through
2Using the commercial FE code Abaqus, we employed C3D10 tetrahedral elements for the nodesubstructures and B31 Timoshenko beam elements for the struts.

47
Figure 3.2∣∣∣ NodeModification and Implementation of Reduced-OrderModels
Truss architecture and geometry definitions: (a) unmodified circular strut of radius r andlength l, (b) square-modified strut, (c) star-modified strut, (d) uniaxial compression of a3 × 3 × 3 reduced-order octahedron model, (e) octahedron node substructures depicting thetetrahedral mesh and the retained DOF points in red, (f) uniaxial compression of a 3 × 3 ×3 reduced-order tetrakaidecahedron model, and (g) tetrakaidecahedron node substructuresdepicting the tetrahedral mesh and the retained DOF points in red.
ten Timoshenko beam elements per strut, which represented the gauge section. Thebeam elements’ DOFs at the ends of the gauge section were coupled to the sixretained DOFs at each termination circular cross-section.
Throughout this work, we probed the octahedron and tetrakaidecahedron geome-tries along the 〈001〉 direction, corresponding to nominally stretching- and bending-dominated directions, respectively. The effective modulus E∗ of the described lat-tices was determined via a linear perturbation step by applying uniaxial compres-sion of ε = 1% in the z-direction, while constraining in-plane translations and allrotations at the top and bottom surfaces of the lattice. This closely resembles ex-

48
perimental conditions where the substrate and the indenter tip pose similar con-straints. We used an isotropic linear elastic material model with the Young’s mod-uli determined in section 3.5.2, and a Poisson’s ratio of ν = 0.49 [93]. To validatethe described reduced-order models, we compared the effective stiffness of a sub-structured versus a fully-resolved unit cell—for different node geometries and (r/l)ratios—and found that the relative difference between the two was at most 3%,while reducing the problem size to 0.02–0.3% of the fully resolved problem (seesection 3.4.2 for details).
3.4.1 Substructuring Implementation and TheoryTo reduce the number of degrees of freedom (DOFs) at the node substructures,a static condensation of degrees of freedom was performed. For each node sub-structure, only Z computational nodes were retained, one at each centroid of the Z
terminal faces (see Fig. 3.2e,g). The retained computational nodes were not part ofthe tetrahedral elements on the terminal face, but their six DOFs were coupled tothose of the tetrahedral-element nodes at the face. The retained DOFs at a giventerminal face were subsequently coupled to the six DOFs of the Timoshenko beam-element node at the edge of the strut representation. In particular, the translationalDOFs were forced to on-average match those of the connecting Timoshenko beam,while the rotational DOFs were coupled to the mean rotation of the tetrahedral facenodes.
The condensation process begins by assembling the stiffness equations in the form [29]Krr Kri
Kir Kii
ur
ui
=
fr
fi
, (3.3)
where ur and ui are the retained and internal DOFs, respectively; fr and fi are theirrespective nodal forces, and Krr, Kri, Kir, and Kii are the corresponding stiffnesssubmatrices. Solving the second matrix equation in Eq. 3.3 for the internal DOFs(exploiting that Kii is nonsingular) yields
ui = K−1ii (fi − Kirur) . (3.4)
Substitution into the first matrix equation in Eq. 3.3 yields the condensed set ofequations as
Krr ur = fr, (3.5)
where the condensed stiffness matrix and force vector are, respectively
Krr = Krr − Kri K−1ii Kir, fr = fr − Kri K−1
ii fi. (3.6)

49
The condensed equations are used to obtain the linear response of the substruc-ture while significantly reducing the computational cost. After solving for the con-densed DOFs, the internal DOFs are obtained from Eq. 3.4.
3.4.2 Reduced-order Model ValidationTo validate the reduced-order models, we compared the effective stiffness of a singleoctahedron unit cell with substructures to that of a fully refined unit cell. The sidesof both types of unit cells were left traction-free and a 1% strain compression wasapplied in the z-direction, while leaving the x-y displacements of top and bottomfaces unconstrained. The node substructures used in the validation consisted ofhalf of the internal node substructures depicted in Figs. 3.2e,g, which simplifiedthe process of applying the boundary conditions. The relative effective stiffnesserror, ∆k∗, between the fully meshed octahedron unit cell (105 to 106 tetrahedralelements, 1× 10⁶ to 5× 10⁶ DOFs, depending on node geometry) and the describedsubstructure-containing unit cell was ∆k∗ < 3% (Fig. 3.3). The relative stiffnesserror of a few percent came with a concomitant problem size reduction to 0.02–0.3% of the fully meshed problem size.
Figure 3.3∣∣∣ Reduced-OrderModel Validation and Error
(a) Full-detail simulation of uniaxial compression of a star-node (r/l) = 0.11 octahedronunit cell, with rollers at the top/bottom and unconstrained at the sides (106 elements); (b)the same simulation with the reduced-order method (126 effective elements); (c) summaryof the reduced-order model error for all node geometry types and a range of (r/l) values,calculated as the relative difference in the calculated effective stiffness: ∆k∗ =
k∗reduced−k∗fullk∗full
.
3.5 Experimental Framework3.5.1 Sample Fabrication and ExperimentsWe fabricated two sets of octahedron and tetrakaidecahedron lattices at differentlength scales. Microlattices were fabricated using Two-Photon Lithography (TPL)direct laser writing (Photonic Professional GT, Nanoscribe GmbH) out of IP-Dip

50
photoresist with the same variable-node geometries used in the reduced-order mod-els. These samples consisted of a 5 × 5 × 5 tessellation of 60 µm unit cells, witheffective strut diameters ranging from 3.0 µm to 12.7 µm, resulting in overall sam-ple dimensions of 300 × 300 × 300 µm (Fig. 3.5d). A laser power of 15 mW and ascan speed of 10 mm s−1 were used for the writing process on a Si substrate. Arraysof 15 µm-diameter and 30 µm-height micropillars with identical process parameterswere also written to directly measure the material properties of cross-linked IP-Dipunder uniaxial compression (see section 3.5.2).
Figure 3.4∣∣∣ Detailed View of TPL-LatticeModified Nodes
Micrographs presenting detailed views of the nodes in the TPL lattices with (r/l) = 0.15.Octahedron lattices with (a) circle, (b) square, and (c) star nodes. Tetrakaidecahedron lat-tices with (d) circle, (e) square, and (f) star nodes. Scale bars in white correspond to 100 µmand yellow bars in insets are 30 µm.
Larger, self-similar lattices were manufactured using a 3D Digital Light Processing(DLP) Ember printer (Autodesk, Inc.) out of the PR-48 (Colorado PhotopolymerSolutions) polymer resin. These lattices also had a 5 × 5 × 5 tessellation of 7.2 mmunit cells, with strut diameters ranging from 0.55 mm to 1.60 mm, and overall sam-ple dimensions of 36×36×36 mm (Fig. 3.5h). In addition, cylinders with diametersof 15 mm and heights of 30 mm were fabricated using identical printing parametersto obtain the material properties of PR-48 under uniaxial compression (see sec-
51
tion 3.5.2). Besides the difference in dimensions, the geometry across all latticeswas kept constant.
We fabricated TPL and DLP samples to span an (r/l) range from 0.07 to 0.15, fo-cusing on the regime where the deviation from classical stiffness scalings becomessignificant [94]. Microlattices with beam slenderness ratios of (r/l) = 0.07, 0.1,and 0.15 as well as lattices with beam slenderness ratios (r/l) = 0.07, 0.11, and0.15 were fabricated, with several samples for each of the three node geometries.The relative densities, ρ, of the octahedron samples ranged from 5.8 % to 22.6 %(Fig. 3.5a-c), and those of the tetrakaidecahedron samples ranged from 1.5 % to6.7 % (Fig. 3.5e-g).
We performed uniaxial compression experiments along the 〈001〉 direction on allsamples at a strain rate of ε = 10−3 s−1, up to ε = 50 % using a G200 XP Nanoin-denter (Agilent Technologies) for the microlattices and an Instron 5500 load framefor the larger lattices. The Young’s moduli of the cross-linked IP-dip and PR-48,Es , were determined from the stress-strain data obtained from the compressionof individual cylinders deformed under the same conditions. The slope of the lin-ear loading portion of the stress-strain response was used to estimate the effectiveYoung’s modulus E∗ of the lattices, as well as Es for the pillar compression tests.The stress-strain data also convey the effective strength of the samples, which isbeyond the scope of this study (the specifically designed node geometries createcomplex stress concentrations that could not be studied systematically within thegiven setup). To compare the stiffness across the two different polymers in thiswork as well as to other published material systems, we use the relative modulusof the structures E∗/Es in the following, where Es is the Young’s modulus of thecorresponding constituent material.
3.5.2 Constituent Material PropertiesTo determine the mechanical properties of the constituent material in the TPL mi-crolattice and 3D DLP lattice samples, we fabricated pillars at each length scaleusing the same printing parameters as the 5 × 5 × 5 lattice architectures. The cylin-drical specimens had diameters of 15 µm and 15 mm for TPL and DLP samples,respectively, and a height-to-diameter ratio of 2. We performed uniaxial compres-sion experiments on several specimens of each type, up to ∼ 10% strain, at a strainrate of 10−3 s−1. Micropillar compressions were carried out in a G200 XP Nanoin-denter (Agilent Technologies), while centimeter-scale pillars were compressed in

52
an Instron 5500 load frame.
Using the stress-strain response of each pillar, Young’s modulus Es and yield strengthσy of Ip-Dip (TPL) and PR-48 (3D DLP) were calculated. Young’s modulus wasobtained by calculating the slope of the linear load regime, while the strength wasdetermined by the intersection of the stress-strain response with a 0.2% strain off-set line from the linear regime. An initial non-linear toe region is commonly ob-served in the stress-strain response due to slight misalignments between the samplesand the indenter tip (or compression head) [94], so the largest slope of the linearload regime was used for the modulus approximation. Es = 2.68 ± 0.07 GPa andσy = 75 ± 2 MPa were calculated for Ip-Dip, while Es = 1.30 ± 0.03 GPa andσy = 33 ± 1 MPa were obtained for PR-48.
3.6 ResultsFig. 3.5i shows that the computational models of 5×5×5 octahedron (rigid) latticesreveal subtle effects of nodal geometry on the effective lattice stiffness. The star-node structures were consistently stiffer, followed by the square-node and circular-node structures (Fig. 3.5i). For the most slender beams, with (r/l) = 0.07, mod-ifying the nodal geometries yielded a maximum stiffness difference of 1%, com-pared to 6% for the least slender (r/l) = 0.15 case. The Young’s moduli obtainedfrom compression experiments on octahedron samples showed good agreementwith those predicted by the reduced-order models. The experiments did not re-veal a clear distinction in stiffness among the octahedron lattices of all node types,which may be attributed to the imperfections introduced by the manufacturing pro-cess. The Two-Photon Lithography process, e.g., was not capable of retaining thenodal integrity at slenderness ratios of (r/l) = 0.15.
Significant effects of node geometry on the effective lattice stiffness were observedin the reduced-order models of 5 × 5 × 5 tetrakaidecahedron (non-rigid) lattices(Fig. 3.5j), as expected from the theoretical considerations described in section 3.2.Modifying the nodal geometries in the computational models yielded a maximumstiffness increase of 17% for the lattices with beams having (r/l) = 0.07; a 28%stiffness increase was observed for those with (r/l) = 0.15. As in the case of the oc-tahedron lattices, the star-node tetrakaidecahedron structures consistently achievedthe highest stiffness, followed by the square-node and circular-node architectures.The more marked effects of nodes in these non-rigid architectures were also re-flected in the experiments, particularly for the least slender architectures. Mechani-

53
cal testing of centimeter-scale DLP tetrakaidecahedron samples with beams whose(r/l) was below 0.15 was not possible due to printing failures attributed to the lowrelative density of these samples.
Figure 3.5∣∣∣ TPL and DLP Lattice Samples and Comparison toModels
Representative top-view of octahedron TPL and DLP (inset) (a) circle-, (b) square-, and (c)star-node samples; (d) perspective view of a star-node octahedron (r/l) = 0.15 TPL micro-lattice. Representative top-view of tetrakaidecahedron TPL and DLP (inset) (e) circle-, (f)square-, and (g) star-node samples; (h) perspective view of a star-node tetrakaidecahedron(r/l) = 0.15 3D DLP lattice (node detail presented in Fig. 3.4). Relative Young’s moduliof reduced-order models (in black) and two-scale experiments for (i) 5 × 5 × 5 octahedronlattices, and (j) 5 × 5 × 5 tetrakaidecahedron lattices, with microlattice samples in red andcm-scale lattices in blue. Error bars (where visible) are presented for the TPL microlatticecompressions and represent the standard deviation of the calculated relative Young’s mod-ulus for at least three identical samples. The TPL samples depicted in this figure were nottested due to manufacturing defects at some nodes, but are included for comparison to thelarger, self-similar, DLP lattices.
In addition to accurately capturing the experimental lattice stiffness in the beamslenderness range studied, the reduced-order models confirm the observation from

54
the spring-beam models in section 3.2 that for a given slenderness, the effect ofnode geometry is more pronounced in non-rigid architectures than in rigid ones.This differing effect can be quantified and explained by extracting the strain en-ergy from a finite 1 × 1 × 1 tessellation3 and comparing its distribution among thenodes and the struts (see Fig. 3.6). In these simulations, a 1% uniaxial strain wasimposed in the z-direction, the x-y displacements at the top and bottom faces wereunconstrained, and the lateral faces were left traction-free. The rigid octahedrongeometry undergoes a transition from having most of the total strain energy con-centrated within the struts for (r/l) < 0.11, to having most of it localized at nodesfor less slender structures. This shift in strain energy distribution further confirmsthat the octahedron undergoes a transition from stretching- to bending-dominateddeformation as the slenderness ratio increases. It also supports the finding that nodegeometry has marginal effects at low slenderness ratios and only becomes slightlypronounced at higher slenderness ratios. The non-rigid tetrakaidecahedron, on theother hand, has most of the strain energy localized at the nodes throughout the entire(r/l) range which indicates bending-dominated deformation and higher sensitivityto node geometry throughout.
Figure 3.6∣∣∣ Strain Energy Distribution in Unit Cells
Strain energy distribution in a 1 × 1 × 1 reduced-order model. (a) Octahedron geome-try (rigid), and (b) tetrakaidecahedron geometry (non-rigid). The strain energy ratio foreach component type (struts or nodes) is defined as the sum of the strain energies of allnodes/struts in the simulation, normalized by the total strain energy in the unit cell.
3This choice of tessellation and boundary conditions was selected as the simplest case thatenables the effect of free boundaries associated with compression experiments such as the onespresented in this work.
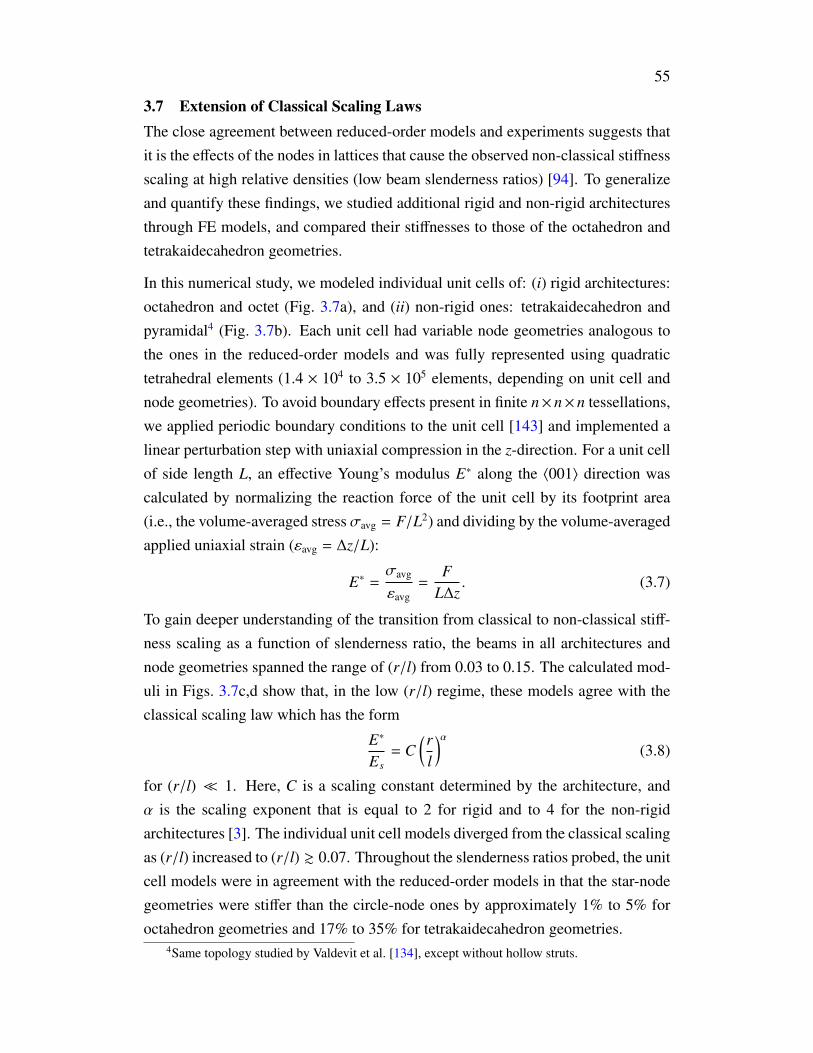
55
3.7 Extension of Classical Scaling LawsThe close agreement between reduced-order models and experiments suggests thatit is the effects of the nodes in lattices that cause the observed non-classical stiffnessscaling at high relative densities (low beam slenderness ratios) [94]. To generalizeand quantify these findings, we studied additional rigid and non-rigid architecturesthrough FE models, and compared their stiffnesses to those of the octahedron andtetrakaidecahedron geometries.
In this numerical study, we modeled individual unit cells of: (i) rigid architectures:octahedron and octet (Fig. 3.7a), and (ii) non-rigid ones: tetrakaidecahedron andpyramidal4 (Fig. 3.7b). Each unit cell had variable node geometries analogous tothe ones in the reduced-order models and was fully represented using quadratictetrahedral elements (1.4 × 10⁴ to 3.5 × 10⁵ elements, depending on unit cell andnode geometries). To avoid boundary effects present in finite n× n× n tessellations,we applied periodic boundary conditions to the unit cell [143] and implemented alinear perturbation step with uniaxial compression in the z-direction. For a unit cellof side length L, an effective Young’s modulus E∗ along the 〈001〉 direction wascalculated by normalizing the reaction force of the unit cell by its footprint area(i.e., the volume-averaged stress σavg = F/L2) and dividing by the volume-averagedapplied uniaxial strain (εavg = ∆z/L):
E∗ =σavg
εavg=
FL∆z
. (3.7)
To gain deeper understanding of the transition from classical to non-classical stiff-ness scaling as a function of slenderness ratio, the beams in all architectures andnode geometries spanned the range of (r/l) from 0.03 to 0.15. The calculated mod-uli in Figs. 3.7c,d show that, in the low (r/l) regime, these models agree with theclassical scaling law which has the form
E∗
Es= C
(rl
)α(3.8)
for (r/l) 1. Here, C is a scaling constant determined by the architecture, andα is the scaling exponent that is equal to 2 for rigid and to 4 for the non-rigidarchitectures [3]. The individual unit cell models diverged from the classical scalingas (r/l) increased to (r/l) & 0.07. Throughout the slenderness ratios probed, the unitcell models were in agreement with the reduced-order models in that the star-nodegeometries were stiffer than the circle-node ones by approximately 1% to 5% foroctahedron geometries and 17% to 35% for tetrakaidecahedron geometries.
4Same topology studied by Valdevit et al. [134], except without hollow struts.

56
Figure 3.7∣∣∣ Extension of Classical Stiffness Scalings
Generalization of nodal effects through numerical models. (a) Representative star-nodeoctahedron and octet finite element meshes (r/l = 0.11) and (b) representative star-nodetetrakaidecahedron and pyramidal unit cells (r/l = 0.11) used for periodic boundary con-dition (PBC) simulations. Classical and extended stiffness scaling fits on PBC simulationsof (c) rigid architectures, and (d) non-rigid architectures. The simulations used for the fitsare represented by hollow markers depicting the node geometry (i.e., circle, square, andstar). As expected, the relative moduli for non-rigid architectures are orders-of-magnitudesmaller than those of rigid architectures for the same beam slenderness range.
To capture the divergence of the simulations from classical stiffness predictionsat higher (r/l) ratios, we include a higher-order term to the classical scaling law

57
Architecture Node Type C1 α C2 β
1.19 2.0 34.9 3.99Octahedron 1.19 2.0 35.5 3.98
? 1.20 2.0 47.1 4.10 2.95 2.0 103.3 3.93
Octet 2.97 2.0 103.7 3.93? 3.02 2.0 142.7 4.06 10.39 4.1 1.31 5.94
Tetrakaidecahedron 12.42 4.1 2.38 5.92? 17.42 4.2 3.99 5.90 150.5 4.2 842 5.90
Pyramidal 140.8 4.2 1015 5.90? 167.7 4.3 1340 5.90
Table 3.1∣∣∣ Extended Stiffness Scaling Fit Parameters for Rigid and Non-Rigid Archi-
tectures
Fitted parameters for PBC simulations assuming the form E∗/Es = C1 (r/l)α + C2 (r/l)β
while only constraining the initial guess for α to be 2 or 4 for rigid and non-rigid architec-tures, respectively.
(Eq. 3.8):E∗
Es= C1
(rl
)α+ C2
(rl
)β, (3.9)
where C1 and C2 are scaling constants, α is the classical scaling exponent, and β isa higher-order scaling exponent that corrects for the non-slender beam geometries.This form of the extended stiffness scaling approaches the classical scaling for small(r/l). Using Eq. 3.9, we fit the unit cell models constraining α to approximatethe corresponding rigid or non-rigid classical scaling exponent (i.e., 2 or 4). Theresulting extended scaling fits shown as red dotted lines in Fig. 3.7c,d agree withthe models throughout the entire (r/l) regime, with the parameters presented inTable 3.1.
To gain physical intuition for the parameters presented in Table 3.1, we use di-mensional analysis as a form of characterizing the stiffness scaling relation for anarbitrary lattice architecture. The effective stiffness E∗ of a given lattice architec-ture can be broadly expressed as a function of its constituent material properties andunit cell geometrical parameters. Assuming perfectly linear constitutive behavior,the material can be characterized by its Young’s modulus Es, presenting the familiarform of a stiffness scaling law:
E∗
Es= f (geom.). (3.10)
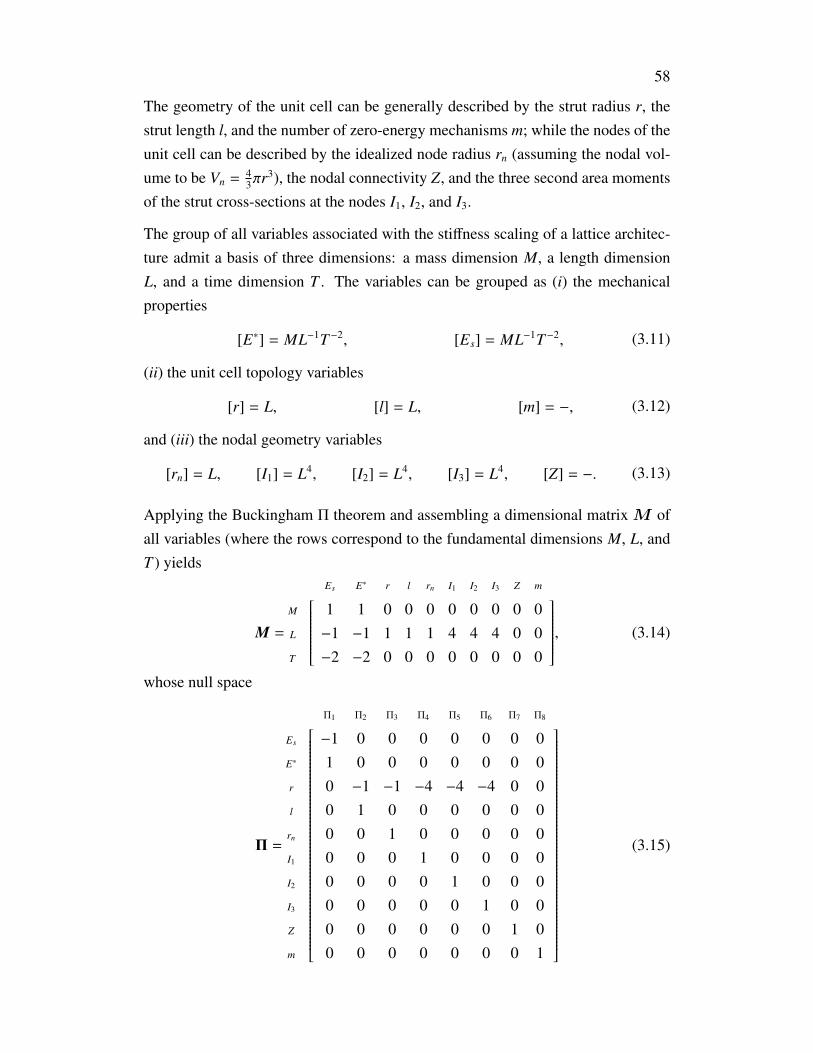
58
The geometry of the unit cell can be generally described by the strut radius r, thestrut length l, and the number of zero-energy mechanisms m; while the nodes of theunit cell can be described by the idealized node radius rn (assuming the nodal vol-ume to be Vn = 4
3πr3), the nodal connectivity Z, and the three second area momentsof the strut cross-sections at the nodes I1, I2, and I3.
The group of all variables associated with the stiffness scaling of a lattice architec-ture admit a basis of three dimensions: a mass dimension M, a length dimensionL, and a time dimension T . The variables can be grouped as (i) the mechanicalproperties
[E∗] = ML−1T−2, [Es] = ML−1T−2, (3.11)
(ii) the unit cell topology variables
[r] = L, [l] = L, [m] = −, (3.12)
and (iii) the nodal geometry variables
[rn] = L, [I1] = L4, [I2] = L4, [I3] = L4, [Z] = −. (3.13)
Applying the Buckingham Π theorem and assembling a dimensional matrix M ofall variables (where the rows correspond to the fundamental dimensions M, L, andT ) yields
M =
Es E∗ r l rn I1 I2 I3 Z m
M 1 1 0 0 0 0 0 0 0 0L −1 −1 1 1 1 4 4 4 0 0T −2 −2 0 0 0 0 0 0 0 0
, (3.14)
whose null space
Π =
Π1 Π2 Π3 Π4 Π5 Π6 Π7 Π8
Es −1 0 0 0 0 0 0 0E∗ 1 0 0 0 0 0 0 0r 0 −1 −1 −4 −4 −4 0 0l 0 1 0 0 0 0 0 0
rn 0 0 1 0 0 0 0 0I1 0 0 0 1 0 0 0 0I2 0 0 0 0 1 0 0 0I3 0 0 0 0 0 1 0 0Z 0 0 0 0 0 0 1 0m 0 0 0 0 0 0 0 1
(3.15)
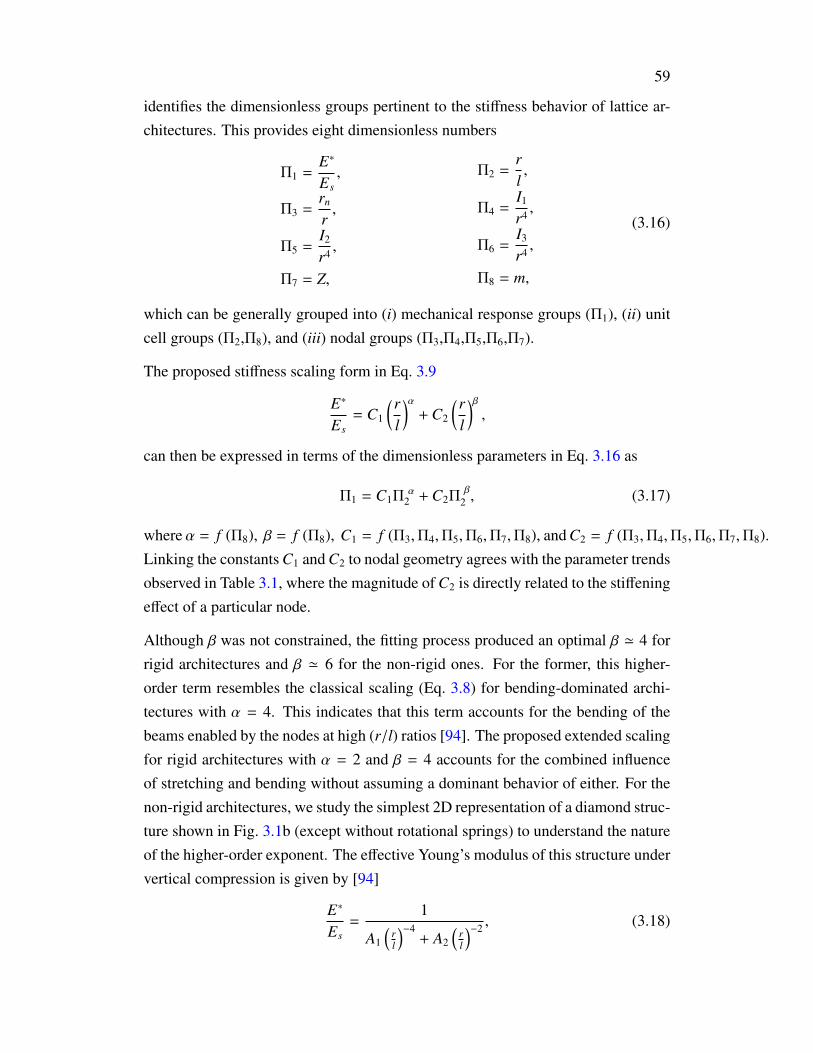
59
identifies the dimensionless groups pertinent to the stiffness behavior of lattice ar-chitectures. This provides eight dimensionless numbers
Π1 =E∗
Es,
Π3 =rn
r,
Π5 =I2
r4 ,
Π7 = Z,
Π2 =rl,
Π4 =I1
r4 ,
Π6 =I3
r4 ,
Π8 = m,
(3.16)
which can be generally grouped into (i) mechanical response groups (Π1), (ii) unitcell groups (Π2,Π8), and (iii) nodal groups (Π3,Π4,Π5,Π6,Π7).
The proposed stiffness scaling form in Eq. 3.9
E∗
Es= C1
(rl
)α+ C2
(rl
)β,
can then be expressed in terms of the dimensionless parameters in Eq. 3.16 as
Π1 = C1Πα
2 + C2Πβ
2 , (3.17)
where α = f (Π8), β = f (Π8), C1 = f (Π3,Π4,Π5,Π6,Π7,Π8), and C2 = f (Π3,Π4,Π5,Π6,Π7,Π8).Linking the constants C1 and C2 to nodal geometry agrees with the parameter trendsobserved in Table 3.1, where the magnitude of C2 is directly related to the stiffeningeffect of a particular node.
Although β was not constrained, the fitting process produced an optimal β ' 4 forrigid architectures and β ' 6 for the non-rigid ones. For the former, this higher-order term resembles the classical scaling (Eq. 3.8) for bending-dominated archi-tectures with α = 4. This indicates that this term accounts for the bending of thebeams enabled by the nodes at high (r/l) ratios [94]. The proposed extended scalingfor rigid architectures with α = 2 and β = 4 accounts for the combined influenceof stretching and bending without assuming a dominant behavior of either. For thenon-rigid architectures, we study the simplest 2D representation of a diamond struc-ture shown in Fig. 3.1b (except without rotational springs) to understand the natureof the higher-order exponent. The effective Young’s modulus of this structure undervertical compression is given by [94]
E∗
Es=
1
A1
(rl
)−4+ A2
(rl
)−2 , (3.18)
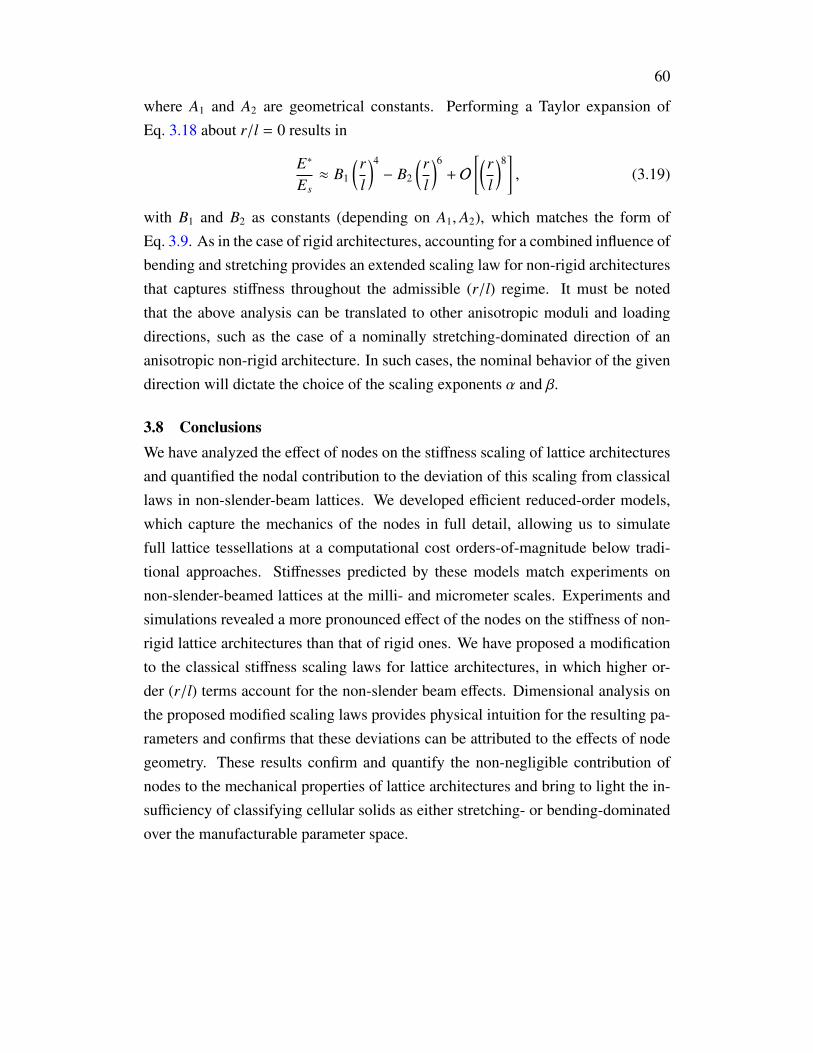
60
where A1 and A2 are geometrical constants. Performing a Taylor expansion ofEq. 3.18 about r/l = 0 results in
E∗
Es≈ B1
(rl
)4− B2
(rl
)6+ O
[(rl
)8], (3.19)
with B1 and B2 as constants (depending on A1, A2), which matches the form ofEq. 3.9. As in the case of rigid architectures, accounting for a combined influence ofbending and stretching provides an extended scaling law for non-rigid architecturesthat captures stiffness throughout the admissible (r/l) regime. It must be notedthat the above analysis can be translated to other anisotropic moduli and loadingdirections, such as the case of a nominally stretching-dominated direction of ananisotropic non-rigid architecture. In such cases, the nominal behavior of the givendirection will dictate the choice of the scaling exponents α and β.
3.8 ConclusionsWe have analyzed the effect of nodes on the stiffness scaling of lattice architecturesand quantified the nodal contribution to the deviation of this scaling from classicallaws in non-slender-beam lattices. We developed efficient reduced-order models,which capture the mechanics of the nodes in full detail, allowing us to simulatefull lattice tessellations at a computational cost orders-of-magnitude below tradi-tional approaches. Stiffnesses predicted by these models match experiments onnon-slender-beamed lattices at the milli- and micrometer scales. Experiments andsimulations revealed a more pronounced effect of the nodes on the stiffness of non-rigid lattice architectures than that of rigid ones. We have proposed a modificationto the classical stiffness scaling laws for lattice architectures, in which higher or-der (r/l) terms account for the non-slender beam effects. Dimensional analysis onthe proposed modified scaling laws provides physical intuition for the resulting pa-rameters and confirms that these deviations can be attributed to the effects of nodegeometry. These results confirm and quantify the non-negligible contribution ofnodes to the mechanical properties of lattice architectures and bring to light the in-sufficiency of classifying cellular solids as either stretching- or bending-dominatedover the manufacturable parameter space.

61
C h a p t e r 4
NODELESS ARCHITECTURES VIA SELF-ASSEMBLEDGEOMETRIES
Section 4.2 has been adapted from:
N.G. Dou, R.A. Jagt, C.M. Portela, J.R. Greer & A.J. Minnich. “Ultralow Thermal Conduc-tivity and Mechanical Resilience of Architected Nanolattices”. Nano Letters (2018) 18, 8pp. 4755–4761. doi: 10.1021/acs.nanolett.8b01191.Contributions: performed mechanical experiments and analyzed the data, performed thecomputational analysis, and participated in the writing of the manuscript;
and the rest of this chapter has been adapted from:
C.M. Portela, A. Vidyasagar†, S. Krödel†, T. Weissenbach, D.Y. Yee, J.R. Greer & D.M Kochmann.“Extreme mechanical resilience of self-assembled nano-labyrithine materials”. In Prepara-tion (2019)Contributions: fabricated samples, performed mechanical experiments and analyzed thedata, performed the computational analysis, and wrote the manuscript.
4.1 Chapter SummaryLow-density materials with tailorable properties have attracted attention for decades,yet stiff materials systems that can resiliently tolerate extreme forces and deforma-tion, while being manufactured at large scales, have remained a rare find [154]. De-signs inspired by nature such as hierarchically designed composites and foams [15,38, 40, 93] and atomic-lattice-mimicking architectures such as the micro-trussesand nanolattices [9, 87, 92, 152, 153] studied in previous chapters have achievedoptimal combinations of mechanical parameters but suffer from limited mechanicaltunability, limited long-term stability, and low throughput volumes. In particular,we have studied the detrimental effect of nodes which prevent these materials fromachieving an optimal linear scaling. Most of these architected materials have alsorelied on symmetry, periodicity, and lack of defects to achieve the desired mechani-cal response [94, 101], and as as a result symmetry-breaking defects cause localizeddeformation and failure, which significantly affects the material’s resilience upon

62
further loading [39, 47, 111]. Shell-type designs [1, 20, 49, 57, 151], on the otherhand, avoid stress concentrations and flaws but all realizations have come with highdensities and limited recoverability.
By harnessing natural self-assembly processes [84, 133, 136], we here presentscalable non-periodic ceramic-shell architectures of ultralow density (reaching 4mg/cm3) with features on the order of tens of nanometers and sample volumes onthe order of cubic centimeters, whose engineered curvature distribution achievesclose-to-optimal stiffness scaling and, moreover, whose careful combination oftopology, geometry and base material results in superior mechanical resilience com-pared to previously reported architected materials. We show the capability of thesearchitectures to maintain more than 50% of their original stiffness and strength afterten cycles of compression up to 30% with no discernible permanent deformation.Guided by theory and computations, we experimentally demonstrate precise con-trol over material morphology, which elicits prescribed (an)isotropic material re-sponse, whose directional stiffness distribution remains the same over a wide rangeof shell thicknesses and relative densities. Our approach provides a pathway toharness self-assembly methods in the design and scalable fabrication of architectedmaterials with simultaneous directionally tunable, high stiffness and unsurpassedrecoverability to 10 cycles with marginal deterioration.
4.2 Detrimental Effect of Nodes to ResilienceTo understand the negative effect of nodes beyond the non-ideal stiffness scalingsexplored in previous chapters, we will briefly discuss their impact on the damageand deterioration of beam-based architected materials. Several beam-based hollowarchitectures have harnessed size effects of nm-thick struts to enable structural re-covery after large deformation, characterizing structural recovery solely by the ratiobetween the original and the post-compression sample heights while acknowledg-ing the presence of significant cracks at nodes [39, 92] as shown in Fig. 4.1. Thesemicro-cracks at nodes are the result of stress concentrations emerging at the junc-tion of two or more struts which makes them inevitable in any beam- or plate-basedgeometry where two or more discrete components meet. The mechanical effect ofthis type of failure at hollow nodes has been observed as a drastic decrease in theeffective stiffness and strength of the materials [39, 92, 93], and has also been iden-tified in the cyclic response of ceramic-polymer microlattices [120]. Furthermore,the detrimental effect of nodes has recently been identified as the main determiningfactor for tensile failure and crack propagation in lattice materials [87].

63
Figure 4.1∣∣∣ Cyclic Response of Al2O3 24-nm-Wall-Thickness Octet Nanolattices
(a) Stress and strain recorded during a 6-cycle compression test of a 24 nm wall thicknessnanolattice. Curves are labeled with the cycle number. SEM images (b) before, (c) dur-ing, and (d) after the test show 98% structural recovery although significant cracks emergeat nodes. The circular marker indicates the stress and strain of the partially compressednanolattice shown in (c). Zoomed images (insets) illustrate the contribution of beam buck-ling, shell buckling, and fracture. Scale bars are 50 µm for (b)–(d) and 10 µm for insets.
In light of this, extreme resilience in architected materials can only be enabled byarchitectures that lack nodes or junctions, while still harnessing size effects at thenano-scale.
4.3 Eliminating Nodes in Architected MaterialsThe design of architected cellular materials to date has heavily relied on truss-basedgeometries, which achieve desirable mechanical properties such as high stiffness- orstrength-to-density ratios [9, 92, 118, 153], flaw tolerance [87], high energy absorp-tion [127], and vibration mitigation [69]. Truss-based architectures, like open-cellfoams, typically engage their structural members in bending, increasingly so forslender features regardless of architecture. This compliant deformation mode is

64
responsible for poor, higher-than-linear scaling of the effective truss stiffness withdensity [94, 115]. Alternatively, plate- and shell-based geometries have been shownto mitigate such bending and to reach theoretical stiffness bounds [15, 128] by im-proving the load distribution within their members as compared to trusses, but usu-ally exhibit poor recoverability: the truss- and plate-based designs suffer from stressconcentrations at junctions, resulting in permanent damage and material failure. Asa solution to this, smooth shell architectures such as triply periodic minimal surfaces(TPMS) avoid sharp junctions and attain high stiffness owing to double curvaturein its components. This concept of nonzero Gaussian curvature, first introduced byGauss in his Theorema Egregium, provides mechanical benefits to doubly curvedsurfaces [113] and has been identified in nature, for instance, in providing rigidity toegg shells [77] and plant leaves [80, 99]. Recently, this concept has led to smoothshell architectures that achieve stretching-dominated behavior and have superiorenergy absorption capabilities than trusses [1, 20, 49, 151].
The beneficial mechanical properties of synthesized truss-, plate-, and beam-basedarchitected materials are largely enabled by the periodicity of symmetric unit cells,all of which are susceptible to symmetry-breaking defects and effects of free bound-aries [74, 101]. Materials with such geometries are typically only achievable usingadditive manufacturing techniques at small scales that are defect-prone and non-scalable, inevitably resulting in their lower-than-theoretical strength- and stiffness-scaling with density. As a point of departure from periodicity, materials that areformed through natural evolution processes like nanoporous foams [18], can benon-periodic and are often comprised of bi-continuous networks of smooth, doublycurved solid morphologies corresponding to different phases. Further morphologytunability, with the potential for direction-dependent properties, can be achievedvia molecular processes like self-assembly of block copolymers [13, 65] or poly-meric micro-emulsions [7, 133, 155]. These processes enable orders-of-magnitudeincrease in fabrication volumes [79, 100] compared to additively manufactured ma-terials and expand the parameter space to allow drastically different features withsizes ranging from tens of nanometers to tens of micrometers, all by simple changesin phase concentrations, molecular weights, or temperature [136]. Architectures ob-tained through these processes may be particularly resilient against defects [57] notonly since they do not rely on periodicity, but also because they could simultane-ously benefit from double curvature if they are reduced to thin shells at the bound-ary between phases. Exploring non-periodic, shell-based architectures with doublecurvature provides a promising scalable pathway to attain low-density architected

65
materials with extremely low weight, high stiffness, and extreme resilience.
4.4 Sample FabricationTo this end, we developed a fabrication method (Fig. 4.2a) that harnesses the self-assembly capabilities of polymeric emulsions to create bi-continuous, doubly curvedshell-based materials with throughput volumes on the order of cubic centimeters.With pore sizes on the order of tens of micrometers, and smooth walls on the orderof tens of nanometers, our materials span six orders-of-magnitude from the smallestfeature dimension to the overall sample dimensions and present the first realizationof a scalable self-assembled nano-architected material. We fabricated the porous bi-continuous template (Fig. 4.2b) exploiting the spinodal decomposition of an epoxy-based emulsion (see Methods), which produced a fully interconnected solid phaseupon polymerization with consistent pore morphologies on the order of tens of mi-crometers [133]. This template was then coated with a 79 nm conformal coating ofALD-deposited Al2O3, followed by O2 plasma ashing to remove the epoxy templateand yield the resulting nano-labyrinthine shell-based material. The polymerization-induced phase separation process that creates the initial bi-continuous templatesgives these nano-labyrinthine materials the potential to be fully tunable using ther-mal, chemical, or mechanical stimuli during self assembly, which could lead tocontrollable morphologies that conform to desired specifications.
To systematically explore the parameter space enabled by this fabrication method,we computed several bi-continuous morphologies achievable through the separa-tion process and experimentally probed their response as thin shell-based nano-labyrinthine materials. To obtain the bi-continuous morphologies, we first describea phase separation process during self-assembly of a generic two-phase system us-ing a Cahn-Hilliard-type phase field model [137], in which ϕ(X, t) = [0, 1], definedat position X and time t, separates solid (ϕ = 1) from void (ϕ = 0) domains. Tocontrol the characteristics of the resulting porous bi-continuous microstructures,we fix the average fill fraction at 50% and tune the surface energy of the interfacebetween the two phases to modify the resulting feature morphology. Drawing in-spiration from nanoporous foams and block copolymers whose morphology anddirectionality can be controlled by properly choosing the alloying [72, 107] or mix-ing ratios [108], we computed anisotropic shell architectures that mimic such direc-tional tunability [84]. To enable this, we prescribe the anisotropic surface energyγ(n) as a function of the surface normal n) to penalize growth along a particularset of directions defined by m1, . . . ,mn, which produces bi-continuous shapes that
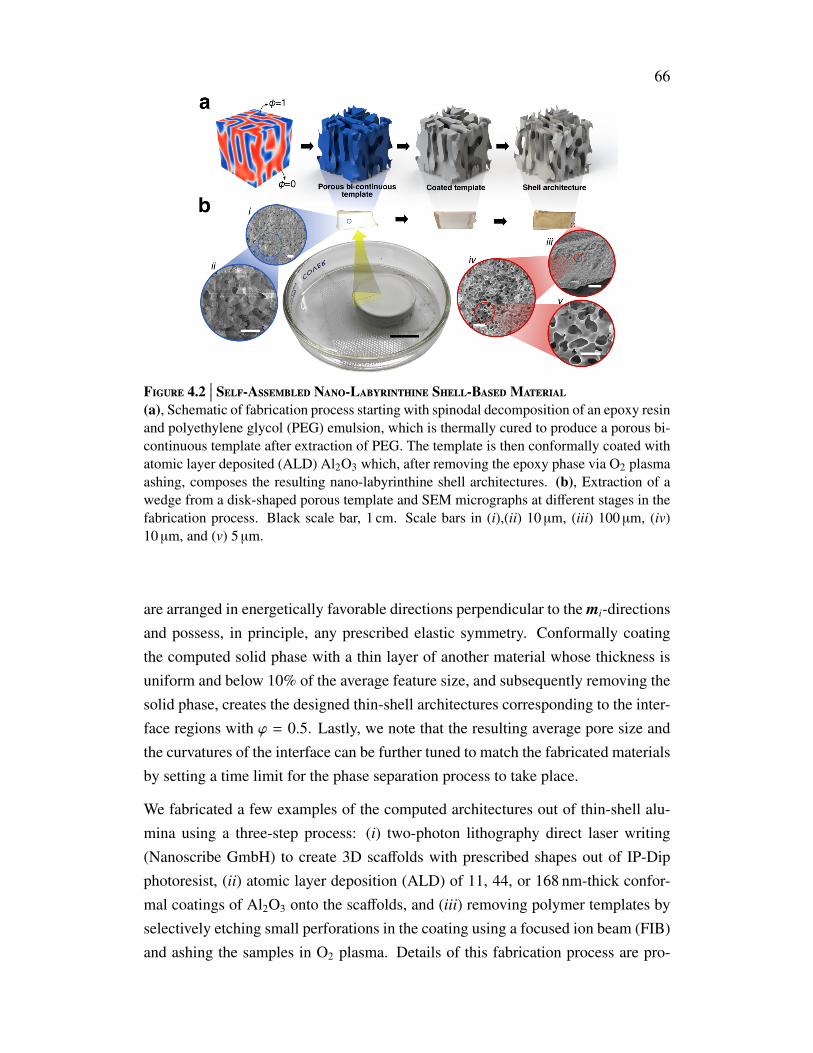
66
Figure 4.2∣∣∣ Self-Assembled Nano-Labyrinthine Shell-BasedMaterial
(a), Schematic of fabrication process starting with spinodal decomposition of an epoxy resinand polyethylene glycol (PEG) emulsion, which is thermally cured to produce a porous bi-continuous template after extraction of PEG. The template is then conformally coated withatomic layer deposited (ALD) Al2O3 which, after removing the epoxy phase via O2 plasmaashing, composes the resulting nano-labyrinthine shell architectures. (b), Extraction of awedge from a disk-shaped porous template and SEM micrographs at different stages in thefabrication process. Black scale bar, 1 cm. Scale bars in (i),(ii) 10 µm, (iii) 100 µm, (iv)10 µm, and (v) 5 µm.
are arranged in energetically favorable directions perpendicular to the mi-directionsand possess, in principle, any prescribed elastic symmetry. Conformally coatingthe computed solid phase with a thin layer of another material whose thickness isuniform and below 10% of the average feature size, and subsequently removing thesolid phase, creates the designed thin-shell architectures corresponding to the inter-face regions with ϕ = 0.5. Lastly, we note that the resulting average pore size andthe curvatures of the interface can be further tuned to match the fabricated materialsby setting a time limit for the phase separation process to take place.
We fabricated a few examples of the computed architectures out of thin-shell alu-mina using a three-step process: (i) two-photon lithography direct laser writing(Nanoscribe GmbH) to create 3D scaffolds with prescribed shapes out of IP-Dipphotoresist, (ii) atomic layer deposition (ALD) of 11, 44, or 168 nm-thick confor-mal coatings of Al2O3 onto the scaffolds, and (iii) removing polymer templates byselectively etching small perforations in the coating using a focused ion beam (FIB)and ashing the samples in O2 plasma. Details of this fabrication process are pro-

67
vided in section 4.9 and in Fig. 4.4. The resulting nano-labyrinthine-sample formfactors were cubic, with overall dimensions of 125 × 125 × 125 µm, and porousfeature sizes on the order of ∼10 µm, to approximate the pores of nano-labyrinthinesamples from Fig. 4.2b. These bi-continuous surface architected materials had arelative density ρ (i.e., fill fraction) of approximately 0.15 % to 2.4 %, which cor-responds to 4 to 62 mg/cm3, depending on shell thickness. Five representative ex-amples that showcase the wide range of self-assembly-like architectures are shownin (Fig. 4.3). The scanning electron microscopy (SEM) images include columnar(Fig. 4.3a), lamellar (Fig. 4.3c), isotropic (Fig. 4.3d), cubic (Fig. 4.3e), and trigo-nal (Fig. 4.3f) architectures, with their numerically computed Young’s moduli (i.e.,stiffness) in each direction shown as contour surfaces in the image insets which isdescribed in the following.
Figure 4.3∣∣∣ Anisotropic Al2O3 Shell-Based Bi-Continuous Geometries
(a) Columnar shell geometry with 11 nm thickness and (b) corresponding elastic surfaceat ρ = 4.8 ± 0.3% showing the computed anisotropy as compared to that of an equallydense octet (grey surface). (c) Lamellar, (d) isotropic, (e) cubic, and (f) trigonal geometrieswith the corresponding elastic surfaces as insets (same ρ as in b). The Voigt bound ofE/Es = 0.048 is presented as a golden spherical surface. When not visible, the octet elasticsurface is contained within the bi-continuous material’s surface. The preferential m vectorsare depicted where applicable. Scale bar, 50 µm.

68
Figure 4.4∣∣∣ Nano-Labyrinthine Sample Fabrication Details
(a) Columnar bi-continuous architecture fabricated using two-photon lithography with an11 nm Al2O3 coating, with five rectangular perforations at the top obtained via focused ionbeam milling; (b) hollow shell-based sample after 80 hours in an O2 plasma ashing system;(c) micrograph of a columnar sample obtained at a high imaging voltage (10 kV) showingthe hollow nature of the samples; high-voltage micrographs for the 11 nm (d) lamellar, (e)isotropic, (f) cubic, and (g) trigonal architectures. Scale bar, 50 µm.
4.5 Elastic Surface CalculationThe mechanical anisotropy of such shell-based architectures is highlighted by theelastic surfaces (Fig. 4.3), which convey the orientation-dependent sample stiff-ness, i.e., Young’s modulus E, calculated using linear elastic shell finite elementmodels with the constituent properties of ALD Al2O3 [14] (see Methods). Wefirst simulated uniaxial compression of each architecture along each ei directionfor i = 1, 2, 3 (i.e., the [100], [010], and [001] directions, respectively), resem-bling actual experimental boundary conditions, to allow comparison to experimen-tal anisotropy values in those three directions. Additionally, we implemented ahomogenization scheme with periodic boundary conditions to calculate the modu-lus in all directions, first obtaining the full elastic modulus tensor C and then usingit to compute the compliance tensor S = C−1, which provided E along any direction.The contoured elastic surfaces were then plotted using all values of E normalized bythe Young’s modulus of ALD alumina, Es, where colors represent the magnitude ofthe normalized modulus (Fig. 4.3b, insets). The deviation of elastic surfaces fromspherical shape is quantitatively related to the elastic anisotropy and is typicallymaximized along directions perpendicular to the preferential m vectors. Fig. 4.3bshows two ellipsoidal lobes along the [001] direction that comprise the elastic sur-

69
face of the columnar architecture shown in Fig. 4.3a, along with lower and uppersurfaces for reference: that of an octet truss lattice (one of the most extensively ex-plored stiffer periodic architectures [35, 94, 115, 153]) represented by a small graysurface centered at the origin, and that of the Voigt theoretical upper bound (definedby the rule of mixtures between Al2O3 and air) shown as a golden sphere. This plotreveals that for this representative case of ρ = 4.8 ± 0.3%, the maximum elas-tic modulus of the columnar architecture outperforms the equivalently lightweightoctet truss by a factor of 3.6 and reaches 48% of the Voigt bound. The contouredelastic surfaces also reveal a stiff omnidirectional response in the absence of prefer-ential directions within the architecture, an example of which is shown in Fig. 4.3d,where the architecture’s response is close to isotropic as would be the case, forexample, in nanoporous materials [85] and stochastic foams [57]. The elastic sur-face of the octet is fully contained within that of the isotropic shell architecture(Fig. 4.3d), which demonstrates that the non-periodic bi-continuous architecturesin this work are substantially stiffer in all directions than equally dense periodictruss architectures. The columnar (Fig. 4.3a), lamellar (Fig. 4.3c), cubic (Fig. 4.3e),and trigonal (Fig. 4.3f) geometries all appear to have tunable stiffness variations.In the case of the columnar architecture, the anisotropy induced by the selectedpreferential directions promotes material arrangement in stress-bearing columnarfeatures along the [001] direction, which renders its relative modulus E/Es in thisdirection the highest for all studied geometries. The lamellar structure (Fig. 4.3d)displays the highest degree of anisotropy, E[001]/E[100] of 177, driven by sheet-like,low inter-connectivity material arrangements along the [010] and [001] directions.These computational results demonstrate that introducing preferential m directionsinto non-periodic architectures allows for prescribing substantial elastic anisotropyand provides a mechanism to design the elastic response along any chosen directionin a single material, attaining performance superior to some periodic architectures.All computed elastic responses appear to be below the theoretical upper bound sinceenforcing shell bi-continuity requires some material arrangement in less-than-idealconfigurations, yet the connectivity is achieved without sharp corners or edges (op-posite of what is typical in periodic architectures) which will become essential ingiving these nano-labyrithine materials exceptional properties beyond stiffness.
4.6 Nanomechanical ExperimentsTo test the computational predictions, we conducted uniaxial compression exper-iments on each architected sample along their 〈100〉 directions in a nanoindenter

70
(G200 XP, KLA) with a flat punch tip to strains of ε = 35% at a quasistatic rateof ε = 10−3 s−1. Additional cyclic compressions on selected architectures wereperformed in situ, in a custom nanomechanical instrument inside of an SEM cham-ber [92] (Quanta 200 FEG, Thermo Fisher). We compressed a minimum of threesamples for each configuration: geometry, orientation, and shell thickness, and con-verted the load vs. displacement data produced by the instrument into stresses andstrains by normalizing by the sample footprint area and height, respectively. Wethen obtained the effective elastic modulus E∗[·] and material strength σ∗y,[·] from thestress-strain data by obtaining the slope of the linear loading regime and the cor-responding load at the onset of nonlinearity (see Methods). Representative stressvs. strain data sets are shown in Fig. 4.5 which reveal the characteristic linear andnonlinear responses of samples at the three different shell thicknesses.
Figure 4.5∣∣∣ Compressions of Columnar Samples at Different Thicknesses
Top row: micrographs before and after 3-cycle in situ uniaxial compressions to ε = 30%(the maximum load in the nanoindenter was reached prior to failure of the 168 nm sample).Middle row: stress-strain response for the in situ cycles. Bottom row: stress-strain responsefor ex situ compression on 3 distinct samples for each thickness. Scale bar, 50 µm.
The 163 nm shell thickness samples (ρ = 2.3 ± 0.1%) exhibited the predicted two-order-of-magnitude anisotropy for the lamellar architecture, with an experimentalE∗[001]/E
∗[100] ratio of 0.057 compared to 0.014 predicted by simulations. The close-

71
to-isotropic and columnar samples approximated the numerical models’ overallanisotropy with experimental E∗[001]/E
∗[100] ratios of 0.87 and 3.0 compared to the
numerical ones of 0.92 and 7.2, respectively. The inherent surface waviness ofthe samples caused by the layer-by-layer 3D printing process slightly underminesthe mechanical properties (Extended Data Figure 4.10), but preserves the desiredqualitative anisotropic response. Thinner-walled samples (i.e., t = 11 and 44 nm)exhibited the same anisotropic behavior and had higher knockdown factors causedby fabrication defects.
Our experiments reveal that the nano-labyrinthine ceramic architectures possesshigh and tunable directional stiffness and do not contain stress concentrations likethose at the junctions of all periodic architectures [39, 75, 87, 120], which enablestheir extraordinary mechanical resilience as shown in Figs. 4.6 and 4.7. Our in
situ experiments reveal that the 11 nm-thick samples exhibited full recovery, withno visible microcracks, after ten compressive cycles to strains of up to 35 %. Thisis in contrast to all other thin-walled ceramic and polymer beam-based architectedmaterials at this scale, which fail by the creation of microcracks at the nodes andwhose strength and energy-absorption hysteresis deteriorate by an order of magni-tude or more after just one loading cycle [39, 93, 120]. While both hollow-beamand nano-labyrinthine architectures structurally recover due to elastic shell buck-ling, the nano-labyrinthine samples in this work are the only ones that do not vis-ibly fracture and maintain substantial mechanical performance with cycling. Forinstance, the columnar architecture (Fig. 4.6) compressed along the [001] direc-tion exhibited a linear loading regime followed by the onset of elastic buckling ofthe Al2O3 shells from a strain of 5% to 10%, beyond which they underwent non-linear buckling and self-contact, ultimately recovering to their original geometryafter each cycle characterized by self-similar hysteretic behavior. This hysteresiscorresponds to significant energy dissipation, most likely through friction and thenonlinear buckling processes, without any permanent structural deformation or ev-ident microcrack formation (see Supplementary Videos 1–4). Increasing the shellthickness to 44 nm changed the failure mechanism to mostly fracture-dominatedwith structural recovery enabled by marginal elastic buckling (see SupplementaryVideos 5–9), while the 163 nm samples underwent mostly catastrophic failure dur-ing the first cycle with their structural integrity compromised (see Extended DataFigure 4.5 & Supplementary Videos 10–14). This is consistent with the compet-ing effects of elastic buckling and material failure found previously for hollow-shell truss architectures [92], which showed significant cyclic degradation driven

72
by stress concentrations at truss junctions. It is also in line with observations of im-proved effective strength in lattice materials [74] where fillets are used to decreasethe curvature at truss nodes.
Figure 4.6∣∣∣ Cyclic Loading and Recovery of Columnar Sample
Cyclic loading of a 11 nm-thick columnar architecture: (a) initial geometry, (b) end of linearregime and onset of buckling, (c) nonlinear buckling regime, (d) end of loading regime,(e)-(g) unloading regime showing elastic recovery, and (h) final geometry after 10 cyclesshowing no permanent microcracks. The panel border color matches the cycle number ofthe stress-strain plot. Scale bar, 50 µm.
We attribute the observed mechanical resilience to the double-curvature of the alu-mina surfaces. The low principal curvatures minimize the formation of stress con-centrations, which prevents localized material failure. We quantify the architecturalmorphology by extracting the point-wise mean and Gaussian curvatures and cal-culating the principal curvature probability distribution (i.e., the distribution of κ1
and κ2). For the columnar architecture, Fig. 4.8a shows that most of its featureshave dimensionless principal curvatures, i.e., κi = κiL where L is the sample char-acteristic dimension, whose absolute value |κi| is less than 20. Performing the sameanalysis for the octet architecture shows significantly larger curvatures and theirbimodal distribution, with a peak curvature dominated by the struts’ non-zero κ2
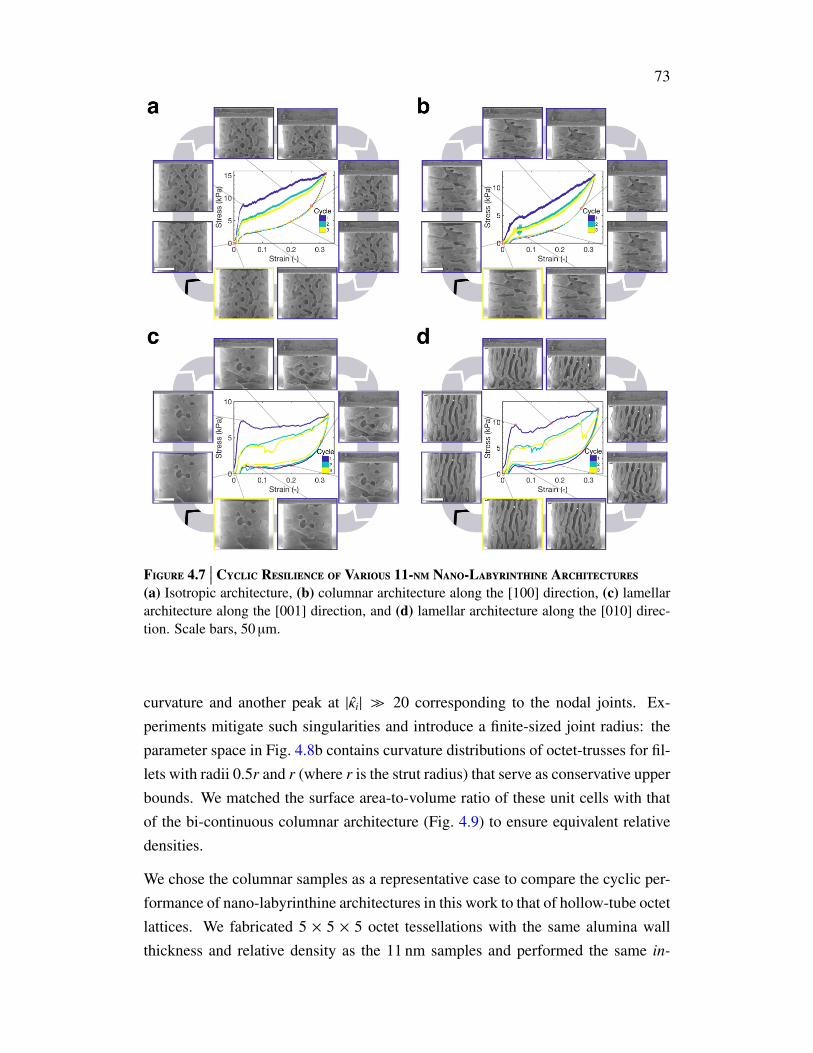
73
Figure 4.7∣∣∣ Cyclic Resilience of Various 11-nm Nano-Labyrinthine Architectures
(a) Isotropic architecture, (b) columnar architecture along the [100] direction, (c) lamellararchitecture along the [001] direction, and (d) lamellar architecture along the [010] direc-tion. Scale bars, 50 µm.
curvature and another peak at |κi| 20 corresponding to the nodal joints. Ex-periments mitigate such singularities and introduce a finite-sized joint radius: theparameter space in Fig. 4.8b contains curvature distributions of octet-trusses for fil-lets with radii 0.5r and r (where r is the strut radius) that serve as conservative upperbounds. We matched the surface area-to-volume ratio of these unit cells with thatof the bi-continuous columnar architecture (Fig. 4.9) to ensure equivalent relativedensities.
We chose the columnar samples as a representative case to compare the cyclic per-formance of nano-labyrinthine architectures in this work to that of hollow-tube octetlattices. We fabricated 5 × 5 × 5 octet tessellations with the same alumina wallthickness and relative density as the 11 nm samples and performed the same in-

74
Figure 4.8∣∣∣ Curvature Distribution and CyclicMechanical Performance
(a) Dimensionless curvature probability distribution for the columnar bi-continuous archi-tecture with the stress distribution for uniaxial loading (inset), κi = κiL, where L is thesample characteristic dimension; (b) two octet architectures with fillets of radii 0.5r and r,where r is the strut radius, and stress distribution for the 0.5r case in uniaxial loading (inset,same color map as a). The normalized curvatures are defined as κi = κiL where κi is aprincipal curvature and L is the unit cell dimension. (c) Evolution of first-cycle-normalizedmechanical properties through cyclic loading for hollow octet and columnar bi-continuousmaterial of relative density ρ = 0.15%, and 11 nm shells. Insets depict both architectures atmaximum compression in an in situ experiment. Inset scale bar, 50 µm.
situ cyclic compressions along the [001] direction (see Fig. 4.9 & SupplementaryVideo 15). We tracked the degradation of the measured modulus E∗i , strength σ∗y,i,and the absorbed energy density ψi = 1
2
∮iσdε, graphically represented as the en-
closed area in the stress-strain response for a given i-th cycle. Fig. 4.8c summarizeshow these three performance metrics, normalized by their values in the first cycle,evolved over ten load cycles. These plots convey that between the first and secondcycles, the energy absorption decreased by 27% for the columnar architecture and

75
Figure 4.9∣∣∣ Cyclic Response of Octet and Columnar Al2O3 Architectures
Micrographs of in situ uniaxial compressions depicting sample morphologies before, atmaximum compression (ε = 30%), and after 10 cycles for (a) an octet 5× 5× 5 tessellationand (b) a columnar architecture, both of equal relative density and 11-nm wall thickness.(c) Cyclic stress-strain response for both samples showing self-similar response for thecolumnar architecture and significant decay in the octet architecture’s response.
by 58% for the octet, asymptotically approaching the tenth-cycle limit of 38% ofthe original energy storage capacity for the columnar and 14% for the octet archi-tectures. Young’s modulus showed a second-cycle drop of 15% for the columnararchitecture compared to 63% for the octet. This significant drop in the octet’smechanical response is caused by the localized material failure and a loss of load-bearing capacity at multiple nodes, whose number increases with cycling. The less-than-half relative drop in energy absorption and a factor-of-3 lower reduction in theYoung’s modulus between 1st and 2nd cycles of the columnar architectures, whencompared with octets, stem from likely internal micro-cracks and variations in theself-contact process that weaken but not necessarily disable load-bearing shells (nocracks were observed on the structure’s outer surfaces). Strength performance alsoappears to be superior for the columnar architecture showing a first-to-second-cycledegradation of 24% degradation compared to 70% for the octet, with the absolutestrengths being greater than those of octet beyond the second cycle. Despite theknock-down factor in stiffness and strength caused by shell waviness (Fig. 4.10), thecolumnar architecture shows considerably superior mechanical performance com-pared to periodic architectures through (at least) ten cycles. Since the deformationmechanisms exhibited by the columnar and octet architectures are representativeof nano-labyrinthine and periodic truss architectures, respectively, the benefits ofnon-periodic, low-curvature shells can be harnessed to produce architected nano-labyrinthine materials with superior mechanical performance than that of an equiv-

76
alent periodic architecture.
Figure 4.10∣∣∣ Effect of ShellWaviness
(a) Columnar bi-continuous architecture fabricated using two-photon lithography show-ing shell waviness due to the layer-by-layer nature of the fabrication process; (b) finiteelement models of a corrugated sheet with varying thicknesses t and amplitudes A, for aconstant wavelength λ = 600 nm (corresponding to two printing layers); (c) stiffness ofthe corrugated sheets kλ normalized by the stiffness of a flat sheet k, for various amplitude-thickness combinations, upon loading from the top with roller boundary conditions on thesides. At small thicknesses, two-order-of-magnitude knockdown can be attributed to corru-gation. Black and white scale bars, 50 µm and 10 µm, respectively.
4.7 Quasi-Linear Stiffness ScalingThe Atomic Layer Deposition (ALD) process used in this work allowed for a widerange of shell thicknesses, from 11 to 168 nm, which enabled the nano-labyrinthinearchitectures to span a relative density range from 0.15 % to 2.4 %. To explore theeffect of relative density on stiffness and anisotropy, we performed finite elementsimulations of three types of architectures with the same relative densities: colum-nar nano-labyrinthine, hollow octet truss, and the Schwarz Primitive triply periodicminimal surface (TPMS). Fig. 4.11 shows a plot of the normalized elastic modu-lus E[001]/Es (top plot) as a function of relative density for these three architecturesalong with their elastic surfaces at three different relative densities (bottom panels).These simulations demonstrate a close-to-constant anisotropy for the columnar ar-chitecture (red), with virtually identical lobular elastic surfaces, and a quasi-linearstiffness scaling exponent of α = 1.17 (fit of the type E[·] ∝ ρ
α) at relative densitiesbelow 5%. The TPMS (blue) and octet (grey) geometries exhibit significant trans-formations in anisotropy, with both having a scaling exponent of ∼1.4, and withthe octet gradually changing its direction of maximal stiffness from [001] to [111]throughout the studied relative density regime. This anisotropy in trusses arisesfrom the competing effects of beam bending and stretching [126] and presents anadditional challenge when designing truss-based materials. Nano-labyrinthine ar-

77
chitectures appear to be immune to significant changes in wall thickness as theyretain their target elastic anisotropy throughout the full explored density range.
Figure 4.11∣∣∣ Stiffness Scaling and Elastic Surface Variations in Nano-Labyrinthine
ArchitecturesNormalized Young’s modulus E[001]/Es as a function of relative density ρ for bi-continuouscolumnar (red), Schwarz Primitive TPMS (blue), and hollow octet (gray) architectures. Fitsfor the ten lowest relative densities from each architecture are depicted as dashed lines,using a fit of the form E[·]/Es = C ρα, with the corresponding scaling exponent α nextto each fit. The elastic surfaces for each structure, along with their 2D projections, areshown for three selected relative densities. Close to constant anisotropy is observed for thebi-continuous architecture as opposed to the TPMS and octet geometries.
The stiffness scaling of nano-labyrintine architectures reveals another counter-intuitivefeature, previously shown only for thick polymeric shells [57]: all architectures dis-play an almost linear stiffness scaling with relative density. Performing the sameanalysis for the rest of the nano-labyrinthine architectures was consistent with thestiffness scaling of the columnar one with scaling exponents ranging from 1.16 to1.21 in the 〈100〉 directions, remaining below the scaling exponents computed for

78
the TPMS and octet architectures. Linear scaling is considered to be optimal, asit corresponds to the rule of mixtures, and is generally associated with stretchingas the primary deformation mechanism; bending manifests in α = 2. Althoughthe double-curvature morphology explains the enhanced resilience observed for allarchitectures, the fact that their elastic deformation is stretching-dominated seemscounter-intuitive at first—but is also tied to the double curvature. In the limit of verythin shells of thickness t, the bending stiffness (scaling with t3) is comparably lessthan the stretching stiffness (scaling with t), so that membrane theory effectivelydescribes the deformation behavior.
To further understand the effect of double-curvature on the load distribution withinthe shells, we analyzed first-order approximations of the columnar architecturesince the exact morphology of nano-labyrinthine architectures is challenging toquantify. We approximated the columnar topology as: (i) an ideal array of cylindri-cal shells with κ1 = 0 and κ2 > 0 having zero Gaussian curvature (i.e., κ1κ2 = 0), (ii)an array of doubly-curved barreled nearly-cylindrical shells with κ1 > 0 and κ2 > 0having positive Gaussian curvature, and (iii) an array of doubly-curved waisted
nearly-cylindrical shells with κ1 < 0 and κ2 > 0 having negative Gaussian curvature(see Fig. 4.12). The curvature distribution presented in Fig. 4.8a demonstrates thatthe negative Gaussian curvature approximation is most appropriate for these archi-tectures. For the idealized cylindrical shell arrangement case (κ1κ2 = 0), we findthat applying an arbitrary distribution of axial load N on one end of the shells pro-duces a solution of straight lines carrying the load throughout the shell, analogousto an arrangement of straight rods. In the nearly-cylindrical case with a negativeGaussian curvature, the solution still has a straight distribution of axial load N,with no decay from the prescribed value at one end (see Supplementary Informa-tion for derivation). Since this would not be the case if the simplified structure hadpositive Gaussian curvature, such as a barrel-like cylinder, it is evident that the neg-ative Gaussian curvature adds rigidity to axial loads in the form of membrane-stresscarrying ability [22, 116], as depicted by the simulations on these elementary stru-cures in Fig. 4.12. This figure also shows vertically aligned domains in the uniaxialcompression simulations of the columnar architecture along which the principalstresses are non-decaying and maximal, resembling the non-decaying solution ofthe waisted cylindrical shells [22, 116]. Given that this solution only applies whilethe membrane hypothesis is valid (i.e., small thicknesses and relative densities), itis expected that bending will take a more prominent role at higher relative densitiesyielding slightly higher scaling exponents due to less ideal stress distributions.
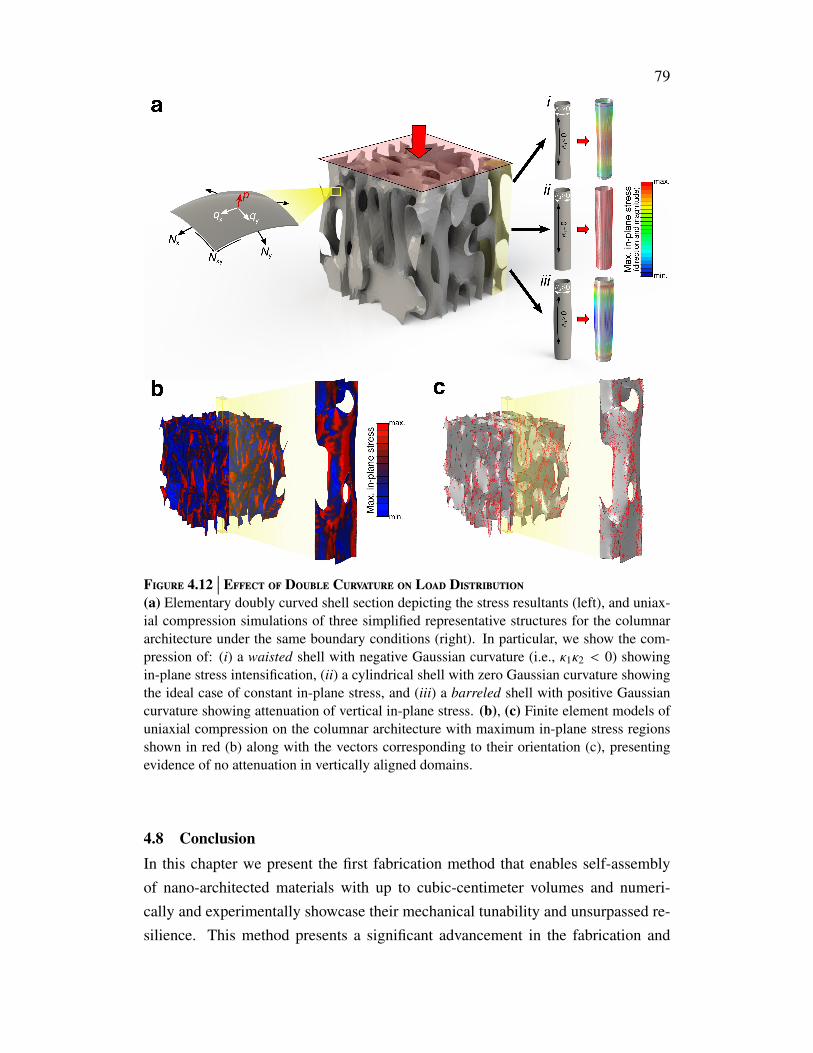
79
Figure 4.12∣∣∣ Effect of Double Curvature on Load Distribution
(a) Elementary doubly curved shell section depicting the stress resultants (left), and uniax-ial compression simulations of three simplified representative structures for the columnararchitecture under the same boundary conditions (right). In particular, we show the com-pression of: (i) a waisted shell with negative Gaussian curvature (i.e., κ1κ2 < 0) showingin-plane stress intensification, (ii) a cylindrical shell with zero Gaussian curvature showingthe ideal case of constant in-plane stress, and (iii) a barreled shell with positive Gaussiancurvature showing attenuation of vertical in-plane stress. (b), (c) Finite element models ofuniaxial compression on the columnar architecture with maximum in-plane stress regionsshown in red (b) along with the vectors corresponding to their orientation (c), presentingevidence of no attenuation in vertically aligned domains.
4.8 ConclusionIn this chapter we present the first fabrication method that enables self-assemblyof nano-architected materials with up to cubic-centimeter volumes and numeri-cally and experimentally showcase their mechanical tunability and unsurpassed re-silience. This method presents a significant advancement in the fabrication and

80
design of architected materials at any scale, since it bypasses the need for slow anddefect-prone additive manufacturing processes. These nano-labyrinthine ceramic-shell architectures also are the first to overcome the common high-stiffness-high-resilience exclusivity while maintaining controllable constant anisotropy over awide range of relative densities, namely from 0.15% to 2.4%. Our architecturescombine two beneficial design strategies explored only independently before: ex-tremely thin shells yielding material size effects and reducing material failure, onthe one hand, and smooth double-curvature structural architectures providing highstiffness, on the other hand. The consequence are high-tunable-stiffness, high-resilience metamaterials which promise potential for scalable fabrication at largescales through self-assembly.
4.9 Detailed Methods Description4.9.1 Sample FabricationThe centimeter-scale bi-continuous polymer was synthesized according to the methodreported by Tsujioka et al. [133]. In brief, 2.34 g of diglycidyl ether of bisphenolA (DGEBA), 0.86 g of 4,4’-methylenebis(cyclohexylamine) (MBCHA), and 8.01gof polyethylene glycol (PEG) 200 were added to a 20 mL vial, mixed vigorously ina vortex mixer to form a clear homogenous solution and then ultrasonicated for 10s to remove any bubbles formed. 1.5 mL of this solution was added to a 1 dram vial(15 mm-diameter) and then cured at 130 C for 3 hrs to form a white solid. Afterpolymerization, the sample was immersed in water for 24 hrs to extract out the PEG200 porogen, followed by drying in vacuum at room temperature for another 24 hrs.The polymer was then sectioned and the inner cores were were conformally coatedin Al2O3 using an atomic layer deposition (ALD) process (Cambridge NanotechS200). The chamber was held at 150 C with a recipe consisting of pulsing H2Ofor 15 ms, purging for 20 s, pulsing trimethyl aluminum (TMA) for 15 ms, purgingagain for 20 s, and repeating the process for the desired layer thickness. The systemwas run for 750 cycles (corresponding to 79 nm) with N2 as the carrier gas at a flowrate of 20 sccm. The coating thickness was verified via spectroscopic ellipsome-try using an alpha-SE Ellipsometer (J.A. Wollam Co., Inc). To expose the epoxycomponent after coating, we made sacrificial cuts on some edges using a razor. Theexposed samples were inserted in an O2 plasma asher between 100 h to 200 h, ina 300 sccm flow rate at 100 W power output, until the epoxy component was fullyremoved.
The computed geometries were fabricated at the microscale using a two photon

81
lithography (TPL) process in a Photonic Professional GT system (Nanoscribe GmbH).A laser power of 15 mW and a scan speed of 10 mm s−1 on an Ip-Dip photoresist.To prevent excessive warping during the developing process, we dried the samplesusing a critical point drying process in an Autosamdri-931 system (Tousimis). Fol-lowing the drying process, the samples were conformally coated in Al2O3 using theatomic layer deposition (ALD) process described above. Depending of the sample,the system was run for 100, 400, or 1600 cycles. After deposition, we introducedperforations on the top ceramic coating using focused ion beam milling (FIB) in anFEI Nova 200 Nanolab system (see Fig. 4.4). The exposed samples were inserted inan O2 plasma asher between 80 h to 100 h, in a 300 sccm flow rate, at 100 W poweroutput. Using a high imaging voltage (∼10 kV) in a scanning electron microscope,it was possible to determine when the totality of the polymer had been removed.
4.9.2 Computational FrameworkThe sample geometries were computed using the numerical framework presentedby Vidyasagar et al. [137]. In this approach, the evolution of a phase field describ-ing anisotropic spinodal decomposition was simulated using a stabilized Fourierspectral technique. The phase field, existing in stable equilibrium at either of thebinary phases (i.e., φ = 0, 1) describes microstructure formation given a particularnon-convex potential energy, respective volume fractions, and preferential direc-tions of anisotropy. The Ginzburg-Landau form of the binary potential ensuredthat the mixture underwent reverse diffusive processes and formed stable phases.The interface energy introduces anisotropy by penalizing normal gradients alongparticular directions. The stabilization and regularization of the Fourier spectralmethod, which was chosen to exploit the computational efficiency of Fast FourierTransforms, ensured that interfacial ringing artifacts caused by non-convexity ofinterface energy were largely mitigated. This is performed using finite differencestencils to obtain asymptotically consistent acoustic wave vectors. The simulationswere initiated with smooth initial Gaussian distributions for probabilistic patternformation and evolution. The interfaces resulting from the simulated spinodal de-composition, i.e., with φ = 0.5, were extracted to yield the geometries used togenerate the metamaterials.
The geometries derived from the computational spinodal decomposition processwere meshed using three-node shell elements (S3R) in Abaqus (Simulia). A meshconvergence study was performed to ensure mesh-independent results, which led to237,000 to 266,000 elements per model, depending on geometry type. Following
82
a corresponding mesh convergence study, the geometries for the octet and TPMSarchitectures consisted of 16,000 and 63,000 elements, respectively.To compare the response of the uniaxial compression experiments to simulations,we performed a set of linear perturbation simulations to establish the linear re-sponse of each geometry. Depending on the parameter being probed, we applied acompression strain of 1% in the selected direction by constraining the out-of-planedisplacement degrees of freedom (dofs) on the plus and minus faces, while leavingthe in-plane displacement dofs and all rotations unconstrained. The remaining fourfaces in the cubic representative volume element (RVE) were left unconstrained, asin the experiments.To predict the full elastic response of the architectures (i.e., elastic surfaces andYoung’s moduli in all directions), we implemented a numerical homogenizationscheme. Upon applying proper periodic boundary conditions, we sequentially im-posed each column of the strain tensor ε ∈ IR6×6 of the form ε = αI (with α = 0.01),and computed the resulting stresses to populate the corresponding effective stresstensor σ ∈ IR6×6. Following Hooke’s law σ = Cε (or σi j = Ci jklεkl followingEinstein’s summation convention), where σ and ε are corresponding columns ofσ and ε, respectively, the full elastic modulus tensor C was obtained. Lastly, thecompliance tensor S = C−1 was calculated to obtain the Young’s modulus E(d) inany direction d as E−1(d) = Si jkldid jdkdl.
4.9.3 Nanomechanical ExperimentsWe performed nanomechanical experiments on the shell-based architectures to de-termine their effective stiffness, strength, and recoverability along the 〈100〉 direc-tions. We performed ex situ uniaxial compression experiments on a minimum ofthree samples per configuration (i.e., each geometry, thickness, and orientation) us-ing a G200 XP Nanoindenter (KLA). The samples were compressed to strains ofup to ε = 35%, at a strain rate of ε = 10−3 s−1, using a 400 µm flat punch tip. The in
situ compressions were performed using an inSEM II Nanoindenter (Nanomechan-ics) under the same conditions as in the ex situ compressions. Cyclic compressionsof up to ten cycles were performed in situ observe the failure mechanisms and toquantify the cycle-specific dissipated energy and recovery. For all experiments, theeffective Young’s modulus was approximated by the loading slope of each cycle’slinear stress-strain regime. For samples exhibiting catastrophic failure (i.e., some ofthe 44 nm samples and all of the 168 nm samples), the strength was approximatedas the maximum load prior to collapse. For the recoverable samples (i.e., some of

83
the 44 nm samples and all of the 11 nm samples), the strength was calculated viathe 0.2% strain offset method.

84
C h a p t e r 5
VIBRATION MITIGATION VIA LATTICE ARCHITECTURES
Section 5.2 has been adapted from:
X. Xia, A. Afshar, H. Yang, C.M. Portela, D.M. Kochmann, C.V. Di Leo & J.R. Greer. “Electro-chemically Reconfigurable Architected Materials”. Nature (2019) 573, 7773 pp. 205–213.doi: 10.1038/s41586-019-1538-z.Contributions: computed the numerical dispersion relations and participated in the writingof the manuscript;
and section 5.3 is part of a collaboration with Jinwoong Cha and Chiara Daraio.
Contributions: designed and implemented the experimental setup, designed and fabricated thesamples, computed the numerical dispersion relations, and conducted the experiments andanalyzed the data.
5.1 Chapter SummaryAt this point in the thesis we have thoroughly explored the static mechanical pa-rameter space of beam- and shell-base architectures but no explorations into theirdynamic response have been done. This chapter will provide an exploration intothe dynamic realm by studying the propagation of mechanical waves in micro-architected beam-based materials of two types.
We will first present a method to fabricate microlattices that utilize electrochemistryto undergo reconfiguration, providing a method to actively modulate the propaga-tion of waves in this material. We numerically explore the dynamic response ofthis material and analyze the emergence of vibrational band gaps upon tunable andreversible reconfiguration.
The second part of this chapter presents a custom experimental technique that en-ables probing the response of small-volume micro-architected materials upon ultra-sonic stimuli in the MHz regime, which is used to measure the emergence of bandgaps upon adding micro-inertia to a polymeric microlattice.

85
5.2 Vibration Band Gaps via Reconfigurable ArchitecturesThe dynamic response of architected materials is an active field of research due totheir ability to exhibit tunable properties such as vibrational band gaps [2, 10, 16,59] or nonlinear wave propagation [33] on top of their already unique static mechan-ical properties. Unlike homogeneous materials, the highly tunable microstructureof these materials has enabled designs that achieve reconfiguration by mechanicaldeformation [104] and instabilities [30, 44], hydration-induced swelling [64, 125],or magnetic actuation [66]. Such smart, multi-functional materials would have along-lasting impact on implantable, deployable, and dynamically tunable devicesif they could overcome the challenges of (i) requiring bulky external control, (ii)only toggling between “on” and “off” states, and (iii) reverting to the initial struc-ture once the external stimulus is removed. Furthermore, most of these reconfig-urable systems are small and idealized; increasing the number of repeating units inperiodic architected materials could potentially induce inhomogeneities similar todefects, gradients or grain boundaries in classical materials [17, 31].
In this section, we demonstrate a mechanism to achieve reconfigurability in ar-chitected materials by exploiting electrochemical alloying/dealloying reactions thatenable continuous, stable, and reversible structural transformations. Using the al-loying couple of silicon and lithium as a prototype system notorious for ∼300%volumetric expansion [89], we designed and fabricated Si-coated tetragonal micro-lattices purposely structured to promote lateral in-plane buckling. Using the result-ing buckled patterns along with the varying constituent material properties due toalloying, we numerically study the evolving dynamic response of these materials atdifferent lithiation stages by computing their dispersion relations.
5.2.1 Fabrication and Experimental Lithiation of Si MicrolatticesTo create micro-architectures with a propensity for collective in-plane buckling, wedesigned a periodic three-dimensional (3D) lattice comprised of tetragonal unit cellswith slender horizontal beams connected to stubby vertical posts. Fig. 5.1a showsa schematic of this lattice geometry and the fabrication process. We first printedthe polymer tetragonal lattice on a glass substrate using two-photon lithography,then sputtered a ∼100 nm-thick Ni conductive layer and deposited a ∼300 nm-thickamorphous Si layer onto each beam within the structure using plasma-enhancedchemical vapor deposition (PECVD). Each sample contained 79 × 79 × 5 unit cellsin the x-, y-, and z-directions, respectively (with the xy-plane corresponding to thesubstrate), and each tetragonal unit cell had a width of 20 µm (horizontal beam

86
length) and a height of 5 µm (vertical post length) (Fig. 5.1b-e). The horizontalbeams had an elliptical cross-section with a vertical major axis of ∼2.6 µm and aminor axis of ∼1.3 µm; the vertical posts had a circular cross-section with a diameterof ∼2.6 µm. A square grid with 5 µm spacing was also patterned on the substrateto prevent delamination of the Si thin film underneath the microlattice (Fig. 5.1c).Each sample contained ∼8.0 µg of Si as the electrochemically active component,with an areal Si loading of 0.25 mg cm−2.
Figure 5.1∣∣∣ Fabrication Process and SEM Characterization of SiMicrolattices Before
and After Lithiation(a) Illustration of the fabrication process of Si microlattices and their structural transfor-mation after lithiation. (b)-(d) SEM images of as-fabricated Si microlattices at differentmagnifications and tilts. (e) SEM image of a FIB-milled cross-section of a representativehorizontal Si-Ni-polymer beam that shows a slight variation in the Ni and Si layer thick-ness. (f)-(i) SEM images of Si microlattices lithiated at a current of C/6 and a cutoff voltageof 0.01 V vs. Li/Li+ at different magnifications and tilts. (b, e, f) are at a tilt angle of 52.(c, d, g, j, i) are top-down views. (f, g) show the orthogonal sinusoidal pattern formedvia cooperative buckling. (h, i) show multiple bistable domains adjoined by clearly visibleboundaries. (h) contains an overlaid illustration of the two bistable states for a four-unit-cellgroup.
Lithiation of Si microlattices inside modified coin cells was conducted galvanos-

87
tatically at a constant current of 5 µA with a Li counter electrode until the voltagedropped to a cutoff voltage of 0.01 V vs. Li/Li+ (see Xia et al. [144] for details).This applied current corresponds to a current density of 0.15 mA cm−2 and a C-rate of ∼C/6, where a C-rate of 1C represents the current at which it takes 1 hourto attain the theoretical capacity of the electrode (3600 mA h g−1Si [102]). Underthese conditions, an average of ∼80% of the theoretical capacity was attained afterthe first lithiation, which corresponds to ∼240% of volumetric expansion in the Sishell [58]. SEM images in Fig. 5.1f-i demonstrate that Si microlattices deformedvia cooperative beam buckling to result in an orthogonal sinusoidal pattern withpairwise opposite concavity upon lithiation. Each horizontal beam accommodatedthe volumetric expansion through radial growth of the cross-sectional area and axialelongation, which prompted in-plane beam buckling. The two ends of each beamwere connected to two nodes, which rotated in opposite directions in response tobuckling-induced torque. We did not observe any cracking or failure of the beamsafter lithiation, and the lattice remained in this stable, buckled state after removingthe applied current. The buckling directions of four neighboring horizontal beamsat each node were coupled through the node’s in-plane rotation, and such cooper-ative buckling led to the formation of the ordered sinusoidal pattern in the lateralplanes (Fig. 5.1g), which is known for its auxetic behavior [27, 28, 68]. The bista-bility of in-plane beam buckling led to the formation of multiple domains in themicrolattice, with the domain boundaries defined by second-mode buckled beams(Fig. 5.1h, i). The buckling pattern transcended vertically across all out-of-planelayers through twisting of the vertical posts (Fig. 5.1f).
5.2.2 In situ Observation and Reversibility of Lithiation-induced BucklingWe constructed an in situ optical setup to capture the dynamics of cooperative buck-ling and domain formation in real-time. A custom-made electrochemical cell witha quartz window was used to visualize structural transformations at a constant cur-rent of C/6 under a digital optical microscope. Fig. 5.2a,b present real-time snap-shots of a typical in situ experiment at progressively lower voltages during lithia-tion (Fig. 5.2a) and at progressively higher voltages during delithiation (Fig. 5.2b).Lithiation was conducted until a cutoff voltage of 0.01 V, and delithiation was con-ducted until a cutoff voltage of 1.5 V. In situ lithiation observation revealed thatincipient slight buckling initiated at a few lattice sites and rapidly spread onto allhorizontal beams, which continued to buckle simultaneously as the lithiation pro-ceeded. Domain boundaries emerged spontaneously between mismatched domains.

88
During delithiation, the horizontal beams almost fully unbuckled, and fracture oc-curred at the nodes when the voltage increased above ∼0.6 V. The Si-Li alloy-ing reaction is a spontaneous discharge process, which implies that the observedlithiation-induced cooperative buckling does not require an external energy supply.
Figure 5.2∣∣∣ In Situ Optical and Electrochemical Characterization of Lithiation-
Induced Cooperative Buckling in SiMicrolattices(a),(b) Progressive optical snapshots during in situ (a) lithiation and (b) delithiation at dif-ferent voltages that reveal cooperative buckling, unbuckling, and domain formation. (c),(d)SEM images of Si microlattices after (c) the 10th lithiation and (d) the 10th delithiationin modified coin cells with a 0.6 V delithiation cutoff voltage. (e) A cyclic voltammogramof a representative Si microlattice with a Li counter electrode at a scan rate of 0.1 mV s−1
between 0.01 V and 1.5 V. The red arrow points out the current fluctuation starting around0.55 V in the 3rd delithiation. (f) Voltage profiles of the 1st and 10th cycles with 1.5 V and0.6 V delithiation cutoff voltages in modified coin cells. The voltages labeled in (f) corre-spond to the voltages shown in (b, c) during in situ experiments. (g) Cycling performanceof Si microlattices with 1.5 V and 0.6 V delithiation cutoffs at C/6 and at varying rates upto 2C.
Fig. 5.2e shows a cyclic voltammogram (CV) of the first three cycles by scanningthe voltage at a rate of 0.1 mV s−1 between 0.01 V and 1.5 V in a modified coin cell.It conveys the reversible Si-Li alloying and dealloying reactions indicated by the re-duction peaks around 0.03 V and 0.21 V and the oxidation peaks around 0.33 V and0.49 V respectively [24, 82]. The initial lithiation of pristine Si occurred at a lower

89
voltage of 0.11 V, and weak reduction peaks around 0.40 V appeared in the secondand third cycles possibly caused by irreversible Li insertion; these features are con-sistent with reports for various binder-free amorphous Si electrodes [82, 114, 150].Noticeable current fluctuations occurred during the third delithiation around 0.55 V,which correlates with the local fracture events observed at a voltage of ∼0.6 V inthe in situ delithiation experiment. To investigate if preventing these unstable eventscould improve cycling reversibility, we conducted galvanostatic cycling tests withtwo delithiation cutoff voltages of 1.5 V and 0.6 V. Fig. 5.2f compares the voltagevs. specific capacity profiles of the 1st and 10th cycles for two samples with thesetwo delithiation cutoff voltages; the voltages that correspond to the in situ snapshotsin Fig. 5.2a,b are also labeled. This plot indicates that restricting the delithiationvoltage to below 0.6 V retained ∼30% of the inserted Li during the 1st lithiation in-side the microlattice and significantly improved the reversible capacity of the Si-Lialloying/dealloying reactions. SEM images of Si microlattices after the 10th lithia-tion and the 10th delithiation with a 0.6 V delithiation cutoff voltage in Fig. 5.2c,dreveal structural integrity and reversibility of geometric transformations in Si mi-crolattices during stable electrochemical cycling. The Li storage capacity vs. cyclenumber plot in Fig. 5.2g demonstrates stable lithiation and delithiation cycling of Simicrolattices, with a 50th cycle capacity retention of 2010 mA h g−1-Si for a 0.6 Vdelithiation cutoff voltage compared with that of only 1025 mA h g−1-Si for a 1.5 Vdelithiation cutoff voltage at a constant current of C/6. Fig. 5.2g also shows thegood rate capability of Si microlattices with a specific capacity of 1300 mA h g−1-Siat a high cycling rate of 2C.
5.2.3 Numerical Dynamic AnalysisThe demonstrated electrochemically driven cooperative buckling in Si microlat-tices uncovers a new regime for dynamic structural reconfiguration in architectedmaterials. Most of the existing reconfigurable materials are soft polymer struc-tures that rely on persistent external stimuli to stay in the deformed geometry [4,27, 30, 64, 66, 104, 125]. The Si microlattices in this work are electrochemicallylithiated to induce simultaneous buckling and plastic deformation, which locks-inthe buckled geometry. The degree of buckling can be continuously tuned and evenreversed by simple electrical control. The Si-Li alloying reaction is an electrochem-ical discharge process that releases energy, which implies that the lithiation-inducedbuckling mechanism can be used as a building block for self-powered deployablestructures that spontaneously transform into the desired geometry while providing

90
energy for lighting or heating. Through the interactions among neighboring beams,cooperative buckling transforms a simple tetragonal lattice into a well-studied sinu-soidal lattice with intriguing mechanical metamaterial properties. These structureshave been shown to have a negative Poisson’s ratio [27, 28, 68] and deform syn-clastically upon out-of-plane bending [81]. In the dynamic realm, they provide anefficient platform for designing tunable phononic crystals.
Elastic Dispersion Relations
To understand the effect of structural reconfiguration on the dynamic responseof this tunable material, we conducted an eigenfrequency analysis on the three-dimensional unit cells at different stages of lithiation using the commercial finiteelement package COMSOL Multiphysics. We considered an extended unit cell con-sisting of 2×2 tetragonal unit cells for the buckled configurations to maintain com-patibility and periodicity, while simulations for the initial as-fabricated configura-tion were done on a single unit cell (Fig. 5.3). The geometry was represented usinglinear tetrahedral elements, with 18,600 to 110,000 elements per unit cell depend-ing on geometry and the required discretization to ensure mesh-independent results.For simplicity, all material properties (i.e., Young’s modulus E, Poisson’s ratio ν,and density ρ) for a given beam were homogenized following a weighted volumeaverage. This resulted in the elements corresponding to the horizontal beams (ellip-tical cross-section) and the vertical beams (circular cross-section) having differentconstituent material properties due to different volume ratios of Si, Ni, and polymerin each.
For a comprehensive understanding of the dynamic response of this material, weconsidered three different cases: (i) as-fabricated Si microlattices (Fig. 5.3a), (ii)lithiated Si microlattices (Fig. 5.3b), and (iii) delithiated Si microlattices (Fig. 5.3c).For as-fabricated Si microlattices, we used the same geometry of the experimentalsamples described above. For lithiated Si microlattices, we considered a realistic80% state of charge (SOC) that corresponds to the Li3Si phase. For delithiatedSi microlattices, we considered a realistic 70% Coulombic efficiency with a 0.6 Vdelithiation voltage cutoff in the first cycle that leads to the Li0.9Si phase. We as-sumed 240% volumetric expansion for Li3Si and 60% for Li0.9Si (compared to Sivolume) based on simulation results by Huang and Zhu [58] and used those val-ues to calculate the corresponding material densities. Poisson’s ratios for Li0.9Siand Li3Si were estimated by the rule of mixtures of the atomic ratios of Si and Li.

91
Figure 5.3∣∣∣ Real- and Reciprocal-Space Unit Cells for Dispersion Relations
(a) Initial, as-fabricated unit cell matching the dimensions of the fabricated samples, (b)lithiated unit cell with buckled beams approximated by sinusoidal functions, resemblingan 80% state of charge state corresponding to a Li3Si phase, (c) delithiated unit cell corre-sponding to a 70% Coulombic efficiency and 0.6 V cutoff corresponding to Li0.9Si, (d) firstBrillouin zone (reciprocal space, black outline) and irreducible Brillouin zone (yellow).The real-space coordinate system is shown in blue.
The Young’s moduli of Si, Li0.9Si, and Li3Si were chosen to be 110 GPa, 85 GPa,and 50 GPa, respectively, based on nanoindentation test results of amorphous Sithin films undergoing lithiation [32]. The calculated material properties for eachmaterial phase are summarized in Table 5.1.
Polymer Ni Si Li0.9Si Li3Si Li
E [GPa] 5 200 110 85 50 –ν 0.38 0.31 0.22 0.31 0.33 0.36
ρ [kg/m3] 1,180 8,080 2,330 1,784 1,199 –
Table 5.1∣∣∣ Material Properties for ReconfigurableMaterial’s Phases
Calculated material properties for each material phase and the Li-Si alloy at different states-of-charge.
The geometry of the buckled beams was approximated using sinusoidal functionsfor simplicity, although slightly smaller curvatures were observed at the center ofsome beams in the samples, and the amplitudes of these functions were chosenbased on experimental SEM images. To estimate the material volume ratios in eachbeam, the thickness of the Li0.9Si and Li3Si layers were calculated from the sinu-soidal geometry and the corresponding volumetric expansion ratios using Solid-Works (Daussault Systèmes). Using these volume ratios, along with the calculatedproperties presented in Table 5.1, we calculated the homogenized material proper-
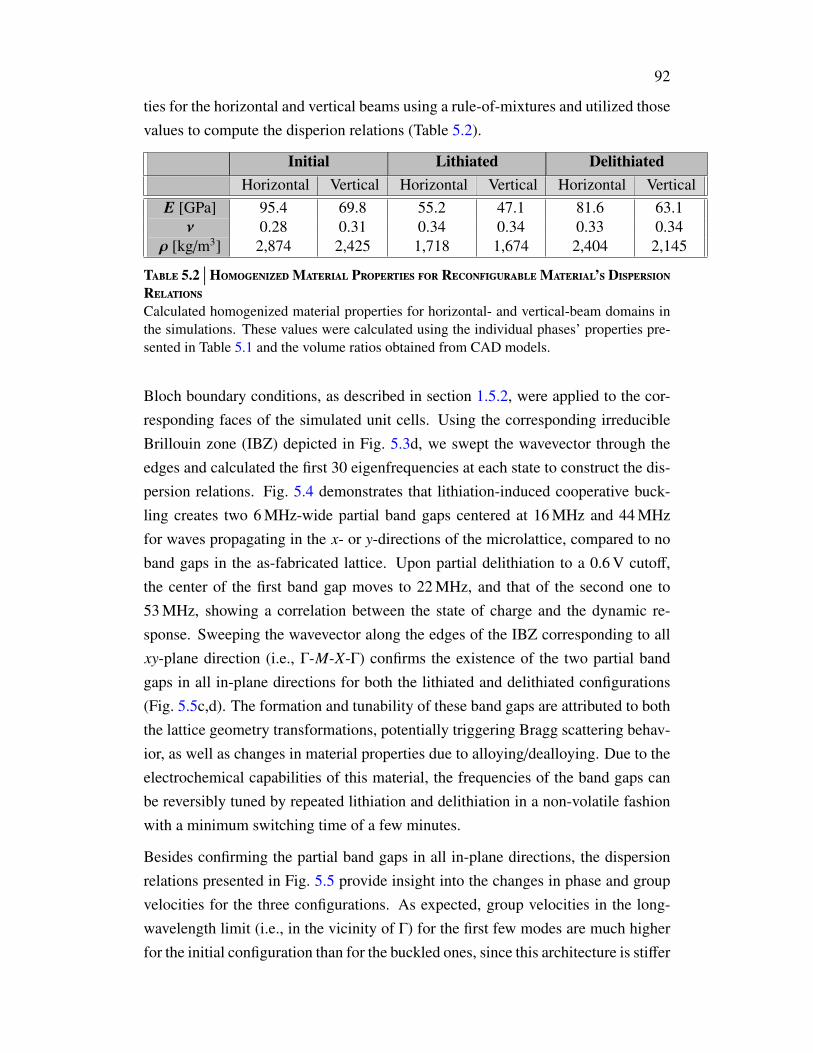
92
ties for the horizontal and vertical beams using a rule-of-mixtures and utilized thosevalues to compute the disperion relations (Table 5.2).
Initial Lithiated DelithiatedHorizontal Vertical Horizontal Vertical Horizontal Vertical
E [GPa] 95.4 69.8 55.2 47.1 81.6 63.1ν 0.28 0.31 0.34 0.34 0.33 0.34
ρ [kg/m3] 2,874 2,425 1,718 1,674 2,404 2,145
Table 5.2∣∣∣ HomogenizedMaterial Properties for ReconfigurableMaterial’s Dispersion
RelationsCalculated homogenized material properties for horizontal- and vertical-beam domains inthe simulations. These values were calculated using the individual phases’ properties pre-sented in Table 5.1 and the volume ratios obtained from CAD models.
Bloch boundary conditions, as described in section 1.5.2, were applied to the cor-responding faces of the simulated unit cells. Using the corresponding irreducibleBrillouin zone (IBZ) depicted in Fig. 5.3d, we swept the wavevector through theedges and calculated the first 30 eigenfrequencies at each state to construct the dis-persion relations. Fig. 5.4 demonstrates that lithiation-induced cooperative buck-ling creates two 6 MHz-wide partial band gaps centered at 16 MHz and 44 MHzfor waves propagating in the x- or y-directions of the microlattice, compared to noband gaps in the as-fabricated lattice. Upon partial delithiation to a 0.6 V cutoff,the center of the first band gap moves to 22 MHz, and that of the second one to53 MHz, showing a correlation between the state of charge and the dynamic re-sponse. Sweeping the wavevector along the edges of the IBZ corresponding to allxy-plane direction (i.e., Γ-M-X-Γ) confirms the existence of the two partial bandgaps in all in-plane directions for both the lithiated and delithiated configurations(Fig. 5.5c,d). The formation and tunability of these band gaps are attributed to boththe lattice geometry transformations, potentially triggering Bragg scattering behav-ior, as well as changes in material properties due to alloying/dealloying. Due to theelectrochemical capabilities of this material, the frequencies of the band gaps canbe reversibly tuned by repeated lithiation and delithiation in a non-volatile fashionwith a minimum switching time of a few minutes.
Besides confirming the partial band gaps in all in-plane directions, the dispersionrelations presented in Fig. 5.5 provide insight into the changes in phase and groupvelocities for the three configurations. As expected, group velocities in the long-wavelength limit (i.e., in the vicinity of Γ) for the first few modes are much higherfor the initial configuration than for the buckled ones, since this architecture is stiffer

93
X
Reduced Wavevector
0
10
20
30
40
50
60
Fre
qu
en
cy (
MH
z)
X
Reduced Wavevector
0
10
20
30
40
50
60
Fre
qu
en
cy
(MH
z)
X
Reduced Wavevector
0
10
20
30
40
50
60
Fre
qu
en
cy (
MH
z)
Si Li3 Si Li0.9Si
a b c
Figure 5.4∣∣∣ SiMicrolattice Elastic Dispersion Relations
(a) as-fabricated Si microlattices, (b) lithiated Li3Si microlattices, and (c) partially delithi-ated Li0.9Si microlattices using Bloch boundary conditions. The Γ-X wavevector path con-sists of that along the edge of the irreducible Brillouin zone, coinciding with the x-direction(equivalent to y-direction due to symmetry).
and stretching-dominated (as opposed to bending-dominated). To decouple the ef-fects of geometry and material properties on the formation of band gaps, we con-structed the dispersion relations of the lithiated and delithiated configurations withthe as-fabricated material parameters (i.e., without changes in the chemical compo-sition of the Si layer). As shown in Fig. 5.5a, using these material properties stillpresents two band gaps in each configuration, with mid-band frequencies changingfrom 18 MHz and 49 MHz to 23 MHz and 54 MHz in the lithiated and delithiatedstates, respectively. This corresponds to relative center-frequency shifts rangingfrom 2 % to 13 %, without any significant qualitative changes in the dispersion.This marginal change in the dynamic response indicates that the geometric trans-formations play a more dominant role than varying material properties in enablingthe formation of band gaps, and strengthen the case for Bragg scattering mecha-nisms (as opposed to local resonance).
To better understand the mechanism that gives rise to these band gaps, we study

94
Figure 5.5∣∣∣ Extended SiMicrolattice Elastic Dispersion Relations
(a) Dispersion relations of the lithiated and delithiated states without accounting for theinherent mechanical property changes upon alloying, (b)–(d), extended dispersion relationsfor the as-fabricated, lithiated, and delithiated unit cells, respectively. The band gaps shownin (c) and (d) prove their existence in all directions within the xy-plane.
the first-order approximation of an Euler-Bernoulli beam in free vibration underpinned-pinned boundary conditions as a potential source of local resonance in theunit cell. Applying the appropriate boundary conditions to the general solution ofthis problem yields a first resonant frequency of f0 = π
2
√EI/ρAL, where I is the
second area moment, A is the cross-sectional area, and L is the length of the beam.Assuming an initially straight geometry (which might over-predict the frequencyby up to ∼30-40% for the curvatures in our samples [25]), and using the effectiveparameters for in-plane bending of the horizontal beams in the Si microlattices (Ta-ble 5.2), we calculated the resonant frequencies to be 11 MHz and 8.6 MHz for thelithiated and delithiated cases, respectively. Since these frequencies are well be-low the first band gaps in each configuration (especially accounting for possibleover-estimation) and do not agree with the trend of the first band gap’s frequency

95
increasing upon delithiation, it is likely that the dominating mechanism for bandgap formation is Bragg scattering instead of local resonance due to beams.
Elastoacoustic Dispersion Relation
Since microdevices that utilize the reconfigurable properties of the Si microlatticescan be readily fabricated as enclosed microlattice-electrolyte systems, we also stud-ied the dynamic response of such devices. To this end, we computed the dispersionrelation of the lithiated microlattice submerged in the electrolyte, while account-ing for coupling between the fluid and the solid. Linear tetrahedral elements wereused for the fluid domain, with a total of 296,000 elements in the geometry. In asimilar fashion to the elastic dispersion relations, we enforce Bloch boundary con-ditions of the form (u+, p+) = (u−, p−)eikx, where u+/− and p+/− correspond to thedisplacement vector and the pressure of a point on the plus and minus faces of theunit cell, applied to the solid and fluid domains respectively, k is the wave vector,and x = x+ − x− is the vector between the plus and minus faces. For simplicity, weapproximated the electrolyte’s properties to be those of water, and we coupled thefluid and solid domains by applying the fluid pressure as a normal traction boundarycondition to the solid elements while shear stresses and viscous effects in the fluidwere neglected.
When compared to the elastic dispersion relation, the elastoacoustic one (Fig. 5.6a)shows a higher density of states at lower frequencies. In addition, we see theemergence of initially non-dispersive fast and slow Biot waves [71] at low frequen-cies. To focus our analysis on the modes that could potentially be experimentallymeasured, we selected those with the largest displacements in the Γ-X-direction(Fig. 5.6b).
These modes were selected by applying an x-direction participation metric of theform
Mx =12
∫Ωs
|ux|
|u|dV +
12
∫Ω f
|Ux|
|U|dV , (5.1)
where u and U are the displacement vectors in the solid and fluid domains, respec-tively. Fig. 5.6 shows these modes with transparencies linked to Mx and color-coded
to qualitatively depict the solid-fluid displacement phase, i.e., φ = sign( ∫
ΩsuxdV∫
Ω fUxdV
),
with red and blue signifying in- and out-of-phase, respectively. This different dy-namic response is marked by the emergence of two acoustic band gaps (in yellow),corresponding to a hybridization of the fast Biot mode with elastic modes of the

96
Figure 5.6∣∣∣ SiMicrolattice Elastoacoustic Dispersion Relation
Numerical study corresponding to the lithiated microlattice submerged in an electrolyte.(a) Overlaid elastic and elastoacoustic dispersion relations for the same geometry, (b) de-tailed view of the elastoacoustic dispersion relation in (a), whose bands have modifiedtransparency depicting the magnitude of their x-direction participation and have been color-coded to depict in-phase (red) or out-of-phase (blue) solid-fluid motion. (c)–(f) Fluid pres-sure fields and elastic modes corresponding to the bands below and above each acousticband gap (yellow). The electrolyte was simplified to have the properties of water, and itspressure field was coupled to the elastic displacements of the microlattice.
microlattice, at ∼10.3 MHz and ∼21.5 MHz. The resulting modes above and belowthese band gaps, shown in Figs. 5.6c-f, depict the strong coupling between the fluid
97
pressure field and the resulting elastic displacements. The observed strong couplingbetween the fluid and solid hints at the beam geometry as an additional tuning pa-rameter to shift or widen the acoustic band gaps. Although the acoustic band gapsare narrower and at different frequencies from the elastic ones shown in Fig. 5.4,this proves the potential of using reconfiguration to create more complex, tunableacoustic band gaps.
Outlook
We envision that tunable phononic band gaps of architected materials, combinedwith the versatility and flexibility of additive manufacturing, could empower novelnon-linear microelectromechanical systems (MEMS) in the RF domain [23]. En-gineering defects in the architected materials also allows for accurate programingof the transformed configurations as well as the formation of domain boundariesbetween several transformed domains, which could also forbid the propagationof waves at certain frequencies. This opens up opportunities to trap and controlphonon modes inside the domain boundaries, which could potentially enable topo-logical metamaterials [123, 124]. Even though the proof-of-concept material sys-tem used in this work (Si-Li) is air-sensitive, other bi-metallic alloying systemswith compatible phase diagrams and realistic diffusion kinetics can be exploredin aqueous electrolytes [42], potentially embedded in dehydration-resistant hydro-gels [146].
5.3 Vibration Band Gaps Enabled by Added Micro-inertiaThe emergence of band gaps in truss architectures via reconfiguration, as shown inSection 5.2, can enable the formation of band gaps commonly through Bragg scat-tering mechanisms. Another potential route consists of designing structural compo-nents or lumped inertia which act as local resonators to also give way to band gaps.This concept has been extensively studied both numerically and experimentally in avariety of periodic 2D materials and structures [5, 59, 105, 140] and has been shownto effectively provide mechanisms to introduce band gaps and wave directionality.This analysis has also been done numerically for 3D truss-based materials whoseunit cells contain some sort of localized micro-inertia [2, 70, 83] wwith tunablegeometry such that the resulting band gaps can be shifted or even widened.
Experimental validation of band gap formation in 3D truss materials has beenachieved with samples at the cm-scale [88, 141], targeting frequencies in the kHz

98
range. Current efforts in this field seek to work with mechanical vibrations in theMHz regime [23], which requires a substantial downscale of material dimensionsas well as reliable techniques to validate their response. Few works have achievedexperimental measurements of 3D truss materials in this frequency range [69, 71],and have only achieved them while the materials are submerged in a fluid (to avoidimpedance mismatching), inherently studying the coupled fluid-solid response andnot that of the material alone.
In this Section we provide a custom method to experimentally measure wave propa-gation in micro-architected 3D materials while in vacuum, and use it to characterizethe dynamic response of a periodic 3D truss-based material. Using advanced fabri-cation techniques, we include µm-scale resonators in the unit cells of the materialand experimentally show the existence of numerically predicted band gaps.
5.3.1 Micro-scale Ultrasonic Transmission MethodExperimentally measuring the dynamic response of micro-architected materialspresents several challenges due to the high frequencies associated with these lengthscales as well as the small sample sizes. In light of these difficulties, we designedand built a custom setup termed the Micro-scale Ultrasonic Transmission Method
(µUTM) that enables dynamic probing of micro-architected materials with overalldimensions of just a few mm3.
The µUTM setup analyzes the transmission of a signal through a material of in-terest using two ultrasonic transducers which come in contact with the sample onopposite sides. These transducers are mounted inside a scanning electron micro-scope (SEM) chamber (Quanta SEM, FEI), which enables in situ observation of thematerial while in a high vacuum environment. The two ultrasonic transducers arefully interchangeable, which allows for a wide range of transducer sizes and nomi-nal frequencies ranging from ∼1 MHz to 125 MHz. For the work presented in thischapter, we utilized two 10 MHz delay line transducers with a nominal element sizeof 0.25 inches and polystyrene delay lines with a nominal 10 µs delay (V202-RM,Olympus). The receiving transducer is mounted on the SEM stage and the sam-ple material is fixed onto the transducer’s delay line surface with colloidal graphitepaste (Fig. 5.7a). The transmitting transducer is mounted on a nanoindenter arm,which enables positioning with nm-precision. Imaging with the electron beam thenallows for accurate sample pre-strain measurements (Fig. 5.7b).
The two transducers are connected to an external lock-in amplifier equipped with

99
an arbitrary waveform generator (UHFLI, Zurich Instruments) via a BNC vacuumfeedthrough. Depending on the desired signal power, a high frequency voltage am-plifier may be connected between the lock-in amplifier and the transmitting trans-ducer. Since each transducer’s position can be fully adjusted, the relative distancebetween the two transducers may be tuned for the desired sample pre-strain. Aschematic of the full setup is shown in Fig. 5.8
Figure 5.7∣∣∣ Micro-scale Ultrasonic TransmissionMethod (µUTM) Setup
(a) Close-up view of the transmitting transducer, the polystyrene delay line, and a micro-architected sample, and (b) photograph of the setup inside the SEM chamber, while thechamber is open and the transducers are not aligned. Scale bar, 1 cm.
NanoindenterTransducer 1Transducer 2
SEM
Sample
HF
Amp
Lock-In Amp OUT
IN
Figure 5.8∣∣∣ µUTM Setup Schematic
The full setup, with both transducers contacting the sample, is depicted. Depending on theamplitude of signal to be transmitted, a high frequency amplifier is connected between thethe lock-in’s output waveform and the transducer.

100
Method Validation
To validate the µUTM setup, we characterized the transmission through a homo-geneous elastomer, aqualene dry couplant (Olympus), through a frequency-spaceranging from 1 MHz to 3 MHz. A cylindrical puck of aqualene with a diameterof 0.64 mm and a 2 mm-thickness was placed between the two transducers withminimal pre-strain. The first test consisted of transmitting a high-frequency si-nusoidal waveform and observing the transmitted waveform using an oscilloscope(DPO 3014, Tektronix), which confirmed low distortion of the signal and an ap-propriate delay corresponding to the two delay lines and the aqualene couplant(Fig. 5.9). As expected, a lower signal amplitude was measured by the receivingtransducer due to the inherent damping in the elastomer as well as a relatively lowcontact force between both transducers.
Figure 5.9∣∣∣ µUTM Validation with Single-Frequency Signal
(a) Image of the setup under vacuum with (b) a 2 mm aqualene puck between the twotransducers. (c) Oscilloscope observation of a 10 MHz pulse transmission, depicting theexpected delay associated with the delay lines and the elastomeric puck.

101
The second test consisted of emitting a chirp signal with a 1 MHz to 3 MHz fre-quency content and analyzing the frequency content of the transmitted signal. Thiswas done to ensure that the transducers could properly send and receive signals inthis frequency range, and to confirm the non-dispersive response of a homogeneouselastomer such as aqualene.
Figure 5.10∣∣∣ µUTM Validation with Chirp Signal
(a) Chirp with frequency content from 1 to 3 MHz and (b) Fast Fourier Transform (FFT) ofthe transmitted signal, showing proper tranmission and reception of the signal. Scale bar,1 mm.
Fig. 5.10 shows the emitted chirp and the resulting transmitted frequency content,which was obtained by computing the fast Fourier transform (FFT) of the signalfrom the receiving transducer. As expected, the frequency content of the signal wasbetween 1 MHz to 3 MHz, showing proper functioning of the transducers and nodispersion from the elastomer.
5.3.2 Auxetic Material with ResonatorsTo design architected materials with band gaps, we used a variation of the auxeticunit cell design presented by Krödel et al. [70]. We implemented the concept ofa resonator by including a cantilever beam at the center of the unit cell with asphere attached at its end. To target frequencies in the MHz regime, we selectedthe tetragonal unit cell dimensions to be lx = ly = 60 µm and lz = 209 µm, witha junction angle θ = 70 (Fig. 5.11a). The strut diameters were kept constant atr = 6 µm between the unmodified unit cell and the one with the resonator. Theresonator’s cantilever beam, placed at the center of the unit cell, was chosen to havelength lr = 53 µm and a sphere with radius rs = 24 µm. These parameters were

102
selected to optimize the band gap response of the material as well as the fabricationprocess.
Figure 5.11∣∣∣ Auxetic Unit Cell Design with Resonators
(a) Auxetic unit cell without a resonator and (b) modified unit cell with a cantilever beamand a spherical mass at its end, acting as the resonator.
Elastic Dispersion Relations
We computed the elastic dispersion relations for the unit cells in Fig. 5.11 in thesame manner as in Section 5.2.3. This analysis was restricted to the Γ-X directionsince this was the direction of experimental interest. The dispersion relation for theunmodified unit cell (Fig. 5.12) shows no band gaps, while that of the resonator-containing unit cell showed the emergence of a band gap centered at ∼1.4 MHz.
The modes corresponding to the bands above and below the band gap (insets inFig. 5.12b) show coupling between the resonator and the rest of the unit cell, mean-ing that the emergence of the band gap is not due to the resonator’s contributionalone. To further analyze this response, we approximate the resonator in Fig. 5.11bas a clamped Euler-Bernoulli beam with a lumped mass at its free end (equivalent

103
Figure 5.12∣∣∣ Dispersion Relation of Auxetic Unit Cells
(a) Dispersion relation of unmodified unit cell from Γ to X showing no band gap, and(b) dispersion relation of the resonator-containing unit cell showing the emergence of aband gap, which seems to appear due to the coupled interaction of the resonator and thesupporting lattice. Pure resonance of the cantilever beam is observed in the kHz regime.
to a spring-mass system), whose resonant frequency can be approximated as
f0 =1
2π
√kbend
mtot, (5.2)
where kbend is the stiffness of the beam in bending, mtot = 33140m + M is the par-
ticipating fraction of the beam mass m plus the lumped mass M at the end. Tak-ing kbend = 3EI/l3
r , where E is the constituent material’s Young’s modulus andI = πr4/4 is the second area moment, and using the dimensions and material prop-erties for the cantilever beam in this work (E = 2.7 GPa, ρ = 1, 200 kg m−3),yields an expected resonant frequency of f0 ≈ 140 kHz. This approximate res-onant frequency is confirmed by the flat band corresponding to f = 124 kHz inFig. 5.12b, whose mode shows the expected motion of the resonator alone. Giventhe dimensions associated with the auxetic unit cell as well as the material proper-ties of polymer, it is impossible to achieve a feasible cantilever configuration withinthe volume of the unit cell to have f0 in the MHz range, hence the need to recur toresonator-unit cell coupled modes for band gap emergence.
µUTM Testing
To experimentally measure the band gap in the dispersion relation, we fabricated10 × 48 × 16 tessellations (in the x-, y-, and z-directions, respectively) of the unitcells in Fig. 5.11 out of IP-S photoresist using a two-photon lithography system

104
(Nanoscribe, GmbH). A laser power of 25 mW and a scan speed of 20 mm s−1 wereused on a Si substrate, leading to overall sample dimensions of ∼0.6 × 2.9 × 3.3mm. To promote proper contact with the transducers, a 6 µm plate was printed onthe plus and minus x-faces of the microlattices. Following sample development inpropylene glycol monomethyl ether acetate (PGMEA) and isopropyl alcohol (IPA),the samples were dried using a critical point dryer (Autosamdri 931, Tousimis) andcarefully delaminated from the substrate using tweezers. Using colloidal graphiteon one of the x-faces as a binder, the sample was then attached to the receivingtransducer and put in contact with the transmitting transducer under vacuum asshown in Fig. 5.13a,b. This orientation ensured probing the microlattices in the Γ-Xdirection.
To probe the transmission response of the microlattices, we performed a frequencysweep of a continuous sine wave from 1 MHz to 3 MHz at a compression strain of∼10 % (Fig. 5.13d,e). Fabrication defects in the unmodified microlattice preventedtesting of this sample due to improper contact and failure of truss members. Theresonator-containing microlattice, on the other hand, showed an ∼200 kHz-wideband gap indicated by a signal amplitude drop of more than an order-of-magnitudecentered at ∼2.4 MHz. The shift in the band gap center-frequency compared to thenumerically predicted one is attributed to an under-estimation of the photoresist’sYoung’s modulus as well as the effect of prestress on the propagation of waves inthe material, which was not accounted for in the dispersion relations.
To confirm the existence of the band gap, we probed the material using a chirp witha frequency content from 1 MHz to 3 MHz. Applying a fast Fourier transform onthe signal from the receiving transducer (Fig. 5.14) indicated the same band gap asthe one observed in Fig. 5.13c.
5.3.3 OutlookThe implementation of the µUTM setup has allowed for previously unachievabledynamic characterization of nano- to micro-architected 3D materials. This abil-ity to validate the exotic properties of such metamaterials could pave the way fora range of explorations towards information transport through mechanical waves,reconfigurable architected materials (as discussed in Section 5.2), or waveguidingand energy focusing for nanoelectromechanical devices. The concept of introduc-ing micro-inertia (i.e., resonators) has proven to be effective for frequency rangesbeyond those of the resonator’s frequencies if proper coupling with the surrounding

105
Figure 5.13∣∣∣ Frequency Sweep of AuxeticMicrolattices
SEM image of the (a) unmodified and (b) resonator-containing microlattices upon contactwith the transducers. (c) Frequency sweep from 1 MHz to 3 MHz, detailed view of sample(c) prior to contact, and (d) with some compressive strain due to contact. Scale bars in (a),(b), 1 mm and (d), (e), 100 µm.
Figure 5.14∣∣∣ Frequency Chirp through AuxeticMicrolattices
(a) Signal from the receiving transducer and (b) FFT of the signal in (a), indicating theexistence of a band gap at ∼2.4 MHz. This transform was computed on an oscilloscope withno filtering, resulting more signal noise than the sweep conducted by the lock-in amplifier.
structure is achieved. Combining these capabilities with those of a reconfigurablematerial could lead to realizations with both tunable and permanent band gaps,

106
drastically expanding the achievable dynamic parameter space.
107
C h a p t e r 6
DYNAMIC LOADING ON CARBON-BASED LATTICEARCHITECTURES
This chapter has been adapted from:
C.M. Portela, A. Vyatskikh & J.R. Greer. “Fabrication and Design of Composites with ArchitectedLayers”. U.S. Patent Application No. 16/206,163 and PCT International Patent ApplicationNo. PCT/US18/63306 (November 30, 2018)Contributions: participated in the conception and design of the project, fabricated samples,performed mechanical tests and analyzed the data, and partially wrote the application;
C.M. Portela, B.W. Edwards, D. Veysset, Y. Sun, K. Nelson, D.M. Kochmann & J.R. Greer. “Su-personic Impact on Nano-architected Carbon Materials”. In Preparation (2019)Contributions: participated in the conception and design of the project, designed and fab-ricated samples, participated in the mechanical testing and analyzed the data, and wrote themanuscript;
and section 6.5 was done in collaboration with Christopher J. Cummins and Jeffrey T. Lloyd (ARL),
who conducted the blast experiments.
6.1 Chapter SummaryThis chapter provides further exploration into the dynamic realm of architectedmaterials by studying the impact and blast responses of lattice architectures at thenanometer and centimeter scales, respectively. We outline fabrication methods thatenable the creation of carbon-based architected materials for these studies at bothscales, and perform quasi-static characterization prior to dynamic loading.
The first exploration pertains to supersonic impact of micro-particles onto nano-architected carbon materials, where we analyze cratering on carbon materials ofdifferent geometric parameters and at impact velocities ranging from ∼40 m/s to∼900 m/s. Using dimensional analysis, we obtain a predictive tool that estimatescratering as a function of the initial impact conditions.
We conclude this chapter by studying the blast loading response of beam-basedcarbon and carbon-epoxy architected materials with sample sizes on the order of
108
a few centimeters and feature sizes on the order of ∼100 µm, which are shown toprovide significant energy dissipation while at densities of ∼285 kg/m3.
6.2 Fabrication ProcessesThe fabrication process of carbon-based materials at the nano- to micro- to macro-scale revolves around optimized pyrolysis processes, i.e., controlled high-temperatureprocessing in inert atmospheres. Most commonly, the precursor material is a poly-mer whose organic components decompose during the pyrolysis process. Since thisprocess involves significant mass reduction and volumetric shrinkage, special careneeds to be taken such that minimal warping occurs. Depending on the precursormaterial and processing temperatures, the resulting pyrolyzed carbon material canincrease in elastic modulus and strength by more than an order of magnitude, whilealso substantially decreasing in density. In this section, we present the methods tofabricate carbon-based materials at two different scales.
6.2.1 Nano-Scale Carbon MaterialsWe fabricated nano-architected carbon materials using a polymeric precursor mate-rial with nm-scale features. The precursor architecture was fabricated out of IP-Dipphotoresist using a two-photon lithography (TPL) Photonic Professional GT (Nano-scribe GmbH) system. Due to the high temperatures associated with the pyrolysisprocess, the samples were printed on a Si substrate (as opposed to SiO2) to preventunwanted substrate warping or melting.
As mentioned above, the significant mass reduction and volumetric shrinkage of theprecursor material presents fabrication challenges, since significant warping occursif the material is not properly decoupled from the substrate. This issue arises fromthe lack of shrinkage in the Si substrate that effectively imposes an unwanted zero-displacement boundary condition to the precursor material in contact with it. Tomitigate this, Bauer et al. [9] and Zhang et al. [152] printed the precursor materialof interest on top of a monolithic pillar of the same material, such that the pillar un-dergoes warping at the point of contact with the substrate while little-to-no warpingoccurs at the top. This is a satisfactory solution since the effective substrate of theprecursor material becomes the top of the pillar, which undergoes shrinkage at thesame rate as the precursor material itself. Although it has proven to be an effectiveapproach to study these materials, it is only viable for precursor samples with foot-print dimensions of ∼100× 100 µm due to the extensive print times associated withthe monolithic pillar.
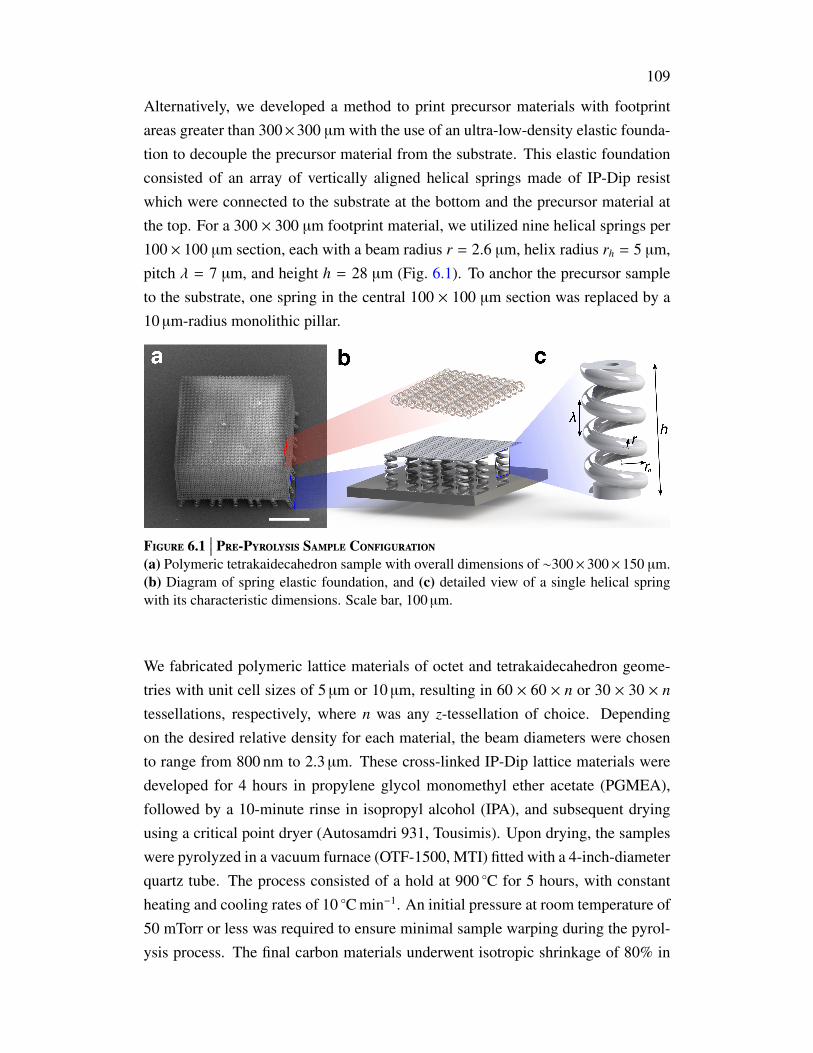
109
Alternatively, we developed a method to print precursor materials with footprintareas greater than 300×300 µm with the use of an ultra-low-density elastic founda-tion to decouple the precursor material from the substrate. This elastic foundationconsisted of an array of vertically aligned helical springs made of IP-Dip resistwhich were connected to the substrate at the bottom and the precursor material atthe top. For a 300 × 300 µm footprint material, we utilized nine helical springs per100 × 100 µm section, each with a beam radius r = 2.6 µm, helix radius rh = 5 µm,pitch λ = 7 µm, and height h = 28 µm (Fig. 6.1). To anchor the precursor sampleto the substrate, one spring in the central 100 × 100 µm section was replaced by a10 µm-radius monolithic pillar.
Figure 6.1∣∣∣ Pre-Pyrolysis Sample Configuration
(a) Polymeric tetrakaidecahedron sample with overall dimensions of ∼300× 300× 150 µm.(b) Diagram of spring elastic foundation, and (c) detailed view of a single helical springwith its characteristic dimensions. Scale bar, 100 µm.
We fabricated polymeric lattice materials of octet and tetrakaidecahedron geome-tries with unit cell sizes of 5 µm or 10 µm, resulting in 60 × 60 × n or 30 × 30 × n
tessellations, respectively, where n was any z-tessellation of choice. Dependingon the desired relative density for each material, the beam diameters were chosento range from 800 nm to 2.3 µm. These cross-linked IP-Dip lattice materials weredeveloped for 4 hours in propylene glycol monomethyl ether acetate (PGMEA),followed by a 10-minute rinse in isopropyl alcohol (IPA), and subsequent dryingusing a critical point dryer (Autosamdri 931, Tousimis). Upon drying, the sampleswere pyrolyzed in a vacuum furnace (OTF-1500, MTI) fitted with a 4-inch-diameterquartz tube. The process consisted of a hold at 900 C for 5 hours, with constantheating and cooling rates of 10 C min−1. An initial pressure at room temperature of50 mTorr or less was required to ensure minimal sample warping during the pyrol-ysis process. The final carbon materials underwent isotropic shrinkage of 80% in

110
each dimension, resulting in unit cell sizes of ∼1 µm and ∼2 µm, and beam diame-ters ranging from ∼200 nm to 600 nm.
Figure 6.2∣∣∣ Carbon-Based NanolatticeMaterial Obtained via Pyrolysis
(a) Sample polymeric tetrakaidekahedron material with 26% relative density and ∼10 µmunit cells, and (b) resulting carbon tetrakaidekahedron material after pyrolysis with ∼2 µmunit cells. (c),(d) Magnified views of (a) and (b), respectively. Black scale bars 40 µm,white scale bars 5 µm.
6.2.2 Macro-Scale Carbon MaterialsWe fabricated the polymeric precursor materials out of PR-48 resin (Colorado Pho-topolymer Solutions) using an Ember DLP 3D printer (Autodesk). The resultingmaterials were rinsed with IPA after printing and then dried with compressed ni-trogen. The overall sample dimensions ranged from a few cubic centimeters to thefull 13 × 6 × 4 cm build volume of the printer. Besides fabricating typical latticematerials with unit cells of ∼1 mm, and beam diameters ranging from 100 µm to200 µm (Fig. 6.4), we fabricated shell-based architectures with wall thicknesses of∼300 µm to showcase the versatility of this method.
Compared to the pyrolysis process from section 6.2.1, these larger volumes of poly-meric precursor material (with masses up to ∼20 g) required a more controlled tem-perature profile to minimize warping during pyrolysis. This temperature profile was

111
optimized based on simultaneous thermogravimetric analysis (TGA) and differen-tial thermal analysis (DTA) performed on a PR-48 block in an N2 environment anda heating rate of 5 C min−1 to 900 C (Fig. 6.3). These results indicated the crit-ical temperatures at which decomposition took place, which resulted in extendedholds at those temperatures during the pyrolysis process. Analogous to the nano-scale sample process, pyrolysis was done in vacuum at pressures below 100 mTorrbut to a peak temperature of 1300 C inside a 4-inch-diameter mullite tube. Thetailored holds at the critical temperatures, along with a total temperature cycle of∼24 h, significantly minimized warping of the resulting carbon materials and en-abled isotropic shrinkage in each dimension of ∼66% and a mass reduction of 95%.
Figure 6.3∣∣∣ TG/DT-Analysis on PR-48
Simultaneous thermogravimetric (TG) and differential thermal analysis (DTA) on a PR-48sample, in a N2 environment and a heating rate of 5 C min−1 to a maximum temperature of900 C. (a) Relative weight evolution as a function of temperature, and (b) relative weightdifferential per degree Celsius as a function of temperature. Data courtesy of Kai Narita.
As mentioned previously, the versatility of this method was demonstrated by thefabrication of periodic beam- and shell-based carbon architected materials with den-sities ranging from 123 kg m−3 to 400 kg m−3 based on the chosen geometric param-eters (Figs. 6.4 & 6.5). Additionally, the fabrication of architected carbon net-shapecomponents was demonstrated by printing and pyrolyzing a tubular structure madeup of tetrakaidecahedron unit cells (Fig. 6.6).
Carbon-Epoxy 3D Composites
As an alternative material system, we fabricated carbon-epoxy composites using thecarbon materials from section 6.2.2 as continuous reinforcing phases, as describedby the general process in Fig. 6.7. The architected carbon reinforcing phases in this

112
Figure 6.4∣∣∣ Carbon-Based LatticeMaterials Obtained via Pyrolysis
(a) Polymeric octet material with a relative density of 15% consisting of a 17 × 17 × 17tessellation, and (b) resulting carbon octet material after pyrolysis, (c) 3D kagome beam,(d)–(f) close-up images of (a)–(c), respectively.
study were infiltrated with a low-viscosity epoxy (635 3:1 thin epoxy, US Compos-ites) and cured at room temperature for 8 hours.
The bi-continuous columnar shell material depicted in Figs. 6.8a,d underwent adensity transition from ρ = 123.7 kg/m3 to 1152 kg/m3, while the octet-cube inFigs. 6.8c,f transitioned from 255 kg/m3 to 1160 kg/m3. The resulting compositematerials had an average density of at least two times lower than that of light metals(e.g., aluminum, ρAl = 2700 kg/m3), and at least 40% lower than some carbon fiberreinforced polymers, which commonly have a density of 1600 – 1800 kg/m3.
6.3 Baseline Quasi-static CharacterizationBefore dynamically testing the nano- and macro-scale materials described above,we characterized their quasi-static response at both scales using well-establishedmethods.

113
Figure 6.5∣∣∣ Bi-Continuous Shell-Based CarbonMaterial
(a),(b) Polymeric shell-based geometry of the columnar type from chapter 4, and (c),(d)resulting carbon material after pyrolysis.
Figure 6.6∣∣∣ Carbon Tubular Part with Tetrakaidecahedron Architecture
(a)–(c) Tubular part in its polymeric form, (d)–(f) resulting carbon tube.

114
Design of phase geometries(CAD)
Manufacture reinforcing phase(s)(AM)
Pyrolysis process(Furnace)
Optional: Apply coating(Electro-plating, evaporation,
ALD, sputtering)
Optional: Infiltrate with matrix phase(s)
Optional: Post-cure material(UV, temperature)
Select precursor resin
Expose resin with designed pattern via SLA or DLP 3D printing, with appropriate exposure settings
Clean printed part and UV post-cure
Place sample inside desired atmosphere (or vacuum)
Set temperature profile (process time, temperatures, holds)
Cool-down and remove from atmosphere (or vacuum)
Vacuum degas, sonicate
Figure 6.7∣∣∣ Fabrication Process of Continuous-Phase 3D Carbon Composites
Flow chart depicting the fabrication process of continuous-phase 3D architected carboncomposites. Optional processes are shown in grey.
Figure 6.8∣∣∣ Carbon-Epoxy Composites
(a)–(c) Carbon phases prior to infiltration, and (d)–(f) resulting composite materials.

115
6.3.1 Nanomechanical TestingTo obtain the static mechanical properties of the nano-architected carbon materi-als, we fabricated representative 10 × 10 × 10 tessellations of the tetrakaidecahe-dron architecture with relative densities of ρ = 8% and 17%, and performed in
situ nanomechanical compression experiments1. Following the pyrolysis step, thesamples were supported by a sacrificial central pillar, which was designed to failupon the initial loading regime to allow proper contact between the substrate andthe sample (Fig. 6.9). A minimum of seven samples per configuration were com-pressed in a custom nanomechanical instrument inside of an SEM chamber (Quanta200 FEG, Thermo Fisher), which provided load-displacement data along with real-time observation of the experiment at quasi-static strain rates of ε = 10−3 s−1. Theload-displacement data was converted to stresses and strains by normalizing by thesample footprint area and height, respectively. Since pillar failure did not occur atthe same point for all samples, zero-strain was defined to be the start of the test forconsistency.
All samples exhibited a linear loading regime once proper contact was established,with some sporadic settling events, as well as brittle, catastrophic failure. The set-tling events and brittle failure are both depicted as sudden strain bursts (i.e., hori-zontal lines with few data points) in the stress-strain response presented in Fig. 6.9.This response was used to compute the effective Young’s moduli and strength of thetwo material configurations, which were defined as the slope of the response afterpillar collapse and the maximum stress prior to catastrophic failure, respectively.Effective Young’s moduli of 0.43 ± 0.09 GPa and 1.1 ± 0.1 GPa were obtained forthe 8% and 17% relative density configurations, respectively, which are consistentwith the values reported by Bauer et al. [9] and Zhang et al. [152] when accountingfor the difference in architecture and relative density compared to the samples inthose works. We also calculated effective strength values of 25±4 MPa and 79±13MPa for the 8% and 17% relative density configurations, respectively, which wereexpectedly lower than those reported for octet carbon nanolattices [9, 152].
6.3.2 Macro-scale TestingUniaxial Compression of Octet Phases and Composites
We performed quasi-static uniaxial compression on octet carbon reinforcing phases(ρ ≈ 15%) with and without epoxy infiltration at a strain rate of ε = 10−3 s−1 using
1We tested these configurations specifically since they represent the types of materials that weretested dynamically later in this chapter.

116
Figure 6.9∣∣∣ Quasi-Static Compression of Carbon Nanolattices
Uniaxial in situ compression of (a) ∼8% relative density samples, and (b) ∼17% relativedensity samples, with insets showing a representative sample before and after compression.In both cases catastrophic, brittle failure was observed. All samples were fabricated ona sacrificial pillar which collapsed at low loads to enable proper sample contact with thesubstrate. Zero-strain was defined as the beginning of the experiment for consistency. Scalebars, 10 µm.
an Instron load frame. Since the underlying tessellation consisted of 17 × 17 × 17unit cells (with a characteristic unit cell size of ∼ 590 µm), we assume sufficientseparation of scales to discuss effective material (rather than structural) properties.
The experiments depicted in Fig. 6.10 were used to obtain an effective modulusand yield strength for this octet carbon material with approximately 15% relativedensity. Young’s moduli of 669.7 and 495 MPa were calculated, while the yieldstrengths—defined as the stress at the initial catastrophic fracture event—were cal-culated to be 11.33 and 8.67 MPa. These carbon phases, without a matrix phase,were susceptible to defects such as minimal warping at the top surface which af-fected contact with the compression head.
Upon infiltration with epoxy, the mechanical behavior of these materials changedsignificantly. Most notably, the material did not undergo any catastrophic events andunderwent significant strain hardening past ε > 0.1. Fig. 6.11 shows the response

117
Figure 6.10∣∣∣ Quasi-Static Compression of CarbonMacro-Lattices
(a) Carbon octet material prior to loading, and (b),(c) representative samples after catas-trophic failure, (d) stress-strain response of two representative samples, depicting discretefailure events.
of the material under compression, with significant densification after ε = 0.5 butno catastrophic failure or through-sample cracks.
These experiments resulted in Young’s moduli of 1.82 and 2.24 GPa, and yieldstrengths of 59.8 and 69.6 MPa. At these strength values, this material has a strengthcomparable to some metals (e.g., copper), while at 13% of their density. We definethe yield strength σy for these materials using the 0.2% strain offset method, and wealso define a flow stress σ f corresponding to the maximum stress before a negativetangent modulus was observed (i.e., before a decrease in stress). The flow stressfor these samples were calculated to be 71.9 and 78.2 MPa. These values andcomparisons to some metals are summarized in Table 6.1.
Although the fill fraction of the carbon phase was low in these materials, infiltrationproved to be a potential route to mitigate catastrophic failure while still enablinga material with relatively low density to be produced. The non-catastrophic andstrain-hardening response for these composites makes them well suited for energyabsorption applications. For instance, in these quasi-static experiments the specific

118
Figure 6.11∣∣∣ Quasi-Static Compression of Carbon-Epoxy Composite
(a) Sample prior to loading, and (b) final sample configuration after compression to ε =
50%. (c), Stress-strain response of two representative samples exhibiting significant strainhardening beyond ε = 10%.
energy absorption (SEA) can be defined as
ψ =Wρ,
where W is the strain energy density, defined as W =∫σdε, and ρ is the material
density. Calculating this metric for the experiments in Fig. 6.11c yielded W = 30.9MJ/m3 and ψ = 26.7 J/g, at a density of ρ = 1159 kg/m3. Comparing these metricsto those of stainless steel 316L octets [127], whose reported values were ψ = 10.1J/g and ρ = 2160 kg/m3, shows that the carbon octet composites have twice theSEA capacity while at half the density.
Four-point Bending of Octet Phases and Composites
We also explored the bending behavior of the same octet carbon materials using a4-point bending setup following ASTM standard D6272.

119
Material Density, ρ [kg/m3] E σy [MPa] σ f [MPa]
Carbon octets 1 291 669.7 MPa 11.33 -Carbon octets 2 273 495 MPa 8.67 -
Composite octets 1 1157 1.82 GPa 59.8 71.9Composite octets 2 1159 2.24 GPa 69.6 78.2
Aluminum 2700 69 GPa 95 -Copper 8960 117 GPa 70 -
Table 6.1∣∣∣ Mechanical parameters of tested carbon octet materials including comparison
to some metals, where E corresponds to the Young’s modulus, and σy and σ f represent theyield strength and flow stress, respectively.
Bending of the carbon phase without a matrix showed catastrophic failure, as ob-served in the compression experiments. Fig. 6.12 shows the experiment and corre-sponding data, which yielded an approximate flexural strength of 10.34 MPa, and abending modulus of EB = 1.4 GPa.
Figure 6.12∣∣∣ Four-Point Bending of Carbon Phase
(a) Sample prior to bending, and (b),(c) failed sample morphology. (d) Correspondingstress-strain response.
The same experiment was performed on epoxy-infiltrated materials (Fig. 6.13),which resulted in bending moduli of 3.3 and 3.9 GPa. A flexural strength valuewas not calculated since no failure was observed within the allowable strain limitof this ASTM standard. After undergoing significant bending, the samples returnedto their original shape with no evident permanent deformation or cracks.

120
Figure 6.13∣∣∣ Four-Point Bending of CompositeMaterial
(a) Sample prior to bending, and (b) sample at the maximum allowable bending, and (c)sample after experiment. (d) Corresponding stress-strain response with no indication offailure. The drastic stiffening beyond strains of 1% corresponded to the sample contactingthe bottom support.
6.4 Supersonic Impact on Nano-scale Carbon Lattice ArchitecturesAs presented in previous chapters, the use of architecture in materials has beenreported to enable novel combinations of static mechanical properties such as highstiffness- and strength-to-density ratios [15, 93, 153]. In the dynamic regime, beam-based architected materials with features on the order of hundreds of microme-ters have been reported to exhibit high energy absorption under low-velocity im-pact [12, 95, 149], which was highly dependent on the type of architecture used. Onthe other hand, ballistic impact experiments to velocities of ∼1,300 m/s on largermetallic truss-core sandwich materials showed a transition ballistic velocity beyondwhich architecture did not significantly affect the material response, hinting to dif-ferent physical phenomena in these two regimes. Evidence of this regime transitionwas also shown at smaller scales in compaction experiments of polymeric micro-lattices [52, 73], which ranged in velocity from 0.15 m/s to ∼300 m/s.
While most of the underlying physics that describe this unique response are scale-independent, i.e., applying to materials with centimeter- to micrometer-scale featuresizes, interesting size effects appear when nanometer-scale features are achieved.Two examples of these size effects have been reported in truss-based materialswith hollow thin-walled ceramic struts [92] and monolithic carbon struts [9, 152],

121
whose feature sizes span from tens of nm to approximately 600 nm. Each of thesestudies independently observed enhanced structural recovery and almost-theoreticalstrength, each directly attributable to the nano-scale feature dimensions. While thissize effect has been thoroughly explored in the quasi-static response of architectedmaterials, no work has explored its implications in the dynamic response of thesematerials. Exploiting these size effects in the dynamic regime has potential to en-able ultralightweight impact-resistant materials for a variety of applications such asballistic impact, blast loading, and micrometeoroid shielding in space.
One of the challenges associated with mechanical testing of nano-architected ma-terials is that these materials rarely achieve a proper separation of scales betweenthe unit cell size and a relevant sample dimension [9, 52, 94, 152]. Several nano-architected materials have been limited to tessellations of just a few (i.e., < 7) unitcells in each direction, which can fall short in approximating the true continuummaterial response. For example, this lack of separation of scales can become detri-mental in impact testing when the time scale associated with impact allows elasticwaves to propagate information from the free boundaries back to the projectile. An-other difficulty in dynamic testing of nano-architected materials is associated withthe lack of reliable methods that achieve consistent loading conditions while beingable to capture nanosecond- and (at least) micrometer-scale response of the sam-ples.
Here, we propose a method to design, fabricate, and test nano-architected carbonmaterials at supersonic impact speeds of up to ∼1 km/s, while properly address-ing the challenges described above. Using tetrakaidecahedron architectures as theperiodic building-blocks, we fabricated these materials by the two-photon polymer-ization and pyrolysis process described in section 6.2.1, which ultimately yielded acarbon-based nano-architected material as shown in Fig. 6.14. The resulting carbonunit cell size was ∼2 µm, with beam diameters ranging from ∼300 nm to 500 nm,achieving relative densities (i.e., fill fractions) of ρ ≈ 8% and 17%. To achieveproper separation of scales, the material tessellation consisted of a minimum of30× 30× 15 unit cells and the SiO2 projectile diameter was approximately an orderof magnitude larger that the unit cell size. In this work, we explore the effects ofrelative density on the impact response of nano-architected carbon materials at im-pact velocities ranging from 40 m/s to 900 m/s and provide an analytical predictivetool for material cratering based on dimensional analysis.

122
Figure 6.14∣∣∣ Nano-Architected Carbon Samples for Supersonic Impact
Representative carbon samples for dynamic testing of (a) ρ ≈ 8%, and (b) ρ ≈ 17%. Sub-figures labeled as (i), (ii), and (iii) correspond to a magnified unit cell view, a top view, anda side view, respectively. All scale bars are 40 µm except those in (i) sub-figures which are1 µm.
6.4.1 Laser Induced Particle Impact TestThe impact experiments were conducted using the laser induced particle impacttest (LIPIT) method in which 14 µm-diameter SiO2 spheres were accelerated by apulsed laser to velocities of up to 1.2 km/s [78, 135]. To accelerate the impactors(i.e., the spheres), the laser was focused on a glass launching pad containing thinlayers of Au and polydimethylsiloxane (PDMS) which caused ablation of the goldfilm and rapid expansion of the elastomer film. The projectiles located at the focussites attained their kinetic energy from the expansion of the elastomer with tunablespeeds depending on the power of the laser pulse. The impact event was capturedusing 16 frames from a high-frame-rate camera (SIMX 16, Specialised Imaging)which was connected to a microscope objective, allowing for exposure times asshort as 3 ns and ∼300 nm-pixel resolution. To decouple any nonlinear processesassociated with the impactor, we preformed a series of impact experiment of theSiO2 particles onto a thick Si substrate prior to impacting carbon nanolattices. Allprojectiles were aimed to impact the samples as close to the center as possibleto minimize the effect of boundaries. By varying impact velocity over 1.5 decades

123
(40–1,100 m/s), we probed different impact regimes while maintaining the impactorgeometry, material, and size constant. Following the impact experiments, we per-formed post-mortem analysis on the samples via confocal and scanning electronmicroscopy (SEM), which allowed for qualitative and quantitative characterizationof the impact cratering process on the carbon materials.
6.4.2 Particle-Substrate ImpactThe impact response of the SiO2 spheres onto Si was characterized by distinct re-bound and shattering regimes. Representative frames from a rebound-regime im-pact are shown in Fig. 6.15a, corresponding to impact and rebound velocities ofv0 = 514 m/s and vr = 339 m/s, respectively. This regime extended to impact ve-locities of ∼650 m/s, around which the shattering regime emerged. A representativeimpact in this regime is presented in Fig. 6.15b, corresponding to an impact veloc-ity of 646 m/s. The last frames in this sequence show catastrophic failure of theparticle which disintegrated into several pieces as the one shown in Fig. 6.15d.
Using the velocities obtained from the camera frames, and assuming a density δ =
2650 kg m−3 for SiO2, a radius r = 14µm, and a mass m = 43δπr3 for all particles,
the impact energy W0 = 12mv2
0 and rebound energy Wr = 12mv2
r for each impact wascalculated. Additionally, the dissipated or inelastic energy was computed as thedifference between the impact and rebound energies, Wi = W0 −Wr. Normalizingthe rebound and inelastic energies by the impact energy and plotting those valuesas a function of the impact energy in Fig. 6.16a shows a non-linear increase indissipation with increasing impact energy, which reaches a maximum value prior toreaching the particle shatter regime.
To understand this anomalous behavior of the SiO2 particles upon high-velocityimpact, we refer to the continuum plasticity model proposed by Schill et al. [119].By applying this model, we assume that inelastic energy is primarily accounted forby densification (i.e., consolidation) of the SiO2 spheres due to the high pressuresassociated with supersonic impact, and thereby neglect contributions of heat lossor damage in the Si substrate (no damage was visible in post-mortem SEM mi-crographs). The consolidation energy density in SiO2 as a function of Jp can beobtained by integrating the consolidation relation presented in this model
pc = p0 +Aα
(1 − J−αp
), (6.1)
where pc is the consolidation pressure (i.e., maximum pressure attained), Jp is thepermanent volumetric deformation factor (i.e., the resulting fraction of the orig-

124
Figure 6.15∣∣∣ SiO2-Si Impact Experiments
Impact of 14 µm-diameter SiO2 onto a Si substrate. (a) Impact and rebound speeds of 514m/s and 339 m/s, respectively, and (b) impact speed of 646 m/s causing particle shatter. (c)Micrograph of initial SiO2 particle, and (d) fragment of a shattered particle. Scale bar in(a),(b), 30 µm, (c),(d), 4 µm.
inal volume after impact), and A, p0, and α are fit parameters provided by themodel [119]. Taking this energy density and multiplying it by the particle volumeprovides an inelastic energy estimate assuming an on-average particle consolidationJp, which is plotted in Fig. 6.16b. Matching the maximum inelastic energy observedexperimentally to the energies predicted by the model, corresponding to an impactvelocity of v0 = 656 m/s, indicates that an on-average volume reduction of up to∼10% (for Jp ≈ 0.9) occurred for particles that did not shatter. Impact velocitiesbeyond the shatter limit are assumed to have caused an on-average consolidationpressure higher than ∼4.6 GPa, as shown in Fig. 6.16c, which could lead to unsta-ble behavior at a defect to initiate fracture. This model validates our approximationthat internal processes of the SiO2 particles can account for the dissipated energy inthese SiO2-Si impacts.
Since the energy loss associated with inelastic processes in SiO2 is not negligible,

125
Figure 6.16∣∣∣ SiO2-Si Impact Energetics
(a) Normalized rebound and inelastic energies, Wr/W0 and Wi/W0, respectively, as a func-tion of impact energy showing a non-linear dissipation response and an abrupt transitionto the particle shatter regime. (b) Estimation of average consolidation Jp of the particlesthat result in comparable inelastic energies to those measured experimentally, applying themodel provided by Schill et al. [119], and (c) corresponding estimated consolidation pres-sures. The velocity of the experimental point with the maximum absolute inelastic energyis labeled in all plots.
Figure 6.17∣∣∣ Inelastic Energy as a Function of Rebound Energy
Impact onto a tetrakaidekahedron carbon material with 17% relative density with (a) impactspeed of 676 m/s and particle embedding, and (b) impact and rebound speeds of 238 m/s and50 m/s, respectively. (c) 17% relative density sample after elastic impact and no permanentdeformation at 50 m/s, (d) post-impact micrograph of sample from (a), and (e) post-impactmicrograph of sample from (b) showing cratering. White scale bars 20 µm, black scale bars5 µm.
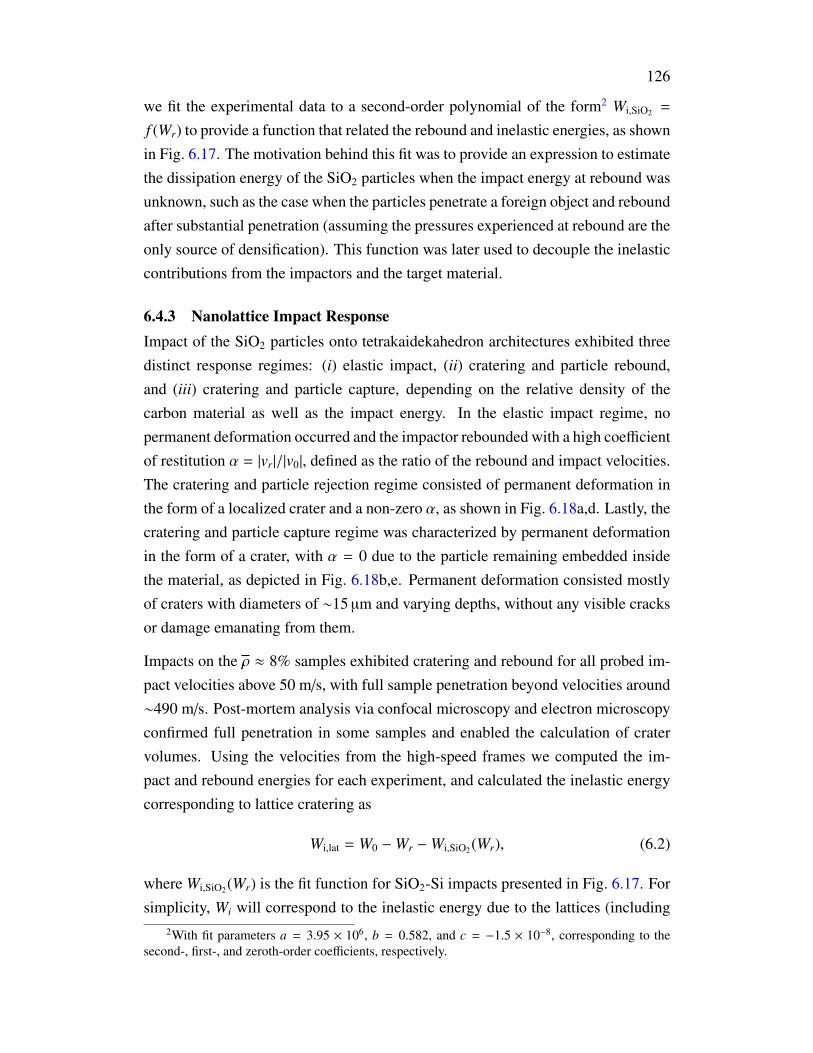
126
we fit the experimental data to a second-order polynomial of the form2 Wi,SiO2 =
f (Wr) to provide a function that related the rebound and inelastic energies, as shownin Fig. 6.17. The motivation behind this fit was to provide an expression to estimatethe dissipation energy of the SiO2 particles when the impact energy at rebound wasunknown, such as the case when the particles penetrate a foreign object and reboundafter substantial penetration (assuming the pressures experienced at rebound are theonly source of densification). This function was later used to decouple the inelasticcontributions from the impactors and the target material.
6.4.3 Nanolattice Impact ResponseImpact of the SiO2 particles onto tetrakaidekahedron architectures exhibited threedistinct response regimes: (i) elastic impact, (ii) cratering and particle rebound,and (iii) cratering and particle capture, depending on the relative density of thecarbon material as well as the impact energy. In the elastic impact regime, nopermanent deformation occurred and the impactor rebounded with a high coefficientof restitution α = |vr|/|v0|, defined as the ratio of the rebound and impact velocities.The cratering and particle rejection regime consisted of permanent deformation inthe form of a localized crater and a non-zero α, as shown in Fig. 6.18a,d. Lastly, thecratering and particle capture regime was characterized by permanent deformationin the form of a crater, with α = 0 due to the particle remaining embedded insidethe material, as depicted in Fig. 6.18b,e. Permanent deformation consisted mostlyof craters with diameters of ∼15 µm and varying depths, without any visible cracksor damage emanating from them.
Impacts on the ρ ≈ 8% samples exhibited cratering and rebound for all probed im-pact velocities above 50 m/s, with full sample penetration beyond velocities around∼490 m/s. Post-mortem analysis via confocal microscopy and electron microscopyconfirmed full penetration in some samples and enabled the calculation of cratervolumes. Using the velocities from the high-speed frames we computed the im-pact and rebound energies for each experiment, and calculated the inelastic energycorresponding to lattice cratering as
Wi,lat = W0 −Wr −Wi,SiO2(Wr), (6.2)
where Wi,SiO2(Wr) is the fit function for SiO2-Si impacts presented in Fig. 6.17. Forsimplicity, Wi will correspond to the inelastic energy due to the lattices (including
2With fit parameters a = 3.95 × 10⁶, b = 0.582, and c = −1.5 × 10⁻⁸, corresponding to thesecond-, first-, and zeroth-order coefficients, respectively.

127
Figure 6.18∣∣∣ Impact Response Regimes
Impact onto a tetrakaidekahedron carbon material with ∼17% relative density with (a) im-pact and rebound speeds of 238 m/s and 50 m/s, respectively, and (b) impact speed of 676m/s and particle embedding. (c) ∼17% relative density sample after elastic impact and nopermanent deformation at 50 m/s, (d) post-impact micrograph of sample from (a) showingcratering, and (e) post-impact micrograph of sample from (b) showing embedded particle.White scale bars 20 µm, black scale bars 5 µm.
the correction for Wi,SiO2) in the remainder of this work. Plotting the energeticsof these impacts (Fig. 6.19a) shows an increase in rebound velocities in the fullpenetration regime, indicative of rebound taking place from the Si substrate. Theslope of 0.69 corresponding for the inelastic energies indicates an on-average abilityof this material to dissipate ∼69% of the impact energy in the probed regime.
The ρ ≈ 17% samples exhibited both cratering and rebound as well as particle em-bedding for all impact velocities beyond the elastic regime, while no full-samplepenetration was observed. Partial cratering was observed at velocities below ∼515m/s before transitioning to an embedding-dominated regime that extended to veloc-ities of up to ∼820 m/s (Fig. 6.19b). Performing a linear fit on the inelastic energyapproximations for these samples yielded a slope of 1.00, indicating an on-averageclose-to-perfect energy dissipation response of these materials in the probed regime.
The distinct response regimes for the ρ ≈ 8% and ρ ≈ 17% came with similar cratermorphologies, as shown in Fig. 6.20. Craters at both relative densities generally hada cylindrical shape, with a diameter of approximately 15 µm, and depths depending

128
Figure 6.19∣∣∣ SiO2-Nanolattice Impact Energetics
Energetic distribution of impacts onto samples with (a) 8%, and (b) 17% relative density.Rebound and full penetration regimes were observed for the ρ = 8% samples, while theρ = 17% samples exhibited a particle embedding regime in addition to the rebound regime(no full penetration observed). Performing a linear fit of Wi as a function of W0 (red dottedlines) yielded an on-average 69% and 100% effectiveness at dissipating impact energy forthe 8% and 17% samples, respectively.
on the impact velocity. No significant spalling or fracture was observed beyond thecylindrical craters for any of the probed velocities, allowing the materials to retainoverall structural integrity. The ρ ≈ 8% samples exhibited larger crater volumes andgenerally lower ejecta velocities (i.e., velocities of debris ejected from the crater)than the ρ ≈ 17% samples at the same velocity, resulting in more debris remainingin the craters after the impact process. Close-up view of the crater base on theρ ≈ 17% sample impacted at 255 m/s shows characteristic indications of brittlefailure in the carbon struts.
6.4.4 Dimensional Analysis of Impact Processes: from planetary impact tonano-impact
Several works in planetary sciences have extensively used dimensional analysisto formulate approximate prediction tools for planetary impact processes [54]. Inthis field, accurate measurement or even observation of impact processes is almostimpossible, limiting researchers to post-mortem analysis of craters. Additionally,experiments performed on earth can fail to replicate conditions such as low gravity,km-diameter impactors, or hyper-velocities, leaving dimensional analysis as thepreferred tool to bridge the gap between dimensionally similar experiments andplanetary impacts.
Although the impact processes presented in this chapter do not face the challenges
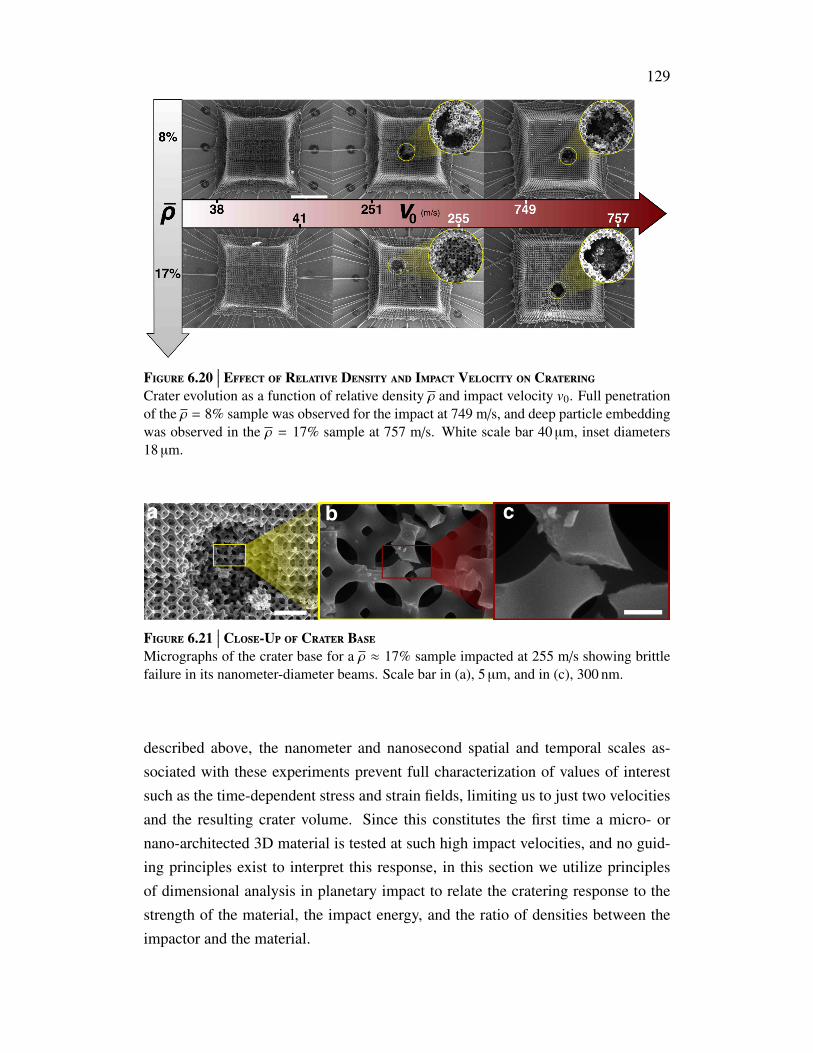
129
Figure 6.20∣∣∣ Effect of Relative Density and Impact Velocity on Cratering
Crater evolution as a function of relative density ρ and impact velocity v0. Full penetrationof the ρ = 8% sample was observed for the impact at 749 m/s, and deep particle embeddingwas observed in the ρ = 17% sample at 757 m/s. White scale bar 40 µm, inset diameters18 µm.
Figure 6.21∣∣∣ Close-Up of Crater Base
Micrographs of the crater base for a ρ ≈ 17% sample impacted at 255 m/s showing brittlefailure in its nanometer-diameter beams. Scale bar in (a), 5 µm, and in (c), 300 nm.
described above, the nanometer and nanosecond spatial and temporal scales as-sociated with these experiments prevent full characterization of values of interestsuch as the time-dependent stress and strain fields, limiting us to just two velocitiesand the resulting crater volume. Since this constitutes the first time a micro- ornano-architected 3D material is tested at such high impact velocities, and no guid-ing principles exist to interpret this response, in this section we utilize principlesof dimensional analysis in planetary impact to relate the cratering response to thestrength of the material, the impact energy, and the ratio of densities between theimpactor and the material.

130
Impact Scaling Relations
Analogous to a standard planetary impact, the objective is to relate the volume ofthe crater V to the parameters relating to the impactor (radius r, velocity v0, anddensity δ) and those relating to the underlying material (strength σy and density ρ)at some gravitational acceleration g in some form
V = f[r, v0, δ︸ ︷︷ ︸
particle
, ρ, σy︸ ︷︷ ︸target material
, g]. (6.3)
Applying the Buckingham-Π theorem to these variables, plus accounting for poros-ity (i.e., relative density ρ) in the target material, admits a total of 5 non-uniquedimensionless groups which are chosen to be [54, 55]
ρVm︸︷︷︸Πv
= f[
grv2
0︸︷︷︸Πg
,σy
ρv20︸︷︷︸
Πσ
,ρ
δ︸︷︷︸Πρ
, ρ
]. (6.4)
Πv represents the ratio between the mass expelled from the crater and the mass ofthe impactor m, i.e., the cratering efficiency, which is related to a gravity term Πg,a strength term Πσ, a density term Πρ, and the relative density ρ.
To provide a form for the function Πv = f(Πg,Πσ,Πρ, ρ
), some works have as-
sumed that the impactor behaves as a point source [54–56] such that the energy andmomentum are coupled into a volume that is small compared to other features of in-terest. As a first-order approximation, we assume this point-source simplification isapplicable to our nano-architected impact experiments, which allows us to replacethe particle-related variables in Eq. 6.3 with a single measure C = rvµ0δ
ν, where theexponents µ and ν are specific to a given target material. The bounds for µ ∈ [ 1
3 ,23 ]
represent a momentum- or energy-dominated response [56], respectively, while νhas been typically found to be ∼0.4. Values for µ have experimentally been foundto range from ∼0.4 for dry sands (ρ ≈ 0.65) to ∼0.55 for water or metals [54], butno value has been obtained for low relative-density materials.
Assuming these experiments are done in a strength-dominant regime with σy
ρgr, which we confirm to be valid since σy3 for our materials (see section 6.3.1)
is nine orders of magnitude larger than ρgr (with ρ = 1, 400 kg/m3 [9]), we canneglect the dependence on Πg and express Eq. 6.4 as [56]
Πv = Π−
3µ2
σ Π3ν−1ρ f (ρ), (6.5)
3ranging from 25 ± 4 MPa to 79 ± 13 MPa.

131
where for simplicity we will assume f (ρ) = ρ γ.
Using confocal microscopy we calculated Πv for all ρ ≈ 17% impacts and fit thedata to the expression in Eq. 6.5, as shown in Fig. 6.22. Restricting µ to its physicalbounds provided best-fit values of µ = 1
3 , ν ≈ 13 , and γ = 1.185, hinting to a
momentum-dominated response.
Figure 6.22∣∣∣ Cratering Scaling Law for ρ ≈ 17% Nanolattices
Fit of the form Πv = Π−
3µ2
σ Π3ν−1ρ ρ γ for the ρ ≈ 17% carbon nanolattice impacts. The fit
parameters were µ = 13 , ν ≈ 1
3 , and γ = 1.185.
6.4.5 OutlookThe experiments presented in this section constitute the first exploration of a nano-architected material under supersonic impact conditions. Besides observing differ-ent impact regimes, the overarching outcome was the ability to use dimensionalanalysis to provide a predictive tool for cratering in these materials. Performingthese experiments for different geometries and relative densities could provide in-sight on the driving mechanisms for cratering and could facilitate the design ofnano-architected materials for impact applications without requiring preliminaryexperiments. The nano-architected materials presented in this section present alightweight solution for impact absorption of high-velocity micro-particle impacts,e.g., micrometeoroids, and could be readily used as protective coatings if they canbe manufactured in larger volumes. Since no size-dependent assumptions went into

132
the dimensional analysis, these predictive tools could potentially apply to dimen-sionally similar impacts at larger scales.
6.5 Blast-loading on Macro-scale Carbon and Composite Lattice Architec-tures
Analytical and numerical explorations on the blast response of truss-core sandwichmetallic materials have shown that these materials are able to sustain significantlylarger blast impulses than monolithic plates of the same weight [145]. At smallerscales, hollow metallic microlattices have been predicted to benefit from plasticbuckling of its tubes to dissipate more than twice the energy than a typical foam ofthe same mass [41].
To expand on the explorations described above, we studied the blast response ofbrittle 3D carbon architected materials and composites under buried blast condi-tions. The objective was to qualitatively observe the failure modes of these materi-als and assess the energy absorption capabilities with and without epoxy infiltration.We fabricated octet and tetrakaidecahedron carbon samples with a relative densityof ρ ≈ 15% and a density of ρ = 285 ± 9 kg/m3 as shown in Fig. 6.23, and selectedthe octet configuration for these experiments due to its rigid architecture. Afterepoxy infiltration, the material density increased to ρ = 1130 ± 40 kg/m3 (see sec-tion 6.2.2 for details). These samples were fabricated to conform to an approximate1 × 0.56 × 0.08 aspect ratio, to conform to larger-scale blast experiments, and hadfinal dimensions of ∼38 × 19 × 3.2 mm corresponding to a 63 × 32 × 5 tessellationof ∼600 µm unit cells.
6.5.1 ExperimentsBuried blast experiments were performed on the carbon and carbon-epoxy octetmaterials which were suspended ∼5 mm above the soil, as shown in Fig. 6.24. Thesandwich configuration was achieved by encompassing the carbon-based materialsbetween two 300 µm-thick stainless steel plates which were clamped together usingscrews.
To ensure controlled soil conditions, a 2.76 specific-gravity soil was passed througha #40 sieve (0.425 mm), oven dried for 24 hours, and wetted to 10% moisturecontent. The treated soil was pressed in ∼10 mm layers to a nominal bulk densityof 2.11 g cm−3, until a controlled-soil cylinder of 311 mm in diameter and 50 mm inheight was obtained. The explosive device (Teledyne RISI RP-3 EBW) was buriedat a depth of ∼1 mm within the controlled-soil cylinder.
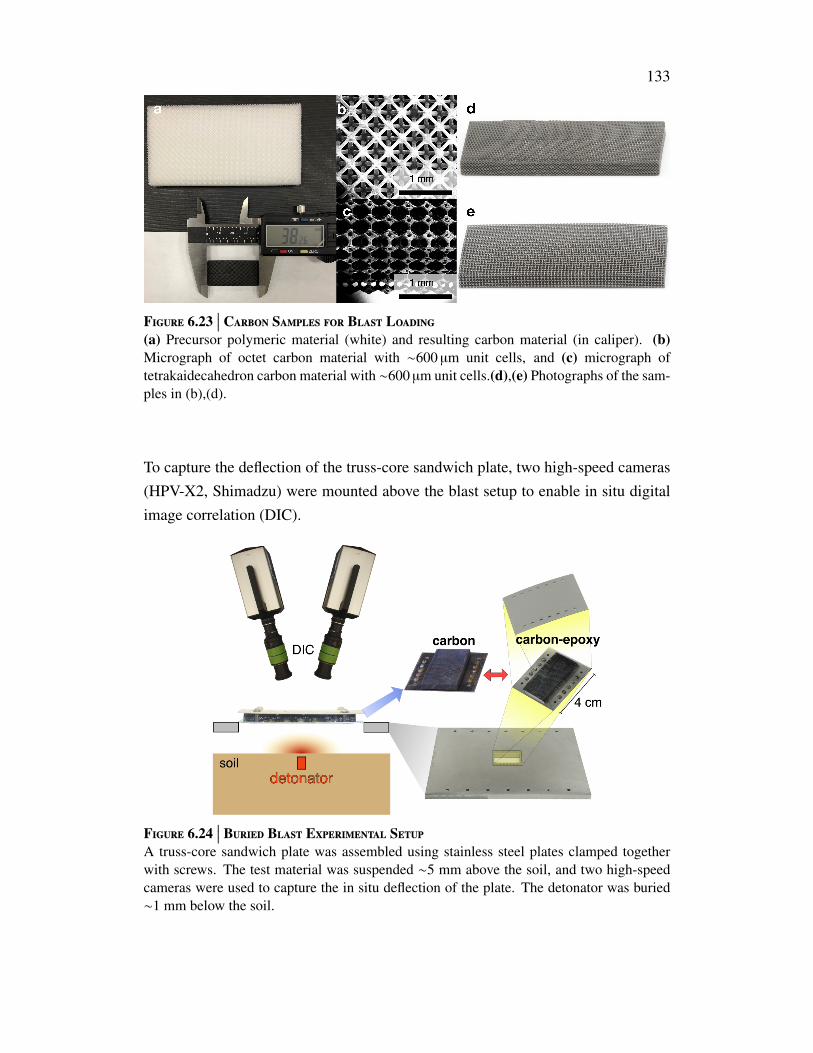
133
Figure 6.23∣∣∣ Carbon Samples for Blast Loading
(a) Precursor polymeric material (white) and resulting carbon material (in caliper). (b)Micrograph of octet carbon material with ∼600 µm unit cells, and (c) micrograph oftetrakaidecahedron carbon material with ∼600 µm unit cells.(d),(e) Photographs of the sam-ples in (b),(d).
To capture the deflection of the truss-core sandwich plate, two high-speed cameras(HPV-X2, Shimadzu) were mounted above the blast setup to enable in situ digitalimage correlation (DIC).
Figure 6.24∣∣∣ Buried Blast Experimental Setup
A truss-core sandwich plate was assembled using stainless steel plates clamped togetherwith screws. The test material was suspended ∼5 mm above the soil, and two high-speedcameras were used to capture the in situ deflection of the plate. The detonator was buried∼1 mm below the soil.

134
In addition to blast experiments on the carbon and carbon-epoxy octet materials(see Supplementary Videos 21 & 22), an identical experiment was performed ontwo clamped stainless steel plates without a core as a control. Selecting a represen-tative pixel from the DIC data at the center of each plate provided the deflection-time response shown in Fig. 6.25 (see Supplementary Videos 23–25). The controlsetup exhibited significant plastic deformation on the top and bottom plates of ∼3mm, most of which occurred within the first ∼40 µs of the experiment. In contrast,both the carbon and carbon-epoxy sandwich plates only underwent elastic deforma-tion on the stainless steel plates with maximum deflections of ∼1 mm, confirmedupon disassembling the sandwich. Remarkably, both carbon-material configura-tions exhibited the same qualitative deflection response regardless of their differentdensities, Young’s moduli, or effective strengths. However, they did present dif-ferent failure mechanisms, with the carbon-epoxy sample exhibiting significantlyfewer cracks than the carbon sample. Both architected materials seemed to havedistributed the blast energy throughout a large fraction of the plate, possibly due tothe inherent connectivity between unit cells.
Figure 6.25∣∣∣ Deflection of Sandwich Plates Upon Blast Impulse
Time-dependent deflection of the center of the top face plate for all configurations. A con-trol sample consisted of the two face plates clamped together, which exhibited significantplastic deformation. The carbon and carbon-epoxy cores fractured, but prevented plasticdeformation of the face plates.

135
6.5.2 OutlookAlthough the exact mechanisms for energy dissipation in these materials remainto be understood, these experiments show the potential of lightweight architectedcarbon materials to be used blast shields. In particular, understanding the effect ofarchitecture and epoxy infiltration on this response could allow for tunable failuremechanisms that might enable the material to endure more than one blast impulse,e.g., with military applications in mind. Future work will include comparison of thisresponse to that of equal-density stochastic metallic and ceramic foams to assess thebenefits of architecture in energy dissipation. Additionally, the effect of strain rateon the infiltrated epoxy could provide insight on the observed response.

136
C h a p t e r 7
SUMMARY & OUTLOOK
7.1 SummaryThe objective of this thesis was to probe beyond the current limits of nano- andmicro-architected materials by numerically and experimentally exploring new ge-ometries and loading regimes. As a result, we were able to thoroughly character-ize the effect of nodes on the mechanical response of lattice architectures, and weprovided an extension to the classical stiffness scaling laws that accounts for non-slender geometries such as the ones currently realizable by additive manufacturingtechniques.
An important step was moving beyond solid and hollow beam-based architecturesand exploring the doubly curved shells and their mechanical benefits. In doing so,we were able to exploit self-assembly techniques which enabled the fabrication ofnode-less architectures with features on the order of ∼10 nm and sample volumeson the order of cubic centimeters. Using numerical tools and advanced fabricationtechniques, we demonstrated the potential of this method to produce tunable nano-architected materials with extreme resilience by harnessing material size effects.
We were able to venture into previously unexplored dynamic mechanical regimes atthese scales through the implementation and application of custom methods such asthe micro-scale ultrasonic transmission method (µUTM) and the laser induced par-ticle impact test (LIPIT). In the mechanical-wave regime, we explored the implica-tions of structural reconfiguration and added micro-inertia to the dynamic responseof the material and numerically & experimentally showed the emergence of vibra-tional band gaps. In the impact regime, we were able to probe nano-architectedmaterials at supersonic speeds for the first time, and showed their potential to dissi-pate energy from these impacts.
Lastly, the knowledge gathered from the explorations mentioned above enabledthe design and fabrication of centimeter-scale lightweight 3D carbon materials andcomposites through novel fabrication routes. These materials were tested underblast conditions and showed significant energy dissipation while at considerablylower densities than commonly used components for these applications.

137
7.2 Outlook7.2.1 Self-AssemblyIn light of all recent accomplishments in the architected materials community, trueapplicability of these materials is still highly dependent on their scalable fabrication.Additive manufacturing can be deemed satisfactory for specialized applications,but widespread use of these materials will rely on novel fabrication techniques. Itis my opinion that several self-assembly methods have the potential to form largevolumes of architected materials (as shown in chapter 4), which will require betterunderstanding and control of the obtained morphologies. Closing the gap betweenlarge-scale fabrication and nanoscale mechanical effects will be crucial in enablingthe realization of nano-architected materials beyond lab settings.
7.2.2 Compliant, Tunable, Resilient MaterialsMost of the explorations in the nano-architected materials realm have been guidedby the search for stiff, strong, and deformation-resistant materials. On the otherhand, I believe the search for compliant and tunable materials that can selectivelyundergo deterministic forms of deformation is also worthwhile. Such materialscan be particularly useful for multi-physics applications that require careful controlof deformation. Additionally, the use of architecture in compliant materials couldprovide novel pathways to explore bio-mechanics problems where low stiffness buthigh resilience are necessary.
7.2.3 MHz and BeyondStudying nano-architected materials under dynamic stimuli has opened the door forthe exploration of mechanical waves in the MHz regime. This presents a significantaccomplishment since these frequencies encompass a variety of ultrasound med-ical applications, which could benefit from wave-guiding or focusing enabled byarchitecture.
Beyond mechanical waves, the dynamic response of nano-architected materials is alargely unexplored field. We have recently witnessed the emergence of techniquesthat enable the study of these materials at previously inaccessible strain rates. Fur-ther work along this path might reveal that nanoscale architecture could providesignificant benefits in the dynamic regime, similar to what has been observed inquasi-statics.
138
7.2.4 CarbonLastly, I believe that carbon has proven to be a versatile constituent material for ar-chitected materials as a whole. The possibility to ‘shape’ carbon into deterministicarchitectures could provide an alternative to carbon-fiber-based parts that are noteasily manufactured. Furthermore, the high strength- and stiffness-to-density ratiosconcomitant with carbon enable these architected materials to achieve efficient ma-terial response. Additional work on the processing of this material system mightenable us to fully control the atomic structure of the resultant constituent carbonwhile pushing for scalable fabrication of carbon-based architected materials.
139
BIBLIOGRAPHY
[1] Oraib Al-Ketan, Rachid Rezgui, Reza Rowshan, Huifeng Du, Nicholas X.Fang, and Rashid K. Abu Al-Rub. Microarchitected Stretching-DominatedMechanical Metamaterials with Minimal Surface Topologies. Advanced En-gineering Materials, 20(9):1800029, sep 2018. ISSN 14381656. doi: 10.1002/adem.201800029. URL http://doi.wiley.com/10.1002/adem.201800029.
[2] Ignacio Arretche and Kathryn H. Matlack. On the Interrelationship Be-tween Static and Vibration Mitigation Properties of Architected Metastruc-tures. Frontiers in Materials, 5(November):68, 2018. ISSN 2296-8016.doi: 10.3389/fmats.2018.00068. URL https://www.frontiersin.org/article/10.3389/fmats.2018.00068/full.
[3] Michael F. Ashby. The properties of foams and lattices. Philosophi-cal transactions. Series A, Mathematical, physical, and engineering sci-ences, 364(1838):15–30, 2006. ISSN 1364-503X. doi: 10.1098/rsta.2005.1678. URL http://rsta.royalsocietypublishing.org/cgi/doi/10.1098/rsta.2005.1678.
[4] Sahab Babaee, Jongmin Shim, James C. Weaver, Elizabeth R. Chen, NikitaPatel, and Katia Bertoldi. 3D soft metamaterials with negative poisson’sratio. Advanced Materials, 25(36):5044–5049, 2013. ISSN 09359648. doi:10.1002/adma.201301986.
[5] Emanuele Baravelli and Massimo Ruzzene. Internally resonating lattices forbandgap generation and low-frequency vibration control. Journal of Soundand Vibration, 332(25):6562–6579, 2013. ISSN 0022460X. doi: 10.1016/j.jsv.2013.08.014. URL http://dx.doi.org/10.1016/j.jsv.2013.08.014.
[6] Francois Barthelat, Huang Tang, Pablo D. Zavattieri, Chunming. Li, and Ho-racio D. Espinosa. On the mechanics of mother-of-pearl: A key feature inthe material hierarchical structure. Journal of the Mechanics and Physics ofSolids, 55(2):306–337, 2007. ISSN 00225096. doi: 10.1016/j.jmps.2006.07.007.
[7] Frank S. Bates, Wayne W. Maurer, Paul M. Lipic, Marc A. Hillmyer, Kristof-fer Almdal, Kell Mortensen, Glenn H. Fredrickson, and Timothy P. Lodge.Polymeric Bicontinuous Microemulsions. Physical Review Letters, 79(5):849–852, aug 1997. ISSN 0031-9007. doi: 10.1103/PhysRevLett.79.849.URL https://link.aps.org/doi/10.1103/PhysRevLett.79.849.

140
[8] Jens Bauer, Stefan Hengsbach, Iwiza Tesari, Ruth Schwaiger, and OliverKraft. High-strength cellular ceramic composites with 3D microarchitec-ture. Proceedings of the National Academy of Sciences, 111(7):2453–2458, 2014. ISSN 0027-8424. doi: 10.1073/pnas.1315147111. URLhttp://www.pnas.org/cgi/doi/10.1073/pnas.1315147111.
[9] Jens Bauer, Almut Schroer, Ruth Schwaiger, and Oliver Kraft. Approach-ing theoretical strength in glassy carbon nanolattices. Nature Materials,15(4):438–443, apr 2016. ISSN 1476-1122. doi: 10.1038/nmat4561.URL http://www.nature.com/doifinder/10.1038/nmat4561http://www.nature.com/articles/nmat4561.
[10] Alireza Bayat and Stavros Gaitanaros. Wave Directionality inThree-Dimensional Periodic Lattices. Journal of Applied Mechan-ics, 85(1):011004, nov 2017. ISSN 0021-8936. doi: 10.1115/1.4038287. URL http://appliedmechanics.asmedigitalcollection.asme.org/article.aspx?doi=10.1115/1.4038287.
[11] Lars A.A. Beex, Ron H.J. Peerlings, and Marc G.D. Geers. A qua-sicontinuum methodology for multiscale analyses of discrete microstruc-tural models. International Journal for Numerical Methods in Engineer-ing, 87(7):701–718, aug 2011. ISSN 00295981. doi: 10.1002/nme.3134. URL http://arxiv.org/abs/1010.1724http://doi.wiley.com/10.1002/nme.3134.
[12] Amer Beharic, Rafael Rodriguez Egui, and Li Yang. Drop-weight impactcharacteristics of additively manufactured sandwich structures with differ-ent cellular designs. Materials and Design, 145:122–134, 2018. ISSN18734197. doi: 10.1016/j.matdes.2018.02.066. URL https://doi.org/10.1016/j.matdes.2018.02.066.
[13] Joel R. Bell, Kwanho Chang, Carlos R. Lopez-Barron, Christopher W.Macosko, and David C. Morse. Annealing of Cocontinuous PolymerBlends: Effect of Block Copolymer Molecular Weight and Architecture.Macromolecules, 43(11):5024–5032, jun 2010. ISSN 0024-9297. doi:10.1021/ma902805x. URL http://pubs.acs.org/doi/abs/10.1021/ma902805x.
[14] Maria Berdova, Tuomo Ylitalo, Ivan Kassamakov, Jouni Heino, Pekka T.Törmä, Lauri Kilpi, Helena Ronkainen, Jari Koskinen, Edward Hæggström,and Sami Franssila. Mechanical assessment of suspended ALD thin filmsby bulge and shaft-loading techniques. Acta Materialia, 66:370–377, 2014.ISSN 13596454. doi: 10.1016/j.actamat.2013.11.024.
[15] Jonathan B. Berger, Hayden N.G. Wadley, and Robert M. McMeeking.Mechanical metamaterials at the theoretical limit of isotropic elastic stiff-ness. Nature, 543(7646):533–537, 2017. ISSN 14764687. doi: 10.1038/
nature21075. URL http://dx.doi.org/10.1038/nature21075.

141
[16] Katia Bertoldi and Mary C. Boyce. Mechanically triggered transformationsof phononic band gaps in periodic elastomeric structures. Physical ReviewB, 77(5):1–4, 2008. ISSN 1098-0121. doi: 10.1103/physrevb.77.052105.
[17] Katia Bertoldi, Vincenzo Vitelli, Johan Christensen, and Martin Van Hecke.Flexible mechanical metamaterials. Nature Reviews Materials, 2, 2017.ISSN 20588437. doi: 10.1038/natrevmats.2017.66.
[18] Juergen Biener, Andrea M. Hodge, Joel R. Hayes, Cynthia A. Volkert,Luis A. Zepeda-Ruiz, Alex V. Hamza, and Farid F. Abraham. Size Ef-fects on the Mechanical Behavior of Nanoporous Au. Nano Letters, 6(10):2379–2382, oct 2006. ISSN 1530-6984. doi: 10.1021/nl061978i. URLhttp://pubs.acs.org/doi/abs/10.1021/nl061978i.
[19] Colin Bonatti and Dirk Mohr. Large deformation response of additively-manufactured FCC metamaterials: From octet truss lattices towardscontinuous shell mesostructures. International Journal of Plasticity, 92:122–147, may 2017. ISSN 07496419. doi: 10.1016/j.ijplas.2017.02.003.URL http://dx.doi.org/10.1016/j.ijplas.2017.02.003https://linkinghub.elsevier.com/retrieve/pii/S0749641917300840.
[20] Colin Bonatti and Dirk Mohr. Mechanical performance of additively-manufactured anisotropic and isotropic smooth shell-lattice materials: Sim-ulations & experiments. Journal of the Mechanics and Physics of Solids,122:1–26, 2019. ISSN 00225096. doi: 10.1016/j.jmps.2018.08.022. URLhttps://doi.org/10.1016/j.jmps.2018.08.022.
[21] Léon Brillouin. Wave Propagation in Periodic Structures: Electric Filtersand Crystal Lattices. Dover phoenix editions. Dover Publications, 2003.ISBN 9780486495569. URL https://books.google.com/books?id=m2WmGiU5nUwC.
[22] Christopher R. Calladine. Theory of Shell Structures. Cambridge Uni-versity Press, Cambridge, 1983. ISBN 9780511624278. doi: 10.1017/
CBO9780511624278. URL http://ebooks.cambridge.org/ref/id/CBO9780511624278.
[23] Jinwoong Cha, Kun Woo Kim, and Chiara Daraio. Experimental real-ization of on-chip topological nanoelectromechanical metamaterials. Na-ture, jun 2018. ISSN 0028-0836. doi: 10.1038/s41586-018-0764-0. URL http://arxiv.org/abs/1806.10680http://dx.doi.org/10.1038/s41586-018-0764-0.
[24] Candace K Chan, Hailin Peng, Gao Liu, Kevin McIlwrath, Xiao Feng Zhang,Robert A Huggins, and Yi Cui. High-performance lithium battery anodesusing silicon nanowires. Nature nanotechnology, 3(1):31–5, 2008. ISSN1748-3395. doi: 10.1038/nnano.2007.411. URL http://www.ncbi.nlm.nih.gov/pubmed/18654447.

142
[25] Chong-seok Chang and Dewey Hodges. Vibration characteristics of curvedbeams. Journal of Mechanics of Materials and Structures, 4(4):675–692,2009. ISSN 1559-3959. doi: 10.2140/jomms.2009.4.675.
[26] Yanyu Chen and Lifeng Wang. Periodic co-continuous acoustic metamateri-als with overlapping locally resonant and Bragg band gaps. Applied PhysicsLetters, 105(19), 2014. ISSN 00036951. doi: 10.1063/1.4902129.
[27] Yanyu Chen, Tiantian Li, Fabrizio Scarpa, and Lifeng Wang. Lattice Meta-materials with Mechanically Tunable Poisson’s Ratio for Vibration Con-trol. Physical Review Applied, 7(2):1–11, 2017. ISSN 23317019. doi:10.1103/PhysRevApplied.7.024012.
[28] Anders Clausen, Fengwen Wang, Jakob S. Jensen, Ole Sigmund, and Jen-nifer A. Lewis. Topology Optimized Architectures with Programmable Pois-son’s Ratio over Large Deformations. Advanced Materials, 27(37):5523–5527, 2015. ISSN 15214095. doi: 10.1002/adma.201502485.
[29] Robert D. Cook, David S. Malkus, and Michael E. Plesha. Concepts and Ap-plications of Finite Element Analysis. Wiley, 1989. ISBN 9780471503194.URL https://books.google.ch/books?id=irZHPgAACAAJ.
[30] Corentin Coulais, Eial Teomy, Koen De Reus, Yair Shokef, and Martin VanHecke. Combinatorial design of textured mechanical metamaterials. Na-ture, 535(7613):529–532, 2016. ISSN 14764687. doi: 10.1038/nature18960.URL http://dx.doi.org/10.1038/nature18960.
[31] Corentin Coulais, Chris Kettenis, and Martin Van Hecke. A characteristiclength scale causes anomalous size effects and boundary programmabilityin mechanical metamaterials. Nature Physics, 14(1):40–44, 2018. ISSN17452481. doi: 10.1038/NPHYS4269.
[32] Luize Scalco de Vasconcelos, Rong Xu, and Kejie Zhao. Operando Nanoin-dentation: A New Platform to Measure the Mechanical Properties of Elec-trodes during Electrochemical Reactions. Journal of The ElectrochemicalSociety, 164(14):A3840–A3847, 2017. ISSN 0013-4651. doi: 10.1149/2.1411714jes.
[33] Bolei Deng, Jordan R. Raney, Vincent Tournat, and Katia Bertoldi. ElasticVector Solitons in Soft Architected Materials. Physical Review Letters, 118(20):1–5, 2017. ISSN 10797114. doi: 10.1103/PhysRevLett.118.204102.
[34] Vikram S. Deshpande, M. F. Ashby, and Norman A. Fleck. Foam topology:Bending versus stretching dominated architectures. Acta Materialia, 49(6):1035–1040, 2001. ISSN 13596454. doi: 10.1016/S1359-6454(00)00379-7.
[35] Vikram S. Deshpande, Norman A. Fleck, and M. F. Ashby. Effective proper-ties of the octet-truss lattice material. Journal of the Mechanics and Physics
143
of Solids, 49(8):1747–1769, 2001. ISSN 00225096. doi: 10.1016/S0022-5096(01)00010-2.
[36] Albert Desmoulins and Dennis M. Kochmann. Local and nonlocal contin-uum modeling of inelastic periodic networks applied to stretching-dominatedtrusses. Computer Methods in Applied Mechanics and Engineering, 313:85–105, 2017. ISSN 00457825. doi: 10.1016/j.cma.2016.09.027. URLhttp://dx.doi.org/10.1016/j.cma.2016.09.027.
[37] Albert Desmoulins, Alex J. Zelhofer, and Dennis M. Kochmann. Auxetic-ity in truss networks and the role of bending versus stretching deforma-tion. Smart Materials and Structures, 25(5), 2016. ISSN 1361665X. doi:10.1088/0964-1726/25/5/054003.
[38] Leon S. Dimas, Graham H. Bratzel, Ido Eylon, and Markus J. Buehler.Tough composites inspired by mineralized natural materials: Computation,3D printing, and testing. Advanced Functional Materials, 23(36):4629–4638, 2013. ISSN 1616301X. doi: 10.1002/adfm.201300215.
[39] Nicholas G. Dou, Robert A. Jagt, Carlos M. Portela, Julia R. Greer, andAustin J. Minnich. Ultralow Thermal Conductivity and Mechanical Re-silience of Architected Nanolattices. Nano Letters, 18(8):4755–4761, 2018.ISSN 15306992. doi: 10.1021/acs.nanolett.8b01191. URL https://dx.doi.org/10.1021/acs.nanolett.8b01191.
[40] Horacio D. Espinosa, Jee E. Rim, Francois Barthelat, and Markus J. Buehler.Merger of structure and material in nacre and bone - Perspectives on denovo biomimetic materials. Progress in Materials Science, 54(8):1059–1100, 2009. ISSN 00796425. doi: 10.1016/j.pmatsci.2009.05.001. URLhttp://dx.doi.org/10.1016/j.pmatsci.2009.05.001.
[41] Anthony G. Evans, Ming Y. He, Vikram S. Deshpande, John W. Hutchin-son, Alan J. Jacobsen, and William B. Carter. Concepts for enhanced energyabsorption using hollow micro-lattices. International Journal of Impact En-gineering, 37(9):947–959, 2010. ISSN 0734743X. doi: 10.1016/j.ijimpeng.2010.03.007. URL http://dx.doi.org/10.1016/j.ijimpeng.2010.03.007.
[42] Eli Fahrenkrug, Junsi Gu, and Stephen Maldonado. Electrochemically gatedalloy formation of crystalline InAs thin films at room temperature in aque-ous electrolytes. Chemistry of Materials, 26(15):4535–4543, 2014. ISSN15205002. doi: 10.1021/cm501752n.
[43] Norman A. Fleck, Vikram S. Deshpande, and Michael F. Ashby. Micro-architectured materials: past, present and future. Proceedings of the RoyalSociety A: Mathematical, Physical and Engineering Sciences, 466(2121):2495–2516, jun 2010. ISSN 1364-5021. doi: 10.1098/rspa.2010.0215.

144
[44] Haoran Fu, Kewang Nan, Wubin Bai, Wen Huang, Ke Bai, Luyao Lu, Chao-qun Zhou, Yunpeng Liu, Fei Liu, Juntong Wang, Mengdi Han, Zheng Yan,Haiwen Luan, Yijie Zhang, Yutong Zhang, Jianing Zhao, Xu Cheng, MoyangLi, Jung Woo Lee, Yuan Liu, Daining Fang, Xiuling Li, Yonggang Huang,Yihui Zhang, and John A. Rogers. Morphable 3D mesostructures and mi-croelectronic devices by multistable buckling mechanics. Nature Materials,17(3):268–276, 2018. ISSN 14764660. doi: 10.1038/s41563-017-0011-3.URL http://dx.doi.org/10.1038/s41563-017-0011-3.
[45] Tochukwu George, Vikram S. Deshpande, and Haydn N.G. Wadley. Me-chanical response of carbon fiber composite sandwich panels with pyramidaltruss cores. Composites Part A: Applied Science and Manufacturing, 47:31–40, apr 2013. ISSN 1359835X. doi: 10.1016/j.compositesa.2012.11.011.
[46] Lorna J. Gibson and Michael F. Ashby. Cellular Solids: Structure and Prop-erties. Cambridge University Press, Cambridge, 2 edition, 1999. ISBN 978-0521499118. URL https://doi.org/10.1017/CBO9781139878326.
[47] Andrew Gross, Panos Pantidis, Katia Bertoldi, and Simos Gerasimidis. Cor-relation between topology and elastic properties of imperfect truss-latticematerials. Journal of the Mechanics and Physics of Solids, 124:577–598,2019. ISSN 00225096. doi: 10.1016/j.jmps.2018.11.007. URL https://linkinghub.elsevier.com/retrieve/pii/S0022509618308615.
[48] Gérald Gurtner and Marc Durand. Stiffest elastic networks. Proceedings ofthe Royal Society A: Mathematical, Physical and Engineering Sciences, 470(2164):20130611–20130611, 2014. ISSN 1364-5021. doi: 10.1098/rspa.2013.0611. URL http://rspa.royalsocietypublishing.org/cgi/doi/10.1098/rspa.2013.0611.
[49] Seung Chul Han, Jeong Woo Lee, and Kiju Kang. A New Type of LowDensity Material: Shellular. Advanced Materials, 27(37):5506–5511, oct2015. ISSN 09359648. doi: 10.1002/adma.201501546. URL http://doi.wiley.com/10.1002/adma.201501546.
[50] Seung Chul Han, Jeong Myung Choi, Gang Liu, and Kiju Kang. A mi-croscopic shell structure with schwarz’s D-Surface. Scientific Reports, 7(1):1–8, 2017. ISSN 20452322. doi: 10.1038/s41598-017-13618-3. URLhttp://dx.doi.org/10.1038/s41598-017-13618-3.
[51] Jonathan A. Harris, R. E. Winter, and Graham J. McShane. Impact responseof additively manufactured metallic hybrid lattice materials. InternationalJournal of Impact Engineering, 104:177–191, 2017. ISSN 0734743X. doi:10.1016/j.ijimpeng.2017.02.007.
[52] James A. Hawreliak, Jonathan Lind, Brian Maddox, Matthew I. Barham,Mark C. Messner, Nathan Barton, Brian J. Jensen, and Mukul Kumar. Dy-namic Behavior of Engineered Lattice Materials. Scientific Reports, 6:
145
28094, 2016. ISSN 2045-2322. doi: 10.1038/srep28094. URL http://www.nature.com/articles/srep28094.
[53] Andrea M. Hodge, Reed T. Doucette, Monika M. Biener, Juergen Biener,Octavio Cervantes, and Alex V. Hamza. Ag effects on the elastic modulusvalues of nanoporous Au foams. Journal of Materials Research, 24(4):1600–1606, 2009. ISSN 08842914. doi: 10.1557/jmr.2009.0184.
[54] Keith A. Holsapple. The Scaling of Impact Processes in Plane-tary Sciences. Annual Review of Earth and Planetary Sciences, 21(1):333–373, 1993. ISSN 0084-6597. doi: 10.1146/annurev.ea.21.050193.002001. URL http://www.annualreviews.org/doi/10.1146/annurev.ea.21.050193.002001.
[55] Kevin R. Housen and Keith A. Holsapple. Impact cratering on porous aster-oids. Icarus, 163(1):102–119, 2003. ISSN 00191035. doi: 10.1016/S0019-1035(03)00024-1.
[56] Kevin R. Housen, William J. Sweet, and Keith A. Holsap-ple. Impacts into porous asteroids. Icarus, 300:72–96, jan2018. ISSN 00191035. doi: 10.1016/j.icarus.2017.08.019. URLhttp://dx.doi.org/10.1016/j.icarus.2017.08.019https://linkinghub.elsevier.com/retrieve/pii/S0019103517305948.
[57] Meng-Ting Hsieh, Bianca Endo, Yunfei Zhang, Jens Bauer, andLorenzo Valdevit. The mechanical response of cellular mate-rials with spinodal topologies. Journal of the Mechanics andPhysics of Solids, 125:401–419, 2019. ISSN 0022-5096. doi:10.1016/J.JMPS.2019.01.002. URL https://www.sciencedirect.com/science/article/pii/S0022509618307750?dgcid=raven_sd_aip_email#sec0007.
[58] Shan Huang and Ting Zhu. Atomistic mechanisms of lithium insertion inamorphous silicon. Journal of Power Sources, 196(7):3664–3668, 2011.ISSN 03787753. doi: 10.1016/j.jpowsour.2010.11.155. URL http://dx.doi.org/10.1016/j.jpowsour.2010.11.155.
[59] Mahmoud I. Hussein, Michael J. Leamy, and Massimo Ruzzene. Dy-namics of Phononic Materials and Structures: Historical Origins, Re-cent Progress, and Future Outlook. Applied Mechanics Reviews,66(4):040802, 2014. ISSN 0003-6900. doi: 10.1115/1.4026911.URL http://appliedmechanicsreviews.asmedigitalcollection.asme.org/article.aspx?doi=10.1115/1.4026911.
[60] Alan J. Jacobsen, William Barvosa-Carter, and Steven Nutt. Micro-scaleTruss Structures formed from Self-Propagating Photopolymer Waveguides.Advanced Materials, 19(22):3892–3896, nov 2007. ISSN 09359648. doi:10.1002/adma.200700797.
https://www.sciencedirect.com/science/article/pii/S0022509618307750?dgcid=raven_sd_aip_email#sec0007
https://www.sciencedirect.com/science/article/pii/S0022509618307750?dgcid=raven_sd_aip_email#sec0007

146
[61] Alan J. Jacobsen, Sky Mahoney, William B. Carter, and Steven Nutt. Vitre-ous carbon micro-lattice structures. Carbon, 49(3):1025–1032, 2011. ISSN00086223. doi: 10.1016/j.carbon.2010.10.059. URL http://dx.doi.org/10.1016/j.carbon.2010.10.059.
[62] Dongchan Jang, Lucas R Meza, Frank Greer, and Julia R Greer. Fab-rication and deformation of three-dimensional hollow ceramic nanostruc-tures. Nature materials, 12(10):893–898, oct 2013. ISSN 1476-1122. doi:10.1038/nmat3738.
[63] Wen Yea Jang, Stelios Kyriakides, and Andrew M. Kraynik. On the com-pressive strength of open-cell metal foams with Kelvin and random cellstructures. International Journal of Solids and Structures, 47(21):2872–2883, 2010. ISSN 00207683. doi: 10.1016/j.ijsolstr.2010.06.014. URLhttp://dx.doi.org/10.1016/j.ijsolstr.2010.06.014.
[64] Sung Hoon Kang, Sicong Shan, Wim L. Noorduin, Mughees Khan, JoannaAizenberg, and Katia Bertoldi. Buckling-induced reversible symmetrybreaking and amplification of chirality using supported cellular structures.Advanced Materials, 25(24):3380–3385, 2013. ISSN 09359648. doi:10.1002/adma.201300617.
[65] Syed N. Khaderi, Maik R.J. Scherer, C. E. Hall, Ullrich Steiner, UpradrastraRamamurty, Norman A. Fleck, and Vikram S. Deshpande. The indentationresponse of Nickel nano double gyroid lattices. Extreme Mechanics Letters,10:15–23, 2017. ISSN 23524316. doi: 10.1016/j.eml.2016.08.006. URLhttp://dx.doi.org/10.1016/j.eml.2016.08.006.
[66] Yoonho Kim, Hyunwoo Yuk, Ruike Zhao, Shawn A Chester, and XuanheZhao. Printing Ferromagnetic Materials. Letter, 2018. ISSN 0028-0836.doi: 10.1038/s41586-018-0185-0.
[67] Charles Kittel. Introduction to Solid State Physics. Wiley series on thescience and technology of materials. Wiley, 1956. URL https://books.google.com/books?id=K1dAAAAAIAAJ.
[68] Carolin Korner and Yvonne Liebold-Ribeiro. A systematic approach to iden-tify cellular auxetic materials. Smart Materials and Structures, 24(2), 2015.ISSN 1361665X. doi: 10.1088/0964-1726/24/2/025013.
[69] Sebastian Krödel and Chiara Daraio. Microlattice Metamaterials for Tai-loring Ultrasonic Transmission with Elastoacoustic Hybridization. Physi-cal Review Applied, 6(6):064005, 2016. ISSN 2331-7019. doi: 10.1103/
PhysRevApplied.6.064005. URL http://link.aps.org/doi/10.1103/PhysRevApplied.6.064005.
[70] Sebastian Krödel, Tommaso Delpero, Andrea Bergamini, Paolo Ermanni,and Dennis M. Kochmann. 3D auxetic microlattices with independently

147
controllable acoustic band gaps and quasi-static elastic moduli. AdvancedEngineering Materials, 16(4):357–363, 2014. ISSN 15272648. doi: 10.1002/adem.201300264.
[71] Sebastian Krödel, Antonio Palermo, and Chiara Daraio. Acoustic proper-ties of porous microlattices from effective medium to scattering dominatedregimes. The Journal of the Acoustical Society of America, 144(1):319–329,2018. ISSN 0001-4966. doi: 10.1121/1.5046068.
[72] Yongwoo Kwon, K. Thornton, and P.W. Voorhees. Morphology and topol-ogy in coarsening of domains via non-conserved and conserved dynamics.Philosophical Magazine, 90(1-4):317–335, jan 2010. ISSN 1478-6435.doi: 10.1080/14786430903260701. URL http://www.tandfonline.com/doi/abs/10.1080/14786430903260701.
[73] Chang Quan Lai and Chiara Daraio. Highly porous microlattices as ultra-thin and efficient impact absorbers. International Journal of Impact En-gineering, 120(December 2017):138–149, 2018. ISSN 0734743X. doi:10.1016/j.ijimpeng.2018.05.014. URL https://doi.org/10.1016/j.ijimpeng.2018.05.014.
[74] Ryan M. Latture, Matthew R. Begley, and Frank W. Zok. Design and me-chanical properties of elastically isotropic trusses. Journal of Materials Re-search, 33(3):249–263, 2018. ISSN 20445326. doi: 10.1557/jmr.2018.2.
[75] Ryan M. Latture, Ricardo X. Rodriguez, Larry R. Holmes, and Frank W.Zok. Effects of nodal fillets and external boundaries on compressive re-sponse of an octet truss. Acta Materialia, 149:78–87, 2018. ISSN 13596454.doi: 10.1016/j.actamat.2017.12.060. URL https://doi.org/10.1016/j.actamat.2017.12.060.
[76] K. H. Law and Leroy Gardner. Lateral instability of elliptical hollow sectionbeams. Engineering Structures, 37:152–166, 2012. ISSN 01410296. doi:10.1016/j.engstruct.2011.12.008. URL http://dx.doi.org/10.1016/j.engstruct.2011.12.008.
[77] A Lazarus, H C B Florijn, and P M Reis. Geometry-Induced Rigidityin Nonspherical Pressurized Elastic Shells. Physical Review Letters, 109(14):144301, oct 2012. ISSN 0031-9007. doi: 10.1103/PhysRevLett.109.144301. URL https://link.aps.org/doi/10.1103/PhysRevLett.109.144301.
[78] Jae Hwang Lee, Jonathan P. Singer, and Edwin L. Thomas. Micro-/nanostructured mechanical metamaterials. Advanced Materials, 24(36):4782–4810, 2012. ISSN 09359648. doi: 10.1002/adma.201201644.
[79] Matthew N. Lee and Ali Mohraz. Bicontinuous macroporous materialsfrom bijel templates. Advanced Materials, 22(43):4836–4841, 2010. ISSN09359648. doi: 10.1002/adma.201001696.

148
[80] Haiyi Liang and L Mahadevan. The shape of a long leaf. Proceedings ofthe National Academy of Sciences, 106(52):22049–22054, dec 2009. ISSN0027-8424. doi: 10.1073/pnas.0911954106. URL http://www.pnas.org/lookup/doi/10.1073/pnas.0911954106.
[81] Yvonne Liebold-Ribeiro and Carolin Körner. Phononic band gaps in periodiccellular materials. Advanced Engineering Materials, 16(3):328–334, 2014.ISSN 15272648. doi: 10.1002/adem.201300064.
[82] Jinyun Liu, Nan Li, Matthew D. Goodman, Hui Gang Zhang, Eric S. Ep-stein, Bo Huang, Zeng Pan, Jinwoo Kim, Jun Hee Choi, Xingjiu Huang,Jinhuai Liu, K. Jimmy Hsia, Shen J. Dillon, and Paul V. Braun. Mechan-ically and chemically robust sandwich-structured C@Si@C nanotube arrayLi-ion battery anodes. ACS Nano, 9(2):1985–1994, 2015. ISSN 1936086X.doi: 10.1021/nn507003z.
[83] Ying Liu, Xiu-zhan Sun, Wen-zheng Jiang, and Yu Gu. Tun-ing of Bandgap Structures in Three-Dimensional Kagome-SphereLattice. Journal of Vibration and Acoustics, 136(2):021016,2014. ISSN 0739-3717. doi: 10.1115/1.4026211. URLhttp://vibrationacoustics.asmedigitalcollection.asme.org/article.aspx?doi=10.1115/1.4026211.
[84] Carlos R. Lopez-Barron and Christopher W. Macosko. Direct Measurementof Interface Anisotropy of Bicontinuous Structures via 3D Image Analy-sis. Langmuir, 26(17):14284–14293, sep 2010. ISSN 0743-7463. doi:10.1021/la102314r. URL http://pubs.acs.org/doi/abs/10.1021/la102314r.
[85] K. R. Mangipudi, E. Epler, and C. A. Volkert. Topology-dependent scalinglaws for the stiffness and strength of nanoporous gold. Acta Materialia, 119:115–122, 2016. ISSN 13596454. doi: 10.1016/j.actamat.2016.08.012. URLhttp://dx.doi.org/10.1016/j.actamat.2016.08.012.
[86] I. Maskery, L. Sturm, A. O. Aremu, A. Panesar, C. B. Williams, C. J.Tuck, R. D. Wildman, I. A. Ashcroft, and R. J.M. Hague. Insights intothe mechanical properties of several triply periodic minimal surface lat-tice structures made by polymer additive manufacturing. Polymer, 152:62–71, 2018. ISSN 00323861. doi: 10.1016/j.polymer.2017.11.049. URLhttps://doi.org/10.1016/j.polymer.2017.11.049.
[87] Arturo J. Mateos, Wei Huang, Yong-Wei Zhang, and Julia R. Greer. Discrete-Continuum Duality of Architected Materials: Failure, Flaws, and Fracture.Advanced Functional Materials, 1806772:1806772, 2018. ISSN 1616-301X.doi: 10.1002/adfm.201806772. URL https://onlinelibrary.wiley.com/doi/abs/10.1002/adfm.201806772.

149
[88] Kathryn H. Matlack, Anton Bauhofer, Sebastian Krödel, Antonio Palermo,and Chiara Daraio. Composite 3D-printed metastructures for low-frequency and broadband vibration absorption. Proceedings of the NationalAcademy of Sciences, 113(30):8386–8390, jul 2016. ISSN 0027-8424.doi: 10.1073/pnas.1600171113. URL http://arxiv.org/abs/1511.09465%0Ahttp://dx.doi.org/10.1073/pnas.1600171113http://www.pnas.org/lookup/doi/10.1073/pnas.1600171113.
[89] Matthew T. McDowell, Seok Woo Lee, William D. Nix, and Yi Cui. 25thanniversary article: Understanding the lithiation of silicon and other alloyinganodes for lithium-ion batteries. Advanced Materials, 25(36):4966–4985,2013. ISSN 09359648. doi: 10.1002/adma.201301795.
[90] Mark C. Messner, Matthew I Barham, Mukul Kumar, and Nathan R Bar-ton. Wave propagation in equivalent continuums representing truss lat-tice materials. International Journal of Solids and Structures, 73-74:55–66, 2015. ISSN 0020-7683. doi: 10.1016/j.ijsolstr.2015.07.023. URLhttp://dx.doi.org/10.1016/j.ijsolstr.2015.07.023.
[91] Lucas R. Meza and Julia R. Greer. Mechanical characterization of hollowceramic nanolattices. Journal of Materials Science, 49(6):2496–2508, 2014.ISSN 00222461. doi: 10.1007/s10853-013-7945-x.
[92] Lucas R. Meza, Satyajit Das, and Julia R. Greer. Strong, lightweight,and recoverable three-dimensional ceramic nanolattices. Science, 345(6202):1322–1326, sep 2014. ISSN 0036-8075. doi: 10.1126/science.1255908. URL http://www.sciencemag.org/cgi/doi/10.1126/science.1255908.
[93] Lucas R. Meza, Alex J. Zelhofer, Nigel Clarke, Arturo J. Mateos, Den-nis M. Kochmann, and Julia R. Greer. Resilient 3D hierarchical architectedmetamaterials. Proceedings of the National Academy of Sciences of theUnited States of America, 112(37):11502–7, 2015. ISSN 1091-6490. doi:10.1073/pnas.1509120112. URL http://www.pnas.org/content/112/37/11502.abstract.
[94] Lucas R. Meza, Gregory P. Phlipot, Carlos M. Portela, Alessandro Maggi,Lauren C. Montemayor, Andre Comella, Dennis M. Kochmann, and Julia R.Greer. Reexamining the mechanical property space of three-dimensionallattice architectures. Acta Materialia, 140:424–432, 2017. ISSN 1359-6454. doi: 10.1016/j.actamat.2017.08.052. URL http://dx.doi.org/10.1016/j.actamat.2017.08.052.
[95] R. A.W. Mines, S. Tsopanos, Y. Shen, R. Hasan, and S. T. McKown. Dropweight impact behaviour of sandwich panels with metallic micro latticecores. International Journal of Impact Engineering, 60:120–132, 2013.ISSN 0734743X. doi: 10.1016/j.ijimpeng.2013.04.007. URL http://dx.doi.org/10.1016/j.ijimpeng.2013.04.007.

150
[96] Michael A. Monn, James C. Weaver, Tianyang Zhang, Joanna Aizenberg,and Haneesh Kesari. New functional insights into the internal architecture ofthe laminated anchor spicules of Euplectella aspergillum. Proceedings of theNational Academy of Sciences, 112(16):4976–4981, 2015. ISSN 0027-8424.doi: 10.1073/pnas.1415502112.
[97] Lauren C Montemayor and Julia R. Greer. Mechanical Responseof Hollow Metallic Nanolattices: Combining Structural and Ma-terial Size Effects. Journal of Applied Mechanics, 82(July):1–10, 2015. ISSN 0021-8936. doi: 10.1115/1.4030361. URLhttp://appliedmechanics.asmedigitalcollection.asme.org/article.aspx?doi=10.1115/1.4030361.
[98] R.K. Nalla, J.H. Kinney, and R.O. Ritchie. Mechanistic fracture criteria forthe failure of human cortical bone. Nature Materials, 2(3):164–168, 2003.ISSN 1476-1122. doi: 10.1038/nmat832.
[99] Utpal Nath, Brian C W Crawford, Rosemary Carpenter, and Enrico Coen.Genetic control of surface curvature. [Science. 2003] - PubMed result. Sci-ence (New York, N.Y.), 299(5611):1404–7, 2003. ISSN 1095-9203. doi: 10.1126/science.1079354. URL http://www.ncbi.nlm.nih.gov/pubmed/12610308.
[100] Sokol Ndoni, Martin E. Vigild, and Rolf H. Berg. Nanoporous Materialswith Spherical and Gyroid Cavities Created by Quantitative Etching of Poly-dimethylsiloxane in Polystyrene-Polydimethylsiloxane Block Copolymers.Journal of the American Chemical Society, 125(44):13366–13367, 2003.ISSN 00027863. doi: 10.1021/ja0360034.
[101] Ban Dang Nguyen, Seung Chul Han, Yoon Chang Jung, and Kiju Kang.Design of the P-surfaced shellular, an ultra-low density material with micro-architecture. Computational Materials Science, 139:162–178, 2017. ISSN09270256. doi: 10.1016/j.commatsci.2017.07.025. URL http://dx.doi.org/10.1016/j.commatsci.2017.07.025.
[102] M. N. Obrovac and V. L. Chevrier. Alloy Negative Electrodes for Li-IonBatteries. Chemical Reviews, 114(23):11444–11502, 2014. ISSN 0009-2665. doi: 10.1021/cr500207g. URL http://pubs.acs.org/doi/10.1021/cr500207g.
[103] M. R. O’Masta, L Dong, L. St-Pierre, H. N.G. Wadley, and V S Deshpande.The fracture toughness of octet-truss lattices. Journal of the Mechanicsand Physics of Solids, 98(October 2016):271–289, 2017. ISSN 00225096.doi: 10.1016/j.jmps.2016.09.009. URL http://dx.doi.org/10.1016/j.jmps.2016.09.009.

151
[104] Johannes T.B. Overvelde, James C. Weaver, Chuck Hoberman, and KatiaBertoldi. Rational design of reconfigurable prismatic architected materi-als. Nature, 541(7637):347–352, 2017. ISSN 14764687. doi: 10.1038/
nature20824. URL http://dx.doi.org/10.1038/nature20824.
[105] Raj Kumar Pal and Massimo Ruzzene. Edge waves in plates with resonators:an elastic analogue of the quantum valley Hall effect. New J. Phys, 19,2017. URL http://iopscience.iop.org/article/10.1088/1367-2630/aa56a2/pdf.
[106] Raj Kumar Pal, Massimo Ruzzene, and Julian J. Rimoli. A continuummodel for nonlinear lattices under large deformations. International Jour-nal of Solids and Structures, 96:300–319, 2016. ISSN 00207683. doi:10.1016/j.ijsolstr.2016.05.020. URL http://dx.doi.org/10.1016/j.ijsolstr.2016.05.020.
[107] C.-L. Park, J.W. Gibbs, P.W. Voorhees, and K. Thornton. Coarsening of com-plex microstructures following spinodal decomposition. Acta Materialia,132:13–24, jun 2017. ISSN 13596454. doi: 10.1016/j.actamat.2017.03.020.URL http://dx.doi.org/10.1016/j.actamat.2017.03.020.
[108] Cheolmin Park, Jongseung Yoon, and Edwin L. Thomas. Enabling nan-otechnology with self assembled block copolymer patterns. Polymer, 44(22):6725–6760, oct 2003. ISSN 00323861. doi: 10.1016/j.polymer.2003.08.011. URL http://linkinghub.elsevier.com/retrieve/pii/S0032386103007432.
[109] Ganesh U. Patil and Kathryn H. Matlack. Effective property evaluationand analysis of three-dimensional periodic lattices and composites throughBloch-wave homogenization. The Journal of the Acoustical Society of Amer-ica, 145(3):1259–1269, 2019. ISSN 0001-4966. doi: 10.1121/1.5091690.URL http://asa.scitation.org/doi/10.1121/1.5091690.
[110] S. Pellegrino and C. R. Calladine. Matrix Analysis of Statically and Kine-matically Indeternimate Frameworks. International Journal of Solids andStructures, 22(4):409–428, 1986.
[111] Minh-Son Pham, Chen Liu, Iain Todd, and Jedsada Lertthanasarn. Damage-tolerant architected materials inspired by crystal microstructure. Nature,2019. ISSN 0028-0836. doi: 10.1038/s41586-018-0850-3. URL http://www.nature.com/articles/s41586-018-0850-3.
[112] Gregory P. Phlipot and Dennis M. Kochmann. A quasicontinuum theory forthe nonlinear mechanical response of general periodic truss lattices. Jour-nal of the Mechanics and Physics of Solids, 124:758–780, 2019. ISSN00225096. doi: 10.1016/j.jmps.2018.11.014. URL https://doi.org/10.1016/j.jmps.2018.11.014.

152
[113] V Pini, J J Ruz, P M Kosaka, O Malvar, M Calleja, and J Tamayo. Howtwo-dimensional bending can extraordinarily stiffen thin sheets. ScientificReports, 6(June):1–6, 2016. ISSN 20452322. doi: 10.1038/srep29627. URLhttp://dx.doi.org/10.1038/srep29627.
[114] Elad Pollak, Gregory Salitra, Valentina Baranchugov, and Doron Aurbach.In situ conductivity, impedance spectroscopy, and ex situ Raman spectraof amorphous silicon during the insertion/extraction of lithium. Journal ofPhysical Chemistry C, 111(30):11437–11444, 2007. ISSN 19327447. doi:10.1021/jp0729563.
[115] Carlos M Portela, Julia R Greer, and Dennis M Kochmann. Impact of nodegeometry on the effective stiffness of non-slender three-dimensional trusslattice architectures. Extreme Mechanics Letters, 22:110–138, 2018. ISSN2352-4316. doi: 10.1016/j.eml.2018.06.004. URL https://doi.org/10.1016/j.eml.2018.06.004.
[116] E. Ramm and W. A. Wall. Shell structures - A sensitive interrelation betweenphysics and numerics. International Journal for Numerical Methods in En-gineering, 60(1):381–427, 2004. ISSN 00295981. doi: 10.1002/nme.967.
[117] Ladan Salari-Sharif and Lorenzo Valdevit. Accurate Stiffness Measure-ment of Ultralight Hollow Metallic Microlattices by Laser Vibrometry. Ex-perimental Mechanics, 54(8):1491–1495, 2014. ISSN 17412765. doi:10.1007/s11340-014-9917-8.
[118] Tobias A. Schaedler, Alan J. Jacobsen, A. Torrents, a. E. Sorensen, J. Lian,Julia R. Greer, Lorenzo Valdevit, and W. B. Carter. Ultralight Metal-lic Microlattices. Science, 334(6058):962–965, nov 2011. ISSN 0036-8075. doi: 10.1126/science.1211649. URL http://www.sciencemag.org/cgi/doi/10.1126/science.1211649.
[119] W. Schill, S. Heyden, S. Conti, and M. Ortiz. The anomalous yield behaviorof fused silica glass. Journal of the Mechanics and Physics of Solids, 113:105–125, 2018. ISSN 00225096. doi: 10.1016/j.jmps.2018.01.004. URLhttps://doi.org/10.1016/j.jmps.2018.01.004.
[120] Almut Schroer, Jeffrey M. Wheeler, and Ruth Schwaiger. Deformation be-havior and energy absorption capability of polymer and ceramic-polymercomposite microlattices under cyclic loading. Journal of Materials Research,33(03):274–289, 2018. ISSN 0884-2914. doi: 10.1557/jmr.2017.485.
[121] N Silvestre. International Journal of Solids and Structures Buckling be-haviour of elliptical cylindrical shells and tubes under compression. Inter-national Journal of Solids and Structures, 45(16):4427–4447, 2008. ISSN00207683. doi: 10.1016/j.ijsolstr.2008.03.019.

153
[122] A.E. Simone and L.J. Gibson. Effects of solid distribution on the stiffnessand strength of metallic foams. Acta Materialia, 46(6):2139–2150, 1998.ISSN 13596454. doi: 10.1016/S1359-6454(97)00421-7.
[123] Roman Süsstrunk and Sebastian D Huber. Observation of phononic helicaledge states in a mechanical topological insulator. Science, 349(6243):47 LP– 50, jul 2015. doi: 10.1126/science.aab0239. URL http://science.sciencemag.org/content/349/6243/47.abstract.
[124] Roman Süsstrunk and Sebastian D. Huber. Classification of topologicalphonons in linear mechanical metamaterials. Proceedings of the NationalAcademy of Sciences, 113(33):E4767–E4775, aug 2016. ISSN 0027-8424.doi: 10.1073/pnas.1605462113. URL http://arxiv.org/abs/1604.01033%0Ahttp://dx.doi.org/10.1073/pnas.1605462113http://www.pnas.org/lookup/doi/10.1073/pnas.1605462113.
[125] A. Sydney Gladman, Elisabetta A. Matsumoto, Ralph G. Nuzzo, L. Mahade-van, and Jennifer A. Lewis. Biomimetic 4D printing. Nature Materials, 15(4):413–418, 2016. ISSN 14764660. doi: 10.1038/nmat4544.
[126] Thomas Tancogne-Dejean and Dirk Mohr. Elastically-isotropic elementarycubic lattices composed of tailored hollow beams. Extreme Mechanics Let-ters, 22:13–18, 2018. ISSN 23524316. doi: 10.1016/j.eml.2018.04.005.URL https://doi.org/10.1016/j.eml.2018.04.005.
[127] Thomas Tancogne-Dejean, Adriaan B. Spierings, and Dirk Mohr.Additively-manufactured metallic micro-lattice materials for high spe-cific energy absorption under static and dynamic loading. Acta Ma-terialia, 116:14–28, 2016. ISSN 13596454. doi: 10.1016/j.actamat.2016.05.054. URL http://linkinghub.elsevier.com/retrieve/pii/S1359645416304153.
[128] Thomas Tancogne-Dejean, Marianna Diamantopoulou, Maysam B. Gorji,Colin Bonatti, and Dirk Mohr. 3D Plate-Lattices: An Emerging Class ofLow-Density Metamaterial Exhibiting Optimal Isotropic Stiffness. AdvancedMaterials, 30(45):1803334, nov 2018. ISSN 09359648. doi: 10.1002/adma.201803334. URL http://doi.wiley.com/10.1002/adma.201803334.
[129] Xin Tang, Vikas Prakash, John J. Lewandowski, Gregory W. Kooistra, andHaydn N G Wadley. Inertial stabilization of buckling at high rates of load-ing and low test temperatures: Implications for dynamic crush resistance ofaluminum-alloy-based sandwich plates with lattice core. Acta Materialia, 55(8):2829–2840, 2007. ISSN 13596454. doi: 10.1016/j.actamat.2006.12.037.
[130] H. C. Tankasala, Vikram S. Deshpande, and Norman A. Fleck. Tensileresponse of elastoplastic lattices at finite strain. Journal of the Mechan-ics and Physics of Solids, 109:307–330, 2017. ISSN 00225096. doi:10.1016/j.jmps.2017.02.002.

154
[131] Ottman A. Tertuliano and Julia R. Greer. The nanocomposite nature of bonedrives its strength and damage resistance. Nature Materials, 15(11):1195–1202, 2016. ISSN 14764660. doi: 10.1038/nmat4719.
[132] S. Timoshenko and J.N. Goodier. Theory of elasticity. McGraw-Hill, NewYork, 1969.
[133] Norio Tsujioka, Norio Ishizuka, Nobuo Tanaka, Takuya Kubo, and KenHosoya. Well-controlled 3D skeletal epoxy-based monoliths obtained bypolymerization induced phase separation. Journal of Polymer Science PartA: Polymer Chemistry, 46(10):3272–3281, may 2008. ISSN 0887624X.doi: 10.1002/pola.22665. URL http://doi.wiley.com/10.1002/pola.22665.
[134] Lorenzo Valdevit, Scott W. Godfrey, Tobias a. Schaedler, Alan J. Jacob-sen, and William B. Carter. Compressive strength of hollow microlat-tices: Experimental characterization, modeling, and optimal design. Journalof Materials Research, 28(17):2461–2473, 2013. ISSN 0884-2914. doi:10.1557/jmr.2013.160. URL http://www.journals.cambridge.org/abstract_S088429141300160X.
[135] David Veysset, Alex J Hsieh, Steven Kooi, Alexei A Maznev, Kevin AMasser, and Keith A Nelson. Dynamics of supersonic microparticle im-pact on elastomers revealed by real-time multi-frame imaging. Scien-tific Reports, 6(1):25577, jul 2016. ISSN 20452322. doi: 10.1038/
srep25577. URL http://dx.doi.org/10.1038/srep25577http://www.nature.com/articles/srep25577.
[136] Thomas Vidil, Nicholas Hampu, and Marc A. Hillmyer. Nanoporous Ther-mosets with Percolating Pores from Block Polymers Chemically Fixed abovethe Order–Disorder Transition. ACS Central Science, 3(10):1114–1120,oct 2017. ISSN 2374-7943. doi: 10.1021/acscentsci.7b00358. URLhttp://pubs.acs.org/doi/10.1021/acscentsci.7b00358.
[137] A Vidyasagar, S Krödel, and D M Kochmann. Microstructuralpatterns with tunable mechanical anisotropy obtained by simulatinganisotropic spinodal decomposition. Proceedings of the Royal Soci-ety A: Mathematical, Physical and Engineering Science, 474(2218):20180535, 2018. ISSN 1364-5021. doi: 10.1098/rspa.2018.0535.URL http://rspa.royalsocietypublishing.org/lookup/doi/10.1098/rspa.2018.0535.
[138] Andrea Vigliotti, Vikram S. Deshpande, and Damiano Pasini. Non linearconstitutive models for lattice materials. Journal of the Mechanics andPhysics of Solids, 64(1):44–60, 2014. ISSN 00225096. doi: 10.1016/j.jmps.2013.10.015. URL http://dx.doi.org/10.1016/j.jmps.2013.10.015.

155
[139] Andrey Vyatskikh, Stéphane Delalande, Akira Kudo, Xuan Zhang, Car-los M. Portela, and Julia R. Greer. Additive manufacturing of 3D nano-architected metals. Nature Communications, 9(1):593, 2018. ISSN 2041-1723. doi: 10.1038/s41467-018-03071-9. URL http://www.nature.com/articles/s41467-018-03071-9.
[140] Pai Wang, Filippo Casadei, Sicong Shan, James C. Weaver, and KatiaBertoldi. Harnessing buckling to design tunable locally resonant acousticmetamaterials. Physical Review Letters, 113(1):1–5, 2014. ISSN 10797114.doi: 10.1103/PhysRevLett.113.014301.
[141] Franziska Warmuth, Maximilian Wormser, and Carolin Körner. Single phase3D phononic band gap material. Scientific Reports, 7(1):1–7, 2017. ISSN20452322. doi: 10.1038/s41598-017-04235-1.
[142] Ulrike G.K. Wegst, Hao Bai, Eduardo Saiz, Antoni P. Tomsia, and Robert O.Ritchie. Bioinspired structural materials. Nature Materials, 14(1):23–36,2015. ISSN 14764660. doi: 10.1038/nmat4089.
[143] Weidong Wu, Joseph Owino, Ahmed Al-Ostaz, and Liguang Cai. ApplyingPeriodic Boundary Conditions in Finite Element Analysis. Simulia Commu-nity Conference, pages 707–719, 2014.
[144] Xiaoxing Xia, A. Afshar, Heng Yang, Carlos M. Portela, Dennis M.Kochmann, Claudio V. Di Leo, and Julia R. Greer. Electrochemically Re-configurable Architected Materials. Under Review, 2019.
[145] Zhenyu Xue and John W. Hutchinson. A comparative study of impulse-resistant metal sandwich plates. International Journal of Impact Engineer-ing, 30(10):1283–1305, 2004. ISSN 0734743X. doi: 10.1016/j.ijimpeng.2003.08.007.
[146] Hyunwoo Yuk, Teng Zhang, German Alberto Parada, Xinyue Liu, and Xu-anhe Zhao. Skin-inspired hydrogel-elastomer hybrids with robust inter-faces and functional microstructures. Nature Communications, 7(May):1–11, 2016. ISSN 20411723. doi: 10.1038/ncomms12028. URL http://dx.doi.org/10.1038/ncomms12028.
[147] Christian J. Yungwirth, Haydn N.G. Wadley, John H. O’Connor, Alan J. Za-kraysek, and Vikram S. Deshpande. Impact response of sandwich plateswith a pyramidal lattice core. International Journal of Impact Engineer-ing, 35(8):920–936, aug 2008. ISSN 0734743X. doi: 10.1016/j.ijimpeng.2007.07.001. URL https://linkinghub.elsevier.com/retrieve/pii/S0734743X07001170.
[148] Alex J. Zelhofer and Dennis M. Kochmann. On acoustic wave beamingin two-dimensional structural lattices. International Journal of Solids andStructures, 115-116:248–269, 2017. ISSN 00207683. doi: 10.1016/j.ijsolstr.2017.03.024.

156
[149] Guoqi Zhang, Bing Wang, Li Ma, Jian Xiong, and Linzhi Wu. Response ofsandwich structures with pyramidal truss cores under the compression andimpact loading. Composite Structures, 100:451–463, 2013. ISSN 02638223.doi: 10.1016/j.compstruct.2013.01.012.
[150] Huigang Zhang and Paul V. Braun. Three-dimensional metal scaffold sup-ported bicontinuous silicon battery anodes. Nano Letters, 12(6):2778–2783,2012. ISSN 15306984. doi: 10.1021/nl204551m.
[151] Lei Zhang, Stefanie Feih, Stephen Daynes, Shuai Chang, Michael Yu Wang,Jun Wei, and Wen Feng Lu. Energy absorption characteristics of metal-lic triply periodic minimal surface sheet structures under compressive load-ing. Additive Manufacturing, 23(August):505–515, 2018. ISSN 22148604.doi: 10.1016/j.addma.2018.08.007. URL https://doi.org/10.1016/j.addma.2018.08.007.
[152] Xuan Zhang, Andrey Vyatskikh, Huajian Gao, Julia R. Greer, and Xi-aoyan Li. Lightweight, flaw-tolerant, and ultrastrong nanoarchitected car-bon. Proceedings of the National Academy of Sciences, page 201817309,2019. ISSN 0027-8424. doi: 10.1073/pnas.1817309116. URL http://www.pnas.org/lookup/doi/10.1073/pnas.1817309116.
[153] Xiaoyu Zheng, Howon Lee, Todd H. Weisgraber, Maxim Shusteff, JoshuaDeOtte, Eric B Duoss, Joshua D Kuntz, Monika M Biener, Qi Ge,Julie A. Jackson, Sergei O Kucheyev, Nicholas X. Fang, and Christo-pher M. Spadaccini. Ultralight, ultrastiff mechanical metamaterials. Sci-ence, 344(6190):1373–1377, jun 2014. ISSN 0036-8075. doi: 10.1126/science.1252291. URL http://www.sciencemag.org/cgi/doi/10.1126/science.1252291.
[154] Xiaoyu Zheng, William Smith, Julie Jackson, Bryan Moran, Huachen Cui,Da Chen, Jianchao Ye, Nicholas Fang, Nicholas Rodriguez, Todd Weis-graber, and Christopher M. Spadaccini. Multiscale metallic metamateri-als. Nature Materials, 15(10):1100–1106, oct 2016. ISSN 1476-1122.doi: 10.1038/nmat4694. URL http://www.nature.com/doifinder/10.1038/nmat4694http://www.nature.com/articles/nmat4694.
[155] Ning Zhou, Frank S. Bates, and Timothy P. Lodge. Mesoporous membranetemplated by a polymeric bicontinuous microemulsion. Nano Letters, 6(10):2354–2357, 2006. ISSN 15306984. doi: 10.1021/nl061765t.
157
A p p e n d i x A
SUPPLEMENTARY VIDEOS
The following supplementary videos are included:
Chapter 4
Video 1: V1_Col[001]_t11nm_x50.mp43-Cycle compression of 11-nm columnar sample along the [001] direction at×50 playback speed.
Video 2: V2_Iso[001]_t11nm_x50.mp43-Cycle compression of 11-nm isotropic sample along the [001] direction at×50 playback speed.
Video 3: V3_Lam[001]_t11nm_x50.mp43-Cycle compression of 11-nm lamellar sample along the [001] direction at×50 playback speed.
Video 4: V4_Lam[010]_t11nm_x50.mp43-Cycle compression of 11-nm lamellar sample along the [010] direction at×50 playback speed.
Video 5: V5_Col[001]_t44nm_x50.mp43-Cycle compression of 44-nm columnar sample along the [001] direction at×50 playback speed.
Video 6: V6_Col[100]_t44nm_x50.mp43-Cycle compression of 44-nm columnar sample along the [100] direction at×50 playback speed.
Video 7: V7_Iso[001]_t44nm_x50.mp43-Cycle compression of 44-nm isotropic sample along the [001] direction at×50 playback speed.
Video 8: V8_Lam[100]_t44nm_x50.mp43-Cycle compression of 44-nm lamellar sample along the [100] direction at×50 playback speed.
Video 9: V9_Lam[010]_t44nm_x50.mp43-Cycle compression of 44-nm lamellar sample along the [010] direction at×50 playback speed.

158
Video 10: V10_Col[001]_t168nm_x20.mp43-Cycle compression of 168-nm columnar sample along the [001] directionat ×20 playback speed. Nanoindenter reached load limit prior to failure, soloading is purely elastic.
Video 11: V11_Col[100]_t168nm_x20.mp41-Cycle compression of 168-nm columnar sample along the [100] direction at×20 playback speed. Catastrophic failure.
Video 12: V12_Iso[001]_t168nm_x20.mp43-Cycle compression of 168-nm isotropic sample along the [001] directionat ×20 playback speed. Nanoindenter reached load limit prior to failure, soloading is purely elastic.
Video 13: V13_Lam[100]_t168nm_x50.mp43-Cycle compression of 168-nm lamellar sample along the [100] direction at×50 playback speed. Failure of shell but no catastrophic collapse.
Video 14: V14_Lam[010]_t168nm_x20.mp41-Cycle compression of 168-nm lamellar sample along the [010] direction at×20 playback speed. Catastrophic failure.
Video 15: V15_Col[001]vsOctet[001]_t11nm_x124.mp4Side-by-side 10-cycle compression of 11-nm columnar and 5 × 5 × 5 octetsamples along the [001] direction at ×124 playback speed.
Chapter 6
Video 16: V16_SiO2Si_v514_vr339.mp4Impact of SiO2 particle onto a Si substrate at v0 = 514 m/s with a reboundvelocity of vr = 339 m/s.
Video 17: V17_SiO2Si_v646_vrshattered.mp4Impact of SiO2 particle onto a Si substrate at v0 = 646 m/s and shattering uponimpact.
Video 18: V18_TkC17_v44_vr23.mp4Elastic impact of SiO2 particle onto ρ ≈ 17% tetrakaidecahedron carbonnanolattice at v0 ≈ 44 m/s and rebounding at vr ≈ 23 m/s. At low velocitiesthese measured speeds are just an estimate, since the uncertainty is inverselyrelated to the speed. No damage was observed, implying the actual reboundspeed must be closer to 44 m/s.
Video 19: V19_TkC17_v238_vr50.mp4Impact of SiO2 particle onto ρ ≈ 17% tetrakaidecahedron carbon nanolatticeat v0 = 238 m/s and rebounding at vr = 50 m/s exhibiting cratering and ejecta.

159
Video 20: V20_TkC17_v676_vrEmbedded.mp4Impact of SiO2 particle onto ρ ≈ 17% tetrakaidecahedron carbon nanolatticeat v0 = 676 m/s exhibiting particle embedding and minor ejecta.
Video 21: V21_BlastOctet_Side.mp4High-speed camera video capturing blast detonation onto a carbon octet-coresandwich plate with 300 µm stainless steel face sheets. The carbon octet corehad a density of ρ = 285 ± 9 kg/m3.
Video 22: V22_BlastCompOctet_Side.mp4High-speed camera video capturing blast detonation onto a carbon-epoxyoctet composite core sandwich plate with 300 µm stainless steel face sheets.The composite core had a density of ρ = 1130 ± 4 kg/m3.
Video 23: V23_ControlSS_2D_DIC_15fps.mp42D DIC of the control sandwich plate (face sheets clamped together) showingsignificant plastic deformation on the top sheet.
Video 24: V24_BlastCarbon_3D_DIC.mp43D DIC of the carbon octet-core sandwich plate’s top sheet.
Video 25: V25_BlastComp_3D_DIC.mp43D DIC of the composite octet-core sandwich plate’s top sheet.