Antidémarrage électronique dans les voitures Škoda - CCH ...
Upload
khangminh22Category
view
1download
0
Excitation electronique et relaxation de materiaux
soumis a une irradiation laser ultrabreve
Jean-Philippe Colombier
To cite this version:
Jean-Philippe Colombier. Excitation electronique et relaxation de materiaux soumis a uneirradiation laser ultrabreve. Physique [physics]. Universite Jean Monnet, 2014. <tel-01271993>
HAL Id: tel-01271993
https://hal-ujm.archives-ouvertes.fr/tel-01271993
Submitted on 9 Feb 2016
HAL is a multi-disciplinary open accessarchive for the deposit and dissemination of sci-entific research documents, whether they are pub-lished or not. The documents may come fromteaching and research institutions in France orabroad, or from public or private research centers.
L’archive ouverte pluridisciplinaire HAL, estdestinee au depot et a la diffusion de documentsscientifiques de niveau recherche, publies ou non,emanant des etablissements d’enseignement et derecherche francais ou etrangers, des laboratoirespublics ou prives.

Université Jean Monnet
Document de synthèse préparé en vue d’obtenir le diplôme d’Habilitation àDiriger des Recherches
Excitation électronique et relaxation de matériaux
soumis à une irradiation laser ultrabrève
Jean-Philippe Colombier
Soutenue publiquement le 21 novembre 2014 devant le jury composé de :
Juergen Reif Professeur des Universités RapporteurUniversité BTU de Cottbus (Allemagne)
Philippe Delaporte Directeur de recherche CNRS RapporteurLaboratoire LP3, Aix-Marseille université
Stéphane Guizard Ingénieur de Recherche CEA RapporteurLaboratoire des Solides Irradiés, Ecole Polytechnique
Eric Fogarassy Directeur de recherche CNRS PrésidentLaboratoire Icube, Telecom Physique Strasbourg
Florence Garrelie Professeur des Universités, Membre IUF ExaminateurLaboratoire Hubert Curien, Université Jean Monnet
Tatiana Itina Directeur de recherche CNRS ExaminateurLaboratoire Hubert Curien, Université Jean Monnet
Florent Pigeon Professeur des Universités ExaminateurLaboratoire Hubert Curien, Université Jean Monnet
Razvan Stoian Chargé de recherche CNRS ExaminateurLaboratoire Hubert Curien, Université Jean Monnet

Table des matières
I Notice individuelle 1Curriculum Vitæ . . . . . . . . . . . . . . . . . . . . . . . . . . . . . . . . . . . . . . . . . 3Synthèse de la carrière . . . . . . . . . . . . . . . . . . . . . . . . . . . . . . . . . . . . . . 4Encadrement doctoral & scientifique . . . . . . . . . . . . . . . . . . . . . . . . . . . . . . 5Activités d’enseignement . . . . . . . . . . . . . . . . . . . . . . . . . . . . . . . . . . . . . 7Participation à des programmes de recherche . . . . . . . . . . . . . . . . . . . . . . . . . 11Implication collective & responsabilités administratives . . . . . . . . . . . . . . . . . . . . 14Publications & production scientifique . . . . . . . . . . . . . . . . . . . . . . . . . . . . . 16
II Mémoire de recherche 27Préambule . . . . . . . . . . . . . . . . . . . . . . . . . . . . . . . . . . . . . . . . . . . . . 29
1 Introduction 311.1 Quelques applications des impulsions ultracourtes . . . . . . . . . . . . . . . . . . . . 32
1.1.1 Particularités et potentialités . . . . . . . . . . . . . . . . . . . . . . . . . . . 321.1.2 Un environnement local favorable . . . . . . . . . . . . . . . . . . . . . . . . . 32
1.2 Confinement de l’énergie & réponse du matériau . . . . . . . . . . . . . . . . . . . . 341.3 Description de l’état transitoire du matériau . . . . . . . . . . . . . . . . . . . . . . . 38
2 Excitation de la structure électronique en phase solide 412.1 Contexte scientifique . . . . . . . . . . . . . . . . . . . . . . . . . . . . . . . . . . . . 422.2 Conséquence du déséquilibre thermique sur la structure de bandes . . . . . . . . . . 44
2.2.1 Effet de l’écrantage sur la densité d’états électroniques . . . . . . . . . . . . . 442.2.2 La répulsion coulombienne à l’origine du décalage de la bande d . . . . . . . 452.2.3 Constitution d’une équation d’état électronique . . . . . . . . . . . . . . . . . 46
2.3 Estimation de l’indice optique sous irradiation . . . . . . . . . . . . . . . . . . . . . . 482.3.1 Dynamique moléculaire et Kubo-Greenwood . . . . . . . . . . . . . . . . . . . 482.3.2 Activation plasmonique du tunsgtène . . . . . . . . . . . . . . . . . . . . . . . 49
3 Excitation d’ondes de surface et structuration périodique 533.1 Formation des structures périodiques de surface . . . . . . . . . . . . . . . . . . . . . 543.2 Expériences clefs de la formation de LIPSS sur des métaux . . . . . . . . . . . . . . 56
3.2.1 Plasmons de surface comme initiateurs d’un dépôt d’énergie inhomogène . . . 563.2.2 Diffusion en profondeur de l’énergie et gradients longitudinaux . . . . . . . . 59
3.3 Aspects mésoscopiques : influence de l’orientation cristalline . . . . . . . . . . . . . . 613.3.1 Distribution de la désorientation cristalline locale . . . . . . . . . . . . . . . . 613.3.2 Dépendance de l’orientation cristalline et formations de défauts . . . . . . . . 63
3.4 Scénario capillaire et déclenchements d’instabilités en surface . . . . . . . . . . . . . 64

Table des matières
4 Produits d’ablation, formation de la plume et excitation en phase plasma 674.1 Mécanismes d’éjection de matière et produits d’ablation . . . . . . . . . . . . . . . . 684.2 Mise en forme temporelle d’impulsions pour l’optimisation . . . . . . . . . . . . . . . 71
4.2.1 Expériences à temps de vol . . . . . . . . . . . . . . . . . . . . . . . . . . . . 714.2.2 Contrôle des espèces ioniques via l’émission spectrale . . . . . . . . . . . . . . 714.2.3 Modélisation de la formation de nanoparticules . . . . . . . . . . . . . . . . . 72
4.3 Optimisation numérique du chauffage en régime d’ablation . . . . . . . . . . . . . . . 744.3.1 Une forme temporelle adaptée à chaque régime d’ablation . . . . . . . . . . . 754.3.2 Optimisation de l’excitation thermique en phase plasma . . . . . . . . . . . . 75
5 Interaction confinée : focalisation dans un solide transparent 795.1 Focalisation dans un solide diélectrique transparent . . . . . . . . . . . . . . . . . . . 80
5.1.1 Régime d’auto-focalisation et équation de Schrödinger . . . . . . . . . . . . . 805.1.2 Etirage d’impulsions pour le contrôle de l’excitation . . . . . . . . . . . . . . 82
5.2 Excitation du plasma électrons-trous . . . . . . . . . . . . . . . . . . . . . . . . . . . 835.2.1 Faisceaux de Bessel ultracourts et structuration par tir unique . . . . . . . . 835.2.2 Imagerie ultrarapide et détermination de la dynamique des électrons libres . 84
5.3 Formation d’onde de choc dans le solide . . . . . . . . . . . . . . . . . . . . . . . . . 865.3.1 Relaxation des contraintes dans la silice . . . . . . . . . . . . . . . . . . . . . 865.3.2 Mesure relative et contrôle de la génération d’onde de choc dans le PZT . . . 88
6 Conclusions et perspectives 916.1 Synthèse des travaux réalisés . . . . . . . . . . . . . . . . . . . . . . . . . . . . . . . 926.2 Description du champ électomagnétique pour l’interaction . . . . . . . . . . . . . . . 94
6.2.1 Modélisation EM & formation de LIPSS en surface . . . . . . . . . . . . . . . 946.2.2 Modélisation EM & formation de nanoréseaux en volume . . . . . . . . . . . 96
6.3 Changement structurel ultrarapide . . . . . . . . . . . . . . . . . . . . . . . . . . . . 976.3.1 Expériences de structuration sur matériaux à transition de phase . . . . . . . 986.3.2 Changement de phase cristalline ultrarapide du nickel . . . . . . . . . . . . . 99
6.4 Modélisation de l’excitation de matériaux non standards . . . . . . . . . . . . . . . . 1016.4.1 Propriétés des alliages inox par DFT . . . . . . . . . . . . . . . . . . . . . . . 1016.4.2 Matériaux carbonés et diélectriques, vers la TD-DFT ? . . . . . . . . . . . . . 102
III Recueil de publications significatives 111
Publication 1 : Physical Review B 71, 165406 (2005) 115
Publication 2 : Physical Review B 82, 035430 (2010) 121
Publication 3 : Optics Express 19, 19150 (2011) 137
Publication 4 : New Journal of Physics 14, 0130139 (2012) 147
Publication 5 : Applied Physics Letters 104, 021107(2014) 167
Publication 6 : Physical Review B 89, 115117 (2014) 171
Conclusion générale 183
iv

Première partie
Notice individuelle


Notice individuelle
Curriculum Vitæ
36 ans, Pacsé 1 enfantLaboratoire Hubert Curien - 18, rue du Pr Benoît Lauras 42 000 Saint-Etienne� : 04 77 91 58 00 - � : 06 63 10 91 47
Expériences Professionnelles
2007–2014 : Maître de conférences à l’Université Jean Monnet de Saint Etienne. 63ème
section. Telecom Saint-Etienne (ex. Istase). Laboratoire Hubert Curien, UMRCNRS 5516 Université Jean Monnet.Décharges « jeune chercheur » obtenues en 2009 et 2010.
2006–2007 : Postdoctorat CNRS à l’Observatoire de Paris -Meudon. Laboratoire d’Etudedu Rayonnement et de la Matière en Astrophysique. Jetset - « Expériencesd’hydrodynamique radiative sur les grands lasers dans le contexte astrophy-sique ».
2005–2006 : Attaché Temporaire d’Enseignement et de Recherche à l’UniversitéJean Monnet de Saint Etienne IUT Mesures Physiques - « Optimisation numé-rique d’expériences d’ablation laser par impulsions laser subpicosecondes ».
2002–2005 : Doctorant CEA au Commissariat à l’Energie Atomique -DAM Ile de France-Bruyères-le-Châtel. CDD au Département de Physique Théorique et Appliquée- (Contrat CTBU).
Formation
2002–2005 : Thèse de doctorat - Spécialité Optique de l’Université Jean Monnet, SaintEtienne. Mention très honorable. « Théorie et simulation de l’interactiondes impulsions laser ultracourtes, à flux modéré, avec les solides métalliques ».Soutenue publiquement le 07 octobre 2005 devant le jury composé de :Gérard Mourou LOA-ENSTA, Palaiseau PrésidentGuillaume Petite CEA-Ecole Polytechnique, Palaiseau RapporteurChristian Stenz CELIA, Bordeaux RapporteurMarc Sentis LP3, Marseille ExaminateurEric Audouard UJM, Saint-Etienne Directeur de thèsePatrick Combis CEA, Bruyères-le-Châtel Co-encadrant
1999–2002 : Magistère des Sciences de la Matière à l’Ecole Normale Supérieure etl’Université Claude Bernard - Lyon I.DEA Particules Noyaux Atomes et Photons en 2001-2002 à l’UniversitéClaude Bernard - Lyon. Mention Bien.Stages de laboratoire : CEA/DAM Ile de France (4 mois) - Institut des SciencesNucléaires de Grenoble (3 mois) - Laboratoire TSI de St Etienne (2 mois).
1997–1999 : DEUG de Sciences de la Matière à l’Université Jean Monnet - SaintEtienne. Mention Assez-Bien.
3

Notice individuelle
Synthèse de la carrière
Nommé sur un poste de Maître de conférences au 1er Septembre 2007 à l’Université JeanMonnet de Saint Etienne, j’effectue mes recherches au Laboratoire Hubert Curien (UMR C.N.R.S.5516) et mon activité d’enseignement à Telecom Saint-Etienne (ex. Istase). Celle-ci est principa-lement axée sur les systèmes optiques et la photonique avancée. Mes activités de recherche auLaboratoire Hubert Curien s’organisent au travers des thèmes suivants :
• Aspects fondamentaux de l’interaction laser ultrabref-matière en phase solide• Applications à la structuration périodique par excitation d’ondes de surface• Ablation laser et optimisation de l’excitation en phase plasma• Simulation de la propagation laser en volume de diélectriques pour la conception de guides
d’onde enterrésLes différentes activités du laboratoire sont regroupées au sein de deux départements scienti-
fiques, eux-mêmes divisés en deux thématiques. Des projets scientifiques structurants du Labora-toire ont été identifiés au sein de ces différentes thématiques. J’ai été intégré dès mon recrutementau sein du projet ULTRA, afin de développer la modélisation de l’interaction laser ultracourt-solide. En 2008, j’ai été sollicité pour mettre en place et prendre la responsabilité du CiTISE(Cycle Initial de Telecom St Etienne). Le CiTISE est une formation réalisée en partenariat entreTSE, la Faculté des Sciences et Techniques et l’IUT GEII. Lors de dernière évaluation AERESdu Laboratoire en 2009, la direction du laboratoire m’a confié l’animation de l’axe transverse« Ripples » au sein de la thématique. Cet axe transverse permet d’assurer la coordinationscientifique entre les projets ULTRA (Resp : R. Stoian) et PLD (Resp : F. Garrelie). Cela a aboutià de nombreux échanges inter-projets et à l’obtention en 2012 d’un programme ANR BlancInternational franco-roumain que je coordonne.
En 2009/2010 et 2010/2011, j’ai demandé et obtenu du Conseil Scientifique de l’Université unedécharge « jeune chercheur », qui m’a permis de fortement développer mes actions dédiées àla modélisation de la structuration de surface, et de participer ainsi à une quinzaine de pro-jets et contrats sur les 4 dernières années. Enfin, le Laboratoire Hubert Curien a présenté deuxprogrammes dans le cadre appels à projet « Investissement d’Avenir » :
• Un projet d’équipement d’excellence EquipEx MANUTECH-USD• Un projet de Laboratoire d’Excellence LabEx MANUTECH-SISE
Ces deux projets ont été retenus respectivement en janvier et mars 2011. Dans les deux cas, le La-boratoire Hubert Curien est chargé de la coordination globale de ces deux initiatives. Mon activitéde recherche est définie au cœur de ces Labex et Equipex. J’ai été sollicité en 2011 pour assurerl’animation scientifique de l’un des 4 axes du Labex Manutech-SISE : l’Axe 1 « Hierar-
chical surfaces » dont l’objectif est la structuration de surfaces avec une approche multi-échelle.Je suis ainsi membre du comité scientifique du LabEx Manutech-SISE. Enfin, en 2014, jeviens d’effectuer ma demande d’autorisation de soutenance d’HDR, après avis favorable ducomité scientifique et de la direction du laboratoire.
4

Notice individuelle
Encadrement doctoral
& scientifique
5 Co-directions et co-encadrements de thèses
[1] Thèse de Mourad Bounhalli (co-Direct. : F. Pigeon & F. Garrelie & Co-tutelle avec Cottbus- Allemagne)« Dynamique de la formation de nanostructures périodiques par impulsions laser ultra brèvessur une surface métallique ».[33% d’encadrement] Thèse MinistèreDébut : 10/2008 - [Soutenue le 15/12/11]
[2] Thèse de Yoan di Maio (co-Direct. : E. Audouard puis F. Pigeon)« Interaction laser-matière en régime d’impulsions ultra-brèves : Application aux matériaux àdestination de senseurs ».[50% d’encadrement] Thèse CIFRE SAGEMDébut : 09/2009 - [Soutenue le 31/05/13]Dérogation accordée par le Conseil Scientifique en 2010.
[3] Thèse de Praveen Kumar Velpula (co-Direct. : R. Stoian)« Ultrafast dynamics and control of laser induced structural modifications on mesoscopicscales : application to laser photoinscription of optical materials ».[30% d’encadrement] Thèse MinistèreDébut : 10/2011 - [Soutenance prévue 09/14]Prix : "Best student oral prize" & "Best Student Paper Award" - Photonics West 2014Dérogation accordée par le Conseil Scientifique en 2014.
[4] Thèse de Andrey Voloshko (co-Direct. : T. Itina)« Modélisation de décharge spark et formation de nanoparticules dans le plasma ».[40% taux d’encadrement] Thèse projet européen BUONAPART-EDébut : 04/2012- [Soutenance prévue 03/15]
[5] Thèse de Anton Rudenko (co-Direct. : T. Itina)« Etude numérique de la nanotransformation des cibles semi-conductrices et diélectriques parirradiation laser ultra-brève ».[50% taux d’encadrement] Thèse Labex Manutech SISE
Début : 04/2014- [Soutenance prévue 03/17]Dérogation accordée par le Conseil Scientifique en 2014.
3 Participations à la formation de doctorants et à leur jury de thèse
[6] Thèse de Matthieu Guillermin [soutenue le 14/05/09]« Étude du panache d’ablation laser femtoseconde, contrôle et optimisation des procédés ».Thèse Ministère effectuée sous la direction de F. Garrelie & E. Audouard
5

Notice individuelle
[7] Thèse de Cherif Sow [soutenue le 06/06/13]« Surfaces fonctionnalisées à base de nanoparticules métalliques pour l’optique - photonique ».Thèse Ministère effectuée sous la direction de F. Goutaland & F. Vocanson
[8] Thèse de Florent Bourquard [soutenue le 06/12/13]« Ablation laser femtoseconde assistée d’une mise en forme temporelle pour le dépôt de couchesminces et la synthèse de nanoparticules ».Thèse Ministère effectuée sous la direction de F. Garrelie & C. Donnet
3 Directions scientifiques de Post-doctorants
[9] Emile Bévillon sur la « simulation de la dynamique des propriétés optiques des matériauxirradiés par impulsions laser ultrabrèves ». [Du 01/09/2012 au 31/12/2014] [28 mois][100% taux d’encadrement] Financement Labex Manutech SISE & ANR Blanc Dylipss
[10] Xxx Sedao sur « Revealing the structural effects induced by LIPSS formation with a HR-EBSD approach ». [Du 01/10/2012 au 31/03/2015] [30 mois][33% taux d’encadrement] Financement Labex Manutech SISE
[11] Liviu Neagu sur « Ultrafast laser-induced periodic surface structure on pre-structured surface». [Du 01/11/2013 au 31/01/2014] puis du [01/07/2014 au 30/11/2014] [7 mois][50% taux d’encadrement] Financement ANR Blanc Dylipss
1 Direction de stage de Master
[12] Aurélie Bruyère sur la « Nano-structuration périodique de surfaces métalliques par laserfemtoseconde : expérience de double-impulsions et analyse fréquentielle ». [Du 01/04/2012 au30/06/2012] [3 mois][100% taux d’encadrement]
L’ensemble de l’encadrement scientifique est résumé sur le synoptique ci-dessous :
6

Notice individuelle
Activités d’enseignement
Listes des matières enseignées
Nom de l’Unité d’Enseignement CM TD TP Public concerné Période(h) (h) (h)
Conversion d’énergie 52 IUT MP 1A 2005-2006Machines thermiques 14 IUT MP 1A 2005-2006Thermodynamique 22 IUT MP 1A 2005-2006Certificat Informatique et Internet 12 Form. Pro. 2006-2007Introduction à l’optique 6 6 FA 1A 2007-2008Introduction à Matlab 18 FI 1A 2007-2009Systèmes linéaires et projets Matlab 24 FI 1A 2007-2009Traitement numérique des données 24 FI 2A 2007-2009Signaux aléatoires 24 FI 1A 2007-2009Ondes scalaires 12 FI 1A 2007-2009Traitement Numérique du Signal 6 6 6 FA 2A 2007-2009Probabilités 40 FI 1A 2007-2011Photométrie 6 6 6 FA 2A 2007-2012Tests et Statistiques 6 6 6 FA 2A 2007-2013Projet Recherche & innovation 10 FI 2A 2012-2013Sources de rayonnement 6 6 FA 2A 2007-2014Thermodynamique 15 15 CiTISE 2A 2009-2014Projets Scientifiques (APP) 14 CiTISE 1A 2009-2014Interaction lumière-matière 6 6 FA 2A 2011-2014Méthodes numériques pour la photonique 11 15 M2 & FI 3A 2009-2014Electromagnétisme 30 FI 1A 2009-2014Electrostatique - Magnétostatique 18 FI 1A 2009-2014Optique non-linéaire 9 9 FI 2A 2012-2014Filamentation laser (semaine photonique) 3 FI 2A & E.D. 2012-2014Théorie des lasers 6 6 FA 2A 2012-2014Introduction à l’optique-photonique 12 FI 1A 2012-2014Stages ouvriers 2 FI 1A 2007-2014Stages de fin d’études 14 FI 3A 2008/2014Tuteur étudiant apprentissage 8 FA 1A-2A-3A 2008-2014
FI & FA sont les "Filière Initiale" et "Filière par Apprentissage" de TSE, respectivement.1A & 2A correspondent aux 1ère année (� Licence 3A) et 2ème année (� Master I) de l’écoled’ingénieur.M2 et E.D. sont les cours en commun avec le Master II & ouverts à la formation doctorale.MP correspond au département "Mesures Physiques"
7
Notice individuelle
Détails des principaux enseignements
Lors de mon intégration à l’école d’ingénieur Telecom Saint-Etienne, mon service d’enseignementétait très différent de celui actuel. A l’exception de certaines matières, quelques cours dont j’avais lacharge ont été modifiés ou supprimés lors d’évolution de la maquette pédagogique. Pour le reste, leschangements de cours ont été un choix, mes deux années de décharge (64h en 2009/2010-2010/2011)m’ayant permis de me libérer des plus éloignés de mes intérêts et les aléas faisant que de nouveauxcours se sont libérés. Ainsi, j’ai été en charge de plusieurs cours de mathématiques à mon arri-vée (probabilités (TD), tests et statistiques (CM & TD) et analyse numérique(TD)) que j’ai puprogressivement troquer contre des cours de physiques plus proches de mes aspirations et de mesactivités de recherche. Aujourd’hui, mon service s’articule essentiellement autour de cours d’électro-magnétisme et de photonique, pour lesquels il m’est bien plus possible de proposer des innovationspédagogiques. Dans les paragraphes qui suivent, je présente quelques uns de ces cours, avec lesquelsj’ai pu faire une connexion avec mes activités au laboratoire.
A l’origine, un cours d’ondes scalaires (principalement autour de l’acoustique) existait enparallèle du cours d’électromagnétisme. J’ai eu la charge de ce cours magistral en 1ère année de laformation d’ingénieur dès mon arrivée à l’école. En plus d’être très formateur sur la manière deprésenter un cours CM dans un amphithéâtre remuant, ce fut l’occasion d’essayer mes premièresarmes pédagogiques sur un sujet proche de l’hydrodynamique que je connaissais bien. Deux ansplus tard, ce cours fut supprimé pour amincir le volume horaire des étudiants mais j’ai pris lecours (CM+TD) de thermodynamique du cycle préparatoire (de niveau L2) qui est égalementun domaine scientifique au cœur de mon travail de recherche. J’ai proposé pour ce cours une ap-proche microscopique d’introduction aux grandeurs classiques (pression, température) qui permet,je trouve, d’apporter une démarche plus physique et d’enseigner un début de structure de la matièreà des étudiants dont le socle de connaissances est basé sur l’électronique et l’informatique.Au cours des sept années, j’ai eu l’occasion de m’investir dans de nombreux cours de la filière parapprentissage, pour lesquels l’approche se doit d’être plus concrète et l’approfondissement un peumoindre, faute de temps. Ces cours s’articulent autour des sources et des effets liés à la lumière,qui constituent les grandes questions que l’on peut retrouver dans le mémoire de recherche qui suit.Ainsi, j’ai eu l’occasion d’enseigner (CM+TD) dans cette filière la photométrie, les sources derayonnement, la théorie des lasers, et l’interaction lumière-matière. Le choix des phéno-mènes prépondérants ainsi que leur compréhension et leurs applications m’a été guidée par mesrecherches.D’un point de vue scientifique plus approfondi, j’ai également pu m’investir dans certains coursde spécialité, accessibles aux étudiants de master et de l’école doctorale, tels que l’optique non-linéaire pour laquelle les ordres de grandeurs, et certains effets sont directement puisés dans mesactivités d’interaction laser-matière en régime ultrabref. Dans cet esprit, j’ai mis en place un TP
8

Notice individuelle
(numérique) sur la propagation laser par filamentation dans le contexte de la semaine de laphotonique, organisée en commun avec Télécom Physique Strasbourg. La méthode proposée estbasée sur celle décrite dans le chapitre 5 du mémoire de recherche qui suit. Un cours CM/TD/TPde 3ème année (en commun avec le Master 2 de la Faculté de Sciences et Techniques) et dont j’ai lacharge en partie, est dédié aux méthodes numériques pour la nanophotonique. Les méthodesenseignées sont pour la plupart basées sur celles que j’ai pu rencontrer au cours de mes activitésde recherche. En particulier, les méthodes de propagation de faisceau (BPM) et de type Finite-Difference Time-Domain (FDTD), sont largement utilisées dans nos simulations de l’interactionmais elles m’ont obligé à me documenter soigneusement.Enfin plus récemment, j’ai repris le cours magistral de 1ère année d’introduction à l’optique-photonique qui demande un certain recul dans ce domaine. Il s’agit d’un cours clef, permettant defaire la promotion du domaine de la photonique, dans un amphithéâtre plus enclin aux activités liéesà l’informatique dans notre école de télécommunications. Depuis 2014, je représente d’ailleurs mescollègues « opticiens », dans le cadre du directoire scientifique et dans la commission de définitionet évolution des programmes (DEP).
Responsabilité du CiTISE
Au cours de ma première année à Telecom St-Etienne (alors Istase), j’ai été sollicité pour mettreen place et prendre la responsabilité du CiTSE (Cycle Initial de Telecom St Etienne), renomméCITISE en 2011 (Cycle Initial en Technologies de l’Information Saint-Étienne). Le CiTISE est uneformation réalisée en partenariat entre TSE, la Faculté des Sciences et Techniques (FST) et l’IUTGénie Electrique et Informatique Industrielle (GEII).
Ce cursus consiste en deux années de préparation ayant pour objectif de dispenser les connais-sances scientifiques et techniques fondamentales au cursus d’ingénieur en STIC. Il s’adresse à desbacheliers S recrutés sur concours national Geipi-Polytech et s’articule autour d’un DUT GEII. Ilest complété sur deux plans. D’une part les bases scientifiques, essentiellement mathématiques etphysique, sont renforcées pour préparer à un cursus long devant s’effectuer sans rupture. D’autrepart, la sensibilisation au métier et aux activités de l’ingénieur est conduite à l’aide de premièresexpériences pré-professionnelles (projets, stage) et par l’apport de techniques transverses (commu-nication, gestion de projet, travail en équipe. . . ). Ce cycle, pionnier en France, présente l’avantaged’intégrer explicitement la problématique de la réorientation, puisque des passerelles avec le DUTet le cycle Licence sont proposées au cours du cycle. De plus, ce parcours professionnalisant (DUT)offre des débouchés à l’étudiant désirant interrompre sa formation en fin de cycle. Depuis la rentrée
9

Notice individuelle
2011, le CITISE s’est ouvert vers d’autres écoles d’ingénieurs dont Télécom Sud-Paris, TélécomParis-Tech, Télécom Bretagne et l’Institut Supérieur d’Optique Graduate School, se dotant alorsd’un comité de pilotage représentatif des différentes formations d’accueil.
Ce cycle accueille aujourd’hui une cinquantaine d’étudiants en 1ère année et une trentaine d’étu-diants en 2ème année, fournissant ainsi environ 20% de la formation initiale ingénieur de TSE, lesautres étudiants rejoignant soit la filière par apprentissage, soit les autres formations.
Les missions qui m’ont été confiées entre 2008 et 2013 (estimées à 140h/an) étaient les suivantes :• Suivi des étudiants (Effectifs d’environ 80 étudiants entre 2008 et 2013)• Définition et évolution de la maquette pédagogique TSE (programme, ECTS...)• Présidences de jurys• Organisation, calendrier et bilans de l’année pédagogique• . . .
En assurant cette responsabilité durant 6 années, j’ai beaucoup appris des processus d’évaluationet d’innovation pédagogiques, même s’ils étaient orchestrés par le directeur de la formation de l’école.En plus de s’intéresser à l’élaboration du contenu général de formation, j’ai pu mesurer l’impactque pouvait avoir les exigences de chacune des structures (TSE, IUT ou FST) sur les difficultés àoffrir une logistique efficace (emploi du temps, répartition entre sites) pour le bon fonctionnementde la formation. Enfin, le rôle de responsable d’année et président de jury est très formateur pourapprofondir les moyens de resensibiliser les étudiants au rythme et au niveau de travail demandéainsi que les collègues enseignants sur les objectifs pédagogiques de la formation.
10

Notice individuelle
Participation à des programmes
nationaux et internationaux
Implication dans des programmes nationaux
• ANR BLANC « NANOFLAM »[2011–2014] 90 ke Implication : 15%« Contrôle de la filamentation et de la génération de plasma avec les impul-
sions non-diffractantes femtosecondes en régime nonlinéaire. Applications à
la nano-structuration laser à ultra haut rapport de forme »Partenaires du projet : LabHC, Ecole Polytechnique & FemtoST Besançon (coord.)
• ANR BLANC « SMARTLASIR »[2011–2014] 160 ke Implication : 15%« SMART 3D ultrafast Laser fabrication of embedded optical functions in
chalcogenide materials using self-improving spatio-temporal adaptive control :
Applications in integrated Spectrometry concepts for IR astrophotonics ap-
plications »Partenaires du projet : Lab. Hubert Curien (coord.), IPAG Grenoble, EVC Université Rennes& FemtoST de Besançon
• Projet GENCI « DARI »[2013–2014] Heures de calculs sur supercalculateurs : 350000h en 2013 et 480000h en 2014Moyens nationaux pour le calcul hautes performances - supercalculateur Curie« Conductivité hors équilibre pour le contrôle de la nanostructuration de
matériaux par laser ultrabref »Partenaires du projet : Lab. Hubert Curien (Coord.) & Commissariat à l’Energie Atomique
• Projet Région « AdaFemtoPLD »[2011–2013] Bourse de Thèse (36 mois) + 25 ke Implication : 30%Projet CIBLE Région Rhône-Alpes« Tailoring the properties of films elaborated by PLD through adaptive op-
timization of femtosecond laser »Partenaires du projet : Lab. Hubert Curien (Coordinateur), Institut Louis Néel & Laboratoirede Tribologie et Dynamique des Systèmes
• Projet « LITHO2PP »[2010–2011] Appel Futur et ruptures de l’Institut TelecomPartenaires du projet : Lab. Hubert Curien, ENSPS (Strabourg) & Telecom Bretagne (coord.)
• Projet « COLAS »[2010] Appel Saint-Etienne Métropole avec partenariat industriel (Impulsion) - 50 ke« Détection en temps réel et contrôle de l’excitation laser pour la structu-
11

Notice individuelle
ration de matériaux par procédés adaptatifs »Partenaire : Laboratoire Hubert Curien
Implication dans des réseaux d’excellence nationaux :
• LABoratoire d’EXcellence Manutech-SISE - Animateur de l’axe 1 : « Hierarchical surfaces »[2012–2014] 4.7 Me[4 axes - 305 personnes regroupant 4 labos partenaires du PRES de Lyon et 3 industriels]
• Projet « DYNOPT » Porteur & Responsable scientifique[2012-2014] Postdoc (18 mois) +15 ke- LABEX MANUTECH-SISE (Axe 4)« Modeling of transient optical properties in ultrashort laser-irradiated ma-
terials by ab initio calculation »Partenaires du projet : LaHC (Coordinateur)
• Projet « SEILIPSS » Porteur[2012-2015] Post-Doc (30 mois) +20 ke - LABEX MANUTECH-SISE (Axe 1)« Mise en évidence d’effets, induits par laser ultrabref, de structures de sur-
face périodiques, à l’aide d’une approche EBSD à haute résolution »Partenaires du projet : LaHC (Coordinateur), LCG - Ecole des Mines de Saint Etienne
• Projet « NANODIELEC » - Co-Responsable scientifique[2014-2017] Bourse de Thèse (36 mois) + 10 ke - ANR LABEX MANUTECH-SISE (Axe 1)« Etude numérique de la nanotransformation des cibles semi-conductrices et
diélectriques par irradiation laser ultra-brève »Partenaire du projet : LaHC (Coordinateur)
• GDR « Modélisation Matériaux » Membre associé [2012–2014]
Implication dans des programmes internationaux :
• Projet ANR BLANC INTERNATIONAL « DYLIPSS » - Coordinateur[2013–2015] - 220 ke Implication : 40%« Dynamique des Structures Périodiques de Surface Induites par Laser »Partenaires du projet : Laboratoire Hubert Curien (Coordinateur), National Institute forLaser, Plasma and Radiation Physics de Bucarest en Roumanie
• Projet Européen « BUONAPART-E »[2012–2016] - 248 ke Implication : 20%« Better Upscaling and Optimization of Nanoparticle and Nanostructure Pro-
duction by Means of Electrical Discharges »Partenaires : 21 Laboratoires & Entreprises en Europe
12

Notice individuelle
• Bourse d’Actions Internationales de la Recherche UJM - Porteur[2011] - 2 ke« Couplage plasmonique & formation de ripples lors d’irradiation
laser ultrabrève »Partenaire : Bundesanstalt für Materialforschung und -prüfung (BAM) Berlin, Allemagne
• Projet « Nanostructuration » ProcopeProgramme Hubert Curien Procope [2010–2011]« Nanostructuration de surface par ablation laser femtoseconde »Partenaire : Brandenburg Technical University (BTU) à Cottbus en Allemagne
• Projet « METHLAS » BrancusiProgramme Hubert Curien Brancusi [2010–2012]« Nanoscale laser processing of materials by designed ultrashort laser pulses »Partenaire : National Institute for Laser, Plasma, and Radiation Physics, Bucarest
• Projet bilatéral CNRS France/RussieProjets Internationaux de Coopération Scientifique (PICS) [2010–2013]« Simulation de la transition de phase et de la nanostructuration par laser »Partenaire : Institute for High-Energy Densities (Moscou, Russian Academy of Sciences)
13
Notice individuelle
Implication collective &
responsabilités administratives
Responsabilités en enseignement au sein de Telecom Saint-Etienne (TSE) :
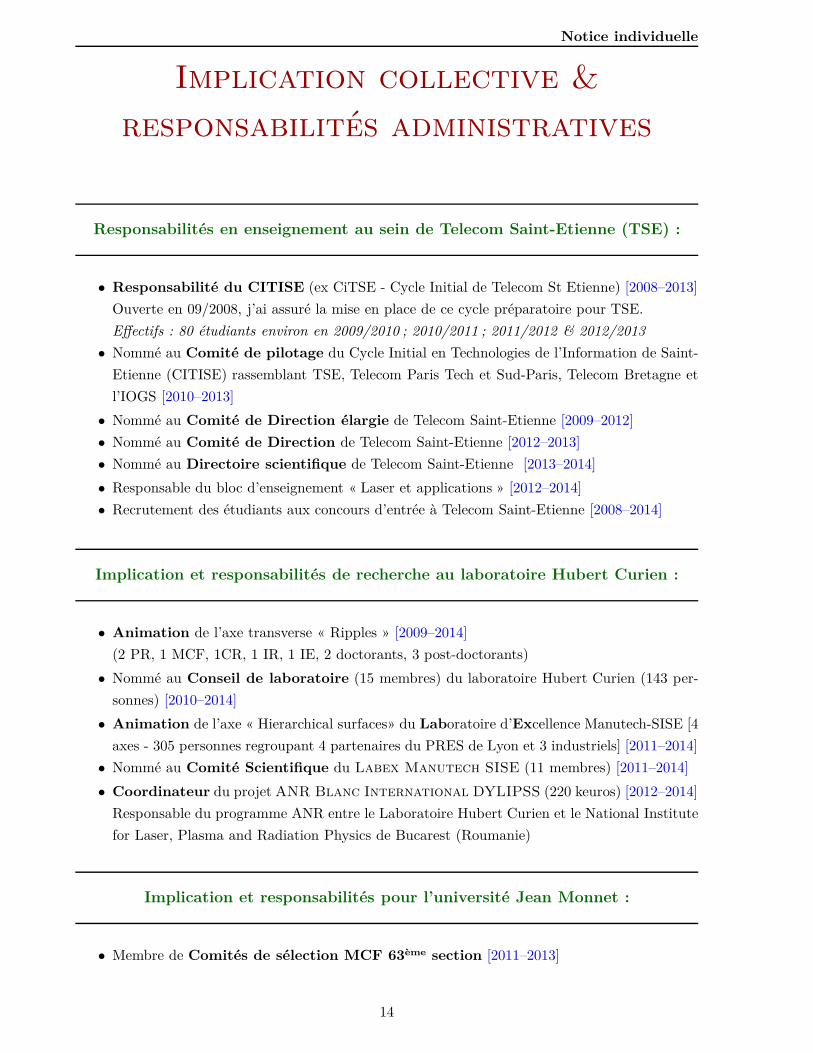
• Responsabilité du CITISE (ex CiTSE - Cycle Initial de Telecom St Etienne) [2008–2013]Ouverte en 09/2008, j’ai assuré la mise en place de ce cycle préparatoire pour TSE.Effectifs : 80 étudiants environ en 2009/2010 ; 2010/2011 ; 2011/2012 & 2012/2013
• Nommé au Comité de pilotage du Cycle Initial en Technologies de l’Information de Saint-Etienne (CITISE) rassemblant TSE, Telecom Paris Tech et Sud-Paris, Telecom Bretagne etl’IOGS [2010–2013]
• Nommé au Comité de Direction élargie de Telecom Saint-Etienne [2009–2012]• Nommé au Comité de Direction de Telecom Saint-Etienne [2012–2013]• Nommé au Directoire scientifique de Telecom Saint-Etienne [2013–2014]• Responsable du bloc d’enseignement « Laser et applications » [2012–2014]• Recrutement des étudiants aux concours d’entrée à Telecom Saint-Etienne [2008–2014]
Implication et responsabilités de recherche au laboratoire Hubert Curien :
• Animation de l’axe transverse « Ripples » [2009–2014](2 PR, 1 MCF, 1CR, 1 IR, 1 IE, 2 doctorants, 3 post-doctorants)
• Nommé au Conseil de laboratoire (15 membres) du laboratoire Hubert Curien (143 per-sonnes) [2010–2014]
• Animation de l’axe « Hierarchical surfaces» du Laboratoire d’Excellence Manutech-SISE [4axes - 305 personnes regroupant 4 partenaires du PRES de Lyon et 3 industriels] [2011–2014]
• Nommé au Comité Scientifique du Labex Manutech SISE (11 membres) [2011–2014]• Coordinateur du projet ANR Blanc International DYLIPSS (220 keuros) [2012–2014]
Responsable du programme ANR entre le Laboratoire Hubert Curien et le National Institutefor Laser, Plasma and Radiation Physics de Bucarest (Roumanie)
Implication et responsabilités pour l’université Jean Monnet :
• Membre de Comités de sélection MCF 63ème section [2011–2013]
14

Notice individuelle
Expertise de travaux nationaux et internationaux
• Relecteur pour de nombreuses revues internationales :� American Institute of Physics : Applied Physics Letters & Journal of Applied Physics� Institute Of Physics : Journal of Physics D : Applied Physics� Elsevier : Applied Surface Science & International Journal of Thermal Sciences� Springer : Applied Physics A� Japan Laser Processing : Journal of Laser Micro/NanoEngineering� Optical Society of America : Optics Express, Journal of the Optical Society of America
B & Optical Materials Express
• Expert international pour des appels à projets nationaux étrangers :� Der Schweizerische Nationalfonds zur Förderung der wissenschaftlichen Forschung (SNF :
Swiss National Science Foundation) [2013] & [2014]
• Chairman de conférences internationales :� Progress in Electromagnetics Research Symposium [2012]� Laser Precision Microfabrication [2012]
Activités de valorisation, vulgarisation et de transfert
• Vulgarisation scientifique :� Bulletins électroniques (BE) n 22 - Actualité technologique internationale (BE Rou-
manie)«Dynamique des Structures Périodiques de Surface Induites par Laser». M. Zamfirescu,J.P. Colombier, B. de Boisdeffre & F. Florihttp ://www.bulletins-electroniques.com/actualites/72483.htm
• Organisation de manifestations scientifiques :� Journée scientifique dédiée à la topograhie multi-échelle des surfaces - Labex Manutech
SISE [2013]
• Valorisation et transfert technologique des résultats :� Membre de l’équipe commune de recherche entre les entreprises HEF et Impulsion, le
LTDS (Lyon) et le LaHC [2009–2011]� Contrat Sagem 45 ke sur l’application de l’interaction laser-matière à destination de
capteurs sensoriels (+Thèse CIFRE) [2010–2013]� Contrat Nuclétudes 10 ke sur l’interaction laser-matière en régime court et ultracourt
[2013–2014]
15

Notice individuelle
Publications
& production scientifique
Articles de rang A dans des revues internationales à comité de lecture (27) :
[1] X. Sedao, C. Maurice, F. Garrelie, J.P. Colombier, S. Reynaud, R. Quey, & F. Pigeon, «In-fluence of crystal orientation on the formation of femtosecond laser-induced periodic surfacestructures and lattice dislocations», Applied Physics Letters 104, 171605 (2014).
[2] P.K. Velpula, M.K. Bhuyan, C. Mauclair, J.P. Colombier, & R. Stoian, «Role of free carriersexcited by ultrafast Bessel beams for sub-micron structuring applications», Optical Enginee-ring 53 (7), 076108 (2014).
[3] E. Bévillon, J.P. Colombier, V. Recoules, & R. Stoian, «Free-electron properties of metalsunder ultrafast laser-induced electron-phonon nonequilibrium : A first-principles study», Phy-sical Review B 89, 115117 (2014).
[4] M.K. Bhuyan, P.K. Velpula, J.P. Colombier, T. Olivier, N. Faure, & R. Stoian, «Single-shothigh aspect ratio bulk nanostructuring of fused silica using chirp-controlled ultrafast laser Bes-sel beams», Applied Physics Letters 104 (2), 021107 (2014).
[5] R. Stoian, J.P. Colombier, C. Mauclair, G. Cheng, M.K. Bhuyan, & P.K. Velpula, «Spatialand temporal laser pulse design for material processing on ultrafast scales», Applied PhysicsA 114 (1), 119-127 (2014).
[6] X. Sedao, C. Maurice, F. Garrelie, J.P. Colombier, S. Reynaud, R Quey, G. Blanc, & F. Pigeon«Electron backscatter diffraction characterization of laser-induced periodic surface structureson nickel surface», Applied Surface Science 302, 114-117 (2014).
[7] F. Goutaland, J.P. Colombier, M.C. Sow, N. Ollier, & F. Vocanson, «Laser-induced periodicalignment of Ag nanoparticles in soda-lime glass», Optics Express 21 (26), 31789 (2013).
[8] R. Stoian, K. Mishchik, G. Cheng, C. Mauclair, C. D’Amico, J.P. Colombier & M. Zamfi-rescu, «Investigation and control of ultrafast laser-induced isotropic and anisotropic nanoscale-modulated index patterns in bulk fused silica», Optical Materials Express 3 (10), 1755(2013).
[9] J.P. Colombier, E. Audouard, & R. Stoian, «Laser pulses designed in time by adaptive hy-drodynamic modeling for optimizing ultrafast laser-metal interactions», Applied Physics A110 (3), 723-729 (2013).
16

Notice individuelle
[10] J.P. Colombier, F. Garrelie, P. Brunet, A. Bruyère, F. Pigeon, R. Stoian & O. Parriaux, «Plas-monic and Hydrodynamic Effects in Ultrafast Laser-Induced Periodic Surface Structures onMetals», Journal of Laser Micro/NanoEngineering 7 (3) 362-368 (2012).
[11] Y. Di Maio, J.P. Colombier, P. Cazottes, & E. Audouard, «Ultrafast laser ablation characte-ristics of PZT ceramic : Analysis methods and comparison with metals», Optics and LaserEngineering 50 (11), 1582-1591 (2012).
[12] J.P. Colombier, P. Combis, E. Audouard, & R. Stoian, «Guiding heat in laser ablation ofmetals on ultrafast timescales : an adaptive modeling approach on aluminum», New Journalof Physics 14, 013039 (2012).
[13] C. Mauclair, M. Zamfirescu, J.P. Colombier, G. Cheng, K. Mishchik, E. Audouard, & R.Stoian, «Control of ultrafast laser-induced bulk nanogratings in fused silica via pulse time en-velopes», Optics Express 20 (12), 12997-13005 (2012).
[14] J.P. Colombier, F. Garrelie, N. Faure, S. Reynaud, M. Bounhalli, E. Audouard, R. Stoian, &F. Pigeon, «Effects of electron-phonon coupling and electron diffusion on ripples growth onultrafast-laser-irradiated metals», † Journal of Applied Physics 111, 024902 (2012).
[15] F. Bourquard, J.P. Colombier, M. Guillermin, A.-S. Loir, C. Donnet, R. Stoian, & F. Gar-relie, «Temporal pulse shaping effects on aluminium and boron ablation plumes generated byultrashort pulsed laser ablation and analyzed by time- and space-resolved optical spectroscopy»,Applied Surface Science 258 (23), p.9374-9378 (2012).
[16] F. Garrelie, J.P. Colombier, F. Pigeon, S. Tonchev, N. Faure, M. Bounhalli, S. Reynaud andO. Parriaux «Evidence of surface plasmon resonance in ultrafast laser-induced ripples», Op-tics Express 19, 19150 (2011).
[17] M. Guillermin, J.P. Colombier, S. Valette, E. Audouard, F. Garrelie & R. Stoian. «Opticalemission and nanoparticle generation in Al plasmas using ultrashort laser pulses temporallyoptimized by real-time spectroscopic feedback», Physical Review B 82, 035430 (2010).
[18] M. Guillermin, A. Klini, J.P. Colombier, F. Garrelie, D. Gray, C. Liebig, E. Audouard, C.Fotakis & R. Stoian, «Tuning spectral properties of ultrafast laser ablation plasmas from brassusing adaptive temporal pulse shaping», Optics express 18, 11159-11172 (2010).
[19] C. Stehlé, M. González, M. Kozlova, B. Rus, T. Mocek, O. Acef, J.P. Colombier, T. Lanz,N. Champion, K. Jakubczak, J. Polana, P. Barroso, D. Bauduin, E. Audit, J. Dostal & M.Stupka, «Experimental study of radiative shocks at PALS facility», Laser and ParticleBeams 28, 253-261 (2010).
[20] B. Dusser, Z. Sagan, H. Soder, N. Faure, J.P. Colombier, M. Jourlin & E. Audouard, «Control-led nano-structrures formation by ultrafast laser pulses for color marking», Optics Express18 (3), 2913 (2010).
17

Notice individuelle
[21] J.P. Colombier, R. Stoian, E. Audouard, P. Combis, A. Rosenfeld, & I.V. Hertel, «Controllingenergy coupling and particle ejection in metallic surfaces irradiated by ultrashort laser pulsesabsorption», Applied Surface Science 255 (24), 9597 (2009).
[22] C. Stehlé, A. Ciardi, J.P. Colombier, M. Gonzalez, T. Lanz, A. Marocchino, M. Kozlova, & B.Rus, «Scaling from astrophysics to the laboratory and vice versa : the power of simulations»,Laser and Particle Beams 27, 709 (2009).
[23] J.P. Cuq-Lelandais, M. Boustie, L. Berthe, T. de Rességuier, P. Combis, J.P. Colombier, M.Nivard, & A. Claverie, «Spallation generated by femtosecond laser driven shocks in thin me-tallic targets», Journal of Physics D : Applied Physics 42, 065402 (2009).
[24] J.P. Colombier, P. Combis, E. Audouard & R. Stoian, «Transient optical response of ultra-fast nonequilibrium excited metals : Effects of an electron-electron contribution to collisionalabsorption», Physical Review E 77, 036409 (2008).
[25] J.P. Colombier, P. Combis, E. Audouard & R. Stoian, «High shock release in ultrafast laserirradiated metals : Scenario for material ejection», Physical Review B 75, 104105 (2007).
[26] J.P. Colombier, P. Combis, A. Rosenfeld, I.V. Hertel, E. Audouard & R. Stoian, «Optimizingenergy coupling at ultrafast laser irradiated metal surfaces by tailoring intensity envelope»,Physical Review B 74, 224106 (2006).
[27] J.P. Colombier, P. Combis, F. Bonneau, R. Le Harzic & E. Audouard, «Hydrodynamic simu-lations of metal ablation by femtosecond laser irradiation», Physical Review B 71, 165405(2005).
† Article sélectionné dans les «highlights of a selection of top articles 2012» par Journal of AppliedPhysics
Articles de conférence (invitée) à comité de lecture (2) :
[28] J.P. Colombier, M. Guillermin, F. Garrelie, E. Audouard & R. Stoian, «Simulations of control-led spectral emission of Al plasmas generated by temporally tailored laser Irradiation», Inter-national Symposium on high power laser ablation 2010, AIP Conference Proceedings1278, 312-323 (2010).
[29] T. E. Itina, N. Shcheblanov, J.P. Colombier, R. Stoian, E. Audouard, T. JY. Derrien, J. Her-mann, M. E. Povarnitsyn & K. V. Khishchenko, «Laser Applications for Nanotechnology :Insights From Numerical Modeling», International Symposium on high power laser ablation2010, AIP Conference Proceedings 1278, 38-50 (2010).
18

Notice individuelle
Articles de conférence sans comité de lecture (10) :
[30] P.K. Velpula, M. Bhuyan, C. Mauclair, J.P. Colombier, & R. Stoian, «Ultrafast imaging offree carriers : a controlled dynamics with chirped non-diffractive Bessel beams», ‡ SPIE Pro-ceedings Series 8967 (2014).
[31] P.K. Velpula, M.K. Bhuyan, C. Mauclair, J.P. Colombier, & R. Stoian «Ultrafast imaging offree carriers : controlled excitation with chirped ultrafast laser Bessel beams», SPIE LASE,896711-896711-8 (2014).
[32] J.P. Colombier, P. Brunet, E. Bévillon, F. Garrelie, R. Stoian, C. Albu, S. Simion, M. Zam-firescu, & F. Pigeon, «Génération de rides sub-microniques à la surface d’un métal irradiépar des impulsions lasers femtosecondes : Effets plasmoniques et hydrodynamiques», 21ème
Congrès Français de Mécanique (2013).
[33] J.P. Colombier, F. Garrelie, P. Brunet, A. Bruyère, F. Pigeon, R. Stoian, & O. Parriaux,«Plasmonic and hydrodynamic effects in ultrafast laser-induced periodic surface structures onmetals», Proceedings of LPM #12-09 (2012).
[34] F. Goutaland & J.P. Colombier, «Ripples Induced By Continuous Ultraviolet Laser ExposureIn Soda-lime Glass», IEEE CLEO Proceedings CM4K (2012).
[35] J.P. Colombier, F. Garrelie, P. Brunet, O. Parriaux, R. Stoian, & F. Pigeon, «Advances inunderstanding how femtosecond laser ripples formation in metal works» in LASERAP pro-ceedings (2012).
[36] Y. Di Maio, E. Audouard, J.P. Colombier, & P. Cazottes, «Femtosecond laser optimizationof piezoceramic cutting», ISOT 2011, Proceedings of International Symposium on Optome-chatronic Technologies (2011).
[37] C. Stehlé, A. Ciardi, J.P. Colombier, A. Marocchino, S. Suzuki-Vidal, S. Lebedev, M. Busquet& E. Audit, «Star-disk systems : What can we learn from laboratory experiments of accretionshocks and jets, in Star Disk interaction in young stellar objects ?» IAU symposium 243(2007).
[38] J.P. Colombier, P. Combis, N. Huot, H. Soder, & E. Audouard, «Suited simulations for opti-mal ultrafast laser processing of metals», Proceedings of SPIE 6106, 168-175 (2006).
[39] J.P. Colombier, P. Combis, F. Bonneau, R. Le Harzic & E. Audouard. «Hydrodynamic simu-lation of the ablation of metals by femtosecond laser pulses», Proceedings of SPIE 5448,853-858 (2004).
‡ Article récompensé par le "Best Student Paper Award within the Photonics West conference".
19

Notice individuelle
Mémoire pour soutenance de diplômes (1) :
[40] J.P. Colombier, «Théorie et simulation de l’interaction des impulsions laser ultracourtes,à flux modéré, avec les solides métalliques», Thèse de doctorat Université Jean Monnet(2005).
Invitations à des conférences orales internationales (12) :
[41] E. Bévillon, J.P.Colombier, V. Recoules, & R. Stoian, e-MRS (2014) Lille, France, «Abinitio determination of transient electronic properties of an ultrafast laser irradiated metalsurface. Consequences for LIPSS formation».
[42] J.P. Colombier, F. Garrelie, E. Bévillon, R. Stoian, & F. Pigeon, International workshop on’laser micro and nano structuring : Fondamentals and applications, Palaiseau, France (2012),«Plasmonic and hydrodynamic effects in ultrafast laser generation of periodic surface struc-tures on metals».
[43] JP Colombier, F. Garrelie, F. Pigeon, R. Stoian, & P. Brunet, LPM2012 : 13th InternationalSymposium on Laser Precision Microfabrication, Washington, USA (2012) «Experimental andtheoretical insights into the formation of femtosecond laser-induced periodic surface structureson metals».
[44] F. Garrelie, J.P. Colombier, A.S. Loir, C. Donnet, R. Stoian, & F. Pigeon, 26th Internationalconference on Surface Modification Technologies, France (2012), «Laser Surface processing».
[45] J.P. Colombier, F. Garrelie, R. Stoian, M. Bounhalli, S. Reynaud, N. Faure, Eric Audouard,& F. Pigeon, 31th International Conference on Progress in Electromagnetics Research Sym-posium (PIERS), Kuala Lumpur, Malaysia (2012), «Formation Dynamics of Ultrafast Laser-induced Periodic-surface Structure».
[46] J.P. Colombier, & R. Stoian, 19th International Conference on Advanced Laser Technolo-gies, Golden Sands, Bulgaria (2011). «Designer pulse for optimal ablation : Guiding heat inultrafast laser ablation plasma».
[47] R. Stoian, J.P. Colombier, M. Guillermin, F. Garrelie, & E. Audouard, Photonics West,United States (2011), «Designer pulses for optimal ablation».
[48] J.P. Colombier, M. Guillermin, F. Garrelie, E. Audouard & R. Stoian, HPLA (2010) :International High-Powered Laser Ablation Conference, Santa Fe, Nouveau Mexique (US) ,«Simulations of controlled spectral emission of Al plasmas generated by temporally tailored
20
Notice individuelle
laser irradiation».
[49] T. Itina, N. Shcheblanov, J.P. Colombier, R. Stoian, E. Audouard, T. Derrien, R. Torres,J. Hermann, M.E. Povarnitsyn, & K.V. Khishchenko, HPLA (2010) : International High-Powered Laser Ablation Conference, Santa Fe, Nouveau Mexique (US) «Laser Applicationsfor Nanotechnology : Insights From Numerical Modeling».
[50] M. Bounhalli, F. Garrelie, J.P. Colombier, R. Stoian, S. Reynaud, N. Faure, M. Guiller-min, E. Audouard, & F. Pigeon. HPLA (2010) : International High-Powered Laser AblationConference, Santa Fe, Nouveau Mexique (US) «The electron-phonon coupling constant as acharacteristic parameter for the formation of Ripples in ultra-short regime».
[51] F. Garrelie, M. Guillermin, A. Sikora, J.P. Colombier, A.-S. Loir, R. Stoian & C. Donnet,e-MRS (2009) : Atelier Franco-Roumain couplé aux symposia P et Q, France «Ultrashortpulsed laser deposition of thin films with femtosecond and temporal shaped laser beam».
[52] R. Stoian, J.P. Colombier, P. Combis, E. Audouard, A. Rosenfeld, I. V. Hertel, N.M. Bul-gakova, & E.E. Campbell, International field emission symposium, France (2008), «Particleemission from solids under the action of ultrashort and temporally tailored laser pulses».
Invitations à des conférences orales nationales (5) :
[53] J.P. Colombier, RTF : Modélisation des procédés ultrabrefs, Carry le Rouet, France (2010)«Nonequilibrium processes and ablation scenario».
[54] F. Garrelie, A. Sikora, M. Guillermin, A.-S. Loir., C. Donnet, J.P. Colombier, R. Stoian.UVX 2010 10ème Colloque sur les Sources Cohérentes et Incohérentes UV, VUV, et X : Ap-plications et développements Récents, France (2010). «Dépôt de couches minces par ablationlaser femtoseconde et nanoseconde : corrélation avec les propriétés du plasma».
[55] J.P. Colombier, IRMSP : Workshop Interaction Rayonnement-Matière : du solide au plasma,Saclay, France (2008) «Stratégies et critères d’optimisation des effets d’une impulsion laserultrabrève irradiant un solide métallique».
[56] J.P. Colombier, FCILA-07, Congrès franco-chinois, Lyon, France (2007) «Thermodynamicscenario for metal ablation under ultrafast laser irradiation».
[57] J.P. Colombier, Journée de modélisation - réseau Femto CNRS, Saint Etienne, France. Mo-délisation des procédés laser ultra brefs en flux intermédiaire (2005), «Adaptation du codehydrodynamique Delpor aux impulsions ultracourtes».
21
Notice individuelle
Invitations à des séminaires internationaux (1) :
[58] J.P. Colombier, BAM [Bundesanstalt für Materialforschung und -prüfung] à Berlin, Alle-magne, novembre (2013). «Determination of optical and thermodynamic properties of a metalsurface during LIPSS formation».
Communications orales et affichées lors de congrès& actes de congrès avec comité de lecture (44) :
[59] J.P. Colombier, L. Neagu, H. Zhang, E. Bévillon, N. Faure, F. Celle, A. Cazier, J.-C. Pommier,F. Garrelie, R. Stoian, & F. Pigeon, 9th International Conference on Photo-Excited Processesand Applications, Matsue, Japan (2014), «Ultrafast laser-induced periodic surface structureon periodic corrugated surface».
[60] E. Bévillon, J.P.Colombier, B. Holst, V. Recoules, & R. Stoian, 9th International Conferenceon Photo-Excited Processes and Applications, Matsue, Japan (2014), «Thermodynamic andtransport properties of metals under ultrafast laser-induced electron-phonon nonequilibrium».
[61] R. Stoian, K. Mishchik, C. Mauclair, P.K. Velpula, M. Bhuyan, J.P. Colombier, C. D’Amico,M. Zamfirescu, & G. Cheng, Conference on Bragg Gratings, Photosensitivity, and Poling inGlass Waveguides, Barcelona, Spain (2014), «Control of Ultrafast Laser Nanostructuring ofGlasses using Temporal and Spatial Pulse Design».
[62] P.K. Velpula, M. Bhuyan, C. Mauclair, J.P. Colombier, & R. Stoian, Photonics West 2014,États-Unis (2014), « Ultrafast imaging of free carriers : a controlled dynamics with chirpednondiffractive Bessel beams».
[63] E. Bévillon, J.P.Colombier, B. Holst, V. Recoules, & R. Stoian, COLA2013 : Conference OnLaser Ablation, Ischia, Italy (2013), «Ab Initio Calculations of Optical Properties of Metalsunder Femtosecond Laser Irradiation».
[64] F. Bourquard, J.P. Colombier, A.S. Loir, C. Donnet, & F. Garrelie, COLA2013 : ConferenceOn Laser Ablation, Ischia, Italy (2013), «Temporally Shaped Femtosecond Pulsed Laser Abla-tion Plume Diagnostic : Plasma and Nanoparticles in situ Characterization».
[65] X. Sedao, F. Garrelie, J.P. Colombier, S. Reynaud, F. Pigeon, G. Blanc, & C. Maurice.Conference on Laser Ablation COLA2013, Italie (2013), «High-Resolution EBSD Study ofFemtosecond Laser-Induced Phase Transformation Associated with LIPSS Formation».
22

Notice individuelle
[66] P.K. Velpula, M. Bhuyan, C. Mauclair, J.P. Colombier, & R Stoian, European Congress andExhibition on Advanced Materials and Processes, Séville, Espagne (2013), «Time-resolveddynamics of ultrafast Bessel and Gaussian beam propagation and energy deposition in trans-parent materials».
[67] R. Stoian, K. Mishchik, C. Mauclair, J.P. Colombier, M. Zamfirescu, & G. Cheng, Euro-pean Congress and Exhibition on Advanced Materials and Processes, Séville, Espagne (2013),«Control of ultrafast laser-induced nanopatterns in bulk silica glass».
[68] E. Bévillon, J.P.Colombier, B. Holst, V. Recoules, & R. Stoian, European Congress andExhibition on Advanced Materials and Processes, Séville, Espagne (2013), «First-principlescalculations of metal properties under ultrashort laser irradiation».
[69] J.P. Colombier, P. Brunet, E. Bévillon, F. Garrelie, R. Stoian, C. Albu, S. Simion, M. Zam-firescu, & F. Pigeon, 21ème Congrès Français de Mécanique du 26 au 30 août (2013), «Gé-nération de rides sub-microniques à la surface d’un métal irradié par des impulsions lasersfemto-secondes : Effets plasmoniques et hydrodynamiques».
[70] X. Sedao, F. Garrelie, J.P. Colombier, S. Reynaud, F. Pigeon, & C. Maurice, e-MRS SpringMeeting (2013), «Investigation of structural effects induced by LIPSS formation with a HR-EBSD approach».
[71] F. Bourquard, J.P. Colombier, AS Loir, C Donnet, & F Garrelie, e-MRS Spring Meeting(2013), «In situ plasma and nanoparticles diagnostic for nanoparticles deposition by tempo-rally shaped femtosecond pulsed laser».
[72] R. Stoian, K. Mishchik, G. Cheng, C. Mauclair, J.P. Colombier, & M. Zamfirescu, Progress inUltrafast Laser Modifications of Materials, Cargese, France (2013), «Investigation and Controlof Ultrafast Laser-Induced Nanoscale Patterns in Bulk Fused Silica».
[73] A. Voloshko, J.P. Colombier, & T. Itina, 1st International Workshop on Metallic Nano-Objects : From Fundementals to Applications MNO, France (2012), «Modeling of nanoparticleformation in plasma discharge».
[74] J.P. Colombier, F. Garrelie, P. Brunet, O. Parriaux, R. Stoian, & F. Pigeon, LASERAP’7,France (2012), «Advances in understanding how femtosecond laser ripples formation in metalworks».
[75] T. J.-Y. Derrien, R. Torres, M. Sentis, J.P. Colombier, & T. Itina, International Conference onPhoto-Excited Processes and Applications, ICPEPA 8 Rochester EU (2012), «Femtosecondlaser-induced surface structures of silicon : thermal and optical study of formation mecha-nism».
[76] J.P. Colombier, & R. Stoian, International Conference on Photo-Excited Processes and Ap-plications, ICPEPA 8 Rochester EU (2012), «Designer pulse for optimal ablation : Guiding
23

Notice individuelle
heat in ultrafast laser ablation plasma».
[77] A. Voloshko, J.P. Colombier, N. Shcheblanov, T. Itina, & M.E. Povarnitsyn, InternationalConference on Photo-Excited Processes and Applications, ICPEPA 8 Rochester EU (2012),«Comparison of metallic nanoparticle formation by ultra-short laser ablation in vacuum, inliquid and by spark discharge in air».
[78] F. Goutaland, M.C. Sow, J.P. Colombier, N. Ollier, & F. Vocanson, Conference On Lasers andElectro-Optics (CLEO) 2012, États-Unis (2012), «Ripples Induced By Continuous UltravioletLaser Exposure In Soda-lime Glass».
[79] R. Stoian, K. Mishchik, C. Mauclair, J.P. Colombier, M. Zamfirescu, & G. Cheng AdvancedLaser Technologies ALT, Suisse (2012), «Investigation and control of ultrafast laser-inducednanoscale patterns in bulk dielectric materials».
[80] A. Voloshko, J.P. Colombier, & T. Itina, Journées Plasmas Froids, France (2012), «Modelingof spark discharge for nanoparticle formation».
[81] Y. Di Maio, E. Audouard, J.P. Colombier, P. Cazottes, & J. Beitia, Photonics West, UnitedStates (2011), «An investigation of piezoelectric cutting by femtosecond laser».
[82] J.P. Colombier, E. Audouard, & R. Stoian, COLA2011 : Conference on laser Ablation,Mexique (2011), «Time-designed laser pulse by adaptive hydrodynamic numerical loops foroptimizing laser-matter interaction on ultrafast time scales».
[83] F. Garrelie, J.P. Colombier, F. Pigeon, S. Tonchev, N. Faure, M. Bounhalli, S. Reynaud, R.Stoian, & O. Parriaux. COLA2011 : Conference on laser Ablation, Mexique (2011), «Ultra-fast laser-induced periodic-surface structure : Formation mechanisms and evidence of surfaceplasmon resonance».
[84] Y. Di Maio, E. Audouard, J.P. Colombier, & P. Cazottes, ISOT2011 : International Sympo-sium on Optomechatronic Technologies, Hong Kong : Hong-Kong (2011), «Femtosecond laseroptimization of piezoceramic cutting».
[85] F. Bourquard, J.P. Colombier, A.-S. Loir, C. Donnet, R. Stoian, & F. Garrelie, COLA2011 :Conference on laser Ablation, Mexique (2011), «Space and time-resolved spectroscopy of alu-minium, carbon and boron ablation plume generated by temporally shaped femtosecond laser».
[86] J.P. Colombier, F. Garrelie, F. Pigeon, R. Stoian, M. Bounhalli, S. Reynaud, N. Faure N., P.Brunet, B. Dusser, & E. Audouard, LPM2011 : The 12th International Symposium on LaserPrecision Microfabrication, Japon (2011), «Ultrafast laser-induced periodic-surface structure :Formation mechanisms and applications in laser marking».
[87] F. Garrelie, J.P. Colombier, F. Pigeon, S. Tonchev, N. Faure, M. Bounhalli, S. Reynaud,& O. Parriaux, e-MRS2011 Symposium J : Laser materials processing for micro and nano
24

Notice individuelle
applications, France (2011), «Ultrafast laser-induced periodic-surface structure : Formationmechanisms and plasmonic effects».
[88] J. Bonse, J. Krüger, A. Rosenfeld, F. Garrelie, J.P. Colombier, R. Stoian, & F. Pigeon,French-German colloquium «50 Years In The Light Of The Laser», Allemagne (2010), «Na-nostructuring of solid surfaces based on laser-induced periodic surface structures (LIPSS) :recent experimental and theoretical approaches».
[89] M. Bounhalli, F. Garrelie, J.P. Colombier, R. Stoian, S. Reynaud, N. Faure, M. Guillermin, E.Audouard, & F. Pigeon, e-MRS 2010, France (2010), «The electron-phonon coupling constantas a characteristic parameter for the formation of ripples in ultra-short regime».
[90] M. Guillermin, J.P. Colombier, F. Garrelie, E. Audouard, R. Stoian, A. Klini, D. Gray, & C.Fotakis. XIème Congrès de la Division Plasmas de la Société Française de Physique, France(2010), «Mise en forme temporelle d’impulsions laser femtosecondes pour l’étude des proces-sus d’ablation et l’optimisation des procédés».
[91] M. Guillermin, JP Colombier, F. Garrelie, R. Stoian, & E. Audouard, COLA 2009 : 10thInternational Conference On Laser Ablation, Singapour (2009), «Control of emission lines inultrashort laser-induced aluminum plasmas using temporal pulse engineering».
[92] M. Guillermin, J.P. Colombier, F. Garrelie, R. Stoian, S. Valette, C. Liebig, A.-S. Loir, &E. Audouard, e-MRS 2009, France (2009), «Adaptive control of femtosecond laser inducedablation ;consequences on plasma emission and thin film deposition».
[93] J.P. Colombier ICPEPA-08 : International Conference on Photo-Excited Processes and Ap-plications, Sapporo, Japon (2008), «Controlling energy coupling and particle ejection fromaluminum surfaces irradiated with ultrashort laser pulses».
[94] M. Guillermin, B. Dusser, J.P. Colombier, A.-S. Loir, F. Garrelie, R. Stoian, E. Audouard,A. Tishchenko, O. Parriaux, & F. Pigeon, LPM 2008 : Laser Precision Microfabrication, Ca-nada (2008), «Ripples formation under femtosecond laser irradiation : mono and multi pulsesstudies and interpretation».
[95] J.P. Colombier, JETSET summer school : From models to observations and experiments,Azores, Portugal (2007), «Radiative shock structure in the context of laser-produced plasmaexperiments».
[96] M. Busquet, J.P. Colombier, & C Stehlé, American Physical Society Meeting Denver, Colo-rado, EU (2007), «1 D analysis of Radiative Shock damping by lateral radiative losses».
[97] J.P. Colombier. JETSET Workshop, Numerical MHD and Instabilities, Sauze d’Oulx, Italie(2007), «Radiative shock structure in the context of laser-produced plasma experiments».
[98] C. Stehlé, A. Ciardi, J.P. Colombier, A. Marocchino, S. Suzuki-Vidal, S. Lebedev, M. Busquet& E. Audit, Grenoble 21-25 may, IAU symposium 243 (2007), «Star-disk systems : What can
25

Notice individuelle
we learn from laboratory experiments of accretion shocks and jets, in Star Disk interaction inyoung stellar objects ?».
[99] J.P. Colombier, D. Bruneel, C. Donnet, N. Huot, R. Stoian, & E. Audouard, 8th InternationalSymposium on Laser Precision Microfabrication, Austria (2006), «Ultrafast laser processingof metals : new tools and new results».
[100] J.P. Colombier, E. Audouard, P. Combis, F. Bonneau & R. Le Harzic, High-Power LaserAblation, Taos - Nouveau Mexique E.U. (2004), «Hydrodynamic simulation of the ablation ofmetals by femtosecond laser pulses».
[101] J.P. Colombier, E. Audouard, P. Combis, F. Bonneau & R. Le Harzic, FEMTO 2004, Ile dePorquerolles, France (2004), «Modélisation de l’interaction des impulsions laser ultracourtesavec la matière, à intensité modérée».
[102] J.P. Colombier, P. Combis, & E. Audouard. International School of Quantum Electronics,Erice-Sicile (Italie) 37th Course : Atoms and Plasmas in Super-Intense Laser Fields (2003),«Ablation of metals by femtosecond laser pulses : An hydrodynamic approach».
[103] E. Audouard, R. Le Harzic, N. Huot, N. Sanner, P. Laporte, S. Valette, R. Fortunier, J.P.Colombier, P. Combis, LASERAP, Sarlat (2003), «Effets thermiques liés au micro usinagefemtoseconde : mesure de la zone thermiquement affectée et compréhension des mécanismesfondamentaux».
Détails sur HAL-UJM ou sur http: // scholar. google. fr/ citations? user= NY74NwoAAAAJ
26
Deuxième partie
Mémoire de recherche


Préambule
Suite à un Magistère de Sciences de la Matière (ENS Lyon) et un DEA de particules élémentaires(UCBL), mes travaux de recherche se sont orientés sur l’interaction laser-matière, sujet alliant unaspect fondamental naturel à une forte dimension applicative. Le côté fondamental découle de laconversion remarquable d’un grain de lumière en énergie intrinsèque à la matière et les applicationss’étendent de la fusion inertielle à la nanostructuration à des fins tribologiques ou pour une fonc-tionnalisation optique de matériau. Après douze ans de travaux, ma curiosité et mon attrait initialdu domaine se sont accentués, enrichis par les perspectives associées au transfert technologique etaux potentialités industrielles de l’étude.
Depuis mon recrutement en tant que maître de conférences à l’université Jean Monnet au seinde la thématique Interaction rayonnement-matière, mon activité en tant que chercheur s’articuleautour de la modélisation et de l’optimisation de l’interaction laser-matériau, et ce pour différentsrégimes d’excitation, états de matière, et types de matériaux. Ce travail a su trouver un écho ausein de plusieurs projets structurants de la thématique : tout d’abord le projet ULTRA (UltrafastLaser Processing : Theory, Applications & Transfer, animé par R. Stoian) dans lequel je suis origi-nellement et principalement impliqué à 80%, le projet PLD (Pulsed Laser Deposition, animé par F.Garrelie) et le projet LaserMode (animé par T. Itina) dédié à la modélisation de l’interaction laser(20% de mon implication). J’ai par ailleurs assuré la concrétisation de la transversalité du thème« structuration périodique de surface » entre les deux premiers projets.
La synthèse de mes travaux de recherche est présentée dans la suite de manière à refléter lanature multi-échelle et multi-applicative du travail réalisé, se détachant ainsi du sens chronologiquede sa réalisation. En guise d’introduction, je présenterai le contexte de l’étude puis la secondepartie sera dévolue aux aspects fondamentaux de l’interaction laser ultracourt-solide, mettant enlumière les remarquables degrés d’excitation atteignables et les états de matière exotiques associés.L’excitation d’ondes de surface et les structures périodiques en résultant, est un des thèmes majeursde mon travail actuel et constitue logiquement la troisième partie de ce document de synthèse. Laquatrième partie est consacrée à l’étude des produits d’ablation, avec pour fil conducteur la miseen forme temporelle des impulsions afin d’optimiser l’excitation des espèces en phase plasma. Unecinquième partie se focalise sur l’interaction en volume d’un matériau, en particulier pour le casde diélectriques transitoirement métallisés. La dernière partie dresse une synthèse des travaux etdétaille les actions émergentes pour augmenter la synergie entre le rayonnement et la réponsesouhaitée du matériau irradié.
29

30
Chapitre 1
Introduction
Le temps est un grand maître, il règlebien des choses.
SertoriusPierre Corneille
Sommaire1.1 Quelques applications des impulsions ultracourtes . . . . . . . . . . . . . 32
1.1.1 Particularités et potentialités . . . . . . . . . . . . . . . . . . . . . . . . . . 321.1.2 Un environnement local favorable . . . . . . . . . . . . . . . . . . . . . . . . 32
1.2 Confinement de l’énergie & réponse du matériau . . . . . . . . . . . . . 341.3 Description de l’état transitoire du matériau . . . . . . . . . . . . . . . . 38
Ce chapitre d’ introduction se propose de présenter le contexte scientifique dans lequelj’ ai eu l’ occasion d’ évoluer au sein du laboratoire Hubert Curien. Il est porté parles objectifs de développement d’ un ensemble d’ applications liées à la structuration desurface de matériaux, et pour la plupart utilisant les impulsions laser ultracourtes commesource pour cette transformation. Pour cette raison, ce chapitre exposera brièvement lesprincipales caractéristiques de ce type d’ impulsions laser en suggérant quelques ordres degrandeurs et présentera plusieurs applications ainsi que les concepts principaux utilisés pourdécrire l’ excitation d’ un solide métallique, diélectrique ou d’ un plasma. Il se veut plutôtpédagogique et n’ est en aucun cas exhaustif.

Chapitre 1. Introduction
1.1 Quelques applications des impulsions ultracourtes
1.1.1 Particularités et potentialités
L’irradiation de matériaux par impulsions laser ultracourtes permet aujourd’hui de façonner desstructures sur différents supports, et ce pour des formes complexes. La surface propose alors unetopographie prometteuse pour fonctionnaliser des systèmes optiques, mécaniques ou électroniques.La figure 1.1 illustre quelques unes de ces fonctionnalisations, pour la plupart réalisées au sein dulaboratoire Hubert Curien (LabHC). Ces structures peuvent atteindre des dimensions caractéris-tiques de l’ordre de quelques centaines de nanomètres, ce qui permet d’envisager des traitementsdu signal optique entièrement nouveaux pour des longueurs d’onde allant du visible au proche in-frarouge. Aussi, il est possible de piéger la lumière à la surface (Fig.1.1a-d) ou dans le volume d’unsupport (Fig.1.1e-i) grâce aux techniques de micro-structuration, et de faire interagir les photonsde manière contrôlée avec le matériau, afin d’obtenir des conditions physiques originales. Des pro-priétés morphologiques singulières ont également été observées à l’échelle nanométrique des solidesirradiés, résultant d’une excitation photonique complexe suivie d’une dynamique de croissance in-duisant des formes d’équilibres variées [1, 2]. Cette structuration sub-micronique présente un fortpotentiel applicatif puisqu’il est possible de façonner des structures de géométries diverses (cavi-tés, découpe, marquage, rides en surface. . . ), offrant ainsi une topologie complexe de la surfaceet suscitant de nombreuses applications (tribologie, mouillabilité, lutte contre la contre-façon. . . ).Le contrôle des procédés de structuration nécessite de maîtriser les excitations mises en jeu, no-tamment les phénomènes impliquant des résonances optiques telles que les plasmons en surfacedu matériau. D’un point de vue physique, l’originalité et la potentialité des applications liées auxtechnologies femtosecondes résultent par ailleurs du pilotage possible de la réaction du matériaule long de voies d’excitation et de relaxation (électroniques, atomiques, thermiques, mécaniques,structurelles, . . .), avec pour conséquences un contrôle précis des mécanismes de structuration [3].L’obtention de micro-et de nano-structures est intimement reliée au confinement de l’énergie, aucaractère thermique limité de l’interaction et à une transformation préférentielle du matériau pourdes états de plasmas énergétiques. Ces caractéristiques influencent non seulement les possibilitésde structuration directe mais également les applications liées à la nanochirurgie, la génération denanoparticules (Fig. 1.1j,k) ou à des fins spectroscopiques (Fig. 1.1l).
1.1.2 Un environnement local favorable
Lors de mon arrivée au LabHC en 2007, la plupart des applications liées aux impulsions laserultracourtes étaient développées au sein de la « plateforme femtoseconde ». Une équipe communede recherche a ensuite été créée en 2008, incluant les entreprises HEF, Impulsion, le LTDS de Lyonet le LabHC. Elle était dédiée au transfert technologique et visait à développer des procédés laserpour des applications spécifiques aux impulsions laser ultracourtes. Depuis 2011, l’université deLyon-St-Etienne bénéficie de deux projets « Investissement d’avenir » portés par le laboratoireHubert Curien : le projet d’EQUIpement d’EXcellence MANUTECH-USD (Ultrafast Surface De-sign) et le projet LABoratoire d’EXcellence MANUTECH-SISE (Science et Ingénierie des Surfaces
32

1.1. Quelques applications des impulsions ultracourtes
Figure 1.1 – Quelques exemples d’applications laser ultrabref-matière. a) Microscopie confocaled’une cavité et d’une rainure après irradiation de PZT [4]. b) Ripples obtenus en surface de tungs-tène après 80 impulsions de 50 fs [5]. c) Marquage coloré visualisé via ses effets diffractifs par unenanostructuration contrôlée en surface d’acier inoxydable [6]. d) Ensemble de rainures pour l’opti-misation de découpe de PZT [4]. e) Profil longitudinal d’un nanocanal dans un échantillon de SiO2irradié par un faisceau de type Bessel [7]. f) Image MEB de la face de sortie d’un nanocanal. g)Nano-réseaux en volume de SiO2, induits par une polarisation respectivement linéaire, h) radialeet i) azimuthale du champ électrique laser [8]. j) Images d’ombroscopie et k) de diffusion du plasmagénéré 1 μs après l’irradition d’une cible de YSZ par une impulsion de 150 fs [9]. l) Cartographied’une émission plasma en fonction de la distance à la cible 300 ns après ablation [10].
et Interfaces 1. Ce LABEX regroupe 4 laboratoires académiques appartenant au PRES de Lyon(appartenant à 6 tutelles différentes : CNRS, Université Jean Monnet, St-Etienne, Ecole Centralede Lyon, Ecole Nationale Supérieure des Mines de St-Etienne, Ecole Nationale d’Ingénieurs deSt-Etienne, Institut National des Sciences Appliquées de Lyon ainsi que 2 entreprises régionales(IREIS et Science et Surface). Il vise à développer l’excellence et l’originalité scientifique en scienceet ingénierie des surfaces et des interfaces. Dans ce contexte, la fonctionnalisation de surfaces tex-turées par laser nécessite de maîtriser la topographie de celle-ci à l’échelle sub-micronique.
Le LabHC dispose actuellement de différents systèmes laser Ti-Sa de durées d’impulsion de 30fs et de 150 fs à 800 nm. Après amplification, les impulsions délivrées contiennent quelques mJqu’il est possible de focaliser en surface ou en volume des matériaux à traiter sur des surfaces de
1. http://manutech-sise.universite-lyon.fr/
33

Chapitre 1. Introduction
quelques centaines de microns carrés. Avec un tel confinement, les intensités atteintes sont de l’ordrede 1012-1014 W/cm2, permettant une transformation de la matière par des voies thermodynamiquesou structurelles exotiques [11]. Un des enjeux consiste à créer un outil d’irradiation dont les pa-ramètres s’adaptent automatiquement au matériau et à la forme souhaités. Aussi, une spécificitéde l’équipe ULTRA dans laquelle mon travail s’inscrit est de manipuler les propriétés laser dansle domaine spatial et temporel. D’un point de vue temporel, des séquences lumineuses pouvantaller jusqu’à une vingtaine de picosecondes peuvent ainsi être réalisées. Cette sophistication a déjàpermis une forte amélioration des procédés laser en augmentant la synergie entre la lumière et lamatière pour diverses applications telles que l’émission du plasma, le contrôle de la génération denanoparticules, ou la conception de guides d’onde de grande longueur [3, 12, 7]. Sur cette échellede temps de quelques picosecondes, différents mécanismes de relaxation se superposent tels que larecombinaison des électrons excités, la conduction thermique, le couplage électron-phonon, la miseen mouvement hydrodynamique de la surface ou de la zone chauffée en volume, la formation duplasma. . . Le contrôle des procédés s’opèrent donc par l’exploitation relative d’une de ces voiesde relaxation. De nouvelles approches sont nécessaires pour compenser les lacunes inhérentes aucontrôle du comportement du matériau dans ces situations complexes. L’approche fondamentaleque je développe depuis mon arrivée au LabHC, principalement centrée autour de la simulationdes phénomènes hors d’équilibre induits par les impulsions laser ultracourtes permet aux expé-riences menées au laboratoire de s’appuyer sur une compréhension aidant à mieux définir les étapesde dé-structuration ou de transformation du matériau irradié. La modélisation numérique permetd’analyser finement les transformations structurelles, les transitions de phase et la mise en mouve-ment du matériau sous irradiation laser dans différents régimes et de discriminer ainsi les conditionsrequises pour atteindre une interaction laser-matière singulière ou optimale pour une applicationdonnée.
1.2 Confinement de l’énergie & réponse du matériau
Les sources lasers femtosecondes, développées il y a une trentaine d’années déjà, permettent àla fois d’explorer le comportement des matériaux sous des conditions thermodynamiques extrêmes,difficilement réalisables par d’autres techniques, mais également de résoudre temporellement lesinteractions lors de réactions chimiques, la dynamique de la structure locale, des propriétés élec-troniques ou des transitions de phase. La résolution temporelle atteinte par ces impulsions a étéexploitée très tôt pour visualiser la dynamique des propriétés du matériau irradié. Ceci est intime-ment lié au fait que la femtoseconde est l’échelle de temps naturelle des déplacements atomiques. Enéchantillonnant cette structure atomique et électronique sur une échelle de quelques femtosecondes,il devient possible de déchiffrer la réponse primaire de la matière, consécutive à un rayonnement.Si une source X ultrabrève est nécessaire pour suivre les changements structuraux pouvant êtreoccasionnés à l’échelle du réseau cristallin, la réponse électronique est, elle, directement accessiblepar un second faisceau laser sonde décalé dans le temps. La signature optique ou spectroscopiqueobtenue en fonction du délai utilisé doit toutefois être déconvoluée de la réponse intrinsèque àcette seconde impulsion et l’interprétation des résultats nécessite une connaissance a priori des phé-
34

1.2. Confinement de l’énergie & réponse du matériau
Figure 1.2 – Schéma chronologique des principaux processus induits au cours ou consécutivementà l’irradiation d’un métal (a), ou d’un diélectrique (b). A la suite de l’étape d’excitation laserpeuplant en électrons la bande de conduction, il est possible de considérer que les deux types dematériaux subissent des étapes de relaxation relativement similaires (c), que nous étudierons ensurface pour les métaux et en volume dans le cas de diélectriques.
nomènes pouvant être induits lors de l’interaction laser. Désireux d’apporter une vision complètedes phénomènes occasionnés lors de la structuration par laser, et ne disposant pas en interne desource X ultrabrève, nous verrons par la suite qu’il nous a été possible de compléter la vision quenous avions des mécanismes primaires engendrés lors de l’excitation électronique et du transportde l’énergie, notamment en jouant sur la mise en forme temporelle de l’impulsion laser.
Une seconde caractéristique importante de ces sources laser ultracourtes est leur capacité àdélivrer des puissances extrêmement élevées, puisqu’une impulsion d’une durée de 50 fs et d’uneénergie de 1 mJ fournit une puissance de 20 GW. Une telle impulsion focalisée sur une tachefocale d’environ 100 μm2, va produire une intensité considérable, de l’ordre de 1015 W cm−2.Cette intensité correspond à un champ électrique d’environ 1011 V/m qui est supérieur au champélectrique vu par l’électron dans l’atome d’hydrogène [13]. La plupart du temps, pour les applicationsqui nous intéressent, de telles intensités ne sont pas atteintes, et nos applications limitent lesintensités utilisables à celles permettant de dépasser l’enthalpie spécifique de fusion (environ 106
J kg−1) ou celle de vaporisation (environ 107 J kg−1) [14]. L’épaisseur sur laquelle l’énergie estdéposée définit alors l’intensité nécessaire. Ainsi, la fluence absorbée requise pour initier l’ablationd’un métal se situera autour de 0.1 J cm−2, en considérant une impulsion typique de 100 fs et uneépaisseur d’absorption de l’ordre de 20 nm.
En conséquence de cette échelle de temps brève et des intensités élevées, le confinement del’énergie conduit à une grande probabilité pour chaque porteur de charge d’interagir avec un pho-
35

Chapitre 1. Introduction
ton incident. La réponse optique à la longueur d’onde laser incidente est bien évidemment trèsdépendante du matériau, en particulier de sa structure de bandes lorsqu’il est à l’état solide. Dansun métal, contrairement aux matériaux à band-gap, les électrons de plus hautes énergies occupentdes bandes partiellement pleines, et la transition d’un état occupé vers un état vide n’impliquepas de seuil d’excitation. Malgré tout, l’absorption de l’énergie laser incidente atteint quelquespour cents seulement car une grande partie du rayonnement est réfléchie. Ceci résulte du fait quele champ électrique est très efficacement écranté, en raison de la forte conductivité électronique.S’il s’agit d’un électron libre, le mécanisme d’absorption est associé à un processus collisionnel eton parle de processus de type Bremsstrahlung inverse. Dans le cas des matériaux possédant desélectrons libres dans leur bande de conduction, l’absorption des photons incidents est traditionnel-lement décomposée sous la forme d’une contribution intrabande et d’une contribution interbande.L’absorption intrabande implique un partenaire de collision lors de l’interaction et nécessite soitun phonon, soit un autre électron, dans le cas particulier des phénomènes dits « Umklapp » surlesquels nous avons spécifiquement travaillés [15]. Un changement global du vecteur d’onde électro-nique est nécessaire pour ce type de transition. L’absorption interbande est souvent perçue commeun mécanisme d’absorption à un électron, puisqu’il n’implique pas nécessairement d’autre parte-naire (cas qualifié de « direct »). Un électron change de bande lors de cette transition impliquantdes règles de sélection optique. Il peut cependant y avoir des transitions dites « indirectes » im-pliquant d’autres particules comme le phonon, modifiant le vecteur d’onde lors de la transition.L’ensemble des processus a été schématisé sur la figure 1.2a) pour les métaux. Les processus liés àl’absorption d’énergie pour les matériaux à band-gap, notamment les diélectriques, sont représentéssur la figure 1.2b), sur la même échelle de temps, dans les premiers instants de l’interaction. Pources matériaux, l’énergie du photon incident hν est typiquement inférieure à l’énergie séparant labande de valence de celle de conduction (EG) mais l’absorption simultanée de plusieurs photonspar un seul électron est possible. C’est le processus d’ionisation multiphotonique (MPI), nécessi-tant jusqu’à 6 photons (EG � 9 eV) pour la silice irradiée à 800 nm, que nous avons considéré auchapitre 5 de ce document. Quand le champ électrique incident devient du même ordre de grandeurque le champ électron-noyau perçu par l’électron, le potentiel de Coulomb se trouve modifié, per-turbant la structure de bande du matériau. Une ionisation par effet tunnel (TI) est alors possible,permettant à l’électron de passer directement de la bande de valence à la bande de conduction.Pour rendre compte de la prépondérance de l’un ou l’autre de ces deux processus, Keldysh a définile paramètre adiabatique γ = ω
e
√mcnε0EG
I où m est la masse réduite de l’électron, e sa charge etω la pulsation laser. Comme nous l’avons représenté sur la figure 1.2b), la transition entre les deuxrégimes se produit autour de γ � 1.5, correspondant à une intensité laser d’environ I � 5.1013 Wcm−2 dans la silice fondue. Enfin, notons que pour les diélectriques, l’injection d’électrons dans labande de conduction est rapidement dominée par le mécanisme d’avalanche électronique, l’injectionmultiphotonique à partir de la bande de valence ne fournissant qu’une faible fraction initiale desélectrons de conduction [16].
Pour tous types de matériaux, il existe donc un état transitoire pour lequel un ensemble d’élec-trons individuellement excités par les photons incidents, peuplent la bande de conduction du sys-tème. Une question légitime émerge de cet état insolite : à partir de quand peut-on considérer
36

1.2. Confinement de l’énergie & réponse du matériau
que ces électrons se comportent comme un système thermalisé, auquel il est possible d’adjoindredes propriétés à l’équilibre ? Deux méthodes expérimentales ont essentiellement été utilisées pourrépondre à cette question il y a déjà une vingtaine d’années : la réflexion transitoire et la spectromé-trie de photoémission pompe-sonde [17, 18]. Cette seconde méthode a permis d’observer l’évolutionde la fonction de distribution électronique du métal excité par l’impulsion « pompe » avec des ré-solutions temporelles sub-picosecondes, montrant une thermalisation relativement tardive, prochede 1 ps. D’un point de vue théorique, le formalisme de Boltzmann ou des méthodes de type MonteCarlo sont nécessaires pour répondre à cette question [19]. Récemment, B. Mueller et B. Rethfeldont montré que, dans le cas d’un métal excité, l’entropie transitoire du système électronique sestabilisait plus ou moins rapidement, en fonction du matériau, de la densité d’état, mais surtout dudegré d’excitation [20]. Ainsi, pour le nickel, l’aluminium ou l’or, 10 fs suffisent pour thermaliser unsystème d’électrons portés à 104K, alors qu’une picoseconde est nécessaire à 103K. Pour la plupartdes applications qui nous intéressent, nous atteignons largement un régime où Te > 104K et noussupposerons notre système électronique thermalisé.
Poursuivant la chronologie des événements consécutifs à l’irradiation laser, et considérant qu’àun certain stade, tous les matériaux possèdent des électrons libres dans la bande de conduction,nous ne distinguons plus les matériaux à band-gap des métaux (figure 1.2c). Le modèle le pluscouramment appliqué pour décrire l’évolution de l’énergie au sein du système irradié considère lesélectrons d’une part et le réseau d’autre part comme deux systèmes thermodynamiques à l’équilibreinterne. Il est connu sous le nom de « modèle à deux températures », décrivant la relaxation des deuxsystèmes après une forte hausse de la température électronique (Te) par rapport à celle du réseaucristallin (Ti) [21]. Il est composé d’un système d’équations de diffusion de la chaleur, couplés par unterme de transfert d’énergie décrits par la différence en température des deux réservoirs multipliéepar la force de couplage électron-phonon γe−ph (ou électron-ion en phase plasma) :
⎧⎪⎪⎨⎪⎪⎩
∂εe
∂t= ∂
∂tCeTe = −∇(Ke∇Te) − γe−ph(Te − Ti) + S(�r, t)
∂εi
∂t=
∂
∂tCiTi = −∇(Ki∇Ti) + γe−ph(Te − Ti)
(1.1)
où Ce et Ci sont respectivement les capacités thermiques électroniques et ioniques, Ke et Ki lesconductivités thermiques électroniques et S(t) le terme source, correspondant au dépôt d’énergielaser en surface. Ce système permet donc de rediffuser l’énergie grâce à une diffusion thermiqueaccrue par le déséquilibre thermique. La force de couplage définit à la fois le taux de chauffagedes ions et la vitesse de thermalisation, jouant à la fois sur la rapidité des changements de phase,l’impulsion mécanique provoquant l’éjection en surface et stoppant plus ou moins tôt la diffusionthermique électronique. Si le modèle est facilement implémentable dans une approche de basseexcitation (inférieure au seuil de fusion), les difficultés s’accroissent lors de son insertion dans descodes de simulation de dynamique moléculaire [22] ou hydrodynamique [23]. En effet, chacun desparamètres (capacité, conductivité, couplage) dépend des températures électronique, ionique, de ladensité d’électrons libres et de la densité matière du matériau, nécessitant des modèles compor-tementaux hors d’équilibre. Un ensemble de lois et modèles utilisés dans le code hydrodynamique
37
Chapitre 1. Introduction
Esther2, servant à décrire cette phase à deux températures, de la phase solide à plasma peut être
trouvé dans les références [24, 25]. De telles approches hydrodynamiques nécessitent une équationd’état matière pour chacun des matériaux considérés. Dans les approches de dynamique moléculaireclassique, un potentiel de type EAM (Embedded Atom Model) dépendant de la température élec-tronique et ajusté à partir des calculs ab initio est utilisé pour décrire l’interaction entre les atomes.Le problème reste le même pour la détermination des propriétés de transport, qui doivent êtrecalculées indépendamment. La question du dépôt d’énergie S(�r, t) peut être traitée sous une formeplus ou moins complexe, allant d’un simple dépôt d’énergie de type Beer-Lambert I = I0 exp(−αz),où α est le coefficient d’absorption, à des modélisations non triviales basées sur une approximationdes équations de Maxwell dans un milieu matériel non homogène. Pour l’ensemble des modélisa-tions que j’ai eu l’occasion d’entreprendre, différents degrés d’approximation ont été mis en œuvretels que la résolution de l’équation de Helmholtz dans un empilement inhomogène (code Esther
utilisé dans le chapitre 4), l’équation de Schrödinger non-linéaire en volume de diélectriques (codede propagation décrit au chapitre 5), ou de type Finite-Difference Time-Domain (FDTD - décritau chapitre 6).
Aujourd’hui aucune description ne regroupe l’ensemble des processus induits par l’impulsionlaser ultracourte, l’absorption et la propagation laser, l’excitation des porteurs de charge, l’évolu-tion des structures électronique et atomique, le chauffage et la diffusion thermique, la relaxationélectron-électron et électron-phonon, les transitions de phase, la mise en mouvement de la surface oula dilatation en volume, . . . Il reste donc préférable de combiner plusieurs modélisations pour ana-lyser les effets de l’impulsion sur le matériau, en fonction du matériau choisi, des caractéristiques del’irradiation (durée, longueur d’onde ou effets cumulatifs à haute cadence) et des besoins expérimen-taux. Les états thermodynamiques induits lors de la transformation du matériau, correspondantsà chacune des applications que nous avons décrites, et dans le cadre des modèles microscopiques etmacroscopiques que nous venons de définir, sont discutés ci-dessous.
1.3 Description de l’état transitoire du matériau
Comme nous venons de le voir, la puissance des lasers ultracourts génère et modifie la populationd’électrons libres dans la bande de conduction du matériau. La rapidité avec laquelle la matière estexcitée l’empêche de se détendre par expansion thermique et permet ainsi un chauffage isochoredes électrons libres restant dégénérés à haute densité. En effet, la couche chauffée en surface a uneépaisseur typique de l’ordre de l’épaisseur de peau soit environ 10 nm pour la plupart des métaux. Ledéplacement de cette couche de surface pendant 100 fs est donnée à partir de la vitesse d’expansion,proche de la vitesse du son (� 5000 m s−1) dans le solide, ou par vs =
√γNekBTe/Mi dans une
hypothèse plasma, où Mi est la masse de l’ion, Ne le nombre d’électrons libres par atome et γ = 3la constante adiabatique dans un solide [14]. Pour une température électronique typiquement del’ordre de 5 eV, le déplacement est d’environ 1 nm, ce qui renvient à augmenter la distance entre
2. Le code 1D Esther intègre notamment les équations du mouvement sous forme lagrangienne, des équationsd’état multiphases, de transfert radiatif et de diffusion thermique, couplés à des modèles d’absorption optique, d’io-nisation (. . . ) et hors d’équilibre pour les impulsions ultracourtes.
38

1.3. Description de l’état transitoire du matériau
chaque couche atomique de 10%, soit typiquement ∼ 0.3Å. Le chauffage isochore apparaît doncêtre une approximation légitime. Dans ce régime de fort chauffage électronique à densité solide,l’énergie cinétique des électrons est du même ordre de grandeur que l’énergie potentielle électron-noyau, ce qui ne correspond ni au régime classique de matière condensée, ni à celui de physiquedes plasmas (faiblement couplé). Récemment, le terme de « matière tiède et dense » (Warm DenseMatter, WDM) a émergé pour décrire cet état frontière entre les deux domaines. La densité de lamatière va d’un ordre de grandeur au-dessous de celle du solide (ρ0/10) à une dizaine de fois savaleur (10ρ0). La température varie entre 0.1 et quelques dizaines d’eV. Dans ce régime, la matièreest souvent dégénérée, fortement couplée et non-idéale.
Pour décrire les états de matière successifs rencontrés lors de l’évolution du système électron-ion,nous superposerons par la suite des équations d’état (EOS) électroniques et des équations d’étatmatière, pour lesquels les électrons et les ions sont à l’équilibre thermodynamique. A l’origine, lesEOS électroniques étaient calculées pour les métaux à partir d’un modèle d’électrons libres, com-plètement paramétrable à partir des valeurs de Te et de la densité volumique d’électrons ne. Lemodèle de Fermi était alors utilisé pour déterminer le potentiel chimique μ, la capacité électroniqueCe, la pression Pe ou certaines fréquences de collision [23, 24, 25]. En régime de matière condensée,l’approximation des électrons quasi-libres n’est pas valable, notamment pour les métaux de transi-tion, soit pour la plupart de ceux utilisés expérimentalement. Ces quantités sont, pour ces métaux,très largement dépendantes de la structure de bande, elle-même dépendante de l’excitation. Nousavons donc récemment étendu les données utilisées en calculant un ensemble de propriétés élec-troniques nécessaires à une bonne définition d’équation d’état [26, 27]. Evidemment, elles ne sontvalables qu’à la densité solide et tout changement de densité nécessiterait une redétermination deces grandeurs. Nous considérerons donc qu’elles sont valables pendant un temps relativement court,de l’ordre de la durée d’impulsion � 100 fs. Le modèle des électrons libres continuera d’être utilisépour les régimes de plasma dense où ρ < ρl avec ρl la densité du liquide.
Les équations d’état matière proviennent de différentes sources. La plupart sont basées surles données fournies par Bushman, Lomonov et Fortov [28] mais certaines proviennent des tablesd’équation d’état SESAME [25]. Ce sont des données à l’équilibre électron-ion, intégrant notammentles changements de phase solide-solide, solide-liquide, liquide-gaz et solide-gaz. Elles intègrent ainsiindirectement une ionisation, notamment pour la phase plasma, qui peut être différente de celledonnée par des tables externes telles que celles utilisées pour la plupart des métaux dans le codeEsther, i.e. celles de Ebeling [29]. La possibilité d’utiliser directement une équation d’état à deuxtempératures existe [30], mais n’a pas été entreprise à ce jour. De nombreuses complications liées audéséquilibre thermique doivent en effet être intégrées, et des questions épineuses subsistent. Ellesconcernent par exemple, et de manière non-exhaustive, la transformation solide-liquide lorsqueTe > Ti, le surchauffage sur des temps très courts [31], le taux d’ionisation et de recombinaison lorsde la transition liquide-gaz [3]. . .
La figure 1.3 illustre le régime thermodynamique caractéristique atteint dans les applications quinous intéressent ici. Comme nous pouvons le constater, nous sommes typiquement dans le régime deWDM, tout au moins lors de la phase de non-équilibre électron-phonon en phase solide, ou électron-ion en phase plasma. Plus spécifiquement, avec les fluences mises en jeu dans nos expériences (≤ 20
39

Chapitre 1. Introduction
Figure 1.3 – Diagramme thermodynamique représentant les phases transitoirement atteintes parle matériau, à la suite d’une irradiation laser ultrabrève. Les états correspondants aux différentsprocessus détaillés dans les prochains chapitres sont indiqués (Excitation de la structure électro-nique en phase solide, transition solide-liquide permettant la structuration périodique (LIPSS),nanoparticules (NPs), plasma dense, et plasma en volume à densité supérieure à la densité critiqueélectronique).
J cm−2), nous ne dépassons pas une température Te de 20 eV et une température plasma de 10 eV.La majorité des processus qui nous intéressent sont contrôlables en modifiant la durée temporelledes impulsions jusqu’à quelques dizaines de picosecondes. Sur cette échelle de temps, la surface sedétend et atteint des densités proches de la densité critique ρc � ρ0/10. Ainsi, les états de matièretransitoires présentés dans la suite de ce travail demeurent dans le cadre thermodynamique dudigramme ci-dessus. Le chapitre suivant, correspondant à la description de l’excitation en phasesolide, dans des conditions de chauffage électronique isochore, correspond à la zone verticale enbleue. La zone correspondant à la formation des structures périodiques de surface induites parlaser (LIPSS), en vert sur notre schéma, se situe à la transition solide-liquide et, dans l’état actuelde nos connaissances, n’est pas supposée dépasser la ligne binodale liquide-gaz, comme nous leverrons au chapitre 3. La formation de plasma dense et les conditions favorables à la générationdes nanoparticules au sein de ce plasma, discutées dans le chapitre 4, sont représentés en rougesur le schéma, contournant la binodale et le point critique. Enfin, les conditions thermodynamiquescorrespondant à la formation de guide d’onde ou de nanoréseaux dans la silice sont supposéescorrespondre à une température comprise entre 0.1 et 1 eV, et à une densité comprise entre ρ0/10et ρ0. La densité critique électronique, pour laquelle un milieu diélectrique devient partiellementabsorbant vis à vis du champ électrique incident est indiquée en référence à la densité matériaucorrespondante pour un métal, comprise entre ρ0/100 et ρ0/10.
40

Chapitre 2
Excitation de la structureélectronique en phase solide
Tout se défait dans la lumière.Comprendre,C’est fracasser la nuit originelle.
Pierre Turgeon
Sommaire2.1 Contexte scientifique . . . . . . . . . . . . . . . . . . . . . . . . . . . . . . 422.2 Conséquence du déséquilibre thermique sur la structure de bandes . . 44
2.2.1 Effet de l’écrantage sur la densité d’états électroniques . . . . . . . . . . . . 442.2.2 La répulsion coulombienne à l’origine du décalage de la bande d . . . . . . 452.2.3 Constitution d’une équation d’état électronique . . . . . . . . . . . . . . . . 46
2.3 Estimation de l’indice optique sous irradiation . . . . . . . . . . . . . . . 482.3.1 Dynamique moléculaire et Kubo-Greenwood . . . . . . . . . . . . . . . . . . 482.3.2 Activation plasmonique du tunsgtène . . . . . . . . . . . . . . . . . . . . . . 49
Ce second chapitre est consacré à la réponse première du matériau lorsqu’ il est soumisà une irradiation laser ultracourte. Si le mouvement et la transformation irréversible dumatériau dans cette première étape peuvent être mis de côté, la structure électronique del’ atome se trouve fortement réarrangée par l’ excitation thermique provoquée. L’ approcheentreprise est basée sur des calculs dits « ab initio » qui se veulent reproduire le plusfidèlement possible le comportement de la matière à l’ échelle atomique. Largementutilisée en sciences des matériaux, cette approche est ici exploitée afin de rendre comptedes interactions complexes d’ un ensemble d’ états quantiques thermiquement excités. Cetteétude fondamentale, depuis les premiers principes se devait d’ être placée parmi les premierschapitres, en tant que travail de fond, dans ce manuscrit.

Chapitre 2. Excitation de la structure électronique en phase solide
2.1 Contexte scientifique
La puissance des lasers ultracourts modifie le spectre de bandes des solides irradiés et génèreune population d’électrons libres dans la bande de conduction des matériaux isolants ou modifiefortement celle des métaux. La rapidité avec laquelle la matière est excitée l’empêche de se détendrepar expansion thermique et permet ainsi un chauffage isochore des électrons libres restant dégénérésà haute densité. La sollicitation électromagnétique est telle que les électrons sont fortement excitésà des températures électroniques très supérieures à la température ionique. Le temps nécessaire àla relaxation de l’énergie des électrons vers le réseau cristallin est alors de plusieurs picosecondes.Ce fort déséquilibre génère une modification des propriétés thermodynamiques et optiques, diffi-cilement mesurables expérimentalement, ce qui justifie le recours à des investigations théoriquesà température ambiante (300K) et à la densité solide. La description du stockage de l’énergie surles électrons, du couplage optique et des différentes voies de relaxation thermique et mécaniques’appuie sur une modélisation plus ou moins complète de l’ensemble des processus concomitants.Les modèles existants sont essentiellement basés sur la théorie des liquides de Fermi permettant dedériver l’ensemble des processus de transport par l’intermédiaire de temps de relaxation dépendantdu déséquilibre [15, 32]. Mais l’approximation d’un temps effectif de collision a de fortes limitationspour ce genre d’irradiation où, en outre, la structure de bande cristalline est fortement modifiéepar la forte excitation électronique engendrée par l’impulsion laser (cf Fig. 2.1). Pour compléter lesconnaissances actuelles des propriétés hors équilibre des métaux sous conditions d’irradiation laser,un ensemble de paramètres thermodynamiques et optiques, fortement dépendants de la structurede bandes a été étudié par des méthodes dites ab initio.
Le laboratoire d’excellence Manutech-SISE, démarré en 2011, intègre un axe de recherchedédié au diagnostic en temps réel des phénomènes physiques associés à la structuration de surfaceainsi qu’à ses applications. Dans ce contexte, j’ai obtenu le projet Dynopt (Dynamique des pro-priétés optiques associées aux irradiations ultrabrèves), comprenant un support de post-doctorat(E. Bévillon) pour 18 mois jusqu’en février 2014. Dans la continuité, le projet ANR BLANC in-ternational Dylipss dont je suis coordinateur (2013-2015) poursuivra le travail engagé dans cettevoie jusqu’en 2015. Depuis septembre 2012, les calculs sont effectués en fonction du degré d’excita-tion électronique supposé être engendré par une excitation laser ultracourte via le package Abinit.Très gourmand en temps, 350000 heures de calcul ont été obtenues sur les machines Curie du TrèsGrand Centre de Calcul (TGCC) pour l’année 2013 et 480000 en 2014 par l’intermédiaire des projetsnationaux GENCI.
Afin de décrire la dynamique rapide des processus de transport au sein du réseau cristallin,les électrons sont traités dans le cadre de la théorie de la fonctionnelle de la densité (DFT) àtempérature finie, où les occupations sont données par la distribution de Fermi-Dirac. Le mouvementdes ions est quant à lui déduit des équations de newton. Une mesure de la conductivité optiquehors équilibre est également accessible grâce au formalisme de Kubo-Greenwood. Abinit utilise unebase d’ondes planes pour développer les fonctions d’ondes électroniques à la fois dans le formalismedes pseudo-potentiels et dans celui de la méthode PAW (Projector Augmented Wave) [33]. Ainsi,l’équation résolue est celle de Schrödinger afin de déterminer précisément les propriétés de l’état
42

2.1. Contexte scientifique
Figure 2.1 – Description schématique des conséquences d’une irradiation laser ultrabrève. Lespropriétés microscopiques transitoires, fortement liées au chauffage des électrons et à la modificationde la structure électronique, définissent les conditions de modification de la surface irradiée.
fondamental correspondant à un système de N électrons en interactions dans un potentiel externevext :
⎡⎣− �
2
2m
N∑i=1
∇2i +
N∑i=1
vext(ri) +12
N∑i�=j
e2
|ri − rj|
⎤⎦ ψ(r1, . . . , rN ) = Eψ(r1, . . . , rN ), (2.1)
où ψ(r1, . . . , rN ) est la fonction d’onde à N électrons et E l’énergie totale. Le premier terme del’équation (2.1) correspond à l’énergie cinétique, le second au potentiel extérieur et le dernier à l’in-teraction électron-électron. En pratique, la détermination de la densité électronique n(r) de l’étatfondamental est suffisante pour calculer toutes les propriétés physiques du système. Notons quece code est développé en partie dans le Service de la Matière Condensée du CEA/DIF avec quinous collaborons pour cette étude, particulièrement la méthode PAW [34] ainsi que le parallélismedestiné aux architectures massivement parallèles [35]. Nous n’avons pas effectué de développementdu code en interne et notre objectif principal consiste à appliquer l’outil existant, et à post-traiterjudicieusement les données de sorties, pour répondre à quelques questions fondamentales dans lerégime de non-équilibre qui préoccupe nos applications. La structure électronique puis l’ensembledes propriétés électroniques pertinentes sous conditions de forts déséquilibres thermiques, corres-pondant aux conséquences d’une irradiation laser ultrabrève, font l’objet d’une étude approfondieet sont présentés dans la suite.
43

Chapitre 2. Excitation de la structure électronique en phase solide
2.2 Conséquence du déséquilibre thermique sur la structure debandes
Les densités d’états électroniques (DOS) ont été déterminées pour plusieurs métaux (Au, Cu,Al, Ni, W, Ti) à différentes températures électroniques (Te) tout en maintenant un réseau froid(Ti = 0). Nous avons ainsi eu accès à l’évolution des propriétés thermodynamiques et au nombred’électrons libres en fonction du degré d’excitation laser. Les matériaux ont été ciblés pour l’intérêtà la fois fondamental et applicatif qu’ils proposent, étant couramment utilisés dans des applicationsliées aux structurations de surface et étant supposés réagir de manière différente aux irradiationslaser femtosecondes. Les résultats concernant l’or et le titane ne seront pas présentés ici puisqu’ilssont respectivement similaires au cuivre et au tungstène. Les DOS calculées ont montré une fortedépendance en fonction de Te, visible sur la figure 2.2a) tant en terme de structure électronique,que de peuplement des électrons au sein de cette structure, ce qui est un résultat original. Destravaux précédents, largement utilisés et reconnus dans la communauté, ont été effectués pourdériver un ensemble de paramètres de propriétés électroniques consécutives à une irradiation en sebasant sur une DOS calculée à Te = 0K [36]. Notre travail complète ainsi l’approche précédenteen détaillant les effets relatifs au changement de densité d’états électroniques. Une étude réaliséesur l’or dans des conditions de fort non-équilibre électron-phonon, avait montré la possibilité derendre certains métaux plus résistants à la fusion, en s’appuyant sur une DOS dépendante deTe, montrant un déplacement de celle-ci en énergie [37]. Notre intention était de prolonger cetteconstatation en la généralisant à différents métaux de transition, possédant des bandes d plus oumoins pleines. L’objectif pour nous n’était pas d’étudier l’effet du déplacement de la DOS sur latempérature effective de fusion, mais d’en déduire les conséquences sur les propriétés électroniques,en particulier sur le nombre transitoire d’électrons pouvant être considérés comme libres pour, àterme, interpréter les calculs des propriétés de transport telles que les propriétés optiques.
2.2.1 Effet de l’écrantage sur la densité d’états électroniques
La structure de bande d’un solide est composée de bandes plus ou moins localisées en énergie.Les modifications importantes constatées dans la structure électronique, consistent essentiellementau décalage du bloc d vers les basses ou les hautes énergies. Ce constat a été quantifié par uneestimation du décalage de la bande d par rapport à sa position en énergie pour Te = 0K et parl’évolution de sa largeur visibles sur la figure 2.2b) [26]. Ni et Cu présentent un fort déplacement dela bande d vers les basses énergies, associé à un rétrécissement de la bande. A l’inverse, le W montreune largeur de bande plutôt stable, légèrement décalée et étirée vers les hautes énergies. Bien sûr,l’Al dépourvu de bandes d n’est pas représenté. Ces observations nous ont conduit à nous intéresserà la variation de la population électronique du bloc d. En effet, la bande d est davantage localiséespatialement, puisqu’elle porte le nombre quantique principal le plus faible de la bande de valence.Cette bande ayant également la faculté de contenir un nombre élevé d’électrons, elle est à mêmede produire un écrantage électronique conséquent. Toute variation du nombre d’électrons d produitdonc une variation de l’écrantage électronique, ce qui modifie l’interaction noyau-électrons, et est
44

2.2. Conséquence du déséquilibre thermique sur la structure de bandes
donc susceptible de produire des décalages de la structure électronique. La variation du nombred’électrons d est donc le premier paramètre que nous avons étudié. Cela a été réalisé via des densitésd’états projetées sur les moments angulaires dans des sphères centrées sur les atomes. Cette étapea mis en évidence une corrélation entre la dépopulation du bloc d (cas de Ni, Cu et de Au) et ledécalage vers les basses énergies des structures électroniques, caractéristique d’une diminution del’écrantage électronique et de l’augmentation de l’interaction noyau-électrons. L’inverse s’est avéréêtre vrai : le peuplement du bloc d produit une augmentation de l’écrantage électronique qui réduitl’interaction noyau-électrons et produit un décalage de la structure électronique vers les hautesénergies (Ti, W).
Figure 2.2 – a) Densités d’états électroniques hors d’équilibre thermique calculées afin d’estimerl’impact du chauffage électronique isochore sur la structure électronique. b) Décalage et variationde la largeur en énergie de la bande d par rapport à sa position et à sa largeur initiale.
2.2.2 La répulsion coulombienne à l’origine du décalage de la bande d
Pour expliquer l’origine du décalage observé de la bande d, nous avons fait intervenir une quan-tité représentant le changement global de la localisation des électrons : l’énergie de Hartree. Celle-ci
correspond à la répulsion inter-électronique du gaz d’électrons, soit EHa = 12
� n(r)n(r′)|r − r′| drdr′.
Dans une distribution parfaitement homogène d’un gaz d’électrons, cette énergie tendrait vers unminimum. Mais les électrons se trouvent contraints par la structure électronique et ne sont pasdistribués de manière homogène. L’application d’une température électronique produit une modifi-cation de la population des états électroniques et de leur distribution, ce qui a des conséquences sur
45

Chapitre 2. Excitation de la structure électronique en phase solide
EHa. Si la nouvelle distribution est plus délocalisée, l’énergie de Hartree est abaissée. A l’inverse, sielle est plus localisée, EHa augmente et son évolution peut être considérée comme un marqueur dela localisation électronique. La variation de l’écrantage électronique définit donc le changement delocalisation. L’énergie de Hartree s’abaisse dans le cas du Ni, Cu et Au ce qui va dans le sens d’unebaisse de la localisation de charges et donc de l’écrantage électronique. A l’inverse, EHa augmentedans les cas du Ti et W, indiquant une augmentation de la localisation électronique et donc del’écrantage électronique. Ces observations viennent corroborer celles concernant le changement depopulation électronique du bloc d discutées plus haut. L’effet d’écrantage relié à la modification dupotentiel électron-électron a de fortes conséquences sur la capacité thermique électronique et sur lapression électronique, comme décrit ci-dessous.
2.2.3 Constitution d’une équation d’état électronique
Pour chaque densité d’état électronique, un ensemble de propriétés thermodynamiques, à la basede la constitution d’équations d’états électroniques, a pu être calculé en fonction de l’excitationélectronique pour les différents métaux. Ces propriétés peuvent être insérées dans d’autres codesde calculs pour décrire l’évolution du système électron-phonon pendant la phase de déséquilibrethermique. La capacité électronique Ce (Fig. 2.3a) augmente avec Te de manière non-linéaire. Les
Figure 2.3 – Propriétés électroniques en fonction du degré d’excitation calculées en vue de consti-tuer une base de données électroniques. a) La capacité électronique affecte le stockage de l’énergie,b) la pression électronique joue sur les voies mécaniques de relaxation de l’énergie. c) La vitessede transfert d’énergie des électrons vers les ions est lui conditionné par la constante de couplageélectron-phonon. d) Le nombre d’électrons libres par atomes est enfin un élément crucial utilisédans de nombreux modèles de transfert et de dissipation de l’énergie.
46

2.2. Conséquence du déséquilibre thermique sur la structure de bandes
précédents modèles d’électrons libres ne permettent pas de reproduire les comportements observés,que ce soit à basse ou à haute température [27]. Il est toutefois possible de déterminer a posteriori lenombre d’électrons affectés par le chauffage électronique, et contribuant à la capacité électronique.Les estimations montrent que les électrons de la bande d, pourtant non-libres, participent avec unplus ou moins grand degré d’efficacité à ce stockage de l’énergie. A titre d’exemple, 19 électronssont nécessaires pour reproduire la capacité électronique du Nickel à 300K, alors qu’il ne possèdeque 10 électrons au total dans sa bande de valence. La théorie des électrons libres ne permet doncpas de reproduire de manière satisfaisante ce type de propriétés pour des métaux autres que lesmétaux simples comme Al. S’il peut paraître logique de supposer que tous les électrons des bandessp participent à Ce, la question est beaucoup plus délicate pour les électrons d qui contribuent avecun certain degré d’efficacité. Nous avons supposé que la réponse de ces électrons localisés devait êtreconsidérée de manière collective, en supposant qu’un coefficient d’activation augmentant (pour Cuet W) ou diminuant (pour Ni) avec Te devait être utilisé [27]. A l’inverse, la pression électronique Pe
est assez bien décrite par la théorie des électrons libres, supposant une dépendance en températureélectronique suivant Pe = nekBTe à haute température. Ce comportement asymptotique est visibledans l’insert de la figure 2.3b), où l’ensemble des métaux considérés répond à cette loi. L’effet de lastructure électronique est alors négligeable et nous pouvons légitimement supposer que les électronslocalisés de la bande d ne contribuent pas. Le coefficient de couplage électron-phonon a égalementété calculé, suivant la loi proposée par Lin et al. [36] :
γe−ph(Te) = π�kBλ⟨ω2⟩
g(εF )
∫ +∞
−∞g2(ε, Te)
(−∂f
∂ε
)dε, (2.2)
où λ⟨ω2⟩
est une constante tenant compte du spectre de phonon dépendante du métal considéré,f(ε) la fonction de Fermi et g(ε, Te) la densité d’état électronique à la température Te. L’évolutionpour les quatre matériaux présentés ici est visible sur la figure 2.3c). Nous avons constaté un trèsbon accord avec les valeurs calculées par Lin et al. et notre étude permet d’étendre pour les tempé-ratures Te ≥ 5 × 10⁴K les données concernant ce paramètre. La modification constatée de la DOSavec la température électronique ne modifie pas profondément ce paramètre et a essentiellementune influence pour les hautes valeurs de Te. Pour ce paramètre de transport, la contribution desélectrons localisés d est primodiale. Cette fois encore, le Nickel est profondément affecté par lechauffage électronique, de par la proximité du haut de sa bande d avec le niveau de Fermi. Uneforte décroissance pour γe−ph est ainsi observable, laissant supposer une moins grande contribu-tion de ce type d’électrons lorsque le niveau de Fermi s’éloigne de la bande d. A l’inverse, le Wet le Cu subissent une forte augmentation de ce paramètre avec une augmentation de Te qui sestabilise (Cu) ou décroît (W) après 20000K. Ceci résulte des mécanismes combinés d’étalementde la distribution de Fermi (smearing), et de modification de la bande d décrite au-dessus. Enfin,l’évolution du nombre d’électrons libres par atome Ne avec la Te, présenté sur la figure 2.3d), estun paramètre qui n’avait jamais été vraiment étudié avec ce type d’approche. Une augmentation deNe est observable pour la plupart des métaux, résultant du fait qu’un certain nombre d’électronsquittent leur état localisé pour venir occuper des états délocalisés des bandes s, p, f, g lorsque Te
augmente. Le comportement non linéaire et non monotone observé est directement attribuable à la
47

Chapitre 2. Excitation de la structure électronique en phase solide
forme de la structure de bande, dépendant du matériau ainsi que du degré d’excitation considéré.Si la question de la thermalisation électronique reste toujours ouverte sur des échelles de temps
très courtes, nos observations sur Ce et γe−ph montrent également que cette hypothèse supposeque les électrons des couches plus internes, jusqu’aux électrons de semi-cœur, en particulier pourle W, sont thermalisés avec le nuage électronique externe. La réalité est sans doute plus complexe,et le temps de thermalisation des électrons de la bande de valence est certainement plus courtque celui des électrons situés sur des couches plus profondes. A la suite de l’excitation indivi-duelle des électrons par les photons laser, une réorganisation s’opère rapidement via des collisionsélectron-électron, ayant des probabilités différentes suivant la localisation en énergie des parte-naires électroniques. Des modèles cinétiques ou de type DFT dépendantes du temps (TD-DFT)doivent être envisagés pour répondre plus correctement à ce type de problème [38]. Ils dépassentnos objectifs actuels et nous en resteront à des données qui sont exploitables sous la forme de pro-priétés sous irradiation dépendant d’un seul paramètre, la température électronique. Enfin, notonsque nous avons rendu disponible à la communauté l’ensemble des résultats principaux discutésici puisqu’ils sont accessibles sur la page web Dynopt du Labex Manutech-sise. En particulier,nous avons fait en sorte que les structures électroniques, soient téléchargeables en ligne sur le lienhttp://manutech-sise.universitelyon.fr/dynopt.
2.3 Estimation de l’indice optique sous irradiation
Dans le cadre de la nanostructuration par laser, l’objectif principal de cette approche ab initioconsistait à déterminer les propriétés optiques grâce à un calcul de Dynamique Moléculaire Quan-tique dépendant de l’excitation électronique engendrée par l’excitation laser pour quelques métaux.Nous avions pour intention initiale de déterminer les propriétés optiques d’un métal à l’état solide(Ti = 300 K) pour une dizaine de températures électroniques et ceci pour un ensemble de ma-tériaux métalliques [Au-Cu-Al-Ti-W-Ni-Inox]. Pour ces métaux, une base de données optiques àl’état solide (Ti = 300 K) en fonction de la température électronique de 0 à 10 eV aurait ainsi étédisponible. Des premiers tests ont été effectués dans ce sens et nous ont montré l’importance de laconvergence des calculs en fonction du nombre d’atomes choisis et de la résolution suffisante de lazone de Brillouin à partir de la grille de k-points. En effet, pour chacun des matériaux initialementchoisis, le calcul de conductivité a présenté de grandes fluctuations aux basses énergies, corres-pondant à la longueur d’onde des lasers employés expérimentalement (400 nm-800 nm). Même sila réalisation de cette base de données s’est avérée être un objectif trop ambitieux compte tenudes moyens numériques requis, des premiers résultats obtenus sur le tungstène se sont révélés êtretrès enrichissants, puisqu’ils montrent la possibilité de modifier les propriétés plasmoniques de cematériau, résultat pour lequel nous avons focalisé nos efforts dans un premier temps.
2.3.1 Dynamique moléculaire et Kubo-Greenwood
Pour cette étude, afin de décrire la dynamique rapide des processus de transport au sein duréseau cristallin, les électrons ont été traités dans le cadre de la DFT à température finie, où les oc-cupations sont données par la distribution de Fermi-Dirac. Les dynamiques moléculaires quantiques
48

2.3. Estimation de l’indice optique sous irradiation
sont réalisées via l’intégration des équations de Newton, les forces conditionnant l’accélération étantissues de la structure électronique. Une fois un équilibre thermodynamique obtenu, les conductivi-tés optiques sont définies dans le cadre de la théorie de la réponse linéaire grâce à l’expression deKubo-Greenwood :
σr(ω) = 2π
3ωΩ∑
k
N∑j=1
N∑i=1
3∑α=1
[f(εi,k) − f(εj,k)] × |〈Ψj,k|∇α|Ψi,k〉|2δ(εj,k − εi,k − �ω), (2.3)
où les indices i et j correspondent à la sommation sur les bandes discrètes (orbitales) inclues dansl’élément de volume Ω de la super-cellule. L’indice α correspond aux trois directions de l’espace.f(εi) représente le facteur de Fermi à l’énergie εi de la ième bande du point k de l’espace réciproque.La conductivité réelle est obtenue en sommant sur tous les points k nécessaires. Cette conductivitéa été calculée pour plusieurs températures électroniques (300K, 10000K et 25000K), dans le butd’échantillonner l’effet de l’irradiation laser.
2.3.2 Activation plasmonique du tunsgtène
Lorsqu’on applique une température électronique finie au système électronique, la conductivitéélectrique et donc les propriétés optiques s’en trouvent profondément modifiées, comme nous pou-vons le voir sur la figure 2.4a). La réponse du système électronique peut être décomposée en unecontribution intrabande σD et une autre interbande σIB telle que σ = σD + σIB . La contributionintrabande est relative à l’absorption par Bremsstrahlung inverse, souvent décrite par un modèlede Drude. Sa contribution a tendance à être augmentée lors du chauffage des électrons. La contri-bution interbande est due à un ensemble de transitions directes ou indirectes, n’impliquant pasnécessairement de changement de vecteur d’onde de l’électron. Sa contribution est principalementdéfinie par la densité d’états électroniques et la superposition des bandes d et sp du W favorisent cemode de transition optique, même si des transitions de d vers d sont toutefois possibles lorsque nousconsidérons un réseau cristallin. A 300K, les données montrent des propriétés optiques dominéespar les transitions interbandes entre 1 eV et 6 eV, correspondant à la largeur de la bande 5d du W.Au-dessous de 1 eV, le comportement est de type Drude, avec une réponse collective principalementintrabande. L’énergie pour laquelle se produit ce recouvrement peut être estimée autour de 0.6 eV,présentant un minimum dans la partie réelle de l’indice.
Le tungstène possède une structure électronique extrêmement stable, comme nous l’avons constatésur la figure 2.2 [26]. Si l’augmentation de la température électronique ne modifie pas la DOS, elleprovoque un étalement de la population électronique au voisinage du niveau de Fermi (Fermi smea-ring), impactant la localisation mais aussi l’efficacité des transitions optiques possibles. La contri-bution de ce type de transitions est sensiblement affectée par le chauffage des électrons, et unediminution de son efficacité est observée dans la région correspondant au rayonnement UV/visibleet proche IR. Nous observons donc que l’excitation thermique a pour effet de rehausser le niveauintrabande tout en diminuant les transitions interbandes, ce qui conduit à lisser les propriétés versun niveau bas sur un large spectre. Ceci a de fortes conséquences sur la réponse optique du matériaulors d’une excitation laser, en particulier en ce qui concerne sa réponse plasmonique de surface [5].
49
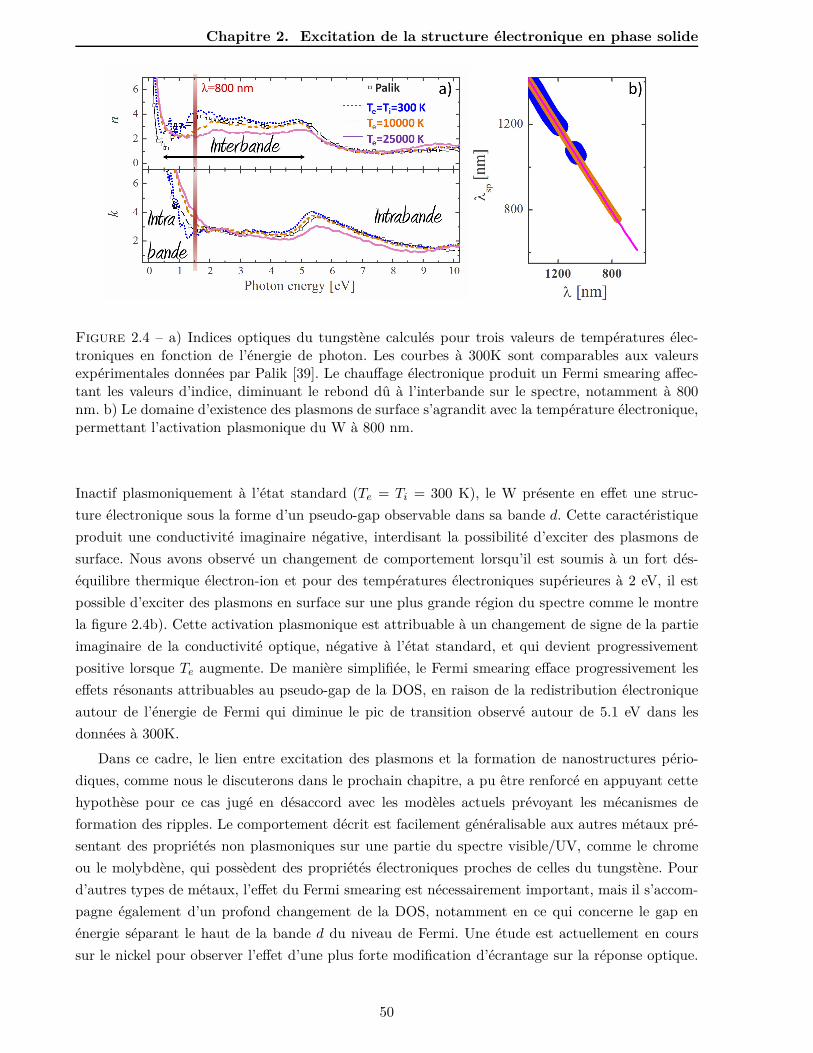
Chapitre 2. Excitation de la structure électronique en phase solide
Figure 2.4 – a) Indices optiques du tungstène calculés pour trois valeurs de températures élec-troniques en fonction de l’énergie de photon. Les courbes à 300K sont comparables aux valeursexpérimentales données par Palik [39]. Le chauffage électronique produit un Fermi smearing affec-tant les valeurs d’indice, diminuant le rebond dû à l’interbande sur le spectre, notamment à 800nm. b) Le domaine d’existence des plasmons de surface s’agrandit avec la température électronique,permettant l’activation plasmonique du W à 800 nm.
Inactif plasmoniquement à l’état standard (Te = Ti = 300 K), le W présente en effet une struc-ture électronique sous la forme d’un pseudo-gap observable dans sa bande d. Cette caractéristiqueproduit une conductivité imaginaire négative, interdisant la possibilité d’exciter des plasmons desurface. Nous avons observé un changement de comportement lorsqu’il est soumis à un fort dés-équilibre thermique électron-ion et pour des températures électroniques supérieures à 2 eV, il estpossible d’exciter des plasmons en surface sur une plus grande région du spectre comme le montrela figure 2.4b). Cette activation plasmonique est attribuable à un changement de signe de la partieimaginaire de la conductivité optique, négative à l’état standard, et qui devient progressivementpositive lorsque Te augmente. De manière simplifiée, le Fermi smearing efface progressivement leseffets résonants attribuables au pseudo-gap de la DOS, en raison de la redistribution électroniqueautour de l’énergie de Fermi qui diminue le pic de transition observé autour de 5.1 eV dans lesdonnées à 300K.
Dans ce cadre, le lien entre excitation des plasmons et la formation de nanostructures pério-diques, comme nous le discuterons dans le prochain chapitre, a pu être renforcé en appuyant cettehypothèse pour ce cas jugé en désaccord avec les modèles actuels prévoyant les mécanismes deformation des ripples. Le comportement décrit est facilement généralisable aux autres métaux pré-sentant des propriétés non plasmoniques sur une partie du spectre visible/UV, comme le chromeou le molybdène, qui possèdent des propriétés électroniques proches de celles du tungstène. Pourd’autres types de métaux, l’effet du Fermi smearing est nécessairement important, mais il s’accom-pagne également d’un profond changement de la DOS, notamment en ce qui concerne le gap enénergie séparant le haut de la bande d du niveau de Fermi. Une étude est actuellement en courssur le nickel pour observer l’effet d’une plus forte modification d’écrantage sur la réponse optique.
50
2.3. Estimation de l’indice optique sous irradiation
La détermination des indices optiques interpolés en fonction de la température électronique devraitpermettre d’interpréter les expériences de microscopie résolues en temps. A terme nous espéronspouvoir mieux contrôler la quantité ainsi que la distribution du dépôt d’énergie, en profondeur maisaussi transversalement, à la surface du métal irradié. La périodicité des nanostructures périodiquesà la surface des matériaux est supposée directement dépendre de leur réponse optique, ce qui élargitle spectre potentiel des applications si nous réussissons à contrôler complètement le dépôt d’énergie.La maîtrise des paramètres de l’impulsion laser, et notamment sa mise en forme temporelle, devraitégalement accroître le contrôle que nous avons sur la phase d’excitation électronique. Ainsi, la com-binaison de ces résultats avec des calculs d’interaction laser-matière via le code hydrodynamiqueEsther, ou des codes de propagation et de dépôt d’énergie électromagnétique, comme ceux décritsdans le dernier chapitre de ce mémoire, permettra d’effectuer une étude résolument multi-échelleet originale des propriétés des matériaux fortement sollicités. Pour prolonger cette étude, le projetANR BLANC international Dylipss (2013-2015) que je coordonne, assurera l’apport de résultatsexpérimentaux de couplage plasmonique, ainsi que de diffraction et de microscopie résolues entemps. Ces résultats seront exploités grâce à la compréhension et aux données théoriques renduespossibles par cette étude fondamentale.
51

Chapitre 2. Excitation de la structure électronique en phase solide
52

Chapitre 3
Excitation d’ondes de surface etstructuration périodique
Le chaos est un ordre à déchiffrer.
L’autre comme moiJosé Saramago
Sommaire3.1 Formation des structures périodiques de surface . . . . . . . . . . . . . . 543.2 Expériences clefs de la formation de LIPSS sur des métaux . . . . . . . 56
3.2.1 Plasmons de surface comme initiateurs d’un dépôt d’énergie inhomogène . . 563.2.2 Diffusion en profondeur de l’énergie et gradients longitudinaux . . . . . . . 59
3.3 Aspects mésoscopiques : influence de l’orientation cristalline . . . . . . 613.3.1 Distribution de la désorientation cristalline locale . . . . . . . . . . . . . . . 613.3.2 Dépendance de l’orientation cristalline et formations de défauts . . . . . . . 63
3.4 Scénario capillaire et déclenchements d’instabilités en surface . . . . . 64
Ce 3 ème chapitre expose quelques résultats obtenus sur la structuration périodique desurface induite par laser. Ce thème a pris une part croissante de mon activité depuis2009. Les structures complexes présentent des périodicités, des topologies et des orientationsvariées et leurs origines restent une question en suspens même si les mécanismes principauxproposés depuis maintenant 30 ans pour des impulsions plus longues sont au cœur desinterprétations actuelles. Les phénomènes de résonances optiques et d’ instabilités de surfaceoctroient à ce sujet un caractère universel et profondément attractif, de part les questionsfondamentales soulevées sur des échelles de temps courtes mais aussi par les applicationspotentielles qui en découlent.

Chapitre 3. Excitation d’ondes de surface et structuration périodique
Proche du seuil en énergie de modification de la plupart des matériaux, il est possible de générerun alignement périodique de rides en surface, souvent appelées « LIPSS » ou « ripples ». Ces struc-tures induites par laser ont été observées depuis le milieu des années 60 mais elles font l’objet d’unregain d’intérêt croissant depuis l’avènement des lasers ultracourts, comme le montre la figure 3.1.Ceux-ci permettent d’atteindre des périodicités largement inférieures à la longueur d’onde laser,allant de quelques dizaines de nanomètres à quelques microns, et ce sur tous les types de maté-riaux, même ceux présentant un band-gap supérieur à la longueur d’onde laser [40]. Ces structurespeuvent atteindre quelques centaines de nm d’amplitude et offrent des perspectives tribologiques,optiques ou de mouillabilité intéressant la communauté scientifique, fondamentale et appliquée [6].Les enjeux actuels se situent principalement autour du contrôle de l’amplitude et de la périodicitédes structures, en fonction des paramètres laser et du matériau irradié. Mon activité sur ce sujet adémarré en 2010, au cours de la thèse de M. Bounhalli (sous la direction de F. Pigeon et F. Garre-lie, en cotutelle avec J. Reif de l’université de Cottbus, Allemagne), afin d’apporter mon expertiseliée aux phénomènes transitoires initiés par l’absorption d’un faisceau laser femtoseconde. Depuis,de nombreux travaux ont été menés, et j’ai pu prendre la responsabilité de l’action transverse surce sujet entre les projets ULTRA et PLD de la thématique « Interaction rayonnement-matière »,l’animation de l’axe « Hierachical Surfaces » du Labex Manutech-SISE depuis 2011, deux projetsfinancés par ce Labex (Dynopt & Seilipss) et enfin la coordination d’un projet ANR Blanc In-ternational Dylipss avec la Roumanie.
Figure 3.1 – Nombre de publications par an mentionnant dans le titre ou le résumé des mots clésautour des LIPSS (periodic surface structures, ripples, . . . ). Notons que parmi celles non catégoriséesdans fs-LIPSS, la source laser peut être ultracourte, même si ce n’est pas directement notifiée.Source : Web of Science.
3.1 Formation des structures périodiques de surface
Les LIPSS regroupent un ensemble de phénomènes périodiques apparaissant en surface de maté-riaux de tous types (diélectrique, polymère, semi-conducteur, métal,...), produits par des impulsionspulsées ultrabrèves, nanosecondes ou microscondes mais aussi continues [41]. Nous ne ferons pas
54

3.1. Formation des structures périodiques de surface
ici d’état de l’art exhaustif, celui-ci pouvant être trouvé dans des articles récents [42, 43]. Cesstructurations apparaissent en surface après généralement une certaine durée d’irradiation ou denombre d’impulsions. La plupart des études s’accordent sur le fait qu’une rugosité de surface estnécessaire pour initier le processus lors de l’interaction laser comme illustré sur la figure 3.2a-b),et la dose nécessaire au déclenchement d’effets visibles correspond sans doute à la création d’unétat de surface suffisamment bruité pour exciter une onde en surface ou provoquer l’instabilitédonnant naissance à la structuration. Depuis le début des années 2000, l’engouement suscité parces structures résultent principalement de l’utilisation d’impulsions ultrabrèves et certainement dedeux effets plus ou moins liés. Une première raison tient au fait que ces impulsions permettent decréer un désordre de charge important dans les matériaux à band-gap, les rendant absorbant sousforme solide, créant des conditions d’excitation favorables à la formation des LIPSS. Tous typesde matériaux (ou presque) peuvent ainsi être structurés. Une seconde raison provient de la possi-bilité, grâce à ces impulsions, de provoquer une structuration avec des périodes bien inférieures àla longueur d’onde, descendant jusqu’à des périodes de quelques dizaines de nm seulement. Il estd’ailleurs convenu de distinguer les LIPSS de basses fréquences, dont la direction est perpendicu-laire à la polarisation (LSFL) de celles de plus hautes fréquences (HSFL), pouvant présenter desdirections parallèles ou perpendiculaires à la polarisation. Enfin, précisons que d’autres LIPSS depériodes supérieures à celle de l’impulsion laser, nommées généralement « grooves », apparaissentparallèlement ou perpendiculairement à la polarisation lorsque la dose est plus importante. Nousavons représenté l’ensemble des LIPSS mentionnés sur la figure 3.2c).
Figure 3.2 – a) Schéma d’interaction du faisceau laser incident avec une surface rugueuse. b)Diffraction sur un réseau en surface ou sur une des composantes de Fourier de la rugosité [43]. c)Principaux types de LIPSS obtenus sous incidence normale, représentés dans le plan de Fourier.
.
A ce jour, plusieurs théories existent pour interpréter l’apparition d’un ordre privilégié aprèsirradiation de la surface. L’explication originelle repose sur une vision purement électromagnétiquedu déclenchement d’ondulations à des périodes bien définies. Elle invoque la nécessité d’avoir unerugosité en surface et propose une théorie basée sur l’interférence d’une onde diffusée ou diffrac-tée en surface, se couplant avec l’onde incidente. L’approche standard se base sur la « théorie deSipe » [44], qui est une solution analytique des équations de Maxwell, à l’interface rugueuse entredeux milieux. Le modèle de Sipe de formation des ripples se base sur un modèle de diffraction
55

Chapitre 3. Excitation d’ondes de surface et structuration périodique
causée par la rugosité de surface. Il suppose des variations transverses de la surface, initialementaléatoires et décomposables analytiquement en une somme de fréquences spatiales individuelles. Ilest possible de calculer la quantité de lumière diffractée par chacune de ces fréquences au-dessousde la surface (3.2b). L’intensité totale sur le matériau résulte alors de la superposition de l’ondeprimaire laser et des ondes diffractées. Il induit implicitement l’excitation d’ondes plasmons ensurface. Le résultat du modèle consiste en la détermination des fréquences spatiales de la variationde surface initiale qui subiront un plus ou moins fort taux de croissance. Un facteur d’efficacité estainsi calculé pour chacune des fréquences et est généralement représenté dans l’espace réciproque(kx, ky). L’une des forces du modèle réside dans sa capacité remarquable à prédire des structures delongueur d’onde Λ � λ, Λ � λ/η et Λ � λ/n, où n est l’indice du matériau et η l’indice réel effectifque nous définirons plus exactement plus loin. L’orientation et la dépendance en angle d’incidenceθ est également correctement décrite. Notons de plus que les modèles électromagnétiques plus com-plets, basés sur une résolution de type FDTD retrouvent des résultats similaires à cette approcheanalytique [46]. Néanmoins, si les structures LSFL sont plutôt bien décrites, celles de type HSFL etgrooves ne sont pas restituées correctement. Pour cette raison, d’autres hypothèses ont été formu-lées et d’autres approches alternatives sont à l’étude. Nous pouvons citer par exemple les approchesd’auto-organisation, basées sur l’hypothèse que la structuration résulte d’une compétition entre desprocessus de création d’interface modulée due à l’érosion et d’un lissage dû à la diffusion de matière[47]. La présence des HSFL est parfois interprétée en terme de génération de seconde harmonique[40] ou d’extrapolation du modèle de Sipe [48]. Un modèle de décroissance paramétrique, impli-quant l’excitation d’une onde plasma dans le matériau commençant à être ablaté par explosioncoulombienne a également été proposé [49]. En volume mais aussi en surface de diélectriques, desstructures de périodes Λ � λ/2n sont également observées, pouvant trouver une explication dans lagénération de deux ondes de surface contre-propagatives, formant une onde stationnaire de périodemoitié de la longueur d’onde effective dans le milieu [43]. Les grooves trouvent aujourd’hui une ex-plication soit à travers un modèle électromagnétique [50], soit par une hypothèse d’onde capillaireen surface de liquide [51].
A travers les hypothèses pré-citées, il ressort que de nombreuses incertitudes demeurent, liéespour la plupart à la difficulté d’appréhender les mécanismes lors de l’interaction avec un laserultracourt. Les compétences de la thématique interaction laser-matière dans les phénomènes ultra-rapides (animée par R. Stoian), jusque là acquises par les procédés liés à l’ablation, à l’excitationde plasma ou au dépôt de couches minces (F. Garrelie), ont été associées aux compétences plas-moniques internes au laboratoire (F. Pigeon, O. Parriaux) pour saisir l’opportunité de proposerquelques expériences dédiées, présentées ci-après, et ainsi valider les principales hypothèses.
3.2 Expériences clefs de la formation de LIPSS sur des métaux
3.2.1 Plasmons de surface comme initiateurs d’un dépôt d’énergie inhomogène
Une première série d’expériences a été menée au laboratoire pour identifier l’origine de cettestructuration sur les métaux ainsi que le rôle du déséquilibre thermique engendré par les irradiations
56

3.2. Expériences clefs de la formation de LIPSS sur des métaux
Figure 3.3 – a) Géométrie d’irradiation à 1 impulsion de réseaux pré-sructurés de différentespériodes à la surface de nickel. La projection du vecteur d’onde incident, le vecteur d’onde du réseauet celui du plasmon sont conservés lors de l’interaction. b) La relation de dispersion du plasmon desurface (en violet) ne permet pas de se coupler avec celle du photon à moins d’impliquer un décalagecorrespondant au vecteur d’onde de rugosité adéquat (ou celle du réseau). c) A la périodicité derésonance attendue pour le plasmon de surface (792 nm), les LIPSS ne sont pas visibles, à ladifférence de Λg = 760 nm pour laquelle la structuration apparaît d), zoomée en e).
ultracourtes. La première d’entre elles a exploité les compétences techniques du LabHC en réalisantdes réseaux à la surface d’un échantillon de nickel [1]. Des réseaux avec un pas allant de 440 nm à 800nm, visibles sur la figure 3.3a), ont ainsi été inscrits grâce à une technologie planaire (interféromètrede type Mach-Zehnder). Ils ont ensuite été irradiés par une impulsion unique de 150 femtosecondes.La profondeur des réseaux ne dépassait pas 10 nm, afin de constituer un précurseur de rugositépour l’excitation d’un plasmon de surface (Fig. 3.3b). En effet, une condition d’accord de phasedoit être réalisée pour le déclenchement de cette résonance de plasmon de surface. Si nous notonskp = k0 sin θ la projection du vecteur d’onde laser sur la surface, où k0 = 2π/λ et θ est l’angled’incidence, la condition s’écrit : kSP = kp ± kg au 1er ordre de diffraction avec kSP le vecteurd’onde du plasmon de surface et kg celui du réseau. Dans le cas d’un faisceau incident en incidencenormale par rapport à la surface, une résonance est donc attendue lorsque kg = kSP .
La recherche d’une résonance en fonction du pas du réseau après irradiation par une impulsionlaser unique a permis de déterminer les conditions de rugosité nécessaires à l’initiation du phéno-mène de structuration périodique. La résonance n’ayant été obtenue qu’en polarisation transversemagnétique et pour une période de réseau bien définie, entre 750 nm et 760 nm, comme le montrela figure 3.3d), l’excitation d’un plasmon de surface a pu être identifiée comme initiateur des LIPSSperpendiculaires à la polarisation et de périodes légèrement inférieures à la longueur d’onde laser.
57

Chapitre 3. Excitation d’ondes de surface et structuration périodique
Ce type d’excitation tend à expliquer la relation observée entre la polarisation et l’orientation dece type de structures [1]. Néanmoins, la période de résonance observée ne correspondait pas à celleattendue. Celle-ci est déterminée par le rapport de la longueur d’onde laser et de η, partie réelle del’indice de réfraction effectif à l’interface métal-air [45] :
λsp =λ
η, où η =
⎧⎨⎩
[n2
n2 + 1
]1/2⎫⎬⎭ . (3.1)
A partir des indices froids donnés par Palik [39], n = 2.48+i4.38, la résonance aurait dû se produirepour λg = λsp = 792 nm. Les figures 3.3c)-d)-e) montrent qu’il n’en est rien et que la résonance estdécalée vers des périodes inféreures, autour de 750 nm. Ceci nous a laissé supposer que la réponseoptique du matériau pour les irradiations était complexe et qu’elle évoluait de manière transitoireau cours de l’irradiation. Cette observation a initié les travaux présentés dans le chapitre précédent,en particulier l’activation plasmonique du tungstène sous irradiation par changement transitoiredes indices optiques [5].
Figure 3.4 – a) Transformée de Fourier des LIPSS formées en surface d’un échantillon pré-structurépar un réseau de 750 nm. b) Cartographie dans l’espace d’indices complexes de la valeur du plasmonde surface. Les deux lignes (verte et bleue en tiret) indiquent les iso-périodes à 750 nm et 760 nm,respectivement. L’étoile indique la position de l’indice n = 0.9 + 2i utilisé pour estimer le facteurd’efficacité de dépôt d’énergie du modèle de Sipe présenté en c).
Les LIPSS formées par une impulsion ont une période similaire à celle du réseau et donc duplasmon de surface supposément excité. La figure 3.4 montre une structuration de période 750nm. Dans une première approche, nous avons cherché les conditions d’indices optiques permettantde produire un plasmon λsp � 750 nm, comme reporté sur la figure 3.4b). A partir d’une desvaleurs possibles de n excité, nous avons effectué un calcul électromagnétique basé sur le modèle deSipe. Le résultat d’efficacité sélective de dépôt d’énergie en fonction des fréquences, présenté sur lafigure 3.4c), montre un très bon accord avec la transformée de Fourier expérimentale, corroborantcette hypothèse d’excitation de plasmon de surface [52]. Les indices optiques du métal permettantde telles longueurs d’onde de plasmon sont toutefois très difficiles à atteindre, et nécessitent uneforte suppression des transitions optiques interbandes [1]. Qualitativement, de telles modifications
58

3.2. Expériences clefs de la formation de LIPSS sur des métaux
semblent possibles, à la fois dues à un décalage du niveau de Fermi vers les hautes énergies et àun décalage inverse de la bande d vers les basses énergies à cause de la modification d’écrantageprésentée dans le chapitre 2 [26]. De manière plus précise, les premières évaluations effectuées parcalcul de type Kubo-Greenwood ne donnent pas de tels changements. Le Fermi smearing a tendanceà adoucir l’effet du décalage du haut de la bande d et du niveau de Fermi en étalant la populationdes électrons dans la densité d’états, atténuant grandement les effets de ce décalage. D’autres calculssont toutefois en cours et une étude plus poussée sera proposée en perspective de ce mémoire (cfchapitre 6). Enfin, de nouveaux travaux en prolongement de celui-ci sont en cours de réalisationdans le cadre du projet ANR Dylipss, menés par L. Neagu, post-doctorat que j’ai supervisé 4 moisen 2013/2014. Ils ont pour but d’identifier les structures apparaissant à des périodes plus petitesque les structures classiques, inférieures à 500 nm mais parallèles à la polarisation du laser. Cetteétude est couplée à une mesure de réflectivité angulaire sur un réseau de pas fixe, afin d’identifier lecouplage optimal d’une seconde résonance plus délicate à interpréter. De nouvelles simulations dedynamique moléculaire sont en cours pour compléter la compréhension des phénomènes observésexpérimentalement sur le nickel, et coupler ainsi les résultats plasmoniques en réflectivité à unemodification transitoire de la structure de bande, ce qui serait un résultat original à fort impactdans la communauté.
3.2.2 Diffusion en profondeur de l’énergie et gradients longitudinaux
Une seconde expérience consacrée à la relaxation de l’énergie dans les métaux a été réalisée peuaprès, également dans le cadre de la thèse de M. Bounhalli et dont les résultats ont été publiés en2012 [2]. Elle avait pour objet la mesure de l’amplitude des structures en fonction du métal consi-déré. Dans ce deuxième type d’expérience, l’étape d’excitation électromagnétique et la questionde la périodicité sont mises de côté pour se focaliser sur la phase de croissance, perpendiculaire àl’interface. Dans cette expérience, nous avons irradié des cibles de ruthénium, tungstène, nickel etcuivre par 50 impulsions de 150 fs. Ces matériaux ont été choisis pour les différences de valeur et dedépendance en température électronique du coefficient de couplage électron-phonon γe−ph, sachantque γRu
e−ph > γWe−ph > γNi
e−ph > γCue−ph [36]. Sur la figure 3.5a), il apparaît que plus ce coefficient est
important, plus l’amplitude des LIPSS est importante. L’analyse en fonction de la fluence localemontre également que lorsque γe−ph décroît avec Te, comme dans le cas du nickel, l’amplitudediminue avec l’excitation, contrairement aux autres matériaux. Le coefficient de couplage, direc-tement lié aux fréquences de collisions électron-phonon, limite le temps de diffusion électroniquedans le cadre du modèle à deux températures. Il n’est donc pas possible de séparer le rôle de ladurée de non-équilibre électron-phonon de celui d’une plus ou moins grande diffusion thermiqueélectronique, d’autant plus que les matériaux possédant un coefficient γe−ph faible, comme le cuivreou l’or, sont dotés d’une conductivité thermique élevée. Nous avons donc corrélé nos observationsavec un paramètre physiquement plus pertinent qui est la longueur de confinement de l’énergie ensurface Lc, représenté sur la figure 3.5b). Lc est définie par la longueur caractéristique de diffusion
59

Chapitre 3. Excitation d’ondes de surface et structuration périodique
thermique au terme de laquelle le matériau atteint la température de fusion Tm en surface :
Lc =(128
π
)1/8 (Ci
AeTm
)1/4 (K
γe−ph
)1/2
(3.2)
où Ci est la capacité ionique, Ae = Ce/Te le coefficient de linéarité de la capacité électronique etK la conductivité thermique. Il apparaît clairement que le confinement de l’énergie en surface (Lc
faible) correspond à un contraste élevé. Ce confinement reflète une diffusion thermique électroniqueplus ou moins importante suivant le matériau considéré. En effet, suite au déséquilibre engendré,les matériaux possédant un fort coefficient de couplage électron-phonon comme le ruthénium ou letungstène ne permettent pas une propagation de l’énergie en profondeur. Au contraire, les métauxayant une plus forte conduction thermique électronique, associée à un plus faible coefficient decouplage électron-phonon laissent diffuser la chaleur sur une plus grande profondeur, diminuant ainsile confinement d’énergie. La distribution finale d’énergie conduit à des gradients de températureou de pression correspondants supposés être à l’origine du plus ou moins grand contraste observé.En effet, l’importance du gradient longitudinal de température doit imposer une plus ou moinsgrande expansion perpendiculaire à la surface, définissant ainsi la topologie locale après relaxationcomplète de l’énergie. La morphologie finale obtenue en surface nécessite toutefois une connaissanceplus approfondie des mécanismes imposants un flux hydrodynamique de matière sur une échelle detemps ultérieure [52].
Figure 3.5 – a) Evolution mesurée de l’amplitude des LIPSS en fonction de la fluence locale pourdifférents métaux. Une corrélation est observée avec la valeur et la dépendance de γe−ph avec Te. b)Longueur de confinement de l’énergie en surface des métaux fonction de la température électroniquemaximale. L’évolution est inverse de celle constatée pour l’amplitude des LIPSS.
Ces mécanismes de déplacement de matière sont aujourd’hui beaucoup moins étudiés que ceuxrelatifs aux phénomènes optiques. Ils nécessitent des expériences in situ, et si possible en temps réelpour sonder l’état de surface sur des échelles de temps typiques de la croissance. Des expériences dediffraction résolues en temps, de type pompe-sonde, sont actuellement à l’étude, en collaborationavec M. Zamfirescu du laboratoire INFLPR de Bucarest. Ces expériences sont effectuées au LabHC,ainsi qu’en Roumanie, et sont financées dans le cadre du projet Dylipss. Elles seront comparées
60

3.3. Aspects mésoscopiques : influence de l’orientation cristalline
à la dynamique de changement de phase solide-liquide et de resolidification de la surface. Ainsi,la sonde ultracourte à 400 nm permettra de suivre le début du signal de diffraction, témoin d’unedéformation périodique de la surface. Le temps nécessaire à l’établissement d’une saturation dusignal servira de signature au temps effectif de croissance, permettant de définir les mécanismesphysiques liés au changement local de topographie. Une baisse de la diffraction dans les premiersinstants consécutifs à l’interaction, pourrait également être le signe d’un changement de phasesolide-liquide en surface pouvant effacer une partie de la structuration. Enfin, ils répondront enpartie aux questions posées par cette expérience sur différents métaux, qui interrogent sur le rôledu feedback [52], d’une impulsion à une autre et d’un matériau à un autre. Dans cette perspectivede mieux définir les conditions transitoires thermodynamiques subies par le matériau et aboutissantà sa structuration en surface, nous avons entrepris un travail original d’analyse micro-structurelle,développé dans le paragraphe suivant.
3.3 Aspects mésoscopiques : influence de l’orientation cristalline
Dans le cadre de la structuration périodique de surface, la caractérisation du matériau irradiéa été relativement peu étudiée sur une échelle mésoscopique par la communauté. Quelques travauxont été menés, notamment sur le silicium par le groupe de H. Haugen de l’université McMaster (On-tario, Canada) et celui de J. Reif à l’université BTU (Cottbus, Allemagne). Peu de travaux avaientété initiés dans ce sens là sur des métaux, alors que de telles caractérisations peuvent se révélerriches en informations sur l’histoire thermodynamique locale subie sur les premiers nanomètres ensurface. Le travail de caractérisation de la sous-couche affectée par la formation de nanostructures,pouvant permettre de remonter aux phénomènes et contraintes subies par le matériau en surfacea été développé en partenariat avec C. Maurice du Laboratoire Claude Goux de l’Ecole des Minesde Saint-Etienne. Ce laboratoire dispose d’un outil et de compétences uniques de diffraction d’élec-trons rétrodiffusés haute résolution (HR-EBSD) pour visualiser les déformations induites dans descristaux ayant subis de fortes contraintes. Cette collaboration a été rendue possible grâce au LabexManutech-SISE et au financement de 30 mois de post-doctorat (X. Sedao sous la direction de F.Garrelie) depuis 2012 sur la mise en évidence des effets thermomécaniques induits par l’action dulaser ultrabref.
3.3.1 Distribution de la désorientation cristalline locale
Précédant la formation des structures en surface, nous supposons que l’énergie du laser est dé-posée et distribuée de manière modulée et inhomogène dans le matériau, initiant des contraintesthermiques locales et/ou des changements de phase transitoires qui peuvent entraîner des modifi-cations micro-structurelles. Une première étude approfondie sur les niveaux de rotation du réseaucristallin a tout d’abord été entreprise pour différentes localisations dans la structure formée etla sous-couche associée après une coupe FIB en cross-section détaillée sur la figure 3.6a) [53]. Ladésorientation locale des plans cristallins est visible sur la figure 3.6b) où la cartographie en faussescouleurs montre une désorientation inhomogène d’environ 2.5 (en vert) allant ponctuellement jus-qu’à 3 . L’amplitude des ripples est d’environ 200 nm et nous pouvons constater que l’épaisseur sur
61

Chapitre 3. Excitation d’ondes de surface et structuration périodique
Figure 3.6 – a) Réalisation d’une découpe par faisceau d’ions focalisés (FIB) permettant d’accéderà une tranche de LIPSS caractérisée par EBSD haute résolution (b). Une forte désorientation estobservée à la fois dans les creux et les bosses. c) Cartographie de densité de dislocations évaluées parla méthode GND. Dans la région d’extrême surface la densité de dislocations est évaluée à 1016 m−2,pouvant correspondre à la zone de transition liquide/solide estimée par un calcul hydrodynamiquede densité (d). Le fond est lui évalué à environ 1015 dislocations m−2, pouvant être produites parle choc se propageant dans le substrat solide plus en profondeur, présenté en (e).
laquelle ces désorientations sont observables sont du même ordre de grandeur. Une cartographie dedensité de dislocations effectuée par la méthode GND (Geometrically Necessary Dislocations) per-met d’associer les désorientations observées à une forte densité locale de dislocations (figure 3.6c).Cette densité décroît lorsque l’on pénètre plus en profondeur dans le matériau. Une fine couche ensurface d’environ 50 nm laisse apparaître des densités de dislocations estimées à 1016 m−2. Nousles associons à la zone de changement de phase solide-liquide subie par la surface du matériau,déterminée par un calcul hydrodynamique Esther sur le nickel, présenté sur la figure 3.6d). Lefond de la sous-couche, entourée en pointillés sur la figure 3.6c), présente une densité de dislocationsplus de 10 fois inférieure, pouvant être corrélée à la zone située sous la couche d’extrême surfaceet subissant l’intense formation de l’onde de choc et de détente de plusieurs GPa, comme nous levoyons sur la figure 3.6e). Les défauts observés peuvent donc être imputables à des changements dephase ainsi qu’à des contraintes élevées plus en profondeur. L’estimation des niveaux de dislocationpermet de corréler les « défauts mesurés » à la topologie observée, sans toutefois préciser l’originede ces défauts et plusieurs autres pistes pourraient être avancées, en dehors de celles discutées. Eneffet, la présence d’une fine couche de nickel amorphe en surface pourrait, par exemple, entraînerla plus forte concentration de défauts observés. Nous rediscuterons de la poursuite de ces travauxdans le dernier chapitre du mémoire.
62

3.3. Aspects mésoscopiques : influence de l’orientation cristalline
Figure 3.7 – a) Image d’électrons secondaires d’un site irradié par 20 impulsions laser à 0.3 Jcm−2. b) Cartographie EBSD où la couleur dépend de l’orientation cristalline par rapport à lanormale à la surface. Les indices correspondant aux plans cristallins sont indiqués. Chaque régionnumérotée est visible dans les inserts de la figure de gauche. c) Image d’électrons secondaires d’unsite irradié par 18 impulsions laser à 0.38 J cm−2. d) Cartographie de désorientation locale parEBSD indiquant une plus grande distorsion des plans (111) du cristal. c-d) illustrent clairement lacompétition entre la formation des LIPSS et l’accumulation de défauts.
3.3.2 Dépendance de l’orientation cristalline et formations de défauts
Une seconde étude sur l’effet de l’orientation cristalline du matériau irradié sur la formationdes LIPSS pour les échantillons polycristallins de nickel a récemment été publiée [54]. Ce travailoriginal permet d’expliquer l’inhomogénéité de la formation des structures à la surface d’un métalirradié par un faible nombre d’impulsions. Cette formation localement non uniforme est attribuableaux réponses singulières des différentes orientations cristallines présentes en surface. La figure 3.7rassemble quelques résultats obtenus dans ce travail où la comparaison des images MEB (a) etEBSD (b) prises sur le même échantillon de nickel irradié montre clairement une disparité dela structuration dépendante du grain considéré. La partie basse de l’impact laser correspond àun cristal orienté (111) alors que les deux autres grains présentent des plans orientés (213) et(215). Trois zones particulières ont été grossies pour observer la présence ou non de LIPSS, dansles grains ou au voisinage d’un joint de grains. Ce résultat indique une forte dépendance dansl’orientation cristalline, le plan orienté (111) apparaissant moins favorable que les autres pour laformation de LIPSS à sa surface. La figure 3.7c) montre des résultats renforçant cette observation
63

Chapitre 3. Excitation d’ondes de surface et structuration périodique
sur un autre impact présentant des plans cristallins de directions orthogonales à (111), soit (100)et (110). Cet impact a été analysé par HR-EBSD (Figure 3.7d), dévoilant ainsi une désorientationplus marquée pour (111) que pour les autres plans. Ceci signifie que les défauts formés sont plusimportants pour ce plan que pour les autres plans. En d’autres termes, une compétition semblese jouer entre l’énergie laser absorbée convertie sous forme de défauts cristallins ou sous la formed’une structuration périodique en surface, potentiellement possible lorsqu’un changement de phasesolide-liquide intervient. Les conclusions de ce travail sont pour l’instant spéculatives mais nouspouvons imaginer que le plan (111), qui est celui le plus difficile à fondre puisque plus dense (satempérature de fusion est proche de celle du bulk), reste solide, accommodant et piégeant alors sesdéfauts après chaque impulsion laser. A l’inverse, lorsque les deux plans (100) et (110) dépassent leseuil de fusion en surface, supposé être plus bas de plusieurs centaines de Kelvin pour les premièrescouches atomiques [55], un écoulement de matière est possible et la structuration s’organise. Ladensité supérieure de défauts observée pour le plan cristallin (111) a récemment été attribuée enpartie à la formation de macles. Cette formation peut se produire, soit sous l’effet de pressions trèsélevées, soit lors d’une resolidification. Le sens privilégié des gradients de pression ne permet pasle maclage de plans (111), diminuant la validité de la première hypothèse. La seconde, liée à uneresolidification est également soumise à caution, sachant que ces défauts sont créés également engrande proportion à basses fluences également, n’impliquant pas, a priori, de changement de phase.
De nouveaux travaux sont actuellement à l’étude sur des monocristaux, afin de caractériseren décomposant plus précisément la réponse inhomogène de l’état initial d’une surface standardpolycristalline. L’analyse de telles structures par HR-EBSD permettra ainsi de cartographier ladéformation du réseau cristallin pour chacune des orientations, en sondant et quantifiant l’aniso-tropie de la photo-excitation et de la réponse du matériau. Ces analyses sont en cours et révèlentla difficulté à imaginer un scénario adéquat, sachant que les résultats dépendent de la fluence, dunombre d’impulsions, de l’état de surface initial, des effets cumulatifs, et finalement de l’orientationcristalline. La caractérisation de ces modifications périodiques devrait toutefois permettre d’appor-ter de nouvelles stratégies d’optimisation de la qualité des propriétés tribologiques ou optiques surdes matériaux polycristallins où l’uniformité du traitement laser est important.
3.4 Scénario capillaire et déclenchements d’instabilités en surface
Pour compléter notre compréhension des phénomènes induits en surface d’un métal irradié, etparce qu’une vision purement électromagnétique du dépôt d’énergie ne suffit pas à expliquer lacroissance observée, une étape ultérieure impliquant un mouvement de matière sous forme liquidefait partie des études en cours. Une analyse théorique des phénomènes couplés a été entreprise encollaboration avec P. Brunet du Laboratoire Matière et Systèmes Complexes de l’université ParisXIII, d’abord en évaluant les temps caractéristiques des différents effets, puis plus précisément parune analyse de stabilité linéaire de la surface libre, et enfin par un modèle unidimensionnel intégrantles effets plasmoniques, thermiques et hydrodynamiques [52, 56]. Nous avons pu ainsi montrerque les temps caractéristiques de certains effets pouvant déstabiliser la couche fluide transitoiresont inférieurs au temps de resolidification. Les effets plasmoniques entraînent une structuration
64

3.4. Scénario capillaire et déclenchements d’instabilités en surface
Figure 3.8 – Illustration d’un écoulement de fluide par effet Marangoni des zones chaudes vers leszones froides, initié par un dépôt d’énergie laser modulé.
spatiale du champ de température aux tout premiers instants après l’impulsion, ainsi qu’une pressionimpulsionnelle globale pouvant donner lieu à une forte accélération transverse de l’interface [23].Les effets hydrodynamiques sont essentiellement liés à la dynamique de la surface libre d’une coucheliquide mince traitée dans l’approximation faible pente (lubrification). La dépendance de la tensionde surface avec la température est supposée conduire à des flux de matière de type Marangoni avecun temps caractéristique τm s’écrivant :
τm � 14
∣∣∣∣ ∂σ
∂T
∣∣∣∣−1 ηΛ2
hmΔT, (3.3)
où hm est l’épaisseur du nickel liquide, σ sa tension de surface, η la viscosité dynamique, Λ lapériode de la modulation en température et ΔT le surchauffage au sein de cette modulation. Nousavons pu estimer que τm � 18 ns et que l’accumulation d’une vingtaine d’impulsions était nécessairepour modifier la topographie d’un métal en conséquence, étant donnée la faible durée de vie de lacouche liquide, estimée à moins de 1 ns [52].
La seconde étude plus complète mais non terminée, a consisté à analyser la stabilité linéaire de lasurface libre en prenant en compte les effets de viscosité, de capillarité et de pression due aux effetsde courbure. Ces effets font apparaître des termes dérivatifs spatiaux d’ordre 2 à 4 dans l’équationdifférentielle régissant la dynamique spatio-temporelle de la hauteur de la couche fluide, ce qui nousa amené à considérer l’équation dite de Kuramoto-Sivashinsky, couramment utilisée dans diversmodèles de croissance d’interface et d’états chaotiques, comme ceux envisagés dans les modèlesd’auto-organisation proposés à l’université BTU (Cottbus, Allemagne) [57]. Les résultats obtenusne nous ont pas permis de faire apparaître un changement de période de la modulation imposée parla température [56]. Celle-ci est le facteur principal de croissance et l’amplitude de modulation del’énergie électromagnétique définit complètement le rôle des autres processus. La question revient
65
Chapitre 3. Excitation d’ondes de surface et structuration périodique
ainsi à l’existence d’une résonance pour le dépôt d’énergie modulée et sur la proportion d’énergiecontenue dans l’excitation de surface de type plasmonique, rejoignant la problématique originale.Pour cette raison, ce sujet est aujourd’hui laissé en suspens, en raison d’un effet capillaire considérécomme moindre vis à vis des effets optiques sur lesquels nous travaillons activement pour expliquerles différentes périodicités des structures observées.
66
Chapitre 4
Produits d’ablation, formation de laplume et excitation en phase plasma
Nothing happens until somethingmoves.
Albert Einstein
Sommaire4.1 Mécanismes d’éjection de matière et produits d’ablation . . . . . . . . . 684.2 Mise en forme temporelle d’impulsions pour l’optimisation . . . . . . . 71
4.2.1 Expériences à temps de vol . . . . . . . . . . . . . . . . . . . . . . . . . . . 714.2.2 Contrôle des espèces ioniques via l’émission spectrale . . . . . . . . . . . . . 714.2.3 Modélisation de la formation de nanoparticules . . . . . . . . . . . . . . . . 72
4.3 Optimisation numérique du chauffage en régime d’ablation . . . . . . . 744.3.1 Une forme temporelle adaptée à chaque régime d’ablation . . . . . . . . . . 754.3.2 Optimisation de l’excitation thermique en phase plasma . . . . . . . . . . . 75
Ce quatrième chapitre rassemble les résultats obtenus autour de l’ éjection de matièreen surface, préférentiellement sous forme plasma, ayant pour application principale ledépôt de couches minces. Ce travail prolonge la structuration directe réalisée à bassesfluences, et est en transition avec le prochain chapitre dédié aux plasmas d’ électrons créésen volume de diélectriques. La question fondamentale pour chacune des applications serésume à : « si un état spécifique de la matière est désiré, quelles sont les caractéristiquescapables de déterminer l’ état requis avec un minimum d’ énergie délivrée ? ». Ainsi,l’ insertion de boucles adaptatives, basées sur la manipulation d’ impulsions du systèmelaser expérimental mais également dans une modélisation numérique de l’ interaction, aouvert une voie naturelle pour la la prédiction de mécanismes non accessibles directementpar l’ expérience.

Chapitre 4. Produits d’ablation, formation de la plume et excitation en phase plasma
Lors de l’irradiation d’un métal par des impulsions laser ultracourtes, nous avons vu au coursdu premier chapitre que l’énergie était confinée temporellement mais aussi spatialement. Ainsi, lamatière est éjectée du milieu d’origine avec une très grande précision, ce qui confère au système desqualités indéniables pour de nombreuses applications telles que la micro-structuration de surface,la génération de nanoparticules ou encore un endommagement minimal à des fins spectroscopiques.Pour ce type d’interaction, le chauffage quasi-isochore des électrons libres du solide insuffle unedynamique puissante de destruction du matériau, franchissant des états thermodynamiques de hautedensité et à haute température. Pour les métaux ou les diélectriques fortement excités, l’explosioncoulombienne est supposée être inhibée par la grande mobilité des électrons dans la bande deconduction, et une approche thermique est privilégiée [58]. A la suite de mon doctorat/post-doctoratplutôt orienté vers les mécanismes liés à l’ablation des matériaux irradiés, j’ai pu apporter aulaboratoire mes compétences de modélisation des processus physiques induits lorsque le matériaupasse d’un état initialement solide à une phase plasma dense, afin d’interpréter les expériencesmenées au laboratoire. Grâce au code hydrodynamique d’interaction laser-matière Esther duCommissariat à l’Energie Atomique que j’ai étendu au cas des impulsions ultracourtes, nous avonspu appliquer dans un premier temps une approche théorique de l’interaction pour identifier lesmécanismes d’éjection de matière. Dans un second temps, la possibilité de manipuler les propriétéslaser dans le domaine temporel laisse supposer une forte amélioration potentielle des procédés laseret nous avons utilisé cette approche numérique pour augmenter la synergie entre la lumière et laréponse de la matière.
4.1 Mécanismes d’éjection de matière et produits d’ablation
Lors de la simulation de l’irradiation d’un métal par une impulsion laser ultrabrève, nous avonsconstaté que la transition solide-plasma s’effectuait dans des conditions non conventionnelles enempruntant des chemins thermodynamiques exotiques, liés aux intenses pressions engendrées [11].En effet, la pression électronique augmente fortement pendant l’impulsion en raison du chauffageisochore du matériau, atteignant ainsi quelques dizaines de GPa en surface. L’énergie transférée desélectrons vers les ions provoque la génération de l’onde de choc principale, qui va se propager dansle solide, alors que celle liée aux électrons reste confinée en surface sur un temps bref, de l’ordrede la durée du déséquilibre thermique, comme nous pouvons le voir sur la figure 4.1a). Le transfertd’énergie des électrons vers les ions, la diffusion de l’énergie plus en profondeur ainsi que l’expansiondu matériau en surface constituent des voies distinctes de relaxation des contraintes internes. Enfonction de la prépondérance d’un ou d’un autre mécanisme, les propriétés thermodynamiquesdu matériau suivent des trajectoires thermodynamiques distinctes dans le plan (P-ρ). En effet, lamatière ablatée en surface du matériau ne franchit pas de transition liquide-gaz puisque les hautespressions initiées par le déséquilibre sont conservées lors du passage au-delà du point critique,du fait de l’expansion violente après le chauffage isochore. Le point critique est ainsi contournéet la matière liquide se fragmente continûment lors de son expansion pour former un gaz puisun plasma. C’est le mécanisme de « fragmentation » du fluide supercritique, qui s’avère être unespécificité de l’irradiation par impulsions courtes et ultracourtes. Plus en profondeur, le matériau
68

4.1. Mécanismes d’éjection de matière et produits d’ablation
Figure 4.1 – a) Simulation de l’évolution du découplage en pression à l’intérieur d’un échantillonde cuivre irradié [23]. La relaxation et en particulier l’onde de détente conditionne les processusd’ablation. b) Chemins thermodynamiques suivis par différentes cellules dans l’aluminium pour dif-férentes profondeurs dans un diagramme (P-ρ). L’amplitude et la distribution spatiale du chauffageisochore (1) conditionnent le processus de fragmentation du fluide supercritique (2) ou d’explosionde phase (3). Un piégeage de la matière ablatée sous forme liquide est également possible lorsqu’enprofondeur des pressions négatives sont rencontrées au sein du liquide (4).
est pratiquement à l’équilibre électron-ion lors de son expansion et il croise la ligne binodale,marquant le début de la transition de phase liquide-gaz. Dans ce cas, un processus d’« explosion dephase » est favorisé et nous assistons à une décomposition explosive du matériau en un mélangebiphasique, de liquide et de vapeur [59]. Une importante proportion des nanoparticules dans leplasma est potentiellement créée lors de cette étape. Néanmoins, la relaxation des fortes contraintesinternes, confinées dans une couche liquéfiée sous la surface, provoque également la génération devide au sein de cette couche. Une couche liquide est ainsi ablatée, résultant de la réflexion del’onde de détente dans la zone chauffée. Il est supposé que cette couche se décompose rapidementen un ensemble de gouttelettes liquides, contribuant également et en forte proportion pour lesimpulsions ultracourtes, à la génération de nanoparticules [12, 60]. Les simulations numériquesmenées nous ont permis de différencier les mécanismes responsables de l’éjection de la matière à lasuite de telles impulsions laser [11]. Les irradiations picosecondes génèrent également un processusde fragmentation, qualifié de trivial car l’expansion plus lente permet d’atteindre un équilibreliquide-vapeur, tout en supprimant le processus d’explosion de phase [61]. Enfin, notons que lorsdu chauffage par une irradiation laser nanoseconde, les chemins thermodynamiques ont tendance àsuivre la ligne binodale avant de subir un processus de vaporisation. La mise en forme temporelledes irradiations laser ultrabrèves entre 100 fs et quelques dizaines de ps donne alors l’opportunitéde contrôler les mécanismes d’ablation ainsi que le degré d’excitation des produits éjectés. Plusieursexpériences spécifiques ont été menées en phase plasma, comme celles décrites ci-après.
69

Chapitre 4. Produits d’ablation, formation de la plume et excitation en phase plasma
Figure 4.2 – a) Résultats d’optimisation lors d’expériences par analyse TOF des ions Al, jouantsur la mise en forme temporelle d’impulsions et b) par contrôle de l’émission spectroscopique, enoptimisant le signal Al-II/Al-I. Les conséquences sur la diminution de la quantité de nanoparti-cules déposées sur le substrat sont clairement visibles pour l’impulsion optimisée (OP), comparéeà l’impulsion ultracourte (SP). c) Ensemble de résultats de simulations hydrodynamiques, validantl’augmentation de l’ionisation des ions pour (OP), et montrant l’éjection d’une couche à la den-sité liquide, en surface du métal irradié par l’impulsion SP. Cette observation a été corrélée avecl’accroissement de la densité de nanoparticules dans le plasma.
70

4.2. Mise en forme temporelle d’impulsions pour l’optimisation
4.2 Mise en forme temporelle d’impulsions pour l’optimisation
4.2.1 Expériences à temps de vol
La première expérience d’optimisation en phase plasma est le fruit d’une collaboration avec leMax Born Institute de Berlin, en réponse au questionnement sur le comportement « linéaire » desmétaux. En effet, contrairement aux diélectriques, les métaux ne sont pas censés présenter de non-linéarités lors de la sollicitation électromagnétique en phase solide, et une mise en forme temporellede l’impulsion est supposée pouvoir optimiser le dépôt d’énergie lors des transitions de phase. Dansce contexte, une durée optimale d’impulsion, produisant le couplage le plus efficace pour générerdes ions dans le plasma d’ablation, a été recherchée pour les potentialités de ce contrôle de dépôtd’énergie. Le taux d’ions et celui de particules neutres émises lors de l’irradiation d’une cible ontété détectés dans le cas d’une impulsion gaussienne standard de 180 femtosecondes et pour le casd’une impulsion plus longue, d’une dizaine de picosecondes, optimisée grâce à un algorithme gé-nétique maximisant l’émission d’ions [62]. Le détecteur utilisé était un spectromètre de masse àtemps de vol (TOF), avec un axe de détection normal à la surface de l’échantillon. La distributionen vitesses des particules émises a également été mesurée dans les deux cas. Les résultats, présentéssur la figure 4.2a), ont été directement comparés aux calculs de la température et de la densité dumatériau atteintes par le gaz ou le plasma se détendant à l’avant de l’échantillon. Une corrélationest ainsi apparue entre la proportion d’ions émis et le degré de chauffage du matériau, au delà dela température critique, correspondant à un fluide supercritique. L’analyse a permis également derelier le taux de particules neutres à la quantité de liquide éjectée au sein de la cible. Les diffé-rentes impulsions envisagées ont permis d’identifier finement les conditions optimales de couplagede l’énergie laser avec le plasma dense [62]. Une meilleure compréhension du rôle des deux méca-nismes antagonistes d’ablation que sont la fragmentation et l’explosion de phase couplés à l’éjectionde la goutte liquide nous a permis d’identifier la nature (ions ou neutres) des produits d’ablation,en fonction du dépôt initial d’énergie.
4.2.2 Contrôle des espèces ioniques via l’émission spectrale
Les premiers résultats obtenus sur l’optimisation de la phase plasma ont initié un second pland’expériences, réalisées en collaboration avec le projet « Pulsed Laser Deposition » porté par F.Garrelie. Parmi les objectifs de ce projet, l’analyse et la manipulation des ions émis à des finsde contrôle du dépôt de couche mince, tiennent une place prépondérante. Ainsi, la thèse de M.Guillermin (dirigée par F. Garrelie et E. Audouard), à laquelle j’ai pu contribuer dès mon arrivéeau laboratoire, était dédiée à l’étude du panache d’ablation laser pour l’optimisation des procédés.
Une attention particulière a été portée à l’influence de la mise en forme temporelle de l’impul-sion sur le dépôt de couches minces, et plusieurs types d’optimisation de l’excitation du plasmaont été réalisées sur l’aluminium et sur le laiton [12, 63]. Pour ces expériences, un diagnostic insitu se basait sur une mesure spectroscopique de l’émission optique du plasma, en particulier surl’optimisation de quelques raies d’émission Al-II par rapport aux raies Al-I pour une fluence laserde l’ordre de � 5 J cm−2. L’utilisation d’impulsions laser étirées sur une dizaine de picosecondes
71

Chapitre 4. Produits d’ablation, formation de la plume et excitation en phase plasma
ou de double-impulsions de délai variable ont montré que ce type d’impulsion laser plus longueengendrait une augmentation de la fraction ionisée et du chauffage de la matière éjectée au détri-ment de la quantité de neutres, rejoignant ainsi les résultats de l’expérience précédente, réaliséeà une fluence moindre (< 1 J cm−2). Des conséquences en terme de dépôt de couche mince sontclairement visibles sur la figure 4.2b), où un grand nombre de particules apparaît sur les dépôtsréalisés avec des impulsions ultracourtes. Des simulations numériques hydrodynamiques nous ontpermis de suivre le profil spatial de la densité du matériau en fonction du temps avec pour finalitél’interprétation de ces expériences d’optimisation du dépôt de couche mince par panache plasma.Les résultats sont synthétisés sur la figure 4.2c). Nous avons constaté que le couplage énergétiqueétait plus efficace pour les impulsions s’étalant sur une dizaine de picosecondes, avec une distribu-tion des espèces ionisées suivant les profils spatiaux de température et de densité de plasma. Ainsi,les espèces les plus ionisées sont situées en front de plasma et les neutres dans le cœur du plasma.Pour les densités considérées sur les échelles de temps de la détection spectroscopique (100-400 ns),nous avons vérifié que les mécanismes de séparation de charge n’avaient pas le temps de se mettre enplace. L’efficacité relative d’émission de chacune des espèces dépend alors principalement des condi-tions thermodynamiques complexes, engendrées par le couplage énergétique avec la séquence laseroptimisée, et modifiée par les processus de relaxation consécutifs. Nous avons par ailleurs constatéque plus en profondeur, et pour les impulsions laser les plus courtes uniquement, la relaxation desfortes pressions induites par le dépôt énergétique conduisait à la formation d’une couche de liquidese détendant et pouvant être le siège d’instabilités hydrodynamiques. En particulier, nous avionsfait l’hypothèse d’instabilités Rayleigh-Taylor qui pourraient décomposer ces gouttelettes liquidesen un ensemble de clusters pouvant être à l’origine de la plus grande quantité de nanoparticulesdéposées sur les substrats [12]. Enfin, il est également possible de définir un couplage optimal enfonction du délai entre deux impulsions courtes afin d’augmenter l’émission spectroscopique duplasma. Lors de la thèse de F. Bourquard (dirigée par F. Garrelie et C. Donnet), et pour le casde l’aluminium, nous avons effectué une étude systématique de la quantité relative d’émission desAl-II comparée aux neutres, en fonction du délai entre deux impulsions [10]. Le temps nécessaire àla formation d’un plasma optiquement épais en surface, soit environ 9 ps, s’est révélé être le délaioptimal entre deux impulsions ultracourtes. Une saturation de l’émission est ensuite observée pourdes délais plus importants, l’absorption s’effectuant alors dans des couches plus internes du plasma.
4.2.3 Modélisation de la formation de nanoparticules
Dans les travaux précédents, nous avons suivi une approche simple, basée sur des résultatsde calcul d’expansion plasma à une dimension (longitudinale). Pourtant, la formation des nano-particules au sein du plasma d’ablation nécessite une description complexe et multi-dimensionelledes phénomènes de nucléation et de coalescence [64]. Une thèse est aujourd’hui en cours pourétudier numériquement leur génération dans le contexte plus général de décharge plasma de type« spark » pour le projet européen Buonapart-E. Ce travail, mené par A. Voloshko, sous la direc-tion de T. Itina et moi-même, s’intéresse aux différents modèles de formation existants aujourd’huidans la littérature, que ce soit pour les plasmas de décharge ou ceux créés par laser [65].
72

4.2. Mise en forme temporelle d’impulsions pour l’optimisation
Figure 4.3 – a) Schéma de principe d’une décharge plasma de type « Spark », avec expansionde la colonne plasma. b) Oscillation de la tension et du courant durant la décharge. c) Calcul dedensité électronique lors d’une décharge plasma par résolution d’un système de dérive-diffusion. d)Processus proche de la cathode, engendrant de mécanisme de pulvérisation en surface (sputtering).e) Evolution du rayon du noyau critique pour lequel un cluster devient stable.
Dans le cas d’un plasma de décharge apparaissant lorsqu’une tension est appliquée entre deuxélectrodes métalliques (cf Fig. 4.3a), il est possible de former des nanoparticules en grande quantité,à condition que la dynamique ainsi que les niveaux de température et de densité soient adéquates.Lorsque la tension est suffisante, quelques électrons sont accélérés dans le champ électrique, ionisantquelques atomes sur leur chemin vers l’anode. Lorsqu’ils atteignent l’anode, le champ électrique estlocalement amplifié par cette séparation des charges positives et négatives en front de propagation,et l’ionisation du gaz ambiant devient plus efficace. Cette étape est modélisable par un système dedérive-diffusion couplé à l’équation de Poisson, permettant de suivre le courant de décharge (Fig.4.3b). Lorsque celui-ci atteint l’électrode opposée, l’émission d’électrons augmente drastiquement, etune colonne conductrice de plasma se forme. A partir de cet instant, un circuit de décharge apparaît,oscillant dans le temps, équivalent à celui d’un circuit RLC, comme nous pouvons le voir sur lafigure 4.3c). Au niveau de la surface de la cathode, la matière est ablatée par effet Joule (évaporationthermique), mais surtout par pulvérisation (sputtering) de la surface. Celle-ci est associée à la fortechute de tension proche de la surface, créant une zone où les ions ont une énergie cinétique leurpermettant de briser les liaisons des atomes de surface, et de les libérer (Fig. 4.3d). Au sein de lacolonne de plasma, modélisée par les équations de Navier-Stokes, couplées à la diffusion thermique[65], des nanoparticules peuvent se former par condensation. Celles-ci proviennent de la nucléationhomogène de noyau liquide au sein d’une phase gazeuse super-saturée. Des conditions sélectives entaille existent [64], la stabilité étant atteinte seulement si les forces de cohésion sont suffisantes pourla maintenir. Le critère classique de taille critique rc, dont l’évolution temporelle est visible sur lafigure 4.3e) s’écrit comme rc = 2σω
kBT θ où σ est la tension de surface, ω le volume de liquide par atome,
73

Chapitre 4. Produits d’ablation, formation de la plume et excitation en phase plasma
T la température et θ le coefficient de super-saturation. De nouvelles étapes dans la modélisationsont encore nécessaires pour compléter la vision d’ensemble, et donner un caractère plus quantitatifà la formation des nanoparticules. Notamment une description des phases ultérieures de coalescenceet d’agglomération des nanoparticules est indispensable pour avoir une estimation plus précise dela quantité de nanoparticules métalliques synthétisées lors d’une décharge spark. Une comparaisonavec les expériences d’ablation laser sera également réalisée par A. Voloshko et elle devrait compléterl’étude actuelle, une fois que les dernières étapes seront prises en compte dans la modélisation.
4.3 Optimisation numérique du chauffage en régime d’ablation
L’approche classique que nous avons suivie consistait à étudier les processus physiques engendréspar une séquence d’irradiation bien définie. De nouvelles situations ont émergé, apportant un appuithéorique aux applications. Cependant, un nouveau défi peut être dicté par une perspective inverse :si un état spécifique de la matière est désiré, quelles sont les caractéristiques capables de déterminerl’état requis avec un minimum d’énergie délivrée ? En parallèle de ce travail d’accompagnement etd’interprétation des expériences, nous avons cherché à prédire les conditions d’irradiation condui-sant à des états thermodynamiques exotiques du matériau ou qui organisent la dé-structurationséquentielle du matériau. L’insertion de modèles hydrodynamiques dans une boucle adaptativeouvre une voie prospective d’optimisation temporelle de la séquence d’irradiation [3, 66]. Ce typed’approche, s’accordant à optimiser numériquement les effets d’une irradiation laser, est schématisésur la figure 4.4.
Figure 4.4 – Boucle de rétroaction appliquée au code hydrodynamique d’interaction Esther.
En optimisant la réponse du matériau sous la contrainte du flux d’énergie laser, celle-ci peutêtre pilotée le long de voies d’excitation et de relaxation jusqu’à un état désiré, avec pour consé-quences un contrôle précis des mécanismes d’ablation et des produits résultants. Une manipulationtemporelle adaptée peut donc orienter les efforts théoriques et expérimentaux vers le contrôle et
74

4.3. Optimisation numérique du chauffage en régime d’ablation
la compréhension des processus induits en faisant interagir la matière avec des champs lasers tem-porellement structurés. Le schéma d’optimisation suivi était basé sur un algorithme génétique, quinous a permis de rechercher la solution optimale parmi un large espace de paramètres. Sur la basede la procédure expérimentale, une stratégie évolutionnaire tout numérique a débuté en 2010 avecle code Esther. Les paramètres optimisés se sont principalement concentrés sur la températuremaximale de surface et sur les voies d’optimisation et de relaxation de l’énergie absorbée en fonctionde la séquence temporelle laser.
4.3.1 Une forme temporelle adaptée à chaque régime d’ablation
Le paramètre d’ajustement (fitness) pour la procédure d’optimisation a été fixé à la tempé-rature maximale atteinte au cours d’une simulation d’irradiation d’un échantillon d’aluminium, àl’incidence normale. La résolution spectrale des systèmes actuels de modulateur spatial de lumière(SLM) est typiquement de 0.05 nm, permettant d’étendre la fenêtre temporelle des impulsions jus-qu’à 42 ps. Les résultats obtenus après irradiation par des séquences d’impulsions sur cette échelletemporelle sont alors comparés à la température atteinte par une impulsion courte de 150 fs (SP)[66]. Afin d’identifier les facteurs clefs d’augmentation du niveau de température à une fluence fixée,la figure 4.5 donne un aperçu des formes temporelles permettant de maximiser (cas OPM) ou deminimiser (cas OPm) les températures maximales atteintes. Nous pouvons constater que puisqueles impulsions courtes ne produisent pas de gradients de densité aux niveaux de fluences considérés,elles sont les plus adaptées pour un dépôt d’énergie efficace au seuil d’ablation (� 0.35 J cm−2),mais également les moins bien adaptées lorsqu’un plasma est créé en surface (figures 4.5c et h).Il est toutefois possible de converger vers des formes temporelles présentant plusieurs pics sur uneéchelle de 1 à 5 picosecondes comme le montrent les figures 4.5b,d,f), qui minimisent encore plusla température, en réponse à la dynamique de changement de phase solide-liquide, en limitant lesinteractions électron-électron favorables à l’absorption [15, 66]. Pour les fluences plus élevées, supé-rieures au seuil d’ablation, une longue enveloppe sur toute la fenêtre temporelle accessible s’avèreêtre l’impulsion optimale (figure 4.5e). Pour des fluences encore supérieures, un pic en fin de sé-quence de l’impulsion permet d’accroître encore la température finale (figures 4.5g et i). Ce type deforme temporelle est reproductible sur une large gamme de fluences, typique d’un comportementuniversel, comme discuté ci-après.
4.3.2 Optimisation de l’excitation thermique en phase plasma
Pour des niveaux d’intensité correspondant à l’ablation de la surface sous forme de plasma,l’impulsion laser optimale sur laquelle la boucle adaptative a convergé systématiquement consisteen une longue enveloppe de quelques dizaines de picosecondes, sur la totalité de la fenêtre temporelleaccessible. Cette enveloppe prend la forme d’une succession de pics relativement faibles comme nousle voyons sur la figure 4.6a) et nous avons vérifié qu’aucun n’avait vraiment d’influence dans les 30premières picosecondes. Un chauffage régulier et continu donnerait un résultat final pratiquementsimilaire et nous n’envisageons pas de dépendance particulière en fonction du métal considéré.Pour ce cas effectué sur l’aluminium, la température maximale était alors de l’ordre de 55000 K,
75
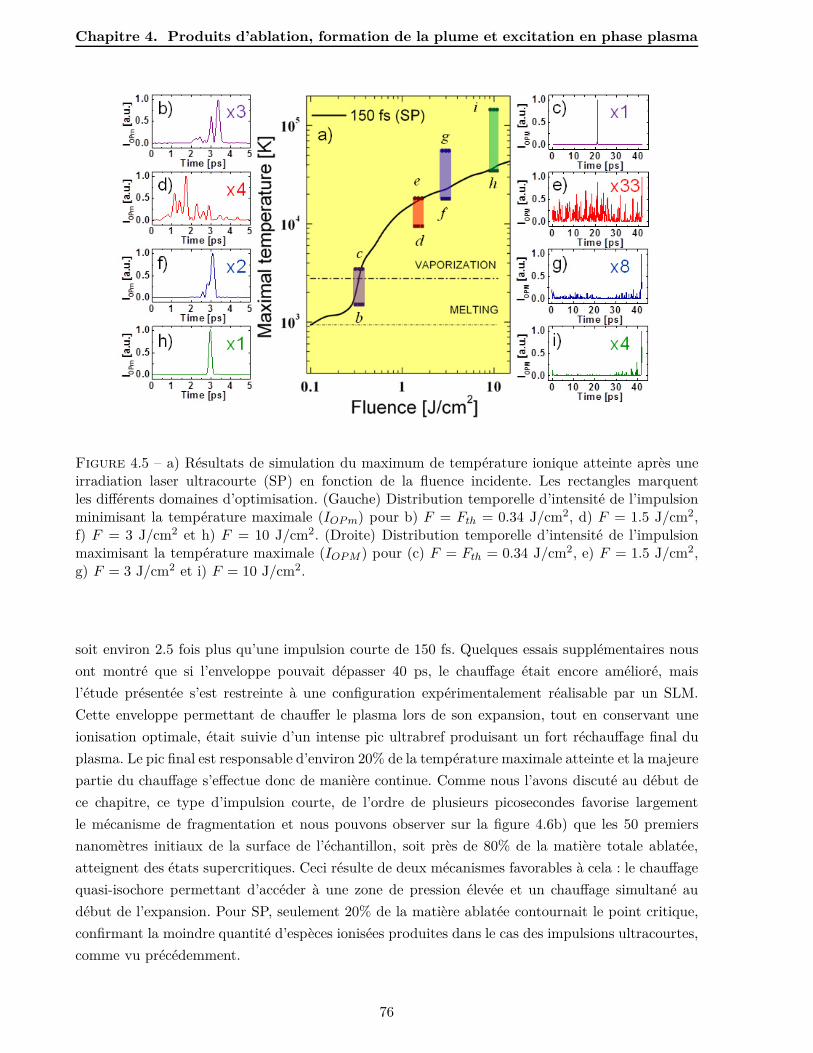
Chapitre 4. Produits d’ablation, formation de la plume et excitation en phase plasma
Figure 4.5 – a) Résultats de simulation du maximum de température ionique atteinte après uneirradiation laser ultracourte (SP) en fonction de la fluence incidente. Les rectangles marquentles différents domaines d’optimisation. (Gauche) Distribution temporelle d’intensité de l’impulsionminimisant la température maximale (IOP m) pour b) F = Fth = 0.34 J/cm2, d) F = 1.5 J/cm2,f) F = 3 J/cm2 et h) F = 10 J/cm2. (Droite) Distribution temporelle d’intensité de l’impulsionmaximisant la température maximale (IOP M ) pour (c) F = Fth = 0.34 J/cm2, e) F = 1.5 J/cm2,g) F = 3 J/cm2 et i) F = 10 J/cm2.
soit environ 2.5 fois plus qu’une impulsion courte de 150 fs. Quelques essais supplémentaires nousont montré que si l’enveloppe pouvait dépasser 40 ps, le chauffage était encore amélioré, maisl’étude présentée s’est restreinte à une configuration expérimentalement réalisable par un SLM.Cette enveloppe permettant de chauffer le plasma lors de son expansion, tout en conservant uneionisation optimale, était suivie d’un intense pic ultrabref produisant un fort réchauffage final duplasma. Le pic final est responsable d’environ 20% de la température maximale atteinte et la majeurepartie du chauffage s’effectue donc de manière continue. Comme nous l’avons discuté au début dece chapitre, ce type d’impulsion courte, de l’ordre de plusieurs picosecondes favorise largementle mécanisme de fragmentation et nous pouvons observer sur la figure 4.6b) que les 50 premiersnanomètres initiaux de la surface de l’échantillon, soit près de 80% de la matière totale ablatée,atteignent des états supercritiques. Ceci résulte de deux mécanismes favorables à cela : le chauffagequasi-isochore permettant d’accéder à une zone de pression élevée et un chauffage simultané audébut de l’expansion. Pour SP, seulement 20% de la matière ablatée contournait le point critique,confirmant la moindre quantité d’espèces ionisées produites dans le cas des impulsions ultracourtes,comme vu précédemment.
76

4.3. Optimisation numérique du chauffage en régime d’ablation
Figure 4.6 – a) Impulsion optimisée à 3 J cm−2 fournissant la température la plus élevée dans leplasma de surface. b) Diagramme de phases thermodynamiques traversées par les couches internesdu matériau au cours du temps. c) Température atteinte par le plasma en fonction du temps etde la distance à la cible. d) Conséquences sur le spectre d’émission du plasma intégré dans les 100premières picosecondes.
La figure 4.6c) représente le chauffage du plasma au cours du temps et en fonction de l’expan-sion (en ordonnée) par rapport à la surface. Deux mailles du calcul Lagrangien ont été superposéesà cette cartographie de température. La première maille, à 2 nm initialement sous la surface etreprésentée en tiret clair, est celle subissant la forte température en fin d’impulsion. La seconde, à10 nm sous la surface est celle concentrant le plus d’énergie spécifique, avec une dilatation limitéepar le plasma environnant. L’énergie laser est principalement déposée entre ces deux mailles aucours du temps, puisque la densité électronique correspondante est de l’ordre de la densité critiqueoptique dans cette région. Les changements de phase solide-liquide et liquide-gaz s’opèrent rapide-ment, dans les 5 premières picosecondes. La transition liquide-gaz ne favorise pas l’absorption etnous pouvons constater que l’impulsion optimisée dépense peu d’énergie dans cette fenêtre, alorsque les pics initiaux étaient relativement marqués sur la première picoseconde. Nous avons égale-ment pu observer deux régimes différents de chauffage pour les deux mailles considérées. Celle desurface bénéficie d’un fort changement d’ionisation avec une plus grande variation temporelle detempérature et de densité, entraînant un chauffage de la matière par recombinaison des électrons,alors que la diffusion thermique reste faible. En revanche, le chauffage ionique de la maille plus
77

Chapitre 4. Produits d’ablation, formation de la plume et excitation en phase plasma
interne est plutôt d’origine collisionnelle, par couplage électron-ion. Notons toutefois que les tempscaractéristiques de ces deux phénomènes sont très mal connus et décrits dans ce régime de plasmadense. Pour conclure, ces impulsions optimisées se sont révélées permettre un couplage optimal pourproduire un plasma chaud et dense, pouvant servir de source secondaire UV intense et brève, avecune densité spectrale d’émission 100 fois supérieure à celle d’un plasma produit par une impulsioncourte comme le montre le calcul radiatif 1D présenté sur la figure 4.6d) [3].
Cette démarche totalement numérique d’optimisation d’expériences aurait pu ouvrir la voieà un éventail de critères optimisables. Nous avions envisagé au départ un contrôle complet deschemins thermodynamiques suivis par la matière, afin de favoriser des voies de relaxation spéci-fiques, des conditions pour lesquelles les propriétés d’absorption optiques ou celles favorables à laformation de nanoparticules sont amplifiées, mais nous avons laissé ce travail en suspens. L’aspectmonodimensionnel du code Esther est un atout majeur pour réaliser un grand nombre de simula-tions, afin d’atteindre une convergence sur un optimum non local, mais également un frein pour ledéveloppement de modèles plus réalistes pour des comparaisons avec l’expérience. Nous noteronségalement ici l’impossibilité que nous avons eu à faire financer ce projet jusqu’ici, après de multiplesdépôts, et qui a finalement entravé notre enthousiasme sur le sujet, mais qui pourrait être relancési l’opportunité se présentait.
78

Chapitre 5
Interaction confinée : focalisation dansun solide transparent
Faster than a Speeding Bullet, MorePowerful than a Locomotive
Superman
Sommaire5.1 Focalisation dans un solide diélectrique transparent . . . . . . . . . . . . 80
5.1.1 Régime d’auto-focalisation et équation de Schrödinger . . . . . . . . . . . . 805.1.2 Etirage d’impulsions pour le contrôle de l’excitation . . . . . . . . . . . . . 82
5.2 Excitation du plasma électrons-trous . . . . . . . . . . . . . . . . . . . . . 835.2.1 Faisceaux de Bessel ultracourts et structuration par tir unique . . . . . . . 835.2.2 Imagerie ultrarapide et détermination de la dynamique des électrons libres 84
5.3 Formation d’onde de choc dans le solide . . . . . . . . . . . . . . . . . . . 865.3.1 Relaxation des contraintes dans la silice . . . . . . . . . . . . . . . . . . . . 865.3.2 Mesure relative et contrôle de la génération d’onde de choc dans le PZT . . 88
Ce cinquième chapitre rassemble les travaux effectués dans le cadre de la structurationen volume de matériaux diélectriques, principalement autour de l’ écriture de guides d’ onde.La question du changement local de l’ indice de réfraction est intimement liée à ladensité d’ électrons libres générés dans la zone de focalisation et à la quantité d’ énergieabsorbée. Ainsi, l’ essentiel du travail de modélisation accompli dans ce cadre se concentresur la description de la propagation et des mécanismes d’ ionisation/recombinaison au seindu matériau. La génération d’ ondes acoustiques est inhérente à l’ interaction laser-solideet nous terminerons par quelques investigations sur ce point.

Chapitre 5. Interaction confinée : focalisation dans un solide transparent
Le régulation thermo-mécanique de l’excitation ne se limite pas à l’évolution hydrodynamiquede la surface irradiée. Une radiation laser ultrabrève et focalisée est capable de générer des change-ments d’indice de réfraction dans les matériaux transparents avec pour potentiel de développementles systèmes photoniques intégrés. Les problèmes soulevés sont inhérents aux mécanismes d’inter-action et à la possibilité de contrôler la physique de l’interaction pour la génération de structuresaux fonctions optiques désirées. Les contraintes imposées lors de la relaxation après irradiationdans le volume du matériau conduisent à une variation locale de l’indice de réfraction relative àla densification ou à la dilatation du verre. La focalisation de l’énergie dans le volume du verreirradié repose sur une propagation non-linéaire du faisceau lumineux au sein du milieu transparent.Ces effets non-linéaires sont fortement dépendants de l’intensité et de nombreuses études expé-rimentales réalisées au LabHC impliquent des comparaisons d’impulsions fs et ps afin de régulerl’excitation. Cette activité de nanostructuration en volume de matériau transparent est au cœur duprojet ULTRA et ma contribution se concentre principalement sur le développement des modèlesde propagation non-linéaire, à partir de l’équation de Schrödinger non-linéaire et à leur utilisationafin d’accompagner l’interprétation des expériences effectuées localement.
5.1 Focalisation dans un solide diélectrique transparent
5.1.1 Régime d’auto-focalisation et équation de Schrödinger
Lorsqu’un champ laser intense se propage à l’intérieur d’un milieu diélectrique, un fort champde polarisation est induit, produisant une densité élevée d’électrons et de trous [67]. L’interactionest fortement non-linéaire, et sa modélisation s’appuie sur de nombreux processus couplés tels quel’excitation multiphotonique, l’ionisation par effet tunnel, l’avalanche, l’absorption par les porteurslibres, la recombinaison, la formation de défauts ainsi que par des interactions électroniques avecd’autres électrons, les trous, ou encore le réseau cristallin. La propagation est quant à elle fortementperturbée par des effets auto-induits (tels que la modulation de phase et la focalisation).
Pour simuler les processus prépondérants dans la silice amorphe, un code de propagation 3Daxisymétrique a été développé en coordonnées cylindriques avant mon arrivée au laboratoire parI. Burakov, et nous l’exploitons à ce jour pour l’ensemble des études théoriques associées auxexpériences menées sur ce sujet. Il résout l’équation non-linéaire de Schrödinger (NLSE) d’enveloppedu champ électrique E en intégrant les principaux termes relatifs à la propagation non-linéairesuivant un axe privilégié z, et notamment la diffraction du faisceau, les effets dus à la dispersionde la vitesse de groupe vg du milieu, l’effet Kerr optique, la défocalisation plasma, l’absorptionmultiphotonique, le processus d’avalanche et l’absorption collisionnelle Brehmsstrahlung [68, 69] :
∂E
∂z=
i
2k0T −1
(∂2
∂r2 +1r
∂
∂r
)E − ik′′
2∂2E
∂t2 − WP I(|E|)Eg
2|E|2 E + . . .
+ ik0n2n0
T
[(1 − fR)|E|2 + fR
∫ t
−∞dτR(t − τ)|E|2
]E − σ
2(1 + iω0τc)T −1(ρE) (5.1)
où t = tlab − z/vg correspond au temps dans le référentiel comobile, T = 1 + (i/ω0)∂/∂t, WP I au
80

5.1. Focalisation dans un solide diélectrique transparent
Figure 5.1 – a) Exemple d’exposition transitoire d’un échantillon de a-SiO2. La séquence résolue entemps de la distribution de fluence correspond à des tranches temporelles de l’impulsion ultracourte,spatialement et temporellement gaussienne (E = 1 μJ, τp = 120 fs). [70] b) Séquence de distributionde fluence pour différentes tranches temporelles dans le cas d’une impulsion courte de type Bessel(E = 6 μJ, τp = 1.8 ps).
taux d’absorption multiphotonique, Eg le potentiel effectif d’ionisation et σ est la section efficaceBrehmsstrahlung définie classiquement par le modèle de Drude. L’évolution du plasma électrons-trous est gouvernée par l’équation d’évolution de densité électronique :
∂ρ
∂t=
[σ
(1 + m/me)Egρ|E|2 + WP I(|E|)
] (1 − ρ
ρ0
)− ρ
τR, (5.2)
où τR et m = 0.5me sont respectivement le temps de recombinaison et la masse réduite de l’électron-trou. A ces équations couplées, sont adjoints un modèle décrivant le champ électrique initial (Gaussou Bessel). Des exemples de propagations simulées dans des cas de faisceaux gaussiens et de Besselsont présentés sur la figure 5.1. Nous voyons dans les deux cas que lorsqu’un plasma de forte densitéest créé dans la zone focale, la distribution de fluence se ressert en amont du plasma (Gauss, casa) ou semble le contourner (Bessel, cas b). En négligeant le transport électronique sur les échellesde temps considérées, la densité d’électrons libres servant de paramètre clef pour l’interprétationdes expériences est intrinsèquement liée aux taux d’absorption multiphotonique et d’ionisation paravalanche, décrits par le modèle de Keldysh, ainsi qu’aux temps caractéristiques de recombinaison.Notre interprétation des expériences réalisées pour la plupart en fonction de la durée d’impulsionse base essentiellement sur la description de la répartition de l’énergie entre le champ laser sepropageant et les électrons auto-induits localement, comme nous allons le voir dans les quelquesexpériences détaillées ci-après.
81

Chapitre 5. Interaction confinée : focalisation dans un solide transparent
5.1.2 Etirage d’impulsions pour le contrôle de l’excitation
La durée d’impulsion a un fort impact sur la propagation non-linéaire de l’impulsion, et il a déjàété démontré qu’une impulsion de quelques picosecondes permettait de déposer l’énergie de ma-nière plus efficace qu’une impulsion ultracourte dans la silice fondue [69]. La raison de ce phénomènecontre-intuitif est principalement liée à la défocalisation de la lumière induite par la grande concen-tration d’électrons libres générés dans le cas de la propagation d’impulsions ultracourtes, comme ilest possible de le voir sur la figure 5.1. Les plasmas en volume générés par des impulsions de duréesplus longues autorisent une meilleure absorption de l’énergie puisque l’apparition de cette grandeconcentration d’électrons est retardée vers la fin de l’impulsion. Une impulsion qui serait en revanchetrop longue aura tendance à ne pas pouvoir réaliser suffisamment d’absorption multiphotonique,l’intensité étant très atténuée, et ne sera pas favorable à l’excitation non-linéaire requise pour lastructuration en volume. Un compromis est donc attendu pour une durée de quelques picosecondesseulement. Les structures générées ont une morphologie fortement influencées par la propagation del’impulsion au voisinage de la zone de focalisation, pouvant s’apparenter à des cavités, des filamentsou à des nanoréseaux périodiques [71]. Les structures générées peuvent être influencées à la fois parune mise en forme spatiale, temporelle ou de polarisation de l’impulsion. Dans le cas des nanoré-seaux périodiques, une expérience d’optimisation d’un signal UV diffracté a permis de montrer lapossibilité de contrôler la période des structures, en modifiant la densité d’électrons libres généréspar des impulsions de différentes durées [8]. Les résultats de cette expérience sont présentés sur lafigure 5.2a-b) et comparés avec des simulations NLSE, où les densités électroniques atteintes sontdonnées sur la figure 5.2c). Nous voyons que des nanoréseaux sont produits en volume de la silice,avec une périodicité très proche de λ/2n, autour de 270 nm pour une impulsion courte à λ = 800nm, comme nous l’avons mentionné pour les diélectriques au chapitre 3 [43]. Leur origine est encorecontroversée mais nous avons pu montrer que la période pouvait être modifiée jusqu’à 210 nm dansle cas d’une impulsion de 0.65 ps (FWHM). Pour les durées d’impulsion supérieures, la périoderéaugmente et se rapproche de la période initialement observée. Pour les simulations effectuéesavec une impulsion de 100 nJ, le processus d’ionisation multiphotonique (MPI) domine et le niveaumaximum d’électrons libres générés diminue avec la durée d’impulsion. Par contre, pour une énergiesupérieure (300 nJ), la densité créée est plus élevée et la défocalisation joue un rôle important pourles faibles durées d’impulsions. Un pic de densité maximum est atteint à 0.6 ps, pour lequel les effetsde défocalisation sont compensés par une photo-ionisation encore efficace. Si ce comportement étaitattendu, une diminution de la période avec l’augmentation de la densité de porteurs ne va pas dansle sens du modèle de Drude dans le cadre de la dépendance observée en λ/2n. Néanmoins, les effetscumulatifs dus au régime multi-impulsionnel et la difficulté à correctement estimer cette densitéd’électrons libres relativisent ce résultat, et le niveau réel de densité dépendant du type d’excitationdemande à être confirmé, ce qui est actuellement à l’étude, comme nous le verrons dans le prochainparagraphe. Accéder à l’équilibre entre les mécanismes d’excitation et de relaxation peut avoir unimpact énorme afin de dépasser la limitation de la structuration à des échelles bien inférieures à lalimite de diffraction. Cette manipulation de l’excitation non-linéaire de la matière par le faisceaulaser nécessite de se baser sur des modèles complets et donc d’améliorer la propagation et l’excita-
82
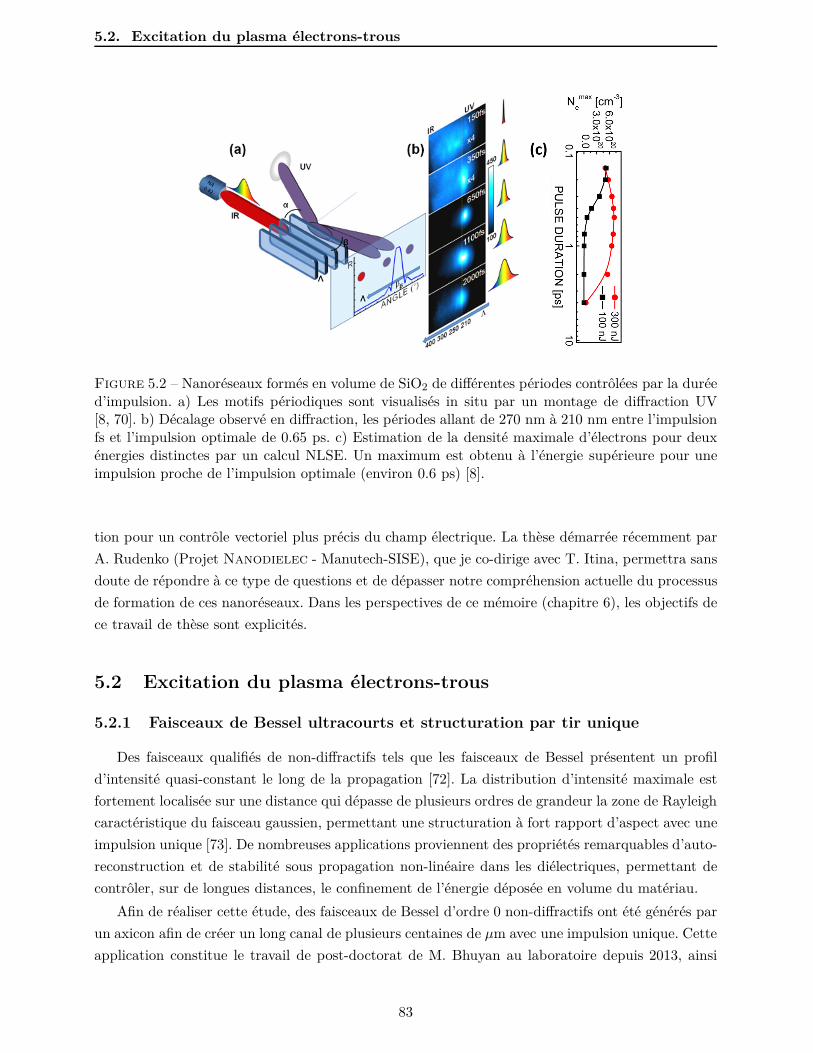
5.2. Excitation du plasma électrons-trous
Figure 5.2 – Nanoréseaux formés en volume de SiO2 de différentes périodes contrôlées par la duréed’impulsion. a) Les motifs périodiques sont visualisés in situ par un montage de diffraction UV[8, 70]. b) Décalage observé en diffraction, les périodes allant de 270 nm à 210 nm entre l’impulsionfs et l’impulsion optimale de 0.65 ps. c) Estimation de la densité maximale d’électrons pour deuxénergies distinctes par un calcul NLSE. Un maximum est obtenu à l’énergie supérieure pour uneimpulsion proche de l’impulsion optimale (environ 0.6 ps) [8].
tion pour un contrôle vectoriel plus précis du champ électrique. La thèse démarrée récemment parA. Rudenko (Projet Nanodielec - Manutech-SISE), que je co-dirige avec T. Itina, permettra sansdoute de répondre à ce type de questions et de dépasser notre compréhension actuelle du processusde formation de ces nanoréseaux. Dans les perspectives de ce mémoire (chapitre 6), les objectifs dece travail de thèse sont explicités.
5.2 Excitation du plasma électrons-trous
5.2.1 Faisceaux de Bessel ultracourts et structuration par tir unique
Des faisceaux qualifiés de non-diffractifs tels que les faisceaux de Bessel présentent un profild’intensité quasi-constant le long de la propagation [72]. La distribution d’intensité maximale estfortement localisée sur une distance qui dépasse de plusieurs ordres de grandeur la zone de Rayleighcaractéristique du faisceau gaussien, permettant une structuration à fort rapport d’aspect avec uneimpulsion unique [73]. De nombreuses applications proviennent des propriétés remarquables d’auto-reconstruction et de stabilité sous propagation non-linéaire dans les diélectriques, permettant decontrôler, sur de longues distances, le confinement de l’énergie déposée en volume du matériau.
Afin de réaliser cette étude, des faisceaux de Bessel d’ordre 0 non-diffractifs ont été générés parun axicon afin de créer un long canal de plusieurs centaines de μm avec une impulsion unique. Cetteapplication constitue le travail de post-doctorat de M. Bhuyan au laboratoire depuis 2013, ainsi
83

Chapitre 5. Interaction confinée : focalisation dans un solide transparent
qu’une partie de la thèse de P.K. Velpula que je co-encadre avec R. Stoian. Avec ce type de faisceaux,plusieurs régimes de structuration de volume ont été observés en fonction de la durée de l’impulsionet de l’énergie portée par celle-ci, la densité d’électrons libres régissant la stabilité de la propagationet de la structuration [7]. Quatre régimes ont été distingués en fonction de l’aspect des nano-canauxproduits ; ils sont représentés sur la figure de synthèse 5.3a). Pour des impulsions ultracourtes, de60 fs jusqu’à environ 1.7 ps, indiqué par le régime 1 sur la figure, un changement positif de l’indicede réfraction (Type I) est observé, évoluant vers une succession de zones de variations positiveset négatives d’indice lorsque l’énergie est plus importante. Ces impulsions courtes ont tendanceà favoriser le processus de MPI et à engendrer un régime de défocalisation-refocalisation pourdes faisceaux de type Bessel, les ailes contournant les zones de défocalisation plasma. Avec desimpulsions de durées plus longues, il est possible de déterminer un régime pour lequel une cavitéuniforme est créée (régime 2), permettant la formation d’un nano-canal notablement homogène,présentant un fort contraste d’indice avec des potentialités applicatives en cristaux photoniqueset en micro-fluidique. Une simulation NLSE, représentée sur la figure 5.3e) montre que pour desdurées d’impulsion de quelques picosecondes, il est possible de déposer beaucoup plus d’énergie surl’axe de propagation, en retardant l’apparition d’une trop forte densité électronique, défavorableà la propagation du faisceau. Ce surplus d’énergie (jusqu’à 10 fois supérieur), permet sans doutede dépasser l’enthalpie de vaporisation de la silice, contrairement à une impulsion courte. Pourdes énergies trop faibles ou trop élevées, deux régimes d’instabilité apparaissent (Régimes 3 et 4),pouvant être reliés à une trop faible concentration en électrons (3) ou à une interférence entre lemouvement hydrodynamique et l’exposition laser (4). Pour aller plus loin dans la compréhension desmécanismes concourants à former les différentes structures, le comportement du nombre d’électronslibres en fonction des propriétés laser doit être plus finement analysé, et si possible de manièrerésolue en temps. Il s’agit des actions en cours d’étude, présentées dans le prochain paragraphe.
5.2.2 Imagerie ultrarapide et détermination de la dynamique des électronslibres
Les différents processus générés dans la zone focale sont d’une importance cruciale pour l’optimi-sation de la nanostructuration de volume et une étude précise des mécanismes primaires d’excitationa démarré fin 2011 dans le cadre de la thèse de P.K. Velpula que je co-encadre avec R. Stoian. Cetteétude se base principalement sur le développement de moyens de détection en temps réel, notam-ment la microscopie à contraste de phase et à transmission optique résolues en temps. Ces détectionsemployant une géométrie pompe-sonde permettent d’évaluer l’évolution de la densité électroniqueau sein du milieu photo-excité sur une échelle de temps de l’ordre de quelques picosecondes. Lesrésultats doivent permettre d’apporter une compréhension fondamentale et globale aux deux typesde structurations observées, correspondant à des changements d’indice de réfraction positif (typeI) et négatif (type II, sous forme de cavité), correspondant à deux régimes distincts d’excitation.Dans le premier cas, lorsque la densité électronique atteinte est relativement faible et que le chauf-fage résultant est bien en deçà de la température de ramolissement de la structure vitreuse, uneffet de densification locale a été observé et confirmé par analyse Raman [76, 77]. Dans le second
84

5.2. Excitation du plasma électrons-trous
Figure 5.3 – a) Distinction des différents régimes de structuration de volume en fonction de ladurée et de l’énergie de l’impulsion de Bessel [7]. Le régime 1 correspond à une zone composée d’unmélange de changement d’indice positif et négatif. Le régime 2 montre une cavité uniforme alors quele 3ème présente un arrangement non-uniforme de cavités (ou zones moins denses) et le régime 4 unecavité fragmentée quasi-périodiquement. b) Transmission optique instantanée pour un délai nul.c) Distribution de densité électronique normalisée à la densité critique dans la région excitée parune impulsion de Bessel pour deux durées différentes (E=6 μJ - Régimes 1 & 2). d) Luminescenceplasma indiquant l’efficacité de dépôt d’énergie, bien supérieure pour l’impulsion longue (1.8 ps)que pour l’impulsion ultracourte (60 fs) (E = 6 μJ). e) Simulations NLSE de dépôt d’énergie dansdes configurations similaires au cas d).
cas atteint en régime picoseconde, le dépôt d’énergie est beaucoup plus efficace, aboutissant à uneaugmentation importante de la température. Une transition de phase entraînant un mouvementhydrodynamique est alors fortement suspectée, l’onde de détente pouvant être à l’origine de la for-mation de cavités, et donc à une zone de densité moindre et à un changement d’indice de réfractionnégatif.
Le système d’imagerie résolue en temps s’appuie sur un microscope optique pouvant fonction-ner en transmission ou en mode contraste de phase (PCM). L’excitation est à 800 nm alors que lasonde, illuminant le système à différents instants, est à 400 nm (60 fs). Deux exemples d’imagesréalisées en transmission optique pour des impulsions de 60 fs et 1.8 ps sont présentés sur la figure5.3b), correspondant respectivement à des régimes de formation de structures de type (I) et (II).La densité d’électrons libres, rapportée à la densité critique, peut être estimée simplement par cettemesure d’absorption optique, en supposant une longueur d’absorption optique a priori (de l’ordrede 1 μm). Pour plus de précision, notamment lorsque la densité d’électrons libres se révèle être plusélevée, une stratégie basée sur une transformée Abel inverse a été mise en place. Les densités élec-troniques atteintes sont bien plus importantes dans le cas de l’impulsion de 1.8 ps, comme le montrela figure 5.3c). Ces résultats indiquent que la densité de porteurs et l’énergie déposée associée défi-nissent la manière dont le matériau va se relaxer, pouvant aboutir à une transition de phase pourl’un des deux régimes seulement. C’est ce que révèle également les calculs NLSE présentés sur lafigure 5.3d), corrélés à une mesure de luminescence plasma, et qui témoignent d’une énergie déposéejusqu’à 4 fois supérieure le long de l’axe de propagation. Une étude plus systématique en énergie,
85

Chapitre 5. Interaction confinée : focalisation dans un solide transparent
durée d’impulsion et résolue en temps est en cours d’analyse par P.K. Velpula pour compléter cespremières observations. Elle devrait permettre de clairement identifier les différentes dynamiquesd’excitation en fonction du niveau initial d’excitation, et s’exprimant par divers changements op-tiques, thermo-mécaniques et structuraux. Une fois encore, citons pour perspectives à ce travailla thèse de A. Rudenko sur la modélisation électromagnétique dans le cas de la structuration desdiélectriques et qui pourrait améliorer le contrôle dynamique de l’énergie délivrée. Celui-ci fourniraun environnement théorique propice pour optimiser la qualité des structures induites, ouvrant alorsla voie à une ingénierie précise de l’indice de réfraction en volume pour la réalisation de structuresguidantes 3D ou pour la création de canaux à des fins microfluidiques.
5.3 Formation d’onde de choc dans le solide
L’excitation en surface ou en volume d’un solide s’accompagne d’un chauffage rapide et localiséproduisant en retour une discontinuité temporelle et spatiale de densité. Cette déformation va serelaxer en générant une onde acoustique de plus ou moins forte amplitude. Nous l’appellerons ondede compression en volume dans la section suivante, et onde de choc dans le cas suivant, l’énergieétant déposée de manière plus brutale en surface.
5.3.1 Relaxation des contraintes dans la silice
Les électrons excités dans la bande de conduction ont la possibilité d’absorber directement, parBremsstrahlung, l’énergie laser incidente. La relaxation de ces porteurs libre passe par des locali-sations électroniques sous forme d’excitons ou de défauts et des déformations localisées atomiqueset structurelles [70]. Parallèlement, le couplage électron-phonon permet un transfert de l’énergievers la matrice de SiO2 sous forme de chaleur. En conséquence, la viscosité décroît, les contraintess’accentuent et la relaxation de la pression s’effectue par la génération d’une onde de compressionsuivie d’une onde de détente. Les ondes de pression constituent ainsi un marqueur pertinent poursuivre l’évolution du transfert d’énergie en fonction, par exemple, de la durée de l’impulsion. Danscette perspective, une analyse PCM dans SiO2 pour différentes durées d’impulsion a été réaliséedans le cadre de la thèse de C. Mauclair (dirigée par R. Stoian et E. Audouard) [74]. Les imagessont présentées sur la figure 5.4a) où les variations de l’indice de réfraction sont supposées res-ter dans le régime de réponse linéaire de la mesure PCM. Les structures acoustiques observéesmontrent une onde sphérique générée au même instant pour toutes les durées d’impulsion maisavec une amplitude maximale pour τp =8 ps. Si cette durée correspond certainement à une énergieabsorbée confinée plus importante, produisant une onde de pression maximale, la relation avec ladensité d’électrons libres est plus délicate et demanderait des investigations plus poussées. Nousavons comparé la structure acoustique observée avec un calcul de propagation photo-acoustique[75], dans lequel nous avons inséré comme terme source le dépôt d’énergie estimé via notre calculNLSE pour une impulsion courte de 150 fs. La dynamique de formation des ondes sphériques estvisible sur la figure 5.4b), concordant bien avec les observations expérimentales. Dans les premièresnanosecondes suivant l’interaction, la géométrie de l’onde de compression conserve l’aspect du dé-pôt d’énergie initial avec des ondes sphériques initiées aux deux extrémités de la trace focale. Ces
86

5.3. Formation d’onde de choc dans le solide
Figure 5.4 – a) Onde de pression observée par PCM dans SiO2 pour différentes durées d’impulsion(Gaussienne spatiale, E = 4.3 μJ, τp = 150 fs). Un maximum est observé pour une impulsion de 8 ps[74]. b) Dynamique des ondes acoustiques planaires générées après dépôt d’énergie d’une impulsionfs estimé par un calcul NLSE couplé à une simulation photo-acoustique [75]. Les composantes àfront sphérique et plan, les ondes de détente et de compression ainsi que le caractère asymétriqueobservé sont bien reproduits.
deux ondes ne peuvent se propager librement de manière isotrope, étant contraintes dans la direc-tion du dépôt d’énergie. Une onde de détente (en sombre sur les images) est ainsi générée, celle degauche étant prépondérante en raison d’un plus fort dépôt d’énergie dans la direction de la sourcelaser. Ce type de simulations reproduit fidèlement la légère asymétrie observée expérimentalement(figure 5.4a), principalement due à l’inhomogénéité du dépôt d’énergie, ce qui montre qu’au delàd’un aspect acoustique similaire, la géométrie du couplage énergétique est bien reconstituée dansla zone focale. Ce travail pourrait être étendu pour différentes durées d’impulsions, pour des fais-ceaux non diffractifs de type Bessel ou pour d’autres diélectriques. Les expériences effectuées surd’autres matériaux n’ont pas montré cette morphologie quasi-sphérique, ce qui a tendance à laisserpenser que la distribution énergétique dans la zone de focalisation pourrait fortement dépendre dela conjugaison des effets de propagation-excitation-relaxation, différents d’un matériau à l’autre.
87

Chapitre 5. Interaction confinée : focalisation dans un solide transparent
5.3.2 Mesure relative et contrôle de la génération d’onde de choc dans le PZT
La génération d’une onde acoustique dans le volume d’un matériau à bande interdite est un sujetà part entière et j’ai eu l’opportunité de co-diriger la thèse de Y. Di Maio (avec E. Audouard puisF. Pigeon) sur l’interaction laser ultrabref-piézoélectrique (PZT) [4]. Cette thèse CIFRE réaliséeen collaboration avec SAGEM, principalement axée sur l’optimisation de la découpe de PZT parlaser, a permis l’enregistrement direct de l’onde acoustique générée par l’interaction laser, aprèspropagation dans le milieu d’épaisseur 170 μm, en face arrière de l’échantillon irradié, comme lemontre la figure 5.5a). Les électrodes en face avant et arrière de l’échantillon étaient constituéesd’une couche de NiP de 5 μm. Au cours d’un impact laser, la déformation induite par l’onde dechoc cause une contrainte interne qui provoque une accumulation de charges sur les électrodespar effet piézoélectrique direct. Nous avons pu observer que le pic principal du signal détecté àl’oscilloscope, correspondant au choc incident après propagation, pouvait être réduit en utilisantune double impulsion avec un délai variable dans le temps (figure 5.5b). L’amplitude du pic a permisde déterminer, à partir de la tension et de la relation électro-mécanique du PZT, les contraintesdépendantes du temps. Le problème majeur de cette expérience est bien sûr la faible résolutiontemporelle accessible par l’oscilloscope (500 MHz-4 Gs/s) mais la propagation sur l’épaisseur del’échantillon et l’intégration temporelle des charges sur la face de sortie, permettent de comparerles différents délais, à défaut d’apporter une résolution temporelle de la dynamique du choc.
Figure 5.5 – a) Diagramme schématique de la mesure de la déformation induite durant l’irradiationd’une cible de PZT. Les inserts montrent les circuits équivalents dus au système de mesure. b)Schéma de principe du dédoublement d’impulsion à délai variable. c) Amplitude et contraintecorrespondante mesurées en face arrière de l’échantillon de PZT irradié, fonction du délai entre 2impulsions (F=10 J cm−2).
Le résultat de l’application d’un délai entre les deux impulsions est visible sur la figure 5.5c),montrant la dépendance de l’amplitude crête du signal enregistré, et rapporté à la contrainte enfonction de la séparation temporelle. Il apparaît que pour un délai nul (1), les deux impulsions sontsuperposées et la contrainte enregistrée est maximale, correspondant à une intensité incidente double
88

5.3. Formation d’onde de choc dans le solide
par rapport à celle correspondant à une impulsion puisque les deux impulsions contiennent la mêmeénergie. Ainsi, les deux impulsions agissent de manière cohérente et leur action simultanée produitune excitation plus importante provoquant une contrainte mesurée supérieure en face arrière del’échantillon. En augmentant le délai entre les deux impulsions, le signal mesuré décroît fortementd’environ 50 % sur un temps très bref, inférieur à 1 ps, pouvant résulter d’un couplage optiquemoins efficace dans la couche NiP mais aussi à une déformation mécanique réduite (2). En effet,la phase de compression résultant de la seconde impulsion pourrait se voir amoindrie par la phased’expansion de la première, minimisant ainsi la contrainte enregistrée. Après un délai très court, lesignal réaugmente et atteint un palier à un niveau de contrainte 25% plus faible que la contraintemaximale. Si ce comportement est relativement long (environ 30 ps), une certaine fluctuation desmesures est notée en fonction du délai imposé. Ce régime correspond probablement au temps deformation et d’expansion du plasma créé en surface par la première impulsion. La seconde rencontredonc une matière en transformation, et son impact est alors minimisée puisque la couche recevantl’impulsion est ablatée, ne pouvant alors produire de dépôt d’énergie confinée dans la matièresolide. La seconde impulsion impacte toutefois le niveau de contrainte puisque le chauffage puisla poussée (pression) provoquée par l’expansion du plasma est sensible à la quantité d’énergieabsorbée lors de cette seconde étape. Pour cette raison, nous pouvons estimer que le délai optimalcorrespondant au rechauffage de cette couche en expansion est égal au temps caractéristique demise en vitesse de la couche chauffée par la première partie de l’impulsion soit τc = ec/vs où ec estl’épaisseur de la zone chauffée après diffusion thermique et vs est la vitesse du son. A partir desestimations d’épaisseur chauffée obtenus dans le nickel [4], le temps caractéristique hydrodynamiqueτc peut être estimé à 18 ps, en très bon accord avec le rebond observé dans la courbe du signalexpérimental (3). Pour des délais supérieurs à τc, l’amplitude crête diminue jusqu’à atteindre unniveau 50% plus faible que celui obtenu avec un délai nul (4). Ce dernier régime correspond au casoù les deux impulsions ont une action presque indépendante l’une de l’autre, puisque la secondeimpulsion rencontre un milieu pré-chauffé par la première mais en phase de relaxation ou déjà relaxé.Précisons que ce comportement où un premier extremum est obtenu dans un temps très court,typiquement inférieur à la picoseconde et où un second, opposé, apparaît pour des délais de plusieurspicosecondes, voire plusieurs dizaines de picosecondes est régulièrement observé dans différentsdiagnostics : émission d’ions lors de cibles métalliques irradiés [78], intensité de plume d’ablation[79], formation de nanostructures [80]. Le délai correspondant à l’extremum peut être interprétécomme le temps caractéristique où l’excitation effective, retardée par le déséquilibre électron-phonondans les métaux, est compensée par la relaxation hydrodynamique. Ces rôles antagonistes ont tousles deux notamment des conséquences sur les propriétés optiques transitoires, puisqu’à la fois lescollisions et la densité des porteurs évoluent lors de ces deux processus [15].
Ce type d’expérience laisse supposer qu’il est possible de contrôler la structuration en volume oude diminuer les endommagements non désirés (tels que l’écaillage en face arrière lors d’une découpe)en optimisant la séquence temporelle d’irradiation, comme nous l’avons déjà montré en phaseplasma du matériau. Ceci passe par une compréhension et une description précise de l’ensembledes mécanismes résultants de l’interaction, concernant à la fois la phase d’excitation et les voies derelaxation en volume du solide irradié.
89

Chapitre 5. Interaction confinée : focalisation dans un solide transparent
90
Chapitre 6
Conclusions et perspectives
Maxwell had plenty of time to thinkWhile dipping his pen in the ink.Today’s computationsWith Maxwell’s equationsDon’t leave you the time for a wink
Amikam Aharoni
Sommaire6.1 Synthèse des travaux réalisés . . . . . . . . . . . . . . . . . . . . . . . . . 92
6.2 Description du champ électomagnétique pour l’interaction . . . . . . . 94
6.2.1 Modélisation EM & formation de LIPSS en surface . . . . . . . . . . . . . . 94
6.2.2 Modélisation EM & formation de nanoréseaux en volume . . . . . . . . . . 96
6.3 Changement structurel ultrarapide . . . . . . . . . . . . . . . . . . . . . . 97
6.3.1 Expériences de structuration sur matériaux à transition de phase . . . . . . 98
6.3.2 Changement de phase cristalline ultrarapide du nickel . . . . . . . . . . . . 996.4 Modélisation de l’excitation de matériaux non standards . . . . . . . . 101
6.4.1 Propriétés des alliages inox par DFT . . . . . . . . . . . . . . . . . . . . . . 101
6.4.2 Matériaux carbonés et diélectriques, vers la TD-DFT ? . . . . . . . . . . . . 102
Après un bref résumé des principaux résultats obtenus ces huit dernières années, quelquesactions en cours ou à venir sont réunies dans ce dernier chapitre. Pour la majorité desexcitations exposées dans les cinq premiers chapitres, un prolongement est envisagé dansla continuité du travail déjà effectué. Une compréhension et une simulation numériquecomplète de tous les processus induits lors de l’ interaction restant hors de portée, nousproposons d’ ouvrir quelques pistes stratégiques, en nous basant sur une approche multi-échelle des modèles à déployer, et qui s’ inscrit à la fois dans les applications ainsi quedans les études fondamentales entreprises au LabHC.

Chapitre 6. Conclusions et perspectives
6.1 Synthèse des travaux réalisés
Lorsqu’un matériau est irradié par une source laser ultracourte, les mécanismes d’absorption op-tique sont principalement non linéaires, dominés par l’ionisation multi-photonique et les processusd’avalanche pour les diélectriques et par le chauffage des électrons libres pour les métaux, impac-tant leur structure de bandes. Les temps caractéristiques de chacun des mécanismes de relaxationrégissent alors les conséquences résultant de l’interaction. Les propriétés de l’impulsion laser, no-tamment sa fluence, sa durée ou une mise en forme temporelle complexe, permettent de contrôler lesprocessus d’excitation électronique, conditionnant alors le dépôt tridimensionnel d’énergie adaptéà chacune des applications visées.
L’interaction laser ultracourt-métal a été plus particulièrement étudiée durant ces dernières an-nées. Ceci résulte du fait que les métaux servent de matériau test pour comprendre les mécanismesfondamentaux associés à la structuration périodique de la surface et à la génération de plasma et denanoparticules. Par ailleurs, cette compréhension s’appuie sur un ensemble d’outils de modélisation,que j’ai dû mettre en œuvre en fonction des besoins spécifiques. En tout premier lieu, le code desimulation Esther pour lequel je contribue au développement depuis mon doctorat, notammentconcernant les modèles hors d’équilibre électron-ion, est régulièrement employé. Récemment, nousavons mis à profit notre collaboration avec le CEA/DIF pour démarrer une étude plus amont sur lastructure électronique et la dynamique moléculaire, au moyen du code Abinit. Divers outils de cal-cul de moindre mesure, basés sur une modélisation des instabilités hydrodynamiques, la dynamiquede diffusion dans un plasma de décharge, des indices optiques ou du modèle électrodynamique deSipe ont également été développés, dans une première approche et en fonction de besoins ponctuels.Pour la propagation des impulsions laser ultracourtes dans les matériaux transparents, un code depropagation résolvant l’équation NLSE sert également d’outil d’analyse aux expériences en volumede diélectriques. Enfin, et plus récemment, des approches FDTD non commerciales sont dévelop-pées pour étudier l’interaction en champ proche avec une surface rugueuse ou pré-structurée ainsique pour la structuration volumique des diélectriques, comme nous allons le voir dans les perspec-tives. La modélisation de l’interaction laser-matière est réalisée par un ensemble d’étapes, qu’il estpossible de synthétiser sous les items suivants :
• Description de l’échantillon (géométrie, interfaces, propriétés physico-chimiques, . . . )• Calcul du champ électromagnétique laser se propageant dans un matériau inhomogène• Evaluation de la réponse du matériau au rayonnement laser (défauts, changement d’indice,
modification de la structure de bandes, . . . )• Détermination de l’ionisation (directe, multi-photonique, tunnel ou par impacts)• Dépôt d’énergie laser sur les électrons du système• Relaxation de l’énergie à travers les processus de transport prépondérants (collisions électron-
électron, électron-phonon, excitons, . . . )• Couplage des systèmes électronique et ionique et introduction de grandeurs macroscopiques• Effets sur les transitions de phase (fusion classique ou ultrarapide, évaporation, explosion de
phase, fragmentation en phase supercritique)• Modification de la géométrie de l’échantillon, structuration.
92
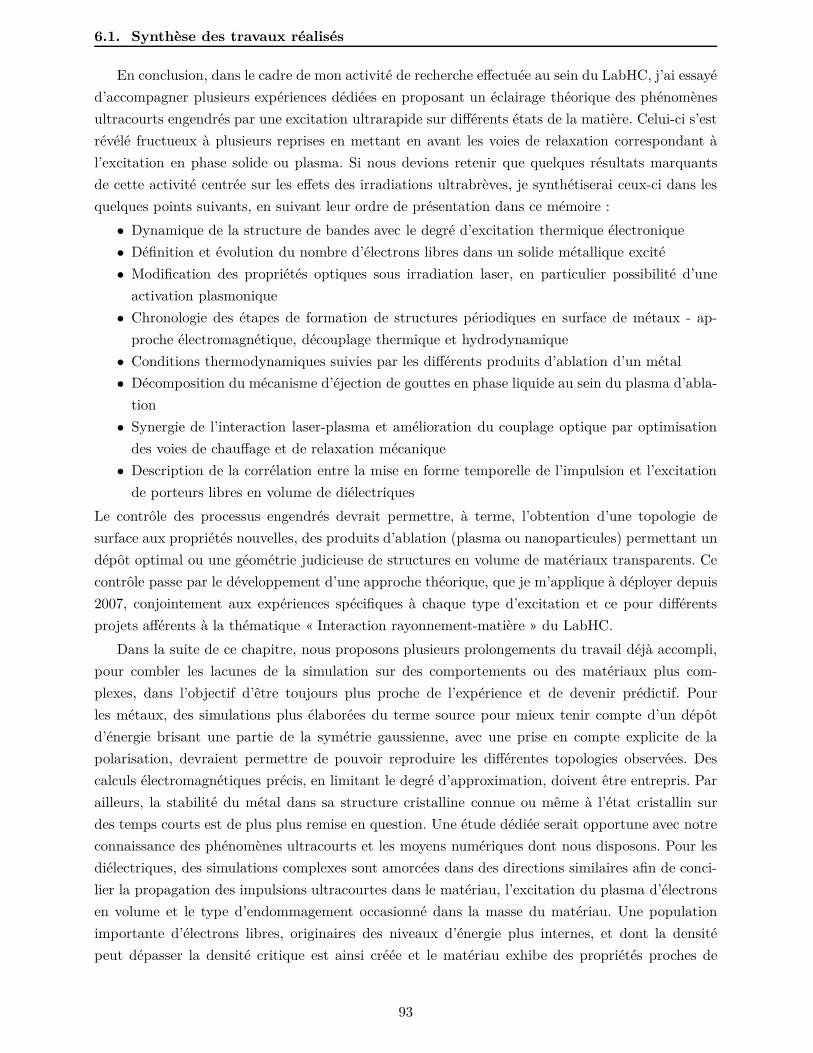
6.1. Synthèse des travaux réalisés
En conclusion, dans le cadre de mon activité de recherche effectuée au sein du LabHC, j’ai essayéd’accompagner plusieurs expériences dédiées en proposant un éclairage théorique des phénomènesultracourts engendrés par une excitation ultrarapide sur différents états de la matière. Celui-ci s’estrévélé fructueux à plusieurs reprises en mettant en avant les voies de relaxation correspondant àl’excitation en phase solide ou plasma. Si nous devions retenir que quelques résultats marquantsde cette activité centrée sur les effets des irradiations ultrabrèves, je synthétiserai ceux-ci dans lesquelques points suivants, en suivant leur ordre de présentation dans ce mémoire :
• Dynamique de la structure de bandes avec le degré d’excitation thermique électronique• Définition et évolution du nombre d’électrons libres dans un solide métallique excité• Modification des propriétés optiques sous irradiation laser, en particulier possibilité d’une
activation plasmonique• Chronologie des étapes de formation de structures périodiques en surface de métaux - ap-
proche électromagnétique, découplage thermique et hydrodynamique• Conditions thermodynamiques suivies par les différents produits d’ablation d’un métal• Décomposition du mécanisme d’éjection de gouttes en phase liquide au sein du plasma d’abla-
tion• Synergie de l’interaction laser-plasma et amélioration du couplage optique par optimisation
des voies de chauffage et de relaxation mécanique• Description de la corrélation entre la mise en forme temporelle de l’impulsion et l’excitation
de porteurs libres en volume de diélectriquesLe contrôle des processus engendrés devrait permettre, à terme, l’obtention d’une topologie desurface aux propriétés nouvelles, des produits d’ablation (plasma ou nanoparticules) permettant undépôt optimal ou une géométrie judicieuse de structures en volume de matériaux transparents. Cecontrôle passe par le développement d’une approche théorique, que je m’applique à déployer depuis2007, conjointement aux expériences spécifiques à chaque type d’excitation et ce pour différentsprojets afférents à la thématique « Interaction rayonnement-matière » du LabHC.
Dans la suite de ce chapitre, nous proposons plusieurs prolongements du travail déjà accompli,pour combler les lacunes de la simulation sur des comportements ou des matériaux plus com-plexes, dans l’objectif d’être toujours plus proche de l’expérience et de devenir prédictif. Pourles métaux, des simulations plus élaborées du terme source pour mieux tenir compte d’un dépôtd’énergie brisant une partie de la symétrie gaussienne, avec une prise en compte explicite de lapolarisation, devraient permettre de pouvoir reproduire les différentes topologies observées. Descalculs électromagnétiques précis, en limitant le degré d’approximation, doivent être entrepris. Parailleurs, la stabilité du métal dans sa structure cristalline connue ou même à l’état cristallin surdes temps courts est de plus plus remise en question. Une étude dédiée serait opportune avec notreconnaissance des phénomènes ultracourts et les moyens numériques dont nous disposons. Pour lesdiélectriques, des simulations complexes sont amorcées dans des directions similaires afin de conci-lier la propagation des impulsions ultracourtes dans le matériau, l’excitation du plasma d’électronsen volume et le type d’endommagement occasionné dans la masse du matériau. Une populationimportante d’électrons libres, originaires des niveaux d’énergie plus internes, et dont la densitépeut dépasser la densité critique est ainsi créée et le matériau exhibe des propriétés proches de
93

Chapitre 6. Conclusions et perspectives
celles d’un métal. Si des propriétés « metal-like » sont régulièrement extrapolées pour décrire lesobservations expérimentales, l’évolution précise des propriétés optiques, thermiques et mécaniquesmériteraient des analyses plus approfondies et je suis convaincu qu’elles doivent être entreprises ausein du LabHC.
6.2 Description du champ électomagnétique pour l’interaction
Différents degrés d’approximation permettent d’estimer la valeur du champ électromagnétiqueen surface, dans la couche de sous-surface ou en volume de l’échantillon. Jusqu’à présent, chacun desmodèles mis en œuvre était basé sur une approche présentant des défauts inhérents à la méthodeentreprise. Par exemple, dans le code hydrodynamique Esther, la résolution pseudo-analytiquede l’équation de Helmholtz n’est réalisable que parce que nous sommes dans une géométrie 1D.Le code de propagation en volume, via la résolution de l’équation de Schrödinger, est basé surl’approximation d’enveloppe lentement variable, qui peut être violée dans des cas de fortes foca-lisations ou non-linéarités. La solution analytique proposée par Sipe pour tenir compte des effetsde surface rugueuse, dans le cadre de la formation de LIPSS, ne permet pas d’être étendue à unemodification transitoire des propriétés topologique ou optique. Enfin, les nanoréseaux formés envolume de diélectriques ne trouvent toujours pas d’explication consistante et complète. Pour cesdifférentes raisons, une résolution complète des champs en 3D+temps, par résolution directe deséquations de Maxwell, et tenant compte de l’excitation transitoire du matériau, paraît opportunesi elle est réalisable.
Les difficultés principales de ce type d’approche reposent sur le temps et la mémoire nécessairesau calcul. En effet, il est possible de montrer qu’une bonne description des effets d’interférencenécessitent une résolution d’environ Δx = λ/40 = 20 nm pour une impulsion laser Ti :Saphir àλ = 800 nm. La structuration périodique de surface sur une tache focale, nécessite ainsi environ3000 cellules dans chacune des deux dimensions de la surface. Enfin, une dizaine de cellules sontrequises en profondeur pour un métal ou un semi-conducteur excité qui, dans l’idéal, nécessiteune plus faible résolution longitudinale si l’on souhaite discrétiser concrètement la distribution deschamps dans l’épaisseur de peau. Une couche de cellule absorbante (« Perfectly Matched Layer »),composée de plusieurs cellules, doit enfin entourer le volume de calcul. 108 cellules sont donc requisesau minimum pour une surface non transparente et 109 pour la propagation dans un diélectrique.Une taille mémoire conséquente est donc indispensable pour conserver l’ensemble des variablesdu champ électromagnétique d’un pas de temps à l’autre, ce qui explique pourquoi ce genre derésolution numérique n’a suscité que récemment un fort intérêt.
6.2.1 Modélisation EM & formation de LIPSS en surface
Des approches de type FDTD (« Finite Different Time-Domain ») ont été déployées ces deuxdernières années pour évaluer la répartition spatiale du champ électromagnétique en surface dematériaux irradiés, et ainsi mettre en évidence les effets de polarisation et de rugosité sur lesstructures périodiques observées en surface [46, 50]. Ces premières études se sont révélées très
94

6.2. Description du champ électomagnétique pour l’interaction
prometteuses pour dépasser les calculs de Sipe pour la formation des LIPSS, étendant la zoologie desstructures possiblement formées d’origine électromagnétique. Nous avons pour objectif de compléterces approches en intégrant un changement des propriétés optiques (comme discutées dans le chapitre2) et topologique du matériau. H. Zhang, que j’ai l’occasion de suivre pour la partie modélisationde son post-doctorat (sous la direction de R. Stoian) au LabHC depuis fin 2013, a inséré des indicesoptiques modifiés par le changement de structure électronique calculée via Abinit dans un calculFDTD à 3 dimensions. Le code de calcul (détaillé dans la référence [81]) résout les équations deMaxwell en supposant que la permittivité du matériau varie lentement à l’échelle d’une périodeoptique de manière à relier directement le vecteur champ de déplacement D au champ électriqueE tel que ∂D/∂t = ε0εrE/∂t, où εr est la permittivité relative du milieu, pouvant dépendre del’excitation thermique électronique. Les équations de Maxwell se simplifient alors sous la forme :
∂E(r, t)∂t
= 1ε0εr(r, t)
∇ × H(r, t), ∂H(r, t)∂t
= 1μ0
∇ × E(r, t). (6.1)
Notons que le fait que la permittivité relative εr(r, t) dépende à la fois de l’espace et du tempspermet de définir une topologie de surface différente d’une impulsion laser à une autre. Cet aspecta été exploité et présenté dans la figure 6.1 où les principales périodicités des structures attenduessont définies par l’énergie absorbée en surface d’un échantillon de tungstène présentant une rugo-sité initiale. Dans le cas où une variation de l’indice optique du métal est négligé (cas a), nouspouvons constater que les structures HSFL (verticales) sont presque aussi marquées que les LSFL(horizontales). A l’inverse, dans le calcul effectué à partir des indices modifiés à une température de25000K présentés sur la figure 2.4, les LSFL sont exaltées par l’excitation de plasmon de surface etles structures HSFL sont peu visibles (cas b). L’utilisation de 8 impulsions, permettant d’introduireun feedback topologique en surface est présenté sur le cas c) et montre à la fois une présence accruedes LSFL et l’apparition de « grooves » parallèles à la polarisation et de période supérieure à lalongueur d’onde laser, telles qu’elles sont définies dans le chapitre 3. La similarité de la transforméede Fourier avec celle obtenue expérimentalement à 80 impulsions, après traitement de l’image MEBcorrespondante, est frappante (cas d). Pour ce matériau et dans ce régime d’irradiation, une modéli-sation électromagnétique apparaît être suffisante pour prédire précisément les périodes ainsi créées.La question de l’amplitude des structures, et de l’utilisation d’un plus grand nombre d’impulsionsne rentre toutefois pas dans le cadre de ce calcul. A partir de cette modélisation, de nombreusesinvestigations sont possibles pour étudier les effets de la dynamique du dépôt d’énergie. Ainsi, unemodification transitoire de la température électronique et donc de l’indice optique peut être priseen compte au cours du calcul, par l’intermédiaire d’une température électronique dans les premièrescellules de surface. Un gradient de propriétés thermiques et optiques serait alors pris en compte.A partir d’une modulation de surface suivant celle du dépôt d’énergie, les effets de feedback pour-raient ainsi être bien plus largement étudiés. Ce point particulier a déjà été étudié à l’université deTwente (Pays-Bas) mais nécessiterait une meilleure modélisation du lien entre l’énergie déposée etla modification topologique [50].
95

Chapitre 6. Conclusions et perspectives
Figure 6.1 – Transformée de Fourier de l’énergie absorbée sous la surface rugueuse d’un échantillonde tungstène. a) Intégration sur une impulsion dans le cas d’indice froid, donnée dans la littérature[39]. b) Intégration sur une impulsion dans le cas de l’indice à Te = 25000K, calculé au chapitre 1.c) Structuration obtenue après 8 impulsions dans le cas de l’indice à Te = 25000K. d) Transforméede Fourier de la structuration obtenue expérimentalement après 80 impulsions.
6.2.2 Modélisation EM & formation de nanoréseaux en volume
Dans le prolongement de ces travaux de modélisation de l’énergie électromagnétique absorbéeen surface, une étude est en cours sur la distribution spatiale du dépôt volumique d’énergie dans lecas de cibles semi-conductrices ou diélectriques. L’objectif à terme est de pouvoir mieux contrôlerla qualité des structures induites en volume, séparées de quelques centaines de nanomètres, afin deréaliser des structures guidantes 3D ou de créer des canaux à des fins microfluidiques. La thèse deA. Rudenko (Projet Nanodielec - Manutech-SISE) sur la modélisation électromagnétique dans lecas de la structuration des diélectriques a récemment démarré en avril 2014 sous la direction de T.Itina et de moi-même. Elle est financée par l’axe 1 (Structures Hiérarchiques) du labex Manutech-SISE afin de prospecter la structuration de volume en apportant une compréhension plus aboutiedes mécanismes engendrant les nanoréseaux observés et discutés dans le chapitre 5. Ce travail dethèse devrait accroître fortement notre capacité à concevoir de nouvelles fonctions optiques dans desmatériaux transparents difficiles à usiner sur de petites dimensions. A ce stade, l’étude de l’excitationélectronique de la silice sous forme amorphe (fondue) ou cristal sera privilégiée pour l’existence demodèles et de données ainsi que pour comparaison avec des expériences réalisables localement. Undes premiers objectifs est de comprendre à la fois l’effet initiateur, la périodicité observée en λ/2n,et l’orientation perpendiculaire à la polarisation laser (figures 6.2a-b). La modélisation démarrée surla formation de nanoréseaux s’appuie sur un schéma de différences finies dans le domaine temporel(FDTD) pour rendre compte de la génération de plasma induit par absorption multiphotonique dela lumière laser intense dans le diélectrique avec présence de petites hétérogénéités. Un travail récenta montré que la génération de plasma se trouve être fortement amplifiée autour des inhomogénéitésde tailles nanométriques présentes dans les verres [84]. Chaque hétérogénéité agit alors comme unegraine de plasma, ayant tendance à croître contre la direction de propagation de la lumière commeprésenté sur la figure 6.2c). Les structures de plasma sont supposées provenir d’inhomogénéités tellesque des vides ou des défauts répartis aléatoirement, interagissant alors fortement et s’organisantdans des plans régulièrement espacés orientés perpendiculairement à la polarisation du laser. Les
96

6.3. Changement structurel ultrarapide
Figure 6.2 – a) Images MEB en cross-section des structures périodiques planaires espacées deλ/2n [83]. b) Schéma de la géométrie des structures induites en volume [84]. c) Densité du plasmacalculée par FDTD à partir d’une onde plane venant de la gauche [84]. Les modulations obser-vées proviennent de l’interface (z = 0) entre une zone homogène (z < 0) et une autre rempliealéatoirement d’inhomogénéités z > 0.
structures seraient alors initiées dans la zone focale et s’étendraient en direction de la source paraccroissement de la structure plasma dû à des effets de champ proche.
Un important travail doit être effectué pour tenir compte à la fois de l’ionisation locale en vo-lume, de la dynamique et du chauffage des porteurs modifiant en retour les propriétés du plasma(densité électronique et fréquence de collisions) et l’absorption du champ électromagnétique. Deseffets hydrodynamiques pourraient également être inclus pour compléter la description des mé-canismes induits, consécutivement à une impulsion. Le régime multi-impulsionnel devrait encoreune fois révéler des caractéristiques intéressantes, amplifiant des périodicités spécifiques par unfeedback électromagnétique. Enfin, lorsque les principaux processus mis en jeu seront inclus, ladépendance avec la durée ou la fluence de l’impulsion pourra être étudiée, proposant ainsi des voiesd’optimisation de la formation des structures [8].
6.3 Changement structurel ultrarapide
Comme nous l’avons discuté à la fin du chapitre 3, de nouveaux travaux sont actuellement àl’étude sur des monocristaux, afin de caractériser plus précisément la réponse inhomogène de l’étatinitial d’une surface polycristalline. L’analyse de telles structures par HR-EBSD permettra ainside cartographier la déformation du réseau cristallin pour chacune des orientations, en sondant etquantifiant l’anisotropie de la photo-excitation et de la réponse du matériau. Un des problèmesrencontrés aujourd’hui réside dans la détermination du type de défauts observés et dans la dif-férenciation des différentes orientations en terme de réponse transitoire au flux laser (absorption,fusion, formation de défauts, . . .). Pour dépasser notre compréhension actuelle des effets antago-nistes de formation de défauts et d’auto-organisation, une collaboration a récemment été initiéeavec le groupe de L. Zhigilei de l’université de Virginie (USA) pour évaluer les effets de l’irradiation
97
Chapitre 6. Conclusions et perspectives
Figure 6.3 – Assemblage d’images de microscopie électronique à transmission d’une bosse et d’unevallée de LIPSS sur un échantillon de nickel irradié et diffraction à aire sélectionnée SAED (enhaut) faisant apparaître des distances (hkl) et des angles caractéristiques de nickel hexagonal.
sur des cibles monocristallines de nickel et de chrome proche du seuil de fusion [85]. Des simulationsde dynamique moléculaire classique devraient ainsi permettre de mieux appréhender l’origine desdéfauts créés, et seront comparées aux analyses HR-EBSD faites par X. Sedao sur les échantillonsmonocristallins. En plus de cette formation de défauts lors de la formation de LIPSS, des étudesconcernant les modifications structurales sont également envisagées dans un régime similaire d’ir-radiation. Nous proposons à la fois une approche expérimentale et théorique pour appréhender ceproblème épineux, comme détaillé ci-dessous.
6.3.1 Expériences de structuration sur matériaux à transition de phase
Des analyses par microscopie électronique en transmission (TEM) se révèlent nécessaires, encomplément de la technique EBSD afin d’accéder à la présence d’une phase amorphe en surface dumatériau. La présence d’une couche amorphe ou d’oxyde en surface, en lien avec la topographierésultante, apparaît être une question essentielle. Des premiers travaux ont été réalisés en parte-nariat avec le Centre Lyonnais de Microscopie (CLYM-Laboratoire MATEIS) pour la préparationet l’analyse TEM. Les premières analyses se sont révélées être très encourageantes et ont permisd’obtenir une observation d’une très grande précision, comme le montre la figure 6.3 constituéed’un assemblage d’images TEM. Une très fine couche (∼20 nm) claire sur la figure, pourrait êtreconstituée de phase oxyde ou amorphe mais nous ne pouvons pas être catégorique à ce stade et uneétude complémentaire incluant une analyse XPS pourrait améliorer notre vision des phénomènes.Une étude de diffraction à aire sélectionnée laisse également penser que ponctuellement, une phasede nickel HCP a pu se former dans cette sous-couche.
Ces résultats doivent être approfondis et complétés par d’autres études qui seraient réaliséessur différents matériaux que le nickel. En particulier, les matériaux présentant des changementsallotropiques, pourraient être utilisés comme une signature des conditions thermodynamiques su-bies par le matériau et ainsi apporter une source de compréhension des mécanismes associés à laformation de ces LIPSS. Par exemple, il est connu que le groupe d’élément titane (Ti, Zr et Hf) a
98

6.3. Changement structurel ultrarapide
une structure cristalline HCP à température ambiante et pression nulle. A plus haute température,ces éléments peuvent se transformer en une phase BCC avant d’atteindre la température de fusion.Enfin sous haute pression (2-10 GPa), une phase ω (réseau hexagonal avec 3 atomes par cellule uni-taire) est attendue à température ambiante [86]. Il serait évidemment très enrichissant d’observerune alternance de phases cristallines sur ce type de matériaux, après irradiation par une impulsionlaser ultracourte, dans des conditions de formation de LIPSS pour lesquelles des conditions de tem-pérature/pression modulées sont sujettes à caution. De plus, ce sont des matériaux présentant unfort intérêt technologique de par leur grande résistance mécanique, leur légèreté et leur résistanceà la corrosion. Dans un objectif similaire, les verres métalliques pourraient également constituésune source importante d’informations puisqu’ils sont amorphes avant irradiation. L’apparition dephases cristallines localisées seraient ainsi un marqueur de dépôt d’énergie laser, exploitables pourun contrôle précis de structurations complexes en surface. Une bourse de thèse de l’université JeanMonnet a été demandée pour la rentrée 2014 pour ce sujet, co-dirigée avec F. Garrelie et en col-laboration avec les Laboratoires Claude Goux et MATEIS, puisqu’il requiert une caractérisationavancée de la structure locale du matériau.
6.3.2 Changement de phase cristalline ultrarapide du nickel
Au chapitre 2, nous avons détaillé un ensemble de propriétés électroniques dépendantes du degréd’excitation et calculées par des méthodes de type DFT. Pour l’ensemble des métaux considérés, lastructure cristalline standard aux conditions ambiantes, a été adoptée. Pourtant, la question d’unemodification ultrarapide de la phase cristalline est légitime sous forte sollicitation lumineuse. Eneffet, nous avons pu constater qu’à chaque température électronique correspondait une structureélectronique accommodant l’énergie d’interaction entre les électrons. Celle-ci pourrait à son touraffecter la structure atomique à condition que l’énergie de la nouvelle structure soit moindre et queles atomes aient le temps nécessaire de se mouvoir durant cette phase de non-équilibre électron-ion.Des premières estimations ont été effectuées par E. Bévillon au moyen du code Abinit et sontprésentées pour le nickel sur la figure 6.4. Il apparaît que lorsque la température électronique aug-mente au-delà d’environ Te = 10000K, la structure FCC n’est plus la plus stable et que la phaseHCP minimise l’énergie totale du système. De même, lorsque Te > 30000K, la phase amorphe pour-rait être privilégiée. Notons que ces calculs ont été réalisés sans relaxer les contraintes en pressionélectronique 1. Ces résultats pourraient être mis en relation avec les observations présentées dansle paragraphe précédent, interprétant alors la présence de nickel HCP comme une transformationsolide-solide avec piégeage dans une phase métastable après refroidissement. Cette hypothèse estencore spéculative et la possibilité de former des nanocristallites HCP après passage par une phaseliquide subsiste, et d’autres investigations doivent être menées. Dans l’hypothèse où la structureélectronique est modifiée durant la phase de non-équilibre, il est intéressant d’évaluer si cette trans-formation pourrait s’effectuer pendant le temps de l’impulsion laser, affectant ainsi des propriétéstelles que les indices optiques, et ainsi la quantité d’énergie absorbée par le système, ou les pro-
1. Dans le cas où elles seraient relaxées, nous avons pu observer qu’au delà d’une certaine valeur de Te, il n’était pluspossible de déterminer la distance interatomique minimisant l’énergie. Dans cette configuration, une désintégrationde la surface serait alors possible pour des températures supérieures à 20000K.
99

Chapitre 6. Conclusions et perspectives
Figure 6.4 – a) Energie des différentes structures cristallines en fonction de l’excitation électro-nique, rapportée à celle de la structure de base (FCC). Densité d’états électroniques du nickel àTe = 0.01K pour les structures b) FCC c) BBC d) HCP e) amorphe.
priétés plasmoniques discutées au chapitre 2. En considérant une impulsion d’une durée de 100 fs,nous avions vu au cours du premier chapitre que la distance interatomique pouvait être modifiéede l’ordre de 10% sur l’épaisseur de peau du métal. Cette modification est supposée être suffisantepour envisager un changement de structure atomique pendant l’impulsion, étant donné le faibledéplacement atomique moyen nécessaire.
Les propriétés électroniques (Ce, Pe, Ne, γe−ph, n) sont à la fois liées à la structure atomique et àla structure électronique. Nous avons donc déterminé la densité d’états électroniques correspondantà chacune des configurations, comme nous l’avons représenté sur la figure 6.4b-e). A une longueurd’onde de 800 nm, et à faible valeur de Te, les principaux états contribuant à la réponse optique sontindiqués sur la figure. Nous observons donc un impact non négligeable du changement de structureatomique sur les états situés à 1.55 eV du niveau de Fermi, affectant ainsi les propriétés optiques.Pour des valeurs plus élevées de Te, un ensemble plus important d’états contribuent aux propriétésde transport et la DOS doit être recalculée pour chacune des configurations.
De par les états de matière exotiques étudiés, ce travail ouvre un champ d’investigations etd’applications extrêmement vaste, nécessitant à la fois de nombreuses heures de calcul et des ca-ractérisations post-mortem précises (TEM et XPS). La dynamique rapide et complexe du réseaucristallin suivant l’excitation électronique gagnerait à être suivie directement par diffraction élec-
100

6.4. Modélisation de l’excitation de matériaux non standards
tronique ultrarapide, ou par diffraction par rayons X résolues en temps. De nouvelles collaborationsseraient utiles à ce stade, le LabHC ne disposant pas actuellement de tels outils et compétences.
6.4 Modélisation de l’excitation de matériaux non standards
Le niveau actuel de modélisation de l’interaction laser-matière se limite généralement à unaspect qualitatif, se concentrant sur la description de comportements singuliers dépendants duniveau d’intensité laser et du matériau considéré. Pourtant, la plupart des applications ne concernepas des matériaux purs comme les métaux que nous avons étudiés mais plutôt des alliages oudes verres aux propriétés structurales complexes. Afin de proposer une simulation plus proche del’expérience, de nouvelles méthodes sont envisagées pour étayer les connaissances et les donnéesexistantes, et si possible dépendantes de la dynamique d’excitation.
6.4.1 Propriétés des alliages inox par DFT
Nous prolongerons notre base de données électroniques par des calculs sur l’acier inoxydable quiest un matériau d’intérêt pour les applications industrielles alors que très peu d’études fondamen-tales ont été faites sur ses propriétés de transport hors équilibre. Elles devraient trouver un fort écholocalement pour le projet Equipex mais également dans la communauté internationale de structu-ration par laser. Bien qu’étant un métal comme les matériaux précédemment étudiés, la structurechimique de l’inox nécessite une méthode de modélisation différente. En effet, les métaux simplespeuvent être modélisés via un ou deux atomes dans une structure cristalline non-défectueuse, commeles structures FCC, BCC ou HCP. L’inox cristallise dans une structure FCC, mais est constitué denombreux éléments en solution solide. Ces derniers doivent donc être distribués de manière homo-gène dans le système étudié, ce qui implique la modélisation d’un grand nombre d’atomes. Dansnotre cas, nous avons commencé l’étude avec des mailles de 108 atomes, ce qui correspond à 27mailles élémentaires. En pourcentage atomique, l’inox 316L contient environ 65%, 0.1% 18%, 11%,1%, 2%, 2% de Fe, C, Cr, Ni, Mo, Si et Mn, respectivement. La stratégie adoptée pour modéliserl’inox serait de considérer une composition différente constituée de 73 atomes de Fe, 21 de Cr et14 de Ni soit 108 atomes. Les distributions homogènes de ces atomes dans la maille de 108 atomesont été générées via la méthode Special Quasirandom Structures (SQS) développée à l’InstitutMax Planck [87]. La modélisation nécessite d’optimiser les positions atomiques respectives et leparamètre de maille de manière à obtenir un système représentatif d’une situation réelle. Ensuiteseulement, il sera possible de déterminer les quantités thermodynamiques, comme nous l’avons faitdans le chapitre 2 pour les corps purs.
Ces résultats pourront être utilisés dans le code hydrodynamique Esther afin de déterminer latempérature électronique atteinte lors d’une excitation, par exemple dans le cadre d’une excitationde surface. Des calculs de propriétés optiques seront également envisagés pour les températuresélectroniques ainsi déterminées. Enfin, par l’intermédiaire des données hors d’équilibre calculées,une mise en forme temporelle des impulsions pourra être employée sur des cibles d’inox pourexploiter la dynamique transitoire des propriétés électroniques.
101

Chapitre 6. Conclusions et perspectives
6.4.2 Matériaux carbonés et diélectriques, vers la TD-DFT ?
Pour conclure sur ce chapitre de perspectives, une prospection sur les résultats accessibles pardes méthodes de DFT dépendantes du temps (TD-DFT) est présentée ci-après pour des matériauxcouramment employés au sein de la thématique interaction laser-matière, le carbone et le quartz.
La TD-DFT a récemment été développée pour décrire, à partir des premiers principes, ladynamique quantique d’électrons induite par un potentiel externe en fonction du temps. Le po-tentiel vecteur externe Aext est lié dans ce cas au champ électrique du laser appliqué tel queElaser(t) = −dAext/dt. Un potentiel vecteur induit, causé par la polarisation, est également néces-saire. La TD-DFT est actuellement déployée dans un régime de réponse linéaire mais égalementnon-linéaire pour simuler la dynamique des électrons induits par une impulsion laser ultracourte.La méthode est couramment utilisée dans le cas des atomes isolés et des molécules irradiés par desimpulsions laser mais plus rarement et difficilement appliquée à la dynamique des systèmes élec-troniques dans le cas de systèmes solides (de type bulk), irradiés par des impulsions ultracourtes[88]. Le processus physique clef cherchant à être simulé est le claquage optique qui produit denombreuses paires électrons-trous. Celui-ci provoque une modification transitoire importante de lastructure électronique, affectant les propriétés de transport. Ainsi, la TD-DFT est capable de traitersimultanément l’ionisation multiphotonique et tunnel que nous avons décrits au premier chapitre.Toutefois, les collisions électron-électron qui provoquent l’avalanche électronique ne sont pas inclusdans l’approximation actuelle de densité locale adiabatique (ALDA).
Les résultats escomptés par de telles simulations sont principalement liés à une déterminationplus réaliste de la quantité d’électrons libres générés sous l’action et la propagation d’une impulsionlaser ultrabrève sur un matériau à plus ou moins grand band-gap. Un exemple de calculs réalisés
Figure 6.5 – a-b) Dynamique électronique reflétant le nombre d’électrons photo-excités par atomede carbone, calculée par TD-DFT en fonction du champ électrique laser incident (intensité maximale1015 W cm−2, durée 40 fs - 400nm) dans une structure diamant [88]. c-d) Dynamique électroniquecalculée dans le α-SiO2 (intensité maximale 2.5 × 10¹⁵ W cm−2, durée 16 fs - 400nm) [89].
102

6.4. Modélisation de l’excitation de matériaux non standards
par T. Otobe de l’Advanced Photon Research Center de Kyoto (Japon) est présenté sur la figure6.5. En réponse au champ électrique externe (Figures 6.5a-c), le nombre d’électrons croît dans labande de conduction du matériau (Figures 6.5b-d) que ce soit dans le cas du diamant (b) ou duquartz (d). Il serait très pertinent de pouvoir associer de tels résultats d’évolution de la densitéd’électrons excités à des calculs électromagnétiques de type FDTD, comme ceux proposés en débutde ce chapitre pour apporter une vision plus aboutie des processus d’excitation et de relaxation desporteurs dépendants des conditions de focalisation et du matériau. Dans ces conditions, un contrôleprécis des mécanismes d’excitation et d’ablation (fusion ultrarapide, exfoliation, . . . ) de matériauxcarbonés serait envisageable pour améliorer les espèces favorables à un dépôt optimal de couchesminces (en collaboration avec F. Bourquard et F. Garrelie). De même, une ingénierie aboutie de l’in-dice de réfraction 3D de diélectriques serait alors envisageable, permettant une fonctionnalisation etun façonnage de composants optiques, basés sur la maîtrise de la dynamique des porteurs en volume.
Les perspectives présentées ici ne sont bien sûr pas exhaustives et sont très fortement influencéespar les actions en cours. Elles sont en partie réalisables sur une échelle de 3 à 4 ans, soit la duréetypique pour une thèse ou le financement d’un projet. Leur réalisation dépendra principalementdes moyens de calcul, financiers et humains obtenus et la poursuite de ces travaux est conditionnéepar l’obtention de ces moyens. Les perspectives liées à l’expansion du plasma, à l’optimisation desespèces et la formation de nanoparticules ne sont pas discutées ici, faute de financements obtenusaprès 8 tentatives à travers 3 projets différents 2. Ainsi, les actions proposées s’orientent plutôtvers la structuration (en surface ou en volume) et sur la dynamique microscopique des systèmes,qui constituent des travaux aujourd’hui soutenus à moyen terme, via les projets ANR Dylipss etSmartlasir, le labex Manutech-SISE ou les financements locaux via l’UJM.
2. Citons les projets ANR JC Adsim dédiés à l’insertion d’un code hydrodynamique dans une boucle adaptativedéposés en 2008-2009, l’ANR Blanc Pushomat sur l’optimisation de couches minces par mise en forme temporelled’impulsions déposé en 2010-2012 et l’ANR Blanc Fantaumas déposé en 2012-2014 sur la LIBS à double-impulsionscourtes.
103

Chapitre 6. Conclusions et perspectives
104
Bibliographie
[1] F. Garrelie, J.P. Colombier, F. Pigeon, S. Tonchev, N. Faure, M. Bounhalli, S. Reynaud and O. Parriaux«Evidence of surface plasmon resonance in ultrafast laser-induced ripples», Optics Express 19, 19150(2011).
[2] J.P. Colombier, F. Garrelie, N. Faure, S. Reynaud, M. Bounhalli, E. Audouard, R. Stoian, & F. Pigeon,«Effects of electron-phonon coupling and electron diffusion on ripples growth on ultrafast-laser-irradiatedmetals», Journal of Applied Physics 111, 024902 (2012).
[3] J.P. Colombier, P. Combis, E. Audouard, & R. Stoian, «Guiding heat in laser ablation of metals onultrafast timescales : an adaptive modeling approach on aluminum», New Journal of Physics 14,013039 (2012).
[4] Y. Di Maio, J.P. Colombier, P. Cazottes, & E. Audouard, «Ultrafast laser ablation characteristics ofPZT ceramic : Analysis methods and comparison with metals», Optics and Laser Engineering 50(11), 1582-1591 (2012).
[5] E. Bévillon, J.P. Colombier, V. Recoules, H. Zhang, C. Li & R. Stoian, «Ultrafast Surface PlasmonicSwitch in Non-Plasmonic Metals», arXiv :1509.03182 (2015).
[6] B. Dusser, Z. Sagan, H. Soder, N. Faure, J.P. Colombier, M. Jourlin & E. Audouard, «Controllednano-structrures formation by ultrafast laser pulses for color marking», Optics Express 18 (3), 2913(2010).
[7] M.K. Bhuyan, P.K. Velpula, J.P. Colombier, T. Olivier, N. Faure, & R. Stoian, «Single-shot high aspectratio bulk nanostructuring of fused silica using chirp-controlled ultrafast laser Bessel beams», AppliedPhysics Letters 104 (2), 021107 (2014).
[8] C. Mauclair, M. Zamfirescu, J.P. Colombier, G. Cheng, K. Mishchik, E. Audouard, & R. Stoian, «Controlof ultrafast laser-induced bulk nanogratings in fused silica via pulse time envelopes», Optics Express20 (12), 12997-13005 (2012).
[9] S. Heiroth, J. Koch, T. Lippert, A. Wokaun, D. Günther, F. Garrelie, & M. Guillermin, «Laser abla-tion characteristics of yttria-doped zirconia in the nanosecond and femtosecond regimes», Journal ofApplied Physics 107, 014908 (2010).
[10] F. Bourquard, J.P. Colombier, M. Guillermin, A.-S. Loir, C. Donnet, R. Stoian, & F. Garrelie, «Temporalpulse shaping effects on aluminium and boron ablation plumes generated by ultrashort pulsed laserablation and analyzed by time- and space-resolved optical spectroscopy», Applied Surface Science258 (23), p.9374-9378 (2012).
[11] J.P. Colombier, P. Combis, E. Audouard & R. Stoian, «High shock release in ultrafast laser irradiatedmetals : Scenario for material ejection», Physical Review B 75, 104105 (2007).
[12] M. Guillermin, J.P. Colombier, S. Valette, E. Audouard, F. Garrelie & R. Stoian, «Optical emission andnanoparticle generation in Al plasmas using ultrashort laser pulses temporally optimized by real-timespectroscopic feedback», Physical Review B 82, 035430 (2010).

Bibliographie
[13] P. Balling & J. Schou, «Femtosecond-laser ablation dynamics of dielectrics : basics and applications forthin films», Reports on Progress in Physics 76, 036502 (2013).
[14] E. G. Gamaly, «The physics of ultra-short laser interaction with solids at non-relativistic intensities»,Physics Report 508, 91-243 (2011).
[15] J.P. Colombier, P. Combis, E. Audouard & R. Stoian, «Transient optical response of ultrafast nonequi-librium excited metals : Effects of an electron-electron contribution to collisional absorption», PhysicalReview E 77, 036409 (2008).
[16] G. Petite, «Mécanismes fondamentaux de l’ablation laser femtoseconde en "flux intermédiaire"», Laserset technologies femtosecondes, 319 (2005).
[17] R. W. Schoenlein, W. Z. Lin, J. G. Fujimoto & G. L. Eesley, «Femtosecond Studies of NonequilibriumElectronic Processes in Metals», Physical Review Letters 58, 1680 (1987).
[18] W. S. Fann, R. Storz, H. W. K. Tom & J. Bokor, «Direct Measurement of Nonequilibrium Electron-Energy Distribution in Subpicosecond Laser-Heated Gold Films», Physical Review Letters 68, 2834(1992).
[19] A. Kaiser, B. Rethfeld, M. Vicanek, & G. Simon, «Microscopic processes in dielectrics under irradiationby subpicosecond laser pulses», Physical Review B, 61(17) 11437, (2000).
[20] B. Y. Mueller and B. Rethfeld, «Relaxation dynamics in laser-excited metals under nonequilibriumconditions», Physical Review B 87, 035139 (2013).
[21] S. I. Anisimov, B. L. Kapeliovich, and T. L. Perel’man, «Electron emission from metal surfaces exposedto ultrashort laser pulses», Sov. Phys. JETP 39, 375 (1974).
[22] C. Schäfer, H. M. Urbassek & L. V. Zhigilei, «Metal ablation by picosecond laser pulses : a hybridsimulation», Physical Review B 66, 115404 (2002).
[23] J.P. Colombier, P. Combis, F. Bonneau, R. Le Harzic & E. Audouard, «Hydrodynamic simulations ofmetal ablation by femtosecond laser irradiation», Physical Review B 71, 165405 (2005).
[24] J.P. Colombier, M. Guillermin, F. Garrelie, E. Audouard & R. Stoian, «Simulations of controlled spectralemission of Al plasmas generated by temporally tailored laser Irradiation», International Symposium onhigh power laser ablation 2010, AIP Conference Proceedings 1278, 312-323 (2010).
[25] P. Combis, L. Videau & J.P. Colombier «Traitement généralisé du déséquilibre thermique électrons-matière dans le code ESTHER», Rapport CEA/DIF/DPTA/SPPE N 34/DO-(2012).
[26] E. Bévillon, J.P. Colombier, V. Recoules, & R. Stoian, «Free-electron properties of metals under ultra-fast laser-induced electron-phonon nonequilibrium : A first-principles study», Physical Review B 89,115117 (2014).
[27] E. Bévillon, J.P. Colombier, V. Recoules, & R. Stoian, «First-principles calculations of heat capacitiesof ultrafast laser-excited electrons in metals», Applied Surface Science 336, 79-84 (2015).
[28] A. V. Bushman, I. V. Lomonosov & V. E. Fortov, «Models of wide-range equations of state for matterunder conditions of high energy density», Sov. Tech. Rev. B :Therm. Phys. 5, 1 (1993).
[29] W. Ebeling, A. Förster, V. Fortov, V. Griaznov, & A. Polishchuk, «Thermophysical Properties of HotDense Plasmas», (Teubner, Stuttgart 1991).
[30] K. V. Khishchenko, in «Physics of Extreme States of Matter-2005 IPCP RAS», Chernogolovka, 170-172(in Russian) (2005).
[31] B. Rethfeld, K. Sokolowski-Tinten, D. von der Linde, & S. I. Anisimov, «Ultrafast thermal melting oflaser-excited solids by homogeneous nucleation», Physical Review B 65, 092103 (2002).
106

Bibliographie
[32] J.P. Colombier, R. Stoian, E. Audouard, P. Combis, A. Rosenfeld, & I.V. Hertel, «Controlling energycoupling and particle ejection in metallic surfaces irradiated by ultrashort laser pulses absorption»,Applied Surface Science 255 (24), 9597 (2009).
[33] S. Mazevet, M. Torrent, V. Recoules & F. Jollet, «Calculations of the transport properties within PAWformalism», High Energy Density Physics 6 21 (2010).
[34] M. Torrent, F. Jollet, F. Bottin, G. Zerah, & X. Gonze, «Implementation of the projector augmented-wave method in the ABINIT code. Application to the study of iron under pressure», ComputationalMaterials Science 42 337 (2008).
[35] F. Bottin, S. Leroux, & S. Knyatzev, «Large scale ab initio calculations based on three levels of paral-lelization», Computational Materials Science 42 329 (2008).
[36] Z. Lin, L. V. Zhigilei, & V. Celli, «Electron-phonon coupling and electron heat capacity of metals underconditions of strong electron-phonon nonequilibrium», Physical Review B 77, 075133 (2008).
[37] V. Recoules, J. Clérouin, G. Zérah, P. M. Anglade, & S. Mazevet, «Effect of intense laser irradiationon the lattice stability of semi-conductors and metals», Physical Review Letters 96 055503 (2006).
[38] D. V. Fisher, Z. Henis, S. Eliezer & J. Meyer-Ter-Vehn, «Core holes, charge disorder, and transitionfrom metallic to plasma properties in ultrashort pulse irradiation of metals», Laser and ParticleBeams 24, 81 (2006).
[39] Handbook of optical constants of solids : ED Palik Ac-ademic, New York, (1985).
[40] A. Borowiec & H. K. Haugen, «Subwavelength ripple formation on the surfaces of compound semicon-ductors irradiated with femtosecond laser pulses», Applied Physics Letters 82, 4462 (2003).
[41] F. Goutaland, J.P. Colombier, M.C. Sow, N. Ollier, & F. Vocanson, «Laser-induced periodic alignmentof Ag nanoparticles in soda-lime glass», Optics Express 21 (26), 31789-31799 (2013).
[42] J. Bonse, J. Krüger, S. Höhm, & A. Rosenfeld, «Femtosecond laser-induced periodic surface structures»,Journal of Laser Applications 24, 042006 (2012).
[43] R. Buividas, M. Mikutis, & S. Juodkazis, «Surface and bulk structuring of materials by ripples with longand short laser pulses : Recent advances», Progress in Quantum Electronics 38 (3), 119 (2014).
[44] J. E. Sipe, J.F. Young, J. S. Preston, & H. M. van Driel, «Laser-induced periodic surface structure. I.Theory», Physical Review B 27, 1141 (1983).
[45] H. Raether, «Surface plasmons on smooth and rough surfaces and on gratings», in Springer Tracts inModern Physics (Springer, 1988), Vol. 111.
[46] J. Z. P. Skolski, G. R. B. E. Römer, J. Vincenc Obona, V. Ocelik, A. J. Huis in ’t Veld, & J. Th.M. de Hosson, «Laser-induced periodic surface structures : Fingerprints of light localization», PhysicalReview B 85, 075320 (2012).
[47] J. Reif, O. Varlamova, & F. Costache, «Femtosecond laser induced nanostructure formation : self-organization control parameters», Applied Physics A : Materials Science & Processing 92,1019(2008).
[48] D. Dufft, A. Rosenfeld, S. K. Das, R. Grunwald, & J. Bonse, «Femtosecond laser-induced periodicsurface structures revisited : a comparative study on ZnO», Journal of Applied Physics 105, 034908(2009).
[49] S. Sakabe, M. Hashida, S. Tokita, S. Namba, & K. Okamuro, «Mechanism for self-formation of periodicgrating structures on a metal surface by a femtosecond laser pulse», Physical Review B 79, 033409(2009).
107

Bibliographie
[50] J. Z. P. Skolski, G. R. B. E. Römer, J. Vincenc Obona, & A. J. Huis in ’t Veld. «Modeling laser-inducedperiodic surface structures : FDTD-feedback simulations», Journal of Applied Physics 115, 103102(2014).
[51] J. F. Young, J. E. Sipe, & H. M. van Driel, «Laser-induced periodic surface structure. III. Fluenceregimes, the role of feedback, and details of the induced topography in germanium», Physical ReviewB 30, 2001 (1984).
[52] J.P. Colombier, F. Garrelie, P. Brunet, A. Bruyère, F. Pigeon, R. Stoian & O. Parriaux, «Plasmonicand Hydrodynamic Effects in Ultrafast Laser-Induced Periodic Surface Structures on Metals», Journalof Laser Micro/NanoEngineering 7 (3) 362-368 (2012).
[53] X. Sedao, C. Maurice, F. Garrelie, J.P. Colombier, S. Reynaud, R Quey, G. Blanc, & F. Pigeon «Electronbackscatter diffraction characterization of laser-induced periodic surface structures on nickel surface»,Applied Surface Science 302, 114-117 (2014).
[54] X. Sedao, C. Maurice, F. Garrelie, J.P. Colombier, S. Reynaud, R. Quey, & F. Pigeon, «Influence ofcrystal orientation on the formation of femtosecond laser-induced periodic surface structures and latticedislocations», Applied Physics Letters 104, 171605 (2014).
[55] N. Georgiev, A. Pavlovska, & E. Bauer, «Surface disordering without surface roughening», PhysicalReview B 52, 2878 (1995).
[56] J.P. Colombier, P. Brunet, E. Bévillon, F. Garrelie, R. Stoian, C. Albu, S. Simion, M. Zamfirescu, & F.Pigeon, «Génération de rides sub-microniques à la surface d’un métal irradié par des impulsions lasersfemtosecondes : Effets plasmoniques et hydrodynamiques», 21ème Congrès Français de Mécanique(2013).
[57] O. Varlamova, J. Reif, S. Varlamov, M. Bestehorn, «Modeling of the laser polarization as control para-meter in self-organized surface pattern», Journal of Nanoscience and Nanotechnology (2011).
[58] N. M. Bulgakova, R. Stoian, A. Rosenfeld, I. V. Hertel, & E. E. B. Campbell, «Electronic transport andconsequences for material removal in ultrafast pulsed laser ablation of materials», Physical ReviewB 69, 054102 (2004).
[59] M. E. Povarnitsyn, T. E. Itina, M. Sentis, K. V. Khishchenko, & P. R. Levashov, «Material decompositionmechanisms in femtosecond laser interactions with metals», Physical Review B 75, 235414 (2007).
[60] E. Lescoute, L. Hallo, D. Hebert, B. Chimier, B. Etchessahar, V. T. Tikhonchuk, J. -M. Chevalier,& P. Combis, «Experimental observations and modeling of nanoparticle formation in laser-producedexpanding plasma», Physics of Plasma 15, 063507 (2008).
[61] P. Lorazo, L. J. Lewis, & M. Meunier, «Thermodynamic pathways to melting, ablation, and solidificationin absorbing solids under pulsed laser irradiation», Physical Review B 73, 134108 (2006).
[62] J.P. Colombier, P. Combis, A. Rosenfeld, I.V. Hertel, E. Audouard & R. Stoian, «Optimizing energycoupling at ultrafast laser irradiated metal surfaces by tailoring intensity envelope», Physical ReviewB 74, 224106 (2006).
[63] M. Guillermin, A. Klini, J.P. Colombier, F. Garrelie, D. Gray, C. Liebig, E. Audouard, C. Fotakis& R. Stoian, «Tuning spectral properties of ultrafast laser ablation plasmas from brass using adaptivetemporal pulse shaping», Optics express 18, 11159-11172 (2010).
[64] Y. B. Zel’dovich & Y. P. Raizer, «Physics of Shock Waves and High-Temperature Hydrodynamic Phe-nomena»,(New York : Academic) (1967).
[65] A. Voloshko, J.-P. Colombier, T. E. Itina, «Comparison of laser ablation with spark discharge techniquesused for nanoparticle production», Applied Surface Science 336, 143-149 (2015).
108

Bibliographie
[66] J.P. Colombier, E. Audouard, & R. Stoian, «Laser pulses designed in time by adaptive hydrodyna-mic modeling for optimizing ultrafast laser-metal interactions», Applied Physics A 110 (3), 723-729(2013).
[67] P. Martin, S. Guizard, P. Daguzan, G. Petite, P. D’Oliveira, P. Meynadier, & M. Perdrix, «Subpicosecondstudy of carrier trapping dynamics in wide-band-gap crystals», Physical Review B 55, 5799 (1997).
[68] A. Couairon, L. Sudrie, M. Franco, B. Prade, & A. Mysyrowicz, «Filamentation and damage in fusedsilica induced by tightly focused femtosecond laser pulses», Physical Review B 71, 125435 (2005).
[69] I. M Burakov, N. M. Bulgakova, R. Stoian, A. Mermillod-Blondin, E. Audouard, A. Rosenfeld, A.Husakou, & I. V. Hertel, « Spatial distribution of refractive index variations induced in bulk fused silicaby single ultrashort and short laser pulses», Journal of applied physics 101 (4) 043506 (2007).
[70] R. Stoian, K. Mishchik, G. Cheng, C. Mauclair, C. D’Amico, J.P. Colombier & M. Zamfirescu, «In-vestigation and control of ultrafast laser-induced isotropic and anisotropic nanoscale-modulated indexpatterns in bulk fused silica», Optical Materials Express 3 (10), 1755-1768 (2013).
[71] R. Stoian, J.P. Colombier, C. Mauclair, G. Cheng, M.K. Bhuyan, & P.K. Velpula, «Spatial and temporallaser pulse design for material processing on ultrafast scales», Applied Physics A 114 (1), 119-127(2014).
[72] J. Durnin, J.J. Miceli, & J.H. Eberly, «Diffraction-free beams», Physical Review Letters 58, 1499(1987).
[73] F. Courvoisier, J. Zhang, M.K. Bhuyan, M. Jacquot, & J.M. Dudley, «Applications of femtosecondBessel beams to laser ablation», Applied Physics A 112, 29 (2013).
[74] C. Mauclair, «Spatio-Temporal Ultrafast Laser Tailoring for Bulk Functionalization of Transparent Ma-terials», Thèse de l’Université Jean Monnet (2010).
[75] B. E. Treeby & B. T. Cox, «k-Wave : MATLAB toolbox for the simulation and reconstruction of pho-toacoustic wave-fields», Journal of Biomedical Optics, 15 (2), 021314 (2010).
[76] P.K. Velpula, M.K. Bhuyan, C. Mauclair, J.P. Colombier, & R. Stoian «Ultrafast imaging of free car-riers : controlled excitation with chirped ultrafast laser Bessel beams», SPIE LASE, 896711-896711-8(2014).
[77] P.K. Velpula, M.K. Bhuyan, C. Mauclair, J.P. Colombier, & R. Stoian, «Role of free carriers excitedby ultrafast Bessel beams for sub-micron structuring applications», Accepted in Optical Engineering(2014).
[78] V. Schmidt, W. Husinsky, & G. Betz, «Dynamics of Laser Desorption and Ablation of Metals at theThreshold on the Femtosecond Time Scale», Physical Review Letters 85, 3516 (2000).
[79] E. Axente, I.N. Mihailescu, J. Hermann, T. Itina, «Ultrafast imaging of free carriers : controlled exci-tation with chirped ultrafast laser Bessel beams», Applied Physics Letters 99, 081502 (2011).
[80] M. Bounhalli, «Dynamique de la formation de nanostructures périodiques par impulsions laser ultra-brèves sur une surface métallique, Thèse de l’Université Jean Monnet (2011).
[81] H. Zhang, S. A. Wolbers, D. M. Krol, J. I. Dijkhuis, & D. van Oosten, «Modelling and experiments ofself-reflectivity under femtosecond ablation conditions», arXiv :1402.4998 [physics.optics] (2014).
[82] Y. Shimotsuma, P. Kazansky, J. Qiu, & K. Hirao, «Self-organized nanogratings in glass irradiated byultrashort light pulses», Physical Review Letters 91, 247405 (2003).
[83] R Taylor, C. Hnatovsky, & E. Simova, «Applications of femtosecond laser induced self-organized planarnanocracks inside fused silica glass», Laser & Photonic Review 2 (1-2), 26 (2008).
109

Bibliographie
[84] R. Buschlinger, S. Nolte, & U. Peschel, «Self-organized pattern formation in laser-induced multiphotonionization», Physical Review B 89, 184306 (2014).
[85] Z. Lin, R. A. Johnson, & L. V. Zhigilei, «Computational study of the generation of crystal defects in abcc metal target irradiated by short laser pulses», Physical Review B 77, 214108 (2008).
[86] R. Ahuja, J. M. Wills, B. Johansson, & Olle Eriksson, «Crystal structures of Ti, Zr, and Hf undercompression : Theory», Physical Review B 48, 16269 (1993).
[87] A. Zunger, S.-H. Wei, L. G. Ferreira, & J. E. Bernard, «Special quasirandom structures», PhysicalReview Letters 65, 353 (1990).
[88] T. Otobe, M. Yamagiwa, J.-I. Iwata, K. Yabana, T. Nakatsukasa & G.F. Bertsch, «First-principleselectron dynamics simulation for optical breakdown of dielectrics under an intense laser field», PhysicalReview B 77, 165104 (2008).
[89] T. Otobe, K. Yabana, & J.-I. Iwata, «First-principles calculation of the electron dynamics in crystallineSiO2», Journal of Physics : Condensed Matter 21, 064224 (2009).
110

Troisième partie
Recueil de publications significatives

Publications significatives
Dans cette dernière partie sont rassemblées quelques publications qui sont représentatives demes activités de recherche successives, dans l’ordre chronologique. Cette sélection a pour objectifd’illustrer chacun des chapitres présentés dans le mémoire de recherche.
Le premier article concerne l’article majeur de mon travail de doctorat effectué au CEA/DIFconcernant l’insertion et les conséquences d’un découplage thermique électron-phonon dans le coded’interaction laser-matière aujourd’hui nommé Esther :
• J.P. Colombier, P. Combis, F. Bonneau, R. Le Harzic & E. Audouard, «Hydrodynamic si-mulations of metal ablation by femtosecond laser irradiation», Physical Review B 71, 165405(2005).
Le second article est consacré à une comparaison simulation-expérience de l’état d’ionisation duplasma induit et des nanoparticules générées pour le dépôt de couche mince :
• M. Guillermin, J.P. Colombier, S. Valette, E. Audouard, F. Garrelie & R. Stoian. «Opticalemission and nanoparticle generation in Al plasmas using ultrashort laser pulses temporallyoptimized by real-time spectroscopic feedback», Physical Review B 82, 035430 (2010).
Le troisième article sélectionné est représentatif des premiers résultats obtenus sur la géné-ration de LIPSS, dans le contexte d’une excitation plasmonique sur réseau et ayant alimenté lequestionnement sur les modifications transitoires des indices optiques :
• F. Garrelie, J.P. Colombier, F. Pigeon, S. Tonchev, N. Faure, M. Bounhalli, S. Reynaud & O.Parriaux «Evidence of surface plasmon resonance in ultrafast laser-induced ripples», OpticsExpress 19, 19150 (2011).
Le quatrième article discute des résultats d’optimisation du code hydrodynamique d’interactionlaser-matière Esther, réalisée au moyen d’une boucle adaptative :
• J.P. Colombier, P. Combis, E. Audouard, & R. Stoian, «Guiding heat in laser ablation ofmetals on ultrafast timescales : an adaptive modeling approach on aluminum», New Journalof Physics 14, 013039 (2012).
Le cinquième article se focalise sur l’utilisation de faisceaux non-diffractifs de type Bessel pourla structuration en volume. Les résultats expérimentaux s’interprètent très bien à partir du dépôtd’énergie estimé par la résolution de l’équation de Schrödinger non-linéaire :
• M.K. Bhuyan, P.K. Velpula, J.P. Colombier, T. Olivier, N. Faure, & R. Stoian, «Single-shothigh aspect ratio bulk nanostructuring of fused silica using chirp-controlled ultrafast laserBessel beams», Applied Physics Letters 104 (2), 021107 (2014).
Enfin, le dernier article est dédié au changement de la structure de bandes de quelques métauxlorsqu’ils sont soumis à une température électronique élevée à densité solide. Les conséquences surla capacité, la pression et le nombre d’électrons libres sont discutées en fonction du changementd’écrantage :
• E. Bévillon, J.P. Colombier, V. Recoules, & R. Stoian, «Free-electron properties of metalsunder ultrafast laser-induced electron-phonon nonequilibrium : A first-principles study», Phy-sical Review B 89, 115117 (2014).
113

Publications significatives
114
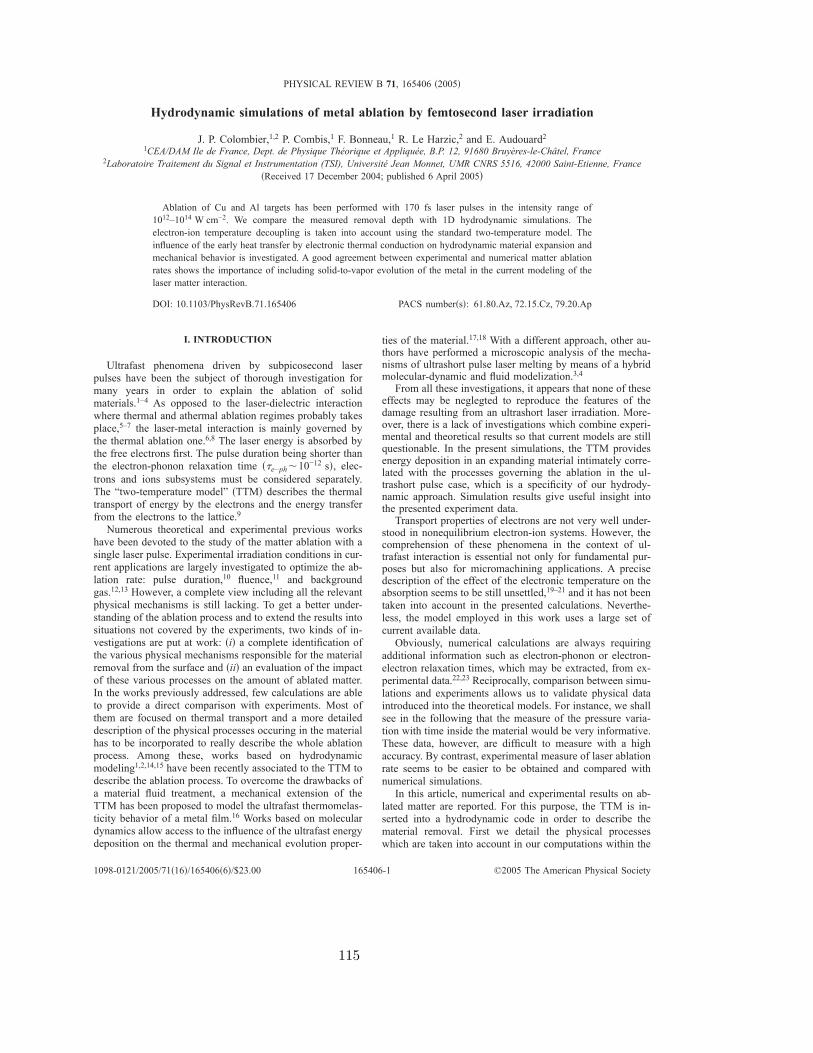
Hydrodynamic simulations of metal ablation by femtosecond laser irradiation
J. P. Colombier,1,2 P. Combis,1 F. Bonneau,1 R. Le Harzic,2 and E. Audouard21CEA/DAM Ile de France, Dept. de Physique Théorique et Appliquée, B.P. 12, 91680 Bruyères-le-Châtel, France
2Laboratoire Traitement du Signal et Instrumentation (TSI), Université Jean Monnet, UMR CNRS 5516, 42000 Saint-Etienne, France�Received 17 December 2004; published 6 April 2005�
Ablation of Cu and Al targets has been performed with 170 fs laser pulses in the intensity range of1012–1014 W cm−2. We compare the measured removal depth with 1D hydrodynamic simulations. Theelectron-ion temperature decoupling is taken into account using the standard two-temperature model. Theinfluence of the early heat transfer by electronic thermal conduction on hydrodynamic material expansion andmechanical behavior is investigated. A good agreement between experimental and numerical matter ablationrates shows the importance of including solid-to-vapor evolution of the metal in the current modeling of thelaser matter interaction.
DOI: 10.1103/PhysRevB.71.165406 PACS number�s�: 61.80.Az, 72.15.Cz, 79.20.Ap
I. INTRODUCTION
Ultrafast phenomena driven by subpicosecond laserpulses have been the subject of thorough investigation formany years in order to explain the ablation of solidmaterials.1–4 As opposed to the laser-dielectric interactionwhere thermal and athermal ablation regimes probably takesplace,5–7 the laser-metal interaction is mainly governed bythe thermal ablation one.6,8 The laser energy is absorbed bythe free electrons first. The pulse duration being shorter thanthe electron-phonon relaxation time ��e−ph�10−12 s�, elec-trons and ions subsystems must be considered separately.The “two-temperature model” �TTM� describes the thermaltransport of energy by the electrons and the energy transferfrom the electrons to the lattice.9Numerous theoretical and experimental previous works
have been devoted to the study of the matter ablation with asingle laser pulse. Experimental irradiation conditions in cur-rent applications are largely investigated to optimize the ab-lation rate: pulse duration,10 fluence,11 and backgroundgas.12,13 However, a complete view including all the relevantphysical mechanisms is still lacking. To get a better under-standing of the ablation process and to extend the results intosituations not covered by the experiments, two kinds of in-vestigations are put at work: �i� a complete identification ofthe various physical mechanisms responsible for the materialremoval from the surface and �ii� an evaluation of the impactof these various processes on the amount of ablated matter.In the works previously addressed, few calculations are ableto provide a direct comparison with experiments. Most ofthem are focused on thermal transport and a more detaileddescription of the physical processes occuring in the materialhas to be incorporated to really describe the whole ablationprocess. Among these, works based on hydrodynamicmodeling1,2,14,15 have been recently associated to the TTM todescribe the ablation process. To overcome the drawbacks ofa material fluid treatment, a mechanical extension of theTTM has been proposed to model the ultrafast thermomelas-ticity behavior of a metal film.16 Works based on moleculardynamics allow access to the influence of the ultrafast energydeposition on the thermal and mechanical evolution proper-
ties of the material.17,18 With a different approach, other au-thors have performed a microscopic analysis of the mecha-nisms of ultrashort pulse laser melting by means of a hybridmolecular-dynamic and fluid modelization.3,4From all these investigations, it appears that none of these
effects may be neglegted to reproduce the features of thedamage resulting from an ultrashort laser irradiation. More-over, there is a lack of investigations which combine experi-mental and theoretical results so that current models are stillquestionable. In the present simulations, the TTM providesenergy deposition in an expanding material intimately corre-lated with the processes governing the ablation in the ul-trashort pulse case, which is a specificity of our hydrody-namic approach. Simulation results give useful insight intothe presented experiment data.Transport properties of electrons are not very well under-
stood in nonequilibrium electron-ion systems. However, thecomprehension of these phenomena in the context of ul-trafast interaction is essential not only for fundamental pur-poses but also for micromachining applications. A precisedescription of the effect of the electronic temperature on theabsorption seems to be still unsettled,19–21 and it has not beentaken into account in the presented calculations. Neverthe-less, the model employed in this work uses a large set ofcurrent available data.Obviously, numerical calculations are always requiring
additional information such as electron-phonon or electron-electron relaxation times, which may be extracted, from ex-perimental data.22,23 Reciprocally, comparison between simu-lations and experiments allows us to validate physical dataintroduced into the theoretical models. For instance, we shallsee in the following that the measure of the pressure varia-tion with time inside the material would be very informative.These data, however, are difficult to measure with a highaccuracy. By contrast, experimental measure of laser ablationrate seems to be easier to be obtained and compared withnumerical simulations.In this article, numerical and experimental results on ab-
lated matter are reported. For this purpose, the TTM is in-serted into a hydrodynamic code in order to describe thematerial removal. First we detail the physical processeswhich are taken into account in our computations within the
PHYSICAL REVIEW B 71, 165406 �2005�
1098-0121/2005/71�16�/165406�6�/$23.00 ©2005 The American Physical Society165406-1
115

framework of hydrodynamical modeling. Then, the effectscaused by relaxation processes on the evolution of shockwaves are examined. We next present the experiments thathave been performed to obtain ablation depth measurementsas a function of the laser fluence. Finally, our discussions arebased on the results of numerical simulations on Cu and Alsamples compared with specific experimental measurements.
II. THEORETICAL MODEL
To represent numerically the interaction between the laserand the metallic target, we used a 1D Lagrangian hydrody-namic code.24 Solving the Helmholtz wave equation permit-ted us to determine the electromagnetic field through theregion illuminated by the laser. The deposited energy is thendeduced using the Joule-Lenz law. A precise result for theabsorption from an arbitrary medium can be obtained fromthe direct solution of the equation for the electromagneticfield. Let us consider a planar wave propagating along the zaxis. We write the following Helmholtz equation for thecomplex amplitude of the electric field Ez with frequency �:
�Ez − � � Ez + �1 + i4�
���T,����2
c2Ez = 0, �1�
where ��T ,�� is the complex conductivity and c is the lightspeed. The function � is calculated as a function of the den-sity ��z� and the temperature T�z�. The relative permittivityof the medium is supposed to be equal to the unity in thecase of a metal target. These simulations need accurate datasuch as transport coefficients in solids, liquids, vapors, anddense or diluted plasmas, specially refractive indices,25 elec-tric and thermal conductivities,26 and mechanical propertiessuch as material strength. The evolution of the irradiatedtarget is governed by the fluid hydrodynamic and heat diffu-sion equations connected with a multi-phase equation ofstate �EOS�. Thermodynamic functions that realistically de-scribe characteristics of metal properties in various parts ofthe phase diagram are needed. Such a set of different metalEOS is generated by means of a numerical tool developed bythe authors of Ref. 27. As an illustration of the EOS used,Fig. 1 displays isobars in the phase diagram temperature-specific energy of the copper for a wide range of pressures.Such data reveal the dependence on the thermodynamicproperties of the melting and vaporization processes.The mechanical propagation of shock waves and fracture
are also simulated. Elastoplasticity is described by a strain-rate-independent model �relevant to high strain rate condi-tions at high pressure, typically beyond 10 GPa�, which ac-counts for pressure-, temperature- and strain-dependent yieldstrength and shear modulus.28 Laser-induced stresses are thecombination of the hydrostatic pressure and the response tothe shearing deformation. In the temperature range of interesthere, the effect of radiative energy transport on the hydrody-namic motion is negligible. Hence we ignore energy trans-port by radiation when solving the hydrodynamic equations.Ultrashort laser irradiation and the associated ionic and
electronic temperature decoupling require us to introducespecific electronic parameters. We assume that free electrons
form a thermal distribution during the interaction and use theFermi-Dirac distribution to determine the electron properties�energy, pressure, and heat capacity� as a function of thedensity and the temperature.29 The evanescent electromag-netic wave is absorbed by the electrons. In our range ofintensity, they are quickly heated at a temperature of few eV.During and after the pulse, the energy diffuses among theelectrons and is then transferred to the lattice. Classical heatdiffusion plays a significant role as soon as a thermal gradi-ent occurs in the material. Diffusion processes are describedby the following equations:
�Ce�Te�t= � �Ke � Te� − ��Te − Ti� + S , �2�
�Ci�Ti�t= � �Ki � Ti� + ��Te − Ti� , �3�
where T, C, and K are the temperature, the specific heat, andthe thermal conductivity, respectively. Indices “e” and “i”stand for electron and ion species. � is the mass density. �characterizes the rate of energy exchange between the twosubsystems and S is the space- and time-dependent lasersource term determined by the Joule-Lenz law. Introductionof the TTM in a hydro-code allows us to take into accountthe density dependence of both specific heats and conductivi-ties. Ce�Te ,�� is calculated with the Fermi model using�-dependent chemical potentials.29 The electron thermal con-ductivity Ke is commonly expressed in the form30
Ke = �e2 + 0.16�5/4�e
2 + 0.44��e2 + 0.092�1/2�e
2 + �i�e, �4�
where e and i are electron and ion temperature normalizedto the Fermi temperature �e=Te /TF , i=Ti /TF� and , �are material-dependent parameters.3,31 The linear variation ofthe coupling term with �Te−Ti� is classic in TTM: we havetaken �=�0 as 3�1016 W K−1 m−3 for copper22 and 3�1017 W K−1 m−3 for aluminum.20 It must be noticed thatthe values of Ke and � are subject to considerable uncertaintyin literature.3 To accurately describe the ultrafast response,
FIG. 1. The representation of isobars in a phase diagram of thecopper EOS in the region of phase transitions.
J. P. COLOMBIER et al. PHYSICAL REVIEW B 71, 165406 �2005�
165406-2
116

we incorporate electronic pressure into the set of hydrody-namic equations. The system of equations for electron andion subsystems can be written in the Lagrangian form:
� e
�t= − pe
�V�t,
� i
�t= − pi
�V�t,
�u�t= −
�
�m�pe + pi�,
�V�t=
�u�m, �5�
where u is the fluid velocity, m is the mass and V is thespecific volume. pe , e , pi , i are the pressure and the spe-cific energy of electrons and ions. Equations �2�–�5� con-nected with a multiphase equation of state �EOS�27 constitutea self-consistent description of the matter evolution. How-ever, the pressure p�Te=Ti� provided by this EOS is the sumof the electronic and ionic pressures at the equilibrium andhas to be replaced by the sum of these two contributions outof equilibrium. The electronic pressure is independently de-termined by means of the standard fermion gas model. As aconsequence, the total pressure used in the above calcula-tions is determined as p�Te�Ti�=pe�Te�−pe�Ti�+pi�Ti�.
III. SIMULATIONS AND ANALYSIS
To start with, the interaction of a 10 J cm−2, 170 fsFWHM Gaussian pulse at 800 nm wavelength with a coppertarget is investigated. Figure. 2 shows the space-time evolu-tion of the induced stress. The metal surface is heated to amaximum of 2950 K, 30 ps after the irradiation. At this time,the free surface expands in a liquid state with a velocity of400 ms−1. Due to the electron heating, an electronic com-pression wave appears at the end of the laser pulse. Theelectron-ion energy exchange results in a significant increasein the ionic pressure, which propagates inside the metal. Be-hind the shock, tensile stress occurs associated with veryhigh strain rate around 109 s−1.In order to study the sensitivity of the above results with
respect to the physical parameters, we compare in Fig. 3 the
time variation of the computed stress at 1 �m depth understandard conditions ��=�0 and Ke=Ke0� with those obtainedwith an increased coupling factor or electronic conductivity.In the first hundred picoseconds, the stress growth is di-
rectly related to the heating depth. The increased couplingfactor leads to a steeper thermal gradient and a lower tem-perature at 1�m depth compared to the other situations. Theresulting stress is therefore lower in this case. The peak ofthe shock wave, propagating from the surface, reaches the1�m depth at 200 ps. Increasing the coupling factor acceler-ates the energy transfer from the electrons to the lattice andresults in higher compression. Inversely, an enhanced elec-tronic conductivity spreads the energy spatial profile andyields reduced stresses. It must be noticed that in the threecases, the compression is followed by a high tensile stressgreater than the characteristic tensile strength of the material.Nevertheless, the loading in tension is not long enough �150ps� to induce a fracture in the medium.32,33 The shock dura-tion and intensity provide a good signature of the balancebetween the electronic diffusion and the electron-ion cou-pling. Further improvements will be discussed in the follow-ing.To obtain local information on the energy transfer induced
by a femtosecond laser irradiation, a high-resolution timemeasurement of the stress reaching the rear side of a thinsample could be achieved.34,35 Such experimental recordscould be directly compared with our simulations whichwould led us to refine the �� ,Ke� physical values accord-ingly. To validate the computation, we performed ablationmeasurements and compared them to the current simulationsusing standard values of �� ,Ke� for aluminum and coppersamples.
IV. EXPERIMENT DETAILS
Ultrashort laser pulses are generated by an amplified allsolid-state Ti:sapphire laser chain. Low energy pulses are
FIG. 2. �Color online� The contour plots of the stress resultingfrom the irradiation of a copper target by a 170 fs, 10 J cm−2 laserpulse.
FIG. 3. The time evolution of the stress in copper at 1 �m depthresulting from a 170 fs, 10 J cm−2 laser pulse. Standard conditions :�=�0 and Ke=Ke0 �solid line�, �=5 �0 �dashed line�, and Ke=10 Ke0 �dotted line�.
HYDRODYNAMIC SIMULATIONS OF METAL ABLATION… PHYSICAL REVIEW B 71, 165406 �2005�
165406-3
117

extracted from a mode-locked oscillator �1.6 nJ/pulse, 80MHz, 800 nm, 120 fs�. The pulses are then injected into anamplifying chain including an optical pulse stretcher, a re-generative amplifier associated with a two-pass amplifier us-ing a 20 W Nd:YLF laser as pumping source, and a pulsecompressor. Linearly polarized pulses with wavelength cen-tered around 800 nm, an energy of 1.5 mJ at 1 kHz repetitionrate, and typical duration of 170 fs were delivered. Thesamples are mounted on a three-motorized-axes system with0.5 �m accuracy. Experiments are performed in the imageplane of an aperture placed before the objective. The result-ing spatial laser profile on sample is “top hat” so that bordersand spurious conical drilling effects are reduced. Focusingobjectives of 25 or 10 mm focal lengths are used to obtainfluences in a range of 0.5 to 35 J cm−2 with the same beamsize, 16 �m in diameter, in the image plane.For ablation depth measurements, grooves are machined
by moving the sample.36 The sample speed is adapted suchthat each point on the groove axis undergoes eight consecu-tive irradiations at each target pass. The number of times thesample passes in front of the fixed beam can be adjusted.Figure 4 shows a scanning electron microscopy �SEM� pic-ture of the machined grooves on copper for two, four, six,eight, and ten passes. The groove depth is measured using anoptical profilometer with a 10 nm depth resolution. The ab-lation rates for each groove are deduced taking into accountthe sample speed, the repetition rate of the laser, the beamsize, and the number of passes. For each energy density, anaveraged ablation rate is determined and the number ofpasses has been chosen to obtain reproducible results. Fromthese experiments on copper and aluminum targets, weevaluate, for different fluences, an ablation depth averagedover a few tens of laser shots. The theoretical ablation depthis deduced from 1D numerical simulations using a criteriondiscussed hereafter.
V. RESULTS AND DISCUSSION
At moderate fluence, the propagation of the shock waveinduced by the energy deposition on the lattice causes thesurface expansion at very high speed and significant nonuni-form strain rates. Simultaneously, the surface of the target ismelted or vaporized as soon as the conditions of temperatureand density required are fulfilled. High strain rates can turnthe liquid region into an ensemble of droplets and ablationfollows. This process is called the homogeneousnucleation.37 Unfortunately, quantitative values on the for-mation and ejection of liquid droplets are difficult to accessbecause the interfacial solid-liquid microscopic properties of
the nucleation centers are not accurately known. Neverthe-less, in our simulation we can consider that the liquid layeraccelerated outside the target corresponds to the ablated mat-ter. Large values of strain rates �109 s−1� indeed signal thatdroplet formation may occur and are sufficient to produceablation. At higher fluence, the surface is strongly vaporized.The gas expands near the free surface and compresses theinternal matter. The vaporized part of the target added to thefraction of the above-defined liquid layer constitute the cal-culated ablated matter. Experimental results on ablation ofcopper and aluminum are compared with the numerical esti-mates in Figs 5 and 6.Sharp numerical ablation thresholds are visible at 3 and
0.5 J cm−2 for Cu and Al targets, respectively. At high flu-ence, the ablation saturates for both materials. This saturationoccurs mainly for two reasons. Vaporization and subsequentgas expansion consume energy that does not contribute to theablation process. Moreover, the liquid layer confinement
FIG. 4. The SEM picture of machined-groove profiles, from twoto ten passes, on a copper sample.
FIG. 5. The experimental and numerical �solid line� ablationdepth as a function of the laser fluence on a copper target obtainedwith a 170 fs laser pulse. The dashed line shows evolution of thespecific removal rate.
FIG. 6. The experimental and numerical �solid line� ablationdepth as a function of the laser fluence on an aluminum targetobtained with a 170 fs laser pulse. The dashed line shows evolutionof the specific removal rate.
J. P. COLOMBIER et al. PHYSICAL REVIEW B 71, 165406 �2005�
165406-4
118

increases as far as the gas expands and limits the liquid re-moval.As defined by Feit et al.,7 a specific removal depth, i.e.,
depth removed per unit of incident fluence, could be a rel-evant parameter to estimate the ablation efficiency at a fixedpulse duration. Calculations of this quantity are carried outas a function of the laser fluence. The dashed curve presentedin Fig. 6 indicates a maximum value of 0.5 J cm−2 in thealuminum case. The curve is smoother for copper in Fig. 5and the maximum specific removal depth is reached at afluence around 5 J cm−2. This point corresponds to the oc-curence of a critical behavior which confirms a change in thehydrodynamic behavior. While the thickness of the liquidlayer grows with the incident energy, the specific removaldepth rises. Afterwards, when the gas expansion starts, agrowing part of the laser energy is transformed in kineticenergy and the specific removal depth drops. This suggeststhat an optimum material removal exists and refers to thesituation when the surface vaporization is limited. It appearsthat this quantity is relevant for material processing whichcan be optimized by operating at this optimal fluence.At low fluence, a noticeable discrepancy arises between
the experimental and numerical results. The calculated ab-lated matter for a copper target is below the experimentalresults, while for an aluminum target, numerical results areabove. We suspect that electron transport properties shouldbe further improved. It has been shown that a significantdecrease in the electrical conductivity may take place as aresult of the electronic temperature increase,19 which ourmodel discards. However, the experimental measurementsand the theoretical calculations come to a reasonable agree-ment at higher fluence. As it has been shown by Fisher etal.,20 in the vicinity of an 800 nm wavelength, the interbandabsorption occuring in an aluminum target decreases withincreasing temperature. The authors show that, with 50 fslaser pulses, the absorbtion coefficient presents a minimumnear the ablation threshold, at 5 �1013 W cm−2 laser inten-sity. The evolution of interband absorption with the tempera-ture is not taken into account in our calculations. Conse-quently, we may overestimate the energy absorbed in thisintensity region.For copper, the simulation overestimates the ablation
threshold. This can be due to a deficit of physical processcomprehension or to the inaccuracy of the parameters intro-duced in the model. No single value of � or Ke can perfectlyfit the sets of data shown in Figs. 5 and 6. As for the discus-sion of pressure presented above, one can think that a changein � or Ke has a similar effect on the threshold fluence FTh.Therefore, it is interesting to investigate the fluence thresholddependence on � and Ke. A parametric analysis has beenperformed for a copper target. Figure 7 displays the thresholdfluence which has been obtained for different parametercouples �� , Ke=Ke0� and ��=�0 , Ke�. The deposited energywith lower thermal conductivity or higher coupling factorcan penetrate deeper into the material. As a consequence, FThis lowered with respect to that of the reference case ��0 ,Ke0�and would be comparable with experimental data in the vi-cinity of the threshold. However, simulations performed inthese conditions have shown a higher disagreement with ex-perimental data at higher fluence due to an earlier expanded
vapor. On the contrary, for a reduced � or an enhanced Kevalue, FTh increased and the ablation depth at high fluence isoverestimated.Results obtained with one-temperature simulations evi-
dence the importance of the TTM to reproduce the experi-mental results. The good agreement obtained between ex-perimental data and simulations underlines the need ofcoupling the TTM model with a hydrodynamic code for ab-lation simulations in metals. Numerical results presented inthis paper give an overall description of processes occuringduring ultrashort laser ablation experiments.
VI. CONCLUSION
In this paper, we have reported new results on the inter-action of femtosecond laser pulses with metal targets at in-tensities up to 1014 W cm−2. Numerical computations werecarried out by means of a 1D hydrodynamic code describingthe laser field absorption and the subsequent phase transi-tions of matter. Simulations were compared to original abla-tion experiments performed on aluminum and coppersamples. The behavior of the ablation depth as a function oflaser fluence confirms the importance of the use of a specifictwo-temperature equation of state and hydrodynamics. Anoptimum condition for laser fluence has been identified andcould provide a precious information for efficient materialprocessing. We have highlighted that the ablation process isnot only governed by electronic diffusion but also by thehigh shock formation and propagation. The differences be-tween experimental and numerical results remain, however,more pronounced for low laser fluences.We took great care to extend the metal properties to the
nonequilibrium case. Nevertheless, inclusion of realistic ma-terial parameters, such as the sophisticated band structure ofmetals or various scattering mechanisms, would allow calcu-
FIG. 7. The calculation of the threshold fluence dependence onthe coupling parameter � and the electronic conductivity Ke forcopper. Simulations are performed for different ratios of the stan-dard value of one parameter remaining and the second one constant.Consequently, the intersection of curves coincides with the valueused in the calculation of the ablation rate presented in Fig. 5.
HYDRODYNAMIC SIMULATIONS OF METAL ABLATION… PHYSICAL REVIEW B 71, 165406 �2005�
165406-5
119
lations with more accuracy. Also, a full nonequilibrium treat-ment should take into account the conductivity dependencewith both electron-electron and electron-phonon collisions.This work is in progress and implies an elaborate opticalabsorption model more suitable for ultrashort laser pulse.Simulations suggest that the in-depth stresses induced by
an ultrashort laser pulse provide information of the matter
dynamics in time, with which experimental pressure mea-surements could be compared. In particular, because it devel-ops over temporal scales larger than the energy depositionone, the characteristic shape of the delayed shock conveysinformation about the interaction physics and it should thussupply a promising way for exploring matter distortionsupon picosecond time scales.
1A. M. Komashko, M. D. Feit, A. M. Rubenchik, M. D. Perry, andP. S. Banks, Appl. Phys. A: Mater. Sci. Process. A69, Suppl.S95 �1999�.
2S. Laville, F. Vidal, T. W. Johnston, O. Barthélemy, M. Chaker,B. Le Drogoff, J. Margot, and M. Sabsabi, Phys. Rev. E 66,066415 �2002�.
3C. Schäfer, H. M. Urbassek, and L. V. Zhigilei, Phys. Rev. B 66,115404 �2002�.
4D. S. Ivanov and L. V. Zhigilei, Phys. Rev. Lett. 91, 105701�2003�.
5R. Stoian, A. Rosenfeld, D. Ashkenasi, I. V. Hertel, N. M. Bul-gakova, and E. E. B. Campbell, Phys. Rev. Lett. 88, 097603�2002�.
6N. M. Bulgakova, R. Stoian, A. Rosenfeld, I. V. Hertel, and E. E.B. Campbell, Phys. Rev. B 69, 054102 �2004�.
7M. D. Feit, A. M. Komashko, A. M. Rubenchik, Appl. Phys. A:Mater. Sci. Process. 79, 1657 �2004�.
8E. G. Gamaly, A. V. Rode, B. Luther-Davies, and V. T. Tikhon-chuk, Phys. Plasmas 9, 949 �2002�.
9S. I. Anisimov, B. L. Kapeliovich, and T. L. Perel’man, Zh. Eksp.Teor. Fiz. 66, 776 �1974� �Sov. Phys. JETP 39, 375 �1974��.
10B. Sallé, O. Gobert, P. Meynadier, M. Perdrix, G. Petite, and A.Semerok, Appl. Phys. A: Mater. Sci. Process. A69, Suppl. S381�1999�.
11S. Nolte, C. Momma, H. Jacobs, A. Tnnermann, B. N. Chichkov,B. Wellegehausen, and H. Welling, J. Opt. Soc. Am. B 14, 2716�1997�.
12A. E. Wynne, B. C. Stuart, Appl. Phys. A: Mater. Sci. Process.A76, 373 �2003�.
13S. Preuss, A. Demchuk, and M. Stuke, Appl. Phys. A: Mater. Sci.Process. A61, 33 �1995�.
14K. Eidmann, J. Meyer-ter-Vehn, T. Schlegel, and S. Hller, Phys.Rev. E 62, 1202 �2000�.
15Y. V. Afanasiev, B. N. Chichkov, N. N. Demchenko, V. A. Isa-kov, and I. N. Zavestovskaya, 28th Conference on ControlledFusion and Plasma Phys. Funchal, ECA 25A, �2001�, p. 2021.
16J. K. Chen, J. E. Beraun, L. E. Grimes, and D. Y. Tzou, Int. J.Solids Struct. 39, 3199 �2002�.
17D. Perez and L. J. Lewis, Phys. Rev. Lett. 89, 255504 �2002�.
18P. Lorazo, L. J. Lewis, and M. Meunier, Phys. Rev. Lett. 91,225502 �2003�.
19H. M. Milchberg, R. R. Freeman, S. C. Davey, and R. M. More,Phys. Rev. Lett. 61, 2364 �1988�.
20D. Fisher, M. Fraenkel, Z. Henis, E. Moshe, and S. Eliezer, Phys.Rev. E 65, 016409 �2001�.
21B. Rethfeld, A. Kaiser, M. Vicanek, and G. Simon, Phys. Rev. B65, 214303 �2002�.
22P. B. Corkum, F. Brunel, N. K. Sherman, and T. Srinivasan-Rao,Phys. Rev. Lett. 61, 2886 �1988�.
23V. E. Gusev and O. B. Wright, Phys. Rev. B 57, 2878 �1998�.24F. Bonneau, P. Combis, J. L. Rullier, J. Vierne, B. Bertussi, M.Commandré, L. Gallais, J. Y. Natoli, I. Bertron, F. Malaise, andJ. T. Donohue, Appl. Phys. B: Lasers Opt. B78, 447 �2004�.
25E. Palik, Hand book of Optical Constants of Solids �Academic,London 1985�.
26W. Ebeling, A. Förster, V. Fortov, V. Griaznov, and A. Polish-chuk: Thermophysical Properties of Hot Dense Plasmas �Teub-ner, Stuttgart 1991�.
27A. V. Bushman, I. V. Lomonosov, and V. E. Fortov, Sov. Technol.Rev. B 5, 1 �1993�.
28D. J. Steinberg, S. G. Cochran, and M. W. Guinan, J. Appl. Phys.51, 1498 �1980�.
29N. W. Ashcroft and N. D. Mermin, Solid State Physics �SaundersCollege, New York, 1976�.
30S. I. Anisimov and B. Rethfeld, Proc. SPIE 3093, 192 �1997�.31X. Y. Wang, D. M. Riffe, Y.-S. Lee, and M. C. Downer, Phys.Rev. B 50, 8016 �1994�.
32F. R. Tuler, and B. M. Butcher, Int. J. Fract. Mech. 4, 431 �1968�.33V. I. Romanchenko and G. V. Stepanov, J. Appl. Mech. Tech.Phys. 21, 555 �1981�.
34L. Tollier and R. Fabbro, J. Appl. Phys. 83, 1224 �1997�.35 J. P. Romain, F. Bonneau, G. Dayma, M. Boustie, T. deRességuier, and P. Combis, J. Phys.: Condens. Matter 14, 10793�2002�.
36R. Le Harzic, Ph.D. thesis, Université de Saint-Etienne, 2002.37B. Rethfeld, K. Sokolowski-Tinten, D. Von der Linde, and S. I.Anisimov, Phys. Rev. B 65, 092103 �2002�.
J. P. COLOMBIER et al. PHYSICAL REVIEW B 71, 165406 �2005�
165406-6
120

Optical emission and nanoparticle generation in Al plasmas using ultrashort laser pulsestemporally optimized by real-time spectroscopic feedback
M. Guillermin,1 J. P. Colombier,1 S. Valette,2 E. Audouard,1 F. Garrelie,1,* and R. Stoian1,†
1Laboratoire Hubert Curien, UMR CNRS 5516, Université de Lyon, Université Jean Monnet, 42000 Saint-Etienne, France2Laboratoire de Tribologie et Dynamique des Systémes, UMR CNRS 5513, École Centrale de Lyon, 69134 Écully, France
�Received 9 November 2009; revised manuscript received 26 May 2010; published 20 July 2010�
With an interest in pulsed laser deposition and remote spectroscopy techniques, we explore here the potentialof laser pulses temporally tailored on ultrafast time scales to control the expansion and the excitation degree ofvarious ablation products including atomic species and nanoparticulates. Taking advantage of automated pulse-shaping techniques, an adaptive procedure based on spectroscopic feedback is applied to regulate the irradianceand enhance the optical emission of monocharged aluminum ions with respect to the neutral signal. This leadsto optimized pulses usually consisting in a series of femtosecond peaks distributed on a longer picosecondsequence. The ablation features induced by the optimized pulse are compared with those determined bypicosecond pulses generated by imposed second-order dispersion or by double pulse sequences with adjustablepicosecond separation. This allows to analyze the influence of fast- and slow-varying envelope features on thematerial heating and the resulting plasma excitation degree. Using various optimal pulse forms includingdesigned asymmetric shapes, we analyze the establishment of surface pre-excitation that enables conditions ofenhanced radiation coupling. Thin films elaborated by unshaped femtosecond laser pulses and by optimized,stretched, or double pulse sequences are compared, indicating that the nanoparticles generation efficiency isstrongly influenced by the temporal shaping of the laser irradiation. A thermodynamic scenario involvingsupercritical heating is proposed to explain enhanced ionization rates and lower particulates density for optimalpulses. Numerical one-dimensional hydrodynamic simulations for the excited matter support the interpretationof the experimental results in terms of relative efficiency of various relaxation paths for excited matter aboveor below the thermodynamic stability limits. The calculation results underline the role of the temperature anddensity gradients along the ablated plasma plume which lead to the spatial distinct locations of excited species.Moreover, the nanoparticles sizes are computed based on liquid layer ejection followed by a Rayleigh andTaylor instability decomposition, in good agreement with the experimental findings.
DOI: 10.1103/PhysRevB.82.035430 PACS number�s�: 52.38.Dx, 42.25.Bs, 05.70.Ln, 79.20.Ds
I. INTRODUCTION
Rapid development in ultrafast laser technologies duringlast decades has been accompanied by an intense researchactivity concerning the control and the understanding oflaser-induced ultrafast processes. The femtosecond laserpulse allows the confinement of electromagnetic energydeposition in space and time. This strong localization of theinteraction reduces the energy expense of ablation and limitsthe thermally affected area.1,2 The fast quasi-isochoric heat-ing produced by femtosecond laser pulses pushes the irradi-ated material in extreme thermodynamical states. At suffi-cient energy, high heating rates allow the onset ofsupercritical relaxation paths for the superficial layers andthe corresponding ablation mechanisms can be assigned toan atomization or fragmentation of the hot fluid.3,4 As thedistribution of the deposited energy density is nonuniform,the deeper layers undergo other ablation mechanisms involv-ing crossing thermodynamics boundaries into the gas-liquidcohabitation zone. Strong pressure wave generation associ-ated with the material expansion induces the decompositionand the ejection of the metastable matter through ablationprocesses described in terms of phase explosion.5–8 Lastly,deep molten layers decay along the binodal in a dominantlyliquid phase subject to capillary forces and forming the re-cast.
The confinement of energy deposition associated to fem-tosecond laser irradiation is critical for applications such as
micromachining,1 laser-induced forward transfer,9,10 or laser-induced breakdown spectroscopy �LIBS�,11,12 through phe-nomena that include localized removal, shock wave genera-tion, or limitation of the target damage extent. The nonlinearproperties of ultrashort laser pulses propagation allow aswell the development of long-distance applications such asremote spectroscopy for atmospheric analysis.13 In the typi-cal ablation regimes, the high kinetic energy of the ablatedspecies in the plasma plume permits the production throughpulsed laser deposition �PLD� techniques of thin films withlow residual stress14–16 and conservation of targetstoichiometry.17 Among the new possibilities opened by thecapability of femtosecond pulses to induce nonequilibriumand extreme states in the irradiated solid, direct nanoparticlesejection is one of the most striking characteristics of ul-trashort laser ablation.18–20 In addition, critical states allowthe onset of specific thermodynamics condition for gas-phasecondensation of nanoparticles.21 This particular effect offemtosecond laser ablation offers a new path to elaboratenanostructured thin films by PLD.22–24
The efficiency of the PLD process is related to the abilityto control the ablation plume characteristics such as compo-sition, excitation, reactivity, and kinetic properties of species,or generation of particulates. In particular, the understandingand the control of the nanoparticles generation processessubsequent to femtosecond laser irradiation are very promis-ing topics in terms of fundamental research and technologi-
PHYSICAL REVIEW B 82, 035430 �2010�
1098-0121/2010/82�3�/035430�16� ©2010 The American Physical Society035430-1
121

cal applications. The ablation products characteristics can beinfluenced through parameters such as laser wavelength,pulse duration, laser fluence, laser spot size, substrate tem-perature, or residual pressure. For example, recent studiesreport the analysis of nanoparticles production according tothese parameters,25–28 indicating a potential control of nano-particles surface density and size distributions. The challengeis to obtain improved and controllable throughputs withminimal energy and material costs.
A promising approach of the laser-matter interaction con-trol consists in the modification of the energy deposition ratethrough the temporal tailoring of laser pulses on ultrafasttime scales. A simple version involves laser systems deliver-ing pulses of different durations by dispersion control on thecompression stage or interferometric setups to generatedouble pulses �DPs� sequences. These techniques have beenapplied to improve processes such as laser microfabricationof metals,29–35 dielectrics,33,36,37 or semiconductors,33,37–39
LIBS12,33,40–44 and PLD.45–47 With the advent of automatedpulse-shaping techniques, the phase modulation derivingfrom spectral filtering of femtosecond laser pulses48 and theassociated effect in the temporal domain allow to definemore complex temporal shapes which can be efficiently usedto optimize processing or material transfer applications.49–51
Moreover, in view of the complexity of the laser ablationprocess, these programmable techniques allow the imple-mentation of improvement loops and advanced optimizationprocedures, making possible new interaction paths and in-creased synergies between light and matter.
In this context, the temporal distribution of the laser irra-diation on ultrafast time scales becomes a key parameter forcontrolling ablation scenarios. Usually several modeling andnumerical simulation studies are used to bring determinantelements toward understanding phenomena underlying fem-tosecond laser ablation.8,52,53 Nevertheless, the analyticaldefinition of adapted temporal shapes of laser pulses for par-ticular optimization purposes, such as control of the plasmaplume excitation and ionization state or influence on thenanoparticles generation, remains a challenge due to themany intermediate and complex phases between excitationand ablation. To overcome these theoretical limitations, it isoften of advantage to actively couple the experimental char-acterization device with the pulse envelope control unit �e.g.,based on spatial light modulators �SLMs�48� in a loop drivenby self-adapting procedures �e.g., learning evolutionary algo-rithm�. Initially applied in the field of femtochemistry,54–57
those adaptive procedures have recently been used to im-prove femtosecond laser ablation processes. The yield ofions production during the ablation of silicon and the laserenergy coupling to an aluminum target have been optimizedusing a feedback based on time-of-flight mass spectrometry�MS-TOF�.6,58,59 The second-harmonic generation signal hasbeen used to characterize and optimize pulses formachining60 while the generation of nanoparticles processhas been influenced by using additionally an electrical low-pressure cascade impactor.61
The study reported in this paper is focused on the controlof femtosecond laser ablation of aluminum in the fluencerange usually employed in LIBS and PLD applications. Fol-lowing the approach reported in a previous study �Ref. 6�
devoted to the optimization of the energy coupling into analuminum target at more moderate laser fluence �typical forprecise machining applications� based on a MS-TOF signalfeedback, we aim here at influencing the ablation and plasmageneration processes through an adaptive procedure of opti-mization based on the spectral measurement of the plasmaplume optical emission corresponding to various atomic con-stituents. This is also motivated by the fact that spectral de-tection is largely employed in PLD studies. This work at-tempts thus to control the excitation and ionization state ofthe ablated material through a suited temporal tailoring of thefemtosecond pulses. Such a control on ablation propertiescould influence the plasma reactivity and the particulatesgeneration, having far reaching consequences for applica-tions. Optimization effects on plasma excitation and ioniza-tion states and on final ablation products could in turn becharacterized and linked to specific thermodynamic sce-narios. The influence of temporally optimized pulses on ab-lation results is successfully reproduced here by numericalsimulations providing elements to correlate temporal featuresof pulse shapes and physical ablation mechanisms inducedby the irradiation. A particular interest is dedicated to nano-particles generation.
The paper is divided in several sections. The followingsection describes the experimental device while Sec. III ex-poses the numerical simulation method of the material ther-modynamic evolution which is based on a hydrodynamicapproach. Section IV is devoted to the experimental andsimulation results concerning the plasma optical-emissionbehavior deriving from the optimization of the laser-pulsetemporal shapes. A discussion about the mechanisms leadingto additional plume excitation correlated with the sequenceof optical transients and phase changes is presented. SectionV presents an analysis of the influence the optimized pulsesexercise on nanoparticles generation.
II. EXPERIMENTAL SECTION
The experimental setup used in this study is depicted inFig. 1 and it is based on two main elements. The radiationsource is a femtosecond laser system with time-tailorablepulses irradiating a solid aluminum sample. The apparatus iscompleted by a detection and evaluation unit based on spec-troscopic analysis of the laser-induced plasma optical emis-sion.
The amplified femtosecond laser system delivers 150 fsfull width at half maximum �FWHM�, 1 mJ, p-polarizedpulses with a wavelength centered at 800 nm. The repetitionrate is controlled externally in the range 0.1 Hz to 1 kHz. Thelaser radiation is focused onto a pure aluminum rotating tar-get �99.9%� in a vacuum chamber �P�10−5 Pa� through a500 mm focal length lens. The incidence angle with respectto the target surface normal is 45°. The average fluence isestimated through recurrent measurements of the impact re-gion surface at various energies62 and is kept around thevalue of 5.8 J /cm2 �more than one order of magnitude largerthan the macroscopic ablation threshold63 evaluated at0.3 J /cm2 in good agreement with previous reports in theliterature5,31,64�.
GUILLERMIN et al. PHYSICAL REVIEW B 82, 035430 �2010�
035430-2
122
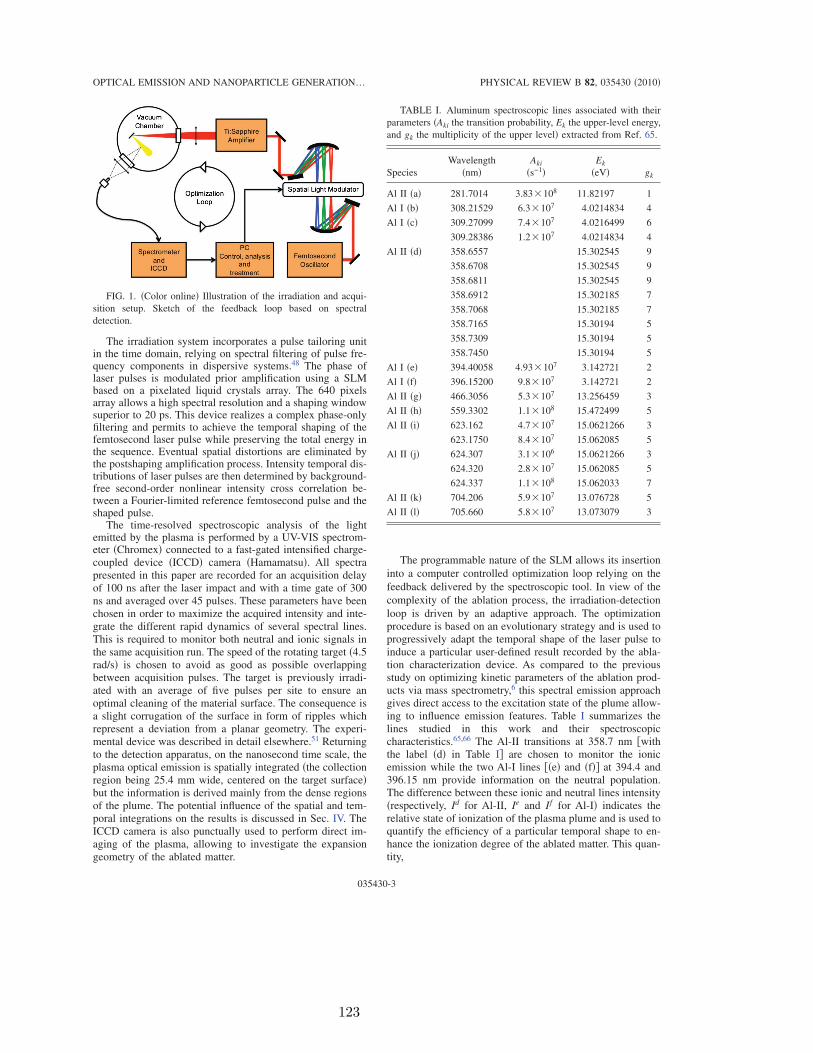
The irradiation system incorporates a pulse tailoring unitin the time domain, relying on spectral filtering of pulse fre-quency components in dispersive systems.48 The phase oflaser pulses is modulated prior amplification using a SLMbased on a pixelated liquid crystals array. The 640 pixelsarray allows a high spectral resolution and a shaping windowsuperior to 20 ps. This device realizes a complex phase-onlyfiltering and permits to achieve the temporal shaping of thefemtosecond laser pulse while preserving the total energy inthe sequence. Eventual spatial distortions are eliminated bythe postshaping amplification process. Intensity temporal dis-tributions of laser pulses are then determined by background-free second-order nonlinear intensity cross correlation be-tween a Fourier-limited reference femtosecond pulse and theshaped pulse.
The time-resolved spectroscopic analysis of the lightemitted by the plasma is performed by a UV-VIS spectrom-eter �Chromex� connected to a fast-gated intensified charge-coupled device �ICCD� camera �Hamamatsu�. All spectrapresented in this paper are recorded for an acquisition delayof 100 ns after the laser impact and with a time gate of 300ns and averaged over 45 pulses. These parameters have beenchosen in order to maximize the acquired intensity and inte-grate the different rapid dynamics of several spectral lines.This is required to monitor both neutral and ionic signals inthe same acquisition run. The speed of the rotating target �4.5rad/s� is chosen to avoid as good as possible overlappingbetween acquisition pulses. The target is previously irradi-ated with an average of five pulses per site to ensure anoptimal cleaning of the material surface. The consequence isa slight corrugation of the surface in form of ripples whichrepresent a deviation from a planar geometry. The experi-mental device was described in detail elsewhere.51 Returningto the detection apparatus, on the nanosecond time scale, theplasma optical emission is spatially integrated �the collectionregion being 25.4 mm wide, centered on the target surface�but the information is derived mainly from the dense regionsof the plume. The potential influence of the spatial and tem-poral integrations on the results is discussed in Sec. IV. TheICCD camera is also punctually used to perform direct im-aging of the plasma, allowing to investigate the expansiongeometry of the ablated matter.
The programmable nature of the SLM allows its insertioninto a computer controlled optimization loop relying on thefeedback delivered by the spectroscopic tool. In view of thecomplexity of the ablation process, the irradiation-detectionloop is driven by an adaptive approach. The optimizationprocedure is based on an evolutionary strategy and is used toprogressively adapt the temporal shape of the laser pulse toinduce a particular user-defined result recorded by the abla-tion characterization device. As compared to the previousstudy on optimizing kinetic parameters of the ablation prod-ucts via mass spectrometry,6 this spectral emission approachgives direct access to the excitation state of the plume allow-ing to influence emission features. Table I summarizes thelines studied in this work and their spectroscopiccharacteristics.65,66 The Al-II transitions at 358.7 nm �withthe label �d� in Table I� are chosen to monitor the ionicemission while the two Al-I lines ��e� and �f�� at 394.4 and396.15 nm provide information on the neutral population.The difference between these ionic and neutral lines intensity�respectively, Id for Al-II, Ie and If for Al-I� indicates therelative state of ionization of the plasma plume and is used toquantify the efficiency of a particular temporal shape to en-hance the ionization degree of the ablated matter. This quan-tity,
TABLE I. Aluminum spectroscopic lines associated with theirparameters �Aki the transition probability, Ek the upper-level energy,and gk the multiplicity of the upper level� extracted from Ref. 65.
SpeciesWavelength
�nm�Aki
�s−1�Ek
�eV� gk
Al II �a� 281.7014 3.83�108 11.82197 1
Al I �b� 308.21529 6.3�107 4.0214834 4
Al I �c� 309.27099 7.4�107 4.0216499 6
309.28386 1.2�107 4.0214834 4
Al II �d� 358.6557 15.302545 9
358.6708 15.302545 9
358.6811 15.302545 9
358.6912 15.302185 7
358.7068 15.302185 7
358.7165 15.30194 5
358.7309 15.30194 5
358.7450 15.30194 5
Al I �e� 394.40058 4.93�107 3.142721 2
Al I �f� 396.15200 9.8�107 3.142721 2
Al II �g� 466.3056 5.3�107 13.256459 3
Al II �h� 559.3302 1.1�108 15.472499 5
Al II �i� 623.162 4.7�107 15.0621266 3
623.1750 8.4�107 15.062085 5
Al II �j� 624.307 3.1�106 15.0621266 3
624.320 2.8�107 15.062085 5
624.337 1.1�108 15.062033 7
Al II �k� 704.206 5.9�107 13.076728 5
Al II �l� 705.660 5.8�107 13.073079 3
FIG. 1. �Color online� Illustration of the irradiation and acqui-sition setup. Sketch of the feedback loop based on spectraldetection.
OPTICAL EMISSION AND NANOPARTICLE GENERATION… PHYSICAL REVIEW B 82, 035430 �2010�
035430-3
123

f = Id − Ie − If , �1�
playing the role of the fitness parameter, guides the numeri-cal adaptive procedure.51
The adaptive procedure is applied to lock up temporalshapes that maximize the fitness value. Detailing this proce-dure, an initial group of temporal shapes randomly defined isranked with respect to the generated fitness value. The bestshapes are then selected and genetic propagators, mimickingbiological evolution �with processes such as crossover andmutation�, are applied in the Fourier spectral domain to de-fine a new group of temporal shapes for laser pulses. Thisprocess is iteratively reproduced until a satisfying optimiza-tion level is achieved. Because of the time-consuming char-acter of the evolutionary procedure, the integration for eachacquisition during the optimization process is set to 15 laserpulses �the final result is then acquired with 45 pulses peracquisition�. Moreover, this allows to limit the erosion of thetarget with a maximum of ten pulses per site.
In order to study the temporal shaping effect on the thin-film deposition process, pure silicon �100� substrates are po-sitioned in the vacuum chamber in front of the aluminumtarget surface at a distance of 38 mm to collect ablationproducts. All deposited layers mentioned in this article arerealized with 15-min-long irradiation at 1 kHz on separatesample areas and the achieved surface morphology is char-acterized using a mechanical profilometer and a scanningelectron microscope equipped with a field-emission gun�FEG-SEM�.
III. SIMULATION OF THERMODYNAMIC EVOLUTION
To accompany the experimental approach, we have per-formed the simulation of the nonequilibrium heating and ex-pansion of an aluminum sample irradiated by an ultrashort ora temporally-shaped laser pulse using a one-dimensionaltwo-temperature hydrodynamic code �Esther�.4 We are inter-ested in the thermal and kinetic properties of the plume at theend of the irradiation sequence. The utilized approach solves,according to a Lagrangian scheme, the fluid equations for theconservation of mass, momentum and energies for electronicand ionic species.4 The thermodynamic properties of the ma-terial �energy, temperature, pressure, density, heat of fusion,and vaporization� are described by the Bushman-Lomonosov-Fortov multiphase equation of state �EOS� thatencompasses a large range of densities and temperaturesstarting from cold condensed state and down to the hotplasma.67 This EOS provides the evolution of the thermody-namic properties and has already been applied to determinepaths followed by the excited matter and even to characterizethe nonequilibrium laser interaction process.6,68 In a firststep, the interaction between the laser field and the target iscalculated by solving the Helmholtz wave equation in theinhomogeneous media. This requires accurate values for thespatially varying conductivity through the Drude model. Weused the values from Ref. 69 in the solid phase while in theplasma phase we have used corresponding values from Ref.70 and, at lower densities, the Spitzer formula.71 The modeldescribing the ultrashort absorption was discussed in more
details elsewhere72 and represents an upgrade from themodel used previously �Ref. 6� by including additional con-tribution to absorption such as umklapp electronic collisions,a matter still under debate. For longer pulses, because of theformation of a density gradient in front of the target due tothe hydrodynamic expansion, shielding occurs and the laserbeam is partially absorbed before it reaches the dense part ofthe target. As coupling into the expanding matter is an im-portant factor, the laser energy can be considerably attenu-ated before it reaches the unperturbed part of the target, lead-ing to less efficient heating of the solid material. The totalamount of matter which undergoes melting and vaporizationis then reduced and the emphasis is moved to plasma evolu-tion. The energy sequence delivered by the shaped pulse dur-ing the initial expansion stages determines the plasma statesreached by the ablated Al target. Laser radiation is absorbedprimarily by inverse Bremsstrahlung through electron-electron, electron-phonon, electron-neutral, and electron-ioncollisions, having the consequence that the electron is raisedto a higher state in the continuum. Photoionization of excitedstates contributes only for energetic photons impinging oneasily ionized gas mixtures and it is neglected here.
Laser heating of metals can be modeled by four basicprocesses: the deposition of radiation energy on free elec-trons, the energy exchange between electrons and lattice, thediffusion of energy through media by free-electron motion,the heating and the conversion to mechanical energy by for-mation and propagation of shock waves. In the course ofultrashort laser heating, where the metal is looked upon as atwo-temperature system, the free electrons are heated to aneffective temperature much higher than that of the lattice.This imposes to include the two-temperature model in ournumerical approach to address the nonequilibrium processes�Ref. 73� and the large local temperature differences betweenthe electrons and the lattice. Subsequently, the transport ofenergy from the electrons to the lattice takes place by meansof an electronic thermal-conduction mechanism. A couplingcoefficient ��Te ,ne� between the electron and phonon sub-systems is considered. The relaxation mechanism is crucialin this work and we have taken a special care to describe thecoupling coefficient in a realistic manner. With respect toRef. 6 and considering the argumentation in Ref. 74, thedependence on electronic properties has been determinedhere by ��Te ,ne�=�0�Te�� �ne /ne
0�1/3, where ne0 is the elec-
tronic density in the initial solid state and �0�Te� the electron-phonon coupling coefficient at solid density. We assume thatthis energy equilibration rate in nonequilibrium electron-ionsystems remains valid for a large class of ionic configura-tions including solid and liquid metals phases, as well aswarm dense matter. For the dilute, hot, and therefore weaklycoupled plasmas for which the thermal energy of the par-ticles greatly exceeds the potential energies, the energy re-laxation among electrons and ions is taken into accountbased on the usual Spitzer model including the Coulomblogarithm. Two ad hoc cutoff parameters are used in thisapproach to mimic the quantum interference and finite-ion-size effects for short-distance collisions as well as the Cou-lomb screening of the charges.75,76 Between the regimes ofwarm dense matter and weakly coupled, nondegeneratedplasmas, we have used a polynomial interpolation to connect
GUILLERMIN et al. PHYSICAL REVIEW B 82, 035430 �2010�
035430-4
124

both models for densities lower than the critical one.For each time step and cells of the Lagrangian simulation,
the number of free electrons is connected to the number ofions by the relation ne=Z
�ni, where Z� is the average ioniza-tion. The data for the ionization state calculated within ageneralized chemical model in a wide range of densities andtemperatures are taken from the Ref. 70. In these tabulateddata, the density varies from 1 to 105 Kg m−3 while the tem-perature ranges from 102 to 108 K. For lower densities, from10−5 to 1 Kg m−3, we have used the data calculated by Refs.77 and 78 which are in agreement with recent ionization datafor Al discussed in the literature.79 These values are calcu-lated for electrons and ions at equilibrium but we assumethat the ionization is mainly determined by the electroniccollisions and we have used the equilibrium values of aver-age ionization for T=Te, the electronic temperature. Duringthe electron-ion relaxation stage, Z� is modified along the Tedecrease and a kind of numerical recombination process oc-curs. To convert this process in energy recombination and toavoid an effect of Te increase due to a drop of ne, we haveadded an energy exchange term in the form
��e
�t=ne�eZ�
�Z�
�t= −
��i
�t, �2�
where �i is the equilibrium matter energy, �e=�ene is theenergy of the electron subsystem, and �e the average energyof a particle.
This numerical approach is used to simulate the ablationphenomena and related effects induced by laser pulses tem-porally shaped on ultrafast time scales. To assist the interpre-tation of experimental results concerning the plasma opticalemission and the particulates generation, we attempt to fol-low the thermodynamics conditions reached by the ejectedmaterial from the initial energy deposition until longer times,typically hundreds of nanosecond. Nevertheless, the numeri-cal approach is limited to a one-dimensional simulation ofthe expansion plume whereas three-dimensional approachesare desirable for simulating the later plume expansion stages.A direct layering to the experimental results is therefore notaccurate and a quantitative interpretation must be done withprecaution. Usually, 1D hypothesis is limited to expansion ofsize similar to the irradiation zone. Nevertheless, in usualPLD conditions where cm scales are typically involved forcollecting the material, we can notice that the ablated matteris deposited on a surface about 104 higher than the focal spot,and that one can expect densities of the plasma up to 104
weaker than the one simulated at 3 cm of the target becauseof the lateral expansion. While supposing that the 1D tem-perature remains correct, the ionization rate appears to be notvery sensitive to such a decrease in density and the tablesprovide an ionization increase of less than 5%. Consequently,we can reasonably suppose that our approach remains suit-able to support in a qualitative manner our results.
IV. PLASMA OPTICAL EMISSION
The first part of discussion concerns plasma emissivity.We present below the experimental results concerning theoptimization of plasma optical emission with respect to the
excitation degree through the tailoring of the laser energytemporal distribution on ultrafast time scales. As indicated,the excitation degree of the species in the plume and therelative concentration of species are supposed to determineto a large extent the reactivity of the plasma. We used thesetup described in Sec. II to enhance the ionic emission ofplasma with respect to the light emitted by neutral species.The experimental results are compared with numerical simu-lations of plasma plume allowing to discuss physical mecha-nisms involved in the specific response of thermodynamicstates of aluminum to the temporal tailoring of energy depo-sition.
A. Experimental results
The adaptive approach driving the presented loop was ap-plied in order to determine the ablation plasma characteris-tics in specific spectral domains. The use of the evolutionaryoptimization procedure permits to modify the emission �re-corded between 100 and 400 ns after laser exposure� of tran-sitions considered in the fitness parameter defined in the Eq.�1�, hence leading to optimal shaped pulses. According to ourdefinition, this induces an enhancement of the Al-II linesintensity �multiplet �d� at 358.7 nm� and a reduction in emis-sion for the Al-I transitions �multiplets �e� at 394.4 and �f� at396.15 nm�. Figure 2�a� shows the comparison betweenspectral intensities induced in the spectral domain used forthe optimization by a femtosecond short pulse �SP� and thoseof the optimized pulses �OP�. The cross-correlation measure-ment of the short and optimized-pulse temporal shapes isdepicted in Figs. 2�b� and 2�c�. The OP sequence consists ofa series of peaks �separated by 1 or 2 ps� superposed onto astretched distribution �Gaussian envelop of 6 ps FWHM�.However, the OP solution is not unique within the sensitivityof the experiment. A second optimal irradiation sequenceOP�, fulfilling the optimization requirements, is presented inFig. 2�d� and will be used later in the text to define thetopology of the search space and the requirements for emis-sion improvements �see Sec. IV D�. The following discus-sion is mainly based on the OP sequence but is pertinent fora large range of pulse shapes that perform similarly in theoptimization run. To describe the observed influence of thetemporally tailored energy deposition on the plasma opticalemission, we define the multiplication factor,
MXPi =
IXPi
ISPi �3�
corresponding to the intensity modification of a particulartransition i with a given shaped pulse with respect to theunshaped femtosecond short pulse. The relative increase inthe integrated intensity emitted by singly charged aluminumions �Al-II� is then given by MOP
d =3.2�0.4 when OP isapplied. Intensities of the two neutral lines used as feedbackfor Al-I atoms are reduced according to MOP
e =0.54�0.07and MOP
f =0.59�0.07. To be further used in the analysis,excitation temperature are evaluated through the Boltzmannratio intensity method80 with transitions ��b� and �e�� for neu-tral aluminum atoms �Al-I� and ��h� and �l�� for aluminumionized one time �Al-II�. The precision of this method is
OPTICAL EMISSION AND NANOPARTICLE GENERATION… PHYSICAL REVIEW B 82, 035430 �2010�
035430-5
125

nevertheless strongly limited by the spatiotemporal integra-tion of the emission line intensity measurements in case ofthe rapidly varying plume. Only rough estimates can bemade and will be used to indicate qualitative tendencies upondifferent excitation situations. The excitation temperature in-duced with femtosecond pulses SP or with optimized pulsesOP are quite similar for both species, approximately 5000 Kfor Al-I and 20 000 K for Al-II. The overall intensitysummed respectively for all Al-I and Al-II transitions aremodified as follows: MOP
Al-I=0.56�0.07 and MOPAl-II
=2.9�0.4 with a similar trend as described for �d�, �e�, and�f� lines. The global intensity emitted by all the transitionslisted in the Table I and corresponding to the plasma lumi-nosity is reduced with a factor MOP
tot =0.76�0.09. We cannow compare the fractions emitted by Al-II or Al-I. The fem-tosecond SP leads to a repartition of the overall studied emis-sion consisting of 91% of total intensity emitted by Al-I and9% by Al-II while optimized pulse OP induces a fraction of68% for neutrals emission and 32% for Al-II atoms.
In order to complete the experimental investigations ofthe plasma behavior, we perform direct imaging of the abla-tion plume in the UV-VIS spectral range at different timedelays after the laser impact. Figure 3 shows images of the
optical plasma emission induced by short and optimizedpulses for an evolution gated between 300 and 400 ns. Theintensity is integrated over ten successive laser pulses. At theusual fluence, the plasma consists dominantly on neutralsemitting in visible and ions in ultraviolet. We note that theSP-induced optical emission is more intense than the onegenerated with optimized pulses as it originates mainly fromthe dominant neutral emission. The extension of the plasmaplume is slightly larger with OP than with SP exposure. Ad-ditionally, the corresponding ablation rates were evaluatedthrough ex situ profilometry measurements of ablation cra-ters. The ablation rate is higher with the short pulse�98�1 nm /pulse� than with the optimized irradiation se-quence �80�4 nm /pulse� at the 5.8 J /cm2 incident fluence.However, considering that not all the ablated material istransported into the gas phase as it will be seen later, it isdifficult to make correlations between the plumes only basedon the ablation rates.
B. Simulation of temperature-density-ionization profiles
Building on the initial results presented in Ref. 6 thatestimate the kinetic plasma properties, we focus here on itsthermal characteristics. The numerical simulations describedin the Sec. III are used to compute the spatial profiles ofdensity n�z� and temperature T�z� of ablated aluminum 250ns after the moment of energy deposition �initial solid sur-face at z=0� in a one-dimensional approach. Here z is theexpansion direction. At this time, the plume is already equili-brated. The inherent limitation of the 1D approach in at-tempting a full description of plume evolution was previ-ously indicated �see Sec. III�. The mean ionization rate Z� �ine− /atom� is used in a tabulated form,77 with respect to den-sity and temperature. The electronic density ne can be writtenas
ne = �k=1
kmax
knk = Z�n�z� �4�
with nk the density of atoms in the k ionized state and kmax=13. Assuming that the Saha equation, giving the ratio Sk=nk+1ne /nk= f�T�, is valid in the range of temperatures and
FIG. 2. �Color online� �a� Spectral intensity of the lines involvedin the optimization process indicating Al-I and Al-II emission afterirradiation induced with short and optimized pulses �respectively,SP and OP�. Temporal distribution of the intensity for SP �b� andseveral optimal forms OP �c� and OP� �d� determined by crosscorrelation �see text for details�.
FIG. 3. �Color online� Plasma images in the UV-VIS domain�from 200 to 800 nm� recorded at 300 ns delay after laser exposurefor a gate integration time of 100 ns. The intensity is accumulatedover ten laser pulses and comes mainly from neutral emission withslight ionic contributions expanding ahead �see text�.
GUILLERMIN et al. PHYSICAL REVIEW B 82, 035430 �2010�
035430-6
126

densities of interest in this work, it can be used to express n1�density of ionized one time atoms Al-II� as a function of neand Sk,
n1 =ne
1 + �k=2
kmax
k
�l=1
k−1
Sl
nek−1
. �5�
Densities n2 to n13 of Al-III to Al-XIV are computed recur-sively with Saha ratio Sk and the density n0 of neutral atomsAl-I is given by n0=n−�k=1
kmaxnk. Figure 4 shows spatial pro-files of atomized species �neutral+ ions� density n�z� andtemperature T�z�. The species proportions nk /n of atoms Al-Ito Al-IV are computed at 250 ns after the moment of energydeposition �corresponding to the middle of experimental ac-quisition time gate� with femtosecond SP and temporally op-timized OP laser pulses. In the following, the areas occupiedby the different species are determined using the FWHM ofthe axial distributions. Several observations can be made.The maximum distance from the surface achieved by thefront of the simulated plasma plume at 250 ns is higher withthe optimized pulse OP �about 22 mm� than with SP �about14 mm�. The analysis of the spatial profiles of atoms in dif-
ferent ionization stage ratio �nk /n in Fig. 4� reveals that thosespecies tend to agglomerate in spatially distinct locations.This will be discussed in the following section. Close to thesurface, the proportion of ionized atoms is low and theplasma consists mainly of Al-I. The temperature spatial pro-file in the vicinity of the surface is almost constant��2600 K� independent of the temporal pulse shape. How-ever, the length of the area occupied by neutral atoms and theionization state �and temperature� of the simulated plumefront are strongly influenced by the temporal tailoring ofincident energy. The femtosecond SP induces a low excita-tion plasma configuration with a large area dominated byneutral atoms �12.5 mm� and a temperature of 12 500 K atthe front mainly occupied by Al-II ions. Comparatively, theoptimized pulse OP leads to a plasma of higher excitationstate with a smaller area associated with Al-I �0–4 mm� anda high front temperature �34 000 K� producing a majority ofAl-IV �not measured�. Al-II atoms are concentrated at thefront of the plume for the femtosecond SP while they arelocalized closer to the solid surface when OP is applied �be-tween 4 and 8.5 mm�. The size of Al-II area is larger with OP�4.5 mm� than with SP �1.5 mm� and the density state corre-sponding to each area is more than one order of magnitudehigher for OP �from 4�1022 to 1023 m−3� than for SP �6�1021–9�1021 m−3�, as shown in Fig. 4.
Although experiment and simulation reveal a good quali-tative agreement, several discrepancies between experimen-tal and numerical results are observed, in particular, concern-ing the temperature values of the ionic species. Two mainelements can be invoked to explain these differences. First,experimental observations are integrated over the range 100–400 ns, this being a temporal window during which theplasma has a fast dynamics and cools down. As well, thespectral emission measurement is spatially averaged, detect-ing simultaneously species located at different regions. Sec-ond, the numerical simulations are based on one-dimensionalcalculation as explained in the previous section. Neverthe-less, we can reasonably suppose that our approach remainsacceptable to give a qualitative picture of the plume behav-ior, including the spatially distinct aglomeration of speciesfollowing the temperature profile and its maximum at theplasma front.
C. Discussion
The comparison between the experimental and numericalresults presented above allows to address several interpreta-tion questions concerning the laser-induced ablation andplume expansion processes. As reported in Sec. IV A, theestimated excitation temperatures of Al-I and Al-II are foundto be different. Although difficult to be resolved due to thespatial integration of spectroscopic measurements along aninhomogeneous plasma,81 this could be correlated with po-tential generation of different agglomeration zones for thosespecies as recently reported in Ref. 82. Although severalmechanisms can be involved, this is consistent with thesimulation results presented above which indicate that thespatial temperature and density profiles of the ablation plumeare not constant along the expansion axis83 and induce spa-
FIG. 4. �Color online� Spatial profiles of atomized species�neutral+ ions� density n�z�, temperature T�z�, and species propor-tions nk /n of atoms Al-I to Al-IV. The profiles are simulated for atime t=250 ns after the laser impact in case of SP and OP laserintensity distributions. The location z=0 corresponds to the initialmetal surface. The incident fluence is 5.8 J /cm2.
OPTICAL EMISSION AND NANOPARTICLE GENERATION… PHYSICAL REVIEW B 82, 035430 �2010�
035430-7
127

tially distinct locations of atoms in different ionization stagesas suggested by the Saha law. This is a notable observationsince the model used in our simulation does not take intoaccount gas-phase charge interaction and inherent internalelectric fields in the plume. This may lead to further chargeseparation84 preserving however the species sequential distri-bution.
With the two temporal distributions of laser energy testedhere, the irradiation leads to a plasma plume characterized bya decreasing density and a two-step behavior for the tem-perature with the distance from the solid surface. The tem-perature profile is quasiconstant close to the surface and in-creases until the maximum value obtained at the front of theplume. This implies that at least two different mechanismsare involved in the plasma formation. To address this ques-tion, the numerical simulation is used to compute the ther-modynamics paths followed by the material at differentdepths starting from the laser energy deposition up to 250 nsof evolution.
Figure 5 shows the results of the modeling applied toshort and optimized pulses. These simulated thermodynam-ics paths indicate at least three remarkable types of behavior.
In both cases, the superficial layers �from the initial surfaceto 40 nm deep� undergo a fast heating which leads to anexpansion above the critical point �CP�. As discussed previ-ously in Ref. 6, that kind of high-temperature relaxation pathcorresponds to an excess of energy which offsets the inter-molecular potentials leading to a reduction in the latent heatof vaporization. The energy of atoms in the condensed phasebecomes comparable to their binding energy inducing thedecomposition of the hot fluid in gas-phase atomic specieswithout involving nucleation. This can be described by afragmentation mechanism of the supercritical fluid in expan-sion and direct transition to plasma.3,4 The atomization de-livers hence the hot gaseous ejecta. The behavior of the ini-tially 5-nm-deep layer allows the comparison between thelaser-induced fragmentation with SP and OP. The maximumtemperature achieved by this layer is larger with OP�77 500 K� than with SP �51 500 K�. Moreover, the maxi-mum specific energy stored in this layer is twice larger withOP �1.68�108 J /Kg� than with SP �5.71�107 J /Kg�. Wecan conclude that the atomization of the hot fluid process isinduced at a higher temperature and specific energy for OPthan for SP taking a favorable turn. As a side note, the layercorresponding to the cell located initially at a depth of 40 nmfollows a supercritical expansion path in the OP case andthen recondenses. This behavior can be attributed to the ex-cess of specific energy stored in the upper layers which in-duces additional compression of this particular layer. Thesecond type of behavior is related to deeper layers undergo-ing a moderate heating accompanied by a strong compres-sion. This leads to an expansion path under the critical pointwhich crosses the binodal line and reaches the gaseous state.This corresponds to the rapid homogenous nucleation of gasin the metastable liquid and determines the ejection of aliquid-gas mixture.68 The associated ablation process can beaccounted for with the so-called phase explosionmechanism.3,8,85 The deepest layers simulated here undergothe last type of behavior: a low heating accompanied by astrong compression. During the following relaxation, theselayers expand and reach the limit of coexistence betweenliquid and gas before recondensing along that binodal line.
Referring to the last two evolutions, results presented inFig. 5 shows that layers initially located between 60 and 90nm in the SP exposure and between 50 and 100 nm for OPcase behave differently. In the OP case, the compression isreduced and the layers recondense without crossing the bin-odal limit. With the SP irradiation, the layers initially locatedat depths between 60 and 90 nm undergo a strong compres-sion of the matter followed finally by a phase-explosion-likemechanism �nucleation-based� as they enter in the metastableregion. However due to particularly strong mechanical loadassociated with SP some confinement effects occur.6 In theirevolution part of these layers follow the binodal limit duringa long time �nanosecond time scale� before crossing it �notethe corresponding moments indicated in Fig. 5�. This behav-ior corresponds to the ejection of liquid droplets and will bediscussed in more details in the last section. This comparisonbetween the behaviors of deeper layers with SP and OP irra-diation indicates a reduction in the phase explosion effi-ciency and an increase in recast when using the optimizedlaser energy distribution. We recall here the additional heat-ing of the superficial layers with OP.
FIG. 5. �Color online� Thermodynamic trajectories of severalsimulation cells within the excited aluminum region in a density-temperature ��-T� diagram for a short and optimized laser pulse �SPand OP�. The cells correspond to material layers initially situated atdifferent depths. Different relevant moments with respect to thebeginning of the laser exposure: 1 ps, 10 ps, 100 ps, and 1 ns, are,respectively, marked by square, circle, up triangle, and diamondsymbols. The simulation ends at 250 ns. The incident fluence valueis 5.8 J /cm2 �more than one order of magnitude above the ablationthreshold�. The solid-liquid �S-L; melting�, the liquid-gas �L-G; bin-odal�, and the onset of instabilities �Sp; spinodal� boundaries givenby the EOS, as well as the position of the critical point �CP� are alsodepicted on the figure. Due to the uncertainty related to the passagevia the instability region, the thermodynamic trajectories are notshown below the spinodal envelope.
GUILLERMIN et al. PHYSICAL REVIEW B 82, 035430 �2010�
035430-8
128

By comparing these results with the different temperatureand density spatial profiles presented in Fig. 4, we can con-clude that a consistent part of the plasma formed by neutralspecies at quasiconstant lower axial temperature and locatedclose to the solid surface is generated by the rapid homog-enous nucleation of gas in the metastable liquid. This typi-cally leads to the ejection of a liquid-gas mixture. The lead-ing part of the ablation plume with increasing temperaturealong the axis is induced by the atomization of the supercriti-cal fluid which produces hot gaseous ejecta. The initial ab-sorption profile during energy deposition is responsible forthis increasing temperature profile observed at 250 ns. It isparticularly the relative weight of the thermodynamical pathsthat is affected by the temporal distribution of the incomingenergy.
The different behaviors generated by SP and OP se-quences can be discussed on the basis of the initial argu-ments presented in Ref. 6 which shows that the thermody-namic states variations during the laser ablation can inducean enhanced energy coupling in the material. This is corre-lated with electronic collisional effects and density changesaccording to the phase transformation succession.86 While incase of SP, the materials stays mainly in condensed phasewith optical properties determined primarily by temperature�and therefore fluence�-induced collisional effects and varylittle during the melting phase,87 these optical properties aretransiently modified during the optimized irradiation se-quence as density varies. This behavior is superposed ini-tially on pure temperature-induced collisional effects andtakes over during the sequence via an intricate mixing oftemperature and density variations. As a proof, specific ex-amples of transient reflectivity behaviors are shown in Fig. 6for particular shapes and will be discussed in the next para-graphs. We note for the moment the drop of reflectivity as-sociated with the onset of hydrodynamic advance �arrowmark� for the shaped pulses preceded by a temperature effect�enhanced for SP and high intensities�.
This allows to adapt the incoming energy rate to enhancethe absorption, resulting in the augmentation of the heat loadin the superficial layers in the case of OP irradiation. Thishypothesis is supported by the previous analysis of thermo-dynamic paths of those layers �presented in Fig. 5� associ-ated with higher maximum temperature and specific energygenerated with OP than with SP. We conclude that the onsetof hydrodynamics effects during the OP exposure �going upto plasma ignition�, such as expansion and the consequentdrop of reflectivity of the irradiated surface, allows an en-hancement of the energy deposition in the first material lay-ers due to the variation of the optical and transport proper-ties. This will be experimentally confirmed in the followingsection. Finally, these results allow to indicate that in ourhigh fluence conditions, the optimization does not lead to aluminescence increase but induces a higher ionization statein the plasma plume.
In this context, the enhancement of the ionic signal withrespect to the neutral emission with the optimized pulse OPis achieved through the more efficient channeling of the in-cident energy into the superficial layer. This enhances theefficiency of the atomization of the supercritical fluid withrespect to nucleation-based mechanisms. Moreover, the opti-
mized pulse generates an Al-II dominated area at higher den-sities with respect to the SP-induced configuration �as re-ported in Fig. 4�. Consequently, the optimized laser energydistribution enhances the number of Al-II and reduces theone of Al-I. We thus suppose that the plasma emission opti-mization with respect to the excitation degree is stronglyrelated to the evolution of the emitter’s quantity of the dif-ferent species. The ionization degree is augmented withoutchanging the total energy of laser pulses. The optimized tem-poral tailoring of the laser exposure sequence allows there-fore to redistribute and increase the excitation of the plasmaplume with a reduced energy cost through a more synergeticinteraction with the irradiated material. This appears to beintrinsically related to provoking and making use of a reflec-tivity drop along side with density variations impeding ther-mal transport.
The shape of the laser pulse can create a complex topol-ogy of the interaction space. In order to simplify and under-stand its influence on the interaction process, we employdesigned pulses which gather features of the OP: two shortpeaks �250 fs duration� with a separation delay of 10 ps �DP�and a Gaussian stretched pulse �LP� of 6 ps FWHM. Thiswas achieved by applying cyclic rectangular �-phase profilesor parabolic phase masks on the SLM. Figure 6 shows inten-sity cross-correlation traces together with a sketch of reflec-tivity behavior for the excited matter in each case calculatedas indicated in Ref. 72, taking into account the effect oftime-evolving collision frequency and the dynamic variationin density and temperature. The arrows indicate the moments
FIG. 6. �Color online� Temporal distribution of the intensity�solid lines� for the short pulse �SP�, the optimized pulse �OP�, thedouble pulse �DP� with 10 ps delay and the long pulse �LP� of 6 psFWHM duration determined by cross-correlation methods. Corre-sponding calculated transient reflectivities of the excited sample�dashed lines�. The dotted line in the SP case is a guide for the eyes.The arrows indicate the observable expansion onset for the simu-lated layer initially located at 10 nm deep.
OPTICAL EMISSION AND NANOPARTICLE GENERATION… PHYSICAL REVIEW B 82, 035430 �2010�
035430-9
129
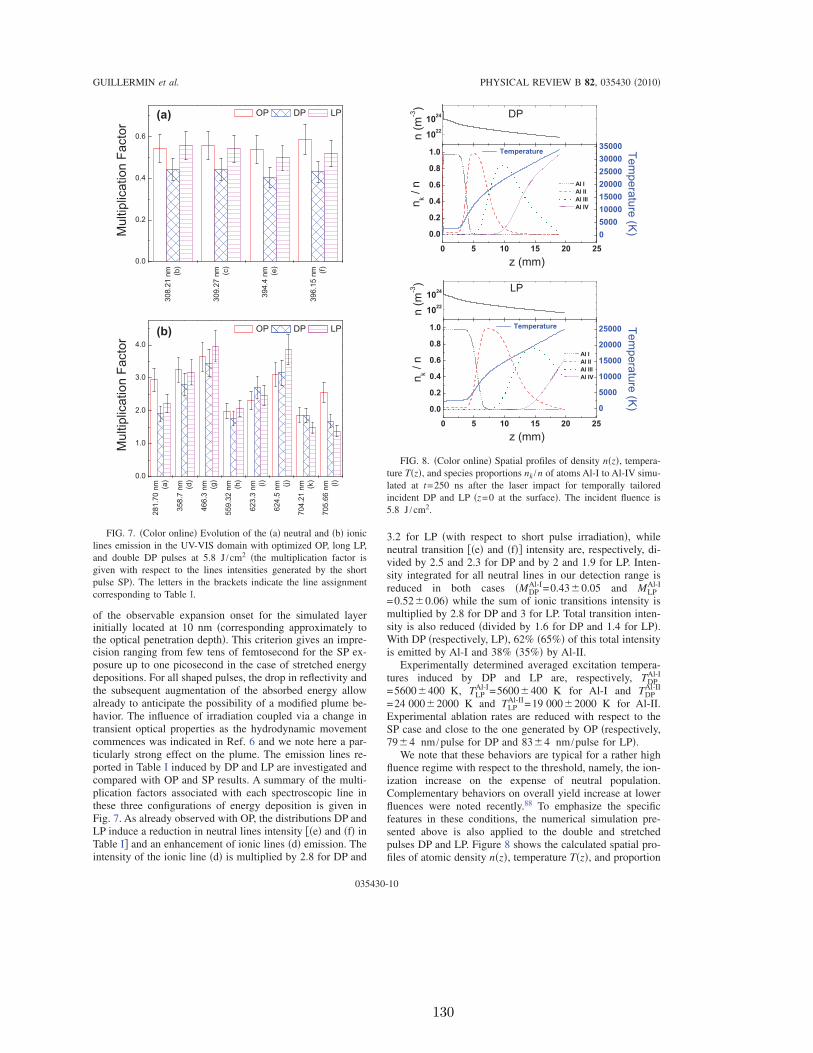
of the observable expansion onset for the simulated layerinitially located at 10 nm �corresponding approximately tothe optical penetration depth�. This criterion gives an impre-cision ranging from few tens of femtosecond for the SP ex-posure up to one picosecond in the case of stretched energydepositions. For all shaped pulses, the drop in reflectivity andthe subsequent augmentation of the absorbed energy allowalready to anticipate the possibility of a modified plume be-havior. The influence of irradiation coupled via a change intransient optical properties as the hydrodynamic movementcommences was indicated in Ref. 6 and we note here a par-ticularly strong effect on the plume. The emission lines re-ported in Table I induced by DP and LP are investigated andcompared with OP and SP results. A summary of the multi-plication factors associated with each spectroscopic line inthese three configurations of energy deposition is given inFig. 7. As already observed with OP, the distributions DP andLP induce a reduction in neutral lines intensity ��e� and �f� inTable I� and an enhancement of ionic lines �d� emission. Theintensity of the ionic line �d� is multiplied by 2.8 for DP and
3.2 for LP �with respect to short pulse irradiation�, whileneutral transition ��e� and �f�� intensity are, respectively, di-vided by 2.5 and 2.3 for DP and by 2 and 1.9 for LP. Inten-sity integrated for all neutral lines in our detection range isreduced in both cases �MDP
Al-I=0.43�0.05 and MLPAl-I
=0.52�0.06� while the sum of ionic transitions intensity ismultiplied by 2.8 for DP and 3 for LP. Total transition inten-sity is also reduced �divided by 1.6 for DP and 1.4 for LP�.With DP �respectively, LP�, 62% �65%� of this total intensityis emitted by Al-I and 38% �35%� by Al-II.
Experimentally determined averaged excitation tempera-tures induced by DP and LP are, respectively, TDP
Al-I
=5600�400 K, TLPAl-I=5600�400 K for Al-I and TDP
Al-II
=24 000�2000 K and TLPAl-II=19 000�2000 K for Al-II.
Experimental ablation rates are reduced with respect to theSP case and close to the one generated by OP �respectively,79�4 nm /pulse for DP and 83�4 nm /pulse for LP�.
We note that these behaviors are typical for a rather highfluence regime with respect to the threshold, namely, the ion-ization increase on the expense of neutral population.Complementary behaviors on overall yield increase at lowerfluences were noted recently.88 To emphasize the specificfeatures in these conditions, the numerical simulation pre-sented above is also applied to the double and stretchedpulses DP and LP. Figure 8 shows the calculated spatial pro-files of atomic density n�z�, temperature T�z�, and proportion
FIG. 7. �Color online� Evolution of the �a� neutral and �b� ioniclines emission in the UV-VIS domain with optimized OP, long LP,and double DP pulses at 5.8 J /cm2 �the multiplication factor isgiven with respect to the lines intensities generated by the shortpulse SP�. The letters in the brackets indicate the line assignmentcorresponding to Table I.
FIG. 8. �Color online� Spatial profiles of density n�z�, tempera-ture T�z�, and species proportions nk /n of atoms Al-I to Al-IV simu-lated at t=250 ns after the laser impact for temporally tailoredincident DP and LP �z=0 at the surface�. The incident fluence is5.8 J /cm2.
GUILLERMIN et al. PHYSICAL REVIEW B 82, 035430 �2010�
035430-10
130

of Al-I to Al-IV density numbers at 250 ns after the laserimpact. The maximum distance from the surface achieved bythe simulated plasma with LP and DP are quite similar �re-spectively, 20 nm and 19 mm� and slightly lower than withOP. LP irradiation leads to a Al-I occupied area close to thesurface �from 0 to 5.5 mm� larger than OP exposure. Thesmallest Al-I area is produced with DP �from 0 to 3.8 mm�.The maximum calculated temperature �at the plasma front�obtained with LP ��24 000 K� is lower than with OP. Theextension of the Al-II area �6 mm� produced with LP isslightly larger than with OP but is also associated with alower density �from 1.6 to 7.7�1022 m−3 for LP and from4�1022 to 1023 m−3 in the OP case�. In the case of DPexposure, the maximum temperature achieved at the plasmafront is similar to the one simulated for OP ��34 000 K�.The Al-II area is associated with the same range of densitiesas with OP �4�1022 to 1�1023 m−3� but its extension isreduced �3.7 mm�. These numerical results seem consistentwith the experimental emission intensity measurements pre-sented in Fig. 7, indicating relatively small differences be-tween the optical plasma emission induced with OP, DP, orLP with respect to Al-II versus Al-I intensity ratio enhance-ment.
D. Pre-excitement requirements for improved coupling
It was mentioned before that several different results ofthe optimization perform similarly with respect to the plasmaemission. A first example was given above with a secondoptimization result leading to the optimal laser sequence OP�depicted on Fig. 2�d�. This section intends to propose adeeper perspective on the influence of the optimized pulse onthe ablation process. From the analysis, it seems that a largeclass of laser-pulse temporal shapes allows to perform theoptimization task and increase the plasma excitation with ahigh efficiency. These observations pertain also the designedpulses, the Al-II optical signal enhancement generated withOP� being also similar to the one obtained with OP, DP, andLP. A common feature of the adapted laser sequences is thestretched energy deposition on several picosecond. This al-lows an optimal preparation of the irradiated material by theleading part of the pulse, an efficient absorption of the trail-ing part and, consequently, a maximization of the effect ofplasma excitation. The questions that impose themselvesconcern the nature of this “preparation” and the related en-ergetic requirements.
To elucidate which mechanisms have to be triggered dur-ing this preparation, we have designed the following experi-ment that temporally separates the preparation phase fromthe main absorption events. We use nonsymmetrical doublepulses separated by 11 ps as depicted in Fig. 9�a� where thelevel of the leading peak was gradually increased while pre-serving constant the total energy. This was achieved usingV-shaped spectral phase masks with variable cusp position.The plasma emission was monitored at the same time. Thisexperimental approach allows to progressively enhance theenergy involved in the preparation process by controlling theenergy balance between the two peaks. We were concernedhere with a brief evaluation on the picosecond-spaced
prepulse forms leading to the onset on ion enhancement. Toincrease the sensitivity of the measurement we have chosen alower fluence, slightly below the threshold of SP ion obser-vation �1.1 J /cm2�. Although the succession of phenomenamay be changed,88 this was motivated by the fact that at theregular fluence of 5.8 J /cm2 the effect was starting atprepulse intensities too low with respect to the main peak forpermitting an accurate measurement. The procedure allowsto detect and characterize the Al-II emission increase in theline labeled �d� in Table I with the augmentation of the en-ergy consumed for the surface preparation �i.e., energy in thefirst peak�. The results, shown in Fig. 9�b�, indicate a thresh-old energy for the first peak �corresponding to 10% of thetotal energy� required to initiate the Al-II signal enhance-ment. This signal achieves a maximum for an energy balanceof 25–75 %. Converting these percentages to fluences of thefirst peak indicates an ion signal rise at the fluence thresholdof 0.1 J /cm2 �close to the optical modification threshold�and a maximum increase achieved for 0.28 J /cm2 �just be-low the onset of visible macroscopic ablation�. These resultssuggest that the optimal preparation with respect to theplasma excitation enhancement is related to the onset of thehydrodynamic movement of the excited material induced bythe leading part of the laser exposure. On the picosecondtime scale, the material expansion is associated with a dropof the reflectivity as shown in Fig. 6 �however at a higherfluence�. This leads to an enhanced coupling of the trailing
FIG. 9. �Color online� �a� Example of asymmetric double pulses�11 ps separation� with different energy balance between the twopeaks at constant total energy. The energy contained in the leadingpeak is gradually increased to “prepare” the material for an en-hancement of the energy coupling. �b� Al-II optical emission inten-sity evolution �line labeled �d�� with the double pulses energy bal-ance �first peak contribution� at 1.1 J /cm2.
OPTICAL EMISSION AND NANOPARTICLE GENERATION… PHYSICAL REVIEW B 82, 035430 �2010�
035430-11
131

part of the laser pulse and consequently increases the ab-sorbed energy per atoms. As final remark, we note that, asthe geometry involves several passages over preirradiatedtarget regions, the possible rippled structure at pulse overlap-ping complicates the accurate interpretation of the laser-matter interaction.
In summary, the optimized pulse favors a conversion ofthe laser incoming energy into thermal energy of the expand-ing material inducing a surface transformation mainly medi-ated by the atomization of the supercritical fluid. The energyis more efficiently channeled in the superficial layers and theablation rate is reduced. This is also consistent with previousobservations6 indicating an effective mechanical to thermalenergy conversion for longer pulse envelopes. The femtosec-ond pulse leads to a preferential channeling of the laser en-ergy into a gas-phase transformation that proceeds domi-nantly in the metastable region via nucleation and induces ahigher ablation rate. This indicates a possible adjustable bal-ance between the amount of ejected gas-liquid mixture �sub-sequent to nucleation� and the excitation of the gaseous frac-tion of ablated matter �through the atomization of thesupercritical fluid�. Modifying the energetic state of theplasma plume may then influence PLD processes through thenanoparticles generation.
V. INFLUENCE ON NANOPARTICLES DEPOSITION
To study the effect of the temporal shape of various laserpulses on the collected material from the plume, thin filmswere elaborated by pulsed laser deposition with irradiationsequences provided by SP, OP, LP, and DP �N=9�105
pulses, P�10−5 Pa�. The FEG-SEM images of the resultingfilms are presented in Fig. 10. The surface morphologies ofthe deposited films are dominated by nanoparticles �with ra-dii between tens and hundreds of nanometer� with a densitystrongly dependent on the temporal profile of the laserpulses. Nanoparticles radius distributions, ranging from 30 to200 nm and displayed in Fig. 11, indicate a decrease in theparticles density from SP �presenting the highest number ofnanoparticles� to DP film �density minimum�. Intermediatedistributions can be determined for OP- and LP-inducedfilms. The relative abundance of each radius is displayed indouble-logarithmic scale in the inset of Fig. 11 and is similarfor the four temporal distributions. These size distributionsf�r� are characterized by a two slope behavior with f1�r��r−2 for r80 nm and f2�r��r−3.7 for r80 nm, which isin concordance with previous reports in the literature.27
Two main classes of processes are usually invoked to ad-dress the problem of nanoparticle generation20: condensationor nucleation of particles in the plasma or gas phase on onehand and direct ejection of aggregates from the liquefied tar-get on the other hand. The condensation processes are domi-nant when the collision rate between particles in the atomicvapor is high with respect to the characteristic time of theexpansion.20 These mechanisms were found to lead to nano-particles with low radii ranging from few nanometer to fewtens of nanometers.20,21,89,90 The direct liquid ejectionmechanisms are associated to the formation, hydrodynamicmotion, and ejection of liquid-density layers separated by
lower-density gaps composed by a liquid-gasmixture6,20,19,91–93. This structuring of the ablated matter is aconsequence of the rarefaction waves propagation in the ir-radiated material during the first stages of expansion.94,95 Theabove observations suggest that this mechanism can be con-trolled by the balance between mechanical and thermal en-ergies of the expanding material.96 Influences are expected aswell on the condensation mechanism as temperature andpressure condition may vary.
We will focus below on the second mechanism �directejection of liquid particles� to explain our experimental find-ings, especially for larger size particulates. The reduction innanoparticles deposition on the film surfaces seen in Fig. 11can be linked to the enhancement of plasma excitation via atemperature control mechanism as this may influence the
FIG. 10. SEM images of thin films produced with SP, OP, LP,and DP indicating the presence of nanoparticles in different con-tents and sizes.
GUILLERMIN et al. PHYSICAL REVIEW B 82, 035430 �2010�
035430-12
132
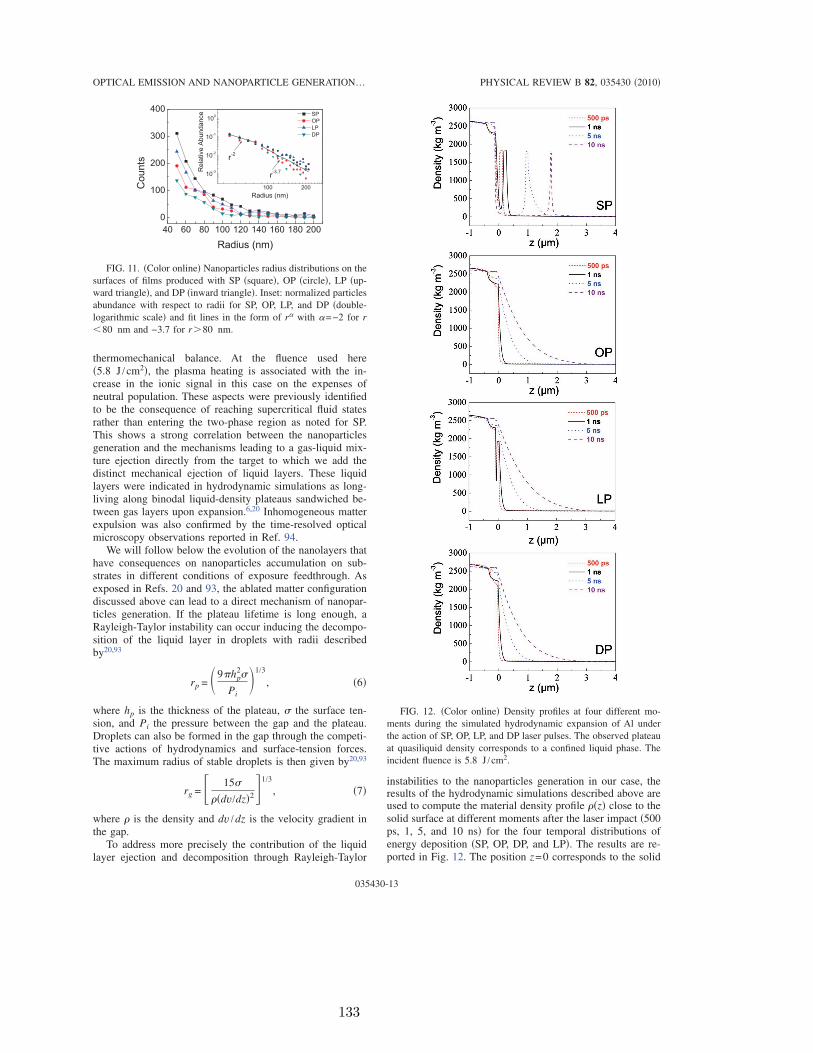
thermomechanical balance. At the fluence used here�5.8 J /cm2�, the plasma heating is associated with the in-crease in the ionic signal in this case on the expenses ofneutral population. These aspects were previously identifiedto be the consequence of reaching supercritical fluid statesrather than entering the two-phase region as noted for SP.This shows a strong correlation between the nanoparticlesgeneration and the mechanisms leading to a gas-liquid mix-ture ejection directly from the target to which we add thedistinct mechanical ejection of liquid layers. These liquidlayers were indicated in hydrodynamic simulations as long-living along binodal liquid-density plateaus sandwiched be-tween gas layers upon expansion.6,20 Inhomogeneous matterexpulsion was also confirmed by the time-resolved opticalmicroscopy observations reported in Ref. 94.
We will follow below the evolution of the nanolayers thathave consequences on nanoparticles accumulation on sub-strates in different conditions of exposure feedthrough. Asexposed in Refs. 20 and 93, the ablated matter configurationdiscussed above can lead to a direct mechanism of nanopar-ticles generation. If the plateau lifetime is long enough, aRayleigh-Taylor instability can occur inducing the decompo-sition of the liquid layer in droplets with radii describedby20,93
rp = 9�hp2�
Pi1/3
, �6�
where hp is the thickness of the plateau, � the surface ten-sion, and Pi the pressure between the gap and the plateau.Droplets can also be formed in the gap through the competi-tive actions of hydrodynamics and surface-tension forces.The maximum radius of stable droplets is then given by20,93
rg = � 15�
��dv/dz�2�1/3
, �7�
where � is the density and dv /dz is the velocity gradient inthe gap.
To address more precisely the contribution of the liquidlayer ejection and decomposition through Rayleigh-Taylor
instabilities to the nanoparticles generation in our case, theresults of the hydrodynamic simulations described above areused to compute the material density profile ��z� close to thesolid surface at different moments after the laser impact �500ps, 1, 5, and 10 ns� for the four temporal distributions ofenergy deposition �SP, OP, DP, and LP�. The results are re-ported in Fig. 12. The position z=0 corresponds to the solid
FIG. 11. �Color online� Nanoparticles radius distributions on thesurfaces of films produced with SP �square�, OP �circle�, LP �up-ward triangle�, and DP �inward triangle�. Inset: normalized particlesabundance with respect to radii for SP, OP, LP, and DP �double-logarithmic scale� and fit lines in the form of r� with �=−2 for r80 nm and −3.7 for r80 nm.
FIG. 12. �Color online� Density profiles at four different mo-ments during the simulated hydrodynamic expansion of Al underthe action of SP, OP, LP, and DP laser pulses. The observed plateauat quasiliquid density corresponds to a confined liquid phase. Theincident fluence is 5.8 J /cm2.
OPTICAL EMISSION AND NANOPARTICLE GENERATION… PHYSICAL REVIEW B 82, 035430 �2010�
035430-13
133

surface �bulk for z0�. The profile induced with the SP at500 ps shows a plateau at liquid density separated from thesurface by a thin gaseous area. This plateau survives until 10ns and is moving away of the surface �at �200 m /s�. Thetemporal distribution LP generates a plateau resembling pat-tern, with less distinct separation from the unablated matter.The latter is suppressed after several nanosecond and recon-densation at solid density occurs. The OP and DP exposuresdo not lead to the formation of a plateau at liquid density, weonly observe a continuous decreasing from solid to low den-sity.
Moreover, the simulation results can be used to calculatethe droplets radii described by the Eqs. �6� and �7�. In ourconditions, the lifetime of the quasiliquid-density plateau canbe estimated between 1 and 10 ns. Then we choose to evalu-ate the droplets sizes associated to the ejection and decom-position of the plateau in the case of SP irradiation sequenceat t=10 ns after laser exposure. The numerical computationresults allows to estimate the different parameters involved:the plateau thickness hp=25 nm, the pressure between thegap and the plateau Pi=3.13 MPa and the velocity gradientin the gap �dv /dz�=1.6�109 s−1. The density of liquid alu-minum is taken as �=2500 kg m−3. The surface tension iscalculated through the following equation97 �=�0+a�T−Tm� with �0=0.83 Nm−1 the surface tension of the equilib-rium liquid, a=−1.34�10−4 N m−1 K−1 a phenomenologi-cal constant and Tm the melting temperature of Al. The simu-lated temperatures in the plateau and in the gap at 10 ns afterlaser irradiation are 3900 K and 3800 K, respectively. Weobtain liquid surface tensions of 0.46 Nm−1 in the plateauand 0.47 Nm−1 in the gap that intervene in estimating theradii. The mean radius of droplets formed consequently tothe plateau decomposition is rp 140 nm while the maxi-mum radius of particulates formed in the gap is rg 100 nm. These values are in good agreement with the ex-perimental findings presented in Fig. 11, being at the middleof the distributions.
Several effects induced by the temporal shaping of laserpulses with the optimal sequences �OP, LP, and DP� can benow correlated. The experimentally observed nanoparticlesdensity is reduced without a change in the relative abun-dance. The phase explosion efficiency is progressively de-creased in the favor of hot material decomposition that ac-centuates the efficiency of the transition to gas phase. Thecomputed evolving liquid-density plateau is progressivelysuppressed. These observations suggest that the decomposi-tion following the instability of the ejected liquid shell playsa major role in the formation of nanoparticles of radii200 nm induced by femtosecond laser ablation in our en-ergetic conditions.
VI. CONCLUSION
In conclusion, we have shown the possibility to influenceand optimize the optical emission of the different atomicspecies in the ablation plume from ultrafast laser irradiatedAl targets. An adaptive procedure based on the spectroscopicanalysis of the plasma luminescence was used to lock up thetemporal shapes for laser pulses which determine specific
emission signals of the plume. The enhancement of the ionic�Al-II� emission with respect to the neutral �Al-I� signal isachieved through a suited temporal tailoring of the laserpulses on picosecond scales. The influence of this optimizedtemporal distribution on optical plasma emission is com-pared to simpler shapes corresponding to stretched anddouble pulses in order to provide insights into the optimiza-tion processes. While the femtosecond unshaped pulse leadsto a weak ionization level, the optimized, double, and longpulses �LPs� generate a larger amount of Al-II ions in theleading part of the plume following a strong temperaturegradient at the front. Consequence of a higher and more con-fined energy coupling, this is achieved through an optimalsurface pre-excitation by the leading part of the laser pulsewhich enhances the absorption of the trailing part. The en-ergy threshold to establish an efficient preparation of the su-perficial layers is determined. The optimization effect startswith the onset of optical modification and is maximum closeto the visible macroscopic ablation threshold. As the energyis coupled in the evolving material, this leads as a side con-sequence to a lower ablation rates for the temporally shapedpulses than those induced by the femtosecond pulse.
Thin films were elaborated in order to study the influenceof temporal shaping of laser pulses on the PLD processes.The efficiency of nanoparticles generation appears to be alsocontrollable through the temporal shapes of the laser pulses.The femtosecond unshaped pulses leads to a high density ofnanoparticles at the deposition surface. The use of the opti-mized, double, or stretched pulses allows to reduce the nano-particles production by balancing the thermomechanical en-ergy content.
Numerical simulations were performed to support the in-terpretation. The theoretical results allow to explain the in-fluence of the laser pulses temporal shape on optical plasmaemission in terms of modifications of the spatial temperatureand density profiles in the plasma. Moreover, the efficiencyof the nanoparticles generation can be correlated with theejection of nanosized liquid layers. This liquid layer couldlead to nanoparticules formation through its decompositionfollowing a Rayleigh-Taylor instability or surface-tensionphenomena.
The reported influence of the temporal shaping of femto-second laser pulses on the optical plasma emission and onnanoparticles generation implies a direct modification of theablation mechanisms. Our study suggests that the temporalshaping of initially ultrafast laser pulses allows to control thebalance between the different relaxation paths of the incidentenergy. In particular, the femtosecond laser pulse induces anablation dominated by homogeneous nucleation processes inthe liquid phase. The optimal tailoring of the laser pulsesallows to reduce the weight of the phase explosion processand to enhance the mechanisms related to the atomization ofthe supercritical fluid inducing a more efficient transition tothe gas phase. Through the temporal pulse shape the balancebetween the two mechanisms can be regulated.
The influence, reported in this paper, of the femtosecondlaser pulses temporal tailoring on the relaxation paths fol-lowed by the excited matter opens a range of perspectives, inparticular, in the field of PLD or LIBS applications where thecontrol of ablated materials characteristics is of prime inter-est.
GUILLERMIN et al. PHYSICAL REVIEW B 82, 035430 �2010�
035430-14
134

ACKNOWLEDGMENTS
The authors would like to thank Patrick Combis fromCommissariat à 1’Énergie Atomique �CEA� for his support
in the development of the Esther code provided by CEA andacknowledge the generous support of the Agence Nationalede la Recherche.
*[email protected]†[email protected]
1 B. N. Chichkov, C. Momma, S. Nolte, F. von Alvensleben, andA. Tünnermann, Appl. Phys. A: Mater. Sci. Process. 63, 109�1996�.
2 R. Le Harzic, N. Huot, E. Audouard, C. Jonin, P. Laporte, S.Valette, A. Fraczkiewicz, and R. R. Fortunier, Appl. Phys. Lett.80, 3886 �2002�.
3 D. Perez and L. J. Lewis, Phys. Rev. B 67, 184102 �2003�.4 J. P. Colombier, P. Combis, F. Bonneau, R. Le Harzic, and E.
Audouard, Phys. Rev. B 71, 165406 �2005�.5 F. Vidal, T. W. Johnston, S. Laville, O. Barthélemy, M. Chaker,
B. Le Drogoff, J. Margot, and M. Sabsabi, Phys. Rev. Lett. 86,2573 �2001�.
6 J. P. Colombier, P. Combis, A. Rosenfeld, I. V. Hertel, E. Aud-ouard, and R. Stoian, Phys. Rev. B 74, 224106 �2006�.
7 M. E. Povarnitsyn, T. E. Itina, M. Sentis, K. V. Khishchenko, andP. R. Levashov, Phys. Rev. B 75, 235414 �2007�.
8 A. K. Upadhyay, N. A. Inogamov, B. Rethfeld, and H. M. Ur-bassek, Phys. Rev. B 78, 045437 �2008�.
9 D. P. Banks, C. Grivas, J. D. Mills, R. W. Eason, and I. Zergioti,Appl. Phys. Lett. 89, 193107 �2006�.
10 R. Fardel, M. Nagel, F. Nüeschb, T. Lippert, and A. Wokaun,Appl. Phys. Lett. 91, 061103 �2007�.
11 B. Le Drogoff, J. Margot, M. Chaker, M. Sabsabi, O. Bar-thélemy, T. W. Johnston, S. Laville, F. Vidal, and Y. von Kaenel,Spectrochim. Acta, Part B 56, 987 �2001�.
12 A. Assion, M. Wollenhaupt, L. Haag, F. Mayorov, C. Sarpe-Tudoran, M. Winter, U. Kutschera, and T. Baumert, Appl. Phys.B: Lasers Opt. 77, 391 �2003�.
13 K. Stelmaszczyk, P. Rohwetter, G. Méjean, J. Yu, E. Salmon, J.Kasparian, R. Ackermann, J.-P. Wolf, and L. Wöste, Appl. Phys.Lett. 85, 3977 �2004�.
14 J. Perrière, E. Millon, W. Seiler, C. Boulmer-Leborgne, V.Craciun, O. Albert, J. C. Loulergue, and J. Etchepare, J. Appl.Phys. 91, 690 �2002�.
15 F. Garrelie, A. S. Loir, C. Donnet, F. Rogemond, R. Le Harzic,M. Belin, E. Audouard, and P. Laporte, Surf. Coat. Technol.163-164, 306 �2003�.
16 R. Teghil, L. D’Alessio, A. De Bonis, D. Ferro, A. Galasso, G.Lanza, A. Santagata, P. Villani, and D. J. Sordelet, Thin SolidFilms 517, 1880 �2009�.
17 M. Jelinek, A. Klini, C. Grivas, J. Lancok, V. Studnicka, J. Ch-val, A. Mackova, and C. Fotakis, Appl. Surf. Sci. 197-198, 416�2002�.
18 S. Eliezer, N. Eliaz, E. Grossman, D. Fisher, I. Gouzman, Z.Henis, S. Pecker, Y. Horovitz, M. Fraenkel, S. Maman, and Y.Lereah, Phys. Rev. B 69, 144119 �2004�.
19 S. Amoruso, G. Ausanio, R. Bruzzese, M. Vitiello, and X. Wang,Phys. Rev. B 71, 033406 �2005�.
20 E. Lescoute, L. Hallo, D. Hebert, B. Chimier, B. Etchessahar, V.T. Tikhonchuk, J.-M. Chevalier, and P. Combis, Phys. Plasmas
15, 063507 �2008�.21 T. E. Itina, K. Gouriet, L. V. Zhigilei, S. Noël, J. Hermann, and
M. Sentis, Appl. Surf. Sci. 253, 7656 �2007�.22 S. Amoruso, R. Bruzzese, N. Spinelli, R. Velotta, M. Vitiello, X.
Wang, G. Ausanio, V. Iannotti, and L. Lanotte, Appl. Phys. Lett.84, 4502 �2004�.
23 F. Garrelie, N. Benchikh, C. Donnet, R. Y. Fillit, J. N. Rouzaud,J. Y. Laval, and A. Pailleret, Appl. Phys. A: Mater. Sci. Process.90, 211 �2007�.
24 B. Liu, Z. Hu, Y. Che, Y. Chen, and X. Pan, Appl. Phys. Lett.90, 044103 �2007�.
25 J. Perrière, C. Boulmer-Leborgne, R. Benzerga, and S. Tricot, J.Phys. D 40, 7069 �2007�.
26 S. Amoruso, R. Bruzzese, X. Wang, N. N. Nedialkov, and P. A.Atanasov, Nanotechnology 18, 145612 �2007�.
27 S. Noël, J. Hermann, and T. Itina, Appl. Surf. Sci. 253, 6310�2007�.
28 M. S. B. Darby, T. C. May-Smith, R. W. Eason, T. Donnelly, J.G. Lunney, and K. D. Rogers, Appl. Surf. Sci. 254, 3364�2008�.
29 B. Sallé, O. Gobert, P. Meynadier, M. Perdrix, G. Petite, and A.Semerok, Appl. Phys. A: Mater. Sci. Process. 69, S381 �1999�.
30 A. Semerok and C. Dutouquet, Thin Solid Films 453-454, 501�2004�.
31 R. Le Harzic, D. Breitling, M. Weikert, S. Sommer, C. Föhl, S.Valette, C. Donnet, E. Audouard, and F. Dausinger, Appl. Surf.Sci. 249, 322 �2005�.
32 N. Jegenyes, J. Etchepare, B. Reynier, D. Scuderi, A. Dos-Santos, and Z. Tóth, Appl. Phys. A: Mater. Sci. Process. 91, 385�2008�.
33 S. Singha, Z. Hu, and R. J. Gordon, J. Appl. Phys. 104, 113520�2008�.
34 J. Alcántara, J. Vadillo, and J. Laserna, Appl. Phys. A: Mater.Sci. Process. 92, 963 �2008�.
35 T. Donnelly, J. G. Lunney, S. Amoruso, R. Bruzzese, X. Wang,and X. Ni, J. Appl. Phys. 106, 013304 �2009�.
36 I. H. Chowdhury, X. Xu, and A. M. Weiner, Appl. Phys. Lett.86, 151110 �2005�.
37 Y. P. Deng, X. H. Xie, H. Xiong, Y. X. Leng, C. F. Cheng, H. H.Lu, R. X. Li, and Z. Z. Xu, Opt. Express 13, 3096 �2005�.
38 T. Y. Choi, D. J. Hwang, and C. P. Grigoropoulos, Appl. Surf.Sci. 197-198, 720 �2002�.
39 Z. Zhang, P. A. Van Rompay, and P. P. Pronko, Appl. Phys. Lett.83, 431 �2003�.
40 R. Noll, R. Sattmann, V. Sturm, and S. Winkelmann, J. Anal. At.Spectrom. 19, 419 �2004�.
41 V. I. Babushok, F. C. DeLucia, Jr., J. L. Gottfried, C. A. Munson,and A. W. Miziolek, Spectrochim. Acta, Part B 61, 999 �2006�.
42 A. Santagata, R. Teghil, G. Albano, D. Spera, P. Villani, A. DeBonis, G. P. Parisi, and A. Galasso, Appl. Surf. Sci. 254, 863�2007�.
43 V. N. Rai, F. Y. Yueh, and J. P. Singh, Appl. Opt. 47, G21
OPTICAL EMISSION AND NANOPARTICLE GENERATION… PHYSICAL REVIEW B 82, 035430 �2010�
035430-15
135
�2008�.44 V. Pinon, C. Fotakis, G. Nicolas, and D. Anglos, Spectrochim.
Acta, Part B 63, 1006 �2008�.45 R. Teghil, L. D’Alessio, A. Santagata, M. Zaccagnino, D. Ferro,
and D. J. Sordelet, Appl. Surf. Sci. 210, 307 �2003�.46 N. Jegenyes, Z. Toth, B. Hopp, J. Klebniczki, Z. Bor, and C.
Fotakis, Appl. Surf. Sci. 252, 4667 �2006�.47 S. Noël and J. Hermann, Appl. Phys. Lett. 94, 053120 �2009�.48 A. M. Weiner, Rev. Sci. Instrum. 71, 1929 �2000�.49 M. Spyridaki, E. Koudoumas, P. Tzanetakis, C. Fotakis, R.
Stoian, A. Rosenfeld, and I. V. Hertel, Appl. Phys. Lett. 83,1474 �2003�.
50 T. Gunaratne, M. Kangas, S. Singh, A. Gross, and M. Dantus,Chem. Phys. Lett. 423, 197 �2006�.
51 M. Guillermin, C. Liebig, F. Garrelie, R. Stoian, A. S. Loir, andE. Audouard, Appl. Surf. Sci. 255, 5163 �2009�.
52 B. J. Garrison, T. E. Itina, and L. V. Zhigilei, Phys. Rev. E 68,041501 �2003�.
53 P. Lorazo, L. J. Lewis, and M. Meunier, Phys. Rev. B 73,134108 �2006�.
54 R. S. Judson and H. Rabitz, Phys. Rev. Lett. 68, 1500 �1992�.55 A. Assion, T. Baumert, M. Bergt, T. Brixner, B. Kiefer, V. Sey-
fried, M. Strehle, and G. Gerber, Science 282, 919 �1998�.56 C. Daniel, J. Full, L. González, C. Lupulescu, J. Manz, A. Merli,
S. Vajda, and L. Wöste, Science 299, 536 �2003�.57 A. Lindinger, C. Lupulescu, M. Plewicki, F. Vetter, A. Merli, S.
M. Weber, and L. Wöste, Phys. Rev. Lett. 93, 033001 �2004�.58 R. Stoian, A. Mermillod-Blondin, N. M. Bulgakova, A. Rosen-
feld, I. V. Hertel, M. Spyridaki, E. Koudoumas, P. Tzanetakis,and C. Fotakis, Appl. Phys. Lett. 87, 124105 �2005�.
59 H. Dachraoui and W. Husinsky, Phys. Rev. Lett. 97, 107601�2006�.
60 X. Zhu, T. C. Gunaratne, V. V. Lozovoy, and M. Dantus, Opt.Express 15, 16061 �2007�.
61 R. Hergenröder, M. Miclea, and V. Hommes, Nanotechnology17, 4065 �2006�.
62 J. M. Liu, Opt. Lett. 7, 196 �1982�.63 S. Nolte, C. Momma, H. Jacobs, A. Tünnermann, B. N. Chich-
kov, B. Wellegehausen, and H. Welling, J. Opt. Soc. Am. B 14,2716 �1997�.
64 M. Hashida, A. F. Semerok, O. Gobert, G. Petite, and J.-F. Wag-ner, Proc. SPIE 4423, 178 �2001�.
65 A. R. Striganov and N. S. Sventitskii, Tables of Spectral Lines ofNeutral and Ionized Atoms �IFI/Plenum, New York, Washington,1968�.
66 The previous reported line of Al-II at 618.157 and 618.168 nm inRef. 51 is not considered anymore. This transition was previ-ously associated with an Al-II line at 618.157 nm which waspresenting an anomalous behavior. It is conceivable that we ob-serve the Fe-I transitions at 618.02 or 618.799 nm.
67 A. V. Bushman, I. V. Lomonosov, and V. E. Fortov, Sov. Tech-nol. Rev. B 5, 1 �1993�.
68 J. P. Colombier, P. Combis, R. Stoian, and E. Audouard, Phys.Rev. B 75, 104105 �2007�.
69 E. Palik, Handbook of Optical Constants of Solids �AcademicPress, London, 1985�.
70 W. Ebeling, A. Förster, V. Fortov, V. Griaznov, and A. Polish-chuk, Thermophysical Properties of Hot Dense Plasmas �Teub-ner, Stuttgart, 1991�.
71 L. Spitzer, Physics of Fully Ionized Gases �Interscience, New
York, 1967�.72 J. P. Colombier, P. Combis, E. Audouard, and R. Stoian, Phys.
Rev. E 77, 036409 �2008�.73 S. I. Anisimov, B. L. Kapeliovich, and T. L. Perel’man, Sov.
Phys. JETP 39, 375 �1974�.74 Z. Lin, L. V. Zhigilei, and V. Celli, Phys. Rev. B 77, 075133
�2008�.75 D. O. Gericke, M. S. Murillo, and M. Schlanges, Phys. Rev. E
65, 036418 �2002�.76 J. Daligault and D. Mozyrsky, Phys. Rev. E 75, 026402 �2007�.77 http://www.t4.lanl.gov/opacity/tops.html78 N. H. Magee, Jr., J. Abdallah, Jr., R. E. H. Clark et al., Astro-physical Applications of Powerful New Databases, AstronomicalSociety of the Pacific Conference Series Vol. 78, edited by S. J.Adelman and W. L. Wiese �Astronomical Society of the Pacific,San Francisco, 1995�, p. 51.
79 D. K. Kim and I. Kim, Phys. Rev. E 68, 056410 �2003�.80 C. Aragòn and J. A. Aguilera, Spectrochim. Acta, Part B 63, 893
�2008�.81 J. A. Aguilera and C. Aragòn, Spectrochim. Acta, Part B 59,
1861 �2004�.82 X. Wang, S. Amoruso, and J. Xia, Appl. Surf. Sci. 255, 5211
�2009�.83 S. Laville, F. Vidal, T. W. Johnston, M. Chaker, B. Le Drogoff,
O. Barthelemy, J. Margot, and M. Sabsabi, Phys. Plasmas 11,2182 �2004�.
84 N. M. Bulgakova, A. V. Bulgakov, and O. F. Bobrenok, Phys.Rev. E 62, 5624 �2000�.
85 A. Miotello and R. Kelly, Appl. Phys. Lett. 67, 3535 �1995�.86 B. J. Siwick, J. R. Dwyer, R. E. Jordan, and R. J. Dwayne Miller,
Science 302, 1382 �2003�.87 M. Kandyla, T. Shih, and E. Mazur, Phys. Rev. B 75, 214107
�2007�.88 M. Guillermin, A. Klini, J. P. Colombier, F. Garrelie, D. Gray, C.
Liebig, E. Audouard, C. Fotakis, and R. Stoian, Opt. Express18, 11159 �2010�.
89 A. V. Bulgakov, I. Ozerov, and W. Marine, Thin Solid Films453-454, 557 �2004�.
90 A. K. Upadhyay and H. M. Urbassek, Phys. Rev. B 73, 035421�2006�.
91 T. E. Glover, J. Opt. Soc. Am. B 20, 125 �2003�.92 T. E. Glover, G. D. Ackerman, A. Belkacem, P. A. Heimann, Z.
Hussain, R. W. Lee, H. A. Padmore, C. Ray, R. W. Schoenlein,W. F. Steele, and D. A. Young, Phys. Rev. Lett. 90, 236102�2003�.
93 B. Chimier and V. T. Tikhonchuk, Phys. Rev. B 79, 184107�2009�.
94 K. Sokolowski-Tinten, J. Bialkowski, A. Cavalleri, D. von derLinde, A. Oparin, J. Meyer-ter-Vehn, and S. I. Anisimov, Phys.Rev. Lett. 81, 224 �1998�.
95 N. Inogamov, Y. Petrov, S. Anisimov, A. Oparin, N. Shaposhni-kov, D. von der Linde, and J. Meyer-ter-Vehn, JETP Lett. 69,310 �1999�.
96 J. P. Colombier, E. Audouard, P. Combis, A. Rosenfeld, I. V.Hertel, and R. Stoian, Appl. Surf. Sci. 255, 9597 �2009�.
97 J. E. Jensen, W. A. Tuttle, R. B. Stewart, H. Brechna, and A. G.Prodell, Brookhaven National Laboratory Selected CryogenicData Notebook �Brookhaven National Laboratory, New York,1980�.
GUILLERMIN et al. PHYSICAL REVIEW B 82, 035430 �2010�
035430-16
136

Evidence of surface plasmon resonancein ultrafast laser-induced ripples
F. Garrelie, J. P. Colombier, F. Pigeon, S. Tonchev, N. Faure, M.Bounhalli, S. Reynaud, and O. ParriauxUniversite de Lyon, F-42023, Saint-Etienne, France
CNRS, UMR 5516, Laboratoire Hubert Curien, F-42000, Saint-Etienne, FranceUniversite de Saint-Etienne, Jean-Monnet, F-42000, Saint-Etienne, France
Abstract: The sensitivity of grating-coupled Surface Plasmon Polaritons(SPPs) on metallic surface has been exploited to investigate the correlationbetween ripples formation under ultrashort laser exposure and SPPs gen-eration conditions. Systematic examination of coupling of single ultrashortlaser pulse on gratings with appropriate periods ranging from 440 nm to800 nm has been performed. Our approach reveals that a surface plasmonis excited only for an appropriate grating period, the nickel sample exhibitsfine ripples pattern, evidencing the plasmonic nature of ripples generation.We propose a systematic investigation supported by a comprehensive studyon the obtained modulation of such a coupling efficiency by means of aphenomenological Drude-Lorentz model which captures possible opticalproperties modification under femtosecond irradiation.
© 2011 Optical Society of AmericaOCIS codes: (320.2250) Femtosecond phenomena; (220.4000) Microstructure fabrication;(240.6680) Surface plasmons.
References and links1. M. Birnbaum, “Semiconductor surface damage produced by ruby lasers,” J. Appl. Phys. 36(11), 3688–3689(1965).
2. D. C. Emmony, R. P. Howson, and L. J. Willis, “Laser mirror damage in germanium at 10.6 μm,” Appl. Phys.Lett.23(11), 598–600 (1973).
3. Z. Guosheng, P. M. Fauchet, and A. E. Siegman, “Growth of spontaneous periodic surface structures on solidsduring laser illumination,” Phys. Rev. B 26(10), 5366–5381 (1982).
4. J. E. Sipe, J. F. Young, J. S. Preston, and H. M. van Driel, “Laser-induced periodic surface structure,” Phys. Rev.B 27(2), 1141–1154 (1983).
5. A. E. Siegman and P.M. Fauchet, “Stimulated woods anomalies on laser illuminated surfaces,” IEEE J. Quant.Elect. 22(8), 1384–1403 (1986).
6. A. Borowiec and H. K. Haugen, “Subwavelength ripple formation on the surfaces of compound semiconductorsirradiated with femtosecond laser pulses,” Appl. Phys. Lett. 82(25), 4462–4464 (2003).
7. E. M. Hsu, T. H. R. Crawford, H. F. Tiedje, and H. K. Haugen, “Periodic xurface xtructures on gallium phosphideafter irradiation with 150 fs 7 ns laser pulses at 800 nm,” Appl. Phys. Lett. 91(11), 111102 (2007).
8. J. Reif, F. Costache, M. Henyk, and S. V. Pandelov, “Ripples revisited: non classical morphology at the bottomof femtosecond laser ablation craters in transient dielectrics,” Appl. Surf. Sci. 197–198, 891–895 (2002).
9. G. Miyaji and K. Miyazaki, “Origin of periodicity in nanostructuring on thin film surfaces ablated with femtosec-ond laser pulses,” Opt. Express 16(20), 16265–16271 (2008).
10. M. Huang, F. Zhao, Y. Cheng, N. Xu and Z. Xu, “Origin of laser-induced near-subwavelength ripples: interferencebetween surface plasmons and incident laser,” ACS Nano 3(12), 4062–4070 (2009).
11. J. Wang and C. Guo, “Formation of extraordinarily uniform periodic structures on metals induced by femtosecondlaser pulses,” J. Appl. Phys. 100(2), 023511 (2006).
12. J. Bonse, A. Rosenfeld, and J. Krger, “On the role of surface plasmon polaritons in the formation of laser-inducedperiodic surface structures upon irradiation of silicon by femtosecond laser pulses,” J. Appl. Phys. 106(10),104910 (2009).
#142205 - $15.00 USD Received 7 Feb 2011; revised 4 Mar 2011; accepted 6 Mar 2011; published 25 Apr 2011(C) 2011 OSA 9 May 2011 / Vol. 19, No. 10 / OPTICS EXPRESS 9035
137

13. M. Huang, F. Zhao, Y. Cheng, N. Xu, and Z. Xu, “Mechanisms of ultrafast laser-induced deep-subwavelengthgratings on graphite and diamond,” Phys. Rev. B 79(12), 125436 (2009).
14. A. D. Boardman, ed., Electromagnetic Surface Modes (Wiley, 1982).15. H. Raether, “Surface plasmons on smooth and rough surfaces and on gratings,” in Springer Tracts in Modern
Physics, (Springer, 1988), Vol. 111.16. A. Y. Vorobyev and C. Guo, “Femtosecond laser-induced periodic surface structure formation on tungsten,” J.
Appl. Phys. 104(6), 063523 (2008).17. T. Tomita, K. Kinoshita, S. Matsuo, and S. Hashimoto, “Effect of surface roughening on femtosecond laser-
induced ripple structures,” Appl. Phys. Lett. 90(15), 153115 (2007).18. Y. Yang, J. Yang, L. Xue, and Y. Guo, “Surface patterning on periodicity of femtosecond laser-induced ripples,”
Appl. Phys. Lett. 97(14), 141101 (2010).19. Y. Han and S. Qu, “The ripples and nanoparticles on silicon irradiated by femtosecond laser,” Chem. Phys. Lett.
495(4–6), 241–244 (2010).20. Q. Z. Zhao, S. Malzer, and L. J. Wang, “Formation of subwavelength periodic structures on tungsten induced by
ultrashort laser pulses,” Opt. Lett. 32(13), 1932–1934 (2007).21. J. M. Liu, “Simple technique for measurements of pulsed Gaussian-beam spot sizes,” Opt. Lett. 7(5), 196–198
(1982).22. D. E. Gray, American Institute of Physics Handbook, 3rd. ed. (McGraw Hill, 1972).23. E. Palik, Handbook of Optical Constants of Solids (Academic Press, 1985).24. A. D. Rakic, A. B. Djurisic, J. M. Elazar, and M. L. Majewski, “Optical properties of metallic films for vertical-
cavity optoelectronic devices,” Appl. Opt. 37, 5271–5283 (1998).25. J. Bonse, A. Rosenfeld, and J. Kruger, “Implications of transient changes of optical and surface properties of
solids during femtosecond laser pulse irradiation to the formation of laser-induced periodic surface structures,”Appl. Surf. Sci. (to be published). DOI: 10.1016/j.apsusc.2010.11.059.
26. Z. Lin and L. V. Zhigilei, “Electron-phonon coupling and electron heat capacity of metals under conditions ofstrong electron-phonon nonequilibrium,” Phys. Rev. B 77(7), 075133 (2008).
27. P. E. Hopkins, J. M. Klopf, and P. M. Norris, “Influence of interband transitions on electron-phonon couplingmeasurements in Ni films,” Appl. Opt. 46(11), 2076–2083 (2007).
1. Introduction
Laser-Induced Periodical Surface Structures (LIPSS) were first observed by Birnbaum on semi-conductor surfaces [1]. Pioneering works to determine the physical processes responsible forperiodic micro-and nanostructuring in laser interaction were started thirty years ago. They re-veal that LIPSS depend on the irradiation conditions as well as the material properties [2–4].Among them, the interference phenomena between the incident pulse and a secondary surfaceelectromagnetic wave generated by scattering of laser radiation has been mostly accepted [5].More recently, ultrafast laser irradiated wide band-gap dielectrics, semi-conductors or metalsexhibit periodic structures often much smaller than the laser wavelength λ , in contrast withstructures formed under long-pulse irradiation with periods close to λ [6, 7]. When solids areexposed to ultrashort laser pulses, the exact mechanisms responsible for the ripples formationare still debated and various effects associated with short timescales have been proposed toexplain the observed structures [8–13]. As ripples have been found to grow along the direc-tion perpendicular to the laser polarization, even if high spatial frequency LIPSS parallel tothe incident electric field have been reported, the hypothesis has been made that ripples can beattributed to the excitation of surface plasmon polaritons [10–12]. Surface plasmons are col-lective longitudinal oscillations of electrons propagating along a metal-dielectric interface atoptical frequencies and it is well known that a surface plasmon is necessarily excited by a TMpolarized wave [14, 15]. Due to the effective coupling of the incident electromagnetic radiationwith the plasmon oscillation, a significant enhancement of the field in the vicinity of the struc-ture can be produced, explaining the polarization dependence of ripples. In the initial stage ofripples formation, the plasmonic wave is supposed to be the main mechanism and the ripplesperiod ΛLIPPS is related to the plasmon coupling theory and derived from previous long-pulselaser experiments [5]:
#142205 - $15.00 USD Received 7 Feb 2011; revised 4 Mar 2011; accepted 6 Mar 2011; published 25 Apr 2011(C) 2011 OSA 9 May 2011 / Vol. 19, No. 10 / OPTICS EXPRESS 9036
138
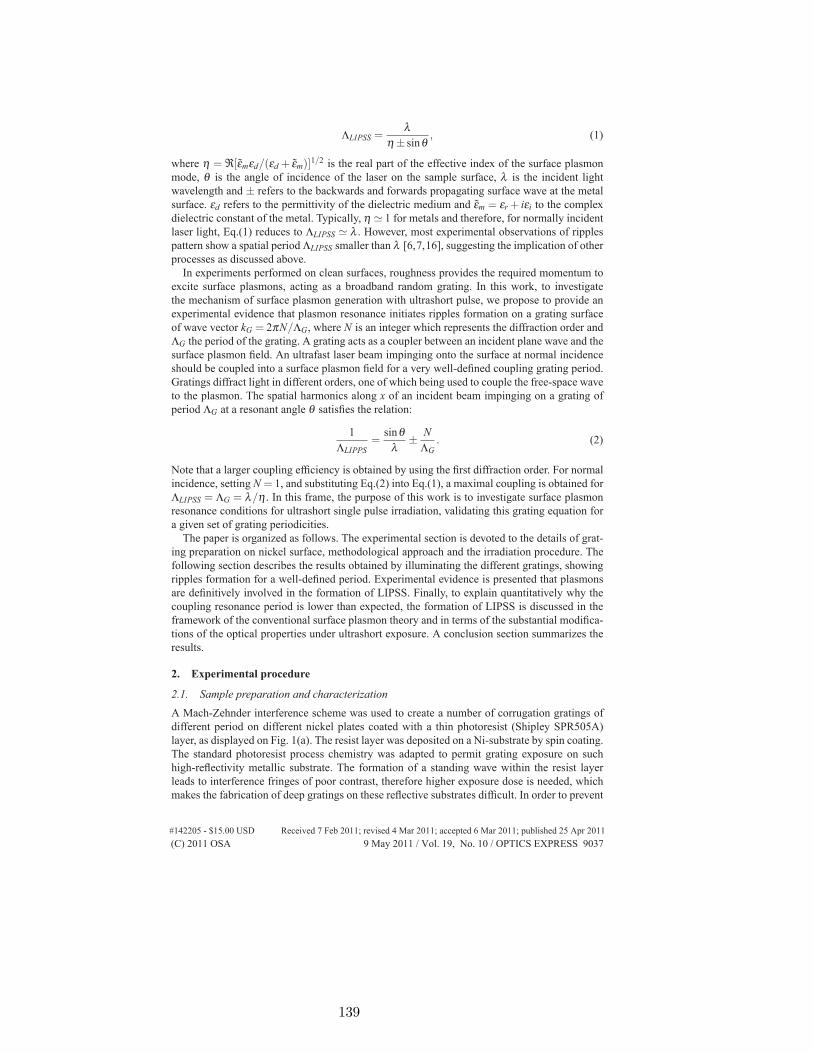
ΛLIPSS =λ
η ± sinθ, (1)
where η = ℜ[εmεd/(εd + εm)]1/2 is the real part of the effective index of the surface plasmonmode, θ is the angle of incidence of the laser on the sample surface, λ is the incident lightwavelength and ± refers to the backwards and forwards propagating surface wave at the metalsurface. εd refers to the permittivity of the dielectric medium and εm = εr+ iεi to the complexdielectric constant of the metal. Typically, η � 1 for metals and therefore, for normally incidentlaser light, Eq.(1) reduces to ΛLIPSS � λ . However, most experimental observations of ripplespattern show a spatial period ΛLIPSS smaller than λ [6,7,16], suggesting the implication of otherprocesses as discussed above.In experiments performed on clean surfaces, roughness provides the required momentum to
excite surface plasmons, acting as a broadband random grating. In this work, to investigatethe mechanism of surface plasmon generation with ultrashort pulse, we propose to provide anexperimental evidence that plasmon resonance initiates ripples formation on a grating surfaceof wave vector kG = 2πN/ΛG, where N is an integer which represents the diffraction order andΛG the period of the grating. A grating acts as a coupler between an incident plane wave and thesurface plasmon field. An ultrafast laser beam impinging onto the surface at normal incidenceshould be coupled into a surface plasmon field for a very well-defined coupling grating period.Gratings diffract light in different orders, one of which being used to couple the free-space waveto the plasmon. The spatial harmonics along x of an incident beam impinging on a grating ofperiod ΛG at a resonant angle θ satisfies the relation:
1ΛLIPPS
=sinθ
λ±N
ΛG. (2)
Note that a larger coupling efficiency is obtained by using the first diffraction order. For normalincidence, setting N = 1, and substituting Eq.(2) into Eq.(1), a maximal coupling is obtained forΛLIPSS = ΛG = λ/η . In this frame, the purpose of this work is to investigate surface plasmonresonance conditions for ultrashort single pulse irradiation, validating this grating equation fora given set of grating periodicities.The paper is organized as follows. The experimental section is devoted to the details of grat-
ing preparation on nickel surface, methodological approach and the irradiation procedure. Thefollowing section describes the results obtained by illuminating the different gratings, showingripples formation for a well-defined period. Experimental evidence is presented that plasmonsare definitively involved in the formation of LIPSS. Finally, to explain quantitatively why thecoupling resonance period is lower than expected, the formation of LIPSS is discussed in theframework of the conventional surface plasmon theory and in terms of the substantial modifica-tions of the optical properties under ultrashort exposure. A conclusion section summarizes theresults.
2. Experimental procedure
2.1. Sample preparation and characterization
A Mach-Zehnder interference scheme was used to create a number of corrugation gratings ofdifferent period on different nickel plates coated with a thin photoresist (Shipley SPR505A)layer, as displayed on Fig. 1(a). The resist layer was deposited on a Ni-substrate by spin coating.The standard photoresist process chemistry was adapted to permit grating exposure on suchhigh-reflectivity metallic substrate. The formation of a standing wave within the resist layerleads to interference fringes of poor contrast, therefore higher exposure dose is needed, whichmakes the fabrication of deep gratings on these reflective substrates difficult. In order to prevent
#142205 - $15.00 USD Received 7 Feb 2011; revised 4 Mar 2011; accepted 6 Mar 2011; published 25 Apr 2011(C) 2011 OSA 9 May 2011 / Vol. 19, No. 10 / OPTICS EXPRESS 9037
139

a) b)
5 μm
Fig. 1. (a) All corrugation gratings of different periods on nickel plates, under natural lightillumination. (b) SEM image of the ΛG = 560 nm grating.
the formation of a field antinode within the resist layer, the resist thickness should be rather thinand 140 nm thickness was chosen. A difficulty faced with a metal surface is that the electricfield at the surface is close to zero since one has to use the TE polarization to create a highcontrast interferogramme. The risk is therefore high that there still are some nanometers ofunexposed and undeveloped photoresist at the groove bottom after development which willprevent the wet etching of the metal substrate in the grooves to take place. To get round thisdifficulty one first makes a preliminary uniform exposure. This first flood-exposure with non-structured light delivers small but non-zero energy dose everywhere within the resist layer. Thisdose offset is adjusted to remain just below the photomodification threshold of the resist. Thesample is then placed in the interferogramme of a conventional Mach-Zehnder scheme fed by a30 mW s-polarized He-Cd laser emitting at 442 nm. In the presence of the initial dose thresholdall points of the resist layer located where an interference fringe is created get photomodifiedhowever small is the dose delivered by the interference fringe. Thus all grooves are open downto the nickel substrate. The physical transfer of the grating from the resist layer to the nickelsubstrate was made by wet etching using an acidic solution. Nickel requires an acid plus anoxidizer to etch properly. Diluted nitric acid (HNO3) contains both. A 10:1 dilution gives anetching speed of 1 nm/sec. A particular attention was paid to the verification of the absence ofany contamination of the nickel surface due to sample preparation. The grating periods rangefrom ΛG = 440 nm to ΛG = 800 nm with 10 nm increment. This range is supposed to coverall possibilities of plasmonic coupling. An example ΛG = 560 nm is shown on Fig. 1(b). Allgratings have the same depth. A depth σ = 10 nm was chosen to be large enough to dominatethe plasmon coupling effect of the surface roughness and small enough to just represent a seedfor plasmon excitation [17, 18].
2.2. Ultrafast irradiation
The laser system used in the experiment was an amplified Ti:sapphire laser (Thales) with apulse duration of 150 fs full width at half-maximum (FWHM) at a repetition rate of 1 kHzand a wavelength of 800 nm. The pulse rate used for samples irradiation was adjusted down tosingle pulse using a Pockels control unit cell. The experiments presented here have all been per-formed with a single pulse irradiation to avoid all accumulative phenomena which would erasethe memory of plasmon resonance. The feedback mechanisms which would also change theinitial periodicity by coupling with the incident light are suppressed by performing single pulseirradiation [19, 20]. The laser beam is focused normally, through an achromatic lens of 50.8mm focal length, onto the sample that is vertically mounted on an X-Y-Z motorized translationstage. The horizontal polarization is controlled by a plate-polarizer. The dimension of the beam
#142205 - $15.00 USD Received 7 Feb 2011; revised 4 Mar 2011; accepted 6 Mar 2011; published 25 Apr 2011(C) 2011 OSA 9 May 2011 / Vol. 19, No. 10 / OPTICS EXPRESS 9038
140
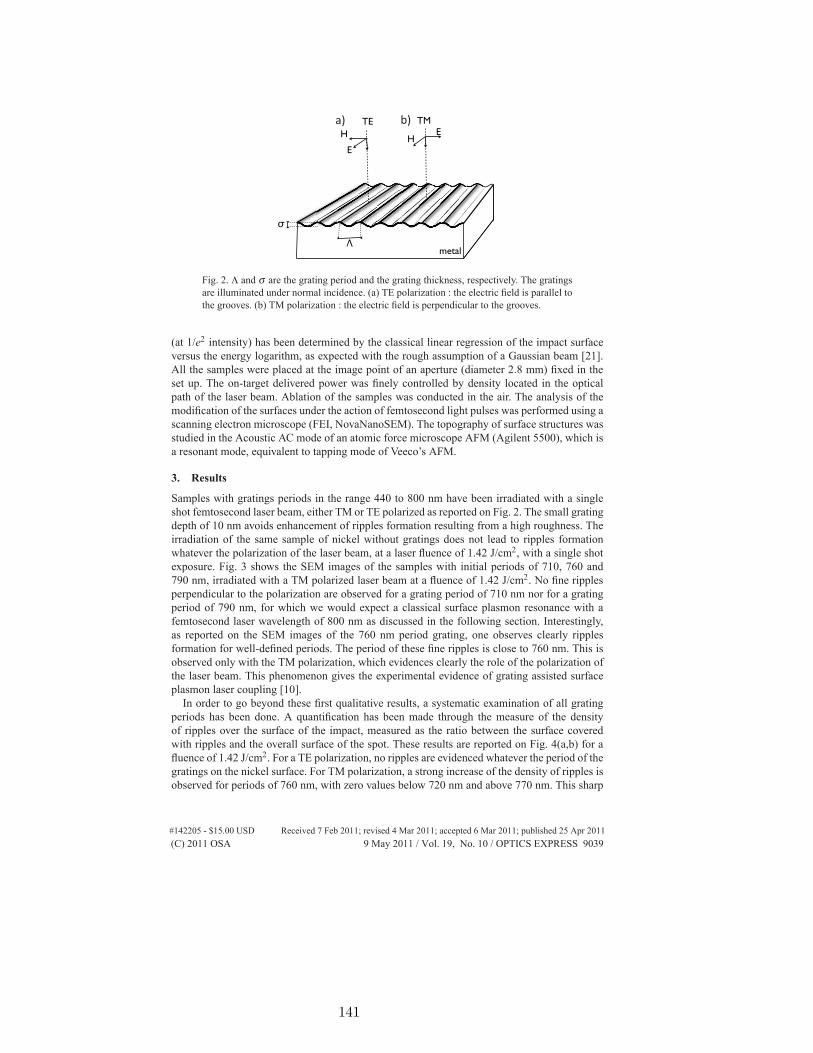
metal
TE TME
HE
H
Λ
σ
a) b)
Fig. 2. Λ and σ are the grating period and the grating thickness, respectively. The gratingsare illuminated under normal incidence. (a) TE polarization : the electric field is parallel tothe grooves. (b) TM polarization : the electric field is perpendicular to the grooves.
(at 1/e2 intensity) has been determined by the classical linear regression of the impact surfaceversus the energy logarithm, as expected with the rough assumption of a Gaussian beam [21].All the samples were placed at the image point of an aperture (diameter 2.8 mm) fixed in theset up. The on-target delivered power was finely controlled by density located in the opticalpath of the laser beam. Ablation of the samples was conducted in the air. The analysis of themodification of the surfaces under the action of femtosecond light pulses was performed using ascanning electron microscope (FEI, NovaNanoSEM). The topography of surface structures wasstudied in the Acoustic AC mode of an atomic force microscope AFM (Agilent 5500), which isa resonant mode, equivalent to tapping mode of Veeco’s AFM.
3. Results
Samples with gratings periods in the range 440 to 800 nm have been irradiated with a singleshot femtosecond laser beam, either TM or TE polarized as reported on Fig. 2. The small gratingdepth of 10 nm avoids enhancement of ripples formation resulting from a high roughness. Theirradiation of the same sample of nickel without gratings does not lead to ripples formationwhatever the polarization of the laser beam, at a laser fluence of 1.42 J/cm2, with a single shotexposure. Fig. 3 shows the SEM images of the samples with initial periods of 710, 760 and790 nm, irradiated with a TM polarized laser beam at a fluence of 1.42 J/cm2. No fine ripplesperpendicular to the polarization are observed for a grating period of 710 nm nor for a gratingperiod of 790 nm, for which we would expect a classical surface plasmon resonance with afemtosecond laser wavelength of 800 nm as discussed in the following section. Interestingly,as reported on the SEM images of the 760 nm period grating, one observes clearly ripplesformation for well-defined periods. The period of these fine ripples is close to 760 nm. This isobserved only with the TM polarization, which evidences clearly the role of the polarization ofthe laser beam. This phenomenon gives the experimental evidence of grating assisted surfaceplasmon laser coupling [10].In order to go beyond these first qualitative results, a systematic examination of all grating
periods has been done. A quantification has been made through the measure of the densityof ripples over the surface of the impact, measured as the ratio between the surface coveredwith ripples and the overall surface of the spot. These results are reported on Fig. 4(a,b) for afluence of 1.42 J/cm2. For a TE polarization, no ripples are evidenced whatever the period of thegratings on the nickel surface. For TM polarization, a strong increase of the density of ripples isobserved for periods of 760 nm, with zero values below 720 nm and above 770 nm. This sharp
#142205 - $15.00 USD Received 7 Feb 2011; revised 4 Mar 2011; accepted 6 Mar 2011; published 25 Apr 2011(C) 2011 OSA 9 May 2011 / Vol. 19, No. 10 / OPTICS EXPRESS 9039
141

� � ��� ���� �� � ��� ���� � � � �� ���� �
� � ��� ���� � � � � � ��� ��
� � ���
��� ���
Fig. 3. SEM images of samples with grating of 710 nm (a), 790 nm (b) and 760 nm (c,d)irradiated with a single pulse TM polarized femtosecond laser beam, at a fluence of 1.42J/cm2.
resonance will be discussed in the following section from theoretical findings on the observedperiod. These phenomena occur not only for this value of fluence (1.42 J/cm2), but also for alower laser fluence of 0.97 J/cm2, as reported on Fig. 4(c,d). The same behavior is observedat this lower energy, attesting that in a well-defined energy range and under single laser shotexposure, grating assisted surface plasmon coupling is likely to play a precursor role in ripplesformation under ultrashort laser irradiation.
4. Discussion
In its simplest form, a surface plasmon polariton is an electromagnetic excitation that may existat the interface of two media with dielectric constants of opposite signs, for instance nickel andair. The charge density wave is associated with bound TM-polarized electromagnetic wave atthe metal dielectric interface. The amplitude of this field decays evanescently into each mediumfrom the considered interface. This field can interfere with the incident laser beam and then canlead to a modulated energy deposition, forming ripples at the surface. To attempt an explanationof the observed behavior regarding the resonant coupling for 750 nm and 760 nm period grat-ings, we discuss hereafter the effects of ultrashort irradiation on the optical properties leadingto a shift in the expected surface plasmon resonance.
#142205 - $15.00 USD Received 7 Feb 2011; revised 4 Mar 2011; accepted 6 Mar 2011; published 25 Apr 2011(C) 2011 OSA 9 May 2011 / Vol. 19, No. 10 / OPTICS EXPRESS 9040
142

6
8
10
es
(%)
a) TM
6
8
10
es
(%)
b) TE
0
2
4
6
ity
of
rip
pl
0
2
4
6
ity
of
rip
pl
44
0
54
0
64
0
74
0
De
ns
Period (nm)
44
0
54
0
64
0
74
0
De
ns
Period (nm)
6
8
10
ple
s (%
)
c) TM
6
8
10
ple
s (%
)
d) TE
0
2
4
0 0 0 0sity
of
rip
p
0
2
4
0 0 0 0sity
of
rip
p
44
0
54
0
64
0
74
0
De
ns
Period (nm)
44
0
54
0
64
0
74
0
De
ns
Period (nm)
Fig. 4. Role of the TM polarization in well-defined ripples on the irradiated area of thenickel substrate: density of ripples as a function of the period of the grating, with a TMpolarization (a,c) and a TE polarization (b,d) and a laser fluence of 1.42 J/cm2 (a,b) and0.97 J/cm2 (c,d). The density of ripples is measured as the ratio between the surface coveredwith fine ripples and the overall surface of the spot.
4.1. Calculated plasmon wavelength for nickel
Applying the appropriate boundary conditions to the fields at the dielectric/metal interface re-
sults in the familiar expression for the plasmon wave vector kSP = k′SP+ ik′′SP = ωc
(εd εm
εd+εm
)1/2.
Provided εr < −εd , a condition satisfied at the air/Ni interface for 800 nm in the Palik’s dataset [23], the plasmon wavelength λSP corresponds to the real part of kSP and can be written:
λSP =2πk′SP
= λℜ
[(εd + εm
εd εm
)1/2]. (3)
As the gratings have been designed in terms of aspect ratio to avoid any shift in the resonanceperiod, calculations start from optical properties applicable for smooth and uncontaminated sur-faces. The tabulated data from Refs. [22,23] give for λ = 800 nm, εr = −13 and εi = 21.7, anda calculated surface plasmon wavelength λSP = 792 nm. If a Drude-type absorption depen-dence is found at low photon energy (λ > 20 μm) for nickel, the interband transitions dominatethe spectral optical properties in the infrared range. Consequently, any treatment of the com-plex dielectric constant close to this region must involve splitting it into two parts, one partcorresponding to intraband excitations described by the Drude model, and an interband partcorresponding to resonant absorptions based on a Lorentz oscillator model, i.e. εm = εD+ εIB.
4.2. Parametric study of the Drude-Lorentz model
From the modeling standpoint, Eq.(3) requires a corrected dielectric function due to nickel ex-citation and should capture the essence of any ultrashort excitation effect compatible with theobserved plasmon resonance shift from 792 nm to 750-760 nm. At a given frequency, the sur-face plasmon wavelength λSP can be tuned by the dielectric constant which require to evaluatematerial excitation. At our laser wavelength, the dominant changes of the optical properties is
#142205 - $15.00 USD Received 7 Feb 2011; revised 4 Mar 2011; accepted 6 Mar 2011; published 25 Apr 2011(C) 2011 OSA 9 May 2011 / Vol. 19, No. 10 / OPTICS EXPRESS 9041
143

expected to originate from the modification of the electronic states. For nickel, the interbandterm εIB is dominated by transitions from the narrow d bands to the Fermi surface states. Laserenergy injection into the electron gas results in a spreading of the electron distribution aroundthe Fermi energy, and thus drastically affects intraband and interband transitions occuring in theelectron system.The frequency-dependent complex dielectric constant εm is described by the Drude-Lorentz
model as [24]:
εm = εr+ iεi = εD+ εIB =
[1−
f0ω2pω(ω − iγ)
]D
+
[k
∑j=1
f jΩ2p(ω2j −ω2)+ iωΓ j
]IB
. (4)
In the simple Drude model, the key parameters describing the dynamics of free carriers in amaterial are plasma frequency ωp and the scattering rate γ of the free electrons undergoingintraband transitions. The motion of localized charge carriers is ascribed to the second term,the Lorentz harmonic oscillators, where f j, ω j, and Γ j are, respectively, oscillator strength, thecenter frequency and the scattering rate of the electrons that are excited via interband transitionj. To determine the intraband and interband dielectric functions in Ni at 300 K, εr and εi werecalculated with the parametrization data listed by Rakic et al [24]. According to these tabulateddata, plasma frequencies have been set to ωp = Ωp = ω0p = 15.92 eV, corresponding to two freeelectrons per atom.In this calculation, as the two parameters εr and εi are varied, the surface plasmon wavelength
is calculated and plotted as contour diagrams in Fig. 5(a). Fig. 5(b) shows the dependence of λSPwith the plasma frequencies related to change in electron number densities for both intrabandand interband contributions. The parametric study is discussed as a function of ωp but similarqualitative arguments can be deduced from changes of relative oscillator strengths.
00a) b)ir
,
i
r
Fig. 5. Calculated plasmon wavelength in the complex permittivity plane (a). Iso-wavelength corresponding to λSP = 750 nm is represented by solid green curve andλSP = 760 nm by dashed blue curve. The expected cold value (792 nm) is pointed inblack. The set of solutions is plotted as a function of the plasma frequencies used in theDrude-Lorentz model (b).
The surface plasmon wavelength, and subsequently the ripples period, has already been sup-posed to decrease with the decreasing electron density for silicon [19, 25]. For Ni, a transitionmetal, the shift of the resonance from 792 nm to 750-760 nm can result from a complex changein electronic densities inside both the d-band and the s-band, due to ultrashort photoexcitation,as shown on Fig. 5(b). λSP = 760 nm solutions represented by the upper blue dashed curveon Fig. 5(b), are reachable for a d-band contribution lower than for room temperature case.λSP = 750 nm isocontour is represented by the lower green solid curve on the same figure, sur-
#142205 - $15.00 USD Received 7 Feb 2011; revised 4 Mar 2011; accepted 6 Mar 2011; published 25 Apr 2011(C) 2011 OSA 9 May 2011 / Vol. 19, No. 10 / OPTICS EXPRESS 9042
144

rounding the available solutions. The distinction of the onset of interband transitions is not clearin Ni where d-bands overlap and have electron energies higher than the Fermi energy, as is ap-parent in the ab-initio calculations of electron band structure by Lin et al. [26]. The overlappingof the high density of states d-band with the Fermi energy ensures that the 3d band electronscan be easily excited to the 4s band. Due to the photon energy greater than the interband tran-sition threshold, electrons in the d-bands are promoted to empty states in the s/p-band near theFermi level through direct interband transitions [27]. As the temperature of the electron systemincreases, empty states will become available below the Fermi level due to Fermi smearing. The4s band has a much smaller density of states as compared to the density of states at the Fermilevel, leading to a shift of the chemical potential to higher energies, reducing the contributionof d-band electrons [26]. The contribution of these electrons available to undergo a transitiondecreases, causing a decrease of the plasma frequency Ωp. Accordingly, the resultant surfaceplasmon wavelength get reduced and agrees with our measurements in Fig. 4. This analysisallows us to identify the range of surface plasmon resonance that can be effectively reachedafter an utrashort excitation. The decrease of the spatial period for the experimentally obtainedsurface ripples could be due to the decrease of the surface plasmon wavelength λSP with thedecreasing plasma frequency in the solid.
5. Conclusion
In conclusion, we have demonstrated that laser-induced surface plasmons lead to the generationof fine ripples on a nickel surface undergoing femtosecond laser irradiation. Single pulse TMirradiations have been performed on a large range of grating periods with properly designedgroove geometry to determine for which grating spatial frequency the incident beam and thesurface plasmon wave vectors are matched. On the basis of this experimental procedure, ourresults reveal that ripples only appear for a well-defined grating period of 750-760 nm, showingthat the coupling with surface plasmons is responsible for the ripples formation. Grating spac-ing which exhibits ripples differs from the one expected from dielectric constant at λ = 800 nm.A Drude-Lorentz model has been applied with various relative intraband and interband contri-butions. The dielectric constant of nickel is supposed to undergo a transiently change due toultrashort excitation. The model shows that nickel surface irradiated by fs laser pulses can leadto a reduction of the surface plasmon wavelength compared to its room-temperature value forparticular conditions of plasma frequencies. Therefore, this result is consistent with the data andprovides information about the varying electronic density of the sample undergoing ultrashortirradiation.
#142205 - $15.00 USD Received 7 Feb 2011; revised 4 Mar 2011; accepted 6 Mar 2011; published 25 Apr 2011(C) 2011 OSA 9 May 2011 / Vol. 19, No. 10 / OPTICS EXPRESS 9043
145

146
T h e o p e n – a c c e s s j o u r n a l f o r p h y s i c s
New Journal of Physics
Guiding heat in laser ablation of metals on ultrafast
timescales: an adaptive modeling approach
on aluminum
J P Colombier1, P Combis2, E Audouard1 and R Stoian1,3
1 Laboratoire Hubert Curien, UMR 5516 CNRS, Universite de Lyon,Universite Jean Monnet, 42000 Saint Etienne, France2 CEA-DAM-DIF Bruyeres-le-Chatel, 91297 Arpajon, FranceE-mail: [email protected]
New Journal of Physics 14 (2012) 013039 (19pp)
Received 11 August 2011Published 20 January 2012Online at http://www.njp.org/doi:10.1088/1367-2630/14/1/013039
Abstract. Using an optimal control hydrodynamic modeling approach andirradiation adaptive time-design, we indicate excitation channels maximizingheat load in laser ablated aluminum at low energy costs. The primary relaxationpaths leading to an emerging plasma are particularly affected. With impulsivepulses on ps pedestals, thermodynamic trajectories are preferentially guided inionized domains where variations in ionization degree occur. This impingeson the gas-transformation mechanisms and triggers a positive bremsstrahlungabsorption feedback. The highest temperatures are thus obtained in theexpanding ionized matter after a final impulsive excitation, as the electronicenergy relaxes recombinatively. The drive relies on transitions to weakly coupledfront plasmas at the critical optical density, favoring energy confinement withlow mechanical work. Alternatively, robust collisional heating occurs in denserregions above the critical point. This impacts the nature, the excitation degreeand the energy content of the ablated matter. Adaptive modeling can thereforeprovide optimal strategies with information on physical variables not readilyaccessible and, as experimentally confirmed, databases for pulse shapes withinterest in remote spectroscopy, laser-induced matter transfer, laser materialprocessing and development of secondary sources.
3 Author to whom any correspondence should be addressed.
New Journal of Physics 14 (2012) 0130391367-2630/12/013039+19$33.00 © IOP Publishing Ltd and Deutsche Physikalische Gesellschaft
147

2
Contents
1. Introduction 22. Computational method 4
2.1. Hydrodynamic model . . . . . . . . . . . . . . . . . . . . . . . . . . . . . . . 42.2. Numerical adaptive loop . . . . . . . . . . . . . . . . . . . . . . . . . . . . . 7
3. Results and discussion 83.1. Standard short pulse (femtosecond) irradiation . . . . . . . . . . . . . . . . . . 83.2. Optimization results . . . . . . . . . . . . . . . . . . . . . . . . . . . . . . . . 93.3. Optimal pulse characteristics: hydrodynamic scenario . . . . . . . . . . . . . . 113.4. Consequences of optimal coupling . . . . . . . . . . . . . . . . . . . . . . . . 15
4. Conclusions 17Acknowledgments 17References 17
1. Introduction
Energy coupling is a key element of many laser–matter interaction fields, ranging fromsecondary radiation sources or extreme matter states to laser material processing and remotesensing. Within this frame-work, increased attention is given to ultrafast laser sources, withthe prospect of increasing the precision of interaction. The latter applications mentioned abovemostly require controlled excitation and material removal events in ablation ranges (severalJ cm−2), as well as evolution paths that deliver heat confinement or highly excited matter.Specifically the generation of critical states that can spontaneously decompose into ionizedphases is examined in applications where the emission of the laser ablation products has tobe particularly intense, e.g. remote laser breakdown spectroscopy or radiation and particlesources [1, 2]. This usually imposes the use of high-energy doses reflected in the photoncost. These states can nonetheless be achieved upon moderate laser exposure by correctlybalancing the energy supply or the conversion between thermal and mechanical loads. Thepurpose is to obtain maximum effects from minimal energy costs related to the laser interaction.However, despite the fact that general ablation scenarios are well comprehended, a completeunderstanding of the recipe on how to obtain improved laser coupling and maximal excitationwith its particular fine-tune control factors requires further investigation. A fundamentalquestion is how to optimize the interaction by identifying ideal laser pulses for desired evolutionscenarios and irradiation results [3]. Specifically related to ultrafast laser exposure, where matterproperties vary from solid to plasma phases on electronic (τe) or ionic relaxation (τhydro) scales,impacting particularly the optical properties, the challenge is to improve the energetic balancebeyond the standard material response. This can be regulated by acting on absorption channelsand transitions dynamics with a modulated energy feedthrough. Well-defined thermomechanicalpaths can be induced and ablation aspects can be mastered to a considerable degree if irradiationis judiciously adjusted on these timescales.
Time manipulation of laser pulses has already been proven to have strong potential forachieving new synergies between light and matter. Temporal field gradients can determineenhanced plasma coupling and improved shock design [4–6]. Light confinement below thediffraction limit and nanostructuring can occur by energetically controlling carrier populations
New Journal of Physics 14 (2012) 013039 (http://www.njp.org/)
148
3
with chirped pulses [7]. Coherent phonon populations may impact heat transport under theinfluence of multipulse sequences in phase with the vibration beat [8]. In laser ablated siliconStoian et al [9] and Dachraoui and Husinsky [10] indicated a manyfold increase in ion emissionwith minimal energy costs under tailored ultrafast irradiation. The improvement was related totwo factors: fast onset of absorptive liquid phases on picosecond scales or controlled generationof carrier plasmas on sub-picosecond scales. A similar ion enhancement was noted for metals[11] that involves hydrodynamic material expansion on tens of ps. This suggests a general effectof energy confinement assisting the phase transitions. Fast succession of density phases relatedto rarefaction was further evoked as a possible control source for nanodroplets in the ablationproducts [11, 12]. This was related to Rayleigh–Taylor instabilities driven by the lifetime ofthe expelled liquid [12, 13]. Equally, pulse forms were used to influence the excitation degreein laser-produced plasmas, either designed in simple double-pulse sequences or complexshapes determined by spectrally controlled feedback loops [12, 14, 15]. Significant spectralenhancement was thus obtained [12] relying on light exposure during the plasma formationstage and coupling in the incipient plasma phase. Alongside ablation products, pulse sequencescould influence deformation rates down to almost complete evanescence of the rarefactionwaves with minimal spallation [16, 17]. In all these cases, laser-induced heat load and thethermomechanical balance play a fundamental role. The consequences of its eventual controlare important for pressure-induced phase transitions, ablation characteristics and materialremoval efficiency, and we explore here global control options from a theoretical perspective.
In practice, experimental approaches offer limited access to primary evolution steps.In these conditions, a predictive theoretical method can provide extended information on how toachieve optimal interactions. Nonetheless, the complexity and lack of coherence of intermediateprocesses make it difficult to predict accurately essential improvement factors except bytrials and educated guesses. Optimal control theories were then developed for controllingcomplicated parameter landscapes with light and have already been applied for regulatingcomplex systems with coherent radiation [18–20]. Assuming the ansatz of controllability, i.e.the probability that a control target can be achieved with a laser controller [21], this allows,on the one hand, calculating optimal energy delivery [22, 23] in the time domain for givenobjectives and, on the other hand, investigating active control knobs from temporal electric fielddistributions.
We extend the control approach to ablation-specific non-coherent phenomena occurringon picosecond scales and propose an adaptive hydrodynamic method by integrating numericalfeedback loops into a hydrodynamic simulation code. With a focus on the temperaturestate parameter and its control, the procedure offers a predictive capability concerningthermodynamic evolutions with regulation laws not experimentally accessible. It will be shownthat a numerical approach is powerful in predicting initial excitation conditions4 required toincrease and maximize the heat load in the ablation products, with major consequences forthe ejected material states: excited species. The interest is twofold: an inquiry into regulationmechanisms and practical relevance for controlled ablation and excitation products. We areparticularly interested here in ways of guiding laser energy towards obtaining higher energeticplasma phases in moderate irradiation regimes, beyond the levels obtainable by standardultrafast laser ablation. A recipe for obtaining optimal pulse (OP) forms will be given and the
4 The concept of excitation involves here in a general manner the ensemble of electronic parameters perturbedduring irradiation.
New Journal of Physics 14 (2012) 013039 (http://www.njp.org/)
149

4
underlying physics will be discussed. This is motivated by the potential impact on the natureand on the energy content of the ablation species, with consequences for related applications.
The paper is organized as follows. The computational method is described in section 2,where details of the hydrodynamic model are given and the numerical feedback loop isdescribed. The discussion section starts by evaluating the results of standard short pulse (SP)irradiation in terms of the limits of the achievable temperature levels. The results of the adaptiveruns based on pulse time-design are then introduced, indicating the OP forms maximizing thetemperature of the ablated matter in a significant range. This is accompanied by a discussionof the main mechanisms concurring with the optimal results and of the possible follow-ups interms of applied and fundamental knowledge. Particular thermodynamic evolutions of ionizedor dense plasma layers are followed, emphasizing heating scenarios in weakly coupled plasmasor supercritical fluids. The consequences of energetic states are pointed out. The conclusionsection concludes the paper.
2. Computational method
2.1. Hydrodynamic model
We modeled the nonequilibrium heating and expansion of aluminum (Al) under SP laserirradiation using a one-dimensional (1D) two-temperature non-equilibrium hydrodynamic code(Esther) [12, 24–26]. The use of a 1D model is justified for our intensity ranges and for spatialand temporal dimensions smaller than those associated with a Rayleigh–Taylor instability(μm, ns). As detailed hereafter, the Lagrangian approach solves the fluid equations for mass,momentum and energy conservation for electronic and ionic species upon energy absorption.Thus it allows a hydrodynamic and thermodynamic view of the evolution of the excited material.The phenomenological treatment is presented in detail in [25, 26] and we only point out herethe major points. The main steps of the hydrodynamic code are given below.
The interaction between the polarized pulsed laser field (λ= 800 nm) and the metaltarget is described by the Helmholtz wave equation in inhomogeneous media. The incidenttemporal laser electric field E(z =∞, t)= |Einc(t)|eiω0t is injected as a boundary condition inthe equation at normal incidence, being propagated towards negative z values:
∂2z E + ε(ω0/c)2 E = 0. (1)
Here ε is the inhomogeneous complex dielectric permittivity of the metal, calculated as afunction of electronic temperature Te, the ionic temperature Ti, the density ρ and the averageionization Z �. The electric field envelope can take various forms as will be seen in the nextsection.
Let us first discuss the optical response of the metal via its dielectric function. Inconsidering absorption and the energy deposition rate, Al is viewed as a model case with parallelbands and a quasi-free-electron behavior in the solid phase. However, a deviation from a free-electron-like behavior occurs around 1.5 eV: our irradiation conditions. The solid metal–lightinteraction includes therefore contributions from intraband (D, Drude-like free-electron heating)and interband (IB, Ashcroft–Sturm model [27]) electronic transitions, followed by free-electronabsorption in the rarefied phases. The transient dielectric function ε and the optical conductivityσ are defined as
ε = εD + εIB = 1− ω2p
ω(ω + iνeff)+ εIB = 1 + i
σ
ωε0, (2)
New Journal of Physics 14 (2012) 013039 (http://www.njp.org/)
150

5
where ωp =√
nee2/meε0 is the plasma frequency and νeff is the effective (non-equilibrium)collision frequency. The latter is given by the sum of the electron–electron [νee(Te, ne)]and electron–phonon/ion [νeph(Te, Ti, ne)] [30] contributions in the solid phase and by[νei(Ti, Te, ne)] in the plasma phase. We typically consider here the plasma phase as anionized high-temperature low-density gas phase where the ionization is higher than 0.1. Incalculating νeff in the solid phase, the νee contribution originates from (e–e) umklapp collisionalprocesses [25]. The electron–phonon contribution to scattering νeph involves (e–ph) interactionsin situations where the electronic temperature is larger than the ionic one. νeph starts from aphenomenological collision frequency ν0
eph which is fitted to match simultaneously tabulateddata of n and k given by [28] and we add evolution laws depending on Te and Ti [25].The (e–ph) estimation follows the first-principle calculations from Lin et al [29] and theformalism of Kaganov et al [30]. In the plasma phase, νei = ν
eqei (Ti, ne) + ν
neqei (Te, ne), indicating
that νei scattering frequency is composed of an equilibrium and a non-equilibrium term.The equilibrium part ν
eqei (Ti, ne) is determined from the tabulated values of conductivity at
equilibrium [31]. These tabulated values were shown to match well experimental situationsdealing with detecting optical conductivities [32]. The second term corresponds to the non-equilibrium contribution to the collision frequency. For ν
neqei (Te, ne), a Spitzer-like dependence
has been assumed where the Coulomb logarithm has been corrected for high-density plasmasby the approach given in [34]. To ensure a convergence towards tabulated equilibrium values,we subtract the equilibrium contribution from the non-equilibrium term. In this manner, thecontribution of electrons out of equilibrium is treated as a correction of the known values of theequilibrium conductivity.
Subsequently, equation (1) including the optical transient response (2) is jointly solvedwith the thermodynamic equations for the interacting electron and ion subsystems written in theLagrangian form. The code explicitly considers the time-dependent thermal non-equilibrium(equations (3a) and (3b)). The specific energy conservation equations that take into accountvariations of the time-dependent energy exchange quantities in the z-direction are givenbelow:
∂tεe = Qeth− Qe−i + Qe
mech− Qrec + QL, (3a)
∂tεi = Qith + Qe−i + Qi
mech + Qrec, (3b)
with the terms detailed below:
QL(z, t)= 1
2ρε0ω0�m[ε]E E∗ = 1
2ρ�[σ ]E E∗, (4a)
Qe,ith = ∂m(ρKe,i∂mTe,i), (4b)
Qe−i(z, t)= γ
ρ(Te− Ti), (4c)
Qe,imech =−pe,i∂tV, (4d)
Qrec(z, t)=− εe
Z �∂t Z
�, with − Z �/τr � ∂t Z� � 0. (4e)
Here ε and K are the specific energy and thermal conductivity for electrons (e) and ions (i),respectively, and m is the mass of the Lagrangian cell. Additionally, V = 1/ρ is the specificvolume of the calculation domain (cell) and pe−i the electrons or ions pressure.
New Journal of Physics 14 (2012) 013039 (http://www.njp.org/)
151

6
The intervening terms shown explicitly in equations (4a)–(4e) are discussed below. Actingas the input source, QL(z, t) is the specific optical power density source generated by the inversebremsstrahlung absorption of the pump laser pulse, before being dissipated in the material.The energy transport and redistribution accounts for several influences [12]: (I) losses bydiffusion Qe,i
th ∼ ∂zTe,i, (II) electron–phonon/electron–ion (e–i) collisional energy coupling withits specific exchange relaxation rate Qe−i, (III) the consumed mechanical work rate Qe,i
mech =−pe,i∂ tV and (IV) recombination kinetics Qrec following variations in the ionization statesinitiated by successive ionization/relaxation events. The absorption, relaxation and transferenergy terms [12] are material state dependent as explained below. The optical conductivityσ relies on the permittivity ε with �[σ ]∼ �m[ε] determining the laser absorption. E representsthe local field in interaction with a varying electronic population ne = ni Z �. This path makes upan important energy exchange channel. As the electron density number varies, the extra energyis either supplied from the laser source (intrinsically considered via the optical conductivity) orreleased to the surrounding. This way it contributes to heating, with Qrec(z, t) indicated aboveaccounting for the rate of specific energy recombination.
One important aspect should now be noted. Being driven essentially by temperature, theseinteraction terms affect the energy deposition and the transformation speed as several processeshave antagonistic effects (i.e. temperature-driven collisional absorption or temperature-dependent effectiveness of heat diffusion). Just as an example, a femtosecond pulse exposureleads to high electronic temperatures that increase heat diffusion, in spite of the short duration ofirradiation. This shows the importance of temperature control in the overall interaction scenarioand, at the same time, suggests a possible optimization potential.
Two quantities have a determining role in establishing the thermal conversion andtransport: the collisional e–ph/e–i coupling efficiency and a time-varying ionization state, bothbeing strongly dependent on temperature and density. During evolution, the e–ph couplinginitially determined from first-principle calculations [33] departs from the solid value [12]as γ (Te, ne)= γ 0 (Te)
(ne/n0
e
)1/3where ‘0’ denotes the solid phase (γ 0(300 K)= 2.45×
1017 W m−3 K−1) and the symbols are usual quantities. For the dilute, hot and therefore weaklycoupled plasmas, the e–i relaxation relies on the Spitzer model as discussed in [34]. Thisformalism accounts then for the relaxation-specific energy exchanged by e–ph and e–i collisionQe−i(z, t). At the same time, the average ionization Z � varies during the electron heating phaseconsuming photons upon increase and releasing the energy by non-radiative recombination∂t Z �|τr
during the quasi-adiabatic expansion. We recall that this impacts strongly on theabsorption mechanisms and therefore on the energy storage. Assuming a strong offset from localequilibrium, the electronic energy drives the ionization values influencing thus the Qrec(z, t).The Z � values as a function of density (ρ) and electronic temperature (Te) are taken from [31],being smeared by a characteristic decay time (τr) where a lower limit of 1 ps was imposed [35].The energy that is delivered to the particle system as Z � goes down corresponds to a variation inthe electronic thermal energy and is reflected in the ionic temperature. The post-recombinationstates correspond to bound states in thermodynamic equilibrium with the surroundings. Themodel does not take into account the energy transfer and redistribution on specific atomicexcitation levels, nor their particular bound–bound radiative relaxation, considered minimalin the irradiation conditions mentioned above. With the above dependences, we note that themacro-evolution of the ablation process is dominantly influenced by the specific energy contentand finally by the ionic temperature (Ti), an essential factor that drives and, at the same time, isdirectly influenced by the succession of laser-induced effects.
New Journal of Physics 14 (2012) 013039 (http://www.njp.org/)
152

7
HYDRODYNAMIC
CODETϕN(ω i)
I(t)
ITERATIONS
FIT
NE
SS
OPTIMIZATION
Figure 1. Schematic representation of the numerical adaptive loop. This involvesa module for designing the temporal form of the laser pulse I (t) via spectralphase modulation ϕ (ω), the hydrodynamic simulation tool for evaluating thelaser irradiation result (temperature, T -based fitness) and a driving optimizationstrategy.
During relaxation, the material thermodynamic properties are described by an upgradedversion of the Bushman–Lomonosov–Fortov multiphase equation of state spanning a largerange of densities and temperatures between condensed states and hot plasmas. The values werereconstructed by Commissariat a l’Energie Atomique (CEA), France, based on [36]. Surfacemotion, induced shock wave and plasma expansion are considered by the hydrodynamic part ofthe calculation, satisfying the continuity relations given below:
∂tu =−∂m(pe + pi), ∂tV = ∂mu, (5)
where u is the fluid velocity.
2.2. Numerical adaptive loop
To derive the best pulse form for correlated matter–light systems, a non-deterministicevolutionary search strategy [18] was developed. This relies on spectral phase modulationfor tailoring the pulse shape [37]. An adaptive loop based on spectral phase modulation ofan initial pulse E (ω) eiϕ(ω) with its corresponding time envelope E (t) was inserted in thehydrodynamic code. This is schematically shown in figure 1. A Fourier transfer function inthe time domain is used to design the corresponding pulse forms for the code. Typically,the temporal envelope Einc(t) of the laser electric field is obtained from the inverse Fouriertransform of a Gaussian spectrum (full-width half-maximum (FWHM) �λ= 2πc
ω2 �ω = 6.2 nm,corresponding to a Fourier limited pulse duration of 150 fs), centered at the laser frequency ω0
(recall that λinc = 800 nm) and modulated by the spectral phase ϕ(ω) [37]:
Einc(t)= E0
2π
∫ +∞
−∞dω eiωt
(exp
[−2 ln(2)
(ω−ω0
�ω
)2])
e−iϕ(ω). (6)
New Journal of Physics 14 (2012) 013039 (http://www.njp.org/)
153

8
Normalization to the laser fluence F is performed in order to ensure that, energetically, thesame irradiation conditions are delivered by each tailored pulse,∫ +∞
−∞dt |Einc(t)|2 = 2F
cε0, (7)
with c being the speed of light and ε0 the dielectric vacuum permittivity.The adaptive phase manipulation technique is briefly indicated below. The Fourier domain
phase ϕ (ω) encompassing the spectral content of the pulse is considered as a string of 640discrete values (pixels) with a spectral resolution of δλ= 0.05 nm. These values match typicalvalues of standard commercial spatial light modulators (SLM). Being linked to the chosenspectral resolution, the shaping window extends to 42 ps, corresponding to pulses that can bedesigned in the laboratory with current optical modulators.
As mentioned, an evolutionary adaptive loop was generated between the programmablepulses and the hydrodynamic code, to improve the laser-generated outputs. As we are interestedin the specific energy content, the desired optimal state is defined using a single physicallyrelevant thermodynamic parameter, the ionic temperature Ti, where experimental determinationremains a challenge. The optimization algorithm is applied to examine the search space of thecost function fcost =max[Ti(z, t)]. The optimality criterion, the maximum Ti (irrespective oftime and excitation zone) achieved in an irradiation sequence, serves therefore as a fitnessparameter for the optimization procedure. Consequently, the phase is manipulated iterativelyusing genetic propagators, supporting the code with corresponding temporal forms thatgradually impacts the temperature level. Via a pixel binning method, increasing time domainswere explored, from less than 1 ps up to the maximal value. The convergence of the numericalprocedure forecasts irradiation conditions for achieving the hottest states at constant energyrequirements, allowing for prediction of the adequate control law. The result of the simulationdoes not only depend on the final state of the system but is also recursively determined by thehistory of the evolution paths during the regulated energy transport.
3. Results and discussion
3.1. Standard short pulse (femtosecond) irradiation
Before approaching the optimization search, one has to establish the limits of the standardSP excitation. A first step in profiling the search space was made by exploring standardheating scenarios induced by femtosecond laser pulses (150 fs) using the hydrodynamic code.Typical temperatures achieved in different fluence ranges are thus calculated. Figure 2 showsthe evolution of the maximal temperature TMAX of the hottest layers (HL) for a standard SPof 150 fs with increasing laser fluence F , mainly in ablation domains. Above 0.34 J cm−2
(the vaporization threshold at normal pressure) the material follows an ablative behaviorwith a sub-linear temperature increase. The value reached for a fluence of 3 J cm−2, well inthe ablation range, is approximately TSP = 22× 103 K. The limited increase, localized at theexpansion front, is particularly linked to the sudden SP energy deposition. Here the energyrelaxation occurs primarily before the hydrodynamic expansion, at relatively constant quasi-solid relaxation parameters, notably high specific heat that moderates the temperature gain. Ithas already been shown [12, 38] that the strong initial compression supported by SP determinesa swift mechanical expansion into the two-phase region, consuming the thermal energy in bothexpansion and the nucleation of the vapor phase.
New Journal of Physics 14 (2012) 013039 (http://www.njp.org/)
154

9
TMAX
0 1 2 3 4
1
2
3
4
5
-SP-MIN
-DP/LP
-OP
-CtP
ABLATION RANGES
VAPORIZATION
SP (150 fs)
TE
MP
ER
AT
UR
E
[10
4K
]
FLUENCE [J/cm2]
Figure 2. The evolution of the hot layer (HL) temperature under standard SPirradiation with increasing laser fluence. The shaded area marks the extendedphase space achieved at 3 J cm−2 when tailored pulses are used. Typical valuesfor constant pulses (CtP) and double and long pulses (DP, LP) are indicated alongthe optimization results (see text).
3.2. Optimization results
The analysis of standard irradiation puts forward the question of whether, for the same energyinput, the temperature can be further controlled. Under these circumstances the adaptiveprocedure was applied to find the extreme values that can be achieved by Ti(z, t) when thepulse form and the energy delivery rate vary in time. As the temperature shows both timeand space variations, we concentrated on the hottest zones and tried to influence the localmaximal Ti values in HL, identifying the highest and the least efficient pulses. An incidentfluence of 3 J cm−2 in the ablation range was chosen. The results of the adaptive run shownotably that, using the same energy input, it is possible to reach a far wider range of maximaltemperatures, between 18× 103 K (the lowest maximal value, denoted sometimes as minimal)and 55× 103 K (the highest maximal value). The extended range of the temperature variationand the present discussion is specific to ablative regimes although observable effects in changingthe highest temperature were obtained at lower fluences, below the threshold for achieving gas-phase states. The pulses that deliver the low or high temperatures close to the extremes of thetemperature ranges at this input fluence are depicted in figures 3(a) and (b). They indicate eithera ps envelope with an impulsive ending for the highest TMAX or a short sequence for the lowestTMAX levels, respectively. We note therefore that an OP design (depicted in figure 3(a)) candetermine a 2.5 times increase in temperature (see the OP level in figure 2). This relies onan energy delivery timescale up to the limit of the shaping window, in conditions where theincident fluence has not changed. Although the results are obtained at 3 J cm−2 input fluence, theobserved pulse spread is also preserved in irradiation regimes beyond the chosen range to higherfluences, with apparently similar effectiveness (tested up to 10 J cm−2). The particular timescalesuggests a departure from stress confinement conditions as the scale is limited by τhydro � λD/cs,approximately 10 ps. Here λD is the characteristic electronic diffusion length and cs is the speedof sound. This high temperature would require 10 times more energy with the SP at similardensities and shows 35% more efficiency than typical double-pulse sequences [12, 15, 16] orlong Gaussian envelopes [12] within the same time frame. The lowest maximal temperature
New Journal of Physics 14 (2012) 013039 (http://www.njp.org/)
155

10
5
4
3
2
1
0 10 20 30 40 500.0
0.5
1.0
0 10 20 30 40 500.0
0.5
1.0
TIME [ps]
(a) x8 MAX
OP
INT
EN
SIT
Y
[arb
.units]
TIME [ps]
(b) x2 MIN
0 10 20 30 40 50
0
100
200
300
DIS
TA
NC
EF
RO
M
SU
RF
AC
E[n
m]
TIME [ps]0 10 20 30 40 50
TIME [ps]
(c) MAX
OP
(d) MIN
HLSL HL
TEMPERATURE [104 K]
HT
NE
HEv
Figure 3. (a, b) Pulse envelopes generating the highest maximal (MAX, alsodenoted as OP) or lowest maximal (MIN) values of the temperature, i.e. inthe hottest zones at a fluence of 3 J cm−2. The intensities are normalized toSP intensity by conserving the time integral of the pulse forms (i.e. energy).(c, d) Spatio-temporal temperature charts with dynamic evolution of HL (dashed)in the maximal and minimal hot zone temperature cases. The regions of hightemperature (HT), high volume energy (HEV ) and plasma e–i non-equilibrium(NE) are indicated. A second SL trajectory is additionally given for OP (seetext for details), bordering the highest accumulated volume energy region. z = 0marks the initial surface position, with matter evolving to positive values andlaser incident from the top.
for the excited material is reached with an impulsive excitation, similar to SP, accompaniedby some low-intensity wings (figure 3(b)). This suggests a similar evolution to the onediscussed in the first paragraphs, in conditions of shock confinement and mechanically drivenexpansion.
To capture the spatio-temporal dynamics, the evolution of the temperature in the expandinglayers is given in figures 3(c) and (d) for the highest (MAX) and the least (MIN) efficient pulses.These graphs depict the levels of temperature achieved in the excited/ablated matter as thematerial expands in space and time.
We discuss below the case of the highest temperature. For the high temperature case theevolution of the highest temperature layer HL is indicated in figure 3(c). This shows that themaximum temperature is confined to the front of expansion. The highest value is obtained atthe end of the sequence, a few ps after the maximum e–i non-equilibrium (marked as NE infigure 3(c)). As Al does not show strong optical variations as it makes the transition to theliquid phase [39], this points to an alteration of the properties related to the onset of the vaporphase. The gas-phase involvement is supported by the space evolution of the expanding matteron hundreds of nm, and it will be confirmed in the next paragraphs. We state, however, that theregion of the highest temperature is not equivalent to the highest internal volume energy density(ρεi, marked as HEV ) located deeper towards the condensed phase. Apart from HL, initiallyplaced at a depth of 2 nm (the initial position of the corresponding Lagrangian cell), a second
New Journal of Physics 14 (2012) 013039 (http://www.njp.org/)
156

11
expanding layer trajectory (10 nm) is given (SL) that illustrates a passage in the vicinity of theenergy concentration region, reaching 42× 103 K. The discussion concentrates first on HL as itlocks the highest temperature. The particular relevance of the SL will become apparent later inthe text (sections 3.3.2 and 3.3.4).
3.3. Optimal pulse characteristics: hydrodynamic scenario
The fundamental question is related to the specific OP time features that enable a maximaltemperature, namely the low-intensity preliminary phase and the final impulse. The OPsequence shows a long pedestal of noisy low-intensity envelope for the first 41 ps. The apparentcomplicated energy spread can be approximated by a smooth constant supply of energy, astypically the sequence of low-intensity spikes are smoothed by a convolution with the psmaterial response. With an integral absorption twice as efficient as SP, this part of the pulse(80% of the total energy) is sufficient to raise the temperature up to 70% of the final OP value.A sudden well-pronounced peak is observed at the end of the sequence that achieves a finalincrease. Different optimization runs allow us to determine similar solutions where the obtainedmaximum temperature depends slightly on the number of iterations, within 2%. This suggestsparameter space topologies with large maxima. The chosen solution has, nevertheless, the majorcharacteristics of the ideal pulse.
We note that the optimal solution here was obtained with a constraint on the shapingwindow (limited to 42 ps). This is related to the practical feasibility of pulse shapes in currentSLMs based on spectral filtering, with sub-nm spectral resolution. Improved solutions can beobtained on time scales extending to 150–200 ps, relying roughly on similar phenomena. In thenext paragraphs, we indicate the particular states that enable this strong heating from a dynamicand energy balance standpoint.
A glance at the hydrodynamic progress of the excited material is given in figure 4. Inparallel with the OP form (figure 4(a)) superimposed on the instant absorbed power map (QL),it describes the sequence of density states (figure 4(b)) and indicates for specific trajectories(HL, SL) the behavior of the speed of sound (figure 4(c)) and ionization degree (figure 4(d)), asindicators for the material state. The corroborated temperature and density information allowsus to decompose the evolution into several stages.
3.3.1. Gas-phase evolution. The first stage (0–10 ps) prepares the hydrodynamic advance tothe gas phase (figures 4(a) and (b)). About 20% of the sequence energy is consumed to initiatevaporization (0.6 J cm−2, approximately two times the threshold), equivalent to an absorbedfluence of 78 mJ cm−2. The energy is deposited mainly in condensed phase over a depth√
2Dτ = 28 nm, above the optical skin depth. This is sufficient to achieve an average specificenergy in the range of 107 J kg−1, energetically enough to initiate the plasma phase with a low-density evolution above the binodal (critical point (CP) energy density EC = 1.1× 10⁷ J kg−1).The density information (figure 4(b)) at the end of this first stage of the laser exposure showsnow the onset of several notable regions that continue to develop at later times: a low-densityfront and an increasingly dense material towards the depth. The vapor layer zsc, visible at about10 ps and affecting the first nm of material, is optically transparent at 800 nm, with a subcriticalelectron density (ne < nc � 1021 cm−3, zc being the critical density border at 800 nm). Withits buffer function between the ablation products and the vacuum, it has the role of slowingdown the evolution of the subsequent layers. As the expansion is repressed and the neighboring
New Journal of Physics 14 (2012) 013039 (http://www.njp.org/)
157

12
0
100
200(a) POWER DENSITY
0
100
200z [n
m]
SL
HL(b) DENSITY
z [n
m]
0
2
4 SL
HLcs
[km
/s]
(c) cs
1
2
3SL
HL(d) Z
*Z*
-5 0 5 10 15 20 25 30 35 40 45 500.9
1.0SL
HL
TIME [ps]
(e) Tvar
/TOP
TV
AR/T
OP
1020
1018
1016
103
102
101
kg/m3
W/kg
zint
zczsc
Figure 4. (a) OP temporal shape superimposed on the instant values of absorbedpower density given on a logarithmic scale (QL). An arrow indicates theabsorption frontier (see zsc below). (b) Density dynamics of excited matterfor OP. The HL, SL evolutions are given (dashed, solid, respectively). Thecontinuous line (zc) represents the critical electron density border (at 800 nm),with zsc being layers with subcritical electronic density and zint layers with highelectronic density. (c) The evolution of the speed of sound cs for HL and SL.(d) The ionization dynamics for HL and SL. (e) Effect of canceling particularpeaks in the OP sequence on the achieved maximal temperature.
matter compressed, the underlying layers zint (among them HL) experience moderate heatingfor another 10 ps under the incoming energy and preserve a density high enough to allow non-negligible e–i coupling. The HL optical density remains always superior to the critical value.
To understand what happens specifically in this time domain, we examine the dynamics ofthe phase transition by monitoring the material state-dependent speed of sound cs =
√(∂p/∂ρ)S
(figure 4(c)). This physical quantity reflects the ion pressure and serves as a sufficiently accurateprobe for the eventual phase transitions. For HL cs stays roughly constant in the first picosecondsand then it experiences a drastic decrease at 9 ps as it penetrates into the two-phase region [40]towards vapor transformation. We note then a swift rise about 20 ps from a value of cs
∼= 0characteristic of the (practically non-ionized) liquid–vapor mixed phase in the vicinity of theCP to values typical of ionized gases, suggesting a rapid transition to an excited plasma phasecharacterized by low heat capacity and high optical conductivity. A similar dependence hasthe gas-phase expansion velocity mirroring the mechanical work. The HL enters the plasmaregion at the earliest time with an overall energy consumption in the liquid–vapor domainof 23% (the energy content of the pulse envelope between 9 and 20 ps corresponding tothe liquid–vapor passage) under quasi-constant delivery that prevents cooling and allows anelectronic temperature gain. During this, the liquid–vapor characteristic internal energy/particleaugments due to e–i coupling, while the mechanical work stays low, comparable to thermalenergy. As HL goes rapidly into a low-density high-temperature plasma phase with Z � >1(20 ps), this phase at ne � nc further absorbs energy at double pace as light delivery continuesbetween 20 and 42 ps. This stage involves 57% of the input sequence and accounts for 85%
New Journal of Physics 14 (2012) 013039 (http://www.njp.org/)
158

13
of the total absorbed energy in the layer. With temperature, Z � increases to quasi-solid values(figure 4(d)) in spite of the now accelerated expansion. The plasma is at present weakly coupled,with a descending scattering time. The bremsstrahlung absorption rises, acting in turn on energydeposition, increasing the accumulation. A positive feedback effect occurs reflected on theultimate, maximal value of the ionic temperature around the end of the laser sequence. Herethe effect of the final peak is deciding, releasing an impulsive heating of the plasma phase at themoment where absorbtion peaks (integral absorption at this moment is 68%). A short excitationis required to counteract the accelerated expansion of the hot plasma (still two times lower thanin the case of SP excitation). Even if conductivity is high in this region, promoted by e–i non-equilibrium, the sudden ionization energy relaxes to the atomic system at the end of the sequencevia recombination as Z � decreases, being the primary factor for the temperature increase. This isequally supported by a moderate value of the heat capacity. This thermodynamic path facilitatesthen transient changes in the energy transport with the possibility of attaining states at T > TC.
3.3.2. Evolution of dense hot regions. We have indicated before a second typical layer,SL, which advances not in the high-temperature zone but in the region of highest energyconcentration HEV . As this maximizes the volume energy density accumulation which canbe a reservoir for further evolution, its behavior is of interest and will be discussed below.The evolution of the SL and its adjacent regions follows a different path as compared toHL. Being localized deeper in supercritical electron density regions, where the laser light isscreened (the electric field is a few times smaller (three times on average), as screening shows aprogressive evolution from the solid phase (EHL/ESL � 2) to the plasma phase (EHL/ESL � 4)),the intermediate electronic heating stage is reduced. This happens despite a favorablehydrodynamic regime for increasing T related to a higher density. However, the energy densitystorage remains significant, particularly due to the high density. With restricted expansion due tozint, the SL does not show a typical gas-phase transition by crossing phase coexistence interfaces,as cs preserves a finite value, but evolves towards the plasma phase as a decomposing hot fluidwith supercritical temperatures (see figure 3(c), TC = 6300 K for Al). The SL denotes therefore atypical supercritical behavior. Ionization Z � remains limited, less sensitive to non-equilibrium,and the e–i collisions are the main factor for heating into warm dense states via supercriticalpaths.
3.3.3. Pulse analysis. To investigate the importance of the presence of several peaks in thepulse form, we designed a specific method for analyzing OP, emphasizing the two types ofenergy-maximization behaviors discussed above: via thermodynamic gas-phase transitions andvia supercritical paths. We defined a rectangular gate of approximately 2.5 ps which was scannedalong the OP sequence replacing at each moment the local peaks with an equal but constantenvelope energy domain. The results, given in figure 4(e), indicate that the small-amplitudepeaks have little influence, mainly in keeping short-living non-equilibrium states. Nevertheless,the absence of the final peak impacting non-equilibrium Te is lowering the TMAX correspondingto the hottest HL temperature range, as this was related to plasma states at highest Z �, eventhough the energy content of the laser sequence was not changed. This shows that the finalcontribution is related to a variation of Z � and points out the importance of recombination inheating the HL, proceeding faster than the low-density collisional coupling. The SL is relativelyinsensitive to the final peak, confirming the alternative collisional heating mechanism.
New Journal of Physics 14 (2012) 013039 (http://www.njp.org/)
159
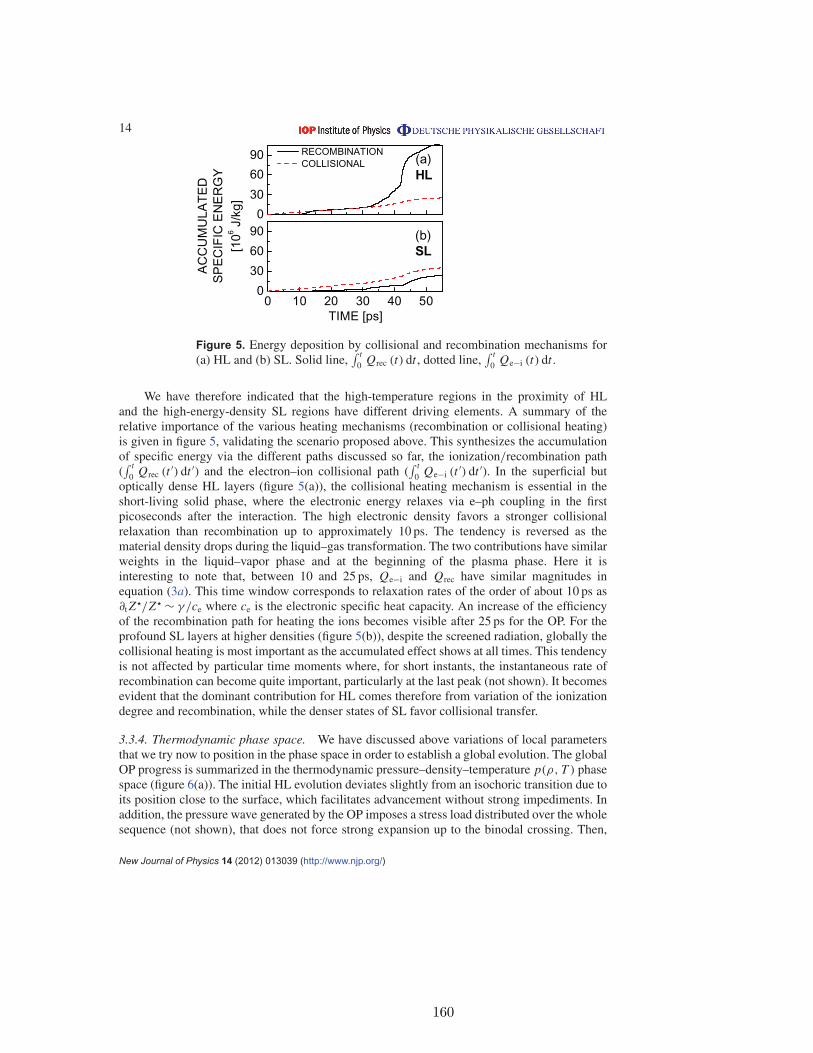
14
0
30
60
90
0 10 20 30 40 500
30
60
90
(a)
HL
RECOMBINATION
COLLISIONAL
AC
CU
MU
LA
TE
D
SP
EC
IFIC
EN
ER
GY
[10
6J/k
g]
(b)
SL
TIME [ps]
Figure 5. Energy deposition by collisional and recombination mechanisms for(a) HL and (b) SL. Solid line,
∫ t0 Qrec (t) dt , dotted line,
∫ t0 Qe−i (t) dt .
We have therefore indicated that the high-temperature regions in the proximity of HLand the high-energy-density SL regions have different driving elements. A summary of therelative importance of the various heating mechanisms (recombination or collisional heating)is given in figure 5, validating the scenario proposed above. This synthesizes the accumulationof specific energy via the different paths discussed so far, the ionization/recombination path(∫ t
0 Qrec (t ′) dt ′) and the electron–ion collisional path (∫ t
0 Qe−i (t ′) dt ′). In the superficial butoptically dense HL layers (figure 5(a)), the collisional heating mechanism is essential in theshort-living solid phase, where the electronic energy relaxes via e–ph coupling in the firstpicoseconds after the interaction. The high electronic density favors a stronger collisionalrelaxation than recombination up to approximately 10 ps. The tendency is reversed as thematerial density drops during the liquid–gas transformation. The two contributions have similarweights in the liquid–vapor phase and at the beginning of the plasma phase. Here it isinteresting to note that, between 10 and 25 ps, Qe−i and Qrec have similar magnitudes inequation (3a). This time window corresponds to relaxation rates of the order of about 10 ps as∂t Z �/Z � ∼ γ /ce where ce is the electronic specific heat capacity. An increase of the efficiencyof the recombination path for heating the ions becomes visible after 25 ps for the OP. For theprofound SL layers at higher densities (figure 5(b)), despite the screened radiation, globally thecollisional heating is most important as the accumulated effect shows at all times. This tendencyis not affected by particular time moments where, for short instants, the instantaneous rate ofrecombination can become quite important, particularly at the last peak (not shown). It becomesevident that the dominant contribution for HL comes therefore from variation of the ionizationdegree and recombination, while the denser states of SL favor collisional transfer.
3.3.4. Thermodynamic phase space. We have discussed above variations of local parametersthat we try now to position in the phase space in order to establish a global evolution. The globalOP progress is summarized in the thermodynamic pressure–density–temperature p(ρ, T ) phasespace (figure 6(a)). The initial HL evolution deviates slightly from an isochoric transition due toits position close to the surface, which facilitates advancement without strong impediments. Inaddition, the pressure wave generated by the OP imposes a stress load distributed over the wholesequence (not shown), that does not force strong expansion up to the binodal crossing. Then,
New Journal of Physics 14 (2012) 013039 (http://www.njp.org/)
160

15
1010
108
106
104
PR
ES
SU
RE
[Pa]
1010
108
106
104
PR
ES
SU
RE
[Pa]
(a)
(b)
101
102
103
103
104
CPBINODAL
TE
MP
ER
AT
UR
E[K
]
DENSITY [kg/m3]
10 nm20 nm
30 nm40 nm
50 nm
101
102
103
103
104
CPBINODAL
SL
HL
TE
MP
ER
AT
UR
E[K
]
30 ps
40 ps20 ps
10 ps
Figure 6. (a) OP thermodynamical trajectories of HL and SL in the p(ρ, T )
phase space. Relevant time moments (symbols corresponding to 10, 20, 30 and40 ps) are given to indicate several transitions, e.g. liquid–vapor transformation,onset of ionization, etc. CP(ρC, TC) marks the critical point. (b) Agglomerationof supercritical OP trajectories following the irradiation with an OP sequence.The assignments relate to the initial depth position of the Lagrangian cells. Thequantity of supercritical matter induced by OP is four times more extended thanin the case of SP.
HL, although showing an evolution in the liquid–vapor zone, is able to rapidly leave the two-phase zone re-intersecting the binodal at 20 ps and reaching a critical low-density plasma phase(ρ < ρC). The evolution crosses diagonally the space above the binodal for the last exposure part(half of the exposure time) into ionized absorbing states. Noteworthy is the SL behavior. The SLcircumvents the CP after half of the irradiation sequence as high-pressure (GPa) supercriticalfluid (justifying the acronym SL for a supercritical layer) but lacks the momentum for a strongevolution into the plasma phase. Following OP exposure 80% of the ablated matter followssupercritical paths as compared to SP (20%). A relevant indication of the OP supercritical paths(labeled as the initial positions of the Lagrangian cells) is given in figure 6(b), showing that,in addition to maximal heat loads, the OP equally favors supercritical paths as efficient waystowards the plasma phase.
3.4. Consequences of optimal coupling
The consequences of creating critical states are multiple, particularly in generating highlyexcited environments as requested e.g. in laser breakdown spectroscopy but also in secondarysource development, accessing at these temperature values in EUV ranges. An example is
New Journal of Physics 14 (2012) 013039 (http://www.njp.org/)
161

16
0 10 20 30 4010
-7
10-6
10-5
10-4
OP
SP
EN
ER
GY
DE
NS
ITY
[J/c
m2/e
V]
FREQUENCY [eV]
Figure 7. Integrated spectral energy density emitted by the electrons for SPand OP, including contributions from all excited layers within the first 100 ps.A significantly increasing magnitude and a shift towards higher energies for theOP-induced spectrum can be observed.
offered in figure 7 showing the emitted integrated spectral energy density of the electrons withinthe first 100 ps. For this particular example the calculations were performed post-optimizationby including a radiative transfer module. The integrated emissivity is determined by radiationtransport. The equation of the radiative transfer in an expanding plasma is calculated withthe assumption of an instantaneous distribution of emission and absorption sources (spatialzones that are radiating at different temperatures) determined by the local plasma conditionsat each fluid element. A multigroup radiation transfer algorithm has been used with 100 energygroups of tabulated local thermodynamic equilibrium opacities extrapolated between the valuesof [28, 41]. A spectral blueshift of 5 eV and a peak increase of more than one order of magnitudeare to be seen for the OP. The optimal path found here could be general, as it relies onthe achievement of high-conductivity plasma phases or supercritical expansion rather than onparticular material properties. Essentially the pulse shows a material expansion and heatingphase that is being driven into ionized domains where the rest of the energy is being deposited.This scenario also indicates a certain robustness against uncertainties in the code parameters. Ifthe temperature level is sensitive to the chosen parameters which are known with some accuracy,the OP form drives essentially the same phenomena and preserves similar characteristics.
Experimental confirmation of the benefits of longer, ps laser pulses determined byadaptive techniques based on either time-of-flight mass spectrometry or spectral emissionhave already been reported, confirming the effect of efficient plasma excitation [11–13]and the possibility of achieving high emissivity or spectral emission shifted towards higherenergies. In these experiments, the monitored effect was a global (temperature- and density-dependent) plasma excitation behavior, spatially and temporally averaged for several hundredsof ns after the excitation, as probing temperature on the short time and scales reported hereremains a challenge. However, they indicate as well the increased light coupling related toplasma interaction, and they validate thus the present results with the increased heating effectof longer envelopes on the emerging plasma. Secondly, as experimentally shown, favoringheat with respect to mechanical load and distributing it over a longer scale reduces tensilestress and cavitation. This impacts the sizes and density of nanodroplets in laser depositiontechniques [12, 13]. Thus, complementing the experimental approaches, the numerical optimalprocedure supports a deeper understanding of the excitation control and access to primary
New Journal of Physics 14 (2012) 013039 (http://www.njp.org/)
162

17
relaxation steps. Finer excitation features are revealed, as no experimental noise or otherlimitations are to be considered. Depending on the chosen application, more developed fitnessfunctions can be chosen to optimize the complex mix of several parameters. As a plus, thenumerical adaptive loop allows us to address local parameters and reveals the fine details ofexcitation. It equally permits introspection into evolution paths non-accessible in experiments,giving a complementary view of the initial relaxation stages.
4. Conclusions
In conclusion, using a numerical adaptive approach, we have indicated that phase transitions canbe guided by suitable energy delivery to maximum heat loads. The method focuses on primaryrelaxation events that establish further evolution in optimal conditions. Hot thermodynamicstates are reached with minimal energy expenses by creating spatio-temporal correlationsbetween flux delivery, absorption transients and relaxation, resulting from ps pedestals withimpulsive endings. A plasma-based recipe was given which relies on early achievementof thermodynamically critical plasma phases at optical density. The role of recombinationwas outlined as a material-heating mechanism. Enhanced collisionally heated supercriticalstates, rich in volume energy, follow in denser regions, with a complementary collisionalenergy deposition mechanism. Adaptive modeling enables optimal irradiation strategies forapplications in material processing and spectroscopy with new evolution paths and the prospectof reconfigurable irradiation tools.
Acknowledgments
We acknowledge support from the Agence Nationale de la Recherche and the SaintEtienne Metropole.
References
[1] Bauerle D 2000 Laser Processing and Chemistry (Berlin: Springer)[2] Singh J P and Thakur S N 2007 Laser Breakdown Spectroscopy (Amsterdam: Elsevier)[3] Bunkin F V, Kirichenko N A, Krasnov I V, Luk’yanchuk B S and Shaparev N Ya 1981 Laser control of
thermochemical processes and optimum laser heating of metal in oxidizing medium Dokl. Acad. NaukSSSR 256 848–52
[4] Engers T, Fendel W, Schuller H, Schulz H and von der Linde D 1991 Second-harmonic generation in plasmasproduced by femtosecond laser pulses Phys. Rev. A 43 4564–7
[5] Gahagan K T, Moore D S, Funk D J, Rabie R L and Buelow S J 2000 Measurement of shock wave rise timesin metal thin films Phys. Rev. Lett. 85 3205–8
[6] McGrane S D, Moore D S, Funk D J and Rabie R L 2002 Spectrally modified chirped pulse generation ofsustained shock waves Appl. Phys. Lett. 80 3919–21
[7] Englert L, Rethfeld B, Haag L, Wollenhaupt M, Sarpe-Tudoran C and Baumert T 2007 Control of ionizationprocesses in high band gap materials via tailored femtosecond pulses Opt. Express 15 17855–62
[8] Liebig C M, Wang Y and Xu X 2010 Controlling phase change through ultrafast excitation of coherentphonons Opt. Express 18 20498–504
[9] Stoian R, Mermillod-Blondin A, Bulgakova N M, Rosenfeld A, Hertel I V, Spyridaki M, Koudoumas E,Tzanetakis P and Fotakis C 2005 Optimization of ultrafast laser generated low-energy ion beams fromsilicon targets Appl. Phys. Lett. 87 124105
New Journal of Physics 14 (2012) 013039 (http://www.njp.org/)
163
18
[10] Dachraoui H and Husinsky W 2006 Thresholds of plasma formation in silicon identified by optimizing theablation laser pulse form Phys. Rev. Lett. 97 107601
[11] Colombier J P, Combis P, Rosenfeld A, Hertel I V, Audouard E and Stoian R 2006 Optimized energy couplingat ultrafast laser-irradiated metal surfaces by tailoring intensity envelopes: consequences for materialremoval from Al samples Phys. Rev. B 74 224106
[12] Guillermin M, Colombier J P, Valette S, Audouard E, Garrelie F and Stoian R 2010 Optical emission andnanoparticle generation in Al plasmas using ultrashort laser pulses temporally optimized by real-timespectroscopic feedback Phys. Rev. B 82 035430
[13] Chimier B and Tikhonchuk V T 2009 Liquid-vapor phase transition and droplet formation by subpicosecondlaser heating Phys. Rev. B 79 184107
[14] Pinon V, Fotakis C, Nicolas G and Anglos D 2008 Double pulse laser-induced breakdown spectroscopy withfemtosecond laser pulses Spectrochim. Acta B 63 1006–10
[15] Amoruso S, Bruzzese R and Wang X 2009 Appl. Phys. Lett. 95 251501[16] Povarnitsyn M E, Itina T E, Levashov P R and Khishchenko K V 2011 Simulation of ultrashort double-pulse
laser ablation Appl. Surf. Sci. 257 5168–71[17] Donnelly T, Lunney J G, Amoruso S, Bruzzese R, Wang X and Ni X 2009 Double pulse ultrafast laser ablation
of nickel in vacuum J. Appl. Phys. 106 013304[18] Judson R S and Rabitz H 1992 Teaching lasers to control molecules Phys. Rev. Lett. 68 1500–3[19] Zhu W, Botina J and Rabitz H 1998 Rapidly convergent iteration methods for quantum optimal control of
population J. Chem. Phys. 108 1953–63[20] Sundermann K and de Vivie-Riedle R 1999 Extensions to quantum optimal control algorithms and
applications to special problems in state selective molecular dynamics J. Chem. Phys. 110 1896–904[21] Huang G M, Tarn T J and Clark J W 1983 On the controllability of quantum-mechanical systems J. Math.
Phys. 24 2608–18[22] Hornung T, Motzkus M and de Vivie-Riedle R 2001 Adapting optimal control theory and using learning loops
to provide experimentally feasible shaping mask patterns J. Chem. Phys. 115 3105–11[23] Schafer-Bung B, Mitric R, Bonaic-Koutecky V, Bartelt A, Lupulescu C, Lindinger A, Vajda S, Weber S M
and Woste L 2004 J. Phys. Chem. A 108 4175–9[24] Colombier J P, Combis P, Stoian R and Audouard E 2007 High shock release in ultrafast laser irradiated
metals: scenario for material ejection Phys. Rev. B 75 104105[25] Colombier J P, Combis P, Audouard A and Stoian R 2008 Transient optical response of ultrafast
nonequilibrium excited metals: effects of an electron–electron contribution to collisional absorption Phys.Rev. E 77 036409
[26] Colombier J P, Guillermin M, Garrelie F, Audouard E and Stoian R 2010 Simulations of controlled spectralemission of Al plasmas generated by temporally tailored laser irradiation: Int. Symp. on High Power LaserAblation (AIP Conf. Proc. vol 1278) pp 312–23
[27] Ashcroft N W and Sturm K 1971 Interband absorption and the optical properties of polyvalent metals Phys.Rev. B 3 1898–910
[28] Palik E 1985 Handbook of Optical Constants of Solids (London: Academic)[29] Lin Z, Zhigilei L V and Celli V 2008 Electron–phonon coupling and electron heat capacity of metals under
conditions of strong electron–phonon nonequilibrium Phys. Rev. B 77 075133[30] Kaganov M I, Lifshitz I M and Tanatarov L V 1957 Relaxation between electrons and crystalline lattices Sov.
Phys.—JETP 4 173–8[31] Ebeling W, Forster A, Fortov V, Griaznov V and Polishchuk 1991 Thermophysical Properties of Hot Dense
Plasmas (Teubner: Stuttgart)[32] DeSilva A W and Katsouros J D 1998 Electrical conductivity of dense copper and aluminum plasmas Phys.
Rev. E 57 5945–51[33] Zhigilei L V, Lin Z and Ivanov D S 2009 Atomistic modeling of short pulse laser ablation of metals:
connections between melting, spallation and phase explosion J. Phys. Chem. C 113 11892–906
New Journal of Physics 14 (2012) 013039 (http://www.njp.org/)
164

19
[34] Gericke D O, Murillo M S and Schlanges M 2002 Dense plasma temperature equilibration in the binarycollision approximation Phys. Rev. E 65 036418
[35] Audebert P et al 2005 Picosecond time-resolved x-ray absorption spectroscopy of ultrafast aluminum plasmasPhys. Rev. Lett. 94 025004
[36] Bushman A V, Lomonosov I V and Fortov V E 1993 Models of wide-range equations of state for matter underconditions of high energy density Sov. Tech. Rev. B 5 1
[37] Stoian R, Wollenhaupt M, Baumert T and Hertel I V 2010 Pulse shaping in laser material processing LaserPrecision Microfabrication (Springer Series in Optical Sciences vol 135) ed K Sugioka, M Meunier and APique (Heidelberg: Springer) pp 121–44
[38] Lorazo P, Lewis L J and Meunier M 2003 Short-pulse laser ablation of solids: from phase explosion tofragmentation Phys. Rev. Lett. 91 225502
[39] Kandyla M, Shih T and Mazur E 2007 Femtosecond dynamics of the laser-induced solid-to-liquid phasetransition in aluminum Phys. Rev. B 75 214107
[40] Sokolowski-Tinten K, Bialkowski J, Cavalleri A, von der Linde D, Oparin A, Meyer-ter-Vehn J and AnisimovS I 1998 Transient states of matter during short pulse laser ablation Phys. Rev. Lett. 81 224–7
[41] Henke B L, Gullikson E M and Davis J C 1998 X-ray interactions: photoabsorption, scattering, transmissionand reflection at E = 50–30000 eV, Z = 1–92 At. Data Nucl. Data Tables 54 181–342
New Journal of Physics 14 (2012) 013039 (http://www.njp.org/)
165

166

Single-shot high aspect ratio bulk nanostructuring of fused silica usingchirp-controlled ultrafast laser Bessel beams
M. K. Bhuyan, P. K. Velpula, J. P. Colombier, T. Olivier, N. Faure, and R. Stoiana)
Laboratoire Hubert Curien, UMR 5516 CNRS, Universit�e de Lyon, Universit�e Jean Monnet, 42000 SaintEtienne, France
(Received 4 October 2013; accepted 29 December 2013; published online 14 January 2014)
We report single-shot, high aspect ratio nanovoid fabrication in bulk fused silica using zeroth order
chirp-controlled ultrafast laser Bessel beams. We identify a unique laser pulse length and energy
dependence of the physical characteristics of machined structures over which nanovoids of diameter
in the range 200–400 nm and aspect ratios exceeding 1000 can be fabricated. A mechanism based on
the axial energy deposition of nonlinear ultrashort Bessel beams and subsequent material
densification or rarefaction in fused silica is proposed, intricating the non-diffractive nature with the
diffusing character of laser-generated free carriers. Fluid flow through nanochannel is also
demonstrated.VC 2014 AIP Publishing LLC. [http://dx.doi.org/10.1063/1.4861899]
The ablation and modification of transparent dielectric
materials using ultrashort laser pulses have been studied for
decades and numerous applications in the field of photonics
and fluidics were demonstrated.1 When a femtosecond (fs)
laser pulse is focused inside transparent materials, material
modifications in terms of refractive index alteration2 and
void generation3 can happen in a confined volume, with
potential in 3D design of optical functions.4 The typical
Gaussian nature of the normally considered laser pulse deter-
mines high degree of spatial energy confinement with the as-
pect ratio of the focal volume, and hence the corresponding
laser induced structure has been observed to be small, lim-
ited by the confocal zone. While being an advantage for 3D
designs, this imposes nevertheless constraint on the speed
and quality of the processed device functionalities in some
applications requiring larger dimensions, e.g., deep-drilling,
high-speed cutting, or one-dimensional geometries.
Solutions have been proposed using suitable loose focusing
geometry triggering filamentation of Gaussian laser beams
inside transparent materials beyond the confocal zone. High
aspect ratio laser structuring in multi-pulse5 and in single-
pulse6,7 regimes was demonstrated with nevertheless limita-
tions on the uniformity and structure dimensions. Since the
control of the filamentation process in any medium is not
straightforward,8 there exist two main issues with structur-
ing: (i) the structure dimensions, i.e., length and diameter
cannot be controlled independently and (ii) the quality in
terms of uniform refractive index variation or extended voids
as often required for fluidic and photonic crystal applications
is poor.7,9
Recently, zeroth-order Bessel beams10 encompassing a
narrow intense central core sustained over a long distance
(called nondiffracting length, Zmax) have been demonstrated
for high aspect ratio nanostructuring of glass in single-shot
regime.11,12 The use of Bessel beams of larger conical half-
angle (h)� 11� (in glass) corresponding to a tight focusing
geometry permitted the achievement of channels of length
up to 100 lm and diameter in the range 200–800 nm. As for
a fixed aperture beam, smaller cone angle corresponds to
longer nondiffracting length of Bessel beams, exploring
looser focusing geometries is of interest for even higher as-
pect ratio structuring. However, with a quest of producing
longer structures, when Bessel beams of h � 7� (in glass)
were used, single-shot channel structuring was not possi-
ble;13 1000 laser pulses were required to produce a single
microchannel (80 lm long and 2 lm diameter) in borosilicate
glass. This is because of the poor stability of nonlinear
Bessel beams of low cone angle15 causing inefficient transfer
of laser energy into the material. In this report, we demon-
strate that low cone angle Bessel beams can have signifi-
cantly higher degree of stability of nonlinear propagation in
transparent materials by properly selecting the laser pulse
duration and energy enabling dispersion control. Using
Bessel beams of h¼ 8.3� (in fused silica), we have fabricated
high aspect ratio (�1000) uniform one-dimensional nano-
voids in fused silica, indicating efficient laser energy transfer
into the material. Accompanied by the simulation of nonlin-
ear laser-matter interaction processes, energetic conditions
for the formation of void-like low density phases were
explored as a function of laser pulse duration, revealing
potential for deep drilling and nanofluidic channels.
The experiments were performed using a Ti:Sapphire
laser system emitting 1 kHz repetition rate Gaussian laser
pulses of full width at half maxima (FWHM) temporal width
sp¼ 60 fs, centred at 800 nm. An axicon-based (apex angle
of 179�) Bessel beam generation setup described in Ref. 12,
was employed. Using suitable imaging and spatial filtering
systems, zeroth order Bessel beams were produced and pro-
jected in bulk fused silica. Fig. 1(a) shows the longitudinal
cross-section of the experimental Bessel beams recorded in
air (h¼ 12�, central core FWHM, r¼ 1.4 lm, and
Zmax ¼ 130 lm FWHM). Note that Zmax and h of Bessel
beams vary (increasing and decreasing, respectively) by a
factor of n when propagating in a medium of refractive index
n. The laser pulses were positively and negatively chirped up
to 5.7 picoseconds (ps) by detuning the compressor. The
group velocity dispersion of the laser pulse propagating
a)Author to whom correspondence should be addressed: Electronic mail:
0003-6951/2014/104(2)/021107/4/$30.00 VC 2014 AIP Publishing LLC104, 021107-1
APPLIED PHYSICS LETTERS 104, 021107 (2014)
This article is copyrighted as indicated in the article. Reuse of AIP content is subject to the terms at: http://scitation.aip.org/termsconditions. Downloaded to IP: 161.3.1.42On: Tue, 03 Jun 2014 20:02:32
167
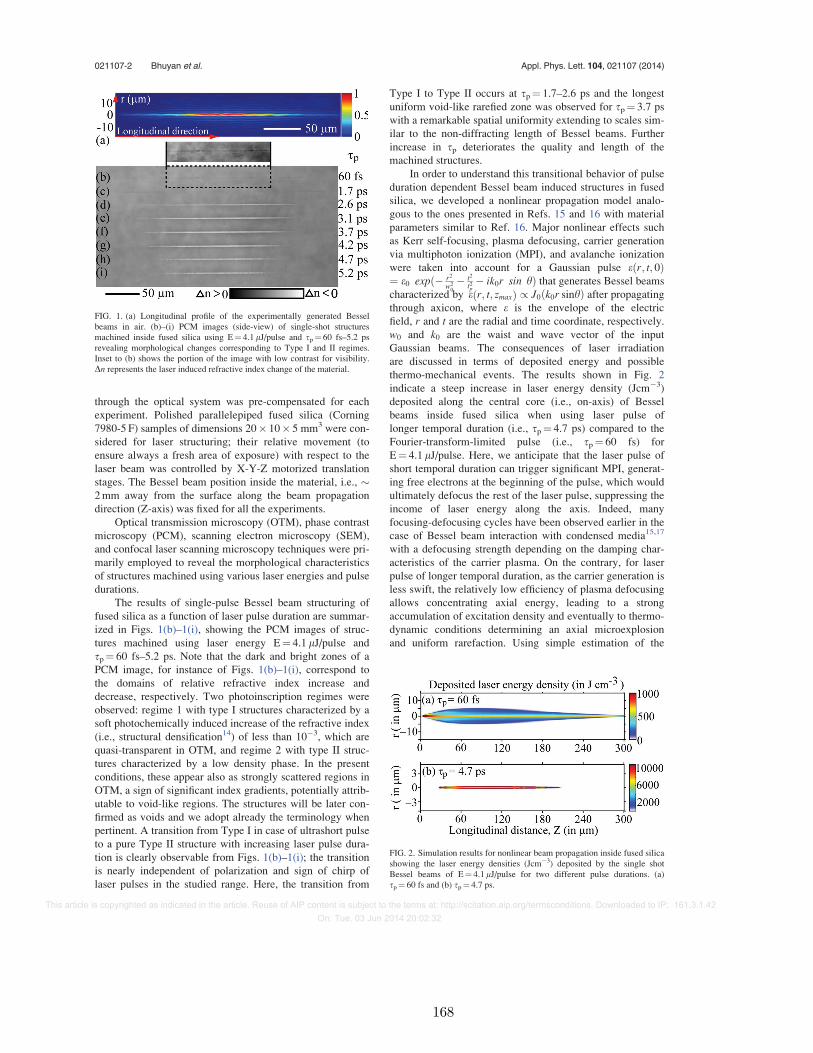
through the optical system was pre-compensated for each
experiment. Polished parallelepiped fused silica (Corning
7980-5 F) samples of dimensions 20� 10� 5 mm3 were con-
sidered for laser structuring; their relative movement (to
ensure always a fresh area of exposure) with respect to the
laser beam was controlled by X-Y-Z motorized translation
stages. The Bessel beam position inside the material, i.e., �2mm away from the surface along the beam propagation
direction (Z-axis) was fixed for all the experiments.
Optical transmission microscopy (OTM), phase contrast
microscopy (PCM), scanning electron microscopy (SEM),
and confocal laser scanning microscopy techniques were pri-
marily employed to reveal the morphological characteristics
of structures machined using various laser energies and pulse
durations.
The results of single-pulse Bessel beam structuring of
fused silica as a function of laser pulse duration are summar-
ized in Figs. 1(b)–1(i), showing the PCM images of struc-
tures machined using laser energy E¼ 4.1 lJ/pulse and
sp¼ 60 fs–5.2 ps. Note that the dark and bright zones of a
PCM image, for instance of Figs. 1(b)–1(i), correspond to
the domains of relative refractive index increase and
decrease, respectively. Two photoinscription regimes were
observed: regime 1 with type I structures characterized by a
soft photochemically induced increase of the refractive index
(i.e., structural densification14) of less than 10�3, which are
quasi-transparent in OTM, and regime 2 with type II struc-
tures characterized by a low density phase. In the present
conditions, these appear also as strongly scattered regions in
OTM, a sign of significant index gradients, potentially attrib-
utable to void-like regions. The structures will be later con-
firmed as voids and we adopt already the terminology when
pertinent. A transition from Type I in case of ultrashort pulse
to a pure Type II structure with increasing laser pulse dura-
tion is clearly observable from Figs. 1(b)–1(i); the transition
is nearly independent of polarization and sign of chirp of
laser pulses in the studied range. Here, the transition from
Type I to Type II occurs at sp¼ 1.7–2.6 ps and the longest
uniform void-like rarefied zone was observed for sp¼ 3.7 ps
with a remarkable spatial uniformity extending to scales sim-
ilar to the non-diffracting length of Bessel beams. Further
increase in sp deteriorates the quality and length of the
machined structures.
In order to understand this transitional behavior of pulse
duration dependent Bessel beam induced structures in fused
silica, we developed a nonlinear propagation model analo-
gous to the ones presented in Refs. 15 and 16 with material
parameters similar to Ref. 16. Major nonlinear effects such
as Kerr self-focusing, plasma defocusing, carrier generation
via multiphoton ionization (MPI), and avalanche ionization
were taken into account for a Gaussian pulse e r; t; 0ð Þ¼ e0 expð� r2
w20
� t2
t2p� ik0r sin hÞ that generates Bessel beams
characterized by e r; t; zmaxð Þ / J0 k0r sinhð Þ after propagatingthrough axicon, where e is the envelope of the electric
field, r and t are the radial and time coordinate, respectively.
w0 and k0 are the waist and wave vector of the input
Gaussian beams. The consequences of laser irradiation
are discussed in terms of deposited energy and possible
thermo-mechanical events. The results shown in Fig. 2
indicate a steep increase in laser energy density (Jcm�3)
deposited along the central core (i.e., on-axis) of Bessel
beams inside fused silica when using laser pulse of
longer temporal duration (i.e., sp¼ 4.7 ps) compared to the
Fourier-transform-limited pulse (i.e., sp¼ 60 fs) for
E¼ 4.1 lJ/pulse. Here, we anticipate that the laser pulse of
short temporal duration can trigger significant MPI, generat-
ing free electrons at the beginning of the pulse, which would
ultimately defocus the rest of the laser pulse, suppressing the
income of laser energy along the axis. Indeed, many
focusing-defocusing cycles have been observed earlier in the
case of Bessel beam interaction with condensed media15,17
with a defocusing strength depending on the damping char-
acteristics of the carrier plasma. On the contrary, for laser
pulse of longer temporal duration, as the carrier generation is
less swift, the relatively low efficiency of plasma defocusing
allows concentrating axial energy, leading to a strong
accumulation of excitation density and eventually to thermo-
dynamic conditions determining an axial microexplosion
and uniform rarefaction. Using simple estimation of the
FIG. 1. (a) Longitudinal profile of the experimentally generated Bessel
beams in air. (b)–(i) PCM images (side-view) of single-shot structures
machined inside fused silica using E¼ 4.1lJ/pulse and sp¼ 60 fs–5.2 ps
revealing morphological changes corresponding to Type I and II regimes.
Inset to (b) shows the portion of the image with low contrast for visibility.
Dn represents the laser induced refractive index change of the material.
FIG. 2. Simulation results for nonlinear beam propagation inside fused silica
showing the laser energy densities (Jcm�3) deposited by the single shot
Bessel beams of E¼ 4.1lJ/pulse for two different pulse durations. (a)
sp¼ 60 fs and (b) sp¼ 4.7 ps.
021107-2 Bhuyan et al. Appl. Phys. Lett. 104, 021107 (2014)
This article is copyrighted as indicated in the article. Reuse of AIP content is subject to the terms at: http://scitation.aip.org/termsconditions. Downloaded to IP: 161.3.1.42On: Tue, 03 Jun 2014 20:02:32
168

temperature (DT) that could rise in the photoexcited volume
as DT¼ Edep=q:Cp, where Edep is the deposited laser
energy density, q and Cp are the solid density and specific
heat capacity of fused silica, respectively (i.e.,
q¼ 2200 kg/m3, Cp ¼ 740 J/kg/K), the temperature rise in
the case of structuring with laser pulse, sp¼ 4.7 ps turned out
to be approximately 5000K, up to an order of magnitude
higher than the ultrashort case, i.e., for sp¼ 60 fs. This indi-
cates a probable pathway for forming the voids (see Figs.
1(d)–1(i)) only for sp> 1.7 ps by steering phase transitions
and rarefaction-led one-dimensional cavitation. Considering
the extreme case, i.e., sp¼ 5.2 ps, the contribution of MPI
decreases and hence the overall excitation efficiency as evi-
denced in Fig. 1(i), where the machined structure shrinks
and becomes non-uniform.
The input laser energy is a further regulating element in
obtaining various types (in terms of morphology) of
machined structures. To explore the stability limits, experi-
ments were performed by varying E up to 30 lJ/pulse over
the laser pulse duration range, i.e., sp¼ 60 fs–5.7 ps. The
results are summarized in Fig. 3(a) for our focusing geome-
try, but they indicate a general behavior. The experimental
observations define four different regimes of structuring
marked through shaded regions (measured error bars
included) of the graph. Note that the bottom shaded border
of Fig. 3(a) represents the variation of laser damage thresh-
old energy with respect to the laser pulse duration. Regime 1
refers to the structuring with laser pulse duration, sp¼ 60
fs–1.7 ps which results in type I (only positive index modifi-
cation) structure (see Figs. 1(b) and 1(c)). For higher laser
energies, this structure develops into a succession of positive
and negative refractive index modified zones, as the nonli-
nearities set in. For example, structure machined using
E¼ 20 lJ/pulse as shown in Fig. 3(b), consists of alterna-
tively placed positive index modifications and rarefied
domains with a periodicity in the range of 50–120 lm, fol-
lowing unsteady focusing and defocusing cycles. Upon
increasing the laser pulse duration further until sp¼ 5.7 ps,
depending on the laser energy, the structure evolves through
three different types of morphology. For instance, machining
using laser pulses of sp¼ 4.7 ps and E¼ 2.7–4.1 lJ (referredas “onset” range), results in structures consisting of ran-
domly arranged, non-uniform rarefied zones without having
positive index modified zone; PCM image of a typical struc-
ture in this range is shown in Fig. 3(c). Such energy ranges
corresponding to 1.7 ps< sp< 5.7 ps range are covered
under regime 3. Regime 2 spans the energy range, i.e.,
4.1 lJ<E< 18.0 lJ/pulse, over which long uniform
void-like rarefied zones were observed similar to the one
shown in Fig. 3(d), indicating a window of stable energy
deposition. Upon further increasing the laser energy, i.e.,
E> 18.0 lJ/pulse, a non-ordinary morphological characteris-
tic was observed along the longitudinal axis of structure;
fragmented void-like regions with a quasi-periodicity
(� 8–10 lm) at the middle of the structure, preceded and fol-
lowed by long uniform rarefied zones were observed (see
Fig. 3(e)). Although, the exact mechanism responsible for
the formation of such unique structure is under investigation,
it can be attributed to the interplay between complex nonlin-
ear Bessel beam propagation in terms of energy balance
between the central core and outer rings,15 and subsequent
rapid material relaxation dynamics18 in fused silica at rela-
tively high laser energy, where hydrodynamic movement can
interfere with the laser exposure. The energy ranges showing
these kinds of structures for all the considered pulse dura-
tions are covered under regime 4.
The above results clearly indicate that over a broad
range of laser energy in combination with laser pulse dura-
tion, highly uniform long rarefied zones, which will be even-
tually shown as voids (i.e., in regime 2 of Fig. 3(a)) can be
fabricated in fused silica. The remarkable aspect ratio and
strong refractive index contrast put forward a strong poten-
tial for photonic crystal and fluidic applications, as one-
dimensional index modified structures with nanosize dimen-
sions are of interest. To better understand their applicability,
we studied the length and diameter variation of uniform
void-like regions as a function of laser energy at a fixed laser
pulse duration, for instance sp¼ 4.7 ps. The length of the
low density phase region is defined as the distance between
their extremities (based on a contrast of the PCM image
greater than 10�2) along the longitudinal axis. A gradual
increase in the structure length with increase in E was
observed, as expected for an apodized Gauss-Bessel beam.
The experimentally measured length of structures fairly
matches with the estimated one based on a pure geometrical
FIG. 3. (a) Threshold laser energies corresponding to four different
morphology-based regimes (uniquely shaded zones) of Bessel beam struc-
turing of fused silica. Structuring with parameters under Regime 1, Regime
2, Regime 3, and Regime 4 produces mixture of rarefied and positive index
modified zone, uniform void, randomly arranged non-uniform void-like low
density phase, and void with fragmentation at the middle as shown in (b),
(d), (c), and (e), respectively.
021107-3 Bhuyan et al. Appl. Phys. Lett. 104, 021107 (2014)
This article is copyrighted as indicated in the article. Reuse of AIP content is subject to the terms at: http://scitation.aip.org/termsconditions. Downloaded to IP: 161.3.1.42On: Tue, 03 Jun 2014 20:02:32
169
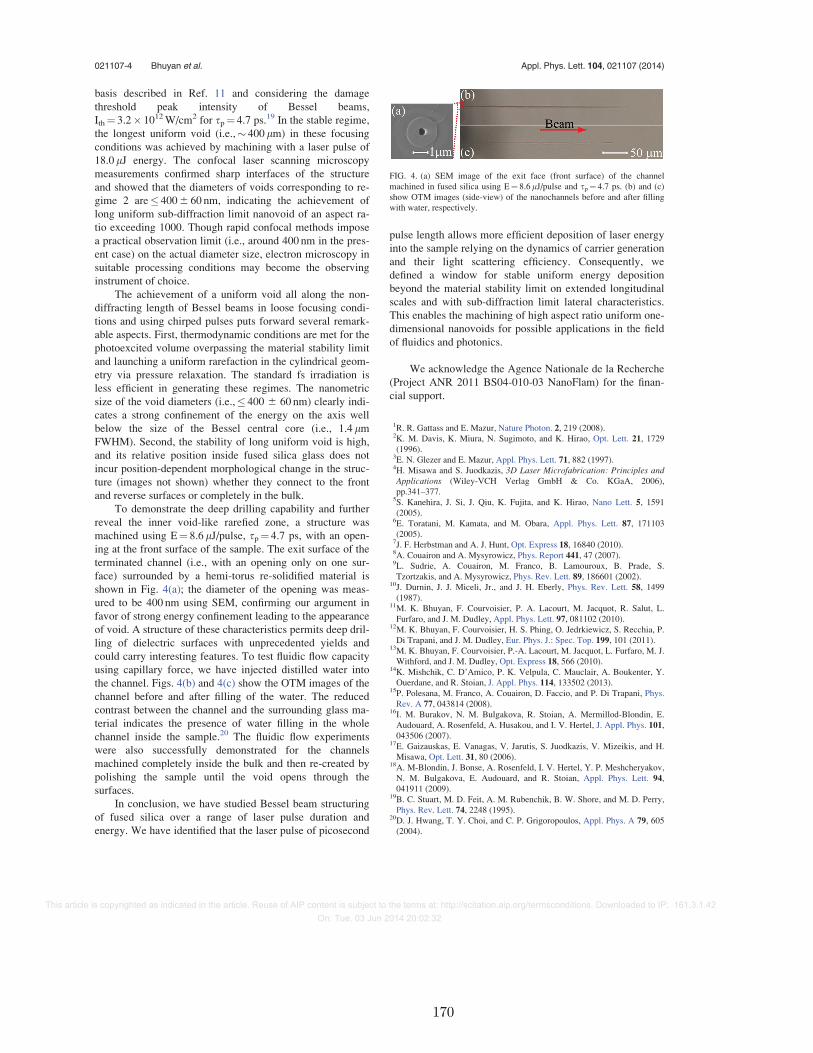
basis described in Ref. 11 and considering the damage
threshold peak intensity of Bessel beams,
Ith¼ 3.2� 1012W/cm2 for sp¼ 4.7 ps.19 In the stable regime,
the longest uniform void (i.e.,� 400 lm) in these focusing
conditions was achieved by machining with a laser pulse of
18.0 lJ energy. The confocal laser scanning microscopy
measurements confirmed sharp interfaces of the structure
and showed that the diameters of voids corresponding to re-
gime 2 are� 4006 60 nm, indicating the achievement of
long uniform sub-diffraction limit nanovoid of an aspect ra-
tio exceeding 1000. Though rapid confocal methods impose
a practical observation limit (i.e., around 400 nm in the pres-
ent case) on the actual diameter size, electron microscopy in
suitable processing conditions may become the observing
instrument of choice.
The achievement of a uniform void all along the non-
diffracting length of Bessel beams in loose focusing condi-
tions and using chirped pulses puts forward several remark-
able aspects. First, thermodynamic conditions are met for the
photoexcited volume overpassing the material stability limit
and launching a uniform rarefaction in the cylindrical geom-
etry via pressure relaxation. The standard fs irradiation is
less efficient in generating these regimes. The nanometric
size of the void diameters (i.e.,� 400 6 60 nm) clearly indi-
cates a strong confinement of the energy on the axis well
below the size of the Bessel central core (i.e., 1.4 lmFWHM). Second, the stability of long uniform void is high,
and its relative position inside fused silica glass does not
incur position-dependent morphological change in the struc-
ture (images not shown) whether they connect to the front
and reverse surfaces or completely in the bulk.
To demonstrate the deep drilling capability and further
reveal the inner void-like rarefied zone, a structure was
machined using E¼ 8.6 lJ/pulse, sp¼ 4.7 ps, with an open-
ing at the front surface of the sample. The exit surface of the
terminated channel (i.e., with an opening only on one sur-
face) surrounded by a hemi-torus re-solidified material is
shown in Fig. 4(a); the diameter of the opening was meas-
ured to be 400 nm using SEM, confirming our argument in
favor of strong energy confinement leading to the appearance
of void. A structure of these characteristics permits deep dril-
ling of dielectric surfaces with unprecedented yields and
could carry interesting features. To test fluidic flow capacity
using capillary force, we have injected distilled water into
the channel. Figs. 4(b) and 4(c) show the OTM images of the
channel before and after filling of the water. The reduced
contrast between the channel and the surrounding glass ma-
terial indicates the presence of water filling in the whole
channel inside the sample.20 The fluidic flow experiments
were also successfully demonstrated for the channels
machined completely inside the bulk and then re-created by
polishing the sample until the void opens through the
surfaces.
In conclusion, we have studied Bessel beam structuring
of fused silica over a range of laser pulse duration and
energy. We have identified that the laser pulse of picosecond
pulse length allows more efficient deposition of laser energy
into the sample relying on the dynamics of carrier generation
and their light scattering efficiency. Consequently, we
defined a window for stable uniform energy deposition
beyond the material stability limit on extended longitudinal
scales and with sub-diffraction limit lateral characteristics.
This enables the machining of high aspect ratio uniform one-
dimensional nanovoids for possible applications in the field
of fluidics and photonics.
We acknowledge the Agence Nationale de la Recherche
(Project ANR 2011 BS04-010-03 NanoFlam) for the finan-
cial support.
1R. R. Gattass and E. Mazur, Nature Photon. 2, 219 (2008).2K. M. Davis, K. Miura, N. Sugimoto, and K. Hirao, Opt. Lett. 21, 1729(1996).
3E. N. Glezer and E. Mazur, Appl. Phys. Lett. 71, 882 (1997).4H. Misawa and S. Juodkazis, 3D Laser Microfabrication: Principles andApplications (Wiley-VCH Verlag GmbH & Co. KGaA, 2006),
pp.341–377.5S. Kanehira, J. Si, J. Qiu, K. Fujita, and K. Hirao, Nano Lett. 5, 1591(2005).
6E. Toratani, M. Kamata, and M. Obara, Appl. Phys. Lett. 87, 171103(2005).
7J. F. Herbstman and A. J. Hunt, Opt. Express 18, 16840 (2010).8A. Couairon and A. Mysyrowicz, Phys. Report 441, 47 (2007).9L. Sudrie, A. Couairon, M. Franco, B. Lamouroux, B. Prade, S.
Tzortzakis, and A. Mysyrowicz, Phys. Rev. Lett. 89, 186601 (2002).10J. Durnin, J. J. Miceli, Jr., and J. H. Eberly, Phys. Rev. Lett. 58, 1499(1987).
11M. K. Bhuyan, F. Courvoisier, P. A. Lacourt, M. Jacquot, R. Salut, L.
Furfaro, and J. M. Dudley, Appl. Phys. Lett. 97, 081102 (2010).12M. K. Bhuyan, F. Courvoisier, H. S. Phing, O. Jedrkiewicz, S. Recchia, P.
Di Trapani, and J. M. Dudley, Eur. Phys. J.: Spec. Top. 199, 101 (2011).13M. K. Bhuyan, F. Courvoisier, P.-A. Lacourt, M. Jacquot, L. Furfaro, M. J.
Withford, and J. M. Dudley, Opt. Express 18, 566 (2010).14K. Mishchik, C. D’Amico, P. K. Velpula, C. Mauclair, A. Boukenter, Y.
Ouerdane, and R. Stoian, J. Appl. Phys. 114, 133502 (2013).15P. Polesana, M. Franco, A. Couairon, D. Faccio, and P. Di Trapani, Phys.
Rev. A 77, 043814 (2008).16I. M. Burakov, N. M. Bulgakova, R. Stoian, A. Mermillod-Blondin, E.
Audouard, A. Rosenfeld, A. Husakou, and I. V. Hertel, J. Appl. Phys. 101,043506 (2007).
17E. Gaizauskas, E. Vanagas, V. Jarutis, S. Juodkazis, V. Mizeikis, and H.
Misawa, Opt. Lett. 31, 80 (2006).18A. M-Blondin, J. Bonse, A. Rosenfeld, I. V. Hertel, Y. P. Meshcheryakov,
N. M. Bulgakova, E. Audouard, and R. Stoian, Appl. Phys. Lett. 94,041911 (2009).
19B. C. Stuart, M. D. Feit, A. M. Rubenchik, B. W. Shore, and M. D. Perry,
Phys. Rev. Lett. 74, 2248 (1995).20D. J. Hwang, T. Y. Choi, and C. P. Grigoropoulos, Appl. Phys. A 79, 605(2004).
FIG. 4. (a) SEM image of the exit face (front surface) of the channel
machined in fused silica using E¼ 8.6lJ/pulse and sp¼ 4.7 ps. (b) and (c)
show OTM images (side-view) of the nanochannels before and after filling
with water, respectively.
021107-4 Bhuyan et al. Appl. Phys. Lett. 104, 021107 (2014)
This article is copyrighted as indicated in the article. Reuse of AIP content is subject to the terms at: http://scitation.aip.org/termsconditions. Downloaded to IP: 161.3.1.42On: Tue, 03 Jun 2014 20:02:32
170

PHYSICAL REVIEW B 89, 115117 (2014)
Free-electron properties of metals under ultrafast laser-induced electron-phonon nonequilibrium:A first-principles study
E. Bevillon,1 J. P. Colombier,1,* V. Recoules,2 and R. Stoian1
1Laboratoire Hubert Curien, UMR CNRS 5516, Universite de Lyon, Universite Jean-Monnet 42000, Saint-Etienne, France2CEA-DIF, 91297 Arpajon, France
(Received 13 December 2013; published 17 March 2014)
The electronic behavior of various solid metals (Al, Ni, Cu, Au, Ti, and W) under ultrashort laser irradiation isinvestigated by means of density functional theory. Successive stages of extreme nonequilibrium on picosecondtime scale impact the excited material properties in terms of optical coupling and transport characteristics.As these are generally modelled based on the free-electron classical theory, the free-electron number is a keyparameter. However, this parameter remains unclearly defined and dependencies on the electronic temperature arenot considered. Here, from first-principles calculations, density of states are obtained with respect to electronictemperatures varying from 10−2 to 105 K within a cold lattice. Based on the concept of localized or delocalizedelectronic states, temperature dependent free-electron numbers are evaluated for a series of metals covering a largerange of electronic configurations. With the increase of the electronic temperature we observe strong adjustmentsof the electronic structures of transition metals. These are related to variations of electronic occupation in localizedd bands, via change in electronic screening and electron-ion effective potential. The electronic temperaturedependence of nonequilibrium density of states has consequences on electronic chemical potentials, free-electronnumbers, electronic heat capacities, and electronic pressures. Thus electronic thermodynamic properties arecomputed and discussed, serving as a base to derive energetic and transport properties allowing the descriptionof excitation and relaxation phenomena caused by rapid laser action.
DOI: 10.1103/PhysRevB.89.115117 PACS number(s): 71.15.Mb, 71.20.−b, 78.47.J−, 79.20.Ds
I. INTRODUCTION
The dynamics of laser-excited materials is an area of intenseresearch as diagnostics of laser-matter experiments can bediscussed by back tracking the transient properties of the irradi-ated material. Particularly, the primary phenomena of transientelectronic excitation and energy transport are of utmostimportance. Irradiating a metal by a short laser pulse (∼100 fs)can lead to a significant rise of the electronic temperature withrespect to the ionic lattice as the energy of the laser pulse can bedeposited before the material system starts dissipating energyby thermal or mechanical ways. The electronic excitation canaffect both electronic and structural properties of the solid,impacting optical coupling, transport, and phase transitions.The confinement of the absorbed energy at solid density pushesthe matter into an extreme nonequilibrium state and newthermodynamic regimes are triggered. The interplay betweenthe ultrafast excitation and the material response still requiresa comprehensive theoretical description for highly excitedsolid materials including in particular the excitation-dependentband structure evolution as this influence the response to laseraction [1]. Recent advances in studying processes inducedby short laser pulses have revealed the determinant role ofprimary excitation events. Their accurate comprehension isnecessary to correctly describe ultrafast structural dynamics[2,3], phase transitions [4,5], nanostructure formation [6], ab-lation dynamics [7,8], or strong shock propagation [9]. In suchnonequilibrium conditions, conduction electrons participatingto energy exchange are expected to evolve in time, dependingon the excitation degree [10]. They largely determine the
material transient properties and transformation paths. In thiscontext, they are a crucial parameter required to describecomplex ultrafast phenomena involving relaxation of excitedstates. Particularly, pure electronic effects (population andband distribution) determining transient coefficients beforestructural transitions set in are of interest and we will followexcitation influence in the form of nonequilibrium electronictemperature.
At the very beginning of the irradiation process, excitedelectrons are unhomogeneously distributed within the elec-tronic band structure of the materials. By collisions andenergy transfer, they quickly reach a Fermi-Dirac distribution.The electronic subsystem is thermalized and the concept ofelectronic temperature (Te) can be applied. Mueller et al. haverecently shown that the electron subsystem thermalizes withina characteristic time τ in the range of tens of femtoseconds forTe larger than 104 K [11]. Then, a first relaxation channel is theenergy transfer between electronic and vibrational excitations.This is commonly described by a two temperature model(TTM) [12,13] based on the assumption that the occupation ofelectronic and phonons states can be separately described bytwo effective temperatures, the electronic Te and the ionictemperature Ti . In the standard approach, energy transferbetween electrons and ions can be modeled by the product ofthe electron-phonon coupling parameter γ and the temperaturedifference. This relaxation occurs in the picosecond timescale [14]. Thus there exists a period of time where theionic temperature remains low, while electrons fast reach athermalized state of high electronic temperature. In this case,strong alteration of electronic properties precedes structuraltransformation, with consequences on the efficiency of energydeposition. Such nonequilibrium states can be modelled inthe framework of first-principles calculations, by interrogating
1098-0121/2014/89(11)/115117(11) 115117-1 ©2014 American Physical Society
171

BEVILLON, COLOMBIER, RECOULES, AND STOIAN PHYSICAL REVIEW B 89, 115117 (2014)
the electronic influence at various degrees of electronicheating, while disregarding in a first approximation, the ionictemperature effects.
Experimentally, excited solids in steady-state cannot becreated and thermal nonequilibrium data in these particularconditions are difficult to be determined from integratedor time-resolved measurements [15–17]. In such complexconditions, simple estimations and models are used to accessthe behavior of intrinsic material properties. A strong needthen exists to perform multiscale calculations both in spaceand in time, capable of replicating the observed behaviorsand to predict material response under excitation. Most ofthe macroscopic models and behavior laws are based onthe picture of free electrons commonly used to describemetals or even dielectric dynamics under laser irradiation[1,3,13,18]. Ab initio microscopic calculations can supplymacroscopic approaches (optical, thermal, hydrodynamical ormechanical) with implicit dependencies on material propertiesand electronic band structures. Since the density of freeelectrons ne is not an observable variable in a quantum me-chanical perspective, its dynamics in thermally excited solidsremains poorly explored whereas the transport parameters andmeasurable dynamics are commonly depicted and fitted bylaws depending on ne.
It has already been shown in previous works that elec-tronic structures determine the thermodynamic functionsand scattering rates of the heated electron subsystem [19].This work analyses and extends the largely used electronicthermodynamic properties derived from the free-electron gasmodel by interrogating the evolution of the free carriers. Thismodel, based on the assumption of free and noninteractingelectrons, works satisfactory in case of simple metals (Na,Mg, Al,. . . ). However, it cannot encompass the complexityobserved for transition metals, where d electrons with a higherdegree of localization than sp electrons can still participate tooptical processes. This indicates a potentially important roleof electron confinement within more or less diffuse orbitals.Moreover, it has already been shown that the increase ofthe electronic temperature strongly affects the shape of thed band [5]. Under such strong modifications of the electronicsystems, it is important to extract from calculations an effectivefree-electron number per atom Ne classically defining ne =Neni . This effective parameter can have importance wheneverexperimental optical or thermal properties are derived andused to extract other parameters such as temperature, stressor conductivity from a nonequilibrium solid. The objectiveof the investigations presented here is to quantify the effectsof thermal activation energy ∼kBTe around Fermi energy onNe consistently with a rigorously calculated band-structureaccounting for Fermi smearing and d-band shifting within therange of 0.01 � Te � 105 K.
We report results from a systematic study on DOS energybroadening performed on a free-electron-like metal (Al) andon transition metals (Ni, Cu, Au, W, and Ti), some of them withnoble character. Section II is devoted to the calculation and pro-cedure details. In Sec. III, DOS dependence on the electronictemperature is discussed. We focus on the observable energeticshift and narrowing of the d band and the implications onthe chemical potential. Finally, in order to obtain the electron
density relevant to light absorption, heat flux, or mechanicalstress induced by electronic heating, an estimation of thenumber of free-electron per atom, based on delocalized statesconsiderations, is calculated at all electronic temperatures anddiscussed for all metals in Sec. IV. Concluding remarks on theeffects of ne evolution on energetic and transport parameters,especially on electronic pressure and electronic heat capacityare made in Sec. V.
II. CALCULATIONS DETAILS
Calculations were done in the framework of the densityfunctional theory (DFT) [20,21], by using the ABINIT package[22], which is based on a plane-waves description of theelectronic wave functions. Projector augmented-waves atomicdata [23–25] (PAW) are used to model nucleus and coreelectrons. The generalized gradient approximation (GGA) inthe form parameterized by Perdew, Burke, and Ernzerhof [26]or the local density approximation (LDA) functional developedby Perdew and Wang [27] are considered for the exchange andcorrelation functional. Semicore electronic states are includedin PAW atomic data of Ti and W as they significantly improvethe description of material properties. The Brillouin zonewas meshed with Monkhorst-Pack method [28], with a 30 ×30 × 30 k-point grid. From the studied metals, only Ni isexpected to have ferromagnetic properties, but our calculationsshowed that magnetic properties vanish above Te = 3× 10³ K,thus all calculations were done without using spin-polarizedmethods. To ensure high accuracy of calculations, latticeparameters were relaxed up to the point where stress goesbeyond 10−4 eV/A, with a cutoff energy of 40 Ha.
Al, Ni, Cu, Au, Ti, W crystallize in different phasesdepending on the environment conditions. Here, we focus oncrystal structures adopted by metals at ambient conditions,namely, face-centered cubic (fcc, space group Fm3m, 225)structure for Al, Ni, Cu and Au; hexagonal close-packed(hcp, space group P 63/mmc, 194) structure for Ti; andbody-centered cubic (bcc, space group Im3m, 229) structurein the case of W. Once structures are chosen, the accuracyof PAW atomic data is tested through calculations at Ti =Te = 0 K conditions of lattice parameters and bulk moduliusing Birch-Murnaghan equation of states. A good agreementis found between our calculated values and experimental data,that are provided in Table I. Some differences are noticeablebetween computed and experimental bulk moduli [31–33],especially when zero-point phonon effects are not taken intoaccount [31]. This confirms the reliability of the used PAWatomic data. The theoretical lattice parameters computed atthis step are then used to calculate Te dependent DOS.
To model laser irradiation effects, we consider time scaleswhere the electrons are thermalized and their distributioncan be described by electronic temperatures. Calculationswere done with Te ranging from 10−2 to 105 K, while Ti
remains equal to 0 K. A number of 40 bands per atom isused to ensure a maximum occupation below 10−4 electronsof the highest energy band at 105 K. Te dependent DFTcalculations are performed following the generalization ofthe Hohenberg and Kohn theorem on many-body systemsto the grand canonical ensemble as proposed by Mermin[29]. The finite electronic temperature is taken into account
115117-2
172
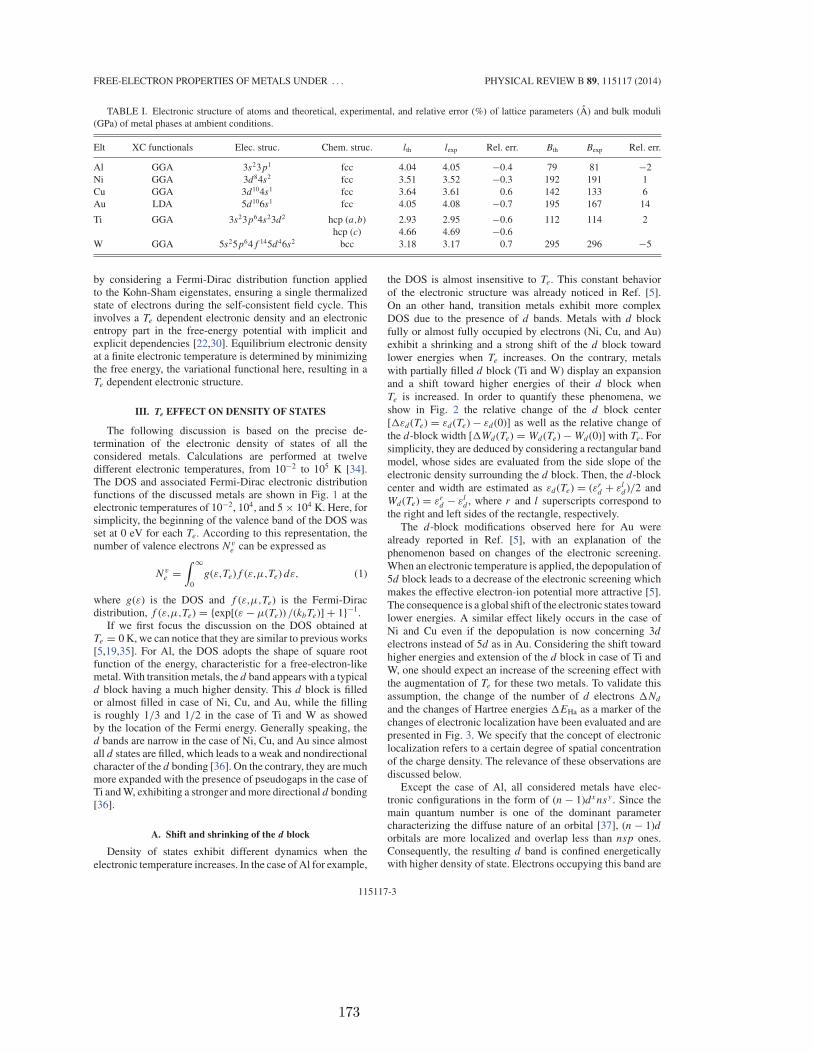
FREE-ELECTRON PROPERTIES OF METALS UNDER . . . PHYSICAL REVIEW B 89, 115117 (2014)
TABLE I. Electronic structure of atoms and theoretical, experimental, and relative error (%) of lattice parameters (A) and bulk moduli(GPa) of metal phases at ambient conditions.
Elt XC functionals Elec. struc. Chem. struc. lth lexp Rel. err. Bth Bexp Rel. err.
Al GGA 3s23p1 fcc 4.04 4.05 −0.4 79 81 −2Ni GGA 3d84s2 fcc 3.51 3.52 −0.3 192 191 1Cu GGA 3d104s1 fcc 3.64 3.61 0.6 142 133 6Au LDA 5d106s1 fcc 4.05 4.08 −0.7 195 167 14
Ti GGA 3s23p64s23d2 hcp (a,b) 2.93 2.95 −0.6 112 114 2hcp (c) 4.66 4.69 −0.6
W GGA 5s25p64f 145d46s2 bcc 3.18 3.17 0.7 295 296 −5
by considering a Fermi-Dirac distribution function appliedto the Kohn-Sham eigenstates, ensuring a single thermalizedstate of electrons during the self-consistent field cycle. Thisinvolves a Te dependent electronic density and an electronicentropy part in the free-energy potential with implicit andexplicit dependencies [22,30]. Equilibrium electronic densityat a finite electronic temperature is determined by minimizingthe free energy, the variational functional here, resulting in aTe dependent electronic structure.
III. Te EFFECT ON DENSITY OF STATES
The following discussion is based on the precise de-termination of the electronic density of states of all theconsidered metals. Calculations are performed at twelvedifferent electronic temperatures, from 10−2 to 105 K [34].The DOS and associated Fermi-Dirac electronic distributionfunctions of the discussed metals are shown in Fig. 1 at theelectronic temperatures of 10−2, 104, and 5× 10⁴ K. Here, forsimplicity, the beginning of the valence band of the DOS wasset at 0 eV for each Te. According to this representation, thenumber of valence electrons Nv
e can be expressed as
Nve =
∫ ∞
0g(ε,Te)f (ε,μ,Te) dε, (1)
where g(ε) is the DOS and f (ε,μ,Te) is the Fermi-Diracdistribution, f (ε,μ,Te) = {exp[(ε − μ(Te)) /(kbTe)]+ 1}−1.
If we first focus the discussion on the DOS obtained atTe = 0 K, we can notice that they are similar to previous works[5,19,35]. For Al, the DOS adopts the shape of square rootfunction of the energy, characteristic for a free-electron-likemetal. With transition metals, the d band appears with a typicald block having a much higher density. This d block is filledor almost filled in case of Ni, Cu, and Au, while the fillingis roughly 1/3 and 1/2 in the case of Ti and W as showedby the location of the Fermi energy. Generally speaking, thed bands are narrow in the case of Ni, Cu, and Au since almostall d states are filled, which leads to a weak and nondirectionalcharacter of the d bonding [36]. On the contrary, they are muchmore expanded with the presence of pseudogaps in the case ofTi and W, exhibiting a stronger and more directional d bonding[36].
A. Shift and shrinking of the d block
Density of states exhibit different dynamics when theelectronic temperature increases. In the case of Al for example,
the DOS is almost insensitive to Te. This constant behaviorof the electronic structure was already noticed in Ref. [5].On an other hand, transition metals exhibit more complexDOS due to the presence of d bands. Metals with d blockfully or almost fully occupied by electrons (Ni, Cu, and Au)exhibit a shrinking and a strong shift of the d block towardlower energies when Te increases. On the contrary, metalswith partially filled d block (Ti and W) display an expansionand a shift toward higher energies of their d block whenTe is increased. In order to quantify these phenomena, weshow in Fig. 2 the relative change of the d block center[�εd (Te) = εd (Te)− εd (0)] as well as the relative change ofthe d-block width [�Wd (Te) = Wd (Te)−Wd (0)] with Te. Forsimplicity, they are deduced by considering a rectangular bandmodel, whose sides are evaluated from the side slope of theelectronic density surrounding the d block. Then, the d-blockcenter and width are estimated as εd (Te) = (εr
d + εld )/2 and
Wd (Te) = εrd − εl
d , where r and l superscripts correspond tothe right and left sides of the rectangle, respectively.
The d-block modifications observed here for Au werealready reported in Ref. [5], with an explanation of thephenomenon based on changes of the electronic screening.When an electronic temperature is applied, the depopulation of5d block leads to a decrease of the electronic screening whichmakes the effective electron-ion potential more attractive [5].The consequence is a global shift of the electronic states towardlower energies. A similar effect likely occurs in the case ofNi and Cu even if the depopulation is now concerning 3d
electrons instead of 5d as in Au. Considering the shift towardhigher energies and extension of the d block in case of Ti andW, one should expect an increase of the screening effect withthe augmentation of Te for these two metals. To validate thisassumption, the change of the number of d electrons �Nd
and the changes of Hartree energies �EHa as a marker of thechanges of electronic localization have been evaluated and arepresented in Fig. 3. We specify that the concept of electroniclocalization refers to a certain degree of spatial concentrationof the charge density. The relevance of these observations arediscussed below.
Except the case of Al, all considered metals have elec-tronic configurations in the form of (n− 1)dxnsy . Since themain quantum number is one of the dominant parametercharacterizing the diffuse nature of an orbital [37], (n− 1)dorbitals are more localized and overlap less than nsp ones.Consequently, the resulting d band is confined energeticallywith higher density of state. Electrons occupying this band are
115117-3
173

BEVILLON, COLOMBIER, RECOULES, AND STOIAN PHYSICAL REVIEW B 89, 115117 (2014)
FIG. 1. (Color online) Electronic density of states (solid lines),associated Fermi-Dirac distribution functions (dotted lines) andcorresponding electronic chemical potential (dashed lines) for allstudied metals. Data for the following electronic temperatures areshown: 10−2 (black), 104 (red), and 5× 10⁴ K (blue) curves [34].
also experiencing spatial localization. Thus, one can expectthat changes in the electronic screening mainly come fromchanges of the electronic occupation of this d band. To gatherdeeper insight, we computed the number of d electrons fromintegrations of angular-momentum projected DOS, and weplotted �Nd as a function of Te in Fig. 3(a). As expected, �Nd
decreases for Ni, Cu, and Au. Te depopulates the d band, whichleads to a decrease of the electronic screening as discussedpreviously. At the opposite, �Nd increases for Ti and W. Thisis a consequence of partially filled d block, since electronic
FIG. 2. (Color online) Relative changes of the d block center (a)and width (b) with the electronic temperature, for all studied transitionmetals.
excitation depopulates both sp bands and the bottom part ofthe d band and populates the top part of the d band. Semicoreelectronic states also undergo an electronic depopulation atTe above 5× 10⁴ K. For example, at 105 K, the depopulationreaches 0.3 electrons for 3p-semicore electronic states of Tiand 0.4 electrons for 4f -semicore electronic states of W.
FIG. 3. (Color online) Changes of the number of d electrons (a)and changes of the Hartree energy (b) with respect to the electronictemperature.
115117-4
174

FREE-ELECTRON PROPERTIES OF METALS UNDER . . . PHYSICAL REVIEW B 89, 115117 (2014)
Consequently, the total number of d electrons increases inagreement with a strengthening of the electronic screeningat least up to 5× 10⁴ K, where the depopulation of semicorestates seems to moderate the effect, as we can see in Fig. 2 witha decrease of shifts and width changes. Finally, the behaviorof Al is particular with an increase of Nd and no effects onthe density of states. This is related to the occupation of ahigh-energy d band that does not contribute to the electroniclocalization.
However, DOS angular-momentum projection methodssuffer from some drawbacks. Firstly, they are performedon spheres centered on atoms and there is always someintersphere information lost during the process. Consequently,some electronic states and some electrons are not accountedfor. Secondly, projections on angular-momentum do not allowdistinctions between 3d, 4d, or 5d bands. Then, the number ofd electrons computed can be the summation of electrons fromlocalized (n− 1)d band with nd or even (n+ 1)d delocalizedbands. Thus, the variation of d electron numbers has some un-certainties, but still provides information about trends. In orderto get a more precise perspective of how electronic screeningis affected by �Nd , we rely on Hartree energy. The changesof Hartree energies with respect to Te are plotted in Fig. 3(b).We recall that this energetic term is the Coulomb repulsiveself-energy of the electronic density: EHa = 1
2
∫∫n(r)n(r ′)|r−r ′| drdr ′.
It corresponds to the global electron-electron interaction. Ina perfectly homogeneous spatial distribution, this quantitywould reach a minimum value, however, constrained bythe electronic structure, electrons are not homogeneouslydistributed. Specifically, semicore states and (n− 1)d bandsstrongly concentrate the charge density, which generates anelectronic screening of the nucleus. Variations of the electronicoccupation of these electronic states with Te impact Hartreeenergies, which can be related to a change of electronicscreening. Thus the evolution of �EHa with Te is an indicatorfor the gain or the loss of electronic localization. This willbe mainly the consequence of Nd changes due to the spatialconfinement of the (n− 1)d band, we discussed above. Theevolution of �EHa also reflects the change of electronicscreening of the ions. In Fig. 3, we can notice a good correlationbetween �Nd and �EHa with Te at least up to temperatures of5× 104 K. When the number of d electrons decreases there is aloss of electronic localization. This leads to a decrease of EHa,which signals a decrease of electronic screening. The oppositephenomenon occurs when the Nd increases, with a gain ofelectronic localization leading to an increase of EHa correlatedto an increase of electronic screening. Finally, �EHa of Alremains roughly equal to zero, while the electronic occupationof high-energy bands increases. It confirms that high-energybands, including d bands, are sufficiently delocalized to beconsidered as ineffective on electronic localization.
From EHa and Nd changes, some unexpected behaviors arealso observed. Firstly, �Nd is correlated to �EHa in the case ofCu and Ni. The stronger is the decrease of �Nd , the stronger isthe decrease of �EHa. However, this rule is no longer availablewhen considering Au. This is due to the fact that d electronsbelong to the 5d orbitals in the case of Au whereas theybelong to 3d orbitals in the case of Cu and Ni. Associatedto more diffuse orbitals, d electrons of Au are already less
localized than those of Cu and Ni, and it leads to a lower lossof localization when d band is depopulated with the increaseof Te. In other words, �EHa is lowered in the specific case ofAu since its d electrons are already less localized. Secondly,�EHa is not correlated to �Nd in case of Ti and W at electronictemperature higher than 5× 10⁴ K. Whereas the number ofd electrons still increases, the Hartree energy decreases, witha particularly strong decrease for W. This is attributed tothe electronic depopulations of semicore electronic states thatoccur at high Te as discussed above. The strong evolution ofHartree energy for W originates from the significant change ofelectronic screening generated by the depopulation of highlylocalized 4f electrons. We assume here that semicore electronsare fully thermalized with valence electrons even if semicorethermalization time scales are difficult to estimate. Being lowin energies, these semicore states are not directly excitedby laser irradiation and thermalization time is dependent onelectron-electron collision frequency [11,38]. At 105 K, Fisheret al. [38] estimate about 1–10 successful impact probabilitiesduring irradiation time scale, for binding energies of semicoreelectronic states similar to the ones considered here. Thissuggests a short thermalization time but accurate descriptionis beyond the scope of the present work.
Generally speaking, we note a relatively good agreementbetween �Nd and �EHa on one side, and �εd and �Wd onthe other side. For Ni, Cu, and Au, the decrease of �Nd leadsto a loss of electronic localization that generates a decrease of�EHa. The effect can be related to the decrease of the electronicscreening and thus to the increase of the global electron-ioneffective potential that shifts electronics states of these metalstoward lower energies. This shift applies nonhomogeneouslyon the d block since bottom d block is less affected bydepopulation and thus by changes of electronic screening thanthe top part, as can be seen on Fermi-Dirac distributions inFigs. 1(b)–1(d). As a result the d block shrinks, and �εd
and �Wd decrease. Shifts also apply to electronic states ofhigher energies, as shown for Cu in Figs. 4(a) and 4(b). ForTi and W, the increase of �Nd leads to an increase of �EHa.The corresponding gain in electronic localization producesa stronger electronic screening. As a result, the electron-ioneffective potential is less attractive and bands are shifted towardhigher energies. It also applies inhomogeneously to the d blockwith its bottom states less affected by changes of electronicpopulation than its top states, as can be seen on Fermi-Diracdistributions in Figs. 1(e) and 1(f). As a consequence, thed block extends and is shifted toward higher energies, and�εd and �Wd increase. Higher-energy electronic states arealso affected by this increase of electronic screening, as we cannote with the shift of other bands toward higher energies for Tiin Figs. 4(c) and 4(d). This discussion synthesizes Te effects onDOS for a range of representative metals, with various possibleimpacts on electronic properties.
B. Electronic distributions
As discussed above, the electronic distribution is ensuredby the Fermi-Dirac function characterized by the electronicchemical potential μ(Te). As already showed by Lin et al. [19],the electronic chemical potential exhibits strong variations,depending on the material studied. More precisely, these
115117-5
175

BEVILLON, COLOMBIER, RECOULES, AND STOIAN PHYSICAL REVIEW B 89, 115117 (2014)
FIG. 4. (Color online) Evolution of the total DOS and spdf
components of the DOS for Cu at 0 (a) and 5× 10⁴ K (b), andfor Ti at 0 (c) and 5× 10⁴ K (d). Dashed lines correspond to Fermilevels.
variations are related to the asymmetric distribution of thedensity of electronic states from both sides of the Fermi energy.For this reason, the electronic chemical potential moves towardhigher energies in the case of Ni, Cu, and Au, while it isdisplaced toward lower energies in the case of Al, Ti and W.In the present calculations, the Te dependence of the DOSproduces important shifts of the d block. Since the d blockconcentrates electronic states, μ(Te) is also strongly affectedby these shifts. In Fig. 5, the relative changes of the electronicchemical potential is shown for all studied materials.
One important observation has to be made here. Previousworks [19] reported evolutions of Te dependent propertiescomputed from DOS performed at Te = 0 K. In the presentcase, this approach takes into consideration the relaxation ofDOS with Te, and changes in the electronic structure areimpacting the electronic chemical potential. As a generalnote, one can observe that trends are similar between thetemperature evolution of μ derived from Te dependent DOSand μ originating from Te = 0 K DOS. The agreement is verygood in the case of Al, that we can attribute to weak changesof its electronic structure with Te. However, in case of Ni, Cu,and Au, the increase of μ is lowered in Te dependent DOSsituation, a difference that is due to the shift of the d blockwith Te. Since the d block is the main electron reservoir, when
FIG. 5. (Color online) Electronic chemical potential evolutionwith the electronic temperature for all studied metals.
it is shifted toward lower energies, the electronic chemicalpotential accounts for this evolution and its displacement tendsto follow. In the case of Cu, for example, at 5× 10⁴ K, μ
from Te dependent DOS is decreased by 2 eV compared to μ
from Te = 0 K DOS. For W and Ti, the decrease of μ is alsolowered in Te dependent DOS. This is attributed to the shift ofthe d block toward higher energies, which is accommodatedby μ. This indicates the importance of considering Te effectson band structure while regarding the evolution of electronicpopulations, with direct consequences on the determination offree-electron numbers.
IV. FREE-ELECTRON NUMBERS
The number of free electrons is a quantity difficult todefine since the quality of being “free” is elusive. In metals,electrons are implicitly considered as free if they belongto orbitals having the highest main quantum number in theatomic electronic configuration (EC) [39]. For example, ECof Al and Cu are respectively 3s23p1 and 3d104s1, and theircorresponding number of free electrons are three and one,respectively. The highest main quantum number is chosen as itcharacterizes the diffuse and overlapping nature of the orbitals.Hence electrons belonging to those orbitals are assumed tobe free of moving in a large space and by extension inthe whole metal, with trajectories limited by collisions andwith parabolic dispersion laws. However, the use of atomicelectronic configurations induces a degree of incertitude whenapplied to condensed phases. In addition, Ne determined fromEC does not allow any change while Te increases. As aconsequence, and motivated by the necessity of giving a certainevaluation of the free-electron quantity, we computed thenumber of free electrons directly from the electronic structuresof metals.
In order to improve the determination of Ne, we have todistinguish electrons belonging to localized states (assumedto be nonfree) from those belonging to delocalized states(considered as free). For this, it is important to determinewhich are the localized states in the density of states. d orbitalsfrom electronic configuration of transition metals defined by(n− 1)dxnsy are less diffuse than sp orbitals due to lower mainquantum number. Consequently, they overlap less and thusinteract less than sp orbitals. The resulting d bands producea characteristic d block of very high density of electronic
115117-6
176

FREE-ELECTRON PROPERTIES OF METALS UNDER . . . PHYSICAL REVIEW B 89, 115117 (2014)
states. At the opposite, sp bands are delocalized and generatesp bands of low density with a square root distribution, similarto Al (see Fig. 1). The difference of density between localizedd block and delocalized sp bands is large and it is then easyto distinguish them in the DOS. Using a method to removelocalized states from the DOS, one can compute free-electronnumbers according to the previous description, i.e., electronsoccupying delocalized electronic states only. Accordingly, thenumber of free electrons is given by the integration of the DOSweighted by the Fermi-Dirac distribution:
Ne =∫ ∞
0gdeloc(ε,Te)f (ε,μ,Te) dε, (2)
with gdeloc being the delocalized part of the density of statesonly.
To remove localized states from the DOS, several methodscan be used. One of the most simple implies to fit the densityof states to a curve having a square root shape, as this willartificially remove the high density of states of the d block[40]. The square root shape is chosen since it is the distributionof the density of electronic states adopted by a free-electron-like metal, as observed for Al in Fig. 1(a). Considering theelectronic structure of d band metals, square root shape is thusa criterium for identifying delocalized states. Here, in orderto keep all DOS subtleties, this square root fit is only used toreplace the d block, resulting in a DOS of delocalized states,that can be written as
gdeloc(ε) = g(ε)− [g(ε)− α√
ε]d block, (3)
where α√
ε is the fit of the DOS. The correction is onlyapplied to the energy range containing the d block. Figure 6exemplifies the whole process in the case of the DOS of Cu,indicating the fit results at 5× 10⁴ K. By proceeding thatway, a small part of d electrons also contributes to the freeelectron number. We assume that a small part of the d bandcan be considered as delocalized too. The analysis of Hartreeenergies [Fig. 3(b)] already showed that some d electrons areless localized than others (case of Au 5d electrons versuscase of 3d electrons of Ni and Cu). Moreover, the d band isnot restricted to the very localized d block, as shown in Fig. 4.Part of it easily matches a square root distribution of electronicstates, indicating non-negligible overlaps and interactions
FIG. 6. (Color online) The blue curve is the density of delocal-ized electronic states for Cu at 5× 10⁴ K. The empty red dots showthe square root fit of the DOS and the dotted black curve represents theremoved part of the initial DOS, constituted of the noncontributinglocalized d block. The hatched part refers to the free electrons andis computed from the integration over the Fermi-Dirac distributioncorresponding to Eq. (2).
FIG. 7. (Color online) Evolution of the number of free electronsper atom (Ne) with the increase of Te, for the considered metals.
between d components, in a similar way to what is observedwith sp components. Finally, as previously discussed, d bondsare mainly weak and nondirectional [36], thus it would not besurprising that, despite a strong localization character, part ofd electrons have an ability to be mobile.
Once they are only made of delocalized states, the DOS cannow be integrated and Ne can be deduced. The number of freeelectrons per atom for all considered metals is presented inFig. 7. It shows strong variations as Te increases, except in thecase of Al, where this number remains constant with Ne = 3.0free electrons per atom. This is an expected free-electronbehavior since excited electrons are leaving delocalized statesto reach other delocalized states. For Ni, Cu, and Au, thelocalized d block can be considered as a reservoir of nonfreeelectrons susceptible to be depopulated with Te, dependingon the relative location of the Fermi energy. Then, nonfreeelectrons from the localized d block reach delocalized statesand become free, which leads to an increase of Ne withTe. In the case of Ti and W, the partially occupied d blockplays an ambivalent role. At low Te, the bottom part of thed block is filled of nonfree electrons while the top part isempty but consists of localized states that can potentially trapexcited electrons. As a consequence, Ne remains constant orslightly decreases at low electronic temperatures. However, attemperatures above 104 K, Ne increases as in the case of Ni,Cu, and Au, by populating delocalized states of higher energy.
The typical values of Ne deduced only from electronicconfigurations of isolated atoms are independent on theelectronic temperature. They are provided in Table II alongsidewith the Ne obtained by the present approach at 0 K.As already mentioned, we obtained a good agreement incase of Al since the electronic structure is only made ofdelocalized states and thus Ne remains constant and equalto the number of electrons from EC. However, differencescan be large with respect to other metals, especially sinceelectronic structure of condensed phases allows the transfer
TABLE II. Number of free electrons, from Ref. [39] and fromthis work obtained at Te = 0 K.
Ne Al Ni Cu Au Ti W
Ref. [39] 3 2 1 1 2 2This work 3.0 1.4 1.9 2.4 1.4 2.2
115117-7
177

BEVILLON, COLOMBIER, RECOULES, AND STOIAN PHYSICAL REVIEW B 89, 115117 (2014)
of electrons between bands. They also come from the factthat we considered the d band as partially delocalized.We observed that the free-electron numbers calculated hereapproach values from other estimations [10,41]. In case of Au,the present Ne is higher than the value typically used. Thisis attributed to different Fermi energies, almost twice higherin our case (10.2 eV) than the value generally consideredin the literature (5.5 eV) [39]. It should also be notedthat prior hypothesis concerning the charge density led tocompensating corrections on other electron parameters relatedto classical models (Drude), via e.g., the effective mass used forAu [42].
V. ENERGETIC AND TRANSPORT PARAMETERS
In order to investigate to what level the band-structuredependence on the excitation degree (via Te) affects macro-scopic transient characteristics and physical quantities, weevaluated thermodynamic properties of electrons when Te
differs from Ti . Such excitation character corresponds toultrashort pulse laser irradiation of metal free surfaces, wherethe spatiotemporal evolution of the electron distributionand its return to equilibrium is calculated by a Boltzmannformalism [18] or by the two temperature model (electronicthermalization assumed). We recall that the TTM describes theenergy evolution of electrons and ions subsystems using twodiffusion equations coupled by an electron-phonon transferterm [13]. The electronic thermal energy gain is connected tothe temperature by the electron specific heat Ce. An accurateevaluation of this property is crucial in laser-matter interactionsimulations since it provides a correct estimate of the riseof temperature in the electron system. TTM enables to takeinto account nonequilibrium effects on the kinetics of thematerial when it is included in classical molecular dynamicssimulations or in two temperatures hydrodynamics approaches[6,43,44]. The electronic contribution to Pe results directlyfrom the electron heating, depending thus on Te but also onthe density of states. Consequently, swift matter dynamicsstart especially due to the pressure gradient generated in theelectron system. The key parameters to correctly reproducethe ultrafast nonequilibrium evolution of the material arethen based on an electronic equation of states, connectingelectronic specific heat Ce and pressure Pe with free-electrondensity ne and temperature. Ce and Pe are generally derivedfrom the thermodynamic properties of an ideal Fermi gas[45–48]. This work allows to insert the subtle effects of DOSmodifications allowing more accurate perspectives. Transportproperties, i.e., electronic thermal and electrical conductivityand electron-phonon coupling strength are also important tocomplete the kinetic equations but they are beyond the scopeof this paper and will be only briefly mentioned. We will focushere on the influence of band structure evaluation on electronicthermodynamic properties.
The electron specific heat of metals can be derived withrespect to the electronic temperature by Ce = ∂E/∂Te, whereE is the internal energy of the electron system. The evolutionof the specific heat under electronic excitation is shown inFig. 8 where several typical behaviors are observed. For Al,Ce rapidly saturates to the lowest value of all other consideredmetals. The rest of metals remains far from saturation and
FIG. 8. (Color online) Evolution of the electronic heat capacitywith respect to the electronic temperature for the studied metals.
reaches much higher values than Al. For W and Ti, Ce
exhibits a first leveling from 104 to 4× 10⁴ K and restartsto increase at higher temperatures. At low and intermediateTe, a relatively good agreement is found with those obtainedfrom g(ε) evaluated at 0 K, where [∂g(ε)/∂Te]V is neglected[19]. For transition metals, increasing discrepancies appearat higher temperatures, mainly due to shifts of the d blockthat are highly affected by Te increase. As expected, thetemperature dependence of Ce is linear at low electronictemperature and tends to saturate for high Te toward thenondegenerate limit 3/2nelkb, where nel includes both freeelectrons and part of d electrons. As already mentioned byLin et al. [19], thermal excitation from the d band resultsin a positive deviation of Ce from the linear temperaturedependence. Similar results are obtained with our temperaturedependent calculations, with an additional deviation resultingfrom excitation of semicore electrons in case of Ti and W andhigh Te.
The electronic pressure Pe is determined by the derivativeof the electronic free energy F with respect to volume as Pe =−∂F/∂V = −∂E/∂V + Te∂S/∂V , where S is the entropyof the system. The last term corresponding to the entropycontribution to the pressure has been shown to be largelydominant in this range of Te [30]. Pe evolution for the differentmetals is plotted in Fig. 9 and shows that Pe increases rapidly asT 2
e for low excitation then scales as Te for higher temperatures.At 2.5× 10⁴ K, the electronic pressure is in the order of tensof GPa, and exceeds 100 GPa at 5× 10⁴ K for all metalsexcept Al. Finally, at 105 K, more than 300 GPa are reached incase of Ni, Cu, Au, and W, while it approaches a level of 200GPa in case of Al and Ti. The fast increase of the electronicpressure is of interest since it is likely impacting the stability orthe properties of materials and their evolution upon excitation,notably the initial steps of the thermodynamic trajectories.This strong increase of Pe with Te comes from the occupationof the high-energy states by the electrons, which is governedby the electronic structure and by entropic changes with theelectronic temperature.
In order to exhibit band-structure effects and to test ourfree-electron approach, we renormalized Pe with respect to thefree-electron gas pressure limit nekbTe. The ratio is plotted inthe inset of Fig. 9. At low electronic temperatures, degeneracyand band structure effects are dominating and the curves arefar from the value of unity, that would characterize an ideal
115117-8
178

FREE-ELECTRON PROPERTIES OF METALS UNDER . . . PHYSICAL REVIEW B 89, 115117 (2014)
FIG. 9. (Color online) Evolution of the electronic pressure withthe electronic temperature for all the studied elements. (Inset)Renormalization of Pe with respect to the free-electron gas pressurelimit nekbTe.
nondegenerated electron gas behavior. However, at higherelectronic temperatures, curves tend to saturate at the valueof 1.0, which indicates that the free electron numbers we havederived are consistently characterizing the electronic pressureof the system. This asymptotic behavior is not achieved usingconstant values of ne given by Ref. [39]. On an other hand,the effect of the entropy contribution on the renormalized Pe
is enhanced. The entropy contribution reflects the electronicdisorder centered around the Fermi level. It comes from acompromise between the number of available electronic statesand the number of electrons allowed to fill these states. Inthis context, when the Fermi level is within the d block, theentropy effect is stronger, as for Ti and W, than when it islocated somewhere else in the DOS (as in the case of Ni, Cu,Au). Al shows the lowest renormalized values due to lowestdensity of states.
Based on these results, an equation of states of the electronsystem can be constructed, including the interactions witha static array of positive ions but neglecting interactionswith phonons. To predict laser light absorption, subsequentmaterial heating and eventual phase transitions, the transportmodel should take into account the observed changes inband structure. In a first approach, transport properties canbe estimated based on classical formulas but including theevolution of ne with Te. In this way, ke conductivity canbe estimated roughly based on the relation derived fromthe kinetic equation between the electron heat capacity andke [49]. If τe is the relaxation time between collisions andve the average electron velocity, then the mean free pathle = veτe allows to make the standard connection whichwrites ke(Te) = 1
3Ce(Te)leve. Concerning the laser absorption,insights from the classical formalism of an electron in anoptical electric field, i.e., the Drude-Lorentz model, can also beobtained from the calculated properties. Whereas the energylevels and their own occupation define the response of thematerial to applied optical fields, it is possible to describe thedielectric function by intraband and interband contributions.The optical properties are related to the structure and theelectronic configuration of the material and the interband is
highly sensitive to the DOS derived in Sec. III. On the otherhand, the intraband part (Drude) only depends on the numberof free carriers per atom and on an effective momentumscattering time τ as σ = nee
2τ/m(1− iωτ ), where ω is thelaser angular frequency. In this way, it becomes possible tomake reasonable deductions about excitation when opticalproperty changes are measured [50]. These insights couldbecome more accurate if we consider informations based onelectronic structure calculations, with higher computationalcosts in this case [51]. Simpler models based on ne andinterband transition from filled to empty states could beuseful as a complementary approach, with nevertheless a loweraccuracy.
VI. CONCLUSION
In the present study, Te dependent density functionalcalculations were performed on a representative range ofmetals: Al, Ni, Cu, Au, Ti, and W, with simple and transitioncharacter. Electronic temperatures from 10−2 to 105 K wereused to evaluate electronic properties in nonequilibriumconditions.
In a first step, DOS modifications with Te are discussed.It is shown that almost all bands are affected by energyshifts, but the most affected states are those involving thelocalized part of the d band, which characterizes the transitionmetals. Shifts towards lower energies and shrinking areobserved for filled or almost filled d block metals, illustratedby Ni, Cu, and Au. Shifts towards higher energies andextensions for partially filled d block, with Ti and W asexamples. All these modifications are explained by evolutionsof electron-ion effective potential that result from variation ofthe electronic screening generated by changes of the electronicoccupation of the localized d block. This was validated bytwo consistent approaches, the evolution of the number ofd electrons and the modification of the Hartree energieswith Te.
Changes of the DOS with electronic temperatures impactelectronic properties, like the electronic chemical potential andthe electronic heat capacities that are discussed and comparedto previous calculations performed at Te = 0 K. A goodagreement is obtained at low and intermediate temperatures,while an increasing discrepancy is observed when shifts withinthe electronic structures become stronger at high temperatures.The concept of electronic pressures is also addressed, withpressures rapidly reaching high values, of tens or hundreds ofgigapascal, questioning material stability as Te increases.
Free-electron numbers, dependent on the electronic tem-perature, are also computed from DOS. They are defined asbelonging to delocalized states characterized by density ofstates having a square root energy dependence. As expected,for a free-electron-like metal as Al, this number remainsconstant. However, Ne always increases for transition metals,with specific behaviors depending of the filling degree of thed block. Ni, Cu, and Au exhibit a Ne that rapidly increaseswith Te, while a small lag is observed for Ti and W, withan increase at higher temperatures. At high temperatures,these free-electron numbers are found consistent with Pe inan ideal-gas limit.
115117-9
179

BEVILLON, COLOMBIER, RECOULES, AND STOIAN PHYSICAL REVIEW B 89, 115117 (2014)
Finally transport properties were addressed via the evolu-tion of the electronic heat capacity and the electronic pressurewith Te. The electronic heat capacity links the quantity ofabsorbed energy to the electronic temperature, giving an accessto the number of free electrons. On the other hand, the rapidlygrowing electronic pressure may impact phase stabilities.Both are crucial properties, since significant deviations of thethermophysical properties of metals from the commonly usedapproximations may have important practical implications inultrashort laser material processing applications.
ACKNOWLEDGMENTS
We acknowledge Marc Torrent for providing efficient PAWatomic data. This work was supported by the ANR projectDYLIPSS (ANR-12-IS04-0002-01) and by the LABEXMANUTECH-SISE (ANR-10-LABX-0075) of the Universitede Lyon, within the program “Investissements d’Avenir”(ANR-11-IDEX-0007) operated by the French NationalResearch Agency (ANR). Part of the numerical calculationshas been performed using resources from GENCI, Projectgen7041.
[1] P. Balling and J. Schou, Rep. Prog. Phys. 76, 036502 (2013).[2] A. Cavalleri, Science 318, 755 (2007).[3] E. G. Gamaly, Phys. Rep. 508, 91 (2011).[4] M. E. Povarnitsyn, K. V. Khishchenko, and P. R. Levashov,
Appl. Surf. Sci. 255, 5120 (2009).[5] V. Recoules, J. Clerouin, G. Zerah, P. M. Anglade, and
S. Mazevet, Phys. Rev. Lett. 96, 055503 (2006).[6] J. P. Colombier, F. Garrelie, N. Faure, S. Reynaud, M. Bounhalli,
E. Audouard, R. Stoian, and F. Pigeon, J. Appl. Phys. 111,024902 (2012).
[7] P. Lorazo, L. J. Lewis, and M. Meunier, Phys. Rev. B 73, 134108(2006).
[8] J. P. Colombier, P. Combis, E. Audouard, and R. Stoian, New J.Phys. 14, 013039 (2012).
[9] V. V. Zhakhovsky, M. M. Budzevich, N. A. Inogamov, I. I.Oleynik, and C. T. White, Phys. Rev. Lett. 107, 135502 (2011).
[10] S. E. Kirkwood, Y. Y. Tsui, R. Fedosejevs, A. V. Brantov, V. Yu.Bychenkov, Phys. Rev. B 79, 144120 (2009).
[11] B. Y. Mueller and B. Rethfeld, Phys. Rev. B 87, 035139 (2013).[12] M. I. Kaganov, I. M. Lifshitz, and L. V. Tanatarov, Zh. Eksp.
Teor. Fiz. 31, 232 (1956) [Sov. Phys. JETP 4, 173 (1957)].[13] S. I. Anisimov, B. L. Kapeliovich, and T. L. Perel’man, Zh. Eksp.
Teor. Fiz. 66, 776 (1974) [Sov. Phys. JETP 39, 375 (1974)].[14] C.-K. Sun, F. Vallee, L. Acioli, E. P. Ippen, and J. G. Fujimoto,
Phys. Rev. B 48, 12365 (1993).[15] W. S. Fann, R. Storz, H. W. K. Tom, and J. Bokor, Phys. Rev.
Lett. 68, 2834 (1992).[16] X. Y. Wang, D. M. Riffe, Y. S. Lee, and M. C. Downer, Phys.
Rev. B 50, 8016 (1994).[17] T. Ao, Y. Ping, K. Widmann, D. F. Price, E. Lee, H. Tam, P. T.
Springer, and A. Ng, Phys. Rev. Lett. 96, 055001 (2006).[18] B. Rethfeld, A. Kaiser, M. Vicanek, and G. Simon, Phys. Rev.
B 65, 214303 (2002).[19] Z. Lin, L. V. Zhigilei, and V. Celli, Phys. Rev. B 77, 075133
(2008).[20] P. Hohenberg and W. Kohn, Phys. Rev. 136, B864 (1964).[21] W. Kohn and L. J. Sham, Phys. Rev. 140, A1133 (1965).[22] X. Gonze, B. Amadon, P.-M. Anglade, J.-M. Beuken,
F. Bottin, P. Boulanger, F. Bruneval, D. Caliste, R. Caracas,M. Cote, T. Deutsch, L. Genovese, Ph. Ghosez, M. Giantomassi,S. Goedecker, D. R. Hamann, P. Hermet, F. Jollet, G. Jomard, S.Leroux, M. Mancini, S. Mazevet, M. J. T. Oliveira, G. Onida, Y.Pouillon, T. Rangel, G.-M. Rignanese, D. Sangalli, R. Shaltaf,M. Torrent, M. J. Verstraete, G. Zerah, and J. W. Zwanziger,Comput. Phys. Commun. 180, 2582 (2009).
[23] P. E. Blochl, Phys. Rev. B 50, 17953 (1994).
[24] G. Kresse and D. Joubert, Phys. Rev. B 59, 1758 (1999).[25] M. Torrent, F. Jollet, F. Bottin, G. Zerah, and X. Gonze, Comput.
Mater. Sci. 42, 337 (2008).[26] J. P. Perdew, K. Burke, and M. Ernzerhof, Phys. Rev. Lett. 77,
3865 (1996).[27] J. P. Perdew and Y. Wang, Phys. Rev. B 45, 13244 (1992).[28] H. J. Monkhorst and J. D. Pack, Phys. Rev. B 13, 5188 (1976).[29] N. D. Mermin, Phys. Rev. 137, A1441 (1965).[30] S. Khakshouri, D. Alfe, and D. M. Duffy, Phys. Rev. B 78,
224304 (2008).[31] R. Gaudoin and W. M. C. Foulkes, Phys. Rev. B 66, 052104
(2002).[32] A. Dewaele, P. Loubeyre, and M. Mezouar, Phys. Rev. B 70,
094112 (2004).[33] J. Zhang, Y. Zhao, R. S. Hixson, G. T. Gray, L. Wang, W.
Utsumi, S. Hiroyuki, and H. Takanori, Phys. Rev. B 78, 054119(2008).
[34] Tabulated data of Te dependent DOS and electronic prop-erties are available online at http://manutech-sise.universite-lyon.fr/dynopt.
[35] D. A. Papaconstantopoulos, Handbook of the Band Structure ofElemental solids (Plenum Press, New York, 1986).
[36] A. V. Ponomareva, E. I. Isaev, Yu. Kh. Vekilov, and I. A.Abrikosov, Phys. Rev. B 85, 144117 (2012).
[37] J. T. Waber and D. T. Cromer, J. Chem. Phys. 42, 4116 (1965).[38] D. V. Fisher, Z. Henis, S. Eliezer, and J. Meyer-Ter-Vehn, Laser
Part. Beams 24, 81 (2006).[39] N. W. Ashcroft and N. D. Mermin, Solid State Physics (Holt,
Rinehart and Winston, New York, 1976).[40] P. A. Loboda, N. A. Smirnov, A. A. Shadrin, and N. G.
Karlykhanov, High Energy Density Phys. 7, 361 (2011).[41] W. Ebeling, A. Forster, V. Fortov, V. Griaznov, and
A. Polishchuk, Thermophysical Properties of Hot Dense Plas-mas (Teubner, Stuttgart 1991).
[42] N. A. Inogamov, S. I. Ashitkov, V. V. Zhakhovskii, Yu. V.Petrov, V. A. Khokhlov, M. B. Agranat, S. I. Anisimov, K.Nishihara, and P. S. Komarov, “Physics of Extreme States ofMatter - 2009” The Compendium of the XXIV Int. Conf. onInteraction of Intense Energy Fluxes with Matter, March 1–6,2009, Elbrus, Kabardino-Balkaria, Russia, edited by V. E.Fortov et al. (Chernogolovka, 2009), pp. 7–11 [Abstr. of XXIVInt. Conf. on Interaction of Intense Energy Fluxes with Matter(Elbrus-2009), March 1–6, 2009, Elbrus, Kabardino-Balkaria,Russia, p. 22–23].
[43] N. A. Inogamov, Yu. V. Petrov, V. V. Zhakhovsky, V. A.Khokhlov, B. J. Demaske, S. I. Ashitkov, K. V. Khishchenko,
115117-10
180

FREE-ELECTRON PROPERTIES OF METALS UNDER . . . PHYSICAL REVIEW B 89, 115117 (2014)
K. P. Migdal, M. B. Agranat, S. I. Anisimov, V. E. Fortov, andI. I. Oleynik, AIP Conf. Proc. 1464, 593 (2012).
[44] Z. Lin, R. A. Johnson, and L. V. Zhigilei, Phys. Rev. B 77,214108 (2008).
[45] R. M. More, K. H. Warren, D. A. Young, and G. B. Zimmerman,Phys. Fluids 31, 3059 (1988).
[46] L. Jiang and H.-L. Tsai, J. Heat Transfer 127, 1167 (2005).[47] J. P. Colombier, P. Combis, F. Bonneau, R. Le Harzic, and
E. Audouard, Phys. Rev. B 71, 165406 (2005).
[48] K. Eidmann, J. Meyer-ter-Vehn, T. Schlegel, and S. Huller, Phys.Rev. E 62, 1202 (2000).
[49] Y. V. Petrov, N. A. Inogamov, and K. P. Migdal, JETP Lett. 97,20 (2013).
[50] J. P. Colombier, P. Combis, E. Audouard, and R. Stoian, Phys.Rev. E 77, 036409 (2008).
[51] Z. Chen, B. Holst, S. E. Kirkwood, V. Sametoglu, M. Reid,Y. Y. Tsui, V. Recoules, and A. Ng, Phys. Rev. Lett. 110, 135001(2013).
115117-11
181

182

Conclusion générale
Ce manuscrit rassemble une grande partie du travail de recherche auquel j’ai participé, que j’aiaccompli ou que j’ai (co-)dirigé ces dernières années au sein du laboratoire Hubert Curien. Il m’apermis d’exposer les diverses voies d’excitation d’un matériau au moyen d’impulsions laser ultra-courtes que j’ai eu l’occasion d’appréhender. Nous avons ainsi vu que les excitations et les relaxa-tions successives pouvaient prendre différentes formes, nécessitant des modélisations spécifiques etconduisant à des applications variées.
La modélisation de l’interaction laser-matière ne se conçoit pas de la même manière lorsque l’onappartient à un groupe théorique et lorsque l’on est immergé au sein d’un laboratoire expérimental,à vocation fondamentale mais également applicatif. J’ai pu me rendre compte de cette différenceen quittant le CEA/DIF, dans lequel j’ai démarré ce travail de modélisation, pour rejoindre lelaboratoire Hubert Curien. Dans le premier cas, mon objectif était de mener un travail théoriqueévolutif, adaptable à différentes sources de rayonnement, configurations expérimentales, et servantd’appuis à de nombreux outils de diagnostics. Dans le second, l’importance est avant tout fixé parl’apport d’une diversité d’outils numériques, pouvant soutenir une interprétation multi-matériaux,multi-énergétiques et multi-échelles des effets de l’irradiation laser. La raison en est claire : on neva pas changer toutes les années de source laser ! Mon court passage en post-doctorat à l’obser-vatoire de Paris m’a permis de réaliser cette transition en douceur, puisque les simulations et lesexpériences étaient pensées par les mêmes personnes, en terme d’un seul et même projet.
La démarche suivie dans mon travail et celle proposée dans ce manuscrit s’inspirent de ce besoinexpérimental et les résultats sont présentés sous la forme d’une inférence inductive entre les résul-tats issus de l’expérience et ceux fournis par un calcul numérique. Les deux voies servent en effetà valider une hypothèse pré-établie, les expériences ainsi que les codes de simulations de l’inter-action laser-matière constituant une production volontaire et réfléchie de phénomènes observableset comparables. Pour cette raison également, j’ai été impliqué dès le départ dans des co-directionsde thèses expérimentales, et pour lesquelles un travail moindre de modélisation était envisagé audépart. Plus récemment, l’occasion m’est donné d’encadrer des travaux plus théoriques, me per-mettant d’étendre mes compétences de modélisation à différentes échelles et pour des phénomènesnouveaux. Je réalise maintenant que l’important reste les connaissances fondamentales et la mé-thode scientifique guidant le raisonnement.
Après un certain nombre d’années à explorer les effets liés à une impulsion laser ultracourte,je sens que mon rôle et mon action s’accroissent au sein de cette communauté. Ils se traduisentpar des invitations dans plusieurs grandes conférences internationales (LPM, PIERS, E-MRS, . . .)et par des sollicitations de collègues à participer à leurs projets. Il s’agit, je pense, de l’une desgrandes satisfactions de notre métier de chercheur à laquelle il faut ajouter l’enrichissement scien-tifique mais aussi relationnel apporté par les doctorants et post-doctorants avec qui nous avonsl’occasion de travailler. Une autre source de satisfaction vient de mon activité d’enseignement, dans
183

laquelle j’ai l’occasion de largement bénéficier des connaissances acquises en recherche, et qu’il m’estpossible de transmettre, en partie, aux étudiants. Sur le plan humain, nos activités pédagogiquesnécessitent une remise en question, une auto-critique, et une humilité dans une société étudiante enévolution permanente. Cette association est, je trouve, primordiale pour compenser un travail aca-démique parfois en quête de légitimité. Plus récemment, mes responsabilités liées à l’élaboration, aufinancement et au suivi de projets de recherche constituent également une source d’enrichissementrelationnel, scientifique et humain.
Pour les raisons évoquées, j’aimerais remercier mes collègues du laboratoire Hubert Curien etde Telecom Saint-Etienne, mais aussi ceux d’autres institutions avec qui je collabore ainsi quemes étudiants, qui participent au quotidien à ce que ce travail d’enseignant-chercheur m’apporte laplus grande satisfaction. Je souhaite également remercier les rapporteurs et les (futurs) membres demon jury, pour leurs remarques et leur disponibilité. Enfin, je souhaite remercier, avec une attentionparticulière, ma famille et mes proches, en particulier bien sûr Virginie et Léo, pour leur soutienquotidien indéfectible.
184

185
Copyright © 2022 FDOKUMEN