Pulse compression in two-photon excitation fluorescence microscopy
12
Pulse compression in two-photon excitation fluorescence microscopy Xiaobao Liang, Wenyan Hu, Ling Fu* Britton Chance Center for Biomedical Photonics, Wuhan National Laboratory for Optoelectronics, Huazhong University of Science and Technology, Wuhan 430074, China. *[email protected] Abstract: The use of shorter pulses is a practical way to improve the signal in two-photon excitation fluorescence microscopy. We report on the theoretical and experimental results of pulse compression in a two-photon excitation fluorescence microscope by using ~100-fs Ti:Sapphire laser and highly nonlinear photonic crystal fiber. Effects of the fiber parameters, transmitted power, and group-delay dispersion provided by the gratings have been investigated to optimize the compressor performance. By using a 20-mm-long photonic crystal fiber with a zero dispersion wavelength of 850 nm, a compressed pulse of 23.6 fs starting from 94 fs at 790 nm is experimentally demonstrated as a verification of our simulations. By integrating the compressor with a two-photon excitation fluorescence microscope, 5.6 times increase in autofluorescence intensity of NAD(P)H in Nasopharyngeal carcinoma cells is demonstrated, showing its potential in enhanced imaging and sensing for disease diagnosis. ©2010 Optical Society of America OCIS codes: (320.5520) Pulse compression; (180.4315) Nonlinear microscopy; (060.5295) Photonic crystal fibers. References and links: 1. W. Denk, J. H. Strickler, and W. W. Webb, “Two-photon laser scanning fluorescence microscopy,” Science 248(4951), 73–76 (1990). 2. C. M. Hsueh, W. Lo, S. J. Lin, T. J. Wang, F. R. Hu, H. Y. Tan, and C. Y. Dong, “Multiphoton Microscopy: A New Approach, in Physiological Studies and Pathological Diagnosis for Ophthalmology,” J. Innovative Opt. Health Sci. 2(01), 45–60 (2009). 3. W. R. Zipfel, R. M. Williams, and W. W. Webb, “Nonlinear magic: multiphoton microscopy in the biosciences,” Nat. Biotechnol. 21(11), 1369–1377 (2003). 4. F. Helmchen, and W. Denk, “Deep tissue two-photon microscopy,” Nat. Methods 2(12), 932–940 (2005). 5. C. Xu, and W. W. Webb, “Measurement of two-photon excitation cross sections of molecular fluorophores with data from 690 to 1050 nm,” J. Opt. Soc. Am. B 13(3), 481–491 (1996). 6. S. Tang, T. B. Krasieva, Z. Chen, G. Tempea, and B. J. Tromberg, “Effect of pulse duration on two-photon excited fluorescence and second harmonic generation in nonlinear optical microscopy,” J. Biomed. Opt. 11(2), 020501 (2006). 7. M. Müller, J. Squier, R. Wolleschensky, U. Simon, and G. J. Brakenhoff, “Dispersion pre-compensation of 15 femtosecond optical pulses for high-numerical-aperture objectives,” J. Microsc. 191(2), 141–150 (1998). 8. R. Du, R. Jiang, and L. Fu, “Enhanced dispersion compensation capability of angular elements based on beam expansion,” Opt. Express 17(19), 16415–16422 (2009). 9. S. Zeng, X. Lv, C. Zhan, W. R. Chen, W. Xiong, S. L. Jacques, and Q. Luo, “Simultaneous compensation for spatial and temporal dispersion of acousto-optical deflectors for two-dimensional scanning with a single prism,” Opt. Lett. 31(8), 1091–1093 (2006). 10. A. M. Larson, and A. T. Yeh, “Delivery of sub-10-fs pulses for nonlinear optical microscopy by polarization- maintaining single mode optical fiber,” Opt. Express 16(19), 14723–14730 (2008). 11. E. Zeek, K. Maginnis, S. Backus, U. Russek, M. Murnane, G. Mourou, H. Kapteyn, and G. Vdovin, “Pulse compression by use of deformable mirrors,” Opt. Lett. 24(7), 493–495 (1999). 12. P. Xi, Y. Andegeko, L. R. Weisel, V. V. Lozovoy, and M. Dantus, “Greater signal, increased depth, and less photobleaching in two-photon microscopy with 10 fs pulses,” Opt. Commun. 281(7), 1841–1849 (2008). 13. F. Verluise, V. Laude, Z. Cheng, C. Spielmann, and P. Tournois, “Amplitude and phase control of ultrashort pulses by use of an acousto-optic programmable dispersive filter: pulse compression and shaping,” Opt. Lett. 25(8), 575–577 (2000). 14. C. V. Shank, R. L. Fork, R. Yen, R. H. Stolen, and W. J. Tomlinson, “Compression of femtosecond optical pulses,” Appl. Phys. Lett. 40(9), 761–763 (1982). #128289 - $15.00 USD Received 11 May 2010; revised 8 Jun 2010; accepted 11 Jun 2010; published 28 Jun 2010 (C) 2010 OSA 5 July 2010 / Vol. 18, No. 14 / OPTICS EXPRESS 14893
Transcript of Pulse compression in two-photon excitation fluorescence microscopy

Pulse compression in two-photon excitation fluorescence microscopy
Xiaobao Liang, Wenyan Hu, Ling Fu*
Britton Chance Center for Biomedical Photonics, Wuhan National Laboratory for Optoelectronics, Huazhong University of Science and Technology, Wuhan 430074, China.
Abstract: The use of shorter pulses is a practical way to improve the signal in two-photon excitation fluorescence microscopy. We report on the theoretical and experimental results of pulse compression in a two-photon excitation fluorescence microscope by using ~100-fs Ti:Sapphire laser and highly nonlinear photonic crystal fiber. Effects of the fiber parameters, transmitted power, and group-delay dispersion provided by the gratings have been investigated to optimize the compressor performance. By using a 20-mm-long photonic crystal fiber with a zero dispersion wavelength of 850 nm, a compressed pulse of 23.6 fs starting from 94 fs at 790 nm is experimentally demonstrated as a verification of our simulations. By integrating the compressor with a two-photon excitation fluorescence microscope, 5.6 times increase in autofluorescence intensity of NAD(P)H in Nasopharyngeal carcinoma cells is demonstrated, showing its potential in enhanced imaging and sensing for disease diagnosis.
©2010 Optical Society of America
OCIS codes: (320.5520) Pulse compression; (180.4315) Nonlinear microscopy; (060.5295) Photonic crystal fibers.
References and links:
1. W. Denk, J. H. Strickler, and W. W. Webb, “Two-photon laser scanning fluorescence microscopy,” Science 248(4951), 73–76 (1990).
2. C. M. Hsueh, W. Lo, S. J. Lin, T. J. Wang, F. R. Hu, H. Y. Tan, and C. Y. Dong, “Multiphoton Microscopy: A New Approach, in Physiological Studies and Pathological Diagnosis for Ophthalmology,” J. Innovative Opt. Health Sci. 2(01), 45–60 (2009).
3. W. R. Zipfel, R. M. Williams, and W. W. Webb, “Nonlinear magic: multiphoton microscopy in the biosciences,” Nat. Biotechnol. 21(11), 1369–1377 (2003).
4. F. Helmchen, and W. Denk, “Deep tissue two-photon microscopy,” Nat. Methods 2(12), 932–940 (2005). 5. C. Xu, and W. W. Webb, “Measurement of two-photon excitation cross sections of molecular fluorophores with
data from 690 to 1050 nm,” J. Opt. Soc. Am. B 13(3), 481–491 (1996). 6. S. Tang, T. B. Krasieva, Z. Chen, G. Tempea, and B. J. Tromberg, “Effect of pulse duration on two-photon
excited fluorescence and second harmonic generation in nonlinear optical microscopy,” J. Biomed. Opt. 11(2), 020501 (2006).
7. M. Müller, J. Squier, R. Wolleschensky, U. Simon, and G. J. Brakenhoff, “Dispersion pre-compensation of 15 femtosecond optical pulses for high-numerical-aperture objectives,” J. Microsc. 191(2), 141–150 (1998).
8. R. Du, R. Jiang, and L. Fu, “Enhanced dispersion compensation capability of angular elements based on beam expansion,” Opt. Express 17(19), 16415–16422 (2009).
9. S. Zeng, X. Lv, C. Zhan, W. R. Chen, W. Xiong, S. L. Jacques, and Q. Luo, “Simultaneous compensation for spatial and temporal dispersion of acousto-optical deflectors for two-dimensional scanning with a single prism,” Opt. Lett. 31(8), 1091–1093 (2006).
10. A. M. Larson, and A. T. Yeh, “Delivery of sub-10-fs pulses for nonlinear optical microscopy by polarization-maintaining single mode optical fiber,” Opt. Express 16(19), 14723–14730 (2008).
11. E. Zeek, K. Maginnis, S. Backus, U. Russek, M. Murnane, G. Mourou, H. Kapteyn, and G. Vdovin, “Pulse compression by use of deformable mirrors,” Opt. Lett. 24(7), 493–495 (1999).
12. P. Xi, Y. Andegeko, L. R. Weisel, V. V. Lozovoy, and M. Dantus, “Greater signal, increased depth, and less photobleaching in two-photon microscopy with 10 fs pulses,” Opt. Commun. 281(7), 1841–1849 (2008).
13. F. Verluise, V. Laude, Z. Cheng, C. Spielmann, and P. Tournois, “Amplitude and phase control of ultrashort pulses by use of an acousto-optic programmable dispersive filter: pulse compression and shaping,” Opt. Lett. 25(8), 575–577 (2000).
14. C. V. Shank, R. L. Fork, R. Yen, R. H. Stolen, and W. J. Tomlinson, “Compression of femtosecond optical pulses,” Appl. Phys. Lett. 40(9), 761–763 (1982).
#128289 - $15.00 USD Received 11 May 2010; revised 8 Jun 2010; accepted 11 Jun 2010; published 28 Jun 2010(C) 2010 OSA 5 July 2010 / Vol. 18, No. 14 / OPTICS EXPRESS 14893

15. W. J. Tomlinson, R. H. Stolen, and C. V. Shank, “Compression of optical pulses chirped by self-phase modulation in fibers,” J. Opt. Soc. Am. B 1(2), 139–149 (1984).
16. G. P. Agrawal, Applications of Nonlinear Fiber Optics (Academic Press, 2001). 17. F. Druon, and P. Georges, “Pulse-compression down to 20 fs using a photonic crystal fiber seeded by a diode-
pumped Yb:SYS laser at 1070 nm,” Opt. Express 12(15), 3383–3396 (2004). 18. S. W. Clark, F. Ö. Ilday, and F. W. Wise, “Fiber delivery of femtosecond pulses from a Ti:sapphire laser,” Opt.
Lett. 26(17), 1320–1322 (2001). 19. A. Baltuška, Z. Wei, M. S. Pshenichnikov, D. A. Wiersma, and R. Szipőcs, “All-solid-state cavity-dumped sub-
5-fs laser,” Appl. Phys,” B-Lasers Opt. 65(2), 175–188 (1997). 20. P. Russell, “Photonic crystal fibers,” Science 299(5605), 358–362 (2003). 21. J. M. Dudley, and J. R. Taylor, “Ten years of nonlinear optics in photonic crystal fibre,” Nat. Photonics 3(2), 85–
90 (2009). 22. J. C. Knight, “Photonic crystal fibres,” Nature 424(6950), 847–851 (2003). 23. S. Lakó, J. Seres, P. Apai, J. Balázs, R. S. Windeler, and R. Szipőcs, “Pulse compression of nanojoule pulses in
the visible using microstructure optical fiber and dispersion compensation,” Appl. Phys. B 76(3), 267–275 (2003).
24. G. McConnell, and E. Riis, “Two-photon laser scanning fluorescence microscopy using photonic crystal fiber,” J. Biomed. Opt. 9(5), 922–927 (2004).
25. G. McConnell, “Improving the penetration depth in multiphoton excitation laser scanning microscopy,” J. Biomed. Opt. 11(5), 054020 (2006).
26. G. McConnell, and E. Riis, “Ultra-short pulse compression using photonic crystal fibre,” Appl. Phys. B 78(5), 557–563 (2004).
27. G. P. Agrawal, Nonlinear Fiber Optics (Academic Press, 2001). 28. E. B. Treacy, “Optical pulse compression with diffraction gratings,” IEEE J. Quantum Electron. 5(9), 454–458
(1969). 29. S. Huang, A. A. Heikal, and W. W. Webb, “Two-photon fluorescence spectroscopy and microscopy of NAD(P)H
and flavoprotein,” Biophys. J. 82(5), 2811–2825 (2002). 30. K. Isobe, W. Watanabe, S. Matsunaga, T. Higashi, K. Fukui, and K. Itoh, “Multi-spectral two-photon excited
fluorescence microscopy using supercontinuum light source,” Jpn. J. Appl. Phys. 44(4), L167–169 (2005). 31. A. M. Larson, A. Lee, P.-F. Lee, K. J. Bayless, and A. T. Yeh, “Ultrashort Pulse Multispectral Non-Linear
Optical Microscopy,” J. Innovative Opt. Health Sci. 2(01), 27–35 (2009). 32. K. König, T. W. Becker, P. Fischer, I. Riemann, and K.-J. Halbhuber, “Pulse-length dependence of cellular
response to intense near-infrared laser pulses in multiphoton microscopes,” Opt. Lett. 24(2), 113–115 (1999). 33. A. Hopt, and E. Neher, “Highly nonlinear photodamage in two-photon fluorescence microscopy,” Biophys. J.
80(4), 2029–2036 (2001). 34. G. H. Patterson, and D. W. Piston, “Photobleaching in two-photon excitation microscopy,” Biophys. J. 78(4),
2159–2162 (2000). 35. Z. Várallyay, J. Fekete, Á. Bányász, and R. Szipőcs, “Optimizing input and output chirps up to the third-order for
sub-nanojoule, ultra-short pulse compression in small core area PCF,” Appl. Phys. B 86(4), 567–572 (2007). 36. D. Li, S. Zeng, Q. Luo, P. Bowlan, V. Chauahan, and R. Trebino, “Propagation dependence of chirp in Gaussian
pulses and beams due to angular dispersion,” Opt. Lett. 34(7), 962–964 (2009). 37. S. Adachi, N. Ishii, T. Kanai, A. Kosuge, J. Itatani, Y. Kobayashi, D. Yoshitomi, K. Torizuka, and S. Watanabe,
“5-fs, Multi-mJ, CEP-locked parametric chirped-pulse amplifier pumped by a 450-nm source at 1 kHz,” Opt. Express 16(19), 14341–14352 (2008).
38. H. Li, D. A. Harris, B. Xu, P. J. Wrzesinski, V. V. Lozovoy, and M. Dantus, “Coherent mode-selective Raman excitation towards standoff detection,” Opt. Lett. 16, 5499–5504 (2008).
1. Introduction
Since its inception in 1990, two-photon excitation fluorescence (TPEF) microscopy has evolved from a photonic novelty to a well-established laboratory tool [1,2]. As the best noninvasive means of microscopic imaging, TPEF microscopy provides spectacular insights into visualization of cellular events within live tissue due to advantages of an inherent sectioning ability, the relatively deep optical penetration, and the direct visualization of intrinsic indicators [3,4]. In contrast with the conventional imaging modalities, the maximum fluorescence output available for TPEF microscopy is obtained by using ultrashort laser pulses of width τ occurring at a rate f, which can enhance the fluorescence output by 1/(τf) compared to continuous-wave illumination [5]. At present, the pulsed laser source in a standard TPEF imaging system is usually a Ti:Sapphire oscillator in the 80-100 femtosecond regime with a tunable wavelength range over 700-1000 nm.
As shorter pulse duration can result in more efficient TPEF events, sub-20-fs laser sources are now commercially available and have been introduced to TPEF microscopy [6]. During the delivery of sub-20-fs pulses for imaging, the important issue that arises from the nonlinear effects and the dispersion concerns temporal and spectral distortions of pulses after the
#128289 - $15.00 USD Received 11 May 2010; revised 8 Jun 2010; accepted 11 Jun 2010; published 28 Jun 2010(C) 2010 OSA 5 July 2010 / Vol. 18, No. 14 / OPTICS EXPRESS 14894
propagation through the microscope systems. Consequently, dispersion elements such as prisms [7–9], chirped mirrors [10], and deformable mirrors [11], the pulse reshaping technology such as multiphoton intrapulse interference phase scan [12] and acousto-optic programmable dispersive filter [13] are used to minimize the pulse distortion on the focal plane. In addition to the dedicated pulse shape control, the wavelength tunability and the average power of the sub-20-fs laser for TPEF imaging systems are also limited compared with an ~100-fs laser.
An alternative way for reduction of pulse duration is pulse compression by using the existing lasers that do not require the operation of cavity optics and mechanisms [14–18]. Optical pulses that fall within the wavelength range of the Ti:Sapphire oscillator can be compressed through the interaction of self-phase modulation (SPM) in single-mode fibers and negative group-velocity dispersion (GVD) of a grating pair [15]. The key of pulse compression is to broaden the spectral bandwidth and impose a positive phase shift (chirp) on the pulse with the SPM and GVD in the fiber, then compensate the chirp by negative GVD from the grating pair to slow down the red-shifted leading edge, and finally get a narrower pulse. However, in the case of pulse compression based on a standard laser source in TPEF microscopy, single-mode, step-index fused silica fibers are not suitable for acting as the nonlinear medium due to the fact that the pulse energy (below 10 nJ) is too low for efficient nonlinear optical effects and the high dispersion around 800 nm (above 100 ps/km-nm for standard fused silica SMFs) limits the bandwidth of the chirp [19].
Over the last decade, fibers using photonic crystals as a new physical mechanism to guide light have revolutionized fiber optics [20–22]. Pulse compression has been associated with the standard Ti:Sapphire laser as a consequence of the development of highly nonlinear photonic crystal fibers (HNPCFs) that have the high nonlinearity and the zero-dispersion wavelengths (ZDWs) within the tunability range of the Ti:Sapphire laser. The first demonstration of PCF-based pulse compression is that 1-nJ, 150-fs pulses from a 76-MHz Ti:Sapphire laser oscillator operating at around 750 nm can be compressed to 25 fs by using a HNPCF and prism pair/chirped mirror compressors [23]. Thereafter, a more compact PCF-grating compressor is developed and is firstly combined with TPEF microscopy to improve the fluorescence signal and the penetration depth [24,25]. Although the effectiveness of the PCF-grating compressor was demonstrated, design and application of such a compressor for TPEF microscopy remain difficult. First, due to the different parameters of fibers, lasers, gratings, and the microscope system, optimizing the compressor performance in terms of the pulse duration and pulse quality are different. Second, no theoretical and experimental investigations on compressor design for TPEF microscopy have been reported.
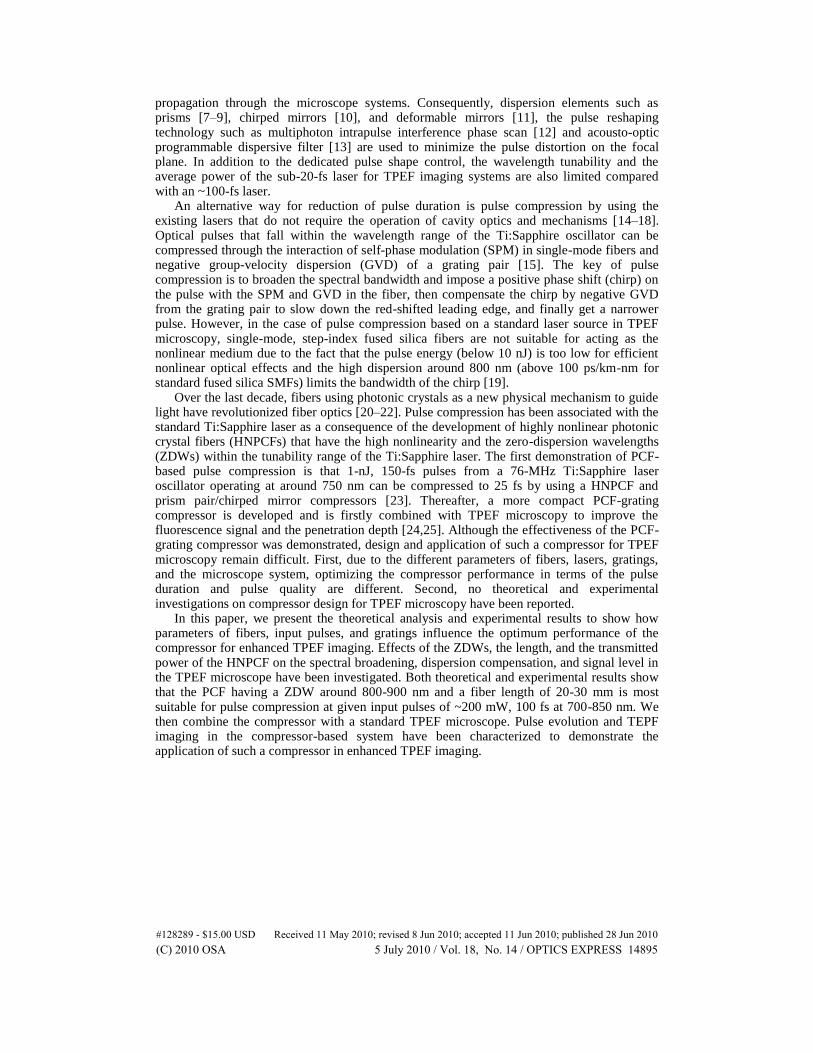
In this paper, we present the theoretical analysis and experimental results to show how parameters of fibers, input pulses, and gratings influence the optimum performance of the compressor for enhanced TPEF imaging. Effects of the ZDWs, the length, and the transmitted power of the HNPCF on the spectral broadening, dispersion compensation, and signal level in the TPEF microscope have been investigated. Both theoretical and experimental results show that the PCF having a ZDW around 800-900 nm and a fiber length of 20-30 mm is most suitable for pulse compression at given input pulses of ~200 mW, 100 fs at 700-850 nm. We then combine the compressor with a standard TPEF microscope. Pulse evolution and TEPF imaging in the compressor-based system have been characterized to demonstrate the application of such a compressor in enhanced TPEF imaging.
#128289 - $15.00 USD Received 11 May 2010; revised 8 Jun 2010; accepted 11 Jun 2010; published 28 Jun 2010(C) 2010 OSA 5 July 2010 / Vol. 18, No. 14 / OPTICS EXPRESS 14895

2. Theory model
The simulation analysis of pulse compression in TPEF microscopy includes two parts. One is the pulse evolution in the HNPCF, and the other is the dispersion compensation using a grating pair and the propagation through the microscope. The preceding theory and simulation results of a fiber-grating compressor are limited by only considering the interaction between SPM and GVD [26]. However in the sub-1-ps regime, the spectral width of the pulse is not negligible compared with the central frequency. As a result, the higher-order nonlinear and dispersive effects would distort the pulse shape and affect the energy distribution of the compressed pulse [16]. To more accurately predict the pulse evolution in the HNPCF, we include self-steepening, Raman response, and higher-order dispersion of the HNPCF to calculate the pulse shape and spectral pattern by using the generalized nonlinear Schrödinger (GNLS) equation [27]:
212 2
2 0
( ( ) ),2 !
k k
k Rkk
AA i A iA i A A A A T A
z k T T T
(1)
where A(z,T) is the slowly varying envelope function, k is the k-th order dispersion of
HNPCF, T is the retarded time, represents the PCF loss, 0 is the central frequency of the
initial pulse, RT is the linear Raman response parameter, and is the nonlinear parameter
which is expressed as
22.
eff
n
A
(2)
In Eq. (2), effA is the effective mode area in the HNPCF,
2n is the nonlinear refractive index
which is equal to that of silica, and is the central wavelength of the pulse.
Split-step Fourier method is used to numerically solve the Eq. (1) [27]. In our calculation, the time grid is 2 fs and time window is 8 ps. As the and the dispersion are not available for
the broad spectral range of the pulse, we calculate the nonlinear parameter at the central wavelength of the pulse and expand the dispersion at the central wavelength by fifth-order Taylor-expansion to obtain the higher-order dispersion[REMOVED NE.CMS_INSERT FIELD]. The fiber loss is ignored as the HNPCF length for pulse compression is usually less than a few ten centimeters.
In the theory model, the compressed pulse after the experience of dispersion introduced by the grating pair and the microscope can be obtained by imposing a phase shift on the pulse after the HNPCF [28]:
1 2 3
2 3( , ) {exp( ) ( ( , ))},2 6
compressed
i iA z T F F A z T (3)
where F is the Fourier transformation of pulse, 2 is the group-delay dispersion (GDD),
and 3 is the third-order dispersion (TOD). The pre-chirp introduced by optical elements such
as Faraday isolator (FI) before the HNPCF also can be expressed in the same way. It should be pointed out that the dispersion of components in the microscope can be experimentally estimated according to the variation of grating separation. In addition, it is also found that the inclusion of linear Raman response in our numerical simulation has no significant effect on the final calculation results due to the fact that no shift of the broadened spectrum is observed.
3. Experimental setup
The schematic diagram of the experimental setup for compressor-based TPEF microscope is shown in Fig. 1. Our Ti:Sapphire laser (Spectra-Physics, Mai Tai) generates optical pulses
#128289 - $15.00 USD Received 11 May 2010; revised 8 Jun 2010; accepted 11 Jun 2010; published 28 Jun 2010(C) 2010 OSA 5 July 2010 / Vol. 18, No. 14 / OPTICS EXPRESS 14896

over 710-990 nm wavelength range with a repetition rate of 80 MHz, providing the average power of 1.2 W at 800 nm. The initial pulse width (80-100 fs) and the spectral bandwidth (7-8 nm) slightly varies with the operation wavelength. The diameter of the laser beam is expanded from 2 mm to 5 mm through the beam expander. Light was then coupled into a piece of HNPCF through a microscope objective (10 × /0.3NA). The HNPCF is manufactured by Crystal Fiber A/S with a 3.0 μm diameter core, as shown in the inset of Fig. 1. The
microstructure of the fiber provides a high nonlinear coefficient of 40 W1
Km1
at 850 nm and a ZDW of 850 nm. The coupling efficiency is approximately 56% in the wavelength range of 750-830 nm. The pulse energy of 1 nJ corresponds to 80 mW average power. The average power of pulses is tuned by a neutral density (ND) filter. FI is used to avoid reflection from the surface of PCF. The positive dispersion introduced by the FI, the beam expander, and the coupling objective is estimated to be ~3100 fs
2.
Fig. 1. Experimental setup of pulse compression in TPEF microscopy. The optical pulses are coupled into a HNPCF and then propagate through a grating pair and a two-photon microscope system. Pulse compression is achieved by chirping and subsequently recombining the frequency components.
Both spectral and temporal profiles of pulses are stretched out due to the effect of SPM and GVD in the HNPCF. The fiber output is collimated by a 40 × /0.65NA objective and then passes through two parallel 600 lines/mm gratings before propagation into a microscope (Olympus, Fluoview 1000) for TPEF imaging. The blazing wavelength of the grating is 740 nm. The diffraction efficiency after a single pass of the grating is about 60% in near IR region.
The grating pair provides a negative dispersion of 424d fs2/mm at 800 nm, which varies as
a function of the grating separation d. By adjusting the grating separation, the correct amount of negative dispersion can be produced to compensate the positive chirp resulted from the HNPCF and the optical elements in the imaging system. Consequently, high frequency components of the pulse can catch up and recombine with the low frequency components to achieve the shortest pulse after the PCF-grating or the imaging objective. In the case of TPEF imaging, the pulse should be negatively prechirped before propagating through the microscope, which provides positive dispersion within the operation range of the Ti:Sapphire laser. In our experiment, the grating pair is separated by 2-20 mm. The total transmission throughput of the microscope is 5-10 mW. The loss is due to the low diffraction efficiency of the grating and the transmission efficiency of the microscope (~10%).
A 60 × /1.2NA water immersion objective (Olympus) is used for TPEF imaging. The autofluorescence from Nasopharyngeal carcinoma (NPC) 5-8F cells is collected backward and detected by the external channel of the microscope system. The photomultiplier tube is masked by a 445/45 nm emission filter (Semrock) to ascertain the intrinsic signal from NAD(P)H. Each image has 512 × 512 pixels, which are sampled at a speed of 10 μs/pixel. In uncompressed case, the light from Ti:Sapphire laser is directly delivered through the microscope without passing through the HNPCF-grating compressor.
Except the pulse delivery in the microscope, ultrafast laser super-broadband turning mirrors (Newport) are used in our setup. All the pulse width is measured with an intensity autocorrelator (APE, Carpe) and its external sensor. The resolution of Carpe is lower than 1 fs. The spectrometer (Ocean Optics, USB2000 +) is used for spectral analysis with the wavelength resolution of 3 nm.
#128289 - $15.00 USD Received 11 May 2010; revised 8 Jun 2010; accepted 11 Jun 2010; published 28 Jun 2010(C) 2010 OSA 5 July 2010 / Vol. 18, No. 14 / OPTICS EXPRESS 14897

NPC cells are cultured in 1640 cell culture medium supplemented with 10% heat-inactivated fetal bovine serum, 100 units/ml penicillin, 0.1 mg/ml streptomycin, and 2 mM glutamine in a humidified atmosphere of 5% CO2 and 95% air at 37 °C and seeded into 8-well cover glass-bottom chambers (Nunc Lab-Tek, Sigma-Aldrich) (2 × 10⁴/well) for imaging. The cells are washed three times with phosphate-buffered saline (PBS) before use and maintained in PBS during imaging.
4. Optimizing PCF and laser parameters for pulse compression
Pulse compression depends on the spectral broadening as an effect of SPM resulting from the intensity-dependent refractive index in fibers. The appropriate length and dispersion characteristics of the PCF are also required to generate a positive and linear chirp in the time domain. Subsequently, the correct amount of dispersion introduced by the grating pair compensates the chirp with a negative phase shift by recombining the frequency components in time domain. As pulse compression is a result of the interaction between SPM and GVD, optimum performance of the compressor is critically dependent on its geometry arrangement and the laser pumping condition. Therefore, it is important to understand how the parameters of fibers, laser, and gratings influence the spectral broadening and dispersion compensation in a HNPCF-grating compressor designed for TPEF microscopy.
4.1 ZDW of PCFs
Pulses propagate below or above the ZDW means that the GVD is positive or negative in the fiber. In addition to SPM, GVD is another factor to determine the chirp of pulses exiting the HNPCF. In order to select the HNPCF having the appropriate ZDW for HNPCF-grating compressor, we calculated the pulse width and the pulse quality factor (QF) in the case of optimum pulse compression by using HNPCFs with various ZDWs. The numerical simulation is based on the model described in Section 2. The calculation is carried out in the case of the transmitted laser power at 160 mW, 94 fs input pulses with a 3100 fs
2 pre-chirp at 790 nm.
HNPCFs chosen for investigation are commercially available from Crystal Fiber A/S. All the HNPCFs have the same strut width to pitch ratio of 6% and the air filling fraction in the photonic crystal region of ~87%. The variation of the ZDW is related to the fiber core diameter, as depicted in Table 1. In the calculation, the QF of the compressed pulse is estimated as the ratio of the energy in the central peak to the total energy of the pulse
2
2
| ( , ) |,
| ( , ) |
b
aA z T dT
QFA z T dT
(4)
where the time a and b correspond two local intensity minima around the central peak.
Table 1. The HNPCFs with various ZDWs
ZDW of HNPCF (nm) 590 753 872 950
Fiber core diameter (μm) 1.1 2.1 3.2 4.2
As shown in Fig. 2, pulses can be compressed down to a width of sub-20-fs when pulses propagate in either positive or negative dispersion regime. In the case of ZDWs shorter than the input wavelength, the duration of the compressed pulse is 9.7 fs and 7.8 fs for ZDWs at 590 nm and 753 nm, respectively. The corresponding temporal and spectral shapes of the compressed pulse are presented as the insets of Fig. 2, where the fiber length L and the GDD provided by the grating pair are selected for producing the broadest spectrum and the shortest compressed pulse. However, the QF of pulses in both cases is below 50%, indicating that the compressed pulse is asymmetric and a large portion of energy transfers into sidelobes. While using HNPCFs having ZDWs at 872 nm and 950 nm, the pulse can be compressed to 15.6 fs and 21.5 fs, respectively, with QFs greater than 80%. It implies that the HNPCF in the negative dispersion regime imposed a nonlinear chirp across the entire width of the pulse, which cannot enable maximum chirp cancellation by the grating pair that is responsible for a
#128289 - $15.00 USD Received 11 May 2010; revised 8 Jun 2010; accepted 11 Jun 2010; published 28 Jun 2010(C) 2010 OSA 5 July 2010 / Vol. 18, No. 14 / OPTICS EXPRESS 14898
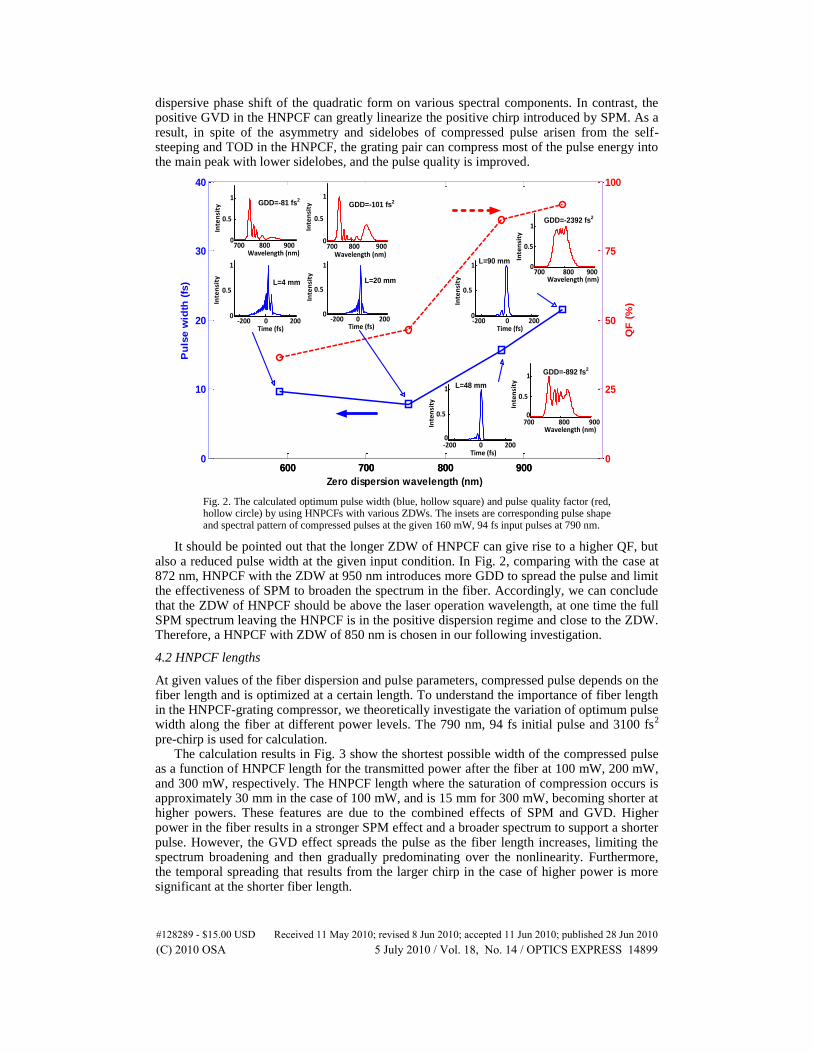
dispersive phase shift of the quadratic form on various spectral components. In contrast, the positive GVD in the HNPCF can greatly linearize the positive chirp introduced by SPM. As a result, in spite of the asymmetry and sidelobes of compressed pulse arisen from the self-steeping and TOD in the HNPCF, the grating pair can compress most of the pulse energy into the main peak with lower sidelobes, and the pulse quality is improved.
600 700 800 9000
10
20
30
40
Zero dispersion wavelength (nm)
Pu
lse w
idth
(fs
)
600 700 800 9000
25
50
75
100
QF
(%
)
700 800 9000
0.5
1
Wavelength (nm)
-200 0 2000
0.5
1
Time (fs)
Inte
nsi
ty
700 800 9000
0.5
1
Wavelength (nm)
Inte
nsi
ty
-200 0 2000
0.5
1
Time (fs)
700 800 9000
0.5
1
Wavelength (nm)
Inte
nsi
ty
-200 0 2000
0.5
1
Time (fs)
Inte
nsi
ty
-200 0 2000
0.5
1
Time (fs)
Inte
nsi
ty
GDD=-81 fs2
L=4 mm L=20 mm
L=48 mm
GDD=-892 fs2
L=90 mm
GDD=-2392 fs2
700 800 9000
0.5
1
Wavelength (nm)
Inte
nsi
ty GDD=-101 fs2
Inte
nsi
ty
Inte
nsi
ty
Fig. 2. The calculated optimum pulse width (blue, hollow square) and pulse quality factor (red, hollow circle) by using HNPCFs with various ZDWs. The insets are corresponding pulse shape and spectral pattern of compressed pulses at the given 160 mW, 94 fs input pulses at 790 nm.
It should be pointed out that the longer ZDW of HNPCF can give rise to a higher QF, but also a reduced pulse width at the given input condition. In Fig. 2, comparing with the case at 872 nm, HNPCF with the ZDW at 950 nm introduces more GDD to spread the pulse and limit the effectiveness of SPM to broaden the spectrum in the fiber. Accordingly, we can conclude that the ZDW of HNPCF should be above the laser operation wavelength, at one time the full SPM spectrum leaving the HNPCF is in the positive dispersion regime and close to the ZDW. Therefore, a HNPCF with ZDW of 850 nm is chosen in our following investigation.
4.2 HNPCF lengths
At given values of the fiber dispersion and pulse parameters, compressed pulse depends on the fiber length and is optimized at a certain length. To understand the importance of fiber length in the HNPCF-grating compressor, we theoretically investigate the variation of optimum pulse width along the fiber at different power levels. The 790 nm, 94 fs initial pulse and 3100 fs
2
pre-chirp is used for calculation. The calculation results in Fig. 3 show the shortest possible width of the compressed pulse
as a function of HNPCF length for the transmitted power after the fiber at 100 mW, 200 mW, and 300 mW, respectively. The HNPCF length where the saturation of compression occurs is approximately 30 mm in the case of 100 mW, and is 15 mm for 300 mW, becoming shorter at higher powers. These features are due to the combined effects of SPM and GVD. Higher power in the fiber results in a stronger SPM effect and a broader spectrum to support a shorter pulse. However, the GVD effect spreads the pulse as the fiber length increases, limiting the spectrum broadening and then gradually predominating over the nonlinearity. Furthermore, the temporal spreading that results from the larger chirp in the case of higher power is more significant at the shorter fiber length.
#128289 - $15.00 USD Received 11 May 2010; revised 8 Jun 2010; accepted 11 Jun 2010; published 28 Jun 2010(C) 2010 OSA 5 July 2010 / Vol. 18, No. 14 / OPTICS EXPRESS 14899

In addition, the QF of the compressed pulse is investigated for different power levels, as shown in the insets of Fig. 3. For one optimized pulse compression at 19.5 fs, the corresponding QF is 86.4%, 81.9%, and 79.8%, respectively, for 100, 200, and 300 mW laser powers.
0 5 10 15 20 25 30 35
10
20
30
40
50
60
70
80
90
Fiber length (mm)
Pu
lse
wid
th (
fs)
100 mW
200 mW
300 mW
-200 0 2000
0.5
1
Time (fs)
No
rmalized
in
ten
sit
y QF=86.4 %
-200 0 2000
0.5
1
Time (fs)
No
rmalized
in
ten
sit
y
QF=81.9 %
-200 0 2000
0.5
1
Time (fs)
No
rmalized
in
ten
sit
y QF=79.8 %
Fig. 3. The calculated pulse width of optimum compression as a function of fiber length for transmitted powers of 100, 200, and 300 mW, respectively. Insets: Temporal shapes and QFs of 19.5-fs compressed pulses achieved by using different powers in the compressor.
Such a QF reduction associated with higher power is primarily caused by the nonlinear chirp at steeper leading and trailing edges after the HNPCF that is uncompensated by the grating pair. It is demonstrated that a high quality pulse can be produced by the HNPCF-grating compressor at a lower power level if the fiber length is sufficient for pulse compression.
Further observation from Fig. 3 reveals that such a HNPCF-grating compressor supports a compressed pulse above 10 fs, although the spectral broadening at 300 mW corresponds to a width of sub-10-fs in Fourier transformation. The main limit factor is the higher-order nonlinear and dispersion effects in both the HNPCF and gratings. Particularly, the grating pair does not compensate the higher-order dispersion in the HNPCF, and results in a net increase in the amount of TOD.
The above results show that the HNPCF piece that is a few centimeter long is most suitable for pulse compression when using a ~100-fs Ti:Sapphire laser for TPEF microscopy. The range of possible fiber length should approach the length, after which saturation of compression shows up. Consequently, a fiber length of 20 mm is used in our following experimental and theoretical investigations assuming that the transmitted power of the fiber is approximately 200 mW.
#128289 - $15.00 USD Received 11 May 2010; revised 8 Jun 2010; accepted 11 Jun 2010; published 28 Jun 2010(C) 2010 OSA 5 July 2010 / Vol. 18, No. 14 / OPTICS EXPRESS 14900

4.3 Transmitted laser powers of PCFs
When a HNPCF of certain dispersion characteristics and length is used to accomplish pulse compression, it turns out that powers inside the fiber and grating separation are the parameters which can be practically adjusted in the experiment. The spectral broadening arises from SPM resulting from the intensity-dependent refractive index, affects the chirp linearization because of the GVD effect, and consequently needs dispersion compensation depending on the grating separation. In this situation, theoretical and experimental investigations into pulse evolution at different power levels are required to understand the operation parameters for optimum pulse compression.
Based on the setup described in Section 3, a 94-fs pulse at 790 nm propagates through a HNPCF with a ZDW of 850 nm and a length of 20 mm, subsequently is compensated by the grating pair. As shown in Fig. 4(a), the spectral intensity profile of a pulse is coincident with the calculated results, exhibiting a multi-peak pattern arisen from SPM. The asymmetry in the spectrum is a manifestation of self-steeping effect and TOD of the fiber. Furthermore, the spectral width increases linearly as a function of the transmitted power after the fiber, which is also depicted in Fig. 4(b). By contrast, the compressed shortest pulse width firstly decreases with the transmitted power, and then slightly increases in our experiment. The shortest pulse width of 23.2 fs is achievable at a fiber transmitted power of 140 mW. However in the case of transmitted power greater than 160 mW, there is a reduction in the performance of the pulse compression. These results are expected as a consequence of fact that the spectrum induced at a higher power is split into positive and negative GVD regimes, which cannot be compensated simultaneously by the grating pair. The deviation between experiments and theory estimation in Fig. 4 is caused by assuming a wavelength independent value for the dispersion in our calculation.
(a) (b)
80 100 120 140 160 180 200 220 24010
20
30
40
50
60
Transmitted power (mW)
Co
mp
ressed
pu
lse w
idth
(fs
)
80 100 120 140 160 180 200 220 24020
40
60
80
100
120
Sp
ectr
al
wid
th (
nm
)
Pulse width (theo)
Pulse width (exp)
Spectral width(theo)
Spectral width(exp)
Fig. 4. Effect of transmitted powers of the HNPCF on pulse compression. (a) Measured and calculated spectrum of pulses exiting a 20-mm-long HNPCF at transmitted powers of 100, 160, and 220 mW; (b) The pulse width and spectral width of compressed shortest pulses as a function of fiber transmitted powers.
To further demonstrate the pulse evolution in the above HNPCF-grating, we consider the case of the transmitted power of 160 mW. Figure 5(a) shows the calculated temporal intensity profiles of fiber input, fiber output, and compressed pulses. The intensity is normalized to the peak intensity of the input pulse. Theoretically, the initial 94-fs pulse can be optimally compressed to 19.5 fs with 82.8% of the power in the central peak. Our experimental results in Fig. 5(b) show that compressed pulse width varies with the grating separations, which correspond to various values of negative GDD for dispersion compensation. The compressed
pulse of 23.6 fs is obtained with a GDD of approximately 1255 fs2. The intensity
#128289 - $15.00 USD Received 11 May 2010; revised 8 Jun 2010; accepted 11 Jun 2010; published 28 Jun 2010(C) 2010 OSA 5 July 2010 / Vol. 18, No. 14 / OPTICS EXPRESS 14901

autocorrelation trace of the compressed pulse is presented in Fig. 5(c), agreeing well with the corresponding calculated result. The result is also consistent with, but slightly shorter than the compressed pulse obtained in the previous work [26].
-1600 -1400 -1200 -1000 -80020
30
40
50
60
Compensated GDD (fs2)
Co
mp
ressed
pu
lse w
idth
(fs
)
-200 -100 0 100 2000
0.2
0.4
0.6
0.8
1
Time Delay (fs)
No
rmali
zed
in
ten
sit
y
Experiment
Theory
-200 -100 0 100 2000
1
2
3
4
Time (fs)
No
rmali
zed
in
ten
sit
y
Fiber input
Fiber output
Compressed
(a) (b) (c)
Fig. 5. Pulse compression of 160 mW, 94 fs pulses at 790 nm. (a) Calculated temporal intensity profiles of the fiber input, fiber output, and compressed pulses. (b) Measured compressed pulse width as a function of GDD provided by the grating pair. (c) The intensity autocorrelation trace of a compressed 23.6-fs pulse compared with the corresponding calculated result.
5. Signal improvement in fluorescence imaging
Based on the above understanding, we integrate the HNPCF-grating compressor with a standard TPEF microscope system that has been shown in Fig. 1. Before acquiring the TPEF images, characterization of the compressed pulse at the focal plane of the imaging objective is necessary to investigate how the dispersion of the microscopic elements acts on the pulse compression. The compressed pulse width after a 60 × /1.2NA objective is measured at 740 nm and 800 nm, respectively, when the grating separation varies to compensate the dispersion of HNPCF and the microscopic elements. The result is shown in Fig. 6(a). A 130-mW, 104-fs pulse at 740 nm is compressed to approximately 38.7 fs with an average power of 7.0 mW after the objective. As a comparison in Fig. 6(b), the pulse is broadened to 190 fs when light propagates through the TPEF microscope without the compressor. Similarly in Fig. 6(c), a 220-mW, 80-fs pulse at 800 nm is compressed to approximately 43.4 fs with 5.6 mW, while a 172 fs pulse width is achieved in the uncompressed case. In Fig. 6(a), it can be seen that more GDD at 740 nm is required to maximally compensate the dispersion of the whole system due to the higher GVD of optical elements in our system at a shorter wavelength.
-500 0 5000
100
200
300
400
500
Delay (fs)
Inte
nsit
y (
a.u
.)
Uncompressed
Compressed
-500 0 5000
100
200
300
400
500
Delay (fs)
Inte
nsit
y (
a.u
.)
Uncompressed
Compressed
(a) (b) (c)
-12000 -10000 -8000
40
60
80
100
120
Compensated GDD (fs2)
Pu
lse w
idth
(fs
)
740 nm
800 nm
Fig. 6. The compressed pulses at the focal plane of a 60 × /1.2NA objective. (a) Pulse width as a function of GDD provided by the grating pair. (b)-(c) The autocorrelation signals of the compressed pulse and the uncompressed pulse at 740 nm and 800 nm, respectively.
Further observations from Figs. 5 and 6 imply that the compression by using the HNPCF-grating compressor can result in a shorter pulse width than that obtained by using both the compressor and the microscope. It is also clear from Fig. 6 that pulse spreading occurs when the beam is directly delivered through the microscope without passing the HNPCF-grating compressor. These results are to be expected because of the dispersion provided by the optical
#128289 - $15.00 USD Received 11 May 2010; revised 8 Jun 2010; accepted 11 Jun 2010; published 28 Jun 2010(C) 2010 OSA 5 July 2010 / Vol. 18, No. 14 / OPTICS EXPRESS 14902
elements in microscope. In particular, the TOD of the microscope gives rise to additional nonlinear chirp across the pulse width.
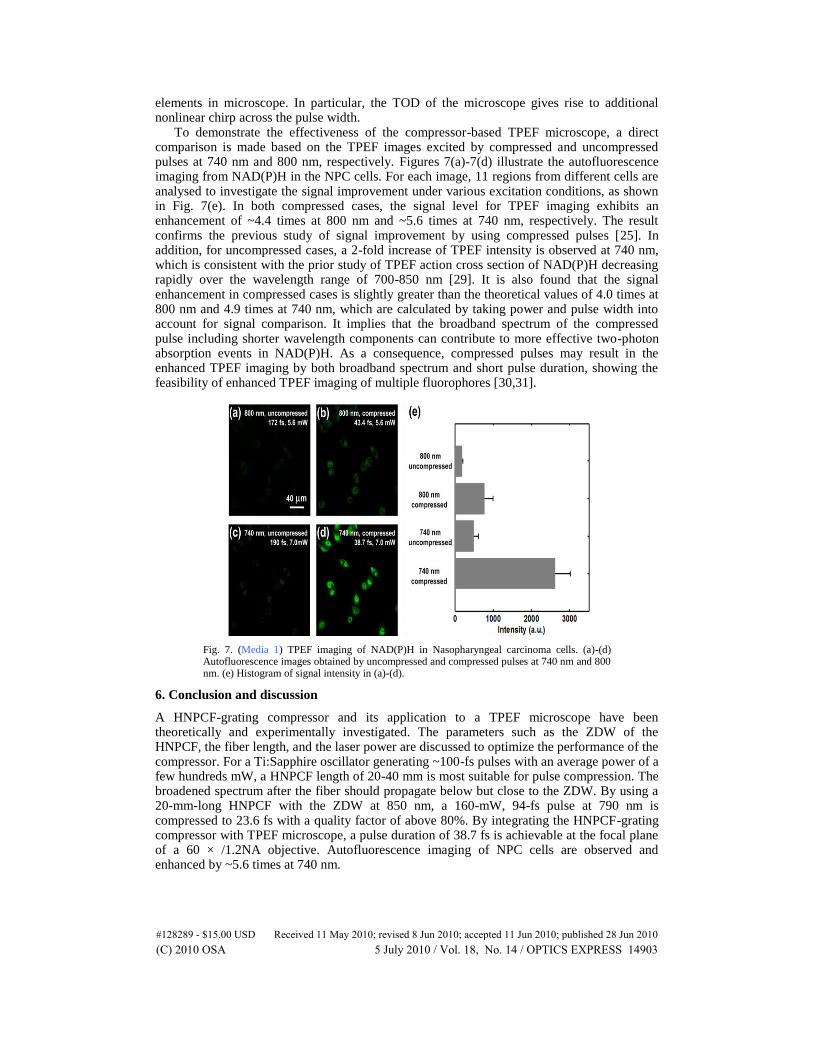
To demonstrate the effectiveness of the compressor-based TPEF microscope, a direct comparison is made based on the TPEF images excited by compressed and uncompressed pulses at 740 nm and 800 nm, respectively. Figures 7(a)-7(d) illustrate the autofluorescence imaging from NAD(P)H in the NPC cells. For each image, 11 regions from different cells are analysed to investigate the signal improvement under various excitation conditions, as shown in Fig. 7(e). In both compressed cases, the signal level for TPEF imaging exhibits an enhancement of ~4.4 times at 800 nm and ~5.6 times at 740 nm, respectively. The result confirms the previous study of signal improvement by using compressed pulses [25]. In addition, for uncompressed cases, a 2-fold increase of TPEF intensity is observed at 740 nm, which is consistent with the prior study of TPEF action cross section of NAD(P)H decreasing rapidly over the wavelength range of 700-850 nm [29]. It is also found that the signal enhancement in compressed cases is slightly greater than the theoretical values of 4.0 times at 800 nm and 4.9 times at 740 nm, which are calculated by taking power and pulse width into account for signal comparison. It implies that the broadband spectrum of the compressed pulse including shorter wavelength components can contribute to more effective two-photon absorption events in NAD(P)H. As a consequence, compressed pulses may result in the enhanced TPEF imaging by both broadband spectrum and short pulse duration, showing the feasibility of enhanced TPEF imaging of multiple fluorophores [30,31].
Fig. 7. (Media 1) TPEF imaging of NAD(P)H in Nasopharyngeal carcinoma cells. (a)-(d) Autofluorescence images obtained by uncompressed and compressed pulses at 740 nm and 800 nm. (e) Histogram of signal intensity in (a)-(d).
6. Conclusion and discussion
A HNPCF-grating compressor and its application to a TPEF microscope have been theoretically and experimentally investigated. The parameters such as the ZDW of the HNPCF, the fiber length, and the laser power are discussed to optimize the performance of the compressor. For a Ti:Sapphire oscillator generating ~100-fs pulses with an average power of a few hundreds mW, a HNPCF length of 20-40 mm is most suitable for pulse compression. The broadened spectrum after the fiber should propagate below but close to the ZDW. By using a 20-mm-long HNPCF with the ZDW at 850 nm, a 160-mW, 94-fs pulse at 790 nm is compressed to 23.6 fs with a quality factor of above 80%. By integrating the HNPCF-grating compressor with TPEF microscope, a pulse duration of 38.7 fs is achievable at the focal plane of a 60 × /1.2NA objective. Autofluorescence imaging of NPC cells are observed and enhanced by ~5.6 times at 740 nm.
#128289 - $15.00 USD Received 11 May 2010; revised 8 Jun 2010; accepted 11 Jun 2010; published 28 Jun 2010(C) 2010 OSA 5 July 2010 / Vol. 18, No. 14 / OPTICS EXPRESS 14903

The work has potential applications to improve the fluorescence output in TPEF microscopy by using standard femtosecond laser resources in biological labs. Compared with longer pulses with a higher average power, the compressed pulses can result in a similar signal level by using relatively low excitation power which is desirable in most of the biological applications. Prior studies have shown that the shorter pulses may decrease the damaging threshold power [32,33] and the two-photon photobleaching rate depends on excitation power with a power-law exponent above 3 [34], but we didn’t observe the optical damage in our experiment. Of course, photobleaching and phototoxicity by using sub-30 fs pulses are interesting topics and deserved to study in the future. In particular, the HNPCF-grating compressor also can be applicable by using longer pulses (such as sub-ps) as the pump resources. The key is to choose appropriate input power and the length of the fiber to make sure that the positive, linear chirp after the interaction between GVD and SPM can be compensated by the gratings.
The main limit of the HNPCF-grating compressor is that the grating pair does not compensate for higher-order dispersion, but induces more TOD into pulses and blocks the pulses to be compressed shorter. Considerable improvement of the HNPCF-grating compressor-based TPEF microscope can be expected by designing a relatively flat dispersion fiber or compensating the initial and third-order chirp with prisms [35,36][REMOVED NE.CMS_INSERT FIELD]. Pulse reshaping technology is also helpful to compress the pulse down to 5 fs for varied applications [37,38].
Acknowledgements
The authors would like to thank Prof. Yixin Zeng for providing the NPC cells, Drs. Zhihong Zhang and Haiming Luo for the preparation of the NPC cells, Prof. Avraham Mayevsky for the manuscript proofreading. The authors also acknowledge the help and advices from Drs. Zoltan. Várallyay and Gail. McConnell. The work is supported by the National Natural Science Foundation of China (Nos. 60708025, 60828009 and 30925013) and Program for New Century Excellent Talents in University (No. NCET-08-0216).
#128289 - $15.00 USD Received 11 May 2010; revised 8 Jun 2010; accepted 11 Jun 2010; published 28 Jun 2010(C) 2010 OSA 5 July 2010 / Vol. 18, No. 14 / OPTICS EXPRESS 14904