Spinel Crystallite size Photoluminescence Excitation
6
Journal of Alloys and Compounds 509 (2011) 10115–10120 Contents lists available at ScienceDirect Journal of Alloys and Compounds jou rn al h om epage: www.elsevier.com/locate/jallcom Luminescent properties and X-ray photoelectron spectroscopy study of ZnAl 2 O 4 :Ce 3+ ,Tb 3+ phosphor K.G. Tshabalala a , S.-H. Cho b , J.-K. Park b , Shreyas S. Pitale a , I.M. Nagpure a , R.E. Kroon a , H.C. Swart a , O.M. Ntwaeaborwa a,∗ a Department of Physics, University of the Free State, Bloemfontein, ZA9300, South Africa b Nano-Materials Center, Korea Institute of Science and Technology, Cheongryang, 39-1 Hawolkok, Seoul 136-791, South Korea a r t i c l e i n f o Article history: Received 14 March 2011 Received in revised form 9 August 2011 Accepted 10 August 2011 Available online 19 August 2011 Keywords: Spinel Crystallite size Photoluminescence Excitation a b s t r a c t Cerium (Ce 3+ )- and terbium (Tb 3+ ) co-doped zinc aluminate (ZnAl 2 O 4 ) nanocrystals were successfully prepared by a combustion method using urea as fuel. The as-prepared samples were annealed in hydro- gen atmosphere to improve their optical properties and crystallinity. The structure and morphology of the samples analyzed using X-ray diffraction (XRD) and high resolution transmission electron microscopy (HRTEM) showed that ZnAl 2 O 4 crystallized in a well known cubic spinel structure. As deduced from X-ray photoelectron spectroscopy (XPS) data, there was partial inversion of cations in as-prepared (unan- nealed) samples implying that the ZnAl 2 O 4 did not crystallize in a cubic normal spinel. Instead, the XPS data demonstrated possible structural readjustment from inverse to normal spinel after annealing. The excitation and emission data collected when ZnAl 2 O 4 :Ce 3+ ,Tb 3+ samples, with different concentrations of Ce 3+ and Tb 3+ ions, were excited at different wavelengths showed that green emission of Tb 3+ was sensitized by Ce 3+ , i.e. there was energy transfer from Ce 3+ to Tb 3+ resulting in improvement of green emission from Tb 3+ . This study therefore, sets out to discuss the sensitizing effect of Ce 3+ and the effect of annealing on the structure of ZnAl 2 O 4 :Ce 3+ ,Tb 3+ . © 2011 Elsevier B.V. All rights reserved. 1. Introduction Zinc aluminate (ZnAl 2 O 4 ) is a well known semiconductor with a wide bulk band gap of 3.5–3.9 eV [1–6]. It belongs to a class of mixed-metal oxides called the spinels which are commonly rep- resented by a general chemical formula AB 2 O 4 where A and B are divalent (2+) and trivalent (3+) cations, respectively. In AB 2 O 4 spinels, 8 of the 64 tetrahedral interstices are occupied by A 2+ cations while 16 of the 32 octahedral interstices are occupied by B 3+ cations [7]. It is well known that ZnAl 2 O 4 can crystallize in a cubic normal or inverse spinel structure depending on the prepara- tion procedure. In the normal spinel structure, the 3+ ions occupy the octahedral site while the 2+ ions occupy the tetrahedral site. In an inverse spinel the divalent and trivalent ions are not just exchanged but there is a mixed occupation by different amounts of A 2+ and B 3+ on the octahedral site while the tetrahedral site is only occupied by the B 3+ cations. In most cases, intermediate structures between normal and inverse spinels are crystallized [8]. Tradition- ally, ZnAl 2 O 4 with normal, intermediate or inverse spinel structure is widely used as a catalyst or ceramic [9]. Today, it is used in many ∗ Corresponding author. Tel.: +27 51 401 2193; fax: +27 51 401 3507. E-mail addresses: [email protected] (K.G. Tshabalala), [email protected] (O.M. Ntwaeaborwa). applications such as optoelectronics, sensor technology and infor- mation display technology [1,2,5,6] because of its excellent optical and hydrophobic properties and high chemical and thermal stabil- ity [10]. For application in display technologies, ZnAl 2 O 4 is used as host matrix for trivalent rare-earth ions (e.g. Tb 3+ , Eu 3+ and Dy 3+ ) [11–13] or transition metals (e.g. Mn 2+ and Cr 3+ ) [14,15] to prepare phosphors emitting mostly in the visible range of the electromag- netic spectrum. Researchers in this study are particularly interested in the performance of a nanocrystalline ZnAl 2 O 4 because of the speculation that nanocrystalline materials may have better optical properties than their bulk counterparts [11]. Different synthesis methods such as sol–gel [16,17], hydrothermal [18,19], combus- tion [6,15,20] and solid state reaction [21] are commonly used to prepare rare-earth/transition metal doped nanocrystalline ZnAl 2 O 4 phosphors. In this study, the solution combustion method was used to prepare Ce 3+ –Tb 3+ co-activated nanocrystalline ZnAl 2 O 4 phos- phors. Compared to other methods, the combustion method has advantages such as cost-effectiveness, low processing tempera- ture, extremely shorter reaction time, high purity and homogeneity of the final product. The flame temperature during urea assisted combustion was sufficient to enable some Al ions in the zinc alumi- nate spinel structure to occupy tetrahedral sites (spinel inversion) [22]. The objective of this study was to prepare an efficient green emitting phosphor through sensitization of Tb 3+ by Ce 3+ . It is well known that Ce 3+ can absorb UV photons and sensitize emission of 0925-8388/$ – see front matter © 2011 Elsevier B.V. All rights reserved. doi:10.1016/j.jallcom.2011.08.054
Transcript of Spinel Crystallite size Photoluminescence Excitation
LZ
KOa
b
a
ARRAA
KSCPE
1
amrascBcttIeAobai
(
0d
Journal of Alloys and Compounds 509 (2011) 10115– 10120
Contents lists available at ScienceDirect
Journal of Alloys and Compounds
jou rn al h om epage: www.elsev ier .com/ locate / ja l l com
uminescent properties and X-ray photoelectron spectroscopy study ofnAl2O4:Ce3+,Tb3+ phosphor
.G. Tshabalalaa, S.-H. Chob, J.-K. Parkb, Shreyas S. Pitalea, I.M. Nagpurea, R.E. Kroona, H.C. Swarta,.M. Ntwaeaborwaa,∗
Department of Physics, University of the Free State, Bloemfontein, ZA9300, South AfricaNano-Materials Center, Korea Institute of Science and Technology, Cheongryang, 39-1 Hawolkok, Seoul 136-791, South Korea
r t i c l e i n f o
rticle history:eceived 14 March 2011eceived in revised form 9 August 2011ccepted 10 August 2011vailable online 19 August 2011
eywords:pinel
a b s t r a c t
Cerium (Ce3+)- and terbium (Tb3+) co-doped zinc aluminate (ZnAl2O4) nanocrystals were successfullyprepared by a combustion method using urea as fuel. The as-prepared samples were annealed in hydro-gen atmosphere to improve their optical properties and crystallinity. The structure and morphology of thesamples analyzed using X-ray diffraction (XRD) and high resolution transmission electron microscopy(HRTEM) showed that ZnAl2O4 crystallized in a well known cubic spinel structure. As deduced fromX-ray photoelectron spectroscopy (XPS) data, there was partial inversion of cations in as-prepared (unan-nealed) samples implying that the ZnAl2O4 did not crystallize in a cubic normal spinel. Instead, the XPS
rystallite sizehotoluminescencexcitation
data demonstrated possible structural readjustment from inverse to normal spinel after annealing. Theexcitation and emission data collected when ZnAl2O4:Ce3+,Tb3+ samples, with different concentrationsof Ce3+ and Tb3+ ions, were excited at different wavelengths showed that green emission of Tb3+ wassensitized by Ce3+, i.e. there was energy transfer from Ce3+ to Tb3+ resulting in improvement of greenemission from Tb3+. This study therefore, sets out to discuss the sensitizing effect of Ce3+ and the effect
ture o 3+ 3+
of annealing on the struc. Introduction
Zinc aluminate (ZnAl2O4) is a well known semiconductor with wide bulk band gap of 3.5–3.9 eV [1–6]. It belongs to a class ofixed-metal oxides called the spinels which are commonly rep-
esented by a general chemical formula AB2O4 where A and Bre divalent (2+) and trivalent (3+) cations, respectively. In AB2O4pinels, 8 of the 64 tetrahedral interstices are occupied by A2+
ations while 16 of the 32 octahedral interstices are occupied by3+ cations [7]. It is well known that ZnAl2O4 can crystallize in aubic normal or inverse spinel structure depending on the prepara-ion procedure. In the normal spinel structure, the 3+ ions occupyhe octahedral site while the 2+ ions occupy the tetrahedral site.n an inverse spinel the divalent and trivalent ions are not justxchanged but there is a mixed occupation by different amounts of2+ and B3+ on the octahedral site while the tetrahedral site is onlyccupied by the B3+ cations. In most cases, intermediate structures
etween normal and inverse spinels are crystallized [8]. Tradition-lly, ZnAl2O4 with normal, intermediate or inverse spinel structures widely used as a catalyst or ceramic [9]. Today, it is used in many∗ Corresponding author. Tel.: +27 51 401 2193; fax: +27 51 401 3507.E-mail addresses: [email protected] (K.G. Tshabalala), [email protected]
O.M. Ntwaeaborwa).
925-8388/$ – see front matter © 2011 Elsevier B.V. All rights reserved.oi:10.1016/j.jallcom.2011.08.054
f ZnAl2O4:Ce ,Tb .© 2011 Elsevier B.V. All rights reserved.
applications such as optoelectronics, sensor technology and infor-mation display technology [1,2,5,6] because of its excellent opticaland hydrophobic properties and high chemical and thermal stabil-ity [10]. For application in display technologies, ZnAl2O4 is used ashost matrix for trivalent rare-earth ions (e.g. Tb3+, Eu3+ and Dy3+)[11–13] or transition metals (e.g. Mn2+ and Cr3+) [14,15] to preparephosphors emitting mostly in the visible range of the electromag-netic spectrum. Researchers in this study are particularly interestedin the performance of a nanocrystalline ZnAl2O4 because of thespeculation that nanocrystalline materials may have better opticalproperties than their bulk counterparts [11]. Different synthesismethods such as sol–gel [16,17], hydrothermal [18,19], combus-tion [6,15,20] and solid state reaction [21] are commonly used toprepare rare-earth/transition metal doped nanocrystalline ZnAl2O4phosphors. In this study, the solution combustion method was usedto prepare Ce3+–Tb3+ co-activated nanocrystalline ZnAl2O4 phos-phors. Compared to other methods, the combustion method hasadvantages such as cost-effectiveness, low processing tempera-ture, extremely shorter reaction time, high purity and homogeneityof the final product. The flame temperature during urea assistedcombustion was sufficient to enable some Al ions in the zinc alumi-
nate spinel structure to occupy tetrahedral sites (spinel inversion)[22]. The objective of this study was to prepare an efficient greenemitting phosphor through sensitization of Tb3+ by Ce3+. It is wellknown that Ce3+ can absorb UV photons and sensitize emission of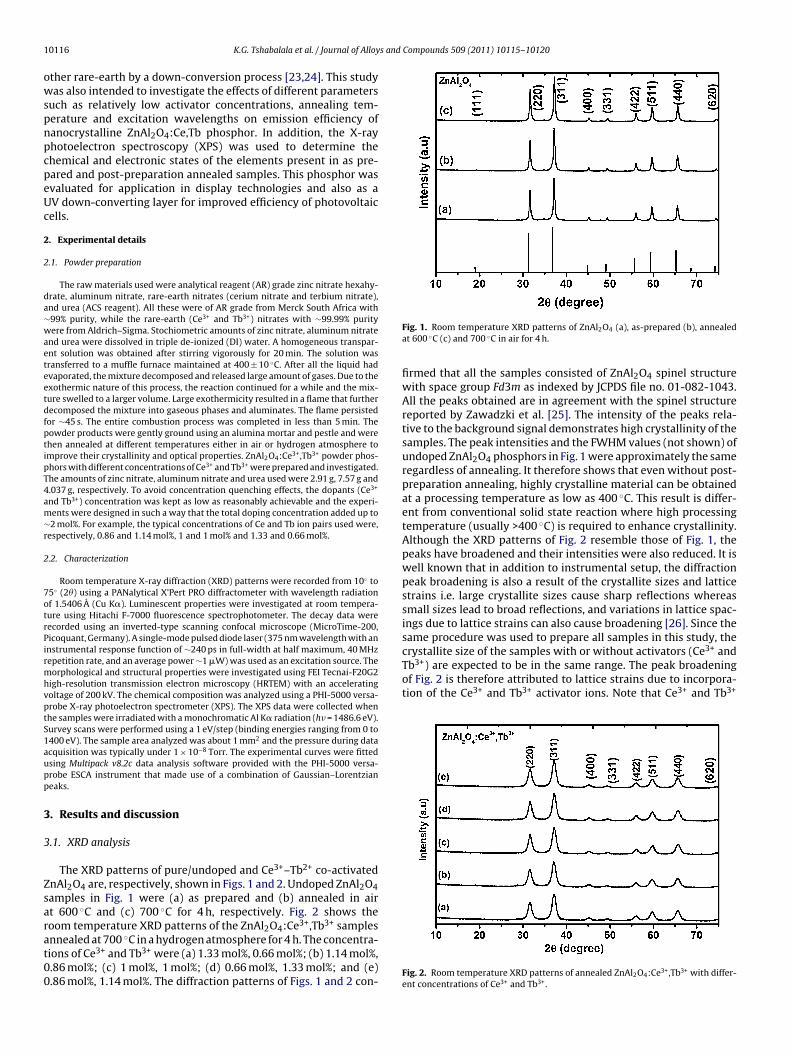
1 s and Compounds 509 (2011) 10115– 10120
owspnpcpeUc
2
2
da∼waeteetdfptipT4am∼r
2
7otrPirmhvptS1aupp
3
3
Zsarat00
Tb3+) are expected to be in the same range. The peak broadeningof Fig. 2 is therefore attributed to lattice strains due to incorpora-tion of the Ce3+ and Tb3+ activator ions. Note that Ce3+ and Tb3+
0116 K.G. Tshabalala et al. / Journal of Alloy
ther rare-earth by a down-conversion process [23,24]. This studyas also intended to investigate the effects of different parameters
uch as relatively low activator concentrations, annealing tem-erature and excitation wavelengths on emission efficiency ofanocrystalline ZnAl2O4:Ce,Tb phosphor. In addition, the X-rayhotoelectron spectroscopy (XPS) was used to determine thehemical and electronic states of the elements present in as pre-ared and post-preparation annealed samples. This phosphor wasvaluated for application in display technologies and also as aV down-converting layer for improved efficiency of photovoltaicells.
. Experimental details
.1. Powder preparation
The raw materials used were analytical reagent (AR) grade zinc nitrate hexahy-rate, aluminum nitrate, rare-earth nitrates (cerium nitrate and terbium nitrate),nd urea (ACS reagent). All these were of AR grade from Merck South Africa with99% purity, while the rare-earth (Ce3+ and Tb3+) nitrates with ∼99.99% purityere from Aldrich–Sigma. Stochiometric amounts of zinc nitrate, aluminum nitrate
nd urea were dissolved in triple de-ionized (DI) water. A homogeneous transpar-nt solution was obtained after stirring vigorously for 20 min. The solution wasransferred to a muffle furnace maintained at 400 ± 10 ◦C. After all the liquid hadvaporated, the mixture decomposed and released large amount of gases. Due to thexothermic nature of this process, the reaction continued for a while and the mix-ure swelled to a larger volume. Large exothermicity resulted in a flame that furtherecomposed the mixture into gaseous phases and aluminates. The flame persistedor ∼45 s. The entire combustion process was completed in less than 5 min. Theowder products were gently ground using an alumina mortar and pestle and werehen annealed at different temperatures either in air or hydrogen atmosphere tomprove their crystallinity and optical properties. ZnAl2O4:Ce3+,Tb3+ powder phos-hors with different concentrations of Ce3+ and Tb3+ were prepared and investigated.he amounts of zinc nitrate, aluminum nitrate and urea used were 2.91 g, 7.57 g and.037 g, respectively. To avoid concentration quenching effects, the dopants (Ce3+
nd Tb3+) concentration was kept as low as reasonably achievable and the experi-ents were designed in such a way that the total doping concentration added up to2 mol%. For example, the typical concentrations of Ce and Tb ion pairs used were,
espectively, 0.86 and 1.14 mol%, 1 and 1 mol% and 1.33 and 0.66 mol%.
.2. Characterization
Room temperature X-ray diffraction (XRD) patterns were recorded from 10◦ to5◦ (2�) using a PANalytical X’Pert PRO diffractometer with wavelength radiationf 1.5406 A (Cu K�). Luminescent properties were investigated at room tempera-ure using Hitachi F-7000 fluorescence spectrophotometer. The decay data wereecorded using an inverted-type scanning confocal microscope (MicroTime-200,icoquant, Germany). A single-mode pulsed diode laser (375 nm wavelength with annstrumental response function of ∼240 ps in full-width at half maximum, 40 MHzepetition rate, and an average power ∼1 �W) was used as an excitation source. Theorphological and structural properties were investigated using FEI Tecnai-F20G2
igh-resolution transmission electron microscopy (HRTEM) with an acceleratingoltage of 200 kV. The chemical composition was analyzed using a PHI-5000 versa-robe X-ray photoelectron spectrometer (XPS). The XPS data were collected whenhe samples were irradiated with a monochromatic Al K� radiation (h� = 1486.6 eV).urvey scans were performed using a 1 eV/step (binding energies ranging from 0 to400 eV). The sample area analyzed was about 1 mm2 and the pressure during datacquisition was typically under 1 × 10⁻⁸ Torr. The experimental curves were fittedsing Multipack v8.2c data analysis software provided with the PHI-5000 versa-robe ESCA instrument that made use of a combination of Gaussian–Lorentzianeaks.
. Results and discussion
.1. XRD analysis
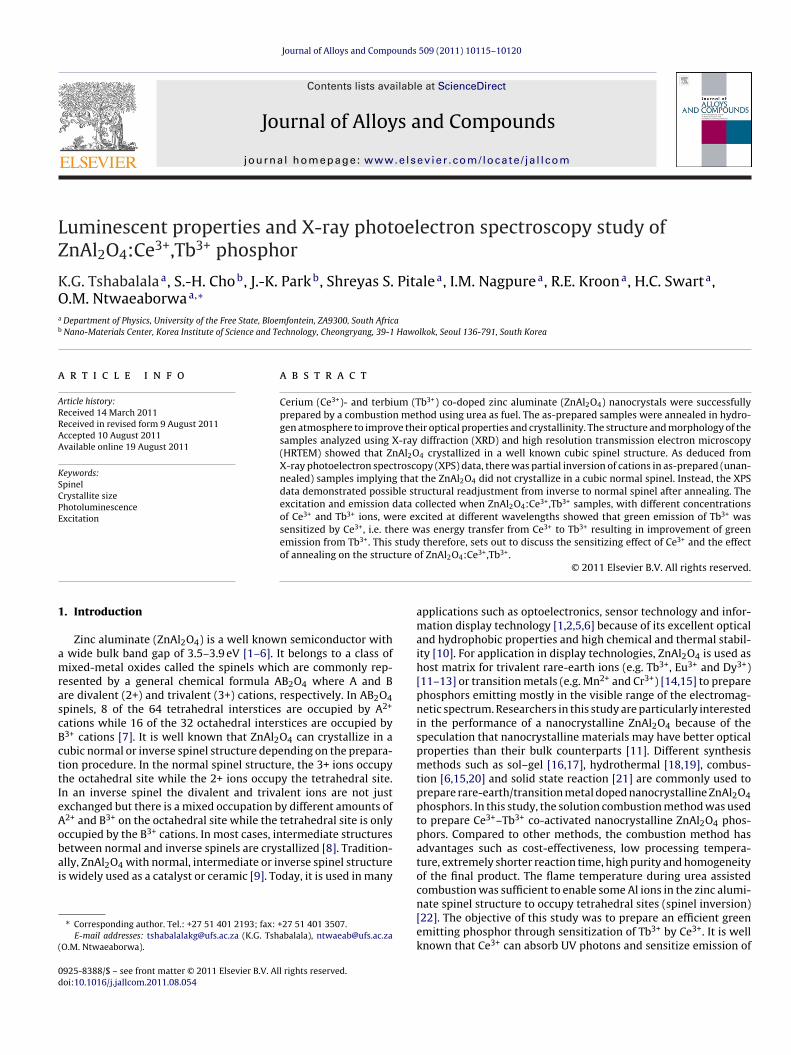
The XRD patterns of pure/undoped and Ce3+–Tb2+ co-activatednAl2O4 are, respectively, shown in Figs. 1 and 2. Undoped ZnAl2O4amples in Fig. 1 were (a) as prepared and (b) annealed in airt 600 ◦C and (c) 700 ◦C for 4 h, respectively. Fig. 2 shows theoom temperature XRD patterns of the ZnAl2O4:Ce3+,Tb3+ samples
nnealed at 700 ◦C in a hydrogen atmosphere for 4 h. The concentra-ions of Ce3+ and Tb3+ were (a) 1.33 mol%, 0.66 mol%; (b) 1.14 mol%,.86 mol%; (c) 1 mol%, 1 mol%; (d) 0.66 mol%, 1.33 mol%; and (e).86 mol%, 1.14 mol%. The diffraction patterns of Figs. 1 and 2 con-Fig. 1. Room temperature XRD patterns of ZnAl2O4 (a), as-prepared (b), annealedat 600 ◦C (c) and 700 ◦C in air for 4 h.
firmed that all the samples consisted of ZnAl2O4 spinel structurewith space group Fd3m as indexed by JCPDS file no. 01-082-1043.All the peaks obtained are in agreement with the spinel structurereported by Zawadzki et al. [25]. The intensity of the peaks rela-tive to the background signal demonstrates high crystallinity of thesamples. The peak intensities and the FWHM values (not shown) ofundoped ZnAl2O4 phosphors in Fig. 1 were approximately the sameregardless of annealing. It therefore shows that even without post-preparation annealing, highly crystalline material can be obtainedat a processing temperature as low as 400 ◦C. This result is differ-ent from conventional solid state reaction where high processingtemperature (usually >400 ◦C) is required to enhance crystallinity.Although the XRD patterns of Fig. 2 resemble those of Fig. 1, thepeaks have broadened and their intensities were also reduced. It iswell known that in addition to instrumental setup, the diffractionpeak broadening is also a result of the crystallite sizes and latticestrains i.e. large crystallite sizes cause sharp reflections whereassmall sizes lead to broad reflections, and variations in lattice spac-ings due to lattice strains can also cause broadening [26]. Since thesame procedure was used to prepare all samples in this study, thecrystallite size of the samples with or without activators (Ce3+ and
Fig. 2. Room temperature XRD patterns of annealed ZnAl2O4:Ce3+,Tb3+ with differ-ent concentrations of Ce3+ and Tb3+.
K.G. Tshabalala et al. / Journal of Alloys and Compounds 509 (2011) 10115– 10120 10117
F ated pt sampl
attlsh
3
ZgasiaHitciFo
3
nZ
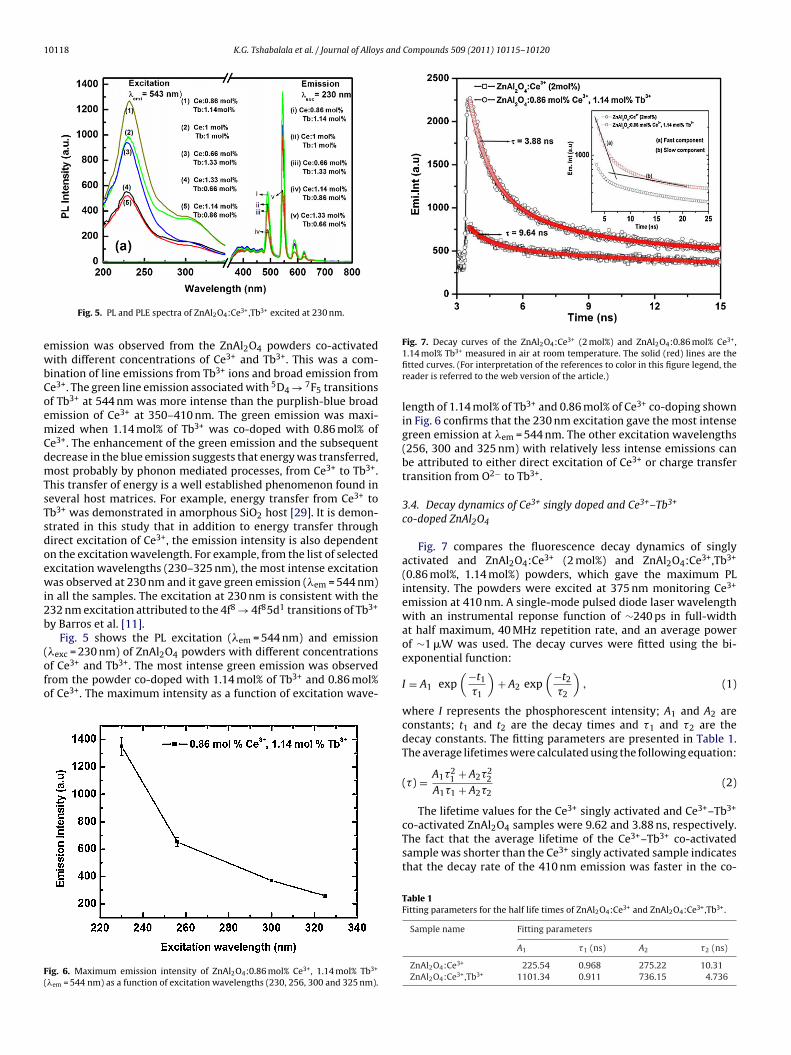
at 350 and 410 nm. These emissions correspond to the allowedtransitions from the lowest sublevel of the 5d state to the 2F7/2and 2F5/2 multiplets of the 4f configuration of Ce3+ [28]. Dual
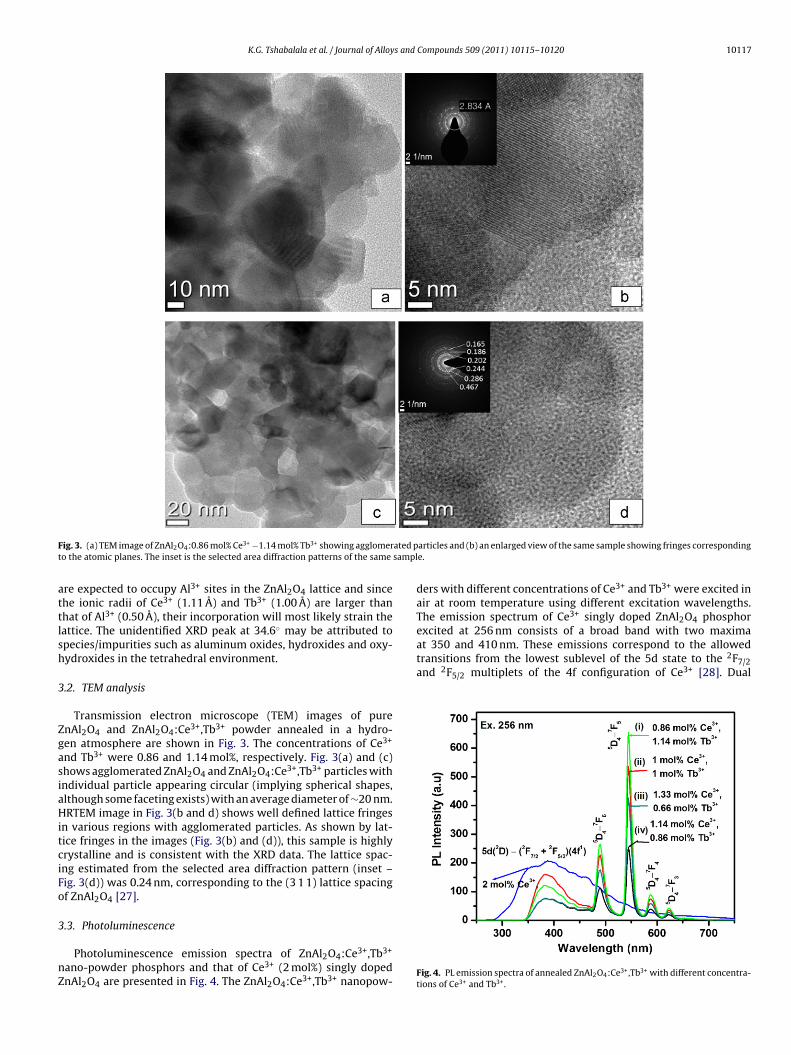
ig. 3. (a) TEM image of ZnAl2O4:0.86 mol% Ce3+ −1.14 mol% Tb3+ showing agglomero the atomic planes. The inset is the selected area diffraction patterns of the same
re expected to occupy Al3+ sites in the ZnAl2O4 lattice and sincehe ionic radii of Ce3+ (1.11 A) and Tb3+ (1.00 A) are larger thanhat of Al3+ (0.50 A), their incorporation will most likely strain theattice. The unidentified XRD peak at 34.6◦ may be attributed topecies/impurities such as aluminum oxides, hydroxides and oxy-ydroxides in the tetrahedral environment.
.2. TEM analysis
Transmission electron microscope (TEM) images of purenAl2O4 and ZnAl2O4:Ce3+,Tb3+ powder annealed in a hydro-en atmosphere are shown in Fig. 3. The concentrations of Ce3+
nd Tb3+ were 0.86 and 1.14 mol%, respectively. Fig. 3(a) and (c)hows agglomerated ZnAl2O4 and ZnAl2O4:Ce3+,Tb3+ particles withndividual particle appearing circular (implying spherical shapes,lthough some faceting exists) with an average diameter of ∼20 nm.RTEM image in Fig. 3(b and d) shows well defined lattice fringes
n various regions with agglomerated particles. As shown by lat-ice fringes in the images (Fig. 3(b) and (d)), this sample is highlyrystalline and is consistent with the XRD data. The lattice spac-ng estimated from the selected area diffraction pattern (inset –ig. 3(d)) was 0.24 nm, corresponding to the (3 1 1) lattice spacingf ZnAl2O4 [27].
.3. Photoluminescence
Photoluminescence emission spectra of ZnAl2O4:Ce3+,Tb3+
ano-powder phosphors and that of Ce3+ (2 mol%) singly dopednAl2O4 are presented in Fig. 4. The ZnAl2O4:Ce3+,Tb3+ nanopow-
articles and (b) an enlarged view of the same sample showing fringes correspondinge.
ders with different concentrations of Ce3+ and Tb3+ were excited inair at room temperature using different excitation wavelengths.The emission spectrum of Ce3+ singly doped ZnAl2O4 phosphorexcited at 256 nm consists of a broad band with two maxima
Fig. 4. PL emission spectra of annealed ZnAl2O4:Ce3+,Tb3+ with different concentra-tions of Ce3+ and Tb3+.
10118 K.G. Tshabalala et al. / Journal of Alloys and Compounds 509 (2011) 10115– 10120
ewbCoemCdmTsTsdoewi2b
(ofo
F(
Fig. 7. Decay curves of the ZnAl2O4:Ce3+ (2 mol%) and ZnAl2O4:0.86 mol% Ce3+,
Fig. 5. PL and PLE spectra of ZnAl2O4:Ce3+,Tb3+ excited at 230 nm.
mission was observed from the ZnAl2O4 powders co-activatedith different concentrations of Ce3+ and Tb3+. This was a com-
ination of line emissions from Tb3+ ions and broad emission frome3+. The green line emission associated with 5D4 → 7F5 transitionsf Tb3+ at 544 nm was more intense than the purplish-blue broadmission of Ce3+ at 350–410 nm. The green emission was maxi-ized when 1.14 mol% of Tb3+ was co-doped with 0.86 mol% of
e3+. The enhancement of the green emission and the subsequentecrease in the blue emission suggests that energy was transferred,ost probably by phonon mediated processes, from Ce3+ to Tb3+.
his transfer of energy is a well established phenomenon found ineveral host matrices. For example, energy transfer from Ce3+ tob3+ was demonstrated in amorphous SiO2 host [29]. It is demon-trated in this study that in addition to energy transfer throughirect excitation of Ce3+, the emission intensity is also dependentn the excitation wavelength. For example, from the list of selectedxcitation wavelengths (230–325 nm), the most intense excitationas observed at 230 nm and it gave green emission (�em = 544 nm)
n all the samples. The excitation at 230 nm is consistent with the32 nm excitation attributed to the 4f8 → 4f85d1 transitions of Tb3+
y Barros et al. [11].Fig. 5 shows the PL excitation (�em = 544 nm) and emission
� = 230 nm) of ZnAl O powders with different concentrations
exc 2 4f Ce3+ and Tb3+. The most intense green emission was observedrom the powder co-doped with 1.14 mol% of Tb3+ and 0.86 mol%f Ce3+. The maximum intensity as a function of excitation wave-ig. 6. Maximum emission intensity of ZnAl2O4:0.86 mol% Ce3+, 1.14 mol% Tb3+
�em = 544 nm) as a function of excitation wavelengths (230, 256, 300 and 325 nm).
1.14 mol% Tb3+ measured in air at room temperature. The solid (red) lines are thefitted curves. (For interpretation of the references to color in this figure legend, thereader is referred to the web version of the article.)
length of 1.14 mol% of Tb3+ and 0.86 mol% of Ce3+ co-doping shownin Fig. 6 confirms that the 230 nm excitation gave the most intensegreen emission at �em = 544 nm. The other excitation wavelengths(256, 300 and 325 nm) with relatively less intense emissions canbe attributed to either direct excitation of Ce3+ or charge transfertransition from O2− to Tb3+.
3.4. Decay dynamics of Ce3+ singly doped and Ce3+–Tb3+
co-doped ZnAl2O4
Fig. 7 compares the fluorescence decay dynamics of singlyactivated and ZnAl2O4:Ce3+ (2 mol%) and ZnAl2O4:Ce3+,Tb3+
(0.86 mol%, 1.14 mol%) powders, which gave the maximum PLintensity. The powders were excited at 375 nm monitoring Ce3+
emission at 410 nm. A single-mode pulsed diode laser wavelengthwith an instrumental reponse function of ∼240 ps in full-widthat half maximum, 40 MHz repetition rate, and an average powerof ∼1 �W was used. The decay curves were fitted using the bi-exponential function:
I = A1 exp(−t1
�1
)+ A2 exp
(−t2
�2
), (1)
where I represents the phosphorescent intensity; A1 and A2 areconstants; t1 and t2 are the decay times and �1 and �2 are thedecay constants. The fitting parameters are presented in Table 1.The average lifetimes were calculated using the following equation:
(�) = A1�21 + A2�2
2A1�1 + A2�2
(2)
The lifetime values for the Ce3+ singly activated and Ce3+–Tb3+
co-activated ZnAl2O4 samples were 9.62 and 3.88 ns, respectively.The fact that the average lifetime of the Ce3+–Tb3+ co-activatedsample was shorter than the Ce3+ singly activated sample indicatesthat the decay rate of the 410 nm emission was faster in the co-
Table 1Fitting parameters for the half life times of ZnAl2O4:Ce3+ and ZnAl2O4:Ce3+,Tb3+.
Sample name Fitting parameters
A1 �1 (ns) A2 �2 (ns)
ZnAl2O4:Ce3+ 225.54 0.968 275.22 10.31ZnAl2O4:Ce3+,Tb3+ 1101.34 0.911 736.15 4.736
K.G. Tshabalala et al. / Journal of Alloys and Compounds 509 (2011) 10115– 10120 10119
Fp
a4ittabpirpBtf(l
3
ZsC7
FT
Ce , 1.14 mol% Tb before and after annealing are shown in
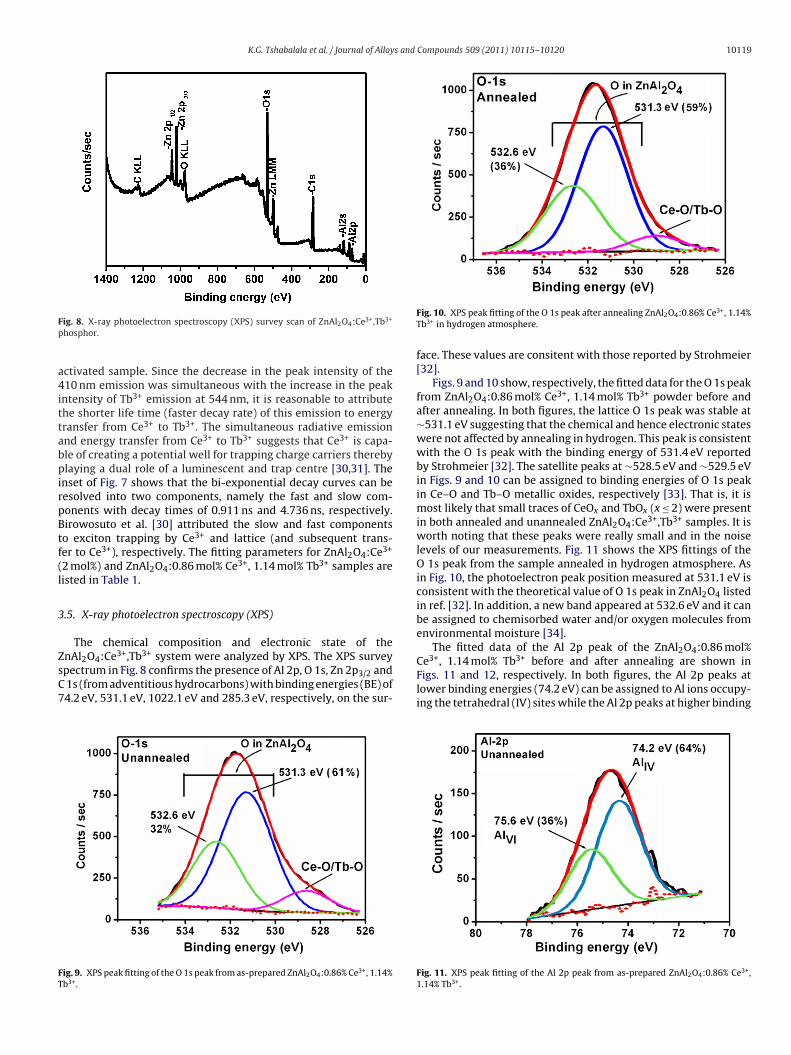
ig. 8. X-ray photoelectron spectroscopy (XPS) survey scan of ZnAl2O4:Ce3+,Tb3+
hosphor.
ctivated sample. Since the decrease in the peak intensity of the10 nm emission was simultaneous with the increase in the peak
ntensity of Tb3+ emission at 544 nm, it is reasonable to attributehe shorter life time (faster decay rate) of this emission to energyransfer from Ce3+ to Tb3+. The simultaneous radiative emissionnd energy transfer from Ce3+ to Tb3+ suggests that Ce3+ is capa-le of creating a potential well for trapping charge carriers therebylaying a dual role of a luminescent and trap centre [30,31]. The
nset of Fig. 7 shows that the bi-exponential decay curves can beesolved into two components, namely the fast and slow com-onents with decay times of 0.911 ns and 4.736 ns, respectively.irowosuto et al. [30] attributed the slow and fast componentso exciton trapping by Ce3+ and lattice (and subsequent trans-er to Ce3+), respectively. The fitting parameters for ZnAl2O4:Ce3+
2 mol%) and ZnAl2O4:0.86 mol% Ce3+, 1.14 mol% Tb3+ samples areisted in Table 1.
.5. X-ray photoelectron spectroscopy (XPS)
The chemical composition and electronic state of thenAl2O4:Ce3+,Tb3+ system were analyzed by XPS. The XPS survey
pectrum in Fig. 8 confirms the presence of Al 2p, O 1s, Zn 2p3/2 and1s (from adventitious hydrocarbons) with binding energies (BE) of4.2 eV, 531.1 eV, 1022.1 eV and 285.3 eV, respectively, on the sur-
ig. 9. XPS peak fitting of the O 1s peak from as-prepared ZnAl2O4:0.86% Ce3+, 1.14%b3+.
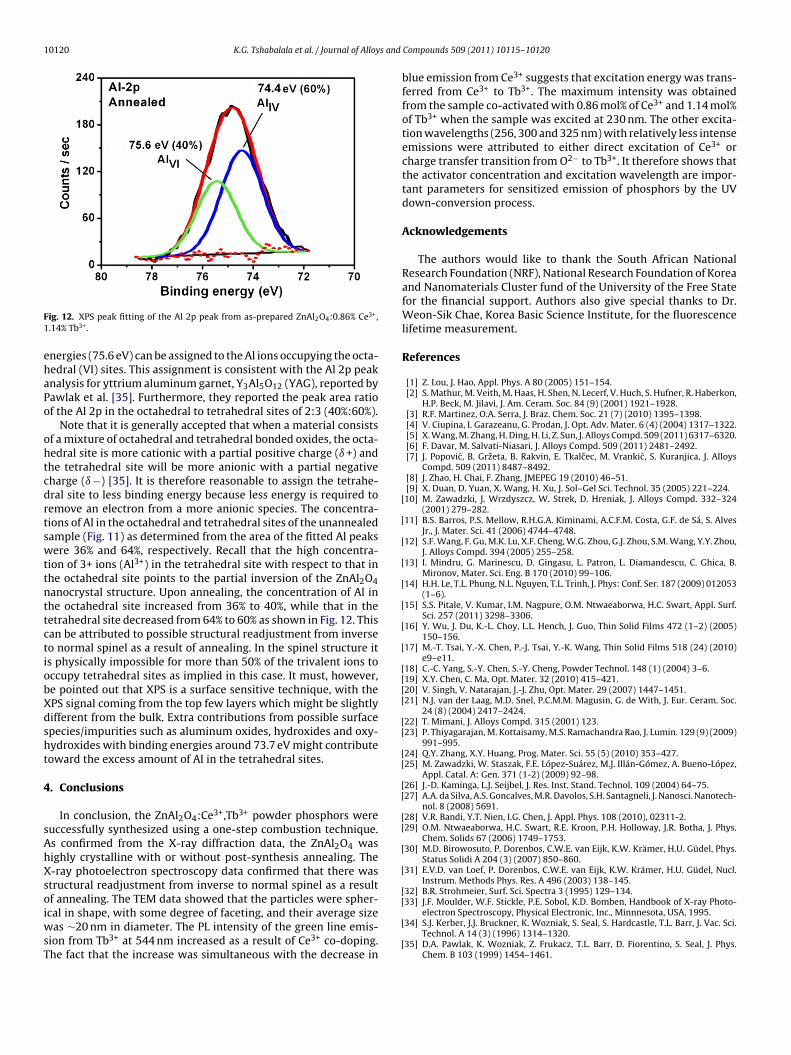
Fig. 10. XPS peak fitting of the O 1s peak after annealing ZnAl2O4:0.86% Ce3+, 1.14%Tb3+ in hydrogen atmosphere.
face. These values are consitent with those reported by Strohmeier[32].
Figs. 9 and 10 show, respectively, the fitted data for the O 1s peakfrom ZnAl2O4:0.86 mol% Ce3+, 1.14 mol% Tb3+ powder before andafter annealing. In both figures, the lattice O 1s peak was stable at∼531.1 eV suggesting that the chemical and hence electronic stateswere not affected by annealing in hydrogen. This peak is consistentwith the O 1s peak with the binding energy of 531.4 eV reportedby Strohmeier [32]. The satellite peaks at ∼528.5 eV and ∼529.5 eVin Figs. 9 and 10 can be assigned to binding energies of O 1s peakin Ce–O and Tb–O metallic oxides, respectively [33]. That is, it ismost likely that small traces of CeOx and TbOx (x ≤ 2) were presentin both annealed and unannealed ZnAl2O4:Ce3+,Tb3+ samples. It isworth noting that these peaks were really small and in the noiselevels of our measurements. Fig. 11 shows the XPS fittings of theO 1s peak from the sample annealed in hydrogen atmosphere. Asin Fig. 10, the photoelectron peak position measured at 531.1 eV isconsistent with the theoretical value of O 1s peak in ZnAl2O4 listedin ref. [32]. In addition, a new band appeared at 532.6 eV and it canbe assigned to chemisorbed water and/or oxygen molecules fromenvironmental moisture [34].
The fitted data of the Al 2p peak of the ZnAl2O4:0.86 mol%3+ 3+
Figs. 11 and 12, respectively. In both figures, the Al 2p peaks atlower binding energies (74.2 eV) can be assigned to Al ions occupy-ing the tetrahedral (IV) sites while the Al 2p peaks at higher binding
Fig. 11. XPS peak fitting of the Al 2p peak from as-prepared ZnAl2O4:0.86% Ce3+,1.14% Tb3+.
10120 K.G. Tshabalala et al. / Journal of Alloys and
F1
ehaPo
ohtcdrtswttnttctiobXdsht
4
sAhXsoiwsT
[
[
[
[
[
[
[
[
[[[[
[[
[[
[[
[[
[
[
[[
ig. 12. XPS peak fitting of the Al 2p peak from as-prepared ZnAl2O4:0.86% Ce3+,.14% Tb3+.
nergies (75.6 eV) can be assigned to the Al ions occupying the octa-edral (VI) sites. This assignment is consistent with the Al 2p peaknalysis for yttrium aluminum garnet, Y3Al5O12 (YAG), reported byawlak et al. [35]. Furthermore, they reported the peak area ratiof the Al 2p in the octahedral to tetrahedral sites of 2:3 (40%:60%).
Note that it is generally accepted that when a material consistsf a mixture of octahedral and tetrahedral bonded oxides, the octa-edral site is more cationic with a partial positive charge (ı +) andhe tetrahedral site will be more anionic with a partial negativeharge (ı −) [35]. It is therefore reasonable to assign the tetrahe-ral site to less binding energy because less energy is required toemove an electron from a more anionic species. The concentra-ions of Al in the octahedral and tetrahedral sites of the unannealedample (Fig. 11) as determined from the area of the fitted Al peaksere 36% and 64%, respectively. Recall that the high concentra-
ion of 3+ ions (Al3+) in the tetrahedral site with respect to that inhe octahedral site points to the partial inversion of the ZnAl2O4anocrystal structure. Upon annealing, the concentration of Al inhe octahedral site increased from 36% to 40%, while that in theetrahedral site decreased from 64% to 60% as shown in Fig. 12. Thisan be attributed to possible structural readjustment from inverseo normal spinel as a result of annealing. In the spinel structure its physically impossible for more than 50% of the trivalent ions toccupy tetrahedral sites as implied in this case. It must, however,e pointed out that XPS is a surface sensitive technique, with thePS signal coming from the top few layers which might be slightlyifferent from the bulk. Extra contributions from possible surfacepecies/impurities such as aluminum oxides, hydroxides and oxy-ydroxides with binding energies around 73.7 eV might contributeoward the excess amount of Al in the tetrahedral sites.
. Conclusions
In conclusion, the ZnAl2O4:Ce3+,Tb3+ powder phosphors wereuccessfully synthesized using a one-step combustion technique.s confirmed from the X-ray diffraction data, the ZnAl2O4 wasighly crystalline with or without post-synthesis annealing. The-ray photoelectron spectroscopy data confirmed that there wastructural readjustment from inverse to normal spinel as a resultf annealing. The TEM data showed that the particles were spher-
cal in shape, with some degree of faceting, and their average sizeas ∼20 nm in diameter. The PL intensity of the green line emis-ion from Tb3+ at 544 nm increased as a result of Ce3+ co-doping.he fact that the increase was simultaneous with the decrease in
[
[
Compounds 509 (2011) 10115– 10120
blue emission from Ce3+ suggests that excitation energy was trans-ferred from Ce3+ to Tb3+. The maximum intensity was obtainedfrom the sample co-activated with 0.86 mol% of Ce3+ and 1.14 mol%of Tb3+ when the sample was excited at 230 nm. The other excita-tion wavelengths (256, 300 and 325 nm) with relatively less intenseemissions were attributed to either direct excitation of Ce3+ orcharge transfer transition from O2− to Tb3+. It therefore shows thatthe activator concentration and excitation wavelength are impor-tant parameters for sensitized emission of phosphors by the UVdown-conversion process.
Acknowledgements
The authors would like to thank the South African NationalResearch Foundation (NRF), National Research Foundation of Koreaand Nanomaterials Cluster fund of the University of the Free Statefor the financial support. Authors also give special thanks to Dr.Weon-Sik Chae, Korea Basic Science Institute, for the fluorescencelifetime measurement.
References
[1] Z. Lou, J. Hao, Appl. Phys. A 80 (2005) 151–154.[2] S. Mathur, M. Veith, M. Haas, H. Shen, N. Lecerf, V. Huch, S. Hufner, R. Haberkon,
H.P. Beck, M. Jilavi, J. Am. Ceram. Soc. 84 (9) (2001) 1921–1928.[3] R.F. Martinez, O.A. Serra, J. Braz. Chem. Soc. 21 (7) (2010) 1395–1398.[4] V. Ciupina, I. Garazeanu, G. Prodan, J. Opt. Adv. Mater. 6 (4) (2004) 1317–1322.[5] X. Wang, M. Zhang, H. Ding, H. Li, Z. Sun, J. Alloys Compd. 509 (2011) 6317–6320.[6] F. Davar, M. Salvati-Niasari, J. Alloys Compd. 509 (2011) 2481–2492.[7] J. Popovic, B. Grzeta, B. Rakvin, E. Tkalcec, M. Vrankic, S. Kuranjica, J. Alloys
Compd. 509 (2011) 8487–8492.[8] J. Zhao, H. Chai, F. Zhang, JMEPEG 19 (2010) 46–51.[9] X. Duan, D. Yuan, X. Wang, H. Xu, J. Sol–Gel Sci. Technol. 35 (2005) 221–224.10] M. Zawadzki, J. Wrzdyszcz, W. Strek, D. Hreniak, J. Alloys Compd. 332–324
(2001) 279–282.11] B.S. Barros, P.S. Mellow, R.H.G.A. Kiminami, A.C.F.M. Costa, G.F. de Sá, S. Alves
Jr., J. Mater. Sci. 41 (2006) 4744–4748.12] S.F. Wang, F. Gu, M.K. Lu, X.F. Cheng, W.G. Zhou, G.J. Zhou, S.M. Wang, Y.Y. Zhou,
J. Alloys Compd. 394 (2005) 255–258.13] I. Mindru, G. Marinescu, D. Gingasu, L. Patron, L. Diamandescu, C. Ghica, B.
Mironov, Mater. Sci. Eng. B 170 (2010) 99–106.14] H.H. Le, T.L. Phung, N.L. Nguyen, T.L. Trinh, J. Phys: Conf. Ser. 187 (2009) 012053
(1–6).15] S.S. Pitale, V. Kumar, I.M. Nagpure, O.M. Ntwaeaborwa, H.C. Swart, Appl. Surf.
Sci. 257 (2011) 3298–3306.16] Y. Wu, J. Du, K.-L. Choy, L.L. Hench, J. Guo, Thin Solid Films 472 (1–2) (2005)
150–156.17] M.-T. Tsai, Y.-X. Chen, P.-J. Tsai, Y.-K. Wang, Thin Solid Films 518 (24) (2010)
e9–e11.18] C.-C. Yang, S.-Y. Chen, S.-Y. Cheng, Powder Technol. 148 (1) (2004) 3–6.19] X.Y. Chen, C. Ma, Opt. Mater. 32 (2010) 415–421.20] V. Singh, V. Natarajan, J.-J. Zhu, Opt. Mater. 29 (2007) 1447–1451.21] N.J. van der Laag, M.D. Snel, P.C.M.M. Magusin, G. de With, J. Eur. Ceram. Soc.
24 (8) (2004) 2417–2424.22] T. Mimani, J. Alloys Compd. 315 (2001) 123.23] P. Thiyagarajan, M. Kottaisamy, M.S. Ramachandra Rao, J. Lumin. 129 (9) (2009)
991–995.24] Q.Y. Zhang, X.Y. Huang, Prog. Mater. Sci. 55 (5) (2010) 353–427.25] M. Zawadzki, W. Staszak, F.E. López-Suárez, M.J. Illán-Gómez, A. Bueno-López,
Appl. Catal. A: Gen. 371 (1-2) (2009) 92–98.26] J.-D. Kaminga, L.J. Seijbel, J. Res. Inst. Stand. Technol. 109 (2004) 64–75.27] A.A. da Silva, A.S. Goncalves, M.R. Davolos, S.H. Santagneli, J. Nanosci. Nanotech-
nol. 8 (2008) 5691.28] V.R. Bandi, Y.T. Nien, I.G. Chen, J. Appl. Phys. 108 (2010), 02311-2.29] O.M. Ntwaeaborwa, H.C. Swart, R.E. Kroon, P.H. Holloway, J.R. Botha, J. Phys.
Chem. Solids 67 (2006) 1749–1753.30] M.D. Birowosuto, P. Dorenbos, C.W.E. van Eijk, K.W. Krämer, H.U. Güdel, Phys.
Status Solidi A 204 (3) (2007) 850–860.31] E.V.D. van Loef, P. Dorenbos, C.W.E. van Eijk, K.W. Krämer, H.U. Güdel, Nucl.
Instrum. Methods Phys. Res. A 496 (2003) 138–145.32] B.R. Strohmeier, Surf. Sci. Spectra 3 (1995) 129–134.33] J.F. Moulder, W.F. Stickle, P.E. Sobol, K.D. Bomben, Handbook of X-ray Photo-
electron Spectroscopy, Physical Electronic, Inc., Minnnesota, USA, 1995.34] S.J. Kerber, J.J. Bruckner, K. Wozniak, S. Seal, S. Hardcastle, T.L. Barr, J. Vac. Sci.
Technol. A 14 (3) (1996) 1314–1320.35] D.A. Pawlak, K. Wozniak, Z. Frukacz, T.L. Barr, D. Fiorentino, S. Seal, J. Phys.
Chem. B 103 (1999) 1454–1461.