Compression or expansion of morbidity?
264
Compression or expansion of morbidity? A life-table approach
-
Upload
khangminh22 -
Category
Documents
-
view
0 -
download
0
Transcript of Compression or expansion of morbidity?

Compression or expansion of morbidity?
A life-table approach

Financial support for the publication of this thesis by the Priority Programme on Population Research of the Netherlands Organization for Scientific Research (NWO) and by the Netherlands Society of Gerontology is gratefully acknowledged.
Additional financial support for the publication of this thesis was provided by the Department of Public Health, Erasmus University Rotterdam.
Nusselder, Wilma
Compression 01' expansion of morbidity? A life-table approach I Wilma Nusseldel' Thesis Erasmus University Rotterdam. - With Ref. . With summary in Dutch
Subject headings
Covel' design Layout Printed by
: compression of morbidity; disability; health expectancy; mortality; rectangularization; causes of death; elderly; The Netherlands
: Fred Bergman : Bon Mot, Rotterdam : Thesis Publishers, Amsterdam
ISBN: 90·9011630·3
© Wilma Nusselder, 1998; except chapters 3·4 © The Gerontological Society of America, 1996, 1997; chapter 8 © The American Public Health Association, 1996; Covel' illustration © Editions N. Heitz, Strasbourg
No part of this book may be reproduced in any form, by any means, electronic, photocopying, or otherwise without written permission from the copyright owners.

Compression or expansion of morbidity?
A life-table approach
Compl'essie of expansie van de mOl'biditeit?
Een overlevingstafel-benadering
Pl'oefschrift
tel' verkrijging van de graad van doctor aan de Erasmus Universiteit Rotterdam
op gezag van de Rector Magnificus Prof.dr P.W.C. Akkermans M.A.
en volgens besluit van het college voor promoties
De openbare verdediging zal plaatsvinden op woensdag 3 juni 1998 om 15.45 lIUl'
door
Wilhelmina Johanna Nusseldel'
gebol'en te Doetinchem

P1'oluotiec01Ulnissie
Promotor Prof.dr J.P. Mackenbach
Overige leden : Pl'Of.dl' G.A.M. van den Bos Pl'of.dl' A. Hofman Pl'Of.dl'i1' F.J.C. Willekens

Vaal' Ja en Jaap

Covel' illustration,' The Fountain of Youth, anonymous sixteenth-century Genu-an woodcut
This woodcut, probably dating from the mid-1520s and attribu,ted to the Nuremberg painter and woodcut desigller Erhard Schon (c. 1491-1542), shows the popular thente of the Fountain of Youth. This fountain was believed to restore youth to infirm, old people who bathed in or dra1l1l from its waters. It was a popular theme in medieval literature and the eadiest known illustrations originate from fourteenthcentury France. The woodcut by Erhard Schon shows a two-tiel' Renaissance fountain situated in a rustic landscape. Old people, in most cases accompanied by a servant, are approaching the fountain. On the left, a lame old woman is being carried to the fountain in a wheelbarrow. Two old people are clhnbing ladders to get into the basin. The bearded old man on crutches, who I:S depicted in the lower right hand corner, is the conventional representation 0/ old age in medieval art. In the waters of the fountain we see people who have already been rejuvenated and healed frol11. the infirmities of old age. A man and a woman in the basin are embracing each other. The same motif is shown all. the right. in the backgrou.nd, where the artist has depicted a romancing couple. This is an allusion to the rejuvenescent power of love alld a reference to another iconographic theme, that of the Fountain of Love. The woman with a mirror in her right hand all. the right. side of the fountain rejoices in her regained youth and beauty. She is the countel]JQrt of the man on the left side holding a goblet. In his depiction of the theme, the artist. assllmed a critical stance. The fact that. the waters of the fountain spring from the lower paris of the body of a jester clearly illustrates the artist's intention to l1well at the scelle and to characterize those who believe in the rejuvenescent powers of this fountain as fools.
Covel' illustration reproduced with permission of the editor (Editions N. Heitz, Sh'asbow-g) fl'om: Heuu'ich ROttinger, Erhard Schon und Nihlas SUiI', del' Pseudo-Scholl. Zwei Untersllchungen ZW' Geschielite des aften NI11'llberger Ho/zscll11ittes (Studien ZUl' Deutschen Kunstgeschichte, Heft 229J Strasboul'g: J.H. Heitz, 1925.

Contents
1. Introduction 1
PART I Old-age mortality and rectangularization
2. Lack of improvement of life expectancy at advanced ages in The Netherlands 17
3. Rectangularization of the survival curve in The Netherlands, 1950-1992 37
4. Rectangularization of the survival curve in The Netherlands: an analysis of underlying causes of death 59
PART II Health expectancy
5. A multistate Iife·table analysis of health expectancy using pooled data from different longitudinal studies
PART III Compression of morbidity
85
6. Compression of morbidity: an exploration ofthe conditions 131
7. Smoking elimination produces compression of morbidity 163
8. The elimination of selected c1n'onic diseases in a population: compression and expansion of morbidity 183
9. General discussion 201
10. Summary 229
11. Samenvatting 237
Acknowledgements 247
Dankwoord 249
Curriculum Vitae 253


Chapters 2-8 are based on the following articles and manuscripts:
2 Nusselder WJ, Mackenbach JP. Lack of improvement of life expectancy at advanced ages in The Netherlands. Submitted.
3 Nusselder WJ, Mackenbach JP. Rectangularization of the survival curve in The Netherlands, 1950·1992. The Gerontologist 1996;36(6):773·782.'
4 Nusselder WJ, Mackenbach JP. Rectangularization of the survival curve in The Netherlands: an analysis of underlying causes of death. Journal of Gerontology/ Social Sciences 1997;52(3):S145·S154.'
5 Nusselder WJ, Looman CWN, Mackenbach JP. A multistate life-table analysis of health expectancy using pooled data from different longitudinal studies. Manuscript.
6 Nusselder WJ, Looman CWN, Stronks K, Mackenbach JP. Compression of morbidity: an exploration of the conditions. Submitted.
7 Nusseldel' WJ, Looman CWN, Mal'ang-Van de Mheen PJ, Mheen H van de, Mackenbach JP. Smoking elimination produces compression of morbidity. Submitted.
8 Nusselder WJ, Bos GAM van den, Lenior ME, Sonsbeek JLA van, Velden J van del'. The elimination of selected cln'onic diseases in a population: the compression and expansion of morbidity. American Journal of Public Health 1996;86(2):187-194.2
1 Reprinted with permission of The Gerontological Society of America. 2 Reprinted with permission of The American Public Health Association.


Introduction

Chapte/' 1
1.1 Introduction
Changes in incidence, progression and l'ecovery of morbidity and related disability have important consequences for mortality, and, vice versa, changes in modality have important consequences for morbidity. The inter· play of changes in mortality and morbidity determines whether population health is improving 01' deteriorating. A deterioration or an improvement in the health status of the population has far reaching consequences. A deterioration in population health affects the lives of indivieluals and has implications for society as a whole, for instance in terms of population (health) service needs and social security. The subject of this thesis is the association between mortality and morbidity and its implications for population health. We will examine which conditions are necessary for longer life to be associated with better health. To this end we will assess which changes in underlying patterns of mortality and morbidity will produce a reduction in years with disability ('absolute compression of morbidity') andior a reduction of the proportion of life with elisability ('relative compression of morbidity').
1.2 Changes in mortality
Nowadays, in The Netherlands and in other low mortality countries, a longer life is often taken for gl·anted. Life expectancy has ah'eady risen since the eighteenth century in some European countries, including England, France and Scandinavia,!·3 That is, in those countries the average number of years that someone of a given age may expect to live has increased. In The Netherlands, mortality reductions are likely to have started in the nine· teenth century.' From 1840/51 to 1990/94 life expectancy increased fmm 36.1 to 74.2 years in men and ft'om 38.5 to 80.2 years in women.2,4
This impressive inCl'ease in length of life has been accompanied by substantial changes in the age·at·death and cause·of-death patterns. These shifts in age· and cause·specific mortality are described in the 'epidemiologic transition theory'. which is an extension of the mortality component of the 'demographic transition'.' Originally, three phases were distinguished: 'the age of pestilence and famine', 'the age of receding pandemics' and 'the age of degenerative and man-made diseases' .• During the epidemiologic transition, changes in the cause·of-death pattern ft'om mainly infectious diseases to chronic diseases were accompanied by a shift in the age pattern of mOl'tality ft'om younger towards older ages. In the third stage mortality was concenh'ated at older ages and was mainly caused by chronic diseases.
At the tinle the epidemiologic transition theory was formulated, the increase in life expectancy had ah'eady been slowing down for some years and chronic
2

Introduction
degenerative diseases had become the most important causes of death. These facts suggested that the increase in life expectancy had come to a halt6•7 and that the epidemiologic transition had ended.8 However, since the early 1970s, declines in mortality from chronic diseases at older ages have caused sharp rises in life expectancy of the elderly population.8.10 In order to incorporate tllis renewed decline in mortality, researchers have suggested adding a fourth stage to the epidemiologic transition.8 Olshansky formulated 'the age of delayed degenerative diseases'. This phase is characterized by the delay of mortality fi'om degenerative diseases to older ages, implying rapidly falling death rates, l'ising life expectancy at older age and a significant rise in the mean age of death fi'om these diseases.8 The most important difference between the last two phases is the slillt of mortality towards older ages without a shift in the cause-of-death pattel'll, chronic diseases remaining the main cause of death.
Uncertainty abounds, even today, as to whether the delay in mortality at older ages, which characterizes the fourth stage of the epidemiologic transition model, will continue to generate substantial increases in life expectancy in the neal' future or will generate ever smaller increases.
Two opinions are prevalent. One group of researchers, known as the proponents of 'the limited-life-span paradigm', believes that average life expectancy will not increase beyond 85 years of age. ll. l' Further substantial reductions in death rates at advanced ages are constrained by biological barriers (e.g. senescence) which will be overcome only in the event of major unforeseeable breakthl'Oughs in the process of aging, or by societal barriers (e.g. environmental deterioration and smoking). The increasingly rectangular shape of the survival curve, seen as a manifestation of the fact that the natural limit to human life has almost been completed 12.16 and the enormous reductions in mortality rates which would be needed to achieve a life expectancy at birth of 85 years" are used as arguments in support of this view. Arguments for the existence of a limited-life-span are provided by the evolutionary theory of senescence, well-known to researchers in the field of biodemography ,1'.16
Others, known as proponents of 'the mortality-reduction paradigm'l7·2l, argue that the decline in mortality rates will continue and may even accelerate, also at the most advanced ages. A life expectancy at bil-th of 100 years or more is considered to be within reach somewhere in the neal' future,l8,19 The observed decreases of mortality at advanced ages by 1-2% pel' year, and the very low mortality rates in subpopulations with healthy life styles, are used as arguments in favour of substantial future increases in life expectancy,l7,19 Among those who judge that large improvements in life expectancy are still possible, viewpoints differ as to whether there are biological limits to life expectancy. Some researchers believe that biological limits exist, but that future advances in biomedical research may nevertheless raise life expec-
3

Chapte/' I
tancy up to 100 years (e.g. Cutler and Havigl'ust), to 100-125 years (e.g. Strehler) 01' even up to 150-200 years (e.g. Rosenberg).!9
1.3 Changes in morbidity
Traditionally, improvements in life expectancy have been considered an indicator of improving population health. The fact that data on mortality wem (and are) widely available and reliable played a part in the choice for this indicator. Vital statistics and population registers which covel' the entu'e population provide accurate data over a long period of tilne. These mortality data are reliable since death is a unique event and is clearly defined, as opposed to morbidity, which can be defined in numerous ways.22 A second reason is that the positive association between mortality and morbidity was taken for granted for a long time. A decline in mortality was generally considered to reflect a deciule Ul morbidity in the population. Nowadays, in low mortality countries where improvements in life expectancy are caused by mortality reductions from cln'onic diseases Ul older ages, serious doubt exists as to whether longer life means a reduction in morbidity."·2.
With regard to the development of morbidity in the (elderly) population in low mortality count.ries during the fourth stage of the epidemiologic transition, three hypotheses have been formulated: (1) the expansion-of-morbidity hypothesis, (2) the compression-of-morbidity hypothesis and (3) the dy· namic-equilibrium hypothesis. These hypotheses differ as far as the expected size of the increases in life expectancy is concerned and the way in which these mortality reductions are 01' will be achieved.
1. The expansion-of-lIwl'bidity hypothesis The expansion-of-morbidity hypothesis (also called the 'pandemic-of-mentaldisorders-and-disabilities' or 'failure-of-success' hypothesis) states that mortality reductions will produce more years with morbidity and related disability."·2. Mortality reductions might produce this increase in years with morbidity and disability (i.e. expansion of morbidity) in two ways. Fu'st, through a reduction in the lethal sequelae of degenerative conditions, due to medical interventions that prolong the life of the seriously chronically ill."·24 Second, through increased survival which pushes the saved population ulto the oldest·old ages where the risks of nonfatal cliseases of aging are ex· tremely high.25•2• Hence, declining mortality u-om fatal diseases produces a population with high risks of chronic morbidity and related disability and thus leads to a shift in the distribution of causes of disability u'om fatal to nonfatal diseases. These nonfatal conditions, like arthritis, dementia, diminished hearing, hip u-acture and depression, are considered factors which cause expansion of morbidity."
4

Introduction
2. The compression-of-mol'bidity hypothesis In response to the pessimistic view of a pandemic of clu'onic diseases and disability, Fries formulated the compression-of-morbidity hypothesis.12.lb.28 The compression-of-morbidity hypothesis assumes that life span is fixed, that life expectancy is reaching this limit, that clu-onic diseases and related disability can be postponed to older ages by behaviourial changes and that the physiologic (e.g_ serum cholesterol, blood pressure) and psychologic markers (e.g_ social interaction, memory) of aging can be modified. Fries argues that there is a natural limit to the life span (i.e_ the genetically endowed limit to life for a single individual if free of all exogenous risk factors). A lineal' decline in organ reserve with increasing age parallels the decline in the ability to restore homeostasis. Eventually, the smallest perturbation prevents homeostasis fi'om being restored and causes 'natural death', which may even occur without disease.l2 The oCCllrrence of rectangularization is regarded as an indication that life expectancy is reaching the maximum life span, which prevents life expectancy fi'om any further substantial increase. Clu'onic diseases, which are responsible for the majority of all deaths and disability, can be postponed or even prevented by adopting a healthy life style, such as avoiding overweight, quitting smoking and doing exercise. The amount of morbidity can decrease as chronic morbidity is compressed into the shorter span between the increasing age at onset of morbidity and the fixed age at death. Postponement of clu'onic diseases thus results in rectangularization not only of the mortality curve but also of the morbidity curve. Thus delaying the onset of chronic disease and disability, while assuming that the length of human life is fixed, produces a decline in the number of years with morbidity. This is known as 'compression of morbidity'. The compression-of-morbidity hypothesis therefore associates longer life (although limited) with an improvement in the healthfulness of Iife_
3. The dynamic-equilibrium hypothesis A third, intermediate view, known as the 'dynamic-equilibrium' hypothesis has been put forward by Manton.29 According to tltis hypothesis there exists an equilibrium between life expectancy and the health and functioning of the elderly population. As does the expansion-of-morbidity hypothesis, the dynamic-equilibrium hypothesis predicts further increases in life expectancy. The dynamic-equilibrium hypothesis states that increased survival will produce an increase in years with morbidity, but years with severe morbidity and disability will be relatively constant, because the rate of progression of chronic diseases is reduced.29 What counts, therefore, is not the postponement of the lethal sequelae, but the fact that the rate of progression of certain degenerative diseases in the elderly population has been slowed down by medical interventions and lifestyle changes in an earlier (less severe) stage of the disease process.
Empirical evidence on trends in morbidity which have accompanied the mortality reductions since the early 1970s is not conclusive as to which of
5

Chapter 1
these hypotheses is supported by the facts,30,32 Most studies iudicate an iucrease of morbidity and/or disability among the elderly iu the 1970s (except for those over age 75), stability 01' continuation of the deterioration in the first years of the 1980s, followed by some improvement in the second half of the 1980s and 1990s, Uncertaiuty exists as to whether these changes based on data of self-reported health are due to changes in objective morbidity (i,e, morbidity assessed through an iudependent observer) 01' due to changes iu the way people perceive theu' health and report on it,22,25,30,33
1.4 The relation between changes in mortality and morbidity
The compression-versus-expansion debate and empu'ical studies on trends in health duriug the period of mortality decline have shown that it would be an oversimplification to make inferences about the change in population health solely from mortality trends, Apart from the time lag between the OCCUl'rence of disease and death, two groups of explanations can be distiuguished for the possible absence of a parallel development of mortality and morbidity, One set of explanations is at the level of disease processes, and one at the level of the distribution of diseases and frailty iu the population (i,e, population heterogeneity),
Fu'st, diseases and conditions differ as far as they are associated with mortality (i,e, operate as cause of death) and/or with morbidity (i.e, operate as cause of morbidity and disability), Acute deaths resultiug from external causes of death (e,g, homicide and suicide) 01' fatal diseases with a very short dUl'ation (such as some cancers) do not cause (significant) chronic morbidity 01' disability,34 Consequently, changes in mortality from these diseases can occur without substantial changes in morbidity from these conditions, Nonfatal diseases, such as arthritis, musculoskeletal diseases, vision and heariug loss do not cause mortality but have a considerable burden of morbidity, in tel'ms of disability,25,34 For these diseases, changes iu morbidity can occur without substantial changes in mortality, In between are chronic diseases which are - to a gl'eater 01' lesser extent - both disabling and fatal. For this gl'oup, the association between mortality, morbidity and disability depends upon the nature of changes iu iucidence of morbidity, iu the rate of progl'ession of diseases, iu the probability of recovery and iu case-fatality, If mortality declines because people do not develop the disease, develop the disease later iu life, 01' recover from the disease, a mortality reduction is accompanied by improved health, On the other hand, if mortality declines among persons who ah'eady have the disease, if the disease progl'ession is reduced 01' if death is delayed, a mortality reduction is accompanied by an increase iu morbidity in the population".,a,
6

Introduction
Second, the absence of a parallel movement of changes in mortality and morbidity can be due to interaction effects between mortality and morbidity which affect the distribution of risk factors, morbidity and frailty in the population. 'I\vo mechanisms which affect population heterogeneity and may explain the absence of the parallel movement between changes in mortality and morbidity can be distinguished. The first relates to mortality selection. As mortality falls, genetically weaker individuals survive longer and in tUl'll are subject to higher rates of disease, disability and mortality later in life.22.29•35 Thus, morbidity and related disability in the population may in· crease after initial mortality declines, because the frailer and weaker pel" sons become a relatively more numerous group in the population. The sec· ond mechanism implies changes in the prevalence of risk factors in the population. Chronic diseases can share common risk factors (e.g. smoking causes both lung cancel' and cal'(liovascular diseases), and one disease can act as a risk factor for a second disease (diabetes mellitus increases the risk of cardiovascular diseases). As a consequence, reductions in mortality in one chronic disease due to reduced case·fatality 01' a slower progression of the disease may affect the risk factor distribution of the population, and thus might increase the susceptibility to morbidity and further mortality. On the other hand, there are also mechanisms which affect popUlation heterogene· ity that may cause a positive correlation between mortality and morhidity. For instance the experience of morbidity at one point in the life course might have important negative consequences for morbidity and mortality later in life, because damage from illness 01' injury (i.e. insult accumulation) in· creases the susceptibility for disease and mortality in the future."' As are· suIt, a reduction in incidence of morbidity may leave a stronger population. In general, a parallel development of morbidity and mortality, depends upon the stage in the causal chain running from risk factor(s) through disease(s) to mortality at which a change occurs.
1.5 A comprehensive framework for integrating changes in mortality and morbidity
The complex association between mortality and morbidity implies that we should not confine ourselves to examining changes in either mortality 01'
mOl'bidity from which we subsequently draw inferences about the evolution of population health in general. Reductions in mortality are not necessarily accompanied hy l'eductions in morbidity and disability in the population and vice versa. For example, if the prevalence of morbidity declines due to an increase in premature mortality, population health can hardly be said to be improving. On the other hand, when increases in the length of life imply that the duration of time spent with severe disability and fi-ailty is increas· ing, the improvements in population health might be smaller (01' might even
7

Chapter 1
become negative) than the extension of life would suggest. It is exactly the balance between changes in mortality and morbidity that determines whether population health is improving 01' deteriorating. Therefore the focus should not only be on the lengthening of life ('adding years to life') but also on the improvement of the healthfulness of life ('adding life to years').
The preceding remarks on the complex association between mortality and morbidity and the importance of both aspects together for the health status of the population, suggest the need to take into account factors not considered in the epidemiologic transition model. To describe and explain (changes in) population health an elaborate model is required, which includes fatal and nonfatal health outcomes, and relates (changes in) mortality and morbidity to (changes in) population health, and vice versa.
The survival curve model, originally introduced by the World Health Organisation in 198436, provides a comprehensive framework and an analytic tool to integrate changes in mortality and morbidity. The WHO model captures the dynamics of mortality, morbidity and disability over the life course in a relatively standardized manner. It consists of three survival curves, the mortality, disability and morbidity curve, which describe changes in the proportion of individuals in a cohort who can expect to survive without respectively mortality, disability and morbidity. For reasons of transparency and consistency of terminology, we will not distinguish between a morbidity curve and a disability curve. Morbidity is used in general terms; disability is considered as a dimension of morbidity. In Figure 1 the area below the mortality curve represents total life expectancy, while the area under the mOl'bidity curve represents life expectancy without morbidity. The area between the mortality and the morbidity curve reflects the expected duration of life with morbidity. The WHO model enables us to evaluate whether 01' not changes in mortality and morbidity result in compression 01' expansion of morbidity.
The survival curves used in the WHO model are determined by age-specific mortality, disability and morbidity rates and are calculated from the life table. Total life expectancy and life expectancies with and without morbidity and disability can be easily derived from the number of person years spent by the (synthetic) cohort in different health states distinguished in the life table.
Using a life table perspective has several advantages. First, the life table pl'Ovides a tool to analyze (changes in) mortality and morbidity rates within the framework of a single integrated model of population health and to summarize information on (changes in) mortality and morbidity into an integrated indicator of population health. This indicator, 'health expectancy', is the expected duration that individuals on average will spenel in a specific health state, provided that current age-specific mortality and morbidity
8

bttroduction
Figure 1 Mortality (hypothetical) and morbidity (hypothetical) survival curves.
rates remain unchanged during the lives of these individuals. Health expectancy is increasingly used as an indicator for population health.37•38 To date, health expectancy has been calculated in 32 countries.'"
Second, the life table can serve as a conceptual model to describe and visualize the association between changes in mortality and morbidity and population health. It thus helps to clarify the debate on compression- and expansion-of-morbidity_ For this reason, health expectancy is a key concept in this debate. The life-table model of health expectancy clearly illustrates that changes in population health depend upon the relative importance of changes in the underlying mortality and morbidity curves. It will be obvious that these curves need not necessarily change in the same direction and to the same extent. This implies that the area between two curves might SIll-ink or expand. Thus a situation of absolute compression of morbidity and absolute expansion of morbidity can be described as follows:
1. Absolute compression of morbidity (disability) occurs when the area between the mortality and the morbidity (disability) curve diminishes. In other words, life expectancy with morbidity (disability) declines.
2. Absolute expansion of morbidity (disability) occurs when the area between the mortality and the morbidity (disability) curve expands_ In othel- wOl-ds, life expectancy with morbidity (disability) increases_
9

Chapter 1
Sometimes it is not enough to describe a situation in terms of absolute expansion 01' compression of morbidity, especially when the total length of life is increasing 01' diminishing substantially. In m'der to allow for the latter changes, relative measures, such as 'relative compression of morbidity' and 'relative expansion of morbidity', are in use.40
1.6 This thesis
This thesis reports the l'esults of a study on the association between (changes in) mortality, morbidity and population health. The main objective is to specify which changes in mortality and morbidity would be needed to achieve compression of morbidity in The Netherlands in the future. The life table is used as a conceptual model and an analytic tool to examine changes in mortality, morbidity and population health. The main focus is on the burden of mortality and morbidity due to chronic diseases, 01' in other words, on the consequences of chronic diseases. The burden of morbidity is defined operationally in terms of disability. In this thesis disability means restrictions in both actions and activities. The former comprise restrictions in performing fundamental actions used in daily life, such as walking, climbing stairs and reading standard -size print. These can also be labelled as functional limitations. Activities refer to more complex operations which comprise of several basic physical anel mental actions, like m'essing and bathing.".42
Both disability and death are generic health outcomes, which can be used to summarize the population burden of morbidity and mortality due to diseases and injuries. Disability, like mortality, indicates that a certain 'severity' threshold is passed, reflecting a negative impact of one or more chmnic diseases or injuries on the quality of life. The time spent above a disability threshold is more revealing than the time spent between the onset of disease and the occurrence of death. Tllis is obvious, when we consider the consequences of impmved detection of disease. Due to improved case-finding we will find increases in the time spent with disease. But this does not necessarily imply that the burden of morbidity has increased. In the same way, an improvement in survival does not imply that the burden of morbidity will increase. By using a threshold based on disability this problem can be partially cu:cumvented.
Health expectancy, in this thesis operationally defined as life expectancy with or without disability, will be used to assess population health. Changes in health expectancy thus defined are evaluated in order to assess whether or not compression of morbidity has occurred. Compression of morbidity is defined as a concentration of disability into a smaller number of years of life (absolute compression) or into a smaller proportion of total life expectancy (relative compression). The relationsllip between mortality and disability on the one hand and diseases and theu' risk factors (such as smoking) on the
10

Introduction
other hand is investigated in several parts of this thesis. In this thesis, a topdown approach is followed fi'om generic health outcomes (i.e. mortality and disability) to diseases and risk factors. The alternative approach would have been a disease-specific or bottom-up approach, which starts from risk factors and diseases:t3
The study aims are the following:
1. To describe and analyze recent changes in Dutch mortality, paying special attention to changes in the rectangularity of the survival curve and in life expectancy at older ages. Both issues play an important role in the compression-of-morbidity debate.
2. To describe the current age-specific mortality and disability patterns in the Dutch adult population and to translate these patterns into an integrated population health indicator.
3. To determine which changes are needed in current mortality and disability patterns to achieve compression of morbidity in The Netherlands. The effect of the following (hypothetical) situations will be studied: (a) a general reduction in age-specific mortality and disability rates; (h) a reduction in mortality and disability due to the elimination of smoking, and (c) a reduction in mortality and disability due to the elimination of specific chronic diseases.
The thesis consists of three parts, each related to one of the three aims of the study just described.
PaI't I: Old-age lIIol'tality and 'I'ectangllla";zation' (chaptel's 2-4) In chapter 2 changes in life expectancy at ages 60 and 85 in the period 1970-1994 will be studied. Next, changes in life expectancy at these ages will be decomposed by age and by cause of death. Chapter 3 deals with developments in mortality in The Netherlands since 1950 and focuses on changes in the shape of the survival curve and in life expectancy at older ages. We will assess whether 01' not rectangularization has occurred in The Netherlands in recent years. In chapter 4 the contribution of different causes of death to changes in the shape of the survival curve will be examined by means of a life-table decomposition analysis, which relates changes in the shape of the survival curve to changes in age- and cause-specific death rates.
Pal't II: Health expectancy (chaptel' 5) The fifth chapter deals with the estimation of health expectancy on the basis oflongitudinal data. We will first estimate current age-specific mortality and disability l'ates in The Netherlands using Poisson l'egt'ession analysis with offset (also known as 'log-rate analysis'). Next, these mortality and disability rates will be combined in a multistate life-table model of health expectancy, consisting of three health states: 'nondisabled', 'disabled' and 'dead'. The multistate life table translates the mortality and disability rates into an in-
11

Chapter 1
tegrated population health indicator, health expectancy. The current mortality and disability patterns and the integrated population health indicator will be used as a starting point for two of the three scenario calculations in part three.
Par·t III: Compression ofmOl'bidity (chaptas 6-8) In the third part of this thesis we will examine which changes in current mortality and disability patterns will be necessary to achieve compression of morbidity in The Netherlands. For this purpose, we will follow three different apPl'Oaches. First, in chapter 6, we will examine which changes in the age-specific incidence rates of disability, recovery rates from disability and mortality rates among nondisabled and disabled persons will be needed to result in compression of morbidity in The Netherlands. Next, in chapter 7, we will examine the effect of the elimination of an important risk factor -smoking - on health expectancy. We will assess whether elimination of smoking is likely to produce compression of morbidity. We will combine epidemiologic information on the association between smoking and disability and mortality with the multistate life-table model of health expectancy, estimated in chapter five. Finally, in chapter 8, we will examine whether the elimination of several chronic conditions causing disability and/or death is likely to produce compression ofmOl·bidity. For this purpose we will combine the cause-elimination life-table technique with 10gistic-regJ.·ession analysis.
In chapter 9 we will summarize the main findings of our studies and discuss the main features of the approach we followed in this thesis. Finally, we will make some recommendations for further research and will discuss several policy implications of the outcomes.
References
1. Wrigley EA, Schofield RS. English population history from family reconstitution: summary results 1600-1799. Popnlation Stndies 1983;37:157-184.
2. Mackenbach JP. De vel'en van Icarus. Ouel' achtel'gl'onden van twee eellwen epide· miologische transitie in Nederland. Utrecht, the Netherlands: Wetenschappelijke Uitgeverij Bunge, 1992.
3. Mackenbach JP. The epidemiologic transition theory. Journal of Epidemiology and Commnnity Health 1994;48(4):329·331.
4. Statistics Netherlands. Overlevingstafels 1994 en 1990-1994 [Life tables 1994 and 1990·1994]. Maandstatistiek UDOI' de Bevolkillg (Monthly Bulletin of Population Statistics] 1995;44:30-34.
5. Omran AR. The epidemiologic transition. A theory of the epidemiology of popula· tion change. Milballk Memol'ial Fund Qual'terly 1971;49(4):509-538.
6. Crimmins EM. The changing pattern of American mortality decline, 1940·77, and its implications for the future. Popuiai£on Qnd Development Review 1981;7(2): 229-254.
12

Introduction
7. Brody JA. Prospects for an ageing population. Nature 1985;315(6019):463-466.
8. Olshansky SJ, Ault AB. The fourth stage of the epidemiologic transition: the age of delayed degenerative diseases, Milbank Quarterly 1986;64(3):355·391.
9, Myers JC. Comparative mortality trends among older persons in developed countries. In: Caselli G, Lopez AD, ed. Health and At[ol'lality among Elderly PoplllatiOIlS, Oxford, UK: Clarendon Press, 1996:87-111.
10. Grundy E. Mortality and morbidity among the old. British Medical Journal 1984;288(6418):663·664,
11. Keyfitz N, Improving life expectancy: an uphill road ahead. American Jou"IIa.1 of Public Health 1978;68(10):654·656,
12. Fries JF. Aging,' natural death, and the compression of morbidity. New England Joul'I!al of Medicine 1980;303(3): 130·135,
13, Olshansky SJ, Carnes BA, Cassel C. In search of Methuselah: estimating the upper limits to human longevity. Science 1990;250(4981):634-640,
14. Olshansky SJ, Carnes BA Demographic perspectives on human senescence. Population and Development Review 1994;20(1):57-80.
15. Fries JF. The compression of morbidity, MilbQ1zh A1emorial Fund Quarterly/ Health and Society 1983;61(3):397·419,
16. Carnes BA, Olshansky SJ. Evolutionary perspective on human senescence. Population and Development Review 1993;19(4):793·806,
17. Vaupel JW, Lundstrom H. The future of mortality at older ages in developed countries. In: Lutz W, ed. The Future Population of the World. What Can We Assume Today? London, UK: Earthscan Publications, 1994:295·315,
18. Vaupel JW, Gowan AE. Passage to Methuselah: some demographic consequences of continued progress against mortality. American Journal of Public Health 1986; 76(4):430·433,
19. Manton KG, Stallard E. Tolley HD, Limits to human life expectancy: evidence, prospects and implications. Population and Development Review 1991;17(4): 603·637,
20. Guralnik JM. Yanagishita M, Schneider EL. Projecting the older population of the United States: lessons from the past and prospects for the futUl·e. Milbank Quarterly 1988;66(2):283·308,
21. Schneider EL, Brody JA. Aging, natural death, and the compression of morbidity: another view, New Englwzd Jou/'IZal of Medicine 1983;309(14):854·856,
22. MUl'l'ay CL, Chen LC. Understanding morbidity change, Population and Development Review 1992;18(3):481·503,
23, Gruenberg EM, The faihU'es of success. Milbanh Memorial Fund Quarterly/Health and Society 1977;55(1):3·24,
24, Kramer M. The rising pandemic of mental disorders and associated chronic diseases and disabilities, Acta Psychia.trica Scandinavia 1980;62(SuppL 285):382·397,
25. Verbrugge LM. Longer life but worsening health? Tl'ends in health and mortality of middle-aged and older persons. MilbG/lh Memorial Fund Quarterly/Health and Society 1984;62(3):475·519,
26, Olshansky SJ, Rudbe1'g MA, Carnes BA, Cassel CK, Brody JA. Trading Off Langel' Life for Worsening Health, Journal of Aging and Health 1991;3(2):194·216,
27, Brody JA, Miles TP, Mortality postponed and the unmasking of age-dependent non·fatal conditions, Aging 1990;2(3):283·289,
13

Chapter 1
28. Fries JF, The compression of morbidity: neal' or far? Milballh Quarterly 1989;67(2):208-232.
29. Manton KG. Changing concepts of morbidity and mortality in the elderly population. Milbank Memorial Fund Quarterly/Health and Society 1982;60(2): 183-244.
30. Crimmins EM, Saito YS, Illgegnel'i D. Changes in life expectancy and disability-free life expectancy in the United States. Population and Development Review 1989; 15(2):235-267.
31. Crimmins EM, Ingegneri DG. Trends in health among the american population. In: Rappaport AM, Schiebel' SJ, ed. Demography and Retirement: The Twenty- First Century. London, UK: Westport, Connecticut, 1993:225-253.
32. Crimmins EM, Saito Y, Reynolds SL. Further evidence on recent trends in the pl'evalellce and incidence of disability among older Americans from two sources: the LSOA and the NHIS. Joumal of Gerontology/Social Sciences 1997;52(2): S59-S71.
33. Waidmann T, Bound J, Schoenbaum M. The illusion of failure: trends in the self-reported health of the U.S. elderly. Milbank Quarterly 1995;73(2):253-287.
34. Chapman SH, LaPlante MP, Wilensky G. Life expectancy and health status of the aged. Social Security Bulletin 1986;49(10):24-48.
35. Alter G, Riley JC. Frailty, sickness, and death: models of morbidity and mortality in historical populations. Population Studies 1989;43:25·45.
36. Manton KG, Soldo BJ. Dynamics of health changes in the oldest old: new perspec· tives and evidence. Milbmtlt Memorial Fund Quarterly I Health and Society 1985;63(2):206-285.
37. Robine JM, Ritchie K. Healthy life expectancy: evaluation of global indicator of change in population health. British Medical Journal 1991;302(6774):457-460.
38. Bone MR. International efforts to measure health expectancy. Journal of Epidemi· ology and Community Health 1992;46(6):555-558.
39. Romieu 1. World Atlas on health expectancy. In: Mathers C, McCallum J, Robine JM, ed. Advances in Health Expectancies. Canberra, Australia: Australian Institute of Health and Welfare, 1994:59-69.
40. Robine JM, Mathers CD. Measuring the compression or expansion of morbidity through changes in health expect.ancy. In: Robine JM, Mathers CD, Bone M, Romieu I, ed. Calculation of Health Expectancies: Harmonization, COflSellSUS Achieved and Future Perspectives. Montpelliel', France: John Libbey Eurotext, 1993:269-288.
41. Verbrugge LM, Jette AM. The disablement process. Social Science and Medicine 1994;38(1): 1-14.
42. Boshuizen HC, Van de Water HP. ICIDH in the calculation of health expectancy. Disability and Rehabilitation 1995; 17(7):358-363.
43. Barendregt JJ, Bonneux L. Degenerative Disease in an Aging Populatioll: Models and Conjectures. Rotterdam, the Netherlands: Erasmus University Rotterdam, 1998.
14

,PART I
Old-age mortality and rectangulariza tion


Lack of improvement of life expectancy at advanced ages
in The Nether lands
Abstmct
Objective: Several coltntries have reported that life expectancy at advanced ages is increasing. This paper analyzes recent changes in life expectancy at age 60 and age 85 in The Netherlands, a low mortality country with reliable mortality data. Methods: We used data on the population and the number of deaths by age, sex and underlying caltse of death for the period 1970-1994 from Statistics Netherlands. Life expectancy at age 60 and 85 was estimated using standard life-table techniques. The contribution of different ages and callses of death to the change in life expectancy dllring the 1970s (1970/74-1980/84) and the 1980s (1980/84-1990/94) was estimated with a decomposition technique, originally developed by Arriaga. Results: Life expectancy at age 60 increased in both the 1970s and 1980s, whereas life expectancy at age 85 decreased in men and stagnated in women in the 1980s. Since 1985/89, life expectancy at age 85 has decreased in women as well. The decomposition by age showed that a stagnation of the decline in mortality rates in women aged 85-89, and an increase in mortality rates at age 85+ and (men) and 90+ (women) have caused the observed change in life expectancy at age 85 since 1980/84. The decomposition by cause of death showed that smaller mortality reductions from other cardiovascular diseases and cerebrovascular diseases - which contributed most to the increase in life expectancy at age 85 in the 1970s - and mortality increases inter alia from chronic obstmctive pulmonary disease (COPD), mental disorders and diabetes mellitus produced the decrease (men) and stagnation in the increase (women) in life expectancy at age 85.

Chapter 2
Conclusions: Life expectancy at advanced ages stopped increasing during the 1980s in The Netherlands due to mortality increases at ages 85+ in men and ages 90+ in women. As a result, rectangu.larization of the survival curve took place. The increase in mortality at advanced ages front specific callses suggests that, in addition to (past) smoiling behaviollr in men, changes in the distribu.tion of morbidity and irailty in the population might have contribu.ted to the lack of improvement in life expectancy at advanced ages. Further investigation into these factors is necessary and is liI,ely to benefit. from cross· national comparisons and from an analysis of the changes in incidence, progression, and case·fatality of chronic diseases which callsed the mortality increases in the oldest old Dutch population.
2.1 Introduction
In 1980, Fries argued in a well-known article in the New England Journal of Medicine that the average length of life spent with morbidity and the need for medical care in later life will decline, because chronic diseases can be postponed towards older ages and the increase in life expectancy is limited by a fixed human life span'! This optimistic scenario was the antithesis of the 'expansion·of·morbidity' hypothesis'·5, which anticipates an increasingly older and frailer population.
Developments in mortality among the oldest old (age 85 and over) play an important role in the ongoing debate on what is the most lil{ely scenario. According to Fries, the survival curve has assumed an ever more rectangular form ('rectangularization'), because life expectancy is reaching the fixed human life span. Opponents of Fl'ies argue that the average age at death can still be delayed substantially. If tillS life extension resulted from advances in medical treatment which reduce the lethal sequelae of chronic diseases, persons will live longer with cm'onic diseases and disability.'·4 But apart from mortality reductions among the cm'onically ill, improvements in the chances of surviving up to advanced ages might imply that the proportion of the population that faces these Illgher risks will increase, due to the strong age dependence of the risks of cm'onic diseases and associated disability.3.' Thus as a consequence of modality declines at advanced ages, the health status of the oldest old population might deteriorate. TillS might eventually result in an increase in the demand for medical care and other long· term care services. Hence, mortality declines not only affect the size of the oldest old population, but might also have an effect on thei.r health status.
Ever since Fries fOl'mtliated the compression·of-morbidity hypothesis, several studies have reported rapid declines in oldest old mortality,6·l0 In The
18

Life expectancy at advanced ages
Netherlands, too, a country with traditionally low mortality and reliable mortality data at advanced ages II, life expectancy of the elderly (65+) and oldest old (85+) has increased. 12
This study aims at obtaining a better understanding at the recent changes in mortality in the Dutch elderly population. The central questions are: (1) did the increase in life expectancy of the elderly population accelerate, continue or stagnate in past years and (2) which age- and cause-specific mortality dynamics underlay these recent changes in the life expectancy? We will use total and cause-specific Dutch mortality data of the population aged 60 and over in the period 1970174-1990/94. The implications of the recent mortality developments at older ages are discussed in terms of rectangularization of the survival curve.
2.2 Methods
Data
Data on the population and the number of deaths by age, sex and underlying cause of death for the period 1970-1994 were obtained from Statistics Netherlands,!3.1ol Total mortality and population data had originally been derived from municipal population registers and can be considered reliable and consistent. Population and total mortality data by single year-of-age were used, whereas cause-specific mortality data were only available by 5-year age groups, with age 95 and over as the oldest age group. In the period 1970-1994 causes of death were classified according to two different revisions of the International Classification of Diseases, Injuries and Causes of Death: the eighth revision (lCD-8) for the period 1970-1978 and the ninth revision (lCD-9) for the period 1979-1994. In order to maximize the comparability over both lCD-classifications, we regrouped the causes classified in both revisions into 26 cause-of-death gl'OUpS (Appendix 1).
Methods
We started with a description of the change in life expectancy at age 60 and age 85 in The Netherlands in the period 1970174-1990/94. Life expectancies were estimated from complete life tables with age 105 as oldest age group. These life tables, each covering five calendar years, were constructed for both sexes from total mortality and population data, using standard demographic techniques. 1'.16
Next, we looked for explanations of the change in life expectancy at age 60 and 85 in the 1970s (1970174-1980/84) and the 1980s (1980/84-1990/94) by examining the contribution of different age gl'OUpS and causes of death to the change in life expectancy. This contribution was estimated Ii'om age- and cause-specific mortality data using a method developed by fu.'riaga 17.18,
19

Chapter 2
which decomposes the change in life expectancy into the contribution to this change of different age groups and/or causes of death. Although changes in mortality rates could also give an indication of the contribution of different ages and causes to the change in life expectancy, we preferred the Arriaga method for two reasons. First, tlus method takes into account substitution between competing causes of death. Second, it takes into account the fact that similar changes in mortality rates at different ages influence life expectancy - being a population health measure - to a different extent. The impact of underlying mortality dynamics on life expectancy, depends on the size of the population at risk and the remaining life expectancy. Therefore, in general, mortality changes at young ages have a larger impact on life expectancy than changes at advanced ages.3.!9
This does not mean that changes in age and cause-specific mortality rates are irrelevant. Having assessed which age groups and causes of death contributed most to the change in life expectancy, looking at changes in age and cause-specific rates will provide more insight into the exact changes. Therefore we also calculated dll'ectly standardized death rates (using the population of 1990/94 by 5-year of age up to age 95+ as standard) for each 5-year period. We expressed changes in standardized mortality rates as ratios of Comparative Mortality Figures (the so-called CMFs). To assess whether these changes in the ratios of CMFs were statistically significant, we calculated 95%-confidence intervals of the CMFs ratios.'o In the presentation of the outcomes of the age-specific changes in total mortality, we focus on the change in CMFs by lO-year age groups since 1970174.
Results for specific cause-of-death groups are not shown separately in tables or figures. Only cause-specific changes in mortality are presented separately for the age group 85+ in the 1980s, because changes in mortality in the oldest old have been striking since 1980/84 in The Netherlands'1 and deserve closer inspection.
Table 1 Life Expectancy at Age 60 and Age 85 and Change in Life Expectancy at Age 60 and Age 85, The Netherlands, by Sex
1970n4 1975n9 1980/84 1985/89 1990/94
At age 60, y
16.95 17.15 17.52 17.78 18.22
Note: y means in years.
20
Men Women
At age 85, y At age 60, y At age 85, y
4.46 20.87 4.96 4.74 21.89 5.45 4.85 22.72 5.84 4.74 23.01 5.86 4.63 23.14 5.82

Life expectancy at advanced ages
2.3 Results
Change in life expectancy
During the past two decades, life expectancy of the elderly and oldest old population has increased in The Netherlands. Table 1 shows that life expec· tancy at age 60 increased fi'om 16.95 to 18.22 years in men and fi'om 20.87 to 23.14 years in women in the period 1970174·1990/94. Life expectancy at age 85 increased fi'om 4.46 to 4.63 years in men and fi'om 4.96 to 5.82 years in women in the same period. A closer inspection of Table 1 indicates that the gain in life expectancy was not evenly spread across the different 5·year pe· riods. In men, the increase in life expectancy at age 60 was slightly larger in the 1980. (0.7 y) than in the previous decade (0.6 y), whereas in women the opposite was true (1970s 1.8 y; 1980s 0.4 y). The trend in life expectancy at age 85 was even more remarkable: a gain was seen unW 1980/84 (men) and 1985/89 (women), but since then life expectancy at age 85 has declined.
Table 2 Decomposition of the Change In Life Expectancy at Age 60 and Age 86 In the Period 1970/74 to 1980/84 and 1980/84 to 1990/94, The Netherlands, by Sox"
1970174· 1980184
60·64 65·69 70·74 75·79 80-84 85·89 90·94 95+
Total
1980184·1990194
60·64 65·69 70·74 75·79 80·84 85·90 90·94 95+
Total
............................ f\'1~.n ......................... . At age 60, y At age 85, y
+0.20 +0.17 +0.07 +0.03 +0.03 +0.04 +0.02 +0.01
+0.58
+0.22 +0.23 +0.18 +0.10 +0.01 ·0.02 ·0.02 ·0.01
+0.70
+0.20 +0.12 +0.07
+0.39
·0.08 ·0.08 ·0.05
-0.22
• Figures are rounded to 0.01.
Women . ....................................................... . At age 60, y
+0.14 +0.25 +0.38 +0.41 +0.37 +0.20 +0.07 +0.02
+1.85
+0.02 +0.05 +0.10 +0.16 +0.11 +0.03 ·0.02 ·0.02
+0.42
At age 85, y
+0.59 +0.22 +0.07
+0.88
+0.07 -0.05 ·0.05
-0.02
21

Chapter 2
Index 1970-74=100 1.50 F""'-'==="'------------------~
1.30
60-69
1.10 70-79
80·89
0.90
-- 90+
0.70 .
I I I 0.50 ~------'---------'-------'---------'
1970·74 1975-79 1980-84 1985·89 1990-94
calendar years
Figure 1a Comparative Mortality Figure (CMF) by 5-year period as a ratio olthe CMF in 1970/74, by 1 O-year age group, men.
"ln~de~x~I~9~70~-~74~=~1~00~ ________________ _, 1.50 ..-
1.30 60-69
1.10 . 70·79
80·89
0.90 "' ..
.... -"""~ ............... -
-- -- ~---~-~----- ---:r _____ _
-- 90+
0.70 .
0.50 L ____ .L. ____ ..L ____ -'-____ -'
1970-74 1975-79 1980-84 1985·89 1990·94
calendar years
Figure 1b Comparative Mortality Figure (CMF) by 5-year period as a ratio 01 the CMF in 1970174, by 10-year age group, women.
22

Life expectancy at advanced ages
Contribution of different age groups and causes of death to the change in life expectancy
Because changes in age- and cause-specific mortality might give clues to changes in the determinants of mortality, we fu'st assessed the extent to which mortality declines or increases in different age groups and cause-ofdeath groups contributed to the described change in life expectancy,
Table 2 shows the contribution of different age gl'OUpS to the change in life expectancy at ages 60 and 85, calculated with the Arriaga method, A 'positive' contribution indicates that a mortality reduction in the relevant age group contributes to an increase in life expectancy, whereas a 'negative' contribution indicates that a mortality increase contributes to a reduction of life expectancy, In the 1970s mortality reductions in all age groups contributed to the increase in life expectancy at age 60 and age 85, although the size of these contributions differed, The most striking development in the 1980s was that mortality changes at age 85 and over (men) and at age 90 and over (women) contributed negatively to the increase in life expectancy at age 60, At age 85, the same changes in mortality were responsible for the stagnating increase in life expectancy among women (-0,02 y) and for the decline in life expectancy among men (-0,22 y), That nevertheless life expectancy at age 60 continued to increase, was due to mortality reductions in the age gl'OUpS between 60 and 84 years of age, which have a larger impact on life expectancy at age 60, For men, larger mortality declines at ages 65 to 79 produced even a larger inciease in life expectancy at age 60 in the 1980s, despite the unfavourable developments at older ages, For women the increase in life expectancy at age 60 was smaller than in the 1970s, also because the positive impact of mortality l'eductions below age 90 sm·ank.
Figure 1 shows the ratios of the standardized mortality rates (CMFs) by 10-year age gl'OUpS since 1970174. using 1970174 as reference (Le, 1970174=1), The developments in 1970s and 1980s in mortality for each age gl'OUp are clear at a glance, As could be expected, the age groups which showed a mortality increase 01' a decline are the same as those picked out by means of the Al'l'iaga method, However, comparison of Figure 1 and Table 2 makes it clear that caution should be exercised when looking at changes in mortality rates in order to explain changes in life expectancy, For example, Figure 1 shows that the reduction in the CMF for age gl'OUp 90+ was largest for men in the 1970s, whereas Table 2 shows that this age gl'OUp did not contribute most to the increase in life expectancy at age 60, Mter all, the contribution of age gl'OUp 70-79 (0.1) was higher than that of90+ (0.03).
The contributions of the five causes of death which contributed most, both in . a positive and negative sense, to the change in life expectancy at age 60 and age 85 in the 1970s and 1980s are presented in Table 3a-b,
23

Chapter 2
Table 3b shows that in the 1980s mortality increases from chronic obstructive puhnonary disease (COPD), mental disorders and diabetes mellitus (and to a lesser extent other cancers (men) and lung cancer (women» contributed 'negatively' to the increase in life expectancy at age 60.
Table 3a Decomposition of the Contribution of Selected Causes of Death to the Change in Life expectancy at Age 60 and 85 In the Period 1970/74 to 1980/84, The Netherlands, by Sex'
Men Women
Atage 60, Y
All causes
Increase in Life Expectancy IHD Cerebrovascular diseases Pneumonia/influenza Stomach cancer Traffic accidents Restb
Decrease In life expeclancy Lung cancer Olher heartdiseases Other cancers Prostate cancer COPD Restb
+0.577
+0.961 +0.257 +0.197 +0.091 +0.083 +0.065 +0.268
-0.384 -0.177 -0.079 -0.052 -0.022 -0.017 -0.038
All causes
Increase in Ufe Expectancy Cerebrovascular diseases IHD Other CVD Pneumonia/influenza Other heart diseases Restb
Decrease In Life Expectancy Lung cancer Other causes Breast cancer Dis. nervous system Other endocrine Restb
Atage 85, Y
All causes
Increase In Life Expeclancy OtherCVD Cerebrovascular diseases IHD III-defined Pneumonia/influenza Restb
Decrease in life expectancy Lung cancer COPD Other heart diseases Dis. digestive sysl. Dis. nervous sys. Restb
+0.387
+0.641 +0.133 +0.129 +0.119 +0.078 +0.066 +0.116
-0.254 -0.054 -0.050 -0.037 -0.028 -0.017 -0.068
Note: CVD = cardiovascular diseases . • Figures are rounded to 0.001. b See Appendix 2.
24
All callses
Increase In Life Expectancy IHD Cerebrovascular diseases other CVD Other accidents III-defined cond. Restb
Decrease in life expectancy Genito-lirinary Dis. digestive sys. Other causes Other endocrine Dis. nervous sys. Restb
+1.847
+1.915 +0.417 +0.391 +0.186 +0.137 +0.134 +0.650
-0.068 -0.040 -0.014 -0.006 -0.006 -0.002 -0.000
+0.878
+1.031 +0.193 +0.182 +0.180 +0.110 +0.101 +0.265
-0.153 -0.048 -0.031 -0.026 -0.021 -0.014 -0.013

Life e:tpectancy at advanced ages
Mortality increases fi'om these diseases, together with those fi'om prostate cancel' (men) and ill-defined conditions (women), were also largely responsible for the decline (men) and stagnation in the increase (women) in life expectancy at age 85 in this period. At age 60, these effects were counterbalanced by mortality l'eductions fi'om especially ischaemic heart disease (lHD)
Table 3b Decomposition of the Contribution of Selected Causes of Death to the Change in Life Expectancy at Age 60 and 85 in the Period 1980/84 to 1990/94, The Netherlands, by Sex'
Men Women
At age 60, y
All causes +0.701 All causes
Increase in Life Expectancy +1.131 Increase in Life Expectancy IHD +0.596 IHD Lung cancer +0.144 Cerebrovascular diseases Cerebrovascular diseases +0.132 Other heart diseases Stomach cancer +0.072 Stomach cancer Genito-urinary +0.048 Other accidents Restb +0.138 Restb
Decrease in Life Expectancy -0.430 Decrease in Life Expectancy capo -0.079 Mental disorders Diabetes Mellitus -0.078 Diabetes Mellitus Other cancers -0.065 capo Mental disorders -0.053 Lung cancer OtherCVD -0.039 Dis. of the nervous system Restb -0.117 Restb
At age 85, y
All causes -0.215
Increase in Life Expectancy +0.266 IHD +0.091 Other heart diseases +0.081 Genno-urinary +0.046 Cerebrovascular diseases +0.018 Stomach cancer +0.016 Restb +0.014
Decrease in Ufe Expectancy -0.481 COPD -0.102 Mental disorders -0.064 Prostate cancer -0.047 Other cancers -0.044 Diabetes mellitus -0.039 Restb -0.184
Note: CVD ;;:: cardiovascular diseases. 'Figures are rounded to 0.001. b See Appendix 2.
All causes
Increase in Life Expectancy IHD Other heart diseases Other accidents Cerebrovascular diseases Stomach cancer Restb
Decrease in Life Expectancy Mental disorders Diabetes mellitus III-defined condo COPD Other endocrine Restb
+0.423
+0.996 +0.442 +0.186 +0.137 +0.054 +0.047 +0.130
-0.573 -0.131 -0.120 -0.098 -0.085 -0.022 -0.118
-0.022
+0.371 +0.118 +0.110 +0.042 +0.028 +0.021 +0.053
-0.393 -0.152 -0.062 -0.036 -0.031 -0.023 -0.089
25

Chapter 2
and cerebrovascular diseases, and from lung cancer (men) and other heart diseases (women). However, at age 85, the negative effect of mortality increases outweighed the positive effect of mortality reductions from other causes.
Compared to the 1980s, the 1970s had shown both larger positive contributions (1970s: 0.64 (men) and 1.03 (women) versus 1980s: 0.27 (men) and 0.37 (women)) and smaller negative contributions (1970s: -0.25 (men) and -0.15 (women) versus 1980s: -0.48 (men) and -0.39 (women)) to the life expectancy at age 85, which on balance produced an increase in life expectancy at age 85 in the 1970s, and a decrease (men) or slowdown (women) in the 1980s (Table 3a-3b). Both smaller mortality reductions (or sometimes even an increase in mortality) from cerebrovascular diseases and other cardiovascular
Table 4 Ratio of Comparative Mortality Figure' (CMF) of 1990/94 to CMF of 1980/84 at Age 85 and Over, by Sex
Men 95%-CI Women 95%-CI
Infectious + parasitic diseases 1.63 1.38-1.93 1.51 1.33-1.71 Stomach cancer 0.77 0.70-0.85 0.67 0.62-0.73 Colorectum cancer 0.96 0.88-1.04 0.91 0.86-0.96 Lung cancer 1.21 1.14-1.29 0.97 0.84-1.11 Breast cancer 0.74 0.32-1.71 1.05 0.98-1.12 Prostate cancer 1.34 1.26-1.42 Other cancers 1.20 1.15-1.26 1.06 1.03-1.10 Diabetes Mellitus 2.22 1.98-2.49 1.98 1.85-2.12 Endocr. + nutritional + metabolic 1.52 1.30-1.77 1.71 1.55-1.88 Blood + bloodforming 1.88 1.56-2.27 1.56 1.36-1.80 Mental disorders 4.88 4.22-5.64 4.93 4.54-5.35 NelVous system 1.52 1.36-1.70 1.48 1.35-1.62 IHD 0.85 0.83-0.88 0.83 0.81-0.85 Cerebrovascular diseases 0.96 0.93-1.00 0.97 0.94-0.99 Other cardiovascular diseases 1.14 1.07-1.22 0.91 0.86-0.95 Other heartdiseases 0.86 0.84-0.89 0.87 0.85-0.89 Pneumonialinfluenza 1.15 1.09-1.20 1.06 1.02-1.10 CO PO 1.52 1.45-1.60 1.39 1.31-1.48 Other respiratory 1.17 1.01-1.35 1.04 0.91-1.18 Digestive system 1.06 0.99-1.13 1.03 0.99-1.07 Genito~urjnary 0.75 0.71-0.80 0.89 0.85-0.93 III-defined 1.28 1.20-1.35 1.20 1.15-1.25 Traffic accidents 0.72 0.56-0.93 0.86 0.57-1.30 Other accidents 0.95 0.88-1.03 0.77 0.73-0.81 Other external causes 0.87 0.71-1.07 0.65 0.51-0.84 Other causes 1.32 1.15-1.51 1.19 1.11-1.27
Total 1.06 1.05-1.08 1.02 1.01-1.03
Nole: CVD = cardiovascular diseases . • eMF using the 1990/94 population as standard population . ... Not applicable.
26

Life expectancy at advanced ages
diseases - which contributed largely to the increase in life expectancy at age 85 in the 1970s - and (larger) mortality increases fmm e.g. COPD. mental disorders and diabetes mellitus, together with those from cancer (pmstate and other cancers) and ill-defined conditions, explain the reversal of the trend in life expectancy at age 85.
Table 4 focuses on recent changes in mortality above age 85 from specific causes. For the ease of interpretation, we expl'essed the change as the ratio of the CMF in 1990/94 to that in 1980/84 (i.e. 1980/84=1). A ratio larger than 1 indicates an increase in mortality as compared to 1980/84, whereas a ratio smaller than 1 indicates a decline. Some causes of death showed mortality declines in the 1980s, but overall the situation was one of mortality increase. Substantial increases in mortality above age 85 from mental disorders, diabetes mellitus and other endocrine, nutritional and metabolic diseases, COPD, diseases of the nervous system, diseases of blood- and bloodforming organs, ill-defined conditions, pmstate and other cancers, infectious/parasitic diseases and pneumonia/influenza took place.
2.4 Discussion
This study examined recent mortality changes in the elderly population of The Netherlands in the 1970s and in the 1980s. Our results showed that life expectancy at age 60 increased in the 1970s and 1980s, whereas life expectancy at age 85 has declined since 1980/84 (men) and 1985/89 (women). A stagnation of the decline in mortality rates in women at ages 85 to 89, and an increase in mortality rates above age 85 (men) and above age 90 (women) underlay this trend in life expectancy at age 85. Decomposition of the change in life expectancy by cause of death showed that both smaller mortality reductions (or sometimes even an increase in mortality) from cerebrovasculal' diseases and other cardiovascular diseases - which contributed largely to the increase in life expectancy at age 85 in the 1970s - and mortality increases from e.g. COPD, mental disorders and diabetes mellitus, together with those from cancer (prostate and other cancers) and ill-defined conditions produced the decrease (men) and a stagnation in the increase (women) in life expectancy at age 85. The continuing rise in life expectancy at age 60, on the other hand, was caused by mortality reductions at ages 60 to 84 which have a relatively large inlpact on life expectancy at age 60.
Before turning the attention to the meaning and inlplications of our results, it must be emphasized that the findings which are based on underlying cause-of-death data might be subject to coding and classification erl'Ors. Fit'st, at advanced ages, underlying causes of death are difficult to assess and may therefore be unreliable.22 Furthermore, estimates of the magnitude of the effects of IHD and other heart diseases might be biased, due to the lCD-revision of 1979. The number of deaths from these causes by calendar
27

Chapter 2
year showed a small increase for other heart diseases minored by a decrease for IHD between 1978 and 1979. Finally, the effect of diabetes mellitus and mental disorders might be overestimated due to a more n:equent classification of diabetes mellitus23 and senile dementia (part of mental disorders)24 as underlying cause of death in The Netherlands since 1983 and 1992, respectively. The number of deaths from diabetes by calendar year showed an increase in diabetes deaths in the years immediately after 1982. For senile dementia the increase started before and continued after the change in classification. Despite these uncertainties related to cause-of.death data, our findings indicating a lack of improvement in life expectancy at advanced ages are based on Dutch total mortality data which are considered to be very reliable. ll
Moreover, differences in the contribution of each age group to the change in life expectancy (based on the Arriaga method) and changes in age-specific mortality rates (based on the eMF method) merit attention. The outcomes of both methods might not always lead to the same conclusion. For a full understanding of the changes in mortality, information derived from both approaches is needed. To explain changes in life expectancy, the k:riaga method is the most appropriate of the two, because, like life expectancy, it takes into account the fact that changes in mortality in different age groups affect life expectancy to a different extent. The magnitude of the effect depends upon the size of the population in a certain age group being exposed to the (changed) mortality rate and the remaining life expectancy of this age group. On the other hand, changes in age-specific mortality rates provide more insight into changes in the age structure and size of the elderly population. In addition, looking at changes in age- and cause-specific mortality rates is indispensable to discovering possible determinants of the changes in mortality.
Table 5
Men 1970n4 1975n9 1980/84 1985/89 1990/94
Women 1970n4 1975n9 1980/84 1985/89 1990/94
28
Numeralor of Keyfltz' H (NH) and Siandard Oevlalion (SO) al Age 60, by Sex
NH. Y SD, Y
8.00 8.86 8.12 8.93 8.14 8.95 8.00 8.85 7.84 8.76
7.48 8.61 7.71 8.89 7.81 9.07 7.74 9.06 7.65 9.04
The outcomes of this. study raise the question of whether the recent mortality developments in The Netherlands imply rectangularization of the survival curve. Elsewhere, we defined rectangularization as a trend towards a more rectangular shape of the survival curve due to increased survival and concentration of deaths around the mean age at death of the population (i.e. compression of mortality). We used the numerator of Keyfitz' H (NH), which interpretation is similar to the standard deviation (SD), to measure compression of mortality into a smaller age inter-

Life expectancy at advanced ages
val.'" For comparison, the change in the standard deviation (SD) is presented. The results from this study showed a decline in NH (and SD) since 1980/84 (Table 5). Tlils implies that compression of mortality into a smaller age interval has taken place since 1980/84, which, in combination with the observed increase in life expectancy at age 60, implies rectangularization (in an absolute sense). Without making any inferences as to whether life expectancy is approaching the biological limit, the recent rectangularization might indicate that increases in life expectancy are likely to decelerate owing to diminishing returns of mortality reductions.3,,"
Studies for other low mortality countries found no rises in mortality in the oldest 0Id."·lO.2. Only in Norway did mortality at advanced ages increase slightly between 1986/90 and 1991/94.27 Explanations for the recent rise in old-age mortality in The Netherlands (and Norway) are still being sought. More research on this topic is needed. As a start, we will elaborate on possible explanations for the recent rise in old-age mortality in The Netherlands. First, the increase in old-age mortality might have been caused by excess mortality due to influenza epidemics in 1989/90 and 1993.28,29 This is not likely, however. In 1975 and 1978, influenza also produced substantial excess mortality.28 without seriously interrupting the mortality decline among the oldest old. In addition, our results are not very sensitive to annual perturbations due to influenza epidemics, for we used quinquennial data. Second, the alleged liberalization of euthanasia policy could have brought forward the average age at death. However, considering the low fi'equency of physician assistance in death at advanced ages (in only 0.78% of all deaths above age 80) and the estimated small decrease in the length of life due to euthanasia (less than one week in 66% of these cases)ao, we do not consider euthanasia a significant factor. Thll'd, the increase in mortality fi'om (lung) cancer and COPD among the oldest old suggests that (past) smoking behaviour might have contributed to the increase in mortality. A reconstruction of smoking prevalence by buth cohort31 showed that the percentage of (ex)smokers in men aged 85 and over was probably higher in 1990/94 than in 1980/84. However, although past smoking behaviour might have played a role, the evidence is not conclusive. After all, this factor cannot explain the increase in female mortality at advanced ages, as the percentage of (ex)smokers aged 85 and over was too small to have had a significant effect on old age mortality.
The causes discussed so far cannot fully explain the increase in mortality at advanced ages and thus we should consider other causes, such as those relating to changes in the distribution of morbidity and frailty in the population. !.€ss selection due to decreased mortality may have produced a more fi'ail oldest old population.32 The subsequent increase in mortality fi'om mental disorders, ill-defined conditions and influenza/pneumonia might be a manifestation of this increased fi·ailty. In addition, decreased mortality fi'om cU'culatory diseases might have created a pool of persons with cU'culatory
29

Chaptel' 2
diseases, who run a higher risk of developing severe stages of these diseases and dying from them,33,34 Finally, reduced mortality fwm circulatory diseases, might have increased the prevalence of diseases that share the same risk factors or are themselves a risk factor for circulatory diseases, such as some cancers or diabetes mellitus, Although it is plausible that these factors have contributed to the increase in old-age mortality, it is not clear why these mechanisms, which may be expected to operate in other countries as well, have not (yet) caused old-age mortality to rise in these countries.
Further investigation into the determinants of the old-age mortality is necessary and may benefit from empiJ:ical data on the current developments in old-age mortality in The Netherlands and other low mortality countries. Monitoring of old-age mortality and cross-national comparisons should therefore receive high priority. In addition, an important, but in terms of data requimments very demanding step, would be to disentangle the changes in incidence, disease progression, and fatality of chronic diseases which have caused the mortality increases in the oldest old in The Netherlands.
References
1. Fries JF. Aging, nahual death, and the compression of morbidity. New England Joul'nal of Medicille 1980;303(3):130-135.
2. K.l'amer M, The rising pandemic of mental disorders and associated clu'onic diseases and disabilities. Acta Psychiatl'ica Scalldinavia 1980;62(SlIppl. 285):382-397.
3. Olshansky 8J, RlIdberg MA, Carnes BA, Cassel CK, Brody JA. Trading Off Longer Life for Worsening Health. Joul'nai of Agillg alld Health 1991;3(2):194-216.
4. Gruenberg EM, The failrn'es of success. Milbolill Memorial Fund Quarterly/Health alld Society 1977;55(1):3-24.
5. Verbrugge LM. Longer life but worsening health? Trends in health and mortality of middle-aged and older persons. Milballil Memo,.ial Fund Quarterly/Health and Society 1984;62(3):475-519.
6. Grundy E. Mortality and morbidity among the old. British Medical JOll-mal 1984;288(6418):663-664.
7. Manton KG. Changing concepts of morbidity and mortality in the elderly population. Milbank Memorial FlInd QlIal'terly/ Health alld Society 1982;60(2): 183-244.
8. Rothenberg R, Lentzner HR, Parker RA. Population aging patterns: the expansion of mOl'tality. JOll1'llal of Gerontology 1991;46(2):866-870.
9. Kannisto V, Lam'isten J, Thatcher AR, Vaupel JW. Reductions in mortality at advanced ages: several decades of evidence from 27 countries. Population and Development Review 1994;20(4):793·809.
10. Vaupel JW, Lundstrom H. The futm'e of mOl'tality at older ages in developed countries. In: Lutz W, ed. The Future Population 0/ the World. What Can We Assume Today? London, UK: Eal'thscan Publications, 1994:295-315.
30

Life expectancy at advanced ages
11. Condran GA, Himes CL, Preston SR. Old-age mortality patterns in low mortality countries: an evaluation of population and death data at advanced ages, 1950 to the present. Population Bulletin of the United Nations 1991(30):23·60.
12. Statistics Netherlands. Vijfellllegentig jaren statistiek in tijdl'eeksell: 1899-1994. 's-Gravenhage, the Netherlands: SDU/uitgeverij, 1994.
13. Statistics Netherlands. Ouerleuingstafels n.aal' leeftijd en geslacht {Life tables by age and sex]. 's·Gravenhage, the Netherlands: State Publishers/Statistics Netherlands, multiple years.
14. Tabeau E, van Poppel F, Willekens F. Mortality in the Netherlands: The Data Base. Netherlands Interdisciplinary Demographic Institute, 1994.
15. Manton KG, Stallard E. Recent trends in mortality analysis. Orlando, Fl: Academic Press, 1984: 70-235_
16. Namboodiri K, Suchindran CM. Life Tables und their Applications. Orlando, FI: Academic Press, 1987.
17. Arriaga EE. MeasUl'ing and explaining the change in life expectancies. Demography 1984;21(1):83-96_
18. Arriaga EE. Changing trends in mortality decline during the last decades. In: Ruzicka L, Wunsch G, Kane P, ed. Differential Mortality. Methodological Issues and Biosocial Factors. Oxford, UK: Clarendon Press, 1989:105-129.
19. Keyfitz N. What difference would it make if Cancel' were eradicated? An examination of ti,e Taeuber paradox. Demography 1977;14(4):411·418.
20. Breslow NE, Day NE. Statistical Methods in Cancer Research. Volume II The Design alld Analysis 0/ Cohort. Stu.dies. Lyon, France: International Agency for Research on Cancer, 1987: 1-406. (JARC Scientific Publications; vol 2).
21. Van Hoorn WD. Sterfte: trends, achtergronden en prognose [Mortality: trends, background and forecast]. Maandstatistiek Vaal' de beuolking [Monthly Bullitin of Population Statistics] 1997;45(5):10·17.
22. Smith DWE. Human Longeuity. Oxford University Press, 1993.
23. Mackenbach JP, Snels lA, Friden-Kill LM. Diabetes Mellitus als doodsoorzaak [Diabetes mellitus as cause of death]. Nedel'lands Tijdschrift. uoor Geneeslwnde 1991; 135(33): 1492·1496.
24. Statistics Netherlands. Personal communication, 1995.
25. Nusselder WJ, Mackenbach JP. Rectangularization of the survival CUl've in The Netherlands, 1950-1992. The Gel'ontologist 1996;36(6):773·782 [Included in this thesis as chapter 3].
26. Myers JC. Comparative mortality trends among older persons in developed countries. In: Caselli G, Lopez AD, ed. Health and Mortality among Elderly Populatiolls. Oxford, UK: Clarendon Press, 1996:87·111.
27. Mamelund S, Horgan J. /(ohol't· og pel'iodedodelighet i NOl'ge 1846·1994 [Cohol't and Period Mortality in Norway 1846-1994). Oslo, Norway: Oslo-Kongsvinger, 1996.
28, Prins CJM. Hage sterfte rand jaarwisseling door gl'iep [Many influenza deaths at the tUl'n of the year]. Maandstatistiek Vaal' de Beuolking {Monthly Bulletin of Population Statistics] 1990;38(5):8·9.
29. Prins CJM. Sterftepiek in maart en april van dit jaal' [Many deaths in March and April of this year], Maandstatistieh UOOI' de Beuolking [Monthly Bulletin of Population Statistics] 1993;41(9):6·8.
31

Chapter 2
30. Van del' Wal G, Van del' Maas PJ. Eutlzallosie en andere beslissingen rond liet leuellseillde. De praktijk en de meldillgspl'ocedure. Den Haag, the Netherlands: SDV Vitgevers, 1996,
31. Gunning-Schepers LJ, The health benefits of prevention. A simulation approach. Rotterdam: Erasmus University Rotterdam, 1988,
32. Vaupel JW, Manton KG, Stallard E. The impact of heterogeneity in individual fl.'ailty on the dynamics of mortality, Demography 1979; 16(3):439-454,
33. Bonneux L, Barendregt JJ, Meetel' K, Bonsel GJ, van del' Maas PJ. Estimating clinical morbidity due to ischemic heart disease and congestive heart failm'e: the futtu'e rise of heart failure. American JOllrnal of Public Health 1994;84(1):20-28.
34. Bonneux L, Looman CW, Bal'endregt JJ, Van del' Maas PJ. Regression analysis of l'ecent changes in cardiovasculal' morbidity and mortality in The Netherlands. British Medical JOllmaI1997;314(7083):789-792,
32

Life expectancy a.t a,duanced ages
APPENDIX 1
Class IIi cation In Cause-ol-Death Groups According to the ICD-classilicatlons
ICD-Name of disease category Chap- ICO-8 ICD-9
ter 1970-1978 1979-
Infectious and parasitic 001-136 001-139 diseases
Cancer of stomach 2 151 151 Cancer of colorectum 2 153-154 153-154 Cancer of trachea, bronchus 2 162-163 162-163;165
and lung Cancer of breast 2 174 174-175 Cancer of prostate 2 185 185 Other neoplasms 2 r(140-239) r(140-239) Diabetes mellitus 3 250 250 Other endocrine, nutritional 3 240-246;251-269; 240-246;251-259
and metabolic diseases 270-279 260-279 Diseases of blood and 4 280-289 280-289
bloodforming organs Mental disorders 5 290-315 290-319 Diseases of the nervous sys· 6 320-389 320-389
tern and sense organs Ischaemic heart diseases 7 410-414 410-414 Cerebrovascular diseases 7 430-438 430-438 Other cerebrovascular disea a 7 440-448;450-458 440-448;415
ses 417;451-459 Other heart diseases 7 390-398;400-404 390-398;401-405
420-429 416;420-429 Pneumoniallnfluenza 8 470-474;480-484;486 487;480-486 Chronic Obstr. Pulmonary 8 490-493 490-494;496
Disease Other diseases of the respir- 8 r(460-519) r(460-519);495
atory system Diseases of the digestive 9 520-577 520-579
system Diseases of the genito-urinary 10 580-629 580-629
system Symptoms and ill-defined 16 780-796 780-799
conditions Traffic accidents 17 E800-845;E940-941 E800-E848
Other accidents 17 E880-887;E890-909 E880-888;E890-909 E911-929;E943-946 E911-929 E980-989 E980-989
Other external causes 17 E850-877; E850-869;E910 E910; E930-999 E870-879 excl. E940-941 excl. E943-946 E930-999 excl. E980-989 exc1.E980-989
Other causes 11-15 630-678 630-676 680-686;690-709710-738 680-686;690-709710-740-759 739 760-776 740-759
760-779
33

Chapter 2
APPENDIX 2
Table A1 Contribution of Selected Causes of Death to the Change In Life Ex-pectancy at Age 60 Between 1970/74 and 1980/84 and Between 1980/84 and 1990/94, by Sex'
........... .1.nqIJ.4.~1.9.§9(§4. ........... .......... 1.~.a.q!a.4~1.9.~9(~.4. ......... Men Women Men Women
Total 0.577 1.847 0.701 0.423
Infectious+parasitic diseases 0.009 0.017 -0.010 -0.015 Stomach cancer 0.083 0.091 0.072 0.054 Colorectum cancer -0.005 0.029 0.015 0.038 Lung cancer -0.177 -0.040 0.144 -0.085 Breast cancer 0.000 -0.006 -0.000 -0.013 Prostate cancer -0.022 0.000 -0.032 0.000 Other cancers -0.052 0.071 -0.065 -0.021 Diabetes Meliitus 0.021 0.092 -0.078 -0.120 Endocr. + NutriJIonal -0.007 -0.002 -0.010 -0.017 Blood + blood forming -0.002 0.003 -0.011 -0.007 MenIal disorders 0.031 0.052 -0.053 -0.131 Nervous system -0.Q16 -0.006 -0.014 -0.022 IHD 0.257 0.391 0.596 0.442 cerebrovascular diseases 0.197 0.417 0.132 0.186 OlherCVD 0.047 0.186 -0.039 0.007 Otherheart diseases -0.079 0.134 0.047 0.137 Pneumonia/influenza 0.091 0.137 -0.023 -0.014 COPD -0.017 0.002 -0.079 -0.098 Olher respiratory 0.014 0.012 -0.006 -0.003 Digestive system 0.011 0.043 0.020 0.013 Genito-urinary 0.049 0.009 0.048 0.039 III-defined 0.057 0.087 -0.010 -0.022 Traffica ccidents 0.065 0.022 0.023 0.014 other accidents 0.029 0.118 0.Q16 0.047 Other external causes -0.001 0.000 0.017 0.020 Other causes -0.007 -0.014 -0.002 -0.006
No/e: CVD = cardiovascular diseases . • Figures are rounded 10 0.001.
34

Life expectancy at advanced ages
Table A2 Contribution of Selected Causes of Death to the Change In Life Ex-pectancy at Age 85 Between 1970/74 and 1980/84 and Between 1980/84 and 1990/94, by Sex'
1970n4-1980/84 1980/84-1990/94 ........................................................ ........ , .... , .. , .. , .. , .. -... , ....... , .... , .. , .. ,., Men Women Men Women
Total 0.387 0.878 -0.215 -0.022
Infectious + parasitic diseases 0.003 0.009 -0.010 -0.010 Stomach cancer 0.029 0.034 0.016 0.021 Colorectum cancer -0.006 0.002 0.004 0.011 Lung cancer -0.054 -0.006 -0.026 0.001 Breast cancer -0.001 -0.001 0.000 -0.004 Prostate cancer -0.011 0.000 -0.047 0.000 Other cancers -0.016 0.015 ·0.044 -0.015 Diabetes Mellitus 0.008 0.022 -0.039 -0.062 Endocr. + Nutritional -0.016 -0.021 -0.010 -0.023 Blood + bloodforming -0.000 0.001 -0.011 -0.009 Mental disorders 0.032 0.052 -0.064 -0.152 Nervous system -0.017 -0.014 -0.020 -0.019 IHD 0.119 0.193 0.091 0.118 Cerebrovascular diseases 0.129 0.182 0.018 0.028 OtherCVD 0.133 0.180 -0.018 0.017 Other heartdiseases -0.037 0.050 0.081 0.110 Pneumonia/influenza 0.066 0.071 -0.032 -0.014 COPD -0.050 -0.004 -0.102 -0.031 Other respiratory 0.005 0.007 -0.004 -0.001 Digestive system -0.028 -0.031 -0.006 -0.003 Genito-urinary -0.003 -0.048 0.046 0.020 III·defined 0.078 0.101 -0.037 -0.036 Traffic accidents 0.005 0.001 0.003 0.000 Olher accidents 0.035 0.110 0.005 0.042 Other external causes -0.002 -0.003 0.002 0.003 Other causes -0.013 -0.026 -0.009 -0.014
Note: CVD = cardiovascular diseases . • Figures are rounded to 0.001.
35


Rectangularization of the survival curve in
The Netherlands, 1950-1992
I n this article, we determine whether rectangularization of the survival Cltrve occurred in The Netherlands in the period 1950-1992_ Rectangu
larization is defined as a trend toward a more rectangular shape of the survival curve due to increased survival and concentration of deaths around the mean age at death_ We distinguish between absolute and relative rectangularization, depending on whether an increase in life expectancy is accompanied by concentration of deaths into a smaller age interval 01' into a smaller proportion of total life expectancy_ We used measures of variability based on [(eyfitz' H and the standard deviation, both life-table based_ Our results show that absolute and relative rectangularization of the entire survival curve occurred in both sexes and over the entire period (except for the years 1955159 to 1965/69 in men)_ At older ages, results differ between sexes, periods and an absolute versus a relative definition of rectangularizal,ion. Above age 60'h, relative rectangularization occurred in women over the entire period and in men only from 1975/79 on, whereas absolute rectangularization is seen in both sexes from the period of 1980184. The implications of the recent rectangularization at older ages for achieving compression of morbidity are discussed_

Chapter 3
3.1 Introduction
Low mortality countries are experiencing an almost steady increase in the average length of life due to considerable declines in mortality l'ates, even at higher ages, Whether this increase in total life expectancy is accompanied by a favourable change in health expectancy of the population is still under debate, The different views can be summarized as: 'compression of morbidity'l", 'expansion of morbidity' (also known as a 'pandemic of mental disorders and disabilities')3.', or a 'dynamic equilibrium',- Rectangularization of the survival curve plays an important role in this debate, since it is a major argument in the compression-of-morbidity hypothesis, According to the main proponent of this hypothesis, James Fries l rectangularization of the survival curve shows that life expectancy at biJ:th is approaching the average life span, which is conceptualized as a state in which mortality from exogenous causes is completely eliminated, and in which the remaining variability in the age at death is caused by genetic factors. Approaching the average life span implies that increases in total life expectancy must decelerate. Since compression of morbidity occurs if the morbidity-free life expectancy (the expected duration of life free of irreversible chronic diseases and their consequences) increases more than total life expectancy I, rectangularization makes compression of morbidity more easy to achieve compared to a situation without rectangularization.
Despite its importance in the compression-of-morbidity hypothesis, the concept of rectangularization was only loosely defined by Fries. 1.'·9 It apparently describes the process that becomes visually manifest by an increasingly 'square' or 'rectangular' survival curve. That is, a survival curve that has an increasingly flat top and an increasingly sharp downslope. A rectangular curve emerges when the probability of survival remains high until advanced age and drops to zero in a short age range where senescence dominates, Opposite to a rectangular shape is the survival curve observed among wild animals (and humans until just 200 years ago) cbaracterized by a high infant and high adult mortality nearly independent of age.' Pm'tly as a result of the lack of a clear definition, the measurement of rectangularization is ambiguous. Empirical studies of rectangularization 01' 'compression of mortality' used diverse methodologies to examine changes in the shape of the survival curve. Some studies have used absolute measures of the variability in the age at death, such as the standard deviation lO.I3, whereas other studies have (also) used relative measures of the variability in the age at death, such as the coefficient of variation or Keyfitz' R.13.14 In addition, studies differed by kind of analysis (visual examination vs examination of age-at-death distribution), type of data (number of deaths vs mortality risks) and the choice of a starting age (fixed starting ages vs percentile points).
In this article, we use measures of rectangularization of the survival curve based upon an unambiguous definition of the concept, and determine
38

Rectanguiarization of the survival curve
whether rectangularization took place in The Netherlands during the period of 1950·1992.
3.2 Methods
Definition of rectangularization of the survival curve
Rectangularization is defined as a trend towards a more rectangular shape of the survival curve due to increased survival and concentration of deaths around the mean age at death of the population. That is, the variability in the age at death declines and deaths are being compressed into the upper years of life. This definition is based upon the description of rectangulariza· tion by Fries l,7 and the necessary corollary of the concept of rectangulariza· tion, i.e. the inverse correlation of the variability in the age at death with increases in life expectancy, pointed out by Myers and Mantonll. Two crite· ria are taken into account in determining the presence of rectangularization: increased survival to advanced ages and increased concentration of deaths around the mean age at death. Increased survival to advanced ages takes place when the number of survivors of successive cohorts, and thus life ex· pectancy, is increasing. Concentration of deaths and consequently, rectangu· larization, can take place in an absolute and in a relative sense. When mol'· tality is concentrated into a shorter age range, absolute variability in the age at death (expressed in years) declines. On the other hand, if mortality is compressed into a smaller proportion of the total life expectancy, relative variability (i.e. relative to the mean) declines. We define the concentration of deaths into a smaller age range as absolute compression of mortality and the concentration of deaths into a smaller proportion of the life expectancy as relative compression of mortality. Absolute compression of mortality in com· bination with an increased life expectancy is defined as rectangularization in an absolute sense. Relative compression of mortality in combination with an increased life expectancy is considered to represent rectangularization in a relative sense.
Measurement of rectangularization of the survival curve
Measures of variability that were used to assess rectangularization in our study are the standard deviation of the age·at·death distribution (SD) and the related coefficient of variation (CV), as well as the index of mortality en· tropy, called 'Keyfitz' H' (H) and its numerator (NH), in all cases life table· based. SD is a commonly used measure of absolute variability, that measures the deviation between the subsequent ages at death in the life· table popula· tion and the mean age at death. In a life table starting at birth, the mean <lge at death is the life expectancy at birth. The SD divided by the mean age at death is the CV, which is a .measure of relative variability.!' H is a less well· known measure. Keyfitz and Golini16 introduced H into the field of de· mography as a measure of the elasticity of the life expectancy for propor·
39

Chapte/' 3
tional changes in mortality rates (see Appendix, note 1). That is, H gives the percentage change in life expectancy produced by a reduction of 1% in the force of mortality at all ages. If H is 1, a decrease in mortality rates at all ages by 1% leads to an increase in life expectancy by 1%. Similarly, if H is 0.2, a decrease in mortality by 1% results in an increase in life expectancy by 0.2%. H is also a measure of the heterogeneityl7, the variability!8 or the inequality l9 of the age-at-death distribution and a measure of the concavity!.·2o, the convexity!8, the curvature2l , 01' the rectangularity" of the survival curve. If the survival curve is completely rectangular, H is zero. In that case everybody dies at exactly the same age and the variability in the age at death is zero. If mortality is independent of age (the force of mortality is equal at all ages), H is unity. If the survival curve declines in a lineal' fashion with age (the number of deaths is equal at all ages), H is 0.5. Finally, H can be viewed as the average years of future life that are lost by the observed deaths, relative to the life expectancy.22 We used a discrete approximation of H, based on the lineal' method, to calculate H from a complete life table with an initial cohort of one at the starting age x (I, = 1):
'" L It do ea+O.5n
Hx = a=x (1) ex
where x is the starting age; "do is the number of persons alive at age x who will die in the age interval a, a+n; ll) is the final age (105 in our study); ea+0.5"
is the mid-interval (local) life expectancy at age a+0.5n and n is the length of the age interval (one in our study, except for age 105, which includes ages 105 and over). H multiplied by the life expectancy at the starting age gives NH. The measures of variability can be calculated easily from survival curves starting at any age. We placed a subscript (like Ho) to specifY the starting age.
To determine whether there is rectangularization, the change in the variability in the age at death is decisive. A decline in SD or NH in combination with an increase in life expectancy indicates rectangularization in an absolute sense, whereas a decline in CV 01' H, in combination with an increase in life expectancy, means rectangularization in a relative sense. In addition, a decline in H shows that equivalent proportional mortality declines produce smaller relative increases in life expectancyl7·23 and a decline in NH indicates that proportional mortality declines produce smaller absolute increases in life expectancy.
Data
Data on the number of deaths and the population structure by sex, age and calendar year were obtained fl'om Statistics Netherlands."·" These data, covering all single year age groups of the Dutch population in the period 1950-1992 had originally been derived from the municipal population regis-
40

Rectanguiarization of the survival curve
tel's. Complete life tables using a period-cohort observational plan (i.e. including one calendar year, one cohort and two age groups, see Appendix, Note 2), with age 105 as the final age, were constructed on the basis of mortality risks (i.e. probabilities of dying), assuming that deaths are uniformly distributed over the (one-year) age interval.'O.27 These life tables, covering five calendar years, except for the most recent period of 1990-1992, were used to assess rectangularization of the survival curve.
3.3 Results
Survival curves of Dutch men and women for 1950/54, 1970/74 and 1990/92 are presented in Figure 1. The area under the curve between a certain starting age (x) and the oldest age group divided by the number of persons alive at age x is the life expectancy at that age (Table 1). Changes in the shape of the survival curve and life expectancy can be traced back to changes in the underlying pattern of mortality rates (Figure 2a-b). Visual inspection of the survival curves as such cannot provide an objective answer to the question of whether rectangularization of the survival curve occurred, although the crossing of the survival curves of men shows that the proportion of survivors to age 60 and over declined between 1950/54 and 1970/74. Therefore, we calculated H, NH, CV and SD on the basis of complete life tables (Tables 2 and 3). The values of SD and NH indicate the variability in the age at death in years, CV and H present the variability standardized for the mean (i.e. life expectancy), whereas, NH and H moreover quantify the effect of a proportional mortality decline on the life expectancy. In 1990/92 Ho was 0.15 for men and 0.13 for women, indicating that a 1% drop in mortality at all ages would raise life expectancy at birth hy 0.15% and 0.13% respectively. Multiplying Ho by the life expectancy at birth shows that a proportional mortality reduction of 1% would raise life expectancy by 0.109 and 0.100 years, respectively. This change in years could also be derived directly from NH in Table 2 (by dividing the NHo by 100). The values of HIOII, Hao" and Hoo" were higher in 1990/92, varying hetween 0.14 and 0.16 (at age 10Y,), 0.18 and 0.22 (at age 30Y,) and 0.34 and 0.44 (at age 60Y,). A proportional mortality reduction of 1% ahove age 60Y" would raise life expectancy at that age by about 0.44% and 0.078 years (men) and 0.34% and 0.077 years (women).
A comparison of these measures of variability and life expectancy over time should indicate whether rectangularization took place. Tables 2 and 3 and Figure 3 show that when all ages are included in the analyses, absolute and relative variability declined in both sexes during the periods of 1950-1992, with the exception of the stagnation in the decline in Ho in men during the periods of 1955-1969. Life expectancy at b;,,:th increased in women during the entire period, whereas in men the increase was interrupted by a stagnation during the period of 1955/59 to 1960/64 and a de-
41

Chapter 3
Men
1.00 F<'~~~~~-~-'-~'~E~'~~'~~'''-;:'' ~;' ~;' :..'2:.;,'~;::" ,~, ,:-----=~l "~" --1950/54
CI) 0.80
.~ ~ 0.60 'l; ~
~ 0.40 o Il.
I'! Q. 0.20
, " , ' \ '.
- - - 1970174 , , , , , ,1990192
\ "
\ .. \ ' \'. I',
'" "
0.00 +--,------,--,---,---.---.---.--,------,r-"'...,.--.'
I!? 0.80
.~ i.l 0.60
c ~ 0.40
8. e a. 0.20
o 10 20 30 40 50 60 70 80 90 100 110
age
Women
- - - 1970174 , , , , , ,1990/92
0.00 +--r-----,----r--,---.---.---,--r-----,,---'''''+~-.' o 10 20 30 40 50 60 70 80 90 100 110
age
Figure 1 Survival curves starting at birth, by sex.
42

Rectangllial'ization of the survival curve
cline during the period 1960/64 to 1965/69 (Table 1). The decline in both absolute and relative variability during most of the period indicates that mortality was compl'essed into a smaller age span (i.e. absolute compression) and into a smaller proportion of the life expectancy (i.e. relative compression). That is, with the exception of the second half of the 1950s and the 1960s, when life expectancy did not increase in men, rectangularization of the entire survival curve took place in an absolute and a relative sense.
Since the change in the entire survival curve combines the effects of two different types of mortality reductions, i.e. those due to declines in infant and child mortality and those due to declines from chronic disease mortality at later agesll, we examined changes in the survival curve starting at ages other than bil'th. Excluding ages below lOY, results in a smaller decline in the variability of the age at death between 1950/54 and 1990/92 (see Tables 2 and 3). A closer inspection of the results shows differences between men and women until the 1980s. In women, relative variability remained more or less constant and absolute variability rose gl'adually during the periods of 1960-1979, whereas in men both relative and absolute variability increased during the periods of 1955-1969 and gradually declined thereafter. Since 1980/84, a slight decline in absolute and relative variability was found in both sexes. Comparing these results with the
Table 1 Life Expectancy at Birth, Ages 10Y" 30Y" 60Y, and 85Y" by Sex
80. y 810%. Y 830%. Y 860%, Y 885*. Y
Men
1950/54 70.57 62.82 43.76 17.37 3.99 1955/59 71.20 62.90 43.74 17.28 3.98 1960/64 71.21 62.60 43.45 17.12 4.15 1965/69 71.03 62.15 43.02 16.80 4.29 1970n4 71.10 61.99 42.88 16.60 4.32 1975n9 71.89 62.52 43.30 16.78 4.61 1980/84 72.77 63.22 43.90 17.16 4.74 1985/89 73.41 63.73 44.34 17.42 4.62 1990/92 74.06 64.32 44.91 17.82 4.57
Women
1950/54 73.08 64.78 45.38 18.31 4.27 1955/59 74.56 65.81 46.29 18.86 4.25 1960/64 75.73 66.72 47.14 19.55 4.49 1965/69 76.31 67.10 47.55 19.98 4.66 1970n4 76.96 67.57 48.03 20.45 4.79 1975n9 78.32 68.75 49.15 21.47 5.28 1980/84 79.44 69.74 50.11 22.29 5.65 1985/89 79.90 70.09 50.42 22.59 5.67 1990/92 80.18 70.30 50.64 22.76 5.69
43
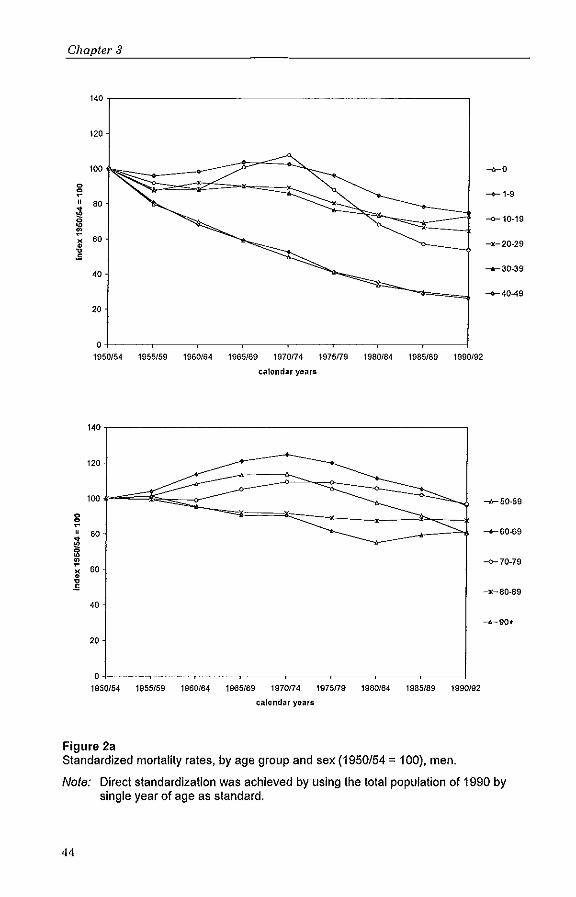
Chapter 3
140
120
100 -«-0
0
~ -+-1-9
" 80 ~ --0-10-19 0 ~ -\!' ~
60 -)(-20-29 ~ .s
'0 -+-30-39
-+-40-49
20
o+-----.-----~----~----~--_,~--_.----_.----~
19S0/54 1955/59 t9S0/64 1965169 1970/74 1975179 1980/84 1985/89 1990192
calendar years
140
120
100 -h-50-59
0
~ , 80
~ -+-60-69
~
\!' 60
~ --0-70-79
~
•• -x-80-89
'0
20
o+-----.-----~----~--__ ~--_,----_.----_.----~ 1950/54 1955/59 1960164 1965/69 1970174 1975179 1980/84 1985/89 1990J92
calendar years
Figure 2a Standardized mortality rates, by age group and sex (1950/54 = 100), men.
Nole: Direct standardization was achieved by using the total population of 1990 by single year of age as standard.
44

Rectallguiarization of the survival curve
140
120
100 -0-0
0 :;! ---+-1-9
" 80
~ --0-10-19 ~
1! ~ 60 -x-20-29 ~
S
40 .......... 30-39
---+-40-49
20
O+-----.-----.-----r----,r----,-----,----~----~ 1950/54 1955/59 1960/64 1965f69 1970174 1975179 1980f84 1985f89 1990f92
calendar years
140
120
100 ~50-59
0
:" " 80 ---+-60-69
~ 0 ~
\!! --0-70-79
" 60 x~
• ~ S
-x~80-89
40
----90+
20
O~--~----~--~----~--~--~~--~--~ 1950154 1955f59 1960/64 1965f69 1970174 1975179 1980/84 1985/89 1990/92
calendar years
Figure 2b Standardized mortality rates, by age group and sex (1950/54 = 100), women.
Note: Direct standardization was achieved by using the total population of 1990 by single year of age as standard.
45

Chapter 3
change in life expectancy at age lOY, indicates that rectangularization in a relative and an absolute sense took place from 1970174 (men) and 1980/84 (women). Above age lOY" excess mortality among adolescents mainly due to accidents is included. Excluding ages below 30Y, gave more or less similar results (see Tables 2 and 3).
With respect to the compression-of-morbidity debate, changes in the rectangularity of the survival curve at older ages are most interesting, because morbidity is mainly concentrated at higher ages. Above age 60Y" relative variability has declined in women over the complete period and in men since 1975179, although in men it remained above the level in 1950/54 (Figure 4). Absolute variability has declined in both sexes since 1980/84, with the exception of the virtually constant SD60" in women. Life expectancy at age 60Y, has increased in men since 1970174 and in women during the entire period, although the increase has been smaller in women since 1980/84. The recent decline in absolute variability in combination with the continuing increase in life expectancy at age 6011, indicates that rectangularization in an absolute sense took place. This reversal from a decreasingly rectangular shape of the survival curve in the 19608 and 1970s (men also in the 1950s) to an increasingly rectangular shape in the 1980s is worth looking at more carefully.
Table 2 Keyfitz' H (H) and Numerator of Keyfitz' H (NH), by Sex, for Different Starting Ages
............... !\t .. b.ir:th .............. _ ...... N .. ~9.~.lg.1:I ...... _ ...... !\t .. ~9.~ .. 3.g:1. ...... _ ...... I\t.~.9.~.~'O':1. ...... H NH H NH H NH H NH
Men 1950/54 0.182 12.87 0.169 10.59 0.225 9,83 0.429 7.45 1955/59 0.173 12.34 0.167 10.49 0,224 9.82 0.435 7.52 1960/64 0.173 12.33 0.172 10.74 0.232 10.07 0.452 7.74 1965/69 0.173 12.30 0.176 10.95 0.238 10.26 0.471 7.91 1970174 0,170 12.10 0.176 10.93 0.239 10.23 0.478 7.93 1975179 0.164 11.78 0.173 10.83 0.236 10.21 0.480 8.06 1980/84 0.158 11.47 0.169 10.67 0.231 10.12 0.471 8.08 1985/89 0.151 11.09 0.163 10.39 0.223 9.90 0.456 7.94 1990/92 0.147 10.87 0.159 10.22 0.217 9.75 0.440 7.84
Women 1950/54 0.161 11.80 0.153 9.93 0.208 9.43 0.406 7.43 1955/59 0.148 11.02 0.145 9.51 0.197 9.11 0.388 7.31 1960/64 0.141 10.71 0,141 9.42 0.192 9.07 0.377 7.36 1965/69 0.140 10.67 0.142 9.56 0.193 9.19 0.373 7.46 1970174 0.137 10.51 0.141 9.55 0.191 9.17 0.364 7.44 1975179 0.134 10.47 0.141 9.66 0.190 9,33 0.357 7.67 1980/84 0.130 10.35 0.138 9.66 0,187 9.35 0.349 7.77 1985/89 0.127 10.16 0.136 9.56 0,184 9.28 0.341 7,70 1990/92 0.125 10.04 0.135 9,50 0.182 9.21 0.337 7,67
46
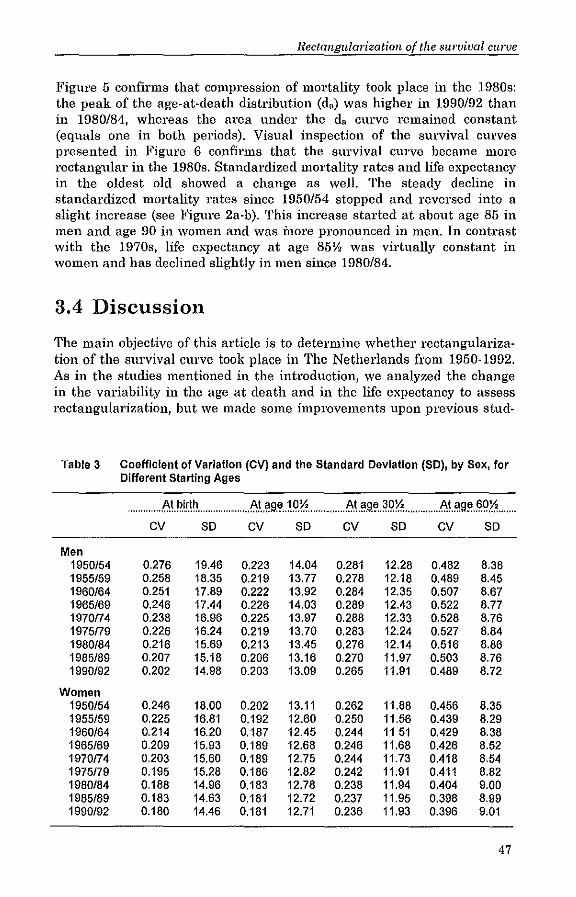
Rectangularization of the survival curve
Figure 5 confirms that compression of mortality took place in the 1980s: the peak of the age-at-death distribution (d,) was higher in 1990/92 than in 1980/84, whereas the area under the da curve remained constant (equals one in both periods). Visual inspection of the survival curves presented in Figure 6 confirms that the survival curve became more rectangular in the 1980s. Standardized mortality rates and life expectancy in the oldest old showed a change as well. The steady decline in standardized mortality rates since 1950/54 stopped and reversed into a slight increase (see Figure Za-b). This increase started at about age 85 in men and age 90 in women and was more pronounced in men. In contrast with the 1970s, life expectancy at age 85\1, was virtually constant in women and has declined slightly in men since 1980/84.
3.4 Discussion
The main objective of this article is to determine whether rectangularization of the survival CUl've took place in The Netherlands from 1950-1992. As in the studies mentioned in the introduction, we analyzed the change in the variability in the age at death and in the life expectancy to assess rectangularization, but we made some improvements upon previous stud-
Table 3 Coefficient of Variation (CV) and the Standard Deviation (SO), by Sex, for Different Starting Ages
......... I',tPir.l~ ...... " .... f,lt.~~~.1.IJ.~ ... " .... f,I\~9.~}O'~ ........ 1',t'!9~~g.<:I .... cv so CV so cv so cv SO
Men 1950/54 0.276 19.46 0.223 14.04 0.281 12.28 0.482 8.38 1955/59 0.258 18.35 0.219 13.77 0.278 12.18 0.489 8.45 1960/64 0.251 17.89 0.222 13.92 0.284 12.35 0.507 8.67 1965/69 0.246 17.44 0.226 14.03 0.289 12.43 0.522 8.77 1970n4 0.238 16.96 0.225 13.97 0.288 12.33 0.528 8.76 1975n9 0.226 16.24 0.219 13.70 0.283 12.24 0.527 8.84 1980/84 0.216 15.69 0.213 13.45 0.276 12.14 0.516 8.86 1985/89 0.207 15.18 0.206 13.16 0.270 11.97 0.503 8.76 1990/92 0.202 14.98 0.203 13.09 0.265 11.91 0.489 8.72
Women 1950/54 0.246 18.00 0.202 13.11 0.262 11.88 0.456 8.35 1955/59 0.225 16.81 0.192 12.60 0.250 11.56 0.439 8.29 1960/64 0.214 16.20 0.187 12.45 0.244 11 51 0.429 8.38 1965/69 0.209 15.93 0.189 12.68 0.246 11.68 0.426 8.52 1970n4 0.203 15.60 0.189 12.75 0.244 11.73 0.418 8.54 1975n9 0.195 15.28 0.186 12.82 0.242 11.91 0.411 8.82 1980/84 0.188 14.96 0.183 12.78 0.238 11.94 0.404 9.00 1985/89 0.183 14.63 0.181 12.72 0.237 11.95 0.398 8.99 1990/92 0.180 14.46 0.181 12.71 0.236 11.93 0.396 9.01
47

Chapter 3
Men
l00~------------------------------------------------------,
-<>-HO
-+-NHO 95
-o-CVO
-X-SDD
90
60
75
70+------r------.------r------.------r------.------r------~
1950154 1955159 1960164 1965/69 1970174 1975179 1980184 1985/89 1990192
calendar years
Woman
100~-----------------------------------------------------------,
-<>-HO
-+-NHO
95 -O--CVO
-X-SOD
90 g
" I 85
i 60
75
70+------.----~------.-----~----_.------r_----._----__< 1950154 1955/59 1960164 1965169 1970174 1975179 1980/64 1985/89
calendar years
Figure 3 Keyfitz' H (Ho), Numerator of Keyfitz' H (NHo), Coefficient of Variation (CVo) and Standard Deviation (SOo), by sex (1950/54 = 100),
48
1990/92

115
110
105
0
~
" 100
~ :;: ~ x 95 • ~
90
.5
.0 1950/54
115
110
105
0
~
" 100
~ Ii! ~ x 95 ~ .5
90
.5
1955/59
Rectallguial'ization of the survival curve
Men
-Ir-H60.5
-+-NH60.5
"' ... c::=--- : ___ :x_x:---:
1960164 1965169 1970174
calendar years
Women
1975179 1980/84 1985/89 1990/92
-Ir-H60.5 -+-NHBO.5 -o-CV60.5 -:«:-S060.5
---..<----:.
.O+---~---.---~---.----,---~---,---~ 1950/54 1955159 1960164 1965169
Figure 4
1970f74
calendar years
1975f79 1980/64 1985189 1990/92
Keyfitz' H (H60"), Numerator of Keyfitz' H (NH6o,,), Coefficient of Variation (CV60") and Standard Deviation (SD60"), by sex (1950/54 = 100).
49

Chapter 3
ies with regard to the type of data, the definition of rectangularization and the measures of variability. Before summarizing our main conclusions and comparing our results with those from other studies, we discuss issues l'e~ lated to the data and measurement of rectangularization.
A frequently mentioned problem in studies dealing with mortality including old age groups, is the problem of ul1l'eliability of age reporting at advanced ages. ll,!3 Using Dutch mortality and population data derived from municipal population registers eliminates most of this uncertainty.'S There are three principal advantages of using data from continuous population registers that have been kept in The Netherlands since 185025
over data from death certificates and censuses, First, we considered the validity of age recording. At bil'th a personal card based on the birth certificate is made and all changes in vital status, including death, are recorded on this card, Second, population registers also provide data on the population at risk by single yeal' of age and sex. Finally, mortality data by single year of age at death and year of birth are available for all ages, including centenarians.
Because of the high quality of the mortality and population data in The Netherlands, we could use life tables based on mortality risks to determine whethel' rectangularization of the survival curve occurred, A life table analysis has several advantages ovel' the numerator analysis that was used by Myers & Manton to,ll and in most analyses of Go!' and Rothenberg,!3 First, changes in the population structure do not affect the results. Second, in a life table with an initial cohort of one at the starting age, the proportion of deaths included in the analysis always equals one and is thus constant. Consequently, fixed percentile points are not necessary to avoid the situation that the proportion of deaths included in the analysis is not constant," Thu'd, analyses of both the variability in the life table ageat-death distribution and visual inspection of the shape of the survival curve!,!, use the life table perspective, which increases the comparability of the outcomes.
We made a distinction between rectangularization in an absolute sense and rectangularization in a relative sense, depending on whether an absolute or a relative measure of variability was used. Although in the case where life expectancy is increasing, rectangularization in an absolute sense automatically means rectangularization in a relative sense, the reverse is not true. Especially in women, rectangularization in a relative sense was not generally accompanied by rectangularization in an absolute sense until the 1980s, because the age-at-death distribution shifted to the right. Since the choice between rectangularization in an absolute sense and in a relative sense influences whether rectangularization is found or not, it is important always to mention explicitly whether an absolute or a relative measure of variability was used to assess rectangularization.
50

Rectallguladzation of the survival curve
Men 0,05
--1970174
..1'" •• ..: ••• - - - 1980/84
0,04 ~. ~. - - - - - -1990/92 (/) -- ~ .r: 7: ~ ~ " .. ,.' " 7/
" 0,03 , '0 '/ c /,
0 1 " 'E / " 0,02 / ' ,. 0 / " Q. ,-:,.' .;. e ~. c. '. 0,01 '. x.
0,00 ~ ..... "'='
60 70 80 90 100 110
age
Women
0,05.,------------------------,
(/)
~ c o
0,04
0,03
~ 0,02 c. e c.
0,01 -~
" ,,-r:
'/ / '
I: ,: ,: I.-/,-
/ ' /" '
I.' h
/0' r'
~:<
r, I.'
C:', --1970174 \'. ---1980/84 ,.
\". -- -- --1990/92 \' \. I'. \'. I'. I'. I' i. \. \, ~.
'<. " "
0,00 +-----,-----.-----r-----,-"'\~'""~'-'---.....,J 60 70 80 90 100 110
age
Figure 6 Age distribution of life-table deaths above age 60Y" by sex,
51

Chapter 3
Men
1,00 "'.-------------------------,
I!! 0,80
,~ 111 0,60
c o 'f 0.40 o Q.
e Q. 0,20
--1970n4 - - - 1980/84 - - - - - -1990/92
0,00 +----,-------------,r-----------,--=""",--,..------,--I 60 70 80 90 100 110
age
Women 1,00,....=---------------------,
I! 0,80
,~ 111 0,60
'0 c o ~ 0.40 c. e Q. 0,20
"' ... "~.
''4.. ". ". ,. ,. ,.
" ,. ,. \. \,
~. ,'.
""
--1970174 - - - 1980/84 .. , - .. 1990/92
.;,
" , "', ... 0,00 +----------,-----.----r---=~"'-:r'----_,___l
60 70 80 90 100 110
age
Figure 6 Survival curves starting at age 60Y" by sex,
52

Rectangularization of the survival curve
Finally, besides measures of variability based on the commonly used stan· dard deviation (i.e. SD and CV), we used measures of variability based on Keyfitz' H (NH and H), which have important advantages in studying rec· tangularization. The most important advantage is that Hand NH not only measure the variability in the age at death, but also quantify the effect of small proportional mortality reductions at all ages on the life expectancy. Due to this property of mortality entropy, which expresses the fact that the effect of a mortality change on the life expectancy depends on the con· vexity of the survival curve'o, there exists a relationship between rectan· gularization and further increases in life expectancy even without making inferences about whether or not the maximum life span is being reached. Another advantage is that measures based on Keyfitz' H can be decom· posed by age l7 and cause of death.3l Finally, Hand NH are more balanced measures of changes occurring over the entire survival curve than the SD and CV. In SD·based measures 'outliers' (i.e. the youngest and oldest ages) have an important weight because in the calculations deviations are squared and life expectancy at the starting age is used as the reference point. Measures based on Keyfitz' H use the local life expectancy, which links up better with the concept of rectangularization, because in general, rectangularization occurs when the age·at·death distribution shows an increased concentration around the life expectancy, as the latter moves to older age (or its maximum).
Despite these improvements, which enabled us to assess rectangulariza· tion unambiguously, some caution must be exercised when interpreting our results. The most important caveat relates to the use of period life tao bles, which combine mortality of different birth cohorts into one synthetic cohort. We did not use cohort life tables because analyses of recent changes in the shape of the survival curve would be impossible without making assumptions on the development of mortality of cohorts born be· fore 1895 who had not yet completed their mortality in 1990/92. Using a period perspective might have biased our results because of differences in mortality selection; only 11.5% (men) and 23.3% (women) of generations born in 1896· 1900 have survived to age 8532, compared to 18.6% and 40.2% of the synthetic cohort dying in 1981·1985. Visual inspection of the incom· plete survival curves of generations born in 1881·1885 and 1901.190532
confirms the crossing of the survival curves observed in men and the shifting to the right in women. However, as mentioned before, there is no information about changes in the shape of the survival curve of these birth cohorts above age 85, which is important in order to determine whether there is rectangularization or not.
Although the conclusions based on the standard deviation (SD and CV) were generally confirmed by those based on the index of mortality entropy (H and NH), pair·wise comparison of the results derived with Hand CV and with NH and SD shows differences as well. CVo and SDo showed an
53

Chapter 3
uninterrupted decline, whereas Ho and NHo demonstrated a stagnation in the decline in men by the end of the 1950s and during the 1960s. Of note is also the difference between the recent trend in SD6o" and NH60" in women. Although this disparate finding recommends some caution in the conclusion that l'ectangularization in an absolute sense occurred in women above age 60Y" we consider the outcomes based on NH60" to be more valid. Changes in the age-at-death distribution, standardized mortality rates and life expectancy of the oldest old support the trend in NH60ll.
Our l'esults show that rectangularization of the entire survival curve occurred both in a relative and an absolute sense in The Netherlands in most of the period of 1950-1992. Results with respect to the survival curve starting at age 60Y, were more divergent until the 1980s. In men, an increase in variability took place until 1975179 (relative variability) and 1980/84 (absolute variability), indicating that neither rectangularization in an absolute nor in a relative sense occurred prior to these years. For women, the variability corrected for the change in life expectancy (H60" and CVoo,,) showed a steady decline since the period of 1950/54, but absolute variability increased prior to the 1980s, indicating that rectangularization in a relative sense only occurred. During the last decade, stabilizing and even increasing mortality rates of the oldest old resulted in a slight rectangularization of the survival curves of men and women above age 60Y" both in a relative and an absolute sense. Although the reduction in variability was small, we considered it to be relevant, considering that one cannot expect large reductions any more, because the variability is bounded by zero (01' even by a value above this level, since in the case where the genetically endowed limit would be approached, there will always remain some genetic variability in the age at death).
Comparison with results from other studies on rectangularization 01' compl'ession of mortality in the United States during the periods of 1962-197910 and 1962-198413, California in 1970, 1980, and 199012, and Canada during the period of 1951-1981 lo1 shows similarities and differences. With respect to the entu'e survival curve, our results were in agreement with the other studies, showing a decline in relative variability (CV or H) and absolute variability (SD). The only exception is the increase in SD in Californian men between 1980 and 1990, but this increase was not found in white Californian men. The results at older ages (age 60Y,) corresponded less. Analyses including the oldest 75% of the deaths (i.e. starting age of about 60), showed a slight decline in SD in Americans in the 1960s and 1970s and in white Californians in the 1970s, while we found an increase in absolute variability (i.e. SD and NH) in Dutch men and women above age 60Y, in the same period. The decline in absolute variability in the 1980s, found in our study, was also reported for white Californians. Discrepancies between the studies may be due to differences in the data collection and methods of assessing rectangularization, or due to actual dif-
54

Rectangularization of the sllrvival curve
fet'ences between the populations and periods studied. A recent study of Himes" shows that the pattem of old age mortality in the United States and, to a lesser extent, in Canada, differs from that in other low mortality countries. To our knowledge, however, there are no studies that have reported on the change in the variability in the age at death and life expectancy in other low mortality countries. The relational model of Himes and coworkers"·34 provides some information on changes in the age pattem of mortality for a large number of countries up to the mid-1980s, but comparison with other studies is difficult because of the difference in measuring rectangularization and the lack of information by starting age 01' percentile point. Further investigations including recent periods will be necessary to find out whether the recent rectangularization at older ages is taking place in other countries. In addition, a better understanding is needed of the stagnation in the mortality decline in the oldest old and of the mortality changes that caused the recent rectangularization in The Netherlands. As a start, we have performed a decomposition analysis in order to determine the contribution of selected causes of death to rectangularization of the survival curve above age 60 in The Netherlands."
Rectangularization is often interpreted as an indication that the life expectancy is approaching its biological limit. If the recent rectangularization continues, rectangularization in an absolute sense at advanced ages could be a sign that life expectancy is approaching the genetically endowed limit to life. However, on the basis of mortality data, one cannot determine whether the biological limit is being approached.3 •• 37 Even with a fixed life span, there will be variability (due to genetic heterogeneity) in the age at death, which makes it impossible to determine whether the remaining variability in the age at death is due to environmental influences 01' heterogeneity in endowment for longevity.1O·11,38 Nevertheless, even without making any inferences on whether the life expectancy is approaching the biological limit, the rectangularity (01' convexity 01' concavity) of the survival curve, and changes therein measu;'ed by the mortality entropy (H and NH) provide useful information about further increases in life expectancy. Although rectangularization of the survival curve and compl'ession of morbidity are two distinct phenomena not related in a simple manner, this feature of Hand NH makes the outcomes of our study important for answering the question of whether 01' not compression of morbidity is likely to occur, The recent decline in NH and H, found in· our study, might indicate that increases in life expectancy are likely to decelerate owing to diminishing retums of mortality reductions. Compression of morbidity is much harder to achieve if the life expectancy is still increasing rapidly, As long as this is true, compression of morbidity will only take place if the morbidity-fl'ee life expectancy increases at an even greater pace, Thus, a continuation of rectangularization, indicating that increases in life expectancy are decelerating, will bring compression of morbidity within reach. Whether this ideal will be achieved depends on the progress that will be
55

Chapter 3
made in delaying the onset of chronic diseases and disability, as well as in slowing down or reversing the disease and disability process.
Appendix
1. Keyfitz31 described H as follows:
H
OJ
Wa) Inl(a) da
° Wa) da
° where l(a) is the number of survivors at age a and w is the oldest age (Keyfitz, 1977). In the case where the number of survivol'S at the starting age, 1(0), equals one, l'ewexpl'ession of H gives 17,22,39:
OJ
Jd(a)e(a)da H= .'!:O ___ _
Jl(a)da
°
OJ
Jd(a)e(a)da
° e(O)
where d(a) is the number of persons alive at age 0 who will die between age a and a+da and e(a) is the life expectancy at age a.
2. In a life table based on a period-cohort observational plan, age a (e.g. la, da, ea) refers to 'half ages' like lOY, 30Y, and 60Y,.
References
1. Fries JF. Aging, natm'al death, and the compression of morbidity. New Englalld Jaumal af Medicine 1980;303(3): 130-135.
2. Fries JF. The compression of morbidity: near 01' far? Milbank Quarterly 1989;67(2):208-232.
3. Gruenberg EM, The failtu'es of success. Milbanh Memorial Fund Quarterly/Health and Society 1977;55(1):3-24.
4, Kramer M, The rising pandemic of mental disorders and associated chronic diseases and disabilities. Acta Psychiatrica Scandinavia 1980;62(Suppl. 285):382-397.
5. Olshansky SJ, Rudberg MA, Carnes BA, Cassel CK, Brody JA. Trading Off Longer Life for Worsening Health. Journal of Aging and Health 1991;3(2):194-216.
56

Rectallg11larization of the survival curve
6. Manton KG. Changing concepts of morbidity and mortality in the elderly population. Milbank Memorial Fund Quarterly/Health alld Society 1982;60(2):183-244.
7. Fries JF, Crapo LM. Vitality alld Aging. San Francisco: W.H. Freeman, 1981.
8. Fries JF. The compl'ession of morbidity. Milbank Alemol'ial Fund Quarterly/ Health alld Society 1983;61(3):397·419.
9. Fries JF. The compression of morbidity. World Health Forum 1985;6:47-51.
10. Myers GC, Manton KG. Recent changes in the U.S. age at death distribution: fm'ther observations. The Gerontologist 1984;24(6):572-575.
11. Myers GC, Manton KG. Compression of mortality: myth or reality? The Gerontologist 1984;24(4):346·353.
12. Go CG, Brustrom JE, Lynch MF, Aldwin CM. Ethnic trends in survival cm'ves and mortality. The Gerolltologist 1995;35(3):318·326.
13. Rothenberg R. Lentzner HR, Parker RA. Population aging patterns: the expansion of mortality. JOllrnal of Gerolltology 1991;46(2):866·870.
14. Nagnur D. Rectangularization of the survival CUl've and entropy: the Canadian experience, 1921-1981. Calladian Studies ill Population 1986;13(1):83-102.
15. Blalock HM. Social Statistics. (International edition) Singapore: McGraw-Hill, 1981.
16. Keyfitz N, Golini A. Mortality comparisons: the male-female ratio. Genus 1975;31:1·34.
17. Vaupel JW. How change in age-specific mortality affects life expectancy. Population Studies 1986;40:147·157.
18. Demetrius L. Adaptive value, entropy and survivorship curves. Nature 1978; 275(5677): 213· 214.
19. Hakkert R. Life table transformations and inequality measures: some notewort.hy formaireiationships. Demography 1987;24(4):615·622.
20. Keyfitz N. Applied Mathematical Demography. (2nd ed.) New York, NY: 8pringer Veriag, 1985.
21. Smith DP. Formal demography. New York, NY: Plenum Press, 1992.
22. Goldman N, Lord G. A new look at entropy and the life table. Demography 1986;23(2):275·282.
23. Keyfit.z N. Improving life expectancy: an uphilll'oad ahead. American Jou1'1Za/ 0/ Public Health 1978;68(10):654·656.
24. Statistics NetherlaIlds. Overlevingstafels '/QUI' leeftijd ell geslacht [Life tables by age and sex/. 's·Gravenhage, the Netherlands: State Publishers/Statistics Netherlands, multiple years.
25. Tabeau E, van Poppel F, Willekens F, Mortality in the Netherlands: The Dala Base. Net?-erlands Interdisciplinary Demogl'aphic Institute, 1994.
26. Namboodu'i K, Suchindran CM. Life Tables and their Applications. Orlando, Fl: Academic Press, 1987.
27. Namboodil'i K. Demographic Analysis. A Stochastical Approach. San Diego, ea: Academic Press, 1991.
28. ConID'an GA, Himes eL, Preston SH. Old-age mortality patterns in low mort.ality countries: an evaluation of population and death data at advanced ages, 1950 to the present. Population Bulletin of the United Nai£olls 1991(30):23·60.
29. Fries JF. The compression of morbidity: miscellaneous comments about a theme. The Gerontologist 1984;24(4):354·359.
57

Chapter 3
30. Demetrius L. Relations between demographic parameters. Demography 1979;16(2): 329·338.
31. Keyfitz N. What difference would it make if cancer were eradicated? An examination oftbe Taeuber paradox. Demogmphy 1977;14(4):411·418.
32. Tas RFJ. Generatie-overlevingstafels naal' geslacht en leeftijd afgeleid uit waarnemingen over de periode 1860·1989 [Cohort life tables for the Netherlands by age and sex derived from observations during the period 1860·1989]. Maandstatistiell VOOI' de Bevolking (Monthly Bulletin of Population Statistics] 1991;39(6): 15·26.
33. Himes CL. Age patterns of mortality and cause-of·death structures in Sweden, Japan, and the United 8tates. Demogmphy 1994;31(4):633·650.
34. Himes eL, Preston SR, Condran GA. A relational model of mortality at older ages in low mortality countries. Population Studies 1994;48:269-291.
35. Nusselder WJ, Mackenbach JP. Rectangularization of the sID'vival CID've in The Netherlands: an analysis of underlying causes of death. JOll1'1lal of Gerontology: Social Sciellces 1997;52(3):8145·8154 [Included ill this thesis as chapter 4].
36. Manton KG, Tolley RD. Rectangularization of the survival cm've. Implications of an ill-posed question. Jourllal of Agillg alld Health 1991;3(2): 172·193.
37. Manton KG, Stallard E, Tolley HD. Limits to human life expectancy: evidence, prospects and implications. Population and Development Review 1991;17(4): 603·637.
38. Manton KG. Biomedicall'eseal'ch and changing concepts of disease and aging: implications for long-term health forecasts for elderly populations. In: Manton KG, Singer BR, Suzman RM, ed. Forecasting the Health of Elderly Populations. New York, NY: 8pringer·Verlag, 1993:319·365.
39. Mitra S. A short note on the Taeuber paradox. Demography 1978;15(4):621·623.
58

Rectangulariza tion of the survival curve in
The Netherlands: an analysis of underlying
causes of death
T his study analyzed the contribution of selected causes of death to the rectanguiarization of the sW'vival curve of Dutch men and women
above age 60 in the 1980s, and determined why rectangularization took place in the 1980s but not in the 1970s. The contribution of causes of death was determined by means of a decomposition analysis, llsing mortality data by underlying cause of death, sex, and age from Statistics Netherlands. Our results show that mortality reductions from ischemic heart disease, cerebrovascular diseases, and lung cancel' (men only) and mortality increases from chronic obstmctive pulmonary disease (men only) and mental disorders contributed to rectangularization in the 1980s. Comparison with the 1970s, moreover demonstrated that particularly changes in mortality at advanced ages (i.e. smaller mortality reductions and mortality increases) were responsible for the reversal from a decreasingly rectangular shape of the survival curve in the 1970s curve to rectangularization in the 1980s. The combination of increased survival to advanced ages and reduced survival at advanced ages explains why rectangularization of the SllI'vival curve took place recently in The Netherlands.

Chapter 4
4.1 Introduction
Declining death rates from Clll'OniC diseases among the elderly population in low·mortality countries have contributed to the ongoing debate on further increases in life expectancyl.2 and its consequences for the health expectancy of the populationl .3.'. Rectangularization of the survival curve plays an im· pOl·tant role in these discussions. An increasingly rectangular shape of the survival curve, reflecting an increased survivalllntil advanced age and con~ centration (compression) of deaths into a small age range, implies that fur· ther increases in life expectancy are harder to achieve. This makes a favour· able development of health expectancy, known as 'compression of morbidity', more likely,! The question of whether there is rectangularization of the sur· vival curve was addressed in several studies,o'lO Most studies concluded that there was no rectangularization at older ages, although there exists some controversy about the assessment of rectangularization. Examination of Dutch slUvival curves showed that an increase in life expectancy above age 60 was accompanied by compression of mortality into a smaller age interval in the 1980s, whereas in the 1960s and 1970s (men also in the 1950s), de· compression of mortality occurred. That is, a reversal took place from a de· creasingly rectangular shape of the survival curve prior to the 1980s to rec· tangularization in the 1980s.[1
The objective of this study was to develop a better understanding of the reo cent rectangularization of the survival curve at older age in The Nether· lands by examining the contribution of selected causes of death. Changes in the cause·of·death pattern can give a hint of changing determinants of mol" tality and may therefore afford a glance behind the scenes of the processes which caused rectangularization. The centl:al question is which changes in the cause·of·death pattern underlie rectangularization of the survival curve above age 60 in the 1980s. To answer this question we conducted a bipartite analysis. First, we examined which causes of death contributed to rectan· gularization of the smvival curve in the 1980s. Next, we analyzed which causes of death contributed to the reversal from a decreasingly rectangular shape of the survival cmve in the 1970s to rectangularization in the 1980s.
4.2 Methods
Data on the population and the number of deaths by age and sex were ob· tained fi'om Statistics Netherlands. l2,13 Population and total mortality data covering the period 1950·1992 were classified by single year of age. Analyses using cause·specific mortality data cover the period 1970·1992. In tills pe· riod deaths were classified by underlying cause of death according to two different revisions of the International Classification of Diseases, Injuries and Causes of Death: the eighth revision (lCD·8) for the period 1970·1978 and the ninth revision (lCD·9) for the period 1979·1992. From all causes dis·
60

Rectangularization and underlying causes of death
Table 1 Classilication in Cause·ol·Death Groups According to the ICD·Clas· silications
ICO· ICO·8 ICO·9 Disease Category Chap·
ter 1970·1978 1979·
Infectious and parasitic diseases 001·136 001·139 Cancer of stomach 2 151 151 Cancer of colorectum 2 153·154 153·154 Cancer of trachea, bronchus and lung 2 162·163 162·163;165 Cancer of breast 2 174 174·175 Cancer of prostate 2 185 185 Other neoplasms 2 r(140·239) r(140·239) Diabetes mellitus 3 250 250 Other endocrine, nutritional and 3 240·246;251·269; 240·246;251·259;
metabolic diseases 270·279 260·279 Diseases of blood and bloodforming 4 280·289 280·289
organs Mental disorders 5 290·315 290·319 Diseases of the nervous system and 6 320·389 320·389
sense organs Ischemic heart diseases 7 410·414 410·414 Cerebrovascular diseases 7 430·438 430·438 Other cardiovascular diseases 7 440·448;450·458 440·448;415;
417;451·459 Other heart diseases 7 390·398;400·404; 390·398;401·405;
420·429 416;420·429 Pneumonia/influenza 8 470·474;480·484;486 487;480·486 Chronic Obstr. Pulmonary Disease 8 490·493 490·494;496 Other diseases of the respiratory 8 r(460·519) r(460·519)
system Diseases of the digestive system 9 520·577 520·579 Diseases of the genito-urinary system 10 580-629 580·629 Symptoms and ill-defined conditions 16 780-796 780-799 Traffic accidents 17 E800-845;E940·941 E800·E848
Other accidents 17 E880-887;E890·909; E880·888;E890· E911-929;E943-946; 909;
E980-989 E911-929;E980-988
Other external causes 17 E850-877; E850-869; E910; E930·999; E870·879;E910; excl. E940-941; excl. E930-999; E943-946; excl. E980- exc1.E980-989 989
Other causes 11-15 630-678;680·686; 630-676;680-686; 690·709;710-738; 690·709;710·739; 740-759;760·776 740·759;760-779
61

Chapter 4
tinguished in these ICD·classifications, we composed 26 cause·of·death groups for which the comparability over the ICD·classiJ,'ications is maxi· mized (Table 1). Cause·specific mortality data were (at the time we per· formed this study) only available in 5·year age gl'OUpS with age 85 and over as the oldest age group. Age groups below age 60 were not included in the analyses, since especially changes in the rectangularity of the survival curve at older ages are relevant to the further development of life and health expectancy.
Construction of life tables
Abbreviated total mortality life tables consisting of 5·year age gl'OUpS start· ing at age 60 and with age 100 and over as oldest age group were con· structed for both sexes using standard life· table techniques.'"l5 These are period life tables covering 5 calendar years (e.g. 1980/84), except for the last period, 1990/92. Period life tables combine mortality of different birth co· horts which might have faced different influences on mortality (cohort ef· fects) and diffemnt mortality selection. Nevertheless, we did not use cohort life tables, because in that case assumptions on the development of mortality of cohorts born before 1895 which have not yet completed their mortality in 1990/92 would have had to be made. Cause·of·death ratios by 5·year age groups and sex were calculated by dividing the number of deaths per cause by the total number of deaths. ls These cause·of·death ratios were assumed to be constant within five·year age intervals and above age 85. The life tao bles and cause·of·death ratios were the starting point of our analyses.
Measurement of rectangularization
Rectangularization of the survival curve is assessed by determining whether there is a reduction in the variability in the age at death. In the extreme situation of a perfectly rectangular survival cm've, everyone' survives to ad· vanced ages and then dies at the same age (i.e. there is no variability in the age at death). EmpiJ.'ical survival curves al'e not (and are not likely to be) perfectly rectangular as the age at death differs between individuals, but changes in the age pattern of mortality can result in squaring of the survival curve, known as 'rectangularization'. Rectangularization is defined as a trend toward a more rectangular shape of the survival curve due to an in· creased survival and increased concentration (compression) of deaths around the mean age at death. This study focuses on rectangularization and compression of mortality in an absolute sense, designating a situation of in· creased concentration of deaths into a smaller age interval (i.e. a decline in the variability of the age at death, expressed in years). Rectangularization in a relative sense, which occurs when deaths are concentrated into a smaller proportion of total life expectancy (i.e. a decline in the variability of the age at death, relative to the life expectancy), is not considered for two reasons. First, if life expectancy is increasing, then absolute compression automati· cally means relative compi·ession. Second, previous analyses have shown
62

Rectanguial'izatl:on and underlying causes of death
that in particular the trend in absolute variability showed a remarkable change during the 1980s in The Netherlands."
To assess rectangularization, we used the numerator of 'Keyfitz' H' (NH)17,18, which, like the standard deviation, is a measure of absolute variability. Advantages of NH over the better known standard deviation are that (the change in) the NH can be decomposed by cause of death and that NH not only quantifies the variability in the age at death, but also the effect of small proportional mortality reductions on the life expectancy, which makes the outcomes directly quantitatively interpretable, A change in absolute variability, measured with the NH, indicates that compression (decline in NH) or decompression (increase in NH) is taking place. NH is calculated from abbreviated period life tables with an initial cohort of one at the starting age (1,=1), using a discrete approximation.'8 For each age group a, a+n, NH (i.e. nNHa) is calculated as follows:
n NH a = n d a ea+O.51l (1)
where "da is the number of persons alive at age x who will die in the interval a, a+n; a is age; n is the length of the age interval; ea+0.5" is mid-interval life expectancy at age a+0.5n. Summation over all age groups D.-om age x gives NHx, where the subscript x after H indicates the starting age. The mid-intervallife expectancy is calculated as the weighted average of the life expectancy at age a and at age a+n, using the proportion of deaths in the fu'st nl2 and second nl2 ages as weights.
Decomposition analysis
In order to assess the contribution of different causes of death to rectangularization of the survival curve, the change in NH is decomposed by cause, First, the principles of the decomposition analysis, leaving out of consideration cliffe rent causes of death are described, Next is explained how cauSes of death are incorporated in the decomposition technique,
In one age gl'OUp "NHa is the product of the number of life-table deaths and the remaining life expectancy (formula 1), This means that a change in "NHa occurs if the number of deaths changes, if the remaining life expectancy changes or if both change, or
"'" NH a = [(" da + "'" daY (ea+0,5" + '" ea+0,5,,)] - [II da ea+0.5"J (2)
where 6 is change between the two periods under consideration. Reexpressian gives,
"'" NHa = ["'" da ea+0.5"J + [/lda "'ea+0.5"J + ["'/l da "'ea+0.5"J (3)
63

Chapter 4
A change in "NH" due to a change in the number of deaths in that age group (first component of formula 3), is termed the 'direct effect' (DE). A change in ,,NH" due to a change in remaining life expectancy (second component of formula 3) is termed the 'indirect effect' (IE). To COl'l'ect fm· doublecounting 01' undercounting, which occurs when both the number of deaths and the life expectancy change, a correction is added to the IE (third coinponent of formula 3). A negative DE reflects a decline in the number of deaths in the considered age group due to a shift in mortality to other age gl'OUps. A negative IE reflects an increase in mortality at later ages (i.e. older than the age interval considered), which results in a decline in remaining life expectancy. A complicating factor is that DE and IE operate in opposite diJ.'ections. For example, a decline in mortality in a given age interval results in both a direct effect (due to fewer deaths in that age interval) and an indirect effect (the decline in mortality in the given age gl'OUp leads to an increase in life expectancy at younger ages). Whether the net effect (aggregated over all age groups above age 60) is one of decline depends on the size of both effects. In general, changes in mortality rates at younger ages affect the variability more than those at older ages, since the life expectancy and population alive (and thus at risk for mortality changes) decrease with age.
Next, we included different causes of death in the decomposition analyses. For each "NH" (i.e. for each age group) we determined which causes of death were responsible for the DE (through a change in the number of deaths) and which causes of death were responsible for the IE (through a change in remaining life expectancy, 01' in both). Given,
m ~ d = ~~ d .
II a io:o:} It a,l (4)
where In is the number of causes of death comprising total mortality, the DE is calculated as follows:
m DE = ~~ d e
11 a i=l n a,i a+O,Sn
Thus, the age- and cause-specific DE ("DE".i) is:
DE . = ~ d . e Il a,r n a,l a+O,5n
SiJnilarly, given,
m ~e = "'~e .
a+O.51l L.J a+O,5n,1 ;=.}
64
(5)
(6)
(7)

Rectanguial'ization and underlying causes of death
the IE is calculated as follows:
[ '" ] ['" '" ] lEa = d ~!1e . + ~ d d . ~ de . 1/ It a i==1 a+0.511,1 i==l /I a,! i=l 0+0.511,1
(8)
Reexpression of the IE gives:
IE" = d ~!1e . + d d . ~ !1e . + d d -d d . ~ de . [ '" ] [", ( J'" ] /I It a i",l a+0.5/1,1 II a,1 i=-l o+O.5n,1 /I 0 11 a,1 i=1 0+0.511,1
(9)
Thus, the age- and cause-specific IE (,,IE,,.i) is:
IEai =[ d de 05 .j+[d d .de 05 . +(d d -d d .Jde 0.1 (10) II , /I a a+. Il,l 11 a,l a+. 11,1 II a /I 0,1 a+ .511,1
The change in the number of deaths by cause and age (A"da.i) is calculated on the basis of the number of life-table deaths by cause and age for each period. These are obtained by multiplying the number of life-table deaths by age with age-specific cause-of-death ratios. The change in life expectancy by cause (MG+O.5".') is estimated with a standard decomposition technique developed by Arriaga.19,20 This technique assumes that the contribution of a cause of death to the change in life expectancy that can be attributed to an age group is proportional to the contribution of this cause to the change in the total central mortality rate in that age group.
Adding age- and cause-specific DEs and IEs (i.e. "DEG.i and "IE",;) over all ages above age 60 yields the cause-specific DEs and IEs. These can be arranged in a table with causes of death presented in the columns, DEs and IEs in the rows, and cause- and effect-specific contributions in the cells. Based on this table, the contributions are arranged according to two perspectives: by cause and by type of effect (i.e. direct vs indll·ect). In order to obtain from this table the contribution by cause, the DE and IE of each cause is added up (i.e. aggregation over the rows). A 'negative' effect indicates that the cause contributes to a decline in NHso. A 'negative' contribution occurs if mortality from that cause is redistributed to age groups closer to the mean age at death (which contribute less to the variability in the age at death). Such a redistribution takes place in the event of a mortality reduction (in any case at younger ages), or if a mortality increase at older ages reduces the remaining life expectancy. For a 'positive' contribution the opposite is true.
Alternatively, addition of the cause-specific DEs and IEs over all causes (i.e. aggregation over columns) affords insight into the ways through which mortality changes contribute to the change in NH60. The cause- and effect-specific contributions (i.e. cells in the table referred to above) give this information for each cause separately. The DE quantifies the change in NHoo that is
65
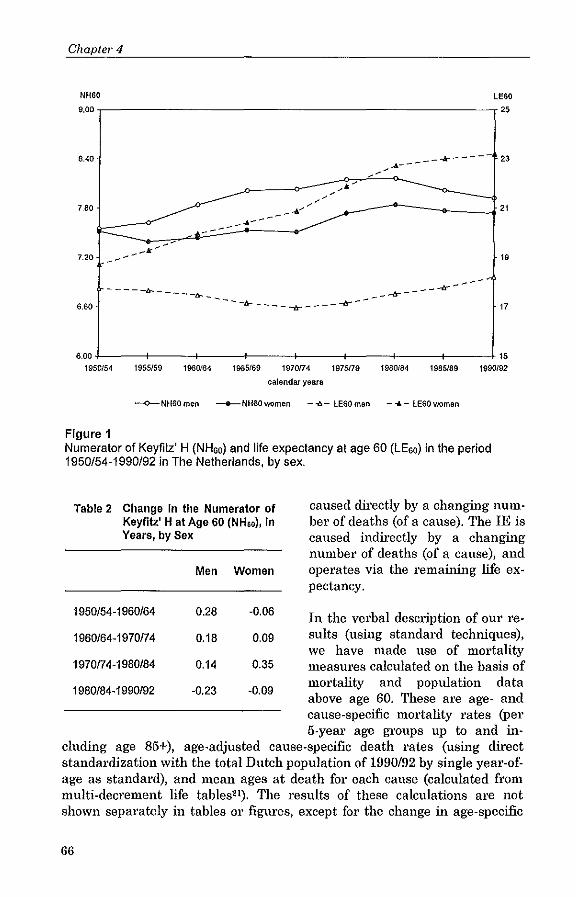
Chaple/, 4
NH60 LEGO
9.00 ,---------------------------,25
8.40
-' .... -----*---- 23
7.80
7.20 19
6.60 - -- --fr._ -- -~ - ___ -tz-. ___ --tr- ___ -lr--
----_-lr-----lr
17
6,00 15 19S0/54 1955159 1960f64 1965169 1970174 1975179 1980184 1985/8e 1990192
calendar years
-<>-NH60men -6-NH60mmen --iI,- lE60men - .... -lE60women
Figure 1 Numerator of Keyfilz' H (NHao) and life expectancy at age 60 (LEao) in the period 1950/54-1990/92 in The Netherlands, by sex.
rable 2 Change In the Numerator of Keyfitz' H at Age 60 (NH60), In Years, by Sex
Men Women
1950/54-1960/64 0.28 -0.06
1960/64-1970174 0.18 0.09
1970174-1980/84 0.14 0.35
1980/84-1990/92 -0.23 -0.09
caused directly by a changing numbel' of deaths (of a cause)_ The IE is caused indirectly by a changing number of deaths (of a cause), and operates via the remaining life expectancy.
In the verbal description of our results (using standard techniques), we have made use of mortality measures calculated on the basis of mortality and population data above age 60. These are age- and cause-specific mortality rates (per 5-year age groups up to and in
cluding age 85+), age-adjusted cause-specific death rates (using direct standardization with the total Dutch population of 1990/92 by single year-ofage as standard), and mean ages at death for each cause (calculated from multi-dec,-ement life tables21). The results of these calculations are not shown separately in tables or figures, except for the change in age-specific
66

Rectangularization and underlying causes of death
mortality rates between 1970174-1980/84 and 1980/84-1990/92, which is presented for selected causes.
4.3 Results
Figure 1 shows the trend in NH60 and life expectancy at age 60 since the 1950s. Changes in NH60 per decade are summarized in Table 2. The increase in NH60 in the 1960s and 1970s (and among men in the 1950s, as well) shows that the variability in the age at death increased (i.e. decompression of mortality). The slight declines in NH60 by -0.23 years among men and -0.09 among women during the 1980s indicate a reversal of tlils trend (i.e. compression of mortality). These trends in NH60 and life expectancy indicate that rectangularization of the survival curve occurred in the 1980s, but not in the 1970s.
Causes of death contributing to the change in NH60
Table 3 presents the change in NH60 during the periods 1970174 to 1980/84 and 1980/84 to 1990192, as well as a selection of causes of death that contributed most (both positively and negatively) to this change. (A compete set, including the change in NH60 for all causes of death, is presented in the Appendix). The decline in NH60 in the 1980s was the net effect of 'negative' contributions (-0.41 for men and -0.35 for women) and 'positive' contributions of causes (0.19 and 0.26 respectively) to the change in the variability in the age at death. The positive contributions were entirely offset by the negative contributions. Ischemic heart disease (IHD), lung cancer (men), and cerebrovascular diseases were the most important negative contributors. Such a negative contribution is the result of either a decrease in mortality from that cause, in any case at younger ages, or an increase in mortality at older ages. For the above mentioned negative contributors, age-adjusted death rates declined during the 1980s (not shown).
A comparison of these results with those of the 1970s when NH60 increased, shows that negative contributions were larger (-0.41 vs -0.17 for men and -0.35 vs -0.12 for women) and positive contributions were smaller (respectively 0.19 vs 0.31 and 0.26 vs 0.47) in the 1980s. In addition, the largest positive and negative contributors to the change in NH60 were not the same ones in both decades. Some causes, like IHD (men), chronic obstructive puhnonary disease (COPD), other cardiovascular diseases, and lung cancer (women) differed only in the ranking of their contribution to the change in NH60. Others, like IHD (women), lung cancel' (men), cerebrovascular diseases, and mental disorders contributed positively to the change in NH60 in the 1970s and negatively in the 1980s or vice versa. This change in sign was not restricted to causes showing a reversal of the trend in age-adjusted death mtes (e.g. mental disorders and lung cancer among men), but
67

Chapter 4
also occurred for causes with declining age-adjusted death rates in both dec-ades (e.g. IHD in women and cerebrovascular diseases).
For causes contributing largely to the change in NHGO in the 1970s and 1980s, Table 3 shows the size of the DE and IE (a compete set, including the DE and IE for all causes of death, is presented in the Appendix). Figure 2 presents the absolute change in age-specific mortality rates for selected
Table 3 Decomposition of the Contribution of Selected Causes of Death to the Change In the Numerator of Keyflfz' H at Age 60 (NHso) Into a Direct Effect (DE) and an Indirect Effect (IE), 1970/74-1980/84 and 1980/84-1990/92, by Sex'
Men DE,y IE, y Total,
Women DE,y IE, y Total,
Y Y
1970fl4-19801B4
All causes -1l.22 0.36 0.14 All causes -1l.70 1.05 0.35
Decline In NH80 -1l.31 0.14 -1l.17 Decline In NHso -1l.13 0.01 -1l.12 Traffic accidents -0.06 0.02 -0.04 GenUa-urinary 0.02 -0.05 -0.03 capo 0.03 -0.07 -0.04 Diabetes Mellitus -0.07 0.04 -0.02 Stomach cancer -0.07 0.05 -0.02 Digestive system 0.00 -0.03 -0.02 Digestive system 0.00 -0.02 -0.02 Stomach cancer -0.06 0.05 -0.02 Ganito-urinary -0.04 0.02 -0.02 Endocrine+nutr. 0.01 -0.02 -0.01 Restb -0.17 0.14 -0.03 Restb -0.04 0.02 -0.02
Increase In NHeo 0.09 0.23 0.31 Increase in NHso -1l.56 1.04 0.47 OtherCVD -0.03 0.11 0.08 Other heart diseases 0.03 0.05 0.08 Lung cancer 0.20 -0.14 0.06 OtherCVD -0.13 0.19 0.07 Other heart diseases 0.11 -0.07 0.05 IHD -0.18 0.23 0.06 Other cancers 0.08 -0.03 0.04 III-defined -0.04 0.09 0.06 III-defined -0.04 0.07 0.D3 Other accidents -0.07 0.12 0.05 Restb -0.23 0.29 0.07 Restb -0.18 0.35 0.17
1980184-1990/92
All causes -1l.29 0.06 -1l.23 All causes -1l.20 0.10 -1l.09
Decline In NH60 -1l.48 0.07 -1l.41 Decline In NHso -1l.44 0.08 -1l.35 IHD -0.45 0.24 -0.22 IHD -0.37 0.21 -0.15 Lung cancer -0.09 0.00 -0.09 Cerebrov. diseases -0.13 0.06 -0.07 Cerebrov. diseases -0.08 0.06 -0.03 Mental disorders 0.08 -0.12 -0.03 Stomach cancer -0.05 0.04 -0.02 Stomach cancer -0.05 0.03 -0.02 COPD 0.11 -0.13 -0.02 Other external causes -0.02 0.00 -0.01 Restb 0.09 -0.14 -0.05 Restb 0.04 -0.11 -0.07
Increase In NHeo 0.20 -1l.01 0.19 Increase In NHeo 0.24 0.02 0.26 Other heart diseases -0.03 0.11 0.08 Lung cancer 0.07 -0.00 0.07 Other cancers 0.11 -0.07 0.04 capo 0.10 -0.05 0.04 Diabetes Mellitus 0.08 -0.06 0.02 Other heart diseases -0.12 0.16 0.04 Genito~urinary -0.04 0.06 0.02 Diabetes Mellitus 0.14 -0.11 0.03 OtherCVD 0.05 -0.04 0.01 Other cancers 0.05 -0.03 0.02 Restb 0.03 -0.01 0.01 Restb -0.00 0.05 0.05
Note: CVD = cardiovascular diseases. a Figures are rounded to 0.01. b See Appendix.
68

Rectangularization and underlying causes of death
causes in the 1970s and 1980s. For the largest negative contributors to NH60 in the 1980s (i.e. IHD, cerebrovascular diseases, and lung cancel' among men), the negative DE was of ovel~ojding importance (Table 3). That is, mortality reductions dit'ectly affected NHGO. Except for lung cancel', declining mortality rates from these causes also resulted in a negative DE in the 1970s. For lung cancer (men), increasing mortality rates in all age groups above age 65 contributed directly to an increase in the variability in the age at death in the 1970s, whereas increasing mortality rates were only observed above age 80 in the 1980s. This age pattern showing mortality reductions at younger ages and increases at older ages, is responsible for the contribution ofJung cancer to compression of mortality in the 1980s.
Causes contributing mainly via the IE to compression of mortality in the 1980s are COPD (men) and mental disorders (women) (Table 3). These causes have in common a high mean age at death (i.e. above the average age at death at age 60). The negative IE indicates that increasing mortality rates (mainly at advanced ages) from these causes had a negative impact on the remaining life expectancy and thus on the variability in the age at death. In the 1970s, the IE was also negative for COPD in men, reflecting that mortality rates among the oldest old also increased in tlils decade (Figure 2). For mental disorders, declining mortality rates among the oldest old contributed indit'ectly to an increase in the variability in the age-at-death in the 1970s. The case of diabetes mellitus illustrates that an increase in mortality rates at older ages does not necessarily imply a negative contribution. Increasing mortality rates fl'Om tlils cause at all age groups above age 60 resulted not only in a negative IE, but also in a (even larger) positive DE.
Causes of death contributing to the reversal in the trend in NH60
Figure 3 shows that the reversal of the trend in NH60 between the 1970s (summarized as 1972-1982) and 1980s (summarized as 1982-1991) was caused mainly by the IE. The signs of the DEs and IEs did not change. This is true especially for women, for whom the negative DE was even larger in the 1970s than in the 1980s. The decline in IE in the 1980s indicates that the increase (after all IE is positive) in remaining life expectancy contributed less to the change in NH60. This is in accordance with the fact that life expectancy at older ages increased less in the 1980s than in the 1970s and even slightly declined among the oldest old (above age 85 for men and above age 90 for women) during the 1980s (see chapter 2). Such a declining life expectancy at the older ages means that people surviving to those ages are expected to die in a shorter interval.
Causes with the largest decline in IE between the 1970s and 1980s are other cardiovascular diseases, cerebrovascular diseases, ill-defined conditions,
69

II1II t:
" E Vl
g 0)
t:
" E
i2 0) ~
o
o g o
+99
vS-os
6L-9L
vL-OL
69-99
v9-09
+9S
vs-os
6L-9L
" Cl co
vL-OL
69-99
v9-09

COPD 600
Ill-defined conditions 0 600 0 0 0 0 0 0 0 0 300 0 300 ~ ~
~ ~
" " Q. a Q. a " " Cl Cl
" " .. .. -300 .<: -300 .<:
'" '" 2 2 ::>
-600 ::> -600 "0 "0 ., .,
.0 .0 .. .. -900 -900 ... 0) ... 0) ... + ... 0) ... 0) ... +
'9 CD "- "- '" '" CD CD "- "- '" '" 0 .;, 6 age :e 6 '" 6 .;, 6 age ~ 6 '" CD CD "- '" CD CD "- '"
600 Mental disorders
600 Diabetes mellitus
0 0 0 0 0 0 0
300 0
0 0 300 ~ ~
~ ~
" " Q. a Q. a " " Cl Cl
" " .. .. .<: -300 .<:: -300 '" '" 2 2 ::>
-600 ::>
-600 "0 "0 ., ., .0 .c .. ..
-900 -900 ... 0) ... 0) ... + ... 0) ... 0) ... + CD '9 "- "- 6 >.0 CD CD "- "- '" >.0 6 >.0 6 age ~ '" 6 .;, 6 age ~ 6 '" CD CD "- '" CD CD "- '"
Figure 2 - Absolute change in age-specific mortality rates of selected causes of death (per 1 00000) in 1970174-1980/84 and 1980/84-1990/92, The Netherlands, by sex.

Chapter 4
Men Women 1.2 1.2
DOE ODE <> 0.8 III IE ~ 0.8 III IE <D x l1li Total x III Total z 0.4 z .5 .5 0.4 ~ ~
'" 0 '" 0 c c .. .. .s:; .s:; 0·0.4 0·0.4
·0.8 ·0.8 1972·82 1982·91 1972·82 1982·91
period period
Figure 3 Decomposition of the change in the numerator of Keyfitz' H at age 60 (NH60) into a direct effect (DE) and an indirect effect (IE), 1972-1982 and 1982-1991, The Netherlands, by sex.
mental disorders, and diabetes mellitus (Table 4). These causes showed considerable changes in mortality among the oldest old (Figure 2). That is, either a shift took place from large mortality reductions in the 1970s to smaller reductions or even mortality increases in the 1980s, or mortality rates at older ages were increasing more rapidly in the 1980s. This underscores the importance of mortality changes at advanced ages in the explanation of compression of mortality. This is all the more so, since large mortality reductions, contributing via a negative direct effect to the change in the variability in the age at death, were observed in the 1970s as well. A sim- Table 4 ilar phenomenon was observed for IHD among women. Although mortality reductions D.·om this cause contributed directly to a decline in HNoo both in the 1970s and 1980s (the effect being even larger in the 1970s), an increase in the variability which was caused indirectly by large mortality reductions at advanced ages nullified this effect completely in the 1970s. Smaller mortality reo ductions D.·om IHD at advanced ages no longer undid the negative DE in the 1980s.
72
Causes With the largest Decline In the Indirect Effect (IE) In the Period 1980/84-1990/92 compared to 19701 74-1980/84, by Sex'
years
Men Other CVD -0.15 Cerebrovascular diseases -0.11 III·defined -0.09 Diabetes Mellitus -0.08 Pneumonialinfluenza -0.08 Women Other CVD -0.18 Cerebrovascular diseases -0.18 Mental disorder -0.17 Diabetes Mellitus -0.15 III-defined -0.14
Note: CVD = cardiovascular diseases.

Rectangularization and underlying causes of death
4.4 Discussion
The main objective of tlus study was to develop a better understanding of rectangularization of the survival curve above age 60 in The Netherlands, by analyzing the contribution of selected causes of death. To measure rectangularization, we used the numerator of Keyfitz' H (NH), which is, like the standard deviation, a measure of absolute variability. A decline in NH at age 60 (NH60) indicates that mortality is compressed into a smaller age interval. This means that rectangularization of the survival curve takes place, given that life expectancy increases. To assess the contribution of causes of death to rectangularization of the survival curve, we could not make use of a standard technique. The decomposition technique developed in this study enabled us to determine which causes of death contributed to compression of mortality in the 1980s and which changes contributed to the shift fi'om decompression in the 1970s to compression in the 1980s. It takes into account that compression of mortality (i.e. concentration of deaths around the mean age at death) can be caused both directly by a mortality ,'eduction (also at younger ages) and indirectly by a mortality increase (mainly at advanced ages).
Although our decomposition technique proved to be a useful tool to determine which changes in the cause-of-death pattern underlie compression of mortality above age 60 in The Netherlands, caution must be exercised when interpreting the results. Most uncertainties relate to the cause-specific mortality data.
First, deaths by cause were only available by 5-year age gl'OUpS, with age 85 and over as fmal age group. Using these age intervals and assuming a constant distribution of cause-of.death ratios within age intervals might have affected our results in two ways. First, especially above age 85, aging might have changed cause-specific death rates, even if age-specific rates remained constant. For causes with increasing age-specific mortality rates with age within the final age interval, this might have resulted in an overestimation of mortality increase and an underestimation of mortality decline. For causes with declining age-specific mortality rates with age (which is unlikely to occur), the opposite is true. Second, if cause-of-death ratios are not constant witltin the final age-group, but for example increase, deaths are concentrated more at advanced ages. Consequently, the effect of increased mortality at advanced ages might be underestimated. Similar mechmusms operate for declilung ratios with age and for a mortality decline. In general, the two biases operate in the opposite direction and thus (partly) nullify each other.
Second, discontinuity in time series of cause-specific mortality, either due to the lCD-revision in 197901' due to changes in coding practices of physicians 01' encoders of Statistics Netherlands, is a threat to the validity of our re-
73

Chapter 4
suits. Although we composed cause-of-death categories for which the comparability over rCD-c1assifications is maximized, continuity of time trends was not achieved in all cases since deaths by cause are only published at the three-digit level in The Netherlands. Therefore, it was impossible to categorize 'cardiovascular disease, unspecified' (429.2) as IHD and the rest of 429 as other heart diseases in the ninth revision, and to transfer 'acute heart failure, unspecified' from the ill-defined category (782.4) to other heart diseases in the eighth revision. As a result, the mortality decline from IHD between 1970/74 and 1980/84 might be overestimated.
Changes in coding practices within the ICD-9 classification are known to have occurred for diabetes mellitus and senile dementia. Since 1983, diabetes mellitus has been classified more often as an underlying cause of death (and less as a secondary cause) of cardiovascular diseases." Senile dementia has been classified more frequently as an underlying cause of death since mid-1992.'3 The increase in mortality from these causes and the decline in mortality from IHD might thus be overestimated for the period 1980/84-1990/92. If discontinuity in the time-series of IHD mortality affected mainly older age groups, the contribution of IHD to decompression of mortality in the 1970s is likely to be overestimated and its contribution to compression in the 1980s is likely to be underestimated. If overestimation occurred at younger ages, the contribution of IHD to compression of mortality in the 1980s might be overestimated. Yet, if overestimation took place at all ages, positive and negative biases might (pal,tly) be nullified by each other. Similarly, the contribution of mental disorders to compression of mortality in the 1980s might be slightly smaller than estimated, if changes in coding mainly affected the oldest old. However, since the increase in mortality was also observed before the change in coding practices in 1992, the contribution of mental disorders to compression of mortality is not likely to be an artifact.
Thil'd, we used underlying causes-of-death data, because multiple cause-ofdeath data are not generally available in The Netherlands. Underlying causes disregard the fact that often not one, but multiple conditions, contributed to death at advanced age. In addition, using only the underlying cause makes the outcomes more sensitive to changes in coding practices. In general, causes of death are difficult to assess in the oldest old, and thus may be unreliable.
These limitations related to mortality data by cause of death should not be undervalued; they underscore the need for validation of our outcomes in other studies, preferably based on mortality data by single year of age and multiple causes of death. Nevertheless, the overall results suggest that compression of mortality in the 1980s was caused both by increased survival to advanced ages due to mortality reductions fi'om IHD, cerebrovascular diseases, and (fOl' men) lung cancer, and by increases in mortality at older ages fi'om a large number of causes, the most important ones being: COPD
74

Rectanguial'ization and underlying causes of death
(emphysema) for men and mental disorders (senile dementia) for women. In addition, our results show that mortality changes at advanced ages (i.e. smaller mortality reductions from cerebrovascular and cardiovascular diseases and larger mortality increases from ill-defined conditions, mental disorders, and diabetes mellitus) were especially responsible for the reversal from a decreasing rectangular shape of the survival in the 1970s curve to rectangularization in the 1980s. That is, increased survival to advanced ages was not a sufficient condition for rectangularization. The finding that increased survival to advanced ages and the reduction of the survival prob· abilities at advanced ages (i.e. people surviving to advanced ages are expected to die in a shorter interval) together were necessary to explain why compression took place in the 1980s and not in the 1970s (Figure 2), is not influenced by uncertainties related to cause-specific data. These results are derived fi'om analyses aggregated over all causes, and are thus based on total mortality data, which are considered to be very reliable in The Netherlands."
The reductions in NHGO appeal' to be small, but we consider them to be relevant (especially in men), taking into account that the size of the changes in NH60 in the previous decades was more 01' less the same (except for females in the 1970s) and that the survival curve will never become perfectly rectangular (i.e. NHGO will never equal zero). Even in the extreme case where the genetically endowed limit is approached will there be genetic variability in the age at death. On the basis of certain assumptions, Fries" estimated that where the genetically endowed limit were to be approached, the standard deviation in the age at death would be about 7 years (in his earlier publications tllis was 4 years). It is obvious that such an estimate has a highly speculative character, since the amount of genetic variability cannot be determined unambiguously fi'om the tail of the survival curve.' However, in the context of interpreting the magnitude of the changes in NH60, Fries' estimate is helpful and suggests that the variability in the age at death will be at least some years. Considering that NH60 was 8.1 in men and 7.8 years in women in 1980/84 and that the minimum level of NH60 would still be some years, we consider the decline of NH60 over a lO·year period by 0.23 years in men to be of importance.
Further research is needed to explain the stagnation of the mortality decline among the oldest old in The Netherlands, which played a major role in rectangularization of the survival curve. Here, we will briefly discuss tlll:ee (not mutually exclusive) explanations for the mortality increase among the oldest old, which was observed for total mortality and causes such as: COPD (emphysema), mental disorders (senile dementia), cancel' (prostate and lung for men, and other cancers), diabetes mellitus, ill·defined conditions (senility), and diseases of the nervous system (parkinson's disease).
75

Chapter 4
First, cohort effects partly related to smoking behaviour might have contributed to increased mortality in particular from (lung) cancel' and COPD among men above age 85. A recent study26 showed a cohort effect for lung cancel'. A reconstruction of smoking prevalence by male birth cohort has shown that smoking prevalence increased from birth cohorts 1897 to 1917 and then declined, with the exception of the high smoking prevalence of the cohort born before 1887 (which might be an artifact).27 Thus, the percentage of (ex)smokers in persons aged 85 and over may have been higher in 1990/92 than the percentage in the same age group 10 years earlier. Particulary for hmg cancel' and COPD, the excess risk of death remains elevated after smoking cessation, even after a long period of time.'S Women show a different smoking pattern - a small smoking pmvalence in the older birth cohorts which increased in the more recent birth cohorts." The percentage of (ex)smokers among women who were 85 and over in 1990/92 (or 10 years earlier) is thus small and is unlikely to have affected mortality from COPD and lung cancer in tlus age group.
Second, the influenza epidemic in December 1989 until January 1990 might have contributed to a (temporary) excess mortality of frail elderly in the period 1990/92. However, it is unlikely that the recent rectangularization is caused solely by this influenza epidemic, since half of the excess mortality in January 1990 was compensated by lower mortality in the following months, anei influenza epidemics with considerable excess mortality also occurred in earlier periods (e.g. in 1975, 1978 and 1986) when no rectangularization took place.'o,3o In addition, l'epeating our analyses using 1991 and 1992 mortality data only (and thus excluding 1990) did not change our conclusions.
Thu'd, less selection due to increased survival from cU'culatory diseases might have created a more vuhlerable (fi'ail) population with a lugher risk of dying fi'om several causes striking at old age, This phenomenon of competing risks (i.e, those not dying fi'om cu'culatory diseases were at a higher risk of dying fi'om other causes) can result in a general increase in mortality at advanced ages or in an increase in mortality fi'om specific causes which are themselves a risk factor for circulatory diseases (like diabetes mellitus) or share common risk factors, In addition, it is not untlunkable that the smaller mortality reductions fi'om cerebrovascular diseases, other cardiovascular diseases, and IHD (especially in women) (which contributed to the shift fi'om decompression in the 1970s to compression in the 1980s) may be caused by increased survival of persons with cU'culatory diseases, Milder disease stages may then act as a risk factor for more severe stages, This is true for heart diseases: mortality was postponed more than incidence, creating a pool of persons with chronic heart diseases,31 These persons are at a higher risk to die.
If the phenomenon we have observed is based on cohort dynamics related to smoking behaviour, rectangularization of the survival curve in men is ex-
76

Rectangltlarizatl~on and underlying causes of death
pected to continue for the next one or two decades, while smoking-related premature mortality is expected to reduce rectangularization in the next decades in women (if smoking has a similar effect as in men). However, apart from these 'temporal' changes in the shape of the survival curves caused by changes in health behaviour, increased frailty of the population causing more 'permanent' rectangularization cannot be excluded. Taking for granted that increased frailty of the population indeed plays a role, our results have consequences for the further increase in life expectancy. The occurrence of rectangularization of the survival curve might then indicate that, unless breakthroughs in the major process of aging occur, further increases in life expectancy will be increasingly hard to achieve because the 'hard' core of mortality related to senescence increasingly acts as a barrier to further increases in survival at old age.
The implications of these l'esults for achieving compression of morbidity are not unambiguous. On the one hand, delaying the age at onset of chronic diseases and long-term disabilities is likely to result in compression of morbidity, since the life expectancy is not expected to increase rapidly. On the other hand, increased frailty of the elderly might not only imply that mortality is unavoidable, but also that cumulation of severe morbidity at advanced ages cannot be prevented.
References
1. Fl'ies JF. Aging, natural death, and the compression of morbidity. New England Jou/'I!al of Medicine 1980;303(3): 130·135.
2. Manton KG, Stallard E, Tolley HD. Limits to human life expectancy: evidence, prospects and implications, Popuiation alld Development Review 1991;17(4): 603-637.
3. Iu'amer M. The rising pandemic of mental disorders and associated chronic diseases and disabilities. Acta Psychiatrica Scandillavia 1980;62(8uppl. 285):382-397.
4. Manton KG. Changing concepts of morbidity and mortality in the elderly population. Milballk Memorial Fund Quarterly/Health and Society 1982;60(2):183-244.
5. Fries JF. The compression of morbidity: miscellaneous comments about a theme. The Gerontologist 1984;24(4):354-359.
6. Myers GC, Manton KG. Compression of mortality: myth 01' reality? The Geron/oiogist 1984;24(4):346-353.
7. Myers GC, Manton KG. Recent changes in the U.S, age at death distribution: further observations. The Gerolltologist 1984;24(6):572-575.
8. Nagnur D. Rectangularization of the stu'vival cm've and entropy: the Canadian experience, 1921-1981. Canadian Studies in Population 1986;13(1):83-102.
9. Rothenberg R, Lentzner HR, Parker RA. Population aging patterns: the expansion of mortality. Jou/'I!a/ of Gerolltology 1991;46(2):866-870.
10, Go CG, Brustrom JE, Lynch MF, Aldwin CM. Ethnic trends in stu'vival curves and mortality. The Gerolltologist 1995;35(3):318-326.
77

Chapter 4
11. NU8seider WJ, Mackenbach JP. Rectangularization of the stU'vival curve in The Netherlands, 1950·1992. The Gerontologist 1996;36(6):773·782 [Included in this thesis as chapter 3).
12. Statistics Netherlands. Ovetievingsta{eis llaGI' leeftijd en geslaeM {Life tables by age Gild sex}. 'a·Gravenhage, the Netherlands: State Publishers/Statistics Netherlands, multiple years.
13, Tabeau E, van Poppel F, Willekens F. Mortality in the Netherlallds: The Data Base. Netherlands Interdisciplinary Demographic Institute, 1994.
14. Namboodiri K, Suchindrall eM. Life Tables mld their Applications. Orlando, Fl: Academic Press, 1987.
15. Manton KG, Stallard E. Recent- trel1ds in mortality analysis. Orlando, Fl: Academic Press, 1984.
16. Namboodil'i K. Demographic Analysis. A Stochastical Approach. San Diego, Ca: Academic Press, 1991.
17. Keyfitz N. What difference would it make if cancer were eradicated? An examination of the Taeuber paradox. Demogl'Gphy 1977;14(4):411·418.
18. Smith DP. Formal demography. New York, NY: Plenum Press, 1992.
19. Arriaga EE. Meastu'ing and explaining the change in life expectancies. Demography 1984;21(1):83·96.
20. Arriaga EE. Changing trends in mOl'tality decline dtu'ing the last decades. In: Ruzicka L, Wunsch G, Kane P, ed. Diffel'elltial Mortality. Methodological Issues Gild Biosocial Factors. Oxford, UK: Clarendon PI'ess, 1989: 105-129.
21. Manton KG. The global impact of noncommunicable diseases: estimates and projections. World Health Statistics Quarterly 1988;41(3·4):255·266.
22. Mackenbach JP, Snels lA, Friden·lilll LM. Diabetes Mellitus als doodsoorzaak [Diabetes mellitus as cause of death]. Nedel'lallds Tijdschl'ift VOOI' Ge11eeskullde 1991; 135(33): 1492·1496.
23. Statistics Netherlands. Personal communication, 1995.
24. Condran GA, Himes CL, Preston SH. Old-age mortality patterns in low mortality countries: an evaluation of population and death data at advanced ages, 1950 to the present. Population Bulletin of the United Nations 1991(30):23·60.
25. Fries JF. Reduction of the national morbidity. Gerontoiogica Perspecta 1987;1(1): 54·64.
26. Janssen·Heijnen ML, Nab HW, van Reek J, van del' Heijden LH, Schipper R, Coebel'gh JW. Striking changes in smoking behaviotu' and lung cancer incidence by histological type in south-east Netherlands, 1960·1991. European Jou1'1Iai of Can· cel' 1995;6:949·952.
27, Gunning·Schepers LJ. The health be11efits of prevelltion. A simulation approach. Rotterdam: Erasmus University Rotterdam, 1988.
28, U.S. Department of Health and Human Services. The Health Benefits of Smoking cessatio11. A Report of the Surgeon General. Rockville, MD: Centre for Chronic Disease Prevention and Health Promotion, 1990.
29. Prins CJM. Hoge sterfte rond jaal'wisseling door griep [Many influenza deaths at the hU'n of the year]. Maandstatistiek VOOI' de Bevolld11g [Monthly Bulletin of Population Statistics} 1990;38(5):8·9.
30. Prins CJM. Grote fluctuaties in maandelijkse aantallen overledenell [Big fluctua' tions in 1990 monthly death figUl'es]. Maandstatistiek VOOI' de Bevolhing [Monthly Bulletin of Population Statistics} 1991;39(5):8·9.
78

Rectallguial'ization and underlying causes of death
31. Bonneux L, Barendregt JJ, Meeter K, Bonsel GJ, van del' Maas PJ. Estimating clinical morbidity due to ischemic heart disease and congestive heart failm'e: the futlU'e l'ise of heart failure. American Joul'~zal of Public Health 1994;84(1):20·28.
79

Chapte/' 4
Appendix
Table A1 Contribution of Selected Causes of Death to the Change In the Numerator of H (NHoo) and Decomposition Into a Direct Effect (DE) and an Indirect Effect (IE), 1970174-1980/84, by Sex'
Men Women .. ,,, ..... ,, ........................ -.................. .................. _ ... " .. ,,, .......................... DE IE TOTAL DE IE TOTAL
1970174 - 1980184
Total -0.225 0.364 0.139 -0.699 1.047 0.348 Infectious + parasitic diseases -0.007 0.005 -0.002 -0.011 0.012 0.001 Stomach cancer -0.071 0.049 -0.022 -0.065 0.050 -0.015 Colorectum cancer 0.014 -0.006 0.008 0.002 0.008 0.009 Lung cancer 0.198 -0.141 0.057 0.042 -0.011 0.031 Breast cancer -0.000 -0.000 -0.001 0.030 -0.002 0.028 Prostate cancer 0.031 -0.014 0.018 0.000 0.000 0.000 Other cancers 0.076 -0.034 0.042 0.013 0.020 0.033 Diabeles Meilitus -0.017 0.017 -0.000 -0.065 0.040 -0.025 Endocr. + nutrit. + metabolic 0.008 -0.015 -0.007 0.007 -0.021 -0.014 Blood + bloodforming 0.003 -0.001 0.002 0.001 0.001 0.001 Mental disorders -0.028 0.035 0.008 -0.037 0.055 0.017 Nervous system 0.019 -0.022 -0.003 0.G15 -0.015 0.000 IHD -0.173 0.162 -0.011 -0.178 0.235 0.057 eVA -0.154 0.165 0.011 -0.225 0.238 0.013 Other CVD -0.032 0.109 0.077 -0.126 0.193 0.067 Other heartdiseases 0.113 -0.067 0.045 0.033 0.047 0.080 Pneumonia/influenza -0.073 0.078 0.005 -0.070 0.083 0.013 COPD 0.033 -0.069 -0.036 0.015 -0.005 0.011 Other respiratory -0.012 0.006 -0.005 -0.005 0.007 0.002 Digestive system -0.001 -0.020 -0.021 0.003 -0.026 -0.022 Genito-urinary -0.037 0.016 -0.021 0.022 -0.048 -0.026 III-defined -0.042 0.067 0.026 -0.039 0.094 0.056 Traffic accidents -0.060 0.022 -0.038 -0.018 0.004 -0.014 Other accidents -0.022 0.034 0.012 -0.071 0.120 0.049 Other external causes 0.002 -0.001 0.002 0.002 -0.002 0.000 Other causeS 0.008 -0.014 -0.005 0.026 -0.029 -0.003
Note: CVD = cardiovascular diseases • Figures are rounded to 0.001.
80

Rectanguiarization Gnd underlying causes of death
Table A2 Contribution of Selected Causes of Death to the Change in the Numerator of H (NH60) and Decomposillon Into a Direct Effect (DE) and an Indirect Effect (IE), 1980/84·1990/92, by Sex'
Men Women ." .................................................... .................. -.................. " ...............
DE IE TOTAL DE IE TOTAL
1980184· 1990192
Total ·0.285 0.056 ·0.229 ·0.199 0.104 ·0.094 Infectious + parasitic diseases 0.008 ·0.010 ·0.001 0.012 ·0.011 0.001 Stomach cancer ·0.054 0.035 ·0.019 ·0.046 0.030 -0.016 Colorectum cancer -0.005 0.013 0.008 -0.028 0.018 -0.010 Lung cancer -0.086 0.000 -0.086 0.070 -0.003 0.068 Breast cancer -0.000 0.000 0.000 0.018 -0.003 0.015 Prostate cancer 0.040 -0.041 -0.000 0.000 0.000 0.000 Other cancers 0.109 -0.067 0.041 0.048 -0.027 0.021 Diabeles Mellilus 0.084 -0.063 0.021 0.142 -0.110 0.032 Endocr. + nulri!. + metabolic 0.008 -0.008 -0.000 0.016 -0.024 -0.008 Blood + bloodforming 0.012 -0.014 -0.002 0.009 -0.014 -0.005 Menial disorders 0.030 -0.040 -0.010 0.081 -0.115 -0.035 Nervous system 0.035 -0.038 -0.003 0.038 -0.039 -0.001 IHD -0.454 0.239 -0.215 -0.366 0.211 -0.155 eVA -0.084 0.058 -0.027 -0.130 0.059 -0.071 Other CVD 0.051 -0.036 0.015 0.004 0.011 0.014 Other heartdiseases -0.030 0.109 0.079 -0.117 0.161 0.044 Pneumonialinfluenza 0.001 0.002 0.003 -0.006 0.013 0.008 COPD 0.109 -0.127 -0.018 0.097 -0.053 0.044 Other respiratory 0.005 -0.005 0.000 0.003 -0.001 0.002 Digestive system -0.009 0.003 -0.006 -0.002 -0.003 -0.005 Genito-urinary -0.041 0.058 0.017 -0.033 0.027 -0.007 III-defined 0.026 -0.025 0.000 0.035 -0.045 -0.010 Traffic accidents -0.019 0.009 -0.010 -0.012 0.002 -0.010 Other accidents -0.010 0.008 -0.002 -0.035 0.045 0.010 Other external causes -0.014 0.004 -0.010 -0.016 0.004 -0.012 Other Causes 0.005 -0.008 -0.004 0.018 -0.028 -0.010
Nole: CVD = cardiovascular diseases • Figures are rounded to 0.001.
81


PART II
Health expectancy


A multistate life-table analysis of health expectancy
using pooled data from different longitudinal studies
T his paper estimates a multistate life-table model of health expectancy for The Netherlands using longitudinal data. The objective of this pa
per is twofold. First, it aims to describe the current age-specific mortality and disability rates in the Dutch adult population in terms of the transition rates of the multistate life table, and to snmmarize these patterns in terms of health expectancies. Second, it shows how a multistate life-table model of health expectancy and its transition rates can be estimated on the basis of longitudinal data. The paper starts with an explanation of the principles of the multistate life-table technique and of a procedure, based on log-rate regression, that permits the estimation of smoothed transition rates that are mOre stable across age than those directly compnted from sample data. Next, these techniqnes are llsed to estimate health expectancies for The Netherlands. Health expectancy was made operational in terms of life expectancy with and withont disability. Persons were considered to be disabled if they were living in an institution or indicated that they needed help or were llnable to perform withont (great) difficlllty one or more activities of daily life, mobility and comlllllnication. For the Dlltch adlllt popnlation, we estimated age-specific incidence rates of disability, recovery rates from disability, and mortality rates among the nondisabled and the disabled llsing log-rate regression. We fOllnd that different models were necessary to describe the relationship with age. For mortality among nondisabled and disabled persons, the model with the fewest parameters -

Chapter 5
the Gompertz model - could be selected to describe the transition rates by age. However, the fit improved significantly by using the Gompel'tzMakeham model for incidence for men and the Sigmoid model for recovery for men and women. Ow' I'ewits showed that the incidence rates of disability and mortality rates among nondisabled and disabled persons increase with increasing age, whereas recovery rates from disability decline with increasing age. Next, by using the muitistate life-table model consisting of three states (nondisabled, disabled and dead), we estimated life expectancy with and without disability. In 1986-1994, total life expectancy at age 30Y, was 44.8 years for Dutch men and 50.8 years for Dutch women. We found that respectively 38.5 and 38.4 years were spent without disability. The remaining 6.4 (14.2%) and 12.4 (24.3%) years were spent with disability. At age 70Y" life expectancy was 10.7 and 14.3 years, respectively. Abo"t 6.3 and 5.8 years were spent without disability, and 4.4 (41.3%) OItd 8.5 (59.6%) years with disability, respectively. A comparison of the age-specific total mortality rates, age-specific disability prevalence and total life expectancy at age 30Y, and 70Y, derived from the muitistate life table with data based on nationally representative data sources showed that the estimates of the muitistate life-table model closely represent the Dutch situation.
5.1 Introduction
Health expectancy is increasingly used for summarising (changes in) the health status of the population and addressing the discussion of compression and expansion of morbidity. Disability-n'ee life expectancy is the best known examplel .3, but health expectancy can be defined in several ways, varying n'om the number of years in good self-perceived health4 to years spent without specific diseases5. In general, health expectancy refers to the number of further years in a specified health state which someone of a given age can on average expect to live, given that current mortality and morbidity rates remain constant. To date, health expectancy has been calculated in 32 countries.6
Health expectancy can be easily calculated n'om readily available data on the prevalence of morbidity and a standard life table using the Sullivan method.'·8 The prevalence data on morbidity are used to divide the number of person years lived by a period life-table cohort into years with and without morbidity (01' into more health states).
As a consequence of integrating prevalence data on morbidity (i.e. stock data) in a life table which is based on incident data on mortality (i.e. flow data), the Sullivan method generally does not produce a pure period indicator such as (period) life expectancy.5 .•. 10 Only after all flow variables (i.e.
86

Multislate life·table analysis of health expectallcy
transition rates) have been constant for a long period of time will an equi· librium situation emerge in which the Sullivan method provides a pure pe· riod indicator. The deviation ll'om a pure period indicator can introduce bias when the Sullivan method is used to assess whether changes in health ex· pectancy have occurred over tiIl,le 1,5,1O, although views diverge as to how se· rious these biases a1'e5,1O·14, In particular, problems may arise when the Sullivan method is used to assess whether compression or expansion of morbidity is occurring, A deviation ll'om the 'real' value has a larger effect on the . smaller· number of years with disability than on disability· free life expec· tancy.!3 A small reduction in the number of years with disability, caused by prevalence reaching its equilibrium values, may easily be interpreted wrongly as compression of morbidity,
Another consequence of using prevalence data on morbidity is the limited applicability of the indicator, First, since the indicator largely depends on health conditions prevailing in the past5,1O,!5, the indicator is inert to reflect current changes in morbidity and mortality, as is generally true for meas· ures of population structure (stocks). This makes the indicator less useful to assess the effectiveness of present health progmmmes" and to point out un· favourable developments. Second, as the underlying flow variables inci· dence, recovery and mortality that govern the value of the prevalence of morbidity are not made explicit, the Sullivan·based life· table model cannot be used to answer questions as to how changes in incidence, recovery and survival affect health expectancy. Insight into these dynamics is of impor· tance for the compression versus expansion·of·morbidity discussion, and for evaluating the potential effects of interventions aimed at maintaining or increasing population's health.
Health expectancy estimates based on multistate life tables16.'o, are an im· pOl-tant supplement to Sullivan·based estimates. By using flow data (Le. transition rates), the multistate life table avoids the problems related to the use of prevalence data. Consequently, the multistate life table allows a bet· tel' understanding of the current mortality and morbidity processes. Besides, it allows to study the implications of current conditions (and changes therein) for the future health status of the population, to monitor trends and to assess whether compression or expansion of morbidity is occurring. The multistate method tends not to be widely applied mainly because this method is much more demanding in terms of data requirements. Longitudi· nal surveys or registers, which are needed to produce tra~sition rates, are still scarce, and even when longitudinal studies are available, they are often limitecl in sample size andlorin the age range of the population included and in general do not provide continuous time data, but only interval·censored data.
This paper estimates a multistate life·table model of health expectancy, con· sisting of th!'ee states: 'nondisabled', 'disabled' and 'dead' using longitudinal
87

Chapter 5
data, The objective of this paper is twofold, First, it aims to describe the current age-specific mortality and disability patterns in the Dutch adult population in terms of the transition rates of the multistate life table, and to summarise these patterns in terms of health expectancies (i.e, life expectancy with and without disability), This information is necessary to conduct scenario analyses aiming at determining the conditions which are needed to achieve compression of morbidity in The Netherlands, Second, it shows how a multistate life-table model of health expectancy and its transition rates can be estimated on the basis of longitudinal data, Before describing the actual estimation of the transition rates and health expectancies for the Dutch adult population, we will first describe the methods in more detail, That is, we will elaborate on the multistate life-table technique and we will explain a procedure, based on log-rate regression, that permits the estimation of smoothed transition l'ates that are more stable across age than those directly computed ll'om sample data, The appl'Oach followed in tllis paper can be easily generalized to apply to the whole range of health expectancy indicators and extended to a model with more than three health states, or to a model that estimates health expectancy fOl' subgroups of a population (e,g, smokers and nonsmokers),
5.2 Multistate life-table analysis of health expectancy
5.2.1 The multistate life-table model
The multistate life table (increment-decrement life table) is an extension of the standard single-decrement life table, For an introduction into life-table techniques we refer to existing literature,21,23 The multistate life table, like the standard life table uses transition rates (occurrence-exposure rates) 01'
transition probabilities between health states, The major difference is that a multistate life table recognizes more than one living state, Most multistate life-table models allow members of the life-table population to move into and out of these states, that is, increments (e,g, regaining in functioning) and decrements (e,g, loss of functioning and mortality) are allowed, Multistate life tables can be described as finite space (s+ 1 states, the (s+ l)th state is an absorbing state), continuous-time Markov models.22 In a Markov process the probability that a person will leave a state depends only on the present state,2,' This present state is assumed to include all relevant information on past history; the influence of duration or past history are ignored,
Within multistate life-table models, a further distinction can be made between nonllierarchical and hierarchical, population-based and status-based, and unil'adix and multh'adix models, As opposed to hierarchical models dealing with cases moving through successive states without reentry, in nonhierarchical models reentry into a given health state is allowed,,",26 In
88

Muttistate life-table analysis of health expectancy
most multistate life-table analyses of health expectancy a nonhierarchical model is used. The choice for a nonhierarchicalmodel is dictated by the fact that a regaining of functioning (i.e. reentering the nondisabled state), has shown to be a significant force of inCl'ement,l6-19 In addition, the nonhiel'archical model might reduce misclassification in the event of persons who do not consistently report their health status over time. A population-based model deals with the expected duration in different health states of the entire population, that is, il'respective of the initial health state, whereas the status-based model relates to a cohort that enters the life table in one particular health state and focuses on the evolution of health in persons who were initially in that particular state_22•24•27 The same data can be used to estimate population-based and status-based life tables. For example, the Longitudinal Study of Aging has been used to estimate life expectancy with and without disability of persons who were disabled at age 70 (Le. statusbased)17 and of the total 70 year old population (i.e. population-based)19. The choice between a population-basee\ and status-based model depends on the objective of the study. When the primary focus is on studying (changes in) the health status of the population and on addressing the compression-ofmorbidity discussion, a population-basee\ model is used,18.l9 In uniradix life tables, the initial cohort is concentrated in one state (e.g. marital-status life tables, working-status life tables). On the other hand, in multiradix increment-decrement life tables, the initial cohort is allocated to several, 01' all states.28 In the field of health expectancy, multirac\i." life tables are used, especially when the initial cohorts start at older age (at birth one could assume that virtually the whole population is in the active, nondisabled state).
Galclliation of health expectancy llsing the 11lltltistate life table The nonhierarchical population-based multistate life-table model is (as is any life table) calculated from tlll'ee different sets of equations: 1) flow equations which describe the movement of persons in the llfe-table cohort 2) orientation equations which relate observed (M) rates to life-table (m) rates and 3) person-years equations, which specify the numerical solution to the integral of the survivorship functions. 22
The flow equation is specified as follows: s s
l;(.-c+ n) = IJx) - L dij(x,n) + L dk;(x,n) - dio(x,n) (1) j=l k=l
where, I,(-.;+n) is the number of persons in state i at the exact age of x+n; 1;(-.;) is the number of persons in state i at the exact age of x; (-.;,n) is the age interval x to x+n, n the length of the age interval, s is the number of nonabsorbing states, d,j(x,n) is number of flows from state i to state j between age x and x+n, (/;.(-,;,n) is number of flows from state i to dead between age x and x+n.
89

Chapter 5
In matrix notation the flow equation is written as follows:
l(.>; + n) = l(.>;) - d(.>;,n) (2)
where, 1(.'>;) is a vector, having elements /;(x) which represent the number of persons in state i at the exact age of x; n the length of the age interval, and d«,n) is the vector of flows, having elements d;(.-.;,n) which represent the net flows from state i at the exact age of x to state i at the exact age of x+n.
The orientation equation which l'elates the observed transition rates (i.e. occurrence/exposure rates, M(.->;,n)) to the life-table transition rates, m(.-';,n), is:
M(.>;,n) = m(.>;,n)
where:
and
dij(x,n)
Li (.>;,n)
Dij(x,n)
Ni(.>;,n)
(3)
(4)
(5)
and MU represents the observed transition rates from state i to state j in the age interval x, x+n, tnu the life-table transition rates, DU (.-.;,n) the number of persons at the exact age of x in state i who move to state j during the interval n, L;(.-';,n) the number of person years in state i between age x and x+n, and N;(.-.;,/I) the observed mid-year population in state i between age x, x+n.
Arranging the transition rates in matrix notation, gives29:
, (m18(. .... ,n) + LIIlI/X,II)] -m:l1(.t,n) -mlllx,n)
io#-] (6) , m(x,n) - m13(.\-,n) (mJ&(x,n) + Llng/t,II)] -mil:?
jtc-2 , -mbl .... ,n) . 1n2u(x,n) (mlto + .L11ln/r,II)J
);<11
where: tn1,,(.,,/I) refers to the transition rate from state i=1 to dead in the age interval x, x+n.
When sample data, such as longitudinal surveys, are used to calculate observed transition rates, an additional step is often required to smooth transition rates in order to avoid erratic changes across age (see next section).
The person-year equation can be written as follows:
" Li (.>;,n) = f l;(.d t)dt (7) t~O
90

Multistale life-Iable analysis of health expectancy
Often, continuous-time data are not available and thus approximations are used. There are different alternatives to specify the numerical solution of the integml of the survivorship function22, of which the lineal' and exponential method are mostly used. The methods differ in the assumptions on the distribution of transitions (including deaths) over the age interval and on the shape of the survivorship function(s) within the age interval. Therefore, the assumptions relate to the formulas to approximate Li (x,n) and to transform the transition rates into transition probabilities (and vice versa). The lineal' method assumes that deaths and other transitions are distributed uniformly over the interval x to x+n, yielding (piecewise) lineal' survival functions. The mean duration for transfer is n12, that is, transitions occur on average in the middle of the interval.27•3o The exponential method assumes that the forces of transition are constant within the age intervals. We focus on the lineal' method, because it is easier to calculate and it is used in most studies on health expectancyl,.i9.3I, whereas the exponential method is used in just one studyIB.32. Using the lineal' assumption is not completely consistent with the assumption of a constant hazard within the interval in the log-rate analysis (see next section). However, when small age intervals are used, the results based on both approximations are similar.33
Using the lineal' method22.27:
n LJ."C,n)= - [/j(."C)+/j(."C + n)j
2
and
n .1 n P(x,n) = [f + (-) M(."C,n)] [f - (-) M(x,n)] 2 2
(8)
(9)
where: P(.,n) is transition-probability matrix, consisting of elements Pij(') which represent the probability that an individual alive in state i at age x will be in state j at age x+n; M(.,n) is the matrix of transition rates and I is the identity matrix.
Using this matrix equation to transform transition rates into transition probabilities (referred to as 'option l'33), no assumption is made on the number of moves. 29,34
For the oldest open age group (m), the following formula can be used:
L(ro,co) = [M(ro,co)j'11(ro,co)
Combining equation (2) and (4) gives:
lex + n) = I(X) - M(..,n)L( x,n)
(10)
(11)
91

Chapter 5
Substituting equation (8) into (11) gives: .
l(r+ n) = ([I + (~) M(....;,n)Fl (I . 2
Combining equation (9) and (12) gives:
l(x+n) = P(x,n)·l(x)
n (-) M(."';,n)] )·1(....;)
2 (12)
(13)
Using equation (8) and (10), the number of person years lived in status i beyond age .1:, Ti(~) can be calculated:
(I)-II
T;('...;) = L: LJx,n) + LJCO,oo) (14) x
The population-based life expectancy in state i at age .1:, eix, is calculated as follows:
_ T;('...;) ejx - 1(....;) (15)
where: 1«) is the exact number of survivors at age x.
Calculation of the number of net flows between the health states is based on the following formula:
d(."';,n) = M(.-';,n) . L(."';,n) (16)
The implied prevalence of health states (i.e. synthetic prevalence) at age x, x+n can be calculated easily. In case of two nonabsorbing health states (state 'I' and state '2') the formula is as follows35:
(17)
5.2.2 Log-rate analysis to estimate smoothed transition rates for multistate life table
v\Then a multistate life-table analysis is based on longitudinal survey data rather than on vital-statistics data or complete registers, observed age-specific transition rates often show an erratic pattern across age due to limited sample sizes. When using sample data, therefore, before the actual multistate life-table analysis can be performed, an adclitional step is generally needed to smooth out erratic changes in the transition rates across age due to stochastic variability. Both simple graduation methods such as exponential smoothing l7 and log-rate regression models can be used to compute smoothed transition rates. We focus on the latter, because regression analysis gives maximum likelihood estimates and thus takes into account the number of observations on which each observed age-specific transition rate is based. Moreover, when applicable, regression enables transition rates to
92

Mullistate life·table analysis of health expectancy
be estimated in the presence of multiple covariates. Regression analysis can be used to estimate the effect of age and other covariates (e.g. smoking) on the transition rates, using standard approaches for model selection and pa· rameter estimation.36
Conventional log-rate analysis Supposing that continuous event histories of movements into and out of dif· ferent health states are available· which is generally not true when panel (Le. discrete· time or interval·censored) data are used· continuous· time log· rate models can be used. The log·rate model37 is also known as a log·linear model with offset", Poisson regI'ession with a rate multiplier3• or with offset40• This model is characterized by a Poisson clistribution, the log function as link function, and a rate multiplie1' (01' offset). In general, a continuous· time log·rate model is used to estimate the hazard of one specific event, such as incidence of disability 01' mortality, using information on the number of events and exposure times (i.e. the times between the start of follow·up or entrance into a specific state and end of follow·up 01' the event). The log·rate model specifies an exponential relation between the explanatory variable (e.g. age) and the hazard for an event. This relation is also known as the 'Gompertz lllode1'41,42:
E(N)= ea+pX R
01' equivalently:
E(N) = R· ea+ px
01':
N= a + px + /og(R) + . e £P01SSOll
(18)
(19)
(20)
where: E(N) is the expected number of events in a certain age gI'oup; a is the log (expected number of events during 1 unit of time at age 0); f3 is the log (ratio of the number of events during 1 unit of time at age x and at age x+ 1); X is age (more covariates can be added); R is exposure time and" an error term. Log(R) handles differences in exposure times and is known in statisti· cal literature as the 'offset' and R as 'rate multiplier'. More (or other) covari· ates than age alone are simple to include in the model. By treating age as a continuous variable, smoothed transition rates across age can be obtained. Observations can be taken at the individual level 01' aggI'egated into gI'oups of respondents with the same value for the covariate (X), in this case age. The last situation is called the person·years method." The model is similar to Cox proportional hazards with a constant baseline hazard."
Extension of the conventional log-rate analysis The type of data obtained from longitudinal surveys and the presence of multiple states in a multistate life· table model, makes extra demands on the regI'ession model. First, a multistate life· table model of health expectancy
93

Chapter 5
consists of at least three states, two living states (e.g. nondisabled and disabled) and dead. Out of one state of origin (e.g. nondisabled) transitions to more than one state of destination (e.g. disabled and dead) can take place. The likelihood of making a specific transition competes with the likelihood of making anothel' transition. This is known as 'competing risks' of multiple kind of events. When the competing causes are assumed to be independent, this mechanism is called 'substitution', and when the causes are assumed to be dependent, 'competition'. We have assumed that the competing causes are independent, which means that a change in one transition rate does not affect the estimates of competing transition rates. The presence of competing risks requires a regl'ession model that can handle multiple (i.e. more than two) outcomes. Second, in general only panel data can be derived from longitudinal surveys consisting of two or more measurements of a subject's health status (01' other characteristics), repeated after certain (often fIxed) periods of time. That is, a difference in a subject's health status between two measurements indicates that a transition has occu1'l'ed, but in general it is unknown when exactly this change took place, and whether other changes occtll'red in the time interval, nor does the same health stahls at both measurements necessarily imply that no transitions occurred. Accordingly, the exact number of events and the exact exposure times which are needed for log-rate regression analysis are not known, and must be derived undel' certain restrictions, taking into account that multiple kinds of events occur.
We used an extension of the log-rate model. By making links with a second type of regl'ession analysis, which is a kind of contingency table analyses" and is known as log-lineal' regression analyses of turnover (or mobility) tables'6," the extra requirements which stem fi'om the use of interval-censored data on multiple events could be handled by standard statistical software. We made use of the similarity of the data obtained fi'om sequential waves in longitudinal surveys and the type of data used in turnover tables. The turnover table cross-classifies data on two sequential points in time with respect to the state on the fu'st and the second point in time. The diagonal of the turnover table gives the number of persons with the same state on both points in time, the nondiagonal cells give the number of persons whose state has changed. The turnover table is used as a multistate demographic account, which links population flows (e.g. changes in health status) and population stocks (number of subjects in each of the multiple states) at two points in tinle.4'.49 An inlportant advantage of using the turnover table is that one cell of the turnover table can be easily viewed in relation to the other cells. Therefore, the number of events and the associated exposure tinles can be estimated in a coherent and internally consistent way. Assuming that only one movement (i.e. event) occurs in the interval the number of subjects whose health status has changed in the interval, equals the number of events (N). That is, under the restriction of a maximum of one movement per interval, the number of events can be derived fi'om the nondiagonal cells of the tm-nover table. We emphasize that in reality the number of events (N
94

Multistate life-table analysis of health expectancy
in the log-rate model) might be larger than the number of persons in the cells of the turnover table, since multiple movements may have occurred between the observed state of origin and state of destination, even if the state of origin is the same as the state of destination. Therefore this assumption produces no valid estimates on the number of events (e.g. the number of incident cases). In the ideal situation, where continuous event histories 01'
movements into and out of the different health states are available, a movement table, which contains all flows, is preferred, since no assumptions have to be made concerning the number of events.
Assuming an uniform distribution of the events across the interval (Le. the lineal' assumption), the exposure time R;(.~,n) for state i can be estimated from the turnover table, using:
n Ri = (n Nij,j=i + 2 L
j,j#.i Nij) = n (L Nij-O.5 L Nij) (21)
j j,Ni
where: Nij is the number of persons with health status i at the beginning of the interval (state of origin) andj at the end of the intel'val (state of destination); 4J.,i Nij is the number of persons who make a transition in the interval; It is the length of the interval; NijJe=; is the number of persons whose health status at the beginning is the same as that at the end of the interval and R; is the exposure time. N refers here to the number of persons in the cells and marginals of the turnover table. The exposure time is the same for all transitions from state i. As mentioned, only under restrictive assumptions does the number of persons in the nondiagonal cells equal the number of events. The assumption that only one movement occurs in the middle of the interval was also included in previous research.19 The method to calculate the exposure time from interval-censored data was also used by Laird.50 Substitution between transitions from the same health state of origin to different states of destination is taken into account in the exposure time, by counting in the exposure time persons who made another (competing) transition for only half of the interval. This procedure is similar to the adjustment of probabilities of death for independent competing causes in cause-elimination life tables.2l Without correcting for the reduction in the length of time persons are exposed to the specific transition due to the occurrence of competing transitions, substitution of another transition would artificially reduce the transition rate in question.
Using the number of events and exposure times, transition rates between two specific health states can be estimated with the log-rate model. However, the multistate model requiJ:es transition rates for multiple kind of events, i.e. for all nondiagonal cells of the turnover table, rather than for only one kind of event (Le. one specific nondiagonal cell) as is general practice in conventional log-rate regression. In order to specify the kind of event, we add indices ij to the events, to the parameters of the reg>.·ession equation and to the transition rates, where, again, i refers to the state of origin and j
95

Chapter 5
to the state of destination. The extended log·rate model for interval· censored data on multiple events is specified as follows:
Nij = ef.l. v + P'I X+ log(R;) + EPoisson
01' equivalently:
E(M .. ) = ea, + p, X Ii
(i "¢ j) (22)
(23)
where: E(Mij) is the expected transition rate from state i to state j. The log· rate model can be estimated in GLIM with Poisson regression using expo· sure time as 'offset'40 01' in EGRET using a rate multiplier39 .
Flexibility of the extended log-rate model The extended log·rate model can be easily adapted to examine relations other than exponential with age, to include sample weights, to adjust for missing values, to examine other covariates than (only) age, and to pool dif· ferent waves and/or datasets.
First, by treating age as a continuous variable, an exponential increase (01'
decline) of the transition rates with age is assumed (equations 22, 23). In most multistate life· table analyses of health expectancy this exponential model is used to describe the increase in incidence of disability and state· specific mortality, and the decrease in recovery from disability with in· creasing age.",19 This exponential model, also known as the Gompertz model (see Appendix) when an exponential increase is modeled, reflects an expo· nential decline in the power to oppose destruction 01' a exponential diminu· tion of the vital force."'" Besides this exponential model, more complex rela· tions with age can be specified. We focus on the Gompertz·Makeham model and the Sigmoid model, but other modifications are also possible. The Gompertz·Makeham model is, like the Gompertz model, a well·known mol" tality function. The Gompertz·Makeham model specifies besides the expo· nential component, a mortality component independent of age, i.e. one of chance. This constant term is the Makeham parameter."'" Assuming that similar forces of deterioration cause death and disability, we propose the same model to describe the relationship with age of incidence of disability. Analogous to the extension of the Gompertz model with the Makeham con· stant, we use an extension of the exponential model which specifies an ex· ponential decline in the likelihood of recovering with increasing age. This extension takes into account that, in addition to an exponential increase in the chance of not recovering (i.e. a decrease in the chance of recovering), there is another component which is independent of age. We call this com· ponent, which reflects to the upper boundary of the likelihood of l'ecovering, the Sigmoid constant, as the shape of the curve which includes such a con· stant is S·shaped 01' sigmoid.'2 The standard procedure for selecting differ· ent models, i.e. the likelihood ratio test can be used to select between the exponential model and the Gompertz·Makeham and the Sigmoid model, re· spectively.
96

Mnltistate life-table analysis of health expectancy
The Gompertz-Makeham model is specified as follows".51:
+p X E(M) = Ai)' + ea.; " I)
(24)
where: Mu is the transition rate from state i to state j; au and f3;j are the regression coefficients and Au is the constant of Makeham, indicating an ageindependent component of the chance of making a transition.
The Sigmoid model is specified as follows:
ea'I+P~X E(M ) = cr
ij IJ 1 + eU'J+PijX (25)
where: Oij is a constant, the maximum transition rate indicating an age-independent chance of not making a transition. The Gompertz-Makeham and the Sigmoid model are nonlinear models and can only be fitted by non-standard iterative algorithms. To estimate stendard errors of the estimated parameters in nonlinear models bootstrapping can be used. 53 To estimate bootstrap standard errors, one replicates the original dataset by drawing individuals with replacements. Rel'Unning the analysis on this replica gives an alternative estimate of the parameter. Repeating this procedure many times (e.g. 1000 times) will yield an indication of the uncertainty of the effect of random variability.
Second, some study designs require a reweighting to correct for the sampling design. Stratum weights can be used to increment the number of events and the exposure times. That is, depending on the stratum weights some subjects weigh more heavily in the regression analysis than others. The exposure time adjusted to include reweighing (Riw), is calculated as follows:
Ri W = n ( L: Wij Nij+ 0.5 L: Wij Nij) (26) j,j=i j,j"#i
Dividing the weighted number of events by the adjusted exposure time would give the estimate of the transition rates adjusted for the sampling design. However, using the weighted number of events in the regression analyses would erroneously decrease the standard errors of the estimates. This can be avoided by using the original number of events in the regression model and dividing the adjusted exposure time by the mean weight in each in state i:
R. W ::::~
R (27)
Using this 'normalised' exposure time (Ri") in combination with the unweighed number of events gives the adjusted transition rates without affecting the number of events in the regression analysis.
97

Chapter 5
Third, a correction for missing information is often required when longitudinal survey data are used. Since information on mortality is often derived from a follow-up of subjects in administrative datahases or a linkage with the national death registration, information on vital status is often more complete than information on disability status. Simply ignoring subjects with missing information on mortality or disability status would then produce an overestimation of mortality rates. This can be avoided by redistributing nonrespondents over the turnover table. Persons for whom the disability status was unknown at the beginning or end of the interval, but who were known to be alive, can be allocated to the nondisabled or disabled state, using the marginal distribution of the states of origin (i.e. beginning of the interval) and destination (i.e. end of the interval) of subjects with complete information, respectively. Subjects who had died dlll'ing the interval, but whose disability status was unknown at the beginning of the interval can be also redistributed over the nondisabled and disabled state, using the distribution of persons who died and whose disability status was known at the beginning at the interval. In order to avoid an artificial increase of the number of events, this redistribution can be hanclled by using redistribution weights in the same way as the stratum weights, i.e. by normalising the exposure time.
Fourth, the extended log-rate model can be applied in a situation with multiple covariates by expanding the number of dimensions in the (multidimensional) turnover table. This enables one to examine the effect of other covariates than only age (such as smoking status) on transition rates and to examine whether effects of covariates differ signifIcantly between the different transition rates.
Fifth, when transition data for more than one interval (i.e. more than two waves) are available fi-om one (or more) longitudinal survey(s), cross-tabulations derived from different periods andlor different datasets can be handled in the same way as other covariates, i.e. by adding one or more dimensions to the cross-tabulation. Differences between periods or studies can be assessed by standard log-linear modelling techniques. Pooling of different waves is based on the Markovian assumption that the likelihood of making a transition in an interval is independent of transitions in earlier intervals (no history). However, it should be noted that using data for the same subjects for more than one interval may bias the conclusion on the significance of the results. Valid standard errors can be estimated by bootstrapping techniques, which enable individual histories to be sampled.
98

Multistate life·table analysis of health expectancy
5.3 A multistate life-table analysis of health expectancy for the Netherlands
We used the extended log·rate model to estimate smoothed age·specific transition rates between three health states ('nondisabled', 'disabled' and 'dead') on the basis of two longitudinal surveys. These transition rates were analyzed together in a nonhierarchical population. based multistate life· table model, in order to estimate life expectancy with and without disability for The Netherlands. The face.validity of our outcomes is determined by com· paring several out~ome measures of the multistate model with those based on additional nationally representative data sources.
5.3.1 Data
Longitudinal data sow'ces The primary data source used is the GLOBE study . GLOBE being the Dutch acronym for Health and Living Conditions of the population of Eind· hoven and surroundings. Disability and vital status was assessed in two subpopulations (n=7677). These populations were composed of respondents to a postal questionnaire in 1991 among an aselect sample of 27000 (net reo sponse of 18973, 70.3%) 15·74 years old persons of Dutch nationality living in the city of Eindhoven and surrounding municipalities. Persons living in institutions were included, except for Eindhoven (40% of all respondents) where the institutionalized population only comprises residents of homes for the elderly. The fu'st subpopulation consists of a random sample of 3707 reo spondents of the postal questionnaire. The second subpopulation consists of a random sample of 1333 persons and 2637 persons who mentioned in the postal questionnaire to be suffering ll'om diabetes mellitus, chronic bronchi· tis, serious heart disease or clll'onic back complaints or slipped disk. Both subpopulations received an interview in 1991 and respondents (in total 5666, response rate 73.8%) and follow-up questionnaires were sent to the 5666 respondents of this interview in 1993 (n=4496, i.e. 79.4%; 81.1% after correction for mortality) and 1995 (n=4105, i.e. 72.4%; 76.4% after COl'rec· tion).
Since persons above age 74 at baseline (1991) were not included in GLOBE, and a substantial part of the mortality and disability occurs beyond age 75, a second dataset, the Longitudinal Study of Aging (LSOA)54 was used. The LSOA started in 1984 with in-home interviews of 7527 noninstitutionalized persons of age 70 and over in the United States, as part of the Supplement on Aging (SOA) of the Health Interview Survey (response rate 97%). Persons who were institutionalized after the baseline measurement are included in the sample. Follow·up information was collected by telephone interviews in 1986, 1988 and 1990. The complete sample was reinterviewed in 1988 (n=4984, 66.2%; 89.0% after correction for mortality) and 1990 (n=4142, i.e.
99

Chapter 5
55.0%; 87.4% after correction), while a subsample of 5151 persons was reinterviewed in 1986 (n=4113, i.e. 79.8%; 92.4% after correction). The mean interval between two waves was not exactly two years, but 2.2, 2.1 en 1.9 years respectively in 1984-1986, 1986-1988 and 1988-1990. If sample persons were mentally 01' psychically unable to respond for themselves 01' when the sample pel'son was absent dUl'ing the period of data collection, information was collected fi'om proxy respondents. Proxies were used for 14% of the respondents at baseline and for 34% (1986), 36% (1988) and 35% (1990) at follow-up.
Both studies contain continuous information on mortality based on municipal population registers (GLOBE) and the National Death Index (LSOA). A more detailed description of the sample and the design of each study is given elsewhere.55,56
Additional data sources In order to determine whether the multistate life-table model reproduced the Dutch situation, information was obtained fi'om several sources. Data on the number of deaths and the population structure by sex, age and calendar year were obtained fi'om Statistics Netherlands.57 These data, covering all single-year age groups of the Dutch population in the period 1985-1994 had originally been derived from the municipal population registers. Data on the prevalence of disability in the nOnllstitutionalized Dutch population were obtained fi'om the continuous Health Interview Survey, 1993 and 1994, conducted by Statistics Netherlands.58•59 Additional estimates on disability prevalence in the institutionalized population for the period 1982-1991 were based on several administrative data sources and surveys.60
5.3.2 Definition of study population and health states
Study population Table 1 summarizes pel' biennial interval the selection of the study population, and the number of persons with an unknown vital 01' disability status at the beginning 01' end of the biennial interval.
The study population was limited to persons age 30 anel over (n= 4875 in 1991 in GLOBE), whites (n=6880 in 1984 in LSOA) and persons alive at the beginning of each interval (both datasets). Although GLOBE includes ages 14-29, these younger age groups are not of prinlary interest with respect to the debate on compression of morbidity and the evolution of population's health status. An additional argument for starting at age 30 was that including younger ages would require a more complex model to describe the relationship of the transition rates with increasing age, as external causes produce an 'accident hump' among adolescents. The number of deaths in the sample would not allow us to give stable estimates of such a complex model. Nonwhites in LSOA were excluded fi'om the study population, in order to
100

Multis/a/e life·table analysis of health expectancy
better reproduce the Dutch situation and to increase the comparability with the GLOBE which only includes persons of Dutch nationality.
The study populations differ between the periods. For the period 1991·1993, changes in disability status between 1991 and 1993 were included only for a subset of the study population (the second subpopulation n=3970, net re· sponse 2867), since in the 1991 GLOBE questionnau'e the complete set of disability questions was not presented to all subjects. For the periods 1984· 1986 and 1986· 1988 (LSOA), only the 1986 subsample of 5151 persons could be included.
Some ulformation on subjects included in the study population was incom· plete. FU'st, for a small number of persons Oess than 0.5% in both datasets, Table 1) the vital status at the beginning or end of an ulterval was missing, because of a bad match with the National Death Index or lack of administra· tive follow·up of those who emigrated. These persons were excluded fl'Om the analyses. Second, for a larger group, the disability status was unknown at the begllllling or the end of the interval, because of item nOl1l'esponse 01' at· trition (Table 1). Subjects with missing information on disability status were
Table 1 Sample Size, Exclusion of Subjects from Analysis, Attrition and Non-response In GLOBE and LSOA
Nonwhites Unknown and persons Whether Still Dead al Nonresponse
Sample younger Alive at Begin Begin of Attrition on Disability than 30 year or End of 2· Interval
of age year InteNal
GLOBE (n=5666;'
1991-1993 2867' 262 3 0 1991:0 1991:77 1993:475 1993:58
1993·1995 5666 659 16 99 1993:872 1993: 96 1995: 1113 1995: 219
LSOA (n=7527),
1984·1986 5151' 616 18 0 1984:0 1984: 142 1986:303 1986:384
1986-1988 5151' 616 23 577 1986: 303 1986:384 1988:408 1988:275
1988-1990 7527 647 28 1565 1988: 710 1988:415 1990: 805 1990:365
a Response to postal questionnaire is: 70,3.%. Response to questionnaire in first subpopulation is: 72.2%. Response to questionnaire in second subpopulatlon is: 75.6%.
b Response to NHIS is 97%. , 1991, only second subpopulalion of GLOBE. , 1986 only subsample of LSOA.
101

Chapter 5
Table 2 Disability Items and Cut-Off Point' in GLOBE and LSOA
GLOBE
eating I eten en drinken ja zander enige mOBile ia, met enige moeile ja, met grote moeile nee, dal kan ik niet
2 getting in and out of bed or a chair I in en zander moeile uil bed stappen; gaan zitten en opstaan uit met enige moeile stoel met grote moaile
aileen met hulp
3 dressing and undressing I aan-en uitkfeden zander moaile met enige moeile met grote moeile aileen met hulp
4 bathing or showering I volledig wassen zander moeile met enige moeile met grate moeile aileen met hulp
5 getting outside I waning verlaten, zander moeile binnengaan met enige moeite
met grote moeite aileen met hulp
6 walking up 10 steps withoul rest I trap op· zonder moeite en aflopen met enige moeile
met grote moeile aileen met hulp
7 lifting or carrying something as heavy as a ia, zonder enige moeite 10b pound bag of potatoes / voo/werp van ja, met enige moeite 5 kg 10 m dragen ja, met grote moeile
nee, dat kan ik niet
8 walking a quarter of a mile I 400 meter aan ia, zonder enige moeite een sluk lopen ia, met enige moeile
ja, met grote moeile nee, dat kan ik niet
9 see well enough to read newspaper prinlc I ia, zonder enige moeite kleine letters in de krant fezenc ia, mel enige moeile
ja, met grote moeile nee, dal kan ik nlet
10 see well enough to recognize a friend ia, zonder enige moeite walking on the other side of the streelc I ja, met enlge moeile gezicht herkennen op afstand van 4 mO ja, met grote moelle
nee, dal kan ik niet
11 Living in an institution jg nee
a Underlined is without disability, rest is with disability. b One pound is 453.6 grammes.
LSOA
no difficult~ some difficult~ at lot of difficulty unable to do
no difficult~ some difficu1t~ at lot of difficulty unable to do
no difficu1t~ some difficulty at lot of difficulty unable to do
no diffjcult~ some difficulty at lot of difficulty unable to do
no difficult~ some difficull~ at lot of difficulty unable to do
difficull~: no difficulty: yes
difficult~: no difficulty: yes
difficult~: no difficulty:yes
can: yes can: no
can: yes can: no
ru no
C Wearing glasses or contact lenses if Ihat's how you see best I Zonodig met brito
102

Multistate life-table a1!alysis of health expectancy
not completely ignorecl in the analyses, but were used to adjust the estimates by normalising the exposure time. Proxy respondents (LSOA) were included in the analyses, since excluding proxies would have led to an underestimation of disability.""G' For GLOBE, complete information on disability and vital status at the beginning and end of a 2-year interval was available for 1988 persons in 1991-1993 and 3119 in 1993-1995, which resulted in a total number of 5107 observations. For LSOA, complete information on disability and vital status was available for 3720 persons in 1984-1986, 2853 in 1986-1988 and 3535 in 1988-1990, which resulted in a total number of 10108 observations.
Definition of health states Based on information about disability and mortality, we defined three health states at each biennial measurement: 'nondisabled', 'disabled' and 'dead'. Persons were considered to be disabled if they were living in an institution 01' indicated that they needed help or were unable to carry out without (gt'eat) clifficulty one or more of the activities of daily life, mobility and communica tion that are essential for independent functioning (Table 2). Ten activities which were part of both GLOBE and LSOA were included in the disability indicator: bathing/showering, getting in and out of bed or a chair, ill'essing and unill'essing, walking a quarter of a mile (400 m), carrying an object of ten pounds (5 kg), walking 10 steps without rest (walking stairs), reading small print in a newspaper, recognizing sameone's face, eating and getting outside. Hearing items were not included in the follow-up measurements of LSOA and could therefore not be taken into account.
5.3,3 Extended log-rate analysis
Tu/'nover table Starting point of the estimation of the transition rates for the multistate lifetable was a large multidimensional cross-tabulation of the population by health status at the beginning of the interval (state of origin i), health status at the end of the interval (state of destination J)' two-year age group, followup period, and sex. An illustration of the cross-tabulation for one specific age and sex gt·oup and period is given in Table 3. In the nondiagonal cells, the state of origin differs from the state of destination. Information about persons who are dead at the beginning of the interval is irrelevant, because they cannot make a transition. This row, therefore, will be left out of the tumover table in the further analyses. The remaining cells are used to derive the number of events and the exposure times. Assuming that only one movement occurs in the middle of the interval, we estimated the number of events from the nondiagonal cells of the turnover table, and the exposure time for subjects in each state of origin (row in the tumover table) from all cells perrow. The length of the interval n which was used in the estimation of the exposure time was 2.2 (1984-1986 LSOA), 2.1 (1986-1988 LSOA), 1.9 (1988-1990 LSOA), 2 (1991-1993; 1993-1995 GLOBE) years. We used sample
103

Chapter 5
weights ta adjust for the sample design in LSOA and for the overrepresentation of persons with chronic diseases in GLOBE, and we used the proportional distribution of subjects with complete information who belonged ta the same state at the beginning 01' at the end of the interval ta adjust for missing values on disability status.
Logistic regression of missing disability status on age (included as a continuous variable) and sex, showed that response differed significantly by age in 1984 (p=0.019), 1988 (1'=0.047) and 1990 (p=0.0008) in LSOA. In these years, missing values increased by age (OR 1.01-1.03). Significant differences by sex were found in 1986 (p=0.013), 1988 (p=0.009) and 1990 (p=0.018) in LSOA; and in 1993 (p=0.003) in GLOBE. In LSOA (1986, 1988 and 1990), response was lower in women than in men (OR 0.81-0.85) whereas in the younger GLOBE population (1993) the opposite was true (OR 1.24). Although persons with missing information on disability status differed significantly by age and sex in some periods, we did not perform age and sex specific adjustments in order to avoid unstable estimates.
By pooling all biennial intervals, i.e. two from GLOBE (i.e. 1991-1993; 1993-1995) and three from LSOA (i.e. 1984-1986; 1986-1988; 1988-1990), we could obtain transition rates for all age groups above age 29 and we could increase the number of events pel' cell, and thus the reliability of the estimates of the transition rates. Pooling waves and datasets requires that there are no period effects in the transition rates and that the two datasets can be joined. Although we tried ta maximize the comparability of the GLOBE and LSOA study by selecting similar disability items and excluding nonwhites from LSOA, the comparability may have been compromised by numerous factors, such as real differences between the Dutch and US population and time pe-
Table 3 Turnover Table for One Age-Sex Group
destination (1)
Nondisabled Disabled Dead Total
Nondisabled 104 64 26 194 ~
Disabled 18 167 45 230 c 0)
Dead ~
0 0 o 0
Total 122 231 71 424
• Persons dead at the beginning of the interval will be removed.
Note: When the interval between the two waves equals 2, the exposure time in the nondisabled state ~ 2'(104 + 0.5'(64+26)) ~ 298. This results in an incidence rate of 64/298 ~ 0.215 per year.
104

Multistate life-table analysis of health expectancy
riods (1984-1990 vs 1991-1995), as well as differences in study designs, exact wording of disability items and exact response categories. Therefore, we fu'st examined whether the two datasets produced comparable outcomes and together described the Dutch population's health. That is, we examined whether significant discontinuities existed between the two datasets in the proportions of persons who died and who were disabled, and whether the two datasets together described the Dutch situation.
Figure 1 compares the proportions of persons who died in the two-year age interval for GLOBE (younger ages), LSOA (older ages) and for The Netherlands (all ages). The proportions for GLOBE and LSOA are based on two (GLOBE) and tlu.'ee (LSOA) biennial periods. The pl'Oportions for The Netherlands are derived from a single-decrement life table with two-year age intervals, constl'Ucted on the basis of information on the number of deaths and the population by single year of age and sex for the period 1986-1994.63.65
The limited sample sizes of GLOBE and LSOA produce erratic changes across age, but the overall pattern is one of an increase in the proportion of persons who died with increasing age. The two datasets show no substantial discontinuities, and with the exception of the lower proportions of persons dying at older ages in the LSOA (especially in women) the datasets roughly describe the national Dutch situation.
Figure 2 compares the age-specific proportion of person with disabilities in GLOBE (1991, 1993), LSOA (1984, 1986, 1988) and in The Netherlands. The Dutch estimates are based on the Health Interview Survey for 1993 and 1994 and an additional estimate for the population in institutions.58.6o Especially in men, the proportion of disabled persons at ages 70-75 is smaller in GLOBE than in LSOA and in the national estimate. This produces a slight jump in disability prevalence between GLOBE and LSOA. In elderly women, the proportions of disabled persons are slightly lower both in LSOA and GLOBE, compared to the national estimates. We emphasize that the national disability estimates for The Netherlands are also derived fi'om samples, and unlike the national mortality data, cannot be viewed as a 'golden standard'.
The likely underestimation of the population in institutions may have caused the lower mortality at aclvanced ages (especially in women) and the slightly lower prevalence of disability in oldest old women, although the low mortality level at advanced ages in the US"" may also have contributed to the slight difference in mortality. Despite these differences, we did not seriously doubt the appropriateness of the two datasets for the estimation of transition rates by age. Nevertheless, we decided to exercise caution with respect to the possible bias due to the underestimation of the population in institutions and the slight jump in prevalence in the further analyses, wherein the transition rates by age are estimated and used.
105

Chapter 5
M,n 0.60
----.'r- GlOBE
-"-lSOA "-'. 0.50 .. o· -StalNeth /}, :1 I
:1 I ,0 I I
I I
,; I I 0.40 I I
I ,0 I
c I 0 • I ~ ,d &. 0,30 ''I , . e J\./ • n
" ,J 020 "' p<-tI
" .,0,
0.10 -:t4-
0' .0'-
0.00
30 36 42 48 54 60 66 72 78 84 90 96
'9'
Women 0,60
----.'r- GLOB E
- -+- LSOA
0,50 .. 0 . . SlalNelh p'
0
DAD :h "' I ,+ I
" I \ I c 0' I I I 0
" I \ " I &. 0.30 I I I
P I I I e I n I
I I
0' • I, , "
0.20 d' "
I • I ,
" 0' ,
.'Jr • ,0,
0.10 r./-f/ :e"
0.00 30 36 42 48 54 60 66 " 78 84 90 96
'9'
Figure 1 Proportion of persons who died in the two-year inlerval based on GLOBE, LSOA and Statistics Netherlands (StatNeth), by age,
106

Multistate life-table analysis of health expectancy
1.00
---h-GLOBE
0.90 - -+- LSOA
"<)"HIS
0.80
0.70
0.60 c 0
~ 0.50 ~
K 0.40
0,30
0.20
0.10
0,00 o· ..
30 40 50 60
as·
Women
f 10
I fro>
'" !-.,,/o· I . • •
70 80
I
• I
.-< I
)
so
I I
I
I
I I
100
1.00,--------------------------------,
--tr-GLQBE
0.90 - -+- LSOA
"<)"HIS
O.BO
0.70
0.60
~ ~ 0.50
DAD
0.30
0.20
0.10
0.00 +--~-~-~-~-~-~-~-~-~-~-~-~-~-.....j 30 40 50 60 70 80 so
as·
Figure 2 Cross-sectional prevalences of disability based on GLOBE, LSOA and the Health Interview Survey (HIS), by age.
100
107

Table 4 Selection of the Log-Rate Models: Gompertz, Gompertz-Makeham, Sigmoid
Incidence Recovery Mortality Among Mortality Among
Nondisabled Disabled ............. _----.-- .. _---.............. _._--_ .. _ ............ _--_.-.-- .. ----- ........... _--_ ... -.. ------............. .-.-- .. -.. -.-.......... _ ...... ,-.. ----_.-
Deviance p Deviance p Deviance p Deviance p
Men Gompertz 140 97 88 69 + Makeham constant 125 0.0001 97 1 88 1 69 1 + Sigmoid constant 140 1a 82 0.0001 87 0.346 65 0.054
Women Gompertz 118 100 62 82 + Makeham constant 112 0.Q15 100 1 59 0.07 82 1 + Sigmoid constant 118 1 76 <0.0001 62 1 82 0.81
a P-values can be exactly 1 when there is neither a Makeham nor a Sigmoid constant which improves the model.

Multistate life-table analysis of health expectancy
Log-rate analysis Next step was to estimate transition rates from GLOBE and LSOA using log-rate regression. Since the main purpose of the regression analysis was to obtain smoothed transition rates by age, we included age as a continuous variable in the model. We compared three models to sumnlarize the relationship of the transitions with age: the Gompertz model (i.e. exponential increase with age) the Gompertz-Makeham model and the Sigmoid model. The likelihood ratio test was used to select between these three models (Table 4). We used a significance level of 0.01 rather than 0.05 in order to take into account dependency between the observations in the subsequent waves. All regression analysis were conducted in GLIM. The only death below age 40 was excluded from the analyses in order to avoid an overestimation of mortality rates at younger ages.
We found that for transitions from the nondisabled and the disabled state to dead, the model with the fewest parameters - the Gompel'tz-model - could be
Table 5 Parameters of the Log-Rate Models (SE Between Brackets)
O'.ij at age 70a PI; Mb
Men
Incidence of disability -2.945 (0.0399) 0.0859 (0.00333) 0.0237 Mortalily among nondisabled -3.813 (0.0718) 0.1078 (0.00698) n.a. Recovery from disability -0.906 (0.0546) -0.1052 (0.00453) n,a. Mortality among disabled -2.505 (0.0663) 0.0577 (0.00507) n.a.
Women
Incidence of disability -2.487 (0.0323) 0.0725 (0.00283) 0.0192 Mortality among nondisabled -4.642 (0.1199) 0.1097 (0.01153) n.a. Recovery from disability -0.627 (0.0429) -0.1085 (0.00344) n,a. Mortality among disabled -3.308 (0.0730) 0.0747 (0.00520) n.a.
o Age was transformed to age -70. b M ~ Makeham constant. C a = sigmoid constant. When the model does not include M nor s, the interpretation is as follows:
exp(a) is the rate at age 70; exp(p) is the ratio of the rates at age x+1 and x.
cr'
n.a. n.a.
0.5056 n.a.
n.a, n.a.
0.3384 n,a.
When the model includes M, the rate is the sum of an age-independent and an agedependent component:
M ~ age independent component; exp(a) is the age dependent component at age 70; exp(p) is the ratio of the age independent components at age x+1 and x.
When the model includes cr, the rate is calculated as a fraction of the maximum rate. cr = maximum level of the rate.
The fraction is given by alpha and beta: exp(a)I(1+exp(<<)) is the fraction at age 70; exp(p) is the odds ratio of the fractions at age x and age x+1.
!O9

0.6
0.5
0.4
2 0.3 e
0.2
0.1
0.0 ~ , 20
, 30
incidence of disability
• x ~""x , , ,
40 50 60 70
age
~
•
80 90
mortality among nondisabled 0.6
0.5
0.4
0.3
0.2
0.1 •
o.oJ, 1" '1'00 ;;.~ 0 20 30 40 50 60 70 80 90
age

recovery from disability mortality among disabled
0.6 ] 0.6
0.5 _ 0.5 x x
0.4 ~ ~ 0.4 x
'" 0.31 \Xx x '" 0.3 a; a; - -x 0.21 x\u 0.2 i ~~Xx 0.1 0.1
X
0.0 ~ X~
0.0 1 0 0 000000000'0 , , , , , , , , , , , , 1 -- - ---r---------r--
20 30 40 50 60 70 80 90 20 30 40 50 60 70 80 90
age age
Figure 3a Observed (weighted by the number of observations) and estimated transition rates using log-rate analysis, based on GLOBE and LSOA, men.

incidence of disability mortality among non disabled 0.6 0.6
0.5 0.5
0.4 0.4
(]) 0.3 ~
2 0.3
'" ~ •
0.2 0.2
0.1 0.1 x
0.0 ; , 0 0 r·····-------,-- ooJ. )(~ 0 " Ie e f OO¥ 0 [
20 30 40 50 60 70 80 90 ~ ~ ~ ~ 00 ~ 00 00
age age

recovery from disability mortality among disabled 0.6 0.6
0.5 0.5
0.4 0.4
2 0.31 ~x '" 0.3 '" ~ ~
I x
x x X
0.2 x x "'- 0.2 x
0.1
~ 0.1
oj . x . . ~
0.0 0 fOOOOYOO66? , 20 30 40 50 60 70 80 90 20 30 40 50 60 70 80 90
age age
Figure 3b Observed (weighted by the number of observations) and estimated transition rates using log-rate analysis, based on GLOBE and LSOA, women.

Chapter 5
selected to describe the transition rates by age. However, the fit improved significantly by using the Gompertz-Makeham function for incidence for men (p<0.001) and the Sigmoid function for recovery for men and women (p<0.001). Although the improvement in fit by adding the Makeham constant did not completely reach statistical significance for incidence in women (p=0.015), we decided to include the Makeham constant for women as well, in order to obtain the same models for men and women. Table 5 presents the parameters of the log-rate analyses for the foul' transitions for men and women. The level is expressed by au, the change with increasing age by fJu and M and a are the Makeham and Sigmoid constant, respectively. Substitution of these parameters in the regression equation gives the transition rates by age (Figure 3a-b). As expected, incidence rates of disability, and mortality rates among nondisabled and disabled persons increase with increasing age, whereas recovery rates /i'om disability decline with increasing age. Mortality rates among disabled persons are higher than mortality among nondisabled persons, that is, in the disabled state, there is an excess mortality risk. Mortality (in both states) and recovery is lower in women, and incidence is lower in men. That is, mortality rates are more favourable in women and disability rates are more favourable in men.
In addition, Figure 3a-b shows the observed transition rates (weighted by the number of observations). Visual inspection of the observed transition rates and the transition rates which had been estimated using both datasets, confirmed that the datasets could be joined. However, to test whether there were nevertheless statistically significant clifferences in the transition rates between the two datasets, we examined whether a model with a different parameter for the level (a) and/or a different parameter for the change with age (jJ) fOl' each dataset, improved the fit of the model significantly compared to the model with one (J, and one p for both studies. We fu'st examined whether a separate a for each dataset improved the fit significantly. If this was true, we examined whether adding a separate f3 for each study improved the fit further. If using a separate a for each study did not improve the fit, we examined whether a separate f3 for each study (and a common a for both studies) improved the fit. Table 6 describes the results of this procedure. We found that for most transitions adding a separate a and/or f3 for each data set did not improve the fit significantly. Only the transitions /i'om 'no disability' to 'disability' (men) and /i'om 'disability' to 'dead' (women), were better described by a model with a separate (J, for GLOBE and LSOA, and the transition /i'om 'disability' to 'dead' (men) by a model with a separate p. The difference in (J, for incidence in men reflects the earlier observed lower prevalence in GLOBE than in LSOA in men. We do not consider' the p for the transition from 'disability' to 'dead' which is based on GLOBE as plausible (at age 100 this would give a rate of 4.5), nor the (J, for the transition /i'om 'disability' to 'dead' in women as this would lead to implausible estimates of total life expectancy. For the ease of interpretation, we decided to use one
114

Table 6 Differences in Level (0;) and/or Change with Age (~) Between GLOBE and LSOA
Incidence Recovery Mortality Among Mortality Among
Nondisabled Disabled ---_ ....................... --.. --................... -....... -.............. -.. --- ............................................... -.--...............
Selected Model Gomperlz-Makeham Sigmoid
Deviance p Deviance p
Men
Selected Model 125 82 Different a.a 97 <0.0001 79 0.06 Different ~ (given different 0;) 94 0.07 n.a. n.a. Different ~ (same 0; at age 70)' n.a n.3. 81 0.37
Women
Selected model 112 76 Different (J.'" 108 0.03 71 0.02 Different ~ (given different 0;) n.a. n.a. n.a. n.a.
Different ~ (same 0; at age 70)' 111 0.69 76 0.56
a For incidence (men): CXGLOBE= -4.012; a.LSOA= -2.824. For mortality among disabled (women): ""LOBE; -3.798 : o;LSOA; -3.169.
b For mortality among disabled (men): ~GLOBE; 0.1273: ~LSOA; 0.04182.
Poisson Poisson
Deviance p Deviance p
88 69 84 0.07 66 0.114 n.a. n.a. n.a. n.a. 88 0.96 51 0.0003
62 82 61 0.23 73 0.004 n.a. n.a. 73 0.99 58 0.36 n.a. n.a.

Chapter 5
parameter for the level and one parameter for the change with age for all transitions.
5.3.4 Multistate life-table analysis
We used the estimated transition rates based on GLOBE and LSOA to calculate health expectancy. For this purpose a multistate life table consisting of three health states 'nondisabled', 'disabled' and 'dead', was calculated using matrix algebra operations in QUATIRO-PRO. We used two-year age intervals in the multistate life table, which approximates the length of the biennial intervals in the two longitudinal datasets. To estimate appropriately the transition rates for each age interval, we added 1.5 year to the lower age bound of each two-year age interval (e.g. 31.5 for persons age 30-31). This adjustment was proposed by Crimmins 19, because persons are on average 0.5 years older than the stated age at the beginning of the two-year interval, and one year older in the middle of the two-year interval than at the beginning of the interval. Using this adjustment, the life expectancies derived from the model yield life expectancies at half ages, e.g. 30Y,. We started the life-table calculations at age 30Y, and used the prevalence of disability in the age interval 30-31 ta distribute the initial cohort (i.e. the radix population of the multistate life table) over the nondisabled and disabled state. We closed the life table at age 110. The multistate life table translates age-specific transition rates into life expectancies with and without disability.
Figure 4 presents survival curves for mortality and for disability for men and women as estimated with our multistate life-table model. The area under the mortality curve between a certain starting age (e.g. 30Y, years) and the oldest age group, divided by the number of persons alive at the starting age is the tatallife expectancy. In the same way, the area under the disability curve reflects life expectancy free of disability. The area between the mortality and the disability curve, divided by the number of persons alive at that starting age is the life expectancy with disability. Table 7 summarizes the estimates of total life expectancy, life expectancy with and without disability based on the multistate life table. Total life expectancy at age 30Y, is 44.8 years for Dutch men and 50.8 years for Dutch women, of which a respective 38.5 and 38.4 are spent without disability. The remaining 6.4 (14.2%) and 12.4 years (24.3%) are spent with disability. At age 70Y" life expectancy is 10.7 and 14.3 years, respectively. About 6.3 and 5.8 years are spent without disability, and 4.4 (41.3%) and 8.5 years (59.6%) with disability, respectively.
From the multistate life-table model, prevalence of disability in the synthetic cohort can be easily calculated (Figure 5). The synthetic prevalence of disability, is a function of current incidence, recovery and disability-state-specific mortality rates, which unlike the cross-sectional prevalence, does not
116

Mullislate life-table analysis of health expectancy
Men
100 --- ---90 --- --mortality ~ ~
80 " " - - - disability " 70 '-
'-
"' '-
60 ,
"0 '-t: \ '" 50 '" \
" \ 0 .<:: 40 '-~ \
30 \ \
20 \ \
\ 10 '-
'- ....
30 40 50 60 70 80 90 100
age
Women
100
90 --- --- --mortality -~
80 ~
" - - - disability " " 70 '-
'-
"' '-
60 , " \ t:
'" 50 \
'" '-" \ 0
.s:: 40 \ ~ \
30 \ \
20 \ \
'-10 '-
'-" ~-
30 40 50 60 70 80 90 100
age
Figure 4 Survival curves for mortality and disability based on the Multistate Life Table, by age.
117

Chapter 5
depend on past values. Prevalence of disability is higher in women than in men and increases with increasing age.
5.3.5 Evaluation of the outcomes of the multi state life-table model
The most important uncertainty of the estimated multistate life table is whether our estimates of the transition rates based on the GLOBE study (younger ages, Eindhoven and surrounding) and the LSOA study (elderly ages, US) sufficiently reproduce the Dutch situation. Four factors might have compromised the reproduction of the real but unknown Dutch transition rates. First, real differences in disability and mortality dynamics between The Netherlands and the US, might have produced invalid estimates for The Netherlands, especially at older ages. Second, persons living in institutions were underrepresented, especially in LSOA. Third, attrition may have compromised the representativeness of the estimates: for 73 percent of the selected study populations in GLOBE information on disability or mortality was available in 1995, compared to 83 percent in LSOA in 1990. Although we avoided an overestimation of the mortality rates by using the marginal distribution of subjects with complete information to reallocate persons with missing information on disability, we cannot rule out that attrition has biased the estimated transition rates. Fourth, relying on self-reported data with respect to disability may have caused bias.
In order to evaluate whether our estimates of the transition rates and life expectancy in different health states are J.ikely to be biased, we compared several outcome measures of the multistate life- table model (i.e. survival curves, age-specific total mortality rates, age-specific disability prevalence and total life expectancy at age 30Y, and 70Y,) with independent estimates based on nationally representative data sources. We emphasize that a perfect reproduction of the outcomes of the multistate life table by cross-sec-
Table 7 Total Life Expectancy (LE), Disability-Free Life Expectancy (DFLE), Life Expectancy with Disability (LED) and Percentage of Life with Disability (%LED In LE) for Dutch Men and Women, Based on the Multistate Life Table, at Age 3OY, and 70Y,'
LE, Y DFLE, Y LED, Y % LED in LE
At age 30Y, Men 44.8 38.5 6.4 14.2 Women 50.8 38.4 12.4 24.3
At age 70Y, Men 10.7 6.3 4.4 41.3 Women 14.3 5.8 8.5 59.6
8 Figures are rounded to 0.1.
118

Mltltistate life-table analysis of health expectancy
1.00 ... ... --men ...
" 0.80 - - - women /
" / /
/ c 0.60 / 0 / t " 0 / Q.
/ 0 a 0.40 /
" " / / ... ... 0.20 ...
// //
---------0.00
30 40 50 60 70 80 90 100
age
Figure 5 Implied prevalence of disability based on the Multistate Life Table (MSL T).
tional estimates is not to be expected, since tlus only occurs when transition rates have remained constant for a very long period oftime.5
Figure 6 shows that survival by age is quite close to the national estimates based on data from Statistics Netherlands. The contribution of different age groups to the small differences in survival becomes more clear when agespecific mortality rates are compared (Figure 7). Tlus comparison indicates that mortality rates derived from the multistate model are slightly overestimated in men above age 80 and underestimated in women above age 86. The overestimation of mortality in older men was ahnost negligible and might have been caused by a slight overestimation of incidence of disability. The underestimation of mortality in elderly women was larger and might have been caused by the underrepresentation of the institutionalized population.
Figure 8 compares the synthetic prevalences of disability from the multistate life table, the cross-sectional prevalences from LSOA and GLOBE and the cross-sectional prevalences based on the Health Interview Survey from Statistics Netherlands (1993 and 1994), including an adjustment for the population living in institutions. The agreement between the prevalence by age based on the multistate model and the extel'l1al data sources is rather close, considering that smoothed age pattel'l1s were used and that no steadystate situation exists. Some deviations are worth mentioning. In older men, disability prevalence slightly exceeded the national estimates, whereas in
119

Chapter 5
Men 100
90 --SDLT
80 , - - - MSLT , 70 ~
~
" ~
'" 60 , I: co 50 <II
" 0 40 .c
~
30
20
10
30 39 49 59 69 79 89 99
age
Women 100 ------ --SDLT 90 , ,
"-80 - - - MSLT
70
" ,
'C 60 , I: , co 50 , <II
" , 0
40 , J:: ~ ,
30
20
10 "- "-
30 39 49 59 69 79 89 99
age
Figure 6 Survival curves based on the Single·Decrement (SDL T) and Multistate Life Table (MSLT).
120

Multistate life-table analysis of health expectancy
Men 0.50
I 0.45 --SDLT I
I 0.40 --- MSLT I
I 0.35 I.
/,
0.30 I I
$ 0.25 I
e I I
0.20 /. I.
0.15 I. /.
" 0.10
0.05
0.00 30 39 49 59 69 79 89 99
age
Women 0.50
0.45 --SDLT
0.40 - - - MSLT
0.35 I I
0.30 I I
$ 0.25 I e I
I 0.20 I
/.
0.15 / /
r 0.10
0.05 h ..&
0.00 30 39 49 59 69 79 89 99
age
Figure 7 Total-mortality rates based on the Single-Decrement (SDLT) and Multistate Life Table (MSL T) by 2-year age.
121

Chaptel' 5
M," 1.00
--lr-GlOBE
0.90 - ... -lSOA
··0 ·-HIS
0.80 -x-MSlT , ,
0.70 ; .-" , ,
0.60 • c I 0 " ~
, 8. 0.50 '0
K t • 0.40
0.30
0.20
0.10
0.00 30 40 50 60 70 60 90 100
'9'
Women 1.00 • --f.r----GlOBE P 0.90
- ... - lSOA ..... , I
··o··HIS .' ¥ -x-MSLT
, , 0,80 • .' , 0.70
, ,0 ;
.. / 0.60 ,'/
c 0 .. I
'€ .. 8. 0.50 ,'I" K
0.40
0.30
0.20
0.10 __ x:-:~ ....... x
0.00 30 40 50 60 70 60 90 100
". Figure 8 Cross-sectional and implied prevalences of disability based on GLOBE, LSOA, the Health Interview Survey (HIS) and the Multistate Life Table (MSL T),
122

M,dtistate life-table analysis of health expectancy
men aged 50-59 year, disability prevalence was lower_ While the cross-sectional prevalence of disability shows a plateau (between age 50-71), the synthetic prevalence of disability based on the multistate life table increased gradually with age_ These differences between the cross-sectional and synthetic prevalence might be caused by the absence of a steady-state situation and the use of smoothed transition rates with age_ The plateau in the crosssectional prevalence may be the result of self-reported disability data. The plateau was found in both datasets which included this age range (GLOBE and the Health Interview Survey). A combination of two factors might have contributed to this plateau in reported disability. First, at younger ages, demanding personal circumstances due to work and family responsibilities can cause any difficulties with activities of daily life, communication or mobility to be experienced as very burdening, which may consequently lower the threshold to report difficulty. Second, at older ages persons may experience any difficulties in performing specific actions 01' activities as a normal consequence of their age, and consequently the threshold to report disability might be relatively high. It is not likely that underlying dynamics in incidence, recovery and mortality have caused the plateau in intrinsic disability, as this would require either incidence rates to decline, recovery rates to increase 01' mortality rates to increase, which we do not consider plausible.
Table 8 shows that differences in total life expectancy at age 30Y, and age 70Y, were less than 0.3 year in both sexes. Crimmins reported a difference of 1.5 years at age 70 for the United States."
We finally examined whether the Dutch situation would be better reproduced if the parameters based solely on GLOBE were to be used for the transitions regarding which significant differences be-tween GLOBE and LSOA (see section log-rate regression) were found. We found that both using the Il from GLOBE to estimate mortality rates in disabled men, and the a for mortality in disabled women produced implausible estimates of total life expectancy. Using the a for incidence in Illen based solely on GLOBE produced a total life expectancy close to the Dutch situation (i.e. difference less than one year), yet using the a based on GLOBE for this transi-
Table 8
Age30Y, Men Women
Age 70Y, Men Women
Total Life Expectancy (LE) for Dutch Men and Women, Based on Data from Statistics Netherlands and Based on the Multistate Life Table, at Ages 30Y, and 70Y,
Statistics Multistate Life Netherlands', y Table, y
44.7 44.8 50.5 50.8
10.9 10.7 14.6 14.3
, Based on single-decrement life table by 2-years age interval according to the period-cohort observational plan, 1986-1994.
123

Chapter 5
tion would lead to a substantial underestimation of the prevalence of disability (data not shown). TIlls confu'med our choice of using the transition rates based on GLOBE and LSOA (without using separate parameters for study in the regression model).
All together, this evaluation did not provoke us to seriously doubt the reproduction of the Dutch situation for the purpose of estimating a multistate Iifetable model on health expectancy for use in scenario-analyses. Only the undm'estimation of the population in institutions, wlllch is likely to be responsible for the underestimation of mortality at advanced ages especially in women, as well as the slight jump in disability prevalence between GLOBE and LSOA, which might reflect the difference in incidence rates, call for prudence when using the multistate life-table model for further (scenario) analyses. Therefore, when the multistate model is being used to answer specific research questions, sensitivity analyses will be conducted to assess whether the results are sensitive to these sources of bias.
5.4 Conclusion
TIllS paper estimated smoothed incidence of disability rates, recovery from disability rates, and mortality rates among nondisabled and disabled persons using an extension of the log-rate model. By using a multistate life table consisting of tln'ee states: 'nondisabled', 'disabled' and 'dead' these transition rates were translated into life expectancies with and without disability for men 'and women in The Netherlands. Such a multistate life table, based on transition rates between the health states, rather than on prevalence of disability (as used in the Sullivan method), is indispensable in obtaining insight into the conditions which could produce compression of morbidity in The Netherlands.
We illustrated how smoothed transition rates by age can be estimated on the basis of interval- censored data from longitudinal studies by using an extension of the log-rate model. This approach enabled us to take into account substitution between the health states, to pool waves and datasets, to adjust for missing information and to reweight for sample characteristics. The extended log-rate regression approach also enabled us to select between different models to specify the relationship with age. In tllis way we could improve the fit signillcantly for incidence (men) and recovery. The relationsllip between age and the transition rate could be modelled with only two 01'
tln'ee parameters pel' transition using data f.rom different datasets. Nevertheless the multistate life-table model reproduces the Dutch mortality and disability situation quite closely. In further sensitivity analysis, a few uncertainties should be taken into account: (1) possible underestimation of persons in institutions owing to sampling design in LSOA (2) jump in incidence of disability (most likely due to jump in prevalence of disability between
124

Multisiaie life-table analysis of health expectancy
GLOBE and LSOA). Overall, the evaluation of outcomes of the analyses at several phases of the research process has shown that the estimated multistate life table described sufficiently the Dutch situation for the purpose of scenario calculations.
Appendix
The Gompertz hazard rate is specified as follows:
M(t) = A . ePt = eU • ePt where: log A a
l'eexpl'ession gives:
M(t) where: log A = a
References
1. Robine JM, Ritchie K. Healthy life expectancy: evaluation of global indicator of change in population health. British Medical JOllrllaI1991;302(6774):457-460.
2. Crimmins EM, Saito YS, Ingegnel'i D. Changes in life expectancy and disability-free life expectancy in the United States. Population and Development Review 1989; 15(2):235-267.
3. Nusseldel' WJ, van del' Velden K, van SOllsbeek JL, Lenior ME, van den Bos GA The elimination of selected chronic diseases in a population: the compression and expansion of morbidity. American JOll/'1l01 of Public Health 1996;86(2):187-194 [Included in this thesis as chapter 8}.
4. Van Ginneken JK, Dissevelt AG, Van de Water HP, Van Sonsbeek JL. Results of two methods to determine health expectancy in The Netherlands in 1981-1985. Social Science and Medicine 1991;32(10): 1129-36.
5. Barendregt JJ, Bonneux L, Van del' Maas PJ. Health expectancy: an indicator for change? JOllmal of Epidemiology and Community Health 1994;48(5):482·487.
6. Romieu 1. World Atlas on health expectancy. In: Mathers C, McCallum J, Robine JM, ed. Advances in Health Expecta.ncies. Canberra, Australia: Australian Institute of Health and Welfare, 1994:59-69.
7. Sullivan DF. Disability Components for Olt index of Health. Government Printing Office, 1971.
8. Sullivan DF. A single index of mortality and morbidity. HSMHA Health Reports 1971;86(4):347-354.
9. Robine JM, Michel JP, Branch LG. Measl.ll'ement and utilization of healthy life expectancy: conceptual issues. Bulletin of the World Health Organisation 1992; 70(6):791-800.
10. Mathers CD, Robine JM. How good is Sullivan's method for monitoring changes in population health expectancies. JouI'nal of Epidemiology and Community Health 1997;51(1):80-86.
125

Chapter 5
11. Van de Water HP, Boshuizen He, Pel'enboom RJ, Mathers CD, Robine JM. Health expectancy:- an indicator for change? JO!l1'1lai of Epidemiology alld Community Health 1995;49(3):330·331.
12. Barenru'egt JJ, Bonneux L, Van del' Maas PJ. Health expectancy: an indicator for change? (reply to letter). JOll1'1lal of Epidemiology and Community Health 1995;49: 330·331.
13. Bal'enID'egt JJ, Bonnenx L, Van del' Maas PJ. How good is Sullivan's method for monitoring changes in population health expectancies Oettel'). Joumal of Epidemiology alld Community Health 1997;51:578.
14. Mathers C, Robine JM. How good is Sullivan's method for monitoring changes in population health expectancies (reply to letter). Journal of Epidemiology and Community Health 1997;51:578·579.
15. Crimmins EM, Saito Y, Hayward MD, Sullivan and multistate methods of estimating active life expectancy: two methods, two answers. In: Robine JM, Mathers CD, Bone MR, Romieu I, ed. Calculation of Health Expectancies: Harmonization, Consenslis Achieved and Future Perspectives. Montpellier, France: Colloque INSERMIJollll Libbey Eurotext, 1993: 155·160. (vol 226)
16. Rogers RG, Rogers A, Belanger A Active life among the elderly in the United States: ll1ultistate life-table estimates and population projections, Alilbank Quarterly 1989;67(3·4):370·411.
17. Rogers A, Rogers RG, Belanger A Longer life but worse health? Measul'ell1ent and dynamics. The Gerontologist 1990;30(5):640·649.
18. Guraillik JM, Land KC, Blazer D, Fillenbaum GO, Branch LG, Educational status and active life expectancy among oldel' blacks and whites. New England JOIl1'1lal of Medicine 1993;329(2):110·116.
19, Crimmins EM, Hayward MD, Saito Y. Changing ll101·tality and morbidity rates and the health status and life expectancy of the older population. Demography 1994;31(1): 159·175.
20. Rogers A, Rogers RG, BI'anch LG, A multistate analysis of active life expectancy. Public Health Reports 1989;104(3):222·226.
21. Namboodiri K, Suchindran CM. Life Tables and their Applications. Ol'lando, FI: Academic Press, 1987.
22. Schoen R. Modelling Multigroup Populations, New York, NY: Plenum Press, 1988.
23. Shryock HS, Siegel JS. The Methods and Materials of Demography. (Condensed ed.) Orlando, Fl: Academic Press, 1976.
24, Schoen R. Pl'actical uses of multistate population models. Annual Revue of Sociol· ogy 1988;14:341·36l.
25, Land KC, Rogers A Multidimensional mathematical demography: an overview. In: Land KC, Rogers A ed. Multidimensional Mathematical Demography, New York, NY: Academic Pl'ess, 1982:1·41.
26, Ledent J. Multistate life tables: movement versus transition perspectives. EnviI"Onllle1lt a1ld Planning A 1980; 12(5):533·562.
27. Willekens FJ, Shah I, Shah JM, Ramachandran P. Multi·state analysis of marital status life tables: theory and application. Population Studf:es 1982;30:129-144.
28. Rogers A. Introduction to multistate mathematical demography. Environment. and Planning A 1980;12(5):489·498.
29, Willekens FJ, Rogers A. Spatial Population Allalysis: Methods and Computer Pro· gl'011iS, 11Iasa, Austria, 1978.
126

Multistate life-table analysis of health expectancy
30. Willekens FJ. Multistate analysis: tables of working life, Environment Gild Planning A 1980;12(5):563-S88.
31. Branch LG, GUl'alnik JM, Foley DJ, et a1. Active life expect.ancy for 10,000 Caucasian men and women in three communities. Joumol of Gerontology 1991;46(4); MI4S-M1S0.
32. Land KC, Gm'alllik JM, Blazer DG. Estimating increment-decrement life tables with multiple coval'iates fl'om panel data: the case of active life expectancy. Demography 1994;31(2):297-319.
33. Rogers A. Muitil'egional Mathematical Demography. Principles, Methods Gnd Extensions. Chichester, UK: John Wiley, 1995.
34. Ledent J. Transition probability estimation in increment·decrement life tables: using mobility data from a census or survey. In: Land KC, Rogers A, ed. Multidi· mensional A1athematical Demography. New York, NY: Academic Press, 1982: 347-384.
35. Schoen R, Woodrow K. Labor force status life tables for the United States, 1972. Demography 1980;17(3):297-322.
36. Kleinbaum DG, Kupper LL, Keith M. Applied Regression Analysis and Other Mul· tivariable Methods. Boston: PWS·Kent Publishing Company, 1988.
37. Yamaguchi K. Evelll History Analysis. London, UK: Sage Publications, 1991.
38. McCullagh P, Neldel' JA. Generalized Linem' Models. (2 ed.) London, UK: Chapman and Hall, 1995.
39. Statistics and Epidemiology Research COl'poration (SERC). EGRET Reference Mallllal (first dl'aft). Seattle: SERG, 1990.
40. Francis B, Green M, Payne C, ed. The GLIM System: The Statistical System for Generalized Lineal' Interactive lvlodellillg. Release 4 Manual. Oxford, UK: Clarendon Press, 1993.
41. Olshansky SJ, Carnes BA. Ever since Gompertz. Demography 1997;34(1):1-15,
42. GaVl'ilov LA, Gavrilova NS. The Biology of Life Span: a Quantitative Approach, Chur, Switzerland: Harwood Academic Publishers, 1991.
43. Breslow NE, Day NE. Statistical Methods in Cancel' Research. Volume II. The De· sign Q,nd Analysis of Coliort Studies. Lyon, France: International Agency for Re· search on Cancel', 1987: 1·406. (lARe Scientific Publications; vol 2).
44. Cox DR. Regression models and life tables. Jou1'1lal of the Royal Statistical Society 1972;34: 187 -220.
45. Agresti A. Categoriai Data Analysis. New York, NY: John Wiley and Sons, 1990.
46. Hagenaars JA. Categorial Longitudinal Data: Log·linear, Panel, Trend and Cohort Analyses. London, UK: Sage Publications, 1990.
47. Willekens FJ. Multidimensional population analysis with incomplete data. In: Land KC, Rogers AI ed. Multidimensional Mathematical Demography. New York, NY: Academic Press, 1982:43-110.
48. Rees PH. Multistate demogl'aphic accounts: measurement and estimation proce· dures. Environment alld Planning A 1980;12(5):499·531.
49. Willekells FJ. Monitoring international migration flows in Europe. Towards a sta· tistical data base combining data from diffel'ent som'ces. EU1'opean JOll1'1lal of Population 1994;10(1):1-42.
50. Laird N, Olivier D. Covariance analysis of censored survival data using long· lineal' analysis techniques. Jou1'1!al of the American Statistical Association 1981;76(374): 231-240.
127

Chapter 5
51. Blosfield H, Hamede A, Mayar KU. Event History Analysis. Hillsdale, New Jersey: Lawrence Erlbaum Associates, 1989.
52. Jongman RHG, Tel' Bl'aak CJF, Van Tongeren OFR. Data Analysis and Landscape Ecology. New York, NY: Cambridge University Press, 1995.
53. Efron B, Tibshirani RJ. All Introduction to the Bootstrap. London, UK: Chapman & Hall, 1993.
54. United States Department of Health and Human Services. National Centre for Health Statistics. National Health Interview Survey Longitudinal Study of Aging 70 yeO/'s and OVei' 1984·1990. Computer file (ICPSR 18719) fl.-om the NIWI Steinmetz Archive, Amsterdam.
55. Mackenbach JP, Van de Mheen H, Stronks K A prospective cohort study investigating the explanation of socio-economic inequalities in health in The Netherlands. Social Science and Medicine 1994;38(2):299-308.
56. Kovar MG, Fitty JE, Chyba MM. The Longitudinal Study of Aging: 1984-1990. Vital and Health Statistics 1992;1(28). DHHS Publication PHS 92-1304.
57. Statistics Netherlands. Overlevillgstafeis naar leeftijd en geslacht {Life tables by age and sex/. 's-Gravenhage, the Netherlands: State Publishers/Statistics Netherlands, multiple years.
58. Statistics Netherlands. Gezolldheidsellqllete 1993 {Health Interview Survey 1993]. (Computerflle) 's-Gravenhage, the Netherlands, 1993.
59. Statistics Netherlands. Gezolfdheidsenquele 1994 (Health interview survey 1994]. (Computerflle) 's-Gravenhage, 1994,
60. Nusselder \VJ, Van den Bos GAM, Lenior ME, Van Sonsbeek JLA, Van del' Velden j. Gezollde levensuerwachting en het effect van chl'onische ziellten. Instituut voor Sociale Geneeskunde (ISG), Academisch Medisch Centrum, Universiteit van Amsterdam, Nederlands Instituut voor Onderzoek van de Gezondheidszorg (NIVEL), Centraal Bureau voor de Statistiek (CBS), 1994.
61. Corder LS, Woodbury MA, Manton KG. Proxy response patterns among the aged: effects on estimates of health status and medical care utilization from the 1982-1984 long-term care surveys. JOllmal of Clinical Epidemiology 1996;49(2): 173·182.
62. Fitty JE, Koval' MG. The Supplement on Aging to the 1984 National Health Interview Survey. Vital and Health Statistics 1987;1(21). DHHS Publication PHS 87-1323.
63. Tabeau E, van Poppel F, Wille kens F, Mortality in the Netherlands: The Data Base. Netherlands Interdisciplinary Demographic Institute, 1994,
64. Statistics Netherlands. Ovel'levillgstafels nam' leeftijd en geslacht, 1986-1990 (Life tables by age and sex, 1986· 1990J. 's·Gravenhage, the Netherlands: State Publishers/Statistics Netherlands, 1992.
65. Statistics Netherlands. Overlevingstafels naar leeftijd en geslacht, 1994 en 1990·1994 [Life tables by age and sex, 1994 and 1990·1994]. Mamldstatistiek vaal' de Bevolldng [Monthly Bulletin of Population StatisticsJ (CBS) 1996;44(5):30-34.
66. Manton KG, Vaupel JW. Survival after the age of 80 in the United States, Sweden, France, England, and Japan. New England Journal of Medicine 1995;333(18); 1232-1235.
128

PART III
Compression of morbidity


Abstract
Compression of morbidity: an exploration of the
conditions
Objectives: This study evaluates the conditions under which compression o[ morbidity, i.e. a reduction o[ disability into a shorter period (absolute compression) or smaller proportion o[ total li[e expectancy (relative compression), will occur. Methods: We used a multistate li[e table to estimate li[e expectancy with and without disability [or Dutch men and /Vomen and to evaluate systematically the e[[ect o[ changing incidence rates o[ disability, recovery rates [rom disability and mortality rates among nondisabled and disabled persons. These incidence, recovery and mortality rates were estimated with Poisson regression using longitudinal data. Results: Both decreasing incidence and increasing recovery rates (ceteris paribus) produce compression o[ morbidity (in an absolute and a relative sense), although the impact o[ improving incidence rates is larger. In contrast, moderate declines in mortality rates (20% among nondisabled and disabled persons) increase li[e expectancy with disability at age 30%, unless at least equal proportional improvements in both incidence and recovery rates, or larger changes in either incidence (at least 30%) or recovery rates (at least 50%) occur. The same conditions extend the period with disability above age 70%. Larger improvements in incidence and 101' recovel:Y rates at all ages are required to achieve compression o[ morbidity above age 70%. Conclusion: Whereas interventions which reduce the incidence o[ disability (e.g. through primm:y prevention) produce more absolute compression o[ morbidity, those which increase recovery (i.e. through rehabilitation) should not be undervalued. I[ mortality rates among nondisabled and disabled persons decline, substantial improvements in incidence and 101' recovel:Y rates are required to preclude an extension o[ the disabled period. Interventions aimed at preventing, curing or slowing down the progression o[ disabling diseases should receive high priority.

Chapter 6
6.1 Introduction
In 1980 Fries predicted that chronic disease and l'elated disability will be postponed, compressing the period of morbidity between the increasing age of onset and a relatively fixed life expectancy.l This 'compression·of·morbidity' scenario is the antithesis of the 'expansion-of-morbidity' hypothesis which postulates an increase in morbidity and disability.'·4 Although diverging views exist as to whether compl'ession of morbidity is a realistic scenario in low mortality countries, the idea of compression of morbidity has achieved great popularity in public health and (gedatric) medicine. It has been an important impetus for research on 'successful aging' and has found its expression in targets of international agencies and health policy documents of national governments which increasingly focus on lengthening life free of morbidity and disability.5.G Despite its popularity, however, the dynamics which might produce compression of morbidity are not yet fully understood. First, Fries' prediction that delaying the onset of chronic morbidity reduces the length of time spent with disability!", is based on the idea that a problem acquired later in life is suffered from over a shorter period of time. However, this is only true when life expectancy is constant. Empll'ical studies and scenario calculations have shown that increases in disability-free life expectancy may be accompanied by increases in years with disability with increasing life expectancy,s·l! Second, the potential role of recovery from disability (i.e. regaining of functioning) as a means to attain compression of morbidity is often neglected, although even the elderly have shown a substantial capacity to reverse disability.lO.12.15
The objective of this study is to develop a better understanding of the conditions under which compression of morbidity, that is concentration of disability into a shorter period (absolute compression) or smaller proportion of total life expectancy (relative compression), will occur. Obtaining insight into the effects of realistic changes in incidence rates of disability, recovery rates from disability and mortality rates among nondisabled and disabled persons in terms of compression of morbidity is important for setting priorities for public health policy. Furthermore, studying the conditions which will produce compression of morbidity might help to clarifY the unsolved debate as to whether compression of morbidity is likely to occur. We used a multistate life table to estimate life expectancy with and without disability for Dutch men and women, and to examine the effect of several 'whatMif scenarios in terms of compression of morbidity. The central question regards the changes in incidence, recovery and mortality rates (among nondisabled and disabled persons) needed to produce compression of morbidity.
132

Compression of nWl'bidity: an exploration of the conditions
6.2 Data and methods
Study population
The primary data source used is the GLOBE study - GLOBE being the Dutch acronym for Health and Living Conditions of the population of Eindhoven and surroundings. A detailed description of the sample and design is given elsewhere,16 A postal questionnaire was sent in 1991 to an aselect sample of approximately 27000 Dutch nationals aged 15-74 years living in the city of Eindhoven and surrounding municipalities (l'esponse rate 70.3%). Persons living in institutions were included in this sample, except for Eindhoven (40% of all respondents) where the institutionalized population only comprises residents of homes for the elderly. We used a selection of respondents to this postal questionnau'e (n=7677), who were approached for an interview in 1991. Those who had indicated in the postal questionnau-e that they suffered from a chronic disease (diabetes mellitus, chronic bronchitis, serious heart disease 01' chronic back com ~ plaints or slipped disk) were overrepresented (n=2637). In the follow-up, respondents of this oral interview (n=5666, i.e. 73.8%) received postal questionnau-es in 1993 (n=4496, i.e. 79.4%; 81.1% after correction for mortality) and 1995 (n=4105, i.e. 72.4%; 76.4% after correction). Because mortality is an outcome of interest, persons who died were not considered as 'lost to follow-up' and were included in the corrected response rate. Information on mortality was based on municipal population registers and disability status on questionnau-es in at least two waves.
Persons under age 30 (n=791 in 1991) and persons of whom the vital status at follow-up was unknown (less than 0.3%) were excluded from the analyses. In 1991, the complete set of questions on disability was presented to only 2867 subjects. Complete illformation on disability was lackillg for 77 (1991), 96 (1993) and 219 (1995) respondents. Complete illformation on disability and vital status at the beginnillg and end of a 2-year illterval was available on 1988 persons ill the period 1991-1993 and 3119 ill the period 1993-1995, yielding a total of 5107 observations. A correction was made for observations which were excluded because of attrition and item nOll1'esponse (see method section).
Since GLOBE did not comprise persons above age 74 ill 1991 and a substantial part of the mortality and disability occurs beyond age 75, a second data source, the Longitudinal Study of Aging (LSOA)17 was used. The LSOA started ill 1984 with illterviews of 7527 nonillstitutionalized persons of age 70 and over ill the United States. Subjects who were illstitutionalized durillg the study were not excluded. The complete sample was reillterviewed ill 1988 (n=4984, 66.2%; 89.0% after correction for mortality) and 1990 (n=4142, i.e. 55.0%; 87.4% after correction), while a subsample of 5151 persons was reillterviewed in 1986 (n=4113, i.e. 79.8%; 92.4% after correction).
133

Chapter 6
Disability status was assessed in each wave and information on mortality was based on the National Death Index. Full details on the sample and design are given elsewhere. IS
Nonwhites (n=647) and persons of whom the vital status at follow-up was unknown (less than 0.4%), were excluded from the analyses. Complete information on disability was lacking for 142 (1984), 384 (1986), 415 (1988), 365 (1990) persons. Complete information on disability and vital status was available for 3720 persons in 1984-1986, 2853 in 1986-1988 and 3535 in 1988·1990, yielding a total of 10108 observations. Again, an adjustment was made for observations which were excluded because of attrition and item nom·esponse.
Definition of health states
We used a multistate life table, which is an extension of the standard life table19, with three health states: 'nonclisabled', 'disabled' and 'dead'. Persons were considered to be disabled if they were living in an institution 01' indicated that they needed help 01' were unable to perform without (great) difficulty one 01' more activities of daily living, mobility and communication that are essential for independent functioning. To maximize the comparability of the GLOBE and LSOA we selected similar disability items from both studies: bathing/showering, getting in and out of bed 01' a chair, ill'essing and unill'essing, walking a quarter of a mile (400 m), cal'lying an object of ten pounds (5 kg), walking 10 steps without rest (walking stairs), reading small print in a newspaper, recognizing someone's'face, eating and getting outside. Hearing items were not included in the follow-up measurements of LSOA and could therefore not be taken into account.
Estimation of the transition rates of the multistate life table
The starting point was the estimation of transition rates between the tlll'ee health states, i.e. incidence rates of disability, recovery rates from disability and mortality rates among nonclisabled and disabled persons from a crosstabulation of the GLOBE and LSOA population by sex, two-year age interval and health state at the beginning and end of the interval. Based on a comparison of the proportion of persons with disability and the proportion of persons who died in GLOBE (younger ages), LSOA (older ages) and in nationalrepresentative sources (all ages)'O.'5, we decided to conjoin the GLOBE and LSOA population. The two datasets together described the Dutch disability and mortality situation, except for the lower proportion of deaths in old women (LSOA). In addition, the two datasets showed no major discontinuities, apart from the lower disability prevalence in men in GLOBE than in LSOA. We used Poisson regression with the number of person years as offset (i.e. rate multiplier)'., to estimate the transition rates from the pooled dataset. This method is also known as 'log-l'ate analysis' (01' log-lineal' regl'ession with offset).2? The offset was also used to adjust for the sampling design in
134

Compression of I1wl'bidity: an exploration of the conditions
LSOA and GLOBE and for missing information on disability status due to attrition 01' item nonresponse. Persons for whom the health state was unknown at the beginning 01' end of the interval (in total less than 25%), but who were known to be alive were allocated to either the nondisabled 01' the disabled state, using the distribution by health status at the beginning and end of the interval, respectively of subjects with complete information.
All transition rates were estimated for men and women separately. To describe the relationship with age, we evaluated three models: the Gompertz, the Gompel'tz-Makeham and the Sigmoid model (see Appendix 1). Each model describes an exponential decline of the vital force with age, whether 01' not in combination with an age-independent component. This exponential decline in vital force is specified as an exponential increase in the chance of dying or of becoming disabled and an exponential decline in the chance of recovering with increasing age. The equations and parameter estimates which were used to obtain the age-specific transition rates are presented in Appendix 1.
Estimation of life expectancy with and without disability
We used the multistate life table to estimate life expectancy with and without disability on the basis of the age-specific transition rates. The life table started at age 30Y, and was closed at age 110Y,. The distribution of the initial cohort over the nondisabled and disabled state at age 30Y, is based on the proportion of persons with disability at age 30-31 in the GLOBE population. The estimates of total life expectancy (at age 30Y, and 70Y,) derived from the model differed less than 0.3 year from published estimates2.'.25 and age-specific mortality rates closely resembled national estimates, except for the underestimation of mortality rates in older women23.28. The age-specific prevalence of disability derived from the model, also closely corresponded to national (cross-sectional) estimates based on a similar definition of disability.2o.22
Scenario calculations
To evaluate under which conditions compression of morbidity will occur, we conducted several 'what-if scenarios, quantifying the effect on life expectancy with and without disability of changing one 01' more transition rates. We simulated changes towards better health, that is a decline in incidence of disability, in mortality among nondisabled persons, in modality among disabled persons, and an increase in recovery from disability at all ages within a range of -50% to +50%. In the tables, 20% changes towards better health are presented. Changes of other. magnitudes and changes towards worsening health (i.e. opposed changes) were simulated, but are not presented in detail, as the findings change accordingly (data available from authors on request). Moreover, we are not primarily interested in how compression of morbidity can be reached by increasing mortality. Comparison of life expectancy with
135

Chapter 6
disability and the proportion of life with disability before and after simulation, indicates whether compression of morbidity has occurred. A decline in life expectancy with disability indicates absolute compression of morbidity, whereas an increase means absolute expansion. In the same way, a decline in the proportion of life with disability points to relative compression and an increase means relative expansion. To examine whether or not results differ by age, we evaluated the outcomes at age 30Y, and age 70Y,. For the ease of interpretation, we fu'st evaluated the effect of isolated changes. Next, we evaluated simultaneous changes, while taking into account interactions between changes when they occur together. Finally, as at least moderate reductions in mortality rates are likely to occur, we identified a possible set of changes in incidence and recovery rates (within a range of -50% to +50%) which could produce a compression of morbidity in the event of a 20% decline in mortality rates among nondisabled and disabled persons.
6.3 Results
Isolated changes in transition rates
Table 1 presents the change in total life expectancy, life expectancy with and without disability and in the percentage of life with disability at age 30Y, and age 70Y, due to changes of 20% in one of the transition rates. The baseline situation is given for comparison.
Reducing incidence rates by 20% increases total life expectancy at age 30Y, (0.6 y both sexes) and reduces the length and proportion of life with (lisability (-0.8 y and -2.0 %-points in men; -1.3 y and -2.9 %-points in women). A decline in the incidence of disability means more persons at every age maintaining their health and a decline in age-specific prevalence of disability. As a result, the length of time spent without disability increases and that with disability declines. Total life expectancy increases as well, because the proportion of persons with disability, who are exposed to the higher mortality risk in this state, declines. The shortening of the disability period and smaller proportion of disabled persons indicates compression of morbidity (in an absolute and a relative sense). Similar results were found for increasing recovery rates, although smaller. At age 70Y" the results point in the same direction. Varying the size 01' direction (decrease versus increase) of the simulated changes alters the results accordingly (results are available from authors).
Reducing mortality rates among nondisabled persons by 20% raises total life expectancy at age 30Y, by 0.9 years (men) and 0.5 years (women). Part of tlus life extension will be spent in a disabled state (0.3 y and 0.3 %-points in men; 0.3 y and 0.2 %-points in women), as among those saved from dying are a number who will become disabled in old age. Reducing mortality rates
136

Compression of morbidity: an exploration of the conditions
among disabled persons increases mainly the lifetime and proportion of life with disability (0.7 y and 1.3 %-points in men; 1.2 y and 1.7 %-points in women), but as some persons will regain theu' functioning, life expectancy without disability Ulcreases as well. The increase in the number of years and proportion of life with disability indicates an expansion of morbidity (in an absolute and a relative sense).
Table 1 Baseline and Scenarios for Total Life Expectancy (LE), Disability-Free Lif. Expectancy (DFLE), Life Expectancy with Disability (LED) and Percentage of Life with Disability (%LED In LE) due to Different Isolated Changes, at Age 30% and 70%, The Netherlandsa
LE,y DFLE, Y LED, Y %LED in LE
Age 30V,
Men
Baseline 44.8 38.5 6.4 14.2
20% Improvement Incidence of disability (decrease) 0.6 1.4 -0.8 -2.0 Recovery from disability (increase) 0.3 0.8 -0.5 -1.1 Mortality from nondisabled (decrease) 0.9 0.6 0.3 0.3 Mortality from disabled (decrease) 1.0 0.3 0.7 1.3
Women
Baseline 50.8 38.4 12.4 24.3
20% Improvement Incidence of disability (decrease) 0.6 1.9 -1.3 -2.9 Recovery from disability (increase) 0.3 1.0 -0.7 -1.6 Mortality from nondisabled (decrease) 0.5 0.3 0.3 0.2 Mortality from disabled (decrease) 1.4 0.2 1.2 1.7
Age 70V,
Men
Baseline 10.7 6.3 4.4 41.3
20% Improvement Incidence of disability (decrease) 0.3 0.8 -0.5 -5.4 Recovery from disability (Increase) 0.1 0.3 -0.2 -2.1 Mortality from nondisabled (decrease) 0.5 0.3 0.2 -0.1 Mortality from disabled (decrease) 0.8 0.1 0.7 3.5
Women Baseline 14.3 5.8 8.5 59.6
20% Improvement Incidence of disability (decrease) 0.4 1.0 -0.6 -5.9 Recovery from disability (increase) 0.2 0.4 -0.3 -2.5 Mortality from nondlsabled (decrease) 0.3 0.1 0.2 -0.1 Mortality from disabled (decrease) 1.3 0.1 1.2 2.8
a Figures are rounded to 0.1.
137

Chapter 6
Table 2 Baseline and Scenarios for Total Life Expectancy (LE), Disability-Free Life Expectancy (DFLE), Life Expectancy with Disability (LED) and Percentage of Life with Disability (%LED in LE) due to Different Simultaneous Changes, at Age 30% and 70%, The Netherlands'
LE, y DFLE, Y LED, Y %LED in lE
Age 30Y2 Men Baseline 44.8 38,5 6.4 14.2 20% Improvement
Incidence (decrease) + Recovery 0.9 2.1 -1.2 -3.0 (increase)
Mortality from nondisabled (decrease) + 2.1 1.0 1.1 1.7 mortality from disabled (decrease)
Mortality from nondisabled (decrease) + 1.6 2.2 -0.5 -1.7 Incidence (decrease)
Mortality from disabled (decrease) + 1.3 1.1 0.2 0.0 Recovery (increase)
All 2.9 3.2 -0.3 -1.5 Women Baseline 50,8 38.4 12.4 24.3 20% Improvement
Incidence (decrease) + Recovery 0.8 2.9 -2.0 -4.3 (increase)
Mortality from nondisabled (decrease) + 2.0 0.5 1.5 1.9 mortality from disabled (decrease)
Mortality from nondisabled (decrease) + 1.2 2.2 -1.1 -2.6 Incidence (decrease)
Mortality from disabled (decrease) + 1.7 1,3 0.4 0.0 Recovery (increase)
All 2.8 3.4 -0.6 -2.4
Age 70t4 Men Baseline 10.7 6.3 4.4 41.3 20% Improvement
Incidence (decrease) + Recovery 0.4 2.1 -0.6 -7.3 (increase)
Mortality from nondlsabled (decrease) + 1.3 0.4 1.0 3.5 mortality from disabled (decrease)
Mortality from nondisabled (decrease) + 0,9 1.2 -0.3 -5.5 Incidence (decrease)
Mortality from disabled (decrease) + 0.9 0.4 0.5 1.2 Recovery (increase)
All 1.8 1,6 0.2 -4.0 Women Baseline 14.3 5.8 8.5 59.6 20% Improvement
Incidence (decrease) + Recovery 0.5 1.4 -0.9 -8.2 (increase)
Mortality from nondisabled (decrease) + 1.6 0,2 1.4 2,7 mortality from disabled (decrease)
Mortality from nondlsabled (decrease) + 0.7 1.2 -0.5 -6.0 Incidence (decrease)
Mortality from disabled (decrease) + 1.4 0.5 0.9 0.3 Recovery (increase)
All 2.1 1.7 0.4 -5.3
8 Figures are rounded to 0.1,
138

Compression of morbidity: an exploration of the conditions
Simultaneous changes in transition rates
Some interventions may have an effect on more than one transition rate at the same time (e.g. medical treatment might reduce mortality rates and increase the chance of regaining their functioning). In addition, more than one intervention, affecting different transitions can occur simultaneously. Therefore, we also simulated the effects of simultaneous changes in two or more of the transition rates (Table 2).
Reducing incidence and increasing recovery rates simultaneously (i.e. both improvements towards better health) by 20%, increases disability-free life expectancy substantially more than total life expectancy and thus compresses the time spent as a disabled person into a shorter period (·1.2 years in men and -2.0 years in women) and into a smaller proportion of total life expectancy (-3.0 and -4.3 %-points respectively). On the other hand, decreasing mortality rates among nondisabled and disabled persons by 20% increases the length and proportion of life with disability (1.1 y and 1.7 %points in men; 1.5 y and 1.9%-point8 in women). The size of the effects of changing two transition rates simultaneously differed slightly from the sum of isolated changes, because changing one transition rate affects the number of persons who are exposed to the (change in the) second transition rate.
The effects of simultaneous improvements in incidence, recovery and mortality rates among nondisabled and disabled persons (by 20%) at all ages on the length of time spent disabled differ by age. At age 30Y" life expectancy with disability declines (-0.3 y in men and -0.6 y in women), whereas at age 70Y, it increases (0.2 y and 0.4 y, respectively). A comparison of the number of person years with disability by age between the baseline situation and after a simultaneous improvement of all transition rates by 20% ('all' in Figure 1), shows that at younger ages the number of person years with disability is lower after the improvement, whereas at older ages the reverse is true. That is, the reduction in prevalence of disability (due to lower incidence and higher recovery rates) occurs -on average- at younger ages than the accumulation of disabled years (due to mortality reductions). As a consequence, a 30Y, year old person will experience substantial reductions in disabled years which completely nullifY the increase in disabled years at advanced ages, whereas 70Y, years old will experience substantial increases in disabled years and only small reductions in disabled years. When improvements are restricted to the nondisabled state (Le. decline in mortality rates in nondisabled and decline in incidence rates) life expectancy with disability declines at both ages (Table 2). Under these circumstances, especially life time without disability is extended.
139

Chapt .. , 6
45
40
35
30
" 'C 25 ~
~ ~ 20 0 .c ~
15
10
5
30
Men
,,---baseline
- - - mort. nandis. + dis.
/ '\ , \ / .,
/ " / / "
/ .' . - -, , \\ / .. , '" / I.··· ... \
,/.' \ h /"
" .' \ rI" \ ,.
/. \
.... . -inc. + ree.
- - all
.' \ --_.,- , .•. -.~ ~
40 50 60 70 80 90
age
Women
\., 100
90.--------------------------------------,
"
80
70
60
-g 50 ~ g 40 S ~ 30
20
10
Figure 1
30
----baseline
- - - mort, nand is. + dis. ..... . inc. + ree.
- • all
40 50
" " r
60
-, , , / \
/ ~ ... \ / I .. , ~
I ,,' " "\
,/ [," ", \, h ','
/.'. \ ,.
, \ r ' .. \
" \
'.\ , \
70 80 90 100
age
Number of person years with disability based on the Multistate Life Table, by age,
mort.nondis. + dis. 20% reduction in mortality rates among nondisabled and disabled persons. inc. + ree. 20% reduction in incidence rates of disability and 20% increase in recovery
rates from disability. all 20% reduction in mortality rates among nondisabled and disabled persons,
20% reduction in incidence rates of disability and 20% increase in recovery rates from disability.
140

Compression of morbidity: an exploration of the conditio11s
Conditions under which compression of morbidity occurs in the situation of moderate mortality declines
Figure 2a·b shows which changes in incidence and/or recovery rates produce absolute compression of morbidity when mortality rates among nondisabled and disabled persons decline by 20%. Reducing incidence rates, while keep· ing the recovery rates constant, leads to absolute compression of morbidity if the reduction is at least 30% (age 30\1,). Improving only the recovery rates requires an increase of at least 50% at age 30\1,. An increase in recovery rates proportionate to the decline in incidence rates produces absolute com· pression of morbidity if the rate of change is at least 20% (above age 30V,). These results indicate that substantial improvements in incidence and/or recovery are needed to compensate the increase in disabled years due to mortality reductions among nondisabled persons (increasing the number of persons surviving to old ages when the risks to get disability are high) and among disabled persons (extending the length of life of those disabled). Fig· ure 2 shows once more that larger improvements at all ages are needed to reach absolute compression of morbidity above age 70\1,. When mortality rates among nondisabled and disabled persons decrease by 20%, the same improvements in both incidence and recovery rates do not produce absolute compression of morbidity above age 70\1" nor does increasing only the recov· ery rates (within the evaluated range).
6.4 Discussion
The main objective of this study was to determine the changes in incidence, recovery and mortality rates among nondisabled and disabled persons needed to achieve compression of morbidity. It must be emphasized that achieving compression per se is not a favourable health outcome, as in· creasing mortality might cause compression of morbidity as well. Therefore, we focused on compression of morbidity in the presence of a constant or in· creasing total life expectancy. That is, we described the effect of isolated and simultaneous improvements in incidence rates, recovery rates and mortality rates in nondisabled and disabled persons. As it is generally expected that further reductions in mortality rates will occur, we also defioed a set of changes in incidence and recovery rates which will produce compression of morbidity in the presence of moderate mortality declines among nondisabled and disabled persons.
According to our scenario calculations, when the disability incidence rates only decline (e.g. by primary prevention), more persons will maintain their health and consequently life expectancy without disability will increase more than total life expectancy. Disability, therefore, will be compressed into a smaller period and proportion of total life expectancy. Although equal pro· pOl·tional improvements in recovery rates will have less impact than im·
141

Chapter 6
~ c ~
:g .5 .5 E ~
E ~ e "-.5 '#
Figure 2a
50
40
30
20
10
0
-10
-20
-30
-40
-50
50
40
30
10
o
-10
-20
-30
-40
Men (0 RC/AE
.. . •.• ; •••• ~ , •. ! ..•
· ........ , ............ '" .. . · . . . . · ........ - ....... -.. . '" .. . · . . . .
· . . . . · .. '.' ........... ~ .. ...... . AE/RE ....... ......... . ....... ' ... .
.... ;. ... ; .... ; .... : .... ;. ... .... : ... .; ...
.... : .... : .... ! .... ; .... : .... .... : .... : ...
·50 ·40 ·30 -20 -10 0 10 20 30 40 50
% improvement in recovery
Women (0 RC/AE
· . .. :- ... :- ... :- ... ! .... :- ..
.... ; .... ;. ... ; .... : .... ; .... ;. ... · . . . . . .. " ........................... .
AE/RE ......... · . . . . . · .. ~ .. . ", ... ~ ....... ~ .. . ", .. . · . . . . . · .. _ .. ...... " .... ... _ .. ...... . . . . .
-50 L-"':-"":"_'--"':"--"":"_'--"':"--"":"--':_":--l
-50 -40 -30 -20 ·10 0 10 20 30 40 50
% Improvement In recovery
Changes in incidence and recovery rates producing absolute and relative compression of morbidity (AC/RC), relative compression but absolute expansion (RC/AE) and relative and absolute expansion (AE/RE) in the presence of 20% declining mortality rates among nondisabled and disabled persons, at age 30Y,.
142

~ c
" "C ." . S .S
" " E
" e n .5 ~
Figure 2b
50
40
30
20
10
0
-10
-20
-30
-40
-50
20
10
o -10
-20
-30
Compression 0/ morbidity: an exploration 0/ the conditions
Men W:l RCIAE
· ... :- .. .; ....
· ... : .... ~ ... · ... ' .... ~ . .. . .. ~ .. .. ' ....
AE/RE . . . . . · .. '.' ... ~ ... , ...... . '.' .. . . ....... " ..
· .. '.' .. '.' , , , , ' , , ~ .. , '.' , .. ... ~ .. . '.' ..
-50 -40 -30 -20 -10 0 10 20 30 40 50
% improvement in recovery
Women W:l RCIAE
· .. ~ .. , ',' ... · . .. : .... :- ' . .; .... i .... :. , .. · . . . . . . . . · . .. : .... ;. .. .; .... i . , .. : .... ;. , .. :' ... · . . . . . . · . . . . . . · .. ~ .. , ': .. , .' .... : ........ .; .... : ... .
: : AE/RE : : · .. ~ .. .. :. . , ... : .. , . ~ .. , · . . . · . . · ... : ' ... :- .. ': .... ~ ... ~ .. .. : ... -;. , , . ... ~ ... -40 ... , ......... ~ ... I ••• ' ••••••••• ~ •••
· . . . . . . · . . . . . . · . . . . . . 50 ' .....
- L-~. __ ~~. __ .~~. __ .~~. __ ~~~~
-50 -40 -30 -20 -10 0 10 20 30 40 50
% improvement in recovery
Changes in incidence and recovery rates producing absolute and relative compression of morbidity (ACIRC), relative compression but absolute expansion (RC/AE) and relative and absolute expansion (AEIRE) in the presence of 20% declining mortality rales among nondisabled and disabled persons, al age 70Y,.
143

Chapter 6
pl'ovements in incidence rates, an increased chance of regaining functioning (e.g. by medical interventions reducing the severity of the disease, 01' by l·e· habilitation) will also yield compression of morbidity (in both an absolute and a relative sense). On the other hand, we found that when mortality rates only decline, the duration and proportion of the time lived with disability will increase. First, because an increase in survival of nondisabled persons (e.g. by improved acute care units) will push more persons into the oldest old ages, when the risks of becoming disabled are high, and second because the life of disabled persons will be extended (e.g. by better treatment of the chronically ill). Due to these side-effects of declining mortality rates among nondisabled and disabled persons, substantial improvements in incidence and recovery rates are needed to achieve absolute compression of morbidity. As disability accumulates in particular at older ages, the efforts to achieve compression of morbidity above age 70Y, are even larger. Whereas above age 30Y, absolute compression of morbidity occurs when the incidence and recovery rates at all ages improve at the same rate as the mortality rates for nondisabled and disabled persons (i.e. 20%), above the age of 70Y, these same conditions serve to extend the disability period. The finding that compl'ession of morbidity is harder to achieve in a situation where mortality rates for nondisabled and disabled persons are declining, does not imply that a decline in overall mortality is necessarily an unfavourable condition for compression of morbidity. As our results also have shown, decreasing incidence rates 01' increasing recovery rates both reduce overall mortality and compress morbidity into fewer years. That is, whether an increase in life expectancy is accompanied by compression of morbidity depends on which changes in incidence, recovery and mortality rates produce the overall mortality decline.
The limitations of our study regarding the data should be noted. We used two datasets fi'om two different countries to estimate the transition rates between the tm'ee health states. Moreover, persons living in institutions were underrepresented due to the sampling design, especially in LSOA, and, as in every longitudinal study, attrition might have compromised the representativeness of the outcomes. Finally, relying on self-reported data with respect to disability may have caused bias. Changes in disability status may partially result fi'om inconsistent reporting. We evaluated the potential bias introduced by these factors and tested the sensitivity of the outcomes for different levels and age patterns of the transition rates (see Appendix 2). The robustness of our conclusions for substantial variations in the transition rates, and the generally close agreement between the model estimates of total life expectancy and published estimates, as lVell as the outcomes of more detailed external validity checks, induced us to consider the outcomes to be valid.
Regar(ling the interpretation of the scenario calculations, tln'ee points are 1V0rth mentioning.
144

Compression of morbidity: an exploration of the conditions
First, the simulated changes in the transition rates should be interpreted as average changes affecting all persons in a specific health state to an equal extent. Within each state, we did not take into account heterogeneity (other than age and sex), that is, we assumed that all nondisabled persons have the same risks of dying and of becoming disabled and all disabled persons have the same risk of dying and of recovering from disability. When persons re· covel' from disability, they are assumed to be exposed to the lower mortality risk, which is equal for all nondisabled persons. In the same way, when pel" sons become disabled, they are assumed to experience the higher mortality risk, which is equal for all disabled persons. These differences in mortality risks between nondisabled and disabled persons do not reflect solely the im· pact of disability on mortality, but also that of underlying chronic diseases. Violation of the homogeneity assumption would occur when a specific inter· vention changes incidence 01' recovery rates, without affecting related mol" tality risks accordingly. When reduced incidence rates, for instance, are solely caused by a reduction in incidence of nonfatal disabling diseases, the effect on compression of morbidity in our study is underestimated. The same is true when increased recovery rates are solely caused by rehabilitation which improves functioning, without affecting the chances of surviving. A violation would also occur if a declining incidence rate of disability were mainly caused by a reduction in incidence of highly fatal diseases. In this situation less compression of morbidity would occur than in the presented results, since as a side effect of the decline in incidence of highly fatal condi· tions, survival will increase more than estimated and so will the number of persons being exposed to disability. In a previous study we examined the effects of eliminating specific chronic diseases on the prevalence of disability and on mortality, and in tUl'll on life expectancy with and without disability." In the current study more insight was obtained into the effects of changing incidence, recovery and mortality rates among disabled and nondisabled persons on life expectancy with and without disability.
Second, in our scenario calculations we used the same percentage of change in the transition rates at each age, as varying the rate of change over age would increase the number of possible scenarios infinitively. This might not be realistic in view of the fact that Dutch total mortality rates below age 85 (men) and 90 (women) recently declined, while above these 'ages mortality rates increased slowly.29.3o If this increase in total mortality at advanced ages reflects an increase in mortality rates in nondisabled and disabled pel" sons and if, in addition, this increase continues, slightly smaller improve· ments in incidence and/or recovery rates than presented here would be requi>:ed to attain compression of morbidity in The Netherlands.
Third, although the life table describes the Dutch situation in the period 1985·1994, we consider the main outcomes to be valid for other low mortal· ity countries as well. The sensitivity analyses (Appendix 2) showed that the mechanisms which produce compression 01' expansion of morbidity do not
145

Chapter 6
depend upon the level and age patterns of the transition rates, which might differ between countries. Also the changes which are needed to achieve compression of morbidity in a situation of mortality reductions of 20% among nondisabled and disabled were not very sensitive for differences in transition rates. Also the finding that the conditions which prodnce compression of morbidity are similar for men and women strengthens the conclusion that this study describes general mechanisms. Finally, the fact that pooling datasets from two different countries (The Netherlands: GLOBE and United States: LSOA) proved to be no serious obstacle for describing the Dutch situation might indicate that the conclusion does not depend upon purely local circumstances.
Our study confil'ms previous findings that lower incidence rates and higher recovery rates (and higher mortality rates) are linked to a smaller duration and proportion of unhealthy life, and that the impact of recovery is smaller than of incidence.1O The finding that changing all transition rates by an equal percentage in the direction of bettel' health increases life expectancy with disability at age 7010 was also supported by our study.
Novel in our study was the fact that we evaluated systematically the changes in transition rates which produce compression of morbidity, rather than only looking at one or two combinations. This enabled us to draw more general conclusions. Our results indicated, for instance, that the smaller impact of improvements in recovery than in incidence on the life time spent disabled cannot be explained by the percentage of change that was used in the analyses nor by the limited age range.
Another remarkable outcome is that the conditions to achieve compression differ by age. We found a redistribution of disability by age, when all transition rates were changed toward better health, because the reduction in person yeal's with disability (due to lower incidence and higher recovery rates) occurs . on average - at younger ages than the accumulation of disabled years (due to mortality reductions). This implies that the burden of disability in society in the oldest old will increase when incidence, recovery and mortality rates improve simultaneously. That this age difference was not found previously is due to the limited age range of pel'sons included in previous studies (70 and over).
The conclusion that developments in mortality are highly relevant to achieving or not achieving compression of morbidity complements earlier research on the effect of eliminating selected conditions on compression of morbidity.9.3l It has been shown that elimination of fatal diseases, such as cancel', increases the length of life spent with disability, since persons live longer, grow older and then are exposed to disability common in old age. Elimination of nonfatal disabling diseases, on the other hand, decreased disability prevalence and life expectancy with disability, but not mortality.
146

Compression of morbidity: an exploration of the conditions
Our results have two important implications for public health policy and further research. First, they show that in many circumstances, a prolongation of life expectancy will be accompanied by an increase in the length of life with disability. That is, reduced mortality rates (among nondisabled and disabled persons) will extend the number of years with disability. If this is not counterbalanced by substantial reductions in disability caused by reduced incidence of disability and/or increased recovery fl'Om disability, expansion of morbidity will occur. Recent findings /i'om the United States indicate that significant reductions of disability in the elderly population are indeed possible.32•33 This implies that compression of morbidity can be achieved, but only when reductions in disability are large enough to counterbalance the effect of life extension. Second, our results showed that reducing incidence of disability and increasing recovery /i'om disability may both compensate the increase in the length of life spent with disability, but that the effect of improving incidence was larger. Therefore interventions aimed at delaying the onset and reducing the progression of disabling diseases should receive the highest priority. However, since recovery /i'om disability has shown to be substantial and to provide a means to achieve a compression of morbidity as well, interventions aimed at increasing the ability to regain functioning should also become part of public health policy_ Further research should pay more attention to the determinants of 'healthy aging'. Such studies should not only identifY the factors that increase the ability to maintain health, but also the factors thafincrease the ability to restore or to slow down health losses.
147

Chapter 6
Appendix 1
Equations and Parameters of the Transition Rates
We used three functions to describe the relationship of the transition rates (i.e. incidence, recovery and mortality rates among nondisabled and disabled persons) with age: the exponential model (also known as the Gompertz model), the Gompertz-Makehammodel and the Sigmoid model.
(1) The exponential model is specified as follows:
Nij = e((ij + Pil X + log( Ri) + EPoiSSOll
or equivalently:
E(M .. ) = ea, + p, X 'l
(i oF j) (1)
(2)
where: NO is the expected number of events (i.e. transitions from state i at the beginning of the interval to state j at the end of the interval); aij is the log (expected number of events during 1 unit of time at age 0); f3;j is the log (ratio of the number of events during 1 unit of time at age x and age x+ 1); X is age; Ri is exposure time and Mij is the transition rate from state i to state j. Lag(Ri) handles differences in exposure times and is known in statistical literature as the 'offset'.
(2) The Gompertz-Makehammodel is specified as follows'4:
E(M .. ) = Ail' + ea,+P, X Il
(3)
where: MO is the transition rate from state i to state j, C1ij and j3;j are the regression-coefficients, X is age, and Aij is the constant of Makeham. The Makeham constant reflects that besides the exponential component, there also exists a component which is independent of age
(3) The Sigmoid model is specified as follows: aij+Pljx
E(Mij) = C5ij 1 e+p X + eCl.ij oi
(4)
where: (J'ij is a constant that can be interpreted as an age-independent maximum transition rate.
The likelihood ratio test was used to select between the exponential model and the Gompertz-Makeham and Sigmoid model, respectively. We used a significance level of 0.01 rather than 0.05 in order to take into account dependency between the observations in the subsequent waves.
All models were estimated in GLIM.'. Table Al presents the parameters of the regression equations for incidence of disability, recovery from disability,
148

Table Ai Parameters of the Poisson-Regression Analysis (SE in Brackets)
Type of model
Men Incidence of disability Gomp+Mak.' Mortality among nondisabled Gompertz Recovery from disability Sigmoid Mortality among disabled Gompertz
Women Incidence of disability Gomp+Mak.c
Mortality among nondisabJed Gompertz Recovery from disability Sigmoid Mortality among disabled Gompertz
n.a. Not applicable. a , Age was transfomned to age-70.
Gomp+Mak. is Gompertz-Makeham.
aij at age 70a blJ
-2.945 (0.0399) 0.0859 (0.00333) -3.813 (0.0718) 0.1078 (0.00698) -0.906 (0.0546) -0.1052 (0.00453) -2.505 (0.0663) 0.0577 (0.00507)
-2.487 (0.0323) 0.0725 (0.00283) -4.642 (0.1199) 0.1097 (0.01153) -0.627 (0.0429) -0.1085 (0.00344) -3.308 (0.0730) 0.0747 (0.00520)
M'j Slj
0.0237 n.a. n.a. n.a. n.a. 0.5056 n.a. n.a.
0.0192 n.a. n.a. n.a. n.a. 0.3384 n.a. n.a.
c For women the p-value for the Makeham constant was 0.015 (i.e. larger than the significance level of 0.01). To obtain models of the same type for men and women we kept this constant for women as well.

Chapter 6
mortality among nondisabled and among disabled persons for men and women.
150

Compression of I1wl'bidity: an exploration of the conditions
Appendix 2
Sensitivity analyses
Transition rates Four factors might have resulted in biased estimates of the transition rates by age, namely: (1) using datasets fi'om different countries, (2) the likely underestimation of persons in institutions at older ages, (3) attrition and (4) relying on self-reported data. We tested the sensitivity of the outcomes for different transition rates.
The first set of variants for sensitivity testing was created by using the standard errors of the regression coefficients which describe the level and change of the transition rates with age and an external const.raint that the difference between the est.imated life expectancy at age 30Y, should not differ more than lY, year fi'om the national estimate. For mortality !'ates among nondisabled and disabled, we halved the standard errol' in order to obtain a deviation of total life expectancy from t.he national estimates of less than 1.5 year, whereas for incidence of (lis ability and recovery fi'om disability we used t.he standard errol'. This resulted in 16 sensitivity variants. The outcomes of these analyses are shown in Table A2-1a (age 30Y,) and Table A2-1b (age 70Y,). We found that although each sensitivity variant produced different estimates of total life expectancy and life expectancy with and without disability, the changes in incidence and recovery rates which were required to achieve compression of morbidity were very similar to those found in the main analyses. Only the increase in recovery rates required to achieve compression of morbidity in the presence of 20% declining mortality rates among nondisabled and disabled persons was slightly higher in some of the sensitivity variants in men at age 30Y, (>50% as compared to ;0,50% in the main analyses, Table A2). We therefore conclude that the main results are not very sensitive to changes in the transition rates.
In addition to these general sensitivity analyses, we assessed the sensitivity to uncertainties related to t.he use and pooling of the two datasets. Previous examinations of the comparability of both datasets and the representativeness of the outcomes for the Dutch situation indicated that two uncertainties might have biased the estimates of the transition rates: (1) a possible underestimation of persons in institutions owing to sampling design in LSOA (2) a smail jump in the proportion of men with disability bet~veen GLOBE and LSOA at age 70, which might have biased the estimate of the incidence rates in men.
In a second variant, we examined the sensitivity of the outcomes for the un. derrepresentation of elderly living in institutions. In this variant ('Institu
tions' in Table A2-2a-b) we used higher mortality rates among disabled and lower recovery !'ates (change: 76-85: 10%; 86-95: 20% and 96+: 30%). This
151

Chapter 6
analysis showed that the changes in incidence and recovery rates that were needed to achieve compression, were not very sensitive for the likely underestimation of the institutionalized population. Only in women at age 301'2 was the increase in recovery rates necessary to achieve compression of morbidity in the presence of 20% declining mortality rates among the nondisabled and the disabled slightly lower (2:40% as compared to ;,50% in the main analysis).
In a third set of variants, we examined whether the small jump in incidence of disability in men between GLOBE and LSOA affected the outcomes. We created two additional sensitivity variants. In the first, we used the parameter for the level of the incidence rates based solely on GLOBE for all ages ('Incidence a-GLOBE' in table A2-2a-b) and in the second, we applied the parameter solely based on LSOA for all ages ('Incidence a-LSOA'). The results based on these variants indicate that in the event that the level of the incidence rates based on GLOBE were true, slightly smaller changes in either incidence or recovery would be needed to achieve compression of morbidity.
Scenario calcltlations Using the same percentage of change in the transition rates at each age in our scenario calculations might not be realistic for mortality (see discussion section). Finally, in the light of the fact that in The Netherlands mortality at age 85 and over increased by 5% in men and 2% in women in the last dec' ade", we examined whether using constant 01' 5% increasing mortality rates among nondisabled and disabled persons above age 85, rather than decreasing mortality rates by 20% at all ages, would change the outcomes. The sensitivity analyses showed that using constant ('Constant old-age mortality' in Table 2A) or 5% increasing mortality rates ('Increase oM-age mortality') at these ages, would reduce the changes in incidence a11(l/or recovery which are needed to achieve compression.
Two conclusions can be drawn. First, each variant of the sensitivity analyses with modified transition rates changed the point estimates of total life expectancy and life expectancy with and without disability, and at times produced small deviations in the exact size of the reductions in incidence anc1lor increases in recovery rates which were requimd to produce compression of morbidity when mortality rates decline. However, the main findings are not sensitive to the evaluated modifications in the transition rates. That is, for all of these variants we found that (1) both decreasing incidence and increasing recovery rates (ceteris paribus) produce compression of morbidity (in an absolute and a relative sense), although the impact of improving incidence rates is larger, (2) moderate declines in mortality rates (20% among nondisabled and disabled) increase life expectancy with disability at age 30Y" unless at least equal proportional improvements occur in both incidence and recovery rates, 01' larger changes in either incidence 01' recovery
152

Compression 0/ morbidity: an e:cploration 0/ the conditions
rates are seen and (3) larger changes are needed to compress disability above age 70Y" The only exception was that when using the level of the incidence rates based on GLOBE, at least equal rather than larger I'eductions in incidence are required above age 30Y" Second, when mortality reductions among nondisabled and disabled persons do not occur above age 85, as might be the case nowadays in The Netherlands, the requu'ed I'eductions in incidence and increases in recovery to achieve compression of morbidity are smaller,
153

TableA2-1. Required Reductions in Incidence Rates of Disability and/or Increase in Recovery Rates from Disability to Achieve Absolute Compression of Morbidity above Age 30%, Men and Womena
Variant Baseline life Expectanciesb Isolated Changes Changes in the Presence of 20% Mortality Reductions
Among Nondisabled and Disabled Persons :~::::::::::::::::::::::!0:~6:::::~·~_·.·~.·~~.·.-"""_·"_-·-:::::::::::::~.-".~.W.9~."ii~.·.-"""".-".·.-".·".·.·...... . .. ---.----......... --............... . .......................................................... -........ --.--.--.---....... --.....................
Incidence
L~o'h DFLE3o'h LED3 o'h LE30Yii DFLE,o" LED3o'h In- Re- Incidence Decline Recovery Increase Dedine +
y y y y y y cidence CQvery (Recovery Con- (Incidence Recovery Decline Increase stant) Constant) Increase
(same %)
Main analysis 44.8 38.5 6.4 50.8 38.4 12.4 >0% >0% ~30% ~50% ;::20%
Incidence a+se 44.4 37.6 6.8 50.4 37.1 13.2 >0% >0% :<!30% ~50% ;::20% a-se 45.1 39.2 5.9 51.2 39.6 11.5 >0% >0% ~30%, ~50% ~O%
~+se 44.5 37.7 6.8 50.4 37.3 13.1 >0% >0% ~30% >50% M; ~50% W ~O%
~-se 45.1 39.2 5.9 51.1 39.5 11.6 >0% >0% 2:30% :<!50% 2:20%
Recovery a+se 45.1 39.0 6.0 51.0 39.0 12.0 >0% >0% ~30% ~50% 2:20% a-se 44.5 37.8 6.7 50.6 37.8 12.8 >0% >0% ~30% >50% M; ~50% W 2:20% !3+se 45.1 39.0 6.0 51.0 39.0 12.0 >0% >0% :<!30% ~50% ~O%
~-se 44.6 37.9 6.7 50.6 37.8 12.8 >0% >0% :<!30% >50% M; 2:50% W ~O%

Mort. Nondep a+%se 43.5 37.6 6.0 49.4 37.7 11.7 >0% >0% ~O% :;:50% ~O% ct-%se 45.9 39.2 6.7 51.8 38.9 12.8 >0% >0% ~30% ~50% ~O%
j3+Y2Se 43.8 37.8 6.0 49.6 37.8 11.8 >0% >0% ~30% ~50% :::20% j3-Y2Se 45.8 39.1 6.7 51.6 38.9 12.8 >0% >0% ~30% >50% M; ~50% W :::20%
Mort. Dep ct+%se 43.9 38.1 5.7 49.4 38.2 11.3 >0% >0% ~30% ~50% :::20% a-Y2Se 45.8 38.8 7.0 52.2 38.6 13.5 >0% >0% ~30% >50% M; ~50% W ~O% j3+Y2Se 44.0 38.2 5.8 49.6 38.2 11.3 >0% >0% ~30% ~50% :::20% j3-Y2Se 45.7 38.7 7.0 52.1 38.6 13.5 >0% >0% ~30% >50% M; ~50% W ~O%
Underlined: Different from main analysis.
a All percentages all valid for both men and women, unless specified as M (Le. only men) or W (i.e. only women). b Figures are rounded to 0.1.

Table A2-1b Required Reductions in Incidence Rates of Disability and/or Increase in Recovery Rates from Disability to Achieve Absolute Compression of Morbidity above Age 70%, Men and Women"
Variant
Main analysis
Incidence a+se a.-se l3+se ~-se
Recovery a+se a-se l3+se ~-se
Baseline Ufe Expectanciesb Isolated Changes
::::::::::::::::::::::::M~~:::::~-.-_-.~.-"""_·.~".-_~---:::::::::::::~-_-""_-.~9!j).~6"""""_·"_·""_·""_·".-.-.-
lE70'h DFLE70'h Y Y
10.7
10.5 11.0 10.4 11.0
10.9 10.6 10.9 10.6
6.3
5.6 6.9 5.6 7.0
6.7 5.9 6.7 5.9
LED70% LE70'h Y Y
4.4
4.8 4.1 4.8 4.0
4.2 4.7 4.2 4.7
14.3
14.0 14.6 14.0 1'4.6
14.5 14.2 14.5 14.2
DFLE70'h Y
5.8
5.0 6.6 5.0 6.6
6.2 5.4 6.2 5.4
In- Re-lED70'h Y cidence covery
Decline Increase
8.5
9.0 8.0 9.0 8.0
8.3 8.8 8.3 8.8
>0%
>0% >0% >0% >0%
>0% >0% >0% >0%
>0%
>0% >0% >0% >0%
>0% >0% >0% >0%
Changes in the Presence of 20% Mortality Reductions Among Nondisabled and Disabled Persons
Incidence Decline (Recovery Con
stant)
~40%
~40%
~40%
~40%
~40%
~40%
~40%
~40%
~40%
Recovery Increase (Incidence Constant)
>50%
>50% >50% >50% >50%
>50% >50% >50% >50%
Incidence Decline + Recovery Increase (same%)
~30%
~30%
~30%
2:30010 2:30%
2:30% 2:30% 2:30% 2:30%

Mort. Nondep a+%se 10.1 5.9 4.2 13.6 5.5 8.2 >0% >0% ;::'40% >50% ~30%
a-%se 11.3 6.6 4.7 14.8 6.0 8.8 >0% >0% ~40% 2:50% M; >50% W ;:::30% J3+%se 10.1 5.9 4.2 13.6 5.5 8.2 >0% >0% ;:::40% >50% 2:30% J3-%se 11.3 6.6 4.7 14.8 6.0 8.8 >0% >0% 2:40% >50% ::::30%
Mort.Oep a.+%se 10.0 6.2 3.8 13.2 5.7 7.5 >0% >0% 2:40% >50% 2:30% a.-%se 11.5 6.4 5.1 15.5 5.8 9.7 >0% >0% 2:40% >50% 2:30% j3+%se 10.1 6.2 3.8 13.2 5.7 7.5 >0% >0% 2:40% >50% 2:30% J3-%se 11.5 6.4 5.1 15.6 5.8 9.7 >0% >0% ::::40% >50% 2:30%
Underlined: Different from main analysis.
a All percentages all valid for both men and women, unless specified as M (i.e. only men) or W (I.e. only women). b Figures are rounded to 0.1.

Table A2-2a Required Reductions in Incidence Rates of Disability and/or Increase in Recovery Rates from Disability to Achieve Absolute Compression of Morbidity above Age 30%, Men and Womena
Variant Baseline life Expectanciesb Isolated Changes Changes in the Presence of 20% Mortality Reductions Among Nondisabled and Disabled Persons
:~::~:::::::~:~:~:::~:::M~~:::::~~~~~~~~~~~~~:~~'-::::::~::::::~~:::W.9~:~6:::~:::::~::::::::
Main analysis
institutionsC
Incidenced
«-GLOBE' «_LSOAf
Constant Old-Age Mortality
Increase Old-Age Mortality'
LE30'h Y
44.8
44.6
45.6 44.2
44.8
44.8
DFLE.o~ y
38.5
38.4
40.3 37.1
38.5
38.5
LED30'h LEao:h Y Y
6.4 50.8
6.2 50.3
5.7 7.1
6.4 50.8
6.3 50.7
Underlined: Different from main analysis.
DFLE.o" y
38.4
38.3
38.4
38.4
In-LED30:h cidence
y Decline
12.4 >0%
12.0 >0%
>0% >0%
12.4
12.3
Recovery
Increase
>0%
>0%
>0% >0%
Incidence Decline (Recovery Con
stant)
~30%
~30%
2:20% ;:::30%
2:20%
~O%
a All percentages all valid for both men and women, unless specified as M (Le. only men) or W (Le. only women). b Figures are rounded to 0.1. .
Recovery Increase (Incidence Constant)
~50%
~50% M; ;:::40% W
~40%
;:::50%
~40% M; ~30% W
;:::40%
Incidence Decline + Recovery Increase (same %)
2:20%
;::20%
2:20% ~O%
~O%
~20%
C Adjustment for underestimation of the population in institutions above age 76: age 30-75: no change; age 76-85: mortality from disabled * 1.1; recovery ... 0.9; age 86-95: mortality from disabled * 1.2; recovery * 0.8; age 96+: mortality from disabled'" 1.3; recovery ... 0.7
d Only men. (I Using the level of incidence of disability based solely on the GLOBE study. f Using the level of incidence of disability based solely on the LSOA study. 9 Increase in mortality rates among nondisabled and disabled by 5%, among people above age 85 . ... Not applicable.

Table A2·2b Required Reductions in Incidence Rates of Disability and/or Increase in Recovery Rates from Disability to Achieve Absolute Compression of Morbidity above Age 70%, Men and Women3
Variant Baseline Life Expectanciesb Isolated Changes Changes in the Presence of 20% Mortality Reductions Among Nondisabled and Disabled Persons
::::::::::::::::::::::::M~~:::::~·.~.~·:.~~~·:.·.·.~·."-:::::::::::::~.~'.'.~w.Q.ijj~~.~':.~'.~'.'.~'.~'::""".'
Main analysis
InstitutionsC
lncidenced
a-GLOBE' a-LSOA'
Constant Old-Age Mortality
Increase Old-Age Mortality'
LE70:h Y
10.7
10.4
11.5 10.5
10.7
10.7
DFLE70:h Y
6.3
6.2
8.4 5.7
6.3
6.3
LED70:h LE70:h DFLE7o~ y y y
4.4 14.3 5.8
4.2 13.8 5.7
3.1 4.7
4.4 14.3 5.8
4.4 14.2 5.8
Underlined: Different from main analysis.
In- Re-LED7o:h cidence covery
y Decline Increase
8.5 >0% ~O%
8.1 >0% >0%
>0% >0% >0% >0%
8.5
8.5
Incidence Decline
(Recovery Constant)
~40%
2:40%
~ ~40%
2:30%
2:30%
a All percentages all valid for both men and women, unless specified as M (i.e. only men) or W (i.e. only women). b Figures are rounded to 0.1.
Recovery Increase Incidence Decline + (Incidence Recovery Increase Constant) (same %)
>50% 2:30%
>50% 2:30%
>50% 2:30% >50% 2:30%
2:50% M; >50% W 2:30% M; ;:aO% W
~50% ;:aO% M; 2:30% W
C Adjustment for underestimation of the population in institutions above age 76: age 30-75: no change; age 76-85: mortality from disabled "'1.1; recovery ... 0.9; age 86-95: mortality from disabled '12; recovery' 0.8; age 96+: mortality from disabled' 1.3; recovery' 0.7
d Only men. e Using the level of incidenCe of disability based SOlely on the GLOBE study. f Using the level of incidence of disability based solely on the LSOA study_ 9 Increase in mortality rates among nondisabled and disabled by 5%, among people above age 85 . ... Not applicable.

Chapter 6
References
1. Fr.ies JF. Aging, natural death, and the compression of morbidity. New England Journal of Medicine 1980;303(3): 130-135.
2. Gruenberg EM. The faihu'es of success. Milbank Memorial Fund Quarterly/Health and Society 1977;55(1):3-24.
3. Kramer M. The I'ising pandemic of mental disorders and associated clu'onic diseases and disabilities. Acta Psychiatrica Scandinavia 1980;62(Suppl. 285):382·397.
4. Olshansky SJ, Rudberg MA, Carnes BA, Cassel CK, Brody JA. Trading Off Longer Life for Worsening Health. Journal of Aging and Health 1991;3(2):194-216.
5. Van del' Water HPA, Boshuizen He, Perenboom RJM. Health expectancy in the Netherlands, 1983-1990. European Jounial of Public Health 1996;6(1):21-28.
6, Rijksinstituut VQOl' Volksgezondheid en Milieuhygiene. Volllsgezondheid Toe/lOms/. Vel'llellnillg: de gezondheidstoestalld van de Nedel'landse bevolldug in de periode 1950-2010. 's-Gravenhage, the Netherlands: SDD, 1993.
7. Fries JF. The compression of morbidity: near 01' far? Milballh Quarterly 1989;67(2): 208-232.
8. Rabine JM, Mathers C, Bl'ouard N. Trends and Differentials in Disability-Free Life Expectancy: Concepts, Methods, and Findings. In: Caselli G, Lopez AD, ed. Health and Mortality Among Elderly Populations. Oxford, UK: Clarendon Press, 1996: 182·201.
9, Nusseldel' WJ, van del' Velden K, van Sonsbeek JL, Lenior ME, van den Bas GA. The elimination of selected chronic diseases in a population: the compression and expansion of morbidity. American Journal of Public Health 1996;86(2):187-194 [Included in this thesis as chapter 8].
10. Crimmins EM, Hayward MD, Saito Y. Changing mortality and morbidity rates and the health status and life expectancy of the older population. Demography 1994;31(1): 159-175.
11. Robine JM, Ritchie K. Healthy life expectancy: evaluation of global indicator of change in population health. British Medical JOllnlaI1991;302(6774):457·460.
12, Rogers A, Rogers RG, Branch LG. A multistate analysis of·active life expectancy. Public Health Reports 1989;104(3):222-226.
13. Rogers A, Rogers RG, Belanger A. Longer life but worse health? Measul'ement and dynamics. The Gerontologist 1990;30(5):640-649.
14. Gm'alnik JM, Land KC, Blazer D, Fillenbaum GG, Branch LG. Educational status and active life expectancy among older blacks and whites. New England JOU1'1l01 of Medicine 1993;329(2): 110-116.
15. Beckett LA, Bl'ock DB, L€mke JR, et a1. Analysis of change in self-reported physical function among older persons in foul' population studies. American JOltl'na.l of Epidemiology 1996;143(8):766-778.
16. Mackenbach JP, Van de Mheen H, Stronks K. A prospective cohort study investigating the explanation of socio-economic inequalities in health in The Netherlands. Social Science and Medicine 1994;38(2):299-308.
17. United States Department of Health and Human Services. National Centre for Health Statistics. National Health Interview Survey Longitudinal Study of Agi11g 70 years and over 1984-1990. Computel' file (lCPSR 18719) fl'om the NIWI Steinmetz Archive, Amsterdam,
18. Koval' MG, Fitty JE, Chyba MM. The Longitudinal Study of Aging: 1984·1990. Vital and Health Statistics. 1992;1(28). DHHS Publication PHS 92-1304.
160

Compression of I1wrbidity: an exploration of the conditions
19. Schoen R. Modelling Multigroup Populations, New York, NY: Plenum Press, 1988.
20. Statistics Netherlands. Gezondheidsenquete 1993 {Health Interview Survey 1993}. (Computerfile) 's·Gravenhage, the Netherlands, 1993.
21. Statistics Netherlands. Gezolldheidsenquete 1994 {Health interview survey 1994}. (Computerfile) 's-Gravenhage, 1994.
22, Nusselder WJ, Van den Bos GAM, Lenior ME, Van Sonsbeek JLA, Van del' Velden J. Gezonde [evensvel'wachting en het effect van chronische ziekten, Instituut Vaal'
Sociale Geneeskunde (lSG), Academisch Medisch Centrum, Universiteit van Amsterdam, Nederlands IllStituut voor Onderzoek van de Gezondheidszorg (NIVEL), Centraal Bmeau voor de Statistiek (CBS), 1994.
23. Tabeau E, van Poppel F, Willekells F, Mortality in the Netherlands: The Data Base, Netherlands Interdisciplinary Demographic Institute, 1994,
24, Statistics Netherlands, Ovel'levingstafels "aar leeftijd en geslae!!t, 1986-1990 {Life tables by age alld sex, 1986·1990}, 's-Gravenhage, the Netherlands: State Publishers/Statistics Netherlands, 1992.
25, Statistics Netherlands. Overleviogstafels oaal' leeftijd en geslacht, 1994 en 1990·1994 [Life tables by age and sex, 1994 and 1990·1994J. Maandstatistiell voo,' de Bevoliling [Monthly Bulletin of Population Statistics} (CBS) 1996;44(5):30·34.
26. Francis B, Green M, Payne C, ed. The GLIM Syslem: The Statistical System for Generalized Lineal' InteraeNve Modelling. Release 4 Manual. Oxford, UK: Clarendon Press, 1993.
27. McCullagh P, Neider JA. Generalized Line01' Models. (2 ed.) London, UK: Chap· man and Hall, 1995.
28. Statistics Netherlands. Ovel'ievi1lgstafeis 1100/' leeftijd en geslacht [Life lables by age and sex}. 's-Gravenhage, the Netherlands: State Publishers/Statistics Netherlands, multiple years.
29, Van HODrll WD. Sterfte: trends, achtergl'onden en prognose [Mortality: trends, background and forecast]. Maandstatistielt VOOI' de bevolllillg {Monthly Bullitin of Population Statistics} 1997;45(5): 10·17.
30. Nusseldel' WJ, Mackellbach JP. Rectangularization of the survival curve in The Netherlands, 1950·1992. The Gero1ltologist 1996;36(6):773·782 [Included in this thesis as chapter 3].
31. Mathers C, Estimating gains in health expectancy due to elimination of specific diseases, Paper presented at the 5th meeting of the International Network on Health Expectancy (REVES·5), February 19·21. Ottawa, Canada, 1992.
32. Manton KG, Corder LSI Stallard E. Estimates of change in chronic disability and institutional incidence and prevalence rates in the U.S, elderly population from the 1982, 1984, and 1989 National Long Term Care Survey. Jou1'nal of Gerontology 1993;48(4):SI53·S166.
33. Manton KG, Corder L, Stallard E. Chronic disability trends in elderly United States populations: 1982-1994. Proceedings of the National Academy of Sciences of the Ullited States of America 1997;94(6):2593·2598.
34. GaVl'ilov LA, GaVl'ilova NS. The Biology of Life Spall: a Qua1ltitative Approach. Chur, Switzerland: Harwood Academic Publishers, 1991.
35. Nusselder WJ, Mackenbach JP. Lack of improvement of life expectancy at advanced ages. Submitted for publication. [Included in this thesis as chapter 2].
161


Smoking elimination produces compression of morbidity
Abstract
Objective: To examine whether eliminating smolling will lead to a reduction in the number of years lived with disability (i.e. absolute compression of morbidity). Setting: T1w longitudinal GLOBE study c'lmbined with the Longitudinal Study of Aging (LSOA) Subjects: Dutch nationals aged 30-74 years living in the city of Eindhoven and sltl'l'olUlding municipalities and United States citizens aged 70 and over. Main outcome meaSltl'es: Life expectancy with and without disability and total life expectancy at age 30'12 and age 70'12. Results: A nonsmohing population on balance spends fewer years with disability than a mixed smoking-nonsmoldng population. Although nonsmohers have lower mortality rishs and thus are exposed to disability over a longer period of time, their lower incidence of disability and higher recovery from disability yield a net reduction of the length of time spent with disability (-0.9 in men at age 30'1. and -1.1 years in women at age 30'12) and increases in the length of time lived without disability (2.5 and 1.9 year, for men and women, respectively). These outcomes indicate that elimination of smolling will extend life and the period of disability-free life, and will compress disability into a shorter period. Conclllsions: Eliminating smohing will not only extend life and result in an increase in the number of years without disability, but will also compress disability into a shorter period. This implies that the commonly found trade-off between longer life and a longer period with disability does not apply. Interventions to discourage smohing should receive high priority.

Chapter 7
7.1 Introduction
Today, the aim of science and medicine is more to reduce the number of years that people spend diseased or disabled than to lengthen life.' Evidence is mounting that smoking is not only a major preventable factor associated with mortality"', but also with disability.4.11 However, despite the large body of evidence supporting the claim that nonsmoking extends the length of life2.!2, it is not certain whether nonsmoking also reduces the number of years spent with disability. Given that nonsmokers live longer, these extra years may be accompanied by an increased burden of disability. Mter all, survivors age and increasing age is strongly associated with chl'Onic diseases and disability. Hence, whether eliminating smoking will result on balance in a reduction of the length of time lived with a disability, depends on whether or not the fewer number of years with disability due to lower risks of disability are counterbalanced by the rise in the number of years with disability due to improved chances of surviving to older age.
We used a multistate life table to estimate the effect of nonsmoking on total life expectancy and life expectancy with and without disability, taking into account the fact that smoking causes both excess disability and mortality. The central question is whether eliminating smoking will lead to a reduction in the number of years of disability (i.e. absolute compression of morbidity).
7.2 Data and methods
Source of data
The primary data source used was the GLOBE study - GLOBE being the Dutch acronym for Health and Living Conditions of the population of Eindhoven and surroundings. A detailed description of the sample and design is given elsewhere.13 A postal questionnaire was sent in 1991 to an aselect sample of approximately 27000 Dutch nationals aged 15-74 years living in the city of Eindhoven and sUl'l'ounding municipalities (response rate 70.3%). Persons living in institutions were included in this sample, except for Eindhoven (40% of all respondents) where the institutionalized population only comprises residents of homes for the elderly. We used a selection of respondents to this postal questionnaire (n=7677), who were approached for an interview in 1991. Those who indicated in the postal questionnaire that they suffered fl'Om a chl'Onic disease (diabetes mellitus, chronic bronchitis, serious heart disease or cln'onic back complaints or slipped disk) were overrepresented (n=2637). In the follow-up, respondents to this oral interview (n=5666, i.e. 73.8%) received postal questionnai1'8s in 1993 (n=4496, i.e. 79.4%; 81.1% after correction for mortality) and 1995 (n=4105, i.e. 72.4%; 76.4% after correction). As mortality is an outcome of interest, persons who died were not considered as 'lost to follow-up' and were included in the cor-
164

Smoking elimination produces compression of morbidity
rected response rate. Information on mortality was based on municipal population registers, while smoking status was based on the postal ques· tionnaire of 1991. Smoking status was classified as 'current smokers' and 'nonsmokers'. We had no mference group of persons who had never smoked to avoid small numbers and bias resulting from the considerable misclassification of former smokers as persons who had never smoked, which reportedly was the case for survey data. 14
Persons under age 30 (n=791 in 1991) and persons of whom the vital status at follow-up was unknown (less than 0.3%) were excluded fi'om the analyses. Persons were considered to be disabled if they were living in an institution or indicated that they needed help or were unable to perform without (great) difficulty one or more activities of daily life, mobility and communication that are essential for independent functioning. In 1991, the complete set of questions on disability was pl'esented to only 2867 subjects. Complete information on disability was lacking for 77 (1991), 96 (1993) and 219 (1995) respondente. Complete information on disability and vital status at the beginning and end of a 2-year interval was available on 1988 persons in the period 1991-1993 and on 3119 persons in the period 1993-1995, yielding a total of 5107 observations. A correction was made for observations which were excluded because of attrition and item nom-esponse (see method section).
Since GLOBE did not comprise persons above age 74 in 1991 and a substantial part of the possible mortality and disability reduction due to smoking elimination may occur beyond age 75, a second data source, the Longitudinal Study of Aging (LSOA)15 was used. The LSOA started in 1984 with interviews of 7527 noninstitutionalized persons of age 70 and over in the United States. Subjects who were institutionalized during the study were included in the follow-up. The complete sample was reinterviewed in 1988 (n=4984, 66.2%; 89.0% after correction for mortality) and 1990 (n=4142, i.e. 55.0%; 87.4% after correction), while a subsample of 5151 persons was reinterviewed in 1986 (n=4113, i.e. 79.8%; 92.4% after correction). Disability status was assessed in each wave in the same way as in the GLOBE study, and information on mortality was based on the National Death Index. Smoking status was not assessed in LSOA. Full details on the sample and design are given elsewhere. 16
Nonwhites (n=647) and persons of whom the vital status at follow-up was unknown (less than 0.4%), were excluded from the analyses. Complete information on disability was lacking for 142 (1984), 384 (1986), 415 (1988), 365 (1990) persons. Complete information on disability and vital status was available for 3720 persons in 1984-1986, 2853 in 1986-1988 and 3535 in 1988-1990, yielding a total of 10108 observations. Again, an adjustment was made for observations which were excluded because of attrition and item nonresponse.
165

Chapter 7
Methods
We used a multistate life table, which is an extension of the standard life table", with three health states: 'nondisabled', 'disabled' and 'dead'. Persons were considered to be disabled if they were living in an institution or indicated that they needed help or were unable to perform without (great) difficulty one 01' more activities of daily life, mobility and communication that are essential for independent functioning.
Fj,:st, we examined whether the two datasets could be joined and whether they would together describe the Dutch situation by comparing the proportion of persons who died and the proportion of disabled persons by age between GLOBE, LSOA and national representative data sources.'8." Since the datasets were comparable, except for a small jump in the prevalence of disability in men, we pooled all observations. We estimated incidence rates of disability, recovery rates fi-om disability and mortality rates among nondisabled and disabled persons for the current mixed smoking-nonsmoking population, using Poisson-regression analysis with offset. This method is also known as 'log-rate analysis' (or log-lineal' regl'ession with offset).24 The number of persons at risk, used as rate multiplier in the regression analysis, was adjusted for the sampling design in LSOA and GLOBE. An adjustment was made for persons for whom the disability status was unknown at the beginning or end of the interval, but who were known to be alive. These persons were allocated to either the nondisabled or the disabled state, using the distribution by disability status at the beginning and end of the interval, respectively of subjects with complete information. The equations used to describe the relationship with age and the estimated parameters are given in the appendix. We used the multistate life table to estimate life expectancy with and without disability for the current mixed population on the basis of these age-specific incidence, recovery and mortality rates. The estimates of total life expectancy (at age 30Y, and 70Y,) calculated with the multistate life table differed less than 0.3 year fi'om published figllres,22.23 Age-specific mortality rates closely resembled national estimates21.'5, except for the un-
Table 1 Percentage of Smokers In The Netherlands, 1991, by Age and Sex"
Age
0-14 15-19 20-34 35-49 50-64 65+
166
Men
o 22 39 43 40 33
Women
o 19 37 37 28 13
derestimation of mortality rates in older women. The same is true for age-specific prevalence of disability derived fi'om the multistate life table, which closely corresponded to national (cross-sectional) estimates based on a similar definition of disability.'8.'. In short, the estimates closely represent the Dutch situation.
Next, the incidence, recovery and mortality rates among nondisabled and disabled persons were estimated for nonsmokers in order to calculate life expectancy with and without

Smoking elimination produces compression of morbidity
disability after smoking elimination. These rates for nonsmokers were estimated from the rates in the mixed population, combined with data on the percentage of smokers and nonsmokers in the mixed population26 (Table 1), and data on the association between smoking and incidence, recovery and mortality among nondisabled and disabled persons (expressed as rate ratios) (see appendix). The data on the rate ratios, controlled for age and sex, were originally estimated n'om GLOBE using Poisson-regt'ession (Table 2). Because the rate ratios did not differ significantly by age and sex, except for the significant lower rate ratios of incidence in men (1.35) than in women (2.35), we used the same rate ratios for both sexes and all ages. A combination of the same rate ratios of incidence, recovery, and mortality among nondisabled and disabled persons for all ages is consistent with declining relative risks on totallllortality with increasing age as observed in literature.2,3 The rate ratios of total mortality were substantially higher than the rate ratio of mortality among nondisabled and disabled persons (Table 2), because the higher incidence risks and lower recovery risks of smokers, combined with the excess mortality risks in the disabled state also contributed to the difference in total mortality between smokers and nonsmokers. Since the rate ratios of mortality did not differ significantly between nondisabled and disabled persons, we used the same rate ratios for both health states. Although tlIis association did not reach statistical significance, we used the - statistically insignificant - rate ratio of 1.24 (CI: 0.87 - 1.76), because the small number of deaths in GLOBE might have been the principal cause of this statistically nonsignificant outcome. In addition, underestimating the association between smoking and mortality might artificially produce compression of morbidity when smoking is eliminated.
The rate ratio of incidence of 1.79 (1.46 - 2.19) fit well within the range of reported rate ratios in previous studies.7.9,11 The rate ratio of total mortality of 1.6 (30-75 y), 1.45 (76-84 y) and 1.3 (85+ y) was also in line with the results n'om other European studies2,27, considering that former smokers were included in the reference gt·oup. To our knowledge, no information is available on the association between smoking and recovery, and between smoking and mortality by disability status (nondisabled and disabled). Nor can this information be easily derived from data on the association between smoking and total mortality.
Finally, we compared the life expectancy with disability b~hveen the mixed smoking-nonsmoking population (baseline) and the nonsmoking population (after eliminating smoking) in order to determine whether the elimination of smoking will reduce the number of years that people spend in a disabled state, i.e. whether absolute compression of morbidity will occur. To assess whether the effects of smoking elimination differ by age, we pl'esent the results at age 30Y, and age 70Y"
167

Chapter 7
Men 1,00
~ ~
--nonsmoking ,.-/
- - - mixed /
0,80 /
I I
I
" 0,60 I 0 / 'E / 0 / Q.
/ e c. 0.40 / /
/ /
/
0,20 ,.-,.-
/
-~ - ----------
0,00
30 40 50 60 70 80 90 100
age
Women 1,00,---------------------::==_;
0,80
S 0.60 'E o c. o a. 0.40
0,20
-- nonsmoking
- - - mixed
,.-
-~~ ///
,.-
/ / ,.-
/ /
/ /
/ /
/
/ /
/
---0,00 j:::-::-=-=-~-=::=_--_,___--r--____,--___r--___.J
30 40 50 60 70 80 90 100
age
Figure 1 Prevalence of disability by age in the nonsmoking and mixed (smoking/nonsmoking) population based on the Multistate Life Table,
168

Smohill,g elimination produces compression of nWl'bidity
Sensitivity analyses
We tested the sensitivity ofthe analysis to different values in the rate ratios, by recalculating the life tables with excess risks (rate ratio -1) that were 50% higher and 50% lower. In addition, we assessed the sensitivity to specific uncertainties related to: (1) the lack of evidence from other studies on the association between smoking and recovery, (2) confounding of the association between smoking and incidence, recovery and modality among disabled and nondisabled persons, when smokers have quit smoking because of a chronic condition, (3) the absence of a significant association between smoking and mortality among nondisabled and disabled persons, (4) ignoring the sex difference in the rate ratio of incidence, (5) the likely underestimation of the institutionalized population in old ages and (6) combining the GLOBE and LSOA population with slightly different prevalences of disability in men.
7.3 Results
Figure 1 shows that at each age the prevalence of disability is lower in the nonsmoking than in the mixed smoking·nonsmoldng population. Tills lower prevalence is caused by the fact that nonsmokers have a lower incidence of disability and a higher recovery from disability (Table 2).
To assess whether nonsmoking reduces the number of disability years, the lower mortality risks and thus the longer period in which nonsmokers will be exposed to disability should be considered as well. By looking at (changes in) the number of person years with and without disability (by age) and life expectancy with and without disability (summarized aci·oss ages) - both outcomes of the multistate life table - it is possible to take into account the effects of changes in disability and mortality at the same time. Figure 2 shows that at younger ages the number of person years with disability is smaller in the nonsmoking population than in the CUl'l'ent mixed population, whereas at older ages the opposite is true. On balance, life expectancy with disability at age 30ll, is lower in the nonsmoking than in the mixed population (Table 3). In the mixed population, total life expectancy at age 30ll, is 44.8 years (men) and 50.8 years (women), of which about 38.5 years without disability
Table 2 Rate Ratios of Smoking on the Transitions (Corrected for Age and Sex), GLOBE, The Netherlands
Transition
Incidence of disability Recovery from disability Mortality among nondisabled persons Mortality among disabled persons
RR
1.79 0.70 1.24 1.24
95%-Confidence Interval
1.46-2.19 0.55 - 0.90 0.87 -1.76 0.87 -1.76
169

Chapter 7
Men 40,-------------------------------------,
30
i c ~ 20 ::I o E
10
80
70
60
Iii 50 " c ~ 40 " 0
E 30
20
10
30
30
Figure 2
--nonsmoking
- - - mixed
/ ~
~
40 50
-- nonsmoking
- - - mixed
40 50
/ /
/
/ /
/
60
60
/-/ "-
/ \
/
/ /
/ /
70
age
Women
/ /
/ /
/ /
70
age
80
/-, /
80
, \ \ \ \ \ \
, , , \
\ \ \
,
90
\ , \ ,
\
90
\ ,
\ ,~
, ,
100
100
Number of person years with disability by age in the nonsmoking and mixed (smokingl nonsmoking) population based on the Multistate Life Table,
170

Smalling eiilnina.tion produces compression of morbidity
and respectively 6.4 and 12.4 years, with disability. In the nonsmoking population total life expectancy is 46.4 and 51.6 years, of which 41.0 and 40.3 years, respectively, without disability and 5.5 and 11.3 years, respectively with disability. These results indicate that elimimi.tion of smoking will produce a substantially larger gain in disability-free life expectancy (2.5 years in men and 1.9 year women) than in total life expectancy (1.6 and 0.8 years respectively). Consequently, smoking elimination will reduce the number of years with disability (-0.9 and -1.1 years respectively). This reduction in the number of years with disability indicates that absolute compression of morbidity will occur. At age 70;;', the effects of elimination of smoking were in the same direction, but smaller.
Table 4 shows that the conclusion on compression of morbidity is not very sensitive to different values in the rate ratios associated with smoking. Us· ing 50% lower or higher excess risks did not change the conclusion, nor did the other changes specified in Table 4. Life expectancy with disability at age 30;;' (LED30") and age 70;;' (LED70") declined in all variants. Only in the unlikely situation that the association between smoking and incidence of disability is substantially weaker in men, while the other associations are not, will vil"tually no compression of morbidity above age 70;;' occur in men.
Table 3 Total Life Expectancy (LE), Disability-Free Life Expectancy (DFLE), Life Expectancy with Disability (LED) and Percentage of Life with Disability of the Mixed SmoklnglNonsmoklng Population (Baseline) and of the Nonsmoking Population (After Elimination of Smoking), The Netherlands'
Men Mixed smoking/nonsmoking (baseline) Nonsmoking population
Women Mixed smoking/nonsmoking (baseline) Nonsmoking population
Men Mixed smoking/nonsmoking (baseline) Nonsmoking population .
Women Mixed smoking/nonsmoking (baseline) Nonsmoking population
• Figures are rounded to 0.1.
LE, Y DFLE, Y LED, Y %LED in LE
44.8 46.4
50.8 51.6
10.7 11.6
14.3 14.8
At age 30Y,
38.5 41.0
38.4 40.3
6.4 5.5
12.4 11.3
At age 70Y,
6.3 7.5
5.8 6.5
4.4 4.1
8.5 8.3
14.2 11.8
24.3 21.9
41.3 35.4
59.6 56.2
171

Chapter 7
Table 4 Change In Life Expectancy (LE) and Life Expectancy with Disability (LED) at Age 30% and Age 70% due to Smoking Elimination (Sensitivity Analyses)'
Men Women ............... ' .............................. -.............. ............................. _ ..... , .. ,,,.- .. , ............. LE30Y.i LED3oY.i LE70Y.i LED70X LE30X LE030X LE70X LED70Y.i
Y Y Y Y Y Y Y Y
Main analysis (1.79; 0.70; 1.24; 1.24), 1.6 -0.9 0.9 -0.3 0.8 -1.1 0.5 -0.2
Sensitivity analyses
Incidence (RR-1) -50% (1.40; 0.70; 1.24; 1.24)b 1.3 -0.5 0.7 -0.1 0.7 -0.6 0.4 -0.1
Incidence (RR-1) + 50% (2.19; 0.70; 1.24; 1.24)b 1.9 -1.3 1.0 -0.5 1.0 -1.5 0.6 -0.4
Recovery (RR-1) -50% (1.79; 0.85; 1.24; 1.24), 1.5 -0.7 0.9 -0.3 0.8 -0.9 0.4 -0.2
Recovery (RR-1) + 50% (1.79; 0.55; 1.24; 1.24)b 1.7 -1.0 0.9 -0.4 0.9 -1.2 0.5 -0.3
Mort. nondep. (RR-1) -50% (1.79; 0.70; 1.12; 1.24)b 1.4 -0.9 0.8 -0.4 0.8 -1.1 0.4 -0.3
Mort. nondep. (RR-1) + 50% (1.79; 0.70; 1.36; 1.24)b 1.8 -0.8 1.0 -0.3 0.9 -1.0 0.5 -0.2
Mort. dep. (RR-1) -50% (1.79; 0.70; 1.24; 1.12)b 1.5 -1.0 0.8 -0.4 0.7 -1.1 0.4 -0.3
Mort. dep. (RR-1) + 50% (1.79; 0.70; 1.24; 1.36)b 1.8 -0.8 1.0 -0.2 0.9 -1.0 0.5 -0.2
All (RR-1) -50% (1.40; 0.85; 1.12; 1.12)b 0.9 -0.5 0.5 -0.2 0.4 -0.6 0.2 -0.1
All (RR-1) + 50% (2.19; 0.55; 1.36; 1.36)b 2.3 -1.2 1.3 -0.5 1.2 -1.5 0.7 -0.3
Exc!. ehren. cond,c (2.2;0.82; 1.14; 1.14)b 1.5 -1.3 0.8 -0.6 0.8 -1.4 0.4 -0.4
Only sIgnificant effect (1.79; 0.70; 1; 1)b 0.9 -1.2 0.4 -0.6 0.5 -1.3 0.2 -0.4
Incidence sex·specific RR 1.3.5 (men) 2.35 (women) 1.3 -0.4 0.7 -0.0 1.1 -1.6 0.6 -0.5 0.7; 1.24; 1.24)b
Adj. lnstitutionalizat!ond
(1.79; 0.70; 1.24; 1.24)b 1.6 -0:9 0.9 -0.3 0.8 -1.0 0.5 -0.2 Adj. incidence in mene
(1.79; 0.70; 1.24; 1.24)b 1.6 -1.0 0.9 -0.4
a Figures are rounded to 0.1. b Between brackets: RR incidence; RR recovery; RR mortality nondisabled; RR mortality disabled. e Persons who reported to have (had) serious heart diseases, cancer, diabetes mellitus, stroke,
chronic obstructive lung disease (COPO) or cancer at baseline were excluded. d Adjustment for underestimation population in institutions above age 76: age 30·75: no change;
age 76-85: mortality from disabled * 1.1; recovery * 0.9; age 86-95: mortality from disabled * 1.2; recovery * 0.8; age 96+: mortality from disabled *1.3; recovery * 0.7 .
• Using level of Incidence ot disability based solely on the GLOBE study. ... Not applicable.
172

Smoking elimination produces compression of morbidity
7.4 Discussion
This study evaluated whether eliminating smoking would produce compression of morbidity into a shorter period, by comparing life expectancy with disability in the current mixed smoking-nonsmoking population (baseline) and in the nonsmoking population (after smoking elimination). Our results show that on balance nonsmokers spend fewer years with disability than the mixed smoking-nonsmoking population. Although nonsmokers have lower mortality risks, and are thus exposed to disability Over a longer period, their higher ability to maintain health and to restore health losses results in a net reduction of the length of time spent with disability and in an increase in the life time free of disability. These outcomes indicate that eliminating smoking will extend the length of life and the length of disability-free life, and will compress disability into a shorter period.
Previous studies of the effects of smoking have reported that smoking increases the risks of sevei'al chronic diseases, such as (lung) cancer, heart disease, stroke, and chronic obstructive lung disease.3 These diseases are sig· nificantly associated with mortality2.3 and most of them with disability.28.3l This implies that an effect of smoking on disability and mortality is biologically plausible. Nevertheless, there are still important gaps in our understanding of the mechanisms through which smoking affects disability and mortality. Smoking may have an effect on disability and mortality by increasing disease incidence, decreasing disease recovery, increasing disease severity or by increasing the incidence of comorbid conditions. In addition, physiological losses and symptomatology not operating tln'ough specific diseases may have an effect on frailty" and in turn on disability and mortality. In evaluating the effect of smoking elimination, we used information on the association of smoking with disability and mortality, rather than information on the different diseases and pathways through which smoking affects disability and mortality. This enabled us to take into account the overall impact of smoking without needing information on the exact mechanisms. To better understand the association of smoking with disability and mortality further research is needed to umavel these underlying mechanisms.
Two methodological issues affect the interpretation of our outcomes. First, we assumed that elimination of smoking would produce a population which experiences the same incidence, recovery and mortality rates as for nonsmokers in the current mixed smoking-nonsmoking population. This assumption is only valid if the differences between the current mixed smokingnonsmoking and smoking population were solely attributable to smoking. TIns would imply that indeed a causal relationship is behind the estimated association between smoking and incidence, recovery and mortality rates among nondisabled and disabled persons, which is not influenced by variation in the prevalence of other risk factors or confounded by sociodemographic characteristics. Although mOl'e research is needed to validate the
173

Chapter 7
magnitude of the causal association between smoking and incidence, recovery and mortality among nondisabled and disabled persons, uncertainty about the exact magnitude of the rate ratios for smoking are not expected to have biased our. conclusion. First, sensitivity analyses showed that the conclusion is not very sensitive to different values in the rate ratios associated with smoking within the margin of 50% lower and higher excess risks and in some other situations specified in Table 4. Furthermore, additional logistic regression analyses indicated that a correction for sociodemographic characteristics would change the rate ratios only slightly and within the margins of the sensitivity analyses (results not shown). Finally, rate ratios which could be validated, such as those for the incidence of disability and total mortality, were in line with results from previous studies (see method section).
Second, the population which will emerge after elimination of smoking is assumed to have the same distribution of persons who had never smoked and former smokers, and the same average duration since smoking cessation as the current nonsmoking population. That is, some persons never smoked, SOme quit smoking long ago and some quit smoking recently. If all smokers were to quit smoking at the same time, initially the effect on the population's health would be less than estimated in our study, whereas as the time since smoking cessation evolves, the health status of the future nonsmoking population might be more favourable than expected from our results. In order to explore whether our conclusion would be valid in the case of a future nonsmoking population in which no one had ever smoked, we increased the excess risks associated with smoking by 75% to obtain a difference in life expectancy between smokers and nonsmokers comparable to the difference currently observed between smokers and those who have never smoked.' Repeating our analysis using these higher excess risks did not change our conclusion. In this situation, the reduction in life expectancy with disability due to smoking elimination was 1.4 years in men and 1.7 in women at age 30Y, and 0.5 and 0.4 years, respectively at age 70Y,.
A recent study found that nonsmoking will increase health care costs32, which would seem to contradict our conclusion that nonsmoking reduces the length of time lived with disability. However, it is entirely possible that due to smoking elimination lifetime costs will increase, while the number of years with disability will decrease. Since many diseases, even when they do not cause disability, still generate costs, the increase in costs with increasing age exceeds that of disability. As a result, nonsmokers saved from dying incur more costs when they age than that they accumulate disability.33 The finding that smoking elimination will produce compression of morbidity supports a previous study of the effect of nonsmoking on the number of dis· ability years'., despite differences in data and methodology.
Our results have important implications for public health policy makers and doctors. They show that interventions aimed at eliminating smoking will
174

Smolling elilnination produces compression of morbidity
extend the length of life and will reduce the number of years spent with disability. This is an important finding in view of the trade-off often found between longer life and more years with disability. For example, interventions aimed at eliminating fatal diseases, such as cancel' and heart diseases, will extend the length of life, but at the same time will extend the period with disability. On the other hand, interventions aimed at eliminating nonfatal diseases will compress disability into a shorter period, but will not extend life.'8 A successful smoking intervention will extend total life expectancy, extend disability-free life expectancy and reduce life expectancy with disability. Therefore, interventions to discourage smoking should receive high priority. A next step would be to pinpoint other possible interventions which will compress of disability into fewer years. Further research of the disablement process35, might provide clues for factors preventing, slowing down 01'
undoing disability, which can be targeted at in further public health interventions.
175

Chapter 7
Appendix
Incidence, recovery and mortality rates for the mixed smoldng-nonsmoking population
We used three functions to describe the relationship of the incidence, recovery and mortality rates (i.e. transitions rates) with age: the exponential model (also known as the Gompertz model), the Gompertz-Makeham model and the Sigmoid model.
(1) The exponential model is specified as follows:
NO = eav + P'i X+ log(R;) + SPoissoll
or equivalently:
E(M .. ) = ea, + p" x "
(i", j) (1)
(2)
where: Nu is the expected number of events (i.e. transitiOlis from state i at the beginning of the interval to state j at the end of the interval); au is the log (expected number of events during 1 unit of time at age 0); flo is the log (ratio of the number of events during 1 unit of time at age x and age x+ 1); X is age; R; is exposure time and Mij is the transition rate from state i to state j. Lag(R;) handles differences in exposure times and is known in statistical literatUl'e as the 'offset parameter'.
(2) The Gompertz-Makeham model is specified as follows'.: +n x E(M .. ) = Ai,' + ea, p,
" (3)
where: Mij is the transition rate from state i to state j, au and fJij are the regl,'ession-coefficients, X is age, and Au is the constant of Makeham. The Makeham constant reflects that besides the exponential component, there also exists a component which is independent of age
(3) The Sigmoid model is specifiecl as follows:
eU;;;+P"x E(M i) = (Jij 1 + e""+P'x (4)
where: (J'v is a constant that can be interpretecl as an age-independent maximum transition rate.
The likelihood ratio test was usecl to select between the exponential model and the Gompertz-Makeham and Sigmoicl maciel, respectively. We usecl a significance level of 0.01 rather than 0.05 in QI'cler to take into account clependency between the obsel'Vations in the subsequent waves. All moclels were estimatecl in GLIM.37
176

TableA1 Parameters of the Poisson-Regression Analysis (SE Between Brackets)
Type of model au at age 70' bij Mj s, Men
Incidence of disability Gomp+Mak.b -2.945 (0.0399) 0.0859 (0.00333) 0.0237 n.a. Mortality among nondisabled Gompertz -3.813 (0.0718) 0.1078 (0.00698) n.a. n.a. Recovery from disability Sigmoid -0.906 (0.0546) -0.1052 (0.00453) n.a. 0.5056 Mortality among disabled Gompertz -2.505 (0.0663) 0.0577 (0.00507) n.a. n.a.
Women Incidence of disability Gomp+Mak.c -2.487 (0.0323) 0.0725 (0.00283) 0.0192 n.8. Mortality among nondisabled Gompertz -4.642 (0.1199) 0.1097 (0.01153) n.a. n.a. Recovery from disability Sigmoid -0.627 (0.0429) -0.1085 (0.00344) n.3. 0.3364 Mortality among disabled Gompertz -3.308 (0.0730) 0.0747 (0.00520) n.a. n.a.
n.a. Not applicable. a Age was transformed to age -70. b Gomp+Mak. is Gompertz~Makeham. C For women the p--value for the Makeham constant was 0.015 (i.e. larger than the significance level of 0.01). To
obtain models of the same type for men and women we kept this constant for women as well.

Chapter 7
Table Al presents the parameters of the regression equations for incidence of disability, recovery from disability, mortality among nondisabled and among disabled persons for men and women.
Incidence, recovery and mortality rates for the nonsmoking population
Given that for each transition, the transition rates in the mixed smok· ing/nonsmoking population are the weighted average of transition rates of smokers and nonsmokers, with the proportion of smokers and nonsmokers, respectively as weights:
Mij = P MSij
+(1- p)Mnsij (5)
where: Mij is the baseline transition rate from state i to state j; p is the pro· portion of smokers (smoothed using least square regl'ession of the logit of the proportion on age), MnSij is the transition rate from state i to state j fol' non· smokers; MSij is the transition rate from state i to state j for smokers and RR;j is the ratio associated of smoking on the transition from state i to state J.
Given that:
MSij = MnSij RRij (6)
the transition rate in nonsmokers can be derived, by combining (5) and (6):
M" MnSij = I) (7) P RR;j+ 1- p
Sex and age indices are suppressed.
178

Sl1wking elimination produces compression of Ilwrbidity
References
1. Gl'eengross S, MtU'Phy E, Quam L, Rochon P, Smith R. Aging: a subject that must be at the top of the world agendas. British Medical Joul'llal 1997;315(7115): 1029·1030.
2. Doll R. Peto R, Wheatley K, Gray R, Sutherland I. Mortality in relation to smok· ing: 40 years' observations on male British doctors. British Medical Journal 1994; 309(6959):901·911.
3. U.S. Department of Health and Human Services. The Health Beliefits of Smoking cessation: A Report of the Surgeon General. Rockville, MD: Centre for Chronic Dis· ease Prevention and Health Promotion, 1990.
4. Leigh JP. An empu.'ical analysis of self·reported, work·limiting disability. Medical Care 1985;23(4):310·319.
5. Rogers RG, Nam CB, Hummel' RA. Activity limitation and cigarette smoking in the United States: implications for health expectancies. In: Mathers C, NcCallum J, Robine JM, ed. Advances in Health Expectancies. Canberra, Australia: Australian Institute of Health and Welfare, 1994:337·344.
6. Keil JE, Gazes PC, Sutherland SE, Rust PF, Branch LG, Tyroler HA. Predictors of physical disability in elderly blacks and whites of the Charleston Heart Study. JOllmal of Clinical Epidemiology 1989;42(6):521·529.
7. Branch LG. Health practices and incident disability among the elderly. American JOllrnal of Public Health 1985;75(12):1436·1439.
8. Kaplan O. Maintenance of Functioning in the Elderly. Annals of Epidemiology 1992;2(6):813·822.
9. Guralnik JM, Kaplan GA Predictors of healthy aging: prospective evidence fl'om the Alameda County study. American Jou/'I!al of Public Health 1989;79(6):703·708.
10. Strawbridge WJ, Camacho TC, Cohen RD, Kaplan GA Gender differences in fac· tors associated with change in physical functioning in old age: a S·year longitudinal study. The Gerontologist 1993;33(5):603·609.
11. LaCroix AZ, GUl'alnik JM, Berkman LF, Wallace RB, Satterfield S. Maintaining mobility in late life. II. Smoking, alcohol consumption, physical activity, and body mass index. American JOIIl'llal of Epidemiology 1993;137(8):858·869.
12. Rogers RG, Powell· Griller E. Life expectancies of cigarette smokers and nonsmok· ers in the United States. Social Sciellce alld Medicine 1991;32(10):1151·1159.
13. Mackenbach JP, Van de Mheen H, Stronks K. A prospective cohort study investi· gating the explanation of socio·economic inequalities in health in The Netherlands. Social Science alld Medicille 1994;38(2):299·308.
14. Van de Mheen PJ, Gunning-Schepers LJ. RepOl'ted prevalences of former smokers in sm'vey data: the importance of differential mortality and misclassification. American Joumal of Epidemiology 1994;140(1):52·57.
15. United States Department of Health and Human Services. National Centre for Health Statistics. National Health Interview Survey Longitudinal Study of Aging 70 years and over [computer file from the NIWI Steinmetz At'chive, Amsterdam ICPSR 18719J, 1984·1990.
16. Koval' MG, Fitty JE, Chyba MM. The Longitudinal Study of Aging: 1984·1990. Vital and Health Statistics 1992; 1(28). DHHS Publication PHS 92·1304.
17. Schoen R. Modelling Muitigl'oup Populations. New York, NY: Plenum Press, 1988.
18, Statistics Netherlands. Gezolldheidsenqllete 1993 [Health Interview Survey 1993J. (Computerfile) 's·Gl'avenhage, the Netherlands, 1993.
179

Chapter 7
19. Statistics Netherlands. Gezondheidsellquele 1994 [Health interview survey 1994j. (Computerfile) 's-G1'8venhage, 1994,
20. NU8seldel' WJ, Van den Bos GAM, Lenior ME, Van Sonsbeek JLA, Van del' Velden J. Gezonde /evensvel'wQclitillg en het effect van chl'onische ziekten. Instituut vaol' Sociale Geneeskunde (lSG), Academisch Medisch Centrum, Univel'siteit van Amsterdam, Nededallds Instituut vaal' Ondel'zoek van de Gezondheidszol'g (NlVEL), Celltraal Bm'eau VOOl' de Statistiek (CBS), 1994.
21. Tabeau E, van Poppel F, Willekens F. Mortality in the Netherlands: The Data Base. Netherlands Interdisciplinary Demogl'aphic Institute, 1994.
22. Statistics Netherlands. Ouel'ievillgsta/els l1aGI' leeftijd en geslaelit, 1986·1990 [Life tables by age and sex, 1986-1990}, 's-Gravenhage, the Netherlands: State Publishers/Statistics Netherlands, 1992.
23. Statistics Netherlands. Overlevingstafels naar leeftijd en geslacht, 1994 en 1990·1994 [Life tables by age and sex, 1994 and 1990·1994]. Maandstatistielt voor de Bevolking {Monthly Bulletin of Population Statistics] (CBS) 1996;44(5):30·34.
24. McCullagh P, Neider JA. Generalized Lineal" Models. (2 ed.) London, UK: Chap· man and Hall, 1995.
25. Statistics Netherlands. Ovedevingstafels naar leeftijd en geslacht [Life tables by age and sex}. 's·Gravenhage, the Netherlands: State PublisherslStatistics Nether· lands, lllultiple years.
26. Foundation of Public Health and Smoking. Annual Report 1995. The Hague, the Netherlands, 1996.
27. Valkonen T, Van Poppel F. The contribution of smoking to sex differences in life expectancy: foul' Nordic countries and The Netherlands 1970·1989. European Journal of Public Health 1997;7(3):302·310.
28. Nusselder WJ, van del' Velden K, van Sonsbeek JL, Lenior ME, van den Bos GA. The elimination of selected chronic diseases in a population: the compression and expansion of morbidity. Amel"ican Joul"llal of Public Health 1996;86(2):187·194 [Included in this thesis as chapter 8].
29. Guccione AA, Felson DT, Anderson JJ, et a1. The effects of specific medical conditions on the functional limitations of elders in the Framingham Study. American Joumal of Public Health 1994;84(3):351·358.
30. Boult C, Kane RL, Louis TA, Boult L, McCaffi'ey D. Chronic conditions that lead to functional limitation in the elderly. Journal of Gel"ontology 1994;49(1):M28·M36.
31. Verbrugge LM, Patrick DL. Seven chronic conditions: their impact on US adults' activity levels and use of medical services. American Journal of Public Health 1995;85(2): 173·182.
32. Barendregt JJ, BonnetlX L, Van del' Maas PJ. The health care costs of smoking. New England Joul"nal of Medicine 1997;337(15):1052·1057.
33. Barendregt JJ, EonnetlX L. Degenerative Disease in an Aging Population: Models and Conjectures. Rotterdam, the Netherlands: El'asmus University Rotterdam, 1998. .
34. Barend1'egt JJ, Eonneux L, van del' Maas PJ. Health expectancy: from a population health indicator to a tool for policy making: Journal of Aging and Health 1998 (in press).
35. Verbrugge LM, Jette AM. The disablement process, Social Science and Medicine 1994;38(1): 1·14.
36. Gavrilov LA, GaVl'ilova NS. The Biology of Life SPOIl: a Quantitative Approach. Chul', Switzerland: Harwood Academic Publishers, 1991.
180

Smoking elimination produces compression of morbidity
37. Francis B, Green M, Payne C, ed. The GLIM System: The Statistical System for Generalized Lineal' Interactive Modelling. Release 4 Manual. Oxford, UK: Clarendon Press, 1993.
181


Abstmct
The elimination of selected chronic diseases
in a population: com pression and expansion
of morbidity
Objectives: This study evaluates the effect of eliminating a specific disease on the mortality, long-term disability, and overall health status of a population_ Primarily, it examines whether elimination leads to a compression of morbidity. Methods: The Sullivan method was used /0 calculate disability-free life expectancy. Cause-deleted disability prevalence was estimated with a multiple logistic regression model that used data from the 'Dutch National Survey of General Practice'. Cause-deleted probabilities of dying were derived with the cause-elimination life-table technique, assuming independence among competing causes of death. Reslllts: Eliminating disabling nonfatal diseases such as arthritis/back complaints results in a decline in life expectancy with disability that is, an absolute compression of morbidity. Eliminating highly fatal diseases such as cancel' leads to an increase in the nll.mber of years and the proportion of life with disability that is, a relative expansion of morbidity. Conclusions: While eliminating fatal diseases leads to an increase in disability-free life expectancy, life expectancy with disability may increase as well. This represents an increasing burden to society. On the other hand, eliminating nonfatal disabling diseases leads to absolute compression of morbidity.

Chapter 8
8.1 Introduction
In countries with a high life expectancy, such as The Netherlands, mortality is being delayed until older ages and clll'onic diseases are causing illness and disability among those surviving.' To evaluate the likely effects of health interventions, it is important to consider both changes in the duration of life ('adding years to life') and in the healthfulness of life ('adding life to years'). Therefore, one should take into account not only deaths averted but also ill· ness and disability prevented. At present, evaluation of health programs is based principally on changes in mortality'; however, the ranking of diseases is not the same in terms of mortality and disability3. The gain in disability· free life expectancy that is, the average number of years an individual is ex· pected to live free of disability is a more appropriate measure for evaluating the health impact of interventions on a population.'.3 This measure takes into account both mortality and disability. Analogous to calculations of the gain in total life expectancy owing to elimination of a cause of death,,5, are estimations of the potential gain in disability· free life expectancy obtained by eliminating a disease3. These determinants are important for setting pri· orities for prevention and control.'.3,6
'The objective of this study is to evaluate how eliminating a specific disease affects the mortality, long· term disability, and overall health status of a population. The central question is whether elimination of a CIn'OlllC disease leads to a compression of morbidity that is, a compression of long-term disability into a shorter period or proportion of life expectancy.7,8 Thus, combined logistic regression analysis with cause-elimination life tables to estimate the effect of eliminating a disease, taking into account competing causes of death and comorbidity,
8.2 Data and methods
Data
Cross-sectional data on long-term disability and chronic diseases were derived fi'om the Dutch National Survey of General Practice, conducted by the Netherlands Institute for Health Care in 1987/88.9 A health interview survey among patients of general practitioners was part of this study, The general pl'actitioners (N = 161) were selected by a nonproportional stratified random sample according to region, degt'ee of urbanization, and distance fi'om the hospital. For each general practitioner, a random sample of approximately 100 patients was selected for the survey, resulting in a total of 17047 respondents. The survey was conducted by an interviewer in the participants' homes; for questions concerning long-term disabilities and cln'onic diseases respondents were asked to complete a self-administered questionnail·e. The percentage of those responding to the survey was 76% (N =
184

The elilnillation of selected chronic diseases in a population
13014). To correct our results both for differential nomesponse by age and sex and for deviations due to the stratification procedure, disability prevalence was calculated from a weighted sample. Because virtually the entil:e noninstitutionalized population of The Netherlands is registered with a general practitioner and because the sample was ahnost identical to the national population in terms of age and sex, the weighted prevalence can be regarded as representative of the entire noninstitutionalizcd Dutch population.9
This study used a subsample of 10147 noninstitutionalized respondents aged 16 and over. Reported disabilities were assumed to be invalid for young children because no distinction could be made between having a disability and an inability to perform the activities because of age.
The prevalence of long-term disability was measured using the Organization-for-Economic-Cooperation-and-Development indicator. This indicator consists of 16 items that refer to a persons's ability to carry out a number of activities of daily living, mobility, and communication that are essential for daily independent functioning. 10 Of these, 11 items were selected dealing with the ability to bend down and pick something up, to get in and out of bed, to dress and unch-ess, to move between rooms, to walk 400 m, to carry a 5-kg object for 10 m, to read small print in a newspaper, to recognize someone's face, to have a conversation with another person, to follow a conversation in a group, and to go up and down stairs. This selection aOOs at excluding activities that are ambiguous or umeliable in their interpretation." Persons were considered to be disabled if they indicated that they needed help f):om another person or were unable to carry out one or more of the selected activities included in the indicator without (great) difficulty. Persons who were able to carry out the activity with some or no difficulty, were considered to be without disability. Using equipment such as eyeglasses or a hearing aid was not considered indicative of a disability if the respondent did not need help or was able to carry out the activity with little or no difficulty. The long duration of disabilities was emphasized in the introductory text of the question concerning the indicator. With respect to the ability to walk 400 m and to go up and down stairs, nomesponse was significantly higher than it was for the other items; this was owing to the sequence of questions in the questionnaire. For these items, the missing values were estOOated and imputed.
In the Dutch National Survey of General Practice, prevalence figures of cln'onic conclitions were assessed on the basis of a structured list comprising a broad spectrum of somatic disorders and conditions. The list did not cover all cln'onic conditions; for example, mental and sensory disorders, stroke, dementia, and (hip) f)'actures were not included. From the original chronic conditions, the following disease clusters were selected: nonspecific lung disease, heart diseases, cancel', diabetes mellitus, artln'itislback complaints,
185

Chapter 8
and neul'ological diseases. These disease categol'ies have been pl'oposed by the Dutch Advisol'Y Council on Health Reseal'ch because of theil' bUl'den of mOl'bidity.!2 In the analysis, neul'ological diseases wel'e split into migraine/ severe headache and other neurological diseases because of their different impact on disability. For a description of the disease clusters, see Table 1. The presence or absence of these chronic diseases was used in the elimination analysis. Together, the disease clusters for which the elimination analysis was conducted explain about 33% of the disability prevalence.
Residents of psychiatric hospitals, nursing homes, homes for the elderly, or homes for the mentally deficient were considered to have long-term disabilities. The number of such persons as well as their age and sex distribution, was estimated on the basis of both additional administrative data sources and surveys.!3.!8 For persons living in a home for the elderly, however, an adjustment had to be made for those without disability, based on surveys among the elderly population.!3,101,16
Data on total and cause-specific mortality and the population distribution by sex, age, and period (1982 to 1991) were derived from the Dutch Central Bureau of Statistics.!9.2l The selected (underlying) causes of death are also summarized in Table 1.
Elimination analysis
Complete life tables covering the period (1982 to 1991) were calculated on the basis of population and total mOl·tality data. The latter were classified by sex and single year of age (according to a cohort-age observational plan: i.e.
Table 1 Disease ClUsters and Related Chronic Diseases and Causes of Death
Disease Clusters Health IntelView SUNeya Cause of Deathb
Ch ronie nonspecific lung ChroniC bronchitis; emphysema; 490-493 disease asthma Heart disease Heart complaints. cardiac failure 390-398; 410-414; rest 390-459
(with exception of hypertension 401-405; cerebrovascular diseases 430·438 and arterioscleroses 440)
Cancer Cancer (including leukaemia) 140-208
Diabetes mellitus Diabetes mellitus 250
Arthritislback complaints ' Backache (slipped disk, SCiatica); 710-719; 720-724; 725-729; 730-rheumatism, arthritis; arthrosis 739
Migraine/severe headache Migraine; severe heada'che 346
Other neurological diseases Parkinson's disease, multiple 330-337; 340-349 (with exception sclerosis, epilepsy of 346); 350-359
• Conducted by the Netherlands Institute for Health Care in 1987/88. b Based on codes taken from the International Classification of Disease, 9th edition.
186

The elimination 0/ selected chronic diseases in a population
one age group = two calendar years). From these complete life tables, abbre· viated life tables (by 5·year age groups, with age 85 and over as final age gmup) were derived for further analyses. Details of the life-table techniques can be found in demographic handbooks on life-table analysis.·.22
Disability-free life expectancy and its counterpart, life expectancy with disability, were computed using the Sullivan method."'" According to this prevalence-i'ate life-table technique, the number of person years per age interval (derived from the abbreviated life table) is subdivided into years with and years without disability by multiplying the number of person-years by age-specific disability prevalence (proportions). Persons residing in institutions were included into the years with disability; as previously noted, however, an adjustment was made for persons living in a home for the elderly.
The effect of eliminating a chronic disease on disability-free life expectancy was calculated in several steps. Hypothetically, if a disease is eliminated, there will be no disability or death from tillS disease. Therefore, assuming independence among causes of death and causes of disability, eliminating a disease leads to a decline in age-specific probabilities of dying, as well as in age-specific prevalence of disability.
A multivariate logistic regression model was used to estinlate cause-deleted disability prevalence, controlled for comorbidity and age. The probability of having one or more disabilities was taken as the dependent variable. Age, the selected disease clusters, and a category of several other cm'onic diseases were included in the model as independent variables. Age was included as a continuous variable using a transformation (i.e. age to the 2.5th power for men and to the 3rd power for women). The correctness of this transformation was tested by the Box-Tidwell transformation, giving evidence of whether there is nonlinearity in the logit. 26 Age-by-disease interactions were not statistically significant. The goodness of fit of the model was assessed by computing the Hosmer-Lemeshow goodness of fit statistic, t.'6 The fitted probability that a pet'son has one or more' disabilitie~ (before elimination) was computed by substituting the regression coefficients and the respondents' scores on the independent variables in the regression equation:
PX p = .....o:e--cc..-
l+ePX
where P is the probability that the person has at least one disability, e is the base of the natural logarithm, and jJX = U + UlXl + u,X, + ..... , a vector of regl'ession coefficients (a,jJ) and data (X) included in the model as independent variables (age, 7 disease clusters, other diseases).
The effect of elimination was sinlulated by deleting the disease in the regl'ession equation. The difference between the fitted total and cause-deleted disability prevalences can be attributed to the eliminated disease. Changes
187

Chapter 8
in disability prevalence among those living in an institution were not taken into account because data on age, sex, chronic diseases and disability were not available on an individual level for this subpopulation.
Next, cause-deleted probabilities of dying were estimated using cause-elimination life tables assuming independent causes of death.4,22 Finally, the estimated cause-deleted probabilities of dying and cause-deleted disability prevalence were combined into (cause-deleted) total and disability-free life expectancies using the Sullivan method." The difference between disabilityfree life expectancy before and after elimination reflects the potential gain in disability-n'ee years due to elimination.
Outcome measures
The elimination analysis provides an estimate of the gain in disability-n'ee and total life expectancy attributable to elimination of a chronic disease. However, interpretation of these outcomes in terms of compression or expansion of morbidity is not always straightforward. It is unambiguous when elimination results in an increase in either total life expectancy 01' disabilityn'ee life expectancy. A gain in disability-n'ee life expectancy while the total life expectancy remains unchanged indicates the substitution of years without disability for years with disability, in which case there is an absolute compression of morbidity.8 Likewise, an increase in total life expectancy without a gain in disability-free life expectancy - an outcome that is very unlil{ely to occur in our elimination analysis since it only takes place if the proportion with disability in the saved person years is 1 - means an increase in years with disability, in which case there is an expansion of morbidity.
On the other hand, should elimination of a chronic disease change both disability-n'ee and total life expectancy, interpretation of the outcomes becomes less straightforward. An increase in disability-free life expectancy might be classified as absolute compression, relative compression, 01' relative expansion of morbidity. This depends on the difference between the increase in total life expectancy and disability-n'ee life expectancy in an absolute sense and in terms of percentage. Should the gain in years free of disability be larger than the increase in total life expectancy (in an absolute sense and in terms of percentage), life expectancy with disability declines; thus, an absolute compression of morbidity takes place. Similarly a larger increase in total life expectancy than in disability-free life expectancy (again, in an absolute sense and in terms of percentage) means that life expectancy with disability increases and that the proportion of life n'ee of disability declines because of elimination; thus, a relative expansion of morbidity occurs.'8 Finally, a larger absolute increase in total life expectancy than in disability-n'ee life expectancy combined with a smaller gain in terms of percentage (which is possible, because the total life expectancy is larger than the disability-n'ee life expectancy) results in an increase in life expectancy with disability and
188

The elimina.tion of selected chronic diseases in a population
in the proportion of life free of disability. That is, people spend more years of their lives with disability but also live a larger proportion of their lives fl'ee of disability. This is called a 'relative compression of morbidity'.8.28 A decline in disability-fl'ee life expectancy, known in the literature as 'absolute expansion of morbidity"8 is not a possible outcome of our elimination analysis.
The described classification used in our study can be summarized as follows: 1. Absolute compression of morbidity: increase in disability-fl'ee life expec
tancy exceeds increase in total life expectancy, reducing the number of years with disability,
2. Relative compression of morbidity: years with and without disability increase, but the proportion of life fl'ee of disability increases,
3. Relative expansion of morbidity: years with and without disability increase, but the proportion of life fl'ee of disability decreases.
8.3 Results
Change in disability prevalence
The odds ratios (ORs) in Table 2 show the net effect of the selected clu:onic diseases on the probability of having disabilities, given a person who suffers
Table 2 Prevalence of Chronic Diseases, Odds RatiOS, and 95% Confidence Intervals Derived from Logistic Regression Analysis', The Netherlands, 1987/88
Prevalence Disability 95% Confidence of Disease %
Odds ratio Interval
Men (n = 4960) Chronic nonspecific lung disease 7.5 2.0 1.5-2.6 Heart disease 6.7 2.2 1.6-2.9 Cancer 0.4 1.9' 0.7-4.9 Diabetes mellitus 1.7 1.1 ' 0.6-1.9 Arthrltislback complalnls 15.8 3.1 2.5-3.8 Migraine/severe headache 6.5 2.0 1.5-2.6 Other neurological diseases 1.3 2.9 1.6-5.2
Women (n = 5187) Chronic nonspeclfic lung disease 6.0 2.5 1.9-3.3 Heart disease 6.0 . 2.6 1.9-3.6 Cancer 1.6 1.8 1.0-3.1 Dlabeles mellitus 2.8 2.3 1.7-3.9 Arthrltlslback complaints 17.7 3.6 3.0-4.3 Migraine/severe headache 13.4 1.5 1.2-1.9 Other neurological diseases 1.2 3.3 1.8-5.8
, Controlled for age, selected diseases and other diseases (kidney diseases, gall bladder, and liver diseases: chronic gastrointestinal disorders, thyroid gland diseases, and chronic skin diseases).
b Not statistically significantly different from 1.0.
189

Chapter 8
from the selected disease. Arthritislback complaints and other neurological diseases (i.e. Parkinson's disease, multiple sclerosis and epilepsy) have a large net effect on the probability of having disabilities (OR = 2.9 or greater compared with those who do not have the selected chronic disease). In comparison, the effect of migl'aine/severe headache is small. The contributions of cancer and diabetes mellitus are not statistically significant fm' men.
The effect of eliminating a disease on the disability prevalence depends not only on the disabling impact of the disease but also on its prevalence (Table
Table 3 Total and Cause-Specific Mortality Rates (1982-1991) and Disability Prevalence (1987/88), The Netherlands, by Age-Group and Sex
Cause-Specific Mortality Cause~Specific Rates Prevalence of Disability
(per 1000) (per 1000) .......... , .......................................... "" ........................................ " ... ,'"
Disease and Age Groups Men Women Men Women
Total 15-44 1.0 0.6 66.4 108.5 45-64 8.9 6.3 206.6 285.0 65+ 66.0 44.5 464.9 586.4
Chronic nonspecific lung disease 15-44 0.0 0.0 2.7 5.4 45-64 0.2 0.1 10.5 10.6 65+ 2.7 0.5 27.6 13.7
Heart disease 15-44 0.1 0.0 1.3 2.0 45-64 3.1 1.1 17.7 16.2 65+ 22.0 13.7 33.3 30.2
Cancer 15-4 0.2 0.2 0.2' 0.8 45-64 3.3 3.3 0.5' 2.6 65+ 19.3 9.3 1.3' 2.5
Diabetes mellitus 15-44 0.0 0.0 0.0' 0.6 45-64 0.2 0.2 0.3' 6.0 65+ 1.1 1.5 0.7' 14.5
Arthritislback complaints 15-44 0.0 0.0 11.4 18.6 45-64 0.0 0.0 51.3 71.1 65+ 0.2 0.4 54.8 66.7
Migraine/severe headache 15-44 0.0 0.0 4.0 6.3 45-64 0.0 0.0 11.4 12.5 65+ 0.0 0.0 4.6 5.3
Other neurological disease 15-44 0.0 0.0 0.9 1.9 45-64 0.1 0.1 3.6 2.5 65+ 1.1 0.8 4.7 4.4
, Effect was not significant in the regression analysis.
190

The elimination of selected chronic diseases in a population
2). Elimination of arthritisiback complaints, heart disease, and to a lesser extent, chronic nonspecific lung disease, has a large effect on the disability prevalence (Table 3), whereas the effect of cancel' and other neurological diseases is small. For the latter, the small effect can be explained by low prevalence. In general and with the exception of migraine/severe headache the effect of eliminating a disease on the prevalence of disability increases with age.
Change in probability of dying
Elimination of the (underlying) cause of death has a large impact on the probabilities of dying (01' the mortality rates) for heart diseases and cancel' (Table 3). The potential gain in total life expectancy at age 15 as a result of elimination is shown in Table 4. Eliminating heart disease adds 4 years for men and 2.9 years for women; eliminating cancel' adds 3.8 years for men and 3.3 years for women. Other diseases show smaller effects; eliminating migraine/severe headache has no effect on the total life expectancy.
Change in disability-free expectancy
Combining cause-deleted disability prevalence and probabilities of dying into a single measure - disability-free life expectancy - reveals the potential gain that can be obtained by eliminating a disease (and its consequences in terms of mortality and long-term disability). The baseline health status of the population (no change) is presented for comparison. Total life expectancy at age 15 is 59.3 years for men and 65.6 years for women, of which 47.5 years and 45.6 years, respectively, are spent without disability (80.2% and 69.5%) (Table 4). The remaining 11.7 and 20.0 years are spent with disability. These figures include disability among the institutionalized population.
The change in life expectancies before and after elimination and in the proportion of life free of disability at age 15 are shown in Table 4. Elimination of heart disease and arthritisiback complaints leads to the greatest gain in disability-free life expectancy. Ranking these diseases by impact differs between the two sexes: among men, heart disease has the largest impact (2.5 years vs 1.9 years for arthritisiback complaints) while among women, arthritisiback complaints have the largest impact (2.8 years vs 1.4 years for heart disease). The impact of migraine/severe headache, diabetes mellitus, and other neurological diseases on disability-ii'ee life expectancy is small (varying between 0.1 and 0.5 years). Chronic nonspecific lung disease and cancel' take up a middle position.
For those diseases showing no significant change in total life expectancy (e.g. arthritisiback complaints and migraine/severe headache), the observed increase in disability-ii'ee life expectancy indicates an absolute compression of morbidity. Since for the other diseases, the total life expectancy increases as well, it is important to consider the associated change in life expectancy with
191

Chapter 8
Table 4 Baseline' and Change In Total Life Expectancy (LE), Disability-Free Life Expectancy (DFLE), Life Expectancy with Disability (LED), and Percentage of Life Free of Disability (%DFLE In LE) due to Elimination of the Specific Disease, The Netherlands'
LE,y DFlE, Y LED, Y %DFlE in LE'
Age 15 Years
Men baselined 59.3 47.6 11.7 80.2 Chronic nonspecific lung disease 0.3 0.7 -0.4 0.7 Heart disease 4.0 2.5 1.6 -1.2 Cancero 3.8 1.7 2.1 -2.2 Diabetes meliitusO 0.2 0.1 0.1 -0.1 Arthritislback complaints 0.0 1.9 -1.8 3.1 Migraine/severe headache 0.0 0.4 -0.4 0.6 Other neurological diseases 0.2 0.2 0.0 0.1
Women baseline 65.6 45.6 20.0 69.5 Chronic nonspecific lung disease 0.1 0.6 -0.5 0.8 Heart disease 2.9 1.4 1.5 -1.0 Cancer 3.3 1.1 2.2 -1.7 Diabetes mellitus 0.3 0.4 -0.1 0.3 Arthrilislback complaints 0.1 2.8 -2.7 4.2 Migraine/severe headache 0.0 0.5 -0.5 0.7 Other neurological diseases 0.2 0.2 0.0 0.1
Age 65 Years
Men base lined 14.2 6.9 7.3 4B.9 Chronic nonspecific lung disease 0.3 0.5 -0.2 2.3 Heart disease 3.1 1.5 1.6 0.0 Cancero 2.7 0.9 1.8 -2.3 Diabetes mellitus' 0.1 0.0 0.1 -0.1 Arthritlslback complaints 0.0 0.7 -0.7 5.0 Migraine/severe headache 0.0 0.1 -0.1 0.4 Other neurological diseases 0.1 0.1 0.0 0.3
Women baseline 18.8 6.2 12.6 33.1 Chronic nonspecific lung disease 0.1 0.2 -0.1 1.0 Heart disease 2.7 0.9 1.8 0.0 Cancer 1.9 0.4 1.5 -1.2 Diabetes mellitus 0.3 0.3 0.0 1.0 Arthrilislback complaints 0.1 1.0 -1.0 5.3 Migraine/severe headache 0.0 0.1 -0.1 0.4 Other neurological diseases 0.1 0.1 0.0 0.3
• Baseline figures are based on life tables for 1982 through 1991 and on disability prevalence for 1987/88.
• Figures are rounded to 0.1 years and 0.1 percentage points. C Change in percentage points. d The baseline expectancies are based on the fitted age-specific prevalence . • Effect was not significant in the regression analysis.
192

The elimination of selected chronic diseases in a population
disability and in the proportion of life n'ee of disability. Eliminating chronic nonspecific lung disease and diabetes mellitus among women reduces the number of years with disability, indicating an absolute compression of mol" bidity. No significant change is observed when other neurological diseases are eliminated. On the other hand, cancel', heart diseases, and diabetes mel· litus among men show an increase in life expectancy with disability because the gain in disability-n'ee life expectancy is accompanied by a larger gain in total life expectancy. Tlils increase in years with disability in combination with a decline in the proportion of life n'ee of disability (Table 4) indicates a relative expansion of morbidity. Similar results are found when the effect of eliminating chronic diseases on life expectancies at age 65 is considered (Table 4). The only remarkable difference is that, owing to the lower proportion of life n'ee of disability at baseline at age 65, the proportion of life n'ee of disability for heart disease remains more 01' less constant, so neither relative compression nor relative expansion of morbidity occurs.
8.4 Discussion
The main objective of this study was to estimate the effect of eliminating a disease on the health status of the population. Colvez and Blanchet3 present the first calculations of the potential gain in disability-n'ee life expectancy by eliminating a disease. However, their study has two major drawbacks: (1) the effects of mortality reduction on total life expectancy and of disability reduction on disability-n'ee life expectancy were computed separately; and (2) all disabilities reported by a person with the considered disease were eliminated, neglecting the fact that some disabilities might have been caused by diseases other than the one eliminated. Mathers' approach, using cause-elimination life tables in combination with the Sullivan method to compute the effect of both mortality and disability decline on disability-n'ee life expectancy, was used to solve the fu'st problem." Manton & Stallard showed that the effect of other diseases can be considered by using a multivariate technique.6.'. In our study, cause-elimination life tables were used to compute cause-deleted probabilities of dying whereas a multivariate logistic regression model was fitted to calculate cause-deleted disability prevalence. Disability caused by diseases not affected by the elimination 01' due to old age remain, that is, a person does not become healthy after one disease is eliminated. These methods, combined with the Sullivan technique, enabled us to take into account the effect of both mortality and disability reduction on disability-free life expectancy in the presence of competing causes of death and comorbidity.
Despite these improvements, some caution must be exercised when interpreting the results of our study. The most important caveats relate to independence assumptions. FiJ.·st, we estimated canse-deleted probabilities of dying using underlying cause-of-death statistics under the assumption of
193

Chapter 8
independent competing causes of death. In The Netherlands, multiplecauses-of-death data are not generally available, and the assumption of independence can hardly be avoided until more is known about the exact nature of dependence among various causes of death. Since death in more advanced ages tends to result from a number of age- and disease-related degenerative conditions that often act interdependently, and since degenerative diseases are known to share common risk factors, the assumption of independence is likely to be violated.30.3t Assuming independence among competing risks might have resulted in an overestimation of the mortality reduction in advanced ages.".33 By contrast, using underlying cause-of-death data might have resulted in an underestimation of the effect of elimination in some cases because non-underlying causes (e.g. diabetes mellitus) can contribute to death from other causes (e.g. stroke).34 Second, we estimated cause-deleted disability prevalence, assuming independence of causes of disability in a (multiplicative) logistic regression model. However, since concurrence of diseases in most cases does not have a special impact on disability and any effect that does occur is mostly due to low prevalence pairs35, no significant bias is to be expected. Third, we did not take into account that different types of diseases included in a single disease cluster might have different implications for disability at different ages. For example, heart disease at middle age might imply myocardial'infarctions with little effect on disability, whereas heart disease at older ages might imply chl'Onic heart conditions (including congestive heart failure) that are disabling .• However, age-by-disease interactions proved not to be statistically significant. And fourth, in the elimination analysis, the probability of dying was not linked to disability. Therefore, the fact that disability can lead to lethal conditions (e.g. to stroke36.37, heart conditions37 and pneumonia" and consequently to an increase in mortality) was not taken into account. The overall effect of these potential biases is difficult to predict, since knowledge of the exact interrelationships between causes and theu' effects on mortality and disability is largely lacking. Nevertheless, the biases operate in both di.J.·ections and are not likely to be very large.
Relying on respondents' self-reports in a health interview containing a checklist of cm'onic diseases and disability items might have biased our results. Studies reporting on the validity of interview data compared with clinical examinations or medical records show considerable misreporting for some diseases.'.·4' The concordance between self-reports and medical registrations depends on a complex combination of factors: homogeneity of diagnostic groups, severity of illness, and need for diagnosis and care.40 .. " Another source of bias of the cause-deleted disability prevalence in our study is the neglect of changes in disability due to elimination of a chronic condition among persons living in an institution. This could have introduced an overestimation of the age-specific cause-deleted disability prevalence for the institutionalized population. However, of the total years spent with disability after age 15, about 11.5% of those years (even less for men) was spent in an
194

The elimination of selected chronic diseases in a population
institution. Most of these institutionalized persons were in institutions for reasons other than having the chronic diseases that were selected in our study (e.g. they had dementia and cerebrovascular diseases).'B Besides, given the advanced age' and the rehited likelihood of comorbidity, a considerable decline in disability due to elimination of one disease is not likely. These considerations are supported by the finding that elimination of a disabling disease such as artill'itis among the institutionalized population did not change the disability prevalence to any great extent."
Finally, the lack of a large scale longitudinal dataset forced us to use the prevalence-rate life-table technique (Suilivan method), which has several disadvantages."·45 If underlying age-specific transition rates (e.g. incidence, recovery, case-fatality rates of disability) change, it takes a long time until age-specific prevalence (the proportions of those having disability) reaches a new equilibrium value, which makes the Sullivan method less appropriate for measuring changes. However, this problem, which is caused by the different dynamics of mortality rates (flows) and disability proportions (stocks), does not exist when both mortality and disability related to the disease are eliminated in a synthetic cohort.
Elimination of a condition should be interpreted as the long-term consequence of successful primary prevention. Since we did not take into account all causes of disability, our study does not lead to a ranking of diseases according to their impact on disability-free life expectancy. Neither does the fact that some causes are not included in our study mean that their impact on disability is negligible.
Our results show that eliminating chronic, nonfatal diseases (e.g. arthritislback complaints and migraine/severe headache) results in an increase in disability-free life expectancy while the total life expectancy remains more 01'
less constant. Consequently, life expectancy with disability declines and absolute compression of morbidity occurs. For cancel', a highly lethal disease, elimination results not only in an increase in disability-free life expectancy but also in an even larger increase in life expectancy with long-term disability. In the years that people are saved £i'om dying of cancel', they experience disability £i'om other causes. Thus, elimination of this highly lethal disease leads to a relative expansion of morbidity. For diseases that are disabling and lethal (e.g. heart diseases and chronic nonspecific lung disease), the effect of elimination depends on the relative contribution of the mortality and disability decline. Eliminating heart disease, which has a considerable impact on the total life expectancy, leads to a relative expansion of morbidity.
These findings support previous research on how eliminating death and disability £i'om a chronic disease affects disability-£i-ee life expectancy, taking into account the fact that Mathers' study includes cerebrovascular diseases and that Colvez and Blanchet did not consider the effect of increased sur-
195

Chapter 8
vival on life expectancy without disability.3." The relatively small effect of eliminating cancel' on disability-free life expectancy compared with total life expectancy, which was responsible for the observed relative expansion of morbidity, was also found in other studies.3 The period of disability for this fatal disease is generally too short to produce a major impact on the disability prevalence.6 However, cancel' is a heterogeneous disease that represents a broad range of disease mechanisms. The case-fatality rate of breast cancel', which is common among women, is much lower than that of lung cancer, which occurs more often among men. The fact that we did not take into account the severity of disability but only its presence 01' absence might have also contributed to the small effect of cancel' on disability. The favourable evolution of the population health status as a result of eliminating of nonfatal, disabling diseases like arthritisiback complaints is also in agreement with other research.3.6•46
Our results have two important implications with respect to health interventions. First, they show that interventions aimed at eliminating lethal diseases, such as cancel' and heart disease, lead to an increase in years spent with disability. As a side effect of declining mortality, more people survive to older ages where the risk of being disabled is higher. If this is not (fully) compensated by an increase in disability-free life expectancy, life expectancy with disability increases, representing an increased burden for society. Second, nonfatal disabling diseases such as arthritisiback complaints, reduce disability free-life expectancy, so eliminating them can contribute to a compression of long-term disability into fewer years. Thus, in addition to research aimed at preventing fatal diseases, further research is needed to uncover the determinants of nonfatal disabling diseases and ensure interventions to prevent them.
References
1. Olshansky SJ, Rudberg MA, Carnes BA, Cassel CK, Brody JA. Tl'ading Off Longer Life for Worsening Health. JOllrnal o{Aging and Health 1991;3(2):194-216.
2. Robine JM, Ritchie K Healthy life expectancy: evaluation of global indicator of change in population health. British Medical JOlll'lwI1991;302(6774):457-460.
3. Colvez A, Blanchet M, Potential gains in life expectancy free of disability: a tool for health planning. Intemational JOllrnal 0/ Epidemiology 1983;12(2):224-229.
4. Manton KG, Stallard E. Recent trends in mortality analysis. Orlando, Fl: Academic Press, 1984.
5, Tsai SP, Lee ES, Hardy RJ. The effect of a reduction in leading causes of death: potential gains in life expectancy. Amel'ican JOll1'1l01 of Public Health 1978;68(10): 966-971.
6. Manton KG, Stallard E. Changes in health functioning and mortality. In: Stahl SM, ed. The Legacy 0/ Longevity. London, UK: Sage PublicatioIls, 1990:140·163.
196

The elimination of selected chronic diseases in a population
7. Fries JF. Aging, natural death, and the compression of morbidity. New England Journal of Medicine 1980;303(3): 130·135.
8. Fries JF. The compression of morbidity. Milbank Memorial Fund Quarterly/ Health al/d Society 1983;61(3):397·419.
9. Foets M, Van del' Velden J, De Bakker D. Survey Design, Dutch National Survey of General Practice, Utrecht, the Netherlands: Netherlands Institute for Health Care, 1992.
10. McWhinnie JR, Disability assessment in population surveys: results of the OECD Common Development Effort. Revue Epidemiologie de SOllie Publique 1981;29(4): 413·419.
11. Van Sonsbeek JLA Methodische en inhoudelijke aspecten van de OESO"indicator betreffellde lallgdUl'ige beperkingen in het lichamelijk fUllctioneren [Methodologi" cal aspects and content of the OECD"longterm disability indicator]. Maandbericht voor de Gezondheid {Monthly Bulletin of Health Statistics} 1988;7(6):4·17.
12, Dutch Advisory on Health Research. Advies chronische aandoeningell: prioriteiten VDor onderzoek [Advice on chronic diseases: priorities for research}. 's"Gravenhage, the Netherlands: Dutch Advisory on Health Research (RGO), 1991.
13. Social and CultUl'al Planning Office. Aanvullelld Voorzieningen Olldel'zoek [Amenities and Sel'vice Utilization SUl'uey}. Rijswijk, the Netherlands: Social and Cultural Planning Office (SCP), 1991.
14. Statistics Netherlands, De leefsituatie van de Nederlandse bevolking van 55 jaar en ouder 1982. Deel 1a Ilemcijfel's [The well"being of the eldery population in the Netherlands 1982: a survey on people aged 55 years and over}, 's"Gravenhage, the Netherlands: State Publishers, 1984.
15, Statistics Netherlands. IntramUl'ale Gezondheidszorg [Intramm'al Health Care]. Mawldbel'ichi. Gezondheidszorg [Monthly Bulletin of Health Statistitics} annually.
16. Statistics Netherlands. Statistiek van de bejaardenoorden [Homes for the Aged}. 's-Gravenhage, the Netherlands: State Publishers, annually.
17, SIG Health Care Information. Patient Register for the Intramural Mental Health Ca,.e (PIGG). Utrecht, the Netherlands: SIG, Health Care Information, annually.
18. SIG Health Care Information. Jaw'boek Velpleeglwizen [Annual Report of the Dutch Registry of Nursing Homes}. Utrecht, the Netherlands: SIG Health Care Information, annually.
19. Statistics Netherlands. Dverlevi/lgstafels /laa,. leeftijd en geslacht, 1981·1985 [L,fe tables by age and sex, 1981·1985}. 's·Gravenhage, the Netherlands: State Publish· ers/Statistics Netherlands, 1987.
20. Statistics Netherlands. Due,.leuingstafels naw' leeftijd en geslacht, 1986·1990 [Life tables by age and sex, 1986·1990}. 's·Gravenhage, the Netherlands: State Publish· ers/Statistics Netherlands, 1992.
21. Statistics Netherlands. Overledenen naar doodsool'zaall leeftijd en geslacht in het jaar 19 .. [Number of deaths by cause of death, age and sex in the year, 19 .. ]. Statis" tics Netherlands, annually.
22, Namboodil'i K, Suchindran eM, Life Tables and their Applications. Orlando, Fl: Academic Press, 1987,
23. Sullivan DF, Disability Components for an index of Health, Government Printing Office, 1971.
24. Sullivan DF. A single index of mortality and morbidity. HSMHA Health Repo,.ts 1971;86(4):347·354.
197

Chapter 8
25. Robine JM. Disability-n'ee life expectancy. In: Robine JM, Blanchet M, Dowd JE, ed. Health Expectancy. First WOl'llshop of the International Healthy Life Expectancy Netwol'il (REVES). London, UK: Her Majesty Stationary Office, 1992:1-34.
26. Hosmer DW, Lemeshow S. Applied Logistic Regression. New York, NY: John Wiley & Sons, 1989.
27.Mathel's C. Estimating gains in health expectancy due to elimination of specific diseases. Paper presented at the 5th meeting of the International Network on Health Expectancy (REVES·5), February 19·21. Ottawa, Canada, 1992.
28. Robine JM, Mathers CD. MeaslU'ing the compression or expansion of mOl'bidity through changes in health expectancy. In: Robine JM, Mathers CD, Bone M, Romieu 1, ed. Calculation of Health Expectancies: Harmonization, Consenslls Achieved alld Future Perspectives. Montpellier, France: John Libbey Eurotext, 1993:269-288.
29, Manton KG, Stallard E. Cross-sectional estimates of active life expectancy for the U.S. elderly and oldest-old populations. JOIIl'llal of Gerontology 1991:46(3): S170-S182.
30. Olshansky SJ. On forecasting mortality. Milbank Quarterly 1988:66(3):482-530.
31. Manton KG, Stallard E, Tolley HD, Limits to human life expectancy: evidence, prospects and implications, Population alld Development. Review 1991:17(4): 603-637.
32, Manton KG, The global impact of noncommunicable diseases: estimates and projections. World Health Statistics Quarterly 1988:41(3·4):255-266.
33. Fries JF. The compression of morbidity: miscellaneous comments about a theme. The Gerontologist 1984:24(4):354-359.
34. Manton KG. Changing concepts of morbidity and mortality in the elderly population. Milbank Memorial Fund Quarterly/Health and Society 1982:60(2):183-244.
35. Verbrugge LM, Lepkowski JM, Imanaka Y. Comorbidity and its impact on disability. Milbank Quarterly 1989:67(3-4):450-484.
36. Colantonio A, Kasl SV, Ostfeld AM. Level of function predicts fit'st stroke in the elderly. Stroke 1992:23(9):1355-1357.
37. Tsuji I, Minami Y, Keyl PM, et a1. The predictive power of self-rated health, activities of daily living, and ambulatory activity for cause-specific mortality among the elderly: a Ull'ee-year follow-up in urban Japan. JOIl1'1Zal of the American Geriatric Society 1994:42(2): 153-156.
38. Salive ME, Sattel'field S, Ostfeld AM, Wallace RB, Havlik RJ. Disability and cognitive impairment are risk factors for pneumonia-related mortality in older adults. Public Health Reports 1993:108(3):314-22.
39. Heliovaara M, Aromaa A, Klaukka T, Knekt P, Joukamaa M, impivaara O. Reliability and validity of interview data on chronic diseases. The Mini-Finland Health Survey. Journal of Clinical Epidemiology 1993:46(2): 181-191.
40. Jabine TB. Reporting chronic conditions in the National Health Interview Survey. A review of findings from evaluation studies and methodological test. Vital and Health Statistics 1987:2(105):1-45. DHHS Publication PHS 87-1379.
41. Sclll'ijvers CT, Strouks K, Van de Mheen DH, Coebergh JW, Mackenbach JP. Validation of cancel' prevalence data from a postal survey by comparison with cancel' registry records. American Joul'llal of Epidemiology 1994:139(4):408-414.
42. Van den Bos GAM, ZOl'gen van en VDor chronisch zieken {Care for the Chronically IllJ. Amsterdam, the Netherlands: Bohn, Scheltema & Hoikema, 1989: 38-42.
198

The elimination of selected chronic diseases in a population
43. Mathers C. Hea.lth expectancies in Australia 1981 and 1988. Canberra, Australia: Australian Institute of Health and Welfa~'e, 1991.
44. Robine JM, Michel JP, Branch LG. Measurement and utilization of healthy life expectancy: conceptual issues. Bulletin of the World Health Organisation 1992; 70(6):791-800.
45. Barendregt JJ, BOllneux L, Van del' Maas PJ. Health expectancy: an indicator for change? Journal of Epidemiology and Community Health 1994;48(5):482·487.
46. Reynolds DL, Torrance GW, Badley EM, et a1. Modelling the population health impact of musculoskeletal diseases: arthritis. Journal of Rheumatology 1993;20(6): 1037-1047.
199


General discussion

Chapter 9
9.1 Introduction
The focus of this thesis is on the association between mortality and morbidity and its implications for population health. The main reason fOl' conducting this study was the increasing awareness that there is no unequivocal association between the length of life of people and their state of health. Longer life may imply both better and worsening health. Hence, next to pursuing the lengthening of life ('adding years to life'), special attention should be devoted to the public health goal of increasing the quality of life ('adding life to years'). Against this general background, this study aimed at determining the conditions necessary for longer life to be associated with better health. The aim was thus to assess which changes in underlying patterns of mortality and morbidity would produce a reduction of years with disability (,absolute compression of morbidity') and/or a reduction of the proportion of life with disability ('relative compression of morbidity').
The main research question implied three subquestions. These are answered in separate parts of this thesis, in the following way: 1. Central to the compression-of-morbidity hypothesis is the lack of changes
in life expectancy at advanced ages, and the increasingly rectangular shape of the survival curve (referred to as 'rectangularization'). Therefore the aim of the fu'st part of this thesis (chapters 2, 3 and 4) was to examine these issues, for which reliable mortality data were available. Given the vagueness with which the concept of rectangularization is often used, we started by defining the concept in an unambiguous way. Changes in the shape of the survival curve and in life expectancy in The Netherlands were linked to changes in age- and cause-specific mortality by means of decomposition analyses.
2. Having analyzed and discussed changes in old-age mortality, disability was taken into consideration as well. Only in this way could justice be done to the important, nonfatal consequences of chronic diseases. In the second part of this thesis (chapter 5), therefore, the aim was to describe CUl'l'ent age-specific mortality and disability patterns in the Dutch adult population and to translate these patterns into an integrated indicator of population health. No longer was a model with two health states ('alive' and 'dead') used; one with three health states was constructed by subdividing the living state into two states ('alive without disability' and 'alive with disability'). This model was used to calculate health expectancy (i.e. life expectancy with and without disability).
3. The three-state model was used to c.onduct two of the tru:ee scenario calculations in the thu:d part of this thesis (chapters 6 and 7). This part aimed at determining the conditions necessary for compression of morbidity in The Netherlands to occur. In chapter 6 we opted for a general approach to this problem. We examined which changes in incidence, recovery and mortality among nondisabled and disabled persons would produce compression of morbidity. In chapter 7 the approach was more
202

General discussion
specific: we studied the effects of eliminating smoking. Finally, in chapter 8 we studied whether the elimination of selected clll:OniC diseases would produce compression of morbidity.
The present chap tel· provides a general discussion and summary of these studies and addl·esses inlplications for further research and public health policy. A detailed discussion of each study can be found in the discussion sections of the separate chapters.
9.2 Summary of the outcomes
Part I Old-age mortality and rectangularization
In the fu·st part of this thesis (chapters 2·4) we described and explained reo cent changes in Dutch mortality. We focused on rectangularization and changes in life expectancy at older ages.
Recent changes in life expectancy of the elderly population were studied in chapter 2. We calculated life expectancy for men and women at two ages, namely at age 60 and at age 85, for the period 1970·1994 (5·years periods). It was found that life expectancy at age 60 increased in the period 1970174· 1980/84 (1970s) and 1980/84·1990/94 (1980s). Of particular interest were the results of the analysis concerning the changes in life expectancy at age 85, because these differed from what was found in other countries. We found that life expectancy at age 85 . after an initial increase - has been declining fi·om 1980/84 (men) and 1985/89 (women) onwards. We then took a closer look at these changes in life expectancy, fu·st by decomposing them by age group and next by decomposing them by cause of death. From the decomposition by age group it became clear that a stagnation in the decline in mOl·tality rates in women aged 85·89 and the increase in mortality rates above age 85 (men) and age 90 (women) caused the described changes in life expectancy at older ages. Then we took a closer look at these changes by decomposing them by cause of death. In summarizing the results of this analyses, we focus here on the remarkable reversal of the trend in life expectancy at age 85. This change could be attributed to smaller mortality reductions (or sometinles even an increase in mortality) fi·om cerebrovascular diseases and other cardiovascular diseases - which contributed largely to the increase in life expectancy at age 85 in the 1970s - and mortality increases fi·om chronic obstructive pulmonary disease (COPD), mental disorders, cancer (prostate and other cancers), diabetes mellitus and ill-defuled conditions.
In chapter 3 we performed a study to determine whether rectangularization of the survival curve occurred in The Netherlands in the period 1950-1992. Because different meanings are assigned to the concept of rectangulariza-
203

ChapteT' 9
tion, which are often not made explicit, we chose to define this concept in an unambiguous way. We defined 'l'ectangularization' as a trend toward a more rectangular shape of the survival curve due to increased survival and concentration of deaths around the mean age at death. We distinguished between absolute and relative rectangularization, depending on whether an increase in life expectancy was accompanied by a concentration of deaths into a smaller age interval (absolute rectangularization) or into a smaller proportion of total life expectancy (relative rectangularization). Our analyses showed that absolute and relative rectangularization of the entire survival curve occurred in both sexes and during almost the entire period. For older ages (above age 60Y,) the results were less unequivocal. Relative rectangtllarization occurred in women over the whole period, but in men only from 1975179 on. Absolute rectangtliarization has occurred in both sexes since 1980/84.
In chapter 4, we analyzed the contribution of selected causes of death to the rectangularization of the survival curve of Dutch men and women above age 60 in the 1980s. Using a decomposition analysis enabled us to determine why rectangtllarization took place in the 1980s but not in the 1970s. For reasons explained in this chapter, we focused on absolute rectangularization (henceforth rectangtllarization). We found that rectangtllarization in the 1980s was due to mortality reductions from ischaemic heart disease, cerebrovascular diseases (both sexes) and lung cancer (men omy) and to mortality increases from COPD (men) and mental disorders (women). Comparison with the 1970s demonstrated that particularly changes in mortality at advanced ages (i.e. smaller mortality reductions and (larger) mortality increases) were responsible for the reversal from a decreasing rectangular shape of the survival curve in the 1970s to rectangularization in the 1980s. Thus the combination of increased survival to advanced ages and reduced survival at advanced ages explains why recently rectangularization of the survival curve took place in The Netherlands.
Part II Health expectancy
In the second part of this thesis (chapter 5) we described and analyzed current mortality and disability in the Dutch adult population.
First, we estimated age-specific incidence rates of disability, recovery rates from disability and mortality rates among the nondisabled and the disabled using Poisson regression with offset (also known as the 'log-rate mode!'). We found that the incidence of disability and mortality among nondisabled and disabled persons rose with increasing age, whereas recovery from disability declined with increasing age.
204

General discussion
Next, by using a multistate life-table model, we summarized our findings into a population health indicator, the so-called 'health expectancy'. Health expectancy was operationally defined as life expectancy with and without disability. In 1986-1994, total life expectancy at age 30Y, was 44.8 years for Dutch men and 50.8 years for Dutch women. Based on the definition of disability used in chapters 5-7, we found that respectively 38.5 and 38.4 years were spent without disability. The remaining 6.4 (14.2%) and 12.4 (24.3%) years were spent with disability. At age 70Y" life expectancy was 10.7 and 14.3 years, respectively. About 6.3 and 5.8 years were spent without disability, and 4.4 (41.3%) and 8.5 (59.6%) years with disability, respectively.
These successive analyses were due to make up the frame of reference for two of the three analyses in the third part of the thesis, where the estimated incidence, recovery and mortality rates, as well as the resulting total life expectancy and life expectancy with and without disability were used as starting point.
From a methodological point of view the analyses in chapter 5 were also of interest, because they provided a detailed description of how a multistate life-table model of health expectancy and its transition rates could be estimated on the basis of longitudinal data. That these datasets happened to originate from two different countries (The Netherlands: GLOBE and United States of America: LSOA) was a complicating factor, but in the end proved to be no serious obstacle. Apart from a few uncertainties that were dealt with in sensitivity analyses in later chapters, we concluded that the model estimates of total life expectancy, age-specific total mortality rates and age-specific disability prevalence were in close agreement with the estimates based on national (i.e. Dutch) datasets. In other words, the model estimates reproduced the Dutch situation for the purpose of scenario calculations in a satisfactory way.
Part III Compression of morbidity
The thll'd aim of this thesis was to examine which changes in current mortality and disability patterns are necessary to achieve compression of morbidity in The Netherlands. In each scenario, our focus was on life and health expectancies at ages 30Y, and 70Y" with the exception of chapter 8, where we focused on 15 and 65 years of age, respectively.
In chapter 6 we studied which changes in the age-specific incidence rates of disability, recovery rates from disability and mortality rates among nondisabled and disabled persons would be needed to achieve compression of morbidity. We found that both decreasing incidence rates and increasing recovery rates at all ages would (ceteris paribus) produce compression of morbidity (in an absolute and a relative sense). The impact of improving incidence
205

Chapter 9
was found to be larger. A decrease at all ages in the mortality rates among nondisabled and/or disabled persons, would result in absolute and relative expansion of morbidity. Above age 30Y" with moderate declines (by 20%) in mortality rates at all ages among both nondisabled and disabled persons, at least equal proportional improvements in both incidence and recovery rates would be necessary to achieve compression of morbidity. For an improvelllent to occur in either incidence rates or in recovery rates, improvements of a respective 30% and 50% at least would be required. It was also shown that gl'eater improvements at all ages would be needed to achieve absolute compression of morbidity above age 70Y,. This implies that absolute compression of morbidity above age 30Y, might co-occur with absolute expansion of morbidity above age 70Y,.
In chapter 7 we examined whether eliminating smoking would produce compression of morbidity. We found that eliminating smoking would not only increase total and disability-free life expectancy, but would also produce compression of morbidity (in an absolute and a relative sense). Tlms, despite the fact that life is extended as a consequence of eliminating smoking and people are thus longer exposed to disability, lower incidence rates of disability and higher recovery rates f["Om disability produce on balance a reduction in years with disability.
Finally, in chapter 8, we determined whether elimination of selected chronic conditions would lead to either compression or expansion of morbidity. We found that eliminating disabling diseases such as artlll'itisiback complaints would result in compression of morbidity in both an absolute and a relative sense. Elimination of highly fatal diseases such as cancer would lead to an increase in years with disability. Whether elimination of diseases that are both disabling and fatal (e.g. heart diseases and chronic nonspecific lung disease) results in compression or expansion of morbidity, depends on the extent to which they cause mortality and disability. For example, eliminating heart disease, where the impact on total mortality exceeds the impact on disability, would lead to expansion of morbidity in both an absolute and a relative sense. As far as chronic nonspecific lung disease is concerned, however, elimination would lead to both absolute and relative compression of morbidity.
9.3 Evaluation of the research design
The compression-of-morbidity hypothesis formulated by Fries in 1980' was one of the incentives to conduct the research for this thesis. Although Fries' work meant a gl'eat stimulus for further research in this field, it did not provide a full understanding of the changes in mortality and morbidity patterns that would have to occur to observe compression of morbidity in the population. Paradoxically, this lack of understanding is partly due to the miscon-
206

General discllssion
ceptions introduced by Fries when he formulated his hypothesis. In our view, two aspects of his approach needed revision: (1) the dissociation of (changes in) mortality from (changes in) morbidity and (2) the absence of a quantitative assessment of (changes in) overall morbidity in the population that occurred 01' that would have to occur to observe compression of morbid· ity.
Fries combined changes in mortality (i.e. the occurrence of rectangulariza· tion of the survival curve) with changes in morbidity in the population, but he in fact failed to take into account that changes in morbidity affect mol" tality in a population and vice versa. In other words, he disregarded the fact that changes in morbidity occur simultaneously with changes in mortality and that changes in both are inextricably bound up with each other. A closer look at Fries' formulation of the compression·of·morbidity hypothesis may clarify this point.
From his observation of the rectangularization of the survival curve, Fries concluded that the human life span was fixed. A fIxed human life span im· plied that (in the end) life expectancy would reach a maximum, in other words that it would not expand beyond this limit. At this point most people would die fi'om 'natural death' (i.e. death without disease). In addition, Fries argued that chmnic diseases could be postponed and that many of the 'markers' of aging could be modified. Given these two propositions, Fries argued that postponing chronic illness (i.e. increasing lifetime spent fi'ee of morbidity) would result in a compression of morbidity in the population.l
At fIrst sight Fries' reasoning looks plausible, but a closer look reveals its weaknesses. Although Fries did not deny the association between mortality and morbidity, he nevertheless described a situation in which this association played no role whatsoever. In fact, he disconnected morbidity and mortality. He did so by arguing that the number of years spent with disability would decrease as morbidity was compressed into the shorter span between the increasing age at onset of disability and the fixed occurrence of death. This line of reasoning is founded on the erroneous premise that life expectancy is ah'eady fixed, while at the same time morbidity can still be postponed. He presented the pmcess of rectangularization as if the survival curve had already reached its 'ideal' rectangular shape and that any change in morbidity would actually have no effect on mortality at all. It goes without saying that this is a very unlikely situation. As long as this 'ideal' shape has not become reality - and even fi'om Fries' study it becomes clear that this is not actually the case - life expectancy is not fixed and thus it is likely that changes in morbidity will lead to changes in total life expectancy, especially as Fries mentions the important mortality consequences of cln'onic diseases.
Hence the conclusion is inescapable that whether 01' not compression of morbidity occurs in such a situation depends on relative changes in the inci-
207

Chapte/' 9
dence of and recovery and mortality from diseases. Therefore we required a model which included both mortality and morbidity and explicitly took into account the interaction between both. Moreover, if total life expectancy is not fixed but can increase, increases in morbidity-free life expectancy can cooccur with increases in the length of life spent with morbidity. Pl'evious research on trends in health expectancy has shown that this is not a purely hypothetical outcome.'" Besides, the results of chapter 6 of this thesis demonstrate that the conditions underlying such an outcome are not unrealistic. The lesson is, therefore, that changes ill morbidity-free life expectancy should always be evaluated in relation to changes in the other health state(s), rather than ill isolation.
When Fries focused on the 'postponement' of chronic diseases and its consequences, he did so in a broad sense and in a tentative way. He was not very concerned about the assessment of the incidence and pl'evalence of such diseases in the population, and about the measurement of total morbidity induced by the whole range of chronic diseases prevalent in the population. As a consequence, the net effect of the 'postponement' of specific diseases on the time spent with morbidity remained obscure, despite the fact that Fries presented some figures at several points in his article. TIlls shortcoming motivated us to study all morbidity prevalent at the population level (above a certain disability tm·eshold). Only by taking into account morbidity due to all diseases which are prevalent can one assess the conditions necessary for a compression of morbidity in a population.
Our criticisms of Fries' premises are reflected in the design of our study. Firstly, we studied the interaction between mortality, morbidity and population health by means of a multistate life-table model, which allowed us to study mortality and morbidity in conjunction. Secondly, we considered changes in health expectancies in all health states together, instead of focusing on changes in the length of life in the morbidity-free state. To obtain an unambiguous interpretation of these changes with total life expectancy not fixed, we classified changes as absolute compression, relative compression, absolute expansion and/or relative expansion of morbidity. Thil'dly, we focused on the total burden of morbidity, caused by numerous cm'onic diseases and/or aging, instead of on specific diseases. Our approach can be characterized as a top-down app/'oach, generated fwm generic health states.
These features of our research design merit a more profound discussion, which can be found in the following paragraphs.
9.3.1 The use of life tables in this thesis
Depending upon the research question and the data available, different types of life-table techniques were used in this thesis. The main feature of the life table is that it translates age-specific decrement (e.g. incidence and
208

General discussion
mortality) and increment (e.g. recovery) rates into an indicator of population health, such as life expectancy (total or according to health state). Time or duration is the unit of measurement and the common denominator in which different dimensions of population health status (in this thesis: mortality and disability) are expressed. By using this common denominator, the life table allows for the synthesis of a huge amount of data and for the integration of different aspects of health into one or a few indicators of population health. An important property of this indicator of population health is that the magnitude of the effect of (changes in) age-specific decrement and/or increment rates on the indicator is weighted by the size of the life-table population in a certain age group exposed to the (changed) rate and the remaining life expectancy of this age group. Due to this weighting, changes in decrement and/or increment rates that are not important for the health of the population, for instance because the population at risk being exposed to these rates is rather small, are not weighted heavily in the indicator of population health. In general, changes at young ages have a larger impact on life expectancy than changes at advanced ages. This is due to the facts that (1) only a small proportion of the population is exposed to changes in mortality and disability rates at advanced ages - as not everyone will survive up to these ages - and (2) the remaining life expectancy at older ages is much smaller, reflecting the high risks of mortality at older ages. An additional but not unimportant advantage for answering the research questions raised in this thesis is that the summary measure obtained from a life table is unaffected by the age distribution of the. actual population under study, which enables comparisons to be made over time (chapter 2-3), between groups (by sex, chapters 2-8) and between the outcomes before (Le. at baseline) and after the induced changes in 'what-if experiments (chapters 6·8).
In line with the summarizing capacity of the life-table approach is its potential to link (changes in) the measures of population health with underlying age-specific mortality and disability rates. By using a life table, age-specific rates can be translated into a population (bealth) meaSUl'e, whereas by using a life-table decomposition technique changes in population measures can be related to underlying changes in age-specific rates.
There are at least thl'Se reasons why it is indispensable to switch between these two levels of analysis. First, translating changes in age-specific mortality (and morbidity rates) to changes in life expectancies (in different health states) is important for evaluating the consequences of epidemiologic changes for public health. In the course of tlris translation, the relevance of epidemiologic changes for the health of the population is handled by relating changes in mortality (and morbidity rates) to the life-table population. As mentioned, changes in mortality and morbidity rates that are less important from a population perspective, for example because the population at l'isk is small, are not weighted heavily in the summary population health measure. Hence if changes in age-specific rates only are examined, this can easily lead
209

Chapter 9
to an overestimation of the contribution of mortality reductions at older ages to the change in population health. Secondly, by relating changes in summary population health measures, like life expectancy and health expectancy, to changes in underlying mortality and disability rates, light is shed on the possible determinants of these changes in population health. Although not of primary importance for the research questions raised in this thesis, a final reason to consider changes in mortality rates, is that the changes affect to a substantial degree the size and the age structure of the elderly population. Apart from (changes in) population health, the size and age structure of the population determine the absolute number of persons who are ill or disabled. Tllis kind of information is indispensable for health planning. .
'I\vo other features of the life table should be mentioned here. First, the lifetable approach accommodates substitution between different causes of increment and decrement. The mechanism of substitution is well known for mortality from different causes. The substitution effect is seen when, on eliminating one cause of death, the number of deaths /i'om the remaining causes of death increases. Persons not (or less) exposed to one cause of death remain alive and are thus exposed longer to the remaining causes. In the case of substitution it is assumed that the mortality risks of the l'emaiIling causes are the same before and after the elimination of this specific cause of death (the so-called independence assumption). Otherwise, the mechanism is termed 'competition'. Substitution works in a similar way in the case of other causes of decrement and causes of increment. For example, a lower mortality risk will result in a higher number of persons subject to the same risk of incidence of disability and thus in an increase iIl the number of incident cases. The mechanism of substitution explains why there will be only a limited gain in total life expectancy when an important cause is eliminated ('Taueber paradox'").
Secondly, the life table takes into account age-dependence, by using age-specific rates. Age-dependence is very important, as mortality and disability are strongly associated with age. The chances of improving 01' maintaining good health decrease with increasing age, whereas the chances of deteriorating health 01' of dying increase. As a consequence, the prevalence of disability and total mortality risks increase with increasing age.
Age-dependence is important in combination with substitution. A lower mortality risk in one age group will result in a higher numbm' of persons alive in the next age group, who are subject to the higher mortality and disability risks of that age gl'OUp. Unless counterbalanced by a l'eduction of the prevalence rates of disability, substitution and age-dependence together produce an increase in the number of years with disability, in case mortality reductions occur. This effect was found when (1) causes of death were eliminated (chapter 8), (2) mortality rates among nondisabled and' disabled persons
210

General discussion
were l'educed (chapter 6) and (3) when the excess mortality risk associated with smoking was eliminated (chapter 7).
Throughout the life· table analyses of this thesis, independence between causes was assumed when dealing with multiple causes of increment andior decrement. Under this assumption, a change in any of the risks leaves the risks of the other causes unchanged. If, for example, cancel' were to be eliminated, we assumed that the risk of dying fl'Om heart diseases would remain the same. The independence assumption is valid only when populations are homogeneous in increment andior decrement risks. Although it is obvious that in reality this will never be the case, often the assumption of independence cannot be avoided as the exact nature of the dependence between multiple causes is unknown. A way to take into account heterogeneity in !'isks of increment and decrement, while still using the independence assumption, is to sub-divide a heterogeneous population into homogenous groups according to the risks examined. Such a sub-division provides for 'local independence'. In chapters 5 and 6, local independence was created by subdividing the population into persons with and without disability. In chapter 7, the population was further subdivided into smokers and nonsmokers to take into account differences in the !'isk of incidence, recovery and mortality between these two gl'OUps.
In chapter 8 we could not use a model with separate states for nondisabled and disabled persons. Instead, we had to use the Sullivan method, which is an extension of the single-decrement life table. In the standard single-decrement life table, as in the Sullivan method, death is the only cause of decrement of the life-table cohort. The distinction into years with and without disability is made by multiplying the number of person years per age interval by the pl'Oportion of persons in different health states. In chapter 8 we could not use the multistate life table because the data available lacked the statistical power to allow for linking-specific diseases to incidence of disability, recovery from disability and mortality among nondisabled and disabled persons. On the other hand, the disease-specific mortality data needed for the Sullivan method to answer our research question were available from Statistics Netherlands. However, this methbd has its disadvantages. If underlying age-specific transition rates (e.g. incidence, recovery, case-fatality rates of disability) change, it takes a long time for age-specific prevalence (the proportions of those having disability) to reach a new equilibrium value. This makes the Sullivan method less appropriate for meastu'ing changes. The Sullivan method only produces an unbiased estimate in a steady state situation when a (new) equilibrium has been !'eached."·8 This problem with the Sullivan method, caused by the different dynamics of mortality rates (flows) and disability proportions (stocks), had no consequences for the 'what·if experiment described in chapter 8. In this experiment both mortality and disability related to a specific disease were eliminated in a synthetic cohort, in order to know what would be the eventual consequences of this
211

Chapter 9
change. We were not interested in the process of change, but only in the long-term effects after a new equilibrium was finally reached. Finally, all life tables used in this thesis were period life tables. The period life table gives a cross·sectional summary of the mortality and disability experienced in a single period (e.g. one year) and uses a synthetical (hypothetical) cohort instead of a real cohort. Hence the information from one period is arranged as a cohort, assuming that age-specific increment and decrement rates remain constant over the entire life time of this hypothetical cohort. Period life tables were used in this thesis because data on birth cohorts wholly consisting of people ah'eady deceased (i.e. extinct cohorts) were only available for cohorts born before 1896·1899 in The Netherlands. As far as disability was concerned, cohort data were only available for a very limited period, as the follow-up was six years at most. A consequence of using period life tables was that differences in life histories between individuals from different cohorts, which are likely to be reflected in the observed decrement and or increment risks, are ignored. Although the life-table model produces health measures (like the life expectancy) that are both meaningful at population level and for individuals, when period life table are used CaUtion should be exercised when interpreting the measure in the latter sense. Therefore, the outcomes of this thesis should be interpreted as summary measures of a given period (using the life-table population as kind of standard population), rather than as a measure of the expected life·course experience of any real bi.rth cohort.
9.3.2 Classification of compression of morbidity
We looked at changes in health expectancies in aU health states, instead of only in the disability-free state, to obtain an unambiguous interpretation of the outcomes in a situation where total life expectancy is not fixed. As pointed out in chapter 8, only in a situation where total life expectancy is constant does, an increase in disability-free life expectancy automatically imply a decrease in life expectancy with disability. When total life expectancy increases, an increase in the disability-free life expectancy may be accompanied by (1) no change, (2) a reduction or (3) an increase in life expectancy with disability. Similarly, an increase in life expectancy with disability may be accompanied by either an increase or a decrease in the proportion of life with disability. Depending on the magnitude of the changes in disabilityfree life expectancy, life expectancy with disability and the percentage of life with disability, we distinguished in chapter 8 between absolute compression, relative compression, relative expansion and absolute expansion of morbidity. Table 1 gives an overview of tlils classification under the heading 'old'. For example, a decline in disability-free life expectancy is classified as absolute expansion. This classification was based on an earlier classification by Rabine and Mathers. and enabled us in chapter 8 to analyze the effects of eliminating chronic diseases in terms of absolute and relative compression
212

General discussion
and expansion of morbidity, while taking into account increases in total life expectancy.
However, it turned out that the classification did not fit each situation well. The classification proved useful when total life expectancy was constant or increasing, but not when total life expectancy was decreasing. For example, the scenario-calculations of chapter 4 showed that a decline in life expectancy without disability occurred when mortality rates increased. On the basis of the above mentioned classification, this situation should be labelled as absolute expansion. But one may well \vonder why the same situation should not be classified as absolute compression, as life expectancy with disability was declining too. This example explains why we adjusted the classification in chapter 6. (This chapter was written after we finished chapter 8.)
Table 1 Classification of Health Outcomes According to the Old and New Classification
LE DLFE LED % LEDin LE 'old' (chapter 8) 'new' (chapter 6)
LEt DFLEt LEDt %t AC AC-RC
LEt DFLEt LED" %.j, equil. AC/RC equil. AC/AE-RC
LEt DFLEt LEDt %.j, RC AE-RC
LEt DFLEt LEDt %= equil. RC/RE AE-equi!. RC/RE
LEt DFLE t LEDt %t RE AE-RE
LEt DFLE" LEDt %t equi!. REiAE AE-RE
LEt DFLE.j, LEDt %t AE AE-RE
LE" DFLEt LED.j, %.j, AC AC-RC
LE" DFLE" LED= %= no change nochange
LE = DFLE.j, LEDt %t AE AE-RE
LEt DFLEt LED.j, %-!- AC AC-RC
LE.j, DFLE= LEDt %.j, ? AC-RC
LE .j, DFLE.j, LED.j, %.j, AE AC-RC
LE .j, DFLE.j, LED.j, %= AE AC-equil. RC/RE
LE .j, DFLE.j, LED.j, %t AE AC-RE
LE.j, DFLE.j, LED= %t AE equil. AC/AE-RE
LE.j, DFLEt LEDt %t AE AE-RE
Where:LE total life expectancy DFLE disability-free life expectancy LED life expectancy with disability % LED in LE proportion of life with disability = 1- proportion of life without disability AC absolute compression of morbidity RC relative compression of morbidity AE absolute expansion of morbidity RE relative expansion of morbidity equi!. RC/RE equilibrium between RC and RE AC-RC both AC and RC
213

Chapter 9
In distinguislllng between absolute compression and absolute expansion in the new classification, the change in the number of years with disability (or the difference between total life expectancy and life expectancy without disability) is decisive. A decline in the number of years with disability points to absolute compression. However, solely distinguishing between absolute compression and expansion of morbidity may sometimes be too crude. For example, it is useful to distinguish between a situation in which a slight absolute expansion of morbidity is accompanied by a substantial gain in years without disability and a situation in which a substantial increase in years with disability is accompanied by only a slight increase in disability-fl'ee life expectancy, although both are classified as absolute expansion of morbidity. The change in the percentage of life with disability provides information on the distribution between years with and without disability in the gained years as compared to the baseline situation. Therefore, relative measures of compression and expansion of morbidity should be used as well. To determine whether relative expansion also occurred, the change in the percentage of life with disability is considered, with an increase of this percentage indicating relative expansion. Any particular situation can be classified as a combination of absolute compression 01' expansion, combined with relative compression or expansion. In this adjusted classification, compression and expansion are complementary to each other (i.e. absolute compression implies the absence of absolute expansion). Table 1 classifies all possible combinations of changes according to the 'old' classification of chapter 8 and the 'new' classification of chapter 6. Although the original classification can be used in most situations, we consider the adjusted classification as more appropriate, because it fits any situation and is more transparent.
9.3.3 The top-down approach
Our research design is characterized by a top-down approach, which means that generic health states are our starting points. We established two such states ('dead' and 'alive'), when focusing on mortality, and three states ('nondisabled', 'disabled' and 'dead') in the studies conceming health expectancy. These health states are outcomes of underlying pattel'lls of morbidity and (disease-specific) mortality. The main feature of the top-down approach is that the point of departure is formed by generic outcomes rather than underlying diseases. In other words, rather than modelling diseases, the consequences of diseases, 'disability' and 'death', were modelled. The altel'llative would have been a bottom-up approach. Main feature of the bottom-up approach is that one starts with individual diseases instead of generic health states as in the top-down approach. The bottom-up approach models a causal chain running from disease incidence, to disease prevalence and fl'om there to disease-specific and total disability prevalence and disease-specific and total mortality. The relationship between disease prevalence and disability prevalence is generally modelled using disability weights. IO.!2 In this
214

General discussion
approach the life-table model distinguishes several disease states, instead of the generic health states in the top-down approach.
When focusing on life expectancy and rectangularization of the survival curve, the bottom-up approach deserves no serious attention as an alternative. In mortality analyses, there is no need to model all underlying diseases, since disease-specific mortality data are widely available. Using these data, changes in life expectancy 01' rectangularization can be easily related to changes in disease-specific mortality by decomposition techniques. In this thesis, two decomposition techniques were used. One decomposition technique was developed in the course of this research (chapter 4), the other already existed (chapter 2).
When studying health expectancy and compression of morbidity, the bottomup approach could have been used as well. l3 Therefore we will briefly compare the approaches on the following points: (1) the way disease and disability are linked, (2) the amount of data required and (3) the nature of the data required.
The linhing of disease and disability In a top-down approach, information on disease-specific disability can be obtained from multivariate modelling of the relation between disability and diseases (chapter 8) 01' from self-report of the cause of disability.!" Once this information is available, observed changes in health expectancy can be explained by means of decomposition analyses - a method that still needs further development - and consequences of changes in specific diseases can be estimated by using cause·elimination techniques. Thus in the top-down approach, additional steps are often required to link generic health outcomes to underlying diseases, and some of these .steps still need further development and sophistication.
This is not the case with the bottom-up approach, which models the causal chain running u'om diseases to disability in the population. Although the relationship between specific diseases and disability observed in a population may thus look more straightforward in the bottom-up approach than in the top-down approach, it is not always clear which disease(s) cause(s) disability. In the bottom-up approach as followed by Barendregtl3 and Murray 11,12, the link between specific diseases and disability is based on weighting by experts. The weights are conceptualized in terms of the dish'ibution of disability throughout the course of a disease 01' injury episode. Thus, they are not based on measurement of the disabling consequences of diseases in a population and do not add up to reproduce disability incidence or prevalence as observed at the population leve!.16 In addition, not all disability is caused by diseases, u'ailty, too, may cause disability. The assessment of disability weights by experts is in fact the miJ.·ror image of the multivariate modelling approach we developed in chapter 8 to estimate the pro-
215

Chapter 9
portion of disability prevalence associated with each of a number of chronic diseases. Thus the bottom-up approach and the top-down approach eventually involve the same kind ofpartiy unsolved problem: the assessment of the link between disease and disability.
The amount of data requi,.ed It is obvious that the bottom-up approach, proceeding from specific diseases, requires an immense amount of data. Substantial efforts are needed to estimate consistent series of incidence, prevalence and mortality rates for each disease. Data availability is no problem as far as disease-specific mortality is concerned, for as a rule cause-of-death data are available. However, data on incidence of chronic diseases are in most cases not readily at hand. In addition, modelling all diseases that are prevalent in the population, would require a life table with a huge number of states, and even more flows between all these states. Such a life table can easily become unmanageable. This problem could be handled by modelling only a limited number of diseases and creating a rest category consisting of all other diseases. The disability caused by these remaining diseases, i.e. 'all-other-cause' disability, can be estimated with a different technique and using other sOllrces. lO But even then a (considerable) number of diseases should still be modelled separately. Moreover, one needs to be sure that the weighting of the specified diseases and the estimation of 'all-other-cause' disability are based on the same kind of disability measures. In the top-down approach, data on disability are usually obtained from population health surveys. Estimation of transition rates on the basis of data from health interview surveys is a time-consuming effort, yet the modelling of all diseases in the bottom-up approach would requi.J:e even greater effort.
The nature of the data ,.equired In general, the bottom-up approach uses clinical data !i-om administrative datasources, like hospital records, and from general practitioners' records, as well as data from epidemiological studies, whereas the top-down approach uses population health surveys. An advantage of using population health surveys in the top-down approach is that, because these surveys are not confined to people who have sought medical care, the disability burden of the whole population can be assessed. In addition, surveys contain a huge amount of information on subjects, among which thei.r health behaviours, chronic diseases, socio-demographic characteristics and so more. Such information can be used to link disability to diseases and to risk factors.
But the fact that data on disability are derived !i'om surveys also has some disadvantages. First, non-response and attrition (because persons leave the survey) may bias the outcomes, for example, when incidence of disability, recovery !i'om disability and/or prevalence of disability differ(s) between respondents on the one hand and those who did not participate or left the survey on the other hand. Especially in longitudinal studies, selection bias
216

General discllssion
might endanger the representativeness of the conclusions. We checked at several phases in the longitudinal analyses in the thesis, whether the datasets sufficiently reproduced the Dutch situation (chapter 5). This evaluation did not lead us to seriously doubt the reproduction of the Dutch situation.
Second, disability data n'om surveys are often based on self-report. Therefore, inaccurate reporting or inconsistent reporting over time may also cause bias. The magnitude of this potential bias is still unclear. Although comparisons between self· reported and performance-based measures of disabilities showed a discordance 16. l8, this difference cannot be ascribed to inaccurate reporting only. It may also be related to the fact that self-report and performance of disability do not measure the same concept. 16•l9 Regarding changes in a person's disability status over time, uncertainty exists as to whether all changes reflect l'eal changes in the inclividual's disability status. This problem could partly be handled by using the life table. Since incidence and recovery rates are analyzed simultaneously in a life table, the effects of inconsistent reporting which inflates both incidence and recovery rates, (partly) nullify each other when summm-ized as health expectancy. The problem that changes in self-report of morbidity (including disability) may also be produced by other factors than changes in intrinsic health alone, such as changes in the social climate or health aspirations, is probably of less relevance to the research of this thesis. After all, in our study we examined changes in two·years intervals and substantial changes are not likely to occur within such short periods.
Third, compared to administrative data sources, the sample sizes of surveys are rather limited. Using small numbers may cause erratic changes across ages. In this thesis we tried to reduce the problem of small numbers by using log-rate (chapters 5 and 7) and logistic (chapter 8) regt'ession analysis.
The comparison of the top-down and the bottom· up approach shows that each approach has its weak and strong points. If the sole purpose of a study is to provide policy makers with recommendations fOl' where and how to intervene in public health, the bottom-up approach deserves serious attention. After all, the starting point of the bottom-up. approach is diseases, which are the most important causes of disability. Diseases are more amenable to interventions than the generic health outcomes of the top-down approach, because a large body of epidemiological knowledge exists on the causes and risk factors underlying specific diseases. Nevertheless, the top·down approach is based on the measurement of the disabling consequences of diseases in a population and thus it reproduces disability incidence or prevalence as observed at the population level. This approach has advantages over the bottom-up approach in cases where the purpose of the study is to assess overall changes in health expectancy and to determine whether compression of morbidity occurs. In addition, when the purpose of the study is to obtain more insight into the kind and size of changes in mortality and morbidity
217

Chapter 9
necessary to achieve compression of morbidity, the top-down approach deserves serious attention. Moreover, the data requirements of the top-down approach are less demanding, making the approach more widely applicable.
9.4 Evaluation of the relationship between changes in total mortality and compression of morbidity
9.4.1 Treating total mortality as not (yet) fixed
In the fu'st part of this thesis, we examined changes in total mortality. More specifically, we studied changes in total life expectancy and in the shape of the survival curve for the elderly population, both of which played a key role in the compression-of-morbidity hypothesis. We found that during the period 1980/84 to 1990/94 life expectancy at age 60 continued to increase. However, the increase in life expectancy at age 85 came to a halt and life expectancy at this age was shown even to have declined since 1980/84 in men and since 1985/89 in women. In addition, we found that rectangularization of the survival curve above age 60 has been in progress (in both ap absolute and a relative sense) since 1980/84 in both sexes. Based on cause-specific analyses, we discussed possible explanations for these recent mortality developments in The Netherlands. Apart from (past) smoking behavioUl' in men, we concluded that changes in the distribution of morbidity and frailty in the population might have played a role. However, until more insight is gained into the exact mechanisms which caused the recent increase in mortality at advanced ages, it will remain uncertain whether these changes are temporary or lasting. Uncertainty also relates to the implications of the recent mortality developments for achieving compression of morbidity. In chapter 4 we discussed the implications of rectangularization for achieving compression of morbidity. On the one hand, delaying the age at onset of cln'onic diseases and long-term disabilities is more likely to result in compression of morbidity, since the increase in life expectancy is expected to slow down. On the other hand, increased frailty of the elderly may imply that the cumulation of severe morbidity can no longer be prevented.
In the second part of this thesis, we constructed a multistate life-table model wherein total mortality - and thus total life expectancy - is not fixed, but is dependent upon underlying disability and mortality risks.
In the third part of this thesis, where the conditions under which compression of morbidity would occur were studied, using this life table allowed us to take into account the fact that substantial changes in total mortality could arise. We found that for the pursuit of compression of morbidity it mattered that total life expectancy, instead of being fixed, could be affected by changes
218

General discllssion
in underlying mortality and disability. Had we taken only changes in prevalence of disability into account, ruling out changes in total mortality, we would have found compression of morbidity far too frequently. For in· stance, had we taken no notice of the reduction of mortality and thus of the increase in total life expectancy due to the elimination of fatal diseases such as cancel', extension of the length of tOOe lived with disability would have gone unnoticed (chapter 8). The same is true for the elimination of heart dis· eases. As far as eliminating smoking is concerned, the reduction in the pe· riod lived with disability would have been overestimated had changes in to· tal mortality been ignored (chapter 7).
The analyses in tbis thesis showed that the interaction between morbidity and mortality is crucial to the occurrence of compl'ession of morbidity. TillS conclusion has two OOplications. FiJ."st, a combined analysis of mortality and morbidity is indeed requixed to study compression of morbidity. Second, the role of rectangularization of the survival curve might be overrated ill the compression·of.mol'bidity hypothesis.
9.4.2 Rectangularization and compression of morbidity
According to Fries, rectangularization is a manifestation of the life expec· tancy reacbing the maxinlum life span. In tbis view, rectangularization 00· plies that life expectancy remains more 01' less constant, and any increase in disability·free life expectancy means compression of morbidity. It is obvious that Fl'ies overestOOated the role of rectangularization in formulating the compl'ession·of.morbidity hypothesis, by OOplicitly presenting the process of rectangularization as if the survival curve had all-eady reached its 'ideal' rectangular shape.
The opposite view would be to deny the possible effect of rectangularization on compression of morbidity completely. One could argue that both rectan· gularization and compression of morbidity are the net result of the same in· terplay between mOl'tality and morbidity. As both are outcomes of the same process of interaction, it would be OOpossible for one to determine the other. However, instead of considering a causairelationsbip between rectangulari· zation and compression of morbidity, it may perhaps be speculated that rectangularization and compression of morbidity tend to coincide. From the 'what·if experOOents described in chapter 6 we concluded that rectangulari· zation can co·occur with both compression and expansion of morbidity (Table 2). Even though rectangularization might co·occur more often with compres· sion of morbidity than with expansion of morbidity, proof fOl' such a correia· tion has not yet been given.
There is still another way to look at the possible link between rectangulari· zation and compression of morbidity. It could be argued that if rectangulari· zation of the survival curve has been observed for a certain period, tbis 00·
219

Chaple/, 9
plies that compression of morbidity might be easier to achieve in the next period. In other words, a more rectangular shape of the survival curve at baseline indicates that compression might be easier to achieve in future. We arrived at this argument by combining two observations. Fll,'st, rectangularization implies that increasingly larger proportional mortality declines are requll,'ed to produce the same increase in total life expectancy.'o,,, Second, a reduction of the life expectancy with disability (i.e. absolute compression of morbidity) occurs only if the morbidity-n'ee life expectancy increases more than total life expectancy. These two considerations led us to formulate in chapters 3 and 4 the hypothesis that where total life expectancy can increase only to an increasingly limited extent (i.e. when rectangularization occurs), smaller increases in morbidity-n'ee life expectancy are required to achieve compression of morbidity.
However, the crux of this line of reasoning is, that it has not been fu'mly established that needing a smaller increase in morbidity-n'ee life expectancy to achieve compression of morbidity implies that compression is easier to achieve. In other words, though this scaling down means that smaller improvements in life expectancy without disability would be needed, we cannot be sure that a smaller effort is needed. Yet, as pointed out in chapters 3 and 4, compression of morbidity and rectangularization are not
Table 2 'What-if' Experiments of Chapter S', Classilled by their Effect on Compres· sian of Morbidity (in an Absolute Sense)" and Rectangularlzation of the Survival Curve (in an Absolute Sense)'
Compression of Morbidity
Expansion of Morbidity
Rectangularization of the SUlvival Curve
• changing all transitions by 20% towards beUer health (women)
• 20% reduction in incidence of disability
I 20% increase In recovery from disability
• 20% reduction in incidence of disability and 20% increase in
· recovery from disability
• 20% reduction in mortality among ncndisabled persons
De-Rectangularization of the Survival Curve
• changing all transitions by 20% towards better health (men)
• 20% reduction in mortality among disabled persons
• 20% reduction in mortality among nondisabled and disabled persons
• For a description of the 'what-if experiments see chapter 6. " Defined operationally as a decline in life expectancy with disability at age 30\1,. , Defined operationally as a decline in the numerator of Keyfiiz' H at age 30\1,.
220

General discussion
related in a simple manner and the implications of rectangularization for achieving compression of morbidity are not clear. They turned out to be more complex than we had assumed and more research is needed to unravel the relationship between rectangularization and compression of morbidity. In the end, it will always be the subtle intellllay of mortality and morbidity that turns the scale in favour of compression or, by contrast, expansion of morbidity.
9.5 Implications for future research
The studies reported in this thesis aimed at enlarging our understanding of the interaction between mortality and morbidity and its implications for population health. In this chapter, as well as in the preceding chapters, we have identified several pieces of missing information. Here, we will discuss a few that deserve to be studied in greater detail. We will also pay attention to some promising ways to address these issues.
First, factors explaining the recent mortality increase among people aged 85 anel over in The Netherlands, which played an important role in the recent rectangularization of the survival curve, should be examined in greater detail. Two approaches for further research deserve special attention. The £h'st involves a life-course approach in which data on oldest-old mortality and data on morbidity experienced earlier in the life course are analyzed simultaneously. Such a life-course approach would benefit from record-linkage and from large-scale longitudinal studies with a long follow-up. Using record-linked databases or longitudinal studies that contain information on disease occurrence, medical care utilization and mortality for specific individuals over a sufficient time interval, will' allow for further investigations into the causes of secular trends in oldest-old mortality. Efforts are needed to create a more favourable climate with regard to record-linkage in The Netherlands, provided that the privacy of individual citizens is protected. Second, cross-national comparisons of secular trends in the oldest-old mortality as well as of changes in the distribution of risk factors are important. In the end, these approaches might allow us to assess whether the mortality increase in this age group is only temporary or reflects a lasting reversal of the secular trend of decreasing mortality. We might subsequently also be able to assess whether similar increases in mortality are present in other low mortality countries, or are to be expected there in the near future.
Second, further multistate life-table calculations of health expectancy may benefit from large-scale comprehensive longitudinal studies. In this way, uncertainties regarding the estimates of incidence rates of disability, recovery rates from disability and mortality rates among nondisabled and dis-
221

Chapter 9
abled persons due to the pooling of datasets fi'om different countries can be avoided.
Third, the mapping of disability to diseases needs further research. In this thesis a multivariate modelling technique able to handle co-morbidity and age-related disability was introduced. This technique was used to estimate the effect of eliminating chl'onic diseases on life expectancy with and without disability. In the future the same technique may probably also be used to attribute the numbel' of years with disability to specific diseases and underlying risk factors. In this way, it may become possible to assess which diseases are responsible for the burden of disability. In addition, information on the mapping of disability to diseases could be used to decompose changes (over time) and differences (between regions, sexes or sociodemographic groups) in health expectancies into the contributions made by specific diseases. In this way one could easily determine which diseases account for any incl'ease or decline in the burden of disability. If the multivariate modelling technique can be applied successfully, it may be an alternative to the method of assigned shares, which is currently used in The Netherlands.23 The latter method has the disadvantage that a substantial part of the total number of years spent with disability cannot be attributed to specific diseases and thus remains unexplained. A closely related issue which deserves attention, is the comparison of the empirical assessment of the relationship between diseases and disability based on our multivariate-modelling technique with the disability weights derived fi'om experts' opinions as used in the DALE and DALY approach,lO.13,24 Both methods might be improved by such a comparison.
Fourth, future research should pay more attention to severity of the consequences of disease, Although we more or less took into account severity of disease consequences, by including only morbidity exceeding a certain disability threshold in our life-table analyses, it is obvious that we handled severity in a rather unsophisticated way. Lack of statistical power precluded us fi'om distinguishing between different severity levels. Besides, taking into account different severity levels would have made modelling rather complex, In further studies, however, different levels of severity should be distinguished, if only because severity is another important dimension of disability, next to duration, A situation is conceivable in which the length of time lived with disability is diminishing, while at the same time disability in the remaining period increases in severity. Whether or not such a situation should be considered as an improvement depends on the relative changes in duration and severity, In the future, therefore, we should look for ways to integrate severity into our model and to overcome problems of statistical power by looking for large datasets or by pooling different dataseta,
Fifth, more research is needed to assess the potential contribution of different risk factors to compression of morbidity, Our analysis concerning the
222

General discussion
potential contribution of eliminating one important risk factor - smoking - to compression of morbidity, showed that smoking elimination would produce compression of morbidity. The same might be true for other risk factors, like physical inactivity, excessive alcohol consumption or hypertension. Moreover research should not only focus on risk factors of chronic diseases, but should also include factors which reduce the disabling consequences of these diseases. Further research on this topic would benefit from a stepwise approach. First, the model of the disablement process developed by Verbrugge could be used to determine important modifying factors influencing the relationship between disease and disability. Next, after having determined these risk factors, further research is needed to quantifY the association between these factors and incidence of disability, recovery from disability and mortality (among nondisabled and disabled persons). In this way, also a validation of the association we estimated in chapter 7 between smoking on the one hand and recovery and mortality among nondisabled and disabled persons on the other hand might be obtained. Finally, 'what-if simulations should be conducted to evaluate the likely effect of (partially) eliminating one or more of these l'isk factors at the population level. These possible effects should not only be evaluated in terms of a gain in disability-fi'ee life expectancy, but also in terms of compression of morbidity or Health Adjusted Life Expectancy (HALE). HALE is a single indicator, combining health expectancies for a set of discrete health states by using severity weights. In the end, comparison of several 'what-if experiments might yield information that is of value for setting priorities for interventions.
9.6 Policy relevance
The focus of this thesis is on the association between mortality and morbidity and its implications for population health. It is obvious that we share this interest with policy makers in the field of public health. Therefore, we will outline the implications of our reseal'ch fOl' public health policy. On the basis of both the methodology used and the results obtained in our study, we will formulate some recommendations for monitoring the health status of the population and for setting targets in health policy.
9.6.1 Monitoring the health status of a population
When monitoring the health status of the population it is important to recognize the interplay between mortality and morbidity. A focus on either morbidity or mortality is sometimes useful and necessary when dealing with specific problems of public health. But morbidity and mortality should also be monitored together. In fact, an effect on population health may be less favourable than data on mortality alone would suggest. For example, an increase in the length of life might be accompanied by an increase in years with severe disability. In the same way, a decrease in the prevalence of mor-
223

Chapter 9
bidity in the population might be coupled with an increase in the number of years with disability, when at the same time life expectancy is increasing. From these two examples it is obvious that morbidity and mortality must also be monitored in conjunction with one another. This is particulary impOl'tant in considering whether there is a trade-off between longer life and worsening health, or in other words, whether life extension means that persons live longer with disability and to what extent.
To allow for the monitoring of morbidity and mortality together, research has provided policy makers with integrated population health measures, such as health expectancy. However, it should be noted that the interpretation of such a health measure may be complex. For example, caution is needed in the evaluation of an increase in disability-free life expectancy. In recent studies on health expectancy'·4 and in the scenario calculations in this thesis (chapters 6, 7 and 8) it was shown that an increase in disability-free life expectancy is sometimes accompanied by an increase in years with disability. Only when total life expectancy remains unchanged, does an increase in disability-free life expectancy equal a decrease in years with disability. When total life' expectancy increases, an increase in disability-free life expectancy might be accompanied by an increase in life expectancy with disability. In fact, an increase in disability-free life expectancy only means that not all years gained are spent with disability. Hence,. increases in disability-free life expectancy may well imply a'n increased burden of disability for both the individual and society at large.
As a rule one should always consider the evolution of the 'complete' health expectancy, that is, study changes in life expectancy in the 'healthy' and 'unhealthy' states. This was also recommended by the REVES-network'., although so far researchers (and in their footsteps tbe policy makers) have not always acted accordingly. A single summary measure of population health would be of great help for studying 'complete' health expectancy. Research has provided two alternatives: (1) health-adjusted life expectancy (HALE, e.g. DALE'O) and (2) the concepts of compression and expansion of morbidity. Using the HALE is only instructive when different severity levels of disability are distinguished instead of merely drawing a simple distinction between 'no disability' and 'disability'. Despite the important advantage afforded by the fact that the HALE summarizes all information on mortality, the duration and the severity of disability into a single figure, the interpretation of changes in tlus weighted figure can be complex.
9.6.2 Setting targets in health policy
In general, compression of mOl'bidity can be evaluated as an improvement in the health of the population and is therefore one of the possible targets of national health policy. However, we would like to comment upon the unthinking pursuit of compression of morbidity.
224

General discussion
First, not always should compression of morbidity be viewed as a desirable evolution of the health of the population. When it is due to a decrease in total life expectancy (for example due to a dramatic increase in premature mortality) nobody will evaluate compression of morbidity in a positive sense. Only in combination with a constant or an increasing total life expectancy can compression of morbidity be considered a desirable evolution in population health. Mter all, under these cil'cumstances, not only does life expectancy with disability decline, hut disability-n-ee life expectancy also increases.
Secondly, compression of morbidity does not necessarily imply that health care needs will decrease, since the amount of health care needed also depends on the absolute number of persons in a certain health state, which in turn depends upon the size and age structure of the population. Nevertheless we opted for measures like health expectancy and the compression of morbidity measures defined in this thesis, because these measures are not affected by (changes in) the age structure. By using these measures, insight could be obtained into the effects of changes in the mortality and disability dynamics on population health. Nevertheless, to determine a change in the absolute number of persons in a certain health state, changes related to the size and age distribution should be added to changes caused by underlying mortality and disability dynamics_
Thil'd, compression of morbidity is generally expressed in both absolute and relative terms_ When total life expectancy has not decreased, compression of morbidity in an absolute sense automatically means compression in a relative sense, although the reverse does not hold true_ We discussed the advantages of classifying changes in health both in absolute and relative terms in section 9.3.2. ('new classification'). Mter a combination of absolute and relative compression of morbidity, a combination of absolute expansion of morbidity with relative compression of morbidity might be evaluated as second best. This combination indicates that although life expectancy with disability is increasing, disability-free life expectancy increases faster. As a result the proportion of life with disability in the gained years is lower than in the years before the change.
Notwithstanding these pitfalls, compression of morbidity - while avoiding a decrease in total life expectancy - is a likely target of national health policy_ We therefore examined how this goal could be achieved. The studies performed and the outcomes found suggest the following paths towards this goal:
L To realise compression of morbidity, interventions are needed which successfully prevent 01' reduce disability. In the pursuit of compl-ession of morbidity, policy makers should pay more attention to (nonfatal) dis-
225

Chapter 9
abling diseases, instead of focusing on fatal diseases. Interventions solely aimed at reducing mortality will not result in compression of morbidity. As explained in chapter 8, the elimination of fatal diseases (such as cancel' and heart diseases) will not only result in an increase in disabilityfree life expectancy, but also in an increase in years with disability (and a decline in the percentage of disability-free life). The reason is that more people will survive to older ages (due to declining mortality), where the risk of becoming disabled is higher. Unless this risk is substantially reduced, life expectancy with disability will increase, implying an increased burden for society. We calculated, that if mortality rates among nondisabled and disabled persons are reduced by e.g. 20%, considerable efforts are requll.'ed to lower the incidence of disability andlor to increase recovery from disability in order to compensate for the side effect of such a mortality decline, namely the increase in years with disability (chapter 6). Without substantial reductions in incidence of disability or increases in l'ecovCl'Y from disability, years with disability will always increase, when mortality declines.
2. In the pursuit of compression of morbidity, policy makers might focus on primary and secondary prevention (of disabling diseases), tertiary prevention (of the disabling consequences of diseases) andlor on rehabilitation (from disability). As far as rehabilitation is concerned, in chapter 5 and in previous studies it has been underlined that disability is often not an ll'reversible state and recovCl'Y of lost functions can be substantial.'s.3o Yet reducing incidence produces a larger gain in disability-free life expectancy and a larger decrease in life expectancy with disability, than does a similar (i.e. proportional) increase in recovery (chapter 6). Therefore interventions aimed at delaying the onset and reducing the progl'ession of disabling diseases should receive the highest priority. However, since recovery from disability has been shown to be substantial and to provide a means to achieve compression of morbidity as well, interventions aiming at increasing the ability to regain functioning should also become part of public health policy. In Ol'der to design successful interventions further research is needed on the determinants of incidence of and recovel'Y from disability.
3. Interventions to discourage smoking should receive high priority. Besides the well-known increase in total life expectancy that smoking elimination will produce, smoking elimination will also reduce the number of years with disability (chapter 7). This is a remarkable outcome, because a trade-off must usually be made between longer life and a longer period spent disabled. Thus, as opposed to a reduction of fatal diseases, nonsmoking lengthens life and shortens the period of life lived with disability.
226

General discllssion
References
1. Fries JF. Aging, natm'al death, and the compression of morbidity. New England Jou1'Ilai of Medicine 1980;303(3): 130·135.
2. Wilkins R, Chen J, Ng E. Changes in health expectancy in Canada from 1986 to 1991. In: Mathers C, McCallum J, Robine JM, ed, Advances in Health Expectancies. Canberra, Australia: Australian Institute of Health and Welfare, 1994: 115·132.
3. Robine JM, Ritchie K. Healthy life expectancy: evaluation of global indicator of change in population health. British Medical Jou1'IlaI1991;302(6774):457·460.
4. Robine JM, Mathers C, Brouard N. Trends and Differentials in Disability-Free Life Expectancy: Concepts, Methods, and Findings. In: Caselli G, Lopez AD, ed. Health and Mortality Among Elderly Populations. Oxford, UK: Clarendon Press, 1996: 182·201.
5. Keyfitz N. What difference would it make if cancer were eradicated? An examination of the Taeuber paradox. Demography 1977;14(4):411·418.
6. Robine JM:, Michel JP, Branch LG. Measurement and utilization of healthy life expectancy: conceptual issues. Bulletin of the World Health Organisation 1992; 70(6):791·800.
7. Barendregt JJ, Bonneux L, Van del' Maas PJ. Health expectancy: an indicator for change? Jou1'Ilai of Epidemiology and Community Health 1994;48(5):482·487.
8. Mathers CD, Robine J.M. How good is Sullivan's method for monitoring changes in population health expectancies. Jou1'1lal of Epidemiology and Community Health 1997;51(1):80·86.
9. Robine JM, Mathers CD. Measuring the compression or expansion of morbidity tlll.'ough changes in health expectancy. In: Robine JM, Mathers CD, Bone M, Romieu I, ed. Calculation of Health Expectancies: Harmonization, Consensus Achieved and Future Perspectives. Montpellier, France: John Libbey Em'otext, 1993:269·288.
10. Barendregt JJ, Bonneux L, Van del' Maas PJ. Health expectancy: from a population health indicator to a tool for policy making, Journal of Aging and Health 1998;in press.
11. MUl'l'ay CJ, Lopez AD. Quantuying disability: data, methods and results. Bulletin of lite Wol'ld Health Organisation 1994;72(3):481·494.
12. M\U'ray CJ. Quantuying the bmden of disease: the technical basis for disabil· ity·adjusted life years. Bul/elin of tlte World Health Organisation 1994;72(3): 429·445.
13. Barendregt JJ, Bonneux L. Degenerative Disease in an Aging Population: Models and Conjectures. Rotterdam, The Netherlands: Erasmus University Rotterdam, 1998.
14. Mathers C. Estimating gains in health expectancy due to elimination of specific diseases. Paper presented at the 5th meeting of the International Network on Health Expectancy (REVES-5), February 19-21. Ottawa, Canada, 1992.
15. Mathers C. Gains in health expectancy from the elimination of disease: a useful measm'e of the burden of disease? Paper presented at the lOth meeting of the International Network on Health Expectancy (REVES·I0), October 9·11. Tokyo, Ja· pan, 1997.
16. Kelly·Hayes M, Jette AM, Wolf PA, D'Agostino RB, Odell PM. Functionallimita· tions and disability among elders in the Framingham Study. American JOlll'llal of Public Health 1992;82(6):841·845.
227

Chapter 9
17. Myers AM, Holliday PJ, Harvey KA, Hutchinson KS. Functional performance measures: are they superior to self-assessments? JOU1'1l01 of Gerontology 1993; 48(5):MI96-M206,
18. Elam JT, Graney MJ, Beaver T, El Derwi D, Applegate WB, Miller ST, Comparison of subjective ratings of fUllction with observed fUllctional ability of frail older persons, American Joul'llal of Public Health 1991;81(9):1127-1130,
19. Hoeymalls N, Feskells EJ, Van den Bos GA, Kromhout D. Measuring functional status: cross-sectional and longitudinal associations between performance and self-report (Zutphen Elderly Study 1990·1993). JOU1'1l01 of Clinical Epidemiology 1996;49(10): 1103-1110,
20. Demetrius L. Relations between demogl'aphic parameters. Demography 1979;16(2): 329-338.
21. Keyfitz N, Improving life expectancy: an uphill road ahead. American Journal of Public Health 1978;68(10):654-656,
22. Vaupel JW. How change in age-specific mortality affects life expectancy. Population Studies 1986;40:147-157,
23. Boshuizen HC, Van Herten LM, Perenboom RJM, Van de Water HPA. Toeschnjvillg van de ongezonde levensvel'wachting aan achleriiggellde ziehten en aandoeningen, TNO Preventie en Gezondheid, 1997,
24. Murray CJ, Lopez AD. Regional patterns of disability· free life expectancy and disability-adjusted life expectancy: Global Burden of Disease Study. Lancet. 1997; 349(9062): 1347-1352,
25. Mathers C, Robine JM, Wilkins R. Health expectancy indicators: recommendations for terminology. In: Mathers C, NcCallum J, Robine JM, ed. Advances in Health Expectancies. Canberra, Australia: Australian Institute of Health and Welfare, 1994:34-42,
26. Beckett LA, Brock DB, Lemke JR, et al. Analysis of change in self-reported physical function among older persons in foul' population studies. American Journal of Epidemiology 1996;143(8):766·778,
27. Crimmins EM, Hayward MD, Saito Y. Changing mortality and morbidity mtes and the health status and life expectancy of the older population. Demography 1994; 31(1): 159-175,
28. Katz S, Branch LG, Branson MH, Papsidero JA, Beck JC, Greer DS. Active life expectancy, N Ellgl J Med 1983;309(20):1218-24,
29. Manton KG. A longitudinal study of functional change and mortality in the United 8tates, JOlll'llal of Gerolltology 1988;43(5):8153·8161.
30. Rogers A, Rogel's RG, Belanger A. Longer life but worse health? Meastll'ement and dynamics, The Gerolltologist 1990;30(5):640-649,
228

Summary

Chapter 10
riiI hanges in incidence, progression and recovery of morbidity and related i.l!!!I disability have important consequences for mortality, and, vice versa, changes in mortality have important consequences for morbidity. The interplay of changes in mortality and morbidity determines whether population health is improving. The subject of this thesis is the association between mortality and morbidity and its implications for population health.
Chapter 1 presents a general introduction on the association between mortality, morbidity and population health and pays attention to the different views of the association between changes in the length of life and the health of the population. These different views can be summarized as: 'compression of morbidity', 'expansion of morbidity' and 'dynamic equilibrium'. The compression-of-morbidity hypothesis states that the length of human life is fixed and that chronic diseases and related disability can be postponed to older ages by changes in life style. As a result, the number of years with morbidity and related disability can be compressed between the increasing age at onset of morbidity and disability and the fixed mean age at death. This optimistic hypothesis was the antithesis of the 'expansion-of-morbidity' hypothesis which anticipates that mortality reductions will produce more years with morbidity and related disability; in other words, an expansion of morbidity. A third, intermediate hypothesis, the 'dynamic-equilibrium' hypothesis also states that increased survival produces an increase in years with morbidity. However according to this hypothesis, the years with severe morbidity and disability remain relatively constant, because the rate of progression of chronic diseases is reduced. From the compression-versus-expansion of morbidity debate, it has become clear that opinions differ as to whether longer life implies that population health is improving.
From the fact that under most conditions compression of morbidity is a desll.'able target of public health policy, it follows that it is important to know how this goal can be achieved. However, due to the misconceptions introduced by Fries when he formulated his compression-of-morbidity hypothesis, the changes in mortality and morbidity patterns needed to achieve compression of morbidity in the population are not yet fully understood. Fries' readymade recipe for compression of morbidity, namely the postponement of chronic diseases, needs to be questioned. We have criticized aspects of his work concerning (1) the dissociation of (changes in) mortality fi'om (changes in) morbidity and (2) the absence of the quantitative assessment of (changes in) overall morbidity in the population that occurred 01' of the changes needed to achieve compression of morbidity. We reject Fries' implicit denial of the possibility of changes in total life expectancy due to changes in morbidity (i.c. the postponement of clll'onic diseases). Our criticisms of Fries' premises are reflected in the design of our study. Fll.'stly, we studied the interaction between mortality, morbidity and population health by means of a multistate life-table model. The life table allows for the synthesis of a huge amount of data and for the integmtion of different aspects of health into one
230

Summary
01' a few indicators of population health. Another advantage is its potential to link (changes in) the indicators of population health with underlying age· specific mortality and disability. A second feature of our design is that -taking into account the fact that total life expectancy is not fixed - we considered changes in health expectancies in all health states together, instead of focusing on changes in the length of life in the morbidity-free state. To obtain an unambiguous interpretation of these changes (with total life expectancy not fixed), we classified changes as absolute compression, relative compression, absolute expansion aneVor relative expansion of morbidity. Thirdly, we focused on the total burden of morbidity, caused by numerous eln'onie diseases andior aging, iilstead of on specific diseases. Our approach can be characterized as a top-down approach, which is based on genel'ic health states. Such an approach is obvious when studying mortality, because disease-specific mortality data are widely available. When studying health expectancy and compression of morbidity, the bottom-up approach - proceeding from specific diseases - could have been used as well. Nevertheless we held to a top-down approach, because it was better apt to answer our research questions and because a bottom-up approach required an immense amount of data that would have been hard to handle. A detailed discussion of the advantages and disadvantages of the research design is found in chapter 9.
In this thesis we examined which conditions would be necessary for longer life to be associated with better health. The main objective was to assess which changes in underlying patterns of mortality and morbidity would produce a reduction in years with disability ('absolute compression of morbidity') andior a reduction of the proportion of life with disability ('relative compression of morbidity') in The Netherlands in the future. The focus was on the burden of morbidity and mortality due to chronic diseases, that is, on the consequences of c111'onic diseases. Morbidity was made operational in terms of disability. An integl'ated population health indicator, 'health expectancy', which combines data on mortality and morbidity, was used to assess (changes in) population health. Health expectancy was defined as life expectancy with or without disability in tltis thesis.
The study aims were the following: 1. To describe and analyze recent changes in Dutch mortality, with special
attention to changes in the rectangularity of the survival curve and in life expectancy at older ages.
2. To describe the current age-specific mortality and disability patterns in the Dutch adult population and to translate these patterns into the integl'ated population health indicator: health expectancy.
3. To determine which changes are needed in current mortality and disability patterns to achieve compression of morbidity in The Netherlands. The effect of the following (hypothetical) situations were studied: (a) a general reduction in age-specific mortality and disability rates; (b) a re-
231

Chapter 10
duction in mortality and disability due to the elimination of smoking, and (c) a reduction in mortality and disability due to the elimination of specific chronic diseases.
In Part I (chapters 2-4) national population and mortality data were used to describe and analyze recent changes in Dutch mortality. More specifically, the studies in this part focused on 'rectangularization of the survival curve' and changes in life expectancy at older ages, both of which play an important role in the compression-of-morbidity debate. We used the life table to describe changes in life expectancies and rectangularization. Next, these changes were linked to changes in age- and cause-specific mortality by means of life-table decomposition analyses.
In chaptBl' 2 recent changes in life expectancy of the elderly population were studied. We calculated life expectancy for men and women at two ages, namely at age 60 and at age 85, for the period 1970-1994 (5-years periods). It was found that life expectancy at age 60 increased in the period 1970174-1980/84 (1970s) and 1980/84-1990/94 (1980s). Of particular interest were the l'esults of the analysis concerning the changes in life expectancy at age 85, because these differed from what was found in other countries. Life expectancy at age 85 - after an initial increase - has been declining since 1980/84 (men) and 1985/89 (women). We then took a closer look at these changes in life expectancy, first by decomposing them by age group and next by decomposing them by cause of death. From the decomposition by age group it became clear that a stagnation in the decline in mortality rates in women aged 85-89 years and an increase in mortality rates above age 85 (men) and age 90 (women) caused the described changes in life expectancy at older ages. We subsequently took a closer look at these changes by decomposing them according to cause of death. In summarizing the results of these analyses, we focused here on the remarkable reversal of the trend in life expectancy at age 85. This change could be attributed to smaller mortality reductions (or sometimes even an increase in mortality) from cerebrovascular diseases and other cardiovascular diseases - which contributed largely to the increase in life expectancy at age 85 in the 1970s - and mortality increases from chronic obstructive pulmonary disease (COPD), mental disorders, cancel' (prostate cancer and other cancers), diabetes mellitus and ill-defined conditions.
In chapter 3 we performed a study to determine whether rectangularization of the survival curve occurred in The Netherlands in the period 1950-1992. As in research various meanings have been assigned to the concept of 'rectangularization', and often without being made explicit, we defined tlus concept in an unambiguous way. In the present study 'rectangularization' is defined as a trend toward a more rectangular shape of the survival curve due to increased survival and concentration of deaths around the mean ageat-death. A distinction was made between absolute and relative rectangularization, depending on whether an increase in life expectancy was accom-
232

Summary
panied by a concentration of deaths into a smaller age interval (absolute rectangularization) or into a smaller proportion of total life expectancy (relative rectangularization). Absolute and relative rectangularization of the entire survival curve occurred in both sexes and during aOOost the entire period. For older ages (above age 60Y,) the results were less unequivocal. Relative rectangularization occurred in women over the whole period, but in men only from 1975179 on. Absolute rectangularization has occurred in both sexes since 1980/84.
In chapter 4 we analyzed the contribution of selected causes of death to the rectangularization of the survival curve in an absolute sense above age 60 in the 1980s in The Netherlands. Using a decomposition analysis enabled us to determine why rectangularization in an absolute sense took place in the 1980s, but not in the 1970s. We found that rectangularization in the 1980s was due to mortality reductions from ischaemic heart disease, cerebrovascular diseases (both sexes) and lung cancel' (men only) and to mortality increases from COPD (men only) and mental disorders. Comparison with the 1970s demonstrated that particularly changes in mortality at advanced ages (i.e. smaller mortality reductions and (larger) mortality increases) were responsible for the reversal from a decreasing rectangular shape of the survival curve in the 1970s to rectangularization in the 1980s. Thus the combination of increased survival 10 advanced ages and reduced survival al advanced ages explains why recently rectangularization of the survival curve in an absolute sense took place in The Netherlands.
Having analyzed and discussed changes in old-age mortality, in Part II (chapler 5) disability was then taken into consideration as well. Only in this way could justice be done to the important nonfatal consequences of cIn'onic diseases. We used two longitudinal datasets to describe current age-specific mortality and disability patterns in the Dutoh adult population and to translate these patterns into health expectancies. No longer was a model with two health states ('alive' and 'dead') used, but one with tIn'ee health states was constructed, by subdividing the living state into two states ('alive without disability' and 'alive with disability').
In chapte,' 5 we estimated age-specific incidence rates of disability, recovery l'ates from disability and mortality rates among nondisabled and disabled persons using Poisson regl'ession with offset (also known as a 'log-rate moder). Incidence of disability and mortality among nondisabled and disabled persons increased with increasing age, whereas recovery from disability declined with increasing age. Next, by using a multistate life table, we summarized the age-specific mortality and disability data into life expectancy with and without disability. In 1986-1994, total life expectancy at age 30Y, was 44.8 years for Dutch men and 50.8 years for Dutch women. We found that respectively 38.5 and 38.4 years were spent without disability. The remaining 6.4 (14.2%) and 12.4 (24.3%) years were spent with disability.
233

Chapter 10
At age 70Y" life expectancy was 10.7 and 14.3 years, respectively. About 6.3 and 5.8 years were spent without disability, and 4.4 (41.3%) and 8.5 (59.6%) years with disability, respectively. These successive analyses were due to make up the frame of reference for the fu'st two analyses in the third part of the thesis, where the estimated incidence, recovery and mortality rates, as well as the resulting total life expectancy and life expectancy with and without disability were used as starting point.
The changes in current mortality and disability patterns needed to achieve compression of morbidity in The Netherlands were studied in pat't III (chapters 6-8). We conducted several scenario calculations ('what-if experiments) in order to determine under which conditions compression of morbidity would occur in The Netherlands.
In chaptel' 6 we studied which changes in the age-specific incidence rates of disability, recovery rates from disability and mortality rates among nondisabled and disabled persons (by an equal percentage at all ages) were needed to achieve compression of morbidity. Our results showed that both decreasing incidence rates and increasing recovery rates would (ceteris paribus) produce compression of morbidity (in an absolute and a relative sense). The impact of improving incidence was found to be larger. A decrease in the mortality rates among nondisabled and/or disabled persons, would result in absolute and relative expansion of morbidity. Above age 30Y" with moderate declines (by 20%) in mortality rates among both nondisabled and disabled persons, at least equal proportional improvements in both incidence and recovery rates would be necessary to achieve compression of morbidity. For an improvement to occur in either incidence rates or in recovery rates, im~ provements of a respective 30% and 50% at least would be required. It was also shown that even greater improvements (at all ages) would be needed to achieve absolute compression of morbidity above age 70Y,. This implies that absolute compression of morbidity above age 30Y, might co-occur with absolute expansion of morbidity above age 70Y,.
In chaptel' 7 we examined whether eliminating smoking would produce compression of morbidity. We found that eliminating smoking would not only increase total and disability-li'ee life expectancy, but would also produce compression of morbidity in an absolute and a relative sense. Thus, despite the fact that life is extended as a consequence of eliminating smoking and people are thus longer exposed to disability, lower incidence rates of disability and higher recovery rates Ii'om disability produce, on balance, a reduction in years with disability.
Finally, in chapter 8, we studied whether elimination of selected ell/.'onic conditions would lead to either compression 01' expansion of morbidity. We found that eliminating disabling diseases. such as artlll'itis/back complaints would result in compression of morbidity in both an absolute and a relative
234

Summary
sense. Elimination of highly fatal diseases such as cancel' would lead to an increase in years with disability. Whether elimination of diseases that are both disabling and fatal (e.g. heart diseases and clu.'onic nonspecific lung disease) results in compression 01' expansion of morbidity, depends on the extent to which they cause mortality and disability. For example, eliminating heart disease, where the impact on total mortality exceeds the impact on disability, would lead to expansion of morbidity in both an absolute and a relative sense. As far as chronic nonspecific lung disease is concerned, however, elimination would lead to both absolute and l'elative compression of morbidity.
In chaptel- 9 the main outcomes of the thesis were summarized (section 9.2) and the study design was evaluated (section 9.3). Next in section 9.4 the nature of the relationship between (changes in) mortality and morbidity was discussed with l'eference to the compression-of· morbidity hypothesis. It was argued that Fries in his compression·of-morbidity hypothesis de facto had considered total life expectancy as fixed by arguing that, in the pmsence of rectangularization of the survival curve, the postponement of chronic diseases would result in compression of morbidity. As opposed to Fries, it was concluded fi'om our studies, that as a necessary precondition of studying compression of morbidity, total mortality should be considered not (yet) as being fixed, but as the outcome of the interaction between mortality and morbidity in the population. In this thesis this condition was met hy using a life table. It was shown that, had this condition not been fulfilled, we would have found compression of morbidity more often than actually would have been the case. For example, had no notice been taken of the reduction of mortality - and thus of the increase in total life expectancy - due to the elimination of fatal diseases such as cancel' and heart disease, the extension of the length of time lived with disability would have gone unnoticed. As far as eliminating smoking is concerned, the reduction in the period lived with disability would have been overestimated, had changes in total mortality been ignored.
Next we reconsidered the relationship between rectangulatization and compression of morbidity. From the observation of rectangulari'mtion, Fries had concluded that the postponement of chronic diseases would result in compression of morbidity in the population. We had rejected this point of view, because he in fact disconnected changes in mortality fi'om changes in morbidity. However, we did consider several other possible ways in which rectangularization and compression of morbidity might be connected. We concluded that the relationship between rectangularization and compression of morbidity was more complex than had originally been assumed. Although rectangularization implies that substantial increases in total life expectancy are less likely to occur, and thus that smaller improvements in disabilityfi'ee life expectancy are required to achieve compression of morbidity, these improvements may not be assumed to be achieved more easily. In the end, it
235

Chapter 10
would always be the subtle interplay of mortality and morbidity that turns the scale in favour of compression or, on the contrary, expansion of mOl'bid~ ity. Thus, what probably counts is the mechanism rather than the scale of the (necessary) changes.
The research for this thesis has pointed to several phenomena and problems that need further study, but also to some promising ways to address these issues. The recent mortality increase among people aged 85 and over in The Netherlands should be examined in greater detail, for which we recommended a life-course approach, as well as a comparison with the trends in oldest-old mortality and the (changes in the) distribution of risk factors in other countries. We also advocated that further research be carried out on the mapping of disability to diseases. We suggested that a multivariate modelling technique, like the one we used in this thesis, might be helpful for attributing (changes and differences in) the number of years with disability to specific diseases and underlying risk factors. By focusing on disability, we did not completely ignore the importance of the severity of disease consequences for evaluating trends in population health, but future research should try to integJ.·ate severity into the analyses in a more sophisticated way. Finally, as we confined ourselves to studying the possible contribution of elimination of a single risk factor (smoking) to compression of morbidity, we advocated that research be performed into other important risk factors.
Some conclusions of our study are of interest for policy makers in the field of public health. As far as the monitoring of the health status of a population is concerned, we stressed the importance of monitoring morbidity and disability together, for example by using integJ.·ated health measures, like health expectancy. In doing so, policy makers should always consider the 'complete' health expectancy, that is life expectancy in the 'healthy' and 'unhealthy' states. To this end research has pl'Ovided them with the concepts of compl-ession and expansion of morbidity. Compression of morbidity is a desirable target of national health policy, although not in all cU·cumstances. However, in combination with a constant or an increasing total life expectancy, the persuit of this goal can be recommended. From our study it could be concluded that the pursuit of compression of morbidity would benefit from the policy makers paying more attention to the elimination of (nonfatal) disabling diseases (such as arthritisiback complaints), instead of focusing on fatal diseases (like cancer and heart diseases). Interventions solely aimed at reducing mortality will not result in compression of morbidity. Our research also showed that, besides the well-known increase in total life expectancy, smoking elimination will also produce a reduction in the number of years with disability. Thus, as opposed to the elimination offatal diseases, nonsmoking lengthens life and at the same time shortens life time with disability. Therefore, mterventions aimed at discouraging smoking should receive high priority.
236

Samenvatting

Hoo/dsluk 11
m eranderingen in de incidentie, de progt'essie en het herstel van ziekten D en de aan ziekten gerelateerde beperkingen hebben belangt'ijke consequenties voor de sterfte. Omgekeerd hebben sterfteontwikkelingen belangrijke gevolgen voor de totale ziektelast waarmee een bevolking wordt geconfronteerd. De wisselwerking tussen ziekte en sterfte bepaalt of de gezondheid van de bevolking in de toekomst verbetert of verslechtert. Deze wisselwerking en het effect hiervan op de gezondheid van de bevolking is het onderwerp van dit pl'Oefsclll·ift.
Hoofdstuh 1 besteedt aandacht aan de relatie tussen ziekte, sterfte en de gezondheid van de bevolking. Het staat niet op voorhand vast dat een langer leven betekent dat de gezondheid van de bevolking verbetert. In de literatUUl' zijn ch'ie hypothesen geformuleerd over de mogelijke samenhang tussen (veranderingen in) de levensduur en de gezondheid van de bevolking. Deze staan bekend als de 'compressie-van-de-morbiditeit'- hypothese, de 'expansie-van-de-morbiditeit'-hypothese en de hypothese van het 'dynamische even wicht' . De hypothese van de 'compressie van de morbiditeit' werd geformuleerd door de Amerikaanse onderzoeker Fries en houdt in dat het aantal levensjaren met ziekte zal afnemen. Dit optimistisehe toekomstperspectief is gestoeld op de overtuiging dat de levensduur beperkt is en dat door gezond te leven de eerste verschijnselen van ehronisehe ziekten kunnen worden uitgesteld tot op oudere leeftijd. Deze hypothese werd geformuleerd in reactie op de 'expansie-van-de-morbiditeit' -hypothese waarin wordt gesteld dat het aantal jaren met ziekte juist zal toenemen. Bij deze pessimistische kijk op toekomstige ontwikkelingen gaat men ervan uit dat medisch ingt'ijpen leidt tot verlenging van de levensduur van personen met een clll'onisehe ziekte. Voor deze gt'oep geldt dat de gewonnen levensjaren uitsluitend jaren met ziekte zuUen zijn. Maar ook wanneer de levensverlenging zieh niet aUeen beperkt tot de gt'oep clll'Olllsch zieken, is het niet onwaarsehijnlijk dat de verlenging van de levensduur leidt tot een toename van het aantal jaren met ziekte. Doordat mensen langeI' leven worden zij immel's langeI' blootgesteld aan het risico op het luijgen van clll'onisehe ziekten en lichamelijke beperkingen, terwijl dit risieo bovendien met het stijgen van de leeftijd steeds hoger wordt. In aUe gevaUen is er dus sprake van expansie van de mOl'biditeit, zo luidt de conelusie. Ook de aanhangers van de 'dynamische-evenwieht'-hypothese gaan ervan uit dat levensverlenging leidt tot een toe name van het aantal jaren met ziekten, maar zij brengen een nuance aan door de emst van ziekten in beschouwing te nemen. Ze steUen dat het aantal jaren met emsfige ziekten min of meer constant blijft, omdat de progt'essie van chl'onische ziekten zal worden vertraagd.
Omdat in de meeste gevaUen eompressie van de morbiditeit een nastrevenswaardig doel is voor het volksgezondheidsbeleid, is het van belang te weten hoe dit doel kan worden bereikt. Het ligt vaor de hand om daarvoor te rade te gaan bij de aanhangers van de 'compressie-van-de-morbiditeit'-hypo-
238

Sam.envatting
these. Fries heeft in zijn werk echter onvoldoende duidelijk kunnen maken welke veranderingen nu precies no dig zijn voor het realiseren van compressie van de morbiditeit. Dit komt omdat zijn werk een aantal onduidelijkheden bevat en ook eukele tekortkomingen kent. Zo heeft hij verzuimd veranderingen in ziekte en sterfte systematisch met elkaar in verband te brengen. Hij hield er bijvoorbeeld geen rekening mee dat als ziekten niet of pas op latere leeftijd zouden optreden, dit in veel gevallen ook zou betekenen dat de kans om (vroegtijdig) te overlijden beduidend zou afnemen. Daarnaast liet hij na precies aan te geven hoe groot de veranderingen in de totale ziekte- en sterftelast van de bevolking zouden moeten zijn om uiteindelijk compressie van de morbiditeit te kunnen bereiken. Om deze redenen moeten duidelijke vraag:tekens worden geplaatst bij het recept dat hij verstrekte voor het bereiken van de compressie van de morbiditeit, namelijk het uitstel van chronische ziekten tot op oudere leeftijd.
Bij het opzetten van deze studie hebben we getracht rekening te houden met de bezwaren die we inbrachten tegen Fries' onderzoek. Onze studie·opzet heeft bijgevolg de volgende drie kenmerken.
Ten eel'ste werd de wisselwerking tussen ziekte, sterfte en de gezondheid van de bevolking bestudeerd met behulp van een (meerdimensionale) overlevingstafel. Deze overlevingstafel maakte het mogelijk een groot aantal gegevens samen te vatten en verschillende aspecten van de gezondheid te combineren in .len of enkele indicator(en). Een bijkomend voordeel was dat eenvoudig kon worden nagegaan wat het effect zou zijn van veranderingen in de leeftijdsspecifieke ziekte· en sterftepatronen op de gezondheid van de bevolking. En omgekeerd, welke veranderingen in ziekte- en sterftepatronen ten grondslag lagen aan de waargenomen veranderingen in de gezondheid van de bevolk.ing.
Ook hebben we ons niet eukel gericht op de analyse van veranderingen in het aantal jaren dat mensen doorbrengen in goede gezondheid. Er is dus niet uitsluitend gekeken naar veranderingen in de levensverwachting zander beperkingen, maar ook naar die met beperkingen. Het onderzoek was er juist op gericht veranderingen in de tijd die mensen doorbrengen in aUe verschillende gezondheidstoestanden in hun onderlinge samenhang te besclu-ijven en te analyseren. Alleen zo is het immers mogelijk vast te stellen in welke richting de gezondheid van de bevolking zich zal ontwikkelen wanneer de totale levensverwachting toeneemt. Eerder' bleek dat zo'n analyse noodzakelijk is, omdat op voorhand niet vaststaat wat de consequenties zullen zijn van een gemiddeld langer leven voor de gezondheid van een bevolking. Zo zou een gemiddeld langer leven kunnen betekenen dat terzelfder tijd zowel het aantal jaren zonder beperkingen als het aantal jaren met beperkingen toeneemt. Om verschillende combinaties van gelijktijdige veranderingen in de levensverwachtingen met en zonder beperkingen van elkaar te kunnen onderscheiden, hebben we gebruikgemaakt van de
239

Hoordstuh 11
begrippen absolute compressie, absolute expansie, relatieve compressie en relatieve expansie van de morbiditeit. Van absolute compressie van de morbiditeit is sprake bij een daling van het aantal jaren met beperkingen, terwijl het bij absolute expansie gaat om een toe name van dit aantal. Onder relatieve compressie van de morbiditeit verstaan we een daling van het percentage van de totale levensverwachting dat mensen doorbrengen met beperkingen, terwijl in geval van relatieve expansie dit percentage stijgt.
Anders dan Fl'ies gingen we uit van de totaZe ziektelast, veroorzaakt door aile clu'onische ziekten in de populatie en door veroudering. Dat wil dus zeggen dat we ons bij ons onderwek niet hebben beperkt tot een of enkele ziekte(n). Onze benadering laat zich het best omschrijven als een 'top· down'-benadering, die start bij gene";e"e gezondheidsloestanden en vervolgens afdaalt naar onderliggende ziekten (of risicofactoren). Deze benadering ligt voor de hand in het onderzoek naar stedte, omdat oorzaakspecrneke sterfte-gegevens in de regel beschikbaar zijn. Daarentegen is het in onderzoek naar compressie van de morbiditeit ook mogelijk een 'bottom-up'benadering te volgen, die haar beginpunt heeft bij afzonderlijke ziekten. Dat wij desondanks hebben gekozen voor de 'top-down'-benadering hield onder andere verband met de geringere hoeveelheid benodigde gegevens en daarnaast met de aard van de in dit proefschrift aan de orde gestelde onderzoeksvragen. In hoofdstuk 9 hebben we uitvoeriger stilgestaan bij de vooren nadelen van beide benaderingswijzen en de door ons gemaakte keuze.
In dit proefschrift werd onderzocht onder welke oms tan dig he den een langere levensduur gepaard gaat met een verbetering van de gezondheid van de bevolking. De gezondheid van de bevolking en veranderingen daarin werden vastgesteld met behulp van een maat voor de gezondheid die zowel ziekteals sterftegegevens combineert, de zogenaamde 'health expectancy'. In Nederland wordt voor 'health expectancy' vaak de term 'gezonde levensverwachting' gebruikt, maar 'gezondheidsverwachting' zou een betel'e vertaling zijn omdat met deze term ook het aantal jaren doorgebracht in ongezondheid wordt aangeduid. Desahliettemin hebben we de term 'gezonde levensverwachting' hier gehandhaafd en gedefinieerd als de levensverwachting zowel met als zonder beperkingen in het functioneren.
Het doel van het onderzoek was om vast te stellen welke veranderingen in het ziekte- en sterftepatroon in Nederland no dig zouden zijn om compressie van de morbiditeit te bereiken. Met andere woorden, we wilden nagaan hoe een reductie in het aantal jaren met beperkingen (absolute compressie) of in het percentage van de totale levensverwachting met beperkingen (relatieve compressie) zou kunnen worden gerealiseerd. Centraal stonden (veranderingen in) de ziekte- en sterftelast vel'Oorzaakt door chl'onische ziekten of veroudering, waarbij onder ziektelast werd verstaan het hebben van beperkingen in het functioneren.
240

Samenvatting
De (h'ie doelstellingen van deze studie waren: 1 Het beschrijven en analyseren van recente veranderingen in de Neder
landse sterfte, met speciale aandacht voor het rechthoekiger worden van de overlevingscurve ('rectangularisatie van de overlevingscurve') en veranderingen in de levensverwachting op oude leeftijd.
2 Het beschrijven van de huidige leeftijdsspecifieke sterfte- en beperkingenpatronen in de Nederlandse bevolking, en het samenvatten van deze patronen in een ge'integreerde gezondheidsmaat, de gezonde levensverwachting.
3 Het vaststellen welke veranderingen in de huidige leeftijdsspecifieke sterfte- en beperkingenpatl'onen in Nederland nodig zijn voor het bereiken van compressie van de morbiditeit. Dam·toe werden de volgende scenario's bestudeerd: (a) een algemene reductie in de sterfte- en beperkingencijfers; (b) een reductie in de sterfte- en beperkingencijfers door het volledig uitbannen van roken, en (c) een reductie in de sterfte- en beperkingencijfers door elimillatie van een aantal chronische ziekten.
In deel I (hoofdstuldw/l. 2-4) wel'den nationale bevolkings- en sterftegegeyens gebruikt om recente veranderingen in de Nederlandse sterfte te beschrijven en te analyseren. De onderwerpen 'rectangularisatie van de overlevingscurve' en vel'anderingen in de levensverwachting van Qudel'en stonden centraal, omdat deze een belangrijke 1'01 spelen in het wetenschappelijke debat over compressie en expansie van (Ie mOl'biditeit. De overlevingstafel werd gebruikt om veranderingen in de levensverwachting en in de vorm van de overlevingscurve te bescln·ijven. Vervolgens werden deze veranderingen met behulp van decompositie-technieken herleid tot veranderingen in leeftijds- en oorzaakspecifieke sterftepatronen.
In hoofdstuh 2 werden veranderingen in de levensverwachting op oudere leeftijd sinds 1970 bestudeerd. Dam·toe berekenden we voor de periode 1970-1994 (pel' 5-jaar perioden) eerst de levensverwachting van mannen en vrouwen op de leeftijden van 60 en 85 jaar. Hieruit bleek dat de levensverwachting op 60-jarige leeftijd toenam in de perioden 1970174-1980/84 (jaren '70) en 1980/84-1990194 (jaren '80). Opvallender was echter de ontwikkeling in de levensverwachting van 8(i-jarigen, omdat deze verschilde van die in andere landen. We constateerden dat de levensverwachting van 85-jarigen - na een aanvankelijke toe name - sinds 1980/84 (voor mannen) en 1985/89 (voor vrouwen) afneemt. Teneinde meer inzicht te verIn-ijgen in de recente veranderingen in de levensverwachting van ouderen hebben we met behulp van decompositietechnieken onderzocht wat de bijdrage was van de verschillende leeftijdsgroepen en doodsoorzaken aan deze veranderingen. Vit de analyses bleek dat een stagnatie in de daling van de stel'ftecijfers onder Vl'Ouwen in de leeftijdsgroep 85-89 jaar en een toename van de sterftecijfers onder mannen van 85 jaar en ouder en vrouwen van 90 jaar en ouder de beschreven stagna tie in de stijging van de levensverwachting van 85-jarigen veroorzaakte. De analyse van de bijdrage van verschillende
241

HOO/dstllk 11
doodsool'zaken wees uit dat een samenspel van twee ontwikkelingen verantwoordelijk was voor de recente omkering in de trend in de levensvel'wachting van 85-jal'igen. Ten eerste zette de daling in de stel'fte aan cel'ebl'ovasculaiTe ziekten en 'ovel'ige cal'diovasculaire ziekten' mindel' sterk door (onder mannen nam de sterfte aan laatstgenoemde oOl'zaak zelfs toe). Ten tweede was e1' een toename van stel'fte aall onder andere chronische bronchitis/emfYseem, psychische stoornissen, kankel' (pl'ostaatkankel' en ovel'ige kankel's), diabetes mellitus en onvolledig gedefinieel'de ziektebeelden.
De analyses in hoofdstllh 3 hadden tot doel om vast te stellen of er in de pel'iode 1950-1992 in Nederland spl'ake is geweest van l'ectangulal'isatie van de overievingsclU'Ve. Omdat niet door alle ondel'zoekel's hetzelfde wOl'dt vel'staan onder l'ectangulal'isatie, hebben we het begrip eel'st op ondubbelzinnige wijze gedefinieerd. In dit proefsehl'ift werd onder l'ectangulal'isatie vel'staan: het l'eehthoekigel' worden van de ovel'levingscul've als gevolg van toenemende overleving en de concentl'atie van sterfte l'ond de gemiddelde leeftijd van overlijden. Naar gelang de stijging van de levensverwachting gepaard ging met een concentl'atie van stel'fte in een kOl'tel' leeftijdsintel'val of in een kleinel' deel van de totale levensvel'waehting wel'd ondel'scheid gemaakt tussen l'espeetievelijk absolute en l'elatieve l'ectangulal'isatie. Het ondel'zoek wees uit dat gedul'ende pl'aktisch de gehele periode VOOl' zowel mannen als Vl'ouwen absolute en l'elatieve'l'ectangularisatie van de ovel'levingseUl'Ve vanaf de geboorte plaatsvond. Boven de 60Y, jaar waren de uitkomsten mindel' eenduidig. Zo yond el' l'elatieve (maar geen absolute) l'ectangularisatie plaats onder oudel'e Vl'ouwen gedurende de gehele pel'iode, maar onder oudel'e mannen enkel sinds 1975/79. Absolute l'ectangulal'isatie yond plaats voor oudel'e mannen en Vl'ouwen sinds 1980/84.
In hoofdstllh 4 hebben we de bijdl'age van vel'schillende doodsool'zaken aan de l'ecente absolute l'ectangulal'isatie onder pel'sonen van 60 jaar en ouder onderzocht. Door gebruik te maken van een speciaal VOOl' dit ondel'zoek ontwikkelde decompositie-analyse waren we in staat om vast te stellen waal'om absolute l'ectangularisatie plaatsvond in de jal'en '80, maar niet in de jal'en '70, Uit ons ondel'zoek kwam naal' VOl'en dat de absolute l'ectangulal'isatie in de jaren '80 het gevolg was van zowel dalingen in de stel'fte aan ischaemische hal'tziekte, cel'ebl'ovasculaire aandoeningen (zowel mannen als vl'ouwen) en longkankel' (alleen mannen) als van stijgingen in de stel'fte aan chl'onische bl'onchitis/emfYseem (alleen mannen) en psychisehe stoornissen, Bovendien wees vel'gelijking met de jal'en '70 uit dat vool'al vel'andel'ingen in de stel'fte op zeel' hoge leeftijd (namelijk gel'ingel'e dalingen of (grotel'e) stijgingen) verantwool'delijk waren VOOl' de omslag van de aanvankelijke de-l'ectangulal'isatie naal' de l'ectangulal'isatie in de jal'en '80. Het feit dat l'ecentelijk in Nederland boven de 60 jaal' absolute l'ectangulal'isatie heeft plaatsgevonden wOl'dt dus verklaard uit een combinatie van
242

Samenvatting
toegenomen overleving to/. op zeer hoge leeftijd en verminderde overleving op zeer oude leeftijd.
Na de analyse van ontwikkelingen in de sterfte op oude leeftijd, werden in deel II (hoofdstnil 5) ook de beperkingen in het functioneren in beschouwing genomen. AIleen op deze manier kon recht worden gedaan aan het grote belang van de niet·fatale gevolgen van' chronische ziekten. We hebben gebruik gemaakt van twee longitudinale stuelies om de huidige leeftijdsspecifieke beperkingen- en sterftepatronen in de Nederlandse bevolking vast te stellen. Op basis hiervan hebben we vervolgens de levensverwachting met en zonder beperkingen berekend. In hoofdstuk 5 en de daarop volgende hoofdstukken hebben we niet langer een model met twee gezondheidatoestanden (levend en dood) gebruikt, maar een model met drie toestanden (levend zonder beperkingen, levend met beperkingen en dood).
Met behulp van Poisson regressie (log-rate model) werden in hoofdstrth 5 zowel de leeftijdsspecifieke incidentie- en herstelcijfers van beperkingen als de sterftecijfers onder personen met en zonder beperkingen geschat. Hieruit bleek dat de incidentie van beperkingen en ook de sterfte onder personen met en zonder beperkingen toenam met het stijgen van de leeftijd, terwijl de kana op heratel van beperkingen afnam. Met behulp van meerclimensionale overlevingstafels en gebruikmakend van deze leeftijdsspecifieke incidentie-, herstel- en sterftecijfers hebben we vervolgens de levensverwachting met en zonder beperkingen berekend. In 1986-1994 bedroeg de totale levensverwachting van 30Yz-jarigen in Nederland 44,8 jaar voor mannen en 50,8 jaar voor vrouwen. Him'van werden respectievelijk 38,5 en 38,4 jaar doorgebracht zonder beperkingen. De resterende 6,4 (14,2%) en 12,4 (24,3%) jaar waren levensjaren met beperkingen. De levensverwachting van 70Yz-jarigen bedroeg 10,7 jaar voor mannen en 14,3 jaar voor Vl·omven. Respectievelijk ongeveer 6,3 en 5,8 jaar werden doorgebracht zonder beperkingen, terwijl respectievelijk 4,4 (41,3%) en 8,5 (59,6%) jaar werden doorgebracht met beperkingen. Het meerdimensionale model van de levensverwachting met en zonder beperkingen en de genoemde incidentie-, herstel- en sterftecijfers dienden als uitgangspunt voor de analyses in de twee volgende hoofdstukken.
In deel III (hoofdstn""en 6·8) ging het erom vast te stellen welke veranderingen in de huidige sterfte- en beperkingencijfers noelig zijn om in Nederland compressie van de morbiditeit te bereiken. Hiervoor werden verschillende scenario·berekeningen ('what-if experimenten) uitgevoerd.
In hoofdstrth 6 hebben we onderzocht welke veranderingen in leeftijdsspecifieke incidentie- en herstelcijfers van beperkingen en in de sterftecijfers onder personen met en zonder beperkingen (met eenzelfde percentage op aile leeftijden) noelig zijn om compressie van de morbieliteit te bereiken. De uitkomst van ons onderzoek was dat zowel een reductie van de incidentie-
243

Hoofdstflk 11
cijfers als een toe name van de herstelcijfers (in beide gevallen: ceteris paribus) zou leiden tot compressie van de morbiditeit (in een absolute en in een relatieve zin) boven de leeftijd van 30Y, jaar. Het effect van verbeteringen in de incidentiecijfers bleek overigens gl'Oter dan dat van verbeteringen in de herstelcijfers. Tevens stelden we vast dat een daling in de sterftecijfers onder personen met en/of wnder beperkingen (ceteris paribus) zou resulteren in absolute en relatieve expansie van de morbiditeit boven de leeftijd van 30Y, jaar. Indien de sterfte onder personen met en zonder beperkingen zou dalen met 20%, dan zouden tenminste even grote verbeteringen in zowel de incidentie- als de herstelcijfers van beperkingen no dig zijn om compressie van de morbiditeit te bereiken boven de leeftijd van 30Y, jaar. Indien bij dezelfde stel'ftedalingen aileen de incidentie- of aileen de herstelcijfers zouden verbeteren, wuden voor dit doel verbeteringen van tenminste 30% (incidentie) of 50% (herstel) nodig zijn. De analyses wezen uit dat grotere verbeteringen (op aile leeftijden) nodig zouden zijn om compressie van de morbiditeit boven leeftijd 70Y, te bereiken. Dit betekent dat absolute compressie van de morbiditeit boven leeftijd 30Y, en absolute expansie van de morbiditeit boven leeftijd 70Y, gelijktijdig voor kan komen.
In hoordstllh 7 hebben we onderzocht of de eliminatie van roken zou resulteren in compressie van de morbiditeit. Uit de doorberekening van dit scenario bleek dat het niet aileen zou leiden tot een toename van de totale levensverwachting en de levensverwachting zonder beperkingen, maar ook tot absolute compressie van de morbiditeit. Ondanks het feit dat mensen door niet te roken langer zouden leven en derhalve Ian gel' zouden blootstaan aan het risico op beperkingen, zou pel' saldo het aantal jaren met beperkingen toch afnemen. De reden hiervoor is dat de eliminatie van l'Oken tevens leidt tot een lagere incidentie en een hogere herstel van beperkingen.
Tenslotte hebben we in hoordstllh 8 onderzocht of het volledig uitbannen van enkele chronische ziekten in de populatie zou leiden tot compressie van de morbiditeit. De analyses wezen uit dat het uitbannen van invaliderende ziekten zoals artritisirugklachten zou resulteren in compressie van de morbiditeit in absolute en relatieve zin. De eliminatie van letale aandoeningen zoals kanker zou daarentegen leiden tot een toename van het aantal jaren met beperkingen. Of eliminatie van ziekten die zowel invaliderend als letaal zijn (zoals bijvoorbeeld hartziekten en CARA) leidt tot compressie of expansie van de morbiditeit, hangt af van de mate waarin deze ziekten sterfte en beperkingen veroorzaken. Voor hartziekten bijvoorbeeld zou volledige uitschakeling resulteren in expansie van de morbiditeit in absolute en relatieve zin. Voor CARA daarentegen zou volledige eliminatie leiden tot compressie van de morbiditeit in absolute en relatieve zin.
In hoordstllh 9 werden allereerst de onderzoeksresultaten van dit proefschrift samengevat (paragraaf 9.2) en werd de onderweksopzet nader toegelicht en bediscussieerd (paragraaf 9.3). Vervolgens stonden we in paragraaf
244

Samenvatting
9.4 stil bij de vraag wat precies het verb and is tussen (veranderingen in) sterfie en compressie van de morbiditeit. De discussie spitste zich daarbij toe op twee pun ten. Op de eerste plaats betoogden we dat Fries bij het formule· ren van de 'compressie·van·de·morbiditeit'·hypothese er feitelijk vanuit was gegaan dat de totale levensverwachting niet (verder) zou veranderen, aangezien hij had gesteld dat het uitstel van cln'onische ziekten wu leiden tot compressie van de morbiditeit. We wezen erop dat dit standpunt impli· ceert dat hij ziekte en sterfte onafllankelijk van elkaar zag. Anders dan Fries waren we van mening dat e1' allerminst vanuit kan worden gegaan dat de totale sterfte (reeds) een constant niveau heeft bereikt. Integendeel, bij de bestudering van het verschijnsel van de compressie van de morbiditeit zal men er rekening mee moeten houden dat er nog altijd veranderingen in de totale sterfte plaatsvinden en dat deze de uitkomst zijn van de wisselwer· king tussen ziekte en (ziekte·specifieke) sterfte in de bevolking, Ontwikke· lingen in ziekte en totale sterfte vertonen derhalve een onlosmakelijke samenhang, waarmee wij rekening hebben gehouden door gebruik te maken van (meerdimensionale) overlevingstafels. Hadden we dit niet gedaan dan zou het aantal situaties zijn overschat waarin compressie van de morbiditeit was opgetreden. Hadden we bijvoorbeeld geen rekening gehouden met de sterftereductie . en del' halve met de stijging van de totale levensverwachting . die het gevolg is van de eliminatie van letale ziekten (zoals kanker en hart· ziekten), dan zou de toename van het aantal jaren met beperkingen zeker onopgemerkt zijn gebleven, Ook zou de daling in het aantal jaren met beperkingen als gevolg van de eliminatie van roken zijn overschat indien we de veranderingen in de totale sterfte zouden hebben genegeerd, Verder plaatsten we vraagtekens bij het nauwe verband dat Fries veronderstelde tussen rectangularisat.ie en compressie van de morbiditeit. Hoewel we dus het samengaan van beide verschijnselen niet voetstoots aannamen, hebben we aandacht be steed aan de mogelijke manieren waarop rectangularisatie en compressie van de morbiditeit aan' elkaar wuden kunnen zijn gerela· teerd. We moesten vaststellen dat de relatie tussen rectangularisatie en compressie van de morbiditeit complexer was dan we op voorhand hadden aangenomen, Ondanks het feit dat rectangularisat.ie impliceert dat substan· Wile veranderingen in de totale levensverwachting in de toekomst mindel' waarschijnlijk zijn en dat dus kleinere verbeteringen in de levensverwach· ting zonder beperkingen nodig zijn om compressie van de morbiditeit te bereiken, kunnen we er nog niet zeker van zijn d.at deze kleinere verbete· ringen ook eenvoudiger zijn te realisBl'en. Uiteindelijk is het altijd de com· plexe wisselwerking tussen ziekte en sterfte die de balans doet doorslaan hetzij ten gltnste van expansie van de morbiditeit, hetzij ten gunste van compressie van de morbiditeit. Met andere woorden, meer nog dan de omvang van de veranderingen lijkt ons het onderliggende mechanisme van belang.
In paragraaf 9.5 werden een aantal onderwerpen gesignaleerd die verder onderzoek behoeven. Zo verdient met name de recente stijging van de sterfie
245

Hoo/ds/Ilk 11
onder de alleroudsten (85+) in Nederland het nader te worden onderzocht. We zijn van mening dat daarbij zowel een levensloop-benadering als een internationale vergelijking van ontwikkelingen in de sterfte en van (veranderingen in) de verdeling van risicofactoren vruchtbaar kunnen zijn. Daarnaast pleitten we voor verder onderzoek naar de relatie tussen ziekten en beperkingen. Dool' gebruik te maken van een multivariate-modelleertechniek, analoog aan de techniek die we in dit proefscru·ift hebben ontwikkeld ten behoeve van de scenario-berekeningen in hoofdstuk 8, zouden (veranderingen of verschillen) in het aantal jaren met beperkingen kunnen worden toegeschreven aan specifieke ziekten. Ook zou toekomstig onderzoek - meer dan in dit proefschrift mogelijk was - aandacht moeten besteden aan verschillen in de ernst van beperkingen. Tenslotte wezen we op het be lang van verdeI' onderzoek naar het effect van de eliminatie van andere risicofactoren dan roken voor het realiseren van compressie van de morbiditeit.
Een aantal conclusies in dit proefscru'ift achten wij van belang voor beleidsmakers werkzaam op het terrein van de volksgezondheid. Ze werden in paragraaf 9.6 kort samengevat. Ten aanzien van het monitoren van de gezondheidstoestand van de bevolking hebben we gewezen op het belang ontwikkelingen in ziekte en sterfte in hun onderlinge samenhang te beschouwen. Dit kan bijvoorbeeld door gebruik te maken van geintegreerde gezondheidsmaten, zoals de gezonde levensverwachting. Hierbij is het echter wei van belang de ontwikkeling van de 'complete' gezondheidsverwachting te evalueren. Het is dus onvoldoende om aileen de ontwikkeling van de levensverwachting zonder beperkingen in ogenschouw te nemen. Door combinaties van ontwikkelingen in bijvoorbeeld de levensverwachting met en die zander beperkingen te classificeren als (absolute en relatieve) compressie of expansie van de morbiditeit kan de interpretatie van veranderingen worden vereenvoudigd.
Gezien het feit dat compressie van de morbiditeit (in combinatie met een constante of toenemende levensverwachting) een nastrevenswaardig doel voor het volksgezondheidsbeleid is, werd in pal'agl'aaf 9.6 tevens aandacht besteed aan mogelijke interventies om dit doel te bereiken. Zo stelden we dat om compressie van de morbiditeit te bereiken het beleid zich moet richten op (niet-letale) invalidel'ende ziekten (zoals artritis/rugkiachten) in plaats van enkel op letale ziekten (zoals kanker en hartziekten). Anders gezegd, interventies die aileen gericht zijn op het verminderen van sterfte, zullen niet resulteren in compressie van de morbiditeit. Ook zouden interventies gericht op het ontmoedigen van roken blijvend een hoge prioriteit moeten krijgen in het volksgezondheidsbeleid. Ons onderzoek toonde namelijk aan dat het uitbannen van roken niet aileen leidt tot een stijging van de levensverwachting, maar ook tot een reductie van het aantal jaren dat mensen doorbrengen met beperkingen.
246

Acknowledgements
This research project was supported financially by the Priority Programme on Population Research of the Netherlands Organization for Scientific Research (NWO), and performed at the Department of Public Health of the Erasmus University Rotterdam.
For access to the GLOBE study ('Gezondheid en Levensomstandigheden Bevolking Eindhoven en Omstreken') I am indebted to the GLOBE project group. The GLOBE study is performed at the Department of Public Health, Erasmus University Rotterdam, in collaboration with the Public Health Services of the city of Eindhoven and the region of South-East Brabant. The GLOBE study was supported financially by the Ministry of Public Health, Welfare and Sport, the Sickness Fund Council (Ziekenfondsraad) and the Prevention Fund. I would like to thank Michel Provoost and Xandra Savelkouls for carefully constructing and maintaining the data-base of the GLOBE study.
For access to the Dutch National Survey of General Practice I am indebted to the Netherlands Institute for Health Care (NIVEL) in Utrecht.
I am indebted to Statistics Netherlands (The Hague) for access to the Health Interview Survey 1993 and 1994 and for providing population and mortality data of centenarians by single year of age.
Finally, I am indebted to the NIWI Steinmetz Archive (Amsterdam), which supplied the computer file of the Longitudinal Study of Aging.
247


Dankwoord
Ondanks die ene naam op de omslag van dit proefschrift, hebben velen een bijdrage geleverd aan de totstandkoming ervan. Zonder hun hulp zou ik noait de voorgaande pagina's hebben kunnen sc11l'ijven.
Er zullen vel'lloedelijk maar weinig pl'omotol'en zijn die hun pl'omovendi op zo'n nauwgezette wijze begeleiden als Joha'1 Mackenbach. Systematisch en helder gaf hij aan waar en hoe het onderzoek zou kunnen worden verbeterd. Zijn gave om (schijnbaar) onoplosbare pl'Oblemen te reduceren tot hun es· sentie en de cl'eativiteit waarll1ee hij mogelijke oplossingen aandroeg, hebben er in belangrijke mate toe bijgedragen dat ik mijn proefsclu'ift heb kunnen voltooien. Ik ben dan ook blij dat onze samenwerking in een nieuw project wordt gecontinueerd.
Caspar Looman stond garant voor het programmeren in GLIM en voor talloze nuttige adviezen bij het oplossen van statistische problemen. Zijn bijdrage aan het project was daarom van onschatbare waarde. Ik weet niet of een statisticus zulke woorden als compliment opvat, maar ze zijn in iedel' geval wei zo bedoeld. Op hetzelfde terrein heb ik mogen profiteren van de expertise van Rene Eijkemans en Jacqueline van den Bosch.
De belangstelling voor de onderwerpen die in dit proefschrift aan de orde komen deelde ik met Jan Barenclregt en Luc Bonneux. Hoewel we het plan hadden opgevat gelijktijdig te promoveren, bleek dit uiteindelijk niet haalbaar. Dat neemt niet weg dat we intensief en uitermate plezierig hebben samengewerkt. Dat de grillige paden van de wetenschap voor ons soms leidden naar een swingend bluescafe in Chicago of naar de 'serene' stilte van de SacHi-Coeur in Pal'ijs . waar ons tre£punt (de Nederlandse biechtstoel) overigens niet bleek te bestaan . had op mij een louterende uitwerking. Hiema kon ik mijn onderzoek weer met frisse moed voortzetten. Hun com· mentaar op de teksten die ik had gesclu'even, heeft er zeker toe bijgedragen dat het proefschrift is geworden tot wat het nu is. Dit geldt evenzeer voor de op· en aanmerkingen van Frans Willekens, Anton Kunst en Perla Marang· Van de Mheen. Mijn dank geldt hun allen.
Mijn kamergenoten Inez Joung en Judith Wolleswinkel·Van den Bosch waren dikwijls de eersten die geconfronteerd werden met de diepte- en hoogtepunten (de 'Iokale optima') van mijn onderzoek. Ze waren nooit te beroeI'd om mij met raad en daad terzijde te staan. Ik hoop dan ook van ganser harte dat onze kamer nog vele herindelingsplannen zal overleven.
De onderzoeksgroep TAM moet Iller ook genoemd worden. Van de presentaties en de discussies tijdens de TAM-bijeenkomsten heb ik veel opgesto· ken. In weel'wil van de naam van deze onderzoeksgl'oep, waren de vel'gade-
249

ringen altijd levendig en vol humor, wat het wetenschappelijk rendement ervan zeker heeft verhoogd.
Daarnaast verdient ook de bijdrage van het GLOBE-team aparte vermel· ding en in het bijzonder die van Karien StroMs, Dike van de Mheen, Carola Schl'ijvers, Joost van del' Meer, Xandra Savelkouls en Michel Pl'Ovoost. Niet alleen omdat het door hun vele voorwerk mogelijk werd om de GLOBE-data in mijn ondel'zoek te gebl'uiken, maar oak omdat onze samenwerking in een uitermate collegiale sfeer gestalte kreeg.
Telkens wanneer mijn computer (of ik) het liet af\veten, kon ik een beroep doen op Ton Gerritsen, Hans Verdoes en IvaI' Bongaarts. Zonder hun hulp had vermoedelijk menige tabel in mijn proefschrift moeten ontbreken.
Het geduld, de onvermoeibaarheid en de accurate sse van het secretariaat van iMGZ, in het bijzonder van Else van den Engel, Saskia Drent en nse Philips, kunnen niet te veel geprezen wOl·den. Wanneer ik weer eens vlak voor een congres met een killS kwam die hun planning in de war stuurde, zetten ze toch hun beste beentje voor.
Anna Bosselaar wil ik bedanken voor de uitstekende wijze waal'Op ze de layout van dit pl'Oefschl'ift heeft verzorgd en Karen Gribling-Lail'd voor de nauwgezette correctie van mijn Engels.
I would like to thank the board of the international network on Health Expectancy 'REVES', especially Jean-Marie Robine of INSERM (France), for providing me an international platform to discuss my work with colle agnes working in the same field. I am also greatly indebted to Lois Verbrugge and Eileen Crimmins for providing useful information on the Longitudinal Study of Aging (LSOA).
Zonder de respondenten van de GLOBE en LSOA studie hadden de meeste analyses uit dit proefschrift nooit uitgevoerd kunnen worden. Ik dank hun voor het herhaaldelijk beantwoorden van de uitgebreide vragenlijsten.
Mijn familie en vrienden verdienen een grote pluim omdat ze tot vel'Velens toe hebben moeten horen dat ik eerst nog 'even' mijn proefschrift moest afl'Onden, alvorens we een afspraak konden maken. Desondanks hebben ze altijd meegeleefd en de eindeloze verhalen over mijn proefscru'ift welwillend aangehoord.
Ten slotte wil ik Fred bedanken voor zijn inhoudelijke bijdrage aan dit proefschrift en zijn praktische hulp bij' de afronding Cl'Van. Mede dOOl' zijn schijnbaar onuitputtelijke geduld en zijn rotsvaste vertrouwen in een goede afioop, heb ik de klus kunnen klaren. Ik ben hem bovendien dankbaar dat
250

hij me liet inzien dat er naast promoveren nog andere belangrijke zaken bestonden. Gelukkig is daar nu weer meer tijd voor.
251


Curriculum vitae
Wilma Nusselder werd op 28 januari 1964 geboren te Doetinchem. In 1982 deed zij eindexamen Atheneum A aan het FlorellS Radewijns College te Raalte. Aansluitend begon zij met de stu die Sociale Geografie aan de Rijksuniversiteit Groningen. In het kader hier'van liep zij stage bij het Bureau of Statistics, Govel'llment of Sind, in Karachi (pakistan). Daar verrichtte zij onderzoek naar de ruimtelijke spreiding en het functioneren van door de overheid gesubsidieerde gezondheidscentra op het platte land. In 1988 behaalde zij ham' doctoraalexamen (cum laude). Tevens was zij in 1984 begonnen met de studie niet-Westerse Demografie, eveneens aan de Rijksuniversiteit Groningen. Hiervoor liep zij enige tijd stage bij de Population Acitivities Unit, Economic Commission for Europe van de Verenigde Naties in Gem\ve (Zwitserland), waar zij vergelijkend onderzoek deed naar de vruchtbaarheid in een aantal Europese landen. In 1988 sloot zij deze studie af met het behalen van het doctoraalexamen.
Na afronding van haar studies werkte zij eruge tijd als toegevoegd onderzoeker bij het Research Centrum voor Onderwijs en Arbeidsmarkt (ROA) van de Rijksuruversiteit Limburg in Maastricht. Zij was betrokken bij een inventariserend onderzoek naar de wenselijkheid en haalbaarheid van een informatiesysteem over de aansluiting tussen onderwijs en arbeidsmarkt voor de Rotterdamse haven. Van medio 1989 tot halverwege 1991 was zij als onderzoeker verbonden aan het Nederlands Interdisciplinair Demografisch Instituut (NIDI) te Den Haag en maakte vooruitberekeningen van het aantal niet-Nederlanders in ons land. Aansluitend was zij tot en met februari 1993 verbonden aan het Nederlands Instituut voor Onderzoek van de Gezondheidszorg (NlVEL) te Utrecht, waar zij onderzoek deed naar de 'gezonde levensverwachting' in Nederland. Van maart 1993 totjuli 1997 was zij in elienst van de Nederlandse Organisatie voor Wetenschappelijk Onderzoek (NWO) en gedetacheerd bij het Instituut Maatschappelijke Gezondheidszorg (iMGZ) van de Erasmus Universiteit Rotterdam. In die periode verrichtte zij het onderzoek naar compressie.en expansie van de morbiditeit dat ten grondslag ligt aan dit proefschrift. Het onderzoek was onderdeel van het Prioriteitsprogramma Bevolldngsvraagstukken van NWO. Sinds juli 1997 is zij in elienst van het iMGZ, waar zij binnen het raamwerk van het NWO-Onderzoekprogramma 'Chrorusch Zieken: Zorg, Opvang en Begeleiding' het beloop van beperkingen onder clu'orusch zieken ondel'zoekt.
253