Choking Under Pressure: A Review of Current Debates, Literature, and Interventions
Upload
khangminh22Category
view
0download
0
Compression under pressure: physiological and methodological factors influencing the
effect of compression garments on running economy
Christopher John McManus
A thesis submitted for the degree of Doctor of Philosophy (Ph.D.) in Sport and Exercise Science
School of Sport, Rehabilitation and Exercise Sciences
University of Essex.
April 2020

i
ABSTRACT
Evidence for the effects of compression garments on sports performance and physiological responses
to dynamic exercise remains equivocal. Contradictory findings within the sporting literature are
confounded by methodological heterogeneity in terms of; intensity and modality of exercise, type of
garment worn, and the interface pressure produced by the garment. The interface pressure applied by
compression clothing is an important measure in evaluating the bio-physical impact of compression.
Interface pressure values obtained in vivo with two portable pressure devices (PicoPress and
Kikuhime) were compared against a reference standard (HOSY). The PicoPress satisfied the a priori
thresholds for acceptable validity at the posterior and lateral orientation with calf stockings and tights,
confirming its future use to assess interface pressure. A small, likely beneficial improvement in
running economy was observed with correctly fitted (95%:5%:0%; η2 = 0.55) but not oversized
compression tights, indicating that a certain level of interface pressure is required.
Compression tights improved running economy only at higher relative exercise intensities (77.7 -
91.5% V̇O2max). The absence of any improvement at lower intensities (67.1 - 77.6 % V̇O2max) suggest
that changes in running economy from compression are dependent on relative exercise intensity when
V̇O2max (%) is used as an anchor of exercise intensity.
Comparing measures from two portable, wireless near-infrared spectroscopy (NIRS) devices
(PortaMon and MOXY) we found that the low-cost and light-weight MOXY device gave tissue
oxygen saturation values at rest and during exercise that were physiologically credible and suitable for
future research. Compression tights did affect ground contact time but not tissue oxygen saturation,
cardiovascular or other kinematic parameters during running at intensities equivalent to long-distance
race speed. Compression tights can produce small improvements in running economy, but effects are
restricted to higher intensity exercise and appear dependent on garment interface pressure. It remains
unlikely that this small positive effect on running economy, in very specific conditions, is enough to
result in a meaningful impact on running performance.

ii
ACKNOWLEDGEMENTS
First and foremost, I would like to sincerely thank Dr Gavin Sandercock and Professor Chris Cooper.
I am eternally grateful for your expertise and guidance. I have learnt a great amount throughout your
supervision and aspire to support students with the passion and patience that you have provided me.
I would also like to thank Nick Morgan. Your enthusiasm and mentorship throughout my career in
sports science has been invaluable. You have provided me with many opportunities, without which
this thesis would not have been possible.
I am forever grateful to the volunteers who participated in my research. Your willingness to
participate and adherence to all that was asked of you (including abstaining from coffee) is the kindest
gesture you could give a researcher and for that I am enormously appreciative.
To my mum and dad, I will never forget how privileged I am and I cannot thank you enough for all
you have done for me. I am very lucky to have your continued support and unconditional love.
Lastly, a special thank you to my fiancé Abi. Your unwavering affection and patience throughout has
enabled me to pursue this path. There have been moments when getting to this point seemed an
eternity away but you have always had the right words to say to keep me on track. You are without
doubt the most caring, supportive and selfless person I know – thank you for everything.

iii
PREFACE
The work presented in this thesis has been peer reviewed as follows;
Peer reviewed publications
McManus, C., Collison, J., Cooper, C (2018) Performance comparison of the MOXY and PortaMon
near-infrared spectroscopy muscle oximeters at rest and during exercise. Journal of Biomedical
Optics, 12 (01):1
McManus, C., Venkatraman, P., Sandercock, G (2020) The measurement of interface pressure applied
by sports compression garments: a comparative study of two portable devices. Measurement,
1;156:107592.
Conference presentations
McManus, C (2019) The measurement of interface pressure applied by sports compression garments:
a comparative study of two portable devices (Oral presentation). European Wound Management
Association, Gothenburg,
McManus, C (2015) Lower body compression tights elicit a practically significant benefit on sub-
maximal running economy (Poster presentation). British Association of Sport & Exercise Sciences, St
Georges Park.

iv
TABLE OF CONTENTS
ABSTRACT ............................................................................................................................................ i
ACKNOWLEDGEMENTS ................................................................................................................. ii
PREFACE .............................................................................................................................................iii
TABLE OF CONTENTS .................................................................................................................... iv
LIST OF TABLES ............................................................................................................................... ix
LIST OF FIGURES ............................................................................................................................. xi
ABBREVIATIONS ............................................................................................................................xiii
CHAPTER I
1 Introduction ..................................................................................................................................... 1
CHAPTER II
2 Literature Review ............................................................................................................................ 4
2.1 Historical context of lower body compression........................................................................ 4
2.2 Medical compression: classifications ...................................................................................... 5
2.3 Medical compression: measurement of pressure .................................................................... 7
2.4 Portable pressure measuring devices .................................................................................... 12
2.5 Sports compression: measurement of interface pressure ...................................................... 14
2.6 Sports compression and exercise performance ..................................................................... 17
2.6.1 Endurance exercise ....................................................................................................... 17
2.6.2 High intensity running and sprint performance ............................................................ 22
2.7 Sports compression and physiological responses ................................................................. 26
2.7.1 Venous blood flow ........................................................................................................ 28
2.7.2 Arterial blood flow ........................................................................................................ 28
2.7.3 Muscle oxygen saturation ............................................................................................. 29
2.7.4 Cardiovascular Function ............................................................................................... 31
2.7.5 Muscle oscillation ......................................................................................................... 33
2.7.6 Proprioception ............................................................................................................... 33
2.7.7 Running kinematics....................................................................................................... 34
2.8 Limitations to literature ......................................................................................................... 35
2.9 Summary ............................................................................................................................... 36
2.10 Thesis aim and objectives ..................................................................................................... 37

v
CHAPTER III
3 The measurement of interface pressure applied by sports compression garments: a comparative
study of two portable devices................................................................................................................ 38
3.1 Rationale ............................................................................................................................... 38
3.2 Abstract ................................................................................................................................. 38
3.3 Introduction ........................................................................................................................... 39
3.4 Methods................................................................................................................................. 40
3.5 Reference Standard Device ................................................................................................... 42
3.5.1 Calibration ..................................................................................................................... 43
3.6 Reference Standard Protocol ................................................................................................. 44
3.7 Portable Devices ................................................................................................................... 45
3.7.1 Calibration ..................................................................................................................... 45
3.8 Portable Device Protocols ..................................................................................................... 46
3.8.1 Water-column method ................................................................................................... 46
3.8.2 In vivo protocol ............................................................................................................. 46
3.8.3 Portable Devices Data Treatment.................................................................................. 47
3.9 Data Analysis Agreement ..................................................................................................... 47
3.10 Results ................................................................................................................................... 48
3.11 Discussion ............................................................................................................................. 52
3.11.1 Limitations .................................................................................................................... 54
3.11.2 Future Research............................................................................................................. 54
3.11.3 Practical Implications .................................................................................................... 54
3.12 Conclusion ............................................................................................................................ 55
CHAPTER IV
4 Assessing the effect of compression tights on submaximal running economy. ............................ 56
4.1 Rationale ............................................................................................................................... 56
4.2 Abstract ................................................................................................................................. 56
4.3 Introduction ........................................................................................................................... 57
4.4 Methods................................................................................................................................. 58
4.4.1 Data Analysis ................................................................................................................ 61
4.5 Results ................................................................................................................................... 62
4.6 Discussion ............................................................................................................................. 69

vi
4.6.1 Influence of Compression Tights on Running Economy .............................................. 69
4.6.2 Influence of Compression Tights on Rating of Perceived Exertion .............................. 71
4.6.3 The Role of Varying Interface Pressure ........................................................................ 71
4.6.4 Practical Application ..................................................................................................... 72
4.7 Conclusion ............................................................................................................................ 74
5 The influence of compression tights on running economy varies by relative intensity ................ 75
5.1 Rationale ............................................................................................................................... 75
5.2 Abstract ................................................................................................................................. 75
5.3 Introduction ........................................................................................................................... 76
5.4 Methods................................................................................................................................. 77
5.4.1 Participants .................................................................................................................... 77
5.4.2 Compression garments .................................................................................................. 78
5.4.3 Experimental design ...................................................................................................... 78
5.4.4 Establishing individual aerobic capacity ....................................................................... 79
5.4.5 Submaximal running economy assessment ................................................................... 79
5.4.6 Data treatment ............................................................................................................... 79
5.4.7 Statistical analysis ......................................................................................................... 80
5.5 Results ................................................................................................................................... 81
5.6 Discussion ............................................................................................................................. 83
5.6.1 Limitations .................................................................................................................... 86
5.7 Conclusion ............................................................................................................................ 86
6 Performance comparison of the MOXY and PortaMon near-infrared spectroscopy muscle
oximeters at rest and during exercise .................................................................................................... 87
6.1 Rationale ............................................................................................................................... 87
6.2 Abstract ................................................................................................................................. 87
6.3 Introduction ........................................................................................................................... 88
6.4 Methods................................................................................................................................. 91
6.4.1 The NIRS devices ......................................................................................................... 91
6.4.2 Testing the Influence of External Pressure ................................................................... 93
6.4.3 Comparing Devices at Rest ........................................................................................... 94
6.4.4 Test – Retest Reliability and Sensitivity of Devices at Rest ......................................... 95
6.4.5 Comparing Devices during Isometric Exercise ............................................................. 96
6.4.6 Comparing Devices during Dynamic Exercise and Occlusion ..................................... 98

vii
6.5 Results ................................................................................................................................. 100
6.5.1 Testing the Influence of External Pressure ................................................................. 100
6.5.2 Comparing Devices at Rest ......................................................................................... 101
6.5.3 Test – Retest Reliability of Devices at Rest ................................................................ 104
6.5.4 Comparing Devices during Isometric Exercise ........................................................... 105
6.5.5 Comparing devices during dynamic exercise and occlusion ...................................... 107
6.6 Discussion ........................................................................................................................... 112
6.6.1 Comparing Devices at Rest ......................................................................................... 112
6.6.2 Testing the Influence of External Pressure ................................................................. 112
6.6.3 Test – Retest Reliability of Devices at Rest ................................................................ 113
6.6.4 Comparing Devices during Isometric Exercise ........................................................... 114
6.6.5 Comparing Devices during Dynamic Exercise ........................................................... 115
6.6.6 Comparing Devices during Occlusion/Reactive Hyperemia and the effect of
physiological calibration ............................................................................................................. 116
6.6.7 Comparing Algorithms ............................................................................................... 117
6.6.8 Real world applications ............................................................................................... 118
6.7 Conclusion .......................................................................................................................... 119
7 Compression tights have no effect on economy of treadmill running at race pace. .................... 121
7.1 Rationale ............................................................................................................................. 121
7.2 Abstract ............................................................................................................................... 121
7.3 Introduction ......................................................................................................................... 122
7.4 Methods............................................................................................................................... 123
7.4.1 Participants .................................................................................................................. 123
7.4.2 Compression Garments ............................................................................................... 124
7.4.3 Experimental Design ................................................................................................... 125
7.4.4 Experimental Procedures ............................................................................................ 126
7.4.5 Statistical Analysis ...................................................................................................... 130
7.5 Results ................................................................................................................................. 131
7.6 Discussion ........................................................................................................................... 135
7.6.1 Variation in Running Economy .................................................................................. 136
7.6.2 Fabric Considerations ................................................................................................. 137
7.6.3 Subjective Measures ................................................................................................... 137
7.6.4 Cardiac Parameters ..................................................................................................... 137

viii
7.6.5 Skin Temperature ........................................................................................................ 138
7.6.6 Muscle Oxygen Saturation .......................................................................................... 138
7.6.7 Running Kinematics .................................................................................................... 140
7.6.8 Interface Pressure Considerations ............................................................................... 140
7.6.9 Limitations .................................................................................................................. 141
7.7 Conclusion .......................................................................................................................... 141
8 Summary ..................................................................................................................................... 142
8.1 Empirical and practical implications of the findings .......................................................... 144
8.1.1 Measuring interface pressure with a portable pressure device .................................... 144
8.1.2 The comparison of wireless NIRS devices ................................................................. 145
8.1.3 The influence of compression on running economy ................................................... 146
8.2 Limitations .......................................................................................................................... 148
8.3 Future research directions ................................................................................................... 149
8.4 Conclusion .......................................................................................................................... 150
9 References ................................................................................................................................... 152
10 Appendices .................................................................................................................................. 168
Appendix 1: University of Essex institutional ethical review board approval ................................ 168
Appendix 2: Participant information packs (Chapters 3 – 7) .......................................................... 170
Appendix 3: Preliminary survey and compression belief questionnaire ......................................... 190
Appendix 4: Published work ........................................................................................................... 192
ix
LIST OF TABLES
Table 2-1. Pressure and residual pressure ratio according to the BS 661210:2018 standard ................. 6
Table 2-2. Pressure and residual pressure ratio according to the RAL-standard ................................... 7
Table 2-3. Pressure and residual pressure ratio according to the ENV 12718:2001 standard................ 7
Table 2-4 Published sports compression studies reporting in vivo interface pressure ......................... 16
Table 2-5 Summary of literature investigating the influence of compression garments on endurance
running performance ............................................................................................................................. 19
Table 2-6 Summary of literature investigating the influence of compression garments on sprint
running performance ............................................................................................................................. 23
Table 3-1 Fabric characteristics of the compression garments. ........................................................... 42
Table 3-2 Interface pressure, significance, agreement values (bias and limits) and slope between
HOSY and portable devices with stockings .......................................................................................... 51
Table 3-3 Interface pressure, significance, agreement values (bias and limits) and slope between the
HOSY and portable devices with tights ................................................................................................ 52
Table 4-1 Interface pressure (mmHg) with oversized (OSG) and correctly sized (CSG) compression
tights for individual participants. .......................................................................................................... 63
Table 4-2 Between-trials comparison of rating of perceived exertion (RPE) during treadmill running
at 60% vV̇O2max. .................................................................................................................................... 64
Table 4-3 Between trials comparison of running economy, respiratory exchange ratio (RER) and
blood lactate values during treadmill running at 60% vV̇O2max ............................................................ 67
Table 4-4 Between trials comparison of heart rate (HR), minute ventilation (VE) and breathing
frequency (BF) during treadmill running at 60% vV̇O2max ................................................................... 68
Table 5-1 Descriptive characteristics of participants (n = 26) ............................................................. 77
Table 5-2 Running economy and substrate utilisation data during a submaximal run with and without
compression tights (Mean [95% CI]). ................................................................................................... 81
Table 5-3 Comparisons in running economy, carbohydrate and fat oxidation between participants
who ran above and below 77.7% V̇O2max with and without compression tights (Mean [95% CI]). ..... 83
Table 6-1 Male and female mean TSI of four NIRS devices at rest. ................................................. 102
Table 6-2 Test-retest measures of device reliability (TSI) at rest. ..................................................... 105

x
Table 6-3. ∆ change in TSI (%) values during 30 s quadriceps isometric contraction task at 30% and
50% maximal voluntary contraction (MVC) of each NIRS device Mean ± SD (range). ................... 106
Table 6-4 Physiological responses during arm cranking and subsequent arterial occlusion. ............. 109
Table 7-1 Descriptive characteristics of participants, training volume and best race performances in
previous 12 months (Mean ± SD). ...................................................................................................... 124
Table 7-2 Cardiovascular responses and running kinematics data during 15 min run with and without
compression tights (Mean [95% CI]). ................................................................................................. 131
Table 7-3 Comparison of vertical oscillation (cm) and intra-individual variability (SD) during the
compression trial between responders and non-responders. ............................................................... 133
Table 7-4 Comparisons of ground contact time (ms) and intra-individual variability (SD) during the
compression trial between responders and non-responders. ............................................................... 133
Table 7-5 SmO2 (%) data during 15 min run with and without compression tights. ......................... 134
Table 7-6 tHb (arbitrary units) data during 15 min run with and without compression tights. .......... 134

xi
LIST OF FIGURES
Figure 1-1 An overview of thesis structure and chapter aims. ............................................................... 3
Figure 2-1. Photograph of the IFTH dynamometer................................................................................ 8
Figure 2-2 Photograph of the HATRA Mrk 2 dynamometer ................................................................. 9
Figure 2-3 Photograph of the HOSY measurement system. .................................................................. 9
Figure 2-4 Graphical illustration of a cylinder with circular cross section of the same girth. The
fundamental principle of Laplace’s Law. ............................................................................................. 10
Figure 2-5 Cross section of the lower leg. Illustration of differing radiuses of curvature at the anterior
and posterior orientation of the lower leg. ............................................................................................ 11
Figure 2-6 The PicoPress compression device, showing the unit, pressure bladder and bladder
dimensions ............................................................................................................................................ 13
Figure 2-7 The Kikuhime compression device, showing the unit and pressure bladder ...................... 13
Figure 2-8 Search strategy for the review of in-vivo interface pressure assessment. .......................... 15
Figure 2-9 A schematic representation of the mechanisms hypothesised in which compression
clothing contributes toward athletic performance ................................................................................. 27
Figure 3-1 Image of SkinsTM Men’s Compression (a) MX Calf Stockings and (b) A400 Long Tights
.............................................................................................................................................................. 41
Figure 3-2 Measuring point for the ankle (Location B) and maximum calf girth (Location C). ......... 43
Figure 3-3 The Hohenstein System (HOSY) showing (a) clamps holding the bottom of the garment,
(b) 20 measuring rods with clamps and (c) measurement tape. ............................................................ 45
Figure 3-4 Linearity and correlation coefficients for the (a) PicoPress and (b) Kikuhime device. ..... 49
Figure 4-1 (a) Lateral and (b) anterior view of Skins TM Men’s Compression A400 Long Tights used
in this investigation. .............................................................................................................................. 59
Figure 4-2 The individual and mean running economy response with correctly fitted compression
compared to control during treadmill running at 60% vV̇O2max. ........................................................... 65
Figure 5-1 Correlation and 95% confidence interval (shaded area) between relative exercise intensity
measured during the control condition (%V̇O2max) and ΔRE. ............................................................... 82
Figure 6-1 Photograph of the underside (left image) and top (right image) of the PortaMon device .. 92
Figure 6-2 Photograph of the underside (left image) and top (right image) of the MOXY device ...... 92

xii
Figure 6-3 (a) Linear regression showing TSI as a function of external pressure (mmHg) (mean ±
SEM), (b) PortaMon minus MOXY (TSI) as a function of external pressure (mmHg). Data fit using
non-linear regression to a sigmoidal curve for illustrative purposes and (c) Bland-Altman plots of
resting TSI of males (n = 21) and (d) females (n = 9) using the combined average of MOXY and
PortaMon devices. ............................................................................................................................... 101
Figure 6-4 Relationship between mean TSI and vastus lateralis skinfold (mm) using the combined
average of MOXY and PortaMon devices .......................................................................................... 103
Figure 6-5 PortaMon minus MOXY (TSI) as a function of adipose tissue thickness (mm). Data fit
using non-linear regression to a sigmoid dose-response curve. .......................................................... 104
Figure 6-6 (a) Group changes in tissue saturation index (∆TSI) during 30 and 50% isometric MVC
tasks and (b) Bland-Altman plots of ∆TSI at 30% MVC (n = 5) and (c) 50% MVC (n = 5) using the
combined average of MOXY and PortaMon devices. ........................................................................ 107
Figure 6-7 (a) Relationship between power output and raw ∆ TSI and (b) calibrated (%) values
during incremental arm cranking ........................................................................................................ 110
Figure 6-8 (a) Individual participant TSI traces for raw and (b) calibrated values during arm cranking
and arterial occlusion .......................................................................................................................... 111
Figure 7-1 Schematic representation of experimental design. ........................................................... 126
Figure 7-2 Method to ensure interface pressure of garment is maintained despite cutting an incision
into fabric. Image for illustrative purposes showing NIRS device positioned at the vastus lateralis,
prior to crepe bandage application. ..................................................................................................... 129
Figure 7-3 Change in running economy (ΔRE) as a function of belief score. ΔRE calculated as
control minus compression. ................................................................................................................ 132
Figure 7-4 Violin plot showing the effects of compression tights on running economy (ΔRE). ΔRE
calculated as control minus compression ............................................................................................ 132
Figure 7-5 The effects of compression garments on skin temperature of the calf (A) and thigh (B)
during 15 min race pace running......................................................................................................... 135

xiii
ABBREVIATIONS
ANOVA – analysis of variance
AROM – active range of motion
ATT – adipose tissue thickness
AUC – area under the curve
BF – breathing frequency
CI – confidence interval
CG – compression garment
CHOOX - carbohydrate oxidation
CV – coefficient of variation
ES – effect size
FATOX – fat oxidation
GCT – ground contact time
HHb - deoxyhaemoglobin
HR – heart rate
Hz - hertz
IP – interface pressure
J – Youden index
La- - blood lactate
LED – light emitting diode
LIST – Loughborough intermittent shuttle test
mmHg – millimetres of mercury
MVC - maximal voluntary contraction
N - newtons
NIRS – near-infrared spectroscopy
O2Hb – oxyhaemoglobin
Pa - pascals

xiv
RE – running economy
RER – respiratory exchange ratio
ROC – receiver operating characteristic
RPE – rating of perceived exertion
SD - standard deviation
SEM -standard error of the mean
SmO2 – saturated muscle oxygenation
SR – spatial resolution
SRS – spatially resolved spectroscopy
TE – typical error
tHb – total haemoglobin
TSI – tissue saturation index
Tsk – skin temperature
USG – urine specific gravity
VE – minute ventilation
V̇CO2 - volume of expired carbon dioxide
VL - vastus lateralis
V̇O2 – volume of oxygen consumption
V̇O2max - maximum volume of oxygen consumption
vV̇O2max - velocity at maximum volume of oxygen consumption
W - watts

1
1 Introduction
Compression garments apply mechanical pressure to the underlying surface and produce a range of
physiological responses. In a clinical setting, the aim of compression is to augment venous and
arterial blood flow and limit the physical space available for swelling to occur. This augmented
physiological response observed at rest is attractive to the athletic population; however, findings from
non-active populations are often inappropriately extrapolated into the sporting domain. Furthermore,
sports compression garments can differ considerably to medical compression garments with regard to
interface pressure applied, graduated compression design and fabric type (elastic vs. inelastic).
Despite an increasing proportion of studies reporting interface pressures in the sports compression
literature, portable pressure measuring devices used to obtain pressure values lack comparison with a
reference standard. Authors have attempted to assess the reliability of portable devices [1,2], however
comparison with a medical device is absent in the literature. By assessing criterion validity and
identifying an appropriate portable pressure monitor, this will assist with interpretation of applied
pressures in a wider context and enable garment comparison with standardised pressure classifications
(Chapter 3).
Evidence that compression garments positively influences exercise performance is limited [3],
however physiological changes observed during locomotion are often observed. A recent meta-
analysis reported small positive effects of compression clothing on running economy, biomechanical
variables, blood lactate clearance and rating of perceived exertion [4], however garments included in
this review vary by fabric composition, limb coverage and interface pressure. A lack of consistency in
research methodologies has brought about a situation where much of the literature is unique in its own
right. Comparison of outcomes between studies investigating two different types of compression
garment (i.e. compression tights and below-knee stockings) should be conducted with caution in light
of the varied body coverage and subsequent extent of interface pressure applied across a limb.
Compression tights elicit external pressure across the full length of the leg (hip-to-ankle) and

2
therefore offer greater interaction with the knee and hip joint and upper and lower leg musculature
compared with below-knee stockings. However, the majority of research investigating the
physiological influence of compression clothing during running has utilised either compression socks
or below-knee stockings [4]. Limited focus to date has been directed towards the role of full-length
tights on the cardiovascular response during exercise (Chapter 4).
During long-distance endurance exercise, energy provision is primarily derived from aerobic
metabolism. Three deterministic physiological variables are commonly associated with endurance
running performance, including maximal oxygen uptake, lactate threshold/fractional utilisation of
V̇O2max and running economy [5–7]. Evidence suggests that during dynamic exercise in healthy
individuals, compression clothing has no effect on maximal oxygen uptake or blood lactate
concentration [8]. However, mixed results are reported regarding running economy [9,10]. Running
economy reflects the metabolic cost of sustaining a particular running speed, representing the
translation of energy turnover into linear running velocity [11]. Should compression tights produce an
ergogenic effect on running economy, it is conceivable that this may contribute toward enhanced
endurance running performance. Tightly controlled investigations are warranted to investigate the role
of garment interface pressure and exercise intensity on measures of running economy with and
without compression tights (Chapter 5).
Tissue muscle saturation is typically measured using near-infrared spectroscopy (NIRS). This non-
invasive optical technique reveals in vivo muscle oxygenation and haemodynamic status and may
provide a mechanistic explanation for the observed changes in running economy with compression
tights. Wireless, portable NIRS devices offer the opportunity to monitor haemodynamic change in a
dynamic field setting. However, as smaller and cheaper devices become commercially available, users
must first be confident in the test-retest reliability and comparative performance of these measurement
devices (Chapter 6).
Few studies have attempted to assess the role of compression tights on running economy at speeds
reflecting an individual’s long-distance competition pace. It is, after all, the exercise intensity most

3
important to the individual and the potential implications of wearing compression tights is of obvious
interest to athletes, coaches and researchers. As running economy is a composite of mechanical and
metabolic factors, assessment of substrate utilization, running kinematics and muscle oxygenation at
competition pace is required. To maximise the likelihood of observing any effect, garments must
apply a minimal pressure threshold [12] (Chapter 7).
A schematic of the thesis structure is provided in Figure 1-1.
Figure 1-1 An overview of thesis structure and chapter aims.

4
2 Literature Review
This chapter provides a brief history and general introduction to the application of compression
garments (CG). This is followed by a description of the current system used to classify medical CGs
based on garment pressures. Then follows a critical discussion of sports compression studies, with
special reference to the measurement of garment interface pressures and inconsistencies between
methods of assessment.
The document next discusses performance studies investigating endurance and high intensity exercise
outcomes when lower body CGs are worn. Physiological responses to exercise with compression will
then be systematically discussed to critique the evidence for mechanisms thought to evoke a
physiological response. The summary provided at the end of this chapter offers insight into potential
future research directions based on current literature.
2.1 Historical context of lower body compression
The theory of applying local compression to human limbs was initially driven by clinical interest
towards decreasing deep venous dilation and increasing blood flow velocity [13,14]. The clinical
complications associated with aging include an increased prevalence of thromboembolic disease. As
such, methods to minimise symptoms of phlebothrombosis and venous thrombosis were of particular
interest. Early investigations supported the application of garments providing graduated compression
in the management of diseases of venous deficiency including; leg ulcers [15], deep vein thrombosis
[16,17] varicose veins [18,19] and venous thrombosis [20]. For further detail, Clark and Demers [21]
provide an extensive historical review of the experimental evidence and therapeutic applications of
lower body positive pressure.
All CGs apply mechanical pressure upon the body’s surface; stabilizing and providing support to
underlying tissues [3]. Mechanical pressure (termed ‘interface pressure’) is the product of the garment
fabrics and their properties and the garment’s anatomical fit. The fabric used in manufacturing

5
determines both ‘physical’ and ‘mechanical’ properties of the CG. Physical properties influence the
CG ability to transfer heat and/or moisture vapour, while mechanical aspects, such as elastic modulus,
elongation and relaxation time establish the extension and recovery behaviour [22]. CG are typically
fitted dependent upon generic anthropometric measures including height, body mass and chest
circumference, highlighting a particular problem when using generalized sizing systems. MacRae et
al., [3] highlights that individuals in the same dimensional range for a garment size i.e. size ‘large’,
would likely vary in body morphology, thus vary in the applied pressure from the garment. To
achieve the desired effect and/or treat a particular medical condition, the correct fit is of paramount
importance. Undersized or oversized garments may provide levels of compression that are not ideal
for a specific individual, whether that be too little compression to elicit a physiological influence, or
too much compression that it inhibits limb movement, blood flow, feel uncomfortable or even cause
tissue damage [23].
2.2 Medical compression: classifications
National standards for compression hosiery have been developed mainly as prerequisites for
reimbursement. These guidelines set out requirements such as testing methods, yarn specification,
compression gradient and durability [24]. There are few national standards for compression hosiery,
i.e.
• British standard for graduated compression hosiery, anti-embolism hosiery and graduated
support hosiery BS661210:2018 [25]
• German standard RAL-GZ for medical compression hosiery 387:1[26],
• French standard ASQUL [27].
Each of these standards are not consistent with one another, differing in recommended levels of
pressure, classification of garments, method of pressure assessment and sizing guidelines. At present,
there is no accepted International or European standard with regard to medical or sporting

6
compression classifications (mmHg). Attempts were made to produce a European standard (draft
standard: ENV 12718:2001), but a consensus could not be achieved and the standard was cancelled in
2005 [28].
The US employs a different system of classification for CGs, however this is not unified within any
specific ‘standards’ documentation (i.e. an FDA regulated classification). Most US compression
hosiery manufacturers simply state the range of compression expected from their garments.
The recommendations set out by the regional standards differ between one another in relation to the
amount of pressure exerted at the ankle and gradient of pressure up the leg. The British standard [25]
lists three compression classifications and recommends graduated design based upon the nearest
inferior anatomical landmark i.e. thigh compression as a percentage of calf compression (Table 2-1).
Table 2-1. Pressure and residual pressure ratio according to the BS 661210:2018 standard
Compression class
Pressure at ankle
(mmHg)
Residual pressure ratio (%)
Proportion of ankle
compression at calf
Proportion of calf
compression at thigh
I 6 – 10 < 100 < 100
II 11 – 18 80 max 85 max
III > 19 70 max 70 max
The German standard [26] classifies compression hosiery into four compression classes (Table 2-2).
The standard also provides predefined pressure ratios (residual pressure ratio), defined as the pressure
exerted by hosiery at a point of the leg above the ankle, expressed as a percentage based on the
pressure at the ankle.

7
Table 2-2. Pressure and residual pressure ratio according to the RAL-standard
Compression
class
Compression
intensity
Pressure at ankle
(mmHg)
Residual pressure ratio (%)
Upper ankle Maximum
calf Mid -thigh
I Low 18 – 21 70 -100 50 - 80 20 - 60
II Moderate 23 – 32 70 -100 50 - 80 20 - 50
III High 34 – 46 70 -100 50 - 70 20 - 40
IV Very High > 49 70 -100 50 - 70 20 - 40
The European standard (ENV 12718:2001) proposed five compression classifications, of which, these
replicated the RAL standards closely (Table 1-3). However, this draft proposal also included a lower
classification, incorporating compression hosiery with a pressure of 10 – 14 mmHg at the ankle (Class
A).
Table 2-3. Pressure and residual pressure ratio according to the ENV 12718:2001 standard
Compression
class
Compression
intensity
Pressure at ankle
(mmHg)
Residual pressure ratio (%)
Upper ankle
Maximum
calf Mid -thigh
A Light 10 – 14 70 -100 50 - 80 20 - 60
I Mild 15 - 21 70 -100 50 - 80 20 - 60
II Moderate 23 – 32 70 -100 50 - 80 20 - 50
III Strong 34 – 46 70 -100 50 -80 20 - 40
IV Very Strong > 49 70 -100 50 -80 20 - 40
2.3 Medical compression: measurement of pressure
Classification of the pressure exerted by CG on the lower limbs varies between countries. These
variations likely impact decisions in clinical practice and possibly the design of research. Pressure is
defined as a force per unit of surface area, for example Newton/m2 or cN/cm2 [29]. However, the

8
international measurement unit “millimetres of mercury” (mmHg) is favoured [30] and easily
transformed from force/cm2 to mmHg using the following conversion;
1 N⁄cm2 = 75.006 mmHg
The pressure exerted by medical garments is established by dynamometers specific to the regional
compression standard, i.e. French, British or German standards. These include the IFTH
dynamometer (French standard; Fig. 2-1), the HATRA Mrk 2 (British standard; Fig. 2-2) hose
pressure and the HOSY (German standard; Fig 2-3) measurement system.
Figure 2-1. Photograph of the IFTH dynamometer (image courtesy of Cornu-Thenard et al., [29]).

9
Figure 2-2 Photograph of the HATRA Mrk 2 dynamometer (image courtesy of Segar Technology).
Figure 2-3 Photograph of the HOSY measurement system.
Each dynamometer measures fabric tension in the garment. Laplace’s Law is then applied to calculate
the pressure delivered to a cylinder of know radius that is covered with a fabric sleeve [31]:
𝑃 = 𝑇/𝑅 (Eq. 1)
Where P is the pressure (Pa), T is the tension (N) and R is the radius of the cylinder (m). However, the
pressure of CGs is usually expressed as mmHg, fabric tension is measured per unit length and limb
circumference is measured instead of limb radius; hence, units in equation (1) are usually converted to
units common within the industry. Equation (2) is a result of unit conversions:
𝑃 =𝐾𝑇
𝐶 (Eq. 2)

10
Where P is the pressure (mmHg), K = 470, the conversion constant, T is the fabric tension (N/cm),
and C is the cylinder circumference (cm). This equation relates the radial pressure exerted by the wall
of a distended tube, the circumferential tension in the wall of the tube and its radius of curvature. The
radius used assumes a circular cross section of the same girth, i.e. a cylinder (Fig 2-4).
Figure 2-4 Graphical illustration of a cylinder with circular cross section of the same girth. The
fundamental principle of Laplace’s Law.
This assumption is a critical limitation of the larger medical compression devices, in that human limb
morphology is not a perfect cylindrical shape, and even less so during dynamic movement, therefore
the cross-sectional shape of the limb is in a constant flux. Pressures calculated using Laplace’s Law
provide an average pressure applied around the cylinder, however, in reality, these pressures vary at a
given cross section of a human limb due to the different radius of curvature (Fig 2-5). The different
radius of curvature around the same cross-section of a limb results in different pressures applied at
various anatomical orientations. In Fig 2-5, the smaller radius of curvature will result in a higher level
of pressure, therefore in this example, pressure applied at the anterior aspect of the limb is greater
than that of the posterior.

11
Figure 2-5 Cross section of the lower leg. Illustration of differing radiuses of curvature at the
anterior and posterior orientation of the lower leg.
Furthermore, Macintyre et al., [31] evaluated the Laplace’s Law for pressure prediction using
pressure measurements on a cylinder with different curvature radiuses. The authors demonstrated that
the Laplace formula significantly overestimated the pressure exerted on small cylinders, however
those with a greater circumference (>30 cm) were accurately predicted. This finding has implications
in the theoretical modelling of medical garment pressures because the ankle pressure determines the
remaining pressures applied upwards of the ankle (residual pressure ranges; see Table 2-1 – 2-3). It is
expected that Laplace’s formula will overestimate the ankle pressure due to the relatively low
circumference (RAL [26] ankle circumference size guides range from 18 – 30 cm). As such, the
limitations of using predictive formulae led researchers and practitioners to look for methods of
assessing in vivo interface pressure. As a consequence, demand for smaller, more portable measuring
devices has increased, whereby direct measurements at specific anatomical locations can be measured
in individuals.
Posterior
Anterior
Medial Lateral
rA
rP

12
2.4 Portable pressure measuring devices
Various small, portable, pneumatic pressure transducers, connected to an air bladder via small tubing
are available. These are thin, flexible, adjustable and optimised for different applications and different
measuring regimes.
Prevalent pneumatic portable devices used to assess interface pressure in compression science include
the PicoPress (Microlab, Padua, Italy; Fig 2-6), Kikuhime (Meditrade, Soro, Denmark; Fig 2-7) and
the SiGaT Tester (Ganzoni-Sigvaris, St Gallen, Switzerland) devices. The portable devices work by
placing a small circular bladder at a defined anatomical location (i.e. maximum calf girth). Once in
place, a small amount of air is pushed up the tubing into the bladder using the in-built syringe. The
screen on the device will display the applied pressure as mmHg. When pressure is measured in vivo,
between garment and the surface of a limb, it is referred to as ‘interface pressure’.
Partsch and Mosti [1] investigated the linearity, reliability and accuracy of the aforementioned
portable pressure devices. Using the legs of human volunteers to assess the reliability, it was reported
that the PicoPress produced the lowest average coefficient of variation (2.79%), followed by the
Kikuhime (4.17%) and SiGaT (8.52%). Device accuracy was determined by comparing the reported
pressure with the pressure applied via a sphygmomanometer cuff. At pressures <20mmHg, the
PicoPress® reported the highest accuracy (<2 mmHg) and the Kikuhime the lowest (6 – 7 mmHg).
The SiGaT device has also been found to report false-high pressure readings due to the large air
bladder. When fully inflated, the bladder thickness stretches the garment and subsequently results in
an artificial pressure increase [32]. Gaied et al., [33] state that results obtained from in vivo devices
are dependent upon the dimensions of the bladder, with larger bladders being more sensitive to
variations in limb diameter. In light of these findings, recommendations for the measurement of
interface pressure [34] suggest that the sensor/bladder should be thin and flexible, and smaller sensors
used for mapping of a circumferential pressure pattern. Large sensor areas (over 5 cm2) should be
used for measuring the interface pressure of larger areas, thus taking advantage of the local pressure

13
distribution being averaged because of the changing curvature. Further, Ferguson-Pell et al., [35]
recommend that the maximal thickness of the sensor/bladders should be 0.5 mm.
Figure 2-6 The PicoPress compression device, showing the unit, pressure bladder and bladder
dimensions (image courtesy of MediGroup Australia)
Figure 2-7 The Kikuhime compression device, showing the unit and pressure bladder (image courtesy
of www.ebm-guidelines.com)
Debate is on-going regarding the strengths and weaknesses of either in vitro measures (i.e. HOSY /
HATRA) and in vivo devices (i.e. portable pneumatic pressure transducers). Portable devices measure
the dynamic interface pressure and report individual-specific compression values based upon a
Size (unit indicated)
Bladder diameter 5 cm
Bladder thickness < 0.3 mm
Size (unit indicated)
Bladder diameter 4 x 3 cm
Bladder thickness > 5 mm

14
person’s unique limb morphology. However, there is no agreement which device is most accurate or
the precise anatomical locations that require assessment.
The combination of different pressure devices and anatomical locations assessed, confounded with no
agreed industry ‘gold standard’, gives rise to inherent risks when trying to compare outcomes of
studies when these fundamental methodological aspects differ between studies.
2.5 Sports compression: measurement of interface pressure
Unlike medical CGs, the optimal interface pressure or compression gradient for athletic purposes is
unknown. Some sports compression manufacturers have opted for unique garment designs i.e. static
pressure gradient (same interface pressure throughout the limb) or negative compression gradient
(increasing interface pressure from the ankle to calf). A bibliographic search began with the collection
of papers from PubMed to explore the range of interface pressures and devices used for the in-vivo
assessment of sports compression garments. The keywords sports compression stockings, garments,
and exercise and the combination of them all were used in the search. Additional articles were
obtained through cross-references with the initial search. The inclusion criteria were as follows:
garment covers lower limb, interface pressure reported at ankle and calf location, in-vivo assessment
performed by researchers. A total of 542 articles were identified by electronic search and 14 of these
met the inclusion criteria (Figure 2-8). Table 2-4 provides a summary of sports compression studies (n
= 14) reporting in vivo interface pressure applied at the ankle and calf. The studies listed in this table
include those reporting interface pressures at the ankle and calf as a minimum and therefore give an
indication of the pressure gradient. Of the 26 individual garments reported, 58% applied a positive
compression gradient (higher interface pressure at the ankle) (n = 15) and the remaining 42% report a
negative gradient. However, the influence of gradient design or interface pressure on sporting
performance remains to be elucidated. Beliard et al., [36] state that heterogeneity between studies
may result in conflicting findings and mask any true efficacy of compression.

15
Figure 2-8 Search strategy for the review of in-vivo interface pressure assessment.
Furthermore, interface pressure is often unreported in studies using sports compression and when
values are stated, the source or method is not always documented. This gives rise to uncertainty
whether values where independently examined or manufacturers-reported pressures. Macrae et al.,
[37] identified 58 sports compression studies published over a five year period (2011 – 2015), with
74% reporting the interface pressure, however only 34% of authors measured the pressure.

16
Table 2-4 Published sports compression studies reporting in vivo interface pressure
Ref. Study Device Orientation of
measurement site
Garment
manufacturer
Interface
pressure
(mmHg)
Ankle Calf
[38] Scanlan Kikuhime medial ankle + calf SKINS 19.5 17.3
[39] Ali (1) Kikuhime lateral ankle + calf Julius Zorn 11 8
[39] Ali (2) Kikuhime lateral ankle + calf Julius Zorn 26 15
[40] Sear Kikuhime medial ankle + calf SKINS 17.8 15.1
[41] Lovell Kikuhime - Body Science 20 15
[42] De Glanville Kikuhime - SKINS 6 14.7
[43] Hamlin Kikuhime - SKINS 8.6 13.4
[44] Reich-Schupke (1) Kikuhime - CEP 17 28
[44] Reich-Schupke (2) Kikuhime - Falke 11 20
[44] Reich-Schupke (3) Kikuhime - Sigvaris 15 19
[44] Reich-Schupke (4) Kikuhime - X-Bionic 11 15
[44] Reich-Schupke (5) Kikuhime - 2XU 17 28
[45] Brophy-Williams (1) Kikuhime medial ankle + calf - 9 20
[45] Brophy-Williams (2) Kikuhime medial ankle + calf - 15 25
[46] Sperlich (1) SIGaT - Sigvaris 21 13
[46] Sperlich (2) SIGaT - Sigvaris 31 23
[46] Sperlich (3) SIGaT - Sigvaris 39 32
[46] Sperlich (4) SIGaT - Sigvaris 46 39
[47] Wahl (1) SIGaT - - 21 13
[47] Wahl (2) SIGaT - - 31 23
[47] Wahl (3) SIGaT - - 46 39
[48] Mosti (1) PicoPress medial ankle + calf Pierre Fabre 25 22
[48] Mosti (2) PicoPress medial ankle + calf Pierre Fabre 20 31.5
[49] Faulkner PicoPress achilles + medial calf SKINS 6.2 13.2
[50] Pruscino Talley Medical - 2XU 19.1 7.2
[51] Maton Salzman MKIII medial ankle + calf Innothera 17 14

17
2.6 Sports compression and exercise performance
Strategies that bring about measurable improvements in performance are highly sought after by
athletes. Undoubtedly, athletic talent, comprehensive training programmes and optimal dietary intake
all contribute towards athletic development and peak performance, however, factors such as clothing
and technological advances, be it advances in electronic devices or fabric properties, are also deemed
potential ergogenic aids, for which athletes are prepared to invest time and money into.
World records have been set by athletes donning CGs, reinforcing the link between compression
clothing and elite performance [52], and whilst these world records are the result of talent and
training, the decision for the athletes to wear these garments demonstrates the confidence held in the
garments to aid performance.
The popularity of compression clothing within a range of sports, particularly endurance athletes,
continues to increase, with monthly unit sales in the US increasing from 5,399 (value of $285,250
p/m) in January 2008, to 22,186 in November 2010 (value of $950,712 p/m) [53]. It was predicted
that by 2019 the global market for compression apparel would grow at a compound annual growth
rate of 5.1% and have reached $3.4 billion [54]. The increasing sales are a result of both high
performance and recreational athletes wearing CG, in particular, at endurance events such as running
and triathlon competitions [47].
2.6.1 Endurance exercise
Table 2-5 summarizes the research investigating the effects of compression on endurance running
defined as activity lasting ≥10 min and measured as time trial performance, distance completed or
time to exhaustion. Of 16 studies identified, five reported positive effects of CG on running
performance [40,47,55–57], however evidence appears equivocal, with studies revealing no change in
performance [47,52,58–65], or even a detrimental effect [66]. Previous meta-analyses have evaluated
the influence of CG on performance [4,36,67–69]. Born et al., [67] report a small improvement in
performance when time to exhaustion and time-trial assessments are grouped together (effect size =

18
0.15). A subsequent meta-analysis was performed on time to exhaustion and time trial performance
separately [4]. In this instance CG had little or no effect on time trial performance ranging from 400
m to marathon distance (mean g = 0.03 ± 0.15), however time to exhaustion in incremental or step
tests or runs to exhaustion revealed small positive effects (mean g = 0.27 ± 0.33). Mota et al., [68]
conducted a review of compression stockings and reported a minor number of studies demonstrate an
improved performance (3 out of 21). In contrast, the authors identified that wearing stockings during
exercise could benefit muscle function or fatigue indicators immediately after and hours after an
exercise bout. The conclusions of Mota et al., [68] support those of Beliard et al.,[36] who found
performance was unchanged regardless of the level of interface pressure. Interestingly, this was the
first and only review that analysed the relationship between interface pressure and performance
outcomes. However, it should be noted that the authors obtained similar garments to those used in the
original investigations conducted 3 – 11 years previous. Clearly, this method assumes that garment
design remained unchanged between the original investigation and the time in which the review took
place. Da Silva et al.,[69] conducted a meta-analysis investigating the association of lower limb CG
and high intensity exercise performance. Analysis of performance outcomes were grouped into three
distance categories; 50 – 400 m, 800 – 3000 m and >5000 m. Of the four studies included in the
>5000 m category, the authors report a weighted mean difference of 1.01 s (95% CI; -84.8 – 86.8),
concluding that lower limb CGs are not associated with improved running performance.
The varied findings reported in the aforementioned reviews and meta-analyses may be explained by
different methodological approaches and the grouping of exercise modality. For example, Engel et al.,
[4] focused specifically on running performance whilst three other systematic reviews or meta-
analyses combine running performance with other modalities (i.e. cycling) [36,67,68]. Furthermore,
only Mota et al., [68] focused on a specific garment type (stockings), whereas the remaining reviews
include a combination of CG, possibly concealing a garment type effect. It would appear that some
limitations of the literature (Chapter 2.8) are also relevant when comparing the findings of systematic
reviews and meta-analyses. Despite the popularity of CGs among elite and recreational athletes, the
evidence for enhanced endurance performance remains limited.

19
Table 2-5 Summary of literature investigating the influence of compression garments on endurance running performance
Author N (Sex) Garment
Interface Pressure
(mmHg) Exercise Modality
and Protocol Findings
Ankle Calf Thigh
Berry &
McMurray [70]
6 (M) Below-knee
stockings
18 8 - V̇O2max test (2 min stages) ↔ No effect on time to exhaustion (P>0.05)
Ali et al [65] 14 (M) Below-knee
stockings
20 14 - 1) Multi-stage shuttle run ↔ No effect on running distance (P>0.05)
↔ No effect on 10 km time trial (P>0.05)
2) 10 km time trial run
Duffield &
Portus [56]
10 (M) Long tight and
long sleeve top
NR NR NR 30 min repeated 20 m
sprints and shuttles
↑ Small increase in total distance covered (d =
0.2-0.4)
Higgins et al
[57]
9 (F) Long tight NR NR NR 4 x 15 min netball specific
exercises
↔ No effect in total distance covered (P = 0.07)
↑ Large increase on distance covered at high
speed (d=0.86)
Kemmler et al
[55]
21 (M) Below-knee
stockings
24 20 - Running V̇O2max test (5
min stages)
↑ Increase in time to fatigue (P <0.05)
↑ Increase in total work completed (P <0.05)

20
Sperlich et al
[8]
15 (M) 1) Below-knee
stockings
2) Long tight
3) Long tight
and long
sleeve top
targeted at 20 mmHg Running to volitional
fatigue at fixed intensity
↔ No effect on time to exhaustion (P>0.05)
Sear et al [40] 8 (M) Whole body
garment
17.8 15.1 13.1 Prolonged high intensity
intermittent exercise test (45
min)
↑ Medium increase in total distance covered (d
= 0.6) and
↑ Medium increase in distance covered at low
intensity (d = 0.6)
Menetrier et al
[59]
14 (M) Below-knee
stockings
15 27 - Running to volitional
fatigue at fixed intensity
(100% vV̇O2max )
↔ No effect on time to exhaustion (P>0.05)
Ali et al [52] 9 (M)
3 (F)
Below-knee
stockings
15
21
32
12
18
23
-
-
-
10 km running time trial ↔ No effect on 10 km time trial (P>0.05)
Wahl et al [47] 9 (M) Below-knee
stockings
21 13 - Running to volitional
fatigue at fixed intensity
(70% V̇O2max) (1% gradient
increase every 1 min)
↑ Small increase in time to exhaustion (d = 0.2)
Barwood et al
[60]
8 (M) Long tights NR 20 11 5 km time trial (in 32 °C) ↔ No effect on 5 km time trial (P>0.05)

21
NR= not reported; M= male; F= female. V̇O2max = maximum volume of oxygen uptake; vV̇O2max = velocity at maximum volume of oxygen uptake; P<0.05 =
statistically significant, d = effect size. ↔ no change with CG, ↑ improvement with CG, ↓ worsening with CG.
Vercruyssen et
al [61]
11 (M) Below-knee
stockings
18 18 - 15.6 km trail-running race ↔ No effect on 15.6 km trail-running
performance (P>0.05)
Del Coso et al
[62]
36 (NR) Below-knee
stockings
NR NR NR Half ironman performance
time
↔ No effect on half ironman performance
(P>0.05)
Bieuzen et al
[71]
11 (M) Below-knee
stockings
- 25 - 15.6 km trail race ↔ No effect on 15.6 km trail-running
performance (P>0.05)
Rider et al [66] 7 (M)
3 (F)
Below-knee
stockings
20 15 -
(manufacturer claim)
Running V̇O2max test (5
min stages)
↓ Decrease in time to exhaustion (P<0.05)
Areces et al
[64]
30 (M)
4 (F)
Below-knee
stockings
20-25 - -
(manufacturer claim)
Marathon performance time ↔ No effect on marathon performance (P>0.05)

22
2.6.2 High intensity running and sprint performance
Table 2-6 summarizes the research investigating the effects of compression on high intensity running
and sprint performance. Studies within this search criterion include those of either single or repeated
sprint efforts, assessing either time to completion, time to exhaustion at high intensity workloads or
rate of fatigue over a repeated bout of maximal sprints. Of 14 studies identified, 11 reported no effect
of CGs on high intensity running and sprint performance [8,10,49,56,72–79], however four studies
revealed a positive effect [57,79–81], and one observing a detrimental effect [8].
Born et al., [80] report a statistically significant improvement with compression clothing. The authors
report improved 30 m sprint time during the final set of 10 sprints during a 30 x 30 sprint test when
wearing long compression tights. However, this particular study was investigating a ‘novel’ garment
design, with adhesive silicone strips placed within the garment, differentiating this particular garment
with many of the previous studies assessing a ‘traditional’ CG. The authors also report a reduced hip
flexion angle and increased stride length in their investigation of repeated sprint performance. This
elegant investigation assessed a number of cardiorespiratory, metabolic, hemodynamic, perceptual,
neuronal and biomechanical parameters, concluding that the improved repeated sprint performance is
due to altered sprint mechanics.
Systematic reviews and meta-analyses provide a collective overview of the available literature. The
combined analysis of five studies produced an overall small positive effect size (ES = 0.12) for
improvements in single and repeated sprints of 10 – 60 m [67]. Furthermore, using weighted mean
differences, Da Silva et al., [69] revealed a 6.1 s (95% CI; -7.2 – 19.4) improvement in running
performance between 800 – 3000 m. Although not statistically significant, the authors highlight the
practical relevance, suggesting a 6 s improvement could greatly impact a race over such distances. At
shorter race distances (50 – 400 m) the weighted mean difference was 0.06 s (95% CI; -2.0 – 2.1),
revealing that the influence of CG might be intensity specific. The influence of CGs in relation to
exercise intensity is explored further in Chapter 6.

23
Table 2-6 Summary of literature investigating the influence of compression garments on sprint running performance
Author N (Sex) Garment
Interface Pressure
(mmHg) Exercise Modality
and Protocol Findings
Ankle Calf Thigh
Doan et al [74] 10 (M) Shorts NR NR NR 60 m sprint time ↔ No effect on 60 m sprint (P>0.05)
Bernhardt &
Anderson [75]
10 (M)
3 (F)
Shorts NR NR NR 20 m sprint ↔ No effect on 20 m sprint time (P>0.05)
Duffield & Portus
[56]
10 (M) Whole body
garment
NR NR NR Intermittent repeated sprint
exercise protocol (20 m
sprint every minute for 30
min)
↔ No effect on repeated sprint performance
(P>0.05)
Duffield et al [77] 10 (M) Whole body
garment
NR NR NR 5 x 20 m repeated sprint
protocol following a
simulated team game
↔ No effect on mean sprint time (P>0.05)
Higgins et al [57] 9 (F) Long tight NR NR NR 4 x 15 minute netball
specific circuit including 20
m sprint at the end of each
15 min quarter
↑ Small decrease in 20 m sprint time (d =
0.23)
Houghton et al
[78]
12 (M) Knee length
shorts and short
sleeve top
NR NR NR 4 x 15 minute LIST
including 15 m sprint at the
end of each stage
↔ No effect on 15 m sprint time (P>0.05)

24
Sperlich et al.,
[8]
15 (M) 1) Below-knee
stockings
targeting 20
15 min treadmill run at
70% V̇O2max followed by
time to exhaustion at peak
running velocity
↓ Small decrease in time to exhaustion with
stockings and whole body garments (d = 0.25 -
0.28)
↔ No effect on time to exhaustion with long
tights (d = 0.13)
2) Long tights targeting 20
3) Whole body
garment
targeting 20
Dascombe et al
[10]
11 (M) 1) Correctly
fitted tights
NR 19.2 13.7 Progressive maximal test
followed by time to
exhaustion at 90%
V̇O2max
↔ No effect on time to exhaustion (P>0.05)
2) Undersized
long tights
NR 21.7 15.9
Goh et al, [79] 10 (M) Long tights NR 13.6 8.6 Running to volitional
fatigue at vVO2max (at 10°
and 32 °C)
↑ Small increase in time to exhaustion at 32
°C (d = 0.48)
↔ No effect on time to exhaustion at 10°C (d
= 0.15)
Varela-Sanz et al
[81]
13 (M)
3 (F)
Below-knee
stockings
15 - 22 NR - Running to volitional
fatigue at fixed intensity
(105% of recent 10 km
pace)
↑ Small increase in time to exhaustion (d =
0.32)
Faulkner et al
[49]
11 (M) 1) Long tights 6.2 13.2 7.1 400 m sprint ↔ No effect on 400 m sprint time (P>0.05)
2) Shorts + calf
stockings
14.2 19.9 7.6

25
Born et al [80] 12 (F) Long tights NR 21.7 17.5 30 x 30 m sprints (1 sprint
per minute)
↑ Decrease in final 10 x 30 m sprint time
(P<0.05)
Venckunas et al
[72]
13 (F) Below knee
stockings
17 NR 18 400 m sprint following 30
minutes steady state (7:30
min/mile pace for 4km)
↔ No effect on 400 m sprint time (P>0.05)
Perez et al [73] 14 (M)
2 (F)
Below knee
stockings
15-20 NR - 1 km run at maximal speed ↔ No effect on 1 km maximal speed (P>0.05)
NR= not reported; M= male; F= female. V̇O2max = maximum volume of oxygen uptake; vV̇O2max = velocity at maximum volume of oxygen uptake; LIST =
Loughborough intermittent shuttle test. P<0.05 = statistically significant, d = effect size. ↔ no change with CG, ↑ improvement with CG, ↓ worsening with
CG.

26
2.7 Sports compression and physiological responses
Physiological responses to compression originate from mechanical pressure applied to the underlying
tissue and the stabilizing support offered by the garment (Figure 2-9). External pressure applied by a
CG increases peripheral tissue pressure [82], and subsequently redirects blood flow to the deep veins.
The redirected blood and narrowing of veins increases blood flow velocity [13], and in turn, alters
arterial [83] and venous [82] flow. Increased arterial flow will increase the delivery of oxygen-rich
arterial blood to the working muscles [84], whilst increases in venous flow enables more rapid
removal of waste metabolites [85]. In addition, by increasing venous flow, CGs can reduce exercise
induced limb swelling [86].
Other physiological responses to CG include augmented mechanoreceptor activation, improved
proprioception and altered running mechanics. Furthermore, the stabilizing effect of compression
around a limb is thought to reduce muscle oscillation during exercise tasks that cause excessive limb
vibration i.e. running [87]. Lower muscle oscillation is associated with reduced muscle fibre
activation [88] and lower oxygen consumption during exercise [9].
Conversely, the potential risks or negative effects of compression application are not widely reported
beyond those associated with excessive interface pressure. During standing, deep veins in the lower
leg are narrowed by an external pressure of 42 mmHg and nearly occluded at 82 mmHg [89].
However, commercially available sports CGs do not typically exceed 30 mmHg and therefore the
risks associated with prolonged occlusion are unlikely. Further psychological and physiological
responses that may be counter-productive to the exercising individual include an increased perceived
body temperature [72] and elevated skin temperature [78]. During exercise, heat loss is often a
desirable, however if CGs attenuate the heat loss capacity this may lead to thermal discomfort,
increased thermoregulatory strain and impaired exercise performance. Furthermore, residual sweat in
the CG following exercise may lead to thermal discomfort due to unwanted heat loss (‘post-exercise
chill’) and therefore CGs should have a short drying time [37]. The following chapter discusses many
of the underlying mechanisms linked with sports compression in relation to exercise performance.

27
Figure 2-9 A schematic representation of the mechanisms hypothesised in which compression clothing contributes toward athletic performance [9,13,90–
95,80,82–88].

28
2.7.1 Venous blood flow
The physiological impact of CGs in relation to cardiovascular response has been widely researched,
with particular attention focused on venous blood flow velocity [82] and venous cross-sectional
diameter [13]. The mechanism responsible for the increase in venous flow and decrease in venous
stasis is via a reduction in the cross-sectional area of the vein [96]. Blood stasis is also shown to
reduce under compression (23-24 mmHg), in both supine and standing participants [97]. This is of
interest to athletes recovering from exercise induced muscle damage and hope to gain from a
reduction in swelling and removal of waste metabolites. In a supine or recumbent position,
compression produces an increase in venous flow velocity in healthy participants [98], however, in an
upright position, changes in velocity are not reported. Furthermore, during exercise intensities
reflective of training or competition, there is little evidence to suggest that compression influences
venous return, cardiac output or stroke volume [3]. These findings indicate that even if changes in
vein diameter and venous blood velocity are observed in healthy individuals, this does not inevitably
indicate increases in flow volume per unit of time, and hence, improved venous return [3].
2.7.2 Arterial blood flow
External pressures of ~30 mmHg applied from the ankle to knee brought about an increase local
arterial flow, increasing pulsatile blood flow by up to 45% when in the supine position [99].
Bochmann et al., [82] demonstrated that arterial perfusion was increased by more than 200% in the
forearm when a CG was worn, concluding that an applied pressure of ~20 mmHg resulted in the
largest flow increase. Additional studies support the theory that an optimal pressure range may exist
for blood flow augmentation, showing that pressures too high reduce blood flow and pressures too
low do not affect flow.
The application of compression forces on a limb may increase muscle blood flow due to changes in
arterial flow, rather than venous flow changes. Compression of underlying tissues reduces the
transmural pressure gradient in local arterioles, thus causing vasodilation and increased blood flow to
that area (the Bayliss effect) [100] . The reduction of transmural pressure and the myogenic response

29
(vessel relaxation) is the likely mediator for the observed increases in muscle flow and perfusion [82].
As previously alluded too, the improvement in arterial flow and consequently oxygen delivery may be
of greater importance for an athlete compared with venous flow response under compression, or
indeed alleviating venous stasis. Kemmler et al., [55] stated that the application of a non-graduated,
static compression stocking (similar interface pressure throughout the length of the garment) would
bring about a greater benefit for an endurance athlete by way of enhanced arterial perfusion, and
suggests that the need for graduated CGs within the athletic domain may be less of a concern.
However, contrary to the speculation, arterial blood velocity under compression stockings remained
unchanged during plantar-flexion exercise [101]. Future research should be targeted at step-wise
increments of interface pressure whilst attempting to observe changes in haemodynamic response,
ideally during a dynamic exercise modality. In light of the potential increase in muscle perfusion due
to external pressure, a concurrent increase in muscle oxygen saturation would be expected.
2.7.3 Muscle oxygen saturation
Depending on body position and the interface pressure, compression clothing elicits a change in
circulatory parameters such as venous and arterial flow. Furthermore, increased muscle oxygen
saturation (measured using near infrared spectroscopy) has been observed in participants wearing
compression [10,84,101]. Near-infrared spectroscopy (NIRS) is a non-invasive technique capable of
providing valuable functional insights into skeletal muscle oxidative metabolism in vivo during
exercise, in healthy and clinical populations [102]. The use of NIRS provides an appropriate measure
of muscle oxygen consumption and blood volume measurement [103].
Bringard et al., [97] reported an increase in calf muscle oxygenation as a result of compression tights
in a supine and upright standing position (gastrocnemius pressure = 23 – 24 mmHg). Furthermore, the
observed increase in calf muscle oxygenation is relative to the amount of interface pressure applied.
Dermont et al., [104] demonstrated increasing muscle oxygenation in a seated position as interface
pressure increased from 16.5 mmHg to 36.5 mmHg. These findings suggest compression may
increase muscle oxygen saturation at rest via its effects on haemodynamics.

30
However, compression induced changes in muscle oxygen saturation during and following exercise is
less consistent. Vercruyssen et al., [61] investigated the influence of compression stockings (ankle-to-
calf pressure 18-13 mmHg;) on prolonged trail running exercise. As part of this experiment,
participants muscle oxygen saturation and muscle blood flow was assessed pre and post exercise (~5
min). The authors reported no difference between conditions (with and without compression
stockings). However, the five minute delay between cessation of exercise and muscle oxygen
saturation assessment limits insight into the acute effect of compression during the exercise bout. In
agreement with Vercruyssen et al., [61], no change in muscle oxygen saturation following a 30 min
submaximal run was observed [59]. However, noticeably higher oxygen saturation was observed with
compression at rest (pre-exercise) and following a run to exhaustion at maximal aerobic speed. The
interface pressure reported in these studies (18 – 27 mmHg) are the values provided by garment
manufacturers and not measured directly.
Exercise reduces tissue oxygen; the rate at which oxygenation returns to normal is an index for rate of
recovery. Increased oxygenation saturation recovery rate in the gastrocnemius medialis muscle was
reported following two minutes of repeated heel raises [105]. It was identified that the relative slope
of recovery rate is dependent upon the magnitude of interface pressure exerted, with an increasing
oxygen saturation recovery rate as pressure increases. At interface pressures from 5-16 mmHg, there
was a positive correlation in recovery rate; however without further data at increasing pressures, the
‘optimal’ interface pressure is unknown. It is expected that muscle oxygen saturation would stop
increasing above a particular external pressure as peripheral and deep circulation will become
impaired. Correctly fitted (as per garment manufacturers guideline) and undersized compression tights
were compared with traditional running shorts during a time to exhaustion test (90% vV̇O2max) [10].
The undersized compression condition was implemented to provide varied compression levels and
shed light on a possible interface pressure dose-response. During the time to exhaustion test, both
compression conditions resulted in a significantly higher deoxyhaemoglobin (HHb) concentration
when compared with the control. The authors suggest that the changes observed in peripheral muscle

31
circulation are due to increases in venous flow. Both compression conditions also reported a
significantly lower HR during moderate intensity running (12 – 16 km·h-1), therefore this may be
associated with the increased venous return and subsequent stroke volume via the Frank-Starling
mechanism. Despite the circulatory changes observed in this investigation, no improvement in
performance (time to exhaustion) or pulmonary oxygen uptake was reported. A possible explanation
for the observed changes in peripheral circulation, particularly muscle oxygenation measures, may
relate to the reduced heat-loss capacity when wearing CGs. Studies have reported an increased skin
temperature of 0.5 - 2 °C under compression clothing [56,74,77,78], however this largely depends on
the garment properties i.e. fabric composition. Thermoregulatory vasodilation may contribute towards
an altered peripheral blood flow response [106], therefore changes in NIRS measures may be a result
of elevated local and whole body temperatures [107].
2.7.4 Cardiovascular Function
If blood flow is augmented through the application of compression, a concomitant change to cardiac
parameters would be expected. Indeed, compression stockings are reported to alter heart rate (HR),
stroke volume and cardiac output in a standing position at rest [12]. However, during exercise, HR,
stroke volume nor cardiac output appear affected by compression clothing at maximal [55,65] and
submaximal intensities [9,38,39,46,56,77,78,101]. These findings suggest that any improvement to
haemodynamic flow from external pressure probably reaches optimal function at rest, or at very low
intensities [108]. It is likely that the exercise induced cardiac and blood flow response outweighs and
severely diminishes any measurable benefit conferred by compression.
The donning of lower body compression clothing has no influence on measures of maximal
[8,9,38,55,70] or submaximal [39,58] aerobic capacity. Despite this, the economy of O2 consumption
during exercise is shown to improve with compression when reported as per unit of distance (i.e.
mlO2. kg-1.km-1). Bringard et al., [9] reported a 9% reduction in the oxygen cost of running at 10, 12
and 14 km·h-1 when participants wore compression tights. The observed improvement in running
economy (RE) was not apparent at a higher intensity (16 km·h-1),

32
More recently, authors have attempted to explore the influence of compression clothing on RE in
more detail. Varela-Sanz et al., [81] had participants undertake a steady state running protocol at a
recent half-marathon pace (14.8 ± 2.2 km·h-1) wearing either graduated compression stockings or
traditional running shorts. Following this, a run to exhaustion at 105% of a recent best 10 km run time
(17 ± 2 km·h-1) was completed. RE was unchanged at half-marathon pace, however a large
improvement (d = 0.90) was reported during the run to exhaustion. In addition, the relative heart rate
experienced (%HRmax) during the run to exhaustion was significantly lower with compression
stockings. The reduction in cardiac stress could infer that graduated compression stockings are more
effective at an exercise intensity above that of half marathon pace (~82% V̇O2max) but below that of
maximal aerobic speed (<100% V̇O2max).
Additional attempts to clarify the influence of CGs on exercise economy at various exercise
intensities have demonstrated little benefit. The oxygen uptake during a run of 40 minutes at 80% of
V̇O2max did not differ between conditions when studying a group of well-trained athletes [39].
Stickford et al., [94] assessed running economy and kinematics in highly trained male runners.
Participants completed 4 min running bouts at 14, 16 and 18 km·h–1. There were no significant
differences in V̇O2 between clothing conditions, however, the average percentage change in
submaximal V̇O2 with compression treatment ranged from -4.8% to + 5.1%. Running economy is
strongly associated with running performance, such that a 5% improvement in RE may translate into a
3.8% improvement in distance running performance[109]. In light of this, the individual response to
compression clothing should not be neglected.
Running economy is a multifactorial measure which reflects the sum of various cardiorespiratory,
metabolic, biomechanical and neuromuscular characteristics [110]. If compression applied to the
lower limb brings about a change to running economy, the mechanism(s) responsible may not
necessarily be a result of haemodynamic change. Other measures that may shed light on the possible
mechanisms explaining altered running economy include changes to muscle oscillation/vibration,
running kinematics or proprioceptive ability.

33
2.7.5 Muscle oscillation
Long term exposure to vibrations that occur as a result of the heel strike during running can have
detrimental effects on soft tissue. These include pain, loss of function [111] and reductions in muscle
contractile force [112]. CGs may potentially attenuate soft tissue vibration during dynamic exercise
such as running and jumping. CGs have been shown to reduce the movement of calf and thigh
musculature during running [113] and counter-movement jumps [74]. A reduction in soft tissue
vibration as a consequence of compression may subsequently alter the muscle activity. In support of
this, CGs have been shown to reduce the cumulative shank muscle activity [114] and gastrocnemius
activity [115] during submaximal running.
Compression-induced reductions in muscle activation, brought about by an attenuated soft tissue
vibration, may have implications for running economy. It follows that if muscle force output can be
maintained in the presence of lower levels of muscle fibre recruitment, oxygen cost may be reduced.
However, despite significantly lower levels of soft tissue vibration and muscle activation with
compression tights, running economy remained unchanged at speeds of 8 – 12 km·h–1 [113]. A
possible explanation for the discordant effect of compression on running economy in this instance
may be due to the duration of submaximal running (3 min). Steady-state V̇O2 is typically achieved
after three minutes of exercise at a constant running speed [116], therefore the duration may have
been too short to observe any measureable change to oxygen cost.
2.7.6 Proprioception
CGs are shown to activate both cutaneous and muscle mechanoreceptors at rest and during movement
[90]. The altered excitability in the central nervous system may explain the observed improvements in
joint position sense [91,117,118], one-leg balance (with eyes closed) [119] and reaching accuracy
[90]. The application of external pressure is shown to assist as a ‘filter function’ of nonspecific
mechanoreceptor activity, enhancing precision and movement sensitivity around the joint where
compression is applied [90]. With heightened proprioceptive potential, it raises the notion that CGs
may enhance kinaesthetic sense during dynamic sporting movement. Only two studies have

34
investigated the role of CGs on task precision during an athletic performance. Wearing an upper body
CG was shown to improve fastball accuracy in collegiate baseball pitchers and improve driving,
approach-shot and chipping accuracy in high-level collegiate golfers [120]. However, in contrast,
throwing accuracy of cricketers is unchanged with full body (long tight and long sleeve top)
compression clothing [56].
It is a plausible that pressure induced mechanoreceptor activation may lead to improved joint sense
position in dynamic exercise, such as running. By improving joint sensing ability, an individual may
favourably alter technique or gait. The following section will discuss the influence of CGs on running
kinematics.
2.7.7 Running kinematics
CGs covering the hip region (tights and shorts) are shown to decrease active hip-joint range of motion
at rest [75] and during counter-movement jumps [74], suggesting a potential ‘ergogenic interplay’
between compression and biomechanical factors [94]. However, during a time to exhaustion test at
~17 km·h–1, no differences were reported in running technique kinematics such as contact time and
flight time with compression stockings [81]. Similarly, compression stockings produced no effect on
gait variables at running speeds between 14 – 18 km·h–1 [94]. In contrast, changes to aerial time and
leg stiffness were observed at 12 km·h–1 during a moderately flat 24 km trail run. In the same study,
lower ground contact time, higher leg stiffness and higher vertical stiffness were also reported during
an all-out hilly 24 km trail run [84]. Despite these findings, exercise performance did not improve.
The aforementioned studies all included below-knee compression stockings as the intervention
condition. In light of the potential hip-joint range of motion interaction with CGs covering the hip,
investigating the influence of compression tights or shorts on running kinematics is of interest. Stride
length is reportedly reduced at running speeds of 10 and 14 km·h–1, but not above or below these
speeds (8 or 18 km·h–1). Furthermore, modification to stride length was only observed in compression
tights applying a high external pressure (calf = 33 mmHg; thigh = 20 mmHg). No change in stride

35
length was observed with compression tights applying a lower level of external pressure (calf = 23
mmHg; thigh = 11 mmHg).
Interestingly, it is suggested that athletes could require an accommodation period for systematically
experiencing their benefit [81]. In support of the postulated accommodation period, reduced landing
force during a fatiguing run was later reported following a period of 3 weeks training wearing
graduated compression stockings (ankle = 24 mmHg; calf = 21 mmHg) [121].
2.8 Limitations to literature
Despite the number of publications, the sports compression category is relatively new, and many
questions remain unanswered. A lack of consistency in research methodologies has brought about a
situation where much of the literature is unique in its own right and therefore unable to compare
outcomes between studies. This is apparent within all areas of compression related scientific evidence,
however particularly exaggerated in the sports literature. The literature often fails to detail the type of
garment worn, garment fabric properties, external pressure exerted, the duration in which the
garments are worn, and the application of a placebo or control condition. Furthermore, various
methodological approaches have resulted in different exercise intensities, types and duration [3]. It is
conceivable to consider that the heterogeneity between studies may mask any true efficacy of
compression, possibly only apparent with more restrictive experimental conditions implemented in
future research [36].
Hill et al., [92] identify a number of additional limitations with sports compression literature
including; small sample sizes, lack of placebo and a poorly described method used to randomise
participants. Additionally, the garments used also vary widely and include upper body and lower body
garments from a range of manufacturers, which are likely to exert different degrees of pressure.
Male and female runners exhibit different hip and knee mechanics during running [122]. Despite this
sexual dimorphism, females are significantly underrepresented in sports and exercise medicine
research [123] and more specifically within sports compression and running research. Engel et al., [4]

36
included a total of 494 participants in a review of compression clothing and running performance.
However, only 11% of these were female, highlighting the gender bias present in this domain of
research. Therefore, care should be taken to account for gender when studying groups of male and
female recreational runners (Chapter 7).
2.9 Summary
Research investigating the effectiveness of CGs during exercise is of particular interest to athletic
populations. However, there are several facets of sports compression research that are yet to be
explored in sufficient detail. The accurate assessment of garment interface pressure is of pressing
importance. Many studies merely document the manufacturers reported pressures, therefore providing
little insight into any potential pressure-response relationship. With the development of portable
pressure monitors, it is possible that future sports compression research will tackle this issue.
However, given the variety of portable pressure devices, it is critical that pressure monitors are
assessed for consistency between devices and compared with reference-standard medical devices.
Meta-analyses report small increases in time to exhaustion [4], and practically relevant improvements
over specific running distances (i.e. 800 – 3000 m) [69]. These small improvements, when observed,
are challenging to delineate due to the confounding study methodologies implemented in the sports
compression literature. Various garment types, different interface pressures applied by CG and the
disparity in exercise modality, intensity and duration are a few examples of the challenges faced when
evaluating the literature. However, of interest is the relationship between CG induced improvements
in running economy and the associated impact this may have on performance [4,9,81,94]. Engel et al.,
[4] indicate a potential small benefit (g = 0.21 ± 0.11) of CG on running economy. However the
garment type ranged from calf sleeves, socks, long tights and whole body compression in the four
studies included in the analysis. By pooling various garment types to produce a mean estimate
illustrates once more the heterogeneity within the sports compression literature. Despite this, if the
application of external pressure has the capability to meaningfully alter cardiovascular, biomechanical

37
or neuromuscular systems, these may have an interactive effect upon the energy cost of locomotion
and subsequently improve running economy. While the findings are inconsistent, the application of
compression to the hip, thigh, knee, calf and ankle has on occasion, demonstrated an adaptive
response. Given that compression tights cover the full length of the leg, including the hip and knee
joint, the use of these garments may provide the greatest opportunity to influence physiological
parameters during submaximal running.
2.10 Thesis aim and objectives
This critical review of the literature has highlighted scope for further investigations that may enhance
the understanding of CGs in the athletic domain. The aim of this thesis was to provide a
comprehensive analysis of sports compression tights on the running economy of moderately trained
runners. Prior to doing so, identification of an appropriate pressure measuring device provides
confidence in the validity of interface pressures reported throughout the thesis. Subsequently, the
interaction between compression tights, running economy and mechanisms underlying any potential
physiological benefit is explored. This was addressed through the following objectives;
Objective 1) To identify a valid portable pressure device and the optimal in vivo anatomical
orientation for interface pressure assessment. (Chapter 3)
Objective 2) To examine the effect of compression tights on running economy using garments of
varying interface pressure. (Chapter 4)
Objective 3) To assess the influence of compression tights on running economy and substrate
utilisation across a range of exercise intensities. (Chapter 5)
Objective 4) To compare two portable, wireless near-infrared spectroscopy devices under a variety of
resting and dynamic conditions. (Chapter 6)
Objective 5) To test the efficacy of compression on running economy, substrate utilization, kinematics
and muscle oxygenation. (Chapter 7)

38
3 The measurement of interface pressure applied by sports compression
garments: a comparative study of two portable devices
3.1 Rationale
Reporting the interface pressure applied by sports CGs is becoming increasingly common. This offers
the opportunity to compare study findings and explore the relationship between interface pressure and
physiological response. However, to achieve this, devices used in the assessment of interface pressure
must be reproducible and valid. Two portable pressure devices, popular in the sports compression
literature and also commercially accessible, were selected and compared with a medical reference
standard. Previous research has investigated the test-retest reliability of these devices in vivo, however
no study has compared the values obtained in vivo with those calculated using a medical reference
standard. Calibration with a medical standard offers the opportunity to identify a portable pressure
monitor appropriate for future studies.
3.2 Abstract
The interface pressure applied by compression clothing is an important measure in evaluating the
efficacy of the bio-physical impact of compression. The aim was to compare two portable pneumatic
pressure measuring devices (PicoPress and Kikuhime), against a non-portable, Hohenstein System
(HOSY) reference standard, used by medical regulatory agencies. Interface pressure obtained in vivo
(calf) by the PicoPress and Kikuhime, were compared with HOSY. The mean bias and limits of
agreement indicate the PicoPress satisfies the a priori thresholds for acceptable validity at the
posterior and lateral orientation with calf stockings (-0.4[-3.3;2.5]; 0.5[-3.4;4.4] mmHg) and tights
(0.2[-4.7;5.1]; 1.2[-0.3;5.4] mmHg) respectively. The Kikuhime did not satisfy thresholds for
acceptable validity at any orientation, overestimating the pressure compared with HOSY. We
recommend using the PicoPress, specifically at the posterior or lateral aspect of the calf. This is of

39
particular relevance when the garment is applying relatively low levels of pressure, applicable to
sports compression.
3.3 Introduction
CGs are popular clothing choices among recreational and professional athletes during and after
exercise. These garments have been shown to enhance athletic performance and accelerate recovery
following strenuous exercise [4,92].
Despite the prospective benefits, little is known regarding the optimal ‘interface-pressure’ a CG
should apply to a particular limb, to produce the greatest athletic benefit [2]. In contrast, the
application of pressure to the lower extremities via tight fitting, elastic garments, is extensively
researched in the clinical field and is part of standard care in patients with chronic venous
insufficiency and lymphatic disease [124]. Unlike sports CGs, medical compression stockings
undergo a standardised assessment procedure to quantify the pressure applied; therefore
recommendations can be made in relation to the treatment protocol including a desired interface
pressure [125]. Such recommendations cannot be made with regard to athletic performance or
recovery due to a number of methodological limitations. Heterogeneity of published literature relating
to research design is commonplace, including but not limited to; variation in garment design, duration
of wear, type of garment and limb coverage. Furthermore, authors fail to measure the pressure of
garments [59] or values are provided by the garment manufacturer and are not directly measured
[126]. If garment pressure is reported, the measurement devices used by researchers vary greatly,
ranging from portable units and force-transducers to medical-grade devices. Until the measurement of
the interface pressure elicited by sports CGs is standardised, developing a consensus and furthering
the field regarding dose-response will continue to be a challenge. The reporting of pressure, obtained
directly by research scientists and clinicians would progress the field of sports compression and

40
enable the investigation of optimal interface pressures (dosage) and gradients required for improved
performance and recovery outcomes [2].
A critical aspect of effective compression therapy is that the appropriate level of pressure is applied to
the limb. Portable pressure sensing devices offer quick, low cost, in vivo assessment during dynamic
movement. Validation of measures made in vivo by these devices is necessary to establish preferable
devices and inform best practice.
Current guidelines for the assessment of in vivo interface pressure list 22 portable devices [34],
including pneumatic, piezoelectric, resistive and capacitive sensors. The authors state that the
quantification of interface pressure will enable comparisons between clinical trials to assess dosage
and the correlation with clinical and physiological measurements. However, many of the portable
devices listed in the guidelines have not been validated nor compared with alternative methods of
pressure assessment i.e. fixed, non-portable reference devices.
Portable devices must undergo rigorous assessment to identify if variation exists between units.
Furthermore, the accuracy of these devices versus a clinically relevant reference standard is necessary
to provide a comparative assessment of performance. By identifying portable devices with acceptable
accuracy, guidelines can be developed further and ultimately assist with understanding the bio-
physical impact of interface pressure on physiological response and performance outcomes.
In light of this, we assessed the criterion validity of interface pressure measures from two
commercially available devices in vivo by comparing pressure measurements against a reference
standard.
3.4 Methods
We compared two portable devices (Kikuhime and PicoPress) commonly used with a ‘reference
standard’ system (HOSY). The HOSY is a mandatory testing system for interface pressure

41
compliance, required for the classification and certification of medical compression hosiery. Two
warp knitted compression garments were used, including calf- stockings (Figure 3-1a), covering the
ankle to below the knee (SkinsTM Men’s Compression MX Calf Stockings, Riverwood, Australia) and
full-length tights (Figure 3-1b), covering the body from ankle to waist (SkinsTM Men’s Compression
A400 Long Tights, Riverwood, Australia).
Figure 3-1 Image of SkinsTM Men’s Compression (a) MX Calf Stockings and (b) A400 Long Tights
(images courtesy of www.skinscompression.com).
The fabric properties of the two CGs were investigated for performance including fabric weight using
Sartorius balance. Fabric thickness was measured using a Shirley thickness gauge (Mitutoyo, Japan)
[127]. Fabric count (number of wales and courses) was measured with a simple eye piece lens that
had 5x magnification. Stretch and recovery was also evaluated to determine the stretch characteristics
of fabric in length and cross wise direction using Fryma Extensiometer [128] and 3 kg load was
applied (Table 3-1). All fabrics were conditioned in standard laboratory conditions (20 ± 2°C, 65 ±

42
0% relative humidity) for 24 h prior to the fabric tests [129]. Garments did not undergo pre-treatment
washing prior to or between measurements.
Table 3-1 Fabric characteristics of the compression garments.
3.5 Reference Standard Device
The Hohenstein System (HOSY, Bönnigheim, Germany) is used to measure interface pressure and
determine if garments meet the German ‘medical compression hosiery’ standards RAL GZ 387/1
[26]. The HOSY measures interface pressure (maximum resolution of 0.01 kPa), wear stretch
(elongation %), tensile force (N/cm) and residual pressure (%). The device (Figure 3-3) comprises
twenty individual tensile testing ‘rods’, each with a width of 50 mm. The force measurement takes
place at the fixed clamp rod via short-distance electronic transducers. The measurement principle of
the HOSY is based on the force exerted by compression fabric in circumferential direction, when
stretched in a longitudinal direction to a specified length and subsequently in a transverse direction
according to its size. For further details of the HOSY see the RAL GZ 387/1 standards [26].
Weight
(g/m2)
Thickness
(mm)
Composition Count
(wpc x cpc)
Extension
(%)
Residual
extension(%)
Stockings
Length
wise
Cross wise
298
(2.83)
0.69 (0.00)
65% Nylon
35% elastane
420 x 250
52.67
(0.94)
96.67
(4.71)
2.67
(0.00)
2.00
(0.94)
Tights
Length
wise
Cross wise
199.33
(0.57)
0.57 (0.01) 76% Nylon
24% elastane
520 x 500
164.89
(13.87)
94.67
(2.67)
8.0
(3.52)
2.67
(1.33)
Number in the brackets indicates standard deviation; cpc – courses per mm; wpc – wales per mm

43
3.5.1 Calibration
Pressure was measured on both garments at the location that corresponded with the maximum calf
girth. The maximum calf girth, commonly referred to as ‘location C’ (Figure 3-2) in published
guidelines [34] and standards [26], was chosen as interface pressures exerted in this region are
commonly cited in both medical [130] and sports compression literature [10]. Prior to the
measurement process, the ankle location (also referred to as ‘location B’) was manually identified on
both garments and subsequently location C is marked at a height of 200 mm above this point.
Calibration of the HOSY device takes place annually by attaching a 5 kg weight to each of the 20
tensioning clamps.
Figure 3-2 Measuring point for the ankle (Location B) and maximum calf girth (Location C) (image
courtesy of RAL GZ 387/1 [26]).

44
3.6 Reference Standard Protocol
A qualified technician attached the garments and operated the HOSY device in a controlled laboratory
environment (18 ± 0°C, 65 ± 0% relative humidity). Briefly, two clamps held the bottom of the
garment in place (Figure 3-3a) with the remaining garment placed in each fixed clamp rod (Figure 3-
3b). Once correctly fastened into the HOSY, the distance of location C (Figure 3-3c) from the bottom
clamps was entered into the operating computer. The garment was stretched (loaded) and relaxed
(unloaded) six times in the cross-wise direction. Each loading cycle extended the garment to the leg
circumference. During the final loading phase the tensile force at each clamp was measured. The
computer program calculates how far each tensioning clamp moves to achieve the desired
circumference and the resultant elongation of the garment so that all clamps reach this position
simultaneously after 20 seconds [26]. A minimum and maximum leg circumference of 370 and 400
mm at Location C was used for this investigation. Initially, the test-retest reliability of the HOSY was
determined by measuring the tights twice. Between each assessment, the garment was unclamped and
removed from the HOSY and reapplied by a qualified technician. The technical error of measurement
(TEM) and coefficient of variation (CV) reported for the HOSY was 0.5 mmHg and 5.8%
respectively. For all data analysis referring to the tights, the mean of the two repeated measures at
minimum and maximum elongation was used. Calf stockings were measured on one occasion only.
Compression classification standards vary by country [131,132] but a unified classification of mild
(10-19 mmHg) and moderate (20-29 mmHg) compression is proposed. With this in mind, when
comparing portable devices with the reference standard and determining device validity, a priori
thresholds are required. The criteria for acceptable validity was defined as a systematic bias of ±2
mmHg and a limit of agreement ±5 mmHg (of the mean bias). A bias of ±2 mmHg accounts for
technical error of the HOSY and the resolution of the portable devices. Limits of agreement of ±5
mmHg identify the variability of the device vs. the reference standard accounting for the 10 mmHg
classification range.

45
Figure 3-3 The Hohenstein System (HOSY) showing (a) clamps holding the bottom of the garment,
(b) 20 measuring rods with clamps and (c) measurement tape.
3.7 Portable Devices
The PicoPress (Microlab, Padua, Italy) is a battery-operated device and comprises a 50 mm circular
sensor manufactured from 200 µm thick flexible plastic tubing attached to the base unit. The
Kikuhime (Meditrade, Soro, Denmark) comprises 30 x 38 mm oval sensor made from 3 mm
polyurethane foam and connected to a transducer via silicone tubing. Both the PicoPress and
Kikuhime operate through pressure being applied to the sensor, thereby displacing the air and acting
on the pressure transducer housed in the battery-operated units. The PicoPress can measure pressure
up to 189 mmHg; and the Kikuhime up to 120 mmHg both with a resolution of 1 mmHg.
3.7.1 Calibration
We calibrated devices according to the manufacturers’ instructions. A self-calibration procedure is
performed when switching the PicoPress unit on. Digital prompts on the device outline the calibration
A
B
C

46
procedure by inserting 2 ml of air into the sensor, setting the unit to read 0 mmHg when hanging
freely. In the same position, the Kikuhime requires the user to manually zero the potentiometer. In
light of the Kikuhime calibration method and unit resolution, there is an inherent calibration offset
error of up to ± 0.49 mmHg [133].
3.8 Portable Device Protocols
3.8.1 Water-column method
To certify measurement validity and linearity from air-filled portable pressure systems such as the
PicoPress and Kikuhime devices, the water column method provides a quick and in-expensive method
making use of hydrostatic pressure.
As previously described [2], by placing the pressure sensor flat at the bottom of a water column, and
filling the column with a specific volume of fluid, a known pressure will be placed on the sensor.
Water depths were calculated to determine incremental pressures of 5 mmHg, from 5 to 25 mmHg,
whereby the depth measurement was taken from the lowest point of the meniscus and the middle of
the sensor. The depth of water (mm) to achieve the target pressures was calculated using the following
equation,
a mmHg = b mmH2O x [7.356 x 10-2]
Five repeated measures were undertaken for each depth, which required the removal of water from the
column each time, before returning it to achieve the predetermined depth.
3.8.2 In vivo protocol
Twelve recreationally active males (mean ± SD: age 19.1 ± 1.0 y, body mass 74.6 ± 4.8 kg, stature
1.77 ± 0.05 m) gave written informed consent to participate in the study in accordance with
Declaration of Helsinki. The ethical committee at the University of Essex approved the current
investigation.

47
All testing was performed in a controlled laboratory environment (18 ± 0°C, 50 ± 2% relative
humidity). Upon arrival, the circumference of the participants calf was measured (location C = 380 ±
12 mm). All participants possessed a maximum calf girth between 370 and 400 mm. To ensure that
garment Location C was accurately positioned at the correct limb height in-situ, position-markers on
each garment were aligned with anatomical markings at the maximal calf-girth. The anterior,
posterior, medial and lateral aspect were identified with a segmometer (Cescorf, Porto Alegre, Brazil).
Limb width was measured at each orientation and the mid-point marked as the location for the
portable device sensor. Using the PicoPress and Kikuhime devices, interface pressure at the anterior,
posterior, medial and lateral aspect around the maximum calf girth was measured. The investigator
placed the air-filled sensor of each device between the garment and skin, ensuring that the sensor
remained flat. Participants stood upright with feet shoulder width apart during all measurements.
Garment order was determined using a balanced two-Latin square design to minimize device and
orientation order effect. For each anatomical site, three repeated measures were obtained at 30-second
intervals.
3.8.3 Portable Devices Data Treatment
In vivo interface pressures were measured at four anatomical orientations and a fifth value calculated
as the average of all four measures (i.e. lateral + medial + anterior + posterior / 4 = mean of four
orientations ( 𝑥 )). A Pearson’s Product Moment correlation was used to analyse the linearity of the
PicoPress and Kikuhime against the water column reference values. Data analyses were conducted
using Graphpad Prism 7 (Graphpad Software, San Diego, California) and reported as mean ± standard
deviation (SD) unless otherwise stated.
3.9 Data Analysis Agreement
Prior to comparing in vivo portable devices with a reference standard, interface pressures must be
established for each participant for the reference device. The HOSY does not measure pressure

48
directly applied to the individual, instead, pressures are determined by elongating the garment to a
pre-determined length, simulating the circumference of a limb. A simple linear regression was
calculated to predict interface pressure based on the HOSY pressure values at minimum and
maximum elongation. As the theoretical circumference increased by 10 mm, interface pressure
applied by the stockings increased by 0.86 mmHg between 370 and 400 mm (19.3 – 21.9 mmHg; y =
0.87x - 12.77). The interface pressure of the tights increased 0.62 mmHg for every 10 mm increase in
circumference (12.5 – 14.4 mmHg; y = 0.62x - 10.32). The regression equation was then used to
determine individualized pressure from the reference standard by factoring the individuals’ calf
circumference. Calculation of the estimated HOSY interface pressure for each participant produced a
mean [95% CI] pressure of 20.1 mmHg [19.5, 20.8] and 13.1 mmHg [12.6, 13.6] for the stockings and
tights respectively. Having established reference values, comparisons can now be made with the
portable, in vivo devices. Normalcy was assessed using the Kolmogorov-Smirnov test. The difference
between the individualised HOSY values and portable device pressures were assessed for significance
using a one-sample t-test (target value = 0). The method proposed by Bland and Altman [134] was
used to assess agreement between the HOSY and each portable device at all anatomical orientations
The difference between devices was calculated as the interface pressure (mmHg) of the HOSY minus
the portable device (PicoPress or Kikuhime), providing bias values and upper and lower limits (± 1.96
SD). Difference was plotted as a function of the HOSY reference value [135] and linear regression
used to calculate slope (B) of the HOSY versus portable device interface pressure. Analyses were
performed using the Statistical Package for the Social Sciences (SPSS) version 25 (SPSS Inc.,
Chicago, Illinois) and the level of significance was set at α = 0.05.
3.10 Results
The PicoPress and Kikuhime interface pressures produced a positive correlation when compared with
the criterion water pressure. Correlation coefficients calculated to evaluate the linear association
between the pressure applied by the water column and two portable pressure devices are shown in
Figure 3-4.

49
Figure 3-4 Linearity and correlation coefficients for the (a) PicoPress and (b) Kikuhime device.
The interface pressures obtained by the reference standard, PicoPress and Kikuhime for the stockings
and tights are shown in Table 3-2 and 3-3 respectively.
The PicoPress produced values which agreed with the reference standard when measured at the
posterior (-0.4 [-3.3; 2.5] mmHg) and lateral (0.5 [-3.4; 4.4] mmHg) orientations (Table 3-2). The
positive mean bias values for measures at the anterior and medial orientation show PicoPress
produced systematically higher values when compared with the reference standard, Table 3-2 shows
0 5 10 15 20 25 300
5
10
15
20
25
30
Water column pressure (mmHg)
Pic
oP
res
s
(m
mH
g)
r = 0.99
95% CI = 0.9986 to 0.9997
0 5 10 15 20 25 300
5
10
15
20
25
30
Water column pressure (mmHg)
Kik
uh
ime
(m
mH
g)
r = 0.99
95% CI = 0.9968 to 0.9993
a)
b)

50
the Kikuhime produced values that were significantly higher (P<0.01) compared with the reference
standard at all measurement orientations, with a bias ranging from -6.1 - -17.6 mmHg.
Table 3-3 shows the between-device agreement for tights. When compared with the reference
standard, the PicoPress (Table 3-3) produced significantly higher values at the anterior orientation
(P<0.01), but not at the posterior, medial and lateral orientation. Of the orientations, the posterior,
lateral and mean satisfied the a priori thresholds for acceptable validity, reporting a bias of 0.2 [-4.7;
5.1], 1.2 [-0.3;5.4] and -0.6 [-4.5; 3.4] mmHg respectively. The Kikuhime produced interface pressure
values that were higher than the HOSY. Regardless of orientation the Kikuhime had a mean bias >2
mmHg at all orientations other than the medial aspect. At the medial orientation, the mean bias was
2.0 mmHg but the limits of agreement were unacceptably wide and did not satisfy the validity
threshold.
Of all the measurements obtained using both portable devices, the unstandardized slope coefficient
produced values ranging from -.02 – 2.4. With the exception of the posterior orientation using the
Kikuhime with calf stockings, all remaining slopes were positive. At the posterior and lateral
orientation, the PicoPress satisfied the validity thresholds with both garments, demonstrating a small
bias, acceptable limits of agreement and a negligible slope. This means the PicoPress, at two specific
orientations, is an accurate proxy measure for interface pressure when compared with the reference
standard.

51
Table 3-2 Interface pressure, significance, agreement values (bias and limits) and slope between
HOSY and portable devices with stockings
Interface
Pressure (mmHg
[SD])
P-
value Bias [95% LoA] B [95% CI]
Orientation PicoPress
Anterior 29.3 [3.9] <0.01 -9.2 [-1.8; -0.6] 2.4 [0.0 – 4.8]
Posterior 20.6 [1.5] 0.35 -0.4 [-3.3; 2.5] 0.5 [-0.4 – 1.4]
Medial 22.0 [2.1] 0.02 -1.8 [-6.5; 2.8] 1.1 [-0.3 – 2.5]
Lateral 19.6 [2.1] 0.37 0.5 [-3.4; 4.4] 0.4 [-0.9 – 1.7]
x̄ 22.9 [1.5] <0.01 -2.7 [-6.4; 0.9] 1.1 [0.1 – 2.0]
Kikuhime
Anterior 37.7 [4.4] <0.01 -17.6 [-26.8; -8.3] 1.7 [-1.2 – 4.6]
Posterior 26.2 [3.0] <0.01 -6.1 [-11.4; -0.8] -0.2 [-1.9 –1.6]
Medial 27.0 [3.8] <0.01 -6.9 [-15.0; 1.2] 1.5 [-1.0 – 4.0]
Lateral 26.5 [3.8] <0.01 -6.3 [-14.3; 1.6] 1.3 [-1.2 – 3.8
x̄ 29.4 [2.5] <0.01 -9.2 [-14.6; -3.9] 1.1 [-0.5 – 2.7]
x̄ = mean of four orientations; SD = standard deviation; LoA = limits of agreement; B =
unstandardized beta coefficient of regression slope; CI = confidence interval. Mean [95% CI]
HOSY pressure = 20.1 [19.5, 20.8] mmHg.

52
Table 3-3 Interface pressure, significance, agreement values (bias and limits) and slope between the
HOSY and portable devices with tights
Interface
Pressure (mmHg
[SD])
P-value Bias
[95% LoA] B [95% CI]
Orientation PicoPress
Anterior 16.9 [2.9] <0.01* -3.8 [-10.1; 2.5] 2.0 [-0.6 - 4.7]
Posterior 12.9 [2.3] 0.82 0.2 [-4.7; 5.1] 1.3 [-0.9 – 3.4]
Medial 13.0 [2.7] 0.93 0.1 [-5.8; 6.0] 2.2 [-0.2 – 4.6]
Lateral 11.9 [1.9] 0.07 1.2 [-3.0; 5.4] 1.3 [-0.5 – 3.1]
13.7 [1.6] 0.35 -0.6 [-4.5; 3.4] 1.7 [0.3 – 3.1]
Kikuhime
Anterior 21.0 [4.4] <0.01* -7.9 [-16.7; 1.0] 1.2 [-2.9 – 5.3]
Posterior 15.9 [2.2] <0.01* -2.9 [-7.0; 1.3] 0.2 [-1.8 – 2.2]
Medial 15.1 [3.4] 0.69 -2.0 [-8.6; 4.7] 0.6 [-2.5 – 3.8]
Lateral 15.1 [2.6] 0.03* -2.1 [-7.4; 3.3] 1.2 [-1.2 – 3.6]
16.8 [2.1] <0.01* -3.7 [-8.1; 0.7] 0.8 [-1.2 – 2.8]
𝑥 = mean of four orientations; SD = standard deviation; LoA = limits of agreement; B =
unstandardized beta coefficient of regression slope; CI = confidence interval. Mean [95% CI]
HOSY pressure = 13.1 [12.6, 13.6] mmHg.
3.11 Discussion
We investigated the validity of two portable pressure measurement devices. First, pressure values
reported by two portable devices were compared with hydrostatic pressure using a water column
method. Second, the two portable pressure devices were compared against reference standard values
analogous to those used to determine the classifications of medical compression hosiery. In agreement
with previous studies using the water column method [2,136,137] we confirmed the Kikuhime and
PicoPress devices produced reliable in vitro measures of hydrostatic pressure (Figure 3-4). However,
this method in isolation does not ensure validity in vivo as measurement error is the sum of
instrumental error and the geometry / mechanical properties of the interface surface. The water
column method is undertaken with the sensor in a flat position, whereas in vivo measures are
commonly taken at locations where the surface is curved, potentially impacting upon the pressure

53
sensor performance [133]. At best, this technique offers the user a simple tool to assess unit precision
and identify if inherent malfunctions with the pressure device exist. However, the water column
method should not be used in isolation to determine the performance of a portable pressure monitor
and its comparability with alternative garment pressure sensing devices.
The present in vivo assessment confirmed the extent to which the point pressures vary at different
orientations. The results are comparable to that previously reported, in that interface pressure at the
anterior orientation of the lower leg is greatest [138–140]. This is likely due to variation in the
anatomic structure and shape of individual human legs. According to Laplace’s law, the pressure
exerted by a CG is inversely proportional to the radius of curvature at a given location. It follows that
pressure applied at the tibialis anterior muscle will result in the highest circumferential pressure due to
a smaller radius of curvature, when compared with the larger radius of the gastrocnemius (medial,
lateral and posterior location).
The PicoPress showed acceptable agreement for posterior and lateral measures of interface pressure
made in both garments. This prominent finding regarding device performance and location of
assessment is important to advance the standardisation of compression testing. In contrast, the
Kikuhime overestimated interface pressures in both garments and at all anatomical sites. Under a
sphygmomanometer cuff at 20 mmHg, the Kikuhime has previously reported a pressure ~25 mmHg
[141]. The Kikuhime systemic overestimation of interface pressure may misclassify compression
garments. However, at 30 – 50 mmHg both devices reported accurate and matching values [141]. The
validity of devices at lower pressures is important when assessing sports CGs which typically produce
interface pressures of ~10 – 30 mmHg [36,142]. Differences in the size and shape of the air-filled
sensors used in both devices might explain the observed bias. The PicoPress uses a circular sensor 40
mm in diameter whereas the Kikuhime uses smaller (38 x 30 mm) oval sensors with a smaller area
(895 mm2). When placed on a cylindrical shape, a smaller sensor will result in a reduced radius of
curvature, possibly explaining the higher interface pressures reported by the Kikuhime.

54
The Kikuhime sensor is also 2 mm deeper than the PicoPress when inflated and also includes a foam
insert. The increased depth of the Kikuhime creates a local protuberance when used in vivo. Any
additional protrusion will distend the fabric of tight fitting garments causing an increase in tension and
the sensor bulge will reduce the radius of curvature and result in a further increase in observed
interface pressure [143].
The B slope coefficient is a product of the calculated HOSY values and compared with the interface
pressure obtained with a portable device. The PicoPress values at the posterior and lateral orientation
for both garments report a low, positive B slope (<1.5 mmHg). The positive slopes indicate that at the
lower end of the reference standard interface pressure, the portable devices report a higher value,
whereas at the higher end of the reference standard pressure, the portable devices tend to
underestimate interface pressures.
3.11.1 Limitations
The current results are a product of the garment and device interaction whereby the specific garment
fabrics have shown to play a pivotal role in altering the interface pressure. The garments used in the
present study, whilst commercially available, do not reflect the wide range of fabric compositions
used for sport and medical compression and therefore caution should be used to extrapolate the
present findings across alternative fabrics.
3.11.2 Future Research
Future research should compare the interface pressure reported by portable pressure devices with CGs
of a known pressure (i.e. 10, 20 and 30 mmHg). By using the PicoPress at the approved orientations,
it will provide insight into the variability of pressure when off-the-shelf garments are measured.
3.11.3 Practical Implications
The PicoPress and Kikuhime are commonly cited devices in medical literature [144,145], sub-
bandage pressure assessment [146,147], and as reference devices in the development of piezoresistive
sensors [148]. However, in the current study, and in agreement with previous research [1,133,141],

55
significant discrepancies between the devices are evident. However, this study not only reports
differences between portable devices, but also compares performance with a reference standard. This
study contributes towards international standardization by identifying a portable pressure sensor
(PicoPress) and assessment location (posterior and lateral) capable of replicating pressure values
established from a reference standard. This is an important finding given the low-cost and speed in
which garment pressure can be determined using a portable pressure monitor when compared with
indirect methods. These findings are particularly relevant for researchers, garment designers and
clinicians monitoring garment pressure, when interpreting the pressure applied in a wider context and
comparing with the standardised pressure classifications.
3.12 Conclusion
Two portable pressure devices were rigorously assessed in order to contribute much needed future
standardization of pressure evaluations for sports compression. When compared with a reference
standard, the PicoPress provides a valid measure of interface pressure at the posterior and lateral
location of the calf. From a practical, in vivo standpoint, we recommend using the PicoPress to assess
interface pressure, specifically at the posterior or lateral aspect of the calf. This is of particular
relevance when the garment is applying relatively low levels of pressure, applicable to sports
compression.

56
4 Assessing the effect of compression tights on submaximal running
economy.
4.1 Rationale
This study intended to explore the influence of compression tights on cardiorespiratory function.
Having identified a portable pressure monitor with criterion validity when compared with a medical
reference standard (Chapter 3), the PicoPress was used to assess garment interface pressure. In this
study, correctly fitted and oversized compression tights where worn by recreationally active male
runners and compared with running shorts. Assessment of cardiovascular parameters during
submaximal exercise with two garment size variants provides an insight into a potential dose-response
regarding interface pressure.
4.2 Abstract
Compression tights are the most commonly used sports compression wear, worn by recreational
athletes globally. Despite their popularity, the influence of commercially available, low-pressure
compression tights on cardiorespiratory function remains limited. This study investigated the effects
of correctly sized and oversized compression tights applying a low interface pressure, on
cardiorespiratory function, compared with a control garment. Eleven recreationally active participants
completed a 15 min run at 60% peak aerobic running speed (vV̇O2max) on three occasions. Running
economy (RE), respiratory exchange ratio, minute ventilation, breathing frequency, heart rate, and
rating of perceived exertion were measured during the steady state run, with blood lactate collected
post exercise. A small, likely beneficial improvement (95%:5%:0%; η2 = 0.55) in RE at 60% vV̇O2max
was observed in the correctly sized compression condition when compared with control. All
remaining variables reported unclear, trivial or possible differences between garment conditions. The
findings suggest that wearing non-graduated, low pressure CGs have a likely benefit for submaximal
RE, however it appears necessary that a certain level of interface pressure is required.

57
4.3 Introduction
CGs are an popular clothing choice among physically active individuals. As the demand for these
specialised CGs grows in popularity with professional and recreationally active markets, the benefits
cited by commercial companies are continually questioned [149]. Medical garments apply
compression in a graduated fashion, with the greatest pressure applied at the distal location, reducing
in pressure proximally. This garment design, when worn by patients with chronic venous
insufficiency or healthy individuals at rest, increases blood flow velocity, reduces swelling and
minimises venous stasis [150,151][150,151]. If enhanced calf skeletal-muscle pump function,
improved venous return and lymphatic drainage are physiological responses to the application of
compression clothing, it is understandable that sportspeople hope for an ergogenic benefit.
Compression tights, that cover the wearer from the waist to ankle, are the most commonly purchased
sports compression wear, accounting for more than one-third of compression wear market revenue in
2015 [152]. However, there is a scarcity of literature assessing compression tights with recreationally
active runners, despite being the largest consumer group. Of the studies that have specifically
investigated the influence of compression tights on running performance, a reduced energy cost of
running, by way of a decrease in oxygen uptake (VO2) slow component [9] has been reported along
with lower muscle activation in key running-related muscles during distance running [153].
Conversely, a detrimental effect of compression tights on running economy at low speeds is reported
[10], suggesting that this may be a result of additional VO2 required to overcome the resistance to
movement that may be caused by compression tights. Other authors have reported no change in
parameters such as time to exhaustion, heart rate [154], rating of perceived exertion [9], oxygen
uptake or lactate during submaximal running [8] when compression tights are worn.
The inconsistency in sports compression literature is confounded by varied research methodologies,
small participant numbers and the type of CG used (interface pressure exerted (mmHg), surface area
covered and fabric properties). With reference to the interface pressure applied by CGs, standard

58
classifications exist for graduated medical compression hosiery [26]. However, there are no agreed
interface pressure classifications for sports compression garments, nor an agreed approach as to how
interface pressure should be measured. Broadly, medical classifications report ‘low’ pressure as 18-21
mmHg applied at the ankle and decreasing progressively up the leg [26]. However, sports CGs are
reported to elicit an interface pressure below this minimum threshold [142], indicating that sports
garments produce lower interface pressures than medical garments.
The primary aim of the present study was to investigate the impact of sports compression tights on
recreational runner’s cardiorespiratory function. Our secondary aim was to investigate a possible
dose-response comparing running economy when wearing correctly fitted compression tights versus
oversized garments. It was hypothesised that measures of cardiorespiratory function during running
would be improved with correctly fitted compression, but not oversized garments.
4.4 Methods
Eleven healthy, non-smoking, recreationally active (>3 sport specific training sessions per week)
males (mean ± SD; age 28.7 ± 6.6 years, weight 68.2 ± 5.3 kg, V̇O2max 54.2 ± 4.9 ml·kg−1·min−1,
vV̇O2max: 19.2 ± 1.4 km h-1 (corrected for 1% gradient)) participated in the study. Participants kept a 3-
day food and activity diary prior to preliminary testing. They were requested to follow the same
dietary intake the day prior and day of testing for all subsequent testing dates. Participants were asked
to refrain from exercise, caffeine and alcohol intake 24 hours prior to testing and refrain from
strenuous exercise 48 hours prior. Furthermore, participants did not consume any food or fluid
(excluding water) in the 2 hours prior to testing. Ethical approval was received from the University of
Essex ethical committee. Participants provided written informed consent in accordance with the
Declaration of Helsinki.
The compression tights used in this investigation, shown in Figure 4-1, were Skins TM Men’s
Compression A400 Long Tights (Riverwood, Australia), and the correctly fitted garment for each
participant was in accordance with the manufacturer’s instructions. For the oversized garment

59
condition, participants wore two sizes above the manufacturer’s instructions. The garments were
made from warp knitted fabrics, with the fibre reported as 76% nylon and 24% elastane. Participants
were blinded to the garment condition by removing the size label. The pressure exerted by the
compression tights on the lower limbs were evaluated by the PicoPress® (Microlabs, Italy) pressure
monitor which has a coefficient of variation of <5% at 20 mmHg,[1] and shown to satisfy criterion
validity with a reference standard device (Chapter 3). Pressure measures were recorded at 3
anatomical locations (ankle = 5 cm above superior sphyrion, posterior calf = maximal calf girth and
anterior thigh = mid-point between mid-trochanterion-tibiale laterale). The control garment consisted
of loose fitting running shorts, thereby providing a comparison between compression tights and
garments typically worn by recreational runners. Participants wore the same short-sleeved top and
running shoes on all occasions.
Figure 4-1 (a) Lateral and (b) anterior view of Skins TM Men’s Compression A400 Long Tights used
in this investigation.

60
The experimental protocol consisted of four sessions, held between 2-4 days apart for all participants.
Each participant attended their sessions at the same time of day, with similar environmental
conditions (temperature: 18 ± 1.0° C) to minimise variation in physiological parameters that might
change with circadian rhythm. A crossover design was incorporated into the study; with garment
order counterbalanced using a Latin square design.
The initial session determined individual maximal aerobic capacity (V̇O2max), and peak running speed
during an incremental treadmill test (vV̇O2max). After a 5 min warm-up at 7 km·h-1 (0% gradient)
participants completed an incremental exercise test on a treadmill (Saturn, HP-Cosmos, Nussdorf,
German) wearing the control garments. The initial treadmill speed of 7 km·h-1 was increased by 1
km·h-1 each minute to a speed of 16 km·h-1. Thereafter treadmill gradient was increased by 2% each
minute until volitional exhaustion[154]. Gradient increases were converted to equivalent demands of
change in running velocity assuming an 1.5% increase in gradient of equates to an 1 km·h-1 increase in
speed of as previously described[155]. To determine vV̇O2max, the speed of the last complete stage
was added to the multiplication of the speed increment by the completed fraction of the incomplete
stage. Following the incremental test and a rest period of 10 minutes, participants were familiarised
with the steady state condition by running on the treadmill for 5 min at 60% of their individualized
vV̇O2max.
During sessions 2-4, participants initially provided a urine sample upon arrival to assess urine specific
gravity (Atago Co., Ltd., Tokyo, Japan) and a 24-hour dietary intake record to confirm dietary and
fluid recommendations had been adhered to. Participants were equally assigned to the control,
compression or oversized condition in an attempt to balance any learning effects. For trials that
required participants to wear compression tights, garment interface pressure was recorded. Following
this, a standardised warm-up on a cycle ergometer (Monark 818 E, Sweden) of 5 min at 100W was
undertaken.

61
Subsequently participants underwent a 15 min steady state (SS) running task at 60% vV̇O2max, at a
gradient of 1%. The mean 60% vV̇O2max between participants was 12.1 ± 1.3 km·h-1. During the SS
run, breathing frequency (BF), minute ventilation (VE) oxygen uptake (V̇O2) and expired carbon
dioxide (V̇CO2) were measured constantly with a breath-by-breath gas analyser (Vyaire CPX,
Mettawa, Illinois, USA). V̇O2 was calculated by linear interpolation between breath-by-breath V̇O2
data to 1 second values and then averaged over the last 3 min of the SS run task. RE was then
calculated as the total volume of oxygen needed to run one kilometre relative to body mass (ml·kg-
1·km-1) at 60% vV̇O2max. Respiratory exchange ratio (RER) was reported as the mean ratio between
V̇O2 consumed and expired V̇CO2 from the final 3 min of steady state running. Heart rate was
recorded throughout the run task using a wireless HR monitor (Polar S810i, Polar Electro, Finland).
Participants reported RPE at 1, 3, 6, 9, 12 and 15 min using Borg’s 6-20 scale [156]. To measure
blood concentration of lactate ([La-]b), capillary samples from the right earlobe (20μL) were collected
(Eppendorf AG, Hamburg, Germany) on completion of the SS run. Samples were analysed using a
Biosen Lactate analyser (Biosen C-line analyser, EKF Industrie, Elektronik GmbH, Barbelen,
Germany).
4.4.1 Data Analysis
All sets of data in the three conditions (control, compression and oversized) were initially tested for
normality using the Shapiro-Wilk test. Analysis of CG interface pressure was conducted via a paired
students t-test to measure potential significant differences between two means. In cases where the
assumptions of normality were not met, the non-parametric Wilcoxon signed-rank test was used for
comparisons of two means. VE, BF, RE, RER, HR and [La-]b were analysed by a one-way ANOVA,
with Bonferroni correction. In cases where the assumptions of normality were not met, the non-
parametric Kruskal-Wallis test was used for comparisons of three conditions. Prior to conducting a
repeated-measures two-way ANOVA (garment x time point) with RPE data, Mauchly's Test of
Sphericity was conducted to assess variances of the differences between all combinations of related

62
groups. Subsequently, a Fishers LSD post hoc test was performed when comparisons were made
across more than two levels.
RE, RER, RPE and [La-]b was subsequently analysed for practical significance using magnitude-based
inferences[157]. Statistical analysis of physiological and perceptual measures was performed using a
specifically designed spreadsheet available for crossover studies[158]. We used a contemporary
statistical approach because conventional statistics typically omit the magnitude of the effect, which
could be considered more relevant to a therapeutic prescription than a statistically significant
result[71]. Physiological data was log-transformed to reduce bias arising from non-uniformity of error
and back-transformed to obtain changes in means in raw values.
The standardised effect size, (defined as (difference in mean)/standard deviation, was calculated for
all variables between each clothing condition. Thresholds for small, moderate and large effects were
0.20, 0.60, and 1.20, respectively. From the spreadsheet, we used magnitude-based inferences about
effect sizes (ES) and then to make inferences about true (population) values of the effect, the
uncertainty in the effect was expressed as 90% confidence limits. Between-trials comparisons
involved calculating the probability that the true (unknown) differences were lower than, similar to, or
higher than the smallest worthwhile difference or change (0.2 x between-participant standard
deviation). Quantitative chances of higher or lower differences were qualitatively ranked as follows:
<1%, almost certainly not; 1-5%, very unlikely; 5-25%, unlikely; 25-75%, possible; 75-95%, likely;
95-99%, very likely and >99%, almost certain. If the chances of harm and benefit were of >0.5% and
<25% respectively, the true difference was assessed as unclear. All statistical tests were processed
using the statistical package SPSS (Version 18) and Microsoft Excel (Microsoft Corporation TM,
Redmond, WA, USA). The level of statistical significance was identified by an alpha value of P <0.05
and data reported as mean ± standard deviation (SD), unless otherwise stated.
4.5 Results

63
Baseline measures performed to assess the IP (mmHg) applied by the compression and oversized
garment revealed significantly higher values with compression tights at the ankle (95% CI = 0.98,
2.72; p = 0.001) and thigh (95% CI = 2.06, 3.71; p = 0.003) compared with the oversized garment
(Table 4-1). The IP at the posterior calf location was not significantly different (95% CI = -0.60, 3.60;
p = 0.052) (Compression: ankle = 3.1 ± 1.3; calf =10.5 ± 3.1; thigh = 6.7 ± 0.6 mmHg. Oversized:
ankle = 1.3 ± 0.9; calf = 9.1 ± 2.7; thigh = 3.8 ± 1.1 mmHg).
Table 4-1 Interface pressure (mmHg) with oversized (OSG) and correctly sized (CSG) compression
tights for individual participants.
Participant no. Ankle (mmHg) Calf (mmHg) Thigh (mmHg)
OSG CSG OSG CSG OSG CSG
1 2 3 9 10 3 7
2 0 2 8 9 3 6
3 1 4 11 19 6 7
4 1 4 10 11 3 7
5 2 5 16 11 3 6
6 3 3 7 8 5 7
7 0 1 7 7 3 7
8 2 2 6 11 4 6
9 1 5 9 10 4 7
10 1 2 8 9 3 8
11 1 4 9 11 5 7
Mean ± SD 1 ± 0.9 3 ± 0.9 9 ± 0.9 11 ± 0.9 4 ± 0.9 7 ± 0.9
For RPE measures there was a significant main effect for time (F (2.2, 65.7) = 65.4, p = <0.001, η2p =
.685) but not for garment (F(2, 30) = 0.41, p = 0.960, η2p = .003) or interaction (garment x time) (F
(4.4, 65.7) = 0.208, p = 0.944, η2p = .014).
Comparing correctly sized compression tights with the oversized condition, RPE using magnitude-
based inferences revealed a possibly beneficial effect at 1 and 6 min (ES = -0.24 and -0.26
respectively). After 1 min of exercise, a possible harmful effect was reported for the oversized
condition when compared with control (ES = 0.04). All further comparisons of RPE between garment
conditions at each time point reported either trivial or unclear differences (Table 4-2).

64
Table 4-2 Between-trials comparison of rating of perceived exertion (RPE) during treadmill running at 60% vV̇O2max. 1 min 3 min 6 min 9 min 12 min 15 min
CT (95% CL) 8.6 (7.5; 9.8) 10.1 (8.6; 11.6) 11.0 (9.6; 12.4) 11.6 (10.1; 13.2) 11.9 (10.0; 13.8) 12.6 (10.8; 14.3)
OSG (95% CL) 8.7 (7.5; 9.9) 10.1 (8.5; 11.7) 11.1 (9.7; 12.5) 11.6 (10.5; 12.8) 11.8 (10.7; 12.9) 12.4 (11.1; 13.6)
CSG (95% CL) 8.3 (7.1; 9.4) 9.8 (8.3; 11.3) 10.6 (8.9; 12.2) 11.6 (10.3; 12.8) 11.9 (10.5; 13.3) 12.5 (10.9; 14.0)
Oversized - Control
difference in mean (90% CL) a 0.10 (-0.7; 0.9) 0.00 (-0.3; 0.3) 0.10 (-0.3; 0.5) 0.00 (-0.5; 0.5) -0.09 (-0.9; 0.7) -0.18 (-0.9; 0.5)
effect size (90% CL) 0.04 (-0.4; 0.5) -0.02 (-0.2; 0.2) 0.04 (-0.1; 0.2) 0.04 (-0.2; 0.3) 0.04 (-0.3; 0.4) -0.01 (-0.3; 0.3)
effect size rating trivial trivial trivial trivial trivial trivial
% of chances for oversized values
to be higher / trivial / lower than
control
25/59/16 2/95/3 6/92/1 10/87/4 19/72/9 11/74/14
rating oversized vs control b Possibly harmful Likely trivial Likely trivial Likely trivial Possibly trivial Possibly trivial
Compression - Control
difference in means (90% CL) a -0.40 (-0.9; 0.2) -0.30 (-0.8; 0.3) -0.50 (-1.2; 0.3) -0.10 (-0.8; 0.6) 0.00 (-0.6; 0.6) -0.09 (-0.9; 0.7)
effect size (90% CL) -0.20 (-0.5; 0.1) -0.12 (-0.4; 0.1) -0.22 (-0.6; 0.1) 0.00 (-0.3; 0.3) 0.04 (-0.2; 0.2) -0.01 (-0.3; 0.3)
effect size rating small trivial small trivial trivial trivial
% of chances for compression
values to
be higher / trivial / lower than
control
2/47/50 2/69/29 2/44/54 10/79/11 9/88/2 10/77/13
rating compression vs control b Unclear Unclear Unclear Likely trivial Likely trivial Likely trivial
Compression - Oversized
difference in means (90% CL) a 0.50 (-1.0; 0.1) -0.30 (-1.0; 0.4) -0.50 (-1.3; 0.2) -0.10 (-0.8; 0.6) 0.09 (-0.6; 0.8) 0.09 (-0.8; 1.0)
effect size (90% CL) -0.24 (-0.5; 0.0) -0.11 (-0.4; 0.2) -0.26 (-0.6; 0.1) -0.04 (-0.3; 0.2) 0.00 (-0.2; 0.2) 0.00 (-0.3; 0.4)
effect size rating
% of chances for compression
values to be higher / trivial / lower
than oversized
small trivial small trivial trivial trivial
0/38/62 6/63/31 1/36/63 7/78/16 7/86/2 16/68/16
rating compression vs oversized b Possibly beneficial Unclear Possibly beneficial Likely trivial Likely trivial Possibly trivial
a Between garment mean difference (90% confidence limit); b Qualitative descriptor. CT, control clothing; OSG, oversized garment; CSG, correctly sized garment.

65
Running economy was not significantly different between compression (207.4 ±10.8 ml·kg-1·km-1),
oversized (211.2 ±10.3 ml·kg-1·km-1) and control (214.2 ±11.6 ml·kg-1·km-1) as determined by one-
way ANOVA (F(2,30) = 1.074, p = 0.35). There was a small and likely beneficial effect of
compression tights on running economy when comparing compression with control (0:5:95%; ES = -
0.55) during steady state exercise (Table 4-3). The individual response to compression is highlighted
in Figure 4-2. No differences in body mass were observed between garment conditions (F(2,30) =
0.007, p = 0.99), indicating that changes in running economy are not related to the changes in body
mass. The effect size for running economy between oversized and control, plus compression and
oversized was small (ES = -0.24 and -0.32 respectively), with unclear inferences.
Figure 4-2 The individual and mean running economy response with correctly fitted compression
compared to control during treadmill running at 60% vV̇O2max.
There was no significant difference (F(2,30) = .343, p = 0.71) in mean RER between compression
(0.91 ± 0.3), oversized (0.90 ± 0.4) and control (0.91 ± 0.3). When compared with the oversized
garment, compression produces a small and possibly harmful effect (60:31:9%; 0.29) on RER.
Additional RER comparisons between garment conditions produced unclear inferences. Following
steady state exercise, there were no significant differences in [La-]b, with trivial effect sizes, and

66
unclear inferences (Table 4-2). Due to signalling interruptions with the HR monitors, complete data
was only collected for seven participants. Furthermore, data was incomplete and interpolation of VE
and BF was not possible for one participant. There was no significant effect of garment condition in
HR, VE and BF (F(2,15) = .207, p = 0.82; F(2,27) = .0.62, p = 0.94 and F(2,27) = .0.21, p = 0.98,
respectively). There were unclear or trivial inferences regarding compression on HR, VE and BF
(Table 4-4).

67
Table 4-3 Between trials comparison of running economy, respiratory exchange ratio (RER) and blood lactate values during treadmill running at 60% vV̇O2max
Economy RER Blood lactate c
(ml•kg-1•km-1) (mmol•L)
CT (95% CL) 214.2 (206.4; 222.0) 0.91 (0.89; 0.93) 2.97 (2.25; 3.69)
OSG (95% CL) 211.2 (204.3; 218.2) 0.90 (0.87; 0.92) 2.90 (2.23; 3.58)
CSG (95% CL) 207.4 (200.1; 214.6) 0.91 (0.88; 0.93) 2.86 (2.16; 3.56)
Oversized - Control
difference in mean (90% CL) a -3.00 (-8.0; 2.0) 0.01 (0.0; 0.0) -0.07 (-0.4; 0.2)
effect size (90% CL) -0.24 (-0.7; 0.2) -0.35 (-0.9; 0.2) -0.11 (-0.5; 0.3)
effect size rating small small trivial
% of chances for oversized values to be higher / trivial /
lower than control
4/40/56 5/26/69 8/60/32
rating oversized vs control b Unclear Unclear Unclear
Compression - Control
difference in means (90% CL) a -6.80 (-11.1; -2.5) 0.00 (0.0; 0.0) -0.11 (-0.5; 0.2)
effect size (90% CL) -0.55 (-0.9; -0.2) -0.06 (-0.6; 0.5) -0.13 (-0.5; 0.3)
effect size rating small trivial trivial
% of chances for compression values to be higher /
trivial / lower than control
0/5/95 19/50/32 8/56/37
rating compression vs control b Likely beneficial Unclear Unclear
Compression - Oversized
difference in means (90% CL) a -3.80 (-9.8; 2.1) 0.01 (0.0; 0.0) -0.04 (-0.4; 0.3)
effect size (90% CL) -0.32 (-0.8; 0.2) 0.29 (-0.3; 0.9) -0.02 (-0.4; 0.4)
effect size rating small small trivial
% of chances for compression values to be higher / trivial /
lower than oversized
4/30/66 60/31/9 15/64/20
rating compression vs oversized b Unclear Possibly harmful Possibly trivial
a Between garment mean difference ± 90% confidence limit; b Qualitative descriptor; c Assumption of normality not met therefore analysed with Kruskal-Wallis test

68
Table 4-4 Between trials comparison of heart rate (HR), minute ventilation (VE) and breathing frequency (BF) during treadmill running at 60% vV̇O2max
HR (n=6) VE (n=10) BF (n=10)
(bpm) L/min (1/min)
CT (95% CL) 170 (163; 177) 92.8 (79.2; 106.3) 42.8 (36.4; 49.1)
OSG (95% CL) 171 (164; 177) 90.0 (77.7; 102.2) 43.5 (38.0; 49.0)
CSG (95% CL) 168 (160; 176) 91.0 (78.3; 103.7) 43.2 (37.7; 48.7)
Oversized - Control
difference in mean (90% CL) a -0.26 (-2.0; 2.5) -2.79 (-5.9; 0.3) -0.74 (-1.3; 2.7)
effect size (90% CL) -0.03 (-0.2; 0.3) -0.12 (-2.7; 0.0) -0.10 (-0.1; 0.3)
effect size rating trivial trivial trivial
% of chances for oversized values to be higher / trivial /
lower than control 14/78/08 0/82/18 19/80/1
rating oversized vs control b Likely trivial Likely trivial Likely trivial
Compression - Control
difference in means (90% CL) a -1.94 (-5.1; 1.2) -1.78 (-3.4; -0.2) -0.41 (-1.1; 1.9)
effect size (90% CL) -0.25 (-0.6; -0.2) -0.08 (-0.2; 0.0) -0.06 (-0.1; 0.2)
effect size rating small trivial trivial
% of chances for compression values to be higher / trivial
/ lower than control 4/38/59 0/99/1 7/93/1
rating compression vs control b Unclear Very likely trivial Likely trivial
Compression - Oversized
difference in means (90% CL) a -2.21 (-4.7; 0.3) 1.01 (-1.3; 3.3) -0.33 (-2.0; 1.3)
effect size (90% CL) -0.28 (-0.6; 0.0) 0.05 (-0.0; 0.2) -0.03 (-0.2; 0.1)
effect size rating small trivial trivial
% of chances for compression values to be higher / trivial
/ lower than oversized 1/30/68 1/98/0 1/95/4
rating compression vs oversized b Unclear Very likely trivial Likely trivial
a Between garment mean difference ± 90% confidence limit; b Qualitative descriptor

69
4.6 Discussion
In the present study, we assessed the influence of correctly fitted and oversized, non-graduated
compression tights on parameters of submaximal running, metabolic response and ratings of perceived
exertion. The major finding is that during steady state running at 60% vV̇O2max, correctly fitted
compression tights that elicit an interface pressure <15 mmHg are likely beneficial in improving RE
when compared with running shorts. We provide new evidence that low-pressure sports compression
tights, applying the greatest interface pressure at the calf, elicit a small yet beneficial influence on RE.
Only possible, trivial or unclear differences were observed in all other measures, with either small or
trivial effect sizes.
4.6.1 Influence of Compression Tights on Running Economy
Running at a velocity of ~12 km·h-1 with compression tights produces a mean improvement in RE of
3.2%. This improvement is comparable to a 6 week interval or continuous training period[159]. In the
investigation implementing interval training, a 3.0% improvement in RE was reported when repeated
4-6 x 4 min bouts at 106% vVO2max was completed (3 d/wk for 6 wk) by recreational runners. In the
same investigation, a separate group of participants underwent continuous training at 94% vV̇O2max (3
d/wk for 6 wk) and produced a 3.1% improvement in RE. Interestingly, a third group of participants
trained at 132% vV̇O2max, yet did not elicit an improvement in RE. However, unlike the current
study, 6 weeks of interval or continuous training brought about additional physiological adaptations
such as a reduction in blood lactate and HR when running at ~13.8 km·h-1. In the present investigation,
the acute donning of compression produced no change in blood lactate, RER, HR, BF or VE,
suggesting that the observed alteration in running economy is more likely due to biomechanical
factors than physiological. Had a reduced VE, HR or greater carbohydrate utilisation during oxidative
phosphorylation been identified, this would have been suggestive of a decreased cardiorespiratory
cost, however this was not observed in this instance. An alternative theory, whilst not explored in the
present study, is that compression leads to an alteration in running technique. Compression sleeves
(ankle to thigh) have been shown to reduce stride length when running at 10 and 14 km·h-1 [160].

70
However, the pressure applied by the garments to elicit a reduction in stride length was significantly
higher than those used in the present study (33.4 and 20.4 mmHg at the calf and thigh respectively). In
the same investigation, garments applying a lower level of pressure, yet approximately twice the
pressure applied by the compression tights in the present study (23.2 and 10.8 mmHg at the calf and
thigh respectively) did not elicit a significant effect on stride length compared with the control
condition. However, despite the lack of statistical significance, a pressure:stride length interaction was
apparent, with low pressure garments causing a small reduction in stride length (2.2 and 1.7 cm at 10
and 14 km·h-1 respectively). It is conceivable that CGs may limit range of motion at the transverse
and frontal planes of the trunk and hip, thereby stabilising the pelvis at the time of foot impact with the
ground. A reduction in active range of motion (AROM) during hip flexion with compression shorts
supports this notion [74,75]. If indeed, the likely beneficial effect of compression tights is due to the
reduced AROM at the hip and subsequent alteration to stride length, only tight fitting shorts or tights
will elicit this physiological response. In support of this, compressive calf stockings (ankle to below
knee) caused no change in stride length, contact time, flight time or stride frequency at 105% of a
recent 10 km running performance (~17 km·h-1) during a time to exhaustion test [81]. Additionally,
well-trained distance runners reported no change in running gait variables, nor running economy when
running at 14, 16 and 18 km·h-1 compared to running shorts [94]. Again, the garments worn were calf
stockings, therefore no pressure is applied to the hip region, and hence gait is unlikely to be
influenced. Furthermore, well-trained distance runners would possess a well-developed running
economy and are less likely to benefit from the application of CGs, already possessing an established,
economically optimal locomotion style. The participants in the present study were recreationally
active individuals (V̇O2max = 54 ml·kg−1·min−1), lacking an optimised, highly economical running
style. As such, compression tights may produce a likely beneficial effect on RE as a result of reducing
excessive range of motion and metabolically expensive stabilising muscular activity [161].

71
4.6.2 Influence of Compression Tights on Rating of Perceived Exertion
In the current study, RPE was similar for all garment conditions when running at 60% vV̇O2max. These
findings are comparable to others when long tights are worn during submaximal running exercise
[9,126]. Despite some authors reporting a reduced RPE during submaximal running when wearing
lower body compression clothing [154,162], it is not possible to truly blind participants to the garment
condition, therefore the role of expectations may influence the perceived experience. CGs have been
shown to influence perception of exertion during steady state cycling at 60% peak power output [163].
Participants were shown a 3 min video clip prior to exercise to influence their expectation of a
sleeveless compression shirt. When participants had a more positive expectation, a reduced perception
of exertion was experienced.
4.6.3 The Role of Varying Interface Pressure
Correctly sized and oversized garments were used to investigate whether a pressure dose-response
existed. When compared with medical compression classifications [26], both garments apply low
pressure at the three anatomical locations. The reduced energy cost observed in the present
investigation is comparable to that of previous studies [9,81]. However limited information is
available regarding the interface pressures, with one study failing to report any pressure values [9] and
the other reporting ankle pressure (15 – 22 mmHg) but fails to document how this information was
collected [81]. Opposing results demonstrate no change in oxygen consumption during a submaximal
run at 70% V̇O2max with compression stockings, long tights or compression shorts with a garment
interface pressure targeted at 20 mmHg [8]. In addition, no change in oxygen consumption was
reported wearing compression tights during a submaximal run at a speed equivalent to the first
ventilatory threshold (VT1). The long tights in this study were the same brand as the present study and
interface pressures were 13.6 and 8.6 mmHg at the calf and thigh respectively; however participants
exercised in either a cold 10°C, or hot 32°C environment, unlike the ambient conditions implemented
in the present study. In the absence of a defined, optimal sports compression interface pressure [142],
a minimum threshold to improve venous return of 17 and 15 mmHg at the calf and thigh respectively

72
is proposed [12]. The compression tights used in the present study did not surpass this minimum
threshold and as such, without a change in venous return, it is unlikely the current, low-pressure tights
will influence cardiac parameters. Furthermore, despite statistically significant differences in interface
pressure reported between the two garments, this difference in practical terms is likely to be
unimportant. It is conceivable that while the CGs apply similar interface pressures, the oversized
garment may offer less support around the hip and knee joint, or places on the garment where stitching
is located and act as anchor points for the garment during dynamic movement. Anecdotally, some
participants reported the oversized garment felt loose around the crotch. This may have led to
restricted hip flexion, requiring greater perceived effort to overcome this restriction.
The varied interface pressure applied by CGs offers a plausible explanation for the conflicting results
observed in the sports compression literature. The variation in interface pressure testing and
measurement devices has previously been discussed (Chapter 3), indicating that even when pressures
are recorded, the absolute pressure values are dependent on the anatomical location of the
measurement and the specific type of measurement device. In light of this, caution should be taken
when directly comparing published interface pressures from varying devices, or from values that are
‘advised’ by the CG manufacturers.
The present study demonstrated that non-graduated, compression tights, applying a low interface
pressure (6 - 15 mmHg), produce a greater benefit compared with an over-sized garment. This
suggests that a minimum interface pressure threshold may exist, whereby interface pressure below a
particular value may not stimulate muscle or skin mechanoreceptors sufficiently. As a result,
minimally compressive garments may not elicit sufficient afferent feedback to assist with reducing
excessive range of motion or assisting with optimised proprioception in recreational runners.
4.6.4 Practical Application
The running speed at 60% vV̇O2max corresponded to a relative intensity of 79.4 ± 6% VO2max. Previous
research identified that recreational half-marathon runners typically perform at this relative intensity
[164] and running at 80% V̇O2max for 90 minutes causes a gradual increase in running economy [165].

73
Strategies to reduce or attenuate the increase in oxygen consumption over a prolonged submaximal
run are advantageous for recreational runners.
Wearing non-graduated, low pressure (<15 mmHg), lower body compression tights during
submaximal running leads to a reduction in oxygen cost of ~3% in the final 3 min of a 15-minute
steady-state protocol. The present results provide evidence that compression tights may be beneficial
to distance runners, since small improvements in running economy become important over long
distances. A 5% improvement in running economy induced approximately 3.8% increase in distance
running performance[6]. Future studies are required to elucidate the mechanisms integrating with the
observed improvement in running economy, plus identify if these physiological changes translate into
a measurable performance enhancement.
Despite the likely beneficial effect of compression tights on RE observed in this study, data was
obtained in a controlled laboratory environment. The applicability of these findings to over-ground
running requires further exploration. Since air and wind resistance are not a factor during laboratory
testing, and running technique differ between treadmill and road, transferring treadmill data to over-
ground running requires caution [110].
The observed reduction in oxygen cost in the present study was 3.2%. The intra-individual variation of
running economy is reported to vary between 1.3 – 5% at speeds of 12 – 18 km·h-1 [166,167].
Therefore, the reported likely beneficial effect of compression on RE could be due to variation in
technical and biological variation. However, Periera et al., [166] revealed a RE coefficient of
variation of 2.0% with participants of a very similar aerobic capacity and training status to the current
study. Furthermore, the time of testing, prior exercise, pre-exercise dietary intake, footwear and
environmental conditions were well controlled with each participant in the current study, thus
minimising possible variables that might negatively impact the intra-individual variation.

74
4.7 Conclusion
In conclusion, the results of this study reveal an improved running economy when running on a
treadmill at ~12 km·h-1 with correctly fitting compression tights, eliciting a non-graduated design with
low interface pressures (<15 mmHg). It seems possible that wearing compression tights during
running may positively influence the non-optimised running technique of recreationally active males.
However, the extent to which compression tights improve running economy requires further
investigation with reference to alternative running intensities and varying garment interface pressures.

75
5 The influence of compression tights on running economy varies by
relative intensity
5.1 Rationale
Correctly fitted compression tights produce a small yet likely beneficial effect on running economy at
a specific running intensity. Further investigation is required to explore the role of compression tights
across a wider spectrum of relative exercise intensities. Furthermore, an appropriately powered
investigation will provide the opportunity to build upon the initial findings of Chapter 4. Running
economy is reported as caloric unit cost rather than oxygen cost, thus offering greater insight into
potential alterations in substrate utilisation during submaximal running with and without correctly
sized compression tights.
5.2 Abstract
The effect of compression tights on running economy (RE) is unclear. The purpose of this
investigation was to assess the influence of compression tights on RE and substrate utilisation across a
range of exercise intensities (67.1 – 91.5% V̇O2max). Twenty-six recreationally active males ran for 15
min with compression tights and a non-compression control condition. Oxygen consumption (V̇O2)
and expired carbon dioxide (V̇CO2) was measured to determine RE as caloric unit cost, carbohydrate
oxidation (CHOOX) and fat oxidation (FATOX). No difference was observed between conditions for
RE, CHOOX or FATOX, however relative exercise intensity (%V̇O2max) correlated with ΔRE (r = -0.501,
P < 0.01). Receiver operator curve analysis revealed that %V̇O2max is a sensitive and specific predictor
of altered RE. Above 77.7% V̇O2max, compression led to significantly lower RE (p < 0.05), whereas no
difference between conditions was observed below 77.7% V̇O2max. These data suggest that
compression tights influence RE dependant on relative exercise intensity when V̇O2max (%) is used as
an anchor of exercise intensity.

76
5.3 Introduction
Running economy (RE) defined as the metabolic cost of travelling a given distance is a useful
indicator of endurance performance [168]. RE is a stronger predictor of performance than maximal
oxygen consumption (V̇O2max) within homogenous populations [169] and small differences in
metabolic cost of running can differentiate performance between elite runners with comparable V̇O2max
and metabolic potential [170]. RE is modulated by metabolic, cardiopulmonary, biomechanical and
neuromuscular factors [110]. The effects of compression on metabolic [10,41], cardiopulmonary
[171], neuromuscular [114] and biomechanical [81,94] systems from CGs may all contribute to
improvements in RE [4] .
Data on the effect of compression tights on submaximal RE are limited to just two investigations both
reporting RE as the volume of oxygen required to run a given distance relative to body mass (i.e.
ml·kg-1·km-1) [9,10]. There was no difference in economy when running at 10, 14 or 16 km·h-1.
Compression improved RE only when running at 12 km·h-1 and also reduced the amplitude of oxygen
uptake at 80%V̇O2max [9]. Dascombe et al., found no difference at running velocities above 8 km·h-1
[10]. It is suggested that divergent results are due to the training status of participants and the level and
spatial distribution of pressure applied by compression tights [36]. Furthermore, inconsistencies might
be due to the relative insensitivity of measures used to report RE. Studies typically report economy as
the oxygen cost of running per unit distance (ml O2·kg-1·km-1) or per unit of time (ml O2·kg-1·min-
1)[9,10]. However, oxygen cost is less sensitive to changes in relative speed [11,110,168] compared
with energy cost reported as the caloric unit cost (kcal·kg-1·km-1). Caloric unit cost accounts for
substrate dependent variations in energy equivalent of a volume of oxygen [11], thereby adjusting for
different substrate use at submaximal speeds.
In light of the limited evidence, an interaction between exercise intensity and RE is apparent when
wearing compression tights. This interaction requires further investigation and is the primary goal of

77
the present study. It was therefore hypothesised that at higher relative exercise intensities, RE would
be improved with compression tights. The aim of the present study was to examine whether
compression tights modify running economy reported as caloric unit cost and substrate use in
recreationally trained individuals. The second aim was to investigate the interaction between relative
exercise intensity and RE with and without compression tights.
5.4 Methods
5.4.1 Participants
Ethical approval was received from the University of Essex ethical committee. Participants provided
written informed consent in accordance with the Declaration of Helsinki. Sample size estimation was
based on expected differences in RE either with and without compression tights [10]. The ES in this
study was 0.76. With an alpha = .05 and power = 0.90, the estimated sample size needed with this
effect size is approximately n=21. Twenty-six healthy male volunteers provided written informed
consent before participation in the study (Table 5-1). All participants were physically active,
participating in sport specific training sessions a minimum of three times per week and free from
musculoskeletal injury within the one month previous.
Table 5-1 Descriptive characteristics of participants (n = 26)
Mean [95%CI]
Age (years) 27.9 [25.1-30.7]
Height (m) 1.79 [1.76-1.81]
Body Mass (kg) 76.1 [72.7-79.5]
BMI (kg·m-2) 23.8 [23.0-24.6]
V̇O2max (ml·kg·-1min-1) 54.7 [52.8-56.7]
vV̇O2max (km-1) 18.7 [18.2-19.2]

78
5.4.2 Compression garments
The CG used in the investigation were Skins TM Men’s Compression A400 Long Tights (Riverwood,
Australia). Garment size was selected in accordance with the manufacturer’s sizing guide. The
garments were made from warp knitted fabrics, with the fibre reported as 76% nylon and 24%
elastane. The pressure exerted by the CGs on the lower limbs were evaluated by the PicoPress®
(Microlabs, Italy) pressure monitor (coefficient of variation = <5% at 20 mmHg [1]). Chapter 3
revealed the PicoPress is a suitable pneumatic pressure monitor. Pressure measures were recorded at
two anatomical locations (posterior orientation of the maximal calf girth and anterior thigh at the mid-
point between mid-trochanterion-tibiale laterale). The control condition consisted of loose fitting
running shorts, thereby providing a comparison between compression tights and garments typically
worn by recreational runners. The same short sleeve top and running shoes were worn on every testing
occasion.
5.4.3 Experimental design
Participants were required to attend on three occasions separated by at least one week. At visit 1
participants performed an incremental treadmill test to determine V̇O2max and peak running speed
(vV̇O2max). This was followed by a 5-min familiarisation at a relative intensity corresponding to 60-
65% vV̇O2max. Compression and control conditions were performed during visits 2 and 3 in a
randomised, counter-balanced order, during which participants completed a 15 min submaximal
treadmill task.
Each participant attended the laboratory (temperature: 18 ± 1.0° C) at the same time each visit to
minimise variation in physiological parameters that might change with circadian rhythm. In the 24
hours prior to testing, participants were asked to refrain from exercise, caffeine and alcohol intake.
Participants were asked to record their diet for the 24 hours before the initial laboratory visit and to
repeat this for all subsequent visits. To ensure running economy was not influenced by dehydration,
participants were recommended to consume fluid the night before and the morning of testing in
accordance with fluid intake recommendations[172] . Participants provided a urine sample on arrival

79
of each session and urine specific gravity (USG) was measured (Atago Co., Ltd., Tokyo, Japan).
Participants only began exercise when USG indicated euhydration (USG <1.020). Two hours prior to
testing, no food and only water were consumed.
5.4.4 Establishing individual aerobic capacity
Respiratory gases were collected continuously throughout the incremental test. Participants wore a
dead-space mask with an impeller turbine assembly (Hans Rudolph, Kansas, USA) and gas
concentrations continuously sampled via a capillary line. Concentrations were determined by
electrochemical (O2) and infrared (CO2) analysers (Vyaire CPX, Mettawa, Illinois, USA). Prior to
each test, the gas analysers were calibrated with gases of known concentration (16% O2 and 5% CO2),
and ambient air. The digital volume transducer was connected to the housing blower and calibrated
automatically using both high and low flow parameters.
Participants completed an incremental exercise test on a motorized treadmill (Quasar; HP Cosmos,
Nussdorf, Germany). The protocol began at 7 km·h-1, after which the speed increased by 1 km·h-1
every minute up to 16 km·h-1. At 16 km·h-1, workload increments continued by increasing the gradient
2% each minute until volition exhaustion. To determine vV̇O2max, a gradient increase of 1.5% was
converted to an equivalent increase in speed of 1 km·h-1 [155]. The calculated speed of the last
complete stage was added to the multiplication of the speed increment by the completed fraction of the
incomplete stage. V̇O2max was determined as the highest 30 s average oxygen consumption.
5.4.5 Submaximal running economy assessment
Participants ran for 15-min at a speed corresponding to 63 ± 2% vV̇O2max (70-90% V̇O2max) and
gradient remained at 1% throughout. Participants ran at the same speed in both sessions, with only the
garment condition changing.
5.4.6 Data treatment
Breath-by-breath data were converted to second-by-second data using linear interpolation. Oxygen
consumption (V̇O2) and carbon dioxide production (V̇CO2) were averaged over the final 3 min of each

80
submaximal exercise test. Second-by-second V̇O2 and V̇CO2 data were used to determine running
economy (RE) as caloric unit cost (kcal·kg-1·km-1), carbohydrate oxidation (CHOOX) and fat oxidation
(FATOX) (g·kg-1·km-1) using equations for moderate to high intensity (50-75% V̇O2max) [173].
Equations for the calculation of energy expenditure and oxidation of carbohydrate and fat from gas
exchange measurements are displayed below;
Energy expenditure (kcal·min-1) = 0.550·V̇CO2 + 4.471·V̇O2
Carbohydrate oxidation (g·min-1) = 4.210·V̇CO2 – 2.962·V̇O2
Fat oxidation (g·min-1) = 1.695·V̇CO2 – 1.701·V̇O2
Expressed to distance (i.e. kcal·km-1) = (kcal·min-1 * 60) / km·h-1
Expressed to body mass (i.e. kcal·kg-1·km-1) = kcal·km-1 / body mass (kg)
To ensure principally aerobic contribution to energy expenditure, we excluded participants if
respiratory exchange ratio (RER) >1.00 during the final 3 min of the submaximal run.
5.4.7 Statistical analysis
Data are presented as mean and 95% confidence intervals (95%CI) for all dependent variables.
Normality of distribution was assessed using the Shapiro-Wilk test. Paired t-tests were used to analyse
mean differences in RE, CHOOX FATOX between conditions. Cohen’s d was calculated as a measure
of effect size [174]. We interpreted values of d=0.2, d=0.5, and d=0.8 as a small, moderate or large
effect size.
We calculated the difference in RE (Δkcal·kg-1·km-1) between conditions (compression – control) for
caloric unit cost and used Pearson’s product-moment correlation to examine associations with relative
(%V̇O2max) and absolute exercise intensity (running speed [km·h-1]). Receiver operator curve (ROC)

81
analysis was used to establish threshold values of %V̇O2max which identify compression tights as
producing a potential ergogenic outcome on running economy. Youden index (J) was the preferred
method to determine the optimal cut-off point of the ROC analysis[175]. J is defined as the maximum
vertical distance between the ROC curve and the diagonal or chance line (J = sensitivity – specificity -
1), therefore the point at which the cut-off threshold is farthest from chance [176]. Statistical tests
were processed using the statistical package SPSS (Version 18) and Microsoft Excel (Microsoft
Corporation TM, Redmond, WA, USA). The level of statistical significance was identified by an alpha
value of P < .05.
5.5 Results
Interface pressure applied by compression tights was 8.9 [7.8 - 9.9] mmHg at the calf and 6.8 [6.3,
7.3] mmHg at the thigh. During the submaximal RE assessment all participants maintained a RER
<1.00 and were included in the analysis.
Table 5-2 shows no difference for %V̇O2max, RE, CHOOX and FATOX (P > 0.05) between the control
and compression condition.
Table 5-2 Running economy and substrate utilisation data during a submaximal run with and without
compression tights (Mean [95% CI]).
Control Compression P-value d=
%V̇O2max 77.5 [74.7-80.2] 76.8 [74.5-79.2] 0.33 0.19
RE (kcal·kg-1·km-1) 1.08 [1.05-1.11] 1.07 [1.04-1.10] 0.38 0.18
CHOOX (g·kg-1·km-1) 0.19 [0.18-0.20] 0.18 [0.17-0.20] 0.22 0.25
FATOX (g·kg-1·km-1) 0.03 [0.03-0.04] 0.03 [0.03-0.04] 0.43 0.16
d = Cohen’s effect size; RE = caloric unit cost; CHOOX = carbohydrate oxidation; FATOX =fat
oxidation. Mean [range] running speed the same in both conditions = 11.7 [10.0 - 14.5] km·h-1.

82
The range of relative exercise intensity was 67.1 – 91.5 %V̇O2max during the control condition and
between 68.6 – 89.9 %V̇O2max with compression. Figure 5-1 shows the difference in RE (Δkcal·kg-
1·km-1) between garment conditions was negatively correlated with relative exercise intensity
(%V̇O2max).
Figure 5-1 Correlation and 95% confidence interval (shaded area) between relative exercise intensity
measured during the control condition (%V̇O2max) and ΔRE.
ROC analysis area under curve value was AUC= 0.925, (95%CI: 0.814 – 1.0; J = 0.650). The cut-off
value that best determined the presence or absence of a change in outcome was 77.7% V̇O2max. Table
5-3 shows group means for RE and substrate utilisation for participants split according to relative
exercise intensity of </>77.7% V̇O2max. Compression tights improved RE above 77.7% V̇O2max by
0.028 kcal·kg-1·km-1 (d = 0.93) compared with control values. Whereas no difference in RE or
substrate utilisation was apparent below 77.7% V̇O2max (difference = 0.014 kcal·kg-1·km-1; d = 0.34).

83
Table 5-3 Comparisons in running economy, carbohydrate and fat oxidation between participants who
ran above and below 77.7% V̇O2max with and without compression tights (Mean [95% CI]).
%V̇O2max <77.7% (n=13) %V̇O2max >77.7% (n=13)
Control Compression d Control Compression d
RE
(kcal·kg-1·km-1)
1.051
[1.013-1.089]
1.065
[1.022-1.107]
d=0.34 1.103
[1.057-1.150]
1.075
[1.029-1.121]
d=0.93
CHOOX
(g·kg-1·km-1)
0.176
[0.156-0.197]
0.165
[0.147-0.184]
d=0.43 0.203
[0.191-0.216]
0.202
[0.185-0.219]
d=0.06
FATOX
(g·kg-1·km-1)
0.034
[0.026-0.042]
0.040
[0.032-0.048]
d=0.46 0.028
[0.023-0.033]
0.026
[0.018-0.034]
d=0.24
d = Cohen’s effect size; RE = caloric unit cost; CHOOX = carbohydrate oxidation; FATOX =fat
oxidation.
5.6 Discussion
The influence of compression tights on running economy varies according to the relative intensity of
exercise. Expressed as caloric cost of exercise, running economy was improved by compression, but
meaningful effects were restricted to exercise intensities >77.7% V̇O2max. Our investigation provides a
new view on the influence of compression tights on RE when reported as caloric unit cost.
At higher (>77.7% V̇O2max) intensities, compression appears to enhance RE, without altering substrate
utilisation. The improved RE at a higher relative exercise intensity supports previous findings
revealing that compression stockings produce a positive effect on RE at 80 and ~90% V̇O2max [9,81].
In agreement with previous compression studies, no difference in RE or substrate utilisation was
observed when garment conditions were compared as a whole group (67.1 – 91.5% V̇O2max) [126] or
below 77.7% V̇O2max [46,47,58].

84
Compression studies typically express economy as oxygen cost per unit of distance (ml·kg-1·km-1).
Describing the VO2 related to a particular velocity provides a useful measure for within-participant
comparisons of different conditions. VO2 may lack sensitivity as it does not account for differences in
substrate use at any given speed[168]. Economy can also be expressed as caloric unit cost (kcal.kg-
1.km−1). This metric is more sensitive to changes in running speed and differences in substrate use [11].
Better sensitivity makes it a better choice when investigating interventions known to cause small
changes in economy such as compression. Unlike oxygen cost, caloric unit cost also provides
information on substrate utilisation. Despite this, previous compression studies have only reported RE
as the oxygen cost. The present study is the first to explore the role of compression tights on caloric
unit cost.
Above 77.7% V̇O2max, RE in the compression condition was 0.03 kcal·kg-1·km-1 lower compared with
control. It is important to compare the observed differences in RE with the typical day-to-day variation
to evaluate the extent in which the observed change is meaningful. The typical error (TE) of energy
cost (kcal·kg−0.75·km−1) in highly trained runners is 3.14% [177]. We report an improvement in RE of
2.6% in the compression condition at a relative exercise intensity above 77.7% V̇O2max when scaling
body mass to a power function exponent of -0.75 (control = 3.250 ± 0.19; compression = 3.169 ± 0.21
kcal·kg−0.75·km−1). However, the reported TE was observed in the absence of dietary and training
constraints. It is plausible that the standardisation of clothing, footwear, dietary and training factors in
the present study would contribute toward a lower TE. Owing to no other comparative TE measures
available for caloric unit cost during treadmill exercise, interpreting the magnitude of the observed
difference requires conversion to an alternative unit of energy expenditure (kJ·min-1). By doing so we
report a difference in energy expenditure of 2.5% between garment conditions above 77.7% V̇O2max.
The within and between-day coefficient of variation for energy expenditure at 70% V̇O2max is between
1.7% [178] and 2.2% [179], therefore the improved energy expenditure reported with compression
tights can be considered real and worthwhile [180].

85
Similar improvements in RE have been observed following 8 weeks of high intensity interval training
[181], 6 weeks of plyometric training [182] and 4 weeks of living and training at altitude [183].
However, chronic training interventions that demonstrate an improvement in RE are also likely to
elicit a number of physiologic adaptations that contribute toward improved distance running
performance. Conversely, when an improved RE is observed with acute interventions such as the
donning of compression tights, it is questionable to what extent this may influence distance running
performance. Whether this improvement in RE translates into meaningful performance benefits is
equivocal. A limitation of assessing the role of CGs on exercise performance is that it is impossible to
blind the participants to the clothing condition. Studies that have investigated the role of compression
tights on distance running performance have demonstrated no effect during a 18.6 km trail run [126]
or a 5 km time trial in a hot environment [60].
Improved running economy within the reported exercise intensity range (77.7 – 91.5% V̇O2max) would
be caused by several factors, including altered biomechanical and neuromuscular systems. In
particular, previous studies revealed that lower body compression reduced stride length at 10 and 14
km·h-1 [160]. Altered stride length may limit intra-individual gait variability in recreationally active
runners[184], maintaining a more consistent gait and contribute toward a lower oxygen cost [185,186].
Conversely, reductions in stride length due to CGs were associated with poorer RE in highly trained
runners; [94]. Novice runners demonstrate greater variability in gait characteristics and therefore the
physical support offered by compression, or the pressure induced stimulation of mechanoreceptors
[80] may limit this variability. Furthermore, RE is related to the stiffness of the propulsive leg, with
greater stiffness eliciting the best RE [110].While compression stockings were shown to increase leg
stiffness during flat and hilly trail running [84], they elicited no change during submaximal treadmill
running [94]. Despite these findings, the influence of compression tights on running leg stiffness is yet
to be investigated and may shed light on the observed improvement in RE. Surface EMG studies
report lower activation of leg musculature during sub-max running with compression stockings [114]
and long tights [153]. Attenuated muscle oscillation may lead to a reduction in recruitment of motor

86
units [74]. Additionally, the semitendinosus muscle is involved in decelerating the momentum of the
swing limb as the knee extends during the mid and late swing phase. Reduced activation of the
semitendinosus muscle with compression tights [153] during submaximal running may also be
associated with an altered stride length, however this remains to be explored.
5.6.1 Limitations
There are several limitations to this study design that require consideration. The absence of surface
electromyography, biomechanical or haemodynamic measures limits the extent in which the observed
results can be interpreted. Furthermore, previous studies have reported that the optimal pressure range
under resting conditions is 8-18 mmHg of graduated compression across the lower limb. This level of
interface pressure is sufficient to significantly increase deep venous velocity and increase venous
return[12,98]. The interface pressure applied by the compression tights in the present study is
considered low and therefore we are unable to determine the impact of compression tights eliciting a
higher interface pressure. Nonetheless, given the present findings, if low interface pressure garments
can produce favourable improvements in RE, athletes may opt to choose lower pressure garments
given the increased perception of comfort [39].
5.7 Conclusion
This study is the first to identify the influence of compression tights on running economy varies by
relative intensity. Wearing compression tights improved running economy at relative exercise
intensities above 77.7% V̇O2max. Conversely, no effect was observed below this threshold. The
mechanism behind these observations requires further investigation to corroborate the plausible
explanations presented here.

87
6 Performance comparison of the MOXY and PortaMon near-infrared
spectroscopy muscle oximeters at rest and during exercise
6.1 Rationale
Tissue oxygen saturation is typically measured using near-infrared spectroscopy (NIRS). This non-
invasive optical technique reveals in vivo muscle oxygenation and haemodynamic status and may
provide a mechanistic explanation for the observed improvement in running economy with
compression tights. In this investigation, a recently developed low-cost NIRS device (MOXY) was
compared against an established PortaMon system that makes use of the spatially resolved
spectroscopy (SRS) algorithm, widely used in sports science and physiology research. This is the first
study to report the influence of varying external pressure at rest and test-retest reliability at rest and
during isometric leg extension exercise of the MOXY device. This study is significant because the use
of non-invasive methods to track and optimise training intensity, such as NIRS, is of increasing
interest to coaches, athletes and scientists, yet data is lacking regarding the reliability of the MOXY
device, nor has its performance been previously compared with alternative NIR systems.
6.2 Abstract
The purpose of the study was to compare muscle oxygenation as measured by two portable, wireless
NIRS devices under resting and dynamic conditions. A recently developed low-cost NIRS device
(MOXY) was compared against an established PortaMon system that makes use of the spatially
resolved spectroscopy (SRS) algorithm. The influence of increasing external pressure on tissue oxygen
saturation index (TSI) indicated that both devices are stable between 2 – 20 mmHg. However, above
this pressure, MOXY reports declining TSI values. Analysis of adipose tissue thickness (ATT) and
TSI shows a significant, non-linear difference between devices at rest. The devices report similar TSI
(%) values at a low ATT (<7 mm) (Portamon minus MOXY difference is +1.1 ± 2.8%) with the major
subsequent change between the devices occurring between 7 and 10 mm; at ATT values >10 mm the

88
difference remains constant (-14.7 ± 2.8%). The most likely explanation for this difference is the small
source-detector separation (2.5 cm) in the MOXY resulting in lower tissue penetration into muscle in
participants with higher ATT. Inter-day test-retest reliability of resting TSI was evaluated on five
separate occasions, with the PortaMon reporting a lower coefficient of variation (1.8 - 2.5% vs. 5.7 -
6.2%). In studies on male participants with low ATT, decreases in the TSI were strongly correlated
during isometric exercise, arterial occlusion and incremental arm crank exercise. However the MOXY
reports a greater dynamic range, particularly during ischemia induced by isometric contraction or
occlusion (∆74.3% vs. ∆43.7%; hyperemia MAX - occlusion MIN). This study shows that in this
participant group both MOXY and PortaMon produce physiologically credible TSI measures during
rest and exercise. However, the absolute values obtained during exercise are generally not comparable
between devices unless corrected by physiological calibration following an arterial occlusion.
Keywords: near-infrared spectroscopy; reliability; muscle oxygen saturation; isometric exercise
6.3 Introduction
The use of wearable devices or wearable bio-sensors, which allow the continuous monitoring of
physiological signals, is important for better monitoring of active lifestyles and the diagnosis and
treatment of diseases [102]. Near-infrared spectroscopy (NIRS) is a non-invasive technique capable
of providing valuable functional insights into skeletal muscle oxidative metabolism in vivo during
exercise, in healthy and clinical populations. NIRS directly measures the oxygen-dependant absorption
of haemoglobin (Hb) in the microcirculation blood vessels (i.e. arterioles, capillaries and venules) and
myoglobin (Mb) in the muscle cytoplasm [187].
Dependent on the NIRS device and illumination type, it is possible to retrieve absolute and/or relative
concentration values of oxyhaemoglobin (O2Hb) and deoxyhaemoglobin (HHb), and a derived
parameter, total-haemoglobin (tHb = O2Hb + HHb) [188]. These values are in a large part
representative of tissue capillaries, arterioles, and venules because, in larger blood vessels, NIR light is
fully absorbed by the high haemoglobin concentration [189]. A further measurement, tissue saturation

89
index (TSI) represents the ratio of oxygenated (O2Hb+O2Mb) concentration to total (tHb+tMb)
concentration, reporting on the dynamic balance between O2 supply and O2 consumption. Taken as a
whole, the range of muscle NIRS parameters can provide information regarding changes in key
dynamic physiological indicators, such as blood flow, oxygen extraction and oxygen consumption;
muscle NIRS studies are therefore relevant in the evaluation of exercise performance, exercise
tolerance [102] and exercise training adaptation that can influence the balance between muscle O2
delivery and muscle utilization [190].
The use of NIRS as a research tool is well established for studying exercise physiology changes in
groups of participants [102,191]. Sports science applications could include monitoring changes in
muscle blood flow and oxidative capacity as a function of training [189]. In support of this, positive
peripheral muscle oxygenation adaptations have been reported as a consequence of cycling sprint
interval training demonstrating that NIRS has the potential to assess the effectiveness of training
interventions at the level of the individual athlete [192]. To be effective outside the research
laboratory, in an applied exercise environment, there is a requirement for low-cost, portable NIR
technology with telemetric capability with the ability to withstand the rigours of sporting
environments such as in swimming [193], short track speed skating [194] and trail running [195]
Past studies comparing NIRS monitors have highlighted discrepancies in the values obtained at rest
and during exercise in human [196–199] and animal [200] systems. The differences between monitors
are likely to be in part associated with the measurement site and spacing of the probes [201,202]. The
specific optical properties of the system, whether laser, white light or LED based, as well as the
specific NIR wavelengths monitored, could also contribute to differences between systems. These
physical properties are most likely reflected in time resolution, signal:noise and reproducibility.
However, the absolute numbers of the derived parameters are highly dependent on the algorithms used
in the calculations. In terms of measurements of TSI, these methods attempt to remove or correct for
the contributions of light scattering and then fit the remaining optical density changes to the known

90
NIR spectra of the hemo(myo)-globin chromophores. Assumptions are also made about light transport
generally assuming the diffusion model.
Time of flight or frequency domain measurements can be used to measure absolute chromophore
concentrations, but such devices are currently unlikely to be cheap enough, or portable enough, to be
of use for routine physical activity measurements. Manufacturers have therefore focussed on
developing methods that only require continuous wave light detection, relying on the use of multi-
wavelength or multi-distance analysis to correct for the scattering. Multi-wavelength measures e.g,
using second derivative spectroscopy [203,204] are now rarely used. However, the use of multi-
distance methods has significantly expanded in recent years. In a recent review, only one of thirteen
current devices measured optical density at a single source:detector distance [102].
In general, multi-distance NIR systems correct for light scattering by one of two methods. The most
common method used in historical terms is Spatially Resolved Spectroscopy (SRS) This measures the
slope of the optical density change as a function of multiple distances. Theoretically, the difference in
these distances should be small compared to the average source:detector separation. This enables the
calculation of scaled absorption coefficient (μa) measures which can allow absolute values of
chromophore ratios, such as tissue oxygen saturation [205]. The major commercial incarnations of the
SRS system historically are the Hamamatsu NIRO and the Artinis OxyMon systems. Alternative
Spatial Resolution (SR) methods use a larger separation between measurement sites; light transport
models assuming the shorter distance predominantly measures surface tissues and the longer distance
deeper tissues, are used to calculate a tissue oxygen saturation for the deeper (muscle/brain) region of
interest [206]. The predominant commercial incarnation of this SR method historically is the
Medtronic INVOSTM and, more recently the FORE-SIGHT ELITE® and the Nonin EQUANOXTM
systems.
Although one can assume that two different devices both using the SRS measurements will generally
report similar muscle oxygen saturations, the same cannot be assumed between devices using SR
methods given the variety of algorithms in use [207], nor of course between an SRS device and an SR

91
device. SRS systems have been widely used in exercise physiology and sports science [102,188].
Recently, a new low-cost SR based device, the MOXY monitor, has been marketed to athletes as a
training tool to inform the user of exercise intensity [195,208]. The PortaMon, a widely used, portable,
SRS oximeter has previously demonstrated a high level of reliability at rest [209] and during isotonic,
multi-joint resistance exercise [210]. Conversely, no studies investigating the test-retest reliability of
the MOXY device have been conducted.
It would be helpful if users of NIRS devices could be confident that the extensive historical SRS
literature on exercise physiology and sports science can be used to help inform their use of this new
SR device. The purpose of the study was to compare these two portable, wireless NIRS devices under
a variety of resting and dynamic conditions. These conditions include (1) the influence of varying
external pressure at rest, (2) test-retest reliability and sensitivity at rest, (3) during isometric leg
extension exercise, (4) during dynamic arm-crank exercise and (5) during an arterial occlusion.
6.4 Methods
6.4.1 The NIRS devices
The two NIRS devices used in the assessment of muscle oxygen saturation include the PortaMon
(PortaMon, Artinis, Medical System) and MOXY muscle monitor (Fortiori Design LLC, USA).
The PortaMon (Figure 6-1) is a compact (83 x 52 x 20 mm), and lightweight (84 g) NIRS system. It is
a dual-wavelength (760 and 850 nm), continuous wave system, containing three pairs of LEDs in a
spatially resolved spectroscopy (SRS) configuration with a source-detector spacing of 30, 35, and 40
mm. The device simultaneously uses the modified Beer-Lambert law and SRS methods to calculate
the absolute concentration of tissue oxy(+myo)haemoglobin, (O2Hb), deoxyhemo(+myo)globin (HHb)
and total hemo(+myo)globin (tHb). As such, tissue oxygen saturation (TSI) is expressed in % and
calculated as [O2Hb] / ([O2Hb] + [HHb]) x 100, which is the ratio of HbO2 to tHb. TSI reflects the
dynamic balance between O2 supply and consumption. During all testing, the system was connected to

92
a personal computer via Bluetooth™ technology for data acquisition (10Hz), analogue-to-digital
conversion and subsequent analysis.
Figure 6-1 Photograph of the underside (left image) and top (right image) of the PortaMon device
(image courtesy of Artinis Medical Systems https://www.artinis.com/portamon)
The MOXY (Figure 6-2) is a self-contained, compact (61 x 44 x 21 mm), and lightweight (48 g) NIRS
system. It employs four wavelengths of NIR light at 680, 720, 760, 800 nm (Schmitz, 2015) and the
sensor contains a single light emitting diode (LED) and two detectors placed 12.5 and 25.0 mm from
the source. The MOXY device reports a change in total tissue hemo(+myo)globin (tHb) and tissue
oxygenation (TSI). During all testing, the system was connected to a personal computer via a
commercially available software programme (Peripedal ©) to provide a graphic display of the data.
Data acquisition (2Hz) was obtained from the sensors internal memory.
Figure 6-2 Photograph of the underside (left image) and top (right image) of the MOXY device (image
courtesy of MOXY Monitor https://www.moxymonitor.com)

93
6.4.2 Testing the Influence of External Pressure
In order to minimize movement artefacts when fixing NIRS devices to the tissue, a variety of
supportive bandages or neoprene sleeves are generally used. These sleeves apply external pressure to
the device and the surrounding limb area under compression. The influence of external pressure on
NIRS derived values is largely undiscussed in the literature, yet if found that TSI data differs due to
varying low external pressure this is of importance for both the research and applied user community.
A repeated-measures experimental design was used to determine the influence of external pressure on
the reliability of two portable NIRS devices. Four recreationally active male participants ([mean ± SD]
age 22.75 ± 5.56 years, body mass 78.03 ± 4.38 kg, height 1.86 ± 0.1 m, vastus lateralis (VL) skinfold
thickness 8.30 ± 2.51 mm) volunteered to participate in this study. None of the participants had known
health problems or any lower extremity muscle or joint injury. Participants were asked not to perform
any strenuous exercise or consume caffeine for at least 24 h prior to visiting the laboratory.
Participants were required to visit the on one occasion. All testing was performed in a controlled
laboratory environment (~20 ºC) at the University of Essex Clinical Physiology laboratory. Upon
arrival, following the collection of descriptive measures, participants performed 10 min of supine rest
on a medical examination bench. The first portable NIRS device was then positioned on the belly of
the vastus lateralis, midway between the greater trochanter and the lateral epicondyle of the femur.
NIRS devices were placed precisely on the VL, whereby the mid-distance between the closest emitting
diode and detector for each device were aligned with the VL location. To ensure the optodes and
detector did not move relative to the participants’ skin, the device was fixed into position using a
waterproof adhesive tape. In addition, bodily hair at or around the sensor placement area was removed
from the skin and participants were asked not to moisturise the area on the day of testing. A portable
pressure monitor (PicoPress, MircoLabs, Italy) was used to assess the external pressure applied to the
leg. An air-filled bladder was placed on the medial aspect of the thigh, at the same vertical alignment
to the NIRS device location. A surgical marker pen was used to mark the position of NIRS device and
bladder placement in order to identify any movement during testing and ensure the second NIRS

94
device was placed at the same location [192]. A black neoprene thigh sleeve (Mueller, WI, USA) was
wrapped around the leg to secure the NIRS device in place firmly against the skin and also ensure that
no external light would be received by the device detectors.
Incremental external pressure (mmHg) was applied to the surrounding area, encompassing the NIRS
device and pressure monitor bladder, using an aneroid sphygmomanometer (Welch Allyn Inc., New
York, NY, USA) connected to a thigh blood pressure cuff (Accoson Works, Essex, UK). All
measurements were recorded in a supine position; with the order of NIRS device application
counterbalanced. Initial external pressure applied was 2 mmHg as a result of the neoprene strapping,
prior to inflating a blood pressure cuff in a step-wise manner.
Initially, the investigator visually observed the live NIRS data on a personal computer until a stable
value was achieved and collected 60 s of data. Stability was defined as a TSI variation <2% over 30
seconds [211]. This procedure was repeated for all NIRS devices. After 4 min of baseline data
collection with the neoprene strap applying 2 mmHg, the sphygmomanometer was inflated to elicit a
pressure of 5 mmHg, with 5 mmHg increments every 4 minutes thereafter, up to and including 30
mmHg. The data acquired from the PortaMon system was downsampled from 10 Hz to 2 Hz to allow
for comparison with the MOXY system. Values are reported as average absolute TSI, calculated from
the final 60 seconds of each 4 min period. Descriptive statistics are presented as mean (TSI) unless
otherwise stated. A simple linear regression was then used to calculate slopes of the NIRS device vs.
external pressure. Subsequently, the TSI of PortaMon minus MOXY at incremental external pressures
could be fitted by a sigmoid curve. All analyses were performed using Graphpad Prism 7 (Graphpad
Software, San Diego, CA).
6.4.3 Comparing Devices at Rest
Muscle oxygenation of the dominant vastus lateralis muscle of each participant was measured with
two MOXY (MOXY1 and MOXY2) and two PortaMon (PortaMon1 and PortaMon2) devices to assess
between and within-device variation. Twenty-one male ([mean ± SD] age 22.33 ± 4.84 years, body
mass 78.24 ± 10.62 kg, height 1.79 ± 0.1 m, VL skinfold thickness 11.59 ± 5.09 mm) and nine female

95
participants (age 21.67 ± 2.40 years, body mass 65.14 ± 7.44 kg, height 1.69 ± 0.04 m, VL skinfold
thickness 26.36 ± 4.77 mm) volunteered to participate in this study. The experimental protocol
involved a single visit to the laboratory. Upon arrival, participants performed 10 min of supine rest on
a medical examination bench. The first of four NIRS devices were positioned on the vastus lateralis
muscle (as described in Sec 2.2) and all measurements were recorded in a supine position. Using a
portable pressure monitor, care was taken to ensure the same external pressure (~8 mmHg) was
exerted by the neoprene strapping surrounding the NIRS device, during each condition. Device order
was counterbalanced using a Latin square design. The investigator visually observed the live NIRS
data on a personal computer until a stable value was achieved (minimum 2 min) and collected 60 s of
data. This procedure was repeated for all four NIRS devices.
Descriptive statistics are presented as mean ± SD unless otherwise stated. A one-way analysis of
variance (ANOVA) was used to compare mean values of resting TSI between the four NIRS devices.
A Tukey’s range test was used for post hoc multiple comparisons. Subsequently, an unpaired t-test
was performed to compare the combined average of two similar devices at rest (Mean TSI (PortaMon
+ PortaMon) vs. Mean TSI (MOXY + MOXY). Accuracy was calculated as the mean absolute
difference, using Bland-Altman agreement plots (±2SD) between resting TSI. A 95% confidence
interval of the mean (95%CL) is also presented for each case. The difference between devices was
calculated as the mean TSI of PortaMon minus MOXY. A Pearson’s product-moment correlation
analysis was used to compare the association between resting values of TSI and quadriceps skinfold
thickness (adipose tissue thickness (ATT) = 0.5 x mean skinfold thickness). Significance was set at P
< 0.05. All statistical analyses were performed using Graphpad Prism 7 (Graphpad Software, San
Diego, CA).
6.4.4 Test – Retest Reliability and Sensitivity of Devices at Rest
Five male participants ([mean ± SD] age 21.2 ± 2.7 years, body mass 71.5 ± 7.7 kg, height 1.78 ± 0.1
m, VL skinfold thickness 11.3 ± 5.3 mm) completed repeated resting measures assessing vastus
lateralis TSI (%) for a total of five occasions. Each visit to the laboratory was separated by at least 24

96
hours, thereby providing a method of assessing inter-day test – retest reliability of four NIRS devices
(MOXY1, MOXY2, PortaMon1 and PortaMon2). Upon arrival on each occasion, participant’s vastus
lateralis was identified as described in Sec 2.2. Neoprene strapping was carefully tightened around the
NIRS device to ensure a pressure of 8 mmHg was exerted. The same researcher attached each device
on every occasion to minimise inter-tester variability. After 10 minutes supine rest, the investigator
visually observed the live NIRS data on a personal computer until a stable value was achieved
(minimum 2 min) and collected 60 s of data. This procedure was repeated for all four NIRS devices
using a Latin square design.
Descriptive statistics are presented as mean ± SD unless otherwise stated. The mean participant TSI
for each NIRS device was used as an indicator of test-retest reliability [157]. The coefficient of
variation (CV) was calculated as a characteristic of the performance of within-participant evaluation
[212], with a CV below 5-10% considered as acceptable absolute reliability [210].
All statistical analyses were performed using Microsoft Excel and GraphPad Prism 7.
6.4.5 Comparing Devices during Isometric Exercise
A repeated isometric quadriceps contraction exercise protocol was implemented to compare the delta
(∆) TSI between four NIRS devices (MOXY1, MOXY2, PortaMon1 and PortaMon2). The same five
male participants ([mean ± SD] age 21.2 ± 2.7 years, body mass 71.5 ± 7.7 kg, height 1.78 ± 0.1 m,
VL skinfold thickness 11.3 ± 5.3 mm) who underwent the test-retest reliability assessment at rest (see
Sec 6.3.4), participated in a quadriceps isometric contraction task. Participants were asked not to
perform any strenuous exercise or consume caffeine for at least 24 h prior to visiting the laboratory.
During the initial visit, the participant’s maximal voluntary isometric contraction (MCV) was
determined. Prior to the isometric contraction task, a nonspecific warm-up on a cycle ergometer
(Monark, 824E) was completed, before performing a maximal voluntary isometric contraction (MVC)
of the knee extensors using an isokinetic dynamometer (KinCom, Chattanooga Inc., TN, USA).
Participants were positioned upright on the dynamometer ensuring the knee joint (lateral femoral

97
epicondyle) and dynamometer axes were accurately aligned and stabilised using leg, waist, and chest
straps to minimise trunk movement during testing. The seat height and distance from the axis was
recorded to ensure accurate repeat positioning. The dominant leg was then fixed at a 60º angle and
three submaximal repetitions of a 5 s continuous quadriceps isometric contraction were performed.
Participants then performed 3 maximal contractions interspersed with a 60 s rest period. The best of
the three contractions was considered the maximal isometric force and values for 30% and 50% MVC
were then calculated.
During the second visit, after resting data was collected from all four NIRS devices (see Sec 6.3.3), the
final NIRS device was left attached to the participant’s leg for the duration of the quadriceps isometric
contraction task. Participants were positioned on the dynamometer (as described above) with no
warm-up. After a stable pre-test TSI value was attained, the participants were instructed to perform
two 30 s sustained isometric quadriceps contractions to the previously defined values of their MVC
(30% and 50%) interspersed by a 3 min rest period. TSI was continuously monitored throughout the
procedure. This procedure was repeated for visits 3, 4, and 5 using a different NIRS device during the
isometric contraction task.
Due to potential differences in resting values for the two devices (Sec. 6.3.3, 6.3.4), TSI was reported
as a change from pre-test (60 s averaging before each test). Maximum and minimum TSI values were
calculated as a three-second average surrounding the highest and lowest values during each of the two
isometric contractions. The Δ in TSI was calculated as the maximum value minus the minimum value
during each 30 s contraction e.g. TSI Max—TSI Min = ΔTSI [193].
Descriptive statistics are presented as mean ± SD unless otherwise stated. A one-way analysis of
variance (ANOVA) was used to compare mean values of ΔTSI between the four NIRS devices. A
Tukey’s range test was used for post hoc multiple comparisons. Accuracy was calculated as the mean
absolute difference, using Bland-Altman agreement plots (±2SD) between resting TSI. A 95%
confidence interval of the mean (95%CI) is also presented for each case. The difference between
devices was calculated as the mean TSI of MOXY minus PortaMon. All statistical analyses were

98
performed using Graphpad Prism 7 (Graphpad Software, San Diego, CA). The studies undertaken all
received ethical approval from the University of Essex ethical committee and participants provided
written informed consent before inclusion.
6.4.6 Comparing Devices during Dynamic Exercise and Occlusion
An incremental asynchronous arm crank exercise protocol, followed by a 5 minute arterial occlusion,
was undertaken to compare TSI values between two NIRS devices (MOXY1 vs PortaMon1). Based on
the effect size observed between NIRS devices during isometric exercise at 50% MVC, a power
analysis for a dependant sample t-test was conducted using G*Power to determine a sufficient sample
size using an alpha of 0.05, a power of 0.80, a large effect size (d = 2.9) and two tails [213]. Based on
the aforementioned assumptions, the desired sample size is 4. We elected to recruit an additional two
participants to allow for participants terminating the arterial occlusion early due to the sensation of
pain. Six male participants ([mean ± SD] age 23.7 ± 4.1 years, body mass 73.3 ± 5.2 kg, ATT 2.7 ±
1.0 mm) completed the exercise and occlusion task, requiring two separate visits to the laboratory,
separated by 3 -7 days. On arrival, following basic anthropometrical measures, the participant
confirmed their dominant arm (all participants’ self-reported right hand dominance) and adipose tissue
thickness was assessed at the muscle belly of the biceps brachii, 8 cm above the mid-arm fold. The
first NIRS device was positioned on the biceps brachii, where the 8 cm marker was used to determine
the mid-point between the device emitter and detectors. The biceps brachii were chosen as previous
literature has reported this muscle eliciting the greatest decrease in tissue oxygenation index during
arm cranking compared with the triceps brachii, brachioradialis and anterior deltoid [190]. A portable
pressure monitor was used to ensure a similar external pressure was exerted by the black crepe
bandage used to hold the device in place. Subsequently the participant’s sat upright, with hands in a
rested position until a stable TSI value was achieved (minimum 2 min) and a resting baseline was
obtained over a 5 minute period.
Prior to arm cranking, participants were positioned with the crank axis aligned to shoulder height, at a
distance that allowed a slight bend in the elbow when arms were extended. A chest strap was applied

99
to minimise trunk movement during testing and seat/crank height were recorded to ensure accurate
repeat testing. Participants were required to arm-crank at 60 rpm beginning at 0 Watts (W) and
increasing by 25 W every 2 min. The exercise end-point was determined when cadence fell below 60
rpm for 3 consecutive seconds.
Following completion of the incremental arm-crank exercise task, participants remained seated with
hands in a rested position for 5 min prior to an arterial occlusion. To enable a physiological calibration
of raw TSI values by identifying the participant’s notional minimum and maximum TSI, an arterial
occlusion was applied for 5 minutes using an automated pneumatic cuff inflator (Hokanson, Bellevue,
USA) positioned at the proximal aspect of the humerus, applying 295-305 mmHg of pressure. After a
5 min occlusion, the cuff was released and participant’s continued to rest for a further 5 min period.
This procedure was repeated for the second visit using the alternative NIRS device. Although we
cannot be sure that this value exactly corresponds to complete deoxygenation of haemoglobin and
myoglobin, in all participants this time was sufficient to result in a stable minimum in saturation value
significantly lower than any observed during exercise.
Initially, the data acquired from the PortaMon system was down sampled from 10 Hz to 2 Hz to match
that of the MOXY system. Following this, both device data-sets were smoothed by calculating the 3
second moving average at 2 Hz. To normalize the NIRS signal and achieve a physiological calibration,
the average value of the final 30 seconds was used to determine notional 0% oxygenation (calibration)
and the 30 second peak hyperemic response upon release of the cuff was used to indicate notional
100% oxygenation (we use the term “notional” as we cannot be absolutely sure that the lower value
could not be decreased further by adding an ischemic exercise component, not that the upper value
could not be increased by hyperoxia and/or methods to increase blood flow or decrease oxygen
consumption; however, the current physiological calibration has the advantage of being relatively easy
to implement and in common use in the field). The Δ in TSI during the occlusion task was calculated
as the maximum value minus the minimum value, identified from the onset of the cuff inflating to the
period following the hyperemic response upon cuff release.

100
During the incremental test, TSI was established for each power output as the final 30 second average
for each stage. These values were subtracted from the resting baseline TSI to provide a delta (Δ) raw
TSI and subsequently converted to a calibrated (% calibration) value.
Descriptive statistics are presented as mean [95% CI] unless otherwise stated. Paired t-tests were used
to compare performance outcomes of the arm-crank test and compare device minimum, maximum and
delta values for raw (TSI) and calibrated (% calibration) data during the occlusion. Furthermore, a
repeated measure ANOVA was conducted to compare values obtained during the incremental arm-
crank test for each power output. Significant F ratios were examined on a post hoc basis using an
uncorrected Fisher’s LSD test. Where data was not obtained for all participants at peak power output
(i.e. only three participants completed the 100 W stage), a paired t-test was conducted on the smaller
sample size to compare differences between devices. The incremental data is reported as the change
from resting baseline in both raw (ΔTSI) and calibrated units (Δ calibration %). A simple linear
regression was then used to calculate slopes of the NIRS device vs. power output.
6.5 Results
6.5.1 Testing the Influence of External Pressure
There was a significant correlation between TSI and external pressure for both MOXY and PortaMon
devices (Fig. 6-3a), in both cases showing a drop in TSI with increasing pressure. The slope was
significantly steeper for the MOXY than the Portamon (a slope of -0.38 ± 0.09 % TSI per mmHg for
the MOXY compared to -0.08 ± 0.03 for the PortaMon). The PortaMon reports a lower resting TSI
(%) at low pressure (<20mmHg); with the major subsequent change between the devices occurring
between 20 and 30 mmHg (Fig. 6-3b). Therefore to decrease variability the subsequent studies were
all undertaken at lower than < 20mmHg, with a target external pressure of 8 mmHg when participants
were supine.

101
Figure 6-3 (a) Linear regression showing TSI as a function of external pressure (mmHg) (mean ±
SEM), (b) PortaMon minus MOXY (TSI) as a function of external pressure (mmHg). Data fit using
non-linear regression to a sigmoidal curve for illustrative purposes and (c) Bland-Altman plots of
resting TSI of males (n = 21) and (d) females (n = 9) using the combined average of MOXY and
PortaMon devices. Each plot represents the difference versus the average of the two devices. Dotted
lines represent the ±2SD limits of agreement
6.5.2 Comparing Devices at Rest
Resting TSI of male and female participants for four NIRS devices is provided in Table 6-1. A one-
way ANOVA of mean resting TSI between the four NIRS devices for female participants
demonstrated a significant difference (P < 0.05), with posthoc multiple comparisons showing a
significant difference between MOXY and PortaMon devices (MOXY1 vs. PortaMon1; MOXY1 vs.

102
PortaMon2; MOXY2 vs. PortaMon1; MOXY2 vs. PortaMon2 = P < 0.05). Conversely, no difference
was found between devices for male participants.
Table 6-1 Male and female mean TSI of four NIRS devices at rest.
Male TSI (%) Female TSI (%)
Mean ± SD [95% CI]
Mean ± SD [95% CI]
MOXY1 75.2 ± 13.1 [69.3, 81.2] 92.7 ± 5.0 * [88.8, 96.6]
MOXY2 73.3 ± 12.8 [67.5, 79.2] 89.1 ± 6.3 * [84.3, 94.0]
PortaMon1 72.8 ± 3.5 [71.2, 74.4] 77.3 ± 2.7 [75.2, 79.4]
PortaMon2 71.6 ± 3.7 [70.0, 73.3] 76.1 ± 2.8 [74.0, 78.3]
Combined MOXY 74.3 ± 12.8 [68.5, 80.1]
90.9 ± 5.1** [87.0, 94.9]
Combined PortaMon 72.2 ± 3.5 [70.6, 73.8] 76.7 ± 2.6 [74.7, 78.7]
* Significantly different from PortaMon1 and PortaMon2 (P > 0.05);
** Significantly different to Combined PortaMon (P > 0.001)
As no significant difference was found at rest between either MOXY1 vs. MOXY2 or PortaMon1 vs.
PortaMon2, the combined mean TSI for MOXY (MOXY1 & MOXY2) and PortaMon (PortaMon1 &
PortaMon2) at rest for male and female participants (Table 6-1) was compared using an unpaired t-test.
Mean female MOXY TSI (90.9 ± 5.1 %) was significantly higher than the PortaMon (76.7 ± 2.6 %)
(t(16) = 7.4, P < 0.05), however no significant difference was observed in male participants between
the MOXY (74.3 ± 12.8 %) and PortaMon (72.2 ± 3.5 %) devices.
At rest, Bland-Altman plots of male participants (Fig. 6-3c) suggest the MOXY device reports a
higher saturation value at higher resting TSI and a lower value at lower resting TSI. So the lack of a
significant difference of the mean value masks a real measurement difference between the devices
even in male participants. Bland-Altman plots of resting female participants (Fig. 6-3d) illustrate a

103
consistently higher TSI with the MOXY device vs PortaMon, regardless of average TSI, consistent
with the difference in the mean values.
Vastus lateralis skinfold thickness (mm) and resting TSI (%) are highly correlated using the combined
mean TSI MOXY (r =.70, P < 0.01) and PortaMon device (r =.73, P < 0.01). Linear regression of VL
skinfold thickness and TSI (Fig. 6-4) show the difference between the slopes (MOXY vs PortaMon)
are significantly different (F(1,54) = 11.97, P = 0.001). The MOXY device shows a regression slope
(y = 1.12*x + 61.22), steeper than that of the PortaMon (y = 0.34*x + 68.16). This indicates that as
skinfold thickness increases, the rise in TSI is greater with the MOXY. The difference between the
two values is non-linear with respect to ATT (Fig. 6-5). The PortaMon and MOXY devices report
similar TSI (%) values at a low ATT (<7 mm); with the major subsequent change between the devices
occurring between 7 and 10 mm; at ATT values >10 mm the difference remains constant. The data fit
well to a sigmoidal dose-response relationship. At the lowest ATT the (Portamon minus MOXY)
difference is +1.1 ± 2.8%; (Mean + SEM), at the highest ATT the difference is -14.7 ± 2.8%; the 50%
change occurs at 8.5 ± 0.6 mm ATT.
Figure 6-4 Relationship between mean TSI and vastus lateralis skinfold (mm) using the combined
average of MOXY and PortaMon devices
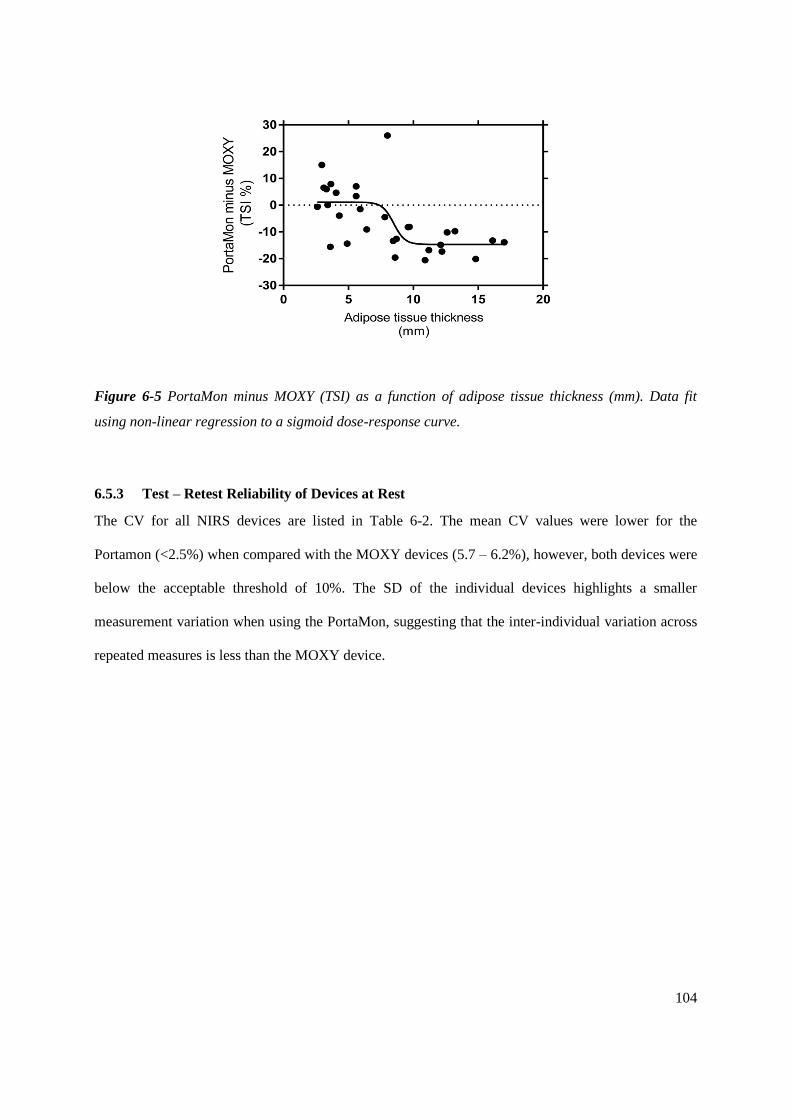
104
Figure 6-5 PortaMon minus MOXY (TSI) as a function of adipose tissue thickness (mm). Data fit
using non-linear regression to a sigmoid dose-response curve.
6.5.3 Test – Retest Reliability of Devices at Rest
The CV for all NIRS devices are listed in Table 6-2. The mean CV values were lower for the
Portamon (<2.5%) when compared with the MOXY devices (5.7 – 6.2%), however, both devices were
below the acceptable threshold of 10%. The SD of the individual devices highlights a smaller
measurement variation when using the PortaMon, suggesting that the inter-individual variation across
repeated measures is less than the MOXY device.

105
Table 6-2 Test-retest measures of device reliability (TSI) at rest.
MOXY1 MOXY2 PortaMon1 PortaMon2
Participant
number Mean ± SD
CV
(%) Mean ± SD
CV
(%) Mean ± SD
CV
(%) Mean ± SD
CV
(%)
1 52.9 ± 4.4 8.4 52.7 ± 3.5 6.7 67.9 ± 1.0 1.5 66.6 ± 1.2 1.7
2 87.8 ± 4.8 5.4 82.9 ± 4.9 5.9 74.7 ± 1.9 2.5 73.8 ± 1.3 1.8
3 56.9 ± 5.5 9.6 53.7 ± 4.9 9.2 66.0 ± 1.1 1.7 64.7 ± 2.6 4.1
4 87.2 ± 3.1 3.6 84.9 ± 3.3 3.9 71.3 ± 0.8 1.1 70.0 ± 1.6 2.3
5 71.8 ± 2.7 3.8 70.1 ± 1.9 2.7 72.7 ± 1.6 2.2 71.1 ± 1.8 2.6
Grouped Data
CV (%) 6.2 [2.8, 9.5] 5.7 [2.5, 8.8] 1.8 [1.1, 2.5] 2.5 [1.3, 3.7]
CV, coefficient of variation [95% confidence interval];
6.5.4 Comparing Devices during Isometric Exercise
Mean torque of 30 and 50% MVC was 256.9 ± 43.5 and 428.2 ± 72.5N respectively. A one-way
ANOVA of ∆TSI during 30 and 50% MVC between the four NIRS devices demonstrated a significant
difference (P < 0.05), with posthoc multiple comparisons showing a significant difference between
MOXY and PortaMon devices (MOXY1 vs. PortaMon1; MOXY1 vs. PortaMon2; MOXY2 vs.
PortaMon1; MOXY2 vs. PortaMon2 = P < 0.05). Table 6-3 displays the ∆TSI values.

106
Table 6-3. ∆ change in TSI (%) values during 30 s quadriceps isometric contraction task at 30% and
50% maximal voluntary contraction (MVC) of each NIRS device Mean ± SD (range).
MOXY1 MOXY2 PortaMon1 PortaMon2
∆TSI 30% MVC (%) 36.5 ± 7.3 a
(28.4 – 47.7)
37.9 ± 14.4 a
(15.2 – 55.2)
9.4 ± 4.4
(5.0 – 16.3)
8.3 ± 4.8
(2.9 – 15.7)
∆TSI 50% MVC (%) 57.3 ± 14.9 b
(41.3 – 77.2)
60.8 ± 13.7 b
(42.3 – 75.9)
14.2 ± 2.3
(11.7 – 16.7)
14.8 ± 4.3
(9.9 – 19.7)
a = significant difference from PortaMon1 and PortaMon2 at 30% MVC (P > 0.05); b = significant
difference from PortaMon1 and PortaMon2 at 50% MVC (P > 0.05).
No significant difference was found during the isometric quadriceps exercise between either MOXY1
and MOXY2 or PortaMon1 and PortaMon2. As such, the combined group averaged data (n = 5) for
MOXY (MOXY1 & MOXY2) and PortaMon (PortaMon1 & PortaMon2) during the quadriceps
isometric contraction task is shown as a composite graph in Figure 6-6a. The general trend was similar
for all five participants between devices. For both systems, an immediate decrease in TSI at the onset
of isometric contraction (30% MVC) was observed. This recovered rapidly following contraction
cessation, and in some cases overshooting (a hyperaemic response). A larger decrease in TSI was
observed at 50% MVC and returning to resting at task cessation. Bland-Altman plots indicate that the
MOXY reports consistently higher ∆TSI at both 30 (Fig. 6-6b) and 50% (Fig. 6-6c) MVC, with a
trend showing the greater the average ∆TSI, the greater the difference.

107
Figure 6-6 (a) Group changes in tissue saturation index (∆TSI) during 30 and 50% isometric MVC
tasks and (b) Bland-Altman plots of ∆TSI at 30% MVC (n = 5) and (c) 50% MVC (n = 5) using the
combined average of MOXY and PortaMon devices. Each plot represents the difference versus mean
∆ value measured as the average of the two MOXY devices compared to the two PortaMon devices.
Dotted lines represent the ±2SD limits of agreement.
6.5.5 Comparing devices during dynamic exercise and occlusion
Peak performance measures, adipose tissue thickness, external pressure applied by the NIRS devices
and TSI data during the incremental arm crank test and subsequent arterial occlusion are presented in
Table 6-4. No significant differences were observed for peak power output or time to exhaustion
between trials and external pressure was applied between 9 – 13 mmHg. During the arterial occlusion
\
\
\
\
\
\
\
\
\
\
\
\
\
\
\
\
\
\
\
\
\
\
\

108
and the following reactive hyperaemia, significant differences were observed between NIRS devices
for minimum, maximum and delta TSI. The MOXY device repeatedly reported a greater delta TSI
when compared with the PortaMon (p <0.01).
During the incremental arm crank test, between-device TSI differences were observed at 25 W when
comparing raw TSI values. In the post-exercise hyperaemic period, the MOXY device also reported a
significantly greater maximum value compared with the PortaMon (p <0.01). However, these
differences were not observed when the TSI range of the devices was calibrated to the min and max
TSI associated with the arterial occlusion.
Despite the lack of significant differences seen at individual power values using the calibrated values,
when the data is taken as a whole, a subtle distinction can be observed. Figure 6-7 demonstrates the
relationship between increasing power output and a progressive decrement in TSI. The regression
slope was not significantly different (P = 0.18) between the MOXY and the PortaMon device for the
raw TSI values (Fig. 6-7a) (a slope of -0.16 ± 0.02 % TSI per 1W for the MOXY compared to -0.12 ±
0.005 for the PortaMon), however the lines are not identical due to a significant difference in the
intercepts (F(1,7) = 47.06, P = <0.01. A similar result is present when comparing the regression
slopes of the calibrated values (Fig. 6-7b) between devices (P = 0.45), reporting similar decrements in
TSI (% calibrated) per 1W increase (MOXY = -0.23 ± 0.03 %; PortaMon = -0.26 ± 0.006 %), yet a
statistically significant difference in the intercepts (F(1,7) = 12.95, P = <0.01). The difference in the
intercepts appears to be due to a lower value of the MOXY after warm up compared to baseline (the
0W point is arm cranking with zero resistance compared to complete rest).
Figure 6-8 shows the raw and calibrated TSI traces during incremental arm cranking and the
subsequent arterial occlusion for individual participants. It is evident from these figures that both
devices follow a similar trend within individuals between both MOXY and PortaMon devices.
Interestingly, following a rapid desaturation during the initial two stages of the arm crank test (0 and
25 W), the TSI trace for participant 3 increased from 50 W to the end of the test. This physiological
observation was reproduced by both devices for this individual on separate testing occasions.

109
Table 6-4 Physiological responses during arm cranking and subsequent arterial occlusion.
MOXY PortaMon P-value
ATT (mm) 2.7 [1.6, 3.7]
External pressure (mmHg) 10.8
[8.7, 13.0]
11.5
[9.5, 13.5] 0.60
TTE (s) 589.7 [538.1, 641.3] 584.7 [515.5, 653.8] 0.64
PPO (W) 97.85 [87.1, 108.6] 96.81 [82.4, 111.2] 0.64
Arterial Occlusion
Min (TSI) 12.9 [7.7, 17.9] 36.6 [28.7, 44.4] <0.01 **
Max (TSI) 87.2 [85.3, 89.0] 80.2 [77.4, 83.0] <0.01 **
Delta (TSI) 74.3 [68.9, 79.8] 43.7 [37.7, 49.7] <0.01 **
Baseline (resting)
Raw (TSI) 61.5 [54.1, 68.9] 64.4 [60.9, 67.9] 0.34
Calibrated (%) 66.5 [55.0, 77.9] 63.6 [54.2, 73.0] 0.43
Incremental Test
Raw (∆ from baseline)
0W -2.1 [-7.6, 3.5] 0.2 [-4.0, 5.4] 0.50
25W -9.6 [-14.4, -4.8] -2.5 [-4.8, 9.3] 0.04 *
50W -11.1 [-16.5, -5.7] -5.6 [-10.4, 7.9] 0.12
75W -14.3 [-22.8,-5.8] -8.3 [-16.2, 7.1] 0.09
100W (n = 3) -19.1 [-25.8, -12.5] -12.3 [-23.8, -0.8] 0.22
Calibrated (∆ from baseline)
0W -4.2 [-11.8, 3.5] -0.3 [-14.6, 14.0] 0.55
25W -14.3 [-21.7, -7.0] -6.9 [-24.5, 10.7] 0.27
50W -16.0 [-25.0, -7.0] -13.9 [-26.2, -1.5] 0.74
75W -20.9 [-34.1, -7.6] -19.1 [-31.5, -6.7] 0.80
100W (n = 3) -29.7 [-44.2, -15.3] -25.8 [-44.4, -7.3] 0.59
Post Ex. Hyperemic Max:
Raw 85.5 [80.4, 90.5] 80.7 [75.6, 85.9] <0.01 **
Calibrated 97.8 [93.0, 102.6] 101.3 [92.7, 109.8] 0.12
* P = < 0.05; ** P = < 0.01;

110
Figure 6-7 (a) Relationship between power output and raw ∆ TSI and (b) calibrated (%) values
during incremental arm cranking (mean ± SEM)

111
Figure 6-8 (a) Individual participant TSI traces for raw and (b) calibrated values during arm cranking and arterial occlusion (MOXY = black line;
PortaMon = grey line).

112
6.6 Discussion
This current study compared two portable, wireless NIRS devices. Whilst the measurement of muscle
oxygen saturation correlated between the MOXY and PortaMon under a variety of resting and
dynamic conditions, significant differences were noted, both with respect to device reliability and
absolute values of saturation.
6.6.1 Comparing Devices at Rest
Light entering the surface above the vastus lateralis will pass through skin and adipose tissue layers
before entering the muscle. It is generally assumed that NIR light reaching a detector has an effective
penetration depth of approximately 50 – 60% of the inter-optode distance [214]. The PortaMon
(maximum source:detector separation of 40mm) would be expected to detect more light from the
deeper muscle tissue than the MOXY (maximum source:detector separation of 25mm). Even in the
absence of differences in the measurement algorithm (discussed later), one would therefore not
necessarily expect identical muscle oxygen saturation values for the two systems.
Whilst the two devices did provide similar values for male participants, in female participants, the
PortaMon reported a lower resting TSI when compared with the MOXY. We showed that this
difference appeared to be consequent to the gender difference in adipose layer. Optical density is
greater in participants with a thin layer of adipose tissue [215]. In SRS systems the increased adipose
layer results in a higher apparent %TSI in female participants [216]. This effect is exaggerated in the
MOXY. The smaller source:detector separation in the MOXY biases the light detected in favour of
more surface tissues. It seems that the SR algorithm used is unable to completely correct for this
effect. It is therefore even more important than usual in NIRS to measure and report on local body fat
composition when using the MOXY, especially when comparing between participants.
6.6.2 Testing the Influence of External Pressure
There were significant effects of the applied pressure on resting TSI, especially for the MOXY. At low
external pressures (2 – 20 mmHg), the PortaMon reported a lower resting TSI (~8%) compared with

113
the MOXY. As external pressure was increased above 20 mmHg, the difference between the two
devices diminished. This difference was predominantly due to changes in the MOXY value, not the
PortaMon. In particular, MOXY values showed a sharp decrease between 20 and 30 mmHg. As
external pressure is applied to the skins surface, arteriole, venule and capillary intravascular
hydrostatic pressure are equal in relation to the distance from the surface of the skin [217] , occluding
the flow of blood to the periphery. As a larger proportion of light detected in the MOXY comes from
surface tissue it is likely that the MOXY is more sensitive to pressure-induced changes in the dermis
and subcutaneous oxygenation and blood flow. Again, the SR algorithm used to measure muscle TSI
is less effective than the SRS method in the PortaMon in correcting for the effects of differences in
blood flow and oxygenation in surface tissues. This finding has an important implication for
researchers when undertaking repeated measures using the MOXY device, particularly when the
removal and re-application of the NIRS device is required. Furthermore, athletes using similar devices
to inform training intensity should standardise the external pressure applied to hold the instrument in
place.
6.6.3 Test – Retest Reliability of Devices at Rest
This is the first study to report reliability data of the MOXY device. In the current study, we report
absolute (the similarity between repeated measures (CV)) reliability. Previous CV of various NIRS
monitors report resting TSI of the vastus lateralis between 2.3 – 5.8% [209,218–220]. These baseline
TSI values are similar to that observed in the MOXY devices in our study (5.7 -6.2%). Interestingly,
the present CV for the PortaMon devices are lower than that previously reported 1.8 - 2.5 vs. 4.7%
[209]. However this variation may be due to differences in the precise anatomical location the device
is placed, leg position (supine vs. seated), gender (male vs male and female) and health status of the
participants (healthy vs chronic heart failure).
The acceptable test-retest reliability can be partially attributed to the homogenous group of
participants used in the present study, with an adipose layer of < 7 mm. Caution is advised if using the
devices on participants with greater adipose thickness and or when taking NIRS measures from an

114
alternative anatomical location. Furthermore, small differences in ambient and muscular temperature
may influence day-to-day variability [189], as may slight changes in posture [97]. It is likely that in
the present study, controlled environmental conditions, abstinence of exercise between testing days
and a supine body position attenuated the variation observed, contributing towards the very strong
test-retest reliability of the devices.
Resting TSI values in the brain are used as threshold values for clinical hypoxia in SR devices such as
the INVOS 5100C, EQUANOX Classic 7600 and FORE-SIGHT Elite [221] although this has been
criticised given the differences in patient skull geometry and consequently light transport. In muscle,
the InSpectra used 2nd derivative spectroscopy to calculate a resting TSI in muscle that was suggested
to report on tissue dysoxia in shock states [222]. This used the thenar (base of thumb) muscle due to
the very small layers of overlaying adipose tissue in this area. In muscle groups more relevant to
exercise physiologists and sports scientists, resting TSI values have been reported in calf muscle in
compression clothing studies [97] and in the gastrocnemius during normobaric hypoxia [223]. When
subjected to a normobaric hypoxic environment, the mean SRS-measured TSI change at rest,
compared with the normoxic condition, was -2.5%. The authors report this finding to not statistically
differ between conditions.
6.6.4 Comparing Devices during Isometric Exercise
There is no difference in ∆TSI between two models of the same device during isometric exercise.
However, significant differences in ∆TSI are apparent when comparing MOXY vs. PortaMon. The
MOXY devices report a greater absolute ∆TSI change when compared with the PortaMon at both 30
and 50% MVC. The ∆TSI observed with the current PortaMon devices is similar to that of a previous
study, also utilising a PortaMon device [193], reporting a ∆TSI reduction of ~6 and 11% from baseline
at 30 and 50% MVC respectively. Very few studies have utilised the MOXY device, however, of
those available, the present ∆TSI at 30% MVC is similar to that observed in the gastrocnemius by
supine individuals undertaking a plantar flexion exercise against a 6kg weight (~37% vs. ~38%) [224]
.

115
Both devices report appropriately that there is a decrease in muscle oxygenation during isometric
exercise. However, unlike the situation for male participants at rest, there are significant differences in
the extent of desaturation observed during exercise. Is it possible to determine which one is likely to
be “correct”? In one sense there is no single “correct” value as, given the differences in
source:detector separation, the NIRS and PortaMon are reporting on different regions of the muscle
(and having to correct for different amounts of surface tissue). However, some limits can be set by
more invasive methods. Comparing oxygen saturation differences between femoral venous and radial
arterial blood with the ∆TSI changes observed in the present study may identify whether one device is
more comparable to direct methods than the other. In trained participants femoral venous oxygen
saturations of 21% and arterial oxygen saturation of 96% were measured following maximal leg
extensions [225]. Assuming the NIRS signal is an approximately equal contribution of arterial,
capillary and venous saturation, one would expect the absolute muscle oxygen saturation to be no
lower than 55% in this case. Even allowing for the fact that femoral venous oxygen saturation
represents the sum of all blood returning from the exercising leg, whereas the NIRS signal originate in
the exercising muscle only [226], the almost 60% drop in TSI in the MOXY device at only 50%
MVC seems rather high. On the other hand, as has been noted [227], the lack of a correction for the
adipose layers can result in an underestimation of TSI changes using SRS methods. The variation
between devices during the MVC exercise could be explained by the muscle contraction causing
interference to the arterial inflow, therefore an increasing intramuscular pressure inducing ischemia.
As such, the need to assess the devices during dynamic exercise provides an opportunity to understand
the dynamic TSI range of the devices without the potential complication of ischemia.
6.6.5 Comparing Devices during Dynamic Exercise
During the incremental arm cranking task, both NIRS devices demonstrated a continuous decline in
TSI as power output increases until volitional fatigue. Whilst some previous investigations have
reported an early decline in muscle oxygen saturation during incremental arm exercise followed by a
plateau at ~50% V̇O2max [228], the general trend in TSI of the current study (Table 6-4) is closer to

116
studies where the biceps brachii TSI progressively decreases throughout arm cranking exercise [190].
Interestingly the continuous decline in mean TSI at each stage of the test (Table 6-4), masked
significant individual variation; in one person (participant 3) an increase in TSI was seen following the
initial fall. The fact that both devices showed the same unusual trend lends confidence to the idea, both
that this individual has differences in the balance between flow and metabolism as exercise proceeds
and that both Portamon and MOXY can detect this effect. By selecting participants and an anatomical
location with very low ATT, and controlling external pressure at ~10 mmHg, variables previously
identified to influence TSI values between devices were controlled. Nevertheless, we still observed a
larger dynamic range in the study in the MOXY compared to the Portamon.
6.6.6 Comparing Devices during Occlusion/Reactive Hyperemia and the effect of physiological
calibration
In an attempt to further explore the remaining differences we performed a “physiological calibration”
of the two devices, comparing the dynamic exercise data from the biceps brachii to an individual
participant and machine-specific 0-100% range determined by a nominal 0% following arterial
occlusion and a nominal 100% following the reactive hyperemia after that occlusion. During the
arterial occlusion (Fig. 6-7) both devices fell to a fixed low level below baseline within the first three
minutes following occlusion and both showed reactive hyperemia following cuff release with the TSI
rising above baseline. This contrasts with a recent study measuring TSI following three minutes
arterial occlusion comparing in older adult patients (66 ± 9 year) scheduled for elective coronary
artery bypass grafting surgery [207]. In these older patients three minutes occlusion was not enough to
decrease TSI to a stable fixed baseline, probably due to a decrease in muscle oxygen consumption in
this group compared to ours.
Despite choosing participants with a similar baseline TSI, significant differences were seen in
ischemia and reperfusion between the Portamon and the MOXY. The range (Hyperemia MAX minus
Occlusion MIN) in the Portamon was ∆43.7 % whereas in the same participants the MOXY change
was ∆74.3%. However, when calibrated against the physiological range observed during and post

117
ischemia, there is now no statistically significant difference between devices during the arm crank
exercise, nor the maximum value obtained during reactive hyperemia post exercise. This suggests that
both methods are equally good at measuring muscle oxygenation changes in males with low ATT.
6.6.7 Comparing Algorithms
The PortaMon uses the well-established modified Beer-Lambert method for measuring changes in
chromophore concentrations [229] and SRS for measuring absolute tissue oxygen saturation [205].
The MOXY uses Beer-Lambert and a proprietary SR algorithm based on a US patent [230].
Pathlength data is generated from a Monte Carlo Model, smoothed and used to generate a matrix of
diffuse reflectance data at discrete values of tissue and sensor optical properties. This matrix is then
used to convert the measured diffuse wavelength data to tissue optical properties, from which the
oxygen saturation measure can be calculated. In their basic form, neither SRS nor SR algorithms take
into account prior knowledge about individual differences in, for example, adipose layer thickness,
resulting in some of the variability seen in this study. Some simple NIRS devices, such as the ASTEM
NIRSRS have incorporated adipose layer measurements to improve the accuracy of their algorithms
[231]. In principle, both PortaMon and MOXY methods described in this paper could make similar
adjustments. Previous authors have incorporated adipose tissue thicknesses of individual participants
as measured by ultrasound combined with SRS measurements in a two layer (adipose/muscle) Monte
Carlo model to directly calculate muscle μa [227]. A similar individualized measure should be possible
for the MOXY device, decreasing the dependence of the TSI value on adipose layer thickness.
The MOXY device reports a significantly larger dynamic range when an arterial occlusion is applied,
despite a shorter source:detector length when compared with the PortaMon. It has been suggested that
the ischemic stimulus is more extensive in the muscle compared with the sub-dermal tissue [201],
therefore, the greater dynamic range reported by the MOXY may be related to the spatial resolution
method enabling a greater muscle contribution than the SRS despite the smaller source:detector
separation in the MOXY. However, it is also likely in part a function of algorithm optimisation and
specialisation. The MOXY is designed to be used on muscle and could reasonably be expected to have

118
been optimised for this system. The Portamon, although designed to be used on muscle, makes no
concessions or alterations to the basic SRS algorithm compared to similar Artinis devices used to
measure brain function.
The minimum and maximum raw TSI values reported for the PortaMon (∆43.7%) are similar to that
previously reported for the NIRO 200-NX [207] following an arterial occlusion applied at the upper
arm (∆33%). This finding is unsurprising given that both the NIRO 200-NX and PortaMon both use
SRS methods. However, the larger dynamic range reported by the MOXY (∆74.3%) surpasses that of
alternative SR devices such as the FORE-SIGHT elite (∆ 46%) and INVOS5100C (∆ 36%) [207].
This illustrates the difficulty in comparing different SR devices which use different algorithms and are
likely sensitive to differences in the source:detector separation even when determining basic
calibration ranges. The INVOS (3cm and 4 cm) and FORESIGHT (2.5cm and 5 cm) use significantly
larger source:detector separations than the MOXY (1.2cm and 2.5cm) and, given their clinical
interests, their algorithm development has likely focused more on brain than muscle measurements.
However, in the absence of devices from these manufacturers with similar source:detector separations
and the proprietary nature of the individual algorithms, it is impossible to speculate further as to the
cause of these differences.
6.6.8 Real world applications
The MOXY is designed to be of use to individuals in a variety of sporting environments. There have
been suggestions as to how NIRS might be of use for individual athletes and coaches in, for example,
tracking and optimising training. However, in many cases, these have merely sought to mimic
currently available tools, such as lactate thresholds, albeit with the benefit of being non-invasive
[232,233]. Even then, differences in optical properties of individuals make these measurements
unreliable in many cases [234]. No one has yet been able to demonstrate a specific benefit of using
muscle NIRS to track training in an individual. What is required is a proper randomised trial
comparing the use of NIRS to optimise training with current standard methods. The advent of
relatively low-cost devices, such as the MOXY, makes such a trial more accessible. However, this

119
work here suggests that, even if successful, the results of such a trial might remain specific for the NIR
device used and not necessarily transferable to other spectrometers. This present study has focused
solely on the TSI values produced by the MOXY and PortaMon devices. Future studies could address
the tHb values reported by the MOXY device and compare these with the (rarely reported) scaled tHb
that can be derived from SRS methods.
Subcutaneous fat is known to have a large impact on NIRS signal. Whilst high ATT results in less
light absorption and therefore a stronger signal, the metabolically inactive fat tissue, coupled with
lower haemoglobin levels will result in less signal change [235] i.e. a blunted dynamic range. Given
the observed influence of high ATT on resting TSI in the MOXY device and the small source:detector
separation used, it is not clear how valid the current algorithm is for use in athletes with higher ATT;
this includes a significant number of female athletes. In order to fully utilize the MOXY device in
individuals with ATT >7 mm, the source-detector distance should be increased accordingly.
Commercial muscle NIRS devices with larger source-detection distances are widely available [191].
Future studies should measure TSI trend during dynamic exercise of those with ATT between 7 - 15
mm and determine whether the influence of ATT can be removed by applying an ischemic calibration
as has been shown previously for muscle oxygen consumption measurements previously [236].
6.7 Conclusion
This study shows that both MOXY and PortaMon devices produce acceptable TSI measures during
supine rest and demonstrate a similar trend during dynamic exercise under appropriately controlled
conditions in specific participant groups. During ischemia (arterial occlusion and isometric
contractions) the MOXY device reports a greater raw dynamic range when compared with the
PortaMon However, by applying a physiological calibration following an arterial occlusion, the
MOXY and PortaMon devices report similar changes from baseline during arm crank exercise. Due to
the limitations of calibrating NIRS, it is not possible to determine which device is a more accurate
measure of absolute muscle oxygen saturation; Although the PortaMon demonstrates a greater

120
repeatability at rest, this may simply be reflective of the smaller dynamic range observed. The MOXY
is marketed at athletes and coaches and priced accordingly (< $1,000), whereas the higher priced
PortaMon (< $10,000) tends to be used primarily by research scientists. For the researcher, the
PortaMon has the advantage of measuring and reporting more NIRS parameters. At least in the case of
vastus lateralis measurements, the PortaMon also appears to be less sensitive to variations in adipose
layer thickness and applied external pressure. We recommend the application of the MOXY device
primarily on individuals with a low adipose tissue thickness, and that the external pressure applied to
hold the device in place is either standardised upon each application or kept below 20 mmHg.

121
7 Compression tights have no effect on economy of treadmill running at
race pace.
7.1 Rationale
The capacity for compression tights to aid running economy at particular relative exercise intensities
(Chapter 5) and when the interface pressure is above a particular threshold (Chapter 4) has been
reported. However, their capacity to influence running economy at race speed is unknown and
arguably of most relevance to endurance athletes. Moderately trained distance runners were assessed
at running speeds associated with their most recent race performance, with and without compression
tights. Multiple physiological parameters were collected, including tissue oxygen saturation using the
MOXY device (Chapter 6). The decision to use the MOXY device rather than the PortaMon was
primarily driven by its lighter weight, thus less likely to impact running gait during submaximal
exercise.
7.2 Abstract
The aim of the present study was to examine whether compression tights modify running economy
(RE), kinematics and muscle oxygenation (SmO2) in recreational runners. Thirteen males and five
females completed two RE tests at a speed corresponding to a recent race time (10k, half marathon or
marathon distance) during a single laboratory session. Test order was randomised between the
treatment trial of compression tights and control trial with running shorts. RE was determined by
oxygen consumption and carbon dioxide expiration during the final three minutes of each fifteen
minute running task on a treadmill. SmO2 was measured using portable, wireless near-infrared
spectroscopy devices positioned on the calf and thigh. Vertical oscillation and ground contact time
were determined from a tri-axial accelerometer device. Skin temperature at the calf and thigh were

122
measured continuously. Ground contact time was shorter with compression (238 ± 20 ms) compared
with control (243 ± 19 ms) trials (P = 0.03), however no differences in RE, SmO2, vertical oscillation,
HR or skin temperature were revealed. Gait variability was calculated as the intra-individual standard
deviation of kinematic variables during the last 3 min of running. Wearing compression tights
decreases ground contact time but does not alter the energetics of running at a competitive race pace.
It appears the individual response to compression tights is most improved in participants with a low
vertical oscillation and exhibit less stride-to-stride variation in vertical oscillation.
7.3 Introduction
Wearing CGs during exercise has gained popularity within the last two decades [237]. World records
have been set by athletes donning compression garments, reinforcing the link between compression
clothing and elite performance [52]. Although the world records are undoubtedly the result of talent
and training, athletes choose to wear these garments in the belief they will aid performance.
Despite the popular use of CGs among elite and moderately trained athletes, the prevailing consensus
indicates only small improvements in time to exhaustion tasks (Hedges g = 0.27 ± 0.33) [4] or during
middle distance running (800 – 3000 m) (weighted mean improvement = 6.1 s) [69]. Wearing
compression garments during 5 and 10 km runs [52,60], 15 km trail running [71] and a marathon [64]
resulted in no ergogenic benefit. The type of garment used in these time-trial performance tests
included either stockings or socks and have not included full length tights. Compression tights have
been shown to improve variables related to running performance such as running economy [9], muscle
oxygenation [10] and running kinematics [80]. Intriguingly, when compression tights have produced a
positive effect, the recorded garment pressure was ~20 mmHg at the calf and 13 – 18 mmHg at the
thigh. Perhaps this is indicative of a required pressure threshold to elicit physiological and
biomechanical changes during endurance running. In support of this observation, a minimum pressure
threshold required to improve venous return of 17.3 mmHg at the calf and 15.1 mmHg at the thigh

123
was proposed [12]. At or above this pressure, compression may narrow superficial blood vessels and
modulate haemodynamic factors [142].
Running economy (RE) defined as the metabolic cost of travelling a given distance is a useful
indicator of endurance performance [168]. Referred to as a multifactorial measure, RE is influenced
by biomechanical, cardiopulmonary, metabolic and neuromuscular systems [110]. In heterogeneous
populations with varying V̇O2max values, a strong positive relationship exists between V̇O2max and
running performance. However, RE is an important determinant of performance among runners who
possess similar V̇O2max values [168]. The benefit of possessing a good RE is evident for elite [167] and
moderately trained individuals [238]. Marginal improvements in RE are directly associated with better
distance running performance and therefore strategies to improve energy cost are of great interest to
runners [238]. Compression tights are shown to elicit a positive effect on RE in recreationally trained
individuals above a relative exercise intensity of 77.7% V̇O2max (see Chapter 5). However, whether
compression tights improve RE at competitive running speeds requires further investigation.
The aim of the present study was to examine whether compression tights modified RE, substrate
utilization, kinematics and muscle oxygenation of moderately trained runners. Garment pressure was
targeted to achieve the minimal pressure threshold and RE assessment was completed at a speed that
corresponded to an individual’s most recent race time over 10k, half marathon or marathon distance.
7.4 Methods
7.4.1 Participants
Ethical approval was received from the University of Essex ethical committee. Participants provided
written informed consent in accordance with the Declaration of Helsinki. Thirteen male and five
female volunteers provided written informed consent before participation in the study (Table 7-1). All
participants were moderately trained runners and had completed a 10,000-m, half marathon or full
marathon within the previous 12 months. A moderately trained runner was defined as a runner who

124
had engaged in a systematic training program of endurance running for at least one year and
completing between 10 – 45 km·week-1. At the time of investigation, all participants were completing
≥3 training sessions a week and free from musculoskeletal injury within the one month previous.
Table 7-1 Descriptive characteristics of participants, training volume and best race performances in
previous 12 months (Mean ± SD).
Males (n=13) Females (n=5)
Age (years) 37.6 ± 10.0 39.2 ± 7.7
Height (m) 1.77 ± 0.07 1.65 ± 0.08
Body Mass (kg) 72.0 ± 8.5 59.8 ± 6.1
Weekly training distance in past 6 months (km)
Event average time
42.9 ± 18.4 27.4 ± 8.7
10,000 m (min:s) 41:33 ± 4:58 (n=9) 49:49 ± 3:30 (n=4)
Half marathon (hr:min) 1:38 ± 0:12 (n=10) 1:47 ± 0:12 (n=3)
Marathon (hr:min) 3:33 ± 0:20 (n=6) 3:35 (n=1)
Note: some participants (n=11) reported personal bests in more than one event
7.4.2 Compression Garments
Full-length compression tights covering the body from ankle to waist were used in the investigation
(Skins TM A400, Riverwood, Australia). Participants were required to wear two compression tights on
top of each other to achieve a target interface pressure of ~20 and ~15 mmHg at the calf and thigh
respectively. Garment size for both tights was selected in accordance with the manufacturer’s sizing
guide. The garments were made from warp knitted fabrics, with the fibre reported as 76% nylon and
24% elastane, fabric thickness as 0.57 ± 0.01 mm and fabric weight 199.33 ± 0.57 g/m2 (See Chapter 3
for fabric specification). The interface pressure exerted by the CGs were evaluated by the PicoPress®
(Microlabs, Italy) pressure monitor (coefficient of variation = <5% at 20 mmHg [1]). Pressure
measures were recorded at two anatomical locations (posterior orientation of the maximal calf girth

125
and anterior thigh at the mid-point between mid-trochanterion-tibiale laterale). The control condition
consisted of loose fitting running shorts, thereby providing a comparison between compression tights
and garments typically worn by recreational runners.
7.4.3 Experimental Design
Participants completed a single experimental session in a controlled laboratory environment
(temperature: 18 ± 1.0° C). In the 24 hours prior to testing, participants were asked to refrain from
exercise, caffeine and alcohol intake. As participants could not be blinded to wearing CGs, a
questionnaire was completed defining their a priori beliefs and experiences regarding compression
garments [94]. Two separate running tests took place during the session to assess the impact of
compression tights on energy cost, muscle oxygenation, running kinematics, heart rate and skin
temperature. Participants wore compression tights and control garments for each test in a randomised
and counterbalanced manner (Figure 7-1).
Body mass and stature was initially recorded using digital platform scales (SECA, Model 813,
Birmingham, UK) and a stadiometer (SECA, Model 213, Birmingham, UK). Skinfold thickness was
measured at the vastus lateralis and gastrocnemius of the dominant leg using skinfold callipers
(Harpenden HSK-BI, British Indicators Ltd, UK). Participants were then fitted with a heart rate
monitor, skin thermistors and two portable muscle oxygenation sensors. Participants performed 15
min supine rest on a medical examination bench prior to the exercise task. Each run test consisted of a
15 min run on a motorized treadmill (Quasar; HP Cosmos, Nussdorf, Germany) at a speed
corresponding to the individuals most recent 10 k, half marathon or marathon time. The calibrated
treadmill gradient remained at 1% throughout. Convective airflow was provided throughout the
running task by a fan (~400 mm diameter,~2 m·s-1) at a distance of 1 m in front of the treadmill.
Between each test, participants remained seated for 15 min followed by a further 15 minutes supine
with water available to consume ad-hoc. During each 15 min run test, heart rate, ground-contact time,
vertical oscillation, skin temperature, respiratory gases and indices of muscle tissue oxygenation were
measured continuously.

126
Figure 7-1 Schematic representation of experimental design. NIRS, near-infrared spectroscopy; HR,
heart rate; V̇O2, oxygen consumption; V̇CO2, expired carbon dioxide; GCT, ground contact time; Vert,
vertical.
7.4.4 Experimental Procedures
Cardiovascular measures
Throughout each run test, participants wore a dead-space mask with an impeller turbine assembly
(Hans Rudolph, Kansas, USA) and gas concentrations continuously sampled via a capillary line.
Concentrations were determined by electrochemical (O2) and infrared (CO2) analysers (Vyaire CPX,
Mettawa, Illinois, USA). Prior to each test, the gas analysers were calibrated with gases of known
concentration (16% O2 and 5% CO2), and ambient air. The digital volume transducer was connected to
the housing blower and calibrated automatically using both high and low flow parameters. Mean
oxygen consumption (V̇O2) and carbon dioxide production (V̇CO2) were averaged from second-by-
second data over the final 3 min of each run test. Second-by-second V̇O2 and V̇CO2 data were used to
determine running economy (RE) as caloric unit cost (kcal·kg-1·km-1), carbohydrate oxidation

127
(CHOOX) and fat oxidation (FATOX) (g·kg-1·km-1) using equations for moderate to high intensity (50-
75% V̇O2max) [173]. To ensure principally aerobic contribution to energy expenditure, we excluded
participants if respiratory exchange ratio (RER) >1.00 during the final 3 minutes of the submaximal
run. Both RE (kcal·kg-1·km-1) and V̇O2 (ml·kg-1·min-1) are reported, enabling comparison with
previously published data.
Heart rate (HR) was continuously monitored using a Garmin HR monitor (Forerunner 720XT, Garmin
Ltd, Schaffhausen, Switzerland). Mean HR was averaged from second-by-second data across the final
3 min of each run test.
Near-infrared spectroscopy
Muscle oxygenation was assessed using near-infrared spectroscopy (NIRS). The MOXY monitor
(Fortiori Design LLC, USA) reports physiologically credible changes in tissue oxygenation (SmO2)
and total haemoglobin (tHb), providing insight into the balance between oxygen supply and
consumption [239]. The MOXY employs four wavelengths of NIR light at 680, 720, 760, 800 nm
[230] and the sensor contains a single light emitting diode (LED) and two detectors in placed 12.5 and
25.0 mm from the source.
One device was positioned on the belly of the vastus lateralis midway between the greater trochanter
and the lateral epicondyle of the femur, the other at the maximal calf girth on the posterior aspect of
the gastrocnemius. To ensure the optodes and detector did not move relative to the participants’ skin,
the devices were fixed into position using a waterproof adhesive tape. In addition, bodily hair at or
around the sensor placement area was removed from the skin and participants were asked not to
moisturise the area on the day of testing. In the compression condition, 6 cm diagonal incisions were
made in the garments to expose the NIRS devices. Black crepe bandage was wrapped around the leg
to secure the NIRS devices and ensure that no external light would be received by the device
detectors. A portable pressure monitor (PicoPress, Microlabs, Italy) was used to ensure the pressure
applied by the bandage was equal to the pressure initially applied under the CGs (~20 mmHg = thigh;

128
15 mmHg = calf), thereby minimising the influence of additional unwanted pressure applied by the
bandage (Figure 7-2). In the control condition, bandage pressure was maintained at 8mmHg to
minimise ischemia induced changes in SmO2 and tHb [239]. During all testing, the system was
connected to a personal computer via a commercially available software programme (Peripedal ©) to
provide a graphic display of the data. Data acquisition (2 Hz) was obtained from the sensors internal
memory and data-sets were smoothed by calculating the 3 second moving average. Due to potential
differences in resting values between run tests, SmO2 was reported as a change from baseline. Baseline
SmO2 and tHb were established as the final 30 seconds of the 15-min supine rest period prior to each
run test. During each run test, the minimum SmO2 and tHb in the initial 1 min was identified (10-s
average) in addition to the final 1 min average at the end of the 15 min treadmill run. These values
were subtracted from the baseline to provide a delta (Δ) 1 min and Δ15 min value. The difference
between Δ1 min and Δ15 min value was calculated (Δdiff) to determine the muscle oxygenation
response for the final 14 minutes of the run task. To ensure sufficient optical density penetrating the
adipose layer, participants with an adipose tissue thickness (ATT) <15 mm were excluded from
analysis [240]. ATT was calculated as 0.5 × mean skinfold thickness.

129
Figure 7-2 Method to ensure interface pressure of garment is maintained despite cutting an incision
into fabric. Image for illustrative purposes showing NIRS device positioned at the vastus lateralis,
prior to crepe bandage application.
Running kinematics
Participants wore a heart rate strap equipped with a tri-axial accelerometer (HRM-Run; Garmin Ltd,
Schaffhausen, Switzerland). The strap was placed on the xiphoid process of the sternum. Output was
sent wirelessly to a wristwatch (Forerunner 920XT, Garmin International Inc., Olathe, KS) via a 2.4
GHz ANT+ system. Vertical oscillation and ground contact time (GCT) were calculated using the
proprietary algorithms of the Garmin Connect software [241], previously reported as valid and reliable
measures [242] compared with a motion-analysis system. Mean vertical oscillation (cm) and GCT
(milliseconds) were averaged from second-by-second data over the final 3 min of each run test.
Vertical oscillation and GCT variability was calculated as the standard deviation for an individual
during the final 3 min of the submaximal run.

130
Temperature measurement
Skin temperature (Tsk) was recorded throughout the run test by taping temperature sensors (Libra
medical Ltd, Model ET402, Ascot, Berks, UK) adjacent to the NIRS devices at the gastrocnemius
(calf) and vastus lateralis (thigh). Tsk was recorded each minute and 3 min averages calculated and
used for data analysis.
Subjective Questionnaire
Participants were asked seven dichotomous questions and answers were summed to give an overall
belief score [94]. Lower scores would indicate little or no experience with and negative opinions on
the effectiveness of CGs.
7.4.5 Statistical Analysis
Data are presented as mean and 95% confidence intervals (95% CI) for all dependent variables. Paired
differences between conditions for dependant variables were initially tested for normality using the
Shapiro-Wilk test. Analysis of RE, HR, SmO2, vertical oscillation and GCT was performed by a
paired samples t-test to measure potential significant differences between two means. To assess
differences in Tsk at different time intervals, a 2 x 5 repeated-measures ANOVA was conducted.
Fishers LSD test was used for post hoc pairwise comparisons. In addition, the magnitude of the
differences between each condition was calculated using Cohen’s d effect size with thresholds for
small, moderate and large effects as 0.2, 0.5, and 0.8 respectively. Pearson’s product-moment
correlation analysis was performed to examine the association between belief score and RE
differences between garment conditions. Statistical tests were processed using the statistical package
SPSS (Version 18) and Microsoft Excel (Microsoft Corporation TM, Redmond, WA, USA). The level
of statistical significance was identified by an alpha value of P < .05.

131
7.5 Results
The pressure applied by the compression tights was 17.8 [95% CI; 15.9 - 19.7] mmHg and 13.1 [95%
CI; 11.8 - 14.3] mmHg at the calf and thigh respectively. One participant recorded an RER > 1.00
during the 15 min treadmill run. As a consequence, all data acquired from that individual was removed
prior to analysis.
No difference was found for cardiovascular measures of RE, RER, V̇O2, HR (Table 7-2). In addition,
correlation analysis revealed no association between belief scores and changes in RE (r = .29; P =
0.27) (Figure 7-3). Figure 7-4 displays the change in running economy for each participant as a violin
plot. A difference was observed between garment conditions for GCT (t (16) = 2.34, P = 0.03),
indicating participants exhibited a shorter contact time with compression tights, however vertical
oscillation remained unchanged.
Table 7-2 Cardiovascular responses and running kinematics data during 15 min run with and without
compression tights (Mean [95% CI]).
Control Compression P-value d=
Cardiovascular parameters
RE (kcal·kg-1·km-1) 1.05 [1.01-1.10] 1.05 [1.02-1.09] 0.91 0.03
RER 0.92 [0.90-0.95] 0.92 [0.90-0.95] 0.69 0.10
V̇O2 (ml·kg-1·min-1) 41.9 [39.4-44.4] 42.1 [39.2-44.9] 0.69 0.10
CHOOX (g·kg-1·km-1) 2.60 [2.28-2.91] 2.59 [2.28-2.90] 0.88 0.04
FATOX (g·kg-1·km-1) 0.37 [0.23-0.51] 0.38 [0.25-0.51] 0.62 0.12
HR (bpm) 153 [145-160] 155 [150-160] 0.30 0.26
Running kinematics
Vertical oscillation (cm) 9.9 [9.0-10.8] 10.2 [9.2-11.1] 0.29 0.27
GCT (ms) 243.1 [233.0-253.2] 237.7 [228.0-247.3] 0.03* 0.57
Values shown as mean [95% CI]. * = statistically significant difference between conditions (P<0.05);
d = Cohen’s effect size; RE = caloric unit cost; RER = respiratory exchange ratio; V̇O2 = Oxygen
consumption; HR = Heart rate; GCT = Ground contact time. Mean [range] running speed the same in
both conditions = 11.9 [10.3 - 14.8] km·h-1.

132
Figure 7-3 Change in running economy (ΔRE) as a function of belief score. ΔRE calculated as control
minus compression. 95% confidence interval indicated by shaded area.
Figure 7-4 Violin plot showing the effects of compression tights on running economy (ΔRE). ΔRE
calculated as control minus compression. Median (dashed) and quartile (dotted) ranges displayed for
whole group. Individual data points presented for male (black) and female (grey) participants.
Compression produced heterogeneous responses in terms of ΔRE (ΔRE range -5.6 – 3.8%) (Figure 7-
4). Post hoc secondary analysis was conducted using participants with the greatest improvements

133
[responder] (n = 4; ΔRE range 1.9 – 3.8%) and decrements [non-responder] (n = 4; ΔRE range -5.6 – -
3.6) in RE to identify whether kinematic variables (vertical oscillation and GCT) explained the
individual response to compression tights. Table 7-3 shows responders had less vertical oscillation (d
= 1.30) and less variability in stride-to-stride vertical oscillation (d = 0.86). However, such large
differences were not observed with GCT between participants who improved RE and those who
worsened (Table 7-4). Intriguingly, participants with improved RE reported small increases in GCT (d
= 0.21) and stride-to-stride GCT variability (d = 0.42).
Table 7-3 Comparison of vertical oscillation (cm) and intra-individual variability (SD) during the
compression trial between responders and non-responders.
Responders
(n=4)
Non-responders
(n=4)
P-value d=
Vertical oscillation (cm) 9.6 ± 1.6 11.7 ± 1.8 0.12 1.30
Vertical oscillation variability 0.3 ± 0.1 0.5 ± 0.4 0.28 0.86
Values are mean ± SD
Table 7-4 Comparisons of ground contact time (ms) and intra-individual variability (SD) during the
compression trial between responders and non-responders.
Responders
(n=4)
Non-responders
(n=4)
P-value d=
GCT (ms) 232.4 ± 27.4 228.1 ± 10.2 0.78 0.21
GCT variability 3.5 ± 1.0 3.1 ± 1.0 0.58 0.42
Values are mean ± SD
Due to data signal drop out, SmO2 and tHb data were available for 14 participants at the vastus lateralis
and for 15 participants at the gastrocnemius. There were no differences in SmO2 and tHb between
garment conditions at any of the time points or the change (ΔDiff) between 1 and 15-min (Table 7-5 +
7-6).

134
For Tsk at the calf and thigh, there were significant main effects for time (p < 0.001) but not garment (p
= 0.11 and p = 0.62) or their interaction (p = 0.47 and p = 0.80) (Fig 7-5).
Table 7-5 SmO2 (%) data during 15 min run with and without compression tights.
Control Compression P-value d
Gastrocnemius (n=15)
Baseline 70.0 [62.8-77.3] 63.8 [55.3-72.3] 0.34 0.25
Δ1 min -45.9 [-52.9- -39.0] -44.7 [-53.6- -35.9] 0.84 0.06
Δ15 min -26.7 [-36.4- -17.1] -24.8 [-36.7- -12.9] 0.74 0.09
Δdiff 19.2 [12.0-26.4] 19.9 [13.0-26.8] 0.75 0.09
Vastus Lateralis (n=14)
Baseline 70.5 [63.9-77.1] 67.9 [61.3-74.5] 0.42 0.22
Δ1 min -35.0 [-39.7- -30.3] -30.5 [-35.9- -25.1] 0.15 0.41
Δ15 min -30.4 [-38.3- -22.5] -23.7 [-30.7- -16.6] 0.14 0.43
Δdiff 4.7 [-0.5-9.8] 6.8 [2.0-11.7] 0.31 0.28
Δdiff = difference between Δ1-min and Δ15-min value. Values are mean [95% CI].
Table 7-6 tHb (arbitrary units) data during 15 min run with and without compression tights.
Control Compression P-value d
Gastrocnemius (n=15)
Baseline 12.5 [12.2-12.8] 12.6 [12.3-12.8] 0.36 0.24
Δ1 min 0.0 [-0.12-0.12] -0.07 [-0.23- 0.09] 0.80 0.07
Δ15 min -0.08 [-0.23-0.07] -0.15 [-0.34- 0.04] 0.63 0.13
Δdiff -0.08 [-0.17-0.02] -0.08 [-0.19-0.02] 0.84 0.05
Vastus Lateralis (n=14)
Baseline 12.7 [12.5-12.9] 12.7 [12.5-13.0] 0.66 0.12
Δ1 min -0.11 [-0.21-0.0] -0.14 [-0.21- -0.08] 0.36 0.25
Δ15 min -0.07 [-0.21-0.07] -0.08 [-0.17- 0.01] 0.84 0.05
Δdiff 0.04 [-0.02-0.09] 0.07 [0.01-0.12] 0.12 0.44
Δdiff = difference between Δ1 min and Δ15 min value. Values are mean [95% CI].

135
Figure 7-5 The effects of compression garments on skin temperature of the calf (A) and thigh (B)
during 15 min race pace running. a Significantly Different to 3 min (P<0.05). b Significantly Different
to 6 min (P<0.05). c Significantly Different to 12 min (P<0.05).
7.6 Discussion
The current study investigated the influence of wearing compression tights on physiological
parameters during submaximal running at long-distance race speed. In the present investigation, no
difference in any cardiovascular, NIRS or skin temperature measure was revealed between garment
conditions. GCT was shorter with compression tights however vertical oscillation remained
unchanged.
Analysed as a whole group, RE was unaffected by wearing compression tights and consistent with
previous findings. Dascombe et al., [10] reported no change in RE or V̇O2 at speeds between 10 – 18
km·h-1 with well-trained middle-distance runners. The interface pressure reported at the calf (19
mmHg) and thigh (~14 mmHg) appear comparable with the present study; however pressure
assessment was conducted with the Kikuhime pressure monitor. Chapter 3 identifies a systemic bias in
the interface pressures reported by the Kikuhime, overestimating the values in comparison to the
PicoPress and a medical reference standard. It is likely that the garments applied an interface pressure
similar to that of the tights used throughout this thesis as the same brand (SKINS) were worn. It is

136
worthwhile noting that in the present study, two garments were worn simultaneously to achieve the
desired pressure threshold previously postulated [12]. However, adherence to this threshold did not
reveal changes in any cardiovascular parameter measured. Similarly, in well-trained runners and
triathletes, there was no effect of compression tights targeting an interface pressure of 20 mmHg on
V̇O2 during a 15 min run at 70% V̇O2max[58]. However, in this instance, interface pressure was not
directly measured so it remains unknown whether the targeted pressure of 20 mmHg was achieved.
The current findings support the literature regarding compression tights having no effect on RE or any
other cardiovascular measures in moderately trained runners. Participants were required to run at a
pace of their recent best time in 10,000 m, half marathon or marathon distance. It is conceivable that
this competition pace is a speed that participants regularly train at and therefore athletes are already
“most” economical at this intensity[243]. In support of this, Varela-Sanz et al.,[81] reported no change
in V̇O2 at half-marathon pace with compression stockings, suggesting that athletes already select the
most economical locomotion style at competition pace and deviating from this style will likely result
in significant decrements in RE.
7.6.1 Variation in Running Economy
Small improvements in RE are associated with better running performance. As little as 1% change in
submaximal V̇O2 is reported to have significant performance implications [6,109]. The present study
included both male and female participants grouped together. Interestingly, when analysed separately,
males report a mean increase of 1.2% in V̇O2 with compression tights, whereas the five female
participants reduced V̇O2 by 2.4% (Figure 7-2). Previously reported intra-individual variation of
oxygen cost in moderately trained runners at 88% of the lactate breakpoint was 2.0% [166].
Furthermore, female distance runners reported a variation in V̇O2 between 1.4 – 2.2% at speeds
between 11.2 – 14.8 km·h-1 [244]. The change observed among female participants in the present
study is greater than previously reported intra-individual variation. This suggests that the observed
change may be of practical benefit and requires further investigation with an adequately powered
study. If the influence of compression tights on running economy differs between male and female

137
runners, this could be associated with gender differences in lower extremity mechanics during running
[122].
7.6.2 Fabric Considerations
It is widely reported that CGs can positively influence physiological parameters such as blood flow
velocity [3] and proprioceptive capability [237]. However, an overlooked area associated with
compression clothing is the additional mass of garments, thereby adding an increased metabolic cost.
The additional weight of a garment may negate any potential benefit caused by increased transmural
pressure and stimulation of mechanoreceptors brought about by compression. Previous studies show
an added shoe mass of ~100g per shoe increases metabolic rate by 1% [245,246]. It is conceivable that
the total mass of the two garments (~350g) worn in the present study may have degraded running
economy.
7.6.3 Subjective Measures
The participants perception of CGs may influence the individual response [163]. Belief in sports
compression did not influence ΔRE. This is unsurprising given the majority of participants (n = 13)
reported positive belief scores (score range 3 – 7), with only one participant showing negative
responses (score range -7 – -3) and three exhibiting neutral responses (score range -2 – 2). In contrast,
Stickford et al.,[94], reports an inverse correlation between belief scores and changes in V̇O2,
revealing that highly trained distance runners reporting more positive feelings about CGs produced
greater decrements in submaximal V̇O2 when compression stockings were worn. Dramatic placebo
effects have been previously reported with athletic footwear, influencing vertical jump
performance[247] and following an induced expectation, a sleeveless compression top reduced
participants perception of exertion during a cycling task. It remains unknown whether an induced
expectation or treatment expectation can bring about changes in RE.
7.6.4 Cardiac Parameters
No significant garment effect on heart rate during submaximal exercise was observed in the present
study. This observation is in agreement with previous investigations, who reported that heart rate is

138
unaffected by compression tights when running at 110% V̇O2max [248], or with compression stockings
during a 10km time trial [52]. In addition, a recent meta-analysis revealed that CGs have little to no
influence on cardiac parameters such as heart rate, cardiac output or stroke volume (g = 0.08 ± 0.37)
[4]. Despite reported increases in venous flow velocity and venous return when compression is applied
at rest, increased cardiac output due to exercise is likely to supersede minor changes to flow velocity
caused by compression. This is perhaps indicative of the effectiveness of skeletal muscle pumps and
venous valves during continuous dynamic exercise [93].
7.6.5 Skin Temperature
Skin temperature was not different between garment conditions at the gastrocnemius or vastus lateralis
at any time point during the exercise task. This is of particular interest considering participants wore
two compression tights and previous investigations have reported higher skin temperatures under
single layer CGs [72,93]. A noteworthy increase in skin temperature (~1°C; d = 0.48) was observed
at the gastrocnemius after three minutes of exercise; however the between-garment difference
diminished as the duration of exercise continued. Elevated skin temperatures associated with
compression clothing are traditionally attributed to lower air circulation and convection, thereby
reducing heat dissipation. However it is plausible that the convective air-flow and fabric properties
mitigate potential changes in skin temperature. Indeed, in the present study, the skin thermistors were
placed at an anterior (vastus lateralis) and posterior (gastrocnemius) orientation. The convective air
flow delivered by the fan may explain the difference in skin temperature between measuring locations.
It is suggested that thermal effects may be more pronounced during prolonged high-intensity or
intermittent exercise, without constant air-flow, however further research is required to substantiate
this theory [93].
7.6.6 Muscle Oxygen Saturation
This is the first study to investigate the influence of CGs on muscle oxygen saturation at two locations
simultaneously. In doing so, it is possible to report on specific oxygenation differences that are not
detectable by a single NIRS measure or global oxygenation assessment. The pattern of muscle oxygen

139
saturation followed a similar pattern at both locations to those previously reported [105]. A rapid
decrease in muscle oxygenation was observed following the onset of exercise, followed by a slow
linear increase. However, in agreement with earlier studies [10,61], no differences between clothing
conditions were observed in muscle oxygen saturation during exercise. During a 15.6 km trial run,
Vercruyssen et al., [61] showed no effect of compression stockings on vastus lateralis oxygen
saturation, however the NIRS probe was not positioned where compression was applied, therefore
the authors could only conclude that compression stockings have no effect on systemic measures
of muscle blood flow and oxygen saturation. Furthermore, Dascombe et al, [10] report no
difference in vastus lateralis muscle oxygenation at running speeds of 12 and 14 km·h–1 when
compression tights are worn, but do report an increased oxygen saturation at 10, 16 and 18 km·h–1.
Several studies have reported positive effects of compression clothing on measures of muscle
oxygen saturation [10,38,105], however these studies include heel-raise exercise [105] or
measures are only obtained during rest periods [59]. Muscle oxygen saturation is determined by
two predominant factors; the oxygen delivery rate and oxygen consumption. Measures of tHb
obtained by NIRS provide a surrogate measure of tissue blood flow [249] and reflect changes to
local blood volume. In the present study, compression tights did not alter total haemoglobin,
indicating that muscle blood volume is unchanged at rest and during exercise between clothing
conditions. However, obtaining NIRS measures during an arterial occlusion of the leg would
provide a greater insight into muscle blood flow. It is not feasible to perform repeated arterial
occlusions during exercise; therefore assessment of local oxygen delivery and consumption has
previously been conducted immediately post-exercise, assuming the metabolic demand is the
equivalent to the final stages of an exercise protocol [250]. Future investigations should implement an
arterial occlusion protocol during brief rest intervals throughout steady state exercise to elucidate on
flow and consumption changes with compression tights.

140
7.6.7 Running Kinematics
The present study was the first to investigate the influence of compression tights on running
kinematics. Previous studies have included compression stockings only [81,84,94] or a combination of
calf and thigh sleeves [160] and reported higher leg stiffness, lower contact time and lower stride
length during constant rate running [84,160]. The present study revealed no differences in vertical
oscillation, however in support of Kerherve et al., [84], a shorter GCT was observed with
compression. Cardiovascular parameters during submaximal running are affected by various factors,
including running kinematics, such as vertical oscillation and GCT [251,252]. However, evidence
appears equivocal regarding the association between GCT and RE, with several authors reporting
either no relationship [253–255], improved RE with longer GCT [256] or improved RE with shorter
contact time [257]. In the current study, a shorter GCT with compression tights caused no measurable
change in RE. The change in contact time may be a result of decreased range of motion at the hip or
knee joint, reducing stride length and contact time. Compression shorts decreased the range of motion
(ROM) at the hip joint at rest, laying supine [75] and during a 60 m sprint [74]. Logically, decreases in
ROM are only observed at the joints covered by the garment. By compression tights covering both the
hip and knee joint, garments of this type offer the greatest opportunity to alter running gait. However,
future research is required to explore whether decreases in ROM are observed at submaximal running
speeds with compression tights.
No changes in mean vertical oscillation were revealed. However, there was substantial inter-individual
variation in the metabolic response to compression that warrants further investigation. Post hoc
analysis was conducted to determine if any characteristics of running mechanics may explain the
individual response to compression tights. When participants are grouped according to changes in RE,
those with the greatest improvement in RE had a lower overall vertical oscillation and vertical
oscillation variability. A reduction in vertical oscillation and stride-to-stride variability may improve
RE due to a lower vertical impulse and the body performing less work against gravity [258,259].
7.6.8 Interface Pressure Considerations

141
Target interface pressures were selected in accordance with recommendations associated with
improved venous return [12], whereas garments pressures shown to influence running mechanics
appear to be higher. Future investigations should assess the influence of compression tights on running
economy applying an interface pressure of ~23 – 33 mmHg around the calf and ~20 mmHg around the
thigh [84,160]. Fortunately, both studies used to inform this target threshold utilised the PicoPress
pressure monitor, providing greater confidence in the precision of the pressure values proposed.
7.6.9 Limitations
The current study was designed to investigate the influence of compression tights at competition
speed. However, in doing so, the participants running speed was determined from recent performances
over 10 km, half- or full marathon. In Chapter 5 a relationship between the influence of compression
tights and relative exercise intensity was reported. Yet, by asking participants to run at speeds
associated with race performance of three varying distances, it is likely that the relative exercise
intensity of participants was varied and possibly fell outside the previously observed range purported
to respond positively to compression. Despite this, the current study confirms compression tights do
not improve running economy at speeds associated with long distance races.
7.7 Conclusion
This study shows for the first time that wearing compression tights while running at speeds associated
with competition pace reduces ground contact time. However, running economy, skin temperature,
muscle oxygen saturation and vertical oscillation are not modified. There is evidence that the
individual response to wearing compression tights varies greatly and could be associated with
kinematic variables such as vertical oscillation. In order to explore the relationship between changes in
running economy with compression tights and running gait parameters, future studies should select
garments with interface pressures previously shown to alter running kinematics (~20 – 33 mmHg)
rather than pressure thresholds that may influence blood flow (15 – 17 mmHg).

142
8 Summary
Lower limb graduated compression garments are an effective adjunct in the management of diseases
of venous deficiency [89], with evidence to suggest that mechanically increasing transmural pressure
causes a reduction in venous stasis, hypervolemia and cross-sectional vein diameter [96,260]. Since
these early investigations, interest in the efficacy of sports compression garments has grown. Despite
the number of sports compression studies, the absence of a common consensus of how to measure
garment interface pressure limits the cross-study comparisons that can be made regarding garment
performance. Establishing a preferred pressure measuring device and assessment method is crucial for
the progression of sports compression literature. Chapter 3 investigated the criterion validity of
portable devices capable of measuring interface pressure, identifying a suitable device for the
subsequent intervention studies.
The literature review revealed few reproducible findings in support of acute performance
improvement. The equivocal results previously reported may be linked to the heterogeneity of
garments investigated [3,36,67,68]. It became evident that compression garments may produce small
improvements in some performance measures (time to exhaustion [4]; 800 – 3000 m [69]) and
physiological parameters (running economy [4]). Given the heterogeneity of the garments
investigated, and the small yet notable improvement in running economy, it is plausible that factors
such as garment type, interface pressure, exercise modality and exercise intensity influence the
efficacy of CGs. This thesis focuses on the influence of compression tights, intentionally selecting a
garment that covers the full leg musculature and the hip and knee joints. In doing so this provides the
greatest opportunity for the garment to interact with various physiological systems (cardiovascular,
haemodynamic, mechanacoreceptive and biomechanical). The influence of compression tights on
running economy was investigated, exploring the effect of garment interface pressure in Chapter 4 and
relative exercise intensity in Chapter 5. Chapter 7 explored the influence of compression tights on
running economy at a competitive race speed. Within this investigation, a NIRS device validated in

143
Chapter 6 was used to monitor muscle oxygen saturation. The main findings of the thesis were as
follows;
1) When compared with a medical reference standard, the PicoPress pneumatic pressure
measuring device satisfied a priori thresholds at the posterior and lateral orientation with
lower limb sports compression garments. Conversely, the Kikuhime did not satisfy
thresholds for acceptable validity at any orientation, overestimating the pressure compared
with a reference standard. These findings indicate that practitioners and researchers can
confidently compare interface pressures obtained with the PicoPress against values reported
with medical compression hosiery. The study also reports the physical properties of the
compression tights used throughout this thesis (Chapter 3).
2) Correctly fitted compression tights applying a low level of interface pressure (ankle = 3.1 ±
1.3; calf =10.5 ± 3.1; thigh = 6.7 ± 0.6 mmHg) caused a small, likely beneficial improvement
(95%:5%:0%; η2 = 0.55) in running economy at 60% vV̇O2max. In contrast, oversized
compression tights applying a lower level of interface pressure (ankle = 1.3 ± 0.9; calf = 9.1 ±
2.7; thigh = 3.8 ± 1.1 mmHg) did not improve running economy. These results indicate that
compression tights applying a specific interface pressure produce a meaningful improvement
in running economy of moderately trained individuals (Chapter 4).
3) The extent in which compression tights improve running economy is dependent on relative
exercise intensity (r= -0.501, P<0.01). Expressed as caloric unit cost, running economy was
improved by compression tights (d=0.93) at high relative exercise intensities (77.1-91.5%
V̇O2max), whereas no effect was observed below this intensity range. This further elucidates
the specific exercise conditions whereby compression tights might improve running economy
(Chapter 5).
4) A recently developed low-cost NIRS device (MOXY) produced physiologically credible and
comparable measures during rest and exercise against an established PortaMon system. The
MOXY is most suited for individuals with a small adipose layer thickness (<7 mm) and when

144
the external pressure holding the device in place is below 20 mmHg. When these conditions
are met, the MOXY produces reliable resting measures of muscle oxygen saturation
(coefficient of variation = 5.7 - 6.2%). Furthermore, decreases in saturation during isometric
exercise, arterial occlusion and dynamic arm crank exercise are strongly correlated between
devices. The MOXY provides a lightweight option to monitor muscle oxygen saturation
during dynamic exercise (Chapter 6).
5) Wearing compression tights decreases ground contact time (P = 0.03) but does not alter
running economy (P = 0.91), SmO2 (P = 0.15-0.84), vertical oscillation (P = 0.29), HR (P =
0.30) or skin temperature (P = 0.47-0.80) at a competitive race pace. It appears the individual
response to compression tights is most improved in participants with a low vertical oscillation
and exhibit less stride-to-stride variation in vertical oscillation (Chapter 7).
8.1 Empirical and practical implications of the findings
8.1.1 Measuring interface pressure with a portable pressure device
Reporting garment interface pressure is critical to enable comparative assessment of study findings. In
order to further understand the bio-physical impact of interface pressure on physiological parameters
and sports performance, optimal methods to measure in vivo pressure must be established. There are
many measuring instruments (HOSY, PicoPress, Kikuhime, etc.) and methods (in vivo, assessment of
fabric properties, etc.) that can be used to obtain the pressure profile of a compression garment.
Despite guidelines published in 2006 alluding to a range of suitable portable pressure devices for in
vivo assessment [34], the comparison of the PicoPress and Kikuhime device in this thesis is the first
study to compare multiple portable devices with a medical reference standard (HOSY). Indeed, the
concluding remarks of Hegarty et al., [261] drew attention to this, stating that ‘future research must
include the HOSY or other methods of measuring pressure. This will allow the point measurements
from different devices to be matched and verified using an independent, continuous data-set, and
correction factors’. Additionally, the authors suggest that ‘discrepancies between the predicted

145
pressures and on-body techniques need to be further studied. This should include testing at different
points along the circumference of the limb with different sensor geometries.’
Chapter 3 found clear discrepancies between the interface pressures reported by two common devices.
Analysis revealed the PicoPress is a suitable pneumatic pressure monitor, whereas the Kikuhime
systemically overestimates interface pressure regardless of anatomical orientation. Interestingly, this
investigation also revealed that the water-column method previously used to assess device accuracy
and reproducibility [2] is insufficient at identifying systemic bias during in vivo assessments. Chapter
3 informs future research and international standardization, revealing a valid measurement device and
assessment location(s). In light of the results, the PicoPress device was used throughout the thesis,
featuring in all subsequent chapters.
8.1.2 The comparison of wireless NIRS devices
NIRS is a simple, non-invasive method for measuring the presence of oxygen in muscles and other
tissues in vivo [262]. In Chapter 6, a recently developed low-cost NIRS device (MOXY) was
compared against an established PortaMon system that makes use of the spatially resolved
spectroscopy (SRS) algorithm, widely used in sports science and physiology research. The
development of new NIRS device technology has taken near-infrared physiological monitoring out of
the laboratory and into an applied sport setting. However, prior to widespread use, researchers and
practitioner must be confident in the validity, reliability and accuracy of new technology. This is the
first study to report the influence of increasing external pressure on measures of muscle oxygen
saturation. Importantly, it was found that above a pressure threshold (>20 mmHg), the MOXY device
reports lower SmO2 values. It is likely that the MOXY is more sensitive to pressure-induced changes
in the dermis and subcutaneous oxygenation and blood flow due to a smaller source:detector
separation and the proprietary spatial resolution algorithm. This novel finding is the first to provide
specific guidance regarding the application of the MOXY to minimise test-retest variation. Subsequent
to the publication of Chapter 6, the manufacturers of the MOXY developed a ‘light shield’ capable of
not only preventing unnecessary light from interfering with the measurements, but also providing a

146
means of controlling the pressure applied once attached to an individual. Furthermore, the
investigation reports the test-retest reliability at rest and during isometric leg extension exercise of the
MOXY and PortaMon device. This study is significant because the use of non-invasive methods to
track and optimise training intensity, such as NIRS, is of increasing interest to coaches, athletes and
scientists, yet data is lacking regarding the reliability of the MOXY device, nor has its performance
been previously compared with alternative NIRS systems. Collectively, the results of Chapter 6 reveal
the MOXY monitor is capable of producing valid measures of muscle oxygen saturation at rest and
under a range of dynamic conditions. Given that the MOXY produces physiologically credible
measures and is ~43% lighter than the PortaMon, the device was used in Chapter 7 as a means of
measuring muscle oxygen saturation during submaximal running.
8.1.3 The influence of compression on running economy
The fundamental contribution of running economy to endurance running performance is widely
acknowledged [238,246]. Strategies to enhance an athletes RE should be a primary objective for
individuals who compete at distance running, including both moderately trained ‘weekend warriors’
and elite athletes alike. Current literature suggests that enhancing RE is achieved through the inclusion
of 6-14 weeks of explosive strength and plyometric training [167,263], however contrary to popular
belief, these findings are equivocal and highlight that such interventions are far from robust [263].
Chronic training interventions require time and the partial replacement of endurance training sessions.
If acute strategies are capable of improving running economy, this would be of significant interest to
athletes and coaches as they would require little to no time or replacement of training sessions in order
to implement. Lower limb compression garments are an example of an acute strategy previously
shown to cause small improvements in running economy [4,9,81,94]. However there was little
evidence to indicate the specific garment type or applied interface pressures required to achieve
meaningful improvements in RE. In Chapter 4, small, likely beneficial improvements in RE are
reported with low-pressure sports compression tights, applying the greatest interface pressure at the
calf. Additionally, it appears that tights must apply an interface pressure above a particular threshold

147
to elicit the observed improvement in RE. Previous studies have identified a dose response
relationship with physiological [10,12] and kinematic variables [160], however this was the first study
to find compression tights improved RE, while also reporting interface pressures obtained in vivo.
Wearing non-graduated, low pressure (<15 mmHg) compression tights during submaximal running
leads to an improved RE (+3.2%) at a relative intensity of ~80% V̇O2max.
Chapter 4 identified garment type, pressure gradient and associated interface pressures capable of
improving RE. Chapter 5 demonstrated that the influence of compression tights on RE was dependant
on relative exercise intensity. Furthermore, in this chapter, RE is reported as energy cost (caloric unit
cost; kcal·kg-1·km-1), which accounts for substrate dependent variations in energy equivalent of a
volume of oxygen [11]. This is the first study to reveal that CGs improve RE at high relative exercise
intensities but not lower (</>77.7% V̇O2max), reporting a mean improvement of 2.8% between 77.7-
91.5% V̇O2max.
During a marathon, participants perform at a speed equivalent to approximately 60 – 75% V̇O2max
[264]. Furthermore, recreational runners are reported to complete a half marathon at a relative exercise
intensity between 75 - 85% V̇O2max [164]. Perhaps the most practically relevant question of the thesis
is whether compression tights can alter RE at competitive long distance race speeds which runners
frequently train at. Despite increasing the interface pressure applied to the lower limbs in accordance
with recommendations associated with improved venous function, no difference was reported in RE
between clothing conditions (Chapter 7). It is plausible that moderately trained runners are already
‘most’ economical at race speed and therefore casts doubt on the usefulness of compression tights
acutely benefiting an endurance runner. Chapter 7 represents the first study to investigate the influence
of compression tights on running kinematics, revealing a shorter ground contact time during the final 3
min at competition speed. Furthermore, substantial inter-individual variation in running economy was
observed with compression (ΔRE range -5.6 – 3.8%), indicating that individuals who possess a lower
overall vertical oscillation and stride-to-stride variability may benefit from compression tights.
Throughout chapters 4, 5 and 7 the typical improvement in RE with compression tights is between 2 –

148
4%. Acute interventions that potentially augment RE are important, as small changes in RE are
associated with improvements in running performance [246]. Nevertheless, intra-individual variation
of RE ranges between 1.9-3.1% in well controlled studies using moderately trained participants
[166,265]. Only when changes in running economy exceed the typical error can we confidently
interpret a meaningful change [177]. The thesis reveals that only in specific garment and exercise
intensity conditions can compression tights improve RE. However, the magnitude of this improvement
is likely to be small. In addition, the improvements in RE are likely to only be observed at unfamiliar
running speeds. Pereira et al., [166] stated that optimum stride length is easier to identify and more
consistent at a familiar speeds. Indeed, Chapter 7 confirms that compression tights produce no
improvement in RE when participants ran a competitive race pace.
8.2 Limitations
A number of limitations within the present work must be acknowledged. Chapter 3 compares two
portable pressure monitors with a medical reference standard. The comparisons made throughout this
investigation were focused on the garment pressure applied at the calf. It is unknown how the devices
perform at any other location such as the ankle or thigh. Thomas [133] revealed that sensor accuracy
of both the PicoPress and Kikuhime are proportional to the circumference of the cylinder to which it is
applied. At smaller circumferences, the portable devices overestimate the pressure applied, due to the
sensors undergoing greater deformity to conform to the curvature. In light of this, it is expected that
ankle interface pressure obtained by the PicoPress and Kikuhime will be higher than that reported by
the HOSY. Conversely, measures at the thigh location should align closer with values obtained using a
medical reference standard due to the larger circumference.
Throughout the thesis the same type of compression garment has be investigated (SKINS, A400 long
tights). Lee et al., [266] found that subtle changes to the level of interface pressure and fabric
composition were capable of influencing the kinematics and kinetics during drop jump landing. Given
that biomechanical responses are garment specific, extrapolating the current results across alternative

149
compression garments should be conducted with caution. Furthermore, the compression tights in the
thesis delivered non-graduated pressure, with the highest interface pressure recorded at the calf. The
medical compression literature clearly indicates that graduated compression is required to have the
greatest benefit on minimising venous stasis and increasing venous blood flow velocity. It is plausible
that graduated compression may influence haemodynamic parameters to a greater extent than non-
graduated during exercise. Sports compression garments often apply low interface pressures at the
ankle, increasing upwards and peaking at the maximum calf girth [36]. This is most likely a
commercial decision driven by consumer demand for garment comfort and ease of donning.
Chapter 5 reveals the influence of compression tights on running economy varies by relative exercise
intensity. This finding was established by analysing the participants RE response at a speed equivalent
to 60-65% vV̇O2max. Retrospective analysis revealed the reported relationship between exercise
intensity and RE response. In this instance, data was not obtained by implementing a repeated
measures design, requiring participants to run at multiple relative exercise intensities i.e. 60, 70, 80
and 90% V̇O2max. By conducting a research design in this manner, it will be possible to elucidate the
present findings.
In Chapter 7 the individual response to wearing compression tights when running at a competitive race
speed varied greatly, yet when analysed as a group, no improvement in RE was observed. It is possible
that the individual response was related to the relative exercise. However, it was not possible to
explore this relationship as participants did not complete a preliminary V̇O2max assessment to establish
relative V̇O2 uptake.
8.3 Future research directions
A vast majority of the sports compression literature has been conducted with male participants.
Chapter 7 revealed that changes in RE among female participants (n=4) was greater than previously
reported intra-individual RE variation. However, this observation lacks statistical power and future

150
research should look to investigate the female response to compression tights with an adequately
powered study. This is particularly relevant due to sex differences in lower extremity mechanics
during running [122].
Lower limb compression garments applying an interface pressure between 20 – 30 mmHg change
running gait variables to a greater extent than those with lower pressures [160]. Chapter 7 reveals a
possible interaction between running kinematics and RE economy changes with compression. This
raises the question whether compression tights with a higher interface pressure (20 – 30 mmHg) would
produce a greater improvement in RE than that observed in the thesis. To achieve these pressures, it is
recommended that single layer garments are identified rather than layering garments on top of one
another as was performed in Chapter 7. This would minimise the additional garment weight thought to
possibly hinder the ergogenic potential of compression on running mechanics.
8.4 Conclusion
The work contained in this thesis has progressed three distinct areas.
(1) The PicoPress provides a valid measure of interface pressure at the posterior and lateral location of
the calf. This finding contributes towards international standardization by identifying a portable
pressure sensor and assessment location capable of replicating pressure values established from a
reference standard. This is an important finding given the low-cost and speed in which garment
pressure can be determined using a portable pressure monitor when compared with indirect methods.
(2) The MOXY and PortaMon NIRS devices produce physiologically credible measures of muscle
oxygen saturation during supine rest and demonstrate a similar trend during dynamic exercise.
However, the use of the MOXY device should be limited to individuals with a low adipose tissue
thickness and the external pressure applied to hold the device in place is either standardised upon each
application or kept below 20 mmHg.
(3) Sports compression tights produce small improvements in RE when garments are correctly fitted,
apply a low level of interface pressure and relative exercise intensity is high. The benefits of

151
compression appear diminished when participants run at a competitive race pace and therefore it is
questionable to what extent compression tights can meaningfully contribute toward improved RE and
ultimately better endurance running performance.

152
9 References
[1] Partsch H, Mosti G. Comparison of three portable instruments to measure compression
pressure. Int Angiol 2010;29:426–30.
[2] Brophy-Williams N, Driller MW, Halson SL, Fell JW, Shing CM. Evaluating the Kikuhime
pressure monitor for use with sports compression clothing. Sport Eng 2013;17:55–60.
https://doi.org/10.1007/s12283-013-0125-z.
[3] MacRae MBA, Cotter JD, Laing RM. Compression garments and exercise. Sport Med
2011;41:815–43.
[4] Engel FA, Holmberg H-C, Sperlich B. Is there evidence that runners can benefit from wearing
compression clothing? Sport Med 2016;46:1939–52. https://doi.org/10.1007/s40279-016-0546-
5.
[5] Bassett JR DR, Howley ET. Maximal oxygen uptake:" classical" versus" contemporary"
viewpoints. Med Sci Sport Exerc 1997;29:591.
[6] Di Prampero PE, Capelli C, Pagliaro P, Antonutto G, Girardis M, Zamparo P, et al. Energetics
of best performances in middle-distance running. J Appl Physiol 1993;74:2318–24.
https://doi.org/10.1152/jappl.1993.74.5.2318.
[7] Conley DL, Krahenbuhl GS. Running economy and distance running performance of highly
trained athletes. Med Sci Sport Exerc 1980;12:357.
[8] Sperlich B, Haegele M, Achtzehn S, Linville J, Holmberg H-C, Mester J. Different types of
compression clothing do not increase sub-maximal and maximal endurance performance in
well-trained athletes. J Sports Sci 2010;28:609–14.
[9] Bringard A, Perrey S, Belluye N. Aerobic energy cost and sensation responses during
submaximal running exercise-positive effects of wearing compression tights. Int J Sports Med
2006;27:373–8. https://doi.org/10.1016/s0162-0908(08)70114-4.
[10] Dascombe BJ, Hoare TK, Sear JA, Reaburn PR, Scanlan AT. The effects of wearing
undersized lower-body compression garments on endurance running performance. Int J Sport
Physiol Perform 2011;6:160–73. https://doi.org/10.1123/ijspp.6.2.160.
[11] Fletcher JR, Esau SP, MacIntosh BR. Economy of running: beyond the measurement of
oxygen uptake. J Appl Physiol 2009;107:1918–22.
https://doi.org/10.1152/japplphysiol.00307.2009.
[12] Watanuki S, Murata H. Effects of wearing compression stockings on cardiovascular responses.
Ann Physiol Anthropol 1994;13:121. https://doi.org/10.2114/ahs1983.13.121.
[13] Stanton JR, Freis ED, Wilkins RW. The acceleration of linear flow in the deep veins of the
lower extremity of man by local compression. J Clin Invest 1949;28:553.
[14] Halperin MH, Friedland CK, Wilkins RW. The effect of local compression upon blood flow in
the extremities of man. Am Heart J 1948;35:221–37.
[15] Cullum N, Nelson EA, Fletcher AW, Sheldon TA. Compression for venous leg ulcers.
Cochrane Libr 2006.
[16] Cooke EA, Benkö T, O’Connell BM, McNally MA, Mollan RAB. The effect of graduated
compression stockings on lower limb venous haemodynamics. Phlebology 1996;11:141–5.
[17] Clarke MJ, Broderick C, Hopewell S, Juszczak E, Eisinga A. Compression stockings for
preventing deep vein thrombosis in airline passengers. Cochrane Database Syst Rev 2016.
153
[18] Jones NAG, Webb PJ, Rees RI, Kakkar V V. A physiological study of elastic compression
stockings in venous disorders of the leg. Br J Surg 1980;67:569–72.
[19] Ibegbuna V, Delis K, Nicolaides AN. Effect of lightweight compression stockings on venous
haemodynamics. Int Angiol a J Int Union Angiol 1997;16:185–8.
[20] Byrne B. Deep vein thrombosis prophylaxis: the effectiveness and implications of using below-
knee or thigh-length graduated compression stockings. Hear Lung 2001;30:277–84.
[21] Clark DE, Demers ML. Lower body positive pressure. Surg Gynecol Obstet 1989;168:81–97.
[22] Chen D, Liu H, Zhang Q, Wang H. Effects of mechanical properties of fabrics on clothing
pressure. Przegląd Elektrotechniczny 2013;89:232–5.
[23] Thomas S, Fram P. An evaluation of a new type of compression bandaging system. World
Wide Wounds 2003:1–14.
[24] Lymphoedema Framework. Compression hosiery in lymphoedema. n.d.
[25] 661210:2018 B. British Standards Institution (2018). 661210; Graduated compression hosiery,
anti-embolism hosiery and graduated support hosiery. Specification. n.d.
[26] RAL-GZ 387/1. Medical compression hosiery. Deutsches institut für gütesicherung und
kennzeichnung. Berlin: E.V. Beuth Verlag; January 2008 2008.
[27] ASQUL. ASQUL (1999). Certificat de qualite-produits. Referentiel technique prescript pour
les otheses elastiques de contention des members. Paris. n.d.
[28] Clark M, Krimmel G. Lymphoedema and the construction and classification of compression
hosiery. Lymphoedema Fram Template Pract Compression Hosiery Lymphoedema London
MEP Ltd 2006:2–4.
[29] Cornu-Thenard A, Benigni J-P, Uhl J-F. Terminology: resistance or stiffness for medical
compression stockings? Veins Lymphat 2013:e4–e4.
[30] Cornu-Thenard A. Measuring units for elastic stockings: priority to mmHg rather than classes.
Phlebologie 1992;45:455–8.
[31] Macintyre L, Baird M, Weedall P. The study of pressure delivery for hypertrophic scar
treatment. Int J Cloth Sci Technol 2004.
[32] van den Berg E, Borgnis FE, Bolliger AA, Wuppermann T, Alexander K. A new method for
measuring the effective compression of medical stockings. Vasa 1982;11:117–23.
[33] Gaied I, Drapier S, Lun B. Experimental assessment and analytical 2D predictions of the
stocking pressures induced on a model leg by Medical Compressive Stockings. J Biomech
2006;39:3017–25. https://doi.org/https://doi.org/10.1016/j.jbiomech.2005.10.022.
[34] Partsch H, Clark M, Bassez S, Benigni J-P, Becker F, Blazek V, et al. Measurement of lower
leg compression in vivo: recommendations for the performance of measurements of interface
pressure and stiffness. Dermatol Surg 2006;32:224–33. https://doi.org/10.1111/j.1524-
4725.2006.32039.x.
[35] Ferguson-Pell M, Hagisawa S, Bain D. Evaluation of a sensor for low interface pressure
applications. Med Eng Phys 2000;22:657–63.
[36] Beliard S, Chauveau M, Moscatiello T, Cros F, Ecarnot F, Becker F. Compression garments
and exercise: no influence of pressure applied. J Sports Sci Med 2015;14:75.
[37] MacRae BA, Laing RM, Partsch H. General considerations for compression garments in
sports: Applied pressures and body coverage. Compression garments Sport. Athl. Perform.
Recover., Springer; 2016, p. 1–32.

154
[38] Scanlan AT, Dascombe BJ, Reaburn PR, Osborne M. The effects of wearing lower-body
compression garments during endurance cycling. Int J Sports Physiol Perform 2008;3:424.
[39] Ali A, Creasy RH, Edge JA. Physiological effects of wearing graduated compression stockings
during running. Eur J Appl Physiol 2010;109:1017–25. https://doi.org/10.1007/s00421-010-
1447-1.
[40] Sear JA, Hoare TK, Scanlan AT, Abt GA, Dascombe BJ. The effects of whole-body
compression garments on prolonged high-intensity intermittent exercise. J Strength Cond Res
2010;24:1901–10. https://doi.org/10.1519/JSC.0b013e3181db251b.
[41] Lovell DI, Mason DG, Delphinus EM, McLellan CP. Do compression garments enhance the
active recovery process after high-intensity running? J Strength Cond Res 2011;25:3264–8.
https://doi.org/10.1519/jsc.0b013e31821764f8.
[42] de Glanville KM, Hamlin MJ. Positive effect of lower body compression garments on
subsequent 40-kM cycling time trial performance. J Strength Cond Res 2012;26:480–6.
https://doi.org/10.1519/JSC.0b013e318225ff61.
[43] Hamlin MJ, Mitchell CJ, Ward FD, Draper N, Shearman JP, Kimber NE. Effect of
compression garments on short-term recovery of repeated sprint and 3-km running
performance in rugby union players. J Strength Cond Res 2012;26:2975–82.
[44] Reich‐Schupke S, Surhoff S, Stücker M. Pressure profiles of sport compression stockings.
JDDG J Der Dtsch Dermatologischen Gesellschaft 2016;14:495–506.
[45] Brophy-Williams N, Driller MW, Shing CM, Fell JW, Halson SL. Confounding compression:
the effects of posture, sizing and garment type on measured interface pressure in sports
compression clothing. J Sports Sci 2015;33:1403–10.
[46] Sperlich B, Haegele M, Krüger M, Schiffer T, Holmberg H-C, Mester J. Cardio-respiratory and
metabolic responses to different levels of compression during submaximal exercise.
Phlebology 2011;26:102–6. https://doi.org/10.1258/phleb.2010.010017.
[47] Wahl P, Bloch W, Mester J, Born D-P, Sperlich B. Effects of different levels of compression
during sub-maximal and high-intensity exercise on erythrocyte deformability. Eur J Appl
Physiol 2012;112:2163–9. https://doi.org/10.1007/s00421-011-2186-7.
[48] Mosti G, Partsch H. Compression stockings with a negative pressure gradient have a more
pronounced effect on venous pumping function than graduated elastic compression stockings.
Eur J Vasc Endovasc Surg 2011;42:261–6.
[49] Faulkner JA, Gleadon D, McLaren J, Jakeman JR. Effect of lower-limb compression clothing
on 400-m sprint performance. J Strength Cond Res 2013;27:669–76.
https://doi.org/10.1519/JSC.0b013e31825c2f50.
[50] Pruscino CL, Halson S, Hargreaves M. Effects of compression garments on recovery following
intermittent exercise. Eur J Appl Physiol 2013;113:1585–96.
[51] Maton B, Thiney G, Dang S, Tra S, Bassez S, Wicart P, et al. Human muscle fatigue and
elastic compressive stockings. Eur J Appl Physiol 2006;97:432–42.
[52] Ali A, Creasy RH, Edge JA. The effect of graduated compression stockings on running
performance. J Strength Cond Res 2011;25:1385–92.
[53] Trend Insight. Compression Apparel Tightening grip on market, March/April.
WwwSportsinsightmagCom 2011.
[54] Research Global Business Intelligence. Press Release: Global Compression Therapy Market to
Grow Significantly by 2019, with the US Leading the Demand.
Http//WwwGbiresearchCom/Media-Center/Press-Releases/Global-Compression-Therapy-

155
Market-to-Grow-Significantly-by-2019-with-the-Us-Leading-the-Demand Last Updat 4th Sept
2013 n.d.
[55] Kemmler W, von Stengel S, Köckritz C, Mayhew J, Wassermann A, Zapf J. Effect of
compression stockings on running performance in men runners. J Strength Cond Res
2009;23:101–5.
[56] Duffield R, Portus M. Comparison of three types of full-body compression garments on
throwing and repeat-sprint performance in cricket players. Br J Sports Med 2007;41:409–14.
[57] Higgins T, Naughton GA, Burgess D. Effects of wearing compression garments on
physiological and performance measures in a simulated game-specific circuit for netball. J Sci
Med Sport 2009;12:223–6.
[58] Sperlich B, Haegele M, Achtzehn S, Linville J, Holmberg HC, Mester J. Different types of
compression clothing do not increase sub-maximal and maximal endurance performance in
well-trained athletes. J Sports Sci 2010;28:609–14.
https://doi.org/10.1080/02640410903582768.
[59] Ménétrier A, Mourot L, Bouhaddi M, Regnard J, Tordi N. Compression sleeves increase tissue
oxygen saturation but not running performance. Int J Sport Med 2011;32:864–8.
https://doi.org/10.1055/s-0031-1283181.
[60] Barwood MJ, Corbett J, Feeney J, Hannaford P, Henderson D, Jones I, et al. Compression
Garments: No enhancement of high-intensity exercise in hot radiant conditions. Int J Sports
Physiol Perform 2013;8:527–35.
[61] Vercruyssen F, Easthope C, Bernard T, Hausswirth C, Bieuzen F, Gruet M, et al. The influence
of wearing compression stockings on performance indicators and physiological responses
following a prolonged trail running exercise. Eur J Sport Sci 2014;14:144–50.
[62] Del Coso J, Areces F, Salinero JJ, González-Millán C, Abián-Vicén J, Soriano L, et al.
Compression stockings do not improve muscular performance during a half-ironman triathlon
race. Eur J Appl Physiol 2014;114:587–95. https://doi.org/10.1007/s00421-013-2789-2.
[63] Bieuzen F, Brisswalter J, Easthope C, Vercruyssen F, Bernard T, Hausswirth C. Effect of
Wearing Compression Stockings on Recovery Following Mild Exercise-Induced Muscle
Damage. Int J Sports Physiol Perform 2013.
[64] Areces F, Salinero JJ, Abian-Vicen J, González-Millán C, Ruiz-Vicente D, Lara B, et al. The
Use of Compression Stockings During a Marathon Competition to Reduce Exercise-Induced
Muscle Damage: Are They Really Useful? J Orthop Sport Phys Ther 2015;45:462–70.
https://doi.org/10.2519/jospt.2015.5863.
[65] Ali A, Caine MP, Snow BG. Graduated compression stockings: physiological and perceptual
responses during and after exercise. J Sports Sci 2007;25:413–9.
[66] Rider BC, Coughlin AM, Hew-Butler TD, Goslin BR. Effect of compression stockings on
physiological responses and running performance in division III collegiate cross-country
runners during a maximal treadmill test. J Strength Cond Res 2014;28:1732–8.
[67] Born D-P, Sperlich B, Holmberg H-C. Bringing light into the dark: effects of compression
clothing on performance and recovery. Int J Sports Physiol Perform 2013:4–18.
[68] Mota GR, de Moura Simim MA, dos Santos IA, Sasaki JE, Marocolo M. Effects of Wearing
Compression Stockings on Exercise Performance and Associated Indicators: A Systematic
Review. Open Access J Sport Med 2020;11:29.
[69] da Silva CA, Helal L, da Silva RP, Belli KC, Umpierre D, Stein R. Association of Lower Limb
Compression Garments During High-Intensity Exercise with Performance and Physiological

156
Responses: A Systematic Review and Meta-analysis. Sports Med 2018;48:1859–73.
https://doi.org/10.1007/s40279-018-0927-z.
[70] Berry MJ, McMurray RG. Effects of graduated compression stockings on blood lactate
following an exhaustive bout of exercise. Am J Phys Med Rehabil 1987;66:121–32.
[71] Bieuzen F, Brisswalter J, Easthope C, Vercruyssen F, Bernard T, Hausswirth C. Effect of
wearing compression stockings on recovery after mild exercise-induced muscle damage. Int J
Sports Physiol Perform 2014;9:256.
[72] Venckūnas T, Trinkūnas E, Kamandulis S, Poderys J, Grūnovas A, Brazaitis M. Effect of
lower body compression garments on hemodynamics in response to running session. Sci World
J 2014;2014.
[73] Moreno-Pérez D, Marín PJ, López-Samanes Á, Cejuela R, Esteve-Lanao J. Muscle Activation
in Middle-Distance Athletes with Compression Stockings. Sensors 2020;20:1268.
[74] Doan BK, Kwon YH, Newton RU, Shim J, Popper EM, Rogers RA, et al. Evaluation of a
lower-body compression garment. J Sports Sci 2003;21:601–10.
https://doi.org/10.1080/0264041031000101971.
[75] Bernhardt T, Anderson GS. Influence of moderate prophylactic compression on sport
performance. J Strength Cond Res 2005;19:292–7. https://doi.org/10.1519/1533-4287.
[76] Reid MM, Duffield R, Minett GM, Sibte N, Murphy AP, Baker J. Physiological, perceptual,
and technical responses to on-court tennis training on hard and clay courts. J Strength Cond
Res 2013;27:1487–95. https://doi.org/10.1519/JSC.0b013e31826caedf.
[77] Duffield R, Edge J, Merrells R, Hawke E, Barnes M, Simcock D, et al. The effects of
compression garments on intermittent exercise performance and recovery on consecutive days.
Int J Sport Physiol Perform 2008;3:454–68.
[78] Houghton LA, Dawson B, Maloney SK. Effects of wearing compression garments on
thermoregulation during simulated team sport activity in temperate environmental conditions. J
Sci Med Sport 2009;12:303–9. https://doi.org/10.1016/j.jsams.2007.09.004.
[79] Goh SS, Laursen PB, Dascombe B, Nosaka K. Effect of lower body compression garments on
submaximal and maximal running performance in cold (10 C) and hot (32 C) environments.
Eur J Appl Physiol 2011;111:819–26.
[80] Born D-P, Holmberg H-C, Goernert F, Sperlich B. A novel compression garment with
adhesive silicone stripes improves repeated sprint performance–a multi-experimental approach
on the underlying mechanisms. BMC Sports Sci Med Rehabil 2014;6:21.
https://doi.org/10.1186/2052-1847-6-21.
[81] Varela-Sanz A, España J, Carr N, Boullosa DA, Esteve-Lanao J. Effects of gradual-elastic
compression stockings on running economy, kinematics, and performance in runners. J
Strength Cond Res 2011;25:2902–10. https://doi.org/10.1519/jsc.0b013e31820f5049.
[82] Bochmann RP, Seibel W, Haase E, Hietschold V, Rödel H, Deussen A. External compression
increases forearm perfusion. J Appl Physiol 2005;99:2337–44.
https://doi.org/10.1152/japplphysiol.00965.2004.
[83] Mann S, Ultsch D, Dietl M, Jansen P. The Effects of Compression Socks on Arterial Blood
Flow and Arterial Reserves in Amateur Sportsmen. Dev Sport Sci 2016;1:1–9.
[84] Kerhervé HA, Samozino P, Descombe F, Pinay M, Millet GY, Pasqualini M, et al. Calf
compression sleeves change biomechanics but not performance and physiological responses in
trail running. Front Physiol 2017;8:247. https://doi.org/doi.org/10.3389/fphys.2017.00247.
[85] Driller MW, Halson SL. The effects of wearing lower body compression garments during a

157
cycling performance test. Int J Sport Physiol Perform 2013;8:300–6.
[86] Kraemer WJ, Flanagan SD, Comstock BA, Fragala MS, Earp JE, Dunn-Lewis C, et al. Effects
of a whole body compression garment on markers of recovery after a heavy resistance workout
in men and women. J Strength Cond Res 2010;24:804–14.
[87] Ehrström S, Gruet M, Giandolini M, Chapuis S, Morin J-B, Vercruyssen F. Acute and Delayed
Neuromuscular Alterations Induced by Downhill Running in Trained Trail Runners: Beneficial
Effects of High-Pressure Compression Garments . Front Physiol 2018;9:1627.
[88] Chaudhari AMW, Jamison ST, McNally MP, Pan X, Schmitt LC. Hip adductor activations
during run-to-cut manoeuvres in compression shorts: implications for return to sport after groin
injury. J Sports Sci 2014;32:1333–40. https://doi.org/10.1080/02640414.2014.889849.
[89] Partsch H. Use of Compression Therapy. In: Goldman MP, Weiss RA, editors. Sclerotherapy
Treat. Varicose Telangiectatic Leg Veins. Sixth Edit, Elsevier Health Sciences; 2011, p. 137–
72.
[90] Barss TS, Pearcey GEP, Munro B, Bishop JL, Zehr EP. Effects of a compression garment on
sensory feedback transmission in the human upper limb. J Neurophysiol 2018;120:186–95.
https://doi.org/10.1152/jn.00581.2017.
[91] Birmingham TB, Kramer JF, Inglis JT, Mooney CA, Murray LJ, Fowler PJ, et al. Effect of a
Neoprene Sleeve on Knee Joint Position Sense During Sitting Open Kinetic Chain
and Supine Closed Kinetic Chain Tests. Am J Sports Med 1998;26:562–6.
https://doi.org/10.1177/03635465980260041601.
[92] Hill J, Howatson G, van Someren K, Leeder J, Pedlar C. Compression garments and recovery
from exercise-induced muscle damage: a meta-analysis. Br J Sport Med 2014;48:1340–6.
https://doi.org/10.1136/bjsports-2013-092456.
[93] MacRae BA, Laing RM, Niven BE, Cotter JD. Pressure and coverage effects of sporting
compression garments on cardiovascular function, thermoregulatory function, and exercise
performance. Eur J Appl Physiol 2012;112:1783–95. https://doi.org/10.1007/s00421-011-2146-
2.
[94] Stickford AS, Chapman RF, Johnston JD, Stager JM. Lower-leg compression, running
mechanics, and economy in trained distance runners. Int J Sports Physiol Perform 2015;10:76–
83. https://doi.org/10.1123/ijspp.2014-0003.
[95] Tschakovsky ME, Hughson RL. Venous emptying mediates a transient vasodilation in the
human forearm. Am J Physiol Circ Physiol 2000;279:H1007–14.
[96] Morris RJ, Woodcock JP. Evidence-based compression: prevention of stasis and deep vein
thrombosis. Ann Surg 2004;239:162.
[97] Bringard A, Denis R, Belluye N, Perrey S. Effects of compression tights on calf muscle
oxygenation and venous pooling during quiet resting in supine and standing positions. J Sports
Med Phys Fitness 2006;46:548.
[98] Lawrence D, Kakkar V V. Graduated, static, external compression of the lower limb: a
physiological assessment. Br J Surg 1980;67:119–21. https://doi.org/10.1002/bjs.1800670214.
[99] Mayrovitz HN. Compression-induced pulsatile blood flow changes in human legs. Clin Physiol
1998;18:117–24. https://doi.org/10.1046/j.1365-2281.1998.00084.x.
[100] Bayliss WM. On the local reactions of the arterial wall to changes of internal pressure. J
Physiol 1902;28:220–31.
[101] Book J, Prince CN, Villar R, Hughson RL, Peterson SD. Investigating the impact of passive
external lower limb compression on central and peripheral hemodynamics during exercise. Eur

158
J Appl Physiol 2016;116:717–27.
[102] Grassi B, Quaresima V. Near-infrared spectroscopy and skeletal muscle oxidative function in
vivo in health and disease: a review from an exercise physiology perspective. J Biomed Opt
2016;21:91313.
[103] Van Beekvelt MCP, Colier WNJM, Wevers RA, Van Engelen BGM. Performance of near-
infrared spectroscopy in measuring local O2 consumption and blood flow in skeletal muscle. J
Appl Physiol 2001;90:511–9.
[104] Dermont T, Morizot L, Bouhaddi M, Ménétrier A. Changes in Tissue Oxygen Saturation in
Response to Different Calf Compression Sleeves. J Sports Med 2015;2015:857904.
https://doi.org/10.1155/2015/857904.
[105] Coza A, Dunn JF, Anderson B, Nigg BM. Effects of compression on muscle tissue
oxygenation at the onset of exercise. J Strength Cond Res 2012;26:1631–7.
[106] Johnson JM. Exercise and the cutaneous circulation. Exerc Sport Sci Rev 1992;20:59–97.
[107] Davis SL, Fadel PJ, Cui J, Thomas GD, Crandall CG. Skin blood flow influences near-infrared
spectroscopy-derived measurements of tissue oxygenation during heat stress. J Appl Physiol
2006;100:221–4.
[108] Ibegbuna V, Delis KT, Nicolaides AN, Aina O. Effect of elastic compression stockings on
venous hemodynamics during walking. J Vasc Surg 2003;37:420–5.
https://doi.org/10.1067/mva.2003.104.
[109] Fallowfield JL, Wilkinson DM. Improving Sports Performance in Middle and Long Distance
Running: A Scientific Approach to Race Preparation. Wiley; 1999.
[110] Barnes KR, Kilding AE. Running economy: measurement, norms, and determining factors.
Sport Med - Open 2015;1:1–15. https://doi.org/10.1186/s40798-015-0007-y.
[111] Cronin JB, Oliver M, McNair PJ. Muscle stiffness and injury effects of whole body vibration.
Phys Ther Sport 2004;5:68–74.
[112] Bongiovanni LG, Hagbarth KE, Stjernberg L. Prolonged muscle vibration reducing motor
output in maximal voluntary contractions in man. J Physiol 1990;423:15–26.
[113] Broatch JR, Brophy-Williams N, Phillips EJ, O’Bryan SJ, Halson SL, Barnes S, et al.
Compression Garments Reduce Muscle Movement and Activation during Submaximal
Running. Med Sci Sports Exerc 2020;52:685.
[114] Kurz E, Anders C. Effects of wearing lower leg compression sleeves on locomotion economy.
J Sports Sci 2018;36:2105–10. https://doi.org/10.1080/02640414.2018.1439355.
[115] Lucas-Cuevas ÁG, Priego Quesada JI, Giménez JV, Aparicio I, Cortell-Tormo JM, Pérez-
Soriano P. Can graduated compressive stockings reduce muscle activity during running? Res Q
Exerc Sport 2017;88:223–9. https://doi.org/10.1080/02701367.2017.1294726.
[116] Bertelli G, Venturini M, Forno G, Macchiavello F, Dini D. An analysis of prognostic factors in
response to conservative treatment of postmastectomy lymphedema. Surg Gynecol Obs
1992;175:455–60.
[117] Kraemer WJ, Bush JA, Newton RU, Duncan ND, Volek JS, Denegar CR, et al. Influence of a
compression garment on repetitive power output production before and after different types of
muscle fatigue. Res Sport Med An Int J 1998;8:163–84.
[118] Perlau R, Frank C, Fick G. The effect of elastic bandages on human knee proprioception in the
uninjured population. Am J Sports Med 1995;23:251–5.
[119] Michael JS, Dogramaci SN, Steel KA, Graham KS. What is the effect of compression garments

159
on a balance task in female athletes? Gait Posture 2014;39:804–9.
https://doi.org/https://doi.org/10.1016/j.gaitpost.2013.11.001.
[120] Hooper DR, Dulkis LL, Secola PJ, Holtzum G, Harper SP, Kalkowski RJ, et al. Roles of an
Upper-Body Compression Garment on Athletic Performances. J Strength Cond Res
2015;29:2655–60. https://doi.org/10.1519/jsc.0000000000000909.
[121] Lucas-Cuevas AG, Priego-Quesada JI, Aparicio I, Giménez J V, Llana-Belloch S, Pérez-
Soriano P. Effect of 3 weeks use of compression garments on stride and impact shock during a
fatiguing run. Int J Sports Med 2015;94:826–31.
[122] Ferber R, Davis IM, Williams DS 3rd. Gender differences in lower extremity mechanics during
running. Clin Biomech (Bristol, Avon) 2003;18:350–7. https://doi.org/10.1016/s0268-
0033(03)00025-1.
[123] Costello JT, Bieuzen F, Bleakley CM. Where are all the female participants in Sports and
Exercise Medicine research? Eur J Sport Sci 2014;14:847–51.
[124] Partsch H. Compression therapy: clinical and experimental evidence. Ann Vasc Dis
2012;5:416–22. https://doi.org/10.3400/avd.ra.12.00068.
[125] Stout N, Partsch H, Szolnoky G, Forner-Cordero I, Mosti G, Mortimer P, et al. Chronic edema
of the lower extremities: international consensus recommendations for compression therapy
clinical research trials. Int Angiol 2012;31:316–29.
[126] Vercruyssen F, Gruet M, Colson SS, Ehrstrom S, Brisswalter J. Compression garments, muscle
contractile function, and economy in trail runners. Int J Sports Physiol Perform 2017;12:62–8.
https://doi.org/10.1123/ijspp.2016-0035.
[127] BS EN ISO 5084. British Standards Institution . (1997). 5084: Textiles. Determination of
thickness of textiles and textile products. Milton Keynes: BSI. 1997.
[128] BS EN ISO 4294. British Standards Institution . (1968). 4294: Textiles, Method of test for
stretch and recovery of fabrics. Milton Keynes: BSI. 1968.
[129] BS EN ISO 139. British Standards Institution. (2005). 139: Textiles. Standard atmospheres for
conditioning and testing. Milton Keynes. BSI. 2005.
[130] Mosti G, Partsch H. Occupational leg oedema is more reduced by antigraduated than by
graduated stockings. Eur J Vasc Endovasc Surg 2013;45:523–7.
https://doi.org/10.1016/j.ejvs.2013.01.032.
[131] Nicolaides A, Kakkos S, Baekgaard N, Comerota A, de Maesenner M, Eklof B, et al.
Management of chronic venous disorders of the lower limbs. Guidelines According to
Scientific Evidence. Part I. Int Angiol a J Int Union Angiol 2018;37:181.
[132] Neumann HA, Partsch H, Mosti G, Flour M. Classification of compression stockings: report of
the meeting of the International Compression Club, Copenhagen. Int Angiol a J Int Union
Angiol 2016;35:122–8.
[133] Thomas S. Practical limitations of two devices used for the measurement of sub-bandage
pressure: Implications for clinical practice. J Wound Care 2014;23:300–13.
https://doi.org/10.12968/jowc.2014.23.6.300.
[134] Bland JM, Altman D. Statistical methods for assessing agreement between two methods of
clinical measurement. Lancet 1986;327:307–10. https://doi.org/10.1016/s0140-6736(86)90837-
8.
[135] Krouwer JS. Why Bland–Altman plots should use X, not (Y+ X)/2 when X is a reference
method. Stat Med 2008;27:778–80. https://doi.org/10.1002/sim.3086.

160
[136] Van den Kerckhove E, Fieuws S, Massage P, Hierner R, Boeckx W, Deleuze JP, et al.
Reproducibility of repeated measurements with the Kikuhime pressure sensor under pressure
garments in burn scar treatment. Burns 2007;33:572–8.
https://doi.org/10.1016/j.burns.2006.08.032.
[137] Chassagne F, Martin F, Badel P, Convert R, Giraux P, Molimard J. Experimental investigation
of pressure applied on the lower leg by elastic compression bandage. Ann Biomed Eng
2015;43:2967–77. https://doi.org/10.1007/s10439-015-1352-1.
[138] Liu R, Kwok Y-L, Li Y, Lao T-T, Zhang X, Dai XQ. A three-dimensional biomechanical
model for numerical simulation of dynamic pressure functional performances of graduated
compression stocking (GCS). Fibers Polym 2006;7:389–97.
https://doi.org/10.1007/bf02875771.
[139] Rong L, Lin KY, Yi L, T. LT, Xin Z. Skin pressure profiles and variations with body postural
changes beneath medical elastic compression stockings. Int J Dermatol 2007;46:514–23.
https://doi.org/10.1111/j.1365-4632.2007.03175.x.
[140] Veraart JCJM, Pronk G, Neumann HA. Pressure differences of elastic compression stockings
at the ankle region. Dermatol Surg 1997;23:935–9. https://doi.org/10.1111/j.1524-
4725.1997.tb00753.x.
[141] Mosti G, Rossari S. The importance of measuring sub bandage pressure and presentation of
new measuring device. Acta Vulnol 2008;6:31–6.
[142] Hill JA, Howatson G, van Someren KA, Davidson S, Pedlar CR. The variation in pressures
exerted by commercially available compression garments. Sport Eng 2015;18:115–21.
https://doi.org/10.1007/s12283-015-0170-x.
[143] Vinckx L, Boeckx W, Berghmans J. Analysis of the pressure perturbation due to the
introduction of a measuring probe under an elastic garment. Med Biol Eng Comput
1990;28:133–8. https://doi.org/10.1007/bf02441768.
[144] Mosti G, Mattaliano V, Arleo S, Partsch H. Thigh compression after great saphenous surgery is
more effective with high pressure. Int Angiol 2009;28:274.
[145] Schuren J, Vos A, Allen JO. Venous leg ulcer patients with low ABPIs: How much pressure is
safe and tolerable? EWMA J 2010;10.
[146] Mosti G, Partsch H. Inelastic bandages maintain their hemodynamic effectiveness over time
despite significant pressure loss. J Vasc Surg 2010;52:925–31.
https://doi.org/10.1016/j.jvs.2010.04.081.
[147] Weller CD, Jolley D, McNeil J. Sub-bandage pressure difference of tubular form and short-
stretch compression bandages: in-vivo randomised controlled trial. Wound Pract Res J Aust
Wound Manag Assoc 2010;18:100.
[148] Chi Y-W, Tseng K-H, Li R, Pan T. Comparison of piezoresistive sensor to PicoPress® in in-
vitro interface pressure measurement. Phlebology 2017:315–20.
https://doi.org/10.1177/0268355517705292.
[149] Hayes SG, Venkatraman P. Materials and technology for sportswear and performance apparel.
n.d.
[150] Motykie GD, Caprini JA, Arcelus JI, Reyna JJ, Overom E, Mokhtee D. Evaluation of
therapeutic compression stockings in the treatment of chronic venous insufficiency. Dermatol
Surg 1999;25:116–20.
[151] Lim CS, Davies AH. Graduated compression stockings. CMAJ 2014;186:E391-8.
https://doi.org/10.1503/cmaj.131281.

161
[152] Allied Market Research. Compression Wear and Shapewear Market by Product Type
(Compression Wear and Shapewear), Application (Performance & Recovery and Body
Shaping & Lifestyle), Gender (Male and Female), Distribution Channel (Multi-Retail Stores,
Specialty Retail Stores, and On. 2016.
[153] Hsu W-C, Tseng L-W, Chen F-C, Wang L-C, Yang W-W, Lin Y-J, et al. Effects of
compression garments on surface EMG and physiological responses during and after distance
running. J Sport Heal Sci 2017. https://doi.org/10.1016/J.JSHS.2017.01.001.
[154] Goh SS, Laursen PB, Dascombe B, Nosaka K. Effect of lower body compression garments on
submaximal and maximal running performance in cold (10 degrees C) and hot (32 degrees C)
environments. Eur J Appl Physiol 2011;111:819–26. https://doi.org/10.1007/s00421-010-1705-
2.
[155] Margaria R, Cerretelli P, Aghemo P, Sassi G. Energy cost of running. J Appl Physiol
1963;18:367–70. https://doi.org/10.1152/jappl.1963.18.2.367.
[156] Borg GA V. Psychophysical bases of perceived exertion. Med Sci Sport Exerc 1982.
[157] Hopkins W, Marshall S, Batterham A, Hanin J. Progressive statistics for studies in sports
medicine and exercise science. Med Sci Sport Exerc 2009;41:3.
[158] Hopkins WG. Analysis of a post-only crossover trial (Excel spreadsheet). Newstats
Org/PostOnlyCrossover Xls 2006.
[159] Franch J, Madsen K, Djurhuus MS, Pedersen PK %J M, Sports S in, Exercise. Improved
running economy following intensified training correlates with reduced ventilatory demands
1998;30:1250–6.
[160] Pirard M, Gellaerts J, Muzic J, Peseux M, Ménétrier A. Effets dose–réponse de la compression
élastique sur la longueur de la foulée. Sci Sports 2016;31:355–8.
https://doi.org/10.1016/j.scispo.2016.07.006.
[161] Gleim GW, Stachenfeld NS, Nicholas JA. The influence of flexibility on the economy of
walking and jogging. J Orthop Res 1990;8:814–23. https://doi.org/10.1002/jor.1100080606.
[162] Rugg S, Sternlicht E. The effect of graduated compression tights, compared with running
shorts, on counter movement jump performance before and after submaximal running. J
Strength Cond Res 2013;27:1067–73. https://doi.org/10.1519/JSC.0b013e3182610956.
[163] Mothes H, Leukel C, Seelig H, Fuchs R. Do placebo expectations influence perceived exertion
during physical exercise? PLoS One 2017;12:e0180434.
https://doi.org/10.1371/journal.pone.0180434.
[164] Williams C, Nute ML. Some physiological demands of a half-marathon race on recreational
runners. Br J Sports Med 1983;17:152–61. https://doi.org/10.1136/bjsm.17.3.152.
[165] Xu F, Montgomery DL. Effect of prolonged exercise at 65 and 80% of VO2max on running
economy. Int J Sports Med 1995;16:309–13.
[166] Pereira M, Freedson P. Intraindividual Variation of Running Economy in Highly Trained and
Moderately Trained Males. Int J Sports Med 1997;18:118–24. https://doi.org/10.1055/s-2007-
972606.
[167] Saunders PU, Pyne DB, Telford RD, Hawley JA. Factors Affecting Running Economy in
Trained Distance Runners. Sport Med 2004;34:465–85. https://doi.org/10.2165/00007256-
200434070-00005.
[168] Shaw A, Ingham SA, Folland JP. The valid measurement of running economy in runners. Med
Sci Sport Exerc 2014;46:1968–73. https://doi.org/10.1249/mss.0000000000000311.

162
[169] Daniels JT. A physiologist’s view of running economy. Med Sci Sports Exerc 1985;17:332–8.
https://doi.org/10.1249/00005768-198506000-00006.
[170] Hütler M, Beneke R. The Effect of Training on Running Economy and Performance in
Recreational Athletes. Med Sci Sport Exerc 2005;37:1794–9.
https://doi.org/10.1249/01.mss.0000176399.67121.02.
[171] Cabri J, Caldonazzi S, Clijsen R. Auswirkung von Kompressionsstrümpfen auf die
Ausdauerleistung während eines submaximalen Laufbandtests. Sport Sport 2010;24:179–83.
https://doi.org/10.1055/s-0030-1270572.
[172] Kerksick CM, Wilborn CD, Roberts MD, Smith-Ryan A, Kleiner SM, Jäger R, et al. ISSN
exercise & sports nutrition review update: research & recommendations. J Int Soc Sports Nutr
2018;15:38. https://doi.org/10.1186/s12970-018-0242-y.
[173] Jeukendrup AE, Wallis GA. Measurement of substrate oxidation during exercise by means of
gas exchange measurements. Int J Sports Med 2005;26 Suppl 1:S28-37.
https://doi.org/10.1055/s-2004-830512.
[174] Cohen J. Statistical power analysis for the behavioral sciences. Academic press; 2013.
[175] Fluss R, Faraggi D, Reiser B. Estimation of the Youden Index and its associated cutoff point.
Biometrical J J Math Methods Biosci 2005;47:458–72.
https://doi.org/10.1002/bimj.200410135.
[176] Akobeng AK. Understanding diagnostic tests 3: receiver operating characteristic curves. Acta
Paediatr 2007;96:644–7. https://doi.org/10.1111/j.1651-2227.2006.00178.x.
[177] Shaw AJ, Ingham SA, Fudge BW, Folland JP. The reliability of running economy expressed as
oxygen cost and energy cost in trained distance runners. Appl Physiol Nutr Metab = Physiol
Appl Nutr Metab 2013;38:1268–72. https://doi.org/10.1139/apnm-2013-0055.
[178] Allison SJ, Bailey DM, Folland JP. Prolonged static stretching does not influence running
economy despite changes in neuromuscular function. J Sports Sci 2008;26:1489–95.
https://doi.org/10.1080/02640410802392715.
[179] Folland JP, Rowlands DS, Thorp R, Walmsley A. Leg heating and cooling influences running
stride parameters but not running economy. Int J Sports Med 2006;27:771–9.
[180] Saunders PU, Pyne DB, Telford RD, Hawley JA. Reliability and variability of running
economy in elite distance runners. Med Sci Sports Exerc 2004;36:1972–6.
[181] Yoshida T, Udo M, Chida M, Ichioka M, Makiguchi K, Yamaguchi T. Specificity of
physiological adaptation to endurance training in distance runners and competitive walkers.
Eur J Appl Physiol Occup Physiol 1990;61:197–201. https://doi.org/10.1007/bf00357599.
[182] Turner AM, Owings M, Schwane JA. Improvement in running economy after 6 weeks of
plyometric training. J Strength Cond Res 2003;17:60–7.
[183] Levine BD, Stray-Gundersen J. “Living high-training low”: effect of moderate-altitude
acclimatization with low-altitude training on performance. J Appl Physiol 1997;83:102–12.
https://doi.org/10.1152/jappl.1997.83.1.102.
[184] Nakayama Y, Kudo K, Ohtsuki T. Variability and fluctuation in running gait cycle of trained
runners and non-runners. Gait Posture 2010;31:331–5.
https://doi.org/10.1016/j.gaitpost.2009.12.003.
[185] Candau R, Belli A, Millet GY, Georges D, Barbier B, Rouillon JD. Energy cost and running
mechanics during a treadmill run to voluntary exhaustion in humans. Eur J Appl Physiol
Occup Physiol 1998;77:479–85. https://doi.org/10.1007/s004210050363.

163
[186] De Ruiter CJ, Verdijk PWL, Werker W, Zuidema MJ, de Haan A. Stride frequency in relation
to oxygen consumption in experienced and novice runners. Eur J Sport Sci 2014;14:251–8.
https://doi.org/10.1080/17461391.2013.783627.
[187] Muthalib M, Millet GY, Quaresima V, Nosaka K. Reliability of near-infrared spectroscopy for
measuring biceps brachii oxygenation during sustained and repeated isometric contractions. J
Biomed Opt 2010;15:17008.
[188] Ferrari M, Muthalib M, Quaresima V. The use of near-infrared spectroscopy in understanding
skeletal muscle physiology: recent developments. Phil Trans R Soc A 2011;369:4577–90.
[189] Ferrari M, Mottola L, Quaresima V. Principles, techniques, and limitations of near infrared
spectroscopy. Can J Appl Physiol 2004;29:463–87.
[190] Lusina S-JC, Warburton DER, Hatfield NG, Sheel AW. Muscle deoxygenation of upper-limb
muscles during progressive arm-cranking exercise. Appl Physiol Nutr Metab 2008;33:231–8.
[191] Perrey S, Ferrari M. Muscle Oximetry in Sports Science: A Systematic Review. Sport Med
2017. https://doi.org/10.1007/s40279-017-0820-1 LB - Perrey2017.
[192] Jones B, Hamilton DK, Cooper CE. Muscle oxygen changes following sprint interval cycling
training in elite field hockey players. PLoS One 2015;10:e0120338.
[193] Jones B, Dat M, Cooper CE. Underwater near-infrared spectroscopy measurements of muscle
oxygenation: laboratory validation and preliminary observations in swimmers and triathletes. J
Biomed Opt 2014;19:127002.
[194] Hesford CM, Laing SJ, Cardinale M, Cooper CE. Asymmetry of quadriceps muscle
oxygenation during elite short-track speed skating. Med Sci Sport Exerc 2012;44:501–8.
[195] Born D-P, Stöggl T, Swarén M, Björklund G. Near-infrared spectroscopy: more accurate than
heart rate for monitoring intensity in running in hilly terrain. Int J Sports Physiol Perform
2017;12:440–7.
[196] Fellahi J-L, Butin G, Fischer M-O, Zamparini G, Gérard J-L, Hanouz J-L. Dynamic evaluation
of near-infrared peripheral oximetry in healthy volunteers: A comparison between INVOS and
EQUANOX. J Crit Care 2013;28:881.e1-881.e6.
https://doi.org/http://dx.doi.org/10.1016/j.jcrc.2013.05.004.
[197] Lee J-H, Park Y-H, Kim H-S, Kim J-T. Comparison of two devices using near-infrared
spectroscopy for the measurement of tissue oxygenation during a vascular occlusion test in
healthy volunteers (INVOS® vs. InSpectraTM). J Clin Monit Comput 2015;29:271–8.
[198] Hyttel-Sorensen S, Sorensen LC, Riera J, Greisen G. Tissue oximetry: a comparison of mean
values of regional tissue saturation, reproducibility and dynamic range of four NIRS-
instruments on the human forearm. Biomed Opt Express 2011;2:3047–57.
https://doi.org/10.1364/BOE.2.003047.
[199] Nygren A, Rennerfelt K, Zhang Q. Detection of changes in muscle oxygen saturation in the
human leg: a comparison of two near-infrared spectroscopy devices. J Clin Monit Comput
2014;28:57–62. https://doi.org/10.1007/s10877-013-9494-x.
[200] Engbers S, Boysen SR, Engbers J, Chalhoub S. A comparison of tissue oxygen saturation
measurements by 2 different near‐infrared spectroscopy monitors in 21 healthy dogs. J Vet
Emerg Crit Care 2014;24:536–44.
[201] Bezemer R, Lima A, Myers D, Klijn E, Heger M, Goedhart PT, et al. Assessment of tissue
oxygen saturation during a vascular occlusion test using near-infrared spectroscopy: the role of
probe spacing and measurement site studied in healthy volunteers. Crit Care 2009;13:S4.
[202] Gómez H, Mesquida J, Simon P, Kim HK, Puyana JC, Ince C, et al. Characterization of tissue

164
oxygen saturation and the vascular occlusion test: influence of measurement sites, probe sizes
and deflation thresholds. Crit Care 2009;13:S3.
[203] Myers DE, Anderson LD, Seifert RP, Ortner JP, Cooper CE, Beilman GJ, et al. Noninvasive
method for measuring local hemoglobin oxygen saturation in tissue using wide gap second
derivative near-infrared spectroscopy. J Biomed Opt 2005;10:34017–3401718.
[204] Matcher SJ, Cooper CE. Absolute quantification of deoxyhaemoglobin concentration in tissue
near infrared spectroscopy. Phys Med Biol 1994;39:1295.
[205] Suzuki S, Takasaki S, Ozaki T, Kobayashi Y. Tissue oxygenation monitor using NIR spatially
resolved spectroscopy. BiOS’99 Int. Biomed. Opt. Symp., International Society for Optics and
Photonics; 1999, p. 582–92.
[206] Muellner T, Nikolic A, Schramm W, Vecsei V. New instrument that uses near-infrared
spectroscopy for the monitoring of human muscle oxygenation. J Trauma Acute Care Surg
1999;46:1082–4.
[207] Steenhaut K, Lapage K, Bové T, De Hert S, Moerman A. Evaluation of different near-infrared
spectroscopy technologies for assessment of tissue oxygen saturation during a vascular
occlusion test. J Clin Monit Comput 2017;31:1151–8.
[208] Cornachione K, McLaren J, Heil DP. Use of a wireless NIRS monitor to track changes in
muscle oxygenation for laboratory-based Nordic skiing test proto-col. Sci Ski VI 2014:369–76.
[209] Niemeijer VM, Spee RF, Jansen JP, Buskermolen ABC, Dijk T, Wijn PFF, et al. Test–retest
reliability of skeletal muscle oxygenation measurements during submaximal cycling exercise in
patients with chronic heart failure. Clin Physiol Funct Imaging 2015.
[210] Scott BR, Slattery KM, Sculley D V, Lockie RG, Dascombe BJ. Reliability of telemetric
electromyography and near-infrared spectroscopy during high-intensity resistance exercise. J
Electromyogr Kinesiol 2014;24:722–30.
[211] Gómez H, Torres A, Polanco P, Kim HK, Zenker S, Puyana JC, et al. Use of non-invasive
NIRS during a vascular occlusion test to assess dynamic tissue O2 saturation response.
Intensive Care Med 2008;34:1600–7.
[212] Atkinson G, Nevill AM. Statistical methods for assessing measurement error (reliability) in
variables relevant to sports medicine. Sport Med 1998;26:217–38.
[213] Faul F, Erdfelder E, Lang A-G, Buchner A. G* Power 3: A flexible statistical power analysis
program for the social, behavioral, and biomedical sciences. Behav Res Methods 2007;39:175–
91.
[214] Bhambhani YN. Muscle Oxygenation Trends During Dynamic Exercise Measured by Near
Infrared Spectroscopy. Can J Appl Physiol 2004;29:504–23. https://doi.org/10.1139/h04-033.
[215] Homma S, Fukunaga T, Kagaya A. Influence of adipose tissue thickness on near infrared
spectroscopic signals in the measurement of human muscle. J Biomed Opt 1996;1:418–24.
[216] Cooper CE, Penfold S-M, Elwell CE, Angus C. Comparison of local adipose tissue content and
SRS-derived NIRS muscle oxygenation measurements in 90 individuals. Oxyg. Transp. to
Tissue XXXI, Springer; 2010, p. 177–81.
[217] Chant ADB. The effects of posture, exercise, and bandage pressure on the clearance of 24na
from the subcutaneous tissues of the foot. Br J Surg 1972;59:552–5.
https://doi.org/10.1002/bjs.1800590713.
[218] Ihsan M, Abbiss CR, Lipski M, Buchheit M, Watson G. Muscle oxygenation and blood volume
reliability during continuous and intermittent running. Int J Sports Med 2013;34:637–45.

165
[219] Roberts LA, Muthalib M, Stanley J, Lichtwark G, Nosaka K, Coombes JS, et al. Effects of cold
water immersion and active recovery on hemodynamics and recovery of muscle strength
following resistance exercise. Am J Physiol - Regul Integr Comp Physiol 2015;309:R389–98.
https://doi.org/10.1152/ajpregu.00151.2015.
[220] Thiel C, Vogt L, Himmelreich H, Hübscher M, Banzer W. Reproducibility of muscle oxygen
saturation. Int J Sports Med 2011;32:277–80.
[221] Deschamps A, Hall R, Grocott H, Mazer CD, Choi PT, Turgeon AF, et al. Cerebral Oximetry
Monitoring to Maintain Normal Cerebral Oxygen Saturation during High-risk Cardiac
SurgeryA Randomized Controlled Feasibility Trial. J Am Soc Anesthesiol 2016;124:826–36.
[222] Lima A, van Bommel J, Jansen TC, Ince C, Bakker J. Low tissue oxygen saturation at the end
of early goal-directed therapy is associated with worse outcome in critically ill patients. Crit
Care 2009;13:S13.
[223] Rupp T, Perrey S. Effect of severe hypoxia on prefrontal cortex and muscle oxygenation
responses at rest and during exhaustive exercise. Oxyg. Transp. to Tissue XXX, Springer;
2009, p. 329–34.
[224] Muller MD, Li Z, Sica CT, Luck JC, Gao Z, Blaha CA, et al. Muscle oxygenation during
dynamic plantar flexion exercise: combining BOLD MRI with traditional physiological
measurements. Physiol Rep 2016;4:e13004.
[225] Mourtzakis M, Gonzalez-Alonso J, Graham TE, Saltin B. Hemodynamics and O2 uptake
during maximal knee extensor exercise in untrained and trained human quadriceps muscle:
effects of hyperoxia. J Appl Physiol 2004;97:1796–802.
[226] MacDonald MJ, Tarnopolsky MA, Green HJ, Hughson RL. Comparison of femoral blood
gases and muscle near-infrared spectroscopy at exercise onset in humans. J Appl Physiol
1999;86:687–93.
[227] Geraskin D, Platen P, Franke J, Kohl-Bareis M. Algorithms for Muscle Oxygenation
Monitoring Corrected for Adipose Tissue Thickness. Adv Med Eng 2007:384–8.
[228] Muraki S, Tsunawake N, Yamasaki M. Limitation of muscle deoxygenation in the triceps
during incremental arm cranking in women. Eur J Appl Physiol 2004;91:246–52.
[229] Delpy DT, Cope M. Quantification in tissue near–infrared spectroscopy. Philos Trans R Soc
London B Biol Sci 1997;352:649–59.
[230] Schmitz R. Systems and methods for measuring oxygenation 2015.
[231] Takagi S, Murase N, Kime R, Niwayama M, Osada T, Katsumura T. Aerobic training enhances
muscle deoxygenation in early post-myocardial infarction. Eur J Appl Physiol 2016;116:673–
85.
[232] Bhambhani YN, Buckley SM, Susaki T. Detection of ventilatory threshold using near infrared
spectroscopy in men and women. Med Sci Sports Exerc 1997;29:402–9.
[233] Belardinelli R, Barstow TJ, Porszasz J, Wasserman K. Changes in skeletal muscle oxygenation
during incremental exercise measured with near infrared spectroscopy. Eur J Appl Physiol
Occup Physiol 1995;70:487–92.
[234] Angus C, Welford D, Sellens M, Thompson S, Cooper CE. Estimation of lactate threshold by
near infrared spectroscopy. Adv Exp Med Biol 1998;471:283–8.
[235] McCully KK, Hamaoka T. Near-Infrared Spectroscopy: What Can It Tell Us about Oxygen
Saturation in Skeletal Muscle? Exerc Sport Sci Rev 2000;28:123–7.
[236] Ryan TE, Erickson ML, Brizendine JT, Young H-J, McCully KK. Noninvasive evaluation of

166
skeletal muscle mitochondrial capacity with near-infrared spectroscopy: correcting for blood
volume changes. J Appl Physiol 2012;113:175–83.
[237] Donath L, Faude O. Compression Garments and Performance Enhancement in Balance and
Precision Tasks. In: Engel F, Sperlich B, editors. Compression Garments Sport. Athl. Perform.
Recover., Cham: Springer International Publishing; 2016, p. 79–87.
https://doi.org/10.1007/978-3-319-39480-0_4.
[238] Engeroff T, Bernardi A, Vogt L, Banzer W. Running economy assessment within
cardiopulmonary exercise testing for recreational runners. J Sports Med Phys Fitness
2016;56:200–5.
[239] McManus CJ, Collison J, Cooper CE. Performance comparison of the MOXY and PortaMon
near-infrared spectroscopy muscle oximeters at rest and during exercise. J Biomed Opt
2018;23:15007. https://doi.org/10.1117/1.JBO.23.1.015007.
[240] Feldmann A, Schmitz RW, Erlacher D. Near-infrared spectroscopy-derived muscle oxygen
saturation on a 0% to 100% scale: reliability and validity of the Moxy Monitor. J Biomed Opt
2019;24:115001.
[241] Adams D, Pozzi F, Willy RW, Carrol A, Zeni J. Altering cadence or vertical oscillation during
running: effects on running related injury factors. Int J Sports Phys Ther 2018;13:633.
[242] Adams D, Pozzi F, Carroll A, Rombach A, Zeni Jr J. Validity and reliability of a commercial
fitness watch for measuring running dynamics. J Orthop Sport Phys Ther 2016;46:471–6.
[243] Jones AM, Carter H. The effect of endurance training on parameters of aerobic fitness. Sports
Med 2000;29:373–86. https://doi.org/10.2165/00007256-200029060-00001.
[244] Morgan DW, Craib MW, Krahenbuhl GS, Woodall K, Jordan S, Filarski K, et al. Daily
variability in running economy among well-trained male and female distance runners. Res Q
Exerc Sport 1994;65:72–7.
[245] Frederick E, Daniels J, Hayes J. The effect of shoe weight on the aerobic demands of running.
In: Bachl N, Prokop L SR, editor. Curr. Top. Sport. Med., Vienna (Austria): Urban &
Schwarzenberg; 1984, p. 616–25.
[246] Hoogkamer W, Kipp S, Spiering BA, Kram R. Altered running economy directly translates to
altered distance-running performance. Med Sci Sport Exerc 2016;48:2175–80.
[247] Mohr M, Trudeau MB, Nigg SR, Nigg BM. Increased Athletic Performance in Lighter
Basketball Shoes: Shoe or Psychology Effect? Int J Sports Physiol Perform 2016;11:74–9.
https://doi.org/10.1123/ijspp.2014-0538.
[248] Berry MJ, Bailey SP, Simpkins LS, TeWinkle JA. The effects of elastic tights on the post-
exercise response. Can J Sport Sci 1990;15:244–8.
[249] Mancini DM, Bolinger L, Li H, Kendrick K, Chance B, Wilson JR. Validation of near-infrared
spectroscopy in humans. J Appl Physiol 1994;77:2740–7.
[250] Southern WM, Ryan TE, Reynolds MA, McCully K. Reproducibility of near-infrared
spectroscopy measurements of oxidative function and postexercise recovery kinetics in the
medial gastrocnemius muscle. Appl Physiol Nutr Metab 2014;39:521–9.
[251] Tartaruga MP, Brisswalter J, Peyré-Tartaruga LA, Ávila AOV, Alberton CL, Coertjens M, et
al. The Relationship Between Running Economy and Biomechanical Variables in Distance
Runners. Res Q Exerc Sport 2012;83:367–75.
https://doi.org/10.1080/02701367.2012.10599870.
[252] Folland JP, Allen SJ, Black MI, Handsaker JC, Forrester SE. Running Technique is an
Important Component of Running Economy and Performance. Med Sci Sports Exerc

167
2017;49:1412–23. https://doi.org/10.1249/MSS.0000000000001245.
[253] Kyröläinen H, Belli A, Komi P V. Biomechanical factors affecting running economy. Med Sci
Sport Exerc 2001;33:1330–7.
[254] Williams KR, Cavanagh PR. Relationship between distance running mechanics, running
economy, and performance. J Appl Physiol 1987;63:1236–45.
[255] Heise GD, Martin PE. Are variations in running economy in humans associated with ground
reaction force characteristics? Eur J Appl Physiol 2001;84:438–42.
[256] Di Michele R, Merni F. The concurrent effects of strike pattern and ground-contact time on
running economy. J Sci Med Sport 2014;17:414–8.
[257] Nummela A, Keränen T, Mikkelsson LO. Factors related to top running speed and economy.
Int J Sports Med 2007;28:655–61.
[258] Slawinski JS, Billat VL. Difference in mechanical and energy cost between highly, well, and
nontrained runners. Med Sci Sport Exerc 2004;36:1440–6.
[259] Teunissen LPJ, Grabowski A, Kram R. Effects of independently altering body weight and body
mass on the metabolic cost of running. J Exp Biol 2007;210:4418–27.
[260] Kraemer WJ, Flanagan SD, Comstock BA, Fragala MS, Earp JE, Dunn-Lewis C, et al. Effects
of a whole body compression garment on markers of recovery after a heavy resistance workout
in men and women. J Strength Cond Res 2010;24:804.
[261] Hegarty-Craver M, Kwon C, Oxenham W, Grant E, Reid Jr L. Towards characterizing the
pressure profiles of medical compression hosiery: an investigation of current measurement
devices and techniques. J Text Inst 2015;106:757–67.
[262] Jobsis FF. Noninvasive, infrared monitoring of cerebral and myocardial oxygen sufficiency
and circulatory parameters. Science 1977;198:1264–7. https://doi.org/10.1126/science.929199.
[263] Barnes KR, Kilding AE. Strategies to Improve Running Economy. Sport Med 2015;45:37–56.
https://doi.org/10.1007/s40279-014-0246-y.
[264] Maughan RJ, Leiper JB. Aerobic capacity and fractional utilisation of aerobic capacity in elite
and non-elite male and female marathon runners. Eur J Appl Physiol Occup Physiol
1983;52:80–7.
[265] Williams TJ, Krahenbuhl GS, Morgan DW. Daily variation in running economy of moderately
trained male runners. Med Sci Sport Exerc 1991;23:944–8.
[266] Lee H, Hong K, Lee Y. Compression pants with differential pressurization: Kinetic and
kinematical effects on stability. Text Res J 2017;87:1554–64.

168
10 Appendices
Appendix 1: University of Essex institutional ethical review board approval

169

170
Appendix 2: Participant information packs (Chapters 3 – 7)

171
Participant Information Sheet
What is the purpose of this study?
This study aims to compare two hand-held devices which measure the pressure applied by compression garments.
How will the study be conducted?
The research will require you to attend the Human Performance Unit once for no longer than 30 minutes. After some basic measurements (calf circumference) you will be asked to wear two compression socks and two compression tights. The pressure applied by these garments on the front, back and side of your calf will be measured. No exercise is required. Please wear shorts to the testing session.
Where will the research take place?
At the Human Performance Unit located in the Centre for Sport and Exercise Science, University of Essex, Wivenhoe Park, Colchester, Essex CO4 3SQ.
By taking part in this study, please be aware that:
I am free to withdraw from the study at any time without giving reason and without penalty
All information collected during this research will remain anonymous
The person in control of the test will explain the nature and purpose of the test and will inform me of any foreseeable risk to my health as a result of my participation
Do I have to take part?
No, it is your choice whether or not to take part. Please talk to others about the study if you wish and ask us if anything is not clear. If you decide to take part, you can leave the study at any time without giving a reason.
What will happen to me if I take part?
When you are recruited you will be shown some of the equipment that will be used during your participation. You will be able to ask any questions that you may have at this point before deciding you are interested in taking part.
Will I be paid for my participation?
You will not be paid for taking part in this study.
Why might you be not able to take part in the study? If you have a history of venous insufficiency, heart disease (including irregular heartbeats), high blood pressure, problems with the nervous system or taking medicine that alters the cardiovascular system or the nervous system you will not be able to participate. In addition, if you have any muscle or joint problems that prevent you from standing for a prolonged period (60 minutes) we ask that you do not take part.

172
What if relevant new information becomes available?
If additional information becomes available during the course of the research, it will mainly be conveyed in the form of e-mail. E-mail or text messages will be used for reminders for you depending on your preference.
What will happen if I don’t want to carry on with the study?
If you decide to take part, you can still leave the study at any time without giving a reason. Identifiable data already collected with consent would be retained and used in the study. No further data would be collected or any other research procedures carried out on or in relation to you.
Who is organising the research?
The University of Essex is organising this study. The research team are employees and students of the University of Essex. The principle investigator is Mr Chris McManus (details below). Other members of the research team include undergraduate students from the School of Sport, Rehabilitation and Exercise Sciences.
Will my taking part in this study be kept confidential?
If you decide to take part in this study, any information collected about you as part of this project will remain confidential and your identity will not be revealed outside the research team. Hardcopy data will be digitized within four weeks of collection. Once digitized, hardcopy data will be destroyed by the principle investigator. Digitized data will be stored on password protected computers and on a GDPR approved EU cloud-based repository. The dataset will be stored on a password protected computer; only accessible by the named investigators. No personally identifiable data/markers (name, address, email address etc.) will be recorded on the same digitized dataset.
A separate, password protected file, that links your name, address and email address to the identifier code will be kept, enabling us to contact you for future reassessments. This file will be password protected, securely stored on a password protected computer, on a password protected GDPR approved EU cloud-based repository.
Anonymous, digitized data will be stored indefinitely on the approved cloud repository as the results will contribute toward an ongoing analysis of health and performance changes of University students.
What will happen to the results of this study?
Any information collected about you will only be used for the purposes of this project. The anonymous results may be published in scientific journals, undergraduate reports and used for teaching. You will not be personally identified in any report or publication. You can request a copy of the findings. You will also be given individual feedback after completion of the study.
What if there is a problem or you are unhappy with the conduct of this study? If you have any concerns about any aspect of the study or you have a complaint, in the first instance please contact the principal investigator of the project Chris McManus (contact details below). If are still concerned or you think your complaint has not been addressed to your satisfaction, please contact the Director of Research in the principal investigator’s department (Dr Matthew Taylor, tel 01206 872818; email [email protected]) , If you are still not satisfied, please contact the University’s Research Governance and Planning Manager, Sarah Manning-Press, Research and Enterprise Office (tel 01206 87-3561; e-mail [email protected]). In the event that something does go wrong and you are harmed

173
during the research and this is due to someone being at fault, you may have grounds for a legal action for compensation but you may have to pay your legal costs. Ethical Approval This project has been reviewed on behalf of the Science and Health Ethics Sub-Committee and has been given approval. For further information about this project please contact Mr Chris McManus, University of Essex Telephone: 01206 874475 e-mail [email protected]
If you do decide to take part, you will be given a copy of this information sheet to keep and will be asked to sign a consent form.
Thank you for taking time to read this Participant Information Sheet.

174

175

176
‘The influence of lower body clothing on sub-maximal running’
Are you...?
• Male
• Aged 18 or over
• Physically active / Runner
• Typically completing at least 2 training sessions per week
• Currently uninjured and without lower limb injury for 4 weeks
• Without illness or circulatory complaints of the lower limbs
Number of Visits:
You will be required to attend the University of Essex for 3 visits. Visit duration will last
approximately 45 min for VISIT 1 and 90 min for VISIT 2 and 3. The table below outlines the
possible dates for participation.
Date Date Date Date
Visit 1
(Maximal
Run Test)
Tuesday 28th
July
Wednesday
29th July
Thursday
30th July
Friday 31st
July
Select 1 date
from this row
Visit 2
(Experimental
Trial)
Monday 3rd
August
Tuesday 4th
August
Thursday 6th
August
Friday 7th
August
Select 1 date
from this row
Visit 3
(Experimental
Trial)
Monday 10th
August
Tuesday 11th
August
Thursday
13th August
Friday 14th
August
Select 1 date
from this row
Time Availabilities for Visit 2 + 3:
• 9:00 – 10:30
• 11:00 – 12:30
• 13:00 – 14:30
• 15:00 – 16:30
• 17:00 – 18:30
• Timings can be discussed and arranged around your schedule for Visit 1; however, both visits
2 + 3 must occur at the same time of day. Please contact us to discuss this.
Visit 1: Preliminary visit = VO2max run test (7-15 minutes) and familiarisation with running at
designated sub-maximal intensity (5 minutes)

177
Visit 2 + 3: Intervention testing (1) Clothing garment 1 (compression), (2) Clothing garment 2
(running shorts)
Protocol:
Visit 1: Upon arrival a physical activity readiness questionnaire and consent form will be provided to
you and a researcher will discuss the protocol verbally. Subsequently, height and weight will be
recorded, prior to undertaking a warm-up on the treadmill of 5-10 minutes. Prior to beginning the
maximal test to exhaustion, a mask will be fitted to your face to allow collection of respiratory gases.
The treadmill will begin at a low-moderate intensity and progressively increasing in speed and incline
until a point of volitional fatigue. After a rest period, the treadmill will be set at 60% of the speed
achieved during the maximum test to act as a familiarisation session (and cool-down) for 5-10
minutes.
Visit 2+ 3: 6 anatomical landmarks will be marked with a small washable pen on your lower leg
(alcohol swabs will be provided to wipe pen off) when undertaking the compression trial. The level of
compression will be measured using a small inflatable bladder between your skins surface and the
compression garment.
Following this, you will undertake the following protocol;
1) 20 minute run at 60% VO2max
2) 60 minute recovery period with blood lactate measures at 0, 5, 10, 15, 30 and 60 minutes (you are
requested to remain seated throughout this period. We can provide laptop / internet access to assist
with occupying time)
• You are asked to record your food consumption and activities during the 24 hours prior to your
first visit. Following this, you are requested to repeat the same food consumption and activities
protocol before all remaining tests. Additional documentation and information will be provided to
aid with this.
• Do not exercise 24 hours before test, we require you to be completely rested for the test. Do no
‘hard’ training or competition for 48 hours before.
• It is imperative that you do not consume alcohol, caffeine or beetroot juice 12 hours before each
trial. This includes tea, coffee, decaf coffee, energy drinks containing caffeine, medication
containing caffeine or any other caffeine containing products. Furthermore, no food should be
consumed in the 3 hours prior to visiting the University.
What feedback do I get and can I have my results?
Upon completion of the 3 visits you can request feedback regarding your performance and data
associated with this. Data that is of likely interest includes;
• Your response to the intervention measured
• VO2max (Maximum oxygen uptake)
• Max heart rate
• Running economy
• Debrief outlining intervention differences
Do I have to take part?

178
It is up to you to decide whether or not to take part. If you decide to take part you will be asked to sign
a consent form. If you decide to take part you are still free to withdraw at any time and without giving
a reason.
What if something goes wrong?
If you wish to complain or have any concerns about any aspect of the way you have been approached
or treated during the course of this study, please contact Dr Dave Parry, Director of the Human
Performance Unit, University of Essex, Wivenhoe Park, CO43SQ, Essex.
Will my taking part in this study be kept confidential?
All information which is collected about you during the course of the research will be kept strictly
confidential so that only the researcher(s) carrying out the research will have access to such
information. All data will be stored on a personal computer and backed up to a safe storage device and
stored in a locked office.
Who may I contact for further information?
If you would like more information about the research before you decide whether or not you would be
willing to take part, please contact:
Chris McManus at the Human Performance Unit, University of Essex, Wivenhoe, Essex, CO4 3SQ.
Email: [email protected]
Phone: 01206 873290 or 01206 874475

179
University of Essex Department of Biological Sciences
Wivenhoe_Park Colchester CO4 3SQ
Telephone: 01206 873333
Facsimile: 01206 872592
URL:http://www.essex.ac.uk/
January 2015
Study Title: Assessment of the inter-day reliability of a wireless near-infrared spectroscopy device
during rest and exercise
Dear Participant,
We would like to take this opportunity to invite you to participate in a research project which will take
place during Monday 26th January – Friday 27th February 2015. Before you decide, we would like
you to understand why the research is being done and what it would involve for you. Part 1 of this
Participant Information Sheet tells you why we are doing this research and what will happen to you if
you take part. Part 2 gives you more details about how the study will be conducted.
Background to this research
The aim of the project is to assess the inter-reliability of two different muscle oxygen saturation
devices: (1) Portamon and (2) Moxy at rest and during a repeat isometric quadriceps contraction test
and compare these values between devices. Muscle oxygen saturation and haemoglobin variables will
be measured non-invasively by a wireless optical device that is attached to the participant’s leg.
PART 1 OF THE INFORMATION SHEET
How have I been selected?
You have been invited to take part in this study because you are student of the Colne Rugby Academy
and you have indicated that you are happy to participate in the study.
Do I have to take part?
No, it is your choice whether or not to take part. Please talk to others about the study if you wish and
ask us if anything is not clear. If you decide to take part, you can leave the study at any time without
giving a reason.
What will happen to me if I take part?
When you are recruited you will be shown some of the equipment that will be used during you
participation. You will be able to ask any questions that you may have at this point before deciding
you are interested in taking part.

180
What will I have to do?
The study involves five visits to The University biomechanics lab. Firstly, to measure your height,
weight and lower limb skin fold thickness and to familiarise you with the data collection procedures
for the exercise testing on your second visit. The first visit will also involve an assessment of maximal
quadriceps voluntary contraction (MVC) upon an isokinetic dynamometer. This first visit should take
no longer than 30 minutes.
The remaining four visits will take no longer than 30 minutes each. You will be required to perform
two thirty second isometric holds at 30 and 50% MVC, while blood oxygen saturation of your leg
muscle will be measured using a non-invasive portable device. The blood oxygenation test is a
completely painless test that uses near infrared light to detect changes in muscle oxygenation in the
tissue.
You will be asked to follow some simple rules prior to attending for your testing:
1. No intense physical exercise for 24 hours before visits
2. No alcohol or caffeine for 24 hours before the test
3. No heavy meal in the last 4 hours before test (have some breakfast with a drink)
How will we contact you about visits?
We will ask you your preferred method of communication such as e-mail to remind you about your
visits.
Will I be paid for my participation?
You will not be paid for taking part in this study.
Why might you be not able to take part in the study?
If you have a history of heart disease (including irregular heartbeats), high blood pressure, problems
with the nervous system or taking medicine that alters the cardiovascular system or the nervous system
you will not be able to participate. In addition, if you any lower limb muscle or joint problems you
will not be able to participate in the study.
What if there is a problem?
Any complaint about the way you have been dealt with during the study or any possible harm you
might suffer will be addressed. The detailed information on this is given in Part 2 of this sheet.
Will my taking part in the study be kept confidential?
We will follow ethical and legal practice and all information about you will be handled in confidence.
The details are included in Part 2.
This completes Part 1. If the information in Part 1 has interested you and you may want to join the
study, please read the additional information in Part 2 before making any decision.

181
PART 2 OF THE INFORMATION SHEET
What if relevant new information becomes available?
If additional information becomes available during the course of the research, it will mainly be
conveyed in the form of e-mail or by letters if you have no access to e-mail (through internal post). E-
mail or text messages will be used for reminders for you depending on your preference.
What will happen if I don’t want to carry on with the study?
If you decide to take part, you can still leave the study at any time without giving a reason. Identifiable
data already collected with consent would be retained and used in the study. No further data would be
collected or any other research procedures carried out on or in relation to you.
Who is organising and funding the research?
The University of Essex is organising this study. The research team are employees of the University of
Essex.
What if there is a problem or you are unhappy with the conduct of this study?
If you have any concerns or issues with the study please speak to Chris McManus in the first instance,
unless you feel it more appropriate to speak to the Head of the Department of Biological Sciences (tel
01206 87-3337; e-mail [email protected]), or to Sarah Manning-Press, Research Governance and
Planning Manager, Research and Enterprise Office (tel 01206 87-3561; e-mail [email protected]).
In the event that something does go wrong and you are harmed during the research and this is due to
someone being at fault, you may have grounds for a legal action for compensation but you may have
to pay your legal costs.
All research is looked at by independent group of people, called a Research Ethics Committee, to
protect your interests.
If you do decide to take part, you will be given a copy of this information sheet to keep, and will be
asked to sign a consent form.
Will my taking part in this study be kept confidential?
If you decide to take part in this study, any information collected about you as part of this project will
remain confidential and your identity will not be revealed outside the research and medical team. Any
information about you which is collected will have your name and address removed so that you cannot
be recognised. Information may be looked at by regulatory authorities to check that the study is being
carried out correctly. However, your name and address will not be disclosed as your identity will be
allocated a code and in this way will remain anonymous. Data will be handled, processed and stored in
accordance with the Data Protection Act 1998
http://www.opsi.gov.uk/acts/acts1998/ukpga_19980029_en_1
What will happen to the results of this study?

182
Any information collected about you will only be used for the purposes of this project and will be
disposed of securely when research is complete. The results may be published in scientific journals,
undergraduate reports and used in presentations to healthcare and other interested parties. You will not
be personally identified in any report or publication. You can request a copy of the findings. You will
also be given individual feedback after completion of the study. This is NOT a clinical diagnosis.
What will happen to any samples I give?
The blood samples you give will be analysed within 24 hours to investigate blood lactate levels. After
this analysis the samples will be destroyed and will not be used for any other research. Prior to
disposal, samples will be stored with no personal details on them just a participant number.
For further information about this project please contact
Chris McManus at the University of Essex (Telephone: 07787259096, e-mail [email protected])
Thank you for taking time to read this Participant Information Sheet.

183
University of Essex Department of Biological Sciences
Wivenhoe_Park Colchester CO4 3SQ
Telephone: 01206 873333
Facsimile: 01206 872592
URL:http://www.essex.ac.uk/
August 2017
Study Title: Performance comparison of the MOXY and PortaMon near-infrared spectroscopy muscle
oxygenation monitors during dynamic arm-crank exercise
Dear Participant,
We would like to take this opportunity to invite you to participate in a research project which will take
place during August 2017 – September 2017. Before you decide, we would like you to understand
why the research is being done and what it would involve for you. Part 1 of this Participant
Information Sheet tells you why we are doing this research and what will happen to you if you take
part. Part 2 gives you more details about how the study will be conducted.
Background to this research
The aim of the project is to assess two different muscle oxygen saturation devices: (1) Portamon and
(2) MOXY at rest and during an incremental arm crank exercise and compare these values between
devices. Furthermore, we wish to investigate the devices when blood flow to the muscle being
assessed is stopped (via an occlusion). Muscle oxygen saturation and haemoglobin variables will be
measured non-invasively by a wireless optical device that is attached to the participant’s leg.
Portamon Device MOXY Device
PART 1 OF THE INFORMATION SHEET
How have I been selected?
You have been invited to take part in this study because you have responded to an advert, email or
alternative form of communication.

184
Do I have to take part?
No, it is your choice whether or not to take part. Please talk to others about the study if you wish and
ask us if anything is not clear. If you decide to take part, you can leave the study at any time without
giving a reason.
What will happen to me if I take part?
When you are recruited you will be shown some of the equipment that will be used during you
participation. You will be able to ask any questions that you may have at this point before deciding
you are interested in taking part.
What will I have to do?
The study involves two visits to The University, Clinical Physiology Lab. Firstly, to measure your
height, weight and bicep skinfold thickness and to undertake an incremental arm crank exercise
followed by a 5 minute period of blood flow occlusion to your dominant arm.
The second visit will be a repeat of the first; however, an alternative device will be placed on your
bicep to that used in the first visit.. The measure of muscle oxygenation is a completely painless
process that uses near infrared light to detect changes in muscle oxygenation in the tissue.
The arm crank exercise will cause some mild feeling of discomfort that is typically associated with
maximal exercise to exhaustion.
The blood flow occlusion may also cause discomfort, tingling feeling in the arm and a sensation of
numbness. These feelings quickly return to normal upon releasing the cuff.
You will be asked to follow some simple rules prior to attending for your testing:
1. No intense physical exercise for 24 hours before visits
2. No alcohol or caffeine for 12 hours before the test
3. No food consumed in the last 2 hours before test
How will we contact you about visits?
We will ask you your preferred method of communication such as e-mail to remind you about your
visits.
Will I be paid for my participation?
You will not be paid for taking part in this study.
Why might you be not able to take part in the study?

185
If you have a history of heart disease (including irregular heartbeats), high blood pressure, problems
with the nervous system or taking medicine that alters the cardiovascular system or the nervous system
you will not be able to participate. In addition, if you any lower limb muscle or joint problems you
will not be able to participate in the study.
What if there is a problem?
Any complaint about the way you have been dealt with during the study or any possible harm you
might suffer will be addressed. The detailed information on this is given in Part 2 of this sheet.
Will my taking part in the study be kept confidential?
We will follow ethical and legal practice and all information about you will be handled in confidence.
The details are included in Part 2.
This completes Part 1. If the information in Part 1 has interested you and you may want to join the
study, please read the additional information in Part 2 before making any decision.
PART 2 OF THE INFORMATION SHEET
What if relevant new information becomes available?
If additional information becomes available during the course of the research, it will mainly be
conveyed in the form of e-mail. E-mail or text messages will be used for reminders for you depending
on your preference.
What will happen if I don’t want to carry on with the study?
If you decide to take part, you can still leave the study at any time without giving a reason. Identifiable
data already collected with consent would be retained and used in the study. No further data would be
collected or any other research procedures carried out on or in relation to you.
Who is organising and funding the research?
The University of Essex is organising this study. The research team are employees of the University of
Essex.
What if there is a problem or you are unhappy with the conduct of this study?
If you have any concerns or issues with the study please speak to Chris McManus in the first instance,
unless you feel it more appropriate to speak to Sarah Mumford, School Manager for the School of
Sport, Rehabilitation and Exercise Science (tel 01206 87-3348; e-mail [email protected]), or to
Sarah Manning-Press, Research Governance and Planning Manager, Research and Enterprise Office
(tel 01206 87-3561; e-mail [email protected]). In the event that something does go wrong and you
are harmed during the research and this is due to someone being at fault, you may have grounds for a
legal action for compensation but you may have to pay your legal costs.

186
All research is looked at by independent group of people, called a Research Ethics Committee, to
protect your interests.
If you do decide to take part, you will be given a copy of this information sheet to keep, and will be
asked to sign a consent form.
Will my taking part in this study be kept confidential?
If you decide to take part in this study, any information collected about you as part of this project will
remain confidential and your identity will not be revealed outside the research and medical team. Any
information about you which is collected will have your name and address removed so that you cannot
be recognised. Information may be looked at by regulatory authorities to check that the study is being
carried out correctly. However, your name and address will not be disclosed as your identity will be
allocated a code and in this way will remain anonymous. Data will be handled, processed and stored in
accordance with the Data Protection Act 1998
http://www.opsi.gov.uk/acts/acts1998/ukpga_19980029_en_1
What will happen to the results of this study?
Any information collected about you will only be used for the purposes of this project and will be
disposed of securely when research is complete. The results may be published in scientific journals,
undergraduate reports and used in presentations to healthcare and other interested parties. You will not
be personally identified in any report or publication. You can request a copy of the findings. You will
also be given individual feedback after completion of the study. This is NOT a clinical diagnosis.
For further information about this project please contact
Chris McManus at the University of Essex (Telephone: 01206 874475, e-mail [email protected])
Thank you for taking time to read this Participant Information Sheet.

187
188

189

190
Appendix 3: Preliminary survey and compression belief questionnaire

191
Name:
Age:
Average days run per week over the last 6 months:
Average miles per week over the last 6 months:
Best race times in the past year (fill out one or more of the following):
10,000 m:
Half marathon:
Marathon:
Most recent race times in the past year (fill out one or more of the following)
10,000 m:
Half marathon:
Marathon:
Please circle Yes (Y) or No (N)
Are you familiar with (have you heard about) sports compression tights/sleeves or socks? Y N
Have you seen runners wear sports compression tights/sleeves or socks? Y N
Do you personally know anyone who has worn sports compression tights/sleeves or socks? Y N
Have you ever worn sports compression tights/sleeves or socks? Y N
Do you believe sports compression tights/sleeves or socks aid in any of the following;
Training Y N
Competition Y N
Recovery Y N

192
Appendix 4: Published work

193

194

195

196

197

198

199

200

201

202

203

204

205

206

207
Copyright © 2022 FDOKUMEN