Magnetism and structural distortions in uranium sulfide under pressure
11
PHYSICAL REVIEW B 87, 214104 (2013) Magnetism and structural distortions in uranium sulfide under pressure J. R. Jeffries, 1 P. S¨ oderlind, 1 H. Cynn, 1 A. Landa, 1 W. J. Evans, 1 S. T. Weir, 1 Y. K.Vohra, 2 and G. H. Lander 3 1 Condensed Matter and Materials Division, Lawrence Livermore National Laboratory, Livermore, California 94550, USA 2 Department of Physics, University of Alabama at Birmingham, Birmingham, Alabama 35924, USA 3 European Commission, Joint Research Centre, Institute for Transuranium Elements, Postfach 2340, D-76125 Karlsruhe, Germany (Received 27 April 2013; revised manuscript received 30 May 2013; published 18 June 2013) Uranium sulfide belongs to a class of uranium monochalcogenides that crystallize in the rocksalt structure and exhibit ferromagnetism at low temperature. The magnetism is believed to play a role in the low-temperature rhombohedral distortion, possibly due to its large magnetic anisotropy. We have performed electrical and structural characterization along with density-functional theory calculations as functions of pressure to help understand the interplay between structure and magnetism in US. Theoretical calculations suggest that ferromagnetic order is responsible for the small distortion at ambient pressure and low temperature. Under pressure, the Curie temperature is reduced monotonically until it discontinuously disappears near a pressure-induced deformation of the crystal structure. This high-pressure distortion is identical to the one correlated with the onset of magnetic order, but with a larger change in the cell angle. Calculations imply a reduction in the electronic band energy as the driving force for the pressure-induced structure, but the loss of magnetic order associated with this distortion remains a mystery. The high-pressure electronic phase diagram may shed light on the magnetostructural free energy landscape of US. DOI: 10.1103/PhysRevB.87.214104 PACS number(s): 64.60.Ej, 75.50.Cc I. INTRODUCTION Uranium sulfide is a member of the ferromagnetic uranium monochalcogenides UX (i.e., US, USe, and UTe), which, under ambient conditions, crystallize in a simple rocksalt (B1-Fm ¯ 3m) structure. The uranium monochalcogenides have been widely studied owing to their simple crystal structure and the ability to tune lattice volumes and electronic structure based on the chalcogen size. 1 US is paramagnetic at room temperature with a moment of 2.2 μ B , lower than the expectations of a localized f 2 or f 3 configuration for the U ions. 2 Below 177 K, US undergoes concomitant magnetic and structural transitions, resulting in a ferromagnetic ground state and a rhombohedral unit cell. 2–6 This rhombohedral unit cell is best described as a small distortion of the cubic rocksalt structure along one of the [111] directions. The ferromagnetic state is characterized by an ordered moment of about 1.55 μ B , manifesting from the sum of a U ion contribution of 1.7 μ B and an antiparallel contribution from the spd conduction electrons of −0.15 μ B . 2,7 The magnetic easy axis is directed along the body diagonal [111] direction of the former rocksalt structure, resulting in one of the largest magnetic anisotropies in a cubic system. 4 No qualitative explanation to this structural phase transition has heretofore been put forward, although there are speculations that the rhombohedral distortion is a consequence of the magnetostriction arising from the ferromagnet order. 5,6 The magnetism in US originates from the 5f electrons in uranium that produce both spin and orbital moments. The 5f spin moment is somewhat smaller (1.30 μ B ) than the antiparallel orbital moment (−3.0 μ B ) 8–10 as is expected from the fact that the 5f band is less than half filled with a substantial spin-orbit interaction. 11 Both the paramagnetic and ferromagnetic states of US, however, exhibit moments below the expectations of purely localized f states, suggesting a strong itinerant component to the f states. This itineracy is corroborated by specific heat measurements that imply an enhanced γ as well as photoemission spectra that reveal a strong 5f peak near the Fermi level. 12–15 Additionally, measurements of the lattice dynamics of US suggest that f -d hybridization 16 is responsible for the small Poisson’s ratio as well as a small U-U interatomic force constant, which leads to an anomalously small bulk modulus with respect to the lattice volume. 17 These measurements point to the importance of the electronic structure, particularly the behavior of the U5f states, in determining the physical properties of this crystallographically simple material. Under pressure at room temperature, US distorts from its ambient-pressure B1 phase to a rhombohedral phase near 10 GPa. 18 For pressures above 30 GPa, hints of another transformation in US may be evident, although peak broad- ening and questions of strain from the pressure medium prevented Gerward and coworkers from concluding a phase transition. 18 This pressure-induced rhomobohedral distortion in US contrasts with the behavior of USe and UTe, for which pressure induces a B1-B2 transition (CsCl type, Pm ¯ 3m). 18 For USe and UTe, the transition to the B2 phase causes an abrupt destruction of ferromagnetic ordering. 20 The rhombohedral phase of US seen above 10 GPa is identical to the low-temperature distortion seen upon entering the ferromagnetic state; however, the ferromagnetic state is not enhanced with pressure. Instead, as shown by ac susceptibility measurements in a diamond anvil cell, the Curie temperature T C of US is suppressed monotonically up to approximately 10 GPa, abruptly disappearing, just as the ferromagnetic states of USe and UTe, for pressures in excess of 10 GPa. 19,20 The behavior of T C under pressure for the UX system has been described theoretically by a competition between increasing hybridization strength and decreasing f occupancy. 21 The spin and orbital moments of US have been shown theoretically to vary by only a small amount with increasing pressure, 22 precluding a quenching of U moments as a mechanism for the destruction of magnetic order. The destruction of magnetic order in USe and UTe is associated with first-order 214104-1 1098-0121/2013/87(21)/214104(11) ©2013 American Physical Society
Transcript of Magnetism and structural distortions in uranium sulfide under pressure

PHYSICAL REVIEW B 87, 214104 (2013)
Magnetism and structural distortions in uranium sulfide under pressure
J. R. Jeffries,1 P. Soderlind,1 H. Cynn,1 A. Landa,1 W. J. Evans,1 S. T. Weir,1 Y. K. Vohra,2 and G. H. Lander3
1Condensed Matter and Materials Division, Lawrence Livermore National Laboratory, Livermore, California 94550, USA2Department of Physics, University of Alabama at Birmingham, Birmingham, Alabama 35924, USA
3European Commission, Joint Research Centre, Institute for Transuranium Elements, Postfach 2340, D-76125 Karlsruhe, Germany(Received 27 April 2013; revised manuscript received 30 May 2013; published 18 June 2013)
Uranium sulfide belongs to a class of uranium monochalcogenides that crystallize in the rocksalt structureand exhibit ferromagnetism at low temperature. The magnetism is believed to play a role in the low-temperaturerhombohedral distortion, possibly due to its large magnetic anisotropy. We have performed electrical and structuralcharacterization along with density-functional theory calculations as functions of pressure to help understandthe interplay between structure and magnetism in US. Theoretical calculations suggest that ferromagnetic orderis responsible for the small distortion at ambient pressure and low temperature. Under pressure, the Curietemperature is reduced monotonically until it discontinuously disappears near a pressure-induced deformationof the crystal structure. This high-pressure distortion is identical to the one correlated with the onset of magneticorder, but with a larger change in the cell angle. Calculations imply a reduction in the electronic band energy asthe driving force for the pressure-induced structure, but the loss of magnetic order associated with this distortionremains a mystery. The high-pressure electronic phase diagram may shed light on the magnetostructural freeenergy landscape of US.
DOI: 10.1103/PhysRevB.87.214104 PACS number(s): 64.60.Ej, 75.50.Cc
I. INTRODUCTION
Uranium sulfide is a member of the ferromagnetic uraniummonochalcogenides UX (i.e., US, USe, and UTe), which,under ambient conditions, crystallize in a simple rocksalt(B1-Fm3m) structure. The uranium monochalcogenides havebeen widely studied owing to their simple crystal structureand the ability to tune lattice volumes and electronic structurebased on the chalcogen size.1 US is paramagnetic at roomtemperature with a moment of 2.2 μB , lower than theexpectations of a localized f 2 or f 3 configuration for theU ions.2 Below 177 K, US undergoes concomitant magneticand structural transitions, resulting in a ferromagnetic groundstate and a rhombohedral unit cell.2–6 This rhombohedral unitcell is best described as a small distortion of the cubic rocksaltstructure along one of the [111] directions. The ferromagneticstate is characterized by an ordered moment of about 1.55 μB ,manifesting from the sum of a U ion contribution of 1.7 μB andan antiparallel contribution from the spd conduction electronsof −0.15 μB .2,7 The magnetic easy axis is directed along thebody diagonal [111] direction of the former rocksalt structure,resulting in one of the largest magnetic anisotropies in a cubicsystem.4 No qualitative explanation to this structural phasetransition has heretofore been put forward, although there arespeculations that the rhombohedral distortion is a consequenceof the magnetostriction arising from the ferromagnet order.5,6
The magnetism in US originates from the 5f electrons inuranium that produce both spin and orbital moments. The5f spin moment is somewhat smaller (1.30 μB) than theantiparallel orbital moment (−3.0 μB)8–10 as is expectedfrom the fact that the 5f band is less than half filled witha substantial spin-orbit interaction.11 Both the paramagneticand ferromagnetic states of US, however, exhibit momentsbelow the expectations of purely localized f states, suggestinga strong itinerant component to the f states. This itineracyis corroborated by specific heat measurements that implyan enhanced γ as well as photoemission spectra that reveal
a strong 5f peak near the Fermi level.12–15 Additionally,measurements of the lattice dynamics of US suggest that f -dhybridization16 is responsible for the small Poisson’s ratio aswell as a small U-U interatomic force constant, which leadsto an anomalously small bulk modulus with respect to thelattice volume.17 These measurements point to the importanceof the electronic structure, particularly the behavior of theU 5f states, in determining the physical properties of thiscrystallographically simple material.
Under pressure at room temperature, US distorts from itsambient-pressure B1 phase to a rhombohedral phase near10 GPa.18 For pressures above 30 GPa, hints of anothertransformation in US may be evident, although peak broad-ening and questions of strain from the pressure mediumprevented Gerward and coworkers from concluding a phasetransition.18 This pressure-induced rhomobohedral distortionin US contrasts with the behavior of USe and UTe, for whichpressure induces a B1-B2 transition (CsCl type, Pm3m).18 ForUSe and UTe, the transition to the B2 phase causes an abruptdestruction of ferromagnetic ordering.20
The rhombohedral phase of US seen above 10 GPa isidentical to the low-temperature distortion seen upon enteringthe ferromagnetic state; however, the ferromagnetic state is notenhanced with pressure. Instead, as shown by ac susceptibilitymeasurements in a diamond anvil cell, the Curie temperatureTC of US is suppressed monotonically up to approximately10 GPa, abruptly disappearing, just as the ferromagnetic statesof USe and UTe, for pressures in excess of 10 GPa.19,20 Thebehavior of TC under pressure for the UX system has beendescribed theoretically by a competition between increasinghybridization strength and decreasing f occupancy.21 The spinand orbital moments of US have been shown theoreticallyto vary by only a small amount with increasing pressure,22
precluding a quenching of U moments as a mechanismfor the destruction of magnetic order. The destruction ofmagnetic order in USe and UTe is associated with first-order
214104-11098-0121/2013/87(21)/214104(11) ©2013 American Physical Society

J. R. JEFFRIES et al. PHYSICAL REVIEW B 87, 214104 (2013)
phase transitions and concomitant discontinuous reductionsin atomic volume, suggesting that magnetic order is tied tothe symmetry of the crystal structure. The case for US is a bitdifferent, however, as the structural phase transition associatedwith the loss of magnetic order seems to be continuouswith no volume discontinuity. The loss of magnetic orderin US is thus puzzling, either indicating its deviation fromthe other members of the UX system or implying other,unknown mechanisms shared within the UX system. In thepresent study we apply experimental methods to investigatestructural and electrical transport properties combined withelectronic-structure calculations at elevated pressures to helpshed light on these interesting behaviors of US.
II. EXPERIMENTAL AND THEORETICAL METHODS
A. Electrical transport
Single crystals of US were previously grown by a re-crystallization process.23 High-pressure electrical transportmeasurements were performed as a function of temperatureand magnetic field using a nonmagnetic designer diamondanvil cell (DAC) in combination with a commercial low-temperature cryostat equipped with a 16-T superconductingmagnet (Quantum Design PPMS). The DAC consisted ofa conventional diamond anvil paired with an 8-probe de-signer diamond anvil;24–26 both anvils had 300-μm culets.The tungsten microprobes of the designer diamond werelithographically capped with tungsten contact pads to facilitateelectrical contact. An MP35N gasket was pre-indented down toa thickness of 40 μm, and a hole, to serve as the high-pressuresample chamber, was drilled in the center of the indentationusing an electric discharge machine (EDM). The samplechamber was packed with solid steatite, which served asthe pressure-transmitting medium, and several ruby chips,which were used as pressure calibrants.27,28 The single-crystalsample was cut with a razor blade and placed in contact withthe electrical contact pads on the designer anvil. Electricalresistivity measurements were performed with the standard,four-probe technique. The lead geometry was established bythe pattern of the designer anvil, which lent itself easily to atransverse and longitudinal transport geometry.
B. Structural characterization
X-ray diffraction measurements were performed in amembrane-driven DAC comprising 300-μm-culet diamondanvils. A rhenium gasket was pre-indented down to 40 μm,and a 120-μm hole was drilled with an EDM. Powdereduranium sulfide was loaded into the sample chamber alongwith a small amount of copper powder, the measured latticecompression of which provided a pressure marker. The DACwas sealed under a high-pressure of neon, which servedas the pressure-transmitting medium. Angle-dispersive x-raydiffraction measurements were performed at the HPCATbeamline 16 BM-D of the Advanced Photon Source at ArgonneNational Laboratory using a 5 × 10 μm microfocused beam.Two incident wavelengths were used (λ = 0.3676 A andλ = 0.4246 A) for different experiments at room temperatureand low temperatures. Low-temperature data were collectedusing a helium-flow cryostat to control temperature; standard
Si diodes were used to measure the temperature. Diffrac-tion data were collected on a Mar345 image plate using30–120 second acquisitions. Two-dimensional diffraction pat-terns were integrated with FIT2D,29 and structural refinementswere performed with the JADE software package.
C. Theoretical modeling
The electronic-structure modeling is here framed withinthe density-functional theory (DFT) with the necessary as-sumption for the electron exchange and correlation functionalchosen to be the generalized-gradient approximation (GGA)34
as currently being the best starting point for actinide DFTcalculations.30,31 Most calculations are performed utilizing anall-electron full-potential linear muffin-tin orbitals (FPLMTO)approach that has been described in detail.35 This FPLMTOimplementation has been used extensively and successfully fortransition32 and actinide33 metals. The “full potential” refersto the use of nonspherical contributions to the electron chargedensity and potential. This is accomplished by expandingthese in cubic harmonics inside nonoverlapping muffin-tinspheres and in a Fourier series in the interstitial region. Weuse two energy tails associated with each basis orbital andfor the semicore 6s, 6p, and valence 7s, 7p, 6d, and 5f
states, these pairs are different. Spherical harmonic expansionsare carried out through lmax = 8 for the bases, potential,and charge density. Because we are studying an actinidesystem, one has to consider the possibility that electroncorrelations such as the spin-orbit interaction and orbitalpolarization may be important. However, strong electroncorrelations leading to 5f -orbital localization is not consideredbecause US is believed to possess itinerant (band-like) 5f
states.36 The technical details of the FPLMTO calculationsare very similar to those performed earlier for plutoniummetal.37–39 Here different magnetic order (ferromagnetic andantiferromagnetic) and even magnetic disorder combined withspin-orbit coupling and orbital polarization are applied.
Spin-orbit coupling is implemented in a first-order varia-tional procedure40 for the valence d and f states, as was donepreviously,41 and for the core states the fully relativistic Diracequation is solved. The inclusion of spin-orbit coupling forthe 5f states of uranium may be essential, since it has beenexperimentally shown to be strong in actinide metals.42 Theorbital polarization was shown to be significant in plutoniummetal43 and is here included as described by Eriksson et al.44
The energy of the orbitals with the spin, orbital, and magneticquantum numbers (σ,l,ml) is shifted an amount proportionalto Lσml . Here Lσ is the total orbital moment from electronswith spin σ . This self-consistent parameter-free techniqueattempts to generalize Hund’s second rule for an atom to abulk condensed-matter state, and enhances the separation ofthe ml orbitals caused by the spin-orbit interaction. Hence,the orbital polarization can be viewed as an amplification of thespin-orbit coupling. The orbital polarization mechanism is alsoknown to improve on the calculated orbital magnetic momentsin US.45 Both the [111] and [100] directions of the spin momentare considered both in the ferromagnetic and antiferromagneticorder.
The phases we are investigating for US all have relativelysmall unit cells. The B1 and B2 phases are cubic with two
214104-2

MAGNETISM AND STRUCTURAL DISTORTIONS IN . . . PHYSICAL REVIEW B 87, 214104 (2013)
atoms per unit cell, while the Immm phase is a 4-atomorthorhombic phase (b/a = 1.036 and c/a = 1.435), whichis a small distortion of a higher symmetry phase (c/a =1.0 and c/a = √
2), where the uranium atoms occupy theface-centered-cubic lattice positions. The Immm phase wassimulated, because it was found to be a candidate structure,albeit a weaker one, based on x-ray diffraction experiments.The axial ratios of the Immm phase are allowed to relaxduring the compression. A rhombohedral strain on the B1phase changes the cubic angle α to something different than90 degrees and results in the R3m phase. A large number of kpoints are chosen and close to about 1000 for all phases in thefull Brillouin zone.
For the disordered magnetic calculations we are using thedisordered-local-moment (DLM) approach. For this purposewe apply the so-called exact muffin-tin orbitals (EMTO)method46 that includes spin-orbit effects.47 Here the one-electron potential is represented by optimized overlappingmuffin-tin (OOMT) potential spheres, where inside the po-tential spheres the potential is spherically symmetric, whereasit is constant between the spheres. The radii of the potentialspheres, the spherical potentials inside the spheres, and theconstant value in the interstitial region are determined byminimizing (i) the deviation between the exact and overlappingpotentials, and (ii) the errors caused by the overlap betweenthe spheres. Within the EMTO formalism, the one-electronstates are calculated exactly for the OOMT potentials. Asan output of the EMTO calculations, one can determinethe self-consistent Green’s function of the system and thecomplete, non-spherically symmetric charge density. Finally,the total energy is calculated using the full charge-densitytechnique.48
The calculations are performed for a basis set includingvalence spdf orbitals. For the electron exchange and correlationenergy functional, the GGA is considered.34 Magnetism ismodeled within the DLM approximation; i.e., the uraniummetal is viewed as an alloy U150U250 with U1 and U2 havingopposite spin direction. The alloy treatment in EMTO isperformed within the coherent potential approximation andthe DLM solution is equivalent to a paramagnetic state; seeRef. 49 for details.
III. RESULTS
A. Electronic structure calculations
Uranium compounds can have varying degrees of localiza-tion of the uranium 5f electrons. In the case of US it hasbeen proposed that the 5f states can accurately be modeledby band (itinerant) states in DFT,36 because of the existence ofa sharp peak of the photoemission close to the Fermi level. Asimple, albeit indirect, analysis of the 5f bonding strengthis to calculate the equilibrium volume, assuming itinerantor localized 5f electrons, and compare with experiment. InTable I we list the results from calculations assuming itinerantand localized (standard rare-earth model with the f electronsin the core) 5f states with experimental room-temperaturedata. The itinerant 5f model agrees quite well with themeasured data in contrast to the localized 5f approach, thussuggesting the band picture of the f electrons in US.
TABLE I. Theoretical equilibrium volume (V0) and bulk modulus(B0) modeled with itinerant (5f band) and localized (5f localized)uranium 5f states together with the room-temperature data discussedin Sec. III B.
Method V0 (A3) B0 (GPa)
5f band 21.5 1055f localized 24.9 83Experimental 20.6 106.4
As regards US magnetic properties, our model reproducesthe easy axis along the [111] direction with a magneticanisotropy energy of 31 meV, which is larger than the 14 meVobtained in earlier calculations that do not consider orbitalpolarization.50 Our calculated magnetic moments are 2.2 μB
and −3.3 μB for the spin and orbital components, respectively.Our model thus overestimates the spin moment (1.3 μB)while comparing nicely with the neutron-scattering data forthe orbital moment (−3.0μB ).2 The aforementioned resultsare obtained for US in its ambient condition (i.e., the B1phase), while at temperatures below TC at about 170 K arhombohedral distortion is accompanied by ferromagneticorder. It is reasonable to assume that the ferromagnetic orderinduces the structural distortion through magnetocrystallineeffects. To investigate this we calculate the total energy as afunction of distortion (cell angle) for three magnetic states,ferromagnetic, nonmagnetic, and paramagnetic (disordered).As shown in Fig. 1, we find that none of these states stabilizethe B1 phase (90 degree cell angle) and that the ferromagneticstate is accompanied by a shift in the cell angle. Therefore,we are unable to directly confirm that magnetocrystallineeffects stabilize B1. It is plausible, however, that the metastableparamagnetic state in Fig. 1 (D), which is calculated at zero
FIG. 1. (Color online) Calculated total energy as a function ofcell angle with 90◦ representing the B1 phase. FM, NM, and Ddenote the ferromagnetic, nonmagnetic, and disordered magnetic(paramagnetic) configurations, respectively.
214104-3

J. R. JEFFRIES et al. PHYSICAL REVIEW B 87, 214104 (2013)
0 50
40
30
20
10
FIG. 2. (Color online) Calculated energy versus atomic volumerelative to the B1 phase for the Immm, R3m, and B2 phases,respectively. The calculated pressures corresponding to the atomicvolumes of the R3m phase are given across the top x axis in GPa.
temperature, could be correct and that thermal entropy isresponsible for sustaining the B1 phase above 170 K.
Next, we focus on the behavior of US under compressionand compute the total energy of the B1, B2, R3m (rhomboderaldistortion of B1), and the Immm phase. In Fig. 2 we show thetotal-energy difference for these structures relative to the B1phase. Notice that the R3m phase is predicted to be stablefor all volumes down to 15 A3 (62 GPa). The rhombohedraldistortion drives the cell angle away from the higher symmetry90◦ angle, producing an R3m cell with either a larger orsmaller cell angle. These angles are roughly symmetric about90◦, but the DFT model predicts that the larger angle has thelowest energy. However, the energy difference between thesetwo cell angles is small and close to the resolution of theenergy calculation. The rhombohedral distortion is predictedto increase with compression and Fig. 3 shows that it becomes
FIG. 3. Calculated rhombohedral distortions (cell angles) of theR3m cell as a function of pressure. The larger cell angle is slightlyfavored in DFT calculations (see text). The 90◦ angle defines the B1phase.
FIG. 4. (Color online) Electronic density of states (DOS) for B1,B2, and the R3m phases at about 90 GPa. The dashed vertical linedenotes the Fermi level. The R3m phase has fewer states occupyinghigher energies close and below EF .
a substantial distortion with higher compression. The reasonR3m is stable over B1 and B2 is found in the electronic densityof states (DOS), displayed in Fig. 4. Below the Fermi level(EF ), B1 and B2 have fairly similar DOS, whereas R3m hasmuch lower occupied energy states resulting in a lower bandenergy at about 90 GPa. At this pressure B2 is actually muchcloser to R3m than B1 is (see Fig. 2). The reason for this isthat even though the band energy looks to be similar (Fig. 4)between B1 and B2, the latter has a much lower electrostaticenergy due to a closer packing of the atoms. This fact willbecome increasingly important at higher compressions andit is not surprising that the B2 phase has been reported at80 GPa.51 In our calculations, however, R3m remains stableup to about 100 GPa.
In Fig. 5(a) we show the total (spin and orbital) magneticmoment as a function of atomic volume for the five studiedphases. Notice that the moments in B1 and R3m are closeuntil complete suppression at about 14.7 A3 (∼65 GPa).Interestingly, both the B2 and the Immm show significantlydifferent magnetic behavior with compression compared toB1 and R3m. In Fig. 5(b) we display the antiparallel spin andmagnetic moments in the R3m phase.
B. Crystal structure
Angle-dispersive x-ray diffraction results for US are shownin Fig. 6. At 300 K, and near 1 GPa, the diffraction patterncan be indexed using the B1 structure. The B1 phase remainsan excellent description of the data until about 8 GPa. Above8 GPa, the patterns show preferential peak broadening [e.g.,the B1 phase (111) and (220) peaks broaden more withpressure than the (200)]. Above 11 GPa, the peak broadeningis sufficient to reduce the quality of the refinements. Consistentwith previous experiments and the theoretical calculationsabove, the data are better fitted using a rhombohedral phase
214104-4

MAGNETISM AND STRUCTURAL DISTORTIONS IN . . . PHYSICAL REVIEW B 87, 214104 (2013)
0 10
20
30
40
50
FIG. 5. (Color online) (a) Calculated total magnetic moments(spin and orbital contributions) for several candidate structuresas functions of atomic volume. The lowest volume (14.7 A3)corresponds to about 65 GPa for the R3m (lowest energy) phase.Calculations imply that the B1 and R3m phases have nearlydegenerate magnetic moments. (b) Spin and orbital components ofthe magnetic moment of the uranium atoms in the R3m phase versusatomic volume. The calculated pressures corresponding to the atomicvolumes of the R3m phase are given across the top x axis in GPa.
(s.g. R3m, No. 166) that is a distortion of the B1 phase. At120 K and ambient pressure, US is in an ordered ferromagneticstate, the onset of which results in rhombohedral distortion(R3m) identical—albeit smaller in magnitude—to that seenunder pressure. Applying pressure at 120 K compresses therhombohedral lattice continuously. The rhombohedral unitcells at 300 and 120 K are indexed in Fig. 6 using hexagonalcoordinates (see below).
Starting from 300 K and ambient pressure, increasingpressure or decreasing temperature into the ordered stateresults in a qualitatively identical distortion of the B1 phase.The rhombohedral unit cell breaks the fcc symmetry of the(111) planes of the B1 phase, resulting in a stretching ofthe lattice along one of the former body diagonal directions.This reduction in symmetry splits the B1 (111) Bragg peak,which has a multiplicity of eight, into two Bragg peaks inthe R3m phase: the (003) peak with a multiplicity of twocorresponding to the stretched body diagonal directions andthe (101) peak with a multiplicity of six corresponding to theremaining body diagonals. Shown in Fig. 7, this distortion canbe represented by one of three equivalent unit cells withinthe R3m space group: a hexagonal, a rhombohedral, or apseudocubic (face-centered rhombohedral) basis.
The hexagonal unit cell [Fig. 7(a)] uses hexagonal coor-dinates for the R3m space group. It is defined by two latticeparameters a and c, and is composed of six atoms per cell withthe U atoms residing at 3a (0,0,0) and the S atoms residing at3b (0,0, 1
2 ). The c axis of the hexagonal structure corresponds
Inte
nsity
(arb
. uni
ts)
~1 GPa3.4 GPa
8.9 GPa
13 GPa
15 GPa
200
220
311
222
400
331
420
422
511
440
531
600
620
111
* * * *
** * *
300 K (λ=0.3676 Å)
003 10
101
2
110
104 113
202 02
4
116
122
214
125 303
306
(a)
5 10 15 20 25
Inte
nsity
(arb
. uni
ts)
2Θ (degrees)
3.4 GPa
6.8 GPa
8.6 GPa
12 GPa
** * *
120 K (λ=0.4246 Å)
012
110
104
113
202
024
116
122
300
214
303
003
101
(b)
FIG. 6. (Color online) Diffraction patterns of US for selectedpressures at 300 K (a) and 120 K (b). Patterns are offset verticallyfor clarity, the different incident wavelengths are noted, and the Cupressure marker is denoted by a purple asterisk. For the 300-K data,the Bragg peaks for the B1 phase are labeled in red below the 1-GPapattern, while those of the R3m phase are labeled (using hexagonalcoordinates; see text) in black above the 15-GPa pattern. For the120-K data, the Bragg peaks for the magnetically ordered R3m phaseare labeled in blue below the 3.4-GPa pattern.
to the stretched body diagonal [111] direction of the originalB1 phase [Fig. 7(d)].
The rhombohedral unit cell [Fig. 7(b)] uses rhombohedralcoordinates for the R3m space group. It can be constructedfrom the original B1 phase by setting each of the six face-centered U atoms and two diametrically opposed corner atomsas the vertices of the new unit cell, which contains two atomsper cell and is defined by a lattice parameter a and a cellangle α. In the B1 phase, this rhombohedral cell would haveα = 60◦, but the high-pressure phase of US distorts to anglesbelow 60◦. In this rhombohedral cell, the U atoms reside at(0,0,0) and the S atoms reside at ( 1
2 , 12 , 1
2 ). The [111] directionof the rhombohedral cell corresponds to the [111] direction ofthe B1 phase that is stretched when the system undergoes itspressure-induced rhombohedral distortion [Fig. 7(e)].
Due to its clear relationship to the original B1 phase, thepseudocubic cell [Fig. 7(c)] is probably the most represented ofthese variants in the literature for US. Like the rhombohedralcell, the pseudocubic cell uses rhombohedral coordinatesdefined by a lattice parameter a and a cell angle α. Unlike
214104-5

J. R. JEFFRIES et al. PHYSICAL REVIEW B 87, 214104 (2013)
(a) (b) (c)
(d) (e) (f)
FIG. 7. (Color online) The three equivalent descriptions of thehigh-pressure rhombohedral phase of US. (a)–(c) Single unit cellsin the hexagonal, rhombohedral, and pseudocubic (face-centeredrhombohedral) bases, respectively. Green (larger) atoms are uranium,yellow (smaller) atoms are sulfur, U-S bonds are shown with bothcolors, and the solid, magenta line is the unit cell boundary [notseen in (c) or (f) due to bonds]. The equivalence of the structures ishighlighted in (d)–(f), where the rocksalt-like bonding is extendedoutside the first unit cells of (a) and (b). The body diagonal that isexpanded with respect to the ambient-pressure B1 structure is markedby the red arrow.
the rhombohedral cell, the pseudocubic cell would haveα = 90◦ in the B1 phase, but, like the rhombohedral cell,the high-pressure phase does have a reduced cell angle. In thepseudocubic cell, which is a face-centered rhombohedral cell,the U atoms reside at (0,0,0) and ( 1
2 , 12 ,0) while the S atoms
reside at ( 12 ,0,0) and ( 1
2 , 12 , 1
2 ), yielding a unit cell with eightatoms per cell, identical to B1. Like the rhombohedral cell, thepseudocubic [111] direction is the same as the stretched [111]direction of the B1 phase [Fig. 7(f)].
Figure 8(a) shows the atomic volume of US as a functionof pressure P at 300, 120, and 55 K. At room temperature, thetransition from the B1 phase to the rhombohedral phase near11 GPa is not accompanied by a volume collapse. For the twolower temperature compression experiments, US is ferromag-netic and already rhombohedral at ambient pressure. Thereare no structural phase transition or unambiguous volumediscontinuities under pressure at 120 or 55 K; however, the datado indicate the presence of a negative thermal expansion in therhombohedral phase between 300 and 120 K. Negative thermalexpansions have been associated with anomalous phononstiffening or invar-like behavior,52–54 but the mechanisms atwork in the rhombohedral phase of US are unclear.
The data have been fitted with a third-order Birch-Murnaghan equation of state:55
P (V ) = 3
2B0
[(V0
V
)(7/3)
−(
V0
V
)(5/3)]
×{
1 + 3
4(B ′
0 − 4)
[(V0
V
)(2/3)
− 1
]}, (1)
where B0 is the bulk modulus, V0 is the ambient-pressureatomic volume, and B ′ is the first derivative of the bulk
17
18
19
20
21
Vol
ume/
atom
(Å3 )
DFT (R3m)
300 K(Fm3m)
300 K(R3m)
120 K55 K
(R3m)
(a)
88.5
89.0
89.5
90.0
pseu
docu
bic
angl
e (d
eg.)
(b)
3.60
3.65
3.70
3.75
3.80
3.85
3.90
0 5 10 15 20 25 30
U-U
dis
tanc
e (Å
)
P (GPa)
(c)
FIG. 8. (Color online) (a) Experimental equations of state forUS under pressure in the B1 (Fm3m; red circles) phase, as wellas the R3m phase at room temperature (blue squares), 120 K(orange “x”), and 55 K (black “+”). The calculated equation ofstate (green diamonds) is also included for the R3m phase, which isthe predicted zero-temperature ground state over this entire pressurerange. The lines through the experimental data points as well as thecalculations are fits to the third-order Birch-Murnaghan equation ofstate. (b) Experimental pseudocubic angle versus pressure in the B1phase at room temperature and R3m phase at different temperatures aswell as the predictions from DFT calculations. Error bars are derivedfrom refinements. (c) Smallest U-U distance at room temperature inthe B1 and R3m phases as a function of pressure. Lines in (b) and (c)are guides to the eye.
modulus. The parameters extracted from these fits are listed inTable II. The calculated equation of state [included in Fig. 8(a)]agrees well with the experimental data, with the exception ofa 4% shift in the calculated volume.
The pseudocubic cell angle under pressure is shown inFig. 8(b). In the B1 phase, the angle is, by definition, 90◦. Thecell angle of the rhombohedral phase decreases with increasingpressure, and the pressure dependence of that decrease iswell captured by DFT calculations when considering only thesub-90◦ rhombohedral distortion. The region between about 8and 11 GPa contains data points for both the B1 and R3m
phases, because either of these phases can provide equal-quality descriptions of the diffraction data at those pressures.The cell angle does seem to show an abrupt departure from90◦ in this region, yielding a change in the cell angle between0.3◦ and 0.6◦ depending on what pressure is used to define theB1-R3m transition. Finally, the U-U nearest neighbor distanceat 300 K is shown in Fig. 8(c). The rhombohedral distortion
214104-6

MAGNETISM AND STRUCTURAL DISTORTIONS IN . . . PHYSICAL REVIEW B 87, 214104 (2013)
TABLE II. Experimentally determined, best-fit parameters for thethird-order Birch-Murnaghan equations of state [Eq. (1)] of US in theB1 phase at room temperature as well as the rhombohedral phase(R3m) at room temperature and 55 K. Results from DFT calculationsare included for comparison. V0 is the atomic volume at ambientpressure, B0 is the bulk modulus, and B ′ is the first derivative of thebulk modulus.
V0 (A3) B0 (GPa) B ′
300 K (Fm3m) 20.6 106.4 4.3300 K (R3m) 20.5 114.1 2.955 K (R3m) 20.4 115.5 5.9DFT (R3m) 21.5 112.6 2.6
causes an abrupt change in the nearest neighbor distance,amounting to an approximately 0.6% reduction.
C. Electrical transport
The temperature dependence of the longitudinal electricalresistivity of US for various pressures is highlighted in Fig. 9.At the lowest measured pressure, 3.1 GPa, the electricalresistivity displays a positive curvature with increasing temper-ature; this curvature clearly gives way to a T -linear resistivityabove about 190 K. At high temperatures, both magnetic andphonon scattering drive the temperature dependence of theelectrical transport. However, below the Curie temperature,TC , random spin-flip scattering is reduced, yielding theobserved reduction of the electrical resistivity with decreasingtemperature. The temperature-dependent electrical resistivityof a ferromagnet below TC can be described by56
ρ(T ) = ρ0 + AmagT2 + cphT , (2)
where ρ0 is the residual resistivity, ρmag = AmagT2 parameter-
izes scattering from gapless magnetic excitations, and ρph =cphT characterizes the typical T -linear scattering expectedfrom phonons for temperatures above the Debye temper-ature. The phonon contribution can be extracted from the
40
80
120
160
200
240
0 100 200 300
3.15.98.311.916.419.924.627.235.642.648.1
ρ (μ
Ω-c
m)
T (K)
FIG. 9. (Color online) Electrical resistivity ρ as a function oftemperature T for various pressures (denoted in the legend in GPa).
40
80
120
160
200
240
0 10 20 30 40
3.14.35.97.28.310.011.914.3
ρ−ρ ph
(μΩ
-cm
)
T2/1000 (K2)
(a)
0.0
0.1
0.2
0 5 10 15 20
35.640.742.645.148.151.7
ρ-ρ m
in (μ
Ω-c
m)
T (K)
(b)
FIG. 10. (Color online) (a) Low-pressure magnetic and impurityscattering, ρ − ρph, versus T 2/1000, highlighting the T 2 dependenceof the resistivity in the ferromagnetic state. (b) Magnification of thehigh-pressure data, ρ − ρmin, showing the development of a negativeslope at the lowest temperatures. Pressures are denoted in each legendin GPa.
high-temperature data (T > TC) and subtracted from theelectrical resistivity curves to yield the impurity and magneticscattering contributions to the electrical resistivity. Thesecontributions are plotted as ρ − ρph versus T 2 in Fig. 10(a),which clearly evinces the T 2 and T -linear behavior of theelectrical resistivity below and above TC , respectively.
With increasing pressure, both the 300- and 10-K valuesof the the electrical resistivity are suppressed (Fig. 9). The T -linear portion of the resistivity extends to lower temperatures,consistent with the suppression of the ferromagnetic stateunder pressure, but the low-temperature T 2 behavior remains,persisting to 14.3 GPa [Fig. 10(a)]. Above 14.3 GPa, thedistinction between temperature regions described by T 2 orT -linear behavior becomes less clear. At the highest pressures(P � 35 GPa), a negative slope in the electrical resistivitydevelops at low temperatures. This negative slope is displayedin Fig. 10(b), which plots the low-temperature resistivitydifference—ρ − ρmin, where ρmin is the value of the resistivityat the minimum temperature Tmin—versus T .
Because the electrical resistivity is sensitive to changes inmagnetic scattering, the ρ(T ) data can be used to track thepressure dependence of TC . The temperature derivative of theresistivity dρ/dT is plotted as a function of T in Fig. 11(a).The sharp peak in dρ/dT seen at 3.1 GPa corresponds toTC . The temperature dependence of dρ/dT shows a sharptransition up to 14.3 GPa, with the peak being suppressed tolower temperature with increasing pressure. This is consistentwith the pressure range up to which Eq. (2) above holds. ForP � 16.4 GPa, the shape of dρ/dT reveals a more gentlecurvature leading to a broad maximum, which is denoted as T ∗.
In addition to the longitudinal electrical resistivity, ithas been shown that the transverse resistance in field (Hallresistance, Rxy) is also sensitive to the ferromagnetic transitionin US.56 The Hall resistance at 6 T is obtained by symmetrizingthe data as Rxy = Rxy(+6 T) − Rxy(−6 T)/2 and displayedin Fig. 11(b). The Hall resistance under pressure shows very
214104-7
J. R. JEFFRIES et al. PHYSICAL REVIEW B 87, 214104 (2013)
0.0
0.2
0.4
0.6
0.8
1.0
1.2
1.4
0 50 100 150 200 250
3.14.35.97.28.310.011.914.316.418.419.921.224.6
dρ/d
T (μ
Ω-c
m/K
)
T (K)
TC
T*
(a)
0
5
10
15
20
25
30
0 50 100 150 200
3.14.37.28.310.011.914.316.418.419.9
Rxy
(mΩ
)
T (K)
(b)
3.1
4.3
7.2
FIG. 11. (Color online) (a) Temperature derivative of the elec-trical resistivity versus temperature for pressures up to 24.6 GPa.The maximum associated with the steeper curvature is denoted asTC (P � 14.3 GPa), while that associated with the gentler curvatureis defined as T ∗ (P �16.4 GPa). (b) Transverse magnetoresistanceRxy versus temperature for various pressures. The maximum in Rxy
corresponds to the onset of ferromagnetism. Pressures are denotedin GPa, and the dashed arrows indicates the direction of increasingpressure.
similar behavior to that of ambient-pressure measurements,displaying a maximum near TC . This maximum is denotedhere as TH . For T near and below TC , Rxy is dominatedby the anomalous Hall effect, which is a consequence ofthe spontaneous magnetization induced by the onset offerromagnetism.57 Whether this anomalous Hall effect isdriven by an intrinsic or extrinsic mechanism is unclear: Thestrong spin-orbit interaction of the uranium ions may suggestan increased propensity for an intrinsic origin, but similarbehavior observed in heavy-fermion materials may argue for agenesis based in skew scattering.58 With increasing pressure,the amplitude of the signature of Rxy is reduced and shiftedto lower temperatures; for P > 16.4 GPa, there is no clearmaximum, suggesting that the ferromagnetic state has beendestroyed.
The quantities extracted from the electrical transport dataare summarized in Fig. 12. The values of the electricalresistivity at 300 and 10 K are monotonically depressedwith pressure [Fig. 12(a)]. In the range between 12–16 GPa,both ρ(300 K) and ρ(10 K) display kinks, and RRR =ρ(300 K)/ρ(10 K) evinces a change in slope. In additionto the disappearance of the signature in Rxy that occurs inthis pressure range, the T 2 behavior from Eq. (2) ceases[Fig. 12(b)]. Higher pressures reveals a maximum in RRRnear 20 GPa followed by a decline. Near 38 GPa, anothersubtle change in slope is visible in RRR, and a slight kinkcan be discerned in ρ(10 K). The minimum that developsin the electrical resistivity also manifests near 38 GPa. Thepressure dependence of Tmin and the slope of the electricalresistivity for T < Tmin are shown in Fig. 12(c). The electricaltransport shows three regions of interest defined from Fig. 12:a low-pressure region below about 14 GPa where the roomtemperature phase is B1 and low-temperature scattering is
25
75
125
175
225
1.5
2.0
2.5
ρ (μ
Ω-c
m)
RR
R=ρ(300 K
)/ρ(10 K)
300 K
10 K
RRR (a)
468
1012141618
-1.2
-1
-0.8
-0.6
-0.4
-0.2
0 10 20 30 40 50 60
T min (K
)
slope (10-2 μΩ
-cm/K
)
P (GPa)
(c)
0.5
1.0
1.5
2.0
2.5
3.0
3.5
c ph (1
0-1 μ
Ω-c
m/K
)
Amag (10
-3 μΩ-cm
/K2)
(b)
FIG. 12. (Color online) (a) The value of the electrical resistivityat 300 and 10 K as well as RRR versus pressure. (b) The pressureevolution of the coefficients for the phonon scattering (left axis) andmagnetic scattering (right axis) terms describing the temperaturedependence of the electrical resistivity at low pressure. (c) Thepressure dependence of the minimum temperature Tmin and the low-temperature slope for T < Tmin. The gray shaded areas indicatepressure regions where RRR exhibits subtle changes in its pressuredependence. Arrows indicate the axis corresponding to each data set.
dominated by ferromagnetic scattering, an intermediate regionwhere the room-temperature phase is R3m and the low-temperature scattering reveals a characteristic temperature T ∗,and a high-pressure region above about 38 GPa where theroom-temperature phase is unknown and the low-temperaturescattering displays a minimum reminiscent of the Kondoeffect. Whether this final high-pressure region is a consequenceof a structural transition or a change in the electronic structurecannot be addressed with the current data.
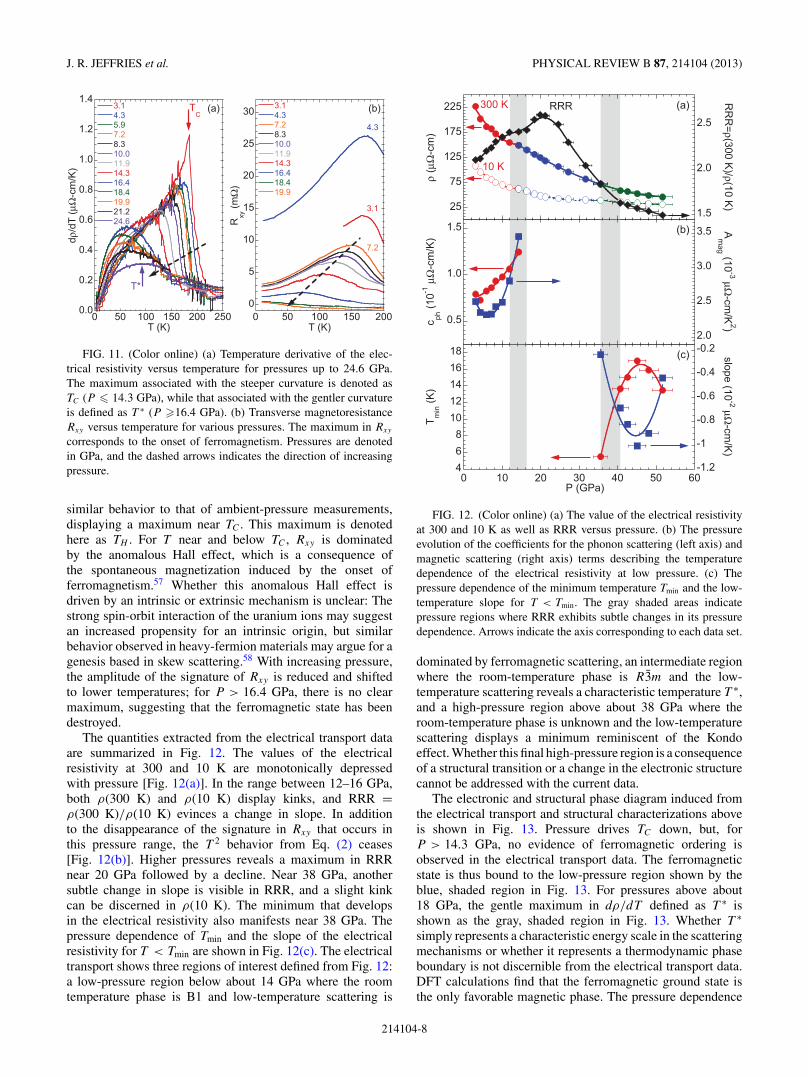
The electronic and structural phase diagram induced fromthe electrical transport and structural characterizations aboveis shown in Fig. 13. Pressure drives TC down, but, forP > 14.3 GPa, no evidence of ferromagnetic ordering isobserved in the electrical transport data. The ferromagneticstate is thus bound to the low-pressure region shown by theblue, shaded region in Fig. 13. For pressures above about18 GPa, the gentle maximum in dρ/dT defined as T ∗ isshown as the gray, shaded region in Fig. 13. Whether T ∗simply represents a characteristic energy scale in the scatteringmechanisms or whether it represents a thermodynamic phaseboundary is not discernible from the electrical transport data.DFT calculations find that the ferromagnetic ground state isthe only favorable magnetic phase. The pressure dependence
214104-8
MAGNETISM AND STRUCTURAL DISTORTIONS IN . . . PHYSICAL REVIEW B 87, 214104 (2013)
0
50
100
150
200
0 10 20 30 40 50 60
T (K
)
P (GPa)
TC
TH
T*
Tmin
R3mPM
R3mFM
B1PM
FIG. 13. (Color online) Temperature-pressure electronic andstructural phase diagram of US. The paramagnetic portion (PM) ofthe phase diagram with cubic B1 symmetry is denoted by the red,shaded region, while the rhombohedral, ferromagnetic (FM) regime(blue, shaded region) is demarcated by TC and TH . For all pressuresabove approximately 11 GPa, experiment and theory suggest thatthe rhombohedral R3m structure is stable from 0–300 K. The grayand purple shaded regions highlight regimes of the phase diagrambounded by the characteristic temperatures T ∗ and Tmin, respectively.
of Tmin from Fig. 12(c) is included at the highest pressures,and the region of the phase space below Tmin, where the slopeof ρ(T ) is negative, is shown as the purple, shaded region.
IV. DISCUSSION
The destruction of magnetism with decreasing atomicvolume is often discussed in the context of the Hill limit.59
The Hill limit proposes a simple assertion that the separationbetween nearest neighbor U atoms is critical in determiningthe electronic ground state of the system by serving as alocalization-delocalization boundary for the 5f electrons. Thisboundary is generally regarded to be about 3.5 A for U.In US, the U-U separation at ambient pressure is about3.9 A, for which the Hill limit concept would imply aferromagnetic ground state. This is indeed true, althoughperhaps serendipitously. Previous experimental and theoreticalresults as well as our DFT calculations above indicate thatUS is better thought of as an itinerant rather than a localizedf-electron system. While the ferromagnetic state is destroyedunder pressure with lattice compression, the U-U nearestneighbor distance is only modestly affected, and remains above3.7 A for all pressures where ferromagnetic order is observed[Fig. 8(c)].
A more formal argument for the behavior of magneticordering in the UX system with pressure was put forth bySheng et al.,21 who propose that the pressure-induced lossof f occupancy and increase in hybridization are largelyresponsible for the observed behavior of TC with pressure.Beginning from a localized system, this construct wouldsuggest that pressure first drives TC up due to an increasingexchange between local f moments, then, with increasinghybridization and loss of f -occupancy, pressure begins to
drive TC down. This increasing and decreasing TC is evidencedin UTe.19 The calculations of Sheng et al. are in qualitativeagreement with the pressure trends of each member of theUX system as well as the general chemical trends acrossthe system. However, this model does not explain the abruptdisappearance of ferromagnetic order in the US, or the UXsystem in general.
An abrupt destruction of ferromagnetic order could becaused by a quenching of the U moments with pressure.However, according to our DFT calculations (Fig. 5) andconsistent with those of Severin et al.,22 pressure reducesthe total moment only by about 15% by 14.3 GPa. Whilethe reduction in moment with pressure may play a role in thereduction in TC , it would seem insufficient to explain the abruptdisappearance of the ferromagnetic state.
The ferromagnetic-paramagnetic transition under pressureis at least sensitive to structural alterations. For USe, theabrupt loss of magnetic order is associated with a first-orderstructural phase transition from the B1 to B2 phase. ForUTe, however, ferromagnetism persists into the B2 phasebefore abruptly disappearing. The B1-B2 transition altersthe U-X coordination, changing the U ions from 6-fold to8-fold coordinated, and this 8-fold U coordination presents anobvious impediment to the development of the rhombohedrallydistorted ferromagnetic state observed in US and USe atambient pressure. Given that in UTe, TC persists despitea change in coordination and, in US, the structural phasetransition (B1-R3m) that destroys magnetic order does notgenerate a new coordination, it is difficult to implicate U-Xcoordination alone as a general driving force for the loss offerromagnetic order in the UX system under pressure.
At ambient pressure, and with decreasing temperature,the B1 phase of US distorts to a rhombohedral structure toaccommodate the ferromagnetic ground state. This distortionis temperature dependent, nearly scaling with the bulk mag-netization of the ferromagnetic state and yielding a maximumdistortion with a pseudocubic angle of 89.6◦.6 This means thatthere is a magnetostriction effect for the ferromagnetic statethat pushes apart the (111) planes of the B1 phase. For lowpressures in the ferromagnetic state, the pseudocubic angleof the R3m structure varies only slightly, going from about89.6◦ at 4 GPa to 89.5◦ at 10 GPa [Fig. 8(b)]. Pressurethus drives the rhombohedral distortion of the B1 phasein the same direction [i.e., pushing apart the original B1(111) planes] as the onset of ferromagnetic order at ambientpressure. It is somewhat counterintuitive then that increasingthe magnitude of this distortion is unfavorable to ferromagneticorder. For P > 10 GPa, the pressure dependence of thepseudocubic angle steepens, decreasing to approximately89.0◦ by 20 GPa. The magnitude of the pseudocubic anglemay be critical to the ferromagnetic ground state, althoughthe underlying physical mechanism that correlates magneticorder with the pseudocubic angle is not obvious, or itmay be completely uncorrelated with magnetic order. It isunfortunately difficult to make a firm conclusion on thismatter.
Finally, the loss of ferromagnetic order in US may bedriven by a change in magnetic exchange, and thus a changein the type of magnetic order. It is possible that the high-pressure region of the electronic phase diagram—shown
214104-9

J. R. JEFFRIES et al. PHYSICAL REVIEW B 87, 214104 (2013)
as a gray region demarcated by black, hatched squares inFig. 13—harbors another magnetically ordered state that isnot ferromagnetic. Such a possibility is tantalizing in thatit might provide a unifying description of the high-pressurebehavior of magnetism in the UX system. The possibility ofother magnetic ordering under pressure is encouraged by theappearance of resistive anomalies in the B2 phase of UTe.19
If these hypothetical, high-pressure magnetic states possessonly a small ordered moment (e.g., antiferromagnetism),then the ac susceptibility measurements of Cornelius et al.20
may have been insensitive to their presence. However, thelack of any resistive signatures in the B2 phase of USe60
and our own theoretical calculations that suggest that theferromagnetic ground state is the lowest energy do notfavor the appearance of additional magnetically orderedstates. Confirming the speculation of other high-pressure,magnetically ordered states in US, USe, or UTe will requirethe development of more complicated theoretical modelscombined with other additional experimental high-pressureprobes (e.g., resonant x-ray diffraction, neutron diffraction,x-ray magnetic dichroism, etc.) that could be sensitive tomagnetic order other than ferromagnetism. Furthermore, high-pressure dichroic measurements of the nominally nonmagneticchalcogen atoms (e.g., at the Se K edge) of the UX systemmay provide valuable information about the magnetism underpressure.61,62
V. CONCLUSIONS
We have measured the electronic and structural phasediagram of US to high pressures using electrical transportand x-ray diffraction. Ferromagnetic order is suppressedwith pressure, abruptly disappearing near a pressure-induced
rhombohedral (R3m) distortion. This pressure-induced distor-tion is qualitatively identical to but stronger in magnitude thanthe distortion that occurs upon entering the ferromagnetic stateat ambient pressure. The structural distortion is well capturedby DFT calculations, which imply that the structural stabilityof the R3m phase is driven by its lower band energy. AsDFT calculations predict a nonzero U moment up to highcompressions, the destruction of magnetic order with theappearance of the R3m phase remains a mystery, but simplearguments based on the Hill limit or changes in structuralcoordination can most likely be ruled out. At higher pressures,the electrical transport measurements reveal new phase regionsthat may be important to understanding the magnetostructuralfree energy landscape of US.
ACKNOWLEDGMENTS
We greatly appreciate fruitful conversations with K. T.Moore. We graciously thank Ken Visbeck for assistance withDAC preparation and Curtis Kenney-Benson for assistancewith acquiring cryogenic data at the Advanced Photon Source.This work was supported by the Science Campaign and LDRD(Tracking Code 11-LW-003) at Lawrence Livermore NationalLaboratory. Lawrence Livermore National Laboratory is oper-ated by Lawrence Livermore National Security, LLC, for theUS Department of Energy, National Nuclear Security Admin-istration, under Contract No. DE-AC52-07NA27344. Portionsof this work were performed at HPCAT (Sector 16), Ad-vanced Photon Source (APS), Argonne National Laboratory.HPCAT operations are supported by DOE-NNSA under AwardNo. DE-NA0001974 and DOE-BES under Award No. DE-FG02-99ER45775, with partial instrumentation funding byNSF. APS is supported by DOE-BES, under Contract No.DE-AC02-06CH11357.
1P. Santini, R. Lemanski, and P. Erdos, Adv. Phys. 48, 537(1999).
2F. A. Wedgwood, J. Phys. C: Solid State Phys. 5, 2427 (1972).3W. J. L. Buyers, T. M. Holden, J. A. Jackman, A. F. Murray, P. de V.DuPlessis, and O. Vogt, J. Magn. Magn. Mater. 31–34, 229 (1983).
4G. H. Lander, M. S. S. Brooks, B. Lebech, P. J. Brown, O. Vogt,and K. Mattenberg, Appl. Phys. Lett. 57, 989 (1990).
5J. A. C. Marples, J. Phys. Chem. Solids 31, 2431 (1970).6T. Herrmannsdorfer, P. Fischer, K. Mattenberger, and O. Vogt, J.Alloys Compd. 414, 14 (2006).
7M. Erbudak and F. Meier, Physica B + C 102, 134 (1980).8S. P. Collins, D. Laundy, C. C. Tang, and G. van der Laan, J. Phys.:Condens. Matter 7, 9325 (1995).
9N. Kernavanois, P. Dalmas de Reotier, A. Yaouanc, J.-P. Sanchez,V. Honkimaki, T. Tschentscher, J. McCarthy, and O. Vogt, J. Phys.:Condens. Matter 13, 9677 (2001).
10T. Okane, J. Okamoto, K. Mamiya, S.-I. Fujimori, Y. Saitoh,U. Muramatsu, A. Fujimori, and A. Ochiai, Physica B 345, 221(2004).
11J. R. Jeffries, K. T. Moore, N. P. Butch, and M. B. Maple, Phys.Rev. B 82, 033103 (2010).
12J. Grunzweig-Genossar, M. Kuznietz, and F. Friedman, Phys. Rev.173, 562 (1968).
13M. Erbudak and J. Keller, Z. Physik. B 32, 281 (1979).14J. M. Fournier and R. Troc, in Handbook on the Physics and
Chemistry of the Actinides, edited by A. J. Freeman and G. H.Lander (North-Holland, Amsterdam, 1984), Vol. 2, p. 29.
15J. Schoenes, in Handbook on the Physics and Chemistry of theActinides, edited by A. J. Freeman and G. H. Lander (North-Holland, Amsterdam, 1984), Vol. 2, p. 341.
16J. Schoenes and P. Bruesch, Solid State Commun. 38, 151(1981).
17J. A. Jackman, T. M. Holden, W. J. L. Buyers, P. de V. DuPlessis,O. Vogt, and J. Genossar, Phys. Rev. B 33, 7144 (1986).
18L. Gerward, J. Staun-Olsen, U. Benedict, S. Dabos, and O. Vogt,High Press. Res. 1, 235 (1989).
19P. Link, U. Benedict, J. Wittig, and H. Wuhl, J. Phys.: Condens.Matter 4, 5585 (1992).
20A. L. Cornelius, J. S. Schilling, O. Vogt, K. Mettenberger, andU. Benedict, J. Magn. Magn. Mater. 161, 169 (1996).
21Q. G. Sheng and B. R. Cooper, J. Magn. Magn. Mater. 164, 335(1996).
214104-10

MAGNETISM AND STRUCTURAL DISTORTIONS IN . . . PHYSICAL REVIEW B 87, 214104 (2013)
22L. Severin, M. S. S. Brooks, B. Johansson, and J. Kubler, J. Magn.Magn. Mater. 140–144, 1423 (1995).
23G. H. Lander, M. H. Mueller, D. M. Sparlin, and O. Vogt, Phys.Rev. B 14, 5035 (1976).
24S. T. Weir, J. Akella, C. Aracne-Ruddle, Y. Vohra, and S. A.Catledge, Appl. Phys. Lett. 77, 3400 (2000).
25J. R. Patterson, S. A. Catledge, Y. K. Vohra, J. Akella, and S. T.Weir, Phys. Rev. Lett. 85, 5364 (2000).
26D. D. Jackson, J. R. Jeffries, W. Qiu, J. D. Griffith, S. McCall,C. Aracne, M. Fluss, M. B. Maple, S. T. Weir, and Y. K. Vohra,Phys. Rev. B 74, 174401 (2006).
27H. K. Mao, J. Xu, and P. M. Bell, J. Geophys. Res. 91, 4673 (1986).28W. L. Vos and J. A. Schouten, J. Appl. Phys. 69, 6744 (1991).29A. Hammersley, S. Svensson, M. Hanfland, A. Fitch, and
D. Hausermann, High Press. Res. 14, 235 (1996).30P. Soderlind, O. Eriksson, B. Johansson, and J. M. Wills, Phys. Rev.
B 50, 7291 (1994).31P. Soderlind and A. Gonis, Phys. Rev. B 82, 033102 (2010).32R. Ahuja, P. Soderlind, J. Trygg, J. Melsen, J. M. Wills,
B. Johansson, and O. Eriksson, Phys. Rev. B 50, 14690 (1994).33P. Soderlind, Adv. Phys. 47, 959 (1998).34J. P. Perdew, J. A. Chevary, S. H. Vosko, K. A. Jackson, M. R.
Pederson, D. J. Singh, and C. Fiolhais, Phys. Rev. B 46, 6671(1992).
35J. M. Wills, O. Eriksson, M. Alouani, and D. L. Price, in ElectronicStructure and Physical Properties of Solids, edited by H. Dreysse(Springer-Verlag, Berlin, 1998), p. 148.
36J. Trygg, J. M. Wills, M. S. S. Brooks, B. Johansson, andO. Eriksson, Phys. Rev. B 52, 2496 (1995).
37P. Soderlind, Europhys. Lett. 55, 525 (2001).38P. Soderlind, A. Landa, and B. Sadigh, Phys. Rev. B 66, 205109
(2002).39P. Soderlind and B. Sadigh, Phys. Rev. Lett. 92, 185702 (2004).40O. K. Andersen, Phys. Rev. B 12, 3060 (1975).41L. Nordstrom, J. M. Wills, P. H. Andersson, P. Soderlind, and
O. Eriksson, Phys. Rev. B 63, 035103 (2000).42K. T. Moore, G. van der Laan, R. G. Haire, M. A. Wall, A. J.
Schwartz, and P. Soderlind, Phys. Rev. Lett. 98, 236402 (2007).43P. Soderlind, Phys. Rev. B 77, 085101 (2008).
44O. Eriksson, M. S. S. Brooks, and B. Johansson, Phys. Rev. B 41,9087 (1990).
45L. Severin, M. S. S. Brooks, and B. Johansson, Phys. Rev. Lett. 71,3214 (1993).
46L. Vitos, Computational Quantum Mechanics for MaterialsEngineers: The EMTO Method and Applications (Springer, London,2007).
47L. V. Pourovskii, A. V. Ruban, L. Vitos, H. Ebert, B. Johansson,and I. A. Abrikosov, Phys. Rev. B 71, 094415 (2005).
48Kollar, L. Vitos, and H. L. Skriver, in Electronic Structure andPhysical Properties of Solids: The Uses of the LMTO Method,Lecture Notes in Physics, edited by H. Dreyss (Springer, Berlin,2000), pp. 85-113.
49A. Landa and P. Soderlind, J. Alloys Compd. 354, 99 (2003).50T. Shishidou and T. Oguchi, Phys. Rev. B 62, 11747 (2000).51T. Le Bihan, A. Bombardi, M. Iridi, S. Heathman, and A. Lindbaum,
J. Phys.: Condens. Matter 14, 10595 (2002).52B. Fultz, Prog. Mater. Sci. 55, 247 (2010).53R. J. Weiss, Proc. Phys. Soc. 62, 28 (1963).54A. C. Lawson, J. A. Roberts, B. Martinez, M. Ramos, G. Kotliar,
F. W. Trouw, M. R. Fitzsimmons, M. P. Hehlen, J. C. Lashley,H. Ledbetter, R. J. McQueeney, and A. Migliori, Philos. Mag. B86, 2713 (2006).
55F. Birch, Phys. Rev. 71, 809 (1947).56J. Schoenes, B. Frick, and O. Vogt, Phys. Rev. B 30, 6578
(1984).57N. Nagaosa, J. Sinova, S. Onoda, A. H. MacDonald, and N. P. Ong,
Rev. Mod. Phys. 82, 1539 (2010).58Y. B. Ning, J. D. Garrett, C. V. Stager, and W. R. Datars, Phys. Rev.
B 46, 8201 (1992).59H. H. Hill, in Plutonium 1970 and Other Actinides, edited by W. N.
Miner (The Metallurgical Society of the AIME, New York, 1970).60P. Link, U. Benedict, J. Wittig, and H. Wuhl, Physica B 190, 68
(1993).61D. Mannix, A. Stunault, N. Bernhoeft, L. Paolasini, G. H. Lander,
C. Vettier, F. de Bergevin, D. Kaczorowski, and A. Czopnik, Phys.Rev. Lett. 86, 4128 (2001).
62M. Usuda, J.-I. Igarashi, and A. Kodama, Phys. Rev. B 69, 224402(2004).
214104-11