Analysis of HCV quasispecies dynamic under selective pressure of combined therapy
38
1 Analysis of HCV quasispecies dynamic under selective pressure of combined therapy Ana CG Jardim 1§ , Cíntia Bittar 1 , Renata PA Matos 1 , Lílian HT Yamasaki 1 , Rafael A Silva 2 , João RR Pinho 3 , Claudia MA Carareto 1 , Isabel MVG de Carvalho-Mello 2 , Paula Rahal 1 1 Departament of Biology, Institute of Bioscience, Language and Exact Science, São Paulo State University, São José do Rio Preto, SP, Brazil 2 Viral Imonology laboratory, Butantan Institute, São Paulo, SP, Brazil 3 Departament of Gastroenterology, São Paulo Institute of Tropical Medicine, School of Medicine, University of São Paulo, SP, Brazil. §corresponding author Email addresses ACGJ: [email protected] CB: [email protected] RPAM: [email protected] LHTY: [email protected] RAS: [email protected] JRRP: [email protected] CMAC: [email protected] IMVGCM: [email protected] PR: [email protected]
Transcript of Analysis of HCV quasispecies dynamic under selective pressure of combined therapy

1
Analysis of HCV quasispecies dynamic under selectiv e pressure of
combined therapy
Ana CG Jardim 1§, Cíntia Bittar 1, Renata PA Matos 1, Lílian HT Yamasaki 1, Rafael A
Silva 2, João RR Pinho 3, Claudia MA Carareto 1, Isabel MVG de Carvalho-Mello 2, Paula
Rahal 1
1Departament of Biology, Institute of Bioscience, Language and Exact Science, São Paulo
State University, São José do Rio Preto, SP, Brazil
2Viral Imonology laboratory, Butantan Institute, São Paulo, SP, Brazil
3Departament of Gastroenterology, São Paulo Institute of Tropical Medicine, School of
Medicine, University of São Paulo, SP, Brazil.
§corresponding author
Email addresses
ACGJ: [email protected]
RPAM: [email protected]
LHTY: [email protected]
RAS: [email protected]
JRRP: [email protected]
CMAC: [email protected]
IMVGCM: [email protected]
2
ABSTRACT
Background
The quasispecies composition of Hepatitis C virus (HCV) could have important implications
with regard to viral persistence and response to interferon-based therapy. The complete
NS5A was analyzed to evaluate whether the composition of NS5A quasispecies of HCV
1a/1b is related to responsiveness to combined interferon pegylated (PEG-IFN) and ribavirin
therapy.
Results
Six hundred and ninety full-length NS5A sequences were analyzed from samples collected
before, during and after treatment from virological sustained responder, non-responder and
the end-of-treatment responder patients. This study provides evidence that homogeneity of
quasispecies composition, low diversity and less complexity of the NS5A region pre-therapy
are associated with viral clearance. Phylogenetic relationships concerning complete NS5A
sequences obtained from patients did not demonstrate clustering associated with specific
response patterns. However, distinctive clustering of pre/post-therapy sequences was
observed, suggesting that an evolutionary process occurred during the time course
examined. In addition, the evolution of quasispecies over time was subjected to purifying or
relaxed purifying selection. This could explain the initial diversified composition of
quasispecies at baseline, followed by an increase in the frequency of a predominant
quasispecies in ‘after treatment’ samples of non-responders and end-of-treatment
responders, probably because it offers some advantage for the virus.
Conclusion
These results suggest that quasispecies diversity of the NS5A region could be important for
understating the mechanism underlying treatment failure in patients infected with chronic
hepatitis C.

3
BACKGROUND
Hepatitis C virus (HCV) is the major etiological agent of chronic hepatitis worldwide [1].
Chronic infection can progress to liver cirrhosis with risk for the development of
hepatocellular carcinoma [2, 3].
The current treatment for chronic hepatitis C is based on interferon (IFN) or pegylated IFN in
combination with ribavirin (RBV), leading to a sustained virological response in
approximately 50% of patients infected with genotypes 1a/1b [4, 5]. Several host
parameters, disease characteristics and virus-related factors are relevant to the possibility of
viral clearance after therapy [6, 7].
A member of the family Flaviviridae, HCV is an enveloped virus with a positive, single-
stranded RNA genome approximately 9.5 kb in length, encoding a single polyprotein of
approximately 3000 amino acids that is co- and post-translationally cleaved by viral and
cellular proteases into structural and non structural proteins [8].
HCV is classified into seven genotypes, HCV-1 to -7, with each genotype being further
subdivided into subtypes such as HCV-1a and 1b [9, 10]. Furthermore, in infected
individuals, HCV circulates as a population of several closely related viral variants referred to
as “quasispecies” [11, 12]. New variants are continuously generated during viral replication
as a result of errors made by the viral RNA-dependent RNA polymerase, which lacks
proofreading activity, during rapid replication [13]. The quasispecies nature of HCV could
have important implications for viral persistence, pathogenicity and resistance to anti-viral
agents [14, 15].
The non-structural 5A (NS5A) protein is implicated in interferon resistance [16]. Enomoto et
al. [17, 18] suggested that the genetic heterogeneity of a specific domain of the NS5A region
of HCV, termed the IFN sensitivity determining region (ISDR), was related to treatment
responses in Japanese patients with HCV genotype 1b infection. This is a controversial
issue, but analysis of published information supports the hypothesis that a relationship exists
between NS5A heterogeneity and response to therapy [19-22].
4
NS5A is an RNA binding phosphorylated protein comprising three domains separated by
trypsin-sensitive low complexity sequences (LCS I and LCS II) and an N-terminal
amphipathic alpha-helix that anchors the protein to intracellular membranes [23-25]. Full-
length NS5A protein appears to be located exclusively in the cytoplasm. However, N-
terminal deleted forms have been found in the nucleus, suggesting that they can move to the
nucleus and act as potent transcriptional activators [26-28].
The NS5A region has generated much interest owing to its association with responses to
therapy. In the present study, the evolution of the complete NS5A region of HCV genotypes
1a and 1b was examined in patients undergoing pegylated IFN plus ribavirin therapy. The
results demonstrate that higher diversity and complexity of quasispecies are related to lower
rates of response to peginterferon and ribavirin therapy. Therefore, quasispecies variability
of the NS5A region could help understand the mechanism underlying treatment failure in
patients infected with chronic hepatitis C.
RESULTS
Patient characteristics
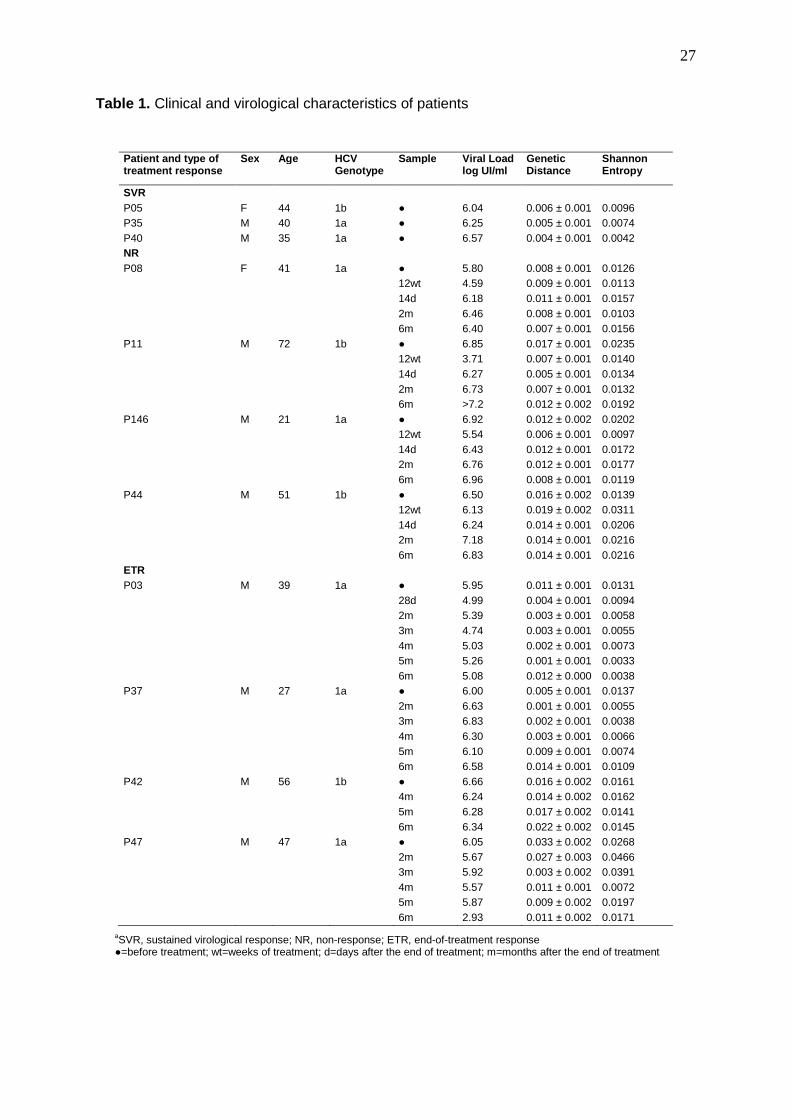
The characteristics of the patients are presented in Table 1. The population was
predominantly male (NR 75% vs. SVR 67% vs. ETR 100%); 55% of patients were infected
with HCV genotype 1a (NR 25% vs. SVR 67% vs. ETR 75%) and 45% of patients were
infected with HCV genotype 1b (NR 75% vs. SVR 33% vs. ETR 25%). The mean age of the
patients was 43 ± 13.9 years (NR 46.3 ±10.6 vs. SVR 39.7 ± 2.6 vs. 42.3 ± 6.2). No
statistically significant differences were observed between groups.
The levels of viremia in baseline samples did not differ significantly among the patient
groups (NR 6.52 vs. SVR 6.39 vs. ETR 6.17). Patients who did not respond to therapy had a
significant decrease in viremia after 12 weeks of treatment (4.99 ± 0.94 log IU/ml; p=0.002),
with recovering levels in samples collected after therapy was complete (6.30 – 6.86 log

5
IU/ml). The viral load values varied among the samples from end of treatment responders.
The mean viremia levels for these patients ranged from 4.99 to 5.90 log IU/ml (Table 1).
Nonsense mutations in the NS5A region are observed in vivo
The dataset of 690 entire NS5A sequences was submitted to genetic analysis. Eight
nonsense mutations were detected in the NS5A sequence, two of them being common to
more than one sequence. Codon 9 nonsense mutation was observed in two clones (before
treatment samples from patients P03 and P40) and codon 84 in three clones (two clones in
the P146 6m and one clone in the P42 4m sample). Nonsense mutations were also
observed in codons 47 (before treatment sample from P47), 233 (P37 5m) and 399 (P44
12wt) (Figure 1). The majority of nonsense mutations were detected in Domain I of the NS5A
region (codons 47 and 84), with only one being located in domain III (codon 399), one in the
Alpha Helix (codon 9) region and one in the Low Complexity Sequence I Region (codon
233). The numeration of codons was based on the NS5A protein, the first codon being the
first amino acid coded for in the NS5A genomic region.
Part of this nonsense mutation could provide a functional NS5A protein. Therefore, the
sequences at the N-terminal region of NS5A in which the nonsense mutation occurred were
analyzed to locate the next methionine residue. The methionines are highlighted in figure 1a.
The nonsense mutation 399 was not investigated owing to the presence of a methionine
after it. This sequence could provide functional proteins despite missing a C-terminal portion
(Figure 1b).
Low genetic complexity and diversity of NS5A are in dicative of sustained response
Shannon entropy analysis showed that the genetic complexity of the NS5A region at
baseline was significantly lower for the SVR group (mean value 0.00706) than for the NR
(0.017529) and ETR groups (0.017427) (p=0.0253 and p=0.0265, respectively) (Figure 2a).
The genetic diversity, calculated using the genetic distance, was also significantly lower for
the SVR group (0.0050) than for the NR (0.0133) and ETR (0.0148) groups (p=0.021 and

6
p=0.022, respectively; Figure 2b). These results demonstrated that quasispecies of SVR
samples at baseline are less complex and diverse than those of NR and ETR samples. The
mean entropy and genetic distance of during-treatment samples for NR and after the
completion of therapy for NR and ETR samples were comparable when the results of
diversity and complexity of each patient were analyzed individually, but no profile was
detected for patients in the same response group. Generally, values had a propensity to
decrease in samples collected during and after the end of treatment. However, these
differences were not significant (Table 1 and Figure 2).
NS5A quasispecies composition is dynamic over time
In order to evaluate the number of NS5A quasispecies in each sample, all sequences in this
study were analyzed using LOCQSPEC 1.0 software. Figure 3 presents LOCQSPEC 1.0
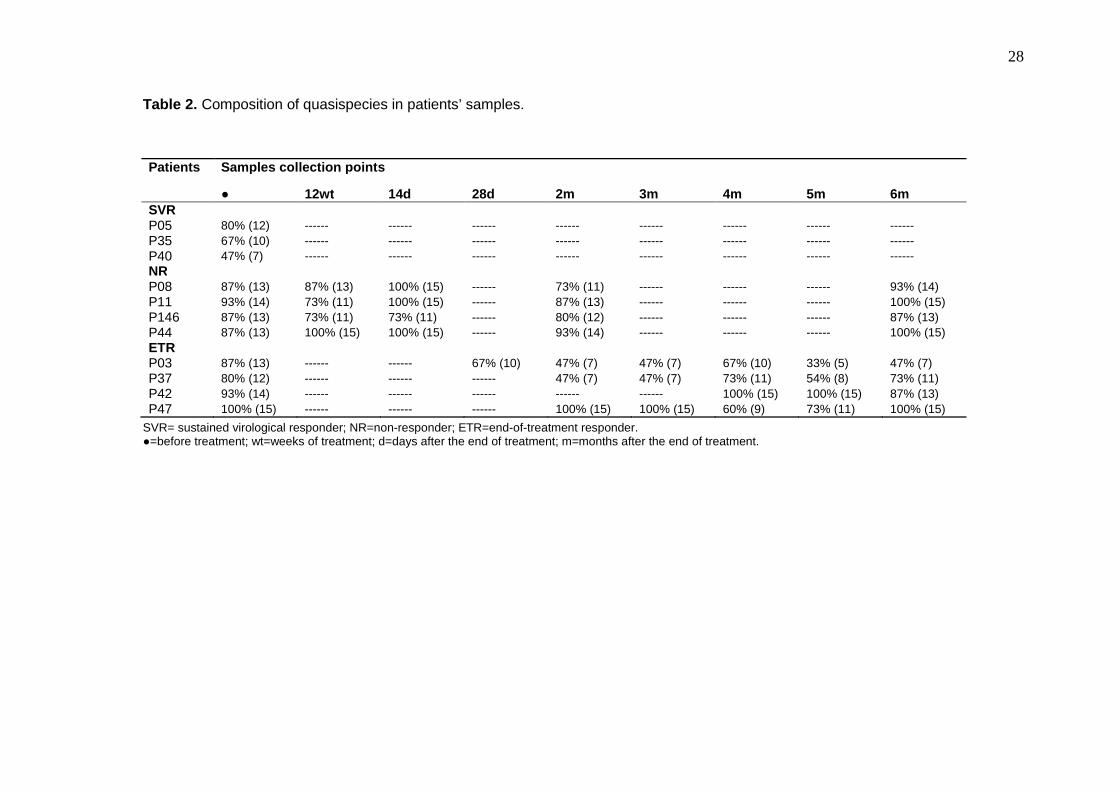
analyses for ETR and NR patients. The percentages of different quasispecies in ETR, NR
and SVR samples are presented in table 2.
Concerning ETR patients, there was no specific profile of quasispecies diversity. However,
samples showed a more varied quasispecies composition before treatment (P03 87%, P37
80%; P42 93% and P47 100%) and a more homogeneous composition in several of the
after-treatment samples (P03 5m 33%; P37 5m 54% and P47 5m 73%, for example).
Despite this, the composition of quasispecies in the samples collected after treatment
demonstrated different dynamics. P03 and P37 samples presented with an oscillation in the
quasispecies composition. There was a decrease in diversity in the 2m samples (P03 2m
and P37 2m 47%), an increase in the 4m samples (P03 4m 67% and P37 4m 73%), a
decrease in the 5m samples (P03 5m 33% and P37 4m 54%) and an increase in 6m
samples (P03 6m 47% and P37 6m 73%). Patient P47 presented with a significant decrease
in the 4m (60%) and increase in the 6m sample (100%), and patient P42 showed a degree
of homogenization in the last sample analyzed (P42 6m 87%) Table 2.
In some cases, the homogenization of quasispecies composition appeared to be related to
the appearance of predominant quasispecies. For patient P03, the predominant
7
quasispecies was identified two months after the end of treatment (40% of sequences) and
was sustained (P03 3m 40%; P03 4m 26%; P03 5m 73%; P03 6m 60%). The same dynamic
was observed for patient P37 (P37 2m 60%, P37 3m 60%; P37 4m 33%; P37 5m 53%; P37
6m 33%). Patient P42 revealed the same quasispecies throughout the after treatment
samples but the frequency was low (P42 4m/5m 6%; P42 6m 13%). A quasispecies was
identified across P47 samples (P47 3m/4m 6%; P47 5m 27%), but the same quasispecies
was not identified at P47 6m (Figure 3a).
The NR samples presented with a more heterogeneous quasispecies composition than the
ETR patient samples (Table 2). Patients P146 and P11 showed a decrease in quasispecies
diversity in samples collected during treatment (P146 12wt/P11 12wt). A specific
quasispecies was observed across the samples but did not appear to be related to
homogeneity. The P08 was the only patient in whom the same quasispecies were identified
in before- and after-treatment samples (Figure 3b).
The SVR samples contained the most homogeneous quasispecies composition when
compared with ETR and NR samples collected before treatment (Figure 3c).
NS5A quasispecies experience genetic evolution over time
Phylogenetic trees were reconstructed from 690 full-length NS5A sequences and reference
sequences as described in the Methods section. Sequences clustered according to
genotype, presenting monophyletic clusters with genotype 1a or 1b references. Viral isolates
corresponding to the same patient samples also clustered, showing they were more closely
related than other patient isolates (Figure 4). The topology of sequences from each patient
was individually analyzed to evaluate the phylogenetic relationship among isolates. In
general, the phylogenetic analysis suggested clustering of isolates of samples collected
before treatment from ETR patients (Additional Information Fig A1-A4). All quasispecies from
samples collected before treatment were grouped in a monophyletic group for patients P42
and P03. The isolates of samples collected at different times after treatment were mixed and
grouped into another cluster. The topology of clusters was 80% sustained by the bootstrap

8
value for P03 sequences. Fourteen of the fifteen quasispecies identified in samples collected
before treatment were grouped together in a monophyletic group (67% sustained by the
bootstrap value) in the P37 sample analysis. Patient P47 topology demonstrated a
monophyletic group of 11 ‘before-treatment’ quasispecies (89% sustained by the bootstrap
value). Before treatment, quasispecies clustering was observed for P146 from NR patients,
where 13 of the 15 isolates were grouped as a monophyletic cluster. Sequences from
samples collected before treatment from patients P44, P11 and P08 tended to group
together with quasispecies identified after 12 weeks of treatment. However, bootstrap values
only sustained clusters for patient P11 (bootstrap value of 69%). (Additional Information Fig
A5-A8)
In some cases, the phylogenetic analysis suggested that isolates identified in samples
collected after treatment demonstrated the longest distances from the main nodes
(Additional Information).
NS5A quasispecies are under relaxed purifying selec tive pressure
Phylogenetic trees were reconstructed using DNA alignment of pre and post-therapy NS5A
sequences corresponding to each patient in the study. The set of sequences relative to a
specific patient was subjected to phylogenetic reconstruction by maximum likelihood. As a
result, eight individual phylogenetic trees were generated (Additional Information Fig A1-A8).
In order to test whether selection pressure varied among different clades, one or two clades
of interest were selected for testing. Clades with predominant quasispecies and those in
which isolates identified in samples collected after treatment that demonstrated the longest
distances from the main nodes were selected, making the assumption that the clade of
interest would demonstrate different values of ω (dN/dS) from other branches of the tree. For
patient P37, it was not possible to select any specific clade; the detailed results are
presented in Table 3. The values of ω ranged among patients from ω = 0.1101 to ω =
0.7177, and the majority of values indicated a purifying selection or relaxed purifying
9
selective pressure. In Figure 5, the ω values illustrate this variation. For patients P47 and
P11, the foreground ω values were statistically different from the background ones. For
these patients, two clades were selected for analysis using phylogenetic topology. For
patient P47 these were clade one, where post-therapy quasispecies demonstrated the
longest distances, and clade two, where predominant quasispecies were grouped.
Accordingly, their ω values were different (clade 1: ωF = 0.2487, 2∆l = 6.4343, and clade 2:
ωF = 0.7177, 2∆l = 21.4983). For patient P11, clade one, where post-therapy quasispecies
were located, and clade two, where quasispecies from the first sample collected after the
end of therapy were grouped, were selected for analysis. The ω values were different for
each of these clades (clade 1 ωF = 0.2685, 2∆l = 9.264, and clade 2 ωF = 0.5783, 2∆l =
11.8750). These results indicate a relaxed purifying selection, with the exception of ωF =
0.7177, which approximates to neutral evolution.
DISCUSSION
Quasispecies composition appears to be important in the IFN resistance mechanisms [29],
and genetic variability has been studied mainly in E2 and NS5A regions of the HCV genome
[30-35]. Additional investigation of NS5A region variability may be relevant as heterogeneity
in this region before treatment has been related to IFN-monotherapy responsiveness.
However, studies have presented controversial data and the mechanism underlying how
NS5A interferes with responsiveness to treatment has yet to be elucidated.
In the present study, the genetic variability of the complete NS5A region in patients infected
with HCV genotype 1 was analyzed. Altogether, 690 sequences of the entire NS5A from 11
patients’ samples were analyzed. No specific profile of quasispecies diversity for all patients
from each response type could be identified. However, samples showed less complexity and
lower diversity of quasispecies composition at baseline for SVR patients than NR and
patients who relapsed after the end of therapy (ETR).

10
These findings are consistent with previous observations made on patients undergoing anti-
HCV therapy that less complexity and lower diversity of HCV quasispecies at the baseline is
associated with viral clearance [19, 21, 36-38]. Therefore, high genetic variability of HCV
could be related to the low efficiency of anti-HCV treatment [22]. Jain et al. observed that the
initial anti-viral effect of interferon is influenced by the quasispecies composition at the time
of treatment initiation, and patients who demonstrated high viral diversity were less likely to
respond to treatment [21].
In agreement with the genetic distance and entropy results, the number of viral strains at
baseline was lower for SVR patients than NR and ETR patients, showing that quasispecies
composition was more homogeneous than other groups of responses. A recent study
evaluating the clinical and virological parameters that could be associated with or predictive
of therapy outcome at baseline demonstrated that a higher number of quasispecies variants
in the E1 E2 region was significantly associated with treatment failure. However, it is inferred
that independent factors cannot provide a consistent prediction of therapy response [39].
Analyzing ETR samples analyzed by tracking the number of strains, it was evident that
quasispecies composition was more homogeneous in post-therapy samples. This
homogeneity was most evident in patients P37 and P03, who presented with homogeneous
quasispecies composition from the rebound and sustained it. As with ETR patients, the HCV
RNA is undetectable by the end of therapy, suggesting that the selective pressure of therapy
acts on quasispecies diversity during therapy until HCV becomes undetectable in samples. It
is plausible that during or after the end of therapy a predominant quasispecies rises in
frequency owing to its ‘better fitness’, while others decrease progressively in frequency or
are eliminated. The persistence of this predominant variant could be favorable for sustaining
the infection, causing it to become chronic again.
Farci at al. evaluated the quasispecies composition of the E1/E2 region in samples from
patients who were untreated or treated with conventional IFN combined with ribavirin.
Analyzing samples of relapse patients, they observed greater viral diversity at baseline, and
an emergence at relapse of a new dominant strain, or the emergence of a minor dominant

11
population [40]. They inferred that the emergence of a new viral strain after rebound implies
that the majority of baseline variants were sensitive to IFN and that the origin of these new
strains is uncertain. The authors concluded that it is probable that very low levels of virus
replication continued to occur despite the disappearance of viremia [40].
A study focusing on breakthrough response pattern, defined by patients who have an initial
response followed by reactivation whilst receiving IFN therapy, did not identify quasispecies
variants from breakthrough in baseline samples [41]. This study assumed that HCV variants
sampled at the time of breakthrough represent drug-resistant quasispecies, and if present at
baseline, they must be present very low frequency. According to the authors viral
breakthrough could be attributed to the selection of pre-existing drug-resistant variants or the
emergence of different quasispecies with reduced sensitivity to IFN. However, the study
indicated that selection is mostly responsible for appearance of drug resistant quasispecies
at breakthrough [41]. As breakthrough and relapse indicate rebound of infection after
undetectable HCV RNA levels, is reasonable that the results presented herein are in
agreement when considering the quasispecies composition and diversity at breakthrough
and relapse time.
The data collected from non-responder samples revealed a very diverse composition of viral
strains over the time course of the investigation. As described previously, the high variability
of the quasispecies population in these patient samples might represent a continuous
process of adaptation [42], as these variants were continuously eliminated during and after
the end of treatment in most cases. Alternatively, it could offer the virus some advantage in
sustaining the infection as a large number of quasispecies may indicate a better opportunity
for virus persistence [43, 44].
Pawlotsky et al. compared pre- and post-therapy NS5A amino acid sequences from non-
responder patients and demonstrated that most variants from after-treatment samples were
not detected before treatment, whereas most pre-treatment variants were no longer evident
after treatment [22]. The data presented here agree with their findings, with the exception of
samples from patient P08. In the P08 samples, a variant was identified at baseline (13% of

12
NS5A amino acid sequences) that was detected after 12 weeks of treatment and two months
after therapy was completed. Several studies have showed that variants resistant to therapy
may be present at baseline, and it is proposed that the persistence of these variants in
patients who fail to respond suggests the existence of virus strains with inherent resistance
to IFN [40, 45].
Consistent with previous observations, phylogenetic analysis of virus sequences obtained
from patients failed to show any clustering associated with specific response [34, 40, 46].
However, the data suggested that pre- and post-therapy isolates from samples of ETR
patients tended to group together in different branches. For NR samples, before-treatment
quasispecies variants tended to group with quasispecies found after 12 weeks of treatment,
and post-therapy sequences grouped together in another branch. The distinctive clustering
of pre/post-therapy sequences had been described previously [22, 41, 47], demonstrating
the evolutionary process occurred over time. In some cases, isolates identified in after-
treatment samples had the longest distances from the main nodes in phylogenetic analysis.
This may suggest that changes can improve the fitness of quasispecies in order to establish
a persistent infection after treatment selection pressure.
In order to investigate whether quasispecies in samples collected after treatment or
predominant quasispecies identified over the time course were under differential selective
pressure, the set of sequences of each NR and ETR patient underwent selective pressure
analysis. In general, the results showed that a purifying selection is driving the evolution of
quasispecies over time. This may explain the initial diversified composition of quasispecies
at baseline for some ETR and NR patients, and an increase of a predominant quasispecies
probably offers some advantage for the virus. The purifying selection was relaxed in some
cases (clades selected for patients P11 and P47), and allows non-predominant and less
advantageous variants to survive at a lower frequency. Relaxed purifying selection may be
indicative of some codons of the entire protein being under positive selection. A study
analyzing PKR binding domain and the V3 domain in the NS5A region identified positively

13
selected sites but failed to detect a pattern mechanism for the inefficient response to anti-
viral treatment [48]. Therefore, further analyses are necessary.
Genetic analyses identified nonsense mutations in the NS5A sequence of some HCV
variants. Nonsense mutations in samples from HCV-infected patients have been described
[34, 49, 50], but the structural and functional implications of such mutations detected in vivo
are unclear. Most of the nonsense mutations detected were located in the N-terminal region
of NS5A (Alpha Helix, Domain I or Low Complexity Sequence I regions of the NS5A); only
one was located in the C-terminal region (domain III). It is known that N-terminal mutants of
NS5A are preferentially located in the nucleus and are reported to function as transcriptional
regulators. A recent study using a HCV replicating cell system revealed that during the life
cycle a variety of N-terminally truncated NS5A fragments are generated [51]. Tests on
several of these truncated NS5A fragments demonstrated that they were preferentially
located in the nucleus or equally distributed between the cytoplasm and nucleus. The full
length NS5A (1-449) was located in the extra-nuclear compartment as previously described.
However, truncated forms impaired HCV replication. In contrast, domain III of the C-terminal
NS5A region can be deleted with no or minimal effect on RNA replication [52, 53], but the C-
terminal region residing between amino acid residues 2404 and 2435 of domain III is crucial
for virus production [54]. To elucidate the effects of nonsense mutations identified in the
present study, further analysis with HCV replicating cells is necessary. Truncated NS5A
forms observed in previous studies show drawbacks in terms of replication or assembly, but
these effects could be overcome by the diversity of quasispecies composition.
CONCLUSIONS
This study demonstrates that heterogeneous diversity of quasispecies pre-therapy
could be related to a low response to IFN-based therapy, and that homogeneity of
quasispecies composition at baseline with viral clearance.

14
Quasispecies distribution of NS5A was variable and distinctly clustered over time,
indicating an evolutionary process driven by the pressure of therapy. In addition, the
evolution of quasispecies over time was subjected to purifying or relaxed purifying selection.
This could explain the initial diversified composition of quasispecies at baseline, followed by
an increase in the frequency of a predominant quasispecies in ‘after treatment’ samples of
non-responders and end-of-treatment responders, probably because it offers some
advantage for the virus.
Therefore, the quasispecies composition and evolution over time are factors to be
considered in terms of patient outcome after combined therapy for chronic hepatitis C.
METHODS
Patients
Eleven naïve patients infected chronically with HCV RNA genotypes 1a or 1b were enrolled
from the Hepatology Department of the São José do Rio Preto School of Medicine. Patients
with other concomitant liver diseases [hepatitis B virus (HBV) or other hepatotropic virus
infections, alcohol abuse, autoimmune hepatitis and hereditary liver diseases] were
excluded. This study was approved by “The Ethics Committee of the School of Medicine of
São José do Rio Preto”, and written informed consent was obtained from all patients.
Plasma samples were collected before, during and after the end of treatment. During the 48-
week treatment, patients received PEG-IFN-α-2b (according to body weight) subcutaneously
once a week and RBV daily, taken orally at a dose of 600-1,200 mg (according to body
weight).
The patients were classified into three groups according to their response to therapy: three
patients demonstrated sustained virological response (SVR); four patients were non-
responders (NR) and four patients were end-of-treatment virological responders (ETR)
(Table 1). SVR was defined as absence of HCV RNA in plasma using qualitative PCR six
months after the end of therapy. NR was defined as continued presence of HCV RNA in

15
plasma during treatment and six months after the end of treatment. Patients who were HCV
RNA-negative at the end of therapy but experienced a relapse were classified as ETR.
For all patients, one sample before treatment was analyzed. Additional samples were
collected during therapy (12 weeks of therapy) and after the end of therapy (14 days, two
and six months) for non-responders, and at the relapse time and then monthly for end-of-
treatment responders. Samples analyzed for each patient are detailed in Table 1. Samples
from the SVR group and before treatment samples from most patients (P05, P35, P40, P44,
P03, P42 and P37) enrolled in this study were analyzed in a previous work and were used in
this study for comparative analyzes of the evolutionary dynamic of quasispecies [35].
Baseline sample of patients P08, P11, P146 and P47 analyzed in this work were not
previously done. Additionally, all samples collected during and after the end of treatment
were exclusively analyzed in this work.
RNA extraction, RT-PCR and NS5A amplification
Total RNA was extracted from 140 µl of plasma using the commercially available QIAamp
Viral RNA Kit (Qiagen, Uniscience). RNA was reverse-transcribed into cDNA using a High-
Capacity cDNA Archive kit (Applied Biosystems, Foster City, CA, USA) and random primers.
The mixture was incubated at 37°C for two hours. For amplification of the entire NS5A
region of the HCV genome, a nested polymerase chain reaction (PCR) was performed using
the primers described previously [50].
The viral load was quantified using the Cobas TaqMan HCV Test according to the
manufacturer’s instructions.
Cloning and sequencing
PCR products of approximately 1.7 kb were purified and ligated into the pCR-XL-TOPO-
vector using the TOPO XL PCR cloning kit (InvitrogenTM Life Technologies, Carlsbad, CA,
USA). The ligation products were transformed into competent cells (InvitrogenTM Life
16
Technologies, Carlsbad, CA, USA). Fifteen transformants were randomly chosen for further
studies, and plasmid DNA was isolated from a 3.0-ml broth culture using the GeneJET
plasmid Miniprep Kit (Fermentas). Recombinant pCR-XL-TOPO-NS5A clones were
sequenced using dideoxy terminator automated sequencing (ABI Prism Ready Reaction Mix;
Applied Biosystems, Foster City, CA, USA) using an ABI Prism 377 and ABI 3130XL
sequencers, according to the manufacturer’s instructions (Applied Biosystems Inc, Foster
City, CA, USA.). Eight to ten sequencing reactions were performed for each clone, using
flanking primers, M13 Forward and M13 Reverse (Invitrogen TM Life Technologies,
Carlsbad, CA, USA), internal forward primers (1aF1 5’CACCAGTGGATAASCTCGGA3’,
1aF2 5’CCCATYAATGCCTACACCAC3’, 1aF3 5’CTGTCYGCTCCATCTCTCA3’ and 1aF4
5’GARTCAGARAACAAAGTGGTG3’ for genotype 1a; 1bF1 5’ATCCTCTCHAR-
CCTTACCAT3’, 1bF2 5’ GRACATTCCCCRTCAACGC3’, 1bF3 5’ 5’GTCCTRACAG-
AATCCACMGTG3’ and 1bF4 5’CCARTTGTCTGCGCCTTC3’ for genotype 1b) and internal
reverse primers (1aR1 5’ACATWGAGCAACACACGAC3’, 1aR2 5’GTTCCC-
TTGAGAGATGGAGC3’ and 1aR3 5’TAGGCATTRATGGGGAAGGT3’ for genotype 1a;
1bR1 5’ARCARCAGACGACGTCCTC3’, 1bR2 5’AGCGGGTCGAAAGAGTCCA 3’ and 1bR3
5’ GAACCGTTTTTGACATGTCC3’ for genotype 1b).
Genetic Analysis of NS5A and Phylogenetic reconstru ction
All sequences were subjected to Phred-Phrap programs [55-57]. These programs analyze
the quality of the sequences and align them in complete NS5A contigs. This study generated
585 sequences of full length NS5A from samples collected during and after treatment and for
patients P08, P11, P146 and P47 also from the sample collected before the beginning of the
treatment. In order to analyze viral evolution along time, 105 sequences from samples
collected before the treatment, previously published (Accession numbers: EU309511 -
EU309525, EU309586 - EU309599 and EU309600 - EU309614) [35], were used in the
analyses. Consequently, 690 full-length NS5A sequences were analyzed in this study,
corresponding to 11 patients. The nucleotide sequence contigs (1344 nucleotides for

17
genotype 1a and 1341 for genotype 1b) were aligned using the Clustal X program (version
1.81) [58] and amino acid sequences were obtained. Primer sequences were removed from
all sequences using the BioEdit program (version 7.0.5.3) [59]. The genetic distance
between pairs of sequences were calculated with MEGA version 4 using the p-distance
method [60]. The variability of amino acid residues in each position (i) was measured by
calculating the Shannon entropy [22]. The entropy value is a measure of the lack of
information at each position of the amino acid sequence. The Shannon Entropy was
calculated at the amino acid level as follows: H(i) = -(Σf(b,i)log(base 2)f(b,i)), where f(b,i) is
the frequency with which each residue b appears in position i of the protein. When different
groups of virological response were compared, the value was normalized by Sn=H/logN,
where N is the total number of sequences analyzed in each sample [59].
To construct the phylogenetic tree of NS5A variants obtained from the patient samples, the
PAUP* version 4 program was used [61]. Phylogenetic trees were constructed using the
maximum likelihood method with the model of substitution, as determined by hierarchical
likelihood ratio test score criteria in Modeltest 3.06 [62]. Base frequency, gamma distribution
and transition/transversion ratios were determined (from the data) by Modeltest 3.06. A
thousand replicates were used to test the support given by the data to the clusters of the tree
topology, and bootstrap values >70 were considered significant [63]. Genetic and
phylogenetic analyses were performed using the standard genotype 1a sequence H77
(NC_004102.1) as a reference and genotype 1b sequence HCV-J (D90208.1), obtained from
GenBank.
Analysis of variable selective pressure
The ratio between the relative rate of non-synonymous substitution to the relative rate of
synonymous substitution (ω=dN/dS) measures the strength of selection acting on a protein-
coding gene. Assuming synonymous mutations are subjected to almost strictly neutral
selection, ω<1, ω=1, and ω>1 represent negative selection, neutral evolution, and positive
Darwinian selection, respectively [64]. Maximum likelihood analysis of the sequence

18
evolution was performed using the CODEML program in the PAML 3.15 software package
[65]. Initially, phylogenetic trees were reconstructed using the maximum likelihood method
and the HKY model of substitution, as determined by hierarchical likelihood ratio test score
criteria in Modeltest 3.06 for each dataset of NS5A sequences corresponding to each non-
responder and end-of-treatment responder in this study. The ratios of global synonymous
changes per site (dS) versus replacement changes per site (dN) for each tree were
calculated using two models described by Yang [66]. The one-ratio model assumed an equal
ω ratio for all branches in the phylogeny. The two-ratio model assumed two ω ratios: one
branch for the background (ω B), one for the foreground branch (ω F = branch of interest)
leading to a specific clade of the phylogenetic trees, specified in the Additional Information.
This analysis makes different assumptions about the dN/dS ratios for branches of interest
relative to the background dN/dS ratio for all other branches. For instance, the ‘‘two-ratio’’
model assumes that the branches of interest have a dN/dS ratio that is different from the
background ratio.
Analysis of quasispecies composition
For analyzing quasispecies variability, software LOCQSPEC 1.0 was designed [67]. This is a
tool built in C++ programming language that allows a set of sequences to be compared,
finding similar or different sequences as results. All sequences of complete NS5A generated
in this study were subjected to the program, and the contigs that presented the same
nucleotide or amino acid sequences were grouped together. Each group corresponds to a
set of identical sequences that were identified more than once. The construction of each
group started with an identity verification based on parity among sequences that were
grouped. The first sequence of the set was directly associated with the first group. For the
other sequences, their identity was checked with regard to the entire set of existing groups.
There was an optimization step in this process to stop the verification when a mismatch was
identified. Otherwise there was identity, the sequence was associated with the group, and
the next sequence started to be verified. If all existing groups were verified and no identity

19
was found, a new group was formed and the new sequence was associated with it.
Therefore, it was possible to determine the number of varied and identical quasispecies in
the same sample.
Statistical Analysis
The results are presented as mean ± SD, or as percentages. Comparisons among the
sustained virological responders, end of treatment responders and non-responders were
determined using Tukey’s or Fisher’s statistical test after performing an one-way ANOVA or
Chi square. In all tests, a P value less than 0.05 was considered significant.
Accession numbers
All sequences obtained in this study were submitted to the GenBank nucleotide sequence
database (http://www.ncbi.nlm.nih.gov/genbank/). Accession numbers: GenBank:HQ823765
- HQ824349 (sequences obtained in this study), GenBank:EU309511 - EU309525,
GenBank:EU309586 - EU309599 and GenBank:EU309600 - EU309614 (sequences
generated in a previous study) [35].
AUTHOR’S CONTRIBUTIONS
ACGJ participated in the design of the study, performed experiments, analyzed the data and
drafted the manuscript.
RPAM performed experiments.
CB and CMAC analyzed the data e critically revised the manuscript.
LHTY and RAS analyzed the data.
JRRP designed the study and contributed to acquisition and analysis of data.
IMVGCM designed the study, analyzed the data and critically revised the manuscript.
PR designed and coordinated the study and helped to draft the manuscript.
All authors read and approved the final manuscript.

20
ACKNOWLEDGEMENTS
We are grateful to FAPESP “Fundação de Amparo à Pesquisa do Estado de São
Paulo – FAPESP” for grants that supported this work (projects with process numbers
07/52073-0 and grant with process number 06/60012-9). We also acknowledge Dr Roberta
Maria Fachini for providing the clinical samples we used in this work.
COMPETING INTERESTS
The authors have declared that no competing interests exist.
REFERENCES
1. GBD: Global burden of disease (GBD) for hepatitis C. J Clin Pharmacol 2004, 44(1):20-29.
2. Chevaliez S, Pawlotsky JM: Hepatitis C virus: virology, diagnosis and management of antiviral therapy. World J Gastroenterol 2007, 13(17):2461-2466.
3. Saito I, Miyamura T, Ohbayashi A, Harada H, Katayama T, Kikuchi S, Watanabe Y, Koi S, Onji M, Ohta Y et al: Hepatitis C virus infection is associated with the development of hepatocellular carcinoma. Proc Natl Acad Sci U S A 1990, 87(17):6547-6549.
4. Fried MW, Shiffman ML, Reddy KR, Smith C, Marinos G, Goncales FL, Jr., Haussinger D, Diago M, Carosi G, Dhumeaux D et al: Peginterferon alfa-2a plus ribavirin for chronic hepatitis C virus infection . N Engl J Med 2002, 347(13):975-982.
5. Manns MP, McHutchison JG, Gordon SC, Rustgi VK, Shiffman M, Reindollar R, Goodman ZD, Koury K, Ling M, Albrecht JK: Peginterferon alfa-2b plus ribavirin compared with interferon alfa-2b plus ribavirin for initial treatme nt of chronic hepatitis C: a randomised trial. Lancet 2001, 358(9286):958-965.
6. Pawlotsky JM: Mechanisms of antiviral treatment efficacy and failure in chronic hepatitis C. Antiviral Res 2003, 59(1):1-11.
7. Pawlotsky JM: Current and future concepts in hepatitis C therapy. Semin Liver Dis 2005, 25(1):72-83.
8. Choo QL, Kuo G, Weiner AJ, Overby LR, Bradley DW, Houghton M: Isolation of a cDNA clone derived from a blood-borne non-A, non-B viral hepatitis genome. Science 1989, 244(4902):359-362.
9. Murphy DG, Willems B, Deschenes M, Hilzenrat N, Mousseau R, Sabbah S: Use of sequence analysis of the NS5B region for routine genotyping of hepatitis C virus with reference to C/E1 and 5' untranslated region sequences. J Clin Microbiol 2007, 45(4):1102-1112.
21
10. Simmonds P, Bukh J, Combet C, Deleage G, Enomoto N, Feinstone S, Halfon P, Inchauspe G, Kuiken C, Maertens G et al: Consensus proposals for a unified system of nomenclature of hepatitis C virus genotypes. Hepatology 2005, 42(4):962-973.
11. Martell M, Esteban JI, Quer J, Genesca J, Weiner A, Esteban R, Guardia J, Gomez J: Hepatitis C virus (HCV) circulates as a population of different but closely related genomes: quasispecies nature of HCV genome distribution. J Virol 1992, 66(5):3225-3229.
12. Domingo E, Martin V, Perales C, Grande-Perez A, Garcia-Arriaza J, Arias A: Viruses as quasispecies: biological implications. Curr Top Microbiol Immunol 2006, 299:51-82.
13. Pawlotsky JM: Hepatitis C virus genetic variability: pathogenic and clinical implications. Clin Liver Dis 2003, 7(1):45-66.
14. Forns X, Bukh J: The molecular biology of hepatitis C virus. Genotypes and quasispecies. Clin Liver Dis 1999, 3(4):693-716, vii.
15. Forns X, Purcell RH, Bukh J: Quasispecies in viral persistence and pathogenesis of hepatitis C virus. Trends Microbiol 1999, 7(10):402-410.
16. Le Guillou-Guillemette H, Vallet S, Gaudy-Graffin C, Payan C, Pivert A, Goudeau A, Lunel-Fabiani F: Genetic diversity of the hepatitis C virus: impact and issues in the antiviral therapy . World J Gastroenterol 2007, 13(17):2416-2426.
17. Enomoto N, Sakuma I, Asahina Y, Kurosaki M, Murakami T, Yamamoto C, Izumi N, Marumo F, Sato C: Comparison of full-length sequences of interferon-sensitive and resistant hepatitis C virus 1b. Sensitivity to interferon is conferred by amino acid substitutions in the NS5A region. J Clin Invest 1995, 96(1):224-230.
18. Enomoto N, Sakuma I, Asahina Y, Kurosaki M, Murakami T, Yamamoto C, Ogura Y, Izumi N, Marumo F, Sato C: Mutations in the nonstructural protein 5A gene and response to interferon in patients with chronic hepatitis C virus 1b infection. N Engl J Med 1996, 334(2):77-81.
19. Puig-Basagoiti F, Forns X, Furcic I, Ampurdanes S, Gimenez-Barcons M, Franco S, Sanchez-Tapias JM, Saiz JC: Dynamics of hepatitis C virus NS5A quasispecies during interferon and ribavirin therapy in responder and non-responder patients with genotype 1b chronic hepatitis C. J Gen Virol 2005, 86(Pt 4):1067-1075.
20. Witherell GW, Beineke P: Statistical analysis of combined substitutions in nonstructural 5A region of hepatitis C virus and interferon response. J Med Virol 2001, 63(1):8-16.
21. Jain MK, Yuan HJ, Adams-Huet B, Reeck A, Shelton J, Attar N, Zhang S, Neumann AU, Carney DS, Gale M, Jr. et al: Pegylated interferon and ribavirin promote early evolution of nonstructural 5A protein in individuals with hepatitis C who demonstrate a response to treatment. J Infect Dis 2009, 200(6):866-876.
22. Pawlotsky JM, Germanidis G, Neumann AU, Pellerin M, Frainais PO, Dhumeaux D: Interferon resistance of hepatitis C virus genotype 1b: relationship to nonstructural 5A gene quasispecies mutations. J Virol 1998, 72(4):2795-2805.
23. Brass V, Bieck E, Montserret R, Wolk B, Hellings JA, Blum HE, Penin F, Moradpour D: An amino-terminal amphipathic alpha-helix mediates membrane association of the hepatitis C virus nonstructural protein 5A. J Biol Chem 2002, 277(10):8130-8139.
24. Penin F, Brass V, Appel N, Ramboarina S, Montserret R, Ficheux D, Blum HE, Bartenschlager R, Moradpour D: Structure and function of the membrane anchor

22
domain of hepatitis C virus nonstructural protein 5A. J Biol Chem 2004, 279(39):40835-40843.
25. Tellinghuisen TL, Marcotrigiano J, Gorbalenya AE, Rice CM: The NS5A protein of hepatitis C virus is a zinc metalloprotein. J Biol Chem 2004, 279(47):48576-48587.
26. Ide Y, Zhang L, Chen M, Inchauspe G, Bahl C, Sasaguri Y, Padmanabhan R: Characterization of the nuclear localization signal and subcellular distribution of hepatitis C virus nonstructural protein NS5A. Gene 1996, 182(1-2):203-211.
27. Pawlotsky JM, Germanidis G: The non-structural 5A protein of hepatitis C virus. J Viral Hepat 1999, 6(5):343-356.
28. Satoh S, Hirota M, Noguchi T, Hijikata M, Handa H, Shimotohno K: Cleavage of hepatitis C virus nonstructural protein 5A by a caspase-like protease(s) in mammalian cells. Virology 2000, 270(2):476-487.
29. Salmeron J, De Rueda PM, Ruiz-Extremera A, Casado J, Huertas C, Bernal Mdel C, Rodriguez L, Palacios A: Quasispecies as predictive response factors for antiviral treatment in patients with chronic hepatitis C. Dig Dis Sci 2006, 51(5):960-967.
30. Duverlie G, Khorsi H, Castelain S, Jaillon O, Izopet J, Lunel F, Eb F, Penin F, Wychowski C: Sequence analysis of the NS5A protein of European hepatitis C virus 1b isolates and relation to interferon sensitivity. J Gen Virol 1998, 79 ( Pt 6):1373-1381.
31. Pascu M, Martus P, Hohne M, Wiedenmann B, Hopf U, Schreier E, Berg T: Sustained virological response in hepatitis C virus type 1b infected patients is predicted by the number of mutations within the NS5A-ISDR: a meta-analysis focused on geographical differences. Gut 2004, 53(9):1345-1351.
32. Gaudy C, Lambele M, Moreau A, Veillon P, Lunel F, Goudeau A: Mutations within the hepatitis C virus genotype 1b E2-PePHD domain do not correlate with treatment outcome. J Clin Microbiol 2005, 43(2):750-754.
33. Gerotto M, Dal Pero F, Pontisso P, Noventa F, Gatta A, Alberti A: Two PKR inhibitor HCV proteins correlate with early but not sustained response to interferon . Gastroenterology 2000, 119(6):1649-1655.
34. Bittar C, Jardim AC, Yamasaki LH, de Queiroz AT, Carareto CM, Pinho JR, de Carvalho-Mello IM, Rahal P: Genetic diversity of NS5A protein from hepatitis C virus genotype 3a and its relationship to therapy response. BMC Infect Dis 2010, 10:36.
35. Nousbaum J, Polyak SJ, Ray SC, Sullivan DG, Larson AM, Carithers RL, Jr., Gretch DR: Prospective characterization of full-length hepatitis C virus NS5A quasispecies during induction and combination antiviral therapy. J Virol 2000, 74(19):9028-9038.
36. Pawlotsky JM, Pellerin M, Bouvier M, Roudot-Thoraval F, Germanidis G, Bastie A, Darthuy F, Remire J, Soussy CJ, Dhumeaux D: Genetic complexity of the hypervariable region 1 (HVR1) of hepatitis C virus (HCV): influence on the characteristics of the infection and responses to interferon alfa therapy in patients with chronic hepatitis C. J Med Virol 1998, 54(4):256-264.
37. Toyoda H, Kumada T, Nakano S, Takeda I, Sugiyama K, Osada T, Kiriyama S, Sone Y, Kinoshita M, Hadama T: Quasispecies nature of hepatitis C virus and response to alpha interferon: significance as a predictor of direct response to interferon. J Hepatol 1997, 26(1):6-13.
38. Ueda E, Enomoto N, Sakamoto N, Hamano K, Sato C, Izumi N, Watanabe M: Changes of HCV quasispecies during combination therapy with interferon and ribavirin . Hepatol Res 2004, 29(2):89-96.

23
39. Saludes V, Bracho MA, Valero O, Ardevol M, Planas R, Gonzalez-Candelas F, Ausina V, Martro E: Baseline prediction of combination therapy outcome in hepatitis C virus 1b infected patients by discriminant analysis using viral and host factors. PLoS One 2010, 5(11):e14132.
40. Farci P, Strazzera R, Alter HJ, Farci S, Degioannis D, Coiana A, Peddis G, Usai F, Serra G, Chessa L et al: Early changes in hepatitis C viral quasispecies during interferon therapy predict the therapeutic outcome. Proc Natl Acad Sci U S A 2002, 99(5):3081-3086.
41. Xu Z, Fan X, Xu Y, Di Bisceglie AM: Comparative analysis of nearly full-length hepatitis C virus quasispecies from patients experiencing viral breakthrough during antiviral therapy: clustered mutations in three functional genes, E2, NS2, and NS5a. J Virol 2008, 82(19):9417-9424.
42. Figlerowicz M, Jackowiak P, Formanowicz P, Kedziora P, Alejska M, Malinowska N, Blazewicz J, Figlerowicz M: Hepatitis C virus quasispecies in chronically infected children subjected to interferon-ribavirin therapy . Arch Virol.
43. Ramirez S, Perez-del-Pulgar S, Carrion JA, Coto-Llerena M, Mensa L, Dragun J, Garcia-Valdecasas JC, Navasa M, Forns X: Hepatitis C virus superinfection of liver grafts: a detailed analysis of early exclusion of non-dominant virus strains. J Gen Virol, 91(Pt 5):1183-1188.
44. Ray SC, Wang YM, Laeyendecker O, Ticehurst JR, Villano SA, Thomas DL: Acute hepatitis C virus structural gene sequences as predictors of persistent viremia: hypervariable region 1 as a decoy. J Virol 1999, 73(4):2938-2946.
45. Figlerowicz M, Jackowiak P, Formanowicz P, Kedziora P, Alejska M, Malinowska N, Blazewicz J: Hepatitis C virus quasispecies in chronically infected children subjected to interferon-ribavirin therapy . Arch Virol 2010, 155(12):1977-1987.
46. Zekri AR, El-Din HM, Bahnassy AA, Khaled MM, Omar A, Fouad I, El-Hefnewi M, Thakeb F, El-Awady M: Genetic distance and heterogenecity between quasispecies is a critical predictor to IFN response in Egyptian patients with HCV genotype-4. Virol J 2007, 4:16.
47. Pellerin M, Lopez-Aguirre Y, Penin F, Dhumeaux D, Pawlotsky JM: Hepatitis C virus quasispecies variability modulates nonstructural protein 5A transcriptional activation, pointing to cellular compartmentalization of virus-host interactions. J Virol 2004, 78(9):4617-4627.
48. Cuevas JM, Torres-Puente M, Jimenez-Hernandez N, Bracho MA, Garcia-Robles I, Wrobel B, Carnicer F, del Olmo J, Ortega E, Moya A et al: Genetic variability of hepatitis C virus before and after combined therapy of interferon plus ribavirin . PLoS One 2008, 3(8):e3058.
49. Fan W, Zhu W, Wei L, Wang Q, Yin L, Du S, Zhuang H: Nonstructural 5A gene variability of hepatitis C virus (HCV) during a 10-year follow up. J Gastroenterol 2005, 40(1):43-51.
50. Jardim AC, Yamasaki LH, de Queiroz AT, Bittar C, Pinho JR, Carareto CM, Rahal P, Mello IM: Quasispecies of hepatitis C virus genotype 1 and treatment outcome with peginterferon and ribavirin . Infect Genet Evol 2009, 9(4):689-698.
51. Sauter D, Himmelsbach K, Kriegs M, Carvajal Yepes M, Hildt E: Localization determines function: N-terminally truncated NS5A fragments accumulate in the nucleus and impair HCV replication. J Hepatol 2009, 50(5):861-871.
52. Appel N, Pietschmann T, Bartenschlager R: Mutational analysis of hepatitis C virus nonstructural protein 5A: potential role of differential phosphorylation in RNA replication and identification of a genetically flexible domain. J Virol 2005, 79(5):3187-3194.
24
53. Moradpour D, Evans MJ, Gosert R, Yuan Z, Blum HE, Goff SP, Lindenbach BD, Rice CM: Insertion of green fluorescent protein into nonstructural protein 5A allows direct visualization of functional hepatitis C virus replication complexes. J Virol 2004, 78(14):7400-7409.
54. Appel N, Zayas M, Miller S, Krijnse-Locker J, Schaller T, Friebe P, Kallis S, Engel U, Bartenschlager R: Essential role of domain III of nonstructural protein 5A for hepatitis C virus infectious particle assembly. PLoS Pathog 2008, 4(3):e1000035.
55. Gordon D, Abajian C, Green P: Consed: a graphical tool for sequence finishing. Genome Res 1998, 8(3):195-202.
56. Ewing B, Green P: Base-calling of automated sequencer traces using phred. II. Error probabilities . Genome Res 1998, 8(3):186-194.
57. Ewing B, Hillier L, Wendl MC, Green P: Base-calling of automated sequencer traces using phred. I. Accuracy assessment. Genome Res 1998, 8(3):175-185.
58. Thompson JD, Gibson TJ, Plewniak F, Jeanmougin F, Higgins DG: The CLUSTAL_X windows interface: flexible strategies for multiple sequence alignment aided by quality analysis tools. Nucleic Acids Res 1997, 25(24):4876-4882.
59. Hall TA: BioEdit: a user-friendly biological sequence alignment editor and analysis program for Windows 95/98/NT. Nucleic Acids Symposium Series 1999, 41:95-98.
60. Tamura K, Dudley J, Nei M, Kumar S: MEGA4: Molecular Evolutionary Genetics Analysis (MEGA) software version 4.0. Mol Biol Evol 2007, 24(8):1596-1599.
61. Swofford DL: PAUP* Phylogenetic Analysis Using Parsimony (*and Others Methods). In. Sunderland, Massachusetts; 2002.
62. Posada D, Crandall KA: MODELTEST: testing the model of DNA substitution. Bioinformatics 1998, 14(9):817-818.
63. McCormack GP, Clewley JP: The application of molecular phylogenetics to the analysis of viral genome diversity and evolution. Rev Med Virol 2002, 12(4):221-238.
64. Yang Z: Inference of selection from multiple species alignments. Curr Opin Genet Dev 2002, 12(6):688-694.
65. Yang Z: PAML: a program package for phylogenetic analysis by maximum likelihood. Comput Appl Biosci 1997, 13(5):555-556.
66. Yang Z: Likelihood ratio tests for detecting positive selection and application to primate lysozyme evolution. Mol Biol Evol 1998, 15(5):568-573.
67. Marucci EA, Zafalon GF, Jardim AC, Yamasaki LH, Bittar C, Rahal P, Machado JM: Routine libraries for pattern recognition in quasispecies. Genet Mol Res 2008, 7(3):970-981.
25
FIGURES
Figure 1. Alignment of sequence representation demo nstrating the nonsense
mutations observed in this study. A) Nonsense mutation at amino-terminal of the NS5A
genomic region, positions 9, 47 and 84. B) One nonsense mutation located at the middle of
the NS5A genomic region position 233, and one nonsense mutation located at the carboxy-
terminal of the NS5A genomic region, position 399. Pink boxes indicate nonsense mutations.
The next methionines are highlighted in gray. References sequences for genotypes 1a
(H77_NS5A1a) and 1b (HCVJ_NS5A1b) are indicated.
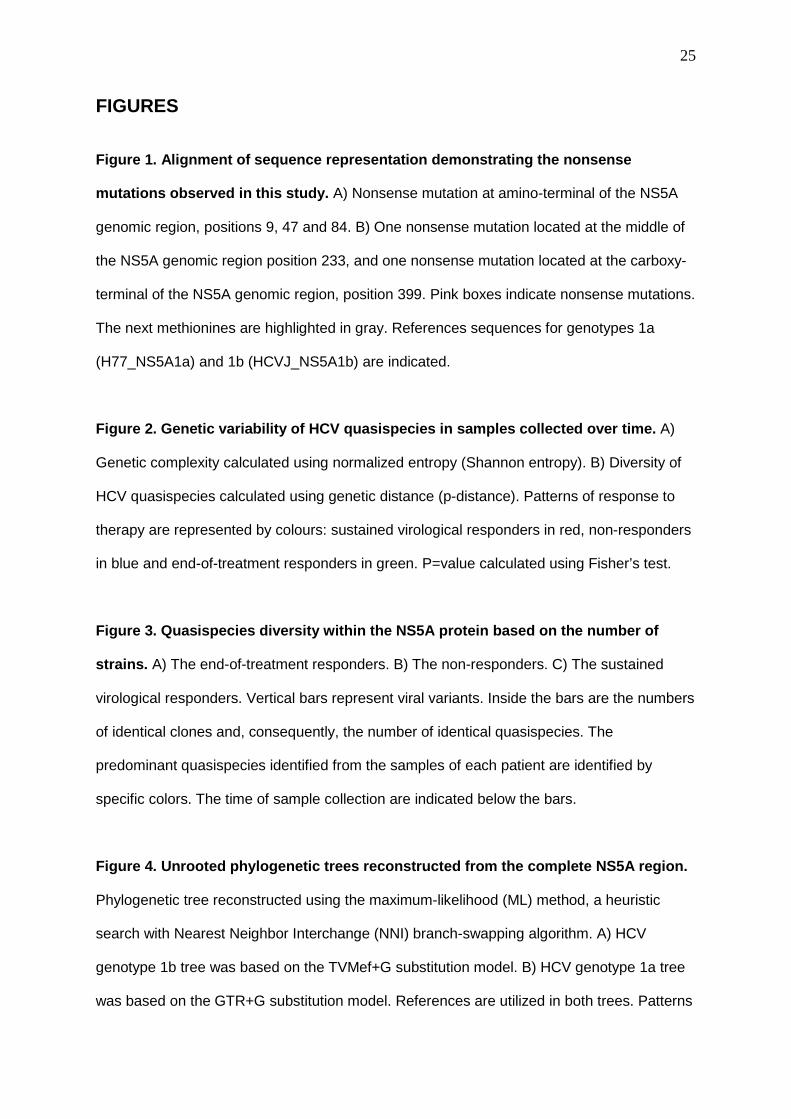
Figure 2. Genetic variability of HCV quasispecies i n samples collected over time. A)
Genetic complexity calculated using normalized entropy (Shannon entropy). B) Diversity of
HCV quasispecies calculated using genetic distance (p-distance). Patterns of response to
therapy are represented by colours: sustained virological responders in red, non-responders
in blue and end-of-treatment responders in green. P=value calculated using Fisher’s test.
Figure 3. Quasispecies diversity within the NS5A pr otein based on the number of
strains. A) The end-of-treatment responders. B) The non-responders. C) The sustained
virological responders. Vertical bars represent viral variants. Inside the bars are the numbers
of identical clones and, consequently, the number of identical quasispecies. The
predominant quasispecies identified from the samples of each patient are identified by
specific colors. The time of sample collection are indicated below the bars.
Figure 4. Unrooted phylogenetic trees reconstructed from the complete NS5A region.
Phylogenetic tree reconstructed using the maximum-likelihood (ML) method, a heuristic
search with Nearest Neighbor Interchange (NNI) branch-swapping algorithm. A) HCV
genotype 1b tree was based on the TVMef+G substitution model. B) HCV genotype 1a tree
was based on the GTR+G substitution model. References are utilized in both trees. Patterns

26
of response are represented by colors: sustained virological responders in red, non-
responders in blue and end-of-treatment responders in green.
Figure 5. Selection pressure in particular clades o f NS5A quasispecies. Omega values
(ω) were analysed for sequences referent to each patient by individual reconstruction of
phylogenetic trees, using the maximum-likelihood (ML) method based on the HKY
substitution model, and analysis of specific clades (Additional Information) using CODEML.
Patients P08, P11, P146 and P44 are non-responders and P03, P42 and P47 are end-of-
treatment responders.
27
Table 1. Clinical and virological characteristics of patients
Patient and type of treatment response
Sex Age HCV Genotype
Sample Viral Load log UI/ml
Genetic Distance
Shannon Entropy
SVR P05 F 44 1b ● 6.04 0.006 ± 0.001 0.0096 P35 M 40 1a ● 6.25 0.005 ± 0.001 0.0074 P40 M 35 1a ● 6.57 0.004 ± 0.001 0.0042 NR P08 F 41 1a ● 5.80 0.008 ± 0.001 0.0126 12wt 4.59 0.009 ± 0.001 0.0113 14d 6.18 0.011 ± 0.001 0.0157 2m 6.46 0.008 ± 0.001 0.0103 6m 6.40 0.007 ± 0.001 0.0156 P11 M 72 1b ● 6.85 0.017 ± 0.001 0.0235 12wt 3.71 0.007 ± 0.001 0.0140 14d 6.27 0.005 ± 0.001 0.0134 2m 6.73 0.007 ± 0.001 0.0132 6m >7.2 0.012 ± 0.002 0.0192 P146 M 21 1a ● 6.92 0.012 ± 0.002 0.0202 12wt 5.54 0.006 ± 0.001 0.0097 14d 6.43 0.012 ± 0.001 0.0172 2m 6.76 0.012 ± 0.001 0.0177 6m 6.96 0.008 ± 0.001 0.0119 P44 M 51 1b ● 6.50 0.016 ± 0.002 0.0139 12wt 6.13 0.019 ± 0.002 0.0311 14d 6.24 0.014 ± 0.001 0.0206 2m 7.18 0.014 ± 0.001 0.0216 6m 6.83 0.014 ± 0.001 0.0216 ETR P03 M 39 1a ● 5.95 0.011 ± 0.001 0.0131 28d 4.99 0.004 ± 0.001 0.0094 2m 5.39 0.003 ± 0.001 0.0058 3m 4.74 0.003 ± 0.001 0.0055 4m 5.03 0.002 ± 0.001 0.0073 5m 5.26 0.001 ± 0.001 0.0033 6m 5.08 0.012 ± 0.000 0.0038 P37 M 27 1a ● 6.00 0.005 ± 0.001 0.0137 2m 6.63 0.001 ± 0.001 0.0055 3m 6.83 0.002 ± 0.001 0.0038 4m 6.30 0.003 ± 0.001 0.0066 5m 6.10 0.009 ± 0.001 0.0074 6m 6.58 0.014 ± 0.001 0.0109 P42 M 56 1b ● 6.66 0.016 ± 0.002 0.0161 4m 6.24 0.014 ± 0.002 0.0162 5m 6.28 0.017 ± 0.002 0.0141 6m 6.34 0.022 ± 0.002 0.0145 P47 M 47 1a ● 6.05 0.033 ± 0.002 0.0268 2m 5.67 0.027 ± 0.003 0.0466 3m 5.92 0.003 ± 0.002 0.0391 4m 5.57 0.011 ± 0.001 0.0072 5m 5.87 0.009 ± 0.002 0.0197 6m 2.93 0.011 ± 0.002 0.0171
aSVR, sustained virological response; NR, non-response; ETR, end-of-treatment response ●=before treatment; wt=weeks of treatment; d=days after the end of treatment; m=months after the end of treatment
28
Table 2. Composition of quasispecies in patients’ samples.
SVR= sustained virological responder; NR=non-responder; ETR=end-of-treatment responder. ●=before treatment; wt=weeks of treatment; d=days after the end of treatment; m=months after the end of treatment.
Patients Samples collection points
● 12wt 14d 28d 2m 3m 4m 5m 6m SVR P05 80% (12) ------ ------ ------ ------ ------ ------ ------ ------ P35 67% (10) ------ ------ ------ ------ ------ ------ ------ ------ P40 47% (7) ------ ------ ------ ------ ------ ------ ------ ------ NR P08 87% (13) 87% (13) 100% (15) ------ 73% (11) ------ ------ ------ 93% (14) P11 93% (14) 73% (11) 100% (15) ------ 87% (13) ------ ------ ------ 100% (15) P146 87% (13) 73% (11) 73% (11) ------ 80% (12) ------ ------ ------ 87% (13) P44 87% (13) 100% (15) 100% (15) ------ 93% (14) ------ ------ ------ 100% (15) ETR P03 87% (13) ------ ------ 67% (10) 47% (7) 47% (7) 67% (10) 33% (5) 47% (7) P37 80% (12) ------ ------ ------ 47% (7) 47% (7) 73% (11) 54% (8) 73% (11) P42 93% (14) ------ ------ ------ ------ ------ 100% (15) 100% (15) 87% (13) P47 100% (15) ------ ------ ------ 100% (15) 100% (15) 60% (9) 73% (11) 100% (15)

29
Table 3. Selection pressure analysis within particular clades of NS5A quasispecies.
Patient Model l 2∆l Estimates P08 one-ratio -4404.76677 ωB = 0.1692 two-ratio -4404.28734 0.9587 ωB = 0.1521 ωF = 0.1872 P11a one-ratio -4558.41000 ωB = 0.1835 two-ratio -4552.47248 **11.8750 ωB = 0.1650 ωF = 0.5783 two-ratio -4553.77795 **9.264 ωB = 0.1419 ωF = 0.2685 P146 one-ratio -4755.95340 ωB = 0.1705 two-ratio -4755.92063 0.0822 ωB = 0.1727 ωF = 0.1618 two-ratio -4754.96926 1.9683 ωB = 0.1818 ωF = 0.1246 P44 one-ratio -6356.59235 ωB = 0.1433 two-ratio -6356.28458 0.6155 ωB = 0.1338 ωF = 0.1521 P03 one-ratio -3854.07081 ωB = 0.2003 two-ratio -3853.33452 1.4726 ωB = 0.1977 ωF = 0.2350 P42 one-ratio -5111.91233 ωB = 0.1101 two-ratio -5111.91231 0.0004 ωB = 0.1102 ωF = 0.1101 P47a one-ratio -5455.19420 ωB = 0.2013 two-ratio -5451.97704 *6.4343 ωB = 0.1604 ωF = 0.2487 two-ratio -5444.44505 **21.4983 ωB = 0.1776 ωF = 0.7177
Non-responder: P08, P11, P146, P44; End-of-treatment responder: P03, P42, P47 X2 critical values, 1 df: *: 3.84; **: 6.63; 2∆ ℓ = 2 (l1-l0) The ω values considered are presented in bold. a Two clades selected for analyses.

30
ADDITIONAL INFORMATION
Additional file 1. Phylogenetic trees reconstructed from sequences obtained from
patient P42 samples. Maximum likelihood tree reconstructed from full length NS5A region
sequences obtained from samples from patient P42 (ETR) plus reference sequence of
genotype 1b HCV-J. The number of 1000 permuted trees supporting a clade indicated when
that proportion was greater than 70%. The same quasispecies are colored in red or pink. A
sequence with nonsense mutation is colored in blue. The clade selected for selective
pressure analysis is indicated by a gray line.
Additional file 2. Phylogenetic trees reconstructed from sequences obtained from
patient P03 samples. Maximum likelihood tree reconstructed from full length NS5A region
sequences obtained from samples of P03 (ETR) plus reference sequence of genotype 1b
HCV-J. The number of 1000 permuted trees supporting a clade indicated when that
proportion was greater than 70%. The same quasispecies are colored in red. Sequence with
nonsense mutation is colored in blue. The clade selected for selective pressure analysis is
indicated by a gray line.
Additional file 3. Phylogenetic trees reconstructed from sequences obtained from
patient P47 samples. Maximum likelihood tree reconstructed from full length NS5A region
sequences obtained from samples of P47 (ETR) plus reference sequence of genotype 1b
HCV-J. The number of 1000 permuted trees supporting a clade indicated when that
proportion was greater than 70%. The same quasispecies are colored in red. Sequence with
nonsense mutation is colored in blue. The clades selected for selective pressure analysis
are indicated by a gray line (clade 1, ω = 0.2487 and clade 2, ω = 0.7177).
Additional file 4. Phylogenetic trees reconstructed from sequences obtained from
patient P37 samples. Maximum likelihood tree reconstructed from full length NS5A region
sequences obtained from samples of P37 (ETR) plus reference sequence of genotype 1b
HCV-J. The number of 1000 permuted trees supporting a clade indicated when that

31
proportion was greater than 70%. The same quasispecies are colored in red. Sequence with
nonsense mutation is colored in blue.
Additional file 5. Phylogenetic trees reconstructed from sequences obt ained from
patient P11 samples. Maximum likelihood tree reconstructed from full length NS5A region
sequences obtained from samples of P11 (NR) plus reference sequence of genotype 1b
HCV-J. The number of 1000 permuted trees supporting a clade indicated when that
proportion was greater than 70%. The same quasispecies are colored in red. The clades
selected for selective pressure analysis are indicated by a gray line (clade 1, ω = 0.5783 and
clade 2, ω = 0.2685).
Additional file 6. Phylogenetic trees reconstructed from sequences obt ained from
patient P44 samples. Maximum likelihood tree reconstructed from full length NS5A region
sequences obtained from samples of P44 (NR) plus reference sequence of genotype 1b
HCV-J. The number of 1000 permuted trees supporting a clade indicated when that
proportion was greater than 70%. The same quasispecies are colored in red. Sequence with
nonsense mutation is colored in blue. The clade selected for selective pressure analysis is
indicated by a gray line.
Additional file 7. Phylogenetic trees reconstructed from sequences obt ained from
patient P146 samples. Maximum likelihood tree reconstructed from full length NS5A region
sequences obtained from samples of P146 (NR) plus reference sequence of genotype 1b
HCV-J. The number of 1000 permuted trees supporting a clade indicated when that
proportion was greater than 70%. The same quasispecies are colored in red. Sequence with
nonsense mutation is colored in blue. The clade selected for selective pressure analysis is
indicated by a gray line.
Additional file 8. Phylogenetic trees reconstructed from sequences obt ained from
patient P08 samples. Maximum likelihood tree reconstructed from full length NS5A region
sequences obtained from samples of P08 (NR) plus reference sequence of genotype 1b
HCV-J. The number of 1000 permuted trees supporting a clade indicated when that

32
proportion was greater than 70%. The same quasispecies are colored in red. The clade
selected for selective pressure analysis is indicated by a gray line.

Figure 1

Figure 2


Figure 5

Additional files provided with this submission:
Additional file 1: Figure A1rev.tif, 182Khttp://www.biomedcentral.com/imedia/1150206370715889/supp1.tiffAdditional file 2: Figure A2rev.tif, 231Khttp://www.biomedcentral.com/imedia/1085069154715889/supp2.tiffAdditional file 3: Figure A3rev.tif, 260Khttp://www.biomedcentral.com/imedia/1205643697158893/supp3.tiffAdditional file 4: Figure A4rev.tif, 183Khttp://www.biomedcentral.com/imedia/2034317407158883/supp4.tiffAdditional file 5: Figure A5rev.tif, 211Khttp://www.biomedcentral.com/imedia/5152138067158883/supp5.tiffAdditional file 6: Figure A6rev.tif, 89Khttp://www.biomedcentral.com/imedia/1181942598715888/supp6.tiffAdditional file 7: Figure A7rev.tif, 237Khttp://www.biomedcentral.com/imedia/2843460937158894/supp7.tiffAdditional file 8: Figure A8rev.tif, 227Khttp://www.biomedcentral.com/imedia/1708999011715890/supp8.tiff