Efficient selective rendering of participating media
8
Efficient Selective Rendering of Participating Media Oscar Anson ∗ University of Zaragoza Spain Veronica Sundstedt † University of Bristol United Kingdom Diego Gutierrez ‡ University of Zaragoza Spain Alan Chalmers § University of Bristol United Kingdom Abstract Realistic image synthesis is the process of computing photorealis- tic images which are perceptually and measurably indistinguishable from real-world images. In order to obtain high fidelity rendered images it is required that the physical processes of materials and the behavior of light are accurately modelled and simulated. Most computer graphics algorithms assume that light passes freely be- tween surfaces within an environment. However, in many applica- tions, ranging from evaluation of exit signs in smoke filled rooms to design of efficient headlamps for foggy driving, realistic modelling of light propagation and scattering is required. The computational requirements for calculating the interaction of light with such par- ticipating media are substantial. This process can take many min- utes or even hours. Many times rendering efforts are spent on com- puting parts of the scene that will not be perceived by the viewer. In this paper we present a novel perceptual strategy for physically- based rendering of participating media. By using a combination of a saliency map with our new extinction map (X-map) we can significantly reduce rendering times for inhomogenous media. We also validate the visual quality of the resulting images using two objective difference metrics and a subjective psychophysical exper- iment. Although the average pixel errors of these metric are all less than 1%, the experiment using human observers indicate that these degradation in quality is still noticeable in certain scenes, unlike previous work has suggested. CR Categories: I.3.7 [Computer Graphics]: Three-Dimensional Graphics and Realism-color, shading, shadowing, and texture—; Keywords: participating media, perception, saliency map, extinc- tion map, selective rendering 1 Introduction Rendering physically-based imagery by using global illumination techniques have become very useful and necessary in certain ar- eas of interest like safety, military or industry [Rushmeier 1994]. The applications in these areas usually deals with the analysis of visual perception under certain unfavorable environmental condi- tions, where the presence of a medium have a noteworthy influ- ence in the visibility (and therefore the design) of certain elements such as road signs, fire exit signs, car headlamps, road lighting, etc. Examples of these participating media include smoke, fog, dust, ∗ e-mail: [email protected] † e-mail: [email protected] ‡ e-mail: [email protected] § e-mail: [email protected] Figure 1: Real photograph of a road with fog showing the effect of light scattering. flames, silty, and abyssal waters or atmospheric phenomena, Figure 1. Simulating these participating media implies the correct computa- tion of the absorption and scattering of light and therefore it has been always computationally expensive. To significantly reduce physically-based rendering times for par- ticipating media, we propose a novel perceptual strategy based on the combination of a saliency map [Itti et al. 1998] with our new extinction map (X-map), which stores in image-space the exponen- tial decay of light in the medium. This combination, that we have called the XS-map, is then used to guide a selective rendering of the scene, with more accurate estimates in the most perceptually important areas of the scene. The novelties of our work can then be summarized as the introduction of the X-map concept and its com- bination with a saliency map to guide a perception-based renderer for inhomogeneous participating media. In addition, two objective metrics are used in order to validate our approach and the perceived quality of selective rendering results is assessed by a two forced- choice preference experiment. The rest of the paper is organized as follows: In Section 2 we present a short summary of how visual perception has been incor- porated in perceptually- based rendering algorithms. In Section 3 the physics of participating media that underpins this work is pre- sented. We describe our novel selective rendering system using the XS-map in Section 4 and present the results in Section 5. Finally, we validate the XS-map using both objective metrics and subjec- tive experiments in Section 6. In Section 7 we conclude the work presented in this paper and discuss ideas for future research. 2 Related Work Early work in perceptually assisted rendering was mainly con- cerned with the acceleration of ray tracing. Although techniques
-
Upload
independent -
Category
Documents
-
view
0 -
download
0
Transcript of Efficient selective rendering of participating media
Efficient Selective Rendering of Participating Media
Oscar Anson∗
University of ZaragozaSpain
Veronica Sundstedt†
University of BristolUnited Kingdom
Diego Gutierrez‡
University of ZaragozaSpain
Alan Chalmers§
University of BristolUnited Kingdom
Abstract
Realistic image synthesis is the process of computing photorealis-tic images which are perceptually and measurably indistinguishablefrom real-world images. In order to obtain high fidelity renderedimages it is required that the physical processes of materials andthe behavior of light are accurately modelled and simulated. Mostcomputer graphics algorithms assume that light passes freely be-tween surfaces within an environment. However, in many applica-tions, ranging from evaluation of exit signs in smoke filled rooms todesign of efficient headlamps for foggy driving, realistic modellingof light propagation and scattering is required. The computationalrequirements for calculating the interaction of light with such par-ticipating media are substantial. This process can take many min-utes or even hours. Many times rendering efforts are spent on com-puting parts of the scene that will not be perceived by the viewer.In this paper we present a novel perceptual strategy for physically-based rendering of participating media. By using a combinationof a saliency map with our new extinction map (X-map) we cansignificantly reduce rendering times for inhomogenous media. Wealso validate the visual quality of the resulting images using twoobjective difference metrics and a subjective psychophysical exper-iment. Although the average pixel errors of these metric are all lessthan 1%, the experiment using human observers indicate that thesedegradation in quality is still noticeable in certain scenes, unlikeprevious work has suggested.
CR Categories: I.3.7 [Computer Graphics]: Three-DimensionalGraphics and Realism-color, shading, shadowing, and texture—;
Keywords: participating media, perception, saliency map, extinc-tion map, selective rendering
1 Introduction
Rendering physically-based imagery by using global illuminationtechniques have become very useful and necessary in certain ar-eas of interest like safety, military or industry [Rushmeier 1994].The applications in these areas usually deals with the analysis ofvisual perception under certain unfavorable environmental condi-tions, where the presence of a medium have a noteworthy influ-ence in the visibility (and therefore the design) of certain elementssuch as road signs, fire exit signs, car headlamps, road lighting, etc.Examples of these participating media include smoke, fog, dust,
∗e-mail: [email protected]†e-mail: [email protected]‡e-mail: [email protected]§e-mail: [email protected]
Figure 1: Real photograph of a road with fog showing the effect oflight scattering.
flames, silty, and abyssal waters or atmospheric phenomena, Figure1.
Simulating these participating media implies the correct computa-tion of the absorption and scattering of light and therefore it hasbeen always computationally expensive.
To significantly reduce physically-based rendering times for par-ticipating media, we propose a novel perceptual strategy based onthe combination of a saliency map [Itti et al. 1998] with our newextinction map (X-map), which stores in image-space the exponen-tial decay of light in the medium. This combination, that we havecalled the XS-map, is then used to guide a selective rendering ofthe scene, with more accurate estimates in the most perceptuallyimportant areas of the scene. The novelties of our work can then besummarized as the introduction of the X-map concept and its com-bination with a saliency map to guide a perception-based rendererfor inhomogeneous participating media. In addition, two objectivemetrics are used in order to validate our approach and the perceivedquality of selective rendering results is assessed by a two forced-choice preference experiment.
The rest of the paper is organized as follows: In Section 2 wepresent a short summary of how visual perception has been incor-porated in perceptually- based rendering algorithms. In Section 3the physics of participating media that underpins this work is pre-sented. We describe our novel selective rendering system using theXS-map in Section 4 and present the results in Section 5. Finally,we validate the XS-map using both objective metrics and subjec-tive experiments in Section 6. In Section 7 we conclude the workpresented in this paper and discuss ideas for future research.
2 Related Work
Early work in perceptually assisted rendering was mainly con-cerned with the acceleration of ray tracing. Although techniques
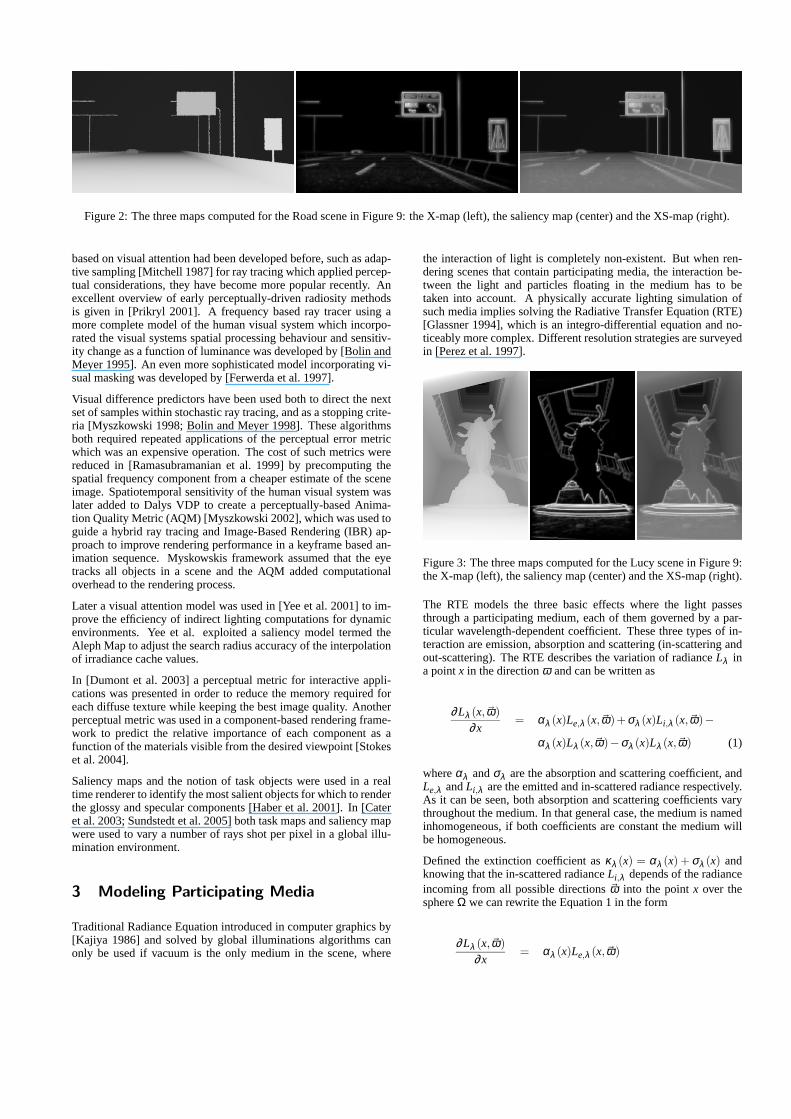
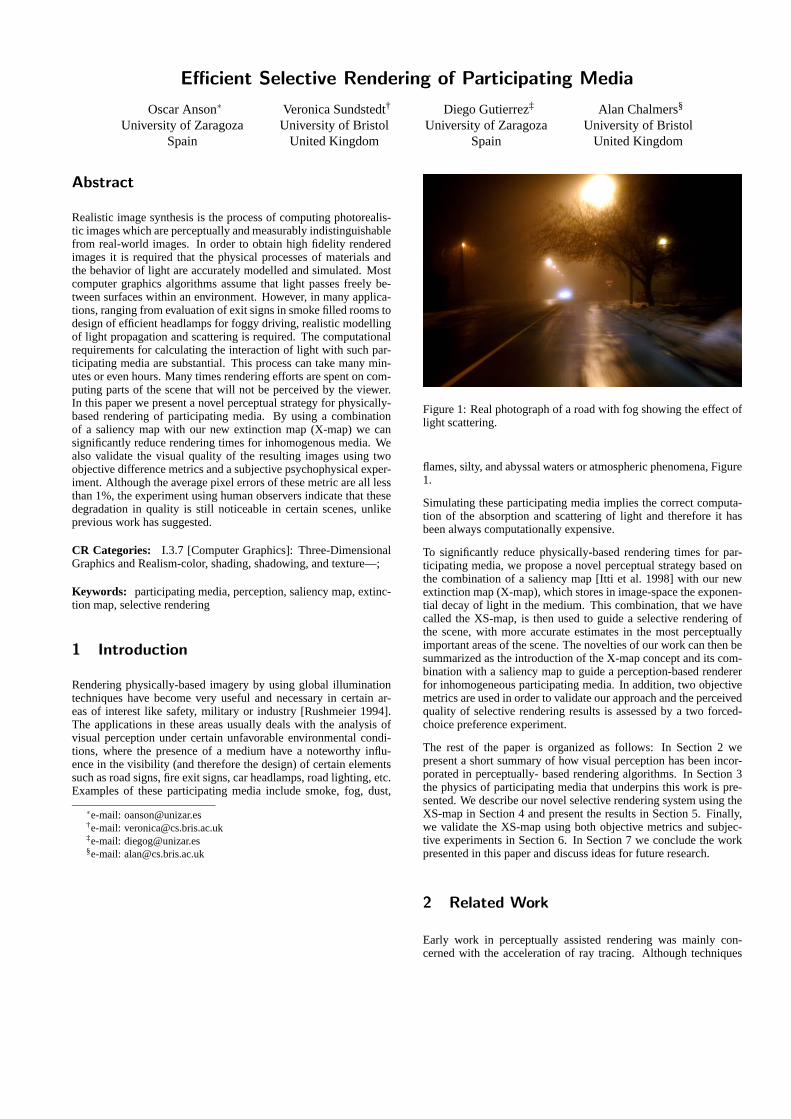
Figure 2: The three maps computed for the Road scene in Figure 9: the X-map (left), the saliency map (center) and the XS-map (right).
based on visual attention had been developed before, such as adap-tive sampling [Mitchell 1987] for ray tracing which applied percep-tual considerations, they have become more popular recently. Anexcellent overview of early perceptually-driven radiosity methodsis given in [Prikryl 2001]. A frequency based ray tracer using amore complete model of the human visual system which incorpo-rated the visual systems spatial processing behaviour and sensitiv-ity change as a function of luminance was developed by [Bolin andMeyer 1995]. An even more sophisticated model incorporating vi-sual masking was developed by [Ferwerda et al. 1997].
Visual difference predictors have been used both to direct the nextset of samples within stochastic ray tracing, and as a stopping crite-ria [Myszkowski 1998; Bolin and Meyer 1998]. These algorithmsboth required repeated applications of the perceptual error metricwhich was an expensive operation. The cost of such metrics werereduced in [Ramasubramanian et al. 1999] by precomputing thespatial frequency component from a cheaper estimate of the sceneimage. Spatiotemporal sensitivity of the human visual system waslater added to Dalys VDP to create a perceptually-based Anima-tion Quality Metric (AQM) [Myszkowski 2002], which was used toguide a hybrid ray tracing and Image-Based Rendering (IBR) ap-proach to improve rendering performance in a keyframe based an-imation sequence. Myskowskis framework assumed that the eyetracks all objects in a scene and the AQM added computationaloverhead to the rendering process.
Later a visual attention model was used in [Yee et al. 2001] to im-prove the efficiency of indirect lighting computations for dynamicenvironments. Yee et al. exploited a saliency model termed theAleph Map to adjust the search radius accuracy of the interpolationof irradiance cache values.
In [Dumont et al. 2003] a perceptual metric for interactive appli-cations was presented in order to reduce the memory required foreach diffuse texture while keeping the best image quality. Anotherperceptual metric was used in a component-based rendering frame-work to predict the relative importance of each component as afunction of the materials visible from the desired viewpoint [Stokeset al. 2004].
Saliency maps and the notion of task objects were used in a realtime renderer to identify the most salient objects for which to renderthe glossy and specular components [Haber et al. 2001]. In [Cateret al. 2003; Sundstedt et al. 2005] both task maps and saliency mapwere used to vary a number of rays shot per pixel in a global illu-mination environment.
3 Modeling Participating Media
Traditional Radiance Equation introduced in computer graphics by[Kajiya 1986] and solved by global illuminations algorithms canonly be used if vacuum is the only medium in the scene, where
the interaction of light is completely non-existent. But when ren-dering scenes that contain participating media, the interaction be-tween the light and particles floating in the medium has to betaken into account. A physically accurate lighting simulation ofsuch media implies solving the Radiative Transfer Equation (RTE)[Glassner 1994], which is an integro-differential equation and no-ticeably more complex. Different resolution strategies are surveyedin [Perez et al. 1997].
Figure 3: The three maps computed for the Lucy scene in Figure 9:the X-map (left), the saliency map (center) and the XS-map (right).
The RTE models the three basic effects where the light passesthrough a participating medium, each of them governed by a par-ticular wavelength-dependent coefficient. These three types of in-teraction are emission, absorption and scattering (in-scattering andout-scattering). The RTE describes the variation of radianceLλ ina pointx in the directionω and can be written as
∂Lλ (x, ~ω)
∂x= αλ (x)Le,λ (x, ~ω)+σλ (x)Li,λ (x, ~ω)−
αλ (x)Lλ (x, ~ω)−σλ (x)Lλ (x, ~ω) (1)
whereαλ andσλ are the absorption and scattering coefficient, andLe,λ andLi,λ are the emitted and in-scattered radiance respectively.As it can be seen, both absorption and scattering coefficients varythroughout the medium. In that general case, the medium is namedinhomogeneous, if both coefficients are constant the medium willbe homogeneous.
Defined the extinction coefficient asκλ (x) = αλ (x) + σλ (x) andknowing that the in-scattered radianceLi,λ depends of the radianceincoming from all possible directions~ω into the pointx over thesphereΩ we can rewrite the Equation 1 in the form
∂Lλ (x, ~ω)
∂x= αλ (x)Le,λ (x, ~ω)

+ σλ (x)∫
Ωpλ (x, ~ω ′, ~ω)Lλ (x, ~ω ′)d~ω ′
− κλ (x)Lλ (x, ~ω) (2)
wherepλ (x, ~ω ′, ~ω) is the phase function that describes the fractionof radiance arriving from direction~ω ′ that is in-scattered along thepath. Solving the integro-differential Equation 2 by integrating withrespect its boundary conditions we have the integral form of theRTE [Siegel and Howell 1992] given by
Lλ (x, ~ω) = e−τλ (x0,x)Lλ (x0, ~ω)
+∫ x
x0
e−τλ (x′,x)αλ (x′)Le,λ (x′, ~ω)dx′
+∫ x
x0
e−τλ (x′,x)σλ (x′)∫
Ωpλ (x′, ~ω ′, ~ω)Lλ (x′, ~ω ′)d~ω ′dx′
(3)
wheree−τλ (x′,x) is the transmittance along the optical path lengthτλ (x′,x), which express the attenuation of the light along its way.Optical length is defined as
τλ (x′,x) =∫ x
x′κλ (s)ds (4)
As it can be seen in Equation 3, the computation of the radianceat a point in the scene directly depends on the radiance of all otherpoints in the medium around it. That fact makes the computation forscenes with participating media more complex and extremely com-putationally expensive than the traditional radiance equation; evenmore if Equation 3 is extended with special wavelenght-dependanteffects such as inelastic scattering [Gutierrez et al. 2005]. In thesimplest case, where the medium is homogeneous, the Equation 3could be simplified.
4 Selective rendering of Media
In order to selectively render nonhomogenous participating me-dia, we have extended our in-house rendering system namedLu-cifer [Gutierrez et al. 2005] with a perceptually-based director. Theoverall goal is to compute scenes with physically accurate partici-pating media, in a reasonable time, while maintaining a high per-ceptual result. This process is completed in two stages. The firststage consists of the generation of an extinction map (X-map) anda saliency map and their combination into the directing map (XS-map). In the second stage, the XS-map, that is a gray scale image,is then used to drive the rendering process itself, rendering in higherquality the brighter areas of the XS-map.
4.1 The X-Map
In the general case of inhomogeneous participating media, the in-tensity of light as it transverses the medium is reduced by the trans-mittancee−τλ (x′,x). This attenuation in the optical path lengthτλbetweenx′ and x described in Equation 4 can be evaluated byray marching. Therefore, independently on how much irradiancereaches a given object, only a fraction of it will finally reach the hu-man eye. The first idea of this work is to pre-compute that fractionbeforehand, storing in image-space attenuation values in an extinc-tion map which we have named the X-map.
To obtain the X-map, rays are casted from the eye into the scene,ray marching through the medium until the first intersection, andsave the result of the exponential decay in the X-map, representingthe percentage of light (both direct and diffuse) which will reachthe eye for each pixel (or sub-pixel if the resolution of the map isincreased). For homogeneous media, the attenuation is onlye−κλ s,and faster ray tracing can be used instead of ray marching. In eithercase, the distance to the intersection is also saved in a Z-buffer.This allows for instantaneous recomputations of the X-map if thedescription of the medium in the scene changes, since intersectionsdo not need to be recalculated at each step.
Figure 4: Fast snapshots for the Lucy scene. Left: initial fast ray-traced snapshot (direct lighting and no medium). Right: A falseestimate of the medium computed from the combination of the ray-traced snapshot and the inverted X-map.
After generating the X-map, a fast raytraced snapshot of the scene(without the medium) is computed as well [Longhurst et al. 2005;Sundstedt et al. 2005]. This step is completed in the order of fewseconds because only direct lighting is computed (see Figure 4 left),and does not add any significant overhead to the overall processtime. But the main aim is to obtain a rapid estimate of the scenewith the medium, which will be used as an input to a saliency gen-erator in order to detect the features of the image that attract theattention of the observer when the medium is present in the scene.But as it was seen in Section 3, rendering the medium can be com-putationally expensive. Instead that, we used the computed X-map,inverting its values, in combination with the early fast snapshot ob-taining an estimate with a false medium. The result is shown inFigure 4 right.
In that sense, the X-map is used in two ways. Firstly for simulatingthe extinction in the scene due to the medium, and secondly, tocombine it with the output of the saliency generator.
4.2 The Saliency Map
The saliency generator, that is a bottom-up, feature-based model,extracts features from an image that humans would automaticallydirect attention to. That input image, in our case, is a fast estimateof the scene generated from the combination of the fast snapshotand an inverted X-map.
The saliency map is then computed from this estimate (in 2-3 sec-onds per image) via a combination of three conspicuity maps of
intensity, colour and orientation. These conspicuity maps are com-puted using feature maps at varying spatial scales. The featurescan be thought of as stimuli at varying scales and conspicuity asa summary of a specific stimulus at all the scale levels combined.Saliency on the other hand can be seen as a summary of all theconspicuity of all the stimuli combined together. A hardware im-plementation can generate a saliency map in the order of tens ofmilliseconds [Longhurst et al. 2006].
4.3 The XS-Map
To complete our setup for selective rendering of participating me-dia, we further propose a novel combination of this X-map with thesaliency map, based on the work of [Sundstedt et al. 2005]. Thiscombination is given byXS(wx,ws,op), whereXS represents thecombined saliency and X- maps, andwx andws are coefficients ap-plied to the values in the X-map and the saliency map respectively,which allow for different weighting to define relative importance ofthe maps. The coefficients are combined through the operatorop.
Selection of appropriate operatorop controls the combination ofthe two maps in the selective renderer. Our results in Section 5were computed using addition to combine the information fromboth maps such that all weighted features are preserved. Suchequal weighting would be XS(0.5,0.5,+), which correspond to ourXS-map rendered images, XS(1,0,+) to the images rendered onlywith the X-map and XS(0,1,+) to the images rendered only with thesaliency map. A multiplicative operator could also be used in orderto represents saliency modulated by the decay of light in the media.In any case, the XS-map will guide the selective rendering processby spending computational resources in areas of higher perceptualimportance and low extinction.
Figures 2 and 3 show the various maps for one of our test scenes, asshown in Figure 9. Figures 2 and 3 (left) show the X-map. Figures2 and 3 (center) demonstrate the saliency map. Figures 2 and 3(right) show the combination of the X-map and the saliency mapwith equal weighting into the XS-map.
5 Results
We have implemented our presented method inLucifer renderersystem that now uses the XS-map to direct some rendering pa-rameters. The maximum number of rays per pixel is input as auser-defined parameter. For each pixel to be shot this number isweighted by the corresponding value in the XS-map. Higher valuesin this director map will result in lower aliasing effects and thereforeincreased quality for the given pixels. The system could easily beextended to support other parameters, such as the size step for raymarching the medium or the estimation quality in a volume photonmap approach.
We rendered four different scenes to construct the tests for our per-ceptual validation. We name them as Balls A, Balls B, Lucy andRoad. For each scene, as shown in Figure 9, we rendered four ver-sions: the gold standard, using only the saliency map, using onlythe X-map and, and finally, using the XS-map. In the gold stan-dard image, sixteen rays per pixel where shot for each pixel in thewhole image, giving a high quality solution reference. For the threeremaining versions, a sixteen rays per pixel ceiling was established.
The whole set of sixteen images were rendered on a PC with a 2,6GHz Pentium 4 processor based on Windows XP and at 512 pixelsin their largest side. Figure 5 shows the timing comparison betweenthe reference gold standard and the solution generated using the
Balls A Balls B Lucy Road
Scene
0
20
40
60
80
100
100
120
140
160
168
Hours
RENDERING TIMES
Gold StandardXS-map
6.571.25 5.62 1.04
32.08
3.21
167.05
16.21
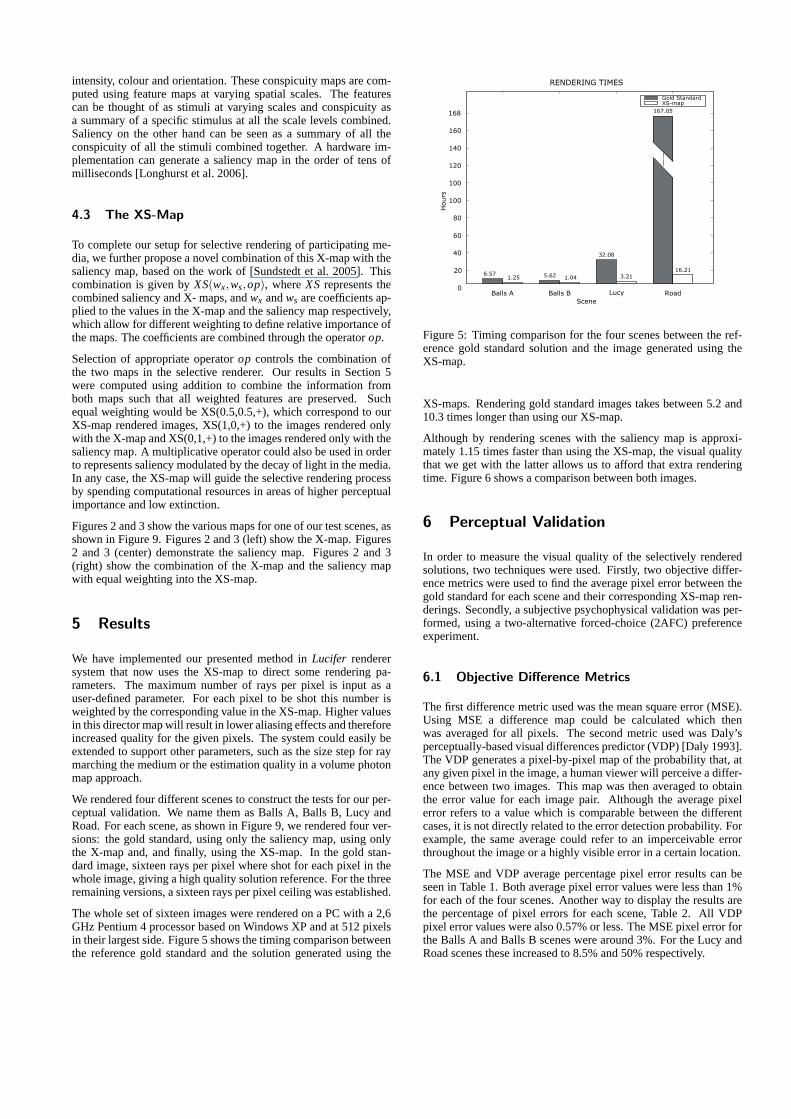
Figure 5: Timing comparison for the four scenes between the ref-erence gold standard solution and the image generated using theXS-map.
XS-maps. Rendering gold standard images takes between 5.2 and10.3 times longer than using our XS-map.
Although by rendering scenes with the saliency map is approxi-mately 1.15 times faster than using the XS-map, the visual qualitythat we get with the latter allows us to afford that extra renderingtime. Figure 6 shows a comparison between both images.
6 Perceptual Validation
In order to measure the visual quality of the selectively renderedsolutions, two techniques were used. Firstly, two objective differ-ence metrics were used to find the average pixel error between thegold standard for each scene and their corresponding XS-map ren-derings. Secondly, a subjective psychophysical validation was per-formed, using a two-alternative forced-choice (2AFC) preferenceexperiment.
6.1 Objective Difference Metrics
The first difference metric used was the mean square error (MSE).Using MSE a difference map could be calculated which thenwas averaged for all pixels. The second metric used was Daly’sperceptually-based visual differences predictor (VDP) [Daly 1993].The VDP generates a pixel-by-pixel map of the probability that, atany given pixel in the image, a human viewer will perceive a differ-ence between two images. This map was then averaged to obtainthe error value for each image pair. Although the average pixelerror refers to a value which is comparable between the differentcases, it is not directly related to the error detection probability. Forexample, the same average could refer to an imperceivable errorthroughout the image or a highly visible error in a certain location.
The MSE and VDP average percentage pixel error results can beseen in Table 1. Both average pixel error values were less than 1%for each of the four scenes. Another way to display the results arethe percentage of pixel errors for each scene, Table 2. All VDPpixel error values were also 0.57% or less. The MSE pixel error forthe Balls A and Balls B scenes were around 3%. For the Lucy andRoad scenes these increased to 8.5% and 50% respectively.

Figure 6: Comparison between the image generated only using thesaliency map (left) and the one rendered with our XS-map (right).On bottom, a zoomed region shows the aliasing differences betweenthem.
Balls A Balls B Lucy RoadMSE 0.13% 0.10% 0.45% 0.87%VDP 0.27% 0.61% 0.76% 0.19%
Table 1: Average MSE and VDP pixel error between the four scenesgold standard and the XS-map renderings.
6.2 Subjective 2AFC Experiments
Although objective visual quality metrics have been successfullyused in the past to assess the pixel error of selective rendered stim-uli [Longhurst et al. 2005; Debattista and Chalmers 2005], it is im-portant to validate the resulting images using subjective responsesfrom human observers. Previous work has shown that VDP re-sponses could replace human judgements in evaluating progressiveradiosity solution convergence [Martens and Myszkowski ]. Eventhough the average pixel errors for all scenes were less than 1%, apsychophysical experiment was run with 48 human observers. Inthis experiment participants performed a 2AFC, that assessed theperceived quality of selective rendering using the XS-map. Withinthis experiment two different display conditions for the experimen-tal images were used, Section 6.2.3 and 6.2.4:
No preference: discriminating which of two consecutively dis-played images (gold standard and XS-map rendered in alteredorder) contained the worse rendering quality using a 2AFCtask.
Preference: discriminating which of two images (gold standardand XS-map rendered in altered order) were most similar toa gold standard. All three images in this condition were dis-
Balls A Balls B Lucy RoadMSE 3.23% 3.04% 8.51% 50.33%VDP 0.35% 0.29% 0.57% 0.04%
Table 2: MSE and VDP pixel error between the four scenes goldstandard and the XS-map renderings.
played at the same time, Figure 7.
6.2.1 Participants
48 participants took part in the experiment (42 men and 6 women;age range: 19-38). 24 participants took part in each condition. Sub-jects had a variety of experience with computer graphics, and allself-reported normal or corrected-to-normal vision.
6.2.2 Stimuli
The visual trial in the experiment was based upon four scenes,namely: Balls A, Balls B, Lucy, and Road, Figure 9. Two imageswere rendered for each of the four scenes. One was rendered in highquality (gold standard) and the other one was rendered selectivelyusing the XS-map. All stimuli were presented on a 17” displaymonitor (1280×1024 resolution). The effects of ambient light wereminimized and the lighting conditions were kept constant through-out the experiment. The participants were seated on an adjustablechair, with their eye-level approximately level with the centre of thescreen, at a viewing distance of 60 cm. All stimuli were displayedon a screen which had a 50% grey background.
6.2.3 No Preference Procedure
Before beginning the experiment, the subjects read a sheet of in-structions on the procedure they were to perform. In the first con-dition participants performed a 2AFC task between two consecu-tively displayed images. One of these images were the gold stan-dard, whereas the other image was selectively rendered using theXS-map. The consecutively shown images were displayed for fourseconds each with a 50% grey image in between lasting for two sec-onds. After each trial, the participants were asked to judge which ofthe two images they thought contained theworse rendering quality.Participants circled their responses by choosing first or second ona questionnaire. Half the high quality images were on the left andhalf on the right, in random order. The first condition was chosento study if participant would be able to distinguish the image con-taining the worse rendering quality in the absence of a perceptuallyideal solution. In reality the XS-map rendered image would not bedisplayed at the same time as a gold standard. To prevent repeatedexposure to the same scene, each participant only performed onetrial for each scene.
6.2.4 Preference Procedure
In the second condition participants had to discriminate, using a2AFC method, which one of the two presented stimuli wasmostsimilar to a reference image (gold standard). The gold standardwas always displayed on top in the center. The XS-map renderedimage and the gold standard were displayed below, side by side,Figure 7. The three images were displayed during a time of eightseconds. Half of the gold standard images were on the left andhalf on the right, in random order. After each trial, participants

Reference (gold standard)
Experiment image 1 Experiment image 2
Figure 7: 2AFC display used in the preference condition. At thetop the reference image (gold standard) is shown. Below are thetwo experiment images (gold standard and XS-map rendered imagewere randomized with half on each side.
circled their responses by choosing left or right on a questionnaire.The second condition was used to study if the outcome of havinga gold standard for comparison would differ from the results in theno reference condition. Our hypothesis was that participants wouldbe more likely to notice the differences in the presence of a goldstandard. This is perhaps the most fair comparison to perform ifone want to claim that images are perceptually indistinguishablefrom a fully converged solution. Although, one could also arguethat this comparison is more likely to constitute a task in itself. Thistask could perhaps also alter the natural eye movements of humanobservers.
6.3 Results
Figure 8 shows the overall results of the experiment. In each pairof conditions, a result of 50% correct selection in each case is theunbiased ideal. This is the statistically expected result in the ab-sence of a preference or bias towards one case, and indicates thatno differences between the gold standard and the XS-map renderedimages were perceived. For the first condition, without a reference,the results show that 67% reported a correct result for the Balls Aand Lucy scene. For the Balls B scene the percentage was 50%and in the Road scene it was as high as 88%. When a referenceimage was introduced the correct percentage for the Balls A scenewas 33%. For the Balls B, Lucy and Road scenes the percentagesincreased to 71%, 83%, and 92% respectively.
6.4 Statistical Analysis and Discussion
The results were analysed to determine any statistical significance.To find out whether the number of participants who correctly clas-sified the worst visual quality image or the one most similar to areference is what we would expect by chance, or if there was reallya pattern of preference, we use a nonparametric technique calledchi-square. A nonparametric test is used when the data is not nor-mally distributed, as is the case for our binomially distributed data.A one-sample chi-square includes only one dimension, such as thecase as in our experiments. The obtained (correct/incorrect) fre-quencies were compared to an expected 12/12 (24 for each condi-tion) result to ascertain whether this difference would be significant.The appropriate analysis is a one-sample chi-square test due to itsnonparametric nature. The chi-square values were computed andthen tested for significance, Table 3.
Balls A Balls B Lucy Road
Scene
0
10
20
30
40
50
60
70
80
90
100
Perc
enta
ge
NO REFERENCE
CorrectIncorrect
Balls A Balls B Lucy Road
Scene
0
10
20
30
40
50
60
70
80
90
100
Perc
enta
ge
REFERENCE
CorrectIncorrect
Figure 8: Experiment results for the two conditions: no referencevs. reference with error bars representing standard deviation.
The obtained values show that when participants did not have a ref-erence image, there was no significant difference between the goldstandard and the XS-map rendered images for the Balls A, BallsB and Lucy scene (p > 0.5), Table 3. This indicates that the par-ticipants not were able to correctly classify the image with worserendering quality. For the Road scene the result were highly signif-icant (p < 0.5). In this scene the participant could easily distinguishwhich of the two was the degraded one.
When the participants had a reference image to compare the exper-iment images with, the result was not significant only for the BallsA scene (p > 0.5). This indicates that the participants not were ableto correctly discriminate the gold standard from the two experimen-tal images. For the Balls B, Lucy and Road scene the results werestatistically different and not what would be expected by chance(p < 0.5). From these three scenes it can be concluded that the par-ticipants did manage to correctly choose the gold standard as mostsimilar to the reference.
These results from our first condition (no reference) are promisingand show that the XS-map can be used to produce rendered imageswith a high perceptual quality. The results from the second con-dition (reference) are also interesting since they indicate that highperceptual results can be obtained, but it is not necessarily true toclaim that the XS-map can produce images indistinguishable from

NO REFERENCE REFERENCEBALLS A χ2(1,N = 24) = 2.67, p = 0.10 χ2(1,N = 24) = 2.67, p = 0.10BALLS B χ2(1,N = 24) = 0, p = 1.00 χ2(1,N = 24) = 4.17, p = 0.04LUCY χ2(1,N = 24) = 2.67, p = 0.10 χ2(1,N = 24) = 10.67, p = 0.00ROAD χ2(1,N = 24) = 13.5, p = 0.00 χ2(1,N = 24) = 16.67, p = 0.00
Table 3: Output for a Chi-square Analysis.
a fully converged solution. Overall the results show that, for certainscenes, the participants managed to distinguish the worse quality orthe image most similar to a reference. Both of these were true forthe Road scene in particular. The results presented in this sectionextend previous work [Longhurst et al. 2005] by showing that a lowaverage pixel error of 1% not directly mean that an image will be in-distinguishable from a gold standard. This show the importance ofusing human observers in the validation process of realistic imagesynthesis algorithms.
7 Conclusions and Future Work
We have presented an original selective rendering system for ef-ficient physically-based simulation of participating media. Withinthis system, we have introduced a novel concept, the X-map, whichprecomputes light attenuation in inhomogeneous participating me-dia (with a straightforward simplification for the homogeneouscase). Combined with a saliency map into the XS-map, this mapcan be used to guide selective rendering of scenes including par-ticipating media, with high quality antialiasing settings for salientfeatures foreseen to be less attenuated by the medium. Using theXS-map we have been able to achieve a substantial speedup of 5-10 times depending on scene. For animated sequences the compu-tational savings can therefore be highly significant.
Furthermore, we performed a perceptual validation of the selec-tively rendered stimuli to assess the visual quality of the resultingimages. The perceptual validation consisted of two parts: usingtwo objective difference metrics and a subjective psychophysicalexperiment. On average the resulting pixel error were less than 1%for all scenes between a gold standard and our selectively renderedimages. Although the average pixel error was low, the subjectiveexperiments showed that participants still could detect a reductionin visual quality of selectively rendered images for certain scenes.Our experiment also extend previous work by showing that a lowaverage pixel error not necessarily means that we can obtain a resultindistinguishable from a full solution. Although, in the absence ofan ideal solution it was possible to achieve a substantial reductionin rendering while keeping a high perceptual result.
Future work will look at the extension of the X-map by supportingother effects due to the participating media such scattering of light.This will be important in order to predict bright areas around lightsources that are not supported in our work, as it can be seen in theRoad scene, Figure 9.
8 Acknowledgements
This research was partly done under the sponsorship of the SpanishMinistry of Education and Research through the project TIN2004-07672-C03-03 and by the Rendering on Demand (RoD) projectwithin the 3C Research programme of convergent technology re-search for digital media processing and communications. We wouldalso like to thank Adrian Gomez for his collaboration in the re-search and everyone that participated in the experiments.
References
BOLIN , M. R., AND MEYER, G. W. 1995. A frequency based raytracer. InSIGGRAPH, 409–418.
BOLIN , M. R., AND MEYER, G. W. 1998. A perceptually basedadaptive sampling algorithm.Computer Graphics 32, AnnualConference Series, 299–309.
CATER, K., CHALMERS, A., AND WARD, G. 2003. Detail to at-tention: exploiting visual tasks for selective rendering. InEGRW’03: Proc. of the 14th Eurographics workshop on Rendering, Eu-rographics Association, Aire-la-Ville, Switzerland, Switzerland,270–280.
DALY, S. 1993. The Visible Differences Predictor: An Algorithmfor the Assessment of Image Fidelity. InDigital Images andHuman Vision, A.B. Watson, MIT Press, Cambridge, MA, 179–206.
DEBATTISTA, K., AND CHALMERS, A. 2005. Component-basedadaptive sampling. InSIBGRAPI 2005, IEEE Computer SocietyPress, 375–382.
DEUSSEN, O., KELLER, A., BALA , K., DUTRE, P., FELLNER,D. W., AND SPENCER, S. N., Eds. Proceedings of the Euro-graphics Symposium on Rendering Techniques, Konstanz, Ger-many, June 29 - July 1, 2005.
DUMONT, R., PELLACINI , F., AND FERWERDA, J. A. 2003.Perceptually-driven decision theory for interactive realistic ren-dering.ACM Trans. Graph. 22, 2, 152–181.
FERWERDA, J. A., PATTANAIK , S. N., SHIRLEY, P., ANDGREENBERG, D. P. 1997. A model of visual masking for com-puter graphics.Computer Graphics 31, Annual Conference Se-ries, 143–152.
GLASSNER, A. S. 1994. Principles of Digital Image Synthesis.Morgan Kaufmann Publishers Inc., San Francisco, CA, USA.
GUTIERREZ, D., MUNOZ, A., ANSON, O., AND SERON, F. J.2005. Non-linear volume photon mapping. InProc. of the Euro-graphics Symposium on Rendering Techniques, Konstanz, Ger-many, June 29 - July 1, 2005, 291–300.
HABER, J., MYSZKOWSKI, K., YAMAUCHI , H., AND SEIDEL,H.-P. 2001. Perceptually Guided Corrective Splatting. InCom-puter Graphics Forum, Proc. of Eurographics 2001, Blackwell,Manchester, UK, A. Chalmers and T.-M. Rhyne, Eds., vol. 20 ofComputer Graphics Forum, Eurographics, C142–C152.
ITTI , L., KOCH, C., AND NIEBUR, E. 1998. A model of saliency-based visual attention for rapid scene analysis.IEEE Trans. Pat-tern Anal. Mach. Intell. 20, 11, 1254–1259.
KAJIYA , J. T. 1986. The rendering equation. InSIGGRAPH ’86:Proc. of the 13th annual conference on Computer graphics andinteractive techniques, ACM Press, New York, NY, USA, 143–150.
LONGHURST, P., DEBATTISTA, K., GILLIBRAND , R., ANDCHALMERS, A. 2005. Analytic antialiasing for selective highfidelity rendering. InSIBGRAPI 2005, IEEE Computer SocietyPress, 359–366.
LONGHURST, P., DEBATTISTA, K., AND CHALMERS, A. 2006.A gpu based saliency map for high-fidelity selective rendering.In AFRIGRAPH 2006 4th Int. Conf. on Computer Graphics, Vir-tual Reality, Visualisation and Interaction in Africa, ACM SIG-GRAPH, 21–29.

MARTENS, W., AND MYSZKOWSKI, K. Psychophysical valida-tion of the visible differences predictor for global illuminationapplications. InIEEE Visualization ’98 (Late Breaking Hot Top-ics), 49–52.
M ITCHELL , D. P. 1987. Generating antialiased images at low sam-pling densities. InSIGGRAPH ’87: Proc. of the 14th annualconference on Computer graphics and interactive techniques,65–72.
MYSZKOWSKI, K. 1998. The visible differences predictor: Ap-plications to global illumination problems. InProc. of the Euro-graphics Workshop, 223–236.
MYSZKOWSKI, K. 2002. Perception-based global illumination,rendering, and animation techniques. InSCCG ’02: Proc. of the18th spring conference on Computer graphics, ACM Press, NewYork, NY, USA, 13–24.
PEREZ, F., PUEYO, X., AND SILLION , F. X. 1997. Global illumi-nation techniques for the simulation of participating media. InProc. of the Eurographics Workshop on Rendering Techniques’97, Springer-Verlag, London, UK, 309–320.
PRIKRYL , J. 2001.Radiosity methods driven by human perception.PhD thesis, Institute of Computer Graphics and Algorithms, Vi-enna University of Technology.
RAMASUBRAMANIAN , M., PATTANAIK , S. N., AND GREEN-BERG, D. P. 1999. A perceptually based physical error metricfor realistic image synthesis. InSIGGRAPH ’99: Proc. of the26th annual conference on Computer graphics and interactivetechniques, 73–82.
RUSHMEIER, H. 1994. Rendering participating media: Problemsand solutions from application areas. InProc. of the 5th Euro-graphics Workshop on Rendering, 117–126.
SIEGEL, R., AND HOWELL, J. R. 1992.Thermal Radiation HeatTransfer. Hemisphere Publishing Corporation, New York.
STOKES, W. A., FERWERDA, J. A., WALTER, B., AND GREEN-BERG, D. P. 2004. Perceptual illumination components: a newapproach to efficient, high quality global illumination rendering.ACM Trans. Graph. 23, 3, 742–749.
SUNDSTEDT, V., DEBATTISTA, K., LONGHURST, P.,CHALMERS, A., AND TROSCIANKO, T. 2005. Visual at-tention for efficient high-fidelity graphics. InSpring Conferenceon Computer Graphics (SCCG 2005), 162–168.
YEE, H., PATTANAIK , S., AND GREENBERG, D. P. 2001. Spa-tiotemporal sensitivity and visual attention for efficient renderingof dynamic environments.ACM Trans. Graph. 20, 1, 39–65.
Figure 9: Stimuli for the visual trial. From top to down: Balls A,Balls B, Lucy and Road. On the left side, the gold standard imagesare shown. On the right side, the XS-map images are shown. In thecase of the Road scene, the gold standard is on top.