Interactive Volume Rendering of Diffusion Tensor Data
17
eScholarship provides open access, scholarly publishing services to the University of California and delivers a dynamic research platform to scholars worldwide. Lawrence Berkeley National Laboratory Lawrence Berkeley National Laboratory Peer Reviewed Title: Interactive Volume Rendering of Diffusion Tensor Data Author: Hlawitschka, Mario Publication Date: 01-29-2010 Permalink: http://escholarship.org/uc/item/9gh7722v Local Identifier: LBNL Paper LBNL-2286E Copyright Information: All rights reserved unless otherwise indicated. Contact the author or original publisher for any necessary permissions. eScholarship is not the copyright owner for deposited works. Learn more at http://www.escholarship.org/help_copyright.html#reuse
-
Upload
uni-leipzig -
Category
Documents
-
view
0 -
download
0
Transcript of Interactive Volume Rendering of Diffusion Tensor Data
eScholarship provides open access, scholarly publishingservices to the University of California and delivers a dynamicresearch platform to scholars worldwide.
Lawrence Berkeley National LaboratoryLawrence Berkeley National Laboratory
Peer Reviewed
Title:Interactive Volume Rendering of Diffusion Tensor Data
Author:Hlawitschka, Mario
Publication Date:01-29-2010
Permalink:http://escholarship.org/uc/item/9gh7722v
Local Identifier:LBNL Paper LBNL-2286E
Copyright Information:All rights reserved unless otherwise indicated. Contact the author or original publisher for anynecessary permissions. eScholarship is not the copyright owner for deposited works. Learn moreat http://www.escholarship.org/help_copyright.html#reuse
Interactive Volume Rendering of DiffusionTensor Data
Mario Hlawitschka1, Gunther H. Weber2, Alfred Anwander3, Owen T.Carmichael4, Bernd Hamann5, and Gerik Scheuermann1
1 University of Leipzig, Germany{hlawitschka|scheuermann}@informatik.uni-leipzig.de
2 Computational Research Division, Lawrence Berkeley National Laboratory,Berkeley, CA 94720-8139, [email protected]
3 Max Planck Institute for Human Cognitive and Brain Science, Leipzig, [email protected]
4 Department of Neurology, University of California, Davis, CA 95616, [email protected]
5 Institute for Data Analysis and Visualization (IDAV) andDepartment of Computer Science,University of California at Davis, CA 95616, [email protected]
1 Introduction
As 3D volumetric images of the human body become an increasingly crucialsource of information for the diagnosis and treatment of a broad variety ofmedical conditions, advanced techniques that allow clinicians to efficientlyand clearly visualize volumetric images become increasingly important. Inter-action has proven to be a key concept in analysis of medical images becausestatic images of 3D data are prone to artifacts and misunderstanding of depth.Furthermore, fading out clinically irrelevant aspects of the image while pre-serving contextual anatomical landmarks helps medical doctors to focus onimportant parts of the images without becoming disoriented. Our goal was todevelop a tool that unifies interactive manipulation and context preserving vi-sualization of medical images with a special focus on diffusion tensor imaging(DTI) data.
At each image voxel, DTI provides a 3× 3 tensor whose entries representthe 3D statistical properties of water diffusion locally. Water motion that ispreferential to specific spatial directions suggests structural organization of theunderlying biological tissue; in particular, in the human brain, the naturallyoccuring diffusion of water in the axon portion of neurons is predominantlyanisotropic along the longitudinal direction of the elongated, fiber-like axons
2 M. Hlawitschka et al.
[MMM+02]. This property has made DTI an emerging source of informationabout the structural integrity of axons and axonal connectivity between brainregions, both of which are thought to be disrupted in a broad range of medi-cal disorders including multiple sclerosis, cerebrovascular disease, and autism[Mos02, FCI+01, JLH+99, BGKM+04, BJB+03].
To date, the predominant visualization techniques for tensor images arebased on pre-calculation of geometric primitives that represent tensor proper-ties. Glyph rendering, for example, converts each tensor into an iconic shapethat is elongated to match the water diffusion properties implied by the tensorentries, whereas line rendering reduces the tensor data to a discrete set of con-tours that trace paths along the presumed locations of axon bundles — thatis, along directions of highly anisotropic water diffusion (see Delmarcelle etal. [DH92, BL92].) However, computation of these geometric primitives can becomputationally expensive, renderings of them can be prone to visual clutterand they are difficult to interactively modify to accentuate varying aspectsof the data in a session-specific way to meet the goals of specific users. Tocircumvent the cluttering problem, clustering of streamlines has been intro-duced, e.g., by Enders et al. [ESM+05], but in the same year, a user studyby Moberts et al. [MVvW05] revealed that clustering neural pathways is ahighly user–dependent topic and the additional computation time cannot beneglected. Others presented techniques to interactively select lines dependingon different features, e.g., Blaas et al. [BBVP05], who try to maintain the con-text by using high quality shading of rendered of lines, still these techniquesused precomputed lines. Kondratieva et al. [KKW05] reduced the computationtime by integrating particle lines on the GPU where a simple Euler approachof order one is used for particle integration. Even on current GPUs the com-putational power is limited and therefore only a limited number of lines canbe rendered which restricts the number of features that can be visualized.
Volume rendering, in contrast, has the potential to present entire imageswithout reducing them to static, discrete sets of geometric primitives. Recentvolume rendering techniques utilizing commodity graphics hardware supportinteractive frame rates and provide a high degree of interactive manipulation.However, the question of how to convert a volume of tensor-valued voxels intocolor and opacity maps for volume rendering is not trivial. Previously, univari-ate or tri-variate summary measures of the anisotropy of water diffusion ateach voxel were computed based on the tensor eigenvalues; the summary mea-sures and direction of the major eigenvector were mapped to alpha channelsand color respectively. Lit Tensors, introduced by Kindlmann [KW99], defineanother approach that employs shading to emphasize anisotropy. Empiricalevidence suggests that physicians become disoriented by direction-encodingschemes that deviate from the traditional approach of assigning red, green, andblue to three cardinal directions (compare Pajevic et al. [PP99]). Therefore,we focus on improving other visualization parameters while keeping this wellknown color coding. This facilitates fast switching between pseudo-coloredsection planes and our volume rendering approach. Previous approaches to
Interactive Volume Rendering of Diffusion Tensor Data 3
volume rendering as presented by Vilanova et al. [VZKL06] focus on set-ting transparency depending on scalar values or modifying the shading usingdirectional information as presented by Kindlmann et al. in [KW99]. Bothapproaches fail to fade out information that is currently not important to theuser, thus, we employ directional parameters in addition to those presentedpreviously to modify the opacity value of the transfer function.
Other approaches to the occlusion problem in volume rendering strive tochange the location or size of features in the volume to make them visible tothe user, see Correa et al. [CSC06] and Bruckner et al. [BG06]. Whereas thesetechniques are capable of effectively uncovering important aspects of the dataand provide good illustrations of the findings, they may be inappropriate ina clinical setting because the location and size of features in brain imagesoften relate directly to the presence or severity of medical disorders (com-pare Simon et al. [SDB+05]) and, therefore, should be preserved. In contrast,our method is inspired by Importance–Driven Volume Rendering by Viola etal. [VKG04] in that we improve visibility of important sections of the imagewhile fading out irrelevant parts and preserving voxel location and size. Ourapproach differs, however, in that it does not require pre-segmented modelsand therefore can be applied to raw DTI and structural magnetic resonance(MR) data without requiring a pre-processing step.
Whereas previous visualization techniques for tensor data are based on ma-nipulation of simple scalar value based alpha functions either using fractionalanisotropy (FA) as single scalar value or Westin’s barycentric spherical, pla-nar and linear anisotropy measures as, ap, al [WPG+97], we introduce transferfunctions that depend on more information of the tensor, especially its eigen-vector directions. While local direction information does not have medicalimportance as, e.g., neural fibers are defined as integral curves in a certainvolume, in many areas of the brain, neighboring fiber bundles have differentdirections but their anisotropy values only change marginally. Kindlmann etal. [KTW06] showed that FA ceases can be found after pre-processing thedata set but these methods cannot be easily transferred to volume rendering.Nevertheless, these areas can be found easily by looking at the local changeof direction.
2 Volume Rendering
Simple volume rendering of DTI data is based on mapping the normalizedmajor eigenvector (x,y,z) to a color by setting RGB = (|x|, |y|, |z|) and usingFA or the barycentric system of linear, planar and spherical anisotropy todefine 1D or 2D opacity transfer functions [EHK+06, VZKL06]. Kindlmanndescribed another approach for volume rendering of diffusion tensor data. Hedefined transparency based on FA values and added color and shading depend-ing on other tensor properties such as direction and shape. Being inspired bythese basic approaches, our method emphasizes the directional features of the
4 M. Hlawitschka et al.
data set by using the default color mapping as it is used in the simple approachand provides additional tools for selecting important features.
The major task for our application is reducing the occlusion problem. Wedo this by allowing the user to interactively manipulate the transfer functiondepending on the full tensor information. Previous methods represent theisosurfaces of anisotropy values and do not take into account that medicaldoctors are mostly interested in fiber bundles. Therefore, it should be possibleto select distinct bundles and hide others that occlude important parts ofthe data set. While anisotropy measures and other tensor invariants haveproven to provide a good estimate of white matter boundaries, they do notprovide information concerning fiber bundle boundaries. However, in mostcases, changes of the directional tensor information provide this information.Therefore, we propose to make use of this directional information in directvolume rendering.
2.1 The Occlusion Problem
Since visualization maps information into two spatial dimensions, occlusionis one of the major problems when handling volumetric data sets. Makingsurfaces more transparent is one of the basic methods, that helps provide ad-ditional information. The selection of good occlusion coefficients is a difficultproblem and painting too many semitransparent surfaces leads to visual clut-ter produced by both mixture of color and additional geometry. We proposean interactive selection of regions of interest by considering local fiber direc-tion. In addition to the transfer function, one or more direction vectors areused to select areas of interest—or areas that should not be shown at all.
Although the color value of the RGB color mapping scheme provides di-rectional information, the map is not invertible, i.e., even neglecting orien-tation, directions cannot be recomputed from the color value. In addition tothat, interpolation of eigenvalues and eigenvectors directions is not the sameas interpolating tensor values and recomputing eigenvalues and eigenvectorsafterwards [ZB02, Kin04]. Therefore we compute the eigenvalues and the re-quired major eigenvector on the GPU using the non–iterative approach byHasan et al. [HBPA01]. Different criteria are used to select transparency val-ues including:
• anisotropy values such as fractional anisotropy (FA), relative anisotropy(RA), linear, planar and spherical anisotropy [WPG+97],
• local direction of major eigenvector, and• a magic lens 6 that modifies the local transfer function [BSP+93].
We experimented with several functions for directional filtering and deter-mined that the type of function itself is not critical. While hard drop–offs in
6 “Magic Lens” is a trademark of Xerox Cooperation
Interactive Volume Rendering of Diffusion Tensor Data 5
transparency should be avoided, it is possible to use linear step functions aswell as smooth step functions, either the one provided by GLSL defined as
f(x) =
0 when x < 03x2 − 2x3 when 0 ≤ x ≤ 11 when x > 1
(1)
or higher–order ones like
f(x)
0 when x < 0(126 + (−420 + (540 + (−315 + 70x)
∗x) ∗ x) ∗ x) ∗ x5 when 0 ≤ x ≤ 11 when x > 1
(2)
Filtering out single directions breaks the typical symmetry of DTI datasets that is provided by the standard color coding, which produces unfamil-iar looking images and interferes with the common way of comparing bothhemispheres of the brain. To maintain the same symmetric properties, as thecolor coding does, one can compare all directions that have the same color(which are up to eight vectors in general, four because of the independenceof eigenvector orientation.) To provide more information about the local di-rection of fibers, the comparison has to be restricted to one direction on thehemisphere. This can be done by defining the vector in one hemisphere andmirroring it at a plane separating both hemispheres of the brain. Having com-puted the normalized direction vector v and the normalized eigenvector e inthe hemisphere, the alpha value is modified by
α ∝ f(‖〈e, v〉‖). (3)
2.2 Preserving Context
It turns out that removing large parts of the image completely, i.e., making itcompletely transparent, may confuse the user. Therefore, our system allowsone to select an opacity for “hidden” areas making them translucent, whichpreserves the context by fading out uninteresting parts of the data only a bitwhile still allowing the user to see more important parts that may lie behindthe uninteresting parts.
2.3 Combined Rendering of MRI and DT-MRI Data
The previous section focused on methods used for rendering DTI data. Whilemany neuroscientists are primarily interested in this type of data, scalar–valued MRI images provide a higher resolution and make it easier to navigatein the brain. In addition, Gyral structure of brain gray matter and thin, softstructures like blood vessels can be seen in MRI scans while they do not showup in most DTI data sets. Therefore, a combined visualization of DTI and
6 M. Hlawitschka et al.
MRI data is useful, especially for surgical planning. We integrate visualizationof conventional MRI and DTI data in our volume rendering approach in twodifferent ways:
• We add it to a single–pass volume rendering and define more complextransfer functions based on both, local DTI and MRI data and
• implement a two–pass volume rendering approach to enforce importance–driven volume rendering.
As we aim to restrict the diffusion tensor color map to the RGB model andmapping, introduction of additional colors would be misleading. Most of theinformation present in MRI data can be seen in simple grayscale slices of thebrain, which is the most common way of displaying them. Therefore, we usevolume rendering of the MRI data only to highlight boundaries of objectsby using a standard 2D grayscale transfer function for MRI data. Specialmaterial attributes and gradient–based shading as done in most volume ren-dering applications, see Bruckner et al. [BVG05], are applied to improve the3D perception of the surfaces.
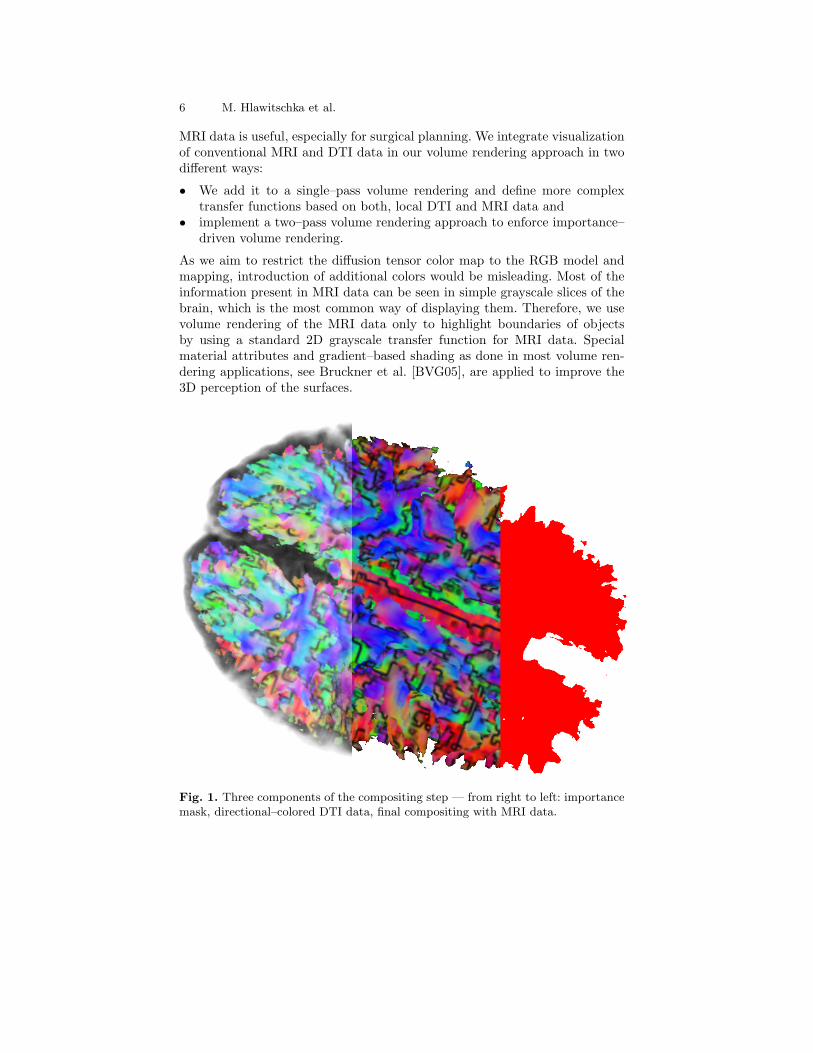
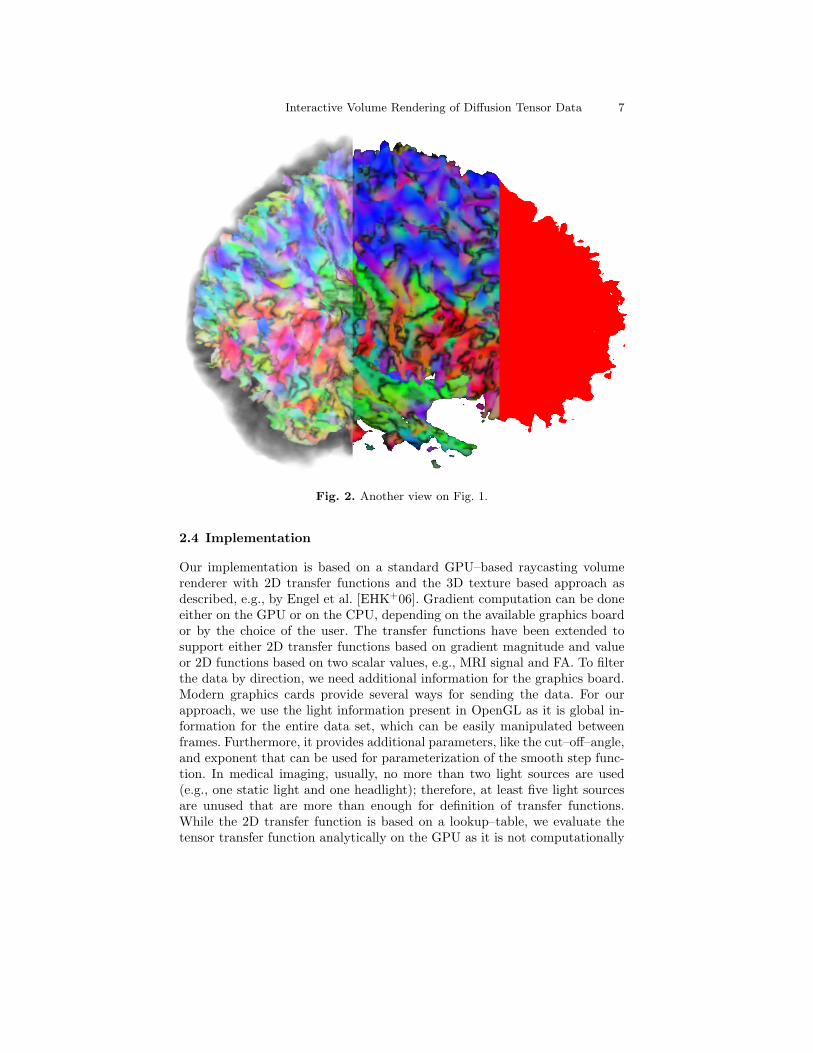
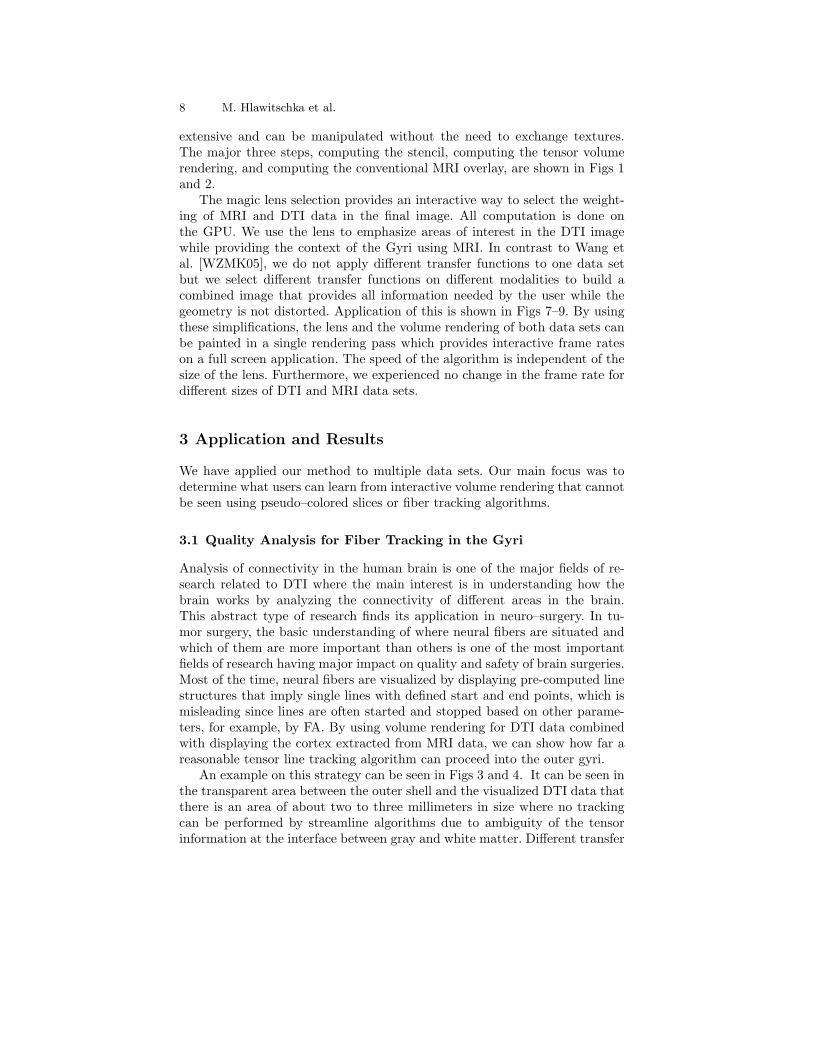
Fig. 1. Three components of the compositing step — from right to left: importancemask, directional–colored DTI data, final compositing with MRI data.
Interactive Volume Rendering of Diffusion Tensor Data 7
Fig. 2. Another view on Fig. 1.
2.4 Implementation
Our implementation is based on a standard GPU–based raycasting volumerenderer with 2D transfer functions and the 3D texture based approach asdescribed, e.g., by Engel et al. [EHK+06]. Gradient computation can be doneeither on the GPU or on the CPU, depending on the available graphics boardor by the choice of the user. The transfer functions have been extended tosupport either 2D transfer functions based on gradient magnitude and valueor 2D functions based on two scalar values, e.g., MRI signal and FA. To filterthe data by direction, we need additional information for the graphics board.Modern graphics cards provide several ways for sending the data. For ourapproach, we use the light information present in OpenGL as it is global in-formation for the entire data set, which can be easily manipulated betweenframes. Furthermore, it provides additional parameters, like the cut–off–angle,and exponent that can be used for parameterization of the smooth step func-tion. In medical imaging, usually, no more than two light sources are used(e.g., one static light and one headlight); therefore, at least five light sourcesare unused that are more than enough for definition of transfer functions.While the 2D transfer function is based on a lookup–table, we evaluate thetensor transfer function analytically on the GPU as it is not computationally
8 M. Hlawitschka et al.
extensive and can be manipulated without the need to exchange textures.The major three steps, computing the stencil, computing the tensor volumerendering, and computing the conventional MRI overlay, are shown in Figs 1and 2.
The magic lens selection provides an interactive way to select the weight-ing of MRI and DTI data in the final image. All computation is done onthe GPU. We use the lens to emphasize areas of interest in the DTI imagewhile providing the context of the Gyri using MRI. In contrast to Wang etal. [WZMK05], we do not apply different transfer functions to one data setbut we select different transfer functions on different modalities to build acombined image that provides all information needed by the user while thegeometry is not distorted. Application of this is shown in Figs 7–9. By usingthese simplifications, the lens and the volume rendering of both data sets canbe painted in a single rendering pass which provides interactive frame rateson a full screen application. The speed of the algorithm is independent of thesize of the lens. Furthermore, we experienced no change in the frame rate fordifferent sizes of DTI and MRI data sets.
3 Application and Results
We have applied our method to multiple data sets. Our main focus was todetermine what users can learn from interactive volume rendering that cannotbe seen using pseudo–colored slices or fiber tracking algorithms.
3.1 Quality Analysis for Fiber Tracking in the Gyri
Analysis of connectivity in the human brain is one of the major fields of re-search related to DTI where the main interest is in understanding how thebrain works by analyzing the connectivity of different areas in the brain.This abstract type of research finds its application in neuro–surgery. In tu-mor surgery, the basic understanding of where neural fibers are situated andwhich of them are more important than others is one of the most importantfields of research having major impact on quality and safety of brain surgeries.Most of the time, neural fibers are visualized by displaying pre-computed linestructures that imply single lines with defined start and end points, which ismisleading since lines are often started and stopped based on other parame-ters, for example, by FA. By using volume rendering for DTI data combinedwith displaying the cortex extracted from MRI data, we can show how far areasonable tensor line tracking algorithm can proceed into the outer gyri.
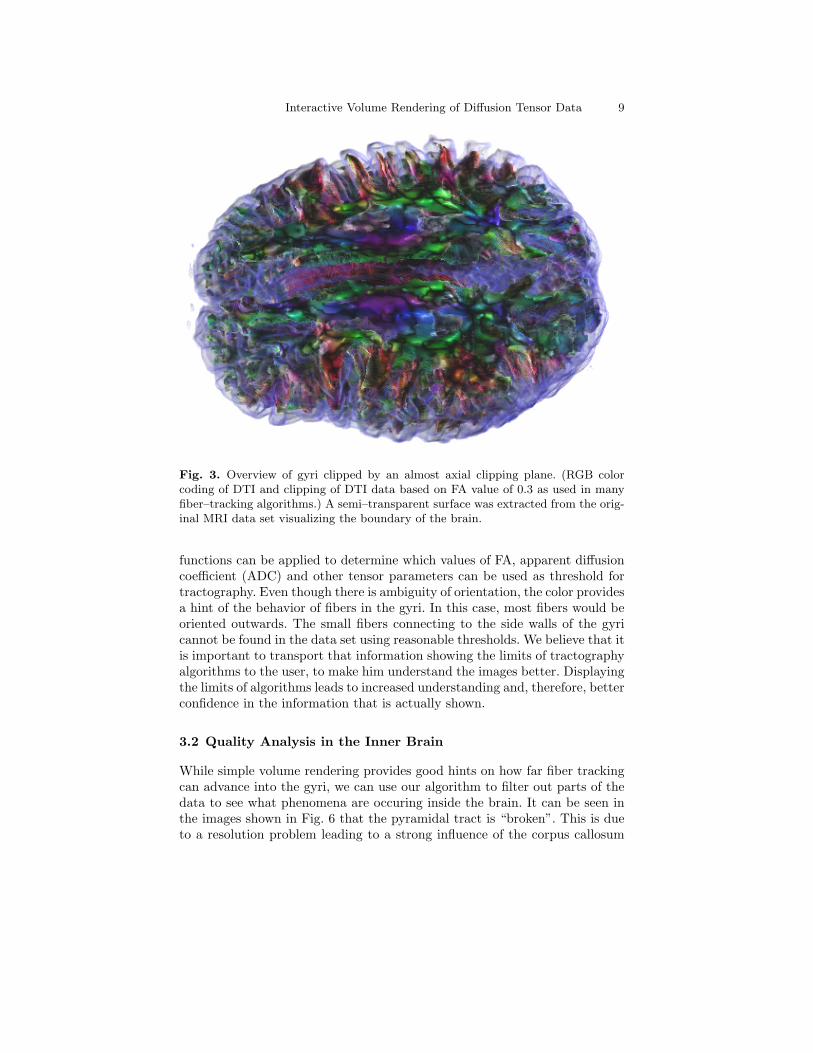
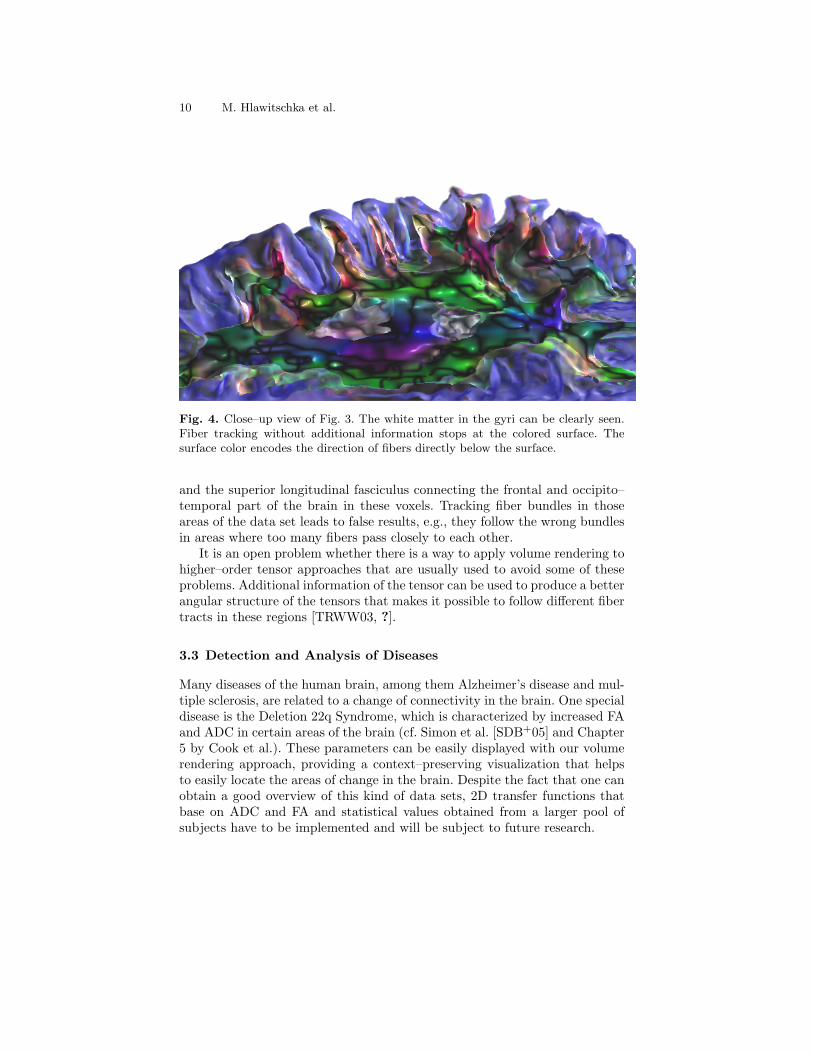
An example on this strategy can be seen in Figs 3 and 4. It can be seen inthe transparent area between the outer shell and the visualized DTI data thatthere is an area of about two to three millimeters in size where no trackingcan be performed by streamline algorithms due to ambiguity of the tensorinformation at the interface between gray and white matter. Different transfer
Interactive Volume Rendering of Diffusion Tensor Data 9
Fig. 3. Overview of gyri clipped by an almost axial clipping plane. (RGB colorcoding of DTI and clipping of DTI data based on FA value of 0.3 as used in manyfiber–tracking algorithms.) A semi–transparent surface was extracted from the orig-inal MRI data set visualizing the boundary of the brain.
functions can be applied to determine which values of FA, apparent diffusioncoefficient (ADC) and other tensor parameters can be used as threshold fortractography. Even though there is ambiguity of orientation, the color providesa hint of the behavior of fibers in the gyri. In this case, most fibers would beoriented outwards. The small fibers connecting to the side walls of the gyricannot be found in the data set using reasonable thresholds. We believe that itis important to transport that information showing the limits of tractographyalgorithms to the user, to make him understand the images better. Displayingthe limits of algorithms leads to increased understanding and, therefore, betterconfidence in the information that is actually shown.
3.2 Quality Analysis in the Inner Brain
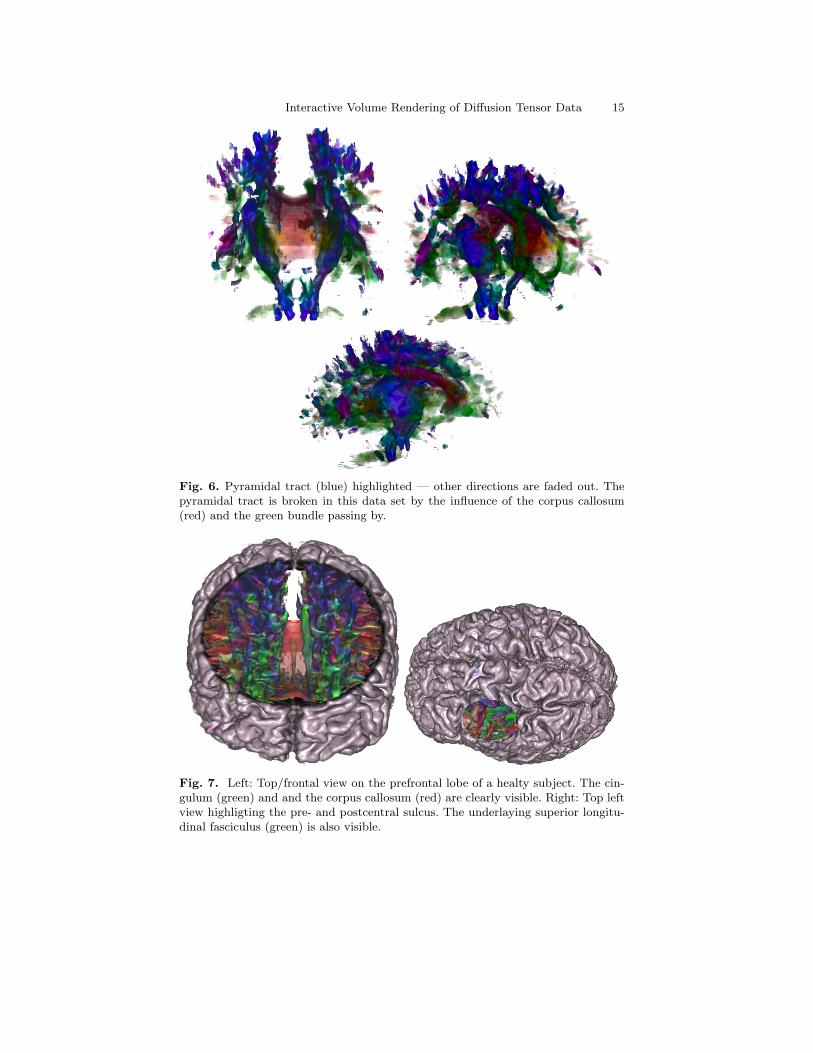
While simple volume rendering provides good hints on how far fiber trackingcan advance into the gyri, we can use our algorithm to filter out parts of thedata to see what phenomena are occuring inside the brain. It can be seen inthe images shown in Fig. 6 that the pyramidal tract is “broken”. This is dueto a resolution problem leading to a strong influence of the corpus callosum
10 M. Hlawitschka et al.
Fig. 4. Close–up view of Fig. 3. The white matter in the gyri can be clearly seen.Fiber tracking without additional information stops at the colored surface. Thesurface color encodes the direction of fibers directly below the surface.
and the superior longitudinal fasciculus connecting the frontal and occipito–temporal part of the brain in these voxels. Tracking fiber bundles in thoseareas of the data set leads to false results, e.g., they follow the wrong bundlesin areas where too many fibers pass closely to each other.
It is an open problem whether there is a way to apply volume rendering tohigher–order tensor approaches that are usually used to avoid some of theseproblems. Additional information of the tensor can be used to produce a betterangular structure of the tensors that makes it possible to follow different fibertracts in these regions [TRWW03, ?].
3.3 Detection and Analysis of Diseases
Many diseases of the human brain, among them Alzheimer’s disease and mul-tiple sclerosis, are related to a change of connectivity in the brain. One specialdisease is the Deletion 22q Syndrome, which is characterized by increased FAand ADC in certain areas of the brain (cf. Simon et al. [SDB+05] and Chapter5 by Cook et al.). These parameters can be easily displayed with our volumerendering approach, providing a context–preserving visualization that helpsto easily locate the areas of change in the brain. Despite the fact that one canobtain a good overview of this kind of data sets, 2D transfer functions thatbase on ADC and FA and statistical values obtained from a larger pool ofsubjects have to be implemented and will be subject to future research.
Interactive Volume Rendering of Diffusion Tensor Data 11
4 Conclusions and Future Work
We have described a novel method that allows us to interactively explorecomplex volumetric DTI data sets. The method has been applied to differentdata sets, and two major applications have been highlighted where patternscould be identified in less time than using conventional methods. We havedemonstrated that all proposed methods can be easily implemented in existingmedical visualization systems.
Acknowledgements
We thank the “German Academic Exchange Service” (DAAD) for partiallyfunding this research and for making this collaboration possible (M. Hlaw-itschka was supported by a DAAD grant.) Furthermore, we want to thankthe Max Planck Institute for Human Cognitive and Brain Sciences in Leipzig,Germany, and Cameron S. Carter, University of California, Davis, ImagingResearch Center, for providing the data sets used in this research. We thankthe members of the Visualization and Computer Graphics Research Group atthe Institute for Data Analysis and Visualization (IDAV) at the University ofCalifornia, Davis, USA, and the members of the FAnToM group at the Univer-sity of Leipzig, Germany, and Xavier Tricoche at the University of Utah, SaltLake City, USA, and Christoph Garth at the University of Kaiserslautern,Germany.
References
[BBVP05] Jorik Blaas, Charl P. Botha, Frans M. Vos, and Frits H. Post. Fast andreproducible fiber bundle selection in DTI visualization. In Claudio T.Silva, Eduard Groller, and Holly Rushmeier, editors, Proceedings ofIEEE Visualization 2005, pages 59–64, Los Alamitos, CA, USA, 2005.IEEE Computer Society, IEEE Computer Society Press.
[BG06] Stefan Bruckner and M. Eduard Groller. Exploded views for volumedata. In Eduard Groller, Alex Pang, Claudio T. Silva, John Stasko, andJarke van Wikj, editors, Proceedings of IEEE Visualization’06, pages1077–1084, Los Alamitos, CA, USA, 2006. IEEE Computer SocietyPress.
[BGKM+04] Naama Barnea-Goraly, Hower Kwon, Vinod Menon, Stephan Eliez,Linda Lotspeich, and Allan L. Reiss. White matter structure in autism:Preliminary evidence from diffusion tensor imaging. Biological Psychi-atry, 55:323–326, 2004.
[BJB+03] J Burns, D Job, ME Bastin, H Whalley, T Macgillivray, EC John-stone, and SM Lawrie. Structural disconnectivity in schizophrenia: adiffusion tensor magnetic resonance imaging study. British Journal ofPsychiatry, 182:439–443, May 2003.
JAWolslegel
Typewritten Text
JAWolslegel
Typewritten Text
JAWolslegel
Typewritten Text
JAWolslegel
Typewritten Text
Work was supported by the U.S. Department of Energy under Contract No.
JAWolslegel
Typewritten Text
DE-AC02-05CH11231.
JAWolslegel
Typewritten Text
JAWolslegel
Typewritten Text
JAWolslegel
Typewritten Text
12 M. Hlawitschka et al.
[BL92] Peter J. Basser and Denis LeBihannis. Fiber orientation mapping inan anisotropic medium with NMR diffusion spectroscopy. 11th AnnualMeeting of the SMRM, Berlin, page 1221, 1992.
[BSP+93] Eric A. Bier, Maureen C. Stone, Ken Pier, Buxton William, andTony D. DeRose. Toolglass and magic lenses: The see–through in-terface. In Proceedings of Siggraph ’93, pages 73–80. ACM, 1993.
[BVG05] Stefan Bruckner, Ivan Viola, and Meister Eduard Groller. Volumeshop:Interactive direct volume illustration. In ACM Siggraph 2005 DVDProceedings (Technical Sketch), August 2005.
[CSC06] Carlos D. Correa, Deborah Silver, and Min Chen. Feature aligned vol-ume manipulation for illustration and visualization. In Eduard Groller,Alex Pang, Claudio T. Silva, John Stasko, and Jarke van Wikj, editors,Proceedings of IEEE Visualization’06, pages 1069–1067, Los Alamitos,CA, USA, 2006. IEEE Computer Society Press.
[DH92] Thierry Delmarcelle and Lambertus Hesselink. Visualization of secondorder tensor fields and matrix data. In Proceedings of IEEE Visualiza-tion 1992, page 316, Los Alamitos, CA, USA, 1992. IEEE ComputerSociety Press.
[EHK+06] Klaus Engel, Markus Hardwiger, Joe M. Kniss, Christof Rezk-Salama,and Daniel Weiskopf. Real–Time Volume Graphics. A K Peters, Ltd,Wellesley, MA 02482, 2006.
[ESM+05] Frank Enders, Natascha Sauber, Dorit Merhof, Peter Hastreiter,Christopher Nimsky, and Marc Stamminger. Visualization of whitematter tracts with wrapped streamlines. In Claudio T. Silva, EduardGroller, and Holly Rushmeier, editors, Proceedings of IEEE Visualiza-tion 2005, pages 51–58, Los Alamitos, CA, USA, 2005. IEEE ComputerSociety, IEEE Computer Society Press.
[FCI+01] M Filippi, M Cercignani, M Inglese, MA Horsfield, and G Comi. Diffu-sion tensor magnetic resonance imaging in multiple sclerosis. Neurology,56(3):304–311, February 2001.
[HBPA01] Khader M. Hasan, Peter J. Basser, Dennis L. Parker, and Andrew L.Alexander. Analytical computation of the eigenvalues and eigenvectorsin DT–MRI. Journal of Magnetic Resonance, 152:41–47, 2001.
[JLH+99] Derek K. Jones, David Lythgoe, Mark A. Horsfield, Andrew Simmons,Steve C. R. Williams, and Hugh S. Markus. Characterization of whitematter damage in ischemic leukoaraiosis with diffusion tensor MRI.Stroke, 30:393–397, 1999.
[Kin04] Gordon Kindlmann. Visualization and Analysis of Diffusion TensorFields. PhD thesis, School of Computing, University of Utah, SaltLake City, UT 84112, USA, September 2004.
[KKW05] Polina Kondratieva, Jens Kruger, and Rudiger Westermann. The ap-plication of GPU particle tracing to diffusion tensor field visualization.In Claudio T. Silva, Eduard Groller, and Holly Rushmeier, editors, Pro-ceedings of IEEE Visualization 2005, pages 73–78, Los Alamitos, CA,USA, 2005. IEEE Computer Society, IEEE Computer Society Press.
[KTW06] Gordon Kindlmann, Xavier Tricoche, and Carl-Fredrik Westin.Anisotropy creases delineate white matter structure in diffusion tensorMRI. In Ninth International Conference on Medical Image Computingand Computer-Assisted Intervention (MICCAI’06), Lecture Notes in
Interactive Volume Rendering of Diffusion Tensor Data 13
Computer Science 4190, pages 126–133, Copenhagen, Denmark, Octo-ber 2006.
[KW99] Gordon Kindlmann and David Weinstein. Hue-balls and lit-tensors fordirect volume rendering of diffusion tensor fields. In VIS ’99: Pro-ceedings of the conference on Visualization ’99, pages 183–189, LosAlamitos, CA, USA, 1999. IEEE Computer Society Press.
[MMM+02] Elias R. Melhem, Susumu Mori, Govind Mukundan, Michael A. Kraut,Martin G. Pomper, and Peter C. M. van Zijl. Diffusion tensor MRimaging of the brain and white matter tractography. American Journalof Roentgenology, 178(1):3–16, January 2002.
[Mos02] Michael Moseley. Diffusion tensor imaging and aging — a review. NMRIn Biomedicine, 15:553–560, 2002.
[MVvW05] Bart Moberts, Anna Vilanova, and Jarke J. van Wijk. Evaluation offiber clustering methods for diffusion tensor imaging. In Claudio T.Silva, Eduard Groller, and Holly Rushmeier, editors, Proceedings ofIEEE Visualization 2005, pages 65–72, Los Alamitos, CA, USA, 2005.IEEE Computer Society, IEEE Computer Society Press.
[PP99] Sinisa Pajevic and Carlo Pierpaoli. Color schemes to represent the ori-entation of anisotropic tissues from diffusion tensor data: Applicationto white matter fiber tract mapping in the human brain. MagneticResonance in Medicine, 42 (3):526–540, 1999.
[SDB+05] T. J. Simon, L. Ding, J. P. Bish, D. M. McDonald-McGinn, E. H.Zackai, and J. Gee. Volumetric, connective, and morphologic changesin the brains of children with chromosome 22q11.2 deletion syndrome:an integrative study. NeuroImage, 25:169–180, 2005.
[TRWW03] David Solomon Tuch, Timothy G. Reese, Mette R. Wiegell, and Van J.Wedeen. Diffusion MRI of complex neural architecture. Neuron,40:885–895, December 2003.
[VKG04] Ivan Viola, Armin Kanitsar, and Meister Eduard Groller. Importance-driven volume rendering. In Holly Rushmeier, Greg Turk, and Jarke J.van Wijk, editors, Proceedings of IEEE Visualization’04, pages 139–145, Los Alamitos, CA, USA, 2004. IEEE Computer Society Press.
[VZKL06] A. Vilanova, S. Zhang, G. Kindlmann, and D Laidlaw. An introduc-tion to visualization of diffusion tensor imaging and its applications.In J. Weickert and H. Hagen, editors, Visualization and Processing ofTensor Fields, pages 121–153. Springer–Verlag Berlin Heidelberg, 2006.
[WPG+97] Carl-Fredrik Westin, Sariel Peled, Hakon Gudbjartsson, Ron Kikinis,and Ferenc A. Jolesz. Geometrical diffusion measures for MRI fromtensor basis analysis. In ISMRM ’97, page 1742, Vancouver Canada,April 1997.
[WZMK05] Lujin Wang, Ye Zhao, Klaus Mueller, and Arie Kaufman. The magicvolume lens: An interactive focus+context technique for volume ren-dering. In Claudio T. Silva, Eduard Groller, and Holly Rushmeier, edi-tors, Proceedings of IEEE Visualization 2005, pages 65–72, Los Alami-tos, CA, USA, 2005. IEEE Computer Society, IEEE Computer SocietyPress.
[ZB02] Leonid Zhukov and Alan H. Barr. Oriented tensor reconstruction: Trac-ing neural pathways from diffusion tensor MRI. In Proceedings of IEEEVisualization ’02, pages 387–394, Los Alamitos, CA, 2002. IEEE Com-puter Society.
14 M. Hlawitschka et al.
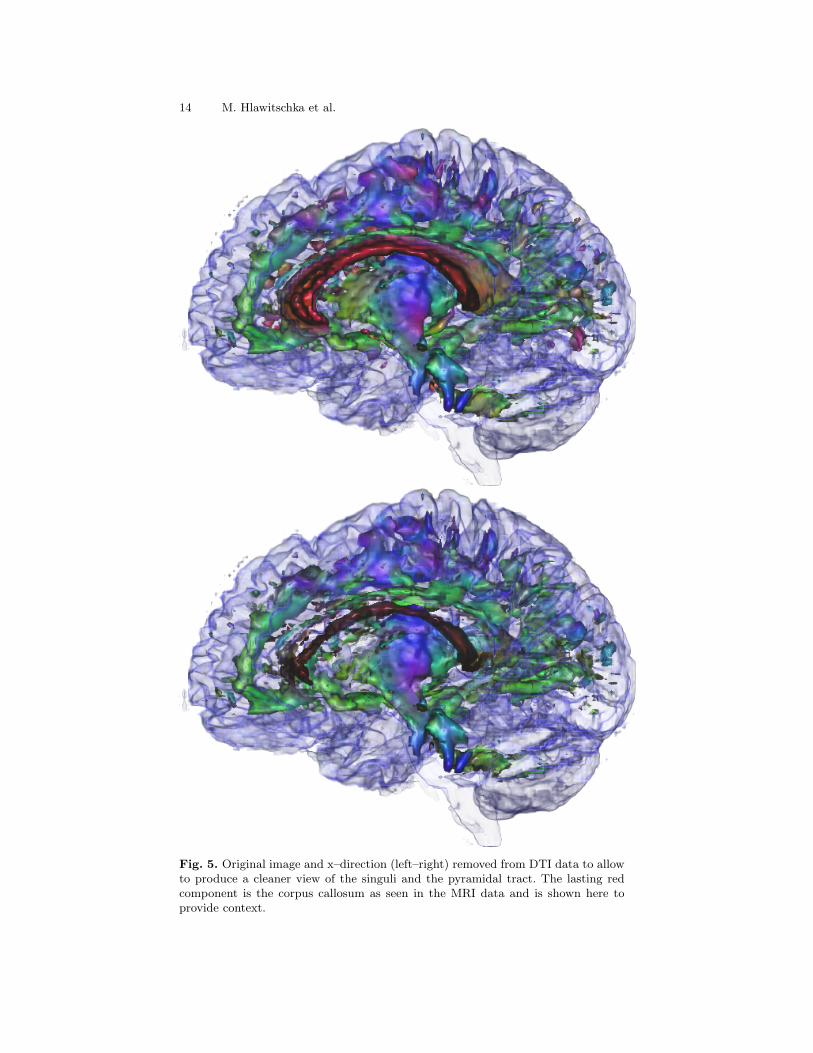
Fig. 5. Original image and x–direction (left–right) removed from DTI data to allowto produce a cleaner view of the singuli and the pyramidal tract. The lasting redcomponent is the corpus callosum as seen in the MRI data and is shown here toprovide context.
Interactive Volume Rendering of Diffusion Tensor Data 15
Fig. 6. Pyramidal tract (blue) highlighted — other directions are faded out. Thepyramidal tract is broken in this data set by the influence of the corpus callosum(red) and the green bundle passing by.
Fig. 7. Left: Top/frontal view on the prefrontal lobe of a healty subject. The cin-gulum (green) and and the corpus callosum (red) are clearly visible. Right: Top leftview highligting the pre- and postcentral sulcus. The underlaying superior longitu-dinal fasciculus (green) is also visible.
16 M. Hlawitschka et al.
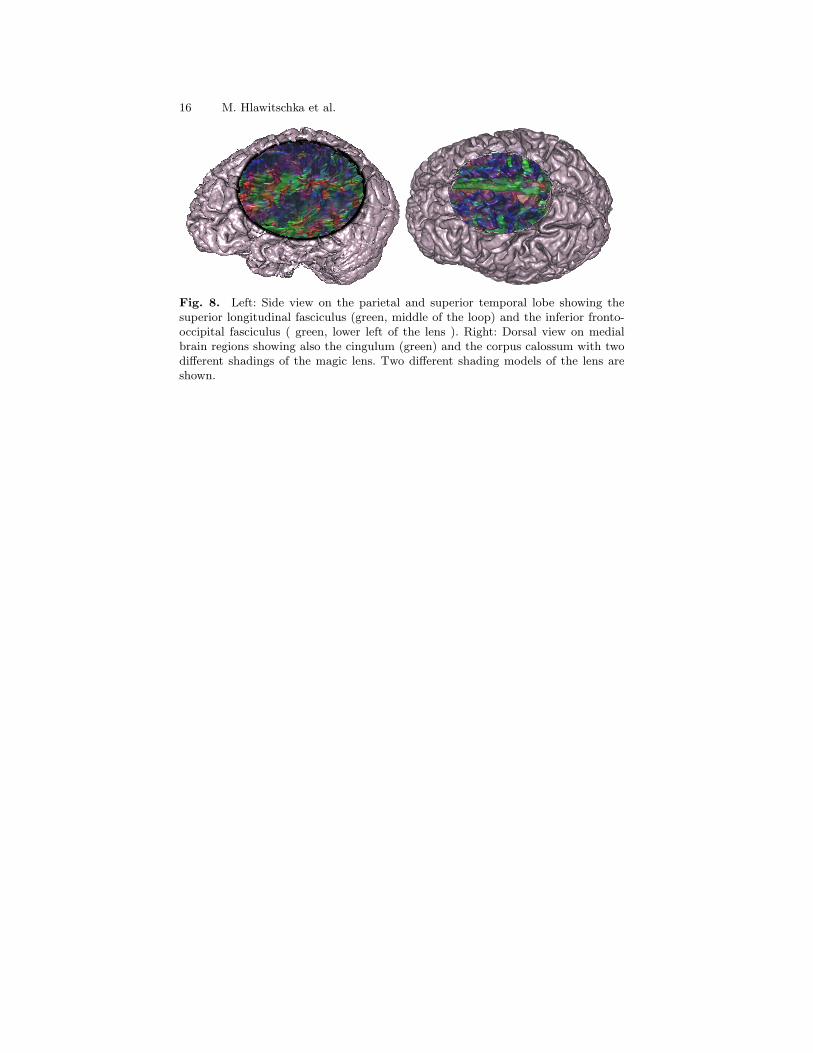
Fig. 8. Left: Side view on the parietal and superior temporal lobe showing thesuperior longitudinal fasciculus (green, middle of the loop) and the inferior fronto-occipital fasciculus ( green, lower left of the lens ). Right: Dorsal view on medialbrain regions showing also the cingulum (green) and the corpus calossum with twodifferent shadings of the magic lens. Two different shading models of the lens areshown.