Regularized positive-definite fourth order tensor field estimation from DW-MRI

18
Continuous Tensor Field Approximationof Diffusion Tensor MRI data
Sinisa Pajevic1, Akram Aldroubi2, and Peter J. Basser3
1 National Institutes of Health, MSCL/CIT, Bethesda, MD 20892-5620, [email protected]
2 Dept. of Mathematics, Vanderbilt University, Nashville, TN 37240-0001, [email protected]
3 National Institutes of Health, STBB/NICHD, Bethesda, MD 20892-5772, [email protected]
Summary. Diffusion Tensor MRI (DT-MRI) measurements are a discrete noisysample of an underlying macroscopic effective diffusion tensor field, D(x), of water.This field is presumed to be piecewise continuous/smooth at a gross anatomicallength scale. Here we describe a mathematical framework for obtaining an estimateof this tensor field from the measured DT-MRI data using a spline-based continuousapproximation. This methodology facilitates calculation of new structural quantitiesand provides a framework for applying differential geometric methods to DT-MRIdata. A B-spline approximation has already been used to improve robustness ofDT-MRI fiber tractography. Here we propose a piecewise continuous approximationbased on Non-Uniform Rational B-Splines (NURBS), which addresses some of theshortcomings of the previous implementation.
18.1 Introduction
Diffusion tensor MRI provides a measurement of an effective diffusion ten-sor of water, Deff, in each voxel within an imaging volume [1]. These diffusionmeasurements are inherently discrete, noisy and voxel-averaged. Here we treatDT-MRI data as discrete noisy samples of an underlying macroscopic piece-wise continuous diffusion tensor field, D(x), where, x = (x, y, z) are the spatialcoordinates in the laboratory frame of reference. This field is presumed to bepiecewise continuous or smooth at a gross anatomical length scale, an as-sumption based on the known anatomy of many soft fibrous tissues, includingwhite matter, muscles, ligaments, and tendons. One of our objectives is to de-velop a mathematical framework to estimate this piecewise continuous field,D(x), from discrete noisy DT-MRI measurements. A reliable estimate of thisfield enables us to use differential geometric methods directly. Additionally, itenables computation and display of intrinsic architectural or microstructural

300 S. Pajevic et al.
MRI features based upon tissue fiber geometry [2, 2]. Some previously sug-gested characteristics are curvature and torsion of the individual fiber tracts,as well as the properties of the tangent field, e.g. twisting, bending, and di-verging [4]. Here we focus on estimating curvature of the fiber tracts (tangentfield) but also show the architectural features of the tensor field itself. Esti-mating such quantities accurately using measured diffusion tensor data andinterpolation is difficult, since their evaluation requires spatial differentiationof noisy tensor quantities. Below we show that they can be calculated morereliably and robustly using continuous tensor field approximation.
Originally, estimating the tensor field from sample tensor data was per-formed using B-spline approximation [5]. It was used with DT-MRI data toelucidate fiber tract trajectories, which can be done by integrating the fiberdirection (vector) field [9]. Other methods for fiber tracking at the time uti-lized interpolation or directly followed the local fiber orientation [6, 7, 8],with exception of Poupon et al. [11] who used a regularization method. In-tegrating a noisy direction vector field can result in fiber trajectories thatwander off course. Using a smoothed representation of the direction field,obtained from the continuous representation of D(x), however, can improvethe fidelity of tract following [9]. Establishing connectivity and continuity ofneural pathways can also benefit from the development of this specialized ten-sor field processing methodology. These tasks require determining continuouslinks between different regions of the brain, or assessing disjunctions betweenthem. Finally, there are a number of generic image processing tasks one wouldlike to perform on high dimensional DT-MRI data, since no signal processingframework currently exists for these. These include: filtering noise, sharpen-ing edges, detecting boundaries; compressing, storing and transmitting largeimage files; interpolating and extrapolating tensor data; resampling data atdifferent resolutions (e.g., rebinning); extracting textural features, segment-ing images, clustering data, and classifying tissues; and detecting statisticaloutliers. The B-spline approximation provides the mathematical underpin-nings for performing these tasks both rapidly and efficiently [10]. However,the problem with it is that it introduces smoothing in the data uniformlyand isotropically and is incapable of dealing with discontinuities. The smallerstructures as well as sudden or rapid changes (edges, high curvatures, etc.) willbe distorted at the levels of approximation/smoothing required to alleviate thenoise effects. To achieve a more efficient approximation we use Non-UniformRational B-Splines (NURBS). They allow for discontinuities and can describecomplex piecewise continuous geometrical shapes with many fewer parametersthan the original B-spline approximation.
Although there are other approaches for finding an approximate tensorfield, in this chapter we focus on a mathematical framework for continuousapproximation based on splines. A number of other methods for tensor fieldapproximation exist, for example see references [11, 12, 13, 14]. Also, Chap. 17by Moakher and Batchelor and Chap. 19 by Weickert and Welk presentnovel and sophisticated ways of interpolating and regularizing tensor fields.
18 Continuous Tensor Field Approximation 301
However, the goal of this chapter is not to review comprehensively the tensorfield approximation methods, instead, we describe and compare two differentspline methods for computing approximated tensor fields: (i) the previouslyproposed method using B-splines and (ii) a new method that uses NURBS.
18.2 Continuous Approximation and Representationof Discrete Tensor Data
The two approximation methods we focus on, (i) and (ii), have many com-mon features which we generalize here. In both, to construct a continuousapproximation to a diffusion tensor field, we start with a set of basis functions(approximants) whose linear combinations define an approximation space. In[5], to make the approximation scheme practicable, we required it possess thefollowing properties: (P1) The set of basis functions must be sufficiently richto represent the diffusion tensor field precisely and accurately; (P2) The math-ematical description of the approximation space is computationally tractable;(P3) The approximation of the diffusion tensor field is implemented using al-gorithms that are fast, robust, and accurate. In this chapter we also require(P4) the approximation scheme must be able to produce a piecewise contin-uous representation. We will see later that this can be done using NURBS,which will provide even richer set of basis functions (strengthening P1), how-ever, the requirement for speed in P3 will have to be relaxed.
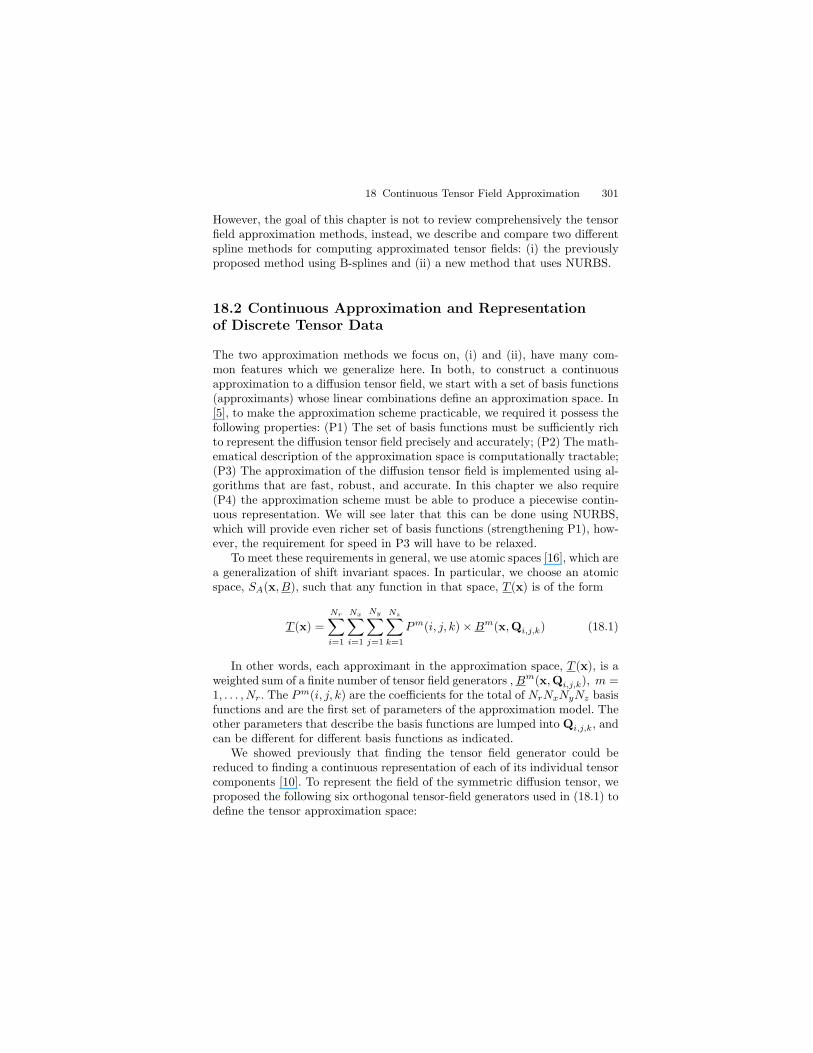
To meet these requirements in general, we use atomic spaces [16], which area generalization of shift invariant spaces. In particular, we choose an atomicspace, SA(x, B), such that any function in that space, T (x) is of the form
T (x) =
Nr∑
i=1
Nx∑
i=1
Ny∑
j=1
Nz∑
k=1
Pm(i, j, k)×Bm(x,Qi,j,k) (18.1)
In other words, each approximant in the approximation space, T (x), is aweighted sum of a finite number of tensor field generators , Bm(x,Qi,j,k), m =1, . . . , Nr. The Pm(i, j, k) are the coefficients for the total of NrNxNyNz basisfunctions and are the first set of parameters of the approximation model. Theother parameters that describe the basis functions are lumped into Qi,j,k, andcan be different for different basis functions as indicated.
We showed previously that finding the tensor field generator could bereduced to finding a continuous representation of each of its individual tensorcomponents [10]. To represent the field of the symmetric diffusion tensor, weproposed the following six orthogonal tensor-field generators used in (18.1) todefine the tensor approximation space:

302 S. Pajevic et al.
B1(x)= b1(x)
1 0 00 0 00 0 0
, B2(x)= b2(x)
0 0 00 1 00 0 0
, B3(x)= b3(x)
0 0 00 0 00 0 1
B4(x)= b4(x)
0 1 01 0 00 0 0
, B5(x)= b5(x)
0 0 10 0 01 0 0
, B6(x)= b6(x)
0 0 00 0 10 1 0
(18.2)Each tensor field generator Bm(x), can now be expressed in terms of a
single function, bm(x), which now serves as a basis for the ith component ofthe tensor field. Based on the choice for this function we distinguish betweentwo implementations for the field generators; the original one that used B-splines [5] and the new one that uses NURBS.
18.3 B-Spline Approximation
With the B-splines we choose bm(x) to be a product of one-dimensional func-tions, i.e., bm(x) = fm(x)gm(y)hm(z). The basis functions are now separablein two ways, first with respect to the components of the tensor, and secondwith respect to the coordinates. Finding the continuous field D(x) can bereduced to applying a one dimensional approximation algorithm along x, yand z coordinates sequentially within the imaging volume for each component[10].
The fm(x), gm(y), hm(z) are B-spline functions [17, 19] which are obtainedby repeated convolutions of the simple box function (Fig. 18.1a) The numberof convolutions determines the order of the B-spline, i.e., linear, quadratic,cubic, etc. The use of the separable basis function provides also an easy wayto account for the nonuniform resolutions in x, y, and z directions in someDT-MRI acquisitions.
(a)
p=3p=1
p=2(b)
Fig. 18.1. (a) 1-D B-spline functions of degree p = 0 through 3. The B-spline ofdegree n is obtained by n-fold convolutions of the box function (p = 0) as indicated.(b) 2-D separable B-spline basis functions with degrees p = 1, 2, and 3

18 Continuous Tensor Field Approximation 303
Using B-spline functions has several advantages: B1) the generators havefinite spatial extent (i.e., finite support), which speeds up and simplifies digitalprocessing algorithms; B2) they can be evaluated fast in a recursive fashion(as well as analytically, faster) in terms of splines of lower degree; B3) thederivatives of B-splines can be expressed recursively in terms of the originalB-splines; B4) by changing the polynomial order or degree of the B-splinefunctions, we can control the degree of smoothness and differentiability ofour continuous approximation; B5) by adjusting the (scale) parameters ofthe B-spline representation we can choose between interpolation (fitting datapoints exactly) and approximation (fitting data points approximately); B6)invariant representation under affine as well as perspective transformations;B7) possess the convex-hull property; and B8) B-spline functions naturallygenerate multi-resolution structures that are useful in analyzing signals andimages at different length scales.
Additionally, the separable multi-dimensional spline functions behave wellfor the cubic and higher order splines as demonstrated in Fig. 18.1b. It showsthat the two-dimensional spline function bm(x) constructed as a product oflinear one-dimensional B-splines is anisotropic (i.e., shows preferential direc-tions) and will produce artifacts when used for scaling (i.e., smoothing) ageneral tensor field. However, when the cubic B-splines are used these ar-tifacts are negligibly small and the bm(x) constructed in this way performnearly as well as the true two-dimensional isotropic basis functions, but aremuch more computationally efficient to implement. In our application we usemainly the cubic B-splines. If higher order derivatives are needed, it is advis-able to use B-splines of higher polynomial order than three to preserve theisotropic properties of the multidimensional basis functions.
Another advantage of using B-splines is that they need very few additionalparameters. In fact the simplest implementation can consist of only one para-meter, the scale parameter, ∆, which controls the smoothness of the model,and indicates the degree of parameter reduction in the model. For example,when the scaling parameter ∆ equals 0.25, the B-spline model is a projectionof the original data to a 4-fold smoother space and in 1-D case requires 4times less parameters. Typically, we use three scale parameters, ∆x, ∆y, and∆z, which control the degree of smoothness along each direction. The shiftson a uniform grid within the imaging volume, are indicated by k, l, and m.The generator for B-splines in this case is written as
Bm(x,Qi,j,k) = Bm(x,∆) = Bm(x∆x − i, y∆y − j, z∆z − k) (18.3)
The optimal choice of the coefficients, Pm(i, j, k), for a given choice of theB-spline and scale parameters is the one that minimizes the least-squareddifference between the original tensor data and the approximated diffusiontensor field [10].

304 S. Pajevic et al.
18.3.1 Implementing B-Spline Approximation
Once the polynomial order of the B-spline is chosen (generally cubic), then fora given DT-MRI data set, we calculate B-spline coefficients in the x, y, andz-directions for each of the six independent diffusion tensor elements usingthe spatial separability property described above. Thus, we perform 18 1-Dtransforms on the tensor data set. The 1-D B-spline approximation we use isbased on a scale conversion algorithm which finds the optimal approximationof the original signal at a given scale ∆ [15, 17, 18, 19]. The only differencein our implementation is the exclusion of the post-filtering step, as describedin the block diagram of the algorithm in [20]. The task of this algorithm isto find the minimal least square approximation of the original signal in thespace scaled down by factor ∆. This algorithm efficiently obtains the B-splinecoefficients by projecting the B-spline expansion of the original signal ontothe scaled space basis. This algorithm is not exact, i.e., it does not providea mathematically precise projection between the two spaces. However, thedeviations from the exact solution are mostly formal in nature. In practice,the performance of this algorithm is nearly optimal, while gaining in speedand efficiency. This and other details of our implementation are described inthe Appendix of [5].
An important step in the implementation is also to choose the appropriatescale parameters. If the scale parameters equal 1, the continuous represen-tation becomes interpolation; if one or more of the ∆i is less than 1, thecontinuous representation becomes a data reduction technique that approxi-mates or fits the discrete tensor data. Since the ∆ is the ratio of the numberof unknown parameters to the number of measured data points for the 1-Dapproximation the scale parameters can only take on specific rational values,{∆}N , which designates the rational number closest to ∆ that contains Nin the denominator. For DT-MR images N is usually large enough to allowsufficient precision in the range of the scale parameter values between 0 and1. We reduce the number of scale parameters by choosing only one ∆ andby assigning the three values of the model as {∆}Nx
, {∆}Ny, {Vr∆}Nz
, whereVr is the voxel aspect ratio (Vr ≈ 2) in our case), thus making the grid ofB-spline coefficients more uniform. Ideally, the value of ∆ should be twice theratio of the maximal spatial frequency of the pure (noise-free) signal and thesampling frequency. Note, however, that our approximation method is not asimple low-pass filter and the projecting onto a smoother space is not thesame as smoothing. The first one provides the least square fit while the latterdoes not, in general. In cases where structures within the image appear at alllength scales, the choice of ∆ is empirical as the structures on the small scales(single or a few voxels) must be blurred in order to improve estimates of largestructures of the diffusion tensor field elsewhere.
The B-spline approximation, although successfully applied to the fibertracking application [9] (see Fig. 18.2), does not provide a reliable frame-work for applying general methods of differential geometry to DT-MRI data.

18 Continuous Tensor Field Approximation 305
Fig. 18.2. Fiber tracts result from integrating along the tangent direction of theB-spline approximated tensor field, and with starting points chosen from the twocircular regions in the area of pons. The obtained result agrees well with knownanatomical data. (See colour plates.)
Calculations of curvature, torsion and other differential geometric quantitieswere highly unreliable [5].
18.4 Non-Uniform Rational B-Splines (NURBS)
Non-Uniform Rational B-Splines, or NURBS as they are widely known, are apowerful tool to describe and model complex curves and surfaces using a smallnumber of parameters [21]. It is a much richer set of basis functions whichgeneralize many concepts of ordinary B-splines. To introduce the NURBSmodel we focus on the 1-D model, since here too the multidimensional modelsare derived using products of basis functions.
There are three main groups of parameters that describe a NURBS model.The first is the knot vector, U , which controls the non-uniformity along aparticular dimension, the second is a set of weights, W, one for each basisfunctions, and the third are the ‘control points’, which correspond to the B-spline coefficients of our model, but we adopted this commonly used jargon.
The knot vector is a set of monotonically nondecreasing numbers in thereal interval [a, b] which parametrizes a given curve, i.e.,
U = {a, . . . , a︸ ︷︷ ︸p+1
, up+1, ..., ui−1, ui, ui+1, ..., um−p−1, b, ..., b︸ ︷︷ ︸p+1
} (18.4)

306 S. Pajevic et al.
As can be seen some values can be repeated and an important quantity isthe multiplicity of the knot, nm, which is equal to the number of times agiven value is repeated. In this way it is possible to control the continuity ofthe curve. Each basis function is Ck-continuous, k = p − nm at a knot withmultiplicity nm, and C∞ continuous elsewhere. The p + 1 repetition of theend points of the interval is just a statement that at the edges the curve isdiscontinuous. Alternatively, one can lower the multiplicity at the end pointsby using boundary conditions.
The set of basis functions is obtained using the recursive structure of theB-splines except that now the factors in front of the interacting B-splinesof lower order are not constant but are functions of the knot vector. Theyare called Non-Uniform B-Splines (NUBS). The NUBS basis functions areobtained using the following recursion:
Bi,p(u) =
(u− ui
ui+p − ui
)Bi,p−1(u)−
(u− ui+p+1
ui+p+1 − ui+1
)Bi+1,p−1(u)
Bi,0(u) =
{1 u ∈ [ui, ui+1)0 otherwise
(18.5)
and the kth derivate at point u can be obtained using
B(k)i,p (u) = p
(B
(k−1)i,p−1 (u)
ui+p − ui−
B(k−1)i+1,p−1(u)
ui+p+1 − ui+1
)(18.6)
Figure 18.3a shows a set of NUBS for the given values of spline degreeand the knot vector. Once a set of NUBS is obtained we use the second set ofparameters, W, which are the weights associated with each of the NUB basis
0 0.2 0.4 0.6 0.8 1
(a)
0 0.2 0.4 0.6 0.8 1
(b)
Fig. 18.3. (a) A set of 1-D NUB-basis functions with p = 2 and the knot vectorU = [0 0 0 0.1 0.6 0.6 0.8 1 1 1]. (b) A set of rational basis functions (NURBS)obtained using the NUBs in (a) and by changing the weights for the 3rd, 4th and5th basis function to 0.2, 0.5 and 5, respectively. The remaining NUBs had weightsw = 1. (See colour plates)

18 Continuous Tensor Field Approximation 307
functions, to obtain the rational basis functions (Fig. 18.3b). The rationalbasis function Ri,p(u) corresponding to the ith NUB basis function, Bj,p, isobtained as
Ri,p(u) =Bi,p(u)wi
n∑
j=0
Bj,p(u)wj
(18.7)
The third set of parameters are the coefficients Pm of the spline model, orin NURBS parlance, control points. The control points are actually tuplets ofB-spline coefficients grouped together to reflect the geometry of the model.For example, for a 3-D space curve the B-spline coefficients of the x(u), y(u)and z(u) functions are grouped together to form a 3-D control point, Pi =(P i
x, Piy, P
iz). The NURBS curve model C(u) can now be written as
C(u) =
n∑
i=0
Ri,p(u)Pi (18.8)
Once the weights and the knot vector are chosen, which we discuss below,the rational basis functions Ri,p(u) are determined, and the model in (18.8)is linear. Thus, when solving this linear system for control points, here toowe can choose between interpolation (number of control points is the sameas the number of data points) or the least square fit (fewer control points).The NURBS curve model can be extended using the function products, asdescribed in Sect. 18.2, to surfaces, volumes and ultimately to tensor fields.Here we finally write our NURBS tensor model in terms of control tensors,Dc
i,j,k,
D(x, y, z) =n∑
i=0
m∑
j=0
l∑
k=0
Ri,j,k(x, y, z)Dci,j,k (18.9)
where Ri,j,k(x, y, z) is a new 3-D rational function defined from NUBS, whichnow require three different knots vectors U, V, and S and can be of differentdegree in each dimension (p, q, r), i.e.,
Ri,j,k(x, y, z) =Bi,p(x)Bj,q(y)Bk,r(z)wi,j,k
n∑
i′=0
m∑
j′=0
l∑
k′=0
Bi′,p(x)Bj′,q(y)Bk′,r(z)wi′,j′,k′
(18.10)
Equation (18.9) is equivalent to (18.1), except that here the Nr independentcomponents of the tensor field are lumped together into a control tensor. Thisgeometric interpretation can be very useful. For example, since the convexhull property has much tighter bounds in the case of the NURBS model wecan use positive semidefiniteness of the control tensors to enforce the sameproperty for the tensor field at any point in space.
The NURBS model shares all the good properties of the B-spline model(B1-B8) but has important additional advantages: (N1) precisely represents

308 S. Pajevic et al.
a large family of mathematical curves, piecewise polynomials, conic sections(circles, ellipses, hyperbolas, parabolas), Bezier curves, and very efficientlyarbitrary shapes (N2) can control the degree of smoothness and continuity,including discontinuous functions, thus suitable for piecewise continuous rep-resentation.
However, although they enable fast evaluation in a recursive fashion atany point in the space (like B-spline), obtaining the appropriate parametersof the model is much harder now. We assume here that one wants to use theproperties N1-N2, otherwise the NURBS model can be simplified. After all,the B-splines are a special case of NURBS with uniformly spaced knot vectorand all weights equal. Here we mainly refer to NURBS as model that requiresnon-uniform knots and varying weights.
As mentioned above, we obtained the control points by solving the linearsystem in (18.8). The knot vector is initially chosen based on the spacingbetween the data (1-D case), but later knots are randomly added or removed.The most difficult part in fitting the NURBS model is to determine the optimalset of weights. Here, we initially set the weights to 1 and after obtaining thedesired set of control points we use simulated annealing to obtain the new setof weights, keeping control points and the knot vector fixed. After randomlyadding or removing a single knot we obtain a new knot vector and with thenew weights calculate the new set of rational basis functions, Ri,p(u). Thisprocedure is repeated until satisfactory solution is obtained.
In the case of one dimensional data one can still obtain useful NURBSfits relatively quickly. Figure 18.4a shows a fit to synthetic 2-D data (noisysamples of two different 2-D curves were joined together to create an apparentdiscontinuity). The solid line indicates the fit to a NURBS model and one cansee that even with a discontinuity, the NURBS describes the curve very wellwith only 14 control points. The B-spline model was incapable of describingsuch curve.
The image inset in Fig. 18.4b shows a 2D-projection of a tract (solid yellowline) onto a slice of DT-MRI volume with color coded orientations. The tract
P
P
P
PP P
P
P
P P
P
P
PP
P
ControlPolygon
ControlPoints
(dashed line)
(labeled )
Discontinuity
FittedCurve
(solid line)
NoisyData(circles)
(a) (b)
Fig. 18.4. (a) 2-D curve NURBS model fit to noisy data (b) 3-D curve NURBSmodel fit to fiber tracking data, indicated on the inset image. (See colour plates)

18 Continuous Tensor Field Approximation 309
passes through the corpus callosum and spans from one end of the brain tothe other. Figure 18.4b shows side by side the same tract in 3-D describedwith NURBS model (left) and B-spline model (right). The B-spline model,parameterized with B-spline coefficients needs a total of 3*130 = 390 parame-ters to produce as faithful representation of the space curve as the NURBSmodel did with only 15 control points (total of 60 parameters). Such a sparserparameter space enables more efficient explorations of connectivity, and moreimportantly can significantly alleviate the noise effects. In the next section wecompare B-spline and NURBS models on the important example of estimatinglocal curvature of the fiber tract.
18.5 B-spline vs NURBS Comparisonon Curvature Estimation
Estimating curvature is problematic for noisy data. The curvature of a fibertract, or a space curve, is defined as
κ(u) =
∣∣∣∣dt(u)
du
∣∣∣∣ =|r× r||r|3
(18.11)
where r = r(u) is the position vector parameterized by u, and t(u) is thetangent of the space curve at r(u). Since higher derivatives are involved, thisestimate is very sensitive to noise (each derivation acts as a linear ramp highpass filter). Another look at the problem is that the fiber tracts are not poly-nomial and their estimates are noisy. Thus in order to faithfully depict a givencurve one has to represent curves with a relatively high number of B-splinecoefficients, thus sampling the noise often. The curvature of noise is infiniteand thus the local estimates of the radius will be biased towards zero, besidesbeing also very noisy. We reported previously that the B-spline approximationdid not produce satisfactory results in this regard. Here we compare B-splineestimates with NURBS estimates.
We test curvature estimation on a simulated space curve consisting offour circular arcs with radii Rc = 100,10,5,35 in arbitrary units. We thensampled 50 points with sampling error of 1%, which are indicated as solidblack circles on the inset in upper right corner of Fig. 18.5. The inset alsoshows the 15 control points of the fit, together with the ‘ideal’ control points(light blue circles) which could describe such curve exactly. There are total of10 ‘ideal’ points but not all are shown since in many cases they are very closeto the control points obtained from the fit. We see that the NURBS fittingroutine can be improved further, however, even this imperfect fit providessignificant improvement over the B-spline approximation. The solid black linein Fig. 18.5a indicates the true radius, with the exception of the three inflectionpoints where the curvature is infinite. The solid blue line indicates the NURBSestimates outperforms the B-spline approximation for any level of smoothness,

310 S. Pajevic et al.
Fig. 18.5. Radii of curvature obtained from a noisy data set of points sampledfrom a curve consisting of four circular arcs (see the inset in upper right corner)with radii 100,10,5,35. The sampling error was 1%. The solid black line indicates thetrue radius (at inflection points the radius is infinite). The solid blue line indicates theNURBS fit, while B-spline approximation estimates are labeled as follows: ∆ = 1,i.e., interpolation (green triangles), ∆ = 0.5 (purple dots), or ∆ = 0.2 (red solidline). Note that the original curve could have been described with only 10 controlpoints (the light blue circles, not all shown). (See colour plates)
as described in the caption. The spike in the NURBS estimate occurs at theinflection point where the radius of curvature is infinite.
In Fig. 18.6 we determined the radius of curvature for every voxel in one ofthe slices using both NURBS estimate and the B-spline approximation with∆ = 0.2 (since such choice produced relatively stable estimates in Fig. 18.5,however with significant loss in resolution. This loss of resolution is evident inFig. 18.6a, where it appears that very little variation of the radius of curvatureis occurring, for example, in the splenium of the corpus callosum. The NURBSestimate in 18.6b does show significant variation. Even though the lower cur-vature structures appear ‘spotty’ in the NURBS estimate they indicate errorsof only 20 % (a good precision for the curvature radius).
18.6 Discussion and Conclusion
The continuous approximation methodology takes noisy, voxel-averaged, anddiscrete statistical samples of an underlying macroscopic effective diffusiontensor field as its input, and produces a piecewise continuous, smooth tensorfield approximation as its output. Besides being able to recover the originalnoiseless tensor field reliably, the approximation schemes substantially reducesbias of the mean and variance of various quantities derived from the tensorfield, e.g., Trace(D(x)). This new methodology also facilitates following nerveand other fiber tract trajectories in vivo. New MR features or parameters

18 Continuous Tensor Field Approximation 311
Fig. 18.6. Color coded images of the radius of curvature obtained at the centerof each voxel for the given slice using B-spline approximation with ∆ = 0.2 (left)and NURBS (right), with colorbar indicating the scales. We see that the NURBSestimates are capable of showing the spatial variation of the fiber curvature. Note,that although the models are continuous, the estimates obtained from them are notnecessarily smooth. The pixelization in the image, however, is arbitrary and we couldhave obtained the estimates at any point in space with the continuous models. (Seecolour plates)
that characterize structure, architecture, and functional assessment of tissuescan be developed from this continuous representation of DT-MRI data. Asanalytical functions are used to approximate the diffusion tensor field, we canevaluate and display quantities such as the gradient tensors [5], which cannotbe evaluated accurately from noisy DT-MRI data.
18.6.1 Microscopic Field (Underlying) vs Macroscopic Field(Voxel Averaged)
The microscopic tensor field is one that describes water diffusion on a micro-scopic scale, whereas the macroscopic effective tensor field describes the tensorfield on a voxel scale. If we assume no intercompartmental mixing of spins, themeasured macroscopic tensor field is just the voxel-average of this microscopictensor field. While these macro and micro fields should be similar in regionscontaining tissue whose distribution of fiber direction is uniform within thevoxel, in tissues whose distribution of fiber direction is non-uniform, such as re-gions where fibers diverge or converge (splay), bend or twist, branch or merge,

312 S. Pajevic et al.
a significant disparity may exist between these fields. Generally, in these re-gions, the macroscopic field will be a powder average of the heterogeneousmicroscopic tensor field within a voxel. An important long-term goal is todevelop techniques to identify regions in which such powder averaging occurs,and then attempt to infer the microscopic tensor field from macroscopic voxel-scale measurements there using additional information from other sources [22](see also Chap. 5 by Alexander).
18.6.2 NURBS vs B-Spline
The B-spline approximation is not nearly as efficient as the NURBS model. Itsestimation of quantities involving higher derivatives is inaccurate and thus themodel is not adequate for applying differential geometric methods. Anothershortcoming of the B-spline approximation method is that it forces continuityof the tensor field at boundaries or interfaces, where there is no physicalrequirement to impose continuity. This results in high approximation errorsat the edges of the structures.
NURBS can account for piecewise continuity by modifying knot vector.NURBS produce promising results for 1-D curves, and to some extent withsurfaces. However, to date, we have been unable to obtain an efficient ten-sor model, mainly due to an extremely large parameter space and the veryrich model, which is difficult to fit (many local minima). It appears that theNURBS methodology will have to be used differently than the B-spline ap-proximation, and a long computation will be required to obtain the model,using various stochastic fitting methods (simulated annealing, genetic algo-rithms, etc.) Once the model is obtained it will be possible to explore itsgeometry, tract fibers, and run various differential geometric models with al-most the same efficiency as with B-splines. Work is underway to improveNURBS fitting and at the same time to generalize this continuous tensor fieldapproximation to treat internal boundaries and discontinuities in the tensorfield more naturally and robustly by using control tensors that do not use theactual coordinates x, y, and z for parameterization. In other words the controltensor will contain information about its position in space. The tensor modelis now written as
D(u, v, s) =
n∑
i=0
m∑
j=0
l∑
k=0
Ri,j,k(u, v, s)Dci,j,k(ri,j,k) (18.12)
Effectively, the control tensor is now a 9-dimensional quantity (6 independenttensor components plus 3 spatial dimensions).
References
1. P.J. Basser, J. Mattiello, and D. Le Bihan. MR diffusion tensor spectroscopyand imaging. Biophysical Journal 66(1), 259-67 (1994).

18 Continuous Tensor Field Approximation 313
2. P.J. Basser. Inferring microstructural features and the physiological state oftissues from diffusion-weighted images. NMR in Biomedicine, 8(7-8), 333-44(1995).
3. P.J. Basser, and C. Pierpaoli. Microstructural and physiological features of tis-sues elucidated by quantitative-diffusion-tensor MRI. Journal of Magnetic Res-onance B 111(3), 209-19 (1996).
4. P.J. Basser. New histological and physiological stains derived from diffusion-tensor MR images. Annals New York Acad Sci 820, 123-38 (1997).
5. S. Pajevic, A. Aldroubi and P.J. Basser. A continuous tensor field approxima-tion of discrete DT-MRI data for extracting microstructural and architecturalfeatures of tissue. Journal of Magnetic Resonance, 154, 85-100 (2002).
6. T. E. Conturo, N. F. Lori, T. S. Cull, E. Akbudak, A. Z. Snyder, J. S. Shimony,R. C. McKinstry, H. Burton, M. E. Raichle, Tracking neuronal fiber pathways inthe living human brain, Proceedings National Acad Sci USA 96, 10422-7 (1999).
7. S. Mori, B. J. Crain, V. P. Chacko, P. C. M. van Zijl, Three-dimensional trackingof axonal projections in the brain by magnetic resonance imaging, Annals ofNeurology, 45, 265-269 (1999).
8. S. Mori, W. E. Kaufmann, G. D. Pearlson, B. J. Crain, B. Stieltjes, M. Solaiyap-pan, P. C. van Zijl, In vivo visualization of human neural pathways by magneticresonance imaging, Annals of Neurology 47, 412-4 (2000).
9. P.J. Basser, S. Pajevic, C. Pierpaoli, A. Aldroubi, and J. Duda. In Vivo Fiber-Tractography in Human Brain Using Diffusion Tensor MRI (DT-MRI) Data,Magnetic Resonance in Medicine, 44:625-632 (2000).
10. A. Aldroubi and P.J. Basser, Reconstruction of vector and tensor fields fromsampled discrete data. in ‘Contemporary Mathematics’. (L.W. Baggett, D.R.Larson, editors) pp. 1-15, American Math. Society, Providence, RI (1999).
11. C. Poupon, C. A. Clark, V. Frouin, J. Regis, I. Bloch, D. L. Bihan, J.-F. Mangin,Regularization of diffusion-based direction maps for the tracking of brain whitematter fascicles, Neuroimage 12 (2), 184-195 (2000).
12. G. Parker, J. A. Schnabel, M. R. Symms, D. J. Werring, G. J. Barker, Nonlinearsmoothing for reduction of systematic and random errors in diffusion tensorimaging, Journal of Magnetic Resonance Imaging, 11, 702–710 (2000).
13. J.-F. Mangin, C. Poupon, C. Clark, D. Le Bihan and I. Bloch, Eddy-CurrentDistortion Correction and Robust Tensor Estimation for MR-Diffusion Imaging,Lecture Notes in Computer Science, 2208, 186 (2001).
14. C.F. Westin, S.E. Maier, H. Mamata, A. Nabavi, F.A., Jolesz, R. Kikinis,Processing and visualization for diffusion tensor MRI. Medical Image Analy-sis, 6, 93-108 (2002).
15. A. Aldroubi, M. Eden, and M. Unser. Discrete spline filters for multiresolutionsand wavelets of L2, SIAM Journal on Mathematical Analysis, 25, 1412-1432(1994).
16. A. Aldroubi. Oblique projections in atomic spaces. Proceedings of the AmericanMath. Society 124, 2051-2060 (1996).
17. M. Unser, A. Aldroubi, and M. Eden. B-Spline Signal Processing: Part II-Efficient Design and Implementation. IEEE Transactions on Signal Processing41(2), 834-848 (1993).
18. C. DeBoor, A Practical Guide to Splines, Springer-Verlag Telos, 199419. M. Unser, A. Aldroubi, and M. Eden. B-Spline Signal Processing: Part I-Theory.
IEEE Transactions on Signal Processing 41(2), 821-833 (1993).

314 S. Pajevic et al.
20. M. Unser, A. Aldroubi, and M. Eden. Enlargment or reduction of digital imageswith minimum loss of information, IEEE Transactions on Image Processing 4,247-258 (1995).
21. L. Piegl, W. Tiller, The NURBS Book, Springer-Verlag, 199722. D.S. Tuch and T.G. Reese and M.R. Wiegell and N.G. Makris and J.W.
Belliveau and V.J. Wedeen. High angular resolution diffusion imaging revealsintravoxel white matter fiber heterogeneity, Magnetic Resonance in Medicine,48, 577-582 (2002).
Copyright © 2022 FDOKUMEN