Line Weaver: Importance-Driven Order Enhanced Rendering ...
12
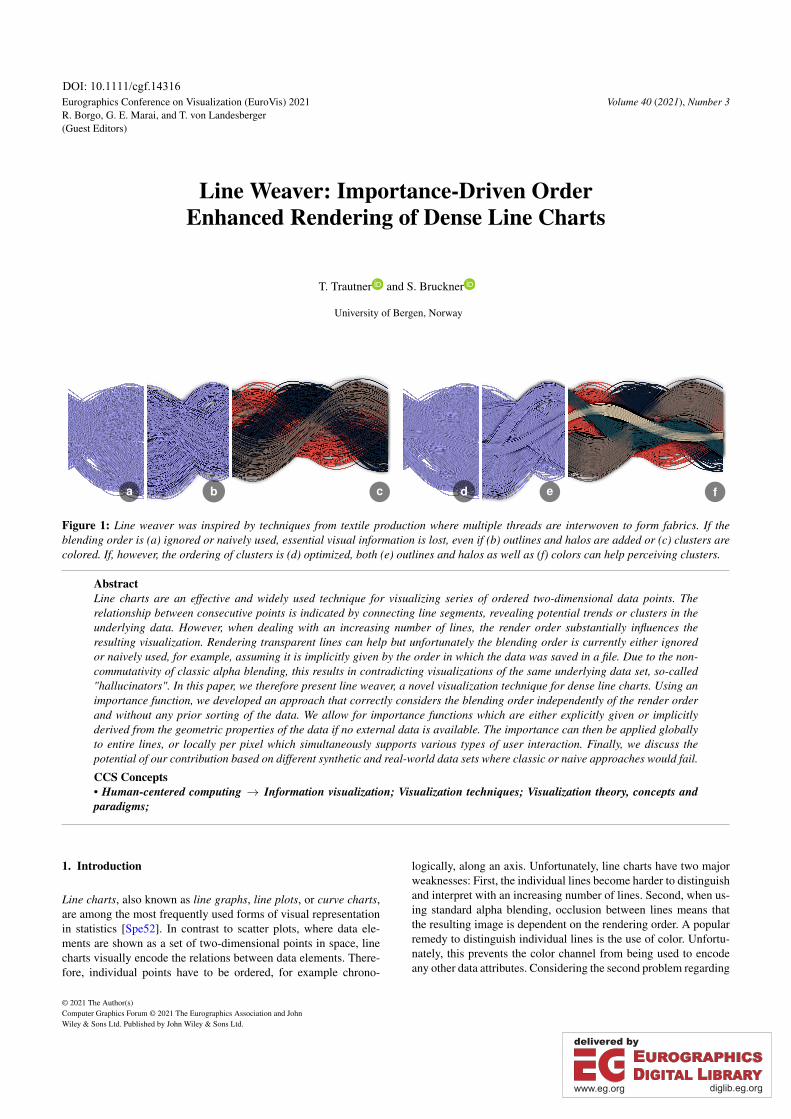
Eurographics Conference on Visualization (EuroVis) 2021 R. Borgo, G. E. Marai, and T. von Landesberger (Guest Editors) Volume 40 (2021), Number 3 Line Weaver: Importance-Driven Order Enhanced Rendering of Dense Line Charts T. Trautner and S. Bruckner University of Bergen, Norway a b c d e f Figure 1: Line weaver was inspired by techniques from textile production where multiple threads are interwoven to form fabrics. If the blending order is (a) ignored or naively used, essential visual information is lost, even if (b) outlines and halos are added or (c) clusters are colored. If, however, the ordering of clusters is (d) optimized, both (e) outlines and halos as well as (f) colors can help perceiving clusters. Abstract Line charts are an effective and widely used technique for visualizing series of ordered two-dimensional data points. The relationship between consecutive points is indicated by connecting line segments, revealing potential trends or clusters in the underlying data. However, when dealing with an increasing number of lines, the render order substantially influences the resulting visualization. Rendering transparent lines can help but unfortunately the blending order is currently either ignored or naively used, for example, assuming it is implicitly given by the order in which the data was saved in a file. Due to the non- commutativity of classic alpha blending, this results in contradicting visualizations of the same underlying data set, so-called "hallucinators". In this paper, we therefore present line weaver, a novel visualization technique for dense line charts. Using an importance function, we developed an approach that correctly considers the blending order independently of the render order and without any prior sorting of the data. We allow for importance functions which are either explicitly given or implicitly derived from the geometric properties of the data if no external data is available. The importance can then be applied globally to entire lines, or locally per pixel which simultaneously supports various types of user interaction. Finally, we discuss the potential of our contribution based on different synthetic and real-world data sets where classic or naive approaches would fail. CCS Concepts • Human-centered computing → Information visualization; Visualization techniques; Visualization theory, concepts and paradigms; 1. Introduction Line charts, also known as line graphs, line plots, or curve charts, are among the most frequently used forms of visual representation in statistics [Spe52]. In contrast to scatter plots, where data ele- ments are shown as a set of two-dimensional points in space, line charts visually encode the relations between data elements. There- fore, individual points have to be ordered, for example chrono- logically, along an axis. Unfortunately, line charts have two major weaknesses: First, the individual lines become harder to distinguish and interpret with an increasing number of lines. Second, when us- ing standard alpha blending, occlusion between lines means that the resulting image is dependent on the rendering order. A popular remedy to distinguish individual lines is the use of color. Unfortu- nately, this prevents the color channel from being used to encode any other data attributes. Considering the second problem regarding © 2021 The Author(s) Computer Graphics Forum © 2021 The Eurographics Association and John Wiley & Sons Ltd. Published by John Wiley & Sons Ltd. https://diglib.eg.org https://www.eg.org
-
Upload
khangminh22 -
Category
Documents
-
view
0 -
download
0
Transcript of Line Weaver: Importance-Driven Order Enhanced Rendering ...
Eurographics Conference on Visualization (EuroVis) 2021R. Borgo, G. E. Marai, and T. von Landesberger(Guest Editors)
Volume 40 (2021), Number 3
Line Weaver: Importance-Driven OrderEnhanced Rendering of Dense Line Charts
T. Trautner and S. Bruckner
University of Bergen, Norway
a b c d e f
Figure 1: Line weaver was inspired by techniques from textile production where multiple threads are interwoven to form fabrics. If theblending order is (a) ignored or naively used, essential visual information is lost, even if (b) outlines and halos are added or (c) clusters arecolored. If, however, the ordering of clusters is (d) optimized, both (e) outlines and halos as well as (f) colors can help perceiving clusters.
AbstractLine charts are an effective and widely used technique for visualizing series of ordered two-dimensional data points. Therelationship between consecutive points is indicated by connecting line segments, revealing potential trends or clusters in theunderlying data. However, when dealing with an increasing number of lines, the render order substantially influences theresulting visualization. Rendering transparent lines can help but unfortunately the blending order is currently either ignoredor naively used, for example, assuming it is implicitly given by the order in which the data was saved in a file. Due to the non-commutativity of classic alpha blending, this results in contradicting visualizations of the same underlying data set, so-called"hallucinators". In this paper, we therefore present line weaver, a novel visualization technique for dense line charts. Using animportance function, we developed an approach that correctly considers the blending order independently of the render orderand without any prior sorting of the data. We allow for importance functions which are either explicitly given or implicitlyderived from the geometric properties of the data if no external data is available. The importance can then be applied globallyto entire lines, or locally per pixel which simultaneously supports various types of user interaction. Finally, we discuss thepotential of our contribution based on different synthetic and real-world data sets where classic or naive approaches would fail.
CCS Concepts• Human-centered computing → Information visualization; Visualization techniques; Visualization theory, concepts andparadigms;
1. Introduction
Line charts, also known as line graphs, line plots, or curve charts,are among the most frequently used forms of visual representationin statistics [Spe52]. In contrast to scatter plots, where data ele-ments are shown as a set of two-dimensional points in space, linecharts visually encode the relations between data elements. There-fore, individual points have to be ordered, for example chrono-
logically, along an axis. Unfortunately, line charts have two majorweaknesses: First, the individual lines become harder to distinguishand interpret with an increasing number of lines. Second, when us-ing standard alpha blending, occlusion between lines means thatthe resulting image is dependent on the rendering order. A popularremedy to distinguish individual lines is the use of color. Unfortu-nately, this prevents the color channel from being used to encodeany other data attributes. Considering the second problem regarding
© 2021 The Author(s)Computer Graphics Forum © 2021 The Eurographics Association and JohnWiley & Sons Ltd. Published by John Wiley & Sons Ltd.
DOI: 10.1111/cgf.14316
https://diglib.eg.orghttps://www.eg.org
Thomas Trautner and Stefan Bruckner / Line Weaver
rendering order, it seems that this has not received much attentionin the literature so far. In Tableau, for example, one of the mostwidespread visualization tools, "the drawing order is driven by theorder of the members in the data source [Tab20]".
However, rendering order and the resulting occlusion relation-ships among graphical elements can have a significant impact ontheir perception, as indicated by the Gestalt principles. The princi-ple of Symmetry and Order, for instance, sometimes also referredto as Law of Prägnanz or the Law of Simplicity describes that thehuman brain tends to interpret visual elements in the simplest possi-ble way to avoid an overflow of visual stimuli. For example, whenlooking at a wireframe representation of a cube, where only theedges connecting the corner points are visible, our brain will tendto recognize the three-dimensional cube instead of individual prim-itives such as triangles, rectangles, or trapezoids that arise from in-tersections of lines.
In this paper, we present a novel technique for the visualizationof line charts that avoids the issues caused by a global renderingorder by introducing the notion of a quantitative importance func-tion that can vary locally. Using a per-pixel blending approach con-trolled by this importance function, we provide explicit control overocclusion relationships, allowing us to make more efficient use ofavailable screen space and present features such as clusters in amore coherent manner. The main contributions of our work can besummarized as follows:
• We introduce a new approach for displaying line-based data thatsupports the use of a quantitative importance function.• We demonstrate how this method can be used with different
types of importance functions.• We present a simple algorithm for deriving an importance func-
tion for grouped line data.• We show that our technique can be efficiently implemented on
modern GPU architectures for high-quality rendering of linedata.
2. Related Work
Visualization of line sets plays an important role in various do-mains and different scientific fields, for example, in their elemen-tary form as classic line charts, when exploring networks or graphsto better understand their structure, when visualizing streamlines orpathlines to analyze fluid flow, when interpreting temporal changesof time series, when displaying multi-dimensional data as paral-lel coordinates, or directly when researching how lines can be ren-dered as efficiently as possible. All research fields study differentchallenges but one they all have in common is that visual clutterincreases when more lines are displayed. For reasons of clarity,this section is therefore divided into two categories with differentclutter-reduction approaches. Section 2.1 focuses on features de-rived from line data sets and how they can be visually encoded, andSection 2.2 presents advanced and optimized rendering techniquesfor dense line and curve data sets.
2.1. Feature Encoding
One possibility for reducing visual clutter could be to visualizea density estimate of underlying lines, instead of visualizing the
entirety of individual lines. Lampe and Hauser [DLH11b] intro-duce an approach based on kernel density estimation (KDE), usingline kernels defined by a start and an end point. In a subsequentstep, the estimated density can then be color-coded using a percep-tually uniform heatmap. A similar approach can be used to esti-mate the density of curves in a continuous [DLH11a] or discretemanner [MF18]. Unfortunately, density representations in generalare not well suited when analyzing individual lines, especially insparse regions. Recent work by Trautner et al. [TBSB20] presentssunspot plots, an approach focusing on this challenge when visu-alizing scatter plots. In case of line charts, however, the problemremains unsolved.
Another visualization technique that suffers from visual clut-ter are parallel coordinate plots (PCPs). Assuming the multi-dimensional data originates from a continuous domain, continuousparallel coordinates [WH09] represent a related approach to KDEsand, therefore, benefit from the same advantages while also suffer-ing from the same disadvantages. Instead of changing the visualrepresentation of parallel coordinates in advance, an initial step canbe reordering the axes. Blumenschein et al. [BZP∗20] recommendthat, especially with highly cluttered data sets, axes with dissimi-lar data dimensions should be arranged next to each other, whereasfor data sets with low clutter, similar axes should be displayed nextto each other. Fua et al. [FWR99] introduce a hierarchical cluster-based enhancement for PCPs. They propose to visually encode in-dividual clusters as variable-width opacity bands in combinationwith proximity-based coloring. The width of such a band repre-sents the extent of the cluster. The center of each band is fullyopaque while transparency linearly decreases towards the top andbottom edges. Unfortunately, they do not provide further specifi-cation on the blending operator or blending order used. Novotnyand Hauser [NH06] introduce a technique specifically targeted atoutlier and trend detection within PCPs. The authors propose todetect outliers first, providing them with a separate visual represen-tation, and then applying aggregation techniques to the underlyingdata to prevent outliers from being smoothed away. Related workby Artero et al. [AdL04] uses image processing techniques to de-tect clusters. Work by Johansson et al. [JLJC06] introduces transferfunctions to highlight different properties of clusters in PCPs. In theend, however, lines are rendered in a given order mostly using thenon-commutative Porter-Duff [PD84] over operator for blending,neglecting that it is not order independent.
Under the assumption that lines can be viewed as three-dimensional trajectories or networks, Kwon et al. [KMLM16] in-troduce edge bundling using a spherical graph layout and depthrouting for edges to improve legibility of graph visualizations. Sub-sequently, line bundles are emphasized by global illumination us-ing real-time ambient occlusion approaches similar to the work byEichelbaum et al. [EHS13]. Here, it is important to mention thatwe do not consider edge bundling as a competing approach but as apossible pre-processing step. The resulting line bundles could sub-sequently be displayed using our technique.
Additional inspiration comes from the work of Nakayana andYano [NY10] who combine classic space-time cubes with KDEs byusing a spatio-temporal kernel for 3D point data to emphasize boththe temporal duration as well as the spatial extent, visualized using
© 2021 The Author(s)Computer Graphics Forum © 2021 The Eurographics Association and John Wiley & Sons Ltd.
400
Thomas Trautner and Stefan Bruckner / Line Weaver
volume rendering. Subsequently, Demšar and Virrantaus [DV10]built upon this idea and applied 3D density estimations to three-dimensional polylines. The interpretation of line sets as volumes[SM04] allows for the use of transfer functions, which inspired usto use importance functions without having to convert the under-lying data to a volume. Moritz and Danyel [MF18], for example,suggest normalizing the contribution of a curve to the density esti-mation by its arc length, correcting for the higher numbers of pixelsthat are needed to render strongly fluctuating curves. Instead, weuse the arc length as a derived geometric property, describing cur-vature and frequency. This enables us to optimize overall visibilityand reduce visual clutter by displaying curves with more variabil-ity in the back and less fluctuating curves in front. However, manyother properties such as visual complexity, as described by Ryan etal. [RMCW18], geometric features derived from families of curvesby Konyha et al. [KLM∗12], or statistical features could be usedinstead.
2.2. Line Rendering
Before the development of more advanced line rendering tech-niques, Spear [Spe52] recommended creating multiple graphs us-ing the same unit scale and comparing them, for example, usingjuxtaposition in case the data set was too cluttered. This is still acommon practice when current techniques reach their limits. Build-ing on that, Cleveland et al. [CMM88] recommended that an aver-age angle of 45 degrees should be kept between adjacent line seg-ments. In the literature, this is often referred to as "banking to 45degrees". Furthermore, line smoothing techniques can be applied,for example as proposed by Rosen and Quadri [RQ21], to initiallyremove high frequencies or noise from the data, which we consideran optional pre-processing step to our approach.
Rendering smooth lines in OpenGL is a basic functionality thathas yet to be supported by all graphics cards. Kilgard’s [Kil20] po-lar stroking technique is a recent approach which uses the arc lengthof a curve for texturing or dashing. A general overview of differentCPU and GPU rendering techniques for transparent 3D line setsis provided by Kern et al. [KNM∗20]. Similar to our method, anA-buffer [Car84] combined with multi-layer alpha blending can beused to approximate transmittance and color of fragments. Whilerendering, A-buffers store additional fragment information, for ex-ample, by using per-pixel linked lists together with a global atomiccounter, as suggested by Yang et al. [YHGT10]. A modification ofA-buffers are K-buffers, introduced by Bavoil et al. [BCL∗07]. In-stead of blending all fragments, only a fixed number of fragmentsare stored and blended. An enhancement of such a K-buffer is usedby Groß and Gumhold [GG21] who introduce a GPU-based raycasting approach supporting ambient occlusion and transparencyby using a billboard proxy geometry.
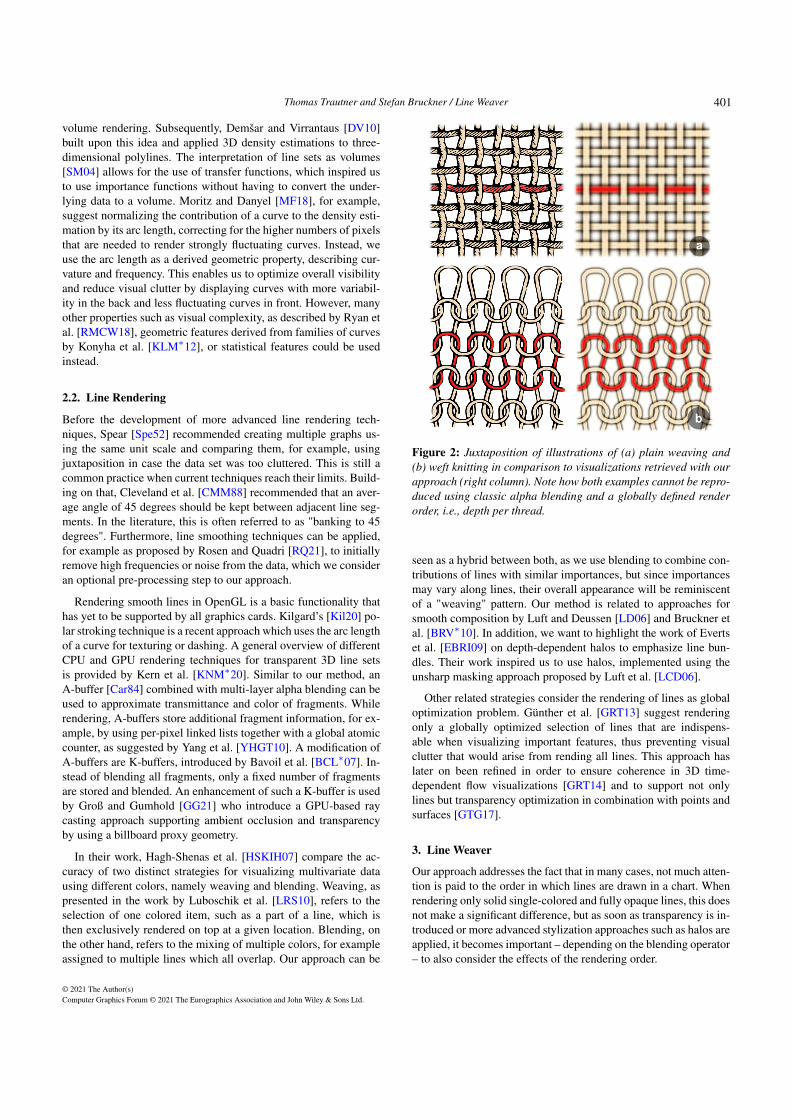
In their work, Hagh-Shenas et al. [HSKIH07] compare the ac-curacy of two distinct strategies for visualizing multivariate datausing different colors, namely weaving and blending. Weaving, aspresented in the work by Luboschik et al. [LRS10], refers to theselection of one colored item, such as a part of a line, which isthen exclusively rendered on top at a given location. Blending, onthe other hand, refers to the mixing of multiple colors, for exampleassigned to multiple lines which all overlap. Our approach can be
a
b
Figure 2: Juxtaposition of illustrations of (a) plain weaving and(b) weft knitting in comparison to visualizations retrieved with ourapproach (right column). Note how both examples cannot be repro-duced using classic alpha blending and a globally defined renderorder, i.e., depth per thread.
seen as a hybrid between both, as we use blending to combine con-tributions of lines with similar importances, but since importancesmay vary along lines, their overall appearance will be reminiscentof a "weaving" pattern. Our method is related to approaches forsmooth composition by Luft and Deussen [LD06] and Bruckner etal. [BRV∗10]. In addition, we want to highlight the work of Evertset al. [EBRI09] on depth-dependent halos to emphasize line bun-dles. Their work inspired us to use halos, implemented using theunsharp masking approach proposed by Luft et al. [LCD06].
Other related strategies consider the rendering of lines as globaloptimization problem. Günther et al. [GRT13] suggest renderingonly a globally optimized selection of lines that are indispens-able when visualizing important features, thus preventing visualclutter that would arise from rending all lines. This approach haslater on been refined in order to ensure coherence in 3D time-dependent flow visualizations [GRT14] and to support not onlylines but transparency optimization in combination with points andsurfaces [GTG17].
3. Line Weaver
Our approach addresses the fact that in many cases, not much atten-tion is paid to the order in which lines are drawn in a chart. Whenrendering only solid single-colored and fully opaque lines, this doesnot make a significant difference, but as soon as transparency is in-troduced or more advanced stylization approaches such as halos areapplied, it becomes important – depending on the blending operator– to also consider the effects of the rendering order.
© 2021 The Author(s)Computer Graphics Forum © 2021 The Eurographics Association and John Wiley & Sons Ltd.
401
Thomas Trautner and Stefan Bruckner / Line Weaver
The algebraic model for visualization design proposed by Kindl-mann and Scheidegger [KS14] explicitly refers to such considera-tions. They illustrate this by using a plot of taxi pick-up and drop-off locations, which they consider as a set of points without aninherent order, and argue that using an order-dependent blendingoperator (such as the common over operator) in this case consti-tutes a failure of representation invariance, which they refer to as"hallucinator", i.e., a deficiency where differences in the imagesmay arise from representational or algorithmic choices (such as therendering order) without reflecting changes in the underlying data.Order-independent operators will, by definition, always generatethe same result irrespective of the rendering order, and in their ex-ample Kindlmann and Scheidegger propose to use additive blend-ing as a possible resolution. In additive blending, the contributionsof all elements to a pixel are averaged and hence their order is ir-relevant. The drawback of this approach is that it completely elim-inates occlusion which in fact can be a powerful cue. As alreadymentioned, we have learned from the Gestalt principles such ascontinuity, closure, and figure-ground that human perception at-tempts to complete missing or occluded image regions.
In our approach, we therefore propose to preserve these cues bystill using a blending operator that exhibits occlusion, but insteadproviding explicit control over occlusion relationships by introduc-ing an importance function. While this may at first glance look likea minor semantic distinction (replacing the term order by the termimportance), it opens up several interesting and, as we will demon-strate in the remainder of this paper, advantageous avenues for im-proving the visualization of line-based data.
We regard line data as set D = {L1,L2, ...,LN} of N polylineswith its members Li = (P1,P2, ...,PM) represented as tuples of Mordered two-dimensional points Pi = (xi,yi). The resulting para-metric curve li(u) of each member is normally a polyline generatedby linear interpolation between its associated points P1,P2, ...,PM ,but of course other interpolation functions are equally possible.We choose this formulation since it is general enough to representcommon visualizations such as time-series charts and parallel co-ordinate plots, which simply constitute different mappings betweenthe underlying data set and the x and y coordinates of the individ-ual points. Our importance function βi(u) ∈ [0,1] now associates ascalar importance value with every position along each curve li(u)and has two major properties that distinguish it from order. First,our importance function is quantitative in nature, not just ordinal.This means that it is possible that two lines may have very similaror even the same importance value. Second, importance does notneed to be constant along a line, but it may vary. These attributesshould be represented in the resulting visualization. Specifically,our approach is based on the following requirements:
• The contributions of individual lines should be independent oftheir order in the data set or the order in which they are rendered.• Line segments with similar importance contributions should con-
tribute similarly to the pixels they cover in the final image.• When the importance differs significantly, line segments with
higher importance should occlude line segments with lower im-portance.
We can draw an analogy to the textile industry, for example,when comparing weaving or knitting techniques as illustrated in
Figure 2. Instead of a global ordering of individual threads, they arelocally woven to interleave forming an intricate pattern that is dis-cernible to human observers. In the same way, our aim is to threadlines in a meaningful pattern, instead of simply pasting them on topof each other. Our approach, therefore, enables the importance ofindividual lines to vary along their trajectory, but without imposingan ordinal relationship among them.
3.1. Importance-Based Blending
In computer graphics, the term order-independent transparencycommonly refers to techniques that aim to enable the rendering oftransparent polygons using the Porter-Duff [PD84] over operator ina way that it does not require prior sorting of the primitives. Thiscan occur in an exact manner producing the same results as primi-tive sorting, e.g., by still performing sorting but rather at the frag-ment level (using data structures such as an A-buffer [YHGT10]) orin an approximate manner, e.g., by using different (typically depth-based [BM08]) blending operators that attempt to mimic the resultsof the over operator as closely as possible. Our goal here, however,is different. We are seeking a blending operator that allows us to vi-sually reflect the properties of our importance function, i.e., by con-veying its quantitative nature as well as its variability over polylineprimitives. The latter can be resolved by changing the granularity atwhich the blending is performed. Switching from a per-primitive toa per-pixel resolution, as it is done in A-buffer based approaches,allows us to freely vary the importance function across a primi-tive. The former, however, is more challenging as the decision ofwhether one element is in front of another in the classic over oper-ator is inherently binary and therefore prone to artifacts.
A good illustration for this is z-fighting, caused by two primitiveswith differences in depth that are close to the numerical precisionof the z-buffer, resulting in visible artifact patterns. As stated pre-viously, we instead want our blending to have a well-defined andmeaningful behavior when importance values are equal or similar.When blending together multiple elements with equal importancevalues, the result should correspond to the average value of all con-tributing elements, while when importance values are far apart, wewant to indicate higher importance values using occlusions. As im-portance values can vary continuously, we further want to avoidabrupt changes between these behaviors. Such smooth transitionscan be achieved using a blending approach inspired by the worksof Luft and Deussen [LD06], and Bruckner et al. [BRV∗10].
Conceptually, this works by having the color contribution of oneelement (e.g., a pixel color) influencing the contributions of otherelements whenever they are within a certain importance range, us-ing a continuous falloff function such that the contributions areequal when the respective importance values are the same. Theindividual contributions (which then include those of other ele-ments within the influence range) are next blended in sequence oftheir importance using the conventional over operator. The adjustedcolor of an element c′i is computed as follows:
c′i =
∑∆(βi,β j)>0
c j∆(βi,β j)
∑∆(βi,β j)>0
∆(βi,β j), (1)
© 2021 The Author(s)Computer Graphics Forum © 2021 The Eurographics Association and John Wiley & Sons Ltd.
402
Thomas Trautner and Stefan Bruckner / Line Weaver
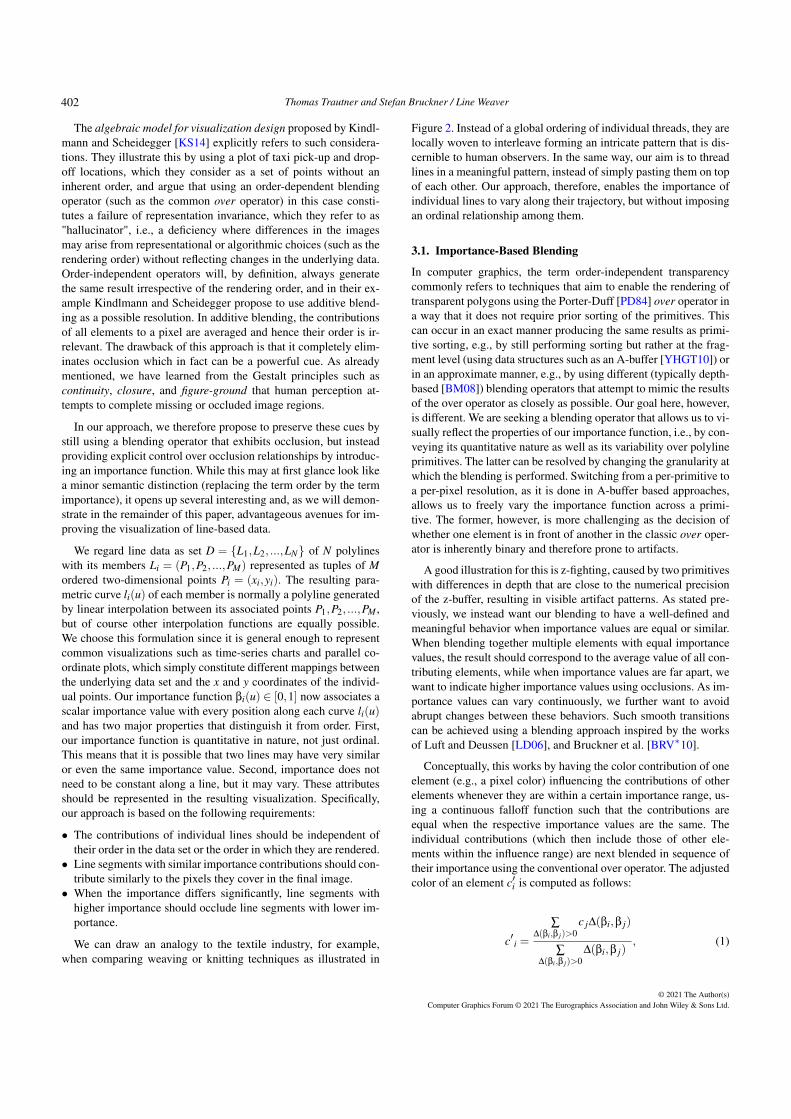
Figure 3: Pairwise comparison of two lines, each with varying im-portance, blended on top of each other: (a) red and turquoise, (b)brown and turquoise, and (c) red and brown, wherein red has astep function, turquoise a sine function, and brown a tent functionas importance, using a smoothness of t = 0.15. Note that the visualresult depends purely on the blending and not the render order.
wherein c j are the opacity-weighted color contributions of the otherelements, βi, β j are the respective importance values, and ∆ is afalloff function that gradually decreases to zero with the absolutedifference of its arguments. In practice, we define ∆ based on a Her-mite polynomial, similar to the common smoothstep function, suchthat it is 1 if the two importance values are the same and becomeszero as their difference exceeds a threshold value:
∆(a,b) =
0 if |a−b| ≥ t
2(|a−b|
t
)3−3(|a−b|
t
)2+1 otherwise
, (2)
wherein t is the user-defined threshold that specifies the range ofcontributions to be considered.
This approach now allows us to flexibly vary the importancefunction along individual lines. If the respective importances varycontinuously, two polylines may pass through each other withoutabrupt changes. In regions where the importances are equal, eachcontributing element will contribute equally. The behavior of ourblending approach with different importance functions is illustratedin Figure 3. We show how the blending result of two completelyoverlapping lines varies based on their importance functions (a stepfunction, a sine function, and a tent function).
3.2. Rendering and Stylization
For high-quality rendering of our polyline sets with variable thick-nesses, we use a method that combines a geometric approach withsigned distance functions (SDFs). This means that instead of gen-erating geometry to define the exact outline, which can be difficultand expensive both due to the potentially high geometric complex-ity (e.g., when rounded joins between line segments are desired)as well as issues with numerical precision, we instead rasterize theline geometry conservatively and then evaluate an SDF for eachfragment in order to determine the exact coverage.
In this method, we create a polygonal scaffolding for each indi-vidual polyline by extruding it on the fly into a triangle strip suchthat all potential pixels of the line are covered, similar to the proxybillboards used by Groß and Gumhold [GG21]. To avoid gaps in
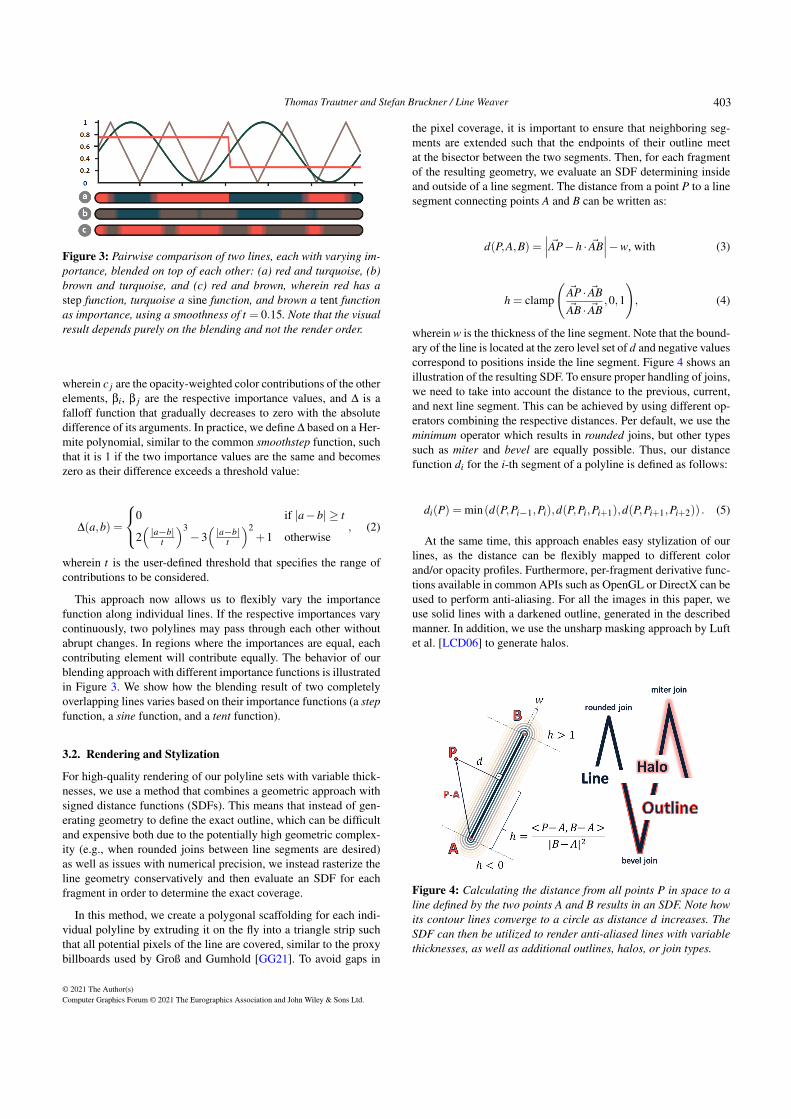
the pixel coverage, it is important to ensure that neighboring seg-ments are extended such that the endpoints of their outline meetat the bisector between the two segments. Then, for each fragmentof the resulting geometry, we evaluate an SDF determining insideand outside of a line segment. The distance from a point P to a linesegment connecting points A and B can be written as:
d(P,A,B) =∣∣∣ ~AP−h · ~AB
∣∣∣−w, with (3)
h = clamp
(~AP · ~AB~AB · ~AB
,0,1
), (4)
wherein w is the thickness of the line segment. Note that the bound-ary of the line is located at the zero level set of d and negative valuescorrespond to positions inside the line segment. Figure 4 shows anillustration of the resulting SDF. To ensure proper handling of joins,we need to take into account the distance to the previous, current,and next line segment. This can be achieved by using different op-erators combining the respective distances. Per default, we use theminimum operator which results in rounded joins, but other typessuch as miter and bevel are equally possible. Thus, our distancefunction di for the i-th segment of a polyline is defined as follows:
di(P) = min(d(P,Pi−1,Pi),d(P,Pi,Pi+1),d(P,Pi+1,Pi+2)) . (5)
At the same time, this approach enables easy stylization of ourlines, as the distance can be flexibly mapped to different colorand/or opacity profiles. Furthermore, per-fragment derivative func-tions available in common APIs such as OpenGL or DirectX can beused to perform anti-aliasing. For all the images in this paper, weuse solid lines with a darkened outline, generated in the describedmanner. In addition, we use the unsharp masking approach by Luftet al. [LCD06] to generate halos.
Figure 4: Calculating the distance from all points P in space to aline defined by the two points A and B results in an SDF. Note howits contour lines converge to a circle as distance d increases. TheSDF can then be utilized to render anti-aliased lines with variablethicknesses, as well as additional outlines, halos, or join types.
© 2021 The Author(s)Computer Graphics Forum © 2021 The Eurographics Association and John Wiley & Sons Ltd.
403
Thomas Trautner and Stefan Bruckner / Line Weaver
a b
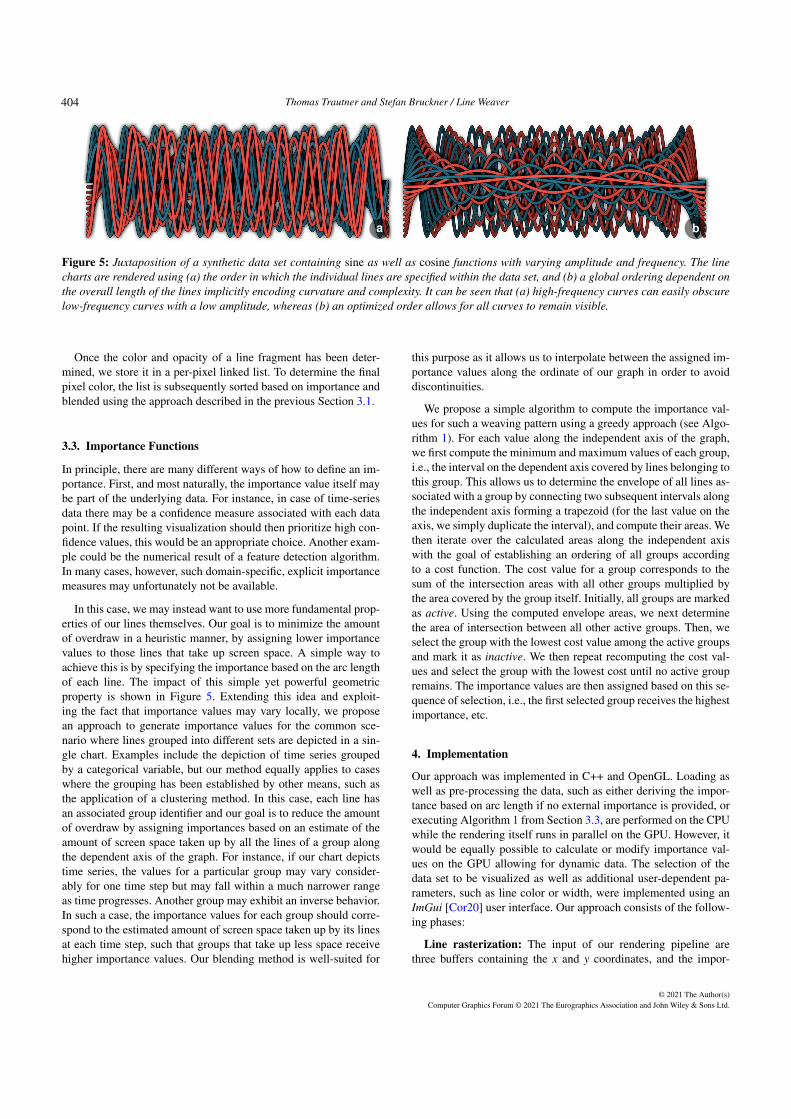
Figure 5: Juxtaposition of a synthetic data set containing sine as well as cosine functions with varying amplitude and frequency. The linecharts are rendered using (a) the order in which the individual lines are specified within the data set, and (b) a global ordering dependent onthe overall length of the lines implicitly encoding curvature and complexity. It can be seen that (a) high-frequency curves can easily obscurelow-frequency curves with a low amplitude, whereas (b) an optimized order allows for all curves to remain visible.
Once the color and opacity of a line fragment has been deter-mined, we store it in a per-pixel linked list. To determine the finalpixel color, the list is subsequently sorted based on importance andblended using the approach described in the previous Section 3.1.
3.3. Importance Functions
In principle, there are many different ways of how to define an im-portance. First, and most naturally, the importance value itself maybe part of the underlying data. For instance, in case of time-seriesdata there may be a confidence measure associated with each datapoint. If the resulting visualization should then prioritize high con-fidence values, this would be an appropriate choice. Another exam-ple could be the numerical result of a feature detection algorithm.In many cases, however, such domain-specific, explicit importancemeasures may unfortunately not be available.
In this case, we may instead want to use more fundamental prop-erties of our lines themselves. Our goal is to minimize the amountof overdraw in a heuristic manner, by assigning lower importancevalues to those lines that take up screen space. A simple way toachieve this is by specifying the importance based on the arc lengthof each line. The impact of this simple yet powerful geometricproperty is shown in Figure 5. Extending this idea and exploit-ing the fact that importance values may vary locally, we proposean approach to generate importance values for the common sce-nario where lines grouped into different sets are depicted in a sin-gle chart. Examples include the depiction of time series groupedby a categorical variable, but our method equally applies to caseswhere the grouping has been established by other means, such asthe application of a clustering method. In this case, each line hasan associated group identifier and our goal is to reduce the amountof overdraw by assigning importances based on an estimate of theamount of screen space taken up by all the lines of a group alongthe dependent axis of the graph. For instance, if our chart depictstime series, the values for a particular group may vary consider-ably for one time step but may fall within a much narrower rangeas time progresses. Another group may exhibit an inverse behavior.In such a case, the importance values for each group should corre-spond to the estimated amount of screen space taken up by its linesat each time step, such that groups that take up less space receivehigher importance values. Our blending method is well-suited for
this purpose as it allows us to interpolate between the assigned im-portance values along the ordinate of our graph in order to avoiddiscontinuities.
We propose a simple algorithm to compute the importance val-ues for such a weaving pattern using a greedy approach (see Algo-rithm 1). For each value along the independent axis of the graph,we first compute the minimum and maximum values of each group,i.e., the interval on the dependent axis covered by lines belonging tothis group. This allows us to determine the envelope of all lines as-sociated with a group by connecting two subsequent intervals alongthe independent axis forming a trapezoid (for the last value on theaxis, we simply duplicate the interval), and compute their areas. Wethen iterate over the calculated areas along the independent axiswith the goal of establishing an ordering of all groups accordingto a cost function. The cost value for a group corresponds to thesum of the intersection areas with all other groups multiplied bythe area covered by the group itself. Initially, all groups are markedas active. Using the computed envelope areas, we next determinethe area of intersection between all other active groups. Then, weselect the group with the lowest cost value among the active groupsand mark it as inactive. We then repeat recomputing the cost val-ues and select the group with the lowest cost until no active groupremains. The importance values are then assigned based on this se-quence of selection, i.e., the first selected group receives the highestimportance, etc.
4. Implementation
Our approach was implemented in C++ and OpenGL. Loading aswell as pre-processing the data, such as either deriving the impor-tance based on arc length if no external importance is provided, orexecuting Algorithm 1 from Section 3.3, are performed on the CPUwhile the rendering itself runs in parallel on the GPU. However, itwould be equally possible to calculate or modify importance val-ues on the GPU allowing for dynamic data. The selection of thedata set to be visualized as well as additional user-dependent pa-rameters, such as line color or width, were implemented using anImGui [Cor20] user interface. Our approach consists of the follow-ing phases:
Line rasterization: The input of our rendering pipeline arethree buffers containing the x and y coordinates, and the impor-
© 2021 The Author(s)Computer Graphics Forum © 2021 The Eurographics Association and John Wiley & Sons Ltd.
404
Thomas Trautner and Stefan Bruckner / Line Weaver
Algorithm 1: Weaving Loominput : A set of groups G = {G1,G2, ...,GK}output: Ordering for each value on the dependent axis
1 for all values x on the independent axis do2 compute group coverage areas A(Gi) ∀Gi ∈ G3 compute group intersection areas I(Gi,G j) ∀Gi,G j ∈ G4 mark all groups as active: P← G5 initialize order to zero: o← 06 while P 6= ∅ do7 compute cost values:8 C(Gi)← A(Gi) ∑
i 6= jI(Gi,G j) ∀Gi,G j ∈ P
9 select group with minimal cost:10 S← argmin
Gi∈PC(Gi)
11 output and increment order, update active groups:12 Ox(S) = o13 o← o+114 P← P\S
tance per tuple. It is, however, unimportant in which order the linesare allocated within the buffers as they are sorted in the blend-ing phase. In a geometry shader, based on the desired line thick-ness, we construct the line scaffolding as triangle strips by usingthe GL_LINE_ADJACENCY primitive type, which provides theshader with access to neighboring vertices without requiring dupli-cation. In the fragment shader, we evaluate the SDF from Equa-tion 5 in order to determine the fragments covered by the line seg-ment and evaluate their colors. The result, together with its impor-tance value, is then added to a per-pixel linked list. We use an imageobject to store the index of the last list entry for each pixel, as wellas a shader storage buffer object (SSBO) to store the fragment data.This buffer contains a single counter for the total number of allo-cated entries, as well as an array of the actual list entries.
Fragment blending: We render a screen-filling quad to traversethe linked list for each pixel, performing blending as described inSection 3.1. We use bubble sort to sort the list entries based ontheir importance and then use our blending operator to determinethe final combined pixel color. If halos based on the method of Luftet al. [LCD06] are enabled, this step is preceded by an additionalblurring pass which is then used as secondary input to darken sur-rounding pixel regions.
Our complete source code is available at:https://github.com/TTrautner/LineWeaver.git
5. Usage Examples
In this section, we now demonstrate the strength and versatility ofline weaver based on three real-world data sets and one artificiallygenerated data set. Each data set has a different number of lines(between 20 and 1,200) and a varying number of clusters (between3 and 5). We further illustrate the properties of our approach by us-ing diverse types of charts such as parallel coordinate plots (PCPs),Andrews plots [And72], and time series plots. Finally, we show
that even user interaction can be efficiently implemented by pre-senting a usage example of a magic lens [SFB94] for focus+context[Hau06] exploration and angular brushing [HLD02].
5.1. Global Importance
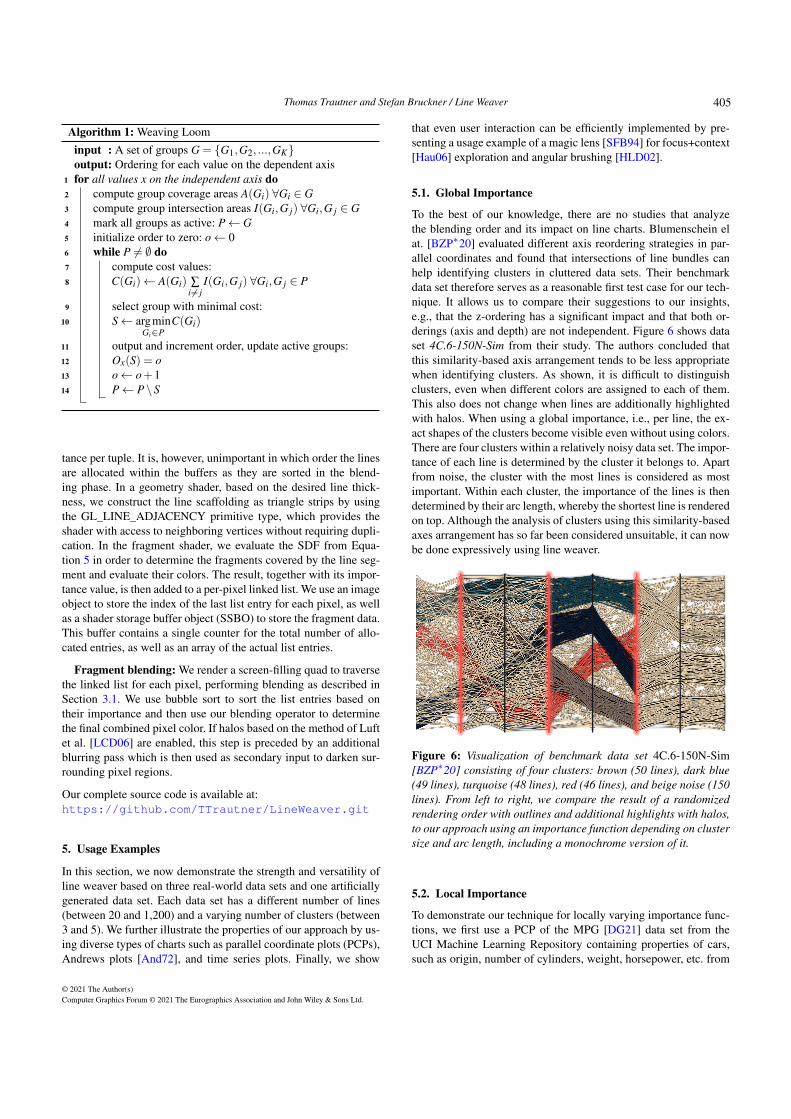
To the best of our knowledge, there are no studies that analyzethe blending order and its impact on line charts. Blumenschein elat. [BZP∗20] evaluated different axis reordering strategies in par-allel coordinates and found that intersections of line bundles canhelp identifying clusters in cluttered data sets. Their benchmarkdata set therefore serves as a reasonable first test case for our tech-nique. It allows us to compare their suggestions to our insights,e.g., that the z-ordering has a significant impact and that both or-derings (axis and depth) are not independent. Figure 6 shows dataset 4C.6-150N-Sim from their study. The authors concluded thatthis similarity-based axis arrangement tends to be less appropriatewhen identifying clusters. As shown, it is difficult to distinguishclusters, even when different colors are assigned to each of them.This also does not change when lines are additionally highlightedwith halos. When using a global importance, i.e., per line, the ex-act shapes of the clusters become visible even without using colors.There are four clusters within a relatively noisy data set. The impor-tance of each line is determined by the cluster it belongs to. Apartfrom noise, the cluster with the most lines is considered as mostimportant. Within each cluster, the importance of the lines is thendetermined by their arc length, whereby the shortest line is renderedon top. Although the analysis of clusters using this similarity-basedaxes arrangement has so far been considered unsuitable, it can nowbe done expressively using line weaver.
Figure 6: Visualization of benchmark data set 4C.6-150N-Sim[BZP∗20] consisting of four clusters: brown (50 lines), dark blue(49 lines), turquoise (48 lines), red (46 lines), and beige noise (150lines). From left to right, we compare the result of a randomizedrendering order with outlines and additional highlights with halos,to our approach using an importance function depending on clustersize and arc length, including a monochrome version of it.
5.2. Local Importance
To demonstrate our technique for locally varying importance func-tions, we first use a PCP of the MPG [DG21] data set from theUCI Machine Learning Repository containing properties of cars,such as origin, number of cylinders, weight, horsepower, etc. from
© 2021 The Author(s)Computer Graphics Forum © 2021 The Eurographics Association and John Wiley & Sons Ltd.
405
Thomas Trautner and Stefan Bruckner / Line Weaver
a b
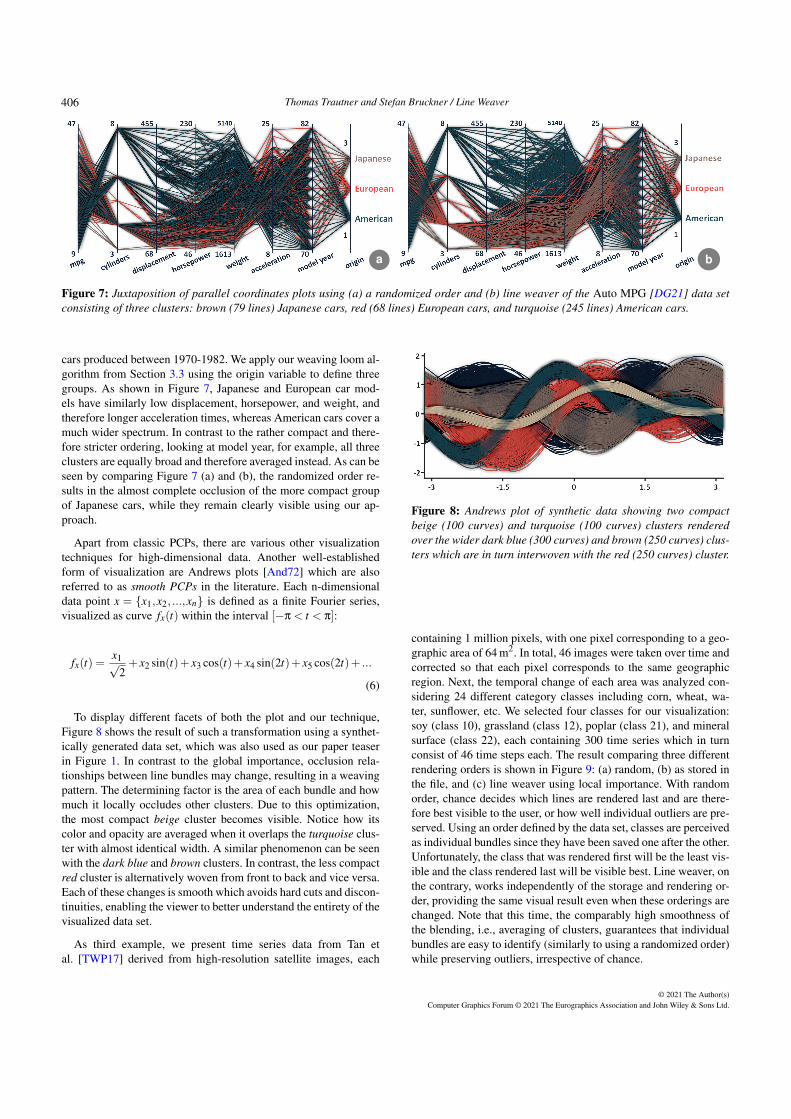
Figure 7: Juxtaposition of parallel coordinates plots using (a) a randomized order and (b) line weaver of the Auto MPG [DG21] data setconsisting of three clusters: brown (79 lines) Japanese cars, red (68 lines) European cars, and turquoise (245 lines) American cars.
cars produced between 1970-1982. We apply our weaving loom al-gorithm from Section 3.3 using the origin variable to define threegroups. As shown in Figure 7, Japanese and European car mod-els have similarly low displacement, horsepower, and weight, andtherefore longer acceleration times, whereas American cars cover amuch wider spectrum. In contrast to the rather compact and there-fore stricter ordering, looking at model year, for example, all threeclusters are equally broad and therefore averaged instead. As can beseen by comparing Figure 7 (a) and (b), the randomized order re-sults in the almost complete occlusion of the more compact groupof Japanese cars, while they remain clearly visible using our ap-proach.
Apart from classic PCPs, there are various other visualizationtechniques for high-dimensional data. Another well-establishedform of visualization are Andrews plots [And72] which are alsoreferred to as smooth PCPs in the literature. Each n-dimensionaldata point x = {x1,x2, ...,xn} is defined as a finite Fourier series,visualized as curve fx(t) within the interval [−π < t < π]:
fx(t) =x1√
2+ x2 sin(t)+ x3 cos(t)+ x4 sin(2t)+ x5 cos(2t)+ ...
(6)
To display different facets of both the plot and our technique,Figure 8 shows the result of such a transformation using a synthet-ically generated data set, which was also used as our paper teaserin Figure 1. In contrast to the global importance, occlusion rela-tionships between line bundles may change, resulting in a weavingpattern. The determining factor is the area of each bundle and howmuch it locally occludes other clusters. Due to this optimization,the most compact beige cluster becomes visible. Notice how itscolor and opacity are averaged when it overlaps the turquoise clus-ter with almost identical width. A similar phenomenon can be seenwith the dark blue and brown clusters. In contrast, the less compactred cluster is alternatively woven from front to back and vice versa.Each of these changes is smooth which avoids hard cuts and discon-tinuities, enabling the viewer to better understand the entirety of thevisualized data set.
As third example, we present time series data from Tan etal. [TWP17] derived from high-resolution satellite images, each
Figure 8: Andrews plot of synthetic data showing two compactbeige (100 curves) and turquoise (100 curves) clusters renderedover the wider dark blue (300 curves) and brown (250 curves) clus-ters which are in turn interwoven with the red (250 curves) cluster.
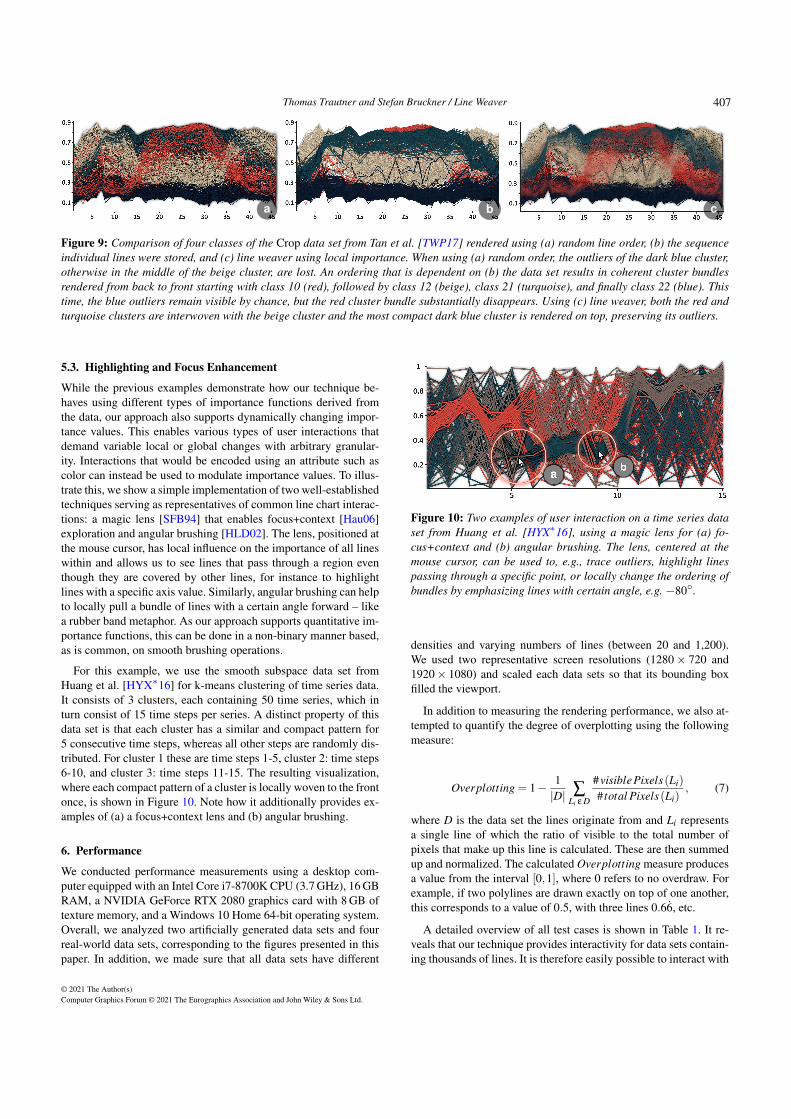
containing 1 million pixels, with one pixel corresponding to a geo-graphic area of 64 m2. In total, 46 images were taken over time andcorrected so that each pixel corresponds to the same geographicregion. Next, the temporal change of each area was analyzed con-sidering 24 different category classes including corn, wheat, wa-ter, sunflower, etc. We selected four classes for our visualization:soy (class 10), grassland (class 12), poplar (class 21), and mineralsurface (class 22), each containing 300 time series which in turnconsist of 46 time steps each. The result comparing three differentrendering orders is shown in Figure 9: (a) random, (b) as stored inthe file, and (c) line weaver using local importance. With randomorder, chance decides which lines are rendered last and are there-fore best visible to the user, or how well individual outliers are pre-served. Using an order defined by the data set, classes are perceivedas individual bundles since they have been saved one after the other.Unfortunately, the class that was rendered first will be the least vis-ible and the class rendered last will be visible best. Line weaver, onthe contrary, works independently of the storage and rendering or-der, providing the same visual result even when these orderings arechanged. Note that this time, the comparably high smoothness ofthe blending, i.e., averaging of clusters, guarantees that individualbundles are easy to identify (similarly to using a randomized order)while preserving outliers, irrespective of chance.
© 2021 The Author(s)Computer Graphics Forum © 2021 The Eurographics Association and John Wiley & Sons Ltd.
406
Thomas Trautner and Stefan Bruckner / Line Weaver
a b c
Figure 9: Comparison of four classes of the Crop data set from Tan et al. [TWP17] rendered using (a) random line order, (b) the sequenceindividual lines were stored, and (c) line weaver using local importance. When using (a) random order, the outliers of the dark blue cluster,otherwise in the middle of the beige cluster, are lost. An ordering that is dependent on (b) the data set results in coherent cluster bundlesrendered from back to front starting with class 10 (red), followed by class 12 (beige), class 21 (turquoise), and finally class 22 (blue). Thistime, the blue outliers remain visible by chance, but the red cluster bundle substantially disappears. Using (c) line weaver, both the red andturquoise clusters are interwoven with the beige cluster and the most compact dark blue cluster is rendered on top, preserving its outliers.
5.3. Highlighting and Focus Enhancement
While the previous examples demonstrate how our technique be-haves using different types of importance functions derived fromthe data, our approach also supports dynamically changing impor-tance values. This enables various types of user interactions thatdemand variable local or global changes with arbitrary granular-ity. Interactions that would be encoded using an attribute such ascolor can instead be used to modulate importance values. To illus-trate this, we show a simple implementation of two well-establishedtechniques serving as representatives of common line chart interac-tions: a magic lens [SFB94] that enables focus+context [Hau06]exploration and angular brushing [HLD02]. The lens, positioned atthe mouse cursor, has local influence on the importance of all lineswithin and allows us to see lines that pass through a region eventhough they are covered by other lines, for instance to highlightlines with a specific axis value. Similarly, angular brushing can helpto locally pull a bundle of lines with a certain angle forward – likea rubber band metaphor. As our approach supports quantitative im-portance functions, this can be done in a non-binary manner based,as is common, on smooth brushing operations.
For this example, we use the smooth subspace data set fromHuang et al. [HYX∗16] for k-means clustering of time series data.It consists of 3 clusters, each containing 50 time series, which inturn consist of 15 time steps per series. A distinct property of thisdata set is that each cluster has a similar and compact pattern for5 consecutive time steps, whereas all other steps are randomly dis-tributed. For cluster 1 these are time steps 1-5, cluster 2: time steps6-10, and cluster 3: time steps 11-15. The resulting visualization,where each compact pattern of a cluster is locally woven to the frontonce, is shown in Figure 10. Note how it additionally provides ex-amples of (a) a focus+context lens and (b) angular brushing.
6. Performance
We conducted performance measurements using a desktop com-puter equipped with an Intel Core i7-8700K CPU (3.7 GHz), 16 GBRAM, a NVIDIA GeForce RTX 2080 graphics card with 8 GB oftexture memory, and a Windows 10 Home 64-bit operating system.Overall, we analyzed two artificially generated data sets and fourreal-world data sets, corresponding to the figures presented in thispaper. In addition, we made sure that all data sets have different
Figure 10: Two examples of user interaction on a time series dataset from Huang et al. [HYX∗16], using a magic lens for (a) fo-cus+context and (b) angular brushing. The lens, centered at themouse cursor, can be used to, e.g., trace outliers, highlight linespassing through a specific point, or locally change the ordering ofbundles by emphasizing lines with certain angle, e.g. −80◦.
densities and varying numbers of lines (between 20 and 1,200).We used two representative screen resolutions (1280× 720 and1920× 1080) and scaled each data sets so that its bounding boxfilled the viewport.
In addition to measuring the rendering performance, we also at-tempted to quantify the degree of overplotting using the followingmeasure:
Overplotting = 1− 1|D| ∑
Li ε D
#visiblePixels(Li)
# total Pixels(Li), (7)
where D is the data set the lines originate from and Li representsa single line of which the ratio of visible to the total number ofpixels that make up this line is calculated. These are then summedup and normalized. The calculated Overplotting measure producesa value from the interval [0,1], where 0 refers to no overdraw. Forexample, if two polylines are drawn exactly on top of one another,this corresponds to a value of 0.5, with three lines 0.66, etc.
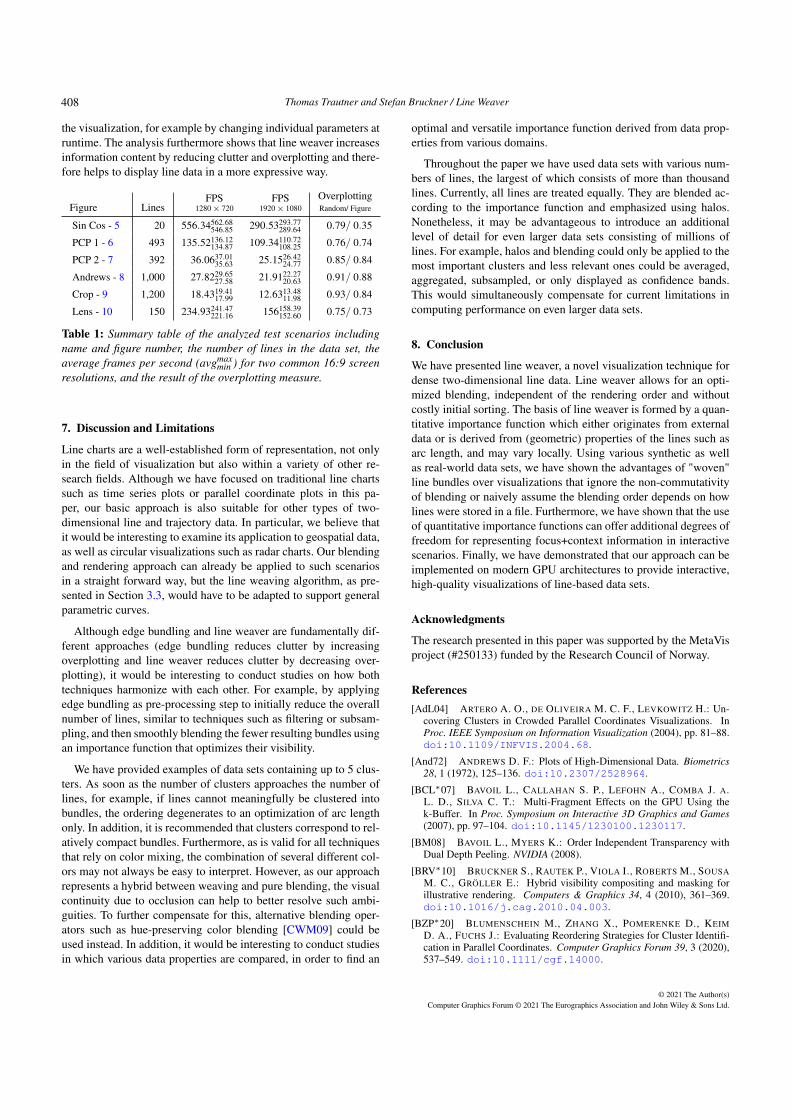
A detailed overview of all test cases is shown in Table 1. It re-veals that our technique provides interactivity for data sets contain-ing thousands of lines. It is therefore easily possible to interact with
© 2021 The Author(s)Computer Graphics Forum © 2021 The Eurographics Association and John Wiley & Sons Ltd.
407
Thomas Trautner and Stefan Bruckner / Line Weaver
the visualization, for example by changing individual parameters atruntime. The analysis furthermore shows that line weaver increasesinformation content by reducing clutter and overplotting and there-fore helps to display line data in a more expressive way.
Figure LinesFPS
1280× 720FPS
1920× 1080OverplottingRandom/ Figure
Sin Cos - 5 20 556.34562.68546.85 290.53293.77
289.64 0.79/ 0.35
PCP 1 - 6 493 135.52136.12134.87 109.34110.72
108.25 0.76/ 0.74
PCP 2 - 7 392 36.0637.0135.63 25.1526.42
24.77 0.85/ 0.84
Andrews - 8 1,000 27.8229.6527.58 21.9122.27
20.63 0.91/ 0.88
Crop - 9 1,200 18.4319.4117.99 12.6313.48
11.98 0.93/ 0.84
Lens - 10 150 234.93241.47221.16 156158.39
152.60 0.75/ 0.73
Table 1: Summary table of the analyzed test scenarios includingname and figure number, the number of lines in the data set, theaverage frames per second (avgmax
min ) for two common 16:9 screenresolutions, and the result of the overplotting measure.
7. Discussion and Limitations
Line charts are a well-established form of representation, not onlyin the field of visualization but also within a variety of other re-search fields. Although we have focused on traditional line chartssuch as time series plots or parallel coordinate plots in this pa-per, our basic approach is also suitable for other types of two-dimensional line and trajectory data. In particular, we believe thatit would be interesting to examine its application to geospatial data,as well as circular visualizations such as radar charts. Our blendingand rendering approach can already be applied to such scenariosin a straight forward way, but the line weaving algorithm, as pre-sented in Section 3.3, would have to be adapted to support generalparametric curves.
Although edge bundling and line weaver are fundamentally dif-ferent approaches (edge bundling reduces clutter by increasingoverplotting and line weaver reduces clutter by decreasing over-plotting), it would be interesting to conduct studies on how bothtechniques harmonize with each other. For example, by applyingedge bundling as pre-processing step to initially reduce the overallnumber of lines, similar to techniques such as filtering or subsam-pling, and then smoothly blending the fewer resulting bundles usingan importance function that optimizes their visibility.
We have provided examples of data sets containing up to 5 clus-ters. As soon as the number of clusters approaches the number oflines, for example, if lines cannot meaningfully be clustered intobundles, the ordering degenerates to an optimization of arc lengthonly. In addition, it is recommended that clusters correspond to rel-atively compact bundles. Furthermore, as is valid for all techniquesthat rely on color mixing, the combination of several different col-ors may not always be easy to interpret. However, as our approachrepresents a hybrid between weaving and pure blending, the visualcontinuity due to occlusion can help to better resolve such ambi-guities. To further compensate for this, alternative blending oper-ators such as hue-preserving color blending [CWM09] could beused instead. In addition, it would be interesting to conduct studiesin which various data properties are compared, in order to find an
optimal and versatile importance function derived from data prop-erties from various domains.
Throughout the paper we have used data sets with various num-bers of lines, the largest of which consists of more than thousandlines. Currently, all lines are treated equally. They are blended ac-cording to the importance function and emphasized using halos.Nonetheless, it may be advantageous to introduce an additionallevel of detail for even larger data sets consisting of millions oflines. For example, halos and blending could only be applied to themost important clusters and less relevant ones could be averaged,aggregated, subsampled, or only displayed as confidence bands.This would simultaneously compensate for current limitations incomputing performance on even larger data sets.
8. Conclusion
We have presented line weaver, a novel visualization technique fordense two-dimensional line data. Line weaver allows for an opti-mized blending, independent of the rendering order and withoutcostly initial sorting. The basis of line weaver is formed by a quan-titative importance function which either originates from externaldata or is derived from (geometric) properties of the lines such asarc length, and may vary locally. Using various synthetic as wellas real-world data sets, we have shown the advantages of "woven"line bundles over visualizations that ignore the non-commutativityof blending or naively assume the blending order depends on howlines were stored in a file. Furthermore, we have shown that the useof quantitative importance functions can offer additional degrees offreedom for representing focus+context information in interactivescenarios. Finally, we have demonstrated that our approach can beimplemented on modern GPU architectures to provide interactive,high-quality visualizations of line-based data sets.
Acknowledgments
The research presented in this paper was supported by the MetaVisproject (#250133) funded by the Research Council of Norway.
References[AdL04] ARTERO A. O., DE OLIVEIRA M. C. F., LEVKOWITZ H.: Un-
covering Clusters in Crowded Parallel Coordinates Visualizations. InProc. IEEE Symposium on Information Visualization (2004), pp. 81–88.doi:10.1109/INFVIS.2004.68.
[And72] ANDREWS D. F.: Plots of High-Dimensional Data. Biometrics28, 1 (1972), 125–136. doi:10.2307/2528964.
[BCL∗07] BAVOIL L., CALLAHAN S. P., LEFOHN A., COMBA J. A.L. D., SILVA C. T.: Multi-Fragment Effects on the GPU Using thek-Buffer. In Proc. Symposium on Interactive 3D Graphics and Games(2007), pp. 97–104. doi:10.1145/1230100.1230117.
[BM08] BAVOIL L., MYERS K.: Order Independent Transparency withDual Depth Peeling. NVIDIA (2008).
[BRV∗10] BRUCKNER S., RAUTEK P., VIOLA I., ROBERTS M., SOUSAM. C., GRÖLLER E.: Hybrid visibility compositing and masking forillustrative rendering. Computers & Graphics 34, 4 (2010), 361–369.doi:10.1016/j.cag.2010.04.003.
[BZP∗20] BLUMENSCHEIN M., ZHANG X., POMERENKE D., KEIMD. A., FUCHS J.: Evaluating Reordering Strategies for Cluster Identifi-cation in Parallel Coordinates. Computer Graphics Forum 39, 3 (2020),537–549. doi:10.1111/cgf.14000.
© 2021 The Author(s)Computer Graphics Forum © 2021 The Eurographics Association and John Wiley & Sons Ltd.
408
Thomas Trautner and Stefan Bruckner / Line Weaver
[Car84] CARPENTER L.: The A -Buffer, an Antialiased Hidden SurfaceMethod. ACM SIGGRAPH Computer Graphic 18, 3 (1984), 103–108.doi:10.1145/964965.808585.
[CMM88] CLEVELAND W., MCGILL M. E., MCGILL R.: The ShapeParameter of a Two-Variable Graph. Journal of the American StatisticalAssociation 83, 402 (1988), 289–300. doi:10.1080/01621459.1988.10478598.
[Cor20] CORNUT O.: ImGui. https://github.com/ocornut/imgui, 2020. Accessed: October.
[CWM09] CHUANG J., WEISKOPF D., MÖLLER T.: Hue-PreservingColor Blending. IEEE Transactions on Visualization and ComputerGraphics 15, 6 (2009), 1275–1282. doi:10.1109/TVCG.2009.150.
[DG21] DUA D., GRAFF C.: UCI Machine Learning Repository. http://archive.ics.uci.edu/ml, 2021. Accessed: March.
[DLH11a] DAAE LAMPE O., HAUSER H.: Curve Density Estimates.Computer Graphics Forum 30, 3 (2011), 633–642. doi:10.1111/j.1467-8659.2011.01912.x.
[DLH11b] DAAE LAMPE O., HAUSER H.: Interactive visualization ofstreaming data with Kernel Density Estimation. In Proc. IEEE Paci-ficVis (2011), pp. 171–178. doi:10.1109/PACIFICVIS.2011.5742387.
[DV10] DEMŠAR U., VIRRANTAUS K.: Space–time density of trajecto-ries: exploring spatio-temporal patterns in movement data. InternationalJournal of Geographical Information Science 24, 10 (2010), 1527–1542.doi:10.1080/13658816.2010.511223.
[EBRI09] EVERTS M. H., BEKKER H., ROERDINK J. B. T. M., ISEN-BERG T.: Depth-Dependent Halos: Illustrative Rendering of Dense LineData. IEEE Transactions on Visualization and Computer Graphics 15, 6(2009), 1299–1306. doi:10.1109/TVCG.2009.138.
[EHS13] EICHELBAUM S., HLAWITSCHKA M., SCHEUERMANN G.:LineAO—Improved Three-Dimensional Line Rendering. IEEE Trans-actions on Visualization and Computer Graphics 19, 3 (2013), 433–445.doi:10.1109/TVCG.2012.142.
[FWR99] FUA Y.-H., WARD M. O., RUNDENSTEINER E. A.: Hi-erarchical Parallel Coordinates for Exploration of Large Datasets.In Proc. IEEE Visualization (1999), pp. 43–50. doi:10.1109/PACIFICVIS.2011.5742387.
[GG21] GROSS D., GUMHOLD S.: Advanced Rendering of Line Datawith Ambient Occlusion and Transparency. IEEE Transactions on Vi-sualization and Computer Graphics 27, 2 (2021), 614–624. doi:10.1109/TVCG.2020.3028954.
[GRT13] GÜNTHER T., RÖSSL C., THEISEL H.: Opacity Optimizationfor 3D Line Fields. ACM Transactions on Graphics 32, 4 (2013), 120:1–120:8. doi:10.1145/2461912.2461930.
[GRT14] GÜNTHER T., RÖSSL C., THEISEL H.: Hierarchical opacityoptimization for sets of 3D line fields. Computer Graphics Forum 33, 2(2014), 507–516. doi:10.1111/cgf.12336.
[GTG17] GÜNTHER T., THEISEL H., GROSS M.: Decoupled OpacityOptimization for Points, Lines and Surfaces. Computer Graphics Forum36, 2 (2017), 153–162. doi:10.1111/cgf.13115.
[Hau06] HAUSER H. R.: Generalizing Focus+Context Visualization.Springer Berlin Heidelberg, 2006, pp. 305–327.
[HLD02] HAUSER H., LEDERMANN F., DOLEISCH H.: Angular brush-ing of extended parallel coordinates. In Proc. IEEE Symposium on Infor-mation Visualization (2002), pp. 127–130. doi:10.1109/INFVIS.2002.1173157.
[HSKIH07] HAGH-SHENAS H., KIM S., INTERRANTE V., HEALEY C.:Weaving Versus Blending: a quantitative assessment of the informationcarrying capacities of two alternative methods for conveying multivari-ate data with color. IEEE Transactions on Visualization and ComputerGraphics 13, 6 (2007), 1270–1277. doi:10.1109/TVCG.2007.70623.
[HYX∗16] HUANG X., YE Y., XIONG L., LAU R. Y., JIANG N., WANGS.: Time series k-means: A new k-means type smooth subspace cluster-ing for time series data. Information Sciences 367-368 (2016), 1–13.doi:10.1016/j.ins.2016.05.040.
[JLJC06] JOHANSSON J., LJUNG P., JERN M., COOPER M.: Reveal-ing Structure in Visualizations of Dense 2D and 3D Parallel Coordi-nates. Information Visualization 5, 2 (2006), 125–136. doi:10.1057/palgrave.ivs.9500117.
[Kil20] KILGARD M. J.: Polar Stroking: New Theory and Methods forStroking Paths. ACM Transactions on Graphics 39, 4 (2020). doi:10.1145/3386569.3392458.
[KLM∗12] KONYHA Z., LEŽ A., MATKOVIC K., JELOVIC M.,HAUSER H.: Interactive Visual Analysis of Families of Curves Us-ing Data Aggregation and Derivation. In Proc. Conference on Knowl-edge Management and Knowledge Technologies (2012), pp. 24:1–24:8.doi:10.1145/2362456.2362487.
[KMLM16] KWON O.-H., MUELDER C., LEE K., MA K.-L.: A Studyof Layout, Rendering, and Interaction Methods for Immersive Graph Vi-sualization. IEEE Transactions on Visualization and Computer Graphics22, 7 (2016), 1802–1815. doi:10.1109/TVCG.2016.2520921.
[KNM∗20] KERN M., NEUHAUSER C., MAACK T., HAN M., USHERW., WESTERMANN R.: A Comparison of Rendering Techniques for 3DLine Sets with Transparency. IEEE Transactions on Visualization andComputer Graphics PrePrint (2020). doi:10.1109/TVCG.2020.2975795.
[KS14] KINDLMANN G., SCHEIDEGGER C.: An Algebraic Process forVisualization Design. IEEE Transactions on Visualization and ComputerGraphics 20, 12 (2014), 2181–2190. doi:10.1109/TVCG.2014.2346325.
[LCD06] LUFT T., COLDITZ C., DEUSSEN O.: Image Enhancementby Unsharp Masking the Depth Buffer. ACM SIGGRAPH Com-puter Graphic 25, 3 (2006), 1206–1213. doi:10.1145/1179352.1142016.
[LD06] LUFT T., DEUSSEN O.: Real-Time Watercolor Illustrationsof Plants Using a Blurred Depth Test. In Proc. Symposium on Non-Photorealistic Animation and Rendering (2006), pp. 11–20. doi:10.1145/1124728.1124732.
[LRS10] LUBOSCHIK M., RADLOFF A., SCHUMANN H.: A New Weav-ing Technique for Handling Overlapping Regions. In Proceedings of theInternational Conference on Advanced Visual Interfaces (2010), pp. 25–32. doi:10.1145/1842993.1842999.
[MF18] MORITZ D., FISHER D.: Visualizing a Million Time Series withthe Density Line Chart. CoRR abs/1808.06019 (2018).
[NH06] NOVOTNY M., HAUSER H.: Outlier-Preserving Focus+ContextVisualization in Parallel Coordinates. IEEE Transactions on Visualiza-tion and Computer Graphics 12, 5 (2006), 893–900. doi:10.1109/TVCG.2006.170.
[NY10] NAKAYA T., YANO K.: Visualising Crime Clusters in a Space-time Cube: An Exploratory Data-analysis Approach Using Space-timeKernel Density Estimation and Scan Statistics. Transactions in GIS 14,3 (2010), 223–239. doi:10.1111/j.1467-9671.2010.01194.x.
[PD84] PORTER T., DUFF T.: Compositing Digital Images. ACM SIG-GRAPH Computer Graphic 18, 3 (1984), 253–259. doi:10.1145/964965.808606.
[RMCW18] RYAN G., MOSCA A., CHANG R., WU E.: At a Glance:Pixel Approximate Entropy as a Measure of Line Chart Complex-ity. IEEE Transactions on Visualization and Computer Graphics 25, 1(2018), 872–881. doi:10.1109/TVCG.2018.2865264.
[RQ21] ROSEN P., QUADRI G. J.: LineSmooth: An Analytical Frame-work for Evaluating the Effectiveness of Smoothing Techniques on LineCharts. IEEE Transactions on Visualization and Computer Graphics 27,2 (2021), 1536–1546. doi:10.1109/TVCG.2020.3030421.
© 2021 The Author(s)Computer Graphics Forum © 2021 The Eurographics Association and John Wiley & Sons Ltd.
409
Thomas Trautner and Stefan Bruckner / Line Weaver
[SFB94] STONE M. C., FISHKIN K., BIER E. A.: The Movable FilterAs a User Interface Tool. In Proc. ACM CHI (1994), pp. 306–312. doi:10.1145/191666.191774.
[SM04] SCHUSSMAN G., MA K.-L.: Anisotropic volume rendering forextremely dense, thin line data. In Proc. IEEE Visualization (2004),pp. 107–114. doi:10.1109/VISUAL.2004.5.
[Spe52] SPEAR M. E.: Charting Statistics. McGraw-Hill, 1952, pp. 39–95.
[Tab20] TABLEAU SOFTWARE: Control the Appearance of Marksin the View. https://help.tableau.com/current/pro/desktop/en-gb/viewparts_marks_markproperties.htm#draw-paths-between-marks, 2020. Accessed: October.
[TBSB20] TRAUTNER T., BOLTE F., STOPPEL S., BRUCKNER S.:Sunspot Plots: Model-based Structure Enhancement for Dense Scat-ter Plots. Computer Graphics Forum 39, 3 (2020), 551–563. doi:10.1111/cgf.14001.
[TWP17] TAN C. W., WEBB G. I., PETITJEAN F.: Indexing and classi-fying gigabytes of time series under time warping. In Proc. SIAM In-ternational Conference on Data Mining (2017), pp. 282–290. doi:10.1137/1.9781611974973.32.
[WH09] WEISKOPF D., HEINRICH J.: Continuous Parallel Coordi-nates. IEEE Transactions on Visualization and Computer Graphics 15,6 (2009), 1531–1538. doi:10.1109/TVCG.2009.131.
[YHGT10] YANG J. C., HENSLEY J., GRÜN H., THIBIEROZ N.:Real-Time Concurrent Linked List Construction on the GPU. Com-puter Graphics Forum 29, 4 (2010), 1297–1304. doi:10.1111/j.1467-8659.2010.01725.x.
© 2021 The Author(s)Computer Graphics Forum © 2021 The Eurographics Association and John Wiley & Sons Ltd.
410