Condensed Interim Consolidated Financial Statements For the ...
Upload
khangminh22Category
view
0download
0
High-Pressure Shock Compression ofCondensed Matter
Editors-in-ChiefLee DavisonYasuyuki Horie
Founding EditorRobert A. Graham
Advisory BoardRoger Cheret, FranceVladimir E. Fortov, RussiaJing Fuqian, ChinaYogendra M. Gupta, USAJames N. Johnson, USAAkira B. Sawaoka, Japan
High-Pressure Shock Compression of Condensed Matter
L.L. Altgilbers, M.D.J. Brown, I. Grishnaev, B.M. Novac, I.R. Smith, I. Tkach, andY. Tkach: Magnetocumulative Generators
T. Antoun, D.R. Curran, G.I. Kanel, S.V. Razorenov, and A.V. Utkin: Spall Fracture
J. Asay and M. Shahinpoor (Eds.): High-Pressure Shock Compression of Solids
S.S. Batsanov: Effects of Explosion on Materials: Modification and Synthesis UnderHigh-Pressure Shock Compression
R. Cheret: Detonation of Condensed Explosives
L. Davison, D. Grady, and M. Shahinpoor (Eds.): High-Pressure Shock Compressionof Solids II
L. Davison, Y. Horie, and T. Sekine (Eds.): High-Pressure Shock Compressionof Solids V
L. Davison, Y. Horie, and M. Shahinpoor (Eds.): High-Pressure Shock Compressionof Solids IV
L. Davison and M. Shahinpoor (Eds.): High-Pressure Shock Compressionof Solids III
A.N. Dremin: Toward Detonation Theory
Y. Horie, L. Davison, and N.N. Thadhani (Eds.): High-Pressure Shock Compressionof Solids VI
R. Graham: Solids Under High-Pressure Shock Compression
J.N. Johnson and R. Cheret (Eds.): Classic Papers in Shock Compression Science
V.F. Nesterenko: Dynamics of Heterogeneous Materials
M. Suceska: Test Methods of Explosives
J.A. Zukas and W.P. Walters (Eds.): Explosive Effects and Applications
G.I. Kanel, S. V. Razorenov, and V.E. Fortov: Shock-Wave Phenomena and theProperties of Condensed Matter
V.E. Fortov, L.V. Altshuler, R.F. Trunin, and A.I. Funtikov: High-Pressure ShockCompression of Solids VII
L.C. Chhabildas, L. Davison, Y. Horie (Eds.): High-Pressure Shock Compression ofSolids VIII

Valery K. Kedrinskii
Hydrodynamicsof ExplosionExperiments and Models
Translated by Svetlana Yu. KnyazevaWith 175 Figures
123
Professor Valery K. KedrinskiiRussian Academy of SciencesLavrentyev Inst. HydrodynamicsLavrentyev prospect 15630090 Novosibirsk, Russian FederationEmail: [email protected]
Editors-in-Chief :
Dr. Lee Davison39 Canoncito Vista RoadTijeras, NM 87059, USAEmail: [email protected]
Dr. Yasuyuki Horie804 East Lake DriveShalimar, FL 32579, USAEmail: [email protected]
Library of Congress Control Number: 2005924364
ISBN-10: 3-540-22481-5 Springer Berlin Heidelberg New YorkISBN-13: 978-3-540-22481-5 Springer Berlin Heidelberg New York
This work is subject to copyright. All rights are reserved, whether the whole or part of the materialis concerned, specifically the rights of translation, reprinting, reuse of illustrations, recitation, broad-casting, reproduction on microfilm or in any other way, and storage in data banks. Duplication ofthis publication or parts thereof is permitted only under the provisions of the German Copyright Lawof September 9, 1965, in its current version, and permission for use must always be obtained fromSpringer. Violations are liable to prosecution under the German Copyright Law.
Springer is a part of Springer Science+Business Media
springeronline.com
© Springer-Verlag Berlin Heidelberg 2005Printed in Germany
The use of general descriptive names, registered names, trademarks, etc. in this publication does notimply, even in the absence of a specific statement, that such names are exempt from the relevant pro-tective laws and regulations and therefore free for general use.
Typesetting and production: LE-TEX Jelonek, Schmidt & Vöckler GbR, LeipzigCover design: design & production GmbH, Heidelberg
Printed on acid-free paper 54/3141/YL 5 4 3 2 1 0

Dedicated to the memory of Academician M.A. Lavrentiev
Preface
In the past century, much progress has been made in the hydrodynamics ofexplosion, the science dealing with liquid flows under shock-wave loading.This area is concerned primarily with studying underwater and undergroundexplosions, cumulation, and the behavior of metals under the action of thedetonation products of high explosives (HE), which produce extreme condi-tions such as pressures of hundreds of kilobars and temperatures up to severalthousand degrees.
This book presents research results of underwater explosions. Included area detailed analysis of the structure and parameters of the wave fields gener-ated by explosions of cored and spiral charges, a description of the formationmechanisms for a wide range of cumulative flows at underwater explosionsnear the free surface, and the relevant mathematical models. Shock-wavetransformation in bubbly liquids, shock-wave amplification due to collisionand focusing, and the formation of bubble detonation waves in reactive bub-bly liquids are studied in detail. Particular emphasis is placed on the investi-gation of wave processes in cavitating liquids, which incorporates the conceptsof the strength of real liquids containing natural microinhomogeneities, therelaxation of tensile stress, and the cavitation fracture of a liquid as the inver-sion of its two-phase state under impulsive (explosive) loading. The problemsare classed among essentially nonlinear processes that occur under shock load-ing of liquid and multiphase media and may be of interest to researchers ofphysical acoustics, the mechanics of multiphase media, shock-wave processesin condensed media, explosive hydroacoustics, and cumulation.
Obviously, the formulation and solution of problems is often initiated un-der the influence of our teachers and colleagues. First of all I would like tomention my teachers, Prof. R.I. Soloukhin and Prof. M.A. Lavrentiev. Theauthor is indebted to Prof. L.V. Ovsyannikov for his attention and continuousinterest in some problems described in the monograph. The contacts and dis-cussions with my colleagues and friends, Profs. V.M. Titov, V.E. Nakoryakov,R.I. Nigmatullin, E.I. Shemyakin, B.D. Khristoforov, Yu.A. Trishin, Kazu-joshi Takayama, Leen van Wijngaarden, Charles Mader, Werner Lauterborn,Brad Sturtevant, David Blackstock, David Crighton, and many others, werevery encouraging. Many results were obtained together with researchers inmy laboratory: Drs. S.V. Stebnovsky, A.R. Berngardt, A.S. Besov, N.N. Cher-nobaev, M.N. Davydov, I.G. Gets, V.T. Kuzavov, E.I. Pal’chikov, S.V. Plaksin,

VIII Preface
and S.P. Taratuta. Recent results obtained in cooperation with Profs. N.F. Mo-rozov, Yu.I. Shokin, Drs. V.A. Vshivkov, G.I. Dudnikova, and G.G. Lazarevaare also included in the book. I am grateful to Profs. V.P. Korobeinikov,B.D. Khristoforov, Fumio Higashino, Leif Bjorno, Leen Wijngaarden, YoichiroMatsumoto, and David Blackstock for valuable comments and recommenda-tions for publication of the English version of the monograph. For this pur-pose the Russian version of the monograph was considerably reworked andextended.
I would like to express my cordial thanks to Dr. S.Yu. Knyazeva for thehigh-quality translation of the book. I am also thankful to Dr. M.N. Davydovfor technical assistance in the preparation of the camera-ready copy.
The English version of the monograph is based on the 2000 Russian edi-tion, which has been revised and supplemented at the suggestion of the series’editorial board.
Novosibirsk, V.K. KedrinskiiFebruary 2005
Contents
Introduction . . . . . . . . . . . . . . . . . . . . . . . . . . . . . . . . . . . . . . . . . . . . . . . . . . 1
1 Equations of State, Initial and Boundary Conditions . . . . . . 71.1 Equations of State for Water . . . . . . . . . . . . . . . . . . . . . . . . . . . . . 71.2 Equations of State for Detonation Products . . . . . . . . . . . . . . . . 151.3 Conservation Laws, PU -Diagrams, and Transition Formulas 18
1.3.1 Transition in a Shock Wave . . . . . . . . . . . . . . . . . . . . . . . . 191.3.2 Transition in a Simple Wave . . . . . . . . . . . . . . . . . . . . . . . 21
1.4 Generalized Equation of Pulsations of an Explosive Cavity . . . 23References . . . . . . . . . . . . . . . . . . . . . . . . . . . . . . . . . . . . . . . . . . . . . . . . . 26
2 Underwater Explosions, Shock Tubes,and Explosive Sound Sources . . . . . . . . . . . . . . . . . . . . . . . . . . . . . 292.1 Kirkwood–Bethe Approximation, Cylindrical Symmetry . . . . . 29
2.1.1 Basic Assumptions, Initial Conditions . . . . . . . . . . . . . . . 292.1.2 Dynamics of an Explosive Cavity,
Riemann’s Function, Delay Integral . . . . . . . . . . . . . . . . . 322.1.3 Calculation of the Delay Integral (for ν = 1, 2) . . . . . . . 342.1.4 Shock Waves
(Cylindrical Symmetry, Comparison with Experiment) 352.1.5 Dynamics of Exponent Index, θ(rfr) . . . . . . . . . . . . . . . . 362.1.6 SW Parameters (Trotyl, Calculation and Experiment) 382.1.7 Asymptotic Approximation for Weak Shock Waves
(ν = 1, 2) . . . . . . . . . . . . . . . . . . . . . . . . . . . . . . . . . . . . . . . 392.2 Hydrodynamic Shock Tubes . . . . . . . . . . . . . . . . . . . . . . . . . . . . . 42
2.2.1 Filler’s Conical Shock Tube . . . . . . . . . . . . . . . . . . . . . . . . 422.2.2 Glass’s One-Diaphragm Shock Tube . . . . . . . . . . . . . . . . 432.2.3 Electromagnetic Shock Tube . . . . . . . . . . . . . . . . . . . . . . . 452.2.4 Two-Diaphragm Hydrodynamic Shock Tubes . . . . . . . . 472.2.5 Shock Tube Application: High-Rate Reactions
in Chemical Ssolutions . . . . . . . . . . . . . . . . . . . . . . . . . . . . 532.3 Explosive Hydroacoustics . . . . . . . . . . . . . . . . . . . . . . . . . . . . . . . . 57
2.3.1 Basic Characteristics of Explosive Sound Sources . . . . . 572.3.2 Hydrodynamic Sources of Explosive Type . . . . . . . . . . . 602.3.3 Wave Field, Spectral Characteristics . . . . . . . . . . . . . . . . 63
X Contents
2.3.4 Array Systems . . . . . . . . . . . . . . . . . . . . . . . . . . . . . . . . . . . 672.3.5 Explosion of Spiral Charges, Wave Structure . . . . . . . . . 69
2.4 HE-Nuclear-Tests, Explosive Acoustics and Earthquakes . . . . . 74References . . . . . . . . . . . . . . . . . . . . . . . . . . . . . . . . . . . . . . . . . . . . . . . . . 78
3 Explosion of Cylindrical and Circular Charges . . . . . . . . . . . . 833.1 Dynamics of a Cylindrical Cavity . . . . . . . . . . . . . . . . . . . . . . . . . 833.2 Cylindrical Cavity: Approximated Models
for Incompressible Liquid . . . . . . . . . . . . . . . . . . . . . . . . . . . . . . . . 873.2.1 Generalized Equation (for c → ∞) . . . . . . . . . . . . . . . . . . 873.2.2 Cylindrical Cavity under Free Surface . . . . . . . . . . . . . . . 893.2.3 The Model of Liquid Cylindrical Layer . . . . . . . . . . . . . . 903.2.4 Oscillation Period of a Cylindrical Cavity . . . . . . . . . . . . 91
3.3 Circular Charges . . . . . . . . . . . . . . . . . . . . . . . . . . . . . . . . . . . . . . . 933.4 Dynamics of a Toroidal Cavity, Numerical Models . . . . . . . . . . 101
3.4.1 Ideal Incompressible Liquid . . . . . . . . . . . . . . . . . . . . . . . . 1013.4.2 Compressible Liquid . . . . . . . . . . . . . . . . . . . . . . . . . . . . . . 1053.4.3 Comparison with Experiments . . . . . . . . . . . . . . . . . . . . . 1103.4.4 Basic Characteristics for Toroidal Charges . . . . . . . . . . . 112
3.5 Comparative Estimates for Spherical Charges . . . . . . . . . . . . . . 1123.6 Oscillation Parameters . . . . . . . . . . . . . . . . . . . . . . . . . . . . . . . . . . 1153.7 Explosions of Spatial Charges in Air . . . . . . . . . . . . . . . . . . . . . . 116
3.7.1 Experimental Arrangement . . . . . . . . . . . . . . . . . . . . . . . . 1163.7.2 Test Measurement Results . . . . . . . . . . . . . . . . . . . . . . . . . 117
References . . . . . . . . . . . . . . . . . . . . . . . . . . . . . . . . . . . . . . . . . . . . . . . . . 123
4 Single Bubble, Cumulative Effectsand Chemical Reactions . . . . . . . . . . . . . . . . . . . . . . . . . . . . . . . . . . 1254.1 Passive Gas Phase . . . . . . . . . . . . . . . . . . . . . . . . . . . . . . . . . . . . . . 125
4.1.1 Short Shock Waves . . . . . . . . . . . . . . . . . . . . . . . . . . . . . . . 1254.1.2 Formation of a Cumulative Jet in a Bubble
(Experiment) . . . . . . . . . . . . . . . . . . . . . . . . . . . . . . . . . . . . 1274.1.3 Real State of a Gas . . . . . . . . . . . . . . . . . . . . . . . . . . . . . . . 1304.1.4 Viscosity and the Effect of Unbound Cumulation . . . . . 1314.1.5 Spherical Cumulation in a Compressible Liquid . . . . . . 1344.1.6 Oscillation Parameters . . . . . . . . . . . . . . . . . . . . . . . . . . . . 136
4.2 Chemical Reactions in Gas Phase . . . . . . . . . . . . . . . . . . . . . . . . . 1374.2.1 Todes’ Kinetics, Initiation of Detonation
by a Refracted Wave . . . . . . . . . . . . . . . . . . . . . . . . . . . . . . 1374.2.2 Generalized Kinetics of Detonation in Gas Phase . . . . . 1394.2.3 Dynamics of Bubbles Filled with a Reactive Mixture . . 141
4.3 Mass Exchange and Chemical Reactions . . . . . . . . . . . . . . . . . . . 1424.3.1 Instant Evaporation of Microdrops . . . . . . . . . . . . . . . . . 1434.3.2 Continuous Evaporation . . . . . . . . . . . . . . . . . . . . . . . . . . . 148
References . . . . . . . . . . . . . . . . . . . . . . . . . . . . . . . . . . . . . . . . . . . . . . . . . 151
Contents XI
5 Shock Waves in Bubbly Media . . . . . . . . . . . . . . . . . . . . . . . . . . . . 1535.1 Nonreactive Media, Wave Structure,
Bubbly Cluster Radiation . . . . . . . . . . . . . . . . . . . . . . . . . . . . . . . 1535.1.1 Shock-Gas Layer Interaction . . . . . . . . . . . . . . . . . . . . . . . 1575.1.2 Shock Waves in Bubble Layers . . . . . . . . . . . . . . . . . . . . . 1585.1.3 Two-Phase Model of a Bubbly Liquid:
Three Estimates of Wave Effects . . . . . . . . . . . . . . . . . . . 1705.1.4 Amplification, Collision, and Focusing
of Shock Waves . . . . . . . . . . . . . . . . . . . . . . . . . . . . . . . . . . 1775.2 Generation of Radiation by Free Bubble Systems . . . . . . . . . . . 185
5.2.1 Toroidal Bubble Cloud, Mach Disks . . . . . . . . . . . . . . . . 1865.2.2 Spherical Bubbly Clusters: SW Cumulation
with a Pressure Gradient Along Front . . . . . . . . . . . . . . . 1925.3 Reactive Bubble Media, Waves of Bubble Detonation . . . . . . . 196
5.3.1 Shock Waves in Reactive Bubbly Systems . . . . . . . . . . . 1975.3.2 Shock Tube with Changing Cross Sections . . . . . . . . . . . 210
References . . . . . . . . . . . . . . . . . . . . . . . . . . . . . . . . . . . . . . . . . . . . . . . . . 217
6 Problems of Cavitative Destruction . . . . . . . . . . . . . . . . . . . . . . . 2236.1 Dynamics of Liquid State in Pulsed Rarefaction Waves . . . . . . 223
6.1.1 Real Liquid State (Nucleation Problems) . . . . . . . . . . . . 2246.1.2 Formation Mechanism of Bubble Clusters . . . . . . . . . . . 2296.1.3 Mathematical Model of Cavitating Liquid . . . . . . . . . . . 2336.1.4 Dynamic Strength of Liquid . . . . . . . . . . . . . . . . . . . . . . . 2346.1.5 Tensile Stress Relaxation
(Cavitation in a Vertically Accelerated Tube) . . . . . . . . 2366.1.6 Transition to the Fragmentation Stage
(Experimental Methods) . . . . . . . . . . . . . . . . . . . . . . . . . . 2386.1.7 “Frozen” Mass Velocities in a Cavitation Zone . . . . . . . 2456.1.8 Model of “Instantaneous” Fragmentation . . . . . . . . . . . . 248
6.2 Disintegration of a Liquid, Spalls . . . . . . . . . . . . . . . . . . . . . . . . . 2576.2.1 Cavitative Destruction of a Liquid Drop . . . . . . . . . . . . . 2576.2.2 Cavitative “Explosion” of a Liquid Drop . . . . . . . . . . . . 2596.2.3 Spall Formation in a Liquid Layer . . . . . . . . . . . . . . . . . . 2626.2.4 Initial Stages of Disintegration: Solids and Liquids . . . . 264
6.3 Cluster, Cumulative Jets, and Cavitative Erosion . . . . . . . . . . . 2676.3.1 Single Cavity and Cumulative Jets:
Experiment and Models . . . . . . . . . . . . . . . . . . . . . . . . . . . 2706.3.2 Bubble Cluster Effect . . . . . . . . . . . . . . . . . . . . . . . . . . . . . 273
6.4 Cavitative Clusters and Kidney StoneDisintegration Problem . . . . . . . . . . . . . . . . . . . . . . . . . . . . . . . . . . 2786.4.1 Shock Waves, Bubbles and Biomedical Problems . . . . . 2786.4.2 Some Results on Modelling of ESWL Applications . . . . 2836.4.3 Hydrodynamic Model of the Disintegration
in the Cavitation Zone . . . . . . . . . . . . . . . . . . . . . . . . . . . . 286

XII Contents
6.4.4 Rarefaction Phase Focusing and Cluster Formation . . . 290References . . . . . . . . . . . . . . . . . . . . . . . . . . . . . . . . . . . . . . . . . . . . . . . . . 292
7 Jet Flows at Shallow Underwater Explosions . . . . . . . . . . . . . 2977.1 State-of-the-Art . . . . . . . . . . . . . . . . . . . . . . . . . . . . . . . . . . . . . . . . 297
7.1.1 Irregular Reflection and Bubbly Cavitation . . . . . . . . . . 2987.1.2 Directional Throwing Out on the Free Surface
(Sultans) . . . . . . . . . . . . . . . . . . . . . . . . . . . . . . . . . . . . . . . . 2997.2 Tensile Stress, Structure of Cavitation Region, Spalls . . . . . . . 300
7.2.1 Development of Cavitation Zone, Spalls(Experimental Studies) . . . . . . . . . . . . . . . . . . . . . . . . . . . . 301
7.2.2 Two-Phase Model of Cavitation Region . . . . . . . . . . . . . 3037.2.3 Parameters of Rarefaction Wave
in the Cavitation Zone . . . . . . . . . . . . . . . . . . . . . . . . . . . . 3107.3 Formation of Jet Flows and Their Hydrodynamic Models . . . . 313
7.3.1 Formation of Vertical Jets on the Free Surface(Experiment, H < Rmax) . . . . . . . . . . . . . . . . . . . . . . . . . . 317
7.3.2 An Analog Model of a Sultan . . . . . . . . . . . . . . . . . . . . . . 3257.3.3 Hydrodynamic Model of a Sultan: Pulsed Motion
of a Solid from Beneath the Free Surface . . . . . . . . . . . . 3307.3.4 Abnormal Intensification Mechanism
of the First Pulsation . . . . . . . . . . . . . . . . . . . . . . . . . . . . . 3337.3.5 Two Models of Formation of Radial Sultans . . . . . . . . . 3397.3.6 Basic Parameters of Sultans . . . . . . . . . . . . . . . . . . . . . . . 3437.3.7 Structure of Sultans: Jet Tandem, Analogy
with a High-Velocity Penetration of a Bodyinto Water . . . . . . . . . . . . . . . . . . . . . . . . . . . . . . . . . . . . . . . 344
7.4 Jet Flows: Shallow Explosions of Circular Charges . . . . . . . . . . 3467.4.1 Gravity Effect . . . . . . . . . . . . . . . . . . . . . . . . . . . . . . . . . . . 3477.4.2 Flow Structure Produced by Explosions
of Circular Charges . . . . . . . . . . . . . . . . . . . . . . . . . . . . . . . 3507.5 Shallow Underwater Explosions, Surface Water Waves . . . . . . . 353References . . . . . . . . . . . . . . . . . . . . . . . . . . . . . . . . . . . . . . . . . . . . . . . . . 356
8 Conclusion: Comments on the Models . . . . . . . . . . . . . . . . . . . . 359
Introduction
In the past century, much progress has been made in the hydrodynamics ofexplosion, the science dealing with liquid flows under shock-wave loading.This area is concerned primarily with studying underwater and undergroundexplosions, cumulation, and the behavior of metals under the action of deto-nation products of high explosives (HE), which produce such extreme condi-tions as pressures of hundreds of kilobars and temperatures of up to severalthousand degrees. Under these conditions, many solid media “forget” abouttheir strength properties and rigid crystal structure and follow the classicallaws of hydrodynamics.
A representative example is a shaped charge, i.e., a solid cylinder of HEthat has a conical cavity (apex inside) at one end. If the surface of thiscavity is lined with a metal layer (liner), the charge gains powerful armor-breaking capabilities. This idea was first patented in 1914. In the 1940s,the shaped-charge theory was developed independently by Birkhoff et al.and by Lavrentiev based on a hydrodynamic model assuming that materialproperties change radically under high pulse loads. According to this concept,the metal liner behaves as an ideal incompressible fluid, behind the detonationwave initiated at the charge end opposite to the cone, and incident on thecone from its apex.
Under the action of the detonation products, the liner collapses to theaxis and the liner walls collide. This results in a jet flow moving in the di-rection of detonation-wave propagation at a velocity ujet of about 10 km/s.The shaped-charge theory is based on the model of collision of free liquidjets, which is practically identical to that used in penetration theory. Thetheory suggests that the impact of a shaped-charge jet on armor generatesa pressure p ≈ 103 kbar in the deceleration region. This estimate is readilyobtained from the formula p ρmet ·ujet ·cmet, if the density of the metal ρmet,the speed of sound in it cmet, and the jet velocity ujet are known. Jet pene-tration into a target is described by the model of jet interaction using reversevelocities. Comparison of results obtained using this model and experimentaldata confirms the “hydrodynamic origin” of these phenomena.
It is known that hydrodynamic cumulation also arises from hypervelocity(few kilometers per second) impact on a metal specimen with a hollow cavityon the rear surface. It results from the interaction of a plane shock wave
2 Introduction
generated by an impinging jet in the specimen with the free surface of thecavity, whose points are imparted different initial velocities.
Similar but low-velocity flows are observed in a liquid when its gravityplays a major role, e.g., the fall of a rain drop on a water surface or theimpact of a water-filled test tube falling vertically on a table (experiment ofG.I. Pokrovsky). In the first case, a hemispherical cumulative cavity on thesurface is produced by penetration and spread of the drop. In the secondcase, the cavity as a meniscus occurs initially due to the capillary effect andwetting. Upon impact the liquid in the test tube “instantaneously” becomesheavy, which leads to cumulative flow in the cavity with jet formation, as inthe case with a drop.
These physical effects can be treated as models for the formation of cu-mulative flows in large-scale underwater explosions. When charge weights arein excess of hundreds of kilograms and typical dimensions of a cavity withexplosion products are up to tens or hundreds of meters, the gravity of theliquid can no longer be ignored: the pressure gradient between the upper andlower points of the explosive cavity, which is of the order of ρliqgR (ρliq is theliquid density), becomes comparable with hydrostatic pressure.
Usually, the behavior of various media under explosive loading is studiedin the so-called impulsive state. The medium is originally considered as anideal incompressible liquid, and its flow is considered using the potential:v = ∇ϕ. Then, using the law of conservation of momentum,
ρ0dvdt
= −∇p ,
and replacing v by ϕ, one can easily obtain
∇(dϕ
dt+
p
ρ0
)= 0
and
ϕ = −ρ−10
τ∫0
p dt ,
where the integral defines the value of the potential on the boundary of thedomain under study, τ specifies the duration of explosive loading, and, inessence, determines the initial distribution of ϕ. This parameter is calcu-lated from the speed of sound in detonation products and from the geomet-rical characteristics of the HE charge used in each particular case. Then, theLaplace equation is solved for the known domain, and the potential distribu-tion in this domain, its gradients, and, hence, the initial distribution of massvelocities are obtained.
The above approach is general, and the model is too “ideal” to be usedwithout restrictions on the medium strength. For shaped-charge liners, thekinetic energy of the liner elements ρu2/2 should exceed the dynamic yield
Introduction 3
point of the liner material σ. For the problems of penetration, hypervelocityimpact, or a contact explosion, the situation is not so simple: the targets, asa rule, have large volumes, and the above condition is satisfied only in a verynarrow zone near the contact region.
These problems can be solved using the so-called “liquid–solid” modelproposed by Lavrentiev, whose idea is extremely simple: the medium is con-sidered an ideal incompressible liquid near the charge or in the impactorcontact zone (where the mass velocity is higher than a certain critical valuev∗) and in the remaining region, it is treated as an absolutely rigid body.The solution of the problem on deformation of a lead column by explosionof a superimposed charge (V.K. Kedrinskii) illustrates the application of thismodel in dynamics with changing “phase” boundary as the particle velocitydecreases (in the zone of contact with the solid body) and particle “freezing”according to the model.
Explosive magnetic cumulation (collapse of a conducting liner) is amongthe problems close to the hydrodynamics of explosion. An original solutionof the problem of the impact on a planet surface at space velocities (50–100 km/s) was proposed by Lavrentiev late in the 1950s to determine thecrater size: the energy lost by the body upon impact is converted into heat,and in the region where this thermal energy exceeds a certain critical value,the solid body is instantaneously gasified.
Finally, we consider the models that are directly concerned with real liq-uids. A peculiar prototype of the problems of explosion hydrodynamics is theBesant problem (late 19th century) on the flow in an empty spherical cavity,which arises instantaneously in an ideal imponderable incompressible liquid.Now it is recognized as an adequate model for an oscillation stage of the cavitywith detonation products during underwater explosion. The problem can besolved using the energy conservation law: the change in the potential energyof the liquid is equal to the increment of its kinetic energy p0(V0 − V ) = Tk.Here V = (4/3)πR3 is the current volume of the cavity and the kinetic energyis readily determined from the expression dTk = (v2/2)dm and has the form
Tk = 2πρ0
∞∫R
v2r2 dr .
In the case of an incompressible liquid, the continuity equation dρ/dt +ρ div v = 0 reduces to div v = 0, whence for arbitrary symmetry, we have∂v/∂r + νv/r = 0 and vrν = f(t). From the condition on the boundary ofa spherical cavity, (f(t) = R2(dR/dt)). Hence,
Tk = 2πρ0R3(dR
dt
)2
.
The energy conservation law now yields(dR
dt
)2
=2p0
3ρ0
[(R0
R
)3
− 1]
.
4 Introduction
It is easy to see that as R → 0, the velocity of the cavity wall dR/dt → ∞.This is a typical example of the classical spherical cumulation. We note that inthis case, the kinetic energy of the liquid generally approaches its limit – theinitial potential energy U0.
An interesting model of explosion hydrodynamics is the problem ofa strong point explosion. The classical model for explosion of a powerful(for example, nuclear) device ignores the dimensions of the device and as-sumes that all the energy is released at a point (L.I. Sedov). Here we confineourselves to the case of an incompressible liquid with no counterpressure, i.e.,we assume that as r → ∞, the pressure p → 0. The governing parametersof the problem are the explosion energy E0 and the liquid density ρ0. Com-bining these parameters with the independent variable t, one can define thelinear dimension of the cavity R as the lower boundary of the perturbationregion R = k(E0/ρ0)1/5t2/5. It is obvious that the flow is self-similar and theself-similarity index is 2/5. We assume that in our problem the explosion en-ergy is entirely converted into the kinetic energy of the liquid (the expandingcavity is empty):
2πρ0R3(dR
dt
)2
= E0 .
Substitution of the expressions for the radius and velocity of the explosivecavity yields the coefficient k = (25/8π)1/5.
It is interesting that the above-mentioned Besant problem is also self-similar in the vicinity of the flow focusing point. Furthermore, the liquid flownear the point R → 0 is completely identical to the case of a strong explosion.Let us assume that R = a tα in the mentioned vicinity. Substitution of thissolution into the Besant equation shows that the latter is satisfied if α = 2/5and the coefficient a has the form a = (25U0/8πρ0)1/5, where U0 is the initialpotential energy.
The hydrodynamics of explosion involves plenty of interesting models,paradoxes, and unexpected analogies. What do the fracture of a ship’s bottomdue to underwater explosion, cavitation erosion, and disintegration of kidneystones in lithotriptor facilities have in common? To a certain extent, this isshock-wave loading. But the main feature common to all these phenomena isthe impact of cumulative jets on a solid surface under cavity collapse near it.
In the 1950s, the limiting weights of explosive charges W required todamage a ship’s bottom in an underwater explosion at various distances hfrom the ship were studied. One would expect that beginning with a contactexplosion, the weight would increase with distance from the bottom. How-ever, experiments revealed a surprising paradox: beginning with a certaindistance h∗, the function W (h) “enters” a rather long (within (2–3)h∗) hor-izontal ledge (M.A. Lavrentiev). Thus, the distance increased but fracturewas achieved without increase in explosive weight. In addition, the nature offracture changed: instead of cracks over a large area, the fracture zone washighly localized.
Introduction 5
The fracture mechanism was determined by the action of the high-velocitycumulative jet formed at the second stage of an underwater explosion – thecollapse of the cavity with detonation products after its first maximum ex-pansion. The proximity of a solid boundary disrupts the one-dimensionalityof the flow even if the cavity was spherical at the moment of maximum expan-sion. Particles on the cavity surface remote from the wall are imparted highvelocities, i.e., the classical cumulative effect occurs. The jet is thus directedtoward the wall and has a velocity of hundreds of meters per second.
The phenomenon of bubble cavitation in a liquid has long been known.Already in the early 20th century, it was found that bubble cavitation onrotating propeller screws was accompanied by mechanical surface damage.Numerous studies have shown that the damage mechanism is determinedby shock-wave generation and the impact of the cumulative microjets pro-duced by the collapse of minute near-surface bubbles in the cavitation zone(bubble cluster). Microstructural analysis of specimens from vibration testsand model experiments in “shock wave–bubble–specimen” systems show thatduring high-velocity interaction, the microjets penetrate into a specimen ata depth comparable to their length and cause appreciable local damage.
The threshold of the power of hydroacoustic systems is also associatedwith the development of bubble cavitation near the radiator surface.
In recent years, there have been extensive studies of shock wave focusingin liquids as applied to problems of lithotripsy (breakup of kidney stones). Inparticular, the mechanism of stone crushing in the focus zone was analyzed.At first glance, the cause of breaking of a stone placed at one of the foci of anellipse is fairly obvious: the focused wave is refracted into the kidney stone,and its subsequent internal reflection from the interface with the acousticallyless rigid media (liquid) results in a rarefaction wave, whose “travel” over thekidney stone leads to the stone breakup (B. Sturtevant). It is argued that theeffect of an outer cloud of cavitation bubbles around a kidney stone shouldbe taken into account in this model. Actually, the nature of the load resultingin stone crushing may appear to be much more complex.
Indeed, when analyzing the structure of a shock wave converging to a fo-cus, it is easy to notice that because of diffraction at the edges of a semi-ellipsoid piezoelectric converter, there is a transition in the shock-wave “tail”from the positive postshock pressure to a rarefaction phase with a fairly largeamplitude and long duration. Focusing of such a wave should inevitably resultin the formation of a bubble cavitation zone in the focus zone (and, naturally,on the surface of the kidney stone). Considering that in practice a series ofsuch shock loads is required for crushing, the periodic action of cavitationcloud (as a whole) on the stone can amplify the Sturtevant effect describedabove. The question arises of whether in this case, too, the breakup mecha-nism involves the high-velocity interaction of cumulative microjets (producedby cavitative bubbles in the vicinity of stone surface) with the target.
6 Introduction
Shock-loaded liquid still remains a puzzle. And it is difficult to solve theseproblems by simply writing a complete system of conservation laws in theform of differential equations and closing defining relations, or by developingunique computer programs and codes. Physical models that include all mainstages and features of the processes occurring in liquids must remain a keyelement in research. Otherwise, it would be impossible to explain the hydro-dynamic properties of metals during impulsive loading or the brittle fractureof water with fragmentation into flat spall layers due to the action of strongrarefaction waves.
Concluding this short introduction we would like to note that the prob-lems of underwater explosions described in this monograph can be condition-ally divided into four groups:
– Shock waves, equations of state, and the dynamics of a cavity with deto-nation products (for unbounded media)
– Shock waves (transformation and amplification) in multiphase media in-cluding a reactive gas phase
– Behavior of a liquid with free boundaries during explosive loading, mi-croinhomogeneities in the liquid and tensile stresses, and inversion of thetwo-phase state of the liquid and its strength property
– High-velocity jet flows at underwater explosions near the free surface andliquid flows with unknown free boundaries
The above-mentioned lines of research are primarily concerned with under-standing the physics of the examined phenomena, searching for the perti-nent control mechanisms, developing experimental methods, and constructingadequate mathematical models for describing fast processes and structuralchanges in liquids. Interest in the problems of explosion hydrodynamics con-sidered here was motivated by the importance of the problems, the apparentillogicality of the phenomena, and the attractiveness of the models proposedby Lavrentiev, which were frequently used as the basis for constructing gen-eral concepts.
1 Equations of State, Initial
and Boundary Conditions
1.1 Equations of State for Water
Various considerations on the state of continuous media during dynamic com-pression, shock transition, and unloading are used to solve a broad spectrumof problems on explosions underwater and to analyze the behavior of contin-uous media under impulsive loading. These approaches are based on certainthermodynamic models and are aimed at providing the most exact descrip-tion of the state of a medium for a wide range of temperatures and pressures.
Derivation of a unique analytical relation, for example, in the form p(T, ρ),in particular for water, is not a simple task due to the complex character ofthe dependence of thermodynamic functions, such as pressure, on density ρ,temperature T or internal energy E.
The first known attempt to describe the state of a real medium was madeby Van der Waals, who considered the effects of the attraction and repulsionof molecules. Since then the interest in this subject has remained stable notonly owing to the endeavor of giving a perfect empirical description of realproperties of real media, but also due to the expansion of the assortmentof subjects under study, from which we will be concerned with liquids (or“liquid” states) and the detonation products of explosives.
The equations of state are usually presented in one of the following forms:
– As a sum of cooling and heating components (the Mie–Gruneisen equa-tion),
p = pc(v) + G(v) · cvT
vµ,
where v is the specific volume, pc is the cooling pressure, G(v) is, cv isthe specific heat at constant volume, µ is the specific mass.
– In a form containing a certain function of entropy s
p = B(s)F (v)
where B(s) is the entropy function, s is the entropy, and F (v) is thefunction of the specific volume.
– In the most common virial formpv
RT= 1 +
B(T )v
+C(T )v2
+D(T )
v3+ . . . ,

8 1 Equations of State, Initial and Boundary Conditions
where the coefficients B, C, D . . . are expressed using statistical mechanics interms of the potential of intermolecular interaction (v is the specific volume).
Let us use the above approaches to consider different equations of state ofliquid media. The most well known is the Tait model (see [1, 2]), which wasoriginally designed to describe compressibility of water:
dV
dp= − A
F (T ) + p.
However, the integral of this equation
ln(
p + F (T )p0 + F (T )
)=
V0
A
V0 − V
V0
results in the contradiction: ln → ∞, when p → ∞, and the right-hand partof the equation (V → 0) is finite. The second version
ln(
p + B(s)p0 + B(s)
)= ln
(V (0, s)V (p, s)
)
is more logical and serves as a basis for numerous alternative descriptions ofthe state of liquid media, both as the shock adiabat and as the equation ofstate:
p + B(s)p0 + B(s)
=(
ρ
ρ0
)n
.
It is assumed that B(s) = 305 MPa, while n = 7.15 for pressures up to3 · 103 MPa.
Ridah [3] proposed using the Tait equation with other values of the basicparameters: B(s) = 321.4 MPa and n = 7.00. Reasoning from the estimatesand comparison with larger scale data, some authors believe that B(s) =const and n = const for pressures up to 104 MPa. The parameters proposed byRidah are more convenient and make it possible to obtain simple expressionsfor the Reimann function σ, which, as shown in [2], is close to mass velocityin the vicinity of the shock wave front in water, as well as for the speeds ofsound c and the shock wave velocity Ush:
σ =
ρ∫ρ0
c
ρdρ =
c0
3[ξ3 − 1
],
where ξ = ρ/ρ0, c = c0
(1 + 3σ
c0
), and Ush c0 +2σ +2σ2
c0. The function can
be used to solve the problems of underwater explosion.Patel and Teja [4] obtained the cubic equation of state for liquids and
liquid mixtures as a modification of the Van der Waals equation,
p =RT
v − b− a(T )
v(v + b) + c(v − b),
1.1 Equations of State for Water 9
where b and c are constants, a(T ) is the temperature function, R is gasconstant, and v = ρ−1 is the specific volume. This equation should satisfythe conditions
∂p
∂v|Tc = 0 ,
∂2p
∂v2|Tc = 0 , and ζc =
pcvc
RTc
(ζc is the critical compressibility factor), which are used to determine theconstants b and c and a(T ):
a(T ) = Ωa
(R2T 2
c
pc
)β(T ) , b = Ωb
(RTc
pc
), c = Ωc
(RTc
pc
).
HereΩc = 1 − ζc ,
andΩa = 3ζ2
c + 3(1 − 2ζc)Ωb + Ω2b + 1 − 3ζc .
The function Ωb is determined as the least positive root of the cubic equation
Ω3b + (2 − 3ζc)Ω2 + 3ζ2
c Ωb − ζ3c = 0 .
The function β(T ) is found from the relations
β =[1 + F (1 −
√T )]2
or β = exp [C (1 − T η)] ,
where F is an empirical parameter.Gurtman et al. [5] proposed an analytical form of the equation of state
for water (GKH equation), which was consistent with the data available forthe densities 50–3 · 104 MPa. The governing equation was equivalent to theMie–Gruneisen equation at cv = const. This condition resulted in the simplerelation for the internal energy E. The authors started from the hypothe-sis that water behaves in a way as a crystalline solid in the vicinity of theHugoniot adiabat and its equation of state is written analogously to that formelting crystals:
p(v, T ) = h1(v) + Th2(v) .
Here h1 and h2 are arbitrary functions of specific volume and their valuescan be easily determined from the known thermodynamic equality(
∂E
∂v
)T
= T
(∂p
∂T
)v
− p .
Comparison yields the obvious relations
h1(v) = −(
∂E
∂v
)T
and h2(v) =(
∂p
∂T
)v
.
10 1 Equations of State, Initial and Boundary Conditions
Under the above condition (∂E/∂T )v = cv = const, the internal energy asthe function E(T, v) now is determined as
E − E0 = cv(T − T0) −v∫
v0
h1(v) dv .
In this case, the GKH equation of state is written as
p(v, E) = pH
[1 − G(v)
2− v0 − v
v
]+
G(v)v
E ,
where G = h2v/cv is the Gruneisen coefficient and pH is the Hugoniot pres-sure. In [5], the following quantities were presented as polynomials:
– The Gruneisen coefficient
G(v) = a0 + a1v + a2v2 + . . . + a7v
7
for a0 = 2 366, 632 4, a1 = −22 669, 420, a2 = 91 259, 368, a3 =−200 175, 85, a4 = 258 585, 11, a5 = −196 872, 84, a6 = 81 850, 023, anda7 = −14 342, 530.
– The Hugoniot adiabat
pH = b1ζ + b2ζ2 + . . . + b7ζ
7 ,
where ζ = v0/v is the relative specific volume, b1 = 21.953 4, b2 = 0,b3 = 1 206.04, b4 = −4 113.87, b5 = 7 193.01, b6 = −5 594.03, and b7 =1 566.61.
– The integral of compression energy
I(v) = −∫
h1(v) dv = c0 + c1v + c2v2 + . . . + c7v
7 ,
where c0 = −3.09 · 1012, c1 = 2.455 · 1013, c2 = −8.255 · 1012, c3 =1.516 · 1014, c4 = −1.624 7 · 1014, c5 = 1.006 · 1014, c6 = −3.284 · 1013, andc7 = 4.238 · 1012. Here G is a dimensionless quantity, pH is measured inkbar, v, in cm3/g, and I, in erg/g, and v0 = 1, 001 8 cm3/g. Following [5],the calculation of heat capacity of water yields cp = 0.86 cal/(g · C) andcv = 0.78 cal/(g · C).
Kuznetsov [6] studied a similar version of the equation of state,
p = pc(ρ) +RρTf(ρ)
µ,
which presented pressure as cooling pc(ρ) and heating components, and ledto the equation of state of an ideal gas (ρ → 0, f → 1, and p0 → 0) or theequation of state for solids. The functions pc(ρ) and f(ρ) were determined

1.1 Equations of State for Water 11
by extrapolating experimental data. For 0 < ρ < 2.3 g/cm3, the followinginterpolation formula was obtained
f(ρ) =1 + 3.5ρ− 2ρ2 + 7.27ρ6
1 + 1.09ρ6.
The shock adiabat generalizes the Tait adiabat,
pH =3050
(ρ7.3 − 1
)1 + 0.7(ρ − 1)4
,
with an error of up to ∆p/p 0.05 with respect to experimental data. In [6],the interpolation formula for temperature in the shock wave front was ob-tained using the data for f , p0, and pH, and the equation of state:
TH 2.6ρHpH10−3 .
The temperature was measured in degrees Celsius, pressure pH in bar, anddensity ρH in g/cm3. The accuracy was ∆T/T 0.1.
Finally, the equation of state for water becomes
p = pH
(1 − 0.012ρ2f
)+ 4.7ρfT for 1 ≤ ρ ≤ 2.3
andp = ζ4 − 470ρfζ + 4.7ρfT for ρ < 1 .
Here
ζ = 10(1 − ρ) + 66(1 − ρ)2 − 270(1 − ρ)3 for 0.8 ≤ ρ ≤ 1
andζ = 6.6(1 − ρ)0.57ρ0.25 for 0 ≤ ρ ≤ 0.8
For high temperatures (T ≥ 1 000 K), Kuznetsov proposed using variableτ ρ (T1/T )3 instead of ρ in the formula for f(ρ), which considerably reducedthe error in energy calculations. Here T1 900 K was an estimated value oftemperature at which the rotation of water molecules was suggested to befree.
The first items in the right-hand parts of the equation of state (for bothranges) represent the “cooling” component. The contribution of rotationallytranslational and vibrational degrees of freedom (subscript i) to the waterheat capacity cv was analyzed in [6]. The final result for T > 273 K andρ ≤ 1 g/cm3 was presented as follows:
cv = R
(3 + [f(ρ) − 1]
[0, 3 +
4R
(T/273)2 + 2.7
])+
3∑i=1
ci .
It was noted that within the range 1 ≤ ρ ≤ 1.2, the value of cv remainedinvariant.
12 1 Equations of State, Initial and Boundary Conditions
In solving the problem of underwater explosion of a finite-radius sphericalcharge in a compressible liquid, Kochina and Melnikova [7] proposed usingthe three basic equations:
– The equation of state
p = (49.414ρ20/3 − 32.62)[1 +
ρT
0.00548ρ20/3 + 0.0799ρ + 0.0206
]
– The shock adiabat
pH =(1 + eS−S0
) (49.414ρ20/3 − 32.62
)– The normalized internal energy
ε = 1 587.564T + ρ−1[280.012ρ20/3 + 32.62
]Here the main functions and variables ρ = ρ/ρ0, T = T/T0, ε = Eρ0/p0, p =p/p0, and entropy S = s/cv are dimensionless, while ρ0 = 101.865 kg · c2/m4,p0 = 61 926 kg/m2, T0 = 288 K, and cv = 3.351 1 · 103 m2/(c2·K).
To perform calculations for strong underwater explosions (up to p >102 MPa), Shurshalov [8] used the equation of state in the form
p = A(v) + B(v)ε .
In this case,
A(v) = −K ′ + KS′/cv
p∗v0, B(v) =
S′
cvv0,
K = K0(1 − θ)(0.71 − θ)
θ1/3
[1 − 2
θexp
(−θ−2)]
, and S = S0θ − 1θ3/4
.
Here p∗ = 104 kg/m2 and v∗ = 10−2 m3/kg are the characteristic valuesof pressure and specific volume, respectively; primes mark derivatives withrespect to θ, where θ = V/V0. Other dimensionless variables and parametersare determined as follows: V = v/v∗, V0 = v0/v∗, S0 = 22.7 · 102 m2/(c2·K),cv = 3.66 · 103 m2/(c2·K), and v0 = 1 cm3/g.
Considering the explosion of a spherical charge at a depth of 60 m for realand instantaneous detonation, Shurshalov used the Kuznetsov equations ofstate to determine
– The internal energy:
ε = 0.1016 · 105T + 0.63 · 105
(1 − ρ−1
) (0, 71 − ρ−1
)ρ−4/3
× [1 − 2ρ exp
(−ρ2)]
+ const
1.1 Equations of State for Water 13
– Entropy:
S = cv
(ln T + 0, 621
ρ−1 − 1ρ−3/4
)+ const ,
where ε, T , and ρ are dimensionless quantities, p0 = 1 atm, ρ = 1 g/cm3,and T0 = 273 K.
When calculating the underwater detonation of a pentolite sphere forpressures up to 2.5 · 104 MPa, Sternberg and Walker [9] used the equation ofstate for water in the virial form,
p = f1v−1 + f2v
−3 + f3v−5 + f4v
−7 ,
where fi are polynomials of internal energy E (Mbar · cm3/g); p and v aremeasured in Mbar and in cm3/g, respectively. The initial state of water wasconsidered at p0 = 1 atm, ρ0 = 0.998 21 g/cm3, and T0 = 20 C, so thatE = 0. In this case, f3 = 0.026 8− 0.414 8E, f4 = −0.005+0.0741E, and theother coefficients depended considerably on E subranges [9].
The temperature of water was determined from the equation of state byintegrating the following equations along the isentrope:(
∂E
∂v
)s
= −p and(
∂T
∂v
)s
= −T
(∂p
∂E
)v
.
At the moment of incidence of the detonation wave onto the interface withdetonation products the temperature of water, Tsh turned out to be approx-imately equal to 1000 C. When the shock wave front moved away for a dis-tance rsh = 1.1rch (rch is the charge radius) in water, the temperature behindthe front decreased abruptly to Tsh 565 C, while the temperature at theinterface with detonation products was 640 C. At a distance rsh = 2rch,the temperature in the shock wave front Tsh continued to decrease to about85C, while at the interface it was 315C. The process of heat loss was ratherrapid.
Development of experimental approaches to the problem of dynamic com-pressibility of water for a wide range of parameters is undoubtedly important.Therefore, original, easy, and reliable techniques that provide unambiguousresults are classical sources of information. A technique proposed about 40years ago to study shock adiabat of water by Altshuller et al. [10] is still valid.It suggests preloading an aluminum shield whose shock adiabat is known.A part of the screen volume is filled with the liquid under test. The essenceof the experiment is that the same basis is applied for measurements of shockwave velocities: Dw in water and Dsc in the screen. A pu-diagram methodis used to determine the states behind the shock wave front in the screenmaterial and in water (Fig. 1). The state behind the shock wave front (1) inthe screen is found from its shock adiabat s and the line Dsc, which is easilyplotted on the pu-diagram from psc = ρscuscDsc. The state behind the shockwave front in water (2) is determined from the unloading isentrope r of the
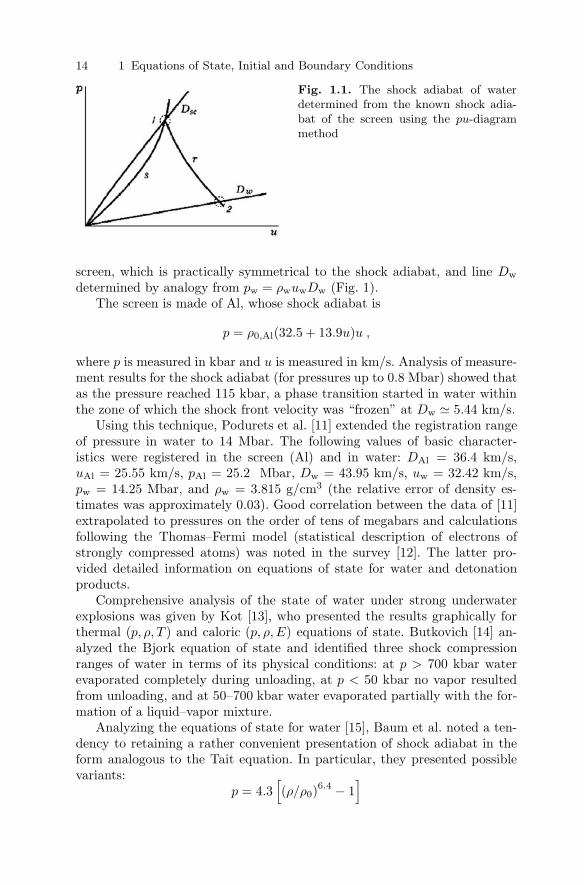
14 1 Equations of State, Initial and Boundary Conditions
Fig. 1.1. The shock adiabat of waterdetermined from the known shock adia-bat of the screen using the pu-diagrammethod
screen, which is practically symmetrical to the shock adiabat, and line Dw
determined by analogy from pw = ρwuwDw (Fig. 1).The screen is made of Al, whose shock adiabat is
p = ρ0,Al(32.5 + 13.9u)u ,
where p is measured in kbar and u is measured in km/s. Analysis of measure-ment results for the shock adiabat (for pressures up to 0.8 Mbar) showed thatas the pressure reached 115 kbar, a phase transition started in water withinthe zone of which the shock front velocity was “frozen” at Dw 5.44 km/s.
Using this technique, Podurets et al. [11] extended the registration rangeof pressure in water to 14 Mbar. The following values of basic character-istics were registered in the screen (Al) and in water: DAl = 36.4 km/s,uAl = 25.55 km/s, pAl = 25.2 Mbar, Dw = 43.95 km/s, uw = 32.42 km/s,pw = 14.25 Mbar, and ρw = 3.815 g/cm3 (the relative error of density es-timates was approximately 0.03). Good correlation between the data of [11]extrapolated to pressures on the order of tens of megabars and calculationsfollowing the Thomas–Fermi model (statistical description of electrons ofstrongly compressed atoms) was noted in the survey [12]. The latter pro-vided detailed information on equations of state for water and detonationproducts.
Comprehensive analysis of the state of water under strong underwaterexplosions was given by Kot [13], who presented the results graphically forthermal (p, ρ, T ) and caloric (p, ρ, E) equations of state. Butkovich [14] an-alyzed the Bjork equation of state and identified three shock compressionranges of water in terms of its physical conditions: at p > 700 kbar waterevaporated completely during unloading, at p < 50 kbar no vapor resultedfrom unloading, and at 50–700 kbar water evaporated partially with the for-mation of a liquid–vapor mixture.
Analyzing the equations of state for water [15], Baum et al. noted a ten-dency to retaining a rather convenient presentation of shock adiabat in theform analogous to the Tait equation. In particular, they presented possiblevariants:
p = 4.3[(ρ/ρ0)
6.4 − 1]
1.2 Equations of State for Detonation Products 15
for the range 30–115 kbar and
p =[140 (ρ/ρ0)
2 − 284]
for the range 115–450 kbar.Despite some uncertainties and limitations noted in [10,17], the paper of
Rice and Walsh [16] became classical and formed a basis for many studies ofthe shock adiabat of water. Its results can be presented as the dependence ofthe shock wave front velocity D on the mass velocity u behind the front:
D = 1.483 + 25.306 lg(1 + u/5.19) ,
where D and u are measured in km/s.Of interest is the analysis performed by Dharmadurai in [18], where the
correlation between the density of a substance at the critical point ρc andthat in the solid state ρs was tested. This has to do with an interestingexperimental fact: for many substances, ρs/3ρc 1, i.e., it is a constantclose to unity (in the experiment, the coefficient in the denominator is equalto 3.07). Using this feature as a new criterion for comparison of variousmodels of the Van der Waals equation for liquids, Dharmadurai proposeda modification of the equation of state
p =RT
V (1 − b/4V )4− a
V 2.
Although a reference to the equations of state for liquids might seemmeaningless, while speaking about solid state, whose density depends on thecrystalline structure, one should pay attention to the fact that, when thematter is cooled below its critical point, it condenses. In this case, due tocohesion forces there is a tendency to “correct” arrangement of moleculesanalogously to the structure of the solid state. As was noted by Eyring andJohn [19], the structure of a liquid is close to that of a solid and can beconsidered as a “mixture” of the degrees of freedom in solid and gaseousstates. Actually, for many liquids, the ratio of density pliq at the point ofnormal boiling to the critical density ρc is close to 2.7, as, for example, forliquid hydrogen, argon, and oxygen. Adding 10% for the density increaseduring solidification, we get a value that is close to the above constant.
1.2 Equations of State for Detonation Products
Determination of the state of detonation products is no less complex than theproblem considered in the first section, because it is necessary to adequatelydescribe thermodynamic properties of gases for wide ranges of temperaturesand pressures, and consider the change of molecular structure, as well as
16 1 Equations of State, Initial and Boundary Conditions
the features of chemical reactions at high pressures [1]. Nevertheless, sincethe “relaxation” of the main parameters of the detonation products in theexpanding cavity is rather rapid, simplified models are preferable. Follow-ing [1], the application of the models “owes a great deal of its success to thefact that the description of detonation phenomena depends slightly on theform of the equation of state”. Some of these models, as, for example, theHulford–Kistiakowsky–Wilson equation [1],
pV
RT= 1 + KT−1/4 · e0.3KT−1/4
,
became a classic. Here K = const and is determined from the relation K =∑niKi, where ni is the number of moles of the ith component of gas in
1 cm3 of the mixture and Ki are empirical constants that characterize eachchemical component (Ki = 108 cm3/mol for water) [1].
Using more precise experimental data, Kuznetsov and Shvedov [20, 21]proposed the following system of transcendental relations that govern thestate of detonation products of hexogen for the range of pressures 0 < ρ∗ <2.3 g/cm3:
p − p0 =Rρϕ (E − ∆ − E0)c∗v + 0.3R(ϕ − 1)
,
p0 = 15.4ρ3 − 12.6ρ2 ,
E0 = 0.77ρ2 − 1.26ρ ,
ϕ = 1 +2.7τ + 15τ4
1 + 2.6τ4, τ = 0.72ρ(T ∗)−0.3 , T ∗ = 0.3
p− p0
ρϕ(τ),
c∗v =1.76RΘ2 exp (Θ)(exp (Θ) − 1)2
+ 2.624R ,
and
∆ =1.76RTΘ
µ(exp (Θ) − 1)
[1 − Θ exp (Θ)
exp (Θ) − 1
].
Here Θ = 3, 200/T , µ = 25, T = 103T ∗ K, p0 and E0 are elastic componentsdepending only on density (p0 in kbar and E0 in kJ/g), µ is the molecu-lar mass, and R is the gas constant. Sought characteristics are determinedfrom the given values of ρ and E (or p and ρ), while the total error doesnot exceed 10%. Using the equations obtained in [21], pressure, its thermalcomponent, the work of adiabatic expansion of the products, the speed ofsound in them, and the isentrope index were calculated versus density (thedata were presented in tables for real and instantaneous detonation).
To describe the state of detonation products, Fonarev and Chernyavskii [22]used the relation for internal energy
E =pv
γ − 1,

1.2 Equations of State for Detonation Products 17
assuming that the adiabatic index γ depended on specific volume V . In thiscase, the range of γ was determined as follows:
γ = 2.63 − 0.96ε at ε < 1,
γ = 1.16 + 0.12/(ε − 0.63) at 1 ≤ ε ≤ 4.7,
γ = 1.18 + 0.061 6/(ε− 2.4) at 4.7 ≤ ε ≤ 24.3,
γ = 1.18 + 0.081(0.23 + 0.001ε)2 at 24.3 ≤ ε ≤ 815,
γ = 1.27 at ε ≥ 815.
Here ε = V/V2, V2 = 1 cm3/g, v = V ρl, p = P/Pl, Pl and ρl are the pressureand the density of the liquid, respectively. The above equation of state wasused in [18, 22] to calculate the explosion of a trotyl charge.
Jacobs [23] proposed an equation of the Mie–Gruneisen type
p = px(ρ) + G(ρ)ρ(E − E∗) ,
where
G(ρ) =13
+7.425[exp(−4.95/ρ)]
ρ,
and
E∗ = a exp (−k/ρ) − bρm + A[(ρ − ρ1)3 + B
]exp [−α(ρ − ρ1)] .
The constants were obtained from processed experimental data and cal-culations. Here, ρ1 is the density at the Jouguet point, a = 2.3466 · 1012,k = 11.12, b = 4.2077 · 108, A = −4.8557 · 109, B = −1.5574 · 1010, m = 2,and α = 2.1051.
Using the same approach, Lee and Hornig [24] calculated the state ofproducts of trinitrotoluene (TNT ). They considered the equation of the isen-trope to be known, while the Gruneisen coefficient was determined from thedependence of the detonation velocity on the initial density of the explosive.
A simpler form was used by Sternberg and Walker [9] to calculate thestate of detonation products of pentolite:
p = AρE + Bρ4 + C exp (−K/ρ)
for A = 0.35, B = 0.002 164, C = 2.0755, and K = 6. Here, E is measuredin Mbar·cm3/g, p, in Mbar, and ρ, in g/cm3, while B, C, and K have theappropriate dimensions. They assumed that the energy released during ex-plosion of pentolite was equal to 0.0536 Mbar·cm3/g, which was equivalentto 1.280 kcal/g, and ρ0 = 1.65 gr·cm−3 was the density of the explosive priorto detonation. The constants were determined in terms of the following det-onation parameters at the Chapman–Jouguet point (index j): D = 0.765 5,Ej = 0.077 5, pj = 0.245 2, cj = 0.571 4, and ρj = 2.21.
18 1 Equations of State, Initial and Boundary Conditions
Finally I would like to mention two monographs of Ch. Mader [25, 26],where one can find the detail information on the state equations.
The present survey of the equations of state for liquids and detonationproducts does not pretend to be comprehensive and represents mainly themost typical models. For each specific problem, the appropriate model isselected depending on the parameter range and with regard to presentationconvenience. Sometimes an experiment prompts unexpected solutions, whichmakes it possible to simplify the statement, as, for example, the solutionproposed for the problem on underwater explosion of a spherical charge byKirkwood and Bethe [2].
Considering the typical exponential shape (in the vicinity of the wavefront) of a shock wave generated by explosion in a liquid, they put forwardthe so-called “peak” approximation. They proposed considering the dynamicsof enthalpy on the wall of the explosive cavity as exponential attenuation anddetermining parameters of this function from boundary and initial conditions.It is obvious that this “physical” approach eliminated the necessity of dealingwith the equation of state of detonation products, as if the latter were notavailable.
1.3 Conservation Laws, PU -Diagrams,and Transition Formulas
Modern computing facilities make it possible to solve the problem on gener-ation and propagation of shock waves during explosions underwater withinthe complete statement. However, it is obvious that calculations of the wavefield even in the nearest zone (of the order of 103 · Rch) involve a numberof difficulties caused primarily by different scales of characteristic time ofthe processes occurring in the detonation products and those associated withthe interface dynamics of the explosive cavity and formation of the shockwave. The problem on shock wave parameters in the far zone, the so-calledasymptotics, can turn out to be unsolvable. In this respect, of most inter-est is the Kirkwood–Bethe model that splits the process into two parts: thedynamics of explosive cavity, whose equation is derived and analyzed inde-pendently of the external wave field, and calculations of the formation ofa shock wave on the basis of disturbances generated by the cavity at eachmoment of time.
As a rule, the initial conditions are formulated and determined using thepu-diagram method within the problems on decay of an arbitrary discontinu-ity. To solve these problems, one needs information on transition conditionsin shock and simple waves (see, for example, [27, 28]). In this case, first thetype of detonation which should be selected, it can be initiated in the chargecenter (allowance should be made for the propagation of the detonation waveup to the interface with the liquid), otherwise the process should be consid-ered as instantaneous detonation with constant volume. It is obvious that
1.3 Conservation Laws 19
in each of the cases the problem of the decay of an arbitrary discontinuitywill yield different initial conditions. Proper solution of the problem on theformation and propagation of a shock wave will be considered in the chap-ter devoted to generation of shock waves, now we shall dwell on transitionconditions only.
1.3.1 Transition in a Shock Wave
If we use the following equation of the state for water
p/ρn = const ,
where p = p + B, (B and n are the parameters of one of the above models ofthe Tait equation), as well as the appropriate expression for specific internalenergy ε
ε =p
ρ(n − 1),
the laws of conservation of mass, momentum, and energy for a strong discon-tinuity are written in the known gas-dynamic form
v2
τ2=
v1
τ1, (1.1)
p2 +v22
τ2= p1 +
v21
τ1, (1.2)
and
p2v2 +v2
τ2·(
ε2 +v22
2
)= p1v1 +
v1
τ1·(
ε1 +v21
2
). (1.3)
Here τ = ρ−1, v1,2 = u1,2 − U is the relative mass velocity, U is the shockwave velocity, and subscripts 1 and 2 denote the conditions ahead and behindthe shock wave, respectively. It follows from Eq. (1.2) that
p2 − p1 = ρ1v21 − ρ2v
22 = ρ1v1 (v1 − v2) .
Assuming that the mass velocity ahead of the shock wave front is u1 = 0and using Eq. (1.1), we easily obtain the pressure jump as a function of themass velocity u2 and the shock wave velocity U :
p2 − p1 = ρ1u2U .
Simple combinations of Eqs. (1.1) and (1.2) result in the following equationsfor relative velocities:
v21 = τ1
p2 − p1
1 − τ2τ1
and v22 = τ2
p2 − p1τ1τ2
− 1.
20 1 Equations of State, Initial and Boundary Conditions
From the law of energy conservation (1.3) on the jump and from the expres-sions obtained for v2
1 and v22 , it follows that
ε2 − ε1 =12(p1 + p2) (τ1 − τ2) .
Substituting the expressions for internal energy, one can readily obtainthe shock adiabat for water
p2
p1=
τ1 − µ2τ2
τ2 − µ2τ1,
where µ2 = (n + 1)/(n − 1).In the equation for shock adiabat, we replace p2 and τ2 by u2 on the basis
of Eqs. (1.2) and (1.1) and obtain
(µ2v2 − v1
)v1 =
(1 + µ2
)τ1p1 . (1.4)
Using the condition u1 = 0 and replacing v by u and U , we obtain theequation for the shock front velocity
U2 − 2βu2U − c21 = 0 ,
where β = (n + 1)/4. Introducing the Mach number M2 = u2/c1, we get thefollowing solution:
U = c1
(βM2 +
√1 + (βM2)
2
). (1.5)
In the first approximation, the solution (1.5) has the form
U (1) c1 + βu2 ,
or, for the Ridah equation of state, (n = 7 and β = 2),
U (1) c1 + 2u2 .
In the second approximation (βM < 1),
U (2) c1
(1 + βM2 + (βM2)
2/2)
.
Transforming Eq. (1.4) (substituting v2 − v1 with u and U), we get therelation on the jump for mass velocities
u2 − u1 =2c1
n + 1
(1
M1− M1
). (1.6)
1.3 Conservation Laws 21
Here M1 = v1/c1 = −U/c1. For the pressure jump, we use Eqs. (1.2)and (1.6):
p2 − p1 =2n
n + 1p1
(M2
1 − 1)
. (1.7)
The pressure jump in the shock wave front is determined from Eqs. (1.1)and (1.6):
ρ2 = ρ1(n + 1)M2
1
2 + (n + 1)M21
. (1.8)
The relations (1.6)–(1.8) determine the transition in the shock wave.
1.3.2 Transition in a Simple Wave
Let us consider an isentropic flow that is described by the laws of conservationof
– Mass,∂ρ
∂t+ u∇ρ + ρ∇u = 0 ;
and
– Momentum,∂u∂t
+ (u∇)u + ρ−1∇p = 0 .
This system is closed by the equation of state
p
p1=(
ρ
ρ1
)n
.
Using the Tait equation of state, we can derive the relation of density andpressure to the sound velocity c
dρ = ρ12
n − 1
(c
c1
)(3−n)/(n−1) dc
c1,
dp = p12n
n − 1
(c
c1
)(n+1)/(n−1) dc
c1
and transform the first two equations of the above system (for one-dimensionalcase) to the form
∂c
∂t+ u
∂c
∂x+
n − 12
c∂u
∂x= 0 , and
∂u
∂t+ u
∂u
∂x+
2n − 1
c∂c
∂x= 0 .
Multiplying the first equation by ±2/(n − 1) and summing up the resultwith the second equation, we obtain after simple transformations the knowngas-dynamics equation
∂
∂t
(u ± 2
n − 1c
)+ (u ± c)
∂
∂x
(u ± 2
n − 1c
)= 0 ,
22 1 Equations of State, Initial and Boundary Conditions
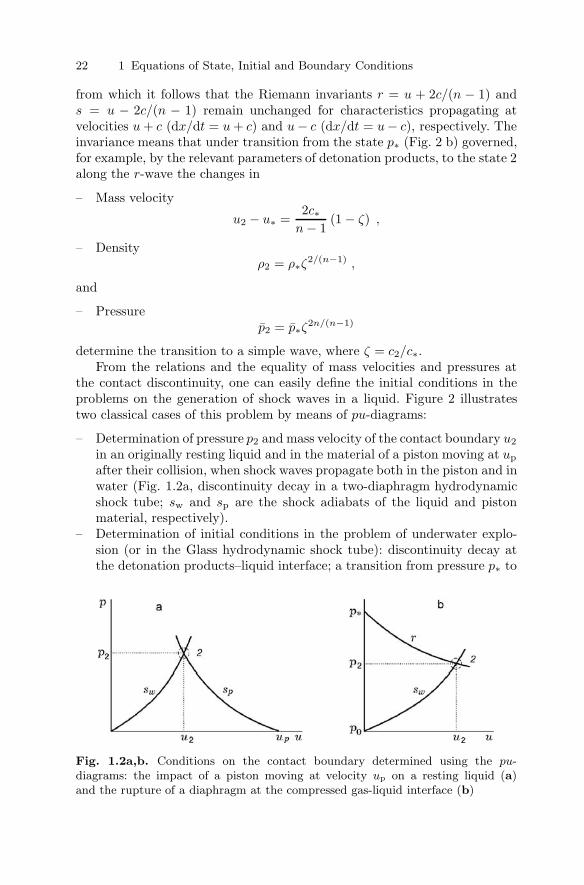
from which it follows that the Riemann invariants r = u + 2c/(n − 1) ands = u − 2c/(n − 1) remain unchanged for characteristics propagating atvelocities u + c (dx/dt = u + c) and u − c (dx/dt = u− c), respectively. Theinvariance means that under transition from the state p∗ (Fig. 2 b) governed,for example, by the relevant parameters of detonation products, to the state 2along the r-wave the changes in
– Mass velocity
u2 − u∗ =2c∗
n − 1(1 − ζ) ,
– Densityρ2 = ρ∗ζ2/(n−1) ,
and
– Pressurep2 = p∗ζ2n/(n−1)
determine the transition to a simple wave, where ζ = c2/c∗.From the relations and the equality of mass velocities and pressures at
the contact discontinuity, one can easily define the initial conditions in theproblems on the generation of shock waves in a liquid. Figure 2 illustratestwo classical cases of this problem by means of pu-diagrams:
– Determination of pressure p2 and mass velocity of the contact boundary u2
in an originally resting liquid and in the material of a piston moving at up
after their collision, when shock waves propagate both in the piston and inwater (Fig. 1.2a, discontinuity decay in a two-diaphragm hydrodynamicshock tube; sw and sp are the shock adiabats of the liquid and pistonmaterial, respectively).
– Determination of initial conditions in the problem of underwater explo-sion (or in the Glass hydrodynamic shock tube): discontinuity decay atthe detonation products–liquid interface; a transition from pressure p∗ to
Fig. 1.2a,b. Conditions on the contact boundary determined using the pu-diagrams: the impact of a piston moving at velocity up on a resting liquid (a)and the rupture of a diaphragm at the compressed gas-liquid interface (b)

1.4 Generalized Equation of Pulsations 23
a final state (p2, u2) occurs in the detonation products in the rarefactionwave along r and in the liquid, along the shock adiabat sw (Fig. 1.2b).
1.4 Generalized Equation of Pulsationsof an Explosive Cavity
It is known that the energy released during the detonation of an explosivecharge underwater is distributed between detonation products and the shockwave. The internal energy of detonation products during expansion of thecavity to R = Rmax converts into the potential energy of the liquid (U∗ =p∞4πR3
max/3), which, in particular enables experimental assessment (basedon the oscillation period) of the share of α in the heat of explosion Q (kcal/g)retained in the detonation products
αQρchVch = p∞Vmax
For standard cast or pressed explosives, the value of α is close to 1/2 inspherical charges, but it changes considerably depending on the flow geometryand the density of specific explosive.
The energy distribution is a dynamic process, while the explosive cavityserves as a piston in the formation of a shock-wave field. Obviously, the moreexact the law of motion of the cavity, the closer to reality the calculationresults for shock wave parameters. In the Kirkwood–Bethe model, this equa-tion is derived independently to describe the dynamic boundary at which theparameters of disturbances governing the wave field are permanently calcu-lated.
The first publications on cavity dynamics in compressible liquids appearedabout half a century ago. One should first of all mention the results of Her-ring [29], Kirkwood and Bethe [2], and Gilmore [30], as well as calculations ofTrilling [31]. Some generalized analysis of these models was reported in [32],similar information is also available in the review made by Flinn [33].
Of major interest is the Kirkwood–Bethe approach to the problems of un-derwater explosion, which allows one to calculate the shock wave parametersin the near zone, as well as the wave asymptotics, and to derive the equationof pulsation for various types of symmetry.
Let us consider a one-dimensional isentropic liquid flow,
dρ
dt+ ρ
(∂v
∂r+
νv
r
)= 0 ,
dV
dt+ ρ−1
0
∂p
∂r= 0 ,
andp = p(ρ) ,
24 1 Equations of State, Initial and Boundary Conditions
which for the potential ϕ, v = −∇ϕ, and the enthalpy h is presented as thesystem of equations:
c−2 dh
dt− ∂2ϕ
∂r2− ν
r
∂ϕ
∂r= 0 , (1.9)
and
− ∂2ϕ
∂r∂t+
∂
∂r
(v2/2 + h
)= 0 . (1.10)
Here ν = 0, 1, 2 governs the type of symmetry.Let us introduce the so-called kinetic enthalpy Ω = h + v2/2 as a new
unknown function. Since the potential is determined to the accuracy of anarbitrary function of t, the law of conservation of momentum takes the simpleform
∂ϕ
∂t= Ω .
Substitution of the function h for Ω and then for ϕ transforms Eq. (1.9) tothe form
c−2 ∂2ϕ
∂t2−(
1 − v2
c2
)∂2ϕ
∂r2− νr−1 ∂ϕ
∂r= c−2 ∂v2
∂t
or, in the acoustic approximation,
c−20
∂2ϕ
∂t2− ∂2ϕ
∂r2− νr−1 ∂ϕ
∂r= 0 .
For the new function Φ = rν/2ϕ, the governing system of conservationlaws becomes more convenient for analysis:
c−20
∂2Φ
∂t2− ∂2Φ
∂r2− ν(2 − ν)
4r2Φ = 0 , (1.11)
and∂Φ
∂t= rν/2Ω .
For plane (ν = 0) or spherical (ν = 2) symmetries, Eq. (1.11) is reduced tothe form
c−20
∂2Φ
∂t2− ∂2Φ
∂r2= 0 .
The solution of the equation has the form Φ = Φ(ξ), where ξ = t − r/c0.We assume that in the asymptotic approximation (to the accuracy of onemember Φ/4r2) it also describes a cylindrically symmetrical flow (ν = 1).
Introducing the function G = rν/2Ω, we see that
∂Φ
∂t=
∂Φ
∂ξ= G ,
∂Φ
∂r= −c−1
0
∂Φ
∂t= −c−1
0 G .
1.4 Generalized Equation of Pulsations 25
Upon substitution, the wave equation transforms to the form
∂G
∂t+ c0
∂G
∂r= 0 , (1.12)
which points to invariance of the function G that remains unchanged atthe characteristics diverging at velocity c0. Following the Kirkwood–Bethemodel [2], this result is generalized to the case when the disturbance propa-gates at velocity c + v, yielding
∂G
∂t+ (c + v)
∂G
∂r= 0 , (1.13)
where c is the local speed of sound. Undoubtedly, validity of this general-ization should be proved by experimental data. It is noteworthy that thisresult is of fundamental character; it allows one to determine the shock waveparameters in the near and far zones and investigate the dynamics of anexplosive cavity. These are the most important problems in underwater ex-plosion studies.
From Eq. (1.13) one can derive the generalized equation of one-dimensionaloscillation of a cavity in a compressible liquid [34, 35]. Substituting the ex-pression G = rν/2(h + v2/2), we obtain(
∂
∂t+ (c + v)
∂
∂r
)[rν/2
(h + v2/2
)]= 0 ,
or upon easy transformations,
rdh
dt+ rv
dv
dt+
ν
2h(c + v) +
ν
2(c + v)
v2
2+ rc
∂h
∂r+ rcv
∂v
∂r= 0 .
Substitution of partial derivatives ∂h/∂r and ∂v/∂r for complete deriva-tives with regard to the laws of conservation of momentum and mass,
∂h
∂r= −dv
dt,
∂v
∂r= −c−2 dh
dt− ν
v
r,
yields
r(1 − v
c
) dv
dt+
34ν(1 − v
3c
)v2 =
ν
2
(1 +
v
c
)h +
r
c
(1 − v
c
) dh
dt. (1.14)
Equation (1.14) is valid for any point of the liquid, including that on thesurface of the cavity containing detonation products. For the cavity, assumingr = R, v = dR/dt = R, and h = H (H is the enthalpy on the cavity wallfrom the side of the liquid) and keeping the notation c for the appropriatespeed of sound [35], Eq. (1.14) becomes:
R
(1 − R
c
)R +
34ν
(1 − R
3c
)R2 =
ν
2
(1 +
R
c
)H +
R
c
(1 − R
c
)dH
dt.
(1.15)
26 1 Equations of State, Initial and Boundary Conditions
It should be noted that Eq. (1.15) is common for all the three types of one-dimensional flows and does not result in the known peculiarities at infinityfor plane and cylindrical geometries even in the case of an incompressibleliquid. We obtain fairly real equations of pulsations [34, 35] of
– A plane cavity,d2R
dt2= c−1 dH
dt(1.16)
– A cylindrical cavity,
R
(1 − R
c
)R +
34
(1 − R
3c
)R2 =
12
(1 +
R
c
)H +
R
c
(1 − R
c
)dH
dt,
(1.17)– A spherical cavity,
R
(1 − R
c
)R +
32
(1 − R
3c
)R2 =
(1 +
R
c
)H +
R
c
(1 − R
c
)dH
dt.
(1.18)
For plane geometry, R means half of the cavity width. Equation (1.18),which, as we see, is a particular case of Eq. (1.15) [35], is sometimes calledthe Gilmore equation [30].
The expression for the local sound speed c and enthalpy H on the cavitywall can be obtained if the equation of state for the liquid is known. Forexample, for the most frequent form of the Tait equation (p+B)/(p∞+B) =(ρ/ρ∞)n, we have
c2 =n(p + B)
ρ= c2
∞
[1 +
p(R) − p∞B
](n−1)/n
,
and
H =c2 − c2∞n − 1
, where c2∞ =
n(p∞ + B)ρ∞
.
Here the subscript ∞ marks the appropriate parameters of undisturbed state,p(R) is the pressure in detonation products, which can be calculated, forexample, using one of the above equations of state. The easiest way is to usethe equation of the adiabat type with the variable γ.
References
1. J.O. Hirschfelder, C.F. Curtiss, R.B. Bird: The Molecular Theory of Gases andLiquids (John Wiley, New York, 1954)
2. R. Cole: Underwater Explosions (Dover, New York, 1965)3. S. Ridah: Shock Waves in Water, J. Appl. Physics 64, 1 (1988)
References 27
4. N.C. Patel, A.S. Teja: A new Cubic Equation of State for Fluids and FluidMixture, Chem. Eng. Science 37, 3 (1982)
5. G.A. Gurtman, J.W. Kirsch, C.R. Hastings: Analitical Equation of State forWater Compressied to 300 kbar, J. Appl. Physics 42, 2 (1971)
6. N.M. Kuznetsov: State Equation and Thermocapacity of Water for Wide Spec-trum of Thermodynamic Parameters, Zh. Prikl. Mekh. i Tekhn. Fiz. 2, 1 (1961)
7. N.N. Kochina, N.S. Melnikova: On explosion in water with regard to com-pressibility. In: Unstable Motions of Compressed Media with Explosive Waves.Transactions of the Steklov Mathematical Institute (1966) pp. 35–65
8. L.V. Shurshalov: Calculation of Powerful Underwater Explosions, Izv. Akad.Nauk SSSR, Gidromekh. 5 (1971)
9. H.M. Sternberg, W.A. Walker: Calculated Flow and Energy Distribution Fol-lowing Underwater Detonation of a Pentolite Sphere, Phys. Fluids 14, 9 (1971)
10. L.V. Altshuller, A.A. Bakanova, R.F. Trunin: Phase Transformations UnderCompression of Water by Strong Shock Waves, Dokl. Akad. Nauk SSSR 121,1 (1958)
11. M.A. Podurets, G.V. Simakov, R.F. Trunin et al.: Water Compression by StrongShock Waves, Zh. Exp. Teor. Fiz. 62, 2 (1972)
12. V.P. Korobeinikov, B.D. Khristoforov: Underwater Explosion, Itogi NaukiTekh. Gidromekh. 9, (1976)
13. C.A. Kot: Intense underwater explosions: IIT Research Institute, Chicago, Illi-noise, USA preprint, 1970
14. T.R. Butkovich: Influence of Water in Rocks on Effects of Underground NuclearExplosion, J. Geophys Research. 1971 76, 8 (1971)
15. F.A. Baum, L.P. Orlenko, K.P. Stanyukovich et al.: Explosion Physics (Nauka,Moscow, 1975)
16. M.H. Rice, J.M. Walsh: Equation State of Water to 250 kbar, J. Chem. Phys.26, 4 (1957)
17. R.A. Papeti, M. Fijisaki: The Rice and Walsh Equation of State for Water:Discussion, Limitation and Extension, J. Appl. Physics 39, 12 (1968)
18. G. Dharmadurai: Solid State Density in Equations of State for Liquids,J. Physics III France, 6 (1996)
19. H. Eyring, M. John: Significant Liquid Structures (John Wiley, New York, 1969)20. N.M. Kuznetsov, K.K. Shvedov: State Equation of Detonation Products of Hex-
ogen, Fiz. Goren. Vzryva 2, 4 (1966)21. N.M. Kuznetsov, K.K. Shvedov: Isentopic Expansion of Detonation Products
of Hexogen, Fiz. Goren. Vzryva 3, 2 (1967)22. A.S. Fonarev, S.Yu. Chernyavskii: Calculation of Shock Waves Under Exlosion
of Spherical Charges of Explosives in Air, Izv. Akad. Nauk SSSR, Gidromekh.5, (1968)
23. S.J. Jacobs: On the equation of state for detonation products of high density.In: 12th Intern. Symp. Combustion, Poitiers, 1968, Abstracts papers (Combust.Inst., S.A., Pittsburgh PA, 1968) pp. 88–89
24. E.L. Lee, H.C. Hornig: Equation of state of detonation products gases. In: 12thIntern. Symp. Combustion, Poitiers, 1968, Abstracts papers (Combust. Inst.,S.A., Pittsburgh PA, 1968) pp. 87–88
25. Ch.L. Mader: Numerical Modeling of Detonations (Los Alamos Series in Basicand Applied Sciences, 1979) University of California Press, p. 485
26. Ch.L. Mader: Numerical Modeling of Explosives and Propellants (CRC Press,1998), p. 439

28 1 Equations of State, Initial and Boundary Conditions
27. L.V. Ovsyannikov: Lectures on Fundamentals of Gas Dynamics (NovosibirskState University, Novosibirsk, 1967)
28. B.L. Rogdestvesky, N.N. Yanenko: Systems of Quasi-Linear Equations (Nauka,Moscow, 1968)
29. C. Herring: Theory of Pulsation of the Gas Bubble Produced by an UnderwaterExplosion, OSRD Rep. 236 (1941)
30. F.R. Gilmore: The Collaps and Growth of a Spherical Bubbl in a Viscous Com-pressible Liquid, Californ. Tech. Univ. Hydrodynamics Lab. 1952. Rep. No. 26-4.
31. L. Trilling: The Collaps and Rebound of a Gas Bubble J. Appl. Physics 23, 14(1952)
32. R.T. Knapp, J.W. Daily, F.G. Hammitt: Cavitation (McGraw-Hill, New York,1970)
33. G. Flinn: Physics of acoustic cavitation in liquids. In: Physical Acoustics,vol. 1, W. Mason (ed.), part B (Academic Press, New York and London, 1966)pp. 7–138
34. V.K. Kedrinskii: On pulsation of a cylindrical gas cavity in an unbounded liq-uid: In: Continuum Dynamics, vol. 8 (Institute of Hydrodynamics, Novosibirsk,1971) pp. 163–168
35. V.K. Kedrinskii: Hydrodynamics of Explosion, Zh. Prikl. Mekh. i Tekhn. Fiz.28, 4 (1987)
2 Underwater Explosions, Shock Tubes,
and Explosive Sound Sources
2.1 Kirkwood–Bethe Approximation,Cylindrical Symmetry
Research of explosive processes in liquid media both for practical purposesand for laboratory modeling is concerned with the estimate of shock waveparameters in the near and far zones, the assessment of the distribution ofexplosion energy between detonation products and the shock wave, as wellas with the analysis of basic features and characteristics of the dynamics ofan explosive cavity with detonation products.
Some of these problems were surveyed by Cole, Korobeinikov and Khristo-forov, and Zamyshlyaev and Yakovlev [1–3]. This chapter reports the resultsobtained for the problem of shock wave generation in a liquid using theKirkwood–Bethe (KB) model [1] initially developed for spherical flows andgeneralized to cylindrical charges [4]. As for any approximation, the resultsobtained within the framework of the KB model should be compared with ex-perimental data or with calculations carried out using other techniques. TheKB model enables derivation of the equation of oscillations of a cylindricalcavity in a compressed liquid and, on this basis, solution of the problem onexplosion of cord charges (cylindrical symmetry). Without this equation, theresolution of many practical problems, in particular on the use of elongatedcharges for underground explosions or for directed emissions at underwaterexplosions, is complicated. The research results presented in this chapter arebased on the data of [4–7].
2.1.1 Basic Assumptions, Initial Conditions
A charge of radius Rch (of infinite length for the case of cylindrical symmetry)is placed in a boundless ideal liquid. We consider an isentropic potential liquidflow whose state is described by the Tait equation.
Initial conditions for detonation products and at the boundary of a gascavity from the side of the liquid are defined assuming an arbitrary dis-continuity decay for instantaneous detonation at constant volume and adi-abatic character of the process, with the adiabatic index γ(ρ) of detonationproducts.
30 2 Shock Waves in Liquids
When defining the behavior of the cavity boundary, we ignore the internalreflections of rarefaction waves propagating in detonation products after thedecay.
The problem is considered in the so-called “peak” approximation, whichimplies that, first, the shock wave parameters are determined only in the nearfront area and, second, the time variation of pressure p and enthalpy h on the“cavity-detonation products” interface is specified by the exponential law
h|r=Rch = h(0) · e−t/θ ,
where the index of the exponent decay θ is determined from the parity con-dition of total time derivatives with respect to pressure (p, pg) and velocity(u, v) on both sides of the interface:
dp
dt=
dpg
dt, and
du
dt=
dv
dt. (2.1)
We determine θ(0) from the generalized equation of oscillations of anexplosive cavity,
R
(1 − R
c
)R +
34ν
(1 − R
3c
)R2 =
ν
2
(1 +
R
c
)H +
R
c
(1 − R
c
)dH
dt,
(2.2)by separating an enthalpy derivative and, upon replacement of dH = ρ−1dpand R = u, reducing Eq. (2.2) to the form
1ρc
dp
dt=
du
dt− ν/2
[(c + u)
(H + u2/2
)− 2cu2]
R(c − u). (2.3)
An analogous equation should be derived for detonation products. Tothis end, we use the solution of the wave equation for converging waves:Φ = Φ (t + r/cg,0) = Φ(ζ). Upon the known transformations similar to thoseperformed in Chap. 1, Φtt = Gt, Φr = Φ′/cg,0 = Φt/cg,0 = G/cg,0 (cg,0 is thespeed of sound in undisturbed gas, subscripts t and r denote the appropriatederivatives, and the prime marks ζ derivative), we obtain the equation forconverging characteristics,(
∂
∂t− cg,0
∂
∂r
)G = 0 ,
which, upon generalization, yields the final form(∂
∂t− (cg − v)
∂
∂r
)G = 0 .
Here G is the invariant on characteristics converging at velocity (cg − v) inthe detonation products.
2.1 Underwater Explosion 31
Expanding this equation by the known analogy with the replacement ofpartial derivatives by total derivatives, we obtain for detonation products thefollowing:
1ρgcg
dpg
dt= −dv
dt+
ν/2[(cg − v)
(Hg + v2/2
)− 2cgv2]
R (cg + v). (2.4)
Summing up the right- and left-hand parts of Eqs. (2.3) and (2.4), with regardto the conditions of Eq. (2.1) at the contact boundary, we have
dp
dt
∣∣∣∣t=0
=νρρgccg
2Rch (ρgcg + ρc)(α1 − α2) , (2.5)
where in view of the condition u = v,
α1 =1
cg + u
[(cg − u)
(Hg +
u2
2
)− 2cgu
2
]
and
α2 =1
c − u
[(c + u)
(H +
u2
2
)− 2cu2
].
On the basis of the “peak” approximation we have
dH
dt=
1ρ
dp
dt= −1
θH(0)e−t/θ
or1
ρ(0)dp
dt
∣∣∣∣t=0
= − 1θ(0)
H(0) ,
which, in terms of Eq. (2.5), yields the expression for the initial value of theexponent decay constant:
θ(0) =2H(0)Rch [ρg(0)cg(0) + ρ(0)c(0)]
νρg(0)c(0)cg(0) (α1 − α2). (2.6)
In addition, the initial conditions include the data on p(0) and u(0) fromdiscontinuity decay (Chap. 1), as well as basic characteristics at the explosivecavity–liquid interface
ρ(0)ρ0
=(
p(0) + B
p0 + B
)1/n
, c(0) = c0
(ρ(0)ρ0
)(n−1)/2
,
and
H(0) =c20
n − 1
[(ρ(0)ρ0
)n−1
− 1
]
32 2 Shock Waves in Liquids
and in detonation products
ρg(0) = ρ∗
(p(0)p∗
)1/γ∗
, c(0)2 = c2∗
(p(0)p∗
)(γ∗−1)/γ∗
,
and
Hg(0) =1
γ∗ − 1p(0)ρg(0)
+p(0)ρg(0)
,
where the initial parameters of instantaneous detonation are determined fromthe known relations p∗ = ρ∗(γ∗−1)Q, c2∗ = D2γ∗/2(γ∗+1). Here the asteriskdenotes detonation products.
2.1.2 Dynamics of an Explosive Cavity, Riemann’s Function,Delay Integral
The assumption on the invariance of the function G on the characteristics(c + v) is of principal importance, because it simplifies considerably the so-lution of the problem on an isentropic flow of an ideal compressible liquid.In view of the invariance of G, to determine the function at any point ofthe liquid with due regard for the delay time, it suffices to know its valueat every moment of time on the surface of the explosive cavity. Thus, if theassumption is accepted, the problem is reduced to the equation of dynamicsof the explosive cavity (2) with one of the equations of state of detonationproducts presented, for example, in Chap. 1.
To determine the shock wave parameters in the vicinity of the front, weuse the original Kirkwood–Bethe model. We apply the peak approximationnot only to determine the initial value of θ(0) (exponent index in the pressureprofile), but also to simulate the enthalpy at the contact boundary.
The equation of motion of the cavity boundary in the “peak” approxima-tion (H(t) = H(0) exp(−t/θ(0)), dR/dt = u, and Mb = u/c) becomes
du
dt= H(t)
[ν
2(1 + Mb) − R
cθ(0)(1 − Mb)
]
− 34u2ν
(1 − 1
3Mb
)[R (1 − Mb)]
−1 , (2.7)
which makes it possible to avoid the equation of state of expanding detonationproducts when considering the near zone.
The next fundamental step in the statement of the problem on underwaterexplosion is replacing the mass velocity u in the vicinity of the shock wavefront by the Riemann function
σ =
ρ∫ρ0
cdρ
ρ,
2.1 Underwater Explosion 33
which for the Tait equation of state for liquid becomes
σ =2c0
n − 1
[(ρ
ρ0
)(n−1)/2
− 1
].
This substitution makes it possible to express all basic characteristics andfunctions of the problem in terms of σ:
c = c0
(1 +
n − 12
σ
c0
), c + u = c0
(1 +
n + 12
σ
c0
),
h = c0σ
(1 +
n − 14
σ
c0
), Ω = c0σ
(1 +
n + 14
σ
c0
),
and
U = c0
1 +
n + 14
σ
c0+
12
(n + 1
4
)2(σ
c0
)2
− 18
(n + 1
4
)4 (σ
c0
)4
+ ...
c0
(1 +
n + 14
σ
c0
),
where, in this case
G (r, tfr) = rν/2c0σ
(1 +
n + 14c0
σ
)= G(R, t) = Rν/2Ω(R, t) .
We introduce β = (n + 1)/4c0. In the last expression, the following timenotation was introduced intentionally: t is the time “rigidly” associated withthe explosive cavity dynamics and tfr is the time “rigidly” associated withthe shock wave front. The latter is defined by the evident condition
tfr =
rfr∫Rch
dr
U= t +
rfr∫R(t)
dr
c + v. (2.8)
The integral in the right-hand part of Eq. (2.8), which defines the propagationtime of the disturbance from its “inception” on the cavity surface at the time tuntil the moment when the disturbance overtakes the shock wave front, is theso-called delay integral. In calculating the integral, the function G determinedfor the time t on the explosive cavity boundary is an invariant.
The problem on underwater explosion is solved following the scheme:
1. Equation (2.7) for the dynamics of an explosive cavity with detonationproducts (within the peak approximation) is solved regardless of the sur-rounding pressure field. Thus, it can be considered as a certain law ofmotion of a flat, cylindrical or spherical piston generating a shock wavein the liquid.Solution of this equation for each moment of time t yields R(t) andG = Rν/2
[H(R) + R2/2
].
34 2 Shock Waves in Liquids
2. Since G is invariant on the characteristics propagating at velocity (c+ v)or (c + σ), the following equality is valid
G = Rν/2[H(R) + R2/2
]= rν/2
(h + σ2/2
)= const . (2.9)
3. The disturbance G(R) “arising” on the surface of the explosive cavity ata time t overtakes the shock front in the delay time
tdel =
rfr∫R(t)
dr
c + σ. (2.10)
We would like to remind readers that c + σ = c0(1 + 2βσ), while U c0(1 + βσ), i.e., c + σ > U . The position of the front rfr is not knownin advance and the front continues to move away from the charge as thedisturbance approaches it.
4. Pressure is determined using the relation Ω(σ):
βσ = (1/2)(√
1 + 4βΩ/c0 − 1)
,
which with regard to the equation Ω = G/rν/2 can be rewritten as
βσ =12
(√1 + 4βG(R)/c0rν/2 − 1
).
In the expression for the Riemann function, ρ is replaced by p:
p
p0=[1 +
n − 12c0
σ
]2n/(n−1)
.
Upon substitution of βσ and simple transformations we finally obtain
p
p0=
⎧⎨⎩1 +
n − 1n + 1
⎡⎣√
1 +4βG(R)c0rν/2
− 1
⎤⎦⎫⎬⎭
2n/(n−1)
. (2.11)
To determine the coordinate of the shock wave front rfr, we have to findthe delay integral (2.8).
2.1.3 Calculation of the Delay Integral (for ν = 1, 2)
To transform the integral we use the invariance of the function G (dG = 0),which is preserved over the whole integration interval for each of its value atfixed R(t):
ν
2σ(1 + βσ)dr + r(1 + βσ)dσ + rβσdσ = 0 .

2.1 Underwater Explosion 35
This enables the change of variables
dr = −2r
ν
(1 + 2βσ)σ(1 + βσ)
dσ
and the reduction of the integral to the intermediate form
tdel = − 2νc0
∫rd(βσ)
βσ(1 + βσ).
It follows from the invariance condition that r = [G(R)/Ω(r)]2/ν and, conse-quently,
tdel = −2G(R)2/ν
νc0
∫d(βσ)
βσ(1 + βσ)Ω2/ν.
From the definition of Ω, βσ(1+βσ) = βΩ/c0, it follows that dβΩ/c0 =(1 + 2βσ)d(βσ) and (1 + 2βσ) =
√1 + 4βΩ/c0. Their substitution in the
integral and the change of variables y = 4βΩ/c0 reduce the integral to theconvenient form
tdel = − 12ν
(4β(R)
c0
)2/ν 4c0
4βΩ(r)/c0∫4βΩ(R)/c0
dy
(1 + y)1/2y2/ν+1. (2.12)
The calculation scheme for pressure profile in this statement involves thefollowing steps:
1. The spatial coordinate r of the point is specified.2. Solving Eq. (2.7) for the cavity dynamics, we obtain the values of R and
G(R) for each time t “rigidly” associated with the explosive cavity.3. From the integral (2.12) for a fixed r we determine the delay times tdel
corresponding to the range of R and G(R) values and, consequently, thetime interval tr = (t + tdel), the time of arrival of disturbances at a pointwith coordinate r (the disturbances being “generated” on the cavity sur-face during expansion at different times t and covered the distance (R−r)over the time tdel at velocities (c + σ)).
4. Based on Eq. (2.11) we construct the distribution p(tr) at a given pointof space.
5. The function p(tr) is ambiguous, and it allows the front position tfr andthe amplitude pfr to be found from the geometrical condition of “equalareas.”
2.1.4 Shock Waves (Cylindrical Symmetry,Comparison with Experiment)
As an example, we calculated the shock wave parameters near the front asa function of distance for detonating cord charges made of different high

36 2 Shock Waves in Liquids
explosives (HE): pentaerythritol tetranitrate (PETN) (ρ∗ = 1.42 g/cm3,Q = 1.4 kcal/g, W = 10 g/m), trotyl (ρ∗ = 1.59 g/cm3, Q = 1.0 kcal/g,W = 11, 2 g/m) and hexogen (ρ∗ = 1.32 g/cm3, Q = 1.29 kcal/g, W =15 g/m). The calculation results were compared with experimental data [8].For all HE types, the detonation velocity was D = 7 km/s. According tothe statement, the problem was considered in the context of the condition of“instantaneous detonation at constant volume”, which suggested the obviousequality R(0) = Rch.
To compare and to process experimental data, for pressures up to pfr >200 MPa the profile of a conical shock wave was built in [8]. This wave’s frontvelocity N was sought by considering the finiteness of the detonation velocityof the detonating cord (method of independent sections) from the formulaN = U [1 + (U/D)2]−1/2, then the front pressure was determined from N .
In Fig. 2.1, the calculation results (curve 1) for pressure in the shock wavefront (G ∝ r0.5, (1)) are compared with experimental data of [8] (dots) forthe given distances r0
fr = rfr/√
q, m3/2/kcal1/2; q = QW is the explosion heatper length unit of the detonating cord. There was satisfactory consistencybetween the data. The calculation results of Rice and Ginell for trotyl (G ∝r0.4) (curve 2) are compared in Fig. 1 with experimental data of [1] (circles).The curve 3 corresponds to the self-similar dependence pfr = 0.29(r0
fr)−2.
Fig. 2.1. Calculation of amplitude ofcylindrical shock wave at underwaterexplosion; circles and dots show theexperimental data of [1] and [7], re-spectively
2.1.5 Dynamics of Exponent Index, θ(rfr)
It is obvious that the problem on shock wave propagation is solved, if inaddition to the wave front pressure at each point of the space, the dynamicsof the exponent index is known. This dependence can be determined from
2.1 Underwater Explosion 37
the relation between the time scales of the gas cavity t and those of thefront tfr [1].
Let us fix the cavity boundary at a certain instant t0 that will correspondto the time tfr,0 of arrival of a shock wave at the point r. Restricting ourselvesto the first-order term, we disintegrate t in the Taylor series in the vicinityof t0:
t t0 +∂t
∂tfr
∣∣∣∣r
(tfr − tfr,0) = t0 +1η
(tfr − tfr,0) .
Here η is the coefficient governing the dynamics of the exponent index θ(rfr).From (2.8) one can easily determine
η =∂tfr∂t
∣∣∣∣r
= 1 +∂
∂t
rfr∫R(t)
dr
c0(1 + 2βσ).
If the variable g = G(R, t)/G(0) is introduced, using the above relationfor βσ and Ω and substituting the variables (dr for dσ), upon simple trans-formations we get
η = 1 − βσ∗βc0(1 + 2βσ∗)
+4
θ(0)
(βgΩ(0)
c0
)2 [ 1 + 2βσ
βσ(1 + βσ)− 1 + 2βσ∗
βσ∗(1 + βσ∗)
+8(
11 + 2βσ
− 11 + 2βσ∗
)− 6 ln
βσ∗(1 + βσ)βσ(1 + βσ∗)
].
Here θ(0) = θ(0)c0/R(0) and the asterisk denotes parameters on the cavityboundary. If the relation between t and rfr is known, one can easily deter-mine η.
Calculation results for the dependence of the exponent index behind thefront θ0 = θ/
√q (s·m1/2/kcal1/2) on the reduced distance r0
fr are comparedwith experimental data of [8] in Fig. 2.2.
Fig. 2.2. Calculations for the pres-sure decay index behind the front ofcylindrical shock wave vs. distance forunderwater explosions: dots show ex-perimental data for trotyl [8]
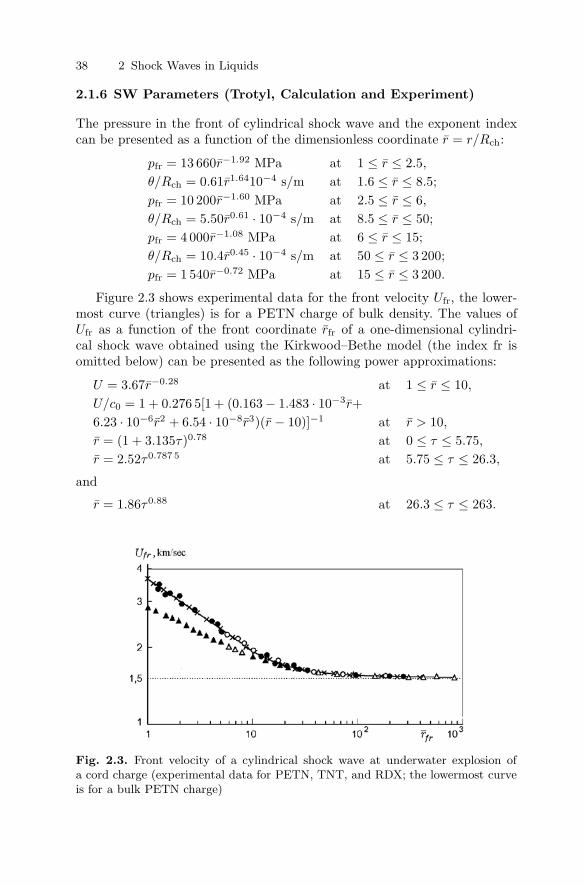
38 2 Shock Waves in Liquids
2.1.6 SW Parameters (Trotyl, Calculation and Experiment)
The pressure in the front of cylindrical shock wave and the exponent indexcan be presented as a function of the dimensionless coordinate r = r/Rch:
pfr = 13 660r−1.92 MPa at 1 ≤ r ≤ 2.5,θ/Rch = 0.61r1.6410−4 s/m at 1.6 ≤ r ≤ 8.5;pfr = 10 200r−1.60 MPa at 2.5 ≤ r ≤ 6,θ/Rch = 5.50r0.61 · 10−4 s/m at 8.5 ≤ r ≤ 50;pfr = 4 000r−1.08 MPa at 6 ≤ r ≤ 15;θ/Rch = 10.4r0.45 · 10−4 s/m at 50 ≤ r ≤ 3 200;pfr = 1 540r−0.72 MPa at 15 ≤ r ≤ 3 200.
Figure 2.3 shows experimental data for the front velocity Ufr, the lower-most curve (triangles) is for a PETN charge of bulk density. The values ofUfr as a function of the front coordinate rfr of a one-dimensional cylindri-cal shock wave obtained using the Kirkwood–Bethe model (the index fr isomitted below) can be presented as the following power approximations:
U = 3.67r−0.28 at 1 ≤ r ≤ 10,U/c0 = 1 + 0.276 5[1 + (0.163− 1.483 · 10−3r+6.23 · 10−6r2 + 6.54 · 10−8r3)(r − 10)]−1 at r > 10,r = (1 + 3.135τ)0.78 at 0 ≤ τ ≤ 5.75,r = 2.52τ0.787 5 at 5.75 ≤ τ ≤ 26.3,
and
r = 1.86τ0.88 at 26.3 ≤ τ ≤ 263.
Fig. 2.3. Front velocity of a cylindrical shock wave at underwater explosion ofa cord charge (experimental data for PETN, TNT, and RDX; the lowermost curveis for a bulk PETN charge)
2.1 Underwater Explosion 39
2.1.7 Asymptotic Approximationfor Weak Shock Waves (ν = 1, 2)
Asymptotic dependences for pressure and the exponent index behind thefront were determined using the known relations of the Kirkwood–Bethe the-ory [5], which are substantially simplified for r Rch, when the dependenceof the Riemann function σ on pressure becomes linear. Let us transform σfor p B:
σ =2c0
n − 1
[(p + B
p0 + B
)(n−1)/2n
− 1
] p − p0
ρ0c0.
Now
G rν/2 p − p0
ρ0, c + σ c0 + 2β
p − p0
ρ0, and Ufr c0 + β
p − p0
ρ0.
Let us assign a certain surface r1 as an initial surface whose parametersgovern the subsequent wave pattern. We shall assume that pressure on thesurface is known as a function of time, p1(t1), where t1 = 0 corresponds tothe moment of arrival of the shock wave front
p1 = pmax exp (−t1/θ1)
at the point r1. The basic equation for time has the form
t = t1 +
r∫r1
dr
c + σ.
For the given dependence p1(t1), we determine the function G(t1), which upon“inception” at the moment t1 on the radius surface r1 remains unchangedunder further propagation of the wave at velocity c + σ, which enables thechange of the variables. Since
G(t1) = rν/2 p − p0
ρ0= r
ν/21
p1 − p0
ρ0,
we havedr = −2r
ν
dp
p − p0,
where r = (ρ0G(t1)/(p − p0))2/ν . The substitution and simple transforma-
tions within the accepted approximations make it possible to determine thedelay time for the asymptotics
tdel = − 2νc0
(ρ0G (t1))2/ν
p−p0∫p1−p0
(1 − 2β
ρ0c0p
)p−2/ν−1 dp .
40 2 Shock Waves in Liquids
This integral can be easily taken and, if the invariance of the function G istaken into account, eventually leads to the following results:
• For spherical symmetry,
tsphdel =
r − r1
c0− 2βG (t1)
c20
lnr
r1
• For cylindrical symmetry,
tcyldel =
r − r1
c0− 4βG (t1)
c20
(r1/2 − r
1/21
)(2.13)
Let’s confine ourselves to the cylindrical asymptotics for which
tcylfr = t1 +
rfr − r1
c0− 4βG(t1)
c20
(r1/2fr − r
1/21
).
In this case t1 can be written as
t1 = θ1 lnpmax − p0
p1 − p0
or, using the invariance of the function G,
t1 = θ1 ln(pmax − p0) r1
(pfr − p0) rfr,
which makes it possible to write tfr as
tcylfr = θ1 ln
(pmax − p0
p1 − p0
)+
rfr − r1
c0− 4βG (t1)
c20
(r1/2fr − r
1/21
).
If we take the differential of both parts and, reasoning from the definitionUfr = drfr/dtfr c0+β(p−p0)/ρ0, substitute dtfr for drfr/Ufr, we easily obtainthe following differential equation for the asymptotics of pressure distributionin the shock wave front:
dpfr
drfr= −
θ12rfr
− n+12c0
pfr−p0ρ0c2
0
(r1rfr
)1/2
+ 34
n+1c0
pfr−p0ρ0c2
0
rfrpfr−p0
[θ1rfr
− n+1c0
pfr−p0ρ0c2
0
(r1rfr
)1/2
+ n+1c0
pfr−p0ρ0c2
0
] . (2.14)
Numerical analysis of this equation shows that within the range 3 200 <rfr < 106, where rfr = rfr/Rch, the amplitude distribution (in MPa) can beapproximated by the following simple dependence:
pfr 1580r 0.72fr
. (2.15)
Here we used the following boundary conditions for r1: r1 = 3 200, p1 =4.73 MPa and θ1 = 59Rch/c0.
2.1 Underwater Explosion 41
For rfr → ∞, Eq. (2.14) is considerably simplified: only the last termsremain in the numerator and in the denominator (in brackets). Thus, thefunction pfr(rfr) is defined by the following differential equation
dpfr
drfr= −3
4pfr − p0
rfr,
whence it follows that the asymptotic dependence of pressure in the shockwave front is determined from the law
pfr − p0
pin − p0=(
rfr
rin
)−3/4
,
where the subscript “in” denotes the shock wave parameters determined fromEq. (2.15) at a distance at the limit of the range mentioned for this de-pendence. This solution coincides with the known Landau–Khristianovichasymptotics [8, 9].
The asymptotics for θ can be determined as follows: using the relation(2.15), we obtain the equation
tfrc0
r1=
rfr∫1
c0
Ufrdr
for the propagation time of the shock wave front to the point rfr and definingthe front velocity U c0 · [1 + (n + 1)pfr/4nB], we obtain
τfr = rfr − 1 − n + 11.18n
p
Br 0.75fr
(r 0.295fr − 1
),
where τfr = tfrc0/r1.The time τ , over which the pressure at the point rfr becomes p, is deter-
mined with regard to the delay time of arrival of the appropriate disturbanceto this point, the invariance of the function G, and the change of t1 throughpmax, and θ1:
τ = θ1
(ln
pmax
p− 1
2ln rfr
)+ (rfr − 1) − n + 1
n
p
Br1/2fr
(r1/2fr − 1
).
Subtracting τfr from τ and assuming τ − τfr = θ and p = pfr/e, one caneasily obtain the distribution for the decay constant,
θ = θ1 (1 + 0.205 ln rfr) + 5.12r 0.295fr
[0.53 − 0.848r−0.295
fr + 0.3185r−0.5fr
].
For distances up to rfr 106 at least, the calculation results can be approx-imated by the simple dependence θ 8.4r 0.244
fr .The asymptotic solution has another power: θ ∝ r 0.25
fr , which is also anal-ogous to the Landau–Khristianovich asymptotics [9, 10].
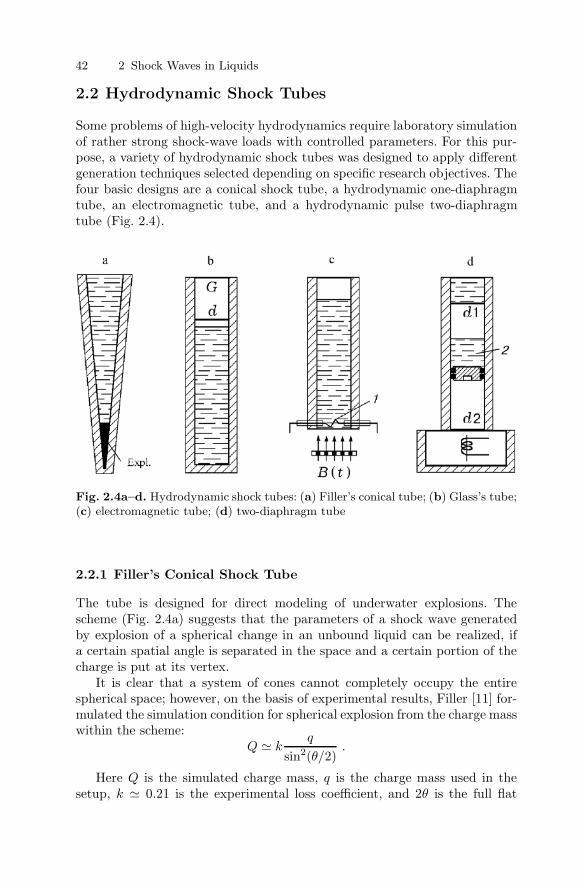
42 2 Shock Waves in Liquids
2.2 Hydrodynamic Shock Tubes
Some problems of high-velocity hydrodynamics require laboratory simulationof rather strong shock-wave loads with controlled parameters. For this pur-pose, a variety of hydrodynamic shock tubes was designed to apply differentgeneration techniques selected depending on specific research objectives. Thefour basic designs are a conical shock tube, a hydrodynamic one-diaphragmtube, an electromagnetic tube, and a hydrodynamic pulse two-diaphragmtube (Fig. 2.4).
Fig. 2.4a–d. Hydrodynamic shock tubes: (a) Filler’s conical tube; (b) Glass’s tube;(c) electromagnetic tube; (d) two-diaphragm tube
2.2.1 Filler’s Conical Shock Tube
The tube is designed for direct modeling of underwater explosions. Thescheme (Fig. 2.4a) suggests that the parameters of a shock wave generatedby explosion of a spherical change in an unbound liquid can be realized, ifa certain spatial angle is separated in the space and a certain portion of thecharge is put at its vertex.
It is clear that a system of cones cannot completely occupy the entirespherical space; however, on the basis of experimental results, Filler [11] for-mulated the simulation condition for spherical explosion from the charge masswithin the scheme:
Q kq
sin2(θ/2).
Here Q is the simulated charge mass, q is the charge mass used in thesetup, k 0.21 is the experimental loss coefficient, and 2θ is the full flat
2.2 Hydrodynamic Shock Tubes 43
angle of the cone. The shock tube with 2θ = 7 was used in the experiments.The explosion of a 0.5-g trotyl charge proved to be equivalent to that of a 113 -gcharge in an unbounded liquid.
Within this scheme, the amplification factor is determined by the rela-tion of the complete spatial angle 4π to the spatial angle separated by theshock tube cone 2π(1 − cos θ) or as sin−2(θ/2). The ideal amplification fac-tor (without losses) is equal to 1,070, its actual value is approximately equalto 230. Since the laws of attenuation of the amplitude and of the pressuredecay constant with distance behind the front proved to be similar to theknown expressions for an unbound liquid, main losses in the scheme (thecoefficient k) are governed by the conditions of detonation initiation in a mi-crocharge in the shock wave “breech”.
2.2.2 Glass’s One-Diaphragm Shock Tube
The tube diagram is shown in Fig. 2.4b: a diaphragm (d) separates a high-pressure chamber with gas (G) from a low-pressure chamber filled with a liq-uid [12]. When the diaphragm is broken, a shock wave (subscript “sh”) prop-agates in the liquid and a rarefaction wave (subscript “rf”) propagates ingas. The subscripts “g” and “l” denote gas (adiabatic index γ) and liquid(adiabatic index n), respectively.
The equation for the hydrodynamic shock tube [12],
cl(γ − 1)2cg
[1 −
(pl + B
psh + B
)1/n]
psh − pl
n(pl + B)
1/2
= 1 −(
psh
pg
)(γ−1)/2γ
,
can be obtained by combining the conditions of the parity of mass veloci-ties ush = u2 and pressures psh = p2 on the contact discontinuity with thefollowing relations:
– For mass velocity in the rarefaction wave,
u2 =2cg
γ − 1
[1 −
(p2
pg
)(γ−1)/2γ]
– For laws of conservation of mass and momentum on the jump,
ρlVl = ρshVsh = m, pl + mVl = psh + mVsh
– For relations between densities and the speed of sound in liquids, usingthe state equation for liquids (Tait or Ridah equations, see Chap. 1),
ρsh
ρl=(
psh + B
pl + B
)1/n
and cl =(
n(pl + B)ρl
)1/2
44 2 Shock Waves in Liquids
Two interesting conclusions follow from the equation. First, this generationscheme produces a maximum shock wave amplitude psh,max in the liquid,which cannot be exceeded, since it appears when pg → ∞:
psh,max
B
[1 −
(psh,max
B
)−1/n]
= 4n
(cg
cl(γ − 1)
)2
.
This proves that the ultimate value psh,max (assuming pl psh and B,whereas B psh,max) depends significantly on the type of gas used in thehigh-pressure chamber. Table 2.1 presents asymptotic values of shock waveparameters obtained in the one-diaphragm hydrodynamic shock tube for dif-ferent gases, assuming that the Tait equation of state is valid for the entirerange.
Second, an interesting implication for practical use of this type of shocktubes is obtained when relatively weak shock waves are generated in theliquid, when pg is of the order of several tens of megapascals. In this case,since psh < pg, one can assume that psh ρlucl, where u is the mass velocityof the liquid behind the shock wave front. Then, the condition on the contactdiscontinuity is noticeably simplified to
2cg
γ − 1
[1 −
(psh
pg
)(γ−1)/2γ]
=psh
ρlcl,
and after simple transformations is reduced to the form
psh/pg 1 − γpg/clcgρl
whence it follows that pressure in the shock wave psh upon the rupture of thediaphragm is practically equal to the initial gas pressure pg. Thus, pressuregauges can be easily calibrated in the shock tube.
The results of [12] also suggest applicability of the Tait adiabat as a shockadiabat for water for dynamic pressures of up to 45 000 MPa, which is con-firmed by experimental data of Rice and Walsh [13] and the Kirkwood–Richardson theory [14] on the shock wave velocity, mass velocities, and thespeed of sound. Analogous results were noted in [15].
Table 2.1. Asymptotic values of shock wave parameters obtained in the one-diaphragm hydrodynamic shock tube for different gases. The Tait equation of stateis assumed to be valid here
Gas psh,max, MPa U , m/s ush, m/s ρsh csh M
Water 1.165 · 103 2.4 · 103 480 1.25 1.76 1.6Air 8.05 · 103 4.65 · 103 1 720 1.59 4.19 3.1Helium 2.0 · 104 6.7 · 103 2 980 1.80 6.09 4.46Hydrogen 7.4 · 104 1.17 · 104 6 300 2.165 10.8 7.8
Note: Here ρsh = ρsh/ρl, csh = csh/cl, and M = U/cl.
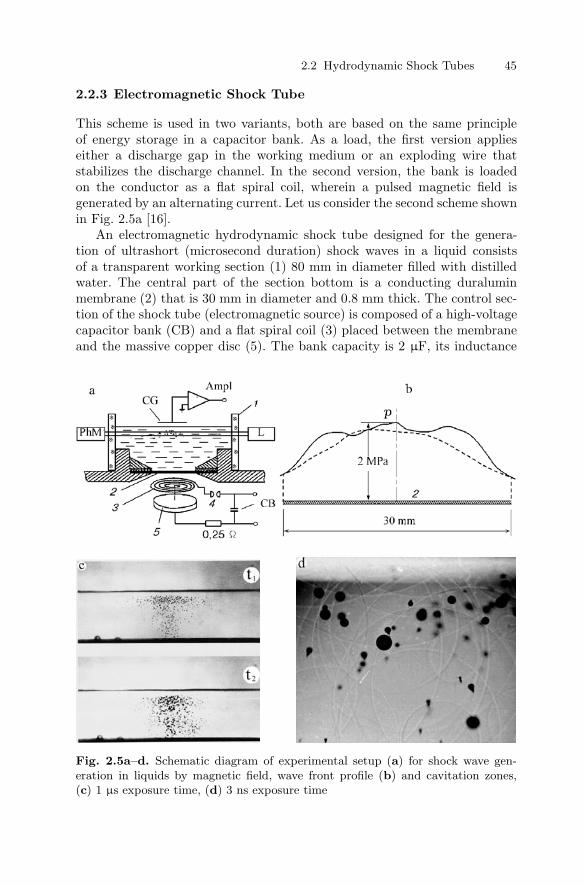
2.2 Hydrodynamic Shock Tubes 45
2.2.3 Electromagnetic Shock Tube
This scheme is used in two variants, both are based on the same principleof energy storage in a capacitor bank. As a load, the first version applieseither a discharge gap in the working medium or an exploding wire thatstabilizes the discharge channel. In the second version, the bank is loadedon the conductor as a flat spiral coil, wherein a pulsed magnetic field isgenerated by an alternating current. Let us consider the second scheme shownin Fig. 2.5a [16].
An electromagnetic hydrodynamic shock tube designed for the genera-tion of ultrashort (microsecond duration) shock waves in a liquid consistsof a transparent working section (1) 80 mm in diameter filled with distilledwater. The central part of the section bottom is a conducting duraluminmembrane (2) that is 30 mm in diameter and 0.8 mm thick. The control sec-tion of the shock tube (electromagnetic source) is composed of a high-voltagecapacitor bank (CB) and a flat spiral coil (3) placed between the membraneand the massive copper disc (5). The bank capacity is 2 µF, its inductance
Fig. 2.5a–d. Schematic diagram of experimental setup (a) for shock wave gen-eration in liquids by magnetic field, wave front profile (b) and cavitation zones,(c) 1 µs exposure time, (d) 3 ns exposure time
46 2 Shock Waves in Liquids
is 25 nH. The bank accumulates energy up to 100 J at a voltage of 10 kV.In the discharge chain, the capacitor bank is connected with the spiral bya spark discharge gap (4) which operates as a cut-off switch.
Ignition of the discharge gap by an external high-voltage pulse results inthe discharge of the capacitor bank on the flat coil that generates powerfulpulsed magnetic field. This magnetic pulse puts into motion the membrane,which excites a flat shock wave in the liquid specimen. If the inductance ofthe discharge chain is low, the “battery–spiral” contour can be closed veryrapidly. The contour parameters are adjusted to generate shock waves withamplitudes of the order of 10 MPa, the rise time of about 1 µs, and theduration of 3–4 µs.
The minimal magnetic field losses in the gap between the membrane andthe disc and practically aperiodic discharge is achieved, when
h > δ =√
2εc2/σω , R = 2√
L/C ,
where h is the membrane thickness, δ is the skinlayer depth, ε is the dielectricconstant, c is the speed of light, σ is the material conductivity, ω is the angularfrequency of the discharge, R is the wave resistance, and L and C are thecontour inductance and capacity, respectively.
If the liquid column in the working section is 30 mm high, due to diffrac-tion effects the linear dimension of the wave zone generated by the membranereduces from 30 mm near the membrane to 20 mm near the free surface ofthe liquid. One can state that a free-wave zone arises in the specimen. Thus,within a reasonable registration time span one can neglect the effect of theworking chamber walls on the process, for example, when studying the initialcavitation stage near the free surface under the reflection of a shock wavefrom it (Fig. 2.5c,d). Figure 2.5c presents two sequential frames of cavita-tion zone development between free surface and membrane (1 µs exposuretime).
The thin structure of cavitation zone and wave field was resolved usingpractically instantaneous photograph with 3 ns exposure time (Fig. 2.5d).Here one can see cavitative bubbles, cumulative jets and a system of shockwaves radiated by bubbles. One can note that bubbles in cavitation zone havedifferent sizes and hence they are in different stages of pulsations. The lattergives the base to conclude that the effect of bubble collapse with cumulativejet formation is a result of interaction of shock waves generated by bubblegroups which are characterized by relative high frequency of pulsation andmore “slow” bubbles. Comparison of Figs. 2.5c and 2.5d shows that obviously1 µs exposure time is enough in order that a general image was smoothedand a cavitation zone became practically uniform one.
Experimental measurements of the mass velocity by an electromagnetictransducer proved that over the observation time, only an incident wave anda wave reflected from free surface as a rarefaction wave were recorded in theregion under study [16].

2.2 Hydrodynamic Shock Tubes 47
The electromagnetic transducer was made of a narrow band of aluminum-backed lavsan film (15 µm thick and 20 mm long) loosely connected withthe contacts. It was placed in a constant magnetic field with the inductionB = 0.06 T. As the band moved at the flow velocity u behind the front ofthe incident and the reflected waves, the voltage corresponding to the knownrelation U = −Blu was induced in the band. Here l is the band lenght.
The experiments showed that the parameters of the shock wave gener-ated by the electromagnetic source are stable and reproducible. Figure 2.5bpresents experimental data for the shock wave front measured by the pres-sure gauge on the polyvinylidene fluoride-(PVDF)-base in the region understudy at distances of 5 and 23 mm from the membrane (dashed line). Onecan see that the wave profile was stabilized when the gauge moved from themembrane to the free surface near which the profile of the shock wave frontwas smoothened.
A He–Ne laser (L) and photomultipliers (PhM) were used to study the ini-tial stage of bubble cavitation, while a variable-capacitance transducer (CG)recorded the displacement of the free surface (see Fig. 2.5a). The transducerwas made of two surfaces placed at a distance of 0.5 mm. The internal andthe external surfaces were 15 mm and 30 mm in diameter, respectively. Theexternal surface made of 15-µm thick backed aluminum film was placed imme-diately on the liquid free surface. The voltage of about 100 V was maintainedbetween the plates. Displacement sensitivity of the transducer was of theorder of 1 µm.
2.2.4 Two-Diaphragm Hydrodynamic Shock Tubes
As is obvious from the foregoing, despite the positive results achieved for HEmicrocharges in conical shock tubes, this method does not enable laboratoryadjustment of the amplitudes and durations of generated waves in a fairlywide parameter range due to design difficulties (large charges) and the criticalsize restrictions (light-weight charges). The gas-dynamic one-diaphragm tuberequires high pressures in the gas chamber and, for technical reasons, fails toprovide a constant wave amplitude and the adjustment of the wave duration.To apply a wide range of parameters in the studies of the propagation ofshock waves in liquids and multiphase media, the shock tubes with explodingwires require rather large storage capacitor banks, complicated block, andframing prevention systems.
However, high amplitudes and durations can be obtained without usingthe sources with even higher pressures of compressed detonation products orlarge capacitor banks. High-velocity liquid flows can be used instead. Indeed,for example, for pressures of about 100–150 MPa and lower, the dependencebetween the amplitude p of the stationary shock wave and the mass velocity uof particles behind the front p ρlclu is linear, it follows that the mass veloc-ity of only 100 m/s corresponds to pressure of 150 MPa. A one-dimensionalliquid flow can easily achieve these velocities, its instantaneous deceleration

48 2 Shock Waves in Liquids
on a solid or liquid obstacle produces the appropriate pressures. This methodwas first proposed in [17] and then studied in [18]. Let us consider it in moredetails.
2.2.4.1 Experimental Setup
The method was based on instantaneous deceleration of a liquid (solid) pis-ton thrown by compressed gas. Schematic diagram of the setup is shown inFig. 2.4d.
The shock tube was positioned vertically and, as a rule, consisted ofthree sections: high-pressure gas receiver (designed for static pressure up to20 MPa), acceleration channel with a liquid or solid piston 2 (the channelwas partially or completely vacuumed depending in the piston type), and theworking section with the liquid separated from the acceleration channel bya diaphragm (d1).
A setup can consist of only two sections, if the liquid under study is usedas a piston. The liquid piston was separated from the receiver diaphragm (d2)by a light hermetically packed transmitting piston (Fig. 2.4d) that preventedoutbreak of gas in the liquid when the diaphragm d2 opens. In this scheme,the shock wave was generated when the liquid piston impinged on the rigidclosed butt end of the acceleration channel. The two-section system witha liquid piston was used to generate a powerful step-like shock wave with anamplitude on the order of hundreds of megapascals and a duration on theorder of hundreds of microseconds.
The diaphragm d2 was made of annealed sheet copper 0.5 mm thick.The depth of special cuts made in the diaphragm was calibrated dependingon the required breaking pressure (load on the piston). The length of theacceleration channel varied from one to two meters. For visual observation,a part of the section near the butt end made of plexiglas was placed ina steel yoke with narrow longitudinal slits. To synchronize the recording withthe illumination flashes, the pressure gauges and the contact pickups (lightguides) were inserted in the lateral and front channel walls. The final stage ofmotion of the liquid piston before the impact was recorded by a high-speedphotorecorder in the regime of continuous scan.
The experiments proved the importance of wall smoothness, because evena slight unevenness led to disturbance in the thrown liquid column, whichresulted in its discontinuity before the impact. Since the volume of the gasreceiver exceeded that of the acceleration channel considerably, the pistonmotion could be considered as uniformly accelerated, its velocity could beestimated from the elementary relation ur
√2prSxm−1, where pr is the
pressure in the receiver, S is the area of the channel cross-section (here, 7 cm2), x is the path traversed by the piston, and m is the piston mass.Thus, for example, if the piston was 0.4 m long and its mass was 370 g withthe initial pressure of 4 MPa in the receiver, the piston was accelerated to140 m/s over the section of about 1.25 m. Under the impact on the tube butt,
2.2 Hydrodynamic Shock Tubes 49
a step-like shock wave was excited with an amplitude of over 200 MPa anda duration of about 600 µs. If the piston length was reduced by a factor offour, other conditions being equal, the wave amplitude increased to 500 MPaand its duration was reduced to approximately 130 µs.
For relatively weak waves with amplitude of the order of 10 MPa [19],both diaphragms (in the two-diaphragm scheme) were made of thin film.The process was triggered by an electromagnet with a needle in the gas re-ceiver designed for forced rupture of the diaphragm d2. In the experimentswith weak waves, a fluorocarbon polymer piston had the form of a disc witha circular stabilizer used to stabilize piston motion along the channel. Gener-ally, four piston types of length (including the stabilizer) 33, 18.5, 11.5, and8 mm and disc thickness 8.5, 11, 7, and 4 mm, respectively, were used. Thepiston velocity was recorded by two fiber-optic transducers, whose operationprinciple was based on light reflection from the piston wall. A bundle of opti-cal fibers with total diameter of 2 mm was flush mounted on the shock tubewall in the end part of the acceleration channel (in front of d1). The otherend of the bundle was split into two parts, with a light source attached to oneend and a photoreceiver FD-27K, to the other end. Along one part of fibers,the light from the source was emitted in the acceleration channel. When thepiston obstructed the transducer, the light was reflected from its wall andpassed along the other part of fibers to a photodiode. The signal from thephotodiode was fed to the frequency counter Ch3-34a through an amplifier.
The piston velocity was measured from the time when it passed by thetransducer on the base of 20 mm. One transducer was placed closer to the di-aphragm, at a distance of 20 mm. The shock wave amplitude was determinedfrom the known relation p ρlucl, where u is the velocity of the contactsurface after the impact. The velocity was determined from the data on thedecay of an arbitrary discontinuity, in the case of impact of a solid piston onthe diaphragm d1, or was equal either to the velocity u (under the impact ofa liquid piston on the rigid butt end) or to u/2 (“liquid–liquid” scheme).
The measurement accuracy depended on the distance between the trans-ducers, their diameter, and the distance from the diaphragm. The systemamplifying the signals from the transducers ensured their actuation when thepiston edge passed the axis of each transducer to the accuracy of 0.25 mm,which yielded a relative error of velocity measurements of about 2.5%. Onecan easily estimate that the measured velocity differed from the velocity at themoment of impact by less than 5%, which was equal to the systematic error.
The diaphragm d1 made of 0.05 mm thick lavsan film was deflected forseveral millimeters under the vacuumization of the channel, which could dis-tort the wave pattern due to the impact of the piston on the convex surface.To form a flat shock wave front, a metallic disc 0.8 mm in diameter was gluedon the lavsan diaphragm using an epoxy adhesive. To eliminate the dampingeffect of air remaining after vacuumization, the upper part of the accelerationchannel had a narrow circular slit and a special cavity.
50 2 Shock Waves in Liquids
2.2.4.2 Measurement Techniques
The pulse profile of weak shock waves (≈ 10 MPa) in a liquid was recordedby piezotransducers, whose working element was flush mounted on the wallof the working section of the shock tube. Since the low mechanical strengthof piezoelectric elements restricted their use for measurement of pressures upto hundreds of megapascals, germanium sensors were used in [17, 20]. Themeasurement approach was based on the known resistance of germanium asfunction of static pressure [21]. Physically, this effect was caused by a changein the width of the forbidden zone EG (the width of the energy gap betweenthe filled valent and vacant zones, that was the conducting zone) with pres-sure p, which, according to experimental data [21], could be determined fromthe dependence (
∂EG
∂p
)T
= α
(α = 5 ·10−6 eV/atm), that was valid up to 1.5 GPa (15 kbar). The variationof the width of the forbidden zone eventually affected the value of the squaredconcentration of proper carriers [21], determined as
n2i = 9.3 · 1031T 3 exp
(−E00
G + αp
kT
),
where p is the pressure in atm; T is the temperature, in K, and k is theBoltzmann constant. For germanium at room temperature and atmosphericpressure E00
G = 0.75 eV, while at p = 10 kbar, EG = 0.8 eV with n2i changing
almost an order of magnitude.The scheme of pressure recording is shown in Fig. 2.6 [20]. A germanium
element 1 (1 × 1 × 0.5 mm) was covered by epoxy resin 3 with an extender(corundum powder) polymerized at room temperature. One of the electrodeswas closed directly on the metallic casing, in which it was sealed by theresin, while the second electrode 2 was isolated. In the electric circuit of thetransducer (SpresG) shown in the figure, R is the load resistance (of thesame order as that of the transducer), C = 0.6 µF is a standard storagebank with voltage on the order of several tens of volts. The gauge casingwas mounted in the steel chamber 4, so that the semiconductor elementbecame the part of the butt end of the shock tube in order to record a shockwave generated under the impact on the butt end, or an incident shock wavegenerated under the impact on a resting liquid 5 and reflected from the buttend. The chamber 4 was the working section of the shock tube that servedas a part of the acceleration channel under the impact on the wall or as thethird section with a liquid under study.
Semiconductor gauges were used to register shock waves within 30–500 MPa [17,20]. The lower limit of the range was defined by the sensitivityof the amplifier used (0.25 cm/mV). Recording sensitivity was not lower than1/300 mV/atm. The rise time of the front pressure was about 2 µs due to the

2.2 Hydrodynamic Shock Tubes 51
Fig. 2.6. Pressure recording by a semiconductor gauge under the impact of a liquidpiston on the tube end: (1) germanium element; (2) electrode; (3) epoxy resin;(4) chamber; (5) shock wave
availability of the epoxy layer on the surface of the semiconductor element,while its own frequency was approximately 30 MHz and the speed of soundin germanium was 4,930 km/s. The sensitivity of the recording scheme couldbe enhanced by increasing the bank voltage. However, the experience showedthat for each specific germanium element there was an optimal experimen-tally adjusted voltage; thermal noise occurred when it was exceeded.
The semiconductor gauges were calibrated by optical (depending on thetime between two neighboring density gradients and using the pressure os-cillogram) and static (oil, T = 18 C) techniques [20]. In the latter case, thegauges were calibrated to the resistance of elements 471 Ω (1) and 747 Ωwith p–n transition (2). The relative resistance of the element depended lin-early on pressure and remained as such up to 20 kbar. Availability of the p–ntransition (gauge 2) enhanced considerably the sensitivity of the recordingsystem, but reduced its resistance to mechanical loads.
Figure 2.7 shows a typical pressure oscillogram recorded at the butt end ofthe two-diaphragm shock tube for the impact of a liquid piston on a restingliquid in the working section. Upon the impact, shock waves propagate inresting and braked media. The butt end gauge records the first reflectedwave 1 with practically constant pressure behind the front. The second jump 2is a result of the interaction between the waves reflected from the pistonand the tube end. Behind the wave front, there is a pressure decline dueto unloading at the lower end of the piston. The third jump 3 is a resultof repeated interaction between the waves. Comparison of the oscillogramwith the wave interaction scheme in the shock tube proves that the sensor
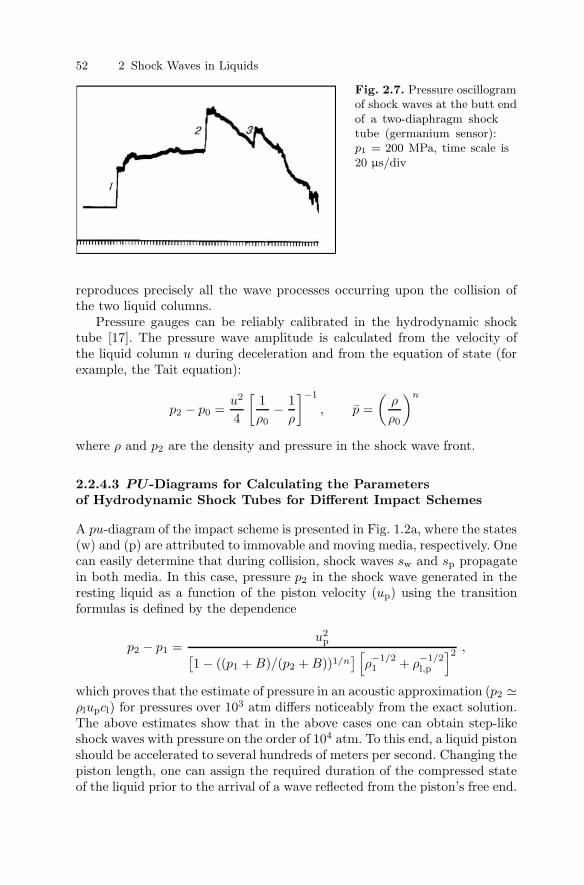
52 2 Shock Waves in Liquids
Fig. 2.7. Pressure oscillogramof shock waves at the butt endof a two-diaphragm shocktube (germanium sensor):p1 = 200 MPa, time scale is20 µs/div
reproduces precisely all the wave processes occurring upon the collision ofthe two liquid columns.
Pressure gauges can be reliably calibrated in the hydrodynamic shocktube [17]. The pressure wave amplitude is calculated from the velocity ofthe liquid column u during deceleration and from the equation of state (forexample, the Tait equation):
p2 − p0 =u2
4
[1ρ0
− 1ρ
]−1
, p =(
ρ
ρ0
)n
where ρ and p2 are the density and pressure in the shock wave front.
2.2.4.3 PU-Diagrams for Calculating the Parametersof Hydrodynamic Shock Tubes for Different Impact Schemes
A pu-diagram of the impact scheme is presented in Fig. 1.2a, where the states(w) and (p) are attributed to immovable and moving media, respectively. Onecan easily determine that during collision, shock waves sw and sp propagatein both media. In this case, pressure p2 in the shock wave generated in theresting liquid as a function of the piston velocity (up) using the transitionformulas is defined by the dependence
p2 − p1 =u2
p[1 − ((p1 + B)/(p2 + B))1/n
] [ρ−1/21 + ρ
−1/2l,p
]2 ,
which proves that the estimate of pressure in an acoustic approximation (p2 ρlupcl) for pressures over 103 atm differs noticeably from the exact solution.The above estimates show that in the above cases one can obtain step-likeshock waves with pressure on the order of 104 atm. To this end, a liquid pistonshould be accelerated to several hundreds of meters per second. Changing thepiston length, one can assign the required duration of the compressed stateof the liquid prior to the arrival of a wave reflected from the piston’s free end.
2.2 Hydrodynamic Shock Tubes 53
In conclusion, we note that, following [18], at up/cp ≤ 1.2 (where up isthe mass velocity behind the shock wave front) the front velocity can beapproximated by the relation cp + kup, where k 2 for water, k 1.56for gold, k 1.36 for steel, and k 1.28 for tungsten. These values wereobtained in solving the problem on the collision of particles with an obstacleat up ≤ 3.6 km/s.
If the target is rigid, the following relations are valid for pressure andvelocity of the shock wave front in a liquid piston:
pp = ρpup(cp + kup) and U = cp + kup , at k 2 .
Here the subscript p denotes the characteristics of the medium interactingwith the target (liquid, thrown particles, etc.). If the target is elastic, theapproximation p2 ρ1u2c1 is valid, where ρ1c1 is the acoustic impedance ofthe target. For liquid targets, we have
p2 = ρpu1(cp + ku1) and U = cp + ku1 ,
where u1 = up − u2 is determined from the equation
u1
up=
[(1 + ρ1c1/ρpcp
2kMp
)2
+ρ1c1/ρpcp
kMp
]1/2
− 1 + ρ1c1/ρpcp
2kMp
(Mp = up/cp), or approximately
u1
up ρ1c1
ρ1c1 + ρpcp,
which is valid, if the impedances of the liquid and the target differ signifi-cantly.
2.2.5 Shock Tube Application: High-Rate Reactionsin Chemical Ssolutions
As is known, the method of shock waves is widely used for experimentalstudies of relaxation processes in gases at high temperatures and sometimesfor physico-chemical studies of condensed media.
The above method of generating strong one-dimensional shock waves ina liquid was proposed in [17]. It can be used to produce a temperature jumpof 3–30 C in a liquid [22].
Following the estimate [23], the temperature jump is determined from thepressure psh behind the shock wave front,
T − T0 2.6ρshpsh · 10−2 ,
where T0 is the initial temperature in C, ρsh is the density in kg/m3, and psh
is the pressure behind the shock wave front in MPa. One can easily determine
54 2 Shock Waves in Liquids
that, if the amplitude is 100 MPa, the temperature jump behind the frontdoes not exceed 3 C.
The method of temperature jump is rather efficient for studying high-rate chemical reactions in solutions with the relaxation time of ≥ 10−6 s.The temperature jump is arranged in different ways:
a) High-voltage discharge (a liquid is heated for about 1 µs; however, thismethod requires highly conductive solutions, i.e., only the solutions with highion concentration can be used)
b) Super-high frequencies (high SHF absorption factor is required, whichprovides a temperature increase only within 0.1–1 C)
c) Optical heating (absorption of visible light, ultra-violet flash lamp andlaser heating systems) [24]
All the methods have some advantages and shortcomings and, as a rule,apply strong restrictions on the working volume of the solution under study.In addition, these methods are characterized by a short-term pulsed equi-librium shift, when the temperature jump is of negligible duration, at leastmuch shorter than the relaxation time.
High-velocity collision, which is used to determine the velocity and theshift of thermodynamic equilibrium for reversible chemical transformationsin solutions, allows one to study the relaxation process for the case of temper-ature or pressure conservation (by analogy with [25]) after the jump and canbe applied in a complex study of liquid-phase reactions with simultaneouspressure and temperature changes.
The left part of Fig. 2.8 shows the scheme of an experimental setup: (1)pressure gauge; (5) condenser; (6) diaphragm; (7) Jupiter-9 lens; (8) light fil-ter; (10) conical Plexiglas windows (dmin = 3 mm, dmax = 8 mm, l = 42 mm);(11) 0.05-mm thick brass membrane; (12), piston. A solution under study (2)was placed in a stainless steel chamber (3). An incandescent lamp (4) (12 V,100 W) was used as a light source. The shift of equilibrium behind theshock wave front was recorded from the absorption on the appropriate wave-length using a photomultiplier FEU-18A (9). Interference light filters (8) ora monochromator PM-2M were used to separate the required wavelength. Anincident shock wave produced a pressure of 110 MPa, the temperature jumpwas 3 C, and the heating time of the solution was less than 2 µs.
The efficiency of the technique was tested for two chemical reactions [22]studied before using other relaxation techniques [26, 27]. The reactions withpronounced temperature effect were selected. Following [28], the system pa-rameters p and T were selected to eliminate the effect of the pressure jumpon reaction rate constants. The system allowed one to study the kinetics ofhigh-rate reactions with half-reaction time varying from several microsecondsto 600 µs.
As the shock wave passed through an equilibrium solution, the tempera-ture jumped behind the front produces an equilibrium shift, which was deter-mined from the change of concentration of the component with the highest
2.2 Hydrodynamic Shock Tubes 55
Fig. 2.8. Schematic diagram of an experimental setup (left) for studying fast re-actions and relaxation processes in the fast reactions in solutions (right)
absorption factor. The wavelengths that provided maximum light absorptionfor each reagent were measured preliminarily using a spectrophotometer.
The rate constants of direct k1 and reverse k2 reactions were deter-mined from the known relations (for the same initial concentration) 1/τ =2c0k2
√k = 2c0k1/
√k, where τ is the experimentally determined time con-
stant, c0 is the initial concentration of reagents, and k = k1/k2 is the equilib-rium constant (determined by an SF-10 spectrophotometer using the staticmethod).
The reaction of tropeolin-0 (weak acid) with water made it possible totest the sensitivity of the method and determine the relaxation time, whosevalue was compared with that determined in [26]. The shift behind the shockwave front in water solution of tropeolin in neutral medium was experimen-tally recorded as the tropeolin concentration changed from 0.78 · 10−5 to6 ·10−5 mol/l. The maximum absorption of tropeolin was achieved at 4250 A.
56 2 Shock Waves in Liquids
A typical oscillogram is shown in curve b on the right side of Fig. 2.8(the time scale is 10 µs, the pressure jump amplitude in the shock wave front 102 MPa). Experimental results for T = 22 C and the time constant τ ofthe first relaxation stage are presented below:
c0 · 105 mol/l 0.78 1.08 1.86 2.90 3.97 6.0τ · 106 s 30.5 20.0 16.6 13.5 10.1 6.0
Two stages of the relaxation process are clearly seen in the oscillogram:an increase in the concentration c after the temperature jump (the solutiondarkened in about 50 µs) and then a decrease to a new equilibrium state.Each value of τ was determined in several sets of measurements. The dis-persion of values did not exceed ±10%. The experiments showed that withincreasing concentration of tropeolin, the relaxation time decreased consid-erably.
For tropeolin in an alkaline medium, the relaxation process (Fig. 2.8,curve c, rightside), whose character was completely consistent with the ex-perimental data of [26], was observed. The relaxation time constants wereclose as well.
The measurements showed that the relaxation time constant dependedslightly on concentration in the region with low concentration of tropeolin(at T = 200C and k = 0.714 · 10−2):
c0 · 105 mol/l 0.78 1.56 1.92 2.25τ · 106 s 25 23.7 21.7 21.7k1 · 10−4 l/(mol·s) 1.2 1.30 1.40 1.40k2 · 10−6 l/(mol·s) 1.7 1.83 2.0 2.0
The constants of electron-transfer rates were measured using the describedtechnique for the reaction
Fe(DMBPy)2+3 + IrCl2−6k1k2
Fe(DMBPy)3+3 + IrCl3−6 .
The optical characteristics of the reagents [22] are presented in Table 2.2.
Table 2.2. Optical characteristics of reagents
Complex λmax, A εmax, mol/cm
Ir Cl2−6 4 900 3 920Fe (DMBPy)2+3 5 290 8 470Fe (DMBPy)3+3 5 430 350Ir Cl3−6 4 150 76
Note: λmax is the wavelength at whichmaximum absorption occurs (εmax is theabsorption factor).
2.3 Explosive Hydroacoustics 57
The complex of bivalent iron had the greatest absorption factor, thus,the equilibrium shift was established on the basis of changing concentration.A typical oscillogram of the relaxation process is shown in curve a on theright side of Fig. 2.8. For equal initial concentrations of reagents c0 = 4.35 ·10−5 mol/l and the ionic force of 0.1 mol, a new equilibrium state had therelaxation time τ = 20.7 µs at T = 22.1 C. The calculated rate constants ofdirect and reverse reactions (for equilibrium constant k = 1.95) were equalto ∼ 8 · 108 and ∼ 4 · 108 l/(mol·s), respectively, and were close to the valuesobtained in [27].
The above experimental results proved the applicability of this techniqueto studying nonequilibrium processes induced by the temperature jump be-hind the front of a strong shock wave in solutions.
2.3 Explosive Hydroacoustics
High-rate changes in the physical and chemical states of a medium accom-panied by abrupt heat release and pressure and temperature increase areusually defined as explosive processes. Chemical media that are capable ofsuch transformations are called explosives. The processes proceeding withvelocities on the order of 1 km/s and higher are called explosive processes.Radiation sources or systems based on such processes are called explosivesound sources. They generate shock and compression waves, which can bedefined as high-pressure zones with high energy density.
Such waves can be generated not only by HE and explosive gas mix-tures, by high-voltage electric discharges and different types of hydrodynamicshock tubes, but also by the so-called explosive-type sources: airguns, water-guns, watershocks, and powerful laser beams focused into a liquid. The mainadvantage of these sources over traditional sources is the high level of trans-formation of explosive energy into an acoustic energy in the form of a strongwide-band signal that is noise resistant and capable of propagating over hun-dreds of kilometers.
Beyond the different types of sources and their characteristics, detona-tion parameters as well as shock waves in near and far fields of standard HE,and their spectral characteristics are considered along with non-traditionalsources designed for solving the problems of directivity and control over ra-diation energy [29].
2.3.1 Basic Characteristics of Explosive Sound Sources
An explosion can be considered as a two-stage process. During the first stage,high energy is accumulated within a limited volume. For example, in thecase of HE, this energy is released at the detonation front due to chemicaltransformation (∼ 1 kcal/g). Under electric discharge the energy accumulatedin the capacitor bank is “pumped” into the discharge channel. The radiation
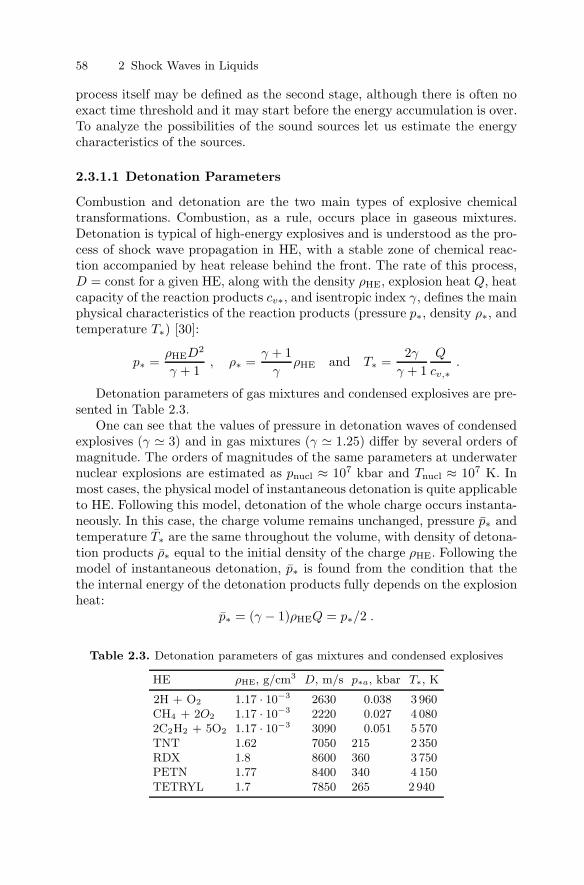
58 2 Shock Waves in Liquids
process itself may be defined as the second stage, although there is often noexact time threshold and it may start before the energy accumulation is over.To analyze the possibilities of the sound sources let us estimate the energycharacteristics of the sources.
2.3.1.1 Detonation Parameters
Combustion and detonation are the two main types of explosive chemicaltransformations. Combustion, as a rule, occurs place in gaseous mixtures.Detonation is typical of high-energy explosives and is understood as the pro-cess of shock wave propagation in HE, with a stable zone of chemical reac-tion accompanied by heat release behind the front. The rate of this process,D = const for a given HE, along with the density ρHE, explosion heat Q, heatcapacity of the reaction products cv∗, and isentropic index γ, defines the mainphysical characteristics of the reaction products (pressure p∗, density ρ∗, andtemperature T∗) [30]:
p∗ =ρHED2
γ + 1, ρ∗ =
γ + 1γ
ρHE and T∗ =2γ
γ + 1Q
cv,∗.
Detonation parameters of gas mixtures and condensed explosives are pre-sented in Table 2.3.
One can see that the values of pressure in detonation waves of condensedexplosives (γ 3) and in gas mixtures (γ 1.25) differ by several orders ofmagnitude. The orders of magnitudes of the same parameters at underwaternuclear explosions are estimated as pnucl ≈ 107 kbar and Tnucl ≈ 107 K. Inmost cases, the physical model of instantaneous detonation is quite applicableto HE. Following this model, detonation of the whole charge occurs instanta-neously. In this case, the charge volume remains unchanged, pressure p∗ andtemperature T∗ are the same throughout the volume, with density of detona-tion products ρ∗ equal to the initial density of the charge ρHE. Following themodel of instantaneous detonation, p∗ is found from the condition that thethe internal energy of the detonation products fully depends on the explosionheat:
p∗ = (γ − 1)ρHEQ = p∗/2 .
Table 2.3. Detonation parameters of gas mixtures and condensed explosives
HE ρHE, g/cm3 D, m/s p∗a, kbar T∗, K
2H + O2 1.17 · 10−3 2630 0.038 3 960CH4 + 2O2 1.17 · 10−3 2220 0.027 4 0802C2H2 + 5O2 1.17 · 10−3 3090 0.051 5 570TNT 1.62 7050 215 2 350RDX 1.8 8600 360 3 750PETN 1.77 8400 340 4 150TETRYL 1.7 7850 265 2 940
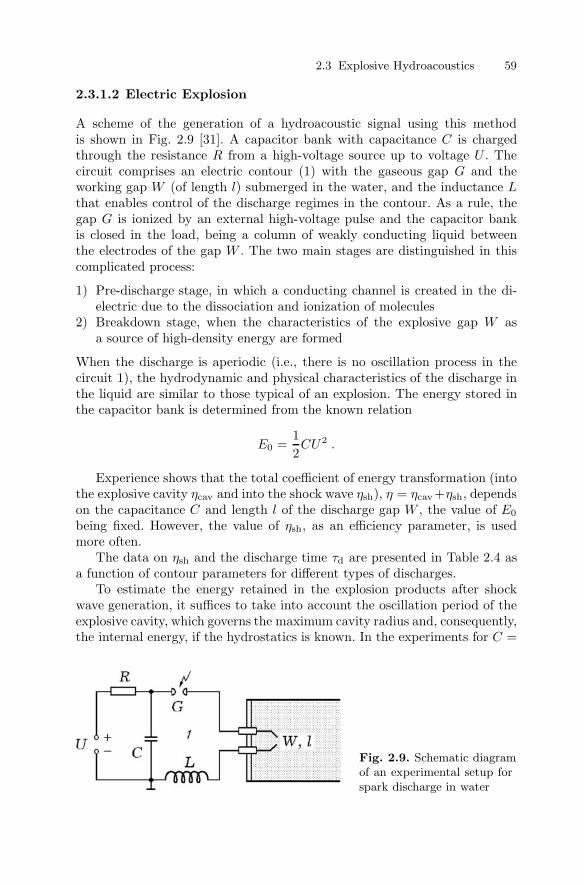
2.3 Explosive Hydroacoustics 59
2.3.1.2 Electric Explosion
A scheme of the generation of a hydroacoustic signal using this methodis shown in Fig. 2.9 [31]. A capacitor bank with capacitance C is chargedthrough the resistance R from a high-voltage source up to voltage U . Thecircuit comprises an electric contour (1) with the gaseous gap G and theworking gap W (of length l) submerged in the water, and the inductance Lthat enables control of the discharge regimes in the contour. As a rule, thegap G is ionized by an external high-voltage pulse and the capacitor bankis closed in the load, being a column of weakly conducting liquid betweenthe electrodes of the gap W . The two main stages are distinguished in thiscomplicated process:
1) Pre-discharge stage, in which a conducting channel is created in the di-electric due to the dissociation and ionization of molecules
2) Breakdown stage, when the characteristics of the explosive gap W asa source of high-density energy are formed
When the discharge is aperiodic (i.e., there is no oscillation process in thecircuit 1), the hydrodynamic and physical characteristics of the discharge inthe liquid are similar to those typical of an explosion. The energy stored inthe capacitor bank is determined from the known relation
E0 =12CU2 .
Experience shows that the total coefficient of energy transformation (intothe explosive cavity ηcav and into the shock wave ηsh), η = ηcav+ηsh, dependson the capacitance C and length l of the discharge gap W , the value of E0
being fixed. However, the value of ηsh, as an efficiency parameter, is usedmore often.
The data on ηsh and the discharge time τd are presented in Table 2.4 asa function of contour parameters for different types of discharges.
To estimate the energy retained in the explosion products after shockwave generation, it suffices to take into account the oscillation period of theexplosive cavity, which governs the maximum cavity radius and, consequently,the internal energy, if the hydrostatics is known. In the experiments for C =
Fig. 2.9. Schematic diagramof an experimental setup forspark discharge in water

60 2 Shock Waves in Liquids
Table 2.4. Explosion data as a function of contour parameters for different typesof discharge
U , kV C, µF l, cm τd, µs ηsh, %, Discharge type
30 0.1 5.0 7.5 32 Aperiodic21.2 0.2 2.5 17.5 25 Aperiodic15 0.4 1.2 25.0 13 Periodic10 0.9 0.5 140.0 3 Periodic
0.1 µF, U = 30 kV, and l = 4 cm, the period is within 5–6 ms. The internalenergy of a (cylindrical) cavity found from the theoretical estimate is
E∗ πρl3(
p0Tb
ρl
)2
,
and is about 0.1 E0 at the ambient pressure p0 = 0.1 MPa. Consequently,ηcav 10%. Thus, taking into account the estimate ηsh (see Table 2.4), thefull performance factor is η 40 %, which is twice as low as the appropriatevalue for cylindrical HE charges. An energy of several kilojoules close to theheat released by a 1-g HE charge, may in principle be stored in the compactcapacitor bank due to the increase in the capacitance C and voltage U .However, as is seen from Table 2.4, as C increases ηsh sharply decreases.To stabilize the discharge, a thin manganine wire can be mounted in thegap W (shock wave generation by exploding wires).
2.3.2 Hydrodynamic Sources of Explosive Type
As stated above, airguns, waterguns and watershocks are explosive-typesources. The principle of their operation is based on the storage of com-pressed gas energy and the transfer of this energy directly into the liquid inthe form of explosively expanding cavity in airguns, by means of transforma-tion of potential energy of ambient liquid in waterguns or through formationof compression wave applying the principle of a two-section hydrodynamicshock tube.
2.3.2.1 Airguns
In the simplest case, an airgun comprises two elements (Fig. 2.10): a pressurechamber (PC) of constant volume and a source as a gas cavity (GC) inthe ambient liquid [32]. The compressed air is supplied from the pressurechamber through the system of ports equipped with a controlling piston intothe ambient liquid. Ideally, the losses in the port and the remaining portionof gas in the pressure chamber are disregarded, and the internal energy ofcompressed gas is converted into the internal energy of the emerging gascavity. The cavity is assumed to be spherical or cylindrical and the gas inside
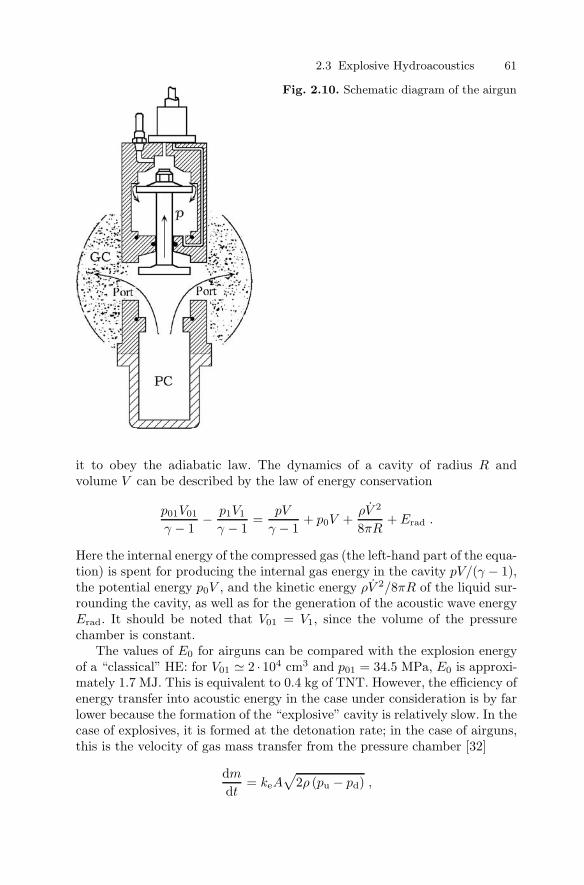
2.3 Explosive Hydroacoustics 61
Fig. 2.10. Schematic diagram of the airgun
it to obey the adiabatic law. The dynamics of a cavity of radius R andvolume V can be described by the law of energy conservation
p01V01
γ − 1− p1V1
γ − 1=
pV
γ − 1+ p0V +
ρV 2
8πR+ Erad .
Here the internal energy of the compressed gas (the left-hand part of the equa-tion) is spent for producing the internal gas energy in the cavity pV/(γ − 1),the potential energy p0V , and the kinetic energy ρV 2/8πR of the liquid sur-rounding the cavity, as well as for the generation of the acoustic wave energyErad. It should be noted that V01 = V1, since the volume of the pressurechamber is constant.
The values of E0 for airguns can be compared with the explosion energyof a “classical” HE: for V01 2 · 104 cm3 and p01 = 34.5 MPa, E0 is approxi-mately 1.7 MJ. This is equivalent to 0.4 kg of TNT. However, the efficiency ofenergy transfer into acoustic energy in the case under consideration is by farlower because the formation of the “explosive” cavity is relatively slow. In thecase of explosives, it is formed at the detonation rate; in the case of airguns,this is the velocity of gas mass transfer from the pressure chamber [32]
dm
dt= keA
√2ρ (pu − pd) ,
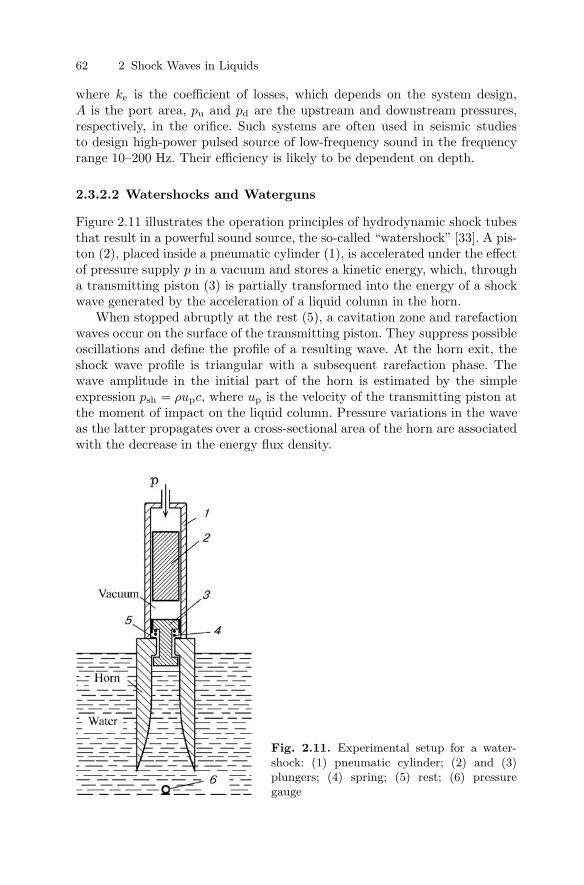
62 2 Shock Waves in Liquids
where ke is the coefficient of losses, which depends on the system design,A is the port area, pu and pd are the upstream and downstream pressures,respectively, in the orifice. Such systems are often used in seismic studiesto design high-power pulsed source of low-frequency sound in the frequencyrange 10–200 Hz. Their efficiency is likely to be dependent on depth.
2.3.2.2 Watershocks and Waterguns
Figure 2.11 illustrates the operation principles of hydrodynamic shock tubesthat result in a powerful sound source, the so-called “watershock” [33]. A pis-ton (2), placed inside a pneumatic cylinder (1), is accelerated under the effectof pressure supply p in a vacuum and stores a kinetic energy, which, througha transmitting piston (3) is partially transformed into the energy of a shockwave generated by the acceleration of a liquid column in the horn.
When stopped abruptly at the rest (5), a cavitation zone and rarefactionwaves occur on the surface of the transmitting piston. They suppress possibleoscillations and define the profile of a resulting wave. At the horn exit, theshock wave profile is triangular with a subsequent rarefaction phase. Thewave amplitude in the initial part of the horn is estimated by the simpleexpression psh = ρupc, where up is the velocity of the transmitting piston atthe moment of impact on the liquid column. Pressure variations in the waveas the latter propagates over a cross-sectional area of the horn are associatedwith the decrease in the energy flux density.
Fig. 2.11. Experimental setup for a water-shock: (1) pneumatic cylinder; (2) and (3)plungers; (4) spring; (5) rest; (6) pressuregauge
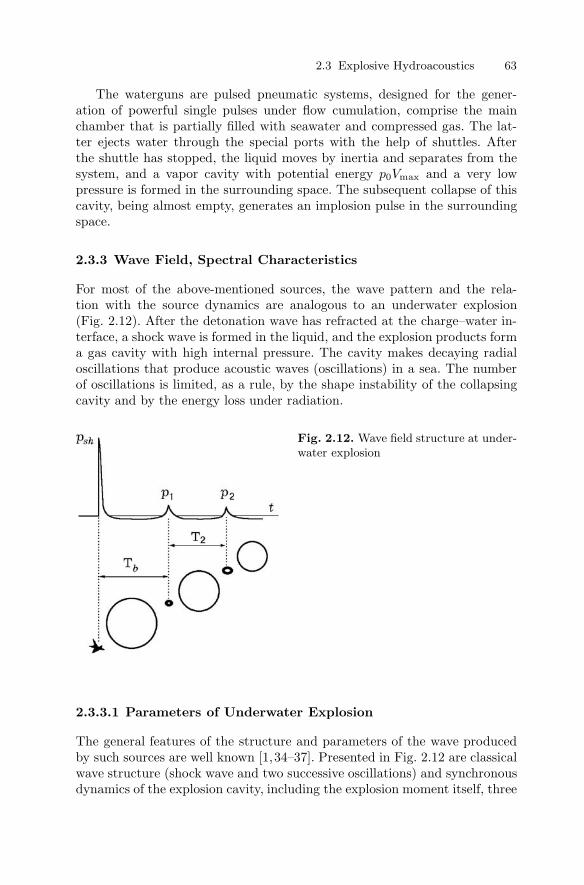
2.3 Explosive Hydroacoustics 63
The waterguns are pulsed pneumatic systems, designed for the gener-ation of powerful single pulses under flow cumulation, comprise the mainchamber that is partially filled with seawater and compressed gas. The lat-ter ejects water through the special ports with the help of shuttles. Afterthe shuttle has stopped, the liquid moves by inertia and separates from thesystem, and a vapor cavity with potential energy p0Vmax and a very lowpressure is formed in the surrounding space. The subsequent collapse of thiscavity, being almost empty, generates an implosion pulse in the surroundingspace.
2.3.3 Wave Field, Spectral Characteristics
For most of the above-mentioned sources, the wave pattern and the rela-tion with the source dynamics are analogous to an underwater explosion(Fig. 2.12). After the detonation wave has refracted at the charge–water in-terface, a shock wave is formed in the liquid, and the explosion products forma gas cavity with high internal pressure. The cavity makes decaying radialoscillations that produce acoustic waves (oscillations) in a sea. The numberof oscillations is limited, as a rule, by the shape instability of the collapsingcavity and by the energy loss under radiation.
Fig. 2.12. Wave field structure at under-water explosion
2.3.3.1 Parameters of Underwater Explosion
The general features of the structure and parameters of the wave producedby such sources are well known [1,34–37]. Presented in Fig. 2.12 are classicalwave structure (shock wave and two successive oscillations) and synchronousdynamics of the explosion cavity, including the explosion moment itself, three
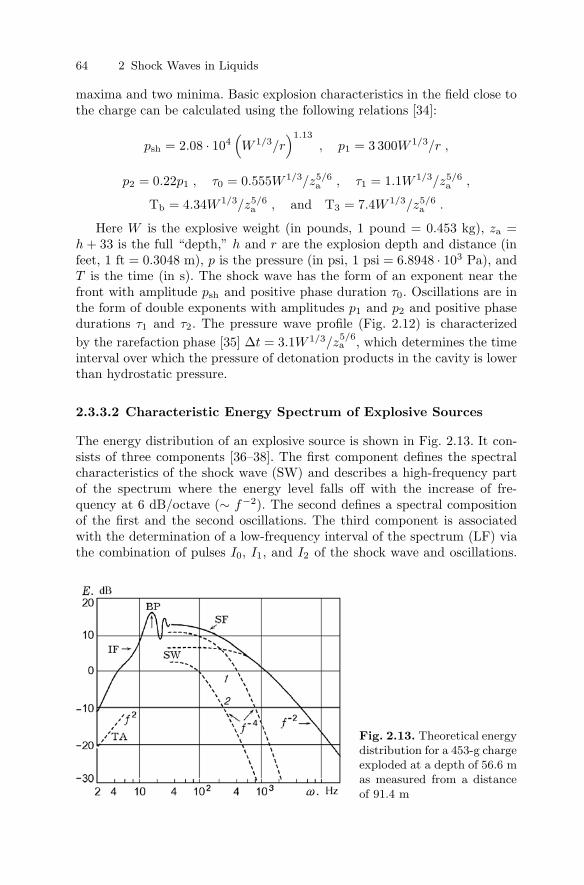
64 2 Shock Waves in Liquids
maxima and two minima. Basic explosion characteristics in the field close tothe charge can be calculated using the following relations [34]:
psh = 2.08 · 104(W 1/3/r
)1.13
, p1 = 3 300W 1/3/r ,
p2 = 0.22p1 , τ0 = 0.555W 1/3/z5/6a , τ1 = 1.1W 1/3/z5/6
a ,
Tb = 4.34W 1/3/z5/6a , and T3 = 7.4W 1/3/z5/6
a .
Here W is the explosive weight (in pounds, 1 pound = 0.453 kg), za =h + 33 is the full “depth,” h and r are the explosion depth and distance (infeet, 1 ft = 0.3048 m), p is the pressure (in psi, 1 psi = 6.8948 · 103 Pa), andT is the time (in s). The shock wave has the form of an exponent near thefront with amplitude psh and positive phase duration τ0. Oscillations are inthe form of double exponents with amplitudes p1 and p2 and positive phasedurations τ1 and τ2. The pressure wave profile (Fig. 2.12) is characterizedby the rarefaction phase [35] ∆t = 3.1W 1/3/z
5/6a , which determines the time
interval over which the pressure of detonation products in the cavity is lowerthan hydrostatic pressure.
2.3.3.2 Characteristic Energy Spectrum of Explosive Sources
The energy distribution of an explosive source is shown in Fig. 2.13. It con-sists of three components [36–38]. The first component defines the spectralcharacteristics of the shock wave (SW) and describes a high-frequency partof the spectrum where the energy level falls off with the increase of fre-quency at 6 dB/octave (∼ f−2). The second defines a spectral compositionof the first and the second oscillations. The third component is associatedwith the determination of a low-frequency interval of the spectrum (LF) viathe combination of pulses I0, I1, and I2 of the shock wave and oscillations.
Fig. 2.13. Theoretical energydistribution for a 453-g chargeexploded at a depth of 56.6 mas measured from a distanceof 91.4 m
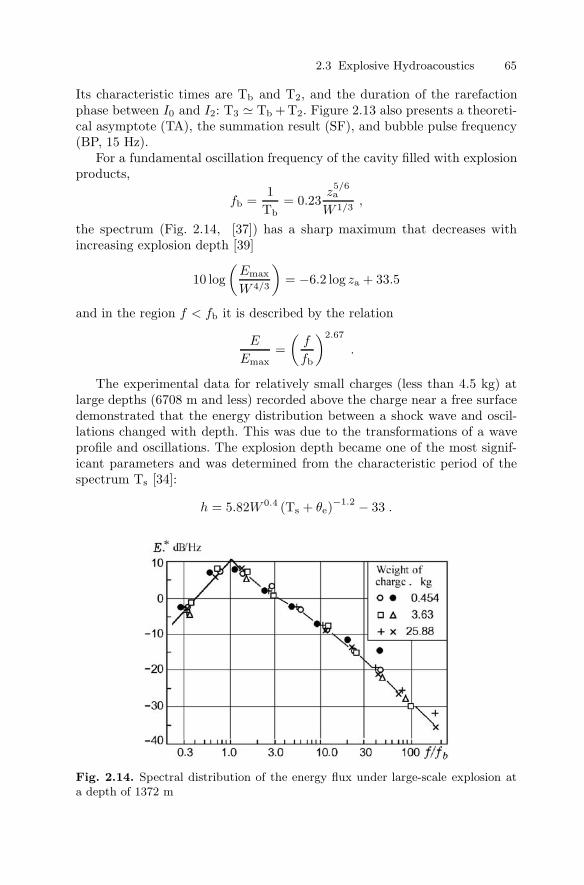
2.3 Explosive Hydroacoustics 65
Its characteristic times are Tb and T2, and the duration of the rarefactionphase between I0 and I2: T3 Tb +T2. Figure 2.13 also presents a theoreti-cal asymptote (TA), the summation result (SF), and bubble pulse frequency(BP, 15 Hz).
For a fundamental oscillation frequency of the cavity filled with explosionproducts,
fb =1
Tb= 0.23
z5/6a
W 1/3,
the spectrum (Fig. 2.14, [37]) has a sharp maximum that decreases withincreasing explosion depth [39]
10 log(
Emax
W 4/3
)= −6.2 log za + 33.5
and in the region f < fb it is described by the relation
E
Emax=(
f
fb
)2.67
.
The experimental data for relatively small charges (less than 4.5 kg) atlarge depths (6708 m and less) recorded above the charge near a free surfacedemonstrated that the energy distribution between a shock wave and oscil-lations changed with depth. This was due to the transformations of a waveprofile and oscillations. The explosion depth became one of the most signif-icant parameters and was determined from the characteristic period of thespectrum Ts [34]:
h = 5.82W 0.4 (Ts + θe)−1.2 − 33 .
Fig. 2.14. Spectral distribution of the energy flux under large-scale explosion ata depth of 1372 m
66 2 Shock Waves in Liquids
The spectrum became scalloped in form and remained the same whenpropagating over large distances, even if the signal was noticeably distorted.Here θe = 2.3 ms was the empirical constant obtained from the data recordedat distances of 460–570 km and 1 150–1300 km from the explosion site ofa 817-g charge at depths of ∼ 18.3 m, the receiver being at a depth ofabout 3 km.
It should be noted that, for the reason mentioned above, the spectrumtransformation should be estimated with great care, since upon explosion oflarge charges at large depths, the explosive cavity could migrate (emerge).The kinetic energy of the radial oscillations of the cavity was converted intothe energy of vertical motion under collapse, thereby the minimum cavitysize and, consequently, the oscillation amplitude might sharply vary.
2.3.3.3 Peculiarities of Pneumatic Systems
As stated above, the operation principle of waterguns [40] consists in forma-tion of a low-pressure vapor cavity, which irradiates a single-implosion pulsewhen collapsing under ambient pressure p0 (Fig. 2.15). The radiation processis adequate here to the phase of the first oscillation of the explosive cavity,and its characteristics can be used (with appropriate coefficient corrections)to estimate the performance of watergun systems.
The profile of the wave generated by an airgun is similar to that shownin Fig. 2.12 for HE, but its amplitude is significantly less and the oscillationdecay is weaker. The latter is explained by the negligible radiating capabilityof the system. In the frames of a spherical or cylindrical model their oscilla-tion frequency, being the fundamental one in the spectrum for the airgun, isdefined by the relations [41]:
fsph = 0.027p0.930 E−0.27
0 and fcyl = 2.86p0.930 E−0.5
0,l ,
where E0,l is the initial energy of the system per unit length. On the basis ofthe above law of energy conservation, the wave pressure may be estimated by
Fig. 2.15. An ideal near-field wave sig-nal of a watergun
2.3 Explosive Hydroacoustics 67
Table 2.5. Efficiency of energy conversion in different types of explosives
No Type of radiator, Transformation efficiency, %
energy, mass Total 0–100 Hz 20–50 Hz 100–1000 Hz
1 TNT, 1.5 g 24 0.3 0.09 2.772 TNT, 44 g 24 1.07 0.317 5.943 TNT, 255 g 24 1.96 0.595 10.14 TNT, 1274 g 24 3.24 1.03 12.85 Combustion of gaseous
mixture, 45 kcal 1.95 1.2 0.415 0.6566 Detonation of mixture,
39 kcal 1.45 0.7 0.233 0.6597 Airgun∗,
35 kcal 0.75–1.5 0.74–1.47 0.31–0.61 0.03
∗ For different rates of port opening.
pr(t) =ρ
4πrV .
It has been confirmed experimentally that airgun efficiency is maximized atlow frequencies (on the order of 10 Hz) and sharply decreases as the explosiondepth increases.
2.3.3.4 Comparative Characteristics of Spectra
Spectral efficiency of the conversion of accumulated energy into acoustic en-ergy can be illustrated by experimental data on the low-frequency regionof the energy spectrum of acoustic signals emitted by different sources [42](a stoichiometric mixture of propane–butane with oxygen was used in theexperiments in the airgun chamber of volume 1 dm3 at pressure 138 atm(2000 psi)).
As is seen from Table 2.5, the most amount of the energy is released inthe band up to 1 kHz. However, for airguns it is already released in the range0–100 Hz. With almost the same energies of radiators, from 35 to 45 kcal(cases 2 and 5–7), the efficiency of conversion into acoustic energy over therange 20–50 Hz is of the same order.
The use of low-energy explosives as an acoustic source is less effectiveas compared to high explosives due to the low detonation velocities. Theirspectrum features are closer to gaseous mixtures.
2.3.4 Array Systems
2.3.4.1 Airgun–Watergun Systems.
The aim of airgun–watergun arrays is to cumulate the wave energy in a givendirection [43,44]. The system comprises n individual sources (Fig. 2.16) with
68 2 Shock Waves in Liquids
Fig. 2.16. Sketch ofexperiments with ann-airgun array
fixed distance d between them. A maximum energy Emax of the signal gen-erated by the system depends on the array parameters and the wavelength.The configuration of the sources and time intervals between detonations de-termines the direction of radiation, whose index is defined by the relation [41]
D1 = 10 log(
Emax
nE0
).
The problem of synchronization in firing each airgun in the array is, cer-tainly, of great importance. If all the sources are initiated simultaneously, thereleased energy for seven sources will be 18.6± 2.3 kJ, which is much higherthan 7.5 ± 0.9 kJ in the case of individual initiation. The total efficiencyof airgun systems is somewhat lower than 2%. To describe the behavior ofarbitrary arrays of airguns, numerical methods have been successfully usedin [32].
2.3.4.2 Explosive Sources of Array Type
As stated above, explosive sound sources as a main element of various sonarsdesigned for generation of quasitonal, directional, strong, long-duration pulsesof high acoustic power have been the focus of research for many years. Theirrange includes spark discharge generators [45], condensed liquid [46], andsolid [47–49] explosives, gaseous explosive mixtures [49–51], as well as devicesin which shock waves are generated by collapsing cavities [38, 53, 54]. Theintegral energy parameters of radiation of some explosive sources in water arecompared in Table 2.5 [42]. Their spectral characteristics were experimentallystudied by Christian, Urick, and Turner and Scrimger [38, 54, 55].
It is known that explosive sources, which are often applied in attempts tosolve a wide spectrum of problems of geophysics, navigation and propagationin the ocean, possess high power and their radiation is registered at largedistances. However, these acoustic sources must provide directivity and low-frequency radiation that is a nontrivial task for pointwise explosive sources.Nevertheless, a special distribution of array type or charge geometry proveto be appropriate for this purpose.
2.3 Explosive Hydroacoustics 69
Some approaches to solving these problems are based on the well-knownconcepts of classical acoustics on directed radiation by specially arrangeddistributed sources. Linear cord charge ensures primary radiation of a shockwave in the plane perpendicular to its axis [49]. A vertically arranged chain ofHE charges initiated individually and successively with a given time intervalbetween initiations [47] provides the radiation of shock wave packet withgiven duration and tonal “coloration.” Explosion of a charge on the basisof a specially profiled cone is used to arrange directed radiation [48]. Theseproblems were considered in [57–60].
Continuous systems of the type of plane or spatial spiral charges designedfor high explosive cord are of particular interest [61–63]. Their advantagesover other types are controllable frequency characteristics of the spectrumand a wave shape that is prescribed by the parameters of a spiral. In sucha system, the detonation front moves along the spiral coils rotating relativeto its axis and provides the cyclic radiation of the shock waves in the givendirection.
It should be noted that the detonation rate of a standard detonating cordis approximately five times as high as the speed of sound in liquids. Thisfact allows one to apply the model of instantaneous explosion of a coil topreliminary estimates and to investigate experimentally the peculiarities ofwave formation process by the example of an exploding circular conductor.Experiments in this statement and research results for the explosion of realcircular charges will be considered in the next chapter.
2.3.5 Explosion of Spiral Charges, Wave Structure
Figures 2.17 and 2.18 present streak-camera records of the formation of a peri-odic succession of shock waves [29,63] in the ambient space due to continuousrotation of the detonation front around the spiral axis.
Figure 2.17a,b illustrates the formation of a succession of three shockwaves radiated in a liquid at underwater explosion of a three-coil spatial spiralcharge. The succession period of waves in this packet was exactly equal to thetime it took for the detonation front to pass one coil of the spiral. Figure 2.18presents the results of the full-scale experiment with a flat spiral charge (spiralof Archimedes) made of detonating cord (about 35-m long) turned in ten coilswith a pitch of about 10 cm. Detonation was initiated from the external coil.One can see that at a distance of 20m from the spiral plane a packet of shockwaves was registered on its geometrical axis (Fig. 2.18a). Figure 2.18b showsthe oscillogram of the shock wave registered from the detonating cord linedhorizontally.
It is quite obvious that depending on the detonation velocity and lineardimensions of the spirals (pitch and diameter), the signal shape might beeither a prescribed succession of shock waves or a single positive signal withmodulated amplitude. In the first case, over one period of the detonationfront turn along the coil, the front of radiated wave could pass the distance
70 2 Shock Waves in Liquids
Fig. 2.17a,b. Formation of a shock wave packet at underwater explosions of spatialspiral charges
2.3 Explosive Hydroacoustics 71
Fig. 2.18a,b. Hydroacousticsignal recorded at underwaterexplosion of a flat spiral chargeat a distance of 20 m along itsaxis (a) and short single signalfrom a cord charge drawn ina line (b)
that was much greater than that covered by detonation along the spiral axis.This corresponded to the condition Dax Ush, where Dax is the axial com-ponent of the detonation velocity and Ush is the velocity of the shock wave inthe liquid. In this case, each next coil would explode in the region far behindthe front of the shock wave radiated by the previous coil. Thus, if the spiralparameters were constant, the radiation would be determined by the succes-sion of shock waves of practically equal amplitude for spirals with uniformparameters.
In the second case, the shock front velocity and the axial component ofdetonation velocity coincided (Dax ≈ Ush). Figure 2.17b shows this variantof the wave formation for vertical arrangement of the spiral axis. In this case,the pressure wave was amplified and the general character of radiation waschanged: the succession of shock waves was transformed into a long solitarywave with modulated amplitude according to the frequency of rotation of thedetonation front around the spiral charge axis.
Naturally, these frequencies could vary if circular elements of the chargehad different linear characteristics. In any case, the wave duration was definedby the length of the detonating cord l and the detonation velocity D. Shots6, 7 and 10, 11 in Fig. 2.17b show the explosion of the second and the thirdcoils of the spiral, respectively, immediately behind the shock wave front inthe liquid. In addition, it is clearly seen in photo 10 that the interaction of theshock wave from the second coil with the explosive cavity from the first coilled to the formation of an additional wave, which significantly complicatedthe overall radiation pattern.
Figure 2.19a,b presents the results of modeling the shock wave formationduring underwater explosion of a flat three-coil spiral charge made of detonat-ing cord (frame-by-frame scanning). The formation of a series of shock wavesduring the explosion of a flat five-coil spiral initiated from the outer side was
72 2 Shock Waves in Liquids
Fig. 2.19a,b. Formation of a shock wave package under the explosion of flat spi-rals (a) and the wave pattern ahead of the charge plane for the charges of the typeof the spiral of Archimedes (b)
visually demonstrated by continuous scanning (Fig. 2.19b, the spiral planewas positioned horizontally and was perpendicular to the figure plane). Onecan expect predominant radiation of the acoustic signal toward the symmetryaxis or in close direction. Initiation of the charge from the external sectionled to converging detonation fronts and to complicated interaction betweenradiated waves, which evidently resulted in a periodic amplitude modulationdue to different radii of circular elements of the flat spiral.
The parameters of radiation induced by the explosion of charges of com-plicated geometry can be estimated in a rather simple way. The wave packetradiated by the charge consists of the succession of shock waves whose ampli-tudes are determined from the data for concentrated charges with equivalentHE weight of the coils. The frequency of the succession of shock waves in thepacket is determined by the coil length and the detonation velocity of theHE, while the duration of the whole packet (or of a solitary wave with modu-lated amplitude) depends on the full travel time of the detonation front alongthe spiral made of detonating cord. This points to the unique possibility tocontrol the duration of radiation.
2.3 Explosive Hydroacoustics 73
The results obtained for the dynamics of cylindrical and toroidal cavitiescontaining detonation products (see details in Chap. 3) can be used to ana-lyze the wave field structure in the circular source approximation, assumingthat the source is “switched” instantaneously or approximated by a set ofpointwise sources “switched” in series with the detonation velocity. The timevariation of the source power at each point of the circle is assumed identicaland is determined from Eq. (1.17) (Chap. 1) with regard to the phase shiftof oscillations due to finite velocity of switching of the source elements (det-onation velocity). Thus, the wave structure radiated during the explosion ofa circular charge is calculated with regard to the delay time for the detona-tion velocity D and the velocity of the acoustic wave c0. In accordance withthe above statement, the acoustic pressure can be determined as
p ρa
4π
2π∫0
S(t − τ)f
dα ,
where f =√
z2 + r2 + a2 − 2a r cosα; r, α, and z are the coordinates of thecylindrical system, the angle α is counted off from the “circle center–initiationpoint” direction, and S is the section area of the toroidal (or cylindrical) cav-ity. The calculations can be substantially simplified using the “peak” approx-imation [1,4]. Figure 2.20 shows the calculation results for the wave structureat the point lying at a distance r = 2a in the circular plane on the “initia-tion point–center” line. The calculations were performed for R0 = 0.15 cm,a = 15 cm, and D = 7.7 km/s. It illustrates the dynamics of shock waveformation for relative pressure p = 4πp/ap(0), where p(0) is the initial pres-sure in the detonation products calculated using the model of instantaneousdetonation for discontinuity decay. The time τ1 was taken with respect to theconstant θ0 = 2.7Rch/c0.
Fig. 2.20a,b. Shock wave structures under instantaneous explosion of a circularcharge in a liquid (1), under explosion with finite detonation velocity (2) and at thefirst coil under continuous rotation of the detonation front (3) (calculation results)
74 2 Shock Waves in Liquids
The curve (1) corresponded to the instantaneous explosion at which onlytwo (direct and reflected from the circle axis) waves were generated; the pro-file (2) is obtained for finite detonation velocity. The three waves arose incomplete accordance with the experiment. The first and the second waveswere shock waves of initial and final sections of the circle, respectively, whilethe third wave was the compression wave reflected upon focusing. Curve (3)described the initial unsteady wave profile for the case of continuous rota-tion of the detonation front about the circle of radius a (the initial sectioncoincided with the profile (2)).
2.4 HE-Nuclear-Tests, Explosive Acousticsand Earthquakes
An analysis of the investigation results published during the last 10–15 yearshas shown that more 70 papers use the keywords “underwater explosions”,though most of them are not interesting in view of the problems of under-water explosions considered in this monograph. Nevertheless, two types ofpapers can be mentioned as containing useful information. The first one isdevoted to the classical problems of explosive hydroacoustics, to numericalmodelling underwater explosions and shock wave interactions with targetsas well as to some methods of shock wave parameter measuring. The othergroup of interesting papers is the class of problems the solution of which isdetermined by the interests of monitoring the Comprehensive Nuclear-Test-Ban-Treaty (CTBT) and by interest to an interdisciplinary problem of thediscrimination between earthquakes and underwater explosions. The shortsurvey of mentioned results is presented in this section.
Two presumed underwater explosions, detonated at a site located ap-proximately 215 km southwest of Oahu, Hawaii, were tested by Reymondet al. [64] on several criteria. In particular, these observations indicate a strongfrequency dispersion in the spectrograms and the identification of a bubbleperiod (0.45 s) in the spectra of the signals, which translates into a yield of275 kg of equivalent TNT for a depth of 50 m. This test provides a perfect op-portunity to assess the capabilities of T-phase stations and hydrophones fordetection, location, identification, and quantification of mentioned explosivesources.
A collaborative research program for the purpose of monitoring CTBT,and examining and analyzing hydroacoustic data from underwater explosionswas carried out by Eneva, Stevens, Khristoforov et al. [65]. These data wereused as constraints on modeling the hydroacoustic source as a function ofdepth below the water surface. This is of interest to the CTBT because ex-plosions in the ocean are more difficult to identify if they are on or near theocean surface. Unique historical Russian data sets have now become availablefrom test explosions of 100-kg TNT cast spherical charges in a shallow reser-voir with a low-velocity air-saturated layer of sand on the bottom. In these
2.4 HE-Nuclear-Tests, Explosive Acoustics and Earthquakes 75
measurements a reduction of peak pressure by about 60–70% was observedfor half-immersed charges as compared with deeper explosions. Besides, peak-pressures were measured during 1957 underwater nuclear explosion (10 kTand depth 30 m) in the Bay of Chernaya (Novaya Zemlya). The 100-kg TNTdata were compared with model predictions. Shockwave modeling was basedon spherical wave propagation and finite element calculations, constrained byempirical data from US underwater chemical and nuclear tests. Peak-pressuremeasurements and pressure-time histories were simulated at a 10 km distancefrom hypothetical 1-kT and 10-kT nuclear explosions conducted at variousdepths in the ocean. The ocean water was characterized by a realistic soundvelocity profile featuring a velocity minimum at 700-m depth. Simulated mea-surements at that same depth predict at least a tenfold increase in peak pres-sures from explosions in the SOFAR channel as compared with very shallowexplosions (e.g., similar to 3-m depth).
The results of using of the Israel Seismic Network (ISN) for discriminationbetween low magnitude earthquakes and explosions were described by Git-terman, Pinsky, Shapira [66], Gitterman, Ben-Avraham, Ginzburg [67] andGitterman, Shapira in [68]. As noted in [66] the results for the Middle East re-gion are important for CTBT monitoring, especially when considering smallnuclear tests which may be conducted under evasive conditions. The perfor-mance of efficient discriminants based on spectral features of seismogramsusing waveforms of 50 earthquakes and 114 quarry and underwater blastswith magnitudes 1.0–2.8, recorded by ISN short-period stations at distancesup to 200 km was explored. The single-station spectral ratio of the low andhigh-frequency seismic energy has shown an overlap between explosions andearthquakes. Different frequency bands were tested; the (1–3 Hz)/(6–8 Hz)ratio provided the best discriminant performance.
In [67], ISN as a spatially distributed multichannel system was uti-lized for the discrimination of earthquakes and underwater explosions inthe Dead Sea based on different spectral features of the seismic radiationfrom underwater explosions and earthquakes, i.e. spectral semblance statis-tics. The analysis of 28 single-shot underwater explosions (UWEs) and 16earthquakes in the magnitude range M–L = 1.6–2.8, within distances of10–150 km, recorded by the ISN, has found that the classical discrimi-nant of the seismic energy ratio between the relatively low-frequency (1–6 Hz) and high-frequency (6–11 Hz) bands, averaged over an ISN subnetworkand shown an overlap between UWEs. The method demonstrates a distinctazimuth-invariant coherency of spectral shapes in the low-frequency range(1–12 Hz) of short-period seismometer systems. The modified statistics pro-vided an almost complete separation between earthquakes and underwaterexplosions.
Spectral analysis of two events (probable earthquakes or probable UWE)that occured off the coast of the Levant and were recorded by the ISN helpedto characterize these events. The observed spectral modulation of the seismic
76 2 Shock Waves in Liquids
waves was compared with the expected spectra due to source mechanism ofUWE and possible effects of the liquid layer (i.e. bubbling, reverberation andchannelling). The results of the study demonstrated that spectral analysis ofseismograms can be used to discriminate between off-coast earthquakes andunderwater explosions recorded in Israel [68].
Wardlaw and Luton [69] studied the interaction structure of shock wave,explosive bubble and target. Shock reflects off the bubble as an expansionthat reduces the pressure level between the bubble and the target, inducingcavitation and its subsequent collapse that reloads the target. By comparingdeformable and rigid body simulations, it is shown that cavitation collapsecan occur solely from the shock-bubble interaction without the benefit oftarget deformation. The addition of a deforming target lowers the flow fieldpressure, facilitates cavitation and cavitation collapse, as well as reduces theimpulse of the initial shock loading.
A cylinder expansion test for high explosives and numerical simulationsof the underwater shock waves were carried out by Itoh, Liu, Nadamitsu [70].It was shown that the behavior of the underwater shock waves at the vicinityof the explosives differs greatly from that far from the explosives. In particu-lar, the strength of the underwater shock wave nearby the explosive rapidlydecreases due to the effect of the expansion of the gas products.
Menon and Lal have studied experimentally the dynamics of explosivebubbles formed during underwater detonations of exploding fuel (hydrogenand/or carbon monoxide–oxygen mixture) in a laboratory water tank [71].Sub-scale explosions are instrumented to provide detailed histories of bubbleshape and pressure. Using geometric and dynamic scaling analyses they haveshown that these sub-scale bubbles are reasonable approximations of bub-bles formed during deep sea underwater explosions. The explosion bubbleundergoes pulsation and loses energy in each oscillation cycle. The observedenergy loss, which cannot be fully explained by acoustic losses, is shown hereto be partly due to the excitation of Rayleigh–Taylor instability excited nearthe bubble minimum at the interface between the gaseous bubble and thesurrounding water.
The time evolution of high-temperature vapor and plasma bubbles gen-erated by underwater electrical discharges was described by Cook et al. [72].The oscillations of these bubbles generate acoustic signatures similar to thesignatures generated by air guns, underwater explosions, and combustiblesources. A set of model equations is developed that allows the time evolutionof the bubble generated by a spark discharge to be calculated numericallyfrom a given power input. The acoustic signatures produced by the modelwere compared to previously recorded experimental data, and the model wasfound to agree over wide ranges of energy and ambient pressure on severalcharacteristic values of the acoustic signatures. The bubble period and theminimum rarefaction pressure were found to depend on depth, while the peakpressures in the expansion and collapse pulses and the acoustic energy in the
2.4 HE-Nuclear-Tests, Explosive Acoustics and Earthquakes 77
expansion pulse were not found to depend on depth over the parameter rangesinvestigated.
The advantages and performance of an impulse sonar that uses the short,energetic pulses emerging from underwater explosions as its sources werestudied in [73]. This transient analysis was carried out for various simpletargets of interest, in the time-domain, in the frequency domain and in thecombined time-frequency domain. The last processing approach exhibits thetime evolution of the target resonances in a more informative way and it isseen to offer additional advantages for target identification purposes.
Propagation histories of underwater shock waves generated by underwaterexplosion of high explosive in the range close to explosive have been obtainedby processing photographs [74]. In order to obtain pressure distributions ofthese shock waves, Kira, Fujita, and Itoh applied the non-linear curve fittingtechnique to these histories. Underwater explosions have been simulated byan arbitrary Lagrangian–Eulerian (ALE) method and calculated results agreewell with experimental results in both propagation histories and pressuredistributions.
Smoothed particle hydrodynamics (SPH) is a gridless Lagrangian tech-nique that is appealing as a possible alternative to numerical techniques cur-rently used to analyze high-deformation impulsive loading events. In [75],Swegle and Attaway have subjected the SPH algorithm to detailed testingand analysis to determine the feasibility of using PRONTO/SPH for theanalysis of various types of underwater explosion problems involving fluid-structure and shock-structure interactions. Of particular interest are the ef-fects of bubble formation and collapse and the permanent deformation ofthin-walled structures due to these loadings. Coupling SPH into the finiteelement code PRONTO represents a new approach to the problem. Resultsshow that the method is well-suited for the transmission of loads from under-water explosions to nearby structures, but the calculation of late time effectsdue to acceleration of gravity and bubble buoyancy will require additionaldevelopment, and possibly coupling with implicit or incompressible methods.
The results of numerical studies of the problems of underwater explo-sion such as the transient pressures in both explosive and surrounding waterwere presented in [76] by Molyneaux and Li. Comparisons with experimentaldata for both cast (Trinitrotoluene) TNT and (Pentaerythritol Tetranitrate)PETN explosives confirmed that the suggested numerical model is capableof providing good predictions for both the magnitude and the form of thepressure transient and it can be applied to a variety of underwater explosionscenarios, e.g., arbitrary charge shape and orientation; multiple charges; andreflections of shock waves at boundary surfaces.
The investigation of the feasibility of using approximate acoustic meth-ods to describe the transient pressure field produced by the rapid expansionof a high pressure vapor bubble generated by an energetic steam explosionhave been carried out in [77] by Frost, Lee, and Thibault. The approximate
78 2 Shock Waves in Liquids
methods were validated by comparing with exact finite difference calcula-tions. The calculations illustrated the importance of compressibility effectsin reducing the peak overpressure between the leading shock and subsequentbubble collapses. The acoustic method was applied to estimate the pressuretransients following a hypothetical large-scale corium–water explosion. Thecalculations provided a more realistic estimate of the pressure transients thanmethods that scale the blast overpressures and impulses in terms of the totalthermal energy available. To obtain a more accurate estimate of the pressuregenerated, the finite pressurization time, transient phase change effects andbubble instabilities must be considered.
A semiconductor sensor for the study of pressure fields in underwaterexplosions was described in [78] by Sigeikin et al. The frequency of the sensor’snatural mechanical oscillations f = 800 kHz, the error of shock wave-pressuremeasurements is less than or equal to ±10%.
References
1. R. Cole: Underwater Explosions (Dover, New York, 1965)2. V.P. Korobeinikov, B.D. Khrisoforov: Underwater Explosion, Itogi Nauki
Tekhn. Gidromekh. 9, pp. 54–119 (1976)3. B.V. Zamyshlyaev, Yu.S. Yakovlev: Dynamic Loads at Underwater Explosion
(Sudostroenie, Leningrad, 1967)4. V.K. Kedrinskii: Kirkwood–Beth Approximation for Cylindrical Symmetry of
Underwater Explosion, Fiz. Goren. Vzryva 8, 1, pp. 115–123 (1972)5. V.K. Kedrinskii: On parameters of weak shock waves at great distance from the
charge. In: Dynamics of Continuous Medium, vol. 10, pp. 212–216 (Institute ofHydrodynamics, SB, the USSR AS, Novosibirsk, 1972)
6. V.K. Kedrinskii: About Some Models of One Dimensional Pulsation of Cylin-drical Cavity in Incompressible Liquid, Fiz. Goren. Vzryva 12, 5, pp.768–773(1976)
7. V.K. Kedrinskii, V.T. Kuzavov: Dynamics of Cylindrical Cavity in Compress-ible Liquid, Zh. Prikl. Mekh. i Tekhn. Fiz. 18, 4, pp. 102–106 (1977)
8. B.D. Khristoforov, E.A. Shirokova: Parameters of Shock Wave at UnderwaterExplosion of Cord Charge, Zh. Prikl. Mekh. i Tekhn. Fiz. 3, 5, pp. 147–149(1962)
9. L.D. Landau: About Shock Waves for Far Distances From Charge, AppliedMath. Mech. 9, 4 (1945)
10. S.A. Khristianovich: Shock Wave in Water Far From Explosion Point, Appl.Math. Mech. 20, 5, pp. 599–605 (1956)
11. W.S. Filler: Propagation of Shock Waves in a Hydrodynamic Conical ShockTube, Phys. Fluids 7, 5, pp. 664–667 (1964)
12. I.I. Glass, L.E. Heuckroth: Hydrodynamic Shock Tube, Phys. Fluids 6, 4, pp.543–549 (1963)
13. M.H. Rice, J.M. Walsh: Equation of State Water to 250 kbar, J. Chem. Phys.26, 4, pp. 814–830 (1957)
References 79
14. J.G. Kirkwood, J.M. Richardson: The Pressure Wave Produced by an Under-water Explosion III, Office of Sc. Research and Development Report No. 813(1942)
15. V.K. Kedrinskii: Features of Spherical Gas Bubble Dynamics in a Liquid, Zh.Prikl. Mekh. i Tekhn. Fiz. 8, 3, pp. 120–125 (1967)
16. A.S. Besov, V.K. Kedrinskii, E.I. Palchikov: Study of Initial Stage of CavitationUsing Diffraction-Optiocal Mathod, Pis’ma Zh. Exp. Teor. Fiz. 10, 4, pp. 240–244 (1984)
17. M.I. Vorotnikova, V.K. Kedrinskii and R.I. Soloukhin: Shock Tube for Study ofOne Dimensional Wave in a Liquid, Fiz. Goren. Vzryva 1, 1, pp. 5–15 (1965)
18. F. Kheiman: Shock Wave Velocity and Pressure Under a Collision of Liquidand Solid at High Velocity, Theor. Fundamentals of Eng. Calc. 90, 3 (1968)
19. Berngardt A.R.: Dynamics of cavitation zone under pulse loading of liquid.PhD Thesis (Lavrentyev Inst. of Hydrodynamics, SB RAS, Novosibirsk, 1994)
20. V.K. Kedrinskii, R.I. Soloukhin, S.V. Stebnovskii: Semiconductor of PressureGauge for Measurement of Strong Shock Waves in a Liquid (> 102 MPa), Zh.Prikl. Mekh. i Tekhn. Fiz. 10, 4, pp. 92–94 (1969)
21. V. Paul, D.M. Warshauer: The role of pressure in studying semiconductors. In:W. Paul, D.M. Warschauer (eds.) Solids Under High Pressure (Mir, Moscow,1966) pp. 205–283
22. V.K. Kedrinskii, N.K. Serdyuk, R.I. Soloukhin, S.V. Stebnovskii: Study of FastReaction in a Solution Behind the Front of Shock Waves, Dokl. Akad. NaukSSSR 187, 1, pp. 130–133 (1969)
23. N.M. Kuznetsov: State Equation and Thermocapacity of a Water for WideSpectrum of Thermodynamic Parameters, Zh. Prikl. Mekh. i Tekhn. Fiz. 2, 1(1961)
24. H. Hoffmann, E. Yeager, J. Stuehr: Apparatus with Laser Formation of Tem-perature Jump for Relaxation Study of Reactions in Solutions, Pribory DlyaNauch. Issled. 5 (1968)
25. H. Hoffmann, E. Yeager: Relaxation Study of Chemical Reactions by PressureJump Method, Pribory Dlya Nauch. Issled. 8, pp. 9–10 (1968)
26. A. Jost: Berich. Phys. Chem. 70, (1966)27. P. Hurwitz, K. Kustin: Inorg. Chem. 3, 6, pp. 823 (1964)28. S.W. Benson: The Foundations of Chemical Kinetics, (McGraw-Hill, New York,
1960)29. V.K. Kedrinskii: Underwater explosive sound sources. In: M. Crocker (ed.)
Encyclopedia of Acoustics, vol. 1 (John Wiley & Sons, New York, 1997)pp. 539–547
30. F. Baum at al.: Explosion Physics (Nauka, Moscow, 1975)31. N. Roy, D. Frolov: Generation of sound by spark discharges in Water. In:
Proc. 3rd Intern. Congress on Acoustics (Elsevier, Stuttgart, Germany, 1961)pp. 321–325
32. R. Laws, L. Hatton, G. Parkes: Energy interaction in marine airgun arrays. In:E. A. E. G., paper No. 1756 (18 Oct. 1989) pp. 1–37
33. A. Laake, G. Meier: Sound generation by the watershock. In: Proc. ICA-12(Toronto, Canada, 1986) pp. 1–3
34. S. Mitchell, N. Bedford, M. Weinstein: Determination of Source Depth Fromthe Spectra of Small Explosives Observed at Long Ranges, J. Acoust. Soc. Am.60, 4, pp. 825–828 (1976)
80 2 Shock Waves in Liquids
35. M. Blaik, E. Christian: Near-Surface Measurements of Deep Explosives, J.Acoust. Soc. Am. 38, 1, pp. 50–62 (1965)
36. D. Weston: Underwater Explosions as Acoustic Sources, Proc. Phys. Society76, 2, 488, pp. 233–249 (1960)
37. A. Arons: Underwater Explosion Shock Wave Parameters at Large DistancesFrom the Charge, J. Acoust. Soc. Am. 26, 3, pp. 343–346 (1954)
38. E. Christian: Source Levels for Deep Underwater Explosions, J. Acoust. Soc.Am. 42, 4, pp. 905–907 (1967)
39. A. Kibblewhite, R. Denham: Measurements of Acoustic Energy From Under-water Explosions, J. Acoust. Soc. Am. 48, 1, pp. 346–351 (1970)
40. E. Tree, R. Lugg, Y. Brummitt: Why Waterguns?, Geophys. Prospecting. 34,pp. 302–329 (1986)
41. J. Barger, W. Hamblen: The Airgun Impulsive Underwater Trancducer, J.Acoust. Soc. Am. 68, 4, pp. 1038–1045 (1980)
42. M. Badashkand: Comparison of Acoustic Effect of Some Explosive SoundSources in Water, Dokl. Akad. Nauk SSSR 194, 6, pp. 1309–1312 (1970)
43. R. Bailey, P. Garces: On the Theory of Airgun Bubble Interaction, Geophys.53, 2, pp. 192–200 (1988)
44. R. Laws, G. Parkers, L. Hattou: Energy Interaction. The Long-Wave Interac-tion of Seismic Waves, Geophys. Prospecting 36, pp. 333–348 (1989)
45. H.A. Wright, J.P. Tobey: Acoustic Generator of the Spark Discharge Type, J.Acoust. Soc. Am. 45, 1 (1969)
46. N.D. Smith, W.L. Roever: Liquid Seismic Explosive and Method of Using, J.Acoust. Soc. Am. 44, 4 (1968)
47. Method and device for echo ranging. US Patent No. 3514748, 26 May 197048. W.P.J. Filler: Directional explosive echo ranging device. US Patent 3521725,
18 May 1962; publ. 28 July 197049. R.M. Johnson, C.A. Axelson: Deep depth line charge. US Patent 3276366,
4 Oct. 196650. V.M. Lyuboshits: Wave Field of Directive Explosion, Izv. Akad. Nauk SSSR,
Mekh. Zhidk. Gaza 3, 1 (1968)51. L.G. Kilmer: Underwater Gas Explosion Seismic Wave Generator, J. Acoust.
Soc. Am. 45, 2 (1969)52. A.A. Maksakov, N.A. Roy: About Underwater Explosion of Gas with High Ini-
tial Volume Density of Energy, Acoust. J. 25, 2 (1979)53. R.S. Brand: Shock Wave Generated by Cavity Collaps, J. Fluid Mech. 2, 1
(1965)54. R.J. Urick: Implosion as Souce of Underwater Sound, J. Acoust. Soc. Am. 35,
12 (1963)55. R.G. Turner, J.A. Scrimger: On the Depth Variation in the Energy Spectra of
Underwater Explosive Charge, J. Acoust. Soc. Am. 48, 3 (1970)56. B.E. Parkis, R.D. Worley: Measurement of Spectrum Levels for Shallow Explo-
sive Source, J. Acoust. Soc. Am. 49, 1 (1971)57. B.M. Buck: Relative Measurements of Pulse Component Source Energies of the
USN Explosive Sound Signal MK61 Detonated at 60 ft, J. Acoust. Soc. Am.55, 1 (1974)
58. M. Sieffert: Method of obtaining of directed explosive wave using underwatercharges. Patent 2541582 (Germany, 1977)
59. G. Noddin: Sonic Pulse Generator, J. Acoust. Soc. Am. 36, 4 (1964)
References 81
60. E. Lavrentiev, O. Kuzyan: Explosions in the Sea (Sudostroenie, Leningrad,1977)
61. V.K. Kedrinskii: On oscillation of a toroidal gas bubble in a Liquid. In: Con-tinuum Mechanics, vol. 16 (Novosibirsk 1974) pp. 35–43
62. V.K. Kedrinskii: About One Dimensional Pulsation of Toroidal Gas Cavity inCompressible Liquid, Zh. Prikl. Mekh. i Tekhn. Fiz. 18, 3, pp. 62–67(1977)
63. V.K. Kedrinskii: Features of Shock Wave Structure at Underwater Explosionsof Spiral Charges, Zh. Prikl. Mekh. i Tekhn. Fiz. 21, 5, pp. 51–59 (1980)
64. D. Reymond, O. Hyvernaud, J. Talandier, E.A. Okal: T-Wave detection of twounderwater explosions off Hawaii on 13 April 2000. Bull. Seismol. Soc. Am. 93,2, 804–816 (2003)
65. M. Eneva, J.L. Stevens, B.D. Khristoforov, J. Murphy, V.V. Adushkin: Analysisof Russian hydroacoustic data for CTBT monitoring. Pure Appl. Geophys. 2.158, 3, 605–626 (2001)
66. Y. Gitterman, V. Pinsky, A. Shapira: Spectral classification methods in moni-toring small local events by the Israel seismic network. J. Seismol. 2, 3, 237–256(1998)
67. Y. Gitterman, Z. Ben-Avraham, A. Ginzburg: Spectral analysis of underwaterexplosions in the Dead Sea. Geophys. J. Int. 134, 2, 460–472 (1998)
68. Y. Gitterman, A. Shapira: Spectral characteristics of seismic events off the coastof the Levant. Geophys. J. Int. 116, 2, 485–497 (1994)
69. A.B. Wardlaw, J.A. Luton: Fluid-structure interaction mechanisms for close-inexplosions. Shock Vib. 7, 5, 265–275 (2000)
70. S. Itoh, Z. Liu, Y. Nadamitsu: An investigation on the properties of underwatershock waves generated in underwater explosions of high explosives. J. Press.Vessel Technol.-Trans. ASME 119, 4, 498–502 (1997)
71. S. Menon, M. Lal: On the dynamics and instability of bubbles formed duringunderwater explosions. Exp. Thermal Fluid Sci. 16, 4, 305–321 (1998)
72. J.A. Cook, A.M. Gleeson, R.M. Roberts, R.L. Rogers: A spark-generated bub-ble model with semi-empirical mass transport. J. Acoustical Soc. Am. 68, 101,4, 1908–1920 (1997)
73. G.C. Gaunaurd, H.C. Strifors: Time-frequency processing of underwater echoesgenerated by explosive sources. Ultrasonics 33, 2, 147–153 (1995)
74. A. Kira, M. Fujita, S. Itoh: Underwater explosion of spherical explosives.J. Mater. Process. Technol. 85, 1–3, 64–68 (1999)
75. J.W. Swegle, S. Attaway: On the feasibility of using smoothed particle Hydro-dynamics for underwater explosion calculations. Computational Mechanics 17,3, 151–168 (1995)
76. T.C.K. Molyneaux, L.Y. Li, Firth N: Numerical-Simulation of Underwater Ex-plosions. Comput. Fluids 23, 7, 903–911 (1994)
77. D.L. Frost, J.H.S. Lee, P. Thibault: Numerical Computation of UnderwaterExplosions due to Fuel Coolant Interactions. Nuclear Eng. Des. 146, 1–3, 165–179 (1994)
78. I.M. Sigeikin, S.G. Zhilenis, V.S. Sotnikov, A.A. Gritsyus: Algaas-film-basedpressure-pulse sensor. Instrum. Exp. Tech. 34, 3, 720–723, part 2 May–June1991
3 Explosion of Cylindrical
and Circular Charges
3.1 Dynamics of a Cylindrical Cavityin a Compressible Liquid
The equation of one-dimensional oscillation of a cylindrical cavity [1, 2],
R(1 − R
c
)R +
34
(1 − R
3c
)R2 =
12
(1 +
R
c
)H +
R
c
(1 − R
c
)dH
dt, (3.1)
was derived assuming a possibility of the asymptotic approximation of theinvariant along the characteristics c + u by the function G = r1/2Ω,
∂
∂t
[r1/2
(ω +
u2
2
)]+ (c + u)
∂
∂r
[r1/2
(ω +
u2
2
)]= 0 ,
and using the equations of continuity and conservation of momentum to re-place partial derivatives for total derivatives, as well as the transitions r → R
and u → R. Here, Ω = ω + u2/2 is the kinetic enthalpy, ω =∫
dp
ρis the
enthalpy, r is the coordinate, u is the speed of liquid particles, and c is thelocal speed of sound.
The enthalpy H on the cavity wall from the side of the liquid was deter-mined from the Tait equation [3],
H =nB
(n − 1)ρ0
[(1 +
p(R) − p∞B
)(n−1)/n
− 1]
,
where B = 305 MPa and n = 7.15 are constants, p(R) is the pressure indetonation products, and the local speed of sound is defined by the formula
c = c0
(1 +
p(R) − p∞B
)(n−1)/2n
(c0 is the speed of sound in undisturbed liquid).Let us analyze some features of the asymptotic approximation accepted
to define the invariance of the function G for the case ν = 1. This approx-imation allows for a certain arbitrariness in the selection of the numericalcoefficient in front of the squared velocity in the oscillation equation. Let
84 3 Explosion of Cylindrical and Circular Charges
us introduce the coefficient β (instead of 3/4) in front of the inertial termof the basic equation (1), rewriting it in the dimensionless form so that thecavity dynamics is studied on the scale of the initial radius of the charge Rch
depending on the time τ = tc0/Rch:
y(1 − y
c
)y + βy2
(1 − y
3c
)=
H
2
(1 +
y
c
)+
y
c˙H(1 − y
c
). (3.2)
Here the dot denotes the initial derivative with respect to τ , c = c/c0,y = R/Rch, and H = H/c2
0. The equation was studied numerically for therange of the coefficient β = 0.75–1.25 in order to select the closest solution tothe experimental data on the oscillation of a cavity with detonation productsat underwater explosion of cylindrical charges.
The results were obtained in laboratory experiments with non-standardcylindrical charges as detonation cord (DC) made of hexogen wrapped ina copper casing. The diameter of HE in the DC was 0.65 and 1.65 mm [4].The charge density ρch = 1.55 g/cm3 and the detonation rate D = 7.7 km/swere determined experimentally, and the charge length to diameter ratio wasnot less than 103.
To calculate the dynamics of an explosive cavity for these charge types,one can restrict oneself to the case of “instantaneous” detonation, where theinitial parameters of the problem (density and speed of sound in detonationproducts and on the cavity boundary from the side of the liquid, the pressureat the contact discontinuity and the velocity of the contact discontinuity)were determined from the condition of discontinuity of arbitrary decay. Cal-culations were performed for two types of isentropes: γ = 3 and the variable γ,whose range as a function of the density of detonation products was takenfrom [5].
We approximated the data of Kuznetsov and Shvedov [5] for ρch =1.6 g/cm3 that were the closest to the experimental data:
p ∼ ρ−2.78 (0.625 ≤ ρ−1 ≤ 1.66) ;p ∼ ρ−2.14 (1.66 ≤ ρ−1 ≤ 2.51) ;p ∼ ρ−1.73 (2.51 ≤ ρ−1 ≤ 5.0) ;p ∼ ρ−1.36 (5.0 ≤ ρ−1 ≤ 20.0) ;p ∼ ρ−1.26 (20.0 < ρ−1) .
It should be noted that in this case, ρ−1 = 0.625 cm3/g corresponds top = 1.295 · 104 MPa.
Calculation results for the cavity expansion are shown in Fig. 3.1, wherey = R/Rch, while the curves (1), (1′), (1′′) (γ = 3) and (2), (2′), (2′′) (variableγ) corresponded to β = 0.75 (data without primes); 1.0 (one prime); 1.25(double prime).
The dashed line shows the slope of the experimental curve y(τ) andcross marks the experimental value of the position of Rmax/Rch. The de-pendence (2′) (β = 1) is shown by dots to mark out the numerical result

3.1 Dynamics of a Cylindrical Cavity in a Compressible Liquid 85
Fig. 3.1. Expansion of a cylindrical cavity with detonation products (calculation):curves 1 and 2 correspond to the constant and variable values of the adiabatic index,respectively; dashed and dotted curves 1, 2 correspond to different values of β
that is the closest to the experimental data: one can see the complete co-incidence of the data in time and the expansion of the explosive cavity andquite satisfactory coincidence in the slope. From the right each dependenceis bound by a vertical line, which shows the moment when the cavity reachedits maximum size.
As one would expect, the closest to the real parameters were those calcu-lated for the case of variable γ. One can see from the diagrams that as thecoefficient β increased, the slope of the curves y(τ) decreased: for curves (2)it was 0.55 at β = 0.75, then it decreased to 0.5 at β = 1.0 and to 0.49 atβ = 1.25. The slope of the experimental curves was 0.45.
Figure 3.2 shows the calculation results from Fig. 3.1 for the dependenceof (2′). The diagram of the dependence is expanded to include three oscilla-tions of the cylindrical cavity. For comparison, experimental data for chargesof different diameter are plotted here: crosses for d = 1.65 mm and dots ford = 0.65 mm. The agreement of the calculation results with the experimentaldata in the field y ≥ 10 was satisfactory. Within 30 ≤ τ ≤ 104, the dy-namics of the expanding explosive cavity could be described by the simpledependence
Rexp/Rch 1.5τ0.45 .
Table 3.1 summarizes basic numerical and experimental characteristicsof oscillations of the cavity containing detonation products of a cylindricalHE charge. Extreme values for the internal energy of detonation productsE allow one to write the expressions for oscillation periods of a cylindricalcavity in a general form in terms of the initial energy of HE per unit lengthQl = QρchπR2
ch
τ∗,i 1.635√
ρ0αiQl
p∞,
86 3 Explosion of Cylindrical and Circular Charges
Fig. 3.2. Oscillation of a cylindrical cavity with detonation products; dots andcrosses show experimental data
where αi = 0.218, 0.14, 0.11 was the share of HE energy spent for radial mo-tion of the liquid flow during the first, the second, and the third oscillations,respectively.
Comparison of experimental and numerical results for underwater explo-sions of cord charges, including the energy distribution between the detona-tion products, the shock wave, and the oscillations proves the validity of theproposed equation of dynamics of a cylindrical cavity (3.2). The equationallows one to make conclusions about the expediency of utilization of thecoefficient β = 1 instead of 3/4 in front of the inertial term.
Table 3.1. Basic numerical and experimental characteristics of oscillations in a cav-ity containing products of a cylindical HE charge
Characteristics Experiment [6] Calculation
Rmax/Rch 135 141τmax 3 · 104 3 · 104
E1 0.22 · Ql 0.218 · Ql
E2 — 0.14Ql
E3 — 0.11Ql
τ∗,1 6 · 104 6 · 104
τ∗,2 — 4.95 · 104
τ∗,3 — 4.5 · 104
Note: Indices 1, 2, and 3 denote the oscilla-tion period τ∗ number; Ql is the HE explo-sion heat per charge unit length; E is theenergy remaining in the detonation prod-ucts after expansion of the cavity; τmax isthe time of the first expansion of the explo-sive cavity.

3.2 Approximated Models, Incompressible Liquid 87
3.2 Cylindrical Cavity: Approximated Modelsfor Incompressible Liquid
As opposed to the case of spherical symmetry, the dynamics of cylindricalcavity in an unlimited incompressible liquid is not described by an exactequation due to the logarithmic peculiarity at infinity. Indeed, the equationof motion of such a cavity can be transformed to the form
ddR
(R2R2 ln
r
R
)= 2R
pg − pr
ρ0,
which yields the first integral
R2R2 lnr
R− R2
0R02ln
r0
R0=
1ρ0
R∫R0
2Rpg dR − p
ρ0(R2 − R2
0)
and expresses the law of energy conservation which for r → ∞ (pr = p∞)makes no sense. Here pr is the pressure in a liquid at the point with coordi-nate r and pg is pressure in gas.
Nevertheless, it is desirable to have at least an approximate model, sincea series of practical problems on underwater and underground explosions ofdistributed charges, in which the model of incompressible liquid is often used,requires simple estimates of the dynamics of cylindrical cavity with detona-tion products. One can consider three fairly apparent approaches to this kindof approximated estimates [6]. One of them deals with a formal ultimate tran-sition (c0 → ∞) in Eqs. (3.1–3.2), which can result in approximated equationsof oscillation of a cylindrical cavity in an incompressible liquid [1]. Below wewill show that this approach enables the estimates of oscillation period of thecavity with detonation products and comparison with experimental data forDC charges of different diameter.
Two other approaches are concerned with the restriction of the spacein which the cavity is considered, a free surface of liquid is introduced.Kuznetsov [7] noted that real experimental statements always involve thefree surface, which makes it possible to obtain an exact equation for incom-pressible liquid, which involves the explosion depth as a parameter. Below weconsider different approximate models and compare them with experimentaldata [6].
3.2.1 Generalized Equation (for c → ∞)
Following the above approach to the derivation of the oscillation equationof a one-dimensional cavity in a compressible liquid, one can easily get itsacoustic analog:
R
(1 − 2
R
c0
)R +
34ν
(1 − 4R
3c0
)R2 =
ν
2H +
R
c0
(1 − R
c0+
R2
c20
)H .
88 3 Explosion of Cylindrical and Circular Charges
It should be noted that the asymptotic approximation was used in thecylindrical version only when deriving the basic equation for the invariantrν/2Ω,
∂rν/2Ω
∂r+ c−1
0
∂rν/2Ω
∂t= 0 ,
while in transition to total derivatives the change was made on the basis ofexact conservation laws. The model of incompressible liquid follows from theultimate transition (c0 → ∞)
2(RR + R2) − R2/2 = H (3.3)
orRR + 3R2/4 = H/2 . (3.3a)
Here H = (pg − p∞)/ρ.Considering the fact that following the calculation results in coincidence
with the experimental data for two basic parameters (ymax, τmax) occurswhen β = 1, it is reasonable to study the ultimate transition in (3.2), whichresults in the following oscillation equation:
RR + R2 = H/2 . (3.3b)
The change of the internal energy of detonation products (gas) per unitlength is defined by the obvious expression
∆Ul =p(0)S0
γ − 1− pS
γ − 1
or, with regard to the adiabate pSγ = const,
∆Ul =p(0)πR2
0
γ − 1
[1 −
(R0
R
)2γ−2]
.
The change of the potential energy of the liquid per unit length is
∆Wl = πp∞(R20 − R2) .
The first integral of Eq. (3.3b) at zero initial velocity becomes
p(0)R20
γ − 1
[1 −
(R0
R
)2γ−2]
= 2ρR2R2 + p∞(R2 − R20) .
Experience in studying the dynamics of spherical cavities suggests that thefirst integral of the oscillation equation is the law of energy conservation.Multiplying both parts of the latter equality by π, we see that the left-handpart of the equality presents a decrease in the internal energy of detonationproducts, while the second term from the right is the increment of the po-tential energy of the liquid. Thus, there are strong grounds to conclude thatthe remaining term of the equality (multiplied by π)
2 π ρR2 R2 = El
3.2 Approximated Models, Incompressible Liquid 89
is the specific kinetic energy of the liquid surrounding an oscillating cylindri-cal cavity, if R(0) = 0.
One can define the velocity potential corresponding to the above definitionof the kinetic energy of a liquid. Let us use the traditional approach andconsider the potential as ϕ r−1/4Φ(t). Let us find the value of Φ(t) fromthe kinematic condition R = −ϕr
∣∣r=R
, which will finally define the potentialand its gradient as
ϕ 4R5/4R
r1/4and
∂ϕ
∂r −R5/4R
r5/4.
For the case of cylindrical symmetry, the kinetic energy of a mass unit(dm = 2πρlrdr) should be considered as energy per unit length l, reasoningfrom the obvious definition dEl = (v2/2)dml. The final result
El = πρ
∫ ∞
R
R2R5/2
r5/2rdr = 2πρR2R2 ,
as we see, corresponds to the above expression. However, substitution of the“guessed” potential in the Cauchy–Lagrange integral does not lead to theoscillation equation of the type (3.3b).
3.2.2 Cylindrical Cavity under Free Surface
Let us consider a cylindrical cavity in a liquid, the cavity diameter being R0
and its center being placed at a depth h from the free surface. It is supposedthat h R0, the free surface is horizontal, and its velocity potential isequal to zero. In this statement, it is convenient to use the bipolar system ofcoordinates with variables γ and β, where γ = const and β = const are theorthogonal circumferences. The coordinates of the Cartesian (x, y) and flatbipolar systems are linked by the relationships
x =a sh γ
ch γ + cosβand y =
a · sin β
ch γ + cosβ,
where a =√
h2 − R2 h, while γ = 0 corresponds to the free surface. TheLaplace equation in the adopted system has the form
ϕγγ + ϕββ = 0 .
In view of the above-mentioned conditions, one can select the coordinate sur-face γ0 as the surface of the cylindrical cavity. The solution of the Laplaceequation has the simple form ϕ = ϕ0γ/γ0. The value of ϕ0 is sought fromthe kinematic condition ζt + ∇ϕ∇ζ = 0, where ζ = 0 (γ − γ0 = 0) isthe equation of the cavity boundary. The Lame coefficients in the adoptedcoordinate system are equal to Lγ,β = a(ch γ + cosβ)−1. Then ϕ0 =
90 3 Explosion of Cylindrical and Circular Charges
a2(dγ0/dt)γ0(ch γ0 + cosβ)−2 and, in view of ch γ0 = h/R 1, the finalexpression for the potential becomes
ϕ a2 dγ0
dtγ ch−2 γ0 .
Hence∇ϕ = L−1
γ
∂ϕ
∂γ= a
dγ0
dtch−2 γ0(ch γ + cosβ)
and∂ϕ
∂t a2 d2γ0
dt2γ
ch2 γ0
− 2a2(dγ0
dt
)2 γ
ch2 γ0
th γ0 .
In the last expression one can use the condition h R, then th γ0 1.Substituting expressions for ∇ϕ and ∂ϕ/∂t in the Cauchy–Lagrange integraland meeting the condition γ = γ0, we obtain the following equations ofoscillation of a cylindrical cavity, given the availability of the free surface:
• In the bipolar system,
−a2 d2γ0
dt2γ0
ch2 γ0
+ a2(dγ0
dt
)2 γ0 th γ0 − 1/4ch2 γ0
= H
• On the physical plane,
[RR + (R)2] ln(2h
R
)− 1
2(R)2 = H (3.4)
Here we used the relationship γ0 = ln(2h/R).The latter equation was first derived by Kuznetsov [7] using the method
of conformal mappings. The form of this equation points to the essentialdependence of the dynamics of cylindrical cavity on the charge depth.
3.2.3 The Model of Liquid Cylindrical Layer
The model follows from the natural assumption that under real conditions,the cavity oscillation involves only a finite mass of the liquid surrounding it.In this model, the external radius of the cylindrical layer r0 is not defined. Itcan be easily shown that the form of the equation of oscillation of a cylindricalcavity in this statement is as follows:
(RR + (R)2) ln(
r20 − R2
0 + R2
R2
)+(
R2
r20 − R2
0 + R2− 1
)R2 = H .
The equation is considerably simplified for r20 R2:
(RR + (R)2) ln(r0
R
)− 1
2R2 = H , (3.5)
where the subscript 0 stands for the initial values of the relevant parameters.
3.2 Approximated Models, Incompressible Liquid 91
Thus, to check the reliability of Eqs. (3.3)–(3.5) representing the threeapproaches, one should compare them with experimental data. Usually twobasic parameters are compared: the maximum expansion (compression) of thecavity under the effect of explosive load and the oscillation period of the cavitywith detonation products. However, the former depends significantly on theamount of energy released under explosion as a shock wave, which makespointless the comparison of approximate models of incompressible liquid withrespect to this parameter. As to the oscillation period, the estimates forspherical (e. g., [3]) and cylindrical symmetries [1,2] prove that it is fairly welldefined by the doubled collapse time of an empty cavity in incompressibleliquid, the cavity initial radius R0 being consistent with the maximum radiusof the first expansion of the cavity with detonation products. The radius canbe determined experimentally (for example, by means of optical registration).
Upon substitution of variables R = yR0 and t = τ√
ρ/p∞R0 the equa-tions for the model of an empty cylindrical cavity in an incompressible idealliquid will be rewritten as:
2 · (yyττ + y2τ ) − 1
2y2
τ = −1 , (a)
2 · (yyττ + y2τ ) = −1 , (b)
(yyττ + y2τ ) · ln
( 2h
yR0
)− 1
2y2
τ = −1 , (c)
(yyττ + y2τ ) · ln
( r0
yR0
)− 1
2y2
τ = −1 . (d)
3.2.4 Oscillation Period of a Cylindrical Cavity
The equation (a) yields the first integral. We multiply both parts by y1/2,yielding
ddy
(y3/2y2) = −y1/2 ,
whence upon easy transformations we obtain the collapse time
τa = −0∫
1
dy√2[y−3/2 − 1]/3
= 0.817F(1
2,76,136
, 1) 1.49 .
Here F (α, β, γ, z) is the hypergeometric Gauss function. In the dimen-sional form, the oscillation period of a cylindrical cavity with detonationproducts (through its maximum radius and hydrostatic pressure p∞) willbecome
Ta 2.98Rmax
√ρ
p∞.
The most interesting results are obtained when considering the model (b),whose first integral is presented above. If the cavity is empty, it practically

92 3 Explosion of Cylindrical and Circular Charges
corresponds to the state that achieves a maximum size upon explosion. Afterthe replacement of variables at zero initial velocity, we obtain the simpleequation
2y2y2τ = 1 − y2 ,
which allows for the exact solution
τ =√
2(1 − y2) .
Hence the dimensionless collapse time τmax and the first oscillation period ofthe cavity τ∗,1 are
τmax =√
2 and τ∗,1 = 2√
2 2.83 ,
which are fairly close to the result of the model a.Taking into account the known character of cavity collapse with abrupt
decrease in the radius only in the vicinity of its minimum and the fact that itis in this region that the kinetic energy of liquid becomes a noticeable part ofthe initial potential energy of the system, one can consider an approximatedversion of the oscillation equations (c) and (d), neglecting the term y2
τ/2 andassuming that y = 1 under the logarithm sign. It is obvious that under theseconditions the models (c and d) become analogous to the models of ultimatetransition and their solutions are of the same form
τc,d √
lnC(1 − y2) ,
where C = 2h/R0 (for a cavity in a half-space) or r0/R0 (for cylindricallayer). Naturally, the period of the first oscillation for these models is writtenas τ∗,(c,d) 2
√lnC.
Hence follows the evident conclusion that the results of the estimatescoincide, if in the models (c) and (d) the value lnC 2, which is not realisticfor the model (c) in which the explosion depth can be adjusted arbitrarily. Forthe model (d) this means that only a limited portion of the liquid is involvedin the oscillation, the portion being defined by the condition according towhich the layer radius and the cavity radius should differ by approximatelyone order of magnitude.
The oscillation period of a cylindrical cavity with detonation products,as a time interval between the moment of arrival of the shock wave to thepressure gauge and the moment of recording of the maximum pressure of thefist oscillation, was studied experimentally using a hexogen DC (d = 0.65,1.65, and 3.0 mm) exploded at depths h = 0.21–3.5 m from the free surface.The charge diameter and the explosion depth were selected reasoning fromthe possibility of clear determination of the dependence of the oscillation pe-riod on the explosion depth assumed in [7]. In experiments with 1.5m-longcharges, the gauges were placed at the midline of the charge at a distance of0.5 m from it. The accuracy of determination of the period was at least 1 µs.

3.3 Circular Charges 93
Experimental data on the oscillation period τ∗,exp (dimensional) and calcu-lation results obtained using the above models are summarized in Table 3.2.
One can see that the depth did not have the influence that could havebeen expected according to [7] and that application of the model (c) wasinexpedient. On the contrary, the models (a,b) provided sufficiently reliableestimates of the parameter under study. It should be noted that the valuecalculated from experimental data using the formula for τ∗,d varied (for fairlywide ranges of explosion depth and charge radius) relative to the average valueof 2.05 and differed in r0 by a factor of 1.5–2 from the above estimate of thereal liquid volume involved in cavity oscillations.
The experiment showed that the first maximum expansion of the cavitywith detonation products (Rmax/Rch) was a constant independent of thecharge radius Rch and was within 130–140 for the studied HE types, whosedetonation velocity was 7.7 km/s and HE density was 1.55 g/cm3.
The maximum relative dispersion of experimental data shown in Table 3.2was noted for the thinnest charge due to the infinitesimal amplitude of itsfirst oscillation and the difficulties in determining the exact position of itsmaximum on the pressure oscillogram. This was fairly reasonable, since forexample, the initial potential energy of the liquid, which was partially spentfor the first oscillation during the collapse of the cavity with detonation prod-ucts, was approximately 20 times lower for the charge with d = 0.65 mm thanfor that with d = 3 mm.
Table 3.2. Experimental and calculation results of cylindrical cavity oscillations
d, mm h, m τ∗,exp, µs τ∗,a(τ∗,b), µs τ∗,c, µs ln(r0/R0)
0.65 0.21 13.2–14.2 13 (12.34) 13.3 2.26–2.622.10 13.0–13.8 13 (12.34) 18.7 2.20–2.47
1.65 0.54 31–32 33.1 (31.43) 33.4 1.94–2.12.10 29–30 33.1 (31.43) 42.3 1.7–1.80.54 58 60.1 (57.1) 52.1 2.05
3.00 2.10 57–57.5 60.1 (57.1) 70.3 1.98–2.013.50 54–55 60.1 (57.1) 76 1.78–1.84
3.3 Circular Charges
Some problems of explosion hydrodynamics are concerned with the fieldstructure of the shock waves produced by underwater explosions of chargesof complicated geometry or with changing flow topology, as for example, inthe case of transformation of an initially spherical cavity with detonationproducts into a torus in the gravity field. The topological effects take place,in particular at large-scale underwater explosions, when the maximum cavity
94 3 Explosion of Cylindrical and Circular Charges
radius reaches tens and thousands of meters, and the cavity is at a sufficientdepth. When the cavity emerges and its lower part collapses due to the highpressure gradient along the vertical cross section, an upward cumulative flowis formed. Calculations performed by Pritchett [8] showed that at a laterpoint the cumulative jet “perforates” the upper part of the cavity surface,shaping it as a ring. The dynamics of this cavity near the free surface isconcerned with other jet effects [9] related to sultans that will be consideredseparately (see Chap. 7 for definition and detailed discussions).
It is appropriate to study the features of the flow appearing in the abovegeometry. In experimental simulation of the flows, two types of sourceswere used: a circular DC charge initiated from one end and a circular con-ductor simulating instantaneous explosion [10]. The wave structure of thefirst type was studied experimentally using DC (0.65, 1.65, and 3 mm indiameter), with circle radii varying from 3 to 30 cm and the distancesto the charge were in the range 0.5–5 m. Typical patterns of the forma-tion of the wave field in the near zone of a circular charge are shown inFigs. 3.3–3.4.
Figure 3.3 illustrates the shock wave front formation in a liquid (calcula-tions in the acoustic approximation) in the plane of a circular charge for twosuccessive positions of the detonation front at a detonation rate of 7.5 km/s.
Experimental studies confirmed the validity of such constructions andgave grounds for applying the acoustic model in further estimates of thestructure of the wave field in a liquid produced by the explosion of a systemof circular charges. Figure 3.4a presents frame-by-frame scanning (figuresshow the frame numbers) with a time interval of 4 µs, while frames 7 and 12interval’s of 20 µs). The records in Figs. 3.4b and 3.4d showed continuousscanning of the had time development of the wave process in the inner regionof the circle (the circle diameter was 5.4 cm) and the coil turn. The plane ofthe turn was parallel to the observation window, which was closed by opaque
Fig. 3.3a,b. Dynamics of the formation of a shock wave front in a liquid under theexplosion of a circular charge for two (a, b) subsequent positions of the detonationfront (calculation)
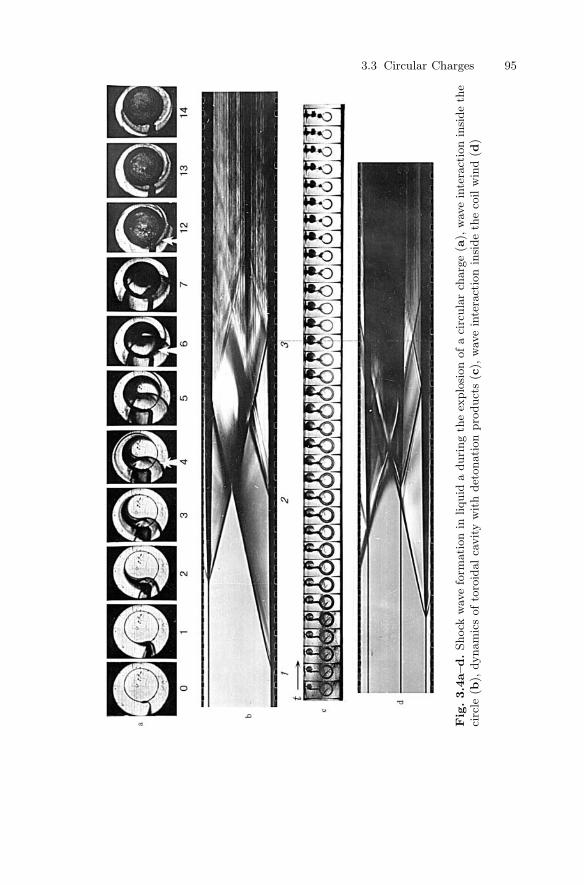
3.3 Circular Charges 95
Fig
.3.4
a–d.
Shock
wav
efo
rmation
inliquid
aduri
ng
the
explo
sion
ofa
circ
ula
rch
arg
e(a
),w
ave
inte
ract
ion
inside
the
circ
le(b
),dynam
ics
ofto
roid
alca
vity
with
det
onation
pro
duct
s(c
),w
ave
inte
ract
ion
inside
the
coil
win
d(d
)
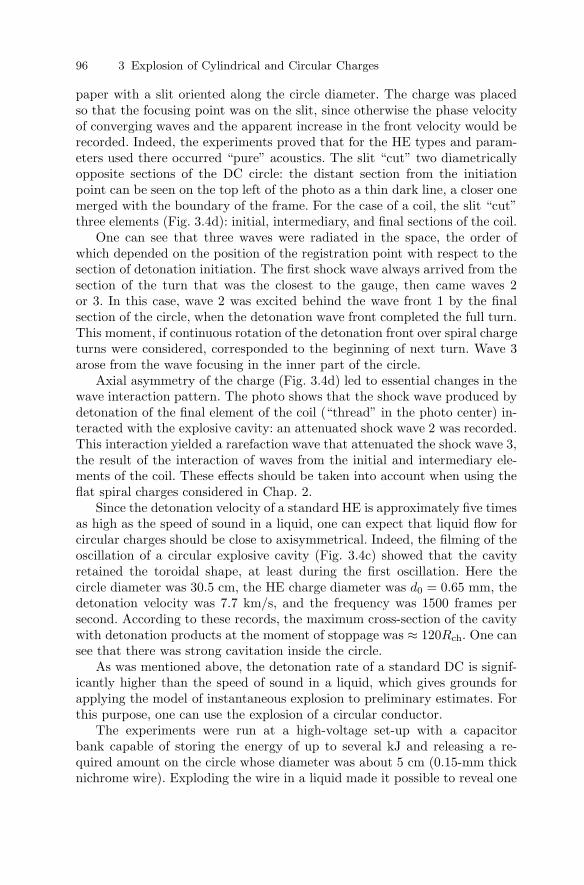
96 3 Explosion of Cylindrical and Circular Charges
paper with a slit oriented along the circle diameter. The charge was placedso that the focusing point was on the slit, since otherwise the phase velocityof converging waves and the apparent increase in the front velocity would berecorded. Indeed, the experiments proved that for the HE types and param-eters used there occurred “pure” acoustics. The slit “cut” two diametricallyopposite sections of the DC circle: the distant section from the initiationpoint can be seen on the top left of the photo as a thin dark line, a closer onemerged with the boundary of the frame. For the case of a coil, the slit “cut”three elements (Fig. 3.4d): initial, intermediary, and final sections of the coil.
One can see that three waves were radiated in the space, the order ofwhich depended on the position of the registration point with respect to thesection of detonation initiation. The first shock wave always arrived from thesection of the turn that was the closest to the gauge, then came waves 2or 3. In this case, wave 2 was excited behind the wave front 1 by the finalsection of the circle, when the detonation wave front completed the full turn.This moment, if continuous rotation of the detonation front over spiral chargeturns were considered, corresponded to the beginning of next turn. Wave 3arose from the wave focusing in the inner part of the circle.
Axial asymmetry of the charge (Fig. 3.4d) led to essential changes in thewave interaction pattern. The photo shows that the shock wave produced bydetonation of the final element of the coil (“thread” in the photo center) in-teracted with the explosive cavity: an attenuated shock wave 2 was recorded.This interaction yielded a rarefaction wave that attenuated the shock wave 3,the result of the interaction of waves from the initial and intermediary ele-ments of the coil. These effects should be taken into account when using theflat spiral charges considered in Chap. 2.
Since the detonation velocity of a standard HE is approximately five timesas high as the speed of sound in a liquid, one can expect that liquid flow forcircular charges should be close to axisymmetrical. Indeed, the filming of theoscillation of a circular explosive cavity (Fig. 3.4c) showed that the cavityretained the toroidal shape, at least during the first oscillation. Here thecircle diameter was 30.5 cm, the HE charge diameter was d0 = 0.65 mm, thedetonation velocity was 7.7 km/s, and the frequency was 1500 frames persecond. According to these records, the maximum cross-section of the cavitywith detonation products at the moment of stoppage was ≈ 120Rch. One cansee that there was strong cavitation inside the circle.
As was mentioned above, the detonation rate of a standard DC is signif-icantly higher than the speed of sound in a liquid, which gives grounds forapplying the model of instantaneous explosion to preliminary estimates. Forthis purpose, one can use the explosion of a circular conductor.
The experiments were run at a high-voltage set-up with a capacitorbank capable of storing the energy of up to several kJ and releasing a re-quired amount on the circle whose diameter was about 5 cm (0.15-mm thicknichrome wire). Exploding the wire in a liquid made it possible to reveal one

3.3 Circular Charges 97
characteristic feature of the wave field formation. A typical pattern registeredby a high-speed photorecorder is shown in Fig. 3.5.
One can clearly see that the shock wave front had a toroidal surface, nearthe circle axis the wave was focused and reflected, which was recorded by thepressure gauge as a compression wave. During further development of the
Fig. 3.5. Dynamics of toroidal cavity and shock wave focusing under the explosionof a circular conductor in a liquid
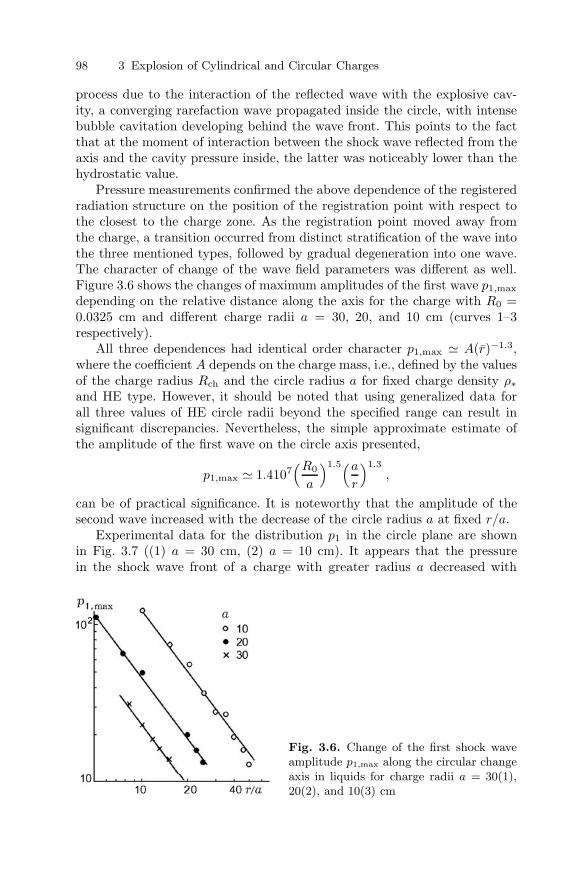
98 3 Explosion of Cylindrical and Circular Charges
process due to the interaction of the reflected wave with the explosive cav-ity, a converging rarefaction wave propagated inside the circle, with intensebubble cavitation developing behind the wave front. This points to the factthat at the moment of interaction between the shock wave reflected from theaxis and the cavity pressure inside, the latter was noticeably lower than thehydrostatic value.
Pressure measurements confirmed the above dependence of the registeredradiation structure on the position of the registration point with respect tothe closest to the charge zone. As the registration point moved away fromthe charge, a transition occurred from distinct stratification of the wave intothe three mentioned types, followed by gradual degeneration into one wave.The character of change of the wave field parameters was different as well.Figure 3.6 shows the changes of maximum amplitudes of the first wave p1,max
depending on the relative distance along the axis for the charge with R0 =0.0325 cm and different charge radii a = 30, 20, and 10 cm (curves 1–3respectively).
All three dependences had identical order character p1,max A(r)−1.3,where the coefficient A depends on the charge mass, i.e., defined by the valuesof the charge radius Rch and the circle radius a for fixed charge density ρ∗and HE type. However, it should be noted that using generalized data forall three values of HE circle radii beyond the specified range can result insignificant discrepancies. Nevertheless, the simple approximate estimate ofthe amplitude of the first wave on the circle axis presented,
p1,max 1.4107(R0
a
)1.5(a
r
)1.3
,
can be of practical significance. It is noteworthy that the amplitude of thesecond wave increased with the decrease of the circle radius a at fixed r/a.
Experimental data for the distribution p1 in the circle plane are shownin Fig. 3.7 ((1) a = 30 cm, (2) a = 10 cm). It appears that the pressurein the shock wave front of a charge with greater radius a decreased with
Fig. 3.6. Change of the first shock waveamplitude p1,max along the circular changeaxis in liquids for charge radii a = 30(1),20(2), and 10(3) cm
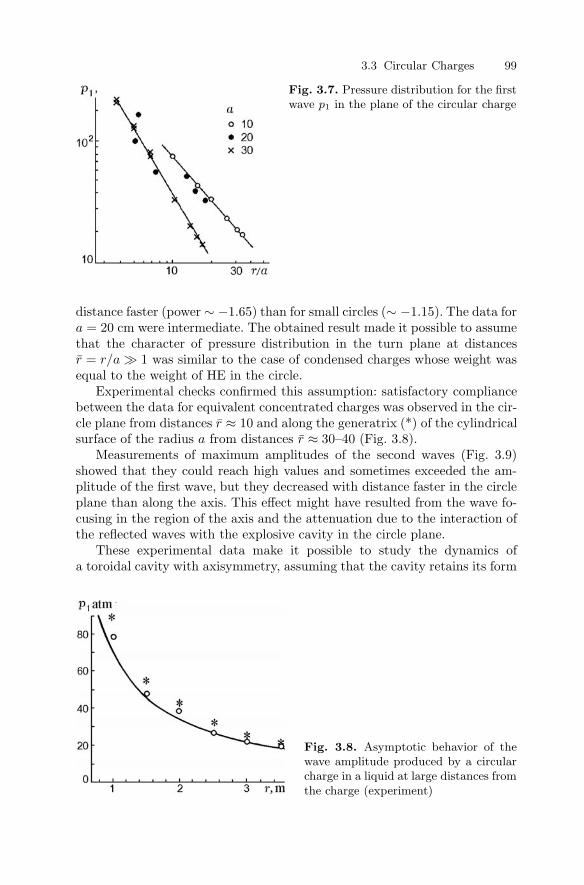
3.3 Circular Charges 99
Fig. 3.7. Pressure distribution for the firstwave p1 in the plane of the circular charge
distance faster (power ∼ −1.65) than for small circles (∼ −1.15). The data fora = 20 cm were intermediate. The obtained result made it possible to assumethat the character of pressure distribution in the turn plane at distancesr = r/a 1 was similar to the case of condensed charges whose weight wasequal to the weight of HE in the circle.
Experimental checks confirmed this assumption: satisfactory compliancebetween the data for equivalent concentrated charges was observed in the cir-cle plane from distances r ≈ 10 and along the generatrix (*) of the cylindricalsurface of the radius a from distances r ≈ 30–40 (Fig. 3.8).
Measurements of maximum amplitudes of the second waves (Fig. 3.9)showed that they could reach high values and sometimes exceeded the am-plitude of the first wave, but they decreased with distance faster in the circleplane than along the axis. This effect might have resulted from the wave fo-cusing in the region of the axis and the attenuation due to the interaction ofthe reflected waves with the explosive cavity in the circle plane.
These experimental data make it possible to study the dynamics ofa toroidal cavity with axisymmetry, assuming that the cavity retains its form
Fig. 3.8. Asymptotic behavior of thewave amplitude produced by a circularcharge in a liquid at large distances fromthe charge (experiment)

100 3 Explosion of Cylindrical and Circular Charges
Fig. 3.9a–c. Pressure distribution for secondary shock waves for the explosion ofa circular charge in a liquid at different distances and positions of pressure gauges(experiment): (a) on the axis, (b) in the circle plane, (c) at the generatrix

3.4 Dynamics of a Toroidal Cavity, Numerical Models 101
during oscillations. They also make it possible to apply the appropriate ap-proximation in mathematical modeling of the process. Thus, for example, onecan consider that the cavity section remains circular. The results obtainedcan be applied to analyze the structure of the wave field of the charges withcomplicated spatial structure. Experiments with DC showed that the modelof instantaneous detonation is quite applicable for studying the cavity dy-namics because it simplifies the calculations of the initial parameters of theproblem.
3.4 Dynamics of a Toroidal Cavity, Numerical Models
3.4.1 Ideal Incompressible Liquid
Let us consider an ideal incompressible imponderable liquid containinga toroidal gas cavity, whose radius is a and the cross-section is a circle ofradius R0. We assume that pressure inside the cavity changes following theadiabatic law p = p(0)(V )−γ∗ , where V = V/V0 is the relative volume of thetorus. We need to know the equation of motion of the boundary of the torus.For this purpose, we consider the orthogonal toroidal system of coordinates,
x =c sh α cos γ
ch α − cosβ, y =
c shα sin γ
ch α − cosβ, and z =
c sin β
chα − cosβ,
where c is the scaling multiplier (the radius of the “basis” circle). Coordinatesurfaces in such a system will be toruses with α = const formed by rotationof a circle of radius R = c/ shα about the z-axis, with the center placedat a distance a = c cth α from the axis; and the spheres β = const formedby rotation of a circle of radius R1 = c/ sinβ, with the center on the z-axislocated at a distance a1 = c ctg β from the coordinate origin about the z-axisand the plane γ = const.
Let us consider the boundary value problem [11]. In the region Ω(t) boundby the closed smooth toroidal surface σ(t) we find the potential ϕ(α, β, γ, t)such that at t ≥ 0 in Ω(t):
∆ϕ = 0 , ϕ → 0 as α → 0 and β → 0 ;ζ(α, β, γ, t) = 0 is the equation of the torus boundary ;ζt + ∇ϕ∇ζ = 0 is the kinematic condition (∗) ;
in σ(t):
−ϕt + 1/2(∇ϕ)2 + p/ρ = p∞/ρ , where p = p(0)(V0/V )γ∗ .
For t = 0, we assume p = p(0), α = α∗, α = 0, where σ(0) is the torussurface.
102 3 Explosion of Cylindrical and Circular Charges
Let us seek the solution of the Laplace equation as
ϕ = ψ√
2 chα − 2 cosβ . (3.6)
Then for ψ it becomes
ψαα + ψββ + sh−2α ψγγ + cth αψα +
14ψ = 0 . (3.7)
Hereafter the subscripts α, β, and γ denote the appropriate partial deriva-tives. The solution of this equation for the axisymmetrical case (ψ is indepen-dent of γ) is known and is expressed in terms of spherical functions. Thus,one can show that
ϕ =√
2 chα − 2 cosβ [A Pν−1/2(ch α) + BQν−1/2(ch α)]× (C sin νβ + D cos νβ) . (3.8)
We are interested in solving the boundary value problem for the regionΩ(t) that is external with respect to σ(t). In this case, α and β change withinthe ranges 0 ≤ α ≤ α0 and −π ≤ β ≤ π (α = 0, β = π is the coordinatecenter and α = 0, β = 0 is infinity). Since the problem is symmetrical withrespect to the torus surface, the solution (3.9) is significantly simplified:
ϕ =√
2 chα − 2 cosβ
∞∑n=0
AnPn−1/2(ch α) cos nβ . (3.9)
Let us consider the case n = 0. Then (3.10) is written as
ϕ = A√
2 chα − 2 cosβ2K(k)
π ch(α/2), (3.10)
where K(k) is the total elliptical integral of the first kind and k = th(α/2) isits modulus. The coefficient A is determined from the kinematic condition, see(∗), which in view of the assumption on the toroidal shape of the cavity and,consequently, the condition that the equation of the boundary is α−α0 = 0,accepts the simple form
α0H2α0
= ϕα
∣∣∣α=α0
, (3.11)
where Hα,β = c(ch α−cosβ)−1 are Lame coefficients and α0 is the coordinateof the cavity boundary. Assuming that a R (ch(α0/2) 1) for A, weobtain
A πc2α0 sh(α0/2)√2 ch α
5/20
. (3.12)
It should be noted that for ch(α0/2) 1, th(α0/2) → 1 and E(k0) → 1(the value of total elliptic integral on the cavity boundary k0 = th(α0/2)),
3.4 Dynamics of a Toroidal Cavity, Numerical Models 103
while K(k0) can be approximated to a sufficient degree of accuracy by theexpression K ln(4 ch(α0/2)) used to derive (3.13). Velocity components ofliquid particles and ϕt are defined by the expressions
ϕα =c2α0 sh(α0/2)
ch5/2 α0
· E(ch α − cosβ) − K(1 − cosβ)sh(α/2)(ch α − cosβ)1/2
,
ϕβ =c2α0 sh(α0/2)
ch5/2 α0
· K th(α/2) sinβ
sh(α/2)(ch α − cosβ)1/2, (3.13)
and
ϕt 2c2 sh(α0/2)
ch5/2 α0
(α0 − 2α20)
K(k)ch(α/2)
(ch α − cosβ)1/2 .
In the last expression we ignored (E − K)/E sh α0 as compared to 2.Substituting (3.14) in the Cauchy–Lagrange integral (see problem state-
ment), we obtain the relationship
p − p∞ = −A1α0 + (B1 − C1)α20 (3.14)
for pressure at any point of the liquid, where
A1 =2ρc2 sh(α0/2)
ch5/2 α0
K(k)ch(α/2)
(chα − cosβ)1/2, B1 = 2A1 ,
and
C1 =c2 sh2(α0/2)
2 ch5 α0
chα − cosβ
sh2(α/2)(K th(α/2) sinβ)2+
+ [E(k)(ch α − cosβ) − K(k)(1 − cosβ)]2 .
Thus, assuming that σ(t) is the coordinate surface, on the basis of theCauchy–Lagrange equation one can obtain the equation of cavity oscillationin toroidal systems,
ρc2 ln(8 ch α0)
ch2 α0
(−α0 + 2α20) −
ρc2α20
2 chα20
= p(0)( chα0
ch α00
)2γ∗ − p∞ , (3.15)
and polar systems,
(RR + R2) ln8a
R− 1
2R2 =
p(0)(R0/R)2γ∗ − p∞ρ
.
It is obvious that the last equation has a common form with different variantsof the equations for cylindrical symmetry. Naturally, one should not expectasymptotic transition (at a → ∞) of the toroidal cavity into a cylindricalone, since an exact solution of this problem, as shown above, is nonexistent.

104 3 Explosion of Cylindrical and Circular Charges
The requirement would be analogous to the transition from a half-space toan unbound liquid in the Kuznetsov statement [5], which, as is known, doesnot lead to desirable result.
Let us write down the law of energy conservation
T + E = const ,
where T = −ρ/2∫σ
ϕ(∂ϕ/∂n) dσ is the kinetic energy of liquid, E = U1 + U2,
U1 is the work against the forces of external pressure, and U2 is the internalenergy of gas in the cavity. Expressions for T and E are as follows:
T =4π2ρc5K(k0)α2
0
ch5 α0
, E =2π2ρc3
(γ∗ − 1) sh2 α00
+2π2p∞c3
sh2 α00
,
where 2π2c3/ sh2 α00 is the initial volume of the torus. Then the law of energyconservation becomes
ρc2 ln(8 chα0)
ch2 α0
α20 + p∞
(1 − sh2 α0
sh2 α00
)
=p(0)
γ∗ − 1
[sh2 α0
sh2 α00
−(
sh α0
shα00
)2γ∗]
.
One can easily show that the law corresponds exactly to the first integral of(3.16).
To determine the accuracy of Eq. (3.11) for ϕ with respect to the expan-sion (3.10), one can consider the Dirichlet problem aimed at determining thepressure in the region Ω, which results in the following relationship:
p =2p(0)
π(2 chα − 2 cosβ)1/2
[Q−1/2(ch α0)2P−1/2(ch α0)
P−1/2(ch α)+
+∞∑
n=1
Qn−1/2(ch α0)Pn−1/2(chα0)
Pn−1/2(ch α) cosnβ
].
Here p and p(0) are excessive pressures with respect to the pressure at infinity.The first addend in brackets corresponds to the value of p defined by thedependence (3.15) at α0 = 0. Let us estimate the following term of theexpansion (n = 1). We have
Q1/2(ch α0) −e−3α0/2, P1/2(ch α0) 2π
eα0/2 ,
andP1/2(ch α) 2
πeα/2E(
√1 − e−2α) .
3.4 Dynamics of a Toroidal Cavity, Numerical Models 105
Now for relative pressure p = (p − p∞)/(p(0) − p∞) with regard to twoexpansion terms one can get the following expression:
p (2 chα − 2 cosβ)1/2
2
[ K(k)K(k0) ch(α/2)
−
− 4π
e−2α0+α/2E(√
1 − e−2α) cosβ]
.
Since α varies within 0 ≤ α ≤ α0, the second addend in brackets will bemaximum at α = α0, namely 4e−3α0/2/π. But under the above conditionsa R (ch(α0/2) 1) and one can consider that exp(α0/2) 2 ch(α0/2),thus the expression for pressure is simplified as
p (2 chα − 2 cosβ)1/2
2
[ch−1(α0/2) − 1
2πch−3(α0/2)
].
It is clear that under the adopted conditions the second term inside thebrackets can be ignored, which implies that the expression (3.11) can beconsidered sufficiently exact.
Let us cite some estimates for pressure at t = 0:
– Beyond the torus in the torus plane (β = 0),
p π
ln(8a/R0)a
rat r a
– At the torus center (β = π, α = 0),
p π
ln(8a/R0)
– On the symmetry axis (α = 0, 0 ≤ β ≤ π),
p πa√z2 + a2 ln(8a/R0)
One can see that at greater distances, the character of pressure changein the first and the last examples is the same and is determined analogouslyto the case of spherical symmetry, within an accuracy of a scaling multiplier.This result correlates well with the conclusion on the feasibility of estimatingthe shock wave amplitude at a great distance from the ring based on theexplosion of spherical HE charge of equivalent weight.
3.4.2 Compressible Liquid
Let us consider the problem of the oscillation of a toroidal cavity producedby an explosion of a circular HE charge within the framework of acousticapproximation, assuming that a R [12]. In this case, according to the
106 3 Explosion of Cylindrical and Circular Charges
experimental data, the cross section of a toroidal cavity practically retainsthe shape of a regular circle throughout the first oscillation period at a ≈103Rch, and at a ≈ 102Rch throughout the first half-period (Rch is the chargeradius). The above problem of torus oscillation in incompressible liquid doesnot allow one to estimate such important parameters as maximum radius ofthe cavity with detonation products and energy distribution between themand the shock wave.
Solution of this axisymmetrical problem involves many difficulties, in-cluding the complexity of solution of the wave equation. Therefore, by firstrestricting oneself to the known frames, one should find the way of construct-ing the equation of one-dimensional oscillation to simplify the problem. Sincean expression for the velocity potential can be found under certain assump-tions for a series of spatial potential problems for ideal incompressible liquid,it can be used to proceed to acoustic models. The validity of this methodwill be estimated below by the example of the equation of one-dimensionaloscillation of bubbles.
1. Let the velocity potential be ϕ = Φ(t)/f(r) for the case of incompress-ible liquid, the form of the function f(r) being dependent on the symmetrytype. Then its acoustic variant can be presented as ϕ = Φ(t − r/c0)/f(r).We consider a potential liquid flow u = −∇ϕ, where u is the mass velocityof liquid, thus
u =Φfr
f2+
Φ′
c0f, (3.16)
where the subscript denotes the appropriate partial derivative and the primemarks a derivative with respect to ζ = t−r/c0. Taking into account the formof ϕ, the Cauchy–Lagrange potential can be expressed as
Φ′ = f(ω + u2/2) . (3.17)
Here ω =∫
dp/ρ, where p and ρ are the pressure and density of the liquid,
respectively. Using the two equations and substituting Ω = ω + u2/2, onecan find the expression for Φ:
Φ = f2 u − Ω/c0
fr,
whose derivative with respect to t has the form
Φ′ = f2 ut − Ωt/c0
fr. (3.18)
Here Ωt = ωt + uut and it is taken into account that Φt = Φ′ and the func-tion f depends only on r. On the basis of the continuity equations (acousticvariant) and conservation of momentum,
ur + νu
r= −
(dω
dt
)c−20 and
∂ω
∂r= −du
dt,
3.4 Dynamics of a Toroidal Cavity, Numerical Models 107
(ν = 0, 1, 2 for flat, cylindrical, and spherical cases, respectively), we findthe expressions for partial derivatives ut and ωt in the expression for Φ′:
ut =du
dt+
νu2
r+ u
dω
dtc−20 ; ωt =
dω
dt+ u
du
dt. (3.19)
Substituting (3.19) into (3.18) and equating the resulting expression toEq. (3.17), we eventually get
f
(1 − 2u
c0
)du
dt+
νfu2
r
(1 − u
c0− rfr
2νf
)= ωfr +
f
c0
dω
dt
(1 − u
c0− u2
c20
).
(3.20)In this equation, which is valid for any point in the liquid, one can proceed tothe cavity wall assuming r = R, u = dR/dt, and H = (p(R)−p∞)/ρ0, wherep(R) is the pressure in detonation products, p∞ is the pressure in liquid atinfinity, and ρ0 is the density of undisturbed liquid. Thus, we have
– For flat cavity (ν = 0, f = 1, fr = 0),(
1 − 2R
c0
)RR =
(1 − R
c0+
R2
c20
)RH
c0
– For spherical cavity (ν = 2, f = r, fr = 1),(
1 − 2R
c0
)RR +
32R2
(1 − 4
R
3c0
)= H +
(1 − R
c0+
R2
c20
)RH
c0
– For cylindrical cavity (ν = 1, assume f =√
r, then fr = r−1/2/2),(
1 − 2R
c0
)RR +
34R2
(1 − 4
R
3c0
)=
H
2+
(1 − R
c0+
R2
c20
)RH
c0
All three equations are completely equivalent to the equations obtained on thebasis of the exact solution of the problem on the invariance of the function Galong the characteristics c0:
( ∂
∂t+ c0
∂
∂r
)G = 0 .
Here G = rν/2Ω.The proposed method is fairly simple; however, one more problem is still
to be solved: in two-dimensional problems the equation of continuity doesnot permit substitution of partial derivatives of velocity components for to-tal derivatives. Analysis of the method has shown that it enables the followingsimplification. Let us assume that in the continuity equation we can neglect
108 3 Explosion of Cylindrical and Circular Charges
the term (ω/c20), i.e., we can consider the relation between the velocity com-
ponents as primarily defined by the frames of the approximation for an idealincompressible liquid. If the solution of the Laplace equation is found for thevelocity potential and given the appropriate statement of the problem, theboundary conditions permit separation of variables, each velocity componentwill be expressed in terms of the total derivative of the cavity radius withrespect to t.
It can be shown that the above assumption slightly changes Eq. (3.20):the terms u/c0 and (u/c0)2 disappear from the right-hand part in bracketsat ω. But from the acoustics viewpoint they can be neglected as well, sincemain losses for radiation under cavity oscillation in incompressible liquid aredefined by the term Rω/c0. The results will be used to find the equationof the cavity dynamics under explosion of a circular charge in the acousticapproximation.
2. Let the liquid contain a toroidal cavity formed as a result of “instan-taneous” detonation of a circular charge and the linear dimensions of thecavity satisfy the condition a R. Then within the framework of the cir-cular source approximation one can write the following expression for thevelocity potential:
ϕ = − a
2π
π∫0
Φ(t − f/c0)f
dα , (3.21)
where Φ = dS/dt; S = πR2 is the cross-sectional area of the torus cavity;f =
√z2 + r2 + a2 − 2ar cosα in the cylindrical coordinate system (r, α, z),
where α is from an arbitrary direction which in the case of a real DC chargeshould be selected with regard to the point of detonation initiation. Followingitem 1, one could put an explicit form of the equation for ϕ for the case ofincompressible liquid. However, in this case it is unclear how the argumentof the function Φ under the transition to the acoustic model should be writ-ten. Therefore, we keep the expression for the velocity potential as (3.21),but agree that one can take the function Φ′ from under the integral sign as-suming that it possesses the properties of the invariant G. This assumptionis insignificant for constructing the oscillation equation of a cavity and caninfluence only the estimate of the fine structure of the shock wave in thenear-charge zone.
By analogy with the above-stated one can write
Φ′ =2π
a
(ω +
V 2
2
)/ π∫0
dα
fand
a
2π
π∫0
Φ · (fr + fz)f2
dα
= u + v −⎛⎝(ω +
V 2
2
)/c0
π∫0
dα
f
⎞⎠ π∫
0
(fr + fz)f
dα , (3.22)
3.4 Dynamics of a Toroidal Cavity, Numerical Models 109
where u, v, and V are the components and the full speed of a liquid particle.Let us take the partial derivative with respect to t from the second equationin (3.22). Then, taking Φ′ from under the integral sign, we obtain
aΦ′
2π
π∫0
fr + fz
f2dα = ut + vt −
⎛⎝(ωt + V Vt)
/c0
π∫0
dα
f
⎞⎠×
π∫0
fr + fz
fdα .
(3.23)One can show that ωt = ω + V V . The partial derivatives ut and vt are
sought from the solution for incompressible liquid. In this case, using for the
velocity potential the expression ϕ = −(a/2π)Φ(t)
π∫0
dα/f , we eventually get
ut = u − a
2πΦ
⎧⎨⎩u
π∫0
(frr
f2− 2f2
r
f3
)dα + v
π∫0
(frz
f2− 2frfz
f3
)dα
⎫⎬⎭
and
vt = v − a
2πΦ
⎧⎨⎩u
π∫0
(frz
f2− 2frfz
f3
)dα + v
π∫0
(fzz
f2− 2f2
z
f3
)dα
⎫⎬⎭ .
Substitute ωt, ut, vt in (3.23) and express Φ′ from the first equation of thesystem (3.22). We obtain the general equation
(1 − 2F1u)u + (1 − 2F1v)v − π
a
F0
F(u2 + v2)+
+a
2πΦF1F2u
2 + +a
2πΦF1F3v
2 +a
πΦF1F4uv − a
2πΦ(F2 + F4)u−
− a
2πΦ(F3 + F4)v =
2π
a
F0
Fω + F1ω , (3.24)
where
F0 =a
2π
π∫0
fr + fz
f2dα ; F =
π∫0
dα
f; Φ = 2πRR ;
F1 =1
c0F
π∫0
fr + fz
fdα ; F2 =
π∫0
frr − 2f2r /f
f2dα ;
F3 =
π∫0
fzz − 2f2z /f
f2dα ; and F4 =
π∫0
frz − 2fzfr/f
f2dα .
110 3 Explosion of Cylindrical and Circular Charges
If we introduce the notation ξ1 = z2 + (r + a)2, ξ2 = z2 + (r − a)2, ξ3 =z2+a2−r2, ξ4 = z2+a2+r2, ξ5 = 2r2−a2−(z−r)2, and ξ6 = 3(z2+a2)−r2,the functions F will finally be written as follows:
F0 =a
2πr√
ξ1
[ξ5
ξ2E(k) + K(k)
], F =
2K(k)√ξ1
,
F1 =π√
ξ1
4rc0K(k)
[1 +
ξ5√ξ1ξ2
], k =
√4ar
ξ1,
F2 = − 3K(k)2r2
√ξ1
+ξ6
r2
E(k)ξ2
√ξ1
− ξ23
√ξ1
2r2ξ22ξ2
1
4ξ4E(k) − ξ2K(k) ,
F3 =2E(k)ξ1
√ξ1
− 2z2√
ξ1
ξ22ξ2
1
4ξ4E(k) − ξ2K(k) ,
and
F4 = −3zE(k)rξ2
√ξ1
+zξ3
√ξ1
rξ22ξ2
1
4ξ4E(k) − ξ2K(k) ,
where K(k) and E(k) are the total elliptic integrals of the first and the secondkind, respectively, and k is their modulus. Proceeding to the torus wall, aftera series of transformations in expressions for the coefficients F from (3.24)we obtain the equation of oscillation of toroidal cavity in compressible liquid:
[1 − 2π
R
c0 ln(8a/R)
]RR +
[1 − π
R
c0 ln(8a/R)
]R2
ln(8a/R)− R
2=
= ω +πR
c0ω . (3.25)
3.4.3 Comparison with Experiments
Experimental studies compared below with the calculation data from (3.25)were run with copper-casing charges. The high-speed filming showed that thefinal detonation velocity does not affect the cavity shape. The initial param-eters of the problem were determined from the condition of discontinuity ofarbitrary decay and instantaneous detonation at constant volume. For isen-tropic index we used the data of [5]: initial charge density of 1.55 g/cm,detonation velocity of 7.7 km/s, and charge diameter of 0.65 mm. Numericaland experimental results are compared in Table 3.3:
The following conclusuions were drawn from analysis of the data presentedin Table 3.3:
1) For a ≥ 3 · 102Rch, the calculation results are in satisfactory agreementwith experimental data.

3.4 Dynamics of a Toroidal Cavity, Numerical Models 111
Table 3.3. Comparison of calculated and experimental results of oscillation ofa toroidal cavity
a/Rch Calculation Experiment
ymax ymin τ∗, s/cm ymax τ∗, s/cm E,%
1.54 · 102 125.83 4.02 0.21 103 0.21 11.83.08 · 102 127.8 3.82 0.24 119.5 0.237 15.94.60 · 102 128.8 3.72 0.256 123.6 0.256 17.01.54 · 103 131.5 3.48 0.3 — — —3.08 · 103 132.8 3.37 0.323 — — —3.08 · 104 136.4 3.09 0.394 — — —
∞ 140.9 3.15 0.2 135 0.2 22
Note: ymax = Rmax/Rch, ymin = Rmin/Rch, τ∗ =tmax/Rch, tmax is the time of expansion of the cavitywith detonation products to the first maximum, E is theportion of energy that remains in the detonation prod-ucts by the moment of the first expansion of the cavity,a/Rch = ∞ corresponds to cylindrical charge, Rmax is thefirst maximum radius of the cavity with explosion prod-ucts, Rmin is the cavity radius at the moment of the firstcompression, Rch is the charge radius.
2) With increasing circle charge radius the oscillation parameters of the ex-plosive cavity Rmax and Rmin, which characterize the energy balance,asymptotically approach the appropriate values of explosion parametersfor cylindrical symmetry.
3) Circular geometry of the charge significantly affects the oscillation periodof the cavity with detonation products: according to the calculation re-sults, even when the circular charge radius is a = 10 m (second line fromthe bottom), the oscillation period of the torus is twice as long as forthe case of cylindrical symmetry. Experimental results confirm the ten-dency to the increase of the oscillation period with increasing the chargeradius.
4) Following the experimental data, as the circular charge radius decreases(to the value when the circular section of toroidal cavity is distorted dur-ing of expansion), a portion of energy falling at the shock wave generatedby this charge increases and at a ≈ 150 ·Rch amounts to almost 90%. Asthe circle radius increases, the energy balance approaches the results forcylindrical symmetry.
The above results verify the efficiency of the method proposed above andthe resulting oscillation equation of toroidal cavity in compressible liq-uid (3.25).

112 3 Explosion of Cylindrical and Circular Charges
3.4.4 Basic Characteristics for Toroidal Charges
Analysis of the numerical results (3.25) for a wide range of circle radii a madeit possible to obtain an approximate analytic expression for maximum radiusof toroidal cavity with detonation products,
ymax 141[1 − 2
3ln−1
( 8a
Rch
)],
which is in satisfactory agreement with experimental data on real detonationcord (DC) and complies with the above conclusions. Both experiments andcalculations showed that the oscillation period of a cylindrical cavity is notan asymptotic for the oscillation period of the torus as the circular chargeradius increases. The period can be estimated using the traditional approach(the model of incompressible liquid): ignoring the term R2/2 and substitutingR for Rmax under the logarithm sign, we consider that these approximationsshould be justified by the experiment. Thus, Eq. (3.25) is reduced to the form
ρ0(RR + R2) ln( 8a
Rmax
) −p∞
and can be integrated, yielding
R2 R2max −
p∞ρ0 ln(8a/Rmax)
t2 .
Assuming that R = 0 in this expression, we obtain for the collapse time ofan empty toroidal cavity in an incompressible liquid
τ Rmax
√ρ0 · ln(8a/Rmax)
p∞.
The collapse time determined from this expression, to within the accuracy ofa certain constant, coincides with the experimental data and numerical resultsfor the initial equation. With allowance for this fact, the final expressionfor the first oscillation period of the explosive cavity of the circular chargebecomes
Tcal 2Rmax
√ρ0 · ln(8a/Rmax)
p∞+ 0.04Rch ,
where R is measured in centimeters, T , in seconds, and the coefficient of thesecond summand is dimensional.
3.5 Comparative Estimates for Spherical Charges
The model of an ideal incompressible liquid is the most frequent and sim-ple approximation for many problems of explosion hydrodynamics. It sug-gests that the liquid density ρ = const and enables investigation of certain
3.5 Comparative Estimates for Spherical Charges 113
important characteristics of the explosion process within the framework ofconservation laws. The equation of continuity in this case allows for the solu-tion in the form vrν = f(t), which at fixed t is invariant and holds for everypoint of the liquid. The model makes it possible to obtain the exact equationonly for a spherical cavity:
Rd2R
dt2+
32
(dR
dt
)2
= ρ−1[p(R) − p∞] ,
which is known as the Rayleigh equation [13]. At p∞ = const its first integralcan be found easily, given the equation of state of detonation products (orgas) inside the cavity. When multiplied by 2πρ, the equation gives the law ofenergy conservation: the change of the internal energy of detonation products,
∆E =2p(0)R3
0
3ρ(γ − 1)
[1 −
(R0
R
)3(γ−1)],
is equal to the increment of kinetic energy Tk = 2πρR3R2 (if R(0) = 0) andpotential energy U = (4/3)πp∞(R3 − R3
0) of the liquid. Detonation prod-ucts are considered as an ideal gas with variable (in general case) adiabaticindex γ. The most convenient form is writing the equation in dimensionlessvariables for y = R/R0 and τ = tR−1
0
√p∞/ρ. The integral makes it possible
to determine two major parameters: the oscillation period τ∗ and the maxi-mum radius of the cavity, with detonation products ymax t (corresponds tothe condition yτ = 0) whose estimate is simplified provided that ymax 1:
y3max ≈ p(0)
p∞(γ − 1)+
32y2
τ (0) ,
and defines the above mentioned energy balance but relates it to the initialpotential energy p∞V0.
The parameters p(0) and yτ (0) define the initial conditions of the prob-lem on the contact discontinuity and are found from the formulas for shocktransition in a liquid and for transition in the unloading wave in detonationproducts (Chap. 1). It should be noted that their definition naturally doesnot account for the model of incompressible liquid, and the results for p(0)and yτ (0) do not depend on the symmetry type.
The charge detonation is assumed instantaneous, the volume V∗ beingconstant and the density of detonation products being equal to the initialdensity of the HE charge. In this case, pressure in detonation products canbe determined from the known relationship p∗ = (γ∗ − 1)ρ∗Qα, which fol-lows from the condition of equality of specific internal energy of detonationproducts to the portion of the explosion heat Q∗ per HE mass unit, whichaccounts for detonation products. The speed of sound c∗ in the products ofinstantaneous detonation is determined from the detonation rate D∗:
c2∗ =
γ∗D2∗
2(γ∗ + 1).
114 3 Explosion of Cylindrical and Circular Charges
Let us consider a specific case for a hexogen change with ρ∗ = 1.65 g/cm3,Q∗ = 1.32 kcal/g, and D∗ = 8.35 km/s. Following the data of Kuznetsovand Shvedov [5], the expansion isentrope of detonation products of this HEis characterized by a practically invariable γ∗, which, as the density of theproducts decreases during their expansion from 2.2 to 0.8 g/cm3, varies inthe narrow range of 2.95–2.75. A change is noticeable within the pressurerange 0.6–0.05, where γ∗ decreases from 2.5 to its minimum value 1.26.
Assume γ∗ = 2.85, then p∗ = 69 kbar and c∗ = 5.08 km/s. The solutionof the problem on discontinuity of an arbitrary decay makes it possible tofind p(0) and R(0) (or yτ (0). Thus, if we assume γ = γ∗ = const, the resultfor ymax can be obtained immediately by equating the appropriate portionof the explosion energy α ·Q∗ρ∗V∗ (where α = 0, 41) to the potential energyof the liquid p∞Vmax at the moment of maximum expansion of the cavity:
ymax =(
αQ∗ρ∗p∞
)1/3
.
When the cavity radius reaches maximum (y = ymax, the time of cavityexpansion τ = τ+), the pressure in detonation products is several ordersof magnitude lower than the hydrostatic pressure p∞ and the cavity canbe considered empty. Under the effect of this pressure difference, the cavitycollapses with initial zero velocity over the time τ = τ−, while the Rayleighequation takes the form of Besant’s equation:
y3y2τ =
23(1 − y3) .
It should be noted that in this equation the cavity radius is normalized byRmax. The time τ− is determined from the appropriate integral of this equa-tion under the assumption that the cavity collapses to zero
τ− =√
3/2
1∫0
y3/2(1 − y3) dy =1√6B(5/6.1/2) 0.915 .
Here B is the beta function. Experimental studies proved that oscillation ofexplosive cavity is symmetrical: the time of its expansion, τ+, of R to Rmax
equals to a high degree of accuracy to the time of its subsequent collapse τ−.Thus, the period of the first oscillation of the cavity τ∗ with detonation prod-ucts can be defined as a sum of τ+ and τ−:
τ∗ = 1.83 or T1 = 1.83Rmax
√ρ
p∞.
It should be noted that the interval between the shock wave front andthe maximum of the first oscillation (or oscillations, if the cavity form re-mains stable) equals to the period T1. If one manages to register the pressureprofile p(t) experimentally, and consequently T1 as well, Rmax automatically
3.6 Oscillation Parameters 115
becomes known, which allows one, provided that the coefficient of energytransfer into radiation is known, to estimate the explosion energy. Likewise,if the explosion heat is known, it is possible to estimate the energy adsorbedby the shock wave.
If the density ρ, hydrostatic pressure p∞, and explosion energy Q1 =Q∗ρ∗V∗, where ρ∗V∗ is the HE charge mass, are accepted as governing pa-rameters of the problem on underwater explosion in an ideal incompressibleliquid, they can be combined with the time dimensionality. It is sufficient toexpress Rmax in Eq. (3.7) in terms of the expression Q1/p∞. The result isthe well-known Willis formula [3],
Ti = 1.14α1/3i
Q1/31 ρ1/2
p5/6∞
,
in which the coefficient αi reflects the degree of HE energy transition intoliquid under detonation and subsequent oscillations. The subscript i denotesthe number of oscillations.
3.6 Oscillation Parameters
In this section we distinguish the characteristic parameters (maximum ra-dius and oscillation period) of the dynamics of explosive cavities containingdetonation products [14]:
• For spherical cavity,
Rimax
(34π
αiE0W
p0
)1/3
, αi = 0.41; 0.14; 0.076 ;
Ti 1.14ρ1/2(αiE0W )1/3p−5/60
• Empirical expression for the current radius,
R/R0 665(t/R∗)0.4 , 10−4 ≤ t ≤ T1/4
• For cylindrical cavity,
Rimax
(βiE0Wl
πp0
)1/2
, βi = 0.218; 0.14; 0.11 ;
Ti 1.635ρ1/20 (βiE0Wl)1/2p−1
0
• For toroidal cavity,
Rmax (
0, 218E0Wl
πp0
)1/2 [1 − 2
3 ln(8a/Rch)
],
T1 2Rmax
√ρ0 ln(8a/Rmax)
p0+ 0, 04Rch
116 3 Explosion of Cylindrical and Circular Charges
Here E0 is the HE explosion heat; W and Wl are the charge mass; i = 1,2, and 3 are the numbers of oscillations; and α and β are HE energy portionsremaining in the detonation products.
3.7 Explosions of Spatial Charges in Air
Spiral charges as hydroacoustic sources were considered in Chap. 2. It wasshown that the wave packets radiated by such charges are characterized bylong duration, weak attenuation, and given frequency of the sequence of shockwaves in the packet. The wave packet can keep its profile and duration owingto the rarefaction phases between shock waves, which prevent the waves fromoverlapping. One can expect that the structure of the wave field produced byexplosion of a spiral charge in air will differ.
Below we consider the results of experimental study of these problems forthe near zone of spatial charges shaped as separate coils and annular spiralsexploded in air.
3.7.1 Experimental Arrangement
In test experiments, linear charges made of standard detonating cord (DC)consisting of RDX 3 mm in diameter and two to three meters long were sus-pended horizontally. The density and specific weight of HE were 1.6 g/cm3
and 11–12 g/m, respectively, the specific heat of explosion was Q =1400 kcal/kg, and the detonation velocity was 7.5 km/s. Pressure transduc-ers (piezoelectric cells of radius r0 = 1 mm) were placed in the central plane,normal to the linear charge axis. Shock waves were recorded at distancesr = 15, 20, 50, and 100 cm from the charge axis along its radius. A sphericalcast charge of 50/50 TNT/RDX (radius of 12 mm, weight equivalent of a1-m long DC charge) was initiated from the center by an ED-637 detonator.The pressure was measured at distances r = 10, 15, 30, . . . , 150 cm from thespherical charge center. The shock-wave velocity in air was measured fromthe time it takes a wave front to pass a base of 15 mm.
In test experiments, the pressure gauges were calibrated and the correla-tion between the shock-wave parameters in air was determined for linear andspherical charges of equivalent weight.
The studies were primarily aimed at analyzing the features and structureof the fields generated by explosions of plane annular charges (diameter D0 =300, 450, and 600 mm), bulk spiral coils (pitch h = 150 mm, D0 = 300 mm,and length L = 1 m), plane spiral coils (h = 150 mm and L = 1 m), andspiral charges (h = 150 mm and L = 10 m). The charges were fixed on a rigidcylindrical frame made of thin steel wire. Detonation was excited from thefurthermost charge end. Shock waves were registered along the charge axiswithin the range of relative distances r∗ = r/R0 = 1–10 or r∗ = r/h = 1–10counted from the central plane of symmetry. For bulk coils, the center of
3.7 Explosions of Spatial Charges in Air 117
symmetry was at the axis at a distance of 75 mm from the butt ends. Thesignals of the pressure transducers were consecutively supplied to a two-beam digital oscillograph and to a computer. The oscillograph was triggeredwith a delayed pulse generator switched into a high-voltage current circuitgenerating pulses of 5 or 10 kV to initiate detonation.
3.7.2 Test Measurement Results
3.7.2.1 Linear and Spherical Charges
The characteristic pressure profiles of the shock waves induced by blastinglinear (a) and spherical (b) charges are shown in Fig. 3.10 for r ≈ 20 cm andr ≈ 30 cm, respectively. The measurements showed that the characteristicshock wave length τ varied with increasing distance to the charge: for r = 150,200, 500, and 1000 mm, τ increased to 150–250, 190–280, 350–420, and 500–580 µs, respectively.
The pressure in the front of the transient shock wave, p1,calc, calculatedfrom the mean shock wave velocity, D, and the experimental data for p1,exp
agreed with the well-known experimental data within the entire measurementregion. The pressure could be approximated by the relation
p1 bx−a , (3.26)
where a = 1.37 and b = 5.65 · 10−2, if p1 was measured in megapascals andx was measured in meters. One could introduce the characteristic size fora cylindrical charge λ = (ql/p0)0.5 (where ql = Qm/L is the explosion heatper unit length) and compare the data for cylindrical and spherical geometrywith the results obtained in [15, 16].
The greatest dispersion in p1 around the mean value was ±(25–30)% andwas observed near the charge. For r = 1 m, the dispersion in p1 decreased to
Fig. 3.10a,b. Experimental pressure profiles obtained by blasting linear(r ≈ 20 cm) (a) and spherical (r ≈ 30 cm) (b) charges
118 3 Explosion of Cylindrical and Circular Charges
±(5–7)% and was almost equal to the measurement error (slightly less than5%). Obviously, during expansion of explosion products, the inhomogeneouscharacter of failure of the DC inert shell had a significant effect on the for-mation and parameters of the shock wave. Attenuation of the shock wave bythe shell was mentioned in [15, 17], though the instability and dispersion ofshock-wave parameters from one experiment to another were not reported.
For spherical charges, the experiments showed that the dispersion in p1
in the shock wave front at distances r = 0.1 and 0.15 m was of the sameorder of magnitude as for linear charges. The instability of the boundary ofexpanding products that influenced the early stage of shock wave generation(in the near zone) was noticed even in the experiments without the shell.At the same time, for r > 0.3 m the dispersion in p1 did not exceed themeasurement error. Within the entire range of measurements for sphericalcharges, the relative pressure p1/p0 in the transient shock wave as a functionof r/r0 could be described by the same Eq. (3.26) only for a = 2.04 andb = 3.56 · 103.
3.7.2.2 Circular and Spiral Charges
The pressure in transient shock waves p1 during the explosion of spatialcharges was determined using the curves calibrated in the incident wave dur-ing the test measurements.
Rings and coils
At the first stage of experiments, charges of equal mass but different shapeswere compared. The characteristic pressure oscillograms for different relativedistances r∗ are plotted in Fig. 3.11 for 1-m long DC charges. The pressureprofiles were identical for all three charge types. A two-wave structure wasobserved in the near zone (r∗ = 1). Note that the amplitude of the secondwave could be higher than that of the first wave by a factor of 1.5 to 2for a ring (Fig. 3.11a) and a bulk spiral (Fig. 3.11b), and by a factor ofsix to seven for a plane spiral (Fig. 3.11c). The first wave was generatedby explosion of the charge end closest to the transducer, while the secondwave was generated by focusing a curved shock wave converging to the innerregion of the charge. At a greater distance from the charge, the bow shockwave had a smoothly decreasing triangular profile (oscillograms on the rightof Fig. 3.11a–c). The wave duration τ for the considered charge geometrywas almost the same for identical r∗, and their value changed almost linearlyfrom 60–125 to 650–700 µs with r∗ increasing from one to ten.
The experimental data on the decay of the first and the second waves andthe dependences p(r∗) showed that for these charge types, the pressure in theshock wave front was almost invariant beginning from r∗ ≥ 3 irrespective ofthe shape of the spatial charge. The wave amplitude in this region is describedby Eq. (3.26) with a = 2.31 and b = 48.6.
3.7 Explosions of Spatial Charges in Air 119
Fig. 3.11a–c. Typical pressure oscillograms along the axes after the explosion ofone-meter long circular DC charge (R0 = 150 mm) (a), a coil of a bulk spiral(R0 = 150 mm and h = 150 mm) (b), and a plane spiral (h = 150 mm) (c).
Comparison of experimental data for spatial and spherical charges of anequivalent HE mass showed that spatial charges yielded a pressure rise bya factor of 2 to 3 as compared with spherical charges concentrated at equalabsolute distances from its geometric center. Note that, among the abovetypes of spatial charges, the best directivity and focusing along the axis (inthe zone nearest to the charge) was exerted by a bulk coil in which thepressure reached 6.5 MPa on the axis for r∗ = 1 in the second wave front.
Spiral charges
As was shown in Chap. 2 [29, 63], the explosion of a spiral charge in watergenerated a shock wave packet whose duration depended on the DC lengthand detonation velocity. Similar effects in air were complicated by strong
120 3 Explosion of Cylindrical and Circular Charges
nonlinear dependence of the shock wave velocity on distances to the charge.One could expect that both the duration of the wave packet and the structureof the wave field in air would differ essentially from those in water.
Characteristic examples are presented in Figs. 3.12 and 3.13 [18,19]. Fig-ure 3.12 shows the structure of the wave field resulting from explosion ofa multiturn spatial spiral as the sequence of shock waves with attenuat-ing amplitudes. Figure 3.13 demonstrates the case of explosion of a planeArchimedes’ spiral. In both cases, the charges were made of a 10-m long DCand a pitch of 15 cm.
The longest signals as the shock wave series recorded by the gauge (themaximal number of secondary shock waves behind the front of the first shock
Fig. 3.12. Shock wave packet radiated under explosion of a spatial spiral charge(DC, L = 10 m, R0 = h = 150 mm, ∆p1 = 0.6 MPa, and r = 50 cm)

3.7 Explosions of Spatial Charges in Air 121
wave was 7–8) were observed in the central cross-section plane of the charge(Fig. 3.12). Here the first pulse was caused by explosion of a spiral coil nearestto the gauge measuring.
Amplitudes of the shock wave sequence in the packet exponentially de-creased as the detonation wave moved away from the central section planewhere the gauge was placed. One could see that sometimes bifurcation ofthe first pulse of the shock wave set was registered (Fig. 3.12, upper os-cillogram). Thus, the amplitudes of both pulses evidently decreased. Thiseffect was obviously related to the formation of the wave field generatedby explosions of the previous turn and the turn in the central section. Forexample, let the detonation front move in the charge from right to left.In this case, if the gauge was slightly shifted to the right with respect tocentral section, the signal from the previous turn could be recorded ear-lier than that of the wave from central turn. Thus, the latter signal prop-agated in the field of pressure and density gradients behind the first pulsefront. The inverse situation occured, when the first shock wave was over-taken by the wave from the central turn. The two waves merged and theamplitude of the first resulting pulse increased essentially (Fig. 3.12, loweroscillogram).
For the Archimedes’ spiral, the pressure oscillograms (Fig. 3.13) recordedalong the axis are presented for different distances and scanning times (2,4, and 8 ms, respectively) for the case when the detonation was initiatedfrom the external turn. They show a complex structure characterized by an
Fig. 3.13a–c. Typical pressure oscillograms recorded under explosion of a planeArchimedes’ spiral (h = 150 mm and L = 10 m) for scanning times of 2 (a), 4 (b),and 8 ms (c)
122 3 Explosion of Cylindrical and Circular Charges
obvious inhomogeneity of the pressure field. The oscillogram in Fig. 3.13acorresponds to a distance of 15 cm from the spiral plane, which was equalto the spiral pitch h. For t ≈ 1600 µs, a strong wave was registered, and itsamplitude was higher by an order of magnitude than that of the other wavesin the packet. As the distance to the charge increased and the amplitudedecreased, we observed the fine structure of wave packet (Fig. 3.13b).
The experiment showed that sometimes the wave packet generated byblasting of a spiral charge had longer duration than the time necessary for thedetonation wave to cover the DC length in the charge (Fig. 3.13c). Obviouslythis “extension” of the signal was associated with the focusing times.
Shock wave velocity in air depends considerably on the distance to thecharge. This fact complicates the analysis of experimental data on the distri-bution of pressure amplitudes in wave packets generated by blasting chargesin the form of a plane coil and Archimedes’ spiral. The data are comparedin Fig. 3.14: (1) pressure ∆p3,4 in the third or fourth waves (the highestamplitude being in the case of Archimedes’ spiral); (2) pressure ∆p1 in thebow shock wave of the same charge; and (3) pressure ∆p1 in the case ofa plane coil. The solid curves represent experimental data (dots). For com-paratively short distances r∗ = 1 (Fig. 3.13a), the greatest amplitude in thewave packet with a total (resolvable) duration of τ ≥ 750 µs was reachedin the third or fourth waves (curve 1, Fig. 3.14). The amplitude of the firstshock wave (curve 2) was lower by almost an order of magnitude. In the in-termediate region 2 < r∗ < 5, several waves with close pressure amplitudes(τ ≈ 650–750 µs) were observed, since the effect of outer spiral turns wasmore explicit as the distance from the charge plane changed (see Fig. 3.13b).For r∗ > 5, as a result of merging of a series of shock waves (curves 1 and 2overlap in Fig. 3.14), a bow shock wave was formed (τ ≈ 700–750 µs), whichwas followed by the second, weaker shock wave approximately 2.1 ms later(see Fig. 3.13c).
Fig. 3.14. Shock wavedecay in a plane coil andan Archimedes’ spiral
References 123
The experimental dependences p(r/h) in the shock wave for a coil anda plane spiral (curves 3 and 1 in Fig. 3.14, respectively) showed that thespiral length in the zone closest to the charge had practically no effect onthe maximum pressures in the shock wave, which were rather close for bothcharge types. An abrupt change was noticed for r∗ > 4: the wave amplitudesin the packet induced by explosion of the spiral were significantly higher thanthe wave amplitudes in the packet generated by explosion of a single coil.Naturally, the wave duration and its total impulse increased. Comparison ofthe pressure oscillograms in Fig. 3.11c and Fig. 3.13 allows one to concludethat weaker shock waves with gradually increasing pressure in the shock wavefront were formed by the large-radius outer coils with detonation propagatingto the center along them, and the maximum pressure amplitude in the lastshock wave was reached due to the focusing of a converging shock wavegenerated by the explosion of the central part of a plane spiral (approximately1 m long).
This effect was more pronounced in experiments with three annularcharges (R0 = 150, 225, and 300 mm). As the radius of an individual ring (ora given coil of Archimedes’ spiral) increased, the pressure in the shock wavein the near zone at a fixed distance decreased.
Summing up, we may say that experimental studies proved that the con-siderable dispersion in pressure and shock wave velocities registered in thenear zone in the case of spatial, spherical, and cylindrical charges duringexplosion in air is due to the instability of the boundary of expanding deto-nation products. It was found experimentally that the decay of a shock waveinduced by blasting spatial charges is less intense and the amplitudes in theshock wave front are two to three times higher than those in spherical chargesof equal mass.
It should also be noted that the duration of the shock wave generatedby blasting spiral charges in air is longer than that in concentrated chargesof equal mass. As the DC length increases, so do the duration (approaching3 ms for a DC length of about 10 m) and impulse of the wave packet ina plane spiral without significant increase in pressure in the shock waves inthe near zone of the spiral plane (at distances from one to several pitches).The greatest jump in the shock wave is observed in the case of focusing ofa converging shock wave in the central region of the charge.
References
1. V.K. Kedrinskii: On oscillation of cylindrical gas cavity in dimensionless liquid.In: Continuum Dynamics, vol. 8 (Institute of Hydrodynamics, SB of the USSRAS, Novosibirsk, 1971) pp. 163–168
2. V.K. Kedrinskii: Kirkwood–Bethe Approximation for Cylindrical Symmetry ofUnderwater Explosion, Fiz. Goren. Vzryva 8, 1, pp. 115–123 (1972)
3. R. Cole: Underwater Explosions (Dover, New York, 1965)

124 3 Explosion of Cylindrical and Circular Charges
4. V.K. Kedrinskii, V.T. Kuzavov: Dynamics of the Cylindrical Cavity in Com-pressible Liquid Zh. Prikl. Mekh. i Tekhn. Fiz. 38, 4, pp. 102–106 (1977)
5. N.M. Kuznetsov, K.K. Shvedov: Isentropic Expansion of Detonation Productsof Hexagen, Fiz. Goren. Vzryva 3, 2 (1967)
6. V.K. Kedrinskii: About Some Models of One Dimensional Pulsation of Cylin-drical Cavity in Incompressible Liquid, Fiz. Goren. Vzryva 12, 5, pp. 768–773(1976)
7. V.M. Kuznetsov: On expansion of a cylindrical cavity in an ideal incompressibleliquid. In: Continuum Dynamics, vol. 14 (Institute of Hydrodynamics, SB ofthe USSR AS, Novosibirsk, 1973)
8. J.W. Pritchett: Incompressible calculations of underwater explosion phenom-ena. In: Proc. 2nd Internat. Conf. on Numerical Methods in Fluid Dynamics(Springer, Berlin, Heidelberg, New York, 1971) pp. 422–428
9. V.K. Kedrinskii, V.T. Kuzavov: Underwater Explosion of Coil Charge NearFree Surface, Zh. Prikl. Mekh. i Tekhn. Fiz. 24, 4, pp. 124–130 (1983)
10. V.K. Kedrinskii: Dynamics of a cylindrical cavity in a boundless compressibleliquid. Zh. Prikl. Mekh. i Tekhn. Fiz. 21, 5 (1980)
11. V.K. Kedrinskii: On oscillation of a toroidal gas bubble in a liquid. In: Con-tinuum Dynamics, vol. 16 (Institute of Hydrodynamics, SB of the USSR AS,Novosibirsk, 1974) pp. 35–43
12. V.K. Kedrinskii: About One Dimensional Pulsation of Toroidal Gas Cavity inCompressible Liquid, Zh. Prikl. Mekh. i Tekhn. Fiz. 18, 3, pp. 62–67 (1977)
13. J.W. Rayleigh: On the Pressure Developed in a Liquid During the Collapse ofa Spherical Cavity, Phil. Mag. 34, pp.94–98 (1917)
14. V.K. Kedrinskii: Hydrodynamics of Explosion (Review), Zh. Prikl. Mekh. iTekhn. Fiz. 28, 4, pp.23–48 (1987)
15. M.A. Tsykulin: Air Shock Wave in Explosion of a Cylindrical Charge of LargeLength, Zh. Prikl. Mekh. i Tekh. Fiz., 1, 3, pp. 188–193 (1960)
16. V.V. Adushkin: Formation of a Shock Wave and Spreading of Explosion Prod-ucts in Air, Zh. Prikl. Mekh. i Tekh. Fiz., 4, 5, pp. 107–1114 (1963)
17. A.A. Vasil’ev and S.A. Zhdan: Shock-Wave Parameters on Explosion of a Cylin-drical Charge in Air, Zh. Fiz. Gorenia i Vzryva, 17, 6, pp. 99–105 (1981)
18. A.V. Pinaev, V.T. Kuzavov and V.K. Kedrinskii: Shock-Wave Structure in theNear Zone Upon Explosion of Spatial Charges in Air, Zh. Prikl. Mekh. i Tekh.Fiz., 41, 5, pp. 81–90 (1980)
19. Alexandr Pinaev, Vasily Kuzavov and Valery Kedrinskii: Structure of NearWave Field at Explosion of Spatial Charges in Air, Proc. of 23d Intern. Symp.on Shock Waves, July 22–27, 2001, ed. by F.Lu, Fort Worth, Texas, USA. pp.158–164 (2001)
4 Single Bubble, Cumulative Effects
and Chemical Reactions
Numerous experimental and theoretical studies of the dynamics of a cavityin an unbounded liquid are concerned with a number of problems of under-water explosion, hydroacoustics, bubble cavitation, and shock initiation ofdetonation in liquid high explosives. The research results are used to analyzethe structure of shock and rarefaction waves in two-phase media, play animportant role in the development of the appropriate mathematical modelsdescribing spherical (cylindrical) cumulation in a viscous liquid, and are di-rectly related both to the dynamics of shock-wave destruction of nephroliths(lithotripsy) and to cavitation erosion. The dynamics of a spherical cavitywith a reactive gas mixture is of particular importance not only for the de-velopment of detonation of liquid HE, but also for the formation of conditionsfor large-scale explosions of tanks with easily ignitable gases. One of the diffi-cult problems in this field is the formation of a reactive mixture in a bubble ifthe carrier phase of the bubbly media is fuel, while the gaseous phase containsan oxidizer.
4.1 Passive Gas Phase
4.1.1 Short Shock Waves
As a rule, the experiments with bubbles involve pulsed shock or compres-sion waves, which are characterized by an explicit, relatively steep front witha pressure jump and an exponent-type profile. The duration of the positivephase of such waves can be up to tens of microseconds and is usually onthe same order as the collapse time of bubbles. The model of bubble–shockwave interaction is based on the assumption, following which the time of thewave front propagation can be neglected against the characteristic time of itsoscillation and the bubble collapse can be considered spherically symmetri-cal, while the incident wave is simulated by pressure at infinity, whose timevariation is assigned in one-to-one correspondence to its profile [1, 2].
Analytical dependences for the collapse time tcol and the relative mini-mum bubble radius Rmin/R0 are represented by
tcol = 0.915 · R0
√ρ/p∞
126 4 Bubble, Cumulation and Chemical Reactions(R0
Rmin
)3γ−3
= 1 + (γ − 1)p∞p0
,
which follow from the Rayleigh equation for p = const, and are not valid forthe case of variable pressure at infinity. Here γ is the gas adiabatic index inthe bubble, R0 and Rmin are the initial and minimum bubble radii, p0 is theinitial gas pressure in the bubble, and p∞ is the amplitude of the incidentstationary shock wave.
Soloukhin [1] analyzed numerically the Rayleigh equation for exponentialpressure change corresponding to the classical profile of a shock wave pro-duced by underwater explosion. This equation was reduced to the convenientdimensionless form
yd2y
dτ2+
32
(dy
dτ
)2
= µ[y−3γ − A exp (−τ)] ,
where y = R/R0, τ = t/θ, µ = (θ/R0
√ρ/p0)2, and A = p∞/p0. One can
easily notice a new dimensionless parameter µ that defines the relation of thetime constant of the pressure differential θ to the characteristic compressiontime t∗ = R0
√ρ/p0 of an empty bubble of radius R0 compressed by constant
pressure p0. The calculation was performed for a wide range of parametersA = 10–103, γ = 1.33–1.67, and µ = 10−2–103.
Based on these calculations, an approximate analytical dependence of theminimum bubble radius on the amplitude of the incident shock wave and theparameter µ was established in [2]:
( R0
Rmin
)3(γ−1)
1 + (γ − 1)µA2
1 + µA.
One can see that for µ → ∞ the minimum radius will be determined onlyby the amplitude A and the adiabatic index, which follows from the Rayleighequation for stepwise waves at zero initial velocity (yτ (0) = 0).
It is obvious that the estimate of the bubble collapse time under theeffect of a short shock wave should contain the same combinations of theparameter µ, so that for µ → ∞ (θ → ∞) the value tcol should achieve theappropriate asymptotics. Let us use the combination µA instead of p∞, then
tcol 0.915 · R0 ·√
ρ
p0· 1 + µA
µA2.
Dividing both parts of the expression by θ, we obtain the simple analyticaldependence for τanl = tcol/θ:
τanl 0.915 ·√
1 + µA
µA.
Its data and those for the minimum radius are compared in Table 1 with thecalculation results (τnum, Rnum).
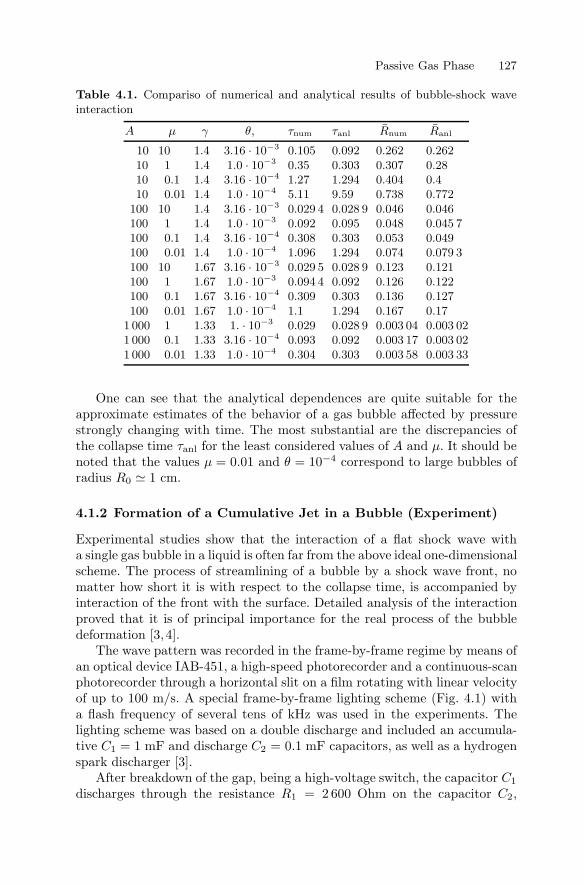
Passive Gas Phase 127
Table 4.1. Compariso of numerical and analytical results of bubble-shock waveinteraction
A µ γ θ, τnum τanl Rnum Ranl
10 10 1.4 3.16 · 10−3 0.105 0.092 0.262 0.26210 1 1.4 1.0 · 10−3 0.35 0.303 0.307 0.2810 0.1 1.4 3.16 · 10−4 1.27 1.294 0.404 0.410 0.01 1.4 1.0 · 10−4 5.11 9.59 0.738 0.772
100 10 1.4 3.16 · 10−3 0.029 4 0.028 9 0.046 0.046100 1 1.4 1.0 · 10−3 0.092 0.095 0.048 0.045 7100 0.1 1.4 3.16 · 10−4 0.308 0.303 0.053 0.049100 0.01 1.4 1.0 · 10−4 1.096 1.294 0.074 0.079 3100 10 1.67 3.16 · 10−3 0.029 5 0.028 9 0.123 0.121100 1 1.67 1.0 · 10−3 0.094 4 0.092 0.126 0.122100 0.1 1.67 3.16 · 10−4 0.309 0.303 0.136 0.127100 0.01 1.67 1.0 · 10−4 1.1 1.294 0.167 0.17
1 000 1 1.33 1. · 10−3 0.029 0.028 9 0.003 04 0.003 021 000 0.1 1.33 3.16 · 10−4 0.093 0.092 0.003 17 0.003 021 000 0.01 1.33 1.0 · 10−4 0.304 0.303 0.003 58 0.003 33
One can see that the analytical dependences are quite suitable for theapproximate estimates of the behavior of a gas bubble affected by pressurestrongly changing with time. The most substantial are the discrepancies ofthe collapse time τanl for the least considered values of A and µ. It should benoted that the values µ = 0.01 and θ = 10−4 correspond to large bubbles ofradius R0 1 cm.
4.1.2 Formation of a Cumulative Jet in a Bubble (Experiment)
Experimental studies show that the interaction of a flat shock wave witha single gas bubble in a liquid is often far from the above ideal one-dimensionalscheme. The process of streamlining of a bubble by a shock wave front, nomatter how short it is with respect to the collapse time, is accompanied byinteraction of the front with the surface. Detailed analysis of the interactionproved that it is of principal importance for the real process of the bubbledeformation [3, 4].
The wave pattern was recorded in the frame-by-frame regime by means ofan optical device IAB-451, a high-speed photorecorder and a continuous-scanphotorecorder through a horizontal slit on a film rotating with linear velocityof up to 100 m/s. A special frame-by-frame lighting scheme (Fig. 4.1) witha flash frequency of several tens of kHz was used in the experiments. Thelighting scheme was based on a double discharge and included an accumula-tive C1 = 1 mF and discharge C2 = 0.1 mF capacitors, as well as a hydrogenspark discharger [3].
After breakdown of the gap, being a high-voltage switch, the capacitor C1
discharges through the resistance R1 = 2 600 Ohm on the capacitor C2,
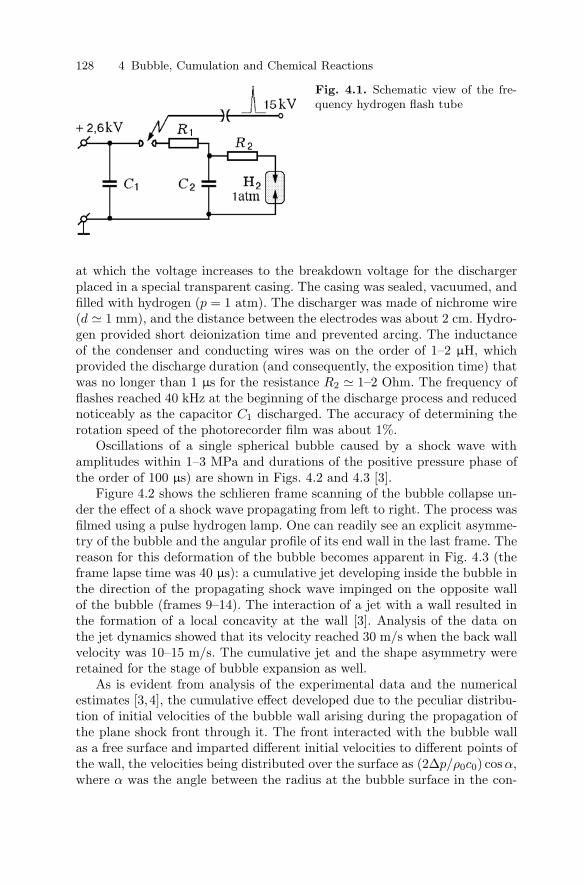
128 4 Bubble, Cumulation and Chemical Reactions
Fig. 4.1. Schematic view of the fre-quency hydrogen flash tube
at which the voltage increases to the breakdown voltage for the dischargerplaced in a special transparent casing. The casing was sealed, vacuumed, andfilled with hydrogen (p = 1 atm). The discharger was made of nichrome wire(d 1 mm), and the distance between the electrodes was about 2 cm. Hydro-gen provided short deionization time and prevented arcing. The inductanceof the condenser and conducting wires was on the order of 1–2 µH, whichprovided the discharge duration (and consequently, the exposition time) thatwas no longer than 1 µs for the resistance R2 1–2 Ohm. The frequency offlashes reached 40 kHz at the beginning of the discharge process and reducednoticeably as the capacitor C1 discharged. The accuracy of determining therotation speed of the photorecorder film was about 1%.
Oscillations of a single spherical bubble caused by a shock wave withamplitudes within 1–3 MPa and durations of the positive pressure phase ofthe order of 100 µs) are shown in Figs. 4.2 and 4.3 [3].
Figure 4.2 shows the schlieren frame scanning of the bubble collapse un-der the effect of a shock wave propagating from left to right. The process wasfilmed using a pulse hydrogen lamp. One can readily see an explicit asymme-try of the bubble and the angular profile of its end wall in the last frame. Thereason for this deformation of the bubble becomes apparent in Fig. 4.3 (theframe lapse time was 40 µs): a cumulative jet developing inside the bubble inthe direction of the propagating shock wave impinged on the opposite wallof the bubble (frames 9–14). The interaction of a jet with a wall resulted inthe formation of a local concavity at the wall [3]. Analysis of the data onthe jet dynamics showed that its velocity reached 30 m/s when the back wallvelocity was 10–15 m/s. The cumulative jet and the shape asymmetry wereretained for the stage of bubble expansion as well.
As is evident from analysis of the experimental data and the numericalestimates [3,4], the cumulative effect developed due to the peculiar distribu-tion of initial velocities of the bubble wall arising during the propagation ofthe plane shock front through it. The front interacted with the bubble wallas a free surface and imparted different initial velocities to different points ofthe wall, the velocities being distributed over the surface as (2∆p/ρ0c0) cosα,where α was the angle between the radius at the bubble surface in the con-
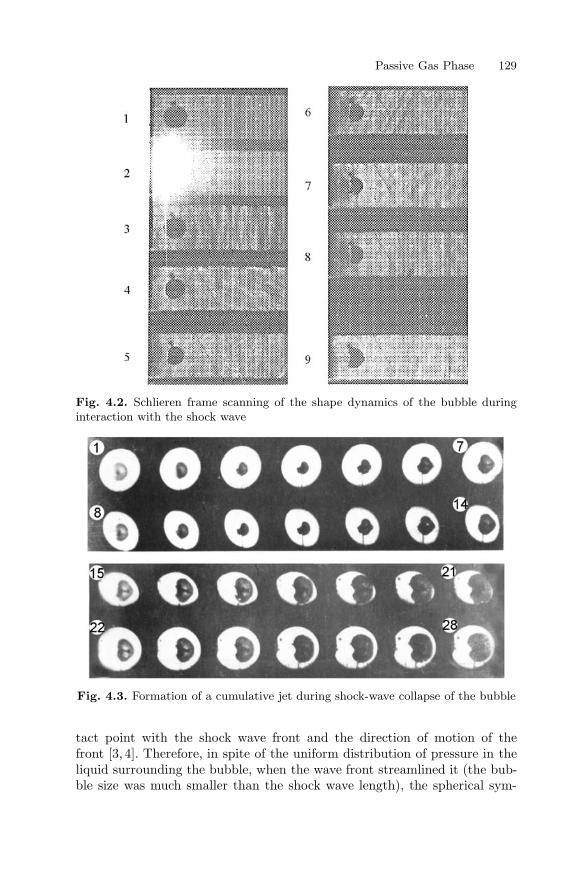
Passive Gas Phase 129
Fig. 4.2. Schlieren frame scanning of the shape dynamics of the bubble duringinteraction with the shock wave
Fig. 4.3. Formation of a cumulative jet during shock-wave collapse of the bubble
tact point with the shock wave front and the direction of motion of thefront [3, 4]. Therefore, in spite of the uniform distribution of pressure in theliquid surrounding the bubble, when the wave front streamlined it (the bub-ble size was much smaller than the shock wave length), the spherical sym-

130 4 Bubble, Cumulation and Chemical Reactions
metry of the process was distorted. This in turn caused the collapse, withformation of a cumulative jet having the same direction as the wave: theclassical cumulative jet occurred as the plane wave achieved the cumulativehollow.
The cumulative effect found in [3, 4] led to bubble destruction, increasedthe dissipative losses, and distorted the structure of the wave reradiated bythe bubbly medium. These effects would vanish if the front was steep andthe pressure amplitude in the front decreased.
4.1.3 Real State of a Gas
Estimating the real state of a gas is an important aspect of bubble dynam-ics studies in a pressure field. It is important both for understanding theshock-wave transformation by a bubbly medium on the whole and for con-structing the appropriate mathematical models. Therefore, the statement ofdirect experiments aimed at determining the state of gas in the bubble in dy-namics is of doubtless interest. Below we describe the experiment arrangedby Kedrinskii and Soloukhin in 1960 [3, 5].
A bubble of very thin rubber filled with stoichiometric gas mixture 2H2 +O2 or 2C2H2 + 5O2 was placed on the propagation trajectory of a shock wavein water. The bubble oscillations were recorded through a slit by a continuous-scanning streak camera with pulsed illumination and the appropriate synchro-nization. It was expected that during the adiabatic collapse of the bubble be-hind the shock front, the temperature of the mixture inside the bubble wouldrise to the ignition point, which would result in explosion of the bubble. Theassumption was confirmed. The ignition was recorded both by spontaneousluminescence of the mixture in the cavity at the ignition moment (pulsedillumination was not used to prevent shading of the explosion flash) andby abrupt change of the cavity radius in time (Fig. 4.4) that evidenced theexplosive character of expansion, which as a rule led the beginning of expan-sion in an inert gas. The dark band at the left center was the initial bubblediameter, the light vertical band was the moment of explosion of the wire
Fig. 4.4. Bubble oscillation: explosive character of expansion after ignition of thegaseous detonation inside the bubble
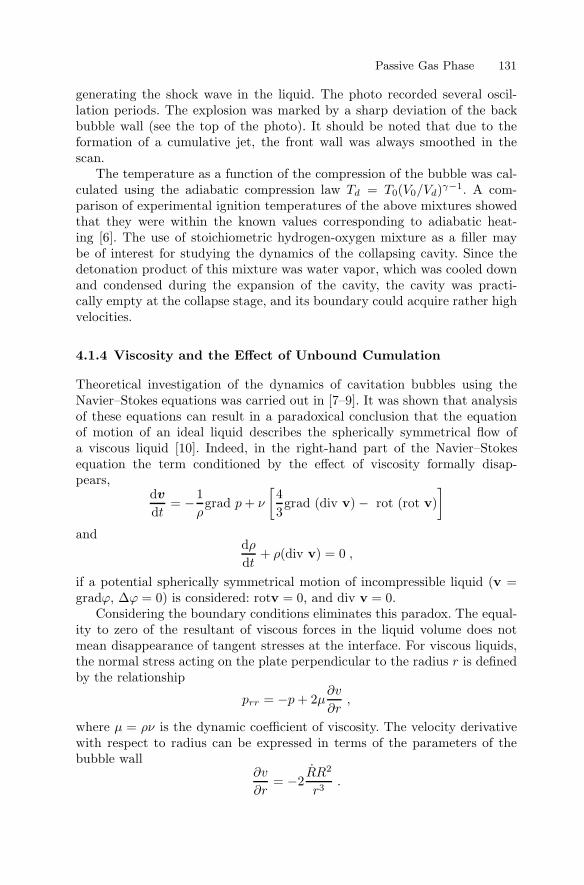
Passive Gas Phase 131
generating the shock wave in the liquid. The photo recorded several oscil-lation periods. The explosion was marked by a sharp deviation of the backbubble wall (see the top of the photo). It should be noted that due to theformation of a cumulative jet, the front wall was always smoothed in thescan.
The temperature as a function of the compression of the bubble was cal-culated using the adiabatic compression law Td = T0(V0/Vd)γ−1. A com-parison of experimental ignition temperatures of the above mixtures showedthat they were within the known values corresponding to adiabatic heat-ing [6]. The use of stoichiometric hydrogen-oxygen mixture as a filler maybe of interest for studying the dynamics of the collapsing cavity. Since thedetonation product of this mixture was water vapor, which was cooled downand condensed during the expansion of the cavity, the cavity was practi-cally empty at the collapse stage, and its boundary could acquire rather highvelocities.
4.1.4 Viscosity and the Effect of Unbound Cumulation
Theoretical investigation of the dynamics of cavitation bubbles using theNavier–Stokes equations was carried out in [7–9]. It was shown that analysisof these equations can result in a paradoxical conclusion that the equationof motion of an ideal liquid describes the spherically symmetrical flow ofa viscous liquid [10]. Indeed, in the right-hand part of the Navier–Stokesequation the term conditioned by the effect of viscosity formally disap-pears,
dv
dt= −1
ρgrad p + ν
[43grad (div v) − rot (rot v)
]and
dρ
dt+ ρ(div v) = 0 ,
if a potential spherically symmetrical motion of incompressible liquid (v =gradϕ, ∆ϕ = 0) is considered: rotv = 0, and div v = 0.
Considering the boundary conditions eliminates this paradox. The equal-ity to zero of the resultant of viscous forces in the liquid volume does notmean disappearance of tangent stresses at the interface. For viscous liquids,the normal stress acting on the plate perpendicular to the radius r is definedby the relationship
prr = −p + 2µ∂v
∂r,
where µ = ρν is the dynamic coefficient of viscosity. The velocity derivativewith respect to radius can be expressed in terms of the parameters of thebubble wall
∂v
∂r= −2
RR2
r3.
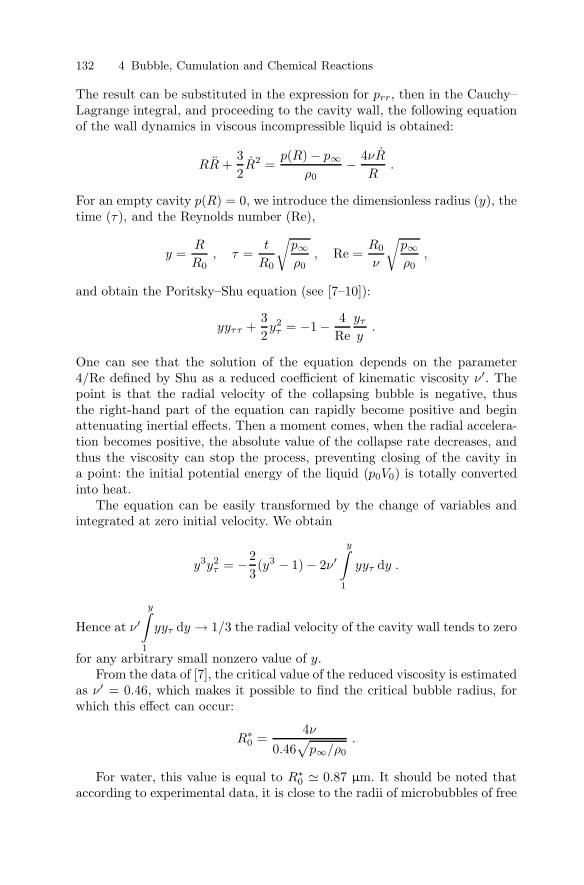
132 4 Bubble, Cumulation and Chemical Reactions
The result can be substituted in the expression for prr, then in the Cauchy–Lagrange integral, and proceeding to the cavity wall, the following equationof the wall dynamics in viscous incompressible liquid is obtained:
RR +32R2 =
p(R) − p∞ρ0
− 4νR
R.
For an empty cavity p(R) = 0, we introduce the dimensionless radius (y), thetime (τ), and the Reynolds number (Re),
y =R
R0, τ =
t
R0
√p∞ρ0
, Re =R0
ν
√p∞ρ0
,
and obtain the Poritsky–Shu equation (see [7–10]):
yyττ +32y2
τ = −1 − 4Re
yτ
y.
One can see that the solution of the equation depends on the parameter4/Re defined by Shu as a reduced coefficient of kinematic viscosity ν′. Thepoint is that the radial velocity of the collapsing bubble is negative, thusthe right-hand part of the equation can rapidly become positive and beginattenuating inertial effects. Then a moment comes, when the radial accelera-tion becomes positive, the absolute value of the collapse rate decreases, andthus the viscosity can stop the process, preventing closing of the cavity ina point: the initial potential energy of the liquid (p0V0) is totally convertedinto heat.
The equation can be easily transformed by the change of variables andintegrated at zero initial velocity. We obtain
y3y2τ = −2
3(y3 − 1) − 2ν′
y∫1
yyτ dy .
Hence at ν′y∫
1
yyτ dy → 1/3 the radial velocity of the cavity wall tends to zero
for any arbitrary small nonzero value of y.From the data of [7], the critical value of the reduced viscosity is estimated
as ν′ = 0.46, which makes it possible to find the critical bubble radius, forwhich this effect can occur:
R∗0 =
4ν
0.46√
p∞/ρ0
.
For water, this value is equal to R∗0 0.87 µm. It should be noted that
according to experimental data, it is close to the radii of microbubbles of free
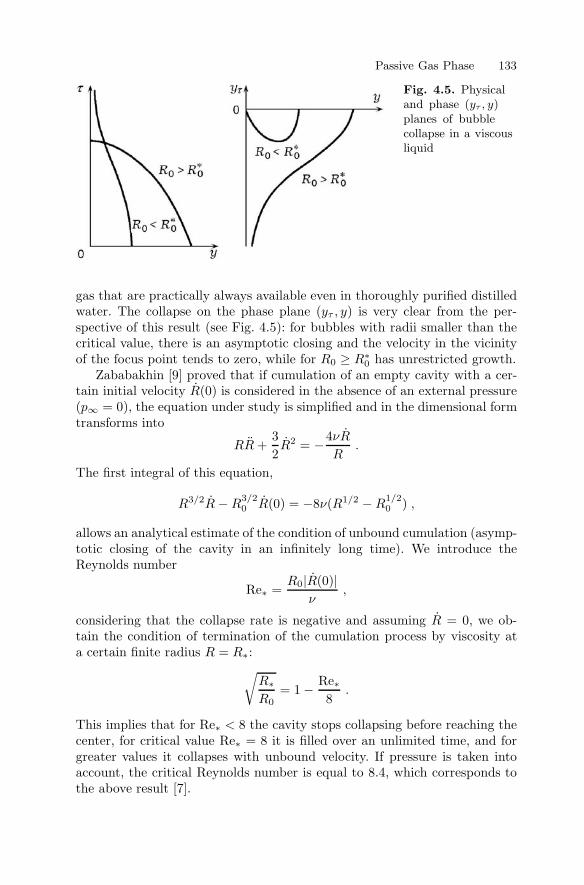
Passive Gas Phase 133
Fig. 4.5. Physicaland phase (yτ , y)planes of bubblecollapse in a viscousliquid
gas that are practically always available even in thoroughly purified distilledwater. The collapse on the phase plane (yτ , y) is very clear from the per-spective of this result (see Fig. 4.5): for bubbles with radii smaller than thecritical value, there is an asymptotic closing and the velocity in the vicinityof the focus point tends to zero, while for R0 ≥ R∗
0 has unrestricted growth.Zababakhin [9] proved that if cumulation of an empty cavity with a cer-
tain initial velocity R(0) is considered in the absence of an external pressure(p∞ = 0), the equation under study is simplified and in the dimensional formtransforms into
RR +32R2 = −4νR
R.
The first integral of this equation,
R3/2R − R3/20 R(0) = −8ν(R1/2 − R
1/20 ) ,
allows an analytical estimate of the condition of unbound cumulation (asymp-totic closing of the cavity in an infinitely long time). We introduce theReynolds number
Re∗ =R0|R(0)|
ν,
considering that the collapse rate is negative and assuming R = 0, we ob-tain the condition of termination of the cumulation process by viscosity ata certain finite radius R = R∗:√
R∗R0
= 1 − Re∗8
.
This implies that for Re∗ < 8 the cavity stops collapsing before reaching thecenter, for critical value Re∗ = 8 it is filled over an unlimited time, and forgreater values it collapses with unbound velocity. If pressure is taken intoaccount, the critical Reynolds number is equal to 8.4, which corresponds tothe above result [7].
134 4 Bubble, Cumulation and Chemical Reactions
4.1.5 Spherical Cumulation in a Compressible Liquid
Let us consider the collapse of an empty cavity in a compressible liquid. Thisstatement allows comparison of a “model” dynamics [2] with exact results [11]over a practically unlimited range of collapse velocities of the cavity wall. Ifthe cavity is empty, H = −p∞/ρ∞ = const, c = c∞, and the equation forspherical cavity,
R(1 − R
c
)R +
32
(1 − R
3c
)R2 =
(1 +
R
c
)H +
R
c
(1 − R
c
)dH
dt,
becomes
R(1 − R
c∞
)R +
32
(1 − R
3c∞
)R2 = −p∞
ρ∞
(1 +
R
c∞
). (*)
In a certain approximation one can obtain the first integral of this equa-tion [2], (R0
R
)3
[1 +
32
( R
H
)2][
1 − R
3c∞
]4
, (4.1)
which in the vicinity of the collapse point allows self-similar solution of thetype of R = Atα with the index α = 2/3. The value of the self-similarity indexdiffers noticeably from the “exact” solution obtained by Hunter [11] using themethod of characteristics. His numerical studies of the complete system ofhydrodynamics equations proved that near the point of collapse of an emptyspherical cavity the solution is self-similar to the index α = 0.555. However,this does not mean that in a real range of mass velocities the Kirkwood–Bethe model fails, since the considered range corresponds to the “boundary”condition R c∞.
In [2], an attempt was made to analyze possible solutions within the for-mal fitting of the condition on the propagation velocity of the disturbance,which eventually can be considered as an approximation of Hunter’s numer-ical solution [11]. In a slightly changed form it is as follows:
(R0
R
)3
1 +32
( R
H
)2[1 − R
c∞
]2. (4.2)
Within the Kirkwood–Bethe model one can easily obtain the acoustic variantof the oscillation equation that coincides with the result of [12]. For an emptycavity, it yields the exact solution [2]:
(R0
R
)3
= 1 +32
( R
H
)2[1 − 4
3R
c∞
]. (4.3)
Recall that for incompressible liquid the solution has the form:(R0
R
)3
= 1 +32
( R
H
)2
. (4.4)
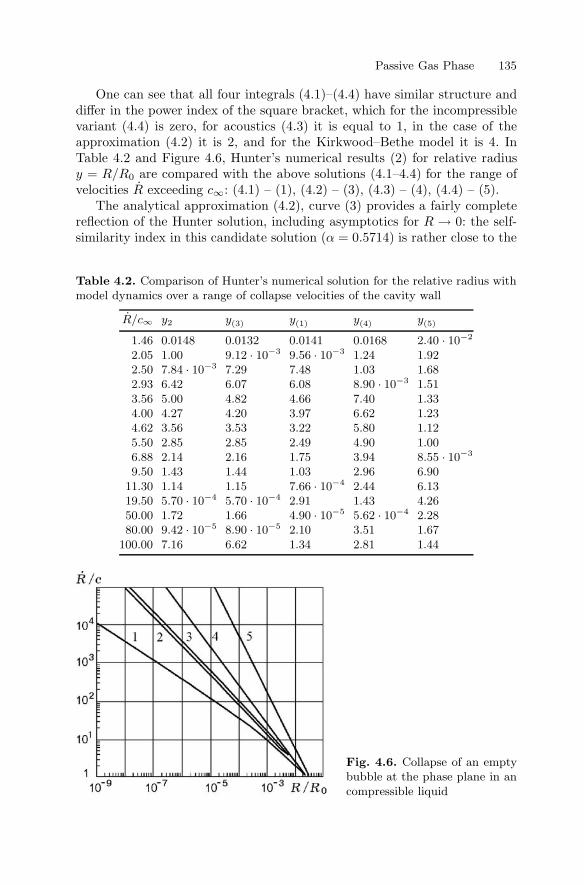
Passive Gas Phase 135
One can see that all four integrals (4.1)–(4.4) have similar structure anddiffer in the power index of the square bracket, which for the incompressiblevariant (4.4) is zero, for acoustics (4.3) it is equal to 1, in the case of theapproximation (4.2) it is 2, and for the Kirkwood–Bethe model it is 4. InTable 4.2 and Figure 4.6, Hunter’s numerical results (2) for relative radiusy = R/R0 are compared with the above solutions (4.1–4.4) for the range ofvelocities R exceeding c∞: (4.1) – (1), (4.2) – (3), (4.3) – (4), (4.4) – (5).
The analytical approximation (4.2), curve (3) provides a fairly completereflection of the Hunter solution, including asymptotics for R → 0: the self-similarity index in this candidate solution (α = 0.5714) is rather close to the
Table 4.2. Comparison of Hunter’s numerical solution for the relative radius withmodel dynamics over a range of collapse velocities of the cavity wall
R/c∞ y2 y(3) y(1) y(4) y(5)
1.46 0.0148 0.0132 0.0141 0.0168 2.40 · 10−2
2.05 1.00 9.12 · 10−3 9.56 · 10−3 1.24 1.922.50 7.84 · 10−3 7.29 7.48 1.03 1.682.93 6.42 6.07 6.08 8.90 · 10−3 1.513.56 5.00 4.82 4.66 7.40 1.334.00 4.27 4.20 3.97 6.62 1.234.62 3.56 3.53 3.22 5.80 1.125.50 2.85 2.85 2.49 4.90 1.006.88 2.14 2.16 1.75 3.94 8.55 · 10−3
9.50 1.43 1.44 1.03 2.96 6.9011.30 1.14 1.15 7.66 · 10−4 2.44 6.1319.50 5.70 · 10−4 5.70 · 10−4 2.91 1.43 4.2650.00 1.72 1.66 4.90 · 10−5 5.62 · 10−4 2.2880.00 9.42 · 10−5 8.90 · 10−5 2.10 3.51 1.67
100.00 7.16 6.62 1.34 2.81 1.44
Fig. 4.6. Collapse of an emptybubble at the phase plane in ancompressible liquid
136 4 Bubble, Cumulation and Chemical Reactions
exact solution shown above. In [13], a reference is given to Schneider’s exactsolution (1949), that is the numerical solution of the system of exact differ-ential equations for the problem on the collapse of an empty cavity, whichpractically coincides with the solution of the equation (*) to the velocitiesR/c∞ 2. From Eq. (4.2) one can reconstruct the equation of cavity oscil-lation. To this end, one should differentiate it with respect to R and use thelast term in the complete equation of oscillations with dH/dt to reconstructthe missing addend considering the radiation losses. The final result acquiresthe form
R(1 − 3R
c+
2R2
c2
)2
R +32
(1 − R
c
)2
R2 = H +R
c
(1 − R
c
)dH
dt.
and can be used in a wide range of oscillation velocities.
4.1.6 Oscillation Parameters
Let us consider the characteristic parameters of the dynamics of single bub-bles affected by shock waves [14].
1. Incompressible liquid (spherical cavity, minimum radius, and collapsetime):• p∞ = const,
( R0
Rmin
)3(γ−1)
= 1 +(γ − 1)p∞
p0, t∗ = 0.915R0
√ρ0
p∞;
• p∞ = pmax exp−t/θ,
( R0
Rmin
)3(γ−1)
1 + (γ − 1)µP 2
1 + µP,
t∗,θ 0, 915R0 ·√
ρ
p0
1 + µA
µA2,
whereµ =
( θ
R0
√ρ0/p0
)2
.
For P = pmax/p0 = 10–103, µ ≥ 0.1, and γ = 5/3, 4/3, 1.4.2. Compressible liquid (spherical cavity, minimum radius, p∞ = const), for
p∞ = 1–1.8 · 103 MPa we get
Rmin
R0 5
3· 103τ∗ + 0.025 ,
where t∗ (in s) is specified above.
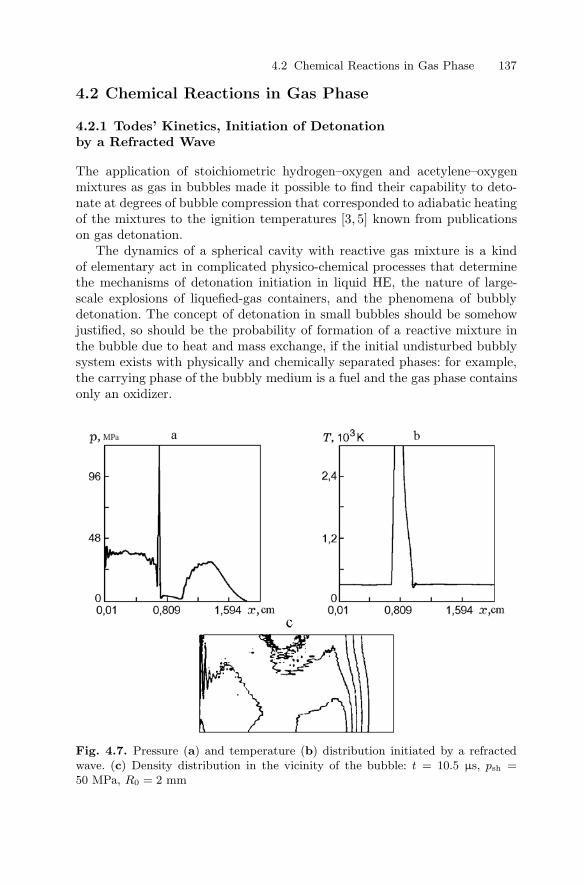
4.2 Chemical Reactions in Gas Phase 137
4.2 Chemical Reactions in Gas Phase
4.2.1 Todes’ Kinetics, Initiation of Detonationby a Refracted Wave
The application of stoichiometric hydrogen–oxygen and acetylene–oxygenmixtures as gas in bubbles made it possible to find their capability to deto-nate at degrees of bubble compression that corresponded to adiabatic heatingof the mixtures to the ignition temperatures [3, 5] known from publicationson gas detonation.
The dynamics of a spherical cavity with reactive gas mixture is a kindof elementary act in complicated physico-chemical processes that determinethe mechanisms of detonation initiation in liquid HE, the nature of large-scale explosions of liquefied-gas containers, and the phenomena of bubblydetonation. The concept of detonation in small bubbles should be somehowjustified, so should be the probability of formation of a reactive mixture inthe bubble due to heat and mass exchange, if the initial undisturbed bubblysystem exists with physically and chemically separated phases: for example,the carrying phase of the bubbly medium is a fuel and the gas phase containsonly an oxidizer.
Fig. 4.7. Pressure (a) and temperature (b) distribution initiated by a refractedwave. (c) Density distribution in the vicinity of the bubble: t = 10.5 µs, psh =50 MPa, R0 = 2 mm
138 4 Bubble, Cumulation and Chemical Reactions
The first time the dynamics of a reactive bubble was numerically esti-mated with regard to the Todes chemical kinetics in [15], the following systemof equations presented in the dimensionless form (β = R/R0) was used:
The Rayleigh equation,
βd2β
dτ2+
32
(dβ
dτ
)2
=T
β3− p∞ − 4
βRedβ
dτ; (4.5)
The temperature equation,
dT
dτ= η
dN
dτ− 3(γ − 1)
βT
dβ
dτ; (4.6)
The kinetics equation,
dN
dτ= ζβ−3
√T e−α/T (1 − N)2 ; (4.7)
where
τ = t
√p0/ρ0
R0, η =
Q
cmT0, α =
Ea
BT0, and ζ =
az√
T0
V0
R0√p0/ρ0
.
(4.8)Here Ea is the activation energy; B is the gas constant; Q is the reactionheat; cm is the heat capacity; N = n/a, where a is the original concentrationof the component and n is the number density of molecules formed duringthe reaction; z is the constant related to molecule radii r1 and r2 and massesm1 and m2 by the relationship z = N0(r1 + r2)2(8πB/N0)
√1/m1 + 1/m2,
where N0 is the Avogadro constant, T = T/T0 is the mixture temperature,Re = R0
√p0ρ0/µ, and p∞ = p∞/p0 is the external pressure.
The calculations showed that during the interaction of a bubble witha shock wave by adiabatic heating, the active mixture inside it explodes al-most instantly at constant volume and a kink occurs on the dynamics curveof the radial velocity of the bubble wall. These results can be considered asa first step in understanding the “elementary” act in the phenomenon of bub-ble detonation, the formation of a quasi-stationary regime in active bubblymedium. The calculations made it possible to reveal one more unexpectedeffect: the explosion of the mixture does not stop the process of bubble col-lapse due to the added mass inertia, thus the pressure and temperature indetonation products continue to increase.
However, one should mention the possibility of the initiation of bubbledetonation following a completely different “scenario”: calculations for theaxisymmetrical problem on the interaction between a strong shock wave anda bubble with acetylene–oxygen mixture made it possible to find that theshock wave refracted into the bubble can be of major importance. It initiatesthe detonation locally, inside the bubble in the vicinity of its wall from theside of arrival of the shock wave [16] (Fig. 4.7). In this case, the bubble does
4.2 Chemical Reactions in Gas Phase 139
not have time to acquire radial velocity. It preserves the initial volume, whilethe detonation wave inside it starts propagating with a delay behind the shockwave front in the liquid: Fig. 4.7 shows the jumps of pressure (a) and temper-ature (b). Figure 4.7c presents the lower half of the calculation domain withdensity distribution: a half of the bubble whose boundary coordinates corre-spond to coordinates in Fig. 4.7a comes forth at the center of the top of thefigure. This new unexpected result has not been studied experimentally yet.
4.2.2 Generalized Kinetics of Detonation in Gas Phase
It is believed that for excitation of a self-sustaining (multifront) detonationin a free gas volume, it is required to release a minimum amount of energyin a certain zone and the energy is defined as the critical initiation energyE∗. The process has typical spatial scales, such as the unit cell size a and theformation radius rform determining a region outside of which the detonationpropagates in the stationary regime.
One of the best approximate models for describing the detonation initia-tion in compliance with the experimental data is a multiple point initiationmodel. It is based on the assumption that transverse wave collisions at thedetonation front initiate multifront detonation. The collision energy E0 isestimated from the cell model proposed by Vasiliev and Nikolaev in [17] andis used for estimating E∗. In the calculations presented below for the mix-ture 2H2 + O2, it is assumed that the induction period τi is completed byinstant chemical reaction, since the time of chemical transformation is muchless than τi and for nonstationary conditions is determined from the integralequality:
τi∫0
dt
τ= 1 and τ =
A
cn1f cn2
oxexp
( Ea
RT
), (4.9)
where cf and cox are the fuel and the oxidizer concentrations, respectively,and n1 and n2 are the orders of the reaction. The mixture temperature T (t)in a bubble is determined by an adiabate with different values of the indexγ before (γ = 1.4) and after (γ = 1.21) the chemical reaction.
In a free volume of a specific gas mixture, the critical initiation energyfor a spherical detonation and a unit cell size a are determined using thedata of [17,18] and are used for calculations of the process parameters in thebubble. For the mixture 2H2 + O2 at p0 = 0.1 MPa and T0 = 298 K (A =5.38·10−5 µs·mol/l, Ea = 17.15 kcal/mol), a = 1.6 mm and E∗ 6 J. Clearly,under these conditions the assumption about the multipoint initiation and,consequently, about the detonation regime of the reaction in gas inside themicrovolume of 1 mm radius is unacceptable. Moreover, in this case the re-quirements for the relative characteristic sizes R ≥ rform a are not met.
However, with increasing pressure p (which occurs in a collapsing bub-ble) the conditions for initiating the detonation in the bubble considerably

140 4 Bubble, Cumulation and Chemical Reactions
improve with respect to the characteristic scale of the process (a decreases∼ 1/p) and the critical initiation energy E∗, which decreases as 1/p2 [19].Parameters of the basic detonation characteristics for the free volume anddifferent initial pressure (corresponding to the pressure pad achieved dur-ing adiabatic compression of the hydrogen–oxygen mixture) are presented inTable 4.3 [17, 18]. Hence, based on the data on variation of the relative pa-rameter R/a, one can conclude on the possibility of initiating detonation inthe bubble during compression [19].
This point is of principal importance for the bubble system, since theconditions required for detonation with respect to R/a and E∗ can be readilyrealized in the bubbly liquid interacting with shock waves. Thus, the reac-tion character in bubbles is determined by the number of cells in the bubblemicrovolume and by the possibility to initiate a detonation process. In thisrespect the concept of self-initiation of the reaction in a mixture due to therising temperature under the effect of external factors (e.g., adiabatic com-pression by an external shock wave) becomes important. Figure 4.8a showsthe dynamics of the “bubble–cell” relation (R/a) that depends on the currentrelative degree of compression of the bubble R0/R. The dotted line shows thedata corresponding to one of the moments, when the increment of the inter-nal energy of gaseous mixture ∆E exceeded the critical initiation energy E∗(Fig. 4.8b, logarithmic scale). The initial conditions were R0 = a = 1.6 mm,γ = 1.4, and the pressure jump at infinity in the liquid surrounding thebubble was equal to p∞ = 10 MPa.
The increase of R/a and sharp decrease of E∗ as the bubble was com-pressed were evidence that, though the detonation regime was unfeasible atthe initial stage, in the course of adiabatic compression the possibility of itsoccurrence became undoubted [19]. Furthermore, beginning from a certaincompression stage, the mixture appeared to be capable of self-initiation dueto growing internal energy (∆E).
Fig. 4.8a,b. The variation dynamics of the number of cells (a) and the values ofE∗ and Ead in a collapsing bubble under adiabatic compression (b)
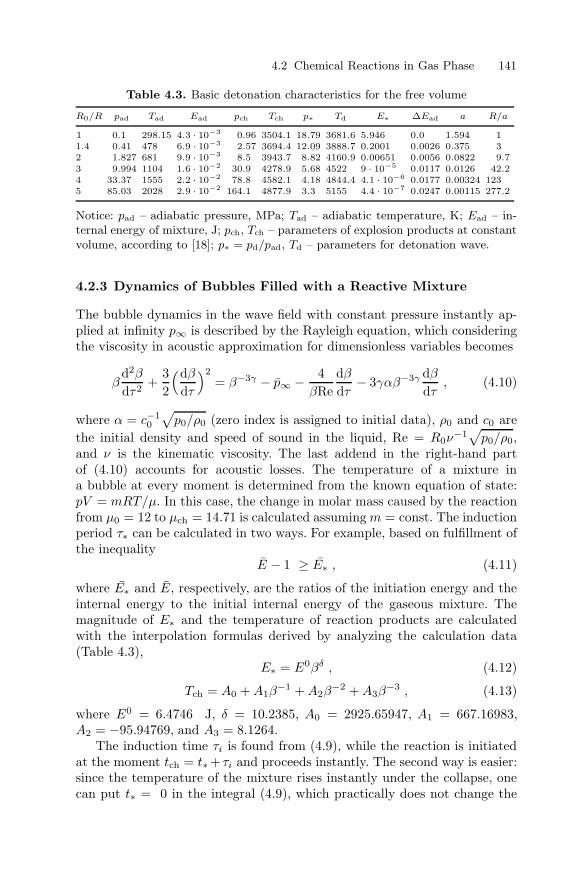
4.2 Chemical Reactions in Gas Phase 141
Table 4.3. Basic detonation characteristics for the free volume
R0/R pad Tad Ead pch Tch p∗ Td E∗ ∆Ead a R/a
1 0.1 298.15 4.3 · 10−3 0.96 3504.1 18.79 3681.6 5.946 0.0 1.594 11.4 0.41 478 6.9 · 10−3 2.57 3694.4 12.09 3888.7 0.2001 0.0026 0.375 32 1.827 681 9.9 · 10−3 8.5 3943.7 8.82 4160.9 0.00651 0.0056 0.0822 9.73 9.994 1104 1.6 · 10−2 30.9 4278.9 5.68 4522 9 · 10−5 0.0117 0.0126 42.24 33.37 1555 2.2 · 10−2 78.8 4582.1 4.18 4844.4 4.1 · 10−6 0.0177 0.00324 1235 85.03 2028 2.9 · 10−2 164.1 4877.9 3.3 5155 4.4 · 10−7 0.0247 0.00115 277.2
Notice: pad – adiabatic pressure, MPa; Tad – adiabatic temperature, K; Ead – in-ternal energy of mixture, J; pch, Tch – parameters of explosion products at constantvolume, according to [18]; p∗ = pd/pad, Td – parameters for detonation wave.
4.2.3 Dynamics of Bubbles Filled with a Reactive Mixture
The bubble dynamics in the wave field with constant pressure instantly ap-plied at infinity p∞ is described by the Rayleigh equation, which consideringthe viscosity in acoustic approximation for dimensionless variables becomes
βd2β
dτ2+
32
(dβ
dτ
)2
= β−3γ − p∞ − 4βRe
dβ
dτ− 3γαβ−3γ dβ
dτ, (4.10)
where α = c−10
√p0/ρ0 (zero index is assigned to initial data), ρ0 and c0 are
the initial density and speed of sound in the liquid, Re = R0ν−1√
p0/ρ0,and ν is the kinematic viscosity. The last addend in the right-hand partof (4.10) accounts for acoustic losses. The temperature of a mixture ina bubble at every moment is determined from the known equation of state:pV = mRT/µ. In this case, the change in molar mass caused by the reactionfrom µ0 = 12 to µch = 14.71 is calculated assuming m = const. The inductionperiod τ∗ can be calculated in two ways. For example, based on fulfillment ofthe inequality
E − 1 ≥ E∗ , (4.11)
where E∗ and E, respectively, are the ratios of the initiation energy and theinternal energy to the initial internal energy of the gaseous mixture. Themagnitude of E∗ and the temperature of reaction products are calculatedwith the interpolation formulas derived by analyzing the calculation data(Table 4.3),
E∗ = E0βδ , (4.12)
Tch = A0 + A1β−1 + A2β
−2 + A3β−3 , (4.13)
where E0 = 6.4746 J, δ = 10.2385, A0 = 2925.65947, A1 = 667.16983,A2 = −95.94769, and A3 = 8.1264.
The induction time τi is found from (4.9), while the reaction is initiatedat the moment tch = t∗ + τi and proceeds instantly. The second way is easier:since the temperature of the mixture rises instantly under the collapse, onecan put t∗ = 0 in the integral (4.9), which practically does not change the
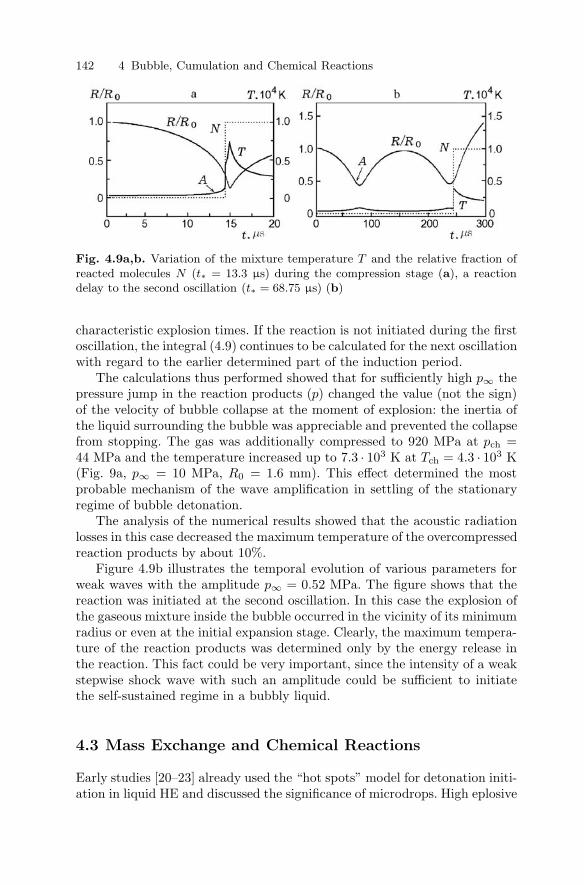
142 4 Bubble, Cumulation and Chemical Reactions
Fig. 4.9a,b. Variation of the mixture temperature T and the relative fraction ofreacted molecules N (t∗ = 13.3 µs) during the compression stage (a), a reactiondelay to the second oscillation (t∗ = 68.75 µs) (b)
characteristic explosion times. If the reaction is not initiated during the firstoscillation, the integral (4.9) continues to be calculated for the next oscillationwith regard to the earlier determined part of the induction period.
The calculations thus performed showed that for sufficiently high p∞ thepressure jump in the reaction products (p) changed the value (not the sign)of the velocity of bubble collapse at the moment of explosion: the inertia ofthe liquid surrounding the bubble was appreciable and prevented the collapsefrom stopping. The gas was additionally compressed to 920 MPa at pch =44 MPa and the temperature increased up to 7.3 · 103 K at Tch = 4.3 · 103 K(Fig. 9a, p∞ = 10 MPa, R0 = 1.6 mm). This effect determined the mostprobable mechanism of the wave amplification in settling of the stationaryregime of bubble detonation.
The analysis of the numerical results showed that the acoustic radiationlosses in this case decreased the maximum temperature of the overcompressedreaction products by about 10%.
Figure 4.9b illustrates the temporal evolution of various parameters forweak waves with the amplitude p∞ = 0.52 MPa. The figure shows that thereaction was initiated at the second oscillation. In this case the explosion ofthe gaseous mixture inside the bubble occurred in the vicinity of its minimumradius or even at the initial expansion stage. Clearly, the maximum tempera-ture of the reaction products was determined only by the energy release inthe reaction. This fact could be very important, since the intensity of a weakstepwise shock wave with such an amplitude could be sufficient to initiatethe self-sustained regime in a bubbly liquid.
4.3 Mass Exchange and Chemical Reactions
Early studies [20–23] already used the “hot spots” model for detonation initi-ation in liquid HE and discussed the significance of microdrops. High eplosive
4.3 Mass Exchange and Chemical Reactions 143
microdrops are formed in bubbles due to their shape instability under oscil-lation behind the shock wave front. This instability results in the formationof microjets and their disintegration into drops.
Alternatively in [24,25] the detonation of bubbly media was determined byheat and mass transfer, the intensity of the processes notably increased withthe development of the bubble surface instability resulting in the formationof microdrops [25]. Naturally, the evaporation of microdrops strongly affectsthe run of a chemical reaction in the gas phase inside the bubble. Moreover,it is impossible to initiate detonation in a system where the fuel and theoxidizer are in different phases [24] without the interphase heat and masstransfer leading to the formation of a reactive mixture inside the bubbles,which can sustain the detonation regime of the reaction run in the bubble.
Evidently, for the model of bubble detonation in such media to be ad-equate, it should account for the effects of inert and chemically reactingadmixtures on the explosive process and reaction dynamics in the processof formation of the mixture. The effects are considered below, depending onthe injection time tinj, the initial sizes of microdrops D0, and the evaporatedliquid mass ML, both in the case of an instant evaporation of microdrops andin the case of a transient evaporation [26].
4.3.1 Instant Evaporation of Microdrops
Let us assume that a gas bubble oscillates in a liquid in the field of instantlyapplied constant external pressure. The real processes of heat and mass trans-fer are replaced by instant evaporation of all liquid drops of mass ML intro-duced in the bubble at time tinj after the beginning of the compression. Thebubble dynamics is described by the Rayleigh equation, assuming that thebubble retains its spherical shape and the gas is ideal:
yy′′ +32(y′)2 = p − p∞ . (4.14)
Here the prime denotes derivatives with respect to the dimensionless time τ(the notation is analogous to earlier calculations), p is introduced to accountfor the acoustic radiation losses of the bubble and the viscous dissipation:
p =ρg T
p0µ− 4 y′
y Re(4.15)
+1c0
√p0
ρL
(1 +
p − p∞B1 + p∞
)−1/n
ydpg
dτ. (4.16)
Here ρg is the gas density, B1 = B/p0 and n are the Tait equation con-stants, c0 is the speed of sound in a liquid, is the universal gas constant,Re = (R0/νd)
√p0 ρ0 is the Reynolds number, νd is the dynamics viscosity of
the liquid, and µ is the molar mass of the gas.
144 4 Bubble, Cumulation and Chemical Reactions
It is assumed that the gas–vapor mixture is non-reactive during the induc-tion time and it is instantaneously transformed into a chemical equilibriumafterwards. The induction period (here τi) is determined from
τi∫0
dt
τ= 1 , (4.17)
where τ = (Ai/η) exp(Ea/ T ) is the induction period at constant parame-ters [27], η = ρµ−1(νH2νO2)
−1/2, νH2 and νO2 are the mole fractions of H2
and O2, respectively, and Ai and Ea are constants.Thermodynamic parameters of the mixture are calculated by the high-
accuracy kinetics model [28–30] without the adiabate of inert gas that istraditionally used for such problems. The kinetics model involves the isen-trope equation, which with regard to
dT
dρ= −Uµµρ − T/ρµ
UT + UµµTand
dρ
dτ= −3ρg0
y′
y4, (4.18)
can be rewritten as
dT
dτ=
dT
dρ
dρ
dτ=(−Uµµρ − T/ρµ
UT + UµµT
)(−3ρg0
y′
y4
), (4.19)
and the chemical equilibrium equation
ρg
µ
(1 − µ/µmax
)2
µ/µmin − 1exp(ED/ T ) =
AT 3/4
4K+
(1 − exp(−θ/T )
)3/2
, (4.20)
where the internal gas energy is calculated from the formula
U =[34
( µ
µa+ 1
)+
32
( µ
µa− 1
) θ/T
exp(θ/T ) − 1
] T
µ+ ED
( 1µ− 1
µmin
).
(4.21)Here T and ρg0 are the gas temperature and initial density; Uµ, UT , µT ,
and µρ are derivatives with respect to the parameters mentioned in the index;ED is the mean dissipation energy of the reaction products; µa, µmin, andµmax are molar masses in atomic, completely dissociated and fully recombinedstates, respectively; θ is the effective excitation temperature of oscillatingdegrees of freedom; and A and K+ are the rate constants of dissociationand recombination of generalized reaction products. In this case the valuesof µa, µmin, and µmax are determined by the gas composition and remainunchanged up to the moment t = tinj. After injection they undergo a jump,then they stay constant. The magnitude of the jump depends on the chemicalcomposition and the mass of the evaporated liquid.
The above model is applicable to hydrogen–oxygen systems of arbitrarychemical composition (including the case of presence of inert components).
4.3 Mass Exchange and Chemical Reactions 145
It enables an adequate account for strong changes of the molecular mass,isentropic index, heat capacities, and for thermal effect of the chemical re-action due to recombination and dissociation, as well as the change of thefuel–oxidizer ratio in the gas phase. For example, for a cryogenic system[H2 (gas)–O2 (liquid)], given the appropriate initial conditions, the molecu-lar mass of gas can vary by an order of magnitude:
µ0 = µO2 , µa = µmin =12
M0 + ML
M0/µH2 + ML/µO2
, (4.22)
µmax =M0 + ML
M0/µH2
at2ML
µO2
≤ M0
µH2
,
µmax =M0 + ML
M0/2µH2 + ML/µO2
at2ML
µO2
>M0
µH2
.
The equality 2ML/µO2 = M0/µH2 corresponds to the evaporation of theproper amount of oxygen at which stoichiometry is established. If the left-hand side is less, the content of oxygen is insufficient; if it is greater, there isan excess of oxygen.
Analogously, for a normal system with a hydrogen–oxygen gas mixture ofarbitrary chemical composition in the bubbles [n1H2 + n2O2 (gas phase) –H2O (liquid)] one can get the following relationships:
µ0 =n2µO2 + n1µH2
n1 + n2, µa = µmin =
M0 + ML
2M0/µ0 + 3ML/µH2O;
µmax =M0 + ML
ML/µH2O + n1M0/(n1 + n2)µ0at 2n2 ≤ n1 ;
µmax =M0 + ML
ML/µH2O + (n1/2 + n2)M0/(n1 + n2)µ0at 2n2 > n1 .
It should be noted that at τ = τi, the gas instantly reaches chemicalequilibrium, which is continuously shifted owing to the bubble dynamics.
The instantaneous change of the gas parameters under the jump can becalculated using the chemical equilibrium equation (4.20) and the conditionU1 = U2, where U1 and U2 are the internal gas energies before and afterthe jump. The bubble radius, the gas density, and the parameters µa, µmin,and µmax do not change at the instant of the jump. Upon the evaporation ofthe liquid mass ML, the thermodynamic parameters and gas composition areabruptly changed, the value of the jump at fixed time and the bubble radiusare calculated in three steps:
1. The gas mass M2 in the bubble and the gas density after the evaporationare calculated using the law of mass conservation, M0 + ML = M2 (hereM0 is the initial gas mass in the bubble).
146 4 Bubble, Cumulation and Chemical Reactions
2. The parameters µa, µmin, and µmax after the evaporation are calculatedfrom M2 and the known initial composition of the gas and the liquidusing the known algorithm [28].
3. The gas pressure and temperature after the evaporation are determinedfrom the equation of state and the law of energy conservation, U1 +UL = U2, where U1 and U2 are internal gas energies before and afterevaporation, and UL is the internal energy of the injected liquid. If theevaporation occurs by the end of the induction period, the molecular massof gas µ is calculated from [28], otherwise µ is calculated from (4.20).
Using the proposed model, we calculated the behavior of the bubble depend-ing on tinj and ML in cryogenic and normal systems with and without inertdiluent. The calculations were performed for the following initial parame-ters: T0 = 87 K (in cryogenic mixture), T0 = 293 K (in normal mixture),initial gas pressure in the bubble p0 = 1.011 · 105 Pa, external pressure ofp∞ = 100 p0, and R0 = 1.6 mm. Other constants were taken from [30–32].We verified the validity of the condition concerning the partial pressure ofevaporated component that cannot exceed the pressure psat of the appropri-ate saturated vapor. The calculation showed that there were domains wherethe behavior of the solutions had physical sense and enabled analysis of thegas temperature variation depending on ML for cryogenic and normal mix-tures. The temperature behavior appeared to differ essentially. For example,as ML/M0 increased, the average gas temperature in the bubble in cryogenicsystem attained a maximum, while in the normal system it monotonicallydecreased.
It was shown in [33] that the model describing bubbly detonation basedonly on pure kinetics of the chemical reactions does not predict formation ofa solitary wave. The temperature distribution after the process reaches thestationary regime corresponds to experimental data for the amplitude andvelocity, which points to the existence of an unrealistically long “tail” in thedetonation wave whose amplitude is close to that of the initiating wave.
It is obvious that a probable mechanism of the formation of a solitarywave is concerned with the intense evaporation of the liquid, which resultsin the decrease of the temperature and gas pressure in the tail of a bubblydetonation wave. Thus, it follows from the calculations that the evaporation ofa small (comparable with the initial gas mass in the bubble) amount of liquidreduces the final gas temperature practically to the initial value. Analysis ofthe gas temperature dynamics has shown that the values of final (after theoscillations attenuate) temperature Tf can essentially depend on the injectiontime tinj, if it is close to the moment of maximum compression of the bubble.If not, this dependence is insignificant. For example, the low value of Tf
at tinj ≥ 15 µs in a cryogenic mixture is explained by the fact that thegas temperature decrease in the bubble due to the evaporation results ina considerable increase of the induction period, which causes the “breakdown”of the reaction when combined with the acoustic losses of the bubble.

4.3 Mass Exchange and Chemical Reactions 147
Figure 4.10 shows the influence of inert diluent (argon) on the time vari-ation of the gas temperature in a cryogenic system. Curve 1 illustrates theprocess of evaporation of liquid oxygen at ML(1) = 0.43 M0 (without argon).Introduction of the equal portion of argon in the gas phase for the same ratioML/M0 results in an abrupt increase of the gas temperature (curve 2). Thepoint is that when argon is added, the value of M0 increases. The mass ofevaporated liquid ML increases as well and the ratio of “hydrogen–oxygen”gas phase approaches the stoichiometric ratio, which results in increased en-ergy release. When the hydrogen/oxygen ratio is analogous to the first case(curve 3), as well as under the evaporation when ML = ML(1) the presenceof argon increases the gas temperature (curve 4). Furthermore, the calcula-tions showed that an increased portion of gaseous argon in the bubble alwaysleads to increased final temperature in cryogenic system and to decreasedtemperature in the normal system. The pressure and the compression de-gree decrease in both cases, while the temperature at the first oscillationgrows.
Figure 4.11 shows the time variation of the isentropic index γ dependingon ML for normal mixture at tinj = 14.5 µs, which implies that the evapo-ration leads to considerable fluctuations of γ. Allowance for this factor is ofprincipal importance and is one of the advantages of the proposed model.
Fig. 4.10. Influence of an inert diluent onthe gas temperature (cryogenic mixture)
Fig. 4.11. Dynamics of the γ index (normalmixture)
148 4 Bubble, Cumulation and Chemical Reactions
4.3.2 Continuous Evaporation
In real conditions, microdrops do not evaporate instantly. Thus, at the nextstage of modeling the gas-phase processes we assumed that at time tinj
a system of liquid microdrops of diameter D0 and the total mass ML wereformed in the bubble instantaneously. At each integration step the continuousevaporation of microdrops was simulated by the instant evaporation of themass ∆m, whose value was determined from the current diameter D of themicrodrop using the known equation of burning of a liquid drop in gas [34]:
dD
dt= −k′ Nu
4D, (4.23)
where the evaporation coefficient k′ was calculated from the formula
k′ =8kg
ρLcpln(L + cp∆T
L
). (4.24)
Here kg is the heat conductivity of combustion products, cp is the thermalcapacity at constant pressure, L is the evaporation heat, ρL is the liquiddensity, Nu = hD/kg is the Nusselt number, and h is the heat transfer co-efficient. If the current gas temperature in the bubble falls below the initialtemperature, the microdrops are assumed not to evaporate (dD/dt = 0).
We calculated the jump of the parameters and their successive changesusing the same algorithm and under the same assumptions as for the case ofinstantaneous evaporation of microdrops.
Figure 4.12 shows the dynamics of the mass of microdrops for three initialdiameters D0 = 1, 5, and 15 µm in a normal mixture given that tinj =13 µs and ML/M0 = 0.45. To compare the evaporation of a drop with thebubble dynamics, the change of the bubble radius y(t) at D0 = 5 µm isshown by the dashed line. One can see that microdrops whose size was on theorder of 1 µm evaporated almost instantly (over a much shorter time periodthan the bubble oscillation period), while for relatively large microdrops theevaporation dynamics could be of significance. Here, as in the case of instant
Fig. 4.12. The relative mass of microdropsversus time for D0: (1), (2), (3)
4.3 Mass Exchange and Chemical Reactions 149
evaporation of microbubbles, we checked the fulfillment of the condition onsaturated vapor pressure. The total volume of microbubbles, which at eachmoment of time must be much less than the bubble volume, was monitoredto avoid recalculation of the pressure in the gas phase.
Figure 4.13 shows the domain of existence of solutions for the normalmixture as the planes (ML, D0) for different injection times tinj. It should benoted that for a cryogenic mixture the maximum value of ML/M0 = 12 in thedomain of existence of solutions was achieved at instant evaporation of drops(D0 = 0, vapour mass ML is instantaneously injected) and tinj = 14.5 µs.One can see from the figure that the cross-section of the three-dimensionalspace by the plane (ML, tinj) at D0 = 0 was a two-dimensional domain ofexistence of solutions for the case of instant evaporation of the liquid. Anabrupt increase of the maximum possible value of ML/M0 for the cross-sections tinj ≥ 16 µs was caused by the pressure increase of saturated vapors.The increase in pressure was a result of gas temperature increase due tochemical reaction and adiabatic compression of the bubble. The dependenceof ML/M0 on D0 for any tinj had a maximum. The initial diameter of mi-crodrops D0 corresponding to the maximum was 1–1.5 µm at tinj < ti, 0 µmat ti < tinj < tmax, and was about 10 µm at tmax < tinj, where tmax was themoment of maximum compression of the bubble.
For the above problem on the formation of a solitary bubble detonationwave, the data on the gas temperature Tf and the finite values µ and γ versusthe injected mass of microdrops ML/M0 are of interest. If for the cryogenicmixture we accepted tinj = 14 µs and D0 = 0.75 µm, while for the normalmixture tinj = 14 we assumed D0 = 1 µm, the calculation gave the followingresults.
Fig. 4.13. Domain of exis-tence of solutions for the caseof continuous evaporation(normal mixture)

150 4 Bubble, Cumulation and Chemical Reactions
The increase of the mass of injected liquid in the normal mixture resultedin a monotone decrease of the final temperature Tf, which in its turn ledto a slight monotone increase of the final values of µ and γ. In this case, µreached its maximum µmax already at ML/M0 = 1 and remained constant.In the case under consideration, Tf > T0, however, there were certain valuesof the parameters tinj and D0 (for example tinj 15 µs and D0 1 µm), atwhich the final gas temperature decreased practically to the initial value andthe bubble detonation wave separated from the initiating wave and turnedinto a solitary wave.
In a cryogenic mixture, the dependences of Tf, µ, and γ on ML/M0 arefundamentally different. As ML/M0 increases, the value of Tf attains a maxi-mum, which corresponds to the stoichiometric ratio between the fuel and theoxidant. In this case, γ reaches a minimum, while µ increases several fold.
Figure 4.14 shows the dynamics of the gas temperature and bubble radiusin the vicinity of the first minimum ymin for normal mixture. The calcula-tions were performed for different values of ML/M0 at tinj = 14.5 µs andD0 = 1 µm. Curves 2–6 present temperature dynamics at ML/M0 equal to0, 0.5, 1, 1.5, and 1.95, respectively. Curve 1 is a set of the curves y(t) (cal-culated for the specified parameters ML/M0) that are barely perceptible inthe scales of the figure. The temperature jump at t = 14.2 µs was relatedto the beginning of the chemical reaction, while its subsequent increase wasconcerned with adiabatic compression of the detonation products due to theinertial properties of the “bubble–liquid” system [19], which in the absenceof evaporated liquid brought the temperature of reaction products to 6 200 K(curve 2).
The injection of microdrops in this example occured at the stage ofinertial compression of the bubble and clearly decreased the gas tempera-ture T with increasing ML/M0. In this case, the temperature maximum wasclearly defined at the moment of maximum collapse of the bubble only upto ML/M0 ≤ 0.5 (the region between curves 2 and 3). For other values ofML/M0, the temperature decrease resulting from the intense evaporation ofthe considerable part of the liquid was more substantial than its growth due
Fig. 4.14. Dynamics of the gastemperature and bubble radiusduring the first oscillation fordifferent values of ML/M0
References 151
to the gas compression, while its maximum did not exceed the gas tempera-ture during injection of microdrops at t = tinj.
As D0 increased, the intensity of evaporation decreased. Therefore, thelimiting value of ML/M0 at which the temperature maximum corresponded tothe maximum collapse of the bubble would increase. In the cryogenic mixture,the temperature maximum occured at maximum compression irrespective ofML/M0.
References
1. R.I. Soloukhin: About Gas Bubble Pulsation in Incompressible Liquid, Proceed-ings of the Scientific Council for Economic Use of Explosion 18, pp. 21–25(1961)
2. V.K. Kedrinskii: Features of the Spherical Gas Bubble Dynamics in Liquid, Zh.Prikl. Mekh. i Tekhn. Fiz. 8, 3, pp. 120–125 (1967)
3. V.K. Kedrinskii: Shock-wave compression of a gas cavity in water: MSc Thesis,Lavrentyev Institute of Hydrodynamics, Leningrad Polytechnic Institute (1960)
4. V.K. Kedrinskii, R.I. Soloukhin: Collapse of a Spherical Gas Cavity in Waterby Shock Wave, Zh. Prikl. Mekh. i Tekhn. Fiz. 2, 1, pp.27–29 (1961)
5. R.I. Soloukhin: About Bubble Mechanism of Shock Inflammation in Liquid,Dokl. Akad. Nauk SSSR 136, 2 (1960)
6. S.G. Zaitsev, R.I. Soloukhin: To Question About an Inflammation of AdiabaticHeated Gas Mixture, Dokl. Akad. Nauk SSSR 112, 6 (1958)
7. H. Poritsky: The collapse or growth of a spherical bubble or cavity in a viscousfluid. In: Proc. 1st US Nat. Congress on Appl. Mech., (1952) pp. 822
8. S.S. Shu: Note on the collapse of a spherical cavity in a viscous incompressiblefluid. In: Proc. 1st US Nat. Congress on Appl. Mech. (1952)
9. E.I. Zababakhin: Filling of Bubbles in Viscous Liquid, Appl. Math. Mech. 24,6 (1960)
10. A.D. Pernik: Cavitation Problems (Leningrad, Sudostroenie, 1966)11. C. Hunter: On the Collapse of an Empty Cavity in Water, J. Fluid Mech. 8, p.
241 (1960)12. C. Herring: Theory of Pulsation of the Gas Bubble Produced by an Underwater
Explosion, OSRD Rep. No. 236 (1941)13. G. Flinn: Physics of acoustic cavitation in liquids. In: W. Mason (ed.) Physical
Acoustics, vol. 1, part B, (1966) pp. 7–13814. V.K. Kedrinskii: Hydrodynamics of Explosion, Zh. Prikl. Mekh. i Tekhn. Fiz.
28, 4, pp. 23–48 (1987)15. V.K. Kedrinskii, F.N. Zamarayev: Wave amplification in reactive bubble media
(plenary lecture). In: Proc. 17th Int. Symp. on Shock Tubes and Waves, ed. byW. Yong (1989) pp. 51–62
16. V.K. Kedrinskii, Ch. Mader: Accidental detonation in bubbly liquids. In:H. Gronig (ed.) Proc. 16th Int. Symp. on Shock Tubes and Waves, (1987)pp. 371–376
17. A.A. Vasiliev, Yu.A. Nikolaev: Closed Theoretical Model of a Detonation Shell,Acta Astraun. 5, pp. 983–986 (1978)
152 4 Bubble, Cumulation and Chemical Reactions
18. A.A. Vasiliev, A.I. Valishev, V.A. Vasiliev et al: Parameters of DetonationWaves at Increased Pressure and Temperature, Chem. Phys. 16, 9, pp. 113–117 (1997)
19. A.A. Vasiliev, V.K. Kedrinskii, S.P. Taratuta: Dynamics of Single Bubble withChemically Reactive Gas, Fiz. Goren. Vzryva 34, 2, pp. 121–124 (1998)
20. F.P. Bowden, A.D. Yoffe: Fast Reaction in Solid (Butterworths Sci. Publ.,London, 1958)
21. K.K. Andreev: Some Consideration on the Mechanism of Initiation of Detona-tion in Explosive, Proc. Roy. Soc. London A 246, pp. 257–267 (1958)
22. C.H. Johansson: The Initiation of Liquid Explosives by Shock and the Impor-tance of Liquid Break-Up, Proc. Roy. Soc. London A 246 (1958)
23. A.V. Pinaev, A.I. Sychev: Discovery and Study of Self- Sustaining Regimes ofDetonation in the Systems of Liquid Fuel-Bubble of Oxidizer, Dokl. Akad. NaukSSSR 290, 3, pp. 611–615 (1986)
24. A.V. Pinaev, A.I. Sychev: Structure and Properties of Detonation in the Sys-tems “Liquid-Gas Bubbles”, Fiz. Goren. Vzryva 22, 3, pp. 109–118 (1986)
25. A.V. Dubovik, V.K. Bobolev: Shock Sensitivity of Liquid Systems (Nauka,Moscow, 1978)
26. V.K. Kedrinskii, P.A. Fomin, S.P. Taratuta: Dynamics of Single Bubble in aLiquid at Chemical Reactions and Interface of Heat-Mass Exchange, Zh. Prikl.Mekh. i Tekhn. Fiz. 40, 2, pp. 119–127 (1999)
27. D.R. White: Density induction times in very lean mixture of D2, H2, C2, C2H2
and C2H4 with O2, In: XI Int. Symp. on Combustion (Academic Press, Pitts-burgh, 1967) pp. 147–154.
28. Yu.A. Nikolaev, P.A. Fomin: Approximate Kinetic Equation for HeterogenicSystems of Gas-Condensed Phase Type, Fiz. Goren. Vzryva 19, 6, pp. 49–58(1983)
29. Yu.A. Nikolaev, D.V. Zak: Coordination of Chemical Reaction Models in Gaswith Second Law of Thermodynamics, Fiz. Goren. Vzryva 24, 4, pp. 87–90(1988)
30. P.A. Fomin, A.V. Trotsyuk: Approximated Calculation of Isotropy of Chemi-cally Balanced Gas, Fiz. Goren. Vzryva 31, 4, pp. 59–62 (1995)
31. A.V. Trotsyuk, P. A Fomin: Model of Bubbly Detonation, Fiz. Goren. Vzryva28, 4, pp. 129–136 (1992)
32. I.S. Grigoriev, E.Z. Meilikhova (eds.): Physical Quantities: Handbook, (Ener-goatomizdat, Moscow, 1991)
33. F.N. Zamaraev, V.K. Kedrinskii, Ch. Mader: Waves in Chemically Active Bub-ble Medium, Zh. Prikl. Mekh. i Tekhn. Fiz. 31, 2, pp. 20–26 (1990)
34. S. Lambarais, L. Kombs: Detonation and Two-Phase Flow (Mir, Moscow, 1966)
5 Shock Waves in Bubbly Media
5.1 Nonreactive Media, Wave Structure,Bubbly Cluster Radiation
In the 1950–70s, a long series of experimental studies was run to investigatethe transformation mechanism of shock waves propagating in a liquid contain-ing gas bubbles. As a result, a number of mathematical models were proposedto study analytically and numerically the main features of the interaction ofshock waves with bubbly media [1–14]. The most interesting features of theprocess are due to the pressure nonequilibrium in the liquid and gas phases,the complicated character of absorption and reradiation of the energy of anincident wave by the two-phase medium [1–3]. These features are distinctlymanifested both in the case of short shock waves (of arbitrary intensity) andin long waves with a steep front. If the relaxation process is relatively long,the initial volumetric concentration of the gas is low and bubble oscillationsare essentially nonlinear. The term shock wave usually refers to the one whosepositive phase is compared with the time of bubble collapse.
Fundamentally different effects were observed under propagation of shockwaves in mixtures with a high (percentrange in tens) gas content and withshort relaxation times, i.e., pressure in bubbles soon became comparable withaverage pressure in the liquid phase and their transport velocity to the aver-age mass velocity of the liquid. These phenomena were also observed duringthe interaction of strong and long shock waves with gas bubbles, includingthe dissolution of bubbles. The results of experimental and numerical studiesof the wave processes in such media [4–6] did not reveal the above features ofthe wave-medium interaction because they mainly occur under equilibriumpressure, velocity, and (sometimes) temperature of the two phases.
Some of these models should be considered from the viewpoint of thepossibility of using the classical approaches to the description of complicatedphysical processes in bubbly media.
Lyakhov’s model [5] applies the adiabatic approximation for both com-ponents of the bubbly medium on the assumption that there is no mutualpenetration:
pg = pg0
(ρg
ρgo
)γ
, pl = pl0 +ρlc
2l
n
[( ρl
ρl0
)n
− 1]
. (5.1)
154 5 Shock Waves in Bubbly Media
If ρg and αg, ρl and αl are the density and the volume content of thegas and the liquid component of the liquid, respectively, and the density ofthe medium is defined as ρ = αgρg + αlρl, the equation of state of a bubblysystem is as follows:
ρ =ρ0
αg(p/p0)−1/γ + αlP−1/n,
where P = n(p− p0)/ρlc2l + 1. Using (5.1), one can easily obtain from formal
considerations the expression for the speed of sound in a bubbly medium,
c2 =[αg(p/p0)−1/γ + αlP
−1/n]2
ρ0[(αg/ρgc2g)(p/p0)−(1+γ)/γ + (αl/ρlc2
l )P−(1+n)/n],
which is considerably simplified for an undisturbed medium:
c20 =
1ρ0
(αg
ρgc2g
+αl
ρlc2l
)−1
.
The shock wave velocity Ush and the mass velocity u are defined as
U2sh =
p − p0
ρ0
1 − αg
( p
p0
)−1/γ
− αlP−1/n
−1
and
u2 =p − p0
ρ0
1 − αg
( p
p0
)−1/γ
− αlP−1/n
.
One can see that c0 decreases with increasing αg due to the abrupt increasein the compressibility of the bubbly medium (−(1/V )(∂V/∂p)) at practicallyinvariable density.
In the Campbell–Pitcher model [4], a small parameter µ (relation of thegas mass to the liquid mass) is used and it is assumed that the liquid isincompressible and the gas is subject to the Boyle law. The medium density ρis defined as (1 + µ)/ρ = µ/ρg + 1/ρl, which results in the equation of state
p
ρ
[1 − ρ
(1 + µ)ρl
]= const .
The speed of sound is
c2 =p
ρ
[1 − ρ
(1 + µ)ρl
]−1
.
Campbell and Pitcher [4] considered the problem on the propagation andcollision of stationary shock waves in a bubbly mixture. The appropriaterelations for average ρ, u, and p are written as
ρ1u1 = ρ2u2 , ρ1u21 + p1 = ρ2u
22 + p2 ,
p1
ρ1+
C + µCvg
1 + µT1 +
u21
2=
p2
ρ2+
C + µCvg
1 + µT2 + +
u22
2,
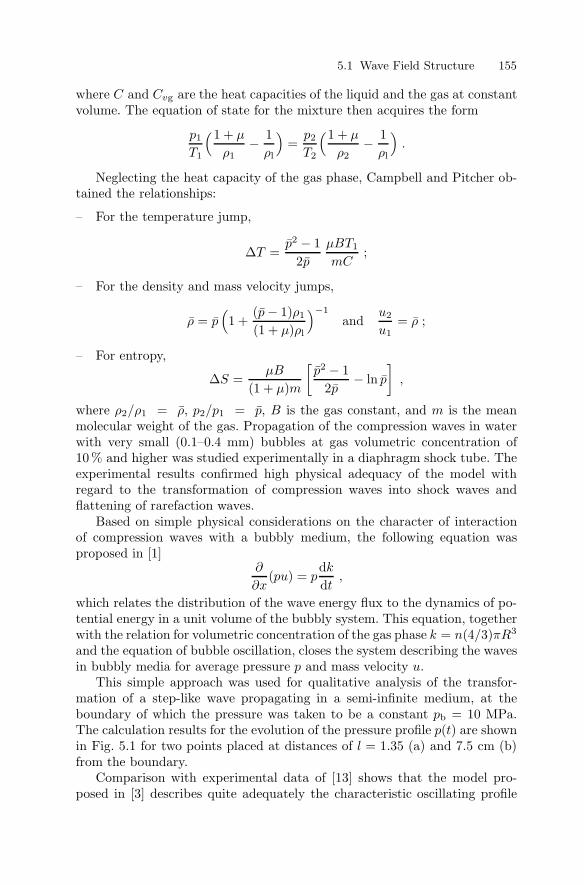
5.1 Wave Field Structure 155
where C and Cvg are the heat capacities of the liquid and the gas at constantvolume. The equation of state for the mixture then acquires the form
p1
T1
(1 + µ
ρ1− 1
ρl
)=
p2
T2
(1 + µ
ρ2− 1
ρl
).
Neglecting the heat capacity of the gas phase, Campbell and Pitcher ob-tained the relationships:
– For the temperature jump,
∆T =p2 − 1
2p
µBT1
mC;
– For the density and mass velocity jumps,
ρ = p(1 +
(p − 1)ρ1
(1 + µ)ρl
)−1
andu2
u1= ρ ;
– For entropy,
∆S =µB
(1 + µ)m
[p2 − 1
2p− ln p
],
where ρ2/ρ1 = ρ, p2/p1 = p, B is the gas constant, and m is the meanmolecular weight of the gas. Propagation of the compression waves in waterwith very small (0.1–0.4 mm) bubbles at gas volumetric concentration of10% and higher was studied experimentally in a diaphragm shock tube. Theexperimental results confirmed high physical adequacy of the model withregard to the transformation of compression waves into shock waves andflattening of rarefaction waves.
Based on simple physical considerations on the character of interactionof compression waves with a bubbly medium, the following equation wasproposed in [1]
∂
∂x(pu) = p
dk
dt,
which relates the distribution of the wave energy flux to the dynamics of po-tential energy in a unit volume of the bubbly system. This equation, togetherwith the relation for volumetric concentration of the gas phase k = n(4/3)πR3
and the equation of bubble oscillation, closes the system describing the wavesin bubbly media for average pressure p and mass velocity u.
This simple approach was used for qualitative analysis of the transfor-mation of a step-like wave propagating in a semi-infinite medium, at theboundary of which the pressure was taken to be a constant pb = 10 MPa.The calculation results for the evolution of the pressure profile p(t) are shownin Fig. 5.1 for two points placed at distances of l = 1.35 (a) and 7.5 cm (b)from the boundary.
Comparison with experimental data of [13] shows that the model pro-posed in [3] describes quite adequately the characteristic oscillating profile
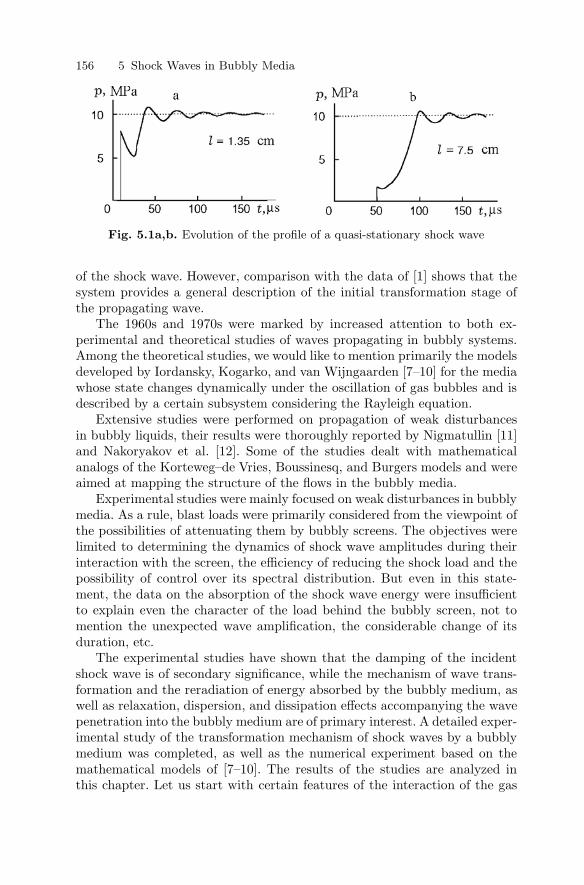
156 5 Shock Waves in Bubbly Media
Fig. 5.1a,b. Evolution of the profile of a quasi-stationary shock wave
of the shock wave. However, comparison with the data of [1] shows that thesystem provides a general description of the initial transformation stage ofthe propagating wave.
The 1960s and 1970s were marked by increased attention to both ex-perimental and theoretical studies of waves propagating in bubbly systems.Among the theoretical studies, we would like to mention primarily the modelsdeveloped by Iordansky, Kogarko, and van Wijngaarden [7–10] for the mediawhose state changes dynamically under the oscillation of gas bubbles and isdescribed by a certain subsystem considering the Rayleigh equation.
Extensive studies were performed on propagation of weak disturbancesin bubbly liquids, their results were thoroughly reported by Nigmatullin [11]and Nakoryakov et al. [12]. Some of the studies dealt with mathematicalanalogs of the Korteweg–de Vries, Boussinesq, and Burgers models and wereaimed at mapping the structure of the flows in the bubbly media.
Experimental studies were mainly focused on weak disturbances in bubblymedia. As a rule, blast loads were primarily considered from the viewpoint ofthe possibilities of attenuating them by bubbly screens. The objectives werelimited to determining the dynamics of shock wave amplitudes during theirinteraction with the screen, the efficiency of reducing the shock load and thepossibility of control over its spectral distribution. But even in this state-ment, the data on the absorption of the shock wave energy were insufficientto explain even the character of the load behind the bubbly screen, not tomention the unexpected wave amplification, the considerable change of itsduration, etc.
The experimental studies have shown that the damping of the incidentshock wave is of secondary significance, while the mechanism of wave trans-formation and the reradiation of energy absorbed by the bubbly medium, aswell as relaxation, dispersion, and dissipation effects accompanying the wavepenetration into the bubbly medium are of primary interest. A detailed exper-imental study of the transformation mechanism of shock waves by a bubblymedium was completed, as well as the numerical experiment based on themathematical models of [7–10]. The results of the studies are analyzed inthis chapter. Let us start with certain features of the interaction of the gas

5.1 Wave Field Structure 157
layer with the shock wave, considering the layered structure as an extremelysimplified model of a bubbly medium.
5.1.1 Shock-Gas Layer Interaction
Assume that a wave front propagates toward the x-axis and interacts withthe gas layer, whose front and back walls at the initial time have the co-ordinates x0(0) = 0 and x1(0) = h0, respectively. When a shock wave ofamplitude p∗ falls onto the layer, its front wall acquires the initial velocityv0 = 2(p∗ − p0)/ρ0c0 due to reflection and begins to move to the right, com-pressing the gas. The rarefaction wave propagating to the left (along the neg-ative x-axis) defines the equation of motion of the wall that can be obtainedfrom the invariance conditions of the function G = x0(ω + v2/2) = ω + v2/2along the characteristics propagating to the left with the velocity c0 − v [2]:
Gt − (c0 − v)Gx = 0 .
Here, ω is the enthalpy and v is the mass velocity at the boundary of thelayer from the side of the liquid. The equation relating the two has the form
dv
dt= − 1
c0
dω
dt. (5.2)
If the pressure in the gas is described by the adiabatic equation p1 =p0[h0/(x1 − x0)]γ , the wave profile is assigned as a triangle p(t) with a pos-itive phase τ , and the enthalpy can be written as ω = ρ−1
0 [p1 − p(t)]. Thefirst integral of (5.2) will define the expression for the current velocity of thefront wall of the gas layer:
ρ0c0x0 = ρ0c0v0 −[p∗
t
τ+ p0
(x1 − x0
h0
)−γ
− p0
]. (5.3)
As the pressure p1 in the gas increases, the back wall of the layer moves in thepositive direction of the x-axis at a velocity x1 so that (5.3) can be writtenas
ρ0c0x1 = p0
(x1 − x0
h0
)−γ
− p0 . (5.4)
A compression wave p1(t) is formed in the liquid to the right of the layer.The wave has a certain maximum amplitude that is determined by the min-imum layer thickness h∗ on the basis of the simultaneous solution of (5.3)and (5.4) and by the duration of the order of τ . The limiting value of theamplitude p1 will correspond to the case when τ → ∞. With allowance for v0,the rate of the layer thickness change h = x1 − x0 can be written as
− ρ0c0h = 2(p∗ − p0) − 2p0
[( h
h0
)−γ
− 1]
. (5.5)
158 5 Shock Waves in Bubbly Media
It is clear that the layer will collapse until the velocities of the wallsbecome equal, i.e., the condition h = 0 is satisfied. One can see from (5.5)that at this moment the pressure in the gas becomes equal to p1 = p∗,while x0 = x1 = (p∗−p0)/ρ0vc0, as follows from (5.3) and (5.4), and remainsinvariable. Thus, the stationary wave with a flat front will be recorded behindthe layer. The rise time of the front, following (5.5), is close to the collapsetime of an empty cavity t∗ = ρ0c0h0/2p∗ and depends linearly on the layerthickness h0.
The equation for the layer in the variables x = h/h0 and t1 = t/τ forshort waves has the form
δx = −(1 − t1
2
)+
p0
p∗x−γ . (5.6)
Here the dimensionless parameter δ = ρ0c0h0/2p∗τ points to the depen-dence of the maximum pressure amplitude p1 in the gas on h0. The conditionx = 0 determines the relation x∗(t1∗). Calculations show that with increasingh0 the maximum p1 decreases and shifts toward higher values of t1∗, stayingon the line governing the pressure decay behind the shock wave front. Onecan notice a typical spreading of the signal and the delay of the reradiationmaximum, which depends on the time of the layer collapse only.
Analysis of the behavior of the gas layer under the interaction with shockwaves provides an insight into wave transformation in bubbly media. A prin-cipal distinction of the process occurring in bubbly media from that in a gaslayer consists in strong inertial and cumulative effects resulting from the col-lapse of spherical bubbles, as well as in transformation of the shock pulse asit passes through the bubbly medium.
It should be noted that if x1 = 0 (the layer is placed on a solid wall),the amplitude of the stationary wave is doubled after the compression ofthe layer, while the amplitude of the short wave increases by a factor of lessthan two. The inertial property of the bubble layer on the solid wall and theassociated possible strong overcompression of the gas in bubbles can resultin the intensification of the effect. In order to analyze the transformation ofshock waves in detail we will study their structure in passing bubble layersof finite thickness.
5.1.2 Shock Waves in Bubble Layers
In analyzing the behavior of a single bubble in the shock wave field it isusually assumed that the energy intensity of the bubble, i.e., its ability toabsorb an essential portion of the energy of the incident wave, is insignificant.Thus, it is assumed that the wave field in the liquid surrounding the bubbleis independent from the state and dynamics of the bubble. This assumptionis acceptable when studying single bubbles. But it is not valid for the caseof the interaction of long or short shock waves with a group of bubbles, both
5.1 Wave Field Structure 159
due to the finiteness of the energy transferred by the wave over the durationof the interaction and the relatively high energy intensity of the bubbly areain general.
An appreciable portion of the energy transferred by the shock wave isspent for the work executed by the wave in such a system (the increase ofthe internal energy of gas in bubbles and the generation of radial liquid flowsaround bubbles during the collapse) already at low volumetric concentra-tion of the gas. It is clear that some portion of the wave energy will notpass through the area and, consequently, the wave profile will be changed.One can increase the size of the area or volumetric concentration of gasin it, thus bringing the energy intensity of the medium to the value ex-ceeding the energy of an incident short shock wave. Obviously, the shockpulse will not go through such a layer. We note that a similar effect is ob-served for long waves of constant amplitude behind the front, but only atthe wave section corresponding to the time of bubble collapse in the givenarea.
5.1.2.1 Short Shock Waves
We define short waves as waves whose positive pressure phase is of the sameduration as the time of bubble collapse. In the experiments, it correspondsto shock waves with an amplitude on the order of pmax 1 MPa and thepositive phase duration of ∼ 100 µs for bubble radii of about 3–4 mm.
During the interaction with shock waves, air bubbles are compressed. Thisresults in the increase of the internal energy of the gas and appearance ofthe radial velocity component, i.e., the kinetic energy of the added mass ofthe liquid surrounding the bubbles. As a result, an intense absorption of theenergy of the incident shock wave is observed as the wave propagates in thebubbly medium. But simultaneous with the absorption of the shock waveenergy, the wave is reradiated by the oscillating bubble layer. The processesoccur simultaneously, but their maximum manifestations (the residue of thewave pulse after passing through a bubble layer of thickness l and the max-imum reradiation of the energy of the incident wave absorbed by the layer)are essentially uncoupled in time [1,3]. This time interval is a function of thesize of bubbles, and, as shown below, it also depends on their concentrationin the mixture, the initial parameters of the shock wave, and the layer length.Practically, this time is determined as the time of “collective” oscillation ofthe bubble layer.
The process of shock wave transformation can be studied in detail onlyin the one-dimensional statement. For this purpose, we used an electric-discharge hydrodynamic shock tube, wherein a shock wave was produced byan explosion of a wire near the bottom (Fig. 5.2). The steady profile of theplane wave with stationary parameters was formed at a certain distance L∗from the explosion site. Beginning from L > L∗ pressure gauges 1 and 2 weremounted at a base of about 0.5 m from the working section to record the

160 5 Shock Waves in Bubbly Media
Fig. 5.2. Diagram of the setup for shock wavegeneration in a bubble layer: (1) and (2) pres-sure gauges, (3) triggering gauge, (4) ionizinghigh-voltage pulse
shape and parameters of the transmitted and incident waves. The pressuregauge 3 was designed to trigger an oscillograph. At a fixed distance from thegauge 2, a layer of calibrated gas bubbles made of thin rubber was fixed toa special lightweight frame, which practically did not affect the structure ofthe wave field.
The method of producing a two-phase layer that occupied the entire cross-section of the tube enabled modification of the gas concentration k0 and thesize of bubbles R0, control over the length of the layer l, and provided reliableresults. The upper edge of the tube was closed, if the reflection in the layerwas studied at the solid wall, or a special device for wave absorption couldbe attached, thus the tube could be considered as infinitely long.
The passage of shock waves through the bubble layer was studied in detailfor a wide range of parameters: 1 ≤ l ≤ 30 cm, 0.004 ≤ k0 ≤ 0.3, 1 ≤ p∗ ≤3 MPa, and 50 ≤ τ ≤ 100 µs. Typical pressure oscillograms illustrating theinitial absorption of a short shock wave by the layer are shown in Fig. 5.3 forvarious values of k0 and l. The scale of signal amplification at the oscillogramswith respect to the shock wave (Fig. 5.3a) incident on the layer varied within2.5:1.
Oscillograms in Fig. 5.3b–c demonstrate the effect of splitting of the inci-dent shock wave (Fig. 5.3a) into two waves [1]: a shock wave pulse (precursor)transformed by the layer and a reradiation of the bubble layer (l = 1 cm,k0 = 0.025, k0 = 0.08). The 3rd, 4th, and 5th oscillograms (b, c, and d,respectively) showed the same effect for a fixed concentration of bubbles(k0 = 0.08) but varying layer length (l = 1, 2, and 3 cm). One can seethat the steepness of the front of the residual shock pulse was practicallypreserved until it was completely absorbed, while the positive phase wasabruptly reduced. The linear dimension of the pulse became comparable with
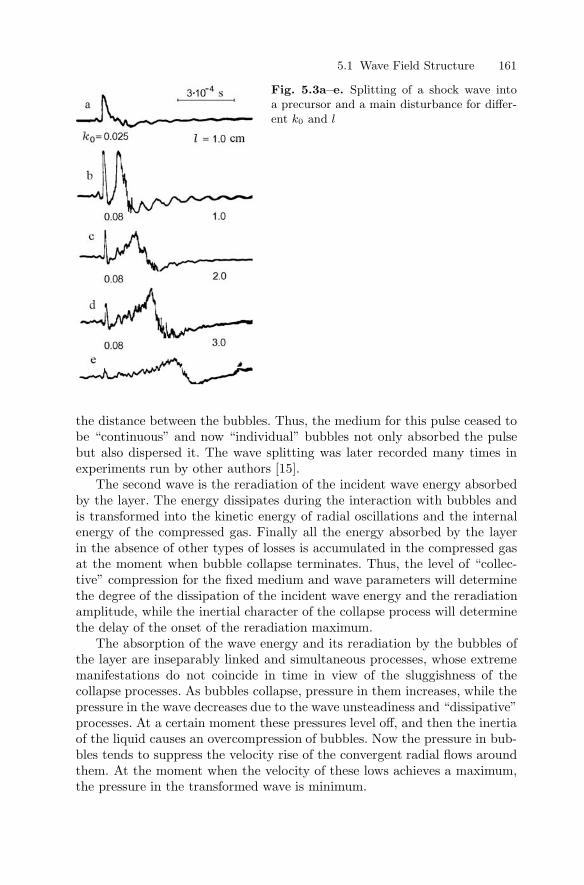
5.1 Wave Field Structure 161
Fig. 5.3a–e. Splitting of a shock wave intoa precursor and a main disturbance for differ-ent k0 and l
the distance between the bubbles. Thus, the medium for this pulse ceased tobe “continuous” and now “individual” bubbles not only absorbed the pulsebut also dispersed it. The wave splitting was later recorded many times inexperiments run by other authors [15].
The second wave is the reradiation of the incident wave energy absorbedby the layer. The energy dissipates during the interaction with bubbles andis transformed into the kinetic energy of radial oscillations and the internalenergy of the compressed gas. Finally all the energy absorbed by the layerin the absence of other types of losses is accumulated in the compressed gasat the moment when bubble collapse terminates. Thus, the level of “collec-tive” compression for the fixed medium and wave parameters will determinethe degree of the dissipation of the incident wave energy and the reradiationamplitude, while the inertial character of the collapse process will determinethe delay of the onset of the reradiation maximum.
The absorption of the wave energy and its reradiation by the bubbles ofthe layer are inseparably linked and simultaneous processes, whose extrememanifestations do not coincide in time in view of the sluggishness of thecollapse processes. As bubbles collapse, pressure in them increases, while thepressure in the wave decreases due to the wave unsteadiness and “dissipative”processes. At a certain moment these pressures level off, and then the inertiaof the liquid causes an overcompression of bubbles. Now the pressure in bub-bles tends to suppress the velocity rise of the convergent radial flows aroundthem. At the moment when the velocity of these lows achieves a maximum,the pressure in the transformed wave is minimum.
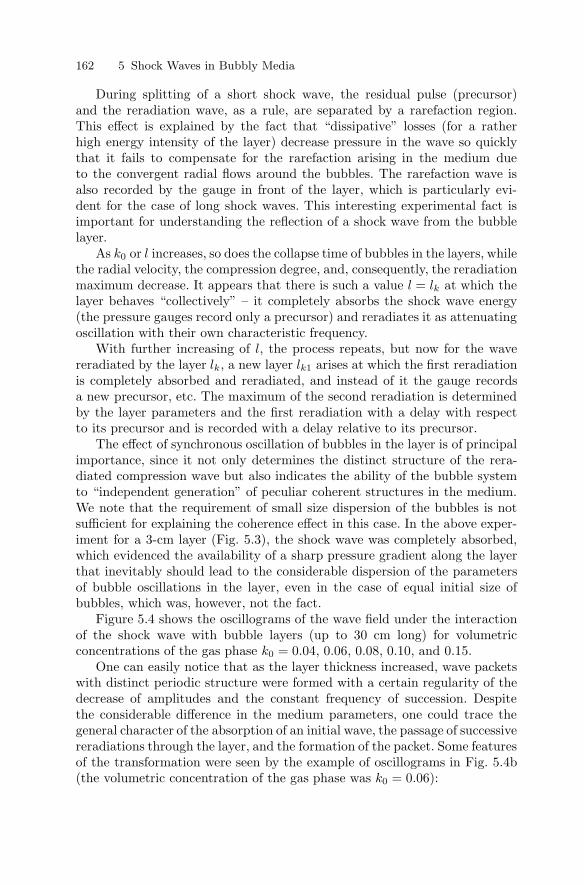
162 5 Shock Waves in Bubbly Media
During splitting of a short shock wave, the residual pulse (precursor)and the reradiation wave, as a rule, are separated by a rarefaction region.This effect is explained by the fact that “dissipative” losses (for a ratherhigh energy intensity of the layer) decrease pressure in the wave so quicklythat it fails to compensate for the rarefaction arising in the medium dueto the convergent radial flows around the bubbles. The rarefaction wave isalso recorded by the gauge in front of the layer, which is particularly evi-dent for the case of long shock waves. This interesting experimental fact isimportant for understanding the reflection of a shock wave from the bubblelayer.
As k0 or l increases, so does the collapse time of bubbles in the layers, whilethe radial velocity, the compression degree, and, consequently, the reradiationmaximum decrease. It appears that there is such a value l = lk at which thelayer behaves “collectively” – it completely absorbs the shock wave energy(the pressure gauges record only a precursor) and reradiates it as attenuatingoscillation with their own characteristic frequency.
With further increasing of l, the process repeats, but now for the wavereradiated by the layer lk, a new layer lk1 arises at which the first reradiationis completely absorbed and reradiated, and instead of it the gauge recordsa new precursor, etc. The maximum of the second reradiation is determinedby the layer parameters and the first reradiation with a delay with respectto its precursor and is recorded with a delay relative to its precursor.
The effect of synchronous oscillation of bubbles in the layer is of principalimportance, since it not only determines the distinct structure of the rera-diated compression wave but also indicates the ability of the bubble systemto “independent generation” of peculiar coherent structures in the medium.We note that the requirement of small size dispersion of the bubbles is notsufficient for explaining the coherence effect in this case. In the above exper-iment for a 3-cm layer (Fig. 5.3), the shock wave was completely absorbed,which evidenced the availability of a sharp pressure gradient along the layerthat inevitably should lead to the considerable dispersion of the parametersof bubble oscillations in the layer, even in the case of equal initial size ofbubbles, which was, however, not the fact.
Figure 5.4 shows the oscillograms of the wave field under the interactionof the shock wave with bubble layers (up to 30 cm long) for volumetricconcentrations of the gas phase k0 = 0.04, 0.06, 0.08, 0.10, and 0.15.
One can easily notice that as the layer thickness increased, wave packetswith distinct periodic structure were formed with a certain regularity of thedecrease of amplitudes and the constant frequency of succession. Despitethe considerable difference in the medium parameters, one could trace thegeneral character of the absorption of an initial wave, the passage of successivereradiations through the layer, and the formation of the packet. Some featuresof the transformation were seen by the example of oscillograms in Fig. 5.4b(the volumetric concentration of the gas phase was k0 = 0.06):
5.1 Wave Field Structure 163
Fig
.5.4
a–e.
Gen
eration
ofw
ave
pack
ets
by
bubble
layer
sfo
ra
wid
era
nge
of
k0
and
l

164 5 Shock Waves in Bubbly Media
1. The wave energy was absorbed immediately behind the front, it changedthe amplitude and the duration of the pulse and “splitted” it but did notchange the front steepness.
2. The “split” pulse retained its position in time, while the maximum ofthe wave reradiated by the medium shifts to the right in the oscillograms(see the top-down sequence). The character of the reradiation suggestedsynchronous collapse of bubbles, i.e., the layer behaved as a coherentstructure. The experimental data confirmed the existence of a series ofprecursors and indicated the distinct periodic structure of the resultingsignal.
3. The length of the coherent layer lk was limited and was determined foreach concentration and initial parameters of the shock wave. Figure 5.5shows the dependence of the delay times Tdel on the reradiation maximumfor four values of k0: 0.04, 0.08, 0.15, and 0.30.As the reference point for Tdel, we took the moment of complete ab-sorption of the initial shock wave by the layer whose length lk,0(k0) wasmarked on the diagram as a cross-point of the dependence Tdel(l) withthe l-axis. This approach made it possible to analyze the evolution ofthe resulting signal by the example of the propagation of an already rela-tively weak reradiation wave with steep front and periodic structure. Themain feature of the transformation of bubbles by the bubble layer wasdistinctly shown by the pressure oscillograms (see Fig. 5.3): the recordingmoment of the first precursor corresponded to the propagation velocity c0
in the pure liquid, the reradiation was shifted with respect to it, and theshift (Fig. 5.5) increased linearly with increasing the layer length.The increasing delay in recording the reradiation maximum was associ-ated with a principal question of the formation and propagation mecha-nism of the so-called long-wave disturbance. The point is that the shiftis often used to justify the conclusion that the low-frequency compo-nent of the signal (reradiation of the layer), unlike its high-frequencypart (the precursor) propagates at practically equilibrium speed of sound
Fig. 5.5. Maximum radiation delayTdel of the layer as a function of itslength l for various volumetric con-centrations of the gas phase (in per-cent)
5.1 Wave Field Structure 165
c2∗ = γp0/ρ0k0 [1] characteristic of a long-wave disturbance in the two-
phase medium [5]. The reradiation amplitudes in the experiment wererather small, the fronts were sloping, and the estimate for c∗ seemed re-alistic, at least for high concentrations and large l. In this case, if thedelay time Tdel was indeed related to the low propagation velocity of themain part of the resulting signal, the value ζ = c2
∗k0 should be constant(γp0/ρ0) for the same gas and hydrostatic pressure and should not de-pend on k0. But in the range of k0 shown in Fig. 5.5 the value of ζ changedapproximately two-fold, which raised doubts about the conclusion on thenature of the delay and pointed to a certain contradiction in the direct“wave analysis” of the experimental data.Another contradiction arose in the numerical analysis of the processwithin the mathematical model of a two-phase medium [7–10] under theassumption of the incompressibility of the liquid component. In this case,c0 → ∞ and no wave structure of the “precursor–reradiation” type shouldexist. However, the data of [1] indicated the possibility of existence of thetwo-wave structure even in this case. This suggests that the contradictionconsisted in the interpretation of the mechanism of the delay Tdel. Theexample of the plane gas layer, as well as the analysis of the oscillogramsof the wave field (Fig. 5.4) and the data presented in Fig. 5.5, showedthat the value Tdel was determined by the collapse time of bubbles in thelayer or the collapse of the layer itself.Thus, the delay in recording of the reradiation maximum was the resultof the delay in its generation, rather than the low propagation velocity. Inthis case, both the initial shock wave and the disturbances that formed theresulting reradiation propagated in the medium with the same velocity c0
typical of the liquid component. The total delay was the superpositionof the successive delays of the wave reradiation (Fig. 5.4a), while thewidth of the front of the resulting reradiation was determined by thetime interval from its maximum to the nearest precursor.
4. As a result of these processes, a reradiation as a wave packet was formedbehind the bubble layer. The structure of the packets for different k0
and l is shown in Fig. 5.4. The duration of the packets exceeded that ofthe positive phase of the incident shock wave by an order of magnitudeand the frequency ν depended on the layer length l at fixed k0.
The frequency characteristics of the wave packet depending on the layerlength and gas concentration within a wide range of their values proved(Fig. 5.6) that ν(l) at k0 = const had a maximum ν∗, which with increasingk0 was shifted to the region of lower values l and its absolute value decreased.Thus, at k0 = 0.04 the packet frequency was ν∗ = 4 kHz at the distance of22 cm, and at k0 = 0.23 the maximum frequency decreased to ν∗ = 1.4 kHzwhile the layer length was l = 3.5 cm.
In principle, all frequency characteristics of the process have a distinctmaximum at a certain layer length lk. The experiments have shown that be-
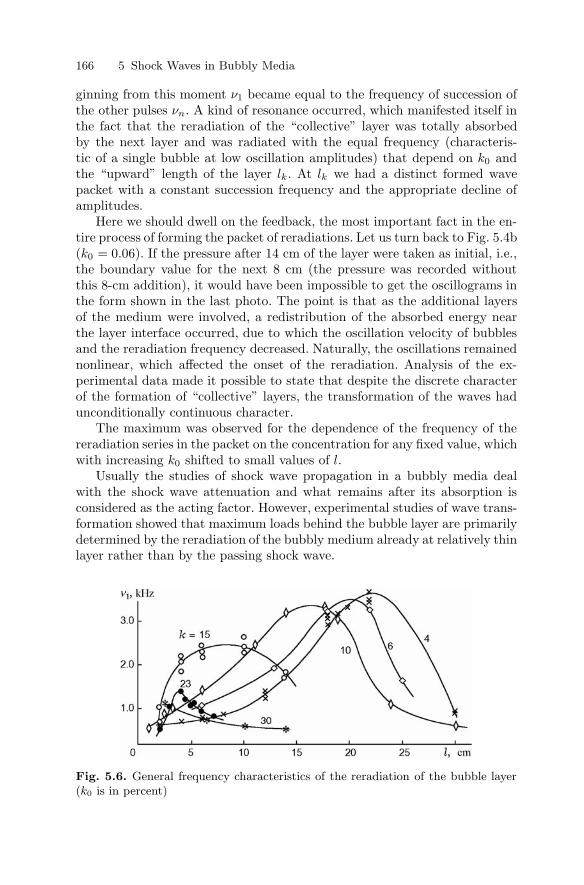
166 5 Shock Waves in Bubbly Media
ginning from this moment ν1 became equal to the frequency of succession ofthe other pulses νn. A kind of resonance occurred, which manifested itself inthe fact that the reradiation of the “collective” layer was totally absorbedby the next layer and was radiated with the equal frequency (characteris-tic of a single bubble at low oscillation amplitudes) that depend on k0 andthe “upward” length of the layer lk. At lk we had a distinct formed wavepacket with a constant succession frequency and the appropriate decline ofamplitudes.
Here we should dwell on the feedback, the most important fact in the en-tire process of forming the packet of reradiations. Let us turn back to Fig. 5.4b(k0 = 0.06). If the pressure after 14 cm of the layer were taken as initial, i.e.,the boundary value for the next 8 cm (the pressure was recorded withoutthis 8-cm addition), it would have been impossible to get the oscillograms inthe form shown in the last photo. The point is that as the additional layersof the medium were involved, a redistribution of the absorbed energy nearthe layer interface occurred, due to which the oscillation velocity of bubblesand the reradiation frequency decreased. Naturally, the oscillations remainednonlinear, which affected the onset of the reradiation. Analysis of the ex-perimental data made it possible to state that despite the discrete characterof the formation of “collective” layers, the transformation of the waves hadunconditionally continuous character.
The maximum was observed for the dependence of the frequency of thereradiation series in the packet on the concentration for any fixed value, whichwith increasing k0 shifted to small values of l.
Usually the studies of shock wave propagation in a bubbly media dealwith the shock wave attenuation and what remains after its absorption isconsidered as the acting factor. However, experimental studies of wave trans-formation showed that maximum loads behind the bubble layer are primarilydetermined by the reradiation of the bubbly medium already at relatively thinlayer rather than by the passing shock wave.
Fig. 5.6. General frequency characteristics of the reradiation of the bubble layer(k0 is in percent)
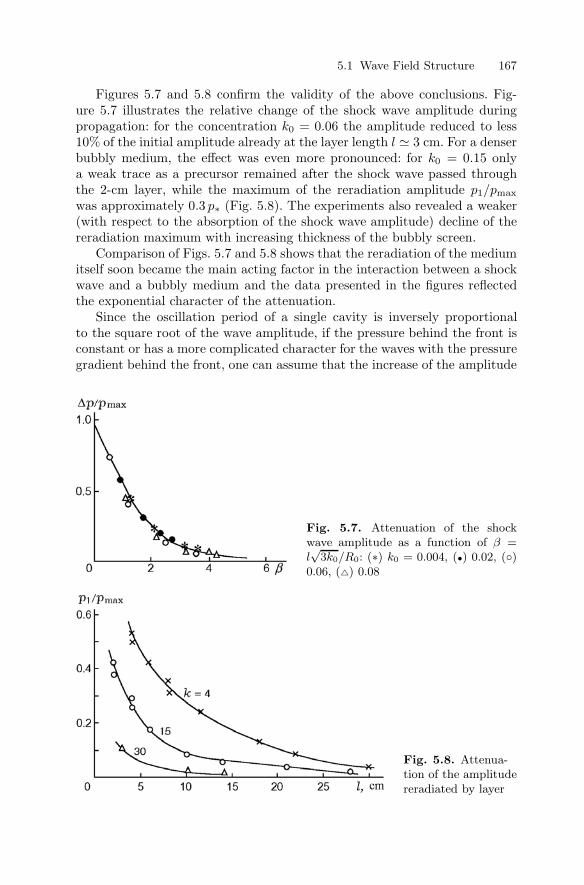
5.1 Wave Field Structure 167
Figures 5.7 and 5.8 confirm the validity of the above conclusions. Fig-ure 5.7 illustrates the relative change of the shock wave amplitude duringpropagation: for the concentration k0 = 0.06 the amplitude reduced to less10% of the initial amplitude already at the layer length l 3 cm. For a denserbubbly medium, the effect was even more pronounced: for k0 = 0.15 onlya weak trace as a precursor remained after the shock wave passed throughthe 2-cm layer, while the maximum of the reradiation amplitude p1/pmax
was approximately 0.3 p∗ (Fig. 5.8). The experiments also revealed a weaker(with respect to the absorption of the shock wave amplitude) decline of thereradiation maximum with increasing thickness of the bubbly screen.
Comparison of Figs. 5.7 and 5.8 shows that the reradiation of the mediumitself soon became the main acting factor in the interaction between a shockwave and a bubbly medium and the data presented in the figures reflectedthe exponential character of the attenuation.
Since the oscillation period of a single cavity is inversely proportionalto the square root of the wave amplitude, if the pressure behind the front isconstant or has a more complicated character for the waves with the pressuregradient behind the front, one can assume that the increase of the amplitude
Fig. 5.7. Attenuation of the shockwave amplitude as a function of β =l√
3k0/R0: (∗) k0 = 0.004, (•) 0.02, ()0.06, () 0.08
Fig. 5.8. Attenua-tion of the amplitudereradiated by layer
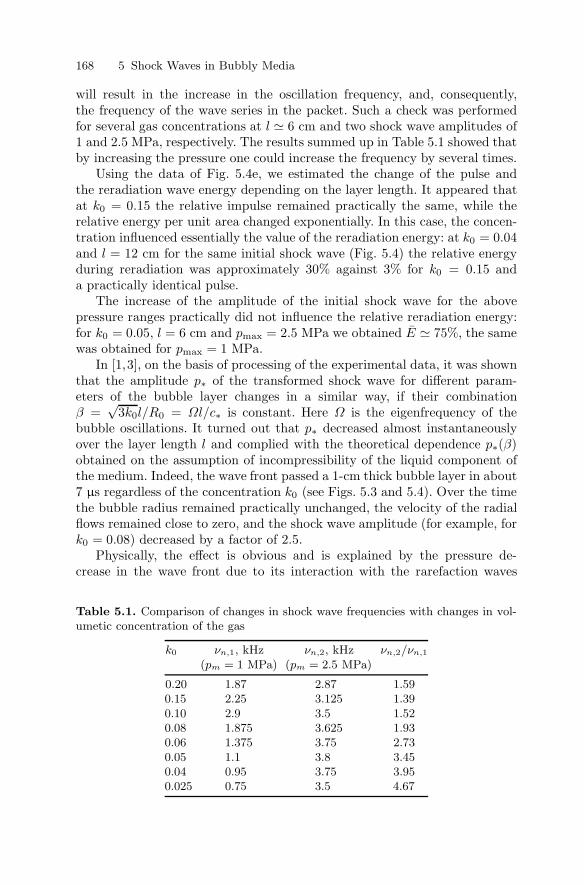
168 5 Shock Waves in Bubbly Media
will result in the increase in the oscillation frequency, and, consequently,the frequency of the wave series in the packet. Such a check was performedfor several gas concentrations at l 6 cm and two shock wave amplitudes of1 and 2.5 MPa, respectively. The results summed up in Table 5.1 showed thatby increasing the pressure one could increase the frequency by several times.
Using the data of Fig. 5.4e, we estimated the change of the pulse andthe reradiation wave energy depending on the layer length. It appeared thatat k0 = 0.15 the relative impulse remained practically the same, while therelative energy per unit area changed exponentially. In this case, the concen-tration influenced essentially the value of the reradiation energy: at k0 = 0.04and l = 12 cm for the same initial shock wave (Fig. 5.4) the relative energyduring reradiation was approximately 30% against 3% for k0 = 0.15 anda practically identical pulse.
The increase of the amplitude of the initial shock wave for the abovepressure ranges practically did not influence the relative reradiation energy:for k0 = 0.05, l = 6 cm and pmax = 2.5 MPa we obtained E 75%, the samewas obtained for pmax = 1 MPa.
In [1,3], on the basis of processing of the experimental data, it was shownthat the amplitude p∗ of the transformed shock wave for different param-eters of the bubble layer changes in a similar way, if their combinationβ =
√3k0l/R0 = Ωl/c∗ is constant. Here Ω is the eigenfrequency of the
bubble oscillations. It turned out that p∗ decreased almost instantaneouslyover the layer length l and complied with the theoretical dependence p∗(β)obtained on the assumption of incompressibility of the liquid component ofthe medium. Indeed, the wave front passed a 1-cm thick bubble layer in about7 µs regardless of the concentration k0 (see Figs. 5.3 and 5.4). Over the timethe bubble radius remained practically unchanged, the velocity of the radialflows remained close to zero, and the shock wave amplitude (for example, fork0 = 0.08) decreased by a factor of 2.5.
Physically, the effect is obvious and is explained by the pressure de-crease in the wave front due to its interaction with the rarefaction waves
Table 5.1. Comparison of changes in shock wave frequencies with changes in vol-umetic concentration of the gas
k0 νn,1, kHz νn,2, kHz νn,2/νn,1
(pm = 1 MPa) (pm = 2.5 MPa)
0.20 1.87 2.87 1.590.15 2.25 3.125 1.390.10 2.9 3.5 1.520.08 1.875 3.625 1.930.06 1.375 3.75 2.730.05 1.1 3.8 3.450.04 0.95 3.75 3.950.025 0.75 3.5 4.67
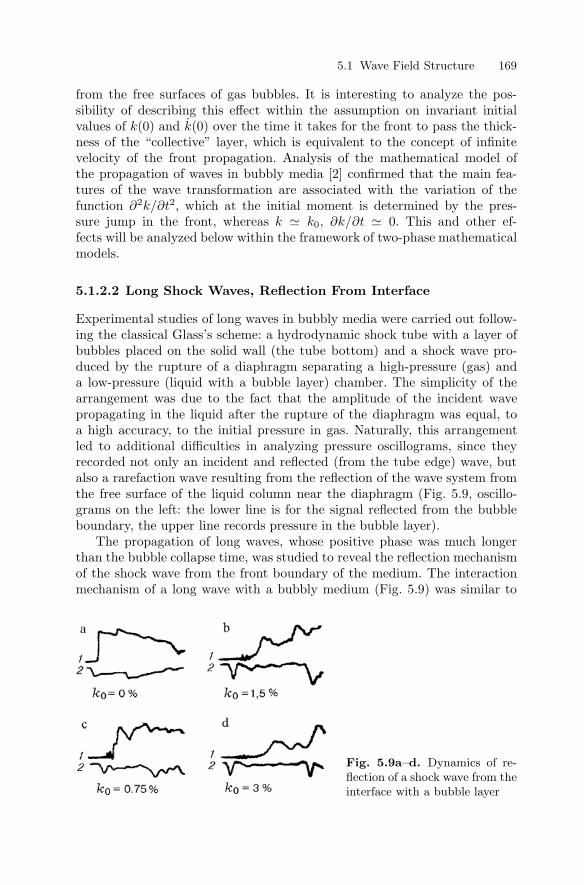
5.1 Wave Field Structure 169
from the free surfaces of gas bubbles. It is interesting to analyze the pos-sibility of describing this effect within the assumption on invariant initialvalues of k(0) and k(0) over the time it takes for the front to pass the thick-ness of the “collective” layer, which is equivalent to the concept of infinitevelocity of the front propagation. Analysis of the mathematical model ofthe propagation of waves in bubbly media [2] confirmed that the main fea-tures of the wave transformation are associated with the variation of thefunction ∂2k/∂t2, which at the initial moment is determined by the pres-sure jump in the front, whereas k k0, ∂k/∂t 0. This and other ef-fects will be analyzed below within the framework of two-phase mathematicalmodels.
5.1.2.2 Long Shock Waves, Reflection From Interface
Experimental studies of long waves in bubbly media were carried out follow-ing the classical Glass’s scheme: a hydrodynamic shock tube with a layer ofbubbles placed on the solid wall (the tube bottom) and a shock wave pro-duced by the rupture of a diaphragm separating a high-pressure (gas) anda low-pressure (liquid with a bubble layer) chamber. The simplicity of thearrangement was due to the fact that the amplitude of the incident wavepropagating in the liquid after the rupture of the diaphragm was equal, toa high accuracy, to the initial pressure in gas. Naturally, this arrangementled to additional difficulties in analyzing pressure oscillograms, since theyrecorded not only an incident and reflected (from the tube edge) wave, butalso a rarefaction wave resulting from the reflection of the wave system fromthe free surface of the liquid column near the diaphragm (Fig. 5.9, oscillo-grams on the left: the lower line is for the signal reflected from the bubbleboundary, the upper line records pressure in the bubble layer).
The propagation of long waves, whose positive phase was much longerthan the bubble collapse time, was studied to reveal the reflection mechanismof the shock wave from the front boundary of the medium. The interactionmechanism of a long wave with a bubbly medium (Fig. 5.9) was similar to
Fig. 5.9a–d. Dynamics of re-flection of a shock wave from theinterface with a bubble layer
170 5 Shock Waves in Bubbly Media
the case of short waves: the wave was transformed with absorption of theenergy of the head, the formation of a precursor, and reradiation.
The records of pressure by the gauge placed at a distance L ahead ofthe boundary of the bubbly medium (lower oscillograms) were of the mostinterest. They showed the development of tensile stresses and their increasewith increasing k0. Indeed, taking into account the significant difference inthe acoustic impedance ρc0 of the adjacent media at the location of the gauge,one could expect that after t∗ = 2L/c0, the recording of the front of the waveincident on the interface had been started and a wave reflected from the frontboundary of bubbles could appear as a rarefaction wave.
Figure 5.9 shows that after a certain time the gauge ahead of the mediumrecorded the appearance of the rarefaction wave. However, the interval dif-fered significantly from the time t∗ required for the front to pass the distancefrom the gauge to the boundary and back at velocity c0 and was equal to180 µs instead of anticipated 20 µs.
As a result, a narrow pressure peak and a rather long-duration zone ofreduced pressure were recorded in the reflected wave. It was obvious that thewidth of the peak was determined by the time the particles took to acquirethe additional mass velocity due to the collapse of bubbles (additional as com-pared with the velocity of the incident compression wave behind the front). Infact, during the collapse the radial velocity of bubble walls increased, so doesthe average velocity of liquid particles, and when it reached ≈ 2∆p/ρ0c0, onecould suggest that the reflection took place. No similar effects were observedfor short waves. This means that their reflection (in the used scale range ofrecording parameters of the medium and waves) were either not allowed, ordid not happen because of relatively low contribution of radial bubble os-cillations in short shock waves. However, in principle, they should exist andshould be dynamically related to the oscillation of bubbles.
5.1.3 Two-Phase Model of a Bubbly Liquid:Three Estimates of Wave Effects
In the early 1960s, a pressure-nonequilibrium two-phase mathematical modelwas published independently by Iordansky (1960) and Kogarko (1961) inRussia and by van Wijngaarden (1964) in the Netherlands to describe waveprocesses occurring in liquids containing gas or gas–vapor bubbles.
The Iordansky–Kogarko–van Wijndaarden (IKvanW) model has becomea revolutionary achievement in the mechanics of multiphase media. It is basedon a simple physical model:
a) The conservation laws are written for the averaged pressure p, density ρ,and mass velocity v;
b) The state of the medium is described by a dynamic subsystem includingthe Rayleigh equation for the bubbles radius R and the expression relatingthe average density ρ and the volumetric concentration of the gas (gas–vapor) phase k.

5.1 Wave Field Structure 171
The basic equations of the model have the formdρ
dt+ ρ div v = 0 ,
dv
dt+
1ρ∇p = 0 ,
ρ = (1 − kb)ρl , kb = k0(R/R0)3 , (5.7)
and
Rd2R
dt2+
32
(dR
dt
)2
=1ρl
(pg − p) .
This system should be supplemented by the equation of state for liquids(Tait’s equations) and gas in the bubbles: in a simplest case this can be anadiabat of the pR3γ = const type.
Within the acoustic approximation the IKvanW model was reduced to socalled “pk-model” [1–3]:
p − c−2l
∂2p
∂t2= −ρ0k0
∂2k
∂t2(5.8)
and∂2k
∂t2=
3k1/3
ρ0R20
(p0k−γ − p) +
16k
(∂k
∂t
)2
.
Here k = kb/k0(R/R0)3.In principle, now we can neglect bubbles and consider the medium as ho-
mogeneous but having some special properties described by the above sub-system of equations of state. Let us estimate the possibility of application ofpk-model (system (5.8)) to the description of wave effects observed experi-mentally.
5.1.3.1 Precursor
A precursor is a residual pulse of the incident shock wave that has preservedthe steepness of its front and has an oscillating profile. The wave packetresults from the radiation of the bubble layer absorbing the energy of the in-cident wave. It appears that the degree of compression of “collective” bubblesin a layer for constant parameters of the medium and shock waves determinesthe dissipation of the wave energy and the amplitude of the layer radiation,while the inertial character of the bubble collapse determines the delay ofthe reradiation maximum. In this case, the absorption of the energy of theincident wave and its reradiation by the bubble layer are continuous and con-current processes, whose maxima do not coincide in time for the above reason.
According to experimental data, one can assume that as a precursor forms,bubbles are radially accelerated (k 1, ∂k/∂t 0) and, consequently, theequation for the concentration k becomes
∂2k
∂t2 3
ρ0R20
(p0 − p) .
172 5 Shock Waves in Bubbly Media
which makes it possible to obtain from (5.8) the Klein–Gordon equation thatdescribes the formation of a precursor
p − c−20
∂2p
∂t2= α2 (p − p0) .
The equation involves a similarity parameter
α2 = 3k0/R20 ,
which depends on the characteristics of the bubbly medium.The solution of the Klein–Gordon equation has the form
p(x, c0t)− p0 = pbond(c0t− x)−αx
c0t−x∫0
pbond(τ)I1(α
√(c0t − τ)2 − x2)√
(c0t − τ)2 − x2dτ ,
where pbond(t) is the pressure at the boundary of the bubbly medium and I1
is the Bessel function.Comparison with experimental data (Fig. 5.7) shows that the parameter
β = α · l or β =√
3ko · l
Ro
(l is the length of the bubble layer) is a similarity criterion of the dampingamplitude of a shock wave in the bubbly medium.
5.1.3.2 Dispersion relationship
To estimate the conformity of the IKvanW model to the real process one canuse the determination of the propagation velocity of small disturbances asa criterion [3]. As an example we can refer to the dispersion phenomenon ofthe sound speed characteristic of multiphase media that was studied experi-mentally by Fox et al. [17] for bubbles of a certain size.
Let there be a discrete size distribution of bubbles for which in the systemdescribing the state of the medium (system (5.8)) the expression for densitycan be given more precisely by
ρ =(ρ0 +
p − p0
c20
)(1 + kb)−1 ,
where kb = Σkbj , kbj = kbj0(Rj/Rj0)3, and the equation for concentrationis rewritten for kbj/kbj0 = kj = (Rj/Rj0)3.
If small disturbances of the density and the concentration of each kind ofbubbles are presented as
ρ′ = ρ − ρ0 =p′
c20
− ρ0kb and kbj = kbj0
[1 + 3
( Rj
Rj0− 1
)],
5.1 Wave Field Structure 173
the initial system (5.8) for the one-dimensional problem will become
c−20 ptt − pxx − ρ0Σkbj0(kj)tt = 0 (5.9)
and
(k′j)tt + Ω2
j k′j = − Ω2
j
γp0p′ ,
where Ω2j = 3γp0/ρ0R
2j0 is the eigenfrequency of a bubble of the jth kind,
kj = kbj/kbj0, k′j = kbj/kbj0 − 1, p′ = p − p0.
We seek the solution in the form p = Aei(ωt−mx) and kbj = Bjei(ωt−mx).Substitution of the relations into the linearized system (5.9) after simpletransformations leads to the following relation for the phase speed of soundcph = ω/m (here m is the wave number):
c20
c2ph
= 1 +c20
c2eq
N∑j=1
kbj01
1 − (ω2/Ω2j )
,
where ceq is the equilibrium speed of sound in the two-phase medium, ac-cording to Lyakhov [5].
For N → ∞, we obtain the dispersion relation for the continuous sizedistribution of bubbles [1]:
1c2ph
=1c20
+1
c2eq
∞∫0
k(R)dR
1 − (ω/Ω)2. (5.10)
In this case,∞∫0
k(R) dR = 1, c2eq =
γp0
ρ0k0(1 − k0), and Ω2 =
3γp0
ρ0R20
,
where k(R) is the concentration ratio of bubbles of radius R.The integral in (5.10) can be transformed as
∞∫0
k(R)dR
1 − (ω/Ω)2=
12
⎛⎝ ∞∫
0
k(R)dR
1 − (ω/a)R+
−∞∫0
k(−R1)d(−R1)1 − (ω/a)R1
⎞⎠ ,
on the condition that the function k(R) acquires the form∞∫0
k(R)dR
1 − (ω/Ω)2=
12ω/a
∞∫−∞
k(R)dR
a/ω − R.
Now we can rewrite (5.10) as
1c2ph
=1c20
+1
c2eq
12ω/a
∞∫−∞
k(R)dR
a/ω − R,
where a =√
3γp0/ρ0.
174 5 Shock Waves in Bubbly Media
We present the experimental data of Fox et al. [15] for the bubble con-centration range as
k(R) = q(R
b
)2(1 +
(R
b
)4)−1
,
where b is an arbitrary scale factor, which is selected based on some physicalconsiderations and q is found from the obvious conditions
∞∫−∞
k(R)dR = 2 or
∞∫−∞
k(R)dR = qb
∞∫−∞
z2dz
1 + z4.
Since the critical points of the subintegral function are (1 + i)/√
2 and(−1 + i)/
√2, following the theorem on deductions [16],
2 = qb2πi
[((1 + i)/
√2)2
4((1 + i)/√
2)3+
((−1 + i)/√
2)2
4((−1 + i)/√
2)3
]=
qbπ√2
,
where q = 2√
2πb . Then the integral in the expression for the phase velocity can
be transformed as follows:
I = qb2
∞∫−∞
R2dR
(a/ω − R)(b4 + R4)=
= qb22πi
[(b(1 + i)/
√2)2
4(b(1 + i)/√
2)3(a/ω − b(1 − i)/√
2)+
+(b(−1 + i)/
√2)2
4(b(−1 + i)/√
2)3(a/ω − b(−1 + i)/√
2)− 1
2(a/ω)2
b4 + (a/ω)4
]=
=√
22
πqba
ω
(a/ω)2 − b2
(a/ω)4 + b4.
Thus, the dispersion relation for the continuous size distribution of bub-bles becomes
c−2ph = c−2
0 + c−2eq
[1 −
( ω
Ω(b)
)2][1 +
( ω
Ω(b)
)4]−1
. (5.11)
Here Ω(b) is the scale factor selected, for example, from the condition ofcoincidence of theoretical and experimental data at a point of the dispersioncurve cph = c0.
Figure 5.10 presents the calculation results for the dispersion curve using(5.11) and the experimental data of [17] obtained for the following conditions:p0 = 0.1 MPa, γ = 1.4, k0 = 0.000 25, 0.0002, and 0.000 15 (curves 1–3,respectively). We note that the results of [17] suggested that the authors
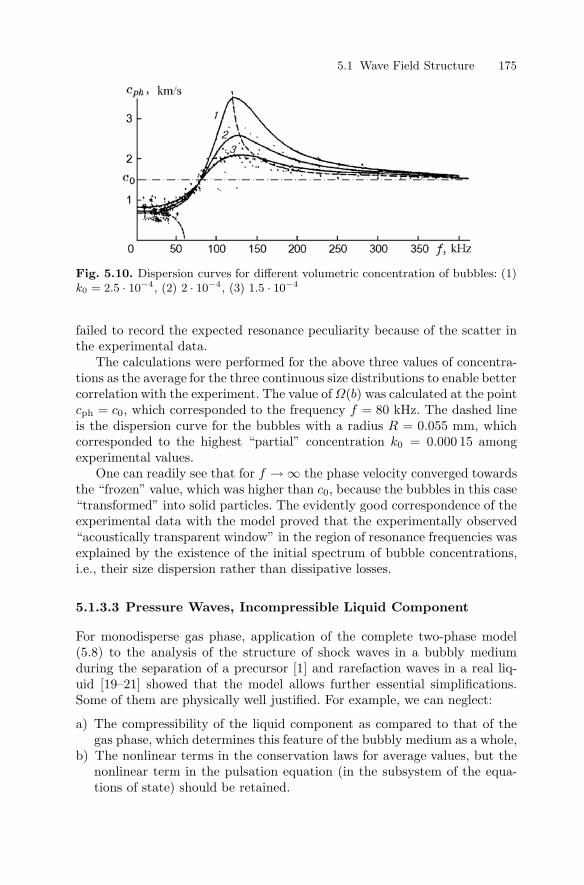
5.1 Wave Field Structure 175
Fig. 5.10. Dispersion curves for different volumetric concentration of bubbles: (1)k0 = 2.5 · 10−4, (2) 2 · 10−4, (3) 1.5 · 10−4
failed to record the expected resonance peculiarity because of the scatter inthe experimental data.
The calculations were performed for the above three values of concentra-tions as the average for the three continuous size distributions to enable bettercorrelation with the experiment. The value of Ω(b) was calculated at the pointcph = c0, which corresponded to the frequency f = 80 kHz. The dashed lineis the dispersion curve for the bubbles with a radius R = 0.055 mm, whichcorresponded to the highest “partial” concentration k0 = 0.000 15 amongexperimental values.
One can readily see that for f → ∞ the phase velocity converged towardsthe “frozen” value, which was higher than c0, because the bubbles in this case“transformed” into solid particles. The evidently good correspondence of theexperimental data with the model proved that the experimentally observed“acoustically transparent window” in the region of resonance frequencies wasexplained by the existence of the initial spectrum of bubble concentrations,i.e., their size dispersion rather than dissipative losses.
5.1.3.3 Pressure Waves, Incompressible Liquid Component
For monodisperse gas phase, application of the complete two-phase model(5.8) to the analysis of the structure of shock waves in a bubbly mediumduring the separation of a precursor [1] and rarefaction waves in a real liq-uid [19–21] showed that the model allows further essential simplifications.Some of them are physically well justified. For example, we can neglect:
a) The compressibility of the liquid component as compared to that of thegas phase, which determines this feature of the bubbly medium as a whole,
b) The nonlinear terms in the conservation laws for average values, but thenonlinear term in the pulsation equation (in the subsystem of the equa-tions of state) should be retained.
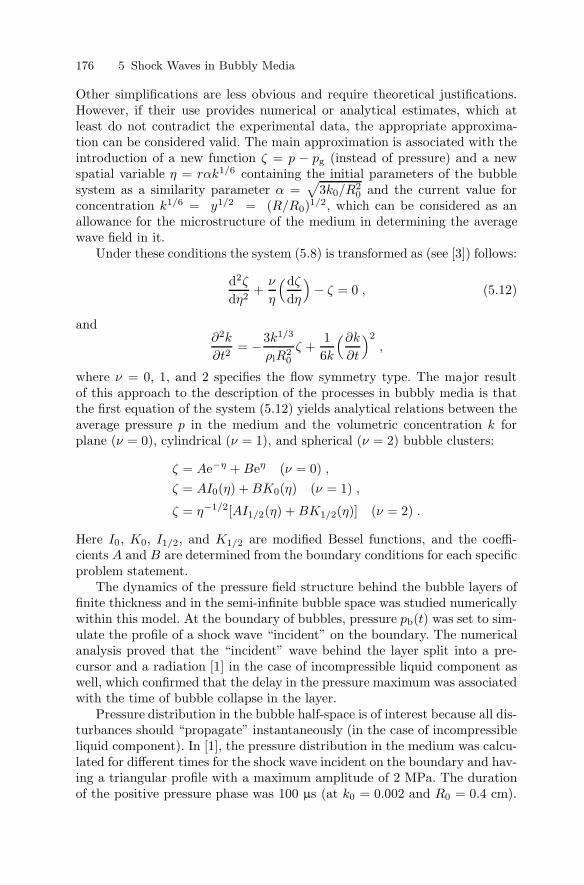
176 5 Shock Waves in Bubbly Media
Other simplifications are less obvious and require theoretical justifications.However, if their use provides numerical or analytical estimates, which atleast do not contradict the experimental data, the appropriate approxima-tion can be considered valid. The main approximation is associated with theintroduction of a new function ζ = p − pg (instead of pressure) and a newspatial variable η = rαk1/6 containing the initial parameters of the bubblesystem as a similarity parameter α =
√3k0/R2
0 and the current value forconcentration k1/6 = y1/2 = (R/R0)1/2, which can be considered as anallowance for the microstructure of the medium in determining the averagewave field in it.
Under these conditions the system (5.8) is transformed as (see [3]) follows:
d2ζ
dη2+
ν
η
(dζ
dη
)− ζ = 0 , (5.12)
and∂2k
∂t2= −3k1/3
ρlR20
ζ +16k
(∂k
∂t
)2
,
where ν = 0, 1, and 2 specifies the flow symmetry type. The major resultof this approach to the description of the processes in bubbly media is thatthe first equation of the system (5.12) yields analytical relations between theaverage pressure p in the medium and the volumetric concentration k forplane (ν = 0), cylindrical (ν = 1), and spherical (ν = 2) bubble clusters:
ζ = Ae−η + Beη (ν = 0) ,
ζ = AI0(η) + BK0(η) (ν = 1) ,
ζ = η−1/2[AI1/2(η) + BK1/2(η)] (ν = 2) .
Here I0, K0, I1/2, and K1/2 are modified Bessel functions, and the coeffi-cients A and B are determined from the boundary conditions for each specificproblem statement.
The dynamics of the pressure field structure behind the bubble layers offinite thickness and in the semi-infinite bubble space was studied numericallywithin this model. At the boundary of bubbles, pressure pb(t) was set to sim-ulate the profile of a shock wave “incident” on the boundary. The numericalanalysis proved that the “incident” wave behind the layer split into a pre-cursor and a radiation [1] in the case of incompressible liquid component aswell, which confirmed that the delay in the pressure maximum was associatedwith the time of bubble collapse in the layer.
Pressure distribution in the bubble half-space is of interest because all dis-turbances should “propagate” instantaneously (in the case of incompressibleliquid component). In [1], the pressure distribution in the medium was calcu-lated for different times for the shock wave incident on the boundary and hav-ing a triangular profile with a maximum amplitude of 2 MPa. The durationof the positive pressure phase was 100 µs (at k0 = 0.002 and R0 = 0.4 cm).
5.1 Wave Field Structure 177
The calculations proved that a compression wave propagates in the mediumwith a variable velocity and with an amplitude exponentially vanishing withtime (Fig. 5.11).
Some time later the bubbles continued oscillating and a compression wavearose again in the initial layers, which propagated inside the layer: a periodicsystem of waves with a decreasing amplitude initiated in the fixed point of thespace. The above examples show that the IKvanW model yields numericalresults that are adequate to the experimental data on the development ofwave processes in bubbly media.
Fig. 5.11. Profile of the “travel-ing” compression wave in the half-space of a bubbly liquid with anincompressible liquid component
5.1.4 Amplification, Collision, and Focusing of Shock Waves
For several decades, experimental, theoretical, and numerical studies of theamplification and focusing of shock waves in various media were traditionallyfocused on the generation of high pressures in homogeneous and multiphasesystems. As to the multiphase systems, one should mention the studies ofthe disintegration mechanisms of kidney stones by convergent shock waves inliquids, the initiation of explosive processes, and the problem of an acoustic“laser.”
Among the studies of the disintegration mechanisms we would like to men-tion the surveys by Gronig and Sturtevant, experimental data and numericalmodels for convergent cylindrical shock waves in a homogeneous mediumby Takayama, Watanabe, Nagoya, Stuka, Kuwahara, Isuzukawa, Horiuchiet al. [22–35] (1989–1993), and the studies of the role of cavitation effects inthe disintegration mechanism [21].
Publication of the studies of the so-called acoustic “laser” [36, 37] deal-ing with the possible methods of excitation of coherent acoustic radiationand its amplification refreshed attention to the peculiar properties of bub-bly media and their ability to amplify shock waves and form a system of
178 5 Shock Waves in Bubbly Media
layers with coherent properties in the medium [1, 2]. The cavitation clusterarising in the heterogeneous liquid under the effect of tensile stresses andthe liquid with bubbles containing explosive gas mixture can be consideredas hydrodynamic and physical analogs of pumping in laser systems, respec-tively. Even under the interaction with a weak shock wave the cavitationcluster radiates a series of compression pulses with the frequency of collec-tive oscillations of bubbles [1, 2], while the interaction of waves in a bubblyliquid can result in a strong pressure pulse. These effects can underlie theprinciples of creation of acoustic analogs of laser systems. Therefore, theproblem of adequate numerical modeling of such processes and the possi-bility of estimation of the level of amplification of the wave field as a re-sult of such interactions are not only of fundamental but also of appliedsignificance.
5.1.4.1 Shock Wave Amplification by a Cavitation ClusterNear the Solid Wall
Discovery of the possibility to generate high dynamic loads near a solidwall [1] by an oscillating cavitation (bubble) cluster allowed observation ofunexpected effects. Under sudden recovery of the hydrostatic pressure on theboundary of the cavitation cluster, the cumulative character of the bubblecollapse and strong inertial effects lead to the generation of a series of strongpressure pulses on the wall surface [1].
This effect was found in numerical calculations of the layer dynamics ata wall carried out within the model (5.12). Let us consider the statement ofthe problem in detail. At a solid wall there is a layer of thickness l formedby uniformly distributed cavitation bubbles with an initial radius R0 andvolumetric concentration k0 formed as a result of pressure drop from thehydrostatic value phs to p0, for example, due to the emergence of the wallfrom the liquid. At the time t = 0 hydrostatic pressure phs is instantaneously“restored” and is kept constant on the layer boundary. The problem is solvedwith the following boundary conditions:
ζ = phs − p0k−γ at x = l
(β =
√3k0
R20
l
)
and∂ζ
∂η= 0 , at x = 0 ,
where the latter is due to the symmetry.The calculations were performed for a wide range of rarefaction waves in
the layer phs/p0 = 300, 200, 100, and 70 and for β = 1, 2, 3, and 4. Thecharacteristic pressure profile at the solid wave is shown in Fig. 5.12. Onecan see that in spite of the low pressure at the boundary of the cavitationzone (phs = 0.1 MPa), a series of strong pressure pulses with amplitudes of
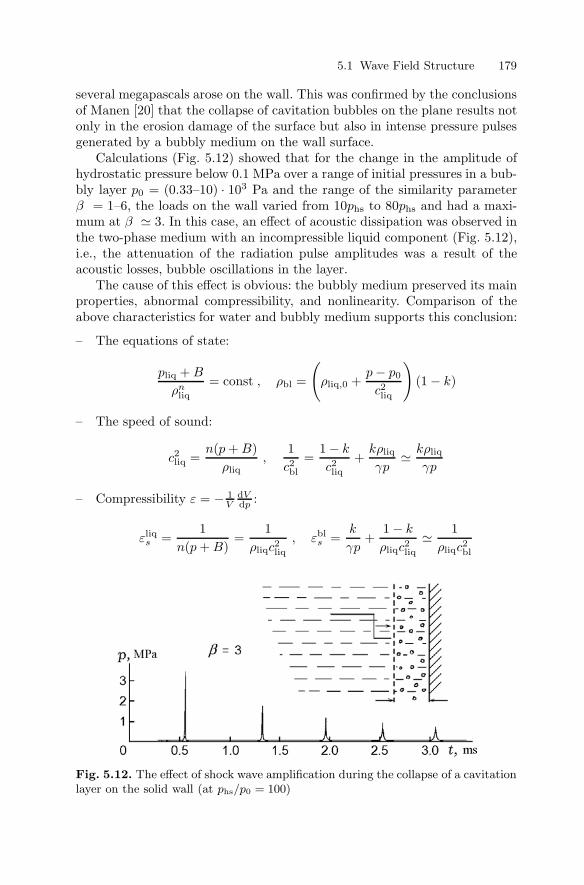
5.1 Wave Field Structure 179
several megapascals arose on the wall. This was confirmed by the conclusionsof Manen [20] that the collapse of cavitation bubbles on the plane results notonly in the erosion damage of the surface but also in intense pressure pulsesgenerated by a bubbly medium on the wall surface.
Calculations (Fig. 5.12) showed that for the change in the amplitude ofhydrostatic pressure below 0.1 MPa over a range of initial pressures in a bub-bly layer p0 = (0.33–10) · 103 Pa and the range of the similarity parameterβ = 1–6, the loads on the wall varied from 10phs to 80phs and had a maxi-mum at β 3. In this case, an effect of acoustic dissipation was observed inthe two-phase medium with an incompressible liquid component (Fig. 5.12),i.e., the attenuation of the radiation pulse amplitudes was a result of theacoustic losses, bubble oscillations in the layer.
The cause of this effect is obvious: the bubbly medium preserved its mainproperties, abnormal compressibility, and nonlinearity. Comparison of theabove characteristics for water and bubbly medium supports this conclusion:
– The equations of state:
pliq + B
ρnliq
= const , ρbl =
(ρliq,0 +
p − p0
c2liq
)(1 − k)
– The speed of sound:
c2liq =
n(p + B)ρliq
,1c2bl
=1 − k
c2liq
+kρliq
γp kρliq
γp
– Compressibility ε = − 1V
dVdp :
εliqs =
1n(p + B)
=1
ρliqc2liq
, εbls =
k
γp+
1 − k
ρliqc2liq
1ρliqc2
bl
Fig. 5.12. The effect of shock wave amplification during the collapse of a cavitationlayer on the solid wall (at phs/p0 = 100)
180 5 Shock Waves in Bubbly Media
– Nonlinearity (BA = ∂(1/ε)
∂p |s − 1):
B
A|bl = γn
nk(p + B)2 + γ(1 + k)p2
[nk(p + B) + γ(1 − k)p]2− 1 ,
B
A|gas = γ − 1 ,
B
A|liq = n − 1 ,
B
A|bl γ
k− 1 ,
here k = k01−k0
ρliqβ3, β = R
R0and B = 321.4 MPa, n = 7, following Ridah
(see Chap. 1, [3]).
In conclusion one can note the experimental results of Reisman et al. [38]on the dynamics and acoustics of cloud cavitation formed by the periodicbreakup and collapse of a sheet or vortex cavity. It was found that severaltypes of shock waves are formed in a collapsing cloud which were associated,in particular, with the coherent collapse of a well-defined and separate cloudwhen it is convected into a region of higher pressure. This type of globalstructure causes the largest impulsive pressures and radiated noise. It wasconcluded that the ubiquity and severity of these propagating shock wavestructures provides a new perspective on the mechanisms reponsible for noiseand damage in cavitating flows involving clouds of bubbles. Besides it wouldappear that shock wave dynamics rather than the collapse dynamics of singlebubbles determine the damage and noise in many cavitating flows.
5.1.4.2 Collision of Stationary Shock Waves.Statement of the Problem
Here we consider a general statement of the problem on the interaction ofshock waves that allows solving a wider spectrum of interaction problem [39].
Let us assume that at the time t = 0, pressure pb increases abruptly andis kept constant at two opposite boundaries placed at a distance L from eachother. At t > 0 shock waves start moving towards each other in the bubblymedium and separate into precursors and main disturbances in the form ofshock waves with an oscillating front.
The two-phase mathematical model that enables the description of theformation, propagation, and interaction of waves involves:
– The laws of conservation for average p, ρ, and u:
∂ρ
∂t= −ρ2 ∂u
∂sand
∂u
∂t= −∂p
∂s
– The Rayleigh equation:
∂β
∂t= S and β
∂S
∂t+
32S2 = C1
T
β3− C2
β− C3
S
β− p
5.1 Wave Field Structure 181
– The equation for temperature:
∂T
∂t= δ(γ − 1)Nu
β3(1 − T )T
− 3(γ − 1)TS
β(5.13)
– The parameters and the equation of state of a liquid:
p = 1 +ρ0c
20
np0
[(ρ
1 − k
)n
− 1]
, k =k0
1 − k0ρβ3 ,
Pe = C4(γ − 1)β|S|
|1 − T | , Nu =√
Pe , Pe > 100 ,10 , Pe ≤ 100 .
C1 =ρg0T0B
p0M, C2 =
2σ
R0p0, C3 =
4µ
R0√
p0ρ0
and
C4 =12R0
√p0/ρ0
ν.
Here s is the Lagrangian variable. The coefficient δ is used in the equationfor energy to account for the heat exchange and to correlate its intensity.The necessity of the latter is associated with the approximate nature of therelations used in the system for the Nusselt and Peclet numbers proposed byNigmatullin, which is quite applicable to weak waves.
Since the velocities of main disturbances are much lower than those of theprecursors, the latter collide first in the flow symmetry plane, reflect from it,and interact with the main waves, somewhat distorting their profile beforethe collision.
The dynamics of the collision of stationary waves will be considered belowby the example of reactive bubbly media. Here we note only that the ampli-fication of the wave amplitude under the collision is explained by the inertialproperties of the “liquid–bubble” system, the abnormal compressibility of thebubbly medium, and the dynamic character of the collision. The data on theamplification of shock waves under collision (the analog of reflection froma solid wall in the case of the equal amplitudes) in the bubbly medium arepresented in Fig. 5.13 and Table 5.2 as the dependencies of pref on k0 (theamplitude of the incident wave is 1 MPa, R0 = 0.1 cm). The calculationswere performed for various L sufficient to shape a stationary wave structurebefore the reflection. The scatter in the data was due to the differences in thephases of interaction of the reflected precursors with the main incident wave.
One can see that the volumetric concentration was crucial for the amplifi-cation: the increase in k0 resulted in the monotonic growth of the maximumpressure in the collision plane (on a “solid wall”), which can be approximatedby the following dependence (Fig. 5.13, dotted curve):
pref/pb 2 + 24.5k1/40 .
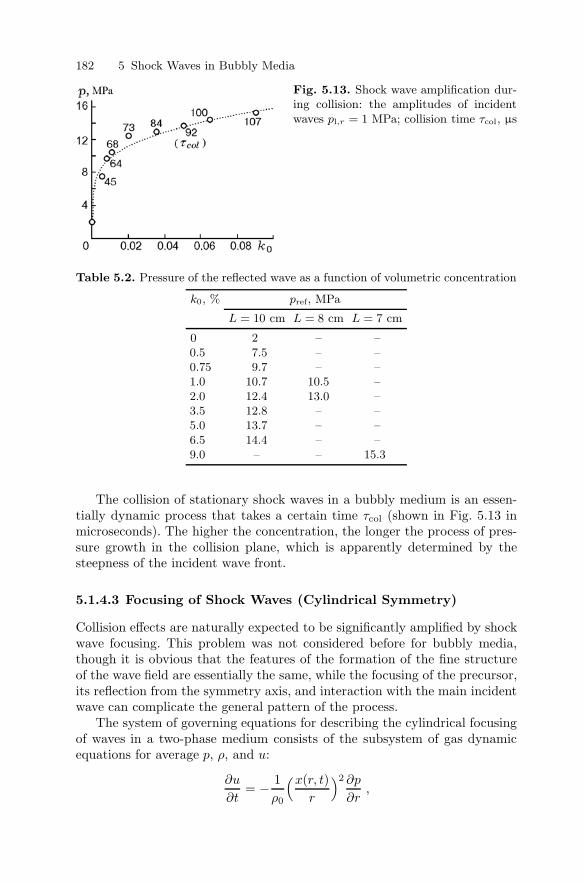
182 5 Shock Waves in Bubbly Media
Fig. 5.13. Shock wave amplification dur-ing collision: the amplitudes of incidentwaves pl,r = 1 MPa; collision time τcol, µs
Table 5.2. Pressure of the reflected wave as a function of volumetric concentration
k0, % pref, MPa
L = 10 cm L = 8 cm L = 7 cm
0 2 – –0.5 7.5 – –0.75 9.7 – –1.0 10.7 10.5 –2.0 12.4 13.0 –3.5 12.8 – –5.0 13.7 – –6.5 14.4 – –9.0 – – 15.3
The collision of stationary shock waves in a bubbly medium is an essen-tially dynamic process that takes a certain time τcol (shown in Fig. 5.13 inmicroseconds). The higher the concentration, the longer the process of pres-sure growth in the collision plane, which is apparently determined by thesteepness of the incident wave front.
5.1.4.3 Focusing of Shock Waves (Cylindrical Symmetry)
Collision effects are naturally expected to be significantly amplified by shockwave focusing. This problem was not considered before for bubbly media,though it is obvious that the features of the formation of the fine structureof the wave field are essentially the same, while the focusing of the precursor,its reflection from the symmetry axis, and interaction with the main incidentwave can complicate the general pattern of the process.
The system of governing equations for describing the cylindrical focusingof waves in a two-phase medium consists of the subsystem of gas dynamicequations for average p, ρ, and u:
∂u
∂t= − 1
ρ0
(x(r, t)r
)2 ∂p
∂r,

5.1 Wave Field Structure 183
∂x
∂t= u , (5.14)
1ρ
=1ρ0
(x(r, t)r
)2 ∂x
∂r,
and the subsystem of kinetic equations presented in the system (5.13).Figure 5.14 presents the numerical results for the focusing of a stationary
shock wave with a front steepness of 1.5 µs in a one-phase liquid. By analogywith the reflection, one can expect that, as compared to a pure liquid inwhich the shock wave amplitude increases by a factor of 20, the focusingin a bubbly system will yield a much stronger effect. The converging one-dimensional cylindrical shock waves were calculated using the system (5.14)for a bubbly medium at similar initial and boundary conditions mentionedin the previous problem (focusing radius r = 5 cm).
The entire pattern of focusing on the shock wave axis in the bubblymedium is shown in Fig. 5.15. Here we should first note the focusing ofa precursor (with time interval of 20–40 µs) has a reflection that will natu-rally affect the profile of the main wave reaching the focus by about 100 µs.It is also noteworthy that the wave amplitude in the focus will increase byan order of magnitude in bubbly media as compared to pure liquids.
Analysis of the calculation results for a wide range of k0 showed that thepressure dynamics in the wave front pmax(r) as the wave focused on the axisis approximated by the Lorenz profile (L):
Fig. 5.14. Focusing of a shock wave in a pure liquid
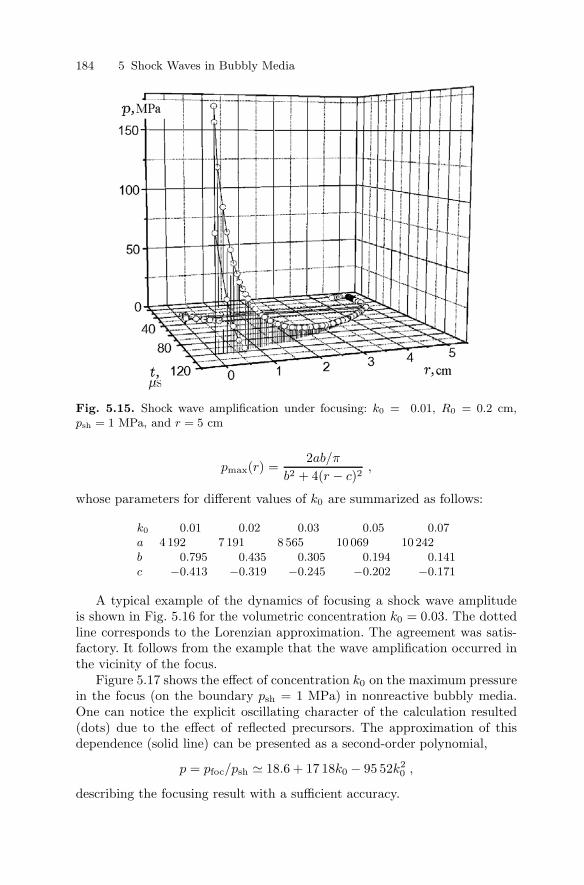
184 5 Shock Waves in Bubbly Media
Fig. 5.15. Shock wave amplification under focusing: k0 = 0.01, R0 = 0.2 cm,psh = 1 MPa, and r = 5 cm
pmax(r) =2ab/π
b2 + 4(r − c)2,
whose parameters for different values of k0 are summarized as follows:
k0 0.01 0.02 0.03 0.05 0.07a 4 192 7 191 8 565 10 069 10 242b 0.795 0.435 0.305 0.194 0.141c −0.413 −0.319 −0.245 −0.202 −0.171
A typical example of the dynamics of focusing a shock wave amplitudeis shown in Fig. 5.16 for the volumetric concentration k0 = 0.03. The dottedline corresponds to the Lorenzian approximation. The agreement was satis-factory. It follows from the example that the wave amplification occurred inthe vicinity of the focus.
Figure 5.17 shows the effect of concentration k0 on the maximum pressurein the focus (on the boundary psh = 1 MPa) in nonreactive bubbly media.One can notice the explicit oscillating character of the calculation resulted(dots) due to the effect of reflected precursors. The approximation of thisdependence (solid line) can be presented as a second-order polynomial,
p = pfoc/psh 18.6 + 17 18k0 − 95 52k20 ,
describing the focusing result with a sufficient accuracy.
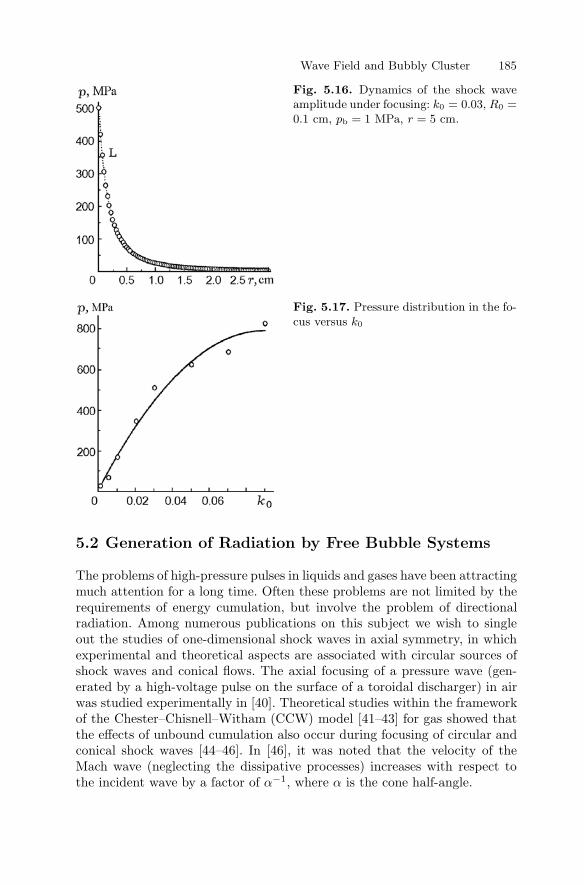
Wave Field and Bubbly Cluster 185
Fig. 5.16. Dynamics of the shock waveamplitude under focusing: k0 = 0.03, R0 =0.1 cm, pb = 1 MPa, r = 5 cm.
Fig. 5.17. Pressure distribution in the fo-cus versus k0
5.2 Generation of Radiation by Free Bubble Systems
The problems of high-pressure pulses in liquids and gases have been attractingmuch attention for a long time. Often these problems are not limited by therequirements of energy cumulation, but involve the problem of directionalradiation. Among numerous publications on this subject we wish to singleout the studies of one-dimensional shock waves in axial symmetry, in whichexperimental and theoretical aspects are associated with circular sources ofshock waves and conical flows. The axial focusing of a pressure wave (gen-erated by a high-voltage pulse on the surface of a toroidal discharger) in airwas studied experimentally in [40]. Theoretical studies within the frameworkof the Chester–Chisnell–Witham (CCW) model [41–43] for gas showed thatthe effects of unbound cumulation also occur during focusing of circular andconical shock waves [44–46]. In [46], it was noted that the velocity of theMach wave (neglecting the dissipative processes) increases with respect tothe incident wave by a factor of α−1, where α is the cone half-angle.
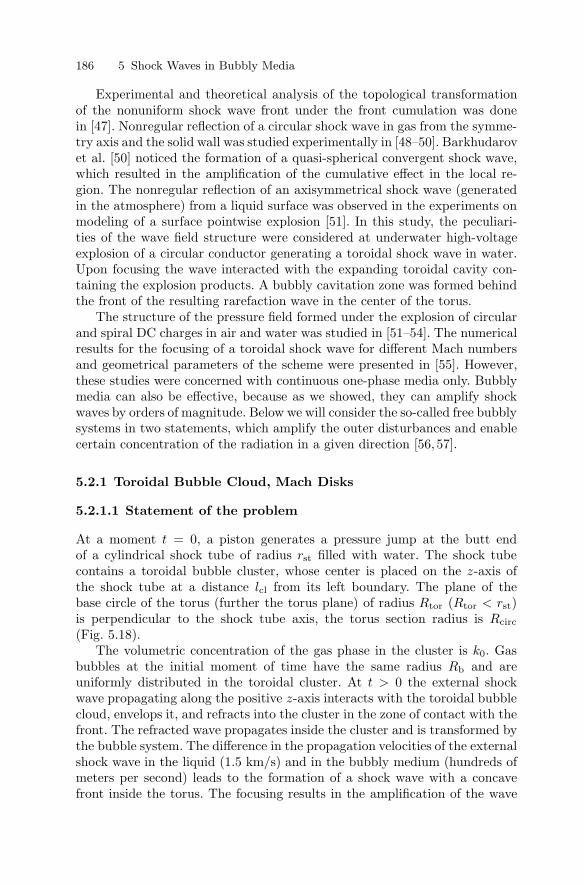
186 5 Shock Waves in Bubbly Media
Experimental and theoretical analysis of the topological transformationof the nonuniform shock wave front under the front cumulation was donein [47]. Nonregular reflection of a circular shock wave in gas from the symme-try axis and the solid wall was studied experimentally in [48–50]. Barkhudarovet al. [50] noticed the formation of a quasi-spherical convergent shock wave,which resulted in the amplification of the cumulative effect in the local re-gion. The nonregular reflection of an axisymmetrical shock wave (generatedin the atmosphere) from a liquid surface was observed in the experiments onmodeling of a surface pointwise explosion [51]. In this study, the peculiari-ties of the wave field structure were considered at underwater high-voltageexplosion of a circular conductor generating a toroidal shock wave in water.Upon focusing the wave interacted with the expanding toroidal cavity con-taining the explosion products. A bubbly cavitation zone was formed behindthe front of the resulting rarefaction wave in the center of the torus.
The structure of the pressure field formed under the explosion of circularand spiral DC charges in air and water was studied in [51–54]. The numericalresults for the focusing of a toroidal shock wave for different Mach numbersand geometrical parameters of the scheme were presented in [55]. However,these studies were concerned with continuous one-phase media only. Bubblymedia can also be effective, because as we showed, they can amplify shockwaves by orders of magnitude. Below we will consider the so-called free bubblysystems in two statements, which amplify the outer disturbances and enablecertain concentration of the radiation in a given direction [56, 57].
5.2.1 Toroidal Bubble Cloud, Mach Disks
5.2.1.1 Statement of the problem
At a moment t = 0, a piston generates a pressure jump at the butt endof a cylindrical shock tube of radius rst filled with water. The shock tubecontains a toroidal bubble cluster, whose center is placed on the z-axis ofthe shock tube at a distance lcl from its left boundary. The plane of thebase circle of the torus (further the torus plane) of radius Rtor (Rtor < rst)is perpendicular to the shock tube axis, the torus section radius is Rcirc
(Fig. 5.18).The volumetric concentration of the gas phase in the cluster is k0. Gas
bubbles at the initial moment of time have the same radius Rb and areuniformly distributed in the toroidal cluster. At t > 0 the external shockwave propagating along the positive z-axis interacts with the toroidal bubblecloud, envelops it, and refracts into the cluster in the zone of contact with thefront. The refracted wave propagates inside the cluster and is transformed bythe bubble system. The difference in the propagation velocities of the externalshock wave in the liquid (1.5 km/s) and in the bubbly medium (hundreds ofmeters per second) leads to the formation of a shock wave with a concavefront inside the torus. The focusing results in the amplification of the wave
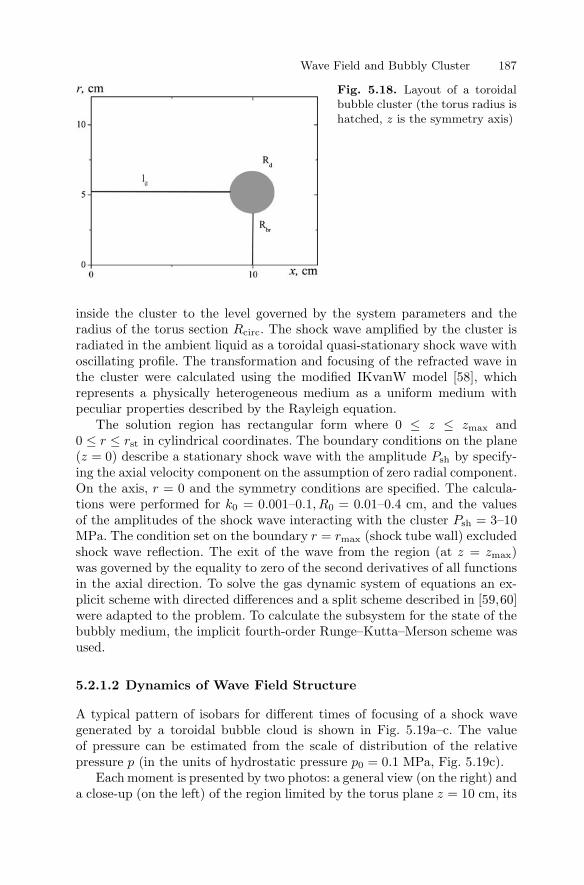
Wave Field and Bubbly Cluster 187
Fig. 5.18. Layout of a toroidalbubble cluster (the torus radius ishatched, z is the symmetry axis)
inside the cluster to the level governed by the system parameters and theradius of the torus section Rcirc. The shock wave amplified by the cluster isradiated in the ambient liquid as a toroidal quasi-stationary shock wave withoscillating profile. The transformation and focusing of the refracted wave inthe cluster were calculated using the modified IKvanW model [58], whichrepresents a physically heterogeneous medium as a uniform medium withpeculiar properties described by the Rayleigh equation.
The solution region has rectangular form where 0 ≤ z ≤ zmax and0 ≤ r ≤ rst in cylindrical coordinates. The boundary conditions on the plane(z = 0) describe a stationary shock wave with the amplitude Psh by specify-ing the axial velocity component on the assumption of zero radial component.On the axis, r = 0 and the symmetry conditions are specified. The calcula-tions were performed for k0 = 0.001–0.1, R0 = 0.01–0.4 cm, and the valuesof the amplitudes of the shock wave interacting with the cluster Psh = 3–10MPa. The condition set on the boundary r = rmax (shock tube wall) excludedshock wave reflection. The exit of the wave from the region (at z = zmax)was governed by the equality to zero of the second derivatives of all functionsin the axial direction. To solve the gas dynamic system of equations an ex-plicit scheme with directed differences and a split scheme described in [59,60]were adapted to the problem. To calculate the subsystem for the state of thebubbly medium, the implicit fourth-order Runge–Kutta–Merson scheme wasused.
5.2.1.2 Dynamics of Wave Field Structure
A typical pattern of isobars for different times of focusing of a shock wavegenerated by a toroidal bubble cloud is shown in Fig. 5.19a–c. The valueof pressure can be estimated from the scale of distribution of the relativepressure p (in the units of hydrostatic pressure p0 = 0.1 MPa, Fig. 5.19c).
Each moment is presented by two photos: a general view (on the right) anda close-up (on the left) of the region limited by the torus plane z = 10 cm, its
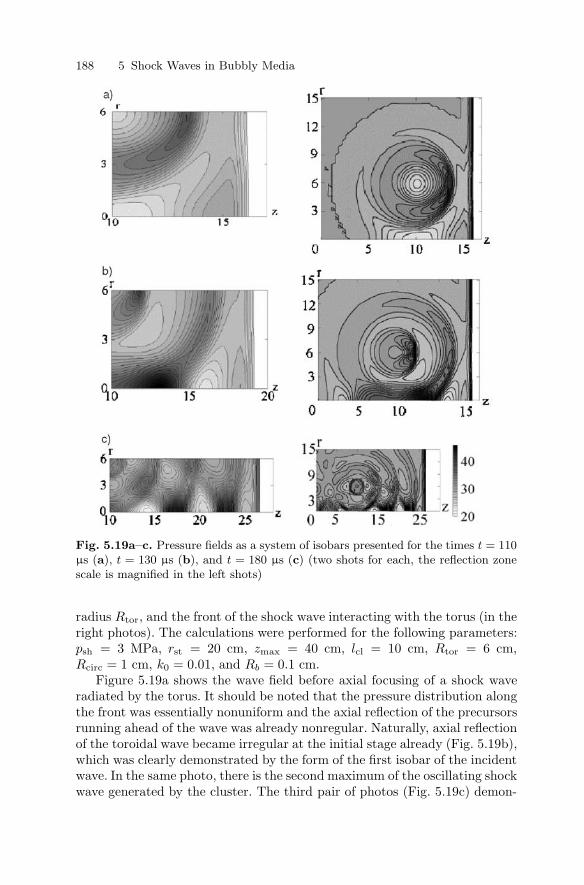
188 5 Shock Waves in Bubbly Media
Fig. 5.19a–c. Pressure fields as a system of isobars presented for the times t = 110µs (a), t = 130 µs (b), and t = 180 µs (c) (two shots for each, the reflection zonescale is magnified in the left shots)
radius Rtor, and the front of the shock wave interacting with the torus (in theright photos). The calculations were performed for the following parameters:psh = 3 MPa, rst = 20 cm, zmax = 40 cm, lcl = 10 cm, Rtor = 6 cm,Rcirc = 1 cm, k0 = 0.01, and Rb = 0.1 cm.
Figure 5.19a shows the wave field before axial focusing of a shock waveradiated by the torus. It should be noted that the pressure distribution alongthe front was essentially nonuniform and the axial reflection of the precursorsrunning ahead of the wave was already nonregular. Naturally, axial reflectionof the toroidal wave became irregular at the initial stage already (Fig. 5.19b),which was clearly demonstrated by the form of the first isobar of the incidentwave. In the same photo, there is the second maximum of the oscillating shockwave generated by the cluster. The third pair of photos (Fig. 5.19c) demon-

Wave Field and Bubbly Cluster 189
strates the formation of two Mach discs on the axis. The complicated wavestructure, including the system of rarefaction waves, the precursors and thefading sequence of pressure peaks of the oscillating shock wave, slightly “ob-scured” the detailed pattern of the region of irregular reflection and requireshigher resolution.
The results are presented in Fig. 5.20a–d for four values of the volumecontent of the gas phase and the times corresponding to the appearance of theirregular reflection at fixed values of other parameters. One can see that forthis type of waves the width of the zone of axisymmetrical irregular reflection(the Mach disc) was finite and was equal to 4–5 cm. A high-pressure zonelimited by the system of closed isobars, which can be defined as the Machdisc core, was distinctly visible in the disc.
In Figure 5.20a–c, the core center was slightly shifted along the axis tothe right with respect to the coordinate z = 15 cm; in Fig. 5.20d the corezone along the axis was placed approximately in the range z = 12–15 cm. Theisobars ahead of the core belonged to the fore front of the appropriate maxi-mum of the focusing shock wave; behind it, the isobars of its trailing edge thatrepresent the structure of the reflected wave. A distinctive feature of the re-flection process was that due to the oscillation structure of the focusing wave,its subsequent maxima with the system of isobars with increasing pressureinteracted with the reflected wave and pressed it to the axis. This suggeststhat this effect resulted in the appearance of the zone of relative rarefactionbehind the Mach disc (see Fig. 5.19c). The numerical results for the growth of
Fig. 5.20a–d. The structure of isobar distribution in the Mach discs for volumetricconcentrations of the gas phase in the torus: (a) k0 = 0.1, (b) k0 = 0.05, (c)k0 = 0.01, (d) k0 = 0.001
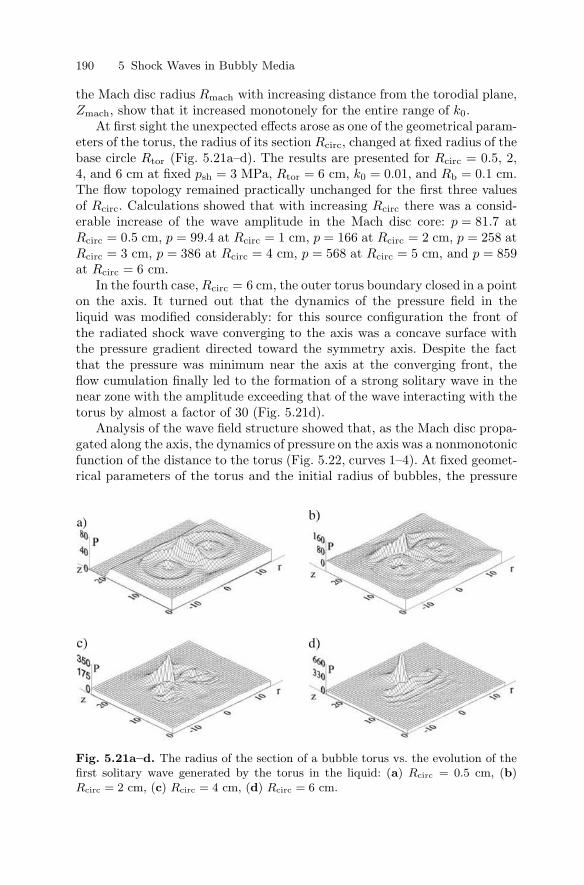
190 5 Shock Waves in Bubbly Media
the Mach disc radius Rmach with increasing distance from the torodial plane,Zmach, show that it increased monotonely for the entire range of k0.
At first sight the unexpected effects arose as one of the geometrical param-eters of the torus, the radius of its section Rcirc, changed at fixed radius of thebase circle Rtor (Fig. 5.21a–d). The results are presented for Rcirc = 0.5, 2,4, and 6 cm at fixed psh = 3 MPa, Rtor = 6 cm, k0 = 0.01, and Rb = 0.1 cm.The flow topology remained practically unchanged for the first three valuesof Rcirc. Calculations showed that with increasing Rcirc there was a consid-erable increase of the wave amplitude in the Mach disc core: p = 81.7 atRcirc = 0.5 cm, p = 99.4 at Rcirc = 1 cm, p = 166 at Rcirc = 2 cm, p = 258 atRcirc = 3 cm, p = 386 at Rcirc = 4 cm, p = 568 at Rcirc = 5 cm, and p = 859at Rcirc = 6 cm.
In the fourth case, Rcirc = 6 cm, the outer torus boundary closed in a pointon the axis. It turned out that the dynamics of the pressure field in theliquid was modified considerably: for this source configuration the front ofthe radiated shock wave converging to the axis was a concave surface withthe pressure gradient directed toward the symmetry axis. Despite the factthat the pressure was minimum near the axis at the converging front, theflow cumulation finally led to the formation of a strong solitary wave in thenear zone with the amplitude exceeding that of the wave interacting with thetorus by almost a factor of 30 (Fig. 5.21d).
Analysis of the wave field structure showed that, as the Mach disc propa-gated along the axis, the dynamics of pressure on the axis was a nonmonotonicfunction of the distance to the torus (Fig. 5.22, curves 1–4). At fixed geomet-rical parameters of the torus and the initial radius of bubbles, the pressure
Fig. 5.21a–d. The radius of the section of a bubble torus vs. the evolution of thefirst solitary wave generated by the torus in the liquid: (a) Rcirc = 0.5 cm, (b)Rcirc = 2 cm, (c) Rcirc = 4 cm, (d) Rcirc = 6 cm.
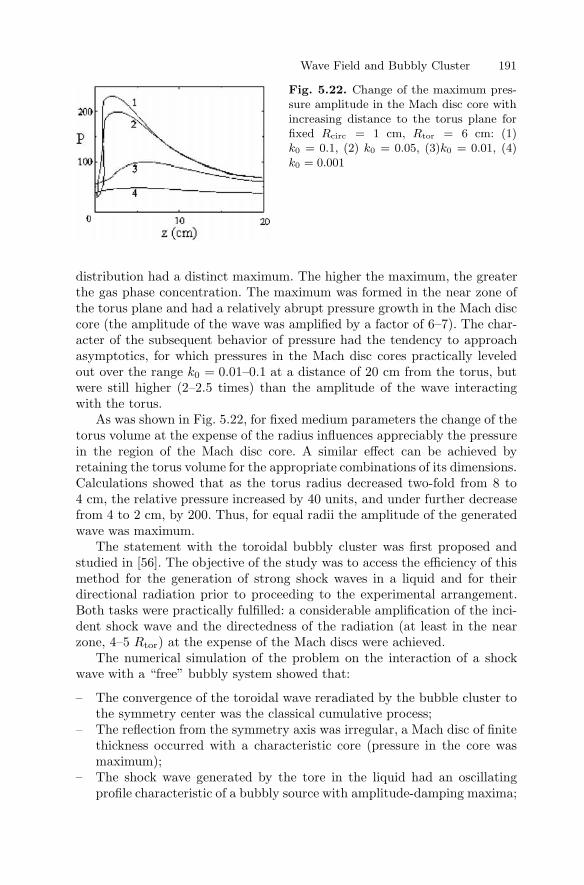
Wave Field and Bubbly Cluster 191
Fig. 5.22. Change of the maximum pres-sure amplitude in the Mach disc core withincreasing distance to the torus plane forfixed Rcirc = 1 cm, Rtor = 6 cm: (1)k0 = 0.1, (2) k0 = 0.05, (3)k0 = 0.01, (4)k0 = 0.001
distribution had a distinct maximum. The higher the maximum, the greaterthe gas phase concentration. The maximum was formed in the near zone ofthe torus plane and had a relatively abrupt pressure growth in the Mach disccore (the amplitude of the wave was amplified by a factor of 6–7). The char-acter of the subsequent behavior of pressure had the tendency to approachasymptotics, for which pressures in the Mach disc cores practically leveledout over the range k0 = 0.01–0.1 at a distance of 20 cm from the torus, butwere still higher (2–2.5 times) than the amplitude of the wave interactingwith the torus.
As was shown in Fig. 5.22, for fixed medium parameters the change of thetorus volume at the expense of the radius influences appreciably the pressurein the region of the Mach disc core. A similar effect can be achieved byretaining the torus volume for the appropriate combinations of its dimensions.Calculations showed that as the torus radius decreased two-fold from 8 to4 cm, the relative pressure increased by 40 units, and under further decreasefrom 4 to 2 cm, by 200. Thus, for equal radii the amplitude of the generatedwave was maximum.
The statement with the toroidal bubbly cluster was first proposed andstudied in [56]. The objective of the study was to access the efficiency of thismethod for the generation of strong shock waves in a liquid and for theirdirectional radiation prior to proceeding to the experimental arrangement.Both tasks were practically fulfilled: a considerable amplification of the inci-dent shock wave and the directedness of the radiation (at least in the nearzone, 4–5 Rtor) at the expense of the Mach discs were achieved.
The numerical simulation of the problem on the interaction of a shockwave with a “free” bubbly system showed that:
– The convergence of the toroidal wave reradiated by the bubble cluster tothe symmetry center was the classical cumulative process;
– The reflection from the symmetry axis was irregular, a Mach disc of finitethickness occurred with a characteristic core (pressure in the core wasmaximum);
– The shock wave generated by the tore in the liquid had an oscillatingprofile characteristic of a bubbly source with amplitude-damping maxima;

192 5 Shock Waves in Bubbly Media
– Focusing of the shock wave resulted in the subsequent formation of a chainof Mach discs on the axis.
5.2.2 Spherical Bubbly Clusters: SW Cumulationwith a Pressure Gradient Along Front
One of the problems concerned with the so-called acoustic “laser” is that ofreactive media capable of absorbing the external disturbance, amplify andreradiate it as an acoustic pulse. Since the “free” systems may be of principalimportance for experimental studies, we consider the statements focused onanalysis of the interaction of shock waves with bubble clusters. The waveprocesses in such free systems are distinguished by a wide spectrum of timeand space parameters, associated with the generation of shock waves withthe amplitudes of tens of megapascals, and governed by a great number ofparameters whose effect can hardly be analyzed in physical experiments.
Therefore, the dynamics of the state of complicated reactive systems andthe development of wave processes in them should be simulated numerically.The numerical analysis of the interaction of a plane stationary shock wavewith a nonreactive spherical cluster within the framework of a two-phasemathematical model of a bubbly liquid shows that the difference in the wavepropagation velocities in the cluster and the ambient liquid, as well as theselection of a real cluster geometry, lead to unexpected effects, which will beanalyzed below.
5.2.2.1 Statement of the Problem
A jump of mass velocity is arranged at a time t = 0 at the butt end ofa cylindrical shock tube of radius rst filled with water. A center of a sphericalbubble cluster of radius Rcl with the volumetric concentration of the gas phasek0 is placed on the z-axis of the tube at a distance lcl from the boundary. Gasbubbles in the cluster have the same initial radius R0. At t > 0 the shockwave propagating along the positive z-axis collides with a spherical bubblecloud, envelops it, and refracts into the cluster in the contact zone. We notethat the equilibrium speed of sound in the cluster cb depends significantlyon the volumetric concentration and, for example, for k0 = 0.01 is on theorder of 102, which is much below the propagation velocity of the wave in theliquid.
Here, as before, the wave processes in the bubbly medium are describedby the modified IKW system [58], including the conservation laws written fora cylindrical region, and the subsystem involves
– The Rayleigh equation
βds
dt+
32s2 = C1
T
β3− C2
β− C3
s
β− p , s =
dβ
dt,
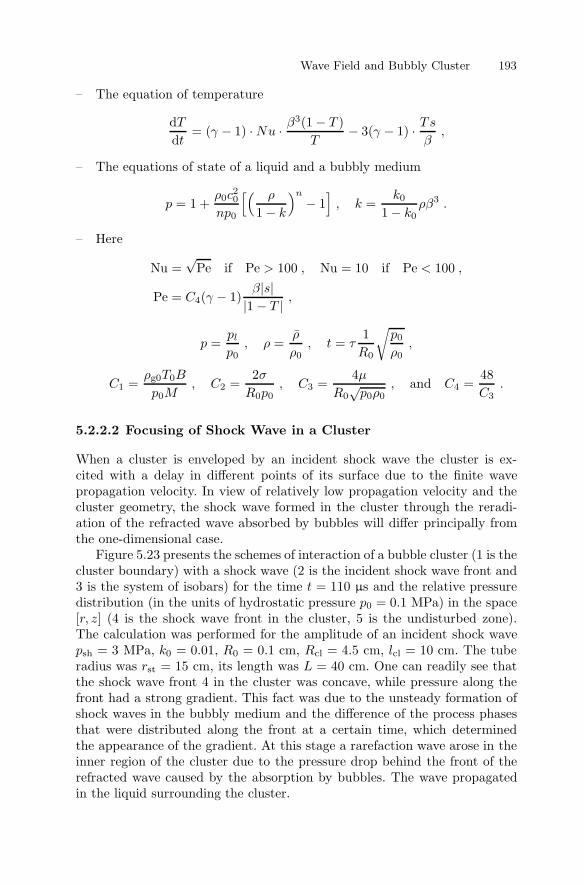
Wave Field and Bubbly Cluster 193
– The equation of temperature
dT
dt= (γ − 1) · Nu · β3(1 − T )
T− 3(γ − 1) · Ts
β,
– The equations of state of a liquid and a bubbly medium
p = 1 +ρ0c
20
np0
[( ρ
1 − k
)n
− 1]
, k =k0
1 − k0ρβ3 .
– Here
Nu =√
Pe if Pe > 100 , Nu = 10 if Pe < 100 ,
Pe = C4(γ − 1)β|s|
|1 − T | ,
p =pl
p0, ρ =
ρ
ρ0, t = τ
1R0
√p0
ρ0,
C1 =ρg0T0B
p0M, C2 =
2σ
R0p0, C3 =
4µ
R0√
p0ρ0, and C4 =
48C3
.
5.2.2.2 Focusing of Shock Wave in a Cluster
When a cluster is enveloped by an incident shock wave the cluster is ex-cited with a delay in different points of its surface due to the finite wavepropagation velocity. In view of relatively low propagation velocity and thecluster geometry, the shock wave formed in the cluster through the reradi-ation of the refracted wave absorbed by bubbles will differ principally fromthe one-dimensional case.
Figure 5.23 presents the schemes of interaction of a bubble cluster (1 is thecluster boundary) with a shock wave (2 is the incident shock wave front and3 is the system of isobars) for the time t = 110 µs and the relative pressuredistribution (in the units of hydrostatic pressure p0 = 0.1 MPa) in the space[r, z] (4 is the shock wave front in the cluster, 5 is the undisturbed zone).The calculation was performed for the amplitude of an incident shock wavepsh = 3 MPa, k0 = 0.01, R0 = 0.1 cm, Rcl = 4.5 cm, lcl = 10 cm. The tuberadius was rst = 15 cm, its length was L = 40 cm. One can readily see thatthe shock wave front 4 in the cluster was concave, while pressure along thefront had a strong gradient. This fact was due to the unsteady formation ofshock waves in the bubbly medium and the difference of the process phasesthat were distributed along the front at a certain time, which determinedthe appearance of the gradient. At this stage a rarefaction wave arose in theinner region of the cluster due to the pressure drop behind the front of therefracted wave caused by the absorption by bubbles. The wave propagatedin the liquid surrounding the cluster.
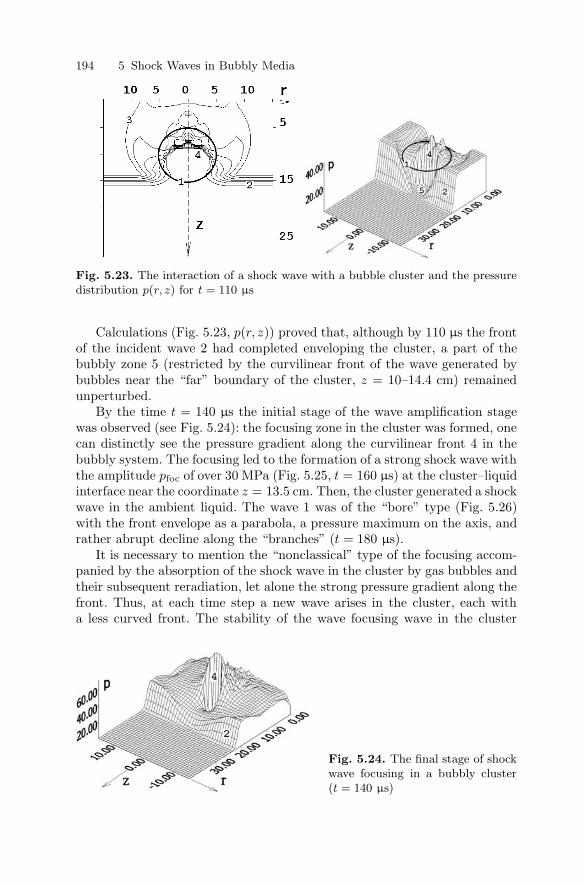
194 5 Shock Waves in Bubbly Media
Fig. 5.23. The interaction of a shock wave with a bubble cluster and the pressuredistribution p(r, z) for t = 110 µs
Calculations (Fig. 5.23, p(r, z)) proved that, although by 110 µs the frontof the incident wave 2 had completed enveloping the cluster, a part of thebubbly zone 5 (restricted by the curvilinear front of the wave generated bybubbles near the “far” boundary of the cluster, z = 10–14.4 cm) remainedunperturbed.
By the time t = 140 µs the initial stage of the wave amplification stagewas observed (see Fig. 5.24): the focusing zone in the cluster was formed, onecan distinctly see the pressure gradient along the curvilinear front 4 in thebubbly system. The focusing led to the formation of a strong shock wave withthe amplitude pfoc of over 30 MPa (Fig. 5.25, t = 160 µs) at the cluster–liquidinterface near the coordinate z = 13.5 cm. Then, the cluster generated a shockwave in the ambient liquid. The wave 1 was of the “bore” type (Fig. 5.26)with the front envelope as a parabola, a pressure maximum on the axis, andrather abrupt decline along the “branches” (t = 180 µs).
It is necessary to mention the “nonclassical” type of the focusing accom-panied by the absorption of the shock wave in the cluster by gas bubbles andtheir subsequent reradiation, let alone the strong pressure gradient along thefront. Thus, at each time step a new wave arises in the cluster, each witha less curved front. The stability of the wave focusing wave in the cluster
Fig. 5.24. The final stage of shockwave focusing in a bubbly cluster(t = 140 µs)
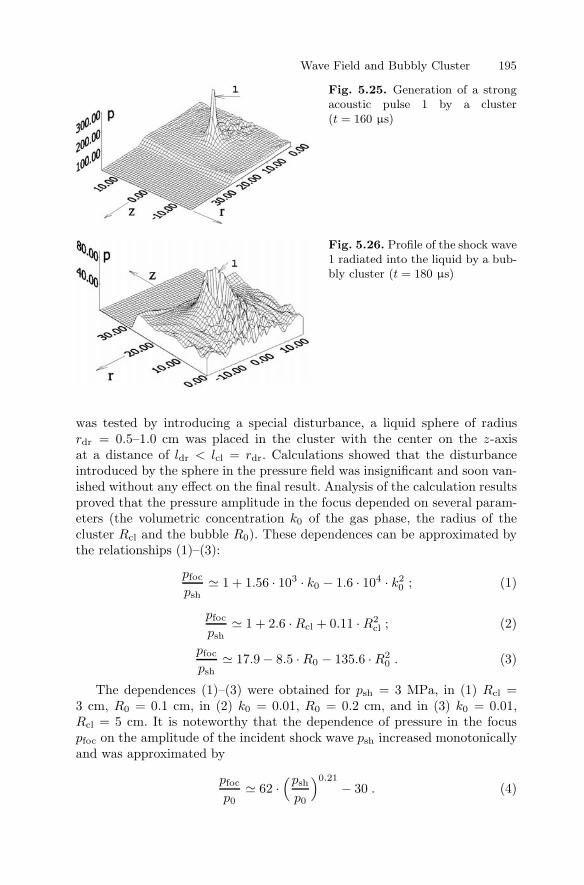
Wave Field and Bubbly Cluster 195
Fig. 5.25. Generation of a strongacoustic pulse 1 by a cluster(t = 160 µs)
Fig. 5.26. Profile of the shock wave1 radiated into the liquid by a bub-bly cluster (t = 180 µs)
was tested by introducing a special disturbance, a liquid sphere of radiusrdr = 0.5–1.0 cm was placed in the cluster with the center on the z-axisat a distance of ldr < lcl = rdr. Calculations showed that the disturbanceintroduced by the sphere in the pressure field was insignificant and soon van-ished without any effect on the final result. Analysis of the calculation resultsproved that the pressure amplitude in the focus depended on several param-eters (the volumetric concentration k0 of the gas phase, the radius of thecluster Rcl and the bubble R0). These dependences can be approximated bythe relationships (1)–(3):
pfoc
psh 1 + 1.56 · 103 · k0 − 1.6 · 104 · k2
0 ; (1)
pfoc
psh 1 + 2.6 · Rcl + 0.11 · R2
cl ; (2)
pfoc
psh 17.9 − 8.5 · R0 − 135.6 · R2
0 . (3)
The dependences (1)–(3) were obtained for psh = 3 MPa, in (1) Rcl =3 cm, R0 = 0.1 cm, in (2) k0 = 0.01, R0 = 0.2 cm, and in (3) k0 = 0.01,Rcl = 5 cm. It is noteworthy that the dependence of pressure in the focuspfoc on the amplitude of the incident shock wave psh increased monotonicallyand was approximated by
pfoc
p0 62 ·
(psh
p0
)0.21
− 30 . (4)
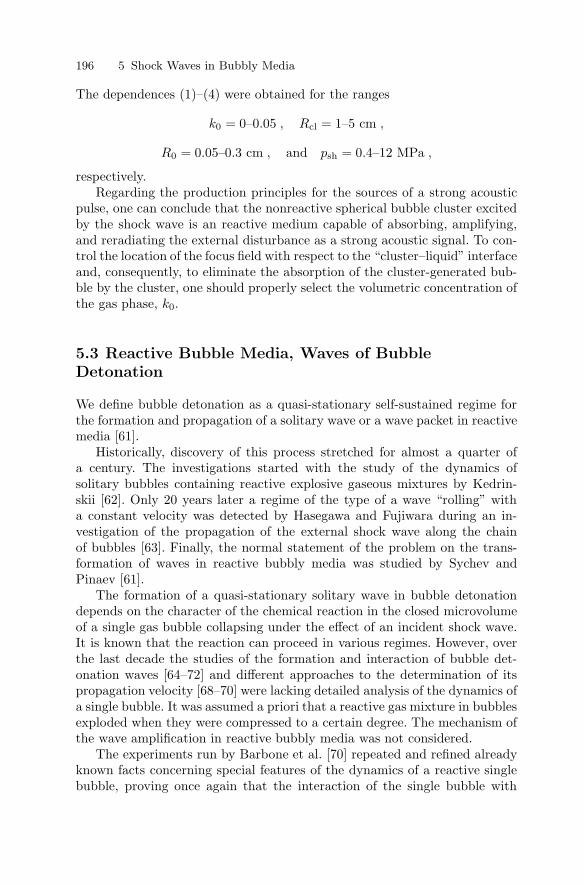
196 5 Shock Waves in Bubbly Media
The dependences (1)–(4) were obtained for the ranges
k0 = 0–0.05 , Rcl = 1–5 cm ,
R0 = 0.05–0.3 cm , and psh = 0.4–12 MPa ,
respectively.Regarding the production principles for the sources of a strong acoustic
pulse, one can conclude that the nonreactive spherical bubble cluster excitedby the shock wave is an reactive medium capable of absorbing, amplifying,and reradiating the external disturbance as a strong acoustic signal. To con-trol the location of the focus field with respect to the “cluster–liquid” interfaceand, consequently, to eliminate the absorption of the cluster-generated bub-ble by the cluster, one should properly select the volumetric concentration ofthe gas phase, k0.
5.3 Reactive Bubble Media, Waves of BubbleDetonation
We define bubble detonation as a quasi-stationary self-sustained regime forthe formation and propagation of a solitary wave or a wave packet in reactivemedia [61].
Historically, discovery of this process stretched for almost a quarter ofa century. The investigations started with the study of the dynamics ofsolitary bubbles containing reactive explosive gaseous mixtures by Kedrin-skii [62]. Only 20 years later a regime of the type of a wave “rolling” witha constant velocity was detected by Hasegawa and Fujiwara during an in-vestigation of the propagation of the external shock wave along the chainof bubbles [63]. Finally, the normal statement of the problem on the trans-formation of waves in reactive bubbly media was studied by Sychev andPinaev [61].
The formation of a quasi-stationary solitary wave in bubble detonationdepends on the character of the chemical reaction in the closed microvolumeof a single gas bubble collapsing under the effect of an incident shock wave.It is known that the reaction can proceed in various regimes. However, overthe last decade the studies of the formation and interaction of bubble det-onation waves [64–72] and different approaches to the determination of itspropagation velocity [68–70] were lacking detailed analysis of the dynamics ofa single bubble. It was assumed a priori that a reactive gas mixture in bubblesexploded when they were compressed to a certain degree. The mechanism ofthe wave amplification in reactive bubbly media was not considered.
The experiments run by Barbone et al. [70] repeated and refined alreadyknown facts concerning special features of the dynamics of a reactive singlebubble, proving once again that the interaction of the single bubble with
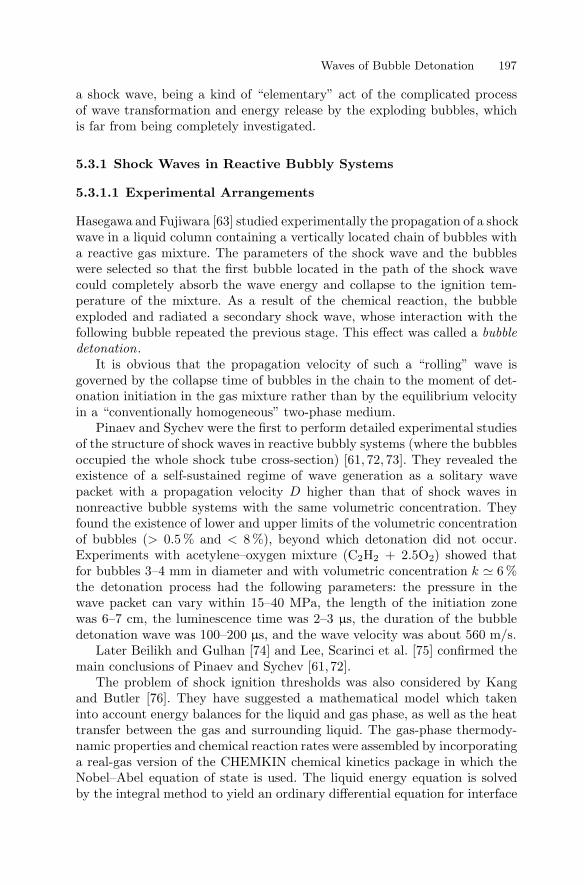
Waves of Bubble Detonation 197
a shock wave, being a kind of “elementary” act of the complicated processof wave transformation and energy release by the exploding bubbles, whichis far from being completely investigated.
5.3.1 Shock Waves in Reactive Bubbly Systems
5.3.1.1 Experimental Arrangements
Hasegawa and Fujiwara [63] studied experimentally the propagation of a shockwave in a liquid column containing a vertically located chain of bubbles witha reactive gas mixture. The parameters of the shock wave and the bubbleswere selected so that the first bubble located in the path of the shock wavecould completely absorb the wave energy and collapse to the ignition tem-perature of the mixture. As a result of the chemical reaction, the bubbleexploded and radiated a secondary shock wave, whose interaction with thefollowing bubble repeated the previous stage. This effect was called a bubbledetonation.
It is obvious that the propagation velocity of such a “rolling” wave isgoverned by the collapse time of bubbles in the chain to the moment of det-onation initiation in the gas mixture rather than by the equilibrium velocityin a “conventionally homogeneous” two-phase medium.
Pinaev and Sychev were the first to perform detailed experimental studiesof the structure of shock waves in reactive bubbly systems (where the bubblesoccupied the whole shock tube cross-section) [61, 72, 73]. They revealed theexistence of a self-sustained regime of wave generation as a solitary wavepacket with a propagation velocity D higher than that of shock waves innonreactive bubble systems with the same volumetric concentration. Theyfound the existence of lower and upper limits of the volumetric concentrationof bubbles (> 0.5 % and < 8 %), beyond which detonation did not occur.Experiments with acetylene–oxygen mixture (C2H2 + 2.5O2) showed thatfor bubbles 3–4 mm in diameter and with volumetric concentration k 6 %the detonation process had the following parameters: the pressure in thewave packet can vary within 15–40 MPa, the length of the initiation zonewas 6–7 cm, the luminescence time was 2–3 µs, the duration of the bubbledetonation wave was 100–200 µs, and the wave velocity was about 560 m/s.
Later Beilikh and Gulhan [74] and Lee, Scarinci et al. [75] confirmed themain conclusions of Pinaev and Sychev [61, 72].
The problem of shock ignition thresholds was also considered by Kangand Butler [76]. They have suggested a mathematical model which takeninto account energy balances for the liquid and gas phase, as well as the heattransfer between the gas and surrounding liquid. The gas-phase thermody-namic properties and chemical reaction rates were assembled by incorporatinga real-gas version of the CHEMKIN chemical kinetics package in which theNobel–Abel equation of state is used. The liquid energy equation is solvedby the integral method to yield an ordinary differential equation for interface
198 5 Shock Waves in Bubbly Media
temperature. Some typical numerical results and shock ignition thresholds,or critical shock pressures necessary to ignite the gas-phase mixture, undervarious conditions for argon-diluted hydrogen/oxygen bubbles in water andglycerin are presented. Comparison with experimental data indicates that themodel can predict the process of bubble collapse and ignition accurately, es-pecially if ignition occurs during the first cycle. Calculations show that initialbubble radius, temperature, pressure, and mixture composition have stronginfluences on bubble collapse and ignition. The ignition threshold decreaseswith increasing initial radius and temperature and decreasing initial gas pres-sure. Ignition is also favored by stoichiometric or fuel-rich mixture diluted byinert gas.
5.3.1.2 Liquid HE, Combustible Mixtures:Mechanisms of Detonation Ignition
A comparison of the research results for the regimes of bubble detonationwith the data on detonation initiation in liquid HE and explosions in con-tainers with fuel enabled conclusions on the adequacy of the mechanismsgoverning these processes [21, 58, 66, 77, 78]. Studies of liquid HE and explo-sions in volatile and ignitable liquids were performed in parallel over severaldecades without using the models of the mechanics of multiphase systems.Nevertheless, the models of hot spots and fractional impact [79–85], vaporexplosions, and explosions of volume-detonating systems [70,86] involved thenonuniformity of the media, the data on the physics of cavitation phenomena,and the energy release under the effect of external pulsed loads.
Often a detailed study of the role of a certain mechanism responsible forthe process evolution, its justification, and experimental justification meetserious difficulties. Therefore, thorough and detailed numerical modeling ofthe processes is required. The cavitation processes in volatile and ignitableliquids, arising at sudden depressurization of containers and collecting binsand often leading to catastrophic breakdowns, might be of principal impor-tance. These processes can be associated with the so-called steam explosions.The above effects were considered by many authors, among them Barboneet al. [69], Hill and Sturtevant [86], Chaves et al. [87]. Two mechanisms ofcatastrophic breakdowns were usually considered [70]:
a) Possible ejection of liquids in the form of two-phase cavitating jets andtheir subsequent spreading with the formation of a gas-droplet cloud, theso-called volume detonation charge;
b) Propagation of a rarefaction wave inside the liquid fuel after partial de-pressurization of the tank resulting in rapid boiling-type processes: thepressure inside the tank could abruptly increase by several times.
In [21,77,78], a fundamentally new mechanism for the generation of high pres-sures in compressed combustible liquid systems was proposed. The essence ofthe mechanism is as follows: numerous bubbles containing an air–fuel vapor
Waves of Bubble Detonation 199
mixture are formed when filling a container, the bubbles can ignite underadiabatic compression. If the container moving at a high velocity comes upagainst an obstacle, the impact produces a system of compression waves inthe liquid that can initiate a bubble detonation wave. On the contrary, un-der depressurization of the container a system of rarefaction waves appearsin the liquid, whose interaction, as shown below, can lead to unexpectedeffects.
The influence of inhomogeneities on the initiation mechanism of liquidexplosives was studied long ago. Thus, Bowden and Ioffe [79] pointed tothe thermal nature of the shock initiation of explosions of liquid HE andemphasized that small gas bubbles, which are usually available in liquids,are potential heat sources of explosion (hot spots model). Andreev [80] andJohansson [81] considered small particles or gas phase of HE in bubbles asthe most plausible reason for detonation initiation.
Within the same model Dubovik and Bobolev [82] studied the effect ofdroplets or HE vapors in the gas atmosphere of the bubble on the develop-ment of the “hot spots” mechanism by estimating the value of the adiabaticinduction period ti and the critical size d0 such that the droplet manages towarm up during the collapse of the bubble:
d0 ≤ π(ξ0τR)1/2 and ti =cpBT 2
∗AQEa
exp(Ea/BT∗) .
Here T∗ is the temperature of the liquid drop, Ea and A are the activationenergy and the preexponential factor for the monomolecular reaction, Q is theheat effect, B is the universal gas constant, cp is the specific heat capacity, τR
is the time of the bubble collapse, and ξ0 is the coefficient of heat conductivity.The estimate is valid only if T∗ is valid over ti.
The mechanism of fractional impact when the detonation process wasinitiated by a sequence of shock waves was considered as well. The first wavewas reflected from the free surface and initiates cavitation, then the secondwave compressed bubbles by forming a system of “hot spots” and initiateddetonation.
Campbell et al. [83] proved experimentally that the mechanism of shockinitiation was determined by the interaction of the wave with microinhomo-geneities and led to the formation of “hot spots” and further amplification ofthe propagating wave until the energy released behind the front was sufficientto initiate detonation.
Field et al. [84] studied the interaction of strong shock waves (amplitude ofthe order of 3 GPa) with a single cavity and an array of bubbles. They relatedlight flashes observed in reactive emulsive systems under bubble collapse tothe formation of a cumulative jet and its impact on the far wall of the bubble.Roberts and Field [85] showed that the inhomogeneities of diameter 1.5 mmintroduced in the sample near the impact point were the main initiators ofthe reaction.

200 5 Shock Waves in Bubbly Media
The studies produced the following conclusions:
1. The shock sensitivity of liquid HE depends on quantitative characteristicsand the character of microinhomogeneities of different origin;
2. Detonation in liquid HE occurs only in the presence (origination) of theinhomogeneities.
Finally, a comparison of the hot spots model and detonating bubbles leadsto the conclusion that the mechanisms governing the above processes andthe bubble detonation can be regarded as identical. Let us consider somescenarios of the development of wave processes and wave amplification inbubbly media, which can justify the validity of this statement.
5.3.1.3 Model of Instantaneous Release of Energy
Wave processes in bubbly liquids are described by a pressure-nonequilibriumtwo-phase mathematical model. Let us apply it to a reactive medium andadd the multiplier δ in the Rayleigh equation [69]:
Rd2R
dt2+
32
(dR
dt
)2
= ρ−1l (δpg − p) .
The multiplier is equal to unity until the gas mixture in a bubble is adia-batically compressed to the temperature of initiation of chemical reaction.At this moment adiabatic explosion at a constant volume causes an abruptpressure increase in bubbles to the value determined by the expression
p = ρ∗(γ∗ − 1)Qexpl ,
where Qexpl is the explosion heat. The expression follows from the conditionthat the total energy released during the reaction is transformed into theinternal energy of its products. In this case, the value of adiabatic indexchanges (γ = 1.25) and the process continues to develop under new conditionswithout any changes in the mathematical model.
Calculations within such a simple kinetics system show that the parame-ters and the structure of the forming bubble detonation wave (Fig. 5.27) areadequate to the real process.
In [58, 69], the following approximation formula was proposed for thepropagation velocity of the bubble detonation wave:
Dbubl λ
√ρ∗(γ∗ − 1)Qexpl
ρ0k0,
where ∗ denotes detonation products, λ is an empirical coefficient that is se-lected assuming that the velocity coincides with experimental data at a cer-tain point. We used the notion of the time of “collective” collapse tcol of
Waves of Bubble Detonation 201
Fig. 5.27a,b. Comparison of calculated (a) and experimental (b) pressure oscillo-grams in the bubble detonation wave
a bubble layer of thickness l introduced in [1] on the basis of analysis ofnumerical estimates:
tcol 0.9R0
√ρ0
pshexp
(l
2
√3k0
R20
).
The function Dbubl(k0) was obtained for the mixture C2H2 + 2.5O2 andan explosion heat of Q = 15.2 MJ/m3 at γ∗ = 1.15, λ2 0.16, and ρ∗ =ρg0(R0/R∗)3, where R∗ was the bubble radius at the moment of explosion ofthe mixture.
We note that the reactive bubbly system can be considered as a specifictype of condensed HE and used the classical relation for the amplitude pbubl
and velocity Dbubl
pbubl =(ρ − ρ0)ρ0
ρD2
bubl ,
where ρ = ρliq(1 − k0k∗), ρ0 = ρliq(1− k0), and k∗ = (R∗/R0)3. Then finally
we obtainedpbubl = ρliqk0(1 − k∗)D2
bubl .
The result corresponded to the experimentally established weak dependenceof the detonation wave amplitude on concentration.
5.3.1.4 Bubble Detonation Waves and “Hot Spots” Mechanism
The above system supplemented by the Todes kinetic model (bimolecularkinetics) [88]
dn
dt= A
√T e−Ea/BT (a − n)2 ,
can be reduced to the following form (Lagrangian coordinates, dimensionlesscharacteristics):
∂ρ
∂t= −ρ2 ∂u
∂s,
∂u
∂t= −∂p
∂s,
202 5 Shock Waves in Bubbly Media
β∂S
∂t+
32S2 = C1
T
β3− C2
S
β− p ,
∂β
∂t= S ,
∂T
∂t= η
∂N
∂t+ δ(γ − 1)Nu
β3(1 − T )T
− 3(γ − 1)TS
β,
∂N
∂t= ζ
1β3
√T e−α/T (1 − N)2 ,
p = 1 +ρ0c
20
np0
[( ρ
1 − k
)n
− 1]
, k =k0
1 − k0ρβ3 ,
Pe = C3(γ − 1)β|S|
|1 − T | , Nu =√
Pe, Pe > 100 ,10, Pe ≤ 100 ,
C1 =ρg0T0B
p0M, C2 =
4µ
R0√
p0ρ0and C3 =
12R0
√p0/ρ0
ν.
Here ρ is the ratio of the density to the initial value, N = n/a is therelative fraction of the reacted components of the gas mixture, a is the initialconcentration of the component, n is the number of molecules formed ina unit volume during the reaction, T is the temperature of the gas mixturetaken with respect to the initial T0, β = R/R0, α is the relative activationenergy, ζ is a constant depending on the initial parameters and the mixturecomposition, η = Q/cmT0 is the specific reaction heat, Ea is the activationenergy, and B is the gas constant.
The coefficient δ in the temperature equation is used to trigger the heattransfer and to correlate its intensity. The necessity of the coefficient is causedby the approximate nature of the relationships used in the system for the Nus-selt and Peclet numbers proposed by Nigmatullin, which is quite acceptablefor the case of weak waves.
It was shown that as a wave propagated through a bubbly medium it at-tenuated due to losses for imparting kinetic energy to the liquid componentand for increasing the internal energy of the gas phase in bubbles under com-pression. If the bubbles were filled with an explosive gas mixture, a reactionwith high energy release could occur under adiabatic heating. In this case,compression waves are radiated into the ambient liquid, which compensatesfor the loss of energy of the incident wave until a self-sustained regime isestablished in the medium.
The Todes kinetics model describes adequately the formation and prop-agation of bubble detonation, but overestimates the value of the amplitude,which can be explained by inadequate description of the kinetics itself. Cal-culations were performed for (α = 51.5, ζ/R0 = 2.7 · 109, η = 70).
In analyzing possible scenarios of the development of wave processes,a question naturally arises on the threshold values of the wave intensity re-quired to initiate detonation in reactive bubbly media. A partial answer tothis question is obtained in calculating the collision of weak shock waves withan amplitude of 0.4 MPa (Fig. 5.28). It was shown that such waves could not
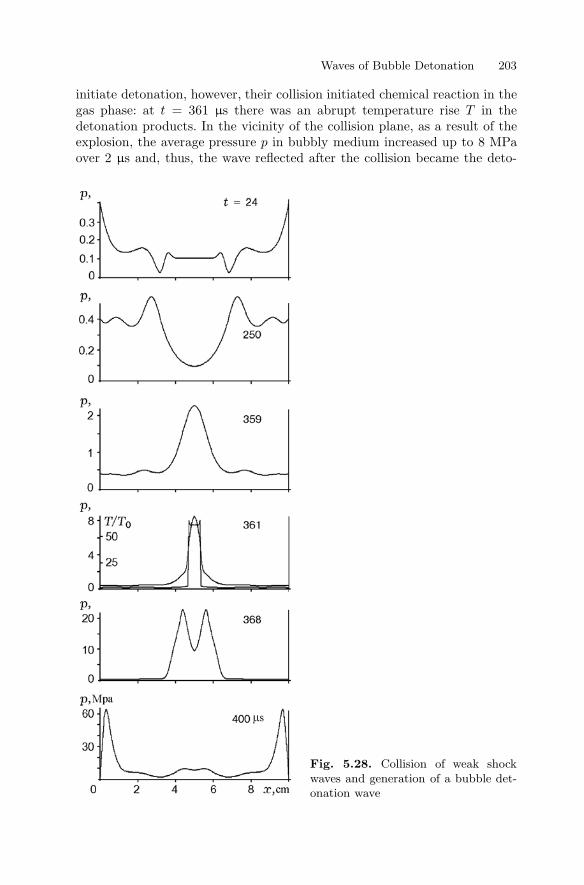
Waves of Bubble Detonation 203
initiate detonation, however, their collision initiated chemical reaction in thegas phase: at t = 361 µs there was an abrupt temperature rise T in thedetonation products. In the vicinity of the collision plane, as a result of theexplosion, the average pressure p in bubbly medium increased up to 8 MPaover 2 µs and, thus, the wave reflected after the collision became the deto-
Fig. 5.28. Collision of weak shockwaves and generation of a bubble det-onation wave

204 5 Shock Waves in Bubbly Media
nation wave. One can see that it was formed in the course of propagation tothe periphery, attaining 60 MPa at a distance of 5 cm from the center, as ifthe bubble layer explodes from inside.
An unexpected effect was found in the numerical analysis of the colli-sion of rarefaction waves (Fig. 5.29) [21, 77] aimed at simulation of both the
Fig. 5.29. Generation of a bubble det-onation wave by the colliding rarefac-tion waves
Waves of Bubble Detonation 205
probable development of the wave process in a container under partial de-pressurization and the natural process of pulse loading of a liquid HE samplewith a free boundary. In the latter case, the compression wave generatedby the shock interacted with the free surface from which a rarefaction waveshould propagate in the sample.
The calculation (Fig. 5.29) showed a possibility of the initiation of a bubbledetonation wave at the sample center resulting from the collision of rarefac-tion waves . This effect is based on the transformation of the rarefaction waveas it propagates through the medium with microinhomogeneities and excitesthe cavitation in it: an oscillation with intense positive phase arises behindthe rarefaction wave front. The oscillation under collision is eventually re-sponsible for the heating of the gas mixture to the ignition temperature. Wenote that intensities of the positive phase of a solitary rarefaction wave are, asa rule, insufficient to do this. Following the calculation results, the wave colli-sion (Fig. 5.29) occurred within 8.5 µs after the beginning of the propagationat the center of a 2-cm thick sample. In this case, the reflected waves becamebubble detonation waves, whose amplitude near the free surface achievedpractically 40 MPa after 17.5 µs. Here we observed the explosion of a samplefrom inside. However, the loading conditions were “paradoxical” in terms ofthe initiation of the explosive process: loading by impulsive tensile stresseswas accompanied by the development of cavitation behind the rarefactionwave front.
5.3.1.5 SW Focusing in a Reactive Bubble System
Heterogeneous structures in real liquids play a principal role in initiating ex-plosions (see Barbone et al. [70], Field et al. (1992) [84], Kedrinskii, Vshivkovet al. [39, 64, 66, 77], etc.). Undoubtedly, the bubbly media with reactive gasphase attract attention as a probable source of powerful acoustic radiation,which can be of help in solving the above problem of the so-called acousticlaser .
Bubble clusters containing explosive gas mixtures can be considered asphysical analogs of pumping in laser systems. Even under interaction witha weak shock wave (or under wave collision) such a cluster generates a strongpressure pulse in the form of a bubble detonation wave [65], which can be con-sidered as one of the principles for creating acoustic analogs of laser systems .Obviously, the focusing in reactive bubbly media intensifies considerably theamplification of bubbly media. For the calculations we use the known systemof governing equations for the cylindrical symmetry that is composed of twosubsystems:
– Conservation laws for average p, ρ, and u:
∂u
∂t= − 1
ρ0
(x(r, t)r
)2 ∂p
∂r,
∂x
∂t= u ,
1ρ
=1ρ0
(x(r, t)r
)2 ∂x
∂r
206 5 Shock Waves in Bubbly Media
– A set of kinetic equations describing the dynamic state of the medium,the heat exchange, and the kinetics of chemical reactions.
The formation of the self-sustained wave regime requires a certain time anda distance that depends on k0. Although in the above examples the lineardimensions of the considered regions were smaller than the distance, the am-plification of the divergent waves was quite sufficient to speak about thebubble detonation as an initiation mechanism of explosive processes in con-tainers with fuel and as a powerful source of a hydroacoustic signal. Howdoes the focusing influence extremely weak amplitudes of the focused wave?
The focusing of a short shock wave was calculated using the Todes kineticsfor the amplitude pb = 5 MPa and the duration of the positive and negativepressure phases t+ = 5 µs and t− = 15 µs, respectively. Such a shock waveprofile simulated the profile of a wave generated by underwater explosion.The concentration of the reactive gas phase in the bubbly medium was inten-tionally taken to be lower than the critical value, k0 = 0.001. The wave wasfocused from the distance of r = 10 cm. The calculations showed that at firstthe wave attenuated and its amplitude decreased to the value at which theincident wave was unable to initiate the detonation regime. Near the focus thewave amplitude increased up to 15 MPa (t = 65µs), which was sufficient tocompress bubbles to the ignition temperature of the mixture and initiate thechemical reaction. The detonation wave excited in the focus further propa-gates to the periphery. As a result of bubble explosion, the pressure increasedto 27.5 MPa (t = 200 µs) and remained practically invariant until the bub-ble detonation wave reached the outer boundary of the region. The problemstatement with detonation excited at the center of a cylindrical sample couldapparently be considered as one of the models of hydroacoustic sources.
When the volumetric concentration of the gas phase was increased by anorder of magnitude, k0 = 10−2, R0 = 0.2 cm, the wave pattern changed dra-matically. As the amplitude of the generating wave decreased (the param-eters of positive and negative phases were unchanged), the incident shockwave could be separated during focusing by initiating the detonation at theboundary approximately at the moment when the initiating wave achievedthe focus line.
Figure 5.30 shows the pressure distribution for different times, pb =3 MPa, and the focusing radius r = 5 cm. One can see that at t = 26 µs(with a delay for the bubble collapse to the ignition temperature of the mix-ture) bubble detonation was excited at the periphery (the temperature jumpshown at the right in Fig. 5.30), the shock wave initiating it reached thefocus after 32 µs: the wave amplitude increased by a factor of 5. However,the bubble concentration in this example was much higher and the intensityof the focused wave was insufficient to excite the detonation regime in thefocus.
The bubble detonation wave moving from the periphery focused andformed simultaneously. After t = 60 µs its amplitude (at a distance 2 cm
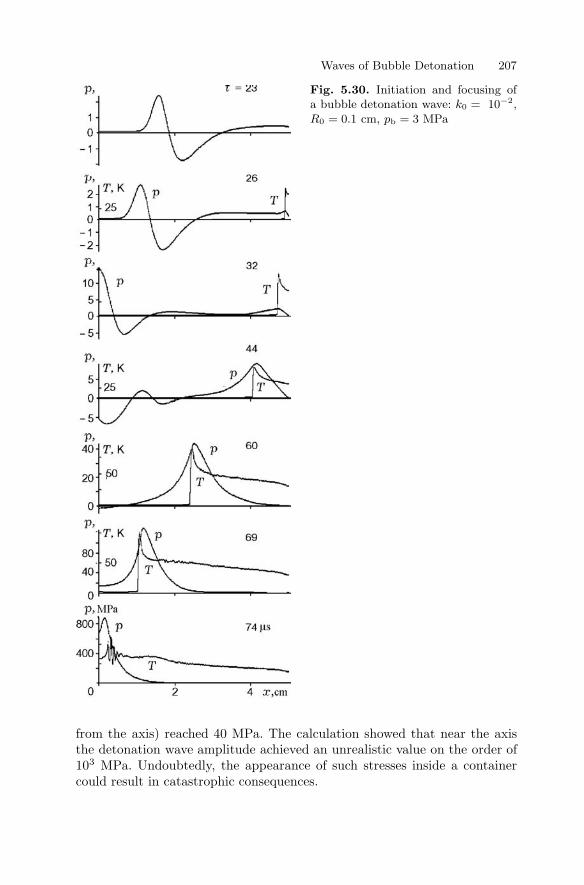
Waves of Bubble Detonation 207
Fig. 5.30. Initiation and focusing ofa bubble detonation wave: k0 = 10−2,R0 = 0.1 cm, pb = 3 MPa
from the axis) reached 40 MPa. The calculation showed that near the axisthe detonation wave amplitude achieved an unrealistic value on the order of103 MPa. Undoubtedly, the appearance of such stresses inside a containercould result in catastrophic consequences.

208 5 Shock Waves in Bubbly Media
It should be noted that high pressures arising during the focusing werea consequence of the inertial effects accompanying bubble oscillation and theovercompression of detonation products. The temperature of the productsachieved (1.5–2)·104 K, which required application of a more realistic kinetics.
5.3.1.6 Modern Kinetics, Phase Transitions
The bubble detonation model is formulated with due regard to the liquidcompressibility and viscosity, the availability of an induction period of chem-ical reaction, the shift of chemical equilibrium, and intensive interphase heatand mass exchange (see Chap. 4). The model includes the modern kinetics(Eqs. (4.18–4.21)) and the equations of the reactive bubble dynamics, takinginto account the evaporation of a liquid phase and the IKvanW model ofa two-phase medium [89, 90]. Only this approach enables simulation of thebubble detonation in a system where an oxidizer and a fuel are originally indifferent phases. It is clear that the detonation process can occur only dueto phase transition (evaporation of the liquid from the bubbles) when anexplosive gas mixture is created inside the bubbles. The detonation is initi-ated by a shock wave P∞ = const. The system of equations is solved usingthe explicit finite difference scheme and applying the Neumann–Richtmeyerlinear and quadratic artificial viscosities. The formation and propagation ofbubble detonation waves are calculated using the given model in the System I[H2+λO2 (gas phase) −(1−α)H2O+α glycerine (liquid phase)] at T0 = 300 Kand the system II [H2 (gas phase) −O2 (liquid phase)] at T0 = 87 K. Here λ isthe stoichiometric factor and α is the volumetric concentration of the glycerinsolution.
It was shown in Chap. 4 that the injection moment of microdropletsscarcely affects the bubble dynamics and gas parameters. Therefore, it issupposed that the injection occurs during the first bubble oscillation at thestage of bubble compression when R/R0 = 0.3. This choice is based on theexperimental results of Sychev and Pinaev [61], who observed the instabilityof the bubble surface at the last stages of bubble compression. Figure 5.31shows the typical structure of the bubble detonation wave upon attainmentof a constant propagation regime in System I (λ = 0.5, α = 0). The calcula-tion was performed for the liquid evaporation (ML/M0 = 1, D0 = 5 µm andk0 = 0.01). The dependence of the velocity of bubble detonation wave W onthe initial concentration of the gas phase k0 with and without evaporationwas analyzed. The computational results for System I without evaporationand the experimental data of [73] are presented in Fig. 5.32. One can seethat the model was in good agreement with the experiment. For k0 < 0.0025and k0 > 0.1, the detonation wave did not separate from the initiating waveand no “solitary” wave was formed. The former was caused by the limitedamount of specific energy released in the medium due to the low concentra-tion of bubbles, the latter was due to considerable damping of the detonationwave.

Waves of Bubble Detonation 209
Fig. 5.31. The structure ofa stationary bubble detonationwave in System I (t = 330 µs).
Analysis of the dependence of the bubble detonation velocity W on thecomposition of the hydrogen–oxygen mixture in the gas phase for variousconcentrations of bubbles showed that the variation of λ practically did notaffect W . The dependence had a weakly expressed maximum correspondingto the stoichiometry (λ = 0.5). The diameter and total mass of the evap-orating microdroplets were varied in the calculations. The evaporation inSystem I occurred at high gas temperature (about 3000 K), whereas the ve-locity of microdroplet evaporation was high enough. Thus, the evaporation ofmicrodroplets with diameters of up to 20 µm was practically instantaneous.Microdroplets with diameters of over 20 µm were not considered, since theyhad no time to evaporate before the moment of maximum bubble compres-sion and their total volume by that time was comparable with the bubblevolume.
An unexpected result was obtained: the increase in the evaporated liq-uid mass led to an increase (though moderate) of the wave velocity. It waslikely that increasing gas pressure in bubbles completely compensated forenergy losses for the liquid evaporation reducing the wave velocity. With in-creasing liquid mass in System II, the detonation wave velocity increasedmonotonically, and the pressure passed through the maximum at the ratioML/M0 = 8, which corresponded to the stoichiometric mixture in gas. As
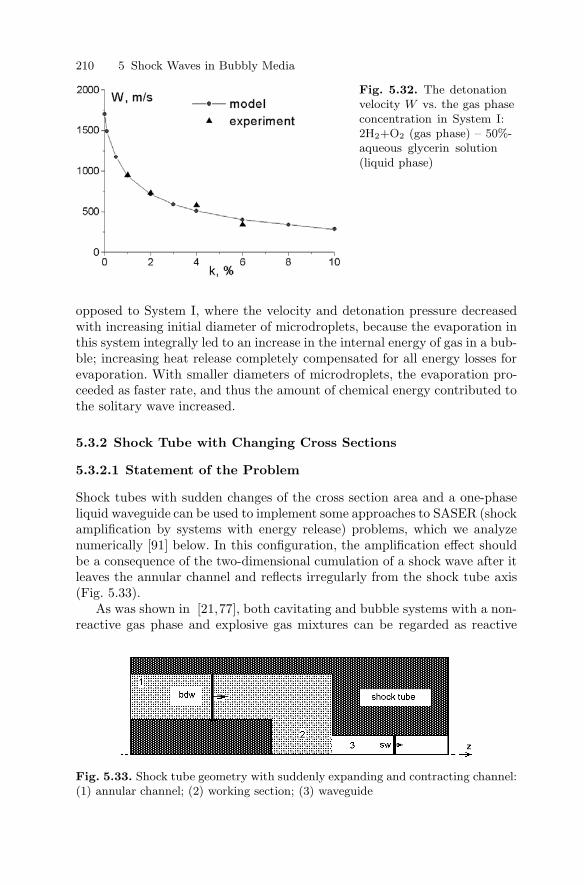
210 5 Shock Waves in Bubbly Media
Fig. 5.32. The detonationvelocity W vs. the gas phaseconcentration in System I:2H2+O2 (gas phase) – 50%-aqueous glycerin solution(liquid phase)
opposed to System I, where the velocity and detonation pressure decreasedwith increasing initial diameter of microdroplets, because the evaporation inthis system integrally led to an increase in the internal energy of gas in a bub-ble; increasing heat release completely compensated for all energy losses forevaporation. With smaller diameters of microdroplets, the evaporation pro-ceeded as faster rate, and thus the amount of chemical energy contributed tothe solitary wave increased.
5.3.2 Shock Tube with Changing Cross Sections
5.3.2.1 Statement of the Problem
Shock tubes with sudden changes of the cross section area and a one-phaseliquid waveguide can be used to implement some approaches to SASER (shockamplification by systems with energy release) problems, which we analyzenumerically [91] below. In this configuration, the amplification effect shouldbe a consequence of the two-dimensional cumulation of a shock wave after itleaves the annular channel and reflects irregularly from the shock tube axis(Fig. 5.33).
As was shown in [21,77], both cavitating and bubble systems with a non-reactive gas phase and explosive gas mixtures can be regarded as reactive
Fig. 5.33. Shock tube geometry with suddenly expanding and contracting channel:(1) annular channel; (2) working section; (3) waveguide
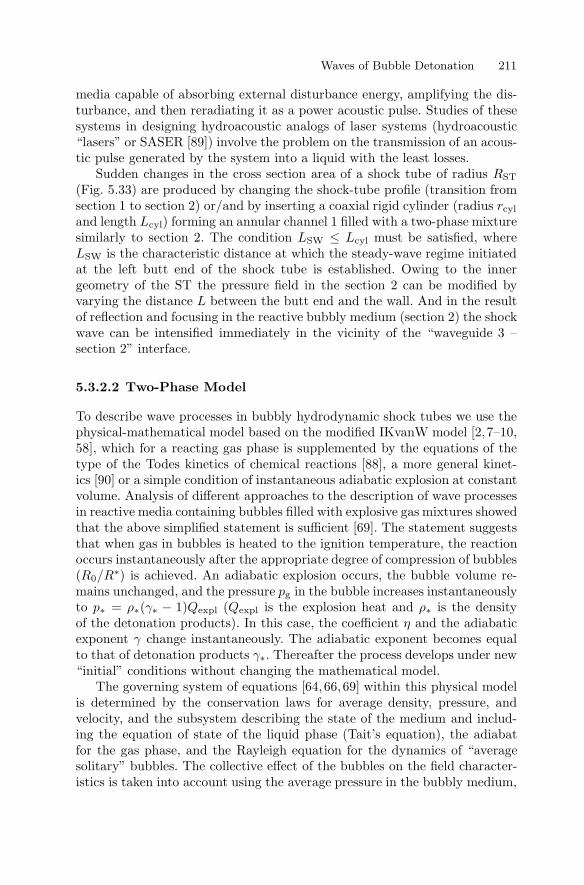
Waves of Bubble Detonation 211
media capable of absorbing external disturbance energy, amplifying the dis-turbance, and then reradiating it as a power acoustic pulse. Studies of thesesystems in designing hydroacoustic analogs of laser systems (hydroacoustic“lasers” or SASER [89]) involve the problem on the transmission of an acous-tic pulse generated by the system into a liquid with the least losses.
Sudden changes in the cross section area of a shock tube of radius RST
(Fig. 5.33) are produced by changing the shock-tube profile (transition fromsection 1 to section 2) or/and by inserting a coaxial rigid cylinder (radius rcyl
and length Lcyl) forming an annular channel 1 filled with a two-phase mixturesimilarly to section 2. The condition LSW ≤ Lcyl must be satisfied, whereLSW is the characteristic distance at which the steady-wave regime initiatedat the left butt end of the shock tube is established. Owing to the innergeometry of the ST the pressure field in the section 2 can be modified byvarying the distance L between the butt end and the wall. And in the resultof reflection and focusing in the reactive bubbly medium (section 2) the shockwave can be intensified immediately in the vicinity of the “waveguide 3 –section 2” interface.
5.3.2.2 Two-Phase Model
To describe wave processes in bubbly hydrodynamic shock tubes we use thephysical-mathematical model based on the modified IKvanW model [2,7–10,58], which for a reacting gas phase is supplemented by the equations of thetype of the Todes kinetics of chemical reactions [88], a more general kinet-ics [90] or a simple condition of instantaneous adiabatic explosion at constantvolume. Analysis of different approaches to the description of wave processesin reactive media containing bubbles filled with explosive gas mixtures showedthat the above simplified statement is sufficient [69]. The statement suggeststhat when gas in bubbles is heated to the ignition temperature, the reactionoccurs instantaneously after the appropriate degree of compression of bubbles(R0/R∗) is achieved. An adiabatic explosion occurs, the bubble volume re-mains unchanged, and the pressure pg in the bubble increases instantaneouslyto p∗ = ρ∗(γ∗ − 1)Qexpl (Qexpl is the explosion heat and ρ∗ is the densityof the detonation products). In this case, the coefficient η and the adiabaticexponent γ change instantaneously. The adiabatic exponent becomes equalto that of detonation products γ∗. Thereafter the process develops under new“initial” conditions without changing the mathematical model.
The governing system of equations [64, 66, 69] within this physical modelis determined by the conservation laws for average density, pressure, andvelocity, and the subsystem describing the state of the medium and includ-ing the equation of state of the liquid phase (Tait’s equation), the adiabatfor the gas phase, and the Rayleigh equation for the dynamics of “averagesolitary” bubbles. The collective effect of the bubbles on the field character-istics is taken into account using the average pressure in the bubbly medium,
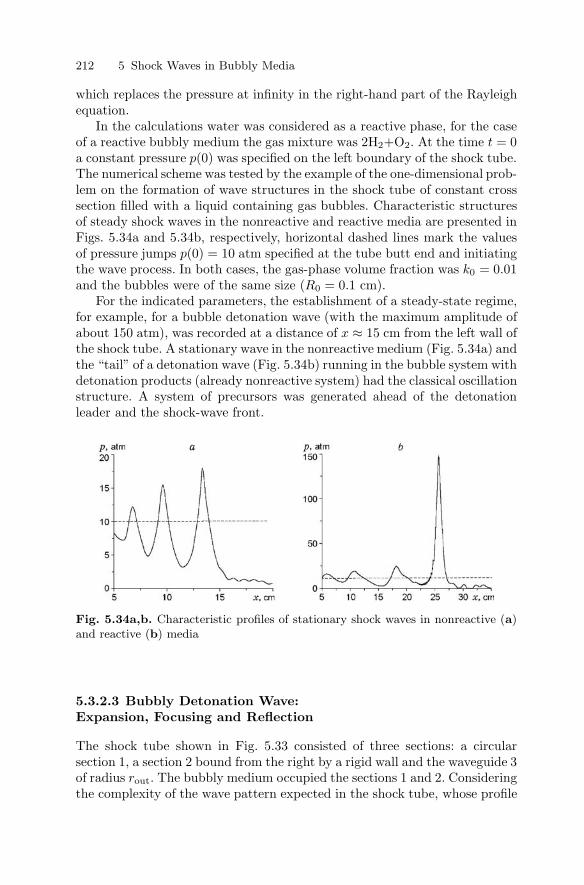
212 5 Shock Waves in Bubbly Media
which replaces the pressure at infinity in the right-hand part of the Rayleighequation.
In the calculations water was considered as a reactive phase, for the caseof a reactive bubbly medium the gas mixture was 2H2+O2. At the time t = 0a constant pressure p(0) was specified on the left boundary of the shock tube.The numerical scheme was tested by the example of the one-dimensional prob-lem on the formation of wave structures in the shock tube of constant crosssection filled with a liquid containing gas bubbles. Characteristic structuresof steady shock waves in the nonreactive and reactive media are presented inFigs. 5.34a and 5.34b, respectively, horizontal dashed lines mark the valuesof pressure jumps p(0) = 10 atm specified at the tube butt end and initiatingthe wave process. In both cases, the gas-phase volume fraction was k0 = 0.01and the bubbles were of the same size (R0 = 0.1 cm).
For the indicated parameters, the establishment of a steady-state regime,for example, for a bubble detonation wave (with the maximum amplitude ofabout 150 atm), was recorded at a distance of x ≈ 15 cm from the left wall ofthe shock tube. A stationary wave in the nonreactive medium (Fig. 5.34a) andthe “tail” of a detonation wave (Fig. 5.34b) running in the bubble system withdetonation products (already nonreactive system) had the classical oscillationstructure. A system of precursors was generated ahead of the detonationleader and the shock-wave front.
Fig. 5.34a,b. Characteristic profiles of stationary shock waves in nonreactive (a)and reactive (b) media
5.3.2.3 Bubbly Detonation Wave:Expansion, Focusing and Reflection
The shock tube shown in Fig. 5.33 consisted of three sections: a circularsection 1, a section 2 bound from the right by a rigid wall and the waveguide 3of radius rout. The bubbly medium occupied the sections 1 and 2. Consideringthe complexity of the wave pattern expected in the shock tube, whose profile
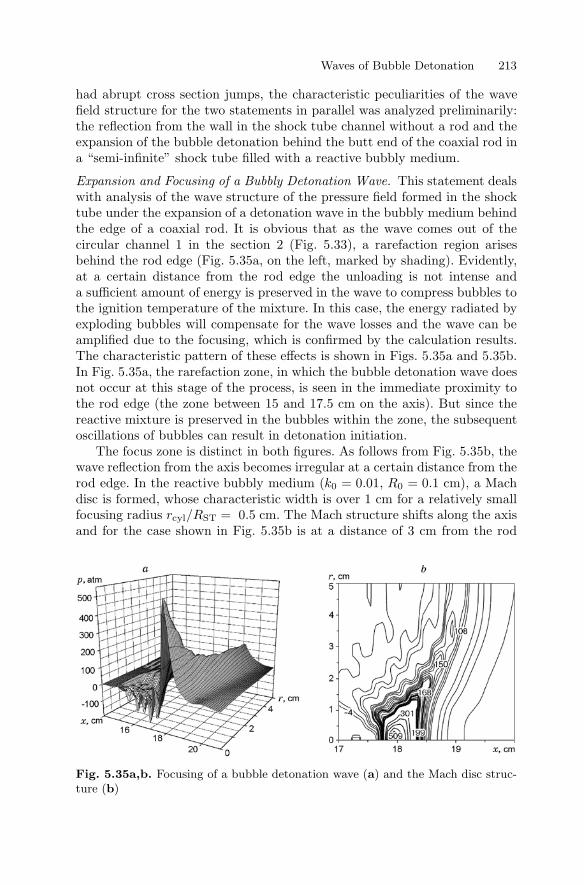
Waves of Bubble Detonation 213
had abrupt cross section jumps, the characteristic peculiarities of the wavefield structure for the two statements in parallel was analyzed preliminarily:the reflection from the wall in the shock tube channel without a rod and theexpansion of the bubble detonation behind the butt end of the coaxial rod ina “semi-infinite” shock tube filled with a reactive bubbly medium.
Expansion and Focusing of a Bubbly Detonation Wave. This statement dealswith analysis of the wave structure of the pressure field formed in the shocktube under the expansion of a detonation wave in the bubbly medium behindthe edge of a coaxial rod. It is obvious that as the wave comes out of thecircular channel 1 in the section 2 (Fig. 5.33), a rarefaction region arisesbehind the rod edge (Fig. 5.35a, on the left, marked by shading). Evidently,at a certain distance from the rod edge the unloading is not intense anda sufficient amount of energy is preserved in the wave to compress bubbles tothe ignition temperature of the mixture. In this case, the energy radiated byexploding bubbles will compensate for the wave losses and the wave can beamplified due to the focusing, which is confirmed by the calculation results.The characteristic pattern of these effects is shown in Figs. 5.35a and 5.35b.In Fig. 5.35a, the rarefaction zone, in which the bubble detonation wave doesnot occur at this stage of the process, is seen in the immediate proximity tothe rod edge (the zone between 15 and 17.5 cm on the axis). But since thereactive mixture is preserved in the bubbles within the zone, the subsequentoscillations of bubbles can result in detonation initiation.
The focus zone is distinct in both figures. As follows from Fig. 5.35b, thewave reflection from the axis becomes irregular at a certain distance from therod edge. In the reactive bubbly medium (k0 = 0.01, R0 = 0.1 cm), a Machdisc is formed, whose characteristic width is over 1 cm for a relatively smallfocusing radius rcyl/RST = 0.5 cm. The Mach structure shifts along the axisand for the case shown in Fig. 5.35b is at a distance of 3 cm from the rod
Fig. 5.35a,b. Focusing of a bubble detonation wave (a) and the Mach disc struc-ture (b)
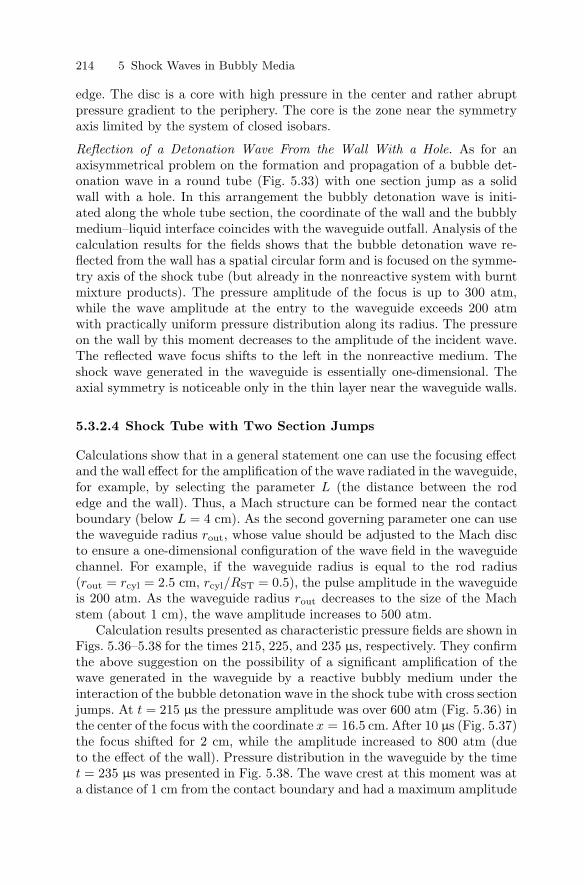
214 5 Shock Waves in Bubbly Media
edge. The disc is a core with high pressure in the center and rather abruptpressure gradient to the periphery. The core is the zone near the symmetryaxis limited by the system of closed isobars.
Reflection of a Detonation Wave From the Wall With a Hole. As for anaxisymmetrical problem on the formation and propagation of a bubble det-onation wave in a round tube (Fig. 5.33) with one section jump as a solidwall with a hole. In this arrangement the bubbly detonation wave is initi-ated along the whole tube section, the coordinate of the wall and the bubblymedium–liquid interface coincides with the waveguide outfall. Analysis of thecalculation results for the fields shows that the bubble detonation wave re-flected from the wall has a spatial circular form and is focused on the symme-try axis of the shock tube (but already in the nonreactive system with burntmixture products). The pressure amplitude of the focus is up to 300 atm,while the wave amplitude at the entry to the waveguide exceeds 200 atmwith practically uniform pressure distribution along its radius. The pressureon the wall by this moment decreases to the amplitude of the incident wave.The reflected wave focus shifts to the left in the nonreactive medium. Theshock wave generated in the waveguide is essentially one-dimensional. Theaxial symmetry is noticeable only in the thin layer near the waveguide walls.
5.3.2.4 Shock Tube with Two Section Jumps
Calculations show that in a general statement one can use the focusing effectand the wall effect for the amplification of the wave radiated in the waveguide,for example, by selecting the parameter L (the distance between the rodedge and the wall). Thus, a Mach structure can be formed near the contactboundary (below L = 4 cm). As the second governing parameter one can usethe waveguide radius rout, whose value should be adjusted to the Mach discto ensure a one-dimensional configuration of the wave field in the waveguidechannel. For example, if the waveguide radius is equal to the rod radius(rout = rcyl = 2.5 cm, rcyl/RST = 0.5), the pulse amplitude in the waveguideis 200 atm. As the waveguide radius rout decreases to the size of the Machstem (about 1 cm), the wave amplitude increases to 500 atm.
Calculation results presented as characteristic pressure fields are shown inFigs. 5.36–5.38 for the times 215, 225, and 235 µs, respectively. They confirmthe above suggestion on the possibility of a significant amplification of thewave generated in the waveguide by a reactive bubbly medium under theinteraction of the bubble detonation wave in the shock tube with cross sectionjumps. At t = 215 µs the pressure amplitude was over 600 atm (Fig. 5.36) inthe center of the focus with the coordinate x = 16.5 cm. After 10 µs (Fig. 5.37)the focus shifted for 2 cm, while the amplitude increased to 800 atm (dueto the effect of the wall). Pressure distribution in the waveguide by the timet = 235 µs was presented in Fig. 5.38. The wave crest at this moment was ata distance of 1 cm from the contact boundary and had a maximum amplitude
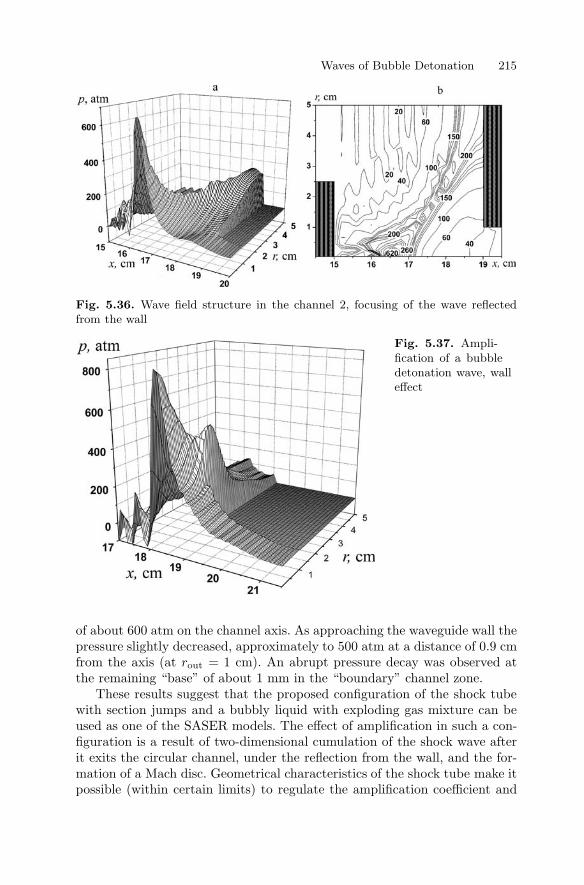
Waves of Bubble Detonation 215
Fig. 5.36. Wave field structure in the channel 2, focusing of the wave reflectedfrom the wall
Fig. 5.37. Ampli-fication of a bubbledetonation wave, walleffect
of about 600 atm on the channel axis. As approaching the waveguide wall thepressure slightly decreased, approximately to 500 atm at a distance of 0.9 cmfrom the axis (at rout = 1 cm). An abrupt pressure decay was observed atthe remaining “base” of about 1 mm in the “boundary” channel zone.
These results suggest that the proposed configuration of the shock tubewith section jumps and a bubbly liquid with exploding gas mixture can beused as one of the SASER models. The effect of amplification in such a con-figuration is a result of two-dimensional cumulation of the shock wave afterit exits the circular channel, under the reflection from the wall, and the for-mation of a Mach disc. Geometrical characteristics of the shock tube make itpossible (within certain limits) to regulate the amplification coefficient and
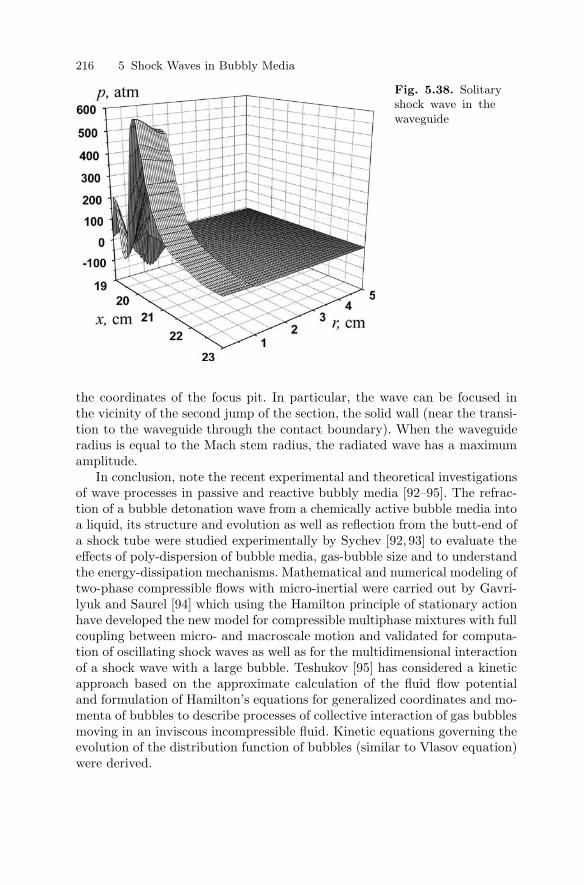
216 5 Shock Waves in Bubbly Media
Fig. 5.38. Solitaryshock wave in thewaveguide
the coordinates of the focus pit. In particular, the wave can be focused inthe vicinity of the second jump of the section, the solid wall (near the transi-tion to the waveguide through the contact boundary). When the waveguideradius is equal to the Mach stem radius, the radiated wave has a maximumamplitude.
In conclusion, note the recent experimental and theoretical investigationsof wave processes in passive and reactive bubbly media [92–95]. The refrac-tion of a bubble detonation wave from a chemically active bubble media intoa liquid, its structure and evolution as well as reflection from the butt-end ofa shock tube were studied experimentally by Sychev [92, 93] to evaluate theeffects of poly-dispersion of bubble media, gas-bubble size and to understandthe energy-dissipation mechanisms. Mathematical and numerical modeling oftwo-phase compressible flows with micro-inertial were carried out by Gavri-lyuk and Saurel [94] which using the Hamilton principle of stationary actionhave developed the new model for compressible multiphase mixtures with fullcoupling between micro- and macroscale motion and validated for computa-tion of oscillating shock waves as well as for the multidimensional interactionof a shock wave with a large bubble. Teshukov [95] has considered a kineticapproach based on the approximate calculation of the fluid flow potentialand formulation of Hamilton’s equations for generalized coordinates and mo-menta of bubbles to describe processes of collective interaction of gas bubblesmoving in an inviscous incompressible fluid. Kinetic equations governing theevolution of the distribution function of bubbles (similar to Vlasov equation)were derived.
References 217
References
1. V.K. Kedrinskii: Propagation of Disturbances in Liquid with Gas Bubbles, Zh.Prikl. Mekh. i Tekh. Fiz. 9, 4, pp. 29–34 (1968)
2. V.K. Kedrinskii: Shock Waves in a Liquid Containing Gas Bubbles, Fiz. Goren.Vzryva 21, 5, pp. 14–25 (1980)
3. V.K. Kendriskii: Propagation of disturbances in a liquid containing gas bubbles.Ph.D. Thesis (Lavrentyev Institute of Hydrodynamics, Novosibirsk, 1968)
4. I.J. Campbell, A.S. Pitcher: Shock Waves in a Liquid Containing Gas Bubbles,Proc. Roy. Soc. A 243, 1235, pp. 534–545 (1958)
5. G.M. Lyakhov: Shock Waves in Multi-Component Media, Izv. Akad. NaukSSSR. Mekh. i Mashinostr. 1, 1, pp. 46–49 (1959)
6. B.P. Parkin, F.R. Gilmore, G.L. Brode: Shock waves in bubbly water, Memo-randum RM-2795-PR (Abridged), Oct. (1961)
7. S.V. Iordansky: On Motion Equations of Liquid with Gas Bubbles, Zh. Prikl.Mekh. i Tekh. Fiz. 1, 3, pp. 102–110 (1960)
8. B.S. Kogarko: On a Model of Cavitating Liquid, Dokl. Akad. Nauk SSSR 137,6, pp. 1331–1333 (1961)
9. B.S. Kogarko: One-Dimentional Transient Fluid Motion and Resulting Gen-eration and Development of Cavitation, Dokl. Akad. Nauk SSSR 155, 6, pp.779–782 (1964)
10. L. van Wijngaarden: On the Equations of Motion for mixtures of Liquid andGas Bubbles, J. Fluid Mech. 33, pp. 465–474 (1968)
11. R.I. Nigmatullin: Fundamentals of Mechanics of Heterogeneous Media (Nauka,Moscow, 1987)
12. V.E. Nakoryakov, B.G. Pokusaev, I.R. Scheiber: Wave Dynamics of Gas andVapor-Liquid Media (Energoatomizdat, Moscow, 1990)
13. L. Nordzii: Shock Waves in Bubble-Liquid Mixtures, Phys. Communications 3,1 (1971)
14. L. Nordzii, L. van Wijngaarden: Relaxation Effects Caused by Relative Motionon Shock Waves in Gas-Liquid/Liquid Mixture, J. Fluid Mech. 66, 1, pp. 115–145 (1974)
15. V.E. Nakoryakov, B.G. Pokusaev et al: Experimental investigation of shockwaves in a liquid with gas bubbles. In: S. Kutateladze, V. Nakoryakov (eds.)Wave Processes in Two-Phase Systems, (Institute of Thermophysics, Novosi-birsk, 1975)
16. V.G. Gasenko, V.E. Nakoryakov, I.R. Schreiber: The Two-Wave Model of Dis-turbance Propagation in Liquid with Gas Bubbles, Zh. Prikl. Mekh. i Tekh. Fiz.20, 6, pp. 119–127 (1979)
17. F. Fox, S. Kerly, G. Larson: Phase Velocity and Absorption Measurements inWater Containing Air Bubbles, Probl. Sovr. Fiz. 27, 3, pp. 534–539 (1955)
18. M.A. Lavrentiev, B.V. Shabat: Methods of the Complex Variable Theory,(Nauka, Moscow, 1965)
19. V.K. Kedrinskii: Dynamics of Cavitation Zone at Underwater Explosion Nearbyfree Surface, Zh. Prikl. Mekh. i Tekh. Fiz. 16, 5, pp. 68–78 (1975)
20. I.D. Manen: Bent Trailing Edges of Propeller Blades of high Powered SingleScrew Ships, Int. Shipbuilding Progress 10 (1963)
21. V.K. Kedrinskii: The Role of Cavitation Effects in the Mechanisms of Destruc-tion and Explosive Processes, J. Shock Waves. 7, 2, pp. 63–76 (1997)
218 5 Shock Waves in Bubbly Media
22. H. Gronig: Past, present and future of shock focusing research. In: K. Takayama(ed.) Proc. Intern. Workshop on Shock Wave Focusing (Sendai, Japan, 1989)pp. 1–38
23. B. Sturtevant: The physics of shock wave focusing in the context of extracor-poreal shock wave lithotripsy. In: R. Brun, L.Z. Dumitrescu (eds.) Proc. 19thIntern. Symp. on Shock Waves. vol. 4 (Springer, Berlin, Heidelberg, New York,1995) pp. 81–86
24. D. Book, R. Lohner: Quatre foil instability of imploding cylindrical shock. In:K. Takayama (ed.) Proc. Intern. Workshop on Shock Wave Focusing (Sendai,Japan, 1989) pp. 193–206
25. K. Takayama: High pressure generation by shock wave focusing in ellipsoidalcavity. In: K. Takayama (ed.) Proc. Intern. Workshop on Shock Wave Focusing(Sendai, Japan, 1989) pp. 1–37
26. M. Watanabe et al: Shock wave focusing in a vertical annular shock tube. In:R. Brun, L.Z. Dumitrescu (eds.) Proc. 19th Intern. Symp. on Shock Waves,vol. 4, (Springer, Berlin Heidelberg New York, 1995) pp. 99–104
27. H. Nagoya et al.: Underwater shock wave propagation and focusing in inhomo-geneous media. In: R. Brun, L.Z. Dumitrescu (eds.) Proc. 19th Intern. Symp. onShock Waves, vol. 4 (Springer, Berlin Heidelberg New York, 1995) pp. 439–444
28. C. Stuka et al.: Nonlinear transmission of focused shock waves in nondegassedwater. In: R. Brun, L.Z. Dumitrescu (eds.) Proc. 19th Intern. Symp. on ShockWaves. vol. 4, (Springer, Berlin, Heidelberg, New York, 1995) pp. 445–448
29. M. Kuwahara et al.: The problems of focused shock waves effect on biologicaltissues. In: K. Takayama (ed.) Proc. Intern. Workshop on Shock Wave Focusing,(Sendai, Japan, 1989) pp. 41–48
30. K. Isuzukawa, M. Horiuchi: Experimental and numerical studies of blast wavefocusing in water. In: K. Takayama (ed.) Proc. Intern. Workshop on ShockWave Focusing, (Sendai, Japan, 1989) pp. 347–350
31. K. Fujiwara et al.: New methods for generating cylindrical imploding shock.In: R. Brun, L.Z. Dumitrescu (eds.) Proc. 19th Intern. Symp. on Shock Waves.vol. 4 (Springer, Berlin, Heidelberg, New York, 1995) pp. 81–86
32. F. Demmig et al.: Experiments and model computation of cylindrical shockwaves with time-resolved deformation and fragmentation. In: R. Brun, L.Z. Du-mitrescu (eds.) Proc. 19th Intern. Symp. on Shock Waves. vol. 4 (Springer,Berlin, Heidelberg, New York, 1995) pp. 87–92
33. T. Hiroe et al.: A numerical study of explosive-driven cylindrical implod-ing shocks in solids. In: R. Brun, L.Z. Dumitrescu (eds.) Proc. 19th Intern.Symp. on Shock Waves. vol. 4 (Springer, Berlin, Heidelberg, New York, 1995)pp. 267–272
34. S. Itoh et al.: Converging underwater shock waves for metal processing. In:R. Brun, L.Z. Dumitrescu (eds.) Proc. 19th Intern. Symp. on Shock Waves.vol. 4 (Springer, Berlin, Heidelberg, New York, 1995) pp. 288–294
35. R. Neemeh: Propagation and stability of converging cylindrical shocks in narrowcylindrical chamber. In: R. Brun, L.Z. Dumitrescu (eds.) Proc. 19th Intern.Symp. on Shock Waves. vol. 4 (Springer, Berlin, Heidelberg, New York, 1995)pp. 273–278
36. I.V. Volkov, S.T. Zavtrak, I.S. Kuten: Rev. E. 56, 1, pp. 1097–1101 (1997)37. S.T. Zavtrak, I.V. Volkov: J. Acoust. Soc. Am. 102, 1, pp. 204–206 (1997)38. G.E. Reisman, Y.C. Wang, C.E. Brennen: J Fluid Mech. 355, 255–283 (1998)
References 219
39. V.K. Kedrinskii, V.A. Vshivkov, G.I. Dudnikova, Yu.I. Shokin: Amplificationof Shock Waves at Collision and Focusing in Bubbly Media, Dokl. Akad. Nauk.361, 1, pp. 400–404 (1998)
40. N.K. Berezhetskaya, E.F. Bolshakov, S.K. Golubev et al.: Zh. Exp. Teor. Fiz.87, 6 (12), p. 1926 (1984)
41. G.B. Whitham: Fluid Mech. 22, 2, p. 146 (1957)42. W. Chester: Phil. Mag. 45, 7, p. 1293 (1954)43. R.F. Chisnell: J. Fluid Mech. 22, 2, p. 286 (1957)44. I.V. Sokolov: Zh. Exp. Teor. Fiz. 91, 4(10), p.1331 (1986)45. I.V. Sokolov: Thermofiz. Vys. Temp. 26, 3, p. 560 (1988)46. I.V. Sokolov: Izv. Akad. Nauk SSSR, Mekh. Zhidk. Gaza 4, p. 148 (1989)47. E.M. Barkhudarov, I.F. Kossyi, M.O. Mdivnishvili, I.V. Sokolov, M.I. Taktak-
ishvili: Izv. Akad. Nauk SSSR, Mekh. Zhidk. Gaza 164, 2, p. 164 (1988)48. E.M. Barkhudarov, M.O. Mdivnishvili, I.V. Sokolov et al.: Piz’ma Zh. Exp.
Teor. Fiz. 52, 7, p. 990 (1990)49. E.M. Barkhudarov, M.O. Mdivnishvili, I.V. Sokolov, M.I. Taktakishvili,
V.E. Terekhin: Izv. Akad. Nauk SSSR, Mekh. Zhidk. Gaza 183, 5, p. 183 (1990)50. E.M. Barkhudarov, M.O. Mdivnishvili, I.V. Sokolov et al.: Shock Waves 3, 4,
p. 273 (1994)51. V.K. Kedrinskii: Hydrodynamics of Explosion, 1st ed. (SB RAS Publishing
House, Novosibirsk 2000)52. V.K. Kedrinskii: Features of Shock Wave Structure at Underwater Explosions
of Spiral Charges, Zh. Prikl. Mekh. i Tekh. Fiz. 21, 5, p. 51 (1980)53. A.V. Pinaev, V.K. Kedrinskii, V.T. Kuzavov: On Shock Wave Focusing at Coil
Charge Explosion in Air, Fiz. Goren. Vzryva 37, 4, p. 51 (2001)54. A.V. Pinaev, V.K. Kedrinskii, V.T. Kuzavov: Shock Wave Structure in Near
Field of Spatial Charges at Explosion in Air, Zh. Prikl. Mekh. i Tekh. Fiz. 41,5, pp. 81–90 (2000)
55. Z. Jiang Z., K. Takayama: Computer and Fluids 27, 5–6 (1998)56. V.K. Kedrinskii, V.A. Vshivkov, G.I. Dudnikova, Yu.I. Shokin, G.G. Lazareva:
Focusing of an Oscillating Shock Wave Emitted by a Toroidal Bubble Cloud,Zh. Exp. Teor. Fiz. 125, 5, pp. 1138–1145 (2004)
57. V.K. Kedrinskii, Yu.I. Shokin, V.A. Vshivkov, G.I. Dudnikova, G.G. Lazareva:Shock Wave Generation in a Liquid by Spherical Bubbly Clusters, Dokl. RAN,381, 6, pp. 773–777 2001
58. V.K. Kedrinskii: The Iordansky-Kogarko-van Wijngaarden model: shock andrarefaction wave interactions in bubbly media. In: A. Biesheuvel, G. van Heust(eds.) Fascination of Fluid Dynamics, (Reprint from Applied Scientific Research58, 1–4 (1997/1998) pp. 115–130)
59. V.M. Kovenya, A.S. Lebedev: Zh. Vych. Mat. Mat. Fiz. 34, 6, p. 886 (1994)60. V.M. Kovenya: Vych. Tekhnol. 7, 2, p. 59 (1992)61. A.I. Sychev, A.V. Pinaev: Self-Sustaining Detonation in a Liquid with Bubbles
of Reactive Gas, Zh. Prikl. Mekh. i Tekh. Fiz. 27, 1, pp. 133–138 (1986)62. Kedrinskii V.K.: Shock-wave compression of a gas cavity in water. MA Thesis.
(Leningrad Polytechnic Institute, Leningrad, 1961)63. T. Hasegawa, T. Fujiwara: Detonation in oxyhydrogen bubbled liquids. In:
Proc. 19th Intern. Symp. on Combustion (Haifa, 1982) pp. 675–68364. V.K. Kedrinskii, F.N. Zamarayev: Wave amplification in chemically reactive
bubble media (plenary lecture). In: W. Yong (ed.) Proc. 17th Intern. Symp.
220 5 Shock Waves in Bubbly Media
on Shock Tubes and Waves (17-21 July, Lehigh Univ., Penns., USA, 1989)pp. 51–62.
65. A.V. Trotsyuk, P.A. Fomin: Bubbly Detonation Model, Fiz. Goren. Vzryva 28,4, pp. 129–136 (1992)
66. V.K. Kedrinskii, V.A. Vshivkov, G.I. Dudnikova, Yu.I. Shokin: Shock WaveInteraction in Reactive Bubble Media, Dokl. RAN 349, 2, pp. 185–188 (1996)
67. V.Sh. Shagapov, N.K. Vakhitova: Waves in a bubbly liquid in the presence ofchemical reactions in gas medium. In: V.K. Kedrinskii (ed.) Proc. XI Intern.Symp. On Nonlinear Acoustics , Ed. by Kedrinskii V.K (Novosibirsk, 1987)pp. 56–58
68. V.Yu. Lyapidevskii: On Velocity of Bubbly Detonation, Fiz. Goren. Vzryva 26,4, pp. 138–140 (1990)
69. V.K. Kedrinskii, Ch. Mader: Accidential detonation in bubbly liquids. In:H. Gronig (ed.) Proc. 16th Intern. Symp. on Shock Tube and Waves (1987)pp. 371–376
70. R. Barbone, D. Frost, A. Makris, J. Nerenberg: Explosive boiling of a depres-surized volatile liquid. In: S. Morioko, L. van Wijngaarden (eds.) Proc. IUTAMSymp. on Waves in Liquid–Gas and Liquid–Vapor Two-Phase Systems (KluwerAcad. Publ., Kyoto, 1995) pp. 315–324
71. A.A. Vasiliev, V.K. Kedrinskii, S.P. Taratuta: Dynamics of Single Bubble withChemical Reactive Gas, Fiz. Goren. Vzryva 34, 2, pp. 121–124 (1998)
72. A.V. Pinaev, A.I. Sychev: Structure and Properties of Detonation in SystemsLiquid-Gas Bubbles, Fiz. Goren. Vzryva 22, 3, pp. 109–118 (1986)
73. A.V. Pinaev, A.I. Sychev: Discovery and Study of Self-Sustaining Regimes ofDetonation in Systems Liquid Fuel-Bubbles of Oxidizer, Dokl. Akad. NaukSSSR 290, 3, pp. 611–615 (1986)
74. A.E. Beylich, A. Gulhan: Waves in reactive bubbly liquids. In: G.E. Meier,P. A, Thompson (eds.) Proc. IUTAM Symp on Adiabatic Waves in Liquid–Vapor Systems (Springer, Berlin, Heidelberg, New York, 1990) pp. 39–48
75. T. Scarinci, X. Bassin, J. Lee, D. Frost: Propagation of a reactive wave ina bubbly liquid. In: K. Takayama (ed.) Proc. 18th ISSW, Sendai, Japan, July1991, vol. 1, (Springer Verlag, Sendai, 1992) pp. 481–484
76. J. Kang, P.B. Butler: Combustion Science and Technology 90, (1–4) (1993),pp. 173–192
77. V.K. Kedrinskii: Bubbly cavitation in intense rarefaction waves and its effects(plenary lecture). In: B. Sturtevant, J.E. Shepherd, H.G. Hornung (eds.) Proc.20th Intern. Symp. on Shock Waves, Pasadena, CalTech., July 1995 (WorldScientific, New York, 1996)
78. V.K. Kedrinskii, V.A. Vshivkov, G.I. Dudnikova, Yu.I. Shokin: Role Cavita-tion in Disintegration Mechanics and Large Scale Explosion Processes, Vych.Tekhnol. 2, 2, pp.63–77 (1997)
79. F.P. Bowden, A.D. Yoffe: Fast Reactions in Solid (London: Butterworths Sci.Publ., 1958)
80. K.K. Andreev: Some Consideration on the Mechanism of Detonation Initiationin Explosive, Proc. Roy. Soc. London. A 246, pp.257–267 (1958)
81. C.H. Johansson: The Initiation of Liquid Explosives by Shock and the Impor-tance of Liquid Break-Up, Proc. Roy. Soc. London. A 246, pp. 269–283 (1958)
82. A.V. Dubovik, V.K. Bobolev: Shock Sensitivity of Explosive Systems (Nauka,Moscow, 1978)

References 221
83. A.W. Campbell, W.C. Davis, J.R. Travis: Shock Initiation of Detonation inLiquid Explosives, Phys. Fluids 4, 4, p. 498 (1961)
84. J.E. Field et al: Hot-Spot Ignition Mechanisms for Explosives and Propellants,Phil. Trans. Roy. Soc. London 339, pp. 269–283 (1992)
85. P. Roberts, J. Field: Simulated of fragment attack on cased munition. In: Proc.10th Intern. Det. Symp. (Boston, 1993)
86. L. Hill, B. Sturtevant: An experimental study of evaporation waves in a su-perheated liquid. In: G. Meier, P. Thompson (eds.) Proc. IUTAM Symp. onAdiabatic Waves in Liquid–Vapor Systems, (Springer, Berlin, Heidelberg, NewYork, 1990) pp. 25–37
87. H. Chaves, H. Lang, G. Meier, H. Speckmann: Flow in real fluids. In: LectureNotes in Physics (Springer, Berlin Heidelberg New York, 1985)
88. O.M. Todes: J. Phys. Chem. 4, 1 (1933)89. V.K. Kedrinskii, Yu.I. Shokin, V.A. Vshivkov, G.I. Dudnikova: Shock amplifi-
cation by bubbly systems with energy release (SABSER). In: Proc. 6th Japan–Russian Joint Symposium on Computational Fluid Dynamics, (Nagoya, 1998)pp. 58–61
90. V.K. Kedrinskii, P.A. Fomin, S.P. Taratuta, A.A. Vasiliev: Phase transitionrole in bubble detonation problems. In: Proc. 22nd Int. Symp. on Shock Waves(London, 1999) pp. 223–228
91. V.K. Kedrinskii, I.V. Maslov, S.P. Taratuta: J Appl. Mech. Tech. Phys. 43, 2(2002), pp. 101–109
92. A.I. Sychev: Structure of Wave Field in Reactive Bubbly Systems in a ShockTubes with Jump of Cross-Sections, Combustion Explosion and Shock Waves36, 3 (2000)
93. A.I. Sychev: Combustion Explosion and Shock Waves 38, 2 (2002)94. S. Gavrilyuk, R. Saurel: J. Comput. Phys. 175, 1 (2002), pp. 326–36095. V. Teshukov: J. Appl. Mech. Tech. Phys. 41, 5 (2000), pp. 879–886
6 Problems of Cavitative Destruction
6.1 Dynamics of Liquid Statein Pulsed Rarefaction Waves
Fracture of a liquid in intense rarefaction waves produced by explosive load-ing near the free surface is a new field in the hydrodynamics of explosions.Only a few of the relevant concepts, such as critical tensile stress and tensilestrength in liquids, have been used for a century. The first studies were staticin nature and the first results in this field were obtained in the middle of the1950s by Berthelot [1]. The first dynamic studies using underwater explosionsnear the free surface were performed by Hilliard in 1919. In a recent studyby Wilson et al. [2] the strength of a liquid was estimated by measuring thevelocity of a dome of sprays produced by shallow underwater explosion. Thecritical tensile stress, p∗, was determined from the amplitude of the wave, p,at which the velocity of the free surface v = (2p−p∗)/ρ0c0 became zero. Theresulting value of p∗ was 0.85 MPa for settled tap water and 1.5 MPa fordeionized and vacuum-evaporated water. Carlson and Henry [3] used high-speed loading of a thin liquid layer by a pulse electron beam and obtained thevalue p∗ = 60 MPa, which may be explained by the very short loading time.
Practically all of the experiments dealt with visible discontinuities inthe liquid, which developed on the cavitation nuclei under the effect of in-tense cavitation waves. These discontinuities (spalls) were observed by theauthor in experiments with underwater explosions of linear HE charges (two-dimensional problem) near the free surface (Fig. 6.1) [4].
It was noted that spalls formed only in a narrow layer near the free surface,in spite of the fact that a strong cavitation expanded over a volume thatwas orders of magnitude larger. The spalls were strongly cavitating layersand their structure resembled foam, which then rapidly broke into separatefragments and drops, forming the spray dome [5].
The fracture of a liquid under explosive loading involves a series of es-sentially nonlinear phenomena, which can be defined as the inversion of thetwo-phase state of the medium, i.e., the transformation of the cavitating liquidinto a gas–droplet system. The inversion comprises the following stages:
– Formation and development of bubble clusters– Unbound growth of the cavitation nuclei to a foamy structure
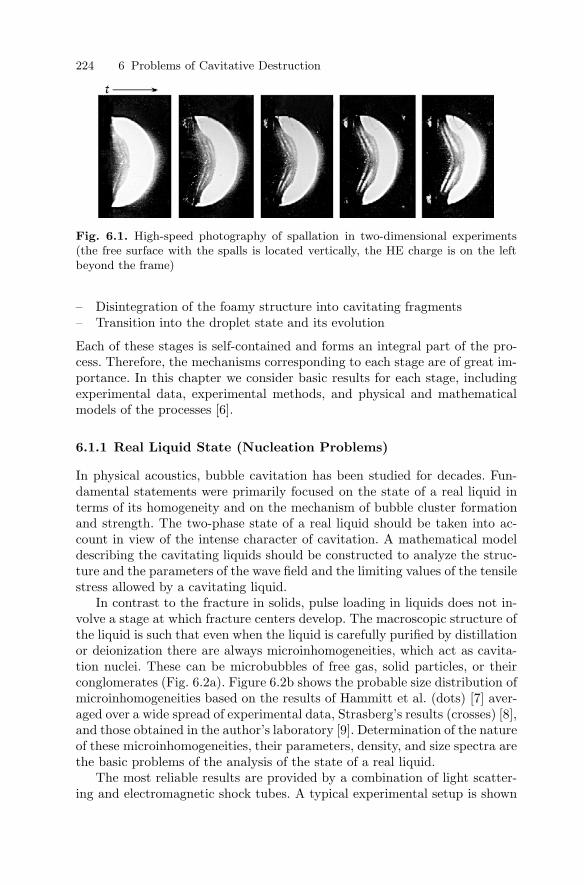
224 6 Problems of Cavitative Destruction
Fig. 6.1. High-speed photography of spallation in two-dimensional experiments(the free surface with the spalls is located vertically, the HE charge is on the leftbeyond the frame)
– Disintegration of the foamy structure into cavitating fragments– Transition into the droplet state and its evolution
Each of these stages is self-contained and forms an integral part of the pro-cess. Therefore, the mechanisms corresponding to each stage are of great im-portance. In this chapter we consider basic results for each stage, includingexperimental data, experimental methods, and physical and mathematicalmodels of the processes [6].
6.1.1 Real Liquid State (Nucleation Problems)
In physical acoustics, bubble cavitation has been studied for decades. Fun-damental statements were primarily focused on the state of a real liquid interms of its homogeneity and on the mechanism of bubble cluster formationand strength. The two-phase state of a real liquid should be taken into ac-count in view of the intense character of cavitation. A mathematical modeldescribing the cavitating liquids should be constructed to analyze the struc-ture and the parameters of the wave field and the limiting values of the tensilestress allowed by a cavitating liquid.
In contrast to the fracture in solids, pulse loading in liquids does not in-volve a stage at which fracture centers develop. The macroscopic structure ofthe liquid is such that even when the liquid is carefully purified by distillationor deionization there are always microinhomogeneities, which act as cavita-tion nuclei. These can be microbubbles of free gas, solid particles, or theirconglomerates (Fig. 6.2a). Figure 6.2b shows the probable size distribution ofmicroinhomogeneities based on the results of Hammitt et al. (dots) [7] aver-aged over a wide spread of experimental data, Strasberg’s results (crosses) [8],and those obtained in the author’s laboratory [9]. Determination of the natureof these microinhomogeneities, their parameters, density, and size spectra arethe basic problems of the analysis of the state of a real liquid.
The most reliable results are provided by a combination of light scatter-ing and electromagnetic shock tubes. A typical experimental setup is shown
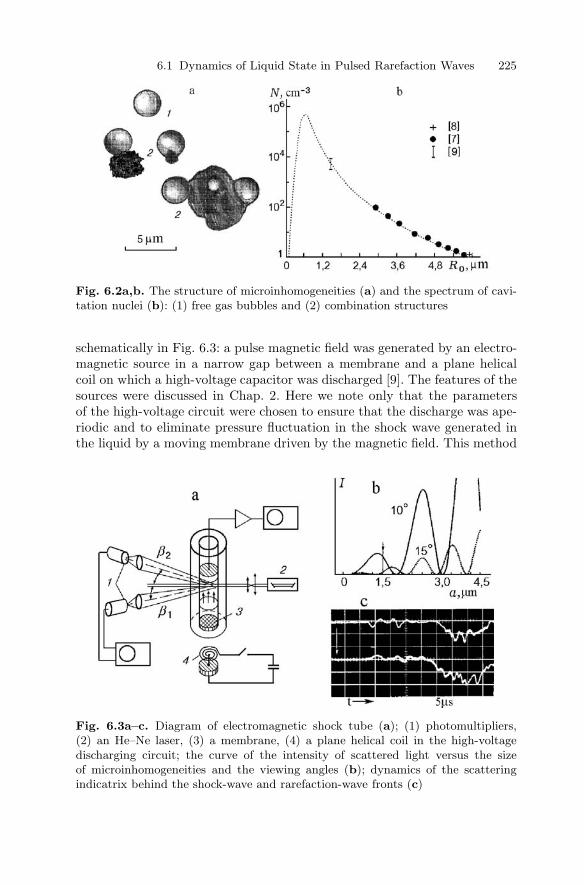
6.1 Dynamics of Liquid State in Pulsed Rarefaction Waves 225
Fig. 6.2a,b. The structure of microinhomogeneities (a) and the spectrum of cavi-tation nuclei (b): (1) free gas bubbles and (2) combination structures
schematically in Fig. 6.3: a pulse magnetic field was generated by an electro-magnetic source in a narrow gap between a membrane and a plane helicalcoil on which a high-voltage capacitor was discharged [9]. The features of thesources were discussed in Chap. 2. Here we note only that the parametersof the high-voltage circuit were chosen to ensure that the discharge was ape-riodic and to eliminate pressure fluctuation in the shock wave generated inthe liquid by a moving membrane driven by the magnetic field. This method
Fig. 6.3a–c. Diagram of electromagnetic shock tube (a); (1) photomultipliers,(2) an He–Ne laser, (3) a membrane, (4) a plane helical coil in the high-voltagedischarging circuit; the curve of the intensity of scattered light versus the sizeof microinhomogeneities and the viewing angles (b); dynamics of the scatteringindicatrix behind the shock-wave and rarefaction-wave fronts (c)
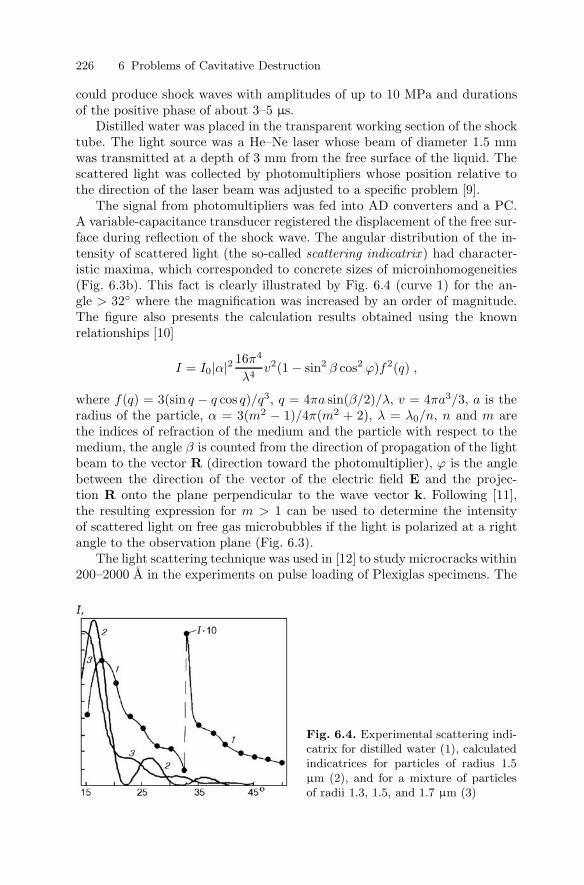
226 6 Problems of Cavitative Destruction
could produce shock waves with amplitudes of up to 10 MPa and durationsof the positive phase of about 3–5 µs.
Distilled water was placed in the transparent working section of the shocktube. The light source was a He–Ne laser whose beam of diameter 1.5 mmwas transmitted at a depth of 3 mm from the free surface of the liquid. Thescattered light was collected by photomultipliers whose position relative tothe direction of the laser beam was adjusted to a specific problem [9].
The signal from photomultipliers was fed into AD converters and a PC.A variable-capacitance transducer registered the displacement of the free sur-face during reflection of the shock wave. The angular distribution of the in-tensity of scattered light (the so-called scattering indicatrix ) had character-istic maxima, which corresponded to concrete sizes of microinhomogeneities(Fig. 6.3b). This fact is clearly illustrated by Fig. 6.4 (curve 1) for the an-gle > 32 where the magnification was increased by an order of magnitude.The figure also presents the calculation results obtained using the knownrelationships [10]
I = I0|α|2 16π4
λ4v2(1 − sin2 β cos2 ϕ)f2(q) ,
where f(q) = 3(sin q − q cos q)/q3, q = 4πa sin(β/2)/λ, v = 4πa3/3, a is theradius of the particle, α = 3(m2 − 1)/4π(m2 + 2), λ = λ0/n, n and m arethe indices of refraction of the medium and the particle with respect to themedium, the angle β is counted from the direction of propagation of the lightbeam to the vector R (direction toward the photomultiplier), ϕ is the anglebetween the direction of the vector of the electric field E and the projec-tion R onto the plane perpendicular to the wave vector k. Following [11],the resulting expression for m > 1 can be used to determine the intensityof scattered light on free gas microbubbles if the light is polarized at a rightangle to the observation plane (Fig. 6.3).
The light scattering technique was used in [12] to study microcracks within200–2000 A in the experiments on pulse loading of Plexiglas specimens. The
Fig. 6.4. Experimental scattering indi-catrix for distilled water (1), calculatedindicatrices for particles of radius 1.5µm (2), and for a mixture of particlesof radii 1.3, 1.5, and 1.7 µm (3)

6.1 Dynamics of Liquid State in Pulsed Rarefaction Waves 227
scattering indicatrix was close to the Rayleigh value and consisted of onepetal. The dynamics of submicrocracks was reconstructed from the changeof the relation of intensities measured in two fixed directions within the zeromaximum. In the case of microbubbles, the indicatrix had several petals,whose intensity, number, and position depended on the size of scatteringparticles. Thus, their dynamics could be reconstructed from the number ofpetals recorded by the photomultiplier at fixed observation angle and therequirements to the measurement accuracy of the intensity could be relaxed.Application of this method yielded a number of important results on the stateof microinhomogeneities in distilled water.
Static measurements reported in [9] revealed stable existence of microin-homogeneities and proved that, in addition to the zero maximum, the scat-tering indicatrix had a clear maximum at β = 17.5 and two smooth maximaat β = 28 and 37. Their position unambiguously determined the radiusof scattering particles as a ≈ 1.5 µm. One could assume that the indicatrixpetals were smoothened due to the size dispersion of the microparticles. Tocheck this assumption, the integral indicatrix was calculated for the mixtureof particles with radii 1.3, 1.5, and 1.7 µm (Fig. 6.4, curve 3). The calcu-lations confirmed smoothening of the second and the third maxima to thesame extent as in the experiments.
Static experiments (unperturbed liquid) with distilled water and a wave-length λ = 0.63 µm showed that the radii of the nuclei were approximately1.5 ± 0.2 µm and were nearly monodisperse. We note that this result mightbe associated with a certain selectivity of the recording system, which wouldlimit its capability of determining the true distribution.
The distribution and sizes of microparticles in distilled water were alsomeasured using the Malvern Instrument M6.10: the distribution maximumin fresh water was about 4 µm and was 0.85 µm (with a magnetic mixer) insettled water (after 10–12 hours of settling). The experimental results of [7] forsettled water were generalized in [13] to the simple relation
√NiVi = C, where
i is the bubble species, Ni is the number of bubbles of a given species, Vi istheir volume, and N 10−9.
Obviously this relation does not describe the entire distribution, whichfrom physical considerations should have a maximum and asymptoticallyapproached zero as the volume of bubbles approached zero and at infinity.A distribution with these properties (see Fig. 6.2b, curve) can be presentedas [14]
Ni = N0(Vi/V∗)2
1 + (Vi/V∗)4. (6.1)
This distribution involves two unknown parameters: the total number of par-ticles per unit volume N0 and the normalization parameter V∗, which can betaken as the volume of a bubble of radius R∗ corresponding to the distribu-tion maximum. If the above experimental value R 0.85 µm is taken as R∗and the “tail” of the distribution (6.1) fits the data of [7, 8] for Ri ≥ 3 µm,

228 6 Problems of Cavitative Destruction
the total density of microinhomogeneities is N 1.5 · 105 cm−3, which isconsistent with the experimental data, 105–106 cm−3, obtained by measuringthe tracks of diffraction spots from light scattered at inhomogeneities of anynature (Fig. 6.5).
Of principal importance is the question on the nature of inhomogeneitiesin a liquid. An original technique combining the shock tube and the scatteringindicatrix method was proposed in [9]. The technique made it possible to solvethe problem unambiguously. The idea was based on the essential dependenceof the intensity of scattered light on the size of inhomogeneities. We selectedtwo observation angles β = 10 and 15. The intensity distribution of thelight scattered at these angles is presented in Fig. 6.3b. The arrow marks theinitial size of the inhomogeneities (1.5 µm).
If the inhomogeneities were the microbubbles of free gas, when the shockwave passed along the liquid the cavitation nuclei would collapse and theintensity of scattered light would vary in different ways for the selected reg-istration angles (Fig. 6.3b), i.e., increase with respect to the background forβ = 10 and decrease for β = 15 [9].
In the experiment, a laser beam 4 mm in diameter was focused alongthe tube diameter (Fig. 6.3) at a depth of 6 mm beneath the free surfaceof water. The oscillograms shown in Fig. 6.3c (β = 10 for beam 1 andβ = 15 for beam 2) had three characteristic sections: oscillations due to theparticle dynamics in the shock wave, reconstruction of unperturbed state,and the section of increasing intensity of oscillations and subsequent decline.The incident shock wave consisted of three attenuating pressure pulses withthe amplitude of 6–7 MPa and a passage period of about 3 µs. The intensityfluctuations of scattered light coincided with the period of passage of thepulses and characterized the dynamics of the average radius of the scatteringparticles.
As follows from Fig. 6.3c, the experimental arrangement actually demon-strated antiphase change of signals from the photomultiplier (the first sectionof oscillograms) related to the decrease in size of cavitation nuclei, which was
Fig. 6.5. Tracks of diffraction spots crossing the laser beam due to natural con-vection of water in the cuvette
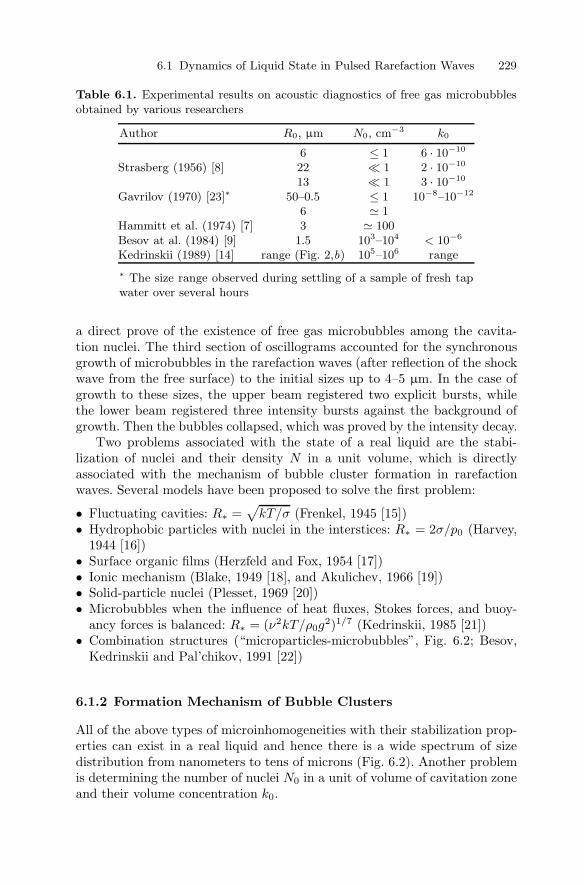
6.1 Dynamics of Liquid State in Pulsed Rarefaction Waves 229
Table 6.1. Experimental results on acoustic diagnostics of free gas microbubblesobtained by various researchers
Author R0, µm N0, cm−3 k0
6 ≤ 1 6 · 10−10
Strasberg (1956) [8] 22 1 2 · 10−10
13 1 3 · 10−10
Gavrilov (1970) [23]∗ 50–0.5 ≤ 1 10−8–10−12
6 1Hammitt et al. (1974) [7] 3 100Besov at al. (1984) [9] 1.5 103–104 < 10−6
Kedrinskii (1989) [14] range (Fig. 2,b) 105–106 range
∗ The size range observed during settling of a sample of fresh tapwater over several hours
a direct prove of the existence of free gas microbubbles among the cavita-tion nuclei. The third section of oscillograms accounted for the synchronousgrowth of microbubbles in the rarefaction waves (after reflection of the shockwave from the free surface) to the initial sizes up to 4–5 µm. In the case ofgrowth to these sizes, the upper beam registered two explicit bursts, whilethe lower beam registered three intensity bursts against the background ofgrowth. Then the bubbles collapsed, which was proved by the intensity decay.
Two problems associated with the state of a real liquid are the stabi-lization of nuclei and their density N in a unit volume, which is directlyassociated with the mechanism of bubble cluster formation in rarefactionwaves. Several models have been proposed to solve the first problem:
• Fluctuating cavities: R∗ =√
kT/σ (Frenkel, 1945 [15])• Hydrophobic particles with nuclei in the interstices: R∗ = 2σ/p0 (Harvey,
1944 [16])• Surface organic films (Herzfeld and Fox, 1954 [17])• Ionic mechanism (Blake, 1949 [18], and Akulichev, 1966 [19])• Solid-particle nuclei (Plesset, 1969 [20])• Microbubbles when the influence of heat fluxes, Stokes forces, and buoy-
ancy forces is balanced: R∗ = (ν2kT/ρ0g2)1/7 (Kedrinskii, 1985 [21])
• Combination structures (“microparticles-microbubbles”, Fig. 6.2; Besov,Kedrinskii and Pal’chikov, 1991 [22])
6.1.2 Formation Mechanism of Bubble Clusters
All of the above types of microinhomogeneities with their stabilization prop-erties can exist in a real liquid and hence there is a wide spectrum of sizedistribution from nanometers to tens of microns (Fig. 6.2). Another problemis determining the number of nuclei N0 in a unit of volume of cavitation zoneand their volume concentration k0.
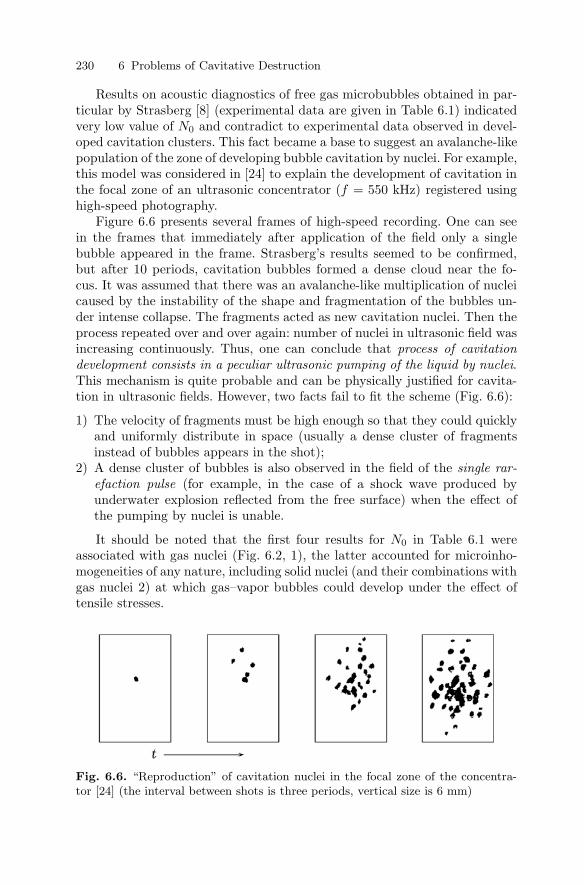
230 6 Problems of Cavitative Destruction
Results on acoustic diagnostics of free gas microbubbles obtained in par-ticular by Strasberg [8] (experimental data are given in Table 6.1) indicatedvery low value of N0 and contradict to experimental data observed in devel-oped cavitation clusters. This fact became a base to suggest an avalanche-likepopulation of the zone of developing bubble cavitation by nuclei. For example,this model was considered in [24] to explain the development of cavitation inthe focal zone of an ultrasonic concentrator (f = 550 kHz) registered usinghigh-speed photography.
Figure 6.6 presents several frames of high-speed recording. One can seein the frames that immediately after application of the field only a singlebubble appeared in the frame. Strasberg’s results seemed to be confirmed,but after 10 periods, cavitation bubbles formed a dense cloud near the fo-cus. It was assumed that there was an avalanche-like multiplication of nucleicaused by the instability of the shape and fragmentation of the bubbles un-der intense collapse. The fragments acted as new cavitation nuclei. Then theprocess repeated over and over again: number of nuclei in ultrasonic field wasincreasing continuously. Thus, one can conclude that process of cavitationdevelopment consists in a peculiar ultrasonic pumping of the liquid by nuclei.This mechanism is quite probable and can be physically justified for cavita-tion in ultrasonic fields. However, two facts fail to fit the scheme (Fig. 6.6):
1) The velocity of fragments must be high enough so that they could quicklyand uniformly distribute in space (usually a dense cluster of fragmentsinstead of bubbles appears in the shot);
2) A dense cluster of bubbles is also observed in the field of the single rar-efaction pulse (for example, in the case of a shock wave produced byunderwater explosion reflected from the free surface) when the effect ofthe pumping by nuclei is unable.
It should be noted that the first four results for N0 in Table 6.1 wereassociated with gas nuclei (Fig. 6.2, 1), the latter accounted for microinho-mogeneities of any nature, including solid nuclei (and their combinations withgas nuclei 2) at which gas–vapor bubbles could develop under the effect oftensile stresses.
Fig. 6.6. “Reproduction” of cavitation nuclei in the focal zone of the concentra-tor [24] (the interval between shots is three periods, vertical size is 6 mm)

6.1 Dynamics of Liquid State in Pulsed Rarefaction Waves 231
A fundamentally new mechanism for the generation of cavitation zoneswas proposed by the author in [25]. The essence of the mechanism was asfollows:
a) It was assumed that a real liquid contained a spectrum of nuclei of radii10−7–10−3 cm and constant density of 105–106 cm−3;
b) The concept of visible (detectable) size of cavitation nuclei was introduced;c) The apparent multiplication of cavitation nuclei in relatively weak ul-
trasonic fields was explained by the successive saturation of the zone bybubbles that needed different times for attaining visible size, dependingon their initial size (Fig. 6.2b);
d) For strong rarefaction phase the entire spectrum of nuclei could reachvisible size simultaneously;
e) Behind the front of strong rarefaction wave the density of saturation ofthe cavitation zone by nuclei reached maximum, the spectrum transformedinto a monodisperse structure.
The last three assertions were based on theoretical and numerical analysis ofthe effects of initial size on the time required for a nucleus to grow to a givensize [18]. Let us consider the simplest case of constant tensile stresses. Thedynamical behavior of a bubble of volume V is described by the first integralof the Rayleigh equation
V 2/V 1/3 = 6ηF (V, V0, p) , (6.2)
where at γ = 1,
F =1 + We V
−1/30
γ − 1V γ
0 (V 1−γ0 − V 1−γ) − p(V − V0) − 3
2We (V 2/3 − V
2/30 )
and dimensionless variables and parameters were introduced as follows: V =(R/Rv)3, Rv is the visible bubble radius, R0 is the radius of the nucleus,V0 = (R0/Rv)3, p = p∞/p0, p∞ is pressure at infinity, We = 2σ/p0Rv,η = p0/ρ0c
20, and the dot denotes a variable with respect to τ = t′c0/Rv.
The function F in the right-hand part of (6.2) describes a family of curvesdependent on V0 and p. A solution exists only for those parts of the curveswhere F ≥ 0.
To enable qualitative analysis of potential solutions we write the derivativeas
FV = (1 + WeV −1/30 )
(V0
V
)γ
− WeV −1/3 − p .
The functions F and FV possess the following properties:
F (0, V0, p) = −∞ , F (V0, V0, p) = 0 , FV (0, V0, p) = ∞ ,
FV (V0, V0, p) = 1 − p , and FV (∞, V0, p) = −p .
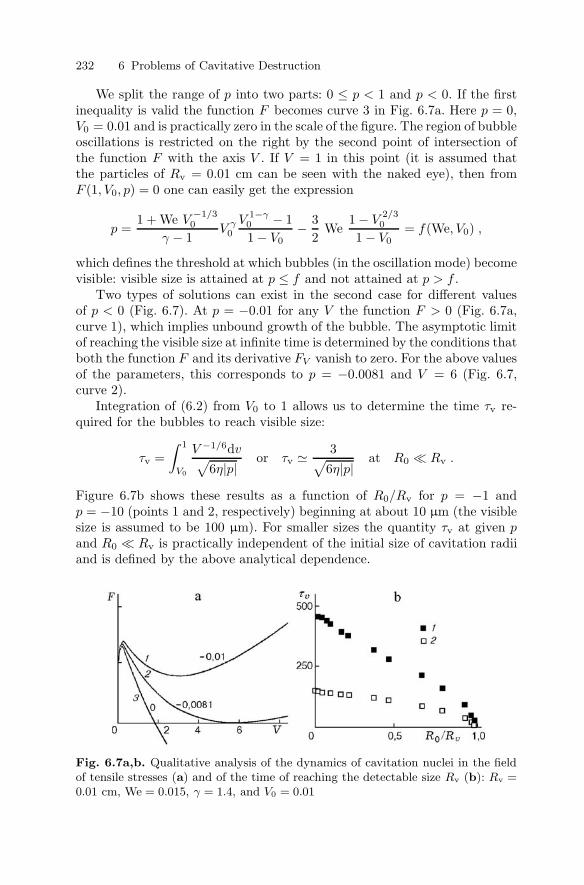
232 6 Problems of Cavitative Destruction
We split the range of p into two parts: 0 ≤ p < 1 and p < 0. If the firstinequality is valid the function F becomes curve 3 in Fig. 6.7a. Here p = 0,V0 = 0.01 and is practically zero in the scale of the figure. The region of bubbleoscillations is restricted on the right by the second point of intersection ofthe function F with the axis V . If V = 1 in this point (it is assumed thatthe particles of Rv = 0.01 cm can be seen with the naked eye), then fromF (1, V0, p) = 0 one can easily get the expression
p =1 + We V
−1/30
γ − 1V γ
0
V 1−γ0 − 11 − V0
− 32
We1 − V
2/30
1 − V0= f(We, V0) ,
which defines the threshold at which bubbles (in the oscillation mode) becomevisible: visible size is attained at p ≤ f and not attained at p > f .
Two types of solutions can exist in the second case for different valuesof p < 0 (Fig. 6.7). At p = −0.01 for any V the function F > 0 (Fig. 6.7a,curve 1), which implies unbound growth of the bubble. The asymptotic limitof reaching the visible size at infinite time is determined by the conditions thatboth the function F and its derivative FV vanish to zero. For the above valuesof the parameters, this corresponds to p = −0.0081 and V = 6 (Fig. 6.7,curve 2).
Integration of (6.2) from V0 to 1 allows us to determine the time τv re-quired for the bubbles to reach visible size:
τv =∫ 1
V0
V −1/6dv√6η|p| or τv 3√
6η|p| at R0 Rv .
Figure 6.7b shows these results as a function of R0/Rv for p = −1 andp = −10 (points 1 and 2, respectively) beginning at about 10 µm (the visiblesize is assumed to be 100 µm). For smaller sizes the quantity τv at given pand R0 Rv is practically independent of the initial size of cavitation radiiand is defined by the above analytical dependence.
Fig. 6.7a,b. Qualitative analysis of the dynamics of cavitation nuclei in the fieldof tensile stresses (a) and of the time of reaching the detectable size Rv (b): Rv =0.01 cm, We = 0.015, γ = 1.4, and V0 = 0.01
6.1 Dynamics of Liquid State in Pulsed Rarefaction Waves 233
For the set of points 1, we see that nuclei within 10 < R0 < 100 µm reachvisible size gradually and approximately 12 µs after application of the stressthe whole range of initial sizes within this range becomes visible. When theamplitude of tensile stresses increases by an order of magnitude, τv for theentire spectrum changes insignificantly (points 2, Fig. 6.7b), i.e., the visiblesize is achieved almost simultaneously.
At low-amplitude tensile stresses, certain effects lead to experimentally-established low saturation of the cavitation zone by detectable bubbles. Forexample, at p = −0.1, the nuclei with initial size 5 · 10−3 cm become visiblein 12.5 µs, the nuclei 5 · 10−4 cm in size become visible after over 47.5 µs,while the nuclei about 4.3 ·10−4 cm in size are a kind of threshold: the time oftheir growth to visible size is infinitely long. Naturally, below this thresholdthe nuclei are not detected, which explains the low number of bubbles in thevisible cavitation cluster.
It was shown in [18] that the above reasoning and conclusions have somerelation to ultrasonic cavitation. Let us consider some features of the dynam-ics of a single bubble in the ultrasonic wave field p∞ = p0+Ap0 cos(ωt), whereA > 0 and interaction starts at the compression stage (quarter-period). AtA = 1.5 (p = −1.5 at the maximum of the negative phase) and ω = 116 kHzthe time it takes for the nuclei of the spectrum 8.6 · 10−3–8.6 · 10−4 cm toreach visible size varies within 20–42 µs. They become visible during the firstunloading phase (the wave period is 54 µs). As A increases, even in the caseof simultaneous growth of the field frequency, a tendency to simultaneousachievement of visible size by a rather wide spectrum of cavitation nuclei isobserved. Thus, for A = 5 and ω = 450 kHz, as the nucleus radii changeby a factor of 30 (R0 = 7 · 10−3–2.2 · 10−4 cm), the time of achievement ofvisible size varies only within the range 7.4–12.3 µs.
6.1.3 Mathematical Model of Cavitating Liquid
The above data support the unambiguous interpretation of a real liquid asa two-phase medium, in spite of the negligibly small initial gas content (vol-ume concentration of k0 10−8–10−12). In this case, it is logical to assumethat the transformation of rarefaction waves (phases) in a real liquid withregard to inversion is similar to the propagation of shock waves in bubblymedia. It also make sense to use the mathematical model of such a mediumfor describing cavitating liquid [6, 27]. This model is a combination of con-servation laws for the average density ρ, pressure p, and mass velocity v,and a subsystem describing the dynamics of the bubbly medium state. Thepk-model as system of equations for two basic characteristics, pressure p andvolume concentration k of the gas–vapor phases, is the most convenient formto describe processes in cavitating media:
∆p − c−20
∂2p
∂t2= −ρ0k0
∂2k
∂t2, (6.3)
234 6 Problems of Cavitative Destruction
and∂2k
∂t2=
3k1/3
ρ0R20
(p0k−γ − p) +
16k
(∂k
∂t
)2
. (6.4)
The advantage of the system (6.3)–(6.4) is that it enables analytical solutions,if the appropriate physical conditions are formulated in the problem. In par-ticular, one can assume for a real liquid that at negligible initial gas contentand micron size of nuclei the bubbly system immediately reaches equilibriumbehind the shock-wave front and is completely “ignored” by the shock wave.
The changing state of the medium with microinhomogeneities behind therarefaction-wave front (or in the external ultrasonic field [28]) makes it pos-sible to consider the assumption on the insignificance of gas in expandingbubbles of the cavitation cloud and the inertia term k2
t /6k in (6.4) as theabove physical conditions. Then the dynamics of volume concentration ina bubble cluster can be described by the equation
∂2k
∂t2 −3k1/3
ρ0R20
p .
Changing the right-hand part of (6.3), neglecting the compressibility ofthe liquid component of the medium (carrier phase), and introducing thespatial variable η = αrk1/6 under the assumption on validity of |pηηη2
r | |pηηrr| and k |rkr/6| (where α =
√3k0/R0), we get the equation of the
Helmholtz type for pressure in a cavitating liquid
∆p p . (6.5)
Such a “heuristic” approach justified its validity in mathematical modelingof the transformation of shock waves in bubbly systems [29].
The simultaneous solution of (6.4) and (6.5) determines the parametersof rarefaction waves and the dynamics of the cavitation process [4,27,30]. Itshould be noted that comparison of these approximations with the numericalsolutions of the complete system of equations and with experimental dataproved that this model provides reliable estimates for the main characteristicsof wave processes in cavitating liquids.
6.1.4 Dynamic Strength of Liquid
It is known that the tensile stresses at the front of a rarefaction wave arecontinuous and reach the maximum value after a final time ∆t∗, which canbe defined as the slope of the front. Solution of the axisymmetrical problem forthe cavitation development at underwater explosion near free surface showsthat this fact is essential in determining the limiting stress the liquid canwithstand [30]. During the time ∆t∗ the volume concentration k of the gas–vapor phase increases by several orders of magnitude with respect to k0 andsignificantly changes the state of the medium and the applied stress field. As
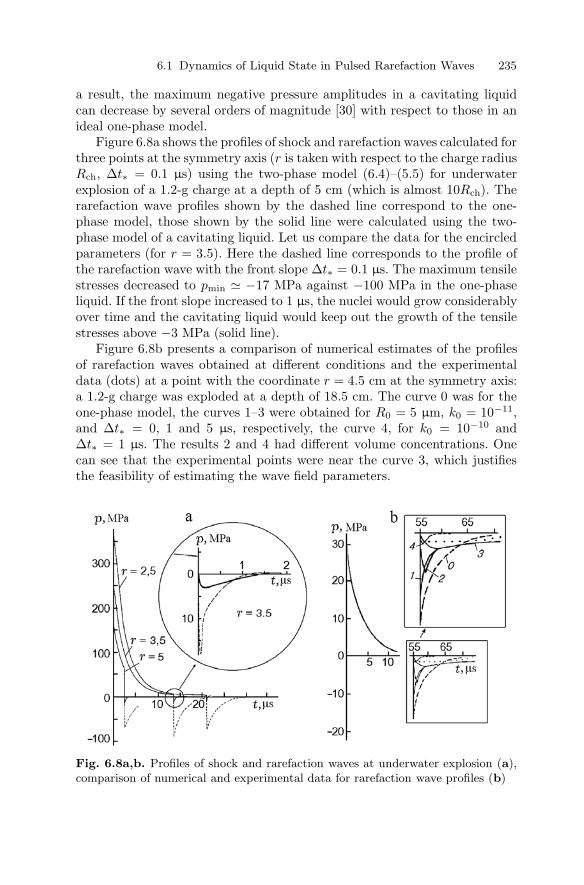
6.1 Dynamics of Liquid State in Pulsed Rarefaction Waves 235
a result, the maximum negative pressure amplitudes in a cavitating liquidcan decrease by several orders of magnitude [30] with respect to those in anideal one-phase model.
Figure 6.8a shows the profiles of shock and rarefaction waves calculated forthree points at the symmetry axis (r is taken with respect to the charge radiusRch, ∆t∗ = 0.1 µs) using the two-phase model (6.4)–(5.5) for underwaterexplosion of a 1.2-g charge at a depth of 5 cm (which is almost 10Rch). Therarefaction wave profiles shown by the dashed line correspond to the one-phase model, those shown by the solid line were calculated using the two-phase model of a cavitating liquid. Let us compare the data for the encircledparameters (for r = 3.5). Here the dashed line corresponds to the profile ofthe rarefaction wave with the front slope ∆t∗ = 0.1 µs. The maximum tensilestresses decreased to pmin −17 MPa against −100 MPa in the one-phaseliquid. If the front slope increased to 1 µs, the nuclei would grow considerablyover time and the cavitating liquid would keep out the growth of the tensilestresses above −3 MPa (solid line).
Figure 6.8b presents a comparison of numerical estimates of the profilesof rarefaction waves obtained at different conditions and the experimentaldata (dots) at a point with the coordinate r = 4.5 cm at the symmetry axis:a 1.2-g charge was exploded at a depth of 18.5 cm. The curve 0 was for theone-phase model, the curves 1–3 were obtained for R0 = 5 µm, k0 = 10−11,and ∆t∗ = 0, 1 and 5 µs, respectively, the curve 4, for k0 = 10−10 and∆t∗ = 1 µs. The results 2 and 4 had different volume concentrations. Onecan see that the experimental points were near the curve 3, which justifiesthe feasibility of estimating the wave field parameters.
Fig. 6.8a,b. Profiles of shock and rarefaction waves at underwater explosion (a),comparison of numerical and experimental data for rarefaction wave profiles (b)
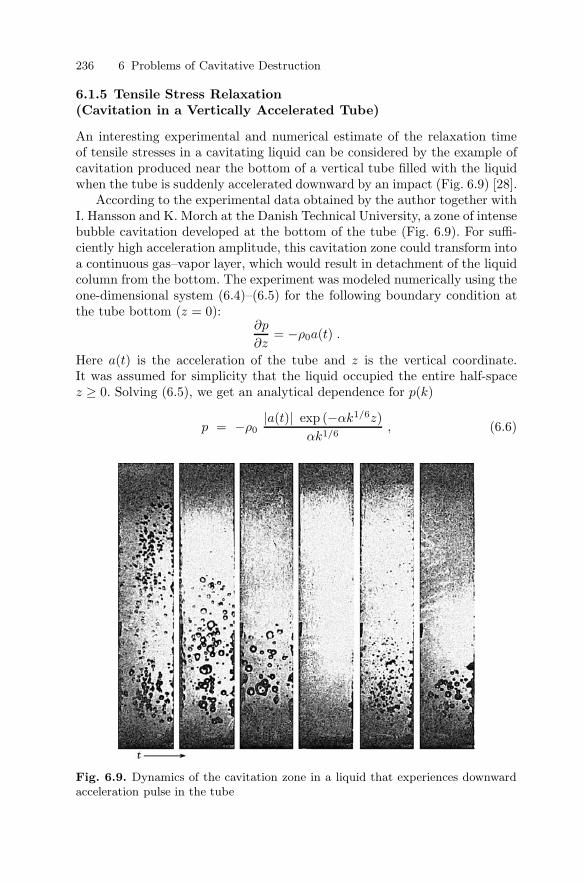
236 6 Problems of Cavitative Destruction
6.1.5 Tensile Stress Relaxation(Cavitation in a Vertically Accelerated Tube)
An interesting experimental and numerical estimate of the relaxation timeof tensile stresses in a cavitating liquid can be considered by the example ofcavitation produced near the bottom of a vertical tube filled with the liquidwhen the tube is suddenly accelerated downward by an impact (Fig. 6.9) [28].
According to the experimental data obtained by the author together withI. Hansson and K. Morch at the Danish Technical University, a zone of intensebubble cavitation developed at the bottom of the tube (Fig. 6.9). For suffi-ciently high acceleration amplitude, this cavitation zone could transform intoa continuous gas–vapor layer, which would result in detachment of the liquidcolumn from the bottom. The experiment was modeled numerically using theone-dimensional system (6.4)–(6.5) for the following boundary condition atthe tube bottom (z = 0):
∂p
∂z= −ρ0a(t) .
Here a(t) is the acceleration of the tube and z is the vertical coordinate.It was assumed for simplicity that the liquid occupied the entire half-spacez ≥ 0. Solving (6.5), we get an analytical dependence for p(k)
p = −ρ0|a(t)| exp (−αk1/6z)
αk1/6, (6.6)
Fig. 6.9. Dynamics of the cavitation zone in a liquid that experiences downwardacceleration pulse in the tube
6.1 Dynamics of Liquid State in Pulsed Rarefaction Waves 237
which, when substituted in (6.4), reduces the equation for volume concentra-tion near the tube bottom to
ddt
(k−1/6 dk
dt
)=
3 a(t)αR2
0
. (6.7)
We want to remind readers that the gas pressure inside the bubbles hasbeen neglected, which is justified for the purpose of estimating the relax-ation time, the above equation can be solved analytically, given the explicitdependence a(t).
We estimate the transformation of the pulse profile, as a model of re-flection of an underwater shock wave from a free surface, assuming that theacceleration and hence the unloading pulse have exponential form. In thiscase, the solution of (6.7) has the form
k5/6 = 1 +5t∗amax
2αR20
[t − t∗(1 − exp (−t/t∗))] . (6.8)
Using (6.6), we obtain main estimates for the relaxation processes in a cavi-tating liquid.
If the maximum tensile stress is instantaneous and the acceleration hasthe form a(t) = amaxe−t/t∗ , one can estimate:
• The relaxation of tensile stresses (by the time t = t∗),
p
pmax 1
e
[ 2αR20e
5t2∗amax
]1/5
• The time of relaxation of stresses (e-fold),
tcav 14.3(k0R20a
−2max)
1/4
Simple estimates done using these equations for k0 = 10−10, R0 = 1 µm,amax = 5 · 107 cm/s2 (corresponding to −30 MPa), and t∗ = 10 µs provedthat
– The amplitude of the rarefaction wave in the cavitating liquid decreased20-fold as compared to p/pmax = 1/e in the one-phase liquid;
– The relaxation time of tensile stresses in the cavitating liquid was lessthan 0.1 µs.
If the slope of the front of tensile stresses is defined as a linear growth of theamplitude of the applied acceleration a(t) = amax(t/t∗), one can easily find:
• The ultimate tensile stress,
p −ρ0
(a2maxR
30
3k0
)2/5
t−2/5∗ .
Following this estimate, the cavitating liquid at t = t∗ accepts only−3 MPa instead of −30 MPa prescribed by the one-phase model. We used
238 6 Problems of Cavitative Destruction
the following parameters: k0 = 10−11, R0 = 0.5 µm, and t∗ = 1 µs forthe front slope.
The calculations in [30] yielded a quantity of the same order, which showedthe reliability of the expressions for estimating both the relaxation time andthe limiting tensile stresses.
The complete system of equations for the cavitating liquid without anyassumptions (including those on the state of the gas) and with regard toheat transfer in the calculation of pressure inside a bubble was applied tothe problem of a shock rarefaction tube. This is an analog of the classicalshock tube with a liquid in the high-pressure chamber and a gas in the low-pressure chamber, and also that of the problem on the decay of an arbitrarydiscontinuity with essentially unsteady and nonlinear conditions. In (6.4), thepressure in gas pg was determined from the known equation
dpg
dt= 3(γ − 1)
q
4πR3− 3γpg
R
dR
dt,
using the following dependences proposed by Nigmatullin to simplify theproblem on heat transfer:
q = 4πR2λg NuT0 − T
2R, T =
pg
(γ − 1)cvρg= T0
( R
R0
)3 pg
pgo,
Nu =√
Pe at Pe > 100 , Nu = 10 at Pe < 100 ,
and
Pe = 12(γ − 1)T0R|S|
ν|T0 − Tg| .
The dynamic structure of the wave field in a cavitating liquid is shown inFig. 6.10 [31]. It was calculated for the following conditions: ν = 0.001 cm2/s,cv = 0.718 · 107 cm2/(s2· deg), λg = 2470 g·cm/(s3·deg), k0 = 10−4, andR0 = 50 µm. The rarefaction wave formation at initial moments (t = 3.3,10, 20, 30, and 40 µs) after the discontinuity decay is shown in Fig. 6.10a.Two wave profiles with regard to heat exchange (curve 1) and for adiabaticversion (curve 2) are compared for the times 90 µs in Fig. 10b and 440 µs inFig. 6.10c. One can see that the wave field split into two characteristic parts:a precursor formed by a centered rarefaction wave and propagating with the“frozen” speed of sound over the unperturbed liquid, and the main distur-bance in the form of a wave with an oscillating front and propagating withthe equilibrium speed characteristic of the two-phase bubbly medium. Wenote the analogy with the separation of shock waves into a precursor anda wave packet observed for bubbly media by the author in [29].
6.1.6 Transition to the Fragmentation Stage(Experimental Methods)
As noted above, for sufficiently intense rarefaction waves, bubble cavitationis characterized by unbound growth of the nuclei from the entire theoretically
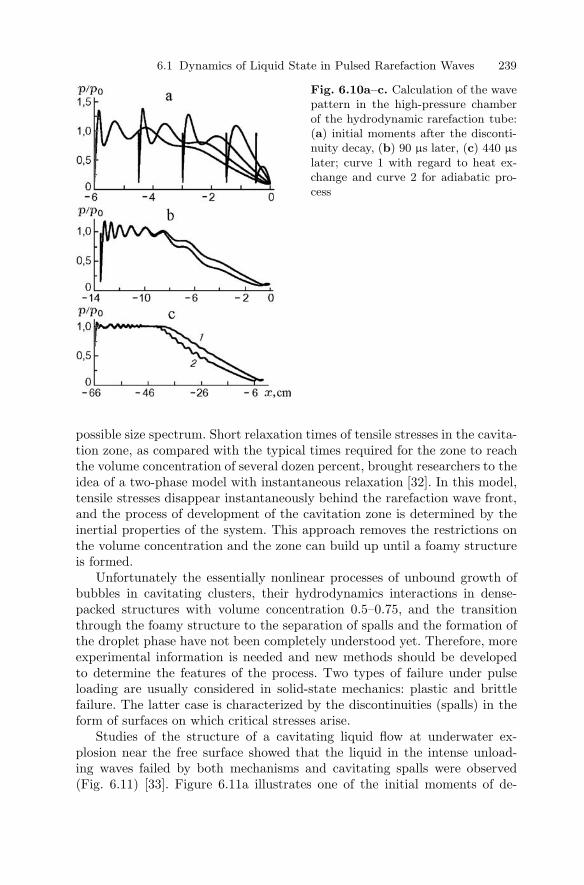
6.1 Dynamics of Liquid State in Pulsed Rarefaction Waves 239
Fig. 6.10a–c. Calculation of the wavepattern in the high-pressure chamberof the hydrodynamic rarefaction tube:(a) initial moments after the disconti-nuity decay, (b) 90 µs later, (c) 440 µslater; curve 1 with regard to heat ex-change and curve 2 for adiabatic pro-cess
possible size spectrum. Short relaxation times of tensile stresses in the cavita-tion zone, as compared with the typical times required for the zone to reachthe volume concentration of several dozen percent, brought researchers to theidea of a two-phase model with instantaneous relaxation [32]. In this model,tensile stresses disappear instantaneously behind the rarefaction wave front,and the process of development of the cavitation zone is determined by theinertial properties of the system. This approach removes the restrictions onthe volume concentration and the zone can build up until a foamy structureis formed.
Unfortunately the essentially nonlinear processes of unbound growth ofbubbles in cavitating clusters, their hydrodynamics interactions in dense-packed structures with volume concentration 0.5–0.75, and the transitionthrough the foamy structure to the separation of spalls and the formation ofthe droplet phase have not been completely understood yet. Therefore, moreexperimental information is needed and new methods should be developedto determine the features of the process. Two types of failure under pulseloading are usually considered in solid-state mechanics: plastic and brittlefailure. The latter case is characterized by the discontinuities (spalls) in theform of surfaces on which critical stresses arise.
Studies of the structure of a cavitating liquid flow at underwater ex-plosion near the free surface showed that the liquid in the intense unload-ing waves failed by both mechanisms and cavitating spalls were observed(Fig. 6.11) [33]. Figure 6.11a illustrates one of the initial moments of de-
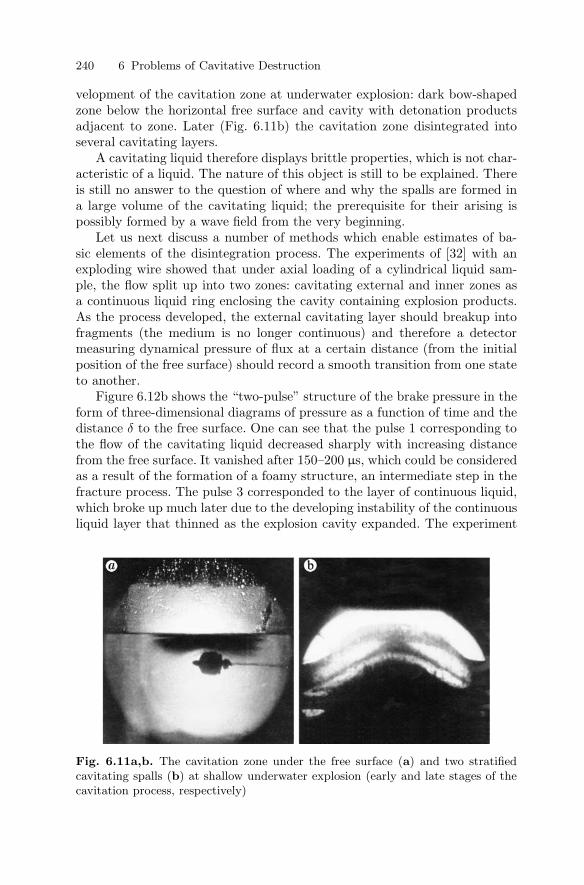
240 6 Problems of Cavitative Destruction
velopment of the cavitation zone at underwater explosion: dark bow-shapedzone below the horizontal free surface and cavity with detonation productsadjacent to zone. Later (Fig. 6.11b) the cavitation zone disintegrated intoseveral cavitating layers.
A cavitating liquid therefore displays brittle properties, which is not char-acteristic of a liquid. The nature of this object is still to be explained. Thereis still no answer to the question of where and why the spalls are formed ina large volume of the cavitating liquid; the prerequisite for their arising ispossibly formed by a wave field from the very beginning.
Let us next discuss a number of methods which enable estimates of ba-sic elements of the disintegration process. The experiments of [32] with anexploding wire showed that under axial loading of a cylindrical liquid sam-ple, the flow split up into two zones: cavitating external and inner zones asa continuous liquid ring enclosing the cavity containing explosion products.As the process developed, the external cavitating layer should breakup intofragments (the medium is no longer continuous) and therefore a detectormeasuring dynamical pressure of flux at a certain distance (from the initialposition of the free surface) should record a smooth transition from one stateto another.
Figure 6.12b shows the “two-pulse” structure of the brake pressure in theform of three-dimensional diagrams of pressure as a function of time and thedistance δ to the free surface. One can see that the pulse 1 corresponding tothe flow of the cavitating liquid decreased sharply with increasing distancefrom the free surface. It vanished after 150–200 µs, which could be consideredas a result of the formation of a foamy structure, an intermediate step in thefracture process. The pulse 3 corresponded to the layer of continuous liquid,which broke up much later due to the developing instability of the continuousliquid layer that thinned as the explosion cavity expanded. The experiment
Fig. 6.11a,b. The cavitation zone under the free surface (a) and two stratifiedcavitating spalls (b) at shallow underwater explosion (early and late stages of thecavitation process, respectively)
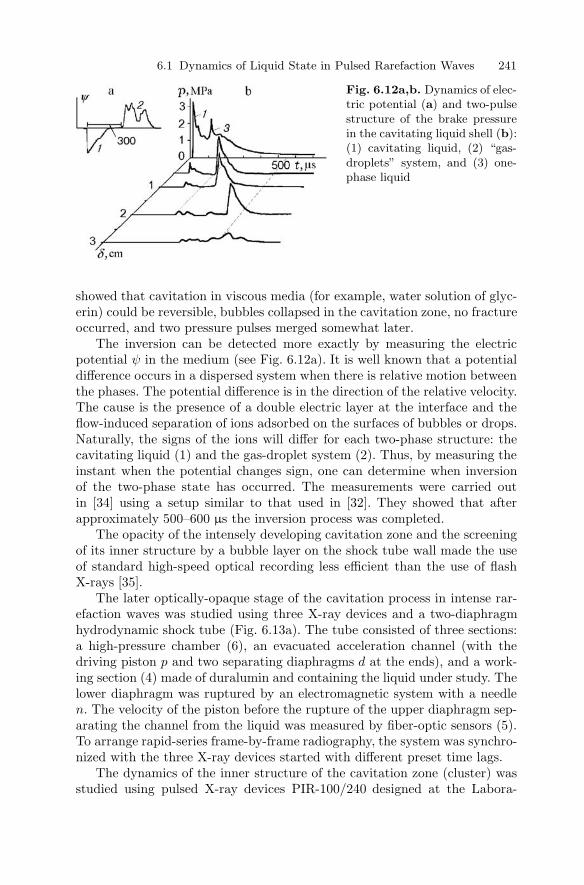
6.1 Dynamics of Liquid State in Pulsed Rarefaction Waves 241
Fig. 6.12a,b. Dynamics of elec-tric potential (a) and two-pulsestructure of the brake pressurein the cavitating liquid shell (b):(1) cavitating liquid, (2) “gas-droplets” system, and (3) one-phase liquid
showed that cavitation in viscous media (for example, water solution of glyc-erin) could be reversible, bubbles collapsed in the cavitation zone, no fractureoccurred, and two pressure pulses merged somewhat later.
The inversion can be detected more exactly by measuring the electricpotential ψ in the medium (see Fig. 6.12a). It is well known that a potentialdifference occurs in a dispersed system when there is relative motion betweenthe phases. The potential difference is in the direction of the relative velocity.The cause is the presence of a double electric layer at the interface and theflow-induced separation of ions adsorbed on the surfaces of bubbles or drops.Naturally, the signs of the ions will differ for each two-phase structure: thecavitating liquid (1) and the gas-droplet system (2). Thus, by measuring theinstant when the potential changes sign, one can determine when inversionof the two-phase state has occurred. The measurements were carried outin [34] using a setup similar to that used in [32]. They showed that afterapproximately 500–600 µs the inversion process was completed.
The opacity of the intensely developing cavitation zone and the screeningof its inner structure by a bubble layer on the shock tube wall made the useof standard high-speed optical recording less efficient than the use of flashX-rays [35].
The later optically-opaque stage of the cavitation process in intense rar-efaction waves was studied using three X-ray devices and a two-diaphragmhydrodynamic shock tube (Fig. 6.13a). The tube consisted of three sections:a high-pressure chamber (6), an evacuated acceleration channel (with thedriving piston p and two separating diaphragms d at the ends), and a work-ing section (4) made of duralumin and containing the liquid under study. Thelower diaphragm was ruptured by an electromagnetic system with a needlen. The velocity of the piston before the rupture of the upper diaphragm sep-arating the channel from the liquid was measured by fiber-optic sensors (5).To arrange rapid-series frame-by-frame radiography, the system was synchro-nized with the three X-ray devices started with different preset time lags.
The dynamics of the inner structure of the cavitation zone (cluster) wasstudied using pulsed X-ray devices PIR-100/240 designed at the Labora-

242 6 Problems of Cavitative Destruction
Fig. 6.13a–c. Shock tube experiments using the X-ray pulse technique (a): (1)X-ray apparatuses, (2) photo film, (3) pressure gauge, (4) working channel withthe liquid, (5) optical sensor for measuring the piston velocity, (6) high-pressurechamber; the effect of “freezing” of the mass velocity profile in the cavitating liquid(b); shock wave profile (c)
tory of Pulse Electrophysics of the Lavrentyev Institute of Hydrodynamics(Novosibirsk). The spectrum of the γ-quantum energy of the devices was ad-justed to the resolution of structural inhomogeneities in the few-centimeters-thick layers of a cavitating liquid: the average radiated energy was 70 keV,the maximum energy was up to 200 keV, and the duration of a single burst inthe pulse half-height was 80 ns. The X-ray/optical schemes were as follows:a signal from the piezosensor (3) placed near the diaphragm d in the workingchannel 4 of the shock tube triggered both the oscillograph and the pulsegenerator, the latter triggered with a preset delay that the X-ray devices andthe flash lamp used for illumination at the early “optical” stage.
A shock wave in the liquid sample was produced by an impact of thepiston. Its positive phase lasted for several tens of microseconds and theamplitude varied within 5–30 MPa. Reflection of the shock wave from thefree surface of the liquid resulted in a strong cavitation, as shown by the X-ray photographs in Fig. 6.14 for different times from zero to 1 ms. The firstframe corresponds to the arrival of the shock wave front to the free surface(the diameter of the liquid column was 30 mm).
We see that after 600 µs the cavitation zone already reached dense pack-ing with coarse gas–vapor cells. Computer processing of the density distribu-tion of the X-ray negatives enabled analysis of the process dynamics withoutinterfering the medium by sensors. Computer-generated versions of the ex-perimental data could be easily handled and offered a unique opportunity toreproduce the dynamic structure of the cavitation zone (the lower limit ofthe resolution in the concentration k was about 2 %) in any cross section.
Figure 6.15 shows a typical computer version of one cavitation stage. Thedark vertical bands at both sides of the photo are the walls of the duralumin
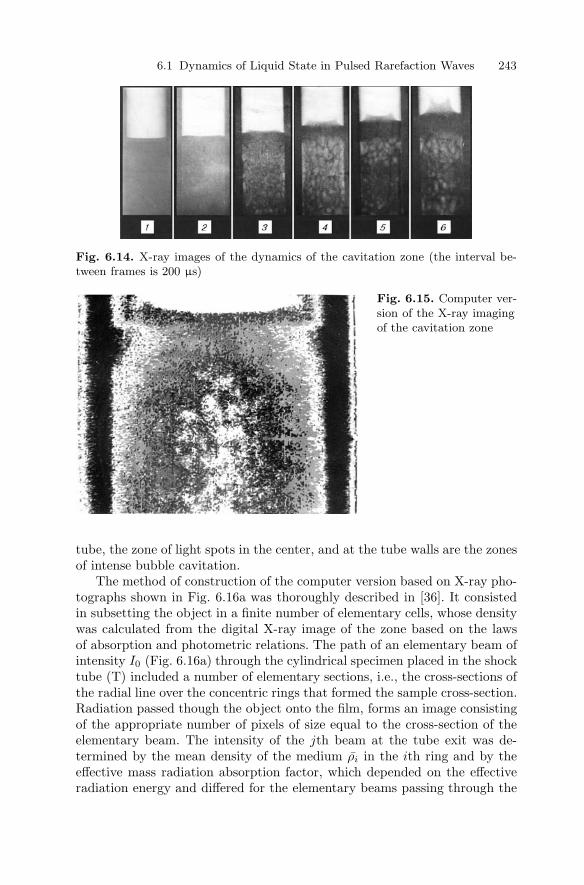
6.1 Dynamics of Liquid State in Pulsed Rarefaction Waves 243
Fig. 6.14. X-ray images of the dynamics of the cavitation zone (the interval be-tween frames is 200 µs)
Fig. 6.15. Computer ver-sion of the X-ray imagingof the cavitation zone
tube, the zone of light spots in the center, and at the tube walls are the zonesof intense bubble cavitation.
The method of construction of the computer version based on X-ray pho-tographs shown in Fig. 6.16a was thoroughly described in [36]. It consistedin subsetting the object in a finite number of elementary cells, whose densitywas calculated from the digital X-ray image of the zone based on the lawsof absorption and photometric relations. The path of an elementary beam ofintensity I0 (Fig. 6.16a) through the cylindrical specimen placed in the shocktube (T) included a number of elementary sections, i.e., the cross-sections ofthe radial line over the concentric rings that formed the sample cross-section.Radiation passed though the object onto the film, forms an image consistingof the appropriate number of pixels of size equal to the cross-section of theelementary beam. The intensity of the jth beam at the tube exit was de-termined by the mean density of the medium ρi in the ith ring and by theeffective mass radiation absorption factor, which depended on the effectiveradiation energy and differed for the elementary beams passing through the

244 6 Problems of Cavitative Destruction
Fig. 6.16a,b. Construction scheme for a computer analog of the cavitation zone(a); computer version of the X-ray image of a later stage of the process (400 and800 µs) (b)
walls of the duralumin tube and the cavitating sample. It was also determinedby the trajectory of the jth beam in the ith ring of the liquid sample and inthe shock tube wall. Naturally, all these parameters should be summed over iin the expression for Ij .
Figure 6.16b shows two frames of cavitation zones to the right of thesymmetry axis after computer processing and “removing” the tube wall: thedensity of the dark and light zones corresponded to that of air and the light,respectively. After 800 µs there was already an intense disintegration of thesample: large voids near the axis and the sample practically separated fromthe tube wall, near which a dense cavitation zone was observed.
Scanned and computer-processed X-ray negatives of the cavitation zonedeveloping behind the front of the shock wave reflected from the free surfacewere used. They provided information on the dynamics of the average den-sity ρ of the cavitation zone and the time t∗ required for the cavitating zoneto reach the bulk density of bubbles as functions of the deformation rate ofthe medium ε [36] (Fig. 6.17):
ρ = ρ0(1 + εt)−1 . (6.9)
Hence one could easily estimate the value of t∗ as t∗ (ε)−1, which wasconvenient for analysis when the profile and parameters of the shock waveincident on the free surface were known.
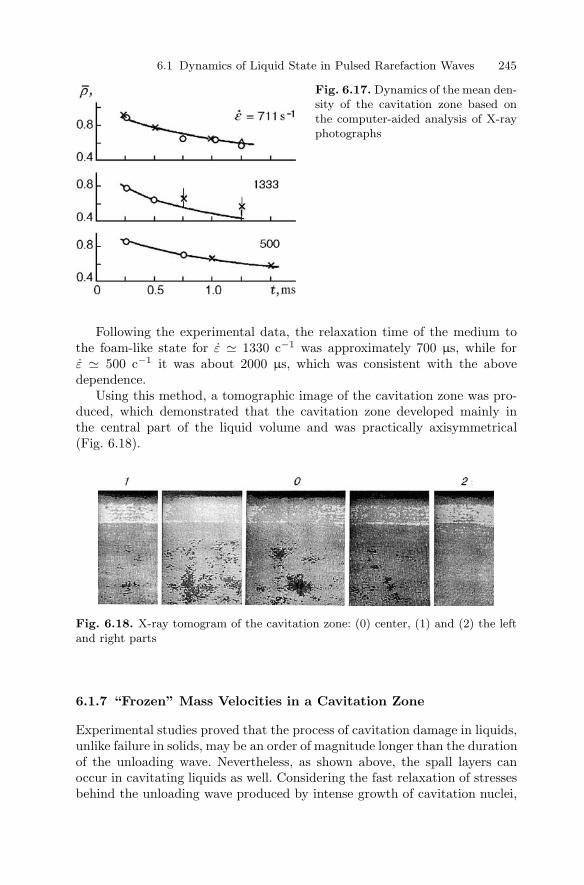
6.1 Dynamics of Liquid State in Pulsed Rarefaction Waves 245
Fig. 6.17. Dynamics of the mean den-sity of the cavitation zone based onthe computer-aided analysis of X-rayphotographs
Following the experimental data, the relaxation time of the medium tothe foam-like state for ε 1330 c−1 was approximately 700 µs, while forε 500 c−1 it was about 2000 µs, which was consistent with the abovedependence.
Using this method, a tomographic image of the cavitation zone was pro-duced, which demonstrated that the cavitation zone developed mainly inthe central part of the liquid volume and was practically axisymmetrical(Fig. 6.18).
Fig. 6.18. X-ray tomogram of the cavitation zone: (0) center, (1) and (2) the leftand right parts
6.1.7 “Frozen” Mass Velocities in a Cavitation Zone
Experimental studies proved that the process of cavitation damage in liquids,unlike failure in solids, may be an order of magnitude longer than the durationof the unloading wave. Nevertheless, as shown above, the spall layers canoccur in cavitating liquids as well. Considering the fast relaxation of stressesbehind the unloading wave produced by intense growth of cavitation nuclei,
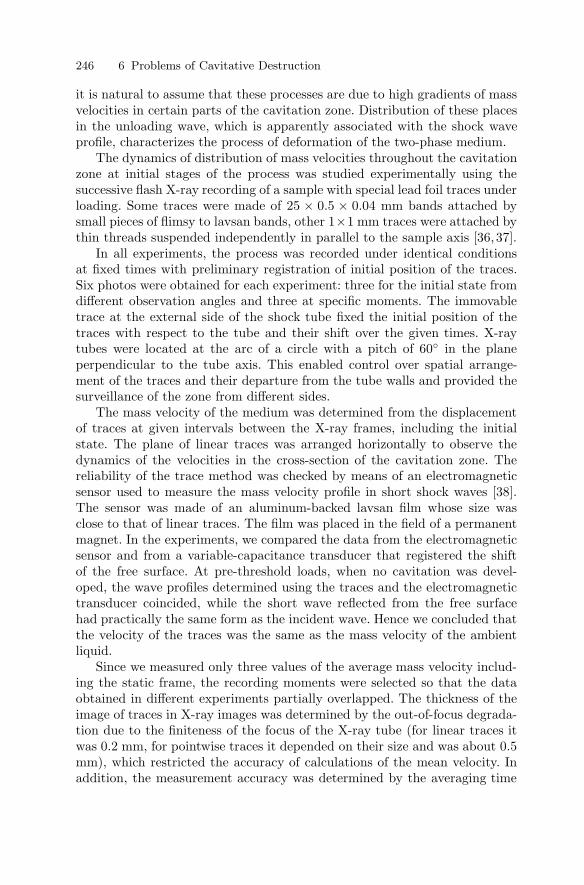
246 6 Problems of Cavitative Destruction
it is natural to assume that these processes are due to high gradients of massvelocities in certain parts of the cavitation zone. Distribution of these placesin the unloading wave, which is apparently associated with the shock waveprofile, characterizes the process of deformation of the two-phase medium.
The dynamics of distribution of mass velocities throughout the cavitationzone at initial stages of the process was studied experimentally using thesuccessive flash X-ray recording of a sample with special lead foil traces underloading. Some traces were made of 25 × 0.5 × 0.04 mm bands attached bysmall pieces of flimsy to lavsan bands, other 1×1 mm traces were attached bythin threads suspended independently in parallel to the sample axis [36, 37].
In all experiments, the process was recorded under identical conditionsat fixed times with preliminary registration of initial position of the traces.Six photos were obtained for each experiment: three for the initial state fromdifferent observation angles and three at specific moments. The immovabletrace at the external side of the shock tube fixed the initial position of thetraces with respect to the tube and their shift over the given times. X-raytubes were located at the arc of a circle with a pitch of 60 in the planeperpendicular to the tube axis. This enabled control over spatial arrange-ment of the traces and their departure from the tube walls and provided thesurveillance of the zone from different sides.
The mass velocity of the medium was determined from the displacementof traces at given intervals between the X-ray frames, including the initialstate. The plane of linear traces was arranged horizontally to observe thedynamics of the velocities in the cross-section of the cavitation zone. Thereliability of the trace method was checked by means of an electromagneticsensor used to measure the mass velocity profile in short shock waves [38].The sensor was made of an aluminum-backed lavsan film whose size wasclose to that of linear traces. The film was placed in the field of a permanentmagnet. In the experiments, we compared the data from the electromagneticsensor and from a variable-capacitance transducer that registered the shiftof the free surface. At pre-threshold loads, when no cavitation was devel-oped, the wave profiles determined using the traces and the electromagnetictransducer coincided, while the short wave reflected from the free surfacehad practically the same form as the incident wave. Hence we concluded thatthe velocity of the traces was the same as the mass velocity of the ambientliquid.
Since we measured only three values of the average mass velocity includ-ing the static frame, the recording moments were selected so that the dataobtained in different experiments partially overlapped. The thickness of theimage of traces in X-ray images was determined by the out-of-focus degrada-tion due to the finiteness of the focus of the X-ray tube (for linear traces itwas 0.2 mm, for pointwise traces it depended on their size and was about 0.5mm), which restricted the accuracy of calculations of the mean velocity. Inaddition, the measurement accuracy was determined by the averaging time

6.1 Dynamics of Liquid State in Pulsed Rarefaction Waves 247
interval. Since the velocity of traces was restricted, the time lapse betweenX-ray flashes was chosen so that it did not affect the resolution of displace-ment of the traces. Relative error related to the time lapse between flashesvaried from 7 % for the interval of 0.3 ms to 20 % for the 0.1 ms interval. Oneof the reasons for the random inaccuracies was the formation of bubbles onthe trace surface that caused their local shift.
The time dependence of the average mass velocity determined from theresults of one set of experiments with identical loading conditions showed thatover the first 0.6–0.8 ms, the velocity of particles was practically invariableand the difference in the trace velocities remained invariant with depth. Inthis run of experiments, the average amplitude of shock waves was 11.4 ±0.6 MPa, the duration was 70 µs, and the wave profile near the front hada “step” (Fig. 6.13c).
The position of linear traces in the photos was determined by the center oflead bands. Although the radial distribution of velocity was not measured, atlater times experiments revealed a bend in linear traces, which qualitativelycharacterized the radial structure of the flow and yielded the velocity profiletypical of a viscous liquid flow.
To show the depth distribution of mass velocities, the measurement resultsof two identical experiments are shown by dots in the coordinates “velocity–Lagrangian coordinate–time” (Fig. 6.13b). The point of origin was related tothe free surface. These results were compared with calculations following themodel of instantaneous relaxation of tensile stresses behind the rarefactionwave front [32] in the following statement. Let a shock wave, whose profileis given as a certain monotone function psh = pfrf(x), where pfr is the pres-sure in the shock-wave front, reaches the free surface (coordinate x = x0)at the time t = 0. At t > 0 a rarefaction wave propagates with the speedof sound c0 in the liquid with monodisperse distribution of microinhomo-geneities as free gas microbubbles of 1 µm radius and nuclei concentrationof N = 104 cm−3. Instantaneous relaxation of tensile stresses occurs behindthe wave front.
Then following the analysis of Chernobaev [32], we write the system ofequations describing a flow of cavitating liquid in Lagrangian mass coordi-nates:
∂x
∂t= u ,
∂1/ρ
∂t=
1ρ0
∂u
∂ξ,
∂u
∂t= 0 ,
p = p0 , and ρ−1 = ρ−10 + vbubl ,
where ξ is the Lagrangian coordinate, u is the mass velocity, ρ and ρ0 arethe density of the mixture and the liquid, respectively, vbubl is the volume ofcavitation bubbles per mixture mass unit, and p0 is the atmospheric pressure.
If we take ξ = x1, within the accepted approximation at the moment ofarrival of the rarefaction wave, the pressure in the point x1 instantaneouslydecreases from p1 = pfrf(2ξ − x0) to p0, the mass velocity u1 becomes equalto 2p1/ρ0c0, and its distribution (by virtue of the law of conservation of

248 6 Problems of Cavitative Destruction
momentum ∂u/∂t = 0) in the cavitation zone becomes equal to u = u(ξ) andis determined by the profile of the initial shock wave:
u(ξ) =2pfr
ρ0c0f(2ξ − x0) .
Now one can easily find the deformation rate of the cavitating liquid ε =∂u/∂ξ as
ε =2pfr
ρ0c0fξ(2ξ − x0)
and, after integrating the equation of continuity, obtain the equation for thefunction ρ(t):
1ρ
=1ρ0
[1 + ε(ξ)
(t − ξ
c0
)].
The subscript ξ at the function f denotes a derivative with respect to the La-grangian coordinate. Based on the experimental pressure profile (Fig. 6.13c),we present the model velocity distributions for the appropriate times inFig. 6.13b (solid lines). One can see that the calculated curves are adequateto the experimental data, support the tendency to the preservation of the ve-locity profile for different times, and suggest “freezing” of the mass velocityprofile in the cavitating liquid. At later times and greater depths from thefree surface one can notice the deviation of calculated curves from the experi-mental data due to the idealization of the pressure profile or the approximatecharacter of the model neglecting the inhomogeneity of the macrostructureof the cavitation zone.
6.1.8 Model of “Instantaneous” Fragmentation
The experiments showed that the minimum surface density of the en-ergy required for cavitation damage of a liquid under pulse loading was0.15 ± 0.03 J/cm2, which was sufficient to break a 16-mm long sample. Inthis case, the critical value of energy was only sufficient to bring the mediumto the state of a foam structure.
Following the data of Chernobaev and Stebnovskii [32,34], the minimumspecific energy of the cavitation damage was 0.4 J/g in the case of explosiveloading. Though the estimate was of general character and disregarded theinhomogeneities of the flow structure along the radius, it was valid for deter-mining the amount of energy to be released in the center of the liquid sampleto disperse it.
It follows from the experiments on explosive loading that the zone ofintense cavitation can be defined by sight as the zone densely packed by bub-bles. In this case, the chains of adjacent bubbles can fill the mixture volumewith the shift for a bubble radius or by parallel transfer. Assuming invariablespherical shape from the initial number of nuclei of the order of 106 cm−3,one can readily estimate that the size of liquid fractions appearing between
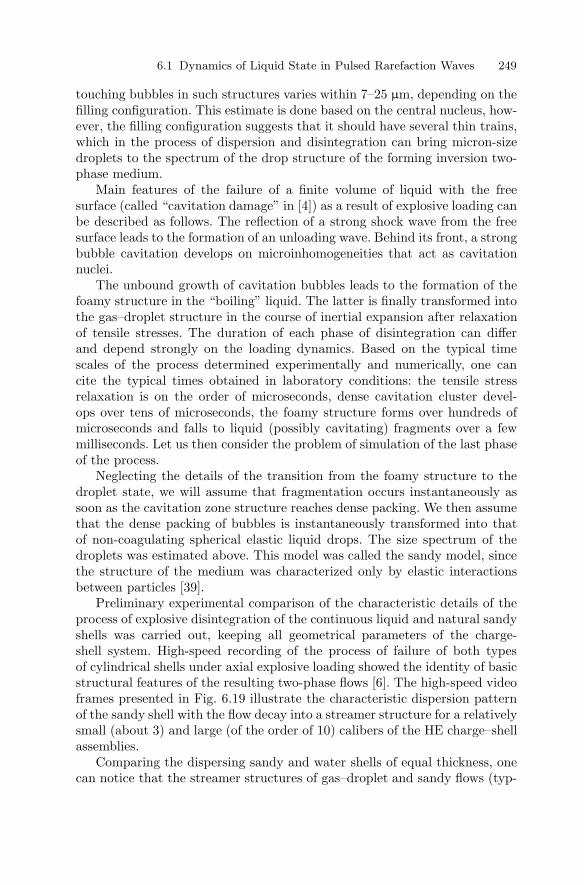
6.1 Dynamics of Liquid State in Pulsed Rarefaction Waves 249
touching bubbles in such structures varies within 7–25 µm, depending on thefilling configuration. This estimate is done based on the central nucleus, how-ever, the filling configuration suggests that it should have several thin trains,which in the process of dispersion and disintegration can bring micron-sizedroplets to the spectrum of the drop structure of the forming inversion two-phase medium.
Main features of the failure of a finite volume of liquid with the freesurface (called “cavitation damage” in [4]) as a result of explosive loading canbe described as follows. The reflection of a strong shock wave from the freesurface leads to the formation of an unloading wave. Behind its front, a strongbubble cavitation develops on microinhomogeneities that act as cavitationnuclei.
The unbound growth of cavitation bubbles leads to the formation of thefoamy structure in the “boiling” liquid. The latter is finally transformed intothe gas–droplet structure in the course of inertial expansion after relaxationof tensile stresses. The duration of each phase of disintegration can differand depend strongly on the loading dynamics. Based on the typical timescales of the process determined experimentally and numerically, one cancite the typical times obtained in laboratory conditions: the tensile stressrelaxation is on the order of microseconds, dense cavitation cluster devel-ops over tens of microseconds, the foamy structure forms over hundreds ofmicroseconds and falls to liquid (possibly cavitating) fragments over a fewmilliseconds. Let us then consider the problem of simulation of the last phaseof the process.
Neglecting the details of the transition from the foamy structure to thedroplet state, we will assume that fragmentation occurs instantaneously assoon as the cavitation zone structure reaches dense packing. We then assumethat the dense packing of bubbles is instantaneously transformed into thatof non-coagulating spherical elastic liquid drops. The size spectrum of thedroplets was estimated above. This model was called the sandy model, sincethe structure of the medium was characterized only by elastic interactionsbetween particles [39].
Preliminary experimental comparison of the characteristic details of theprocess of explosive disintegration of the continuous liquid and natural sandyshells was carried out, keeping all geometrical parameters of the charge-shell system. High-speed recording of the process of failure of both typesof cylindrical shells under axial explosive loading showed the identity of basicstructural features of the resulting two-phase flows [6]. The high-speed videoframes presented in Fig. 6.19 illustrate the characteristic dispersion patternof the sandy shell with the flow decay into a streamer structure for a relativelysmall (about 3) and large (of the order of 10) calibers of the HE charge–shellassemblies.
Comparing the dispersing sandy and water shells of equal thickness, onecan notice that the streamer structures of gas–droplet and sandy flows (typ-
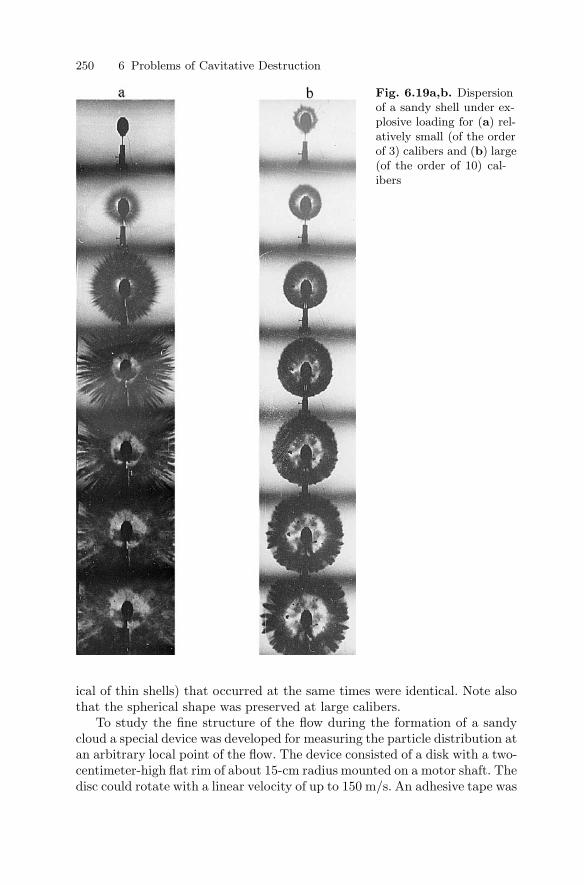
250 6 Problems of Cavitative Destruction
Fig. 6.19a,b. Dispersionof a sandy shell under ex-plosive loading for (a) rel-atively small (of the orderof 3) calibers and (b) large(of the order of 10) cal-ibers
ical of thin shells) that occurred at the same times were identical. Note alsothat the spherical shape was preserved at large calibers.
To study the fine structure of the flow during the formation of a sandycloud a special device was developed for measuring the particle distribution atan arbitrary local point of the flow. The device consisted of a disk with a two-centimeter-high flat rim of about 15-cm radius mounted on a motor shaft. Thedisc could rotate with a linear velocity of up to 150 m/s. An adhesive tape was
6.1 Dynamics of Liquid State in Pulsed Rarefaction Waves 251
attached to the external perimeter of the disk with the adhesive compoundoutward. The entire device was mounted inside a hermetically sealed housingwith a small 2×2 cm window opposite the tape and a ventilator. The trap wasplaced at a given distance from the charge-shell assembly and was acceleratedto the required velocity in accordance with the flow duration in order toeliminate the possibility of repeated superposition of the flow. The durationof the flow was determined by analyzing the evolution of the process in thevicinity of the given point. Since the trap window was always open, it wasnot necessary to synchronize the startup of the trap with the process. Underexplosive loading a part of the flow entered the trap, tiny particles werecaught on the rotating strip. The time variation of the concentration anddistribution of particles as the flow passed by the given point were thusmeasured.
Figure 6.20 shows two scans of the structure of the sandy flow for thecaliber 6Rch recorded at distances of 0.5 and 1 m from the assembly; thetime interval between frames was 1 ms. It is interesting to note that particlesin the flow were stratified according to size. At 0.5 m, smaller particles werein the tail of the flow (recorded at later times), while at 1 m the trap pickedup only large particles. Thus the sandy cloud to the stop instant turned outto be strongly stratified: small particles occupied the central zone and largeparticles were distributed at the periphery. Under careful investigation of theinternal structure of the dispersing shell one can notice its turbidity in thecentral part due to or a return of some particles to the center from peripheryor greater inertia of particles in a flow.
The observed stratification effect was studied within the frame work ofabove sandy model (model of instantaneous inversion of two-phase state)for a spherical HE charge with density ρch and radius r1 surrounded bytwo-phase shell “liquid particles–air” of external radius r2 [39]. A volumeconcentration of the dispersed phase in the shell, 74%, was assumed to beequal to the concentration of dense packing of spheres. Detonation of thecharge was modelled by an instantaneous explosion at constant volume. Thepressure of the detonation products was taken to be an average value and thedensity was ρch. The spherically symmetrical motion of the two-phase mixturecan be described by the following system of equations of the mechanics ofheterogeneous media written separately for each component:
∂ρ1
∂t+ r−2 ∂
∂r(r2ρ1u1) = 0 ,
∂ρ2
∂t+ r−2 ∂
∂r(r2ρ2u2) = 0 ,
∂ρ1
∂t+ r−2 ∂
∂r(r2ρ1u1) + α1
∂p2
∂r+
∂
∂rα1(p1 − p2) = −f ,
∂ρ2
∂t+ r−2 ∂
∂r(r2ρ2u2) + α2
∂p2
∂r= f ,
∂ρ2e2
∂t+ r−2 ∂r2ρ2e2u2
∂t=
α2p2
ρ02
(∂ρ02
∂t+ u2
∂ρ02
∂r
),

252 6 Problems of Cavitative Destruction
Fig. 6.20. Dispersion of a sandy shell under explosive loading: dynamics of theflow structure
6.1 Dynamics of Liquid State in Pulsed Rarefaction Waves 253
and∂
∂t(ρ1E1 + ρ2E2) + r−2 ∂
∂r[r2(ρ1u1E1+
+ρ2u2E2) + r2(α1u1p1 + α2u2p2)] = 0 .
Here ρi = ρ0i αi (i = 1, 2), α1+α2 = 1, f = 0, 75(α2ρ
01Cd/d)|u1−u2|(u1−u2),
where subscripts 1 and 2 refer to the gas and dispersed phases; d is the particlediameter, ρi, ρ0
i , αi, ui, pi, Ei, and ei are the average and true densities, thevolume concentration, the velocity, the pressure, and the total and internalenergies of the ith phase, respectively. The expressions for the drag coef-ficients can be found in [39]. The Tait equation was used for the dispersedphase. The system of equations was closed by the assumption on simultaneousdeformation of the phase: when α2 > 0.74 the particles deformed stacking atthe vertices of regular tetrahedrons, while the surface of contact between twoparticles was planar, but beyond the contact points the particles preservedtheir spherical shape.
The particle-in-cell method was used for the numerical calculations. Inview of high velocity nonequilibrium of the phases to ensure stability of cal-culations, the right-hand part of the momentum conservation equations wasapproximated as follows: one factor was chosen from the lower (in time) layerof the difference grid and another factor from the upper layer. The explosivewas hexogen with density ρch = 1.65 g/cm3 and caloricity of 1.32 kcal/g.The other initial parameters of the problem were r1 = 0.3 cm, r2 = 1.5 cm,e = 5 526 J/g, ρ1 = 1.65 g/cm3, α2 = 0.74, ρ0
2 = 1 g/cm3, u2 = 0, ande2 = 0. The ambient medium of the droplet shell was air with initial param-eters ρ1 = 0.001 g/cm3, u1 = 0, and e1 = 250 J/g.
The calculations were performed for three types of liquid particles: d =1, 6, and 60 µm. Three stages of the process could be identified from thenumerical results. The first stage was associated with the discontinuity decayon the inner boundary of the two-phase region (Fig. 6.21a), which led to
Fig. 6.21a–c. Distribution of pressure (a), concentration (b), and mass velocity(c) under explosive launching of a shell composed of liquid droplets
254 6 Problems of Cavitative Destruction
a rarefaction wave in the detonation products and a shock wave in the gasand dispersed phases (broken lines). In this case, the shock wave in the gas(solid line) was somewhat delayed and its amplitude was much smaller than inliquid particles of diameter 1 µm (lines 1–3 correspond to times 3, 6, and 9 µs).
The shock wave compressed the dispersed phase, which acquired a veloc-ity that was higher than the gas velocity: the boundary of the detonationproducts did not keep up with the inner edge of the dispersed layer. Afterreaching the external boundary a diverging shock wave was produced in theair, while a rarefaction wave propagated through the particles. Together withdivergent effects, the rarefaction wave led to a rapid drop in tensile stress inthe particles, whose density in the shell dropped below the bulk value (theparticles divided and the shell became permeable for gas phase): Fig. 6.21bshows the distribution of the concentration of the dispersed phase in the layerfor the times 0 and 20 µs (solid line).
At the second stage, the kinetic energy was transferred to the dispersedphase. This stage ended after 60–70 µs, when the pressure in the detonationproducts went down to atmospheric pressure and the particles began to de-celerate: Fig. 6.21c shows the distribution of mass velocities for t = 20 and100 µs (curves 1 and 2, respectively); the diameter of particles was 6 µm.
The third stage was characterized by the cumulation of the rarefactionwave toward the center and a strong return flow of the gas (Fig. 6.22, curves 1and 2) that decelerated and then entrained small particles toward the center(Fig. 6.22, curves 3 and 4, the velocity of liquid particles was negative), thusproducing the size stratification observed experimentally. The pressure in theinner cavity increased again, the particles stopped and were then carried offby the diverging gas flow. As a result, attenuating oscillations of the two-phase flow appeared with light particles.
The dynamics of the flow external and inner boundaries for d = 1 µm(broken curves 1) and d = 6 µm (dash-dot curves 6) is shown in Fig. 6.23.
Fig. 6.22. Distribution of mass velocity of the gas and the dispersed phase (brokencurves) under explosive launching of the shell of liquid droplets (later times, thethird stage of the process, particles 1 µm in size): (1) t = 300 µs, (2) t = 350 µs,(3) t = 400 µs, (4) t = 500 µs

6.1 Dynamics of Liquid State in Pulsed Rarefaction Waves 255
Fig. 6.23. Expansion and structure ofa sandy shell under explosive loading
The amplitude and frequency of oscillations of the dispersed zone in the firstcase (d = 1 µm) was greater than in the second (d = 6 µm) in view oflower permeability. Thus, the wave processes in the gas phase influenced thedynamics of the inner layer boundary, which consisted of small particles andoscillated with the periodicity of reflection and focusing of waves typical forthe diverging two-phase shell.
In the case of large particles where d = 60 µm, the resistance of thecloud was sufficiently low and though it led to rarefaction in the inner region(of the order of 50 kPa), the return flow of the gas did not effect its motion.Therefore the trajectory of heavy particles determined the external boundaryof the drop cloud. This effect also produced a sharp (by about a factor of 40)increase in the thickness of the two-phase layer under dispersion, during whichparticles of the size range 1–60 µm by the time t = 3 ms occupied the spacebetween rin = 5 cm to rex 45 cm (Fig. 6.23).
The sandy model of one stage of disintegration of a liquid under explosiveloading may find an interesting extension within the experimental studies ofthe flow structure of a dusty layer in a rarefaction wave [32]. The followingexperiment was performed at the Karman Laboratory of Fluid Mechanics andJet Propulsion (California Institute of Technology) by Sturtevant: a 60-cmlayer of glass balls of diameter 125 µm was packed on the bottom of a cylin-drical chamber filled with air at atmospheric pressure and separated froma low-pressure chamber by a diaphragm. After rupture of the diaphragma rarefaction wave propagated in the air gap, reached the layer boundary, re-flected from it, and was partially refracted inside the layer. The experimentsshowed that the refracted wave induced a rapid extension of gas into thepores between the particles. Horizontal spall discontinuities of the type seenin liquids (Fig. 6.24) were observed, which then transformed into a system ofcavities forming a honeycomb structure (see comparison of the X-ray shotsof the cavitation zone) [40].
256 6 Problems of Cavitative Destruction
Fig. 6.24. Structure of a 125-µm layer of glass balls in the rarefaction wave
According to the experimental data of [40], the thickness of the spalls inthe dusty layer was several times the particles diameter. In the upper part ofthe layer, the particles obtained an average acceleration of about 275 g in thefirst 5 ms and reached velocities of about 15 m/s. We note that the densityin the dusty layer was about 5 · 105 cm−3, which corresponded to the densityof cavitation nuclei, while the layer itself simulated the state of a cavitatingliquid when the bubble zone reached the bulk density.
The above analysis of the essentially nonlinear effects determining the be-havior of real liquids under explosive loads showed that, in spite of the com-plexity of the problem, adequate physical-mathematical models describingwave processes in cavitating and disintegrating liquids could be constructed.We can conclude that some progress shown in the problem of inversion ofthe two-phase state was noteworthy. The above experimental methods andmathematical models provided answers to a number of fundamental ques-tions related to the disintegration mechanics of a liquid. Unsolved problemsinclude the mechanism of “brittle” failure of the foamy structure and thefoam-droplet transition, the development of methods suitable for the entirespectrum of nuclei, the stability of combination structures of the “gas nucleus-solid particles” type, the metastable state of a liquid in the “deep” negativephase, and the kinetics of the formation of vapor centers in the front of anintense rarefaction wave.
However, it is noteworthy that lately some progress has been shown in theproblem of inversion of the two-phase state concerned with the peculiaritiesof the flow structure of a cavitating medium at late stages of disintegration.
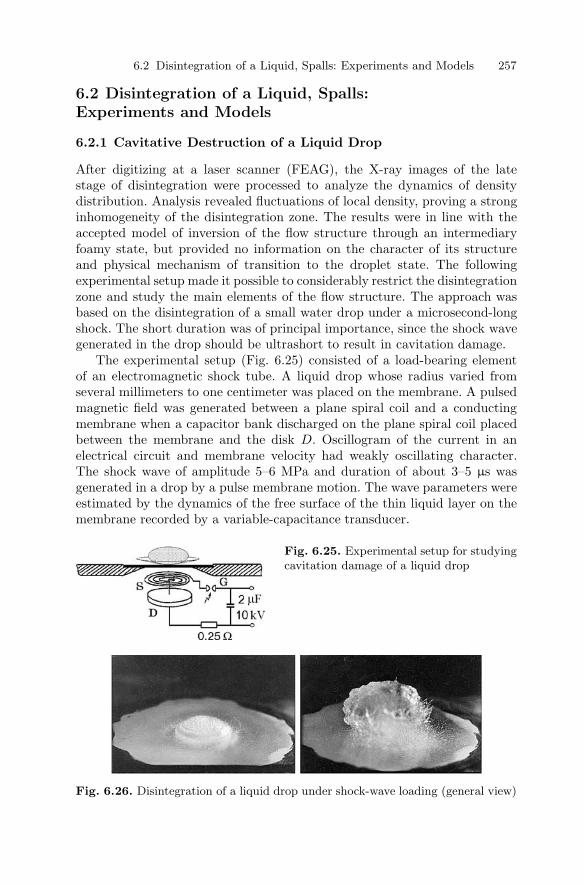
6.2 Disintegration of a Liquid, Spalls: Experiments and Models 257
6.2 Disintegration of a Liquid, Spalls:Experiments and Models
6.2.1 Cavitative Destruction of a Liquid Drop
After digitizing at a laser scanner (FEAG), the X-ray images of the latestage of disintegration were processed to analyze the dynamics of densitydistribution. Analysis revealed fluctuations of local density, proving a stronginhomogeneity of the disintegration zone. The results were in line with theaccepted model of inversion of the flow structure through an intermediaryfoamy state, but provided no information on the character of its structureand physical mechanism of transition to the droplet state. The followingexperimental setup made it possible to considerably restrict the disintegrationzone and study the main elements of the flow structure. The approach wasbased on the disintegration of a small water drop under a microsecond-longshock. The short duration was of principal importance, since the shock wavegenerated in the drop should be ultrashort to result in cavitation damage.
The experimental setup (Fig. 6.25) consisted of a load-bearing elementof an electromagnetic shock tube. A liquid drop whose radius varied fromseveral millimeters to one centimeter was placed on the membrane. A pulsedmagnetic field was generated between a plane spiral coil and a conductingmembrane when a capacitor bank discharged on the plane spiral coil placedbetween the membrane and the disk D. Oscillogram of the current in anelectrical circuit and membrane velocity had weakly oscillating character.The shock wave of amplitude 5–6 MPa and duration of about 3–5 µs wasgenerated in a drop by a pulse membrane motion. The wave parameters wereestimated by the dynamics of the free surface of the thin liquid layer on themembrane recorded by a variable-capacitance transducer.
Fig. 6.25. Experimental setup for studyingcavitation damage of a liquid drop
Fig. 6.26. Disintegration of a liquid drop under shock-wave loading (general view)
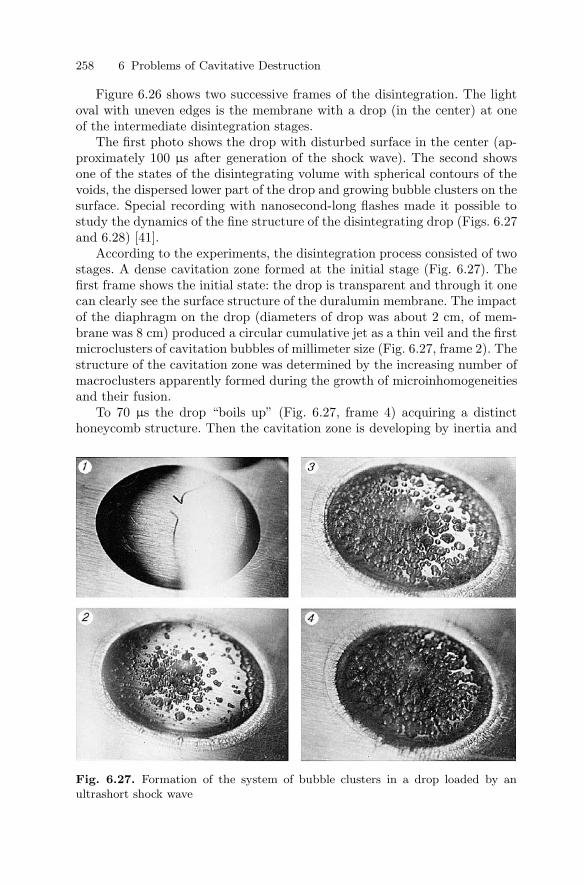
258 6 Problems of Cavitative Destruction
Figure 6.26 shows two successive frames of the disintegration. The lightoval with uneven edges is the membrane with a drop (in the center) at oneof the intermediate disintegration stages.
The first photo shows the drop with disturbed surface in the center (ap-proximately 100 µs after generation of the shock wave). The second showsone of the states of the disintegrating volume with spherical contours of thevoids, the dispersed lower part of the drop and growing bubble clusters on thesurface. Special recording with nanosecond-long flashes made it possible tostudy the dynamics of the fine structure of the disintegrating drop (Figs. 6.27and 6.28) [41].
According to the experiments, the disintegration process consisted of twostages. A dense cavitation zone formed at the initial stage (Fig. 6.27). Thefirst frame shows the initial state: the drop is transparent and through it onecan clearly see the surface structure of the duralumin membrane. The impactof the diaphragm on the drop (diameters of drop was about 2 cm, of mem-brane was 8 cm) produced a circular cumulative jet as a thin veil and the firstmicroclusters of cavitation bubbles of millimeter size (Fig. 6.27, frame 2). Thestructure of the cavitation zone was determined by the increasing number ofmacroclusters apparently formed during the growth of microinhomogeneitiesand their fusion.
To 70 µs the drop “boils up” (Fig. 6.27, frame 4) acquiring a distincthoneycomb structure. Then the cavitation zone is developing by inertia and
Fig. 6.27. Formation of the system of bubble clusters in a drop loaded by anultrashort shock wave
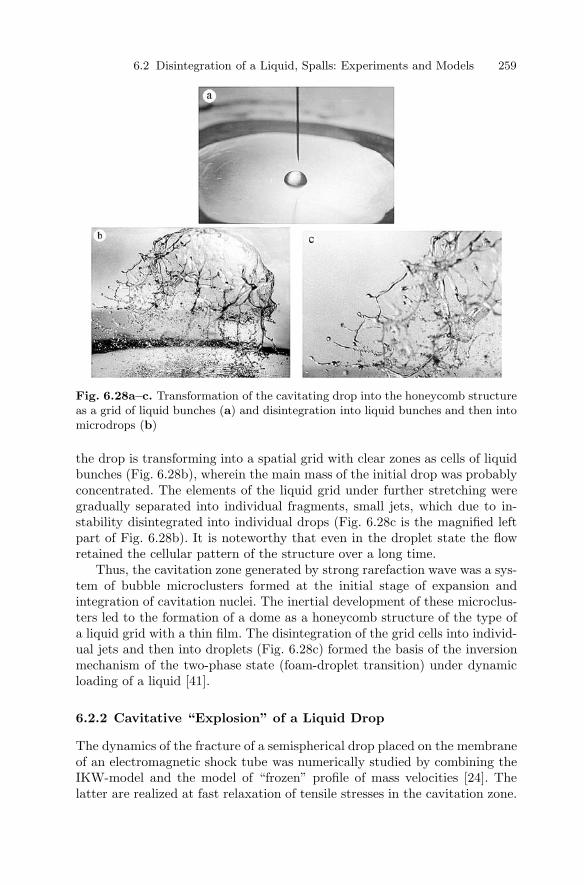
6.2 Disintegration of a Liquid, Spalls: Experiments and Models 259
Fig. 6.28a–c. Transformation of the cavitating drop into the honeycomb structureas a grid of liquid bunches (a) and disintegration into liquid bunches and then intomicrodrops (b)
the drop is transforming into a spatial grid with clear zones as cells of liquidbunches (Fig. 6.28b), wherein the main mass of the initial drop was probablyconcentrated. The elements of the liquid grid under further stretching weregradually separated into individual fragments, small jets, which due to in-stability disintegrated into individual drops (Fig. 6.28c is the magnified leftpart of Fig. 6.28b). It is noteworthy that even in the droplet state the flowretained the cellular pattern of the structure over a long time.
Thus, the cavitation zone generated by strong rarefaction wave was a sys-tem of bubble microclusters formed at the initial stage of expansion andintegration of cavitation nuclei. The inertial development of these microclus-ters led to the formation of a dome as a honeycomb structure of the type ofa liquid grid with a thin film. The disintegration of the grid cells into individ-ual jets and then into droplets (Fig. 6.28c) formed the basis of the inversionmechanism of the two-phase state (foam-droplet transition) under dynamicloading of a liquid [41].
6.2.2 Cavitative “Explosion” of a Liquid Drop
The dynamics of the fracture of a semispherical drop placed on the membraneof an electromagnetic shock tube was numerically studied by combining theIKW-model and the model of “frozen” profile of mass velocities [24]. Thelatter are realized at fast relaxation of tensile stresses in the cavitation zone.
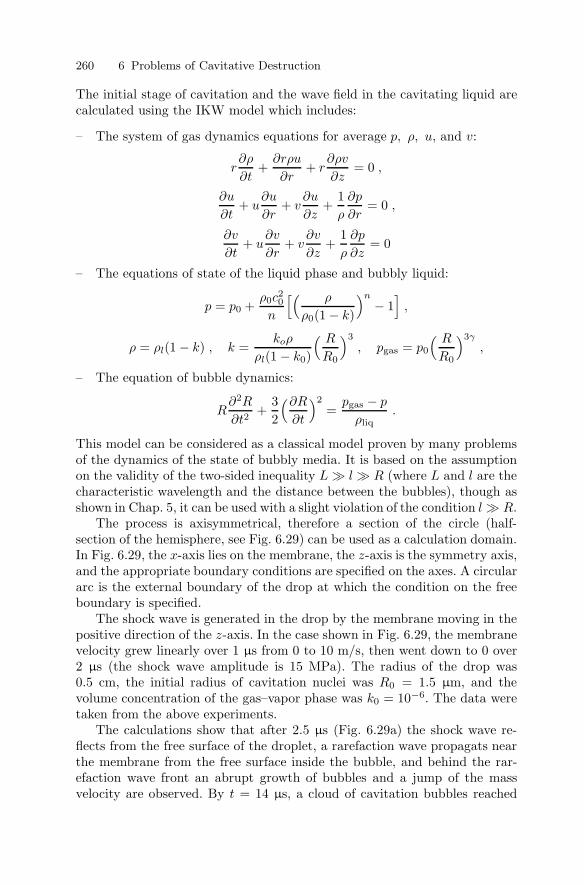
260 6 Problems of Cavitative Destruction
The initial stage of cavitation and the wave field in the cavitating liquid arecalculated using the IKW model which includes:
– The system of gas dynamics equations for average p, ρ, u, and v:
r∂ρ
∂t+
∂rρu
∂r+ r
∂ρv
∂z= 0 ,
∂u
∂t+ u
∂u
∂r+ v
∂u
∂z+
1ρ
∂p
∂r= 0 ,
∂v
∂t+ u
∂v
∂r+ v
∂v
∂z+
1ρ
∂p
∂z= 0
– The equations of state of the liquid phase and bubbly liquid:
p = p0 +ρ0c
20
n
[( ρ
ρ0(1 − k)
)n
− 1]
,
ρ = ρl(1 − k) , k =koρ
ρl(1 − k0)
( R
R0
)3
, pgas = p0
( R
R0
)3γ
,
– The equation of bubble dynamics:
R∂2R
∂t2+
32
(∂R
∂t
)2
=pgas − p
ρliq.
This model can be considered as a classical model proven by many problemsof the dynamics of the state of bubbly media. It is based on the assumptionon the validity of the two-sided inequality L l R (where L and l are thecharacteristic wavelength and the distance between the bubbles), though asshown in Chap. 5, it can be used with a slight violation of the condition l R.
The process is axisymmetrical, therefore a section of the circle (half-section of the hemisphere, see Fig. 6.29) can be used as a calculation domain.In Fig. 6.29, the x-axis lies on the membrane, the z-axis is the symmetry axis,and the appropriate boundary conditions are specified on the axes. A circulararc is the external boundary of the drop at which the condition on the freeboundary is specified.
The shock wave is generated in the drop by the membrane moving in thepositive direction of the z-axis. In the case shown in Fig. 6.29, the membranevelocity grew linearly over 1 µs from 0 to 10 m/s, then went down to 0 over2 µs (the shock wave amplitude is 15 MPa). The radius of the drop was0.5 cm, the initial radius of cavitation nuclei was R0 = 1.5 µm, and thevolume concentration of the gas–vapor phase was k0 = 10−6. The data weretaken from the above experiments.
The calculations show that after 2.5 µs (Fig. 6.29a) the shock wave re-flects from the free surface of the droplet, a rarefaction wave propagats nearthe membrane from the free surface inside the bubble, and behind the rar-efaction wave front an abrupt growth of bubbles and a jump of the massvelocity are observed. By t = 14 µs, a cloud of cavitation bubbles reached
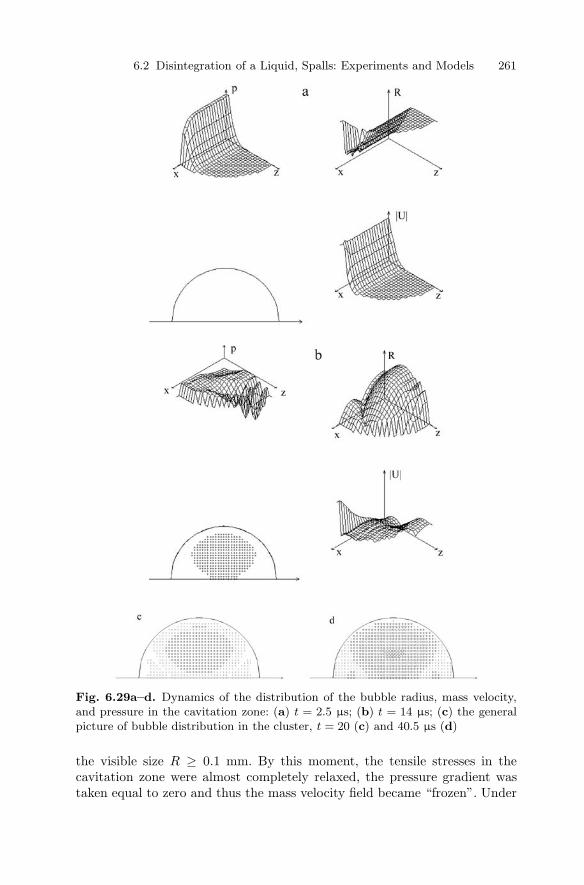
6.2 Disintegration of a Liquid, Spalls: Experiments and Models 261
Fig. 6.29a–d. Dynamics of the distribution of the bubble radius, mass velocity,and pressure in the cavitation zone: (a) t = 2.5 µs; (b) t = 14 µs; (c) the generalpicture of bubble distribution in the cluster, t = 20 (c) and 40.5 µs (d)
the visible size R ≥ 0.1 mm. By this moment, the tensile stresses in thecavitation zone were almost completely relaxed, the pressure gradient wastaken equal to zero and thus the mass velocity field became “frozen”. Under
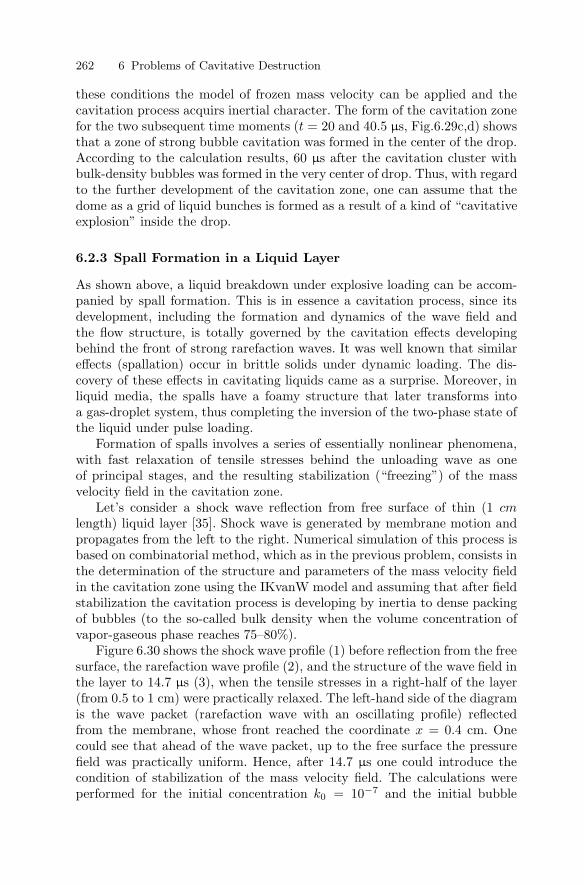
262 6 Problems of Cavitative Destruction
these conditions the model of frozen mass velocity can be applied and thecavitation process acquirs inertial character. The form of the cavitation zonefor the two subsequent time moments (t = 20 and 40.5 µs, Fig.6.29c,d) showsthat a zone of strong bubble cavitation was formed in the center of the drop.According to the calculation results, 60 µs after the cavitation cluster withbulk-density bubbles was formed in the very center of drop. Thus, with regardto the further development of the cavitation zone, one can assume that thedome as a grid of liquid bunches is formed as a result of a kind of “cavitativeexplosion” inside the drop.
6.2.3 Spall Formation in a Liquid Layer
As shown above, a liquid breakdown under explosive loading can be accom-panied by spall formation. This is in essence a cavitation process, since itsdevelopment, including the formation and dynamics of the wave field andthe flow structure, is totally governed by the cavitation effects developingbehind the front of strong rarefaction waves. It was well known that similareffects (spallation) occur in brittle solids under dynamic loading. The dis-covery of these effects in cavitating liquids came as a surprise. Moreover, inliquid media, the spalls have a foamy structure that later transforms intoa gas-droplet system, thus completing the inversion of the two-phase state ofthe liquid under pulse loading.
Formation of spalls involves a series of essentially nonlinear phenomena,with fast relaxation of tensile stresses behind the unloading wave as oneof principal stages, and the resulting stabilization (“freezing”) of the massvelocity field in the cavitation zone.
Let’s consider a shock wave reflection from free surface of thin (1 cmlength) liquid layer [35]. Shock wave is generated by membrane motion andpropagates from the left to the right. Numerical simulation of this process isbased on combinatorial method, which as in the previous problem, consists inthe determination of the structure and parameters of the mass velocity fieldin the cavitation zone using the IKvanW model and assuming that after fieldstabilization the cavitation process is developing by inertia to dense packingof bubbles (to the so-called bulk density when the volume concentration ofvapor-gaseous phase reaches 75–80%).
Figure 6.30 shows the shock wave profile (1) before reflection from the freesurface, the rarefaction wave profile (2), and the structure of the wave field inthe layer to 14.7 µs (3), when the tensile stresses in a right-half of the layer(from 0.5 to 1 cm) were practically relaxed. The left-hand side of the diagramis the wave packet (rarefaction wave with an oscillating profile) reflectedfrom the membrane, whose front reached the coordinate x = 0.4 cm. Onecould see that ahead of the wave packet, up to the free surface the pressurefield was practically uniform. Hence, after 14.7 µs one could introduce thecondition of stabilization of the mass velocity field. The calculations wereperformed for the initial concentration k0 = 10−7 and the initial bubble
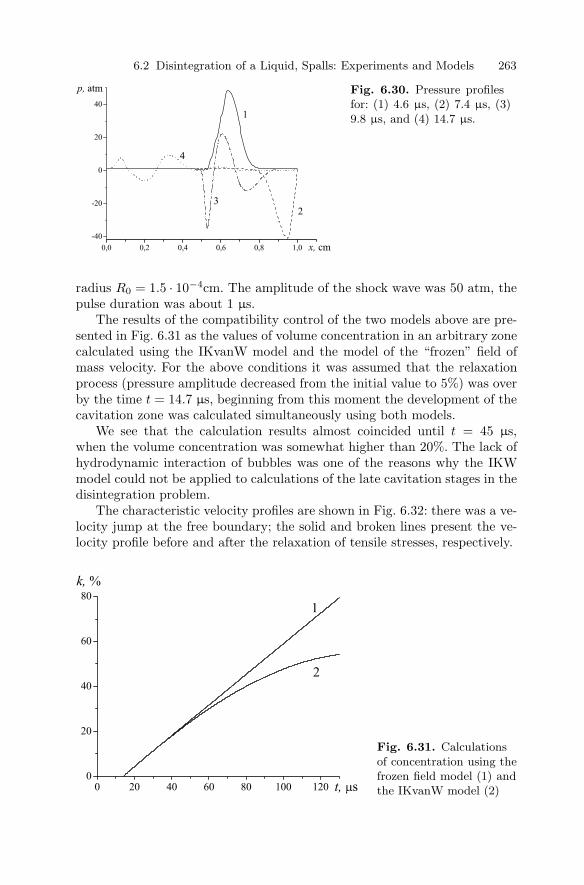
6.2 Disintegration of a Liquid, Spalls: Experiments and Models 263
Fig. 6.30. Pressure profilesfor: (1) 4.6 µs, (2) 7.4 µs, (3)9.8 µs, and (4) 14.7 µs.
radius R0 = 1.5 · 10−4cm. The amplitude of the shock wave was 50 atm, thepulse duration was about 1 µs.
The results of the compatibility control of the two models above are pre-sented in Fig. 6.31 as the values of volume concentration in an arbitrary zonecalculated using the IKvanW model and the model of the “frozen” field ofmass velocity. For the above conditions it was assumed that the relaxationprocess (pressure amplitude decreased from the initial value to 5%) was overby the time t = 14.7 µs, beginning from this moment the development of thecavitation zone was calculated simultaneously using both models.
We see that the calculation results almost coincided until t = 45 µs,when the volume concentration was somewhat higher than 20%. The lack ofhydrodynamic interaction of bubbles was one of the reasons why the IKWmodel could not be applied to calculations of the late cavitation stages in thedisintegration problem.
The characteristic velocity profiles are shown in Fig. 6.32: there was a ve-locity jump at the free boundary; the solid and broken lines present the ve-locity profile before and after the relaxation of tensile stresses, respectively.
Fig. 6.31. Calculationsof concentration using thefrozen field model (1) andthe IKvanW model (2)
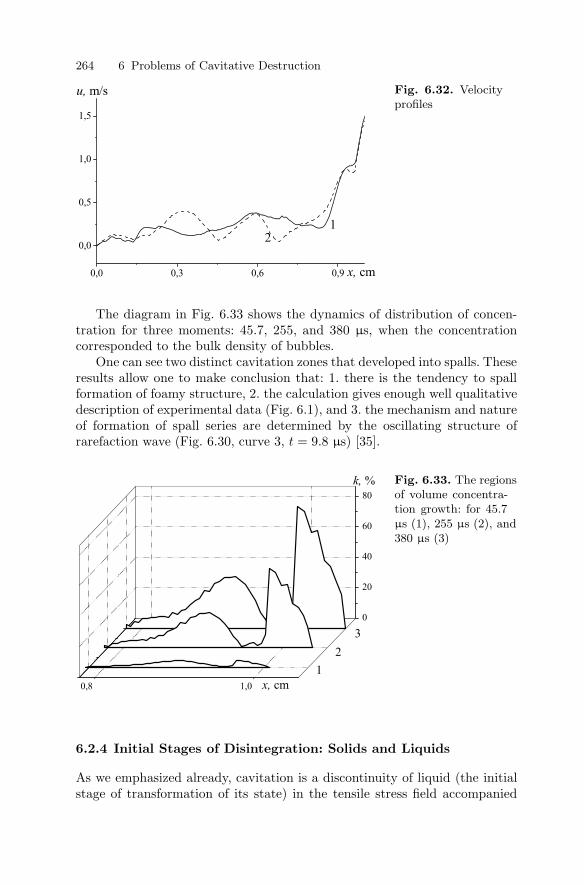
264 6 Problems of Cavitative Destruction
Fig. 6.32. Velocityprofiles
The diagram in Fig. 6.33 shows the dynamics of distribution of concen-tration for three moments: 45.7, 255, and 380 µs, when the concentrationcorresponded to the bulk density of bubbles.
One can see two distinct cavitation zones that developed into spalls. Theseresults allow one to make conclusion that: 1. there is the tendency to spallformation of foamy structure, 2. the calculation gives enough well qualitativedescription of experimental data (Fig. 6.1), and 3. the mechanism and natureof formation of spall series are determined by the oscillating structure ofrarefaction wave (Fig. 6.30, curve 3, t = 9.8 µs) [35].
Fig. 6.33. The regionsof volume concentra-tion growth: for 45.7µs (1), 255 µs (2), and380 µs (3)
6.2.4 Initial Stages of Disintegration: Solids and Liquids
As we emphasized already, cavitation is a discontinuity of liquid (the initialstage of transformation of its state) in the tensile stress field accompanied
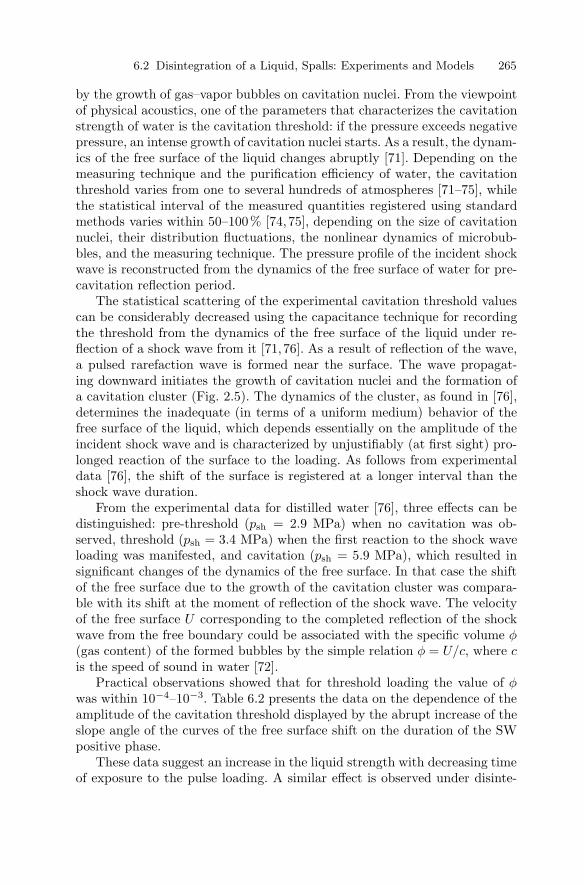
6.2 Disintegration of a Liquid, Spalls: Experiments and Models 265
by the growth of gas–vapor bubbles on cavitation nuclei. From the viewpointof physical acoustics, one of the parameters that characterizes the cavitationstrength of water is the cavitation threshold: if the pressure exceeds negativepressure, an intense growth of cavitation nuclei starts. As a result, the dynam-ics of the free surface of the liquid changes abruptly [71]. Depending on themeasuring technique and the purification efficiency of water, the cavitationthreshold varies from one to several hundreds of atmospheres [71–75], whilethe statistical interval of the measured quantities registered using standardmethods varies within 50–100% [74,75], depending on the size of cavitationnuclei, their distribution fluctuations, the nonlinear dynamics of microbub-bles, and the measuring technique. The pressure profile of the incident shockwave is reconstructed from the dynamics of the free surface of water for pre-cavitation reflection period.
The statistical scattering of the experimental cavitation threshold valuescan be considerably decreased using the capacitance technique for recordingthe threshold from the dynamics of the free surface of the liquid under re-flection of a shock wave from it [71,76]. As a result of reflection of the wave,a pulsed rarefaction wave is formed near the surface. The wave propagat-ing downward initiates the growth of cavitation nuclei and the formation ofa cavitation cluster (Fig. 2.5). The dynamics of the cluster, as found in [76],determines the inadequate (in terms of a uniform medium) behavior of thefree surface of the liquid, which depends essentially on the amplitude of theincident shock wave and is characterized by unjustifiably (at first sight) pro-longed reaction of the surface to the loading. As follows from experimentaldata [76], the shift of the surface is registered at a longer interval than theshock wave duration.
From the experimental data for distilled water [76], three effects can bedistinguished: pre-threshold (psh = 2.9 MPa) when no cavitation was ob-served, threshold (psh = 3.4 MPa) when the first reaction to the shock waveloading was manifested, and cavitation (psh = 5.9 MPa), which resulted insignificant changes of the dynamics of the free surface. In that case the shiftof the free surface due to the growth of the cavitation cluster was compara-ble with its shift at the moment of reflection of the shock wave. The velocityof the free surface U corresponding to the completed reflection of the shockwave from the free boundary could be associated with the specific volume φ(gas content) of the formed bubbles by the simple relation φ = U/c, where cis the speed of sound in water [72].
Practical observations showed that for threshold loading the value of φwas within 10−4–10−3. Table 6.2 presents the data on the dependence of theamplitude of the cavitation threshold displayed by the abrupt increase of theslope angle of the curves of the free surface shift on the duration of the SWpositive phase.
These data suggest an increase in the liquid strength with decreasing timeof exposure to the pulse loading. A similar effect is observed under disinte-
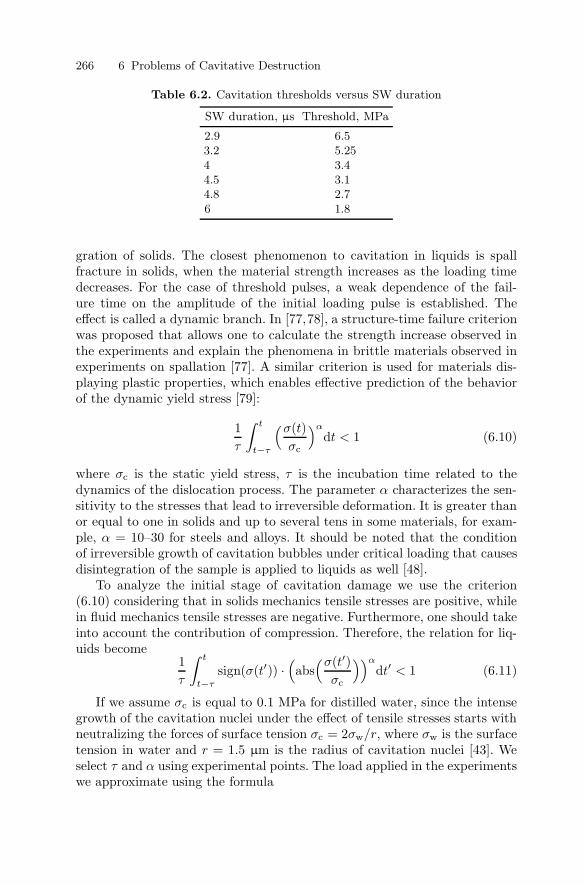
266 6 Problems of Cavitative Destruction
Table 6.2. Cavitation thresholds versus SW duration
SW duration, µs Threshold, MPa
2.9 6.53.2 5.254 3.44.5 3.14.8 2.76 1.8
gration of solids. The closest phenomenon to cavitation in liquids is spallfracture in solids, when the material strength increases as the loading timedecreases. For the case of threshold pulses, a weak dependence of the fail-ure time on the amplitude of the initial loading pulse is established. Theeffect is called a dynamic branch. In [77,78], a structure-time failure criterionwas proposed that allows one to calculate the strength increase observed inthe experiments and explain the phenomena in brittle materials observed inexperiments on spallation [77]. A similar criterion is used for materials dis-playing plastic properties, which enables effective prediction of the behaviorof the dynamic yield stress [79]:
1τ
∫ t
t−τ
(σ(t)σc
)α
dt < 1 (6.10)
where σc is the static yield stress, τ is the incubation time related to thedynamics of the dislocation process. The parameter α characterizes the sen-sitivity to the stresses that lead to irreversible deformation. It is greater thanor equal to one in solids and up to several tens in some materials, for exam-ple, α = 10–30 for steels and alloys. It should be noted that the conditionof irreversible growth of cavitation bubbles under critical loading that causesdisintegration of the sample is applied to liquids as well [48].
To analyze the initial stage of cavitation damage we use the criterion(6.10) considering that in solids mechanics tensile stresses are positive, whilein fluid mechanics tensile stresses are negative. Furthermore, one should takeinto account the contribution of compression. Therefore, the relation for liq-uids become
1τ
∫ t
t−τ
sign(σ(t′)) ·(abs
(σ(t′)σc
))α
dt′ < 1 (6.11)
If we assume σc is equal to 0.1 MPa for distilled water, since the intensegrowth of the cavitation nuclei under the effect of tensile stresses starts withneutralizing the forces of surface tension σc = 2σw/r, where σw is the surfacetension in water and r = 1.5 µm is the radius of cavitation nuclei [43]. Weselect τ and α using experimental points. The load applied in the experimentswe approximate using the formula

6.3 Cluster, Cumulative Jets, and Cavitative Erosion 267
σ(t) = −PA · sin(πτ
T
)· e−t/T1 (6.12)
where PA is the pulse amplitude, T is the pulse duration, and T1 characterizesthe subsidence ratio. The maximum absolute value of the amplitude in thepulse Pm is achieved at t = (T/π)arctg(πT1/T ):
Pm =πT1√
T 2 + π2T 21
· exp( T
πT1arctg
(πT1
T
))
The applied load σ(t) induces a pressure wave moving toward the surface.If the surface coordinate is zero and the time is reckoned from the momentwhen the wave arrives at the surface, the wave can be written as σ(t +x/c)H(t + x/c). Upon reflection from the surface the wave acquires the form−σ(t − x/c)H(t − x/c) and pressure in the liquid will be determined by thesum of two waves. Here H(t) is the Heaviside step function, c is the velocityof propagation of the wave in the liquid (c = 1500 m/s). The calculationsshow that the experimental loading curves are well described by the formula(6.12) at T1 = 2.85 · 10−6 s.
To calculate the critical strength we substitute normalized values of pres-sure for all times for which pressure is nonzero in the integral of (6.11). Thenwe find the time and the coordinate at which the maximum value of the in-tegral is achieved. The sought value of Pm is the value at which in the giventime instant the criterion (6.11) becomes equality in the given coordinate.The calculations show that the best agreement with the experiment is ob-served for α within the range from 0.4 to 0.5. In particular case at α = 0.5and τ = 19 µs the experimental data turned out to practically coincide withthe theoretical values of strength as a function of the pulse duration Pm(T )calculated from (6.11).
Thus, it was established experimentally that the cavitation strength ofwater grows as the duration of the loading pulse decreases; the appropriatedependence is nonlinear. Application of the structure-time criterion makes itpossible to calculate the experimentally observed increase in the cavitationthreshold with decreasing pulse duration. The data evidence the fundamentalcharacter of the structure-time approach that provides adequate reflectionof the dynamics of failure of solids and the initial disintegration stage ofliquids [45].
6.3 Cluster, Cumulative Jets, and Cavitative Erosion
The experiments on laboratory modeling of ultrasonic cavitation erosion de-scribed in [28] showed that a bubble cluster formed in the liquid interlayerbetween the horn and the sample under the effect of tensile stresses in the rar-efaction zones. Figure 6.34 illustrates a typical picture of the process recordedby high-speed camera. The frequency of horn oscillations was 20 kHz, the
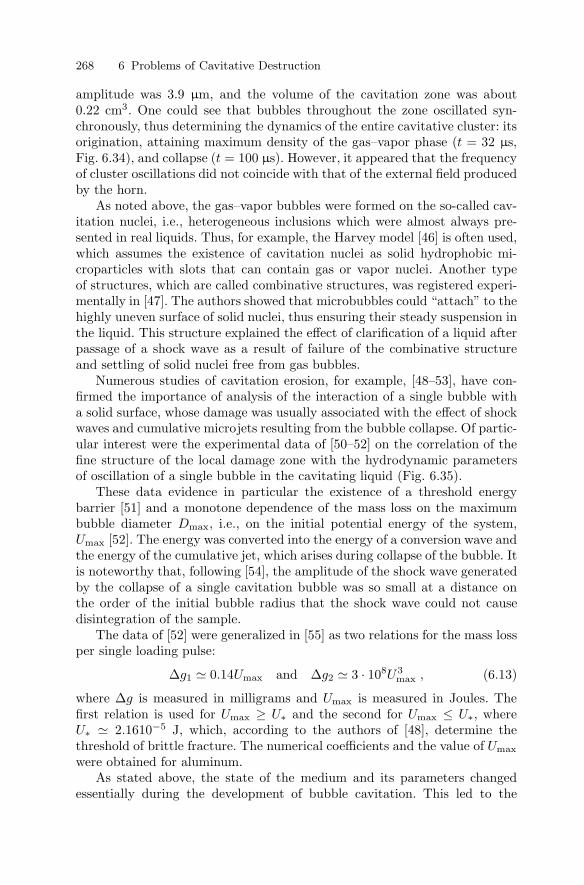
268 6 Problems of Cavitative Destruction
amplitude was 3.9 µm, and the volume of the cavitation zone was about0.22 cm3. One could see that bubbles throughout the zone oscillated syn-chronously, thus determining the dynamics of the entire cavitative cluster: itsorigination, attaining maximum density of the gas–vapor phase (t = 32 µs,Fig. 6.34), and collapse (t = 100 µs). However, it appeared that the frequencyof cluster oscillations did not coincide with that of the external field producedby the horn.
As noted above, the gas–vapor bubbles were formed on the so-called cav-itation nuclei, i.e., heterogeneous inclusions which were almost always pre-sented in real liquids. Thus, for example, the Harvey model [46] is often used,which assumes the existence of cavitation nuclei as solid hydrophobic mi-croparticles with slots that can contain gas or vapor nuclei. Another typeof structures, which are called combinative structures, was registered experi-mentally in [47]. The authors showed that microbubbles could “attach” to thehighly uneven surface of solid nuclei, thus ensuring their steady suspension inthe liquid. This structure explained the effect of clarification of a liquid afterpassage of a shock wave as a result of failure of the combinative structureand settling of solid nuclei free from gas bubbles.
Numerous studies of cavitation erosion, for example, [48–53], have con-firmed the importance of analysis of the interaction of a single bubble witha solid surface, whose damage was usually associated with the effect of shockwaves and cumulative microjets resulting from the bubble collapse. Of partic-ular interest were the experimental data of [50–52] on the correlation of thefine structure of the local damage zone with the hydrodynamic parametersof oscillation of a single bubble in the cavitating liquid (Fig. 6.35).
These data evidence in particular the existence of a threshold energybarrier [51] and a monotone dependence of the mass loss on the maximumbubble diameter Dmax, i.e., on the initial potential energy of the system,Umax [52]. The energy was converted into the energy of a conversion wave andthe energy of the cumulative jet, which arises during collapse of the bubble. Itis noteworthy that, following [54], the amplitude of the shock wave generatedby the collapse of a single cavitation bubble was so small at a distance onthe order of the initial bubble radius that the shock wave could not causedisintegration of the sample.
The data of [52] were generalized in [55] as two relations for the mass lossper single loading pulse:
∆g1 0.14Umax and ∆g2 3 · 108U3max , (6.13)
where ∆g is measured in milligrams and Umax is measured in Joules. Thefirst relation is used for Umax ≥ U∗ and the second for Umax ≤ U∗, whereU∗ 2.1610−5 J, which, according to the authors of [48], determine thethreshold of brittle fracture. The numerical coefficients and the value of Umax
were obtained for aluminum.As stated above, the state of the medium and its parameters changed
essentially during the development of bubble cavitation. This led to the

6.3 Cluster, Cumulative Jets, and Cavitative Erosion 269
Fig. 6.34. Dynamics of the cavitation zone between the horn and the sample inthe erosion tests

270 6 Problems of Cavitative Destruction
Fig. 6.35. Calculated (crosses) andexperimental (circles) parameters ofthe damage zone under the impact ofa cumulative microjet on the sample
idea of using the two-phase model of a real liquid to estimate the erosiontest results. This approached is of importance, because, in spite of the lo-cal character of erosion effects, frequency of pulse loadings and their in-tensity should depend on the hydrodynamic characteristics of the bubblecluster and the structure of the wave field in it. The inhomogeneity of themedium in erosion tests was first considered in [13, 28]. In the following sec-tion using the two-phase model of a cavitating liquid and generalized ex-perimental and numerical data on local fracture of the sample by cumula-tive microjets, we considered different approaches to the estimate of erosioneffects.
6.3.1 Single Cavity and Cumulative Jets: Experiment and Models
Above we mentioned the interesting experimental results for an “incidentshock wave–bubble–specimen” system obtained in [47], where the dependenceof the pit depth of the cavity hp formed by an impact of a cumulative microjeton the shock wave amplitude psh compressing the bubble near the specimenand on the hardness Hv of the specimen material were studied for aluminum(Fig. 6.35). We use these results to determine the relation between the pene-tration depth of the jet and the mass loss under a single load on the specimen.Obviously the frequency of the effect and its intensity can be determined onlywithin the two-phase model of the dynamics of a cavitating liquid.
Over a fairly wide range of parameters the pit depth is hp ∝ psh/Hv. Weshould note that in the classical problems on cumulative-jet penetration intotargets the microhardness Hv is involved in the condition of equality of pres-sures at the jet–target interface and is considered as a parameter responsiblefor dissipative processes:
ρj(Vj − Vp)2/2 = ρmV 2p /2 + Hv .
Here Vp and Vj are the penetration and the jet velocities, respectively. Thiscondition makes it possible to determine the minimum velocity of the cumula-
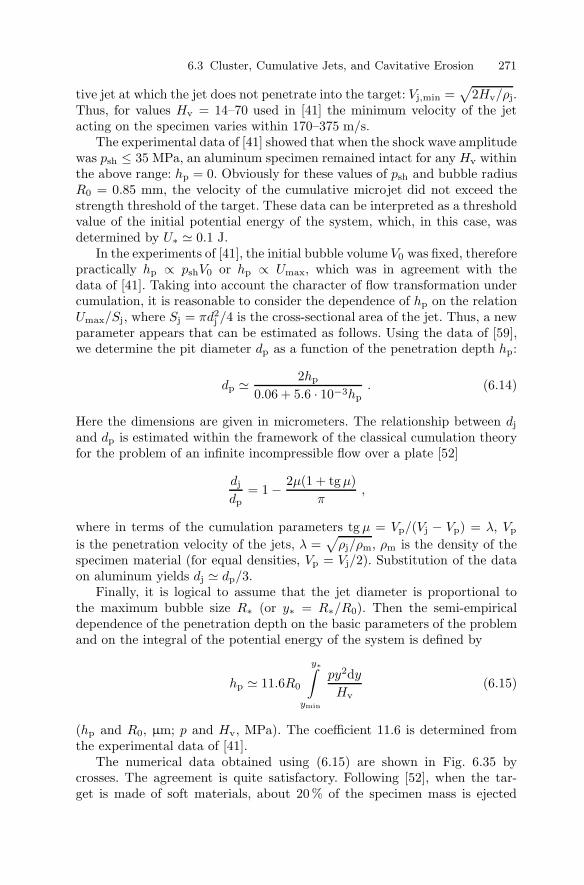
6.3 Cluster, Cumulative Jets, and Cavitative Erosion 271
tive jet at which the jet does not penetrate into the target: Vj,min =√
2Hv/ρj.Thus, for values Hv = 14–70 used in [41] the minimum velocity of the jetacting on the specimen varies within 170–375 m/s.
The experimental data of [41] showed that when the shock wave amplitudewas psh ≤ 35 MPa, an aluminum specimen remained intact for any Hv withinthe above range: hp = 0. Obviously for these values of psh and bubble radiusR0 = 0.85 mm, the velocity of the cumulative microjet did not exceed thestrength threshold of the target. These data can be interpreted as a thresholdvalue of the initial potential energy of the system, which, in this case, wasdetermined by U∗ 0.1 J.
In the experiments of [41], the initial bubble volume V0 was fixed, thereforepractically hp ∝ pshV0 or hp ∝ Umax, which was in agreement with thedata of [41]. Taking into account the character of flow transformation undercumulation, it is reasonable to consider the dependence of hp on the relationUmax/Sj, where Sj = πd2
j /4 is the cross-sectional area of the jet. Thus, a newparameter appears that can be estimated as follows. Using the data of [59],we determine the pit diameter dp as a function of the penetration depth hp:
dp 2hp
0.06 + 5.6 · 10−3hp. (6.14)
Here the dimensions are given in micrometers. The relationship between dj
and dp is estimated within the framework of the classical cumulation theoryfor the problem of an infinite incompressible flow over a plate [52]
dj
dp= 1 − 2µ(1 + tg µ)
π,
where in terms of the cumulation parameters tg µ = Vp/(Vj − Vp) = λ, Vp
is the penetration velocity of the jets, λ =√
ρj/ρm, ρm is the density of thespecimen material (for equal densities, Vp = Vj/2). Substitution of the dataon aluminum yields dj dp/3.
Finally, it is logical to assume that the jet diameter is proportional tothe maximum bubble size R∗ (or y∗ = R∗/R0). Then the semi-empiricaldependence of the penetration depth on the basic parameters of the problemand on the integral of the potential energy of the system is defined by
hp 11.6R0
y∗∫ymin
py2dy
Hv(6.15)
(hp and R0, µm; p and Hv, MPa). The coefficient 11.6 is determined fromthe experimental data of [41].
The numerical data obtained using (6.15) are shown in Fig. 6.35 bycrosses. The agreement is quite satisfactory. Following [52], when the tar-get is made of soft materials, about 20% of the specimen mass is ejected
272 6 Problems of Cavitative Destruction
from the pit produced by the cumulative jet. If the pit is a cone, the ejectedvolume can be calculated using (6.14),
Ver h3
p
(0.134 + 0.0125hp)2, (6.16)
where hp is determined from (6.15). Under the assumption that preciselythis mass (ρmVer) determines the erosion effect (mass loss by the specimen)for plastic materials, Eqs. (6.13) allow one to estimate numerically the dam-age dynamics, if the density of bubbles per unit area and their oscillationfrequency are known. These parameters are found by analysis of the initialstate of microinhomogeneities in the liquid and by solution of the problem ofa cavitation cluster.
It should be noted that the above-mentioned threshold is not the onlyrestriction in the estimate of the erosion effect. The second basic constraintis the length of a cumulative jet. Following [53], the penetration depth Lp ofthe cumulative jet, the jet length Lj and density ρj, and the density of thetarget material ρm are related by
Lp = λLj .
Thus, a cumulative jet penetrates into a liquid only to the depth equal toits length (λ = 1). The presence of an interlayer between the cavitation bubbleand the specimen wall reduces considerably the effectiveness of its action. Asis clear from Kurbatskii’s calculation of the axisymmetrical problem [46] ofthe collapse of an initially spherical hollow cavity near a solid wall, a microjetforms near the initial position of the center of the bubble even when theinterlayer thickness is L = 0.5Rmax. The jet length is on the order of its half-radius (Lj = L), while the distance to the specimen is about three lengthsof the jet. Although the velocity is fairly high (greater than 180 m/s), sucha jet cannot produce any effect on the specimen.
When a bubble comes in contact with the surface, a jet with length Lj Rmax and diameter dj 0.2Rmax and with an almost uniform velocity fieldis generated. Figure 6.36 shows the dynamics of the bubble profile and theparticle trajectories for various times. Profile b in Fig. 6.36a corresponds toa dimensionless time 0.812 5, profile h is for 1.090 6 and the time of collapse ofa hollow cavity in an unbounded liquid is 1.092 9 (0 is the initial profile). Thevelocity of the jet tip at the moment of contact with the bottom boundarycan be estimated in m/s as Vj 1.3 · 104
√p/ρj, if pressure and density
are measured in MPa and kg/m3, respectively. Thus, the above strengththreshold for the contact of a bubble with a surface can be overcome for thesoftest material only when the external pressure p is no less than 0.2 MPa.The kinetic energy of the jets is only 0.4 % of Umax, which exceeds 0.01 %markedly [48].
As to the external field, the above reasoning dealt with hydrostatics andarbitrary bubble shape before the collapse. However, in reality, a cavitation
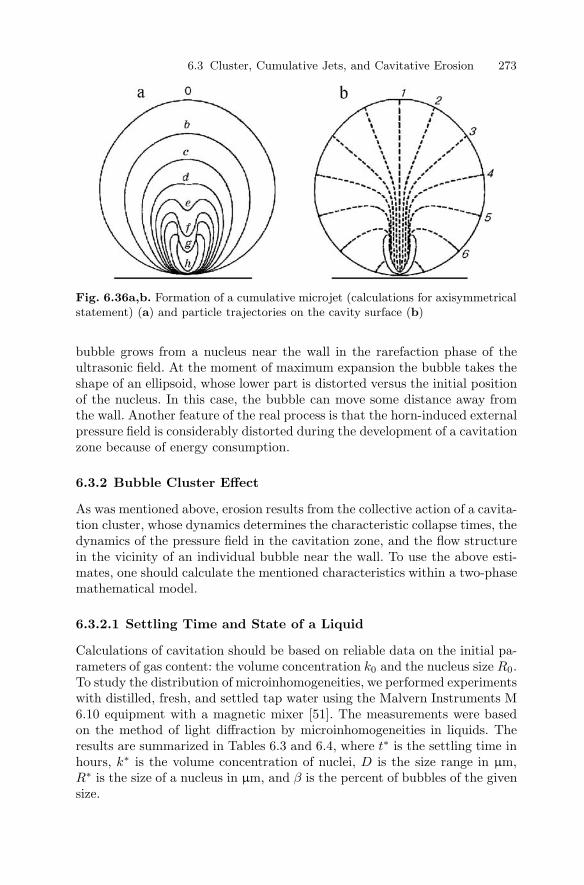
6.3 Cluster, Cumulative Jets, and Cavitative Erosion 273
Fig. 6.36a,b. Formation of a cumulative microjet (calculations for axisymmetricalstatement) (a) and particle trajectories on the cavity surface (b)
bubble grows from a nucleus near the wall in the rarefaction phase of theultrasonic field. At the moment of maximum expansion the bubble takes theshape of an ellipsoid, whose lower part is distorted versus the initial positionof the nucleus. In this case, the bubble can move some distance away fromthe wall. Another feature of the real process is that the horn-induced externalpressure field is considerably distorted during the development of a cavitationzone because of energy consumption.
6.3.2 Bubble Cluster Effect
As was mentioned above, erosion results from the collective action of a cavita-tion cluster, whose dynamics determines the characteristic collapse times, thedynamics of the pressure field in the cavitation zone, and the flow structurein the vicinity of an individual bubble near the wall. To use the above esti-mates, one should calculate the mentioned characteristics within a two-phasemathematical model.
6.3.2.1 Settling Time and State of a Liquid
Calculations of cavitation should be based on reliable data on the initial pa-rameters of gas content: the volume concentration k0 and the nucleus size R0.To study the distribution of microinhomogeneities, we performed experimentswith distilled, fresh, and settled tap water using the Malvern Instruments M6.10 equipment with a magnetic mixer [51]. The measurements were basedon the method of light diffraction by microinhomogeneities in liquids. Theresults are summarized in Tables 6.3 and 6.4, where t∗ is the settling time inhours, k∗ is the volume concentration of nuclei, D is the size range in µm,R∗ is the size of a nucleus in µm, and β is the percent of bubbles of the givensize.
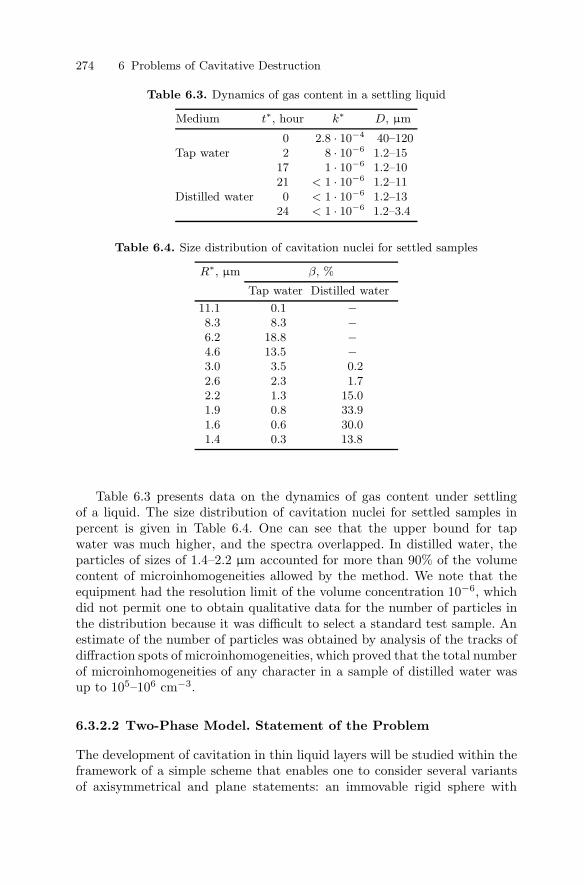
274 6 Problems of Cavitative Destruction
Table 6.3. Dynamics of gas content in a settling liquid
Medium t∗, hour k∗ D, µm
0 2.8 · 10−4 40–120Tap water 2 8 · 10−6 1.2–15
17 1 · 10−6 1.2–1021 < 1 · 10−6 1.2–11
Distilled water 0 < 1 · 10−6 1.2–1324 < 1 · 10−6 1.2–3.4
Table 6.4. Size distribution of cavitation nuclei for settled samples
R∗, µm β, %
Tap water Distilled water
11.1 0.1 −8.3 8.3 −6.2 18.8 −4.6 13.5 −3.0 3.5 0.22.6 2.3 1.72.2 1.3 15.01.9 0.8 33.91.6 0.6 30.01.4 0.3 13.8
Table 6.3 presents data on the dynamics of gas content under settlingof a liquid. The size distribution of cavitation nuclei for settled samples inpercent is given in Table 6.4. One can see that the upper bound for tapwater was much higher, and the spectra overlapped. In distilled water, theparticles of sizes of 1.4–2.2 µm accounted for more than 90% of the volumecontent of microinhomogeneities allowed by the method. We note that theequipment had the resolution limit of the volume concentration 10−6, whichdid not permit one to obtain qualitative data for the number of particles inthe distribution because it was difficult to select a standard test sample. Anestimate of the number of particles was obtained by analysis of the tracks ofdiffraction spots of microinhomogeneities, which proved that the total numberof microinhomogeneities of any character in a sample of distilled water wasup to 105–106 cm−3.
6.3.2.2 Two-Phase Model. Statement of the Problem
The development of cavitation in thin liquid layers will be studied within theframework of a simple scheme that enables one to consider several variantsof axisymmetrical and plane statements: an immovable rigid sphere with
6.3 Cluster, Cumulative Jets, and Cavitative Erosion 275
radius a is placed within a hollow sphere (horn of radius aex) filled withliquid and oscillating with frequency f . The size of the gap δ between themis controlled by shifting their centers L.
As mentioned above, the cavitating flow is described by the conservationlaws for average characteristics and is closed by the relations for concentra-tion k in the monodisperse mixture of bubbles. As a governing system ofequations we use the system (6.4)–(6.5) [28, 29]
∆p p (6.17)
and∂2k
∂t2=
3k1/3
ρ0R20
(p0k−γ − p) +
16k
(∂k
∂t
)2
. (6.18)
with the spatial variable η = αrk1/6 [28, 29].For the axisymmetrical problem of the development of cavitation in a nar-
row clearance between two spherical surfaces, the solution of (6.17) is pre-sented as a combination of the Bessel functions Kn+1/2(ζr) and the Legendrepolynomials Pn(cos Θ) and becomes
p =∑
n
Bnr−1/2Kn+1/2(ζr)Pn(cosΘ) .
Here ζ = αk1/6 and α =√
3k0/R20. Below we shall restrict ourselves to two
terms in the series. Then, the approximate solution of (6.17) determining theanalytical dependence p(k) is found as
p √
π/2ζ exp (−ζr)r−1[B0 + B1(1 + 1/ζr) cosΘ].
The coefficients in the expansion are found from the boundary conditions
∂p
∂r= 0 at r = a and n∇p = −ρ0β(t) at r = r∗ ,
where n is the unit normal to the surface aex, β(t) = −nbω2 sin(ωt) is theacceleration of the surface, and b is the amplitude of the acceleration.
The pressure in the cavitation zone near the horn surface (r = r∗) isfinally determined from the relation
p = p0 + ρ0br∗ω2 sin(ωt)[1 − (2 + ζa)r∗/(1 + ζa)a]/N , (6.19)
where N = cos γr∗(1 + ζr∗)[1 + (1 + ζa)2]/a(1 + ζa) − [1 + (1 + ζr∗)2] +
sin γ tg Θ(1 + ζr∗), cos γ = (a2ex − L2 + r2
∗)/2r∗aex, r∗ =√
a2ex − L2 sin2 Θ −
L cosΘ.The substitution of (6.19) into (6.18) reduces the problem to the solution
of an ordinary second-order differential equation, in which the spatial coordi-nate r acts as a parameter. The angle Θ is reckoned from the centerline, thecoordinate origin is placed at the sphere center a, and r∗ is the coordinate ofthe point at the radius center aex.
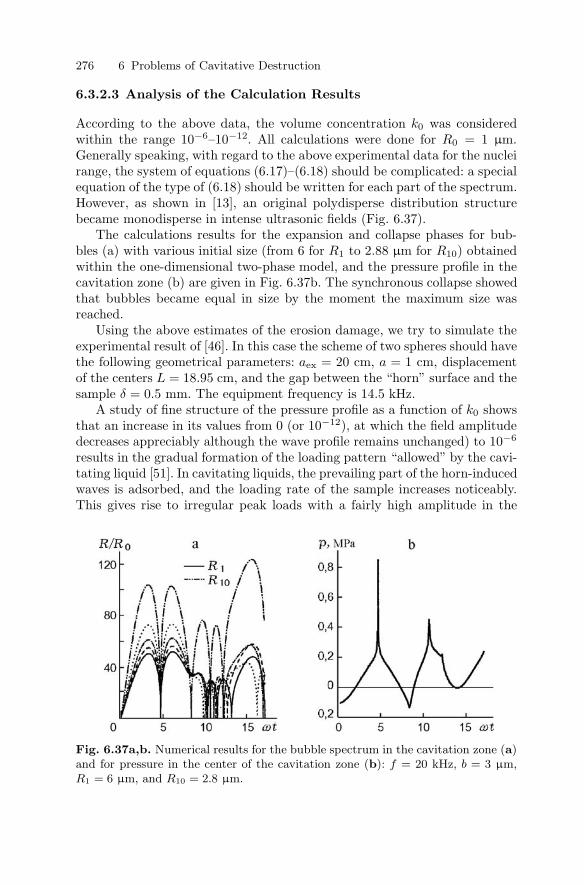
276 6 Problems of Cavitative Destruction
6.3.2.3 Analysis of the Calculation Results
According to the above data, the volume concentration k0 was consideredwithin the range 10−6–10−12. All calculations were done for R0 = 1 µm.Generally speaking, with regard to the above experimental data for the nucleirange, the system of equations (6.17)–(6.18) should be complicated: a specialequation of the type of (6.18) should be written for each part of the spectrum.However, as shown in [13], an original polydisperse distribution structurebecame monodisperse in intense ultrasonic fields (Fig. 6.37).
The calculations results for the expansion and collapse phases for bub-bles (a) with various initial size (from 6 for R1 to 2.88 µm for R10) obtainedwithin the one-dimensional two-phase model, and the pressure profile in thecavitation zone (b) are given in Fig. 6.37b. The synchronous collapse showedthat bubbles became equal in size by the moment the maximum size wasreached.
Using the above estimates of the erosion damage, we try to simulate theexperimental result of [46]. In this case the scheme of two spheres should havethe following geometrical parameters: aex = 20 cm, a = 1 cm, displacementof the centers L = 18.95 cm, and the gap between the “horn” surface and thesample δ = 0.5 mm. The equipment frequency is 14.5 kHz.
A study of fine structure of the pressure profile as a function of k0 showsthat an increase in its values from 0 (or 10−12), at which the field amplitudedecreases appreciably although the wave profile remains unchanged) to 10−6
results in the gradual formation of the loading pattern “allowed” by the cavi-tating liquid [51]. In cavitating liquids, the prevailing part of the horn-inducedwaves is adsorbed, and the loading rate of the sample increases noticeably.This gives rise to irregular peak loads with a fairly high amplitude in the
Fig. 6.37a,b. Numerical results for the bubble spectrum in the cavitation zone (a)and for pressure in the center of the cavitation zone (b): f = 20 kHz, b = 3 µm,R1 = 6 µm, and R10 = 2.8 µm.
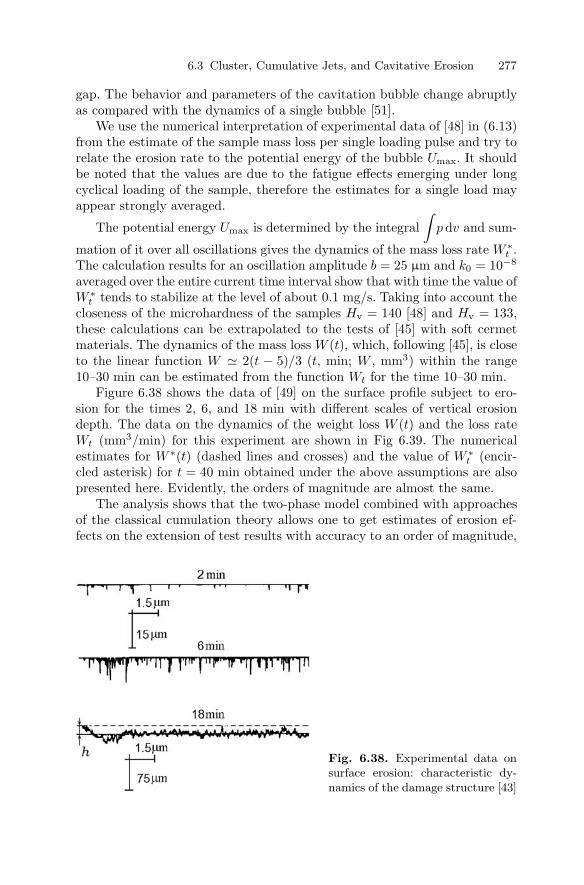
6.3 Cluster, Cumulative Jets, and Cavitative Erosion 277
gap. The behavior and parameters of the cavitation bubble change abruptlyas compared with the dynamics of a single bubble [51].
We use the numerical interpretation of experimental data of [48] in (6.13)from the estimate of the sample mass loss per single loading pulse and try torelate the erosion rate to the potential energy of the bubble Umax. It shouldbe noted that the values are due to the fatigue effects emerging under longcyclical loading of the sample, therefore the estimates for a single load mayappear strongly averaged.
The potential energy Umax is determined by the integral∫
p dv and sum-
mation of it over all oscillations gives the dynamics of the mass loss rate W ∗t .
The calculation results for an oscillation amplitude b = 25 µm and k0 = 10−8
averaged over the entire current time interval show that with time the value ofW ∗
t tends to stabilize at the level of about 0.1 mg/s. Taking into account thecloseness of the microhardness of the samples Hv = 140 [48] and Hv = 133,these calculations can be extrapolated to the tests of [45] with soft cermetmaterials. The dynamics of the mass loss W (t), which, following [45], is closeto the linear function W 2(t − 5)/3 (t, min; W , mm3) within the range10–30 min can be estimated from the function Wt for the time 10–30 min.
Figure 6.38 shows the data of [49] on the surface profile subject to ero-sion for the times 2, 6, and 18 min with different scales of vertical erosiondepth. The data on the dynamics of the weight loss W (t) and the loss rateWt (mm3/min) for this experiment are shown in Fig 6.39. The numericalestimates for W ∗(t) (dashed lines and crosses) and the value of W ∗
t (encir-cled asterisk) for t = 40 min obtained under the above assumptions are alsopresented here. Evidently, the orders of magnitude are almost the same.
The analysis shows that the two-phase model combined with approachesof the classical cumulation theory allows one to get estimates of erosion ef-fects on the extension of test results with accuracy to an order of magnitude,
Fig. 6.38. Experimental data onsurface erosion: characteristic dy-namics of the damage structure [43]
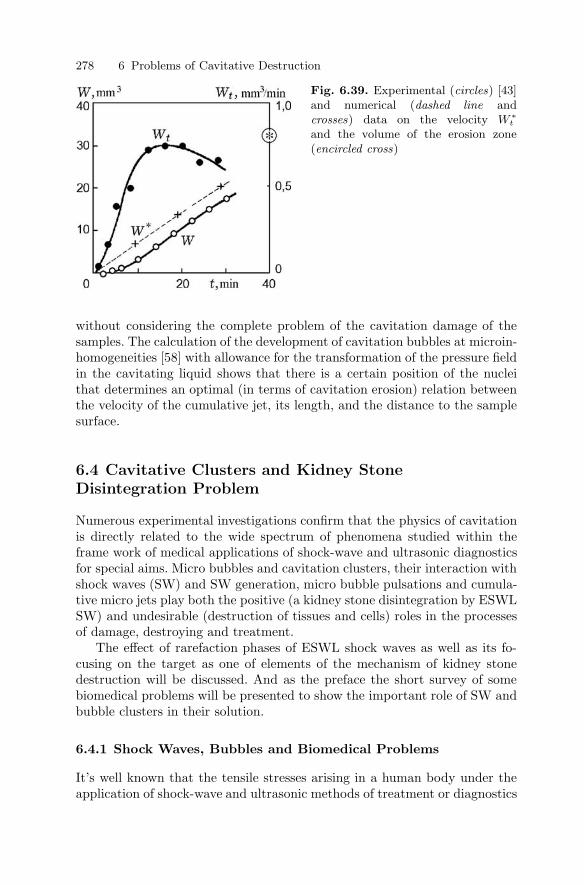
278 6 Problems of Cavitative Destruction
Fig. 6.39. Experimental (circles) [43]and numerical (dashed line andcrosses) data on the velocity W ∗
t
and the volume of the erosion zone(encircled cross)
without considering the complete problem of the cavitation damage of thesamples. The calculation of the development of cavitation bubbles at microin-homogeneities [58] with allowance for the transformation of the pressure fieldin the cavitating liquid shows that there is a certain position of the nucleithat determines an optimal (in terms of cavitation erosion) relation betweenthe velocity of the cumulative jet, its length, and the distance to the samplesurface.
6.4 Cavitative Clusters and Kidney StoneDisintegration Problem
Numerous experimental investigations confirm that the physics of cavitationis directly related to the wide spectrum of phenomena studied within theframe work of medical applications of shock-wave and ultrasonic diagnosticsfor special aims. Micro bubbles and cavitation clusters, their interaction withshock waves (SW) and SW generation, micro bubble pulsations and cumula-tive micro jets play both the positive (a kidney stone disintegration by ESWLSW) and undesirable (destruction of tissues and cells) roles in the processesof damage, destroying and treatment.
The effect of rarefaction phases of ESWL shock waves as well as its fo-cusing on the target as one of elements of the mechanism of kidney stonedestruction will be discussed. And as the preface the short survey of somebiomedical problems will be presented to show the important role of SW andbubble clusters in their solution.
6.4.1 Shock Waves, Bubbles and Biomedical Problems
It’s well known that the tensile stresses arising in a human body under theapplication of shock-wave and ultrasonic methods of treatment or diagnostics
6.4 Cavitative Clusters and Kidney Stone Disintegration Problem 279
can tend to cavitative phenomena as well as in a case of normal liquids.Often for the study of these phenomena it’s required to determine the special(including 3D) mathematical models. With this point of view the resultspublished in [59–61] become interesting.
Taking into account the translational motion and the deformation of eachbubble induced by mutual interactions among the bubbles the governingequations of three-dimensional motions for an arbitrary configuration of Nbubbles were derived by Takahira et al. [59]. The authors have investigatedthe dynamics of a bubble cluster in a liquid by means of a series expansionof spherical harmonics and have shown, in particular, that the lowest natu-ral frequency of the bubbles is much lower than the frequency of an isolatedbubble. It was shown that the heat transfer inside the bubble is importantfor investigating the nonlinear bubble oscillations and the subharmonic os-cillation of interacting bubbles occurs more easily than that of an isolatedbubble due to bubble–bubble interactions [60].
Chapter 5 [1,3] an effect of collective behavior of gas bubbles in two-phaselayer under a shock wave was discussed. One can note that the authors [61]studying numerically nonlinear oscillations of spherical bubbles in a soundfield have detected the analogous results. It was shown that when bubbleswith different initial radii oscillate in a sound field, the independent oscillationof each bubble is suppressed by bubble interactions and the bubbles take ona collective behavior.
Interesting experiments were performed by Ceccio et al. [62] to examinedifferences in bubble cavitation inception, form, and acoustic emission infresh and salt water. Differences detected are attributed to variations in thefreestream nuclei population, and it is hypothesized that the solution of saltreduced the number and size of freestream nuclei. Differences in the overallacoustic emission were attributed to variation in the bubble event rate andaverage maximum bubble size between the fresh and salt water cavitation.
An overview of the basic physical principles of shock waves, and the his-tory and basic research behind shock-wave use in medicine for disintegra-tion of kidney and ureteral stones, in orthopaedics and traumatology waspresented in [63]. One noted that the theory of shock-wave therapy for or-thopaedic diseases involves the stimulation of healing processes in tendons,surrounding tissue and bones. This is a completely different approach fromthat of urology, where shock waves are used for disintegration. Thiel consid-ers [64] that the concept of orthopaedic disorders is that shock waves stimu-late or reactivate healing processes in tendons, surrounding tissue and bones,probably through microdisruption of avascular or minimally vascular tissuesto encourage revascularization, release of local growth factors, and the re-cruitment of appropriate stem cells conducive to more normal tissue healing.
It’s well known that lithotripsy is a common effective treatment for kidneystones. However, focal volumes are often larger than stones, and surround-ing tissue is often injured. Sokolov, Bailey and Crum [65] have suggested

280 6 Problems of Cavitative Destruction
new dual-pulse lithotripter consisting of two opposing, confocal and simulta-neously triggered electrohydraulic sources to accelerate stone fragmentationand to reduce cell lysis in vitro. Model gypsum stones and human erythro-cytes were exposed to dual pulses or single pulses. The results of tests in vitrohave shown that at the focus, model stones treated with 100 dual pulses ata charging voltage of 15 kV broke into eight times the number of fragmentsas stones treated with 200 single pulses at 18 kV.
Using an experimental system that mimics stone fragmentation in therenal pelvis, the role of stress waves and cavitation in stone comminution inshock-wave lithotripsy (SWL) was investigated in [66]. Spherical plaster-of-Paris stone phantoms (D = 10 mm) were exposed to 25, 50, 100, 200, 300 and500 shocks at the beam focus of a Dornier HM-3 lithotripter operated at 20 kVand a pulse repetition rate of I Hz. This apparent size limitation of the stonefragments produced primarily by stress waves (in castor oil) is likely causedby the destructive superposition of the stress waves reverberating inside thefragments, when their sizes are less than half of the compressive wavelength inthe stone material. On the other hand, if a stone is only exposed to cavitationbubbles induced in SWL, the resultant fragmentation is much less effectivethan that produced by the combination of stress waves and cavitation. It isconcluded that, although stress-wave-induced fracture is important for theinitial disintegration of kidney stones, cavitation is necessary to produce finepassable fragments, which are most critical for the success of clinical SWL.Stress waves and cavitation work synergistically, rather than independently,to produce effective and successful disintegration of renal calculi in SWL.One can mention that an analogous effect was predicted in the results of thenumerical studies in [67].
Several mechanisms of kidney stone fragmentation in extracorporal shock-wave lithotripsy (ESWL) were also under discussion in [68]. As a new mech-anism, the circumferential quasistatic compression or “squeezing” by evanes-cent waves in the stone has been introduced. The fragmentation was studiedin the experiments with self-focusing electromagnetic shock-wave generatorswith focal diameters comparable to or larger than the stone diameter. A quan-titative model of binary fragmentation by “quasistatic squeezing” was devel-oped. This model predicts the ratio of the number of pulses for fragmentationto 2-mm size and of the number of pulses required for the first cleavage intotwo parts. This “fragmentation ratio” depends linearly on the stone radiusand on the final size of the fragments.
Stone comminution and tissue damage in lithotripsy are sensitive to theacoustic field within the kidney, but yet knowledge of shock waves in vivo islimited. In this connection Cleveland et al. [69] have made measurements oflithotripsy shock waves inside pigs with small hydrophones. A hydrophonewas positioned around the pig kidney following a flank incision. It appearedthat a combination of nonlinear effects and inhomogeneities in the tissuebroadened the focus of the lithotripter. The shock rise time was on the order
6.4 Cavitative Clusters and Kidney Stone Disintegration Problem 281
of 100 ns, substantially more than the rise time measured in water, and wasattributed to higher absorption in tissue.
A novel, less invasive, shock wave source that can be introduced into anarbitrary position in a human body percutaneously has been developed [70].The shock wave source consists of an explosive, an optical fiber, a ballooncatheter, and a Nd:YAG laser, which generates a spherical explosive shockwave. The destructive potential of the present source for injuring tissue wasconfirmed. The subsequent cell elongation and split in the direction of theshock wave has been observed.
According to the prior study [70], a rapid recanalization therapy of cere-bral embolism, using liquid jet impacts generated by the interaction of gasbubbles with shock waves, can potentially penetrate through thrombi withvery efficient ablation. The studies in [71] were undertaken to examine theliquid jet impact effect on fibrinolysis in a tube model of an internal carotidartery. The shock wave was generated by detonating a silver azide pelletweighing about a few µg located in a balloon catheter. Thrombi were formedusing fresh human blood and gelatin. The fibrinolysis induced by the liquidjet impact with urokinase was explored as the percentage of the weight loss ofthe thrombus. The results suggest that liquid jet impact thrombolysis has thepotential to be a rapid and effective therapeutic modality in recanalizationtherapy for patients with cerebral embolism and other clinical conditions ofintra-arterial thrombosis.
The interaction of air bubbles attached to gelatin surfaces, extirpated liv-ers or abdominal aortas of rats with underwater shock waves was investigatedin [72] to help clarify the tissue-damage mechanism associated with cavitationbubbles induced during extracorporeal shock-wave lithotripsy. The bubble at-tached to gelatin or a rat’s liver surface migrates away from the surface withan oscillatory growth/collapse behavior after the shock-wave interaction. Thepenetration depth of the liquid jet into the gelatin and the radius of the sub-sequent damage pit on the surface depend on the initial bubble radius.
The effect of extracorporeal shock waves on hemoglobin released fromred blood cells was recently found to be minimized under minute static ex-cess pressure [73]. The experiments carried out have shown that a dominantmechanism of shock wave action is a shock wave–gas bubble interaction.
A method for real-time in vitro observation of cavitation on a prostheticheart valve has been developed. Cavitation of four blood analog fluids (dis-tilled water, aqueous glycerin, aqueous polyacrylamide, and aqueous xanthangum) has been documented for a Medtronic/Hall prosthetic heart valve [74].The observations were made on a valve that was located in the mitral po-sition, with the cavitation occurring on the inlet side after valve closure onevery cycle. Stroboscopic videography was used to document the cavity lifecycle. Bubble cavitation was observed on the valve occluder face. For eachfluid, cavity growth and collapse occurred in less than 1 ms, which providesstrong evidence that the cavitation is vaporous rather than gaseous. The
282 6 Problems of Cavitative Destruction
cavity duration time was found to decrease with increasing atrial pressureat constant aortic pressure and beat rate. The area of cavitation was foundto decrease with increasing delay time at a constant aortic pressure, atrialpressure, and bear rate. Cavitation was found to occur in each of the fluids,with the most cavitation seen in the Newtonian fluids (distilled water andaqueous glycerin).
As a rule, in studies of cells or stones in vitro, the material to be exposedto shock waves (SWs) is commonly contained in plastic vials. It is difficultto remove air bubbles from such vials. The attempt to determine whetherthe inclusion of small, visible bubbles in the specimen vial has an effect onSW-induced cell lysis was made [75]. It was found that even small bubblesled to increased lysis of red blood cells and that the degree of lysis increasedwith bubble size. Thus, bubble effects in vials could involve the proliferation ofcavitation nuclei from existing bubbles. Whereas injury to red blood cells wasgreatly increased by the presence of bubbles in vials, lytic injury to culturedepithelial cells was not increased by the presence of small air bubbles. Thissuggests different susceptibility to SW damage for different types of cells.Thus, the presence of even a small air bubble can increase SW-induced celldamage, perhaps by increasing the number of cavitation nuclei throughoutthe vial, but this effect varies with cell type.
Impulsive stress in repeated shock waves administered during extracorpo-real shock-wave lithotripsy (ESWL) causes injury to kidney tissue. In a studyof the mechanical input of ESWL, the effects of focused shock waves on thinplanar polymeric membranes immersed in a variety of tissue-mimicking fluidshave been examined [76]. A direct mechanism of failure by shock compres-sion and an indirect mechanism by bubble collapse have been observed. Thinmembranes are easily damaged by bubble collapse. After propagating throughcavitation-free acoustically heterogeneous media (liquids mixed with hollowglass spheres and tissue), shock waves cause membranes to fail in fatigue bya shearing mechanism. As is characteristic of dynamic fatigue, the failurestress increases with strain rate:, determined by the amplitude and rise timeof the attenuated shock wave. Shocks with large amplitude rind short risetime (i.e., in uniform media) cause no damage. Thus the inhomogeneity oftissue is likely to contribute to injury in ESWL. A definition of dose is pro-posed which yields a criterion for damage based on measurable shock waveproperties.
The role of shock waves in the treatment of soft tissue pain is at presentunknown. There is a potential for further therapeutic applications of shockwaves since shock waves exert a strong biological effect on tissue, which ismediated by cavitation. Experiments using shock waves for tumor therapyhave shown some promising results [77], yet devices that generate waveformsother than lithotripters are probably better suited. Shock waves cause a tran-sient increase in the permeability of the cell membrane, and this might leadto further applications of shock waves.

6.4 Cavitative Clusters and Kidney Stone Disintegration Problem 283
Characteristics of the underwater shock waves and of ultrasound focus-ing were studied by Takayama [78] by means of holographic interferometricflow visualization and polyvinyliden-difluoride (PVDF) pressure transduc-ers. These focused pressures, when applied to clinical treatments, could ef-fectively and noninvasively disintegrate urinary tract stones or gallbladderstones. However, as it was noted, despite clincal success, tissue damage oc-curs during ESWL treatments, and the possible mechanism of tissue damageis briefly described.
Miller and Song studied lithotripter shock waves with cavitation nucle-ation agents and shown that they can produce tumor growth reduction andgene transfer in vivo [79]. Cavitation nucleation agents (CNA) can greatlyenhance DNA transfer and cell killing for therapeutically useful applicationsof nonthermal bioeffects of ultrasound (US) and shock waves (SW). Eithersaline, Optison US contrast agent, a vaporizing perfluoropentane droplet sus-pension (SDS) or air bubble were injected intratumorally at 10% of tumorvolume as a CNA. In some tests, droplets or contrast agent were injected IV.Shock waves (SW) were generated from a spark-gap lithotripter at 7.4 MPapeak negative pressure amplitude. IV injection of Optison or droplet nucle-ation agents before SW treatment reduced tumor growth to factors of 1.0 and0.7, but did not increase transfection. These results demonstrate the efficacyof CNA in vivo and should lead to improved strategies for simultaneous SWtumor ablation and cancer gene therapy.
6.4.2 Some Results on Modelling of ESWL Applications
In his survey [55] Groening gave a brief review of extracorporeal shockwave lithotripsy (ESWL) and distinguished the works of Jutkin, Goldberg(1959), Forssman (1975), Chaussy et al., Reichenberger and Naser, Zieglerand Wurster (1986), Muller (1987), Delius and Brendel, Takayama et al.,and Coleman and Saunders (1988), in which the structure and parametersof the wave field in the focus zone were studied in detail. But the cavita-tion effects in them were simulated primarily as a result of the interaction ofshock waves with artificially produced gas bubbles and had no connection tocavitation, as a new medium state, which considerably varies the wave-fieldparameters [6] and the conditions at which bubble collapse with cumulativemicrojet formation is possible.
Physical aspects of wave focusing in the context of ESWL were analyzedby Sturtevant [56], who raised the question on the mechanism of disintegra-tion of kidney stones and on the role of the rarefaction wave in it. Accordingto [56], strong rarefaction waves following the shock wave front lead to re-duced duration of its positive phase, the sharply peaked waveform, and tolimitation of the amplitude. When such a wave penetrates into the target, itinduces shear stresses leading to spalls.
Kuwahara [57] cited experimental data for the disintegration processrecorded by the high-speed video camera. Following his data, when a shock
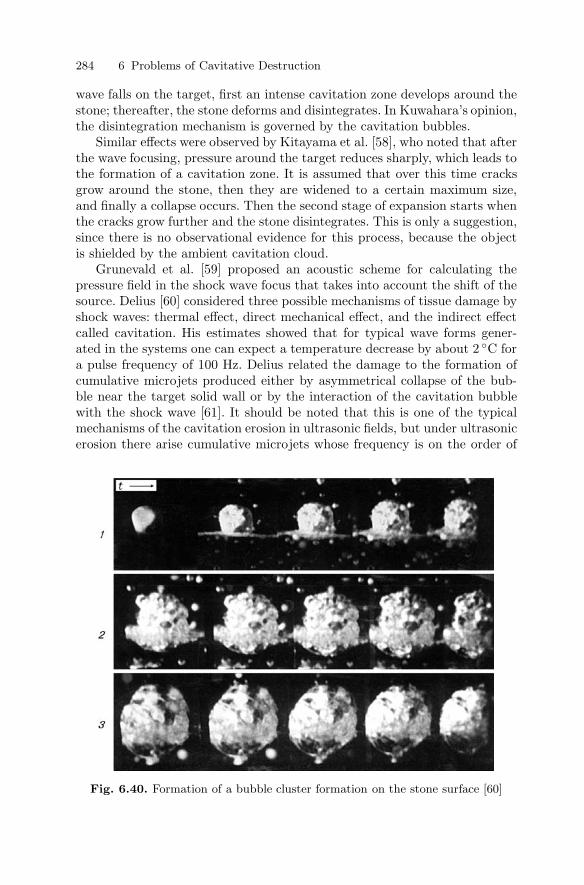
284 6 Problems of Cavitative Destruction
wave falls on the target, first an intense cavitation zone develops around thestone; thereafter, the stone deforms and disintegrates. In Kuwahara’s opinion,the disintegration mechanism is governed by the cavitation bubbles.
Similar effects were observed by Kitayama et al. [58], who noted that afterthe wave focusing, pressure around the target reduces sharply, which leads tothe formation of a cavitation zone. It is assumed that over this time cracksgrow around the stone, then they are widened to a certain maximum size,and finally a collapse occurs. Then the second stage of expansion starts whenthe cracks grow further and the stone disintegrates. This is only a suggestion,since there is no observational evidence for this process, because the objectis shielded by the ambient cavitation cloud.
Grunevald et al. [59] proposed an acoustic scheme for calculating thepressure field in the shock wave focus that takes into account the shift of thesource. Delius [60] considered three possible mechanisms of tissue damage byshock waves: thermal effect, direct mechanical effect, and the indirect effectcalled cavitation. His estimates showed that for typical wave forms gener-ated in the systems one can expect a temperature decrease by about 2 C fora pulse frequency of 100 Hz. Delius related the damage to the formation ofcumulative microjets produced either by asymmetrical collapse of the bub-ble near the target solid wall or by the interaction of the cavitation bubblewith the shock wave [61]. It should be noted that this is one of the typicalmechanisms of the cavitation erosion in ultrasonic fields, but under ultrasonicerosion there arise cumulative microjets whose frequency is on the order of
Fig. 6.40. Formation of a bubble cluster formation on the stone surface [60]
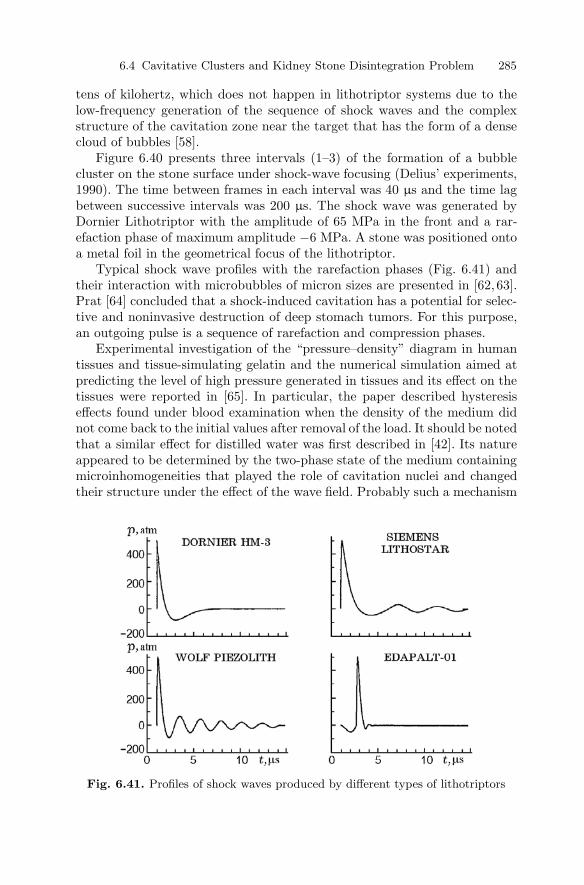
6.4 Cavitative Clusters and Kidney Stone Disintegration Problem 285
tens of kilohertz, which does not happen in lithotriptor systems due to thelow-frequency generation of the sequence of shock waves and the complexstructure of the cavitation zone near the target that has the form of a densecloud of bubbles [58].
Figure 6.40 presents three intervals (1–3) of the formation of a bubblecluster on the stone surface under shock-wave focusing (Delius’ experiments,1990). The time between frames in each interval was 40 µs and the time lagbetween successive intervals was 200 µs. The shock wave was generated byDornier Lithotriptor with the amplitude of 65 MPa in the front and a rar-efaction phase of maximum amplitude −6 MPa. A stone was positioned ontoa metal foil in the geometrical focus of the lithotriptor.
Typical shock wave profiles with the rarefaction phases (Fig. 6.41) andtheir interaction with microbubbles of micron sizes are presented in [62, 63].Prat [64] concluded that a shock-induced cavitation has a potential for selec-tive and noninvasive destruction of deep stomach tumors. For this purpose,an outgoing pulse is a sequence of rarefaction and compression phases.
Experimental investigation of the “pressure–density” diagram in humantissues and tissue-simulating gelatin and the numerical simulation aimed atpredicting the level of high pressure generated in tissues and its effect on thetissues were reported in [65]. In particular, the paper described hysteresiseffects found under blood examination when the density of the medium didnot come back to the initial values after removal of the load. It should be notedthat a similar effect for distilled water was first described in [42]. Its natureappeared to be determined by the two-phase state of the medium containingmicroinhomogeneities that played the role of cavitation nuclei and changedtheir structure under the effect of the wave field. Probably such a mechanism
Fig. 6.41. Profiles of shock waves produced by different types of lithotriptors

286 6 Problems of Cavitative Destruction
determines the nature of hysteresis found in blood [65]. On the other hand,some researchers, for example, [66], doubt the key role of cavitation in thedisintegration of kidney stones.
Sato et al. [67] proposed using soft-flash radiography to visualize shock-induced cavitation zones in living tissues. Earlier, the method of flash X-rayswas used for the same purposes in studying the dynamics of irreversible cavi-tation processes in distilled water with high-density gas–vapor phase [35, 68].
Isuzugawa et al. [69] studied experimentally different types of reflectorsin order to generate spherical shock waves in water and focus them in certaintypes of oils.
The list of references could be continued, but the explanations of thereasons for disintegration would remain the same as mentioned above: cumu-lative jets arising under collapse of cavitation bubbles and/or shear stressesproduced by ultrashort strong shock waves inside the target and resulting indevelopment of microcracks in it.
On the basis of the above statements and known experimental facts, weshall analyze other possible mechanisms of target disintegration.
6.4.3 Hydrodynamic Model of the Disintegrationin the Cavitation Zone
Figure 6.40 shows that focusing of the shock wave with the rarefaction phaseresults in total locking of the target by a dense bubble layer already at theinitial stage of evolution of the cavitation cluster. Future behavior of thecluster and the effect of its dynamics on the target cannot be analyzed andpredicted directly.
However, some principal points of the probable effect of the cluster onthe target can be simulated by the example of the development of cavita-tion effects on the bottom of a vertical tube containing liquid and driven bya downward acceleration from an impact [28]. Obviously, in this case, due toinertial properties the liquid will tend to budge, while the motion of the tubebottom will simulate a piston removed from the liquid: a rarefaction wave willpropagate in the liquid. Upon sufficiently strong impact (and accordingly ata certain critical amplitude of the rarefaction wave) the bottom can separatefrom the liquid. This effect can be considered as an unbound development ofthe cavitation cluster near the tube bottom up to the formation of a foam-likestructure or practically continuous gas–vapor layer. Thus, we return to theinversion of the two-phase state of the liquid. However, now we are interestedin other consequences of the effect.
Figure 6.42 demonstrates the same sequence of the events near the bottomof the tube that received the acceleration a∗ of the type of a symmetrical half-wave with an amplitude of about 2 · 104 m/s2 and the pulse width of about300 µs. Acceleration and pressure gauges were built in the tube bottom.Their oscillograms are presented in Figs. 6.43 and 6.44, respectively. Theexperiments were run by the author at the Danish Technical University within
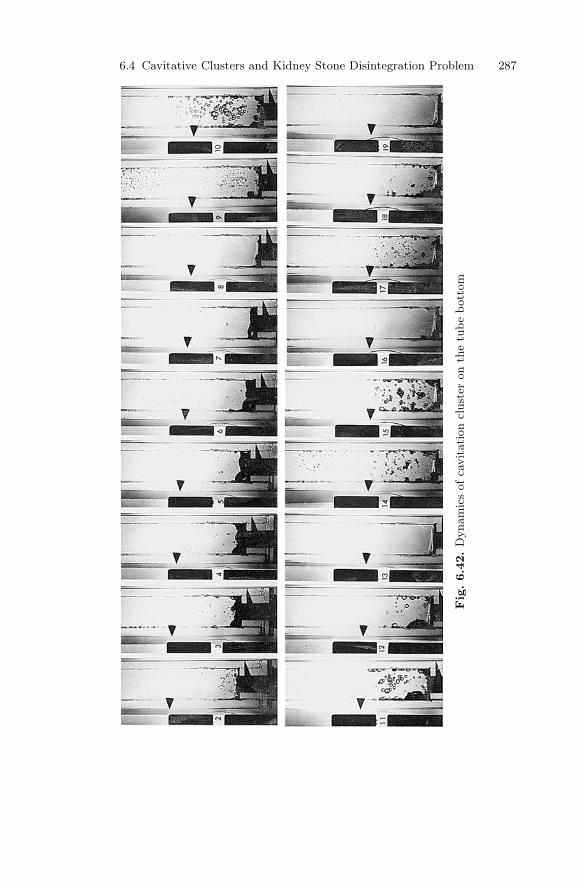
6.4 Cavitative Clusters and Kidney Stone Disintegration Problem 287
Fig
.6.4
2.
Dynam
ics
ofca
vitation
clust
eron
the
tube
bott
om
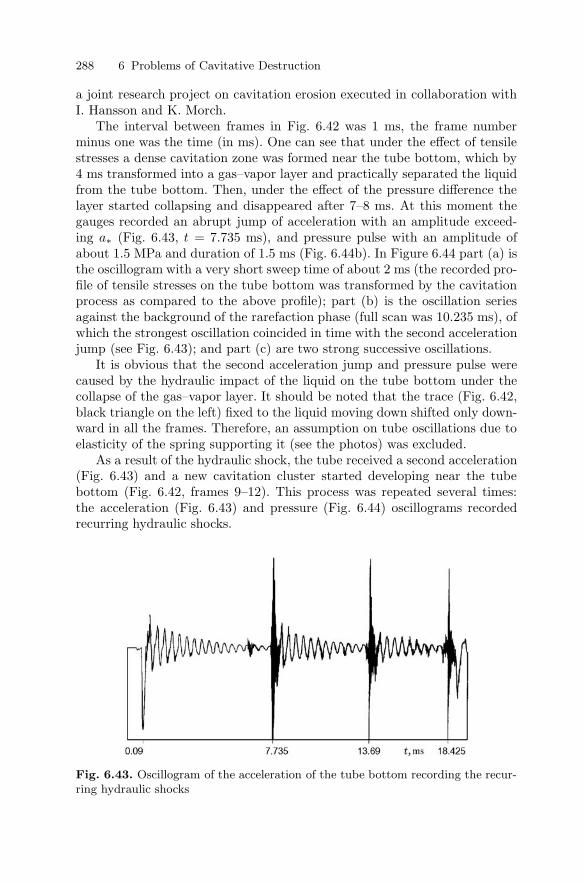
288 6 Problems of Cavitative Destruction
a joint research project on cavitation erosion executed in collaboration withI. Hansson and K. Morch.
The interval between frames in Fig. 6.42 was 1 ms, the frame numberminus one was the time (in ms). One can see that under the effect of tensilestresses a dense cavitation zone was formed near the tube bottom, which by4 ms transformed into a gas–vapor layer and practically separated the liquidfrom the tube bottom. Then, under the effect of the pressure difference thelayer started collapsing and disappeared after 7–8 ms. At this moment thegauges recorded an abrupt jump of acceleration with an amplitude exceed-ing a∗ (Fig. 6.43, t = 7.735 ms), and pressure pulse with an amplitude ofabout 1.5 MPa and duration of 1.5 ms (Fig. 6.44b). In Figure 6.44 part (a) isthe oscillogram with a very short sweep time of about 2 ms (the recorded pro-file of tensile stresses on the tube bottom was transformed by the cavitationprocess as compared to the above profile); part (b) is the oscillation seriesagainst the background of the rarefaction phase (full scan was 10.235 ms), ofwhich the strongest oscillation coincided in time with the second accelerationjump (see Fig. 6.43); and part (c) are two strong successive oscillations.
It is obvious that the second acceleration jump and pressure pulse werecaused by the hydraulic impact of the liquid on the tube bottom under thecollapse of the gas–vapor layer. It should be noted that the trace (Fig. 6.42,black triangle on the left) fixed to the liquid moving down shifted only down-ward in all the frames. Therefore, an assumption on tube oscillations due toelasticity of the spring supporting it (see the photos) was excluded.
As a result of the hydraulic shock, the tube received a second acceleration(Fig. 6.43) and a new cavitation cluster started developing near the tubebottom (Fig. 6.42, frames 9–12). This process was repeated several times:the acceleration (Fig. 6.43) and pressure (Fig. 6.44) oscillograms recordedrecurring hydraulic shocks.
Fig. 6.43. Oscillogram of the acceleration of the tube bottom recording the recur-ring hydraulic shocks
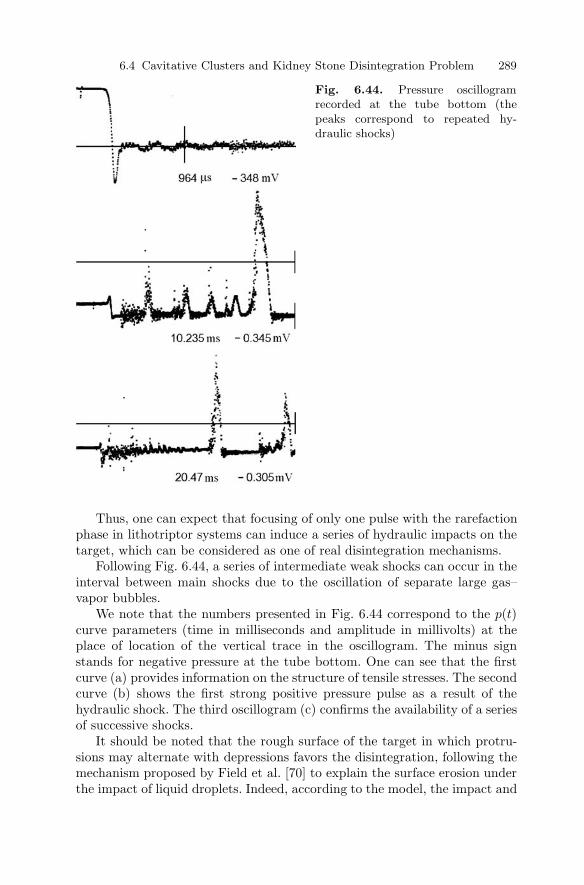
6.4 Cavitative Clusters and Kidney Stone Disintegration Problem 289
Fig. 6.44. Pressure oscillogramrecorded at the tube bottom (thepeaks correspond to repeated hy-draulic shocks)
Thus, one can expect that focusing of only one pulse with the rarefactionphase in lithotriptor systems can induce a series of hydraulic impacts on thetarget, which can be considered as one of real disintegration mechanisms.
Following Fig. 6.44, a series of intermediate weak shocks can occur in theinterval between main shocks due to the oscillation of separate large gas–vapor bubbles.
We note that the numbers presented in Fig. 6.44 correspond to the p(t)curve parameters (time in milliseconds and amplitude in millivolts) at theplace of location of the vertical trace in the oscillogram. The minus signstands for negative pressure at the tube bottom. One can see that the firstcurve (a) provides information on the structure of tensile stresses. The secondcurve (b) shows the first strong positive pressure pulse as a result of thehydraulic shock. The third oscillogram (c) confirms the availability of a seriesof successive shocks.
It should be noted that the rough surface of the target in which protru-sions may alternate with depressions favors the disintegration, following themechanism proposed by Field et al. [70] to explain the surface erosion underthe impact of liquid droplets. Indeed, according to the model, the impact and
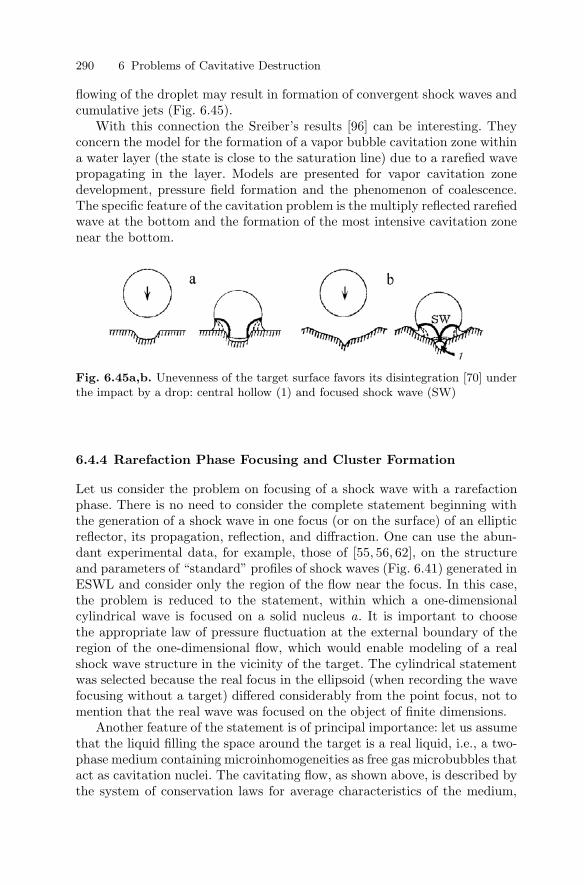
290 6 Problems of Cavitative Destruction
flowing of the droplet may result in formation of convergent shock waves andcumulative jets (Fig. 6.45).
With this connection the Sreiber’s results [96] can be interesting. Theyconcern the model for the formation of a vapor bubble cavitation zone withina water layer (the state is close to the saturation line) due to a rarefied wavepropagating in the layer. Models are presented for vapor cavitation zonedevelopment, pressure field formation and the phenomenon of coalescence.The specific feature of the cavitation problem is the multiply reflected rarefiedwave at the bottom and the formation of the most intensive cavitation zonenear the bottom.
Fig. 6.45a,b. Unevenness of the target surface favors its disintegration [70] underthe impact by a drop: central hollow (1) and focused shock wave (SW)
6.4.4 Rarefaction Phase Focusing and Cluster Formation
Let us consider the problem on focusing of a shock wave with a rarefactionphase. There is no need to consider the complete statement beginning withthe generation of a shock wave in one focus (or on the surface) of an ellipticreflector, its propagation, reflection, and diffraction. One can use the abun-dant experimental data, for example, those of [55, 56, 62], on the structureand parameters of “standard” profiles of shock waves (Fig. 6.41) generated inESWL and consider only the region of the flow near the focus. In this case,the problem is reduced to the statement, within which a one-dimensionalcylindrical wave is focused on a solid nucleus a. It is important to choosethe appropriate law of pressure fluctuation at the external boundary of theregion of the one-dimensional flow, which would enable modeling of a realshock wave structure in the vicinity of the target. The cylindrical statementwas selected because the real focus in the ellipsoid (when recording the wavefocusing without a target) differed considerably from the point focus, not tomention that the real wave was focused on the object of finite dimensions.
Another feature of the statement is of principal importance: let us assumethat the liquid filling the space around the target is a real liquid, i.e., a two-phase medium containing microinhomogeneities as free gas microbubbles thatact as cavitation nuclei. The cavitating flow, as shown above, is described bythe system of conservation laws for average characteristics of the medium,
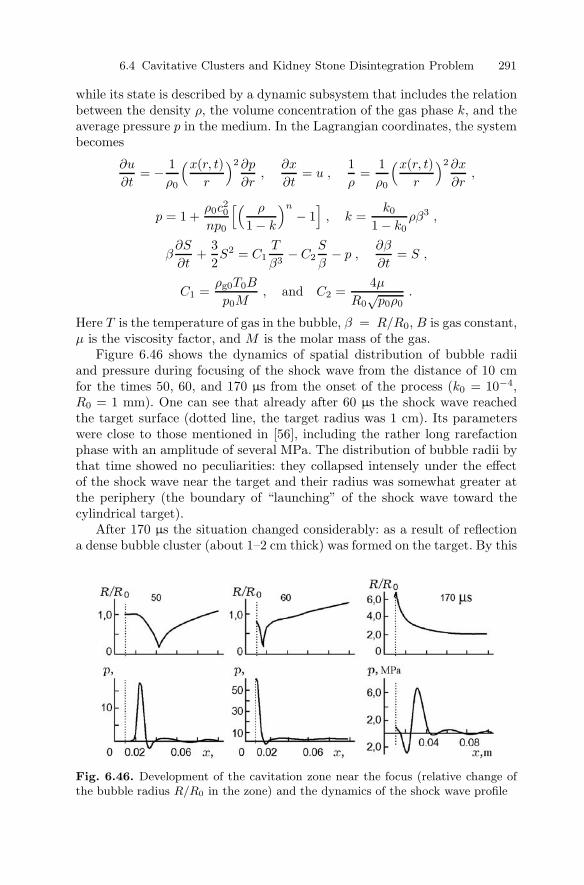
6.4 Cavitative Clusters and Kidney Stone Disintegration Problem 291
while its state is described by a dynamic subsystem that includes the relationbetween the density ρ, the volume concentration of the gas phase k, and theaverage pressure p in the medium. In the Lagrangian coordinates, the systembecomes
∂u
∂t= − 1
ρ0
(x(r, t)r
)2 ∂p
∂r,
∂x
∂t= u ,
1ρ
=1ρ0
(x(r, t)r
)2 ∂x
∂r,
p = 1 +ρ0c
20
np0
[( ρ
1 − k
)n
− 1]
, k =k0
1 − k0ρβ3 ,
β∂S
∂t+
32S2 = C1
T
β3− C2
S
β− p ,
∂β
∂t= S ,
C1 =ρg0T0B
p0M, and C2 =
4µ
R0√
p0ρ0.
Here T is the temperature of gas in the bubble, β = R/R0, B is gas constant,µ is the viscosity factor, and M is the molar mass of the gas.
Figure 6.46 shows the dynamics of spatial distribution of bubble radiiand pressure during focusing of the shock wave from the distance of 10 cmfor the times 50, 60, and 170 µs from the onset of the process (k0 = 10−4,R0 = 1 mm). One can see that already after 60 µs the shock wave reachedthe target surface (dotted line, the target radius was 1 cm). Its parameterswere close to those mentioned in [56], including the rather long rarefactionphase with an amplitude of several MPa. The distribution of bubble radii bythat time showed no peculiarities: they collapsed intensely under the effectof the shock wave near the target and their radius was somewhat greater atthe periphery (the boundary of “launching” of the shock wave toward thecylindrical target).
After 170 µs the situation changed considerably: as a result of reflectiona dense bubble cluster (about 1–2 cm thick) was formed on the target. By this
Fig. 6.46. Development of the cavitation zone near the focus (relative change ofthe bubble radius R/R0 in the zone) and the dynamics of the shock wave profile
292 6 Problems of Cavitative Destruction
time, the volume concentration k in the cluster increases by about a factorof 300 and pressure in the bubbles was almost zero. One could expect thataccording to the above experimental data the pressure difference at the ex-ternal boundary of the bubble cluster and the mean pressure inside it shouldlead to the cluster collapse and the mentioned hydraulic effect.
References
1. D.H. Trevena: Cavitation and Tension in Liquids (Hilger, Bristol Philadelphia1987)
2. D.A. Wilson, J.W. Hoyt, J.W. McKune: Measurement of Tensile Strength ofLiquid by Explosion Technique, Nature 253, 5494 (1975)
3. G.A. Carlson, K.W. Henry: Technique for Studying Tension Failure in Appli-cation to Glycerol, J. Appl. Phys. 42, 5 (1973)
4. V.K. Kedrinskii: Surface Effects at Underwater Explosion (Review), Zh. Prikl.Mekh. i Tekh. Fiz. 19, 4, pp. 66–87 (1978)
5. R. Cole: Underwater Explosions (Dover, New York, 1965)6. V.K. Kedrinskii: Nonlinear Problems of Cavitative Disintegration of Liquid at
Explosive Loading, Zh. Prikl. Mekh. i Tekh. Fiz.34, 3, pp. 74–91 (1993)7. F.G. Hammitt, A. Koller, O. Ahmed, J. Pjun, E. Yilmaz: Cavitation threshold
and superheat in various fluids. In: Proc. of Conf. on Cavitation (Mech. Eng.Publ. Ltd, London, 1976), pp. 341–354
8. M. Strasberg: Undissolved air cavities as cavitation nuclei. In: Cavitation inHydrodynamics (National Phys. Lab., London, 1956)
9. A.S. Besov, V.K. Kedrinskii, E. I Pal’chikov: Studying of Initial Stage of Cav-itation Using Diffraction-Optic Method, Pis’ma Zh. Exp. Teor. Fiz. 10, 4, pp.240–244 (1984)
10. K.S. Shifrin: Light Diffusion in Turbid Media (Gostekhizdat, Moscow-Leningrad, 1951)
11. H.C. van de Hulst: Light Scattering by Small Particles (John Wiley, New York,1957)
12. L.D. Volovets, N.A. Zlatin, G.S. Pugachev G.S.: Arising and Development ofMicro-Cracs, Pis’ma Zh. Exp. Teor. Fiz., Arising and Development of Micro-Crack in Plexiglas at Dynamic Tensile (Spell), 4, pp. 1079–1084 (1978)
13. V.K. Kedrinskii: Peculiarities of bubble spectrum behavior in the cavitationzone and its effect on wave field parameters. In: Proc. Conf. Ultrasonics Intern.85 (Gilford, London, 1985), pp. 225–230 (1985)
14. V.K. Kedrinskii: On relaxation of tensile stresses in cavitating liquid. In: Proc.13th Intern. Congress on Acoustics, vol 1 (Dragan Srnic Press, Sabac, 1989)pp. 327–330
15. R.L. Gavrilov: Content of Free Gas in Liquids and Methods of its Measure-ment, In: L.D. Rozenberg (ed.) Physical Base of Ultrasonic Technology (Nauka,Moscow, 1970), pp. 395–426
16. M.G. Sirotyuk: Experimental Studying of Ultrasonic Cavitation, In: L.D. Rozen-berg (ed.) Strong Ultrasonic Fields, part 4 (Nauka, Moscow, 1968) pp. 75–81
17. V.K. Kedrinskii: On multiplication mechanism of cavitation nuclei. In: E. Shaw(ed.) Proc. of 12th Int. Congress on Acoustics (Toronto, 1986), pp.14–18 (1986)
References 293
18. V.K. Kedrinskii, V.V. Kovalev, S.I. Plaksin: On Model of Bubbly Cavitation ina Real Liquid, Zh. Prikl. Mekh. i Tekh. Fiz. 27, 5, pp. 81–85 (1986)
19. V.K. Kedrinskii: Dynamics of Cavitation Zone at Underwater Explosion NearFree Surface, Zh. Prikl. Mekh. i Tekh. Fiz. 16, 5, pp. 68–78 (1975)
20. I. Hansson, V. Kedrinskii, K. Morch: On the Dynamics of Cavity Cluster,J. Phys. D Appl. Phys. 15, pp. 1725–1734 (1982)
21. V.K. Kedrinskii: Perturbation Propagation in Liquid with Gas Bubbles, Zh.Prikl. Mekh. i Tekh. Fiz. 9, 4, pp. 29–34 (1968)
22. V.K. Kedrinskii: Negative Pressure Profile in Cavitation Zone at UnderwaterExplosion Near Free Surface, Acta Astron. 3, 7–8, pp. 623–632 (1976)
23. V.K. Kedrinskii, S. Plaksin: Rarefaction wave structure in a cavitating liquid.In: V.K. Kedrinskii (ed.) Problems of Nonlinear Acoustics: Proc. of IUPAP-IUTAM Symposium on Nonlinear Acoustics, Part 1 (Novosibirsk, 1987), pp.51–55
24. N.N. Chernobaev: Modeling of shock-wave loading of liquid volumes. In:S. Morioka, L. van Wijngaarden (eds.) Proc. IUTAM Symposium on Adia-batic Waves in Liquid–Vapor Systems, (Springer, Berlin Heidelberg New York,1989), pp. 361–370
25. V.K. Kedrinskii: The Experimental Research and Hydrodynamic Models ofa “Sultan”, Arch. Mech. 26, 3, pp. 535–540 (1974)
26. S.V. Stebnovskii: On Mechanism of Pulse Fracture of Liquid Volume, Zh. Prikl.Mekh. i Tekh. Fiz. 20, 2, pp. 126–132 (1989)
27. A. Berngardt, E. Bichenkov, V. Kedrinskii, E. Pal’chikov: Optic and X-ray in-vestigation of water fracture in rarefaction wave at later stages. In: M. Pichal(ed.) Proc. IUTAM Symp. on Optical Methods in the Dynamics of Fluidsand Solids, (Prague, 1984, Springer, Berlin, Heidelberg, New York, 1985),pp. 137–142
28. A.R. Berngardt, V.K. Kedrinskii, E.I. Pal’chikov: Evolution of Internal Struc-ture of Zone of Liquid Fracture at Pulse Loading, Zh. Prikl. Mekh. i Tekh. Fiz.36, 2, pp. 99–105 (1995)
29. Berngardt A.R.: Dynamics of the cavitation zone under impulsive loading ofa Liquid. PhD Thesis, Novosibirsk (1995)
30. A.S. Besov, V.K. Kedrinskii, E.I. Pal’chikov: On threshold cavitation effectsin pulse rarefaction waves. In: P. Pravica (ed.) Proc. of 13th Int. Congress onAcoustics vol. 1 (Dragan Srnic Press, Sabac, 1989), pp. 355–358
31. I.G. Getz, V.K. Kedrinskii: Dynamics of Explosive Loading of Two-Phase Vol-ume, Zh. Prikl. Mekh. i Tekh. Fiz.30, 2, pp. 120–125 (1989)
32. A.V. Anilkumar: Experimental studies of high-speed dense dusty gases: Thesis,Pasadena (1989)
33. V.K. Kedrinskii, A.S. Besov, I.E. Gutnik: Inversion of Two-Phase State ofLiquid at Pulse Loading, Dokl. RAN 352, 4, pp. 477–479 (1997)
34. M.N. Davydov: Development of Cavitation in a Drop at Shock-Wave Load-ing, Dynamics of Continue Medium (Lavrentyev Institute of Hydrodynamics,Novosibirsk, 2001) 117, pp. 17–20
35. M.N. Davydov, V.K. Kedrinskii: Two-Phase Models of Cavitative Spell Forma-tion in Liquid, J. Appl. Mech. Techn. Phys. 44, 5 (2003) pp. 72–79
36. A.S. Besov, V.K. Kedrinskii, E.I. Palchikov: On Threshold Effects in PulseRarefaction Wave, Pis’ma Zh. Exp. Teor. Fiz. 15, 16, pp. 23–27 (1989)
37. M. Cornfeld: Elasticity and Strength of Liquids (Inostrannaya Literatura,Moscow, 1951), p. 46
294 6 Problems of Cavitative Destruction
38. L.Y. Briggs: Appl. Phys., 26 (1955); 21 (1950)39. R. Knepp, J. Daily, F. Hammit: Cavitation (Mir, Moscow, 1974)40. A.D. Pernik: Cavitation Problems (Sudostroenie, Leningrad, 1966)41. A. Besov, V. Kedrinskii: Dynamics of bubbly clusters and free surface at shock
wave reflection. In: J. Blake, J. Boulton-Stone, N. Thomas (eds.) Proc. Intern.Symp. on Bubble Dynamics and Interface Phenomena (Birmingham, 6–9 Sept.1993, Kluwer Academic Publisher, 1994), pp. 93–103
42. N.F. Morozov, Yu.V. Petrov, A.A. Utkin: Dokl. Akad. Nauk 313, 2 (1990)43. N.F. Morozov, Yu.V. Petrov: Problems of Dynamics of Failure of Solids (St. Pe-
tersburg University Publishers, St. Petersburg, 1997) p. 13244. A.A. Gruzdkov, Yu.V. Petrov: Dokl. Akad. Nauk 364, 6 (1999)45. A.S. Besov, V.K. Kedrinskii, N.F. Morozov, Yu.V. Petrov, A.A. Utkin: On
Analogy of Initial Stage of Fracture of Solids and Liquids at Pulse Loading,Dokl. Akad. Nauk 378, 3, pp. 333–335 (2001)
46. E.N. Harvey, A.H. Whiteley, W.D. McElroy et al.: Bubble Formation in An-imals. II. Gas Nuclei and Their Distribution in Blood and Tissues, J. Cell.Compar. Physiol. 24, 1 (1944)
47. A.S. Besov, V.K. Kedrinskii, Y. Matsumoto et al.: Microinhomogeneity struc-tures and hysteresis effects in cavitating liquids. In: Proc. 14th Int. Congresson Acoustics (Beijing, 1992), pp. 1–3
48. T. Okada, Y. Iwai, A. Yamamoto: A Study of Cavitation Erosion of Cast Iron,J. Wear, 84 (1983)
49. T. Okada, Y. Iwai, Y. Hosokawa: Comparison of Surface Damage Caused bySliding Wear and Cavitation Erosion on Mechanical Face Seal, J. Tribology, 42(1984)
50. Y. Tomita, A. Shima, K. Takayama: Formation and limitation of damage pitscaused by bubble-shock wave interaction. In: K. Takayama (ed.) Proc. NationalSymp. Shock Wave Phenomena, (Tohoku 1989)
51. N. Sanada, A. Asano, J. Ikeuchi et al.: Interaction of a gas bubble with anunderwater shock wave, pit formation on the metal surface. In: Proc. 16th Int.Symp. Shock Tubes and Waves (VCH Publ., Weinheim, 1988)
52. V. Makarov, A.A. Kortnev, S.G. Suprun, G.I. Okolelov: Cavitation erosion andspectrum analysis of pressure pulse heights produced by cavitation bubbles. In:Proc. 6th Int. Symp. Nonlinear Acoustics, vol. 2 (Moscow State Univ., Moscow,1976)
53. S. Fujikawa, T. Akamatsu: Experimental Investigations of Cavitation BubbleCollapse by a Water Shock Tube, Bull. ASME 21, 152 (1978)
54. R. Ivany, F. Hammitt: Cavitation Bubble Collapse in Viscous CompressibleLiquids Numerical Analysis, Trans. ASME. Ser. D. 4 (1965)
55. V.K. Kedrinskii, V.A. Stepanov: Cavitation effects in thin films In: M. Hamil-ton, D. Blackstock (eds.) Proc. 12th ISNA, Frontiers of Nonlinear Acoustics(Elsevier Applied Sci., London New York, 1990), pp. 470–475 (1990)
56. V.P. Alekseevskii: On the Theory of Armor Perforation by Cumulative Jets(UkrSSR Academy of Sciences Publishers, Kiev, 1953)
57. M.A. Lavrentiev: Cumulative Charge and Principle of its Action, Uspekhi Mat.Nauk 12, 4, pp. 41–52 (1957)
58. K.A. Kurbatskii, V.K. Kedrinskii: Collapse of a bubble in the cavitation zonenear a rigid boundary. In: Abstr. 124th Meeting of ASA (New Orleans, 1992)
59. H. Takahira, T. Akamatsu, S. Fujikawa: JSME Intern J, Series B-Fluids andTherm. Eng. 37: 2 (1994) pp. 297–305
References 295
60. H. Takahira: JSME Intern J, Series B-Fluids and Therm. Eng. 40: 2 (1997)pp. 230–239
61. H. Takahira, S. Yamane, T. Akamatsu: JSME Intern J, Series B-Fluids andTherm. Eng. 38: 3 (1995) pp. 432–439
62. S. Ceccio, S. Gowing, Y.T. Shen: Journal of Fluids Engineering-Transactionsof the ASME 119, 1 (1997) pp. 155–163
63. M. Thiel, M. Nieswand, M. Dorffel: Minimally Invasive Therapy and AlliedTechnologies 9, 3–4 (2000) pp. 247–253
64. M. Thiel: Clinical Orthopaedics and Related Research 387, (2001) pp. 18–2165. D.L. Sokolov, M.R. Bailey, L.A. Crum: Ultrasound in Medicine and Biology,
29, 7 (2003) pp. 1045–105266. S.L. Zhu SL, F.H. Cocks, G.M. Preminger, P. Zhong: Ultrasound in Medicine
and Biology, 28, 5 (2002) pp. 661–67167. V.K. Kedrinskii: On a mechanism of target disintegration at shock wave focus-
ing in ESWL.: In: P.K. Kuhl, L. Crum (eds.) Proc.16th Intern. Congress onAcoustics, Seattle, USA, vol. 4 (University of Washington, Washington, 1998)pp. 2803–2804
68. W. Eisenmenger: Ultrasound in Medicine and Biology 27, 5 (2001) pp. 683–69369. R.O. Cleveland, D.A. Lifshitz, B.A. Connors et al.: Ultrasound in Medicine and
Biology 24, 2 (1998) pp. 293–30670. T. Kodama, H. Uenohara, K. Takayama: Ultrasound in Medicine and Biology
24, 9 (1998) pp. 1459–146671. T. Kodama, M. Tatsuno, S. Sugimoto et al.: Ultrasound in Medicine and Biol-
ogy, 25, 6 (1999) pp. 977–98372. T. Kodama, K. Takayama: Ultrasound in Medicine and Biology 24, 5 (1998)
pp. 723–73873. M. Delius, F. Ueberle, W. Eisenmenger: Ultrasound in Medicine and Biology
24, 7 (1998) pp. 1055–105974. C.M. Zapanta, E.G. Liszka, T.C. Lamson et al.: J. Biomech. Engin.-Trans.
Asme 116, 4 (1994) pp. 460–46875. J.C. Williams, M.A. Stonehill, K. Colmenares et al.: Ultrasound in Medicine
and Biology 25, 3 (1999) pp. 473–47976. D. Howard, B. Sturtevant: Ultrasound in Medicine and Biology 23, 7 (1997)
pp. 1107–112277. M. Delius: Zentralblatt fur Chirurgie, 120, 4 (1995) pp. 259–27378. K. Takayama: Japan. J. Appl. Phys., Part 1, Regular Papers Short Notes and
Review Papers, 32, 5B (1993) pp. 2192–219879. D.L. Miller, J.M. Song: Ultrasound in Medicine and Biology, 28, 10 (2002)
pp. 1343–134880. H. Gronig: Past, present and future of shock focusing research. In: Proc. Intern.
Workshop on Shock Wave Focusing (Sendai, 1989) pp. 1–3881. B. Sturtevant: The physics of shock focusing in the context of ESWL. In: Proc.
Intern. Workshop on Shock Wave Focusing (Sendai, 1989) pp. 39–6482. M. Kuwahara: Extracorporeal shock wave lithotripsy. In: Proc. Intern. Work-
shop on Shock Wave Focusing (Sendai, 1989) pp. 65–8983. O. Kitayama, H. Ise, T. Sato, K. Takayama: Non-invasive gallstone disinte-
gration by underwater shock focusing. In: H. Gronig (ed.) Proc. 16th Intern.Symp. on Shock Tubes and Waves (VCH, Aachen, 1987) pp. 897–904
296 6 Problems of Cavitative Destruction
84. M. Grunevald, H. Koch, H. Hermeking: Modeling of shock wave propagationand tissue interaction during ESWL. In: H. Gronig (ed.) Proc. 16th Intern.Symp. on Shock Tubes and Waves (VCH, Aachen, 1987) pp. 889–895
85. M. Delius: Effect of lithotriptor shock waves on tissues and materials. In:M. Hamilton, D. Blackstock (eds.) Proc. 12th ISNA, Frontiers of NonlinearAcoustics, (ESP Ltd, London, 1990) pp. 31–46
86. V.K. Kedrinskii, R.I. Soloukhin: Collapse of a Spherical Gas Bubble in Waterby a Shock Wave, J. Applied Mechanics and Technical Physics 2, 1, pp. 27–29(1961)
87. C. Church, L. Crum: A theoretical study of cavitation generated by four com-mercially available ESWL. In: M. Hamilton, D. Blackstock (eds.) Proc. 12thISNA, Frontiers of Nonlinear Acoustics, (ESP Ltd, London, 1990) pp. 433–438
88. C. Church: A Theoretical Study of Cavitation Generated by an ExtracorporealShock Wave Lithotripter, J. Acoust. Soc. Am. 86, 1, pp. 215–227 (1989)
89. F. Prat: The cytotoxicity of shock waves: cavitation and its potential applica-tion to the extra-corporeal therapy of digestive tumors. In: Brun, Dumitrescu(eds.) Proc. 19th Int. Symp. on Shock Waves, (Marseille, 1993)
90. H. Nagoya, T. Obara, K. Takayama: Underwater shock wave propagation andfocusing in inhomogeneous media. In: Brun, Dumitrescu (eds.) Proc. 19th Int.Symp. on Shock Waves, vol. 3 (Marseille, 1993) pp. 439–444
91. C. Stuka, P. Sunka, J. Benes: Nonlinear transmission of the focused shock wavesin nondegassed water. In: Brun, Dumitrescu (eds.) Proc. 19th Int. Symp. onShock Waves, vol. 3 (Marseille, 1993) pp. 445–448
92. E. Sato et al.: Soft flash X-ray system for shock wave research. In: Brun, Du-mitrescu (eds.) Proc. 19th Int. Symp. on Shock Waves, vol. 3 (Marseille, 1993)pp. 449–454
93. I. Bayikov, A. Berngardt, V. Kedrinskii, E. Pal’chikov: Experimental Methodsof Study of Cavitative Cluster Dynamics, Zh. Prikl. Mekh. i Tekh. Fiz. 25, 5,pp. 30–34 (1984)
94. K. Isuzugawa, M. Fujii, Y. Matsubara et al.: Shock focusing across a layerbetween two kinds of liquid. In: Brun, Dumitrescu (eds.) Proc. 19th Int. Symp.on Shock Waves (Marseille, 1993)
95. J.E. Field, M.B. Lesser, J.P. Dear: Proc. Roy. Soc. London A, 401 (1985)96. I.R. Shreiber: Acustica 83, 6 (1997) pp. 987–991
7 Jet Flows at Shallow Underwater Explosions
7.1 State-of-the-Art
Apparently the problems of liquid flows produced by shallow underwaterexplosions were first considered in a relatively full scope by Cole [1]. Theresearch results obtained in this field over the next quarter of the century weresurveyed in [2–4]. It has been shown that the changes in the medium structureobserved near the free surface and the formation of directional high-velocityflows are associated with the reflection of shock waves and the dynamicsof a cavity with detonation products. The directional throwing out on thefree surface at shallow underwater explosions is called “sultan” in Russianpublications [3,4]. Sometimes sultans are refered to as “splashes” in English.Sultans are defined as a throwing out of water (vertical water column).
In the 1960s, two models were proposed to explain the formation mecha-nism of sultans. According to the first physical model formulated by M.A. Lav-rentyev in [5], a spherical shock wave reflecting from the free surface initiatesthe development of intense bubble cavitation, which separates a part of theliquid beneath the charge. As a result, a cumulative semi-spherical pit isformed on the free surface, while the cavity with detonation products con-fining about a half of the energy of detonated HE produces a velocity fieldorthogonal to the pit surface. In the result the flow similar to spherical cu-mulation must be arisen. Thus, following Lavrentyev’s model, only the jointeffect of the shock wave and the cavity with detonation products can inducethe formation of a sultan.
Another model was proposed by L.V. Ovsyannikov [6] based on analysisof the problem of a floating bubble in an exact mathematical statement. Onthe basis of approximate representation of the analytical solution (for initialmoments of time), he offered a hypothesis suggesting that given the properdepth and charge weight, an upward cumulative jet is formed in the bot-tom part of the explosive cavity during its floating and deformation. The jetshaped by the moment of arrival of the cavity at the free surface “perforates”the explosive cavity and governs the sultan flow.
It should be noted that the term “sultan” (throwing out or fountain) isoften used to denote different aspects of the phenomenon. In [5, 6], it wasused to denote a cumulative jet, i.e., a continuous jet that is often observedabove the separated dome under the explosion of light charges at certaindepths. Kolsky et al. [7] called it “central spout” and note that it appears
298 7 Jet Flows at Shallow Underwater Explosions
long before the moment when the cavity with detonation products reaches itsmaximum size. In [8,9], the term was used to denote a hollow liquid column atthe grounds of the cloud of detonation products and water splashes thrownout to the atmosphere. In [10], the phenomenon on the whole was calledsultan: a jet beneath the dome with the hollow liquid column at the grounds(experiments were performed for the charge weights W = 0.075–136 kg).There was some uncertainty in understanding of the nature of the verticaljet by the authors of [10]: on the one hand they used the term for a narrowjet of detonation products burst into the atmosphere, then while studyingthe jet height they determined the amount of liquid in the jet as 150 W ,which was practically unfeasible due to the splashes surrounding the gas jetonly.
In terms of the above considerations on the formation of the directionalthrowing out on the free surface it is logical to start the prehistory of thestudies from cavitation problems.
7.1.1 Irregular Reflection and Bubbly Cavitation
The generation of cavitation and the features of the structure of the wavefield near the free surface were considered in [2, 11–16]. In [11], the shockwave parameters were studied experimentally and the development of thecavitation zone was analyzed for 1-g and 100-kg charges exploded at depths(1–8) ·Rch. Measurements were performed for the depths (1–16) ·Rch for thedistances to the explosion site up to 120 ·Rch (Rch is the charge radius). Thezone of nonlinear interaction of the shock wave produced by the underwa-ter explosion with the free surface was determined in [12–14]. It was foundthat the zone is bounded from above by the trajectory of the triple point,where the front of the relaxed shock wave, the unperturbed front of the in-cident shock wave, and the rarefaction wave converged. The “smooth” fallof pressure behind the front of the disturbed wave characteristic of the non-linear zone suggested that no visible cavitation ruptures occurred in thiszone [11].
Thus, the “triple point” trajectory can be considered as a theoreticallypossible upper boundary of the cavitation zone, which, as we show below, isconsistent with experimental data. Therefore, the development of the visiblecavitation zone should be observed in the region of regular reflection, forwhich, according to [2, 12], the acoustic method for determining pressure isvalid (the method applies the principle of superposition of the pressure fieldproduced by the explosion of a virtual charge). As a rule, the studies basedon the acoustic method are reduced either to the calculation of the zone ofnegative pressures [15], which at best yields only the initial condition for thedevelopment of cavitation, or to the estimates of the size and number of spallzones [2, 16] using the results for strength properties of the liquid [17]. It isnoteworthy that the calculations of the zone of tensile stresses made in [15]for the depths of 1–12 m and charge weights of 50, 100, and 5000 g prove that
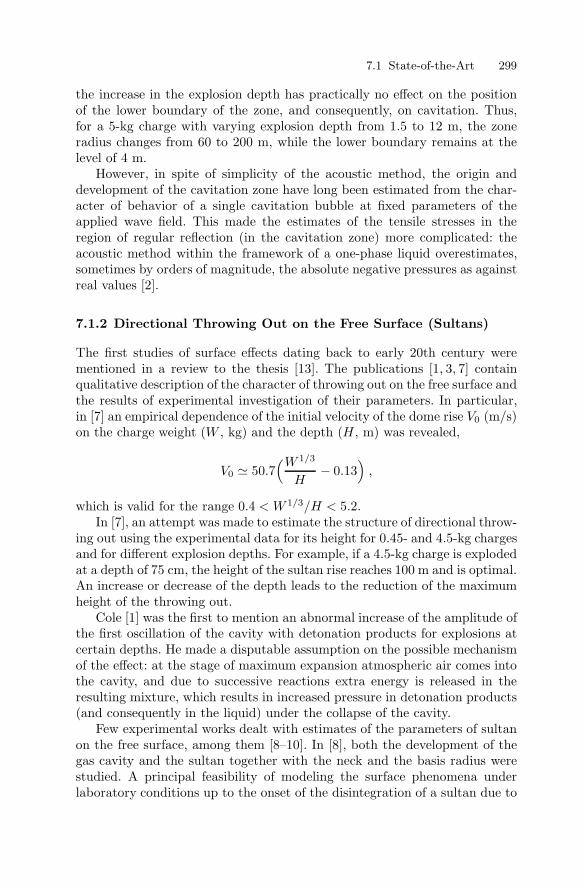
7.1 State-of-the-Art 299
the increase in the explosion depth has practically no effect on the positionof the lower boundary of the zone, and consequently, on cavitation. Thus,for a 5-kg charge with varying explosion depth from 1.5 to 12 m, the zoneradius changes from 60 to 200 m, while the lower boundary remains at thelevel of 4 m.
However, in spite of simplicity of the acoustic method, the origin anddevelopment of the cavitation zone have long been estimated from the char-acter of behavior of a single cavitation bubble at fixed parameters of theapplied wave field. This made the estimates of the tensile stresses in theregion of regular reflection (in the cavitation zone) more complicated: theacoustic method within the framework of a one-phase liquid overestimates,sometimes by orders of magnitude, the absolute negative pressures as againstreal values [2].
7.1.2 Directional Throwing Out on the Free Surface (Sultans)
The first studies of surface effects dating back to early 20th century werementioned in a review to the thesis [13]. The publications [1, 3, 7] containqualitative description of the character of throwing out on the free surface andthe results of experimental investigation of their parameters. In particular,in [7] an empirical dependence of the initial velocity of the dome rise V0 (m/s)on the charge weight (W , kg) and the depth (H , m) was revealed,
V0 50.7(W 1/3
H− 0.13
),
which is valid for the range 0.4 < W 1/3/H < 5.2.In [7], an attempt was made to estimate the structure of directional throw-
ing out using the experimental data for its height for 0.45- and 4.5-kg chargesand for different explosion depths. For example, if a 4.5-kg charge is explodedat a depth of 75 cm, the height of the sultan rise reaches 100 m and is optimal.An increase or decrease of the depth leads to the reduction of the maximumheight of the throwing out.
Cole [1] was the first to mention an abnormal increase of the amplitude ofthe first oscillation of the cavity with detonation products for explosions atcertain depths. He made a disputable assumption on the possible mechanismof the effect: at the stage of maximum expansion atmospheric air comes intothe cavity, and due to successive reactions extra energy is released in theresulting mixture, which results in increased pressure in detonation products(and consequently in the liquid) under the collapse of the cavity.
Few experimental works dealt with estimates of the parameters of sultanon the free surface, among them [8–10]. In [8], both the development of thegas cavity and the sultan together with the neck and the basis radius werestudied. A principal feasibility of modeling the surface phenomena underlaboratory conditions up to the onset of the disintegration of a sultan due to
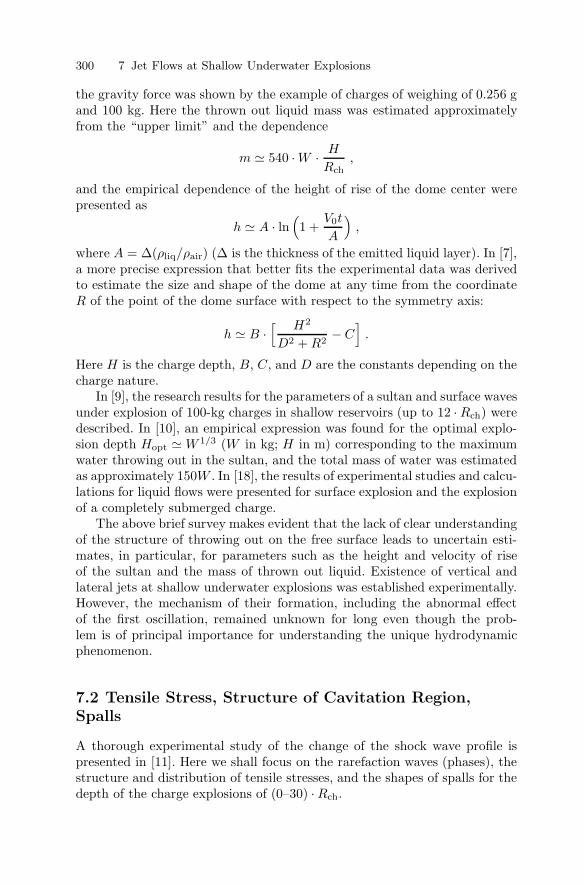
300 7 Jet Flows at Shallow Underwater Explosions
the gravity force was shown by the example of charges of weighing of 0.256 gand 100 kg. Here the thrown out liquid mass was estimated approximatelyfrom the “upper limit” and the dependence
m 540 · W · H
Rch,
and the empirical dependence of the height of rise of the dome center werepresented as
h A · ln(1 +
V0t
A
),
where A = ∆(ρliq/ρair) (∆ is the thickness of the emitted liquid layer). In [7],a more precise expression that better fits the experimental data was derivedto estimate the size and shape of the dome at any time from the coordinateR of the point of the dome surface with respect to the symmetry axis:
h B ·[ H2
D2 + R2− C
].
Here H is the charge depth, B, C, and D are the constants depending on thecharge nature.
In [9], the research results for the parameters of a sultan and surface wavesunder explosion of 100-kg charges in shallow reservoirs (up to 12 · Rch) weredescribed. In [10], an empirical expression was found for the optimal explo-sion depth Hopt W 1/3 (W in kg; H in m) corresponding to the maximumwater throwing out in the sultan, and the total mass of water was estimatedas approximately 150W . In [18], the results of experimental studies and calcu-lations for liquid flows were presented for surface explosion and the explosionof a completely submerged charge.
The above brief survey makes evident that the lack of clear understandingof the structure of throwing out on the free surface leads to uncertain esti-mates, in particular, for parameters such as the height and velocity of riseof the sultan and the mass of thrown out liquid. Existence of vertical andlateral jets at shallow underwater explosions was established experimentally.However, the mechanism of their formation, including the abnormal effectof the first oscillation, remained unknown for long even though the prob-lem is of principal importance for understanding the unique hydrodynamicphenomenon.
7.2 Tensile Stress, Structure of Cavitation Region,Spalls
A thorough experimental study of the change of the shock wave profile ispresented in [11]. Here we shall focus on the rarefaction waves (phases), thestructure and distribution of tensile stresses, and the shapes of spalls for thedepth of the charge explosions of (0–30) · Rch.
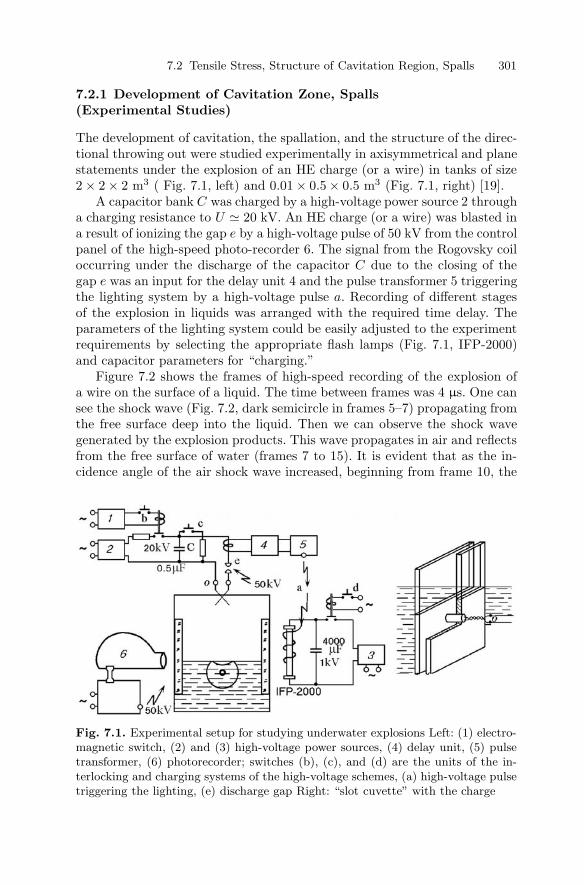
7.2 Tensile Stress, Structure of Cavitation Region, Spalls 301
7.2.1 Development of Cavitation Zone, Spalls(Experimental Studies)
The development of cavitation, the spallation, and the structure of the direc-tional throwing out were studied experimentally in axisymmetrical and planestatements under the explosion of an HE charge (or a wire) in tanks of size2 × 2 × 2 m3 ( Fig. 7.1, left) and 0.01 × 0.5 × 0.5 m3 (Fig. 7.1, right) [19].
A capacitor bank C was charged by a high-voltage power source 2 througha charging resistance to U 20 kV. An HE charge (or a wire) was blasted ina result of ionizing the gap e by a high-voltage pulse of 50 kV from the controlpanel of the high-speed photo-recorder 6. The signal from the Rogovsky coiloccurring under the discharge of the capacitor C due to the closing of thegap e was an input for the delay unit 4 and the pulse transformer 5 triggeringthe lighting system by a high-voltage pulse a. Recording of different stagesof the explosion in liquids was arranged with the required time delay. Theparameters of the lighting system could be easily adjusted to the experimentrequirements by selecting the appropriate flash lamps (Fig. 7.1, IFP-2000)and capacitor parameters for “charging.”
Figure 7.2 shows the frames of high-speed recording of the explosion ofa wire on the surface of a liquid. The time between frames was 4 µs. One cansee the shock wave (Fig. 7.2, dark semicircle in frames 5–7) propagating fromthe free surface deep into the liquid. Then we can observe the shock wavegenerated by the explosion products. This wave propagates in air and reflectsfrom the free surface of water (frames 7 to 15). It is evident that as the in-cidence angle of the air shock wave increased, beginning from frame 10, the
Fig. 7.1. Experimental setup for studying underwater explosions Left: (1) electro-magnetic switch, (2) and (3) high-voltage power sources, (4) delay unit, (5) pulsetransformer, (6) photorecorder; switches (b), (c), and (d) are the units of the in-terlocking and charging systems of the high-voltage schemes, (a) high-voltage pulsetriggering the lighting, (e) discharge gap Right: “slot cuvette” with the charge
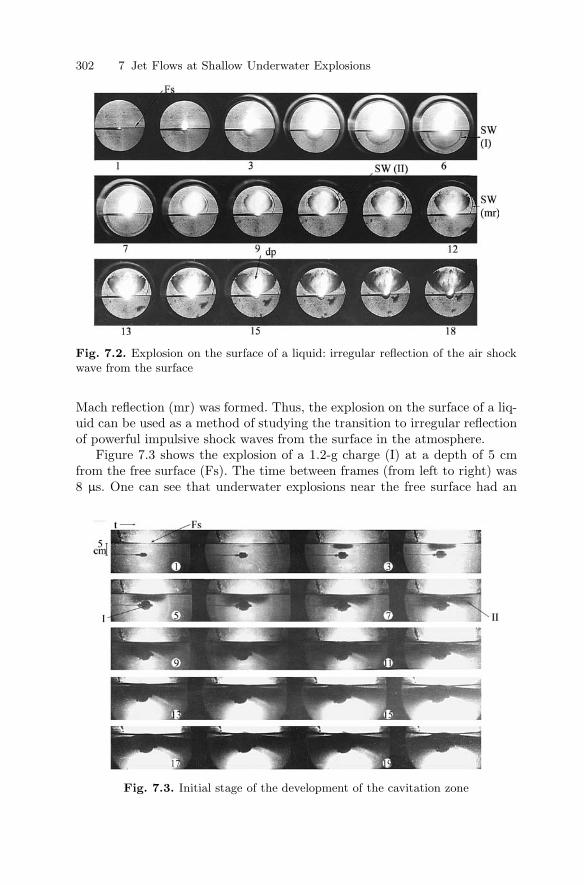
302 7 Jet Flows at Shallow Underwater Explosions
Fig. 7.2. Explosion on the surface of a liquid: irregular reflection of the air shockwave from the surface
Mach reflection (mr) was formed. Thus, the explosion on the surface of a liq-uid can be used as a method of studying the transition to irregular reflectionof powerful impulsive shock waves from the surface in the atmosphere.
Figure 7.3 shows the explosion of a 1.2-g charge (I) at a depth of 5 cmfrom the free surface (Fs). The time between frames (from left to right) was8 µs. One can see that underwater explosions near the free surface had an
Fig. 7.3. Initial stage of the development of the cavitation zone

7.2 Tensile Stress, Structure of Cavitation Region, Spalls 303
elongated cavitation zone (II) with dropped ends, the upper boundary ofthe zone moved away from the free surface, separating the zones of regularand irregular reflection. Later the cavitation will occupy all visible region: itslower boundary propagated inside the liquid.
The experimental data suggest that cavitative bubbles appeared behindthe rarefaction wave in the zone of visible cavitation almost instantaneously.The rarefaction wave weakened in the course of propagation and a transparentzone arose behind the front. However, this does not mean that there was nocavitation: it is quite probable that cavitation bubbles in the zone failed toreach visible size. Nevertheless, the effect of such “invisible” cavitation onthe parameters and the structure of the field of tensile stresses could still beappreciable.
7.2.2 Two-Phase Model of Cavitation Region
As was noted in the previous chapter, a real liquid always contains free gas ascavitation bubbles [20,21], and, following the contemporary concepts [22], theradii of cavitation nuclei vary over the interval 5 ·10−7–5 ·10−3 cm dependingon the state of the liquid, while the volume concentration of the gas is within10−8–10−12 cm−3. The gas content parameters are very low. However, thegrowth of the nuclei in the rarefaction wave results in the appearance ofthe cavitation zone with high concentration of the gas–vapor phase, and thechange of both the state of the medium and the structure of the wave field.Therefore, it is natural to believe that, as was mentioned above, a real liquidcontaining microinhomogeneities is a two-phase medium [23].
Let us consider the two-phase model of the development of the cavita-tion zone at underwater explosion [23] when a shock wave reflects from thefree surface, obeying the principle of superposition of the pressure field pro-duced by the explosion of a virtual charge. In this case, the liquid compo-nent of the two-phase liquid can be deemed incompressible, considering thatthe compressibility of the two-phase medium is primarily determined by thecompressibility of the free gas in it, and the nonlinearity of the process de-pends on the dynamics of cavitation nuclei. The main problem is definingan approximate analytical dependence of the mean pressure on the volumeconcentration p(k) of gas in the medium. As we noted, the first attempts toelaborate a mathematical model of a liquid with gas bubbles, whose dynam-ics is described by the Rayleigh equation, were made in [24–26]. The modelwas adapted to the problems of bubble cavitation in [23].
7.2.2.1 Definition of the Function p(k)
Let us consider the system of equations describing an axisymmetrical two-phase flow
∆ξ ξ ,∂2k
∂τ2= −3k1/3ξ +
16k
(∂k
∂τ
)2
, (7.1)

304 7 Jet Flows at Shallow Underwater Explosions
where k = (R/R0)3 is the relative volume concentration of the gas, τ =t√
p0/ρ0R20, ξ = p− k−γ, p is the pressure in the medium taken with respect
to the initial unperturbed p0, and γ is the adiabatic index of the gas inthe cavitation nuclei. For simplicity we neglect the nonspherical shape ofthe bubbles, the mass of gas in them and their motion with respect to theliquid. We shall assume that the cavitation nuclei of equal size are uniformlydistributed in the liquid and their number per unit volume is constant.
During transformations we introduce the additional assumptions on thesmall magnitudes of terms of the krr/kγ+1 type with respect to prr andthe terms of the rkr type as compared to 6k (the subscript denotes the ap-propriate derivative with respect to r). The first assumption is obvious: themultiplier 1/kγ+1 reduces sharply during the development of cavitation. Thevalidity of the second assumption can be estimated using the growth of a sin-gle nucleus under the effect of negative pressure. This estimate (the degreeinaccuracy is about 20–30%) is allowable for the initial stage of expansionof cavitation nuclei in the zone, when their interaction is not intense, and isapparently an upper estimate for the following stages when the interactionof bubbles with the field of tensile stresses practically levels off their con-centration in the cluster and kr decreases considerably. These conditions forthe introduction of the variable r (see below) make it necessary to use thesign in (7.1) to emphasize a somewhat heuristic character of the equation,in which the spatial coordinate “traces” the change of the microscale of theflow, the size of cavitation bubbles.
We want to remind the readers here that the system (7.1) is distinguishedby the complex form of the equation of state of the medium, which includesthe second-order equation for k (an analog of the Rayleigh equation). In theright-hand part of the equation, the pressure at infinity is presented by theaveraged pressure in the two-phase medium.
In the case of explosion of a spherical charge near the free surface, itis convenient to consider the problem in an axisymmetrical statement. Asspatial variables we introduce θ and r = rαk1/6, where α =
√3k0/R0. Then
for the first equation of the system (7.1) gives us
1r2
∂
∂r
(r2 ∂ξ
∂r
)+
1r2 sin θ
∂
∂θ
(sin θ
∂ξ
∂θ
)= ξ . (7.2)
The equations permits separation of variables and the solution is sought asξ = Ψ(r)Θ(θ). Substituting it in (7.2) and designating the separation constantby ν(ν + 1), we get the equations
ddr
(r2 dΨ
dr
)− [r2 + ν(ν + 1)]Ψ = 0 (7.3)
and1
sin θ
ddθ
(sin θ
dΘ
dθ
)+ ν(ν + 1)Θ = 0 .
7.2 Tensile Stress, Structure of Cavitation Region, Spalls 305
The solution of the second equation can be expressed in terms of the Leg-endre spherical functions Pν(cos θ) and Qν(cos θ). Substitution of the functionΨ = r−1/2v into the first equation of the system (7.3) shows that its solutionfor the function v is the modified Bessel function. Finally, taking into accounta binding solution in the region under consideration that is defined by thevariation intervals 0 ≤ θ ≤ π and r > 0, for ν = n (the integral positivenumber n = 0, 1, 2, . . .), the solution of (7.2) is written as
ξ = r−1/2∞∑
n=0
AnKn+1/2(r)Pn(cos θ) . (7.4)
The obtained expression defines the sought relation p(k) within the aboveassumptions.
7.2.2.2 Statement of the Problem
To simulate the problem on the development of a cavitation region [23, 27],we assume that a liquid containing cavitation nuclei of radius R0 with volumeconcentration of the gas k0 consists of two identical cavities with detonationproducts. The cavities of radius a are placed at points O and O1 at a dis-tance h from each other. Both cavities can expand following the adiabaticlaw and the initial pressure pα is known. Let us assume that the dynamicsof a real explosive cavity a1(t) and its virtual analog a(t), as well as the adi-abatic index of the detonation products γ, are known. We assume that fora cavity placed at the point O (the point of location of the virtual charge)pα < 0, and for that at the point O1 pα,1 > 0, and make a phase displacement(by the multiplier σ0(t − (r − r1)/c0)) of the effect of the virtual source atthe point O with respect to the source at the point O1, simulating the delayof the arrival of the rarefaction wave at this point:
σ0 =
0 , if t < (r − r1)/c0 ,
1 , if t ≥ (r − r1)/c0 .
Here r and r1 are physical coordinates of the point in the systems with thecenters O and O1, respectively, and c0 is the speed of sound in unperturbedliquid. Then the pressure at any point of the system is determined by thesuperposition of solutions of the type (7.4):
ξ = r−1/2σ0
∞∑n=0
AnKn+1/2(r)Pn(cos θ)+
+ r−1/21
∞∑n=0
BnKn+1/2(r1)Pn(cos θ1) . (7.5)
306 7 Jet Flows at Shallow Underwater Explosions
We note that the angles θ and θ1 are reckoned from the direction O − O1,each in its system. The coefficients in (7.5) are found from the boundaryconditions at the surfaces of the explosive cavities:
ξ = pα < 0 at r = a(t)αk1/6
andξ = pα1 > 0 at r1 = a1(t)αk1/6 .
Here we take into account the experimentally established absence of cavita-tion in the vicinity of the boundary of the explosive cavity, whence it followsthat pressure in detonation products at the interface with the liquid and themean pressure in the two-phase medium are equal. We note that (7.5) is alsovalid for the HE charge at shallow depths of h/2 for reasonable time intervals,when the free surface of the liquid can be considered as plane.
It is not difficult to show that in expanding (7.5) one can confine oneselfto the case n = 0, if the ratio of radii of explosive cavities to the distance hbetween them is assumed to be sufficiently small. Then we have
ξ = r−1/2σ0A0K1/2(r) + r−1/21 B0K1/2(r1) . (7.6)
The coefficients A0 and B0 are determined from the boundary conditions:From the first boundary condition,
pα(aαk1/6)1/2 = A0K1/2(aαk1/6) +( a
r∗1
)1/2
B0K1/2(r∗1αk1/6) ;
From the second boundary condition,
pα1(a1αk1/6)1/2 =(a1
r∗)1/2
A0K1/2(r∗αk1/6) + B0K1/2(a1αk1/6) ,
where r∗1 =√
h2 + a21 − 2a1h cos θ1 and r∗ =
√h2 + a2 − 2ah cos θ.
Assuming r∗ r∗1 h and pα = −pα1 , we obtain A0 = −B0. PresentingK1/2 as K1/2(z) =
√π/2z exp(−z) [28] and taking into account the above
assumptions with respect to a/h for B0 we obtain the simple expression
B0 =
√2π
pα1a1αk1/6 exp(a1αk1/6) .
Finally, the solution (7.6) acquires the form
ξ = pα1
(a1
r1
)[e−(r1−a1)αk1/6 −
(r1
r
)σ0e−(r−a1)αk1/6
],
7.2 Tensile Stress, Structure of Cavitation Region, Spalls 307
where r =√
r21 + h2 − 2hr1 cos θ1, the pressure in the detonation products
is determined from the adiabat pα1 = p(0)(a1)−3γ , and the dynamics of theexplosive cavity is described by the empirical dependences
a1 = 1 + 0.022106(t/a0) at t < 10−4
anda1 = 158.5(t/a0)0.4 at t ≥ 10−4 ,
where the initial radius a0 of the HE charge is in centimeters and t is inseconds.
Thus, the initial system of equations (7.1) reduces to the form
ξ = pα1
(a1
r1
)[e−(r1−a1)αk1/6 −
(r1
r
)σ0e
−(r−a1)αk1/6]
(7.7)
and∂2k
∂τ2= −3k1/3ξ +
16k
(∂k
∂τ
)2
which, if the initial data are know, allows one to solve the problem on thedevelopment of the cavitation zone and the profile of the rarefaction wave init. Obviously, in this statement (system (7.7)) the coordinates r and r1 actas parameters, which, in principle, reduces the problem to the solution of anordinary differential equation for k at given r and r1.
7.2.2.3 Calculation of the Cavitation Zone Dynamics
Before proceeding to the solution of the problem, one should know two basicphysical parameters: the initial radius R0 of the cavitation nucleus and thevolume concentration k0 of the free gas in water. For this purpose, we use theexperimental data of [21,29,30] summed up in [22]: k0 10−12 for distilledwater, k0 10−12–10−10 for tap water after 7–12 hours of settling, andk0 10−9–10−8 for tap water after an hour of settling.
The upper limit of the size of cavitation nuclei is R0 2 · 10−2 cm,R0 5 · 10−3 cm in fresh tap water, R0 5 · 10−4 cm in water settled forseveral hours, R0 5 · 10−5 cm in water with stabilized content of free gas(after 7–12 hours of settling).
In the calculations we accept k0 = 10−11 and R0 = 5 · 10−5 cm. Sincecavitation bubble becomes visible when its radius is R∗ 10−2 cm [31],the cavitation zone is registered only if the radius of the cavitation in therarefaction wave increases by three orders of magnitude. The calculationsshow that the nuclei reach this size over a short time interval.
Let us consider the explosion of a 1.2-g charge of radius Rch 0.53 cmat a depth of h/2 = 5.3 cm [23,27]. We accept the initial pressure p(0) in theproducts of instantaneous detonation to be equal to 4 · 104 atm and γ = 3.We note that the dynamics of nuclei under propagation of the positive phase
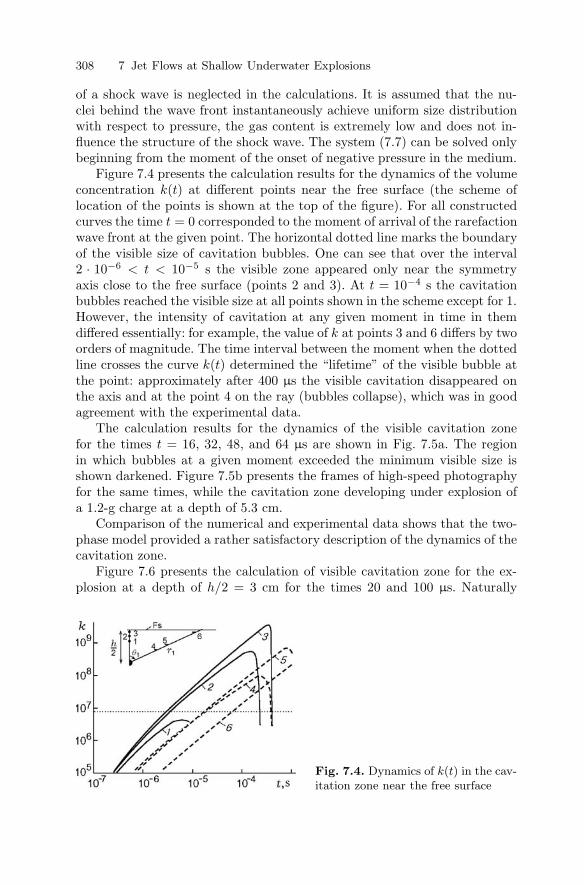
308 7 Jet Flows at Shallow Underwater Explosions
of a shock wave is neglected in the calculations. It is assumed that the nu-clei behind the wave front instantaneously achieve uniform size distributionwith respect to pressure, the gas content is extremely low and does not in-fluence the structure of the shock wave. The system (7.7) can be solved onlybeginning from the moment of the onset of negative pressure in the medium.
Figure 7.4 presents the calculation results for the dynamics of the volumeconcentration k(t) at different points near the free surface (the scheme oflocation of the points is shown at the top of the figure). For all constructedcurves the time t = 0 corresponded to the moment of arrival of the rarefactionwave front at the given point. The horizontal dotted line marks the boundaryof the visible size of cavitation bubbles. One can see that over the interval2 · 10−6 < t < 10−5 s the visible zone appeared only near the symmetryaxis close to the free surface (points 2 and 3). At t = 10−4 s the cavitationbubbles reached the visible size at all points shown in the scheme except for 1.However, the intensity of cavitation at any given moment in time in themdiffered essentially: for example, the value of k at points 3 and 6 differs by twoorders of magnitude. The time interval between the moment when the dottedline crosses the curve k(t) determined the “lifetime” of the visible bubble atthe point: approximately after 400 µs the visible cavitation disappeared onthe axis and at the point 4 on the ray (bubbles collapse), which was in goodagreement with the experimental data.
The calculation results for the dynamics of the visible cavitation zonefor the times t = 16, 32, 48, and 64 µs are shown in Fig. 7.5a. The regionin which bubbles at a given moment exceeded the minimum visible size isshown darkened. Figure 7.5b presents the frames of high-speed photographyfor the same times, while the cavitation zone developing under explosion ofa 1.2-g charge at a depth of 5.3 cm.
Comparison of the numerical and experimental data shows that the two-phase model provided a rather satisfactory description of the dynamics of thecavitation zone.
Figure 7.6 presents the calculation of visible cavitation zone for the ex-plosion at a depth of h/2 = 3 cm for the times 20 and 100 µs. Naturally
Fig. 7.4. Dynamics of k(t) in the cav-itation zone near the free surface
7.2 Tensile Stress, Structure of Cavitation Region, Spalls 309
Fig. 7.5. Numerical (a) and experimental (b) results for the dynamics of the visiblecavitation zone (h/2 = 5.3 cm)
the figure shows only the qualitative dynamics of the cavitation zone withdecreasing explosion depth. As in the experiment (see below, for example,Fig.7.16), the periphery part of the cavitation zone in this case went downmore sharply and its main density fell at the periphery zone with respect tothe charge.
Fig. 7.6. Qualitative dynamics ofthe cavitation zone (h/2 = 3 cm):(1) initial size of charge (dotted line),(2) cavity with detonation products,(3) cavitation, (4) rarefaction wavefront
310 7 Jet Flows at Shallow Underwater Explosions
7.2.3 Parameters of Rarefaction Wave in the Cavitation Zone
The system (7.7) enables calculations of the parameters and dynamics of thetensile stress field in the cavitation zone, which appeared to be essentiallydependent upon the front steepness of rarefaction wave. We note that thisconcept in the given statement corresponds to the time of growing of absolutevalue of tensile stresses in the rarefaction wave front [32, 33] in the mediumwith a compressible liquid component. This parameter in the first equationof the system can be formally regulated by the multiplier σ0. It can be takento be equal to unit at t = 0 (the case of instantaneous application of the max-imum negative pressure) or presented as a time function governing the lawof increase of tensile stresses in the medium (the steepness of the rarefactionwave front). The function is taken from some additional considerations andis determined experimentally or numerically, for example, from the differenceof the time of arrival of the characteristics of the rarefaction wave with zeroand maximum amplitudes at a point under consideration [2].
An approximate estimates (based on the data of [2]) of the “steepnessof the rarefaction wave front” for the case h/2 = 5.3 cm (curves 1 and 2)and h/2 = 14 cm (curves 3 and 4) are presented in Figure 7.7 for vertical(1, 3) and horizontal (2, 4) beams at different distances from the charge. Withallowance for these data further studies were carried out for the time intervalof the “front steepness,” τfr = 0–1 µs.
The calculation results for the parameters and dynamics of the field oftensile stresses are presented in Figs. 7.8–7.10. Figure 7.8 shows the timevariation of the volume concentration k of gas phase (a) and pressure in therarefaction wave p (b) at the point with the coordinates z = 3.8 cm and r = 0(on the symmetry axis) during the explosion of a 1.2-g charge at a depth of5.3 cm. The calculation was performed for τfr = 0 µs (curves 1, instantaneousjump of the amplitude of tensile stresses), τfr = 0.1 µs (curves 2), and τfr =1 µs (curves 3). For comparison we present the dependence p(t) in the one-
Fig. 7.7. Estimates of the front steepnessin the rarefaction wave
7.2 Tensile Stress, Structure of Cavitation Region, Spalls 311
Fig. 7.8. The effect of thefront steepness in the rar-efaction wave on ultimatetensile stresses and thecavitation zone dynamics
phase liquid and the k value as the lower boundary of the visible zone (dottedlines). The initial parameters were k0 = 10−11, R0 = 5 ·10−5 cm, W 1.2 g,a0 = 0.53 cm, h/2 = 5.3 cm, and pdet = 4 · 104 atm.
It is easy to see that the steep slope of the front for only 1 µs (curves 3)led to the decrease of the tensile stresses allowed by the cavitating mediumby two orders of magnitude. The calculations show that the change of thevolume gas concentration k was not so much affected by the steep slope.
For the same conditions, Fig. 7.9 presents the calculation results forthe distribution of durations (∆t−max, Fig. 7.9a) and maximum amplitudes(∆p−max, Fig. 7.9b) for tensile stresses at vertical (H) and horizontal (r1,Fig. 7.9c) axes. The figures at the curves 1, 2, and 3 corresponded to the timesof occurrence of the steep slope τfr = 0, 0.1, and 1 µs. One can see that thetwo-phase medium could maintain the negative pressures up to hundreds ofatmospheres (curve 1, Fig. 7.9b and c) only within 0.1 µs (curve 1′, Fig. 7.9a),over which the pressure decreased by an order of magnitude and more. Thisresult complies with the known experimental data: a real liquid subject toinstantaneous tension of 100 atm preserved the pressure only over 0.2 µs.
As indicated above, pressure in the front of a real rarefaction wave achievesits maximum over a finite time period. According to the calculations, overthis time the size of cavitation nuclei increases considerably and the volumeconcentration increases by several orders of magnitude appreciably changing
312 7 Jet Flows at Shallow Underwater Explosions
Fig. 7.9a–c. Distri-bution of the wavefield parameters inthe cavitation zonenear the free surfacefor various steep-nesses of the rarefac-tion wave front
the state of the medium. As a result, calculated negative pressures, the max-imum values allowed by the medium, decrease by two orders of magnitude(Fig. 7.9b and c, curves 2 and 3) as τfr changes from 0 to 1 µs. In terms of theorder of magnitude these values are comparable with the experimental data.
Figure 7.10 shows the angle distribution θ1 (the distance r1 = 4.4 cm fromthe charge center is fixed) for maximum tensile stresses ∆p−max (Fig. 7.10a),maximum volume concentration kmax of gaseous phase (Fig. 7.10b), and theduration of the negative pressure phase ∆t−max (Fig. 7.10c).
The calculations were performed for the above initial parameters andτfr = 0.1 µs. Obviously, the abrupt change of kmax over the angle rangecos θ1 = 0.4–1.0 was accompanied by adequatly abrupt change of the durationof exposure to tensile stresses and relatively slight change of their amplitudes.
We would like to remind readers that the calculated and experimentalrarefaction wave profiles at the point with coordinates θ1 = 0 and r1 = 14 cmfor explosion of a 1.2-g charge at a depth of 18.5 cm were compared in Chap. 6(Fig. 6.8b). There the experimental curves lie between two calculated profilesof the rarefaction phase: curve 3 (initial parameters R0 = 5 · 10−4 cm, k0 =10−11, τfr = 5 µs) and curve 4 (initial parameters R0 = 5 · 10−4 cm, k0 =10−10, τfr = 1 µs). The parameters were selected on the basis of the aboveranges of the gas content and real conditions of the experiment. Profile 3was the closest to the experimental data in the order of magnitude and theshape.
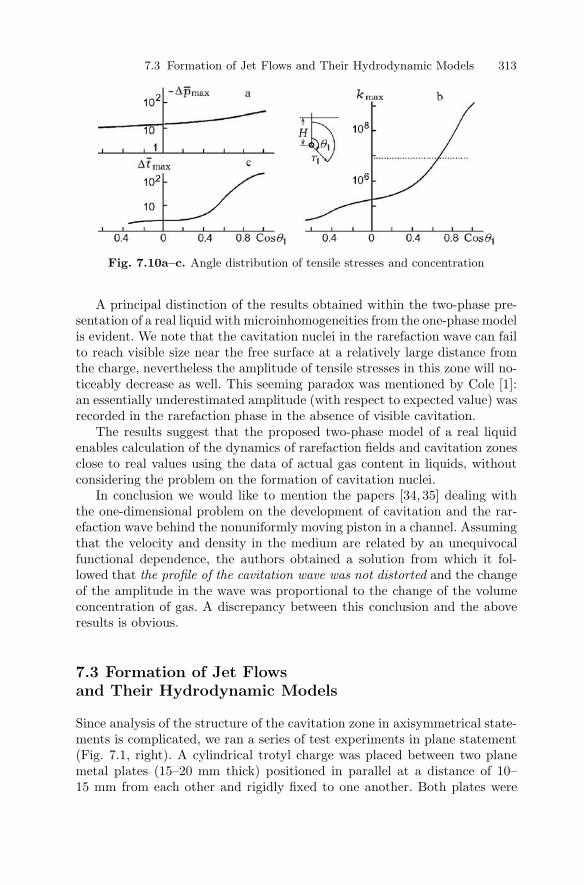
7.3 Formation of Jet Flows and Their Hydrodynamic Models 313
Fig. 7.10a–c. Angle distribution of tensile stresses and concentration
A principal distinction of the results obtained within the two-phase pre-sentation of a real liquid with microinhomogeneities from the one-phase modelis evident. We note that the cavitation nuclei in the rarefaction wave can failto reach visible size near the free surface at a relatively large distance fromthe charge, nevertheless the amplitude of tensile stresses in this zone will no-ticeably decrease as well. This seeming paradox was mentioned by Cole [1]:an essentially underestimated amplitude (with respect to expected value) wasrecorded in the rarefaction phase in the absence of visible cavitation.
The results suggest that the proposed two-phase model of a real liquidenables calculation of the dynamics of rarefaction fields and cavitation zonesclose to real values using the data of actual gas content in liquids, withoutconsidering the problem on the formation of cavitation nuclei.
In conclusion we would like to mention the papers [34, 35] dealing withthe one-dimensional problem on the development of cavitation and the rar-efaction wave behind the nonuniformly moving piston in a channel. Assumingthat the velocity and density in the medium are related by an unequivocalfunctional dependence, the authors obtained a solution from which it fol-lowed that the profile of the cavitation wave was not distorted and the changeof the amplitude in the wave was proportional to the change of the volumeconcentration of gas. A discrepancy between this conclusion and the aboveresults is obvious.
7.3 Formation of Jet Flowsand Their Hydrodynamic Models
Since analysis of the structure of the cavitation zone in axisymmetrical state-ments is complicated, we ran a series of test experiments in plane statement(Fig. 7.1, right). A cylindrical trotyl charge was placed between two planemetal plates (15–20 mm thick) positioned in parallel at a distance of 10–15 mm from each other and rigidly fixed to one another. Both plates were
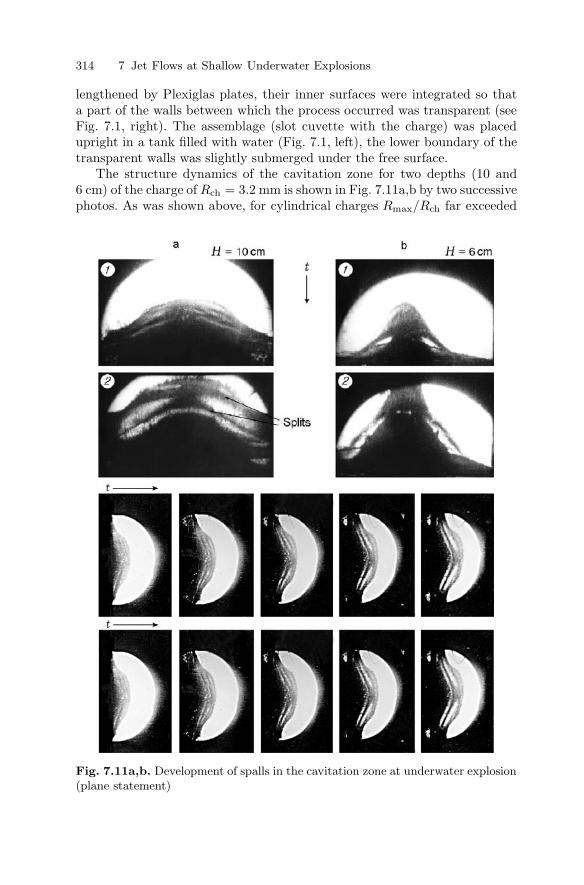
314 7 Jet Flows at Shallow Underwater Explosions
lengthened by Plexiglas plates, their inner surfaces were integrated so thata part of the walls between which the process occurred was transparent (seeFig. 7.1, right). The assemblage (slot cuvette with the charge) was placedupright in a tank filled with water (Fig. 7.1, left), the lower boundary of thetransparent walls was slightly submerged under the free surface.
The structure dynamics of the cavitation zone for two depths (10 and6 cm) of the charge of Rch = 3.2 mm is shown in Fig. 7.11a,b by two successivephotos. As was shown above, for cylindrical charges Rmax/Rch far exceeded
Fig. 7.11a,b. Development of spalls in the cavitation zone at underwater explosion(plane statement)
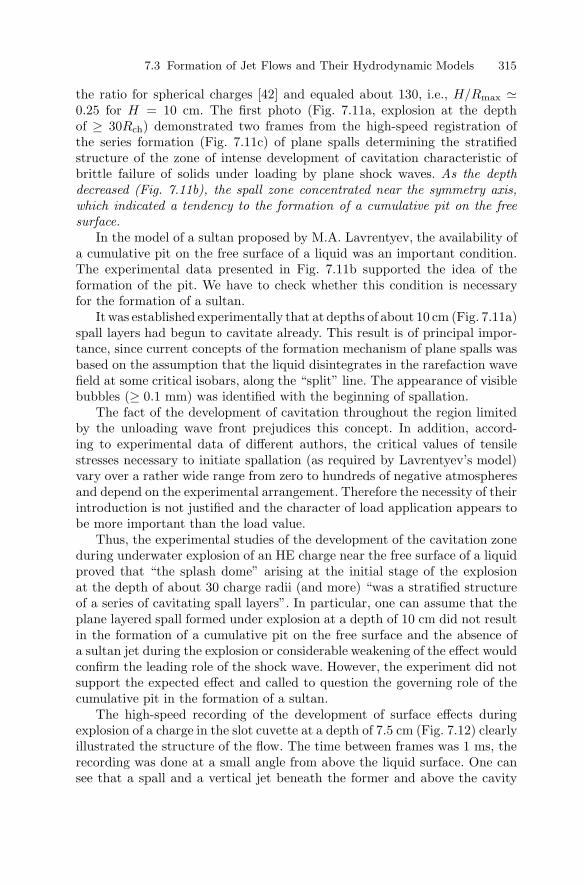
7.3 Formation of Jet Flows and Their Hydrodynamic Models 315
the ratio for spherical charges [42] and equaled about 130, i.e., H/Rmax 0.25 for H = 10 cm. The first photo (Fig. 7.11a, explosion at the depthof ≥ 30Rch) demonstrated two frames from the high-speed registration ofthe series formation (Fig. 7.11c) of plane spalls determining the stratifiedstructure of the zone of intense development of cavitation characteristic ofbrittle failure of solids under loading by plane shock waves. As the depthdecreased (Fig. 7.11b), the spall zone concentrated near the symmetry axis,which indicated a tendency to the formation of a cumulative pit on the freesurface.
In the model of a sultan proposed by M.A. Lavrentyev, the availability ofa cumulative pit on the free surface of a liquid was an important condition.The experimental data presented in Fig. 7.11b supported the idea of theformation of the pit. We have to check whether this condition is necessaryfor the formation of a sultan.
It was established experimentally that at depths of about 10 cm (Fig. 7.11a)spall layers had begun to cavitate already. This result is of principal impor-tance, since current concepts of the formation mechanism of plane spalls wasbased on the assumption that the liquid disintegrates in the rarefaction wavefield at some critical isobars, along the “split” line. The appearance of visiblebubbles (≥ 0.1 mm) was identified with the beginning of spallation.
The fact of the development of cavitation throughout the region limitedby the unloading wave front prejudices this concept. In addition, accord-ing to experimental data of different authors, the critical values of tensilestresses necessary to initiate spallation (as required by Lavrentyev’s model)vary over a rather wide range from zero to hundreds of negative atmospheresand depend on the experimental arrangement. Therefore the necessity of theirintroduction is not justified and the character of load application appears tobe more important than the load value.
Thus, the experimental studies of the development of the cavitation zoneduring underwater explosion of an HE charge near the free surface of a liquidproved that “the splash dome” arising at the initial stage of the explosionat the depth of about 30 charge radii (and more) “was a stratified structureof a series of cavitating spall layers”. In particular, one can assume that theplane layered spall formed under explosion at a depth of 10 cm did not resultin the formation of a cumulative pit on the free surface and the absence ofa sultan jet during the explosion or considerable weakening of the effect wouldconfirm the leading role of the shock wave. However, the experiment did notsupport the expected effect and called to question the governing role of thecumulative pit in the formation of a sultan.
The high-speed recording of the development of surface effects duringexplosion of a charge in the slot cuvette at a depth of 7.5 cm (Fig. 7.12) clearlyillustrated the structure of the flow. The time between frames was 1 ms, therecording was done at a small angle from above the liquid surface. One cansee that a spall and a vertical jet beneath the former and above the cavity
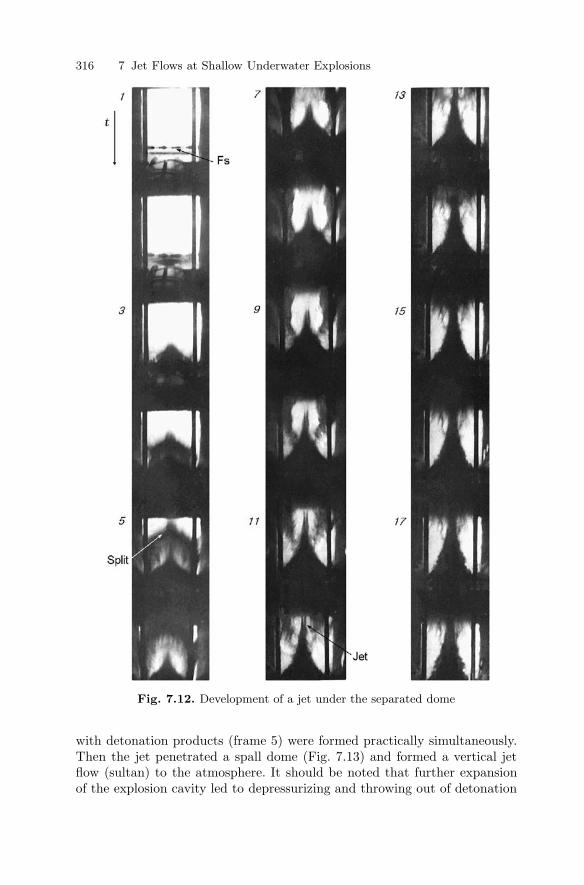
316 7 Jet Flows at Shallow Underwater Explosions
Fig. 7.12. Development of a jet under the separated dome
with detonation products (frame 5) were formed practically simultaneously.Then the jet penetrated a spall dome (Fig. 7.13) and formed a vertical jetflow (sultan) to the atmosphere. It should be noted that further expansionof the explosion cavity led to depressurizing and throwing out of detonation
7.3 Formation of Jet Flows and Their Hydrodynamic Models 317
Fig. 7.13. Development of the dome and rise of the vertical sultan jet
products into the atmosphere. As a consequence, a surface closure of theexplosive cavity was observed, which tended to the formation of a secondaryvertical jets.
When analyzing the phenomena produced on the free surface of a liq-uid by underwater explosions, researchers were mainly focused on describingthe external parameters of sultans. The experiments, theoretical studies, andmodels discussed in this section made it possible to reveal the formationmechanism and conditions for such jets, determine main parameters of sul-tans, and understand their structure. It was found that depending on theexplosion depth an entire class of cumulative jets was formed on the free sur-face, from a vertical jet tandem at the initial stage of the first expansion ofthe cavity with detonation products to the “eruption” of the vertical throw-ing out under the emergence of a giant cavity with detonation products ofa nuclear charge on the surface.
Below we consider the flows under explosion at depths of H = (0–2)·Rmax,where Rmax is the maximum radius of the cavity with detonation productsunder explosion in an unbounded liquid. Mainly lightweight charges wereused in the experiments. Based on the research results for the explosions oflarge charges, for example, from [1,8–10], the laboratory data are reasonablyextrapolated to large-scale experiments.
7.3.1 Formation of Vertical Jets on the Free Surface(Experiment, H < Rmax)
It is convenient to consider the flow features when geometrical parametersare reduced to the value of the first maximum of the explosive cavity, whichis automatically related to the charge weight, if the density and the reactionheat are known. It is known that the maximum radii of the explosive cavityfor different oscillations Rmax,i and the oscillation periods Ti are determinedby the equations
Rmax,i [
34π
αiEW
p0
]1/3
and Ti 1.83√
ρ0
p0
[34π
αiEW
p0
]1/3
,
where p0 is the hydrostatic pressure in bar; E is the heat of explosive trans-formation of the HE in kcal/g; αi is the coefficient determining the part of
318 7 Jet Flows at Shallow Underwater Explosions
the energy remaining in the detonation products, i is the pulsation number,and W is the charge weight in g.
For 1-g charges one can readily obtain the values of maximum radii ofthe cavities with detonation products Rmax,i 23α
1/3i (cm), as well as the
oscillation periods Ti 42α1/3i 10−3 (s), where α1,2,3 is equal to 0.41, 0.14,
and 0.076 [1], respectively, for spherical charges used in the experiments. Inreal numbers, we get Rmax,1,2,3 17.1, 11.9, and 9.7 cm and T1,2,3 31.3,21.9, and 17.8 ms.
Figures 7.14–7.16 present different stages of the development of the surfacephenomena at depths of 15, 5, and 2 cm (or H = H/Rmax 0.88, 0.29, and0.12). Numbers under the frames correspond to ms.
Analysis of the experimental results showed that the distinct vertical jetappeared under the dome at the times reckoned from the explosion start(below τ = t
√p0/ρ0/Rch):
τ(H) =
⎧⎪⎪⎪⎨⎪⎪⎪⎩
30.1 (or 17 ms for W 1 g) at H 0.9 ,
8.8–10.6 (or 5–6 ms) at H 0.6 ,
1.33 (or 0.75 ms) at H 0.3 ,
0.44 (or 0.25 ms) at H 0.12 .
The initiation of the jet with rather insignificant maximum velocity ofthe jet rise of about 15 m/s and height 1.3–1.5 m fell at the explosion depthH 1–0.9. The main structure of throwing out on the free surface at theseexplosion depths was a cone-shaped splash dome. At the bottom of the pho-tos in Fig. 7.14 one can see a “nonhermetic” cavity with detonation productsat these depths (the time interval t2 = 30–36 ms and later): there was a pipedregion produced by the surface closing of the explosive cavity after depres-surizing and formation of upward and downward vertical jets.
With decreasing explosion depth the jet became more distinct: at H 0.6the jet velocity was about 30 m/s, its average diameter at a hight of 1.2 mwas equal to 1–1.5 cm, while near the bottom (the dome vertex height was0.4 m) the diameter was 5–7 cm. Further decrease in H led to a sharp growthof the jet velocity, which reached 100 m/s at H 0.3. The velocity was about300 m/s at H 0.15 and the jet was clearly visible against the backgroundof the dome of splashes (Fig. 7.15). The tendency to form a jet was retainedat shallower depths (Fig. 7.16). Following [36, 37], the velocity of rise of thethrowing out vertex (in this case, the dome vertex) on the free surface underexplosion of a charge at depths twice the charge radius at the initial timecould exceed 2 km/s, the Mach number of the incident flow could achieve 4for small charges and 7 for charges of weight of about 100 kg.
The change of the maximum jet velocity vjet (m/s) is shown in Fig. 7.17a.Here the data on the velocity of the dome vertex vk (m/s) [36, 37] obtainedfor the range H 0.06–0.1 for a 0.2-g TNT charge and a 100-kg trotyl chargeare presented for comparison.
7.3 Formation of Jet Flows and Their Hydrodynamic Models 319
Fig
.7.1
4.
Surf
ace
effec
ts(H
0.9
)
320 7 Jet Flows at Shallow Underwater Explosions
Fig
.7.1
5.
Surf
ace
effec
ts(H
0.3
)

7.3 Formation of Jet Flows and Their Hydrodynamic Models 321
Fig
.7.1
6.
Surf
ace
effec
ts(H
0.1
)
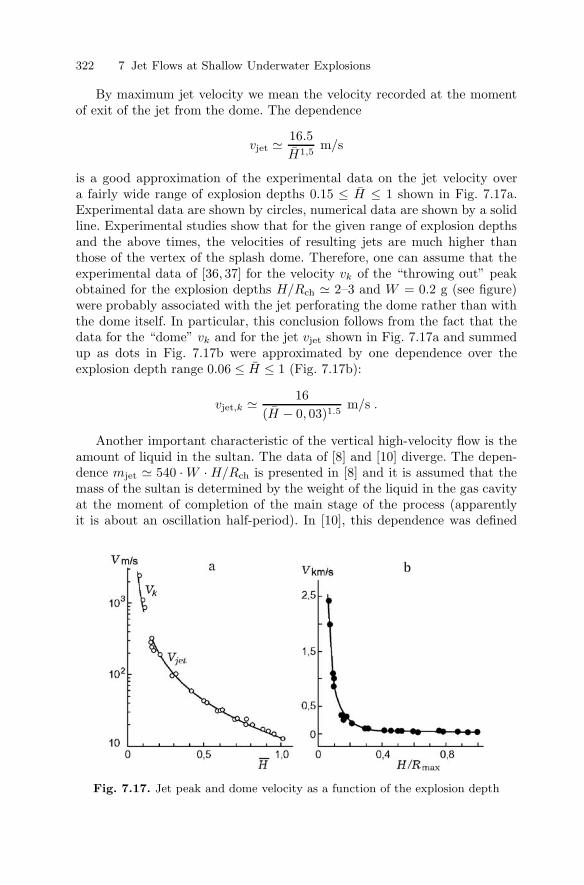
322 7 Jet Flows at Shallow Underwater Explosions
By maximum jet velocity we mean the velocity recorded at the momentof exit of the jet from the dome. The dependence
vjet 16.5H1,5
m/s
is a good approximation of the experimental data on the jet velocity overa fairly wide range of explosion depths 0.15 ≤ H ≤ 1 shown in Fig. 7.17a.Experimental data are shown by circles, numerical data are shown by a solidline. Experimental studies show that for the given range of explosion depthsand the above times, the velocities of resulting jets are much higher thanthose of the vertex of the splash dome. Therefore, one can assume that theexperimental data of [36, 37] for the velocity vk of the “throwing out” peakobtained for the explosion depths H/Rch 2–3 and W = 0.2 g (see figure)were probably associated with the jet perforating the dome rather than withthe dome itself. In particular, this conclusion follows from the fact that thedata for the “dome” vk and for the jet vjet shown in Fig. 7.17a and summedup as dots in Fig. 7.17b were approximated by one dependence over theexplosion depth range 0.06 ≤ H ≤ 1 (Fig. 7.17b):
vjet,k 16(H − 0, 03)1.5
m/s .
Another important characteristic of the vertical high-velocity flow is theamount of liquid in the sultan. The data of [8] and [10] diverge. The depen-dence mjet 540 · W · H/Rch is presented in [8] and it is assumed that themass of the sultan is determined by the weight of the liquid in the gas cavityat the moment of completion of the main stage of the process (apparentlyit is about an oscillation half-period). In [10], this dependence was defined
Fig. 7.17. Jet peak and dome velocity as a function of the explosion depth
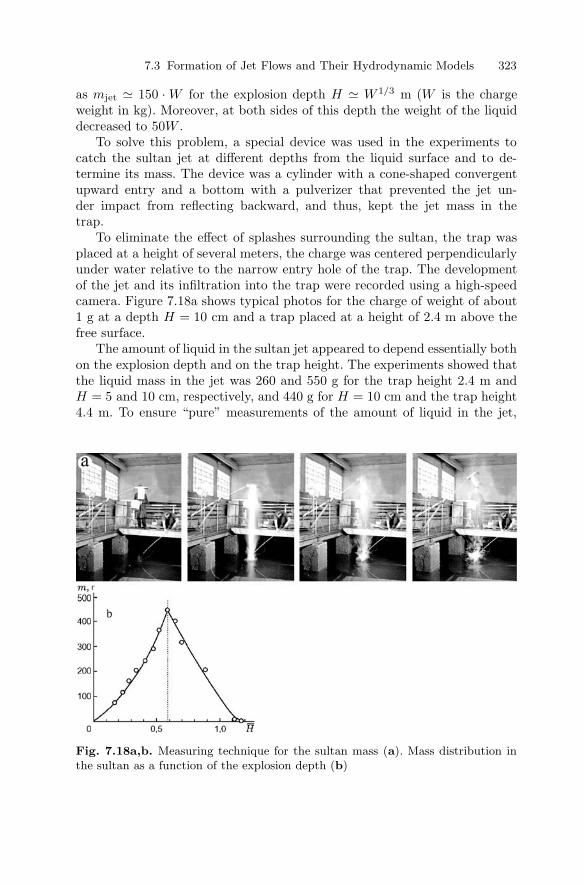
7.3 Formation of Jet Flows and Their Hydrodynamic Models 323
as mjet 150 · W for the explosion depth H W 1/3 m (W is the chargeweight in kg). Moreover, at both sides of this depth the weight of the liquiddecreased to 50W .
To solve this problem, a special device was used in the experiments tocatch the sultan jet at different depths from the liquid surface and to de-termine its mass. The device was a cylinder with a cone-shaped convergentupward entry and a bottom with a pulverizer that prevented the jet un-der impact from reflecting backward, and thus, kept the jet mass in thetrap.
To eliminate the effect of splashes surrounding the sultan, the trap wasplaced at a height of several meters, the charge was centered perpendicularlyunder water relative to the narrow entry hole of the trap. The developmentof the jet and its infiltration into the trap were recorded using a high-speedcamera. Figure 7.18a shows typical photos for the charge of weight of about1 g at a depth H = 10 cm and a trap placed at a height of 2.4 m above thefree surface.
The amount of liquid in the sultan jet appeared to depend essentially bothon the explosion depth and on the trap height. The experiments showed thatthe liquid mass in the jet was 260 and 550 g for the trap height 2.4 m andH = 5 and 10 cm, respectively, and 440 g for H = 10 cm and the trap height4.4 m. To ensure “pure” measurements of the amount of liquid in the jet,
Fig. 7.18a,b. Measuring technique for the sultan mass (a). Mass distribution inthe sultan as a function of the explosion depth (b)
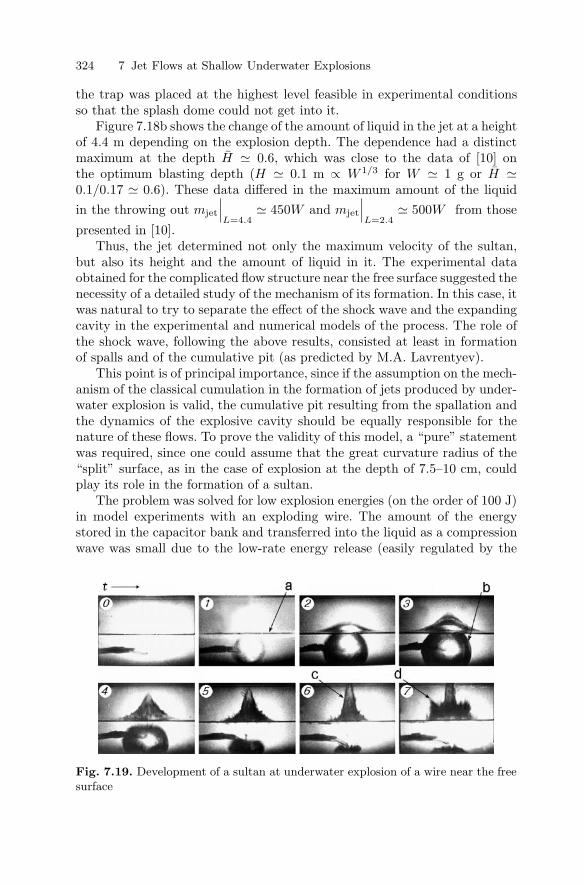
324 7 Jet Flows at Shallow Underwater Explosions
the trap was placed at the highest level feasible in experimental conditionsso that the splash dome could not get into it.
Figure 7.18b shows the change of the amount of liquid in the jet at a heightof 4.4 m depending on the explosion depth. The dependence had a distinctmaximum at the depth H 0.6, which was close to the data of [10] onthe optimum blasting depth (H 0.1 m ∝ W 1/3 for W 1 g or H 0.1/0.17 0.6). These data differed in the maximum amount of the liquidin the throwing out mjet
∣∣∣L=4.4
450W and mjet
∣∣∣L=2.4
500W from those
presented in [10].Thus, the jet determined not only the maximum velocity of the sultan,
but also its height and the amount of liquid in it. The experimental dataobtained for the complicated flow structure near the free surface suggested thenecessity of a detailed study of the mechanism of its formation. In this case, itwas natural to try to separate the effect of the shock wave and the expandingcavity in the experimental and numerical models of the process. The role ofthe shock wave, following the above results, consisted at least in formationof spalls and of the cumulative pit (as predicted by M.A. Lavrentyev).
This point is of principal importance, since if the assumption on the mech-anism of the classical cumulation in the formation of jets produced by under-water explosion is valid, the cumulative pit resulting from the spallation andthe dynamics of the explosive cavity should be equally responsible for thenature of these flows. To prove the validity of this model, a “pure” statementwas required, since one could assume that the great curvature radius of the“split” surface, as in the case of explosion at the depth of 7.5–10 cm, couldplay its role in the formation of a sultan.
The problem was solved for low explosion energies (on the order of 100 J)in model experiments with an exploding wire. The amount of the energystored in the capacitor bank and transferred into the liquid as a compressionwave was small due to the low-rate energy release (easily regulated by the
Fig. 7.19. Development of a sultan at underwater explosion of a wire near the freesurface
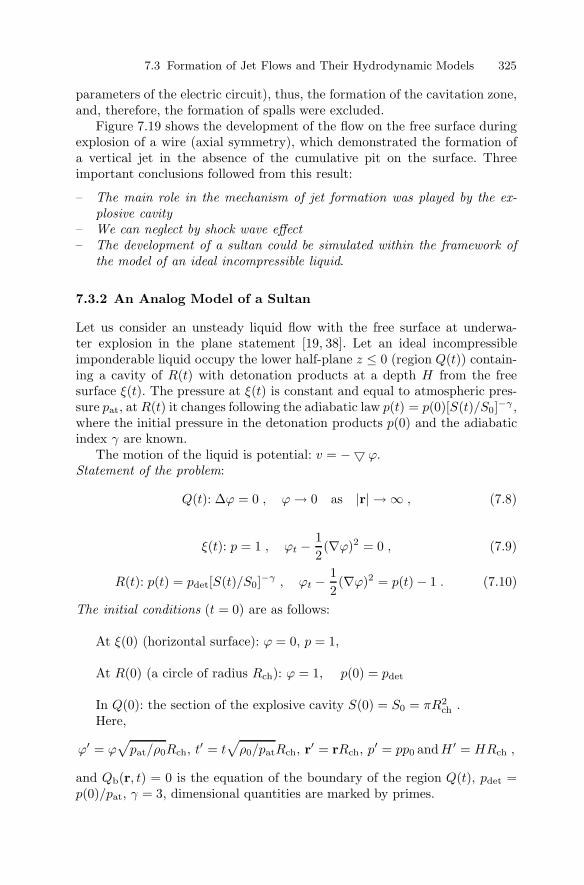
7.3 Formation of Jet Flows and Their Hydrodynamic Models 325
parameters of the electric circuit), thus, the formation of the cavitation zone,and, therefore, the formation of spalls were excluded.
Figure 7.19 shows the development of the flow on the free surface duringexplosion of a wire (axial symmetry), which demonstrated the formation ofa vertical jet in the absence of the cumulative pit on the surface. Threeimportant conclusions followed from this result:
– The main role in the mechanism of jet formation was played by the ex-plosive cavity
– We can neglect by shock wave effect– The development of a sultan could be simulated within the framework of
the model of an ideal incompressible liquid.
7.3.2 An Analog Model of a Sultan
Let us consider an unsteady liquid flow with the free surface at underwa-ter explosion in the plane statement [19, 38]. Let an ideal incompressibleimponderable liquid occupy the lower half-plane z ≤ 0 (region Q(t)) contain-ing a cavity of R(t) with detonation products at a depth H from the freesurface ξ(t). The pressure at ξ(t) is constant and equal to atmospheric pres-sure pat, at R(t) it changes following the adiabatic law p(t) = p(0)[S(t)/S0]−γ ,where the initial pressure in the detonation products p(0) and the adiabaticindex γ are known.
The motion of the liquid is potential: v = − ϕ.Statement of the problem:
Q(t): ∆ϕ = 0 , ϕ → 0 as |r| → ∞ , (7.8)
ξ(t): p = 1 , ϕt − 12(∇ϕ)2 = 0 , (7.9)
R(t): p(t) = pdet[S(t)/S0]−γ , ϕt − 12(∇ϕ)2 = p(t) − 1 . (7.10)
The initial conditions (t = 0) are as follows:
At ξ(0) (horizontal surface): ϕ = 0, p = 1,
At R(0) (a circle of radius Rch): ϕ = 1, p(0) = pdet
In Q(0): the section of the explosive cavity S(0) = S0 = πR2ch .
Here,
ϕ′ = ϕ√
pat/ρ0Rch, t′ = t√
ρ0/patRch, r′ = rRch, p′ = pp0 andH ′ = HRch ,
and Qb(r, t) = 0 is the equation of the boundary of the region Q(t), pdet =p(0)/pat, γ = 3, dimensional quantities are marked by primes.
326 7 Jet Flows at Shallow Underwater Explosions
The problem consists in the search for the function ϕ = ϕ(r, t) in thevariable region Q(t). The problem was solved by combining the method ofelectrohydrodynamic analogies (EHDA) and the method of finite-differencesfor the Cauchy–Lagrange integrals. The first was used to solve the Laplaceequation (7.8), the second for Eqs. (7.9) and (7.10). The solution was reducedto the determination of the distribution of the values of the velocity potentialϕj,k,i and its gradients ∇ϕj,k.i at the boundaries ξ(ti) and R(ti) at everymoment of time ti. The subscripts i, j, and k stand for the time incrementand points at ξ and R, respectively.
The statement does not mention the kinematic condition
∂Qb
∂t−∇ϕ∇Qb = 0
at the boundary of the region Q(t) that is automatically met in solving theLaplace equation using the EHDA method, since when it is implementedat the conducting paper to determine the potential and distribution, andconstructing the current lines for all time intervals, the same “liquid particles”(points) are traced at both boundaries of the region Q(t).
Using the definition dϕ/dt = ϕt + v∇ϕ = ϕt − v2, the conditions (7.9)and (7.10) at the boundaries of the region for the potential can be written inthe differential form
ξ(ti+1) : ϕj,i+1 = ϕj,i − 12v2
j,i∆ti , (7.11)
and
R(ti+1) : ϕk,i+1 = ϕk,i − 12v2
k,i∆ti + (p(ti) − 1)∆ti .
As was mentioned above, to solve the problems concerned with explosiveprocesses, the so-called impulsive statement is often used. The statementsuggests that when only instantaneous pressures affect the liquid (for a veryshort time over which the position of the boundaries of the region practicallydoes not change) on the basis of the law of conservation of momentum,
∇(
dϕ
dt− p/ρ0
)= 0 ,
the potential on the boundary can be determined as
ϕ = ρ−10
∫ τ0
0
pdt ,
where τ0 sets the duration of exposure to the explosive load [39]. This valueon the boundary R(0) is taken as an analog unit.
The relation of the hydrodynamic potential ϕh to the electric potential ϕe
is expressed by the scale coefficients different for each moment of time ti.
7.3 Formation of Jet Flows and Their Hydrodynamic Models 327
Determining these coefficients, for the given time one can realize the knownboundary values of the hydrodynamic potential through their electric analogson the conducting paper. For this purpose, the boundary contours are cov-ered by tires wound on insulation frames (shaped as the boundaries) [40]with leads at the points j and k. When the values of the potential, ac-cording to (7.11), are established at the boundaries, the distribution of ϕin Q(t) is practically obtained and we have only to mark it on the paperas equipotential lines. Then, selecting the increment of r, we determine thedistribution of hydrodynamic velocities vj,k,i along the boundaries ξ and Ras ∆ϕ/∆r (here ∆ denotes the increment and ∆r is taken along the nor-mal to equipotential lines) and construct the flow lines. Thus, at the time tithe flow pattern is completely determined and for the next time incrementti+1 = ti + ∆ti using the data on vj,k,i, one can find a new position of theboundaries ξi+1, Ri+1, and from (7.11) the new distribution of ϕj,k,i+1 onthem.
This distribution is realized again on the conducting paper upon deter-mination of the scale factor and the calculation is continued for any timeinterval that is of interest for the process under study. Figure 7.20 shows thecalculation results for the initial stage of unsteady liquid flow with the freeboundary for different times at pdet = 4 · 104 (determined on the assump-tion that the detonation throughout the HE charge volume is instantaneous),H = 4, Rch = 1.5 cm, ρ0 = 1 g/cm3, pa = 1 bar, and τ0 = 10−7 s (in thedimensionless form 6.66 · 10−5). In view of the flow symmetry with respectto the vertical axis passing through the center of the explosive cavity, onlyhalves of the half-plane (the symmetry axis on the conducting paper is madeby the line of the cut) are considered in the calculation (and in the figure).
Figure 7.20 shows the equipotential lines ϕ = const and the flow lines (thenumbers 1–6 correspond to the times t = 0, 2.7, 5.8, 87, 127, and 208 µs). Theentire pattern of the development of the jet (sultan) is shown in Fig. 7.21 forthe times 0, 2.7, 5.8, 87, 127, 208, 308, and 408 µs. Here for the same times(Fig. 21b, 127 µs) the equipotential lines and the lines of flow supplementthe pattern of the forming flow.
Figure 7.22 presents the diagrams for the fluctuation of the velocity v ofliquid particles on the free surface (I, on the axis; II and III, along the bound-ary) and on the boundary of the explosive cavity (1 and 3 are the top andbottom particles on the axis; 2 represents particles on the horizontal diame-ter). One can see that for approximately 10 µs the flow character at all pointsis identical, 5–6 µs after the start the acceleration of liquid particles changesthe sign due to the atmospheric pressure, their velocities start decreasingand about 10–20 µs after the decrease is several-fold. The velocities of liquidparticles on the free surface first “follow” the behavior of the boundary ofthe gas cavity, but “stabilize” over the interval of about 20–40 µs and startgrowing again. For the points II and III, this growth stops at 100 µs and thecharacter of their dynamics becomes identical again to that of the points on
328 7 Jet Flows at Shallow Underwater Explosions
Fig. 7.20. Initial stageof the dynamics of theboundaries ξ(t) and R(t)
the surface of the explosive cavity, while the velocity of the point I on thesymmetry axis continues growing.
Comparing Figs. 7.20–7.22, one can find that the reason for this effect isthe onset of formation of a vertical cumulative jet over the interval 20–40 µs.Analysis of the calculation results shows that the distinctive features of themechanism of this effect are as follows: already over the interval 5 < t < 20 µs(Fig. 7.20, 3) the lines of the flow bend over the symmetry axis. At almost allpoints shown in Fig. 7.22, a decrease in the velocity is observed, which aftersome rise (at the points II and III) continues except for the vicinity of the axisand the free surface (point I). Here it becomes apparent the inertial propertiesof the liquid layer over the explosive cavity that has acquired a strong impulseat the initial moments of time.
7.3 Formation of Jet Flows and Their Hydrodynamic Models 329
Fig. 7.21a,b. Development of a sultan under the expansion of an explosive cavitywith initial pressure p(0) = 4 · 103 MPa at the depth H
′= 4 · Rch under the free
surface
Fig. 7.22. Dynamics of mass velocities at characteristic points at the boundariesξ(t) and R(t)
Pressure in the detonation products and the expansion rate of the cavitycontinue decreasing, while the acceleration of the liquid near the point Iincreases. Tensile stresses arising in the region of the axis between the freesurface and the explosive cavity lead to the local pressure decrease, and, asa result, to the turn and cumulation of the flow onto the symmetry axis: thegrowth of the particle velocity at the points I–III (over the time 20–90 µs)confirms this effect. Together with the vertical flow it results in the formationof a directional throwing out, a sultan. The velocity of liquid particles near thesymmetry axis increases sharply, while that of the particles II and III remotefrom the axis decreases. Soon these particles start to “follow” the behavior

330 7 Jet Flows at Shallow Underwater Explosions
of the gas cavity whose effect on them is more tangible. This determines thestructure of the resulting flow as a narrow vertical jet.
We note the effect of the cumulative flow on the dynamics of the upperhalf of the explosive cavity, whose velocities (at the point 1) decrease muchslower than those of the lower half (points 2 and 3): the explosive cavityexpands upward and transforms into an ellipsoid.
As was mentioned above, a necessary element of the sultan model pro-posed by M.A. Lavrentiev was a cumulative pit on the free surface of theliquid. The calculations made using the model for the free surface with a cu-mulative pit showed that the pit could amplify the effect of the formation ofthe directional jet under explosion at depths equal to several charge radii butdoes not effect on the mechanism of its formation.
7.3.3 Hydrodynamic Model of a Sultan: Pulsed Motionof a Solid from Beneath the Free Surface
Interpreting the formation mechanism of vertical jet flows produced by under-water explosions on the free surface allows a rather graphic model of a sultanto be constructed. Indeed, the sultan jet is shaped due to the momentumobtained by the liquid with a maximum velocity at the axis, abrupt decreaseof the velocity of the cavity with detonation products, and occurrence of ten-sile stresses near the axis and flow cumulation on the axis. Obviously, theseeffects can be simulated assuming that the explosive cavity acts as a pistonwith the same feature of motion “acceleration–deceleration”. An unsteadyflow under impulsive motion of a solid submerged in a liquid from beneaththe free surface can serve as the model [19, 38].
Let us consider the problem in the plane statement. Let a cylinder ofradius R move upright with the velocity V0 in an ideal incompressible liquidoccupying the lower half-plane z ≤ 0. At the time t = 0 the cylinder is ata distance H = H/R > 1 under the horizontal free surface ξ(0). As it occurspartially (or completely) over the surface at the time t = t0, the cylinderstops instantaneously. There is a liquid layer on top of the cylinder, whichis imparted an impulse and is “left on its own.” How will the liquid behavethen? This problem can be solved using the EHDA method. It is reducedto seeking the unknown boundary ξ(t) and the potential ϕ(r, t) such that att ≥ 0
Q(t) : ∆ϕ = 0 , ϕ → 0 at |r| → ∞ ;
on ξ(t) : p = 1 , ϕt − 12(∇ϕ)2 = 0 ;
and
on R :∂ϕ
∂r=−V0 cos θ at t0 > t ≥ 0 ,
0 at t ≥ t0 .
At t = 0 : ξ(0) is the horizontal surface, at which ϕ = 0, p = 1. Here r and θare the polar coordinates, the angle θ is reckoned from the vertical axis.
7.3 Formation of Jet Flows and Their Hydrodynamic Models 331
The kinematic condition is omitted here, since, as was noted before, itis satisfied automatically in finding the boundary ξ(t). The condition on Rat t ≥ t0 is met simply by cutting a circle of radius R on the conductingpaper. The entire pattern of launching of the jet by a solid under impulsivemotion from beneath the free surface is shown in Fig. 7.23. It is clear that inspite of the distinctions in the dynamics of the “pistons” (the explosive cavityexpands, while the solid retains the size and moves only translationally) theflow character is amazingly identical (compare Figs. 7.19 and 7.23)!
Analysis of the dynamics of mass velocities in the calculations show thatafter the cylinder stops the velocity of particles on the free surface (nearthe axis) first noticeably decreases, then rapidly increases, which practicallyrepeats the dynamics and velocity distribution for the case of explosion. Themoment of stoppage of the body corresponds to the moment of emergenceof negative acceleration of the wall of the cavity with detonation products.The calculation (Fig. 7.23) performed for V0 = 10 m/s, R = 5 cm, andH = 1.4, shows that some time after the stoppage the liquid layer on thesolid surface concentrates to the axis of symmetry and forms a jet instead offlowing down. The pattern does not change qualitatively, if the cylinder Rhaving the velocity V0 at t = 0 moves with negative acceleration up to V = 0or instantaneously brings an impulse to the liquid and remains at the sameplace. The calculation results are supported by experimental studies.
Experimental simulation of sultans was performed for the plane and ax-isymmetrical cases with metal spheres, hollow half-cylinders or half-spheres.The momentum was driven to the hollow bodies by an explosion of a dis-tributed or concentrated charge (HE or exploding wire) placed immediately
Fig. 7.23. Formation of a jet dur-ing impulsive motion of a solidfrom beneath the free surface (cal-culation)
332 7 Jet Flows at Shallow Underwater Explosions
under the surface of the body, whose internal part (facing the charge) wascovered by special layers adsorbing shock waves in case of need. The wavesthat streamlined the thrown surface were already rather weak and did notdistort the integrity of the liquid above the thrown surface. As suggested bythe numerical estimates, the initial distribution of the particle velocities onthe free surface was an important factor within these statements and shouldhave relatively abrupt gradient with the maximum at the symmetry axis.The curvature radius of the thrown surface was selected of the same order asthe maximum radius of the explosive cavity in an unbounded liquid.
Figure 7.24a and b illustrates the experimental simulation of the process ofthe jet formation and acceleration by impulsive motion of a solid. The figureshows the case of impulsive motion of a solid sphere from underwater and theformation of a jet after the sphere stoppage. The horizontal line in the lowerpart of frames is the free surface separating liquid from air. Figure 7.24bshows a half-sphere of diameter 8 cm (its peak point is at a depth of 2cm) accelerated from under the liquid surface by a cavity resulting from theexplosion of a wire and was naturally way decelerated above the liquid surface.The recording speed was 600 frames per second, the energy accumulated inthe discharge gap was about 200 J. Figure 7.25 shows further developmentof the jet accelerated by a half-sphere. The recording speed was 25 frames
Fig. 7.24a,b. Jet formation under the acceleration of a solid sphere by mechanicalpulse (a) and of a half-sphere thrown by explosion of a wire (b) from beneath theliquid surface (experiments)
7.3 Formation of Jet Flows and Their Hydrodynamic Models 333
Fig. 7.25. Late stage of the development of a cumulative flow resulting from thepulse motion of a half-sphere
per second, the vertical scale of the frame was about 2 m (the depth ofsubmergence of the half-sphere was 4 cm). Due to the velocity gradient thejet expanded and then disintegrated into drops. Varying the depth of initialsubmergence and the velocity of the accelerated body, one could obtain freeflight of the jet.
Figure 7.26 shows the development of a sultan jet during launching ofa half-cylinder by a 1.2-g HE charge from the depth of 2 cm (the time in-terval is 20 ms). The jet developed against a background of a vertical “scalerule” with the distance between the grades of 1 m. The high-speed photosshowed that the thrown body imparted an impulse to the liquid layer aboveit and the deceleration of the body created conditions for modeling the for-mation of a jet during underwater explosion.
The above experimental results and the numerical analysis support a con-clusion on the similarity of the formation mechanisms of jets at shallow un-derwater explosions and throwing of a liquid layer by a spherical or cylindricalsolid from beneath the free surface.
7.3.4 Abnormal Intensification Mechanism of the First Pulsation
The second stage of underwater explosion at depths H ≥ Rmax starts af-ter the cavity with detonation products reaches its maximum size and alsocontributes to the formation of a system of cumulative jets [19,38,41] at un-

334 7 Jet Flows at Shallow Underwater Explosions
Fig. 7.26. Full-scale experiment on the acceleration of a hemicylindrical solid shellby HE charge and a cumulative jet formation, 5 m length
7.3 Formation of Jet Flows and Their Hydrodynamic Models 335
derwater explosions. Here the explosive cavity does not depressurize, a domeof fairly thin liquid layer is formed on the surface, while at the moment ofstoppage of the cavity the pressure in it is almost zero and the cavity canbe considered empty. Under the effect of hydrostatic pressure the cavity col-lapses and remaining “empty” over a considerable part of the half-periodradiates a compression wave (the first pulsation) at the end of collapse.
A sharp and unobvious amplification of the maximum amplitude of thefirst pulsation at underwater explosions near the free surface (as comparedwith deep explosions) was established experimentally in [1]. The change of theamplitude (sometimes several-fold) is characteristic of a very narrow range ofthe submergence depth of the HE charge, which, as established in numerousstudies for charges of various weight [1], are close to the maximum radius ofthe cavity with detonation products under the explosion in an unboundedliquid.
Figure 7.27 presents the data of [1] on the change of the relative valueof the maximum amplitude of the first pulsation p1 = p1/p1,∞ dependingon the charge depth, expressed in the terms of maximum radius of theexplosive cavity for the charges of weights 137 kg (circles) and 250 g (tri-angles). The following features of the experimental arrangement should benoted. The data on the explosion of a 137-kg charge were given with al-lowance for potential reflections from the free surface and the bottom, butthe effect of the boundaries on the size and shape of the cavity duringthe first and the second half-periods were naturally. The maximum cavitydiameter for 137-kg charge was equal to about 17 m (trotyl equivalent),while the depth of the explosion site was only 33 m. The data for the 250-g charge did not exclude the effect of the reflections from the boundariesfor the magnitude and the shape of the pressure wave, while the explo-sion depth to the maximum cavity diameter ratio was more satisfactory andequaled six.
The accuracy of positioning the charge is very important. However, thedata presented in Fig. 7.27 [1] indicated the existence of an abnormal in-crease in the amplitude of the first pulsation for charges of different weightin the region H = H/Rmax 1. The results for 1.2-g charge (marked by *)demonstrated the same character of the dependence p1(H) (but already ina practically “semi-infinite” region). It should be noted that the diagramsshowed an abrupt disappearance of the secondary pressure field (of the firstpulsation) under a slight decrease of the explosion depth as compared withthe “abnormal” value.
Cole [1] cited the explanation proposed by Kirkwood for the abnormaleffect, though he did not consider it convincing: at the stage of maximum ex-pansion the cavity depressurized and atmospheric air mixed with detonationproducts. Then, due to some further reactions an additional energy releasesin the mixture, this effect led to the amplification of the first pulsation undersubsequent collapse of the cavity.
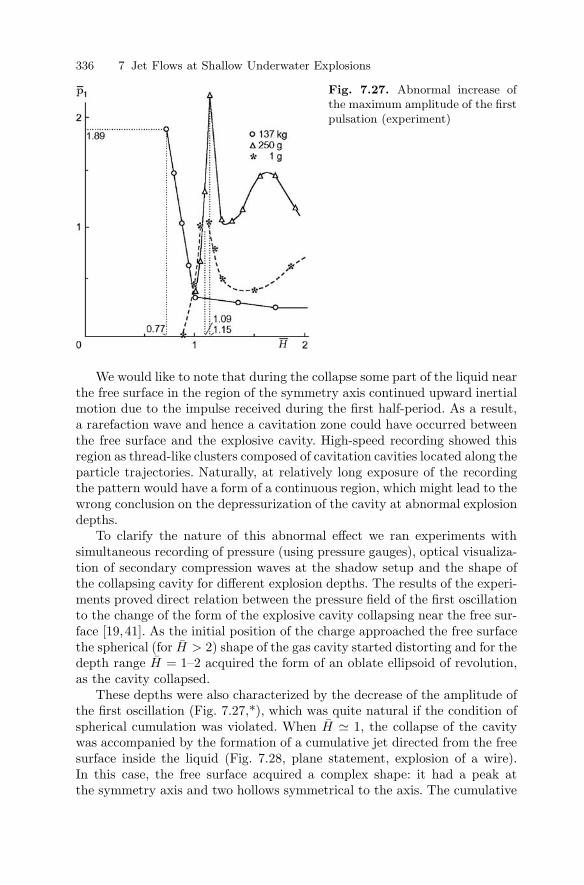
336 7 Jet Flows at Shallow Underwater Explosions
Fig. 7.27. Abnormal increase ofthe maximum amplitude of the firstpulsation (experiment)
We would like to note that during the collapse some part of the liquid nearthe free surface in the region of the symmetry axis continued upward inertialmotion due to the impulse received during the first half-period. As a result,a rarefaction wave and hence a cavitation zone could have occurred betweenthe free surface and the explosive cavity. High-speed recording showed thisregion as thread-like clusters composed of cavitation cavities located along theparticle trajectories. Naturally, at relatively long exposure of the recordingthe pattern would have a form of a continuous region, which might lead to thewrong conclusion on the depressurization of the cavity at abnormal explosiondepths.
To clarify the nature of this abnormal effect we ran experiments withsimultaneous recording of pressure (using pressure gauges), optical visualiza-tion of secondary compression waves at the shadow setup and the shape ofthe collapsing cavity for different explosion depths. The results of the experi-ments proved direct relation between the pressure field of the first oscillationto the change of the form of the explosive cavity collapsing near the free sur-face [19,41]. As the initial position of the charge approached the free surfacethe spherical (for H > 2) shape of the gas cavity started distorting and for thedepth range H = 1–2 acquired the form of an oblate ellipsoid of revolution,as the cavity collapsed.
These depths were also characterized by the decrease of the amplitude ofthe first oscillation (Fig. 7.27,*), which was quite natural if the condition ofspherical cumulation was violated. When H 1, the collapse of the cavitywas accompanied by the formation of a cumulative jet directed from the freesurface inside the liquid (Fig. 7.28, plane statement, explosion of a wire).In this case, the free surface acquired a complex shape: it had a peak atthe symmetry axis and two hollows symmetrical to the axis. The cumulative
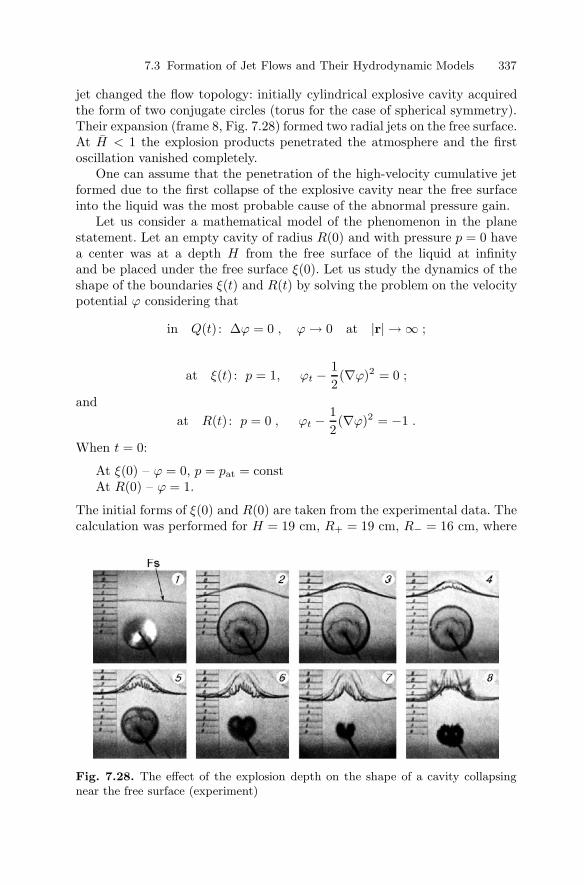
7.3 Formation of Jet Flows and Their Hydrodynamic Models 337
jet changed the flow topology: initially cylindrical explosive cavity acquiredthe form of two conjugate circles (torus for the case of spherical symmetry).Their expansion (frame 8, Fig. 7.28) formed two radial jets on the free surface.At H < 1 the explosion products penetrated the atmosphere and the firstoscillation vanished completely.
One can assume that the penetration of the high-velocity cumulative jetformed due to the first collapse of the explosive cavity near the free surfaceinto the liquid was the most probable cause of the abnormal pressure gain.
Let us consider a mathematical model of the phenomenon in the planestatement. Let an empty cavity of radius R(0) and with pressure p = 0 havea center was at a depth H from the free surface of the liquid at infinityand be placed under the free surface ξ(0). Let us study the dynamics of theshape of the boundaries ξ(t) and R(t) by solving the problem on the velocitypotential ϕ considering that
in Q(t) : ∆ϕ = 0 , ϕ → 0 at |r| → ∞ ;
at ξ(t) : p = 1, ϕt − 12(∇ϕ)2 = 0 ;
andat R(t) : p = 0 , ϕt − 1
2(∇ϕ)2 = −1 .
When t = 0:
At ξ(0) – ϕ = 0, p = pat = constAt R(0) – ϕ = 1.
The initial forms of ξ(0) and R(0) are taken from the experimental data. Thecalculation was performed for H = 19 cm, R+ = 19 cm, R− = 16 cm, where
Fig. 7.28. The effect of the explosion depth on the shape of a cavity collapsingnear the free surface (experiment)
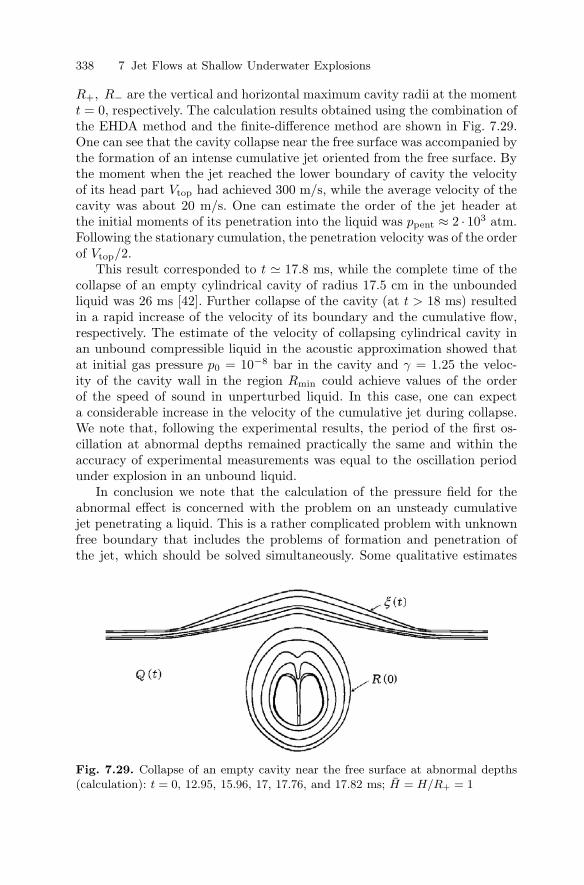
338 7 Jet Flows at Shallow Underwater Explosions
R+, R− are the vertical and horizontal maximum cavity radii at the momentt = 0, respectively. The calculation results obtained using the combination ofthe EHDA method and the finite-difference method are shown in Fig. 7.29.One can see that the cavity collapse near the free surface was accompanied bythe formation of an intense cumulative jet oriented from the free surface. Bythe moment when the jet reached the lower boundary of cavity the velocityof its head part Vtop had achieved 300 m/s, while the average velocity of thecavity was about 20 m/s. One can estimate the order of the jet header atthe initial moments of its penetration into the liquid was ppent ≈ 2 · 103 atm.Following the stationary cumulation, the penetration velocity was of the orderof Vtop/2.
This result corresponded to t 17.8 ms, while the complete time of thecollapse of an empty cylindrical cavity of radius 17.5 cm in the unboundedliquid was 26 ms [42]. Further collapse of the cavity (at t > 18 ms) resultedin a rapid increase of the velocity of its boundary and the cumulative flow,respectively. The estimate of the velocity of collapsing cylindrical cavity inan unbound compressible liquid in the acoustic approximation showed thatat initial gas pressure p0 = 10−8 bar in the cavity and γ = 1.25 the veloc-ity of the cavity wall in the region Rmin could achieve values of the orderof the speed of sound in unperturbed liquid. In this case, one can expecta considerable increase in the velocity of the cumulative jet during collapse.We note that, following the experimental results, the period of the first os-cillation at abnormal depths remained practically the same and within theaccuracy of experimental measurements was equal to the oscillation periodunder explosion in an unbound liquid.
In conclusion we note that the calculation of the pressure field for theabnormal effect is concerned with the problem on an unsteady cumulativejet penetrating a liquid. This is a rather complicated problem with unknownfree boundary that includes the problems of formation and penetration ofthe jet, which should be solved simultaneously. Some qualitative estimates
Fig. 7.29. Collapse of an empty cavity near the free surface at abnormal depths(calculation): t = 0, 12.95, 15.96, 17, 17.76, and 17.82 ms; H = H/R+ = 1
7.3 Formation of Jet Flows and Their Hydrodynamic Models 339
within the model of an ideal incompressible liquid in the plane statementwere obtained in [19] and [43].
7.3.5 Two Models of Formation of Radial Sultans
As was shown above, as a result of the penetration of a cumulative jet intoa liquid, the explosive cavity with detonation products is split into two cavi-ties symmetrical with respect to the axis (in the plane case) or acquires theform of a torus (axisymmetrical case). Due to inertia of the liquid, these cav-ities collapse to a certain minimum size with pressure p pat, though muchlower than during the first symmetrical oscillation. Then the cavities (torus)start expanding and in this sense the problem is equivalent to the first stageof the explosion considered above. But now the cavity with detonation prod-ucts is of more complicated form and the free surface, as shown in Fig. 7.28,is far from being plane.
Within the model and the calculation method we shall consider a planeliquid flow arising under the expansion of two cavities symmetrical with re-spect to the axis. We take the initial forms of the cavities and the free surfacefrom the solution of the problem on the collapse of an empty cylindrical cavitywith the initial circular section [19] near the free surface and the depth of sub-mergence of the center equal to 0.8 cavity radius and from the experimentalsimulation data for the case of exploding wires.
Let two gas cavities of R(0) at the time t = 0 be placed at certain equaldistance H from the free surface ξ(0) symmetrically with respect to the axis(Fig. 7.30) in an ideal incompressible liquid. The pressure at ξ(t) is con-stant and equal to pat, at R(t) it changes following the known adiabatic law.The solution of the problem consists of seeking for unsteady boundaries ξ(t)and R(t), and the velocity potential, for which the conditions stated in theproblem on the sultan are valid. At t = 0, ξ(0) and R(0) have the form shownin Fig. 7.30. The situation was modeled for the explosion of a 1.2-g charge,the depth of the secondary “explosive” expansion of the cavities, H = 13 cm,was reckoned from the free surface at infinity to the upper point of the bound-ary R(0), the initial pressure of the detonation products in the cavities wasequal to p(0) = 104 bar.
The calculation results for the surfaces ξ(t) and R(t) are presented for thetimes 0, 110, 130, 160, and 190 µs. One can see that a radial jet (circular jetin the case of “explosive” expansion of a torus) developed symmetrically onthe free surface of the liquid.
Analysis of the calculation results for the dynamics of mass velocitiesfor the reference points marked in Fig. 7.30 showed how gradually a flow wasformed with velocities much higher than those of peripheral and central pointsnear the point with the fourth order number (the first is at the symmetryaxis). This suggests that the flow on the free surface near this point becamedistinctly directional. Undoubtedly this flow was analogous to the first stageof the formation of sultans with the only distinction, the free surface here
340 7 Jet Flows at Shallow Underwater Explosions
Fig. 7.30a,b. Calculation of the formation of radial throwing out: (a) general flowpattern, (b) the system of equipotentials and current-flow lines for t = 130 µs
had two cumulative pits with the axes inclined to the symmetry axis, and asthe result the directional throwing out occurred at an angle to the symmetryaxis.
The radial character of the sultan under explosion near the inclined freesurface was also illustrated by the model experiments. Figure 7.31a showsthe formation of a directional radial jet resulting from successive explosion oftwo wires. The first explosion I produced the inclined surface, the second II(frame 2) was performed with a delay determined from the preset deepeningof the second “charge” H < 1. Figure 7.31b illustrates the same effect ofdirectional radial throwing out during subsequent explosion (with a delayfor the formation of an explosive cavity) of two HE charges at the bottom ofa water reservoir (the experiment was run at the Institute of Water Transport,Novosibirsk).
Radial sultansduring the secondexpansionof theexplosive cavity (Fig. 7.19,frame 7) also arose during modeling of the process by throwing a half-sphere(Fig. 7.25, frames 1 and 2, the result of the second oscillation of the explosivecavity under the thrown half-sphere). In this case, the role of the inclinedsurface was played by a curved surface near the sultan jet that was alreadyformed at the first stage of throwing. Cole [1] pointed to the existence ofradial fountains that occurred under shallow explosions of large HE charges(137 kg). As the explosion depth changed (downward from the surface) theradial fountains sometimes foreran vertical fountains. One of the mechanismsof their formation could be concerned with the cavitation effects. Indeed,strong tensile stresses occurring as a result of the reflection of powerful shockwaves from the free surface resulted in the formation of a cavitation regionwith considerable concentration of cavitation bubbles, whose lifetime wascomparable with the characteristic time of the process under consideration.The fast expansion of the cavity with detonation products occurred in themedium with essentially distorted continuousness. Then, by appearance theeffect was equivalent to the explosions in soils near the free surface, at which,as a rule, radial throwing out unrelated to the above cumulative jets wereobserved. This reminds us of the so-called streamer structure (see Chap. 6)
7.3 Formation of Jet Flows and Their Hydrodynamic Models 341
Fig. 7.31a,b. Experimental formation of radial jets: (a) modeling with explodingwires, (b) full-scale experiment
characterized by instabilities arising under the expansion of a cavitating liquidlayer.
This model is illustrated qualitatively in Fig. 7.32 by the example of twoexperiments: explosion of a one-gram HE charge at a depth of 10 cm ina pure liquid (a) and in a liquid containing gas bubbles of diameter 3–5 mmand concentration of several tens of percents (b). It should be noted thatunderwater explosion in a bubbly medium can be used to model explosionsin soils. Indeed, at certain concentration of the gas phase the bubbly liquidlost connectivity and explosive processes in it could develop following theaccepted soil models, according to which:
– In the near zone, the soil behaved as an ideal liquid (in a model mediumin the near zone, bubbles affected by powerful shock waves will fail anddissolve, thus the two-phase medium becomes uniform)
– In the middle zone, the wave strongly attenuated (modeled by the ab-sorption of the shock wave by a bubbly medium)
342 7 Jet Flows at Shallow Underwater Explosions
Fig. 7.32a,b. Surface effects under explosion of a one-gram HE charge at a depthof 10 cm (experiment): (a) uniform liquid, (b) bubbly medium
7.3 Formation of Jet Flows and Their Hydrodynamic Models 343
– In the far zone, the saturated bubbly medium behaved as loose soil (forexample, the contents flew away from the free surface under the effect ofexpanding cavity with HE detonation products)
Above we considered the models of radial jet flows for the depths of the orderof 30 charge radii and less. It is noteworthy that radial flows occurred duringthe explosion of large HE charges at a depth of about (50–60)Rch [44] at themoment of arrival of the explosive cavity at the surface.
7.3.6 Basic Parameters of Sultans
Figure 7.33 demonstrates the effect of the explosion depth by the example ofunderwater explosions of light charges: H > 0.9 was the region of existenceof the first oscillation, H ≈ 1.1 was the abnormal effect, H < 0.9 was thedepressurizing of the explosive cavity, and H ≈ 0.6 was the maximum liquidthrowing out in the jet. Over the interval H = 0.5–0.15, the velocity of the jetpeak increased by a factor of 6–7, while the amount of liquid in it decreasedby an order of magnitude.
Based on the generalized data of [7,8,10] and the results presented in thischapter, the main parameters of the vertical emission can be presented asfollows:
hmax 60 · W 1/4 ∼ (EWρg )1/4 is the maximum rise height;
H∣∣hmax
0.5 · W 1/4 is the appropriate explosion depth;Tmax 2.25 · W 1/8 ∼ (EW
ρg5 )1/8 is the time of rise to hmax;Mmax 300 · W ∼ (EW
gH ) is the maximum amount of liquid in the jet;HMmax W 1/3 is the explosion depth corresponding to Mmax;vjet 30W 0.5
H1.5 ∼ (EWρH3 )1/2 is the maximum velocity of the jet peak for
the explosion depths H = H/Rmax 0.15–1.
Fig. 7.33. Abnormal amplitudes ofthe first pulsation p1, dynamics of theliquid mass M , and the velocity of thesultan peak v (experiment)
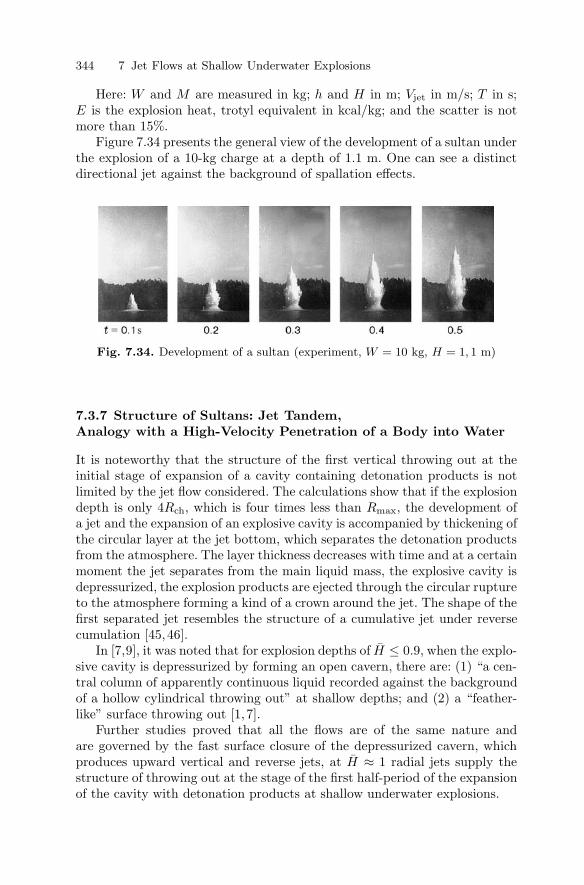
344 7 Jet Flows at Shallow Underwater Explosions
Here: W and M are measured in kg; h and H in m; Vjet in m/s; T in s;E is the explosion heat, trotyl equivalent in kcal/kg; and the scatter is notmore than 15%.
Figure 7.34 presents the general view of the development of a sultan underthe explosion of a 10-kg charge at a depth of 1.1 m. One can see a distinctdirectional jet against the background of spallation effects.
Fig. 7.34. Development of a sultan (experiment, W = 10 kg, H = 1, 1 m)
7.3.7 Structure of Sultans: Jet Tandem,Analogy with a High-Velocity Penetration of a Body into Water
It is noteworthy that the structure of the first vertical throwing out at theinitial stage of expansion of a cavity containing detonation products is notlimited by the jet flow considered. The calculations show that if the explosiondepth is only 4Rch, which is four times less than Rmax, the development ofa jet and the expansion of an explosive cavity is accompanied by thickening ofthe circular layer at the jet bottom, which separates the detonation productsfrom the atmosphere. The layer thickness decreases with time and at a certainmoment the jet separates from the main liquid mass, the explosive cavity isdepressurized, the explosion products are ejected through the circular ruptureto the atmosphere forming a kind of a crown around the jet. The shape of thefirst separated jet resembles the structure of a cumulative jet under reversecumulation [45, 46].
In [7,9], it was noted that for explosion depths of H ≤ 0.9, when the explo-sive cavity is depressurized by forming an open cavern, there are: (1) “a cen-tral column of apparently continuous liquid recorded against the backgroundof a hollow cylindrical throwing out” at shallow depths; and (2) a “feather-like” surface throwing out [1, 7].
Further studies proved that all the flows are of the same nature andare governed by the fast surface closure of the depressurized cavern, whichproduces upward vertical and reverse jets, at H ≈ 1 radial jets supply thestructure of throwing out at the stage of the first half-period of the expansionof the cavity with detonation products at shallow underwater explosions.
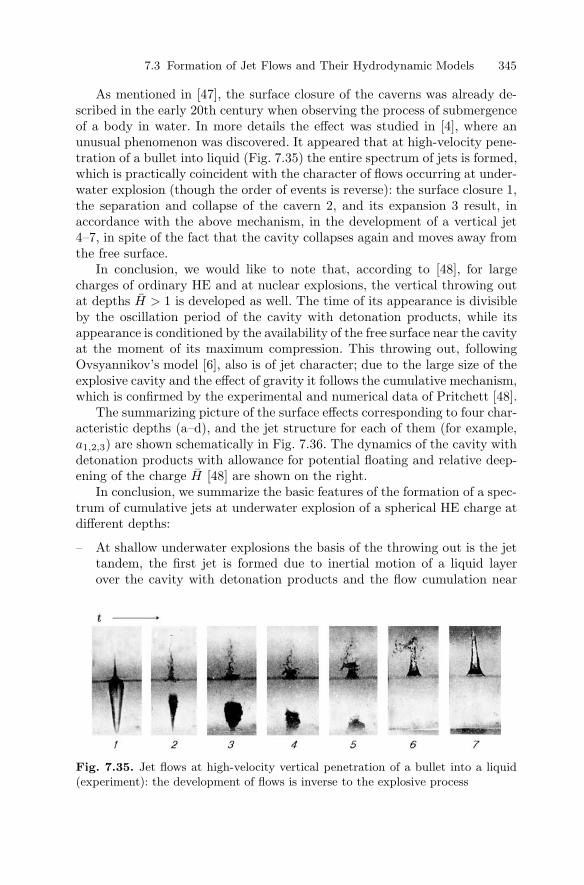
7.3 Formation of Jet Flows and Their Hydrodynamic Models 345
As mentioned in [47], the surface closure of the caverns was already de-scribed in the early 20th century when observing the process of submergenceof a body in water. In more details the effect was studied in [4], where anunusual phenomenon was discovered. It appeared that at high-velocity pene-tration of a bullet into liquid (Fig. 7.35) the entire spectrum of jets is formed,which is practically coincident with the character of flows occurring at under-water explosion (though the order of events is reverse): the surface closure 1,the separation and collapse of the cavern 2, and its expansion 3 result, inaccordance with the above mechanism, in the development of a vertical jet4–7, in spite of the fact that the cavity collapses again and moves away fromthe free surface.
In conclusion, we would like to note that, according to [48], for largecharges of ordinary HE and at nuclear explosions, the vertical throwing outat depths H > 1 is developed as well. The time of its appearance is divisibleby the oscillation period of the cavity with detonation products, while itsappearance is conditioned by the availability of the free surface near the cavityat the moment of its maximum compression. This throwing out, followingOvsyannikov’s model [6], also is of jet character; due to the large size of theexplosive cavity and the effect of gravity it follows the cumulative mechanism,which is confirmed by the experimental and numerical data of Pritchett [48].
The summarizing picture of the surface effects corresponding to four char-acteristic depths (a–d), and the jet structure for each of them (for example,a1,2,3) are shown schematically in Fig. 7.36. The dynamics of the cavity withdetonation products with allowance for potential floating and relative deep-ening of the charge H [48] are shown on the right.
In conclusion, we summarize the basic features of the formation of a spec-trum of cumulative jets at underwater explosion of a spherical HE charge atdifferent depths:
– At shallow underwater explosions the basis of the throwing out is the jettandem, the first jet is formed due to inertial motion of a liquid layerover the cavity with detonation products and the flow cumulation near
Fig. 7.35. Jet flows at high-velocity vertical penetration of a bullet into a liquid(experiment): the development of flows is inverse to the explosive process

346 7 Jet Flows at Shallow Underwater Explosions
Fig. 7.36. Surface effects at underwater explosions and the schemes of their devel-opment (based on experimental data)
the symmetry axis, the second jet is a result of the surface closure of thecavern upon depressurizing of the cavity.
– At abnormal depths the explosion is accompanied by the formation ofa downward vertical cumulative jet, change of the flow topology, and fur-ther development of radial cumulative jets under the secondary expansionof a toroidal cavity with detonation products.
– During large-scale explosions at depths corresponding to the region ofexistence of the first oscillation, there are vertical throwing out whosemechanism is determined by the development of the cumulative jet in thebottom part of the giant floating and collapsing explosive cavity (hundredsof meters in radius) in a heavy liquid, if in due time it appears near thefree surface and the cumulative jet is capable of perforating the remainingliquid layer.
7.4 Jet Flows: Shallow Explosions of Circular Charges
This section deals with analysis of formation mechanisms of the sultans gen-erated by powerful deep-water explosions. These processes are governed bythe gravity forces that influence the rate of emergence of the explosive cavityduring oscillations and the change of its topology. The latter is due to thedevelopment of the cumulative flow in the lower half of the spherical cavityduring the second half-period of oscillations. The vertical cumulative jet per-forates the upper boundary of the buoyant cavity, transforming the sphere

7.4 Jet Flows: Shallow Explosions of Circular Charges 347
into a torus. Furthermore, the oscillation process continues displaying all fea-tures of inertial motion. Several scenarios of the appearance of directionalthrowing out on the free surface are possible. One of them is associated withthe estimate of the rate of emergence and the information on the pulsationperiod, which allows prediction of the probability of coincidence of two events.This is the concurrence of the time required for the formation of a cumulativejet and the time it takes the explosive cavity to reach the free surface. Thescenario with an oscillating torus is also probable.
7.4.1 Gravity Effect
As was mentioned, gravity has a considerable effect on the dynamics of theexplosive cavity at large-scale underwater explosions: a vertical motion (emer-gence) arises, whose impulse over the time t (assuming that the cavity remainsspherically symmetrical) is determined by the integral
I =43πρg
t∫0
R3(t) dt .
With allowance for the added mass, which amounts to half the volume of theliquid displaced by the cavity, one can estimate the emergence velocity of theexplosive cavity
V∗ 2g
R3
t∫0
R3(t) dt .
Zamyshlyaev and Yakovlev [2] analyzed the development of the explosivecavity and proposed a simple approximation of its dynamics divided the ex-pansion time equal to a half of the first oscillation period T into two intervals:
R
Rmax R0
Rmax
[1 + 3.73
(Rmax
R0
)2.5 t
T
]0.4
at t/T ≤ 0.1
andR
Rmax[sin
(πt
T
)]0.36
at 0.1 ≤ t/T ≤ 0.5 .
The formula for the impulse I can be expressed in terms of the relativevariables z = R/Rmax and τ = t/T , and the limit of integration can berestricted by the expansion time τ = 1/2. Then the impulse acquired by thesystem over the cycle is defined by the dependence
I =43πρgR3
maxT
1/2∫0
z3 dτ .
The multiplier under the integral can be expressed in terms of the explo-sion energy Q and the hydrostatic pressure p0. One should remember that the
348 7 Jet Flows at Shallow Underwater Explosions
potential energy of the system U = p0Vmax and Q are related by the depen-dence U = α1Q, while T = 1.14α
1/31 Q1/3ρ1/2p
−5/60 . Following [1], α1 0.41
and α2 0.14 for the first and the second oscillations, respectively. Using thedata of [2] for R(t), one can estimate the integral in the last determination ofthe impulse. It is equal to about 0.1. Thus, the impulse can be determined as
I 0.035gρ3/2Q4/3p−11/60 .
The emergence rate of the explosive cavity (in the vicinity of Rmin) at τ =1/2 for a 1-kg charge exploded at a depth of 600 m estimated in accordancewith the relation
V∗ 0.228gρ1/2(α1EW )1/3p−5/60
yields a value of about 60 cm/s. For a 30-kg charge it is about 180 m/s ata specific explosion energy E 1 kcal/g.
One can assume that at the following motion stages the vertical impulseis retained, as well as the total energy of the system (as a sum of currentvalues of the potential energy, the kinetic energies of the radial and forwardmotion, and the internal energy of explosion products with regard to theenergy loss for radiation under the first oscillation). After the first oscillationthe internal energy of compressed explosion products decreases considerably(to 0.14Q), while the value of the cavity size at the first minimum correspondsto approximately three initial volumes of the HE charge. This result is easilyobtained assuming that at an energy release of 0.14Q1 the same value of Rmax
can be reached only if the charge volume exceeds the initial value by a factorof α1/α2.
Within the framework of the Navier–Stokes equations under the assump-tion of incompressibility of a liquid, Pritchett [48] calculated the dynamicsof the cavity with the detonation products of a 30-kiloton device blasted ata depth of 610 m. The calculations showed that after over 7.5 s the cav-ity came up for approximately 340 m, making three oscillations. The es-timate of the emergence rate of the cavity (from the slope of the tangentto the trajectory of the initial stage of the second expansion) at the mo-ment corresponding to the first minimum yielded a value of about 150 m/s.Thus, the dependence V∗(H) provided a fairly acceptable estimate of thisparameter.
Of particular interest are calculations of an explosive cavity, whose shapeduring the first collapse already transformed from a sphere into a toroid dueto the development of an upward cumulative jet in the bottom part of cav-ity. The radius of the cavity at the first maximum was equal to 115 m: itcorresponded to the pressure difference of 2.3 MPa between the upper andthe lower points of the cavity [48]. Naturally, this suggested that sphericalsymmetry was not retained under these collapse conditions. Since the cumu-lative jet was directed upward, after it touched the upper boundary of thecavity a vortex-type flow started forming with a “core” as a rather stabletoroid with detonation products and a vertical jet. It should be noted that in
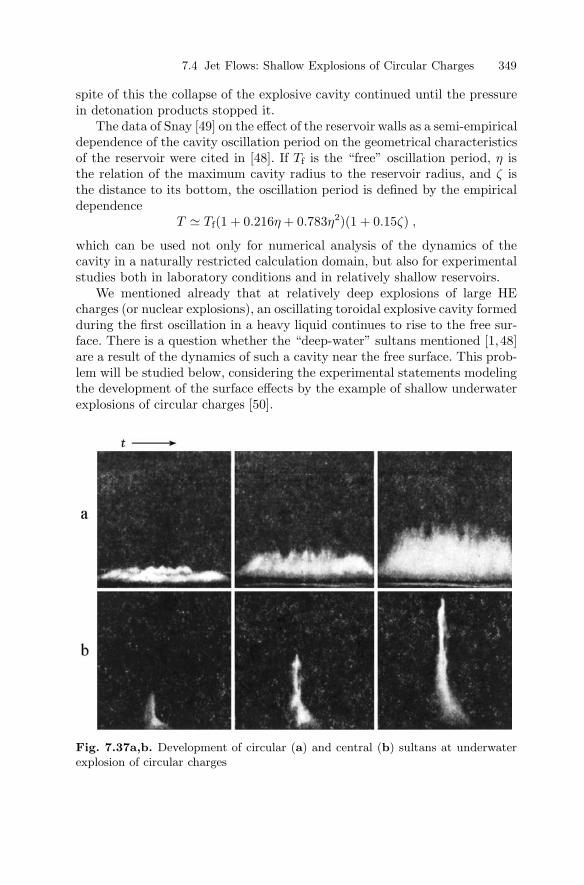
7.4 Jet Flows: Shallow Explosions of Circular Charges 349
spite of this the collapse of the explosive cavity continued until the pressurein detonation products stopped it.
The data of Snay [49] on the effect of the reservoir walls as a semi-empiricaldependence of the cavity oscillation period on the geometrical characteristicsof the reservoir were cited in [48]. If Tf is the “free” oscillation period, η isthe relation of the maximum cavity radius to the reservoir radius, and ζ isthe distance to its bottom, the oscillation period is defined by the empiricaldependence
T Tf(1 + 0.216η + 0.783η2)(1 + 0.15ζ) ,
which can be used not only for numerical analysis of the dynamics of thecavity in a naturally restricted calculation domain, but also for experimentalstudies both in laboratory conditions and in relatively shallow reservoirs.
We mentioned already that at relatively deep explosions of large HEcharges (or nuclear explosions), an oscillating toroidal explosive cavity formedduring the first oscillation in a heavy liquid continues to rise to the free sur-face. There is a question whether the “deep-water” sultans mentioned [1,48]are a result of the dynamics of such a cavity near the free surface. This prob-lem will be studied below, considering the experimental statements modelingthe development of the surface effects by the example of shallow underwaterexplosions of circular charges [50].
Fig. 7.37a,b. Development of circular (a) and central (b) sultans at underwaterexplosion of circular charges
350 7 Jet Flows at Shallow Underwater Explosions
7.4.2 Flow Structure Produced by Explosions of Circular Charges
We want to remind readers here that the features of the structure of the wavefield arising under explosion of circular charges have been considered in detailin above sections. As was mentioned, if the circle radius is ar ≥ 150 Rch, thefinal value of the detonation rate does not affect significantly the formationof the circular explosive cavity that keeps the form of a regular torus for longenough to get reliable modeling results.
The first experiments run in a natural reservoir, under the field condi-tions for circular charges with diameter of up to 2 m made of standard DC(Rch = 1, 5 mm), confirmed the validity of the proposed model (Fig. 7.37).Figure 7.37a presents three successive moments of the high-speed recordingof the development of a circular sultan under the explosion of DC charge,2-m diameter, at a depth of 30 cm. We note that the maximum radius of thecavity with detonation products for a linear charge made of the same DCwas approximately 20 cm. As the circle diameter decreased at fixed explosiondepth, the character of the surface throwing out changed: Fig. 7.37b illus-trates the development of a central sultan in the test with a circular charge0.4 m in diameter, which confirmed the probability of appearance of a verticalthrowing out on the free surface at deep large-scale explosions.
The structure of such flows was revealed in detailed laboratory studieswith semi-ring charges whose plane was placed in parallel to the free surface,while the charge (or wire) ends were placed on a transparent vertical wall.In particular, such an arrangement made it possible to observe the flow de-velopment in the region of the circle axis. Figure 7.38 shows the high-speedphotos of the explosion of a semi-ring 1 made of DC (Rch = 0.0325 cm) 18cm in diameter at a depth of 9 cm below the free surface 2. The time intervalbetween frames was 0.5 ms.
Two features should be emphasized: a cylindrical trace 3 (frames 3–7) inthe cavitation zone (near the symmetry axis) and a thin vertical jet 4 onthe surface in the dome center. The latter, as is known, consisted of splitcavitating layers. It is obvious that the spall structure (with formation ofa fountain-like throwing out 4) in the experiments with circular charges wasdetermined by the form of a quasi-toroidal front of shock wave and by its
Fig. 7.38. Flow structure during explosion of a semi-ring HE charge
7.4 Jet Flows: Shallow Explosions of Circular Charges 351
focusing. To support this suggestion, the charge was placed in a dead-endcircle of metal tube filled with water whose parameters were selected sothat the leakproofness of the container and its size were preserved duringthe explosion. Naturally, only the shock wave “worked” under these condi-tions.
Thus, the experimental result was as follows: the fountain throwing outwas observed in the experiment, while there was no central cylindrical trace inthe cavitation zone. This result confirmed the fact that during the expansionof a toroidal cavity with detonation products, a jet was formed in the regionof the symmetry axis of the circular charge due to the cumulation of the liquidflow on the axis. The details of the structure of the central jet were identifiedin similar arrangements with exploding wire. Figure 7.39 shows the sequenceof the development of a flow on the free surface 2 and the cavity dynamics 1during the explosion of a nichrome semi-ring wire (5 cm in diameter) ata depth of 4 cm. The time between frames was 4/3 ms. One can see thatthe energy per unit length of the conductor released under the discharge ofa high-voltage capacitor bank was rather high in this experiment: the cavitywas heavily deformed in the center and its maximum size was on the orderof the explosion depth.
The peculiarities of this flow “section” in the central zone suggested thatthe vertical sultan forming on the free surface was a hollow central circularjet 3, whose nature was determined by the initial shape of the charge (ratherthan by the depressurizing of the cavity) and was apparently associated withthe closure of the circular jet on the surface, as one of the structures of thevertical sultan in the geometry of this kind of flows. At later times (frames5–7) the structure of the throwing out on the surface was similar to that inexperiments with spherical charges.
The experimental results for the dependence of the height of the centraljet h(τ) at underwater explosions of circular charges of diameter 40–80 cm(standard DC) at depths of H = 20–80 cm are summarized in Fig. 7.40.Despite the noticeable scatter in experimental data for the initial stage of riseof the sultan that might be due to the overlapping of the “fountain” throwingout of the split dome, we can make a conclusion on the general similarity ofthe development of central jets for different linear parameters of circularcharges and explosion depths. Over the main time interval (τ 4 101–104),
Fig. 7.39. The structure of the vertical jet during explosion of a semi-ring wire
352 7 Jet Flows at Shallow Underwater Explosions
Fig. 7.40. The height of the centralsultan jet during underwater explo-sion of circular charges
the dependence h(τ) was of power character and was approximated by thesimple expression
h
H τ1/2 where τ =
(EW
ρchH5
)1/2
· t
or
h (
EW
ρchH
)1/4
t1/2 .
Here E is the explosion energy per HE unit mass, W is the HE mass, ρch isthe HE charge density, and t is the dimensional time.
7.4.2.1 Hydrodynamic model
It is logical to apply the above hydrodynamic model of a sultan to throwing ofa liquid layer by a solid. However, in the case of circular charge this problem isfurther complicated by the necessity of modeling of the convergent flow, whosedynamics changes considerably during the expansion of a toroidal cavity.Nevertheless, it appears that if the dimensions of a solid tore correspondto the maximum dimensions of the cavity with detonation products, theexpected effect can be achieved.
Fig. 7.41. Formation of circular and central jets during impulsive motion of a solidtore from under the liquid surface

7.5 Shallow Underwater Explosions, Surface Water Waves 353
Figure 7.41 shows the development of circular 4 and central 3 jets duringthe impulsive motion from beneath the liquid surface 1 of a solid toroid 2that was imparted an upright impulse (high-speed recording). The impulsewas imparted to the structure shown in the figure by the explosion of an HEmicrocharge using a device rigidly connected with the toroid and placed ata depth of several toroid diameters. The interval between the first frames was4 ms, all subsequent intervals were 4.3 ms. One can see that, as in the fieldexperiments, two jet systems were formed after the toroid stop: a circular(full analogy with throwing of cylindrical and spherical shells) and axial dueto cumulation of flow to the axis that acquired radial mass velocities in theupward motion of a solid toroidal surface.
The results show that one of the possible formation mechanisms of thejet flow on the free surface formed at underwater explosion of large chargesis determined by the flow cumulation to the axis at the stage of expansionof the toroid formed during the emergence of an initial spherical cavity withdetonation products in a heavy liquid and the change of the flow structurewith the formation of a stable toroidal cavity.
7.5 Shallow Underwater Explosions,Surface Water Waves
As the conclusion to this section I would like to mention a few results, some ofwhich were practically inaccessible to Russian readers for a long time. Never-theless, even a little information would be useful to have for a more completerepresentation different aspects of problems of shallow underwater explosions.
A numerical implementation of a generalized hydrodynamics has beenused by Rogers and Szymczak to compute a number of violent surface motions(characterized by the collision of different portions of the free surface) [51].In particular in a test of the predictions of the generalized hydrodynamics,the evolution of a plume generated by underwater explosions was comparedwith a computed plume history. An important diagnostic tool for studyingviolent surface motions has been the analysis of the sum of the kinetic andinternal energies of the flow. Accordingly, one includes some results of aninvestigation into mechanisms for energy dissipation, as well as a descriptionof some relations between energy loss and modes of cavity collapse.
A theory on the generation and collapse of water craters created by explo-sions in shallow water was developed in [52] by Khangaonkar and Lemehaute.A leading wave generated by a crater lip radiates outward while the watercrater collapses towards the center. This phenomenon is similar to the dambreak problem on a dry bed. The water edge reaches the center and formsa cylindrical dissipative bore the height of which decays rapidly with dis-tance from the center. The method is applied to wave records obtained inthe laboratory, ponds, and lakes with TNT explosions and also tested withthe wave records from nuclear explosions, with yields ranging over 11 orders

354 7 Jet Flows at Shallow Underwater Explosions
of magnitude. It is found consistently that the characteristic size of watercrater created by underwater explosions in shallow water can be determinedas R(c) = W0.25, with R(c) in feet, and W in pounds of TNT. The relativehydrodynamic energy dissipation is nearly a constant 40% of the potentialenergy of the initial crater with lip.
Mechanisms in the generation of airblasts by underwater explosions werestudied by Malme, Carbonell, and Dyer in [53]. Small-scale experimental testswere conducted to explore the formation and propagation of airblasts result-ing from underwater explosions. The objects of the work were to describe themechanisms of the explosion energy transferring through the interface and torelate the pressure field and water motion to the observed airblast pressures.The resulting airblast signature was found to be produced by acoustic radia-tion from a large surface area following the passage of the transmitted shock.When the interface velocity above the charge is supersonic, the character ofthe airblast signature becomes more shock-like and the explosion is said tobe “shallow”. While the airblast generating mechanisms of deep explosionsare still present, their effect is generally overshadowed by the shock waveassociated with the supersonically rising dome and plume. The intensity ofthis shock is closely related to the Mach number of the plume. A method ofcalculating the airblast from shallow explosions was developed. This methodconsiders the driving mechanism of the plume to be the impulse transmit-ted by the explosion to the water above the charge. The plume motion isstrongly influenced by the reaction of the air and is predicted analytically us-ing supported-shock theory. This permits an approximate calculation of thepeak airblast pressure using existing theory on off-axis shock-wave generationby supersonic blunt bodies.
Craig [54] has carried out a series of experiments on the water wave ampli-tude vs depth of charge detonation at underwater explosions. The position ofthe center of charges (25.4 mm in diameter) was varied from +6.4 to −610 mmrelative to the water surface (0 mm). Craig noted that the shape, size, andthe plume created in the result of the momentum of the collapsing water areapparently influenced by details of the explosive bubble collapse, by the rem-nant of the water encasing the steam of the mushroom cloud, and by waterback from the jet. It’s known that the wave amplitude vs. depth of a givencharge of explosive has two maxima. One maximum corresponds to so calledthe upper critical depth (UCD) and occurs when the charge is between one-half and just fully submerged. The work [54] was done to confirm the UCDphenomenon as well as to provide quantitative data useful for calibratinga computer model of the phenomena. Increasing the charge radius by a factorof two (50.8 mm in diameter) did not result in any clear qualitative change.
As shown in [54], the explosive bubble had a general downward mo-tion contrary to expectations from consideration of buoyancy alone. How-ever, this motion is not in qualitative disagreement with the “image-source”model [55]. A point of concern in the experiments performed in a smallertank by Ch. Mader [56] was the cause of the root extending from the bottom
7.5 Shallow Underwater Explosions, Surface Water Waves 355
of the explosive bubble. It was assumed that the root can be due to eitherthe small tank size, the method of support of the charge, or the MDF. Theanalogous studies were carried out by Hendricks and Smith [57] on above andbelow surface effects of one-pound underwater explosion. One needs to takeinto account that in this work a root was called a stem.
One can note that the root does not seem to have been previously recog-nized as separate from the bubble. Tracings of the bubble outline accordingto [58] could be interpreted as an approximate hemispherical bubble anda root. According to the experimental data of Kriebel [59] the tracing of thebubble generated by exploding wires can be explained in the same way. Theroot in these experiments was identified as a jet caused by inward collapse ofthe walls of the water column just before the cavity becomes fully expanded.
Hirt and Rivard [60] have investigated some aspects of explosively gener-ated water cavities near the ocean surface to reproduce (in particular, upwardand downward moving jets) in the numerical simulations the results of exper-iments and calculations received in [4, 54]. The authors [60] have supportedthe experimental observation of [4] regarding the source depth that producethe maximum upward jet mass. They also shown that the combination offollowing conditions can create the ideal situation for maximum effect: (1)it’s desirable that the explosive cavity pressure acts on the water surface untilit expands, and (2) one would like the cavity pressure to equilibrate with theatmosphere. It was noted, in particular, that a significant question arises withregard to the scaling that can be expected between nuclear and HE explosivesources at or near the UCD. Their opinion is unlikely that HE and nuclearsources can be scaled simply in terms of yield because, for instance, nucleardevices is producing a significant amount of vaporized water, a feature notassociated with HE tests.
The survey of experimental and theoretical efforts devoted to obtain-ing an understanding of explosion-generated water waves was presented byHirt in [61]. The subject of this report was using the appropriate computa-tional model to reproduce experimental data for high explosive tests, whichwould be a useful tool both for exploring scaling relationships and assess-ing the applicability of similar scaling rules for nuclear sources. The authorhas noted [61] that although several investigations have used hydrodynamiccomputer codes to simulate nuclear bursts in water, for example, [62], andhydrodynamic phenomena such as jets, roots, stems and plumes [4,54] thesestudies were qualitative and no detailed attempt has been made to verify com-putational models with experimental data for water wave parameters. In [61]a state-of-the-art computer program for free-surface hydrodynamics [63] wasapplied to model near-surface explosions and to investigate scaling processes.Based on these studies, modified scaling procedure including gravity and at-mospheric pressure effects were developed.
Theoretical problems for explosion-generated wave propagation were alsostudied by Pace et al. [64], LeNehaute [65] and Houston, and Chou [66].
356 7 Jet Flows at Shallow Underwater Explosions
References
1. R. Cole: Underwater Explosions (Dover, New York, 1965)2. B.V. Zamyshlyaev, Yu.S. Yakovlev: Dynamic Loads at Underwater Explosion
(Sudostroenie, Leningrad, 1967)3. V.P. Korobeinikov, B.D. Khristoforov: Underwater Explosion, Itogi Nauki
Tekh. Gidromekh, 9, pp. 54–119 (1976)4. V.K. Kedrinskii: Surface Effects at Underwater Explosions (Review), Zh. Prikl.
Mekh. i Tekh. Fiz. 19, 4, pp. 66–87 (1978)5. M.A. Lavrentiev, B.D. Shabat Hydrodynamics Problems and Mathematical
Models (Nauka, Moscow, 1973)6. L.V. Ovsyannikov: On floating of a bubble. In: Some Mathematics and Me-
chanics Problems (Nauka, Leningrad, 1970)7. H. Kolsky, I.I. Lewis et al.: Splashes from Underwater Explosion,
Proc. Roy. Soc. A 196, pp. 379–402 (1949)8. V.L. Zaonegin, L.S. Kozachenko, V.N. Kostyuchenko: Experimental Study of
Gas Bubble and Sultan Growth at Underwater Explosion, Zh. Prikl. Mekh. iTekh. Fiz. 1, 2 (1960)
9. L.S. Kozachenko, B.D. Khristoforov: Surface Effects at Underwater Explosions,Fiz. Goren. Vzryva 8, 3, pp. 433–439 (1972)
10. V.G. Stepanov, Yu.S. Navagin et al.: Hydroexplosive Pressing of Ship Units(Sudostroenie, Leningrad, 1966)
11. B.D. Khristoforov: Interaction of Shock Wave in Water with Free Surface, Zh.Prikl. Mekh. i Tekh. Fiz. 2, 1, pp. 30–38 (1961)
12. A.G. Ryabinin, S.A. Khristianovich, A.A. Grib: On the Reflection of PlaneShock Wave in Water from Free Surface, Prikl. Mat. Mekh. 20, 4 (1956)
13. A.G. Ryabinin: Reflection of a shock wave from the free surface in water.Ph.D. thesis, Leningrad (1957)
14. B.I. Zaslavskii: On Reflection of Spherical Shock Wave in Water from FreeSurface, Zh. Prikl. Mekh. i Tekh. Fiz. 4, 6, pp. 50–59 (1963)
15. M. Dubesset, M. Lavergne: Calcul de Cavtation due aux Explosions Sous-Marines a Faible Profoundeur, Intern. J. Acoustica 20, 5 (1968)
16. R.A. Wentzell, H.D. Scott, R.P. Chapman: Cavitation due Shock Pulses Re-flected from the Sea Surface, J. Acoust. Soc. Am. 46, 2 (1969)
17. L. Briggs: Limiting Negative Pressure of Water, J. Appl. Phys. 21, 7 (1950)18. Ch.L. Mader: Detonations near the water surface. In: Los Alamos Scientific
Laboratory of the University of California, report LA-4958, US-34 (Los Alamos,New Mexico, 87544, June 1972)
19. V.K. Kedrinskii: The Experimental Research and Hydrodynamical Models ofa “Sultan”, Arch. Mechanics 26, 3, pp. 535–540 (1974)
20. G. Flinn: Physics of acoustic cavitation in liquids. In: W. Mason (ed.) PhysicalAcoustics, vol. 1 B, (Academic Press, 1964) pp. 7–138
21. L.R. Gavrilov: Content of free gas in liquids and methods for measuring it. In:L. Rozenberg (ed.) Physic Base of Ultrasound Technology, Part 2 (M.: Nauka,1970) pp. 395–426
22. V.K. Kedrinskii: On relaxation of tensile stresses in cavitating liquid. In:P. Pravica (ed.) Proc. 13th Intern. Congress on Acoustics, vol. 1 (DraganSrnic Press, Sabac, 1989) pp. 327–330
References 357
23. V.K. Kedrinskii: Dynamics of Cavitation Zone at Underwater Explosion NearFree Surface, Zh. Prikl. Mekh. i Tekh. Fiz. 16, 5 (1975)
24. B.S. Kogarko: On One Model of Cavitative Liquid, Dokl. Akad. Nauk SSSR137, 6, pp. 1331–1333 (1961)
25. S.V. Iordanskii: On the Equations of Liquid Motion with Gas Bubbles, Zh. Prikl.Mekh. i Tekh. Fiz. 1, 3, pp. 102–110 (1960)
26. L. van Wijngaarden: O the Equations of Motion for Mixtures of Liquid andGas Bubbles, J. Fluid Mechanics 33, 3, pp. 465–474 (1968)
27. V.K. Kedrinskii: Dynamics of a cavity and a wave. In: V. Monakhov (ed.)Dynamics of Continuum, vol. 38 (Novosibirsk, 1979) pp. 48–70
28. I.S. Gradshtein, I.M. Ryzhik: Tables of Integrals, Sums, Series, and Products(M.: Fiz.-Mat. Lit., 1962)
29. M.M. Hasan, K.S. Jyengar: Size and Growth of Cavitation Bubble Nuclei, Na-ture 199, 4897 (1963) p. 995
30. M. Strasberg: Onset of Ultrasonic Cavitation in Tap Water, J. Acoust. Soc.Am. 31, 2, p. 163 (1959)
31. Se Din-Yu: Bubble Growth in a Viscous Liquid Under Short-Time Pulse, Theor.Osnovy Inzh. Rasch., 4 (1970) pp. 121–124
32. V.K. Kedrinskii: Negative Pressure Profile in a Cavitation Zone at UnderwaterExplosion Near Free Surface, Acta Astronaut. 3, 7–8, pp. 623–632 (1976)
33. V.K. Kedrinskii: Influence of the developing cavitation zone on the rarefactionwave parameters. In: S. Kutateladze (ed.) Nonlinear Wave Processes in Two-Phase Media, Proc. of the 20th Siberian Thermophys. Workshop (Novosibirsk1976) pp. 90–99
34. B.S. Kogarko: One Dimensional Unsteady Motion of Liquid with Arising andDevelopment of Cavitation, Dokl. Akad. Nauk SSSR 155, 5, pp. 779–782 (1964)
35. Yu.A. Boguslavskii: To the Question About Arising and Development of Cavi-tative Rarefaction Wave, Acoust. Journ. 13, 4, pp. 538–540 (1967)
36. M.A. Tsykulin: On Arising of Shock Wave in Air at Underwater Explosion, Zh.Prikl. Mekh. i Tekh. Fiz. 2, 1 (1961)
37. V.N. Kostyuchenko, N.N. Simonov: Experimental Study of Shock Wave in Airat Underwater Explosion in Shallow Water, Zh. Prikl. Mekh. i Tekh. Fiz. 1, 1(1960)
38. V.K. Kedrinskii: About Underwater Explosion Near Free Surface, Dokl. Akad.Nauk SSSR 212, 2 (1973)
39. N.E. Kochin, I.A. Kibel’, N.V. Rose: Theoretical Hydromechanics, Part 1,(M.:Fiz.-Mat. Lit., 1963) Chap. 4
40. F.P. Fil’chakov, V.I. Panchishin: Modeling of Potential Fields on ConductingPaper (Naukova Dumka, Kiev, 1961)
41. V.K. Kedrinskii: Sultan Formation at Underwater Explosion, Izv. Akad. NaukSSSR, Mekh. Zhidk. Gaza, 4 (1971)
42. V.K. Kedrinskii: On oscillation of a cylindrical gas cavity in unbounded liquid.In: M. Lavrentyev (ed.) Dynamics of Continuum, vol. 8 (Novosibirsk, Instituteof Hydrodynamics, 1971) pp. 163–168
43. D.F. Hopkins, J.M. Robertson: Penetration of 2D Jet of Incompressible Liquid,Mechanics, 1 (1969)
44. H.G. Snay: Underwasser-Explosionen Hydromechanische Vorgange undWirkungen. In: Naval Hydrodynamics, Publ. 515. Chap. XII. (Nat. Acad. Sci.,Nat. Research Council, 1957)
358 7 Jet Flows at Shallow Underwater Explosions
45. V.M. Titov: About Regimes of Hydrodynamic Cumulation at Shell Collapse,Dokl. Akad. Nauk SSSR 247, 5 (1979)
46. V.K. Kedrinskii: Hydrodynamics of Explosion (Review), Zh. Prikl. Mekh.i Tekh. Fiz. 28, 4, pp. 23–48 (1987)
47. G. Birkhoff: Hydrodynamics (Inostr. Lit., Moscow, 1963)48. J.W. Pritchett: Incompressible calculation of underwater explosion phenomena.
In: Proc. 2nd Int. Conf. on Numerical Methods in Fluid Dynamics (Springer,Berlin Heidelberg New York, 1971) pp. 422–428
49. H.G. Snay: Model tests and scaling. In: Naval Ordnance Lab. Rep., NOLTR-63-257 (1964)
50. V.K. Kedrinskii, V.T. Kuzavov: Underwater Explosion of Coil Charge NearFree Surface, Zh. Prikl. Mekh. i Tekh. Fiz. 24, 4, pp. 124–130 (1983)
51. J.C.W. Rogers, W.G. Szymczak: Philosophical Transactions of the Royal Soci-ety of London, Series A-Mathematical Physical and Engineering Sciences 355,1724 (1997) pp. 649–663
52. T. Khangaonkar, B. Lemehaute: Applied Ocean Research 14, 2 (1992)pp. 141–154
53. Ch.I. Malme, J.R. Carbonell, I. Dyer: Mechanisms in the generation of airblastsby underwater explosions. In: US National Ordnance Laboratory, White Oak,Matyland, report NOLTR 66-88, Sept 23 1966
54. B.G. Craig Experimental observations of underwater detonations near the wa-ter surface. In: Los Alamos Scientific Laboratory of the University of California,Los Alamos, New Mexico 87544, report LA-5548-MS, UC-34, Apr 1974
55. A.R. Bryant: The Gas Globe: Underwater Explosion Research 2 (Published byONR), (1950)
56. Ch.L. Mader: Detonation near the water surface. In: Los Alamos ScientificLaboratory of the University of California, Los Alamos, New Mexico 87544,report LA-4958, US-34, June 1972
57. J.W. Hendricks, D.L. Smith: Above and below surface effects of one-poundunderwater explosion. In: Hydra I, (US), report NRDL-TR-480 (1960)
58. F.H. Young, R.R. Hammond: A non-spherical model describing the motion ofa shallow underwater explosion bubble. In: (US), report NRDL-TR-771 (1964)
59. A.R. Kriebel: Simulation of underwater nuclear bursts at shallow depth withexploding wires. In: report URS7028-1 (1971)
60. C.W. Hirt, W.C. Rivard: Wave generation from explosively formed cavities. In:Defense Nuclear Agency, report DNA-TR-82-131 (1983)
61. C.W. Hirt: Phenomena and scaling of shallow explosions in water. In: FlowScience, Inc., report FSI-85-3-1 (1985)
62. M.B. Fogel et al.: Water waves from underwater nuclear explosions. In: PacificaTechnology, report PT-U82-0572 (1983)
63. B.D. Nichols, C.W. Hirt, R.S. Hotchkiss: SOLA-VOF: a solution algorithm fortransient fluid flow with multiple free boundaries. In: Los Alamos ScientificLaboratory, report LA-8355 (1980)
64. C.E. Pace et al.: Effect of charge depth of submergence on wave height andenergy coupling. In: report WES-TR-1-647-4 (1968)
65. B. LeMehaute: Theory of explosion-generated water waves: Advances in Hy-droscience, 7, 1 (1971)
66. J.R. Houston, L. Chou: Numerical modeling of explosion waves. In: US ArmyEngineer Waterways Experiment Station, Technical report (1982)
8 Conclusion: Comments on the Models
Analysis of different approaches to studying high-velocity hydrodynamic flowsproves that “heuristic” models (i.e. ones guessed on the basis of some physicprinciples) often allow one to describe the phenomena when no exact solutionscan be obtained or an approximate mathematical model cannot be adequatelyjustified. In these cases, experiments play the role of “the existence theorem”and set the limits of reliability of the approaches.
Underwater Explosion
Indeed, formally, the transition from the exact acoustic model of the invari-ance of the function G = r · (h + u2/2) on the characteristics c0 to itsinvariance on the characteristics (c + u):
∂G
∂t+ c0
∂G
∂r= 0 , ⇒ ∂G
∂t+ (c + u)
∂G
∂r= 0 .
is unproved. But this approach made it possible to solve the problem ofunderwater explosion, i.e. to calculate the dynamics of an explosive cavityand the wave field parameters from the near zone to the asymptotic. Ratherreliable correlation between the calculation results and experimental dataproved the validity of the idea.
A solution for cylindrical symmetry, the most complicated case in model-ing the explosion in an incompressible liquid, was obtained owing to a kindof “inverse problem” that involves:
– Deducing an equation for the dynamics of a cavity in a compressible liquid
R(1 − R
c
)R + β
(1 − R
3c
)R2 =
12
(1 +
R
c
)H +
R
c
(1 − R
c
)dH
dt(8.1)
– Experimental determination of the coefficient β (β = 1)– The limiting transition in the speed of sound (c → ∞)– The transformation of (8.1) into
RR + R2 =12H (8.2)
360 8 Conclusion: Comments on the Models
The first integral of the equation multiplied by 2π,
πp(0)R(0)2
γ − 1
[1 −
(R(0)R
)2γ−2]
= 2πρ0R2R2 + πp∞(R2 − R(0)2) ,
is the law of energy conservation, according to which the decrease in theinternal energy of detonation products (in the left-hand part of the equation)should be equal to the change of the potential energy of the liquid–cavitysystem (the second summand in the right-hand part) and the kinetic energyincrease. Hence it follows that the expression
E = 2πρ0R2R2
determines the kinetic energy E of the incompressible liquid surroundinga cylindrical cavity. We keep in mind that this is eventually a result of theasymptotic approximation and the “empirical correction,” but since the resultis favorable, it has the right to exist.
We note that Eq. (8.2) allows for an analytical solution for an emptycavity, which in the dimensionless form is rewritten as
τ2 = 2 · (1 − y2) ,
where y = R/R0 and τ = t ·√p∞/ρ/R0. Hence one can readily determine thefirst oscillation period of the cylindrical explosive cavity τ∗ = 2τmax = 2
√2,
if R0 is the radius of the explosive cavity with detonation products at themoment of maximum expansion. A comparison shows that the analyticalestimate of this parameter differs from the experimental data only by severalpercent.
Bubble Cavitation and Cavitation Fracture of a Liquidunder Shock-Wave Loading
The definition of the state of a real liquid with natural microinhomogeneitiesas that of a two-phase medium has radically modified the approaches tothe description of cavitation phenomena. The main point is that it enableslogical combination of the two problems: the evolution dynamics of cavitationphenomena and the strength of a liquid. The problems are at bottom reducedto one problem on wave processes in a cavitating liquid , in which the structureand the parameters of the wave field both depend on and determine thecavitation processes.
The processes can be described within a two-phase pk-model suggestedfor nonreacting bubbly media:
p − c−2l
∂2p
∂t2= −ρ0k0
∂2k
∂t2, (8.3)
∂2k
∂t2=
3k1/3
ρ0R20
(p0k−γ − p) +
16k
(∂k
∂t
)2
. (8.4)
8 Conclusion: Comments on the Models 361
The model contains only two sought functions: the mean pressure p in thebubbly medium and the volume concentration k of the gas phase. Withinthe two approximations considering physical features of any bubbly systems,Eq. (8.3) can be rewritten as
∆p p .
The first approximation, the incompressibility of a liquid component, isquite justified, since the compressibility of a cavitating liquid is mainly de-termined by the compressibility of the gas–vapor phase. The second approx-imation is the allowance for the microscale of the heterogeneous structureof the medium through the new spatial variable ζ = αrk1/6, and is rather“heuristic” because of the absence of a rigorous proof of validity of the re-quired inequalities (Chap. 6). However, practical coincidence of the structureof a visible cavitation zone calculated using this model with the experimentaldata makes this approach quite justified.
As a result, the pressure in a cavitating liquid is determined from theHelmholtz equation, while the concentration k in the system of Eqs. (8.3–8.4)is solved using the spatial coordinates r and θ as parameters (in the ax-isymmetrical statement). Experiments proved that this approach is correct.Moreover, in describing the development of the cavitation zone near the bot-tom of a vertical tube filled with water that obtains a downward accelerationpulse the approach yields an analytical solution of Eq. (8.4) and an explicitestimate for the relaxation of the wave field in a cavitating liquid.
It is believed that the modeling of cavitation is complicated by the nat-ural size distribution of nuclei. How should one consider the dynamics oftheir summary effect on the process, structure, and parameters of the wavefield? An example of the calculation of the influence of dispersion effects ina bubbly medium on the its “acoustic transparency” is illustrated in Chap. 5.In this example, the governing system contains a certain discrete set of theRayleigh equations for each kind of bubbles. Application of the sophisticatedtwo-phase model makes it possible to explain the experimental data thatmight seem strange at first sight. Later on it is shown that this sophistica-tion is often redundant. For example, in the problems on impulsive loading ofliquids with rarefaction wave amplitudes of tens or even hundreds of negativeatmospheres it suffices to use the “integral” Eq. (8.4) describing the dynamicsof an average volumetric concentration. It was established in ad hoc studiesthat in rather strong rarefaction fields, the originally disperse systems ac-quire at early stages a monodisperse structure that is retained throughoutthe cavitation process.
The idea of instantaneous relaxation of tensile stresses in the zone ofintense cavitation is justified only “physically.” However, it enables a consid-erable simplification of the mathematical model and removes the restrictionon the development of cavitation up to “dense packing” of bubbles. Analysisof the flow parameters in the cavitation zone within the model of instanta-neous relaxation yields an unexpected conclusion: the mass velocity profile is
362 8 Conclusion: Comments on the Models
“frozen” in the cavitation zone. Experiments on measuring the mass velocityby means of special traces and flash X-radiography in a hydrodynamic shocktube confirm this result. Thus, the model of instantaneous relaxation is jus-tified. We note that this model enables solving the problem on spallation incavitating liquids during shock-wave loading.
We mentioned that the cavitation processes are the initial stage of the dis-integration of liquid media with microinhomogeneities by impulsive loading.The final stage of the disintegration is the formation of separate cavitat-ing fragments (spalls), their further decay into smaller parts, and, as a re-sult, formation of a gas–droplet medium. The entire process is defined asthe inversion of the two-phase state of the medium. It seems that its com-plexity does not allow for an intelligible mathematical modeling even for thedevelopment of a physical analog of the transition process. Nevertheless, anadequate physical model is formulated assuming that for k ≈ 0.6–0.7 thedense packing of bubbles immediately transforms into a dense package ofelastic nonconfluent liquid drops. This model is called “sandy” model.
Calculations of the dispersion of such a shell with drops and comparisonwith the data of high-speed recording of the dynamic failure of liquid shellsand shells composed of sand having diverse particle sizes shows that themodel works and explains obscure facts of particle size distribution over thesection of the disintegrating shell and the effect of the “fog” in the centralpart of a gas–vapor cloud formed by the explosion.
If we carry the “heuristic” idea of restricting the size of a liquid sam-ple destroyed during shock-wave loading to seeming absurdity, it would bereduced to the size of a droplet. But this idea turned out to be fruitful forpresenting a physical disintegration model and allowed one to reveal the finestructure of the inversion transition of one two-phase state (cavitating liquid)into another, the gas-droplet system.
Sultans
In solving the problems of the structure and mechanisms of the formation ofdirected throwing out on the free surface at shallow underwater explosions,the key role was played by the experiment–mathematical model–physicalmodel–experiment sequence. Experimental results were used to simplify themathematical model and the statement of the appropriate problem. The so-lution of the problem was a step towards constructing a physical model andverifying the understanding of the process mechanisms in model experiments.Thus, all problems of the complicated structure of vertical and radial sultanswere solved successively and a new class of cumulative jets formed at var-ious explosion depths was discovered. These studies were completed by thedemonstration of hydrodynamic models of sultans formed under impulsivemotion of a solid body from under the free surface and high-velocity pene-tration of the body into water, and the development of a direct method ofmeasuring the change of the liquid mass in the sultan jet.
Copyright © 2022 FDOKUMEN