Elastic thickness of the lithosphere in the Marquesas and Society Islands
Upload
univ-montp2Category
view
1download
0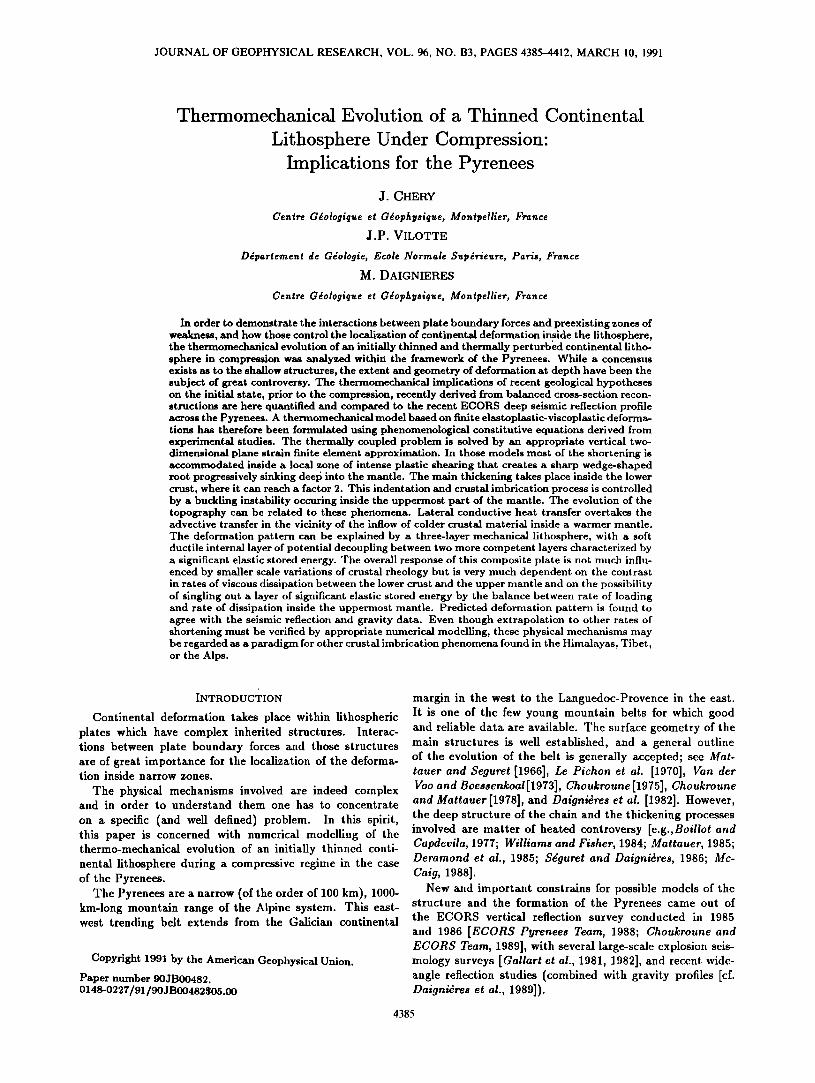
JOURNAL OF GEOPHYSICAL RESEARCH, VOL. 96, NO. B3, PAGES 4385-4412, MARCH 10, 1991
Thermomechanical Evolution of a Thinned Continental
Lithosphere Under Compression: Implications for the Pyrenees
J. CHERY
Centre Gdologique et Gdophysique, Montpellier, France
J.P. VILOTTE
Ddpartement de Gdologie, Ecole Normale $up•rieure, Paris, France
M. DAIGNIERES
Centre Gdologique et Gdophysique, Montpellier, France
In order to demonstrate the interactions between plate boundary forces and preexisting zones of weakness, and how those control the localization of continental deformation inside the lithosphere, the thermomechanical evolution of an initially thinned and thermally perturbed continental litho- sphere in compression was analyzed within the framework of the Pyrenees. While a concensus exists as to the shallow structures, the extent and geometry of deformation at depth have been the subject of great controversy. The thermomechanical implications of recent geological hypotheses on the initial state, prior to the compression, recently derived from balanced cross-section recon- structions are here quantified and compared to the recent ECORS deep seismic reflection profile across the Pyrenees. A thermomechanical model based on finite elastoplastic-viscoplastic deforma- tions has therefore been formulated using phenomenological constitutive equations derived from experimental studies. The thermally coupled problem is solved by an appropriate vertical two- dimensional plane strain finite element approximation. In those models most of the shortening is accommodated inside a local zone of intense plastic shearing that creates a sharp wedge-shaped root progressively sinking deep into the mantle. The main thickening takes place inside the lower crust, where it can reach a factor 2. This indentation and crustal imbrication process is controlled by a buckling instability occuring inside the uppermost part of the mantle. The evolution of the topography can be related to these phenomena. Lateral conductive heat transfer overtakes the advective transfer in the vicinity of the inflow of colder crustal material inside a warmer mantle. The deformation pattern can be explained by a three-layer mechanical lithosphere, with a soft ductile internal layer of potential decoupling between two more competent layers characterized by a significant elastic stored energy. The overall response of this composite plate is not much influ- enced by smaller scale variations of crustal rheology but is very much dependent on the contrast in rates of viscous dissipation between the lower crust and the upper mantle and on the possibility of singling out a layer of significant elastic stored energy by the balance between rate of loading and rate of dissipation inside the uppermost mantle. Predicted deformation pattern is found to agree with the seismic reflection and gravity data. Even though extrapolation to other rates of shortening must be verified by appropriate numerical modelling, these physical mechanisms may be regarded as a paradigm for other crustal imbrication phenomena found in the Himalayas, Tibet, or the Alps.
INTRODUCTION
Continental deformation takes place within lithospheric plates which have complex inherited structures. Interac- tions between plate boundary forces and those structures are of great importance for the localization of the deforma- tion inside narrow zones.
The physical mechanisms involved are indeed complex and in order to understand them one has to concentrate
margin in the west to the Languedoc-Provence in the east. It is one of the few young mountain belts for which good and reliable data are available. The surface geometry of the main structures is well established, and a general outline of the evolution of the belt is generally accepted; see Mat- tauer and Seguret [1966], Le Pichon et al. [1970], Van der Voo an Boessenoal[1973], Choukroun [1975], Choukroun and Mattauer[1978], and Daignidres et al. [i982]. However,
on a specific (and well defined) problem. In this spirit, the deep structure of the chain and the thickening processes this paper is concerned with numerical modelling of the involved are matter of heated controversy [e.g.,Boiliot and thermo-mechanical evolution of an initially thinned conti- Capdcvila, 1977; Williams and Fisher, 1984; Mattauer, 1985; nental lithosphere during a compressive regime in the case Derarnond et al., 1985; Sdguret and Daignidres, 1986; Mc- of the Pyrenees. Caig, 1988].
The Pyrenees are a narrow (of the order of 100 km), 1000- New and important constrains for possible models of the km-long mountain range of the Alpine system. This east- structure and the formation of the Pyrenees came out of west trending belt extends from the Galician continental the ECORS vertical reflection survey conducted in 1985
and 1986 [ECORS Pyrenees Team, 1988; Choukroune and ECORS Team, 1989], with several large-scMe explosion seis-
Copyright 1991 by the American Geophysical Union. mology surveys [Gallart el al., 1981, 1982], and recent wide- Paper number 90JB00482. angle reflection studies (combined with gravity profiles [cf. 0148-0227/91/90JB00482505.00 Daigni•res et al., 1989]).
4385
4386 CHERY ET AL.: THERMOMECHANICAL MODELING OF CONTINENTAL DEFORMATION
In this paper we investigate the thermomechanical impli- cations of a particular model of the evolution of the Pyrenees proposed by several authors [Choukroune, 1975; Mattauer, 1968], adding some hypothesis on the predeformational stage drawn by Mattauer[1985] and Sdguret and Daignidres [1986] on the basis of balanced cross-section methods. As men-
tioned above, this model is by no mean the only one which has been proposed, and no attempt will be made here to set- tle between the different models. Our effort will rather con-
sist in testing wether those particular assumptions are ten- able by thermomechanical predictions of their effects and in understanding the physical influence of lithospheric theolo- gies on the evolution of the deformation within this frame- work.
This has been done by a new thermomechanical model based on large elastoviscoplastic tranformations [Vilotte et al., 1987; Vilotte, 1989]. Phenomenological constitutive re- lations are derived from experimental studies in order to describe the behavior of lithospheric materials with special consideration for the low-temperature regime. With reason- ably well-known kinematic boundary conditions, obtained from plate tectonics, the thermally coupled problem is solved by an appropriate finite element formulation. Besides the in- trinsic limitations of the model, interesting conclusions can be drawn from comparing the model predictions and deep seismic reflection data of the ECORS profile which can some- how be regarded as the first map of present crustal defor- mation in depth aceross an entire orogenic belt.
The present paper is a continuation of previous modelling efforts on intracontinental deformation by Bird and Piper
[1980], Bird [1988], Vilotte et al. [1982, 1984, 1986, 1987], England and McKenzie [1982], and England and Houseman [1986, 1988]. The relatively short wavelength in the defor- mation of the present problem required however a different approach from that used for larger-scale continental defor- mation.
GEODYNAMICAL FRAMEWORK
The Pyrenean mountain belt results from the localiza- tion of the continental deformation in relation with inherited
structures like the North Pyrenean Transform Zone (NPTZ) during a large-scale compressive period. The structural zones and their present surface geometry seem nowadays well established as originally proposed by Mattauer [1968]. In cross section the main features are a fanlike geometry with northward directed thrusts in the north and southward
thrusts in the south and a localized deformation within an
east-west narrow low pressure-high temperature (LP-HT) metamorphic belt located near a major vertical discontinu- ity, the North Pyrenean Fault (NPF) [see Choukroune and ECORS Team, 1989].
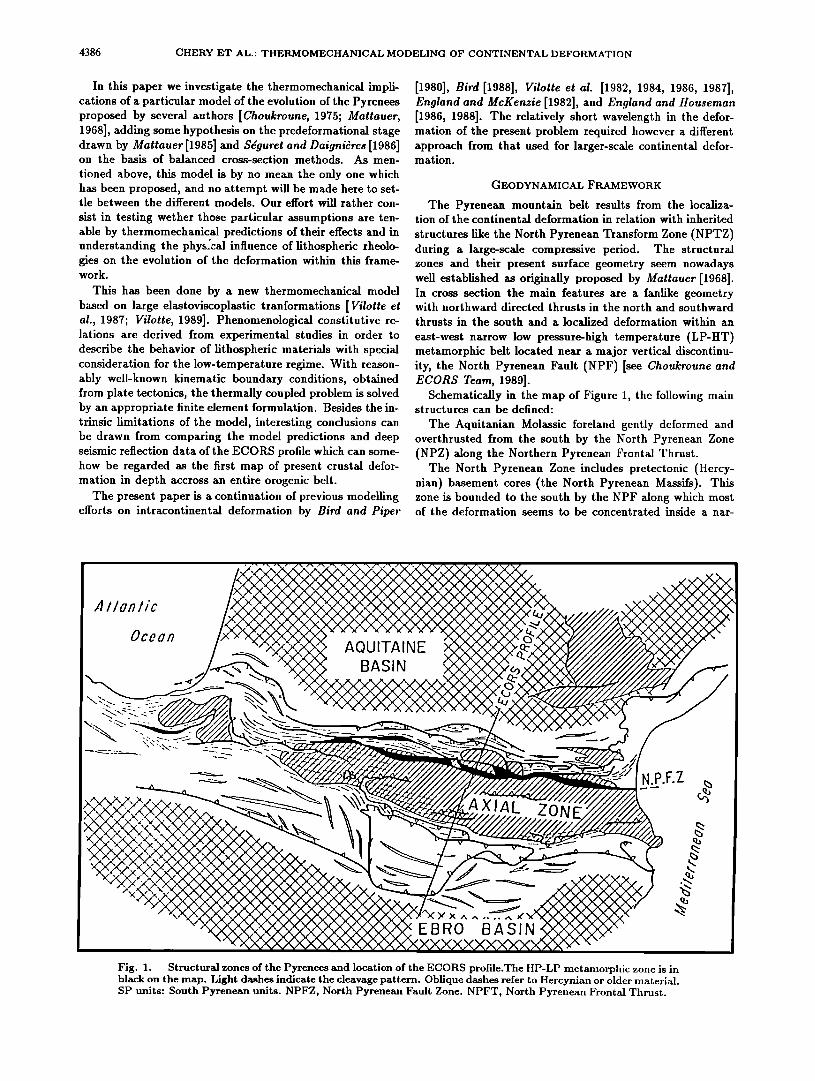
Schematically in the map of Figure 1, the following main structures can be defined:
The Aquitanian Molassic foreland gently deformed and overthrusted from the south by the North Pyrenean Zone (NPZ) along the Northern Pyrenean Frontal Thrust.
The North Pyrenean Zone includes pretectonic (Hercy- nian) basement cores (the North Pyrenean Massifs). This zone is bounded to the south by the NPF along which most of the deformation seems to be concentrated inside a nar-
//on//c
OC•O/Y AQUITAINE
BASIN
EBRO BASIN
N.P.F.Z
Fig. 1. Structural zones of the Pyrenees and location of the ECORS profile. The HP-LP metamorphic zone is in black on the map. Light dashes indicate the cleavage pattern. Oblique dashes refer to Hercynian or older material. SP units: South Pyreheart units. NPFZ, North Pyreheart Fault Zone. NPFT, North Pyreheart Frontal Thrust.
CHERY ET AL.: THERMOMECHANICAL MODELING OF CONTINENTAL DEFORMATION 4387
row LP-HT belt [Goldberg et al., 1986]. Within the NPZ, strain is high and the stretching direction is vertical except in the metamorphic belt where it is horizontal [Choukroune, 1975]. Seismic refraction data [Daignidres et a/.,1982] and teleseismic delays [Him et al., 1984; Gallart et al., 1985] suggest a rapid change of the depth of the Moho from 30-35 km or less to the north of the NPF outcrop to 40-50 km to the South of it. The NPF is generally considered as the boundary between Iberian and European plates.
The Axial zone (the highest part of the chain) consists of of Hercynian material reworked during the Alpine orogeny by a southward directed thrust system and of small remains of Mesozoic covers [Mattauer and $dguret, 1966].
In the South Pyrenean zone, Mesozoic and Cenozoic rocks belonging to a large detached unit are overthrusted to the south over the Ebro (southern) molassic foreland.
A general framework of the evolution of the belt is gen- erally accepted. In order to fit the structural evolution of the Pyrenean system with the opening of the Bay of Biscay a pre-orogenic transform fault zone, the NPTZ is generally assumed and related to the present-day NPZ [Le Pichon et al., 1971]. A left-lateral drift of about 400 km along the NPTZ is assumed during early Cretaceous times by Le Pi- chon et al. [1971] and Choukroune et al. [1973]. In relation to this motion, the southern margin of the European plate was thinned, and at smaller scale, pull-apart basins were developed. High heat flux is assumed for those structures, 110-90 m.y. ago. In upper Cretaceous times, a compressive regime starts in the North Pyrenean basins with the end of the opening of the Bay of Biscay. Metamorphism and de- formation were then restricted to the narrow NPZ. As the
compression continued during Tertiary times, the deforma- tion migrated southward and also northward. Estimation of the bulk shortening leads to values of 50-60 km in the western part and 80-90 km in the eastern part. The distri- bution of the shortening evolves along the strike of the belt: it occurs mostly south of the NPZ in the eastern part and north of the fault in the western part.
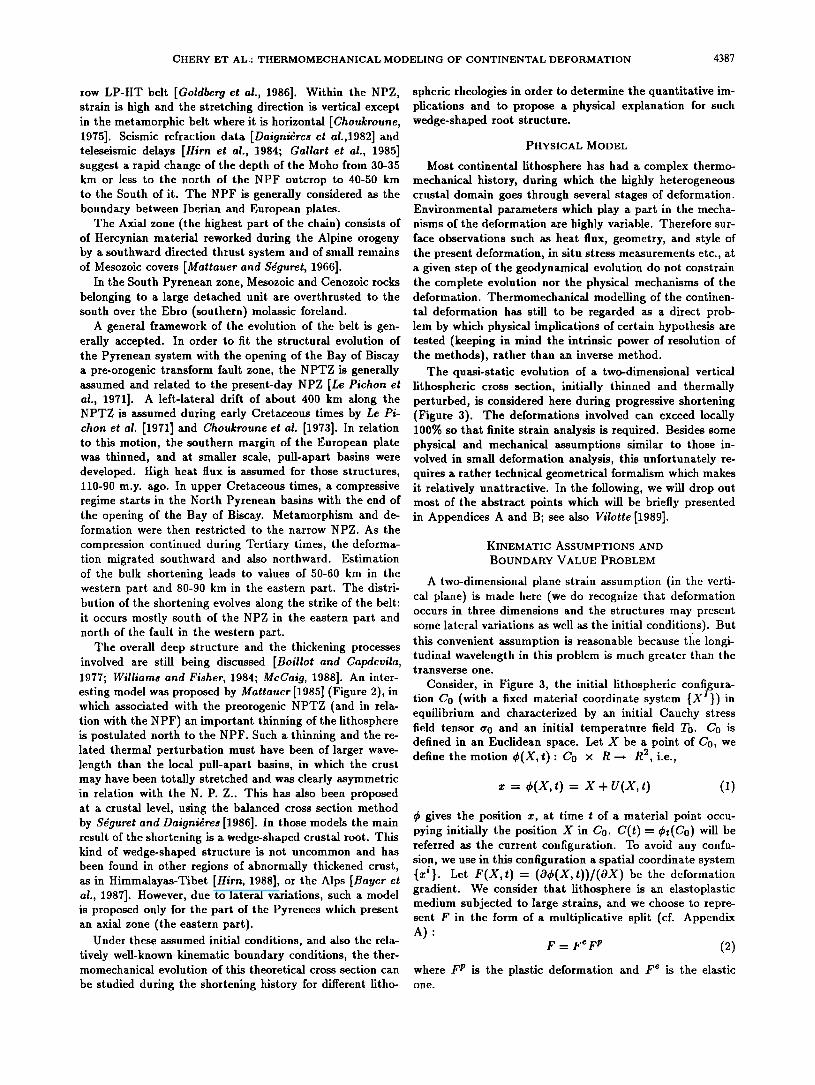
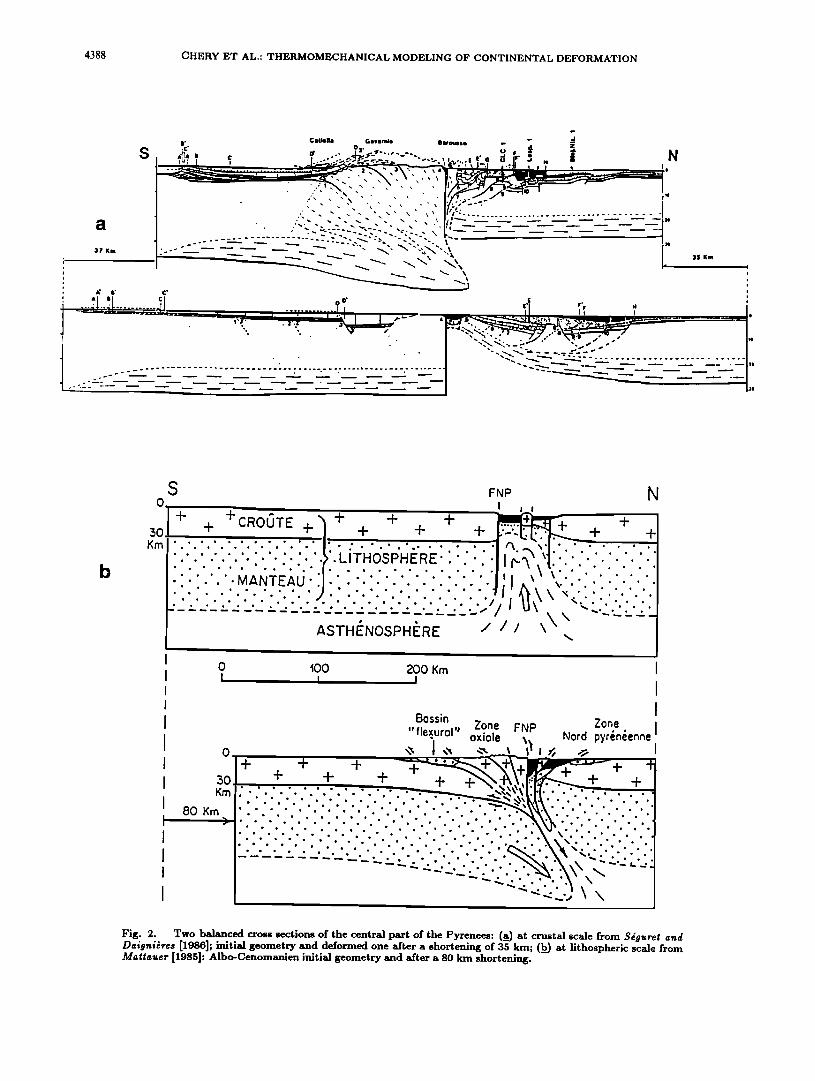
The overall deep structure and the thickening processes involved are still being discussed [Boillot and Capdevila, 1977; Williams and Fisher, 1984; McCaig, 1988]. An inter- esting model was proposed by Mattauer[1985] (Figure 2), in which associated with the preorogenic NPTZ (and in rela- tion with the NPF) an important thinning of the lithosphere is postulated north to the NPF. Such a thinning and the re- lated thermal perturbation must have been of larger wave- length than the local pull-apart basins, in which the crust may have been totally stretched and was clearly asymmetric in relation with the N. P. Z.. This has also been proposed at a crustal level, using the balanced cross section method by S•guret and Daigni•res [1986]. In those models the main result of the shortening is a wedge-shaped crustal root. This kind of wedge-shaped structure is not uncommon and has been found in other regions of abnormally thickened crust, as in Himmalayas-Tibet [Him, 1988], or the Alps [Bayer et al., 1987]. However, due to lateral variations, such a model is proposed only for the part of the Pyrenees which present an axial zone (the eastern part).
Under these assumed initial conditions, and also the rela- tively well-known kinematic boundary conditions, the ther- momechanical evolution of this theoretical cross section can
be studied during the shortening history for different litho-
spheric theologies in order to determine the quantitative im- plications and to propose a physical explanation for such wedge-shaped root structure.
PHYSICAL MODEL
Most continental lithosphere has had a complex thermo- mechanical history, during which the highly heterogeneous crustal domain goes through several stages of deformation. Environmental parameters which play a part in the mecha- nisms of the deformation are highly variable. Therefore sur- face observations such as heat flux, geometry, and style of the present deformation, in situ stress measurements etc., at a given step of the geodynamical evolution do not constrain the complete evolution nor the physical mechanisms of the deformation. Thermomechanical modelling of the continen- tal deformation has still to be regarded as a direct prob- lem by which physical implications of certain hypothesis are tested (keeping in mind the intrinsic power of resolution of the methods), rather than an inverse method.
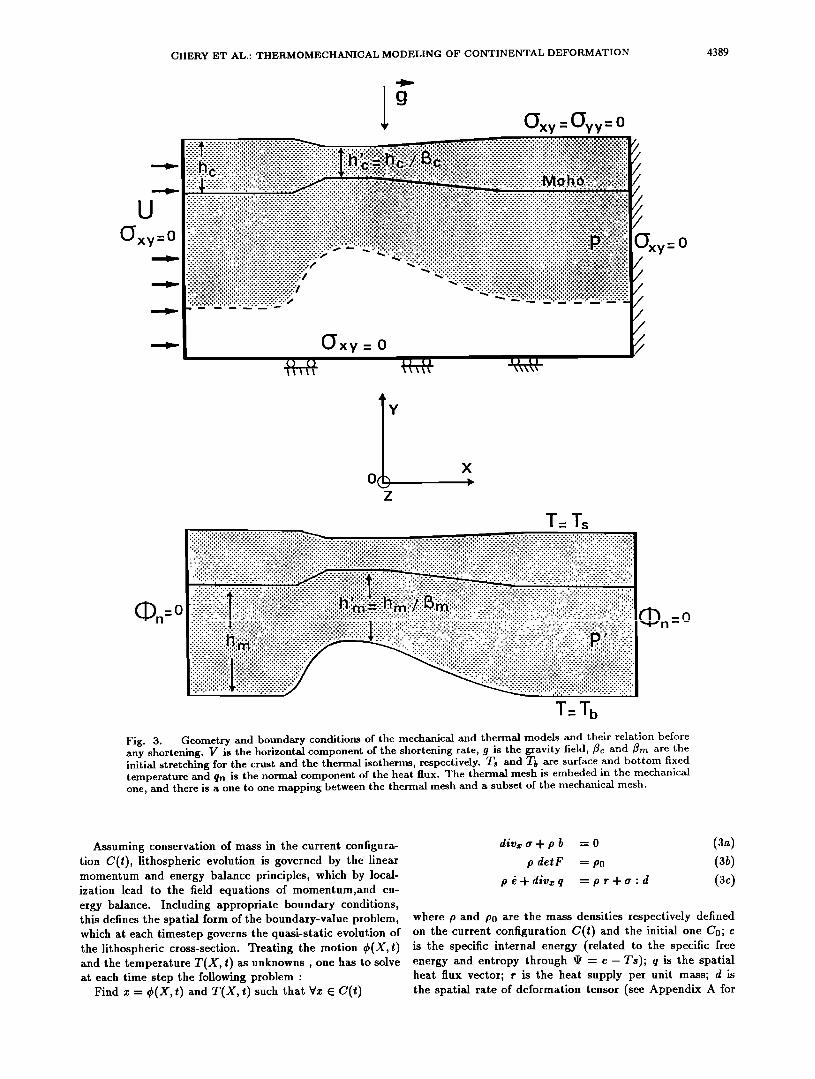
The quasi-static evolution of a two-dimensional vertical lithospheric cross section, initially thinned and thermally perturbed, is considered here during progressive shortening (Figure 3). The deformations involved can exceed locally 100% so that finite strain analysis is required. Besides some physical and mechanical assumptions similar to those in- volved in small deformation analysis, this unfortunately re- quires a rather technical geometrical formalism which makes it relatively unattractive. In the following, we will drop out most of the abstract points which will be briefly presented in Appendices A and B; see also Vilotte [1989].
KINEMATIC ASSUMPTIONS AND
BOUNDARY VALUE PROBLEM
A two-dimensional plane strain assumption (in the verti- cal plane) is made here (we do recognize that deformation occurs in three dimensions and the structures may present some lateral variations as well as the initial conditions). But this convenient assumption is reasonable because the longi- tudinal wavelength in this problem is much greater than the transverse one.
Consider, in Figure 3, the initial lithospheric configura- tion Co (with a fixed material coordinate system {X I}) in equilibrium and characterized by an initial Cauchy stress field tensor tr0 and an initial temperature field To. C0 is defined in an Euclidean space. Let X be a point of Co, we define the motion qb(X,t): C0 x R --• R 2, i.e.,
ß = O(x, t) = x + u(x, t) (1)
•b gives the position z, at time t of a material point occu- pying initially the position X in Co. C(t) = rkt(Co) will be referred as the current configuration. To avoid any confu- sion, we use in this configuration a spatial coordinate system {zi}. Let F(X,t)= (Ork(X,t))/(OX) be the deformation gradient. We consider that lithosphere is an elastoplastic medium subjected to large strains, and we choose to repre- sent F in the form of a multiplicative split (cf. Appendix A):
= (2)
where F p is the plastic deformation and F e is the elastic one.
4388 CHERY ET AL.: THERMOMECHANICAL MODELING OF CONTINENTAL DEFORMATION
b
S
3O Km
0 '100 200 Km ! I I
30 Km
80 Km r
Bossin Zone "flexurol" Zone FNP ß oxiole Nord pyr•n•enne
+ + + + + + + + +
ß ß . ß . ß ß ß .
ß ß ß . ß ß . ß ß ß ß .
ß . ß . . ß ß ß . , , ß ß ß ß ß ß ß ß ß ß ß ß . ß ß ß ß ß ß ß ß ß ß ß ß ß ß ß ß ß ß ß ß ß ß ß . . ß ß ß
ß ß . . ß ß ß ß ß ß ß ß . ß ß ß ß ß ß ß ß ß ß ß ß ß ß
Fig. 2. Two balanced cross sections of the central part of the Pyrenees: (_a) at crustal scale from Sdlluret and Daigni•res [1986]; initial geometry and deformed one after a shortening of 35 kin; (b_) at lithospheric scale from Mattauer [1985]: Albo-Cenomanien initial geometry and after a 80 km shortening.
CHERY ET AL.: THERMOMECHANICAL MODELING OF CONTINENTAL DEFORMATION 4389
Oxy-O
Cxv_Cvv: o
=============================================================== ...:?:i:!ii:i:!!i:!:!:!:i:i:i:!:i:i:i:!:i:i:i:i:i:i:i:i:!:i:i:i:!:!:!:i:!:i:i:!:!:!:!:!:i:i:i:i:i:i:!:i:!:i:! ::::::::::::::::::::::::::::::::::::::::::::::::::::::::::: ============================================================================================= .,,,,-,,.,,,,,.,,,,.,-.-,-.-,,,,,-,.,,,,,,,,,,,,,,,,,,,, ••`•.••••.:•:•:•:•:•:•:•:•••••••:.:•••••••••••••••••••••.••••••••••.•••••••••••••••••••••• ========================================================= ==============================================================================
x o ,.-
z
T= Ts
T- Z b
Fig. 3. Geometry and boundary conditions of the mechanical and thermal models and their relation before any shortening. V is the horizontal component of the shortening rate, g is the gravity field, •c and •rn are the initial stretching for the crust and the thermal isotherms, respectively. Ts and Tb are surface and bottom fixed temperature and qn is the normal component of the heat flux. The thermal mesh is embedcd in the mechanical one, and there is a one to one mapping between the thermal mesh and a subset of the mechanical mesh.
Assuming conservation of mass in the current configura- tion C(I), lithospheric evolution is governed by the linear momentum and energy balance principles, which by local- ization lead to the field equations of momentum,and en- ergy balance. Including appropriate boundary conditions, this defines the spatial form of the boundary-value problem, which at each timestep governs the quasi-static evolution of the lithospheric cross-section. Treating the motion c)(X,t) and the temperature T(X, t) as unknowns , one has to solve at each time step the following problem:
Find x = 05(X, t) and T(X, t) such that Vx 6 C(t)
divx er + p b = 0 (3a)
p detF = Po (3b) p • + div•: q = p r + er ß d (3c)
where p and P0 are the mass densities respectively defined on the current configuration C(t) and the initial one Co; e is the specific internal energy (related to the specific free energy and entropy through 9 - e- Ts); q is the spatial heat flux vector; r is the heat supply per unit mass; d is the spatial rate of deformation tensor (see Appendix A for
4390 CHERY ET AL.' THERMOMECHANICAL MODELING OF CONTINENTAL DEFORMATION
proper definitions). With the boundary conditions
•,(•) . ,, = i(t) ß e ow(t) ½(x,t) = •(t) ß 6 o•c(t)
•'(•) = ½(t) ß e ofc(t) q(•) . • = •(t) ß e o•c(t)
(4)
and the initial conditions
•(x, 0) = •0(x) T(X, O) =To(X)
Assuming intrinsic and thermal dissipations to be uncoupled and introducing Fourier's complementary law, the energy balance equation (3.c) can be rewritten in the more classical form
p c J' + div•[K(x, t)V•T(x)] = p r(x) + Eint(x, t)
where •int is the plastic dissipation function which depends on the assumed functional form of the free energy •; the terms coming from the temperature dependence of the elas- tic properties are dropped out here for simplicity; see Apen- dix A for more details. The functional form of the consti-
tutive equations have now to be specified in order to solve this boundary value problem.
tually interacting and competing [cf. Carter and Tsenn, 1987]. Phenomenological constitutive formulations cannot, however, be considered as intrinsic but depend on a reference volume and on the type of loading. The degree of precision required to be able to predict possible losses of homogeneity in the deformation or bifurcations is still a matter of physical experience.
The elastoviscoplastic-plastic formulation proposed here [ Vilotte, 1989] is rather simple but does capture some of the complex phenomenology of rocks. The elastic part of the deformation is included here in spite of the fact that it is supposed to remain small, because it can control localiza- tion instabilities and some overall features of lithospheric response such as flexure.
Assuming that there is no coupling between elastic and in- elastic deformations, we derive the elastic deformation from an uncoupled hyperelastic model recently reintroduced by Sirno [1986], Sirno and Ortiz [1985] in which the Kirchoff stress tensor r is given by (see Appendix A, for related def- initions):
r = je Pl + t• je-2/3 dev[b e ] (5a)
dr(J•) (•) P= dje
where
PHENOMENOLOGICAL CONSTITUTIVE EQUATIONS
To formulate and identify phenomenological behavior of polycrystalline lithospheric materials is not an easy prob- lem, even though an extensive literature is now available from laboratory experiments (cf. recently, Carter and Tsenn [1987],T senn and Carter [1987], Patterson [1987], Kirby [1985, and 1983]). Even if much progress has been made in the understanding of different modes of deformation (in term of the validity domain and the governing micromech- anisms), our knowledge of rock physical properties and be- havior under arbitrary loading paths is still rather deficient, let alone our ability to quantify such behavior. This owes to the variety and complexity of the observed phenomenol- ogy and specially to the simultaneous influences of pressure, temperature, and strain rate. Moreover, direct use of labora- tory data in a mechanical model at lithospheric scales raises some difficulty and bring into play still unsolved problems in extrapolation. Any phenomenological formulation will have to deal with a large spectrum of rock behavior. Small- scale physical mechanisms even if they must determine and explain large-scale behavior cannot be explicitly translated in an operational method. They do however, provide the only physical guidance to establish procedures and to in- terpret results. Rocks are strongly heterogeneous materi- als (at all scales) which exhibit severall interacting inelas- tic mechanisms. At one end, low pressure-low temperature (LP-LT), small-scale mechanisms involved are microcrack growth in mode I, and frictional slip-induced plastic flow, both expected to be pressure dependent and almost time independent. At the other end, high pressure-high tem- perature (HT-HP), micromechanisms are, as for most poly- crystalline agregates, governed by dislocation and diffusion processes, grain boundary sliding etc., all expected to be strongly thermally activated, time dependent, and almost pressure independent. In between there is a wide transi- tional domain where different inelastic mechanisms are mu-
I je)2 je b e F eF eT (5c) U(Je) = • K (log ; = detFe ; =
This is an uncoupled extension to the compressible range of the classical neo-Hookean model.
The shallow depth (LT-LP) regime will be described by a frictional type of time independent plasticity where'
d p = •/h(r, ...) if ft(r, p) = 0 (6a)
and
ft _• 0 ff _• 0 f'• --0 (6b)
where d p is an Eulerian measure of the rate of the plastic deformation tensor (see Appendix A), h is the plastic flow direction defined here in the deviatoric stress space, and • is a Drucker-Prager type of yield surface:
dev r
h(,-) = II dev r II (6c)
I•(•, p) =11 dev r II -• •(p); •(p) = •0 - tan •b p (6d) the yield criterion (6d) is similar to Byerlee's law. Extrap- olation of (6d) below about 4-10 km is difficult since one expects a change of the frictional behavior which becomes independent of the normal stress [see Brace and Kohlstedt, 1980; Hobbs and Ord, 1988].
The deeper (HT-HP) regime is classically described by a power law creep, i.e. ,
d vp = •/o exp(-Q/RT) H(c))
•(•) = II dev •11 - x/• •0
,/,f•.). 0_g (7)
where H(.) stands here for the Heaviside step function, Q is
CHERY ET AL.' THERMOMECHANICAL MODELING OF CONTINENTAL DEFORMATION 4391
the effective activation energy, n is the power law exponent, and if0 is a fluidity parameter (or the so called preexpo- nential term) which characteristic dimension is Pa -n s -1. This is a plausible three-dimensional extension of the simple uniaxial creep law.
In fact, plasticity and creep are always coupled, and at low temperatures, several dissipation mechanisms are in- teracting with different characteristic time scales. Those time scales may become very different for certain loading for which only short time scale dissipation (compared to the loading one) can build up inelastic deformation. This break down of the power law has recently received some atten- tion [Tsenn and Carter, 1987; Kirby and Kronenberg, 1984]. From a phenomenological point of view, it looks like the power law exponent n becomes then a function of r and T. One can replace this continuous function by combining two discrete values of power law exponent n: an infinite one (per- fect plasticity), for very short time scale dissipation, and a finite n, for temperature activated viscous dissipation. The inelatic rate of deformation is therefore partitioned as
d in = dp q_ d v p (8)
and one has to introduce a plastic yield surface: here a Von Mises one, i.e., re(r) = [[ dev rll- V•7•k0; and a family of equipotentials all homothetics to an elastic yield surface, i.e., g(r) = [I dev r[[- v/•K• p. Then
areoo d in = •/H(f2) •rr + •/o H(g) q3(r) n exp(-Q/RT) •rr (9)
where here ff is determined with the condition that the stress state always remains inside or on the plastic yield surface
¾r ½ R a {r I g(r) < O} •_ {r I fe(r) < O} (10)
Such a formulation can describe the power law breakdown of most materials provided that kg can be determined.
NUMERICAL EXPERIMENTS
A rather idealized layered structure for the hthosphere has been assumed. Following Meissner [1986] and Strehlau and Meissner [1987], each of the layers was characterized by a mean composition on the basis of average seismic wave velocities. Such a correlation is clearly nonunique and a layered structure might appear quite unrealistic in view of the structural complexity and lateral heterogeneity of the exposed crustal crosssections [see Fountain and Salisbury, 1981]. Nethertheless such an approach will serve to identify some of the theological features of the lithosphere.
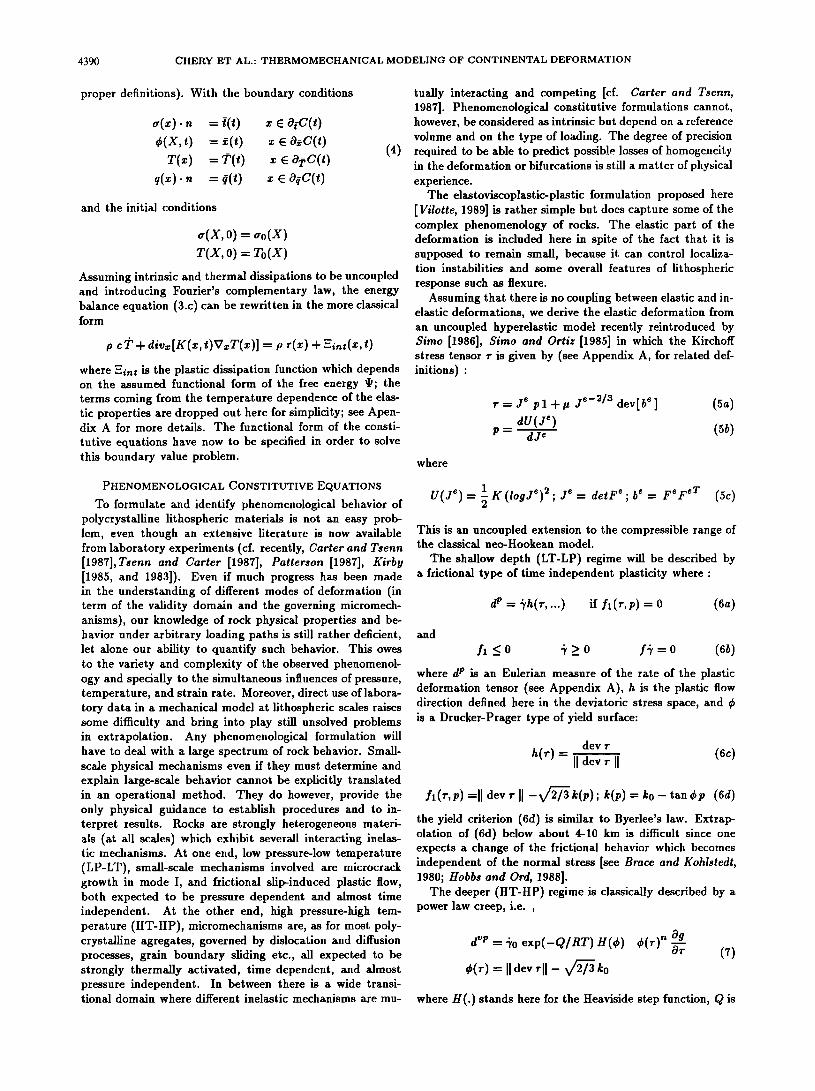
A quartz-controlled theology is postulated for the upper crust, a feldspar or pyroxene controlled one for the lower crust, and an olivine or pyroxene theology for the upper mantle. Tables I and 2 summarize the different models and
the values of the thermal-mechanical parameters. Given the initial temperature distribution of Figure 5c, these different structures may be illustrated, for different uniform refer- ence strain rates, in term of viscosity profiles (Figure 4), where the partitioned model (8) is not taken into account. One has to be very cautious about such a static image of the lithospheric strength, and it is worth mentioning that
,lO 3 1
o
cL -40-
-60-
-80-
-100-
-120, 18
og •oO(viscosity 1 .•o• 22 24 6 ' ' • I • •0
I profile b I, •_/- •/-•,,• •= •o-' •.-' • • --4o ?JZ
z I,,•, •.o• --•o /o, .... [-p7 ,o-"__,oo
/ -1 !• I L •_C_M•C• • -- 120
20 22 24 26
?g (viscos ityl. o • 24 z 0
-2o
-4o
-6o
--80
--lOO
-120 26
JVISCOSITY PROFILES]
ß , o ', •ø g •o0 (v•i•sc q•s ityl• ,lO 3 :o
--2o ,
--40
--60
--80
--100
-120 26
ß 10 31 ! . I i ! . o L•.j•.•.J
pro• • -•
•/ I/ 1• , -•o- / ,/ • - • . /ko, g, 7 _•oo. •o• y - •- /) •= •o-"
/ -12o -JF .... •-• • , 8 2o 22 2•
,og •oO(viscosityl• 22 24 ,10 3 0
--20
--40
--60
-80
-lOO
-120 26
ß 10 31 o
(_ -zu I:)rof[•• '•' CL-40 .•/ • /
© t- ..... .• / / /_ • -•o, • 2? ////'• I -•o- / // /y •/
,.01 •.•. • I• = ,• N_•00_ /__•__2 I- 18 20 •2 24
og •oO(viscosity ) .lO• 22 24 6
I ' i tj
--4O
---60
---80
--lOO
-120 26
13 17 1 Fig. 4. Viscosity profiles for two different uniform reference strain rates: 10- and 10- s- . Profiles correspond to the different crustal and mantle parameters of Tab]es 1 and 2. The reference geotherm is the initial geotherm of the numerical simulations. No partitioned mechanism is taken into account here for the upper mantle.
4392 CHERY ET AL.: THERMOMECHANICAL MODELING OF CONTINENTAL DEFORMATION
pl.1 ETAT IN ITIAL
I I
1.i mcillcge
/!!lillll•lilj!111/111ill i jltllj!liilJ t I i
' I j '11111111111tllltll J !J!lltllJi! IillilJ jl IliiJ!ililitllll] II Jllijii lillllJl I '•ill '' ii
.... LJ J ! ! LJ ..... .... ..... ..... ..... !._l..J__œ.j_! .... j_J__!_j_J .... !...J .... !.__LJ_j_.j.•_L_J ! .... ..... •J_i_._l .... l I./. •1. •.1. I. I i..I I i i 1.. i J .•1 1.i grille
1.g temperature gO0
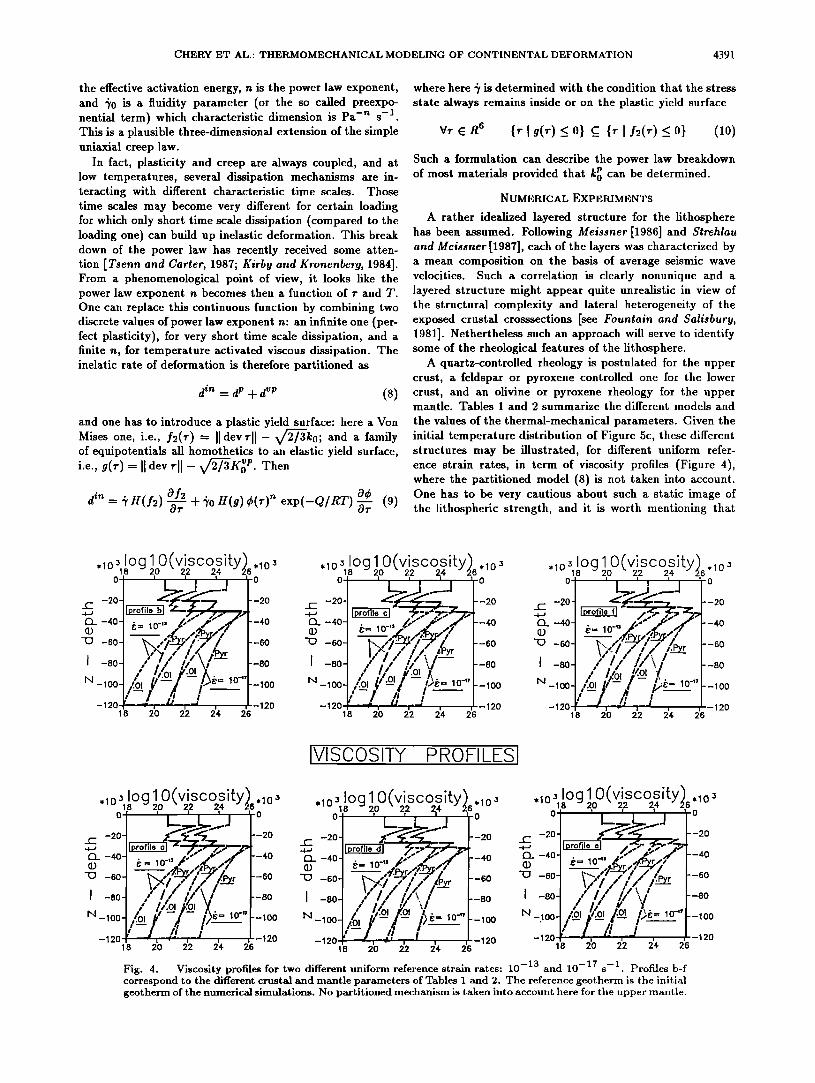
Fig. 5. Initial numerical structure: geometric stretching of the crust is/•c=1.5 and thermal stretching/•m=2.0. (_a) Initial mechanical mesh, the mesh is composed of 260 isoparametric elements Q• - P1. Each element contains nine integration points for all area and volume integrals. (b_) Initial reference squared grid: a uniform squared grid is imposed on the initial configuration and will be followed through the deformation in order to visualize the gradient of deformation. (c_) Temperature distribution, in degrees Celsius, after initial stretching: temperature distribution on the left side of the structure is representative of the initial unperturbed thermal structure.
viscosity contrasts depend strongly on the assumed uniform strain rate. It may be rather dangerous to base our intuition about possible localizations and heterogeneity interactions inside the crust on such a simplistic picture.
The boundary value problem defined by equations (3) and (4), and the appropriate constitutive equations, can be re- formulated as the search for the stationary points of a vari- ational functional. This problem was solved by a finite ele- ment method (see Appendix B for an outlines of the method, and Vilotte et al. [1987] and Vilotte [1989]. Mechanical and thermal problems are solved by a staggered method over two different embedded meshes.
The initial geometry of the mechanical mesh shown in
Figures 5 and 3 is composed of 260 nine-node isoparametric elements. The crust has four different layers and is initially 30 km thick. A homogeneous initial crustal thinning is im- posed: the maximum streching value is fie = 1.5, and its horizontal variation was chosen with reference to the mod- els proposed by Sdguret and Daignigres [1986]. This local geometrical perturbation is isostaticaly compensated, and its wavelength is of the order of 40 km. A constant velocity is imposed on the left boundary of the vertical cross section. The upper boundary surface is a free surface, and gravita- tional forces are explicitly included in the computation. The surface topography is given by the deformation of this inter- face, as far as erosion and sedimentation processes can be
CHERY ET AL.' THERMOMECHANICAL MODELING OF CONTINENTAL DEFORMATION 4393
neglected. The lower boundary surface is located within the as-
thenosphere and is free-glide. Although the displacements in the lower part of the mesh can not be considered as representative of convection, mechanicM interactions at the asthenosphere-lithosphere boundary are adequately de- scribed if the driving mechanism of the evolution is consid- ered to be located on the edges of the plates.
The thermal mesh is Mso shown in Figure 3. It is spa- tially embedded inside the mechanical mesh, in the sense that there is a one to one mapping between each point of the thermal mesh and a subset of the mechanical mesh. At the
upper surface a (2ohsrant temperature is imposed, while on the two lateral boundaries a zero lateral flux is prescribed. The lower boundary is indentified as the base of the me- chanical lithosphere and corresponds to an imposed tem- perature Tm "• 12500 (2. This interface has a weB-defined image inside the mechanical mesh and corresponds to the asthenosphere- lithosphere boundary, beneath which a ho- mogeneized adiabatic temperature distribution is assumed. The temperature dependence of power law creep is rewritten as
•'o exp(-Q/RT) = ;•m exp[Q/RTm (1- Tm/T)] (11)
Due to the thermal activation parameters, the equivalent stress relaxation times for mantle materials, at high tem- perature T_ • 12500 (2, are many orders of magnitude lower (more than 8) than those defined at _• 6000 (2, for a given deviatoric state of stress, and one has to be careful with the time marching algorithm (see Appendix A and B).
The initial thermal perturbation, associated with the ge- ometrical one, is simulated here by a simple stretching of the isotherms with an amplitude /•m = 2.0, and horizontal variations of/•m and •c are homothetic. The thermal pa- rameters adopted here are typical of a relatively young con- tinental lithosphere: initial unperturbed heat flux is about 65 mW m -2 and for the perturbed one about 75 mW m -2.
NUMERICAL RESULTS
All the calculations presented here were done on a Cray 2 of the Minnesota Supercomputer Institute. Several numer- ical experiments were performed, but a systematic study of parameter space is out of reach because each run, involving 250 time steps and eight nonhnear subiterations per time step, takes about 3 hours (2PU due to the strong material and geometrical nonlinearities. This may be improved and a new vectorized version of our code will cut the CPU time
down to about 1 hour. The numerical formulation itself is
briefly reported in Appendix B and in more details from Vilotte [1989]. The initial mesh and thermal structure is shown Figures 5a and 5c. Model G4c2b, cf. Tables I and 2, was chosen as the reference model.
A COMPLETE REFERENCE EVOLUTION
As already mentioned, a spatial formulation has been adopted for this large transformation analysis. Therefore aJl the measures of the different physical quantities repre- sented here are Eulerian, referred to the current configura- tion which is the only one of geophysical significance. Most of the results are presented as contour maps on the deformed geometry of the lithosphere. Those quantities were first de- termined at the nodal points of the mesh via a variational recovery procedure, Zienkiewicz et al. [1985]. Each element
is then subdivided in four or more linear rectangles, and the physical variables are interpolated at the new nodes using quadratic shape functions. Finally, inside each rectangle a bilinear interpolation is performed.
In all the runs presented in the following, the imposed shortening velocity is v = 310 -10 m s -1 and the mean time step used is 10 TM -- 1012 s. All the results are presented at different successive values of shortening (4%,7%,10% ,12%).
Second Invariant o] the Plastic Strain Tensor
This measure of the plastic deformation represents the de- viatoric part of the deformation, essentially the shear strain. The Eulerian plastic deformation e p is defined in Appendix A, and its second invariant I2(e p) is given by
I2(e p) = v/l/2 dev eP ' dev eP (•2)
Plastic deformation can be locally as high as 200% and in most parts of the mesh is most of the total strain (Figure •).
Localization starts (Figure 6a) inside the lower crust in the vicinity of the sharp transition between normal and thinned crust. This is due to two main reasons: One is
the strong initial lateral temperature gradient in this zone, cf. Figure 5c. The other one is the lateral gradient in com- position induced by geometric thinning. Inside the mantle and related with this crustal feature, two broad curvihnear arched bands accommodate the shortening at depth. Be- yond those zones, the crust and the mantle remain free of deformation (i.e. I2(e p) < 5%).
During the shortening, Figures 6b and 6c, the locahzation and the intensity of plastic deformation increase and lead to a strong crustal thickening and the development of a wedge- shaped root, progressively driven into the mantle. Intense plastic shearing takes place inside this root, the progressive sinking of which induces local deformation inside the mantle. Otherwise mantle deformation is homogeneous with depth and accommodates an overall flexure of the upper part and more locally the intrusion of lower crust materiM. On both sides of the root, the crust presents some asymmetric plastic deformation on a scale of the order of 160 km. Without this
zone, the crust remains undeformed.
Strong lateral viscosity contrasts around the wedge-sha- ped root create a intra-crustal indentation process which in turn strongly contributes to the evolution of the root and its destabilization.
Second Invariant o] the Stress and Elastic Strain Tensors
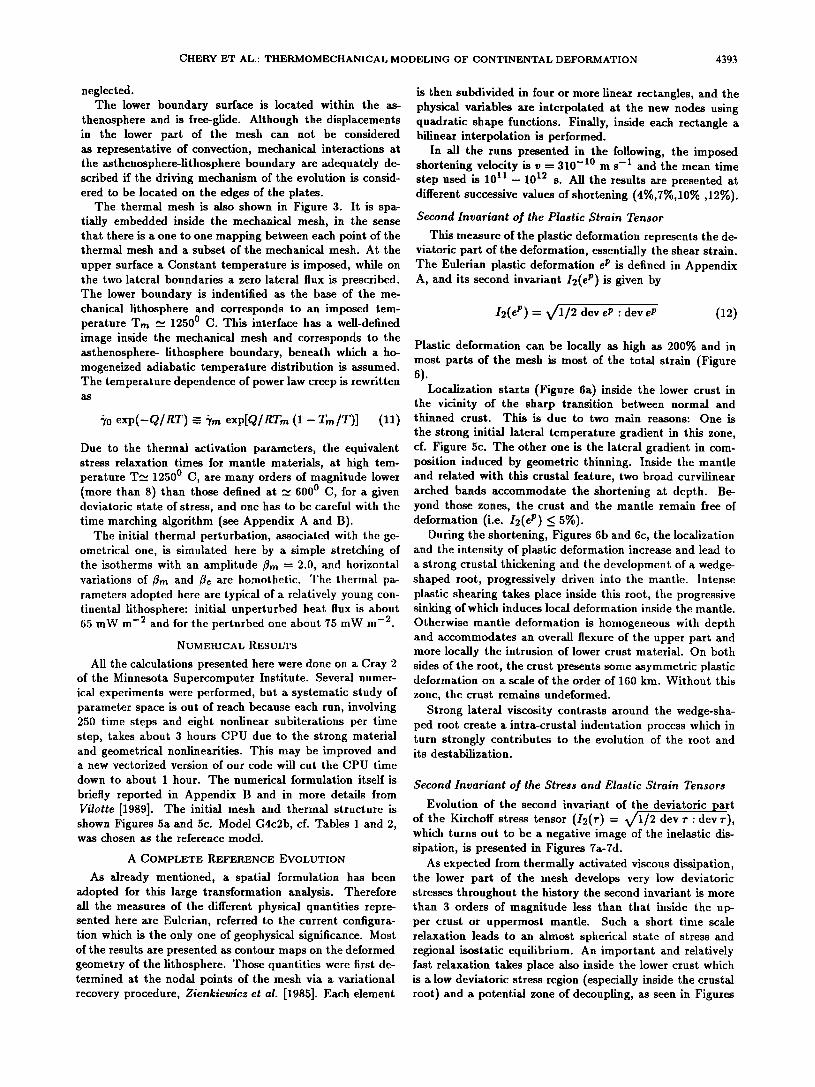
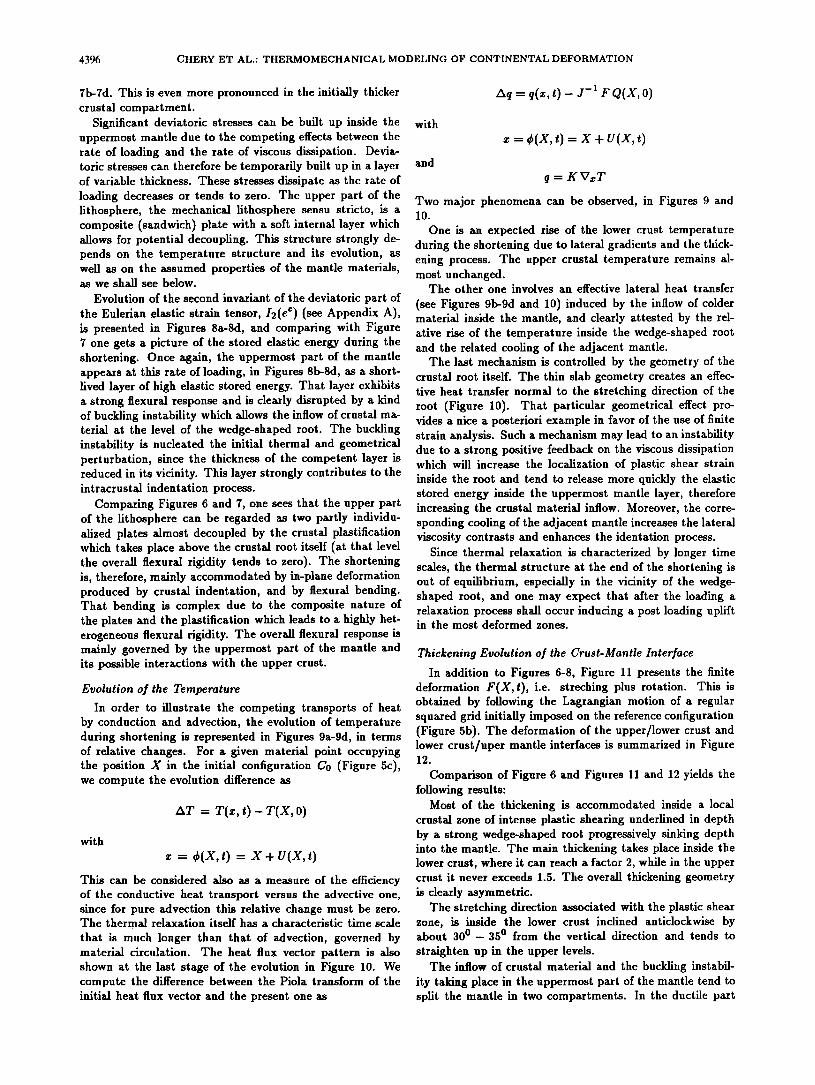
Evolution of the second invariant of the deviatoric part of the Kirchoff stress tensor (I2(r) = v/l/2 dev r: dev r), which turns out to be a negative image of the inelastic dis- sipation, is presented in Figures 7a-7d.
As expected from thermally activated viscous dissipation, the lower part of the mesh develops very low deviatoric stresses throughout the history the second invariant is more than 3 orders of magnitude less than that inside the up- per crust or uppermost mantle. Such a short time scale relaxation leads to an almost spherical state of stress and regional isostatic equilibrium. An important and relatively fast relaxation takes place also inside the lower crust which is a low deviatoric stress region (especially inside the crustal root) and a potential zone of decoupling, as seen in Figures

4394 CHERY ET AL.: THERMOMECHANICAL MODELING OF CONTINENTAL DEFORMATION
f.6 : g4c2b plastic srain
ste ) 61 0.050 "0.100 '0.20 0.,o o.ao ' ..
b
c
\
step 181
step 221 0.050 'o. '• "oo ....... 'o':'½••. ;'i "'"'i'::';. .. Fig. 6. Contour map of the second invariant of the Eulerian plastic strain I2(e p) for model G4c2b at (_a) 4% (step 61), (b) 7% (step121), (c_) 10% (step 181), (_d) 12% (step 221) of shortening. Gray scale is the same for all those maps. The four crustal layers are also shown on this map.
CHERY ET AL.: THERMOMECHANICAL MODELING OF CONTINENTAL DEFORMATION 4395
f.8 g4c2b deviatoric stress
Q
sf. ep 1
, •
step 121
c
sf. ep 181
d
sf. ep 221
ß
ß
ß : .
ß
ß
..
Fig. 7. Contour map of the second invariant of the deviatoric part of the Kirchoff stress Iu(r) for model G4c2b, same time steps as Figure 6. Gray scale is logarithmic and the same for all those maps.
4396 CHERY ET AL.: THERMOMECHANICAL MODELING OF CONTINENTAL DEFORMATION
7b-7d. This is even more pronounced in the initiMly thicker crustM compartment.
Significant deviatoric stresses can be built up inside the uppermost mantle due to the competing effects between the rate of loading and the rate of viscous dissipation. Devia- toric stresses can therefore be temporarily built up in a layer of variable thickness. These stresses dissipate as the rate of loading decreases or tends to zero. The upper part of the lithosphere, the mechanicM lithosphere sensu stricto, is a composite (sandwich) plate with a soft internal layer which Mlows for potential decoupling. This structure strongly de- pends on the temperature structure and its evolution, as well as on the assumed properties of the mantle materials, as we shM1 see below.
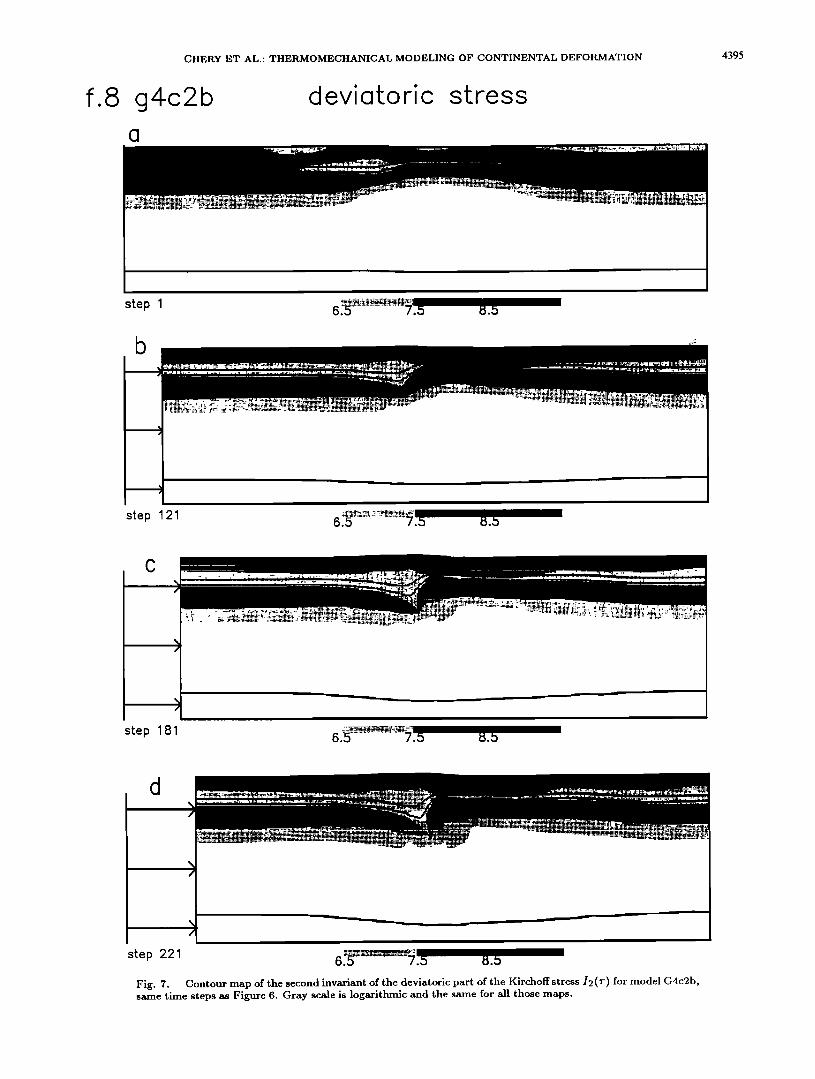
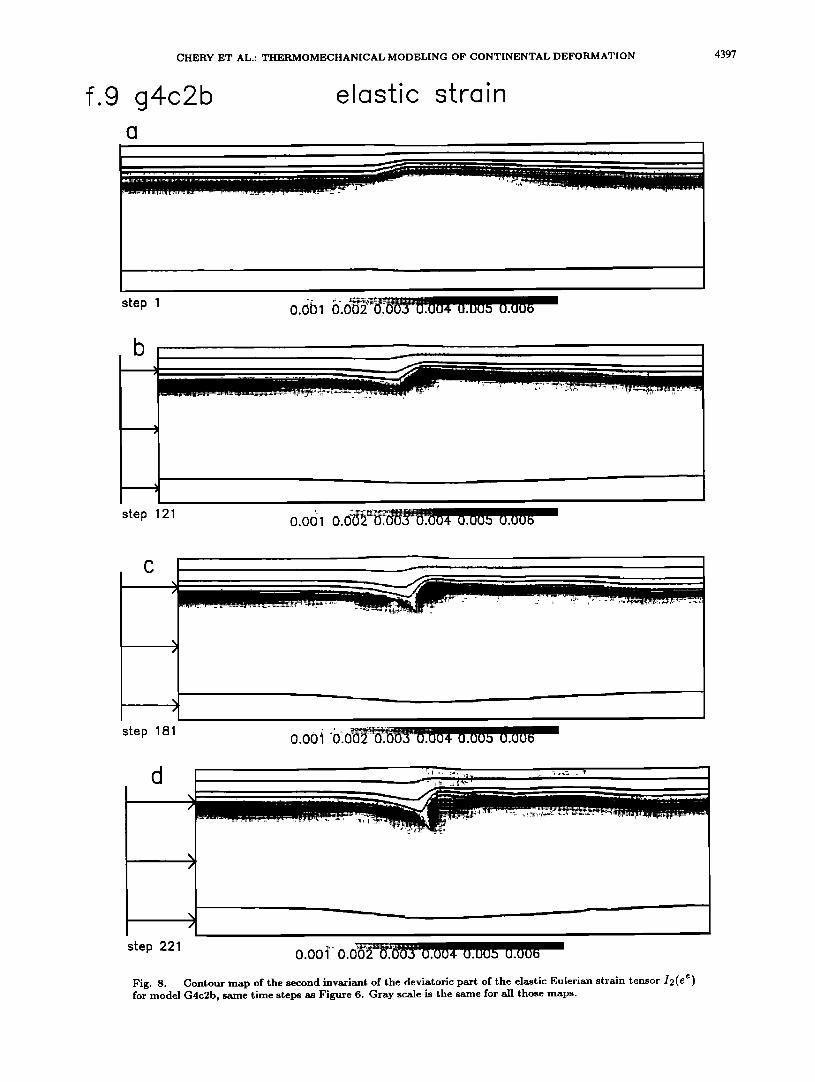
Evolution of the second invariant of the deviatoric part of the Eulerian elastic strain tensor, I2(e e) (see Appendix A), is presented in Figures 8a-8d, and comparing with Figure 7 one gets a picture of the stored elastic energy during the shortening. Once again, the uppermost part of the mantle appears at this rate of loading, in Figures 8b-8d, as a short- lived layer of high elastic stored energy. That layer exhibits a strong flexural response and is clearly disrupted by a kind of buckling instability which allows the inflow of crustal ma- teriM at the level of the wedge-shaped root. The buckling instability is nucleated the initial thermM and geometricM perturbation, since the thickness of the competent layer is reduced in its vicinity. This layer strongly contributes to the intracrustal indentation process.
Comparing Figures 6 and 7, one sees that the upper part of the lithosphere can be regarded as two partly individu- alized plates Mmost decoupled by the crustM plastification which takes place above the crustM root itself (at that level the overall ttexural rigidity tends to zero). The shortening is, therefore, mainly accommodated by in-plane deformation produced by crustM indentation, and by flexurM bending. That bending is complex due to the composite nature of the plates and the plastification which leads to a highly het- erogeneous flexurM rigidity. The overall flexurM response is mainly governed by the uppermost part of the mantle and its possible interactions with the upper crust.
Evolution of the Temperature
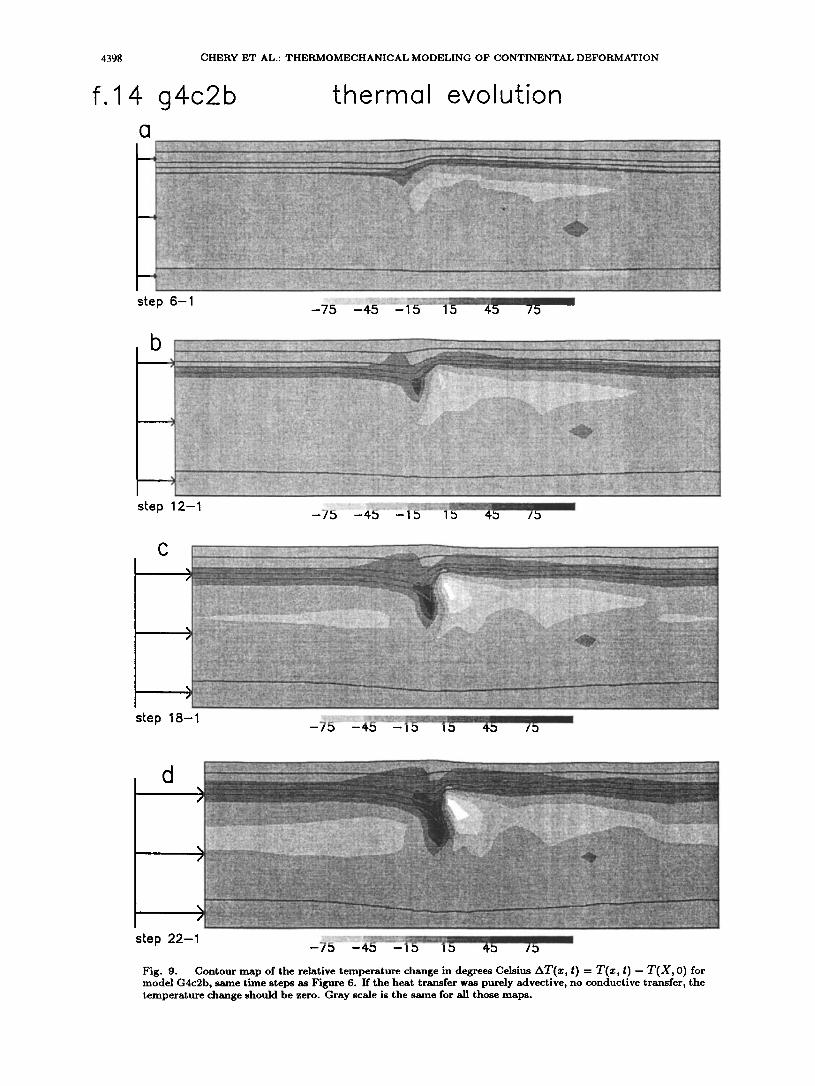
In order to illustrate the competing transports of heat by conduction and advection, the evolution of temperature during shortening is represented in Figures 9a-9d, in terms of relative changes. For a given materiM point occupying the position X in the initiM configuration Co (Figure 5c), we compute the evolution difference as
AT = T(z, t) - T(X, O)
with
ß = 4(x, t) = x + v(x, t)
This can be considered also as a measure of the efficiency of the conductive heat transport versus the advective one, since for pure advection this relative change must be zero. The thermal relaxation itself has a characteristic time scMe
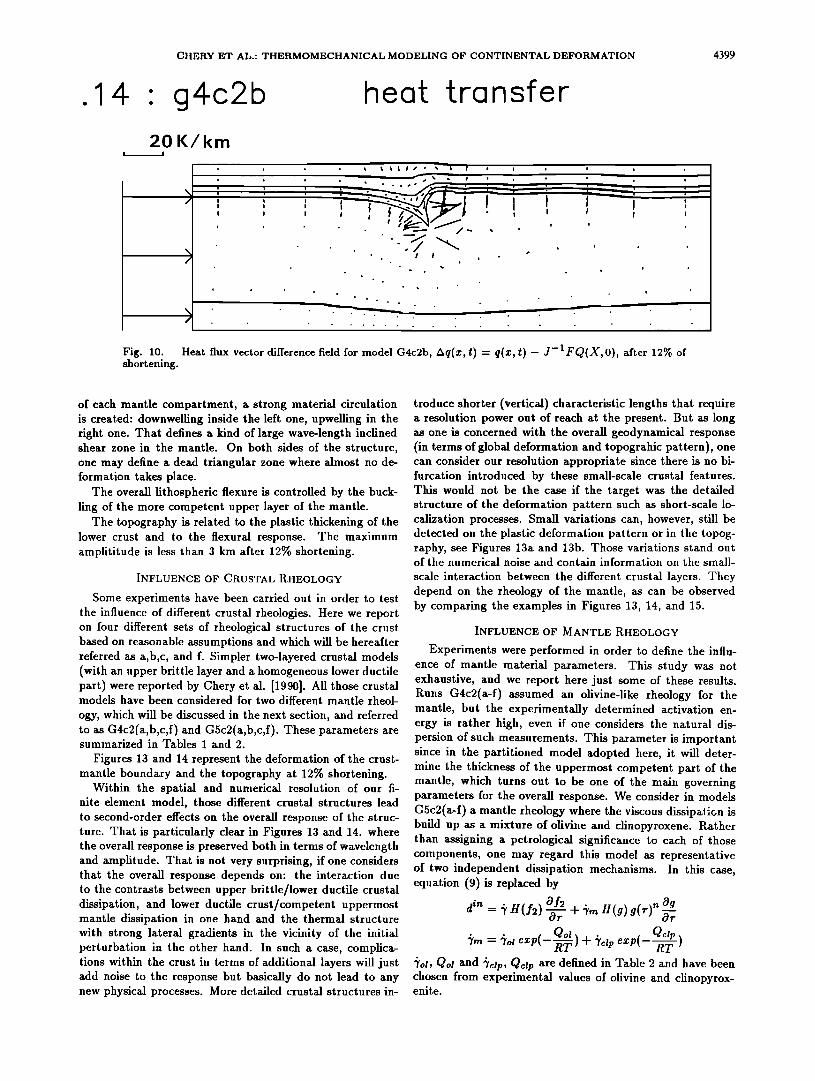
that is much longer than that of advection, governed by material circulation. The heat flux vector pattern is Mso shown at the last stage of the evolution in Figure 10. We compute the difference between the Piola transform of the initial heat flux vector and the present one as
Aq = q(z, t) -- j-1 F Q(X, O)
with
= t) = x + v(x, t)
and
q = K VzT
Two major phenomena can be observed, in Figures 9 and 10.
One is an expected rise of the lower crust temperature during the shortening due to laterM gradients and the thick- ening process. The upper crustM temperature remains M- most unchanged.
The other one involves an effective laterM heat transfer
(see Figures 9b-9d and 10) induced by the inflow of colder materiM inside the mantle, and clearly attested by the rel- ative rise of the temperature inside the wedge-shaped root and the related cooling of the adjacent mantle.
The last mechanism is controlled by the geometry of the crustal root itself. The thin slab geometry creates an effec- tive heat transfer normM to the stretching direction of the root (Figure 10). That particular geometricM effect pro- vides a nice a posteriori example in favor of the use of finite strain anMysis. Such a mechanism may lead to an instability due to a strong positive feedback on the viscous dissipation which will increase the localization of plastic shear strain inside the root and tend to release more quickly the elastic stored energy inside the uppermost mantle layer, therefore increasing the crustM materiM inflow. Moreover, the corre- sponding cooling of the adjacent mantle increases the laterM viscosity contrasts and enhances the identation process.
Since thermM relaxation is characterized by longer time scales, the thermal structure at the end of the shortening is out of equilibrium, especiMly in the vicinity of the wedge- shaped root, and one may expect that after the loading a relaxation process shM1 occur inducing a post loading uphft in the most deformed zones.
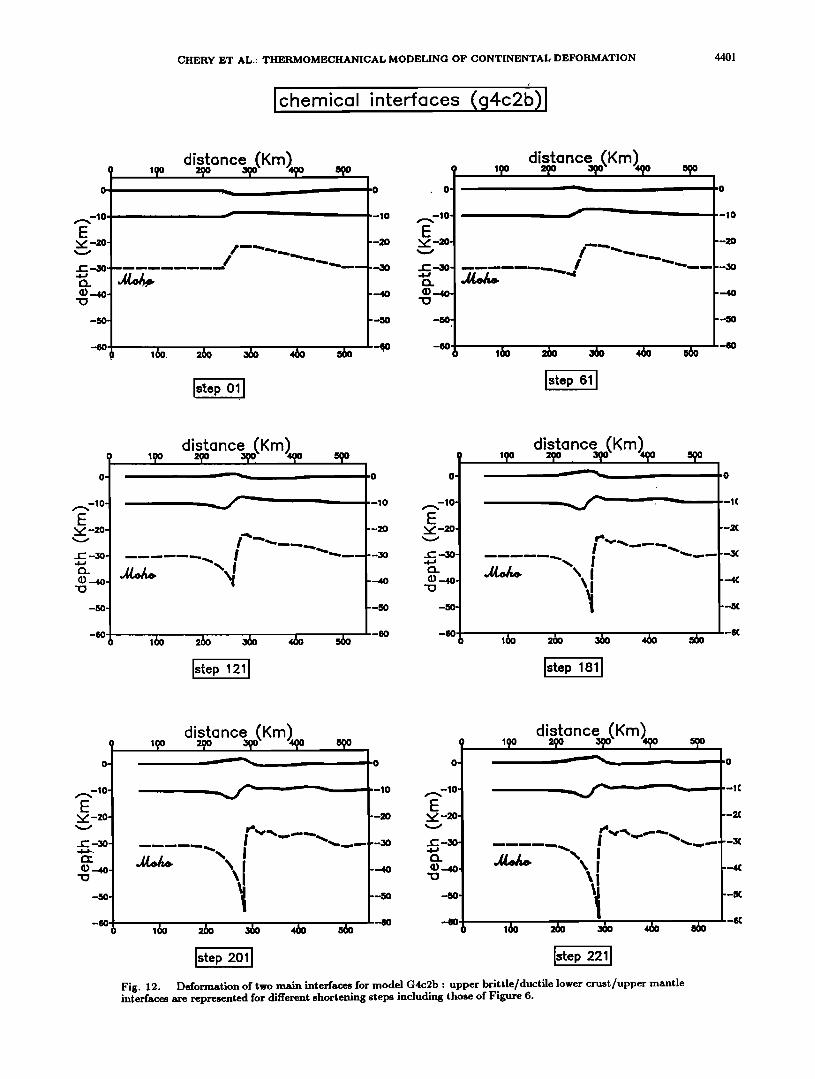
Thickening Evolution of the Crust-Mantle Interface
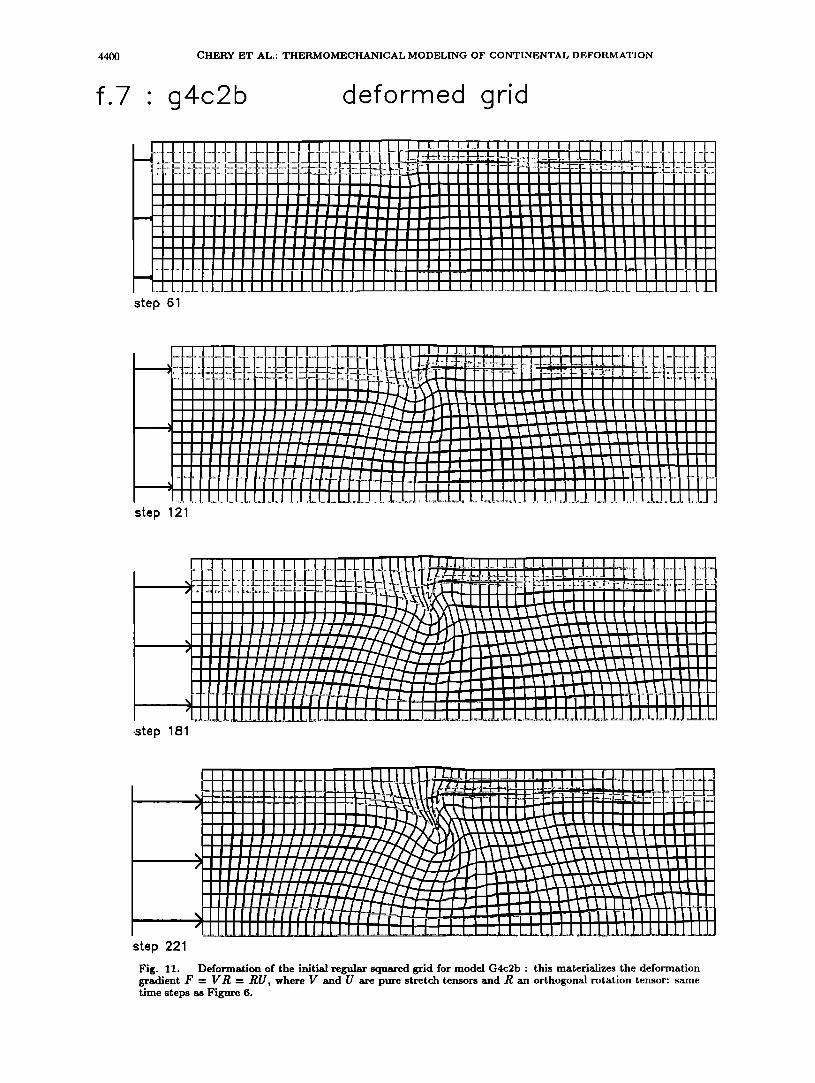
In addition to Figures 6-8, Figure 11 presents the finite deformation F(X,t), i.e. streching plus rotation. This is obtained by following the Lagrangian motion of a regular squared grid initially imposed on the reference configuration (Figure 5b). The deformation of the upper/lower crust and lower crust/uper mantle interfaces is summarized in Figure 12.
Comparison of Figure 6 and Figures 11 and 12 yields the following results:
Most of the thickening is accommodated inside a local crustM zone of intense plastic shearing underhned in depth by a strong wedge-shaped root progressively sinking depth into the mantle. The main thickening takes place inside the lower crust, where it can reach a factor 2, while in the upper crust it never exceeds 1.5. The overall thickening geometry is clearly asymmetric.
The stretching direction associated with the plastic shear zone, is inside the lower crust inchned anticlockwise by about 300- 350 from the vertical direction and tends to straighten up in the upper levels.
The inflow of crustM materiM and the buckling instabil- ity taking place in the uppermost part of the mantle tend to split the mantle in two compartments. In the ductile part
CHERY ET AL.: THERMOMECHANICAL MODELING OF CONTINENTAL DEFORMATION 4397
f.9 g4c2b elastic strain
Q
step 1 0.001' 0.002 0.003- 0.004- O.00b O.001::i
step 181
Fig. 8. Contour map of the second invariant of the deviatoric part of the elastic Eulerian strain tensor I2(ee) for model G4c2b, same time steps as Figure 6. Gray scale is the same for all those maps.
4398 CHERY ET AL.: THERMOMECHANICAL MODELING OF CONTINENTAL DEFORMATION
f.14 g4c2b thermol evolution
(]
i!!iilii..' :• .r..' F' ."-.'iiiiii3'i!-'i! '.din ::i r--•ilill • •i" .' i.• •i,2 •iiii:'ii3!•iu ill i•"..'i!i• ;,•!i'-'.-+.?'.::: • • • i i".-" i '--3iiDiii--"iii.•i i iiii!illiiii i iii4ii."!.'. .' !-.: ii.' i iiil!iiiiiiiiii•'iii:qi:iiiiiiii',,,i,,,i-Y.-'!:ii!!l!-'.!ti• iliiiiiiilq ":3ii •iii•-:i!! iD.'".-'illi :"•.'•ql .:ii iiii •Ji '.=.' i lli i i!ii" .-"-.i":i::iiiii1.3if:: i.-" i iii.,:i!li!ii-:; ':.! "._':ill'-!i!! iil i i i il." 13 • • !-" ." i i i! i i;•-g-" :•:`••`•i•i•:i•:•:•i•]••`•i•q••:•:••i••]•i•`•:••i• i!111-iiilh.-iiliiiiill-2!q:-ii•iF!i!ii!i:•i:i•i-='-1];*-ii`2F.i,,W:l•3r::: :!111F!!!!!iiii•ilF. h•i i ilii•i•ii •ii i • :½"iii"•i! • :!il i i !'•ii i½.1i •½."-i ill :•iiii!•1iili• •11• •11!•i •!i • i•ii i :r•i'..'!.r.'i •11!i i •1i •i•iiii!ii!i!iiii•:•iiiiiiiii!11 i • ;•i'_-.':i i•i• •iiiiiiiii:".:-i! • •i•i!!i•i•! i-'-.'. •11!iiiili!11 •111! • •:.-':11!ii-".',•1i :..4!•11iili ½ •11i i iii• i!i! i"-' :-." ::::::::::::::::::::::::::::::::::::::::::::::::::::::::::::::::::::::::::::::::::::::::::::::::::::::::::::::::::::::::::::::::::::::::::::::::::::::::::::::::::::::::::::::::::::::::::::::::::::::::::::::::::::::::::::::::::::::::::::::::::::::::::::::::::::::::: .n:! ::::::::::::::::::::::::::::::::::::::::::::::::::::::::::::::::::::::: i i:'!:'i:'iiiil:i ii F. ili :i•11ti • •i iii ::•:i '2 ii i! i i.• :•,•i• • • ̀2 !!i!i:!il:!: i!!•! .=,i! :::;iii!i::' i ̀2:`2 :•il ii i ili :-;•:! il •-:-`21`23111!!!1!Hi:!!!iii:iF 11:2'-' `211r' H! !: •!l! `2 ilii:-!•i •1!iH 3`2 ;1111.'".'11 i! i ill •"-ii!:iiFii3 •i• •,ii `2:iil!• q. '•i! ill i i';il i• •!!!i !11u-:!!!i`2!i`2;;!!!ili i!!1!!! !'.'!ij i':__. ,•!ili]!i: i iiii!i!i•.F!i•i;: ,:•.-. i :::::::::::::::::::::::: '½::,:,• ``:•m:m:•``::::::`--.+:`-```.::`•:::`q:`qim`::•;•:•F::•m:`:i::`--`•:•-`=•:``•:::::=`":•:``u•::•:•::`•:•`:•m::•:c•m:`:• m`.•c:•`il•::::``.m`:m::``:::::•.•:::::::•``:`-•::::•```-:`r`•i:::::m`•""•:m•":q::::":::::q:::m•:•````:::•:::•``:::•m•:::i::::::•::m::::``•::m•`•li•:•i:h"::•h:i• :• :i:!!i•`2!!i`211!111.:i! i.•111 i ill!!! 3!!ill !i.• •.m'.!!i.-q:!!-'% i! i ii:'!3il:i i:i :q!!•ilmi3i:i •:,,, !if.": 'X•.i • ,q•F-; '2!:;; :?.'!•. i i :'..'ill if!ill ,=.i H i! •!!:ii:. `2 • i! !if!, ::q .'-.' •.•il ih• •iil!i;!i-"! i ifil!ill • i''' •.qii.:i:i:' •::!i I •i • •11`2 '21 !'i ill'ill !! i''' ;`2!i:'!illi !! i I!•iii !1! ii ̀2 !i! .'7• i lili ill!! i: !•i;:-i! i il!`2!i!iiii:•i ii illi!•.!33, H."::?,.•,: i•i,,,• i!_i :': • !•.]] !i •11•i!i !i!• i.=:il !•i• .'=.'• i '2 i! •-2 i• .•?,,•
ill! .• Lkr.:l { !-" • !'-'-"ii':-'3i •q •iiiiiiill •ii hill ill i!: u•11:i '2 •".'.!..'iiDii i3!lil`21{i:illi! .'!.: • il .F! H!-'-Hiii• ..•L!il{':!i-•iiiiiiii ii • l-."• L r..' i-" i:i i• i.• ii •lii! !iili!-'.l "•i:.-.• ii.: iF.-'i{ •im'-i i:.-.:i-:i"ii!•l ! 12 •!i !• ".-'.qii !.!4!!l i-. 'ql .u. l• ".-i •i{ll!iii g iiiii{.':iiii !{iiillii•i•iii .'-'..-"J! i ! •ii :•"-'. iiiiiiiiiiilL':ii iiliiiL'.'iL-' •{li{iiiiiii-".l!{i ii .r... !!i "=' :?.' ..'" '.. il • DD: = ". !!ii•!•1!!1ii•i •i•-'..iqliiii'•i!ii•q•1!iiii=.'.. ß !.:--..'• •!•:.:-.'1ii'•!'dl:i-"iil•iiiii•i•i•lim'.e--414 i.,.=.½4':::!i i•ii•i•iil! i•ii1•i•iii'•iii•liii!i!1;½j4!iiii:•ii!i",il •i• ili!i'• ii'::L-:4 i':illi [.i ill!•!!ii•1!i•iil iiil•.!"di•i•?.:.--:.i•iill]iiiii!lili!il!liiiiil i!lil i•. iil!iii!l ii!iii•11•ii i.: !,'-!! !:i!!!i`2!!F:'!`2`2!i!:-!i!i•!ill !111! !i! • i!:i!:`2 ! !•'-,;i•-•.:!i•!!i !ill :illill !1!i !!! I ! i ! :".".:`2 :q4 i !•.:;]•]• •."i• !'½;ilii•1111!`2 fill!! it!1!!i.qi!iF;;;i!!1! i!i !ilil•111r:`211L:!!!:ir: `2ilii i!111ii! iiii•!ii •i !; ii!iii:l-•qil ,ql •r.' ii• !!i!!ii•11.-'i'.-!!!•,2 iii•ili!ii•!!11.ql !!ili!i• i! ii,2iiii:qil i•:•! i! i i: :d'21!.,'.•!i!i• •;• ̀2 i!il,u--'-! i • i iiii!i::iil.r.-qiii!iiiiiiiig=]:.;: F.-'iiiii"iiiii.:!-"i!'.:iii:.-.:iiiiiii•ii• ':!iilgiii •i3T!i..']i::•iiii.L-:!iii-:iik• F.Z• iiii[ml-'..';im m?-'m'i`2 :ira i..'.m F •:iii3i• u!!.-'.:.:!m iii:i::i::::".'}•]•];:;];:]]; ];•'i;:::::: 7:::::::: :: :::::: Z:•illlli:'ill;illllqi•.:; ii:il;ilil!•-.•.'-iiii'..'i...'.illl :i •ii,, i.-..;;;;=; • i iii i i;; i;; ;i.-' .'i.':qiim!m.' !-'i• .:.:-'i i -'::: i i • :'., i u i i i!-:,•i i F..' i i .." ii.'-' i il..'i .".'-'..'".: i i • iii iii "'-': i • .."--L.: • •&•
ii! i!ii!ii'-'•ii !•il i.: i-"• !iiii!iii•-iil-Y..i!.ii • ": i I i i ..=.'. i r..-.; i i •ilili il.-'-'.iiii ill iiii !-.'!•iDi '..-.: ! iil .:-.-' ! !-:.{ i!! •, ..".' '-' • .•-'4 l! }.] D! i:.4:.-'.'iii .•.iiii!i i! !jill !!'.'-:.-."."-i!-'ii ii i!i iiil !i:.• .:-i .3i •i r.' iil D.'i.'..'• i iiiilii !!i!i i-'.'i iiiiiL-=.-ii•:i iii.."! iii i ;•ilil !i•i D'.2-'.-q!i •i•ii. :.-:! .b'ii !iil•i:.4 .L.!.."iliiiiiiill i!!iii!].! iii ii. iilli!'.. iii!iii3iii'r-'..r-:iii • ii •-Z.i-" '-•-:.i • • "ii".-." [iii}i{i-.:3.{ }}{ii]•.':li •-!!ii! !•i!{i!ii]i il!! i!i iii!ni.•..'.-iiiiD•! ii.-'-.-".-'ii•i•'ii iil iiiiii! '•{i i•ilili •ili'.-! • •-2-1L+-L•i ."- igi i•ii'.-'i i!iii• •':r.-'.r.-'[!i] •iiiii ii,.'iiii!.,!iiil!ilili. il!•.iiiiii iil.':i. •ilii i ."i i! !iii:.-.'i4"-'.ili ..'i i! iiiiiiiiill.':! =•ii•!! i! !,.'iii'..-'..ii iiii•"-iii•i! !iliD".-iii! iiiiiii!`2i!i i:-:1!!.-'!•ii! ,2!i it!i ..3'2if!Hi!ill-' ii`2`21 •!`2111 !ii'--'-' 133!!!!'2! .::'--ill !Z."-•i•-•F.i•.! !i{Hi!i
-7'5 ............. '""'"'4'5 ........... '"'""'i"5 ............ 'i' ß
c
step 18-1
d
step 22-1
Fig. 9. Contour map of the relative temperature change in degrees Celsius AT(•, t) = T(•, t) - T(X, O) for model G4c2b, same time steps as Figure 6. If the heat transfer was purely advective, no conductive transfer, the temperature change should be zero. Gray scale is the same for all those maps.
CHERY ET AL.: THERMOMECHANICAL MODELING OF CONTINENTAL DEFORMATION 4399
.14 : g4c2b heat transfer
20K/km !
Fig. 10. Heat flux vector difference field for model G4c2b, /Xq(z, t) = q(z, t) - J-1FQ(X, 0), after 12% of shortening.
of each mantle compartment, a strong materiM circulation is created: downwelling inside the left one, upwelhng in the right one. That defines a kind of large wave-length inclined shear zone in the mantle. On both sides of the structure, one may define a dead triangular zone where almost no de- formation takes place.
The overall lithospheric flexure is controlled by the buck- ling of the more competent upper layer of the mantle.
The topography is related to the plastic thickening of the lower crust and to the flexural response. The maximum amplititude is less than 3 km after 12% shortening.
INFLUENCE OF CRUSTAL RHEOLOGY
Some experiments have been carried out in order to test the influence of different crustal theologies. Here we report on four different sets of rheological structures of the crust based on reasonable assumptions and which will be hereafter referred as a,b,c, and f. Simpler two-layered crustal models (with an upper brittle layer and a homogeneous lower ductile part) were reported by Chery et al. [1990]. All those crustal models have been considered for two different mantle theol-
ogy, which will be discussed in the next section, and referred to as G4c2(a,b,c,f) and G5c2(a,b,c,f). These parameters are summarized in Tables I and 2.
Figures 13 and 14 represent the deformation of the crust- mantle boundary and the topography at 12% shortening.
Within the spatial and numerical resolution of our fi- nite element model, those different crustal structures lead to second-order effects on the overall response of the struc- ture. That is particularly clear in Figures 13 and 14. where the overall response is preserved both in terms of wavelength and amplitude. That is not very surprising, if one considers that the overall response depends on: the interaction due to the contrasts between upper brittle/lower ductile crustal dissipation, and lower ductfie crust/competent uppermost mantle dissipation in one hand and the thermal structure with strong lateral gradients in the vicinity of the initial perturbation in the other hand. In such a case, complica- tions within the crust in terms of additional layers will just add noise to the response but basically do not lead to any new physical processes. More detailed crustal structures in-
troduce shorter (vertical) characteristic lengths that require a resolution power out of reach at the present. But as long as one is concerned with the overall geodynamical response (in terms of global deformation and topograhic pattern), one can consider our resolution appropriate since there is no bi- furcation introduced by these small-scale crustal features. This would not be the case if the target was the detailed structure of the deformation pattern such as short-scale lo- calization processes. Small variations can, however, still be detected on the plastic deformation pattern or in the topog- raphy, see Figures 13a and 13b. Those variations stand out of the numerical noise and contain information on the small-
scale interaction between the different crustal layers. They depend on the theology of the mantle, as can be observed by comparing the examples in Figures 13, 14, and 15.
INFLUENCE OF MANTLE RHEOLOGY
Experiments were performed in order to define the influ- ence of mantle material parameters. This study was not exhaustive, and we report here just some of these results. Runs G4c2(a-f) assumed an olivine-hke theology for the mantle, but the experimentally determined activation en- ergy is rather high, even if one considers the natural dis- persion of such measurements. This parameter is important since in the partitioned model adopted here, it will deter- mine the thickness of the uppermost competent part of the mantle, which turns out to be one of the main governing parameters for the overall response. We consider in models G5c2(a-f) a mantle theology where the viscous dissipat-;cn is build up as a mixture of olivine and clinopyroxene. Rather than assigning a petrological significance to each of those components, one may regard this model as representative of two independent dissipation mechanisms. In this case, equation (9) is replaced by
Of 2 Og d in= • H(f2) '•r q- :•rn H(g) g(r)" O--• •m = •oI ezP(- R• ) + +clp ezp(- Qclp
•oI, Qol and •clp, Qclp are defined in Table 2 and have been chosen from experimental values of olivine and clinopyrox- enite.
4400 CHERY ET AL.' THERMOMECHANICAL MODELING OF CONTINENTAL DEFORMATION
f.7 ß g4c2b deformed grid
step 61
step 121
ß step 181
step 221
Fig. 11. Deformation of the initial regular squared grid for model G4c2b: this materializes the deformation gradient F = V R = RU, where V and U are pure stretch tensors and R an orthogonal rotation tensor: same time steps as Figure 6.
CHEl•Y ET AL.: THEI•MOMECHANICAL MODELING OF CONTINENTAL DEFOI•MATION 4401
Ichemical interfaces (g4c2b)!
distance
Istep 011
'-10
E --2o ,,./' -2o-.
--30 •" -30-
distance
Istep Sl I
distanc•,i•(Km i iii
IsteP 1211
0 O'
--10 -lO-
E --.2o ,,,,,, -20-
- -5O r- -30-
distance .(Km)• •o =p • • • ,,
Istep 1811
o
-1(
--2c
,--4(
-10'-
-2o-
'0 O'
, -1o ,._.,-lO- E
--2o ::z:: -2o-
distance .(Km)• 2(•)0 3(•)C) 5•1 ' _
"\i Iste p !step
Fig. 12. Deformation of two main interfaces for model G4c2b: upper brittle/ductile lower crust/upper mantle interfaces are represented for different shortening steps including those of Figure 6.
.-IC
--2C
4402 CHERY ET AL.: THERMOMECHANICAL MODELING OF CONTINENTAL DEFORMATION
-20.00
-30.00
-40.00
-50.00
-60.0O
Moho (c4p) topography (c4p) 3.00 -
2.00
1.00
fk-o.oo (]3
-(D
-1 .oo
o ' ' "'6o .... 26o .... 6o' ' ' "46o .... 6o"' km -2.oo o'"' 16o .... '6o .... .... s6o"
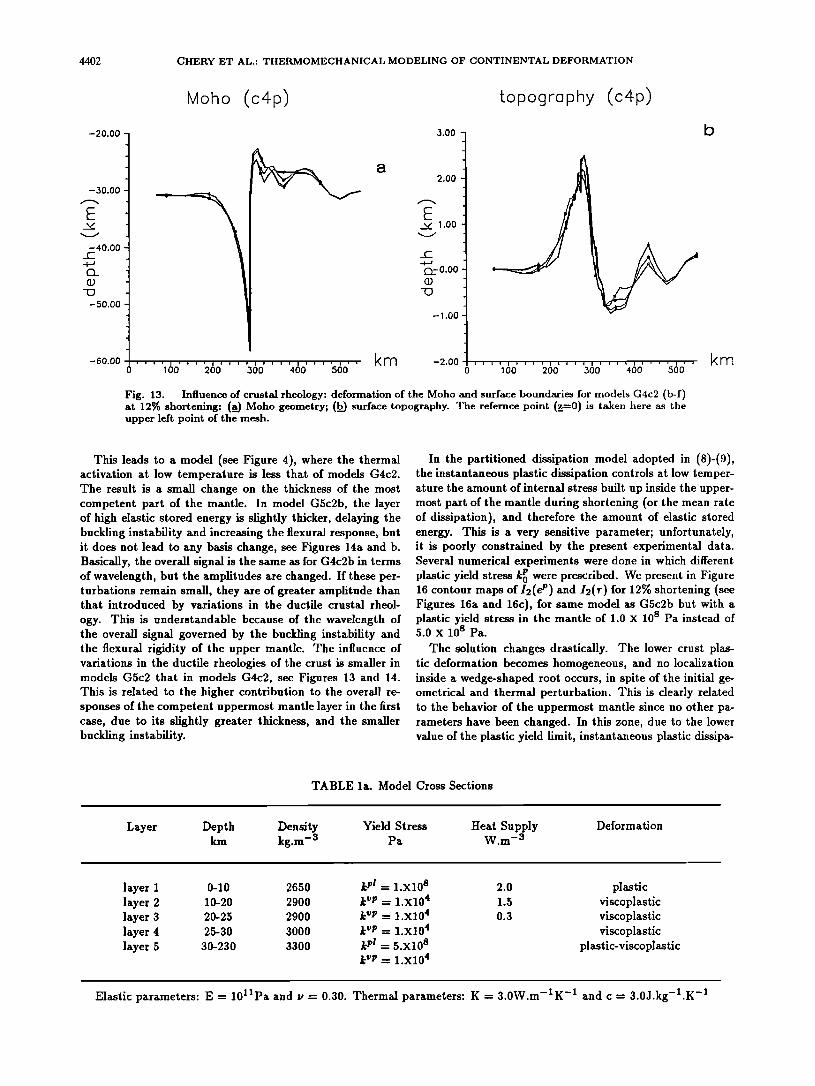
Fig. 13. Influence of crustal rheology: deformation of the Moho and surface boundaries for models G4c2 (b-f) at 12% shortening: (_a) Moho geometry; (b) surface topography. The referrice point (z_=0) is taken here as the upper left point of the mesh.
b
km
This leads to a model (see Figure 4), where the thermal activation at low temperature is less that of models G4c2. The result is a small change on the thickness of the most competent part of the mantle. In model G5c2b, the layer of high elastic stored energy is slightly thicker, delaying the buckling instability and increasing the flexural response, but it does not lead to any basis change, see Figures 14a and b. Basically, the overall signal is the same as for G4c2b in terms of wavelength, but the amplitudes are changed. If these per- turbations remain small, they are of greater amplitude than that introduced by variations in the ductile crustal theol- ogy. This is understandable because of the wavelength of the overall signal governed by the buckling instability and the flexural rigidity of the upper mantle. The influence of variations in the ductile theologies of the crust is smaller in models G5c2 that in models G4c2, see Figures 13 and 14. This is related to the higher contribution to the overall re- sponses of the competent uppermost mantle layer in the first case, due to its slightly greater thickness, and the smaller buckling instability.
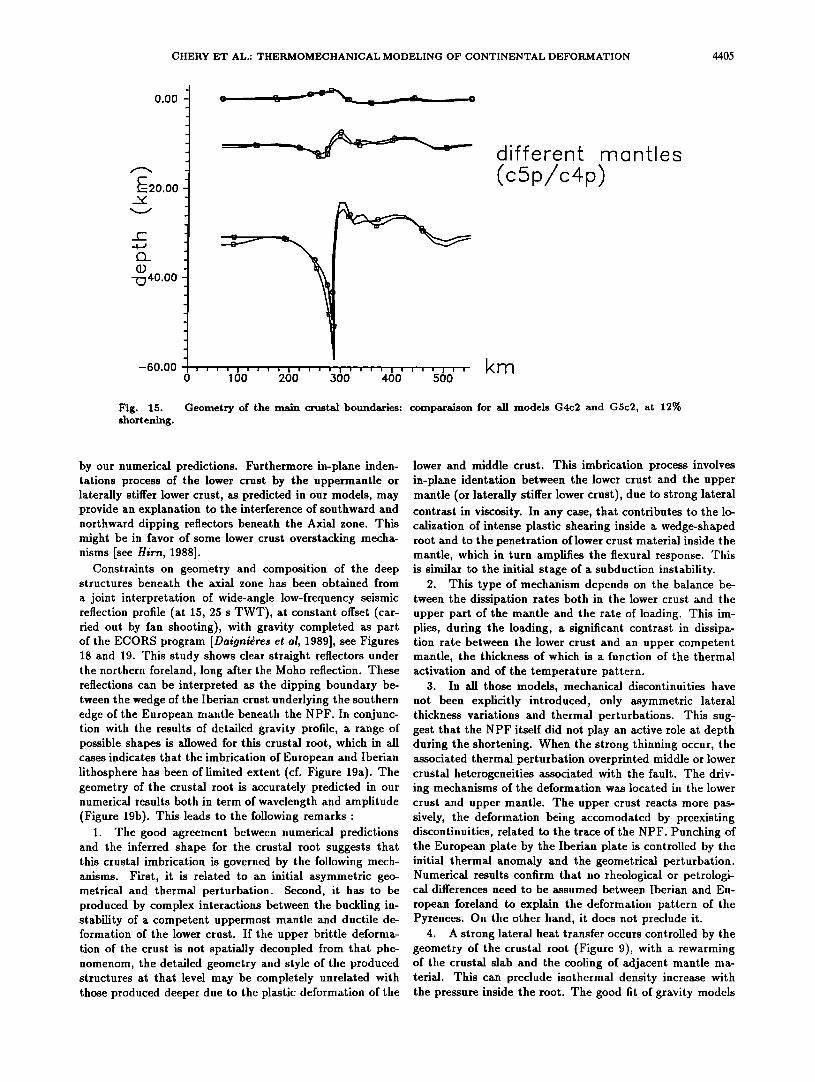
In the partitioned dissipation model adopted in (8)-(9), the instantaneous plastic dissipation controls at low temper- ature the amount of internal stress built up inside the upper- most part of the mantle during shortening (or the mean rate of dissipation), and therefore the amount of elastic stored energy. This is a very sensitive parameter; unfortunately, it is poorly constrained by the present experimental data. Several numerical experiments were done in which different plastic yield stress kg were prescribed. We present in Figure 16 contour maps of I2(e p) and I2(r) for 12% shortening (see Figures 16a and 16c), for same model as G5c2b but with a plastic yield stress in the mantle of 1.0 x l0 s Pa instead of 5.0 x 10 s Pa.
The solution changes drastically. The lower crust plas- tic deformation becomes homogeneous, and no localization inside a wedge-shaped root occurs, in spite of the initial ge- ometrical and thermal perturbation. This is clearly related to the behavior of the uppermost mantle since no other pa- rameters have been changed. In this zone, due to the lower value of the plastic yield limit, instantaneous plastic dissipa-
TABLE la. Model Cross Sections
Layer Depth Density Yield Stress Heat Supply Deformation km kg.m -3 Pa W.m -a
layer 1 0-10 2650 k pl = 1.x108 2.0 plastic layer 2 10-20 2900 k vr = 1.x104 1.5 viscoplastic layer 3 20-25 2900 k vp = 1.x104 0.3 viscoplastic layer 4 25-30 3000 k vr = 1.X104 viscoplastic layer 5 30-230 3300 k pl = 5.x108 plastic-viscoplastic
kVr = 1.x104
Elastic parameters: E = 1011Pa and v = 0.30. Thermal parameters: K = 3.0W.m- • K- • and c = 3.0J.kg-l.K- •
CHERY ET AL.: THERMOMECHANICAL MODELING OF CONTINENTAL DEFORMATION 4403
TABLE lb. Layered Lithospheric Structure
Model Layer Composition
G4c2 a
G4c2 b
G4c2 c
G4c2 d
G4c2 e
G4c2 f
layer 1 - layer 2 wet quartzite layer 3 dry quartzite layer 4 quartzo-diorite layer 5 wet dunire
layer 1 - layer 2 wet granite layer 3 dry granite layer 4 quartzo-diorite layer 5 wet dunite
layer 1 - layer 2 wet granite layer 3 dry granite layer 4 orthopyroxene(wet) layer 5 wet dunite
layer 1 - layer 2 wet quartzite layer 3 dry quartzite layer 4 orthopyroxene(wet) layer 5 wet dunite
layer 1 - layer 2 wet quartzite layer 3 dry quartzite layer 4 orthopyroxene(dry) layer 5 wet dunlie
layer 1 - layer 2 wet granite layer 3 dry granite layer 4 orthopyroxene(dry) layer 5 wet dunire
G5c2 idem except layer 5 clinopyroxenite+wet dunire
tion is the dominant mechanism over a thicker layer beneath the crust-mantle boundary, but the elastic stored energy inside this layer is greatly reduced. The flexural behavior of that layer decreases, and no significant lateral thickness variation is induced by the initial perturbation, so that the buckling instability can not develop. The shortening is ac- commodated by uniform thickening of all the mechanical lithosphere. This behavior is produced as long as the plas- tic yield limit k• is kept lower than 10 8 Pa. Under that limit the system is quite stable, and no buckling mode is excited, the deformation can therefore remain uniform. In such cases, the mean rate of dissipation inside the upper- most part of the mantle (plastic and viscous) is sufficiently fast with respect to the prescribed rate of loading, so as to prevent that any significant elastic energy be stored in that layer. The contrast between stored energy in the lower duc- tile crust and this layer is greatly reduced. This prevents buckling from developing.
As soon as a sufficient contrast can be created, due to the competing effect between rate of loading and rate of dissipation, then buckling can be excited and will control the strong plastic shear localization inside a wedge-shaped lower crust root. Unfortunately, present information on the low-temperature dissipation mechanisms of mantle rocks is scarce.
DISCUSSION
We will now discuss the geodynamical implications of these numerical experiments in light of the Pyreheart evo- lution and the recent seismic reflection profile across the belt. The initial state of the vertical cross section was in-
spired from original models proposed by Mattauer [1985], and Sdguret and Daignidres [1986]. They are quite different from other pubhshed models that start from a flat and nu- deformed foreland. Our initial state can be considered as
typical of asymmetric transform plate boundaries and takes into account strong lateral thickness variations. No explicit vertical discontinuity is introduced here, but the initial ther- mal perturbation plays the key role.
With these initial hypotheses, the thermomechanical mo- del presented here provides a possible physical explanation for the formation, in a compressive regime, of a narrow mountain range and a complex crustal thickening processes with the formation of strongly asymmetric wedge-shaped crustM root. Such an evolution is strongly controlled not only by the initiM perturbation which induces laterM gradi- ent in composition and temperature but also by the contrast between rates of dissipation at the crust-mantle and upper middle crust interfaces. That last parameter controls the possible buckling of the uppermost mantle layer.
The overall response is governed by a three layered me- chanical plate model where lower and middle crust act as a soft internal layer of possible decoupling between two more competent ones. If the rate of dissipation inside the up- per mantle is slow compared to the rate of loading, then significant elastic energy gets stored on top of the mantle, and a buckling mode in that layer is excited as shortening continues, leading to a localized thickening process.
The overall deformation of the hthosphere is controlled by a flexural response, with a northward dip bending of the southern compartment. In-plane lower crustal indenta- tions lead to strong plastic shear strain localization and the formation of a wedge-shaped root with an inflow of crustal material into the upper mantle. This can be regarded as the early stage of a continental subduction [Mattauer, 1986].
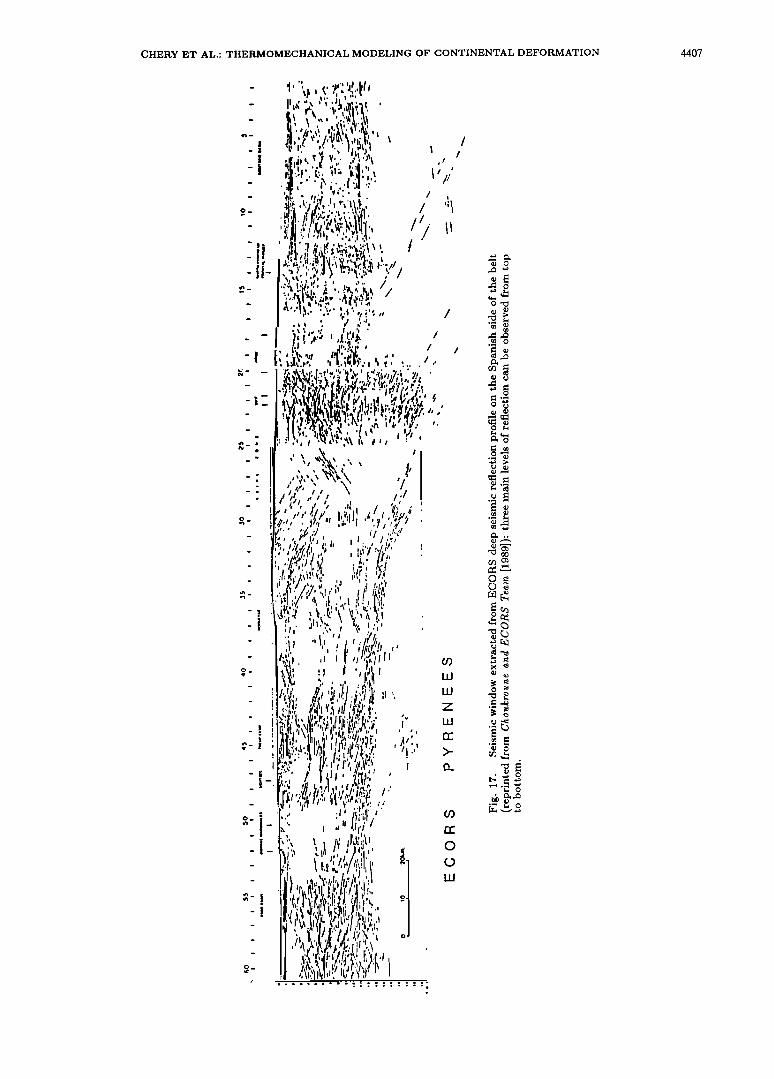
Our numerical models reproduce very closely the main deformation pattern recently recognized with ECORS deep seismic reflection profile across the Pyrenes [ECORS Pyre- nees Team, 1988; Choukroune and ECORS Team, 1989].
The flexural response shows up clearly in the seismic pro- file for the Iberian foreland (see Figure 17). The bending may be defined by two sets of reflectors: one near the surface at 0.5 s TWT (two way travel time) in the south (underneath the Ebro bassin), point 61, which dips toward the Axial zone down to 3 s TWT, point 36; the second is a thick group of discontinous reflectors (at the lower hmit of the "layered" lower crust) starting at 11 s TWT in the south, point 61, and dipping towards the Axial zone down to 15 s TWT, point 32. The thickness between those horizons is constant and clearly indicates a flexural type of deformation. That is in very good agreement with the predicted flexural response
4404 CHEIR.Y ET AL.: THEI:tMOMECHANICAL MODELING OF CONTINENTAL DEFOI:tMATION
TABLE 2. Creep Parameters for Lithospheric Materials
Material Source %,pa-ns- 1 n Q,k J.mol- 1
Granitic-Gneissic Composition
dry w. granite 1 3.16x10 -26 3.3 186.0 wet w. granite 1 7.94x10 -16 1.9 140.6 dry s. quartzite 1 6.02x10 -24 2.7 134.0 wet s. quartzite 1 1.26x10⁻¹³ 1.9 172.6
A mphibolite-Granulitic. Dioritic Composition
quartz diorite 2 5.01x10- lS 2.4 293.0
Mafic- Granulitic Composition
dry orthopyroxene 1 1.26x10⁻¹⁵ 2.4 293.0 wet orthopyroxene 1 1.00x10⁻¹⁹ 2.8 271.0 dry ciinopyroxene 2 3.16x10 -37 5.3 380.0
Ultramafic Composition
wet dunire 2 2.51x10 -17 3.4 444.0 dry dunire 2 6.30x10⁻¹⁷ 3.5 533.0
Source' 1, Carter et Tsenn [1987] and 2, Strehlau and Meissner [1987].
of our models, see in Figures 11a and 11d. From the initial perturbation, one can see that strong lateral heat transfer occurs. That leads progressively to an asymmetry of the relative temperature change i n the lower crust (see Figure 9). This could explain part of the difference in the reflecting structures of the lower crust beside other petrological expla- nations. Similarly, the apparent continuity in the reflecting structures of the middle crust can be related to that thermal
evolution and also to some possible intracrustal decoupling beyond the resolution of our model. In the models studied here, no Petrological or mechanical differences are assumed between the two forelands. The thickening pattern from the seismic profile is clearly asymmetric and occurs in the left compartment in the Southward foreland, see Figures 18 and 19. This thickening takes place mostly inside the lower crust (Figure 12). This geometry is reproduced very closely
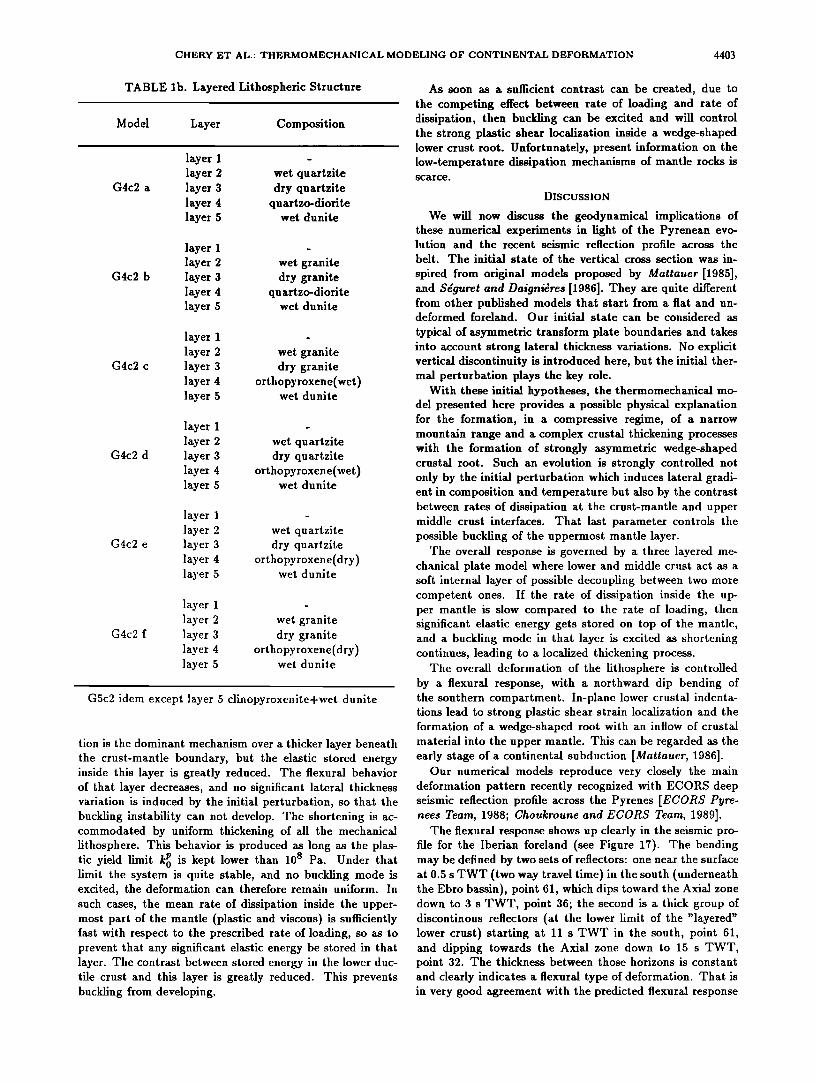
moho (c5p) topography (c5p)
-20.00 -
-30.00
-40.00
-50.00
-60.00 o"' 60' "6o' "36o' "6o' "s6o"
a
km
3.00 - b .
2.00
1.o0
•D_o.oo
-0
-1 .oo
-2.00 0
i i i i I i i i i i i i i i i i'i i ! i i i i i I i i 1 O0 200 300 400 500
km
Fig. 14. Influence of crustal rheology: same as Figure 13 for models G5c2 (b-f).
CHERY ET AL.' THERMOMECHANICAL MODELING OF CONTINENTAL DEFORMATION 4405
0.00
E20.00
-%]40.00
-60.00 100 200 300 400 500
differen manles
(cSp/c4p)
km
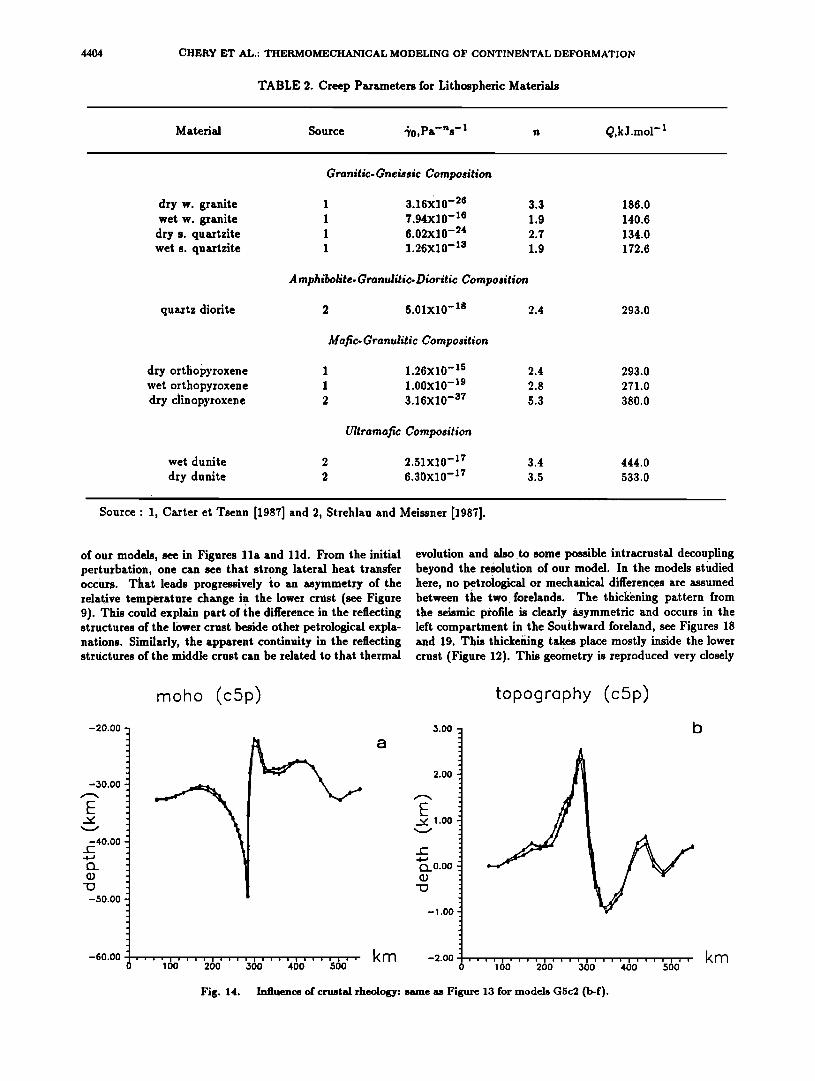
Fig. 15. Geometry of the main crustal boundaries: comparaison for all models G4c2 and G5c2, at 12% shortening.
by our numerical predictions. Furthermore in-plane inden- tations process of the lower crust by the uppermantle or laterally stiffer lower crust, as predicted in our models, may provide an explanation to the interference of southward and northward dipping reflectors beneath the Axial zone. This might be in favor of some lower crust overstacking mecha- nisms [see Him, 1988].
Constraints on geometry and composition of the deep structures beneath the axial zone has been obtained from
a joint interpretation of wide-angle low-frequency seismic reflection profile (at 15, 25 s TWT), at constant offset (car- ried out by fan shooting), with gravity completed as part of the ECORS program [Dai!Ini•res et al, 1989], see Figures 18 and 19. This study shows clear straight reflectors under the northern foreland, long after the Moho reflection. These reflections can be interpreted as the dipping boundary be- tween the wedge of the Iberian crust underlying the southern edge of the European mantle beneath the NPF. In conjunc- tion with the results of detailed gravity profile, a range of possible shapes is allowed for this crustal root, which in all cases indicates that the imbrication of European and Iberian lithosphere has been of limited extent (cf. Figure 19a). The geometry of the crustal root is accurately predicted in our numerical results both in term of wavelength and amplitude (Figure 19b). This leads to the following remarks:
1. The good agreement between numerical predictions and the inferred shape for the crustal root suggests that this crustal imbrication is governed by the following mech- anisms. First, it is related to an initial asymmetric geo- metrical and thermal perturbation. Second, it has to be produced by complex interactions between the buckling in- stability of a competent uppermost mantle and ductile de- formation of the lower crust. If the upper brittle deforma- tion of the crust is not spatially decoupled from that phe- nomenom, the detailed geometry and style of the produced structures at that level may be completely unrelated with those produced deeper due to the plastic deformation of the
lower and middle crust. This imbrication process involves in-plane identation between the lower crust and the upper mantle (or laterally stiffer lower crust), due to strong lateral contrast in viscosity. In any case, that contributes to the lo- calization of intense plastic shearing inside a wedge-shaped root and to the penetration of lower crust material inside the mantle, which in turn amplifies the flexural response. This is similar to the initial stage of a subduction instability.
2. This type of mechanism depends on the balance be- tween the dissipation rates both in the lower crust and the upper part of the mantle and the rate of loading. This im- plies, during the loading, a significant contrast in dissipa- tion rate between the lower crust and an upper competent mantle, the thickness of which is a function of the thermal activation and of the temperature pattern.
3. In all those models, mechanical discontinuities have not been explicitly introduced, only asymmetric lateral thickness variations and thermal perturbations. This sug- gest that the NPF itself did not play an active role at depth during the shortening. When the strong thinning occur, the associated thermal perturbation overprinted middle or lower crustal heterogeneities associated with the fault. The driv- ing mechanisms of the deformation was located in the lower crust and upper mantle. The upper crust reacts more pas- sively, the deformation being accomodated by preexisting discontinuities, related to the trace of the NPF. Punching of the European plate by the Iberian plate is controlled by the initial thermal anomaly and the geometrical perturbation. Numerical results confirm that no theological or petrologi- cal differences need to be assumed between Iberian and Eu-
ropean foreland to explain the deformation pattern of the Pyrenees. On the other hand, it does not preclude it.
4. A strong lateral heat transfer occurs controlled by the geometry of the crustal root (Figure 9), with a rewarming of the crustal slab and the cooling of adjacent mantle ma- terial. This can preclude isothermal density increase with the pressure inside the root. The good fit of gravity models
4406 CHERY ET AL.: THERMOMECHANICAL MODELING OF CONTINENTAL DEFORMATION
f. 17-b : g5cSb step 22
g5c.:Sb 12 O.050'""O';"TO0 ........ U:2"O ........ '-0':' J=•i':-"": i.-; t ..
b
c
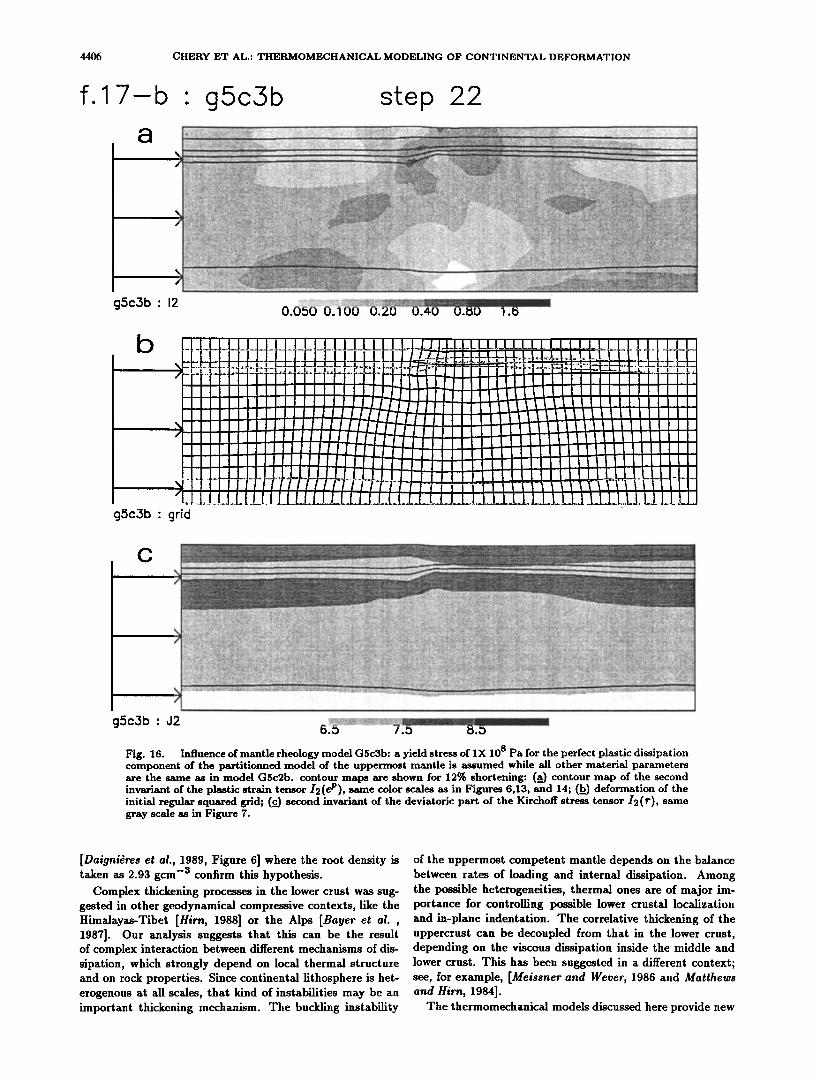
g5c3b' J2 6:5 ........................................ 7. "' i. Fig. 16. Influence of mantle rheolog:y model GSc3b: a :yield stress of IX 10 8 Pa for the perfect plastic dissipation component of the partitionned model of the uppermost mantle is assumed while all other material parameters are the same as in model GSc2b. contour maps are shown for 12% shortening: (a_) contour map of the second invariant of the plastic strain tensor 12(eP), same color scales as in Figures 6,13, and 14; (b_) deformation of the initial regular squared grid; (c_) second invariant of the deviatoric part of the Kirchoff stress tensor 12(r), same gra:y scale as in Figure 7.
[Daignidres et al., 1989, Figure 6] where the root density is taken as 2.93 gcm -a confirm this hypothesis.
Complex thickening processes in the lower crust was sug- gested in other geodynamical compressive contexts, like the Himalayas-Tibet [Him, 1988] or the Alps [Bayer ½t al. , 1987]. Our analysis suggests that this can be the result of complex interaction between different mechanisms of dis- sipation, which strongly depend on local thermal structure and on rock properties. Since continental lithosphere is her- erogenous at all scales, that kind of instabilities may be an important thickening mechanism. The buckling instability
of the uppermost competent mantle depends on the balance between rates of loading and internal dissipation. Among the possible heterogeneities, thermal ones are of major im- portance for controlling possible lower crustal localization and in-plane indentation. The correlative thickening of the uppercrust can be decoupled from that in the lower crust, depending on the visco.us dissipation inside the middle and lower crust. This has been suggested in a different context; see, for example, [Meissner and Wever, 1986 and Matthews and Him, 1984].
The thermomechanical models discussed here provide new
CHERY ET AL.: THERMOMECHANICAL MODELING OF CONTINENTAL DEFORMATION 4407
4408 CHERY ET AL.: THERMOMECHANICAL MODELING OF CONTINENTAL DEFORMATION
a
s N
gal ,,
- 40
-•0
120-
0 i i i i i i I 1 I i 1
40 80 120 160 200 240 km
b 2O
4O
6O
8O
2.75
ß ß 2.80 ß
ß ß
ß ß
FNP I
3.28
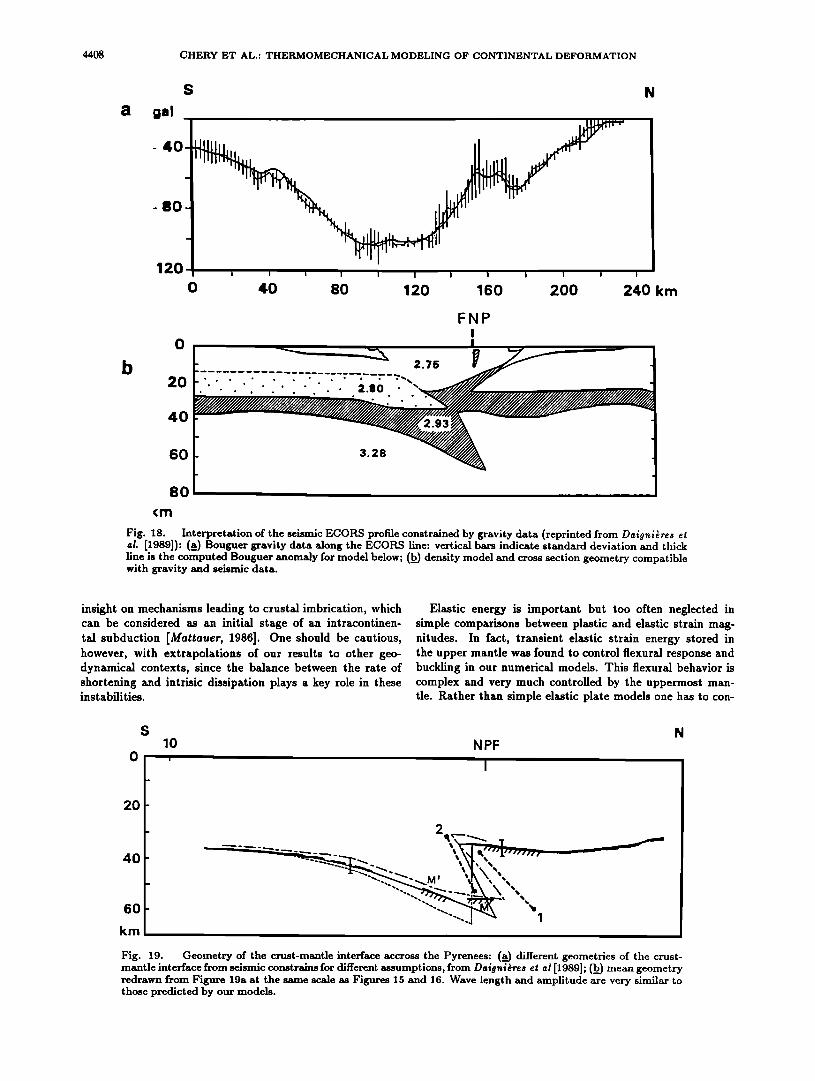
Fig. 18. Interpretation of the seismic ECORS profile constrained by gravity data (reprinted from Daiyni•res et al. [1989]): (_a) Bouguer gravity data along the ECORS line: vertical bars indicate standard deviation and thick line is the computed Bouguer anomaly for model below; (b_) density model and cross section geometry compatible with gravity and seismic data.
insight on mechanisms leading to crustal imbrication, which can be considered as an initial stage of an intracontinen- tal subduction [Mattauer, 1986]. One should be cautious, however, with extrapolations of our results to other geo- dynamical contexts, since the balance between the rate of shortening and intrisic dissipation plays a key role in these instabilities.
Elastic energy is important but too often neglected in simple comparisons between plastic and elastic strain mag- nitudes. In fact, transient elastic strain energy stored in the upper mantle was found to control flexural response and buckling in our numerical models. This flexural behavior is complex and very much controlled by the uppermost man- tle. Rather than simple elastic plate models one has to con-
10
20-
NPF
I
N
Fig. 19. Geometry of the crust-mantle interface accross the Pyrenees: (a_) different geometries of the crust- mantle interface from seismic constrains for different assumptions, from Daigni•res et al [1989]; (b__) mean geometry redrawn from Figure 19a at the same scale as Figures 15 and 16. Wave length and amplitude are very similar to those predicted by our models.
CHERY ET AL.: THERMOMECHANICAL MODELING OF CONTINENTAL DEFORMATION 4409
sider a composite plate. The flexural rigidity of this plate is highly heterogeneous and tends to zero in certain parts where plastification occurs over all the plate thickness. On the other hand, if one consider plastic shear instabilities as possible inside the lower crust, then elastic stored energy be- comes again a crucial parameter controlling the stiffness of the loading frame. Lithosphere deformation is strongly non uniform with depth, and one must regard vertically uniform assumptions with suspicion. This points out the importance of reliable deep seismic reflection profiles across orogenic belt since the observed surface deformation pattern might be un- related to that at depth. If at upper crust levels a significant part of the deformation is influenced by preexisting disconti- nuities (inducing strong anisotropic localization), the picture may drastically change at depth where the main parameters are thickness and thermal perturbations, with quite different scale lengths.
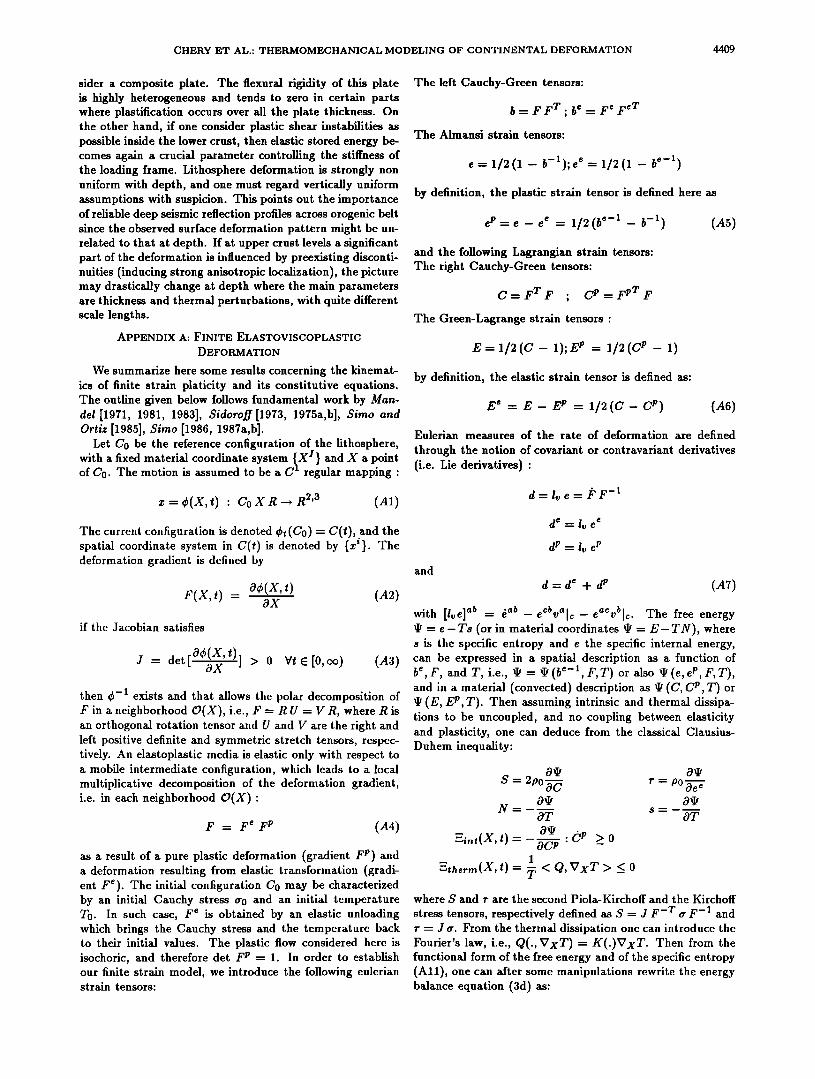
APPENDIX A: FINITE ELASTOVISCOPLASTIC
DEFORMATION
We summarize here some results concerning the kinemat- ics of finite strain platicity and its constitutive equations. The outline given below follows fundamental work by Man- del [1971, 1981, 1983], Sidoroff [1973, 1975a,b], Sirno and Ortiz [1985], Sirno [1986, 1987a,b].
Let Co be the reference configuration of the lithosphere,
with a fixed material coordinate system (X I } and X a point of Co. The motion is assumed to be a C' regular mapping:
x=•b(X,t) : CoXR-•R 2'• (A1)
The current configuration is denoted dr(Co) = C(t), and the spatial coordinate system in C(t) is denoted by {xi}. The deformation gradient is defined by
F(X, t) = O&(X, t) (A2) OX
if the Jacobian satisfies
aO(x,t)] J = det[ OX > 0 Vt(•[0, c•) (A3)
then •-• exists and that allows the polar decomposition of F in a neighborhood O(X), i.e., F = R U = V R, where R is an orthogonal rotation tensor and U and V are the right and left positive definite and symmetric stretch tensors, respec- tively. An elastoplastic media is elastic only with respect to a mobile intermediate configuration, which leads to a local multiplicative decomposition of the deformation gradient, i.e. in each neighborhood O(X):
F = r e r p (A4)
as a result of a pure plastic deformation (gradient F p) and a deformation resulting from elastic transformation (gradi- ent Fe). The initial configuration Co may be characterized by an initial Cauchy stress a0 and an initial temperature To. In such case, F e is obtained by an elastic unloading which brings the Cauchy stress and the temperature back to their initial values. The plastic flow considered here is isochoric, and therefore der F p = 1. In order to establish our finite strain model, we introduce the following eulerian strain tensors:
The left Cauchy-Green tensors:
b = F F T; b e = F e F eT The Aimansi strain tensors:
e = 1/2(1 - b-1);ee= 1/2(1 - b e-1 )
by definition, the plastic strain tensor is defined here as
eP=e -- e e = 1/2(b e-1 -- b -1) (A5)
and the following Lagrangian strain tensors: The right Cauchy-Green tensors:
C: F T F ; C p = F pT F The Green-Lagrange strain tensors:
E=I/2(C- 1);E p = 1/2(C p - 1)
by definition, the elastic strain tensor is defined as:
E e = E- E p = 1/2(C-C r) (A6)
Eulerian measures of the rate of deformation are defined
through the notion of covariant or contravariant derivatives (i.e. Lie derivatives):
d=l,•e= PF -•
and
d e = l. c e
d p = lve p
d - d e + d p (A7)
with [lve] ab = d ab - e eb vale - e ae vble. The free energy q• = e- Ts (or in materiM coordinates q• = E-TN), where s is the specific entropy and e the specific internal energy, can be expressed in a spatial description as a function of be, F, and T, i.e., q• = q• (be-l,F,T) or also q• (e, eP, F,T), and in a material (conveered) description as q• (C, C p, T) or ß (E, E p, T). Then assuming intrinsic and thermal dissipa- tions to be uncoupled, and no coupling between elasticity and plasticity, one can deduce from the classical Clausius- Duhem inequality:
$ = 2po •-• N=
OT
Eint(X, t) = 0•I . •p > 0 OCP - 1
Ethe•m(X, t) = • < Q, VxT > < 0
r = PO Oe e
8• OT
where S and r are the second Piola-Kirchoff and the Kirchoff
stress tensors, respectively defined as S = J F -T •r F-1 and r = J a. From the thermal dissipation one can introduce the Fourier's law, i.e., Q(., VxT): K(.)VxT. Then from the functional form of the free energy and of the specific entropy (All), one can after some manipulations rewrite the energy balance equation (3d) as:
4410 CHERY ET AL.: THERMOMECHANICAL MODELING OF CONTINENTAL DEFORMATION
cOT .• OS ' D] Po •- q- divx[K(.)VxT] = Po R + mint q- T[•-• (A8a)
where
C = T ON OT = -T•--•, and D = 1/2/• (A8b)
In the lithosphere the plastic deformation is isochoric while the elastic one has a volumetric component. Since plas- tic deformation can become very large, it is important for numerical reasons to uncoupled elastoplastic deviatoric re- sponse from the elastic volumetric response. This can be achieved through a kinematic split of the deformation gra- dient as proposed by Sidoroff [1975a,b]
F = j1/a•; b e = j2/3•'•; detF p = det•= 1; det•e = 1
Then the assumed uncoupled hyperelastic model of Sirno [1986] is derived from the free energy
1
ß (•,F,T)= •.t•(•-I-3)+U(J) with
1
U(J) = • K (In J) 2 (A9) and where K,/t are the bulk elastic and the shear elastic moduli respectively.
APPENDIX B : NUMERICAL FORMULATION
The variational formulation of the quasi-static elastoplas- tic evolution follows that proposed by Sirno et al. [1985], Sirno [1987a,b], Zienkiewicz et al. [1985]. It is based, for the mechanical part, on a three-field, mixed variational formula- tion. An additional variable (9 is introduced which is in the
continuum case the Jacobian of the deformation gradient itself, O(X,t) -- J(X,t), but when constructing the finite dimensional approximation, this becomes only a point-wise approximation. At each time, tn • [0, c•) of the quasi- static evolution,and for a given thermal structure, T(X, tn), {½bn, On, pn } are solutions of the boundary value problems if they are stationary points of the Lagrangian functionM:
L(qb, O,p) =/c [U(O) + q•dev (•,EP) +P(J-O)] dV o
+ Z ext (•b) (B1)
where ?.ext (•b) is the potential energy associated with body forces and prescribed tractions:
b.ddV-•o i-ddF (B2) ,(Co) •(•,(Co))
Let d be an admissible deformation and r/ a kinematically admissible variation about d. The tangent space of kine- matically admissible variations is defined as
then the Euler-Lagrange equations, at time step tn, are si•n- ply obtained as:
DeL. 01.= Q, =/½ I-p, + dU(O) o dO I.]O dV = 0 (Bb) where the last term of (B3) is the virtual work of the ex- ternal forces. •/ is typically taken in Hi(Co), and 5p • P,(resp.50 e Q) in L2(Co). The finite element solution of (B3-Bb) will be sought in finite dimensional subspaces K a C K, pa C P, Qa c Q, whose b•es are sets of poly- nomiMs with conmpact support. Here we used a piecewise biquadratic appro•mation for d and a discontinuous locally linear approximation for p and •, i.e an element Q•- P•. The tangent stiffness matrix w• obt•ned kom the hn- earization of the discrete version of (B3) which is in fact a nonhnear function of the configuration d- Such hneariza- tion is an uphill work, and we simply refer here to the papers of Simo [1986, 1987b]. The coupled problem is solved in a staggered manet; i.e., a temperature distribution Tn+l is first computed on the l•t configuration C(tn) as the solu- tion of a weak variationM formulation of (ASa), assuming the last configuration C(tn) in equihbrium as the reference configuration for the time step tn +1:
/C pnc•bTdV+/c [KVx•.VxbTdv (t.) (t.)
(t.) •(c(t.))
that problem is solved using a fully implicit method. This reduces, at each time step, to an iterative solution of the fol- lowing linearized system: find {•bn+ 1, Pn+l, Jn+l } knowing Tn+l :
Hn + + [vT rt, 50, Q,+ o
ß n+• -1 •J dv =0 (B6) 1T Jn+• -1 0 •p
where A is the consistent tangent stiffness matrix including the geometric stiffness matrix. One can adopt an iterative solution strategy to solve this mixed variational formulation as reported by Zienkiewicz et al. [1985].
At each subiterative step i of the linearized system (B6), one performs first a geometric update of the structure:
1
with
Fu=I+Vu
then by an elastoplastic operator splitting one perform, at each integration point, an elastic predictor assuming during that step:
CHERY ET AL.' THERMOMECHANICAL MODELING OF CONTINENTAL DEFORMATION 4411
d = d e + d p and d p = O
and
F e(ø) F•4-1F v-1 n+l -- n
with
= followed by a plastic corrector
d = d e + d p = 0
and computes •'n+l as solution of
Or -JPo [ • 0--• -- Oe eOe e Oe e OeP ] ' de Finally, one has to update the intermediate configuration, this is done assuming an isotropic response in two steps, see Sirno et al. [1985]:
1. Invert elastic relation (Sa-Sb), i.e., solve the con- strained problem:
-e
dev •'n+l -- 2/• dev bn+l with det •e n+l : 1
2. Update
and
e •jn2[3•e Vr[ 4-1 = 4-1"n4-1
rne e p F e -1 4-1 -- V•4-1 and rd+ 1 = rn+l n4-1
A plastic corrector step is done with a radial return algo- rithm for perfect plasticity and with an algorithm proposed by Ortiz and Sirno [1986] (generalized to nonlinear power dissipation) or a fifth-order Runge-Kutta method (with mo- nitoring local truncation error and time step) for viscoplas- ticity.
For viscous dissipation this step is identical to a non linear relaxation, controlled locally by the relaxation time:
1 0 • ](l--n) where
•0= •___
For the shortening problem, due to the kinematical bound- ary conditions, two time scales are involved: one is given by the increment of shortening, i.e., the time step t, and the other one by the local relaxation time. The relaxation time is only local and varies tremendously inside the cross section (by more than 8 orders of magnitude). Therefore the time marching must be carefully monitored since if AT > > • the point will behave locally as a perfect plastic material and no viscous stress redistribution can be taken into account. This
is done by an automatic procedure, which checks the relax- ation time at each time step and defines (according to this spectrum) a new global time step and time subincrements.
Acknowledgments. J.P. Vilotte was as a Minnesota Supercom- puter Institute (MSI) Visiting Scholar. The computation has mainly been done on the Cray2 of the MSI. We are very grateful to O.C. Zienkiewicz, R. Madariaga, and M. Mattauer for con-
structive and thorough discussions during this work and to D.A. Yuen for inviting one of us (J.P.V.) to the MSI. This work has been partly funded by DBT instabilitds (report 89/42). Many thanks are due to R. Madariaga for his critical review. UMSI 89/59 and ENS Department of Geology contribution 74.
REFERENCES
Bayer, R., M. Cazes, G.V. Dal Piaz, B. Damotte, G. Elter, G. Grosso, A. Him, R. Lanza, B. Lombardo, and ECORS-CROP, Premiers rdsultats de la traversde des Alpes occidentales par sismique reflexion verticale, C. R. Acad. Sci., 305, 1461-1470, 1987.
Bird, P., Formation of the Rocky mountains, western United States: A continuum computer model, Science, 238, 1501- 1507, 1988.
Bird, P., and K. Piper, Plane-stress finite-element models of tec- tonic flow in southern California, Phys. Earth Planet. Inter., 21, 158-175, 1980.
Boillot, G., and R. Capdevila, The Pyrenees: Subduction or col- lision?, Earth Planet. Sci. Lett., 35, 151-160, 1977.
Brace, W.F., and D.L. Kohlstedt, Limits on lithospheric stresses imposed by laboratory experiments, J. Geophys. Res., 85, 6248-6252, 1980.
Carter, N.L., and M.C. Tsenn, Flow properties of continental lithosphere, Tectonophysics, 136, 27-63, 1987.
Chery, J., J.P. Vilotte and M. Daigni•res, How to build an asym- metric crustal root shuch as the Pyrenean one: A Thermo- mechanical model, Bull. Soc. Geol. Ft.,2, 211-218, 1990 Choukroune, P., Strain patterns in the Pyrenean chain, Phi- los. Trans. li. Soc. London, 283, 271-280, 1975.
Choukroune, P., and M. Mattauer, Tectonique des plaques et Pyr•ndes: Sur le fonctionnement de la fatlie Nord-Pyrdndenne; Comparaison avec les modeles actuels, Bull Soc. Geol. Ft., 20, 689-700, 1978.
Choukroune, P., M. S•guret, and A. Galdeano, Caractdristiques et •volutionstructurale des Pyrdn•es, Bull Soc. Gdol. Ft., 7, 601-611, 1973.
Choukroune, P., and ECORS Team, The ECORS Pyrenean deep seismic profile reflection data and the overall structure of an orogenic belt, Tectonics, 8, 23-29, 1989.
Daigni6res, M., J. Gallart, E. Banda, and A. Hirn, Implications of the seismic structure for the orogenic evolution of the Pyrenean range, Earth Planet. Sci. Lett., 57, 88-100, 1982.
Daigni•res, M., B. de Cabissole, J. Gallart, A. Him, E. Surinach, M. Torne, and ECORS Pyrenees Team, Geophysical constrains on the deep structure along the ECORS Pyrenees line, Tecton- ics, 8, 1051-1058, 1989.
Deramond, J., R.H. Graham, J.R. Hossack, P. Baby, and G. Crouzet, Nouveau module de la chaine des Pyrdn•es, C. li. Acad. Sci., 301, 1213-1216, 1985.
ECORS Pyrenees Team, The ECORS deep reflection seismic sur- vey across the Pyrenees, Nature, 331, 508-511, 1988.
England, P., and G. Houseman, Finite strain calculations of conti- nental deformation, 2, Comparison with the India-Asia collision zone. J. Geophys. lies., 91, 3664-3676, 1986.
England, P.C. and G. A. Houseman, The mechanics of the Ti- betan plateau, Philos. Trans. li. Soc. London, Set. A, 326, 301-320, 1988.
England, P., and D. McKenzie, A thin viscous sheet model for continentaldeformation, Geophys. J. li. Astron. Soc., 70, 295- 321, 1982.
Fountain, D.M., and M.H. Salisbury, Exposed cross-sections thro- ugh the continental crust: Implications for crustal structure, petrology and evolution, Earth Planet. Sci. Lett., 56, 263-277, 1981.
Gallart, J., E. Banda, and M. Daigni•res, Crustal structure of the Paleozoic axial zone of the Pyrenees and transition to the North Pyrenean Zone, Ann. Geophys., 36, 141-158, 1981.
Gallart, J., M. Daigni•res, E. Banda, E. Surinach, and A. Hirn, The eastern Pyrenean domain: Lateral variations at crust man- tle level, Ann. Geophys., 37, 457-480, 1982.
Gallart, J., M. Daigni&res, J. Gagnepain-Beyneix, and A. Hirn, Relationship between deep structure and seismicity in western Pyrenees, Ann. Geophys., 3, 239-248, 1985.
Goldberg, J.M., H. Maluski, and A.F. Leyreloup, Petrological and age relationship between emplacement of magmatic brec-
4412 CHERY ET AL.: THERMOMECHANICAL MODELING OF CONTINENTAL DEFORMATION
cia, alkaline magmatism and static metamorphism in the North Pyrenean Zone, Tectonophysics, 129, 275-290, 1986.
Him, A., Features of the crust-mantle structure of Himalayas- Tibet: A comparaison with seismic traverses of Alpine, Pyre- nean, and Variscan orogenic belts, Philos. Trans. R., Soc., London, Set. A, 326, 17-32, 1988.
Him, A., M. Daigni•res, J. Gallart, and M. Vadell, Explosion seismic sounding for throws and dips in the continental moho, Geophys. Res. Left., 7, 263-266, 1980.
Him, A., G. Poupinet, G. Wittlinger, J. Gallart, and F. Thou- venot, Teleseismic prospecting of lithospheric contrasts beneath the Pyrenees and Alps, Nature, 308, 531-533, 1984.
Hobbs, B.E., and A. Ord, Plastic instabilities: Implications for the origin of intermediate and deep focus earthquakes, J. Geo- phys. Res., 93, 10521-10540, 1988.
Kirby, S.H., Rheology of the lithosphere, Rev. Geophys., 21, 1458-1487, 1983.
Kirby, S.H., Rock mechanics observations pertinent to the rheol- ogy of the continental lithosphere and the localization of strain along shear zones, Tectonophysics, 119, 1-27, 1985.
Kirby, S.H., and A.K. Kronenberg, Deformation of the clinopy- roxenite: Evidence for a transition in flow mechanisms and
semibrittle behavior, J. Geophys. Res., 80, 3177-3182, 1984. Le Pichon, X., J. Bonnin, and J.C. Sibuet, La faille Nord Pyr&
n•enne: Faille transformante li4e a l'ouverture du golfe de gascogne, C. R. Acad. Sci., 271, 1941-1944, 1970.
Le Pichon, X., J. Bonnin, J. Francheteau, and J.C. Sibuet, Une hypothese d'•volution tectonique du Golfe de Gascogne, in His- toire structurale du Golfe de Gascogne, vol. VI, 11, pp. 1-44, Technip, Paris, 1971.
Mandel, J., Plasticitd et Viscoplasticit•, Cours CISM, 97, Udine, Springer-Verlag, New York, 1971.
Mandel, J., Sur la d4finition de la vitesse de d4formation elas- tique et sa relation avec la vitesse de contrainte, Int. J. Solids Struct., 17, 873-878, 1981.
Mandel, J., Sur la d•finition de la vitesse de d4formation elas- tique en grande transformation elastoplastique, Int. J. Solids Struct., 19, 573-578, 1983.
Mattauer, M., Les traits structuraux essentiels de la chaine pyr4- n•enne, Rev. Geogr. Phys. Geol. Dyn., 10, 3-11, 1968.
Mattauer, M., Presentation d'un module lithosphdrique de la chat- ne des Pyr•n4es, C. R. Acad. Sci., 300, 71-74, 1985.
Mattauer, M., Intracontinental subduction, crust-mantle decolle- ment and crustal stacking wedge in the Himalayas and other collision belts, Collision Tectonics, edited by M.P. Coward and A.C. Ries, Geol. Soc. London Publ, 19, 37-50, 1986.
Mattauer, M., and M. Seguret, Sur le style des d•formations terti- aires de la zone axiale hercynienne des Pyr•n4es, C. R. Somm. Soc. Geol. Ft., 1, 10-11, 1966.
Matthews, D.H., and A. Him, Crustal thickening in Himalayas and Caledonides, Nature, 308, 497-498, 1984.
McCaig, A.M., Deep geology of the Pyrenees, Nature, 331,480- 481, 1988.
Meissner, R., The Continental Crust, Academic, San Diego,
Sidoroff, F., Variables internes en visco41asticit4, II, Milieux avec configuration interm4diaire, J. Mec., 1,t, 571-595, 1975b.
Simo, J.C., On the computational significance of the intermediate configuration and hyperelastic relations in finite deformation plasticity, Mech. Mater., ,t, 439-451, 1986.
Simo, J.C., A framework for finite strain elastoplastlcity based on maximum plastic dissipation and the multiplicative decompo- sition, part I, Continuum formulation, Comput. Method Appl. Mech. Eng., 66, 199-220, 1987a.
Simo, J.C., A framework for finite strain elastoplasticity based on maximum plastic dissipation and the multiplicative decompo- sition, part II, Computational aspects, Comput. Method Appl. Mech. Eng., 68, 1-32, 1987b.
Simo, J.C., and M. Ortiz, A unified approach to finite defor- mation elastoplastic analysis based on the use of hyperelastic constitutive equations, Cornput. Method Appl. Mech. Eng., •/0, 137-150, 1985.
Simo, J.C., R.L. Taylor, and K.S. Plister, Variational and projec- tion methods for the volume constrains in finite deformation
elasto-plasticity, Comput. Method Appl. Mech. Eng., 51,177- 208, 1985.
Strehlau, J., and R. Meissner, Estimation of crustal viscosities and shear stresses from an extrapolation of experimental steady steady state flow data, in Composition, Structure and Dynam- ics of the Lithosphere-Asthenosphere System, Geodyn. Set., vol. lb, edited by K. Fuchs and C. Froidevaux, AGU, Washing- ton, D.C., 1987; pp. 69-87
Tsenn, M.C., and N.L. Carter, Flow properties of continental lithosphere, Tectonophysics, 136, 1-26, 1987.
Van der Voo, R., and A. Boessenkool, Permian paleomagnetic result fron the western Pyrenees delineating the plate boundary between the Iberian peninsula and stable Europe, J. Geophys. Res., 78, 5118-5127, 1973.
Vi!otte, J.P., Mod•lisation thermom4canique de la d•formation intra- continentale, Thesis d'4tat, Univ. of Montpellier, 1989.
Vilotte, J.P., M. Daigni&res, and R. Madariaga, Numerical mod- eling of intraplate deformation. Simple mechanical models of continental collision, J. Geophys. Res., 87, 10,709-10, 728, 1982.
Vilotte J.P., M. Daigni•res, R. Madariaga, and O.C. Zienkiewicz, The role of a heterogeneous inclusion during continental colli- sion, Phys. Earth Planet. Inter., 96, 236-259, 1984.
Vilotte, J.P., R. Madariaga, M. Daigni•res, and O.C. Zienkiewicz, Numerical study of continental collision: Influence of byuoancy forces and an initial stiff inclusion, Geophys. J. R. Astron. Soc., 8,t, 279-310, 1986.
Vilotte, J.P., M. DaignJ•res, J. Chery and R. Madariaga, Some applications of large plastic deformations in geodynamics, in: Computational Plasticity, Owen, Hinton and Onate, pp. 1635- 1648, Pineridge, Swansea, Wales, 1987.
Williams, G.D., and M.W. Fisher, A balanced cross section across the Pyrenean orogenic belt, Tectonics, 3(7), 773-780, 1984.
Zienkiewicz, O.C, FLow formulation for numerical solution of forming processes, in Numerical Analysis of Forming Pro- cesses, pp.1-43, edited J.F.T. Pittman, John Wiley, New York,
Calif., 1986. 1984. Meissner, R., and T. Wever, Intracontinental seismicity, strength Zienkiewicz, O.C., J.P. Vilotte, S. Toyoshima, and S. Nakasawa,
of crustal units, and the seismic signature of fault zones, Philos. Iterative method for constrained and mixed approximation: Trans. R. Soc. London, Set. A, 317, 45-61, 1986.
Ortiz, M., and J.C. Simo, An analysis of a new class of integration algorithms for elastoplastic constitive relations, Int. J. Numer. Method. Eng., 23, 353-366, 1986.
Patterson, M.S., Problems in the extrapolation of laboratory rhe- ological data, Tectonophysics, 133, 33-43, 1987.
S•guret, M., and M. Daigni•res, Crustal scale balanced cross sec- tions of the Pyrenees: A discussion, Tectonophysics, 129, 303- 318, 1986.
Sidoroff, F., The geometrical concept of intermediate configura- tion and elasto-plastic finite strain, Arch. Mech., 25, 299-309, 1973.
Sidoroff, F., Variables internes en visco•lasticitd, I, Variables in- ternes scalaires et tensorielles, J. Mdc., 1,t, 545-566, 1975a.
An inexpensive improvement of F.E.M. performance, Comput. Method Appl. Mech. Eng., 51, 3-29, 1985.
J. Chery and M. Daigni•res, Centre G4ologique et G•ophysique, U.S.T.L., P1. E. Bataillon, 34060-Montpellier cedex, France.
J.P. Vilotte, D•partement de G4ologie, Ecole Normale Sul•- rieure, 24 Rue Lhomond, 75231-Paris cedex 05, France.
(Received April 3, 1989; revised October 23, 1989
accepted October 26, 1989.)
Copyright © 2022 FDOKUMEN