Ground temperature, active-layer thickness and ground-ice ...
Upload
bensakovichCategory
view
2download
0
JOURNAL OF GEOPHYSICAL RESEARCH, VOL. 98, NO. Bll, PAGES 19,565-19,577, NOVEMBER 10, 1993
Elastic Thickness of the Lithosphere in the Marquesas and Society Islands
PAUL E. FILMER1, MARCIA K. MCNUTT, AND CECILY J. WOLFE 2
Department of Earth, Atmospheric, and Planetary Sciences, Massachusetts Institute of Technology, Cambridge
Analysis of sea surface gravity data along six profiles collected during the Crossgrain 2 and EW9103 expeditions to the Marquesas Islands demonstrates that the elastic plate thickness T e is remarkably uniform, with a value of 18+2 km over the entire chain. Given the 50 Ma age of the Marquesan lithosphere at the time of loading, this T e value agrees with the empirical relationship between elastic plate thickness and plate age for hotspot volcanoes in the North Pacific, Atlantic, and Indian oceans. Using more limited gravity data from the Society chain, we find that the best fitting elastic plate thickness there is resolvably higher, 23+2 km. In both cases, our values for T e are larger than those derived from analysis of satellite altimetry profiles. We attribute the low Te values derived from satellite altimetry to inaccuracies in available gridded bathymetric databases for this part of the world and the assumption of a high value for the density of the seafloor. Although our shipboard data sample only two French Polynesian island chains, the results suggest that the amount of elastic plate thinning over the South Pacific Superswell may be less than previously proposed, thus eliminating conflict between estimates of the thermal structure of the Superswell lithosphere as derived from elastic plate thickness and that derived from heat flow, depth anomalies, and Love wave dispersion.
INTRODUCTION
Recent analyses of geophysical and geochemical data from the south central Pacific have conf'm'ned that the mantle beneath French
Polynesia is highly anomalous compared to that underlying the North Pacific and North Atlantic ocean basins. Most of the
geophysical observations, such as depth anomalies that become increasingly shallow with lithospheric age, low velocities for Love waves, and a broad low in the geoid, can be explained as manifestations of a thinner (75 km thick) thermal lithosphere maintained by a superplume rising through a low-viscosity zone in the upper mantle [McNutt and Judge, 1990]. In recognition of the broad dimensions of this topographically elevated area, 2000 km N- S by 5000 km E-W, McNutt and Fischer [ 1987] termed this area the "Superswell" (Figure 1).
Of the unusual characteristics of the Superswell, the one that has proved most difficult to reconcile with thermal models is the elastic plate thickness of the lithosphere as determined from the amplitude and wavelength of flexure beneath islands as seen in satellite geoid and gravity data. As shown by Calmant and Cazenave [1987], elsewhere in the ocean basins the thickness of the elastic plate Te in kilometers supporting hotspot volcanoes increases roughly as 2.7+1.51•/, where tl is the age in million years of the lithosphere at the time of loading. In accordance with this empirical formula, Te beneath volcanoes formed on 50 Ma lithosphere is approximately 19 km, while that for volcanoes erupted onto 80 + Ma lithosphere (Hawaii, Bermuda, Cape Verde) is 25 to 30 km. If the lithosphere surrounding these hotspot volcanoes has the thermal structure of a 125-km-thick thermal plate, the thickness of the
1Now at Universities Space Research Association, Washington, D.C. 2Also at MIT/Woods Hole Joint Program in Oceanography, Woods
Hole, Massachusetts.
Copyright 1993 by the American Geophysical Union.
Paper number 93JB01720. 0148-0227/93/93 JB-01720 $05.00
elastic plate would correspond to the depth to the 400+20øC isotherm. For Superswell volcanoes, however, estimates of Te are 5 to 10 km less than predicted by this empirical formula [Calmant and Cazenave, 1986, 1987], corresponding to the depth to the 400øC isotherm for a thermal plate less than 50-km thick. This estimate of the thermal plate thickness for the Superswell is much less than the 75 km inferred from the other types of geophysical data [McNutt and Judge, 1990] and quite inconsistent with heat flow observations [Stein and Abbott, 1991].
In this study, we report the results from an analysis of high- resolution sea surface gravity data that allow us to reconcile these different estimates for the thickness of the Superswell lithosphere. By putting substantial effort into producing the best possible bathymetric maps for the areas of study, we are able to fit the observed gravity with a simple two-parameter elastic plate model to a precision approaching the original accuracy of the gravity measurements.
DATA ANALYSIS
Figure 2 shows the locations of six profiles of gravity and bathymetry crossing the Marquesas Island chain collected during the Crossgrain 2 expedition in 1987 of the R/V Thomas Washington operated by Scripps Institution of Oceanography and during the EW9103 expedition in 1991 of the R/V Maurice Ewing operated by Lamont-Doherty Earth Observatory. One long and two shorter lines were also collected across the Society chain on the latter expedition (Figure 3). The gravimoter used for Crossgrain 2 was a Bell BGM-3, and bathymetry was derived from the SeaBeam swath mapping system. For the EW9103 expedition, we used the Hydrosweep swath mapping system and had available both KSS- 30 and Bell gravimeters, but the KSS-30 proved more reliable. The nominal error for the gravimeters is less than 1 mGal, and after applying the E6tv6s correction we estimate the uncertainty in the gravity measurements to be less than 2 mGal for the Global Positioning System (GPS)-navigated EW9103 data and less than 5 mGal for the Crossgrain data navigated with Transit satellites [Bell and Watts, 1986].
19,565

19,566 FILMER ET AL.' ELASTIC PLATES IN THE MARQUESAS AND SOCIETY ISLANDS
200' 0'
-5'
-10'
-15'
-20'
c}
-25'
-30'
-35'
-40' 200'
205' 210' 215' 220' 225' 230' 235' 240' 245' 250' 255'
P•nrt• I. •)Caroline I. Vostok I.(•Flint I.
o..
ISLANDS
, ..•u?uroa I. ..
Gainbier I.
Henderson I. •, o
'Pitcairn •. Ducie I.
ß Rapa I.
205' 210' 215' 220' 225' 230' 235' 240' 245' 250' 255'
Sala y Gomez I. .
Easter I.
260' O'
-5'
-10'
-15'
-20'
-25'
-30'
-35'
-40' 260'
Fig. 1. Map of the South Pacific, showing the location of the major tectonic features. The 4500-m isobath is indicated, giving a rough idea of the extent of the Superswell [McNutt and Fischer, 1987], which is bounded on the east by the East Pacific Rise and on the southwest by the Austral Islands. The Marquesas Fracture Zone forms the northern boundary of the Superswell, except perhaps locally near the Marquesas Islands.
Preparation of Bathyrnetric Maps
With the availability of satellite and particularly GPS navigation, the success in modeling marine gravity data is no longer limited by the accuracy in the gravity data but rather by how well we account for the gravitational attraction of the bathymetry. While the bathymetry is very accurately measured along the ship track, off- track bathymetry has a substantial effect on the gravity data. We used the following procedure to produce the new Marquesas and Society maps shown here. First, we digitized the contours of the most recent French bathymetric and navigational charts for each region [Monti and Pautot, 1975; F. Avedik, unpublished data, 1990]. We supplemented the contours with data from Digital Bathymetric Data Base 5 (DBDB5), a standard digital file of depth soundings on a 5-min global grid, in regions lacking control and reinterpolated the data onto our 5-min grid. Although the DBDB5 data are readily available and convenient to use, the control for the depths is unknown as it was partially based on classified information. Finally, we merged our ship board data onto the grid by replacing grid points beneath the ship track with multibeam data and using a ramp function to linearly interpolate between the new bathymetry and the existing grid points out to a distance of four nodes from the ship track. For the Ewing Hydrosweep data, in
regions away from the islands the swath width was wide enough to use the depths recorded by the outer beams to replace the values at grid points parallel to but off the ship track.
The new maps (Figures 2 and 3) are a substantial improvement over the digital bathymetry used in many prior studies in French Polynesia. For example, Figure 4 compares the depths observed along the gravity lines in the Marquesas area with those extracted from the DBDB5 grid. Note that the DBDB5 data tend to overestimate the inter-island mass of the archipelago and thus bias estimates of elastic plate thickness to low values. Smith [1993] has also cautioned against the use of such digital bathymetry in flexure studies.
The classic moat and arch from lithospheric flexure are nowhere observed in the bathymetric data from the Marquesas and Society Islands. Based on the flexure seen in the gravity data (Figures 5 and 6), it is apparent that the moat and arch are buried beneath their archipelagic aprons [Menard, 1956]. The aprons are well developed along the older parts of the chain, but thin to the southeast. In the northwestern and central parts of the Marquesas chain, the apron buries the abyssal hills of the preexisting seafloor out as far as the location of the flexural arch. Based on arrivals
from air gun shots recorded by sonobuoys, the mature apron is 1 to 2 km thick and corresponds to seismic velocities of 4 to 5 km/s

FILMER ET AL.: ELASTIC PLATES IN THE MARQUESAS AND SOCIETY ISLANDS 19,567
_5 ø
_6 ø
_7 ø
_8 ø
_9 ø
-10 ø
-11 ø
-12 ø
-13 ø 215 ø
DUMONT D' -
3 .-4
.' :
ß
..
21 6 ø 21 7 ø 21 8 ø 21 9 ø 220 ø 221ø 222 ø 223 ø 224 ø 225 ø 226 ø
Fig. 2. Bathymetric map of the Marquesas Islands. Dashed lines indicate the locations of the six gravity and bathymetry profiles plotted in Figure 5. Dotted lines are ship tracks contributing bathymetry from the Crossgrain 2, EW9103, and EW9106 expeditions. Contour interval is 250 m, with heavier lines every 1000 m.
[Filmer et al., 1993], consistent with Menard's [1956] interpretation that it is composed of subaqueous lava flows and volcaniclastic turbidites. The apron in the Society region extends to the Tuamotu Plateau to the north and to an unnamed seamount chain
to the south.
Flexural Modeling
We estimated the flexural rigidity of the lithosphere flexed beneath the weight of the islands by first computing, in the wavenumber domain, the deflection W of a thin elastic plate with flexural rigidity D:
W(k•,ky) =Po-Pw Pm-Po (2•rk)4D ]-] l+(pm_Po)g n(kx,ky) (1)
in which kx and ky are the horizontal wavenumbers; Po, Pw and Pm are the densities of the seafloor load, water, and mantle,
respectively; k is the modulus of the horizontal wave vector; and g is the acceleration of gravity (9.8 m/s2). The fact that the flexural moat in the Marquesas is overfilled with material of high seismic velocity [Filmer et al., 1993] supports the assumption in (1) that the flexural moat is completely filled with material of the same density as the volcanoes. H(kx, ky) is the two-dimensional digital Fourier transform of the bathymetric maps in Figures 2 and 3. The flexural
rigidity D is related to the elastic plate thickness Te via
D= ETe3 12(1_v2) (2)
in which E is Young's modulus (8x10¹¹ N/m 2) and v is Poisson's ratio (0.25).
The gravity anomaly was then calculated as the sum of the gravitational effects of the seafloor load and the plate deflection from (1) using Parker's [1972] method, retaining up to the fifth nonlinear term. We calculated the average depth to the topography, zt, from the data, estimated the Moho depth, Zm, from analysis of R/V Ewing sonobuoys [Caress et al., 1991], and allowed Te and the density of the bathymetry, Po, to range from 5 to 29 km and 2500 to 2800 kg/m 3, respectively. Although theoretically zt and Zm could also be left as free parameters, by setting them to the observed values we were able to better constrain the values of Te by eliminating spurious fits to the data with inappropriate values for zt and Zm. After calculating the theoretical gravity anomaly over the two-dimensional grid, we extracted profiles by interpolating grid points onto the ship tracks. For the long lines (lines 1-6 in the Marquesas and line 2 in the Societies), the best fitting slope was removed from the data and model before computing the misfit. (Such slopes are caused by gravimeter drift and long-wavelength

19,568 FILMER ET AL.: ELASTIC PLATES IN THE MARQUESAS AND SOCIETY ISLANDS
-13'
-14'
-15'
-16' -
17'
-21'
205'
1
I
206' 207' 208' 209 ø 210 ø 211 ø 212 ø 213 ø 214 ø
Fig. 3. Bathymetric map of the Society Islands. Dashed lines indicate the locations of the three gravity and bathymetry profiles plotted in Figure 6. Contour interval is 250 m, with heavier lines every 1000 m.
215'
variations in gravity unimportant for a study of flexure.) For the with higher densities (lines 3 and 5) skirted the flanks of the shorter half profiles (lines 1 and 3 in the Societies), no trend was volcanic islands (Figure 2). The best fitting models reproduce both removed but the mean of the model was adjusted to match that of the amplitude and wavelength of the data for lines 2-6 quite well the data.
The theoretical model best fitting each observed profile was determined using both root-mean-square (RMS) and one-norm measures of miffit. The one norm minimizes the sum of the
absolute values of the differences between data and model, and therefore the misfit measure is less sensitive than RMS to isolated
outliers, such a spikes in the data. Because both misfit measures are in reasonable agreement in this application, we only show the RMS results (Figures 7 and 8). Most misfit plots show some trade- off between Te and Po, such that higher values of Te and lower
(Figure 5), and obvious misfits can be explained by the existence of uncharted seamounts that the ship only intersected on the lower slope (e.g., at 219.2 ø longitude along line 4, Figure 5) or uncorrected "tears" in the Crossgrain gravity record (e.g., between 221ø and 222 ø longitude on line 6, Figure 5).
Based on misfit curves for the Societies (Figure 8), a value for Te of about 23 km provides an excellent fit to the data (Figure 6). Again, line 2 that traverses a well-sedirnented portion of the chain is better fit with a lower density (2500 kg/m3), whereas line 3 crossing basement outcrops at the southeast end yields a higher
values of Po fit as well as low values of Te with higher values of density (2700 kg/m3). We did not compute RMS and one-norm Po. However, all of the misfit plots except for line 1 in the Marquesas show a well-defined minimum.
The best fitting elastic plate thicknesses are all about 18 km for lines 2-6 in the Marquesas area, although the best fitting value for Po varies. We think that this variation in Po is real because those profiles with lower effective densities (lines 2 and 4) intersected the chain at deep interisland basins filled with sediment, whereas those
misfit curves for line 1 in the Societies because no shipboard bathymetry was available for that line. The fit to the observed gravity using the same elastic parameters that yielded the minimum RMS misfit for line 3 replicates well the wavelength of the observed gravity (Figure 6), but it is apparent that there is some misfit to the amplitude which may be attributed to inaccuracies in our bathymetry grid. We do not fit well the amplitude of the gravity over the

FILMER ET AL.: ELASTIC PLATES IN THE MARQUESAS AND SOCIETY ISLANDS 19,569
Line 3
-2800
-1000 • -3200
-2000 -3600
-3000 -4000
_oooLcy,_, -5000 • I -4800
216 220 224 216
Line 6
218 220 222
•'-1500
-2000
-2500 •'-3000
-3500
-4000
-4500
Line 2
_
- /
220.5 222.0
Line 5
-1000-
-2000 •• jl -4000 It • -5000 • • i •
218 220
Line 1 -2000
• -2500 -• -3000
-3500 -4000
-• -4500 (1.) • -5000
219 222 225
Longitude
-1000 -
-2000
-3000
-4000
-5000
Line 4
218 220 222
LongiLude
Fig. 4. Comparison of the observed bathymetry along the ship tracks crossing the Marquesas Islands with that interpolated from the DBDB5 bathymetry grid.
southem seamount chain, but this region is poorly mapped and little is known about the age of these volcanoes. It seems unlikely that the southern seamounts are an old chain erupted on-ridge because the peak of one seamount rises 3 km above the seafloor but shows no evidence of having been eroded at wave base (line 2, Figure 6). In fact, this southern chain may be coeval with the Societies: they strike parallel to the Societies at a distance such that their position could be controlled by the tensional stresses in the upper plate that developed on the flexural arch of the Society volcanoes.
The southeastern line in the Marquesas is the one exception to the generally good results in fitting the gravity, with the misfit plot showing a saddle rather than a trough in the area of parameter space covered (Figure 7). We think that the failure to fit this line is caused by the existence of uncharted seamounts off-track at the young end of the chain. Note in Figure 2 that all seamounts at the southeast end of the Marquesas lie exactly along our ship tracks, with blank gaps in between. We suspect that the density of seamounts is similar in these uncharted regions, but until more bathymetric data are readily available, we cannot conclude anything about the elastic properties of the lithosphere near "zero age". Elsewhere in the Marquesas, such seamounts undoubtedly existed but have since been buried beneath the archipelagic aprons. Because of the small density contrast of the seamounts with respect to the apron sediments, failure to account for these features does not hamper our ability to model the gravity. In comparison to the
Marquesas, the southeastern end of the Society chain was better surveyed prior to our expedition, and we achieve an excellent fit to line 3 (Figure 6) despite extremely rough bathymetry.
DISCUSSION AND CONCLUSIONS
Our success in accurately modeling the gravity data from the Marquesas and Society Islands and in tightly constraining the elastic plate thickness can be attributed to the use of our new bathymetric maps. For example, Figure 9 shows the fits to the six Marquesas profiles obtained using DBDB5 bathymetry and the preferred elastic plate parameters as determined from the misfit plots in Figure 7. The fit to the wavelength of the arch is generally good, even with the less accurate bathymetry, but any estimates of Te based on amplitude modeling would be very imprecise. Assuming that bathymetry in island chains is lineated in the direction perpendicular to gravity profiles, as is done when applying the admittance formulation [McKenzie and Bowin, 1976] to isolated crossings, also produces a poor fit to the data and prevents fight constraints on Te (Figure 10).
The uniform value of elastic plate thickness throughout the Marquesas demonstrates that possible variations in Te caused by differences in the age of the lithosphere at the time of loading [Watts et al., 1980], magnitude of the load (through the finite yield strength of oceanic lithosphere [McNutt and Menard, 1982]), and

19,570 FILMER ET AL.: ELASTIC PLATES IN THE MARQUESAS AND SOCIETY ISLANDS
• 80
• 60 ,• 40
o
u Eo
Line 2
220.5 222.0
-2000
'-•'-3000
-4000
220.5 222.0
• 60
• 4O go
o 2 go
-2000
-3000 -4000
-5000
Line 1
- r,, I
218 220 222 224
218 220 222 224
Longi[ude
Fig. 5. Free-air gravity and center beam bathymetry profile pairs across the Marquesas Islands. Profiles am numbered consecutively from the south, as in Figure 2. Flexural moats are observable in all profiles except the southernmost. Dashed lines show the predicted gravity using an elastic plate thickness of 18 km for all profiles and topographic densities as follows: line 1, 2650 kg/m3; line 2, 2500 kg/m3; line 3, 2700 kg/m3; line 4, 2550 kg/m3; line 5, 2650 kg/m3; line 6, 2650 kg/m 3.
the time since loading (on account of lithospheric reheating [Detrick and Crough, 1978]) are all negligible. Existing models for the magnitudes of these three effects appear to be consistent with this conclusion. For example, the effect of lithospheric age at the time of loading, tl, can be calculated by the empirical formula Te = 2.7,•'•t [Calmant and Cazenave, 1987] using the magnetic
lineations of Kruse [1988] and the volcano geochronology of Brousse et al. [1990]. The predicted reduction in elastic plate thickness to the south is only 0.2 km, well within the uncertainty from gravity modeling, because the reduction in volcano age to the south is almost perfectly offset by a corresponding decrease in lithospheric age. Similarly, the predicted dependence of effective

FILMER ET AL.' ELASTIC PLATES IN THE MARQUESAS AND SOCIETY ISLANDS 19,571
E 40
-1000 -2000 -8000 -4000 -5000
Line 4
218 220 222
218 22O 222
Line
150
100
o '-r--•g•
216 218 220 222 224
-2000
--4000
216 218 220 222 224
Longi[ude
Fig. 5 (continued)

19,572 FILMER ET AL.' ELASTIC PLATES IN THE MARQUESAS AND SOCIETY ISLANDS
2O
0
-20
216 218
Line 6
-2000 L -3000
-4000
220 222
;816 218 220 222
Line 5
100 -
80
60
40 •
20
-20
1000 -
-2000
-3000
-4000
-5000
218 220
218 220
Longitude
Fig. 5. (continued)
elastic thickness on magnitude of the load, as calculated from the yield strength envelopes from McNutt and Menard [1982] using maximum plate curvature values derived in our forward modeling, is less than 0.5 km, even in the central part of the chain. Finally, if reheating of the Marquesan lithosphere by the hot spot is confined
to depth of 45 km or greater, as predicted by modeling of the geoid anomaly and bathymetric swell by Fischer et al. [1986], there should be no detectable reduction in elastic plate thickness over the age span of the Marquesas Islands, 1.4 to 5.5 Ma [Brousse et al., 1990].

FILMER ET AL.: ELASTIC PLATES IN THE MARQUESAS AND SOCIETY ISLANDS 19,573
Line
• 60
u 40
-• •o
ß '• 0 1>
r,..U -20 -
-20 -19 -18 -17 -16
-1500-
-2000
-2500
-3000
-3500
-4000
-4500
-20 -19 -18 -17 -16
La[i[ude
-15
Line 3
t
-20.0 -19.0 -18.0
-52oo •'-3600
-4000
-4400
-4800
• 40 •' 20
ß ,• 0
• -20
Line 1
-20.0 -19.0 -18.0 -17.4 [6.8 -16.2
La[i[ude La[i[ude
Fig. 6. Free-air gravity and center beam bathymetry profile pairs across the Society Islands. Profiles are numbered as in Figure 3. Flexural moats are observable in all gravity profiles except the southernmost. Dashed lines show the predicted gravity using an elastic plate thickness of 23 km for all profiles and topographic densities as follows: line 1, 2700 kg/m3; line 2, 2500 kg/m3; line 3, 2700 kg/m 3.
Our elastic thickness for the Marquesas Islands agrees with the 18-km value determined by Fischer et al. [1986] from three- dimensional modeling of the geoid over the Marquesas Islands but is larger than the value of 14 km determined by Calmant and Cazenave [1987]. Similarly, our value of 23 km for the Society chain for the region between Bora Bora and Tahiti is larger than
their estimate of 15-18 km [Calmant and Cazenave, 1986]. We suspect that the discrepancy might result from their attempt to match the geoid data along individual satellite-altimetry passes with that predicted by loading an elastic plate with the DBDB5 digital bathymetry. The individual satellite passes retain more of the high- frequency information in the original altimetry data than does the
19,574 FILMER ET AL.' ELASTIC PLATES IN THE MARQUESAS AND SOCIETY ISLANDS
Line 1 Line 4
20
• 15
o 10
2500 2600 2700 2800
Surface Density (kg/m**3) 2500 2600 2700 2800
Surface Density (kg/m**3)
Line 2
• 20
• 15
o 10
5 i i i i
2500 2600 2700 2800
Surface Density (kg/m**3)
Line 5
25
15 4 5 6
10 7
5 ' ' ' ' 2500 2600 2700 2800
Surface Density (kg/m**3)
Line 3
• 20
o 10 .•-•
5
2500 2600 2700 2800
Surface Density (kg/rrL**3)
Line 6
o tO
2500 2600 2700 2800
Surface Density (kg/m**3)
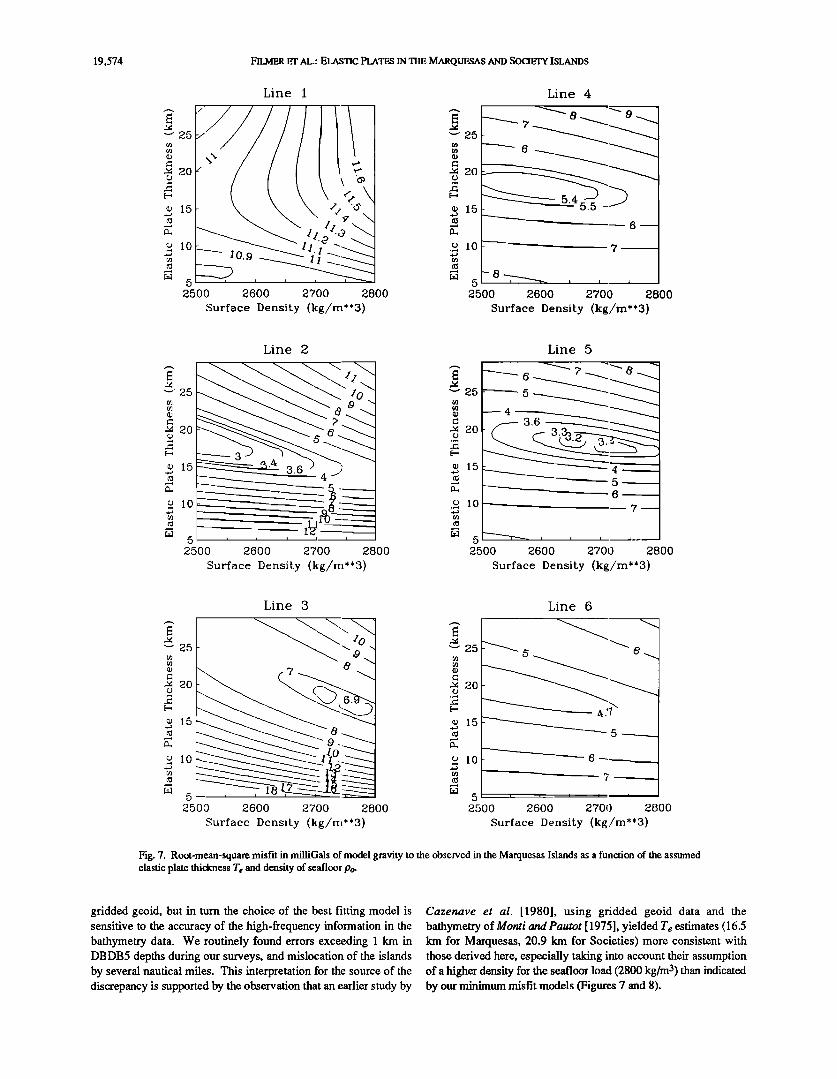
Fig. 7. Root-mean-square misfit in milliGals of model gravity to the observed in the Marquesas Islands as a function of the assumed elastic plate thickness Te and density of seafloor Po.
gridded geoid, but in turn the choice of the best fitting model is sensitive to the accuracy of the high-frequency information in the bathymetry data. We routinely found errors exceeding 1 km in DBDB5 depths during our surveys, and mislocation of the islands by several nautical miles. This interpretation for the source of the discrepancy is supported by the observation that an earlier study by
Cazenave et al. [1980], using gridded geoid data and the bathymetry of Monti and Pautot [1975], yielded Te estimates (16.5 km for Marquesas, 20.9 km for Societies) more consistent with those derived here, especially taking into account their assumption of a higher density for the seafloor load (2800 kg/m 3) than indicated by our minimum misfit models (Figures 7 and 8).

FILMER ET AL.' ELASTIC PLATES IN THE MARQUESAS AND SOCIETY ISLANDS 19,575
$o½ieky Line
ß 15 2 9
o 10 .,•
• 10
•00 2800
• 2o
15
2600 2700 2500 2600 2700
Surface Density (kg/m**3) Surface Density (kg/m**3) 2800
Fig. 8. Root-mean-square misfit in milliGals of model gravity to the observed in the Society Islands as a function of the assumed elastic plate thickness Te and density of seafloor Po.
The conclusions from this study suggest that the elastic plate thickness values for the Superswell may not be as low as previously proposed. As shown in Figure 11, these revised Te values are consistent with a thermal plate thickness for French
Polynesia of 75km or greater, assuming that the age of the lithosphere at the time of loading is approximately 50 Ma for the Marquesas [Kruse, 1988] and 70 Ma for the Societies [Calmant and Cazenave, 1986]. Furthermore, these values indicate no
Line 160
40
0
-40 216 220 224
Line 2
80- 6O
4O
20
-20
220.5 222.0
60
30
20
10
0
-10
-20
-30
Line 6
-20
Line 1
/
I I I
219 222
I I
225
lOO
80
60
40
20
o
-20
216 218 220 222
Line 5
218 220
Line 4 100
80
60
40
20
0 • I•. -
-20 / v • ! I I I I I I I
218 220 222
Longi[ude Longi[ude
Fig. 9. Comparison of the observed gravity to that predicted from an elastic plate loaded by DBDB5 bathymetry for the Marquesas Islands. The same elastic plate parameters as in Figure 5 were assumed.

19,576 FILMER ET AL.: ELASTIC PLATES IN THE MARQUESAS AND SOCIETY ISLANDS
80
60
40
Line 5, 2D Assump[ion
217
I 1
218 219 220 22t
Longitude
Fig. 10. Comparison of the observed gravity to that predicted from an elastic plate loaded by the observed shipboard bathymetry from line 5 in the Marquesas Islands, assuming that the bathymetry is lineated perpendicular to the strike of the profile. The same elastic plate parameters as in Figure 5 were assumed.
discrepancy with the heat flow observations, which preclude a thermal plate much thinner than 75 km [Stein and Abbott, 1991]. However, our analysis only includes two island chains in French Polynesia. Calmant and Cazenave [1986] report anomalously low elastic plate thicknesses for the Cook-Austral chain as well. Therefore, before we can be confident that the flexural data from the
Superswell are completely consistent with other measures of thermal plate thickness, it is necessary to acquire better bathymetry and shipboard gravity from this chain. The Cook-Austral chain is even more remote than the Society and Marquesas Islands, and therefore errors in the DBDB5 bathymetry are quite possible there as well.
Determining the amount of elastic plate thinning associated with Cook-Austral islands also has implications for how we interpret the
0
-lO
-15
-20
-25
-30 0 20
i ! i
40 60 80
50 kin
75 kin
..... 125 kin
ß data
lOO 120
Age (Ma)
Fig. 11. Predicted depths of the base of the elastic plate as a function of age of the oceanic lithosphere when loaded for three different values for the thickness of the thermal lithosphere: 50 km, 75 km, and 125 km. The 400øC isotherm is used as the base of the elastic plate. Open circles show the values for elastic thickness determined in this study.
record of Cretaceous volcanism on seamount chains presently in the North Pacific but over French Polynesian hot spots at the time of volcanism. Based on careful analysis of shipboard gravity data equivalent in quality to that used here, both Smith et al. [1989] and Wolfe and McNutt [1991 ] concluded that the Cretacous seamounts of the Darwin Rise erupted on anomalously weak elastic plates, such that Te does not exceed 15 km for volcanoes that erupted on plates 60 Ma and older at the time of volcanism. If further analysis reveals that elastic plate thickness for the present-day Superswell are closer to 20 km for seamounts erupted on old lithosphere, then we might conclude that (1) the age of the volcanoes in the North Pacific has been underestimated; (2) Superswell-type volcanism in the South Pacific produced thinner thermal plates 100 m.y. ago compared to the present; and/or (3) there has been some minor viscous relaxation over the past 100 m.y. of the elastic stresses supporting the Darwin Rise volcanoes. However, hypothesis 1 probably cannot be invoked everywhere over the Darwin Rise, since paleontological samples confirm some of the radiometric age dams [Winterer et al., 1993], and hypothesis 2 is inconsistent with the observation that the paleodepth-age relationship for the Darwin Rise is similar to that of the present-day Superswell [McNutt et al., 19901.
There is some uncertainty as to whether the Marquesas Islands should be considered part of the Superswell. In their original definition, McNutt and Fischer [1987] proposed that the northern boundary of the Superswell lay at the Marquesas Fracture Zone, just south of the islands, because of the lack of depth anomalies north of the fracture zone (except for the Marquesas swell itself) and the "normal" elastic plate thicknesses for the Marquesas Islands. However, based on isotope systematics, the Marquesas show the same enriched trends typical of Superswell volcanism [Brousse et al., 1990]. Based on the curves in Figure 11, it is no longer possible to use elastic plate thickness, particularly for volcanoes loading lithosphere only 50 Ma old, to determine whether this chain is part of the Superswell. We can reconcile the isotope data for the Marquesas and the lack of regional depth anomaly by proposing that these islands are an isolated, local extension of Superswell-type volcanism north of the Marquesas Fracture Zone.
Acknowledgments. We thank the officers and crew of the R/Vs Thomas Washington and Maurice Ewing for contributing to the high quality of the data presented here. Anny Cazenave, Garry Karner, and Martin H. P. Bott kindly reviewed the manuscript. This work was supported by grants 8609526-OCE and 8817764-OCE from the National Science Foundation.
REFERENCES
Bell, R.E., and A.B. Watts, Evaluation of the BGM-3 sea gravity meter system onboard R/V Conrad, Geophysics, 51, 1480-1493, 1986.
Brousse, R., H.G. Barsczus, H. Bellon, J.-M. Cantagrel, C. Diraison, H. Guillou, and C. Leotot, Les Marquises (Polyndsie fran•aise): Volcanologie, g6ochronologie, discussion d'un module de point chaud, Bull. Soc. Gdol. Ft., 8, 933-949, 1990.
Calm ant, S., and A. Cazenave, The elastic thickness under the Cook- Austral and Society Islands, Earth Planet. Sci. Lett., 77, 187-202, 1986.
Calmant, S., and A. Cazenave, Anomalous elastic thickness of the oceanic lithosphere in the south-central Pacific, Nature, 328, 236-238, 1987.
Caress, D.W., J.C. Mutter, M.K. McNutt, and R.S. Detrick, A combined multichannel seismic reflection and seismic refraction profile through the Marquesas Island chain, Eos Trans. AGU, 72(44), Fall Meeting suppl.,438, 1991.
Cazenave, A., B. Lago, K. Dominh, and K. Lambeck, On the response of the ocean lithosphere to sea-mount loads from Geos 3 satellite radar altimeter observations, Geophys. J. Roy. Astron. Soc., 63, 233-252, 1980.

FILMER ET AL.: ELASTIC PLATES IN THE MARQUESAS AND SOCIETY ISLANDS 19,577
Detrick, R.S., and S.T. Crough, Island subsidence, hot spots, and lithospheric thinning, J. Geophys. Res., 83, 1236-1244, 1978.
Filmer, P.E., M.K. McNutt, H. Webb, and D.J. Dixon, Volcanism and archipelagic aprons: A comparison of the Marquesan and the Hawaiian Islands, Mar. Geophys. Res., in press, 1993.
Fischer, K. M., M.K. McNutt, and L. Shure, Thermal and mechanical constraints on the lithosphere beneath the Marquesas swell, Nature, 322, 733-736, 1986.
Kmse, S.E., Magnetic linearions on the flanks of the Marquesas swell: Implications for the age of the seafloor, Geophys. Res. Lett., 15, 573- 576, 1988.
McKenzie, D.P., and C. Bowin, The relationship between gravity and bathymetry in the Atlantic Ocean, J. Geophys. Res., 81, 1903-1915, 1976.
McNutt, M.K. and K.M. Fischer, The south Pacific Superswell, in Seamounts, Islands, and Atolls, edited by B.H. Keating, P. Fryer, R. Batiza, and G.W. Boehlert, Geophys. Mono. Ser., vol. 43, pp. 25-34, AGU, Washington, D.C., 1987.
McNutt, M.K., and A.V. Judge, The Superswell and mantle dynamics beneath the south Pacific, Science, 248, 969-975, 1990.
McNutt, M.K., and H.W. Menard, Constraints on yield strength in the oceanic lithosphere derived from observations of flexure, Geophys. J. R. Astron. Soc., 71,363-394, 1982.
McNutt, M.K., E.W. Winterer, W. Sager, J. Natland, and G. Ito, The Darwin Rise: A Cretaceous superswell?, Geophys. Res. Lett., 17, 1101- 1104, 1990.
Menard, H.W., Archipelagic aprons, Am. Assoc. Pet. Geol. Bull., 40, 2195-2210, 1956.
Monti, S., and G. Pautot, Cartes Bathyrndtriques de la Polyndsie franfaise, Centre National Exploration des Oceans (CNEXO), Brest, France, 1975.
Parker, R.L., The rapid calculation of potential anomalies, Geophys. J. R. Astron. Soc., 31,447-455, 1972.
Smith, W.H.F., On the accuracy of digital bathymetric data, J. Geophys. Res., 98, 9591-9604, 1993.
Smith, W.H.F., H. Staudigel, A.B. Watts, and M.S. Pringle, The Magellan Seamounts: Early Cretaceous record of the south Pacific isotopic and thermal anomaly, J. Geophys. Res., 94, 10,501-10,523, 1989.
Stein, C.A., and D.H. Abbott, Heat flow constraints on the South Pacific Superswell, J. Geophys. Res., 96, 16,083-16,099, 1991.
Watts, A.B., J.H. Bodine, and N.M. Ribe, Observations of flexure and the geological evolution of the Pacific Ocean basin, Nature, 283, 532-537, 1980.
Winterer, E.L., J.H. Natland, R. Van Waasbergen, R.A. Duncan, M.K. McNutt, C.J. Wolfe, I. Premoli-Silva, W.W. Sager, and W.V. Sliter, Cretaceous guyors in the northwest Pacific: An overview of their geology and geophysics, in Mesozoic Pacific: Geology, Tectonics, and Volcanism, Geophys. Monogr. Ser., vol. 77, edited by M. Pringle, pp. 307-334, AGU, Washington, D.C., 1993.
Wolfe, C.J., and M.K. McNutt, Compensation of Cretaceous seamounts of the Darwin Rise, northwest Pacific Ocean, J. Geophys. Res., 96, 2363- 2374, 1991.
P.E. Filmer, Universities Space Research Association, 300 D Street S.W., Suite 801, Washington, D.C. 20024.
M.K. McNutt, and C.J. Wolfe, Department of Earth, Atmospheric, and Planetary Sciences, Massachusetts Institute of Technology, Cambridge, MA 02139.
(Received February 9, 1993; revised June 9, 1993;
accepted June 22, 1993.)
Copyright © 2022 FDOKUMEN