Behaviour of concrete block masonry prisms under axial compression
18
Behaviour of concrete block masonry prisms under axial compression E.H. Fahmy and T.G.M. Ghoneim Abstract: A nonlinear three-dimensional finite element model was developed to study the complex behavior of ungrouted and grouted concrete block masonry prisms under axial compression. The model detects crack initiation and traces crack propagation in the masonry assemblage. Variable strengths for blocks, mortar, and grout were used to study the effect of the mechanical properties of prism constituents, and their combinations, on the prism strength and modulus of elasticity. The effect of the number of courses was also investigated. The results of the finite element analysis were used to develop simplified relationships to predict prism strength and modulus of elasticity. Good agreement was observed between the available experimental data and the predicted prism strengths. Key words: compressive strength, concrete blocks, failure modes, finite element, masonry, modulus of elasticity, prisms. Resum6 : Un modkle d'ClCments finis tridimensionnels non linCaires a CtC dCveloppC pour Ctudier le comportement complexe de prismes de ma~onnerie de blocs de bCton IiaisonnCe par injection et non IiaisonnCe, soumis i une compression axiale. Le modkle dCtecte l'amorce de fissures et retrace la propagation de celles-ci dans l'assemblage de ma~onnerie. Des resistances variables pour les blocs, le mortier et le coulis ont CtC utilisCes pour Ctudier l'effet des propriCtCs mCcaniques des composantes des prismes, et leurs combinaisons, sur la resistance et le module d'ClasticitC des prismes. L'effet du nombre d'assises a Cgalement CtC analysC. Les rCsultats de l'analyse par la mCthode des ClCments finis ont CtC utilisCs pour Claborer des relations simples permettant de prCvoir la rtsistance et le module d'ClasticitC des prismes. Une bonne concordance a Ct observCe entre les donnCes expkrimentales existantes et les rksistances prkvues. Mots clis : rrtsistance en compression, blocs de biton, mode d'Cchec, Clement fini, ma~onnerie, module dlClasticitC, prismes. [Traduit par la redaction] Introduction can practically be considered representative for masonry Compressive strength is the most important characteristic of masonry. CAN3-S304-M84 and ACI 530-88IASCE 5-88 use the prism compressive strength as a basis for determining the allowable stresses for masonry under different loading con- ditions. Grout provides large cross-sectional area, which increases the compressive load carrying capacity of masonry. Hamid and Drysdale (1979) have developed a mathematical model to predict the prism strength depending on the mechani- cal properties of prism components. Cheema and Klingner (1986) have developed an analytical model for masonry prism considering the constituents as linear elastic materials. They accounted for material nonlinearity by using the secant modulus of elasticity. Boult (1979) and Hamid and Chuk- wunenye (1986) have shown that a three-course prism model Received July 18, 1994. Revised manuscript accepted January 31, 1995. E.H. Fahmy and T.G.M. Ghoneim. Construction Engineering Unit, The American University in Cairo, P.O. Box 2511, Cairo, Egypt. Written discussion of this paper is welcomed and will be received by the Editor until February 29, 1996 (address inside front cover). strength investigation. This paper presents the results of an investigation to (i) study the stress distributions and failure modes of ungrouted and grouted concrete masonry prisms under axial compres- sion; (ii) determine the effect of the mechanical properties of the prism constituents and number of courses on the prism strength and modulus of elasticity; and (iii) develop simpli- fied relationships to predict the prism strength and modulus of elasticity. The finite element method was used in the present study to obtain a detailed description of stress distributions in the three orthogonal directions of the prism. Finite element model A nonlinear three-dimensional finite element model was developed using ANSYS finite element package (Swanson Analysis Systems Inc. 1990). A three-dimensional concrete element with eight nodes, each having three translation degrees of freedom, was used in this model. This element accommodates material nonlinearity, cracking, and crushing of concrete. To simplify the complexity of the geometry and interaction of prism constituents, the following assumptions were made: (i) For ungrouted prisms, mortar was placed along the full Can. J. Civ. Eng. 22: 898-915 (1995). Printed in Canada 1 Imprimt au Canada Can. J. Civ. Eng. Downloaded from www.nrcresearchpress.com by 70.53.64.150 on 06/04/14 For personal use only.
-
Upload
independent -
Category
Documents
-
view
1 -
download
0
Transcript of Behaviour of concrete block masonry prisms under axial compression

Behaviour of concrete block masonry prisms under axial compression
E.H. Fahmy and T.G.M. Ghoneim
Abstract: A nonlinear three-dimensional finite element model was developed to study the complex behavior of ungrouted and grouted concrete block masonry prisms under axial compression. The model detects crack initiation and traces crack propagation in the masonry assemblage. Variable strengths for blocks, mortar, and grout were used to study the effect of the mechanical properties of prism constituents, and their combinations, on the prism strength and modulus of elasticity. The effect of the number of courses was also investigated. The results of the finite element analysis were used to develop simplified relationships to predict prism strength and modulus of elasticity. Good agreement was observed between the available experimental data and the predicted prism strengths.
Key words: compressive strength, concrete blocks, failure modes, finite element, masonry, modulus of elasticity, prisms.
Resum6 : Un modkle d'ClCments finis tridimensionnels non linCaires a CtC dCveloppC pour Ctudier le comportement complexe de prismes de ma~onnerie de blocs de bCton IiaisonnCe par injection et non IiaisonnCe, soumis i une compression axiale. Le modkle dCtecte l'amorce de fissures et retrace la propagation de celles-ci dans l'assemblage de ma~onnerie. Des resistances variables pour les blocs, le mortier et le coulis ont CtC utilisCes pour Ctudier l'effet des propriCtCs mCcaniques des composantes des prismes, et leurs combinaisons, sur la resistance et le module d'ClasticitC des prismes. L'effet du nombre d'assises a Cgalement CtC analysC. Les rCsultats de l'analyse par la mCthode des ClCments finis ont CtC utilisCs pour Claborer des relations simples permettant de prCvoir la rtsistance et le module d'ClasticitC des prismes. Une bonne concordance a Ct observCe entre les donnCes expkrimentales existantes et les rksistances prkvues.
Mots clis : rrtsistance en compression, blocs de biton, mode d'Cchec, Clement fini, ma~onnerie, module dlClasticitC, prismes. [Traduit par la redaction]
Introduction can practically be considered representative for masonry
Compressive strength is the most important characteristic of masonry. CAN3-S304-M84 and ACI 530-88IASCE 5-88 use the prism compressive strength as a basis for determining the allowable stresses for masonry under different loading con- ditions. Grout provides large cross-sectional area, which increases the compressive load carrying capacity of masonry. Hamid and Drysdale (1979) have developed a mathematical model to predict the prism strength depending on the mechani- cal properties of prism components. Cheema and Klingner (1986) have developed an analytical model for masonry prism considering the constituents as linear elastic materials. They accounted for material nonlinearity by using the secant modulus of elasticity. Boult (1979) and Hamid and Chuk- wunenye (1986) have shown that a three-course prism model
Received July 18, 1994. Revised manuscript accepted January 31, 1995.
E.H. Fahmy and T.G.M. Ghoneim. Construction Engineering Unit, The American University in Cairo, P.O. Box 2511, Cairo, Egypt.
Written discussion of this paper is welcomed and will be received by the Editor until February 29, 1996 (address inside front cover).
strength investigation. This paper presents the results of an investigation to
(i) study the stress distributions and failure modes of ungrouted and grouted concrete masonry prisms under axial compres- sion; (ii) determine the effect of the mechanical properties of the prism constituents and number of courses on the prism strength and modulus of elasticity; and (iii) develop simpli- fied relationships to predict the prism strength and modulus of elasticity.
The finite element method was used in the present study to obtain a detailed description of stress distributions in the three orthogonal directions of the prism.
Finite element model
A nonlinear three-dimensional finite element model was developed using ANSYS finite element package (Swanson Analysis Systems Inc. 1990). A three-dimensional concrete element with eight nodes, each having three translation degrees of freedom, was used in this model. This element accommodates material nonlinearity, cracking, and crushing of concrete. To simplify the complexity of the geometry and interaction of prism constituents, the following assumptions were made:
(i) For ungrouted prisms, mortar was placed along the full
Can. J. Civ. Eng. 22: 898-915 (1995). Printed in Canada 1 Imprimt au Canada
Can
. J. C
iv. E
ng. D
ownl
oade
d fr
om w
ww
.nrc
rese
arch
pres
s.co
m b
y 70
.53.
64.1
50 o
n 06
/04/
14Fo
r pe
rson
al u
se o
nly.
Fahmy and Ghoneim
Fig. 1. Stress-strain behavior of an imposed force test, nth iteration. a'
t
cross-sectional area of the block units, as recommended by Harnid and Chukwunenye (1986). Although the Canadian code (CAN3-S304-M84) neglects the webs in calculating the ungrouted prism strength, Hamid and Chukwunenye (1986) have shown that the vertical stress distribution at the face- shell along the height of faceshell-bedded prisms is highly nonuniform compared to that of full-bedded prisms. They have also shown that larger lateral tensile stresses are created in the webs due to the beam action caused by the gap between the webs.
(ii) Tapering of faceshells and webs was eliminated with the minimum thickness of faceshells and webs considered. This assumption may not affect the results of the ungrouted prisms, where the contribution of mortar is governed by the minimum cross-sectional area of faceshells and webs. On the other hand, for grouted prisms, it leads to neglecting the effect of tapering on the grout column.
(iii) Perfect bond (no slippage) was assumed at the inter- faces between blocks and mortar. It has been shown (Hamid and Chukwunenye 1986) that the shear stresses developed at the block-mortar interfaces are far below the frictional resistance due to normal compressive stresses, which justi- fies the second assumption.
The nonlinear material behavior was modeled by the Besseling (sublayer) model that allows for a multilinear stress -strain behavior. The criterion for failure of concrete under multiaxial state of stress was expressed in the follow- ing form (Swanson Analysis Systems Inc. 1990):
where F is a function of the principal stress state, and S is a failure surface expressed in terms of the material compres- sive strength, f,, and tensile strength, f,. If [1] is not satis-
fied, no cracking or crushing occurs. Otherwise, if any principal stress is tensile, the material will crack with the crack plane normal to the direction of that principal stress. Crushing will occur if [I] is satisfied and the three principal stresses are compressive.
In the finite element program, cracking was modeled using the smeared crack modeling technique, in which an adjustment of material properties was made by introducing a plane of weakness in a direction normal to the crack face. Also, a shear transfer coefficient, P, , was introduced to represent the shear strength reduction factor for the subse- quent loads which induce sliding (shear) across the crack face. If the crack closes, all compressive stresses normal to the crack plane are transmitted across the crack plane and only a shear reduction factor, PC, for a closed crack is intro- duced. In the finite element model, P, and PC were taken as 0.10 and 0.80, respectively.
Due to nonlinearity, small load increments were applied to allow for solution convergence. Convergence is achieved when the plasticity ratio, ~ E P ' / E ~ ' , (Fig. 1) at all integration points in the structure is less than a preset value p (Swanson Analysis Systems Inc. 1990). A large value of p would lead to less accurate computed (converged) stresses; a very small value of p would significantly increase the number of itera- tions required for convergence. For the present finite ele- ment model, this value was taken as 0.01. The integrity of the structure due to progressive cracking was checked after each load increment. Failure was assumed to occur when the plasticity ratio was higher than the preset value or if non- converged concrete elements exist.
A model representing one-eighth of a three-course prism (Fig. 2) was used. The values of x-displacements of plane OCGD; Y-displacements of plane BCGF, and Z-displace- ments of plane OABC were set to zero, as they are planes of
Can
. J. C
iv. E
ng. D
ownl
oade
d fr
om w
ww
.nrc
rese
arch
pres
s.co
m b
y 70
.53.
64.1
50 o
n 06
/04/
14Fo
r pe
rson
al u
se o
nly.

Can. J. Civ. Eng. Vol. 22, 1995
Fig. 2. Finite element model.
z G r o u t
4 e (If an,) \7
D
Web -
symmetry. The upper face was subjected to uniform vertical displacement and zero lateral restraint to simulate a friction- less loading platen in an experimental test.
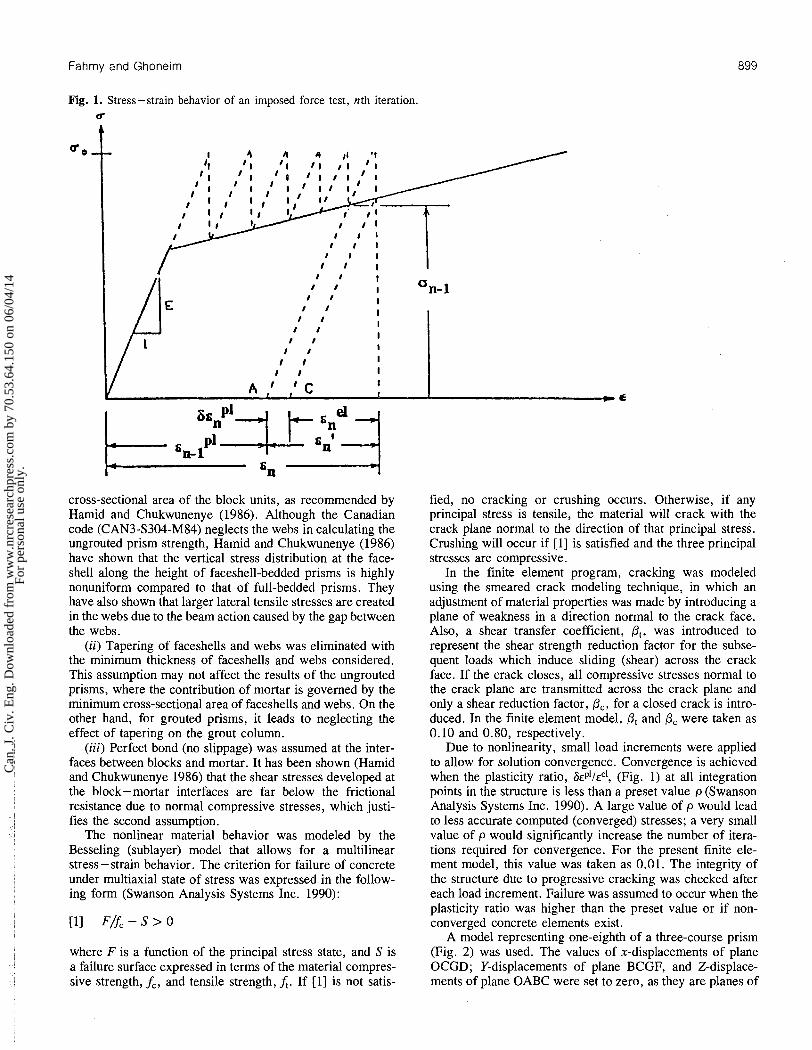
I Material characteristics Parabolic curves were adopted to represent the stress - strain relationship of blocks, mortar, and grout materials. The adopted curves pass through points a, b, and c (Fig. 3a) defined as follows: point a is the origin; point b represents the stress defined by the initial modulus of elasticity, El, at 25 % of the full strain range; and point c is the stress defined by the secant modulus of elasticity, E0.2, at 0.2% strain. The initial modulus of elasticity of block units, Eib, was taken as (ACI 31 8 M-83)
[2] El, = 0 . 0 4 3 ~ ; 56 where wb is the unit weight of block a n d h b is the compres- sive strength of the block unit. Furthermore, for the finite element model, the parabolic curve was replaced by a multi- linear five-segment curve (Fig. 3b). Poisson's ratio was con- sidered as 0.18 (Hamid and Chukwunenye 1986). The block splitting tensile strength, Ab, was taken as (Cheema and Klingner 1986)
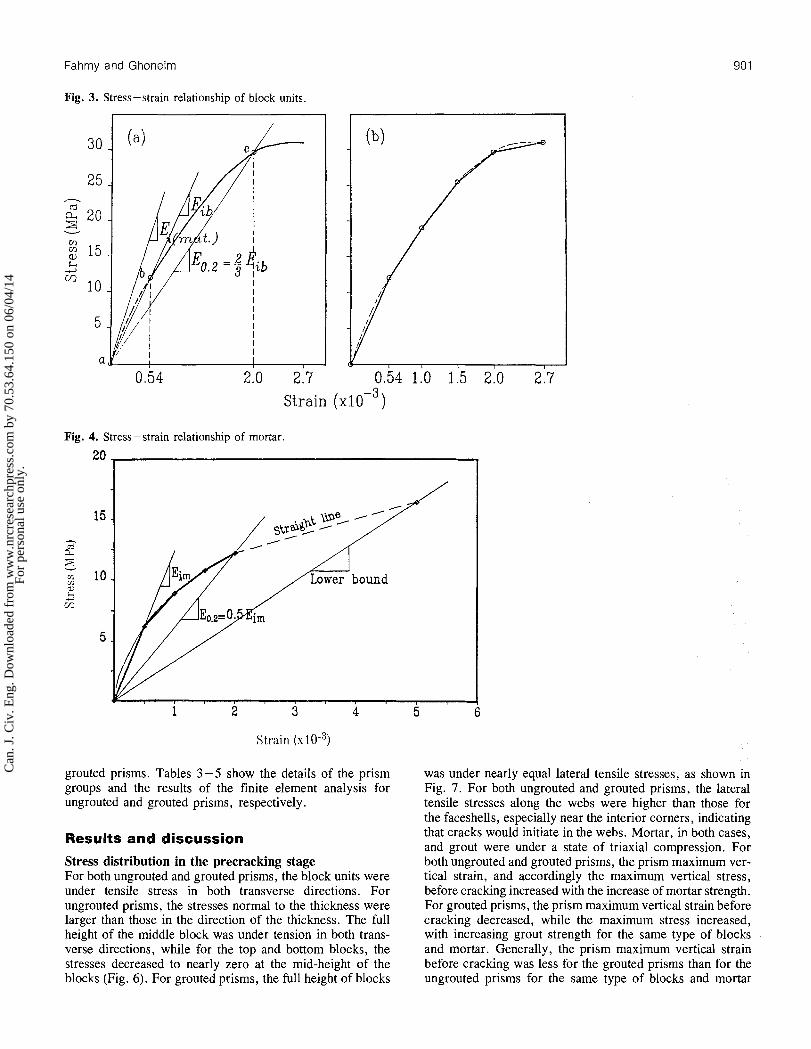
whereLb is the compressive strength of the material of the block unit. The stress-strain relationship for mortar was idealized using the same procedure for blocks (Fig. 4). The initial modulus of elasticity, Eim, was taken as (Cheema and Klingner 1986)
where f,, is the mortar compressive strength. The secant modulus at 0.2% strain, E0.2m, was taken as %Ei,; and the confined mortar behavior was described by an idealized stress -strain curve depending on the block strength (Cheema and Klingner 1986). Poisson's ratio was taken as 0.21 (Hamid and Chukwunenye 1986); and the mortar split- ting tensile strength, Am, was determined as (Cheema and Klingner 1986)
Hedstrom and Hogan (1990) have shown that a linear relationship between grout strength, f,,, and its modulus of elasticity is more appropriate than the ACI 530-88 formula- tion that relates the grout modulus of elasticity to the square root of its strength. Hence, in the present model, the grout initial modulus of elasticity, Ei,, was taken as 950f,,; the secant modulus of elasticity of grout at 0.2% strain, E0,2g, was taken as %E%; the ultimate strain was taken as 0.3%; and Poisson's ratio was taken as 0.21. The grout splitting tensile strength, A,, was taken as
Analytical model verification
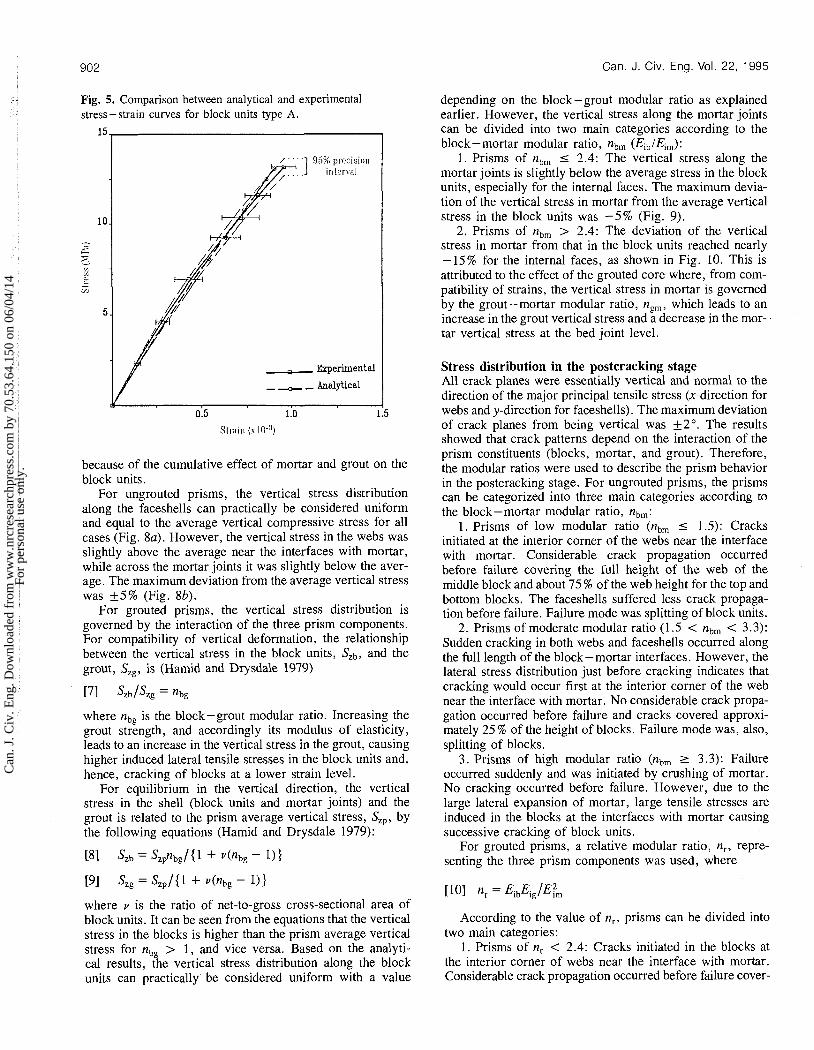
To verify the validity of the finite element idealization for blocks, five block units (type A) with dimensions 190 x 190 x 390 mm which meet the ASTM C90 requirements for dimensions, absorption, and strength of normal weight grade N units were tested under compression, and fitted with a strain measurement device, to determine the compressive strength and modulus of elasticity of the units. The measured dimensions of the block units were used to define the geome- try of a finite element model for one block unit. Using the experimentally determined unit weight and compressive strength of the block units, the idealized stress-strain relation- ship for the block units material was determined. Figure 5 shows the comparison between the experimentally obtained stress-strain curve for block units type A, with its 95 % con- fidence interval, and that obtained from the finite element analysis. The good agreement between the experimental and analytical results (Table 1) verifies the validity of the finite element idealization.
Analytical investigation
Having proved the validity of the finite idealization for block units, the model was extended by assuming two other types of block units (B and C). The two types were taken such that the initial modulus of elasticity was increased over that of type A by 25 % and 50%, respectively. The three types had the same geometry, thus the block strength and modulus of elasticity would be the only parameters affecting the prism characteristics. Three types of mortar (Nl , N2, and S) con- forming with ASTM C270, and CSA A224, requirements and two types of grout (GW and GN) complying to ASTM C1091 requirements were used in the analysis. Table 2 shows the properties of blocks, mortar, and grout.
The prism specimens were grouped into four groups to determine the effect of the properties of the constituent mate- rials on the prism behavior, and to study the effect of the number of courses on the prism, for both ungrouted and
Can
. J. C
iv. E
ng. D
ownl
oade
d fr
om w
ww
.nrc
rese
arch
pres
s.co
m b
y 70
.53.
64.1
50 o
n 06
/04/
14Fo
r pe
rson
al u
se o
nly.
Fahmy and Ghoneim
Fig. 3. Stress-strain relationship of block units.
Fig.
Strain (xloP3)
4. Stress-strain relationship of mortar.
20 i
Strain (x 1 O-R)
grouted prisms. Tables 3-5 show the details of the prism groups and the results of the finite element analysis for ungrouted and grouted prisms, respectively.
Results and discussion
Stress distribution in the precracking stage For both ungrouted and grouted prisms, the block units were under tensile stress in both transverse directions. For ungrouted prisms, the stresses normal to the thickness were larger than those in the direction of the thickness. The full height of the middle block was under tension in both trans- verse directions, while for the top and bottom blocks, the stresses decreased to nearly zero at the mid-height of the blocks (Fig. 6). For grouted prisms, the full height of blocks
was under nearly equal lateral tensile stresses, as shown in Fig. 7. For both ungrouted and grouted prisms, the lateral tensile stresses along the webs were higher than those for the faceshells, especially near the interior corners, indicating that cracks would initiate in the webs. Mortar, in both cases, and grout were under a state of triaxial compression. For both ungrouted and grouted prisms, the prism maximum ver- tical strain, and accordingly the maximum vertical stress, before cracking increased with the increase of mortar strength. For grouted prisms, the prism maximum vertical strain before cracking decreased, while the maximum stress increased, with increasing grout strength for the same type of blocks and mortar. Generally, the prism maximum vertical strain before cracking was less for the grouted prisms than for the ungrouted prisms for the same type of blocks and mortar
Can
. J. C
iv. E
ng. D
ownl
oade
d fr
om w
ww
.nrc
rese
arch
pres
s.co
m b
y 70
.53.
64.1
50 o
n 06
/04/
14Fo
r pe
rson
al u
se o
nly.
Can. J. Civ. Eng. Vol. 22, 1995
Fig. 5. Comparison between analytical and experimental stress -strain curves for block units type A.
because of the cumulative effect of mortar and grout on the block units.
For ungrouted prisms, the vertical stress distribution along the faceshells can practically be considered uniform and equal to the average vertical compressive stress for all cases (Fig. 8a). However, the vertical stress in the webs was slightly above the average near the interfaces with mortar, while across the mortar joints it was slightly below the aver- age. The maximum deviation from the average vertical stress was +_5% (Fig. 8b).
For grouted prisms, the vertical stress distribution is governed by the interaction of the three prism components. For compatibility of vertical deformation, the relationship between the vertical stress in the block units, Szb, and the grout, S,,, is (Hamid and Drysdale 1979)
where nbg is the block-grout modular ratio. Increasing the grout strength, and accordingly its modulus of elasticity, leads to an increase in the vertical stress in the grout, causing higher induced lateral tensile stresses in the block units and, hence, cracking of blocks at a lower strain level.
For equilibrium in the vertical direction, the vertical stress in the shell (block units and mortar joints) and the grout is related to the prism average vertical stress, Szp, by the following equations (Hamid and Drysdale 1979):
where v is the ratio of net-to-gross cross-sectional area of block units. It can be seen from the equations that the vertical stress in the blocks is higher than the prism average vertical stress for nb, > 1, and vice versa. Based on the analyti- cal results, the vertical stress distribution along the block units can practically be considered uniform with a value
depending on the block-grout modular ratio as explained earlier. However, the vertical stress along the mortar joints can be divided into two main categories according to the block-mortar modular ratio, nbm (EiblEim):
1. Prisms of nb, 5 2.4: The vertical stress along the mortar joints is slightly below the average stress in the block units, especially for the internal faces. The maximum devia- tion of the vertical stress in mortar from the average vertical stress in the block units was -5% (Fig. 9).
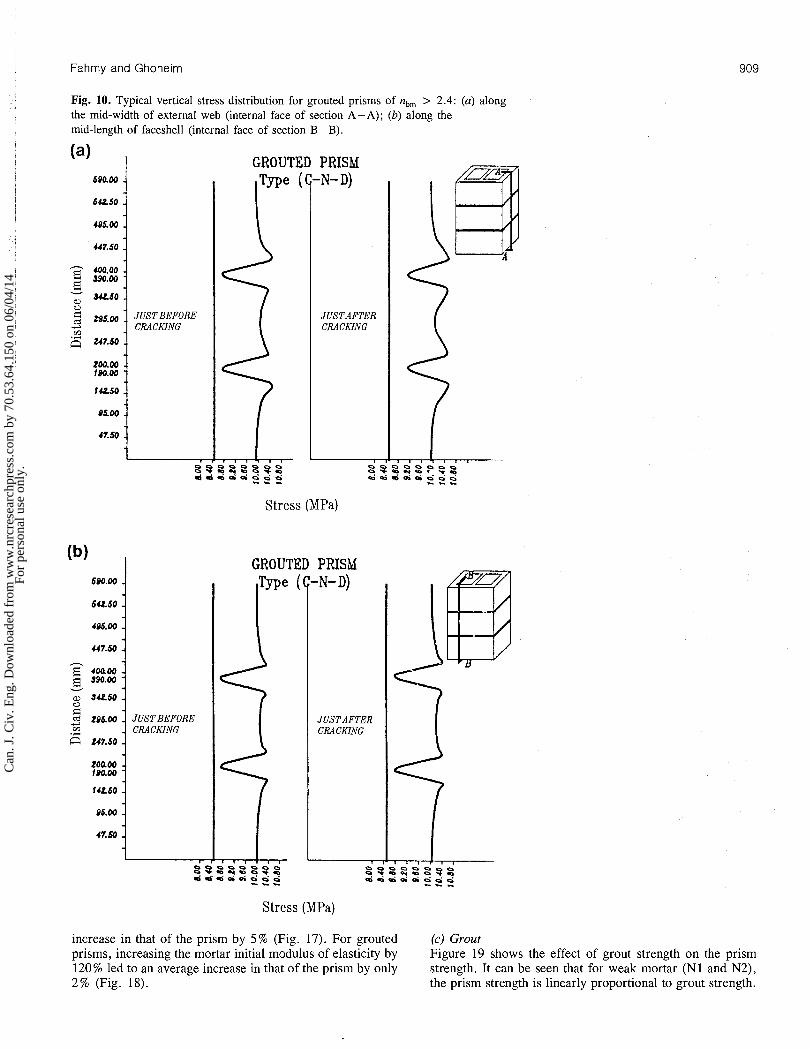
2. Prisms of nbm > 2.4: The deviation of the vertical stress in mortar from that in the block units reached nearly - 15% for the internal faces, as shown in Fig. 10. This is attributed to the effect of the grouted core where, from com- patibility of strains, the vertical stress in mortar is governed by the grout-mortar modular ratio, ngm, which leads to an increase in the grout vertical stress and a decrease in the mor- tar vertical stress at the bed joint level.
Stress distribution in the postcracking stage All crack planes were essentially vertical and normal to the direction of the major principal tensile stress (x-direction for webs and y-direction for faceshells). The maximum deviation of crack planes from being vertical was f 2". The results showed that crack patterns depend on the interaction of the prism constituents (blocks, mortar, and grout). Therefore, the modular ratios were used to describe the prism behavior in the postcracking stage. For ungrouted prisms, the prisms can be categorized into three main categories according to the block- mortar modular ratio, nbm:
1. Prisms of low modular ratio (nbm 5 1.5): Cracks initiated at the interior corner of the webs near the interface with mortar. Considerable crack propagation occurred before failure covering the full height of the web of the middle block and about 75 % of the web height for the top and bottom blocks. The faceshells suffered less crack propaga- tion before failure. Failure mode was splitting of block units.
2. Prisms of moderate modular ratio (1.5 < nbm < 3.3): Sudden cracking in both webs and faceshells occurred along the full length of the block - mortar interfaces. However, the lateral stress distribution just before cracking indicates that cracking would occur first at the interior corner of the web near the interface with mortar. No considerable crack propa- gation occurred before failure and cracks covered approxi- mately 25 % of the height of blocks. Failure mode was, also, splitting of blocks.
3. Prisms of high modular ratio (nbm 1 3.3): Failure occurred suddenly and was initiated by crushing of mortar. No cracking occurred before failure. However, due to the large lateral expansion of mortar, large tensile stresses are induced in the blocks at the interfaces with mortar causing successive cracking of block units.
For grouted prisms, a relative modular ratio, n,, repre- senting the three prism components was used, where
According to the value of n,, prisms can be divided into two main categories:
1. Prisms of n, < 2.4: Cracks initiated in the blocks at the interior corner of webs near the interface with mortar. Considerable crack propagation occurred before failure cover-
Can
. J. C
iv. E
ng. D
ownl
oade
d fr
om w
ww
.nrc
rese
arch
pres
s.co
m b
y 70
.53.
64.1
50 o
n 06
/04/
14Fo
r pe
rson
al u
se o
nly.

Fahmy and Ghoneim
Table 1. Comparison between experimental and analytical results for block units type A.
Property
- -- -
Experimental Analytical
Standard Analytical Experimental Results deviation results (%)
Gross compressive strength, fgross (MPa) 7.71 0.619 7.65 0.992 Net compressive strength, f,,, (MPa) 13.22 1.070 13.11 0.992 Initial modulus of elasticity, Eib (GPa) 16.81 0.825 14.83 0.882 Ultimate strain at failure, E, ( X 9.64 0.229 9.11 0.945 Secant modulus of elasticity at failure,
Esb @Pa) 13.70 0.795 14.28 1.050
Table 2. Properties of prism constituent materials.
Block units Mortar Grout
Property A B C N1 N2 S GW GN
w (kg/m3) 2143 2240 2380 - - -
Ei (GPa) 14.83 18.53 22.24 5.60 8.40 12.40 14.08 19.31 E0.2 (GPa) 9.88 12.36 14.83 2.80 4.20 6.20 7.04 9.66 f, (MPa) 13.11 16.69 20.00 5.60 8.40 12.40 14.77 20.29 ft (MPa) 1.87 2.09 2.29 1.38 1.69 2.05 1.60 1.92
Table 3. Constituents and analytical results of groups I and 11. of the web near the interface with mortar. Limited crack propagation occurred before failure and cracks covered
Prism Block Mortar No. of f , , Ei, ESP about 25% of the height of all block units. No cracking group Code type type courses (MPa) (GPa) occurred in the grout prior to failure.
I A-N1 A N1 3 7.02 14.10 13.24 For all cases, the failure mode was splitting of block units.
A-N2 A N2 3 9.00 14.29 13.83 Mortar did not suffer any damage before the prism failure.
A-S B-N 1 B-N2 B-S C-N1 C-N2 C-S
I1 AS2 AS3 AS4 AS5 AS7 AS9 ASW
ing the full height of the middle-block web and from 75 % to nearly the full height of the webs of the top and bottom blocks. For faceshells, cracks near the corners propagated up to nearly the full prism height in most cases, while less crack propagation took place away from the corners of the face- shells. Also, considerable crack propagation occurred in the grout at the interface with blocks before failure.
2. Prisms of n, L 2.4: Cracks initiated in the webs of the blocks along the full length of the block-mortar interfaces. However, the lateral stress distribution just before cracking indicates that cracking would occur first at the interior corner
Effect of constituent materials and number of courses
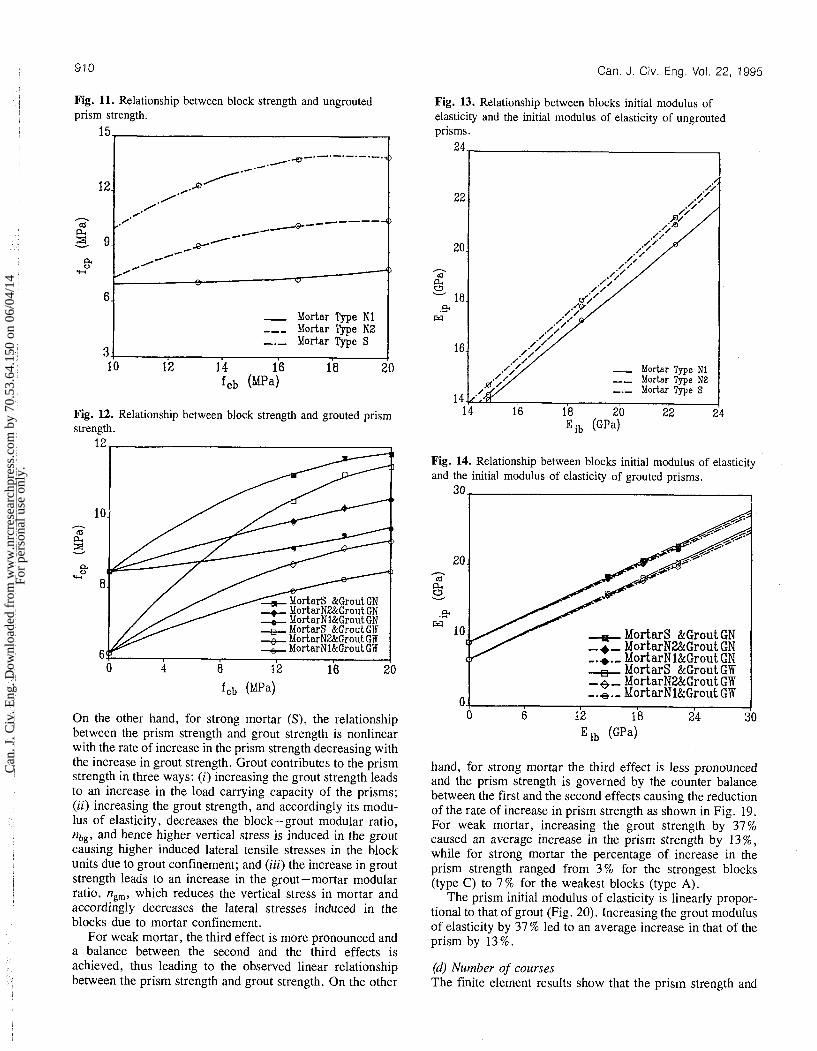
(a) Block units For both ungrouted and grouted prisms, prism strength, f,,, increased with increasing the block strength.
For ungrouted prisms, increasing the block strength by 50% resulted in an average increase in the prism strength of approximately 15%. Block strength has two opposite effects on the prism strength: (i) the tensile strength of the block increases with the increase of its compressive strength, accordingly higher load carrying capacity of the prism would be expected; and (ii) the increase in block strength is accom- panied by an increase in its modulus of elasticity leading to higher induced lateral tensile stresses in the blocks due to mortar confinement and, consequently, reduction of prism strength is expected. It is clear from Fig. 11 that the rate of increase in the prism strength decreases with increasing the block strength except for very low mortar strength (speci- mens B-N1 and C-N1) where the failure mode changes from block splitting to mortar crushing. In this case, increasing the block strength leads to higher lateral confining stresses in mortar and consequently an increase in its triaxial compres- sive strength. In spite of such increase in mortar strength, the prism strength is still below what it should be if failure were due to block splitting.
The percentage of increase in the prism strength with increasing the block strength was less for the grouted prisms than for the ungrouted prisms. For weak grout (GW), a 50%
Can
. J. C
iv. E
ng. D
ownl
oade
d fr
om w
ww
.nrc
rese
arch
pres
s.co
m b
y 70
.53.
64.1
50 o
n 06
/04/
14Fo
r pe
rson
al u
se o
nly.
904
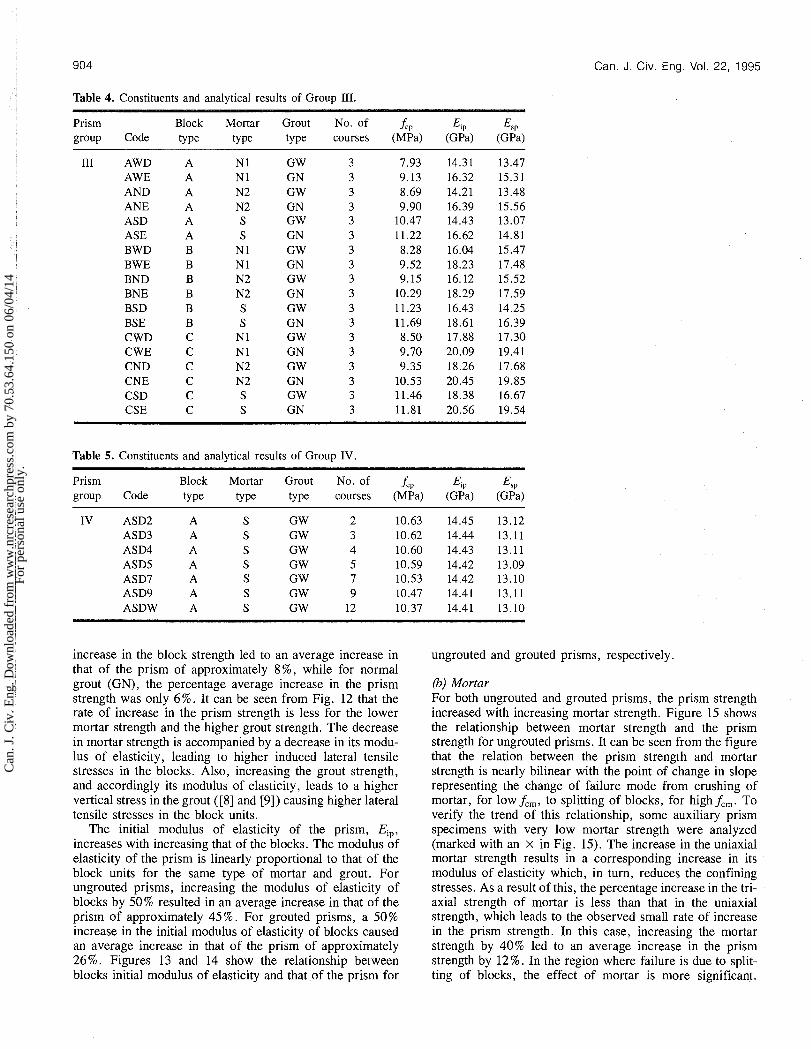
Table 4. Constituents and analytical results of Group 111.
Can. J . Civ. Eng. Vol. 22, 1995
Prism Block Mortar Grout No. of group Code type type type courses
EIP ESP (GPa) (GPa)
I11 AWD AWE AND ANE ASD ASE BWD BWE BND BNE BSD BSE CWD CWE CND CNE CSD CSE
Table 5. Constituents and analytical results of Group IV.
Prism Block Mortar Grout No. of f,, EiP ESP group Code type type type courses (MPa) (GPa) (GPa)
IV ASD2 A S GW 2 10.63 14.45 13.12 ASD3 A S GW 3 10.62 14.44 13.11 ASD4 A S GW 4 10.60 14.43 13.11 ASD5 A S GW 5 10.59 14.42 13.09 ASD7 A S GW 7 10.53 14.42 13.10 ASD9 A S GW 9 10.47 14.41 13.11 ASDW A S GW 12 10.37 14.41 13.10
increase in the block strength led to an average increase in that of the prism of approximately 8 % , while for normal grout (GN), the percentage average increase in the prism strength was only 6%. It can be seen from Fig. 12 that the rate of increase in the prism strength is less for the lower mortar strength and the higher grout strength. The decrease in mortar strength is accompanied by a decrease in its modu- lus of elasticity, leading to higher induced lateral tensile stresses in the blocks. Also, increasing the grout strength, and accordingly its modulus of elasticity, leads to a higher vertical stress in the grout ([8] and [9]) causing higher lateral tensile stresses in the block units.
The initial modulus of elasticity of the prism, Eip, increases with increasing that of the blocks. The modulus of elasticity of the prism is linearly proportional to that of the block units for the same type of mortar and grout. For ungrouted prisms, increasing the modulus of elasticity of blocks by 50% resulted in an average increase in that of the prism of approximately 45%. For grouted prisms, a 50% increase in the initial modulus of elasticity of blocks caused an average increase in that of the prism of approximately 26%. Figures 13 and 14 show the relationship between blocks initial modulus of elasticity and that of the prism for
ungrouted and grouted prisms, respectively.
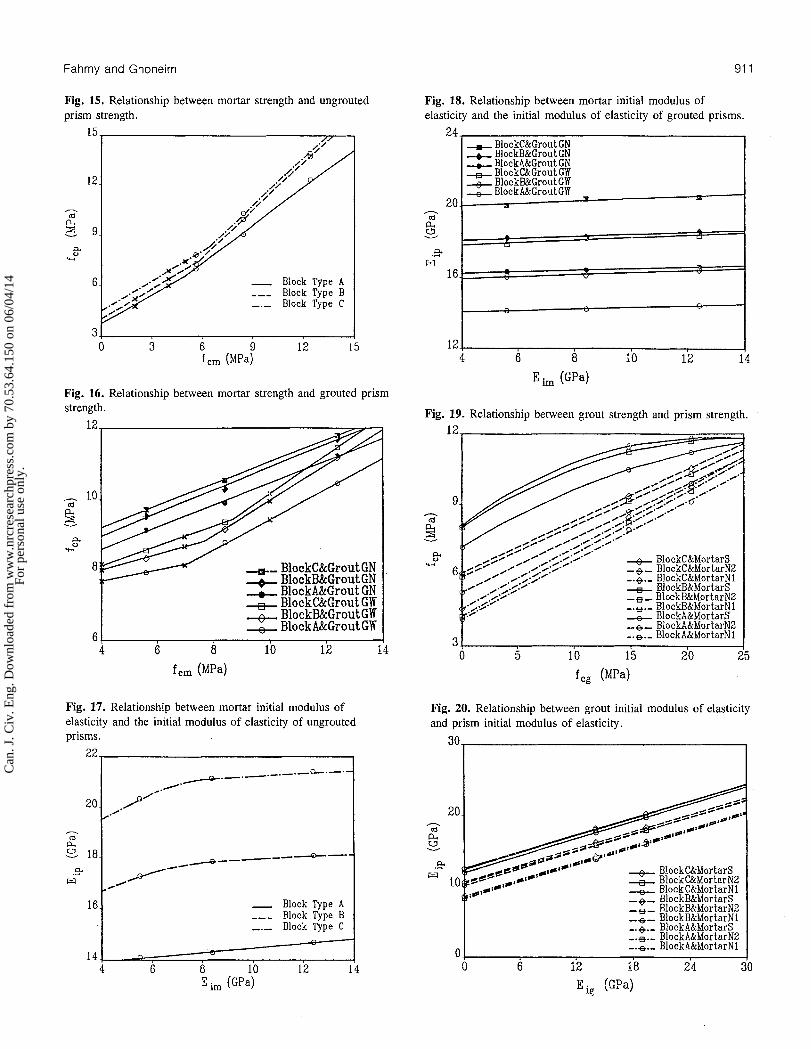
(b) Mortar For both ungrouted and grouted prisms, the prism strength increased with increasing mortar strength. Figure 15 shows the relationship between mortar strength and the prism strength for ungrouted prisms. It can be seen from the figure that the relation between the prism strength and mortar strength is nearly bilinear with the point of change in slope representing the change of failure mode from crushing of mortar, for lowf,,, to splitting of blocks, for highf,,. To verify the trend of this relationship, some auxiliary prism specimens with very low mortar strength were analyzed (marked with an X in Fig. 15). The increase in the uniaxial mortar strength results in a corresponding increase in its modulus of elasticity which, in turn, reduces the confining stresses. As a result of this, the percentage increase in the tri- axial strength of mortar is less than that in the uniaxial strength, which leads to the observed small rate of increase in the prism strength. In this case, increasing the mortar strength by 40% led to an average increase in the prism strength by 12%. In the region where failure is due to split- ting of blocks, the effect of mortar is more significant.
Can
. J. C
iv. E
ng. D
ownl
oade
d fr
om w
ww
.nrc
rese
arch
pres
s.co
m b
y 70
.53.
64.1
50 o
n 06
/04/
14Fo
r pe
rson
al u
se o
nly.

Fahmy and Ghoneim
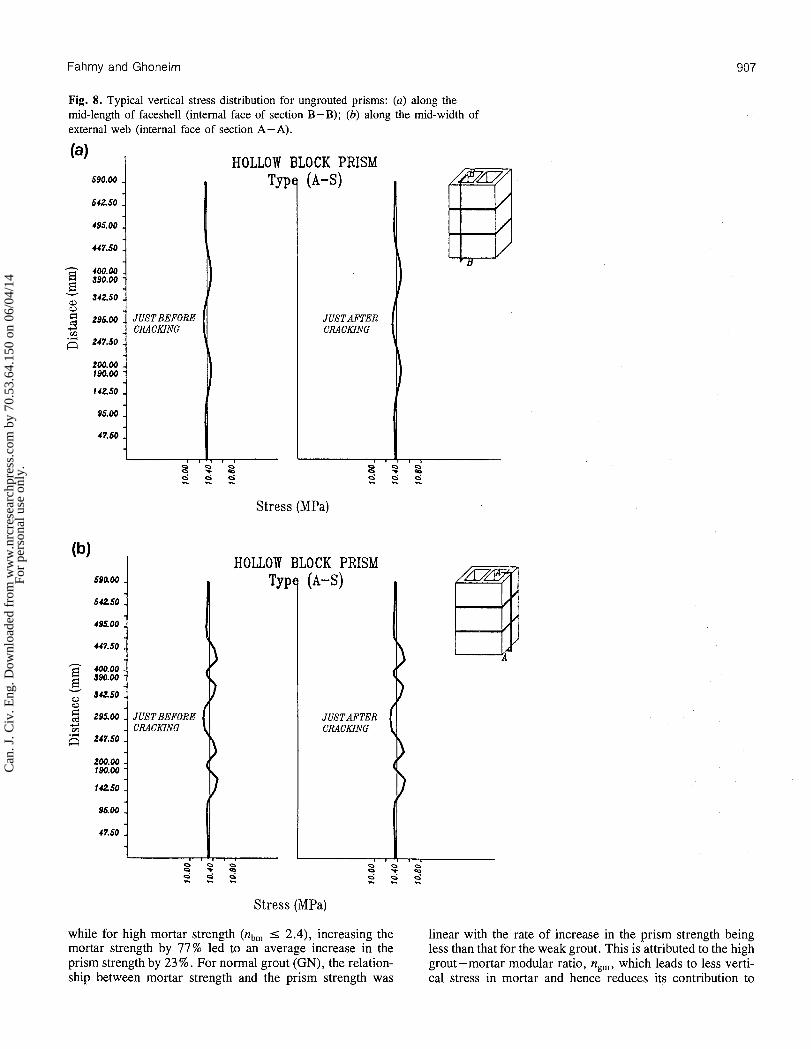
Fig. 6 . Typical lateral stress distribution for ungrouted prisms: (a) along the mid-width of external web (internal face of section A-A); (b) along the mid-length of faceshell (internal face of section B-B).
HOLLOW BLOCK PRISM I - (A-S)
JUST BEFORE JUST AFTER ! CT~- 1 ccKtNG'
Stress (MPa)
Stress (MPa)
Higher mortar strength leads to less induced lateral tensile prisms, the relationship between the prism strength and mor- stresses in the blocks, which is the main cause of the prism tar strength varied with the type of grout (Fig. 16). failure in this case. Increasing the mortar strength by 120% For weak grout (GW), the relation was nearly bilinear caused an average increase in that of the prism by 75% with the point of change in slope being at a block-mortar (specimens A-Nl vs. A-S and B-Nl vs. B-S). For grouted modular ratio of nearly 2.4. As explained earlier, before this
Can
. J. C
iv. E
ng. D
ownl
oade
d fr
om w
ww
.nrc
rese
arch
pres
s.co
m b
y 70
.53.
64.1
50 o
n 06
/04/
14Fo
r pe
rson
al u
se o
nly.
Can. J. Civ. Eng. Vol. 22, 1995
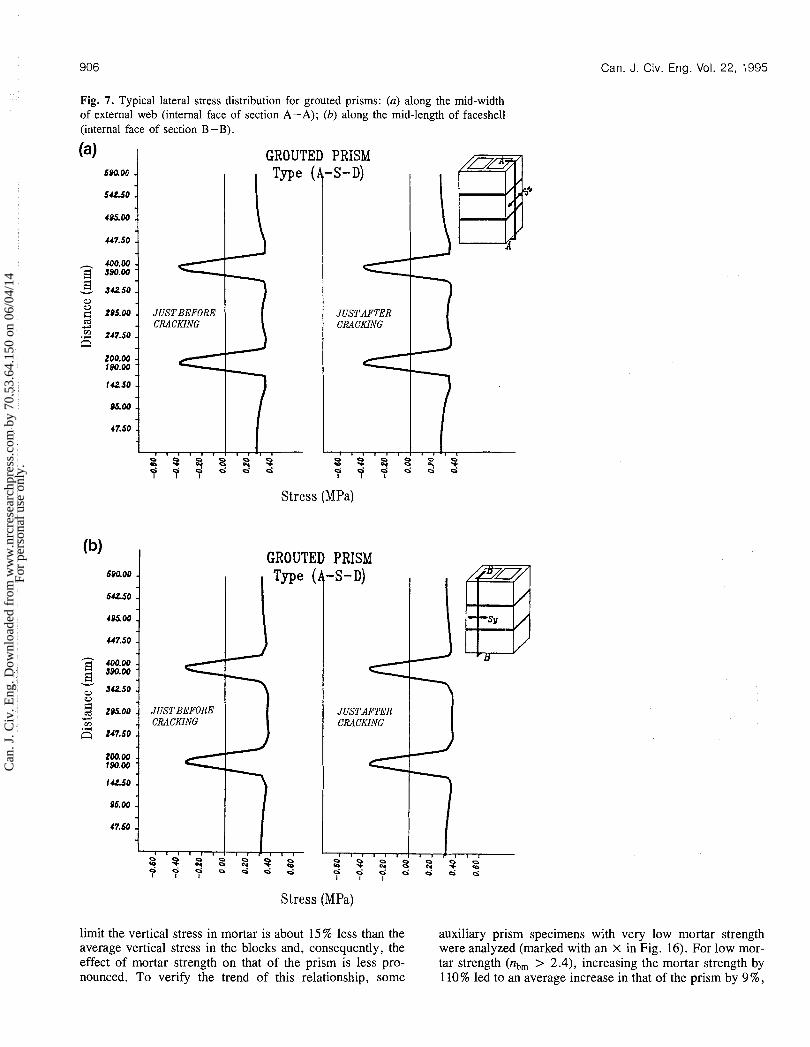
Fig. 7. Typical lateral stress distribution for grouted prisms: (a) along the mid-width of external web (internal face of section A-A); (b) along the mid-length of faceshell (internal face of section B-B).
(a) I GROUTED PRISM
Stress (MPa)
GROUTED PRISM 69400 4 I , Type (A-S-D
'B
312.50 0
.+ JUSTAFTER cn CRACKlNG
247.50
Stress (MPa)
limit the vertical stress in mortar is about 15% less than the auxiliary prism specimens with very low mortar strength average vertical stress in the blocks and, consequently, the were analyzed (marked with an X in Fig. 16). For low mor- effect of mortar strength on that of the prism is less pro- tar strength (nb, > 2.4), increasing the mortar strength by nounced. To verify the trend of this relationship, some 110% led to an average increase in that of the prism by 9%,
Can
. J. C
iv. E
ng. D
ownl
oade
d fr
om w
ww
.nrc
rese
arch
pres
s.co
m b
y 70
.53.
64.1
50 o
n 06
/04/
14Fo
r pe
rson
al u
se o
nly.
Fahmy and Ghoneim
Fig. 8. Typical vertical stress distribution for ungrouted prisms: (a) along the mid-length of faceshell (internal face of section B-B); (b) along the mid-width of external web (internal face of section A-A).
Stress (MPa)
HOLLOW BLOCK PRISM
Stress (MPa)
while for high mortar strength (nbm I 2.4), increasing the linear with the rate of increase in the prism strength being mortar strength by 77 % led to an average increase in the less than that for the weak grout. This is attributed to the high prism strength by 23 % . For normal grout (GN), the relation- grout -mortar modular ratio, ngm , which leads to less verti- ship between mortar strength and the prism strength was cal stress in mortar and hence reduces its contribution to
Can
. J. C
iv. E
ng. D
ownl
oade
d fr
om w
ww
.nrc
rese
arch
pres
s.co
m b
y 70
.53.
64.1
50 o
n 06
/04/
14Fo
r pe
rson
al u
se o
nly.
Can. J. Civ. Eng. Vol. 22, 1995
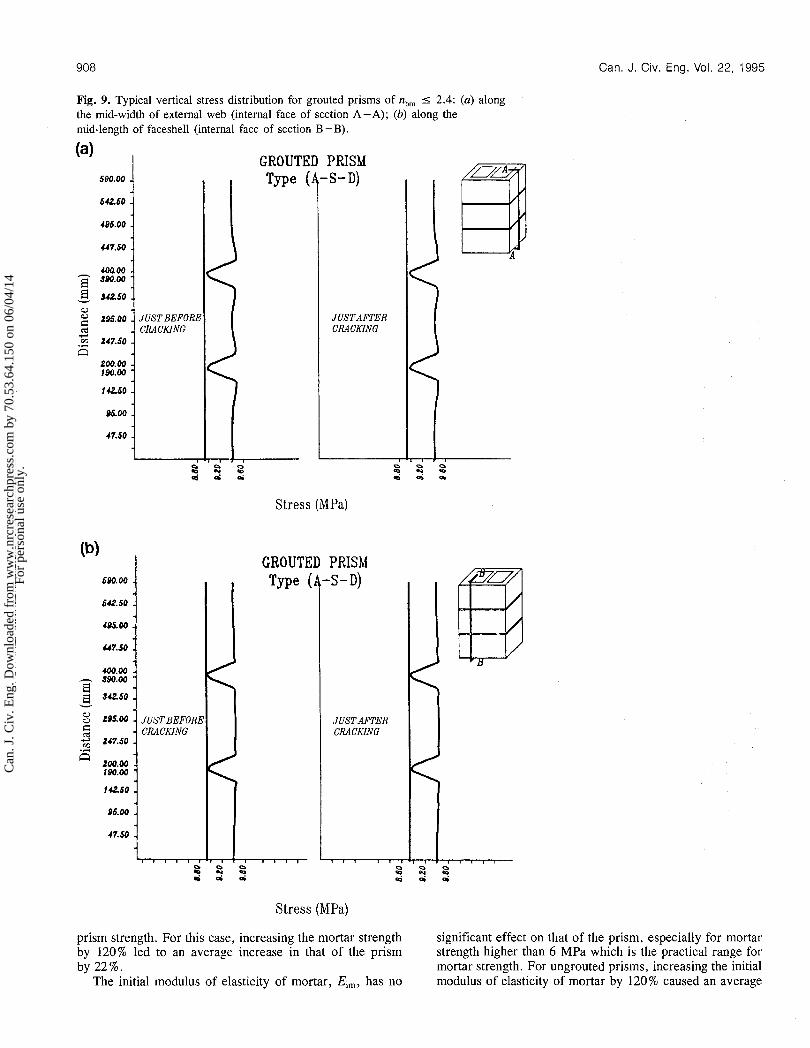
Fig. 9. Typical vertical stress distribution for grouted prisms of n,, I 2.4: (a) along the mid-width of external web (internal face of section A-A); (b) along the mid-length of faceshell (internal face of section B-B).
Stress (MPa)
Stress (MPa)
prism strength. For this case, increasing the mortar strength significant effect on that of the prism, especially for mortar by 120% led to an average increase in that of the prism strength higher than 6 MPa which is the practical range for by 22%. mortar strength. For ungrouted prisms, increasing the initial
The initial modulus of elasticity of mortar, Ei,, has no modulus of elasticity of mortar by 120% caused an average
(b)
690.00 .
642.50 . 495.00 -
447.50 .
*a0.40 - - 590.40 - ,a,: -
g 295.00 - s - $ 247.60 . . -
200.00 ; frn.40
1 a 5 0 .
96.00 . 47.50 -
% - a 0 0 a ,.;: m g j z z
GROUTED PRISM Type
JUSTBEFORE CRACKING
(A-S-D)
JUSTAFTER CRACKING
Can
. J. C
iv. E
ng. D
ownl
oade
d fr
om w
ww
.nrc
rese
arch
pres
s.co
m b
y 70
.53.
64.1
50 o
n 06
/04/
14Fo
r pe
rson
al u
se o
nly.
Fahrny and Ghoneirn
Fig. 10. Typical vertical stress distribution for grouted prisms of n,, > 2.4: (a) along the mid-width of external web (internal face of section A-A); (b) along the mid-length of faceshell (internal face of section B-B).
(a) , GROUTED PRISM
Stress (MPa)
60400 . 64Z50 .
4 5 0 0 .
447.50 .
a gz- a - S4Z50.
0
$ m . W i--' m .A p, U7.M .
IW.00 - 180.W - 1 4 Z M .
9600.
47.60 .
Stress (MPa)
JUST BEFORE CRACKING
B S O B P B S O
increase in that of the prism by 5% (Fig. 17). For grouted (c) Grout prisms, increasing the mortar initial modulus of elasticity by Figure 19 shows the effect of grout strength on the prism 120% led to an average increase in that of the prism by only strength. It can be seen that for weak mortar (N1 and N2), 2 % (Fig. 18). the prism strength is linearly proportional to grout strength.
d e e 6 6 5 = =
Can
. J. C
iv. E
ng. D
ownl
oade
d fr
om w
ww
.nrc
rese
arch
pres
s.co
m b
y 70
.53.
64.1
50 o
n 06
/04/
14Fo
r pe
rson
al u
se o
nly.
Can. J. Civ. Eng. Vol. 22, 1995
Fig. 11. Relationship between block strength and ungrouted prism strength.
- Mortar Type N1 --- Mortar Tppe N2 -.- Mortar Type S
3, 10 12 14 16 18 20
fcb ( D a )
Fig. 12. Relationship between block strength and grouted prism strength.
On the other hand, for strong mortar (S), the relationship between the prism strength and grout strength is nonlinear with the rate of increase in the prism strength decreasing with the increase in grout strength. Grout contributes to the prism strength in three ways: (i) increasing the grout strength leads to an increase in the load carrying capacity of the prisms; (ii) increasing the grout strength, and accordingly its modu- lus of elasticity, decreases the block-grout modular ratio, nbg, and hence higher vertical stress is induced in the grout causing higher induced lateral tensile stresses in the block units due to grout confinement; and (iii) the increase in grout strength leads to an increase in the grout-mortar modular ratio, n,,, which reduces the vertical stress in mortar and accordingly decreases the lateral stresses induced in the blocks due to mortar confinement.
For weak mortar, the third effect is more pronounced and a balance between the second and the third effects is achieved, thus leading to the observed linear relationship between the prism strength and grout strength. On the other
Fig. 13. Relationship between blocks initial modulus of elasticity and the initial modulus of elasticity of ungrouted prisms.
Fig. 14. Relationship between blocks initial modulus of elasticity and the initial modulus of elasticity of grouted prisms.
hand, for strong mortar the third effect is less pronounced and the prism strength is governed by the counter balance between the first and the second effects causing the reduction of the rate of increase in prism strength as shown in Fig. 19. For weak mortar, increasing the grout strength by 37% caused an average increase in the prism strength by 13%, while for strong mortar the percentage of increase in the prism strength ranged from 3 % for the strongest blocks (type C) to 7 % for the weakest blocks (type A).
The prism initial modulus of elasticity is linearly propor- tional to that of grout (Fig. 20). Increasing the grout modulus of elasticity by 37 % led to an average increase in that of the prism by 13 %.
(d) Number of courses The finite element results show that the prism strength and
Can
. J. C
iv. E
ng. D
ownl
oade
d fr
om w
ww
.nrc
rese
arch
pres
s.co
m b
y 70
.53.
64.1
50 o
n 06
/04/
14Fo
r pe
rson
al u
se o
nly.
Fahrny and Ghoneirn 91 1
Fig. 15. Relationship between mortar strength and ungrouted prism strength.
.2.
- Block Type A --- Block Type B
Block Type C
0 3 6 9 12 15 f c m (MPa)
Fig. 16. Relationship between mortar strength and grouted prism strength.
Fig. 17. Relationship between mortar initial modulus of elasticity and the initial modulus of elasticity of ungrouted prisms.
22 I
- Block Type A --- Block Type B -.- Block Type C
Fig. 18. Relationship between mortar initial modulus of elasticity and the initial modulus of elasticity of grouted prisms.
12 j I 4 6 8 i0 12 14
E (GPa)
Fig. 19. Relationship between grout strength and prism strength.
0 5 10 15 2'0 25
fc, (MPa)
Fig. 20. Relationship between grout initial modulus of elasticity and prism initial modulus of elasticity.
Can
. J. C
iv. E
ng. D
ownl
oade
d fr
om w
ww
.nrc
rese
arch
pres
s.co
m b
y 70
.53.
64.1
50 o
n 06
/04/
14Fo
r pe
rson
al u
se o
nly.

91 2 Can. J. Civ. Eng. Vol. 22, 1995
Fig. 21. Effect of number of courses on ungrouted prisms: (a) prism strength; (b) prism initial modulus of elasticity.
Fig. 22. Effect of number of courses on grouted prisms: (a) prism strength; (b) prism initial modulus of elasticity.
0 3 6 9 1; Number of courses
Number of courses
initial modulus of elasticity decrease with increasing the number of courses for both ungrouted and grouted prisms (Figs. 2 1 and 22, respectively). However, for ungrouted prisms, insignificant effect was observed for number of courses more than 5. The prism strength for a 12-course prism is 98% of that for a 5-course prism and 92% of that for a 3-course prism. For grouted prisms, the continuity pro- vided by the grouted cores reduces the effect of number of courses. The prism strength for a 12-course prism is 98% of that for the 3-course prism.
For both ungrouted and grouted prisms, the initial modu- lus of elasticity of a 12-course prism is approximately 99.7 % of that for the 3-course prism.
Prediction of prism strength and modulus of elasticity
Based on the above discussion, it can be seen that both prism strength and initial modulus of elasticity depend on the modular ratios of the prism constituent materials. Since the compressive strength of all prism components is proportional to their modulus of elasticity, it would be more practical to
Number of courses
0 3 6 9 12 Number of courses
use the relative strength ratios to predict prism strength and initial modulus of elasticity.
For ungrouted prisms, a block-mortar strength ratio, f b m , was used, which is given by
[I1] fbm =fcb / f cm
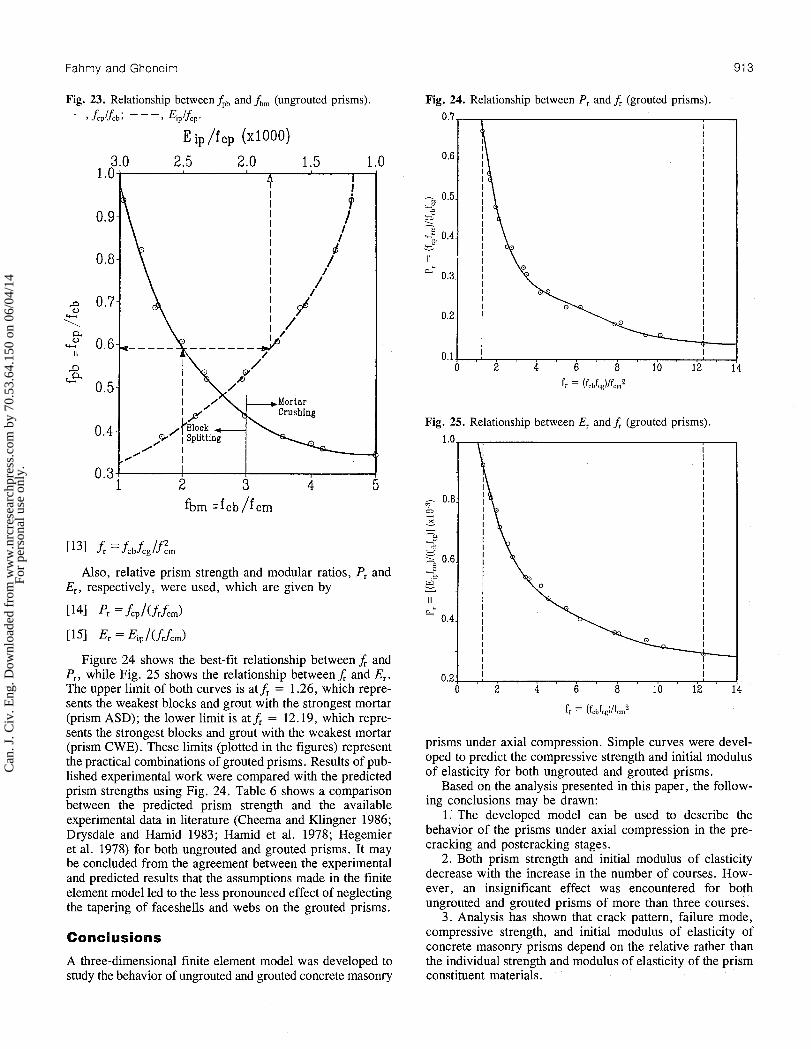
Figure 23 shows the best-fit curve, using the least squares method, for the relationship between fbm and the relative prism strength, fpb, given by
[I2] fpb = f c p / f c b
The figure also shows the best-fit curve for fpb related to EiP/&,. It can be seen from Fig. 23 that for fbm > 3.0 (which is equivalent to a nbm value of 3.3), the decrease in the relative prism strength is insignificant as the failure mode changes from splitting of blocks to crushing of mortar. This curve can be used as a tool to predict the prism strength and initial modulus of elasticity for a given strength of blocks and mortar, as shown in the example in Fig. 23.
For grouted prisms, a strength ratio, f,, was used, which is given by
Can
. J. C
iv. E
ng. D
ownl
oade
d fr
om w
ww
.nrc
rese
arch
pres
s.co
m b
y 70
.53.
64.1
50 o
n 06
/04/
14Fo
r pe
rson
al u
se o
nly.
Fahmy and Ghoneim
Fig. 23. Relationship between fpb and f,, (ungrouted prisms). -, L P l f , b ; - --, EipKp .
E ip /f cp (x 1000)
3.0 2.5 2.0 1.5 1 .O
fbrn =fcb / fc rn
Also, relative prism strength and modular ratios, PI and E,, respectively, were used, which are given by
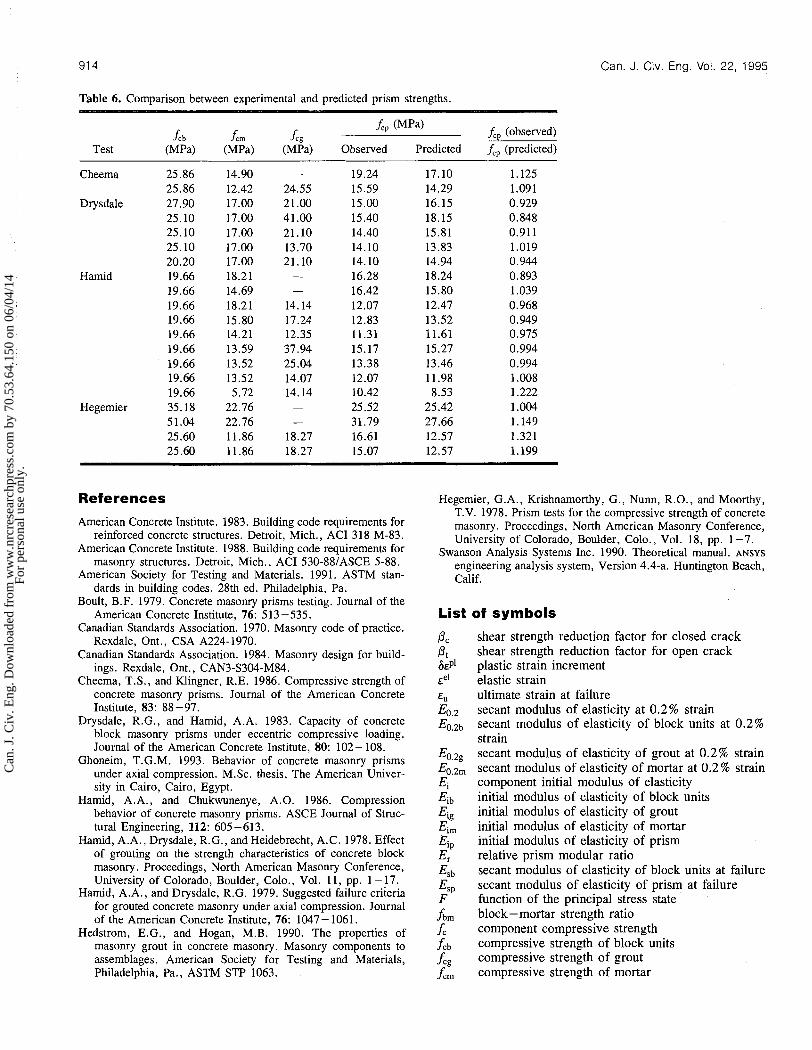
Figure 24 shows the best-fit relationship between f, and P,, while Fig. 25 shows the relationship betweenf, and E,. The upper limit of both curves is atf, = 1.26, which repre- sents the weakest blocks and grout with the strongest mortar (prism ASD); the lower limit is atf , = 12.19, which repre- sents the strongest blocks and grout with the weakest mortar (prism CWE). These limits (plotted in the figures) represent the practical combinations of grouted prisms. Results of pub- lished experimental work were compared with the predicted prism strengths using Fig. 24. Table 6 shows a comparison between the predicted prism strength and the available experimental data in literature (Cheema and Klingner 1986; Drysdale and Hamid 1983; Hamid et al. 1978; Hegemier et al. 1978) for both ungrouted and grouted prisms. It may be concluded from the agreement between the experimental and predicted results that the assumptions made in the finite element model led to the less pronounced effect of neglecting the tapering of faceshells and webs on the grouted prisms.
Conclusions
A three-dimensional finite element model was developed to study the behavior of ungrouted and grouted concrete masonry
Fig. 24. Relationship between Pr and f, (grouted prisms)
Fig. 25. Relationship between Er and f, (grouted prisms).
prisms under axial compression. Simple curves were devel- oped to predict the compressive strength and initial modulus of elasticity for both ungrouted and grouted prisms.
Based on the analysis presented in this paper, the follow- ing conclusions may be drawn:
1. The developed model can be used to describe the behavior of the prisms under axial compression in the pre- cracking and postcracking stages.
2. Both prism strength and initial modulus of elasticity decrease with the increase in the number of courses. How- ever, an insignificant effect was encountered for both ungrouted and grouted prisms of more than three courses.
3. Analysis has shown that crack pattern, failure mode, compressive strength, and initial modulus of elasticity of concrete masonry prisms depend on the relative rather than the individual strength and modulus of elasticity of the prism constituent materials.
Can
. J. C
iv. E
ng. D
ownl
oade
d fr
om w
ww
.nrc
rese
arch
pres
s.co
m b
y 70
.53.
64.1
50 o
n 06
/04/
14Fo
r pe
rson
al u
se o
nly.
91 4
Table 6. Comparison between experimental and predicted prism strengths.
Can. J. Civ. Eng. Vol. 22, 1995
Lb Test (MPa)
Cheema 25.86 25.86
Drysdale 27.90 25.10 25.10 25.10 20.20
Hamid 19.66 19.66 19.66 19.66 19.66 19.66 19.66 19.66 19.66
Hegemier 35.18 51.04 25.60 25.60
A m f,, (MPa) (MPa) Observed Predicted
f,, (observed)
f,, (predicted)
References Hegemier, G.A., Krishnamorthy, G., Nunn, R.O., and Moorthy,
American Concrete Institute. 1983. Building code requirements for reinforced concrete structures. Detroit, Mich., ACI 318 M-83.
American Concrete Institute. 1988. Building code requirements for masonry structures. Detroit, Mich., ACI 530-88lASCE 5-88.
American Society for Testing and Materials. 1991. ASTM stan- dards in building codes. 28th ed. Philadelphia, Pa.
Boult, B.F. 1979. Concrete masonry prisms testing. Journal of the American Concrete Institute, 76: 5 13 -535.
Canadian Standards Association. 1970. Masonry code of practice. Rexdale, Ont., CSA A224-1970.
Canadian Standards Association. 1984. Masonry design for build- ings. Rexdale, Ont., CAN3-S304-M84.
Cheema, T.S., and Klingner, R.E. 1986. Compressive strength of concrete masonry prisms. Journal of the American Concrete Institute, 83: 88 -97.
Drysdale, R.G., and Hamid, A.A. 1983. Capacity of concrete block masonry prisms under eccentric compressive loading. Journal of the American Concrete Institute, 80: 102- 108.
Ghoneim, T.G.M. 1993. Behavior of concrete masonry prisms under axial compression. M.Sc. thesis, The American Univer- sity in Cairo, Cairo, Egypt.
Hamid, A.A., and Chukwunenye, A.O. 1986. Compression behavior of concrete masonry prisms. ASCE Journal of Struc- tural Engineering, 112: 605 -613.
Hamid, A.A., Drysdale, R.G., and Heidebrecht, A.C. 1978. Effect of grouting on the strength characteristics of concrete block masonry. Proceedings, North American Masonry Conference, University of Colorado, Boulder, Colo., Vol. 11, pp. 1-17.
Harnid, A.A., and Drysdale, R.G. 1979. Suggested failure criteria for grouted concrete masonry under axial compression. Journal of the American Concrete Institute, 76: 1047- 1061.
Hedstrorn, E.G., and Hogan, M.B. 1990. The properties of masonry grout in concrete masonry. Masonry components to assemblages. American Society for Testing and Materials, Philadelphia, Pa., ASTM STP 1063.
T.V. 1978. Prism tests for the compressive strength of concrete masonry. Proceedings, North American Masonry Conference, University of Colorado, Boulder, Colo., Vol. 18, pp. 1 -7.
Swanson Analysis Systems Inc. 1990. Theoretical manual. ANSYS
engineering analysis system, Version 4.4-a. Huntington Beach, Calif.
List of symbols
P C
Pt
~ E P '
Eel
Eu
E0.2
E0.2b
E0.2,
E0.2m
E i
Eib
E i g
Eim
EiP
E r
Esb 3 fbm
f c fcb
fc , fcm
shear strength reduction factor for closed crack shear strength reduction factor for open crack plastic strain increment elastic strain ultimate strain at failure secant modulus of elasticity at 0.2% strain secant modulus of elasticity of block units at 0.2% strain secant modulus of elasticity of grout at 0.2% strain secant modulus of elasticity of mortar at 0.2% strain component initial modulus of elasticity initial modulus of elasticity of block units initial modulus of elasticity of grout initial modulus of elasticity of mortar initial modulus of elasticity of prism relative prism modular ratio secant modulus of elasticity of block units at failure secant modulus of elasticity of prism at failure function of the principal stress state block-mortar strength ratio component compressive strength compressive strength of block units compressive strength of grout compressive strength of mortar
Can
. J. C
iv. E
ng. D
ownl
oade
d fr
om w
ww
.nrc
rese
arch
pres
s.co
m b
y 70
.53.
64.1
50 o
n 06
/04/
14Fo
r pe
rson
al u
se o
nly.
Fahmy and Ghoneim
f,, compressive strength of prism fgroSs block compressive strength based on the gross cross-
sectional area f,,, block compressive strength based on the net cross-
sectional area f ungrouted prism relative strength fjb relative strength ratio f, material tensile strength ftb tensile strength of block unit material f,, tensile strength of grout f, tensile strength of mortar Lb ultimate compressive strength of block unit material v net-to-gross cross-sectional area of block units (based
on the minimum cross-sectional area of block unit)
block -grout modular ratio block -mortar modular ratio grout -mortar modular ratio relative modular ratio grouted prism relative strength tolerance of plasticity ratio at convergence failure surface vertical stress along the block units vertical stress along the grout vertical stress along the prism unit weight of block unit
Can
. J. C
iv. E
ng. D
ownl
oade
d fr
om w
ww
.nrc
rese
arch
pres
s.co
m b
y 70
.53.
64.1
50 o
n 06
/04/
14Fo
r pe
rson
al u
se o
nly.